Energy saving in airports by trigeneration. Part I: Assessing economic and technical potential
10
Energy saving in airports by trigeneration. Part I: Assessing economic and technical potential E. Cardona * , A. Piacentino, F. Cardona DREAM – Department for Energy and Environmental Researches, Faculty of Engineering, Universita ` di Palermo, Viale delle Scienze, 90128 Palermo, Italy Received 24 March 2005; accepted 27 January 2006 Available online 20 March 2006 Abstract Airports are very energy-intensive areas, because of the large buildings (both terminals and non-passengers areas) equipped with heat- ing and air-conditioning systems, the high power demand for lighting and electric equipment and the energy requests from many facilities within the airport area. The contemporaneous and high demand for power and heat makes cogeneration to represent a viable solution for energy saving; in southern climate zones, however, combined heating, cooling and power (CHCP) systems can lead to even better results. This paper constitutes the first part of a work in two parts; starting from an analysis of typical energy demand profiles in airports, economical and technical criteria to assess the feasibility of trigeneration plants are proposed. Typical results for large airports are also presented. Part II of this work presents an in-depth analysis for the Malpensa 2000 airport, oriented to optimize the design and the oper- ation of the CHCP system. Ó 2006 Elsevier Ltd. All rights reserved. Keywords: Trigeneration; Airports; Energy saving; Feasibility 1. Introduction Energy consumption in airports depends on a large number of factors, so that any attempt to define general criteria for efficiency increase is hazardous. Energy demand depends on both structural (surface, volume, building orientation, external and roof thermal insulation, double glazing, etc.) and operational variables (number of passengers per year, average occupancy levels in air-conditioned areas, seasonal fluctuations in number of passengers, etc.) related to the size of the airport. Also, the climatic conditions play a primary role, depending heating and cooling loads on the fluctuations of external temperature. A significant contribution to the overall energy demand derives from the facilities usually situated within the air- port area, like restaurants, shopping centres, baggage stores, etc. Even if energy cost accounts for only 3–5% of airports’ variable cost, the absolute values of energy consumption are very significant; thus, large margins for increase in energy efficiency exist, which have been analysed by many experts in transportation and energy systems [1,2]. A sys- tematic approach to energy saving requires a qualitative and quantitative analysis of heat, cooling and power loads. The actions oriented to increase the overall energy effi- ciency in airports can be classified as follows: • Low or no-cost actions: abatement of inefficiencies in energy transportation and use (heat losses in pipelines, malfunction of control and regulation system, etc.), training of new skills in energy management among employees or improvements in the monitoring and tar- geting system, with sophisticated controls and periodical energy auditing. Investigations for UK airports [1] revealed a significant potential for such actions. 1359-4311/$ - see front matter Ó 2006 Elsevier Ltd. All rights reserved. doi:10.1016/j.applthermaleng.2006.01.019 * Corresponding author. Tel./fax: +39 091 236113. E-mail address: [email protected] (E. Cardona). www.elsevier.com/locate/apthermeng Applied Thermal Engineering 26 (2006) 1427–1436
-
Upload
independent -
Category
Documents
-
view
1 -
download
0
Transcript of Energy saving in airports by trigeneration. Part I: Assessing economic and technical potential
www.elsevier.com/locate/apthermeng
Applied Thermal Engineering 26 (2006) 1427–1436
Energy saving in airports by trigeneration. Part I: Assessingeconomic and technical potential
E. Cardona *, A. Piacentino, F. Cardona
DREAM – Department for Energy and Environmental Researches, Faculty of Engineering, Universita di Palermo,
Viale delle Scienze, 90128 Palermo, Italy
Received 24 March 2005; accepted 27 January 2006Available online 20 March 2006
Abstract
Airports are very energy-intensive areas, because of the large buildings (both terminals and non-passengers areas) equipped with heat-ing and air-conditioning systems, the high power demand for lighting and electric equipment and the energy requests from many facilitieswithin the airport area. The contemporaneous and high demand for power and heat makes cogeneration to represent a viable solutionfor energy saving; in southern climate zones, however, combined heating, cooling and power (CHCP) systems can lead to even betterresults. This paper constitutes the first part of a work in two parts; starting from an analysis of typical energy demand profiles in airports,economical and technical criteria to assess the feasibility of trigeneration plants are proposed. Typical results for large airports are alsopresented. Part II of this work presents an in-depth analysis for the Malpensa 2000 airport, oriented to optimize the design and the oper-ation of the CHCP system.� 2006 Elsevier Ltd. All rights reserved.
Keywords: Trigeneration; Airports; Energy saving; Feasibility
1. Introduction
Energy consumption in airports depends on a largenumber of factors, so that any attempt to define generalcriteria for efficiency increase is hazardous.
Energy demand depends on both structural (surface,volume, building orientation, external and roof thermalinsulation, double glazing, etc.) and operational variables(number of passengers per year, average occupancy levelsin air-conditioned areas, seasonal fluctuations in numberof passengers, etc.) related to the size of the airport. Also,the climatic conditions play a primary role, dependingheating and cooling loads on the fluctuations of externaltemperature.
A significant contribution to the overall energy demandderives from the facilities usually situated within the air-
1359-4311/$ - see front matter � 2006 Elsevier Ltd. All rights reserved.
doi:10.1016/j.applthermaleng.2006.01.019
* Corresponding author. Tel./fax: +39 091 236113.E-mail address: [email protected] (E. Cardona).
port area, like restaurants, shopping centres, baggagestores, etc.
Even if energy cost accounts for only 3–5% of airports’variable cost, the absolute values of energy consumptionare very significant; thus, large margins for increase inenergy efficiency exist, which have been analysed by manyexperts in transportation and energy systems [1,2]. A sys-tematic approach to energy saving requires a qualitativeand quantitative analysis of heat, cooling and power loads.The actions oriented to increase the overall energy effi-ciency in airports can be classified as follows:
• Low or no-cost actions: abatement of inefficiencies inenergy transportation and use (heat losses in pipelines,malfunction of control and regulation system, etc.),training of new skills in energy management amongemployees or improvements in the monitoring and tar-geting system, with sophisticated controls and periodicalenergy auditing. Investigations for UK airports [1]revealed a significant potential for such actions.
Nomenclature
ATD aggregate thermal demandATDboil fraction covered by the auxiliary boilerATDCHP fraction covered by heat recovery from the en-
gineC costCcool cooling demandCHP combined heat and powerCHCP combined heat cooling and powerDGH distributed generation with heatE electric demandEexch. energy exchange with the gridEI energy intensityF fuelFLOT full load operation timeH heat productionHLV lower heat value [MJ/kg or MJ/N m3]i interest rateIC specific installed capacityMPE market price for electricity purchase [€/kWhe]MPfuel market price for fuel [€/kg or € Nm3]MPexch. electricity price, coincident with MPel when pur-
chased from the grid, negative when soldNCC net cash flow
Ntr number of transits [passengers/year]pax passengerPHRuser power to heat ratio, on the demand sidePHRprime mover ratio between power and heat recovery
from prime moverSopt. optimal sizeSs spark-spreadTDD thermal demand for direct usesTDM, EDM thermal and electric demand managementTPEC total primary energy consumptionYEC specific yearly energy consumption
Greek letters
ge,av. average efficiency of the national generation sys-tem
ge electric efficiencygt thermal efficiency
Subscripts
marg marginal (CHCP system over conventional one)energy related to energy flowsmaint maintenanceamortization related to amortization of investment
Table 1Typical values of specific installed capacity and energy consumption inairports
Electricity Heat Cooling
IC 0.5–0.8 kWe/pax 50–160 Wt/m2 50–200 Wc/m
3
YEC 4.5–5.8 kW he/pax 30–55 kW ht/m3 20–40 kW hc/m
3
1428 E. Cardona et al. / Applied Thermal Engineering 26 (2006) 1427–1436
• High cost/long term actions: actions based on retrofit-ting the technology with major changes in the philoso-phy of energy conversion, like the adoption of a CHPsystem or the use of thermal wheels and run-aroundcoils in place of traditional energy systems. Large bene-fits can be achieved, but these actions are very expensiveand risky and should be considered after implementingthose in the above two categories.
In this paper the economic and technical feasibility ofCHCP plants in airports is discussed.
Today, CHP and CHCP plants are operating in manyairports all over the world; best examples are the90 MWe CHP plant at the JFK airport (New York), the50 MWe CHP plant at Heathrow (London), the 50 MWe
CHCP plant at Malpensa (Milan) and the 40 MWe CHCPplant at Kuala Lumpur. However, we will show that air-ports are very suitable for CHCP applications and a largerspread can be expected.
2. Energy demand in airports
Because of the large differences in energy demandamong airports, a feasibility study should be performedfor each case study with ad hoc considerations. However,in this work some outlines on CHCP applications in air-ports are proposed, starting from a statistical distributionof available energy consumption data.
Energy demand in airports is correlated to many factors;among these, heat losses by air infiltration and lossestrough windows and roofs (and thus related to the heatedor air-conditioned surface and volume) are prevalent. InTable 1 average values for installed capacity and yearlyenergy consumption are presented [3].
In Table 2 characteristic data for a restricted number ofairports in Italy are presented.
The wide ranges indicated for the specific energy con-sumption in Table 1 are due to the large differences in ther-mal transmittance of walls and roofs, in the use of highefficiency lighting systems, etc. Furthermore, energydemand in airports can widely vary year by year, depend-ing on eventual variations in the number of passengersand facilities: most airports are growing much faster thanthe economy as a whole, and this requires large efforts toforecast demand [4] and frequent increases in the energysupply as well. Therefore, when designing a CHCP plantfor airports a modular approach should be adopted, likein most of CHCP installations in airports all over the world
Table 2Main data of the examined airports
Passengersper year(2003)(103 units)
Heated andair-conditionedareas (m2)
Latitude
Airport no. 1:Malpensa 2000,Milan
26.000 329.000 45�39 0 North
Airport no. 2:Fiumicino,Rome
27.900 285.000 41�46 0 North
Airport no. 3:Falcone andBorsellino, Palermo
3.400 38�11 0 North
E. Cardona et al. / Applied Thermal Engineering 26 (2006) 1427–1436 1429
which usually consist of several small groups to cover thegrowing energy demand. In the meantime, a modularapproach enhances the reliability of supply, which is amain concern for airports.
Another important aspect when sizing the plant regardsthe shape of energy demand profiles. A regular profilethroughout the year favours the CHCP feasibility, allowingto operate the plant at high load levels in CHCP mode formost of the year. As said, number of passengers (whichinfluences both the electrical demand and the internal loadfor air-conditioning), heat transfer trough the building
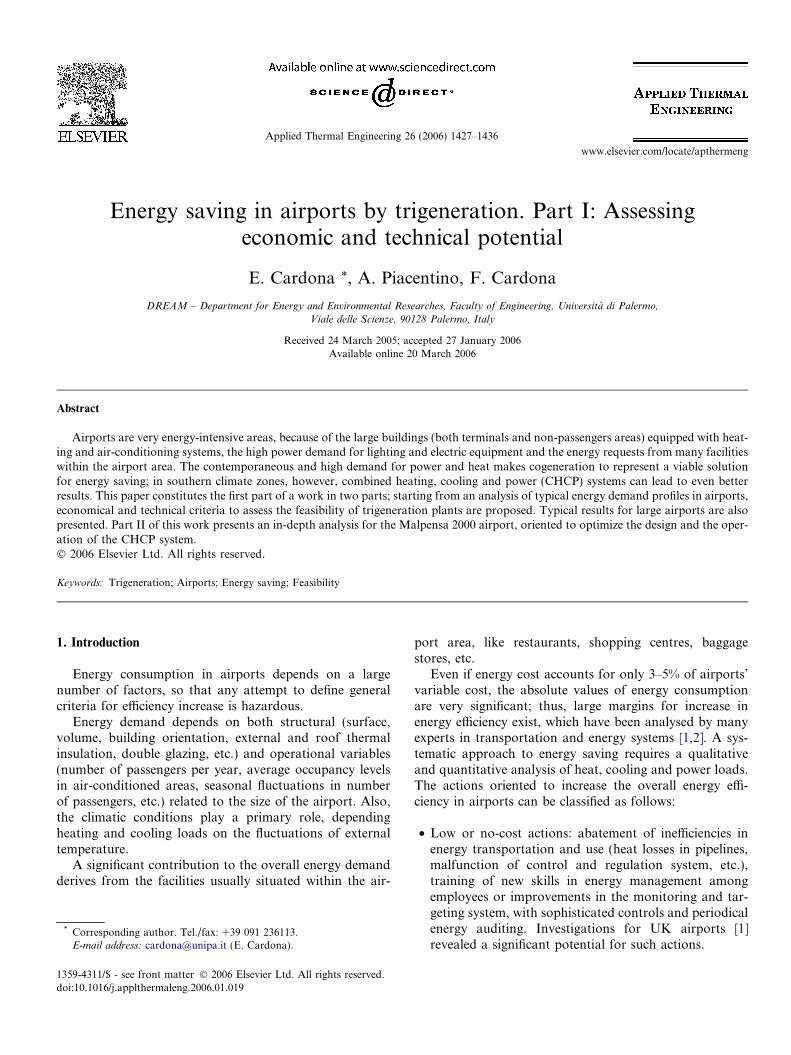
Fig. 1. Monthly passenger traffic in (a) large international airports: New YPalermo—Falcone–Borsellino, Malaga, Nice-Cote d’Azur.
envelope and lighting are the main factors contributing tothe overall energy demand. In Fig. 1a and b the passengerstraffic in six airports all over the world is presented. InFig. 1a very large international airports are presented, withover 25 million passengers per year, whilst those to whichFig. 1b is referred are smaller airports, with less than 11million passenger per year. As evident, the traffic trendsof large airports is more regular, while large fluctuationscan be observed in the small airports’ traffic, due to theinfluence of seasonal tourism.
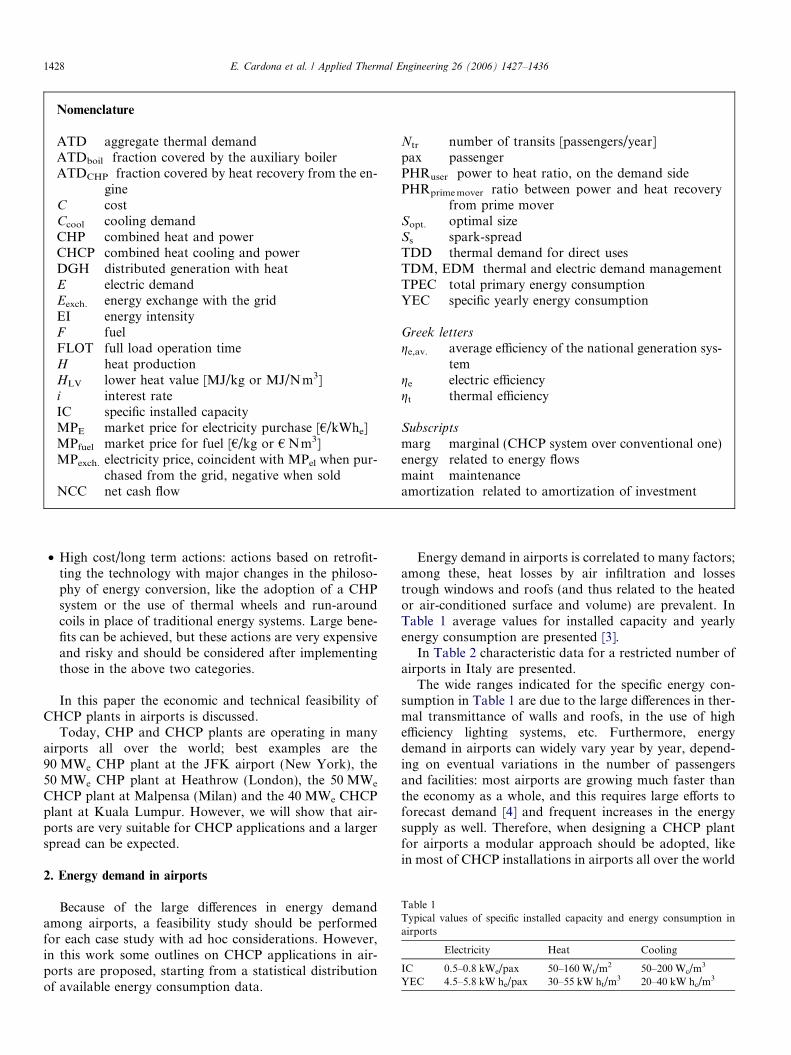
Basing on our experience, we can thus affirm that inlarge airports major opportunities for CHCP applicationsexist, because of the higher required capacity and the moreregular demand profiles. CHCP applications in small air-ports usually lead to longer payback periods; however,each case should be investigated separately, because alsoin small airports CHCP can represent a viable solution infavourable tariff contexts. In Fig. 2a–c the energy demandprofiles in the Italian airports referred to in Table 2 are rep-resented on monthly basis.
In Fig. 2a, bars in black and in white-dotted respectivelyrepresent the direct thermal loads and the heat consump-tion for feeding an absorption chiller covering the wholecooling demand; this indirect heat demand makes the over-all heat demand profile much more regular. The electricdemand monthly profile, represented in Fig. 2c, is also very
ork—JFK, Rome—Fiumicino, London—Heathrow, (b) small airports:
Fig. 2. Monthly energy consumption for (a) heat, (b) cooling, (c) electricity.
1430 E. Cardona et al. / Applied Thermal Engineering 26 (2006) 1427–1436
regular because electric load is related to quite constantactivities 12 month a year.
The daily demand profiles (not represented here) forheat and cooling are quite regular (variations up to+20%/�20% with respect to the average value), with littleincreases during morning or afternoon, depending on thebuildings’ orientation. The electric load daily profile ischaracterised by higher power requests during the evening,with a demand leap when the lighting system of runwaysand control tower lights up. Obviously, some electric loadsrequire a very high safety of supply; hence, dedicatedengines or inverter groups (consisting of a rectifier, a stor-age battery package and an inverter) are usually availablefor energy supply in case of power grid failures.
Despite this quantitative analysis of energy consumptionin airports, a qualitative analysis is needed to assess whethera CHCP system can comply with all energy requests. Mostairports are provided with central systems for hot or warmwater production (usually natural gas or diesel oil fuelledboilers) and for cooling (large electric chillers); power isusually purchased at 15–20 kV. All-air systems are mainlyadopted, with air-treatment units where temperature andhumidity are adjusted; a typical range of temperature forthe heat exchanges in such units is 85–70 �C.
Water temperature in the cooling jacket circuit of recip-rocating engines typically exceeds these values, being suffi-cient for feeding the air-heating system; heat recoveryfrom this circuit amounts to 20–30% of the energy input
E. Cardona et al. / Applied Thermal Engineering 26 (2006) 1427–1436 1431
by fuel. In gas turbines the whole heat recovery is fromexhaust gases, at a much higher temperature. Dependingon the cooling demand levels, a single or a double effect lith-ium bromide absorption chiller can be installed, producing5–7 �C cold water for the air-treatment units. Single effectabsorption chiller require super-heated feeding water at120–130 �C or low pressure steam (typically 70–90 kPa);only high temperature heat recovery from exhaust gases iscompatible with the temperature required by absorptionchillers.
3. Technical feasibility of CHCP in airports
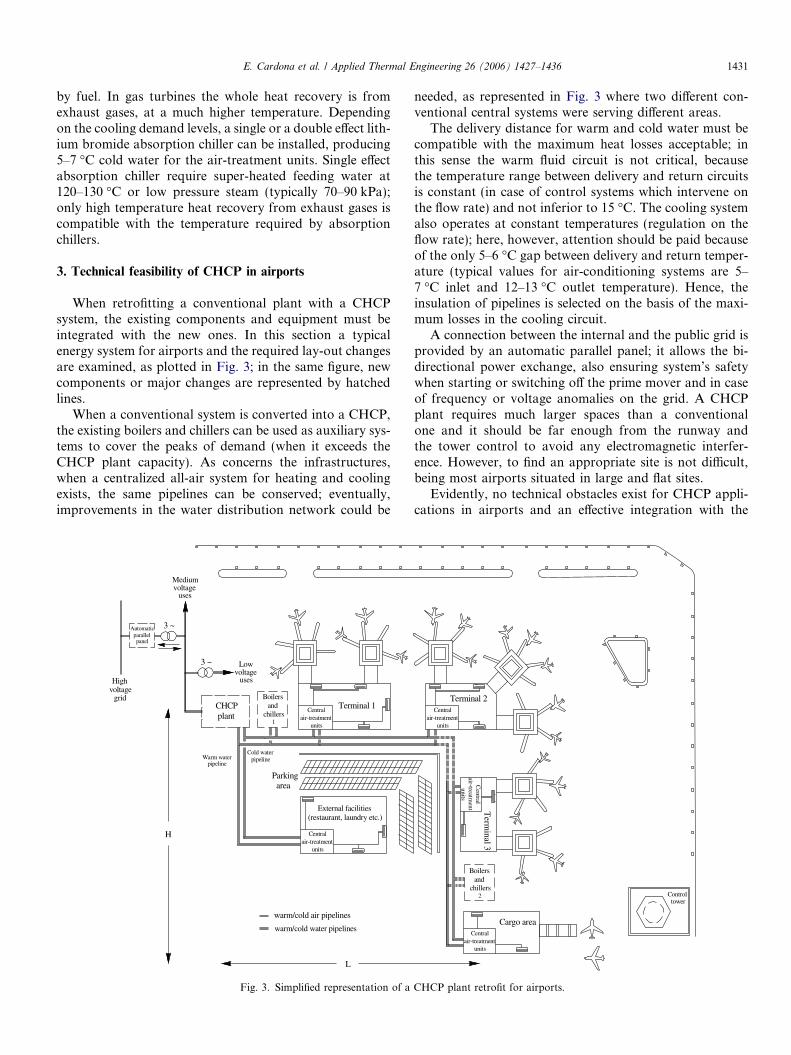
When retrofitting a conventional plant with a CHCPsystem, the existing components and equipment must beintegrated with the new ones. In this section a typicalenergy system for airports and the required lay-out changesare examined, as plotted in Fig. 3; in the same figure, newcomponents or major changes are represented by hatchedlines.
When a conventional system is converted into a CHCP,the existing boilers and chillers can be used as auxiliary sys-tems to cover the peaks of demand (when it exceeds theCHCP plant capacity). As concerns the infrastructures,when a centralized all-air system for heating and coolingexists, the same pipelines can be conserved; eventually,improvements in the water distribution network could be
Terminal 1
Parking area
External facilities(restaurant, laundry etc.)
Boilersand
chillers1
Centralair-treatment
units
air-treatmentunits
Central
CHCP plant
Warm waterCold water
pipelinepipeline
Highvoltage
grid
3 ~
Mediumvoltage
uses
3 ~ Lowvoltage
uses
L
H
Automaticparallelpanel
warm/cold air pipelines
warm/cold water pipelines
Fig. 3. Simplified representation of a
needed, as represented in Fig. 3 where two different con-ventional central systems were serving different areas.
The delivery distance for warm and cold water must becompatible with the maximum heat losses acceptable; inthis sense the warm fluid circuit is not critical, becausethe temperature range between delivery and return circuitsis constant (in case of control systems which intervene onthe flow rate) and not inferior to 15 �C. The cooling systemalso operates at constant temperatures (regulation on theflow rate); here, however, attention should be paid becauseof the only 5–6 �C gap between delivery and return temper-ature (typical values for air-conditioning systems are 5–7 �C inlet and 12–13 �C outlet temperature). Hence, theinsulation of pipelines is selected on the basis of the maxi-mum losses in the cooling circuit.
A connection between the internal and the public grid isprovided by an automatic parallel panel; it allows the bi-directional power exchange, also ensuring system’s safetywhen starting or switching off the prime mover and in caseof frequency or voltage anomalies on the grid. A CHCPplant requires much larger spaces than a conventionalone and it should be far enough from the runway andthe tower control to avoid any electromagnetic interfer-ence. However, to find an appropriate site is not difficult,being most airports situated in large and flat sites.
Evidently, no technical obstacles exist for CHCP appli-cations in airports and an effective integration with the
Terminal 2
Term
inal3
Cargo area
chillersand
Boilers
2
Central
unitsair-treatment
Central
unitsair-treatment
unitsair-treatm
entC
entral
Controltower
CHCP plant retrofit for airports.

Table 4Average efficiencies of CHP units
Electricefficiency,ge (%)
Thermalefficiency,gt (%)
PHRprime mover
Otto cycle reciprocate engine 30–37 40–48 0.6–0.9Diesel cycle reciprocate engine 32–40 36–46 0.7–1Gas turbine 27–35 40–45 0.6–0.8
1432 E. Cardona et al. / Applied Thermal Engineering 26 (2006) 1427–1436
existing energy system can significantly reduce the cost ofthe plant retrofit.
4. Economic feasibility of CHCP systems
Economics of CHCP application is a complex issue,the profitability depending on plant design, operationcriteria and external variables (energy prices and eventualtax exemptions); hence, no general rules for the eco-nomic feasibility are valid for airports all over the world.A primary role is played by the so called spark-spread, adimensionless parameter expressing the inherent conve-nience in electricity production from fossil fuels, definedas follows:
Ss ¼MPE
1ge;av. �
3:6HLV�MPfuel
ð1Þ
where the 3.6 factor is introduced to compare homogenousquantities. In Italy, for instance, a high Ss value makes usu-ally CHP systems a viable solution, more than in othercountries where the electricity price is lower [5].
Let now investigate whether the energy demand in air-ports is intrinsically suitable for CHCP. With reference toFig. 2a and c and considering the slight demand variabilitywithin each month, the average power to heat ratios(PHRs) for the examined Italian airports were calculated(see Table 3).
These values were compared with the typical PHR ofcommercial CHP derived from the results of many investi-gations on the technical features of prime movers availablein literature [6,7] and summarised in Table 4. The averagepower to heat ratios during the year maintains close to thetypical values (similar for all the examined technologies) ofcommercial CHP groups; hence, no general preference fora CHP technology over the others can be expressed basingon its peculiar PHR. The choice is primarily driven by thedemand levels; for systems with capacity from 500 kWe upto 30–40 MWe it is convenient to use reciprocating engines(unit size up to 1–2 MWe, total capacity up to 5–8 MWe) orgas turbines, eventually coupling two or more groupsaccording to the suggested modular approach. Only in verylarge airports steam turbines are installed to cover the baseload.
Being the average power to heat ratio in airports close tothe typical values for prime movers, only little amounts ofheat waste or electricity exchanges with the grid (dependingon the adopted management strategy, i.e. following theheat or the power demand) [8] would occur for most ofthe year. The following equations express this conceptquantitatively:
Table 3Average power to heat ratios in the examined Italian airports
January February March April May June Ju
PHR 0.43 0.41 0.47 0.60 0.59 0.46 0.4
TDM :
Edeficit ¼ ATD � ðPHRprime mover � PHRuserÞif PHRuser < PHRprime mover
Esurplust ¼ ATD � ðPHRuser � PHRprime moverÞif PHRuser > PHRprime mover
8>>><>>>:
ð2Þ
EDM :
H aux. boiler ¼ E � 1PHRuser
� 1PHRprime mover
� �if PHRuser < PHRprime mover
H rejected ¼ E � 1PHRprime mover
� 1PHRuser
� �if PHRuser > PHRprime mover
8>>>>><>>>>>:
ð3Þ
Thus, one of the main CHCP design criteria oriented to thechoice of a prime mover with a PHRprime mover close to theaverage PHRuser can be easily fulfilled for applications inairports. Referring to a parameter commonly used for theassessment of CHP feasibility in new applications [8], wederived:
DGHairports P 0:8 ð4Þwhere
DGH ¼P8760
j¼1 IfEj
PHRprime mover�ATDj> 1
� �; 1;
Ej
PHRprime mover�ATDj
h i8760
ð5ÞBeing 0.8 a very high value for applications in the tertiarysector, Eq. (4) suggests large opportunities for polygenera-tion in airports. The suitability of airports for CHCP appli-cations is also confirmed by the regularity of the aggregateheat demand duration curve derived from the available con-sumption data and represented in Fig. 4a. In Fig. 4b the full
load energy curve is plotted [9], which represents the yearlyenergy amount provided at full load as a function of primemover size. The size Sopt in Fig. 4a and b represents a nearoptimal solution, which allows to operate the prime moverat full load for most of year and to cover most of yearly en-ergy demand. The typical duration curve for airports ismore regular than in other sectors [9–11], suggesting largermargins for an effective operation of CHCP systems.
As we said, the energetic convenience to adopt trigener-ation plants does not imply their economic feasibility; itensures large margins for energy savings (most technolo-
ly August September October November December
8 0.49 0.54 0.63 0.61 0.56
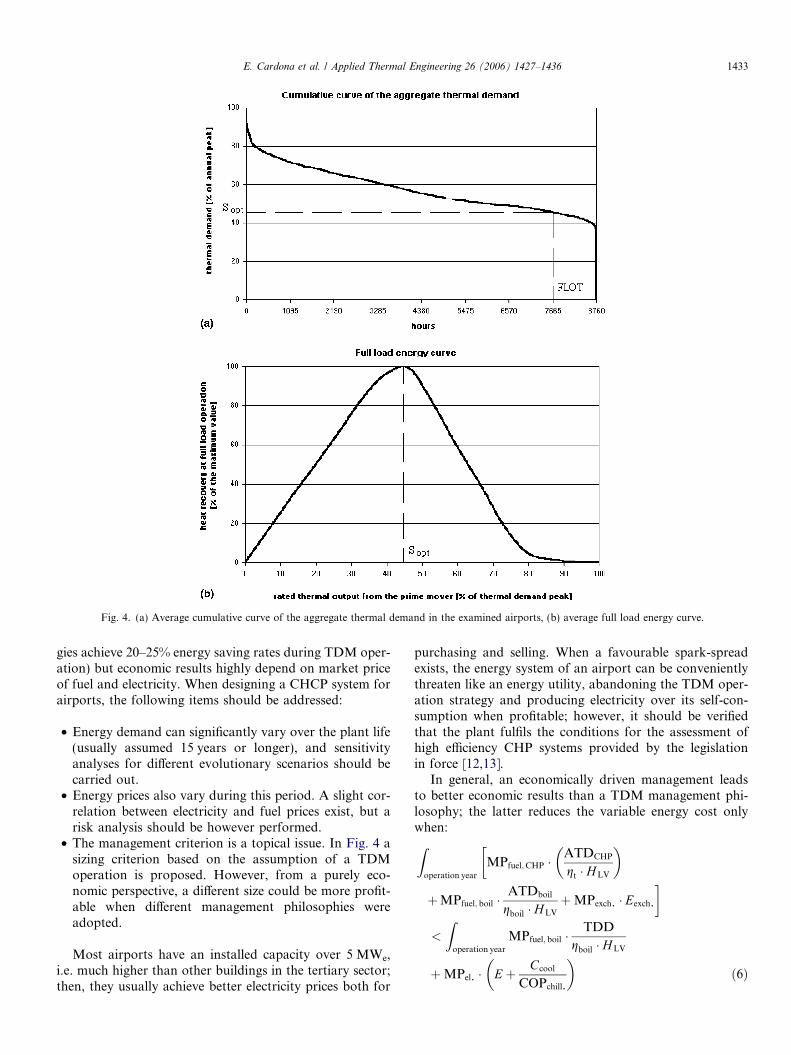
Fig. 4. (a) Average cumulative curve of the aggregate thermal demand in the examined airports, (b) average full load energy curve.
E. Cardona et al. / Applied Thermal Engineering 26 (2006) 1427–1436 1433
gies achieve 20–25% energy saving rates during TDM oper-ation) but economic results highly depend on market priceof fuel and electricity. When designing a CHCP system forairports, the following items should be addressed:
• Energy demand can significantly vary over the plant life(usually assumed 15 years or longer), and sensitivityanalyses for different evolutionary scenarios should becarried out.
• Energy prices also vary during this period. A slight cor-relation between electricity and fuel prices exist, but arisk analysis should be however performed.
• The management criterion is a topical issue. In Fig. 4 asizing criterion based on the assumption of a TDMoperation is proposed. However, from a purely eco-nomic perspective, a different size could be more profit-able when different management philosophies wereadopted.
Most airports have an installed capacity over 5 MWe,i.e. much higher than other buildings in the tertiary sector;then, they usually achieve better electricity prices both for
purchasing and selling. When a favourable spark-spreadexists, the energy system of an airport can be convenientlythreaten like an energy utility, abandoning the TDM oper-ation strategy and producing electricity over its self-con-sumption when profitable; however, it should be verifiedthat the plant fulfils the conditions for the assessment ofhigh efficiency CHP systems provided by the legislationin force [12,13].
In general, an economically driven management leadsto better economic results than a TDM management phi-losophy; the latter reduces the variable energy cost onlywhen:Z
operation year
MPfuel;CHP �ATDCHP
gt � H LV
� ��
þMPfuel; boil �ATDboil
gboil � H LV
þMPexch. � Eexch.
�
<
Zoperation year
MPfuel; boil �TDD
gboil � H LV
þMPel. � E þ Ccool
COPchill.
� �ð6Þ
1434 E. Cardona et al. / Applied Thermal Engineering 26 (2006) 1427–1436
Finally, different criteria can be adopted (net present value,payback period, etc.) to compare the capital cost of theCHCP system and the increased operation and mainte-nance cost with the reduction in the variable energy cost.
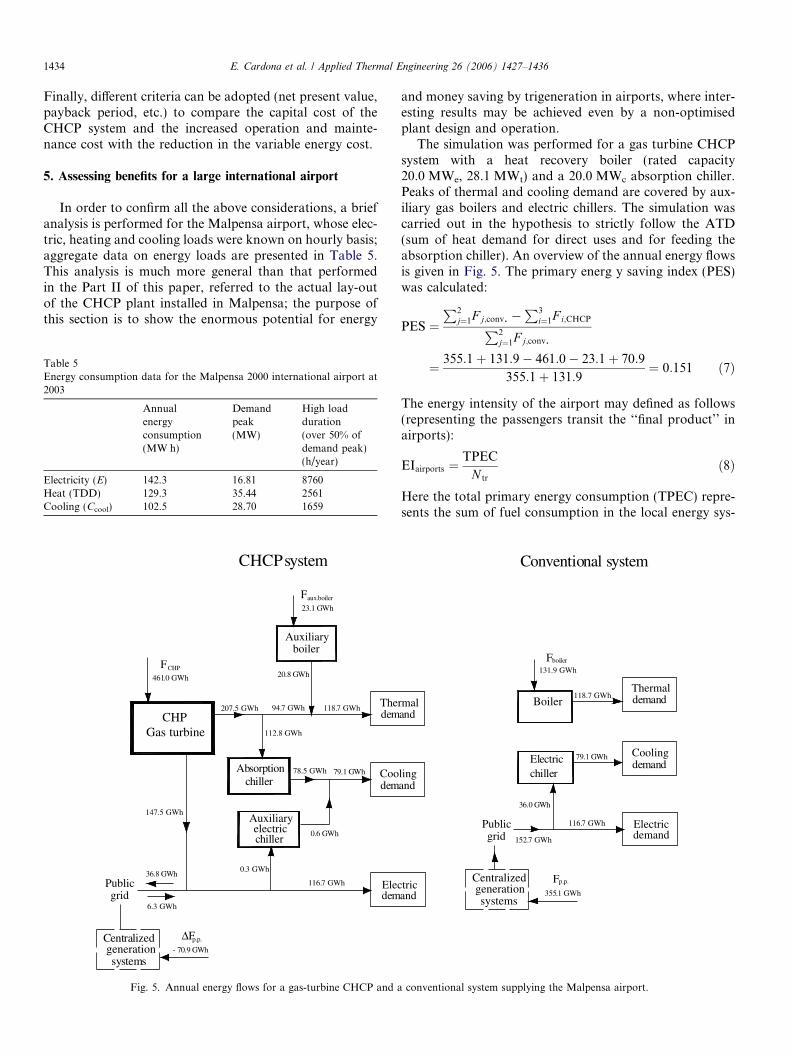
5. Assessing benefits for a large international airport
In order to confirm all the above considerations, a briefanalysis is performed for the Malpensa airport, whose elec-tric, heating and cooling loads were known on hourly basis;aggregate data on energy loads are presented in Table 5.This analysis is much more general than that performedin the Part II of this paper, referred to the actual lay-outof the CHCP plant installed in Malpensa; the purpose ofthis section is to show the enormous potential for energy
The
Elec
Coodem
dem
dem
Auxiliaryboiler
Absorptionchiller
electricAuxiliary
chiller
Publicgrid
116.7 GWh
147.5 GWh
207.5 GWh 94.7 GWh 118.7 GWh
20.8 GWh461.0 GWh
112.8 GWh
78.5 GWh 79.1 GWh
6.3 GWh
0.3 GWh
CHPGas turbine
36.8 GWh
0.6 GWh
23.1 GWh
CHCP system
Faux.boiler
F
ΔF
CHP
p.p.
- 70.9 GWh
systemsgeneration
Centralized
Fig. 5. Annual energy flows for a gas-turbine CHCP and a
Table 5Energy consumption data for the Malpensa 2000 international airport at2003
Annualenergyconsumption(MW h)
Demandpeak(MW)
High loadduration(over 50% ofdemand peak)(h/year)
Electricity (E) 142.3 16.81 8760Heat (TDD) 129.3 35.44 2561Cooling (Ccool) 102.5 28.70 1659
and money saving by trigeneration in airports, where inter-esting results may be achieved even by a non-optimisedplant design and operation.
The simulation was performed for a gas turbine CHCPsystem with a heat recovery boiler (rated capacity20.0 MWe, 28.1 MWt) and a 20.0 MWc absorption chiller.Peaks of thermal and cooling demand are covered by aux-iliary gas boilers and electric chillers. The simulation wascarried out in the hypothesis to strictly follow the ATD(sum of heat demand for direct uses and for feeding theabsorption chiller). An overview of the annual energy flowsis given in Fig. 5. The primary energ y saving index (PES)was calculated:
PES ¼P2
j¼1F j;conv. �P3
i¼1F i;CHCPP2j¼1F j;conv.
¼ 355:1þ 131:9� 461:0� 23:1þ 70:9
355:1þ 131:9¼ 0:151 ð7Þ
The energy intensity of the airport may defined as follows(representing the passengers transit the ‘‘final product’’ inairports):
EIairports ¼TPEC
N tr
ð8Þ
Here the total primary energy consumption (TPEC) repre-sents the sum of fuel consumption in the local energy sys-
rmal
tric
lingand
and
and
demand
Electricdemand
demandCooling
Thermal
Electricchiller
Publicgrid
Boiler118.7 GWh
79.1 GWh
116.7 GWh
36.0 GWh
152.7 GWh
355.1 GWh
131.9 GWh
Conventional system
Fp.p.
boilerF
Centralizedgenerationsystems
conventional system supplying the Malpensa airport.
E. Cardona et al. / Applied Thermal Engineering 26 (2006) 1427–1436 1435
tem and in a power plant eventually supplying the airportwith electricity.
The CHCP system reduces significantly the energyintensity:
EIconv. ¼487:0 GW h=year
26� 106 passengers=year
¼ 18:7kW h
passenger;
EICHCP ¼413:2 GW h=year
26� 106 passengers=year
¼ 15:9kW h
passengerð9a; bÞ
Assuming 225 gCO2/kW ht emission for the boilers,500 gCO2/kWhe for electricity production in natural gaspower plants [14] and 650 gCO2/kWhe emission for theCHP gas turbine, the emission reduction results:
DCO2 ¼ 17; 182 ton=year ¼ 16:7%CO2;conv. system ð10Þ
The profitability condition can be expressed as follows:
NCCmarg ¼ DCenergy þ DCmaint þ DCamortization 6 0 ð11Þ
For a rough estimation the increased maintenance cost canbe neglected, because energy costs are largely prevalent.Assuming 14 M€ investment for the system, 15 years plantlife cycle and 5% interest rate, we have:
DCamortization ¼ Ci �i � ð1þ iÞ15
ð1þ iÞ15 � 1ffi 1:35� 106 €=year ð12Þ
The energy cost variation depends on electricity and natu-ral gas prices; assuming coincident the purchasing and sell-ing price of electricity (which is a realistic assumption forlarge installations), we have:
DCenergy ¼ Cenergy;CHCP � Cenergy;conv.
¼ 3:6� 106
HLV
ð461:0þ 23:1ÞMPfuel
� 30:5� 106MPE �3:6� 106
H LV
� 131:9MPfuel
� 152:7� 106MPE ¼3:6� 106
HLV
� 352:2MPfuel
� 183:2� 106MPE ð13Þ
where MPE represents the weighted average price of elec-tricity. From Eqs. (11)–(13) we obtain:
3:6� 106
HLV
� 352:2MPfuel � 183:2� 106MPE þ 1:35� 1066 0
) MPE P3:6� 352:2
183:2 �H LV
MPfuel þ 0:0073 ð14Þ
and considering the definition of SS provided in Eq. (1), theprofitability condition finally becomes:
SS PH LV � ge
3:6� 6:92
H LV
þ 0:0073
MPfuel
� �
) SS P 1:92ge þ0:0073 � H LV � ge
3:6MPfuel
ð15Þ
The two elements at the right side of Eq. (15) represent theminimum spark-spread needed to cover the fuel cost andthe capital investment, respectively. Assuming a 0.32 elec-tric efficiency, a 0.78 total efficiency and a 0.19 € Nm3 fuelprice, a minimum 0.74 value for the spark-spread is deter-mined, which represents the lower limit for the economicviability. Actually, the SS for CHP application in Italy usu-ally exceeds 1.1–1.3, being proven the economic feasibilityof the CHCP plant.
It was shown that even a non-optimized CHCP systemmay achieve significant primary energy saving and reduc-tion in pollutants’ emissions and cost; this testifies the largepotential of trigeneration plants for airports.
6. Conclusions
In this work the technical and economical viability ofCHCP systems for energy supply in airports was discussed,starting from an analysis of energy consumption dataavailable for three airports in Italy; no obstacles were rec-ognized for the technical feasibility of CHCP. The averageratio between electric and thermal load in airports is suit-able to make CHCP systems operate with small heat wasteor energy exchanges with the grid; also, the load energyduration curve revealed the opportunity for a regularannual operation in airports. A feasibility analysis per-formed for a non-optimized CHCP system predicted alarge potential for primary energy saving and reductionin operating cost and pollutants’ emissions. As concernsthe economical feasibility, a proper plant lay-out andmanagement strategy should be adopted; this issue isextensively examined for a particular case in Part II of thiswork.
References
[1] UK Sustainable Cities and Aviation Network, Energy Management,Available online at the SCAN-UK official web-site: <http://www.scan-uk.mmu.ac.uk/Topics/energy.html>.
[2] P. Upham, A comparison of sustainability theory with UK andEuropean airports policy and practice, Journal of EnvironmentalManagement 63 (2001) 237–248.
[3] C.A. Balaras, E. Dascalaki, A. Gaglia, K. Droutsa, Energy conser-vation potential. HVAC installations and operational issues inHellenic airports, Energy and Buildings 35 (2003) 1105–1120.
[4] V.A. Profillidis, Econometric and fuzzy models for the forecast ofdemand in the airport of Rhodes, Journal of Air TransportManagement 6 (2000) 95–100.
[5] E. Cardona, S. Culotta, CHOSE – Energy Saving by Combined Heat,Cooling and Power Plants in the Hotel Sector, Save II Program –Contract No. XVII/4.1031/Z/98-036, Bruxelles, May 2001.
[6] ONSITE SYCOM, Review of Combined Heat and Power Technol-ogies, grant number 98R030974 with the US Department of Energy,Office of Energy Efficiency, October 1999, Available online at theweb-site: <www.distributed-generation.com/Library/CHP.pdf>.

1436 E. Cardona et al. / Applied Thermal Engineering 26 (2006) 1427–1436
[7] E. Cardona, A. Piacentino, DABASI – WWW promotion of energysaving by CHCP plants – Database and Evaluation, Save II Program– Contract No. 4.1031/Z//02-060, January 2005.
[8] M. Czachorski, W. Ryan, J. Kelly, Building load profiles and optimalCHP systems, ASHRAE Transactions: Symposia HI-02-5-5 682-690,2002.
[9] E. Cardona, A. Piacentino, A methodology for sizing a trigenerationplant in mediterranean areas, Applied Thermal Engineering 23 (13)(2003) 1665–1680.
[10] E. Cardona, A. Piacentino, Design and management of CHCP plantsfor hospitals, in: Proc. 58� National ATI Conference, Padova 2003,September, vol. III, pp. 1745–1756 (in Italian).
[11] E. Cardona, A. Piacentino, A validation methodology for a combinedheating cooling and power (CHCP) pilot plant, Journal of EnergyResources Technology 126 (4) (2004) 285–292.
[12] Directive 2004/8/EC of the European Parliament and of the Coun-cil, Official Journal of the European Union L 52 (50–60) – 21.02.2004.
[13] E. Cardona, A. Piacentino, Cogeneration: a regulatory frameworktoward growth, Energy Policy 33 (16) (2005) 2100–2111.
[14] Environmental emissions from energy technology systems: the totalfuel cycle, in: Proc. IEA/OECD Expert Seminar, Paris, 1989.