Energy demand and environmental implications in urban transport — Case of Delhi
10
Pergamon Atmospheric Environment Vol. 30, No. 3, pp. 403412, 1996 Copyright 0 1995 Ekvier Science Ltd Printed in Great Britain. All rights reserved 1352-2310/96 $15.00 + 0.00 13522310(95)00111-5 ENERGY DEMAND AND ENVIRONMENTAL IMPLICATIONS IN URBAN TRANSPORT-CASE OF DELHI RANJAN KUMAR BOSE Tala Energy Research Institute, India Habitat Centre, Lodi Road, New Delhi-3, India (First received 18 November 1992 and in final form 1 February 1995) Abstract-A simple model of passenger transport in the city of Delhi has been developed using a computer- based software called-Long Range Energy Alternatives Planning (LEAP) and the associated Environ- mental Database (EDB) model. The hierarchical structure of LEAP represents the traffic patterns in terms of passenger travel demand, mode (rail/road), type of vehicle and occupancy (persons per vehicle). Transport database in Delhi together with fuel consumption values for the vehicle types, formed the basis of the transport demand and energy consumption calculations. Emission factors corresponding to the actual vehicle types and driving conditions in Delhi is introduced into the EDB and linked to the energy consumption values for estimating total emission of CO, HC, NO,, SO*, Pb and TSP. The LEAP model is used to estimate total energy demand and the vehicular emissions for the base year-1990/91 and extrapolate for the future-1994/95,2000/01,2004/05 and 2009/10, respectively. The model is run under five alternative scenarios to study the impact of different urban transport policy initiatives that would reduce total energy requirement in the transport sector of Delhi and also reduce emission. The prime objective is to arrive at an optimal transport policy which limits the future growth of fuel consumption as well as air pollution. Key word index: Delhi, passenger transport, energy demand, emissions, scenario analysis. INTRODUCTION Air pollution from motor vehicles is one of the most serious and rapidly growing environmental problems in the large cities of the developing world. The in- creasing size of cities and the haphazard growth of work places and re:sidential areas leads to longer and increasing number of trips per person (Bose and Srinivasachary, 19!)2). This in turn leads to higher energy consumption and emission of air pollutants. Insufficient emphasis has been given to public transport in most developing country cities, with a consequent dramatic growth in the numbers of private vehicles and an exacerbation of the energy and environmental problems. However, very little work has been done as yet to assess the environmental implications of urban transport in developing coun- tries. There can be several reasons for this, among these the lack of suitable tools and reliable data for doing the analysis. Paper presented at the: Conference on Urban Thermal Environment, Special in Tohwa, 1992 (CUTEST’92), 7-10 September 1992, Tohwa Institute for Science, Tohwa Uni- versity, Fukuoka, Japan. * Currently a Fulbright Post-doctoral Fellow in the Center for the Advanced Study of India and the School of Engineer- ing and Applied Science, University of Pennsylvania, PhiI- adelphia, U.S.A. The environmental impacts of urban transport are particularly obvious in the huge cities (each over one million population) of India. With increase in income levels, inadequate provision of public transport servi- ces, unconstrained expansion of our cities and minim- al importance given to non-motorized vehicles, the private vehicle population in India has grown by nearly 16 per cent per annum in the last decade (ACMA, 1990). In most major urban centers these private modes will continue to form the predominant transport system in the foreseeable future with conse- quent problems of congestion, higher costs, higher energy consumption and heavy atmospheric pollu- tion. Traffic speeds are also falling leading to in- creased energy consumption. Further, since the road-based systems are dependent on oil, which is imported, it is important for energy planners to plan for greater efficiency of energy use in urban transport which would reduce the oil import bill, and also reduce growing air pollution. The Tata Energy Research Institute (TERI), New Delhi, has studied the problem for several years and has built up a collection of data on the parameters which influence and characterize urban traffic in In- dian cities. A recent collaborative effort with the UNEP Collaborating Centre on Energy and Environ- ment, Riso National Laboratory, Denmark, has ex- ploited this information-along with Long Range En- ergy Alternatives Planning (LEAP) and the associated
-
Upload
independent -
Category
Documents
-
view
0 -
download
0
Transcript of Energy demand and environmental implications in urban transport — Case of Delhi
Pergamon Atmospheric Environment Vol. 30, No. 3, pp. 403412, 1996 Copyright 0 1995 Ekvier Science Ltd
Printed in Great Britain. All rights reserved 1352-2310/96 $15.00 + 0.00
13522310(95)00111-5
ENERGY DEMAND AND ENVIRONMENTAL IMPLICATIONS IN URBAN TRANSPORT-CASE OF DELHI
RANJAN KUMAR BOSE Tala Energy Research Institute, India Habitat Centre, Lodi Road, New Delhi-3, India
(First received 18 November 1992 and in final form 1 February 1995)
Abstract-A simple model of passenger transport in the city of Delhi has been developed using a computer- based software called-Long Range Energy Alternatives Planning (LEAP) and the associated Environ- mental Database (EDB) model. The hierarchical structure of LEAP represents the traffic patterns in terms of passenger travel demand, mode (rail/road), type of vehicle and occupancy (persons per vehicle). Transport database in Delhi together with fuel consumption values for the vehicle types, formed the basis of the transport demand and energy consumption calculations. Emission factors corresponding to the actual vehicle types and driving conditions in Delhi is introduced into the EDB and linked to the energy consumption values for estimating total emission of CO, HC, NO,, SO*, Pb and TSP. The LEAP model is used to estimate total energy demand and the vehicular emissions for the base year-1990/91 and extrapolate for the future-1994/95,2000/01,2004/05 and 2009/10, respectively. The model is run under five alternative scenarios to study the impact of different urban transport policy initiatives that would reduce total energy requirement in the transport sector of Delhi and also reduce emission. The prime objective is to arrive at an optimal transport policy which limits the future growth of fuel consumption as well as air pollution.
Key word index: Delhi, passenger transport, energy demand, emissions, scenario analysis.
INTRODUCTION
Air pollution from motor vehicles is one of the most serious and rapidly growing environmental problems in the large cities of the developing world. The in- creasing size of cities and the haphazard growth of work places and re:sidential areas leads to longer and increasing number of trips per person (Bose and Srinivasachary, 19!)2). This in turn leads to higher energy consumption and emission of air pollutants.
Insufficient emphasis has been given to public transport in most developing country cities, with a consequent dramatic growth in the numbers of private vehicles and an exacerbation of the energy and environmental problems. However, very little work has been done as yet to assess the environmental implications of urban transport in developing coun- tries. There can be several reasons for this, among these the lack of suitable tools and reliable data for doing the analysis.
Paper presented at the: Conference on Urban Thermal Environment, Special in Tohwa, 1992 (CUTEST’92), 7-10 September 1992, Tohwa Institute for Science, Tohwa Uni- versity, Fukuoka, Japan.
* Currently a Fulbright Post-doctoral Fellow in the Center for the Advanced Study of India and the School of Engineer- ing and Applied Science, University of Pennsylvania, PhiI- adelphia, U.S.A.
The environmental impacts of urban transport are particularly obvious in the huge cities (each over one million population) of India. With increase in income levels, inadequate provision of public transport servi- ces, unconstrained expansion of our cities and minim- al importance given to non-motorized vehicles, the private vehicle population in India has grown by nearly 16 per cent per annum in the last decade (ACMA, 1990). In most major urban centers these private modes will continue to form the predominant transport system in the foreseeable future with conse- quent problems of congestion, higher costs, higher energy consumption and heavy atmospheric pollu- tion. Traffic speeds are also falling leading to in- creased energy consumption. Further, since the road-based systems are dependent on oil, which is imported, it is important for energy planners to plan for greater efficiency of energy use in urban transport which would reduce the oil import bill, and also reduce growing air pollution.
The Tata Energy Research Institute (TERI), New Delhi, has studied the problem for several years and has built up a collection of data on the parameters which influence and characterize urban traffic in In- dian cities. A recent collaborative effort with the UNEP Collaborating Centre on Energy and Environ- ment, Riso National Laboratory, Denmark, has ex- ploited this information-along with Long Range En- ergy Alternatives Planning (LEAP) and the associated
404 R. K. BOSE
Environmental Database (EDBtto estimate the en- gram calculates the energy-related emissions over the time ergy demand and emission levels under different scen- horizon considered$.
arios for traffic development in Delhi (Bose, 1993). Under each activity level, five reference years can be
This paper aims to estimate the energy demand in chosen for which the energy demand and environmental emissions are evaluated. LEAP reauires data under each
the passenger transport sector of Delhi, using the activity level for at least the base yiar. For the remaining LEAP model. The energy demand estimates are years the model estimates energy demand and air pollution linked to emission factoryin the EDB to estimate by using a specified growth factor. Alternatively, apart from
the vehicular emissions of different pollutants in the base year data in LEAP, it also requires data for any of
Delhi. The study is restricted to passenger transport. the future years (estimated exogenously) and then by using internolationiextraoolation method. the model can estimate
Energy demand estimates and vehicular emissions are estimated for the years 1990/91 (base year) and extrapolated for-1994195, 2000/01, 2004105 and 2009/10 under five alternative scenarios. The extent of fuel savings and reduction in total emissions are esti- mated under alternative scenarios and then compared with the business-as-usual (BAU) scenario. BAU scen- ario represents a continuation to 2009/10 of present trends of vehicular growth, fuel efficiency norms and modal split pattern.
1 I I
energy demand and emissions. This paper uses the latter method for estimation of energy demand and emission levels in the transport sector of Delhi city.
LEAP@ameworkfor urban transport The specific model for energy demand and emissions by
the transport sector in Delhi using LEAP framework is described in the body of the paper. The four levels are illustrated by a schematic diagram in Fig. 1. The reference years considered for this study are 1990/91 (base year), 1994/95, 2000/01, 2CQ4/05 and 2009/10.
METHODOLOGY Energy demand and emissions
For the energy demand program of LEAP, the TERI
LEAP is an energy-planning system developed by the database for the transport sector of Delhi is analyzed and
Stockholm Environment Institute. Boston (SEI-B). The SYS- compiled under different levels. The first four levels include:
tern includes an EDB which was also devkloped’by SEI-B with additional support from the United Nations Environ- ment Programme (UNEP), and is a joint UNEPjSEI activ- ity. LEAP is an accounting framework, within which the user can create models of demand and supply.
LEAP generalframework The central concept of LEAP is an end-use driven scenario
analysis. In this approach, the computer system is used to analyze the current energy scene and to simulate alternative energy futures along with environmental emissions under a range of user-defined assumptions. Rather than being
??Total passenger travel demand in billion passenger kilo- metre (lo9 pkm or bpkm), under Sector. Travel demand is estimated by multiplying-vehicle population, vehicle utiliz- ation?[ and occupancy level& ??Share of total travel demand catered by road and rail,
under Subsector. ??Share of different types of passenger vehicles (modal
split) with respect to total travel demand, under End-Use. The modal split is worked out on the basis of passenger travel demand catered for different categories of vehicles. ??Inverse of occupancy level or vehicle space per passen-
ger, under Device. a single pre-set of statistically based energy demand models, the LEAP system is a powerful and flexible model-building Under Energy Intensity, fuel efficiency norms associated
tool that enables a wide range of models to be constructedt. with each type of vehicle at the fourth level (Deoise), ex-
LEAP emphasizes the detailed evaluation of specific energy pressed in GJ km-‘, is compiled within the LEAP frame-
problems within the context of integrated energy and envir- work. Whereas, Emission Coeficients-expressed in mass of
onmental planning for each “what if” scenario-or combina- pollutants emitted (emission factorstare compiled for the
tions of scenarios. This in turn can help clarify which pol- six major pollutants-CO, HC, NO,, SO,, Pb and
icies, investments and actions are needed to guide energy TSP-under typical urban-driving cycles)) in the EDB struc-
demands and supply in that direction. ture of LEAP (TIP, 1985).
Within the LEAP framework, the energy demand program A Linkage is then developed between the device level in
provides a disaggregated, end-use approach to analyze en- both energy demand and EDB. Next, the LEAP model is run
ergy requirements. First, data are assembled in a hierarchical to estimate the level of energy demand and emission level of
format based on four levels: Sector, Subsector, End-Use, and different pollutants, in a range of defined scenarios described
Device. Next, data on the average energy requirements (En- be,ow,
ergy Intensity) of each Device (at the fourth level) are re- quired at the final step for estimating the energy require- ments at the sectoral/subsectoral/end-use levels. On the other hand, the environment program is used to estimate the environmental emissions and impacts associated with an energy scenario. These estimates are based on Emission Coef- $ A more detailed description of LEAP can be found in the
ficients contained in the Environmental Database (EDB). To LEAP User Guide, available on request from SEI-B
run the environment program, first the energy demand pro- (Lazarus et al., 1993).
gram is linked to the EDB program. The environment pro- 51 Vehicle utilization is the average annual distance travel- led bv a vehicle.
$ dccupancy is the average number of passengers travelled per vehicle.
1) A typical urban driving cycle is a four-cycle mode and t Because LEAP is an end-use accounting framework consists of idling, acceleration, cruising and deceleration. The
rather than statistically based model, it does not attempt to driving cycles are simulated by running the vehicles on capture the confidence interval of the energy demand estima- a chassis dynamometer in the Indian Institute of Petroleum tion. Laboratory in Dehradun (IIP, 1985).

Urban transport of Delhi 405
1 Elergy demand scenarios1
End-use
Modal
split
Device Energy intensity Energy demanc
Vehicle Fuel Scenario
space efficiency analysis
per of
passenger vehicles
(per cent) (veh P- \ (GJ km-‘) (GJ or mtoe)
Link
End-use
Modal
split
Device Emission factor Emission
Type of Emission Scenario
fuel factor of analysis
used various
pollutants
(g I-\ (tonne)
Fig. 1. LEAP schematic diagram for urban transport.
SCENARIO CONSTRUCTION AND ASSUMPTIONS
Five scenarios are considered to study the impact of different urban tramport policy initiatives that would reduce total energy requirement in the transport sec- tor of Delhi and also reduce emission. These scenarios are defined below:
Scenario 1. Business as usual scenario (BAU) . This scenario assumes that the present trends of vehicular growth in Delhi will continue, and fuel efficiency norms, modal split pattern and occupancy levels will remain unchanged till 2009/10 from 1990/91 observa- tions.
Strategies to contain growth offuel consumption and emissions Scenario 2. Improvement in the vehicular speed. It is assumed that, through appropriate traffic manage- ment measures, travel speed on Delhi roads will in- crease from an average present speed of 20 to 40 km h- ’ (energy efficient speed) by 1994/95 for all types of vehicles. With this, fuel efficiency will improve for each mode of passenger vehicles. This would bring an overall saving of gasoline and diesel oil and also reduce pollution levels when compared with the BAU scenario.
Scenario 3. Increase the share of buses. It is assumed that through appropriate transport policy interven- tions, there will be an increase in the share of buses during 2000/10 to the level observed in 1981/82. In other words, modal split during 2000/01 will be brought to the same level as was the case in Delhi during 1981/82. Thus in Scenario 3, a large portion of, the passenger travel demand in Delhi will be met by bus services thereby it would bring overall efficiency of passenger movement. The extent of total petroleum demand will therefore reduce in this scenario along with reductions in emission levels, when compared with BAU scenario. Scenario 4. Introduce mass rapid transit system (MRTS) . It is assumed that MRTS is introduced in this scenario by 2004105 and continues to grow fur- ther in phases. This means that by 2004/05, a portion of passenger road transport will be substituted by railway and would save petroleum demand over fu- ture years and also reduce emission levels, as com- pared with BAU scenario. Scenario 5. Maximum conservation scenario. This scenario envisages adoption of measures to improve the speed of vehicular traffic by 1994/95 (in the short run), increasing the share of public bus by 2000/01 (in the medium run), and introduction of MRTS by 2004/05 (in the long run). Overall reduCtion of the

406 R. K. BOSE
energy demand and emission levels are evaluated with respect to the BAU scenario.
DATABASE
Travel demand in Delhi from 1981/82 to 1988/89 is presented in Table 1. The same table also provides the modal split of vehicles in Delhi during these years. Further, total travel demand in Delhi is extrapolated for the five reference years by using the following time trend equation.
y = 36.77 + 5.39 t; RZ = 0.98. (1)
The coefficients in the equation is obtained by re- gressing data on total travel demand (y) with respect to the time period [t = (n + 1) - 1981/82), with n = year] using data from Table 1.
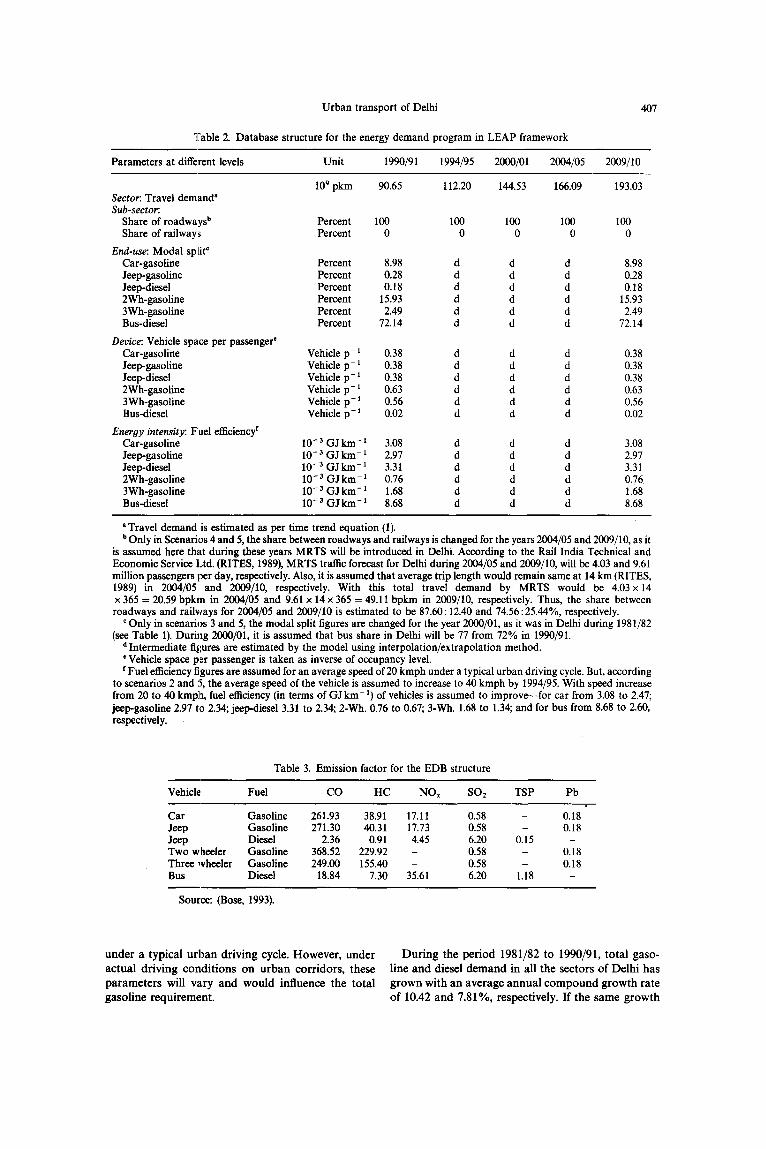
Data required for the energy demand program in LEAP framework is presented in Table 2 along with data on Energy Intensities of different vehicles. For the EDB, Emission Coeficients (the emission factors) from the transport sector is presented in Table 3.
RESULTS AND ANALYSIS
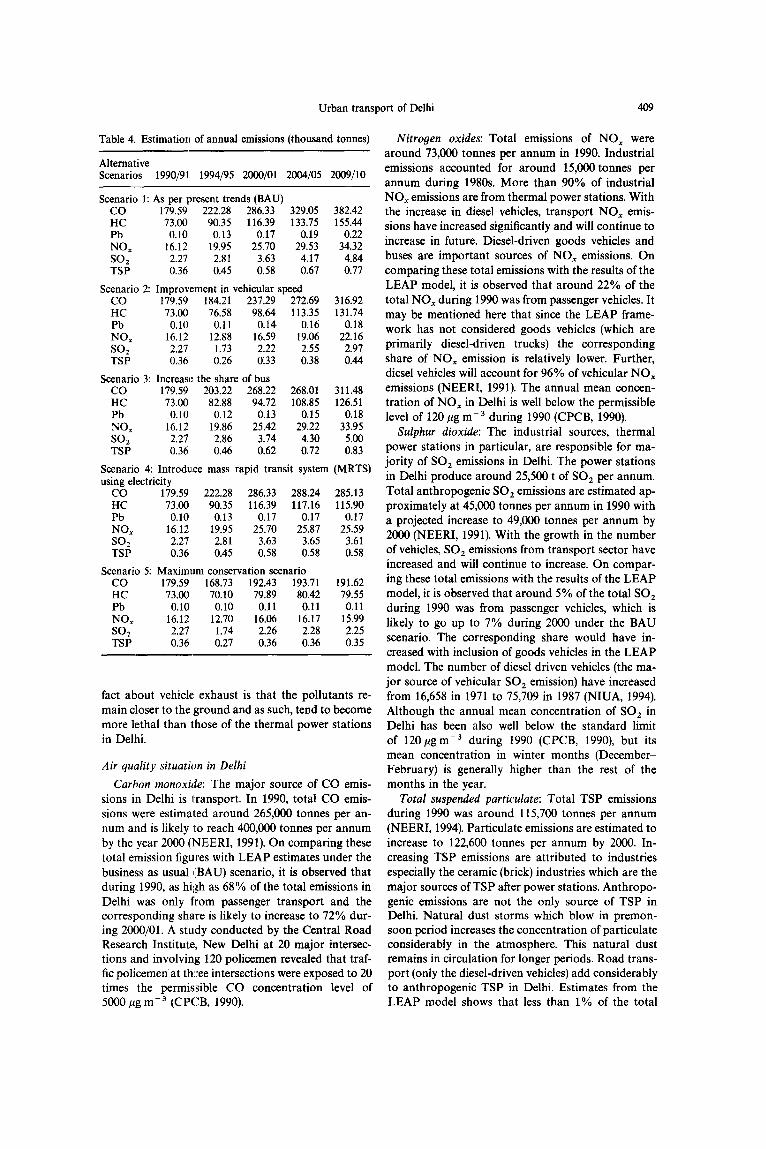
LEAP model is run under alternative scenarios to obtain estimates of transport energy demand (for only passenger movement) in Delhi for 1990/91 (base year), 1994195, 2000/01, 2004105 and 2009/10, respectively (Fig. 2). The break-down of energy demand by differ- ent modes for the corresponding years, is also esti- mated. Vehicular emissions of CO, HC, Pb, NO,, SO* and TSP are also estimated by the model, for the reference years under alternative scenarios. Estimated annual emissions (loading) of these pollutants are presented in Table 4. The model also provides the estimated emission share of different pollutants from gasoline and diesel vehicles. Figure 3 shows the esti- mated total emission of different pollutants during 2009/10 under five alternative scenarios. The model results under different scenarios have shown how, with different policy interventions, energy demand and emissions in the transport sector could be re- duced.
Consumption of gasoline and diesel together for meeting passenger travel demand, in Delhi, is esti- mated to be 713,470 t of oil equivalent (toe) for the base year 1990/91 (Fig. 2). Of this total energy de- mand, gasoline consumption is about 62% (442,300 toe) and the rest 38% (271,170 toe) is diesel oil. The demand figures are compared with actual consumption of gasoline and diesel in Delhi during 1990/91 (GOI, 1991). It is observed that the gasoline demand, according to the model estimate is 20% higher than actual consumption. Higher estimates of gasoline consumption in Delhi could be due to use of normative values of fuel efficiency and trip length,
Urban transport of Delhi
Table 2. Database structure for the energy demand program in LEAP framework
407
Parameters at different levels Unit 1990/91 1994195 2000/01 2004/05 2009/O
Sector: Travel demand” Sub-sector:
Share of roadways” Share of railways
End-use: Modal split’ Car-gasoline Jeep-gasoline Jeep-diesel 2Wh-aasoline 3Wh-gasoline Bus-diesel
Deoice: Vehicle space per passenger’ Car-gasoline Jeep-gasoline Jeep-diesel ZWh-gasoline 3Wh-gasoline Bus-diesel
Energy intensity: Fuel efficiency’ Car-gasoline Jeep-gasoline Jeep-diesel ZWh-gasoline 3Wh-gasoline Bus-diesel
lo9 pkm 90.65 112.20 144.53 166.09 193.03
Percent 100 Percent 0
Percent 8.98 Percent 0.28 Percent 0.18 Percent 15.93 Percent 2.49 Percent 72.14
Vehicle p- 1 0.38 Vehicle p- ’ 0.38 Vehicle p-i 0.38 Vehicle p - 1 0.63 Vehicle p - 1 0.56 Vehicle p - 1 0.02
10e3 GJ km-’ 3.08 10e3 GJ km-’ 2.97 10d3 GJ km-’ 3.31 10e3 GJ km-i 0.76 10e3 GJ km-’ 1.68 10e3 GJkm-’ 8.68
100 100 100 0 0 0
d d d 8.98 d d d 0.28 d d d 0.18 d d d 15.93 d d d 2.49 d d d 72.14
d d d 0.38 d d d 0.38 d d d 0.38 d d d 0.63 d d d 0.56 d d d 0.02
d d d d d d
:: d d d d
d d d d d d
100 0
3.08 2.97 3.31 0.76 1.68 8.68
a Travel demand is estimated as per time trend equation (1). b Only in Scenarios 4 and 5, the share between roadways and railways is changed for the years 2004/05 and 2009/10, as it
is assumed here that during these years MRTS will be introduced in Delhi. According to the Rail India Technical and Economic Service Ltd. (RITES, 1989), MRTS traRlc forecast for Delhi during 2004/05 and 2009/10, will be 4.03 and 9.61 million passengers per day, respectively. Also, it is assumed that average trip length would remain same at 14 km (RITES, 1989) in 2004/05 and 2009/10, resnectivelv. With this total travel demand bv MRTS would be 4.03 x 14
I . _
x 365 = 20.59 bpkm in 2004/05 and 9.61 x 14 x 365 = 49.11 bpkm in 2009/10, respeciively. Thus, the share between roadways and railways for 2004/05 and 2009/10 is estimated to be 87.60 : 12.40 and 74.56 : 25.44%, respectively.
‘Only in scenarios 3 and 5, the modal split figures are changed for the year 2000/01, as it was in Delhi during 1981/82 (see Table 1). During 2000/01, it is assumed that bus share in Delhi will be 77 from 72% in 1990/91.
*Intermediate figures are estimated by the model using interpolation/extrapolation method. ‘Vehicle space per passenger is taken as inverse of occupancy level. ‘Fuel efficiency figures are assumed for an average speed of 20 kmph under a typical urban driving cycle. But, according
to scenarios 2 and 5, the average speed of the vehicle is assumed to increase to 40 kmph by 1994/95. With speed increase from 20 to 40 kmph, fuel efficiency (in terms of GJ km- ‘) of vehicles is assumed to improve-for car from 3.08 to 2.47; jeep-gasoline 2.97 t’o 2.34; jeep-diesel 3.31 to 2.34; 2-Wh. 0.76 to 0.67; 3-Wh. 1.68 to 1.34; and for bus from 8.68 to 2.60, respectively.
Table 3. Emission factor for the EDB structure
Vehicle
Car Jeep Jeep
Fuel
Gasoline Gasoline Diesel
CO HC NO, SO2
261.93 38.91 17.11 0.58 271.30 40.31 17.73 0.58
2.36 0.91 4.45 6.20
TSP Pb
’ _ 0.18 _ 0.18
0.15 - Two wheeler Gasoline 368.52 229.92 - 0.58 - 0.18 Three wheeler Gasoline 249.00 155.40 - 0.58 - 0.18 Bus Diesel 18.84 7.30 35.61 6.20 1.18 _
Source: (Bose, 1993).
under a typical urban driving cycle. However, under During the period 1981/82 to 1990/91, total gaso- actual driving conditions on urban corridors, these line and diesel demand in all the sectors of Delhi has parameters will vary and would influence the total grown with an average annual compound growth rate gasoline requirement. of 10.42 and 7.81%, respectively. If the same growth

408 R. K. BOSE
‘000 toe 1600
with shift to buses
ith improved s
with maximum conservation
2000/01 2004/05 2009/10
Year
Fig. 2. Energy demand for passenger transportation in Delhi.
200 300 400 500 600
000 tonne
Fig. 3.
trend continues, then total gasoline and diesel de- mand is likely to go up to 954,912 and 1,547,944 toe respectively by 2000/01. But, according to the model estimates, gasoline and diesel requirement for passen- ger transport alone would be of the order of 705,200 and 432,550 toe, respectively in the BAU scenario during the same period. The question is, can we really meet this large demand of petroleum fuels only to cater the passenger travel requirement? Of course, the answer is no.
The model estimates under different scenarios have shown how with different policy interventions energy demand in the transport sector could be reduced. In the case of diesel, over one-third of the total diesel oil is consumed by passenger transport in Delhi, while the remaining two-thirds is shared by industry and freight transport.
The share of buses in the total energy consumption (713,470 toe) is 37% in 1990/91. The share of car and jeep together is 33%; two wheelers with 23%; and three wheelers with 7%, respectively.
The loading of various pollutants in Delhi during 1990/91 is estimated to be CO (179,590 t); HC (73,000 t); Pb (100 t); NO, (16,120 t); SO, (2270 t) and TSP (360 t) respectively as given in Table 4. Gasoline driven vehicles responsible for as much as 97% of CO and HC loading, while the diesel driven vehicles pro- duce the remaining 3%. Gasoline driven vehicles also contribute 32% of the total NO, emission, and 15% of SO, emission. Also, only gasoline vehicles contrib- ute Pb emission. On the other hand, diesel vehicles only contribute TSP (diesel smoke) emission. These pollutants are known to have adverse effects on the health of human beings and animals. They also cause damage to vegetation, materials and buildings. Addi- tionally, HC and NO, emissions undergo photo- chemical reactions and generate several secondary pollutants, e.g. peroxy benzyl, acyl nitrates, aldehydes, etc. which are irritants to the eyes, nose and throat irritants (IIP, 1985). Although in quantitative terms, the pollutants released from vehicles are less than those released by thermal power stations, an alarming
Urban transport of Delhi 409
Table 4. Estimation of annual emissions (thousand tonnes)
Alternative Scenarios 1990/91 1994/95 2000/01 2004/05 2009/10
Scenario 1: As per present trends (BAU) co 179.59 222.28 286.33 329.05 382.42 HC 73.00 90.35 116.39 133.75 155.44 Pb 0.10 0.13 0.17 0.19 0.22 NO, 16.12 19.95 25.70 29.53 34.32 SOZ 2.27 2.81 3.63 4.17 4.84 TSP 0.36 0.45 0.58 0.67 0.77
Scenario 2: Improvement in vehicular speed co 179.59 184.21 237.29 272.69 316.92 HC 73.00 76.58 98.64 113.35 131.74 Pb 0.10 0.11 0.14 0.16 0.18 NO, 16.12 12.88 16.59 19.06 22.16 SOZ 2.21 1.73 2.22 2.55 2.97 TSP 0.36 0.26 0:33 0.38 0.44
Scenario 3: Increase the share of bus co 179.59 203.22 268.22 268.01 311.48 HC 73.00 82.88 94.72 108.85 126.51 Pb 0.10 0.12 0.13 0.15 0.18 NO, 16.12 19.86 25.42 29.22 33.95 SC% 2.27 2.86 3.74 4.30 5.00 TSP 0.36 0.46 0.62 0.72 0.83
Scenario 4: Introduce mass rapid transit system (MRTS) using electricity
co 179.59 222.28 286.33 288.24 285.13 HC 73.00 90.35 116.39 117.16 115.90 Pb 0.10 0.13 0.17 0.17 0.17 NO, 16.12 19.95 25.70 25.87 25.59 SO, 2.27 2.81 3.63 3.65 3.61 TSP 0.36 0.45 0.58 0.58 0.58
Scenario 5: Maximum conservation scenario co 179.59 168.73 192.43 193.71 191.62 HC 73.00 70.10 79.89 80.42 79.55 Pb 0.10 0.10 0.11 0.11 0.11 NO, 16.12 12.70 16.06 16.17 15.99 so2 2.27 1.74 2.26 2.28 2.25 TSP 0.36 0.27 0.36 0.36 0.35
fact about vehicle exhaust is that the pollutants re- main closer to the ground and as such, tend to become more lethal than ihose of the thermal power stations in Delhi.
Air quality situation in Delhi
Carbon monoxide: The major source of CO emis- sions in Delhi is transport. In 1990, total CO emis- sions were estimated around 265,000 tonnes per an- num and is likely to reach 400,000 tonnes per annum by the year 2000 (NEERI, 1991). On comparing these total emission figures with LEAP estimates under the business as usual I(BAU) scenario, it is observed that during 1990, as high as 68% of the total emissions in Delhi was only from passenger transport and the corresponding share is likely to increase to 72% dur- ing 2000/01. A study conducted by the Central Road Research Institute, New Delhi at 20 major intersec- tions and involving 120 policemen revealed that traf- fic policemen at three intersections were exposed to 20 times the permissible CO concentration level of 5000 pg me3 (CPCB, 1990).
Nitrogen oxides: Total emissions of NO, were around 73,000 tonnes per annum in 1990. Industrial emissions accounted for around 15,000 tonnes per annum during 1980s. More than 90% of industrial NO, emissions are from thermal power stations. With the increase in diesel vehicles, transport NO, emis- sions have increased significantly and will continue to increase in future. Diesel-driven goods vehicles and buses are important sources of NO, emissions. On comparing these total emissions with the results of the LEAP model, it is observed that around 22% of the total NO, during 1990 was from passenger vehicles. It may be mentioned here that since the LEAP frame- work has not considered goods vehicles (which are primarily diesel-driven trucks) the corresponding share of NO, emission is relatively lower. Further, diesel vehicles will account for 96% of vehicular NO, emissions (NEERI, 1991). The annual mean concen- tration of NO, in Delhi is well below the permissible level of 120 pg mm3 during 1990 (CPCB, 1990).
Sulphur dioxide: The industrial sources, thermal power stations in particular, are responsible for ma- jority of SO, emissions in Delhi. The power stations in Delhi produce around 25,500 t of SO, per annum. Total anthropogenic SOz emissions are estimated ap- proximately at 45,000 tonnes per annum in 1990 with a projected increase to 49,000 tonnes per annum by 2000 (NEERI, 1991). With the growth in the number of vehicles, SO, emissions from transport sector have increased and will continue to increase. On compar- ing these total emissions with the results of the LEAP model, it is observed that around 5% of the total SO, during 1990 was from passenger vehicles, which is likely to go up to 7% during 2000 under the BAU scenario. The corresponding share would have in- creased with inclusion of goods vehicles in the LEAP model. The number of diesel driven vehicles (the ma- jor source of vehicular SO, emission) have increased from 16,658 in 1971 to 75,709 in 1987 (NIUA, 1994). Although the annual mean concentration of SO, in Delhi has been also well below the standard limit of 120pgmm3 during 1990 (CPCB, 1990), but its mean concentration in winter months (December- February) is generally higher than the rest of the months in the year.
Total suspended particulate: Total TSP emissions during 1990 was around 115,700 tonnes per annum (NEERI, 1994). Particulate emissions are estimated to increase to 122,600 tonnes per annum by 2000. In- creasing TSP emissions are attributed to industries especially the ceramic (brick) industries which are the major sources of TSP after power stations. Anthropo- genie emissions are not the only source of TSP in Delhi. Natural dust storms which blow in premon- soon period increases the concentration of particulate considerably in the atmosphere. This natural dust remains in circulation for longer periods. Road trans- port (only the diesel-driven vehicles) add considerably to anthropogenic TSP in Delhi. Estimates from the LEAP model shows that less than 1% of the total

TSP. emissions in Delhi is from diesel buses. The corresponding share will increase with the inclusion of diesel-driven goods vehicles, which has not been con- sidered in the LEAP framework. In fact, annual emis- sions from the road transport sector in Delhi was found out to be 3% of the total emissions in Delhi during 19SSj89, while the share from the other eco- nomic sectors were-industry (67%), power plants (27%), domestic (2%) and commercial (la/o), respect- ively (Bose, 1990). The annual mean concentration of particulate matter is higher than the prescribed limits??. The summer months (May-June) have con- centrations as high as 1500~gm-~. Natural dust storms which blow in the city during summer, causes higher concentrations of particulate matter. Un- doubtedly, the particulate matter poses pollution menace for almost throughout the year.
Finally, with regard to Pb and HC emissions in Delhi, there is hardly any information available from secondary sources.
Scenario analysis
Scenario 1. This is the business as usual (BAU) scen- ario, in which modal split and average traffic speed remain unchanged and vehicle populations continues to grow. The energy demand is estimated at 883,090 t; 1,137,550 t; 1,307,240 t; and 1519,270 toe for the years 1994/95, 2000/01, 2004/05 and 2009/10, respectively (Fig. 2). The fuel requirement under BAU scenario will more than double by 2009/10 uis-&is 1990/91 and so will the loading of different pollutants (Table 4). Out of the total estimated energy demand, buses in Delhi will consume the greatest share of oil (37%), followed by cars and jeeps (together 32%), two wheelers (23%) and three wheelers (7%) respectively. The principal emissions from gasoline vehicles are CO
tt5OOpg me3 for industrial areas; 2COpgm-3 for resi- dential areas and 100 pg mm3 for sensitive areas (CPCB, 1990).
410 R. K. BOSE
(97% of the total emissions), unburnt HC (97%) and Pb (100%); whereas for diesel vehicles the principal pollutants are TSP (lOO%), NO, (68%) and SO, (85%) respectively. Scenario 2. One of the critical factors affecting energy efficiency in urban transport is journey speed. The limited data on the effect of journey speed on fuel consumption have shown that, in general, the opti- mum level of fuel consumption for different vehicles lies in the range of 4&50 km h- ‘. Therefore, Scenario 2 investigates the effect on total energy demand and pollution loading that could be achieved through ap- propriate traffic management measures, increasing the average speed for all types of vehicles on all Delhi roads from the present level of 20-40 km h- ’ by 1994195.
There is an overall saving of nearly 27% of total energy requirement in future if Scenario 2 is imple- mented (Fig. 4). The reduction in gasoline demand is estimated to be 17% and diesel demand 42%. There is an overall reduction of emissions of different pollu- tants. Reduction in loading of CO, HC, Pb, NO,, SO, and TSP during 2009/10 is presented in Fig. 5. Max- imum reduction is observed in the case of TSP (be- tween 42 and 43%), followed by SO, (38%), NO, (35%), Pb (between 15 and 18%), CO (17%) and HC around 15%. Scenario 3. Under this scenario, the model has esti- mated total energy demand if the share of bus goes up from 72% 1990/91 to 78% by 2000/01, which was the situation in Delhi during 1981/82. There is a drop in total fuel demand by 9% from 2000/01 onwards as compared to Scenario 1, with reduction in gasoline demand by 19%. But, since more buses are added to the fleet, diesel demand goes up by 7%. Whereas during 1994/95, the extent of fuel savings is only 4%, with gasoline savings around 8% but diesel demand increasing by 3%. It may be noticed here that out of the total energy requirement, the share of diesel in buses goes up from 40% in 1994195 to about 44% in
-10 0 10 20 30 40 50 60
(%I
Fig. 4.

Urban transport of Delhi 411
co HC
Pb
NOIl
SO2 TSP
-10 0 10 20 30 40 50 60
($6)
Fig. 5.
2009/20. On the other hand, dependence on gasoline vehicles is reduced.
With more buses on the road, there is an overall improvement as far as emissions of CO, HC and Pb is concerned (Table 4) with respect to Scenario 1. Reduc- tion in loading for these three pollutants is about the same i.e. 8% during 1994/95. However, for the years 2000/01, 2004/05 and 2009/10, the reduction in emis- sion of CO and HC compared to BAU is around 19%. For Pb there is an overall reduction of 24% in 2000/01,21% in 20&l/05 and 18% in 2009/10 respec- ti:ely due to substitution of gasoline-driven vehicles by diesel-driven buses. With more public buses on the road, contribution share of principal pollutants emit- ted from gasoline vehicles will come down. Scenario 4. Here it is assumed that Delhi will have an electricity-based mass rapid transit system (MRTS) by 2004/05 and nearly 12% of the total passenger travel demand will be met by MRTS. However, by the terminal year 2009/10, the share of MRTS in the total travel demand will be around 25%. So in this scen- ario, apart from gasoline and diesel, electricity will also be required for passenger transportation. From Fig. 2 it may be noticed that total energy demand will go down by 12% in 2004/05 and the reduction will be about 24% in 2009/10. There is an overall reduction of gasoline and diesel demand, each by around 12% in 2004/05 and 25% in 2009/10, respectively, as some portion of travel demand in Delhi will be met by MRTS in these years. During 2004/05, nearly 1% of the total energy demand in the passenger transport sector will be in the form of electricity for MRTS and its share will go up I:O about 2.4% by 2009/10. Reduc- tion in pollution emissions is observed from 2004/05 as compared to BAU. CO, HC, NO, and SO, emis- sions are reduced, leach by about 12%, Pb by 11% and TSP by 13% in 2004/05. In the terminal year CO, HC, NO,, SO, and TSP are reduced, each by about 25% and Pb by abfout 23%. Scenario 5. This scenario assumes that if Scenarios 2-4 are implemented in phases in 1994/95, 2000/01 and 2004/05, respectively, and simulates the extent of
overall energy savings in the transport sector and the reduction in emission levels. This scenario is termed as “a maximum conservation scenario”. There is a net saving of 30% in total energy demand in 1994195 as compared to Scenario 1. Net saving increases to around 35% in 2000/01,42% in 2004105 and 50% in 2009/10. Gasoline demand during the same periods will go down by 24, 33, 41 and 50%, respectively. In the case of diesel oil, the corresponding savings are 41, 38, 46 and 54%, respectively. It may be noticed here that out of the total energy requirement, dependence on electricity for MRTS will be around 1.5% in 2004/05 and 3.6% in 2009/10. The remaining share will be either met by diesel (35.4% in 2004/05 and 34.7% in 2009/10) or gasoline (63.1% in 2004/05 and 61.7% in 2009/10). The emissions share of CO, HC and Pb are relatively higher for gasoline-driven ve- hicles, i.e. 97, 97 and lOO%, respectively. For diesel driven vehicles, the principal pollutants are TSP, NO, and SO, with their shares as 100, 65 and 83% res- pectively.
There is also significant reduction in emissions in Scenario 5 when compared with BAU (Table 4). The maximum reduction in emissions is observed in the case of TSP (40% in 1994/95,38% in 2001/01,46% in 2004/05 and 55% in 2009/10). The corresponding reduction in emissions of other pollutants are: CO (24,33,41 and 50%); HC (22,31,40 and 49%); Pb (23, 35,42 and 50%); NO, (36,38,45 and 53%); and SO, (38, 38, 45 and 54%) respectively.
CONCLUSIONS
The BAU scenario, in which present trends in trans- port demand, modal split and fuel economy are as- sumed to continue, has shown a dramatic increase in energy demand and the resultant emissions. The alter- native scenarios have shown how the increase in en- ergy consumption and pollutant levels can be limited through measures such as increasing the average speed of urban traffic, encouraging a shift to buses, the

412 R. K. BOSE
introduction of new forms of mass transit and through conservation efforts. Given that both gasoline and diesel are imported in India, the reductions in fuel consumed in the different scenarios translate directly into foreign exchange saved, which is an independent policy objective. No one measure can achieve the gigantic task of containing the growth of fuel con- sumption and emissions. A successful policy must include a mixture of the above elements.
The study has shown how the LEAP/EDB system, combined with appropriate detailed local data on traffic patterns, energy consumption and emission fac- tors, can provide a valuable tool for assessing future urban transport options in developing countries.
Acknowledgements-This research paper is based on my work as a Visiting Scientist/Energy Planner at the UNEP Collaborating Centre on Energy and Environment, Riso National Laboratory, Roskilde, Denmark from 1 October to 31 December 1991. -The support and encouragement of Dr John M. Christensen, Head, and his colleague Dr Gordon Mackenzie, Senior Energy Planner of the UNEP Centre is gratefully acknowledged.
REFERENCES
Bose R. K. (1993) Transport in Delhi--energy and environ- mental consequences. Industry Enuir. UNEP 16,21-25.
Bose R. K. and Srinivasachary V. (1992) Impact of road transportation systems on energy and environment-an analysis of metropolitan cities of India. Research report submitted to the Ministry of Urban Development, Gov- ernment of India. Prepared by the Tata Energy Research Institute, New Delhi.
Bose R. K. (1990) Environmental implications of energy use in the city of Delhi. Encology 5, 1-9.
CPCB (1990) Ambient air quality statistics of India-1990. Central Pollution Control Board, Delhi.
GO1 (1991) Indian petroleum and natural gas statistics -1990/91. Economics and Statistics Division, Ministry of Petroleum and Chemicals, Department of Petroleum and Natural Gas, Government of India, New Delhi.
GOI/ESCAP (1991) Sectoral energy demand in India. Gov- ernment of India in collaboration with the Economic and Social Commission for Asia and the Pacific, New Delhi.
IIP (1985) State of art report on vehicle emissions. Indian Institute of Petroleum, Dehradun.
Lazarus M. et al. (1993) LEAP-Long-range energy alterna- tives planning system: User Guide. Stockholm Environ- ment Institute, Boston, Tellus Institute, 11 Arlington Street, Boston, MA 02116, U.S.A.
NEERI (1991) Air Pollution Aspects of Three Indian Mega- cities, Vol. I; Delhi. National Environmental Engineering Research Institute, Nagpur.
NIUA (1994) Urban environmental maps for Delhi, Bombay, Ahmedabad and Vadodam. National Institute of Urban Affairs. New Delhi.
RITES (1989) Mass rapid transport system for Delhi-re- ACMA (1990) Automotive industry of India-facts and fig- port on phase 1A. Rail India Technical and Economic
ures 1989-90. Automative Component Manufacturers As- Service Ltd., New Delhi. sociation of India, New Delhi.