Byzantine Hours, Works and Days in Byzantium, Athens-Thessaloniki-Mystras

ARTICLE IN PRESS
0360-1323/$ - se
doi:10.1016/j.bu
�Correspondfax: +30 231 09
E-mail addr
Building and Environment 42 (2007) 122–138
www.elsevier.com/locate/buildenv
Energy consumption modeling analysis and environmental impactassessment of model house in Thessaloniki—Greece
Christopher Koroneos�, George Kottas
Laboratory of Heat Transfer and Environmental Engineering, Aristotle University of Thessaloniki, P.O. Box 483, 54124, Thessaloniki, Greece
Received 8 April 2003; received in revised form 7 July 2005; accepted 5 August 2005
Abstract
The purpose of this study is to evaluate the annual energy consumption of an existing house in the city of Thessaloniki, Greece.
The software tool HOT2000 was employed for this purpose. This work involves the prediction of the annual energy cost in the
monetary units of euro. Hence, the estimated outputs are compared to the actual values retrieved from the annual utility bills in
order to check the accuracy of the estimated results with the real values during the year. In this work, life cycle analysis of the fuel
used is included and the environmental impact assessment is being calculated. The emission of the electricity production are all
recorded and used in the analysis. It has been shown that climatic conditions and the type of building materials play a crucial role in
energy savings.
r 2005 Elsevier Ltd. All rights reserved.
Keywords: Energy consumption analysis; Model house; LCA
1. Introduction
The fact that the primary energy supply is notlimitless and the energy cost is increasing day by daydetermined the reduction of the energy requirements tothe residential buildings. The reduction of the fuelconsumption will not only provide cost savings for thehousehold but also will limit the greenhouse effects bygas emissions. Consequently, an energy consumptionanalysis is made in order to evaluate the energyperformance.
The use of computer simulation is a cost-effective wayto evaluate the annual energy consumption of a modernhouse in Greece. The analysis is made using the energyanalysis software named HOT2000 in order to estimatethe heating load including the annual energy cost. Thebase model of the house is developed using the availableinformation about the physical characteristics, the
e front matter r 2005 Elsevier Ltd. All rights reserved.
ildenv.2005.08.009
ing author. Tel.: +30 231 0995968;
96012.
ess: [email protected] (C. Koroneos).
operating conditions and the energy-related behaviorof the occupants. This information can be found using:
�
Technical specifications of the model house andcomplete set of drawings. � The utility bills over the past 12 months of the powercompany, heating oil, etc.
� Monthly values of the climatologic conditions duringthe year.
The base model is then modified by changing somevalues of certain parameters, which are based on areasonable justification. The modification of the basemodel is usually seen as a proof of an adequatesimulation.
Since the utility bills during a year are available, theycan be easily compared to the estimated values of thesoftware’s results. Through the utility bills, the unit costof the power and the heating oil can be retrieved, whichis necessary for the software’s annual cost estimation.However, a perfect agreement between the predicted andthe measured energy consumption cannot be easily

ARTICLE IN PRESSC. Koroneos, G. Kottas / Building and Environment 42 (2007) 122–138 123
achieved. Moreover, a perfect agreement could coversome existing errors.
The next step of the analysis has to do with theenvironmental impact of the consumption energy over a12-month period. The analysis concerns the primaryenergy sources for the production of each energy formused in the model house including the air and waterpollutants.
2. Model house
The specific model house is used for the simulation ofthe temperature variations observed within a typicalhouse in Thessaloniki, Greece. The model house, shownin Fig. 1, has a floor area of 225m2 and consists of fouridentical external walls, 15m in length and 3m in height,with a total window opening of 5.2m2 on each externalwall and a total door opening of 1.736m2, 0.8m inlength and 2.17m in height.
Fig. 1. Ground and cross sectio
The window opening area is equal to the sum area ofall the windows on each wall and it is considered as onewindow opening. Since the same model will be used inevaluating the load for various constructions, which willnot be mentioned here, this simplification is notimportant but will assist in drawing conclusions sincesimilar constructions are present on every wall. Themodel house has been divided into four identical zones,which are separated by internal partition walls. Eachpartition wall has a door opening with a total areaequal to the area of all actual door openings of eachzone.
The houses in Greece are usually built with hollowbricks, which are made by fired clay. The external wallconsists of double brick with interior insulation andwith thermal conductivity K ¼ 0:60 kcal=hm2. Thewindows are aluminum type with double clear glasswith 13mm air space and with thermal conductivityK ¼ 5:00 kcal=hm2. The natural air infiltration isconsidered average with air tightness 4.55 ach andpressure 50 Pa. The floor is marble without insulation
n of the Model House [1].

ARTICLE IN PRESS
Table 2
Four-month period electricity consumption [2,3]
Period Electricity
consumption in kWh
Cost (h)
Jan/Feb/Mar 1290.0 349
Apr/May/June/July 1242.0 336
Aug/Sep/Oct/Nov 1224.6 332
Dec 449.2 122
Total annual 4205.8 1139
Table 3
Electricity consumption of appliances
Appliance Consumption
(W)
Mean
functioning
time (h/day)
Mean monthly
consumption
(kWh)
Refrigerator 35.4 24 25.84
Television 158 4 19.22
Computer 215 2 13.08
Kitchen oven 3200 1 97.31
Miscellaneous 1667 1 50.00
Total 205.45
C. Koroneos, G. Kottas / Building and Environment 42 (2007) 122–138124
and with thermal conductivity K ¼ 2:12 kcal=h=m2=1C.The ceiling is flat concrete with thermal conductivityK ¼ 2:18 kcal=h=m2=1C and the house is built oncrawlspace foundation type. Using these values asbuilding assembly inputs, the heat loss can be calculatedfor every constructional component.
The analysis is in accordance with the data ofthe year 2000 and it is considered that four people livein the house. Two of them are adults. The space isheated by radiant central heating using heating oil fuel,which is burned in order to recycle the hot waterthrough the heating pipes and to preserve a steadytemperature of 21 1C in each zone. The total heatedfloor is about 225m2 and the heated volume is about675m2. The central heating installation is functioningautomatically by a thermostat, which is used to preservea constant room temperature of 21 1C in each zone(room).
Domestic hot water is provided by a boiler, attachedto the central heating and powered by heating oil fuel orelectricity. The desired temperature of the hot water is55 1C and the daily consumption for the specific numberof occupants is assumed to be 225 l. These values areessential for the estimation of domestic water heatingenergy consumption. Also, it is considered that thehouse is not equipped with fireplace and the only energysources are the heating oil and electricity.
3. Annual consumption of heating oil and electricity
As mentioned before, for the energy analysis the dataof the oil and power consumption within 12 months isnecessary. The specific data are available from the utilitybills and are given in Tables 1 and 2 for the heating oiland the electricity consumption, respectively.
The heating oil consumption during summer period(Table 1) is used mainly to cover the energy load neededfor the hot domestic water and does not exceed 25 l. Theheating oil cost is in accordance with the prices duringthe year 2000.
Table 1
Monthly heating oil consumption [2,3]
Month Heating oil
consumption (l)
Month Heating oil
consumption (l)
January 610 July 15
February 480 August 25
March 360 September 50
April 280 October 230
May 120 November 370
June 20 December 540
Total annual consumption 3100 l
Heating oil cost h 0.31/l
The available electricity company utility bills, whichare listed in Table 2, provide information only every 4months. Since the 4-month period is too long, furtherestimation for the consumption of each appliance inorder to obtain approximate results of the monthlyelectricity consumption is necessary.
It is assumed that the appliances mentioned in Table 3consume a constant amount of electricity every month.The official manual of each supplier provides informa-tion of the electricity consumption of each appliance.The miscellaneous appliances are mainly auxiliarycooking appliances such as microwave oven, dish-washers, toaster, etc. or laundry appliances and it isgiven an estimated value of 50 kWh per month which isequal to 1667W.
The electricity consumption from the lighting is notincluded in Table 3 because the daily usage of the lightsis influenced by the daylight duration. The daylightduration varies according to the season. The dailylighting usage time is given in Table 4 and every periodis divided according to the utility bill period. Theduration of the lighting usage begins when it is gettingdark until around 1 o’clock a.m. The results of themonthly percentage of lighting usage are shown in theTable 4. The monthly percentage is calculated dividingthe total duration per period by the mean daily durationof lighting usage of each month.
Since it is considered that the monthly electricityconsumption of 205.45 kWh is constant, the variation of

ARTICLE IN PRESSC. Koroneos, G. Kottas / Building and Environment 42 (2007) 122–138 125
the total monthly electricity consumption is due tolighting. Table 5 presents the results of the total monthlyelectricity consumption based on the monthly percen-tage of lighting usage. The electricity consumption oflighting usage is calculated from the consumption of theperiod minus the constant monthly electricity. Forinstance, the total consumption of January is calculatedas follows:
1290 kWh; total consumption of the period
January2March� 3� 205:45 kWh;
constant consumption for the 3 months
¼ 673:65 kWh consumption of lighting usage for the
period January2March:
The consumption of lighting usage is 36.6% of673.65 kWh, ¼ 246.56 kWh. The total consumption is
Table 4
Daily electricity consumption of lighting according to the daylight
duration
Month Mean daily
duration of
lighting usage
(h/day)
Total duration
per period (h/
day/period)
Monthly
percentage (%)
January 7.5 20.5 36.6
February 7 34.2
March 6 29.2
April 5 17.5 28.7
May 4.5 25.7
June 4 22.8
July 4 22.8
August 4.5 22.5 20.0
September 5 22.1
October 6 26.6
November 7 31.3
December 8 8 100.0
Table 5
Total monthly power consumption
Month Electricity consumption of
lighting usage (kWh/period)
Percent (%)
January 673.65 36.6
February 34.2
March 29.2
April 420.20 28.7
May 25.7
June 22.8
July 22.8
August 402.80 20.0
September 22.1
October 26.6
November 31.3
December 243.75 100.0
Total annual
calculated from the sum of the amount of lighting plusthe constant consumption and it is given in the lastcolumn of Table 5.
Fig. 2 shows the diagram and the data of the monthlyconsumption of the electricity and heating oil. It is clearthat during the winter, the greatest consumption of theheating oil is in January because of the lowest externaltemperatures and the greatest consumption of theelectricity is also in January and December becausethese months have the shortest days and the lightingneeds are increased.
4. Climate values and weather parameters in the area of
the model house
The software HOT2000 provides energy analysisresults according to the values of the climate conditionand to the weather parameters of the model house area.The climate of Thessaloniki area is mostly sunny with anaverage daily solar radiation of 12.83MJ/m2. Therequired data for the analysis are the average airtemperature and its variation, the solar radiation andthe wind velocity. All these data are given in Tables 6–8,respectively.
In Table 6, the temperatures listed in minimumcolumn are defined as the mean value of all days’minimum temperatures per month. This is valid foraverage and maximum columns. The variation is thedifference between the maximum mean temperature andthe minimum one.
In Table 7, the monthly average global solar radiationexpressed as mean daily global solar radiation measuredin megajoules/metre square/day (MJ/m2/day) on ahorizontal surface. HOT2000 calculates the amount ofradiation available on a vertical surface from thehorizontal surface measurements. The monthly diffuse
Electricity consumption for
lighting (kWh/month)
Total electricity
consumption (kWh/month)
246.56 452.01
230.39 435.84
196.71 402.16
120.60 326.05
107.99 313.44
95.81 301.26
95.81 301.26
80.56 286.01
89.02 294.47
107.14 312.59
126.08 331.53
243.75 449.20
1740.42 4205.82

ARTICLE IN PRESS
0100200300400500600700
Janu
ary
Febru
ary
Mar
chApr
ilM
ayJu
ne July
Augus
t
Septe
mbe
r
Octobe
r
Novem
ber
Decem
ber
Month
Heating oil consumption in lt
Electricity consumption in kWh
Fig. 2. Monthly consumption of heating oil and electricity.
Table 6
Monthly average air temperature [5]
Month Average air temperature (1C)
Minimum Average Maximum Variation
January 0.6 3.1 7.7 7.1
February 4.4 7.7 12.0 7.6
March 4.8 9.3 14.5 9.7
April 11.4 16.4 21.8 10.4
May 15.0 20.5 25.8 10.8
June 18.3 24.2 30.1 11.8
July 20.3 26.9 33.6 13.3
August 20.3 26.6 33 12.7
September 16.5 21.8 28.4 11.9
October 13.4 16.7 21.2 7.8
November 11.1 14.8 19.6 8.5
December 6.0 9.3 13.8 7.8
Table 7
Monthly solar radiation [5]
Month Solar radiation
Global Diffusion
MJ/m2 MJ/m2/day MJ/m2/day
January 243.5 7.85 3.71
February 238.8 8.53 3.66
March 374.1 12.07 5.03
April 405.9 13.53 5.09
May 574.8 18.54 6.72
June 592.7 19.76 7.51
July 642.7 20.73 7.2
August 609.9 19.67 6.46
September 415.8 13.86 5.21
October 223.6 7.21 3.12
November 162.0 5.40 2.86
December 142.1 4.58 2.21
C. Koroneos, G. Kottas / Building and Environment 42 (2007) 122–138126
solar radiation is measured in MJ/m2/day on ahorizontal surface.
The diagrams of the monthly average air temperature,solar radiation and wind velocity are shown in Figs. 3–5,respectively. According to Fig. 4, the period with the
intense solar radiation in Thessaloniki area starts onMarch and lasts till the end of September and the solargains are in high levels. On the other hand, the monthlyaverage wind velocity is more intense during the firsttrimester of the year which enhances the heat losses ofthe model house, as shown in Fig. 5.
The average temperature for the month of interest T̄ i
is calculated:
T̄ i ¼
PTi
N.
The standard deviations of the monthly temperatures(StdTmp) can be derived from
StdtmpðmonthÞ ¼
ffiffiffiffiffiffiffiffiffiffiffiffiffiffiffiffiffiffiffiffiffiffiffiffiPðTi � T̄ iÞ
ðN � 1Þ
s,
where N is the number of years of record, Ti thetemperature for the month of interest in year i, and T̄ i
the average temperature for the month of interest.The specific data are given by measurements for 10
years and all results are shown in Table 9.The average temperature data of the Tables 6 and 9 in
combination with the wind velocity data of Table 8 areused as input for the calculation of the heat losses forevery component. The data of Table 7 concerning thesolar radiation are used for the calculations of the solargains. The internal energy gains are calculated using thenumber of the occupants, lighting and other appliancesas input.
5. Results of the input data
According to the information and to all the necessaryvalues or parameters of the model house, the softwareHOT2000 can provide a full energy analysis report asfollows:
�
Heat loss summary per constructive component. � Heat loss by air leakage and ventilation.
ARTICLE IN PRESS
Table 8
Monthly average wind velocity [5]
Month Monthly average wind velocity (m/s) Month Monthly average wind velocity (m/s)
January 2.50 July 1.67
February 1.95 August 1.64
March 2.03 September 1.56
April 1.58 October 1.20
May 1.53 November 1.06
June 1.92 December 1.25
05
10152025303540
Janu
ary
Febru
ary
Mar
chApr
ilM
ayJu
ne July
Augus
t
Septe
mbe
r
Octobe
r
Novem
ber
Decem
ber
Month
Tem
per
atu
re [
°C] Minimum
Average Maximum Variation
Fig. 3. Monthly average air temperature [5].
0
5
10
15
20
25
Janu
ary
Febru
ary
Mar
chApr
ilM
ayJu
ne July
Augus
t
Septe
mbe
r
Octobe
r
Novem
ber
Decem
ber
Month
So
lar
Rad
iati
on
[M
J/m
2 .d
ay]
GlobalDiffusion
Fig. 4. Monthly average solar radiation [5].
00.5
11.5
22.5
3
Janu
ary
Febru
ary
Mar
chApr
ilM
ayJu
ne July
Augus
t
Septe
mbe
r
Octobe
r
Novem
ber
Decem
ber
Month
Win
d v
elo
city
[m
/s]
Fig. 5. Monthly average wind velocity [5].
C. Koroneos, G. Kottas / Building and Environment 42 (2007) 122–138 127
�
Monthly energy profile. � Annual domestic water heating summary. � Energy consumption summary report. � Estimated greenhouse gas emissions.All calculated heat losses and energy consu-mption analysis are estimates that are based on thedata entered and assumptions within the program.Actual energy consumption and heat losses are

ARTICLE IN PRESSC. Koroneos, G. Kottas / Building and Environment 42 (2007) 122–138128
influenced by the practices, the localized weather, theequipment characteristics and the lifestyle of theoccupants.
5.1. Heat loss summary per constructive component
Each constructive component causes, in combinationwith the heat insulation that is equipped with, heatlosses when there is temperature difference betweenindoor and outdoor air space. All heat losses of eachcomponent including the heat losses due to air infiltra-tion are shown in Table 10.
According to the results in Table 10, the crawlspacefoundation type has the largest heat losses percentage incomparison with the rest constructive components of thehouse. The reason is that the specific type of foundationhas a poor insulation.
Table 9
Monthly average temperatures for 10 years period [5]
Year Month
Jan Feb Mar Apr May J
1990 4.8 5.6 10.8 13.5 17.1 2
1991 6.2 6.3 10.2 14.6 17.7 2
1992 5.6 4.8 8.8 14.4 18.9 2
1993 8.5 7.1 11.6 15.1 18.9 2
1994 5.8 9.8 10.2 14.1 19.1 2
1995 5.5 6.1 6.6 12.7 20.9 2
1996 7.5 7.6 9.4 10.6 20.6 2
1997 7.0 9.4 7.7 15.0 18.8 2
1998 6.4 6.0 11.0 15.4 19.4 2
1999 3.1 7.7 9.3 16.4 20.5 2
T̄ i 6.0 7.0 9.6 14.2 19.2 2
Stdtmp(month) 3.29 3.58 3.46 3.41 3.05
Table 10
Annual heat loss summary per constructive component [4]
Component Area (m2)
Ceiling 225
Main walls 270
Doors 7.61
Exposed floors 225
South windows 5.20
East windows 5.20
North windows 5.20
West windows 5.20
Foundation 405
Ventilation Volume (m3)
675
Total annual
5.2. Monthly energy profile
The first column in Table 11 shows all the heat losses,as energy loads. The second column shows the energygains from internal space of the house and the thirdcolumn shows the energy gains from solar energy. Theinternal gains concern the gains used to offset the spaceheating loads for the month. During summer, all solargains are small and equal to the energy needed in orderto balance the energy from the heat losses. Theadditional energy is the heat required to balance thesummary of all the heat losses and it is shown in thesame table as auxiliary energy. The auxiliary energy iscalculated by deducting all energy gains, internal andsolar, from the energy load.
In Fig. 6 it is shown clearly that the maximumadditional energy needed for heating is during January.During summer and during September the required
un Jul Aug Sep Oct Nov Dec
4.3 25.0 26.5 21.2 16.9 8.9 9.1
3.4 24.9 26.9 21.1 17.2 9.8 8.2
3.9 25.0 25.7 21.6 18.6 10.6 7.2
3.4 26.7 26.6 24.4 18.0 12.0 7.2
5.3 26.7 25.2 21.3 15.8 12.1 9.2
3.5 25.0 25.7 19.7 15.1 9.9 4.8
4.0 26.8 24.6 20.2 13.7 10.7 8.2
4.8 26.7 27.3 21.5 17.1 6.8 5.5
4.3 27.0 26.7 22.4 18.0 10.6 5.9
4.2 26.9 26.6 21.8 16.7 12.9 7.7
4.1 26.1 26.2 21.5 16.7 10.4 7.3
2.17 2.96 2.65 2.87 3.33 3.56 3.44
Heat losses (MJ) Annual heat losses (%)
5180.5 5.07
23617.2 23.14
4474.6 4.38
11357.6 11.13
4001.5 3.92
4001.5 3.92
4001.5 3.92
4001.5 3.92
39521.6 38.72
Heat losses (MJ) Annual heat losses (%)
1922.2 1.88
102079.70 100%

ARTICLE IN PRESS
Table 11
Monthly energy profile [4]
Month Energy load (MJ) Internal gains (MJ) Solar gains (MJ) Aux. energy (MJ)
January 21756.9 1846.2 2547.1 17363.6
February 15374.1 1654.3 2115.9 11603.8
March 15199.0 1825.1 2752.2 10621.7
April 8054.8 1742.7 2461.1 3850.9
May 4362.2 1788.4 2384.7 189.1
June 1054.2 981.1 73.1 0.0
July 268.1 268.1 0.0 0.0
August 120.6 120.6 0.0 0.0
September 3008.2 1796.3 1211.9 0.0
October 7834.8 1869.1 1855.3 4110.5
November 9668.6 1802.6 1570.3 6295.8
December 15377.9 1865.2 1530.6 11982.0
Total annual 102079.5 17559.6 18502.4 66017.5
0
5000
10000
15000
20000
25000
Janu
ary
Febru
ary
Mar
chApr
ilM
ayJu
ne July
Augus
t
Septe
mbe
r
Octobe
r
Novem
ber
Decem
ber
Month
En
erg
y [M
J]
Energy loadInternal gainsSolar gainsAux. energy
Fig. 6. Monthly energy profile [4].
Table 12
Greenhouse effect from the gas emissions [4]
Energy consumption due to space heating 85 184MJ
Energy consumption due to domestic hot water 34 538MJ
Total annual energy consumption 119 722MJ
Annual Greenhouse effects by gas emissions 12 388 kg
C. Koroneos, G. Kottas / Building and Environment 42 (2007) 122–138 129
energy load for space heating is covered by the internaland solar gains. The total annual gains are equal to36 062MJ and they balance approximately 35% of theannual energy load.
In Table 11, the annual additional energy of66 017.5MJ, which is described in the table as auxiliaryenergy, is provided to the house by the central heatinginstallation considering a total efficiency coefficient of77.5% [4]. According to this coefficient, the result of theannual energy consumption for heating is estimated to85 184MJ.
5.3. Annual energy profile due to the domestic water
heating system
According to the software’s calculations, for anannual consumption of 225 l of domestic hot water perday and for a desired temperature of 55 1C, the result ofthe annual energy load is 19 169MJ [4]. Due to thestandby losses and the transfer losses from the tanklocation, a seasonal efficiency is taken to be equal to55.5% [4]. Consequently, the total energy required for
the domestic hot water is increased to 34 538MJ. Thisenergy load could be minimized if a solar collectorsystem is used, since the solar radiation of area isintensive.
6. Annual energy consumption and environmental effects
The greenhouse effect by the gas emissions from theenergy production is shown in Table 12.
Energy delivery in the form of process heat orelectricity plays an important role in ecological con-siderations. It is not sufficient to take into account the

ARTICLE IN PRESS
Fig. 7. Process chain of the energy sources [6].
Table 13
Primary energy sources of the electricity production [6]
Material Hu [MJ/unit]
Raw brown coal before extraction (kg) 9.5
Natural gas (m3) 40.2
Raw hard coal before extraction (kg) 19
Crude oil from drilling well (kg) 45.6
Uranium from ore (g) 451
Wood (kg) 16.9
C. Koroneos, G. Kottas / Building and Environment 42 (2007) 122–138130
environmental burden due to the combustion of energysources. The entire path from deposits till the consump-tion must be taken into account. An overview of theprocess chain from the energy sources is shown in Fig. 7.
6.1. Life cycle inventories of different types of electricity
production
The inventories in Table 13 contain the cumulativedata of all processes presented in Fig. 7. The deliveryenergy, in this case the electricity, is the amount of allthe partial energy need for the production of the finalenergy source. It is calculated from the total of theprimary energy source in MJ deducted from the usefulelectrical energy. For the conversion of the primaryenergy sources to MJ, the upper heating values are used,shown in Table 13.
In Table 14 the primary energy sources needed for theproduction of a kWh of electricity by oil, brown coal orhydroelectricity is shown.
In Greece, 99.5% of the electricity production is madeby conventional energy sources such as oil, brown coaland hydroelectricity plants. The rest 0.5 of the power isproduced by renewable energy sources, solar and windenergy mainly. According to the available data ofelectricity production, the percentage of the productionper energy source is given in Table 15, including theefficiency too. The second column lists the values for theefficiency of actual power generation in the powerstation. The third column shows the efficiencies for theentire chain from the primary energy sources to theterminal station. The last column lists the actualefficiencies including the power line losses.
In combination with all the available data of themonthly power consumption of the residential house,the corresponding electricity production per energysource can be calculated. For example, in January452.01 kWh were consumed. A total of 23% of thisamount was produced by oil, 49.30% was produced bybrown coal and the 27.20% was produced by hydro-electricity. The rest 5% was produced by renewablesources and this amount will not be analyzed here. Theresults are given in Table 16.
Since the production of the electricity that has beenconsumed during the year has been calculated per
energy source, a further analysis is made in order tocalculate the primary energy sources of this consump-tion. The results are shown in Table 17.
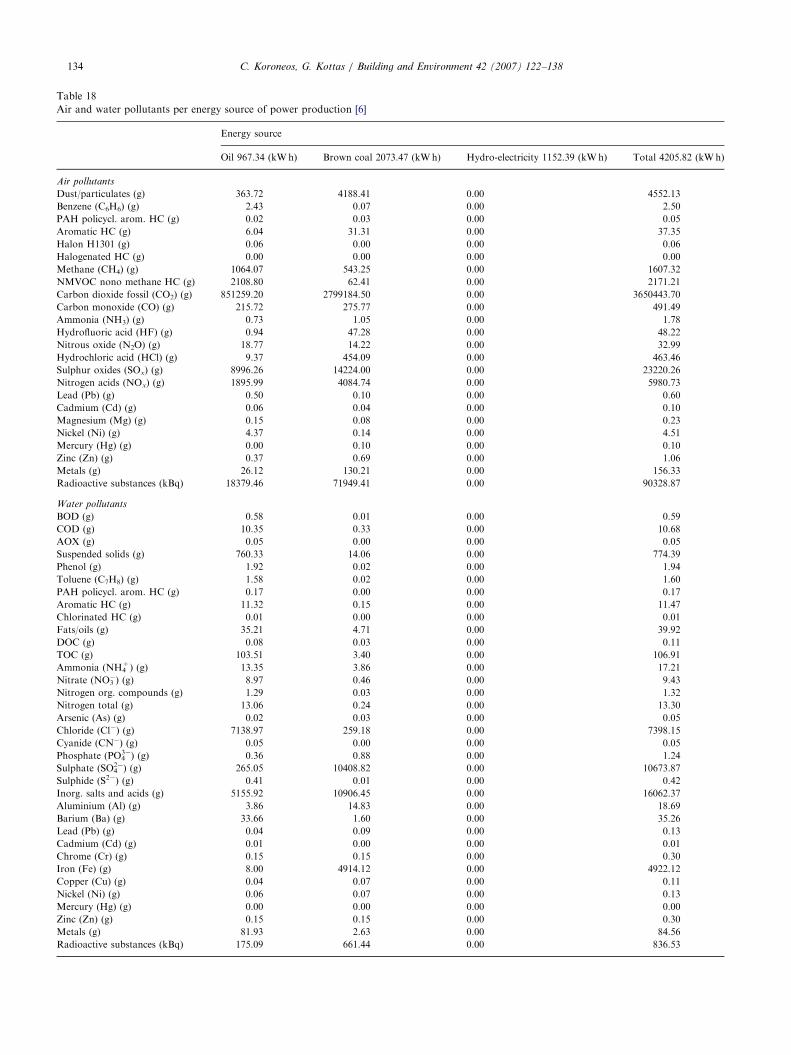
According to values in g of the air and waterpollutants per kWh of power production by using asenergy sources oil, brown coal and hydroelectricity, afurther analysis is made in order to calculate the annualquantity in g of the pollutants. This analysis can be doneusing the data of the total annual electricity consump-tion of the house, given in Table 16, per energy source.The air and water pollutants from the production ofelectricity by oil are given [6] per kWh. It is easy tocalculate the pollutants for the annual production ofelectricity from oil, 967.34 kWh. The same calculationsare made for brown coal and hydroelectricity and theresults are shown in the Table 18.
6.2. Life cycle inventories of thermal energy systems
The same analysis is made for the production of thethermal fuel for heating. The inventories of the primaryenergy sources for the heating oil are shown in the Table19 and contain the cumulative data of all processespresented in Fig. 7.
The delivery energy, in this case the heating oil, isthat amount of energy, which must be used for theproduction of the final energy. It is calculated fromthe sum of the primary energy sources in MJ minusthe useful thermal energy. For conversion of theprimary energy sources to MJ, the upper heating valuesare used.
Since the data of the monthly consumption ofthe heating oil during the year are already available in

ARTICLE IN PRESS
Table 14
Primary energy sources of the electricity production [6]
Primary energy sources Energy sources
Oil (kWh) Brown coal (kWh) Hydroelectricity (kWh)
Raw brown coal before extraction (kg) 3.21E�03 1.48E+00 0.00E+00
Natural gas (nm3) 1.39E�02 1.30E�03 0.00E+00
Raw hard coal before extraction (kg) 2.42E�03 4.41E�03 0.00E+00
Crude oil from drilling well (kg) 2.75E�01 1.69E�03 0.00E+00
Uranium from ore (g) 2.18E�04 3.99E�04 0.00E+00
Potential energy water (MJ) 1.41E�02 2.57E�02 4.70E+00
Wood (kg) 2.37E�05 4.33E�05 0.00E+00
Supply energy (MJ) 9.68E+00 1.09E+01 1.10E+00
Table 15
Electricity production and efficiency in Greece (1999) [6]
Energy source Production (%) Efficiency of power stations (%) Efficiency to terminal power station (%) Total efficiency (%)
Oil 23.00 37.10 27.60 27.10
Gas 0.00 38.00 34.90 34.20
Nuclear power 0.00 31.00 25.30 24.80
Hard coal 0.00 37.00 29.10 28.50
Brown coal 49.30 31.00 27.70 27.20
Hydroelectricity 27.20 90.00 78.00 76.50
Table 16
Corresponding electricity production during the year per energy source
Month Power consumption (kWh) Power production per energy source
Oil (kWh) Brown coal (kWh) Hydroelectricity (kWh)
January 452.01 103.96 222.84 123.85
February 435.84 100.24 214.87 119.42
March 402.16 92.50 198.26 110.19
April 326.05 74.99 160.74 89.34
May 313.44 72.09 154.53 85.88
June 301.26 69.29 148.52 82.55
July 301.26 69.29 148.52 82.55
August 286.01 65.78 141.00 78.37
September 294.47 67.73 145.17 80.68
October 312.59 71.90 154.11 85.65
November 331.53 76.25 163.44 90.84
December 449.2 103.32 221.46 123.08
Total annual 4205.82 967.34 2073.47 1152.39
C. Koroneos, G. Kottas / Building and Environment 42 (2007) 122–138 131
Table 1, a further calculation is made to obtain themonthly consumption of primary energy source. Theresults are shown in the Table 20.
Following to the values in g of the air and waterpollutants per kg of the production of the heating oil, a
further analysis is made in order to calculate the annualquantity in g of the pollutants. This analysis can be doneusing the data of the total annual heating oil consump-tion of the house, given in Table 1. The results areshown in the Table 21.

ARTICLE IN PRESS
Table 17
Monthly consumption of primary resources per energy source of power production [6]
Month Resources, commercial fuels (primary energy sources) Energy source
Oil Brown coal Hydro-electric power Total
January Raw brown coal (kg) 0.33 329.80 0.00 330.13
Natural gas (nm3) 1.45 0.29 0.00 1.74
Raw hard coal (kg) 0.25 0.98 0.00 1.23
Crude oil from drilling well (kg) 28.59 0.38 0.00 28.97
Uranium from ore (g) 0.02 0.09 0.00 0.11
Potential energy water (MJ) 1.47 5.73 582.10 589.30
Wood (kg) 0.00 0.01 0.00 0.01
Supply energy (MJ) 1006.33 2428.96 136.24 3571.53
February Raw brown coal (kg) 0.32 318.01 0.00 318.33
Natural gas (nm3) 1.39 0.28 0.00 1.67
Raw hard coal (kg) 0.24 0.95 0.00 1.19
Crude oil from drilling well (kg) 27.57 0.36 0.00 27.93
Uranium from ore (g) 0.02 0.09 0.00 0.11
Potential energy water (MJ) 1.41 5.52 561.27 568.20
Wood (kg) 0.00 0.01 0.00 0.01
Supply energy (MJ) 970.32 2342.08 131.36 3443.76
March Raw brown coal (kg) 0.30 293.42 0.00 293.72
Natural gas (nm3) 1.29 0.26 0.00 1.55
Raw hard coal (kg) 0.22 0.87 0.00 1.09
Crude oil from drilling well (kg) 25.44 0.34 0.00 25.78
Uranium from ore (g) 0.02 0.08 0.00 0.10
Potential energy water (MJ) 1.30 5.10 517.89 524.29
Wood (kg) 0.00 0.01 0.00 0.01
Supply energy (MJ) 895.40 2161.03 121.21 3177.64
April Raw brown coal (kg) 0.24 237.90 0.00 238.14
Natural gas (nm3) 1.04 0.21 0.00 1.25
Raw hard coal (kg) 0.18 0.71 0.00 0.89
Crude oil from drilling well (kg) 20.62 0.27 0.00 20.89
Uranium from ore (g) 0.02 0.06 0.00 0.08
Potential energy water (MJ) 1.06 4.13 419.90 425.09
Wood (kg) 0.00 0.01 0.00 0.01
Supply energy (MJ) 725.90 1752.07 98.27 2576.24
May Raw brown coal (kg) 0.23 228.70 0.00 228.93
Natural gas (nm3) 1.00 0.20 0.00 1.20
Raw hard coal (kg) 0.17 0.68 0.00 0.85
Crude oil from drilling well (kg) 19.82 0.26 0.00 20.08
Uranium from ore (g) 0.02 0.06 0.00 0.08
Potential energy water (MJ) 1.02 3.97 403.64 408.63
Wood (kg) 0.00 0.01 0.00 0.01
Supply energy (MJ) 697.83 1684.38 94.47 2476.68
June Raw brown coal (kg) 0.22 219.81 0.00 220.03
Natural gas (nm3) 0.96 0.19 0.00 1.15
Raw hard coal (kg) 0.17 0.65 0.00 0.82
Crude oil from drilling well (kg) 19.05 0.25 0.00 19.30
Uranium from ore (g) 0.02 0.06 0.00 0.08
Potential energy water (MJ) 0.98 3.82 387.99 392.79
Wood (kg) 0.00 0.01 0.00 0.01
Supply energy (MJ) 670.73 1618.87 90.81 2380.41
July Raw brown coal (kg) 0.22 219.81 0.00 220.03
Natural gas (nm3) 0.96 0.19 0.00 1.15
Raw hard coal (kg) 0.17 0.65 0.00 0.82
Crude oil from drilling well (kg) 19.05 0.25 0.00 19.30
Uranium from ore (g) 0.02 0.06 0.00 0.08
Potential energy water (MJ) 0.98 3.82 387.99 392.79
Wood (kg) 0.00 0.01 0.00 0.01
Supply energy (MJ) 670.73 1618.87 90.81 2380.41
C. Koroneos, G. Kottas / Building and Environment 42 (2007) 122–138132

ARTICLE IN PRESS
Table 17 (continued )
Month Resources, commercial fuels (primary energy sources) Energy source
Oil Brown coal Hydro-electric power Total
August Raw brown coal (kg) 0.21 208.68 0.00 208.89
Natural gas (nm3) 0.91 0.18 0.00 1.09
Raw hard coal (kg) 0.16 0.62 0.00 0.78
Crude oil from drilling well (kg) 18.09 0.24 0.00 18.33
Uranium from ore (g) 0.01 0.06 0.00 0.07
Potential energy water (MJ) 0.93 3.62 368.34 372.89
Wood (kg) 0.00 0.01 0.00 0.01
Supply energy (MJ) 636.75 1536.90 86.21 2259.86
September Raw brown coal (kg) 0.22 215.44 0.00 215.66
Natural gas (nm3) 0.94 0.19 0.00 1.13
Raw hard coal (kg) 0.16 0.64 0.00 0.80
Crude oil from drilling well (kg) 18.63 0.25 0.00 18.88
Uranium from ore (g) 0.01 0.06 0.00 0.07
Potential energy water (MJ) 0.95 3.74 379.20 383.89
Wood (kg) 0.00 0.01 0.00 0.01
Supply energy (MJ) 655.63 1586.71 88.75 2331.09
October Raw brown coal (kg) 0.23 228.08 0.00 228.31
Natural gas (nm3) 1.00 0.20 0.00 1.20
Raw hard coal (kg) 0.17 0.68 0.00 0.85
Crude oil from drilling well (kg) 19.77 0.26 0.00 20.03
Uranium from ore (g) 0.02 0.06 0.00 0.08
Potential energy water (MJ) 1.01 3.96 402.56 407.53
Wood (kg) 0.00 0.01 0.00 0.01
Supply energy (MJ) 695.99 1679.80 94.22 2470.01
November Raw brown coal (kg) 0.24 241.89 0.00 242.13
Natural gas (nm3) 1.06 0.21 0.00 1.27
Raw hard coal (kg) 0.18 0.72 0.00 0.90
Crude oil from drilling well (kg) 20.97 0.28 0.00 21.25
Uranium from ore (g) 0.02 0.07 0.00 0.09
Potential energy water (MJ) 1.08 4.20 426.95 432.23
Wood (kg) 0.00 0.01 0.00 0.01
Supply energy (MJ) 738.10 1781.50 99.92 2619.52
December Raw brown coal (kg) 0.33 327.76 0.00 328.09
Natural gas (nm3) 1.44 0.29 0.00 1.73
Raw hard coal (kg) 0.25 0.98 0.00 1.23
Crude oil from drilling well (kg) 28.41 0.37 0.00 28.78
Uranium from ore (g) 0.02 0.09 0.00 0.11
Potential energy water (MJ) 1.46 5.69 578.48 585.63
Wood (kg) 0.00 0.01 0.00 0.01
Supply energy (MJ) 1000.14 2413.91 135.39 3549.44
C. Koroneos, G. Kottas / Building and Environment 42 (2007) 122–138 133
6.3. Environmental impact assessment
After further examination of the air and waterpollutants caused by the production of the fuels usedto the model house, ECO-INDICATOR 95 method [7]has been used to quantify the environmental impact.According to this method, the pollutants listed in Tables18 and 21 are reduced to an equivalent reference basepollutant in order to be added or compared asequivalent quantities. For example, the pollutantreference base for global warming potential effect isCO2. The results of the equivalent quantities for each
effect are listed in Tables 22 and 23, for the pollutantscaused by the production of electricity and of heatingoil, respectively. The values of the equivalent quantitiesare multiplied by the normalization method in order toobtain the normalization values of each environmentaleffect. The results are listed in the same tables. Thenormalization value is necessary in order to comparean environmental effect numerically with another one.(Fig. 8)
The results of the normalization can indicate only thequantity of each environmental effect. A diagram ofnormalized values indicates only which effect has
ARTICLE IN PRESS
Table 18
Air and water pollutants per energy source of power production [6]
Energy source
Oil 967.34 (kWh) Brown coal 2073.47 (kWh) Hydro-electricity 1152.39 (kWh) Total 4205.82 (kWh)
Air pollutants
Dust/particulates (g) 363.72 4188.41 0.00 4552.13
Benzene (C6H6) (g) 2.43 0.07 0.00 2.50
PAH policycl. arom. HC (g) 0.02 0.03 0.00 0.05
Aromatic HC (g) 6.04 31.31 0.00 37.35
Halon H1301 (g) 0.06 0.00 0.00 0.06
Halogenated HC (g) 0.00 0.00 0.00 0.00
Methane (CH4) (g) 1064.07 543.25 0.00 1607.32
NMVOC nono methane HC (g) 2108.80 62.41 0.00 2171.21
Carbon dioxide fossil (CO2) (g) 851259.20 2799184.50 0.00 3650443.70
Carbon monoxide (CO) (g) 215.72 275.77 0.00 491.49
Ammonia (NH3) (g) 0.73 1.05 0.00 1.78
Hydrofluoric acid (HF) (g) 0.94 47.28 0.00 48.22
Nitrous oxide (N2O) (g) 18.77 14.22 0.00 32.99
Hydrochloric acid (HCl) (g) 9.37 454.09 0.00 463.46
Sulphur oxides (SOx) (g) 8996.26 14224.00 0.00 23220.26
Nitrogen acids (NOx) (g) 1895.99 4084.74 0.00 5980.73
Lead (Pb) (g) 0.50 0.10 0.00 0.60
Cadmium (Cd) (g) 0.06 0.04 0.00 0.10
Magnesium (Mg) (g) 0.15 0.08 0.00 0.23
Nickel (Ni) (g) 4.37 0.14 0.00 4.51
Mercury (Hg) (g) 0.00 0.10 0.00 0.10
Zinc (Zn) (g) 0.37 0.69 0.00 1.06
Metals (g) 26.12 130.21 0.00 156.33
Radioactive substances (kBq) 18379.46 71949.41 0.00 90328.87
Water pollutants
BOD (g) 0.58 0.01 0.00 0.59
COD (g) 10.35 0.33 0.00 10.68
AOX (g) 0.05 0.00 0.00 0.05
Suspended solids (g) 760.33 14.06 0.00 774.39
Phenol (g) 1.92 0.02 0.00 1.94
Toluene (C7H8) (g) 1.58 0.02 0.00 1.60
PAH policycl. arom. HC (g) 0.17 0.00 0.00 0.17
Aromatic HC (g) 11.32 0.15 0.00 11.47
Chlorinated HC (g) 0.01 0.00 0.00 0.01
Fats/oils (g) 35.21 4.71 0.00 39.92
DOC (g) 0.08 0.03 0.00 0.11
TOC (g) 103.51 3.40 0.00 106.91
Ammonia (NH4+) (g) 13.35 3.86 0.00 17.21
Nitrate (NO3�) (g) 8.97 0.46 0.00 9.43
Nitrogen org. compounds (g) 1.29 0.03 0.00 1.32
Nitrogen total (g) 13.06 0.24 0.00 13.30
Arsenic (As) (g) 0.02 0.03 0.00 0.05
Chloride (Cl�) (g) 7138.97 259.18 0.00 7398.15
Cyanide (CN�) (g) 0.05 0.00 0.00 0.05
Phosphate (PO43�) (g) 0.36 0.88 0.00 1.24
Sulphate (SO42�) (g) 265.05 10408.82 0.00 10673.87
Sulphide (S2�) (g) 0.41 0.01 0.00 0.42
Inorg. salts and acids (g) 5155.92 10906.45 0.00 16062.37
Aluminium (Al) (g) 3.86 14.83 0.00 18.69
Barium (Ba) (g) 33.66 1.60 0.00 35.26
Lead (Pb) (g) 0.04 0.09 0.00 0.13
Cadmium (Cd) (g) 0.01 0.00 0.00 0.01
Chrome (Cr) (g) 0.15 0.15 0.00 0.30
Iron (Fe) (g) 8.00 4914.12 0.00 4922.12
Copper (Cu) (g) 0.04 0.07 0.00 0.11
Nickel (Ni) (g) 0.06 0.07 0.00 0.13
Mercury (Hg) (g) 0.00 0.00 0.00 0.00
Zinc (Zn) (g) 0.15 0.15 0.00 0.30
Metals (g) 81.93 2.63 0.00 84.56
Radioactive substances (kBq) 175.09 661.44 0.00 836.53
C. Koroneos, G. Kottas / Building and Environment 42 (2007) 122–138134

ARTICLE IN PRESSC. Koroneos, G. Kottas / Building and Environment 42 (2007) 122–138 135
numerically the greater or less contribution than othereffect. On the other hand, the results of the valuationcan indicate the relative importance of each effect. Thevaluation results are calculated by the normalizationvalue of each effect multiplied by the valuation factor.The results are listed in Tables 24 and 25 for theproduction of electricity and heating oil, respectively.
7. Energy consumption summary report and conclusions
The final evaluations of the annual consumption ofheating oil and electricity are shown in Table 26. It iseasily concluded that the values from the calculationsand the actual values from the utility bills do not have asignificant deviation. Since the indicative heating oil costper litre and also the cost of the electricity per kWh isgiven in euro according to the utility bills, the softwareprovides the result of the annual energy cost evaluation.Table 27 shows the result of these inputs.
Table 20
Monthly consumption of primary energy sources for the production of heat
Month Primary energy source
Raw brown
coal (kg)
Natural gas
(nm3)
Raw hard coal
(kg)
Crude oil f
drilling we
(kg)
January 33.31 9.98 25.07 689.30
February 26.21 7.85 19.73 542.40
March 19.66 5.89 14.80 406.80
April 15.29 4.58 11.51 316.40
May 6.55 1.96 4.93 135.60
June 1.09 0.33 0.82 22.60
July 0.82 0.25 0.62 16.95
August 1.37 0.41 1.03 28.25
September 2.73 0.82 2.06 56.50
October 12.56 3.76 9.45 259.90
November 20.20 6.05 15.21 418.10
December 29.48 8.83 22.19 610.20
Total 169.26 50.72 127.41 3503.00
Table 19
Primary energy sources of the heating oil production [6]
Resources commercial fuels (primary energy
sources)
Heating oil (kg)
Raw brown coal (kg) 5.46E�02
Natural gas (nm3) 1.64E�02
Raw hard coal (kg) 4.11E�02
Crude oil from drilling well (kg) 1.13E+00
Uranium from ore (g) 3.71E�03
Potential energy water (MJ) 2.39E�01
Wood (kg) 4.03E�04
Supply energy (MJ) 1.50E+01
The electricity used for space heating is consumedfor the needs of the central heating components suchas burner, pump circulator, etc. Also, it is consideredthat electricity was not used for domestic hot waterheating.
The total energy cost of the residential house isestimated to be 2190.62 euros total amount, whichmeans that the average monthly cost is approximately182 euros. The annual consumption of the heating oilcould be reduced in order to minimize the annual energycost according to the following suggestions:
�
ing
rom
ll
Reduction of the room temperature to 20 1C in eachzone.
� Installation of a programmable thermostat. Thesetpoint temperature is changed at night, between23:00 and 6:00 from 21 to 17 1C.
� Air infiltration rate at 50 Pa is reduced from 4.55 to1.5 air change per hour.
� Frequent maintenance of the central heating. � Installing a solar collector for domestic hot water.Since the reduction of the heating oil consumption isachieved, the annual gas emissions will be reduced too.
According to the results of the environmental effects’valuation shown in Fig. 9, the heating oil production of3100 kg, used for 1 year, burdens almost five times morethan the production of 4205.82 kWh electricity, con-sumed for the same period. The metals and theacidification are the effects with the most severe impactto the environment for both cases of electricity andheating oil production.
oil [6]
Uranium from
ore (g)
Potential
energy water
(MJ)
Wood (kg) Supply energy
(MJ)
2.26 145.79 0.25 9150.00
1.78 114.72 0.19 7200.00
1.34 86.04 0.15 5400.00
1.04 66.92 0.11 4200.00
0.45 28.68 0.05 1800.00
0.07 4.78 0.01 300.00
0.06 3.59 0.01 225.00
0.09 5.98 0.01 375.00
0.19 11.95 0.02 750.00
0.85 54.97 0.09 3450.00
1.37 88.43 0.15 5550.00
2.00 129.06 0.22 8100.00
11.50 740.90 1.25 46500.00

ARTICLE IN PRESS
Table 21
Air and water pollutants of the heating oil production [6]
Energy source (Thermal) Heating oil H (kg) Annual consumption 3100 kg
Air pollutants
Dust/particulates (g) 2.48E+00 7688.00
Benzene (C6H6) (g) 1.21E�02 37.51
PAH policycl. Arom. HC (g) 4.76E�05 0.15
Aromatic HC (g) 2.99E�02 92.69
Halon H1301 (g) 2.70E�04 0.84
Halogenated HC (g) 9.71E�08 0.00
Methane (CH4) (g) 4.71E+00 14601.00
NMVOC nono methane HC (g) 8.99E+00 27869.00
Carbon dioxide fossil (CO2) (g) 3.76E+03 11656000.00
Carbon monoxide (CO) (g) 1.30E+00 4030.00
Ammonia (NH3) (g) 4.44E�04 1.38
Hydrofluoric acid (HF) (g) 8.92E�03 27.65
Nitrous oxide (N2O) (g) 7.63E�02 236.53
Hydrochloric acid (HCl) (g) 8.76E�02 271.56
Sulphur oxides (SOx) (g) 5.21E+01 161510.00
Nitrogen acids (NOx) (g) 9.52E+00 29512.00
Lead (Pb) (g) 2.43E�03 7.53
Cadmium (Cd) (g) 1.38E�03 4.28
Magnesium (Mg) (g) 1.38E�05 0.04
Nickel (Ni) (g) 2.84E�02 88.04
Mercury (Hg) (g) 1.50E�05 0.05
Zinc (Zn) (g) 2.65E�03 8.22
Metals (g) 1.69E�01 523.90
Radioactive substances (kBq) 3.23E+02 1001300.00
Water pollutants
BOD (g) 2.49E�03 7.72
COD (g) 4.85E�02 150.35
AOX (g) 1.96E�04 0.61
Suspended solids (g) 3.24E+00 10044.00
Phenol (g) 8.13E�03 25.20
Toluene (C7H8) (g) 6.70E�03 20.77
PAH policycl. arom. HC (g) 7.38E�04 2.29
Aromatic HC (g) 4.82E�02 149.42
Chlorinated HC (g) 4.97E�05 0.15
Fats/oils (g) 1.50E+00 4650.00
DOC (g) 1.22E�04 0.38
TOC (g) 4.48E�01 1388.80
Ammonia (NH4+) (g) 5.78E�02 179.18
Nitrate (NO3�) (g) 3.74E�02 115.94
Nitrogen org. compounds (g) 5.61E�03 17.39
Nitrogen total (g) 5.60E�02 173.60
Arsenic (As) (g) 1.77E�04 0.55
Chloride (Cl�) (g) 3.05E+01 94550.00
Cyanide (CN�) (g) 2.19E�04 0.68
Phosphate (PO43�) (g) 4.52E�03 14.01
Sulphate (SO42�) (g) 1.53E+00 4743.00
Sulphide (S2�) (g) 1.74E�03 5.39
Inorg. salts and acids (g) 2.21E+01 68510.00
Aluminium (Al) (g) 6.69E�02 207.39
Barium (Ba) (g) 1.47E�01 455.70
Lead (Pb) (g) 4.57E�04 1.42
Cadmium (Cd) (g) 6.44E�05 0.20
Chrome (Cr) (g) 1.14E�03 3.53
Iron (Fe) (g) 1.16E�01 359.60
Copper (Cu) (g) 4.30E�04 1.33
Nickel (Ni) (g) 4.90E�04 1.52
Mercury (Hg) (g) 6.39E�07 0.00
Zinc (Zn) (g) 1.16E�03 3.60
Metals (g) 3.53E�01 1094.30
Radioactive substances (kBq) 3.00E+00 9300.00
C. Koroneos, G. Kottas / Building and Environment 42 (2007) 122–138136

ARTICLE IN PRESS
Table 22
Normalization values of the pollutants caused by the production of electricity for every effect. [7]
Environmental effect Equivalent quantities Normalization factor Normalization value
Global warming potential, kg/kg CO2 3677.32552 0.0000742 0.27286
Ozone depletion, kg/kg CFC-11 0.0009600 1.24 0.0011904
Acidification, kg/kg SO4 27.89511 0.00888 0.24771
Eutrophication, kg/kg PO4 0.78657 0.0262 0.02061
Carcinogenesis, kg/kg B(a)P 0.00002 106 0.00229
Winter smog, kg/kg SPM 27.77239 0.0106 0.29439
Metals, kg/kg Pb 0.1624892 17.8 2.8923076
Table 23
Normalization values of the pollutants caused by the production of heating oil for every effect. [7]
Environmental effect Equivalent quantities Normalization factor Normalization value
Global warming potential, kg/kg CO2 11884.590100 0.0000742 0.881837
Ozone depletion, kg/kg CFC-11 0.013440 1.24 0.016666
Acidification, kg/kg SO4 182.454207 0.00888 1.620193
Eutrophication, kg/kg PO4 3.930823 0.0262 0.102988
Carcinogenesis, kg/kg B(a)P 0.000393 106 0.041669
Winter smog, kg/kg SPM 169.198000 0.0106 1.793499
Metals, kg/kg Pb 0.748412 17.8 13.321742
0
2
4
6
8
10
12
14
16
18
Electricity Heating oil
Metals
Winter smog
Carcinogenesis
Eutrophication
Acidification
Ozone depletion
Global warming potential
Fig. 8. Annual total amount of effects’ normalization values [7].
Table 24
Valuation of the pollutants caused by the production of electricity for every effect [7]
Environmental effect Normalization value Valuation factor Valuation result
Global warming potential, kg/kg CO2 0.27286 2.5 0.68214
Ozone depletion, kg/kg CFC-11 0.0011904 100 0.11904
Acidification, kg/kg SO4 0.24771 10 2.47709
Eutrophication, kg/kg PO4 0.02061 5 0.10304
Carcinogenesis, kg/kg B(a)P 0.00229 10 0.02289
Winter smog, kg/kg SPM 0.29439 5 1.47194
Metals, kg/kg Pb 2.8923076 5 14.46154
C. Koroneos, G. Kottas / Building and Environment 42 (2007) 122–138 137

ARTICLE IN PRESS
Table 25
Valuation of the pollutants caused by the production of heating oil for every effect [7]
Environmental effect Normalization value Valuation factor Valuation result
Global warming potential, kg/kg CO2 0.881837 2.5 2.204591
Ozone depletion, kg/kg CFC-11 0.016666 100 1.666560
Acidification, kg/kg SO4 1.620193 10 16.201934
Eutrophication, kg/kg PO4 0.102988 5 0.514938
Carcinogenesis, kg/kg B(a)P 0.041669 10 0.416691
Winter smog, kg/kg SPM 1.793499 5 8.967494
Metals, kg/kg Pb 13.321742 5 66.608708
Table 26
Annual energy profile [4]
Energy fuel Space heating Domestic hot water heating Appliances Total
Heating oil (l) 2178.3 869.5 0.0 3074.9
Electricity (kWh) 349.0 0.0 3832.5 4181.5
Table 27
Annual energy cost evaluation [4]
Energy fuel Annual consumption Annual energy cost
Heating oil 3074.9 l h 1117.41
Electricity 4181.5 kWh h 1073.21
Total amount h 2190.62
0
10
20
30
40
50
60
70
80
90
100
il
Metals
Winter smog
Carcinogenesis
Eutrophication
Acidification
Ozone depletion
Global warming potential
Fig. 9. Annual total effects’ valuation [7].
C. Koroneos, G. Kottas / Building and Environment 42 (2007) 122–138138
References
Electricity Heating o
[1] Florides GA, Kalogirou SA, Tassu SA, Wrobel LC. ‘‘Modeling of
the modern houses of Cyprus and energy consumption analysis’’
Abstract, Mechanical Engineering Department, Higher Technical
Institute, Nicosia, Cyprus, 2000.
[2] Greek Public Electric Company, Utility bills of the house.
[3] Zmeureanu R, Brau J, Bernard L, Vlym Y, Mordel F, Timores F.
‘‘Evaluation of energy performance of an existing house
in Montreal using four energy analysis software’’ Abstract,
Concordia University, Montreal, Canada, 2000.
[4] HOT2000. User’s manual, Version 8.73, Natural resources
Canada, 2002.
[5] Aristotle university of Thessaloniki, Climatic Data 1930–2000,
Meteorology and Agriculture Department.
[6] Environmental series No. 250/II (1998). Life cycle inventories for
packaging, vol. II, Berne Swiss Agency for the Environmental
Forest and Landscape (SAEFL).
[7] Goedkoop MJ. The Eco-indicator 95 Final report (in
English), NOH Report 9523, Pre consultants, Amersfoort (NL),
July 1995.
Copyright © 2022 FDOKUMEN


![“Yunanistan” [Greece]](https://static.fdokumen.com/doc/165x107/63250e4a85efe380f30680d9/yunanistan-greece.jpg)