Energy Auditing - Case Study of Karnataka - CSTEP
17
Energy Auditing
-
Upload
khangminh22 -
Category
Documents
-
view
0 -
download
0
Transcript of Energy Auditing - Case Study of Karnataka - CSTEP

Energy Auditing


Energy Auditing
Case Study of Karnataka
Rishu Garg
Sandhya Sundararagavan
Center for Study of Science, Technology and Policy (CSTEP)
December, 2018
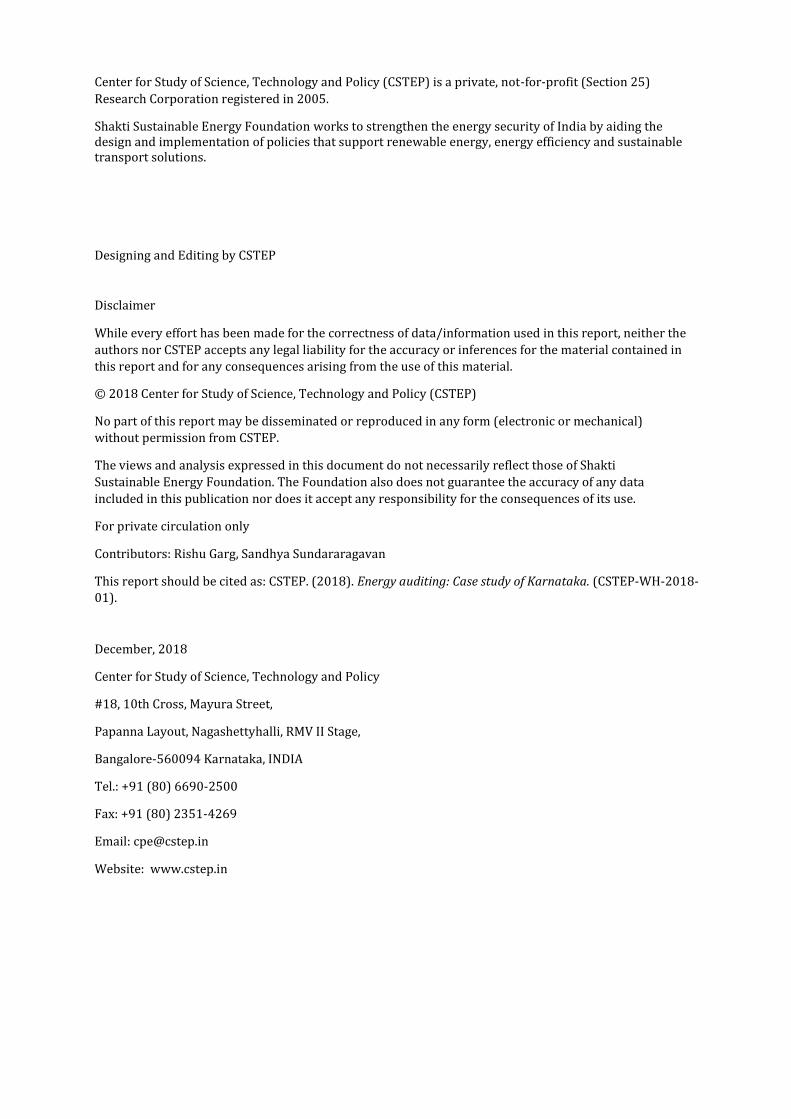
Center for Study of Science, Technology and Policy (CSTEP) is a private, not-for-profit (Section 25)
Research Corporation registered in 2005.
Shakti Sustainable Energy Foundation works to strengthen the energy security of India by aiding the design and implementation of policies that support renewable energy, energy efficiency and sustainable transport solutions.
Designing and Editing by CSTEP
Disclaimer
While every effort has been made for the correctness of data/information used in this report, neither the
authors nor CSTEP accepts any legal liability for the accuracy or inferences for the material contained in
this report and for any consequences arising from the use of this material.
© 2018 Center for Study of Science, Technology and Policy (CSTEP)
No part of this report may be disseminated or reproduced in any form (electronic or mechanical)
without permission from CSTEP.
The views and analysis expressed in this document do not necessarily reflect those of Shakti
Sustainable Energy Foundation. The Foundation also does not guarantee the accuracy of any data
included in this publication nor does it accept any responsibility for the consequences of its use.
For private circulation only
Contributors: Rishu Garg, Sandhya Sundararagavan
This report should be cited as: CSTEP. (2018). Energy auditing: Case study of Karnataka. (CSTEP-WH-2018-01).
December, 2018
Center for Study of Science, Technology and Policy
#18, 10th Cross, Mayura Street,
Papanna Layout, Nagashettyhalli, RMV II Stage,
Bangalore-560094 Karnataka, INDIA
Tel.: +91 (80) 6690-2500
Fax: +91 (80) 2351-4269
Email: [email protected]
Website: www.cstep.in
Acknowledgements
CSTEP is grateful for the support provided by Shakti Sustainable Energy Foundation for
conducting this study.
We deeply appreciate the valuable feedback provided by Mr Sumanth Shankar Rao (Former
Managing Director, Mangalore Electricity Supply Company Limited) during the course of the
study. We are thankful to Dr Jai Asundi (Research Coordinator, CSTEP) for his support and
encouragement. The authors also acknowledge the editorial team for their support.

Energy Auditing: Case Study of Karnataka
© CSTEP www.cstep.in
1
1. Background
A healthy distribution sector is
considered as the key to a financially
viable power sector. One of the major
challenges affecting the health of Indian
distribution sector is the high aggregate
technical and commercial (AT&C) loss.
AT&C loss is the sum of technical loss and
commercial loss. The technical loss
occurs due to flow of energy into
transmission and distribution network.
Technological advancements could help
in reduction of technical loss to an
optimum level. As per international
norms, the technical loss in a distribution
system should be in the range of 4-5%.
On the other hand, the commercial loss is
mostly man-made and occurs due to
inefficient billing and collection of the
energy supplied, illegal connections,
theft, meter tampering, and pilferage, etc.
The commercial loss is occurring mostly
due to managerial issues and could be
brought down to zero with efficient
administrative practices.
Over the years, the central as well as
various state governments have initiated
several programmes targeted at reducing
AT&C loss and enhancing operational
performance of distribution companies
(DISCOMs). In 2001, Accelerated Power
Development and Reform Programme
(APDRP) was launched to reduce the
AT&C loss to 15%. The scheme could not achieve the desired objective due to limitations in
execution of the programme such as incorrect reporting of AT&C loss by DISCOMs, and
inadequate utilisation of funds for network improvement. The scheme was reintroduced in 2008
as Restructured Accelerated Power Development and Reform Programme (RAPDRP) with the
same objective of reducing AT&C loss to 15%. The RAPDRP scheme is now subsumed in to the
Integrated Power Development Scheme (IPDS), introduced in 2013. The most recent programme
launched in this regard is the Ujwal DISCOM Assurance Yojana (UDAY), aimed at improving the
operational and financial health of DISCOMs. One of the main objectives of UDAY is to bring down
the AT&C loss in India to 15% by FY2019.
Reduction in AT&C loss is considered to bring both operational and financial efficiency in the
distribution sector as a direct correlation exists between the AT&C loss and financial distress of
Highlights
Currently, high AT&C loss is considered to be the
biggest challenge of Indian distribution sector.
While DISCOMs are working towards bringing
down the AT&C loss through several initiatives,
streamlining the current energy audit process in
DISCOMs could be a game changer. Some of the
recommendations that could be useful, are
provided below:
A tagging drive of feeder-DT-Consumer should be considered as an essential first step
towards streamlining the energy audit
process, as inaccurate tagging leads to
erroneous calculation of billing and collection efficiency.
Installation of boundary meters to account for
feeder energy input should be mandated as lack of boundary meters leads to double
accounting and inaccurate apportionment of
the energy input to feeder, (for feeders
spanning across multiple O&M divisions).
A monitoring group to verify and validate the data before uploading onto the portal could
help in avoiding data entry errors, as such
errors results in inaccurate calculation of
AT&C loss.
Regular maintenance and accuracy checks of feeder, DT and consumer meters should be
mandated along with 100% metering. This is
because while metering is carried out, only
~50% of the meters are in good working
condition.

Energy Auditing: Case Study of Karnataka
© CSTEP www.cstep.in
2
the DISCOMs. Therefore, it is important for all the DISCOMs to contain their AT&C loss at
normative levels of 5-10%. Currently, AT&C loss in India is in the range of 6-10% for states such
as Andhra Pradesh, Telangana and in states like Bihar, Jharkhand and Uttar Pradesh, it ranges
between 30 to 45%.
2. Energy Audit for a DISCOM
Energy Conservation Act, 2001, defines energy auditing as the “verification, monitoring, and
analysis of use of energy including submission of technical report containing recommendations
for improving energy efficiency with cost benefit analysis and an action plan to reduce energy
consumption” (Ministry of Law, Justice and Company Affairs, 2001). Energy audit is used to
identify the AT&C loss by measuring energy input and energy output in the distribution network.
It helps to highlight the areas where losses are occurring, and thus, helps to introduce suitable
checks and balances to curb those losses.
As per a Ministry of Power (MoP) report, around INR 4,000 crores of revenue is lost due to 1%
AT&C loss (MoP, 2015). This amounts to a revenue loss of around INR 1 lakh crore with AT&C
loss (at all India level) in the range of 25-26% (MoP, 2018). As long as AT&C loss continues to be
in such a high range, it is difficult for the DISCOMs to be commercially viable. Hence, there is an
urgent need to identify the areas of waste and leaks, and focus efforts to take corrective action.
This could be achieved by conducting energy audits, and highlighting issues such as inaccurate
tagging, theft and errors in metering and billing. Energy audit would help in identifying and
measuring the AT&C loss accurately, thereby aiding DISCOMs to take measures for reducing it.
This should result in substantial savings for DISCOMs along with higher revenue earning.
Typically, in a DISCOM, energy audit is carried out by consolidating the data in their jurisdiction
and conducting analysis so as to measure the quantum of energy loss in the system. The energy
received from each 11 kV substation is measured for all the outgoing feeders through installation
of appropriate energy meters. This provides the DISCOMs with the actual quantity of energy input
to each feeder, every month. The energy input is then compared with the corresponding figures
of monthly energy sales to the consumers, connected to the particular feeder. Difference of the
energy input and monthly sales indicates the loss in each feeder. While quantum of energy lost is
obtained through this procedure, it does not aid in segregating the loss into technical and
commercial loss. The MoP report (MoP, 2015) also states that there is no methodology developed
so far by any state government or DISCOM to compute technical and commercial loss separately.
3. Energy Audit for a DISCOM- Case of Karnataka
Karnataka signed up for UDAY Scheme in June 2016 with an objective of improving operational
efficiency of its DISCOMs. As per the scheme, Karnataka has a target of reducing its AT&C loss to
14.2% by FY19. The Karnataka DISCOMs seem to have brought down their AT&C loss over the
last five years. The AT&C loss has reduced from 21% in FY13 to 15% in FY18 (Figure 1).

Energy Auditing: Case Study of Karnataka
© CSTEP www.cstep.in
3
Figure 1: Karnataka AT&C Loss (%) from FY13 to FY18
Source: PFC report on performance of state power utilities, UDAY portal
Karnataka adopted energy auditing as a major reform initiative in 2001 to calculate energy loss.
Karnataka Electricity Regulatory Commission (KERC) developed an energy audit format in
2003, to determine technical and non-technical loss separately (Figure 2). Karnataka DISCOMs
initiated the energy audit for 11 kV substations in June 2003 although KERC mandated it in
September 2001(CAG, 2011).
The most important step in bringing down the AT&C loss is to measure it accurately. While the
technical loss could be measured based on the specifications of the electrical equipment in the
network, commercial loss is mostly unaccounted for. In such cases, energy audit can play a
crucial role in accurate assessment of the shares of both technical and commercial loss in
overall AT&C loss figures.
The KERC format provides a detailed description on calculation of technical and commercial
loss separately.
2122
19 1816 15
0
5
10
15
20
25
FY13 FY14 FY15 FY16 FY17 FY18
Figure 2: KERC format for energy audit at 11 kV feeder level

Energy Auditing: Case Study of Karnataka
© CSTEP www.cstep.in
4
Energy Input, Energy Consumed and Energy Loss
The energy fed to the feeders at the entry point is measured at the Karnataka Power Transmission
Corporation Limited (KPTCL) substations using electronic meters. The Assistant Engineer (AE)
or Junior Engineer (JE) records the hourly readings from the energy meters of the feeders. For
the purpose of energy auditing, the energy input (X) to feeder is calculated based on the initial
and final reading recorded in the meter connected to the 11 kV feeder:
Energy Input (X) = (FR – IR) x MC
X = Energy input to the feeder from the substation
FR = Final meter reading of current month
IR = Initial meter reading of current month
MC = Meter constant
If additional energy is imported to the feeder from other sources, then the imported energy (P)
is added into the energy input to calculate the net energy input to the feeder.
Final energy Input to the feeder (Y) = Energy input (X) + Energy imported (P)
The energy consumed (Z) is available from the monthly bills of the consumers (both high tension
(HT) and low tension (LT) consumers) associated with the feeder. The difference between the
energy input and energy consumed gives the energy loss (R) in the network, if the feeder is
supplying to the consumers in the same sub-division {Equation (1)}. In case of energy exported
to other sub-divisions from the feeder, the energy loss is calculated as given in equation (2).
Energy Loss (R) = Energy Input(X) – Energy Consumed (Z) ---------------------------------- (1)
Energy Loss (R) = [Energy Input(X) – Energy exported (Q)] – Energy Consumed (Z) -----(2)
Segregation of Energy Loss into Technical and Commercial Loss
The energy loss is segregated into technical and commercial loss by calculating technical loss (S)
in the feeder, and associated distribution transformers (DTs).
Technical Loss (S) = Technical loss in 11 kV feeder (T) + Technical loss (Copper and Iron
loss) in DTs (U)
Technical Loss in the 11kV Feeder (T)
The following parameters are required to calculate technical loss in the 11 kV feeder:
Load Factor (LF) = Energy input to the feeder/ (Peak load X number of hours during the period)
Loss load factor (LLF) = k x LF + (1-k) x LF2
Where,
k = 0.2 for medium voltage feeders and distribution substation
Diversity Factor (DF) = Connected load (kVA)/Peak load (kVA)
Load Diversification Factor (LDF) = Connected capacity of DTs (kVA) x Length of the feeder (km)/
(kVA x km)
KVA x km = sum product of the total load incident on each section of the feeder multiplied by its
length.
Energy Auditing: Case Study of Karnataka
© CSTEP www.cstep.in
5
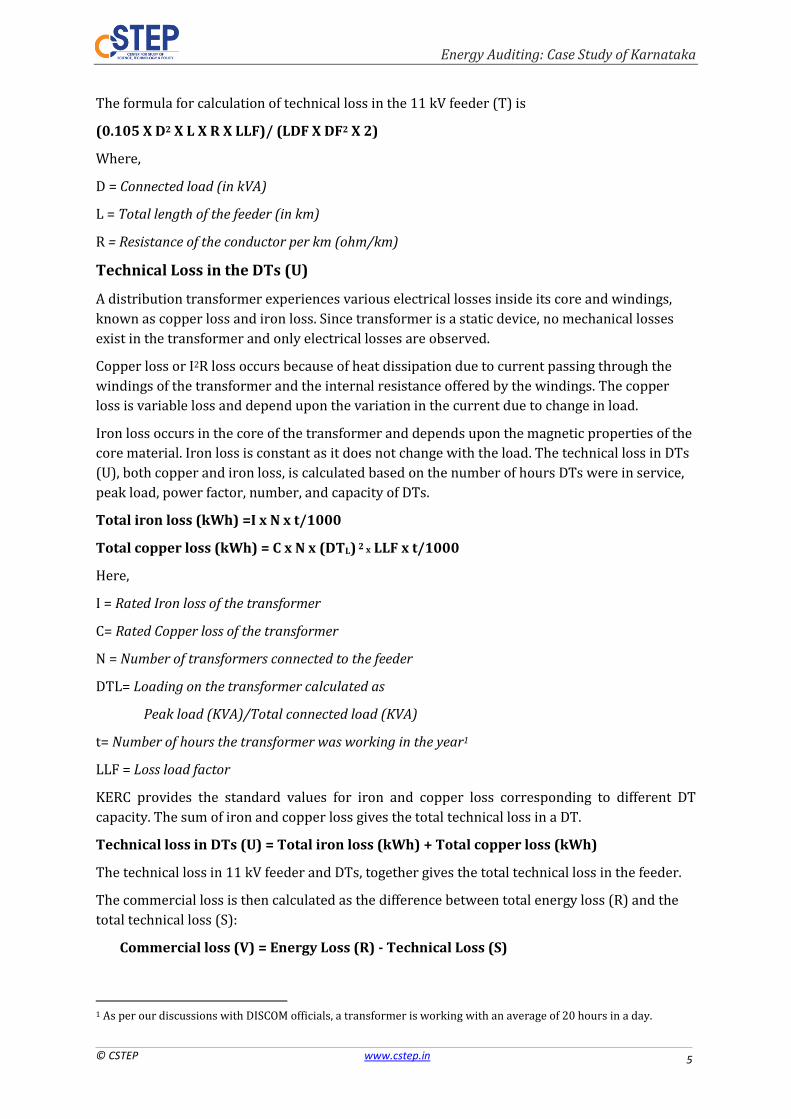
The formula for calculation of technical loss in the 11 kV feeder (T) is
(0.105 X D2 X L X R X LLF)/ (LDF X DF2 X 2)
Where,
D = Connected load (in kVA)
L = Total length of the feeder (in km)
R = Resistance of the conductor per km (ohm/km)
Technical Loss in the DTs (U)
A distribution transformer experiences various electrical losses inside its core and windings,
known as copper loss and iron loss. Since transformer is a static device, no mechanical losses
exist in the transformer and only electrical losses are observed.
Copper loss or I2R loss occurs because of heat dissipation due to current passing through the
windings of the transformer and the internal resistance offered by the windings. The copper
loss is variable loss and depend upon the variation in the current due to change in load.
Iron loss occurs in the core of the transformer and depends upon the magnetic properties of the
core material. Iron loss is constant as it does not change with the load. The technical loss in DTs
(U), both copper and iron loss, is calculated based on the number of hours DTs were in service,
peak load, power factor, number, and capacity of DTs.
Total iron loss (kWh) =I x N x t/1000
Total copper loss (kWh) = C x N x (DTL) 2 x LLF x t/1000
Here,
I = Rated Iron loss of the transformer
C= Rated Copper loss of the transformer
N = Number of transformers connected to the feeder
DTL= Loading on the transformer calculated as
Peak load (KVA)/Total connected load (KVA)
t= Number of hours the transformer was working in the year1
LLF = Loss load factor
KERC provides the standard values for iron and copper loss corresponding to different DT
capacity. The sum of iron and copper loss gives the total technical loss in a DT.
Technical loss in DTs (U) = Total iron loss (kWh) + Total copper loss (kWh)
The technical loss in 11 kV feeder and DTs, together gives the total technical loss in the feeder.
The commercial loss is then calculated as the difference between total energy loss (R) and the
total technical loss (S):
Commercial loss (V) = Energy Loss (R) - Technical Loss (S)
1 As per our discussions with DISCOM officials, a transformer is working with an average of 20 hours in a day.
Energy Auditing: Case Study of Karnataka
© CSTEP www.cstep.in
6
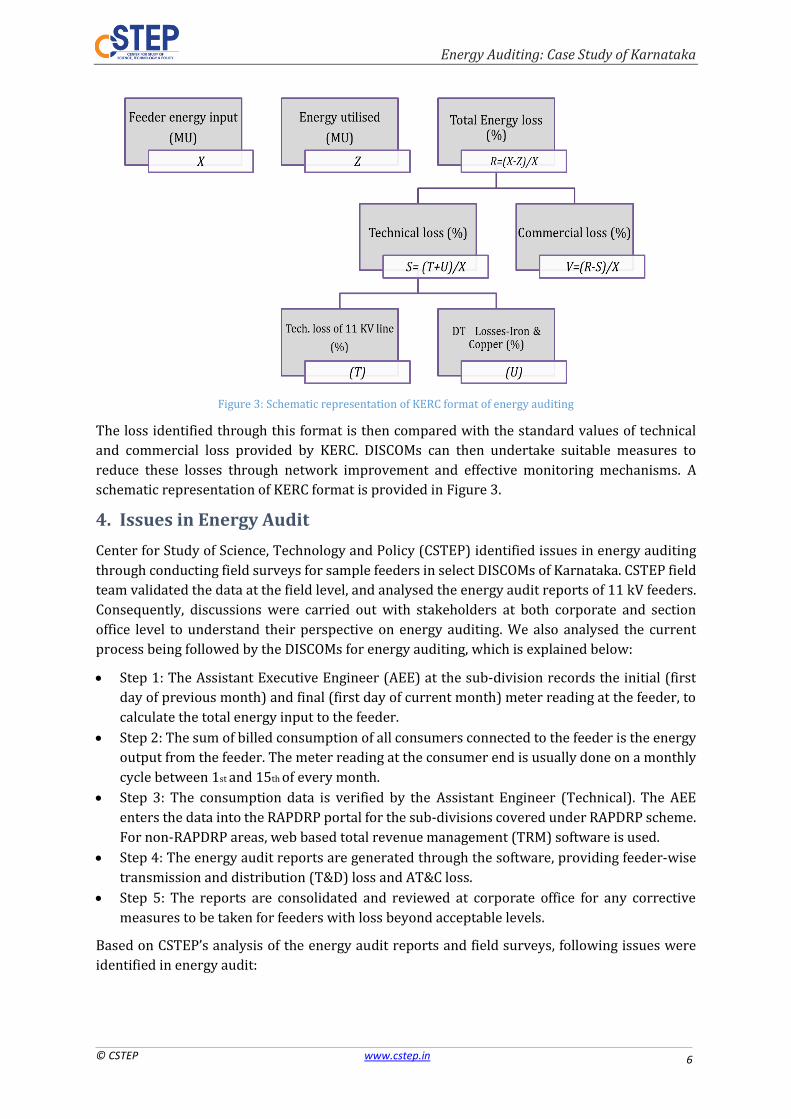
Figure 3: Schematic representation of KERC format of energy auditing
The loss identified through this format is then compared with the standard values of technical
and commercial loss provided by KERC. DISCOMs can then undertake suitable measures to
reduce these losses through network improvement and effective monitoring mechanisms. A
schematic representation of KERC format is provided in Figure 3.
4. Issues in Energy Audit
Center for Study of Science, Technology and Policy (CSTEP) identified issues in energy auditing
through conducting field surveys for sample feeders in select DISCOMs of Karnataka. CSTEP field
team validated the data at the field level, and analysed the energy audit reports of 11 kV feeders.
Consequently, discussions were carried out with stakeholders at both corporate and section
office level to understand their perspective on energy auditing. We also analysed the current
process being followed by the DISCOMs for energy auditing, which is explained below:
Step 1: The Assistant Executive Engineer (AEE) at the sub-division records the initial (first
day of previous month) and final (first day of current month) meter reading at the feeder, to
calculate the total energy input to the feeder.
Step 2: The sum of billed consumption of all consumers connected to the feeder is the energy
output from the feeder. The meter reading at the consumer end is usually done on a monthly
cycle between 1st and 15th of every month.
Step 3: The consumption data is verified by the Assistant Engineer (Technical). The AEE
enters the data into the RAPDRP portal for the sub-divisions covered under RAPDRP scheme.
For non-RAPDRP areas, web based total revenue management (TRM) software is used.
Step 4: The energy audit reports are generated through the software, providing feeder-wise
transmission and distribution (T&D) loss and AT&C loss.
Step 5: The reports are consolidated and reviewed at corporate office for any corrective
measures to be taken for feeders with loss beyond acceptable levels.
Based on CSTEP’s analysis of the energy audit reports and field surveys, following issues were
identified in energy audit:
Energy Auditing: Case Study of Karnataka
© CSTEP www.cstep.in
7
a) Lack of segregation of energy loss: It was observed from the energy audit reports that
currently, only energy loss is calculated for feeders. The DISCOMs have not implemented the
KERC format for calculation of technical and commercial loss separately, for all the feeders.
b) Inaccurate data entry: The analysis of DISCOM’s energy audit reports revealed that in few
cases, the billed consumption data for the consumers was inaccurate which led to incorrect
calculation of AT&C loss. DISCOMs generally outsource meter reading to an external agency.
There is currently no mechanism to periodically validate the data entered by these third-
party agencies.
c) Incomplete tagging: In some cases, it was found that energy utilised (billed consumption) in
the feeder is more than the energy input to the feeder. This can only occur in case of inaccurate
tagging of consumers to feeder and DT. Following are some of the other issues related to
tagging:
Consumption data for a few consumers that are physically connected to one feeder was,
however, reflected under another feeder in the database
Mismatch in DT-consumer mapping in the database and physical connectivity of DTs and
associated consumers
New consumers were not mapped with DTs to update the database on a continuous basis
d) DT metering: One of the pre-requisites for an effective energy audit is the accurate metering
of DTs. The field survey analysis of feeders and associated DTs revealed the following issues:
Incomplete DT metering: It is found that by March 2018, only 55% of metering is
completed in CESC (tariff order 2017-18)
Defective meters: Around 14% of the surveyed DT meters were not recording data due to
issues such as Meters Not Recording (MNR), Meters Burnt out (MBO) or no display
(Figure 4). There are no proper checks and balances to identify these defective meters.
Unconnected meters: For a few DTs (5% of the surveyed DTs), while the meters were
installed, they were not connected and hence it could not record the data (Figure 5).
Meters placed high: It was found during survey that around 14,000 DTs were installed
with meters which could be accessed remotely, through a central server located in the
corporate office. Due to this, meters were placed high so as to avoid any tampering or
damage to the meter (Figure 6). However, all the DTs associated with the feeder were not
connected with remote access meters, which means that for few DTs, meter reader need
to record readings manually. For instance, out of 40 DTs connected to the feeder, remote
access meters are provided for only 30 DTs. Remaining 10 need to be read manually. This
would result in mismatch in the time synchronisation for manual and online readings,
leading to erroneous calculations. The analysis of the server data also revealed that the
daily readings recorded by these meters were not consistent. The inaccurate tagging was
observed in the server data as well.
Location inaccessible: It was found during the survey that the DT locations were not
maintained properly, leading to frequent DT failures (Figure 7). In some cases, DTs were
fully covered with bushes and trees, which made it difficult to record the readings.
Poor maintenance of DT meters: It was found that DT meters were not maintained
properly. Even the newly installed DT meters were found infested with rats and birds’
nests (Figure 8).
e) Single line diagrams: Our survey revealed that single line diagrams (SLDs) were not
available for most of the feeders. In case of availability of SLDs, they were not updated due to

Energy Auditing: Case Study of Karnataka
© CSTEP www.cstep.in
8
which some of the DTs could not be located. Also, SLDs are not updated to reflect replacement
or augmentation of failed or old DTs.
f) Lack of boundary meters: In some cases, it was found that a feeder is supplying energy to
more than one sub-division. In absence of boundary meters, it is difficult to calculate the
amount of energy exported to each sub-division by the same feeder. This leads to double
Figure 4: Meter Burnt Out (MBO) Figure 5: Meter not connected
Figure 6: Meter placed high Figure 7: DT location inaccessible
Figure 8: Bird's nest inside the newly installed DT meter

Energy Auditing: Case Study of Karnataka
© CSTEP www.cstep.in
9
accounting of energy exported by the feeder as well as inaccurate apportionment of energy
between sub-divisions having same feeder.
5. Recommendations for an Effective Energy Audit
It is observed that most of the issues in the energy audit process occur due to lack of monitoring
and verification of the data being recorded and entered into the portal. Thus, streamlining of the
energy audit process is the need of the hour. Following are some of the measures which could be
adopted by DISCOMs to carry out effective energy audit at feeder level:
a) Compliance of KERC format: Implementation of KERC format at feeder level would help
DISCOMs in assessing whether loss is high due to technical or managerial issues. This would
help DISCOMs to take suitable measures on network strengthening or stringent monitoring
mechanisms.
b) Data entry validation: A mechanism needs to be put in place for regular validation of the
data collected and entered by third party contracts. The DISCOMs employees need to
supervise the meter reading carried out by outsourced party so as to curb any mismatch in
the initial phase of meter reading itself.
c) Tagging drive: It is observed that most of the errors occur due to inaccurate tagging of
feeders to DTs and DTs to consumers. Hence, a tagging drive is recommended in which all
consumers and DTs are tagged within a stipulated timeframe. Figure 9 provides a
methodology which could be adopted for the tagging drive led by a JE. The best performing
division could be rewarded which could motivate an effective implementation of the
initiative.
Figure 9: Methodology for tagging drive
d) 100% DT metering and regular maintenance: KERC has recently mandated DT-wise
energy audit for all DISCOMs. It is important to meter all the DTs so that issues could be
identified between feeder and DTs itself. In addition to completing the DT metering, it is also
important to proactively maintain the meters so as to avoid any short-circuit.
e) Availability of SLDs and continuous network updation: The tagging drive would aid in
developing SLDs for all the feeders. Also, these SLDs should be updated on a continuous basis
Feeder to DT tagging using
GPS
Validation of tagging
DT to consumer tagging
Validation of tagging
Conduct weekly review meeting
Update GIS network with
new connection
Conduct frequent spot
checks
Reward best performing division for
tagging

Energy Auditing: Case Study of Karnataka
© CSTEP www.cstep.in
10
with addition of new DTs, and consumers. This would also help in tracking the expansion of
the network in any particular area.
f) Installation of boundary meters: Installation of boundary meters should be mandated in
every sub-division in order to record energy received from each 11 kV feeder distinctly. This
will help in correct estimation of energy input from each feeder in a given area. Also, energy
input and energy utilised needs to be captured on a regular basis in the database for accurate
calculation of feeder-wise loss.
g) Streamlining of energy audit process: The energy audit process in a DISCOM needs to be
streamlined through a mechanism of assessor and monitoring group. This process would
ensure purging of the errors occurring due to lack of monitoring and verification of the
collected data. Figure 10 illustrates the proposed energy audit process including both
assessor and monitoring group. The assessor group is the operational group and would be
involved in data collection, data entry, preparing and consolidating energy audit reports. The
monitoring group would validate and verify the accuracy and authenticity of the data
collected and consolidated by assessor group.
The JE at the section office, records the feeder meter reading and calculates the energy input
to the feeder. The meter reader or lineman records the consumer meter readings, the sum of
which gives the energy output of the feeder. During the recording of consumer meter readings
(the billing cycle), both assessor and monitoring group should make sure that accurate
tagging is done from feeders to DTs and DTs to consumers. The JE and Lineman (Assessor
group) should be responsible for accuracy of tagging, and an AE (Monitoring Group) should
validate and verify the tagging process along with updation of new connections.
The AE, at the division office, will consolidate the feeder level energy audit reports, and also
highlight any discrepancies in the consolidated energy audit report, on bi-weekly basis. The
discrepancies need to be discussed with the Executive Engineer (EE), who would then suggest
any corrective action to be undertaken for resolving discrepancies.
The Superintendent Engineer (SE) shall review the energy audit report for high-level tagging
issues and feeders with high loss, on monthly basis. The corrective action plan suggested by
SE should be adhered to and updated in the next monthly meeting.
The proposed process is expected to ensure that Feeder-DT-consumer tagging is updated
every month with onset of the billing cycle. Furthermore, it would make the field-level
functionaries more accountable to ensure the correctness of the energy audit reports.

Energy Auditing: Case Study of Karnataka
© CSTEP www.cstep.in 11
Co
rpo
rate
Feedback
Figure 10: Proposed Energy Audit Process
Assessor Group
Monitoring Group
Level Activities Frequency Level Activities Frequency
1st
-15th
of every month
Hourly Daily
3 months
MR/
Linemen
JE
Se
ctio
n (
O&
M)
Feeder meter reading Data Entry DT to Feeder tagging
Consumer & DT meter readings Consumer to DT tagging
Monitor tagging of new connections Validate tagging
AE 3-4 months
Corrective
action
Monthly
Bi-weekly
Div
isio
n
AE Generate energy audit reports Report discrepancies
Discussion on discrepancies EE Bi-weekly
Corrective actions for tagging & high loss feeders
SE Monthly Monthly Energy
Audit Team
Tagging Status
High loss feeders

Energy Auditing: Case Study of Karnataka
© CSTEP www.cstep.in
12
6. References
CAG. (2011). CAG Audit report on performance of government companies in Karnataka
(Perfrormance report). Bangalore.
MoP. (2015). 12th report of Standing committee on energy (16th Lok Sabha), MoP- Measures to
check commercial losses; Presented to Lok Sabha on 11.12.2015 Laid in Rajya Sabha on
14.12.2015 (Report) (p. 100). New Delhi: Standing Committee on Energy.
MoP. (2018, August). UDAY Portal. Retrieved 27 August 2018, from
https://www.uday.gov.in/atc_india.php