Endocrine disruptive estrogens role in electron transfer: Bio-electrochemical remediation with...
10
Endocrine disruptive estrogens role in electron transfer: Bio-electrochemical remediation with microbial mediated electrogenesis A. Kiran Kumar b , M. Venkateswar Reddy a , K. Chandrasekhar a , S. Srikanth a , S. Venkata Mohan a,⇑ a Bioengineering and Environmental Center (BEEC), Indian Institute of Chemical Technology (CSIR-IICT), Hyderabad 500 607, India b IICT-CCMB Dispensary, Indian Institute of Chemical Technology (CSIR-IICT), Hyderabad 500 607, India article info Article history: Received 24 June 2011 Received in revised form 12 October 2011 Accepted 12 October 2011 Available online 20 October 2011 Keywords: Bio-electrochemical treatment (BET) Dehydrogenase Microbial fuel cell (MFC) Voltammetry Wastewater treatment abstract Bioremediation of selected endocrine disrupting compounds (EDCs)/estrogens viz. estriol (E3) and ethy- nylestradiol (EE2) was evaluated in bio-electrochemical treatment (BET) system with simultaneous power generation. Estrogens supplementation along with wastewater documented enhanced electro- genic activity indicating their function in electron transfer between biocatalyst and anode as electron shuttler. EE2 addition showed more positive impact on the electrogenic activity compared to E3 supple- mentation. Higher estrogen concentration showed inhibitory effect on the BET performance. Poising potential during start up phase showed a marginal influence on the power output. The electrons gener- ated during substrate degradation might have been utilized for the EDCs break down. Fuel cell behavior and anodic oxidation potential supported the observed electrogenic activity with the function of estro- gens removal. Voltammetric profiles, dehydrogenase and phosphatase enzyme activities were also found to be in agreement with the power generation, electron discharge and estrogens removal. Ó 2011 Elsevier Ltd. All rights reserved. 1. Introduction Endocrine disrupting compounds (EDCs)/estrogens are exoge- nous substances that interferes and alters the functions of endo- crine system and consequently causes adverse health effects in an intact organism, or its progeny or (sub) populations (Damstra et al., 2002). Estrogens indirectly interact with the endocrine sys- tem that regulates the body’s function resulting in excessive secre- tion or suppression of hormones by the phenomenon called endocrine disruption, which may involve the appearance of infer- tility, sexual under development, altered or reduced sexual behav- ior, attention deficit or hyperactivity, altered thyroid or adrenal cortical function, increased incidents of certain cancers, birth de- fects, etc. (Vogel, 2005). Even at nanogram levels these compounds increase the risk of cancer and decrease egg and sperm production, reduce gamete quality and tend to complete feminization of male fish (Notch et al., 2007). Occurrence of EDCs in the aquatic water bodies including fresh water environment and their possible dis- ruptive effects on indigenous fauna was reported in many of the countries (Damstra et al., 2002). From the recent past, concern about the environmental fate and behavior of natural and synthetic organic chemicals detected in water has been increased. Natural or synthetic estrogens exhibit two or three orders of magnitude high- er estrogenic activity than the chemical compounds and are con- sidered to be dominant contributors to estrogenic activity in the treated wastewater (Barnes et al., 2008). Estrogens are considered as pseudo persistent pollutants due to their continuous entry into the environment through sewage/domestic wastewater. Removal of estrogens is extremely important to reduce the potential risk caused by them in treated wastewater. Various treatment method- ologies have been reported for the removal of estrogens, viz. en- zyme mediated, ultrasound destruction, ozonation, adsorption, potassium ferrate treatment, membrane bioreactors, and reverse osmosis, etc. in the literature (Huang et al., 2005; Auriol et al., 2006, 2008; Sei et al., 2008; Mao et al., 2009; Kiran Kumar et al., 2009, 2011). Estrogens degradation efficiency with biocatalyst was reported but with lower concentrations (Jobling et al., 1998). However, the removal efficiencies strongly dependent on the type 0960-8524/$ - see front matter Ó 2011 Elsevier Ltd. All rights reserved. doi:10.1016/j.biortech.2011.10.037 Abbreviations: AO, activation over-potentials; BET, bio-electrochemical treat- ment; C, control operation; C1, concentration 1 (500 lg/L); C2, concentration 2 (1000 lg/L); C3, concentration 3 (2000 lg/L); COD, chemical oxygen demand; CP, concentration polarization; CV, cyclic voltammetry; DH, dehydrogenase; DSW, designed synthetic wastewater; DSWE, DSW and E3; e - , electrons; E 0 anodic , initial anodic potential; E anodic , anodic potential at resistance; EDCs, endocrine disruptive estrogens compounds; E3, estriol; EE2, ethynylestradiol; EIA, enzymatic immuno- assay; ELISA, enzyme-linked immunosorbent assay; FAD + , flavin adenine dinucle- otide; FADH 2 , flavin adenine dinucleotide (reduced); H + , protons; I, current; LSV, linear sweep voltammetry; MFC, microbial fuel cells; NAD + , nicotinamide adenine dinucleotide; NADH + H + , nicotinamide adenine dinucleotide (reduced); OCV, potential difference/open circuit voltage; OL, ohmic losses; OLR, organic loading rate; PEM, proton exchange membrane; PT, phosphatase; RDAP, relative decrease in the anode potential; SDR, substrate degradation rate; TF, triphenyl formazan; TTC, 2,3,5-triphenyltetrazolium chloride; UASB, upflow anaerobic sludge blanket; VFA, volatile fatty acids; % I, percentage inhibition. ⇑ Corresponding author. Tel./fax: +91 40 27191664. E-mail address: [email protected] (S. Venkata Mohan). Bioresource Technology 104 (2012) 547–556 Contents lists available at SciVerse ScienceDirect Bioresource Technology journal homepage: www.elsevier.com/locate/biortech
-
Upload
independent -
Category
Documents
-
view
3 -
download
0
Transcript of Endocrine disruptive estrogens role in electron transfer: Bio-electrochemical remediation with...

Bioresource Technology 104 (2012) 547–556
Contents lists available at SciVerse ScienceDirect
Bioresource Technology
journal homepage: www.elsevier .com/locate /bior tech
Endocrine disruptive estrogens role in electron transfer: Bio-electrochemicalremediation with microbial mediated electrogenesis
A. Kiran Kumar b, M. Venkateswar Reddy a, K. Chandrasekhar a, S. Srikanth a, S. Venkata Mohan a,⇑a Bioengineering and Environmental Center (BEEC), Indian Institute of Chemical Technology (CSIR-IICT), Hyderabad 500 607, Indiab IICT-CCMB Dispensary, Indian Institute of Chemical Technology (CSIR-IICT), Hyderabad 500 607, India
a r t i c l e i n f o a b s t r a c t
Article history:Received 24 June 2011Received in revised form 12 October 2011Accepted 12 October 2011Available online 20 October 2011
Keywords:Bio-electrochemical treatment (BET)DehydrogenaseMicrobial fuel cell (MFC)VoltammetryWastewater treatment
0960-8524/$ - see front matter � 2011 Elsevier Ltd. Adoi:10.1016/j.biortech.2011.10.037
Abbreviations: AO, activation over-potentials; BEment; C, control operation; C1, concentration 1 (50(1000 lg/L); C3, concentration 3 (2000 lg/L); COD, cconcentration polarization; CV, cyclic voltammetrydesigned synthetic wastewater; DSWE, DSW and E3anodic potential; Eanodic, anodic potential at resistancestrogens compounds; E3, estriol; EE2, ethynylestradassay; ELISA, enzyme-linked immunosorbent assay; Fotide; FADH2, flavin adenine dinucleotide (reduced);linear sweep voltammetry; MFC, microbial fuel cells;dinucleotide; NADH + H+, nicotinamide adenine dpotential difference/open circuit voltage; OL, ohmicrate; PEM, proton exchange membrane; PT, phosphatathe anode potential; SDR, substrate degradation rate;2,3,5-triphenyltetrazolium chloride; UASB, upflow anvolatile fatty acids; % I, percentage inhibition.⇑ Corresponding author. Tel./fax: +91 40 27191664
E-mail address: [email protected] (S. Venkata
Bioremediation of selected endocrine disrupting compounds (EDCs)/estrogens viz. estriol (E3) and ethy-nylestradiol (EE2) was evaluated in bio-electrochemical treatment (BET) system with simultaneouspower generation. Estrogens supplementation along with wastewater documented enhanced electro-genic activity indicating their function in electron transfer between biocatalyst and anode as electronshuttler. EE2 addition showed more positive impact on the electrogenic activity compared to E3 supple-mentation. Higher estrogen concentration showed inhibitory effect on the BET performance. Poisingpotential during start up phase showed a marginal influence on the power output. The electrons gener-ated during substrate degradation might have been utilized for the EDCs break down. Fuel cell behaviorand anodic oxidation potential supported the observed electrogenic activity with the function of estro-gens removal. Voltammetric profiles, dehydrogenase and phosphatase enzyme activities were also foundto be in agreement with the power generation, electron discharge and estrogens removal.
� 2011 Elsevier Ltd. All rights reserved.
1. Introduction ior, attention deficit or hyperactivity, altered thyroid or adrenal
Endocrine disrupting compounds (EDCs)/estrogens are exoge-nous substances that interferes and alters the functions of endo-crine system and consequently causes adverse health effects inan intact organism, or its progeny or (sub) populations (Damstraet al., 2002). Estrogens indirectly interact with the endocrine sys-tem that regulates the body’s function resulting in excessive secre-tion or suppression of hormones by the phenomenon calledendocrine disruption, which may involve the appearance of infer-tility, sexual under development, altered or reduced sexual behav-
ll rights reserved.
T, bio-electrochemical treat-0 lg/L); C2, concentration 2hemical oxygen demand; CP,; DH, dehydrogenase; DSW,; e-, electrons; E0
anodic, initiale; EDCs, endocrine disruptiveiol; EIA, enzymatic immuno-AD+, flavin adenine dinucle-H+, protons; I, current; LSV,NAD+, nicotinamide adenine
inucleotide (reduced); OCV,losses; OLR, organic loadingse; RDAP, relative decrease inTF, triphenyl formazan; TTC,aerobic sludge blanket; VFA,
.Mohan).
cortical function, increased incidents of certain cancers, birth de-fects, etc. (Vogel, 2005). Even at nanogram levels these compoundsincrease the risk of cancer and decrease egg and sperm production,reduce gamete quality and tend to complete feminization of malefish (Notch et al., 2007). Occurrence of EDCs in the aquatic waterbodies including fresh water environment and their possible dis-ruptive effects on indigenous fauna was reported in many of thecountries (Damstra et al., 2002). From the recent past, concernabout the environmental fate and behavior of natural and syntheticorganic chemicals detected in water has been increased. Natural orsynthetic estrogens exhibit two or three orders of magnitude high-er estrogenic activity than the chemical compounds and are con-sidered to be dominant contributors to estrogenic activity in thetreated wastewater (Barnes et al., 2008). Estrogens are consideredas pseudo persistent pollutants due to their continuous entry intothe environment through sewage/domestic wastewater. Removalof estrogens is extremely important to reduce the potential riskcaused by them in treated wastewater. Various treatment method-ologies have been reported for the removal of estrogens, viz. en-zyme mediated, ultrasound destruction, ozonation, adsorption,potassium ferrate treatment, membrane bioreactors, and reverseosmosis, etc. in the literature (Huang et al., 2005; Auriol et al.,2006, 2008; Sei et al., 2008; Mao et al., 2009; Kiran Kumar et al.,2009, 2011). Estrogens degradation efficiency with biocatalystwas reported but with lower concentrations (Jobling et al., 1998).However, the removal efficiencies strongly dependent on the type
548 A. Kiran Kumar et al. / Bioresource Technology 104 (2012) 547–556
of treatment applied and the physicochemical properties of theestrogens (Kiran Kumar et al., 2009, 2011).
Microbial fuel cell (MFC) is a hybrid bio-electrochemical systemwhich directly transforms chemical energy stored in chemicalbonds of substrate into electrical energy via electrochemical reac-tions involving biochemical pathways where microorganismsserve as biocatalyst (Lefebvre et al., 2011; More and Ghangrekar,2010; Oh et al., 2010; Venkata Mohan et al., 2008b,c, 2009;Hamelers et al., 2010). The bio-potential developed between thebacterial metabolic activity [redox reactions generating electrons(e-) and protons (H+)] and electron acceptor conditions (separatedby a membrane) leads to generate bioelectricity in MFC. Exploitingwastewater as substrate to harness electricity is considered as asustainable approach and is the present age of energy research.More recently, MFC function as bioelectrochemical treatment sys-tem (BET) was established where several pollutants viz. azo dyes,phenol, nitrates, sulphates, chloroaniline, petroleum sludge, etc.have been reported through the anodic oxidation or cathodicreduction reactions (Luo et al., 2009; Mu et al., 2009a,b; Butleret al., 2010; Hamelers et al., 2010; Mohanakrishna et al., 2010;Venkata Mohan et al., 2010b; Venkata Mohan and Chandrasekhar,2011). Anode chamber of MFC/BET resembles anaerobic treatmentunit where substrates gets metabolized into its products throughredox reactions and enzyme activities. Enzyme catalyzed transferof electrons from an intracellular electron carrier molecule (redoxmediator) to proton (H+) will occur as a part of metabolic activityduring fermentation process (Venkata Mohan et al., 2010a;Venkateswar Reddy et al., 2010). Oxidation of substrate in orderto obtain energy and synthesis of cellular components from carbonsource through energy coupling mechanisms is a general processduring bacterial metabolic activities. The pollutants present inwastewater can also act as mediators between the fuel cell compo-nents, especially electrodes and biocatalyst, and get reduced.
In this context, detailed studies were performed to evaluate thefunction of BET system in remediation of selected estrogen com-pounds with simultaneous power generation. The functional roleof estrogens in electron discharge during BET operation was alsostudied. Phosphatase (PT) and dehydrogenase (DH) are importantenzymes involved in the carbon degradation and redox reactionsfor the inter-conversion of metabolic intermediates. PT and DHactivities were also evaluated during estrogens bioremediation un-der microbial electrogenesis. Synergistic interaction of biochemicaland electrochemical oxidation processes during estrogens removalwas discussed in detail.
2. Experimental design
2.1. Endocrine disruptive compound (EDC)
Estriol [E3, C18H24O3; 1,3,5 (10)-estratriene-3,16a,17b-triol;Sigma–Aldrich] and 17a-ethynylestradiol [EE2; C20H24O2, 17-ethy-nyl-13-methyl-7,8,9,11,12,14,15,16-octahydro-6H-cyclopenta [a]phenanthrene-3,17-diol; Sigma–Aldrich] were used as modelestrogen compounds after diluting to the required concentrationsin water.
2.2. Biocatalyst
Anaerobic consortia from operating full scale UASB reactortreating wastewater was used as biocatalyst (Venkata Mohanet al., 2008a). Parent culture was enriched under anaerobic micro-environment at pH 6.0 in designed synthetic wastewater (DSW)constituting glucose (3 g/L) as carbon source along with the othernutrients such as, NH4Cl (0.5 g/L), KH2PO4 (0.25 g/L), K2HPO4
(0.25 g/L), MgCl2 (0.3 g/L), CoCl2 (25 g/L), ZnCl2 (11.5 mg/L), CuCl2
(10.5 mg/L), CaCl2 (5 mg/L), MnCl2 (15 mg/L), NiSO4 (16 mg/L)and FeCl3 (25 mg/L), with a chemical oxygen demand (COD) of3600 mg/L (80 rpm; 48 h).
2.3. System configuration
Single chambered MFC/BET was fabricated with open-air cath-ode using ‘perspex’ material (total/working volume: 0.5/0.42 L).Non-catalyzed graphite plates [5 � 5 cm; 10 mm thick; surfacearea 70 cm2 (plain cathode) and 83.5 cm2 (perforated anode;0.1 cm diameter)] were used as electrodes. Prior to use, electrodeswere soaked overnight in deionized water (�18 h). Proton ex-change membrane (Nafion 117; Sigma–Aldrich) was fixed betweenanode and cathode. Top portion of the cathode was exposed to airwhile bottom portion was fixed to PEM and was in contact withwastewater. Anode was completely submerged in the anolyte (Sfig.1). Copper wires were used for contact with electrodes after sealingwith epoxy sealant. Provisions were made in the design for sam-pling ports, wire input points (top), inlet and outlet ports and gasoutlet. Leak proof sealing was provided at joints to maintain anaer-obic microenvironment in the anode compartment.
2.4. Operation
Anodic chamber was inoculated with enriched anaerobic cul-ture (0.04 L) by dissolving in DSW (0.38 L). Prior to feeding, pH ofthe wastewater was adjusted to 6 (acidophilic) using concentratedorthophosphoric acid (88%) or 1 N NaOH. Wastewater was fed toreactor from inlet provided at the bottom of anode chamber tofacilitate the flow in upward direction passing through anode to-wards cathode (advective flow). Anolyte was continuously stirredat 80 rpm to eliminate concentration gradient during operation.BET was operated in fed batch mode at room temperature(29 ± 2 �C). Before every feeding event, inoculum was allowed tosettle down (30 min; settling) and exhausted feed (0.38 L) was re-moved (decanted; 15 min) under anaerobic conditions. Settledinoculum (�0.04 L by volume) was used for subsequent opera-tions. Feeding, decanting and recirculation operations were per-formed using peristaltic pumps controlled by electronic timer.After every feeding event, anode chamber was sparged with oxy-gen free N2 gas for 2 min to maintain anaerobic microenvironment.Initially, BET was operated at an OLR of 0.195 kg COD/m3 day forstabilized performance with respect to power generation and sub-strate removal. After obtaining stable performance the anodechamber was fed with EDC compounds dissolved in DSW. OLRwas maintained constantly (0.458 kg COD/m3 day) throughoutthe operation and the concentration of EDCs was varied. Differentconcentrations of E3 was dissolved in DSW and fed to reactor [C1,500 lg/L; C2, 1000 lg/L; C3, 2000 lg/L]. Remediation of E3 wasalso evaluated under 2000 mV poised potential (PP) with C2 con-centration. 2000 mV was selected as external potential based onthe observations made in previous study where increased treat-ment efficiencies were observed (Srikanth et al., 2010). Remedia-tion of EE2 was also evaluated at C2 [1000 lg/L] concentration.Operation details along with the performance were as depictedin Table 1.
2.5. Analysis
Power output and substrate degradation were considered to as-sess the performance of BET during operation with varying natureand concentrations of estrogens. Potential difference/open circuitvoltage (OCV) and current (I) (in series; 100 X) measurementswere recorded by digital multi-meter. Power (mW) was calculatedusing P = IV. Power density (mW/m2) and current density (mA/m2)were calculated by relating the obtained power and current with
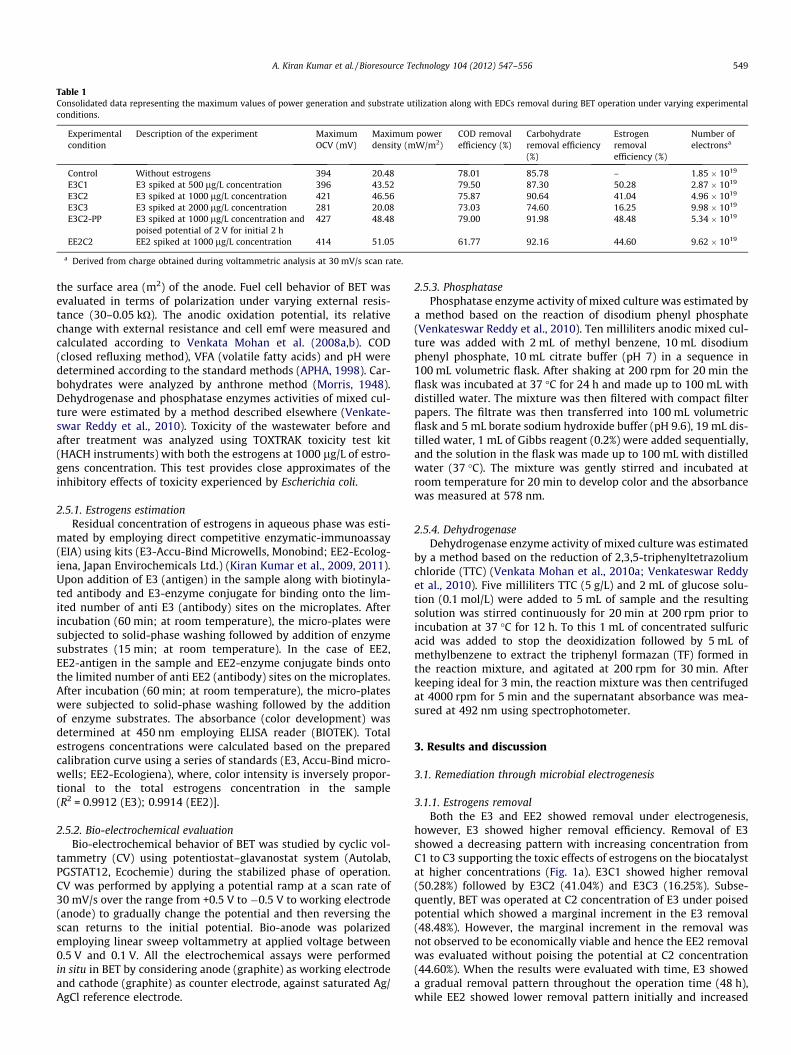
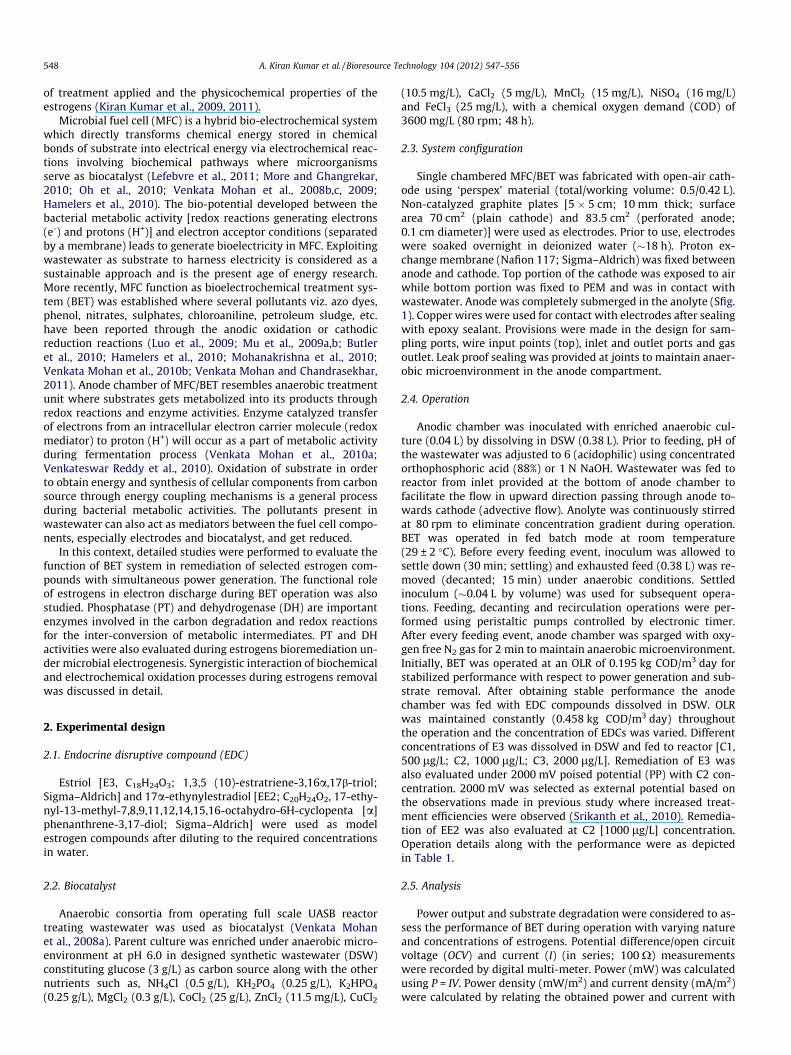
Table 1Consolidated data representing the maximum values of power generation and substrate utilization along with EDCs removal during BET operation under varying experimentalconditions.
Experimentalcondition
Description of the experiment MaximumOCV (mV)
Maximum powerdensity (mW/m2)
COD removalefficiency (%)
Carbohydrateremoval efficiency(%)
Estrogenremovalefficiency (%)
Number ofelectronsa
Control Without estrogens 394 20.48 78.01 85.78 – 1.85 � 1019
E3C1 E3 spiked at 500 lg/L concentration 396 43.52 79.50 87.30 50.28 2.87 � 1019
E3C2 E3 spiked at 1000 lg/L concentration 421 46.56 75.87 90.64 41.04 4.96 � 1019
E3C3 E3 spiked at 2000 lg/L concentration 281 20.08 73.03 74.60 16.25 9.98 � 1019
E3C2-PP E3 spiked at 1000 lg/L concentration andpoised potential of 2 V for initial 2 h
427 48.48 79.00 91.98 48.48 5.34 � 1019
EE2C2 EE2 spiked at 1000 lg/L concentration 414 51.05 61.77 92.16 44.60 9.62 � 1019
a Derived from charge obtained during voltammetric analysis at 30 mV/s scan rate.
A. Kiran Kumar et al. / Bioresource Technology 104 (2012) 547–556 549
the surface area (m2) of the anode. Fuel cell behavior of BET wasevaluated in terms of polarization under varying external resis-tance (30–0.05 kO). The anodic oxidation potential, its relativechange with external resistance and cell emf were measured andcalculated according to Venkata Mohan et al. (2008a,b). COD(closed refluxing method), VFA (volatile fatty acids) and pH weredetermined according to the standard methods (APHA, 1998). Car-bohydrates were analyzed by anthrone method (Morris, 1948).Dehydrogenase and phosphatase enzymes activities of mixed cul-ture were estimated by a method described elsewhere (Venkate-swar Reddy et al., 2010). Toxicity of the wastewater before andafter treatment was analyzed using TOXTRAK toxicity test kit(HACH instruments) with both the estrogens at 1000 lg/L of estro-gens concentration. This test provides close approximates of theinhibitory effects of toxicity experienced by Escherichia coli.
2.5.1. Estrogens estimationResidual concentration of estrogens in aqueous phase was esti-
mated by employing direct competitive enzymatic-immunoassay(EIA) using kits (E3-Accu-Bind Microwells, Monobind; EE2-Ecolog-iena, Japan Envirochemicals Ltd.) (Kiran Kumar et al., 2009, 2011).Upon addition of E3 (antigen) in the sample along with biotinyla-ted antibody and E3-enzyme conjugate for binding onto the lim-ited number of anti E3 (antibody) sites on the microplates. Afterincubation (60 min; at room temperature), the micro-plates weresubjected to solid-phase washing followed by addition of enzymesubstrates (15 min; at room temperature). In the case of EE2,EE2-antigen in the sample and EE2-enzyme conjugate binds ontothe limited number of anti EE2 (antibody) sites on the microplates.After incubation (60 min; at room temperature), the micro-plateswere subjected to solid-phase washing followed by the additionof enzyme substrates. The absorbance (color development) wasdetermined at 450 nm employing ELISA reader (BIOTEK). Totalestrogens concentrations were calculated based on the preparedcalibration curve using a series of standards (E3, Accu-Bind micro-wells; EE2-Ecologiena), where, color intensity is inversely propor-tional to the total estrogens concentration in the sample(R2 = 0.9912 (E3); 0.9914 (EE2)].
2.5.2. Bio-electrochemical evaluationBio-electrochemical behavior of BET was studied by cyclic vol-
tammetry (CV) using potentiostat–glavanostat system (Autolab,PGSTAT12, Ecochemie) during the stabilized phase of operation.CV was performed by applying a potential ramp at a scan rate of30 mV/s over the range from +0.5 V to �0.5 V to working electrode(anode) to gradually change the potential and then reversing thescan returns to the initial potential. Bio-anode was polarizedemploying linear sweep voltammetry at applied voltage between0.5 V and 0.1 V. All the electrochemical assays were performedin situ in BET by considering anode (graphite) as working electrodeand cathode (graphite) as counter electrode, against saturated Ag/AgCl reference electrode.
2.5.3. PhosphatasePhosphatase enzyme activity of mixed culture was estimated by
a method based on the reaction of disodium phenyl phosphate(Venkateswar Reddy et al., 2010). Ten milliliters anodic mixed cul-ture was added with 2 mL of methyl benzene, 10 mL disodiumphenyl phosphate, 10 mL citrate buffer (pH 7) in a sequence in100 mL volumetric flask. After shaking at 200 rpm for 20 min theflask was incubated at 37 �C for 24 h and made up to 100 mL withdistilled water. The mixture was then filtered with compact filterpapers. The filtrate was then transferred into 100 mL volumetricflask and 5 mL borate sodium hydroxide buffer (pH 9.6), 19 mL dis-tilled water, 1 mL of Gibbs reagent (0.2%) were added sequentially,and the solution in the flask was made up to 100 mL with distilledwater (37 �C). The mixture was gently stirred and incubated atroom temperature for 20 min to develop color and the absorbancewas measured at 578 nm.
2.5.4. DehydrogenaseDehydrogenase enzyme activity of mixed culture was estimated
by a method based on the reduction of 2,3,5-triphenyltetrazoliumchloride (TTC) (Venkata Mohan et al., 2010a; Venkateswar Reddyet al., 2010). Five milliliters TTC (5 g/L) and 2 mL of glucose solu-tion (0.1 mol/L) were added to 5 mL of sample and the resultingsolution was stirred continuously for 20 min at 200 rpm prior toincubation at 37 �C for 12 h. To this 1 mL of concentrated sulfuricacid was added to stop the deoxidization followed by 5 mL ofmethylbenzene to extract the triphenyl formazan (TF) formed inthe reaction mixture, and agitated at 200 rpm for 30 min. Afterkeeping ideal for 3 min, the reaction mixture was then centrifugedat 4000 rpm for 5 min and the supernatant absorbance was mea-sured at 492 nm using spectrophotometer.
3. Results and discussion
3.1. Remediation through microbial electrogenesis
3.1.1. Estrogens removalBoth the E3 and EE2 showed removal under electrogenesis,
however, E3 showed higher removal efficiency. Removal of E3showed a decreasing pattern with increasing concentration fromC1 to C3 supporting the toxic effects of estrogens on the biocatalystat higher concentrations (Fig. 1a). E3C1 showed higher removal(50.28%) followed by E3C2 (41.04%) and E3C3 (16.25%). Subse-quently, BET was operated at C2 concentration of E3 under poisedpotential which showed a marginal increment in the E3 removal(48.48%). However, the marginal increment in the removal wasnot observed to be economically viable and hence the EE2 removalwas evaluated without poising the potential at C2 concentration(44.60%). When the results were evaluated with time, E3 showeda gradual removal pattern throughout the operation time (48 h),while EE2 showed lower removal pattern initially and increased
Control E3C1 E3C2 E3C3 E3C2-PP EE2C20
10
20
30
40
50
EDC
rem
oval
effi
cien
cy (%
)
Experimental variation
0
10
20
30
40
50
0 10 20 30 40 500
500
1000
1500
2000Pow
er d
ensi
ty (m
W/m
2 )
Control E3C1 E3C2 E3C3 E3C2-PP EE2C2ED
C re
mov
al (μ
g/L)
Time (h)
0
10
20
30
40
50
60
70
80
90
100
Rem
oval
efic
ienc
y (%
)
COD Carbohydrates
Control E3C1 E3C2 E3C3 E3C2-PP EE2C2Experimental variation
a
b
c
Fig. 1. (a) Variation in the estrogen removal pattern with the function ofexperimental conditions studied; (b) EDC removal and power generation efficiencyagainst time with the function of experimental conditions studied; (c) COD andcarbohydrate removal efficiency against experimental variations studied.
550 A. Kiran Kumar et al. / Bioresource Technology 104 (2012) 547–556
with time (Fig. 1b). Both the estrogens (E3C2 and EE2C2) showedreduction in toxicity levels after treatment in BET. EE2 bearingwastewater showed higher initial toxicity levels (% I, 17%) com-pared to E3 (8%). After treatment, complete reduction in toxicity le-vel was observed in E3 bearing wastewater (0%), while negligiblereduction in toxicity levels (15%) was observed with EE2 bearingwastewater. The simultaneous bio-electrochemical reactions hap-pened during initial phase might have induced the electrochemicaloxidation favoring the break down of EE2 into simpler form sup-porting its removal during the later phase. Estrogens function inelectron transfer as shuttler between anode and biocatalyst wasdepicted in Fig. 2.
3.1.2. Substrate removalCOD removal efficiency decreased with increasing estrogens
concentration (C: 78.01%; E3C1: 79.5%; E3C2: 75.87%; E3C3:73.03%) which might be due to the inhibitory effect of EDCs on bac-terial metabolic activities (Fig. 1c). However, the application ofpoised potential showed an increase in COD removal efficiency(79%). On the contrary, carbohydrate removal was observed to in-crease with increasing estrogens concentration (C: 85.78%; E3C1:87.3%; E3C2: 90.64%; E3C3: 74.6%; E3C2-PP: 91.98%). This mightbe due to the requirement of electrons to induce the bio-electro-chemical treatment which can be generated from the glucose oxi-dation. The EE2 spiked anodic fuel showed marginally highercarbohydrate removal (92.16%) over E3 spiked fuel (90.64%). How-ever the COD removal efficiency was comparatively less (61.77%)in the case of EE2 bearing wastewater. This might be due to the ra-pid conversion of carbon to its intermediary metabolites in the duecourse of generating electrons. The generated electrons might notbe further converted to their respective end products due to thecomplex nature of EE2 over E3.
3.1.3. Phosphorylation–dephosphorylationPhosphatase (PT) function is to deactivate the carbon source by
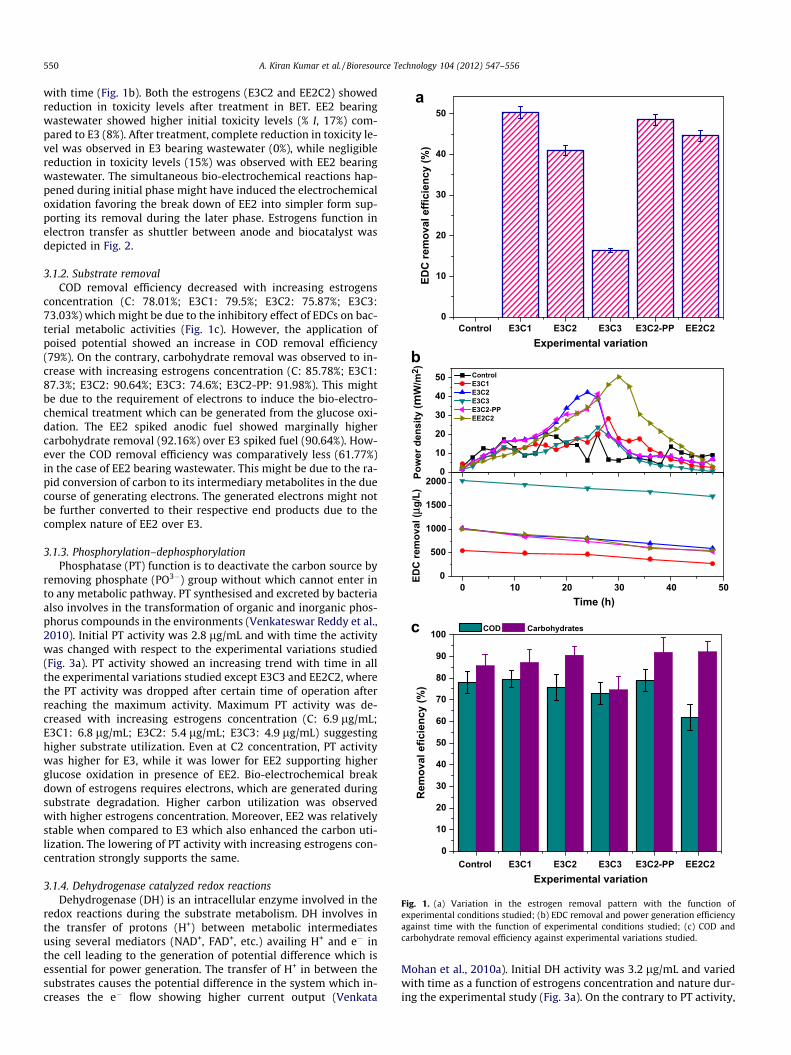
removing phosphate (PO3�) group without which cannot enter into any metabolic pathway. PT synthesised and excreted by bacteriaalso involves in the transformation of organic and inorganic phos-phorus compounds in the environments (Venkateswar Reddy et al.,2010). Initial PT activity was 2.8 lg/mL and with time the activitywas changed with respect to the experimental variations studied(Fig. 3a). PT activity showed an increasing trend with time in allthe experimental variations studied except E3C3 and EE2C2, wherethe PT activity was dropped after certain time of operation afterreaching the maximum activity. Maximum PT activity was de-creased with increasing estrogens concentration (C: 6.9 lg/mL;E3C1: 6.8 lg/mL; E3C2: 5.4 lg/mL; E3C3: 4.9 lg/mL) suggestinghigher substrate utilization. Even at C2 concentration, PT activitywas higher for E3, while it was lower for EE2 supporting higherglucose oxidation in presence of EE2. Bio-electrochemical breakdown of estrogens requires electrons, which are generated duringsubstrate degradation. Higher carbon utilization was observedwith higher estrogens concentration. Moreover, EE2 was relativelystable when compared to E3 which also enhanced the carbon uti-lization. The lowering of PT activity with increasing estrogens con-centration strongly supports the same.
3.1.4. Dehydrogenase catalyzed redox reactionsDehydrogenase (DH) is an intracellular enzyme involved in the
redox reactions during the substrate metabolism. DH involves inthe transfer of protons (H+) between metabolic intermediatesusing several mediators (NAD+, FAD+, etc.) availing H+ and e� inthe cell leading to the generation of potential difference which isessential for power generation. The transfer of H+ in between thesubstrates causes the potential difference in the system which in-creases the e� flow showing higher current output (Venkata
Mohan et al., 2010a). Initial DH activity was 3.2 lg/mL and variedwith time as a function of estrogens concentration and nature dur-ing the experimental study (Fig. 3a). On the contrary to PT activity,

Glucose
Degradation
e-
EDC
EDC*
End product
Induced EO
Glucose
Degradation
e-
EDC
e-
Glucose
Degradation
e-e-
e-
e-
e-
e-
e-
e- Induced EO through DET
EDC as electron shuttler
Anode
Fig. 2. Schematic representation of hypothetical EDC break down to its end products through electrochemical oxidation and its function as mediator between anode andbiocatalyst (EO: electrochemical oxidation; EDC: endocrine disrupting compounds; e�: electron).
A. Kiran Kumar et al. / Bioresource Technology 104 (2012) 547–556 551
DH activity showed an increasing trend with time in all the exper-imental variations except E3C3, where the DH activity wasdropped after reaching maximum value at 24th h. Higher DH activ-ity with time indicates higher H+ shuttling between metabolicintermediates and continuous redox reactions supporting thebio-electrochemical remediation of estrogens. EE2C2 showed max-imum DH activity (7.6 lg/mL) indicating higher redox reactionsproviding reducing powers from the substrate metabolism. Poisedpotential also showed marginal increment in the DH activity(6.4 lg/mL) compared to the control (5.9 lg/mL) supporting themarginal improvement in the estrogens removal.
3.1.5. Change in redox state and acid metabolitesVFA and pH are integral expressions of the redox conditions of
any anaerobic process as well as intrinsic index of the microbialgroup. VFA production is associated with the conversion of organicfraction to acid metabolites in the acidogenic microenvironment.Marked variation in VFA concentration was observed during BEToperation with the function of experimental variations studied(Fig. 3b). VFA profile showed almost similar pattern in all the casesexcept EE2C2, where high VFA generation was observed which sus-tained for extended period and dropped at the end, while in allother cases almost similar concentration of VFA (685 ± 20 mg/L)was generated till 24th h and dropped thereafter. The higher car-bon utilization observed in the case of EE2C2 supports the VFAgeneration. The observed higher DH activity and drop in PT activityalso strongly supported the simultaneous redox reactions favoringthe availability of reducing powers required for bio-electrochemi-cal remediation. System pH was observed to corroborate well withthe VFA profile. Initial operating pH was adjusted to acidophilic(pH 6) because of the known fact that the power generation effi-ciency will be higher under acidophilic operation (Raghavuluet al., 2009). Moreover, the proton transfer and electron dischargebetween metabolic intermediates will be higher under acidophilicredox environment which facilitates higher availability of reducing
powers (Venkata Mohan et al., 2010a) and this will have positiveimpact on the break down of pollutants (estrogens). Generationand consumption of VFA was observed in all the experimental vari-ations studied resulting in a drop in the pH till 24th h and also agradual increment thereafter. Whereas, in the case of EE2C2, agradual and continuous drop in pH was observed till the end ofexperiment. This might be due to the high redox reactions cata-lyzed by DH, inter converting the acid metabolites and generatingthe H+ and e� during operation. Increase in VFA concentration dur-ing BET operation enumerated the effective functioning of the aci-dogenic metabolic process and was analogous with thecorresponding power production, substrate degradation and en-zyme activities.
3.2. Estrogens role in electron transfer
Variations in the OCV, current density and power density weredepicted in Fig. 4a. Control operation showed an OCV of394 ± 2 mV and CD of 162 ± 2 mA/m2 resulting in a PD of19.5 ± 1 mW/m2. Addition of both the estrogens has shown theincrement in power generation efficiency of BET compared to con-trol which strongly supports their positive role in electron trans-port (Fig. 2). However, the power generation efficiency variedwith the function of nature and concentration of the estrogens.The addition of E3 (1000 lg/L) to the anodic fuel enhanced thepower output (E3C1, 395 ± 2 mV and 42.50 ± 1 mW/m2; E3C2,420 ± 1 mV and 44.52 ± 2 mW/m2). However, further incrementin the E3 concentration showed a drop (281 ± 1 mV and19 ± 0.5 mW/m2) in the power output suggesting the inhibitoryeffect of estrogens on anodic biocatalyst (Fig. 1b). Application ofexternal potential to the system at C2 concentration showed neg-ligible increment in the power output (427 ± 1 mV and46.5 ± 2 mW/m2) which corroborated well with the observedestrogens removal. The voltage output was almost similar to E3when EE2 was added at C2 concentration (413 ± 1 mV). However,
2
3
4
5
6
7
0 10 20 30 40 5012345678
Phos
phat
ase
activ
ity ( μ
g/m
L of
phe
nol) Control
E3C1 E3C2 E3C3 E3C2-PP EE2C2
Time (h)
Deh
ydro
gena
se
activ
ity ( μ
g/m
L of
toul
ene)
5.0
5.5
6.0
6.5
0 10 20 30 40 50300
450
600
750
pH
Control E3C1 E3C2 E3C3 E3C2-PP EE2C2
Time (h)
VFA
(mg/
L)
a
b
Fig. 3. (a) Profiles of phosphatase and dehydrogenase enzyme activities againsttime; (b) pH and VFA against operation time, with the function of experimentalvariations studied.
552 A. Kiran Kumar et al. / Bioresource Technology 104 (2012) 547–556
the electron discharge (current) was increased resulting in higherpower (51 ± 0.5 mW/m2). The time taken to reach the maximumpower output was higher with EE2 (around 30th h) than E3(around 24th h). This might be attributed to the gradual breakdown of the EE2 molecule into its metabolic intermediates undermicrobial electrogenesis due to its stable structure than E3.
3.2.1. Fuel cell behavior in response to estrogen removalPolarization curve is plotted with current density against poten-
tial and power density under varying resistances (30–0.05 kX) tovisualize the maximum power density and current density with re-spect to the nature and concentration of estrogens after attainingmaximum voltage (Fig. 4b). Maximum power density was foundwith EE2C2 (40.02 mW/m2) at cell design point (400 O) followedby E3C2 (34.56 mW/m2 at 500 O), E3C2-PP (31.84 mW/m2 at300 O), control (24.32 mW/m2 at 500 O), E3C1 (22.26 mW/m2 at300 O) and E3C3 (20.19 mW/m2 at 300 O). Polarization curve helpsto find the cell design point and is a usual practice to operate thefuel cell at the left side of the power density peak, where high volt-age or low current density is possible. Fuel cell operation at higherpower density means operation at lower voltages (lower cell effi-ciency), while operation at peak power density can cause instabil-ity because the system has a tendency to oscillate between lowerand higher current densities. According to this principle the BET
fed with estrogens can be operated beyond 300 O for all the exper-imental variations except EE2C2 and E3C2 where cell design pointswere obtained at 400 O and 500 O, respectively. Rapid voltage sta-bilization was observed at higher resistances compared to lowerresistances in all the cases, especially in EE2C2 operation. Rela-tively higher electron discharge observed at lower resistancesmight be the probable reason for higher potential drop and slowstabilization of the voltage. At lower resistances the electronsmove more easily through the circuit than at higher resistance, oxi-dizing electron carriers at the anode. This also might have helpedin the oxidation of estrogens at lower resistances increasing theelectron discharge.
The potential curve in the polarization helps to understand thelosses during electron transfer in fuel cells. Electron transfer (director mediated) from the bacteria towards the electrode in the anodechamber is generally hampered by anodic over-potentials, whichcan be described as transfer resistances and they lower the energyefficiency of the fuel cell. Activation overpotentials (AO), ohmiclosses (OL) and concentration polarization (CP) are crucial duringfuel cell operation (Rinaldi et al., 2008; Venkata Mohan and Chan-drasekhar, 2011). Oxidation of a compound at the anode surface orreduction of a compound at the bacterial surface or its interior re-quires activation energy which incurs a potential loss, generallydescribed as AO. OL are caused by electrical resistances of elec-trodes, electrolyte and membrane and they are especially impor-tant at higher current levels. In the present study, the addition ofEDCs to the anodic fuel helped in overcoming the potential losses,especially with EE2. However, at very high concentration the losseswere increased again depicting lower PD and CD. Poised potentialalso helped in decreasing the losses which is visualized as incre-ment in the current, however is negligible. CP occurs when sub-strate oxidizes faster at the anode generating more electronsthan that can be transported to the anode surface and subse-quently to the cathode. This enables a large oxidative force onthe anode which results in the drastic potential drop making thefuel cell unstable. In the present study, the higher electronsreleased during anodic oxidation might be used for the estrogensoxidation, especially in the case of EE2 which helps to overcomethe CP. Supply of sufficient substrate to the anode at rates of atleast the equivalent of the current generation is crucial to sustainthe current generation. Limited mass transfer of substrate towardsthe anode can result in concentration or mass transfer losses (Leeet al., 2009).
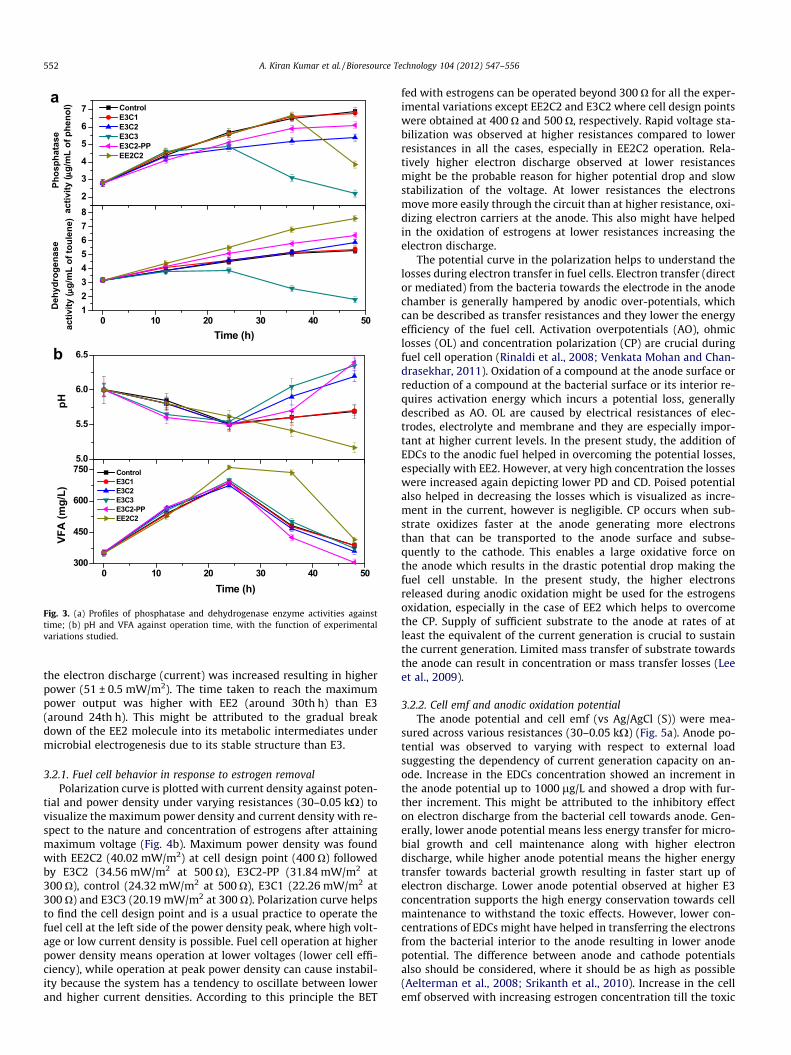
3.2.2. Cell emf and anodic oxidation potentialThe anode potential and cell emf (vs Ag/AgCl (S)) were mea-
sured across various resistances (30–0.05 kX) (Fig. 5a). Anode po-tential was observed to varying with respect to external loadsuggesting the dependency of current generation capacity on an-ode. Increase in the EDCs concentration showed an increment inthe anode potential up to 1000 lg/L and showed a drop with fur-ther increment. This might be attributed to the inhibitory effecton electron discharge from the bacterial cell towards anode. Gen-erally, lower anode potential means less energy transfer for micro-bial growth and cell maintenance along with higher electrondischarge, while higher anode potential means the higher energytransfer towards bacterial growth resulting in faster start up ofelectron discharge. Lower anode potential observed at higher E3concentration supports the high energy conservation towards cellmaintenance to withstand the toxic effects. However, lower con-centrations of EDCs might have helped in transferring the electronsfrom the bacterial interior to the anode resulting in lower anodepotential. The difference between anode and cathode potentialsalso should be considered, where it should be as high as possible(Aelterman et al., 2008; Srikanth et al., 2010). Increase in the cellemf observed with increasing estrogen concentration till the toxic

150
300
60120180240
0 20 40 60 80 100
015
30
45
60
mV
Control E3C1 E3C2 E3C3 E3C2-PP EE2C2OCV
Power density
mA
/m2
Current density
mW
/m2
Time (h)
0
9
18
27
36
45
0
100
200
300
400
0
9
18
27
36
45
0 50 100 150 200 250 300
30 25 20 15 10 5 0
0
100
200
300
400
Volta
ge (m
V)
Current density (mA/m2)
Pow
er d
ensi
ty(m
W/m
2 ) Control
E3C1 E3C2 E3C3 E3C2-PP EE2C2
Resistance (kΩ)
a
b
Fig. 4. (a) Open circuit voltage (OCV), current density and power density profiles measured during BET operation; (b) Fuel cell behavior in terms of polarization with thefunction of experimental conditions studied at maximum performance of BET [measured across variable resistance (30 kX–50 X)].
A. Kiran Kumar et al. / Bioresource Technology 104 (2012) 547–556 553
levels might be supporting the large enough potential differencefor the cell growth as well as electron discharge. The optimal anodepotential satisfies both cell growth and energy output (Wang et al.,2009; Srikanth et al., 2010). Anode potential can also be correlatedto metabolic pattern of biocatalyst and the energy dissipation.Compared to E3, EE2 spiked anodic fuel showed higher anode po-tential initially which dropped with decreasing resistance. How-ever, the drop is lower at less resistance when compared to E3,while the current generation is higher which is suggesting its high-er involvement in carrying the electrons towards anode.
3.2.3. Deviation in the anodic oxidation with loadDeviation in the anodic oxidation potential with respect to
external varying resistance was depicted in terms of relative de-crease in the anode potential (RDAP) which is also useful in deter-mining the maximum sustainable power. The fuel cell will be insteady state if the power generated by the BET equals the power
consumption for an extended time and the power production issaid to be sustainable. Sustainable power calculations were madeconsidering the initial anodic potential (Eo
anodic) and anodic poten-tial at each applied external resistance (Eanodic) after reaching a sta-ble cell potential at respective experimental conditions (VenkataMohan et al., 2008b). Electron discharge (current) was started at10 kX in the case of EE2C2 condition supporting its early responseto the external load compared to other conditions. E3C2 and E3C2-PP conditions responded at 5 kX showing the current generation.Though, they responded to a lower resistance, the variation in cur-rent generation was negligible among these three conditions. Allthe other experimental conditions showed electron discharge ateven lower resistances indicating their inefficiency. Among thethree efficient conditions, EE2C2 showed a gradual deviation inthe anodic oxidation till the least external resistance applied, whileE3C2 and E3C2-PP conditions showed a gradual drop till 500 X anddrastically dropped thereafter. This behavior indicates the concen-
0
100
200
300
400
500
0 5 10 15 20 25 30-400
-300
-200
-100
0
Resistance (k Ω)
Cel
l emf (
mV)
A
node
pot
entia
l (m
V)
Control E3C1 E3C2 E3C3 E3C2-PP EE2C2
-0.750 -0.500 -0.250 0 0.250 0.500 0.750-0.08
-0.04
-0.00
0.03
0.07
0.10
E / V Vs. Ag/AgCl (S)
i / A
Black: Control; Red: E3C1; Blue: E3C2; Wine: E3C3; Cyan: E3C2-PP; Green: EE2C2
a
b
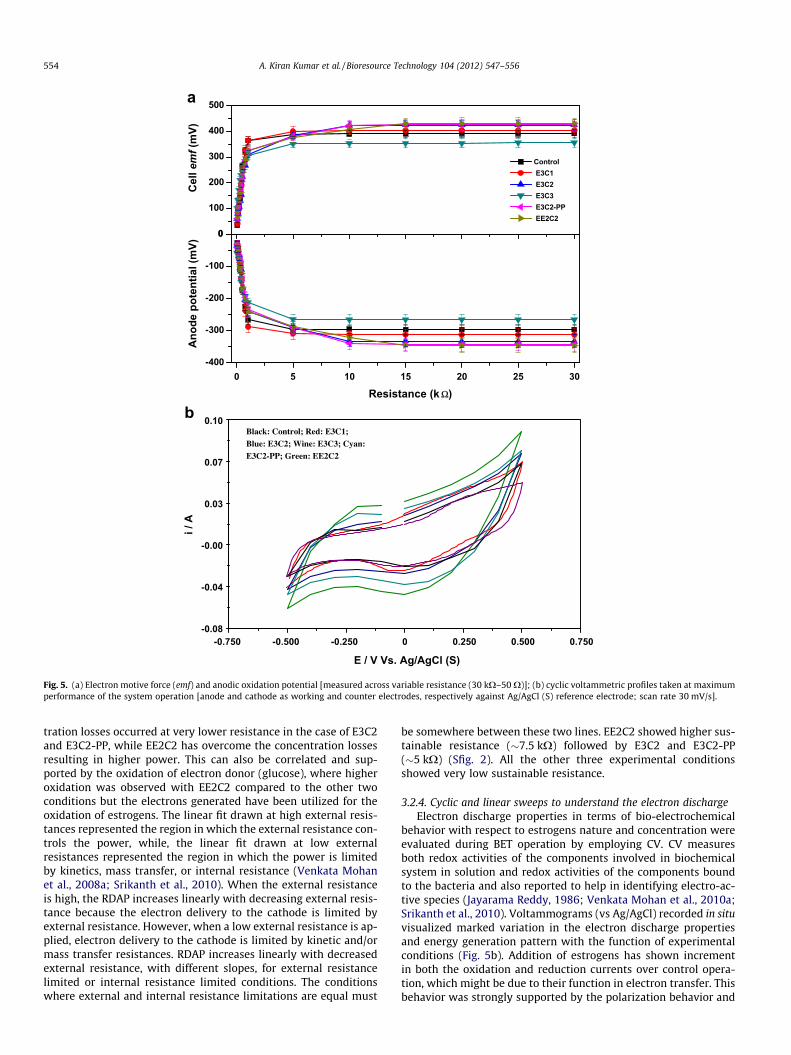
Fig. 5. (a) Electron motive force (emf) and anodic oxidation potential [measured across variable resistance (30 kX–50 X)]; (b) cyclic voltammetric profiles taken at maximumperformance of the system operation [anode and cathode as working and counter electrodes, respectively against Ag/AgCl (S) reference electrode; scan rate 30 mV/s].
554 A. Kiran Kumar et al. / Bioresource Technology 104 (2012) 547–556
tration losses occurred at very lower resistance in the case of E3C2and E3C2-PP, while EE2C2 has overcome the concentration lossesresulting in higher power. This can also be correlated and sup-ported by the oxidation of electron donor (glucose), where higheroxidation was observed with EE2C2 compared to the other twoconditions but the electrons generated have been utilized for theoxidation of estrogens. The linear fit drawn at high external resis-tances represented the region in which the external resistance con-trols the power, while, the linear fit drawn at low externalresistances represented the region in which the power is limitedby kinetics, mass transfer, or internal resistance (Venkata Mohanet al., 2008a; Srikanth et al., 2010). When the external resistanceis high, the RDAP increases linearly with decreasing external resis-tance because the electron delivery to the cathode is limited byexternal resistance. However, when a low external resistance is ap-plied, electron delivery to the cathode is limited by kinetic and/ormass transfer resistances. RDAP increases linearly with decreasedexternal resistance, with different slopes, for external resistancelimited or internal resistance limited conditions. The conditionswhere external and internal resistance limitations are equal must
be somewhere between these two lines. EE2C2 showed higher sus-tainable resistance (�7.5 kX) followed by E3C2 and E3C2-PP(�5 kX) (Sfig. 2). All the other three experimental conditionsshowed very low sustainable resistance.
3.2.4. Cyclic and linear sweeps to understand the electron dischargeElectron discharge properties in terms of bio-electrochemical
behavior with respect to estrogens nature and concentration wereevaluated during BET operation by employing CV. CV measuresboth redox activities of the components involved in biochemicalsystem in solution and redox activities of the components boundto the bacteria and also reported to help in identifying electro-ac-tive species (Jayarama Reddy, 1986; Venkata Mohan et al., 2010a;Srikanth et al., 2010). Voltammograms (vs Ag/AgCl) recorded in situvisualized marked variation in the electron discharge propertiesand energy generation pattern with the function of experimentalconditions (Fig. 5b). Addition of estrogens has shown incrementin both the oxidation and reduction currents over control opera-tion, which might be due to their function in electron transfer. Thisbehavior was strongly supported by the polarization behavior and

A. Kiran Kumar et al. / Bioresource Technology 104 (2012) 547–556 555
anodic-oxidation potentials. However, EE2 addition showed highercatalytic current compared to E3 addition during both oxidationand reduction phases. The catalytic current was also observed toincrease with increasing E3 concentration up to 1000 lg/L andshowed drastic drop thereafter which might be due to the inhibi-tory effect of estrogen on the metabolic activities at toxic loads. Re-dox pairs corresponding to the electron carriers were not observedon CV (vs Ag/AgCl) with any case of experimental variation mightbe due to the usage of anode as working electrode instead of noblemetal electrodes which generally have higher electrochemicalproperties. The capacitance was also observed to increase withincreasing estrogens concentration and was very higher with EE2indicating higher electron holding capacity of BET when operatedwith EE2.
Number of electrons transferred to the working electrode (an-ode) with the function of experimental variation can be calculatedfrom the charge (Q) obtained against applied potential during vol-tammetric analysis. Exo-electrogenic biocatalyst acts as drivingforce to generate electrons from substrate degradation and theseelectrons will transfer towards the working electrode and depictedas current in the voltammetric signature. Marked improvement inthe electron transfer was observed after loading estrogens com-pared to the control operation (1.85 � 1019) (Table 1). The electrontransfer was increased with increment in the estrogens concentra-tion (E3C1, 2.87 � 1019; E3C2, 4.96 � 1019; E3C3, 9.98 � 1019)which might be due to the higher electron discharge from the bio-catalyst against increasing estrogens concentration. Significantincrement in electron transfer was observed with the EE2 bearingwastewater (EE2C2, 9.62 � 1019) compared to E3 bearing waste-water (E3C2, 4.96 � 1019) which is strongly supported by the ob-served electrogenesis and carbon consumption. Application ofpoised potential showed marginal improvement in the electrontransfer (E3C2-PP, 5.34 � 1019) which is also supported by themarginal variations observed in the electron discharge, estrogenremoval and substrate degradation efficiencies. Overall, the BETperformance illustrated variation in power generation and sub-strate degradation with the function of concentration and natureof estrogens.
Anode was also polarized through linear sweep voltammetry(LSV) between 0.5 V and 0.1 V using potentiostat–glavanostat sys-tem at each experimental variation (not shown). LSV depicts themaximum feasible current generation from the system at appliedvoltage. Current generation from the anode varied with the rangeof applied voltage irrespective of the experiment studied. Observedcatalytic current from LSV was directly proportional to the appliedvoltage in all the cases studied. Marked improvement in catalyticcurrent was recorded with the addition of estrogen compoundscompared to the control supporting their role in electron transfer.Catalytic current showed significant variation with the function ofestrogen compound. Addition of EE2 to the wastewater showed agood increment in the catalytic current compared to the E3 bearingwastewater. Increment of catalytic current was observed withincreasing E3 concentration up to 1000 lg/L. However, furtherincrement in E3 concentration showed a marked drop in the cata-lytic current lower than the control operation supporting its inhib-itory effect. Overall, the electrogenic activity of the systemsustained at lower concentrations of estrogens, while marked dropin the activity was observed at higher estrogens concentration sug-gesting their inhibitory effect on microbial metabolism.
4. Conclusions
Simultaneous bio-electrochemical reactions occurring in theBET system resulted in the bioremediation of estrogen compounds.Improved electrogenic activity was observed at lower concentra-
tion of estrogens, while operation at higher concentrations docu-mented drop in the activity indicating their inhibitory effect onthe process performance.
Higher power generation was noticed with addition of estrogencompounds along with wastewater which attributes their functionin the electron transfer. Generation and discharge pattern of elec-trons showed good correlation with the power output and sub-strate degradation. Dehydrogenase and phosphatase enzymeactivities also depicted good correlation with the substrate degra-dation and bio-electrochemical activity.
Acknowledgements
The authors wish to thank Director, CSIR-IICT, Hyderabad for hisencouragement in carrying out this work. M.V.R, K.C. and S.S. wishto thank the Council of Scientific and Industrial Research (CSIR) forproviding research fellowships.
Appendix A. Supplementary data
Supplementary data associated with this article can be found, inthe online version, at doi:10.1016/j.biortech.2011.10.037.
References
Aelterman, P., Freguia, S., Keller, J., Verstraete, W., Rabaey, K., 2008. Loading rate andexternal resistance control the electricity generation of microbial fuel cells withdifferent three-dimensional anodes. Appl. Microbiol. Biotechnol. 78, 409–418.
APHA, 1998. Standard Methods for the Examination of Water and Wastewater.American Public Health Association/American water works Association/Waterenvironment federation, Washington DC.
Auriol, M., Filali-Meknassi, Y., Tyagi, R.D., Adams, C.D., Surampalli, R.Y., 2006.Endocrine disrupting compounds removal from wastewater, a new challenge.Process. Biochem. 41, 525–539.
Auriol, M., Youssef, F.-M., Adams, C.D., Tyagi, R.D., Noguerol, T.-N., Benjamin, P.,2008. Removal of estrogenic activity of natural and synthetic hormones from amunicipal wastewater: efficiency of horseradish peroxidase and laccase fromTrametes versicolor. Chemosphere 70, 445–452.
Barnes, K.K., Kolpin, D.W., Furlong, E.T., Zaugg, S.D., Meyer, M.T., Barber, L.B., 2008. Anational reconnaissance of pharmaceuticals and other organic wastewatercontaminants in the United States: (I) Groundwater. Sci. Total Environ. 402,192–200.
Butler, C.S., Clauwaert, P., Green, S.J., Verstraete, W., Nerenberg, R., 2010.Bioelectrochemical perchlorate reduction in a microbial fuel cell. Environ. Sci.Technol. 44 (12), 4685–4691.
Damstra, T., Barlow, S., Bergman, A., Kavlock, R., Van der Kraak, G., 2002. GlobalAssessment of the State-of the-Science of Endocrine Disruptors in WHOPublication, No. WHO/PCS/EDC/02.2. World Health Organisation, Geneva.
Hamelers, H.V.M., Annemiek, T.H., Tom, H.J.A., Sleutels, Jeremiasse, Adriaan.W.,Strik, David.P.B.T.B., Buisman, Cees.J.N., 2010. New applications andperformance of bioelectrochemical systems. Appl. Micro. Biol. 85 (6), 1673–1685.
Huang, Q., Weber Jr., W.J., 2005. Transformation and removal of bisphenol a fromaqueous phase via peroxidase-mediated oxidative coupling reactions: efficacy,products, and pathways. Environ. Sci. Technol. 39, 6029–6036.
Jayarama Reddy, S., 1986. Studies on electrode processes by cyclic voltammetry,chronoamperometry, chronopotentiometry and controlled potentialcoulometry. Sri Venkateswara University, Tirupati.
Jobling, S., Nolan, M., Tyler, C.R., Brighty, G.C., Sumpter, J.P., 1998. Widespreadsexual disruption in wild fish. Environ. Sci. Technol. 32 (17), 2498–2506.
Kiran Kumar, A., Chiranjeevi, P., Mohanakrishna, G., Venkata Mohan, S., 2011.Natural attenuation of endocrine-disrupting estrogens in an ecologicallyengineered treatment system (EETS) designed with floating, submerged andemergent macrophytes. Ecol. Eng. 37, 1555–1562.
Kiran Kumar, A., Venkata Mohan, S., Sarma, P.N., 2009. Sorptive removal ofendocrine-disruptive compound (estriol, E3) from aqueous phase by batch andcolumn studies: kinetic and mechanistic evaluation. J. Hazard. Mater. 164, 820–828.
Lee, H.-S., Torres, C., Rittmann, B.E., 2009. Effects of substrate diffusion and anodepotential on kinetic parameters for anode-respiring bacteria. Environ. Sci.Technol. 43, 7571–7577.
Lefebvre, O., Shen, Y., Tan, Z., Uzabiaga, A., Chang, I.S., Ng, H.Y., 2011. Full-loopoperation and cathodic acidification of a microbial fuel cell operated ondomestic wastewater. Bioresour. Technol. 102, 5841–5848.
Luo, H., Liu, G., Zhang, R., Jin, S., 2009. Phenol degradation in microbial fuel cells.Chem. Eng. J. 147, 259–264.

556 A. Kiran Kumar et al. / Bioresource Technology 104 (2012) 547–556
Mao, L., Huang, Q., Lu, J., Gao, S., 2009. Ligninase-mediated removal of natural andsynthetic estrogens from water: I. Reaction behaviors. Environ. Sci. Technol. 43,374–379.
Mohanakrishna, G., Venkata Mohan, S., Sarma, P.N., 2010. Bio-electrochemicaltreatment of distillery wastewater in microbial fuel cell facilitatingdecolorization and desalination along with power generation. J. Hazard.Mater. 177, 487–494.
More, T.T., Ghangrekar, M.M., 2010. Improving performance of microbial fuel cellwith ultrasonication pre-treatment of mixed anaerobic inoculum sludge.Bioresour. Technol. 101, 562–567.
Morris, D.L., 1948. Quantitative determination of carbohydrates with dreywoodsanthrone reagent. Science 107, 254–255.
Mu, Y., Korneel, R., Rene, R.A., Zhiguo, Y., Jurg, K., 2009a. Decolorization of azo dyesin bio-electrochemical systems. Environ. Sci. Technol. 43, 5137–5143.
Mu, y., Ren, R.A., Korneel, R., Jurg, K., 2009b. Nitrobenzene removal inbioelectrochemical systems. Environ. Sci. Technol. 43 (22), 8690–8695.
Notch, E.G., Miniutti, D.M., Mayer, G.D., 2007. 17a-ethinylestradiol decreasesexpression of multiple hepatic nucleotide excision repair genes in zebrafish(Danio rerio). Aqua. Toxicol. 84, 301–309.
Oh, S.T., Kim, J.R., Premier, G.C., Lee, T.H., Kim, C., Sloan, W.T., 2010. Sustainablewastewater treatment: how might microbial fuel cells contribute. Biotechnol.Adv. 28, 871–881.
Rinaldi, A., Mecheri, B., Garavaglia, V., Licoccia, S., Nardoc, P.D., Traversa, E., 2008.Engineering materials and biology to boost performance of microbial fuel cells:a critical review. Energy Environ. Sci. 1, 417–429.
Raghavulu, S.V., Venkata Mohan, S., Kannaiah Goud, R., Sarma, P.N., 2009. Effect ofanodic pH microenvironment on microbial fuel cell (MFC) performance inconcurrence with aerated and ferricyanide catholytes. Electrochem. Commun.11, 371–375.
Sei, K., Takeda, T., Soda, S.O., Fujita, M., Ike, M., 2008. Removal characteristics ofendocrine-disrupting chemicals by laccase from white-rot fungi. J. Environ. Sci.Health: Part A. Tox./Haz. Sub. Environ. Eng. 43, 53–60.
Srikanth, S., Venkata Mohan, S., Sarma, P.N., 2010. Positive anodic poised potentialregulates microbial fuel cell performance with the function of open and closedcircuitry. Bioresour. Technol. 101, 5337–5344.
Venkata Mohan, S., Mohanakrishna, G., Srikanth, S., Sarma, P.N., 2008a. Harnessingof bioelectricity in microbial fuel cell (MFC) employing aerated cathode throughanaerobic treatment of chemical wastewater using selectively enrichedhydrogen producing mixed consortia. Fuel 87, 2667–2677.
Venkata Mohan, S., Mohanakrishna, G., Sarma, P.N., 2008b. Effect of anodicmetabolic function on bioelectricity generation and substrate degradation insingle chambered microbial fuel cell. Environ. Sci. Technol. 42, 8088–8094.
Venkata Mohan, S., Veer Raghavulu, S., Sarma, P.N., 2008c. Influence of anodicbiofilm growth on bioelectricity production in single chambered mediatorlessmicrobial fuel cell using mixed anaerobic consortia. Biosens. Bioelectron. 24,41–47.
Venkata Mohan, S., Veer Raghuvulu, S., Dinakar, P., Sarma, P.N., 2009. Integratedfunction of microbial fuel cell (MFC) as bio-electrochemical treatment systemassociated with bioelectricity generation under higher substrate load. Biosens.Bioelectron. 24, 2021–2027.
Venkata Mohan, S., Srikanth, S., Lenin Babu, M., Sarma, P.N., 2010a. Insight into thedehydrogenase catalyzed redox reactions and electron discharge pattern duringfermentative hydrogen production. Bioresour. Technol. 101, 1826–1833.
Venkata Mohan, S., Mohanakrishna, G., Velvizhi, G., Lalit Babu, V., Sarma, P.N.,2010b. Bio-catalyzed electrochemical treatment of real field dairy wastewaterwith simultaneous power generation. Biochem. Eng. J. 51, 32–39.
Venkata Mohan, S., Chandrasekhar, K., 2011. Self-induced bio-potential and graphiteelectron accepting conditions enhances petroleum sludge degradation in bio-electrochemical system with simultaneous power generation. Bioresour.Technol. 102, 9532–9541.
Venkateswar Reddy, M., Srikanth, S., Venkata Mohan, S., Sarma, P.N., 2010.Phosphatase and dehydrogenase activities in anodic chamber of singlechamber microbial fuel cell (MFC) at variable substrate loading conditions.Bioelectrochemistry 77, 125–132.
Vogel, J.M., 2005. Tunnel vision:the regulation of endocrine disruptors. Policy Sci.37, 277–303.
Wang, X., Feng, Y., Ren, N., Wang, H., Lee, H., Li, N., Zhao, Q., 2009. Accelerated start-up of two-chambered microbial fuel cells: effect of anodic positive poisedpotential. Electrochim. Acta 54, 1109–1114.