Enclosure 1, List of RAI # 2.4.1-1 Response Data Files and ...
254
Southern Nuclear Operating Company AR-07-0197 Enclosure 1 List of RAI # 2.4.1-1 Response Data Files NOTE: The pages that follow contain the same electronic file listing information that was previously provided to the NRC in the enclosure (Attachment 1) to SNC's submittal letter AR-06-2865, dated December 27, 2006. The files whose names have been shaded are contained in hard-copy format in Enclosure 2. The files whose names have been enclosed by borders have been converted to satisfy NRC electronic submission criteria and are now located on a compact disc in Enclosure 3. Page 1 of 6
-
Upload
khangminh22 -
Category
Documents
-
view
1 -
download
0
Transcript of Enclosure 1, List of RAI # 2.4.1-1 Response Data Files and ...

Southern Nuclear Operating Company
AR-07-0197
Enclosure 1
List of RAI # 2.4.1-1 Response Data Files
NOTE: The pages that follow contain the same electronic file listing information that waspreviously provided to the NRC in the enclosure (Attachment 1) to SNC's submittal letterAR-06-2865, dated December 27, 2006. The files whose names have been shaded arecontained in hard-copy format in Enclosure 2. The files whose names have beenenclosed by borders have been converted to satisfy NRC electronic submission criteriaand are now located on a compact disc in Enclosure 3.
Page 1 of 6

AR-07-0197Enclosure 1List of RAI # 2.4.1-1 Response Data Files
(a) DIGITAL MAPSGIS Work
f4kgri d •etadatashp.pýdtBasin Map no labels.jpgGage.mxdiGageLocationMap.jpg
GageLocationMapAniotated.jpgNWS basins above Vogtle.bmp,ýUSGS gage locations labeled.jjCJUSGS Quad Index Map.jpgl-
V0gte Watershed.bmpShape Files
BasinH12.dbfBasinH12.prjBasinH12.sbnBasinH12.sbxBasinH12.shpBasinH12.shp.xmlBasinHl2.shxSavanaRiverPoly.dbfSavanaRiverPoly.prjSavanaRiverPoly.sbnSavanaRiverPoly.sbxSavanaRiverPoly.shpSavanaRiverPoly.shp.xmlSavanaRiverPoly.shxSC-hu l2polygon.dbfSC-hu l2polygon.prjSC-hul2polygon.sbnSC-hul2polygon.sbxSC-hul2polygon.shpSC-hu l2polygon.shp.xmlSC-hul2polygon.shx
NWS watershed filesbasinsoutlines.txtNWScoords Input to CORPCON.txtnwsfi.txi,NWSout.txtNWSwatersheds.dgnNWSwatersheds.dwgIUSGSgagesNatCoords.txtJUSGSgagesUTM.txij. SGSgagsUTM1 .tx,
USGS QuadranglesTopo website
BathymetryFishing website
Page 2 of 6

AR-07-0197Enclosure 1List of RAI # 2.4.1-1 Response Data Files
(b) HYDROLOGIC FEATURESProposed Water Management Changes
Ivww.sas.usace.army.mi1 projects-projects brunharb.pdfiwww.sas.usace.army.mil-projects-projects clemdam.pdfwww.sas.usace.army.mil projects-projects hartrehb.pdf?www.sas.usace.army.mil-projectsprojects 1owshbasddLf
iwww.sas.usace.army.mil-projects-projects-nsbld.pdfL_www.sas.usace.army.mil projects-projects oatescrk.pdfiwww.sas.usace.army.mil-projects-projectsjrbrdam.pdf _www.sas.usace.army.mil-pprojectprojectsrbrmitigation.pddfwww.sas.usace.army.mil-projects-projects-shwrda96.pdfwww.sas.usace.army.mil-projectsprojectssrbcomp.pdf
lvww.sas.usace.army.mi lprojects=pej ects thurrehb.pdfDam Data
US Army_Cops link•BC&W Letter.pdti_,MWCMDamSections.pdf
Channel Diversion DataTopo WebsiteCoposite To Map VEGP1971.p
(c) HYDROLOGIC TIME SERIESHydrology Calculations
PMFHMR51 .dj vuHMR52.djvu
PMPComplete.dj vu
USGS gage data
gage7320.bmrpgage7500.bmj'gage8500.bmpE_____List of USGS Savannah R gagilt!Savannah River gages.txtr!Savannah River gages2tx
Annual Mean flowAugustaGAAvgAnnualQs.pd•,_BurtonsFerryAverageAnnualQpd_JacksonAnnuaMean.p__
Page 3 of 6

AR-07-0197Enclosure 1List of RAI # 2.4.1-1 Response Data Files
Hydrology Calculations (Cont'd)
Annual Peaknpeak.txt_
AugustaAnnualPeakQs.pdf_BurtonsFerryAnnualPeak.pdCalhounAnnualPeakQs.pdý-CalhounFallsAnnualPeakQs._pdClyoAnnualPeakQ.pdfl_JacksofiAnnualPeakQ.pdf
peak.txt
peak7Q6,0.txt•peak7000Watstore.txtpeaktabformatted.txtrQpea•W3297000.txt
Qpeak3O2197320.txtpeak302197500.txi
Qpeak302198500.txqpeak7000mdy.txtF
VSGSReport1990.pdAverage Daily
avgda[ly.txf_AugustaGAAnnualAvgDailyQspdflAugustadailyQ.bmo,____BurtonsFerryAverageDaily.pdI• jCalhoux allsAnnualAvgOa yQ ~f
jlyoGAAnnuAlAvgDailyQs.pdýJacksonAnnualAvgDaiyQs.p~d
DailyVaify.txt [Note: file name corrected from previously specified "day.txt"]CommonPd.bmrp___CommonPeriodAnnotated.bmiDailyQ7000.bmpDayQJackson.txtQdailyAugusta.txtQdailyBurtonsFerry.txtQdailyClyo.txtirotalPeriod&closures.bmlTotalPeriod.bmp
Low Flow (SWSTAT Model)lýw~txtSNOClow.wdmSNOclow.wdu
Monthlyý oth~txt_AugustaMonthlyAvgQs.pdf
BurtonsFerryMonthlyQ.pdtCalhounMonthlyAvgQtpdfPlyoMonthlyQs.pdf__,iJacks onMonthl yQUxd
Page 4 of 6

AR-07 -0197Enclosure 1List of RAI # 2.4.1-1 Response Data Files
Hydrometeorologic DataIce jam eventsAir Temperature
N--CD-c OO3.pdfVogtle Temperature 1984.xlsVogtle Temperature 1985.xlsVogtle Temperature 1986.xlsVogtle Temperature 1987.xlsVogtle Temperature 1988.xlsVogtle Temperature 1989.xlsVogtle Temperature 1990.xlsVogtle Temperature 1991.xlsVogtle Temperature 1.992.xlsVogtle Temperature 1993.xlsVogtle Temperature 1994.xlsVogtle Temperature 1995.xlsVogtle Temperature 1996.xlsVogtle Temperature 1997.xlsVogtle Temperature 1998.xlsVogtle Temperature 1999.xlsVogtle Temperature 2000.xlsVogtle Temperature 2001.xlsVogtle Temperature 2002.xls
SR Water Temperature•D5ar and Alhadeff 1997)1p2
Stream Flow DataAugusta gagesBurtons Ferry gagesWaynesboro gagesJackson gagesUSGS mean-daily flow-Augusta 40-03_April21.txtUSGS mean-daily flow-Augusta 84-39_April23.txtUSGS mean-daily flowBurtonsFerry 40-03_April2O.txtUSGS mean-daily flowJackson 72-02_April20.txtIUSGS Near Waynesboro.pdj
Bathymetry Near IntakeIntake Cross Section Points.xlsPlant Vogtle River Survey Discharge Cross Sections~pdPlant Vogtle River Survey Intake Cross Sections.pd_Plant Vogtle River Survey Topo~pd_
Groundwater Head Dataesp-gw-data.xls
Page 5 of 6

t
AR-07-0197Enclosure IList of RAI # 2.4.1-1 Response Data Files
(d) MODELING DATANWS Model
basins.txthucsOl2Plane3.jpj,hucs012Plane4.jpg,HUCslnNWSbasin.dbfHUCslnNWSbasin.dbf.xml
HsINNWSbasins. pgIncludedHUCs.dbf1ncludedHUCs.jpgNWSRFS documentation.msgNWSRFS documentation.txi,NWSRFS for Savannah River.msgNwsrfs for-Savannah Rvr.txiNWSsubbasins.dbfNWSsubbasins.dbf.xmlNWSwatersheds.dgnNWSwatersheds.dwgSavannah River Routing parameters.msg,$avannah River routing parameters.txtSavannah River Unit Hydrographs.msgSavannah Rvr Unit Hydr ogaphs.txSP hucs012.jpgsrblagk.txC-,srbuhg.txt r
USGS.dataIj___Vogtle FIG 1.2 4 esbwr V8 9 2.jpg
HEC-RAS FilesDamBreak.zip
Page 6 of 6

Southern Nuclear Operating Company
AR-07-0197
Enclosure 2
Hard-Copy Data

Page 1 of I
24kgrid a-e~t JO 45p. pcWShapefile
Description Stil Attributes
Horizontal coordinate systemGeographic coordinate system name: GCSAssumedGeographicjlDeta ils.
Bounding coordinatesHorizontal
In decimal degreesWest: -160.375000East: -66.875000North: 49.500000South: 18.875000
In projected or local coordinatesLeft: -160.375000Right: -66.875000Top: 49.500000Bottom: 18.875000
Spatial data descriptionVector data information
ESRI description24kgrid
ESRI feature type: SimpleGeometry type: PolygonTopology: FALSEFeature count: 56617Spatial Index: FALSELinear referencing: FALSE
SDTS descriptionFeature class: SDTS feature type, feature count
24kgrid: G-polygon, 56617
I/C:\temp\metadata1O.htm PN e.-0I 3/13/2006file:/

Lasiuf slpMo
1
Pnj ie IoP

Cn( eL oceb owý m~p.jp
PAIDe I o

Giie Lock MqA) AA~.Aolt,-!eJjpj
Fni. e~ f±F

WjV/S bA s INS Above- V051Ja.brny
P03e I

USGS ýAy ocPmsi-ea~p
'of)

ASG's Qu.ad ]IiidJX fV)pj/
F'A3el )i0cH

V084/- VIý fERSheJ. btn4p
&g~e 10) O

nwsfi.txtVolume in drive M is FRES0304-FVolume Serial Number is 9CCF-FA19
Directory of M:\Iist\GIS work\NWS watershed files
12/05/200612/05/200601/24/200601/25/200612/05/200601/25/200601/27/200601/26/200605/22/200605/22/200605/22/2006
05:34 PM05:34 PM11:49 AM04:08 PM05:34 PM05:44 PM01:56 PM01:21 AM05:33 PM05:37 PM05:37 PM
<DIR><DIR>
194,037 basinsoutlines.txt174,337 NWScoords Input to CORPCON.txt
34 nwsfi.txt358,755 NWSout.txt354,304 NWSwatersheds.dgn380,871 NWSwatersheds.dwg
216 USGSgagesNatCoords.txt242 USGSgagesUTM.txt242 USGSgagesUTMl.txt
9 File(s) 1,463,038 bytes2 Dir(s) 53,735,170,048 bytes free
Pagel of I

USGSgagesNatCoords.txtgl, 34 21 15, 82 48 55g2, 34 15 20, 82 44 42g3, 34 04 15, 82 38 30g4, 33 38 40, 82 12 05g5, 33 33 06, 82 02 19g6, 33 22 25, 81 56 35g7, 33 13 01, 81 46 04g8, 32 56 20, 8130 10g9, 32 3141, 81 16 08
Page I oP I

USGSgagesUTM.txtgl,460453.419,1584603.487g2,481461.073,1548590.834g3,512371.836,1481212.690g4,645647.529,1325735.338g5,695227.940,1292000.653g6,724479.076,1227266.540g7,778205.824,1170426.936g8,859891.449,1069675.783g9,932915.134,920744.309
Page I ef I

USGSgagesUTMl.txtgl,460453.419,1584603.487g2,481461.073,1548590.834g3,512371.836,1481212.690g4,645647.529,1325735.338g5,695227.940,1292000.653g6,724479.076,1227266.540g7,778205.824,1170426.936g8,859891.449,1069675.783g9,932915.134,920744.309
Page 1 of I

CG - Brunswick Harbor Deepening Page 1 of 2
CONSTRUCTION GENERAL
I
Ti w
BRUNSWICK HARBOR DEEPENINGStudy authorized pursuant to House Committee on
AUTHORITY Public Works resolution adopted 25 August 1960.Project authorized in WRDA 99.
PURPOSE Deep Draft Navigation
SPONSORS Georgia Ports Authority - Feasibility and PEDSPONSORS Georgia Department of Transportation - Construction
PLAN OF The recommended project includes deepening of theentrance channel from a depth of 32 to 38 feet,
IMPROVEMENT deepening the inner harbor channels to terminalfacilities along East River and Colonels Island from adepth of 30 to 36 feet, and creating a new turningbasin in Upper East River and the raising of AndrewsIsland Dikes to regain lost capacity.
PROJECT COST TotalProject $ 101,581,000
FirstCost
CostShare65/35 $ 65,109,000Federal $ 36,472,000
Non-
Federal
SCHEDULE m Chief of Engineers Report signed 6 October 1998
* PED phase initiated 13 October 1998
* ROD signed on 12 May 1999
* Project authorized in WRDA 1999
* PCA signed 5 April 2002
* Construction initiated 16 September 2002
* Post Authorization Change (PAC) Report to increase cost
estimate and 902 limit submitted Sep 2003
* New authorized amount approved in Energy Bill Dec 2003
* Construction scheduled for completion in Jan 06
FEDERAL FUNDING FY 04 (Work Allowance) $ 5,564,000IFY 05 (Budget) $ 9,267,000
REMAININGm Finalize plans and specifications for Jekyll Island
http://www.sas.usace.army.mil/projects/projects/brunharb.htm 3/15/2006

CG - Brunswick Harbor Deepening Page 2 of 2
SIGNIFICANTACTIONS
Mitigation contract and Phase II rock portion.
m Award of Inner Harbor dredd6inc.REMARKS The Brunswick Pilots and the US Coast Guard are extremely
concerned over navigation safety issues that exist in thevicinity of the new Sidney Lanier Bridge since the existing200 foot channel is cut through rock and needs to beexpanded to the new 400 foot authorized width. Themost significant economic impact will be caused by theinability of large car carriers to transit the harbor tothe Colonel's Island Auto Processing Facility.
0 Half size, low resolution (72 dpi)
MAP0 Full size, higher resolution (150 dpi)
Congressional Fact Book March 2004
[Return to Main Page]
http://www.sas.usace.army.mil/projects/projects/brunharb.htm 3/15/2006

CG - Clemson Upper and Lower Diversion Dams, Clemson, SC Page I of 2
CONSTRUCTION GENERAL
'I
l~-~MR
CLEMSON UPPER AND LOWER DIVERSION DAMSCLEMSON, SC - HARTWELL LAKE
PROJECT Flood Control Acts of 1950 and 1958 (original project authorization) - Partof Hartwell Lake project WRDA 76 f/Cost Allocation WRDA 86 f/15% CostDESCRIPTION Sharing WRDA 2000 f/Seismic Remediation
PURPOSE Constructed in 1960-61 as part of Hartwell project to protect lowlands atClemson University. Seismic remediation will further protect the universityagainst catastrophic impacts which could exceed $1.1 Billion in physicaland economic damages as well as prevent probable loss of human life.
PLAN OF * To remediate geotechnical deficiency by providing a "deep soil cement
IMPROVEMENT mix" as a repair method
m The fix is designed to provide additional strength to prevent totalliquefaction failure during earthquake events that can be triggered byseismic events as low as 0.07 to 0.10g. Such event has a returnprobability of once in every 475 yrs. or in other words a 1 in 10 chance of
occurring in any fifty year period.
m Dam Safety Assurance Program Evaluation Report was approved by Mr.Jim Crews, CESAD Dam Safety Officer, on 15 May 2000 and submitted to
HQUSACE.
0 HQUSACE submitted approved Evaluation Report to ASA (CW) on 15 June
2000.
SCHEDULE * Complete Design - Jun 20030 Award Construction Contract - Sep 2003
a Complete Construction - Mar 2005
PROJECT COST FY04 (Work Allowance) $ 800,000FY05 (Budget) $3,800,000
http://www.sas.usace.army.milIprojects/projects/clemdam.htm 3/15/2006

CG - Clemson Upper and Lower Diversion Dams, Clemson, SC Page 2 of 2
FEDERAL FUNDING " Total Federal CG Appropriation Required is $9,761,000
" Cost-shared with SEPA and water supply users in Lavonia, GA and Hart
County, GA.
ISSUES None
SUMMARY * The Savannah District completed final design and award was made on 26Sep 2003. The construction was budgeted for completion in September2003. However, final design was not completed until June 2003.
Construction is scheduled to take 18 months with completion in FY 05.
m Cost share payments will be made by increasing existing annual paymentsin accordance with existing contracts and in accordance with WRDA 76
and WRDA 86 requirements.
REMARKS Located near the campus of Clemson University, the area protected bythe dams could contain tens of thousands of people. Any delay in thisproject increases the risk to health and safety for the citizens of the area,if an earthquake should strike the area.
MAP Half size, lower resolution Full size, high resolutionCongressional Fact Book_ (72..dMa2(150 dpi)Congressional Fact Book March 2004
[Return to Main Page]
http://www.sas.usace.army.mil/projects/projects/clemdam.htm 3/15/2006

CG - Hartwell Lake Powerhouse, GA & SC Page 1 of 2
HARTWELL LAKE POWERHOUSE, GA & SC (Major Rehab)Flood Control Acts of 1950 and 1958 (original project authorization)
AUTHORITY and HQUSACE guidance for Major Rehab Program.Improve reliability and outputs of the hydropower plant at HartwellPURPOSE Dam.
PLAN OF m Rewind 4 generators, replace stator cores
IMPROVEMENT * Replace/refurbish key electrical/mechanical peripheral equipmentn Refurbish turbines and water passages
m Replace 6 single-phase transformers with 2 three-phase transformers
* Refurbish/repair/replace headgates, stoplogs and drafttube gates.
m Refurbish switchyard
m Excitor replacement
PROJECT COST $32,700,000
SCHEDULE * Completion of Evaluation Report July 1993
" Completion of PED December 1995" Circuit Breaker supply contract 100% complete
" Generator rewind contract awarded July 1996, currently 100% complete" Transformer Supply contract 100% complete
" Circuit Breaker Installation 100% complete
" Transformer Installation 100% complete
" Phase I - Project physically complete September 2000
" Phase II - Switchyard upgrade added to project Summer 2001
" Project completion scheduled for Sep 2005
FEDERAL FUNDING FY 04 (Work Allowance) $ 1,0851 FY 05 (Budget) $ 733,000
REMAININGSIGNIFICANT
" Install switchyard circuit breakers and complete switchyard upgrade
" Install exciters
http://www.sas.usace.army.mil/projects/projects/hartrehb.htm 3/15/2006

CG - Hartwell Lake Powerhouse, GA & SC Page 2 of 2
ACTIONSREMARKS Hartwell's power plant switchyard serves as a connection point between several
different power-generating facilities. Timely completion of the rehab project willlessen impacts on the production and delivery of electricity to the preferencecustomers, not only that power produced by the Hartwell power plant, but alsothat power produced in the vicinity.
MAP Half size, low resolution (72doi) Full size, higher resolution (150dpi)
Congressional Fact Book March 2004
[Return to Main Page]
http://www.sas.usace.army.mil/projects/projects/hartrehb.htm 3/15/2006

CG - Lower Savannah River Environmental Restoration, GA & SC Page 1 of 1
'4 V.L
.. 4.J:
LOERSAANAHRIERENIRNMNTL ESORTIN
GA & SC
AUTHORITY WRDA 1996, Public Law 104-303, Section 102.
PURPOSE Environmental Restoration and Water QualityPURPOSE Restoration surrounding cuts #3 and #4 and Mill Creek.
SPONSOR City of Savannah, Georgia
PLAN OF The plan includes construction of a partial diversionstructure at the entrance to navigation cut #3 and
IMPROVEMENT cutoff bend #3 (river mile 40.9), improvement to the
channel to the mouth of Bear Creek in bend #3 andrestoration of the mouth of Mill Creek (river mile 42.0).
PROJECT COST Cost Share: 75/25 $ 3,435,000Federal $ 1,145,000Non-Federal $4,580,000
Total Project Cost
SCHEDULE * PCA Execution July 2000
• Award Construction Contract September 2001
* Initiation of Construction November 2001
* Project Physical Completion September 2002
* Completed O&M Manual June 2003
FEDERAL FUNDING FY 04 (Work Allowance) $ 0FY 05 (Budget) $ 0
REMAININGSIGNIFICANT ACTIONS E Continue 5 year monitoring program
MAP Half size, low resolution Full size, higher resolutionMAP72 i15 Sdpil
[Return to Main Page]
http://www.sas.usace.army.mil/projects/projects/lowshbas.htm 3/15/2006

CG - New Savannah Bluff Lock & Dam, GA Page 1 of 2
NEW SAVANNAH BLUFF LOCK AND DAM, GAAUTHORITY Original authorization was Flood Control Act 1970, Section
216 for commercial navigation purposes. Authorization forrepair and transfer in WRDA 2000, amended by OmnibusAppropriations Act.
PURPOSE m Structure was completed in 1937 to serve commercial navigation on the
Savannah River Below Augusta Navigation project.
m Commercial navigation ceased in 1979.
* Structure serves critical need by maintaining constant pool elevation,which serves both municipal and industrial water supply intakes and boat
races and regattas, even during periods of low flow.
w Amend 216 study to address repair of the facility, addition of a fish-way
and transfer of the facility to the City of N. Augusta and Aiken County,
S.C.
POTENTIAL * Study is 100% Federally funded. Major stakeholders (City of Augusta, City
SPONSORS of N. Augusta, Aiken Co. industries) are actively involved.
STUDY COST PEDFederal $1,121,000Non-Federal 0
Total $1,121,000
Section 216 Studies are 100% Federally funded.
SCHEDULE m Initiated Feasibility Phase July 1998
n Final Section 216 Feasibility Level Report - Oct. 2000
w Revised Section 216 Feasibility Level Report September 2002
m Addendum to the 216 Study consisting of 35% design and estimate
m March 2003
m Completed 100% design on lock mechanical work - Sep 2003
STATUSm Report recommended deauthorization due to no cost sharing partners
m Congressional action WRDA 2000 & Omnibus Appropriations Act for FY
http://www.sas.usace.army.mil/projects/projects/nsbld.htm 3/15/2006

CG - New Savannah Bluff Lock & Dam, GA Page 2 of 2
2001
" Authorize transfer of structure
" Direct full repair of full Federal expense
" Provide fish passage at full Federal expense
" Complete Report with 35% design reflecting Congressional direction
" Mar 2003
" Execute MOU with local interests - FY 05
" FY 2005 CG funds needed to initiate construction
FEDERAL FUNDING FY 04 (Work Allowance) $ 10,000FY 05 (Budget) $ 0
REMAINING Complete MOU, complete all design and construction.
SIGNIFICANTACTIONSREMARKS The refurbishing this of Lock and Dam to a serviceable level is needed to
prevent failure of one or more Lock and Dam components. A failure ofthese components would eliminate recreational lockage through toAugusta, and would eliminate the Corps' ability to provide lockage to passandromous fish upstream.
MAP Full size, high resolution Full size, higher resolutionCongressionalF tB k (h72 di (150 d2lCongressional Fact Book March 2004
[Return to Main Page]
http://www.sas.usace.army.mil/projects/projects/nsbld.htm 3/15/2006

CG - Oates Creek Deficiency Correction, Georgia Page 1 of 2
CONSTRUCTION GENERAL
OATES CREEKAUTHORITY Water Resources Development Act of 1986
PURPOSE Correct the deficiencies in the Oates Creek Flood ControlProject in Augusta, Georgia. Original project includedwidening and realigning over 13,000 feet of channelwith either grass-lines or concrete channel and is nownot meeting the designed flood protection. DeficiencyCorrection new start for FY 2001.
SPONSOR Augusta-Richmond County, Georgia
PLAN OF Includes remedial work on the upper and lowerearthen channels. Excavate channel bottom repairing
IMPROVEMENT and regarding in the upper channel, construction of a
drop structure and rip-rapping lower half of the sideslope. Also regarding in the lower channel removal ofdamaged erosion control matting, and placement of a12 foot wide concrete low flow channel to eliminateerosion problems. Objective in the upper channel is toprevent erosion and head cutting in the channelbottom. Objective in the lower channel is to enablemowing and easier maintenance.
PROJECT COST Cost Share: 65/35Federal $1,755,000Non-Federal $ 945,000
Total Project Cost $2,700,000
SCHEDULE * PCA Executed Aug 2003
N Shelve project for possible FY 06 funding
FEDERAL FUNDING FY 04 (Work Allowance) $ 1,000FY 05 (Budget) $ 0
REMAINING Secure funding - and award construction contract for repair
SIGNIFICANTACTIONSREMARKS Contract award on this project will significantly improve
Richmond County's ability to effectively maintain theproject, which affects the flood-fighting capability ofthe project. Which in turn reduces potential for flooddamages and correspondly quality of life for nearbyresidents.
o Half size, low resolution (72 dpi)
http://www.sas.usace.army.mi1/projects/projects/oatescrk.htm 3/15/2006

CG - Oates Creek Deficiency Correction, Georgia Page 2 of 2
MAPS
Congressional Fact Book
[Return to Main Page]
m Full size, higher resolution (150 dpi)
March 2004
http://www.sas.usace.army.mil/projects/projects/oatescrk.htm 3/15/2006

CG - Richard B. Russell Dam & Lake, GA & SC Page 1 of 2
RICHARD B. RUSSELL DAM & LAKE, GA & SCAUTHORITY Flood Control Act of 1966, modified by WRDA of 1976 and
WRDA of 1986.
PURPOSE Multiple purpose hydroelectric project
PLAN OF m Concrete Dam (1,884' x 195') and Reservoir (26,650 acres)
IMPROVEMENT m Powerhouse (648 MW)
m 4 Conventional Units (328 MW)
* 4 Reversible Pump-Turbine Units (320 MW)
0 5 Cost Shared State Parks and Other Recreational Facilities (Public Law
89-72)
PROJECT COST m $626 Million (All Work - Current Estimate to Complete)
* Includes total pumped storage cost of $138 million
s Including environmental work, pumped storage doubles hydropower
capacity for 22% of the total project cost.
SCHEDULE" Project is 99% complete
" Completed Phase III Environmental Testing October 1996
" Completed final Phase III Environmental Report Review August 1997
" Completed NEPA documentation with Environmental Assessment (EA)
August 1999
http://www.sas.usace.army.mil/projects/projects/rbrdam.htm 3/15/2006

CG - Richard B. Russell Dam & Lake, GA & SC Page 2 of 2
" U.S. filed motion for Summary Judgment in December 1999 to dissolvethe 14 year injunction than banned commercial operation
" Plaintiffs filed a motion of opposition to Summary Judgment in February2000
* Georgia also filed a motion in February 2000 to intervene
" U.S. filed a motion of opposition to Georgia's request in March 2000
" U.S. District Court permitted to enter the lawsuit in June 2000
" The Hearing on the Corps Motion for Decision by Summary Judgment wasconducted 17 Oct 2000. After 18 months, the U.S. District Court provideda favorable decision on 3 May 2002 permitting the commercial operationof pumped storage. After initial checkout testing of the units and theenvironmental monitoring protection systems, the District declared thepump units and associated maximum 320 MW available to SEPA in
September 2002
FEDERAL FUNDING FY 04 (Work Allowance) $1,845,000FY 05 (Budget) $4,600,000
SITUATION WITH With commercial operations, we continue to perform the
STATE RESOURCE required environment monitoring and coordination of data with
AGENCIES the resource agencies on a quarterly basis.
COURSE OF The Savannah District has implemented springtime pumpinglimitations and other mitigation measures, that includeACTION construction of an oxygenation system in JST Lake to mitigate
potential summertime temperature impacts to the fisheryhabitat as well as environmental monitoring of a commercialoperation for at least five years commitment and decision tooperate the project in accordance with these measures arecontained in the final NEPA documentation, signed 17 August1999. Colonel Joseph K. Schmitt, the Savannah DistrictCommander, signed the NEPA decision document and Findingof No Significant Impact (FONSI) in Aug 1999. Funding for theJST 02 system and other measures have been approved, butconstruction and implementation are dependent upon receiptof funds as requested in FY 05 and FY 06.
SUMMARY With commercial operation now gained through a U.S. DistrictCourt decision, the environmental monitoring will continue intoFY 10. The project will be physically complete in FY 07 withcompletion of the 02 system to be installed in JST andcompletion of the installation of the static start system forpumped storage and installation of new SF6 circuit breakers isscheduled for FY 05.
REMARKS Delays in completion of environmental features will limit the full operationof the pump-back units, which will limit power production to the preferencecustomers in the Southeast.
MAP Full size, high resolution Full size, higher resolution_______72 di)i d pi)
Congressional Fact Book March 2004
[Return to Main Page]
http://www.sas.usace.army.mil/projects/projects/rbrdam.htm 3/15/2006

CG - Richard B. Russell, SC Mitigation Lands Page 1 of 2
RICHARD B. RUSSELL
SOUTH CAROLINA MITIGATION LANDSEA and Appendices PDF format click here
AUTHORITY WRDA 1986, 1999, modified by WRDA 2000
PURPOSE Convey title of 10,165 acres of land in South Carolinafrom Federal ownership to the State of South Carolinato continue wildlife management of these landsas part of the mitigation of the Richard B. Russellproject. Additionally, the Secretary would pay $4,850,000in a lump sum to the State to replace the annual O&Mpayments the U. S. Army Corps of Engineers makes tothe State of South Carolina for wildlife management ofthese lands.
PROJECT COST $4,850,000
SCHEDULE m Re-submit Letter Report - Dec 2001
" Submitted PMP, Draft MOA, and Draft Disposal Deed May
2002
" ASA (CW) approval of preliminary documents - Jan 2003
" Execute MOA - Jul 2004
" Complete Environmental Documentation - Sep 2004
" Complete RE Closure Documents - Aug 2005
FEDERAL FUNDING FY 04 (O&M) $10,000FY 05 (O&M) $50,000
FY 04 (CG) $3,362,000FY 0S (CG) $0
REMAINING Execute MOA with State, complete environmental and
SIGNIFICANT RE closure documents, transfer lands and pay State
ACTION and obtain reimbursement of transfer costs.
" Half size, low resolution (72 dpi)
MAPS" Full size, higher resolution (150 dpi)
http://www.sas.usace.army.miL/projects/projects/rbrmitigation.htm3/5203/15/2006

CG - Richard B. Russell, SC Mitigation Lands Page 2 of 2
[Congressional Fact Book
[Return to Main Page]
I March 2004
http://www.sas.usace.army.mil/projects/projects/rbrmitigation.htm 3/15/2006

CG - Savannah Harbor WRDA 96 Page 1 of 2
CONSTRUCTION GENERAL
i"
SAVANNAH HARBOR WRDA '96 IMPLEMENTATIONAUTHORITY WRDA of 1996; Policy Guidance Letter No. 47
PURPOSE To reduce the costs of dredge material disposal forour non-Federal Sponsor
SPONSOR Georgia Department of Transportation (GADOT)
PROPOSED PLAN OF WRDA '96 allowed for the cost sharing of FederalProject dredge material diked disposal areas initial
IMPROVEMENT construction and long-term maintenance. The purpose
of this project is to transfer 65% of the costs of dredgematerial disposal from the non-Federal sponsor to theFederal Government as allowed b this Law.
COST OF Federal T21,970,000
IMPLEMENTATION Non-Federal $ 11,830,000Total r$3 3,800, 000
IMPLEMENTATION The above costs for implementation includes the
maintenance of dikes GADOT has raised since WRDA'96, and future costs of dike raising and O&M costs.The sponsor is not seeking reimbursement for costsassociated with construction of these dike raisings theyhave funded since WRDA '96.
SCHEDULE HQUSACE, ASA(CW) waiver approvalDistrict Draft of PCASponsor Concurrence with PCAPCA Package transmitted to HQUSACESponsor Concurrence with HQ Strike-thruHQUSACE, ASA PCA ApprovalWRDA '96 PCA Executed
STATUS An update to the Dredge Material Management Plan(DMMP) for Savannah Harbor has been finalized andreviewed by South Atlantic Division and HQUSACE. Allcomments have been coordinated with the GADOT andresolved, with the exception of one. A waiver requesthas been prepared for approval to begin theOperations and Maintenance of the existing disposalareas (that have been raised since October 96)immediately upon the execution of the ProjectsCooperation Agreement to resolve that exception.
http://www.sas.usace.army.mil/projects/projects/shwrda96.htm 3/15/2006

CG - Savannah Harbor WRDA 96 Page 2 of 2
Awaiting resolution of the waiver request is the soleremaining issue, which once resolved, will allow thePCA to he nrocessed.
FEDERAL FUNDING FY 04 (Work Allowance) $ 41,600 (O&M Funds)
FY 05 (Budget) $2,900,000 (CG Funds)
REMAINING SIGNIFICANT * Approval of the waiver request
ACTIONS l Draft, Finalize, and Execute the PCAMAP Half size, low resolution Full size, higher resolution
(72 dpi) (150 do i
Congressional Fact Book March 2004
[Return to Main Page]
http://www.sas.usace.army.mil/projects/projects/shwrda96.htm 3/15/2006

GI - Savannah River Basin Comprehensive, GA & SC Page 1 of 3
GENERAL INVESTIGATIONS
SAVANNAH RIVER BASIN COMPREHENSIVE, GA & SCAUTHORITY
STUDYAUTHORIZINGLANGUAGE
WRDA 1986, 1999, modified by WRDA 2000
"Sec. 414. Savannah River Basin ComprehensiveWater Resources Study
(a) In general--The Secretary shall conduct acomprehensive study to address the current and futureneeds for flood damage prevention and reduction,water supply, and other related water resources needsin the Savannah River Basin.(b) Scope--The scope of the study shall be limited toan analysis of water resources issues that fall withinthe traditional civil works missions of the Army Corpsof Engineers.(c) Coordination--Notwithstanding paragraph (2), theSecretary shall ensure that the study is coordinatedwith the Environmental Protection Agency and ongoingwatershed study by the Agency of the Savannah RiverBasin."
PURPOSE m Conduct basin-wide water resources management
study focusing on water quantity related issues.
m Investigate current operational plans for 3 Federalreservoirs to determine if changes or reallocationsare warranted to meet current and future needsfor flood control, water supply, fish and wildlifeenhancement, drought control, water quality,recreation, and other related purposes.
SPONSORS 0 Georgia Department of Natural Resources
0 South Carolina Department of Natural Resources
STUDY & COSTFORMAT
ReconnaissancePhase
$548,000
Feasibility Phase $4 million
m 9 years
* 50/50 cost-shared
* Formulate alternativess 18
http://www.sas.usace.army.mil/projects/projects/srbcomp.htm 3/15/2006

G1 - Savannah River Basin Comprehensive, GA & SC Page 2 of 3
months
* 100%
Federally
funded
* Developdetailedplan of
study
to meet current andfuture basin water
resources needs
SCHEDULE * Initiated Reconnaissance Phase February 1998
" Completed Reconnaissance Report July 1999
" Signed FCSA June 2000
" Initiated Feasibility Study June 2000
" Complete Study September 2009
FEDERAL FUNDING FY 04 (Work Allowance) $130,000FY 05 (Budget) $250,000
STATUS Feasibility Phase underway and is approximately 40%complete. The original time frame has been extendedby 4 years to reflect funding restraints on the Federalside.
REMAINING n Finalize HEC Res Sims Model - Feb 04
SIGNIFICANT * Finalize USGS 50 yr Hydrologic Model - Feb 04
ACTIONS m Complete Water Allocation Op Scenarios - Feb 04
m Complete Drought Management Evaluations &
Recommendations - Sep 04
m Initiate and Complete any NEPA actions for
Drought Mgt - Oct 04
m Complete any NEPA EA Actions - Jan 05
m Complete any NEPA EIS Actions - Jun 05
m Complete all Model Run Evaluations - Jun 05
- Complete Phase I Recommendations and
m Draft Decision Documents - Sep 05
m Initiate Phase II actions - Oct 05
RELATIONSHIP EPA Watershed Project Is focusing on waterquality,and other basin needs
" Preserve and enhance aquatic ecosystems inrecognition of multiple uses.
" Articulating goals and objectives.
* Developing recommendations for short term and
long-term action by various stakeholders orgroups of stakeholders.
The Corps of Engineers' Water ResourcesStudy is focusing on water quantity
" Investigate current operational plans for 3reservoirs to determine if changes are warrantedto meet current and future needs.
" Address flood control, water supply, fish andwildlife enhancement, drought control, waterquality, recreation, aquatic plant control.
" COE study is a means to implement certainrecommendations of EPA's study.
" Study management plan includes EPA PolicyCommittee as part of study coordination activities.
WEBSITE Additional study information and progress can be
http://www.sas.usace.army.mil/projects/projects/srbcomp.htm 3/15/2006

GI - Savannah River Basin Comprehensive, GA & SC Page 3 of 3
MAPS
Congressional Fact Book
[Return to Main Page]
found on the study's web oe.Half size, low Full size, higher resolution
re ui(150 dpi)
March 2004
http://www.sas.usace.army.mil/projects/projects/srbcomp.htm 3/15/2006

CG - Thurmond Lake Powerhouse Rehab Page 1 of 2
THURMOND LAKE POWERHOUSE, GA & SC (Major Rehab)Flood Control Act of 1944 (original project
AUTHORITY authorization) and HQUSACE guidance for Major RehabProgram.
PURPOSE Improve reliability and outputs of the hydropowerPURPOSE_ plant at Thurmond Dam.
PLAN OF * Rewind 7 generators
[MPROVEMENT m Replace 7 hydroelectric turbines with dissolved oxygenimproving turbines
m Replace/refurbish key electrical/mechanical peripheralequipment, (Governor, Exciters and Circuit Breakers)
m Replace 4 transformers
PROJECT COST $69,200,000
SCHEDULE m Completion of Feasibility Report March 1994
* Completion of PED April 1996
* Circuit Breaker Supply contract 100% complete
* Exciters Supply contract 100% complete
m Installation contract for Circuit Breakers and Exciters 100%complete
a Transformer supply contract 100% complete
m Generator rewind contract 100% complete
m Turbine supply contract 70% complete
* Project physically complete September 2006
FEDERAL FUNDING * FY 04 (Work Allowance) $3,465,000
N FY 05 (Budget) $4,000,000
REMAININGSIGNIFICANT * Continue Turbine Replacement Contract
ALCTIONS
* Half size, low resolution (72 dpi)
http://www.sas.usace.army.mil/projects/projects/thurrehb.htm3 3/15/2006

CG - Thurmond Lake Powerhouse Rehab Page 2 of 2
I---- - ruar ~It.C. 11.J, C, CbUIUCIVI I t .LJU UL)II
MACOngressional Fact Book March 2004
[Return to Main Page]
http://www.sas.usace.army.mil/projects/projects/thurrehb.htm 3/15/2006

I CLR;Cci-W Le-Wer.
50- -269
5-040
SOU~ C~Q14A u O~YAI &~E, CL~JIA. OUTi ~I~O1It4 lO
Nov~aib~r1~, 1972
q~4th conj~~ ul AT,(45 240O8:. iatd 31 -Oc tobr. 1972, ý%di,5, hve mode hydooke~hfg sthi~dls pvftlni,?n~o fOh.
ipment ofr* ff4 Ovc oe oay~Occr~ee uc1r StotoScoroIPj*. A.,.onerse sum"ar of m idn n ocutn
~ou~~ gch i ~f cýtjt ppd rond o m r vo I bl
The asIignft* f relcted. spccll t Wthe Jqliovong
i4 Copurdtiont of ptbbemxmmF~ PF) .heg~~ of nfh Ita ~nd K-,Oweo Rnsron O~pciey;
b R oatIn' of the PMF~ydi og hs Thr:g oaw n ~wefe~yifoCl0issurn~tis, 4dtrft ~ao~~so i~tagewvond.. ouflo at
,C. Co~mputation of wove l~rq~ersk idvra1eit of rup on -mýtsý of the, Jocasspe, Keowee- and ~Ulttl '%v~e 00i . spciv.y thae j9.b
rma.i mim reseirvoi r stages dv4u th proabe ._w~ru lo
~d- A summwary of ~~cornclustiodoresredtoobveJp.tcu.-iya
ot. t6 the safiety of he damcnu aur uhgedrm los
methods." hdrom",ete orogia iiti vn bmo flodin -eo sighmen ~fn setal wtt hs dp-t6 govejw fke 4e~wrmiriction'Of spi I "way a~p~ r, nd
lre cdams, generofy as nsjm~i~di~ the -lFerupry I9rnternts~ $9Sfety) An- "A ys " R 0 ts or Iula ow ~~s
(4~374PA8 e

L1C- Letfer~pdf ,`.
LM L;4fm~on, - tige -2 Noe 1r 5, ~
Cne ncano Jrin lkes fomdb hs,-~odm ,adisJr o
th lorge:,0 e0og to lkw* hw zes t~ ý'ct--aspne ef~eowee,.n -UteR v~er'Ddirs eoT~Whohve'top eltyc-
t~lori of8 1$' T:., On ieah ýca the, upstredmem~bonment 1s 'surfaced with dumped -rock;:r e'ifr- - 2" -t;.h1-c. .3 0,..' •."•.•: 7...s .,.hi, V .to 2.0 H.
froi~ ~~ ~5,o ~hi h ro'kf I joc~ssee. bcmij 'Ioe btt~ ni~sv$WII A
He3c I fi77.!Ti!•iil, ocated• a.bout :I:•y 2:mi let::.oi:re
fro Ke - we e Dqrn, CorvtrolIS 1.48 squcxre mrfles _o-f tfhe, totol1 439 ýquare mile basin a~bovee, K eoiwe L-1fle RT'ver Dcs The top -eievctAion, qf The embornkmi~net, 11 251 msl .
Upfro,ýhý owytra tok~.i~f!enbn-ýns ecch Ahci'e a slope: -of 1' Vto 1 .75'kQ rj Z f wp* f eI _ fOeet ý f eev>rt
ine v ,r leYai~o ~hh 'Inciudes 4i Zthre edr in
. Keiowee 1,ake ýhas aý grots i~b .Acpacty of 956ý QGOareft 4. ~ n~m~d fijl P6-,1 evdf 0 800' MsI , W1 t, a s ft:area o~f 1'8 1172 'qcre s ;(29 square mites). '; A
Th~e I swer evovr hcs, a ~gross -sto rage cqpo cJA y of It 160.,:000 ocre-feet at -a no(Tzna~fu I - vciro , 11.0 feet. msi-, cnd- a s &aýe or'eaof756 ace '2, si;=6ý 6nf1esj ,.;
d.4 The: loWee Da si L~way to~sts 6f four ~taintr ateos 381 W;x 3 i51 H ',-~~ith~o~r~ ~~v~i~r bf76I _tbp fbrt2 dsare cpocity of c'6 OQ~kFe AA ,AtA~
pet-secnd -atp r:awl ful1-atei level. of'SOO' .ms. T•h .:oes.se. p tain e-'" -
jq fs0ý8,, cret-6OOtib 1077, ' es1i j.:_ to mrbinred c ciyt 4 -' t;
e,; in d, 'Tllwd t" :K'we !d ' "9. z9 h e.:P r tu. •," . ..6J ne 6ipcge ofqcashargin dfwater. Cperct; -picns for Jocase
diclcre ~drgfjn o4,'Rd Jfrneed~d. However, such turblne o~perations could be precluded•c JI.4w .... r- for, ri : r .,.n.d - ergency -. nd t ns "... ..
;iqdd"'ifhe~r~66 Flros.A c ý d jljr, it}-e AstijdAes reported herein, re~tas ffrO06 -
Ssme i04 $.e zero Jn -roui~i nth Pro*1eM imvM Fig AA
A) A
At.4AA.A". "
... .. ..
--•"A- A*Ai i•7A A••• AA-<•.•.j.I
" ' ...A.A ;t. * '" ':.....
.. .. .....- A li A. -:A -.- -.- . : -; - A7:i A7!t!•L :•:i!,iii:.i.L• •.:.•.•;• ! • •"A A '•' :.7A : . .• 7! )_:-" ': "- •-: i ,: • . - : :• :.i i .. '- • .. . Ao • . . .. t- . . .. .
A .--;.A~.A 5AA'.-4AA.AA A< AA . ..A;A.....A... . .. .A.. .. A AA-A.A"I~•' i!]~ ~ii "• " " " " " t -"i tAAAAA. A-:AA.....•A

LB~% C -\
ReprtW-41, 3' o2GiWT~f -'tiU.SWehr Puea9 .(nl 3 O ) Aleratv aealdsri~butions of.,~
&ý PjuýF6d fo-h1&sure piteit&oP~nAP)esitsfo JO he;tee Do-wuldresl milen:osrlhpe.
hea V, it ýPM~P conrcent~rcatoh occu,:red over this crea; t~he critcal 'PMFi hydrograph at K~owee
'Cým ould ri~ilf wit~hý.h-ea'is ?M anut-,otetoe-oec 291 sqi re mik l ;< '"
inere~t araýeten Joa~ssee'ond ,.he darns forming ..Ký" '-eow~eerLake, P.MF hydrogi9.Phs,
, i f ý:r nputed~b opp cati n o~fZ:s,ynthet~i-C "t'-hydrographs t-o esti otes ofiPM? rcinfatll'~ '
excesa5urnig'cl I at~iitr1ofl index of -05 inc~h-per ~hour. The synthetic unit hydrograpb
were ýve fo 6~mne L n ýdrainage gr~ecs tri~butay to full ,reservoirs 'to account for the
O CO'IflI ýe tcsff --t I f u uua l~IyAý6-5e w44ter turfaces of Lake -Keowee and Lake Jocassee at1
n~rtl0~f~al ~ Ah'icb rpresnt ore than 9 percent of the tot~al 439 square i
- Th seecto oý ceff i~ents used in dvongsynthetic ~nj f ky~drogrdphs:
iw4 osed on tuie~o uni H/'irgrcplhs derive'd from analyses 'of niO;jr ftoods.
- The c~tbpu~ed PRMF -bydrogtaph ýof -inflow Into:1 245sse 00ke Ja ek~f2~~
c-f. .c a Ivrl9A'f volijme of 2 10, 000 acre.,feet (26. 4: incesun'off f rom148 sq.. mi.).
.Asmig rh eservoir wo~uld be-fit1ed to eievatijon I O rla the 'beijinning .f t1,e?PM~, x
cnd'ol1l ý'e160ses maqde through the twso sp~illwayq gae, e~lk reservoir 009ge of 14, 122,51 -
msl I~ ýW ýmp4Jtfed;, stages ýexceedi ng I. 11.9. 7' 'ms'I w.qypqd pr#eVi I f-r12 hours,. Thlie. e k
rate of. reservoir- ou fb~ rougH7 the spi-way. woulAd be 72,'O j.0. ý
-:7. Fhe, mpu'ed~O IFMF hyr ohýfiiointQ Lalke X7eomee hI4d aPeockof5,~.O
-C.fi, ~n J runoff Vdrr~e of 550, 000 acre-feet {2i3.. 5 inches r11unoff from 439 square il')
,A~~iiijg th~ ~v~~ir woul4 ~e InitlLy fi I ed -to ele-Ation -8bO s~ ad'llrloe'n
tHr..uli mfo'f Sp' itway, dates ,'P .peOk5 reservoir level of'809; -$Y is I wds' -co u ed; leI S'
,ex*~ierl 3býO61'6 l'od'Ir~ for 12 hours. These valIues '01o preicatdo
o~Y3pt~nA' ms'lE~fC woud prevossfrmJcse ~eevi 're mad To the i'b"v '
Way 'hf~ot flost , rovg'h'power lt~vribies.
,-RaARD 'F- WAt -AC'T1
F-ý F1I ng,! o' review 'of t.He coppartent 4deqac of 'excit'~ damS, t~o safely oom-OM-~
daeWave gctIO: In 'IcoJe Jocassee and to-ke'Keoe hite vnt hZIgh M.45s biowit
toward he ý rs sl~ol d prevajIl for ,4ev'eiro hours While lreseivoi-.r 'leeosArequant to or #ear:
~th ~~melvaios i~~ or-AFMFnWo1,.Rlvn proedres -and compu~t~"
tloo~ ~nf'ire~ n ub I atiomi by, the Army. CrS oif toori~r (Eý 1110!-2.<Ž, n
'17 '~t 1*,0-ý2-8 ',,dced I Aqys~t 1964) were used i h oayss

~Hu4.o Psig e Jmb#~5, 1972
Wij reors san~d~analyses ho that WMnd vlcte as high as J5' to 40 rnileiýper-Had, or urai~os~o j~o,:,hom,_mayocc ur Frnfrequently in tHe vici:nity ofLnk e,
'and Lqke Keowee. ~RLser-ich-studi-eslindicat~e that, oveir-Acahd -wind velocities'of~mnph Woýld accelerate approximately 2~5.percent over the open water surfatis
:7m -htstooer-,water-v'e~loci.t-ies ~of.144 to 50 mph. ,Whether or not suchconcid With peok--------------ls dring the, PMF, 'and 'be, riertd, over'fhb
~e etcqin acriticqlt'direction. 'toward The~re-spective dams, is largely a matter ofIre; Ingnrlst&d~ifes shPwthaf-wnd. dir'rti~ons tedd&ocInge isubstantiolly Oerids as sfor~m centers moe, even 't*hugh velocities, inyvarious ~di~rections may P ris5t'-att eý far Iseveiral hours. 'In general recoanil..Jpnof;:fethei i=-,robabi] ity of the most''V~nýyd e'Pc~ty-dUirat~ion-dir~e ion--reltotion-bl,..ý-c-oicid~ing-ýwi:t'h maoximumi reservolir,4evel1s"i;afi&5 cited obove provide,:for adoption 'of- "des'g w..ndP criteria that are can-
ontebasis of' avaicioble datoancd deýsin ojectives involved. Esimates.-'hsertria are ýused:-as-rotds to over-oil I judqement of possibtle wave effects!;on
Feafures. In the instant case, ~a "1des'ign wind" coqrresponding to an~ over-lanidf-P25 :mph,.for,,a period.-of--6 hours -wos; consideried, raoiiqbte hi estimating heights, of"
at might- bae expected-during 'the PM'F. However, tfhePossi~b Ie, effects of wave actlon"Ird conceivarbly result- from 'wi-nds equal to 40 mtph OVer- lad. eeas considered 4or;'ý&:'ha'zards from possible br~eaching -of t'he ýdams frbromwad've :erosion would hot -exist'ri ng extrem~e conditions. (Wind velocities 'cited herei~n ree to "over-land" rat-es,
~ elcty inre:e.over water have been' a~crcd~oued: Thi in wav~e
THe,4J~ocass'ee~ Dam* tp ele~vdfion 11265 n1 rrovdei freor o251aoveuted '-naxim'uim reseivoirr level du~fn te'M lvto 1122- .5'~ inlConputatid-s'ý,that al sustained w~ind -ve'locity *ý'ven al to 25- mp vrland,., .cf] g oveft ,ch1,'" Icouid reSUftL in 1_1;ignfi_ otwaves." (h5) 1.s,9 feet high, which-~woul'd &breakUp~~o ik aeO ocacsee Domn'to a vert ical ýheiqt of approximately 2.5 feet above"
r 1 eli-revqi~ing ýcuri'nq 1hePMF; a-neg4 lgilble amount of wo-ve splash or over-7wcsý"es exceedingrh rngtps ovr~h rest-'of the dam. For-corresponding codfns'ted win'd velocity'e~qual to 40 'mphpoyer- land would produce runup approximately
_h 'h- r',<andlmoerd ,te amounts of wave-spls an w ve over-,ash migh pss o~~tefk'e dom ForaC- period' oifa few 'hours. In view of the c-horcteri-t ics of the ro.ckfflinent -f Jocasee.iDam, 't is' concluded that this wae6inwol o e sufficie~nt'sent an risk: of'breac kirigý of the em bankmetnt oaf Jocassee Dam .
JTh Ke'owýee Dam~top'elevation: o'f 815' mslhi provid.0o, 1freeboardof se.2 fe'et aboveute mqxiimum reservoir level during the PMP1*'O-. Alvto 80,1ml -suie
loCi~y',r.6,Mo blL~.640'rmph -over-Iland, blowing foword the darn over an effec't.ive2.2mre e significant wvs32high, 'apble--:Of runn ,
Oil th riip enbanknment' (skpe :'2); the.)ixMa fum e~v i-n a~spect-um of 100,Q'vac.s;r -ID'dbgut 6heJ fot6,hsqher~ Accord iig ly, -qOnipuftaiOns kidircte thut Keowee'Dom-!noug,' o lpreyentwave over-wath Underte" most-cirticoal PMF condi'tic;,.Thsmoni Js,,#Plicab t ti'ttle River DdT whqr,6 thf efecive fetch (1 .9 miles') isIeSSý:th.e, _Kiwee: -Dm. , ,
-An0
winj
wQQ.is 11
-- -,fir

)1 P% d-X- I A P U n 7
'G'. ýHulIman;Pg November 15,, 1-9772`
...d.ures-and'.iC-i' te.ý"....'i,. icy con-epts; me-thods. h ydrmete .iD i
ýc , n•11 d basic flood i'u n 'studieg areu cositent wt.ngin~eering pructices asotewihhedsgofwveryy 'large dams: in the:Unted
n "o" i : ' •. . 1."
the~Y osf'er-a -s'der o4 cnevtminvauios'eaning: to tlhe -Projecits
F~by this report.
J ..cassee Amd. R rIr'.
C'.1 ThePoal Mmu 'Flood hydýrogro;h of injflow i !nto tok Jocaosse t'Wwoud:
peck discharge, of, approxiatey24,00c anvd -az rnoff volume of 2:1`0.,000..aqie-b:: Amaxim;m ree- lv 1,222.5' is1 c ou ld .b i". tw.ined. i"n e
•i•:''.ll ~ ~ ~ ~ ~ ' ,. d:': ...... Ionobll ,llpossl ...
the PM!F under the most:0d dverse r tnCe cAtosId;eredrasnbgy posle.
c. Theyto elevation of 1,25' ms] of Jocassee Dam provides a freeboard al.owne.
;ib'I ewave'ruOnup on ,,th~~e rockfi iI 'embank~ment equal to ~2..5 feetabove the peak PMAFi.r I.;'e (1, 122 • 5 ms) eO.Stimated here.-ifn. It isrermotely possible that sustabned •Wnd
s'(equalo:'tp 25:,•to,40 .0mph: M. ver lend), .blowi.ng toward tthe dam ýco.uld cause •ývend;;:som~ew.av~e ov~er-washof t•he J.ocasse~e embank~ment for ,a,;f~ew :ho~urs duri[ng t•he: 1•F.
ý. !the rod,'kfilI. ýcomposition of: the dam embankmentis such as to.preclude brehing of
Dan'krnent frfom- waves 'wash of th-e gneralI mnagni~tude ,i~ndi-,ca'ted:.
a., The ;P~robcblMIe'oiu Flood Hydgrographf inflow 'into Lake Keowee would
peo k discharge of. adpproxmtl 45 :00cfs and a xnincff vol~uMe of .55.0,j000ace
~: A mximumroivoir.level.of appr-x~hately 81f0.' msl cou-ld be attained.ind
'eowee du-rlrn thepfl PF :Utder the' trost, c~ri'trQI cIrcumotonoesz cnidered 're snably
e.

) R "_ d-J V/
-PN b 1.5,. 972 "
ib sq.; •- ....win. ve ... c i :•V 4 mph 'O le . .ov'o;e '
MIF~~ col o~ oe run4ponh rmpcvrdac
' •~LE•RT L. ,COCRAIN .. •.;.i.
Direc tr of SpeLcicl- rol"ctstLyfes., -Bissetto,it Carlisle A W., ff
•:• ': .•
II
I,
/4
4,-
4;
47
PA 3 P_ G o

C(ORPS OF ENGINEERS U. 9, ARMYCORPS OF ENGINEERS U. S ARMY
\ 'eIx
•R E S E R V 0 1 R
QQk
!
¢,d
I-J
0
NJ0GENERAL PLAN
r)
3(t~
U~)
~0DOWNSTREAM ELEVATION
1- n...
sum~
fs IV r,
. .. . .N
NON-OVERFLOW SECTION INTAKE SECTION SPILLWAY SECTION
U•1*,N.* ravin l5ura, SAvlyl AIWA, e* **R SCRESERVOIR REGULATION MANUAL
RIAWELL LA4CONCRETE DAM ANDEARTH EMBANKMENTS
VI ISV *...lSe bISS; , .mu
I

(4
r1
C-)
(Lo
-4-
11)
0l

IR S R V 0 R
N
I
I,
m
ý-3
H
G E 0 R G I A 0 L I N
PLAN
ftllA 101
COWNOTEAM ELV.TIO
vilt30 -ao" .,,poll335 P58.111.1 flo 010 10 I33 *b*ltO ,~o1L3E
loo a10 ~ r No *roii 0 Iw A
..* ~ l ,1100940 'D 0, Z.. V5,40
I -. (100,00 ,~ 41 ~E/2 100
lopo11o 9010/ FS0080101 Aogl,, .1 ~ lldhmlit 39: IS
NIO ETION NON -OVERFLOW orCIrOtN SPILLWAY SECTION
f7 3.00 a "o Rwma .11. AN
El Joys j -/,U~
_IA e'llIA
EMBANKMUENT SEC7IOM
SAVANNAH NIVES BASIN, SAVANNAI RlVER, OA. AND S.CRESERVOIR REGULATION MANUAL
CLARK HILL LAKE
CONCRETE DAM ANDEARTH EMBANKMENTSIl. ISto S STN 5 %011*401. A.%N.,.
COAPS w I•"Kml.S"W.t "*"

j A e7000- 6 n~
1
N1
iI
I*|
IJ
~*1
PAJ~e I OF'I

j IIJ e'732-0.krrp
F
7
*1.
K-I.." ~ 1
I
I
r
PA~J e I

7500. brmp
I~ If
IFj
r*.- 144 -e d
LL
-I"I
Ja
JF4
I

ilj e 5OO 0 b r,
I II
*'* •J
III -,
Pei e I

List of USGS Savannah R gages.txt
# USGS NWISWeb site number list
# This file can be used to retrieve data from the# USGS NWISWeb internet based retrieval system using# the 'File of site Numbers' search criteria.
# This file can be editted, but the number of columns# must be equal for each row, and the 'siteno' column# must remain.
# The columns include:# agency-cd -- Agency code. If no value is found, 'USGS' is assumed# siteno -- USGS site number# stationnm -- USGS site name. This column is include for viewing only,# it is not used by the nwisweb system.
agency-cd siteno stationnm5s 15s 56sUSGSUSGSUSGSUSGSUSGSUSGSUSGSUSGSUSGSUSGSUSGSUSGSUSGSUSGSUSGSUSGSUSGS
02187252021875000218900002195000021964840219700002197300j0219730120219730550219732002197321021973230219732402197334021973380219733902197340
SAVANNAH RIVER BELOW HARTWELL LK NR HARTWELL, GASAVANNAH RIVER NEAR IVA,S.C.SAVANNAH RIVER NEAR CALHOUN FALLS, S. C.SAVANNAH RIVER NEAR CLARKS HILL, S.C.SAVANNAH RIVER NEAR NORTH AUGUSTA, SCSAVANNAH RIVER AT AUGUSTA, GA
MILL CREEK AT SAVANNAH RIVER SITE, SCCROUCH BR NR H AREA AT SAVANNAH RIVER SITE, SCUPPER THREE RUNS ABOVE F-AREA AT SAVANNAH RIVER SI
SAVANNAH R. NR JACKSON, SCX-004 AT SAVANNAH RIVER SITE, SCD-006 AT SAVANNAH RIVER SITE, SCD-003 AT SAVANNAH RIVER SITE, SCSITE NO. 3 AT SAVANNAH RIVER SITE, SCSITE NO. 5 AT SAVANNAH RIVER SITE, SCSITE NO. 5B AT SAVANNAH RIVER SITE, SCSITE NO. 6 AT SAVANNAH RIVER SITE, SC
USGS 021973405 C-001 AT SAVANNAH RIVER SITE, SCUSGS 02197342 SITE NO. 7 AT SAVANNAH RIVER SITE, SCUSGSUSGSUSGSUSGSUSGSUSGSUSGSUSGSUSGSUSGS
021973424 C-003 AT SAVANNAH RIVER SITE, SC021973426 C-004 AT SAVANNAH RIVER SITE, SC02197345 K-011, AT SAVANNAH RIVER SITE, SC021973455 INDIAN GRAVE BRANCH AT SAVANNAH RIVER SITE, SC021973471 PEN BRANCH AT RD B, AT SAVANNAH RIVER SITE, SC02197351 P-013 AT SAVANNAH RIVER SITE, SC021973515 STEEL CK ABOVE RD B AT SAVANNAH RIVER SITE, SC021973525 L-007 OUTFALL AT SAVANNAH RIVER SITE, SC02197354 P-007 AT SAVANNAH RIVER SITE, SC021973565 STEEL CREEK @ ROAD A @ SAVANNAH RIVER SITE, SC
USGS 02197362 P-19 AT SAVANNAH RIVER SITE, SCUSGS 02197500 SAVANNAH R AT BURTONS FERRY BR NR MILLHAVEN, GA
Page 1 of Z-

List of USGS Savannah R gages.txtUSGS 02198500 SAVANNAH RIVER NEAR CLYO, GA
Page 2 o FZ

Savannah River gages.txt
# US Geological Survey# retrieved: 2006-01-13 18:36:26 EST# URL: http://waterdata.usgs.gov/nwis/dvstat
# The Site File stores location and general information about ground water,# surface water, and meteorological sites# for sites in USA.
# The following selected fields are included in this output:
# agencyscd -- Agency# siteno -- Site identification number# station_nm -- Site name# latva -- DMS latitude# long va -- DMS longitude# coord-acyscd -- Latitude-longitude accuracy# coorddatumcd -- Latitude-longitude datum# state cd -- State code# countycd -- County code# altva -- Altitude of Gage/land surface# altacy-va -- Altitude accuracy# altdatumcd -- Altitude datum# huccd -- Hydrologic unit code
# query started 2006-01-13 18:36:26 EST
# there are 32 sites matching the search criteria.
agency-cd sitenocounty-cd altva5s 15slos 16s
stationnmlatva long-vaalt-acy-va altdatumcd50s 11s 12s
coordacyscdhuccdIs los
coorddatum_cd statecd
2s 3s 8s 3s
USGS0824855USGS007USGSNAD27USGSNAD27USGSNAD27USGS245
02187252S02187500432.260218900045021950001302196484450219700096.58
SAVANNAH RIVER BELOW HARTWELL LK NR HARTWELL, GANAD27 45 007 470. NGVD29 03060103SAVANNAH RIVER NEAR IVA,S.C. 341520 0824442 U
NGVD29 03060103SAVANNAH RIVER NEAR CALHOUN FALLS, S. C. 340415001 363.53 NGVD29 03060103SAVANNAH RIVER NEAR CLARKS HILL, S.C. 333840 0821205073 182.69 NGVD29 03060103SAVANNAH RIVER NEAR NORTH AUGUSTA, SC333306 0820219037 150. NGVD29 03060106SAVANNAH RIVER AT AUGUSTA, GA 332225 0815635 U
NGVD29 03060106
342115
NAD27 45
0823830 U
U
U
NAD27 13
USGS 021973007NAD27 45 011
MILL CREEK AT SAVANNAH RIVER SITE, SC177.4 5 NGVD29 03060106
Pagel o 0
331914 0813532 F

Savannah River gages.txtCROUCH BR NR H AREA AT SAVANNAH RIVER SITE, SC 331727USGS 021973012
0813857USGS331741USGS003USGS003USGS011USGS011USGSNAD27USGSNAD27USGSNAD27USGSNAD27USGSNAD27USGSNAD27USGSNAD27USGSNAD27
F NAD270219730550814133 R
45 003 230.UPPER THREE RUNS ABOVE F-AREANAD27 45 003 120
NGVD29 03060106AT SAVANNAH RIVER SI
5 NGVD29 030601060814604 R NAD27 4502197320
77.0002197321110.02197323120.
SAVANNAH R. NR JACKSON, SC 3313015 NGVD29 03060106
X-004 AT SAVANNAH RIVER SITE, SC 331237NGVD29 03060106
D-006 AT SAVANNAH RIVER SITE, SC 331212NGVD29 03060106
0814538 U
0814438 U
0814434 U
NAD27 45
NAD27 45
NAD27 4502197324 D-003 AT SAVANNAH RIVER SITE, SC 331207120 NGVD29 0306010602197334 SITE NO. 3 AT SAVANNAH RIVER SITE, SC 331631 0813912 R4502197338450219733945021973404502197340:45021973424502197342'450219734245
011 198.9 .10 NGVD29 03060106SITE NO. 5 AT SAVANNAH RIVER SITE, SC 331650003 250.6 NGVD29 03060106SITE NO. 5B AT SAVANNAH RIVER SITE, SC 331629003 191.2 .1 NGVD29SITE NO. 6 AT SAVANNAH RIVER SITE, SC 331623003 187.9 NGVD29 03060106
5 C-001 AT SAVANNAH RIVER SITE, SC 331513011 245 NGVD29 03060106SITE NO. 7 AT SAVANNAH RIVER SITE, SC 331440011 155. 251 NGVD29 03060106
4 C-003 AT SAVANNAH RIVER SITE, SC 331447011 280. NGVD29 03060106
6 C-004 AT SAVANNAH RIVER SITE, SC 331420011 220. NGVD29 03060106
0814015 U
0814006 R
0814005 U
0814053 U
0814145 U
0814027 U
0814025 U
USGS 02197345011 200.
K-011, AT SAVANNAH RIVER SITE, SC 331240 0814028NGVD29 03060106
U NAD27 45
USGS0814031USGS0813851USGS011USGS0813613USGSNAD27USGS011USGS0813744USGS011USGS0813010USGS103
021973455 INDIAN GRAVE BRANCH AT SAVANNAH RIVER SITE, SC 331245M NAD27 45 003 225. NGVD29 03060106021973471 PEN BRANCH AT RD B, AT SAVANNAH RIVER SITE, SC 331212U NAD27 45 011 160. NGVD29 0306010602197351 P-013 AT SAVANNAH RIVER SITE, SC 331353 0813506 U NAD27260. NGVD29 03060106021973515 STEEL CK ABOVE RD B AT SAVANNAH RIVER SITE, SC 331258U NAD27 45 011 208 NGVD29 03060106021973525 L-007 OUTFALL AT SAVANNAH RIVER SITE, SC 331226 081372745 011 195.42 NGVD29 0306010602197354 P-007 AT SAVANNAH RIVER SITE, SC 331333 0813439 U NAD27310 NGVD29 03060106021973565 STEEL CREEK @ ROAD A @ SAVANNAH RIVER SITE, SC 330844
45
U
45
U02197362270.02197500U0219850013.39
NAD27 45 011 110.0 NGVD29 03060106P-19 AT SAVANNAH RIVER SITE, SC 331406 0813500 U NAD27 45
NGVD29 03060106SAVANNAH R AT BURTONS FERRY BR NR MILLHAVEN, GA 325620NAD27 13 251 52.42 NGVD29 03060106SAVANNAH RIVER NEAR CLYO, GA 323141 0811608 R NAD27 13
0 NGVD29
Page 2 0-p z

Savannah River gages2.txt
# US Geological Survey# retrieved: 2006-01-13 18:47:09 EST# URL: http://waterdata.usgs.gov/nwis/dvstat
# The Site File stores location and general information about ground water,# surface water, and meteorological sites# for sites in USA.
# The following selected fields are included in this output:
# siteno -- Site identification number# drainareava -- Drainage area# contrib drainareava -- Contributing drainage area# discharge-begin-date -- Daily streamflow data begin date# discharge-end&date -- Daily streamflow data end date# dischargescount-nu -- Daily streamflow data count# peak-begin.date -- Peak streamflow data begin date# peak-enddate -- Peak streamflow data end date# peak-countnu -- Peak streamflow data count
# query started 2006-01-13 18:47:09 EST
# there are 32 sites matching the search criteria.
siteno drainareavadischargecountnu peal15s 8s 8s02187252 2090.1999-08-24 1502187500 2231.001981-07-24 3202189000 2876.001980-03-28 8202195000 6150.000000-00-00 002196484 7150.2002-03-04 1302197000 7508.2004-06-14 1330219730072000-09-23 30219730122001-07-03 100219730552002-02-08 102197320 8110.00
contribdrainareava discharge-begindate dischargeend-datepeak-countnuk_begin-date peak&enddate
1984-10-01
1950-10-01
1896-10-01
1940-05-14
1988-10-01
1883-10-01
1999-09-30
1981-09-30
1979-09-30
1954-06-30
2002-09-30
2003-09-30
4502 1985-01-21
11323 1949-10-08
17044 1897-04-05
5161 0000-00-00
5113 1989-09-21
35793 1796-01-17
1994-10-01
1991-10-01
2001-05-11
2000-09-30
2002-09-30
2002-09-30
1394 1995-01-07
4018 1992-04-21
508 2002-02-08
1971-10-01 2002-09-30Page oF
10733 1972-01-21

2002-03-05021973211996-06-08021973232004-09-27021973242000-09-2202197334 5.951999-06-2902197338 0.282002-03-1202197339 0.572002-02-0602197340 7.532002-08-270219734051996-08-2402197342 12.52002-02-070219734241996-08-130219734261996-03-07021973451996-06-140219734551996-06-140219734711996-06-14021973511996-08-030219735152002-02-070219735252002-03-05021973541996-09-040219735652002-02-07021973621995-12-1902197500 86502003-03-2102198500 98502004-03-03
30
12
21
17
19
19
19
23
13
22
13
13
132.0610
13
13
17
17
13
18
13
53
80
Savannah River gages2.txt
1983-12-16 1996-09-30 4673
1984-05-23 2003-09-30 7070
1983-12-15 2000-09-30 6085
1972-10-01 1999-09-30 9714
1972-10-01 2002-09-30 10928
1980-10-01 2002-09-30 8035
1972-10-01 2002-09-30 10903
1983-12-15 1996-09-30
1972-10-01 2002-09-30 10869
1983-12-15 1996-09-30
1983-12-16 1996-09-30
1983-12-16 1996-09-30 4673
1986-10-23 1996-09-30
1983-12-16 1996-09-30
1983-12-20 1996-09-30 4669
1986-04-02 2002-09-30
1985-10-01 2002-09-30
1983-12-20 1996-09-30 4500
1985-03-01 2002-09-30
1983-12-16 1996-09-30 4673
1939-10-01 2003-09-30 18993
1929-10-01 2003-09-30 25567
1984-02-27
1984-06-29
1984-06-29
1979-11-02
1984-05-07
1984-05-07
1979-11-02
4674 1984-07-01
1979-11-03
4674 1984-05-28
4622 1984-05-28
1984-03-14
3631 1987-03-01
4673 1984-05-28
1984-03-07
6026 1986-06-10
6183 1985-10-17
1984-07-19
6423 1985-06-08
1984-02-21
1929-10-00
1925-01-24
Page2 o2 "

USGS Surface Water data for USA: Calendar Year Strearnflow Statistics Page I of 2
Data Category: Geographic Area:
Water Resources Surface Water [7j United States ' ]l1
OUTAGE SCHEDULED: Thursday March 16,2006 from 7PM - 7:30PM EST for maintenance
The nwis.waterdata.usgs.gov server will be undergoing routine maintenance Thursday, March 16,2006 at 7PM EST for approximately 30 minutes. During this outage, NWISWeb Water Quality,Ground Water Levels and Historical Daily Value data will NOT be available.
Real-time data will continue to be available at http://waterdata.usgs.gov/nwis
Calendar Year Streamflow Statistics for the NationUSGS 02197000 SAVANNAH RIVER AT AUGUSTA, GA
Available data for this site [Surface-water: Annual streamflow statistics- [•
http://nwis.waterdata.usgs.gov/nwis/annual/?siteno=02197000&agency-cd=USGS 3/16/2006

USGS Surface Water data for USA: Calendar Year Streamflow Statistics
Ai.giAi t, q 'vLs4A OyAJ /Qs A pgcWdFPage 2 of 2
V4
119o31 13,530o1904 5,528]
1905 8,6761F1906]1 15,8401
119461 11,07011194711 10,360
119481 14,099]
1194911 13,8901
119701 6,9671F1971]1 9,479111971 9,957
119731 12,740
19941 10,2201
1995 11,340
1199761 10,120F11997]1 9,2701
F192511 7,892] 151 7,9 1941 9,840 1981 1366
11926 7,743 119511 6,222 119751 13,5901 11999]1 5,409
11927 6,219] 11952] 8,221] 1197611 12,290 12000]1 4,729L1928j 11,210 119531 7,372 11977 10,3201 I200111 4,827
11929 21,130 11954 6,944 119781 336 2002 4,419
11930 7,6371
Questions about data Water Webserver TeamFeedback on this websiteNWISWeb Support TeamSurface Water data for USA: Calendar Year Streamflow Statisticshttp://waterdata.usgs.gov/nwis/annual/calendar-year?
Retrieved on 2006-03-16 18:14:56 ESTDepartment of the Interior, U.S. Geological SurveyPrivacy Statement I1 Disclaimer IH Accessibility II FOIA1.57 1.32 ,nadwwO1
Top tExplanation of terms
http ://nwis.waterdata.usgs.gov/nwis/annual/?siteno=02197000&agency-cd=USGS 3/16/2006

USGS Surface Water data for USA: Calendar Year Streamflow Statistics Page I of I
'B ot~&FercyAve.~je /4~A)NtAI3/62.~'/XIP
Water Resources
Data Category: Geographic Area:
Surface Water United States iF
Calendar Year Streamflow Statistics for the NationUSGS 02197500 SAVANNAH R AT BURTONS FERRY BR NR MILLHAVEN, GA
Available data for this site Surface-water: Annual strearnfiow statistics 01
Questions about data Water Webserver TeamFeedback on this websiteNWISWeb Support TeamSurface Water data for USA: Calendar Year Streamflow Statisticshttp://waterdata.usgs.gov/nwis/annual/calendar•year?
Retrieved on 2006-04-14 17:43:00 EDTDepartment of the Interior, U.S. Geological SurveyPrivacy Statement II Disclaimer 11 Accessibility 11 FOIA1.25 1.25 riadwwOl
Explanation of terms
http://nwis.waterdata.usgs.gov/nwis/annual/?siteno=02197500&agency-cd=USGS 4/14/2006

USGS Surface Water data for USA: Calendar Year Streamflow Statistics
J~qCh%,AjAN1IVIAAMeU) f ifNPage 1 of 1
Data Category: Geographic Area:
Surface Water L United States Li [90Water Resources
Calendar Year Streamflow Statistics for the NationUSGS 02197320 SAVANNAH R. NR JACKSON, SC
Available data for this site -Surface-watenrAnnuak-trea-mfLowstatisics-ij1 [
Aiken County, South Carolina Output formatsHydrologic Unit Code 03060106 IHTML table of all dataLatitude 33013'01', Longitude 81046'04' NAD27Drainage area 8,110.00 square milesGage datum 77.00 feet above sea level NGVD29 1L[Reselect output format
Annual meanYear streamflow,
in ft3/sF119-81]1 6,0501
[1982 7,509]
[1985 6,751]
Yea Annual meanear] streamflow,in ft3/s
F1986ll 5,978I
F1988 5,213
F19891 7,912
Annual meanYear streamflow,
in ft 3/s
1999 6,309
20001 5,372]
F200111 5,437]___________________ ~jL~ ~1I~
Questions about data Water Webserver TeamFeedback on this websiteNWISWeb Support TeamSurface Water data for USA: Calendar Year Streamflow Statisticshttp ://waterdata.usgs.gov/nwis/annua/calendar-year?
Retrieved on 2006-04-01 16:50:59 ESTDepartment of the Interior, U.S. Geological SurveyPrivacy Statement 11 Disclaimer 11 Accessibility 11 FOIA1.27 1.25 nadwwOl
PopExplanation of terms
http://nwis.waterdata.usgs.gov/nwis/annual/?siteno=02197320&agency-cd=USGS 4/l/2006

annpeak.txtVolume in drive M is FRES0304-FVolume Serial Number is 9CCF-FA19
Directory of M:\list\Hydrology Calcs\USGS gage data\Annual Peak
12/05/2006 05:24 PM12/05/2006 05:24 PM12/05/2006 05:24 PM03/16/2006 06:19 PM04/14/2006 04:42 PM03/16/2006 06:10 PM03/16/2006 06:22 PM03/16/2006 06:27 PM03/16/2006 06:24 PM01/17/2006 05:22 PM01/17/2006 04:59 PM01/17/2006 05:22 PM01/17/2006 05:20 PM01/17/2006 02:35 PM01/17/2006 02:59 PM01/17/2006 02:52 PM01/17/2006 03:09 PM01/17/2006 03:43 PM03/16/2006 03:47 PM
<DIR><DIR>
34 annpeak.txt75,231 AugustaAnnualPeakQs.pdf56,950 BurtonsFerryAnnualPeakQ.pdf44,699 CalhounAnnualPeakQs.pdf64,516 CalhounFallsAnnualPeakQs.pdf64,395 ClyoAnnualPeakQ.pdf52,779 JacksonAnnualPeakQ.pdf9,895 peak.txt11,978 peak7000.txt9,895 peak7000Watstore.txt11,978 peaktabformatted.txt9,895 Qpeak302l97000.txt2,373 Qpeak302197320.txt4,073 Qpeak302l97500.txt6,025 Qpeak302198500.txt11,978 Qpeak7000mdy.txt
3,340,773 USGSReportl990.pdf17 File(s) 3,777,467 bytes2 Dir(s) 53,735,227,392 bytes free
Page 1 04

USGS Surface Water for USA: Peak Streamflow Page 1 of 3
Data Category: Geographic Area:
Surface Water -j] I United States R-[Water Resources
OUTAGE SCHEDULED: Thursday March 16,2006 from 7PM - 7:30PM EST for maintenance
The nwis.waterdata.usgs.gov server will be undergoing routine maintenance Thursday, March 16,2006 at 7PM EST for approximately 30 minutes. During this outage, NWISWeb Water Quality,Ground Water Levels and Historical Daily Value data will NOT be available.
Real-time data will continue to be available at http://waterdata.usgs.gov/nwis
Peak Streamflow for the NationUSGS 02197000 SAVANNAH RIVER AT AUGUSTA, GA
Available data for this site [Stehomepage KO]
Output formats
Richmond County, Georgia TableHydrologic Unit Code 03060106Latitude 33o22'25", Longitude 81056'35'' NAD27Drainage area 7,508. square miles Tab-separated fileGage datum 96.58 feet above sea level NGVD29 IWATSTORE formatted file
Reselect output formatI- --I
WaterYear Date
Gage Stream-Height flow(feet) (cfs)
1796 'Jan. 17, 1796 I 38.028o,0o021840 May 28, 18401 37.5 260,0002
1852 Aug. 29, 18521 36.8 230,0002
1864 Jan. 01, 1864 34.0 160,0002
1865 Jan. 11, 1865 36.4 220,0002
1876 IDec. 30, 18751 28.60 86,4001
1877 IApr. 14, 18771 31.40 119,0001
1878 INov. 23, 187711 23.50 51,5001879 [Aug. 03, 187911 22.00 44,0001
1880 IDec. 16, 187911 30.10 102,0001881 IMar. 18, 188111 32.20 130,000
1882 Sep. 12, 18821 29.30 93,3001883 IJan. 22, 1883 30.80 111,000
Water Gage Stream-Date Height flow
(feet) (cfs)
1937 Jan. 04, 1937I 30.0 91,400
1938 Oct. 21, 1937] 30.10 91,4001939 IMar. 02, 1939] 24.10 90,90
1940 Aug. 15, 1940] 29.40 239,000
11941 IJul. 08, 1941 22.89 53,30011942 IMar. 23, 1942] 24.56105,000
11943 Jan. 20, 1943 25.101117,0001944 IMar. 22, 19441 25.53128,00011945 IApr. 27, 1945 23.16 64,0001
1946 Jan. 09, 1946 24.43 97,200
1947 IIJan. 22, 1947 23.97 86,0001948 Feb. 10, 1948 23.90 83,200
1949 Nov. 30.1948 26.61 154,000
S1950 Ioct. 09, 1949 I[ 20.10 32,500II II
http://nwis.waterdata.usgs.gov/nwis/peak?siteno=02197000&agencycd=USGS&format... 3/16/2006

USGS Surface Water for USA: Peak Streamflow Page 2 of 3
11884 IlApr. 16, 1884 28.0011 81,00011885 IJan. 26, 1885 27.50 77,000
1886 IMay 21, 188611 32.50] 135,0001887 IJul. 31, 1887 ]I 34.50 173,0001888 ISe,. 11, 18881[ 38.70 303,00011889 ]Feb. 19, 188911 33.30] 149,000
1890 Feb. 27, 189011 22.90 48,5001891 IMar. 10, 189111 35.50 197,000
I 1892 IJan. 20, 1892 32.80 140,000[1893 iFeb. 14, 1893 j[ 25.00 60,0001[1894 Aug. 07, 189411 24.00 54,000
11951 IOct. 22, 1950 I 22.321 46,300
1952 Mar. 06, 1952] 21.5339,3005
11953 iMay 08, 1953][ 20.80135,20061954 iMar. 30, 1954][ 17.39 25,5006
11955 [lApr. 15, 19551[ 16.77123,9006
11956 IApr. 12, 1956][ 14.70 18,6006
1957 iMay07, 1957][ 14.08 18,0006
S1•958 *Apr. 18, 1958][ 22.911[66,3006]
11895 IJan. 11, 1895 II 30.4011 106,0001896 IJul. 10,1896 30.50 107,000
[ 1897 IApr. 06, 18971 29.30] 93,3001[ 1898 SIsep. 02, 1898j( 31.30 117,000
[1899 IFeb. 08, 1899J[ 31.00 113,0001900 Feb. 15, 19001 32.70 138,000
[1901 1Apr. 04, 190111 31.801 124,0001902 IMar. 01, 1902 34.60 175,000
[ 1903 IlFeb. 09, 1903 II 33.2011 147,0001
11959 IJun. 08, 1959 j1 18.65128,50061
S1960 [Feb. 14, 1960][ 20.58134,900611961 IIApr. 02, 1961[ 20.56 34,80061
11962 IJan. 09, 1962][ 20.09132,5006
11963 [Mar. 23, 1963] 19.52 31,3006
[1964 [Apr. 09, 1964 24.16 87,1006
11965 ]lDec. 27, 1964 20.62 34,6006
1966 IMar. 06,196621.50l39,30061
11967 Aug. 25,_ 196718.10126,50061,968Jan. 12, 1968] 20.9435,9006
11969 IApr. 21, 1969] 22.24145,6006
S1•970 IApr. 01, 1970]17.68125,2006
11971 IMar. 05, 197 23301 63,9006
1972 IJan. 20, 10972 20.36 33,7006
F19773 IApr. 08, 1119731 21.63]F40,2006
[1904 [IAug. 10,190411 25.50 63,000
[ 1905 Feb. 14, 1905 25.80 64,800
[ 1906 IJan. 05, 1906 ]129.60 96,600
[ 1907 [Oct. 05, 1906 123.60 52,000
1908 IAug. 38.80 307,0001
1F1909 IlJun. 05, 1909 II 28.70o1 87,3001
11910 IMar. 02, 191011 26.401 69,8001S1911 [Apr. 14, 1911j[ 19.10 32,8001912 liMar. 17, 191211 36.80 234,00011913 IMar. 16, 191311 35.10 156,ooo
1914 IDec. 31, 191311 24.30 48,00011915 [[Jan. 20, 1915 28.20 61,000
S1916 [[Feb. 03, 191611 31.00 82,4001917 ][Mar. 06, 1917j[29.20 68,000
[1918 [[Jan. 30,1918 1 25.50 45,500
1919 IDec. 24, 19181135.00 128,000
11920 Dec. 11, 1919!35.40 133,000
1•974 Feb. 23, 1974][ 20.13 32,9006
1975 Mar. 25, 1975][ 22.24 45,6006
1•976 iJun. 05, 1976]1 20.27 33,3006I 1977 Apr. 07, 1977][ 20.50 34,2006
11978 [Jan. 26, 1978][ 21.98 43,1006
I1979 Feb. 27, 1979j[ 21.13 37,3006
11980 [Mar. 31, 1980]1 2.33 47,2006
1981 Feb. 12, 1981][ 14.70 17,7006
198i Jan. 02, 19082] 19.39 30,7006
1 II II 1 II II
http://nwis.waterdata.usgs.gov/nwis/peak?siteno=02197000&agencycd=USGS&format... 3/16/2006

USGS Surface Water for USA: Peak Streamflow Page 3 of 3
A u.~&ciu4~ A~m.~n-'i~ IU
1921 IFeb. 11, 1921 11 35.10 129,0001[1922 •lFeb. 16, 1922 32.001 92,000
•[1923Feb. 28, 1923Jj28.00 59,700[1924Sep. 22, 1924 Fj 28.00 59,700I 1925 IJan. 20, 1925 36.50 150,000
[ 1926 ]lJan. 20, 1926 2.30 5,3o0•[1927Dec. 30, 19261124.00 39,000
[1928 lAug. 17, 192811 40.40 226,0001•[1929Sep. 27, 1929 463 343,000
•[1930Oct. 02, 192911 45.10 350,oo0[1931 [Nov. 17, 19301119.90 26,100[1932 Jan. 09, 1932 30.40 93,800
1933 Oct. 18, 1932 ]I 30.30 92,6001
[1934-][Mar. 05, 193412. 73,200
[1935"Mar. 14, 1935 27.40 63,700
[1936Apr. 08, 1936 41.20 258,000
1983 IApr. 10,7198311 23.211 66,006S1984 May 05, 1984] 2. 34,00061985 Feb. 07519 1.891 25,7006
1 1986 IOct. 03, 1985]15.741,0006
S1987 Mar. 06, 1987 18.98 29,2006
19~~8Feb. 05, 1988 10.6113,6006
I 1989 Sep. 22, 1989 15.33 20,2006
1•990 F~eb. 27 1990 20.69 3,30061•991 IOct. 13,J990 I2 59,0 06
1•99~2~ Mar. 27, 199211 16.2921
1 •99~3 JIan. 14, 1993 21.1 45,1006
1994 Jul. 01, 1994 21.40 40,7006
F1995 IlFeb. 19, 1095 I 20.218 33,60061
1996 IFeb. 05, 1996S1997 Mar. 10, 1997
1998 Feb. 07, 1998
1999 Feb. 02,i1999
20.481134,40061
18.14-] 2,00121•.63][43,000•l14.721[119,00061
2000Jan. 25, 2 000 II 102-002Mar. 04,;2002 7.14] 8,51061
I .. .I . . . . ^^•II .~...I . . .,ikIN0I[May 24, I2 .1,
2004 IJun. 14,2004 13.8217600IL .iI~
11 Peak Streamflow Qualification Codes.
0
0
0
2 -- Discharge is an Estimate5 -- Discharge affected to unknown degree by Regulation or Diversion6 -- Discharge affected by Regulation or Diversion
Questions about data Water Webserver TeamFeedback on this websiteNWISWeb Support TeamSurface Water for USA: Peak Streamflowhttp://waterdata.usgs.gov/nwis/peak?
Retrieved on 2006-03-16 18:17:20 ESTDepartment of the Interior, U.S. Geological SurveyPrivacy Statement 11 Disclaimer 1 Accessibility 11 FOIA1.55 1.29 nadwwOl
Explanation of terms
http://nwis.waterdata.usgs.gov/nwis/peak?siteno=02197000&agencycd=USGS&format... 3/16/2006

USGS Surface Water for USA: Peak Streamflow Page I of 2
Water Resources
Data Category: Geographic Area:
Surface Water United States Di [1
Peak Streamflow for the NationUSGS 02197500 SAVANNAH R AT BURTONS FERRY BR NR MILLHAVEN, GA
Available data for this site I -- . jI
Screven County, GeorgiaHydrologic Unit Code 03060106Latitude 32056'20', Longitude 81030'10" IDrainage area 8,650 square milesGage datum 52.42 feet above sea level NG\
rOutput formats
Table
GraphqAVL /
11ITab-separated file
IWater Gage rStream-
Date Height flow_____3-]10t 1929 1__ 3(feet) (cfs)11930 ][ocr. 1929 If 30.8011220,0001
I I
1940 Aug. 18, 194o[ 27.001 141,000
[1941 IlJul. 13, 1941 I[ 18.20 38,400I[1942 Mar. 26, 19421 22.00] 73,000[ 1943 IlJan. 23, 1943 j[ 22.60 80,9001[ 1944 Mar. 26, 1944 23.40 89,3001945 IMay01, 1945j[ 18.80 42,9001
1946 Jan. 12, 1946 ][ 21.60 68,60011947 [Jan. 25, 1947 21.53 67,5001
1948 Feb. 14, 19481 21.10 61,0001949 IDec. 03, 194811 24.911108,000
]1950 IOct. 14, 1949 I 14.87 18,5001
S1951 IOct. 27, 1950 16.53 25,7001
1952 IMar. 29, 1952 8.261 8,5oo1953 IMay 13, 19531 17.52 31,8006
11954 ][Apr. 06,19541 14.40 17,60061
[19551][Apr. 18, 19551 13.21 15,0006
[1956 Mar. 19, 1956 11.82 3,7006
WATSTORE formatted file
Reselect output format
Water Gage, Stream-Date Height flow
(feet) (cfs)
1965 f[Apr. 04, 1965][ 17.66 32'8006
1966 IMar. 09,1 96611 18.05]37,10061
1967 Jun. 17, 1967 15.47 22,00061
1968 Jan. 16, 1968 16.64 26,80061
1969 Apr. 25, 196911 18.3] 137,2006
1970 Apr. 04,1970] 14.14 18,2006
1983 [Apr. 15, 198311 ][60,0006.... i .. .. ... I .... II1
1984 ~IMay 12, 198411 17.8311 33,9000]1985 Feb. 10, 1985 14.69] 19,70061
1986 Nov. 25, 198511 12.71][ 15,20061
1987 Mar. 10, 198711 16.79 27,6006
1988 Oct. 02, 1987 10.80 11,90061
1989 Mar. 26, 198911 14.73] 19,8006
1990 [Mar. 02, 199011 1814 6,0006
1991 Oct. 17, 1990o 17.66 32,7006
1992 Mar. 30,1992]j 14.17 18,3006
1993 Jan. 10, 1993 Jj 18.66 39'600611957 IlMay 11, 195711 12.2711 I
http://nwis.waterdata.usgs.gov/nwis/peak?siteno=02197500&agencycd=USGS&format... 4/14/2006

USGS Surface Water for USA: Peak Streamflow
b(A4o &s Fefrr ApjmAleqkId
Page 2 of 2
I ___II _______II 11 3,9°°6111958 IApr. 22, 1958]1 1.9441,4006
[1959 IJun. 13, 1959] 16.591 2,4006
11960 Feb. 17, 1960]18 37,1006
11961 IIApr. 25, 1961], 17.60l32,4006
[1962 JIIan. 15, 1962][ 16.75 27,4006
1'963 MIar. 27, 1963]17 29,2006
1964 Apr. 15, 196411 22.071 ,7006
1994 lAug. 26, 1994117.791133,6006
1995 IMar. 01, 1995]17.86 34,1006
11996 Feb. 16, 1996• 17.701 33,06
1997 IMar. 14,1997 16.95 28,4006
1998 IFeb. 10, 1998 18.70 39,9006
1,999 IFeb.05, 19991 12.84 1,1006
2000 Jan. 28, 2000 12 ,2006
12001 Mar. 07, 20011 13,4006
I 2002 Feb. 09, 2002 7.25 8,95061
2003 Mar. 21, 200317.4 29,3006
M] Peak Streamflow Qualification Codes.
* 5 -- Discharge affected to unknown degree by Regulation or Diversion* 6 -- Discharge affected by Regulation or Diversion
Questions about data Water Webserver TeamFeedback on this websiteNWISWeb Support TeamSurface Water for USA: Peak Streamflowhttp://waterdata.usgs.gov/nwis/peak?
Retrieved on 2006-04-14 17:40:53 EDTDepartment of the Interior, U.S. Geological SurveyPrivacy Statement 11 Disclaimer I Accessibility 11 FOIA1.26 1.28 nadwwO1
TopExplanation of terms
http://nwis.waterdata.usgs.gov/nwis/peak?siteno=02197500&agencycd=USGS&format... 4/14/2006

USGS Surface Water data for USA: Calendar Year Streamflow Statistics Page I of 2
CHlkoLiNAlmthWI) Pe-k s.~iData Category: Geographic Area:
Surface Water United States [2Water Resources
OUTAGE SCHEDULED: Thursday March 16,2006 from 7PM - 7:30PM EST for maintenance
The nwis.waterdata.usgs.gov server will be undergoing routine maintenance Thursday, March 16,2006 at 7PM EST for approximately 30 minutes. During this outage, NW[SWeb Water Quality,Ground Water Levels and Historical Daily Value data will NOT be available.
Real-time data will continue to be available at http://waterdata.usgs.gov/nwis
Calendar Year Streamflow Statistics for the NationUSGS 02189000 SAVANNAH RIVER NEAR CALHOUN FALLS, S. C.
Available data for this site ',Surface-water: Annual streamflow statisticsj FGO-
11
Questions about data Water Webserver TeamFeedback on this websiteNWISWeb Support TeamSurface Water data for USA: Calendar Year Streamflow Statisticshttp://waterdata.usgs.gov/nwis/annuaa/calendar-year?
To PExplanation of terms
http://nwis.waterdata.usgs.gov/nwis/annual/?siteno=02189000&agencycd=USGS 3/16/2006

USGS Surface Water data for USA: Calendar Year Streamflow Statistics
Retrieved on 2006-03-16 18:08:46 ESTDepartment of the Interior, U.S. Geological SurveyPrivacy Statement 11 Disclaimer 11 Accessibility 11 FOIA1.54 1,29 nadwwO1
Page 2 of 2
http://nwis.waterdata.usgs.gov/nwis/annualV?siteno=02189000&agency-cd=USGS 3/16/2006

USGS Surface Water for USA: Peak Streamflow Page I of 3
Water Resources
C(A t F4AI sA/?tto ep k -0s4 - -I,Data Category: Geographic Area:
Surface Water Di United States -- o-
OUTAGE SCHEDULED: Thursday March 16, 2006 from 7PM - 7:30PM EST for maintenance
The nwis.waterdata.usgs.gov server will be undergoing routine maintenance Thursday, March 16,2006 at 7PM EST for approximately 30 minutes. During this outage, NWISWeb Water Quality,Ground Water Levels and Historical Daily Value data will NOT be available.
Real-time data will continue to be available at http://waterdata.usgs.gov/nwis
Peak Streamflow for the NationUSGS 02189000 SAVANNAH RIVER NEAR CALHOUN FALLS, S. C.
Available data for this site ý Site home page [n] GO]
Output formats
Abbeville County, South Carolina lTableHydrologic Unit Code 03060103 lGraphLatitude 34004'15?, Longitude 82038'30" NAD27Drainage area 2,876.00 square miles Tab-separated fifeGage datum 363.53 feet above sea level NGVD29 WATSTORE formatted file
Reselect output format
Water Gage Stream-Date Height flow__________ (feet) (cfs)
[1897 I[Apr. 05, 1897l[ 15.301 57,400
1900 IFeb. 14, 1900]1 19.70 76,500
[1901 ISep. 18, 1901J[ 17.40 66,500
[1902 IFeb. 28, 1902][ 19.60 76,100
[1903 jJun. 07, 1903] 15.40 57,80011904 Aug. 09, 1904][.9o1 33,900
1905 IJul. 02, 1905 ][ 3.00 47,4001_1906 ]Mar. 20, 1906 11.80 42,200
1907 I~Oct. 04, 1906 9 33,900
11908 Aug. 25,1908 28.201114,00011909 [Jun. 04, 1909 12.20 43,900
1910 IMar. 01, 1910 12.50 45,200
1911 [[Jan. 04,1911 [I5 23,500
11912 IMar. 16, 1912119.50 75,7001
Gage Stream-
Date Height flowL Ye...... (feet) (cfs)
11940]Aug. 13,-1940 11.52 96,5006
1941 iJul. 07, 1041 6. 36,3006
1942 Feb. 18,j 1942] 7.73 47,2006
1943 Jan. 18, 1.943 8.21 53,1006
1944 Mar. 20, 1944 7.91] 49,50061
11945 JApr. 25, 19451 6.401 33,3006
11946]Jan. 08, 1946 9.41 68,40061947 Jan. 20, 1947 7.47 44,80061948 Mar. 07,.1948 6.11 29,8006
1949 Nov. 29i,1948 8.94 61,8006
1950 Oct. 08,,1949 5.98 29,40061
11951 Oct. 21, 1950 5.98 28'8006III I I
http://nwis.waterdata.usgs.gov/nwis/peak?siteno=02189000&agencycd=USGS&format... 3/16/2006

USGS Surface Water for USA: Peak Streamflow
cpkmjAIA1x ifeaQ3.Page 2 of 3
'11
1913 [IMar. 15, 1913 13.2011 48,3001 1952 Mar. 24, 195211 8.6511914 Dec. 30, 191311[2 22,2001915 iJul. 01, 1915 10.90 38,300
II II
1916 IDec. 30, 1915 12.40 44,8001917 1Mar. 25, 1917][ 11.3ol 40,0001
1953 1Feb. 22, 1953 II 6"94111954 ]lJan. 17, 1954 I
[1955 Feb. 07,09551[ 6.89
1956 Isep. 26, 1 956][ 7.0211918 JiAug. 03, 191811 8.1011 26,1001919 IDec. 23, 1918]115.70 59,100
1920 IDec. 10, 1919][ 16.60 63,100
1921 IFeb. 09, 1921 Ij 14.00l] 51,800
1957 Apr. 06,1957
1958 Nov. 19,.1957
11959 Jun. 02,10959
6.791 38,16.761 38,
6.4111 32,81922 IMar. 11, 1922110 34,800
1923 IDec. 19, 1922]1 10.30 35,700
1924 ISep. 21, 1924][ 11.30 40,0001
1925 [[Jan. 19, 1925 9. 31,700
1926 ][Jan. 19, 1926 II8.0[ 28,300
1927 ][Dec. 29, 1926][8 27,8001928 IAug. 17, 1928][ 11.90 130,000
1929 ISep. 27, 1929 ]I87 85,4001930 IlOct. 02, 1929] 10.10 105,000
1931 11Apr. 23, 1931][421 15,800
1932 IDec. 04,1931][701 41,400
1933 [[Oct. 17, 1932][ 11.60 97,600
1934 IJun. 05,1934[II71 39,400
1935 ]]Jan. 10, 1935 ]6° 29,400
1936 [Apr. 07, 19361 11.50 96,2006
1937 [Oct. 01, 1936 ] 9 63,0006
1938 ]]Oct. 20, 1937]II 53,1006
19=39 IAug. 19, 19391 7.8849,6006
11960 Feb. 13,;1960 5.03 F11961 Mar. 08,,1961] 4 17
962 IDec. 1%91961][ F.626
19fl3Apr. 30;,:196:3] "10
1964 IIApr. 08, 1964
1965 Oct. 06,1964 6.91 44,
1 Mar.041, 1966[ 7.50[52
11967 Jun. 05,1967][ 6.76 [391968Jan. 10, 1968 6.17 33,':
1969 Jan. 20,1969[ 7.04]143,4
11970 IJul. 29, 1970] 589
11971 [[Mar. 04, 1971][ 6.97
11972 Jan. 10,01972[ 6.2035,711973 Dec. 16,9721 6.8043,4
11974 Apr. 05,1974][ 3.841 ,
[1975 [Mar. 14ý, 975] 7.3]2[47,1
1976 IMar. 16, 197611 6.7211 39,dl II II
11977 IMar. 301, j9771[ 6.35
11978 Jan. 26,1978I 71645,
11979 Ipr. 13,4979] 7.7852,11980 IMar. 28,198011 10.30191,
_________________________ j L~ _________________
21 Peak Streamflow Qualification Codes.
* 6 -- Discharge affected by Regulation or Diversion
http://nwis.waterdata.usgs.gov/nwis/peak?siteno=02189000&agencycd =-USGS&format... 3/16/2006

USGS Surface Water for USA: Peak Streamflow
Questions about data Water Webserver TeamFeedback on this websiteNWISWeb Support Team ExplSurface Water for USA: Peak Streamflowhttp://waterdata.usgs.gov/nwis/peak?
Page 3 of 3
Topanation of terms
Retrieved on 2006-03-16 18:21:33 ESTDepartment of the Interior, U.S. Geological SurveyPrivacy Statement 11 Disclaimer 11 Accessibility 11 FOIA1.53 1.31 nadwwOl
http://nwis.waterdata.usgs.gov/nwis/peak?site-no=02189000&agency-cd=USGS&format... 3/16/2006

USGS Surface Water for USA: Peak Streamflow
.0 oAN4l~eQ J
Page 1 of 3
Data Category: Geographic Area:
Surface Water E•[ United States - I•Water Resources
OUTAGE SCHEDULED: Thursday March 16,2006 from 7PM - 7:30PM EST for maintenance
The nwis.waterdata.usgs.gov server will be undergoing routine maintenance Thursday, March 16,2006 at 7PM EST for approximately 30 minutes. During this outage, NWISWeb Water Quality,Ground Water Levels and Historical Daily Value data will NOT be available.
Real-time data will continue to be available at http://waterdata.usgs.gov/nwis
Peak Streamflow for the NationUSGS 02198500 SAVANNAH RIVER NEAR CLYO, GA
Available data for this site 'Site home page II
Output formats
Effingham County, Georgia TableHydrologic Unit Code GaphLatitude 32031'41 ", Longitude 81016'08" NAD27Drainage area 9,850 square miles Tab-separated fileGage datum 13.39 feet above sea level NGVD29 IWATSTORE formatted file
I Reselect output format
Water IGage Stream-Date Height flow
_____ __________ (feet) (cfs)
1925 ]IJan. 24, 1925 23.90 134,000
11926 ]Jan. 28, 1926 J[ 15.40 3 1,4001
11927 IMar. 06, 1927 13.40 20,600
11928 IAug. 23,1928 22.30106,00011929 IMar. 11, 1929] 23.60128,00011930 IOct. 06, 1929 29.701270,000
11931 lNov. 28,1930 12.77 18,200!
11932 IJan. 15, 1932][ 19.18 59,600
1933 IJan. 04, 1933 l[ 19.20 59,600
1934 IJun. 15, 1934 ][ 17.20 43,800
1935 ]lMar. 22, 1935j1 15.20 29,1001936 IIApr. 13, 193611 26.00 176,000
11937 IJan. 11, 1937 If 19.4011 65,800
Water Gage Stream-Date Height flow(feet) (cfs)
196~5 IApr. 06, 1965 16.2 3,0006
1966 ]lMar. 11, 196617.10 42,8006
1967 IJun. 22, 1967 13.67122,5006
1968 IIJan. 21, 1968 14.84 28,0006
S1969 bApr. 29, 1969 16.74 39,7006
1970 ][Apr. 07, 19701ol3.31]121,000611971 IMar. 06, 197111 18.11] 54,5006
11972 [Jan. 26, 1972 16.3o136,40061973 IIApr. 15, 1973•17.29 44,5006
1974 M~ar. 01, 1974]15.78133,0006
197~5 MIar. 24, 1975•[ 17.83 50,60061
1 1976 Jun. 14, 1976] 1.87 3,50061938 [Apr. 16, 19381[ 17.80 48,40011I II iIII
http://nwis.waterdata.usgs.gov/nwis/peak?siteno=02198500&agency_cd=USGS&format... 3/16/2006

USGS Surface Water for USA: Peak Streamflow
CJ/~J\~A~Ok !Jtf
Page 2 of 3
1939 IMar. 08, 19391L 20.40o 70,100o1940 IlAug. 22, 19401 23.60128,000
11941 Jul. 17, 1941 ]16.30 36,500
1942 IMar. 29, 1942 20.00 73,000
1943 Jan. 27, 1943 20.00 73,000
1944 IMar. 29, 1944]1 21.60 95,200
1945 [May 05, 1945][ 16.00 34,400
1946 ][Jan. 16, 1946][ 19.50 64,400
1947 [Jan. 28, 1947] 19.40 63,2001948 ]Feb. 17, 1948][ 19.66 71,000
11949 IIDec. 06, 1948J[ 22.1711104,00011950 Ioct. 19, 1949][ 12.21 16,000
j1951 INov. 01, 1950][ 13.38 22,600
[1952 ][Apr. 02, 1952][ 16.90 41,3005
[1953 Ma~y~17 19537 [ 15.80 3,8006
[1954 IIApr. 12, 1954][ 12.49 18,8006
[1955 IApr.23, 1955][11.3 - 5,50061
[1956 IIMar. 22, 1956][210.47 14,1006
11957 IMay 15,19571[ 11.15 15,ooo6
[1958 ]lApr. 25, 1958[[ 17.41 45,5006
[1959 IJun. 18, 1959J[ 14.36 26,0006
[1960 IFeb. 19, 1960 17.35140,9006[1961 IlApr. 25, 1961][ 16.20 34,9006
[1962 IJan. 19, 1962][ 14.87 28,2006
11963 [[Mar. 31, 1963 15.27 29,2006
11964 ]Apr. 18, 1964 Io20.221183,8006
1977 IDec. 22, 1976 15.8511 33,40061•978 IFeb. 03, 1978I 16.81J 38,7006
1•979Apr. 27, 1979116.34 36,6006
S1•980 A~pr. 02, 1980][ 1.401 5,6006191Feb. 16, 1981]1 03 360
1982 IJan. 11, 1982][ 12.9 9,5006
198 AIIpr. 17,1983 1 40 ,6006
1984 IMay 14, 1984]16.48 3,7006
11985 IFeb. 15, 1985 12.89 19,5006
11986 INov. 28,1985]1 115,8006
198 IMar. 13, 1987]15 9,7006
1•988 IOct. 04,1•91 8.93711,4006
1989 ISep. 26, 1989 190.5414,2006
1990 Mar. 05, 1990 16.70 39,4006
11991 IjOct. 20, 1.990 ]16.0 34,9006
11992 IIApr. 03, 199212.57 17,6006
[1993 [[Jan. 13, 1993 18.51 60,1006
1994 IAug. 30,199416.29136,5006
1995 IMar. 04,1995 1 40,7006
11996 M~ar. 21, 1996]16.736,9006
I 1997 IMar. 17, 1997][-130,3006
1998 IMar. 12, 1998][ 1 5,0006
[1999 [Feb. 07, 1999 10.8614,6006
12000 ]Jan. 30, 2000][ 9.7513,0006
2=001 IMar. 20, 2001][ 9.90 14,4006
2002 IFeb. 10, 2002115.77 8,2606
12003 IMar. 24, 2003]16.7 39,9006
1I2004 Mar. 03, 2004]12.77_18,5006
II II II
It Peak Streamflow Qualification Codes.
* 5 -- Discharge affected to unknown degree by Regulation or Diversion* 6 -- Discharge affected by Regulation or Diversion
Questions about data Water Webserver Team T-op
http://nwis.waterdata.usgs.gov/nwis/peak?siteno=02198500&agencycd=USGS&format... 3/16/2006

USGS Surface Water for USA: Peak Streamflow
C I 0 AN II\k)2 ,L#"Feedback on this websiteNWISWeb Support TeamSurface Water for USA: Peak Streamflowhttp://waterdata.usgs.gov/nwis/peak?
Page 3 of 3
Explanation of terms
Retrieved on 2006-03-16 18:26:47 ESTDepartment of the Interior, U.S. Geological SurveyPrivacy Statement 11 Disclaimer 1 Accessibility 11 FOIA1.53 1.3 nadwwOl
http://nwis.waterdata.usgs.gov/nwis/peak?siteno=02198500&agencycd=USGS&format... 3/16/2006

USGS Surface Water for USA: Peak Streamflow
-- ~ cksc)ýjA Nn 4Page 1 of 2
Pee O~zp c
Data Category: Geographic Area:
I Surface Water i--l United States DWater Resources
OUTAGE SCHEDULED: Thursday March 16,2006 from 7PM - 7:30PM EST for maintenance
The nwis.waterdata.usgs.gov server will be undergoing routine maintenance Thursday, March 16,2006 at 7PM EST for approximately 30 minutes. During this outage, NWISWeb Water Quality,Ground Water Levels and Historical Daily Value data will NOT be available.
Real-time data will continue to be available at http://waterdata.usgs.gov/nwis
Peak Streamflow for the NationUSGS 02197320 SAVANNAH R. NR JACKSON, SC
Available data for this site Site home page _nj, FGO]
http://nwis.waterdata.usgs.gov/nwis/peak?site-no=02197320&agency-cd=USGS&format... 3/16/2006

USGS Surface Water for USA: Peak Streamflow
J ako m A tj~i&4Pea/•Q. 1oJf'
Page 2 of 2
195 I oFeb.08, 1995 I 2,1986 IINov. 24, 1985 1 15,9006
21 Peak Streamflow Qualification Codes.
* 6 -- Discharge affected by Regulation or Diversion
Questions about data Water Webserver TeamFeedback on this websiteNWISWeb Support TeamSurface Water for USA: Peak Streamflowhttp://waterdata.usgs.gov/nwis/peak?
Retrieved on 2006-03-16 18:23:05 ESTDepartment of the Interior, U.S. Geological SurveyPrivacy Statement II Disclaimer 11 Accessibility 11 FOIA1.52 1,27 nadwwOl
ETopExplanation of terms
http://nwis.waterdata.usgs.gov/nwis/peak?siteno=02197320&agencycd=USGS&format... 3/16/2006

Z02197000H02197000N02197000Y02197000302197000302197000302197000302197000302197000302197000302197000302197000302197000302197000302197000302197000302197000302197000302197000302197000302197000302197000302197000302197000302197000302197000302197000302197000302197000302197000302197000302197000302197000302197000302197000302197000302197000302197000302197000302197000302197000302197000302197000302197000302197000302197000302197000302197000302197000302197000
peak.txtUSGS
3322250815635001345245SW030601067508.SAVANNAH RIVER AT AUGUSTA. GA
96.58
17960117 280000218400528 260000218520829 230000218640101 160000218650111 220000218751230 8640018770414 11900018771123 5150018790803 4400018791216 10200018810318 13000018820912 9330018830122 11100018840416 8100018850126 7700018860521 13500018870731 17300018880911 30300018890219 14900018900227 4850018910310 19700018920120 14000018930214 6000018940807 5400018950111 10600018960710 10700018970406 9330018980902 11700018990208 11300019000215 13800019010404 12400019020301 17500019030209 14700019040810 6300019050214 6480019060105 9660019061005 5200019080827 30700019090605 8730019100302 6980019110414 3280019120317 23400019130316 15600019131231 4800019150120 6100019160203 82400
38.037.536.834.036.4
28.6031.40
23.50,22.0030.1032.20
29.3030.80
28.0027.5032.5034.5038.7033.30
22.9035.5032.80
25.0024.0030.4030.50
29.3031.3031.0032.7031.8034.6033.20
25.5025.8029.6023.6038.80
28.7026.4019.1036.8035.1024.3028.2031.00
Page 1 OP 5

peak. txt302197000302197000302197000302197000302197000302197000302197000302197000302197000302197000302197000302197000302197000302197000302197000302197000302197000302197000302197000302197000302197000302197000302197000302197000
302197000302197000302197000302197000302197000302197000302197000302197000302197000302197000302197000302197000302197000302197000302197000302197000302197000302197000302197000302197000302197000302197000302197000302197000302197000
1917030619180130191812241919121119210211192202161923022819240922192501201926012019261230
68000455001280001330001290009200059700597001500005530039000
19280817 22600019290927 34300019291002 35000019301117 2610019320109 9380019321018 9260019340305 7320019350314 6370019360408 25800019370104 9140019371021 9140019390302 9090019400815 23900019410708 5330019420323 10500019430120 11700019440322 128000
29.2025.5035.0035.4035.10
32.0028.0028.0036.50
27.3024.0040.4046.3045.1019.9030.4030.3028.5027.4041.20
30.1030.1024.1029.40
22.8924.5625.1025.53
23.1624.4323.9723.9026.61
20.1022.3221.5320.8017.3916.7714.7014.0822.9118.6520.5820.5620.0919.5224.1620.6221.50
19450427194601091947012219480210194811301949100919501022195203061953050819540330195504151956041219570507195804181959060819600214196104021962010919630323196404091964122719660306
640009720086000832001540003250046300393005352006255006239006186006180006663006285006349006348006325006313006871006346006393006
Page 2 o-3

peak.txt302197000 19670825 265006 18.10302197000 19680112 359006 20.94302197000 19690421 456006 22.24302197000 19700401 252006 17.68302197000 19710305 639006 23.30302197000 19720120 337006 20.36302197000 19730408 402006 21.63302197000 19740223 329006 20.13302197000 19750325 456006 22.24302197000 19760605 333006 20.27302197000 19770407 342006 20.50302197000 19780126 431006 21.98302197000 19790227 373006 21.13302197000 19800331 472006 22.33302197000 19810212 177006 14.70302197000 19820102 307006 19.39302197000 19830410 661006 23.21302197000 19840505 340006 20.35302197000 19850207 257006 17.89302197000 19851003 210006 15.74302197000 19870306 292006 18.98302197000 19880205 136006 10.61302197000 19890922 202006 15.33302197000 19900227 353006 20.69302197000 19901013 592006 22.803021,97000 19920327 221006 16.29302197000 19930114 451006 21.81302197000 19940701 407006 21.40302197000 19950219 336006 20.28302197000 19960205 344006 20.48302197000 19970310 263006 18.11302197000 19980207 430006 21.63302197000 19990202 190006 14.72302197000 20000125 168006 13.25302197000 20020304 85106 7.14302197000 20030524 316006 20.42302197000 20040614 176006 13.82
Page 3 oFP

peak7000.txt
# U.S. Geological Survey# National Water Information System# Retrieved: 2006-01-17 16:59:23 EST
# - WARNING -----------# The data you have obtained from this automated# U.S. Geological Survey database have not received# Director's approval and as such are provisional# and subject to revision. The data are released# on the condition that neither the USGS nor the# United States Government may be held liable for# any damages resulting from its use.
# More data may be available offline.# #For more information on these data, contact Water Webserver Team.
# This file contains the annual peak streamflow data.
# This information includes the following fields:
# agencyscd Agency Code# siteno USGS station number# peak-dt format MM/DD/YYYY# peakyva Annual peak streamflow value in cfs# peakscd Peak Discharge-Qualification codes (see explanation below)# gage..ht Gage height for the associated peak streamflow in feet# gageht_cd Gage height qualification codes# yearjlast-pk Peak streamflow reported is the highest since this year# agdt Date of maximum gage-height for water year (if not concurrent with peak)# agjtm Time of maximum gage-height for water year (if not concurrent with peak# aggage ht maximum Gage height for water year in feet (if not concurrent with peak# ag-gage-ht cd maximum Gage height code
# Sites in this file include:# USGS 02197000 SAVANNAH RIVER AT AUGUSTA, GA
# Peak Streamflow-Qualification Codes(peak-cd):# 1 ... Discharge is a Maximum Daily Average# 2 ... Discharge is an Estimate# 3 ... Discharge affected by Dam Failure# 4 ... Discharge less than indicated value,# which is Minimum Recordable Discharge at this site# 5 ... Discharge affected to unknown degree by# Regulation or Diversion# 6 ... Discharge affected by Regulation or Diversion# 7 ... Discharge is an Historic Peak# 8 ... Discharge actually greater than indicated value# 9 ... Discharge due to Snowmelt, Hurricane,# Ice-Jam or Debris Dam breakup
Page 1 of 7

peak7000.txtA ... Year of occurrence is unknown or not exactB ... Month or Day of occurrence is unknown or not exactC ... All or part of the record affected by Urbanization,
Mining, Agricultural changes, Channelization, or otherD ... Base Discharge changed during this yearE ... Only Annual Maximum Peak available for this year
Gage height qualification codes(gage-ht-cd,aggage.htscd):1 ... Gage height affected by backwater2 ... Gage height not the maximum for the year3 ... Gage height at different site and(or) datum4 ... Gage height below minimum recordable elevation5 ... Gage height is an estimate6 ... Gage datum changed during this year
agency-cd sitenoag-dt agjtm5s 15s8s llsUSGS 02197000
USGS 02197000
USGS 02197000
USGS 02197000
USGS 02197000
USGS 02197000
USGS 02197000
USGS 02197000
USGS 02197000
USGS 02197000
USGS 02197000
USGS 02197000
USGS 02197000
USGS 02197000
USGS 02197000
peak-dt peakjtm peak-va peak-cd gaag-gageht ag-gagehtcd mlOd 6s 8s 27s 8s19d01/17/1796 280000 2
2006-01-15 21:47:5605/28/1840 260000 2
2006-01-15 21:47:5608/29/1852 230000 2
2006-01-15 21:47:5601/01/1864 160000 2
2006-01-15 21:47:5601/11/1865 220000 2
2006-01-15 21:47:5612/30/1875 86400
2006-01-15 21:47:5604/14/1877 119000.
2006-01-15 21:47:5611/23/1877 51500
2006-01-15 21:47:5608/03/1879 44000
2006-01-15 21:47:5612/16/1879 102000
2006-01-15 21:47:5603/18/1881 130000
2006-01-15 21:47:5609/12/1882 93300
2006-01-15 21:47:5601/22/1883 111000
2006-01-15 21:47:5604/16/1884 81000
2006-01-15 21:47:5601/26/1885 77000
2006-01-15 21:47:56
Page2 of 7
Lgeht gagejht_cdodifydt
13s 4
38.0
37.5
36.8
34.0
36.4
28.60
31.40
23.50
22.00
30.10
32.20
29.30
30.80
28.00 3
27.50
yearjlast-pk
10d 6s•s
3

USGS
USGS
USGS
USGS
USGS
USGS
USGS
USGS
USGS
USGS
USGS
USGS
USGS
USGS
USGS
USGS
USGS
USGS
USGS
USGS
USGS
USGS
USGS
USGS
02197000 05/21/18862
02197000 07/31/18872
02197000 09/11/18882
02197000 02/19/18892
02197000 02/27/18902
02197000 03/10/18912
02197000 01/20/18922
02197000 02/14/18932
02197000 08/07/18942
02197000 01/11/18952
02197000 07/10/18962
02197000 04/06/18972
02197000 09/02/18982
02197000 02/08/18992
02197000 02/15/19002
02197000 04/04/19012
02197000 03/01/19022
02197000 02/09/19032
02197000 08/10/19042
02197000 02/14/19052
02197000 01/05/19062
02197000 10/05/19062
02197000 08/27/19082
02197000 06/05/1909
peak7000.txt135000
.006-01-15 21:47:56173000
2006-01-15 21:47:56303000
006-01-15 21:47:56149000
2006-01-15 21:47:5648500
006-01-15 21:47:56197000
2006-01-15 21:47:56140000
2006-01-15 21:47:5660000
006-01-15 21:47:5654000
006-01-15 21:47:56106000
006-01-15 21:47:56107000
006-01-15 21:47:5693300
006-01-15 21:47:56
:006-01-15
:006-01-15
:006-01-15
:006-01-15
:006-01-15
:006-01-15
:006-01-15
'006-01-15
006-01-15
006-01-15
006-01-15
21:47:56
21:47:56
21:47:56
21:47:56
21:47:56
21:47:56
21:47:56
21:47:56
21:47:56
21:47:56
21:47:56
117000
113000
138000
124000
175000
147000
63000
64800
96600
52000
307000
87300
32.50
34.50
38.70
33.30
22.90
35.50
32.80
25.00
24.00
30.40
30.50
29.30
31.30
31.00
32.70
31.80
34.60
33.20
25.50
25.80
29.60
23.60
38.80
28.70
26.40
3
3
3
2006-01-15 21:47:56USGS 02197000 03/02/1910 69800
2006-01-15 21:47:56
Page 3 of 7

peak7000.txtUSGS 02197000 04/14/1911 32800 19.10
2006-01-15 21:47:56USGS 02197000 03/17/1912 234000 36.80
2006-01-15 21:47:56USGS 02197000 03/16/1913 156000 35.10
2006-01-15 21:47:56USGS 02197000 12/31/1913 48000 24.30
2006-01-15 21:47:56USGS 02197000 01/20/1915 61000 28.20
2006-01-15 21:47:56USGS 02197000 02/03/1916 82400 31.00
2006-01-15 21:47:56USGS 02197000 03/06/1917 68000 29.20
2006-01-15 21:47:56USGS 02197000 01/30/1918 45500 25.50
2006-01-15 21:47:56USGS 02197000 12/24/1918 128000 35.00
2006-01-15 21:47:56USGS 02197000 12/11/1919 133000 35.40
2006-01-15 21:47:56USGS 02197000 02/11/1921 129000 35.10
2006-01-15 21:47:56USGS 02197000 02/16/1922 92000 32.00
2006-01-15 21:47:56USGS 02197000 02/28/1923 59700 28.00
2006-01-15 21:47:56USGS 02197000 09/22/1924 59700 28.00
2006-01-15 21:47:56USGS 02197000 01/20/1925 150000 36.50 3
2006-01-15 21:47:56USGS 02197000 01/20/1926 55300 27.30
2006-01-15 21:47:56USGS 02197000 12/30/1926 39000 24.00
2006-01-15 21:47:56USGS 02197000 08/17/1928 226000 40.40
2006-01-15 21:47:56USGS 02197000 09/27/1929 343000 46.30
2006-01-15 21:47:56USGS 02197000 10/02/1929 350000 45.10
2006-01-15 21:47:56USGS 02197000 11/17/1930 26100 19.90
2006-01-15 21:47:56USGS 02197000 01/09/1932 93800 30.40
2006-01-15 21:47:56USGS 02197000 10/18/1932 92600 30.30 3
2006-01-15 21:47:56USGS 02197000 03/05/1934 73200 28.50
2006-01-15 21:47:56USGS 02197000 03/14/1935 63700 27.40
2006-01-15 21:47:56
Page 4 of r7

peak7000.txtUSGS 02197000 04/08/1936 258000 41.20
2006-01-15 21:47:56USGS 02197000 01/04/1937 91400 30.10 3
2006-01-15 21:47:56USGS 02197000 10/21/1937 91400 30.10
2006-01-15 21:47:56USGS 02197000 03/02/1939 90900 24.10
2006-01-15 21:47:56USGS 02197000 08/15/1940 239000 29.40
2006-01-15 21:47:56USGS 02197000 07/08/1941 53300 22.89
2006-01-15 21:47:56USGS 02197000 03/23/1942 105000 24.56
2006-01-15 21:47:56USGS 02197000 01/20/1943 117000 25.10
2006-01-15 21:47:56USGS 02197000 03/22/1944 128000 25.53
2006-01-15 21:47:56USGS 02197000 04/27/1945 64000 23.16
2006-01-15 21:47:56USGS 02197000 01/09/1946 97200 24.43
2006-01-15 21:47:56USGS 02197000 01/22/1947 86000 23.97
2006-01-15 21:47:56USGS 02197000 02/10/1948 83200 23.90
2006-01-15 21:47:56USGS 02197000 11/30/1948 154000 26.61 3
2006-01-15 21:47:56USGS 02197000 10/09/1949 32500 20.10
2006-01-15 21:47:56USGS 02197000 10/22/1950 46300 22.32
2006-01-15 21:47:56USGS 02197000 03/06/1952 39300 5 21.53
2006-01-15 21:47:56USGS 02197000 05/08/1953 35200 6 20.80
2006-01-15 21:47:56USGS 02197000 03/30/1954 25500 6 17.39
2006-01-15 21:47:56USGS 02197000 04/15/1955 23900 6 16.77
2006-01-15 21:47:56USGS 02197000 04/12/1956 18600 6 14.70
2006-01-15 21:47:56USGS 02197000 05/07/1957 18000 6 14.08
2006-01-15 21:47:56USGS 02197000 04/18/1958 66300 6 22.91
2006-01-15 21:47:56USGS 02197000 06/08/1959 28500 6 18.65
2006-01-15 21:47:56USGS 02197000 02/14/1960 34900 6 20.58
2006-01-15 21:47:56
Page 5 o P7

peak7000.txtUSGS 02197000 04/02/1961 34800 6 20.56
2006-01-15 21:47:56USGS 02197000 01/09/1962 32500 6 20.09
2006-01-15 21:47:56USGS 02197000 03/23/1963 31300 6 19.52
2006-01-15 21:47:56USGS 02197000 04/09/1964 87100 6 24.16
2006-01-15 21:47:56USGS 02197000 12/27/1964 34600 6 20.62
2006-01-15 21:47:56USGS 02197000 03/06/1966 39300 6 21.50
2006-01-15 21:47:56USGS 02197000 08/25/1967 26500 6 18.10
2006-01-15 21:47:56USGS 02197000 01/12/1968 35900 6 20.94
2006-01-15 21:47:56USGS 02197000 04/21/1969 45600 6 22.24
2006-01-15 21:47:56USGS 02197000 04/01/1970 25200 6 17.68
2006-01-15 21:47:56USGS 02197000 03/05/1971 63900 6 23.30
2006-01-15 21:47:56USGS 02197000 01/20/1972 33700 6 20.36
2006-01-15 21:47:56USGS 02197000 04/08/1973 40200 6 21.63
2006-01-15 21:47:56USGS 02197000 02/23/1974 32900 6 20.13
2006-01-15 21:47:56USGS 02197000 03/25/1975 45600 6 22.24
2006-01-15 21:47:56USGS 02197000 06/05/1976 33300 6 20.27
2006-01-15 21:47:56USGS 02197000 04/07/1977 34200 6 20.50
2006-01-15 21:47:56USGS 02197000 01/26/1978 43100 6 21.98
2006-01-15 21:47:56USGS 02197000 02/27/1979 37300 6 21.13
2006-01-15 21:47:56USGS 02197000 03/31/1980 47200 6 22.33
2006-01-15 21:47:56USGS 02197000 02/12/1981 17700 6 14.70
2006-01-15 21:47:56USGS 02197000 01/02/1982 30700 6 19.39
2006-01-15 21:47:56USGS 02197000 04/10/1983 66100 6 23.21
2006-01-15 21:47:56USGS 02197000 05/05/1984 34000 6 20.35
2006-01-15 21:47:56USGS 02197000 02/07/1985 25700 6 17.89
2006-01-15 21:47:56Page6 of 7

peak7000.txtUSGS 02197000 10/03/1985 21000 6 15.74
2006-01-15 21:47:56USGS 02197000 03/06/1987 29200 6 18.98
2006-01-15 21:47:56USGS 02197000 02/05/1988 13600 6 10.61
2006-01-15 21:47:56USGS 02197000 09/22/1989 20200 6 15.33
2006-01-15 21:47:56USGS 02197000 02/27/1990 35300 6 20.69
2006-01-15 21:47:56USGS 02197000 10/13/1990 59200 6 22.80
2006-01-15 21:47:56USGS 02197000 03/27/1992 22100 6 16.29
2006-01-15 21:47:56USGS 02197000 01/14/1993 45100 6 21.81
2006-01-15 21:47:56USGS 02197000 07/01/1994 40700 6 21.40
2006-01-15 21:47:56USGS 02197000 02/19/1995 33600 6 20.28
2006-01-15 21:47:56USGS 02197000 02/05/1996 34400 6 20.48
2006-01-15 21:47:56USGS 02197000 03/10/1997 26300 6 18.11
2006-01-15 21:47:56USGS 02197000 02/07/1998 43000 6 21.63
2006-01-15 21:47:56USGS 02197000 02/02/1999 19000 6 14.72
2006-01-15 21:47:56USGS 02197000 01/25/2000 16800 6 13.25 6
2006-01-15 21:47:56USGS 02197000 03/04/2002 8510 6 7.14
2006-01-15 21:47:56USGS 02197000 05/24/2003 31600 6 20.42
2006-01-15 21:47:56USGS 02197000 06/14/2004 17600 6 13.82
2006-01-15 21:47:56
Page7 of' 7

peak7000Watstore.txtZ02197000H02197000N02197000Y02197000302197000302197000302197000302197000302197000302197000302197000302197000302197000302197000302197000302197000302197000302197000302197000302197000302197000302197000302197000302197000302197000302197000302197000302197000302197000302197000302197000302197000302197000302197000302197000302197000302197000302197000302197000302197000302197000302197000302197000302197000302197000302197000302197000302197000302197000302197000
USGS3322250815635001345245SW030601067508.SAVANNAH RIVER AT AUGUSTA, GA
17960117 2800002 38.018400528 2600002 37.518520829 2300002 36.818640101 1600002 34.018650111 2200002 36.418751230 86400 28.6018770414 119000 31.4018771123 51500 23.5018790803 44000 22.0018791216 102000 30.1018810318 130000 32.2018820912 93300 29.3018830122 111000 30.8018840416 81000 28.0018850126 77000 27.5018860521 135000 32.5018870731 173000 34.5018880911 303000 38.70
96.58
18890219189002271891031018920120189302141894080718950111189607101897040618980902189902081900021519010404190203011903020919040810190502141906010519061005
1490004850019700014000060000540001060001070009330011700011300013800012400017500014700063000648009660052000
33.3022.9035.5032.80
25.0024.0030.4030.50
29.3031.3031.0032.7031.8034.6033.20
25.5025.8029.6023.6038.80
28.7026.4019.1036.8035.10
24.3028.2031.00
19080827 30700019090605 8730019100302 6980019110414 3280019120317 23400019130316 15600019131231 4800019150120 6100019160203 82400
Page 1 o 1 .5

peak7000Watstore.txt302197000 19170306 68000 29.20302197000 19180130 45500 25.50302197000 19181224 128000 35.00302197000 19191211 133000 35.40302197000 19210211 129000 35.10302197000 19220216 92000 32.00302197000 19230228 59700 28.00302197000 19240922 59700 28.00302197000 19250120 150000 36.50302197000 19260120 55300 27.30302197000 19261230 39000 24.00302197000 19280817 226000 40.40302197000 19290927 343000 46.30302197000 19291002 350000 45.10302197000 19301117 26100 19.90302197000 19320109 93800 30.40302197000 19321018 92600 30.30302197000 19340305 73200 28.50302197000 19350314 63700 27.40302197000 19360408 258000 41.20302197000 19370104 91400 30.10302197000 19371021 91400 30.10302197000 19390302 90900 24.10302197000 19400815 239000 29.40302197000 19410708 53300 22.89302197000 19420323 105000 24.56302197000 19430120 117000 25.10302197000 19440322 128000 25.53302197000 19450427 64000 23.16302197000 19460109 97200 24.43302197000 19470122 86000 23.97302197000 1 9480210 83200 23.90302197000 19481130 154000 26.61302197000 19491009 32500 20.10302197000 19501022 46300 22.32302197000 19520306 393005 21.53302197000 19530508 352006 20.80302197000 19540330 255006 17.39302197000 19550415 239006 16.77302197000 19560412 186006 14.70302197000 19570507 180006 14.08302197000 19580418 663006 22.91302197000 19590608 285006 18.65302197000 19600214 349006 20.58302197000 19610402 348006 20.56302197000 19620109 325006 20.09302197000 19630323 313006 19.52302197000 19640409 871006 24.16302197000 19641227 346006 20.62302197000 19660306 393006 21.50
Page 2 of 3

peak7000Watstore.txt302197000 19670825 265006 18.10302197000 19680112 359006 20.94302197000 19690421 456006 22.24302197000 19700401 252006 17.68302197000 19710305 639006 23.30302197000 19720120 337006 20.36302197000 19730408 402006 21.63302197000 19740223 329006 20.13302197000 19750325 456006 22.24302197000 19760605 333006 20.27302197000 19770407 342006 20.50302197000 19780126 431006 21.98302197000 19790227 373006 21.13302197000 19800331 472006 22.33302197000 19810212 177006 14.70302197000 19820102 307006 19.39302197000 19830410 661006 23.21t302197000 19840505 340006 20.35302197000 19850207 257006 17.89302197000 19851003 210006 15.74302197000 19870306 292006 18.98302197000 19880205 136006 10.61302197000 19890922 202006 15.33302197000 19900227 353006 20.69302197000 19901013 592006 22.80302197000 19920327 221006 16.29302197000 19930114 451006 21.81302197000 19940701 407006 21.40302197000 19950219 336006 20.28302197000 19960205 344006 20.48302197000 19970310 263006 18.11302197000 19980207 430006 21.63302197000 19990202 190006 14.72302197000 20000125 168006 13.25302197000 20020304 85106 7.14302197000 20030524 316006 20.42302197000 20040614 176006 13.82
Page 3 Q

peaktabformatted.txt
# U.S. Geological Survey# National Water Information System# Retrieved: 2006-01-17 17:20:25 EST
# - WARNING -----------# The data you have obtained from this automated# U.S. Geological Survey database have not received# Director's approval and as such are provisional# and subject to revision. The data are released# on the condition that neither the USGS nor the# United States Government may be held liable for# any damages resulting from its use.
# More data may be available offline.
# #For more information on these data, contact Water Webserver Team.
# This file contains the annual peak streamflow data.
# This information includes the following fields:
# agencyscd Agency Code# siteno USGS station number# peak-dt format YYYY-MM-DD# peak-va Annual peak streamflow value in cfs# peakscd Peak Discharge-Qualification codes (see explanation below)# gagejht Gage height for the associated peak streamflow in feet# gagejht_cd Gage height qualification codes# yearjlastpk Peak streamflow reported is the highest since this year# ag-dt Date of maximum gage-height for water year (if not concurrent with peak)# agjtm Time of maximum gage-height for water year (if not concurrent with peak# ag-gage.ht maximum Gage height for water year in feet (if not concurrent with peak# ag-gagejhtncd maximum Gage height code
# Sites in this file include:# USGS 02197000 SAVANNAH RIVER AT AUGUSTA, GA
# Peak Streamflow-Qualification Codes(peak-cd):# 1 ... Discharge is a Maximum Daily Average# 2 ... Discharge is an Estimate# 3 ... Discharge affected by Dam Failure# 4 ... Discharge less than indicated value,# which is Minimum Recordable Discharge at this site# 5 ... Discharge affected to unknown degree by# Regulation or Diversion# 6 ... Discharge affected by Regulation or Diversion# 7 ... Discharge is an Historic Peak# 8 ... Discharge actually greater than indicated value# 9 ... Discharge due to Snowmelt, Hurricane,# Ice-Jam or Debris Dam breakup
Page 1 of 7

peaktabformatted.txtA ... Year of occurrence is unknown or not exactB ... Month or Day of occurrence is unknown or not exactC ... All or part of the record affected by Urbanization,
Mining, Agricultural changes, Channelization, or otherD ... Base Discharge changed during this yearE ... Only Annual Maximum Peak available for this year
Gage height qualification codes(gagehtcd,aggageihtscd):1 ... Gage height affected by backwater2 ... Gage height not the maximum for the year3 ... Gage height at different site and(or) datum4 ... Gage height below minimum recordable elevation5 ... Gage height is an estimate6 ... Gage datum changed during this year
agency-cd sitenoag.dt ag-tm5s 15s8s 11sUSGS 02197000
USGS 02197000
USGS 02197000
USGS 02197000
USGS 021.97000
USGS 02197000
USGS 02197000
USGS 02197000
USGS 02197000
USGS 02197000
USGS 02197000
USGS 02197000
USGS 02197000
USGS 02197000
USGS 02197000
peak.dt peakjtm peak-va peak-cd gage-ht gage-htcdag-gageht aggagehtcd modifydt10d 6s 8s 27s 8s 13s 4s19d1796-01-17 280000 2 38.0
2006-01-15 21:47:561840-05-28 260000 2 37.5
2006-01-15 21:47:561852-08-29 230000 2 36.8
2006-01-15 21:47:561864-01-01 160000 2 34.0
2006-01-15 21:47:561865-01-11 220000 2 36.4
2006-01-15 21:47:561875-12-30 86400 28.60
2006-01-15 21:47:561877-04-14 119000 31.40
2006-01-15 21:47:56i877-11-23 51500 23.50
2006-01-15 21:47:561879-08-03 44000 22.00
2006-01-15 21:47:561879-12-16 102000 30.10
2006-01-15 21:47:561881-03-18 130000 32.20
2006-01-15 21:47:561882-09-12 93300 29.30
2006-01-15 21:47:561883-01-22 111000 30.80
2006-01-15 21:47:561884-04-16 81000 28.00 3
2006-01-15 21:47:561885-01-26 77000 27.50
2006-01-15 21:47:56
Page 2 of 7
yearjlast-pk
10d 6s

peaktabformatted.txtUSGS 02197000 1886-05-21 135000 32.50
2006-01-15 21:47:56USGS 02197000 1887-07-31 173000 34.50
2006-01-15 21:47:56USGS 02197000 1888-09-11 303000 38.70
2006-01-15 21:47:56USGS 02197000 1889-02-19 149000 33.30
2006-01-15 21:47:56USGS 02197000 1890-02-27 48500 22.90
2006-01-15 21:47:56USGS 02197000 1891-03-10 197000 35.50
2006-01-15 21:47:56USGS 02197000 1892-01-20 140000 32.80 3
2006-01-15 21:47:56USGS 02197000 1893-02-14 60000 25.00
2006-01-15 21:47:56USGS 02197000 1894-08-07 54000 24.00
2006-01-15 21:47:56USGS 02197000 1895-01-11 106000 30.40
2006-01-15 21:47:56USGS 02197000 1896-07-10 107000 30.50 3
2006-01-15 21:47:56USGS 02197000 1897-04-06 93300 29.30
2006-01-15 21:47:56USGS 02197000 1898-09-02 117000 31.30
2006-01-15 21:47:56USGS 02197000 1899-02-08 113000 31.00
2006-01-15 21:47:56USGS 02197000 1900-02-15 138000 32.70
2006-01-15 21:47:56USGS 02197000 1901-04-04 124000 31.80
2006-01-15 21:47:56USGS 02197000 1902-03-01 175000 34.60
2006-01-15 21:47:56USGS 02197000 1903-02-09 147000 33.20
2006-01-15 21:47:56USGS 02197000 1904-08-10 63000 25.50
2006-01-15 21:47:56USGS 02197000 1905-02-14 64800 25.80
2006-01-15 21:47:56USGS 02197000 1906-01-05 96600 29.60
2006-01-15 21:47:56USGS 02197000 1906-10-05 52000 23.60
2006-01-15 21:47:56USGS 02197000 1908-08-27 307000 38.80 3
2006-01-15 21:47:56USGS 02197000 1909-06-05 87300 28.70
2006-01-15 21:47:56USGS 02197000 1910-03-02 69800 26.40
2006-01-15 21:47:56
Page 3 o0 7

peaktabformatted.txtUSGS 02197000 1911-04-14 32800 19.10
2006-01-15 21:47:56USGS 02197000 1912-03-17 234000 36.80
2006-01-15 21:47:56USGS 02197000 1913-03-16 156000 35.10
2006-01-15 21:47:56USGS 02197000 1913-12-31 48000 24.30
2006-01-15 21:47:56USGS 02197000 1915-01-20 61000 28.20
2006-01-15 21:47:56USGS 02197000 1916-02-03 82400 31.00
2006-01-15 21:47:56USGS 02197000 1917-03-06 68000 29.20
2006-01-15 21:47:56USGS 02197000 1918-01-30 45500 25.50
2006-01-15 21:47:56USGS 02197000 1918-12-24 128000 35.00
2006-01-15 21:47:56USGS 02197000 1919-12-11 133000 35.40
2006-01-15 21:47:56USGS 02197000 1921-02-11 129000 35.10
2006-01-15 21:47:56USGS 02197000 1922-02-16 92000 32.00
2006-01-15 21:47:56USGS 02197000 1923-02-28 59700 28.00
2006-01-15 21:47:56USGS 02197000 1924-09-22 59700 28.00
2006-01-15 21:47:56USGS 02197000 1925-01-20 150000 36.50 3
2006-01-15 21:47:56USGS 02197000 1926-01-20 55300 27.30
2006-01-15 21:47:56USGS 02197000 1926-12-30 39000 24.00
2006-01-15 21:47:56USGS 02197000 1928-08-17 226000 40.40
2006-01-15 21:47:56USGS 02197000 1929-09-27 343000 46.30
2006-01-15 21:47:56USGS 02197000 1929-10-02 350000 45.10
2006-01-15 21:47:56USGS 02197000 1930-11-17 26100 19.90
2006-01-15 21:47:56USGS 02197000 1932-01-09 93800 30.40
2006-01-15 21:47:56USGS 02197000 1932-10-18 92600 30.30 3
2006-01-15 21:47:56USGS 02197000 1934-03-05 73200 28.50
2006-01-15 21:47:56USGS 02197000 1935-03-14 63700 27.40
2006-01-15 21:47:56
Page4 o0 7

peaktabformatted.txtUSGS 02197000 1936-04-08 258000 41.20
2006-01-15 21:47:56USGS 02197000 1937-01-04 91400 30.10 3
2006-01-15 21:47:56USGS 02197000 1937-10-21 91400 30.10
2006-01-15 21:47:56USGS 02197000 1939-03-02 90900 24.10
2006-01-15 21:47:56USGS 02197000 1940-08-15 239000 29.40
2006-01-15 21:47:56USGS 02197000 1941-07-08 53300 22.89
2006-01-15 21:47:56USGS 02197000 1942-03-23 105000 24.56
2006-01-15 21:47:56USGS 02197000 1943-01-20 117000 25.10
2006-01-15 21:47:56USGS 02197000 1944-03-22 128000 25.53
2006-01-15 21:47:56USGS 02197000 1945-04-27 64000 23.16
2006-01-15 21:47:56USGS 02197000 1946-01-09 97200 24.43
2006-01-15 21:47:56USGS 02197000 1947-01-22 86000 23.97
2006-01-15 21:47:56USGS 02197000 1948-02-10 83200 23.90
2006-01-15 21:47:56USGS 02197000 1948-11-30 154000 26.61 3
2006-01-15 21:47:56USGS 02197000 1949-10-09 32500 20.10
2006-01-15 21:47:56USGS 02197000 1950-10-22 46300 22.32
2006-01-15 21:47:56USGS 02197000 1952-03-06 39300 5 21.53
2006-01-15 21:47:56USGS 02197000 1953-05-08 35200 6 20.80
2006-01-15 21:47:56USGS 02197000 1954-03-30 25500 6 17.39
2006-01-15 21:47:56USGS 02197000 1955-04-15 23900 6 16.77
2006-01-15 21:47:56USGS 02197000 1956-04-12 18600 6 14.70
2006-01-15 21:47:56USGS 02197000 1957-05-07 18000 6 14.08
2006-01-15 21:47:56USGS 02197000 1958-04-18 66300 6 22.91
2006-01-15 21:47:56USGS 02197000 1959-06-08 28500 6 18.65
2006-01-15 21:47:56USGS 02197000 1960-02-14 34900 6 20.58
2006-01-15 21:47:56
Page5 of 7

peaktabformatted.txtUSGS 02197000 1961-04-02 34800 6 20.56
2006-01-15 21:47:56USGS 02197000 1962-01-09 32500 6 20.09
2006-01-15 21:47:56USGS 02197000 1963-03-23 31300 6 19.52
2006-01-15 21:47:56USGS 02197000 1964-04-09 87100 6 24.16
2006-01-15 21:47:56USGS 02197000 1964-12-27 34600 6 20.62
2006-01-15 21:47:56USGS 02197000 1966-03-06 39300 6 21.50
2006-01-15 21:47:56USGS 02197000 1967-08-25 26500 6 18.10
2006-01-15 21:47:56USGS 02197000 1968-01-12 35900 6 20.94
2006-01-15 21:47:56USGS 02197000 1969-04-21 45600 6 22.24
2006-01-15 21:47:56USGS 02197000 1970-04-01 25200 6 17.68
2006-01-15 21:47:56USGS 02197000 1971-03-05 63900 6 23.30
2006-01-15 21:47:56USGS 02197000 1972-01-20 33700 6 20.36
2006-01-15 21:47:56USGS 02197000 1973-04-08 40200 6 21.63
2006-01-15 21:47:56USGS 02197000 1974-02-23 32900 6 20.13
2006-01-15 21:47:56USGS 02197000 1975-03-25 45600 6 22.24
2006-01-15 21:47:56USGS 02197000 1976-06-05 33300 6 20.27
2006-01-15 21:47:56USGS 02197000 1977-04-07 34200 6 20.50
2006-01-15 21:47:56USGS 02197000 1978-01-26 43100 6 21.98
2006-01-15 21:47:56USGS 02197000 1979-02-27 37300 6 21.13
2006-01-15 21:47:56USGS 02197000 1980-03-31 47200 6 22.33
2006-01-15 21:47:56USGS 02197000 1981-02-12 17700 6 14.70
2006-01-15 21:47:56USGS 02197000 1982-01-02 30700 6 19.39
2006-01-15 21:47:56USGS 02197000 1983-04-10 66100 6 23.21
2006-01-15 21:47:56USGS 02197000 1984-05-05 34000 6 20.35
2006-01-15 21:47:56USGS 02197000 1985-02-07 25700 6 17.89
2006-01-15 21:47:56
Page 6 of 7

peaktabformatted.txtUSGS 02197000 1985-10-03 21000 6 15.74
2006-01-15 21:47:56USGS 02197000 1987-03-06 29200 6 18.98
2006-01-15 21:47:56USGS 02197000 1988-02-05 13600 6 10.61
2006-01-15 21:47:56USGS 02197000 1989-09-22 20200 6 15.33
2006-01-15 21:47:56USGS 02197000 1990-02-27 35300 6 20.69
2006-01-15 21:47:56USGS 02197000 1990-10-13 59200 6 22.80
2006-01-1.5 21:47:56USGS 02197000 1992-03-27 22100 6 16.29
2006-01-15 21:47:56USGS 02197000 1993-01-14 45100 6 21.81
2006-01-15 21:47:56USGS 02197000 1994-07-01 40700 6 21.40
2006-01-15 21:47:56USGS 02197000 1995-02-19 33600 6 20.28
2006-01-15 21:47:56USGS 02197000 1996-02-05 34400 6 20.48
2006-01-15 21:47:56USGS 02197000 1997-03-10 26300 6 18.11
2006-01-15 21:47:56USGS 02197000 1998-02-07 43000 6 21.63
2006-01-15 21:47:56USGS 02197000 1999-02-02 19000 6 14.72
2006-01-15 21:47:56USGS 02197000 2000-01-25 16800 6 13.25 6
2006-01-15 21:47:56USGS 02197000 2002-03-04 8510 6 7.14
2006-01-15 21:47:56USGS 02197000 2003-05-24 31600 6 20.42
2006-01-15 21:47:56USGS 02197000 2004-06-1.4 17600 6 13.82
2006-01-15 21:47:56
Page 7 o f '7

Z02197000H02197000N02197000Y02197000302197000302197000302197000302197000302197000302197000302197000302197000302197000302197000302197000302197000302197000302197000302197000302197000302197000302197000302197000302197000302197000302197000302197000302197000302197000302197000302197000302197000302197000302197000302197000302197000302197000302197000302197000302197000302197000302197000302197000302197000302197000302197000302197000302197000302197000302197000
Qpeak302l97000.txtUSGS
3322250815635001345245SW030601067508.SAVANNAH RIVER AT AUGUSTA, GA
17960117 2800002 38.018400528 2600002 37.518520829 2300002 36.818640101 1600002 34.018650111 2200002 36.418751230 86400 28.6018770414 119000 31.4018771123 51500 23.5018790803 44000 22.0018791216 102000 30.1018810318 130000 32.2018820912 93300 29.3018830122 111000 30.8018840416 81000 28.0018850126 77000 27.5018860521 135000 32.5018870731 173000 34.5018880911 303000 38.7018890219 149000 33.3018900227 48500 22.9018910310 197000 35.5018920120 140000 32.8018930214 60000 25.0018940807 54000 24.0018950111 106000 30.4018960710 107000 30.5018970406 93300 29.3018980902 117000 31.3018990208 113000 31.0019000215 138000 32.7019010404 124000 31.8019020301 175000 34.6019030209 147000 33.2019040810 63000 25.5019050214 64800 25.8019060105 96600 29.6019061005 52000 23.6019080827 307000 38.8019090605 87300 28.7019100302 69800 26.4019110414 32800 19.1019120317 234000 36.8019130316 156000 35.1019131231 48000 24.3019150120 61000 28.2019160203 82400 31.00
96.58
Page 1 o ' 3

302197000302197000302197000302197000302197000302197000302197000302197000302197000302197000302197000302197000302197000302197000302197000302197000302197000302197000302197000302197000302197000302197000302197000302197000302197000302197000302197000302197000302197000302197000302197000302197000302197000302197000302197000302197000302197000302197000302197000302197000302197000302197000302197000302197000302197000302197000302197000302197000302197000302197000
1917030619180130191812241919121119210211192202161.923022819240922192501201926012019261230
6800045500128000133000129000920005970059700
-1500005530039000
19280817 22600019290927 34300019291002 35000019301117 2610019320109 9380019321018 9260019340305 7320019350314 6370019360408 25800019370104 9140019371021 9140019390302 9090019400815 23900019410708 5330019420323 10500019430120 11700019440322 128000
Qpeak3O2l197000.txt29.2025.5035.0035.4035.10
32.0028.0028.0036.50
27.3024.0040.4046.3045.1019.9030.4030.3028.5027.4041.2030.1030.1024.1029.40
22.8924.5625.1025.53
23.1624.4323.9723.9026.61
20.1022.3221.5320.8017.3916.7714.7014.0822.9118.6520.5820.5620.0919.5224.1620.6221.50
Page 2 V
19450427194601091947012219480210194811301949100919501022195203061953050819540330195504151956041219570507195804181959060819600214196104021962010919630323196404091964122719660306
640009720086000832001540003250046300393005352 006255006239006186006180006663006285006349006348006325006313006871006346006393006-

3021970003021970003021970003021970003021970003021970003021970003021970003021970003021970003021970003021970003021970003021970003021970003021970003021970003021970003021970003021970003021970003021970003021970003021970003021970003021970003021970003021970003021970003021970003021970003.02197000302197000302197000302197000302197000302197000
1967082519680112196904211970040119710305197201201973040819740223197503251976060519770407197801261979022719800331198102121982010219830410198405051985020719851003198703061988020519890922199002271990,1013199203271993011419940701199502191996020519970310199802071999020220000125200203042003052420040614
26500635900645600625200663900633700640200632900645600633300634200643100637300647200617700630700666100634000625700621000629200613600620200635300659200622100645100640700633600634400626300643000619000616800685106
316006176006
Qpeak3O2l197000.txt18.1020.9422.2417.6823.3020.3621.6320.1322.2420.2720.5021.9821.1322.3314.7019.3923.2120.3517.8915.7418.9810.6115.3320.6922.8016.2921.8121.4020.2820.4818.1121.6314.7213.257.1420.4213.82
Page 3 o F -3

Z02197320H02197320N02197320Y02197320302197320302197320302197320302197320302197320302197320302197320302197320302197320302197320302197320302197320302197320302197320302197320302197320302197320302197320302197320302197320302197320302197320302197320302197320302197320302197320302197320302197320302197320302197320
Qpeak302197320.txtUSGS
3313010814604004545003SW0306010681 10.00 77.00SAVANNAH R. NR JACKSON. SC
19720121197304091974022419750916197607061977040819780128197904281980040119810213 17300619820220 205006198304111984030919850208 20600619851124 1590061987030719880206 13200619890923 168006199002281990101419920327 1880061994070319950220199603161997031119980209 619981028 17300620000126 16500620010306 15500620020305 88706
19.0219.7118.6420.2218.8418.8519.6519.1220.72
15.1617.12
21.5719.30
17.2114.29
18.3512.4214.90
19.6120.05
16.2619.1918.9118.8618.4119.83
15.2314.8613.758.77
Page 1 of I

Z02197500H02197500N02197500Y02197500302197500302197500302197500302197500302197500302197500302197500302197500302197500302197500302197500302197500302197500302197500302197500302197500302197500302197500302197500302197500302197500302197500302197500302197500302197500302197500302197500302197500302197500302197500302197500302197500302197500302197500302197500302197500302197500302197500302197500302197500302197500302197500302197500302197500302197500302197500
Qpeak302l97500.txtUSGS
3256200813010001345251SW030601068650 52.42SAVANNAH R AT BURTONS FERRY BR NR MILLHAVEN. GA
192910 -22000019400818 1410001941071319420326194301231944032619450501194601121947012519480214194812031949101419501027195203291953051319540406195504181956031919570511195804221959061319600217196104251962011519630327196404151965040419660309196706171968011619690425197004041983041519840512198502101985112519870310198710021989032619900302199010171992033019930110199408261995030119960216
38400730008090089300429006860067500610001080001850025700385005318006176006150006137006139006414006274006371006324006274006292006717006328006371006220006268006372006182006600006339006197006152006276006119006198006360006327006183006396006336006341006330006
30.8027.0018.2022.0022.6023.4018.8021.6021.5321.1024.9114.8716.5318.2617.5214.4013.2111.8212.2718.9416.5918.2817.6016.7517.2222.1017.6618.0515.4716.6418.3114.14
17.8314.6912.7116.7910.8014.7318.1417.6614.1718.6617.7917.8617.70
Page 1 ofP

302197500302197500302197500302197500302197500302197500302197500
19970314199802101999020520000128200103072002020920030321
28400639900616100615200613400689506
293006
Qpeak302197500.txt16.9518.7012.8412.2011.337.2517.34
Page 2 of 2

Qpeak3O2lI98500.txtZ02198500H02 198500N02198500Y02198500302198500302198500302198500302198500302198500302198500302198500302198500302198500302198500302198500302198500302198500302198500302198500302198500302198500302198500302198500302198500302198500302198500302198500302198500302198500302198500302198500302198500302198500302198500302198500302198500302198500302198500302198500302198500302198500302198500302198500302198500302198500302198500302198500302198500302198500302198500
USGS3231410811608001345103SW 9850SAVANNAH RIVER NEAR CLYG. GA
13.39
19250124 13400019260128 3140019270306 2060019280823 10600019290311 12800019291006 27000019301128193201151933010419340615193503221936041319370111193804161939030819400822194107171942032919430127194403291945050519460116194701281948021719481206194910191950110119520402195305171954041219550423195603221957051519580425195906181960021919610425196201191963033119640418196504061966031119670622196801211969042919700407
182005960059600438002910017600065800484007010012800036500730007300095200344006440063200710001040001600022600413005358006188006155006141006150006455006260006409006349006282006292006838006380006428006225006280006397006210006
23.9015.4013.4022.3023.6029.7012.7719.1819.2017.2015.2026.0019.4017.8020.4023.6016.3020.0020.0021.6016.0019.5019.4019.6622.1712.2113.3816.9015.8012.4911.3510.4711.1517.4114.3617.3516.2014.8715.2720.2216.5217.1013.6714.8416.7413.31
Page 1 ofp 0

Qpeak302198500.txt302198500 19710306 545006 18.11302198500 19720126 364006 16.30302198500 19730415 445006 17.29302198500 19740301 330006 15.78302198500 19750324 506006 17.83302198500 19760614 335006 15.87302198500 19761222 334006 15.85302198500 19780203 387006 16.81302198500 19790427 366006 16.34302198500 19800402 586006 18.40302198500 19810216 136006 10.39302198500 19820111 195006 12.89302198500 19830417 586006 18.40302198500 19840514 377006 16.48302198500 19850215 195006 12.89302198500 19851128 158006 11.50302198500 19870313 297006 15.57302198500 19871004 114006 8.93302198500 19890926 142006 10.54302198500 19900305 394006 16.70302198500 19901020 349006 16.09302198500 19920403 176006 12.57302198500 19930113 601006 18.51302198500 19940830 365006 16.29302198500 19950304 407006 16.84302198500 19960321 369006 16.79302198500 19970317 303006 15.27302198500 19980312 530006 18.00302198500 19990207 146006 10.86302198500 20000130 130006 9.75302198500 20010320 144006 9.90302198500 20020210 82606 5.77302198500 20030324 399006 16.75302198500 20040303 185006 12.77
Page 2 o0 -F.
Qpeak7000mdy.txt
# U.S. Geological Survey# National Water Information System# Retrieved: 2006-01-17 15:43:40 EST
# - WARNING -----------# The data you have obtained from this automated# U.S. Geological Survey database have not received# Director's approval and as such are provisional# and subject to revision. The data are released# on the condition that neither the USGS nor the# United States Government may be held liable for# any damages resulting from its use.
# More data may be available offline.
# #For more information on these data, contact Water Webserver Team.
# This file contains the annual peak streamflow data.
# This information includes the following fields:
# agency-cd Agency Code# siteno USGS station number# peak-dt format MM/DD/YYYY# peak.va Annual peak streamflow value in cfs# peakscd Peak Discharge-Qualification codes (see explanation below)# gagejht Gage height for the associated peak streamflow in feet# gage-htcd Gage height qualification codes# yearjlast.pk Peak streamflow reported is the highest since this year# agdt Date of maximum gage-height for water year (if not concurrent with peak)# ag-tm Time of maximum gage-height for water year (if not concurrent with peak# ag-gage ht maximum Gage height for water year in feet (if not concurrent with peak# aggageht cd maximum Gage height code
# Sites in this file include:# USGS 02197000 SAVANNAH RIVER AT AUGUSTA, GA
# Peak Streamflow-Qualification Codes(peak-cd):# 1 ... Discharge is a Maximum Daily Average# 2 ... Discharge is an Estimate# 3 ... Discharge affected by Dam Failure# 4 ... Discharge less than indicated value,# which is Minimum Recordable Discharge at this site# 5 ... Discharge affected to unknown degree by# Regulation or Diversion# 6 ... Discharge affected by Regulation or Diversion# 7 ... Discharge is an Historic Peak# 8 ... Discharge actually greater than indicated value# 9 ... Discharge due to Snowmelt, Hurricane,# Ice-Jam or Debris Dam breakup
Page 1 o0 7

Qpeak7000mdy.txtA ... Year of occurrence is unknown or not exactB ... Month or Day of occurrence is unknown or not exactC ... All or part of the record affected by Urbanization,
Mining, Agricultural changes, Channelization, or otherD ... Base Discharge changed during this yearE ... Only Annual Maximum Peak available for this year
Gage height qualification codes(gage-ht-cd,ag-gage-ht-cd):1... Gage height affected by backwater2... Gage height not the maximum for the year3 ... Gage height at different site and(or) datum4 ... Gage height below minimum recordable elevation5 ... Gage height is an estimate6 ... Gage datum changed during this year
agencyscd sitenoa-_dt agtm
5s 15s8s llsUSGS 02197000
USGS 02197000
USGS 02197000
USGS 02197000
USGS 02197000
USGS 02197000
USGS 02197000
USGS 02197000
USGS 02197000
USGS 02197000
USGS 02197000
USGS 02197000
USGS 02197000
USGS 02197000
peak.dt peak-tm peak.va peak-cdag-gageht ag-gagehtcd10d 6s 8s 27s19d01/17/1796 280000
2006-01-15 21:47:5605/28/1840 260000
2006-01-15 21:47:5608/29/1852 230000
.2006-01-15 21:47:5601/01/1864 160000
2006-01-15 21:47:5601/11/1865 220000
2006-01-15 21:47:5612/30/1875 86400
2006-01-15 21:47:5604/14/1877 119000
2006-01-15 21:47:5611/23/1877 51500
2006-01-15 21:47:5608/03/1879 44000
2006-01-15 21:47:5612/16/1879 102000
2006-01-15 21:47:5603/18/1881 130000
2006-01-15 21:47:5609/12/1882 93300
2006-01-15 21:47:5601/22/1883 111000
2006-01-15 21:47:5604/16/1884 . 81000
2006-01-15 21:47:56
gage-ht gage-htcdmodifydt8s 13s 4s
2 38.0
2 37.5
2 36.8
2 34.0
2 36.4
28.60
31.40
23.50
22.00
30.10
32.20
29.30
30.80
28.00 3
yearjlast_pk
10d 6s
USGS 02197000 01/26/1885 770002006-01-15 21:47:56
Page 2 of 7
27.50

Qpeak7000mdy.txtUSGS 02197000 05/21/1886 135000 32.50
2006-01-15 21:47:56USGS 02197000 07/31/1887 173000 34.50
2006-01-15 21:47:56USGS 02197000 09/11/1888 303000 38.70
2006-01-15 21:47:56USGS 02197000 02/19/1889 149000 33.30
2006-01-15 21:47:56USGS 02197000 02/27/1890 48500 22.90
2006-01-15 21:47:56USGS 02197000 03/10/1891 197000 35.50
2006-01-15 21:47:56USGS 02197000 01/20/1892 140000 32.80 3
2006-01-15 21:47:56USGS 02197000 02/14/1893 60000 25.00
2006-01-15 21:47:56USGS 02197000 08/07/1894 54000 24.00
2006-01-15 21:47:56USGS 02197000 01/11/1895 106000 30.40
2006-01-15 21:47:56USGS 02197000 07/10/1896 107000 30.50 3
2006-01-15 21:47:56USGS 02197000 04/06/1897 93300 29.30
2006-01-15 21:47:56USGS 02197000 09/02/1898 117000 31.30
2006-01-15 21:47:56USGS 02197000 02/08/1899 113000 31.00
2006-01-15 21:47:56USGS 02197000 02/15/1900 138000 32.70
2006-01-15 21:47:56USGS 02197000 04/04/1901 124000 31.80
2006-01-15 21:47:56USGS 02197000 03/01/1902 175000 34.60
2006-01-15 21:47:56USGS 02197000 02/09/1903 147000 33.20
2006-01-15 21:47:56USGS 02197000 08/10/1904 63000 25.50
2006-01-15 21:47:56USGS 02197000 02/14/1905 64800 25.80
2006-01-15 21:47:56USGS 02197000 01/05/1906 96600 29.60
2006-01-15 21:47:56USGS 02197000 10/05/1906 52000 23.60
2006-01-15 21:47:56USGS 02197000 08/27/1908 307000 38.80 3
2006-01-15 21:47:56USGS 02197000 06/05/1909 87300 28.70
2006-01-15 21:47:56USGS 02197000 03/02/1910 69800 26.40
2006-01-15 21:47:56
Page 3 o 7

Qpeak7000mdy.txtUSGS 02197000 04/14/1911 32800 19.10
2006-01-15 21:47:56USGS 02197000 03/17/1912 234000 36.80
2006-01-15 21:47:56USGS 02197000 03/16/1913 156000 35.10
2006-01-15 21:47:56USGS 02197000 12/31/1913 48000 24.30
2006-01-15 21:47:56USGS 02197000 01/20/1915 61000 28.20
2006-01-15 21:47:56USGS 02197000 02/03/1916 82400 31.00
2006-01-15 21:47:56USGS 02197000 03/06/1917 68000 29.20
2006-01-15 21:47:56USGS 02197000 01/30/1918 45500 25.50
2006-01-15 21:47:56USGS 02197000 12/24/1918 128000 35.00
2006-01-15 21:47:56USGS 02197000 12/11/1919 133000 35.40
2006-01-15 21:47:56USGS 02197000 02/11/1921 129000 35.10
2006-01-15 21:47:56USGS 02197000 02/16/1922 92000 32.00
2006-01-15 21:47:56USGS 02197000 02/28/1923 59700 28.00
2006-01-15 21:47:56USGS 02197000 09/22/1924 59700 28.00
2006-01-15 21:47:56USGS 02197000 01/20/1925 150000 36.50 3
2006-01-15 21:47:56USGS 02197000 01/20/1926 55300 27.30
2006-01-15 21:47:56USGS 02197000 12/30/1926 39000 24.00
2006-01-15 21:47:56USGS 02197000 08/17/1928 226000 40.40
2006-01-15 21:47:56USGS 02197000 09/27/1929 343000 46.30
2006-01-15 21:47:56USGS 02197000 10/02/1929 350000 45.10
2006-01-15 21:47:56USGS 02197000 11/17/1930 26100 19.90
2006-01-15 21:47:56USGS 02197000 01/09/1932 93800 30.40
2006-01-15 21:47:56USGS 02197000 10/18/1932 92600 30.30 3
2006-01-15 21:47:56USGS 02197000 03/05/1934 73200 28.50
2006-01-15 21:47:56USGS 02197000 03/14/1935 63700 27.40
2006-01-15 21:47:56
Page 4 of 7

Qpeak7000mdy.txtUSGS 02197000 04/08/1936 258000 41.20
2006-01-15 21:47:56USGS 02197000 01/04/1937 91400 30.10 3
2006-01-15 21:47:56USGS 02197000 10/21/1937 91400 30.10
2006-01-15 21:47:56USGS 02197000 03/02/1939 90900 24.10
2006-01-15 21:47:56USGS 02197000 08/15/1940 239000 29.40
2006-01-15 21:47:56USGS 02197000 07/08/1941 53300 22.89
2006-01-15 21:47:56USGS 02197000 03/23/1942 105000 24.56
2006-01-15 21:47:56USGS 02197000 01/20/1943 117000 25.10
2006-01-15 21:47:56USGS 02197000 03/22/1944 128000 25.53
2006-01-15 21:47:56USGS 02197000 04/27/1945 64000 23.16
2006-01-15 21:47:56USGS 02197000 01/09/1946 97200 24.43
2006-01-15 21:47:56USGS 02197000 01/22/1947 86000 23.97
2006-01-15 21:47:56USGS 02197000 02/10/1948 83200 23.90
2006-01-15 21:47:56USGS 02197000 11/30/1948 154000 26.61 3
2006-01-15 21:47:56USGS 02197000 10/09/1949 32500 20.10
2006-01-15 21:47:56USGS 02197000 10/22/1950 46300 22.32
2006-01-15 21:47:56USGS 02197000 03/06/1952 39300 5 21.53
2006-01-15 21:47:56USGS 02197000 05/08/1953 35200 6 20.80
2006-01-15 21:47:56USGS 02197000 03/30/1954 25500 6 17.39
2006-01-15 21:47:56USGS 02197000 04/15/1955 23900 6 16.77
2006-01-15 21:47:56USGS 02197000 04/12/1956 18600 6 14.70
2006-01-15 21:47:56USGS 02197000 05/07/1957 18000 6 14.08
2006-01-15 21:47:56USGS 02197000 04/18/1958 66300 6 22.91
2006-01-15 21:47:56USGS 02197000 06/08/1959 28500 6 18.65
2006-01-15 21:47:56USGS 02197000 02/14/1960 34900 6 20.58
2006-01-15 21:47:56
Page5 o "7

Qpeak7000mdy.txtUSGS 02197000 04/02/1961 34800 6 20.56
2006-01-15 21:47:56USGS 02197000 01/09/1962 32500 6 20.09
2006-01-15 21:47:56USGS 02197000 03/23/1963 31300 6 19.52
2006-01-15 21:47:56USGS 02197000 04/09/1964 87100 6 24.16
2006-01-15 21:47:56USGS 02197000 12/27/1964 34600 6 20.62
2006-01-15 21:47:56USGS 02197000 03/06/1966 39300 6 21.50
2006-01-15 21:47:56USGS 02197000 08/25/1967 26500 6 18.10
2006-01-15 21:47:56USGS 02197000 01/12/1968 35900 6 20.94
2006-01-15 21:47:56USGS 02197000 04/21/1969 45600 6 22.24
2006-01-15 21:47:56USGS 02197000 04/01/1970 25200 6 17.68
2006-01-15 21:47:56USGS 02197000 03/05/1971 63900 6 23.30
2006-01-15 21:47:56USGS 02197000 01/20/1972 33700 6 20.36
2006-01-15 21:47:56USGS 02197000 04/08/1973 40200 6 21.63
2006-01-15 21:47:56USGS 02197000 02/23/1974 32900 6 20.13
2006-01-15 21:47:56USGS 02197000 03/25/1975 45600 6 22.24
2006-01-15 21:47:56USGS 02197000 06/05/1976 33300 6 20.27
2006-01-15 21:47:56USGS 02197000 04/07/1977 34200 6 20.50
2006-01-15 21:47:56USGS 02197000 01/26/1978 43100 6 21.98
2006-01-15 21:47:56USGS 02197000 02/27/1979 37300 6 21.13
2006-01-15 21:47:56USGS 02197000 03/31/1980 47200 6 22.33
2006-01-15 21:47:56USGS 02197000 02/12/1981 17700 6 14.70
2006-01-15 21:47:56USGS 02197000 01/02/1982 30700 6 19.39
2006-01-15 21:47:56USGS 02197000 04/10/1983 66100 6 23.21
2006-01-15 21:47:56USGS 02197000 05/05/1984 34000 6 20.35
2006-01-15 21:47:56USGS 02197000 02/07/1985 25700 6 17.89
2006-01-15 21:47:56
Page 6 of• 7

Qpeak7000mdy.txtUSGS 02197000 10/03/1985 21000 6 15.74
2006-01-15 21:47:56USGS 02197000 03/06/1987 29200 6 18.98
2006-01-15 21:47:56USGS 02197000 02/05/1988 13600 6 10.61
2006-01-15 21:47:56USGS 02197000 09/22/1989 20200 6 15.33
2006-01-15 21:47:56USGS 02197000 02/27/1990 35300 6 20.69
2006-01-15 21:47:56USGS 02197000 10/13/1990 59200 6 22.80
2006-01-15 21:47:56USGS 02197000 03/27/1992 22100 6 16.29
2006-01-15 21:47:56USGS 02197000 01/14/1993 45100 6 21.81
2006-01-15 21:47:56USGS 02197000 07/01/1994 40700 6 21.40
2006-01-15 21:47:56USGS 02197000 02/19/1995 33600 6 20.28
2006-01-15 21:47:56USGS 02197000 02/05/1996 34400 6 20.48
2006-01-15 21:47:56USGS 02197000 03/10/1997 26300 6 18.11
2006-01-15 21:47:56USGS 02197000 02/07/1998 43000 6 21.63
2006-01-15 21:47:56USGS 02197000 02/02/1999 19000 6 14.72
2006-01-15 21:47:56USGS 02197000 01/25/2000 16800 6 13.25 6
2006-01-15 21:47:56USGS 02197000 03/04/2002 8510 6 7.14
2006-01-15 21:47:56USGS 02197000 05/24/2003 31600 6 20.42
2006-01-15 21:47:56USGS 02197000 06/14/2004 17600 6 13.82
2006-01-15 21:47:56
Page 7 o-f '7

LA5GCS Re~por. 19'ipe dp
FLOOD FREQUENCY OFTHE SAVANNAH RIVERA\T AUGUSTA, GEORGIA
U.S. GEOLOGICAL SURVEYWater-Resources Investigations Report 90-4024
C
Prepared in cooperation withU.S. ARMY CORPS OF ENGINEERS

FLOOD FREQUENCY OF THE SAVANNAH RIVER
AT AUGUSTA, GEORGIA
By Curtis L. Sanders, Jr., Harold E. Kubik, Joseph T. Hoke, Jr., andWilliam H. Kirby
U.S. GEOLOGICAL SURVEY
Water-Resources Investigations Report 90-4024
Prepared by
U.S. GEOLOGICAL SURVEY and
U.S. ARMY CORPS OF ENGINEERS
Columbia, South Carolina
1990

DEPARTMENT OF THE INTERIOR
MAN UEL LUJAN, JR., Secretary
U.S. GEOLOGICAL SURVEY
Dallas L. Peck, Director
Comments on the utility of thisreport or requests for additionalinformation on the Water Resourcesof South Carolina should bedirected tot
District ChiefU.S. Geological Survey1835 Assembly Street, Suite 677AColumbia, South Carolina- 29201
Copies of this report may bepurchased from:
U.S. Geological SurveyBooks and Open-File ReportsFederal Center, Bldg. 810Box 25425Denver, Colorado 80225

CONVERSION FACTORS AND ABBREVIATIONS OF UNITS
The inch-pound units used in this report may be converted to metric(International System) units by the following factors:
Iq
Multiply
acre-foot (acre-ft)
cubic foot (ftW)
cubic foot per second(ft 3/s)
foot (ft)
inch (in.)
mile (mi)
square mile (mi 2 )
By
1,2332
2.832x10⁻²
2.832xlO -
0.3048
25.4
1.609
2.59
To obtain
cubic meter (i 3 )
cubic meter (me)
cubic meter per second(m3/s)
meter (m)
millimeter (mm)
kilometer (km)
square kilometer (kmi)
Sea level: In this report "sea level" refers to the National GeodeticVertical Datum of 1929 (NGVD of 1929) - a geodetic datum derived froma general adjustment of the first-order level networks of both the UnitedStates and Canada, formerly called Sea Level Datum of 1929.

CONTENTS
Page
Abstract ....................................................... 1Introduction ..... '. ........................... ............. 1
Purpose and scope ................................................ 2Description of study area ....................................... 3Previous studies ............................................... 5Acknowledgments ................................................. 5
Available flood records .. ..... ................. 5Approach ............................................................ 10Simulated peak discharges ............................................ 15
Unregulated peak discharges ............. ....................... 19Regulated peak discharges ....................................... 21
Computation of daily lake-inflow hydrographsfor the period 1927-51 ................................... 21
Simulation of initial pool elevation ....................... 22Computation of hourly inflow hydrographs ................... 26
Hydrograph method ..................................... 27Area A ........................................... 27Area D ........................................... 41Area E ........................................... 42Area B and C ..................................... 42
Rainfall-runoff method ................................ 67Relation of regulated to unregulated peak discharges ................. 67Unregulated flood frequency .......................................... 69Regulated flood frequency ............................................ 76Summary ......................................................... 83References ... "..................................................84
iii

ILL USTRATION'S
Page
Figure 1. Map showing location of study area and location of gagingstations in the study area .............................
2-6. Graphs showing:2. Annual peak discharges and simulated unregulated
peak discharges for the Savannah River atAugusta, Ga. (02197000) for 1786-1985 ............
3. Flood-frequency relations based on two differentperiods of record for the Broad River aboveCarlton, Ga. (02191300) ...........................
4. Flood-frequency relations based on two differentperiods of record for the Savannah River nearCalhoun Falls, S.C. (02189000) ....................
5. Map showing areas, drainage areas, and gaging stationsused in estimating unregulated inflow hydrographs ......
6. Schematic diagram of the study area ......................7-16. Maps showing lines of equal rainfall for Savannah River
basin upstream from Augusta, Ga. for storms of:7. August 23-26, 1908 ..................................8. March 14-16, 1912 .............................9. August 1928 ..........................................
10. February 26 to March 3, 1929 ........................11. March 3-6, 1929 ...............................12. September 25-27, 1929.............................13. September 29 to October 2, 1929 ..................14. April 1-9, 1936 ...............................15. August 11-15, 1940 .............................16. November 26-29, 1948 ...........................
17-24. Graphs showing estimated inflow hydrographs forareas A-E for%
.17. Flood of August 1908 ................................18. Flood of March 1912 .................................19. Flood of August 1928 ............. ..................20. Flood of February to March 1929 .....................21. Floods of September and October 1929 ................22. Flood of April 1936 .................................23. Flood of August 1940 ................................24. Flood of November 1948 ..............................
4
9
12
13
1617
30313233343536373839
4849505152535455
iv

ILLUSTRATIONS--ContinuedPage
25-32. Graphs showing measured flood hydrograph/sfor unregulated conditions and simulatedhydrograph/s for the regulated conditions for theSavannah River at Augusta, Ga. (02197000) for:
25. Flood of August 1908 ................................ 5626. Flood of March 1912 ................................. 5727. Flood of August 1928 ................................ 5828. Flood of February to March 1929 ..................... 5929. Floods of September and October 1929 ................ 6030. Flood of April 1936 ................................ 6131. Flood of August 1940 ................................ 6232. Flood of November to December 1948 .................. 63
33. Relation between regulated peak discharges andunregulated peak discharges for the Savannah Riverat Augusta, Ga. (02197000) ............................ 68
34. Unregulated peak discharge frequency curve for theSavannah River at Augusta, Ga. (02197000) .............. 74
35. Unregulated and regulated peak discharge frequency curvesfor the Savannah River at Augusta, Ga. (02197000) ...... 79
TABLES
Table I. Characteristics of major reservoirs on the SavannahRiver upstream of Augusta, Ga ............................ 3
2. Annual peak stages and discharges for the SavannahRiver at Augusta, Ga. (02197000) for the period1796-1985 ............................................... 7
3. Drainage areas and periods of record for gaging stationsin the Savannah River basin from which stage anddischarge data were obtained ............................ 8
4. Published peak stages for early floods of the SavannahRiver at Augusta, Ga. (02197000) ........................ 11
5. Measured regulated and simulated unregulated peakdischarges for the Savannah River at Augusta, Ga.(02197000) for the period 1952-1985 ..................... 20
6. Equations for computing daily inflow hydrographs .......... 237. Simulated initial lake elevations prior to major
floods .................................................. 268. Areal rainfall amounts for the floods of 1908, 1912, 1928,
1929, 1.930, 1936, 1940, and 1949 water years ............ 40
v

TABLES--ContinuedPage
9. Muskingum routing parameters used in the HEC-5 modelfor the Savannah River from Hartwell Dam nearHartwell, Ga. (02187250) to the Savannah River nearAugusta, Ga. (02197000) ................................. 44
10. Measured and simulated peak discharges for regulated andunregulated conditions for the Savannah River atAugusta, Ga. (02197000) ................................. 64
I. Peak discharges and frequency plotting positions forunregulated conditions for the Savannah River atAugusta, Ga. (02197000) .................................. 70
12. Discharges of unregulated floods of selected percentchance exceedances of the Savannah River atAugusta, Ga. (02197000) ................................. 75
13. Peak discharges and frequency plotting positions forregulated conditions for the Savannah River atAugusta, Ga. (02197000) ................................ 80
14. Discharges of regulated floods of selected percentchance exceedances of the Savannah River atAugusta, Ga. (02197000) ................................. 82
vi

FLOOD FREQLENCY OF THE SAVANNAH RIVER AT AUGUSTA, GEORGIA
By
Curtis L. Sanders, Jr., U.S. Geological SurveyHarold E. Kubik, U.S. Army Corps of Engineers
Joseph T. Hoke, Jr., U.S. Army Corps of EngineersWilliam H. Kirby, U.S. Geological Survey
ABSTRACT
A flood-frequency study of the Savannah River at Augusta, Georgia(02197000) was made to provide information on floods of variousprobabilities of occurrence. The study was complicated by the fact that theSavannah River upstream of Augusta has been regulated since water year 1952by one or more of three large Federal multi-purpose dams. Although theperiod of record, available for analysis of regulated conditions was 34years, the pre§ ment period was imporptat t the flooy
a- se itinclude--a number of large floods that. even when-adjusted for regulation, exceed all floods since water year 1952. A'reservoir routing model was used to adjust nine such floods for the effectsof regulation by the dams. The model results also were used to develop arelation for estimating regulated peak discharges for additional unregulatedfloods as far back as 1796 that could not be modeled because of lack ofdata. The one-percent chance exceedance flood for current (1990) reservoiroperation criteria on the Savannah River at Augusta was computed to be180,000 cubic feet per second.
INTRODUCTION
Increased development of the Savannah River flood plain and greaterinterest in managing development to minimize damages caused by floods haveemphasized the need for reliable information on flood frequency of theSavannah River at Augusta, Georgia. The U.S. Geological Survey (USGS) andthe U.S. Army Corps of Engineers (COE) jointly made a study to providesuch information.
Although peak discharges for major floods since 1796 at this site havebeen documented, the flood-frequency analysis was complicated because theSavannah River upstream from Augusta has been regulated since water year1952 due to construction of three large Federal multi-purpose projects:Hartwell Dam, Richard B. Russell Dam, and J. Strom Thurmond Dam (formerlycalled Clarks Hill). These reservoirs have changed the statisticalcharacteristics of flooding on the river, and the regulated flow records arethose most directly relevant to present and future conditions.
1

The analysis could not be based solely on the regulated period ofrecord, however, because the period since regulation began has beenexceptionally free of large storms such as those that occurred prior toregulation. Most of those large storms were caused by infrequent climaticevents, including hurricanes.
The record of floods prior to commencement of regulation in 1951 couldnot be combined directly with the record of regulated floods. Instead, tocompile a hamou neous record f istical analysis, it was necessarvt-o-use ydraulic simulation models - termie th ffectsof eseryoirrulation on lood magnitudes. Using these models, the regulated post-1951
od £ecordb were convenrtedinto equivalent de-regulated records whichcould be combined with the pre-1952 observed unregulated floods. Inaddition, the models were used to simulate the effects of regulation on nineunregulated floods for which sufficient data were available for computation.In this way, a homogeneous record of unregulated flows and a homogeneousrecord of regulated flows were developed for statistical analysis.
The extended record of unregulated floods was analyzed by standardprocedures of flood-frequency analysis. The resultant unregulated floodfrequency curve is representative of flood hydrology on the basin in thelong term in the absence of regulation. The unregulated frequency curve wascombined with relations between corresponding regulated and unregulatedflood magnitudes to derive a frequency curve representative of regulatedconditions. In addition, an independent graphical frequency analysis of theregulated data was performed.
Purpose and Scope
The purpose of this report is to provide discharges for flood ofselected percent chances of exceeda -- aa River at Augustas a number 0 70 0 based on current reservoir operatinq criteria
'(1990) TCOE, 1974).
This report presents the results of the flood-frequency analysis anddescribes procedures used in the analysis to:
- generate unregulated-peak discharge data during periods whenregulated flow conditions existed;
- generate regulated peak discharge data for major floods duringperiods when unregulated conditions existed; and
- develop the flood-frequency relation from the adjusted data.
The flood-frequency data presented in this report for regulated conditionsare based on 1990 reservoir operating procedures. This analysis may notapply if substantial changes are made in the operation of the three largereservoirs upstream of Augusta.
2

Description of Study Area
The Seneca and Tugaloo Rivers, which originate in the Blue Ridgephysiographic province, join within Lake Hartwell. The Savannah River flowsfrom Hartwell Dam to the Atlantic Ocean, forming the State boundary betweenSouth Carolina and Georgia (fig. 1). The river transects two physiographicprovinces, the Piedmont and the Coastal Plain (Cooke, 1936). The city ofAugusta is on the Fall Line, which separates these two provinces. The slopeof the river ranges from an average of about 3 feet per mile in the Piedmontto less than 1 foot per mile in the Coastal Plain.
Upstream from the Fall Line, three large Federal multi-purpose dams(Hartwell Lake, Richard B. Russell Lake, and J. Strom Thurmond Lake,formerly Clarks Hill Lake) provide hydropower, water supply, recreationalfacilities and a limited degree of flood control (table 1). J. StromThurmond Dam is responsible for most of the flow, regulation that affects theSavannah River at Augusta. 3. Strom Thurmond Dam and Lake will hereafter bereferenced as Thurmond Dam and Lake. Richard B. Russell Lake and Dam willhereafter be referenced as Russell Lake and Dam. St Creek uiltin 1916 and located between Thurmond Dam and Au usta, impoun a minorrun-of-the-river reservoir compare o the three major reservoirs. StevensCreek dam and other dams upstream of Hartwell Lake have little impact onflood discharges at Augusta.
Table l.--Characteristics of major reservoirs on the Savannah River upstreamof Augusta, Georgia
mnil, square miles]
Monthand year Drainage Storage (1,000 acre-feet)
Lake filling began' area Flood Conservation Total(mi2)
Hartwell Feb. 1961 2,088 293,000 1,416,000 2,843,000Richard B. Oct. 1984 2,900 140,000 127,000 1,026,000
Russell3. Strom Dec. 1951 6,144 390,000 1,045,000 2,900,000
Thurmond
'Partial filling due to construction could have occurred priorto this date.
3

83° 82° 810
_r_
Figure 1.--Location of study area and location of gaging stations in the study area.

Previous Studies
The first comprehensive listing of floods of the Savannah River waspublished in U.S. House of Representatives Executive Documents No. 1 and 213in 1890. Updated listings of floods in Georgia, along with frequencyrelations, were published by Carter (1951); Bunch and Price (1962); andPrice (1979). A similar USGS report for South Carolina (Whetstone, 1982)lists peak discharges for the Savannah River at Calhoun Falls, Augusta andClyo, and provides unregulated flood-frequency information based on theperiod prior to 1952 and regulated flood-frequency information based on theperiod 1952-79.
The USGS tabulated peak discharges for floods prior to 1962 for severalgaging stations in the Savannah River basin (Speer and Gamble, 1964). TheCOE (1971) developed flood profiles for the Savannah River downstream ofAugusta for recurrence intervals of 5, 10, 15, 50, and 100 years. Otherstudies that provide information on peak discharges and floods aredocumented in several House Documents presented in the reference section ofthis report. Other useful reports include- two by Emigh (1914 and 1929) ofthe Weather Bureau, reports by Patterson (1889) and Phillips (1892); andseveral reports by the COE (1929, 1945, 1952, 1953 and 1974). Anunsteady-flow computer model has been used by the USGS to deteiriine floodro i es e ween ugustaan C o or 000r various
magnitudes (McDonald and Sanders, 1987).
Acknowledgments
The assistance of Rachel Brewer, city clerk of Augusta, Ga., inlocating historic information pertaining to floods in Augusta, isgratefully acknowledged. The authors are also indebted to the FederalEnergy Regulatory Commission, which provided additional informationregarding floods in Augusta, and to Dr. Edward Cashin, a professor ofAugusta College, who has been extremely helpful in providing informationregarding the history of Augusta.
AVAILABLE FLOOD RECORDS
Some information is available on floods in Augusta as early as 1722 andfor flood stages, as early as 1796. A stage of 40 feet (ft) for the floodof 1796 was first published by the U.S. Weather Bureau (USWB) (Emigh, 1914).A stage gage was established on the Savannah River in Augusta at 5th Streetabout 1835; the datum of the gage and for the city was the low water of1835.
5

Daily stage readings were published for the Savannah River at Augustafrom 1875 to July 1952 by the National Weather Service (formerly U.S.Weather Bureau). Stages were recorded continuously from about 1927 to 1936at 5th or 13th Streets in Augusta, except for short periods when the recorderwas removed due to bridge construction or relocation of the gage. A staffgage was used when the *recorder was not operated. The gage was located at5th Street from 1927 to 1932, and at 13th Street from October 1, 1932, toSeptember 30, 1936. On July 4, 1934, a staff gage was established on theSavannah River near Butler Creek, 13 miles downstream at a different datum,and used until July 30, 1936. A water stage recorder was operated at theButler Creek site from October 1, 1936 to November 10, 1948, when the gagewas moved 0.2 miles upstream to its present location at the New SavannahBluff Lock and Dam. The station name (Savannah River at Augusta, Ga.) andstation number (02197000), have not changed, and peak discharges at the foursites are considered equivalent.
Peak discharges prior to 1912 were determined using a stage-dischargerating established by discharge measurements made during the 1890's andearly 1900's. The COE first published discharges for the major floods inU.S. House of Representatives Executive Documents No. 1 and 213 and the U.S.Weather Bureau published discharges for the major floods in 1891. The USGSlisted the peak stages and discharges for the floods of 1840, 1852, 1865,1876, and 1888, and maximum daily stages and discharges for "all the largefloods" from 1840 to 1905, (Murphy, 1906). The USGS published peak stagesand discharges for the Savannah River in 1951 (Carter, 1951).
Carter (1951) indicates that discharges for all floods above 225,000ft3/s (cubic feet per second) are known (either by direct measurement orindirect calculations). Newspapers and other publications (listed inReferences) used to verify the occurrences of floods indicate that, inaddition to the floods used in the analysis described in this report,notable floods also occurred on the Savannah River in 1722, 1741, 1793,1820, 1824, 1830, 1833, 1851, 1854, 1870 and 1875. The Augusta Gazette(Chronicle) newspaper began publication in October, 1785. It appears thatthe newspaper (its name changed several times over the years) reported anymajor flooding of the city.
Flood data for all floods of the Savannah River at Augusta used inthis analysis are listed in table 2 and plotted in figure 2. The flood dataare presented by water year. A water year is the 12-month period October 1through September 30, and is designated by the calendar year in. which itends. Other gaging stations in the study area with records of stage anddischarge used in this study are listed in table 3 and shown in figure 1.
6

Table 2.--Annual peak stages and discharges for the Savannah River at[uusta. Ga. (02197000) for the e eriod 1796 - 1985
[ft, feet; ftl/s, cubic feet per second]
Wateryear
117961840
21852
'18641865
18761877187818791880
18811882188318841885
18861887188818891890
18911892189318941895
18961897189818991900
19011902190319041905
190619071908
Date
Jan. 17May 28Aug. 29Jan. 1Jan. 11
Dec. 30Apr. 14Nov. 23Aug. 3Dec. 16
Mar. 18Sept. 12Jan. 22Apr. 16Jan. 26
May 21July 31Sept. 11Feb. 19Feb. 27
Mar. 10Jan. 20Feb. 14Aug. 7Jan. 11
July 10Apr. 6Sept. 2Feb. 8Feb. 15
Apr. 4Mar. IFeb. 9Aug. 10Feb. 14
Jan. 5Oct. 5Aug. 27
Stage(ft)
4037.837.434.936.9
28.631.423.522.030.1
32.229.330.828.027.5
32.534.538.733.322.9
35.532.825.024.030.4
30.529.331.331.032.7
31.834.633.225.525.8
29.623.638.8
Discharge(ft'/s)
360,000270,000250,000185,000240,000
86,400119,00051,50044,000
102,000
130,00093,300111,00081,00077,000
135,000173,000303,000149,00048,500
197,000140,00060,00054,000
106,000
107,00093,300
117,000113,000138,000
124,000175,000147,00063,00064,800
96,60052,000
307,000
Wateryear
19091910191119121913
19141915191619171918
19191920192119221923
19241925192619271928
19291930193119321933
19341935193619371938
19391940194119421943
194419451946
4
Date Stage(ft)
June 5 28.7Mar. 2 26.4Apr. 14 19.1Mar. 17 36.8Mar. 16 35.1
Dec. 31 24.3Jan. 20 28.2Feb. 3 31.0Mar. 6 29.2Jan. 30 25.5
Dec. 24 35.0Dec. 11 35.4Feb. II 35.1Feb. 16 32.0Feb. 28 28.0
Sept.22 28.0Jan. 20 36.5Jan. 20 27.3Dec. 30 24.0Aug. 17 40.4
Sept 27 46.3Oct. 2 45.1Nov. 17 19.9Jan. 9 30.4Oct. 18 30.3
Mar. 5 28.5Mar. 15 27.4Apr. 8 41.2Jan. 4 30.1Oct. 21 30.1
Mar. 2 24.10Aug. 15 29.40July 8 22.89Mar. 23 24.56Jan. 20 25.10
Mar. 22 25.53Apr. 27 23.16Jan. 9 24.43
Discharge(ft'Is)
87,30069,80032,800
234,000156,000
48,00061,00082,40068,00045,500
128,000133,000129,00092,00059,700
59,700150,00055,30039,000
226,000
343,000350,000
26,10093,80092,600
73,20063,700
258,00091,40091,400
90,900239,00053,300
105,000117,000
128,00064,00097,200
Wateryear
19471948194919501951
619521953195419551956
1957195819591960
71961
19621963196419651966
19671968196919701971
19721973197419751976
19771978197919801981
198281983
19841985
Date Stage(ft)
Jan. 22 23.97Feb. 10 23.90Nov. 30 26.61Oct. 9 20.10Oct. 22 22.32
Mar. 6. 21.53May 8 20.80Mar. 30 17.39Apr. 15 16.77Apr. 12 14.70
May 7 14.08Apr. 18 22.91June 8 18.65Feb. 14 20.58Apr. 2 20.56
Jan. 9 20.09Mar. 23 19.52Apr. 9 24.16Dec. 27 20.62Mar. 6 21.50
Aug. 25 18.10Jan. 12 20.94Apr. 21 22.24Apr. 1 17.68Mar. 5 23.30
Jan. 20 20.36Apr. 8 21.63Feb. 23 20.13Mar. 25 22.24June 5 20.27
Apr. 7 20.50Jan. 26 21.98Feb. 27 21.13Mar. 31 22.33Feb. 12 14.70
Jan. 2 19.39Apr. 10 23.21Mar. 5 - 20.35Feb. 7 17.89
Discharge(ft '/s)
86,00083,200
154,00032,50046,300
39,30035,20025,50023,90018,600
18,00066,30028,50034,90034,800
32,50031,30087,10034,60039,300
26,50035,90045,60025,20063,900
33,70040,20032,90045,60033,300
34,20043,10037,30047,20017,700
30,70066,10034,00025,700
Note: ' Flood of January 17, 1796, reached a stage of about 40 feet (at site and datumof Fifth Street gage), marked by local residents; discharge approximately360,000 ft
3/s, by slope conveyance study.. Little information exists and the
data are considered approximate. Data furnished by the U.S. Army Corps of Engineers.
A horizontal line in "Water year" column indicates discontinuous record.
3 U.S. House of Representatives Document No. 64.
4 Lines across the "Date" and "Discharge" columns Indicate a change in the sitethat significantly affects the stage-dlschage relation.
I A line across the "Stage" column indicates a change in gage datum andmeans that the stages above and below the line are not comparable.
6 Filling of Thurmond Lake began In December 1951.
7 Filling of Hartwell Lake began in February 1961.
6 Filling of Russell Lake began in October 1984.
7

Table 3.--Drainage areas and periods of record for gaging stations in theSavannah River basin from which staae and discharae data were obtained
Station
Stationnumber
02184000
02187000
02187250
02187500
02189000
02189004
02191300
02192000
02194500
02195000
02197000
Site orstation
Tugaloo River nearHartwell, Ga.
Seneca River nearAnderson, S.C.
Hartwell Lake nearHartwell, Ga.
Savannah River nearIva, S.C.
Savannah River nearCalhoun Falls, S.C.
Richard B. Russell nearCalhoun Falls, S.C.
Broad River aboveCarlton, Ga.
Broad River nearBell, Ga.
Thurmond Lake nearClarks Hill, S.C.
Savannah River nearClarks Hill, S.C.
Savannah River atAugusta, Ga.
Drain agearea,
square miles
909
1,026
2,088
2,231
2,876
2,900
760
1,430
6,150
6,150
7,508
Period of record
1925-19271940-1960
1928-1959
1959-current year
1950-current year
1896-18981899-19001930-19321938-1982
1984-current year
1898-1988
1926-19321937-current year
1951-current year
1940-1954
1883-18911896-19061925-current year
8

400,000
0z0
0
(-)
w
a-F-
LLQ
0z
0
C)
5a_0v
350,000
300,000
250.000
200,000
150,000
100,000
50,000
I I i I tI I I I I I I 'I UNREGULATED PERIOD I OF RECORD . REGULATEI
1~~~~I _ _- PWQ;O-HISTORIC PERIOD I OF RECORD (1786-1985) i RECORD.j
UNREGULATED- __PERIOD OF RECORD 1(1876-1985) iG 1
PERIOD'OFU ANNUAL PEAK DISCHARGES RECORD
(1952-1985)U SIMULATED UNREGULATED
DISCHARGES
A I" II K
II
"V
Base discharge is225.000 cubic
feet per second.
U-
'010
1 :,'a,
1940 1960 1980 2000 20200'17(
I I I I80 1780 1800 1820 1840 1860 1880 1900 1920
WATER YEAR
Figure 2.--Annual peak discharges and simulated unregulated peak discharges for the Savannah River atAugusta, Ga. (02197000) for 1786-1985.

Based on information currently (1990) available, the range ofuncertainty for the stage of the flood of 1796 extends from 37 to 41 ft,with a corresponding range of discharge from 240,000 ft 3/s to 410,000 ft 3/s.The published stage of 40 feet and discharge of 360,000 ft 3/s were used inthe frequency analysis of this report. The first reference to a stage of 40ft appeared in House Executive Document No. 23, dated January 1881. Otherreferences that show a stage of 40 ft are Emigh (1914), COE (1929), HouseDocument No. 64 (1935), and Carter (1951). Carter (USGS, written commun.,3/23/50) indicates that in 1930 the COE had knowledge of a high-watermark for the 1796 flood and had determined the discharge by aslope-conveyance computation; no records of the high-water mark or thecomputation are available at this time (1990).
Publications prior to House Document No. 64 (1935) list various valuesfor peak stages for several early floods on the Savannah River at Augusta.Most publications indicate that the gage at the 5th street bridge was readroutinely from 1 to 4 times daily (Hall and Hall, 1907). During floods thegage was read more frequently. Therefore, the differences may be becausesome publications may show observed stage and other publications may show theinterpolated peak stage based on more than one observed stage. These floodsand the peak stages published prior to 1951 and those used in this reportare listed in table 4.
APPROACH
Peak discharges for 5 historic and for floods in water years 1876-1985as given in table 2 consist of unregulated peak discharges prior to 1952 andregulated peak discharges since 1952.
To determine the one-percent chance exceedance flood, a flood in whichthe peak discharge has a one-percent chance of being exceeded in any year,it is desirable to use the longest period of record possible (InteragencyAdvisory Committee on Water Data, 1982).
The period of record used for a flood-frequency analysis can have asubstantial effect on the discharge for a given probability of exceedance;for example, the one-percent chance exceedance flood computed for the BroadRiver near Carlton, Ga. for the period 1898-1985 is 49 percent greater thanthat computed for the period 1952-85 (fig. 3). Similarly, the one-percentchance exceedance flood computed forthe Savannah River near Calhoun Falls,S.C. for the period 1900-1960 is 18 percent greater than that computed forthe period 1931-60 (fig. 4). These differences would be even greater if thelarge floods that occurred during the eighteenth and nineteenth centurieswere included. The peak discharges for neither river were subject tosignificant regulation during these periods.
10

Table 4.--Published peak stages for early floods of the Savannah River at Augusta, Ga. (02197000)
[dashes indicate no data]
U.S. House ofRepresen- U.S. House of U.S. House oftatives Represent- Represent-
Executive tatives tativesDocument Document Corps of Document ThisNo. 213 Murphy Emigh No. 615 Engineers No. 64 Carter report
Flood 1890 1906 1914 1916 1929 1935 1951 1990
1796 -- -- 40 39.5 40 40.0 40 40
1840 37.5 37.8 37.8 37.8 37.8 37.8 37.8 37.8
1852 36.8 36.8 37.4 37.4 37.4 37.4 37.4 37.4
1864 34.0 -- 34.9 34.9 34.9 34.9 - 34.9
1865 36.4 36.4 36.9 36.9 36.9 36.9 36.9 36.9
1888 38.7 38.7 38.7 38.8 38.7 38.7 38.7 38.7
1908 -- -- 38.8 38.9 38.8 38.8 38.8 38.8
I-A
'An analysis of the flood
feet for the flood of 1796.
frequency in this report includes discharges for stages of 37, 40, and 41

70,000
60,000
50,000
z0o 40,000
LU
I-30,000LULLJ
Z 20,000
o 15,000Cl,
50.0 20.0 10.0 5.0 2.0 1.0 0.5
EXCEEDANCE PROBABILITY, IN PERCENT
Figure 3.--Flood-frequency relations based on two different periods of record for the Broad River aboveCarlton, Ga. (02191300)

0z0U.)COW
ccI-
LU.wLiUUJ0
zLd0CDc
160,000
140,000
120,000
100,000
80,000
60,000
40,00050.0 20.0 10.0 5.0 2.0 1.0 0.5
EXCEEDANCE PROBABILITY, IN PERCENT
Figure 4.--Flood-frequency relations based on two different periods of record for the Savannah River nearCalhoun Falls, S.C. (02189000).

The analysis used in this report utilizes the period of record from1786 through 1985 and includes the combined regulation capability ofThurmond, Hartwell and Russell Dams, and is based on 1990 dam operatingcrit E 1974). The period of record-com-mences w-ith the-water year'1786) in which the Augusta Chronicle commenced publication, because theChronicle apparently reported any significant flooding of Augusta for theperiod of record.
The approach used in the analysis was:
A. Peak discharges for regulated conditions for 1952-85 were fconverted to peak discharges for unregulated conditionsusing a streamflow routing model and inflow hydrographsestimated from daily streamflow and reservoir storage data.
B. Peak discharges for nine major unregulated floods wereconverted to peak discharge for regulated conditions, usinga reservoir routing model, current reservoir operationcriteria, streamflow routing parameters, inflow hydrographs,and simulated initial lake elevations. The inflow hydrographswere developed using a rainfall-runoff model or usinghydrographs of the Broad River near Bell, Ga. (02192000)or above Carlton, Ga. (02191300) adjusted for relativedrainage area size, storm rainfall amounts, and calibrationresiduals. Hypothetical regulated peak discharges were alsodeveloped using the unregulated discharges multiplied byfactors of 1.25, 1.50, and 2.00.
Initial lake elevations were determined for the beginningof major floods using a reservoir routing model and dailyflows computed from daily discharge data at gaging stations.Median daily lake elevations were used when inflow data -were not available for use in the reservoir routing model.
C. A relation between regulated and unregulated peak dischargesWas~~ Fsing the data from steps A-and B.
D. A flood-frequency relation for unregulated conditions wasdeveloped by fitting a Pearson Type III distribution to thelogarithms of the unregulateq peak discharges. A systematicrecord period of 1876-1985, a historical period of 1786-1985,and a historical flood threshold of 225,000 ft 3/s were used.For an explanation of the significance of these flood-frequencyparameters, see Hydrology Subcommittee Bulletin l7BZateragency - .Committee on Water Data, 1982).
14

F
E. The flood-frequency relation for unregulated conditions wasconverted to a flood-frequency relation for regulatedconditions using total probability methods and the relationbetween regulated and unregulated peak discharges.
F. Frequency plotting positions were computed for the highest 10regulated peak discharges above a historic threshold discharge-of 90,000 ft 3/s using a historic period of 1786-1985 and forthe measured regulated peak discharges for water years 1952-85,historically adjusted to match the longer period. The 10highest discharges were either simulated or obtainedfrom the regulated-unregulated frequency relation.
G. The final regulated flood frequency relation was obtained byaveraging the independent estimates developed in steps E and F.
SIMULATED PEAK DISCHARGES
The regulated peak discharges for water years 1952-85 were converted tounregulated peak discharges using daily lake stage and storage data, dailydischarge data and the streamflow routing capabilities of the HEC-l computerprogram (COE, 1985). Unregulated peak discharges for floods during wateryears 1908, 1912, 1928, March and September 1929, 1930, 1936, 1940, and1949, were converted to regulated peak discharges using estimated daily,hourly, and bi-hourly hydrographs, streamflow routing parameters, 1990lake operation criteria and the HEC-5 reservoir-routing computer program(COE, 1982).
The lake system and areas A-E for which hydrographs were computed areshown in figure 5 and schematically in figure 6. Hydrographs for areas Aand C were combined for use in simulating unregulated peak discharges forwater years 1952-85, regulated peak discharges for the 1936 flood, andinitial lake elevations for 1927-85. The inflow hydrographs for each ofthe areas represent the flow contributed by the area to the river or lake.The "local inflow" of an area is the difference between the flow from animmediate upstream area and the outflow from the area in question.
Regulated discharges for the Savahnah River at Augusta for 1952-85 wereconverted to unregulated discharges by routing of inflows using theHEC-istreamflow model (COE, 1985). HEC-l has rainfall-runoff modelingcapability, which was used to generate hourly inflow hydrographs for the1936 flood.
15

83* 82z
LAKE
155082 mi2
DRIAEAE
A GAGING S ATO AN
02197000 NUMER0
I -
Bas fomUS GooooalSuve
34 ARLTON BELL°"
v .• .,.•...• J. S TRom
02192000 H UtURyUOND
i 1358 mi
EXPLANATION C Ia2974 1692 mi,•=..•DRAINAGE BA8IN
BOUNDARY
A ig AREA DESIGNATdON AND ga i g st o s eTiu m atin
1550 mi u uDRAINAGE AREAin 02lo h 0
02197000 NUMBERAU ST
2970000 030 MILES '
0 210 30 K LOMEF'fERS
Base from U.S. Geological Survey18i.500t,000 Hydrologic Unit maps,
ouhCarolina, and Georgia, 1974.
Figure 5.--Areas, drainage areas, and gaging stations used in estimatingunregulated inflow hydrographs.
16

02184000(Vi 187000 (V3 IQ0)
INFLOW E (QE)
TWELL LAKE
500 (Q4 ,Q, ,QI)
<0
021 91 30((C
RUSSELL LAKE
)5.Q8)
THURMOND LAKE<~00,
(Q6 IQl0 IQ12)
EXPLANATION
LAKE 102197000(Q 7 10 1 31
> RIVER
INFLOW HYDROGRAPHFROM AREAS A-E(OUTLINED IN FIGURE 1)
A GAGING STATION
Figure 6.--Schematic diagram of the study area.
QO)
17

The HEC-l computer program is a generalized hydrologic programdeveloped by the COE Hydrologic Engineering Center (HEC) to simulate thesurface-runoff response of a river basin to precipitation by representingthe basin as an interconnected system of hydrologic and hydraulic components(COE, 1985). Input to the HEC-l computer program consisted of routingparameters, inflow hydrographs, precipitation data, andinterception/infiltration parameters. The HEC-l program supports a varietyof hydrologic computation procedures. In this study, the Soil ConservationService (SCS) curve number method was used to compute rainfall excess, theunit hydrograph method was used to compute discharge from rainfall excessand the Muskingum method was used for flood routing in channels.
A reservoir routing model, HEC-5 (COE, 1982), was used to route dailyinflow hydrographs through the three reservoirs to establish initial lakeelevations for hourly hydrographs for eight floods, which were routedthrough the system using the HEC-5 model.
The HEC-5 computer program is a generalized hydrologic reservoircomputer program developed by the COE Hydrologic Engineering Center tosimulate operation of reservoirs for flood-control purposes during a singleflood or for conservation purposes (such as maintenance of minimum flows forwater supply) and for period-of-record routings (COE, 1982). The HEC-5model was developed to assist in planning studies for evaluation of proposedreservoirs, and to assist in sizing the flood control and conservationstorage requirements for a specified project. The program allows simulationof the sequential operation of a system of reservoirs of any configurationfor short-interval historic or synthetic floods. For detailed information,refer to the users manual (COE, 1982).
Input to the HEC-5 model consisted of routing parameters, stage-storagerelations for reservoirs, reservoir operation rules and constraints, systemconfiguration, inflow hydrographs, and initial pool elevations.
The Muskingum method for channel routing was used to route hydrographsthrough channel reaches and through each reservoir to the dam. TheMuskingum method approximates outflow from a channel reach as a linearfunction of inflows at current and previous time steps. Flow was routedthrough the dams using reservoir storages, reservoir operation criteria(COE, 1974), and flow constraints at downstream locations.
HEC-5 was modified to accommodateýthe complex channel flow capacitycriteria specified in plate A-7-1 of the "Reservoir Regulation Manual,Savannah River Basin," (COE, 1974).
18

Requirements for releases from Thurmond Dam include:
1) maintenance of minimum weekly average flow of 3,600 ft 3/s forwater supply and hydropower generation,
2) variation of operating channel flow capacity at Augusta from20,000 ft 3/s to 30,000 ft 3/s, depending on pool elevations,
3) releases in excess of 30,000 ft 3/s to prevent dam overtopping, and
4) maintenance of discharge at Augusta equal to maximumlocal inflow during periods of falling reservoir stages duringfloods to lower lake levels as quickly as possible.
Unregulated Peak Discharges
Regulated peak discharges were converted to unregulated peak dischargesby the following methodology:
i. For water years 1952-85, daily inflow hydrographs were estimatedusing peak discharge, daily discharge, and daily lake elevationdata. Local inflows were computed from the hydrologic storageequation, Local Inflow = Outflow - Upstream Inflow + Change inStorage. Where there were no reservoirs in the areas where localinflows were computed, the changes in storage was assumed to bezero. Where the areas included reservoirs, changes in storage werecomputed using measured lake elevations and relations of lakestorage to lake elevation (COE, 1974). Negative daily localinflows sometimes resulted using the change-in-storage method, mostlikely because of non-equilibrium conditions at the time of daywhen reservoir elevations were measured. These negative inflowswere set at a representative minimum flow. In such cases, allhydrograph ordinates were multiplied by a constant to adjust thecomputed volume to equal the measured volume. Inflow hydrographswere transferred to other locations in proportion to drainage arearatios.
2. The daily inflow hydrographs were converted to 2-hourhydrographs by interpolatibn,4 and then routed through theregulated river system to ensure that flood volumes werepreserved.
3. The 2-hour inflow hydrographs were then routed through thestream system without the reservoirs, using HEC-1, to simulateunregulated hydrographs and peak discharges for the water years1952-85 (fig. 2 and table 5).
19

Table 5.--Measured regulated and simulated unregulated peak discharges for theSavannah River at Auqusta, Ga. (02197000) for the period 1952-1985
[ft3/s, cubic feet per second]
Measured SimulatedWater year regulated unregulated
discharge discharge(ft 3/s) (ft 3/s)
19521953195419551956
19571958195919601961
19621963196419651966
19671968196919701971
19721973197419751976
19771978197919801981
1982198319841985
39,30035,20025,50023,90018,600
18,00066,30028,50034,90034,800
32,50031,30087,10034,60039,300
26,50035,90045,60025,20063,900
33,70040,20032,90045,60033,300
34,23043,10037,30047,20017,700
30,70066,10034,00025,700
137,00056,40059,i0068,40065,200
53,40086,10054,90084,700
113,000
81,70094,000
143,000111,000131,000
102,00079,000
114,00074,300
180,000
114,00098,00086,000
149,000104,000
90,900138,000125,000108,00056,100
88,000102,00065,60066,300
20

F
Regulated Peak Discharges
Regulated discharges were simulated for flood events during water years1908, 1912, 1928, March and September 1929, 1930, 1936, 1940 and 1949 by:
1. Assuming initial lake elevations for the 1908 and 1912floods to be equal to median daily lake levels at Hartwell andThurmond Lakes and the rule curve elevation for Russell Lake.
2. Estimating daily inflow hydrographs into each lake for theperiod 1927-1951.
3. Simulating daily lake elevations for the period 1927-1951using the daily inflow hydrographs and the HEC-5 model toprovide initial lake elevations for the floods beingrouted.
4. Estimating hourly inflow hydrographs for the floods beingrouted, using a rainfall-runoff model or using hydrographsof the Broad River near Bell, Ga. (02192000) or aboveCarlton, Ga. (02191300) adjusted for relative drainagearea size, storm rainfall amounts, and calibrationresiduals. Hypothetical regulated peak discharges were alsodeveloped using the unregulated discharges multiplied byfactors of 1.25, 1.50, and 2.00.
5. Calibrating the HEC-5 model using hydrographs from gaging stationson the Savannah River.
6. Routing the calibrated inflow hydrographs to Augusta usingthe HEC-5 model with regulated conditions.
Computation of Daily Lake Inflow Hydrographs for the Period 1927-51
Daily lake inflow hydrographs were estimated for 1927-51 and used withthe HEC-5 program to estimate initial pbol elevations for floods in water years1928, 1929, 1930, 1936, 1940, and 1949, for which hourly hydrographswere available. The procedure used to compute daily inflow hydrographs dependedon available data.
Local inflows were computed from the hydrologic storage equation asexplained previously. Some hydrographs were computed by multiplying dailydischarges collected at other sites on the same stream in an area by theratios of the drainage areas of the sites.
21

During the subtraction process, negative flows were occasionallycomputed. These negative flows were eliminated by the following steps:
1. computing the annual means of the unadjusted daily values,
2. adjusting all flows below a reasonable minimum flow to theminimum flow,
3. computing the annual means of the adjusted daily flows, and
4. preserving measured annual volume, by multiplying the adjusteddaily flows of step 2 by the ratios of the annual means of theunadjusted values to the annual means of the adjusted annualmeans in step 3.
Equations for computing daily inflows are listed in table 6.
Simulation of Initial Pool Elevations
Initial pool elevations for the 1928, March and September 1929, 1930,1936, 1940, and 1949 water-year floods were determined by routing thedaily inflow hydrographs through the reservoirs using HEC-5. Currentrequirements for flood control, hydropower, and conservation storage wereincorporated into the model. Hydropower production loads were usedaccording to Southeastern Power Administration contract requirements.Storage rule curves obtained from the Reservoir Regulation Manual (COE,1974) for Thurmond and Hartwell Lakes and the Interim Reservoir RegulationCriteria (COE, written commun., 1983) for Russell Lake. Channel capacity atAugusta was set according to Plate A.7.l of the Reservoir Regulation Manual(COE, 1974). Initial pool elevations for Hartwell and Thurmond Lakes forthe 1908 and 1912 floods were estimated using median daily lake elevationsfor periods preceding the flood dates for years 1963-85 (Hartwell) and1971-85 (Thurmond), excluding 1981. Records for calendar year 1981 for bothlakes and prior to 1971 for Thurmond Lake were excluded because ofuncharacteristically low lake elevations. The rule-curve elevation was usedfor Russell Lake. Initial pool elevations are listed in table 7.
22

Table 6.--Eguations for comoutino daily inflow hydroqraphs
Period(inclusive)
Equations for computing daily discharge
October 1927 - June 1928
July 1928 - January 1940
February 1940 - September 1950
October 1950 - June 1961
October 1927 - May 1930
April 1930 - April 1932
May 1932 - March 1938
April 1938 - January 1961
October 1927 - March 1930
April 1930 - April 1832
May 1932 - March 1938
April 1938 - May 1940
June 1940.- June 1954
October 1927 - May 1940
June 1940 - June 1954
to Hartwell Lake
QEi = K, Q.r (Dh/Di)
QE2 = Q3(V4 Dh/VaDi)
QE3 = (QI+Q3) (V4 Dh/Di(VI+V3))
QE4 = Q4 Oh/Di
to Russell Lake
QDO = QE' (Dr-Dh)/Dh
QD2 = Qs-Qs
QDi = QE (Dr-Dh)/Dh
QD2 = Qs-Q8
to Thurmond Lake
QC2
go2Qc 3
= Q7-Q9-QIO
= Q7-Q9 -Q11
= 7QQl
= Q7-Q9 -Q10
=Q124hO0
to the reach of the Savannah Riverbetween Thurmond Dam and theSavannah River at Augusta,
Georgia (02197000)
QBI = K, Q7
QB2 = Q7-QI4
23

Table 6.--Equations for computing daily inflow hydrographs--Continued
whereDh is the drainage are9 for Hartwell Lake near Hartwell, Ga.
(02187250); in mi-.
Di is the drainage area for the Savannah River near Iva, S.C.(02187500), in mi'.
Dr is the drainage area for the Richard B: 2Russell Lake near
Calhoun Falls, S.C. (02189004), in mi .
Ki is an adjustment factor (1.05) to preserve volumes.
K2. is an average of factors (K3 ) computed by the equation%
K3 = Q13 - Q12
Q7
QB1-2 is the daily mean discharge from area B to the Savannah Riverat Augusta (02197000) in ft 3/s.
QC1-3 is the daily mean discharge from areas A and C at ThurmondDam, in ft 3/s.
QDI-2 is the daily mean discharge from area D at Russell Dam, inft 3/s.
QEi-2 is the daily mean discharge from area E to Hartwell Lake, inft /s.
Q, is the daily mean discharge for the Tugaloo River nearHartwell, Ga. (02184000) in ft 3/s;
Q2 is the daily mean discharge for the Broad River near Bell, Ga.(02192000) in ft 3/s;
Q3 is the daily mean disgharge for the Seneca River near Anderson,S.C. (02187000) in ft 3 /s;
Q4 is the daily mean discharge for the Savannah River nearIva, S.C. (02187500) in ft 3/s;
Q~r is the daily mean discharge for the Savannah River nearnear Iva, in fts/s, computed from the regression equation:
= 39.99 Q2 0 .664
Qs is the daily mean discharge for Savannah River near CalhounFalls, S.C. (02189000)in ft 3/s;
Q6 is the daily mean discharge for Savannah River near ClarksHill, S.C. (02195000) in ftl/s;
24

Table 6.--Equations for computing daily inflow hydrographs--Continued
Q7 is the daily mean discharge for the Savannah River atAugusta, Ga. (02197000), in ft 3/s;
Q6 is the daily mean discharge as determined by routing theHartwell inflows to the Savannah River near CalhounFalls, S. C. (02189000) using the HEC-l Model, in ft 3/s;
Qq is the daily mean discharge for the reach of theSavannah River between Thurmond Dam and the SavannahRiver at Augusta (02197000), in ft 3/s;
Q1o is the daily mean discharge as determined by routing theHartwell and Russell inflows to Thurmond Dam using the HECMATHPK program (Robert Carl, written commun.), in ft 3/s;
Q11 is the daily mean discharge, to Thurmond Lake as determinedby routing the flow of the Savannah River at CalhounFalls, S.C. (02189000) to Thurmond Lake using the HECMATHPK program, in ft 3/s;
Q12 is the daily mean discharge, for the Savannah River nearClarks Hill, S.C. (02195000), in ft 3/s;
Q13 is the daily mean discharge as determined by routing theflow of the Savannah River near Clarks Hill, S.C.(02195000) to the Savannah River at Augusta, Ga.(02197000), by the HEC-1 program in ft3/s;
Q1, is the daily mean discharge as determined by routingthe flow of the Savannah River near Clarks Hill, S. C.(02195000) to the Savannah River at Augusta, (02197000),by the HEC MATHPK program, in ft 3/s;
V, is the accumulated daily discharge for the Tugaloo Rivernear Hartwell, Ga. (02184000), in ft 3/s;
V3 is the accumulated dailykdischarge for the Seneca Rivernear Anderson, S.C. (02187000), in ft 3/s.
V4 is the accumulated daily discharge for the Savannah Rivernear Iva, S.C. (02187500), in ft 3/s.
25

Table 7.--Simulated initial lake elevations prior to major floods
Beginningflooddate
Initial lake elevation(feet)
Hartwell Russell Thurmond
Aug. 21, 1908
Mar. 14, 1912
Aug. 13, 1928
Sept. 25, 1929
Mar. 24, 1936
Aug. 12, 1940
Nov. 26, 1948
658.6
657.8
660.0
657.2
659.0
648.8
656.4
475.0
475.0
475.0
474.1
475.0
472.0
475.0
329.7
328.6
330.3
327.7
328.5
321.5
327.5
Computation of Hourly Inflow Hydrographs
For the 1908, 1912, 1928, March and September 1929, 1930, 1940, and1949 water-year floods, measured hydrographs were available for thefollowing stations: Broad River near Bell, Ga. (02192000), Broad Riverabove Carlton, Ga. (02191300), Savannah River near Calhoun Falls, S.C.(02189000), and Savannah River at Augusta, Ga. (02197000). The peakdischarges for the eight floods for which measured hourly hydrographs wereavailable occurred on the following dates:
Calendar date
August 27, 1908March 17, 1912August 17, 1928March 6, 1929
September 27, 1929October 2, 1929August 15, 1940November 30, 1948
Hereafter, these floods willrather than by calendar date.
Water year
1908191219281929t-
1929193019401949
be identified by month and (or) water year
26

Regulated peak discharges at Augusta for the eight floods wereestimated using measured hourly hydrographs and rainfall maps toestimate initial hourly hydrographs for five areas of the Savannah Riverupstream of Augusta, labeled A through E in figures 5 and 6. Shapes of theinitial hourly hydrographs were derived from hydrographs of the Broad Riverabove Carlton and near Bell. The initial hourly hydrographs were thenadjusted for timing and discharge residuals at Augusta, and routed throughthe reservoirs using the HEC-5 reservoir flow-routing model. This method ofdetermining hourly hydrographs is described as "hydrograph method" in thisreport.
The rainfall-runoff option of the HEC-1 model was used to simulateinflow hydrographs for the 1936 flood because measured discharge data werenot available for the Savannah River near Calhoun Falls, S.C. (02189000).This method of determining inflow hydrograph is described as"rainfall-runoff method" in this report.
Hypothetical inflow hydrographs were computed by multiplying thedischarges of the inflow hydrographs by factors of 1.25, 1.50, and 2.00.The hypothetical inflow hydrographs were used to determine the effects ofregulation for floods larger than were actually experienced.
Hydrograph Method
Initial hydrograph shapes for areas of the Savannah River drainagebasin upstream of Augusta were determined in the hydrograph method by usingobserved hydrographs for the Broad River, adjusted by relative drainageareas and rainfall volume. Hydrographs for areas B and C were refinedfurther by adding prorated residuals between the computed hydrograph and themeasured hydrograph of the Savannah River at Augusta. Hydrographs for areasC, D, and E were subsequently adjusted to shapes greater in discharge andshorter in time to account for the effect of shorter travel times throughthe reservoirs. Stevens Creek Reservoir was assumed to have negligibleimpact on large floods in the Savannah River, compared to the much largerflow regulation effected by Hartwell Lake, Russell Lake, and ThurmondReservoir.
Area A.--An hourly hydrograph for area A, the Broad River drainagebasin upstream from its mouth, beginning with construction of a "shape"hydrograph, was computed as described bplow:
1. The shapes of the hydrographs for the Broad River above Carlton,Ga., (760 mi 2) (square miles) and near Bell, Ga., (1,430 mi2 ) wereassumed to be representative of the shape of initial hourlyhydrographs for areas A, B, C, and D, which-range from 820 mi2
to 1,692 mi 2 . The Carlton hydrographs were used for the 1908 and1912 floods because records were not available for the Bell gage.Hydrographs for the 1928, 1929, 1930, 1940, and 1949 floods wereestimated using measured hydrographs at Bell.
27

2. Measured hydrograph discharges were multiplied by the factor Ry,and measured hydrograph times were multiplied by the factor Rx,to maintain a direct relation between volume and R (the drainagearea ratio) where:
R = AB/AG,
Ry = RO- 5 8 , and
Rx = R/R
and
AB is the drainage area of the Broad River at itsmouth, in mi 2 (table 3),
AG is the drainage area for the Broad River aboveCarlton, Ga. (02191300) or near Bell,Ga. (02192000), in mi2 , and
0.58 is the average slope of the relation of flooddischarge of selected frequencies todrainage area, (Price, 1979 p. 17).
R is the ratio of the drainage area of the Broad Riverat its mouth to the drainage area aboveCarlton, Ga. (02191300) or near Bell, Ga.(02192000).
Ry is the drainage area adjustment factor for thehydrograph discharge. Peak discharges at twosites vary directly with the 0.58 exponent ofthe ratio of their respective drainage areas.The exponent of 0.58 is based on the slope ofthe regression between peak discharge for selectedrecurrence intervals and drainage area, asdetermined by Price (1979, p. 17).
Rx is the drainage area adjustment factor for thehydrograph time 'Sase. Hydrograph volumes weredetermined to vary directly with drainage arearatio on the average.
28

3. Operation (2) broadened the hydrograph and moved the centroidand peak later in time. The hydrographs were adjusted so thatthe hydrographs at the mouth occurred 20 hours later than atthe Broad River above Carlton or 8 hours later than at the BroadRiver near Bell as projected from concurrent hydrographs at thetwo stations.
Discharges of the "shape hydrographs" constructed for the mouth of theBroad River were then multiplied by RA to adjust for rainfall volume, assumingthat flood volumes vary directly with the ratio of rainfall volumes upstream ofthe two sites and runoff and loss rates are similar. The following equationswere used:
VA= VG(PGAG + PA (AB-AG))/PGAG, and
RA = VA/VS,
whereVA is the hydrograph volume at the mouth of the
Broad River, in ft 3/s-hrs, adjusted for rainfalland drainage area,
VG is the hydrograph volume at the gaging station, in ft 3/s-hrs,
VS is the volume of the "shape hydrograph", in ft 3/s-hrs,
PG is the average rainfall, in inches, for the drainage areaupstream of the Broad River above Carlton, Ga.(02191300) or near Bell, Ga. (02192000) as derivedfrom rainfall given in table 8 and from rainfallmaps shown in figures 7-16.
PA is the average rainfall, in inches, for the drainagearea between the Broad River above Carlton, or nearBell and the mouth of the Broad River, derived andtabulated as described for PG,
AG as previously described, and
RA is the ratio of the hydrograph volume at the mouth of theBroad River (adjusted for rainfall and drainage area)to the volume of the "shape hydrograph."
29

00) co0.
35°
350 °
____ 34°
0
340 °
5-5
0 10 20 30 40 MILESI I I I I Io 1O 20 30 40 KILOMETERS
r'.
Figure 7.-- Lines of equal rainfall for Savannah River basin upstream fromfor storm of August 23-26, 1908.
Augusta, Ga.

Co)'. CoN.
I 350
35°t
--- 340
GZIESVILLE
U.)I-.
340
EXPLANATION
3-3
0 10 20 30 40 MILESI I I I
I I I I LO0 10 20 30 40KILOMETERS
(i~
Figure 8.--Lines of equal rainfall for Savannah River basin upstream from Augusta, Ga. forstorm of March 14-16, 1912.

350
GAINESVILLE
SALUDA
CA
34e
EXPLANATION
5-5 RAINFALL CONTOUR--Showsline of equal rainfall, in inches.
0 10 20 30 40 MILESI I I I II I I I I
0 10 20 30 40 KILOMETERS
Figure 9.--Lines of equal rainfall for Savannah River basin upstream from Augusta, Ga. forstorm of August 1928.

CDto.
350
-1340
340 -
GAINESVILLE
ATHENS.
5
EXPLANATION
5- 5 RAINFALL CONTOUR-Showsline of equal rainfall, in inches.
0 10 20 - 30 40 MILES
0 I I I I0 10 20 30 40 KILOMETERS
co
Figure 10.--Lines of equal rainfall for Savannah River basin upstream from Augusta, Ga. forstorm of February 26 to March 3, 1929.

wLa.
350
35,
340
340 j-~
5-5
0 10 20 30 40 MILESI I I I I
I 10 310 I0 10 20 3040 KILOMETERS
(0o'i
Figure ll.--Lines of equal rainfall for Savannah River basin upstream from Augusta, Ga. forstorm of March 3-6, 1929.

(I~
0GAINESVILLE
W, 9
34° 0" ONL
EXPLANATION
6- 6 RAINFALL CONTOUR--Showsline of equal rainfall, in inches.
0o
Figure 12.--Lines of equal rainfall for Savannah River basinstorm of September 25-27, 1929.
0 10 20 30 40 MILES0} • I • I I i I II I I I 4 IO0 10 20 30 40KILOMETERS
upstream from Augusta, Ga. for

o Co
_ 350
35- °
340
U,w'
340 K
0 10 20 30 40 MILESI 0 41o 0LOME SI lO
C;)'ji
0'
Figure 13.--Lines of equal rainfall for Savannah River basin upstream from Augusta, Ga. forstorm of September 29 to October 2, 1929.

,6;. Vý350
350 °
4347
GAINESVHLLE'
U.)-I
340 -
EXPLANATION
0 10 20 30 40 MILES0 1 II I* 4 IL T0 10 20 30 40 KILOMETERS
15.Figure 14.--Lines of equal rainfall for Savannah River basin upstream from Augusta, Ga. for
storm of April 1-9, 1936.

350
350 =
340
C0
34
7-7
0 10 20 30 40 MILES
0 10 20 30 410 KILOMETERS
Figure 15.--Lines of equal rainfall for Savannah River basin upstreamstorm of August 11-15, 1940.
from Augusta, Ga. for

CO)
w35
3401
6-6
0 10 20 30 40 MILESI I I I II I ] I I
S I 1 I I "0 10 20 30 40 KILOMETERS
(ao
Figure 16.--Lines of equal * for Savannah River basin upstream from Augusta, Ga. forof November 26-29, 1948.

C
Table 8.--Areal rainfall amounts for the floods of 1908, 1912, 1928, 1929, 1930, 1936, 1940, and 1949 water years
[dashes indicate no data]
Area Amount of rainfall for indicated flood, in inches
Aug. Mar. Aug. Mar.' Sept. Oct. Apr. 2 Aug. Nov.1908 1912 1928 1929 1929 .1930 1936 1940 1949
A, mouth ofBroad River tostation 02191300 10.28 4.28
A, upstream ofstation 02191300 4.85 3.25
A, mouth of BroadRiver tostation 02192000 -- -- 6.43 5.26, 4.98 10.88 8.50 11.30 8.60 6.04
A, upstream ofstation 02192000 5.85 4.67, 4.48 8.04 6.68 9.91 8.32 6.03
B, station 02197000to Thurmond Dam 3.23 2.34 3.91 4.26, 4.16 10.25 9.42 7.10 8.58 3.21
C, Thurmond Dam todownstream ofBroad River 4.49 3.36 5.22 5.36, 4.75 11.80 8.62 9.26 9.18 5.22
0, Upstream ofBroad River toHartwell Dam 11.42 4.83 6.50 4.43, 4.32 7.29 6.23 10.08 9.53 5.08
E, Upstream ofHartwell Dam 7.12 4.25 8.00 4.08, 3.69 6.69 3.48 7.20 9.44 5.09
'Rainfall amounts for floods of March I and 6, 1929.2 Rainfall-runoff method rather than hydrograph method was used for computing inflow hydrographs.

The hydrograph for the Broad River at its mouth for the 1908 flood wasnot adjusted for rainfall, because the large difference between rainfallamounts downstream and upstream of the Carlton gage resulted in unrealistichydrograph simulations.
Area D.--Hourly hydrographs for area D were created by first creating a"shape hydrograph" from measured hydrographs for the Broad River aboveCarlton or near Bell as was done for the Broad River at its mouth.Discharges of the "shape hydrograph" were then multiplied by a ratio (RD),using the equations:
VD = VG PD AD/PG AG, and
RD = VD/VS,
where
VD is the hydrograph volume for area D, in ft'/s-hrs,
P0 is the average rainfall volume, in inches, for thedrainage area D,
AD is the drainage area of area D, in mi 2 , and
AG, VG, PG, and VS are as previously defined.
Rainfall adjustments were not made for the 1908 and 1912 floods becausethe large difference between rainfall amounts for the area upstream of theBroad River above Carlton and rainfall for area D resulted in hydrographswith volumes too large in comparison with observed hydrographs for theSavannah River near Calhoun Falls.
The initial hydrographs for area D (and also areas C and E) wereshortened in time and increased in discharge, to reflect the effect ofshorter travel times through the reservoir compared to travel time fornatural conditions. Pre-and post-reservoir 6-hour unit hydrographsdeveloped by the COE (1969) and an average time of rainfall excess of 12hours for the drainage basin between Russell and Hartwell dams were used tomake the adjustments, according to the following methodology:
1. Twelve-hour unit hydrographs were generated for pre- andpost-reservoir conditions. The post-reservoir hydrographwas computed for a minimum flood-pool elevation of 475 feetabove sea level for Russell Lake.
41

2. Discharges of the pre-reservoir hydrograph were multipliedby a flow factor of 1.25 because the average discharge of the12-hour unit hydrographs for post-reservoir conditions was 25percent greater than the average discharge for pre-reservoirconditions.
3. The bases of the hydrographs were shortened to preservevolumes, by dividing the time increments by 1.25.
4. The time difference between peak flows of the pre- andpost-reservoir 12-hour unit hydrographs was 6 hours, andthe timing of the peaks of the revised hydrographs wasadjusted to maintain the same time differential.
Area E.--Hourly hydrographs for area E were computed by subtracting thehydrographs for area D from the observed hydrographs for the Savannah Rivernear Calhoun Falls, S.C. (02189000) and adjusting the resultant hydrograph 7hours earlier. Routing by the Muskingum method indicated that there wasvery little attenuation of the inflow hydrograph between Hartwell Dam andRussell Dam. The hydrographs for area D were moved from zero to four hourslater to avoid computation of negative discharges.
The hydrographs for area E were adjusted to reflect the effects ofshorter travel times through the reservoir as was done for area D, usingunit hydrograph information developed by the COE (1952). The average timeof rainfall excess was 18 hours at Hartwell Dam. After developing 18-hourunit hydrographs and a flow ratio of 1.17, the hydrographs were adjusted, aspreviously explained. The timing of the peaks of the revised hydrographpeaks were adjusted to maintain a 9-hour differential, the time differencebetween peak flows of the pre- and post-reservoir 18-hour unit hydrographs.
Areas B and C.--As shown in figure 5 and 6, area B lies betweenThurmond Dam and the Savannah River at Augusta. Area C lies betweenThurmond Dam and downstream of the confluence at the Savannah and BroadRivers. Hourly hydrographs were computed for areas B and C by the followingmethod:
1. "Shape hydrographs" were created for areas B and C using the
same methodology as described for area D. Volumes of thesehydrographs (VsB and VSC) were computed.
2. Volumes were computed for the inflow hydrographs, based on volumesof hydrographs of the Broad River at its mouth and of the SavannahRiver near Calhoun Falls and Augusta adjusted by drainage arearatios and average rainfall amounts as shown by the equations:
42

VDIF = VAUG - VA - VOE,
VB = VDIF PB AB/(PB AB + PC AC), and
VC = VDIF PC AC/(PB AB + PC AC),
where
VDIF is the total volume of runoff in ft 3/s-hours, for areasB and C;
VAUG is the volume of runoff in ftl/s-hours, of the measuredunregulated hydrograph for the Savannah River atAugusta (02197000);
VA is the volume of runoff, in ft 3 /s-hours,.of area A;
VDE is the total volume of runoff, in ft 3/s-hours, of areas D andE combined from measured discharges for the Savannah Rivernear Calhoun Falls;
VB and VC are the volumes of runoff, in ft 3/s-hours, of areas B and
P8 and PC are the average rainfalls, in inches, of areas B and C,respectively; and
AB and AC are the drainage areas, in mi 2 , of areas B and C, respectively.
3. The "shape hydrographs" were then adjusted for volume bymultiplying the discharges by the following ratios:
RB = VB/VSB
RC = VC/VSC
where
VSB,SC : volume of runoff, irA ft 3/s-hours, of the "shapehydrographs" for areas B and C, respectively.
4. The hydrographs developed in step 3 and the hydrographs for areas Aand D-E were then routed downstream to Augusta using HEC-1 andcompared with the measured hydrograph at that location. Muskingumrouting coefficients used in the model are given in table 9.
43

Table 9.--Muskingum routing parameters used in the HEC-5 model for the
Savannah River from Hartwell Dam near Hartwell, Ga. (02187250) to
the Savannah River near Auqusta, Ga. (02197000)
Natural conditions Regulated conditions
Reach X K Number X K Number(hours) of (hours) of
sub-reaches sub-reaches
For all floods:
Hartwell Dam toRussell Dam
Russell Dam toBroad River
For the 1908, 1912,
Broad River toThurmond Dam
Thurmond Dam toAugusta, Ga.
0.2 7.5 5
0.2 3.0 3
1928, 1929, and 1930 floodst
0.0
0.2
4.0
3.0
1
3
0.2
0.2
9.0
10.0
6
5
0.0
0.2
6.0
10.0
1
5
For the 1940 and 1948 floods:
Broad River toThurmond Dam 0.2 15.0 5 0.0 6.0 1
Thurmond Dam toAugusta, Ga. 0.2 16.0 8 0.2 16.0 8
Note: X constant which expresses the relative importance of inflow andoutflow in determining storage.
K = constant which is the ratio of storage to discharge, expressed inhours.
44

5. hydrographs for areas B and C were then shifted as much as 6hours earlier or later, except for the 1928 flood for whichboth hydrographs were shifted 12 hours earlier in time. Forthe 1940 and 1949 floods, the Muskingum "K" routing coefficientwas adjusted to achieve a "best fit' of the routed hydrographto the measured hydrograph of the Savannah River at Augusta.The Nuskingum "K" routing coefficient is about equal to thetravel time of the flood through the reach. The value of "0 wasincreased by 6 hours for the unregulated flood of 1940 because theflood was a two-peak event, and the travel time of the second floodwas lengthened because travel of the second flood was impeded bythe presence of the first flood in the lower reaches. The value of"K was increased by 6 hours for the 1949 unregulated flood becausethat flood was of much lower magnitude than the other floods, andits travel time would be greater because of greater flowresistance and length of travel.
6. An adjustment was made to the hydrographs for areas B and C todistribute residuals between the routed and measured hydrographs,based on the following:
(a) Drainage areas A, 8, and C are nearly the same (fig. 5).Therefore, area A was used to define a preliminary "shape"hydrograph for areas B and C.
(b) Area A is longer and narrower than areas B and C (fig. 5),and, therefore, the final hydrographs for areas B and C wouldbe expected to be shorter in time and greater in dischargethan a "shape hydrograph" derived from area A.
(c) The "shape hydrograph" derived from area A does notreflect differences in rainfall distribution withinareas B and C.
(d) The residuals between the routed hydrograph and the measuredhydrograph for the Savannah River at Augusta are assumed toreflect the differences described in (6b) and (6e) and areused to refine the hydrographs developed in step 5.
Hydrographs for areas B and C were adjusted for residuals by thefollowing methods
I. The hydrograph for area C was moved downstream to the SavannahRiver at Augusta by advancing it in time by 10 hours forhydrographs measured at 5th Street in Augusta and 11 hoursfor hydrographs measured at the present Butler Creek site.Routing was hot necessary, because the Muskingum routingshowed very little hydrograph attenuation for the reach.
45

2. The hydrograph for area C was then combined with the hydrographfor area B.
3. Residuals were computed by:
a. Simulating the hydrograph for the Savannah River atAugusta using the hydrographs of areas B and C unadjustedfor residuals, the Broad River hydrograph at its mouth, andthe Savannah River hydrograph upstream of Broad River.
b. Subtracting the simulated hydrograph from the measuredhydrograph at Augusta to obtain the residuals.
4. The residual for each specific time was then prorated by the ratioof the discharge of area B (or C) to the summed discharge of areasB and C and added to the discharge of area B (or C) according tothe following equations:
QT = QB + QC,
RB = RT QB/QT,
RC = RT QC/QT,
QFB = QB + RB, and
QFC = QC + RC,
where
QT is the total discharge, in ft 3/s, for a specific
time on the hydrograph;
QB and QC are the discharges, in ft 3/s, for areas B and C,
respectively;
RT is the residual discharge, in ft 3/s;
RB and RC are the prorated regidual discharges, in ft 3/s, for areas
B and C, respectively;
QFB and QFC are the discharges, in ft 3/s, at areas B and
C, respectively adjusted for residual discharge.
46

Except for the 1928 flood, the resulting hydrographs lookedreasonable in comparison with the measured Augusta hydrographs.The Broad River hydrograph was not well suited for the 1928flood, because the residual adjustment resulted in a double peakfor the hydrographs for areas B and C. Therefore, thesehydrographs were manually smoothed and verified by steps 5 and 6that follow.
5. The adjusted hydrograph for area C was then moved to ThurmondDamr by moving it 10 or 11 hours earlier depending on thelocation of the Augusta gage.
6. All hydrographs were then routed to Augusta for a final comparisonwith the measured hydrograph. Minor negative flows computed atthe beginning and ending tails of the hydrographs were adjusted toa minimum value.
As previously described for areas D and E, the hydrograph for area Cwas adjusted in shape to reflect the effects of shorter travel timesthrough the reservoir, using unit hydrograph information developedby the COE (1945). However, post-reservoir 6-hour unit hydrographswere not available for area C. The unit hydrograph was determinedby deriving hydrographs for the lake area and non-lake area fromthe pre-reservoir hydrograph, consistent with the methods used forHartwell and Russell Lakes, and combining them with unit tributaryhydrographs using accelerated travel times. The average time ofrainfall excess was 36 hours for the Savannah River basinat Thurmond Dam. After developing 36-hour unit hydrographsand a flow ratio of 1.13, the hydrographs were adjusted aspreviously explained. The time difference between pre- andpost-reservoir hydrographs was adjusted to 12 hours to agreewith the relative timing of the unit hydrograph peaks.
The computed inflow hydrographs for the eight floods are shownin figures 17-24. The simulated regulated hydrographs and themeasured unregulated hydrographs for the Savannah River atAugusta are shown in figureý 25-32. Peak discharges simulatedfor regulated conditions are listed in table 10.
47

110,000
100,000
Z 90,000z00• 80,000
5- 70,000I-w
S620,000
50,0000zLj 40,000CDcc< 30,000m0co,
520,000
10,000
024AU
25GUST
Figure 17.--Estimated inflow hydrographs for areas A-E for flood of August 1908.

100,000
90,000
0Z 80,00000uJ0 70,000
a.60,000
UJwLiL
_Ž 50,000
(D
0
z 40,000
E 30,0000
co 20,000
10,000
014 15 16 17 18 19
MARCH
Figure 18.--Estimated inflow hydrographs for areas A-E for flood of March 1912.

1
z00wCl,
0~u-0
Luo
0'
z
Ld
16AUGUST

100,000
90,000
z 80.00000uUCO 70,000
60,000LULULL
o 50,000Ln
Z 40,000
uS(D." 30,000
I
U) 20,000
10,000
026 27 28FEBRUARY
1 2 3 4 5 6 7 8MARCH
9 10
Figure 20.--Estimated inflow hydrographs for areas A-E for flood of February to March 1929.

200,000 ,
180,000
z 160,000-00Cf) 140,000
- 120,000.LUI
U100,000-
Z 80,000 -
rr 60,000 -U
20,000
0025 26 27
SEPTEMBER28 29 30 1 2
OCTOBER3
Figure 21.--Estimated inflow hydrographs for areas A-E for floods of September and October 1929.

100,000 I
90,000
z 80,000o AREAALI- AREABCO 70,000 AREA C
I-- AREA DiLAREA E
60,000ALU.
LL
O 50,000-Do p
z 40,000
LU /cr 30,000
CO 20,000, \ \v .
10,000 / -- i/,0
24 25 26 27 28 29 30 31 1 2 3 4 5 6MARCH APRIL
7 8 9
Figure 22.--Estimated inflow hydrographs for areas A-E for flood of April 1936.

140,000
120,000
80,0
z0WO 100,000
CD)
iU 80,000LL0
o60,000z
cc
<40,000
20,000
012 13 14 15 16
AUGUST
Figure 23.--Estimated inflow hydrographs for areas A-E for flood of August 1940.

100,000
90,000
O 80,000z0lU
70,000ccuI~l
60,000u-I
U-_2 50,000
0
Z 40,000ud
cc30,000
C/)520,000
10,000
0
Ltr
26 27 28 29 30NOVEMBER
Figure 24.--Estimated inflow hydrographs for areas A-E for flood of November 1948.
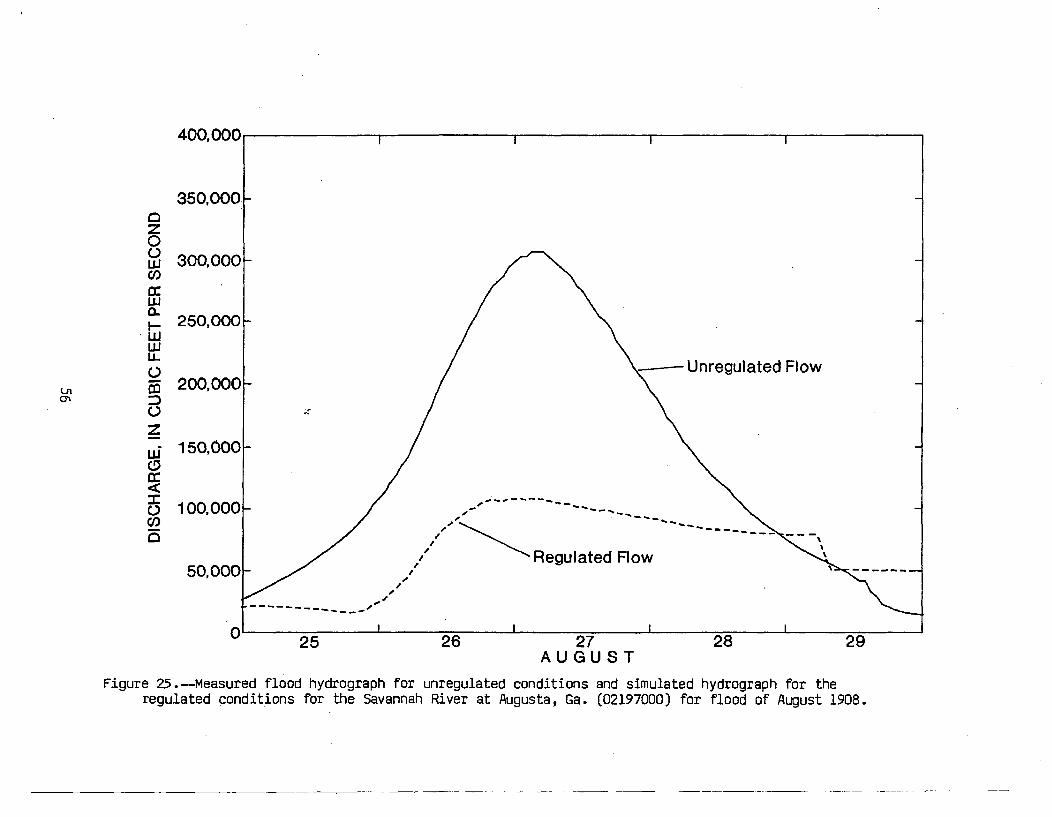
0z0
300000-,a)
Ul0-n 250,000ujU-o - U nregul ated Fl owO 200,000DzL 150,000
100,000CO)
50,000Regulated Flow
25 26 27 28 29AUGUST
Figure 25.-Measured flood hydrograph for unregulated conditions and simulated hydrograph for theregulated conditions for the Savannah River at Augusta, Ga. (02197000) for flood of August 1908.

400,000
350,0000z0
•wj 300,000
C.250,000"-
W
0m 200,000
z
Ld 150,000
0
100,000-1 -.ReUnreguFlatdwo
50,000I0
15 16 17 18
MARCMAR egCae Flo
Figure 26.--Measured flood hydrograph for unregulated conditions and simulated hydrograph for theregulated conditions for the Savannah River at Augusta, Ga. (02197000) for
flood of March 1912.
19

350,000
zo 300,000-C-)LUCO)
LU 250,000
LULULnn
o D Unregulated Flow
150,000Ld
:C 100,0000
CO Regulated Flow
50,000
-------------------------------------
015 16 17 18 19
AUGUST
Figure 27.--Measured flood hydrograph for unregulated conditions and simulated hydrograph for theregulated conditions for the Savannah River at Augusta, Ga. (02197000) for flood of August 1928.

.400,000
350,0000z0o 300,000w
.. 250,000
WI-LILo200,000
U,
Unregulated Flow -z- 150,000Ld
I100,000 1/-
W If I -- ----
26 27 28 1 2 3 4 5 6 7 8 9
FEBRUARY MARCH
Figure 28.--Measured flood hydrographs for unregulated conditions and simulated hydrographs for theregulated conditions for the Savannah River at Augusta, Ga. (02197000) for flood of March 1929.
10

400,000
350,000
z Unregulated Flow-0O 300,000wCo
CL 250,000
I-
1 00,000'
o C0
--- z" - I ", \I .. .- . ....- - -....
50,000- ) f/ Regulated Flow
-150,000
25 26 27 28 29 30 1 2 3 4 5SEPTEMBER OCTOBER
Figure 29.--Measured flood hydrographs for unregulated conditions and simulated hydrograph for theregulated conditions for the Savannah River at Augusta, Ga. (02197000) for
floods of September and October 1929.
6

400,000400,00c I I I I I I II I I I I I I
350,000
az00COw
ccw
I-
iUCn
0
.zuj0IM
D/
0
300,000 I
250,000
200,000CYN
150,000
,-Unregulated Flow
- FI I
7/
/ Iii I
I I
-,/ k/ •
I '•i
s/
., I I Regulated Flow I
100,000
50,000o
0 1 2 3 4 5 6 7 8 9 10 11 12 13 14 15 16 17 18 19 20 21APRIL
Figure 30.--Measured flood hydrographs for unregulated conditions and simulated hydrographs for theregulated conditions for the Savannah River at Augusta, Ga. (02197000) for flood of April 1936.

400,000
350,000
z00 300,000
0.L 250,000S25000nregulated Flow
U-
O 200,000
z- 150,000
CD,
M 100,000 Regulated Flow
CO5
50,000
013 14 15 16 17
AUGUST
Figure 31.--Measured flood hydrographs for unregulated conditions and simulated hydrographs for theregulated conditions for the Savannah River at Augusta, Ga. (02197000) for flood of August 1940.
18

400,000
350,000
z00 300,000w0CL 250,000
0 200,000
z 150,000 ---- Unregulated FlowLid
100,000
0)
50,000 Regulated Flow
01 27 1 28 1 29 1 30 1 11 2 1
NOVEMBER DECEMBER
Figure 32.--Measured flood hydrographs for unregulated conditions and simulated hydrographs for theregulated conditions for the Savannah River at Augusta, Ga. (02197000) for flood of November toDecember 1948.
3

Table 1O.--Measured and simulated regulated and unregulated peak dischargesfor the Savannah River at Augusta, Ga. (02197000)
[ftc/s, cubic feet per second; dashes indicate no data]
IAmplifi-Month Water cation Unregulated Regulated
year factor discharge discharge(ft 3/s) (ft /s)
January 1796 -- 2360,000 4191,000
May 1840 -- 2270,000 4118,000
August 1852 -- 2250,000 4105,000
January 1865 -- 2240,000 4 99,700September 1888 -- 2303,000 4143,000
August 1908 -- 2307,000 3108,000August 1908 1.25 3383,000 3153,000August 1908 1.50 1459,000 32029000August 1908 2.00 1613,000 3331,000March 1912 -- 2234,000 3 62,700March 1912 1.25 3291,000 3 92,800March 1912 1.50 '349,000 3120,000March 1912 2.00 1465,000 31879000August 1928 -- 2226,000 3 44,200August 1928 1.25 3282,000 1 66,400August 1928 1.50 33399000 31029000August 1928 2.00 1452,000 3182,000March 1929 -- 2190,000 1106,000March 1929 1.25 3343,000 3134,000March 1929 1.50 3286,000 1167,000March 1929 2.00 3381,000 3247,000September 1929 -- 2343,000 31809000September 1929 1.25 34299000 1237,000September 1929 1.50 35149000 3298,000September 1929 2.00 36869000 1421,000October 1930 -- 23509000 3252,000October 1930 1.25 3437,000 33289000October 1930 1.50 35249000 3400,000October 1930 2.00 3699,000 3491,000
64

Table l0.--Measured and simulated regulated and unregulated peak dischargesfor the Savannah River at Augusta, Ga. (02197000)--Continued
[ftl/s, cubic feet per second; dashes indicate no data]
'Amplifi-Month Water cation Lhregula ted Regulated
year factor discharge discharge(fts/s) (ft 3/s)
AprilAprilAprilAprilAugustAugustAugustAugustNovemberNovemberNovemberNovemberMarchMayMarchAprilAprilMayAprilJuneFebruaryAprilJanuaryMarchAprilAprilAprilApril
1936193619361936194019401940194019491949194919491952195319541955195619571958195919601961196219631964196419641964
1.251.502.00
1.251.502.00
1.251.502.00
1.251.502.00
2258,000'322,0003386,0003515,000
2239,000'299,000'358,000'478,0002154,0003194,0003232,000
3310,0003137,0003 56,4003 59,1003 68,400' 65,2003 53,4003 86,1003 54,9003 84,700'l13 ,0002 81,7003 94,0003143,0003197,0003236,0003315,000
3181,000'265,000'346,0003488,000
3 90,2003111,0003134,0003203,000' 34,7003 52,7003 78,4003129,0002 39,3002 35,2002 25,5002 23,9002 18,6002 18,0002 66,3002 28,5002 34,9002 34,8002 32,5002 31,3002 87,1003154,0003190,0003266,000
65

Table l0.--Measured and simulated regulated and unregulated peak discharqesfor the Savannah River at Augusta, Ga. (02197000)--Continued
[ft3/s, cubic feet per second; dashes indicate no data]
'Amplifi-Month Water cation Unregulated Regulated
year factor discharge discharge(ft 3 /s) (ft 3/s)
December 1965 -- 3111,000 2 34,600March 1966 -- 31,000 2 39,300August 1967 -- 3102,000 2 26,500January 1968 -- 3 79,000 2 35,900April 1969 -- 114,000 2 45,600April 1970 -- 3 74,300 2 25,200March 1971 -- 3180,000 2 63,900January 1972 -- ll4,000 2 33,700April 1973 -- 3 98,000 2 40,200February 1974 -- 3 86,000 2 32,900March 1975 -- 3149,000 2 45,600June 1976 3- 104,000 2 33,300April 1977 -- 3 90,900 2 34,200January 1978 -- 138,000 2 43,100February 1979 -- 3125,000 2 37,300March 1980 -- 1108,000 2 47,200February 1981 -- 3 56,100 2 17,700January 1982 -- 3 88,000 2 30,700April 1983 -- 3102,000 2 66,100May 1984 -- 3 65,600 2 34,000February 1985 -- 3 66,300 2 25,700
'Factorfloods.
by which inflow hydrographs were multiplied to synthesize larger
2 Discharge was measured.
3Discharge was simulated by computer modeling.
.Discharge was simulatedunregulated discharge.
from relation of regulated discharge to
66

Rainfall-Runoff Method
A rainfall-runoff model (HEC-I) was used to simulate hourlyhydrographs for the 1936 flood upstream from Thurmond Dam. Discharge datawere not available for the Savannah River at Calhoun Falls and for the BroadRiver near Bell, therefore, the hydrographs to Hartwell, Russell, andThurmond Lakes were simulated using HEC-l. Hydrographs for the reach fromThurmond Dam (02195000) to Augusta are from the Savannah District ReservoirRegulation Manual Plate A-25 (COE, 1974).
Daily rainfall data for 20 gages in the Savannah River basin upstreamfrom Thurmond Dam for January through April 1936 were obtained from the NWS.Using these data, Thiessen polygons were determined to estimate the arealdistribution of rainfall over the basin. The daily rainfall data wereadjusted to hourly values and linearly interpolated.
Models were developed for each area using the SCS unit hydrographmethod (SCS, 1972; McCuen, 1982) in FEC-I. SCS curve numbers for the areasranged from 62 to 99. A curve number of 99 was used for rainfall on lakes.Hourly rainfall values were input and weighted according to the Thiessenpolygons. Inflow hydrographs to each of the three lakes were computedusing HEC-1 for the period of heaviest rainfall, mid-March to mid-April.
The unregulated inflows were routed to Augusta using the Muskingumrouting method. The simulated unregulated discharges were compared tomeasured discharges and adjustments were made to HEC-1 parameters asnecessary to calibrate the models. Once the models were calibrated,regulated discharges were simulated using the unregulated inflow hydrographsand the HEC-5 model with reservoir storage and current operation data. Thesimulated regulated hydrograph and the measured unregulated hydrograph areshown in figure 30. The peak discharge for regulated conditions is listedin table 10.
RELATION OF REGULATED TO UNREGULATED PEAK DISCHARGES
Regulated peak discharges were related to unregulated discharges usingmeasured and simulated data for the floods of 1908, 1912, 1928, March andSeptember 1929, 1930, 1936, 1940, 1949, and 1952-85.
The relation was determined graphically (fig. 33) from data listed intable 10.
67

z.0C-)
Cf)CL.
wF-
m
Z)LId0
cr
0
z
cc
C,)
-J
1,000,000
500,000
100,000
I I I I I I I I I
EQUAL FLOW LINEI I I 1/I
........... REGULATED-UNREGULATED DISCHARGE LINE
-0 DERIVED FROM HYDROGRAPHS OF ACTUAL EVEI
+ DERIVED FROM HYDROGRAPHS MULlIPLIEDBY 1.25. 1.50, OR 2.00 RATIO
ITS
00oj
.: /-*0+
+ +
+
++
+
+(7%00
+°0 0
50,000 F ,+
'* P 061D
0
0
0
0
2
I ~l I I I I II I I I I I I I10,00010,c)00 100,000UNREGULATED DISCHARGE, IN CUBIC FEET PER' SECOND
1,000,000
Figure 33.--Relation between regulated peak discharges and unregulated peak discharges for theSavannah River at Augusta, Ga. (02197000).

The data in figure 33 show that the reservoirs have little effect onthe extremely large floods because reservoir storage is small compared tothe flood volume. The scatter in the points in figure 33 is caused bydifferences in initial pool elevations, flood volumes, and timing of inflowhydrographs. The relation in figure 33 reflects average conditions for awide range of flood flows. The logarithmic residuals from the curve ofrelation are normally distributed with a mean and standard deviation of-. 016 and 0.145 respectively.
UNREGULATED FLOOD FREQUENCY
A flood frequency curve for unregulated flow (table 11 and fig. 34)was derived from measured unregulated peak discharges at Augusta, listed intable 2 for water years 1786-1951, and from simulated unregulated peakdischarges for water years 1952-85, listed in table 5, using the log-PearsonType III method as described by the Interagency Advisory Committee on WaterData (IACWD, 1982). A systematic record period of 1876-1985 and a historicrecord period of 1786-1985 were used. The record of peak discharges isconsidered to be complete for peak discharges equal to or greater than225,000 ftl/s (Carter, 1951).
Reports by the COE (1929, 1974) indicate that all peak discharges above165,000 fts/s were probably known for the period since 1796. Although thismay be the case, if it were true it would imply that the probability ofhaving a 54-year period (1786-1839) with only one flood (1796) exceeding165,000 ft 3/s would be only 0.019 and that the probability of having onlyfour such floods in the 90-year pre-systematic record (1786-1875) would beonly 0.033. These probabilities are based on the occurrence of 12 floodsgreater than 165,000 ft 3/s in the 110-year systematic record period1876-1985. Because it is rather unlikely that so few floods of thismagnitude would have occurred during the periods considered, the possibilitywas considered that a higher threshold would be more appropriate. Emigh(1914) indicates that widespread flooding actually occurred at stagesexceeding about 36 ft (210,000 ft 3 /s); floods exceeding this levelalmost certainly would have been recorded. A slightly higher discharge of225,000 ft 3 /s was used as a threshold by Carter (1951). Under thehypothesis that the flood record is complete above this level, theprobabilities quoted above become 0.09.7 and 0.22, which are considerablymore likely. It is more likely, therefore, that the criteria for a completehistorical record of floods above a certain threshold (IACWD, 1982) would bemet if the historical flood threshold were set at 225,000 ft /s rather thanat 165,000 ft 3/s; therefore, the higher value was used in this study.
69

Table ll.--Peak discharges and frequency plotting positions for unregulatedconditions for the Savannah River at Augusta, Ga. (02197000)
[ftc/s, cubic feet per second]
Chronological RankedFrequency
Water Peak Water Peak plottingyear discharge year discharge position
(ft 3/s) (percent)
17961840185218651876
18771878187918801881
18821883188418851886
18871888188918901891
18921893189418951896
18971898189919001901
190219031904190519061907
360,000270,000250,000240,00086,400
119,00051,50044,000
102,000130,000
93,300111,00081,00077,000
135,000
173,000303,000149,000
48,500197,000
140,00060,00054,000
106,000107,000
93,300117,000113,000138,000.124,000
175,000147,00063,00064,80096,60052,000
17961930192919081888
18401936185218651940
19121928189119711902
18871913194919251889
19751903196418921900
19781952188619201966
188119211919194419791901
360,000350,000343,000307,000303,000
270,000258,000250,000240,000239,000
234,000226,000197,000180,000175,000
173,000156,000154,000150,000149,000
149,000147,000142,800140,000138,000
138,000136,900135,000133,000131,000
130,000129,000128,000128,000125,000124,000
0.501.001.491.992.49
2.993.483.984.484.98
5.475.976.687.598.51
9.4310.3511.2612.1813.10
14.0114.9315.8516.7617.68
18.6019.5220.4321.3522.27
23.1824.1025.0225 •9326.8527.77
70

Table ll.--Peak discharges and frequency plotting positions for unregulatedconditions for the Savannah River at Auqusta, Ga. (02197000)
[ft'/s, cubic feet per second]
Chronological RankedFrequency
Water Peak Water Peak plottingyear discharge year discharge position
(ft 3/s) (percent)
1908190919101911
19121913191419151916
19171918191919201921
19221923192419251926
19271928192919301931
19321933193419351936
307,00087,30069,80032,800
234,000156,00048,00061,00082,400
68,00045,500
128,000133,000129,000
92,00059,70059,700
150,00055,300
39,000226,000343,000350,000
26,100
93,80092,60073,20063,700
258,000
1877189819431969
19721899196118831965
19801896189519421976
18801967198319731946
19061963193218821897
19331922193719381939
119,000117,000117,000114,000
114,000113,000113,000111,000
108,000107,000106,000105,000104,000
102,000102,000102,000
98,00097,200
96,60094,00093,80093,30093,300
92,60092,00091,40091,40090,900
28.6829.6030.5231.44
32.3533.2734.1935.10
36.9437.8538.7739.6940.61
41.5242.4443.3644.2745.19
46.1147.0247.9448.8649.78
50.6951.6152.5353.4454.36
71

Table l1.--Peak discharges and frequency plotting positions for unregulatedconditions for the Savannah River at Augusta, Ga. (02197000)--Continued
[ftl/s, cubic feet per second]
Chronological RankedFrequency
Water Peak Water Peak plottingyear discharge year discharge position
(ft 3/s) (percent)
19371938193919401941
19421943194419451946
19471948194919501951
19521953195419551956
19571958195919601961
91,40091,40090,900
239,00053,300
105,000117,000128,00064,00097,200
86,00083,200
154,00032,50046,300
136,90056,40059,10068,40065,200
53,40086,10054,90084,700
113,000
19771982190918761958
19471974196019481916
19621884196818851970
19341910195519171985
19841956190519451935
90,90088,00087,30086,40086,100
86,00086,00084,70083,20082,400
81,70081,00079,00077,00074,300
73,20069,80068,40068,00066,300
65,60065,20064,80064,00063,700
55.2856.1957.1158.0358.95
59.8660.7861.7062.6163.53
64.4565.3666.2867.2068.12
69.0369.9570.8771.7872.70
73.6274.5375.4576.3777.29
72

Table 11.--Peak discharges and frequency plotting positions for unregulatedconditions for the Savannah River at Augusta, Ga. (02197000)--Continued
[ft'/s, cubic feet per second]
Chronological RankedFrequency
Water Peak Water Peak plottingyear discharge year discharge position
(ft 3/s) (percent)
1962 81,700 1904 63,000 78.201963 94,000 1915 61,000 79.121964 142,800 1893 60,000 80.041965 111,000 1923 59,700 80.951966 131,000 1924 59,700 81.87
1967 102,000 1954 59,100 82.791968 79,000 1953 56,400 83.701969 114,000 1981 56,100 84.621970 74,300 1926 55,300 85.541971 180,000 1959 54,900 86.45
1972 114,000 1894 54,000 87.371973 98,000 1957 53,400 88.291974 86,000 1941 53,300 89.211975 149,000 1907 52,000 90.121976 104,000 1878 51,500 91.04
1977 90,900 1890 48,500 91.961978 138,000 1914 48,000 92.871979 125,000 1951 46,300 93.791980 108,000 1918 45,500 94.711981 56,100 1879 44,000 95.62
1982 88,000 1927 39,000 96.541983 102,000 1911 32,800 97.461984 65,600 1950 32,500 98.381985 66,300 1931 26,100 99.29
73

500,000
400,000
0z
o 200,000C-,
LUwUL
0
D 100,000
_z 80,000uS(.Dcc 60,000
C/)S40,000
U]0-
00
00
I~~~ 0 I *
"4S
20,000
99.5 99 98 95 90 80 70 60 50 40 30 20 10 5 2 1 0.5 0.2
EXCEEDANCE PROBABILITY, IN PERCENT
Figure 34.--Unregulated peak discharge frequency curve for the Savannah River at Augusta, Ca. (02197000).

Table 12.--Discharges of unregulated floods of selected percent chanceexceedances of the Savannah River at Augusta, Ga. (02197000)
[ftc/s, cubic feet per second]
Peak dischargePercent chance of exceedance (ft 3/s)
50 92,00020 138,00010 174,0004 226,0002 269,0001 316,0000.5 368,0000.2 445,000
The Interagency Advisory Committee on Water Data (1982) suggests thatthe flood frequency relation should be tested for the sensitivity of lowerexceedance probabilities to inclusion of floods that exceed the low outliercriteria by small amounts. The initially computed low outlier criterion was20,800 ft 3/s, compared to the three smallest floods, which had peakdischarges of 32,800, 26,100, and 32,500 ft 3/s for 1911, 1931, and 1950,respectively.
The estimated one-percent chance exceedance flood was insensitive toalternative values of the low-outlier criterion in the range of 35,000 to70,000 ft 3/s. The estimated one-percent chance exceedance flood changedmarkedly when the criterion was lowered to include the three smallestfloods. This sensitivity of the one-percent chance exceedance flood to themagnitudes of the smallest observed floods is not hydrologically reasonable;therefore, the low outlier criterion was set at 35,000 ft /s.
The one-percent chance exceedance flood for unregulated conditions forthe Savannah River at Augusta is 316,000 ftW/s. Peak discharges for otherexceedance probabilities are listed in table 12 and shown in figure 34.
75

An analysis was performed to test the sensitivity of the unregulatedflood frequency relation to variations in the peak stage and discharge ofthe 1796 flood, ranging from 37 to 41 feet and 240,000 to 410,000 ft 3P/s.Discharges computed for the one-percent chance exceedance flood were threepercent lower and one percent higher, respectively, for the lower and upperranges of peak discharge estimates.
REGULATED FLOOD FREQLENCY
A regulated flood frequency relation for the Savannah River at Augustawas developed by adjusting the unregulated frequency relation for regulatedconditions using the relation between regulated and unregulated peakdischarges and an application of the total probability theorem. Graphicalprocedures and computation of probability distributions were used and theresults compared. The two methods of analysis are called "total probabilitymethod" and the "plotting position method" in this report.
The unregulated flood frequency relation (fig. 34) quantifies theeffect of hydrometeorological variables that determine unregulated floodoccurrence and magnitude. The relation between regulated and unregulatedpeak discharges (fig. 33) quantifies the predictable portion of the effectof reservoir-operation variables on the regulated magnitude of a givenunregulated flood. The residuals about the trend line of theregulated-unregulated relation quantify the unpredictable effect ofreservoir-operation and hydrometeorological variables on the regulatedmagnitude of a given unregulated flood.
A graphical comparison of unregulated peak flows of the Broad Rivernear Bell with concurrent regulated peak flows of the Savannah River atAugusta showed that regulated peak flows at Augusta for the period 1952-61did not differ significantly from those during the 1962-85 period afterHartwell Dam was constructed. Russell Lake is considered to have littleimpact on flood control, because of its relatively small flood controlstorage. Therefore, the record 1952-85 was considered to be homogeneouswith respect to the construction of Hartwell and Russell Dams.
The total probability method is based on the so-called TotalProbability Theorem (Mood and others, 1974; Benjamin and Cornell, 1970)which expresses the probability of an event in terms of a sum of
76

probabilities of constituent events. As applied to regulated flows, theTotal Probability Theorem states that
P(Qr > x) = ý P(Qu = z) P(Qr > xI Qu = z)
where Qr is the regulated flood magnitude, Qu is the unregulated floodmagnitude, P is the probability of the indicated event, and P(Qr > x Q u
= Z) is the conditional probability that Qr exceeds x, given that Qu equals
z. The sum includes all possible values of Qu . The probability P(Qu = z)
is defined by the unregulated frequency curve. The conditional probability
is defined by the regulated-flood trend line and the statistics of the
residuals, as follows. The relation between the regulated and unregulated
floods can be expressed as
Qr = H(Qu) + e
where H is the mathematical function that represents the trend line in
figure 33 and c is a random variable representing the residuals. between
the actual regulated flow, Qr' and the trend line. All variables in this
relation are expressed in terms of logarithms. The conditional
probability then can be expressed as
P(Qr > X1 Qu = Z) = P( > x -H(z) Qu = z)
The probability distribution of e is determined by means of statistical
analysis of the residuals. This result therefore may be substituted into the
Total Probability formula, with the rgsult:
P(Qr > x) = P(Qu = z) P(e > x - H(z)j Qu = Z)
Because both probability terms in this formula are known, the formula can be
evaluated and the probability of Q r 's exceeding x can be determined.
77

Evaluation of this formula was carried out numerically by a computerprogram (W. Kirby, USGS, written commun., 1990.). For use in the program, theunregulated frequency curve was defined by its quantiles at annual exceedanceprobabilities of 0.5, 0.1, and 0.01; the regulated-flood trend line wasdefined by 14 points read off the curve in figure 33; and the probabilitydistribution of e was defined by the mean and standard deviation oflogarithmic residuals from the trend line in figure 33. The computerprogram computed the regulated-flood exceedance probabilities for selectedvalues of discharges x. The results are shown as a regulated frequencycurve in figure 35. The unregulated frequency relation of figure 34 also isshown in figure 35 for comparison. These results are consistent withresults of similar computations performed independently by the COE's methodof coincident frequency analysis, computer program CFA (H.E. Kubik, COE,written commun., 1990).
A flood frequency relation was also computed using the Weibullprobability plotting position method presented by the Interagency Committeeon Water Data (1982). Regulated flood magnitudes and their frequencyplotting positions are given in Table 13. A historic period of record of1786 to 1985 and a systematic period of record of 1952-85 were used. Aregulated historic threshold discharge of 90,000 ft 3/s was determined byconverting the 225,000 ft 3/s unregulated historic threshold discharge toregulated discharge using the relation in figure 33. Regulated dischargesfor ten floods were determined above this threshold discharge from resultsof model simulations or from conversion of unregulated peak discharges toregulated peak discharges (table 10) using the relation in figure 33.Measured regulated peak discharges were available for water years 1952-85.Results of the plotting position method are shown in figure 35 along withthe total probability results.
Comparison of the total probability and plotting-position curves asshown in figure 35 indicates agreement within about 15 percent throughoutthe range of probabilities of interest. This level of agreement iswithin the limits of uncertainty of either method. Therefore, the averageresults of the two methods are adopted and listed in table 14. Theone-percent chance exceedance flood under 1990 reservoir operatingconditions is 180,000 ft 3 /s. The results of this analysis may be becomeinapplicable if significant changes are made in reservOir operatingprocedures.
A sensitivity analysis of the effects of possible inaccuracies in the1796 peak discharge on the regulated flood-frequency relation was conducted.Variations in the 1796 discharge from 240,000 to 410,000 ft 3/s(stages 37 to 41 feet) were considered. Under these variations, dischargescomputed for the one-percent chance exceedance flood were -4 percent and +4percent of the one-percent chance exceedance flood.
78

500,000
a o "' 1•uz0
cc200,000 0
U'I
O~//
I- //w0
D 100,0000 TOTALz_ PROBABILITY
Ui dluuoMETHOD
< 60,000
O PLOTTINGv POSITION
< 40,000 METHODw
- tADOPTED METHOD
20 1 f20 990 70 60 50 40 30 20 10 5 2 1 0.5
EXCEEDANCE PROBABILITY, IN PERCENT
Figure 35.--Unregulated and regulated peak discharge frequency curvesfor the Savannah River at Augusta, Ga. (02197000).
79

Table 13.--Peak discharges and frequency plotting positions for regulatedcondit17o-ns for the Savannah River at Augusta, Ga. (02197000)
[ftl/s, cubic feet per second]
Chronological Ranked
Water Peak Water Peak Frequencyyear discharge year discharge plotting
(ft 3/s) (ft 3/s) position(percent)
17961840185218651888
19081929193019361940
19521953195419551956
19571958195919601961
19621963196419651966
19671968196919701971
191,000118,000105,00099,700
143,000
108,000106,000252,000181,00090,200
39,30035,20025,50023,90018,600
18,00066,30028,50034,90034,800
32,50031,30087,10034,60039,300
26,50035,90045,60025,20063,900
19301796193618881840
19081929185218651940
19641958198319711980
19691975197819731952
19661979196819531960
19611965197719841972
252,000191,000181,000143,000118,000
108,000106,000105,00099,70090,200
87,10066,30066,10063,90047,200
45,60045,60043,10040,20039,300
39,30037,30035,90035,20034,900
34,80034,60034,20034,00033,700
0.501.001.491.992.49
2.983.483.984.484.97
6.619.39
12.1714.9517.74
20.5123.2926.0828.8631.64
34.4237.2039.9842.7645.54
48.3251.1053.8856.6659.44
80

Table 13.--Peak discharges and frequency plotting positions for regulatedconditions for the Savannah River at Augusta, Ga. (02197000)--Continued
[ft'/s, cubic feet per second]
Chronological Ranked
Water Peak Water Peak Frequencyyear discharge year discharge plotting
(ft 3 /s) (ft 3/s) position(percent)
1972 33,700 1976 33,300 62.221973 40,200 1974 32,900 65.001974 32,900 1962 32,500 67.781975 45,600 1963 31,300 70.561976 33,300 1982 30,700 73.34
1977 34,200 1959 28,500 76.121978 43,100 1967 26,500 78.901979 37,300 1985 25,700 81.681980 47,200 1954 25,500 84.461981 17,700 1970 25,200 87.24
1982 30,700 1955 23,900 90.021983 66,100 1956 18,600 92.801984 34,000 1957 18,000 95.581985 25,700 1981 17,700 98.36
81

Table 14.--Discharges of regulated floods of selected percent chanceexceedances of the Savannah River at Augusta, Ga. (02197000)
[ft 3/s, cubic feet per second]
Peak dischargePercent chance of exceedance (ft 3/s)
50 34,500
20 51,500
10 69,000
4 105,000
2 140,000
1 180,000
0.5 240,000
0.2 345,000
82

SUM+ARY
A flood-frequency relation was established for the Savannah River atthe long-term gaging station at Augusta, Georgia (02197000) to fill anincreasing need for reliable information on floods of various exceedanceprobabilities. The flood-frequency analysis was complicated by the factthat the Savannah River upstream of Augusta has experienced regulation offlow caused by Thurmond, Hartwell and Russell Dams, which began filling in1951, 1961, and 1984, respectively.
In addition to the 5 historic floods, unregulated peak discharge datafor the Savannah River at Augusta are available for water years 1876-1951,and regulated peak discharge data are available for 1952-85. Because it isnecessary to use the longest possible period of record in flood-frequencyanalyses and especially because of the absence of major floods since 1951,unregulated major floods prior to 1952 were adjusted for regulation and wereincluded in the analysis. Regulated peak discharges since 1951 were alsoconverted to unregulated peak discharges for use in determining theunregulated flood-frequency relation.
Unregulated discharges for the 1952-85 period were simulated usingdaily streamflow records converted to 2-hour data and routed to Augusta(02197000) without regulation to simulate unregulated peak discharges to beincluded in an unregulated peak discharge data base for 1786-1985. Anunregulated flood frequency relation was generated using the log-PearsonType III method, using a historical threshold discharge of 225,000 ft 3/sand a low-outlier threshold of 35,000 ftW/s. The one-percent chanceexceedance unregulated discharge for the Savannah River at Augusta is316,000 ft 3/s.
Nine large unregulated floods were adjusted for regulated conditionsusing the HEC-5 computer model and hourly inflow hydrographs estimated fromdischarge records at gaging stations within the basin and fromrainfall-runoff modeling. Routing parameters and initial pool elevationsestimated by daily flow routings or by median lake elevations were alsoused in the HEC-5 model. Regulated peak discharges were related tounregulated peak discharges. These relations were used to convertunregulated peak discharge to regulated peak discharges for selectedunregulated floods that could not be modeled.
A flood-frequency relation for regulated conditions was developed bythe graphical method using a regulated historic base discharge of 90,000ft 3/s and by total-probability computations. The regulated one-percentchance exceedance flood for the Savannah River at Augusta for current (1990)reservoir operation methodology is 180,000 fts/s. The regulatedflood-frequency relation may change if reservoir operation methods change.
83

REFERENCES
Augusta Chronicle and Gazette of the State, January 23, 1796: Augusta,Georgia.
-----, January 30, 1796: Augusta, Georgia.-----, February 6, 1796: Augusta, Georgia.
Augusta Chronicle and Georgia Gazette, Thursday March 9, 1820:Augusta, Georgia.
-., Saturday September 18, 1824: Augusta, Georgia.Bunch, C.M., and Price, McGlone, 1962, Floods in Georgia, magnitude and
frequency: U.S. Geological Survey Open-File Report, AtLanta,Georgia, 152 p.
Benjamin, J.R., Cornell, C.A., 1970, Probability, Statistics, and Decisionfor Civil Engineers: McGraw-Hill New York, 684 p.
Carter, R.W., 1951, Floods in Georgia, magnitude and frequency: U.S.Geological Survey, Circular 100.
Cashin, Edward J.,.1980, The Story of Augusta: Richmond County Board ofEducation, Augusta, Georgia.
Charleston Daily Courier, Tuesday August 31, 1852: Charleston, S.C.-----, Wednesday September 1, 1852: Charleston, S.C.
Charleston News and Courier, September 2, 1888, The fury of the floods:Charleston, S.C.
Cooke, C.W., 1936, Geology of the Coastal Plain of South Carolina: U.S.Geological Survey Bulletin 867, 196 p.
Corley, Florence Fleming, 1960, The Confederate City: Columbia, S.C.Courier, June 1840: Charleston, S.C.
-----, September 2, 1852: Charleston, S.C.Daily Chronicle and Sentinel, Thursday May 28, 1840: Augusta, Georgia.
-----, Saturday May 30, 1840: Augusta, Georgia.-., Wednesday March 1, 1851: Augusta, Georgia.-----, April 10, 1851, Augusta, Georgia.-----, August 29, 1852: Augusta, Georgia.-----, September 9, 1852, Health of Augusta: Augusta, Georgia.-., August 31, 1852: Augusta, Georgia.-, August 20, 1858: Augusta, Georgia.-----, January 3, 1864: Augusta, Georgia.-----, January 13, 1865: Augusta, Georgia.----- , August 1, 1866: Augusta, Georgia.-----, March 15, 1870, Batteaux used in the Street: Augusta, Georgia.
Elliot, Daniel, and Doyon, Ray, 1981, Archaeology and Historical Geographyof the Savannah River Floodplain neAr Augusta, Georgia: SoutheasternWildlife Services, Inc., Athens, Ga.
84

Emigh, E.D., January 1914, Freshets in the Savannah River: U.S. Departmentof Agriculture, Weather Bureau. (Monthly Weather Review)
-----, Report on the floods in the Savannah River, September andOctober, 1929: U.S. Department of Agriculture, Weather Bureau,October 18, 1929.
Georgia State Gazette and Independent Register, Saturday, March 16, 1793:Augusta, Georgia.
Hall, B.M., and Hall, M.R., 1907, Water Resources of Georgia: U.S.Geological Survey Water Supply and Irrigation Paper no. 197.
-----, 1908, Water Powers of Georgia: Geological Survey of Georgia,Bulletin No. 16.
Hall, M.B., and Hoyt, J.C., 1905, Progress of Stream Measurements forcalendar year 1904: U.S. Geological Survey Water Supply andIrrigation Paper no. 127.
Hoyt, J.C., 1904; Progress of stream measurements for calendar year 1903:U.S. Geological Survey Water Supply and Irrigation Paper, no. 98.
Interagency Advisory Committee on Water Data, 1982, Guidelines fordetermining flood flow frequency: Hydrology Subcommittee, U.S.Geological Survey Bulletin No. 17B.
Jones, C.C., and Dutcher, Salem, 1890, Memorial History of Augusta,Georgia: D. Mason and Co., Syracuse, N.Y.
McDonald, B.B., and Sanders, C.L., 1987, Simulated flood discharges andelevations for the Savannah River, South Carolina and Georgia, usingan unsteady streamflow model: U.S. Geological Survey Water-ResourcesInvestigations Report 84-4158, 34 p.
McCuen, R.H., 1982, A guide to hydrologic analysis using SCS methods.Prentice-Hall, Inc., Englewood Cliffs, N.J., 145 p.
Mood, A.M., Graybill, F.A., and Boes, D.C., 1974, Introduction to the Theoryof Statistics 3rd Ed.: McGraw-Hill, New York, 56 p.
Murphy, E.C., 1906, Destructive floods in the United States in 1905: U.S.Geological Survey Water Supply and Irrigation Paper No. 162, 111 p.
Newell, F.H., 1903; Progress of stream measurements for calendar year 1902:U.S. Geological Survey Water Supply and Irrigation Paper No. 83.
0Neall, J.B. and Chapman, A.M., 1892, The Annals of Newberry: Aull andHouseal, Newberry, S.C.
Patterson, George, 1889, The Savannah, her destructive floods, their Causesand Speedy Remedy: J.M. Richardson, Augusta, Georgia.
Phillips, William, 1892, Topography and Hydrography in the vicinity ofAugusta, Georgia: John M. Weigle and Co., Augusta, Georgia.
Price, McGlone, 1979, Floods in Georgia, magnitude and freguency: U.S.Geological Survey Water Resources Investigations Report 78-137
Russell, L., 1891, Stages of water, Miscellaneous River Stations 1875 to 1889,Inclusive, Part III: U.S. War Department.
85

South Carolina Historical Magazine, July 1970, John Tobler's Description ofSouth Carolina (1753): South Carolina Historical Society, Charleston,S.C.
Speer, P.R., and Gamble, C.R., 1964, Magnitude and frequency of floods in theUnited States. Part 2A. South Atlantic slope basins, James River toSavannah River: U.S. Geological Survey Water-Supply Paper 1673, 329 p.
Spencer, R.E., Rivers and Floods: U.S. Weather Bureau, Monthly WeatherReview, v. 57, October 1929.
Tri-weekly Chronicle and Sentinel, Thursday Morning, May 28, 1840: Augusta,Georgia.
U.S. Army Corps of Engineers, 1945, Savannah River basin, Clark Hillproject: U.S. Army Corps of Engineers, South Atlantic Division,Definite Project Report, v. 2, app. 1, p. 1-19, 1-23, plates 106-7.
-----, 1952, Savannah River basin, Hartwell Reservoir: U.S. Army Corps ofEngineers, South Atlantic Division, Definite Project Report, v. 2,app. 1, p. 1-11, plates 54-5.
-, 1969, Trotters Shoals Dam-a-d-Reerv r, Savannah River: U.S. ArmyCorps of Engineers, South Atlantic Division, Design Memorandum 2 -Hydrology and Hydraulics Analysis, p. 38, plate 29.
-----, 1971, Special flood hazard information report, Savannah River,Augusta, Georgia: U.S. Army Corps of Engineers, Savannah District,13 p.
-----, 1983, Interim Reservoir Regulation Criteria, Richard B. Russell Damand Lake: Written communication.
-----, Hydrologic Engineering Center, 1982, HEC-5, Simulation of FloodControl and Conservation Systems Users Manual.
-., Hydrologic Engineering Center, 1985, HEC-l, Flood hydrograph package,users manual.
-----, Savannah District, 1929, Report of flood study on Savannah River atAugusta, Georgia: Report No. 10059/43-61.
-., Savannah District, June 1953, Savannah River Basin-ReservoirRegulation Manual.
-----, Savannah District, 1974, Savannah River Basin-Reservoir RegulationManual.
U.S. Geological Survey, 1899, Water Supply and Irrigation Paper No. 27:Government Printing Office, Washington.
U.S. House of Representatives, Executive Document No. 124, 1854, vol. 12,33rd Congress, Ist session.
-----, Executive Document No. 90, 1879, vol. 16, 45th Congress, 3rd session.-----, Executive Document No. 23, 1881, vol. 18, 46th Congress, 3rd session.-----, Executive Document No. 213, 1890, 51st Congress, Ist session.-, Executive Document No. 1, 1890, part 2, VII, 51st Congress, 2nd
session.-----, Executive Document No. 255, 1891, 51st Congress, 2nd session.-----, Executive Document No. 50, 1892, vQl. 28, 52nd Congress, 3rd session.
U.S. House of Representatives, Document No. 962, 1908, vol 20, 60thCongress, 1st session.
-., Document No. 487, 1919, vol. 27, 61st Congress, 2nd session.-----, Document No. 1319, 1913 vol. 27, 62nd Congress, 3rd session.-., Document No. 1389, 1913, 62nd Congress, 3rd session.
86

U.S. House of Representatives Document No. 615, 1916, vol. 23, 64th Congress,1st session.
--- Document No. 1243, 1916, vol. 25, 64th Congress, Ist session.--- Document No. 1934, 1917, vol. 22, 64th Congress, 2nd session.--- Document No. 333, 1917, vol. 34, 65th Congress, 1st session.-- Document No. 985, 1918, vol. 18, 65th Congress, 2nd session.--- Document No. 101, 1928, 70th Congress, 1st session.--- Document No. 64, 1935, 74th Congress, 1st session.
U.S. Soil Conservation Service, 1972, Hydrographs: National EngineeringHandbook, Section 4.
U.S. Weather Bureau, 1929, Monthly Weather Review, October 1929, Volume 57,1929: U.S. Department of Agriculture.
Whetstone, Benjamin H., 1982, Techniques for Estimating Magnitude andFrequency of Floods in South Carolina: U.S. Geological Survey WaterResources Investigations Report 82-1, 78 p.
Wingfield, Nesbit, The Savannah River Levee, Augusta, Ga.: EngineeringNews, v. 72, no. 6, August 6, 1914.
87

avgday.txtVolume in drive M is FRES0304-FVolume Serial Number is 9CCF-FA19
Directory of M:\list\Hydrology Calcs\USGS gage data\Average Daily
12/05/2006 05:24 PM <DIR>12/05/2006 05:24 PM <DIR>03/15/2006 09:33 AM 58,060 AugsutaGAAnnualAvgDailyQs.pdf02/13/2006 11:03 AM 2,104,702 AugustadailyQ.bmp12/05/2006 05:24 PM 34 avgday.txt04/14/2006 04:30 PM 58,091 BurtonsFerryAverageDaily.pdf03/15/2006 09:31 AM 58,373 CalhounFallsAnnualAvgDailyQs.pdf03/15/2006 09:35 AM 58,512 ClyoGAAnnualAvgDailyQs.pdf03/15/2006 09:34 AM 57,478 JacksonAnnualAvgDailyQs.pdf
7 File(s) 2,395,250 bytes2 Dir(s) 53,735,227,392 bytes free
Page I o- I

USGS Surface Water data for USA: Daily Streamflow Statistics Page I of 2
iS)A&A~IMAvq bq T//Qs p-AfPData Category: Geographic Area:
Water Resources Surface Water D United States D o
Daily Streamflow Statistics for the NationUSGS 02197000 SAVANNAH RIVER AT AUGUSTA, GA
Available data for this site [Surface-water: Daily streamflow statistics -0 [GO
Richmond County, Georgia Output formatsHydrologic Unit Code 03060106 HTML table of all dataLatitude 33°22'25", Longitude 81056'35' NAD27Drainage area 7,508. square miles Tab-separated dataGage datum 96.58 feet above sea level NGVD29 Reselect output format
oa ] o Mean of daily mean values for this day for 98 years of record1 , in ft3 /s
_mnth r- Jan Feb II Mar II Apr I Jun Jul J AugF Sep [ t-Nov-De1 10790 113 2011173 90116289 1068011812917 77081 83591 828117 5987]817221138011 860159001 162301 0950] 8078 8381 8139 8205 10460 6316 7694
311360I 11960 14110lol 17210105708107 78711 8541 175461086574 7651
4 12460 12860l13420ll15820 10130 F7917 712618446 75861• 8 8 647•75 13170• 133 801 14440111409991--f1 79431170851179011174511749690 68
[--12130-113339111492011517011 9621118233 7356 8065 7634143-672 861
7 •1186013850111502911592011 98751187601 7357 8125177091793 6303 -8444
12600152501115910157401101601189851 7993] 79211 79861 65F663 8810] 1
[9 -26 155901116410 o15490111014085321 8653] 84401 7689 66896 7631
10 12080154591116070111512010110118316 85411 83291 8819 72364 60
11-i 1155015330114549 911456011 93181181031 73 27 352 96 8717243 665 812121790 15190 113940 136501 8830 80261[7387IF72871 7867 747 6635 83721
13i 12245Z0]l 14620111452011127801864818111]7342 7680 16671 75608814-- 1160 14330111494011127301 085701 7788 8807 16223 61 F6 2 273 915 11200 1409011469011131108~38888291 76691 9442] 63721 7344 9516 10860 134691154901113619839319036117872] 938 63315916-7227F12
F-17 1111570 1388011158801 1345011 83691F88251176991195701F6543 188•17• 999518-•1235015020114779 1227017988 8540 F7635] 9034 7583 6975i7398 9486119- 13900I15020 13869 116507629180561 7612 84471 75986 731I 902520 15450 1l41701114490 11670 83187589117735 8776116913168547297 88541
I 21 11148201114130111578011116201I 9137117369[17393 807811654011 72511687911 97971
http://nwis.waterdata.usgs.gov/nwis/dvstat/?siteno=02197000 3/15/2006

USGS Surface Water data for USA: Daily Streamflow Statistics
AqA-A# ON vi &, /At cA v iy Qa p Ias Page 2 of 2
V a I
22 12730215110 16450117 9283 7657 7171 7790 6591 72336834 98451
23 11158014790 16189 10830 9216 7228IF6961 F7473] 64381 73736792 9854124 11800 14010F16550110380 87881731816879 7321•6270 758407131 9289125 111990 13780115960 10060 84998373] 7196 72136418 70357296 9232126 11219011388011507910501 7805118399 F762317367 6989 649197352 95951
27 F11760 14160 153701050 7795 7699F74991 8905 6709F 75511 i0100728 1F12601608915380 10190 790417406] 74281 7615 89021 677875841100901
29 1113101119801[530 97671 786672091 76558•20775161 634279501101601
30 1145011 16010480 7794 75981[84458447 F7140 6319 8448 1102031 111250 W16I 210W 7823W118962[8352W I 6173W1 1111001
1 -- Available period of record may be less than value shown for certain days of theyear.
Questions about data Water Webserver TeamFeedback on this websiteNWISWeb Support TeamSurface Water data for USA: Daily Streamflow Statisticshttp://waterdata.usgs.gov/nwis/dvstat?
Retrieved on 2006-03-15 09:32:51 ESTDepartment of the Interior, U.S. Geological SurveyPrivacy Statement II Disclaimer 11 Accessibility 11 FOIA1.36 1.33 nadwwOl
TOPExplanation of terms
http://nwis.waterdata.usgs.gov/nwis/dvstat/?siteno=02197000 3/15/2006

4 do),/N 0'
400000
359900
319800
279700
239600
199500
159400
119300
79200
39100
-1000
Closure of Clark Hill Dam(J. Strom Thurmond)
Closure of Hartwell Dam
I Closure of Richard B. Russel Dam
IIII
I
.i.11 J111905 1910 1915 1920 1925
Itbill I Lý" 4141 1
I
ElB-u-iu NJ9111 " 179 1 a I I'm 1 ,Iqww, rr. . - ,I [i
1885 1890 1895 1900 1930 1935 1940 1945 1950 1955 1960 1965 1970 1975 1980 1985 1990 1995 2000
OBSERVED FLOW a 02197000
NA e ) OF!/

USGS Surface Water data for USA: Daily Streamflow Statistics Page 1 of 2
BAr~o&jFe-r7 Aver-e-t4'H d
Data Category: Geographic Area:
Water Resources Surface Water F1, United States ]1
Daily Streamflow Statistics for the NationUSGS 02197500 SAVANNAH R AT BURTONS FERRY BR NR MILLHAVEN, GA
Available data for this site 'Surface-wat-er-:-Daily-streamflow--st-atistics-[:--: GOI ~ ~ ~ ~ ~ E F ____________________________________
Screven County, Georgia Output formats
Hydrologic Unit Code 03060106 IHTML table of all dataLatitude 32056'20", Longitude 81030'10" NAD27Drainage area 8,650 square miles Tb-separaGage datum 52.42 feet above sea level NGVD29 [Reselect output format
Day o] Mean of daily mean values for this day for 52 years of record 1, in ft3 s
mn l Jan IFeb IMar Apr I y Jun IIjul Aug Sep IOfl Nov Dec]1 ]111640111900145301161201111670182701 7836] 75338046845] 713081
I 2 ][1137o1112130o14499•160801189078214 79 7644 8149168711 700915
f 3 111430[12170 14549g159801l1930l8037[8060- 7695•• 8228 F68581 70567 9981I4 I119101218014720111572011216079351]1 768201 835 716918 115 9803
S 111980 121201482911156091124101F7801 804067712 8495 F68891 725219
16 111760118101114840154001123601771317950 78301 8406][6957 73761 41i
I7][11 6801-g 114850111507011121201177181 05079611 8309 6954174021
I8 ][1123011920115160147791119401 7653 F80 80531 8129697 7470418
[9 1[ 1120111231011 114430111178011774218 1 80981179131170541174481851J 1260919 14140111660 79468133 8123 i7887 71661 7363131
11 [11001112860 16480140901i1165018173 8250 81417852 72721 7351]90811.. ,,, ,I F•.. . . •,, _. .
I 12 L1i222011132391[1717011456011116201183391183461I 79861177181173721174251190751S13 1111970_113650o1739015040 114908564 8406 6• 7743 7492 173309•S14 11117001411017120115230]11300118704 8333 7931 7677F7566 72991 78
15 l 1116501448011665015129111101187181 8310 7944F7562 175971744391--0I 16 ][11760l14530116310 147291108801188068F327 855617498] 7674I176859717 ][11740 14440 16120144901 10100] 8694 830497311 7277 7613 7674 1118 ][1730114249116050114430111029085118 3716 101305 7150741117548196861
I19 1111840o141201159001114420o100o5018397 815 998317060 173161 76391[9708
[20 1122201400157901142601 9678182311 864 96821 7006173041 7758952 111268014099159601114120119302118082 8776 92051 6937 74121 777895
http://nwis.waterdata.usgs.gov/nwis/dvstat/?siteno=02197500 4/14/2006
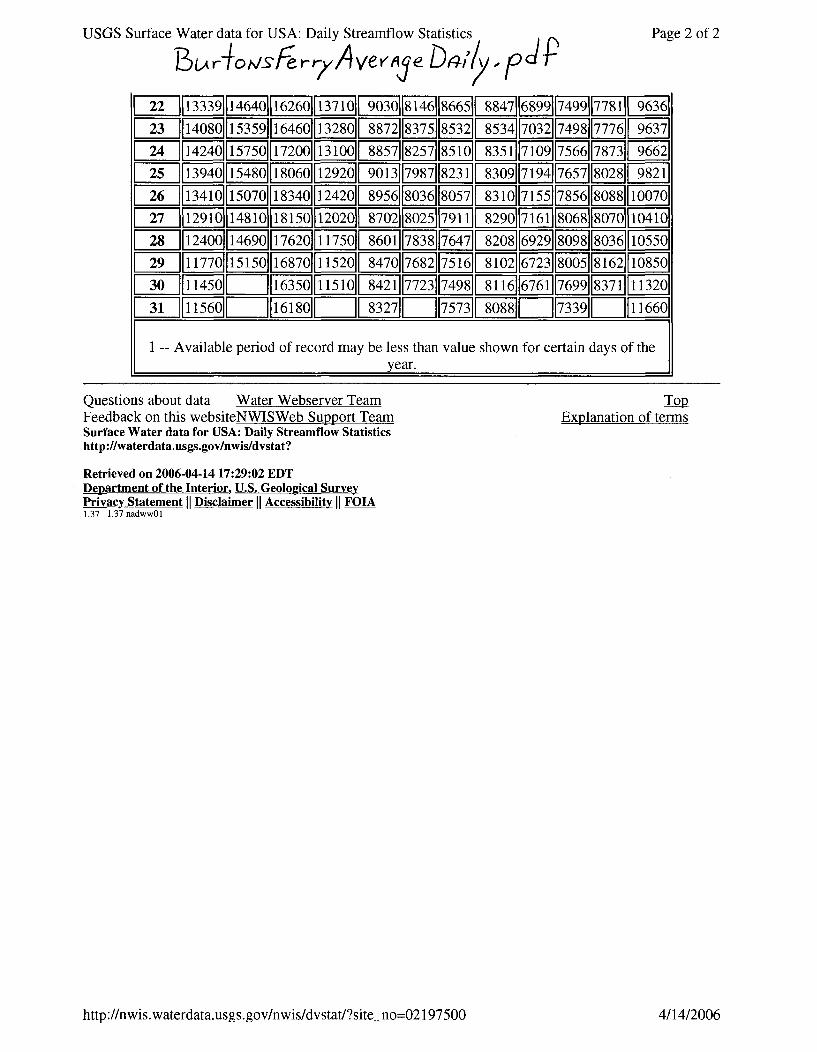
USGS Surface Water data for USA: Daily Streamflow Statistics
B ýrhoa~sFerr Avel Ae- D#41~yp/
Page 2 of 2
1 22 1 333911464011626011137 1 1814611866511 8847 1699 1778111 9636123 11 0153591646013280 82 8375 185321 85347032 7498 7776 963724-111424015750111720011131001 8857 ]82571185101 8351117109117566 78731 9662I
25[----- 4-0 15480 18060 129209013-7987IF8231 830917194176578028 982126 113410 15070 18340 12420 89568036 F8057 8310 87155 78568088 10070
-I27 1291014810118150120208702802579171 8290716 1 8070710410128111240014690117620o11750 8607838 7647] 8208 628098 8036 10550
29 11117701•5150 116870 11520 847076821 7516 810216F738005 88162110850
--30 11-1- W 116350 11510 842-J1 7723IF7498 81161671]7699 8371 1132031 111-6 0W116180 W 8--32]7W7573 8o88W--33 1W 116601
1 -- Available period of record may be less than value shown for certain days of theyear.
Questions about data Water Webserver TeamFeedback on this websiteNWISWeb Support TeamSurface Water data for USA: Daily Streamflow Statisticshttp://waterdata.usgs.gov/nwis/dvstat?
Retrieved on 2006-04-14 17:29:02 EDTDepartment of the Interior, U.S. Geological SurveyPrivacy Statement 11 Disclaimer II Accessibility II FOIA1.37 1.37 nadwwOl
TopExplanation of terms
http://nwis.waterdata.usgs.gov/nwis/dvstat/?siteno=02197500 4/14/2006

USGS Surface Water data for USA: Daily Streamflow Statistics Page 1 of 2
Data Category: Geographic Area:
Water Resources Surface Water [] IUnited States F901
Daily Streamflow Statistics for the NationUSGS 02189000 SAVANNAH RIVER NEAR CALHOUN FALLS, S. C.
Available data for this site Surface-water: Daily streamflow statistics -]-[ 0
Abbeville County, South Carolina Output formatsHydrologic Unit Code 03060103 IHTML table of all dataLatitude 34'04'15", Longitude 82038'30' NAD27Drainage area 2,876.00 square miles Tab-separated dataGage datum 363.53 feet above sea level NGVD29 Reselect out ut format
*Day ofli Mean of daily mean values for this day for 49 years of record1 , in ft3/smonth [ [Feb Mar Apr May Jun Jul Aug Sep] Oct Nov Dec
S1 ][5364158981165601892369255443144551 38722 4237 3286 3630 4632
2 [508746221] 6427-[82296832- 16-][4482 4081 3904 30781 38271-45341I 3 I[5719]r 579611 6734[-75-81682416~--• [- 1 402011 416711 371811 296011 3821144351
4J56326219117497715-8 F6529 -502•3008]F4237 35471 3205 4180 533815 ]5596 15686116972 8424 5786 57963114 4531 3558 3488 4082 639
I6 JI 632411 592511 645211 881911 545411 551 393511 428511 364211 33231404811[56381F7 ][743776831740885219 53805EE58 46318 F4310 4473 3224 3810 5778
8 ][65931 676117349 8164 5243 6334-[4592 4356F4503 3887382-0 55631[ 9 ][5991][-6038 19634081945215 5651 4681 4450 4410 3780 3864 4983[ 10 ][63041[62261 57446916-50394783 4567[ 4226 F3976 F3412378 51511
[ 11 I 6274 116374 6054 6539 5265 4809 4260 3953 3885 3451 3932 49611
[ lZ ]55771][6749] 682479 567064912146171 3676 ] 3593F34613 38613 ][5061]80151 705317949 i552 1 511311 5354 3819 3246 4227 331
[ 14 ]I[ 66810817193-8068F5405 1522547181 5460 3958 3128 3872 5486
[ 15 ]s5451] 6564 6791 7346 5621[4838 45031 4829 4023 F3178 4062•-6332
[ 16 n[58401 6167 7183 779•1 5561 4552 4880 4299 3899 3248 4064 5910
I17 ][6253I16370 6959746] F5493F4819 489914407F 3956F 3186 4004-565
18 ][6401 6974 6071 6864 5345 5148 4658 4863 3937 3299 45-32 5487619 ]6468] 6621]6076 69961 F5339]-4973-1512714654 37.11][32821 480 5520]
F 20 iT 714111 65841F698211 7193-5422 F521475911 411411 3667133401[462 56821 ][7074 7106 7352 6842 5789 •517 4663 4012 3741 3639 4303 6541
http://nwis.waterdata.usgs.gov/nwis/dvstat/?siteno=02189000 3/15/2006

USGS Surface Water data for USA: Daily Streamflow Statistics . pCA16boFAI/Y u~Avv u d Af& Y \/ o ~lOg
Page 2 of 2
22 ][6061 72118108--6423 5717 5128 4353 4114 3478 3333 4507 6862[ 23 ][57431 6675]F 8035 -61-93-51[- 4999144141 4290 3301 3131F4308 6130
[ 24 ]s5919 6069 8340 6133 5611[ 5239 4326 4160 3375 3287 428ý56311[ 25 ]6l07 59681 7747176 515- 5323]F42618 4246 3428 318917 4358-[ 26 ][5687 6205F 7591 -63711-4968 51141 43911 3963I 3705 3524 4400 F4741
[ 27 ][5432_ 6620 75476'•-4261 472247011 4367] 3760o 3852 • 7-487"0 607• 128 ][ 594511 652511 76241 F60674- 84551 423111 401611 373111 320111 io5 941-
29 II5903 5381J 7737 6111 5369 5269 4003 4081 3386 3481 5503 64251
30 ]5[55=5 81oo -693-2E 532F54942 4129 4709 3125 3492-57053F6421] 31 ][6ooII[8o63---] --54l9 -] 409811 5175 --I 3446I' ]57691
1 -- Available period of record may be less than value shown for certain days of theyear.
Questions about data Water Webserver TeamFeedback on this websiteNWISWeb Support TeamSurface Water data for USA: Daily Streamflow Statisticshttp://waterdata.usgs.gov/nwis/dvstat?
Retrieved on 2006-03-15 09:29:21 ESTDepartment of the Interior, U.S. Geological SurveyPrivacy Statement 11 Disclaimer 11 Accessibility 11 FOIA1.71 1.4 nadwwO1
TMpExplanation of terms
http://nwis.waterdata.usgs.gov/nwis/dvstat/?siteno=02189000 3/15/2006

USGS Surface Water data for USA: Daily Streamflow Statistics
C IyvCAAmAa 1o A vj N) /7IxsilPPage 1 of 2
Data Category: Geographic Area:
Water Resources Surface Water ] United States Fo
Daily Streamflow Statistics for the NationUSGS 02198500 SAVANNAH RIVER NEAR CLYO, GA
Available data for this site Surface-water: Daily streamflow statistics F•
Effingham County, Georgia Output formatsHydrologic Unit Code HTML table of all dataLatitude 3203141", Longitude 81o16'08" NAD27 __________Drainage area 9,850 square miles Tab-separated dataGage datum 13.39 feet above sea level NGVD29 I Reselect out ut format
Da Mean of daily mean values for this day for 70 years of record1 , in ft3/s
-i i50 F-419511132501[ 9907] 9131 8949 1 8791 902 F88•94111112 7301409917310l19110112920[ 9794 8953 8987 8562110330 86
1329 14050 17118650112730 9685 8856 810 8489 10340 44291
4 1340 14260-17150 18610F 12780 95 8883 8801 8417 10350861913450 14490 17480 1840012810l 9484 8853 878418438 1 9]
13450i2• 14720 117900 1183801 127901 93301187211 87291 857i1 1038081161000
7 13450 1 18170118320112860 9240F8642] 8678F868 103408114]109201
11-8 1342 0 1 18090 18320113060 9220 8633 8645 8721 10370 80771089 13250[1492017960 181601130501 92948594 8620887331103708061064010 13089-14970170 1812012900 94398567 8579 8658 10390127-105201
11 13F80 150• •1 17980 12580 9585 8624 8673 8587 929827115
12 13 5 70 1 17760112290 967518691] 8778849581 8421 050
13 15 15 17 17660]12130 970018654 87501833986 8565 21055014- 1440 1459 817017720 1120901 97771[86341 8728[[81531 84508521 0590
15- 14399 18 80 18520117930 12060 994618739 87378 8080824817]10716-i14290[ 163018700 1180901111980110090118933 8744 [80681 8293 8502 08501714050 1660186101117940 I118901110170ll9028] 8681118104I 82438441098021••1813890 1680184801 1762011117001 101601190381 8606 0261 8232 849 11019 399 177 18300[ 17190 11480 10040 9055 9260 78871 825885611 300120 1391 166901l1814011167401111310o 99501190981 9891177791824878 140
16 F837 . . .. . . . .. . 0 2]
II II II II II II II II II II II II 1
http://nwis.waterdata.usgs.gov/nwis/dvstat/?siteno=02198500 3/15/2006

USGS Surface Water data for USA: Daily Streamflow Statistics Page 2 of 2
C /.yo AA,6., , /A ,A,/> M N/ Y21 II13940II16490I117980II16380I11114011 9821119113111013011765511 816811876411115901
]22 114040 116310 117890 116089 1090 6598710160 175671 813411880411116401
23 11428011626011793011587010640949790F90 9989 7499 8177F8880 11680124 11453011642011806011555010410-94219075 96467 7497 8212 8950]117001
25 114979116670 18170 15170 1024093279070 9314 F7574 826519024 11760126 1549011704011869011482910170- 92499070F 91017 7635 848691751 11740127 l15640117350119360145601-02009258o9024 9033 1 7635 1 1 9352 11710128 11550917470200101428010150r--9344-8868••F 9082] 7639 8743 9418]11820129 l15230118810120190113960 10070935••7 8724 9069 7604 819371]119501
130 114879W120050113640 100109252 8612 9002] 7537 701 9329]120701S31 11449011 Z119760W1 I99 --W16491 8868W1 I9 13 11218o]
[1 -- Available period of record may be less than value shown for certain days of the year.
Questions about data Water Webserver Team TopFeedback on this websiteNWISWeb Support Team Explanation of termsSurface Water data for USA: Daily Streamflow Statisticshttp://waterdata.usgs.gov/nwis/dvstat?
Retrieved on 2006-03-15 09:35:10 ESTDepartment of the Interior, U.S. Geological SurveyPrivacy Statement 11 Disclaimer 11 Accessibility 11 FOIA1.36 1.33 nadwwOl
http://nwis.waterdata.usgs.gov/nwis/dvstat/?siteno=02198500 3/15/2006

USGS Surface Water data for USA: Daily Streamflow Statistics Page 1 of 2
I:Yn CksQA A a~ t~/Avb Ln,v Os.PData Category: Geographic Area:
Water Resources Surface Water [] United States go
Daily Streamflow Statistics for the NationUSGS 02197320 SAVANNAH R. NR JACKSON, SC
Available data for this site Surface-water: Daily streamflow statistics - H F
Aiken County, South Carolina. Output formatsHydrologic Unit Code 03060106 HTML table of all dataLatitude 33013'01", Longitude 81'46'04" NAD27Drainage area 8,110.00 square miles ITab-separated dataGage datum 77.00 feet above sea level NGVD29 IReselect output format
Mean of daily mean values for this day for 31 years of record1 , in ft3 /s
]monthH Jan'[ Feb Mar A Apr J lMay A••- ug[ Se oct NovDe
1- 8843 109901065011115201931~-~ 87 7 3375 77725 7052 7188 81151-2-909111140o1101o50 10540 -875 F79747 7581 7334 7079 7167 8850
--- 9807 11920 11320 1056 60 -- 7941 - 7691 F7778 F7141 F7541 70-8 8730
4 9931 11990 11470110660 8858 F83937922 7877 7433 770817193 85245 I97591114301125591109009146 8316 7743 7420 7791 7885 7261 8674
6 I 967711156011214011115018650 8323 8097•7441 7891 77791 7233F88407J[ 9407116501204010630857883 102 7409 778 7589 7218 8908
I8 J[ 9032 117301121601 102907630 8169 7924 7463 7395 7581 7141 90531
I9__J 9086111620112240l 101807377--82477316 7566 73227791 772251971211
E [940211183012020 104708088 79447700 7752 7428 7937 7354 8978-11- 9922 11430o11100o109207937 F8374 E72F7465 7247 F7994 7435 92191
[-12-][l- 11980 114801 105 O••F08381[81751 7-10ý 7766 170421 7991 77510 927113110800 1206011790103601858682 7079 7695 7059 7850 7542 9356
14 10870111850111920 993751 8554 70•42o- 7798 17047 F7693] 7745 908415 10640111930111740 9614180968441 71-83178591 7299 F7367] 8222 9007
16 10430] 1184011510104908221 8061 7270 7835 720817330 8354 9235
117 11050111092011157011051018368 7730 7478 7945 7015 F7739 7940 932618 ]107701054011340101508784F7774 7583 811• 6855 7308 7681 9248
19 ]1129o 111101075095299375 77F1•5755F803 6841 7717 7734 964
20 ]o111480110840111056011 93208814 767 7688 774371 6826769517644 941
21 11260 10200110800 9484 8461 8276 7558F 7482 6702 7905 7584-962
http://nwis.waterdata.usgs.gov/nwis/dvstat/?siteno=02197320 3/15/2006

USGS Surface Water data for USA: Daily Streamflow Statistics Pa•
[221111430111026010990938181731880017393 I7431I[7010117758 177319 953612- 111580110760111022019379 ] 873988781 74 736 1171611 7848] 8381 9469124]111300 1108011 9758 9780 9255 8404 7360 7312 7366 8257 8387 9350
25 111240 11250110010 F 9456 0 95031 82307091 73357141] 8340 F8529] F936226-•110980111109011111601 938092361 8154[] 1 7284 7216 8108 8117 9653-27--110900111380 111501 97809021 8113 7057 7332 7115 7974 77992- 9-5241
28 1111230110990110860 95428956 F82401 6866-174301 6977 F8022 78631-529 1107201054011550 F 9237 917718481 F6835 835 71o06 7759 8o77 8781130oF10850 X 11950l 9728 9396 18469E19 7984 7017] F736o0 85277 8777]
[ 31 FIO087O1[11900]1 119236]F 114-5179574 1716o0 -F 88161
ge 2 of 2
1 -- Available period of record may be less than value shown for certain days of theyear.
Questions about data Water Webserver TeamFeedback on this websiteNWISWeb Support TeamSurface Water data for USA: Daily Streamflow Statisticshttp://waterdata.usgs.gov/nwis/dvstat?
Retrieved on 2006-03-15 09:34:05 ESTDepartment of the Interior, U.S. Geological SurveyPrivacy Statement 11 Disclaimer 1 Accessibility 11 FOIA1.4 1.36 nadwwO1
TopExplanation of terms
http://nwis.waterdata.usgs.gov/nwis/dvstat/?siteno=02197320 3/15/2006

daily.txtVolume in drive M is FRES0304-FVolume Serial Number is 9CCF-FA19
Directory of M:\list\Hydrology Calcs\USGS gage data\Daily
12/05/200612/05/200604/21/200604/22/200612/05/200601/17/200604/21/200601/17/200601/17/200611/11/200604/21/200604/21/200604/21/200604/21/2006
05:24 PM05:24 PM01:32 PM12:49 PM05:24 PM04:44 PM01:25 PM04:38 PM02:51 PM01:00 PM01:27 PM11:06 AM01:53 PM01:37 PM
<DIR><DIR>
2,104,702 CommonPeriod.bmp2,104,702 CommonPeriodAnnotated.bmp
34 daily.txt2,104,702 DailyQ7000.bmp
347,004 DayQJackson.txt1,155,707 QdailyAugusta.txt614,360 QdailyBurtonsFerry.txt934,276 QdailyClyo.txt286,720 SNOClow.wdm
60 SNOClow.wdu2,104,702 TotalPeriod&closures.bmp2,104,702 TotalPeriod.bmp
12 File(s) 13,861,671 bytes2 Dir(s) 53,735,219,200 bytes free
Page 1 of2 I

Comorn Negiocl. 8m~p
80000
021970000219750002197320
64000 F-
48000 I-
02
I32000 F-
li
16000
'I I
1972 1974 1976 1978 1980 1982 1984 1986 1988 1990 1992 1994 1996 1998 2000
OBSERVED DAMLY OW
PA3 e )~9 J Ij

CO orWcN le r-I OJ ANNOi4-k, 14 hhr
80000
64000
48000
V2
32000
16000
1972 1974 1976 1978 1980 1982 1984 1986 1988 1990 1992 1994 1996 1998 2000
OBSERVED DAILY FLOW

DAi IxQ 760D, mef400000
359900
319800
279700
239600
199500
159400
119300
79200
39100
-1000 LI
11
II hi , lbII
II lIiI ý I i I II . J1 LLlk it,,, 1ýjl ýL I1in.m.n U A II ±i~ maurI -I
I , I I , , , -~~ ~ ~~~ ~~ ~~~ III~WU - - ~ ! '- ~ w' a n ~ u~ImI•llRl-l'l•l I I-19"-1 1 . -11I I I I I I I I I I I I I I - -L I L L I I I I I I I I I I I I I I I
1885 1890 1895 1900 1905 1910 1915 1920 1925 1930 1935 1940 1945 1950 1955 1960 1965 1970 1975 1980 1985 1990 1995 2000
OBSERVED FLOW at 02197000
PAýe ,I -)

-IC'#A /Pey-lofJ q-c /2S~res.L m
400000
320000
240000
En
160000
80000
1885 1890 1895 1900 1905 1910 1915 1920 1925 1930 1935 1940 1945 1950 1955 1960 1965 1970
OBSERVED DAILY FLOW
1975 1980 1985 1990 1995 2000
)Iof,

TotniFercL.bp
400000-02191000-02197500
-02191320
320000 k
240000 1-
Ln
160000 I-
80000
I LI li ,l IL
lII jl L1111,11Aý111 ilk ~ IL I I , , I 1 11 1 11 1 1,7 1 ",1 . I 1 1 1
In -------- EMEMEMENUM LL.LLL&,LLL6 Irki It III Itki flaw1b limb 161.6.1k Iwo oil .I win IMINIMIN
1885 1890 1895 1900 1905 1910 1915 1920 1925 1930 1935 1940 1945 1950 1955 1960 1965 1970 1975 1980 1985 1990 1995 2000
OB SERVID DAILY FLOW

low.txtVolume in drive M is FRES0304-FVolume Serial Number is 9CCF-FA19
Directory of M:Alist\Hydrology Calcs\USGS gage data\Low Flow
12/05/2006 05:25 PM <DIR>12/05/2006 05:25 PM <DIR>04/01/2006 07:17 PM 12,533 3&7dayLowFlowFRQNCY.OUT01/17/2006 04:53 PM 2,906 DURANL7000.OUT04/01/2006 06:12 PM 2,840 DURANLshortAugSeries.OUT12/05/2006 05:25 PM 34 low.txt04/01/2006 06:24 PM 16,772 NDAY.OUT
5 File(s) 35,085 bytes2 Dir(s) 53,735,219,200 bytes free
Page 1 o-F I

month.txtVolume in drive M is FRES0304-FVolume Serial Number is 9CCF-FA19
Directory of M:\list\'Hydrology Calcs\USGS gage data\Monthly
12/05/2006 05:25 PM <DIR>12/05/2006 05:25 PM <DIR>03/16/2006 06:14 PM 107,811 AugustaMonthlyAvgQs.pdf04/14/2006 04:38 PM 74,590 BurtonsFerryMonthlyQ.pdf03/16/2006 06:07 PM 71,898 CalhounMonthlyAvgQs.pdf03/16/2006 06:28 PM 88,440 ClyoMonthlyQs.pdf03/16/2006 06:25 PM 59,178 JacksonMonthlyQs.pdf12/05/2006 05:25 PM 34 month.txt
6 File(s) 401,951 bytes2 Dir(s) 53,735,219,200 bytes free
Page 1 of- I

USGS Surface Water data for USA: Monthly Streamflow Statistics
Av Gspi
Page 1 of 4
Data Category: Geographic Area:
Surface Water D ý United States Li 10Water Resources
OUTAGE SCHEDULED: Thursday March 16, 2006 from 7PM - 7:30PM EST for maintenance
The nwis.waterdata.usgs.gov server will be undergoing routine maintenance Thursday, March 16,2006 at 7PM EST for approximately 30 minutes. During this outage, NWISWeb Water Quality,Ground Water Levels and Historical Daily Value data will NOT be available.
Real-time data will continue to be available at http://waterdata.usgs.gov/nwis
Monthly Streamflow Statistics for the NationUSGS 02197000 SAVANNAH RIVER AT AUGUSTA, GA
Available data for this site [Surface-water: Monthly streamflow statisticsD FG- 0
Richmond County, Georgia Output formatsHydrologic Unit Code 03060106 HTML table of all dataLatitude 33022'25', Longitude 81056'35' NAD27Drainage area 7,508. square miles Tab-separated dataGage datum 96.58 feet above sea level NGVD29 IReselect output format
YEAR Monthly mean streamflow, in ft3/sYA JaIFe Ma Apr May Jun Jul [Augl Sep Oct _ Nov D
1883 [ 2,611][ 3,9011[ 4,2
1884 110,57013,300 33,180118,100 6,536114,979 8,337 4,61869[ 2,3701 2,903 9,9
1885 21,820 15,800 8,516 5,878 7,036 6,463[ 3,888 3,9291 11,730111,970 11,2
1886 [23,720 9,36713,100 21,560 19,570 16,580 19,230 7,2591 3,283 5,261 6,7
1887 [6,128130 9,900 5,387 4,645 6,398112,450135,0301 5,570 4,305 8,5
1888 E16,940 19,88024,650 14,740 13,790 8,493 5,256 6,097 47,850 12,250 19,510[12,81889 [26,57030,840 15,830110,650 6,219 7,451 10,750115,509 9 4,975 5,41890 J[ 5,137 9,023112,340 7,661 9,608 5,491 8,192 6,0021 19,540[ 7,0
1891 [[14,660 34,300 43,0601 8,755 8,647 6,534 13,66952 3,520 5,95 7,51896 ][11,26011,82 7,0051 5,2981 4,9071 3,9511116,800] 3,431 •-• 2,7921 7,904 10•,2
1897 ][ 9,167124,470120,200 18,630 7,516 5,538 7,301 8,177140 3,741 3,857 5,2
1898 ]6,519 4,929 6,298111,710 4,415 3,574 11,160113,440121,490114,52010 [10,31899 ][16,020 34,870124,790143 7,638 6,090 5,145 5,128 5 5,6084,0 7,0
1900 jI 7,262L26,2401118,3301120,0901 9,2651122,7001° 9,58911 5,7751 6,19716,68111 7,43211 9,71901 1114,281 6 115,1401125,3801115,3401119,57011 8,979l126,2601120,57011 9,17011 7,5471118,5
ir
http://nwis.waterdata.usgs.gov/nwis/monthly/?siteno=02197000&agency-cd=USGS 3/16/2006

USGS Surface Water data for USA: Monthly Streamflow Statistics
A~s~r~Av Qspf:JSPage 2 of 4
1902 1111,6901127,6001136,0001113,4601 8,39411 7,48711 5,52511 5,84311 7,46011 6,42311 5,8501112,71903 05 39,560E 32,930 19,900 10,040 17,280 7,275 8,195 5,316 4,179 4,979 4,4
1904 5 9,2061 8,579 5,512 w 4,088 3,76911,700 3,7951 2,079 3,015 4,7
1905 1 7 18,780 7,274 5,41697 4,704 12,609 7,745 4,218 3,916 3,789[19,21906 128,670o10,650 23,290 10,760 8 1,102 • 19,480 16,180 19,620 18,140 8,8241 9,5
1925 4:40,410 10,240 8,892 7,369 3,2 58 3,001 1,706 1,453 2,656 5,757 4,5
1926 116,330 11,920 11,930 7 3, 434 4,958 6,858 3,992 3,118 5,437 8,61927 I 5,840110,4001110,34011 5,8451 i3,427 5,61311 9,27611 3,56911 2,72711 2,62511 3,1211112,0
1928 j[ 6,566 9,379 9,545 13,289 13,339 8,328 10,060 29,970 14,470 7,495 6,317 5,51929 ]F 8,176 22,690 52,440 14,870 20,670 10,350 8,318 5,870135,850 42,170 16,990 15,11930 13,400 12,010 12,010 8,9061 5,588 4,806 3,645 4,511][ 3,348 7,627 8,71931 II9,9331 6,9671 8,287 10,8 • 1 3,7941 4,7201 4,3041 2,501 2,399] 2,6141115,7
1932 [20,430 17,890112,260 7,203[10,600 4,157 9,261j[ 3,409 11,020 10,510 27,31933 E,14,860 19,910 9,088 6,966 5,020 5,124 4,611 5,284 3,385 3,580 4,3
1934 5,286 6,111115,4301 7,816 15,900 6,3681 5,92 4,748110,580 4,387 6,5
1935 [11,620 8,819 12,130101 6,963 4,361 6,805 6,899 6,247 2,923 7,043 5,6
1936 [40,960123,470116,640587 7,889 5,766 4,322 6,857 4,024 18,750 5,770 12,61937 E,31,61923,18013,610 1 13,710 7,244 5,518 8,195 6,793 13,270 6,245 6,4
1938 [6,468E 4,812 8,597 19 6,018 8,517 13,919 7,191 3,978 3,010 4,387 5,11939 ][6,503 25,09022,4001 8,399 6,032 5,860311,83o4 3,412 3,192 4,3
1940 ]8,433 13,890E10,150 8 4,497 4,436 4,571 27,130 8,205 2,682 6,602 7,51941 ][ 8,308F 5,18810,73017,052 3,615 6,138 15,870 5,322 2,735 2,325 2,67310,8
1942 ][ 7,382F13,650 26,590 8,49 8,897 5,832 5,784 7,266 5,046 4,072 4,472 10,31943 -26,32914,670 19,3801 8,975 6,725 13,619 6,219 4,932 3,662 4,528 6,1
1944 [10,46018,720 33,670 2 ,620 11 5,936 4,745 4,493 3,701 3,953 4,066 4,61945 [5,80213,4001 9,961127 685 4,507 5,182 5,008 7,770 3,897 4,527:15,91946 [26,17921,370 16,56015413,080 7,316 5,522 5,368 3,906 7,506 5,844 5,01947 21,560 8,909 16,0701,610 6,0301 5,870 4,366 4,3361 3,248 4,887 20,450 13,91948 11,310 29,049 24,120 1,2 8,4191 6,631 10,330 8,349 6,834 4,791 21,250 21,61949 [:17,920125,14012,86014918,670 11,900 14,190 11,800 13,080 9,557 9,393 8,41950 ][ 9,481[( 8,759 [11,570 7,607 5,907[ 7,448[ 6,9161 4,3581 8,250[ 8,5411 5,165[ 8,3
1951 ][6,581 7,451E: 9,764 1 6,580 5,963 4,570 3,464 3,389 2,728 4,196 8,61952 ][ 8,6541 5,84229,08021, 6,782 4,342 3,627 3,889 3,332 3,385 4,017 3,71953 ][ 4,084] 5,889 11,390[-6,4015,150 5,778 5,750 5,6961 7,2311 7,171 6,4981 7,1
1954 9 7,247 7,269: 9,4201,4 7,306 6,575 6,230 5,677 5,584 5,818 5,846 4,9
1955 ]4,600E 5,278 5,767 7,11 5,804 5,227 5,205 5,2251 4,976 5,076 5,1
1956 ]4,418 4,861E 5,668 6,17 1 [ 5,425 5,266 5,547 6,189 5,437 5,622 5,91957 E[ 6,105 5,988 6,7728,2 9,802 6,138 6,143 6,171 6,452 7,347 9,310 13,1
http://nwis.waterdata.usgs.gov/nwis/monthly/?siteno=02197000&agency-cd=USGS 3/16/2006

USGS Surface Water data for USA: Monthly Streamflow Statistics
A Au Ltsiiý IA o~h/x A~QpfPage 3 of 4
1958 Li12,78o1114,o3o1115,12o1123,52o1112,26oll 6,60911 8,79611 7,83515 7 911 5,72211 5,67511 5,71959 6,026 7,395 7,322 6,721 58013,060 6,613 7,070 8,559112,680112,400 9,2
1960 E15,07028,480 18,660 18 ,020 ] 6,267 6,414 7,344 6,538 6,514 5,867 5,9
1961 6,198 9,951[11,980 21,770 w 6,783 8,840 7,700 7,835 5,679 5,537 12,71962 114,9601 9,9781113,1801115,420• j 8,96189 5,6761 5,9921 6,050[ 5,9601 5,8521 5,8
1963 9,178 9,88518,4507,7514,900 10,090 11,220 7,875 7,488 6,559 6,826 9,8
1964 [16,36016,720 27,51043527,050 7,143 10,970 11,900 14,480 17,740 10,950 17,6
1965 [17,61010,120 17,45016 9,574 12,760 7,652 9,027 7,959 7,057 6,958 7,01966 [ 8,783E13,610 23,610 7 110,480 9,031 6,830 6,731 6,896 6,478 6,478 6,71967 ][ 8,7181 8,4391 9,228 6,87 7,0361114,4401 8,7131 8,625] 8,7401 6,2861 7,5931115,1
1968 1[18,44ol 7,1751 7,199 7,55 7,6201 9,6071 7,3661 7,50011 6808 6,6491 6,8341 6,4
1969 ][1o,21o 13,590 11,350 2,8013,6801 7,3701 6,9421 7,1281 7,1771 6,6021 6,586 6,81970 ][ 6,9451 7,0931 8,55218,09 6,5821 6,5481 7,0591 6,8891 6,562[ 6,4601 6,2831 6,51971 ][ 7,1511 7,314 21,580 8,65 9,374 7,3391 7,248 8,4711 7,3061 7,198 7,5041]14,11972 119,2501116,1601 8,5691 7,7371 9,3471110,3901 8,4291 7,129117071 6,581 6,8512[i,51973 115,2601119,080 18,180o5,2 11,030 22,830 7,9061 7,4691 6,446,076 6,1531 7•,8
1974 16,160 22,3501 8,762 1,0 7,865] 7,093 7,3021 8,1811 7,3 6,451 681 7,01975 112,170 18,1401128,490 138013,4301 9,2351 8,231H 7,54611 7,8111,100 •13912,61976 112,250 110,410 116,750312i,60011,120 116,940 113,2001 7,379w17611 8,8801 9,583 20,5
1977 113,2101 8,9241113,020 20,1801 8,396 7,745] 7,6121 7,235116,09 7,045 1194011,6
1978 I16,3001117,990 9,7468,12 12,0701 8,532 7,0821 6,8331 6,9 6,470[6-,435 6,41979 I 6,8211111,0401118,690 2472011,8001114,4491 7,6291 7,778w17311 8,49110,0011•,31980 113,160 112,520 23,610 267010,610 11,590 7,7201 7,196117,94 6,535 691 6,51981 ][ 6,6701 7,2111 6,390 6179 I•i 6,2031 5,5871 5,667w15841 5,294 4,62 5,71982 ][ 9,3461111,6201 7,779 8,098 104][ 5,9851 5,9311 5,9881 6,51 6,697 597 8•,81983 [13,780 17,210 17,230 2621 8,244[ 9,724 6,489 6,5731 6,4671 6,067 5,53 9,01984 ][12,780o 14,160 ]19,060 1,1017,0401 8,2521 8,120115,5701 7,367[ 6,239] 6,0141 5,71985 ][ 6,2521112,3601 7,050 613 5,5151 5,2561 5,7151 5,678115,75 6,581 6,63 6,4
1986 J[ 7,461[ 6,609 6,534 555 5,479 5,834 5,9541 6,0921 5,516 4,514 451 5,51987 ][ 8,365 10,660 ]15,290o9,93 5,6391 5,3531 6,1361 8,6711 9,41 7,0361 6,2841 5,81988 ][ 5,9981 6,0821 5,637 5172 4,4761 4,2711 4,2191 4,3201 4,47 4,9391 4,4421 4,31989 ][4,7341 5,2901 6,149 579 4,6721 4,8101 6,0011 5,5411 7,1413,1501 5,977 15,51990 ]1o,120o121,6401125,1001 7,8921111,5801 6,450] 6,5461 8,3401 [6,82510,5801 6,433[ 6,51991 ][ 7,4221 9,3711112,3101111,5701116,8301 9,2221110,9001114,810L1 69316,353 7,201 6[-,81992 ][ 7,8251 7,4831 12,030°8,72 5,6641 8,0981 6,5241 8,05011 70011,240 15,8027,21993 130,240 22,920 22,910 19,0401Ii] 7,644 6,9381 6,8851 5,5531 5,223 5,363 5,6
1994 II7,362[ 7,5441 9,658 8,7757• 5,7791 7,5761[12,050 1i5,820k[ 9531] 13,460 11,280 13,41995 !13,930!!19,020!!18,980! 7,388! 5,897! 6,127! 6,843! 8,000
USGS Surface Water data for USA: Monthly Streamflow Statistics
A~&~~c vio+A5Avjy-s .pcLPPage 4 of 4
1 1996 9,6271124,2101l23,46011 9,29011 7,93511 8,30711 5,22011 6,04711 6,98611 8,20411 5,45511 7,21997 I[10,640o[13,860[[14,960[ 9,1271 9,1[ 8,644[ 7,325[ 8,489[ 5,306[ 6,430[ 6,491[[11,01998 ]121,530130,600124,960 22,460119,020 7,571 6,768 6,522 7,651 6,566 6,183 5,5
1999 [ 5,669 7,711 5,704 5,620L4735 4,878 5,499 6,173 5,812 4,764 4,288 4,22000 5,921 4,8821 5,014 4,371 4 4,269 4,359 5,180 5,661 4,387 4,196 4
2001 I 4,853 4,9081 7,038 4,764 4 7 5,160 4,564 4,589 4,284] 4,436 4,527 42002 ]l 4,69011 4,7741 4,6871 4,6411 4 0 4,1391 4,2461 4,2041 4,318 3,973 4,304 4,8
1 2003 ][ 4,12611 5,5481L17,8201113,660j 19,0601114,199 j16,8501110,4201[ 5,514[ __ __
Mean•of 12,100 14,120 15,370 13,080 8,979 8,098 7,669 8,168 7,413 7,115 7,038 9,1monthlystreamfiowls______ ____________
Questions about data Water Webserver TeamFeedback on this websiteNWISWeb Support TeamSurface Water data for USA: Monthly Streamflow Statisticshttp://waterdata.usgs.gov/nwis/monthly?
Retrieved on 2006-03-16 18:12:58 ESTDepartment of the Interior, U.S. Geological SurveyPrivacy Statement I1 Disclaimer 11 Accessibility 11 FOIA1.84 1.62 nadwwOl
TQopExplanation of terms
http://nwis.waterdata.usgs.gov/nwis/monthly/?siteno=02197000&agency-cd=USGS 3/16/2006

USGS Surface Water data for USA: Monthly Streamflow Statistics Page I of 3
Water Resources
Data Category: Geographic Area:
iSurface Water United States 1
Monthly Streamflow Statistics for the NationUSGS 02197500 SAVANNAH R AT BURTONS FERRY BR NR MILLHAVEN, GA
Available data for this site -Surface-w-ater:Monthly-steamfiow-statisti cs--l
Screven County, Georgia Output formatsHydrologic Unit Code 03060106 HTML table of all dataLatitude 32056'20", Longitude 81030'10" NAD27Drainage area 8,650 square miles Tab-separated dataGage datum 52.42 feet above sea level NGVD29 Reselect output format
YEAR Monthly mean streamflow, in ft3/s
__b Mar IIApr IIMay IIJun IJul IAug ISep [OIct Nov I[De1939 [ 4,182 3,807 4,7
1940 ][ 9,086114,790110,680 9,345 5,114 5,071 5,0781 28,040 9 3,573 6,783 8,11941 ][ 9,548 6,139 9,687 9,919 4,192 5,262119,400 6,3751 2,984 3,284 9,71942 ][111,30114,670128,120111,900 9,450 7,007 6,498I 7,473 4,945 5,249 8,11943 F27,530l 21,240116,320 10,740 7,371 15,380 7,433I 4,566 5,540 6,41944 E12,6301 33,880 25,430 13,270 6,894 5,651 5,308 1 4,602 4,332 5,9
1945 ][ 6,787112,29011l,690110,270111,840 5,1721 5,405 6,006 8,0 4,877 5,024[12,3
1946 [33,19022,330116,690119,180114,099 8,167 6,172 5,9661 8,020 6,210 5,51947 121,510[[10,4801117,6801116,6601 7,625[ 7,6181 5,541[ 5,4971[447[ 5,9541122,070[[16,1
1948 E12,86030426,710 21,570 9,045 8,674 10,430 9,1771• 6,818112,150 32,41949 [21,6502804,970l5,759l2063013,50l15,5012,1016,10010510l10470 9,3
1950 11,07010,450 12,580 9,574 6,944 8,663 7,7301 5,608 897 8,696 6,109 8,91951 J[ 7,864 8,425 10,550112,730 7,4831 6,615 5,2331 4,147 3,8 3,598[ 8,61952 ][ 9,916 7,315l28,710126,620 8,169 4,7051 4,178l 4,628l ] 4,074 [ 4,813 4,6
1953 ]5,649[ 7,137113,3501 8,969 16,640 6,878 6,5711 6,314 j 7,910 7,320 8,41954 ]8,609 8,011 9,425 12,670 7,786 6,591 6,422 5,8445 5,880 6,19[ 5,51955 ][ 5,594 6,256 6,401 8,094l 6,331 5,648 5,604 5,6291 5,233 5,578 5,81956 ]I 5,0671 6,1921 7,3421 7,7451 7,0981 5,941H 5,5311 5,89011666] 5,842 5,88 6,51957 ][ 6,5221 6,820[ 7,7531 8,9581110,4501 7,0001 6,4971 6,4331 7,171 8,6601 8,7691114,5
1958 [:13,66015 16,660]24,310 13,980 7,559 9,066 8,178 5 5,810 6,080 6,31959 6,972 9,057 8,823 7,846l 6,36513,990l 7,128 7,198 9 14,2401[5010,7
http://nwis.waterdata.usgs.gov/nwis/monthly/?siteno=02197500&agency-cd=USGS 4/14/2006

USGS Surface Water data for USA: Monthly Streamflow Statistics
&L~4 eCjSvi~rr/IOmJ17yQ.ýpcHPage 2 of 3
1960 1115,609[32,429124,520 23,490111,250 7,593 7,534 8,249 7,261 7,252 6,478 6,6
1961 [[ 7,255 9,672 16,130 24,200 10,900 7,413 10,650 8,817 9,717 6,181 6,540 13,4
1962 [18,760111,86017,820118,270 9 9,320 6,808 6,866 6,834 6,812 7,032 7,2
1963 [10,64011,920117,980110,670115,480 10,130113,260 8,787 8,462 7,695 7,566110,8
1964 F17,85020,040 27,080 46,240 29,9801 8,41811,140 13,310 o20,01020,15014,240117,71965 [21,18012,770 19,010 21,870 11,770 13,640 9,797 10,580 8,836 8,121 7,934 7,9
1966 110,130113,28930,180 9,741112,85011,030 8,041 7,9881 7,776 7,530 7,543 7,9
1967 10,460 9,752[11,230 8,155 8,282 15,960 10,530 9,677 10,580 7,252 8,632 16,3E1968 122,2001110,0701 8,6431 8,5351 8,4791110,5001 8,0751 8,0931 7,5241 7,4591 7,9371 7,81969 ]10,5001117,0501112,7091118,9701117,9101 8,3661 7,7511 7,9101 8,91 7,3421 7,4331 7,81970 ][ 7,9541 8,3081 9,6951110,0701 7,6601 7,4571 7,6851 7,7941 7,26811982 ] 7,158 6,356 8,9
1983 ][15,6091119,6701120,7201129,5401 9,6211110,4601 7,2681 6,9291 7,0271 6,4081 6,1501 9,51984 ][13,7801114,9501123,5401115,5801121,3001 9,361] 8,4701117,810117921 6,8481 6,7701 6,51985 J[ 6,9871113,7191 7,8131 6,5301 5,8731 5,7791 6,1561 6,0981 5,6581j 6,4131 7,6811 7,81986 J[ 8,1581 8,1781 7,8871 5,9151 5,4811 5,9531 5,6491 6,1531 5,5581 4,6571 4,5291 6,01987 ][ 9,8931111,7001117,7801111,6501 6,2461 5,6391 6,2981 8,660L1 ,531 7,4951 6,5961 6,11988 ][ 6,5021 6,5161 6,0891 5,8861 4,994][ 4,8561 4,5101 4,4841 5,4691 5,3361 4,9811 4,81989 ][ 5,4191 5,785'1 7,1081 6,8551 5,0531 5,2961 6,7171 5,69411 8,614,8001 6,450 17,21990 ][11,560o120,7701130,2401110,6201112,310l 7,5261 6,788[ 8,535w1 7,212,6901 7,1361 6,8
1991 ][ 8,217 110,760 14,9291 14,560 l19,830 10O,2101111,810 19,220L18,221 6,6191 7,8451 7,51992 ][ 9,0161 8,5601113,2301111,1201 6,3851 9,8121 8,1221 9,026E22 7,3113,2101114,3801131,31993 ]135,2901128,2201127,3891126,000l 9,7881 8,3791 7,0161 6,8581 6,51 5,993] 6,6321 6,61994 II8,3781 9,021 11,12901110,4201 6,3871 6,7171115,7091116,0101112,4201115,5091113,0101116,2
1995 116,5501119,0801124,6401 8,3881 6,2531 7,2881 7,1381 8,8341110,2901110,7801118,2101116,11996 II9,5751126,3791125,4501113,6301 9,622 10,3801 6,7641 7,482117511 8,5111 5,3361 7,21997 111,5101114,6101 19,350 [10,360 [11,2501 9,2121 7,7371 8,7951 5,6541 6,9321 7,4971112,51998 124,5101133,8801131,3101127,2001124,4201 8,6711 7,4361 6,9031 j8,61311 7,3751 6,929[ 6,31999 ][ 6,7451 9,6901 6,9461 6,6531 5,5361 5,3251 6,4201 6,4311 6,11 5,6851 5,1191 5,12000 ][ 7,1431 6,0801 6,0291 4,8491 4,5141 4,7861 4,7181 5,2681 6,51 5,0961 5,2051 5,42001 ][ 5,961[ 5,8061 7,900[ 6,5011 5,319[ 6,313[ 5,6451 5,4451 5,5[ 4,935[ 4,984[ 5,22002 ][ 5,5171 5,8701 5,6871 5,7341 4,8811 4,7001 4,7461 4,71811 ,53] 4,5771 5,1971 5,82003 I[ 5,224J1 6,419
USGS Surface Water data for USA: Monthly Streamflow StatisticsB3• •6-/-o, y A,,,, o fl'hIl/ Q .pciDPage 3 of 3
Feedback on this websiteNWISWeb Support TeamSurface Water data for USA: Monthly Streamflow Statisticshttp://waterdata.usgs.gov/nwis/monthly?
Retrieved on 2006-04-14 17:37:09 EDTDepartment of the Interior, U.S. Geological SurveyPrivacy Statement i1 Disclaimer 11 Accessibility 1I FOIA1.46 1.41 nadwwOl
Explanation of terms
http ://nwis.waterdata.usgs.gov/nwis/monthly/?siteno=02197500&agency-cd=USGS 4/14/2006

USGS Surface Water data for USA: Monthly Streamflow Statistics Page I of 3
C4Ao4,0 'V.) OAJ72 A* AvQs .pJp
Data Category: Geographic Area:
Surface Water [] United States D.1 [-]Water Resources
OUTAGE SCHEDULED: Thursday March 16,2006 from 7PM - 7:30PM EST for maintenance
The nwis.waterdata.usgs.gov server will be undergoing routine maintenance Thursday, March 16,2006 at 7PM EST for approximately 30 minutes. During this outage, NWISWeb Water Quality,Ground Water Levels and Historical Daily Value data will NOT be available.
Real-time data will continue to be available at http://waterdata.usgs.gov/nwis
Monthly Streamflow Statistics for the NationUSGS 02189000 SAVANNAH RIVER NEAR CALHOUN FALLS, S. C.
Available data for this site 'Surface-water: Monthly streamflow statisticsr¶ 0
Abbeville County, South Carolina Output formatsHydrologic Unit Code 03060103 HTML table of all dataLatitude 34'04'15', Longitude 82038'30" NAD27Drainage area 2,876.00 square milesGage datum 363.53 feet above sea level NGVD29 Reselect output format
YEAR Monthly mean streamflow, in ft3/s
______J-an Feb Mar IApr May Jun Jul Aug Sep Ioct Nov I1896 [1,822 5,646 6,4701897 ][ 4,456 11,360 10,950 13,350 6,L10 4,698 4,415 2,6551, 2,240 2,819 3,355
1898 4,497 3,231 3,639 5,394
1899 ] [ 5,799 4,9203,4 3,03112,870 2,549 2,474 4,495
1900 ][ 5,16813 9,485 10,050 5,235 11,430 3,019 2,70011
1930 I 49 4,71513,459 2,65712,03912,22312,30913,790 4,7911931 ][4,243321• 4,0141 5,931 4,4991 2,566 2,8481 2,8542111 1,7721 1,9451 9,915
1932 9,727 6,827 5,945 5,4571938 5,583,41314,1645,4 4,75512,80812,17313,068 3,0951939 ][ 3,88710o,620l 7,957 5,1821 4,837 3,764 2,81 6,431J12,6811 2,318 2,278[ 2,507
1940 ][ 2,940 5,000 4,3991 4,48111 2,8671 2,6022,896 11,1404,296 2,304 3,534 4,2511941 ][ 4,3111 308 4,2911 3,741 2,665j[ 2,268 [7,557[ 3,187 1,9701 1,8451 1,915[ 4,9351942 ][ 3,4441] 6,4611 8,322 3,943 4,71[ 3,921 3,442 4,389 3,486 2,685 3,0401 7,1511943 [1,7901 7,002 7,568 7,5341 5,5211 4,8317163 4,18513,428 2,698 3,167 3,625
1944 ][ 4,956 7,927112,490 8,734 5,5281 3,892 3,77 2,85312,990 2,646 3,009[ 3,47119 I I I
http://nwis.waterdata.usgs.gov/nwis/monthly/?siteno=02189000&agency-cd=USGS 3/16/2006

USGS Surface Water data for USA: Monthly Streamflow Statistics Page 2 of 3
1945 3,84211 6,50611 5,69911 6,60911 4,24311 3,163113,10011 3,187113,96511 2,91511 3,43011 7,1661946 1112,93o111,410 9,3977,1361 7,485 4,5793,8831 3,73412,6161 3,21 3,474 3,207
1947 ][ 9,152 4,603 5,198 5,849 3,666 3,58512,497 2,2552,100 3,245 6,192 4,
1948 ]E 4,299 8,011 8,981 6,857 4,655 3739 5,903 5,607 4,146 2,940 11,290 8,018
1949 ][ 9,328110,670 7,274 9,067 9,0671 7,3129,6611[ 7,55918,540 6,984 6,370 5,625
1950 ][ 6,3181 6,039 6,506 5,2421 4,034 5,47714,8831 3,33016,114 4,837 3,328 4,990
1951 EE3441 3,994 5,507 5,779 4,414 4,329[2,89111 2,35012,138 1,728 3,086 8,0601952 5,014 6,330116,910 7,387 5,014 3,64912,43411 3,6412,3631 1,933 2,27111 3,1601953 6,292 9,588 7,856 4,745 6,605 3,822 3,323 2,28312,330 2,161 2,121 6,606
1954 9,577 5,384 6,415 6,283 4,235 3,40212,106 1,6111,216 978 1,52411955 3,322 6,344 3,867 5,104 4,781 2,735 3,011 2,67411,665 1,760 2,0771
1956 ][ 1,889 6,763 6,126 7,824 4,187 2,39612,755 1,68513,285 2,428 2,5071
1957 ][ 4,232 6,675 5,934 8,491 4,207 3,96812,676 2,05612,346 4,316 8,310 6
1958 ][ 6,146 6,830 7,141 9,266 7,653 4,184 5,521 3,914 2,624 2,745 2,4142,
1959 ][ 3,517 4,471 4,833 6,270 5,598 6,91314,069 2,18514,526 5,736 4,3391 91960 ]j 7,2521110,3801 8,2591 9,2991 5,4541 4,153]13,7391 4,324113,7031 4,5811 3,1591 3,487
1961 1 3,655 3,09j1 3,560 5,175 969 4,51214,983 5,040 4,873 2,559 3,76210,900
1962 II 5,597 1,648 1,792 6,737 4,11[ 5,73313,415 4,47513,672 3,847 2,812 61963 II 4,786 2,945 8,820 6,223 7,799 3,66915,812 4,81713,817 3,784 3,988 61964 II 6,3981 6,8131111,2301121,5101110,7801 4,063116,9841 6,377115,3451110,9801 8,0421110,7501965 II 5,7181 5,2251110,2201 9,2431 6,634[ 8,438115,637[ 6,100115,8811 5,0111 4,432114,01966 II 4,866] 4,8731111,3201 4,6301 7,3121 6,119]}3,8561 5,764]]4,7271 3,8171 3,757]]3,11967 II 5,4591 3,8551 3,9351 2,9351 4,543ll11,030114,5871 6,356115,020l 3,4541 7,0301110,2801968 II 9,270[J 3,5851 4,8421 5,407[ 3,8871 5,021114,4621 5,412114,1351 4,1581 4,4081 4,0
1969 II 6,541][ 8,0851 4,836l 6,0921 7,1471 5,397114,5781 5,890114,0601 3,7831 5,17714,31970 II 3,694]1 3,4961 3,791] 5,5081 3,0541 4,046115,2151 4,216114,9491 2,8431 2,8281 3,41971 II3,8731 4,3871 4,3581 3,6391 4,8501 3,962113,7411 4,251 5,3621 2,3991 7,1501 8,3
1972 II7,2311 7,8021 4,6341 3,5551 5,8201 6,366114,2161 5,835114,3581 2,5991 4,4251 9,1
1973 II7,4551 8,5001110,4001111,0001 9,2321112,440114,89111 5,462114,7871 3,5681 4,583I16,21974 112,0801112,260l 6,2691 7,3801 6,0621 4,838115,74411 6,393115,1971 2,2761 3,9131 4,7
1975 II4,8871 7,8311113,0501110,5501 8,4971 5,029114,42611 5,094114,5701 8,1321 9,2441 7,5561976 II6,7131 6,1311 8,0441 8,8021 7,6621110,980118'24711 4,780114,2961 3,6101 6,4901 7,2
1977 II 7,9151 3,5271 5,5801113,8401 4,7421 4,663114,381j1 5,047114,5001 4,0661 6,8981 7,7
1978 II 9,713]1 8,0521 5,740[ 4,1051 7,3361 5,329114,22811 4,4561[4,5161 3,0191 3,8871 4,01979 j[ 4,584]I 6,4441110,430113,8001 8,957 110,140!L5,4401[ 5,772JL5,1771 __ .__ __Mean
196 5 98 6,3 7,2 7,5 5,5 5,44,9 4,43,8 3,4 4,4 5,8mo9t66
196a7iws___
http://nwis.waterdata.usgs.gov/nwis/monthly/?siteno=02189000&agency-cd=USGS 3/16/2006

USGS Surface Water data for USA: Monthly Streamflow Statistics
CA/tL4AjoI~'ovA/y Avj'Qs-pdfPPage 3 of 3
Questions about data Water Webserver TeamFeedback on this websiteNWISWeb Support TeamSurface Water data for USA: Monthly Streamflow Statisticshttp://waterdata.usgs.gov/nwis/monthly?
Retrieved on 2006-03-16 18:05:25 ESTDepartment of the Interior, U.S. Geological SurveyPrivacy Statement 11 Disclaimer 11 Accessibility 11 FOIA1.7 1.45 nadwwOl
Explanation of terms
http://nwis.waterdata.usgs.gov/nwis/monthly/?siteno=02189000&agencyscd=USGS 3/16/2006

USGS Surface Water data for USA: Monthly Streamflow Statistics
•i ~C AI /'.: . :'-,.
Page I of 3
Data Category: Geographic Area:
Surface Water United States D- -- 1Water Resources
OUTAGE SCHEDULED: Thursday March 16,2006 from 7PM - 7:30PM EST for maintenance
The nwis.waterdata.usgs.gov server will be undergoing routine maintenance Thursday, March 16,2006 at 7PM EST for approximately 30 minutes. During this outage, NWISWeb Water Quality,Ground Water Levels and Historical Daily Value data will NOT be available.
Real-time data will continue to be available at http://waterdata.usgs.gov/nwis
Monthly Streamflow Statistics for the NationUSGS 02198500 SAVANNAH RIVER NEAR CLYO, GA
Available data for this site [Surface-water: Monthly streamflow statistics [- 0
Effingham County, Georgia Output formatsHydrologic Unit Code ]HTML table of all dataLatitude 32'31'41", Longitude 81o16'08, NAD27 TtDrainage area 9,850 square miles Tab-separated data
Gage datum 13.39 feet above sea level NGVD29 Reselect output format]
YEAR Monthly mean streamflow, in fi 3/sYEAR___ anFeb] - Mar Ae r May Jun Jul [IAug[ Sep Oct Nov I[De
1929 83,660119,440121,21930 18,580 2 16,790 -14,140 9,3611 8,050 7,040] 5,9F3- 5,081T9,468110,91931 [13,30 9,129l10,400 12,530111,610 5,315 5,271 5,800L308 2,772 3,232 12,31932 [24,35017,370l17,870 11,830 8,525 10,470 6,349 9,612 10,520 12,230 19,5
1933 27,360 22,910 16,370111,090 9,573 6,142 6,744 5,3181 j
1937 ] 10,520 10,840 8,7
1938 ]9,233l 6,9931 9,275l22,960 7,663 9,678 7,82215,890157 4,249 5,514[ 5,91939 ]F 8,327 20,560 31,050 13,600 9,4931 7,487 6,506 10,4507 5,094[ 4,321[ 5,1
1940 ][ 9,487 13,320 12,820 10,340 5,935 5,659 5,705132,860 9 1 4,293 1 7,204 8,81941 :[1,670 7,180 9,833111,240 4,873 4,951 21,260 7,43014 9 3,431 3,847 7,5
1942 [14,87913,68029,1801F7,220 9,391 9,0721 7,328 7,841 5,406 5,597 8,4
1943 [26,1[23,750 19,740 16,400 12,659 8,151 14,570 8,205221 4,679 5,719[ 6,1
1944 114,0o0oo18,110134,780 30,7804,610 7,426[ 6,1651 5,535 5,164[ 4,855[ 6,81945 ][ 7,604110,670 13,640 9,871 12,470 5,496 5,435 7,242 , 5,456 5,157110,1
1946 1[34,230019590I17,31017,970F14,2801 9,24311 6,70411 6,5001 5711 8,29911 7,3461[ 6,2
http://nwis.waterdata.usgs.gov/nwis/monthly/?siteno=02198500&agency-cd=USGS 3/16/2006

USGS Surface Water data for USA: Monthly Streamflow StatisticsC />o ~o. #/jQs.pJF Page 2 of 3
1947 1119 2X01112 6OII2Oi29OII2O~OOII 973311 947911 6~S 1411 619911 929011 71241196A10119071948 17,760137,320133,880 ,510,820 9,98310,920 10,l4095 8,511]J11,200739,1
1949 123,670 26,930 17,980816,71022,240 13,890 15,150 12,760 17,700 11,44011 9,8
1950 [11,64011,260 13,400 10,610 7,500 9,273 7,871 6,318 10,330 8,08082 9,4
1951 9,156 9,25911,080 14,050 8,288 6,783 5,737 4 4,207 5,869 8,71952 E11,59o 8,907_27,930 31,150 10,040 5,836 4,635 5,0194 4,776 5,330 5,21953 II 6,5468 8,32116,13011418,160 7,511 6,697 6,556t896 9,262 7,899 9,81954 1[ 9,81411 8,4841110,8801114,1201 8,95011 7,08911 6,64611 5,96o158931 5,91911 6,4701[ 6,0
1955 [ 6,3477 7,049 9,750 7,209 6,307 6,232 6,248 , 5,824 6,217 6,7
1956 ][ 5,8537 9,142 9,039 7,892 6,287 6,015 6,324 w 6,918 6,617 7,31957 ]I 7,584 7,7351 8,51910,130111,9801 8,1191 6,9231 6,679E1 7 10,220 8 [17,1
1958 [5,37o 18,670 19,530 27,589 17,310 8,492 9,9771 8,645 6,028 6,207 6,8
1959 ][ 7,992111,880112,080 9,964 6,771114,070 7,813 7,96311 , 14,399[192,3
1960 [11,960134,460 29,470 27,13013,500 8,239 8,072 9,083 7 7,645 7,039[ 7,5
1961 [[ 8,493 9,986 19,680 25,570 15,179 7,815 11,230 9,997 11,020 6,560 6,934 12,4
1962 [21,530 12,200 21,130 19,95011,900 9,994 7,241 7,319, 8,028 7,833 7,9
1963 11,830 16,139 17,340 14,630 16,540111,540116,540 9,5828 8,658 8,270 11,8
1964 919,640245029,170 55,679]33,890[ 9,415 11,08015,659123,520[21,150 16,730 18,0
1965 E24,660 17,350 22,300 27,780 14,060 13,39013012,609 9 8,875 8,696 8,61966 ][11,870o 14,2801133,6701111,640 13,3801 13,7601 9,072[ 8,773117,7 7,648 7,6641 8,0
1967 [12,54 11,060 12,980 8,413 8,941 15,980 12,150 9,586 12,180 7,680 8,877 15,6
1968 ][23,89o12,780l 9,299 9,110 8,946110,920 8,397 8,1037, 7,642 8,175 8,1
1969 ]9,77518,590 13,289 17,880 22,560 9,194 8,082 8,667 9,8[ 7,709 7,785 8,41970 ] 8,850 9,532 11,360 12,720 7,843 7,529 7,728 7 8 ,4[ 7,715 8,421[ 8,7
1971 11,880111,170 25,640 15,420 12,559 9,685 9,215 12,260 9745 9,469 9,463119,11972 ][20,840126,320 12,500 10,370 10,890 10,520 13,1301 8,4Q00 j 7,407- 7,70411,31973 [2o,76o270822,970 34,870 15,040 27,770 14,6704:10,650 J 8,303 8,200 10,4
1974 [[18,070 2696017,170 17,230 9,475 8,934 8,318 9,853 8 7,582 7,848 8,5
1975 [113,830 22,410 32,400 36,980 16,980 14,349 11,860 9,414 9011,470 15,350:15,5
1976 ]13,869 14,79015,730 18,370 11,540121,740 16,490 8,664 8,62 11,210 10,670124,41977 ][20,070o111,4501116,2101125,9201 9,9381 8,0431 7,6671 8,18911769 7,6681111,9901114,5
1978 [1,840 26,910 12,540 1,220 14,050 9,955 7,835 7,531 7 6,696 6,820 7,3
1979 ]8,234[10,360 26,290 24,150 19,830117,850 9,815 9,105 9510,250 11,880114,41980 I[12,550o120,0401127,639 141,750 113,1601115,420[ 8,4971 7,2011 6,1[ 7,8451 7,975[ 7,71981 17,7821 9,345 8,161 8,159 6,232 7,618 6,075, 6,729[ 617 5,629 5,3151 6,4
1982 112,3801!12,4801111,4601 8,5541 8,8551 7,276 7,23 7,169117191 7,6601 6,584[ 8,71983 I15,1701121,170 23,800 31,450 12,830 10,650 789 7,1411 7,9 6,715 6,593 10,41984 !13,769 !16,470..27,389. 16,900.25,33,___0 10,57____0 8,91818,860!.826. 7,075. 6,899. 6__,8
http://nwis.waterdata.usgs.gov/nwis/monthly/?siteno=02198500&agency-cd=USGS 3/16/2006

USGS Surface Water data for USA: Monthly Streamflow Statistics
C/yb m/v/)//OvAs,y6spJpPage 3 of 3
1985 II 7,2461114,49011 8,80411 7,08711 6,10611 5,85011 6,15911 6,373LL611I 6,60011 8,55411 9,81986 ]: 8,790 9,996 8,832 6,664 5,860 6,216 5,810 6,294,0 5,191]l 5,195 7,11987 ][12,100114,449 20,910 13,730 6,945 6,304 6,722 8,697 10,060 7,894 6,895 6,6
1988 ][ 7,334 7,504 7,043 6,699 5,830 4,925 4,696 4,879 6,21 6,006 5,550 ,1989 ][ 6,324 6,723 9,033 9,022 6,141 6,006 7,456 6,3261 9,815,050 7,179 16,9
1990 E814,920 19,33033,19014,420 11,490 8,662 7,0661 8,3021 8 14,770 9,526 8,11991 810,470114,52018,280116,510120,800113,030113,350122,530111,280 7,528 8,560 8,1
1992 [10,390 9,812113,860112,850 6,808110,800 9,308 10,300 9,89115,110 14,190 35,61993 43,930 32,560 30,140 32,229 11,110 9,063 7,460 7,214168 5,749 6,682 7,21994 ][ 9,185[10,070 12,770 11,760 7,272 7,133 16,039 14,390116,680[16,280 15,270 17,0
1995 [[18,900121,260130,340[10,200 7,178 8,703 7,741 10,530 12,390 11,580 17,370118,2
1996 ][10,400125,119 25,720 17,200 10,380 11,140 8,167 8,8101 8,31 9,169 6,279 8,3
1997 ]E12,470115,110122,020111,380112,530 9,729 8,853 9,944 6,3701 7,627 9,222 13,1
1998 ][28,480142,490 39,360 30,730 27,339 10,860 8,406 7,836198 8,108 8,146 7,41999 ][ 8,233 11,000 7,816 7,470 6,625 6,518 8,443 7,5547 6,156 5,423 5,5
2000 E[ 7,2799 7,282 7,117 5,698 4,948 5,129 5,183 5,767 5,826 5,545 5,92001 ] 6,665 6,533 10,190 7,944 5,417 6,786 5,862 5,457,2 4,962 5,048 5,3
2002 ]E 5,619 6,027 6,070 5,930 5,101 4,825 4,805 4,661 , 4,934 5,663 6,72003 ][ 6,304J1 7,554!12 1,620!12 1,310j j20,020J 22,5001120,3401115,5301 8,433____
Mean
of 13,980 15,709 18,280 17,090 11,690 9,608 8,861 9,030 8,112 9,059 8,634 11,0monthlystreamfiows ___ ___ ___ ___ ___ ___ ______ ___
Questions about data Water Webserver TeamFeedback on this websiteNWISWeb Support TeamSurface Water data for USA: Monthly Streamflow Statisticshttp://waterdata.usgs.gov/nwis/monthly?
Retrieved on 2006-03-16 18:27:46 ESTDepartment of the Interior, U.S. Geological SurveyPrivacy Statement 11 Disclaimer 11 Accessibility 11 FOIA1.78 1.5 nadwwOl
Explanation of terms
http://nwis.waterdata.usgs.gov/nwis/monthly/?siteno=02198500&agency-cd=USGS 3/16/2006

USGS Surface Water data for USA: Monthly Streamflow Statistics Page I of 2
Data Category: Geographic Area:
Water Resources Surface Water D United States r~ý g
OUTAGE SCHEDULED: Thursday March 16,2006 from 7PM - 7:30PM EST for maintenance
The nwis.waterdata.usgs.gov server will be undergoing routine maintenance Thursday, March 16,2006 at 7PM EST for approximately 30 minutes. During this outage, NWISWeb Water Quality,Ground Water Levels and Historical Daily Value data will NOT be available.
Real-time data will continue to be available at http://waterdata.usgs.gov/nwis
Monthly Streamflow Statistics for the NationUSGS 02197320 SAVANNAH R. NR JACKSON, SC
Available data for this site LSurface-water: Monthly streamflow statistics Ii i1
Aiken County, South Carolina Output formatsHydrologic Unit Code 03060106Latitude 33013'01", Longitude 81046'04" NAD27Drainage area 8,110.00 square miles Tab-separated dataGage datum 77.00 feet above sea level NGVD29 I[Reselect output format
YEAR Monthly mean streamflow, in ft3/s
YEAR Jan Feb Mar Apr IMayl Jun Jul IAug ISep i[i Oct Nov[ De
1971 ] 16,9731 7,280 13,91972 1635 8,499 7,641 9,220 1 9,777 9,149 7,1[61 ,6 6,682 6,765l11,71973 ][14,810[18 1 9,275 8,005-- 6,695 6,692 8,41974 [16,960 9 8,120 7,244 7,295 8,3647, 7,206 7,250 7,4
1975 ]112,839 13,930 9,854[ 8,653 7,502 w 11,750114,57013,51976 113,23o11,64 7,691 9,382 9,967
1977 ]114,870 9,364113,760 8,704 7,573 7,368 7,276E 7,249 12,91013,01978 F411,110 8,677 13,289 9,101 6,879 6,8306, 6,180 461[ 6,31979 F 6,737 1 8,685 8,5291 ,794 8,745 111,4601[F2,51980 ] 11,090113,030 7,8221 7,242 6,927 7,28[ 6,61981 ][ 6,803 7,836 6,898 6,641 5,679 6,710 5,465 5,689-- 5,071][ 4,563 5,71982 [1lO, 701 8,3081 8,070 6,393 5,926 5,900 5,959 6,6 6,714] 6,016 8,7
1983 ][14,779 9,075 10,500 6,951 6,6271 6,70 6,136 57 9,11984 [[12,95140[ 15 85 8,2655 6,500 6,451 6,0
1985 ] 6,482 1 7,4781l 6,283 5,568 5,351 5,820 5,725[ 6,521 6,8761[ 6,6II IIm m mI m m mImImImImI I [-
http://nwis.waterdata.usgs.gov/nwis/monthly/?siteno=02197320&agencycd=USGS 3/16/2006

USGS Surface Water data for USA: Monthly Streamflow Statistics
TeCkSOAN5 1vb/y Qs ,pi~F
Page 2 of 2
1986 II 7,60111 7,17011 6,90411 5,7501 ,431 5,73911 5,86911 6,35411 5,555ll 4,85911 4,58211 5,91987 [9,39911,590 i1,01,[1 5,434 6,221][ 8,941 9,859 7,552 6,455 5,81988 ][ 6,160 6,193 5,728 5,461 [ 4,720 4,560 4,530][ 4,628 5,423 5,487 4,958 4,7
1989 ][ 5,162 5,833 6,983 6,701 [ 5,123 5,334 6,739][ 5,9781 8,67014,2801 6,92416,8
1990 11,380 9,043 11,950J 6,817 6,401][ 8,358 7,180 7,105 7,0
1991 j8,09710,170 1 9,750 11,430 16,510 7,645 6,621 7,560 7,4
1992 ][ 8,793 8,283112,910110,080 5 8,673 7,509 8,723 7,806 12,630
1993 9,660 8,632 7,620 7,573 6,437 6,147 6,498 6,6
1994 ][ 8,413E 8,672,10,99010,070 6,594 7,270 1 12,86015,4
1995 ][11,210 8,012 6,330 6,937 7,4221 9,02710,630 11,290 14,1
1996 ][ 9,469 11,820 9,943 10,710 7,407 8,09680 8,769 5,634 7,6
1997 111,790114,850 11,160 11,490 9,784E 8,263 9,418 6,090 7,312 7,57012,2
1998 ] 8,659 7,476 7,018 8,901 7,826 7,416 6,7
1999 j 7,096 9,446 7,075 6,901 5,789 5,672 6,427 6,761 6 5,088 4,600 4,52000 ][ 6,5051 5,6371 5,7461 4,8831 4,6801 4,9901 4,901] 5,6591 6'41 5,0411 4,956] 5,1
2001 ][ 5,531 5,637 8,030 5,830 4,837 5,968 5,169 5,094 4,763 4,659 4,744 5,02002 ]I 5,11011 5,306!t 5,35511 5,18511 4,575J1 4,38811 4,441][ 4,46211 4,711]1__ - _
MKeanof n9,858 10,090 8,457 8,426 7,893 7,933 7,080 7,409 7,216 7,458 7,315 8,8monthlystreanmflows ._____..___
Questions about data Water Webserver TeamFeedback on this websiteNWISWeb Support TeamSurface Water data for USA: Monthly Streamflow Statisticshttp://waterdata.usgs.gov/nwis/monthly?
Retrieved on 2006-03-16 18:24:32 ESTDepartment of the Interior, U.S. Geological SurveyPrivacy Statement I1 Disclaimer II Accessibility 1 FOIA1.6 1.37 nadwwO1
TpQPExplanation of terms
http://nwis.waterdata.usgs.gov/nwis/monthly/?siteno=02197320&agency-cd=USGS 3/16/2006
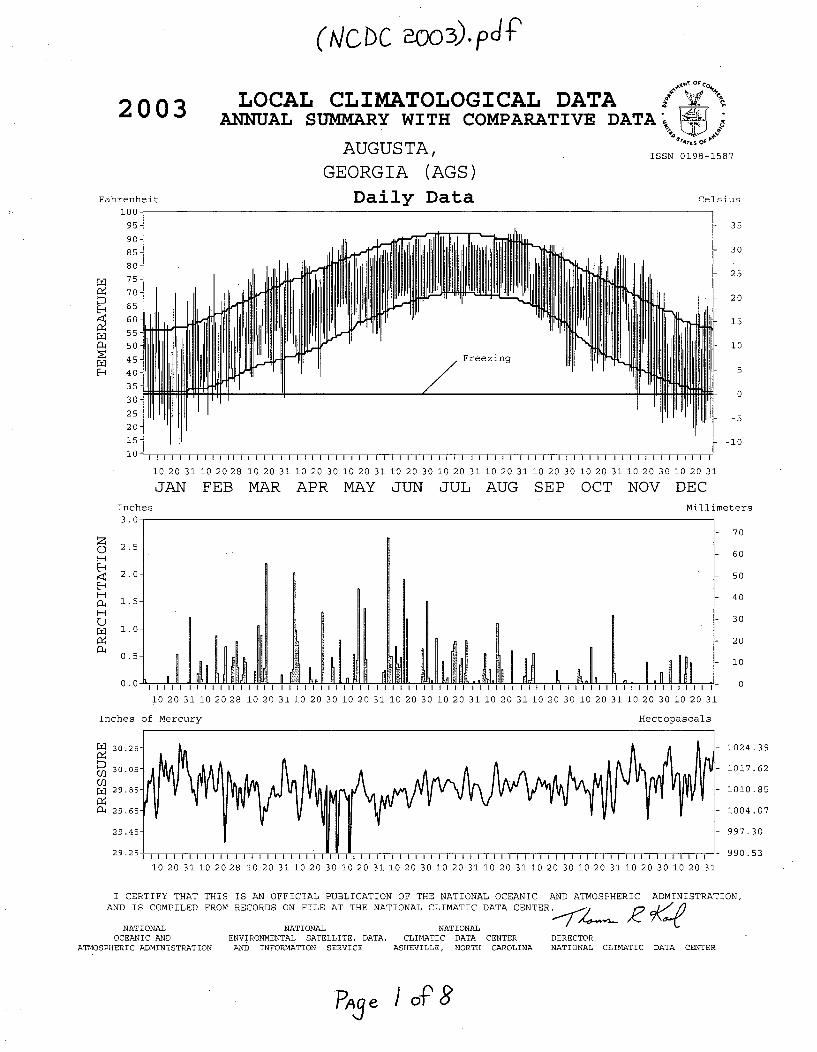
(tVCibC aOO3).plf'
2003 LOCAL CLIMATOLOGICAL DATAANNUAL SUMMARY WITH COMPARATIVE DATA*
AUGUSTA, ISSN 0198-1587
GEORGIA (AGS)
Fahrenheit100 -
90185-
80-75-
• 70-
S 65-60-!F4 55 -
S 50-45-
40-
35
25
20
15
Daily Data Celsius
35
30
25
20
15
10
5
0
-5
-10'I'lS I I I I I I I I I I I I I I I I I I I I I I I t I I I I I I I I I I I I I II I
10 20 31 10 20 28 10 20 31 10 20 30 10 20 31 10 20 30 10 20 31
JAN FEB MAR APR MAY JUN JULInches
I I I I I I I I I I I I I I I I I I I I I I I I I I I I I
10 20 31 10 20 30 10 20 31 10 20 30 10 20 31
AUG SEP OCT NOV DECMillimeters
3.
z0H
H
U
(a4
2.5-
2.0-
1.5-
1.0-
0.5-
0. I I I I 1 I I I I 1 0 0 1 1 110 2 0 3 1 10 2 0 2 8 10 2 0 ' I I I I I I I I I I I I I I I I I I I I I I I I I I I I I I I I t I I I I I I I I I I I I I I I I I I I I 1I31 10 20 30 10 20 31 10 20 30 10 20 31 10 20 31 10 20 30 10 20 31 10 20 30 10 20 31
Hectopascals
- 70
- 60
- 50
- 40
- 30
- 20
- 10
0
1024.39
1017.62
1010.85
1004.07
997.30
990.53
Inches of Mercury
03U312
30.2!
30.0!
29.8!
29.6!
29.4!
29.2!
10 20 31 10 20 28 10 20 31 10 20 30 10 20 31 10 20 30 10 20 31 10 20 31 10 20 30 10 20 31 10 20 30 10 20 31
I CERTIFY THAT THIS IS AN OFFICIAL PUBLICATION OF THE NATIONAL OCEANIC AND ATMOSPHERIC ADMINISTRATION,AND IS COMPILED FROM RECORDS ON FILE AT THE NATIONAL CLIMATIC DATA CENTER> •/
NAz qTIOA t• lTrNlATIO IONq•AL T eT.
OCEANIC ANDATMOSPHERIC ADMINISTRATION
ENVIRONMENTAL SATELLITE, DATA, CLIMATIC DATA CENTERAND INFORMATION SERVICE ASHEVILLE, NORTH CAROLINA
DIRECTORNATIONAL CLIMATIC DATA CENTER
Pc3 e- b or8

(NICDC z-0C3), r
METEOROLOGICAL DATA FOR 2003AUGUSTA, GA (AGS)
LATITUDE: LONGITUDE: ELEVATION (FT): TIME ZONE: WBAN: 03820P1 q7' '7" W C~RMfl~ lPfl UAPfl* 1P7
ELEMENT JAN FEB MAR APR MAY JUN JUL AUG SEP OCT NOV DEC YEAR
MEAN DAILY MAXIMUM 54.1 59.8 68.9 74.0 81.6 87.1 88.0 89.0 83.8 76.9 72.5 56.7 74.4HIGHEST DAILY MAXIMUM 72 77 82 85 90 91 93 94 90 84 85 70 94
DATE OF OCCURRENCE 09 15 29 30 31+ 27+ 09+ 27 04+ 21 02 01 AUG 27m MEAN DAILY MINIMUM 29.6 36.1 47.6 50.0 61.1 65.9 70.3 70.8 61.5 50.8 42.7 28.0 51.2
LOWEST DAILY MINIMUM 14 25 33 31 51 52 66 68 43 41 22 17 14DATE OF OCCURRENCE 24+ 11 31 01 13 02 24 12+ 30+ 23+ 30 21 JAN 24+
AVERAGE DRY BULB 41.9 48.0 58.3 62.0 71.4 76.5 79.2 79.9 72.7 63.9 57.6 42.4 62.8MEAN WET BULB 36.5 43.0 53.3 56.6 65.7 70.1 73.5 66.1 58.3 52.5 37.4MEAN DEW POINT 27.3 37.2 49.1 52.2 62.3 67.1 71.5 62.6 54.3 48.0 31.5NUMBER OF DAYS WITH:
N MAXIMUM 2 90' 0 0 0 0 3 8 14 15 4 0 0 0 44'E MAXIMUM 32° 0 0 0 0 0 0 0 0 0 0 0 0 0
MINIMUM 32' 21 8 0 1 0 0 0 0 0 0 6 24. 60MINIMUM 0 0 0 0 0 0 0 0 0 0 0 0 0 0
HEATING DEGREE DAYS 712 472 215 105 4 0 0 0 12 73 246 694 2533n COOLING DEGREE DAYS 0 0 14 22 210 351 446 470 247 45 33 0 1838
MEAN (PERCENT) 61 72 77 75 77 78 83 83 77 77 77 73 76HOUR 01 LST 71 82 85 87 88 90 94 94 92 92 91 89 88HOUR 07 LST 75 84 91 93 89 88 94 93 92 91 93 89 89
HOUR 13 LST 43 57 62 56 59 58 66 66 52 52 52 48 56HOUR 19 LST 58 64 69 67 73 77 80 82 79 83 80 75 74
PERCENT POSSIBLE SUNSHINE
G NUMBER OF DAYS WITH:HEAVY FOG(VISBY • 1/4 MI) 3 3 4 12 5 3 6 7 13 9 9 6 80THUNDERSTORMS 0 1 5 2 7 8 14 8 2 2 0 0 49
SUNRISE-SUNSET: (OKTAS)CEILOMETER () 12,000 FT.)
c. SATELLITE (> 12,000 FT.)r MIDNIGHT-MIDNIGHT: (OKTAS)
CEILOMETER () 12,000 FT.)SATELLITE (> 12,000 FT.)
o NUMBER OF DAYS WITH:CLEARPARTLY CLOUDYCLOUDY
MEAN STATION PRESS. (IN.) 29.97 29.90 29.81 29.81 29.89 29.88 29.87 29.87 29.98 30.00MEAN SEA-LEVEL PRESS. (IN.) 30.12 30.06 29.96 29.96 30.04 30.03 30.03 30.14 30.16
RESULTANT SPEED (MPH) 4.2 0.7 1.2 1.7 1.0 0.7 0.7 1.8 0.8 0.7 2.3RES. DIR. (TENS OF DEGS.) 27 35 06 27 22 21 20 02 34 29 29MEAN SPEED (MPH) 7.3 6.6 5.6 5.7 6.2 4.2 4.9 3.7 4.6 3.9 4.7 4.8 5.2PREVAIL.DIR. (TENS OF DEGS.) 25 28 08 15 25 19 20 15 02 .02 29 29 24MAXIMUM 2-MINUTE WIND:
l SPEED (MPH) 30 37 30 23 32 31 33 29 29 28 29 30 37M DIR. (TENS OF DEGS.) 33 30 29 30 24 28 33 32 29 30 27 29 30z
DATE OF OCCURRENCE 23 04 20 05 18 11 19 16 04 14 28 19 FEB 04MAXIMUM 5-SECOND WIND:
SPEED (MPH) 37 45 36 28 43 43 45 37 36 36 38 39 45DIR. (TENS OF DEGS.) 34 31 28 31 22 31 31 32 29 30 27 30 31DATE OF OCCURRENCE 23 04 20 05 18 11 18 16 04 14 28 19 JUL 18
zo WATER EQUIVALENT:
TOTAL (IN.) 2.00 3.72 7.02 6.35 6.32 9.99 7.00 3.75 1.87 2.72 0.77 2.02 53.53GREATEST 24-HOUR (IN.) 1.23 0.79 2.42 2.03 1.76 2.81 1.58 1.62 0.55 1.44 0.39 0.66 2.81
DATE OF OCCURRENCE 29-30 26-27 19-20 07 22-23 06-07 01-02 15-16 07 28-29 19 13-14 JUN 06-07NUMBER OF DAYS WITH:
PRECIPITATION Ž 0.01 6 11 15 11 14 15 17 10 8 9 6. 8 130PRECIPITATION Ž 0.10 3 9 11 8 9 13 12 7 5 6 2 5 90PRECIPITATION Ž 1.00 1 0 2 2 2 3 1 1 0 1 0 0 13
SNOW, ICE PELLETS,HAIL:TOTAL (IN.) T 0.0 0.0 0.0 0.0 0.0 0.0 0.0 0.0 0.0 0.0 0.0 TGREATEST 24-HOUR (IN.) T 0.0 0.0 0.0 0.0 0.0 0.0 0.0 0.0 0.0 0.0 0.0 T
DATE OF OCCURRENCE 23 JAN 230
MAXIMUM SNOW DEPTH (IN.) T 0 0 0 0 0 0 0 0 0 0 0 TDATE OF OCCURRENCE 23 JAN 23
NUMBER OF DAYS WITH:SNOWFALL > 1.0 0 0 0 0 0 0 0 0 0 0 0 0 0
published by: NCDC Asheville, NC 2
Pp3 e

(/vcc OO3).ipcj
NORMALS, MEANS, AND EXTREMESAUGUSTA, GA (AGS)
LATITUDE:33' 22' 11" N
LONGITUDE:81* 57' 53" W
ELEVATION (FT):
GRND: 160 BARO: 163
TIME ZONE:
EASTERN (UTC + 5)
WBAN: 03820
ELEMENT POR JAN FEB MAR APR MAY JUN JUL AUG SEP OCT NOV DEC YEAR
NORMAL DAILY MAXIMUM 30 56.5 61.3 69.2 76.7 83.9 89.6 92.0 90.2 85.3 76.5 67.8 59.1 75.7MEAN DAILY MAXIMUM 47 56.4 60.7 68.2 76.8 83.9 89.4 91.9 90.6 85.6 76.9 68.3 59.1 75.6HIGHEST DAILY MAXIMUM 53 82 86 89 96 99 105 107 108 101 97 90 82 108
YEAR OF OCCURRENCE 2002 1962 1995 1986 2000 1952 1980 1983 1999 1954 1961 1998 AUG 1983MEAN OF EXTREME MAXS. 55 74.3 76.1 80.6 88.8 93.4 98.1 99.0 97.9 94.6 88.3 81.5 76.1 87.4NORMAL DAILY MINIMUM 30 33.1 35.5 42.5 48.1 57.2 65.4 69.6 68.4 62.4 49.6 40.9 34.7 50.'6MEAN DAILY MINIMUM 47 32.8 34.7 40.3 49.0 57.9 65.9 70.1 69.1 63.3 50.6 41.5 34.4 50.8LOWEST DAILY MINIMUM 53 -1 0 0 26 35 47 55 54 36 22 15 5 -1E,
YEAR OF OCCURRENCE 1985 1998 1998 1982 1971 1984 1951 1968 1967 1952 1970 1981 JAN 1985MEAN OF EXTREME MINS. 55 16.6 18.9 25.0 33.5 43.6 54.6 62.5 60.6 49.7 34.2 24.8 18.5 36.9
Q' NORMAL DRY BULB 30 44.8 48.4 55.9 62.4 70.5 77.5 80.8 79.3 73.8 63.1 54.4 46.9 63.1Pq MEAN DRY BULB 55 45.2 48.5 55.3 63.0 71.1 77.9 81.0 80.1 74.6 64.1 54.5 46.9 63.5E MEAN WET BULB 48 40.3 42.8 48.3 55.5 63.3 69.7 72.7 72.3 67.4 57.3 48.4 41.7 56.6
MEAN DEW POINT 48 34.4 36.0 41.4 49.4 58.8 65.9 69.7 69.4 64.3 53.3 43.1 36.1 51.8NORMAL NO. DAYS WITH:
MAXIMUM Ž 90' 30 0.0 0.0 0.0 0.6 5.9 16.0 23.5 19.4 9.4 0.6 0.0 0.0 75.4
MAXIMUM •32' 30 0.4 0.2 * 0.0 0.0 0.0 0.0 0.0 0.0 0.0 0:0 0.1 0.7
MINIMUM • 32' 30 15.0 11.5 4.6 0.9 0.0 0.0 0.0 0.0 0.0 0.6 6.5 13.1 52.2MINIMUM • 0 30 * 0.0 0.0 0.0 0.0 0.0 0.0 0.0 0.0 0.0 0.0 0.0 0.0
u NORMAL HEATING DEG. DAYS 30 617 469 301 129 21 1 0 0 5 118 317 547 2525NORMAL COOLING DEG. DAYS 30 1 2 15 52 191 385 506 459 285 74 15 1 1986
NORMAL (PERCENT) 30 70 67 66 66 70 72 74 77 77 75 74 72 72HOUR 01 LST 30 80 77 77 80 86 87 88 91 90 89 86 82 84HOUR 07 LST 30 84 84 85 86 87 87 89 92 92 91 89 85 88HOUR 13 LST 30 55 50 48 45 48 52 54 56 55 50 51 54 52HOUR 19 LST 30 68 61 57 55 60 63 67 72 77 78 74 71 67
m PERCENT POSSIBLE SUNSHINE
MEAN NO. DAYS WITH:HEAVY FOG(VISBY•1/4 MI) 53 3.5 2.7 2.1 2.4 2.3 1.3 1.6 3.1 3.8 3.6 3.9 3.9 34.2THUNDERSTORMS 53 0.9 1.8 2.7 3.6 6.0 9.3 12.0 9.4 3.4 1.3 0.8 0.7 51.9
m MEAN:
N SUNRISE-SUNSET (OKTAS) 1 7.2 3.2 4.0 5.6 4.8 5.6 4.0MIDNIGHT-MIDNIGHT (OKTAS) 1 6.4 4.0 4.0 4.8 4.0
D MEAN NO. DAYS WITH:D CLEAR 1 2.0 2.0 9.0 14.0 7.0 2.0 6.0 3.0 7.0 5.0 10.0
1 PARTLY CLOUDY 1 2.0 1.0 2.0 8.0 2.0 2.0 2.0 4.0 1.0 1.0U CLOUDY 1 2.5 3.0 12.0 3.0 4.0 6.0 7.0 3.0 1.0 7.0
MEAN STATION PRESSURE(IN) 30 29.97 29.93 29.88 29.86 29.83 29.84 29.87 29.88 29.89 29.93 29.96 29.98 29.90m MEAN SEA-LEVEL PRES. (IN) 47 30.14 30.09 30.04 30.02 30.00 29.99 30.03 30.01 30.04 30.08 30.11 30.15 30.06
MEAN SPEED (MPH) 27 6.8 7.1 7.4 7.0 6.2 5.8 5.6 5.0 5.2 5.3 5.5 6.2 6.1PREVAIL.DIR(TENS OF DEGS) 28 28 29 29 18 14 14 24 14 04 04 29 29 24MAXIMUM 2-MINUTE:
N SPEED (MPH) 9 40 37 40 37 44 45 36 38 36 38 38 35 45
DIR. (TENS OF DEGS) 26 30 29 28 29 34 21 01 02 34 18 28 34YEAR OF OCCURRENCE 1997 2003 1999 2001 1995 1998 1995 2002 1997 1995 2001 2000 JUN 1998
MAXIMUM 5-SECOND:SPEED (MPH) 9 54 45 51 55 52 53 47 49 45 52 49 43 55DIR. (TENS OF DEGS) 25 31 29 34 29 33 21 01 01 33 03 28 34YEAR OF OCCURRENCE 1997 2003 1999 1997 1995 1998 1998 2002 1997 1995 1995 2000 APR 1997
NORMAL (IN) 30 4.50 4.11 4.61 2.94 3.07 4.19 4.07 4.48 3.59 3.20 2.68 3.14 44.58Z MAXIMUM MONTHLY (IN) 53 8.91 7.67 11.92 8.43 9.61 9.99 11.43 11.34 9.51 14.82 7.76 8.65 14.820 YEAR OF OCCURRENCE 1987 1961 1980 1961 1979 2003 1967 1986 1975 1990 1985 1981 OCT 1990
MINIMUM MONTHLY (IN) 53 0.75 0.69 0.88 0.60 0.36 0.68 1.02 0.65 0.31 T 0.09 0.32 TE YEAR OF OCCURRENCE 1981 1968 1968 1970 2000 1984 1987 1980 1984 1953 1960 1955 OCT 1953
MAXIMUM IN 24 HOURS (IN) 53 3.61 3.69 5.31 3.96 4.44 5.08 3.71 5.98 7.30 8.57 3.82 3.12 8.57U YEAR OF OCCURRENCE 1960 1985 1967 1955 1981 1981 1979 1964 1998 1990 1985 1970 OCT 1990N NORMAL NO. DAYS WITH:
f PRECIPITATION Ž 0.01 30 11.0 8.7 9.8 7.4 9.0 10.1 11.2 10.9 7.8 6.2 7.2 9.5 108.8
PRECIPITATION Ž 1.00 30 1.2 1.2 1.3 0.8 0.8 1.4 1.1 1.4 0.9 1.0 0.8 0.7 12.6
NORMAL (IN) 30 0.3 1.0 0.* 0.0 0.0 0.0 0.0 0.0 0.0 0.0 0.0 0.1 1.4MAXIMUM MONTHLY (IN) 49 2.6 14.0 1.1 T 0.0 T 0.0 0.0 0.0 0.0 T 1.0 14.0
YEAR OF OCCURRENCE 1992 1973 1980 1992 1994 1968 1993 FEB 1973MAXIMUM IN 24 HOURS (IN) 49 2.6 13.7 1.1 T 0.0 T 0.0 0.0 0.0 0.0 T 1.0 13.7
YEAR OF OCCURRENCE 1992 1973 1980 1992 1994 1968 1993 FEB 19730z MAXIMUM SNOW DEPTH (IN) 47 2 13 1 0 0 0 0 0 0 0 0 1 13
YEAR OF OCCURRENCE 1988 1973 1980 1958 FEB 1973NORMAL NO. DAYS WITH: I
SNOWFALL Ž 1.0 30 0.1 0.2 0.0 0.0 0.0 0.0 0.0 0.0 0.0 0.0 0.0 0.0 0.3
published by: NCDC Asheville, NC 3
3 oAgPAS e

(Avcbc 2003). p d-2PPRrTOTTATTON (~inr'Hpe~ ATTOrTTRTA (A (Ac'}
YEAR JAN FEB MAR APR MAY JUN JUL AUG SEP OCT NOV DEC ANNUAL
1974 3.99 5.76 2.32 4.02 4.15 3.63 4.05 3.86 2.83 0.09 2.38 4.05 41.131975 3.71 5.22 5.23 4 .43 5.01 5.10 5.32 3 .53 9.51 1.29 2 .12 4.58 55.051976 3 .51 0.95 4.11 2.00 6.12 4.77 2.00 1.81 6.12 5.06 3 .61 5.61 45.671977 3.66 1.90 8.18 1.22 2.53 1.80 3.07 7.84 3.26 3.48 3.71 3.01 43.661978 7.76 1.50 3.54 3.58 2.16 1.59 1.70 4.91 1.34 1.12 2.50 1.26 32.96
1979 3.40 7.34 2.48 5.27 9.61 1.56 6.12 3.56 4.81 1.50 1.95 1.85 49.451980 4.07 3.17 11.92 1.28 1.84 4.31 2.12 0.65 5.06 1.62 2.24 0.96 39.241981 0.75 5.26 2.62 2.27 5.29 7.08 1.72 6.20 0.72 2.91 0.91 8.65 44.381982 3.00 4.60 1.54 5.23 3.78 3.46 3.56 3.09 1.91 3.65 2.34 4.93 41.091983 4.47 6.02 6.86 5.47 1.93 3.90 1.44 4.99 5.40 2.31 4.64 5.24 52.67
1984 3 .40 4.93 5.88 6.50 7.55 0.68 7.70 4 .42 0.31 1.00 0.65 1.25 44.271985 3.22 6.63 1.28 0.97 1.75 2.92 3.71 1.79 0.39 6.21 7.76 1.65 38.281986 1.46 2.51 3.23 1.02 2.80 1.41 6.26 11.34 0.74 3.92 4.93 4.12 43.741987 8.91 7.23 4.27 0.77 1.57 5.75 1.02 3.99 2.04 0.18 4.06 1.38 41.171988 4.30 3 .30 3.14 5.04 1.60 4.89 1.77 3.47 5.55 5.40 1.30 1.31 41.07
1989 1.51 3.23 4.37 5.24 2.96 8.84 8.15 3.19 3.73 2.14 1.29 4.68 49.331990 2.71 2.70 2.03 1.07 1.84 1.44 1.92 6.46 1.11 14.82 2.57 1.98 40.651991 7.50 1.97 8.51 3.15 5.76 5.57 11.12 6.98 1.36 0.57 1.39 2.53 56.411992 4.57 4.50 3.69 2.70 1.19 4.82 7.04 5.72 3*28 4.94 6.71 2.24 51.401993 5.94 3.23 7.57 1.52 1.28 1.54 2.47 2.77 3.45 4.24 1.58 2.70 38.29
1994 3.94 4.24 6.40 1.14 0.95 6.15 3.41 6.70 0.62 9.02 2.62 3.01 48.201995 6.54 7.00 1.02 2.09 2.70 5.44 3.82 4.92 7.01 4.24 2.20 3.60 50.581996 3.49 1.75 5.13 1.71 1.96 4.09 6.39 6.24 2.96 1.90 0.70 2.06 38.381997 3 .67 4 .84 2.27 3 .35 1.61 3 .65 5 .83 2.24 5.89 5.04 5.02 6.94 50.351998 7.50 6.36 6.10 7.13 2.06 2.31 2.63 3.04 8.74 0.02 0.58 1.37 47.84
1999 5.57 2.52 2 .73 2,02 1.19 6.43 3 .68 2.27 5.43 2.81 1.12 0 .97 36.742000 6.45 1.01 2.92 1.13 0.36 5.50 3.03 6.63 6.01 0.03 3.38 1.40 37.852001 2.64 1.98 7.43 0.94 3.76 4.98 5.00 1.28 3.56 0.18 0.83 0.97 33.552002 2.63 2.33 3.71 1.43 2.00 4.55 4.58 1.60 6.74 2.94 4.01 4.26 40.782003 2.00 3.72 7.02 6.35 6.32 9.99 7.00 3.75 1.87 2.72 0.77 2.02 53.53
POR=
133 YRS 3.87 4.08 4.54 3.33 3.22 4.29 4.87 4.61 3.47 2.59 2.53 3.32 44.72
WBAN : 03820
AVERAGE TEMPERATURE (°F) 2003 AUGUSTA, GA (AGS)
YEAR JAN FEB MAR APR MAY JUN JUL AUG SEP OCT NOV DEC ANNUAL
1974 56.8 48.6 58.7 61.8 71.6 74.2 78.4 78.4 73.2 60.5 52.0 45.9 63.41975 47.4 50.1 53.1 60.7 72.5 75.8 77.5 80.6 74.5 66.7 56.7 47.4 63.61976 42.6 53.7 60.4 63.3 67.9 75.3 80.3 78.3 72.4 59.7 48.4 44.3 62.21977 35.5 44.6 59.2 65.1 72.4 80.2 82.7 79.7 76.5 60.9 58.5 46.2 63.51978 39.1 40.1 52.5 63.2 69.5 78.2 81.8 80.8 75.5 62.6 58.9 48.1 62.5
1979 41.4 44.0 56.5 63.1 70.6 74.8 80.0 79.6 74.3 62.4 55.6 45.9 62.41980 45.9 43.1 52.5 63.2 70.7 77.9 83.7 82.3 77.3 61.4 52.5 45.1 63.01981 39.6 48.6 52.3 65.2 68.3 81.1 81.5 77.0 71.4 59.3 51.6 41.2 61.41982 40.1 48.9 56.3 58.7 70.2 79.8 82.5 78.7 73.0 64.0 56.9 53.1 63.51983 41.9 46.7 54.4 58.8 70.6 75.4 82.6 83.3 72.8 65.1 53.9 44.5 62.5
1984 43.0 50.2 55.3 61.3 69.9 78.5 79.8 80.3 72.8 72.0 52.5 55.2 64.21985 42.1 48.8 58.7 65.7 73.2 80.4 81.7 80.3 75.2 70.7 64.6 44.2 65.51986 42.7 52.6 55.8 63.4 72.5 81.5 86.0 79.6 77.6 66.2 60.9 48.4 65.61987 44.6 47.3 54.8 60.6 73.1 79.2 82.5 83.8 75.8 57.8 56.5 50.4 63.91988 41.1 46.0 55.5 62.4 69.1 76.3 81.2 81.4 75.4 59.0 55.6 45.7 62.4
1989 50.5 50.4 57.6 62.9 69.2 78.9 80.9 80.0 74.7 65.4 55.8 41.4 64.01990 51.8 56.7 59.4 62.4 71.5 79.4 83.5 82.0 76.2 66.6 56.3 51.5 66.41991 46.8 52.3 58.5 66.4 75.3 78.5 82.3 80.5 75.1 65.0 51.9 50.4 6S.31992 46.4 51.0 54.1 61.2 67.6 75.8 81.8 79.1 75.6 62.3 55.5 46.6 63.11993 50.1 46.4 53.6 60.7 72.4 81.5 86.3 82.4 77.7 65.1 55.8 45.5 64.8
1994 42.4 50.8 58.7 65.6 68.4 78.6 79.5 77.8 72.3 63.3 57.4 50.5 63.81995 46.1 47.8 58.0 64.2 72.3 76.0 81.3 80.8 73.1 65.6 50.5 44.5 63.41996 44.S 48.8 51.1 60.9 72.4 76.8 80.5 78.1 73.3 61.9 51.2 48.2 62.31997 47.3 .51.4 59.6 66.7 74.4 80.5 78.2 74.0 63.2 51.2 46.81998 49.3 62.0 74.7 81.5 83.1 79.8 75.3 65.7 58.0 51.7
1999 48.3 50.0 51.8 66.0 68.3 76.7 81.2 83.0 72.6 63.2 56.0 46.6 63.62000 43.9 50.1 58.1 60.3 74.4 79.2 80.4 79.1 72.7 62.4 52.9 38.5 62.72001 44.0 52.5 53.1 63.8 70.8 77.0 79.3 80.4 72.5 61.4 58.9 51.5 63.82002 47.0 46.5 57.1 67.3 69.7 78.1 82.1 80.0 77.4 67.1 52.2 44.4 64.12003 41.9 48.0 58.3 62.0 71.4 76.5 79.2 79.9 72.7 63.9 57.6 42.4 62.8
POR=129 YRS 46.8 48.9 55.4 63.7 72.0 78.7 81.3 80.3 75.6 64.9 54.9 47.7 64.2
published by: NCDC Asheville, NC 4 WBAN : 03820
PAg e .Y1oPF

(t\CbC 2o03)i.pJHEATING DEGREE DAYS (base 65°F) 2003 AUGUSTA, GA (AGS)
YEAR JUL AUG SEP OCT NOV DEC JAN FEB MAR APR MAY JUN TOTAL
1974-75 0 0 11 152 393 588 539 415 374 171 3 0 26461975-76 0 0 2 62 285 540 687 320 167 97 29 2 21911976-77 0 0 0 191 490 635 906 565 206 65 13 0 30711977-78 0 0 0 153 215 578 797 689 380 93 33 0 29381978-79 0 0 0 103 184 531 723 582 265 79 15 2 2484
1979-80 0 0 4 125 294 584 588 631 385 97 17 0 27251980-81 0 0 10 143 370 608 778 452 391 67 33 0 28521981-82 0 0 13 187 400 730 765 446 286 206 7 0 30401982-83 0 0 6 125 253 383 710 504 332 198 8 0 25191983-84 0 0 23 66 326 630 674 424 306 146 31 1 2627
1984-85 0 0 4 16 382 296 710 451 222 75 5 0 21611985-86 0 0 6 28 83 639 685 342 287 112 12 0 21941986-87 0 5 0 82 170 513 625 491 319 177 5 0 23871987-88 0 0 0 220 266 448 732 545 294 102 12 0 26191988-89 0 0 1 209 282 594 441 411 258 153 41 0 2390
1989-90 0 0 8 97 282 722 403 244 202 118 11 0 20871990-91 0 0 7 93 263 417 560 355 223 52 3 0 19731991-92 0 0 3 76 404 461 570 398 339 160 45 0 24561992-93 0 0 9 103 289 565 457 518 348 148 6 0 24431993-94 0 0 7 86 300 599 693 401 220 62 34 0 2402
1994-95 0 0 1 88 232 446 580 476 225 89 11 0 21481995-96 0 0 11 94 438 629 626 460 425 165 27 0 28751996-97 0 0 2 127 410 516 545 383 176 46 51997-98 0 0 0 127 408 556 491 114 0 01998-99 0 0 0 67 214 413 509 415 403 87 19 0 2127
1999-00 0 0 12 1il 270 561 648 424 216 154 2 0 23982000-01 0 0 10 109 380 816 646 344 364 110 1 0 27802001-02 0 0 15 157 198 416 555 511 270 56 43 0 22212002-03 0 0 0 59 387 630 712 472 215 105 4 0 25842003- 0 0 12 73 246 694
WBAN : 03820
COOLING DEGREE DAYS (base 65'F) 2003 AUGUSTA, GA (AGS)
YEAR JAN FEB MAR APR MAY JUN JUL AUG SEP OCT NOV DEC ANNUAL
1974 1 4 16 48 226 284 420 421 268 22 11 3 17211975 2 3 11 51 242 332 395 488 293 122 43 0 19821976 0 0 30 51 127 320 482 419 228 34 0 0 16911977 0 0 33 77 250 461 555 465 355 34 27 0 22571978 0 0 1 46 177 402 531 497 324 35 9 13 2035
1979 0 0 9 29 197 301 473 460 288 52 20 0 18291980 0 0 2 50 201 396 585 543 385 39 0 0 22011981 0 0 6 79 143 491 515 378 208 19 4 0 18431982 0 0 23 22 174 450 549 431 254 100 16 21 20401983 0 0 10 18 187 318 555 573 263 76 0 0 2000
1984 0 0 13 39 188 411 468 481 244 241 16 1 21021985 9 4 33 100 263 468 525 480 318 209 78 0 24871986 0 0 12 71 248 501 655 464 383 126 56 4 25201987 0 0 8 48 264 432 548 590 331 5 17 1 22441988 0 1 5 31 147 346 510 518 323 32 8 1 1922
1989 0 8 38 99 178 423 500 471 305 117 12. 0 21511990 0 18 36 49 219 438 578 536 350 151 9 6 23901991 0 6 29 99 329 414 542 483 310 82 16 14 23241992 0 1 6 56 135 330 526 444 331 27 14 0 18701993 2 0 2 27 240 503 666 547 393 96 31 2 2509
1994 0 9 28 82 149 418 456 403 227 40 9 4 18251995 0 0 17 75 244 338 514 497 262 122 10 0 20791996 0 1 2 50 264 362 487 414 257 40 4 1 18821997 3 8 21 105 294 489 418 277 80 0 01998 10 29 304 502 570 463 316 95 13 9
1999 2 0 0 124 128 359 512 563 247 64 8 0 20072000 2 0 13 20 298 433 487 444 247 38 21 0 20032001 1 2 0 83 187 365 449 487 244 57 23 4 19022002 5 2 34 132 197 399 538 472 377 134 8 0 22982003 0 0 14 22 210 351 446 470 247 45 33 0 1838
published by: NCDC Asheville, NC 5
PAe5o F8

(AJCbC &OOA-ýdpdP
SNOWFALL (inches) 2003 AUGUSTA, GA (AGS)
YEAR JUL AUG SEP OCT NOV DEC JAN FEB MAR APR MAY JUN TOTAL
1974-75 0.0 0.0 0.0 0.0 0.0 T 0.0 0.0 T 0.0 0.0 0.0 T1975-76 0.0 0.0 0.0 0.0 0.0 0.0 T 0.0 0.0 0.0 0.0 0.0 T1976-77 0.0 0.0 0.0 0.0 0.0 0.0 0.5 0.0 0.0 0.0 0.0 0.0 0.51977-78 0.0 0.0 0.0 0.0 0.0 0.0 T 1.1 0.0 0.0 0.0 0.0 1..11978-79 0.0 0.0 0.0 0.0 0.0 T 0.0 3.4 0.0 0.0 0.0 0.0 3.4
1979-80 0.0 0.0 0.0 0.0 0.0 0.0 0.0 4.2 1.1 0.0 0.0 0.0 5.31980-81 0.0 0.0 0.0 0.0 0.0 T 0.0 T 0.0 0.0 0.0 0.0 T1981-82 0.0 0.0 0.0 0.0 0.0 0.0 1.5 T 0.0 0.0 0.0 0.0 1.51982-83 0.0 0.0 0.0 0.0 0.0 0.0 T T T 0.0 0.0 0.0 T1983-84 0.0 0.0 0.0 0.0 0.0 0.0 T T 0.0 0.0 0.0 0.0 T
1984-85 0.0 0.0 0.0 0.0 0.0 0.0 T T 0.0 0.0 0.0 0.0 T1985-86 0.0 0.0 0.0 0.0 0.0 0.0 T 0.0 0.0 0.0 0.0 0.0 T1986-87 0.0 0.0 0.0 0.0 0.0 0.0 T T 0.0 0.0 0.0 0.0 T1987-88 0.0 0.0 0.0 0.0 0.0 0.0 2.3 0.0 0.0 0.0 0.0 0.0 2.31988-89 0.0 0.0 0.0 0.0 T 0.0 3.7 0.0 0.0 0.0 0.0
1989-90 0.0 0.0 0.0 0.0 0.0 0.4 0.0 0.0 0.0 0.0 0.0 0.0 0.41990-91 0.0 0.0 0.0 0.0 0.0 0.0 0.0 0.0 T 0.0 0.0 0.0 T1991-92 0.0 0.0 0.0 0.0 0.0 0.0 2.6 0.0 0.0 T 0.0 0.0 2.61992-93 0.0 0.0 0.0 0.0 0.0 0.0 0.0 T T 0.0 0.0 0.0 T1993-94 0.0 0.0 0.0 0.0 0.0 1.0 0.0 0.0 0.0 0.0 0.0 T 1.0
1994-95 0.0 0.0 0.0 0.0 0.0 0.0 0.0 T 0.0 0.01995-96 0.0 0.0 0.0 0.0 0.0 0.0 1.4 0.0 0.0 0.0 0.01996-97 0.0 0.0 0.0 0.0 0.0 0.0 0.0 0.0 0.01997-981998-99 0.0 0.0 0.0 T 0.0 0.0 0.0 0.0
1999-00 0.0 0.0 0.0 0.0 0.0 0.02000-012001-022002-03 T T 0.0 0.0 0.0 0.0 0.02003- 0.0 0.0 0.0 0.0 0.0 0.0
POR=
49 YRS 0.0 0.0 0.0 0.0 T 0.1 0.3 0.7 T T 0.0 T 1.1
WBAN : 03820
REFERENCE NOTES:
PAGE 1: GENERAL CONTINUED:THE TEMPERATURE GRAPH SHOWS NORMAL MAXIMUM AND NORMAL CLEAR INDICATES 0 - 2 O0TAS, PARTLY CLOUDY INDICATES
MINIMUM DAILY TEMPERATURES (SOLID CURVES) AND THE 3 - 6 OKTAS, AND CLOUDY INDICATES 7 OR 8 OKTAS.ACTUAL DAILY HIGH AND LOW TEMPERATURES (VERTICAL BARS). WHEN AT LEAST ONE OF THE ELEMENTS (CEILOMETER OR
SATELLITE) IS MISSING, THE DAILY CLOUDINESS ISPAGE 2 ARD 3: NOT COMPUTED.
H/C INDICATES HEATING AND COOLING DEGREE DAYS. WIND DIRECTION IS RECORDED IN TENS OF DEGREES (2 DIGITS)RH INDICATES RELATIVE HUMIDITY CLOCEMISE FROM TRUE NORTH. "88" INDICATES CALM. "36"W/O INDICATES WEATHER AND OBSTRUCTIONS INDICATES THUE NORTH.S INDICATES SURSHINE. RESULTANT WIND IS THE VECTOR AVERAGE OF THE SPEED ANDPR INDICATES PRESSURE. DIRECTION.CLOUDINESS ON PAGE 3 IS THE SUM OF THE CEILOMETER AND AVERAGE TEMPERATURE IS THE SUM OF THE MEAN DAILY MAXIMUM
SATELLITE DATA NOT TO EXCEED EIGHT EIGHTHS(OKTAS). AND MINIMUM TEMPERATURE DIVIDED BY 2.
SNOWFALL DATA COMPRISE ALL FORMS OF FROZENGENERAL: PRECIPITATION, INCLUDING HAIL.
T INDICATES TRACE PRECIPITATION, AN AMOUNT GREATER A HEATING (COOLING) DEGREE DAY IS THE DIFFERENCE BETHEENTHAN ZERO BUT LESS THAN THE LOWEST REPORTABLE VALUE. THE AVERAGE DAILY TEMPERATURE AND 65° F.
+ INDICATES THE VALUE ALSO OCCURS ON EARLIER DATES. DRY BULB IS THE TEMPERATURE OF THE AMBIENT AIR.BLANK ENTRIES DEMOTE MISSING OR UNREPORTED DATA. DEW POINT IS THE TEMPERATURE TU WHICH THE AIR MUST BENORMALS ARE 30-YEAR AVERAGES (1971 - 2000) . COOLED TO ACHIEVE 100 PERCENT RELATIVE HUMIDITY.ASOS INDICATES AUTOMATED SURFACE OBSERVING SYSTEM. WET BULB IS THE TEMPERATURE THE AIR WOULD HAVE IF THEPM INDICATES THE LAST DAY OF THE PREVIOUS MONTH. MOISTURE CONTENT WAS INCREASED TO 100 PERCEMT RELATIVEPOR (PERIOD OF RECORD) BEGINS WITH THE JANUARY DATA HUMIDITY.
MONTH AND IS THE NUMBER OF YEARS USED TO COMPUTETHE MEAN. INDIVIDUAL MONTHS WITHIN THE POR MAY ON JULY 1, 1996, THE NATIONAL WEATHER SERVICE BEGAN USINGBE MISSING. THE "METAR" OBSERVATION CODE THAT WAS ALREADY EMPLOYED
WHEN THE POR FOR A NORMAL IS LESS THAN 30 YEARS, BY MOST OTHER NATIONS OF THE WORLD. THE MOST NOTICEABLETHE NORMAL IS PROVISIONAL AND IS BASED ON THE NUMBER DIFFERENCE IN THIS ANNUAL PUBLICATION WILL BE THE CHANGEOF YEARS INDICATED. IN UNITS FROM TENTHS TO EIGHTS (OKTAS) FOR REPORTING THE
0.' OR " INDICATES THE VALUE OR MEAN-DAYS-WITH AMOUNT OF SKY COVER.IS BETWEEM 0.00 AND 0.05.
CLOUDINESS FOR ASOS STATIONS DIFFERS FROM THE NON-ASOSOBSERVATION TAKEN BY A HUMAN OBSERVER. ASOS STATIONCLOUDINESS IS BASED ON TIME-AVERAGED CEILOMETER DATAFOR CLOUDS AT OR BELOW 12,000 FEET AND ON SATELLITEDATA FOR CLOUDS ABOVE 12,000 FEET.
THE NUMBER OF DAYS WITH CLEAR, PARTLY CLOUDY, ANDCLOUDY CONDITIONS FOR ASOS STATIONS IS THE SUMOF THE CEILOMETER AND SATELLITE DATA FOR THESUNRISE TO SUNSET PERIOD.
published by: NCDC Asheville, NC 6
PA3eG of

(ICDC 2oo3) 42003
AUGUSTA,GEORGIA (AGS)
The boundary between the Piedmont Plateau and theCoastal Plain, known as the Fall Line, crosses theSavannah River basin in a generalnortheast-southwest direction near Augusta,Georgia. The Weather Service Office at Bush Fieldis located in the Savannah River Valleyapproximately 2 miles west of the river and 203miles above the mouth of the Savannah. Hills some200 feet higher than the station are foundslightly more than 1 mile to the west andapproximately 4 miles to the southwest, and some 5miles to the south and southeast. Swampland isfound immediately to the north, east, and south ofthe station.
Measurable snow is a rarity and then remains onthe ground only a short time. Ice storms,damaging winds, and very low temperatures are alsoof rare occurrence.
Augusta has been protected, to a great extent,from flooding of the Savannah River by theconstruction of two multipurpose dams. The ClarkHill Dam is located 21.7 miles above the city andHartwell Dam has been constructed 89 miles aboveAugusta.
The length of the growing season averages 241days. The average last occurrence in the springof temperatures of 32 degrees is mid-March, andthe first in the fall is mid-November.
ea7~8

('INCbC ?oo33)XpcfSTATION LOCATION AUGUSTA, GEORGIA
LATITUDE
NORTH
L0NG
UDE
WEST
ELEVATION ABOVE
SEA 1 G0DLEVELI .. . .
Occupied Occupied
From To
LOCATION
Airline
Distances
and
Directions
from
previous
Location
GR0UND
TE SM IP TE ERATUR
E
WNIND
INSTRUMENT
E
TREME
THERM0METERS
PSYCHR0METER
SUN-SH
NE
SWI
TCH
TI RP AP II NNG G
AB IU GC EKET
WE
IG
HI
NG
R
AI
N
G
AGE
8
NCH
RAIN
0AGE
HYGR0THE
M
0EM
TES
AUT
H0Q
ATI
CE
eT
SERVI
NG
TYPE
M AMOST = AUTOBS = ASOSW = AWOS
REMARKS
I 4 4 +-4-4-+-~-~-4-+-~-4-4-4-NOTE:
AIRPORT
Administration BuildingDaniel Field AirportWrightsboro Road
Administration Building(2nd floor)Daniel Field
Airport, Wrightsboro Rd
Transient Building +Bush Field
+Dept. of Commerce Bldgeff. 12/16/55weather Bureau Bldg.eff. 12/1/SB.Weather Service Bldg.eff. 12/14/71.Weather Service/FAA Bldgeff. 5/29/87.
Bush Field
-7/3/41
2/14/44
7/1/50
2/14/44
6/305/50
400 ft.W
SameBldg.
33*28' 182*02' 1420 46 29 29 29
33*28' 32*02' 420 46d43 S
6
e4
f4
3
305/01/94 17.5Emi.SEE
33*22' 181*58' 143 1250i145 g2Sj136 k20
6 NA NA.3
NAh5n5p5
NA
Army 8/25/42 to 9/19/42.
d. Effective 2/21/46.e. Installed September 1949.
f. Raised 8/25/51.g. Effective 3/9/63.h. Commissioned 1700' ESE of
thermometer site 2/1/64.i. Effective 2/1/64.j. Value from resurvey
3/28/68.k. Minor move 2/15/76.m. Installed 9/23/76.n. Type change 7/28/82.p. Type change 12/16/85.
ASOS Commissioned 05/01/94.q. Ground elevation.
05/01/941 Fresent INA 33*22' 181'581 jq165 S
For Hard Copy Subscription:Price and ordering information: NCDC Subscripting Service Center,310 State Route 956, Building 300, Rocket Center, WV 26726.
INQUIRIES/COMMENTS CALL: Toll Free (866) 742-3322Visit our Web Site for other weather data:www.ncdc.noaa.gov
Non- Subscription Request:NCDC Customer Services;Phone: 828-2711-4800Fax: 828-271-4876Email: ncdc.orders (a)noaa.gov
OFFICAL BUSINESSPENALTY FOR PRIVATE USE $300CHANGE SERVICE REQUESTED
FIRST CLASSPOSTAGE & FEES PAID
United States Department of CommerceNOAA Permit No. G - 19
* NOTES: For earlier station history see previous edition.
PAj e 8 of 9