Employee Compensation Strategy as Sustainable Competitive ...
23
sustainability Article Employee Compensation Strategy as Sustainable Competitive Advantage for HR Education Practitioners Eungoo Kang 1 and Hyoyoung Lee 2, * Citation: Kang, E.; Lee, H. Employee Compensation Strategy as Sustainable Competitive Advantage for HR Education Practitioners. Sustainability 2021, 13, 1049. https://doi.org/10.3390/su13031049 Received: 12 December 2020 Accepted: 13 January 2021 Published: 20 January 2021 Publisher’s Note: MDPI stays neutral with regard to jurisdictional claims in published maps and institutional affil- iations. Copyright: © 2021 by the authors. Licensee MDPI, Basel, Switzerland. This article is an open access article distributed under the terms and conditions of the Creative Commons Attribution (CC BY) license (https:// creativecommons.org/licenses/by/ 4.0/). 1 Business and Technology, Saint Mary’s University of Minnesota, Minneapolis, MN 55404, USA; [email protected] 2 Cha Mirisa Liberal Arts, Duksung Women’s University, Seoul 01369, Korea * Correspondence: [email protected] Abstract: By building on compensation literature, the current study explored and identified the ties between workers’ competencies, corporate cultures, and compensation schemes. These schemes were typically the subject of literature on the factors dealing with the implementation of incentive systems for pay for performance (PFP) or problems that can lead to a PFP system’s failure. Unfortunately, when it comes to research that HR education practitioners may do, the literature has been scarce. It shows which organizational elements might be necessary to examine when deciding whether a PFP or an alternative compensation program is acceptable. This study aimed to add insight into this gap in research. The findings of this study showed from the use of data from 385 American employees in the manufacturing industry that there are significant relationships statistically between employee competencies and organizational cultures and those findings can be corroborated with existing researches, suggesting compensation schemes were related to multiple types of competence organizations and different organization cultures, thus adding meaningfully to the current literature. Keywords: HR management; compensation strategy; organizational element 1. Introduction There should be not questionable that employees of a company are an essential foundation for a sustainable competitive advantage. According to major academic studies, employees’ performance in the area of Human Resource Management (HRM) from an employee compensation system could lead to benefits [1–3]. Nevertheless, a prior research has received little attention to enhancing the understanding of employees’ different cultures and abilities, which, despite these essential studies, encourage such remedial approaches. The compensation that is important for both individual employees and the organization as a whole is one of the highest costs for an organization [4]. In case of the possible source of sustained competitive gain for the corporation: the field of compensation may be critical for the success or failure of an organization [2,5], and the characteristics of the workers and their interactions form the basis for strategic planning and implementation [6]. The study of Cummings and Worley [3] also stated that a compensation scheme should be driven by the policy, structure, employee engagement, and work as an integral part of the HR (Human Resource) education practitioners designing an organization and training employees. However, among academics there appears to be disagreement regarding whether pay-for performance (PFP) programs in which there is a direct relationship between an employee’s performance results and their compensation reward [6,7] should be used in or- ganizations as a compensation strategy to enhance organizational performance or whether they are inherently ineffective or even counterproductive in that role. This indicates that within the compensation literature review, there is still a large amount of confusion between two sides regarding the utilization of PFP incentive systems. Consequently, this insuffi- ciency of agreement among HRM experts regarding appropriate PFP system deployment becomes an important issue among academics and practitioners. This study starts from Sustainability 2021, 13, 1049. https://doi.org/10.3390/su13031049 https://www.mdpi.com/journal/sustainability
-
Upload
khangminh22 -
Category
Documents
-
view
3 -
download
0
Transcript of Employee Compensation Strategy as Sustainable Competitive ...

sustainability
Article
Employee Compensation Strategy as Sustainable CompetitiveAdvantage for HR Education Practitioners
Eungoo Kang 1 and Hyoyoung Lee 2,*
�����������������
Citation: Kang, E.; Lee, H. Employee
Compensation Strategy as
Sustainable Competitive Advantage
for HR Education Practitioners.
Sustainability 2021, 13, 1049.
https://doi.org/10.3390/su13031049
Received: 12 December 2020
Accepted: 13 January 2021
Published: 20 January 2021
Publisher’s Note: MDPI stays neutral
with regard to jurisdictional claims in
published maps and institutional affil-
iations.
Copyright: © 2021 by the authors.
Licensee MDPI, Basel, Switzerland.
This article is an open access article
distributed under the terms and
conditions of the Creative Commons
Attribution (CC BY) license (https://
creativecommons.org/licenses/by/
4.0/).
1 Business and Technology, Saint Mary’s University of Minnesota, Minneapolis, MN 55404, USA;[email protected]
2 Cha Mirisa Liberal Arts, Duksung Women’s University, Seoul 01369, Korea* Correspondence: [email protected]
Abstract: By building on compensation literature, the current study explored and identified the tiesbetween workers’ competencies, corporate cultures, and compensation schemes. These schemes weretypically the subject of literature on the factors dealing with the implementation of incentive systemsfor pay for performance (PFP) or problems that can lead to a PFP system’s failure. Unfortunately,when it comes to research that HR education practitioners may do, the literature has been scarce.It shows which organizational elements might be necessary to examine when deciding whether aPFP or an alternative compensation program is acceptable. This study aimed to add insight intothis gap in research. The findings of this study showed from the use of data from 385 Americanemployees in the manufacturing industry that there are significant relationships statistically betweenemployee competencies and organizational cultures and those findings can be corroborated withexisting researches, suggesting compensation schemes were related to multiple types of competenceorganizations and different organization cultures, thus adding meaningfully to the current literature.
Keywords: HR management; compensation strategy; organizational element
1. Introduction
There should be not questionable that employees of a company are an essentialfoundation for a sustainable competitive advantage. According to major academic studies,employees’ performance in the area of Human Resource Management (HRM) from anemployee compensation system could lead to benefits [1–3]. Nevertheless, a prior researchhas received little attention to enhancing the understanding of employees’ different culturesand abilities, which, despite these essential studies, encourage such remedial approaches.The compensation that is important for both individual employees and the organization asa whole is one of the highest costs for an organization [4]. In case of the possible source ofsustained competitive gain for the corporation: the field of compensation may be criticalfor the success or failure of an organization [2,5], and the characteristics of the workers andtheir interactions form the basis for strategic planning and implementation [6]. The studyof Cummings and Worley [3] also stated that a compensation scheme should be driven bythe policy, structure, employee engagement, and work as an integral part of the HR (HumanResource) education practitioners designing an organization and training employees.
However, among academics there appears to be disagreement regarding whetherpay-for performance (PFP) programs in which there is a direct relationship between anemployee’s performance results and their compensation reward [6,7] should be used in or-ganizations as a compensation strategy to enhance organizational performance or whetherthey are inherently ineffective or even counterproductive in that role. This indicates thatwithin the compensation literature review, there is still a large amount of confusion betweentwo sides regarding the utilization of PFP incentive systems. Consequently, this insuffi-ciency of agreement among HRM experts regarding appropriate PFP system deploymentbecomes an important issue among academics and practitioners. This study starts from
Sustainability 2021, 13, 1049. https://doi.org/10.3390/su13031049 https://www.mdpi.com/journal/sustainability
Sustainability 2021, 13, 1049 2 of 23
the prevailing literature that stated on the firm circumstances about which practitionersexamine before implementing a PFP program. The present authors point out that PFPcompensation schemes should be aligned with employee competencies and corporatecultures that are both reinforced by proper reward system.
The discussion of the present research also centers on a contrasting compensationscheme, “skill-based pay” (SBP), or “pay-for-knowledge”. Gomez-Mejia and Balkin [8]determined performance-based compensation and skill-based compensation to be differentconcepts. A SBP system pays for an employee’s knowledge, skills and abilities [9]. It isa reward system which is based on wage rates on the range of skills employees canapply to their jobs. Employees’ compensation plans are totally more based on individualskills such as skill type, skill depth, and skill range than depending on how employeesperform their jobs at a particular time. Thus, SBP motivates employees to acquire newcompetencies and skills [10] and rewards employees with additional pay in exchange forformal certification of the employee’s mastery of skills, knowledge, and competencies [11].Just about all companies should still use their ‘Pay for Performance’ (PFP) compensationprograms as ‘the best practice’ [12–17]. The same opposition is present, although someresearchers are using several examples of organizational performance enhancements usingPFP compensation schemes [18–20]. While the entire academic community expects differentviewpoints, the fact that the best sector in management academia does not agree on PFPis alarming.
We noted the study of Lawler [21] and Zarifian [22] which contrasted between PFP andSBP system in their reasonable approaches and were aroused the curiosity with the pastresearch of Díaz-Fernández et al. [6] and Kerr and Slocum [23]. As a result, we wouldlike to check if there might be a meaningful connection between the strategic competen-cies an organization is trying to possess, and the corporate culture and reward systemwhich might also link that specific competency. This study demonstrates that the PFPrecompense schemes can be tested by organizations, not with a "best practice" approach(always/never). Firms that want the skills of adaptability, an innovative approach, or tech-nological competence may create a clan culture and relate this culture to SBP systems.In comparison, promoting a PFP-associated consumer culture may be the course of actionfor businesses seeking customer attention and performance guidance.
Purpose of the Present Study
Most of the PFP compensation systems literature focuses either on the implementationfactors of these programs or on problems that could fail a PFP program. Before implementa-tion, practitioners strive to understand whether a particular compensation scheme is used.However, there is little research at their disposal to help them see what organization, if anyPFP program or alternative compensation program could fit their situation and be relevant.This research was intended to provide insight into this apparent lacuna. In addition tothe literature strength of the present study, we assumed that an organization’s employees’specific skills are connected with a particular culture of the organization. We relied on twoprevious studies that already realized that pay systems and employee capacities have strongrelationships with pay structures and organizational cultures [6,23]. The present studyhas collaborated and questioned current research related to pay system/organizationalculture and employee knowledge by identifying a clear correlation between the employee’scompetence and company organization using a structural equation review.
By identifying the meaningful associations between worker’s competency and corpo-rate culture through the structural equation analysis, the present study collaborated andchallenged the existing research pertaining to pay system / organizational culture andemployee competency [6,23], insisting that different orientations of reward practice mightbe matched to different types of competencies and cultures. Finally, for HR practitionerswho determine the correctness of PFP scheme for their companies, the present authorsoffer a helpful framework relating specific culture and competency with the utilizationeither a PFP or SBP system.

Sustainability 2021, 13, 1049 3 of 23
2. Literature Review2.1. Pay for Performance (PFP)
The literature review departs from stating the definition of PFP compensation scheme.A compensation system that bases reward on individual performance results is suggestedto be a PFP scheme in the present study [6,8]. The employee understands that there is astraight connection between their performance results and their compensation reward,generally PFP indicates that there is a meaningful proportion of total compensation that is“pay at risk” [24], while a commission scheme might be a pure example of PFP. To providean incentive for the employee to perform, the linkage between the employee’s performanceand their pay in PFP programs is assumed [6,7,25]. For example, Cammann & Lawler [26]made a link between expectancy theory and PFP compensation system. Ultimately leadingto a successful performance and the resulting positive outcome might motivate employees,they noted the potential impact of expectancy of effort.
Indeed, numerous scholars have suggested that PFP compensation should be a “bestpractice” for all organizations at all times [12,13,15–17,27–30]. Further, by using PFPcompensation programs, they have suggested that the improvement of organizationalperformance can be achieved. In fact, improved motivation for employees can be achievedby offering incentives about outstanding performance. The previously cited authors furtherasserted that organizations may utilize rewards such as promotions and merit boosts,in addition to intrinsic rewards such as goal accomplishment, to encourage sustained highlevels of performance of employees.
Recent studies espoused PFP system has significant positive effects for employeeperformance. Using over 10,000 workers for five years and found out that merit payschemes are connected strongly with worker’s performance in the future, Nyberg, Pieper& Trevor [27] tested whether key contextual factors such as job characteristics and the expe-rience of pay structure) play in PFP effectiveness. Furthermore, these researchers foundout that the strength of PFP’s effect has a significant positive impact for employee tenureand that merit pay scheme and bonus pay scheme could replace for each other. By compar-ing selected workers in organizations, Uriesi [31] investigated that the influences of PFPscheme on worker’s performance using the Romanian sample. As evaluated by the directsupervisors of each employee, the work performances of employees who are compensatedthrough PFP systems were significantly higher than those of employees who were notimplemented by PFP system. As indicated by the study of Uriesi [31], the effect of PFPbased systems were mediated by their strong and positive impacts on workers’ perceptionsregarding procedural justice and distributive justice.
However, other researchers have a different opinion about which PFP compensationshould be a “best practice” for all organizations at all times. They avowed that PFP com-pensation system has a negative effect for employees or might be effective in enhancingperformance but that planning and execution are critical for improving employee perfor-mance. For instance, the study [19] showed that those who argue for PFP do agree thatsuccessful PFP schemes are contingent upon thoughtful implementation. The researchgroup of [19] also stated that the PFP program would have a better chance of successif it had clear goals and provides adequate compensation. Finally, a main reason of thedeficiency of desirable PFP plans in companies is due to be a deficiency of more specificand clearer object. By applying both empirical and theoretical contexts in the prior litera-ture, Eijkenaar [32] presented an outline of main issues in the using of PFP compensationschemes. Moreover, he discussed that organizations should consider carefully how to placethe incentives in a frame for preventing unexpected employee behaviors. In conclusion,his study argued that even if the fundamental idea of PFP programs are simple, to designeffective and fair performance-based program, companies are required a complicatedconsideration with various interrelated features.
Traditionally, many researchers have also focused on complementing PFP’s deficiency,suggesting certain conditions between pay and performance. The study [33] arguedthat a successful PFP program depends on whether there is a meaningful link between
Sustainability 2021, 13, 1049 4 of 23
compensation program and worker’s performance in the mind of the worker. Employeesmust understand their PFP plan to respond in good manner they say in further discussion.As suggested, then, the compensation relationship with pay and performance shouldbe simple and easy for employees to understand and calculate. The study of Kaplan &Norton [34] proposed that PFP system may be work properly if a “balanced scorecard”method is implemented by practitioners. By tapping financial measures and customersatisfaction measures, a balanced scorecard helps practitioners to obtain overall aspects.While also standing in contrast with the idea that performance metrics should be simpleand understandable for employees, this again suggests the importance of performancemetrics in assessing employees.
Researchers also discussed that PFP program ought to be used only when objective,quantifiable standards and goals are available to assess employee performance [6,35].The study of Campbell, Campbell and Chia [36] pointed out that employees might reducetheir effort due to the difference job performance and the actual reception of reward, theissue of time lapse. Rewarding behaviors that are unintended is also an issue that exists.For example, the research found out that hospitals that were quick to cancel required oper-ations to reach targeted results under a PFP program [37]. Casalino and his associates [38]suggested like opinions. Observing that physicians would avoid high-risk patients whomight cause them not to meet performance objectives under a PFP compensation scheme,he provides empirical evidence from the healthcare industry. Pointing out that an introduc-tion of a major performance-based pay system in England was related to drop emergencyadmission rate in hospitals for incentivized circumstances compared with circumstanceswhich were not incentivized.
Hamel and his colleagues [18] addressed that PFP program has been in operationthroughout the 10 years in medical industry and doctors have been ambivalent about it.They argue that some elements of the program in which the framework bolstered commonlyaccepted medical standards were welcomed by doctors. However, they were also concernedabout a loss of control and professionalism in addition to becoming less skilled in dealingwith certain conditions, such as diabetes, since nurses were increasingly involved in chronicdisease management. Despite welcoming the initial pay increase, this resulted in manypractitioners beginning to resent the PFP program as successive governments took backthe initial large increases with a succession of below inflation boosts.
Ultimately, reward specialists and academics have argued on whether or not PFP isan effective tool for motivation. That it provides direct incentive, as tangible means ofrecognizing individuals’ achievements, and the flexibility to retain key staff are some ofthe potential advantages of PFP. On the negative side, adversaries of PFP in this way assertthat it can be discriminatory, demotivate most employees at the expense of some highperformers, and erode ‘felt fair’ perceptions of equity [39]. The extant research on PFPcompensation programs provides little direction to practitioners beyond the necessity forcareful implementation and the literature seems bereft of research that might offer guidancefor linking organizational factors situationally with the use of different compensationprograms, as many previous studies have shown. Thus, to resolve this issue, the presentstudy, as noted earlier, utilized both PFP and SBP compensation schemes to compare theirrelevance which are predominated previously in the compensation literature [8,40].
2.2. Skill-Based Pay (SBP)
The present study also discusses on a contrasting compensation scheme, “Skill-BasedPay” (SBP), or “Pay-For-Knowledge”. The prior study [11] defined SBP system in moredetail. They stated SBP is a compensation system that employees are compensated withadditional wage in return for formal certification of the mastery of credentials, expertise,and skills. Expertise in performing tasks is obtained and can be seen. Knowledge can bethought of as acquired information used in performing tasks, while competencies can bedefined as more normal skills or traits need to perform tasks, many times in multiple rolesor jobs. Because it is based on the characteristics of the person rather than the job, SBP is a

Sustainability 2021, 13, 1049 5 of 23
person-based system. Where workers have the right even though they are not qualified,the wage is dependent on jobs in more traditional pay structures based on employment.
The company invests in the growth and advancement of workers, employees seehigher job security, and the organization stresses the autonomy of employees by basingcompensation on the worker rather than the work under the SBP system [41,42]. As aresult, SBP plans should be positively linked to behaviors such as employees’ happinessand engagement. Are competitive and sustainable in factories where the related skills (forexample, machinery operators, welders, etc.) are more concrete than service firms [43,44].Because there is little doubt that performance has been at the key part in reward system fordecades and thus, practitioners have absolutely willingness to compensate more productiveworkers as a strong HR strategy, the literature review seems to have more insight based onPFP as compared to SBP. With the multi-faceted nature of jobs in the 21century, however,the effectiveness of SBP has been contended by compensation scholars who insist that asimple measure of performance-based scheme might be hard to justify and SBP system hasmany advantages for organizations including a flexible workforce, labor cost reduction,quality and productivity improvement [10,11].
In their contingency approaches, as already mentioned earlier, the present study notedthat previous studies [21,22] specifically contrasted PFP and SBP programs. The authorsof the present study was particularly intrigued with the work of Kerr and Slocum [23]and Diaz-Fernandez et al. [6]. There was further thought that there might be an importantlink between the competencies an organization is trying to deploy, and the culture andcompensation program that might best support that specific competency. Between orga-nizational culture and compensation programs, Kerr and Slocum [23] offered vision intothe relationship. Linking employee competencies with both PFP and SBP compensationscheme, Diaz-Fernandez and his associates [6] provided evidence more recently. Offeringan insight into literature that provides little research to direct what organizational com-ponents could be important to decide if their condition might be correlated with a PFPprogram or an alternative compensation program, this study investigated specifically em-ployee’ competencies, organizational cultures, and their relationships with compensationsystems to resolve the problem that provides little direction to compensation practitioners.Before taking a look at competencies and their relationship with compensation systems,the literature review of employee competency departs from investigating the definitionof competency.
2.3. Employee Competency
Research says that competencies are an important factor for organizations to keepcompetitive advantage and can lead effective employee performance. In addition to theseopinions, present authors further wondered what specific elements of competency existin the literature and investigated the past studies that opine the elements of competency.Studies of employee competency historically have followed two main approaches thatwere developed independently per past research. In a competency set, the mixture of bothcore competencies that are common to workers around the enterprise and competenciesthat are unique to specific jobs is probable.
In most organizations, competency structures include both ‘transferable’ or behavioralcompetencies and technical/functional competencies (’hard’ skills). Job performancerequirements and the levels and outcomes that individuals performing a role shouldachieve or that workers in a specific occupational field should be able to do are addressedas many studies are ’hard’ or practical skills. Past reviews often refer to transferable skillsas personal or behavioral features that show people their work [45–47].
First, a relatively enduring feature to an employee that is associated with effectiveperformance in a job is how personal competency has been defined [45]. Differentiating out-standing from average performers based on the prior literature, Boyatzis and Boyatzis [48]provides three clusters of behavioral competency. The three are as follows: (1) Cognitivecompetencies, such as system thought and pattern recognition; (2) competencies of emo-

Sustainability 2021, 13, 1049 6 of 23
tional intelligence, including competencies of self-knowledge and self-regulation, such asemotional self-awareness and emotional self-control; and (3) competencies of social in-telligence, such as empathy and teamwork, including social awareness and relationshipmanagement competencies.
Defined by not just the ability to do something, but how it is done, behavioral com-petencies are often called transferable skills. Particularly true of leadership competencies,they also describe a way of doing things in relation to other people. Continuing afterthe cognitive ability, such as self-awareness, social skills, and self-regulation [45,47,49],many studies insisted that the behavioral approach focuses on many attributes. Able to betaught through learning and development, this strategy suggests that, unlike personalityor intellect, competencies are essentially behavioral. Asumeng [50] discussed that abilitiesand expertise are behavioral attitudes that mostly predict success, which is importantfor any organization thinking strategically and finding prosperity—measured by outputanalysis (real actions and outcomes), which, in return, represents the level of organizationin the market and gives a competitive advantage. Martina and his associates [51] submittedthat the inputs of individuals (knowledge, skills, abilities, attitudes, and values) are the com-petence and are considered an essential predictor for prosperity organizations. Things thata person continually considers or needs to stimulate action and motivate, direct, and selectconduct towards certain acts or goals and away from others are, therefore, motivations.
Second, those things that employees who need to work in a particular occupationalzone ought to be able to exhibit [45] are functional competencies (skills or know-how).This requires that competency management also have professional and technical com-petencies integrated with generic competencies. This functional method would seem todeal with this business requirement. By controlling the word ‘competency’ to describeonly employees’ skills and know-how considered essential for handling a task [45,52],the functional approach points out that competencies can be required for performingthe task successfully. In other words, functional competencies are often referred to aswell-established technical skills and simply mean the ability to perform some technicaltask such as operating machinery, performing double entry accounting. Functional skillsrefer to the functions, procedures, and responsibilities in an organization and cover the ex-pertise and skills needed to perform a particular task or job effectively. [45,52]. Severalstudies focus on job-related (functional) competences based on job-related standards ratherthan behavioral competency even though some are definitely supported by behavioralcompetencies [53–55].
In sum, the literature in terms of employee competency has mentioned that awarenessis the knowledge a person has in particular areas of content, and skill is the ability to per-form a particular physical or mental activity. Therefore, expertise and skills (technical skills)that are fundamentally important for the job tend to be obvious, and comparatively surfacecharacteristics whereas autonomy, traits, and motive skills (behavioral competencies) weremore secret, deeper and central to personality are those which drive an individual’s successin the job [51,56,57]. Although there is still a lot of evidence of behavioral competence inthe US, a more comprehensive definition of competence, which also emphasizes job-relatedpractical skills and experience, is gaining ground clearly [45]. As previous paragraphsshow, prior studies have provided two perspectives in terms of competencies. Based onthose approaches, to effectively build competency-based HR strategies that directly connectcompensatory methods with their partners Díaz-Fernández and his colleagues [6] inte-grate behavioral and functional approaches, using five employee competencies previouslydeveloped in the publications [47,56,58–60].
2.4. Five Employee Competencies
As we already mentioned, the employee competencies considered in the presentstudy totally based on the prior study [6]. Diaz-Fernandez and his associates insistedfive separate competencies based on numerous prior studies [47,56,58–60]. Thirty yearsof research carried out by McBer and later by the Hay Group [61] have cross-culturally
Sustainability 2021, 13, 1049 7 of 23
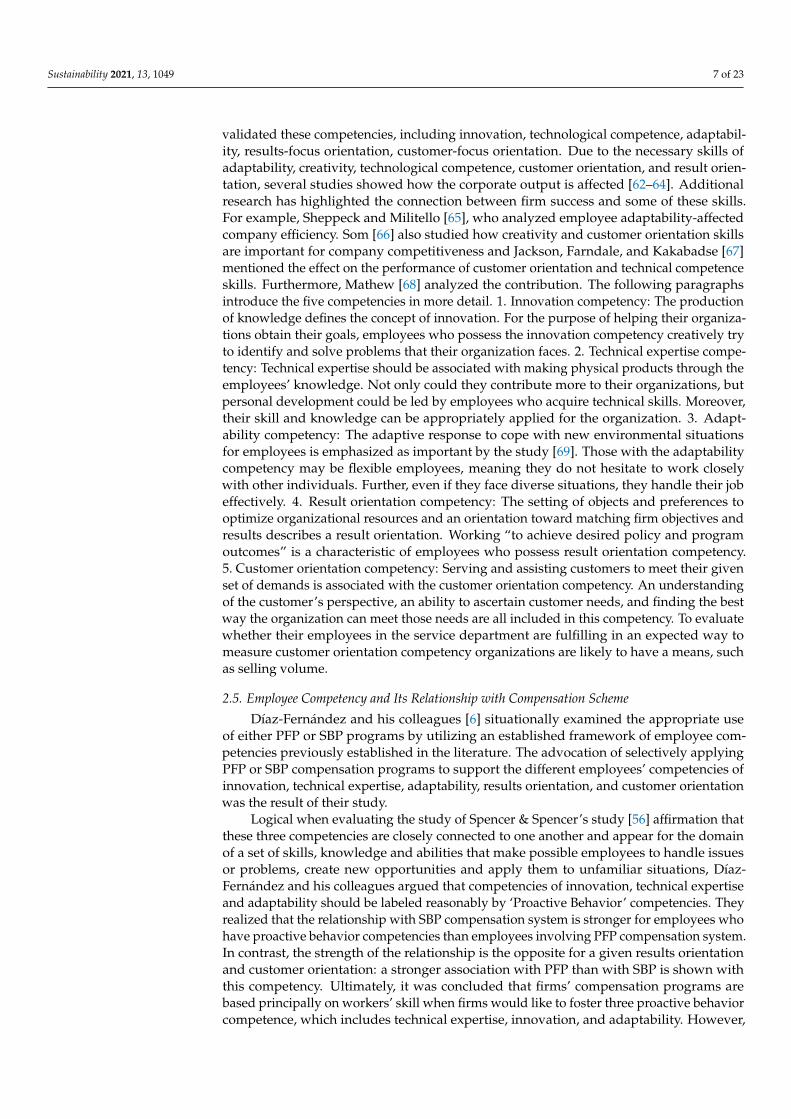
validated these competencies, including innovation, technological competence, adaptabil-ity, results-focus orientation, customer-focus orientation. Due to the necessary skills ofadaptability, creativity, technological competence, customer orientation, and result orien-tation, several studies showed how the corporate output is affected [62–64]. Additionalresearch has highlighted the connection between firm success and some of these skills.For example, Sheppeck and Militello [65], who analyzed employee adaptability-affectedcompany efficiency. Som [66] also studied how creativity and customer orientation skillsare important for company competitiveness and Jackson, Farndale, and Kakabadse [67]mentioned the effect on the performance of customer orientation and technical competenceskills. Furthermore, Mathew [68] analyzed the contribution. The following paragraphsintroduce the five competencies in more detail. 1. Innovation competency: The productionof knowledge defines the concept of innovation. For the purpose of helping their organiza-tions obtain their goals, employees who possess the innovation competency creatively tryto identify and solve problems that their organization faces. 2. Technical expertise compe-tency: Technical expertise should be associated with making physical products through theemployees’ knowledge. Not only could they contribute more to their organizations, butpersonal development could be led by employees who acquire technical skills. Moreover,their skill and knowledge can be appropriately applied for the organization. 3. Adapt-ability competency: The adaptive response to cope with new environmental situationsfor employees is emphasized as important by the study [69]. Those with the adaptabilitycompetency may be flexible employees, meaning they do not hesitate to work closelywith other individuals. Further, even if they face diverse situations, they handle their jobeffectively. 4. Result orientation competency: The setting of objects and preferences tooptimize organizational resources and an orientation toward matching firm objectives andresults describes a result orientation. Working “to achieve desired policy and programoutcomes” is a characteristic of employees who possess result orientation competency.5. Customer orientation competency: Serving and assisting customers to meet their givenset of demands is associated with the customer orientation competency. An understandingof the customer’s perspective, an ability to ascertain customer needs, and finding the bestway the organization can meet those needs are all included in this competency. To evaluatewhether their employees in the service department are fulfilling in an expected way tomeasure customer orientation competency organizations are likely to have a means, suchas selling volume.
2.5. Employee Competency and Its Relationship with Compensation Scheme
Díaz-Fernández and his colleagues [6] situationally examined the appropriate useof either PFP or SBP programs by utilizing an established framework of employee com-petencies previously established in the literature. The advocation of selectively applyingPFP or SBP compensation programs to support the different employees’ competencies ofinnovation, technical expertise, adaptability, results orientation, and customer orientationwas the result of their study.
Logical when evaluating the study of Spencer & Spencer’s study [56] affirmation thatthese three competencies are closely connected to one another and appear for the domainof a set of skills, knowledge and abilities that make possible employees to handle issuesor problems, create new opportunities and apply them to unfamiliar situations, Díaz-Fernández and his colleagues argued that competencies of innovation, technical expertiseand adaptability should be labeled reasonably by ‘Proactive Behavior’ competencies. Theyrealized that the relationship with SBP compensation system is stronger for employees whohave proactive behavior competencies than employees involving PFP compensation system.In contrast, the strength of the relationship is the opposite for a given results orientationand customer orientation: a stronger association with PFP than with SBP is shown withthis competency. Ultimately, it was concluded that firms’ compensation programs arebased principally on workers’ skill when firms would like to foster three proactive behaviorcompetence, which includes technical expertise, innovation, and adaptability. However,

Sustainability 2021, 13, 1049 8 of 23
firms should focus their compensation approach on the individual worker’s output toencourage results orientation and customer orientation competency [6].
2.6. Organizational Culture
Sustainable organizational culture includes an organization’s specific attitudes, tech-nologies, individual style (e.g., dress code of workers) per Schein [70]. By showing anegative connection between the type of hierarchy cultural system and worker’s moti-vation, the prior study [71] showed that the organizational culture is a critical factor informing the level of employee motivation. The values, trust, and point of view of its groupwhich build and influence norms of behavior for employees are also reflected in organi-zational culture. For examples, it was suggested by Lawler [21] that an organization’scompensation plan can have a significant effect on the produced culture. It was noted byhim that some organizations that give significant rewards to risk takers develop a culturethat risk taking might be supported, while others develop a culture of teamwork andcommitment partly because of its egalitarian reward system. Then, that indicates that thereis a strong connection between establishing compensation scheme for organizations andorganizational culture. The potential connection between culture and compensation prac-tices was also documented by Wright [72]. She described a possible framework connectingelements of the reward system to differing cultural perspectives that might complement areward system. It is not in doubt that there exists a strong relationship between culture andcompensation systems as contended by prior research. Furthermore, Kerr & Slocum [23]also asserted that the type of culture (clan and market) may be mutually supportive of onecompensation scheme or the other.
1. Clan culture: Clan culture emphasizes more discretion and flexibility than the con-trol of hierarchy and the stability and compete organizations (market culture). An openand friendly workplace where people share a lot descriptive of clan culture–this culturecan be compared to an extended family. Mentors or even parental figures are often foundin leaders. Sense of tradition and group loyalty are strong elements of this culture. Groupcohesion is of great importance and provides the benefits of human resource developmentfor long term period. A premium is placed on teamwork, participation, and consensuswhile strongly emphasizing concern for people. In the clan culture, growth and acquiringnew resources are long-term focuses. Industry leadership and acquiring unique and newproducts or services are important. In the culture, individual initiative and freedom arealso encouraged [73,74]. Therefore, the clan culture refers to amicable and “cozy” workingenvironment, wherein the employees are perceived as extended family and superiors areunderstood as mentors; workers are characterized by high commitment to both job andorganization and the development of friendly relations [75].
2. Market culture: Next, a clan culture is contrasted against a market culture by Kerr &Slocum [23]. A market culture is identified by a sense of individual initiative and ownership,mutual short-term commitments between the organization and its members, high levelsof member independence, supervisors as negotiators and resource allocators, and rets onself-interest, competition and utilitarianism. Market culture encourages individuality inwhich everyone pursues their own interests and induces rivalry. Fortunately, members ofother rival organizations become the target of this rivalry that is directed outward. The term‘market’ refers to the nature of a company that operates as a market is to pay attentionto performance, results, and income and stress the importance of market position andcontrol [73]. Using coordinated utilization of every resource within the company, strongmarket culture organizations can achieve superior customer value and do so profitablyaccording to the study of [76]. Thus, market culture organizations emphasize relationships-more specifically transactions-with suppliers, customers, contractors, unions. They feelthat they can best achieve success [74] and can create more customer value from executingthe required actions with the most efficient means available through effective externalrelations, resulting in high firm performance levels [77].
Sustainability 2021, 13, 1049 9 of 23
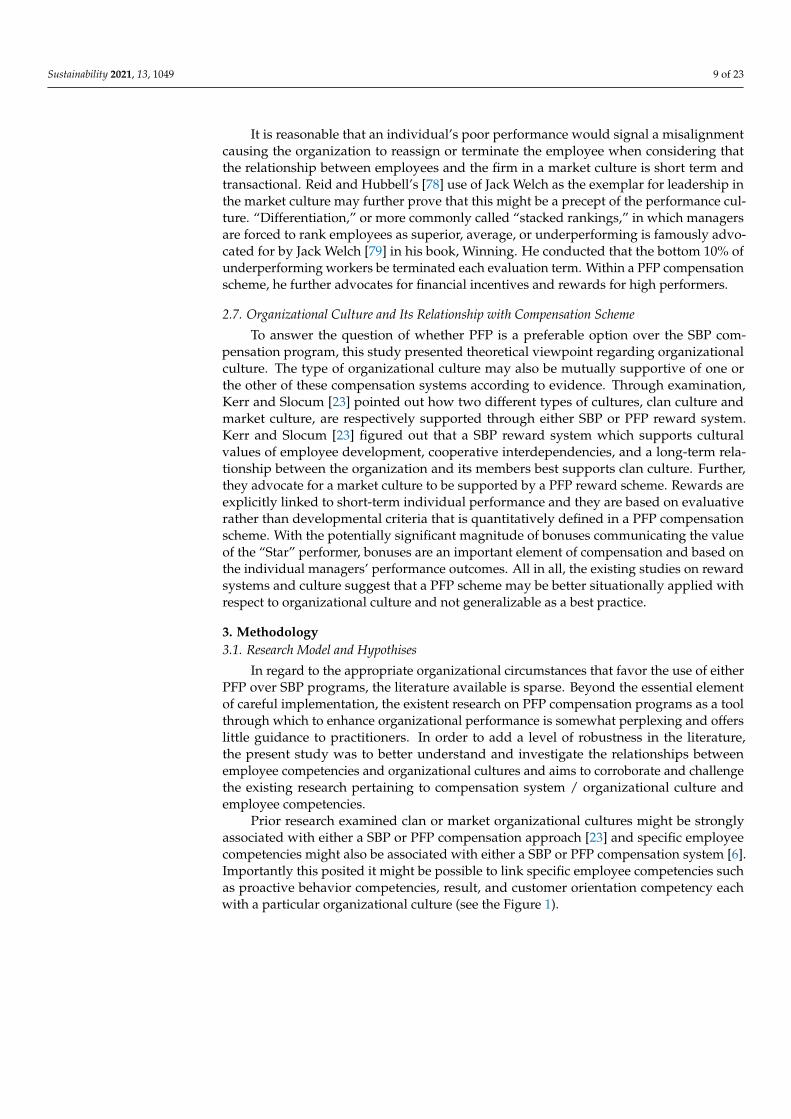
It is reasonable that an individual’s poor performance would signal a misalignmentcausing the organization to reassign or terminate the employee when considering thatthe relationship between employees and the firm in a market culture is short term andtransactional. Reid and Hubbell’s [78] use of Jack Welch as the exemplar for leadership inthe market culture may further prove that this might be a precept of the performance cul-ture. “Differentiation,” or more commonly called “stacked rankings,” in which managersare forced to rank employees as superior, average, or underperforming is famously advo-cated for by Jack Welch [79] in his book, Winning. He conducted that the bottom 10% ofunderperforming workers be terminated each evaluation term. Within a PFP compensationscheme, he further advocates for financial incentives and rewards for high performers.
2.7. Organizational Culture and Its Relationship with Compensation Scheme
To answer the question of whether PFP is a preferable option over the SBP com-pensation program, this study presented theoretical viewpoint regarding organizationalculture. The type of organizational culture may also be mutually supportive of one orthe other of these compensation systems according to evidence. Through examination,Kerr and Slocum [23] pointed out how two different types of cultures, clan culture andmarket culture, are respectively supported through either SBP or PFP reward system.Kerr and Slocum [23] figured out that a SBP reward system which supports culturalvalues of employee development, cooperative interdependencies, and a long-term rela-tionship between the organization and its members best supports clan culture. Further,they advocate for a market culture to be supported by a PFP reward scheme. Rewards areexplicitly linked to short-term individual performance and they are based on evaluativerather than developmental criteria that is quantitatively defined in a PFP compensationscheme. With the potentially significant magnitude of bonuses communicating the valueof the “Star” performer, bonuses are an important element of compensation and based onthe individual managers’ performance outcomes. All in all, the existing studies on rewardsystems and culture suggest that a PFP scheme may be better situationally applied withrespect to organizational culture and not generalizable as a best practice.
3. Methodology3.1. Research Model and Hypothises
In regard to the appropriate organizational circumstances that favor the use of eitherPFP over SBP programs, the literature available is sparse. Beyond the essential elementof careful implementation, the existent research on PFP compensation programs as a toolthrough which to enhance organizational performance is somewhat perplexing and offerslittle guidance to practitioners. In order to add a level of robustness in the literature,the present study was to better understand and investigate the relationships betweenemployee competencies and organizational cultures and aims to corroborate and challengethe existing research pertaining to compensation system / organizational culture andemployee competencies.
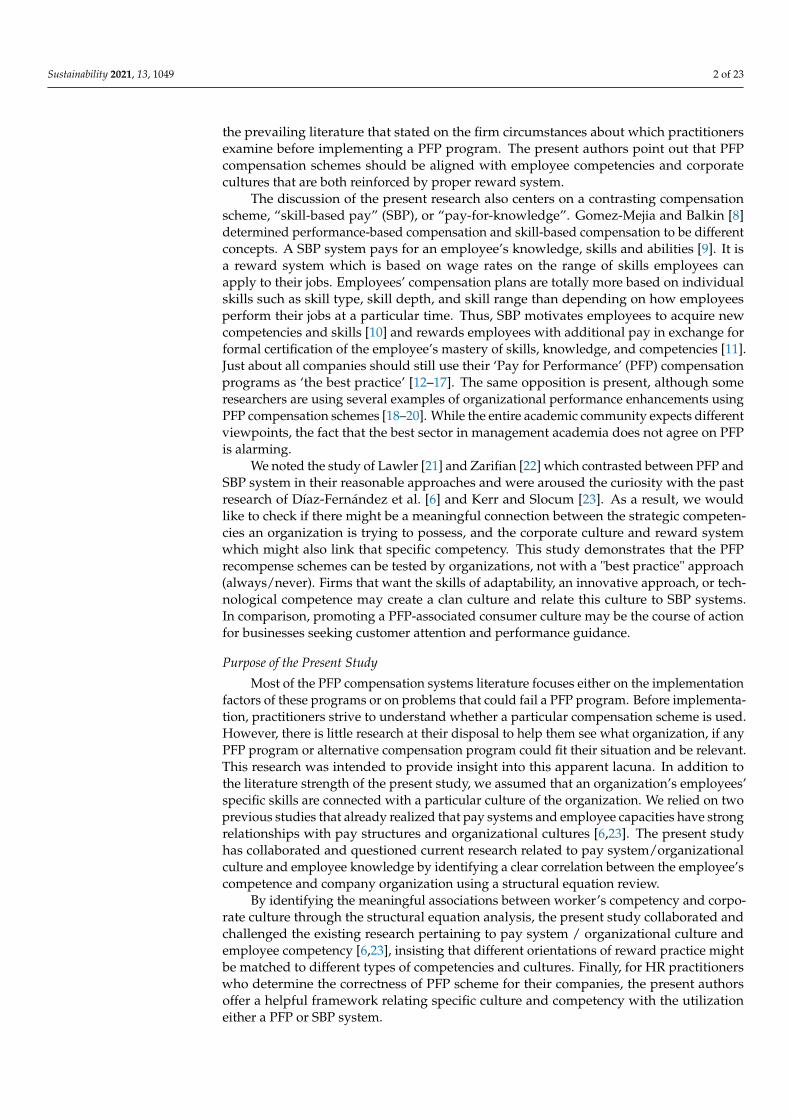
Prior research examined clan or market organizational cultures might be stronglyassociated with either a SBP or PFP compensation approach [23] and specific employeecompetencies might also be associated with either a SBP or PFP compensation system [6].Importantly this posited it might be possible to link specific employee competencies suchas proactive behavior competencies, result, and customer orientation competency eachwith a particular organizational culture (see the Figure 1).

Sustainability 2021, 13, 1049 10 of 23
Figure 1. The research model of the present research.
Investigating the strong relationship between employee competency and organiza-tional culture, this study might offer a source of information for current organizations thatthe firm’s compensation strategy with sustainable HR practices might include organiza-tional culture or employee competencies as a component of analysis. Finally, corroboratingthe existing studies, the hypotheses associated with:
Hypotheses 1 (H1). The proactive behavior competencies are more strongly matched with clancultural attributes than with market cultural attributes.
Hypotheses 2 (H2). Result orientation competency is more strongly matched with market culturalattributes than with clan cultural attributes.
Hypotheses 3 (H3). Customer orientation competency is more strongly matched with marketcultural attributes than with clan cultural attributes.
3.2. Variables and Sample
The total questions of the questionnaire that are used to gather variable values fromthe participants were 25 questions and all questions were based entirely on prior studies.Variables about employee competencies were 13 questions and borrowed directly by priorstudy [6] and the part of the organizational cultures on the instrument were 12 questionsand based totally on the study [80]. The Table 1 shows specific description of variables inmain factors.
The units of analysis for this study’s sample were as follows: production departmentemployees (factory workers, employees in product design & development and QualityControl), customer service department employees in the manufacturing industry, and 385American employees interacting directly with customers, or who are directly involved inthe creation of a product in the manufacturing companies. To measure the relationshipbetween main factors, there were two reasons why the sample of this study should beselected by the production workers and the companies of manufacturing industry.
First, rather than merely applying existing knowledge to workplace activities, the em-ployees who are in manufacturing sector can be expected to use their technical, genericknowledge, and skills to contribute to the production of new knowledge within the work-place on an ongoing basis. That is why previous studies [6,19,81] suggested that futureresearch of employees’ competencies can work well with the manufacturing industry. Next,analyzing relevant personal competencies in a homogeneous group of employees whowere employed in production roles and customer service roles was the focus of this study.Employee competency management is more feasible in this sector more than other sectors,and production workers perform the core activities in the manufacturing sector [6,44].To measure customer-orientation competency, then, the customer service departments inthe manufacturing companies were selected. As indicated by Díaz-Fernández et al. [6],there is no linkage between the competency of customer orientation and the dimensionsof production departments. This study, thus, reasonably hypothesized that employees inthe customer service department can concentrate on their customers directly with commis-

Sustainability 2021, 13, 1049 11 of 23
sions or bonuses in line with sales volumes, and this type of competency will be measuredeasily with PFP in the customer service department [82].
3.3. Original Measurement Tool for Competency
To measure five employees’ competencies, the present study directly duplicated the in-strument of Díaz-Fernández et al. [6]. Investigating the relationship between employees’competencies and compensation systems, Díaz-Fernández and his associates containedtotal 39 questions (employee competency: 30 questions, pay systems: 9 questions) in theirquestionnaire. The employees’ competencies analyzed in their study – proactive behavior(innovation, technical expertise, adaptability), customer orientation and results orientation– were measured using the scale suggested by Spencer [83]. They measured all items on aLikert scale ranging from 1 to 7 (1 = strongly disagree, 7 = strongly agree). In their study,Díaz-Fernández and his colleagues [6] have provided rich information about reliability andvalidity for their instrument. They performed the Confirmatory Factor Analysis (CFA) tocheck the quality of their instrument. The CFA is a powerful statistical technique that hasbecome an increasingly popular tool in all areas of social science and allows researchers toevaluate the degree to which their measurement hypotheses are consistent with actual dataproduced by respondents using the scale, verifying reliability and validity simultaneouslyof the instrument [6].
According to the study of Díaz-Fernández et al. [6], CFA analysis could confirmthe reliability and validity of their competency and compensation scales. Regardingemployees’ competencies, there were three factors (proactive behavior competencies, result-orientation competency and customer-orientation competency). And the two dimensionsof the compensation systems proposed in their study were found to be significant (PFP andSBP). For each factor, selected items among all items are only included in final sample ifestimated items are significant with factor loadings higher than 0.7. Factor loadings reflectthe degree to which each item is linked to a factor. Therefore, If an item is hypothesized toload on a particular factor, then researchers hope to find a significantly-large positive factorloading. such results are found, then researchers will likely retain that item. If, however,a factor loading. If is small and/or non-significant, then researchers will likely concludethat the item is unrelated to the factor, removing it from the scale. Thus, Díaz-Fernándezand his associates eliminated some of the items (lower than 0.7) of the original scales intheir instrument, in accordance with a statistical significance. As a result, total 17 questionswere left to use for their instrument and they found out that all extracted 17 questions(employee competency: 13 questions and compensation system: 4 questions) are reliableand convergent validity exists. For this reason, this study used 13 items to measure fiveemployees’ competencies.
Table 1. The description of variables in main factors.
Main Factors Number of Questions Description
Proactive Competencies(1) Innovation
(2) Technical Expertise(3) Adaptability
222
* Innovation—Separate out fresh ideas from a wide variety of sources.Take fresh perspectives and risks in their thinking. * Technical
Expertise—Show curiosity in exploring beyond the limits of jobs.Collaborate in the resolution of technical problems.
* Adaptability—Smoothly handle multiple demands, shifting prioritiesand rapid changes. Flexible in perception of events.
Result Orientation 3Set challenging goals and take calculated risks. Pursue information
to reduce uncertainty and find way to improve. Learn howto improve performance.
Customer Orientation 4Understand customer needs and match them to services or products.Seek ways to increase customer satisfaction and loyalty. Gladly offer
appropriate assistance, etc.

Sustainability 2021, 13, 1049 12 of 23
Table 1. Cont.
Main Factors Number of Questions Description
Clan Culture 6Long-term relationships between firm and employees. Developmental
and mentoring supervision. Collegiality and mutual interests.Shared fate, etc.
Market Culture 6Short-term relationships between firm and employees. Supervision
through resource allocation. Worker independence and individuality.Individual initiative. High competition, etc.
3.4. Original Measurement Tool for Organizational Culture
In order to measure two organizational cultures (Clan and Market), the present studydirectly borrowed the instrument of Nazarian (2013)’s study [80]. To investigate the rela-tionship between cultures and leadership styles, Nazarian [80] included total 12 organi-zational culture questions in his research instrument (Clan culture: 6 questions, Marketculture: 6 questions) with seven-point Likert-scale format (1 = extremely strongly disagree,7 = extremely strongly agree) and these 12 questions were copied entirely by the Organi-zational Culture Assessment Instrument (OCAI) for his instrument. The OrganizationalCulture Assessment Instrument (OCAI) was a tool to measure the organizational culturedeveloped by Cameron and Quinn [84] and has been used in a variety of extensive studieswith solid reliability and validity from the Far and Middle East to USA and Canada [80].
According to the study of Nazarian [80], his seven-point Likert-scale of OCAI wasabsolutely supported by the reliability and validity. In order to measure the reliability ofthis instrument, he measured internal consistency using Cronbach’s alpha which has beenwidely used to measure the reliability of scales. As many studies mentioned, an alpha valuemore than 0.7 would be considered as indicative of acceptable reliability. The reliabilityof his instrument about organizational cultures was examined and the result showed thatthe Cronbach’s alpha coefficient for all 12 questions of clan and market culture were withinan acceptable range (Clan culture: 0.768, Market culture: 0.878) [80]. The instrument ofNazarian also provided useful information about convergent validity of his measurementtool regarding clan and market culture. In his study, Pearson correlation analysis wasconducted to ensure convergent validity between culture items and their relevant itemstheoretically (leadership types) and correlation coefficients of all constructs of organiza-tional culture were found to be all in the acceptable range (all correlation coefficients ofclan and market culture are more than 0.35). Convergent validity refers to the degree towhich measures of constructs that theoretically should be related, are in fact related. As aresult, Nazarian [80] concluded that his OCAI instrument with seven-point Likert scale hasrobust validity to measure organizational cultures based on the study of Robinson, Shaver,& Wrightsman [85] that has suggested that the item-total correlation is to be at least 0.30 tobe significant. As mentioned earlier, the present study directly borrowed the OCAI instru-ment of Nazarian to measure organizational cultures and modifications were never madeto these questions since they have been proven to be accurate and effective in diagnosingorganizational cultures with robust quality of instrument.
3.5. Data Collection Procedure
The present authors were able to collect the real data concerning main factors (em-ployees’ competencies and cultures) from both production department employees (productdesign & development, quality control and factory workers) and customer service depart-ment employees in the manufacturing industry between 3 October 2019 and 15 December2019, distributing questionnaires in person or sent online. We allowed considerable time(15 days) for participants to answer the questions to ensure that participants who an-swer the survey provide trustable data. We also took significant time and effort to obtaintrustable data from each participant, assuring study participants that this survey is ananonymous survey whereby all responses will remain confidential and be analyzed at an

Sustainability 2021, 13, 1049 13 of 23
aggregate for the academic purpose, as suggested by multiple studies [86–88]. In addition,a cover letter was attached to the survey to inform all invited participants the following:they were absolutely free to decline to answer any particular questions they do not wishto answer for any reason and could also terminate their involvement at any time duringthe process, emphasizing their participations are entirely voluntary. This made it muchmore likely that the responses of the participants are honest [89].
3.6. Data Analysis Tool
The statistical processing and analysis methods to achieve the purpose of this studyare as follows. First, in order to verify the reliability of measuring tools for competency andculture values, internal consistency was examined through Cronbach’s α value. Second,a confirmatory factor analysis was conducted to measure the validity of the measurementmodel composed of variables of competency and culture while confirming the suitabilityof this structural equation research model. Lastly, a structural equation model analysis(Path analysis) was conducted to examine the structural relationship between competencyand culture to measure a hypothesis for this research. The statistical processing of collecteddata was analyzed as follows using IBM SPSS statistics 24 and AMOS 24.0 programsThe ‘Likert scale’ ranging from 1 to 7 (1 = extremely strongly disagree, 7 = extremelystrongly agree) was used to measure the relationships between main factors throughthe structural equation analysis.
4. Findings4.1. Information of Obtained Real Data
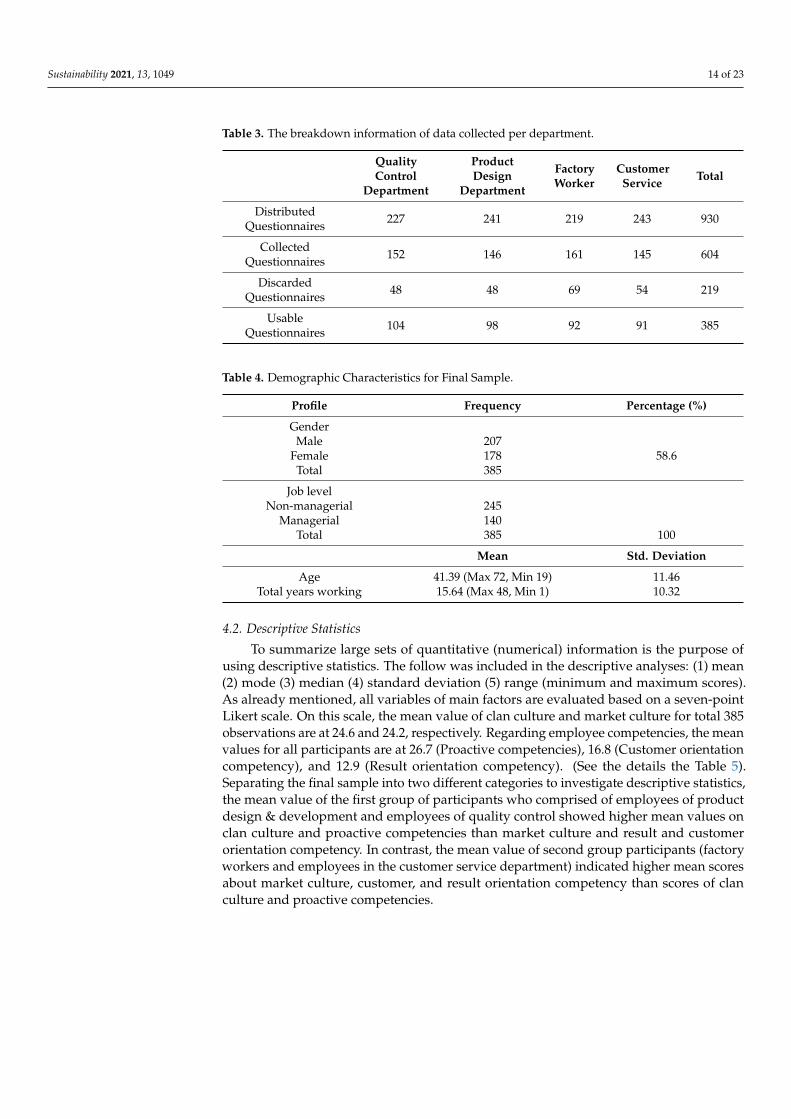
Before analyzing the obtained data through statistical analysis, as suggested by Nazar-ian [80], all researchers should screen the collected raw data, checking missing data. Missingdata is one of the most important issue in data analysis and the careful investigation ofmissing data at the primary level helps to ensure data accuracy in the subsequent stages ofdata analysis [90]. In this study, the result of data collection showed that a total of 930 sets(100%) of questionnaires were distributed to respondents on 3 October 2019, out of which604 sets (64.9%) were returned by 15 December 2020. However, 184 sets of questionnaireshad to be discarded because more than 20% of the questions in the questionnaires were notanswered by the participants [80]. Additionally, 19 participants who did not enter theirdemographic information at all and 16 participants who entered illogical responses (ex:entering same numbers for whole survey questions) were also eliminated in final dataset.Thus, total 219 (184 + 19 + 16) sets were discarded. As a result, usable questionnaires fordata analysis were 385 sets, reflecting 41.4% valid response rate. Discarded data was notreplaced by new participants because this study was designed to obtain over 300 responsesfrom participants and collected dataset was 385 sets even if considering discarded data sets.Table 2 shows the information of total collected data and Table 3 indicates the breakdowninformation of data collected per department. And Table 4 presents the demographiccharacteristics for final sample.
Table 2. The information of total collected data.
Total Percentage (%)
Questionnaires Distributed 930 100
Uncollected Questionnaires 326 35.1
Collected Questionnaires 604 64.9
Discarded Questionnaires 219 23.5
Usable Questionnaires 385 41.4
Sustainability 2021, 13, 1049 14 of 23
Table 3. The breakdown information of data collected per department.
QualityControl
Department
ProductDesign
Department
FactoryWorker
CustomerService Total
DistributedQuestionnaires 227 241 219 243 930
CollectedQuestionnaires 152 146 161 145 604
DiscardedQuestionnaires 48 48 69 54 219
UsableQuestionnaires 104 98 92 91 385
Table 4. Demographic Characteristics for Final Sample.
Profile Frequency Percentage (%)
GenderMale 207
Female 178 58.6Total 385
Job levelNon-managerial 245
Managerial 140Total 385 100
Mean Std. Deviation
Age 41.39 (Max 72, Min 19) 11.46Total years working 15.64 (Max 48, Min 1) 10.32
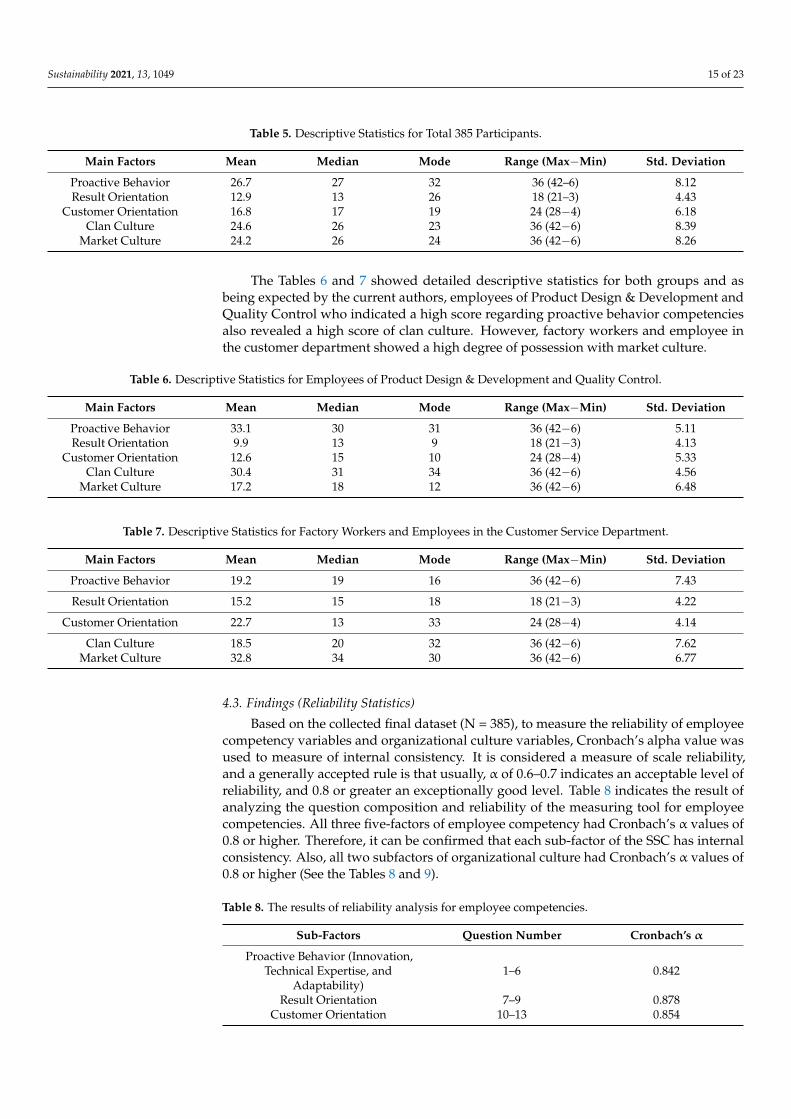
4.2. Descriptive Statistics
To summarize large sets of quantitative (numerical) information is the purpose ofusing descriptive statistics. The follow was included in the descriptive analyses: (1) mean(2) mode (3) median (4) standard deviation (5) range (minimum and maximum scores).As already mentioned, all variables of main factors are evaluated based on a seven-pointLikert scale. On this scale, the mean value of clan culture and market culture for total 385observations are at 24.6 and 24.2, respectively. Regarding employee competencies, the meanvalues for all participants are at 26.7 (Proactive competencies), 16.8 (Customer orientationcompetency), and 12.9 (Result orientation competency). (See the details the Table 5).Separating the final sample into two different categories to investigate descriptive statistics,the mean value of the first group of participants who comprised of employees of productdesign & development and employees of quality control showed higher mean values onclan culture and proactive competencies than market culture and result and customerorientation competency. In contrast, the mean value of second group participants (factoryworkers and employees in the customer service department) indicated higher mean scoresabout market culture, customer, and result orientation competency than scores of clanculture and proactive competencies.
Sustainability 2021, 13, 1049 15 of 23
Table 5. Descriptive Statistics for Total 385 Participants.
Main Factors Mean Median Mode Range (Max−Min) Std. Deviation
Proactive Behavior 26.7 27 32 36 (42–6) 8.12Result Orientation 12.9 13 26 18 (21–3) 4.43
Customer Orientation 16.8 17 19 24 (28−4) 6.18Clan Culture 24.6 26 23 36 (42−6) 8.39
Market Culture 24.2 26 24 36 (42−6) 8.26
The Tables 6 and 7 showed detailed descriptive statistics for both groups and asbeing expected by the current authors, employees of Product Design & Development andQuality Control who indicated a high score regarding proactive behavior competenciesalso revealed a high score of clan culture. However, factory workers and employee inthe customer department showed a high degree of possession with market culture.
Table 6. Descriptive Statistics for Employees of Product Design & Development and Quality Control.
Main Factors Mean Median Mode Range (Max−Min) Std. Deviation
Proactive Behavior 33.1 30 31 36 (42−6) 5.11Result Orientation 9.9 13 9 18 (21−3) 4.13
Customer Orientation 12.6 15 10 24 (28−4) 5.33Clan Culture 30.4 31 34 36 (42−6) 4.56
Market Culture 17.2 18 12 36 (42−6) 6.48
Table 7. Descriptive Statistics for Factory Workers and Employees in the Customer Service Department.
Main Factors Mean Median Mode Range (Max−Min) Std. Deviation
Proactive Behavior 19.2 19 16 36 (42−6) 7.43
Result Orientation 15.2 15 18 18 (21−3) 4.22
Customer Orientation 22.7 13 33 24 (28−4) 4.14
Clan Culture 18.5 20 32 36 (42−6) 7.62Market Culture 32.8 34 30 36 (42−6) 6.77
4.3. Findings (Reliability Statistics)
Based on the collected final dataset (N = 385), to measure the reliability of employeecompetency variables and organizational culture variables, Cronbach’s alpha value wasused to measure of internal consistency. It is considered a measure of scale reliability,and a generally accepted rule is that usually, α of 0.6–0.7 indicates an acceptable level ofreliability, and 0.8 or greater an exceptionally good level. Table 8 indicates the result ofanalyzing the question composition and reliability of the measuring tool for employeecompetencies. All three five-factors of employee competency had Cronbach’s α values of0.8 or higher. Therefore, it can be confirmed that each sub-factor of the SSC has internalconsistency. Also, all two subfactors of organizational culture had Cronbach’s α values of0.8 or higher (See the Tables 8 and 9).
Table 8. The results of reliability analysis for employee competencies.
Sub-Factors Question Number Cronbach’s α
Proactive Behavior (Innovation,Technical Expertise, and
Adaptability)1–6 0.842
Result Orientation 7–9 0.878Customer Orientation 10–13 0.854

Sustainability 2021, 13, 1049 16 of 23
Table 9. The results of reliability analysis for organizational cultures.
Sub-Factors Question Number Cronbach’s α
Clan Culture 1–6 0.877Market Culture 7–12 0.894
4.4. Findings (Confirmantory Factor Analysis)
The current study also conducted a confirmatory factor analysis (CFA) to measurea conversion validity and confirm whether competency and culture’s measurement vari-ables reasonably explained the latent variables. Conversion validity tries to investigatethe measurement items consistently measure the constituent concept and can be knownas the factor load between the latent variable and the observed variable, and usually,if the factor is 0.5 or more, it can be checked that there is a proper validity. Table 10 showsthat the value of average variance extracted (AVE) is more than 0.5, which means thatall measurement variables regarding competency and culture can be regarded as havingconversion validity since they revealed more than the corresponding reference value (0.5).
Table 10. The results of Confirmatory factor analysis.
Items UnstandardizedFactor Loadings
StandardizedFactor Loadings S.E. C.R. AVE Construct
Reliability
PB-Innovation 1.00 0.88PB-Technical.E 0.91 0.65 0.05 14.23 *** 0.754 0.912
PB-Adaptability 1.04 0.84 0.05 19.95 ***OC(Clan) 1.00 0.83 0.748 0.892
OC(Market) 0.87 0.79 0.05 18.62 *** 1
*** p < 0.001.
4.5. Findings (Path Analysis)
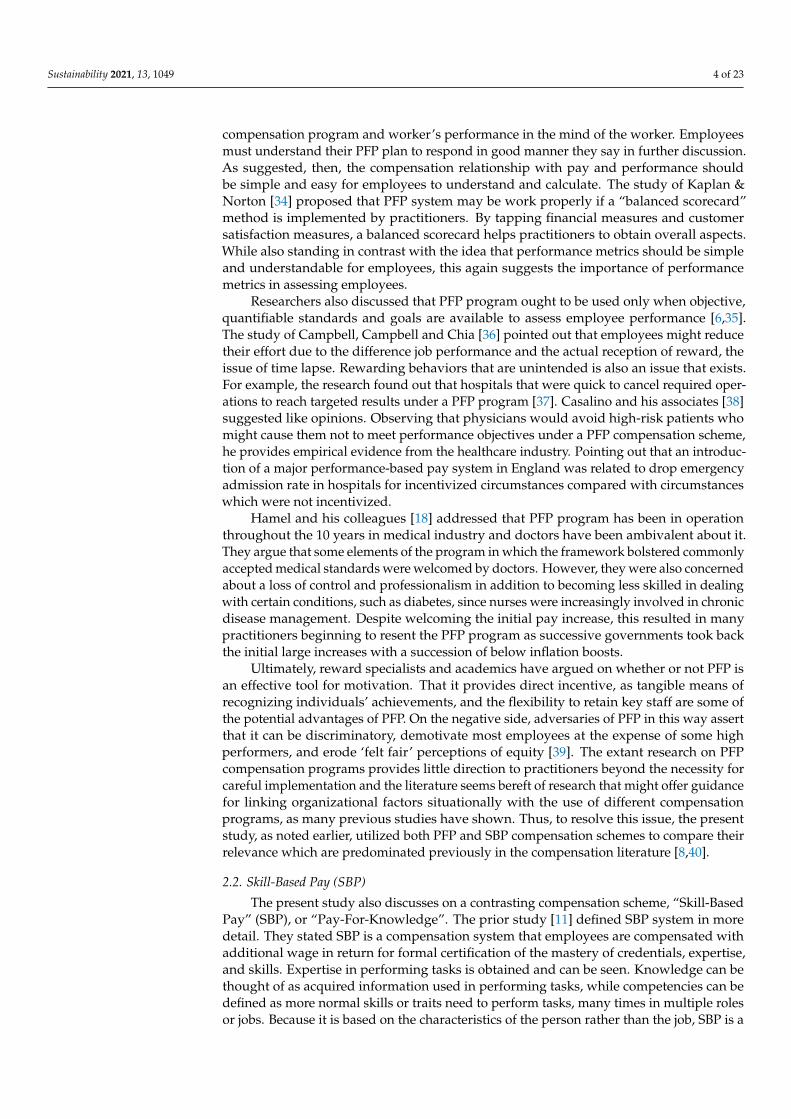
To determine the research model’s fit, χ2, RMR, TLI, GFI, CFI, and RMSEA were usedas indicators. For model fit, the absolute fit (χ2, RMR, GFI, RMSEA, etc.) and incremental fit(TLI, CFI, etc.) were used. Statistical results of the final analysis indicated both hypothesis1 and 2 are in expected direction and the present authors could accept all hypotheses(see the Tables 11 and 12, and Figure 2 in detail).
Table 11. The results of Path analysis (clan culture and competencies).
Path Unstandardized Coefficients Standardized Coefficients (β) S.E. T
Clan Ô PB competencies 0.42 0.41 0.06 5.55 ***
Clan Ô R competency −0.37 −0.36 0.07 −6.76 ***
Clan Ô C competency −0.28 −0.31 0.05 −6.11 ***
χ2 = 246.25 (df = 95, p < 0.001), RMR = 0.016, GFI = 0.956, TLI = 0.947, CFI = 0.987, RMSEA = 0.053 (90% CI: 0.048~0.067), *** p < 0.001.
Table 12. The results of Path analysis (market culture and competencies).
Path Unstandardized Coefficients Standardized Coefficients (β) S.E. T
Market Ô PB competencies 0.39 −0.35 0.08 4.83 ***
Market Ô R competency −0.27 0.30 0.06 −6.34 ***
Market Ô C competency −0.46 0.45 −0.06 −4.51 ***
χ2 = 222.39 (df = 95, p < 0.001), RMR = 0.018, GFI = 0.935, TLI = 0.966, CFI = 0.973, RMSEA = 0.057 (90% CI: 0.048~0.067), *** p < 0.001.

Sustainability 2021, 13, 1049 17 of 23
Sustainability 2021, 13, x FOR PEER REVIEW 16 of 23
PB-Technical.E 0.91 0.65 0.05 14.23 *** 0.754 0.912 PB-Adaptability 1.04 0.84 0.05 19.95 ***
OC(Clan) 1.00 0.83 0.748 0.892 OC(Market) 0.87 0.79 0.05 18.62 *** 1
*** p < 0.001
4.5. Findings (Path Analysis) To determine the research model's fit, χ2, RMR, TLI, GFI, CFI, and RMSEA were used
as indicators. For model fit, the absolute fit (χ2, RMR, GFI, RMSEA, etc.) and incremental fit (TLI, CFI, etc.) were used. Statistical results of the final analysis indicated both hypothesis 1 and 2 are in expected direction and the present authors could accept all hypotheses (see the Tables 11 and 12, and Figure 2 in detail).
Table 11. The results of Path analysis (clan culture and competencies).
Path Unstandardized Coefficients Standardized Coefficients (β) S.E. T
Clan PB competencies 0.42 0.41 0.06 5.55 *** Clan R competency −0.37 −0.36 0.07 −6.76 *** Clan C competency −0.28 −0.31 0.05 −6.11 ***
χ2 = 246.25 (df = 95, p < 0.001), RMR = 0.016, GFI = 0.956, TLI = 0.947, CFI = 0.987, RMSEA = 0.053(90% CI: 0.048~0.067), *** p < 0.001.
Table 12. The results of Path analysis (market culture and competencies).
Path Unstandardized
Coefficients Standardized Coefficients
(β) S.E. T
Market PB competencies 0.39 −0.35 0.08 4.83 *** Market R competency −0.27 0.30 0.06 −6.34 *** Market C competency −0.46 0.45 −0.06 −4.51 *** χ2 = 222.39(df = 95, p < 0.001), RMR = 0.018, GFI = 0.935, TLI = 0.966, CFI = 0.973, RMSEA = 0.057(90% CI: 0.048~0.067), *** p < 0.001.
Figure 2. The verification diagram of the employees’ competencies and cultures. *** p < 0.001.
Figure 2. The verification diagram of the employees’ competencies and cultures. *** p < 0.001.
5. Discussion and Recommendation5.1. Discussion
The present study may prove significant for Human Resources (HR) practitioners.This study advocates the strong connections between organizational culture, employeecompetencies and compensation schemes in consideration of the close relationship be-tween organizational elements (competencies and cultures) and compensation systems andsynthesize the results of this study and existing researches [6,23]. As previously mentioned,human resource practitioner, Aon Hewett, suggests that as many as 90% of U.S. companiesuse individual PFP practices, up from 50% in the past twenty years [91], and proves thatthere is tremendous pressure to adopt PFP compensation schemes as a ‘best practice.’This study suggests that following the crowd might not be the most effective alternativefor current organizations, and learning precisely which competencies and cultures aresignificant to the strategy of the organization might be critical touchstones.
First, while not as predominate as PFP in commerce, the current authors insists thatthe employees’ competencies of proactive behavior such as innovation, technical expertiseand adaptability are positively associated with clan cultural attributes and SBP compensa-tion system according to the findings of two previous studies [6,23] and the present studywhich used 385 American workers in the manufacturing sector as a sample. That an SBPreward system encourages employees to acquire new knowledge and skills, fostering proac-tive behaviors that are supportive of the activities inherent in innovation, adaptability, andtechnical expertise competencies may be the reason that this is true [6]. Where attitudes andbehaviors are difficult to observe and where tasks are not standardized it might be correctto base compensation systems on an individual’s skills. However, since the competencies ofcustomer orientation and results orientation are easier to observe and monitor in additionto being more attuned to standardized procedure, they are more appropriately matchedwith a PFP compensation system. This, then, implies that the tendency to apply skills andknowledge to generate measurable results that are easily assessed [6] is associated withthe result and customer orientation.
From the perspective of the relationship between clan culture and an SBP rewardsystem, a clan culture is characterized by the following: a long-term commitment betweenorganizational members and the organization, an interdependent relationship betweenmembers and supervisors based on mentorship and development, a sense of collective
Sustainability 2021, 13, 1049 18 of 23
collegiality, and resting on mutual interests and shared fate. Relatively frequent promotionsinclude tenure and often motivated by the individual’s need for development throughexposure to new functional areas. The implication is that a clan culture might be associatedwith an SBP reward system that emphasizes security and salary, with salary increases com-ing from supervisory assessments that focus on tenure and mostly subjective, qualitativefactors including cooperative, rather than competitive, member behavior [23]. Therefore,rather than strict evaluation of performance, assessment feedback is oriented towardemployee development. Concentrating on corporate performance rather than individualperformance, this indicates that bonuses are a relatively small portion of total compensation.Thus, the cultural values of employee development, cooperative interdependencies, and along-term relationship between the organization and its members might be associated withan SBP reward system. Moreover, with its ability to incentivize and reward employeegrowth and development, it seems reasonable to suggest that an SBP compensation systemappears to be most compatible with a clan culture.
The present study conducted the structural equation analysis and discovered a config-urational frame between proactive behavior competencies and clan culture. This mightbe due to clan culture supporting employee growth and development and providing asense of psychological safety, leading to likely increase employee propensity to proposenew ideas [92]. In addition, the organizational encouragement inherent in a clan culturewas found to be conducive to creativity [93]. Thus, the clan culture concentrates on fos-tering the accumulation of knowledge within the organization, and within this culture,human resource development is strongly consistent with the intention to be innovative [94].In line with technical performance and adaptability capability, as innovative thinkingcan be considered to achieve those goals, this indicates that the focus on employee de-velopment means that organizational members prefer the goals of growth and resourceacquisition [94]. According to Chuang and colleagues [95], employees might associatethe organizational emphasis on the ability to modify manufacturing technology withthe culture of employee development.
Consequently, an organization’s ability to utilize the clan culture’s ability to encourageknowledge creation through employee development might derive proactive behavior asan employee competency. For this reason, the current authors reasonably suspect that clanculture seems to be associated with three employee competencies of proactive behaviorwhich is matched properly by a SBP reward program when corroborating previous researchand the findings of the present study.
Second, PFP compensation practice is associated with the circumstances such as resultand customer orientation competencies and market culture, as asserted by the current study.Earlier studies [6,23] points to a weaker connection with the SBP compensation systemand clan culture in the customers’ skills and results from orientation. The explanation forthis may be that it is easier to track and monitor workers’ performance associated withboth these competencies than with the competencies of constructive conduct to make itpossible for both abilities to be better balanced by a compensation system [6]. Competencyin the outcome orientation is mainly linked to the tendency to use skills and expertise forconcrete outcomes that can be easily measured [59]. In addition, an employee’s individualPFP compensation scheme needs an objective method of measuring such observable results.This indicates a correlation between a PFP compensation system and the effect of a personwho can see how his or her work success directly relates to his/her compensation [96].Employees who succeed optimize their success work towards achieving the desired re-sults of their policies and programs. Likewise, companies determine how employeesshould be linked to their customers to sell amounts. These organizations have a way ofmeasuring if their customers are pleased with their employees’ success [6,56]. Therefore,the priority for workers with customer orientation skills is the recognition of customerneeds [56]. Furthermore, customer attention skills success can be calculated easily becauseemployees’ sales can be assessed [6]. As sales-related commissions or incentives facilitate
Sustainability 2021, 13, 1049 19 of 23
and encourage customer-focused results, workers must also be reimbursed by individualperformance-based compensation [6,82].
Because of the more observable nature of activities that require more results orienta-tion and a customer orientation than innovation, technical expertise, and adaptability, it is,therefore, quite reasonable that organizations might be expected to use PFP compensationsystem when they encourage a greater extent the result and customer orientation. Kerrand Slocum [23] went on to contrast a clan culture with a market culture as it pertains tothe relationships between PFP compensation system and market culture. A market cultureis characterized by the following: mutual short-term commitments between the organiza-tion and its members, elevated levels of member independence, supervisors as negotiatorsand resource allocators, a sense of individual initiative and ownership, and resting onself-interest, competition and utilitarianism. Thus, individuality in which everyone pur-sues their own interests is encouraged by the market culture. Further, relative to a clanculture, promotions are infrequent and the exception rather than the norm, being motivatedprimarily to fill a vacancy rather than foster employee development.
Because a PFP plan (1) bases reward on evaluative rather than developmental criteriathat is quantitatively defined and (2) explicitly links rewards to short-term individualperformance, Kerr and Slocum [23] recommended a PFP compensation system to match amarket culture. With the potentially generous size of bonuses communicating the value ofthe ‘Star’ performer, there is, therefore, little doubt bonuses are a significant part of compen-sation and based on the individual managers’ performance outcomes. That demonstratesthat salary boosts are impacted by the external labor market, the cost of living, in additionto elements of performance. Consequently, to match a clan culture, PFP compensationschemes, which are associated with values of employee independence, individual initia-tive and risk-taking, and the short-term, transactional nature of the relationship betweenthe organization and its members does not seem to be a reasonable option, while a marketculture’s focus on goal attainment of specified metrics might make PFP compensationmodels a more compatible choice [23].
As previously discussed, the present study established positive connections betweenresult and customer orientation competency and a market culture. Since the competitiveand individualistic nature of the market culture might be associated with a result andcustomer orientation, as would a PFP compensation program, these findings would seemto be reasonable. Kerr and Slocum [23] defined what might be called a market culture.Individual and organizational capabilities are continually assessed for fit through a rigorousmeasuring and reporting of results, and a focus on measurable priorities, aligning withthe quantitative, competitive, and individualistic nature of assessment is typical of a marketculture which involves an alignment of individual talent and organizational needs [23,78].
Necessarily required to use quantifiable performance metrics to evaluate employees’performance, result and customer orientation competency might be consistent with market-based culture. According to Cameron and his colleagues [97], it is also consistent withthe idea that an important norm in a market culture is meeting short-term performancetargets and delivering results. Thus, it stands to reason that an individual’s poor perfor-mance would signal a misalignment causing the organization to reassign or terminatethe employee, considering the relationship between employees and the organization in amarket culture is short-term and transactional [23]. In conclusion, result and customer ori-entation as an employee competency may be developed from an organization’s capabilityto utilize the market culture’s strength in encouraging more result-oriented employees thanthose more oriented to behaviors. Relying on prior studies and the findings of this study,the current authors reasonably suspects that market culture seems to be associated withthe employee competency of result and customer orientation which is matched properlyby a PFP reward program.
Sustainability 2021, 13, 1049 20 of 23
5.2. Limitation and Reccomendation
As mentioned in previous sections, this study analyzed the relationships betweenemployee skills and organizational cultures to resolve the gaps in compensation literatureand found statistical results that show that different corporate cultures could combinewith unique employee skills. These findings are consistent with the authors’ expectationsoutlined in the last section, which means all beta coefficients between skills and cultureswere in the expected direction without any unexpected results. Thus, these statisticalresults of the present study contradict the current investigations on compensation pro-grams/organizational culture and employee competencies [6,23]. They indicate that differ-ent compensation programs may be related to other modes of work for potential researchersand practitioners. They also support existing research and suggest that the present studyadds to the HR compensation literature by synthesizing and applying existing studies tonew statistical findings. Thus, promoting the company’s compensation policy should notbe excluded as an aspect of consideration by its workers’ organizational cultures.
Nevertheless, the limitations provided by this study should be remembered by futureresearchers and practitioners. The results of this study may not be significant for otherindustries except manufacturing. However, the sample of participants for this study wassufficient for empiric research. The response rates were highly reasonable, given that thosefindings are focused solely on the produced field. Furthermore, since only the USA wasbased on this study’s geographical area, this study’s results might not be necessary foremployees from other countries. As for future studies, the authors intends to considerusing additional existing instruments other than the Nazarian [80] and Díaz-Fernándezet al. [6] research instruments used in this study. For this reason, any future studies will useadditional tools to determine whether ties between competence, culture, and compensationwill produce similar results to the results of the present study to reinforce the relationshipbetween the three factors. In several areas of culture, expertise, balance, and the copying ofexisting instruments, many resources, such as publishing company databases, newspaperarticles, and book anthologies have been produced, and copies can be found directly fromthe author, such as the testing, measurements and survey questionnaire.
Next, it can reasonably be said, as a previous research study have shown [6] thatit is a cumulative process which needs time for the acquisition and development of em-ployees’ competencies before the results can be shown in an assessment of competence.This suggests that HR practitioners will take a longer timeline to search for the moreaccurate skill that affects the link between the compensation system, employee competence,and the organization’s culture. For this explanation, it can present a substantial compe-tency evaluation scale, which is a methodology for assessing the know-how, qualifications,and ability of an employee, to examine the precise competence effect and point out thatskill management has an important influence on improving the overall quality of the finalproduct. Furthermore, this study suggests future research to examine whether the methodsof compensation used by competencies and cultures vary within the business. Therefore,the prospective study may decide whether a wide number of organizations can generalizeclear ties between rewards, skills, and culture. In the future research, different kindsof jobs ought to be examined with a focus on the perceptible differences in employees’competencies within the same organization. This indicates that future studies should beanalyzed to check whether employees’ competencies are controlled by job position as astrategic aspect and whether the compensation methods that are used according to compe-tencies and cultures differ throughout the company, perhaps by job level or department.As a result, future research might be able to determine if the strong connections betweencompensation, competency, and culture, checking out the generalizability to the broadspectrum of organizations.
Author Contributions: Investigation, E.K.; Methodology, E.K. and H.L.; Resources, E.K.; Software,H.L.; Writing—original draft, E.K.; Writing—review & editing, H.L. All authors have read and agreedto the published version of the manuscript.
Sustainability 2021, 13, 1049 21 of 23
Funding: This research received no external funding.
Informed Consent Statement: The procedure of data collection was conducted with informedconsent.
Data Availability Statement: Data can be available on request from the first author and correspond-ing author.
Conflicts of Interest: The authors declare no conflict of interest.
References1. Shields, J.; Dolle-Samuel, C.; Brown, M.; Kaine, S.; Dolle-Samuel, C.; North-Samardzic, A.; McLean, P.; Plimmer, G. Developing
position-based base pay systems. In Managing Employee Performance & Reward: Concepts, Practices, Strategies; Cambridge UniversityPress: Cambridge, UK, 2015; Volume 8, p. 180.
2. Purce, J. The impact of corporate strategy on human resource management. In New Perspectives on Human Resource Management;Routledge: Abingdon, UK, 2014.
3. Cummings, T.G.; Worley, C.G. Organization Development and Change; Cengage Learning: Boston, MA, USA, 2009.4. Gupta, N.; Jenkins, G.D., Jr. The Politics of Pay: Who gets what is often a matter of who is the better game player than of who
really deserves more pay. You cannot overlook political dynamics if you want your company’s compensation system to beeffective. Compens. Benefits Rev. 1996, 28, 23–30. [CrossRef]
5. Barney, J. Firm resources and sustained competitive advantage. J. Manag. 1991, 17, 99–120. [CrossRef]6. Díaz-Fernández, M.; López-Cabrales, A.; Valle-Cabrera, R. In search of demanded competencies: Designing superior compensa-
tion systems. Int. J. Hum. Resour. Manag. 2013, 24, 643–666. [CrossRef]7. Perry, J.L.; Engbers, T.A.; Jun, S.Y. Back to the future? Performance-related pay, empirical research, and the perils of persistence.
Public Adm. Rev. 2009, 69, 39–51. [CrossRef]8. Gomez-Mejia, L.R. Structure and process of diversification, compensation strategy, and firm performance. Strat. Manag. J. 1992,
13, 381–397. [CrossRef]9. Ingram, E. The advantages of knowledge-based pay. Personnel J. 1990, 69, 138–140.10. Klarsfeld, A.; Balkin, D.B.; Roger, A. Pay policy variability within a French firm: The case of skill-based pay in a process
technology context. J. High Technol. Manag. Res. 2003, 14, 47–70. [CrossRef]11. Ledford, G.; Heneman, H. Skill Based Pay; Society for Human Resource Management: Alexandria, VA, USA, 2011.12. Ferreira, D.C.; Marques, R.C.; Nunes, A.M. Pay for performance in health care: A new best practice tariff-based tool using a
log-linear piecewise frontier function and a dual–primal approach for unique solutions. Oper. Res. 2019, 1–46. [CrossRef]13. Rehman, S.; Shahrukh, H.M.; Virk, A.M.; Butt, M. Pay for Performance (Pfp) Increasing Creativity Through Intrinsic Motivation.
Int. J. Res. Bus. Soc. Sci. 2019, 8, 74–90. [CrossRef]14. Ederer, F.; Manso, G. Is pay for performance detrimental to innovation? Manag. Sci. 2013, 59, 1496–1513. [CrossRef]15. Rosenthal, M.B.; Frank, R.G.; Li, Z.; Epstein, A.M. Early experience with pay-for-performance: From concept to practice. JAMA
2005, 294, 1788–1793. [CrossRef]16. Delery, J.E.; Doty, D.H. Theoretical frameworks in strategic human resource management: Universalistic, contingency and
configurational perspectives. Acad. Manag. J. 1996, 39, 802–835.17. Gupta, N.; Shaw, J.D. Let the evidence speak: Financial incentives are effective. Compens. Benefits Rev. 1998, 30, 26–32. [CrossRef]18. Hamel, M.B.; Roland, M.; Campbell, S. Successes and Failures of Pay for Performance in the United Kingdom. N. Engl. J. Med.
2014, 370, 1944–1949. [CrossRef]19. Bryson, A.; Forth, J.; Laroche, P. Evolution or revolution? The impact of unions on workplace performance in Britain and France.
Eur. J. Ind. Relat. 2011, 17, 171–187. [CrossRef]20. Edward, P.L. Performance pay and productivity. Am. Econ. Rev. 2000, 90, 1346–1361.21. Lawler, E.E. Strategic Pay: Aligning Organizational Strategies and Pay Systems; Jossey-Bass: San Francisco, CA, USA, 1990.22. Zarifian, P. Objectif Compétence. Pour une Nouvelle Logique; Liaisons sociales: Paris, France, 1999; p. 229.23. Kerr, J.; Slocum, J.W. Managing Corporate Culture Through Reward Systems. Acad. Manag. Perspect. 1987, 1, 99–108. [CrossRef]24. Begley, T.; Lee, C. The Role of Negative Affectivity in Pay-at-Risk Reactions: A Longitudinal Study. J. Appl. Psych. 2005, 90, 382.
[CrossRef]25. Oliver, R.L.; Anderson, E. Behavior-and outcome-based sales control systems: Evidence and consequences of pure-form and
hybrid governance. J. Personal Selling Sales Manag. 1995, 15, 1–15.26. Cammann, C.; Lawler, E.E. Employee reactions to a pay incentive plan. J. Appl. Psych. 1973, 58, 163. [CrossRef]27. Nyberg, A.J.; Pieper, J.R.; Trevor, C.O. Pay-for-performance’s effect on future employee performance: Integrating psychological
and economic principles toward a contingency perspective. J. Manag. 2016, 42, 1753–1783. [CrossRef]28. Jensen, U.; Yamashiro, G.; Tibbetts, K. What Do We Know about Teacher Pay-for-Performance? Kamehameha Schools:
Honolulu, Hawai, 2010.29. Shearer, B. Piece rates, fixed wages and incentives: Evidence from a field experiment. Rev. Eco. Stud. 2004, 71, 513–534. [CrossRef]

Sustainability 2021, 13, 1049 22 of 23
30. Macduffie, J.P.; Pfeffer, J. Competitive Advantage Through People: Unleashing the Power of the Work Force. Adm. Sci. Q. 1995,40, 524–527. [CrossRef]
31. Uriesi, S. Efficiency of Pay for Performance Programs in Romanian Companies and the Mediating Role of Organizational Justice.Ann. Alexandru Ioan Cuza Univ. Econ. 2017, 64, 1–18. [CrossRef]
32. Eijkenaar, F. Key issues in the design of pay for performance programs. Euro. J. Health Econ. 2013, 14, 117–131. [CrossRef]33. Greiner, J.M. Monetary Incentives and Work Standards in Five Cities: Impacts and Implications for Management and Labor; Urban
Institute: Washington, DC, USA, 1977.34. Kaplan, R.S.; Norton, D.P. The balanced scorecard: Measures that drive performance. Harv. Bus. Rev. 2005, 83, 172.35. Eisenhardt, K.M. Agency-and institutional-theory explanations: The case of retail sales compensation. Acad. Manag. J. 1988,
31, 488–511.36. Campbell, D.J.; Campbell, K.M.; Chia, H.B. Merit pay, performance appraisal, and individual motivation: An analysis and
alternative. Human Resour. Manag. 1998, 37, 131–146. [CrossRef]37. Bevan, G.; Hood, C. What’s measured is what matters: Targets and gaming in the English public health care system. Public Adm.
2006, 84, 517–538. [CrossRef]38. Casalino, L.P.; Alexander, G.C.; Jin, L.; Konetzka, R.T. General internists’ views on pay-for-performance and public reporting of
quality scores: A national survey. Health Aff. 2007, 26, 492–499. [CrossRef]39. Suff, P.; Reilly, P.; Cox, A. Paying for Performance: New Trends in Performance-Related Pay; The Institute for Employment Studies:
Brighton, UK, 2007; pp. 1–38.40. Harris, D.; Helfat, C. Specificity of CEO human capital and compensation. Strateg. Manag. J. 1997, 18, 895–920. [CrossRef]41. Al-Waqfi, M.A.; Agarwal, N.C. Determinants of role orientation and organisational commitment under skill-based pay: A path
model. Inter. J. Hum. Resour. Dev. Manag. 2006, 6, 4–21. [CrossRef]42. Uen, J.F.; Chien, S.H. Compensation structure, perceived equity and individual performance of R&D professional: The moderating
effects of achievement orientation. J. Amer. Acad. Bus. 2004, 4, 401–405.43. Mitra, A.; Gupta, N.; Shaw, J.D. A comparative examination of traditional and skill-based pay plans. J. Manager. Psych. 2011,
26, 278–296. [CrossRef]44. Shaw, J.D.; Gupta, N.; Mitra, A.; Ledford Jr, G.E. Success and survival of skill-based pay plans. J. Manag. 2005, 31, 28–49.45. Le Deist, F.D.; Winterton, J. What is competence? Hum. Resour Dev. Inter. 2005, 8, 27–46. [CrossRef]46. Armstrong, M. Chapter 21. In Employee Reward, 2nd ed.; Chartered Institute of Personnel & Development: London, UK,
1999; pp. 293–309.47. Boyatzis, R.E. The Competent Manager: A Model for Effective Performance; John Wiley & Sons: Hoboken, NJ, USA, 1982.48. Boyatzis, R.; Boyatzis, R.E. Competencies in the 21st century. J. Manag. Dev. 2008. [CrossRef]49. McClelland, D.C. Testing for competence rather than for "intelligence". Am. Psychol. 1973, 28, 1–14. [CrossRef]50. Asumeng, M. Managerial competency models: A critical review and proposed holistic-domain model. J. Manag. Res. 2014, 6, 1–21.
[CrossRef]51. Martina, K.; Hana, U.; Jiri, F. Identification of managerial competencies in knowledge-based organizations. J. Compet. 2012,
4, 129–142.52. Strebler, M.T.; Bevan, S. Competence-Based Management Training. Report 302; The Institute for Employment Studies: Brighton,
UK, 1996.53. Holton, E.F.; Lynham, S.A. Performance-driven leadership development. Adv. Dev. Hum. Resour. 2000, 2, 1–17. [CrossRef]54. Aragon, S.R.; Johnson, S.D. Emerging roles and competencies for training in e- learning environments. Adv. Dev. Hum. Resour.
2002, 4, 424–439. [CrossRef]55. van Klink, M.R.D.; Boon, J. Competencies: The triumph of a fuzzy concept. Inter. J. Hum. Resour. Dev. Manag. 2003, 3, 125–137.
[CrossRef]56. Spencer, L.M.; Spencer, S.M. Competence at Work; Wiley: New York, NY, USA, 1993.57. Frank, E. The UK’s Management Charter Initiative: The first three years. J. Euro. Indus. Train. 1991, 17, 9–11. [CrossRef]58. Collins, J.C.; Porras, J.I. Building a visionary company. Calif. Manag. Rev. 1995, 37, 80–100. [CrossRef]59. Zingheim, P.K.; Ledford, G.L.; Schuster, J.R. Competencies and competency models: Does one size fit all. ACA J. 1996, 5, 56–65.60. Zingheim, P.K.; Schuster, J.R. Competencies and rewards: Substance or just style? Compens. Benefits Rev. 2003, 35, 40–44.
[CrossRef]61. Spencer, S.M.; Rajah, T.; Mohan, S.; Lahiri, G. The Indian CEOs: Competencies for success. Vision 2008, 12, 1–10. [CrossRef]62. Floyd, S.W.; Lane, P.J. Strategizing throughout the organization: Managing role conflict in strategic renewal. Acad. Manag. Rev.
2000, 25, 154–177. [CrossRef]63. Buchanan, D.A. Demands, instabilities, manipulations, careers: The lived experience of driving change. Hum. Relat. 2003,
56, 663–684. [CrossRef]64. Hsieh, Y.H.; Chen, H.M. Strategic fit among business competitive strategy, human resource strategy, and reward system.
Acad. Strateg. Manag. J. 2011, 10, 11.65. Sheppeck, M.A.; Militello, J. Strategic HR configurations and organizational performance. Hum. Resour. Manag. 2000, 39, 5–16.
[CrossRef]66. Som, A. Redisigning the Human Resources Function at Lafarge. Hum. Resour. Manag. 2003, 42, 271–288. [CrossRef]

Sustainability 2021, 13, 1049 23 of 23
67. Jackson, S.; Farndale, E.; Kakabadse, A. Executive development: Meeting the needs of top teams and boards. J. Manag. Dev. 2003,22, 185–265. [CrossRef]
68. Mathew, J. The relationship of organisational culture with productivity and quality: A study of Indian software organisations.Empl. Relat. 2007, 29, 677–695. [CrossRef]
69. Almahamid, S.; McAdams, A.C.; Kalaldeh, T. The Relationships among Organizational Knowledge Sharing Practices, Employees’Learning Commitments, Employees’ Adaptability, and Employees’ Job Satisfaction: An Empirical Investigation of the ListedManufacturing Companies in Jordan. Interdiscip. J. Inf. Knowl. Manag. 2010, 5, 327–356.
70. Schein, E.H. Organizational Culture and Leadership; John Wiley & Sons: Hoboken, NJ, USA, 2010.71. Panagiotis, M.; Alexandros, S.; George, P. Organizational culture and motivation in the public sector. the case of the city of
zografou. Procedia Econ. Financ. 2014, 14, 415–424. [CrossRef]72. Wright, A.M. Culture and compensation: Unpicking the intricate relationship between reward and organizational culture.
Thunderbird Inter. Bus. Rev. 2010, 52, 189–202.73. Pilch, I.; Turska, E. Relationships between Machiavellianism, organizational culture, and workplace bullying: Emotional abuse
from the target’s and the perpetrator’s perspective. J. Bus. Ethics 2015, 128, 83–93. [CrossRef]74. Tharp, B.M. Four Organizational Culture Types. Organizational Culture White Papper. The Human Resource Department
of the State of Arizona. 2009. Available online: https://hr.az.gov/sites/default/files/media/RESULTS_ORIENTATION.pdf(accessed on 19 January 2021).
75. Belias, D.; Koustelios, A. Organizational culture and job satisfaction: A review. Inter. Rev. Manag. Market. 2014, 4, 132.76. Gallagher, S.; Brown, C.; Brown, L. A strong market culture drives organizational performance and success. Employ. Relat. Today
2008, 35, 25–31. [CrossRef]77. Narver, J.C.; Slater, S.F. The effect of a market orientation on business profitability. J. Market. 1990, 54, 20–35. [CrossRef]78. Reid, J.; Hubbell, V. Creating a performance culture. Ivey Bus. J. 2005, 69, 1–4.79. Welch, J.; Welch, S.; Primus, B.; Winkelmann, H.; Grawe, S.; Szymczyk, M. Winning; HarperCollins: New York, NY, USA, 2005;
Volume 84.80. Nazarian, A. The Mediating Influence of Leadership Style and Moderating Impact of National Culture and Organisational Size on the
Culture-Effectiveness Relationship: The Case of Iran. Ph.D. Thesis, Brunel University, Brunel Business School, Uxbridge, UK, 2013.81. Samurçay, R.; Fischer, M. Work Process Knowledge. The Contribution of Work Process Knowledge to Competence in Electrical Maintenance;
Routledge: London, UK, 2002; pp. 148–159.82. Tremblay, M.; Cote, J.; Balkin, D.B. Explaining sales pay strategy using agency, transaction cost and resource dependence theories.
J. Manag. Stud. 2003, 40, 1651–1682. [CrossRef]83. Spencer, L.M. Competency Model Statistical Validation and Business Case Development, HR Technologies White Paper. 2004.
Available online: http://www.hrcompass.com/validation.html (accessed on 19 January 2021).84. Cameron, K.S.; Quinn, R.E. Diagnosing and Changing Organizational Culture: Based on the Competing Values Framework; John Wiley &
Sons: Hoboken, NJ, USA, 2011.85. Robinson, J.P.; Shaver, P.R.; Wrightsman, L.S. Criteria for scale selection and evaluation. Meas. Personal. Soc. Psychol. Attitudes
1991, 1, 1–16.86. Simon, M.K.; Goes, J. Assumption, Limitations, Delimitations, and Scope of the Study. Ph.D. Thesis, Dissertation Success, York,
UK, 2013.87. Baron, M.A. Guidelines for Writing Research Proposals and Dissertations; Division of Educational Administration, University of
South Dakota: Vermillion, SD, USA, 2008; pp. 1–52.88. Cycyota, C.S.; Harrison, D.A. Enhancing survey response rates at the executive level: Are employee-or consumer-level techniques
effective? J. Manag. 2002, 28, 151–176. [CrossRef]89. Rusticus, S.A.; Lovato, C.Y. Impact of sample size and variability on the power and type I error rates of equivalence tests:
A simulation study. Pract. Assess. Res. Eval. 2014, 19, 11.90. Dong, Y.; Peng, C.Y.J. Principled missing data methods for researchers. Springer Plus 2013, 2, 222. [CrossRef]91. Gerhart, B.; Fang, M. Pay for (individual) performance: Issues, claims, evidence and the role of sorting effects. Human Resour.
Manag. Rev. 2014, 24, 41–52. [CrossRef]92. Baron Baer, M.; Frese, M. Innovation is not enough: Climates for initiative and psychological safety, process innovations, and firm
performance. J. Organ. Behav. 2003, 24, 45–68. [CrossRef]93. Amabile, T.M.; Conti, R.; Coon, H.; Lazenby, J.; Herron, M. Assessing the work environment for creativity. Acad. Manag. J. 1996,
39, 1154–1184.94. Büschgens, T.; Bausch, A.; Balkin, D.B. Organizational culture and innovation: A meta-analytic review. J. Product Innov. Manag.
2013, 30, 763–781. [CrossRef]95. Chuang, F.M.; Morgan, R.E.; Robson, M.J. Clan culture, strategic orientation and new product performance in Chinese marketing
ventures: An exploration of main and moderating effects. J. Strateg. Market. 2012, 20, 267–286. [CrossRef]96. Boudreau, J.W.; Berman, R. Using performance measurement to evaluate strategic human resource management decisions:
Kodak’s experience with profit-sharing. Hum. Resour. Manag. 1991, 30, 393–410. [CrossRef]97. Cameron, K.S.; Quinn, R.E.; DeGraff, J.; Thakor, A.V. Competing Values Leadership, 2nd ed.; Edward Elger: Northampton, MA,
USA, 2014.