Employee commitment in context: The nature and implication of commitment profiles
16
Employee commitment in context: The nature and implication of commitment profiles ☆ John P. Meyer a, ⁎, Laura J. Stanley b , Natalya M. Parfyonova a a Department of Psychology, The University of Western Ontario, Canada b Department of Management, College of Business, East Carolina University, NC, USA article info abstract Article history: Received 13 June 2011 Available online 23 July 2011 It is well established that employee commitment can take different forms (e.g., affective, normative, and continuance), yet it is only recently that theory has been advanced to explain how these different forms combine to influence behavior (Meyer & Herscovitch, 2001). We tested this theory with data from employees in three human services organizations (N = 403). Using latent profile analyses, we identified six distinct profile groups and found that they differed on measures of need satisfaction, regulation, affect, engagement, organizational citizenship behavior, and well-being. The observed differences are consistent with the notion that a commitment profile provides a context that determines how the individual components are experienced (Gellatly, Meyer, & Luchak, 2006). We discuss the theoretical and practical implications of this context effect. © 2011 Elsevier Inc. All rights reserved. Keywords: Organizational commitment Three-component model Self-determination theory Latent profile analysis Organizational citizenship behavior Employee well-being According to the three-component model (TCM) of organizational commitment (Allen & Meyer, 1990; Meyer & Allen, 1991), commitment can take multiple forms, each characterized by a different psychological state or mindset. Affective commitment (AC) reflects an emotional attachment and desire to remain with the organization, normative commitment (NC) is experienced as a sense of obligation to remain, and continuance commitment (CC) reflects an awareness of the costs associated with leaving. All three forms of commitment tie an individual to the organization and decrease the likelihood of leaving, but their implications for on-the-job behavior can differ. Considered individually, AC is expected to have the strongest positive effects on in-role and discretionary performance, followed by NC; CC is expected to be unrelated or negatively related to discretionary performance. However, Meyer and Allen (1991, p. 68) argued that employees can “experience all three forms of commitment to varying degrees” and that it is important to consider how “the various forms of commitment might interact to influence behavior.” That is, the three forms of commitment should be considered as components within a commitment profile. The TCM has been tested extensively and has received considerable support (see Allen & Meyer, 1996; Meyer, Stanley, Herscovitch, & Topolnytsky, 2002, for detailed reviews). However, until recently, the vast majority of research has focused on the independent or additive contributions of the three components to the prediction of behavior. Only a few studies tested for interactions among the components (e.g., Jaros, 1997; Randall, Fedor, & Longenecker, 1990; Somers, 1995). This may have been due, in part, to the absence of a theoretical framework to guide research (Jaros, 1997). To address this problem, Meyer and Herscovitch (2001) developed a set of propositions concerning (a) the nature of interactions among the components, and (b) the behaviors associated with varying commitment profiles (i.e., patterns of scores on the three components). These propositions have since been tested in several studies (e.g., Gellatly, Meyer, & Luchak, 2006; Johnson, Groff, & Taing, 2009; Somers, 2009, 2010; Stanley, Vandenberg, Vandenberghe, & Bentein, 2009; Wasti, 2005) and received qualified support (see below). Arguably one of the more intriguing findings was the Journal of Vocational Behavior 80 (2012) 1–16 ☆ The research reported in this manuscript was supported by a research grant from the Social Sciences and Humanities Research Council to the first author. Natalya Parfyonova is now with the Human Resource Systems Group, Ottawa, Ontario. ⁎ Corresponding author at: Department of Psychology, The University of Western Ontario, London, Ontario, Canada N6A 5C2. E-mail address: [email protected] (J.P. Meyer). 0001-8791/$ – see front matter © 2011 Elsevier Inc. All rights reserved. doi:10.1016/j.jvb.2011.07.002 Contents lists available at ScienceDirect Journal of Vocational Behavior journal homepage: www.elsevier.com/locate/jvb
-
Upload
independent -
Category
Documents
-
view
2 -
download
0
Transcript of Employee commitment in context: The nature and implication of commitment profiles

Employee commitment in context: The nature and implication ofcommitment profiles☆
John P. Meyer a,⁎, Laura J. Stanley b, Natalya M. Parfyonova a
a Department of Psychology, The University of Western Ontario, Canadab Department of Management, College of Business, East Carolina University, NC, USA
a r t i c l e i n f o a b s t r a c t
Article history:Received 13 June 2011Available online 23 July 2011
It is well established that employee commitment can take different forms (e.g., affective,normative, and continuance), yet it is only recently that theory has been advanced to explainhow these different forms combine to influence behavior (Meyer & Herscovitch, 2001). Wetested this theory with data from employees in three human services organizations (N=403).Using latent profile analyses, we identified six distinct profile groups and found that theydiffered on measures of need satisfaction, regulation, affect, engagement, organizationalcitizenship behavior, and well-being. The observed differences are consistent with the notionthat a commitment profile provides a context that determines how the individual componentsare experienced (Gellatly, Meyer, & Luchak, 2006). We discuss the theoretical and practicalimplications of this context effect.
© 2011 Elsevier Inc. All rights reserved.
Keywords:Organizational commitmentThree-component modelSelf-determination theoryLatent profile analysisOrganizational citizenship behaviorEmployee well-being
According to the three-component model (TCM) of organizational commitment (Allen & Meyer, 1990; Meyer & Allen, 1991),commitment can takemultiple forms, each characterized by a different psychological state ormindset. Affective commitment (AC)reflects an emotional attachment and desire to remain with the organization, normative commitment (NC) is experienced as asense of obligation to remain, and continuance commitment (CC) reflects an awareness of the costs associated with leaving. Allthree forms of commitment tie an individual to the organization and decrease the likelihood of leaving, but their implications foron-the-job behavior can differ. Considered individually, AC is expected to have the strongest positive effects on in-role anddiscretionary performance, followed by NC; CC is expected to be unrelated or negatively related to discretionary performance.However, Meyer and Allen (1991, p. 68) argued that employees can “experience all three forms of commitment to varyingdegrees” and that it is important to consider how “the various forms of commitment might interact to influence behavior.” That is,the three forms of commitment should be considered as components within a commitment profile.
The TCMhas been tested extensively andhas received considerable support (seeAllen&Meyer, 1996;Meyer, Stanley, Herscovitch,& Topolnytsky, 2002, for detailed reviews). However, until recently, the vast majority of research has focused on the independent oradditive contributions of the three components to the prediction of behavior. Only a few studies tested for interactions among thecomponents (e.g., Jaros, 1997; Randall, Fedor, & Longenecker, 1990; Somers, 1995). Thismayhavebeendue, in part, to the absenceof atheoretical framework to guide research (Jaros, 1997). To address this problem, Meyer and Herscovitch (2001) developed a set ofpropositions concerning (a) the nature of interactions among the components, and (b) the behaviors associated with varyingcommitment profiles (i.e., patterns of scores on the three components). These propositions have since been tested in several studies(e.g., Gellatly, Meyer, & Luchak, 2006; Johnson, Groff, & Taing, 2009; Somers, 2009, 2010; Stanley, Vandenberg, Vandenberghe, &Bentein, 2009; Wasti, 2005) and received qualified support (see below). Arguably one of the more intriguing findings was the
Journal of Vocational Behavior 80 (2012) 1–16
☆ The research reported in this manuscript was supported by a research grant from the Social Sciences and Humanities Research Council to the first author.Natalya Parfyonova is now with the Human Resource Systems Group, Ottawa, Ontario.⁎ Corresponding author at: Department of Psychology, The University of Western Ontario, London, Ontario, Canada N6A 5C2.
E-mail address: [email protected] (J.P. Meyer).
0001-8791/$ – see front matter © 2011 Elsevier Inc. All rights reserved.doi:10.1016/j.jvb.2011.07.002
Contents lists available at ScienceDirect
Journal of Vocational Behavior
j ourna l homepage: www.e lsev ie r.com/ locate / jvb
observation that the way any single component of commitment relates to behavior is influenced by the context created by the othercomponentswithin a commitment profile (Gellatly et al., 2006). For example, howNC is experienced and relates to behaviormight bedifferent depending on the strength of AC and CC.
Another recent development concerning the TCMhas been attempts to identify themechanisms underlying the relations betweencommitment and behavior. For example, Meyer, Becker, and Vandenberghe (2004) proposed a model linking the TCM to theories ofmotivation, most notably self-determination theory (SDT: Deci & Ryan, 1985; Ryan & Deci, 2000) and regulatory focus theory (RFT:Higgins, 1997, 1998). More recently, Johnson, Chang, and Yang (2010) elaborated on how RFT might be applied to understand thenature and focus of employee commitment in theworkplace, andMeyer andMaltin (2010) extended the application of SDT to explainthe implications of commitment for employee well-being. However, there are relatively few empirical studies applying theories ofmotivation to explain commitment-behavior relations. This is surprising, given the number of calls in the literature to identify themechanisms underlying the relationship between commitment and behavior (e.g., Meyer & Allen, 1997).
This study addressed these new developments in commitment theory. More specifically, we developed and tested hypothesesregarding (a) the motivational states associated with different commitment profiles, and (b) the implications of these profiles forjob performance and employee well-being. The findings of this study provide a better understanding of the motivationalmechanisms underlying commitment mindsets and provide a more complete understanding of how these commitment mindsetsrelate to outcomes of interest to both organizations and their employees.
Commitment profiles: Theory and research
Following Meyer and Allen (1991, 1997), Meyer and Herscovitch (2001) argued that the three components of commitment—AC,NC, and CC—combine to form a commitment profile. Furthermore, they proposed that behavior varies in predictable ways acrossprofile groups. To illustrate, they identified eight potential profile groups each characterized by a combination of high or low scores onthe three components. They hypothesized that the optimal profile for purposes of retention and job performance would be one withstrongAC combinedwithweakNCandCC.Hereinafter,we refer to this as anAC-dominant profile, anduse the term dominant similarlyin other profile labels to identify the strongest component(s) (i.e., those that dominate theprofile). BecauseCC(perceived cost) andNC(obligation) both involve constraints on behavior,Meyer andHerscovitch predicted that high scoreswould have amitigating effect onthe impact of “pure” AC (p. 313). That is, although the probability of staying and performing effectively should be relatively high foremployees with fully committed (i.e., strong AC, NC, and CC), AC/NC-dominant, and AC/CC-dominant profiles, it was expected to belower than for employees with an AC-dominant profile. Employees with CC-dominant, NC-dominant, or CC/NC-dominant profileswere expected to have a greater likelihood of staying than uncommitted employees (i.e., those with low scores on all threecomponents), but were not expected to do more than was required of them in terms of performance.
Several studies have been conducted to test Meyer and Herscovitch's (2001) propositions (Gellatly et al., 2006; Sinclair,Tucker, Wright, & Cullen, 2005; Somers, 2009; 2010; Stanley et al., 2009; Wasti, 2005). Findings concerning the AC-dominant,NC-dominant, and CC-dominant profiles were largely as expected and mirror the results of earlier studies examining thebehavioral correlates of AC, NC, and CC (see Cooper-Hakim & Viswesvaran, 2005; Meyer et al., 2002). The more intriguing findingsare those involving profiles with more than one dominant component. To elaborate, we focus first on the findings reported byGellatly et al. (2006) because they served as the basis for our hypotheses regarding context effects.
Gellatly et al. (2006) measured AC, NC, and CC and used amedian-split approach to create the eight profile groups discussed byMeyer and Herscovitch (2001). The profile groups were then compared with regard to mean scores on self-report measures ofintention to stay and organizational citizenship behavior (OCB). Contrary to expectation, the AC/CC-dominant profile group didnot differ from the AC-dominant group in intention to remain or OCB. Moreover, intention to stay and OCB were greater in theAC/NC-dominant groups than in the AC-dominant group. Thus, there was no evidence to support Meyer and Herscovitch'spropositions regarding the mitigating effects of CC and NC—to the contrary, NC appeared to have a synergistic effect.
Gellatly et al. (2006) also conductedmoderated regression analyses and found three-way interactions for both outcome variables.Simple slopes analyses revealed that NC related positively to discretionary behavior when it was combinedwith strong AC. However,when combinedwith strongCC andweakAC,NC correlated negativelywith discretionary behavior. Based on thesefindings, Gellatly etal. suggested that the other components in a profile provide a context that has implications for how a particular component isexperienced. Most notably, when NC is combined with strong AC it might be experienced as a “moral imperative” (i.e., a desire to dothe right thing). However, when combined with strong CC in the absence of AC, NC may be experienced as an “indebted obligation”(i.e., a need to do what is expected).
Although not specifically conducted to test for context effects, several other profile studies provide relevant results. Forexample, studies using k-means cluster analysis or latent profile analysis (LPA) to identify profile groups have consistentlydemonstrated the lowest levels of turnover intention among employees with fully committed, AC/NC-dominant, and AC-dominant profiles (Somers, 2009; Stanley et al., 2009; Wasti, 2005). Turnover intentions were found to be significantly greaterfor employees with uncommitted, CC-dominant, and CC/NC-dominant profiles. Somers (2010) compared profile groups in termsof actual turnover and found the lowest rates in the fully committed and AC/NC-dominant groups, although only the formerdiffered significantly from the other groups.
A similar pattern of findings was obtained in comparisons involving job performance and OCB. Wasti (2005) found that OCBwas greatest among employees with a fully committed profile, followed by thosewith AC-dominant and AC/NC-dominant profiles.In a study focusing on AC and CC only, Sinclair et al. (2005) found that supervisor-rated performance and OCB were lowest among
2 J.P. Meyer et al. / Journal of Vocational Behavior 80 (2012) 1–16

employees with moderate CC and low AC. Performance and OCB for employees with moderate AC and CC did not differ from thosewith moderate AC and low CC (no profile group demonstrated strong scores on AC or CC).
Although retention and performance have been the dominant criteria of interest in commitment profile studies, a few studiesalso examined differences in employee well-being. Employeewell-being is a general termwhich refers to a range of variables suchas job satisfaction, physical and mental health, and the absence of workplace, and physical or psychological strain (see Meyer &Maltin, 2010). Wasti (2005) found that Turkish employees with AC-dominant and AC/NC-dominant profiles experienced less jobstress than those with a CC-dominant profile. In a second study, she found that fully committed employees experienced less stressthan all other profile groups. Somers (2009) found that US nurses with an AC/NC-dominant profile were among the lowest of anyprofile group in job stress, and the lowest in carry-over stress (i.e., work-related stress that persists outside theworkplace). Finally,in a study of Greek public service employees, Markovits, Davis, and van Dick (2007) found the highest levels of intrinsic jobsatisfaction among those with fully committed, AC-dominant, and AC/NC-dominant profiles. The satisfaction of employees with aCC/NC-dominant profile was considerably lower and similar to the uncommitted and CC-dominant groups.
Considered together, the findings of these profile studies are generally consistent with Gellatly et al.'s (2006) observationregarding context effects. The most obvious contradiction to Meyer and Herscovitch's (2001) original propositions is the findingthat strong NC added to rather than mitigated the impact of AC on desired behavior and well-being. Even relatively strong CC wasassociatedwith positive outcomeswhen it was combinedwith strong AC. Thus, the nature and implications of NC and CC appear todepend on the strength of the other components in a profile (i.e., context). However, more research is needed to fully understandthe contextual effects of commitment as they relate to outcomes. The next section discusses several recent theoreticaldevelopments aimed at furthering our understanding of these underlying mechanisms.
Developments in commitment theory
Another recent development in the TCMhas been the integrationwith theories of motivation,most notably SDT (e.g., Meyer et al.,2004; Meyer, Becker, & Van Dick, 2006; Meyer & Maltin, 2010; Meyer & Parfyonova, 2010). Meyer et al. (2004) first noted thesimilarities in the mindsets characterizing the components of commitment in the TCM and the motivational states identified by Deciand Ryan (1985) and Ryan and Deci (2000) in SDT. They suggested that an integration of the two theories might lead to a betterunderstanding of the mechanisms by which commitment exerts its influence on behavior.
According to SDT, the perceived source of goal-oriented motivation varies along a continuum of autonomy, from externalregulation (i.e., to attain rewards or avoid punishment), through introjected regulation (i.e., tomeet expectations and avoid shame), tofully autonomous regulation (i.e., to achieve valued goals and self-expression). Meyer et al. (2004) proposed that CC would beassociatedwith external regulation, NCwith introjected regulation, and ACwith autonomous regulation. Gagné, Chemolli, Forest, andKoestner (2008) and Gagné et al. (2010) recently provided some evidence consistent with this proposition. More recently, however,Meyer andParfyonova (2010)argued that thesepredictionsmayneedmodification in light of recentfindings concerning commitmentprofiles. For example, they suggested thatNCmight be associatedwith introjected regulation onlywhen it is combinedwith strong CCandweak AC.When combined with strong AC, NC should be accompanied by a strong sense of autonomous regulation. Interestingly,Gagné and her colleagues found that NC correlated significantly with both introjected and autonomous regulation.
An important determinant of motivated behavior according to SDT is the desire to satisfy three basic psychological needs—theneeds for autonomy, competence, and relatedness (Ryan & Deci, 2000). The need for autonomy is satisfied when, at the deepestlevels of reflection, individuals believe that what they are doing is freely chosen and consistent with their core values. The need forcompetence is satisfied when people believe they have the capability to accomplish their tasks and achieve their objectives.Finally, the need for relatedness is satisfied when a person feels connected to others.
Building on the earlier integration of the TCM and SDT,Meyer andMaltin (2010) proposed that need satisfaction levels shoulddiffer across commitment profile groups. More specifically, because they are pursuing a course of action consistent with theirdesires and values, employees with AC-dominant, AC/NC-dominant, and fully committed profiles should experience satisfactionof all three needs. In contrast, the behavior of employees with CC-dominant or CC/NC-dominant profiles is more constrained andtherefore these employees should experience less need satisfaction, particularly satisfaction of the need for autonomy.Consistent with this reasoning, Greguras and Diefendorff (2009) found that AC was associated positively with the satisfaction ofall three needs. However, we are unaware of any studies relating need satisfaction to NC and CC, or comparing satisfaction levelsacross profile groups.
In sum, recent efforts to integrate the TCMand SDT have important implications for understanding the nature and consequences ofthemindsets associatedwith varying commitment profiles. This integration alongwith the findings of earlier profile studies served asthe basis for the development of our study hypotheses.
The present study: Objectives and hypotheses
A first objective in our researchwas to identify groups of employees with different commitment profiles. To this end, we usedlatent profile analysis (LPA: Vermunt & Magidson, 2002). LPA uses latent categorical variables to identify groups of individualswith similar patterns of scores (profiles) on a set of variables, and has several advantages over analytic techniques used inprevious research, including the fact that it is model-based and involves the use of objective criteria in decisions regarding thenumber of subgroups to extract (Vandenberg & Stanley, 2009). Although, like cluster analysis, it is difficult to specify a prioriwhat profile groups will emerge for a given sample using LPA, for present purposes we based our hypotheses on the findings of
3J.P. Meyer et al. / Journal of Vocational Behavior 80 (2012) 1–16

previous research. A summary of the profile groups obtained in these studies is provided in Table 1. Studies including all threecomponents have typically identified between five and seven profile groups reflecting both quantitative and qualitativedifferences. Quantitative differences exist when the relative strength of all three components differs across groups, whereasqualitative difference exist when the hierarchical ordering of the strength of the three components differs across profiles (seeMarsh, Lüdtke, Trautwein, & Morin, 2009).
Among the most commonly identified profile groups are AC-dominant, CC-dominant, AC/NC-dominant, NC/CC-dominant,fully committed, and uncommitted. Several studies also identified groups with moderate levels of all three components.The only profile group included in Meyer and Herscovitch's (2001) theoretical treatment that has yet to be found is the NC-dominant group. Therefore, based on the findings of these studies, we developed the following hypothesis regarding profileemergence.
Hypothesis 1. Multiple (five to seven) profile groups with distinct patterns of AC, NC, and CC exist within the employee sample.As we move beyond a focus on individual components of commitment to examine commitment profiles, it is important to gain
an understanding of themindsets accompanying these profiles. For example, if AC is characterized by a desire to remain and NC bya sense of obligation to remain, what is the mindset of an employee with an AC/NC-dominant profile? The same question can beasked of profiles with other combinations (e.g., AC/CC-dominant, CC/NC-dominant, and fully committed). Therefore, another ofour objectives was to address these questions with a focus on motivational states.
As noted previously, Gellatly et al. (2006) speculated that an AC/NC-dominant profile might be experienced as a moralimperative, and that a CC/NC-dominant profile might reflect indebted obligation. These labels imply the existence of motivationalstates, but Gellatly et al. did not elaborate on the basis for their speculation or offer a theoretical framework that could be appliedto the analysis of mindsets across the full range of potential profiles. Other researchers have also applied descriptive labels to theprofile groups they identified, but again these only hint at the nature of themotivational mindset (e.g., Sinclair et al., 2005; Stanleyet al., 2009). In the present study we based our hypotheses on established motivation theory.
As noted earlier, Meyer et al. (2004) suggested that CC would be associated with external regulation, NC with introjectedregulation, and AC with autonomous regulation. However, Meyer and Parfyonova (2010) proposed that employees with strongNC might experience autonomous regulation as long as AC was also strong. Meyer and Maltin (2010) made a similar argumentregarding CC. Thus, we propose that the form of regulation experienced by employees with strong NC and CC will depend on thecontext created by the other components in the commitment profile (Gellatly et al., 2006). Given that autonomous regulation hasbeen linked to need satisfaction (Gagné & Deci, 2005), it follows that a similar pattern of findings should emerge with regard tosatisfaction of the needs for autonomy, competence, and relatedness. Therefore, we developed and tested the followinghypotheses.
Hypothesis 2. Profile groups with strong NC in combination with strong AC (i.e., AC/NC-dominant or fully committed) have greaterneed satisfaction and autonomous regulation than groups with strong NC but weak AC (i.e., NC-dominant or CC/NC-dominant).
Hypothesis 3. Profile groups with strong CC in combination with strong AC (i.e., AC/CC-dominant or fully committed) havegreater need satisfaction and autonomous regulation than groups with strong CC alone (i.e., CC-dominant) or in combination withstrong NC and weak AC (i.e., CC/NC-dominant).
If our earlier hypotheses concerning themotivational states associatedwith commitment profiles are accurate, then SDT researchprovides another basis for predictingdifferences in behavior andwell-being across profile groups. Indeed, there is anextensive body ofresearch demonstrating that satisfaction of the needs for autonomy, competence, and relatedness, and the experience of autonomousversus controlled regulation, relate positively to job performance and employeewell-being (e.g., Baard, Deci, & Ryan, 2004; Deci et al.,2001;Gagné, Koestner,& Zuckerman, 2000; Ilardi, Leone, Kasser, &Ryan, 1993: seeGagné andDeci (2005) for amoredetailed review).Therefore, it follows that the same profiles associated with more autonomous regulation and need satisfaction will perform theirassigned duties more effectively, engage in more OCB, and experience greater well-being than those associated with controlledregulation and less need satisfaction. Therefore, we tested the following hypotheses.
Table 1Summary profiles obtained in previous research.
All high All mod. All low AC-dom. NC-dom. CC-dom. AC/NC-dom. AC/CC-dom. CC/NC-dom Method
Wasti (2005)—S1 ✓ ✓ ✓ ✓ ✓ ✓ Cluster analysisWasti (2005)—S2 ✓ ✓ ✓ ✓ ✓ ✓ Cluster analysisGellatly et al. (2006) ✓ ✓ ✓ ✓ ✓ ✓ ✓ ✓ Median splitMarkovits et al. (2007) ✓ ✓ ✓ ✓ ✓ ✓ ✓ ✓ Median splitSomers (2009) ✓ ✓ ✓ ✓ ✓ Cluster analysisSomers (2010) ✓ ✓ ✓ ✓ ✓ ✓ ✓ Cluster analysisStanley et al. (2009) ✓ ✓ ✓ ✓ ✓ ✓ Latent profile analysis
Note. AC=affective commitment; NC=normative commitment; CC=continuance commitment.
4 J.P. Meyer et al. / Journal of Vocational Behavior 80 (2012) 1–16
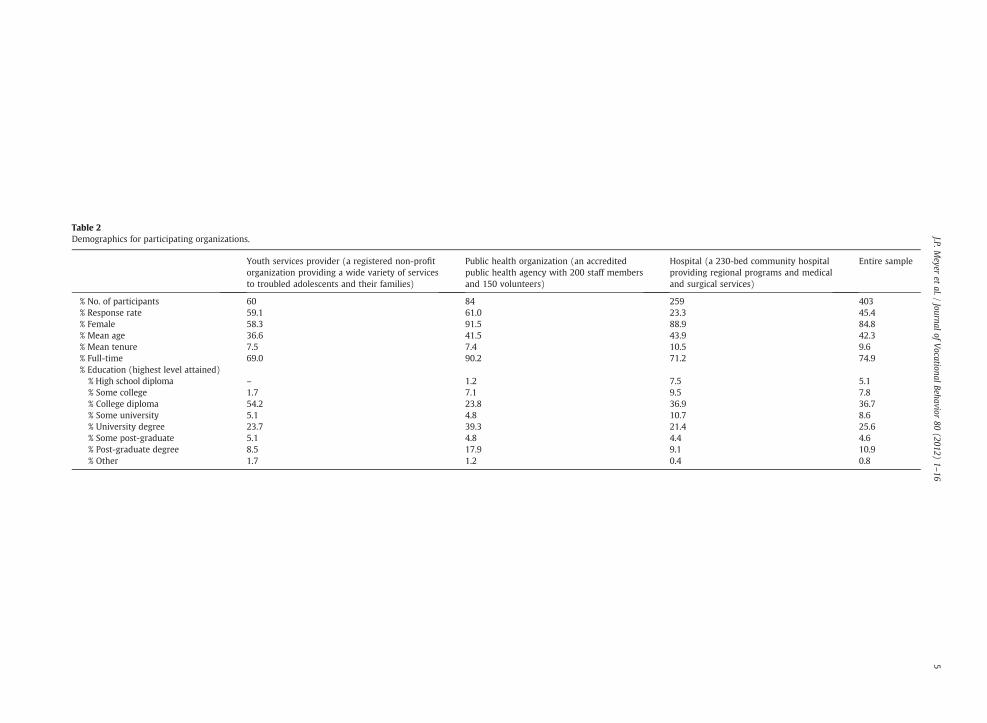
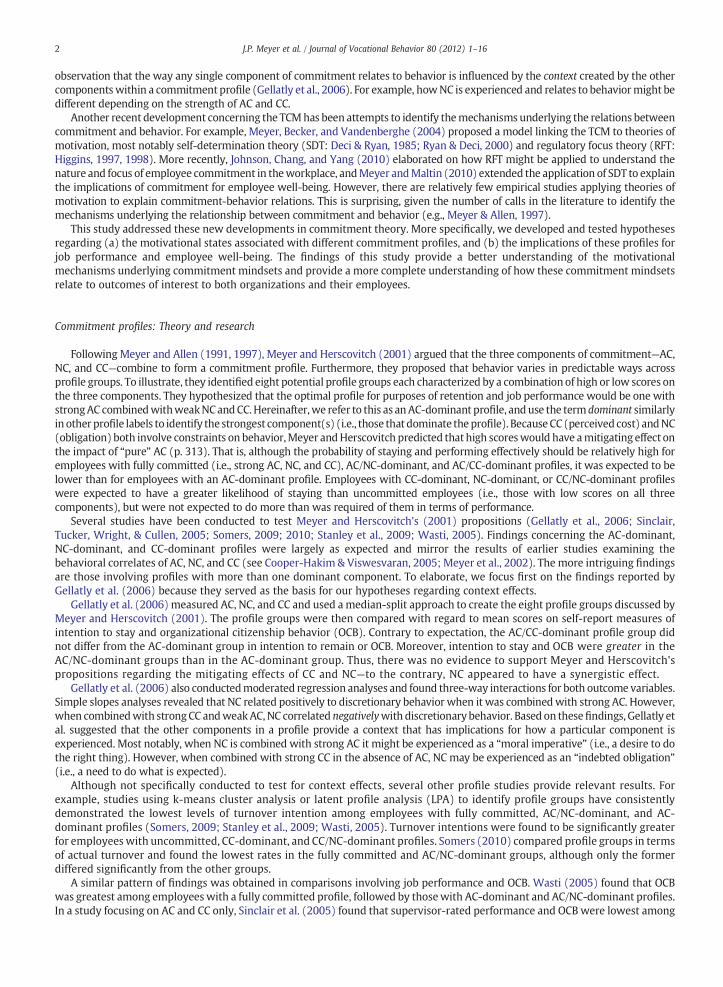
Table 2Demographics for participating organizations.
Youth services provider (a registered non-profitorganization providing a wide variety of servicesto troubled adolescents and their families)
Public health organization (an accreditedpublic health agency with 200 staff membersand 150 volunteers)
Hospital (a 230-bed community hospitalproviding regional programs and medicaland surgical services)
Entire sample
% No. of participants 60 84 259 403% Response rate 59.1 61.0 23.3 45.4% Female 58.3 91.5 88.9 84.8% Mean age 36.6 41.5 43.9 42.3% Mean tenure 7.5 7.4 10.5 9.6% Full-time 69.0 90.2 71.2 74.9% Education (highest level attained)
% High school diploma – 1.2 7.5 5.1% Some college 1.7 7.1 9.5 7.8% College diploma 54.2 23.8 36.9 36.7% Some university 5.1 4.8 10.7 8.6% University degree 23.7 39.3 21.4 25.6% Some post-graduate 5.1 4.8 4.4 4.6% Post-graduate degree 8.5 17.9 9.1 10.9% Other 1.7 1.2 0.4 0.8
5J.P.M
eyeret
al./Journal
ofVocational
Behavior80
(2012)1–16

Hypothesis 4. Profile groups with strong NC in combination with strong AC (i.e., AC/NC-dominant or fully committed) have (a)greater in-role performance and OCB and (b) greater well-being than groups with strong NC but weak AC (i.e., NC-dominant orCC/NC-dominant).
Hypothesis 5. Profile groups with strong CC in combination with strong AC (i.e., AC/CC-dominant or fully committed) have (a)greater in-role performance and OCB and (b) greater well-being than groups with strong CC alone (i.e., CC-dominant) or incombination with strong NC and weak AC (i.e., CC/NC-dominant).
Method
We recruited organizations for participation in a larger program of research pertaining to employee engagement through theregional chapters of a professional association. Three organizations, a mid-size hospital, a youth services provider, and a publichealth agency participated in this study. A brief description of the organizations and demographic information is provided inTable 2. Participating employees completed either an online or paper survey, and were asked to invite a co-worker to complete apeer-report form. For the paper survey, employees received a sealed envelope with a peer-report form as part of their surveypackage. They were asked to forward the envelope to a co-worker who was very familiar with their work. For the online survey,employees forwarded a web link to the peer-report form. Self-reported surveys and peer-report forms were matched usingpersonal codes created by the employees.
The self-report survey contained measures of organizational commitment, motivation, need satisfaction, work engagement,positive and negative affect, and general health, while the peer-rating forms included measures of the target employee's in-role jobperformance and OCB directed toward individuals and the organization (OCBI and OCBO, respectively). Although 403 employeesresponded to the self-reported survey, only 180 peer-report forms could be matched with relevant self-report surveys.
Measures
Organizational commitmentWemeasured commitment to the organizationwith the shortened 9-item version of Meyer, Allen, and Smith's (1993) scales used
by Gellatly et al. (2006). Each of the three components of commitment was measured with three items. Sample items are: “I feel astrong sense of “belonging” to this organization” (AC); “This organization deserves my loyalty” (NC); and “I feel that I have too fewoptions to consider leaving this organization” (CC). Responses were made on a 7-point scale (1 “strongly disagree” and 7 “stronglyagree”), and reliabilities were .87, .69, and .79, respectively.
Need satisfactionWe used nine items adapted from Sheldon, Elliot, Kim, and Kasser (2001) to measure satisfaction of the needs for
autonomy, competence, and relatedness. Sample items are: “When at work, I feel that my choices are based on my trueinterests and values” (autonomy); “When at work, I feel very capable of what I am doing” (competence); “When at work, Ifeel a sense of contact with people who care for me and whom I care for” (relatedness). Responses were made on a 7-pointscale (1 “strongly disagree” and 7 “strongly agree”). Reliabilities for the need satisfaction scales were .76, .74, and .89,respectively.
Autonomous vs. controlled regulationWe used the 12-itemMotivation at Work Scale (Gagné et al., 2008) to measure intrinsic, identified, introjected, and external
motivation. Sample items are: “I work at my job because I enjoy this work very much” (intrinsic); “I work at my job because thisjob fits my personal values” (identified); “I work atmy job becausemy reputation depends on it” (introjected); and “I work atmyjob because it allows me to make a lot of money” (external). Responses were measured on a 7-point scale (1 “not at all” and 7“exactly”). Reliabilities for the four scales were .85, .83, .71, and .71, respectively. As in previous research (e.g., Judge, Bono, Erez,& Locke, 2005; Sheldon & Elliot, 1998), we created a single index of autonomous vs. controlled regulation by combining thescores for introjected and external (controlled motivation) scales and subtracting them from the combined scores for theintrinsic and identified (autonomous motivation) scales. Positive scores reflect greater autonomous than controlled regulationand negative scores reflect the reverse.
In-role job performanceTo obtain peer ratings of the target employees’ in-role job performance, we used the four itemswith the highest factor loadings on
the in-role behavior factor reported by Williams and Anderson (1991). A sample item is: “My co-worker adequately completesassigned duties.” Responses were made on a 7-point frequency scale with anchors ranging from “never” (1) to “every day” (7). Scalereliability was .90.
OCBI and OCBOWe obtained peer ratings of OCBI and OCBO using 12 items from Lee and Allen's (2002) Organizational Citizenship Behavior Scale.
Sample items are: “My co-worker helps others who have been absent” (OCBI); “My co-worker shows pride when representing the
6 J.P. Meyer et al. / Journal of Vocational Behavior 80 (2012) 1–16

Table 3Descriptive statistics and correlationsa.
Variables Mean SD 1 2 3 4 5 6 7 8 9 10 11 12 13 14 15 16 17 18
1. AC 4.63 1.542. NC 4.20 1.47 .773. CC 4.16 1.52 .18 .304. Sat.—need for autonomy 5.19 1.16 .46 .35 −.065. Sat.—need for competence 5.67 0.96 .35 .26 .00 .626. Sat.—need for relatedness 5.12 1.34 .58 .42 −.00 .61 .477. Autonomous regulation 2.89 2.57 .37 .27 −.14 .40 .31 .378. Positive affect 3.46 0.80 .48 .40 −.05 .52 .48 .42 .419. Negative affect 1.73 0.67 −.28 −.22 .04 −.32 −.28 −.25 −.25 −.2710. Work engagement 4.32 1.20 .56 .50 .07 .51 .49 .48 .45 .65 −.3011. General health complaints 1.95 0.46 −.30 −.20 .12 −.36 −.36 −.31 −.22 −.48 .60 −.3312. In-role performance 6.55 0.68 .14 .07 −.03 .20 .16 .31 .16 .19 −.02 .08 −.0713. OCBI 6.09 0.90 .25 .19 .01 .25 .24 .36 .17 .24 −.10 .23 −.22 .6614. OCBO 5.62 1.11 .35 .29 .02 .31 .25 .36 .24 .30 −.19 .37 −.21 .51 .7115. Age 42.3 10.59 .11 .12 .09 .01 .09 −.01 −.10 .12 −.06 .16 −.06 −.05 −.07 .0016. Genderb 1.85 0.36 .13 .07 .07 .11 .20 .13 .11 .15 −.14 .16 −.07 .21 .10 .13 −.0317. Tenure 9.5 8.45 .05 .05 .20 −.08 .02 −.02 −.10 −.04 .02 −.05 −.05 .03 .02 .00 .57 −.0218. Public health organizationc 0.21 0.41 .14 .03 .02 .14 .11 .10 .05 .00 −.17 .02 −.01 −.06 −.12 −.01 −.04 .10 −.1419. Hospitalc 0.64 0.48 −.06 −.02 .02 −.10 −.07 −.04 −.17 .06 .13 .09 .03 −.02 .03 −.04 .20 .15 .18 −−.69
a n=403. Correlation values greater than .13 are significant at pb .01; correlation values greater than .11 are significant at pb .05. For in-role performance, OCBI, and OCBO, n=180, and correlation values greater than .19are significant at pb .01, and those greater than .14 are significant at pb .05.
b Man=1; Woman=2.c Hospital and Public Health Organization were dummy coded 1 or 0 and the excluded organization, Youth Services, served as the comparator.
7J.P.M
eyeret
al./Journal
ofVocational
Behavior80
(2012)1–16

organization in public” (OCBO). Responses were made on a 7-point frequency scale with anchors ranging from “never” (1) to “everyday” (7). The scale reliabilities were .91 and .92, respectively.
Positive and negative affectWe used the Positive and Negative Affect Schedule (PANAS; Watson, Clark, & Tellegen, 1988) to assess the extent to which
employees felt positive and negative affect at work in the past fewweeks. Both positive and negative affect weremeasuredwith 10adjectives (e.g., “interested” for positive affect and “ashamed” for negative affect) using a 5-point scale (1 “very slightly or not atall” and 5 “very much”). Reliabilities of the two scales were .91 and .89 respectively.
General healthWe used a 12-item version of the General Health Questionnaire (Goldberg et al., 1997) to measure the frequency with which
participants experiencedmental health problems, including symptoms of anxiety, depression, and social dysfunction (e.g., “Have yourecently lost much sleep over worry?”). Responses were measured on a 4-point scale (1 “not at all” and 4 “much more than usual”).High scores reflect more health complaints; scale reliability was .89.
Work engagementWe included work engagement in our study because it goes beyond the more traditional conceptualization of well-being as the
absence of illness and is more in line with the notion of optimal functioning associated with positive psychology (cf. Seligman &Czikszentmihalyi, 2000). We measured work engagement using a 9-item version of the Utrecht Work Engagement Scale (UWES;Schaufeli, Bakker, & Salanova, 2006). The UWES consists of three subscales: vigor (3 items), absorption (3 items), and dedication(3 items). Sample items are: “At work, I feel bursting with energy” (vigor), “I am immersed in my work” (absorption), and “I amenthusiastic aboutmy job” (dedication). Responses to the scaleweremadeon a 7-point frequency scale (1 “never” and 7 “every day”).Because previous research did not find convincing evidence of a three-factor structure for the 9-item scale (Schaufeli et al., 2006), weconducted an exploratory principal-axis factor analysis to assess dimensionality in the present study. Only one factor had aneigenvalue greater than 1.0, suggesting that the UWES could be represented as a unidimensional construct. The reliability of thecombined index was .92.
Analyses
There were four phases involved in the data analysis. In the first phase, we conducted confirmatory factor analyses (CFA) toevaluate the discriminant validity of the 10 self-report measures and address concerns about common method bias (Podsakoff &Organ, 1986). More specifically, we compared the fit of a 10-factor model against a series of alternative models in which variableswere combined (e.g., AC and NC items were assigned to the same factor).
In the second phase,we conducted LPA using themaximum likelihood estimator inMPlus 5.21 (Muthén&Muthén, 1998-2007) toidentify latent commitmentprofiles. As noted earlier, LPAuses latent categorical variables to identify groupsof individualswith similarpatterns of scores on a set of variables, in this case the three components of commitment. FollowingNylund, Asparouhov, andMuthen(2007), the optimal number of profiles was determined through an iterative process inwhich a two-profilemodel was estimated andsuccessive profiles were then added.
Eachmodelwas evaluated using several criteria: (a) the sample-adjustedBayesian information criterion (SABIC; Sclove, 1987), (b)bootstrapped likelihood ratio test (BLRT;McLachlan & Peel, 2000), (c) number of cases in each profile, and (d) posterior probabilitiesassociated with each profile. The SABIC is used to select the model with best fit and fewest parameters from among a set ofnonhierarchical models. The BLRT evaluates the extent to which a model with k profiles provides a better fit than a model with k-1profiles. A BLRT p-value less than 0.05 indicates that there is statistically significant improvement in fit when an additional profile isincluded. Nylund et al. (2007) suggested that the optimal solution should (a) show the lowest SABIC and BLRT, (b) have a significantBLRT p-value, (c) not contain profiles with a small number of individuals, and (d) show clearly defined profiles, indicated by a highprobability that individuals actually belong to the profile to which they were assigned and a low probability of belonging to otherprofiles (i.e. as reflected in the posterior probability values). Lubke andMuthén (2005) suggested that theory should also be taken intoconsiderationwhen determining the optimal number of profiles. Therefore, we inspected themean commitment scores of each of thesolutions to assess the distinctiveness of the profiles.
Table 4Model fit statistics.
SABIC BOOTLRT (log-likelihood)
2—Profile 4168.17 270.83—Profile 4073.64 105.834-Profile 4044.89 40.04*5—Profile 4039.30 16.88*6—Profile 4036.40 14.19*
SABIC=Sample-adjusted Bayesian Information Criterion;.BOOTLRT=Bootstrapped Likelihood Ratio Test.*pb .05.
8 J.P. Meyer et al. / Journal of Vocational Behavior 80 (2012) 1–16

In the third phase, we conducted one-way analyses of variance (ANOVAs) to evaluate the uniqueness of the profiles generatedby the LPA. We used profile membership as the independent variable, and AC, NC, and CC as the dependent variables. To assist inlabeling the profile groups, we also conducted pairwise comparisons of the three component scores within profile groups.
The fourth phase of the analysis was undertaken to test our hypotheses regarding profile differences in motivation,performance and well-being. More specifically, we conducted one-way ANCOVAs, controlling for gender, age, tenure, andorganization, followed by post hoc comparisons using the profile groups as the independent variable. Separate analyses wereconducted for each of themotivation, performance, andwell-beingmeasures. Gender, age, tenure, and organizationwere includedas control variables because they had significant, albeit weak, correlations with some of the criterion variables in our analyses andwere found to differ across the profile groups thereby providing possible alternative explanations for our finding.
It should be noted that our analyses involving in-role performance and OCB were conducted with a reduced sample of 180 dueto the low response rate for peer raters. Before conducting these analyses, we tested to determine whether respondents werereasonably well distributed across the six-profile groups. We found that this was indeed the case and therefore conducted theanalysis with the existing profile groups rather than redoing the LPA with the smaller sample.
Results
Means, standard deviations, and correlations among the study variables are presented in Table 3. All correlation coefficientsamong the commitment components were positive, with the strongest being between AC and NC (r=.77).
Confirmatory factor analyses
The CFA conducted to evaluate discriminant validity and test for common method variance among the self-report measuresrevealed a goodfit for the hypothesized10-factormodel (χ2=3333.10,pb .001; df=1596;CFI=0.92, RMSEA=.05).All items loadedsignificantly on their latent factorwith factor loadings above .40, and themodel showeda betterfit than alternativemodelswith fewerfactors.
Latent profile analysis
We began the LPA by specifying a two-profile model and added successive profiles until we encountered non-convergenceproblems (Vermunt & Magidson, 2002). The optimal model included six profiles, which is consistent with previous research usingcluster analysis or LPA (see Table 1). Tables 4, 5, and 6 present fit statistics, profile membership, and posterior probabilities,respectively. As can be seen fromTable 4, the six-profilemodel showed the lowest SABIC (4036.40) and BLRT (14.19) values. The BLRTp-value for the five-profile model was significant (pb .05), indicating that the addition of a sixth profile improvedmodel fit. Results inTable 5 indicate that the number of cases in each profile group is sufficient to warrant retention (range=27 to 123). The posteriorprobabilities in Table 6 indicate that the profiles in the six-profile model are distinguishable from one another. The probabilities thatindividuals belong to their assigned profileswere high (0.76–0.90),whereas probabilities that individuals belong to other profilewerelow (0.00–0.14). Finally, a plot of the standard scores for AC, NC, and CC across the six profile groups in Fig. 1 reveals that the pattern ofmeans in the six-profile model is consistent with previous findings and is theoretically meaningful.
The results of the ANOVAs conducted to compare commitment levels across profile groups revealed significant differences in AC(F(5, 396)=333.23, pb .00), NC (F(5, 396)=259.2, pb .00), and CC (F(5, 396)=135.46, pb .00). Profiles 1, 3, 4 and 5 differed
Table 5Profile membership for the profile models.
1 2 3 4 5 6
2—Profile 145 2573—Profile 63 164 1754—Profile 110 96 40 1565—Profile 34 78 130 119 416—Profile 27 44 123 74 78 56
Table 6Classification posterior probabilities for the 6-profile model.
Profile Profile 1 Profile 2 Profile 3 Profile 4 Profile 5 Profile 6
1 0.90 0.05 0.00 0.05 0.00 0.002 0.02 0.82 0.06 0.10 0.00 0.003 0.00 0.01 0.76 0.09 0.06 0.084 0.03 0.05 0.09 0.81 0.00 0.025 0.00 0.00 0.08 0.00 0.84 0.086 0.00 0.00 0.14 0.03 0.07 0.76
Note: Values in bold are the average posterior probabilities associated with the profiles to which individuals were assigned.
9J.P. Meyer et al. / Journal of Vocational Behavior 80 (2012) 1–16

quantitatively in terms of the overall levels of all three components of commitment. However, consistent with Hypothesis 1, we alsofound qualitative differences where employees scored high on one (e.g., Profile 2) or two (e.g. Profile 6) components and low on theothers. Pairwise comparisons conducted within the profile groups (see Table 7) showed that there were significant differencesbetween the component scores within each profile.
We used the results of the ANOVAs and post hoc comparisons to name the profiles. As can be seen fromTable 7, Profile 1 (7% of thesample) has the lowest scores on all three components and reflects a general lack of commitment overall. Of the three components,however, CC is strongest in this profile. We labeled this the uncommitted profile. CC is significantly greater in Profile 2 (11% of thesample) than in any other profile, and AC and NC are lower than in any other profile except Profile 1. Therefore, we used the labelCC-dominant to describe Profile 2. The three components are of approximately equal strength in each of Profiles 3 (31% of the sample)and 4 (18% of the sample), with AC scores slightly elevated in Profile 4. Themain difference between these profiles is that values for allthree components are slightly greater in Profile 3 than in Profile 4. Based on the relative equality of scoreswithin these profiles and themean levels, Profile 3 and Profile 4 reflectmoderate commitment and low-moderate commitment, respectively. Finally, AC and NC arehigher in Profiles 5 (19%of the sample) and 6 (14%of the sample) than in any other profile group, and are significantly higher in Profile5 than in Profile 6. CC is also significantly higher in Profile 5 than in Profile 6; indeed, CC is lower in Profile 6 than in any group otherthan the uncommitted (Profile 1). Therefore, we use the labels fully committed to describe Profile 5 and AC/NC-dominant to describeProfile 6.
We did not find evidence for CC/NC-dominant, NC-dominant, or AC-dominant profile groups. Consequently, as we note below,we were unable to test fully some of our hypotheses.
Analyses of covariance
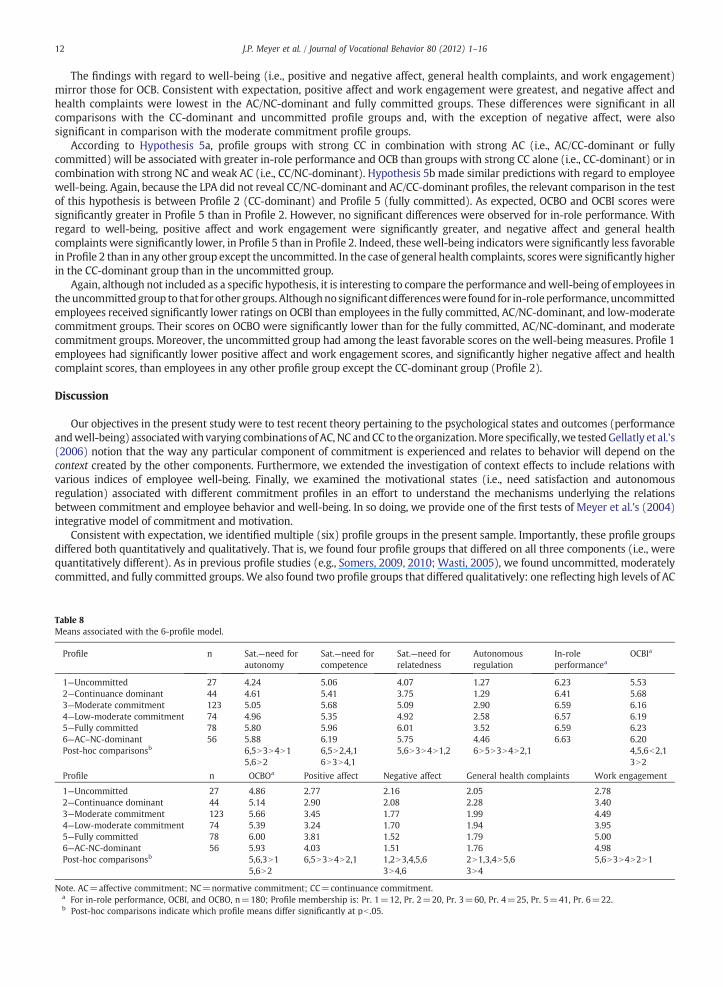
The correlations in Table 3 and profile comparisons in Fig. 2 provided justification for controlling gender, age, tenure, andorganization in tests of our hypotheses. Therefore,we chose to test our hypotheses using one-wayANCOVAswith profilemembership
-2.50
-2.00
-1.50
-1.00
-0.50
0.00
0.50
1.00
1.50
ACNCCC
Profile 1:Uncommitted
Profile 6: AC-NCDominant
Profile 5: FullyCommitted
Profile 4:Low-ModerateCommitment
Profile 3:Profile 2:CC-Dominant Moderate
commitment
Fig. 1. Characteristics of the latent profiles on the indicators. Standard scores are reported to aid interpretation.
Table 7Commitment means associated with the 6-profile model.
Profile n AC NC CC
1—Uncommitted 27 1.63 1.51 2.522—CC-dominant 44 2.77 2.69 5.563—Moderate commitment 123 4.81 4.46 4.704—Low-moderate commitment 74 3.77 3.18 2.875—Fully committed 78 6.32 6.00 5.426—AC/NC-dominant 56 5.90 4.90 2.58Post-hoc comparisonsa 5N6N3N4N2N1 5N6N3N4N2N1 2N5N3N4N6N1
Note. AC=affective commitment; NC=normative commitment; CC=continuance commitment.a Post-hoc comparisons indicate which profile means differ significantly at pb .05.
10 J.P. Meyer et al. / Journal of Vocational Behavior 80 (2012) 1–16

as the independent variable and age, gender, tenure, and organization as covariates. However, prior to performing these analyses, weconducted tests of the theoretical assumptions underlying ANCOVA, including normality, homogeneity of variance, and homogeneityof regression slopes. These assumptions were met.
The one-way ANCOVAs revealed significant differences between the profiles with regard to satisfaction of the needs forautonomy (F(5,391)=17.19,MSE=1.09, pb .00), competence (F(5,391)=8.60,MSE=.81, pb .00), and relatedness (F(5,391)=30.34,MSE=1.29, pb .00), autonomous regulation (F(5,391)=12.93,MSE=5.42, pb .00), OCBI (F(5,169)=2.93,MSE=.77, pb .02), OCBO(F(5,169)=4.02,MSE=1.15,pb .00), positive affect (F(5,391)=22.22,MSE=.48,pb .00), negativeaffect (F(5,391)=7.15,MSE=.39,pb .00), general health complaints (F(5,391)=9.52,MSE=.19, pb .00), and work engagement (F(5,391)=33.45,MSE=.96, pb .00).There were no significant differences between profiles with respect to in-role performance. For those variables where we foundoverall effects, we conducted post hoc pairwise comparisons. The results of these post hoc analyses are shown in Table 8.
According toHypothesis 2, profile groupswith strongNC in combinationwith strongAC (i.e., AC/NC-dominant or fully committed)will be associated with greater need satisfaction and autonomous regulation than groups with strong NC but weak AC (i.e.,NC-dominant or CC/NC-dominant). This hypothesis could not be fully tested because the LPA did not produce NC-dominant orCC/NC-dominant profile groups. However, consistent with expectation, satisfaction of all three needs and autonomous regulationwere significantly greater in the two profile groups characterized by strong AC and NC (i.e., Profiles 5 and 6) than in any other profilegroup.
According to Hypothesis 3, profile groups with strong CC in combination with strong AC (i.e., AC/CC-dominant or fullycommitted) will be associated with greater need satisfaction and autonomous regulation than groups with strong CC alone(i.e., CC-dominant) or in combination with strong NC and weak AC (i.e., CC/NC-dominant). Because the LPA did not revealCC/NC-dominant and AC/CC-dominant profiles, the relevant comparison in the test of this hypothesis is between Profile 2(CC-dominant) and Profile 5 (fully committed). As expected, autonomous regulation and satisfaction of all three needs weresignificantly greater in Profile 5 than in Profile 2. Indeed, satisfaction of the need for relatedness for Profile 2 was significantlylower than for any other profile group, and satisfaction of the needs for autonomy and autonomous regulation were lower (albeitnot significantly) only in Profile 1 (uncommitted).
Although not included as a specific hypothesis, it is interesting to note that employees in the uncommitted profile group(Profile 1) had the lowest or second lowest scores on autonomous regulation and need satisfaction. The differences weresignificant in all comparisons with Profiles 3, 5, and 6.
Hypotheses 4 and 5 addressed the relations between profile membership and employee performance and well-being.According to Hypothesis 4, profile groupswith strong NC in combinationwith strong AC (i.e., AC/NC-dominant or fully committed)will be associated with greater in-role performance and OCB (Hypothesis 4The Model 1 citations have been linked to Eq. 1. Pleasecheck if the linking is correct.a) and greater well-being (Hypothesis 4b) than groups with strong NC but weak AC (i.e., NC-dominant or CC/NC-dominant). Again, these hypotheses could not be fully tested because the LPA did not produce NC-dominant orCC/NC-dominant profile groups. However, consistent with expectation, OCBI and OCBO were highest in the AC/NC-dominant andfully committed groups, and these differences were significant in comparisons with the CC-dominant and uncommitted profilegroups. There were no significant differences across the profile groups for peer ratings of in-role performance.
-0.50
-0.40
-0.30
-0.20
-0.10
0.00
0.10
0.20
0.30
0.40
AgeGenderTenurePublic Health OrgHospital
Profile 1:Uncommitted
Profile 6: AC/NC-Dominant
Profile 5: FullyCommitted
Profile 4:Low-ModerateCommitment
Profile 3:Profile 2:CC-Dominant Moderate
commitment
Fig. 2. Characteristics of the latent profiles on the covariates. Age and tenure are standardized to aid interpretation. Gender is coded 1 for man and 2 for woman.Hospital and Public Health Organization were dummy coded 1 or 0, and positive (negative) scores indicate a greater (lesser) number of employees in that profilecompared to the Youth Services Organization.
11J.P. Meyer et al. / Journal of Vocational Behavior 80 (2012) 1–16
The findings with regard to well-being (i.e., positive and negative affect, general health complaints, and work engagement)mirror those for OCB. Consistent with expectation, positive affect and work engagement were greatest, and negative affect andhealth complaints were lowest in the AC/NC-dominant and fully committed groups. These differences were significant in allcomparisons with the CC-dominant and uncommitted profile groups and, with the exception of negative affect, were alsosignificant in comparison with the moderate commitment profile groups.
According to Hypothesis 5a, profile groups with strong CC in combination with strong AC (i.e., AC/CC-dominant or fullycommitted) will be associated with greater in-role performance and OCB than groups with strong CC alone (i.e., CC-dominant) or incombination with strong NC and weak AC (i.e., CC/NC-dominant). Hypothesis 5b made similar predictions with regard to employeewell-being. Again, because the LPA did not reveal CC/NC-dominant and AC/CC-dominant profiles, the relevant comparison in the testof this hypothesis is between Profile 2 (CC-dominant) and Profile 5 (fully committed). As expected, OCBO and OCBI scores weresignificantly greater in Profile 5 than in Profile 2. However, no significant differences were observed for in-role performance. Withregard to well-being, positive affect and work engagement were significantly greater, and negative affect and general healthcomplaints were significantly lower, in Profile 5 than in Profile 2. Indeed, thesewell-being indicators were significantly less favorablein Profile 2 than in any other group except the uncommitted. In the case of general health complaints, scoreswere significantly higherin the CC-dominant group than in the uncommitted group.
Again, although not included as a specific hypothesis, it is interesting to compare the performance andwell-being of employees intheuncommitted group to that for other groups. Althoughnosignificantdifferenceswere found for in-roleperformance, uncommittedemployees received significantly lower ratings on OCBI than employees in the fully committed, AC/NC-dominant, and low-moderatecommitment groups. Their scores on OCBO were significantly lower than for the fully committed, AC/NC-dominant, and moderatecommitment groups. Moreover, the uncommitted group had among the least favorable scores on the well-being measures. Profile 1employees had significantly lower positive affect and work engagement scores, and significantly higher negative affect and healthcomplaint scores, than employees in any other profile group except the CC-dominant group (Profile 2).
Discussion
Our objectives in the present study were to test recent theory pertaining to the psychological states and outcomes (performanceandwell-being) associatedwithvarying combinationsof AC, NC andCC to theorganization.More specifically,we testedGellatly et al.'s(2006) notion that the way any particular component of commitment is experienced and relates to behavior will depend on thecontext created by the other components. Furthermore, we extended the investigation of context effects to include relations withvarious indices of employee well-being. Finally, we examined the motivational states (i.e., need satisfaction and autonomousregulation) associated with different commitment profiles in an effort to understand the mechanisms underlying the relationsbetween commitment and employee behavior and well-being. In so doing, we provide one of the first tests of Meyer et al.'s (2004)integrative model of commitment and motivation.
Consistent with expectation, we identified multiple (six) profile groups in the present sample. Importantly, these profile groupsdiffered both quantitatively and qualitatively. That is, we found four profile groups that differed on all three components (i.e., werequantitatively different). As in previous profile studies (e.g., Somers, 2009, 2010; Wasti, 2005), we found uncommitted, moderatelycommitted, and fully committed groups.We also found two profile groups that differed qualitatively: one reflecting high levels of AC
Table 8Means associated with the 6-profile model.
Profile n Sat.—need forautonomy
Sat.—need forcompetence
Sat.—need forrelatedness
Autonomousregulation
In-roleperformancea
OCBIa
1—Uncommitted 27 4.24 5.06 4.07 1.27 6.23 5.532—Continuance dominant 44 4.61 5.41 3.75 1.29 6.41 5.683—Moderate commitment 123 5.05 5.68 5.09 2.90 6.59 6.164—Low-moderate commitment 74 4.96 5.35 4.92 2.58 6.57 6.195—Fully committed 78 5.80 5.96 6.01 3.52 6.59 6.236—AC–NC-dominant 56 5.88 6.19 5.75 4.46 6.63 6.20Post-hoc comparisonsb 6,5N3N4N1 6,5N2,4,1 5,6N3N4N1,2 6N5N3N4N2,1 4,5,6b2,1
5,6N2 6N3N4,1 3N2
Profile n OCBOa Positive affect Negative affect General health complaints Work engagement
1—Uncommitted 27 4.86 2.77 2.16 2.05 2.782—Continuance dominant 44 5.14 2.90 2.08 2.28 3.403—Moderate commitment 123 5.66 3.45 1.77 1.99 4.494—Low-moderate commitment 74 5.39 3.24 1.70 1.94 3.955—Fully committed 78 6.00 3.81 1.52 1.79 5.006—AC-NC-dominant 56 5.93 4.03 1.51 1.76 4.98Post-hoc comparisonsb 5,6,3N1 6,5N3N4N2,1 1,2N3,4,5,6 2N1,3,4N5,6 5,6N3N4N2N1
5,6N2 3N4,6 3N4
Note. AC=affective commitment; NC=normative commitment; CC=continuance commitment.a For in-role performance, OCBI, and OCBO, n=180; Profile membership is: Pr. 1=12, Pr. 2=20, Pr. 3=60, Pr. 4=25, Pr. 5=41, Pr. 6=22.b Post-hoc comparisons indicate which profile means differ significantly at pb .05.
12 J.P. Meyer et al. / Journal of Vocational Behavior 80 (2012) 1–16

andNCand low levels of CC (Profile 6) andone reflecting strongCC andweakAC andNC (Profile 2). The existenceof thesequalitativelydistinct profiles allowed us to address the implications of context effects (Gellatly et al., 2006).
Unfortunately, we did not obtain the AC-dominant, NC-dominant, or CC/NC-dominant profile groups needed to fully test ourhypotheses. As a result, we could not assess the implications of combining NC with strong AC (moral imperative) as opposed tocombining it with strong CC and weak AC (indebted obligation). However, we were able to test for context effects involving CC bycomparing profileswhere CC alonewas strong (Profile 2)with a profilewhere itwas combinedwith strongAC andNC (Profile 5). Thefact that LPAdoes not always generate theprofile groupsneeded to test substantive hypotheses is a limitation thatwe address inmoredetail below.
As expected, we found that themotivational state, job performance, andwell-being associatedwith strong CC differed dependingonwhether it was combinedwith strong orweak AC andNC.When combinedwith strong AC and NC, CCwas associatedwith greaterautonomous regulation, need satisfaction,OCB, andwell-being (i.e., higher positiveaffect andwork engagement, lowernegative affect,and fewer health complaints). These finding are consistent with earlier studies (e.g., Somers, 2009, 2010; Stanley et al., 2009; Wasti,2005) in disconfirming Meyer and Herscovitch's (2001) proposition that strong CC would mitigate the effects of strong AC. Rather,they support the notion that the mindset and outcomes associated with CC can vary with context. When CC dominates the profile, itmay reflect a threat of economic cost (e.g., lost wages or benefits) or the loss of other “side bets” (Becker, 1960). However, when itcombines with strong AC and NC, it may reflect the potential loss of valued opportunities or resources (Powell &Meyer, 2004). Basedon our findings, it appears that the way CC is experienced can have important implications for employees and their organizations.
Althoughwecould not fully test our hypothesis concerning context effects forNC,wedidfind that the twoprofiles characterized bystrong AC and NC had the highest levels of autonomous regulation, need satisfaction, OCB, and well-being of all the profile groups(all comparisons with the uncommitted and CC-dominant profiles were significant). Together, these findings are consistent withprevious research and with the suggestion that, when combined with strong AC, NC is experienced as a moral imperative (Gellatlyet al., 2006;Meyer&Parfyonova, 2010). Therefore,when employeeswant to remain in the organization andbelieve it is the right thingto do, they are happier, more satisfied, more self-directed, healthier, more engaged, and more willing to exert discretionary effort onbehalf of the organization than when they are uncommitted or feel that they have to remain. We return to a discussion of thetheoretical andpractical implications of context effects later. First, it is important to consider the strengths and limitations of our study.
Strengths and limitations
The present study is one of relatively few that have been conducted to testMeyer andHerscovitch's (2001) propositions regardingthe nature and consequences of commitment profiles within the TCM framework. Moreover, it was guided by recent theoreticaldevelopments (Meyer et al., 2004; Meyer & Maltin, 2010; Meyer & Parfyonova, 2010) involving the integration of the TCM and SDT.We also applied analytic procedures (LPA) that have advantages over the median-split and cluster-analytic techniques usedpreviously (see Marsh et al., 2009; Pastor, Barron, Miller, & Davis, 2007; Vandenberg & Stanley, 2009). Finally, we examined a widerrange of outcomemeasures, including measures of relevance to both organizations and their employees, than has typically been thecase in previous research.
Although our use of self-report measures to test many of our hypotheses might be considered a limitation, there are threereasons whywe believe that this is not of major concern. First, the CFA provided evidence suggesting that the study variables weredistinguishable. Second, we used peer assessments for three of our criterion variables and (with the exception of in-roleperformance) the pattern of findings was very similar to those for the self-report measures. Finally, if anything, the existence ofcommon method variance mitigates against detecting qualitatively distinct profile groups as we did in this study.
Other limitations of our study included the low response rate and high overall ratings provided by the peer raters. The high ratings forin-role performance in particularmight have prevented us from finding significant differences across profile groups. It is noteworthy thatwe found significant differences for OCBdespite the generally high ratings. Ratersmayhave felt somewhatmore comfortable in assigninglower (and perhaps more accurate) ratings for OCB than for in-role performance due to their discretionary nature.
Despite it benefits, one disadvantage of using LPA is that it does not always yield the profile groups included in one's hypotheses.Although this is a problem for hypothesis testing, it should not be taken as a limitation of LPA for the study of commitment moregenerally. To the contrary, LPA is effective at identifying the profile groups that exist within a particular sample and, when appliedacross studies, might help to identify the most commonly occurring profile groups. There may be good reasons why certain profilegroups are not represented in a particular sample. For example, participants in the present studywere all employed in human serviceorganizations and therefore any obligation they feltmay have derivedmore from their sense of purpose (amoral imperativemindset)than from a need to reciprocate or fulfill others’ expectations (an indebted obligationmindset). This might explain the absence of aCC/NC-dominant group. However, this profile group has emerged in other studies using cluster analyses (Somers, 2010;Wasti, 2005).Indeed, a review of existing profile studies (see Table 1) reveals that, with the exception of an NC-dominant group, most of the profilegroupings identified by Meyer and Herscovitch (2001) have emerged in one or more studies using cluster analysis or LPA.Consequently, the best way to identify and understand the implications of the full range of potential profile groupswithin a broaderpopulation of employees is to look across studies.
Implications for theory and practice
The findings of this study have several important implications for commitment theory. First, they provide additional evidence forthe importance of considering context when examining the implications of a particular component of commitment (Gellatly et al.,
13J.P. Meyer et al. / Journal of Vocational Behavior 80 (2012) 1–16

2006). In this case, we found the strongest evidence of context effects for CC. These findings suggest the need to take a new look at theimplications of CC.
CC has generally been viewed as a negative form of commitment - although employees feel compelled to complywith a particularcourse of action (e.g., stayingwith an organization), they are typically seen as lesswilling than thosewith strongAC or NC to engage indiscretionary actions (e.g., OCB) for the benefit of theorganization (Meyer &Herscovitch, 2001).Meyer andHerscovitch proposed thatthis sense of entrapment would carry over andmitigate the otherwise positive effects of AC for employees for whomAC and CCwereboth strong. Our findings suggest that this is not necessarily the case. When AC and NC are also strong, employees with strong CCappear satisfied, self-directed, and engaged in their work. Indeed, it may be the potential loss of these positive conditions thatcontributes to their awareness of cost associated with leaving. Thus, from a theoretical perspective, the implications of CC forwork-relevant behavior and employeewell-beingmust be viewed in light of the strength of the other components, and the nature ofthe costs that are perceived to follow from the discontinuation of a course of action.
It is only recently that commitment has been viewed as a motivational construct and the TCM has been integrated with theories ofworkmotivation (e.g., Johnson et al., 2010;Markovits, Ullrich, VanDick, &Davis, 2008;Meyer et al., 2004;Meyer &Maltin, 2010;Meyer&Parfyonova, 2010). Thepresent study is oneof thefirst to explore commitment profiles and their implications for behavior andwell-beingwithin a motivational framework. Most notably, it demonstrates that employees with commitment profiles characterized by strong ACand NC experience high levels of need satisfaction and feel autonomously regulated as they engage in their work activities. According toSDT, satisfaction of the needs for autonomy, competence, and relatedness is essential for psychological health (Ryan & Deci, 2000; Ryan,Huta, & Deci, 2008). Consequently, it is not surprising that we found the highest levels of positive affect and work engagement and thelowest negative affect and fewest health complaints among employees in the AC/NC-dominant and fully committed profile groups.
Identifying need satisfaction as a basis for the commitment mindsets might also have implications for understanding thedevelopment of commitment. For example, SDT researchers have identified various need-supportive work conditions (Deci et al.,2001) and managerial behaviors (Parfyonova, 2009) that contribute to satisfaction of the needs for autonomy, competence, andrelatedness. Not surprisingly, these conditions have much in common with variables that have been found to be among the bestpredictors of AC and NC, including perceived organizational support (Rhoades & Eisenberger, 2002), organizational justice (Colquitt,Conlon, Wesson, Porter, & Ng, 2001), transformational leadership (Meyer et al., 2002), and value congruence (Kristof-Brown,Zimmerman,& Johnson, 2005). This suggests that need satisfactionmight be an importantmechanism involved in thedevelopment ofAC and NC, and a moral imperative mindset. We discuss the practical implications of this observation below.
From a practical standpoint, the present findings confirm the benefits to organizations of having a workforce with a strong ACand NC. Indeed, it may be that the combination of AC and NC is superior to strong AC alone (see Wasti, 2005; Stanley et al., 2009;Somers, 2009, 2010, for evidence). There appears to be little evidence that a strong NC detracts from AC. In the present study, wealso found that strong CC need not be a concern as previously thought, as long as it is combined with strong AC and NC. In light ofthese findings it appears that organizations wanting to assess the commitment levels in their workforce should consider theprevalence of various profile groups rather than the levels of individual components in isolation.
Although it is unlikely that organizations will want or be able to conduct complex profile analyses, this may be unnecessary asresearch cumulates to demonstrate the relative benefits of various profiles. A simpler approach (e.g., splitting at the scalemidpoint) may be sufficient to identify the prevalence of different groups within an organization. To date, the evidence suggeststhat employees with an AC/NC-dominant or fully committed profile will be both more productive and healthier than those withother profiles, including an AC-dominant profile (Gellatly et al., 2006; Somers, 2009; Wasti, 2005). Uncommitted employees areunlikely to remainwith the organization for any length of time, but they are also unlikely to feel a sense of satisfaction of their coreneeds and/or to be optimally healthy and productive while they remain in the organization. Indeed, we found that theuncommitted profile group had among the lowest scores in terms of need satisfaction, autonomous regulation, OCB, andwell-being of any group, with the exception of the CC-dominant group. The latter could arguably be the most problematic of allgroups. Although more likely than uncommitted employees to remain with the organization (Gellatly et al., 2006), employeeswith a CC-dominant profile are unlikely to engage in discretionary forms of work behavior. They are also likely to experience anabove-average level of health complaints—even more than the uncommitted in the present study. Again however, it is not aheightened level of CC alone that is the problem, but rather its combination with weak AC.
Finally, organizations wanting to foster optimal commitment profiles may find it useful to recognize that employees with thoseprofiles reported high levels of satisfaction of their needs for autonomy, competence, and relatedness. Although more research isnecessary to establish causal priority, it appears that satisfying the core needs identified in SDT might be one principle upon whichorganizations can design commitment-enhancing interventions. The specific organizational policies or managerial practices requiredto satisfy theseneedsmaydiffer across situations (Meyer&Allen, 1997), but canbedesigned andevaluatedona casebycasebasiswiththese needs in mind. The results of our findings, along with a large body of research on SDT (see Gagné & Deci, 2005; Ryan & Deci,2000), suggest that such an approach is likely to have benefits for both the organization and its employees.
To conclude, wewant to note that the shift in attention to commitment profiles reflects a broader trend in organizational researchtoward greater use of a person-centered approach (Wang & Hanges, 2011; Zyphur, 2009). In contrast to the more common variable-centered approach where the objective is to explain relations among variables, the person-centered approach involves theidentification and comparison of homogeneous subgroups within a population. Consequently, it treats individuals in a more holisticfashion and allows for the possibility that a particular set of attributes (e.g., components of commitment) might be experienceddifferently, and have different implications, in combination than they do individually. The person-centered approach allows one totake a different perspective on a phenomenon of interest and serves to complement the variable-centered approach (Marsh et al.,2009;Wang & Hanges, 2011; Zyphur, 2009).We have attempted here to demonstrate its benefits for theory and practice concerning
14 J.P. Meyer et al. / Journal of Vocational Behavior 80 (2012) 1–16
commitment, but itmay have similar benefits in other domainswhere a systemof variables (e.g., leadership styles; job characteristics;cultural values) can be expected to combine in different way to produce different outcomes.
References
Allen, N. J., & Meyer, J. P. (1990). The measurement and antecedents of affective, continuance, and normative commitment to the organization. Journal ofOccupational Psychology, 63, 1–18.
Allen, N. J., & Meyer, J. P. (1996). Affective, continuance, and normative commitment to the organization: An examination of construct validity. Journal of VocationalBehavior, 49, 252–276.
Baard, P. P., Deci, E. L., & Ryan, R. R. (2004). Intrinsic need satisfaction: A motivational basis of performance and well-being in two work settings. Journal of AppliedSocial Psychology, 34, 2045–2068.
Becker, H. S. (1960). Notes on the concept of commitment. The American Journal of Sociology, 66, 32–40.Colquitt, J. A., Conlon, D. E., Wesson, M. J., Porter, C. O. L. H., & Ng, K. Y. (2001). Justice at themillennium: Ameta-analytic review of 25 years of organizational justice
research. Journal of Applied Psychology, 86, 425–445.Cooper-Hakim, A., & Viswesvaran, C. (2005). The construct of work commitment: Testing an integrative framework. Psychological Bulletin, 131, 241–259.Deci, E. L., & Ryan, R. M. (1985). Intrinsic motivation and self-determination in human behavior. New York: Plenum.Deci, E. L., Ryan, R. M., Gagné, M., Leone, D. R., Usunov, J., & Kornazheva, B. P. (2001). Need satisfaction, motivation, and well-being in the work organizations of a
former Eastern Bloc country: A cross-cultural study of self-determination. Personality and Social Psychology Bulletin, 27, 930–942.Gagné, M., & Deci, E. L. (2005). Self-determination theory and work motivation. Journal of Organizational Behavior, 26, 331–362.Gagné, M., Chemolli, E., Forest, J., & Koestner, R. (2008). A temporal analysis of the relation between organisational commitment andworkmotivation. Psychologica
Belgica, 48, 219–241.Gagné, M., Koestner, R., & Zuckerman, M. (2000). Facilitating acceptance of organizational change: The importance of self-determination. Journal of Applied Social
Psychology, 30, 1843–1852.Gagné, M., Forest, J., Gilbert, M. -H., Aubé, C., Morin, E., & Malorni, A. (2010). The motivation at work scale: Validation evidence in two languages. Educational and
Psychological Measurement, 70, 628–646.Gellatly, I. R., Meyer, J. P., & Luchak, A. A. (2006). Combined effects of the three commitment components on focal and discretionary behaviors: A test of Meyer and
Herscovitch's propositions. Journal of Vocational Behavior, 69, 331–345.Goldberg, D. P., Gater, R., Sartorius, N., Ustun, T. B., Piccinelli, M., Gurje, O., et al. (1997). The validity of two versions of the GHQ in theWHO study of mental illness
in general health care. Psychological Medicine, 27, 191–197.Greguras, G. J., & Diefendorff, J. M. (2009). Different fits satisfy different needs: Linking person-environment fit to employee commitment and performance using
self-determination theory. Journal of Applied Psychology, 94, 465–477.Higgins, E. T. (1997). Beyond pleasure and pain. American Psychologist, 52, 1280–1300.Higgins, E. T. (1998). Promotion and prevention: Regulatory focus as a motivational principle. In M. P. Zanna (Ed.), Advances in experimental social psychology,
Vol. 30. (pp. 1–46). New York: Academic Press.Jaros, S. J. (1997). An assessment of Meyer and Allen's (1991) three-component model of organizational commitment and turnover intentions. Journal of Vocational
Behavior, 51, 319–337.Ilardi, B. C., Leone, D., Kasser, T., & Ryan, R. M. (1993). Employee and supervisor ratings of motivation: Main effects and discrepancies associated with job
satisfaction and adjustment in a factory setting. Journal of Applied Social Psychology, 23, 1789–1805.Johnson, R. E., Groff, K. W., & Taing, M. U. (2009). Nature of the interactions among organizational commitments: Complementary, competitive or synergistic?
British Journal of Management, 20, 431–447.Johnson, R. E., Chang, C. -H., & Yang, L. -Q. (2010). Commitment and motivation at work: The relevance of employee identity and regulatory focus. Academy of
Management Review, 35, 226–245.Judge, T. A., Bono, J. E., Erez, A., & Locke, E. A. (2005). Core self-evaluation and job and life satisfaction: The role of self-concordance and goal attainment. Journal of
Applied Psychology, 90, 257–268.Kristof-Brown, A. L., Zimmerman, R. D., & Johnson, E. C. (2005). Consequences of individual's fit at work: A meta-analysis of person-job, person-organization,
person-group, and person-supervisor fit. Personnel Psychology, 58, 281–342.Lee, K., & Allen, N. J. (2002). Organizational citizenship and workplace deviance: The role of affect and cognitions. Journal of Applied Psychology, 87, 131–142.Lubke, G. H., & Muthén, B. (2005). Investigating population heterogeneity with factor mixture models. Psychological Methods, 10, 21–39.Markovits, Y., Davis, A. J., & van Dick, R. (2007). Organizational commitment profiles and job satisfaction among Greek private and public sector employees.
International Journal of Cross-cultural Management, 7, 77–99.Markovits, Y., Ullrich, J., Van Dick, R., & Davis, A. J. (2008). Regulatory foci and organizational commitment. Journal of Vocational Behavior, 70, 483–489.Marsh, H. W., Lüdtke, O., Trautwein, U., & Morin, A. J. S. (2009). Classical latent profile analysis of academic self-concept dimensions: Synergy of person- and
variable-centered approaches to theoretical models of self-concept. Structural Equation Modeling: A Multidisciplinary Journal, 16, 191–225.McLachlan, G., & Peel, D. (2000). Finite mixture models. New York: John Wiley & Sons, Inc..Meyer, J. P., & Allen, N. J. (1991). A three-component conceptualization of organizational commitment. Human Resource Management Review, 1, 64–89.Meyer, J. P., & Allen, N. J. (1997). Commitment in the workplace: Theory, research, and application. Thousand Oaks, CA: Sage.Meyer, J. P., Allen, N. J., & Smith, C. A. (1993). Commitment to organizations and occupations: Extension and test of a three-component conceptualization. Journal of
Applied Psychology, 78, 538–551.Meyer, J. P., Becker, T. E., & Vandenberghe, C. (2004). Employee commitment and motivation: A conceptual analysis and integrative model. Journal of Applied
Psychology, 89, 991–1007.Meyer, J. P., Becker, T. E., & Van Dick, R. (2006). Social identities and commitment at work: Toward an integrativemodel. Journal of Organizational Behavior, 27, 665–683.Meyer, J. P., & Herscovitch, L. (2001). Commitment in the workplace: Toward the general model. Human Resource Management Review, 11, 299–326.Meyer, J. P., & Maltin, E. R. (2010). Employee commitment and well-being: A critical review, theoretical framework, and research agenda. Journal of Vocational
Behavior, 77, 323–337.Meyer, J. P., Stanley, D. J., Herscovitch, L., & Topolnytsky, L. (2002). Affective, continuance, and normative commitment to the organization: A meta-analysis of
antecedents, correlates, and consequences. Journal of Vocational Behavior, 61, 20–52.Meyer, J. P., & Parfyonova, N. M. (2010). Normative commitment in the workplace: A theoretical analysis and re-conceptualization. Human Resource Management
Review, 20, 283–294.Muthén, L. K., & Muthén, B. O. (1998–2007). Mplus User's Guide (Fifth Edition). Los Angeles, CA: Muthén & Muthén.Nylund, K. L., Asparouhov, A., &Muthen, B. (2007). Deciding on the number of profiles in latent profile analysis and growthmixturemodeling. AMonte Carlo study.
Structural Equation Modeling, 14, 535–569.Parfyonova, N. (2009). Employee motivation, performance, and well-being: The role of managerial support for autonomy, competence and relatedness needs.
Unpublished Doctoral Dissertation, Department of Psychology, The University of Western Ontario.Pastor, D. A., Barron, K. E., Miller, B. J., & Davis, S. L. (2007). A latent profile analysis of college students’ achievement goal orientation. Contemporary Educational
Psychology, 32, 8–47.Podsakoff, P. M., & Organ, D. W. (1986). Self-reports in organizational research: Problems and prospects. Journal of Management, 12, 69–82.Powell, D. M., & Meyer, J. P. (2004). Side-bet theory and the three-component model of organizational commitment. Journal of Vocational Behavior, 65, 157–177.Randall, D. M., Fedor, D. B., & Longenecker, C. O. (1990). The behavioral expression of organizational commitment. Journal of Vocational Behavior, 36, 210–224.
15J.P. Meyer et al. / Journal of Vocational Behavior 80 (2012) 1–16

Rhoades, L., & Eisenberger, R. (2002). Perceived organizational support: A review of the literature. Journal of Applied Psychology, 87, 698–714.Ryan, R. M., & Deci, E. L. (2000). Self-determination theory and the facilitation of intrinsic motivation, social development, and well-being. American Psychologist, 55,
68–78.Ryan, R. M., Huta, V., & Deci, E. L. (2008). Living well: A self-determination theory perspective on eudaimonia. Journal of Happiness Studies, 9, 139–170.Schaufeli, W. B., Bakker, A., & Salanova, M. (2006). The measurement of work engagement with a short questionnaire: A cross-national study. Educational and
Psychological Measurement, 66, 701–716.Sclove, L. S. (1987). Application of model selection criteria to some problems in multivariate analysis. Psychometrika, 52, 333–343.Seligman, M. E. P., & Czikszentmihalyi, M. (2000). Positive psychology: An introduction. American Psychologist, 55, 5–14.Sheldon, K. M., & Elliot, A. J. (1998). Not all personal goals are personal: Comparing autonomous and controlled reasons for goals as predictors of effort and
attainment. Personality and Social Psychology Bulletin, 24, 546–557.Sheldon, K. M., Elliot, A. J., Kim, Y., & Kasser, T. (2001). What is satisfying about satisfying events? Testing 10 candidate psychological needs. Journal of Personality
and Social Psychology, 89, 325–339.Sinclair, R. R., Tucker, J. S., Wright, C., & Cullen, J. C. (2005). Performance differences among four organizational commitment profiles. Journal of Applied Psychology, 90,
1280–1287.Somers, M. J. (1995). Organizational commitment, turnover and absenteeism: An examination of direct and interaction effects. Journal of Organizational Behavior, 16,
49–58.Somers, M. J. (2009). The combined influence of affective, continuance, and normative commitment on employeewithdrawal. Journal of Vocational Behavior, 74, 75–81.Somers, M. J. (2010). Patterns of attachment to organizations: Commitment profiles and work outcomes. Journal of Occupational and Organizational Psychology, 83,
443–453.Stanley, L. J., Vandenberg, R. J., Vandenberghe, C., & Bentein, K. (2009). Commitment profiles and turnover intentions. Paper presented at the annual meeting of the
Society for Industrial and Organizational Psychology, New Orleans, LA.Vandenberg, R. J., & Stanley, L. J. (2009). Statistical and methodological challenges for commitment researchers: Issues of invariance, change across time, and
profile differences. In H. J. Klein, T. E. Becker, & J. P. Meyer (Eds.), Commitment in organizations: Accumulated wisdom and new directions (pp. 383–416). Florence,KY: Routledge/Taylor and Francis Group.
Vermunt, J. K., & Magidson, J. (2002). Latent class cluster analysis. In J. A. Hagenaars, & A. McCutcheon (Eds.), Applied latent class analysis (pp. 89–106). Cambridge, UK:Cambridge University Press.
Wasti, S. A. (2005). Commitment profiles: Combinations of organizational commitment forms and job outcomes. Journal of Vocational Behavior, 67, 290–308.Watson, D., Clark, L. A., & Tellegen, A. (1988). Development and validation of brief measures of positive and negative affect: The PANAS scales. Journal of Personality
and Social Psychology, 54, 1063–1070.Williams, L. W., & Anderson, S. E. (1991). Job satisfaction and organizational commitment as predictors of organizational citizenship and in-role behaviors. Journal of
Management, 17, 601–617.Future topic: Latent class procedures in organizational research. Wang, M., & Hanges, P. J. (Eds.). (2011). Organizational Research Methods, 14, .Zyphur, M. J. (2009). When mindsets collide: Switching analytical mindsets to advance organizational science. Academy of Management Review, 34, 677–688.
16 J.P. Meyer et al. / Journal of Vocational Behavior 80 (2012) 1–16