Empirical Evidence on the Role of Trading Suspensions in Disseminating New Information to the...
26
Journal of Business Finance & Accounting, 33(7) & (8), 1142–1167, September/October 2006, 0306-686X doi: 10.1111/j.1468-5957.2006.00597.x Empirical Evidence on the Role of Trading Suspensions in Disseminating New Information to the Capital Market Peter-Jan Engelen and Rezaul Kabir* Abstract: This paper examines the effect of temporarily suspending the trading of exchange- listed individual stocks. We evaluate whether regulatory authorities can successfully use the mechanism of trading suspension in forcing companies to disclose new and material information to the capital market. Previous studies on trading suspensions mainly concentrate on North- American stock markets and find conflicting results. This study utilizes a new data set comprising of firms listed on Euronext Brussels – an important segment of Europe’s leading cross-border exchange. Our results show that suspension is indeed an effective means of disseminating new information. Stock prices adjust completely and instantaneously to the new information released during trading suspensions. We also observe a significant increase in trading volume with the reinstatement of trading. On the other hand, we do not find support for the claim that trading suspensions increase the volatility of stock prices. Overall, our results show the efficacy of trading suspensions in disseminating new information. Keywords: trading suspension, trading halt, information disclosure, regulation, stock market 1. INTRODUCTION Do investors care about the quality of the financial markets in which they operate? Although an affirmative answer seems obvious and natural, it is only recently that the law and finance literature initiated by the seminal papers of La Porta, Lopez-de-Silanes, Shleifer and Vishny (1997 and 1998) started investigating the relationship between a country’s legal framework and its financial development. These studies offer strong empirical evidence on the importance of the legal environment (market integrity, investor protection) of a country for the development of its financial markets and *The authors are respectively, from the Utrecht School of Economics, Utrecht University, The Netherlands; and the Department of Accounting and Finance, University of Stirling, UK. The paper was written while the second author was at Tilburg University. The authors thank Marc Deloof, Luc Renneboog, Martin Walker (an editor), Sabine Verboven, and an anonymous referee for helpful comments. (Paper received December 2002, revised version accepted May 2005. Online publication 7 April 2006) Address for correspondence: Peter-Jan Engelen, Utrecht School of Economics, Utrecht University, Vreden- burg 138, 3511 BG Utrecht, The Netherlands. e-mail: [email protected] C 2006 The Authors Journal compilation C 2006 Blackwell Publishing Ltd, 9600 Garsington Road, Oxford OX4 2DQ, UK and 350 Main Street, Malden, MA 02148, USA. 1142
-
Upload
stamforduniversity -
Category
Documents
-
view
2 -
download
0
Transcript of Empirical Evidence on the Role of Trading Suspensions in Disseminating New Information to the...
Journal of Business Finance & Accounting, 33(7) & (8), 1142–1167, September/October 2006, 0306-686Xdoi: 10.1111/j.1468-5957.2006.00597.x
Empirical Evidence on the Role of TradingSuspensions in Disseminating NewInformation to the Capital Market
Peter-Jan Engelen and Rezaul Kabir*
Abstract: This paper examines the effect of temporarily suspending the trading of exchange-
listed individual stocks. We evaluate whether regulatory authorities can successfully use the
mechanism of trading suspension in forcing companies to disclose new and material information
to the capital market. Previous studies on trading suspensions mainly concentrate on North-
American stock markets and find conflicting results. This study utilizes a new data set comprising
of firms listed on Euronext Brussels – an important segment of Europe’s leading cross-border
exchange. Our results show that suspension is indeed an effective means of disseminating new
information. Stock prices adjust completely and instantaneously to the new information released
during trading suspensions. We also observe a significant increase in trading volume with the
reinstatement of trading. On the other hand, we do not find support for the claim that trading
suspensions increase the volatility of stock prices. Overall, our results show the efficacy of trading
suspensions in disseminating new information.
Keywords: trading suspension, trading halt, information disclosure, regulation, stock
market
1. INTRODUCTION
Do investors care about the quality of the financial markets in which they operate?Although an affirmative answer seems obvious and natural, it is only recently that thelaw and finance literature initiated by the seminal papers of La Porta, Lopez-de-Silanes,Shleifer and Vishny (1997 and 1998) started investigating the relationship between acountry’s legal framework and its financial development. These studies offer strongempirical evidence on the importance of the legal environment (market integrity,investor protection) of a country for the development of its financial markets and
*The authors are respectively, from the Utrecht School of Economics, Utrecht University, The Netherlands;and the Department of Accounting and Finance, University of Stirling, UK. The paper was written while thesecond author was at Tilburg University. The authors thank Marc Deloof, Luc Renneboog, Martin Walker(an editor), Sabine Verboven, and an anonymous referee for helpful comments. (Paper received December2002, revised version accepted May 2005. Online publication 7 April 2006)
Address for correspondence: Peter-Jan Engelen, Utrecht School of Economics, Utrecht University, Vreden-burg 138, 3511 BG Utrecht, The Netherlands.e-mail: [email protected]
C© 2006 The AuthorsJournal compilation C© 2006 Blackwell Publishing Ltd, 9600 Garsington Road, Oxford OX4 2DQ, UKand 350 Main Street, Malden, MA 02148, USA. 1142
DISSEMINATING NEW INFORMATION TO THE CAPITAL MARKET 1143
economic growth. A legal environment that offers better investor protection is shownto expand the ability of companies to raise external finance through either debt orequity.In its recent proposal of the Market Abuse Directive, the European Commission alsostresses the importance of an adequate legal framework for companies to raise capital.1
The Federation of European Stock Exchanges (FESE) subscribes to that statement aswell (FESE, 2000 and 2001). As the European Commission defines market abuse as asituation in which investors ‘have used information which is not publicly available totheir own advantage’, the supervision of ongoing disclosure obligations, particularly thead-hoc disclosure of price-sensitive news, is of crucial importance in order to promotemarket integrity and market quality.
A widely used mechanism to regulate disclosure of new information to the capitalmarket is trading suspension. We define trading suspension as a temporary interruptionin the official trading of an individual stock listed on a stock exchange.2 Authoritiesusually adopt this regulatory measure to disseminate price-sensitive information duringthe trading hours of a stock exchange with the intention of providing investors extratime to evaluate newly released information about a specific company. The regulationis especially used when it is believed that a listed firm is not publicly disclosing materialinformation. Trading suspension is thus considered to be a crucial regulatory measurein order to maintain a fair and orderly market in which ‘all investors should havesimultaneous access on a timely basis to the information they require to take theirinvestment decisions’ (FESCO, 2001).
The desirability of trading suspension is subject to considerable debate amongregulators, market participants and academics (Wu, 1998). Proponents of tradingsuspension argue that it provides investors extra time to evaluate newly releasedinformation so that no specific group of investors obtains an undue advantage in stocktrading. They also argue that stock prices become more informative, uncertainty isreduced and investors are protected from volatile price movements. On the other hand,critics argue that trading suspensions simply delay stock price adjustments, imposeadditional costs on investors who are deprived of trading opportunities and make astock exchange less attractive to investors. Ultimately, the regulatory authority needs ‘toweigh the benefits of allowing continuous trading against the desirability of interposingprocesses which afford market users the opportunity to reassess a changed situationand to alter their orders accordingly’.3
How effective are trading suspensions? Do suspensions allow the stock market toreceive new information? Do stock prices adjust quickly to the information releasedduring the suspension period? Does the stock volatility increase due to suspension? By
1 European Commission, Explanatory Memorandum, Proposal for a Directive of the European Parliament andof the Council on Insider Dealing and Market Manipulation (30 May, 2001).2 The term ‘trading suspension’ can also refer to other kinds of regulatory measures. A ‘circuit breaker’
involves a market-wide halt of trading of all stocks. Restrictions are imposed on the movement of market-wide prices (or volumes) beyond pre-set parameters in order to reduce market volatility (e.g. rule 80B ofthe NYSE). Besides market-wide circuit breakers, restrictions on daily price variations of individual securitiesalso exist (e.g. rule 4404/1 Euronext Rule Book). In case of a ‘listing suspension’, the supervisory authoritydecides to suspend the stock exchange listing of a particular security until the situation of non-compliancewith the continuing obligations arising from a listing has been remedied. Finally, ‘delisting’ refers to thepermanent cancellation of the listing.3 Forum of European Securities Commissions (FESCO), Standards for Regulated Markets, 1999, standard 7,
paragraph 14.
C© 2006 The AuthorsJournal compilation C© Blackwell Publishing Ltd. 2006
1144 ENGELEN AND KABIR
addressing these issues, this study assesses the overall efficiency of trading suspensionsto disseminate new information among market participants. Therefore, we examine thepattern of trading activity before and after the trading suspension in order to evaluatethis regulatory policy measure. Moreover, based on detailed information collectedfrom the stock exchange, the empirical analysis traces if the stock return behaviorsurrounding the trading suspension is affected by the publicly announced reason forthe suspension.
The study complements the existing literature in several ways. First, our sample oftrading suspensions offers an opportunity to examine this regulatory measure on a stockmarket that is well suited to testing only the pure information effect. Many earlier studieshave investigated samples from the North-American stock markets where the majorityof suspensions were due to an imbalance between buy and sell orders or delayedopenings (Hopewell and Schwartz, 1978; and Kryzanowski and Nemiroff, 2001).4 Thesample we investigate does not contain these specific types of suspensions. Disclosureof new information to the capital market is the only reason that trading suspensionsare mandated by the authorities. As the law and finance literature suggests that theinstitutional and the legal environment matter, mixed empirical results obtained fromthe North-American capital markets cannot be transformed automatically to evaluateother (European) markets.
Second, we analyze a new data set collected from Euronext Brussels. This exchangeis part of Europe’s leading cross-border exchange: Euronext.5 In terms of total marketcapitalization as of March 2005, Euronext is almost equal to that of the London StockExchange and twice as big as that of Deutsche Borse. The study on Euronext Brusselsoffers an opportunity to evaluate trading suspensions that occur without any influenceof market makers or specialists, as is the case, for instance, on the New York StockExchange (NYSE). While trading suspensions on the NYSE tend to protect specialists(Howe and Schlarbaum, 1986), trading suspensions on Euronext Brussels do not aimto protect any particular member or interest group. So, an unbiased impact of theregulatory action can be measured which takes place without any interference frominterest groups.6
Third, the study aims to contribute to the current debate between the EuropeanCommission and FESE on whether a stock exchange can add value by ensuringmarket integrity. Although FESE and the European Commission are both committedto achieving a high level of market quality, they disagree on its implementation. TheEuropean Commission supports the idea of a single central, administrative regulatory
4 Although often used synonymously, it is useful to make a distinction between trading halt and tradingsuspension. The former is generally used for short durations (up to one trading session), whereas the latteris generally used for more than one trading session. Trading halts in a strict sense do not necessarily lead toa disclosure of new information; these are in most cases intended to correct order imbalances or delayedopenings. Imbalance suspensions are initiated by specialists when they are temporarily unable to continuemaking a market in their specialist stock because of the quantity or mix of orders in that stock. Such requestsare approved by the market authority for an extraordinary number of orders that cannot be properly matchedimmediately or for an unusual mix of orders requiring the specialist to await offsetting orders for properexecution.5 In 2000, three stock exchanges, the Brussels Stock Exchange, the Amsterdam Exchanges and the Paris
Bourse, merged together to form a single securities market called Euronext. Two more exchanges, LondonInternational Financial Futures and Options Exchange and the Portuguese exchange, merged with Euronextin 2002.6 This is because it is difficult to predict univocally the bias of specialists’ involvement in the decision
process of suspensions.
C© 2006 The AuthorsJournal compilation C© Blackwell Publishing Ltd. 2006

DISSEMINATING NEW INFORMATION TO THE CAPITAL MARKET 1145
authority in each EU Member State, which should be independent of an exchange.Because many stock exchanges demutualize fully, operate with a profit motive andhave become listed companies themselves (e.g. Euronext, London and Stockholmstock exchanges), the European Commission argues that such exchanges cannot anylonger be entrusted with regulation as they have a conflict of interest. Instead of acentral authority substituting the supervision of the exchanges, FESE (2001) stresses thecomplementary role of the exchanges and their experience and investment in detectionand market surveillance. It particularly stresses the need for market knowledge andproximity and supports the allocation of regulatory powers ‘closer to the market’.The alleged benefits of allocating the supervision to the exchange itself are: (a)familiarity with the trading system and its screening and filtering algorithms, (b) closercontact with market participants and (c) more timely actions when market irregularitiesare detected, all of which are crucial elements to install a trading suspension fordisseminating price-sensitive news. This study adds to the debate whether a regulation‘close to the market’, such as the regulation on the dissemination of price-sensitiveinformation during the trading hours of Euronext Brussels, can maintain an orderlymarket.
The remainder of this paper is organized as follows. In Section 2, we review theexisting literature. In Section 3, we explain the phenomenon of trading suspensionwith the help of an example. Section 4 explains the research methodology and Section5 describes the sample. Empirical results are reported in Section 6. The final sectionsummarizes and presents conclusions.
2. REVIEW OF THE LITERATURE
Hopewell and Schwartz (1978) examine trading suspensions (halts) on the NYSE.About 92% of these suspensions did not exceed the length of one trading day.In addition, almost half of these suspensions are not related to disclosure of newinformation, but to order imbalances. The authors find that events triggeringnews suspensions typically result in suspensions of longer duration and stock pricechanges of greater magnitude than for imbalance suspensions. They also observe thatstock prices adjust rapidly to the new information released during the suspensionperiod.
On the other hand, investigating trading suspensions on Canadian stock exchanges,Kryzanowski (1979) finds that only the good news disseminated during a tradingsuspension is rapidly impounded in stock prices. When suspension leads to thedisclosure of bad news, the stock market fails in full and rapid impounding of thatinformation in stock prices. One particular feature of this sample is the very longduration of suspensions: the average length of the trading suspension period for thegood and bad news sample are 15 and 10 weeks, respectively.
Suspensions ordered by the Securities and Exchange Commission (SEC) in theUS are also of relatively longer duration. Howe and Schlarbaum (1986) analyzea sample of these suspensions with an average length of 12 weeks. They find asubstantial disclosure of bad news during the suspended period. Moreover, theyobserve that stock prices continue to decline even after the reinstatement of trading.The results of Kryzanowski (1979) and Howe and Schlarbaum (1986) suggest thattrading suspensions are not an effective means of disclosing new information. These
C© 2006 The AuthorsJournal compilation C© Blackwell Publishing Ltd. 2006
1146 ENGELEN AND KABIR
results are also confirmed by Ferris, Kumar and Wolfe (1992), who examine 40 SEC-initiated trading suspensions and detect anticipatory stock price behavior as well asincomplete price adjustment to new information released during suspension, especiallyfor the bad news sub-sample.
With the availability of new data sources, recent studies have started examining otherissues related to suspensions. Ferris, Kumar and Wolfe (1992), Lee, Ready and Seguin(1994) and Christie, Corwin and Harris (2002) observe increased volume and volatilityafter trading suspensions. Corwin and Lipson (2000) document a decline in liquidityaround trading suspensions on the NYSE. Kryzanowski and Nemiroff (1998) detecthigher trading activity in the pre-suspension period on the Montreal Stock Exchange.Trading activity declines to pre-suspension level within two days after the resumptionof trading. Increased volatility is also observed in the post-suspension period, but itdeclines very quickly to the pre-event level. Recently, Kryzanowski and Nemiroff (2001)analyze the behavior of the components of the spread surrounding suspensions onCanadian stock exchanges.
Interest in trading suspensions on non-American stock exchanges has also increasedrecently. Kabir (1994) observes that more than 70% of trading suspensions on theLondon Stock Exchange remain in force for more than one month. A majorityof the suspended companies are afterwards removed from exchange listings dueto merger, acquisition and liquidation. His findings of anticipatory price behavior,as well as significant stock price increases after the reinstatement of trading, castdoubt on the efficacy of suspensions in disseminating new information. Wu (1998)examines suspensions taking place on the Hong Kong Stock Exchange and findsthe presence of some anticipatory price behavior in the pre-suspension period andincreased trading volume and stock return variance in the post-suspension period.Tan and Yeo (2003) investigate trading suspensions on the Singapore Exchange. Theirresults show that suspensions lead to the release of new sensitive information. The reviewof empirical studies thus shows mixed results concerning the effectiveness of tradingsuspensions.
3. TRADING SUSPENSION: AN ILLUSTRATION
In Belgium, the suspension of trading is the mandate of the Market Authority onEuronext Brussels. The rules of suspension are formulated in broad and vague terms.The Exchange can suspend trading in one or more securities for the duration that itfinds necessary to protect the public interest. The mission of the Exchange is to ensureequality among shareholders and correct information to the public, in particular withregard to the dissemination of price sensitive information. The generally followedpolicy is that any public disclosure of price sensitive information should be made afterthe closure of the market on the day on which the fact occurred or on which thedecision was taken. This policy is justified on two grounds. Firstly, a disclosure during theopening hours would distort the stock’s price formation. Secondly, a disclosure after theclosing of the market allows information dissemination in the broadest sense (throughthe press). These grounds are obviously at odds with the goal of an informationallyefficient stock market. Moreover, foreign dual listings can complicate such disclosurepolicy.
The guideline usually followed for trading suspensions can be described as follows.The Company Information Department of Euronext Brussels continuously monitors
C© 2006 The AuthorsJournal compilation C© Blackwell Publishing Ltd. 2006

DISSEMINATING NEW INFORMATION TO THE CAPITAL MARKET 1147
the price and the trading volume patterns of all listed stocks. If any abnormalbehavior is detected or if there are rumors in the market, the Department contactsthe listed company to find out if there is any press release pending. If there is asuspicion of information leakage prior to the press release and a possibility of insidertrading, the Exchange takes the decision to suspend the trading of the stock and asksthe company to release the information to the market. When a company wants todistribute a press release during the opening hours, it has to inform the CompanyInformation Department. The Exchange independently decides whether to install atrading suspension or not.
For example, on March 30, 1998, Euronext Brussels suspended trading in the sharesof Barco (a Belgian industrial firm) for 35 minutes from 3:25 p.m. until 4 p.m. Thesuspension decision was taken because Barco was involved with the acquisition of GerberSystems Corporation, a subsidiary of the NYSE-listed company Gerber Scientific Inc.The news was earlier released in the US by Gerber Scientific Inc. during an analystsmeeting held in New York. Barco issued a press release in Brussels confirming theacquisition.
The stock price behavior surrounding the suspension is shown in Figure 1. We can seethat the share price of Barco increased substantially after the opening of the Exchange.The opening share price was 235. By the time the suspension decision was taken, the
Figure 1
Trading Suspension: An Illustration
0
5000
10000
15000
20000
25000
30000
35000
–5 –4 –3 –2 –1 0 1 2 3 4 5Event window
Vol
ume
225.00
230.00
235.00
240.00
245.00
250.00
255.00
Stoc
k pr
ice
VolumeStock price
Day [–1] Day [0] Day [+1]
16.30 10.00 15.25 16.00 16.30 10.00
Halt
235.75
235
238.47
242.69
238.47
244.42
Day
Time
Stock price
Notes:This graph illustrates the daily stock price and the daily trading volume behavior surrounding the
trading suspension of Barco that took place on March 30, 1998 (defined as day 0). Stock price is
expressed in Euros. Volume is the number of common shares traded, expressed in thousands.
C© 2006 The AuthorsJournal compilation C© Blackwell Publishing Ltd. 2006

1148 ENGELEN AND KABIR
share price increased by 1.5% to 238.47. This sudden share price increase togetherwith the news from the US have led the market authority on Euronext Brussels todecide to temporarily suspend the trading of Barco shares.7 The suspension of such ashort duration led to the release of additional new information which was interpretedpositively by investors. Stock prices of Barco jumped by another 1.7% from 238.47 justbefore the start of suspension to 242.69 at the reinstatement of trading. This changein stock price reflects the content of new information released during the suspensionperiod.
The volume of trade indicates a similar interpretation of the news disclosed duringthe trading suspension. There was a relatively higher trading volume on the dayafter suspension compared to the day before suspension. Investors appeared to havereacted to the information released through suspension by initiating new buy orsell orders. An increased trading volume was not observed anymore during the daysafterwards.
4. RESEARCH METHODOLOGY
(i) Stock Return Analysis
We analyze the stock return behavior surrounding trading suspensions by using theevent study methodology. We test if the average abnormal return (AARE) on theday of the event (suspension) is equal to zero (the null hypothesis). The alternativehypothesis is a non-zero abnormal stock return. Following MacKinlay (1997), the testsare expressed as follows:8
{H0 : AARE = 0
H1 : AARE �= 0.(1)
If trading suspensions are effective, we expect to find no abnormal returns priorto or after the suspension. In other words, suspensions are assumed to be installedunexpectedly and to be withdrawn when a full disclosure of information takes place.The average abnormal return on the event day is derived from aggregating individualstock abnormal returns aligned in event time, and is expressed as:
AARE = 1
N
N∑i=1
ARi,E (2)
where N is the number of stocks in the sample.9
7 Based on consultations with Mr. V. Van Dessel, Head of the Market Authority of Euronext Brussels.8 In the empirical analysis, we also consider other moments of abnormal returns.9 The following notations are used in the rest of the paper: Ri,t = the continuously compounded return of
stock i in period t; Rm,t = the continuously compounded market index return in period t; ARi,t = abnormalreturn of stock i on day t of the estimation period; ARi,E = abnormal return of stock i on the event day;Rm,t = market index return on day t of the estimation period; Rm,E = market index return on the event day;
m = average market index return during the estimation period; T = number of trading days in the estimation
period; S i = estimated standard deviation of the abnormal return of stock i during the estimation period;SARi,E = standardized abnormal return of stock i on the event day.
C© 2006 The AuthorsJournal compilation C© Blackwell Publishing Ltd. 2006
DISSEMINATING NEW INFORMATION TO THE CAPITAL MARKET 1149
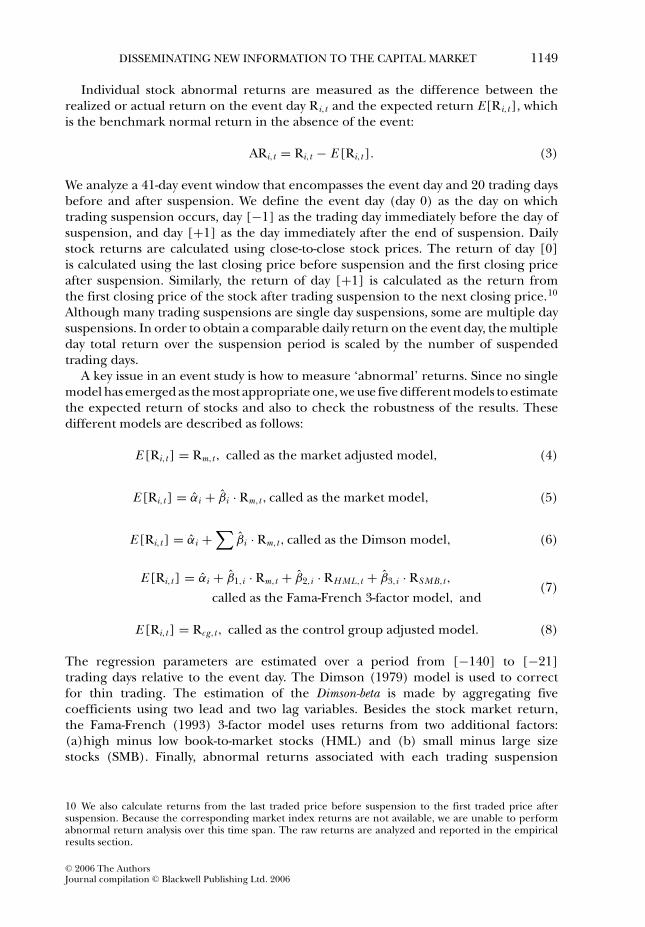
Individual stock abnormal returns are measured as the difference between therealized or actual return on the event day Ri,t and the expected return E[Ri,t], whichis the benchmark normal return in the absence of the event:
ARi,t = Ri,t − E [Ri,t ]. (3)
We analyze a 41-day event window that encompasses the event day and 20 trading daysbefore and after suspension. We define the event day (day 0) as the day on whichtrading suspension occurs, day [−1] as the trading day immediately before the day ofsuspension, and day [+1] as the day immediately after the end of suspension. Dailystock returns are calculated using close-to-close stock prices. The return of day [0]is calculated using the last closing price before suspension and the first closing priceafter suspension. Similarly, the return of day [+1] is calculated as the return fromthe first closing price of the stock after trading suspension to the next closing price.10
Although many trading suspensions are single day suspensions, some are multiple daysuspensions. In order to obtain a comparable daily return on the event day, the multipleday total return over the suspension period is scaled by the number of suspendedtrading days.
A key issue in an event study is how to measure ‘abnormal’ returns. Since no singlemodel has emerged as the most appropriate one, we use five different models to estimatethe expected return of stocks and also to check the robustness of the results. Thesedifferent models are described as follows:
E [Ri,t ] = Rm,t , called as the market adjusted model, (4)
E [Ri,t ] = αi + βi · Rm,t , called as the market model, (5)
E [Ri,t ] = αi +∑
βi · Rm,t , called as the Dimson model, (6)
E [Ri,t ] = αi + β1,i · Rm,t + β2,i · RHML,t + β3,i · RS MB,t ,
called as the Fama-French 3-factor model, and(7)
E [Ri,t ] = Rcg,t , called as the control group adjusted model. (8)
The regression parameters are estimated over a period from [−140] to [−21]trading days relative to the event day. The Dimson (1979) model is used to correctfor thin trading. The estimation of the Dimson-beta is made by aggregating fivecoefficients using two lead and two lag variables. Besides the stock market return,the Fama-French (1993) 3-factor model uses returns from two additional factors:(a)high minus low book-to-market stocks (HML) and (b) small minus large sizestocks (SMB). Finally, abnormal returns associated with each trading suspension
10 We also calculate returns from the last traded price before suspension to the first traded price aftersuspension. Because the corresponding market index returns are not available, we are unable to performabnormal return analysis over this time span. The raw returns are analyzed and reported in the empiricalresults section.
C© 2006 The AuthorsJournal compilation C© Blackwell Publishing Ltd. 2006
1150 ENGELEN AND KABIR
are compared with those of industry-matched returns of non-suspended controlgroupstocks.
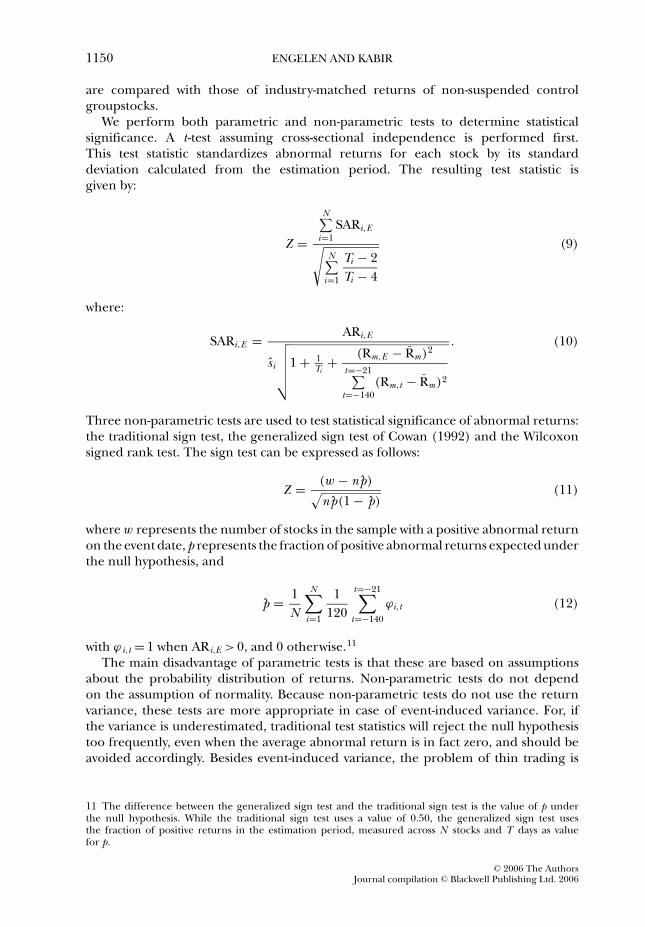
We perform both parametric and non-parametric tests to determine statisticalsignificance. A t-test assuming cross-sectional independence is performed first.This test statistic standardizes abnormal returns for each stock by its standarddeviation calculated from the estimation period. The resulting test statistic isgiven by:
Z =
N∑i=1
SARi,E√N∑
i=1
Ti − 2
Ti − 4
(9)
where:
SARi,E = ARi,E
si
√√√√√1 + 1Ti
+ (Rm,E − Rm)2
t=−21∑t=−140
(Rm,t − Rm)2
. (10)
Three non-parametric tests are used to test statistical significance of abnormal returns:the traditional sign test, the generalized sign test of Cowan (1992) and the Wilcoxonsigned rank test. The sign test can be expressed as follows:
Z = (w − np)√np(1 − p)
(11)
where w represents the number of stocks in the sample with a positive abnormal returnon the event date, p represents the fraction of positive abnormal returns expected underthe null hypothesis, and
p = 1
N
N∑i=1
1
120
t=−21∑t=−140
ϕi,t (12)
with ϕ i,t = 1 when ARi,E > 0, and 0 otherwise.11
The main disadvantage of parametric tests is that these are based on assumptionsabout the probability distribution of returns. Non-parametric tests do not dependon the assumption of normality. Because non-parametric tests do not use the returnvariance, these tests are more appropriate in case of event-induced variance. For, ifthe variance is underestimated, traditional test statistics will reject the null hypothesistoo frequently, even when the average abnormal return is in fact zero, and should beavoided accordingly. Besides event-induced variance, the problem of thin trading is
11 The difference between the generalized sign test and the traditional sign test is the value of p underthe null hypothesis. While the traditional sign test uses a value of 0.50, the generalized sign test usesthe fraction of positive returns in the estimation period, measured across N stocks and T days as valuefor p.
C© 2006 The AuthorsJournal compilation C© Blackwell Publishing Ltd. 2006
DISSEMINATING NEW INFORMATION TO THE CAPITAL MARKET 1151
also crucial for a test specification. Cowan (1992) shows that the generalized sign testperforms well for thinly traded stocks.12
(ii) Trading Volume Analysis
We also analyze the trading volume behavior surrounding trading suspensions.Abnormal change in trading volume is an alternate way of investigating the valueof information disclosed through an event. The trading volume analysis, performedfollowing the methodology used by Michaely, Thaler and Seguin (1994) and Wu (1998),is briefly described below.
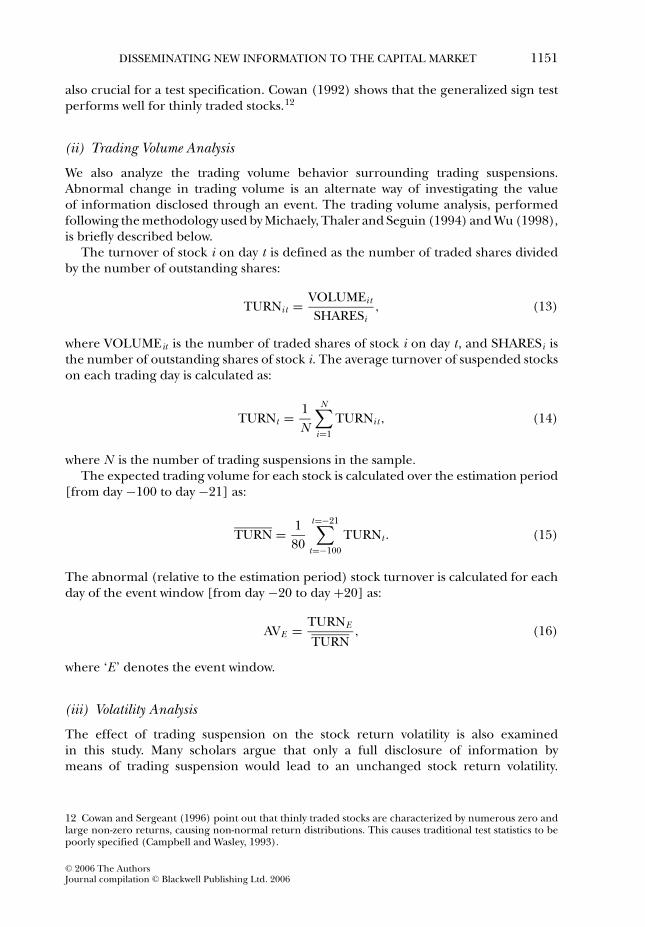
The turnover of stock i on day t is defined as the number of traded shares dividedby the number of outstanding shares:
TURNi t = VOLUMEi t
SHARESi, (13)
where VOLUMEit is the number of traded shares of stock i on day t, and SHARESi isthe number of outstanding shares of stock i. The average turnover of suspended stockson each trading day is calculated as:
TURNt = 1
N
N∑i=1
TURNi t , (14)
where N is the number of trading suspensions in the sample.The expected trading volume for each stock is calculated over the estimation period
[from day −100 to day −21] as:
TURN = 1
80
t=−21∑t=−100
TURNt . (15)
The abnormal (relative to the estimation period) stock turnover is calculated for eachday of the event window [from day −20 to day +20] as:
AVE = TURNE
TURN, (16)
where ‘E’ denotes the event window.
(iii) Volatility Analysis
The effect of trading suspension on the stock return volatility is also examinedin this study. Many scholars argue that only a full disclosure of information bymeans of trading suspension would lead to an unchanged stock return volatility.
12 Cowan and Sergeant (1996) point out that thinly traded stocks are characterized by numerous zero andlarge non-zero returns, causing non-normal return distributions. This causes traditional test statistics to bepoorly specified (Campbell and Wasley, 1993).
C© 2006 The AuthorsJournal compilation C© Blackwell Publishing Ltd. 2006
1152 ENGELEN AND KABIR
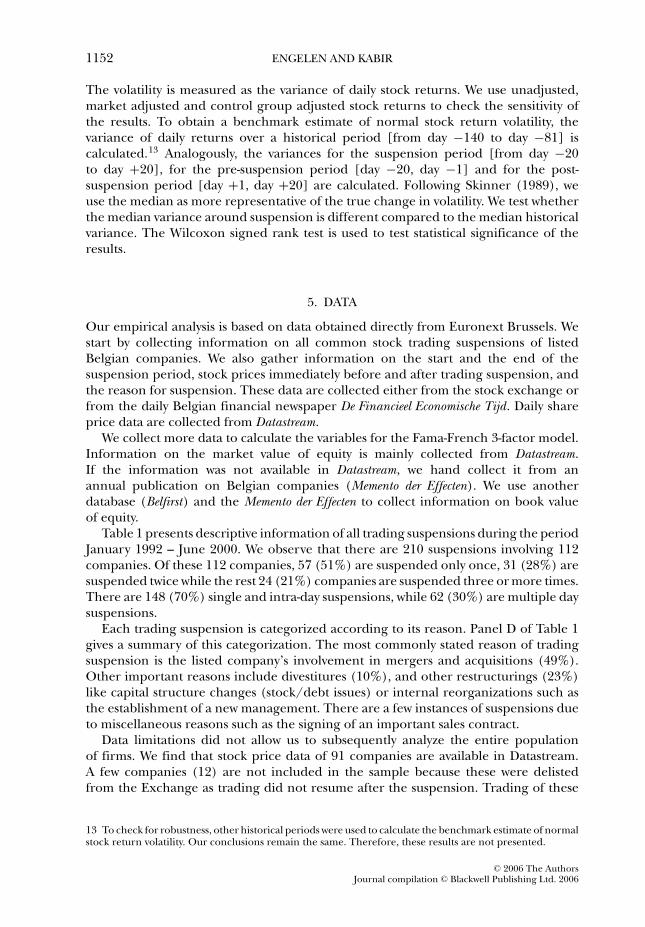
The volatility is measured as the variance of daily stock returns. We use unadjusted,market adjusted and control group adjusted stock returns to check the sensitivity ofthe results. To obtain a benchmark estimate of normal stock return volatility, thevariance of daily returns over a historical period [from day −140 to day −81] iscalculated.13 Analogously, the variances for the suspension period [from day −20to day +20], for the pre-suspension period [day −20, day −1] and for the post-suspension period [day +1, day +20] are calculated. Following Skinner (1989), weuse the median as more representative of the true change in volatility. We test whetherthe median variance around suspension is different compared to the median historicalvariance. The Wilcoxon signed rank test is used to test statistical significance of theresults.
5. DATA
Our empirical analysis is based on data obtained directly from Euronext Brussels. Westart by collecting information on all common stock trading suspensions of listedBelgian companies. We also gather information on the start and the end of thesuspension period, stock prices immediately before and after trading suspension, andthe reason for suspension. These data are collected either from the stock exchange orfrom the daily Belgian financial newspaper De Financieel Economische Tijd. Daily shareprice data are collected from Datastream.
We collect more data to calculate the variables for the Fama-French 3-factor model.Information on the market value of equity is mainly collected from Datastream.If the information was not available in Datastream, we hand collect it from anannual publication on Belgian companies (Memento der Effecten). We use anotherdatabase (Belfirst) and the Memento der Effecten to collect information on book valueof equity.
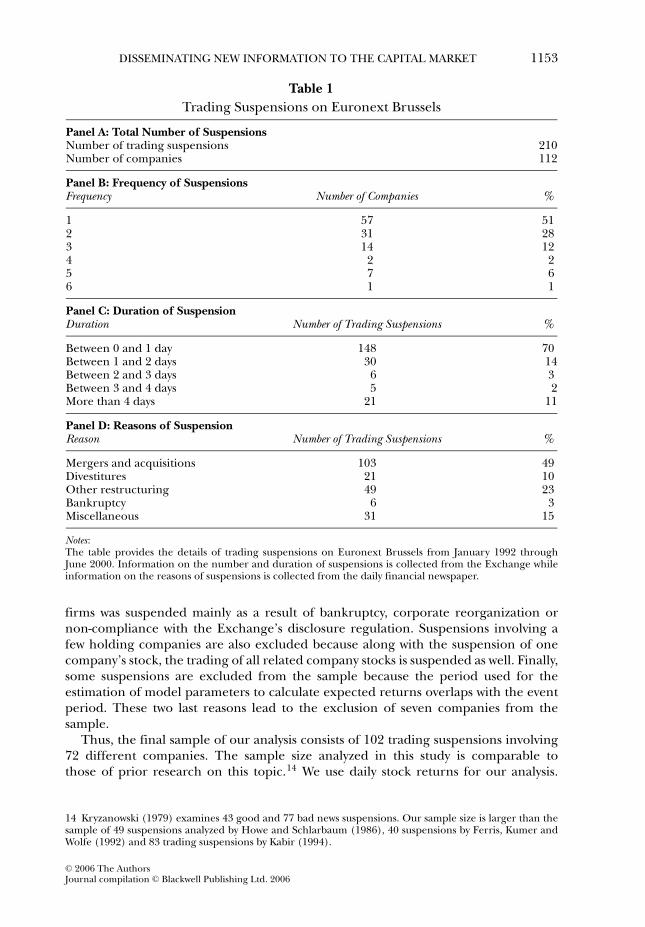
Table 1 presents descriptive information of all trading suspensions during the periodJanuary 1992 – June 2000. We observe that there are 210 suspensions involving 112companies. Of these 112 companies, 57 (51%) are suspended only once, 31 (28%) aresuspended twice while the rest 24 (21%) companies are suspended three or more times.There are 148 (70%) single and intra-day suspensions, while 62 (30%) are multiple daysuspensions.
Each trading suspension is categorized according to its reason. Panel D of Table 1gives a summary of this categorization. The most commonly stated reason of tradingsuspension is the listed company’s involvement in mergers and acquisitions (49%).Other important reasons include divestitures (10%), and other restructurings (23%)like capital structure changes (stock/debt issues) or internal reorganizations such asthe establishment of a new management. There are a few instances of suspensions dueto miscellaneous reasons such as the signing of an important sales contract.
Data limitations did not allow us to subsequently analyze the entire populationof firms. We find that stock price data of 91 companies are available in Datastream.A few companies (12) are not included in the sample because these were delistedfrom the Exchange as trading did not resume after the suspension. Trading of these
13 To check for robustness, other historical periods were used to calculate the benchmark estimate of normalstock return volatility. Our conclusions remain the same. Therefore, these results are not presented.
C© 2006 The AuthorsJournal compilation C© Blackwell Publishing Ltd. 2006
DISSEMINATING NEW INFORMATION TO THE CAPITAL MARKET 1153
Table 1
Trading Suspensions on Euronext Brussels
Panel A: Total Number of SuspensionsNumber of trading suspensions 210Number of companies 112
Panel B: Frequency of SuspensionsFrequency Number of Companies %
1 57 512 31 283 14 124 2 25 7 66 1 1
Panel C: Duration of SuspensionDuration Number of Trading Suspensions %
Between 0 and 1 day 148 70Between 1 and 2 days 30 14Between 2 and 3 days 6 3Between 3 and 4 days 5 2More than 4 days 21 11
Panel D: Reasons of SuspensionReason Number of Trading Suspensions %
Mergers and acquisitions 103 49Divestitures 21 10Other restructuring 49 23Bankruptcy 6 3Miscellaneous 31 15
Notes:The table provides the details of trading suspensions on Euronext Brussels from January 1992 throughJune 2000. Information on the number and duration of suspensions is collected from the Exchange whileinformation on the reasons of suspensions is collected from the daily financial newspaper.
firms was suspended mainly as a result of bankruptcy, corporate reorganization ornon-compliance with the Exchange’s disclosure regulation. Suspensions involving afew holding companies are also excluded because along with the suspension of onecompany’s stock, the trading of all related company stocks is suspended as well. Finally,some suspensions are excluded from the sample because the period used for theestimation of model parameters to calculate expected returns overlaps with the eventperiod. These two last reasons lead to the exclusion of seven companies from thesample.
Thus, the final sample of our analysis consists of 102 trading suspensions involving72 different companies. The sample size analyzed in this study is comparable tothose of prior research on this topic.14 We use daily stock returns for our analysis.
14 Kryzanowski (1979) examines 43 good and 77 bad news suspensions. Our sample size is larger than thesample of 49 suspensions analyzed by Howe and Schlarbaum (1986), 40 suspensions by Ferris, Kumer andWolfe (1992) and 83 trading suspensions by Kabir (1994).
C© 2006 The AuthorsJournal compilation C© Blackwell Publishing Ltd. 2006
1154 ENGELEN AND KABIR
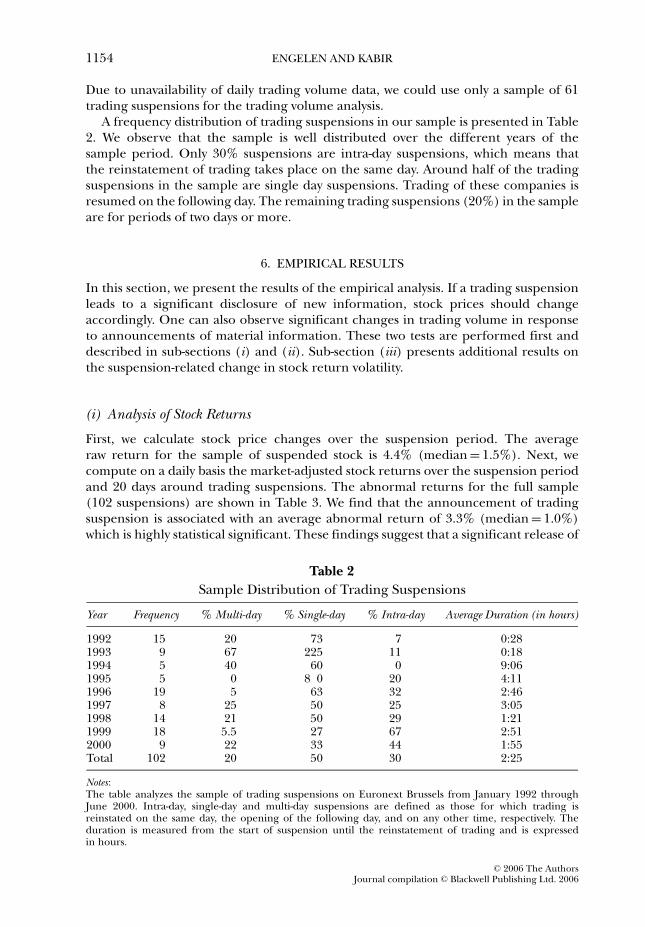
Due to unavailability of daily trading volume data, we could use only a sample of 61trading suspensions for the trading volume analysis.
A frequency distribution of trading suspensions in our sample is presented in Table2. We observe that the sample is well distributed over the different years of thesample period. Only 30% suspensions are intra-day suspensions, which means thatthe reinstatement of trading takes place on the same day. Around half of the tradingsuspensions in the sample are single day suspensions. Trading of these companies isresumed on the following day. The remaining trading suspensions (20%) in the sampleare for periods of two days or more.
6. EMPIRICAL RESULTS
In this section, we present the results of the empirical analysis. If a trading suspensionleads to a significant disclosure of new information, stock prices should changeaccordingly. One can also observe significant changes in trading volume in responseto announcements of material information. These two tests are performed first anddescribed in sub-sections (i) and (ii). Sub-section (iii) presents additional results onthe suspension-related change in stock return volatility.
(i) Analysis of Stock Returns
First, we calculate stock price changes over the suspension period. The averageraw return for the sample of suspended stock is 4.4% (median = 1.5%). Next, wecompute on a daily basis the market-adjusted stock returns over the suspension periodand 20 days around trading suspensions. The abnormal returns for the full sample(102 suspensions) are shown in Table 3. We find that the announcement of tradingsuspension is associated with an average abnormal return of 3.3% (median = 1.0%)which is highly statistical significant. These findings suggest that a significant release of
Table 2
Sample Distribution of Trading Suspensions
Year Frequency % Multi-day % Single-day % Intra-day Average Duration (in hours)
1992 15 20 73 7 0:281993 9 67 225 11 0:181994 5 40 60 0 9:061995 5 0 8 0 20 4:111996 19 5 63 32 2:461997 8 25 50 25 3:051998 14 21 50 29 1:211999 18 5.5 27 67 2:512000 9 22 33 44 1:55Total 102 20 50 30 2:25
Notes:The table analyzes the sample of trading suspensions on Euronext Brussels from January 1992 throughJune 2000. Intra-day, single-day and multi-day suspensions are defined as those for which trading isreinstated on the same day, the opening of the following day, and on any other time, respectively. Theduration is measured from the start of suspension until the reinstatement of trading and is expressedin hours.
C© 2006 The AuthorsJournal compilation C© Blackwell Publishing Ltd. 2006

DISSEMINATING NEW INFORMATION TO THE CAPITAL MARKET 1155
Tab
le3
Ab
no
rmal
Sto
ckR
etu
rns
Aro
un
dT
rad
ing
Su
spen
sio
ns
for
the
Fu
llSam
ple
Day
Mea
nA
RM
ean
CA
RSt
anda
rdD
evia
tion
t-tes
tT
rad.
Sign
Test
Gen
.Sig
nTe
stM
edia
nA
RW
ilcox
onTe
st%
Posi
tive
Ret
urns
−20
−0.0
02
−0.0
02
0.0
22
−0.8
50.9
9−0
.41
−0.0
001
−0.8
85
45.1
−15
−0.0
02
−0.0
03
0.0
19
−1.3
50.7
9−0
.21
−0.0
002
−1.1
82
46.1
−10
0.0
02
0.0
00
0.0
23
1.9
70.5
9−0
.01
−0.0
002
0.5
01
47.1
−50.0
03
0.0
04
0.0
20
1.6
60.7
91. 3
80.0
015
1.4
82
53.9
−4−0
.002
0.0
03
0.0
21
−1.1
90.2
00.3
9−0
.0001
−0.8
05
49.0
−30.0
00
0.0
02
0.0
16
−0.0
90.7
9−0
.21
−0.0
001
−0.0
20
46.1
−2−0
.001
0.0
01
0.0
35
0.8
10.2
00.7
80.0
002
0.1
17
51.0
−10.0
03
0.0
05
0.0
26
1.2
50.2
00.3
9−0
.0001
0.9
85
49.0
00.0
33
0.0
38
0.1
37
28.2
0∗∗
2.3
8∗
2.9
6∗∗
0.0
102
2.7
37
∗∗61.8
1−0
.001
0.0
36
0.0
35
0.2
20.5
9−0
.01
−0.0
001
−0.3
21
47.1
2−0
.002
0.0
34
0.0
25
−0.4
00.4
00.1
9−0
.0001
−0.2
67
48.0
30.0
04
0.0
38
0.0
35
2.3
0∗
0.7
91.3
80.0
012
1.6
42
53.9
4−0
.001
0.0
37
0.0
27
−0.6
41.9
8∗
−1.4
0−0
.0019
−1.2
65
40.2
5−0
.001
0.0
36
0.0
32
−0.3
80.5
91.1
80.0
002
0.2
47
52.9
10
−0.0
03
0.0
28
0.0
20
−1.9
21.3
9−0
.81
−0.0
003
−0.9
15
43.1
15
0.0
02
0.0
25
0.0
22
0.5
40.5
9−0
.01
−0.0
001
−0.1
44
47.1
20
−0.0
03
0.0
13
0.0
18
− 1.4
31.5
8−1
.00
−0.0
007
−1.6
16
42.2
Not
es:
Th
eta
ble
rep
ort
sm
arket
adju
sted
avera
ge
abn
orm
alst
ock
retu
rns,
cum
ula
tive
avera
ge
abn
orm
alst
ock
retu
rns,
stan
dar
dd
evi
atio
ns,
t-st
atis
tic
and
sig
nst
atis
tic
for
day
sd
uri
ng
the
eve
nt
win
do
w[−
20
,+2
0]
for
the
en
tire
sam
ple
of
102
trad
ing
susp
en
sio
ns.
Ital
sop
rese
nts
mar
ket
adju
sted
med
ian
abn
orm
alre
turn
s,W
ilco
xo
nsi
gn
ed
ran
kst
atis
tic
and
the
frac
tio
no
fp
osi
tive
abn
orm
alre
turn
s.T
he
aste
risk
s∗∗
den
ote
sig
nif
ican
ceat
the
1%
leve
lan
d∗
den
ote
ssi
gn
ific
ance
atth
e5
%le
vel.
C© 2006 The AuthorsJournal compilation C© Blackwell Publishing Ltd. 2006

1156 ENGELEN AND KABIR
Figure 2
Cumulative Average Abnormal Returns Around Suspensions: Good and Bad NewsSub-samples
–0.1
–0.08
–0.06
–0.04
–0.02
0
0.02
0.04
0.06
0.08
0.1
0.12
–20 –18 –16 –14 –12 –10 –8 –6 –4 –2 0 2 4 6 8 10 12 14 16 18 20
Event window
CA
R
bad news good news
Notes:This figure presents daily market adjusted cumulative average abnormal returns (CAR) for the event
window [−20, +20] surrounding trading suspensions for the good and the bad news sub-samples.
information occurs over the suspension period. We also observe that 62% of abnormalreturns at the announcement day is positive. Furthermore, the results show that thereis no anticipatory return behavior before trading suspension. The 20-day cumulativeabnormal return is only 0.5% which is statistically indifferent from zero. We do notobserve any significant abnormal return pattern in the post-suspension period. Asshown in Table 3, the overall results of the mean abnormal return are confirmed bythe median abnormal returns and the fraction of companies experiencing positiveabnormal returns.15
In order to perform an additional analysis, we divide the full sample of tradingsuspensions into good news and bad news sub-samples. To categorize a tradingsuspension in one of these two sub-samples, the tick sign test of Kraus and Stoll (1972),Hopewell and Schwartz (1978) and King, Pownall and Waymire (1991) is used. Wefind that the average abnormal return associated with trading suspension is 8.4% forthe good news sub-sample and −4.2% for the bad news sub-sample. The cumulativeabnormal returns for the 41-day event window are presented in Figure2. Again, wesee no anticipatory price behavior in the pre-suspension period for both sub-samples.Share prices fully adjust to new information released during the suspension period.
Since the samples we analyzed so far include trading suspensions due to differentnews categories, any aggregation across all stocks could make the results difficult tointerpret. It is possible that the price impacts of different news categories offset eachother, and thus, a smaller abnormal return is observed. Therefore, we divide thetotal sample into three sub-samples according to the three most important reasonsfor trading suspensions, i.e. mergers and acquisitions (54 suspensions), divestitures(14 suspensions) and other restructurings (21 suspensions). King, Pownall and
15 Qualitatively similar results are obtained from using the four other benchmark models. These are notreported here for reasons of brevity, but are available from the authors on request.
C© 2006 The AuthorsJournal compilation C© Blackwell Publishing Ltd. 2006
DISSEMINATING NEW INFORMATION TO THE CAPITAL MARKET 1157
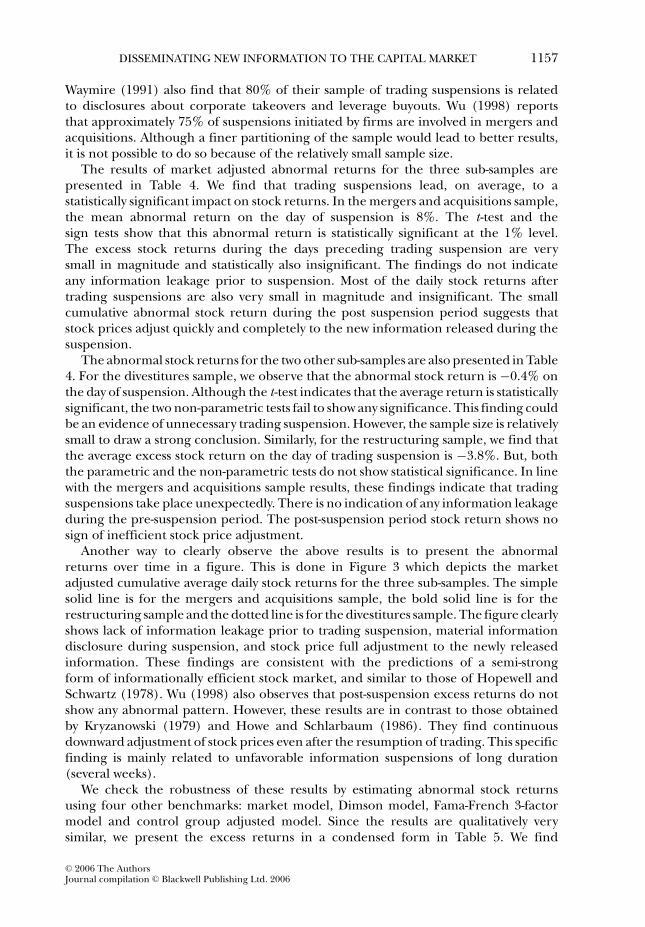
Waymire (1991) also find that 80% of their sample of trading suspensions is relatedto disclosures about corporate takeovers and leverage buyouts. Wu (1998) reportsthat approximately 75% of suspensions initiated by firms are involved in mergers andacquisitions. Although a finer partitioning of the sample would lead to better results,it is not possible to do so because of the relatively small sample size.
The results of market adjusted abnormal returns for the three sub-samples arepresented in Table 4. We find that trading suspensions lead, on average, to astatistically significant impact on stock returns. In the mergers and acquisitions sample,the mean abnormal return on the day of suspension is 8%. The t-test and thesign tests show that this abnormal return is statistically significant at the 1% level.The excess stock returns during the days preceding trading suspension are verysmall in magnitude and statistically also insignificant. The findings do not indicateany information leakage prior to suspension. Most of the daily stock returns aftertrading suspensions are also very small in magnitude and insignificant. The smallcumulative abnormal stock return during the post suspension period suggests thatstock prices adjust quickly and completely to the new information released during thesuspension.
The abnormal stock returns for the two other sub-samples are also presented in Table4. For the divestitures sample, we observe that the abnormal stock return is −0.4% onthe day of suspension. Although the t-test indicates that the average return is statisticallysignificant, the two non-parametric tests fail to show any significance. This finding couldbe an evidence of unnecessary trading suspension. However, the sample size is relativelysmall to draw a strong conclusion. Similarly, for the restructuring sample, we find thatthe average excess stock return on the day of trading suspension is −3.8%. But, boththe parametric and the non-parametric tests do not show statistical significance. In linewith the mergers and acquisitions sample results, these findings indicate that tradingsuspensions take place unexpectedly. There is no indication of any information leakageduring the pre-suspension period. The post-suspension period stock return shows nosign of inefficient stock price adjustment.
Another way to clearly observe the above results is to present the abnormalreturns over time in a figure. This is done in Figure 3 which depicts the marketadjusted cumulative average daily stock returns for the three sub-samples. The simplesolid line is for the mergers and acquisitions sample, the bold solid line is for therestructuring sample and the dotted line is for the divestitures sample. The figure clearlyshows lack of information leakage prior to trading suspension, material informationdisclosure during suspension, and stock price full adjustment to the newly releasedinformation. These findings are consistent with the predictions of a semi-strongform of informationally efficient stock market, and similar to those of Hopewell andSchwartz (1978). Wu (1998) also observes that post-suspension excess returns do notshow any abnormal pattern. However, these results are in contrast to those obtainedby Kryzanowski (1979) and Howe and Schlarbaum (1986). They find continuousdownward adjustment of stock prices even after the resumption of trading. This specificfinding is mainly related to unfavorable information suspensions of long duration(several weeks).
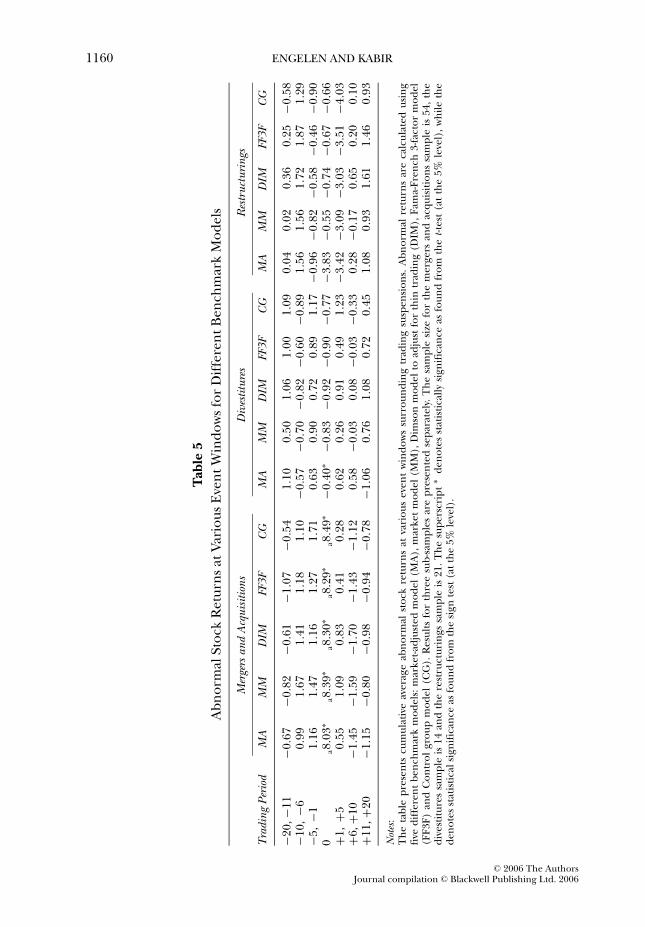
We check the robustness of these results by estimating abnormal stock returnsusing four other benchmarks: market model, Dimson model, Fama-French 3-factormodel and control group adjusted model. Since the results are qualitatively verysimilar, we present the excess returns in a condensed form in Table 5. We find
C© 2006 The AuthorsJournal compilation C© Blackwell Publishing Ltd. 2006
1158 ENGELEN AND KABIR
Tab
le4
Ab
no
rmal
Sto
ckR
etu
rns
Aro
un
dT
rad
ing
Su
spen
sio
ns
for
Th
ree
Su
b-s
amp
les
Mer
gers
and
Acq
uisi
tions
Div
estit
ures
Res
truc
turi
ngs
Gen
.G
en.
Gen
.T
rad.
Sign
Tra
d.Si
gnT
rad.
Sign
Day
AR
CA
Rt-t
est
Sign
Test
Test
AR
CA
Rt-t
est
Sign
Test
Test
AR
CA
Rt-t
est
Sign
Test
Test
−20
0.0
02
0.0
02
0.2
40.2
70.7
2−0
.002
−0.0
02
−0.5
31.0
7−0
.78
−0.0
07
−0.0
07
−0.9
41.0
9−0
.83
−15
−0.0
04
−0.0
04
−1.6
20.8
2−0
.37
0.0
02
0.0
13
0.6
20.0
00.2
9−0
.003
−0.0
08
−1.3
31.0
9−0
.83
−10
0.0
02
− 0.0
05
1.9
10.0
00.4
5−0
.003
0.0
08
−0.2
11.6
0−1
.31
0.0
07
0.0
07
1.6
10.2
20.4
8−5
0.0
02
0.0
05
0.8
00.5
40.9
90.0
05
0.0
10
1.7
60.5
30.8
3−0
.001
0.0
15
0.7
40.6
5−0
.39
−40.0
00
0.0
05
−0.7
40.5
40.9
90.0
01
0.0
11
0.9
10.5
30.8
3−0
.005
0.0
10
−1.0
31.0
9−0
.83
−30.0
03
0.0
07
0.9
90.8
21.2
70.0
01
0.0
12
0.1
41.0
7−0
.78
−0.0
05
0.0
04
−1.0
21.9
6−1
.70
−20.0
05
0.0
12
0.9
30.2
70.7
2−0
.006
0.0
06
0.3
50.0
00.2
90.0
00
0.0
05
1.1
40.6
50.9
2−1
0.0
03
0.0
15
0.7
60.8
2−0
.37
0.0
05
0. 0
12
1.8
91.0
7−0
.78
0.0
02
0.0
06
1.2
30.6
50.9
20
0.0
80
0.0
95
39.7
5∗∗
3.2
7∗∗
3.7
2∗∗
−0.0
04
0.0
07
3.2
4∗∗
0.5
30.8
3−0
.038
−0.0
32
−1.7
30.2
20.4
81
−0.0
05
0.0
90
−1.8
40.2
70.1
70.0
14
0.0
21
2.5
9∗
0.0
00.2
9−0
.008
−0.0
40
−0.3
01.0
9−0
.83
2−0
.002
0.0
88
−0.6
20.5
40.9
9−0
.004
0.0
17
−1.0
91.6
0−1
.31
−0.0
04
−0.0
44
−0.1
40.6
5−0
.39
30.0
08
0.0
96
3.4
1∗∗
1.9
1∗
2.3
6∗
0.0
03
0.0
20
−1.7
00.5
3−0
.24
−0.0
15
−0.0
59
−1.4
31.5
3−1
.26
40.0
03
0.1
00
0.3
40.0
00.4
5−0
.003
0.0
17
−0.7
11.6
0−1
.31
−0.0
07
−0.0
67
−1.9
71.9
6−1
.70
50.0
01
0.1
01
0.0
20.2
70.1
7−0
.004
0.0
14
−1.0
30.5
3−0
.24
0.0
01
−0.0
66
0.7
42.8
43.1
1∗
10
−0.0
06
0.0
86
−2.0
01.3
6−0
.92
−0.0
03
0.0
20
−1.2
21.6
0−1
.31
0.0
00
−0.0
63
0.0
70.2
20.4
815
0.0
01
0.0
83
−0.1
30.5
4−0
.10
0.0
00
0.0
22
0.3
70.0
00.2
90.0
08
−0.0
42
0.8
90.2
20.4
820
−0.0
04
0.0
75
−1.5
92.1
8−1
.73
0.0
01
0.0
09
0.4
50.5
30.8
3−0
.005
−0.0
52
−1.1
50.6
5−0
.39
Not
es:
Th
eta
ble
rep
ort
sm
arket
adju
sted
avera
ge
abn
orm
alst
ock
retu
rns,
cum
ula
tive
avera
ge
abn
orm
alst
ock
retu
rns,
t-st
atis
tic
and
sig
nst
atis
tics
for
day
sd
uri
ng
the
eve
nt
win
do
w[−
20
,+2
0]
for
thre
esu
b-s
amp
les.
Th
esa
mp
lesi
zefo
rth
em
erg
ers
and
acq
uis
itio
ns
sam
ple
is54,th
ed
ivest
itu
res
sam
ple
is14
and
the
rest
ruct
uri
ngs
sam
ple
is2
1.T
he
aste
risk
s∗∗
den
ote
sig
nif
ican
ceat
the
1%
leve
lan
d∗
den
ote
ssi
gn
ific
ance
atth
e5
%le
vel.
C© 2006 The AuthorsJournal compilation C© Blackwell Publishing Ltd. 2006

DISSEMINATING NEW INFORMATION TO THE CAPITAL MARKET 1159
Figure 3
Cumulative Average Abnormal Returns Around Suspensions: Three Sub-samples
–0.08
–0.06
–0.04
–0.02
0.00
0.02
0.04
0.06
0.08
0.10
0.12
–20 –18 –16 –14 –12 –10 –8 –6 –4 –2 0 2 4 6 8 10 12 14 16 18 20
Event window
CA
R
M&A Divest. Restr.
Notes:This figure presents daily market adjusted cumulative average abnormal returns (CAR) for the event
window [−20, +20] surrounding trading suspensions for three sub-samples: Mergers and Acquisitions
(M&A), Divestitures (Divest) and Restructurings (Restr).
that the average abnormal stock returns in the pre-suspension period are negligibleand statistically insignificant. For the mergers and acquisitions sample, the excessreturn over the suspended period (trading period 0) is positive and significant.The finding is insensitive to the model used to estimate excess returns. The stockreturn results during the post-suspension period are also robust. The behavior ofexcess stock returns for the mergers and acquisitions sample suggests that new andmaterial information is conveyed to the market through trading suspension. Themarket also rapidly impounds the information released during suspension. The resultsfrom the divestitures and restructurings samples are also robust to the choice ofmodel used in estimating excess stock returns. Here we find that stock price changesare, on average, insignificant. No material information disclosure takes place duringsuspensions.
(ii) Analysis of Trading Volume
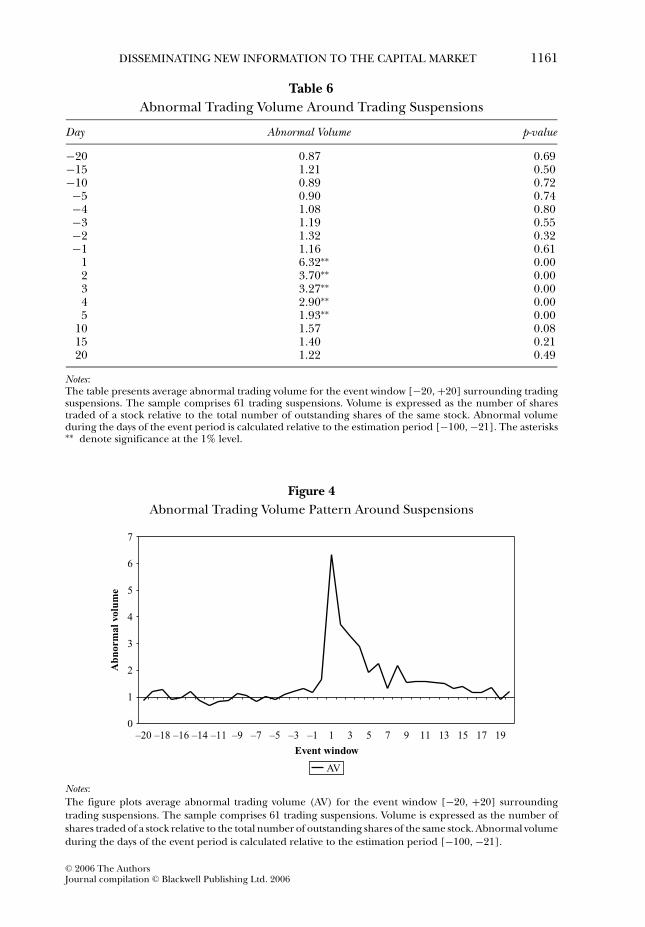
The average abnormal trading volume surrounding trading suspensions [from day−20 to day +20] is estimated using equation (16). These are reported in Table 6and graphically shown in Figure 4. The results indicate that no abnormal tradingvolume pattern is present before trading suspensions. On the first trading day afterthe suspension, the average turnover is six times as high as normal. This increase isstatistically significant at the 1% level. On day [+2] and [+3] the abnormal tradingturnover is 3.70 and 3.27 (the estimated t-values are 8.51 and 7.15, respectively).Table 6 shows that significant abnormal volumes are found during the first five
C© 2006 The AuthorsJournal compilation C© Blackwell Publishing Ltd. 2006
1160 ENGELEN AND KABIR
Tab
le5
Ab
no
rmal
Sto
ckR
etu
rns
atV
ario
us
Eve
nt
Win
do
ws
for
Dif
fere
nt
Ben
chm
ark
Mo
dels
Mer
gers
and
Acq
uisi
tions
Div
estit
ures
Res
truc
turi
ngs
Tra
ding
Peri
odM
AM
MD
IMFF
3FC
GM
AM
MD
IMFF
3FC
GM
AM
MD
IMFF
3FC
G
−20,−1
1−0
.67
−0.8
2−0
.61
−1.0
7−0
.54
1.1
00.5
01.0
61.0
01.0
90.0
40.0
20.3
60.2
5−0
.58
−10,
−60.9
91.6
71.4
11.1
81.1
0−0
.57
−0.7
0−0
.82
−0.6
0−0
.89
1.5
61.5
61.7
21.8
71.2
9−5
,−1
1.1
61.4
71.1
61. 2
71.7
10.6
30.9
00.7
20.8
91.1
7−0
.96
−0.8
2−0
.58
−0.4
6−0
.90
0a8.0
3∗
a8.3
9∗
a8.3
0∗
a8.2
9∗
a8.4
9∗
−0.4
0∗
−0.8
3−0
.92
−0.9
0−0
.77
−3.8
3−0
.55
−0.7
4−0
.67
−0.6
6+1
,+5
0.5
51.0
90.8
30.4
10.2
80.6
20.2
60.9
10.4
91.2
3−3
.42
−3.0
9−3
.03
−3.5
1−4
.03
+6,+1
0−1
.45
−1.5
9−1
.70
−1.4
3− 1
.12
0.5
8−0
.03
0.0
8−0
.03
−0.3
30.2
8−0
.17
0.6
50.2
00.1
0+1
1,+2
0−1
.15
−0.8
0−0
.98
−0.9
4−0
.78
−1.0
60.7
61.0
80.7
20.4
51.0
80.9
31.6
11.4
60.9
3
Not
es:
Th
eta
ble
pre
sen
tscu
mu
lati
veav
era
ge
abn
orm
alst
ock
retu
rns
atva
rio
us
eve
nt
win
do
ws
surr
ou
nd
ing
trad
ing
susp
en
sio
ns.
Ab
no
rmal
retu
rns
are
calc
ula
ted
usi
ng
five
dif
fere
nt
ben
chm
ark
mo
dels
:m
ark
et-
adju
sted
mo
del
(MA
),m
ark
et
mo
del
(MM
),D
imso
nm
od
el
toad
just
for
thin
trad
ing
(DIM
),F
ama-
Fre
nch
3-f
acto
rm
od
el
(FF
3F
)an
dC
on
tro
lgro
up
mo
del
(CG
).R
esu
lts
for
thre
esu
b-s
amp
les
are
pre
sen
ted
sep
arat
ely
.T
he
sam
ple
size
for
the
merg
ers
and
acq
uis
itio
ns
sam
ple
is5
4,
the
div
est
itu
res
sam
ple
is14
and
the
rest
ruct
uri
ngs
sam
ple
is21.
Th
esu
pers
crip
t∗
den
ote
sst
atis
tica
lly
sign
ific
ance
asfo
un
dfr
om
the
t-te
st(a
tth
e5
%le
vel)
,w
hil
eth
ed
en
ote
sst
atis
tica
lsi
gn
ific
ance
asfo
un
dfr
om
the
sig
nte
st(a
tth
e5
%le
vel)
.
C© 2006 The AuthorsJournal compilation C© Blackwell Publishing Ltd. 2006
DISSEMINATING NEW INFORMATION TO THE CAPITAL MARKET 1161
Table 6
Abnormal Trading Volume Around Trading Suspensions
Day Abnormal Volume p-value
−20 0.87 0.69−15 1.21 0.50−10 0.89 0.72−5 0.90 0.74−4 1.08 0.80−3 1.19 0.55−2 1.32 0.32−1 1.16 0.61
1 6.32∗∗ 0.002 3.70∗∗ 0.003 3.27∗∗ 0.004 2.90∗∗ 0.005 1.93∗∗ 0.00
10 1.57 0.0815 1.40 0.2120 1.22 0.49
Notes:The table presents average abnormal trading volume for the event window [−20, +20] surrounding tradingsuspensions. The sample comprises 61 trading suspensions. Volume is expressed as the number of sharestraded of a stock relative to the total number of outstanding shares of the same stock. Abnormal volumeduring the days of the event period is calculated relative to the estimation period [−100, −21]. The asterisks∗∗ denote significance at the 1% level.
Figure 4
Abnormal Trading Volume Pattern Around Suspensions
0
1
2
3
4
5
6
7
–20 –18 –16 –14 –11 –9 –7 –5 –3 –1 1 3 5 7 9 11 13 15 17 19
Event window
Abn
orm
al v
olum
e
AV
Notes:The figure plots average abnormal trading volume (AV) for the event window [−20, +20] surrounding
trading suspensions. The sample comprises 61 trading suspensions. Volume is expressed as the number of
shares traded of a stock relative to the total number of outstanding shares of the same stock. Abnormal volume
during the days of the event period is calculated relative to the estimation period [−100, −21].
C© 2006 The AuthorsJournal compilation C© Blackwell Publishing Ltd. 2006
1162 ENGELEN AND KABIR
trading days after suspensions. It reflects the economic significance of the informationreleased during suspension. It also confirms our earlier findings from the stock returnanalysis indicating that suspensions are associated with the release of new and materialinformation. Figure 4 clearly shows that the trading volume has a decreasing trendfrom day [+1] onwards. Trading volume returns to its normal level gradually. Overall,our results are consistent with the results of prior empirical studies of Ferris, Kumarand Wolfe (1992), Lee, Ready and Seguin (1994), Wu (1998) and Kryzanowski andNemiroff (1998).
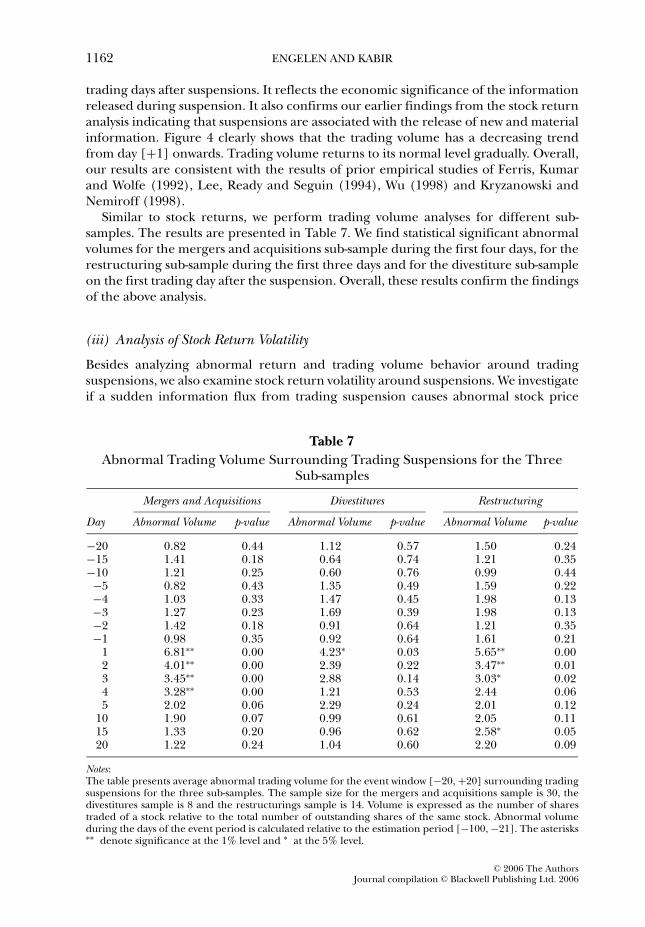
Similar to stock returns, we perform trading volume analyses for different sub-samples. The results are presented in Table 7. We find statistical significant abnormalvolumes for the mergers and acquisitions sub-sample during the first four days, for therestructuring sub-sample during the first three days and for the divestiture sub-sampleon the first trading day after the suspension. Overall, these results confirm the findingsof the above analysis.
(iii) Analysis of Stock Return Volatility
Besides analyzing abnormal return and trading volume behavior around tradingsuspensions, we also examine stock return volatility around suspensions. We investigateif a sudden information flux from trading suspension causes abnormal stock price
Table 7
Abnormal Trading Volume Surrounding Trading Suspensions for the ThreeSub-samples
Mergers and Acquisitions Divestitures Restructuring
Day Abnormal Volume p-value Abnormal Volume p-value Abnormal Volume p-value
−20 0.82 0.44 1.12 0.57 1.50 0.24−15 1.41 0.18 0.64 0.74 1.21 0.35−10 1.21 0.25 0.60 0.76 0.99 0.44−5 0.82 0.43 1.35 0.49 1.59 0.22−4 1.03 0.33 1.47 0.45 1.98 0.13−3 1.27 0.23 1.69 0.39 1.98 0.13−2 1.42 0.18 0.91 0.64 1.21 0.35−1 0.98 0.35 0.92 0.64 1.61 0.21
1 6.81∗∗ 0.00 4.23∗ 0.03 5.65∗∗ 0.002 4.01∗∗ 0.00 2.39 0.22 3.47∗∗ 0.013 3.45∗∗ 0.00 2.88 0.14 3.03∗ 0.024 3.28∗∗ 0.00 1.21 0.53 2.44 0.065 2.02 0.06 2.29 0.24 2.01 0.12
10 1.90 0.07 0.99 0.61 2.05 0.1115 1.33 0.20 0.96 0.62 2.58∗ 0.0520 1.22 0.24 1.04 0.60 2.20 0.09
Notes:The table presents average abnormal trading volume for the event window [−20, +20] surrounding tradingsuspensions for the three sub-samples. The sample size for the mergers and acquisitions sample is 30, thedivestitures sample is 8 and the restructurings sample is 14. Volume is expressed as the number of sharestraded of a stock relative to the total number of outstanding shares of the same stock. Abnormal volumeduring the days of the event period is calculated relative to the estimation period [−100, −21]. The asterisks∗∗ denote significance at the 1% level and ∗ at the 5% level.
C© 2006 The AuthorsJournal compilation C© Blackwell Publishing Ltd. 2006
DISSEMINATING NEW INFORMATION TO THE CAPITAL MARKET 1163
volatility. This is a parameter that can be of interest to regulatory bodies in order todecide whether to impose a trading suspension or not.
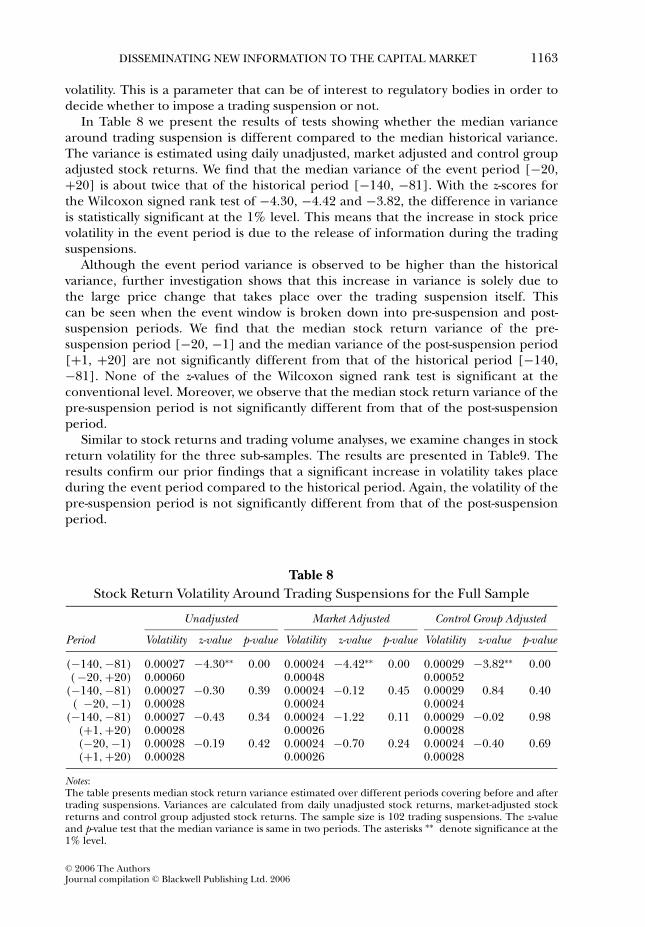
In Table 8 we present the results of tests showing whether the median variancearound trading suspension is different compared to the median historical variance.The variance is estimated using daily unadjusted, market adjusted and control groupadjusted stock returns. We find that the median variance of the event period [−20,+20] is about twice that of the historical period [−140, −81]. With the z-scores forthe Wilcoxon signed rank test of −4.30, −4.42 and −3.82, the difference in varianceis statistically significant at the 1% level. This means that the increase in stock pricevolatility in the event period is due to the release of information during the tradingsuspensions.
Although the event period variance is observed to be higher than the historicalvariance, further investigation shows that this increase in variance is solely due tothe large price change that takes place over the trading suspension itself. Thiscan be seen when the event window is broken down into pre-suspension and post-suspension periods. We find that the median stock return variance of the pre-suspension period [−20, −1] and the median variance of the post-suspension period[+1, +20] are not significantly different from that of the historical period [−140,−81]. None of the z-values of the Wilcoxon signed rank test is significant at theconventional level. Moreover, we observe that the median stock return variance of thepre-suspension period is not significantly different from that of the post-suspensionperiod.
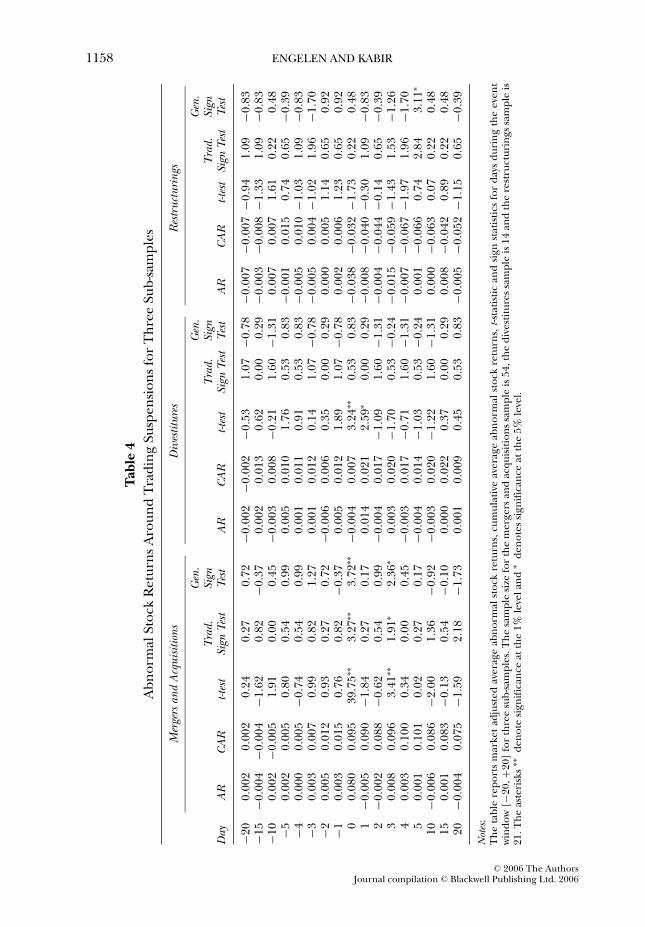
Similar to stock returns and trading volume analyses, we examine changes in stockreturn volatility for the three sub-samples. The results are presented in Table9. Theresults confirm our prior findings that a significant increase in volatility takes placeduring the event period compared to the historical period. Again, the volatility of thepre-suspension period is not significantly different from that of the post-suspensionperiod.
Table 8
Stock Return Volatility Around Trading Suspensions for the Full Sample
Unadjusted Market Adjusted Control Group Adjusted
Period Volatility z-value p-value Volatility z-value p-value Volatility z-value p-value
(−140, −81) 0.00027 −4.30∗∗ 0.00 0.00024 −4.42∗∗ 0.00 0.00029 −3.82∗∗ 0.00( −20, +20) 0.00060 0.00048 0.00052
(−140, −81) 0.00027 −0.30 0.39 0.00024 −0.12 0.45 0.00029 0.84 0.40( −20, −1) 0.00028 0.00024 0.00024
(−140, −81) 0.00027 −0.43 0.34 0.00024 −1.22 0.11 0.00029 −0.02 0.98(+1, +20) 0.00028 0.00026 0.00028(−20, −1) 0.00028 −0.19 0.42 0.00024 −0.70 0.24 0.00024 −0.40 0.69(+1, +20) 0.00028 0.00026 0.00028
Notes:The table presents median stock return variance estimated over different periods covering before and aftertrading suspensions. Variances are calculated from daily unadjusted stock returns, market-adjusted stockreturns and control group adjusted stock returns. The sample size is 102 trading suspensions. The z-valueand p-value test that the median variance is same in two periods. The asterisks ∗∗ denote significance at the1% level.
C© 2006 The AuthorsJournal compilation C© Blackwell Publishing Ltd. 2006
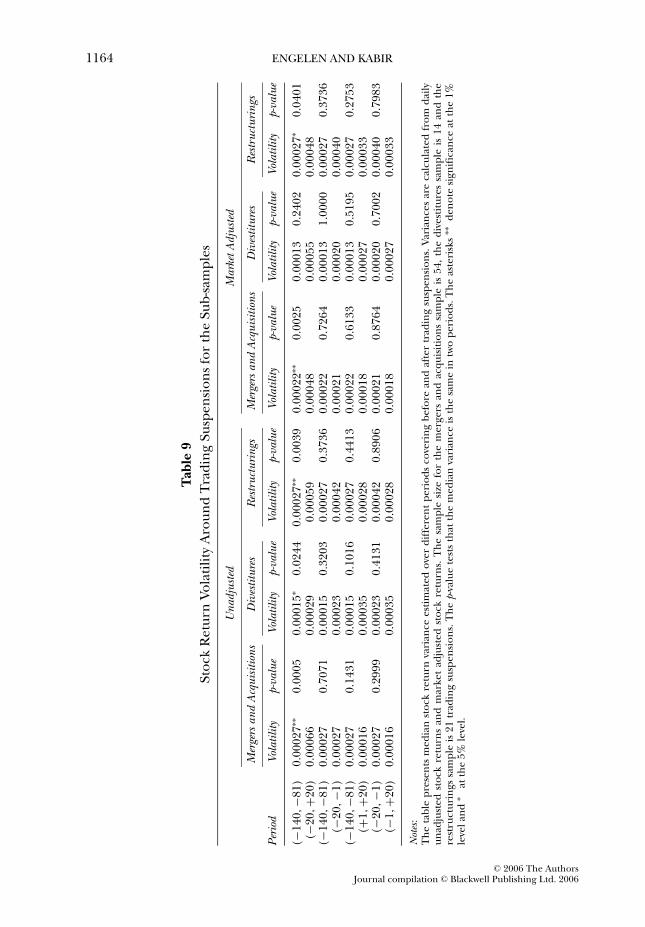
1164 ENGELEN AND KABIR
Tab
le9
Sto
ckR
etu
rnV
ola
tili
tyA
rou
nd
Tra
din
gSu
spen
sio
ns
for
the
Su
b-s
amp
les
Una
djus
ted
Mar
ketA
djus
ted
Mer
gers
and
Acq
uisi
tions
Div
estit
ures
Res
truc
turi
ngs
Mer
gers
and
Acq
uisi
tions
Div
estit
ures
Res
truc
turi
ngs
Peri
odVo
latil
ityp-
valu
eVo
latil
ityp-
valu
eVo
latil
ityp-
valu
eVo
latil
ityp-
valu
eVo
latil
ityp-
valu
eVo
latil
ityp-
valu
e
(−140,−8
1)
0.0
0027
∗∗0.0
005
0.0
0015
∗0.0
244
0.0
0027
∗∗0.0
039
0.0
0022
∗∗0.0
025
0.0
0013
0.2
402
0.0
0027
∗0.0
401
(−20,+2
0)
0.0
0066
0.0
0029
0.0
0059
0.0
0048
0.0
0055
0.0
0048
(−140,−8
1)
0.0
0027
0.7
071
0.0
0015
0.3
203
0.0
0027
0.3
736
0.0
0022
0.7
264
0.0
0013
1.0
000
0.0
0027
0.3
736
(−20,−1
)0.0
0027
0.0
0023
0.0
0042
0.0
0021
0.0
0020
0.0
0040
(−140,−8
1)
0.0
0027
0.1
431
0.0
0015
0.1
016
0.0
0027
0.4
413
0.0
0022
0.6
133
0.0
0013
0.5
195
0.0
0027
0.2
753
(+1,+2
0)
0.0
0016
0.0
0035
0.0
0028
0.0
0018
0.0
0027
0.0
0033
(−20,−1
)0.0
0027
0.2
999
0.0
0023
0.4
131
0.0
0042
0.8
906
0.0
0021
0.8
764
0.0
0020
0.7
002
0.0
0040
0.7
983
(−1,+2
0)
0.0
0016
0.0
0035
0.0
0028
0.0
0018
0.0
0027
0.0
0033
Not
es:
Th
eta
ble
pre
sen
tsm
ed
ian
sto
ckre
turn
vari
ance
est
imat
ed
ove
rd
iffe
ren
tp
eri
od
sco
veri
ng
befo
rean
daf
ter
trad
ing
susp
en
sio
ns.
Var
ian
ces
are
calc
ula
ted
fro
md
aily
un
adju
sted
sto
ckre
turn
san
dm
arket
adju
sted
sto
ckre
turn
s.T
he
sam
ple
size
for
the
merg
ers
and
acq
uis
itio
ns
sam
ple
is54,
the
div
est
itu
res
sam
ple
is1
4an
dth
ere
stru
ctu
rin
gs
sam
ple
is21
trad
ing
susp
en
sio
ns.
Th
ep-
valu
ete
sts
that
the
med
ian
vari
ance
isth
esa
me
intw
op
eri
od
s.T
he
aste
risk
s∗∗
den
ote
sig
nif
ican
ceat
the
1%
leve
lan
d∗
atth
e5
%le
vel.
C© 2006 The AuthorsJournal compilation C© Blackwell Publishing Ltd. 2006
DISSEMINATING NEW INFORMATION TO THE CAPITAL MARKET 1165
We conclude that there is no increase in stock return volatility prior to or aftertrading suspension. Our overall results show that compared to the suspension period,a reduction in both trading volume and stock return volatility takes place during thepost-suspension period. It implies that the decision taken by the Exchange to suspendtrading and to reinstate trading did not lead to a significant increase in volatility. TheExchange’s policy appears to be successful towards the dissemination of price sensitiveinformation without causing an abrupt change in volatility. The evidence contradictsthe results reported by Ferris, Kumar and Wolfe (1992) for the US market. They reportan increase of volatility around trading suspensions. On the other hand, Wu (1998)demonstrates that increased volatility observed in the post-suspension period is only atemporary phenomenon.
7. CONCLUSIONS
This paper empirically examines trading suspensions on Euronext Brussels. The studyis of particular interest because of three reasons. First, these suspensions occur inorder to compel firms to disclose new information to the market. This is different fromsuspensions of trading due to delayed openings and at times of imbalances in buy or sellorders and extreme volatility. Second, prior studies show conflicting results with regardto the effectiveness of trading suspensions. Both efficient and inefficient stock priceadjustments are documented. Third, this empirical study adds to the debate whetheran exchange can add value by ensuring market integrity, compared to a single central,administrative regulatory authority which is promoted by the European Commission.With respect to the dissemination of price-sensitive information and the installmentof trading suspensions, the study evaluates whether an allocation of regulatory powers‘close to the market’ can operate efficiently.
In this study, we focus on three different parameters: stock return, tradingvolume and return volatility to determine in a robust way the efficacy of tradingsuspensions. First, we examine a sample of 102 trading suspensions. Next, we subdividethis sample into three sub-samples based on the nature of information disclosed:mergers and acquisitions, divestitures and restructurings. Our results show that tradingsuspensions are associated with a significant release of new information. This is notsurprising because trading suspensions on Euronext Brussels are mostly associatedwith the release of non-routine information, which is extremely price sensitive such asmergers and acquisitions. On average, the magnitude of the abnormal return overthe span of the trading suspension is more than 8% for the mergers and acquisi-tions sub-sample. None of the five different benchmark models report conflictingresults.
Our investigation shows that there is no anticipatory or unusual return behaviorbefore trading suspensions. Nor is there any significant abnormal return pattern inthe post-suspension period. It indicates that there is a complete and instantaneousadjustment to the new information released during trading suspensions. Once again, allfive benchmark models show similar results. It seems that the Exchange was successfulconcerning the correct timing to install a trading suspension as well as to reinstatetrading.
Analyzing the abnormal trading volume we find that an increase in trading volumetakes place as trading resumes after the suspension. The daily trading volume pattern,however, shows a decreasing trend and a gradual return to the normal level. The
C© 2006 The AuthorsJournal compilation C© Blackwell Publishing Ltd. 2006
1166 ENGELEN AND KABIR
volume analysis confirms the results of the abnormal return analysis. Finally, weperform an analysis of stock return volatility around trading suspensions. We observe asignificant increase in volatility associated with trading suspensions. However, there wasno significant change in volatility before and after the suspension. These results, again,suggest that information released during the trading suspension, is fully incorporatedin stock prices.
Overall, our results show that the regulatory action of a supervisory authority ‘closeto the market’ such as Euronext Brussels is effective in temporarily suspending thetrading of individual stocks. The disclosure of new information and the time obtainedby investors to evaluate this information appear to produce no destabilizing effect inthe stock market. It rather indicates the efficacy of trading suspensions to disseminateprice sensitive new information among market participants.
REFERENCES
Campbell, C. and C. Wasley (1993), ‘Measuring Security Price Performance Using DailyNASDAQ Returns’, Journal of Financial Economics, Vol. 33, pp. 73–92.
Christie, W., S. Corwin and J. Harris (2002), ‘Nasdaq Trading Halts: The Impact of MarketMechanisms on Prices, Trading Activity, and Execution Costs’, Journal of Finance, Vol. 57,pp. 1443–78.
Corwin, S. and M. Lipson (2000), ‘Order Flow and Liquidity Around NYSE Trading Halts’,Journal of Finance, Vol. 55, pp. 1771–801.
Cowan, A. (1992), ‘Nonparametric Event Study Tests’, Review of Quantitative Finance andAccounting , pp. 343–58.
——— and A. Sergeant (1996), ‘Trading Frequency and Event Study Test Specification’,Journal of Banking and Finance, Vol. 20, pp. 1731–57.
Dimson, E. (1979), ‘Risk Measurement when Shares are Subject to Infrequent Trading’, Journalof Financial Economics, Vol. 7, pp. 197–226.
Fama, E. and K. French (1993), ‘Common Risk Factors in the Returns on Stocks and Bonds’,Journal of Financial Economics, Vol. 33, pp. 3–56.
Ferris, S., R. Kumar and G. Wolfe (1992), ‘The Effect of SEC-ordered Suspensions on Returns,Volatility, and Trading Volume’, Financial Review, Vol. 28, pp. 1–34.
FESCO (2001), Measures to Promote Market Integrity. A Follow-up Paper to FESCO’s First Paper onMarket Abuse, Report No. 01–052f (August 1), 23 p.
FESE (2000), Report and Recommendations on European Regulatory Structures (September), 21 p.——— (2001), Regulatory Responsibilities of European Exchanges (July), 16 p.Hopewell, M. and A. Schwartz (1978), ‘Temporary Trading Suspensions in Individual NYSE
Securities’, Journal of Finance, Vol. 33, pp. 1355–73.Howe, J. and G. Schlarbaum (1986), ‘SEC Trading Suspensions: Empirical Evidence’, Journal
of Financial and Quantitative Analysis, Vol. 21, pp. 323–33.Kabir, R. (1994), ‘Share Price Behaviour Around Trading Suspensions on the London Stock
Exchange’, Applied Financial Economics, Vol. 24, pp. 289–95.King, R., G. Pownall and G. Waymire (1991), ‘Corporate Disclosure and Price Discovery
Associated with NYSE Temporary Trading Suspensions’, Contemporary Accounting Research,pp. 509–31.
Kraus, A. and H. Stoll (1972), ‘Price Impacts of Block Trades on the New York Stock Exchange’,Journal of Finance, Vol. 27, pp. 569–88.
Kryzanowski, L. (1979), ‘The Efficacy of Trading Suspensions: A Regulatory Action to Preventthe Exploitation of Monopoly Information’, Journal of Finance, Vol. 34, pp. 1187–200.
——— and H. Nemiroff (1998), ‘Price Discovery Around Trading Halts on the MontrealExchange Using Trade-by-trade Data’, Financial Review, Vol. 34, pp. 195–212.
Kryzanowski, L. and H. Nemiroff (2001), ‘Market Quote and Spread Component CostBehavior Around Trading Halts for Stocks Interlisted on the Montreal and Toronto StockExchanges’, Financial Review, Vol.36, pp. 115–38.
C© 2006 The AuthorsJournal compilation C© Blackwell Publishing Ltd. 2006
DISSEMINATING NEW INFORMATION TO THE CAPITAL MARKET 1167
La Porta, R., F. Lopez-de-Silanes, A. Shleifer and R. Vishny (1997), ‘Legal Determinants ofExternal Finance’, Journal of Finance, Vol. 52, pp. 1131–50.
——— ——— ——— ——— (1998), ‘Law and Finance’, Journal of Political Economy, Vol. 106,pp. 1113–55.
Lee, C., M. Ready and P. Seguin (1994), ‘Volume, Volatility, and New York Stock ExchangeTrading Halts’, Journal of Finance, Vol. 49, pp. 183–214.
MacKinlay, A. (1997), ‘Event Studies in Economics and Finance’, Journal of Economic Literature,Vol. 35, pp. 13–39.
Michaely, R., R. Thaler and P. Seguin (1994), ‘Price Reactions to Dividend Initiations andOmissions: Overreaction or Drift?’, Journal of Finance, Vol. 50, pp. 573–608.
Skinner, D. (1989), ‘Options Markets and Stock Return Volatility’, Journal of Financial Economics,Vol. 23, pp. 61–78.
Tan, R. and W. Yeo (2003), ‘Voluntary Trading Suspensions in Singapore’, Applied FinancialEconomics, Vol. 13, pp. 517–23.
Wu, L. (1998), ‘Market Reactions to the Hong Kong Trading Suspensions: Mandatory versusVoluntary’, Journal of Business, Finance & Accounting , Vol. 25, pp. 419–37.
C© 2006 The AuthorsJournal compilation C© Blackwell Publishing Ltd. 2006