Empirical Analysis of the Effects of Joint Decisions on Food Stamp Program, Temporary Assistance for...
27
An Empirical Analysis of the Effects of Joint Decisions on Food Stamp Program, Temporary Assistance for Needy Families, and Labor Force Participation Sonya Kostova Huffman and Helen H. Jensen Working Paper 02-WP 314 September 2002 Center for Agricultural and Rural Development Iowa State University Ames, Iowa 50011-1070 www.card.iastate.edu Sonya Kostova Huffman is a postdoctoral research associate at the Center for Agricultural and Rural Development, Iowa State University. Helen Jensen is a professor of economics and head of the Food and Nutrition Policy Division, Center for Agricultural and Rural Development, Iowa State University. Prepared for presentation at the Joint Center for Poverty Research (JCPR)/Census Grant Conference, September 5-6, 2002. The authors thank Maureen Kilkenny, Brent Kreider, and Wallace Huffman from Iowa State University for valuable discussions and comments. This research was supported by a small competitive grant from the JCPR. This publication is available online on the CARD website: www.card.iastate.edu. Permission is granted to reproduce this information with appropriate attribution to the authors and the Center for Agricultural and Rural Development, Iowa State University, Ames, Iowa 50011-1070. For questions or comments about the contents of this paper, please contact Sonya K. Huffman, 260 Heady Hall, Iowa State University, Ames, IA 50011-1070; Ph: 515-294-4299, Fax: 515-294- 6336; E-mail: [email protected]. Iowa State University does not discriminate on the basis of race, color, age, religion, national origin, sexual orientation, sex, marital status, disability, or status as a U.S. Vietnam Era Veteran. Any persons having inquiries concerning this may contact the Office of Equal Opportunity and Diversity, 1031 Wallace Road Office Building, Room 101, 515-294-7612.
Transcript of Empirical Analysis of the Effects of Joint Decisions on Food Stamp Program, Temporary Assistance for...

An Empirical Analysis of the Effects of Joint Decisions on Food Stamp Program, Temporary Assistance for Needy
Families, and Labor Force Participation
Sonya Kostova Huffman and Helen H. Jensen
Working Paper 02-WP 314 September 2002
Center for Agricultural and Rural Development Iowa State University
Ames, Iowa 50011-1070 www.card.iastate.edu
Sonya Kostova Huffman is a postdoctoral research associate at the Center for Agricultural and Rural Development, Iowa State University. Helen Jensen is a professor of economics and head of the Food and Nutrition Policy Division, Center for Agricultural and Rural Development, Iowa State University. Prepared for presentation at the Joint Center for Poverty Research (JCPR)/Census Grant Conference, September 5-6, 2002. The authors thank Maureen Kilkenny, Brent Kreider, and Wallace Huffman from Iowa State University for valuable discussions and comments. This research was supported by a small competitive grant from the JCPR. This publication is available online on the CARD website: www.card.iastate.edu. Permission is granted to reproduce this information with appropriate attribution to the authors and the Center for Agricultural and Rural Development, Iowa State University, Ames, Iowa 50011-1070. For questions or comments about the contents of this paper, please contact Sonya K. Huffman, 260 Heady Hall, Iowa State University, Ames, IA 50011-1070; Ph: 515-294-4299, Fax: 515-294-6336; E-mail: [email protected]. Iowa State University does not discriminate on the basis of race, color, age, religion, national origin, sexual orientation, sex, marital status, disability, or status as a U.S. Vietnam Era Veteran. Any persons having inquiries concerning this may contact the Office of Equal Opportunity and Diversity, 1031 Wallace Road Office Building, Room 101, 515-294-7612.

Abstract
This study examines the interaction between Food Stamp Program (FSP) and
Temporary Assistance for Needy Families (TANF) program participation, provides a
model of joint decisions made by households on FSP, TANF, and labor force
participation, and explains why households choose different alternatives.
We use the first Survey of Program Dynamics (SPD) longitudinal data and the 1998
SPD experimental data files. The modeling component consists of estimating equations to
predict the probability of particular choices made by households. The households choose
the alternative that gives the highest utility. The results show that the program parameters
do matter. Variations across states in payment standards, benefit reduction rates, and
income disregards help to identify household choices.
Keywords: labor force participation, Food Stamp Program, FSP, TANF, Temporary
Assistance for Needy Families.

AN EMPIRICAL ANALYSIS OF JOINT DECISIONS ON FOOD STAMP
PROGRAM, TEMPORARY ASSISTANCE FOR NEEDY FAMILIES, AND LABOR FORCE PARTICIPATION
Introduction
The Personal Responsibility and Work Opportunity Reconciliation Act (PRWORA)
of 1996, better known as welfare reform, is set to expire in the fall of 2002. PRWORA
ended the promise of unlimited cash assistance to the poor. Instead, it gave block grants
to states, which could then offer poor families temporary subsidies while adults in the
household prepared to enter the job force. At the center of the welfare reform debate is
whether the current reforms have been sufficient to move poor families out of poverty,
into jobs, and into more stable (married) family situations; and whether states, with
substantial new powers to redesign welfare programs, can accomplish the overall
program goals. Since 1996, Participation in the Temporary Assistance to Needy Families
(TANF) program has fallen by 56 percent. The 5.4 million persons receiving TANF in
fiscal year 2001 was the smallest percentage of the population receiving assistance since
1961 (Office of Planning, Research and Evaluation 2002).
In the era following welfare reform and the evolution of the TANF program, the
Food Stamp Program (FSP) has become the largest federal food assistance program for
low-income households. For many low-income households, food stamps represent an
important share of household resources. As the unemployed poor become working poor,
why are so many disappearing from food stamp rolls—even though many are still eligible
for the federal benefit? From 1994 to 1999, the FSP experienced an unprecedented
decline in participation. Participation fell from 27.5 million people in 1994 to 17.2
million people in 2000 (USDA 2002). The strong economy and changes in social welfare
programs have accounted for a part of the decline. But while the declining caseloads
mean fewer people are receiving assistance, they tell us nothing about the circumstances
of the families that leave and whether they are making a successful transition off welfare.
The new 2002 farm legislation reauthorizes the FSP for five years and reinstates food

2 / Huffman and Jensen
stamp eligibility for legal immigrants residing in the United States for at least five years,
and for all immigrant children and disabled individuals.
The changes in the linkages among social assistance programs under welfare reform
are likely to have significant effects on the behavior of low-income individuals and
families. The overall purpose of this study is to examine the economic and welfare
program factors affecting the well-being of low-income families and the effects of
welfare reform on labor supply decisions.
Most of the previous studies on FSP participation have examined the determinants of
participation in the FSP among low-income or FSP-eligible households (see Gleason,
Schochet, and Moffitt 1998 and Currie 2000 for a literature review). Currie (2000)
focuses on evidence of how the FSP and other federal nutrition programs have met the
goals of the federal food and nutrition programs. Because of common program eligibility
rules for TANF and the FSP, joint participation parameters are of interest. Fraker and
Moffitt (1988) model the effect of joint participation in the FSP and the Aid to Families
with Dependent Children (AFDC) program on labor supply. As they show, the budget
constraint for individuals on both the FSP and AFDC programs is complex and includes
many kinks. Fraker and Moffitt estimate that in 1980, the FSP reduced labor supply of
female heads of families by about 9 percent and the AFDC program had only a slightly
greater effect on labor supply. Marginal changes in benefit levels and the benefit
reduction rates had small effects on labor market participation. Hagstrom (1996) uses
data from the 1984 Survey of Income and Program Participation (SIPP) to model the
effect of food stamp participation on the family labor supply of married couples and finds
that the FSP has a weak effect on the labor supply of married couples. Decreasing the
FSP benefit by 25 percent would reduce the proportion of husbands and wives who
choose not to work by less than 1 percent, while increasing the food stamp benefit by 25
percent would raise the FSP participation by 7 percent. Keane and Moffitt (1998)
estimate that a reduction of the AFDC tax rate would have scarcely any effect on labor
supply and would increase the participation rate in both AFDC and food stamps. Hoynes
(1996) models the effects of cash transfers on labor supply and welfare participation in
two-parent families. She shows that labor supply and welfare participation are highly
responsive to changes in the benefit structure under the AFDC–Unemployed Parent

The Effects of Joint Decisions on TANF, Food Stamp Program, and Labor Force Participation / 3
program. In sum, the effects of program parameters and labor market variables are likely
to be complex, and evidence is still not clear-cut on their relative importance.
Among studies that have examined the effects of the 1996 reform on post-1996
caseloads are the Council of Economic Advisers (1999), and Schoeni and Blank (2000).
Studies by Zedlewski and Braumer (1999) and Wilde et al. (2000) document that many
families that left welfare also left the FSP even though they were still eligible for food
stamps. Ohls (2001) suggests that families leaving TANF because of employment or
other reasons might not be told that they are still eligible to receive food stamps, or
families who enter the TANF program may not receive the information that they
automatically are eligible for food stamp assistance. Moffitt (2002) gives an extensive
review of the rules of the TANF program and the research that has been conducted on
AFDC and TANF to date. He points out that while there is strong evidence that the
TANF program has increased employment and earnings and decreased caseloads, the
separate effects of work requirements, time limits, sanctions, and other features are
unknown.
The fundamental motivation for this study is the question of interactions among FSP,
TANF program, and labor force participation under different program designs and
economic conditions. A goal of this study is to provide in-depth analyses of current
circumstances of individuals and households that participate in the FSP and TANF and to
make comparisons to those who left or who do not participate in welfare programs even
though they are eligible. The study also examines the effects of key welfare program
parameters such as benefit levels, welfare tax (the benefit reduction rate), income
disregard, and sanctions for non-compliance with work requirements.
The objective of this study is to provide a model of the joint decisions by households
to participate in the FSP, the TANF program, and/or to work. In this paper we show that
the variations across states in payment standards, benefit reduction rates, and income
disregards help to identify household choices. The results show that the program
parameters do matter. Participation in TANF is positively related to the probability of
FSP participation and negatively related to being in the work force. Working decreases
the probability of receiving food stamps. Work, TANF, and FSP participation are
significantly related. This paper includes seven sections: (1) FSP and TANF eligibility

4 / Huffman and Jensen
criteria and benefits; (2) the theoretical model; (3) empirical model and estimation; (4)
data and variables; (5) results; (6) policy simulations; and (7) conclusions.
Food Stamp and Temporary Assistance to Needy Families Programs: Eligibility and Benefits
The FSP established uniform national eligibility standards. Households who qualify
for this program must be income and asset poor. That is, the gross income of a household
must be at or below 130 percent of the poverty line and net income must be less than 100
percent of the poverty line. However, states have some discretion within federal rules.
States may exclude certain types of income and resources not counted under other
welfare programs and they are given new options on the use of standardized deductions.
A household must also have assets worth less than $2,000 ($3,000 for households with
someone 60 years of age or over). The maximum amount of food stamps a household can
receive depends on the household size. Benefits also vary with income. For those who
meet the eligibility criteria, the food stamp benefit is equal to the maximum benefit (Gh)
given the household size minus 30 percent of the household’s net income.
The PRWORA gives each state a fundamental role in assisting poor families, and,
under TANF, each state has different eligibility rules and benefits. Eligible TANF
families, however, must have sufficiently low income and asset levels. The income test
requires that net family income not exceed a maximum benefit level that varies by family
size and state of residence. Net income includes unearned income as well as countable
earned income (earned income less an earned income disregard). A family having no
income is eligible to receive the maximum permitted TANF grant in the state (BTsh). For
a family with income, the TANF benefits are calculated as the difference between the
maximum potential benefit or “pay standard” ( B̂Tsh), and net-family income:
BTsh = min{BTsh, [ B̂Tsh - Nh – ts(whHh - Es)]}, (1)
where Nh is the household unearned income, Es is a state earned income disregard (a
dollar amount of earned income not counted when calculating the amount of welfare cash
transfer), ts is the benefit reduction rate, which is applied to earnings that exceed the

The Effects of Joint Decisions on TANF, Food Stamp Program, and Labor Force Participation / 5
income disregard, and is between 0 and 1. The size of the welfare grant falls as earned
income rises, but not dollar for dollar. This maintains incentives for eligible household
members to work and not just rely on transfers.
Under PRWORA, welfare responsibility is left to state-run TANF programs.
However, the act did include some strong rules. Recipients are now required to work, and
most can collect aid for no more than five years over a lifetime. TANF recipients must
secure a job after two continuous years on assistance. In 1997, at least 25 percent of
single-parent-headed households and 75 percent of two-parent households were engaged
in work activities in each state. Single parents receiving TANF benefits were required to
work at least 20 hours per week by 1997 and at least 30 hours per week by 2000. Two-
parent families must work 35 hours per week with the stipulation that parents can share
the work hours. The required work activities include specified “priority” activities:
employment, on-the-job training, job search and job readiness, community service,
vocational educational training, or provision of childcare in community service. This
requirement tends to force families into the workplace and off welfare. If adults who are
required to participate in activities do not comply with requirements, the state has the
option to sanction or reduce the unit’s benefit. A sanction generally results in the removal
of the non-complying individual from the unit for benefit computation purposes, a
percentage reduction in the entire unit’s benefit, or a full benefit sanction. States increase
the severity of the sanction based on the amount of time or the number of times the
individual is non-compliant. States may not use TANF funds to assist a family that
includes an adult who has received assistance for more than five years, and the state may
set a time limit of less than five years. The state is allowed to exempt up to 20 percent of
its caseload for reasons such as no job availability or a high unemployment rate, age of
parent, and disability or illness.1 Families eligible for TANF are automatically eligible for
Food Stamp and Medicaid programs.
Theoretical Model
A static model of household behavior is developed where work and program
participation are chosen to maximize household utility function subject to a budget
constraint reflecting transfers. The model is used to explain the joint decisions to

6 / Huffman and Jensen
participate in TANF, the FSP, and labor markets of a population of households eligible
for those programs. The household head chooses whether to work or not and
simultaneously decides whether to participate in TANF or the FSP. The FSP and TANF
participation and labor supply decisions are interdependent because labor supply
decisions depend on the FSP and TANF benefits (through their effect on the budget
constraint), the TANF participation decision depends on labor supply (through its effect
on the TANF benefits), and the FSP participation decision depends on labor supply and
TANF participation (through their effect on the food stamp benefits—each payment is
reduced by an extra dollar of earnings and extra dollar of TANF benefit). Therefore, the
combination of program participation choices must be treated jointly with the labor
supply choice, and the labor supply equation must be estimated jointly with the TANF
and FSP participation equations.
Following Moffitt (1983), consider the following family utility function:
U (L, X, Pt, Pf) = U (L, X) + dtPt + dfPf (2)
where L is the household head leisure, X is purchased goods, Pt is an indicator equal to 1
if the family participates in TANF and 0 if not, Pf is equal to 1 if the family participates in
the FSP and 0 if not, dt is the marginal disutility of TANF participation, and df is the
marginal disutility of FSP participation (dt and df represent tastes for receiving cash
transfers and food stamps respectively). The program participation indicators in equation
(2) represent the costs of participating in the welfare program and are included to explain
and account for non-participation among eligible families. If stigma is associated with
program participation (and if Pt and Pf capture nothing besides stigma), dt < 0 and df < 0.
Hence, we would expect that ∂U/∂L > 0, ∂U/∂X > 0, ∂U/∂Pt < 0, and ∂U/∂Pf < 0. The
budget constraint gives monthly disposable income:
I = wH + N + Pt(Bt(H)-Ct) + Pf(Bf(H)-Cf) = PxX, (3)
where w is the hourly wage rate per work hour, Bt(H) and Bf(H) are the benefit functions
for TANF and the FSP respectively, Ct and Cf are the monetary costs associated with

The Effects of Joint Decisions on TANF, Food Stamp Program, and Labor Force Participation / 7
TANF and FSP participation respectively, and H is the household head labor supply. Full
income is
w(! - L) + N + Pt(B(H)-C) + Pf(Bf(H)-Cf) - PxX = 0, (4)
or
F = w! + N + Pt(B(H)-C) + Pf(Bf(H)-Cf) = PxX + wL,
where !(=L+H) is the household head time endowment.
The household head is assumed to choose H (or L), Pt, and Pf simultaneously to
maximize its utility U (L, X, Pt, Pf) subject to the budget constraint in equation (3). The
household head chooses the (H, Pt, Pf) combination that provides the highest indirect
utility.
The optimal choices are
X*= dX[w, Px, N, Bt′(H), Bf′(H), Ct, Cf, Z], (5)
L*= dL[w, Px, N, Bt′(H), Bf′(H), Ct, Cf, Z], (6)
H*= ! - L*= SH[w, Px, N, Bt′(H), Bf′(H), Ct, Cf, Z], (7)
Pt*= dPt[w, Px, N, Bt′(H), Bf′(H), Ct, Cf, Z], (8)
Pf*= dPf[w, Px, N, Bt′(H), Bf′(H), Ct, Cf, Z]. (9)
where Z is a vector of other explanatory variables. Given these equations, we have also
the following wage equation: w*=w[H, Z].
Participation in welfare programs is not costless. Costs are associated with a family
filing an application, going for an interview, as well as with the opportunity cost from
reduced expected future benefits due to a lifetime time limit imposed in TANF, and with
opportunity costs of foregone labor earnings to become eligible. In addition, as Moffitt
(1983) suggests, stigma is associated with AFDC participation and this helps explain the
observed lower-than-expected participation rates. Families facing relatively low costs of
current period participation are more likely to participate than are those facing higher
costs. Ohls (2001) suggests that households might not participate in the FSP because of
lack of transportation or potential embarrassment of receiving food stamps, or because
8 / Huffman and Jensen
the application process is too burdensome. Zedlewski (2001) show that more families
reported leaving the FSP because of administrative issues in 1999 than in 1997. Given
states’ freedom in designing TANF programs, important and hard-to-measure differences
exist among states that may affect labor supply and TANF decisions. For example, the
way in which a state TANF bureaucracy encourages or discourages participation in the
TANF program is likely to affect stigma and transaction costs of participating and
therefore account for some of the cross-state differences in participation. However, this is
difficult to measure. While the costs and stigma associated with claiming benefits may be
important, the empirical analysis cannot directly address these issues but they can be
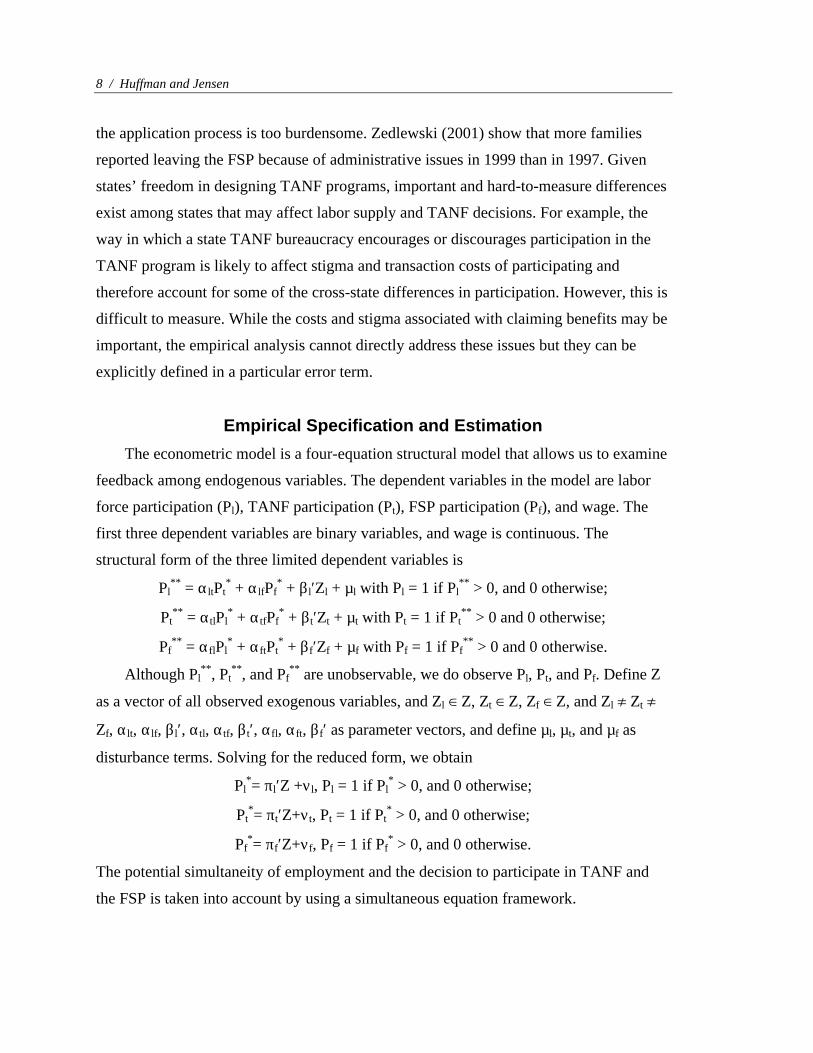
explicitly defined in a particular error term.
Empirical Specification and Estimation
The econometric model is a four-equation structural model that allows us to examine
feedback among endogenous variables. The dependent variables in the model are labor
force participation (Pl), TANF participation (Pt), FSP participation (Pf), and wage. The
first three dependent variables are binary variables, and wage is continuous. The
structural form of the three limited dependent variables is
Pl** = αltPt
* + αlfPf* + βl′Zl + µl with Pl = 1 if Pl
** > 0, and 0 otherwise;
Pt** = αtlPl
* + αtfPf* + βt′Zt + µt with Pt = 1 if Pt
** > 0 and 0 otherwise;
Pf** = αflPl
* + αftPt* + βf′Zf + µf with Pf = 1 if Pf
** > 0 and 0 otherwise.
Although Pl**, Pt
**, and Pf** are unobservable, we do observe Pl, Pt, and Pf. Define Z
as a vector of all observed exogenous variables, and Zl c Z, Zt c Z, Zf c Z, and Zl g Zt g
Zf, αlt, αlf, βl′, αtl, αtf, βt′, αfl, αft, βf′ as parameter vectors, and define µl, µt, and µf as
disturbance terms. Solving for the reduced form, we obtain
Pl*= πl′Z +νl, Pl = 1 if Pl
* > 0, and 0 otherwise;
Pt*= πt′Z+νt, Pt = 1 if Pt
* > 0, and 0 otherwise;
Pf*= πf′Z+νf, Pf = 1 if Pf
* > 0, and 0 otherwise.
The potential simultaneity of employment and the decision to participate in TANF and
the FSP is taken into account by using a simultaneous equation framework.

The Effects of Joint Decisions on TANF, Food Stamp Program, and Labor Force Participation / 9
We use two-stage estimation procedure (Nelson and Olson 1978). First, we estimate
the reduced form or estimate πl, πt, and πf by maximum-likelihood applied to each
equation. Second, we form the instruments ZP ll'* ˆˆ π= , ZP tt
'* ˆˆ π= , and ZP ff'* ˆˆ π= . Third, we
replace Pl*, Pt
*, and Pf* on the right-hand side of the structural equations by the
corresponding Zl'π̂ , Zt
'π̂ , Zf'π̂ and treat these instruments as fixed regressors and the
resulting equations as single-equation models. We then estimate the structural parameters
by maximum likelihood applied to each equation separately. In the independent probit
model, we also include variables we use for identification in the simultaneous equation
models. At least one variable in the vector Zl cannot be in Zt and Zf, and vice versa. For
the vector Zl, we use children under age 6, children under age 13, and children under age
18 as variables for identification; for vector Zt we use the TANF program parameters
(pay standard, benefit reduction rate, income disregard, and sanction), and for vector Zf
we use age and age squared, and the FSP benefit.
The empirical specification of the individual human-capital-based wage equation is
ln(wage) = ß0 + ß1age+ß2agesq+ß3edu+ß4male+ß5O′+µw,
where O′ is a vector of exogenous variables including race (white=1), marital status
(married=1), and labor market variables (state unemployment rate); and whether the
household head is male (male=1); variable µw is a normal random error term. The wage
equation also includes a labor-market selection variable.
Data and Variables
We use the U.S. Census Bureau’s first Survey of Program Dynamics (SPD)
longitudinal data and the 1998 SPD experimental data files for the empirical analysis.
The SPD contains detailed information about the characteristics of and the choices made
by participant and non-participant households. The SPD survey is comprised of two SIPP
files, the SPD Bridge file and the SPD file. The SIPP files are 1992 and 1993 SIPP Panel
data and they are recoded to look and feel much like the Census Bureau’s March Current
Population Survey (CPS) files. The SPD Bridge file is a CPS instrument administered on
the SPD population. The SPD file collects data on assets and many other important
variables. Available longitudinal data are restricted to the variables on the March CPS.

10 / Huffman and Jensen
As a result, the SPD longitudinal file has core employment, earnings, income, health
insurance, and Medicaid information but lacks other data, such as assets that were left off
the file. Therefore, the 1998 SPD experimental file is merged into the SPD longitudinal
file. The 1998 Experimental Data were minimally edited, and imputations were not
performed for missing data.
The longitudinal SPD file provides information on income, job participation,
program participation, health insurance and utilization, and the well-being of adults and
children during the reference period (1997).
The demographic variables for each member of the household include age, sex,
education level, race, marital status, and household relationship. The economic
characteristics include work experience, non-labor income, and an indicator (0, 1) of not
receiving any cash benefits. The work experience information covers employment status,
weeks worked, whether heads of household are looking for work or on layoff, average
hours employed per week, and other job-specific characteristics. It also contains detailed
information on variables that are necessary to determine the eligibility and the benefits
for welfare programs, such as age, disability status of household members, and data on
income, labor force status, and household’s participation in government-sponsored
programs such as TANF, Food Stamps, and Medicaid. The data about state TANF
parameters is collected from the Green Book (U.S. House of Representatives 1998) and
Gallagher et al. (1998). Information about unemployment rates is from the U.S. Census
Bureau (1999).
Only non-elderly (between ages 18 and 65), non-disabled household heads are
included in the sample (both the elderly and the disabled are eligible for other transfer
programs). Households are also excluded from the sample if they are categorically
ineligible for the TANF program, that is, if they do not have a child under age 18 in the
family. Households with assets that exceed the state asset limit are excluded from the
sample (Table 1). The resulting sample includes 4,545 households with low wealth, 66
percent of which are married-couple families, and 57 percent of which have a male as a
household head (weighted data). The household head is the person (or one of the persons)
in whose name the housing unit is owned or rented. If the house is owned or rented
jointly by a married couple, the household head may be either the husband or the wife.

The Effects of Joint Decisions on TANF, Food Stamp Program, and Labor Force Participation / 11
TABLE 1. State TANF parameters and unemployment rates
State Asset Limit ($) B ($) E ($) t (%) Sanction (months) UNRATE (%)
Alabama 2,000 137 0 80 6 5.1 Alaska 1,000 821 150 67 Until compliance 7.5 Arizona 2,000 275 90 70 6 4.6 Arkansas 3,000 162 0 100 3 5.3 California 2,000 493 225 50 6 6.3 Colorado 2,000 280 120 67 3 3.3 Connecticut 3,000 443 1157 100 3 5.1 Delaware 1,000 270 120 67 Lifetime 4.0 D.C. 1,000 298 100 50 6 7.9 Florida 2,000 241 200 50 3 4.8 Georgia 1,000 235 120 67 Lifetime 4.5 Hawaii 5,000 452 200 44 6 6.4 Idaho 2,000 276 0 100 Until compliance 5.0 Illinois 3,000 278 0 33 6 4.7 Indiana 1,500 229 120 67 36 3.5 Iowa 5,000 361 0 40 6 3.3 Kansas 2,000 352 90 60 2 3.8 Kentucky 2,000 225 120 67 Until compliance 5.4 Louisiana 2,000 138 1020 100 6 6.1 Maine 2,000 312 108 50 6 5.4 Maryland 2,000 313 0 65 1 5.1 Massachusetts 2,500 474 120 50 0.5 4.0 Michigan 3,000 371 200 80 1 4.2 Minnesota 5,000 437 0 64 6 3.3 Mississippi 1,000 96 90 100 Lifetime 5.7 Missouri 5,000 234 120 67 6 4.2 Montana 3,000 366 200 75 6 5.4 Nebraska 6,000 293 0 80 6 2.6 Nevada 2,000 289 0 50 1 4.1 New Hampshire 2,000 481 0 50 1 3.1 New Jersey 2,000 322 0 50 3 5.1 New Mexico 1,500 410 150 50 1 6.2 New York 2,000 467 90 55 6 6.4 North Carolina 3,000 236 120 67 6 3.6 North Dakota 5,000 340 0 62 Until compliance 2.7 Ohio 1,000 279 250 50 6 4.6 Oklahoma 1,000 225 120 50 Until compliance 4.1 Oregon 2,500 427 0 50 Until compliance 5.8 Pennsylvania 1,000 316 0 50 Lifetime 5.2 Rhode Island 1,000 449 170 50 0.5 5.3 South Carolina 2,500 160 0 50 1 4.5 South Dakota 2,000 380 90 80 6 2.7 Tennessee 2,000 142 150 100 3 5.4 Texas 2,000 163 120 67 6 5.4 Utah 2,000 362 100 50 Until compliance 3.1
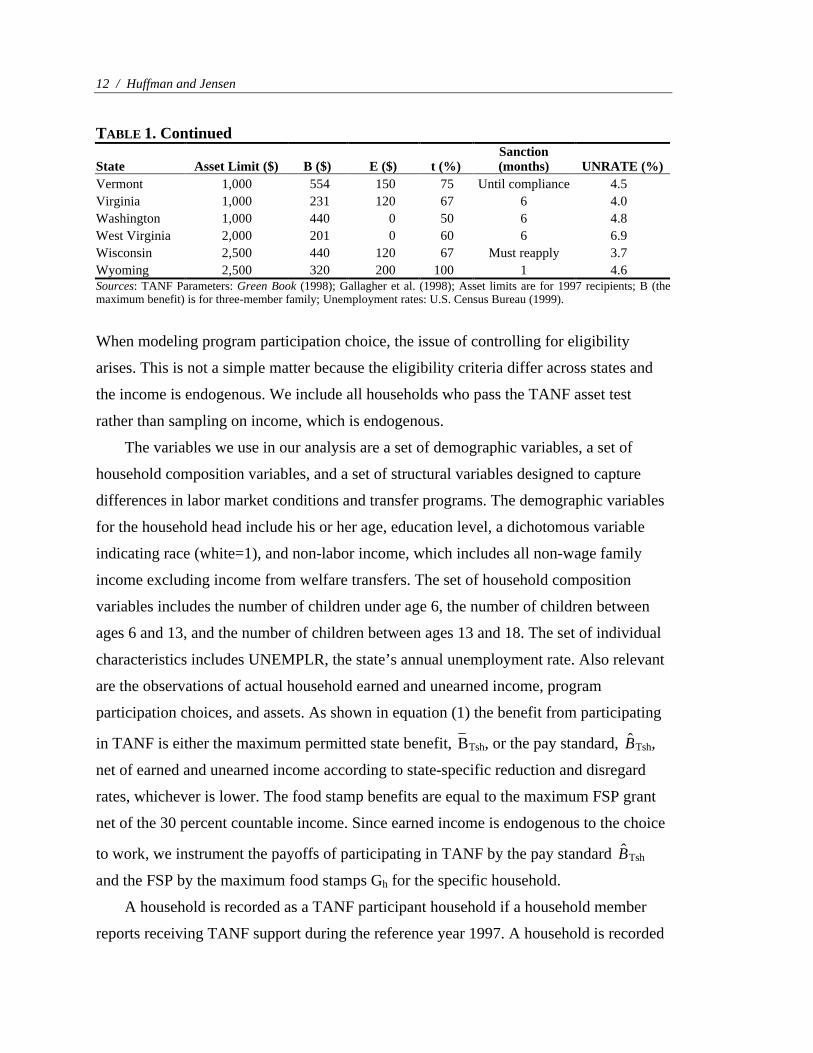
12 / Huffman and Jensen
TABLE 1. Continued
State Asset Limit ($) B ($) E ($) t (%) Sanction (months) UNRATE (%)
Vermont 1,000 554 150 75 Until compliance 4.5 Virginia 1,000 231 120 67 6 4.0 Washington 1,000 440 0 50 6 4.8 West Virginia 2,000 201 0 60 6 6.9 Wisconsin 2,500 440 120 67 Must reapply 3.7 Wyoming 2,500 320 200 100 1 4.6 Sources: TANF Parameters: Green Book (1998); Gallagher et al. (1998); Asset limits are for 1997 recipients; B (the maximum benefit) is for three-member family; Unemployment rates: U.S. Census Bureau (1999).
When modeling program participation choice, the issue of controlling for eligibility
arises. This is not a simple matter because the eligibility criteria differ across states and
the income is endogenous. We include all households who pass the TANF asset test
rather than sampling on income, which is endogenous.
The variables we use in our analysis are a set of demographic variables, a set of
household composition variables, and a set of structural variables designed to capture
differences in labor market conditions and transfer programs. The demographic variables
for the household head include his or her age, education level, a dichotomous variable
indicating race (white=1), and non-labor income, which includes all non-wage family
income excluding income from welfare transfers. The set of household composition
variables includes the number of children under age 6, the number of children between
ages 6 and 13, and the number of children between ages 13 and 18. The set of individual
characteristics includes UNEMPLR, the state’s annual unemployment rate. Also relevant
are the observations of actual household earned and unearned income, program
participation choices, and assets. As shown in equation (1) the benefit from participating
in TANF is either the maximum permitted state benefit, BTsh, or the pay standard, B̂Tsh,
net of earned and unearned income according to state-specific reduction and disregard
rates, whichever is lower. The food stamp benefits are equal to the maximum FSP grant
net of the 30 percent countable income. Since earned income is endogenous to the choice
to work, we instrument the payoffs of participating in TANF by the pay standard B̂Tsh
and the FSP by the maximum food stamps Gh for the specific household.
A household is recorded as a TANF participant household if a household member
reports receiving TANF support during the reference year 1997. A household is recorded

The Effects of Joint Decisions on TANF, Food Stamp Program, and Labor Force Participation / 13
as an FSP participant household if a household member reports receiving food stamps
during the reference year. Household heads are classified as not working if they report
working zero hours during the reference period, and they are classified as working if they
report working one or more hours per week during the reference period. Table 2 presents
the means and standard errors of the sample (weighted) percentage data. Table 3 shows
the distribution of the sample by labor and welfare participation for all household heads
and for single and married household heads. Over 30 percent of the single households
participate in the FSP and TANF while only 6 percent of the married households
participate in these programs. Married household heads work more (93 percent) than do
the single ones (86 percent).
The household heads are classified into eight groups: (i) working, FSP and TANF
participant; (ii) not working, FSP and TANF participant; (iii) working, not FSP
participant, TANF participant; (iv) working, FSP participant, not TANF participant; (v)
not working, not FSP participant, TANF participant; (vi) not working, FSP participant,
not TANF participant; (vii) working, FSP participant, not TANF participant; and (viii) not
working, not FSP participant, not TANF participant. Table 4 summarizes the main
descriptive characteristics of these groups. The first row of the table gives the
demographic characteristics of the whole sample. Those who work and are non-
participants in the FSP and TANF (group 7) are more likely to be male, married, white, to
have more education, and to have less children. The TANF and FSP participants who do
not work (group 2) are less likely to be married and more likely to have more children.
TANF-only participants (group 5) are most likely to be female and have the least
education and the smallest amount of non-labor income.
Table 5 compares the main demographic characteristics of welfare participants with
those of non-participants. The welfare participants are most likely to be single, younger,
and have more children, have less non-labor income, and have less education. They are
also less likely to work compared to the non-participants.
Table 6 presents the duration of participation in the FSP and TANF in 1997. The
average number of months in TANF for TANF-only participants is 9.68, while for
participants in both TANF and the FSP the number of months is slightly higher—10.15.
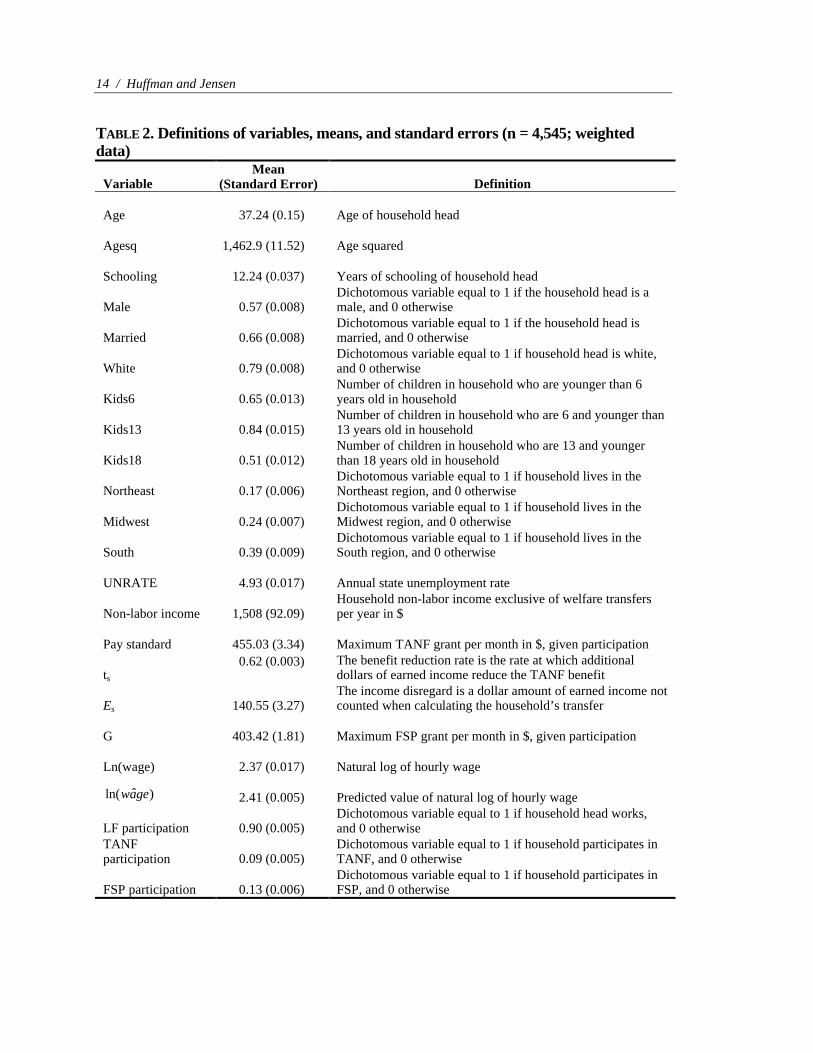
14 / Huffman and Jensen
TABLE 2. Definitions of variables, means, and standard errors (n = 4,545; weighted data)
Variable Mean
(Standard Error) Definition
Age 37.24 (0.15) Age of household head
Agesq 1,462.9 (11.52) Age squared
Schooling 12.24 (0.037) Years of schooling of household head
Male 0.57 (0.008) Dichotomous variable equal to 1 if the household head is a male, and 0 otherwise
Married 0.66 (0.008) Dichotomous variable equal to 1 if the household head is married, and 0 otherwise
White 0.79 (0.008) Dichotomous variable equal to 1 if household head is white, and 0 otherwise
Kids6 0.65 (0.013) Number of children in household who are younger than 6 years old in household
Kids13 0.84 (0.015) Number of children in household who are 6 and younger than 13 years old in household
Kids18 0.51 (0.012) Number of children in household who are 13 and younger than 18 years old in household
Northeast 0.17 (0.006) Dichotomous variable equal to 1 if household lives in the Northeast region, and 0 otherwise
Midwest 0.24 (0.007) Dichotomous variable equal to 1 if household lives in the Midwest region, and 0 otherwise
South 0.39 (0.009) Dichotomous variable equal to 1 if household lives in the South region, and 0 otherwise
UNRATE 4.93 (0.017) Annual state unemployment rate
Non-labor income 1,508 (92.09) Household non-labor income exclusive of welfare transfers per year in $
Pay standard 455.03 (3.34) Maximum TANF grant per month in $, given participation
ts The benefit reduction rate is the rate at which additional dollars of earned income reduce the TANF benefit
Es
0.62 (0.003)
140.55 (3.27) The income disregard is a dollar amount of earned income not counted when calculating the household’s transfer
G 403.42 (1.81) Maximum FSP grant per month in $, given participation
Ln(wage) 2.37 (0.017) Natural log of hourly wage
ˆln( )wage 2.41 (0.005) Predicted value of natural log of hourly wage
LF participation 0.90 (0.005) Dichotomous variable equal to 1 if household head works, and 0 otherwise
TANF participation 0.09 (0.005)
Dichotomous variable equal to 1 if household participates in TANF, and 0 otherwise
FSP participation 0.13 (0.006) Dichotomous variable equal to 1 if household participates in FSP, and 0 otherwise

The Effects of Joint Decisions on TANF, Food Stamp Program, and Labor Force Participation / 15
TABLE 3. Distribution of the sample by labor force and welfare participation, and by family type
Working Not working All All Household Heads
Not participate in TANF and FSP 3,638 80 % 244 5.4 % 3,882 85 % Participate in TANF but not in FSP 59 1.3 % 12 0.3 % 71 2 % Participate in FSP but not in TANF 224 4.9 % 48 1.1 % 272 6 % Participate in TANF and FSP 193 4.2 % 128 2.8 % 321 7 % All 4,113 90.5 % 432 19.5 % 4,545 100%
Single Household Heads Not participate in TANF and FSP 966 64.0 % 71 4.7 % 1,037 68.7 % Participate in TANF but not in FSP 38 2.5 % 8 0.5 % 46 3.0 % Participate in FSP but not in TANF 139 9.2 % 33 2.2 % 172 11.4 % Participate in TANF and FSP 150 9.9 % 104 6.9 % 254 16.8 % All 1,293 85.7 % 216 14.3 % 1,509 100%
Married Household Heads Not participate in TANF and FSP 2,672 88.0 % 173 5.7 % 2,845 93.7 % Participate in TANF but not in FSP 21 0.7 % 4 0.1 % 25 0.8 % Participate in FSP but not in TANF 85 2.8 % 15 0.5 % 100 3.3 % Participate in TANF and FSP 42 1.4 % 24 0.8 % 66 2.2 % All 2,820 92.9 % 216 7.1 % 3,036 100%
Source: 1st longitudinal SPD data.
TABLE 4. Main demographic characteristics of different household groups (weighted data)
No. of Households Unweighted Male Married Educ White Kids Age
Nonlab Income
Sample 4545 0.57 0.66 12.24 0.79 1.999 37.24 1,508 Pt=Pf=Pl=1 192 0.19 0.18 11.33 0.56 2.45 33.88 2,169 Pt=0, Pf=Pl=1 224 0.32 0.32 11.46 0.62 2.22 34.08 971 Pt=Pf=1, Pl=0 128 0.08 0.13 10.57 0.52 2.82 34.81 582 Pt=Pl=1, Pf=0 59 0.28 0.33 11.8 0.61 2.02 37.92 1,475 Pt=1, Pf=Pl=0 12 0.15 0.24 9.69 0.59 2.16 39.42 703 Pt=Pl=0, Pf=1 48 0.16 0.28 10.94 0.71 2.12 34.42 1,204 Pt=Pf=Pl=0 244 0.25 0.72 11.85 0.82 2.2 36.92 2,371 Pt=Pf=0, Pl=1 3638 0.65 0.73 12.46 0.83 1.91 37.76 1,494

16 / Huffman and Jensen
TABLE 5. Main demographic characteristics of welfare participants and non-participants (weighted data)
% of House-holds Un-
weighted Male Married Educ White Kids Age Nonlab Income
FSP partic
TANFpartic
Labor partic
Welfare participants 0.15 0.21 0.24 11.2 0.59 2.39 34.6 1,283 0.9 0.6 0.71
Non- participants 0.85 0.63 0.73 12.4 0.83 1.93 37.7 1,547 0.94
TABLE 6. Participation in TANF and the FSP
Only TANF participants Only FSP participants
TANF and FSP participants
Number of months in TANF
9.68
10.15
Number of months in FSP 9.14 10.81 Number of households 71 272 320
The number of months in the FSP is 9.14 for FSP-only participants and it is 10.81 for
participants in both TANF and the FSP.
Empirical Results
The dependent variables of the empirical model are TANF, FSP, labor force
participation, and ln hourly wage. The simultaneous equation model is estimated using
the instrumental variable estimator proposed by Nelson and Olson (1978).
At the first stage, each endogenous variable is regressed on a set of instrumental
variables. The instruments consist of all exogenous variables in the model. The predicted
values for the limited dependent variables are the predicted values Zl'π̂ , Zt
'π̂ , Zf'π̂ , rather
than the predicted probability. The second stage is to substitute for the endogenous
variables on the right-hand side of the system using the predicted values and then
estimate the system by probit (TANF, FSP, labor force participation) and least squares
(wage equation).

The Effects of Joint Decisions on TANF, Food Stamp Program, and Labor Force Participation / 17
Wage Equation
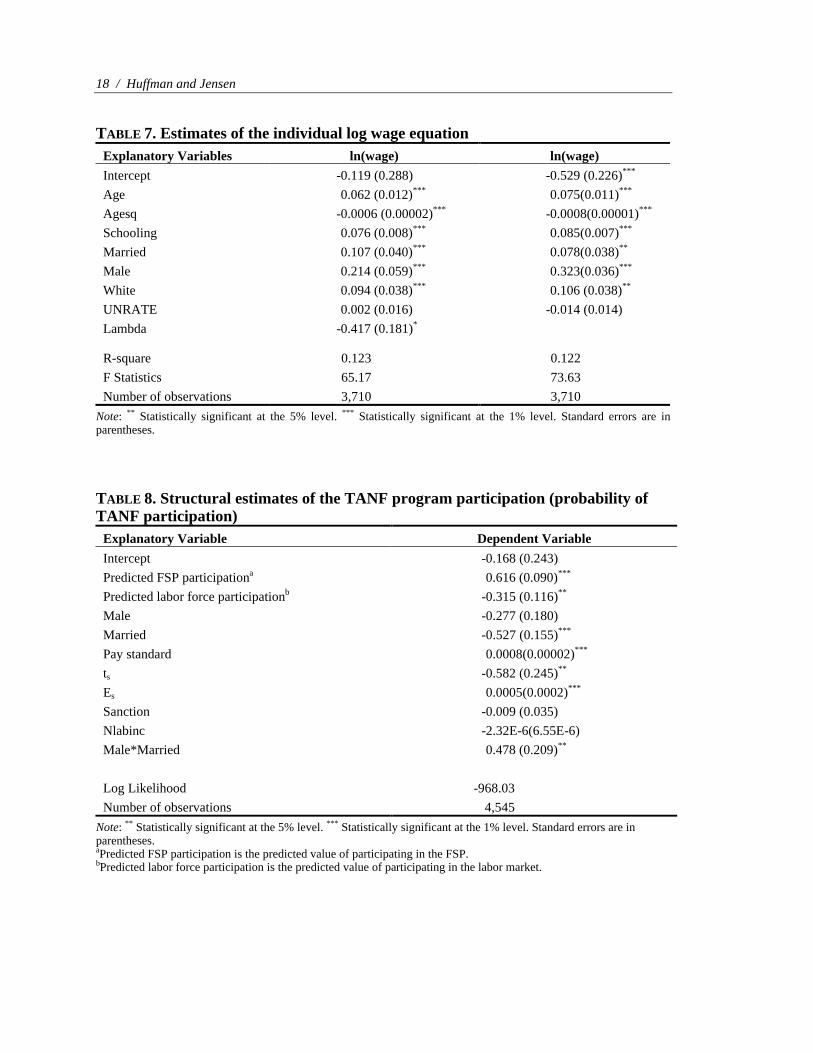
Two sets of estimates for the wage equation are reported in Table 7, one with a
selection term and one without a selection term. The wage equation is concave in age,
and the age effect peaks at age 51. The findings on other coefficients are consistent with
other studies. One additional year of schooling has the direct effect of increasing the
wage by 7.6 percent. Added schooling increases wage income through increased labor
productivity, holding other factors equal. Being male or white also increases an
individual’s wage. The hypothesis of the joint test of all the non-intercept coefficients,
except for the coefficient of the selection term, is rejected. The sample value is 28.36 (the
critical value is 2.01). The R2 is 12 percent. We estimated a wage equation for the
household heads who work and then used the predicted wage in the labor force
participation equation in place of the actual wage, as an instrumental variable.
TANF Participation
The structural estimates of the TANF program participation are presented in Table 8.
All coefficients have the hypothesized signs and many are highly significant. With
respect to the state welfare policy instruments, the effects are as follows:
1. The higher are the benefits (pay standard), the higher is the TANF participation.
2. TANF participation is positively related to the earned income disregard and
negatively related to the benefit reduction rate, and the effects are highly signifi-
cant.
3. The higher is the sanction, the less likely is the household to participate in
TANF, but the effect is not statistically different from zero.
Being male and married decreases the probability of being in TANF. Participation in
TANF is positively related to the probability of FSP participation and negatively related
to being in the work force. The higher non-labor income a household has, the smaller is
the probability of that household’s TANF participation.2
FSP Participation
The structural estimates of the TANF program participation are presented in Table 9.
Being a TANF participant increases the probability of FSP participation. Working
decreases the probability of receiving food stamps. Both effects are statistically
18 / Huffman and Jensen
TABLE 7. Estimates of the individual log wage equation Explanatory Variables ln(wage) ln(wage) Intercept -0.119 (0.288) -0.529 (0.226)***
Age 0.062 (0.012)*** 0.075(0.011)***
Agesq -0.0006 (0.00002)*** -0.0008(0.00001)***
Schooling 0.076 (0.008)*** 0.085(0.007)***
Married 0.107 (0.040)*** 0.078(0.038)**i
Male 0.214 (0.059)*** 0.323(0.036)***
White 0.094 (0.038)*** 0.106 (0.038)**i UNRATE 0.002 (0.016) -0.014 (0.014)ii Lambda -0.417 (0.181)* i i R-square
0.123
0.122
F Statistics 65.17 73.63 Number of observations 3,710 3,710
Note: ** Statistically significant at the 5% level. *** Statistically significant at the 1% level. Standard errors are in parentheses. TABLE 8. Structural estimates of the TANF program participation (probability of TANF participation)
Explanatory Variable Dependent Variable Intercept -0.168 (0.243)
Predicted FSP participationa 0.616 (0.090)***
Predicted labor force participationb -0.315 (0.116)**
Male -0.277 (0.180)
Married -0.527 (0.155)***
Pay standard 0.0008(0.00002)***
ts -0.582 (0.245)**
Es 0.0005(0.0002)***
Sanction -0.009 (0.035) Nlabinc -2.32E-6(6.55E-6) Male*Married 0.478 (0.209)**i Log Likelihood -968.03 Number of observations 4,545
Note: ** Statistically significant at the 5% level. *** Statistically significant at the 1% level. Standard errors are in parentheses. aPredicted FSP participation is the predicted value of participating in the FSP. bPredicted labor force participation is the predicted value of participating in the labor market.

The Effects of Joint Decisions on TANF, Food Stamp Program, and Labor Force Participation / 19
TABLE 9. Structural Estimates of the FSP program participation (Probability of FSP participation)
Explanatory Variable Dependent Variable Intercept 0.329 (0.347)
Predicted TANF participationa 0.254 (0.098)**
Predicted labor force participationb -0.735 (0.130)***
Male 0.098 (0.139) Married -1.062 (0.163)***
G 0.0007 (0.0003)**
Nlabinc -0.00001(6E-6)**
Male*Married 0.631 (0.157)***
Log Likelihood -1,335.19 Number of observations 4,545
Note: ** Statistically significant at the 5% level. *** Statistically significant at the 1% level. Standard errors are in parentheses. aPredicted TANF participation is the predicted value of participating in TANF program. bPredicted labor force participation is the predicted value of participating in the labor market.
significant. The higher is the food stamp benefit, the higher is the probability of a
household being in the FSP. Being married decreases the probability of being in TANF.
Having higher non-labor income makes the household less likely to participate in the
FSP, and the effect is significant.
Labor Force Participation
The structural estimates of the TANF program participation are presented in Table
10. Variables that are excluded from the labor force participation equation are pay
standard, benefit reduction rate, income disregard, sanction, and FSP benefit variables.
The education, race, age, and age squared of the household head variables are excluded
from the labor force participation equation in particular to identify the wage effect in
labor force participation.
Working is positively related to a higher (predicted) wage and being male. The
choice not to work is explained by having more children. Participation in the TANF
program decreases the probability of working. Working decreases the probability of
being a TANF and/or an FSP participant. Therefore, work, TANF, and FSP participation
are correlated and highly significant. Higher unemployment rates decrease the probability
of labor force participation.

20 / Huffman and Jensen
TABLE 10. Structural estimates of the labor force participation (probability of labor force participation)
Explanatory Variable Dependent Variable Intercept -0.487 (0.472)
Predicted TANF participationa -0.309 (0.105)***
Predicted FSP participationb 0.315 (0.186)
Male 0.444 (0.188)**
Married -0.344 (0.199) Kids6 -0.191 (0.077)**
Kids13 -0.169 (0.060)***
Kids18 -0.087 (0.050)
)ˆln( geaw 1.140 (0.329)***
UNRATE -0.147 (0.039)***
Nlabinc -2.44E-6 (4.8E-6)**
Male*Married 0.369 (0.217)
Log Likelihood -1,181.67 Number of observations 4,545
Note: ** Statistically significant at the 5% level. *** Statistically significant at the 1% level. Standard errors are in parentheses. aPredicted TANF participation is the predicted value of participating in TANF program. bPredicted FSP participation is the predicted value of participating in FSP.
Policy Simulations
In this section, we present the simulated effects of changes in policy parameters and
wage on labor force and program participation. We evaluate an increase in payment
standards, a decrease in the benefit reduction rate, and an increase in income disregard on
the probability of TANF, FSP, and labor participation. We also examine the effect of an
increase in the (predicted) wage on the probability of labor participation. The simulations
are constructed by using the model estimates to predict the probabilities of TANF, FSP,
and labor force participation given the household variables (demographic characteristics,
non-labor income, welfare program parameters). Predicting the probabilities for each
observation and then taking the mean over all observations creates average probabilities.
Changing the program parameters and wage allows us to compare the probabilities of
TANF, FSP, and labor force participation with those experienced under the current law.
The baseline estimates are displayed in the first column of Table 11. The predicted
TANF participation rate is 8.6 percent, FSP, 13 percent, and labor force, 90.5 percent.

The Effects of Joint Decisions on TANF, Food Stamp Program, and Labor Force Participation / 21
TABLE 11. Simulated changes in program parameters and wage (absolute and percentage changes in parentheses)
Base
25% Increase in Pay
Standard $100 Increase in
Income Disregard 10% Increase
in BRR
10% Increase in (Predicted)
Wage Probability of
TANF participation 0.0859
0.0932 (0.0073, 9%)
0.0884 (0.0025, 3%)
0.0819 (-0.0040, -5%)
Probability of
FSP participation
0.1302
0.1412
(0.0110, 8%)
0.1289
(-0.0012,-1%)
0.1284
(-0.0018, -1%) Probability of
labor force participation
0.9050
0.8961
(-0.0089, -1%)
0.9022
(-0.0027, -0.30%)
0.9081
(0.0031, 0.34%)
0.9362
(0.0313, 3.46%)
The second column of Table 11 presents the estimated change related to a 25 percent
increase in the pay standard. This change in the pay standard has a significant effect on
TANF and FSP participation (it increases the probability of TANF and FSP participation
by 9 and 8 percent respectively, as indicated in the parentheses) and a small effect on
labor participation (it decreases the probability of labor force participation by 1 percent).
The third column of Table 11 presents the results of a $100 increase in the income
disregard. This change in the pay standard has a larger effect on TANF participation (it
increases the probability of TANF participation by 3 percent) and smaller effects on FSP
and labor participation (is decreases the probability of FSP and labor force participation
by 1 and 0.30 percent respectively). As in the previous studies, we found that an increase
in the TANF benefit reduction rate has a larger effect on TANF and FSP participation (it
decreases the participation in both programs) and a very small effect on labor force
participation.
The results of the simulations imply that participation in TANF and the FSP among
households with low assets who are potentially eligible for TANF is sensitive to changes
in program parameters. Although labor participation is affected by a change in program
parameters to some degree, it is most affected (positively) by the (predicted) wage.
22 / Huffman and Jensen
Conclusions
This study explores the effects of household- and state-specific characteristics on
labor force, TANF, and FSP participation choices. The knowledge and information
gained from this study may provide policy makers with insights on the effects of these
interventions for individuals and families attempting to achieve financial independence
and self-sufficiency. This study also provides information on economic, programmatic,
and non-programmatic factors that affect the well-being of low-income individuals and
families, which could lead to better program design. Participation in welfare programs
differs across the eligible households. Our analysis of the data shows that 13 percent of
the asset-eligible households participate in the FSP, and only 9 percent participate in the
TANF program.
The factors that determine FSP and TANF participation are education, family
structure, and benefits, as well as labor market conditions. The most important and
significant characteristics for work effort are (predicted) wage (positive effect) and
number and age of children (negative effect). The findings of the model of joint TANF,
FSP, and labor force participation are consistent with the findings in the existing
literature. If the family heads are male or married, then the probability that the household
participates in TANF or the FSP is significantly lower, and the probability that the
household head works is significantly higher. Households with children are less likely to
be in the labor force.
We found lower program participation for married families; a negative relation
between welfare participation and labor supply, and a positive relation between the cash
transfer program and food stamps. Decreases in cash transfers reduce welfare
participation and encourage labor efforts. Our results show that the welfare program
parameters affect TANF participation. The results imply that, among households with
low assets who are potentially eligible for TANF, participation in the TANF and FSP
programs is sensitive to changes in program parameters. Although labor participation is
affected by change in program parameters to some degree, it is most affected (positively)
by the (predicted) wage.

Endnotes
1. For a detailed discussion of the exemptions from time limits, see Gallagher et al.
1998, p. IV-1.
2. We estimated the structural equation of the probability of TANF participation with
children less than 6 years of age, but the coefficient was not statistically significant
and we excluded it from the reported results.

References
Council of Economic Advisers. 1999. “Technical Report: Economic Expansion, Welfare Reform, and the Decline in Welfare Caseloads: An Update.” A Report by Council of Economic Advisers, Washington, D.C.
Currie, J., 2000. “U.S. Food and Nutrition Programs.” In Means-Tested Transfers in the U.S. Edited by R. Moffitt. Chicago: The University of Chicago press, forthcoming.
Fraker, T., and R. Moffitt. 1988. “The Effects of Food Stamps on Labor Supply: A Bivariate Selection Model.” Journal of Public Economics 35(2): 25-56.
Gallagher, L.J., M. Gallagher, K. Perese, S. Schreiber, and K. Watson. 1998. “One Year After Welfare Reform: A Description of State Temporary Assistance for Needy Families (TANF) Decisions as of October 1997.” Report of The Urban Institute, Washington, D.C., May 1.
Gleason, P., P. Schochet, and R. Moffitt. 1998. “The Dynamics of the Food Stamp Program in the Early 1990’s.” Report submitted to the U.S. Department of Agriculture, Food and Nutrition Service. Mathematica Policy Research, Inc., Princeton, N.J.
Hagstrom, P. 1996. “The Food Stamp Participation and Labor Supply of Married Couples.” Journal of Human Resources 31(2): 383-403.
Hoynes, H. 1996. “Welfare Transfers in Two-Parent Families: Labor Supply and Welfare Participation under AFDC-UP.” Econometrica 64(2): 295-332.
Keane, M., and R. Moffitt. 1998. “A Structural Model of Multiple Program Participation and Labor Supply.” International Economic Review 39(3): 553-89.
Moffitt R. 1983. “An Economic Model of Welfare Stigma.” American Economic Review 73: 1023-35.
———. 2002. “The Temporary Assistance for Needy Families Program.” NBER Working Paper 8749. National Bureau of Economic Research, Washington, D.C.
Nelson, F.D., and L. Olson. 1978. “Specification and Estimation of a Simultaneous Equation Model with Limited Dependent Variables.” International Economic Review 19(3): 695-710.
Ohls, J. 2001. Testimony on House of Representatives, Committee on Agriculture, Subcommittee on Department Operations, Oversight, Nutrition, and Forestry. Washington, D.C. http://www.mathematica-mpr.com/PDFs/ohlstestimony.pdf (accessed August 2002).
Office of Planning, Research and Evaluation. 2002 “Fourth Annual Report to Congress.” Washington, D.C. http://www.acf.dhhs.gov/programs/opre/director.htm#annual (acessed August 2002).
Schoeni, R., and R. Blank. 2000. “What Has Welfare Reform Accomplished? Impacts on Welfare Participation, Employment, Income, Poverty, and Family Structure.” NBER Working Paper 7627. National Bureau of Economic Research, Washington, D.C.

The Effects of Joint Decisions on TANF, Food Stamp Program, and Labor Force Participation / 25
U.S. Census Bureau. 1999. “Statistical Abstract of the United States.” The National Data Book. Washington, D.C.
U.S. Department of Agriculture (USDA), Food and Nutrition Service. 2002. “Food Stamp Participation and Costs.” http://www.fns.usda.gov/pd/fssummar.htm (accessed August 2002).
U.S. House of Representatives, Committee on Ways and Means. 1998. 1998 Green Book: Background Material and Data on Programs within the Jurisdiction of the Committee on Ways and Means. Washington, D.C.: U.S. Government Printing Office. May 19.
Wilde, P., P. Cook, C. Gundersen, M. Nord, and L. Tiehen. 2000. “The Decline in Food Stamp Program Participation in the 1990’s.” Report FANRR-7. U.S. Department of Agriculture, Economic Research Service, Washington, D.C.
Zedlewski, S., and S. Brumer. 1999. “Declines in Food Stamp and Welfare Participation: Is There a Connection? Assessing the New Federalism Discussion Paper 99-13. The Urban Institute, Washington, D.C.
Zedlewski, S. 2001. “Former Welfare Families Continue to Leave the Food Stamp Program.” Assisted by A. Gruberd. Assessing the New Federalism Discussion Paper 01-05. The Urban Institute, Washington, D.C.