
Emerging Trends in Mechatronics - Oapen
230
Emerging Trends in Mechatronics Edited by Aydin Azizi
-
Upload
khangminh22 -
Category
Documents
-
view
2 -
download
0
Transcript of Emerging Trends in Mechatronics - Oapen

Emerging Trends in MechatronicsEdited by Aydin Azizi
Edited by Aydin Azizi
Mechatronics is a multidisciplinary branch of engineering combining mechanical, electrical and electronics, control and automation, and computer engineering
fields. The main research task of mechatronics is design, control, and optimization of advanced devices, products, and hybrid systems utilizing the concepts found in all these fields. The purpose of this special issue is to help better understand how mechatronics will impact on the practice and research of developing advanced
techniques to model, control, and optimize complex systems. The special issue presents recent advances in mechatronics and related technologies. The selected topics give an overview of the state of the art and present new research results and prospects for the
future development of the interdisciplinary field of mechatronic systems.
Published in London, UK
© 2019 IntechOpen © jntvisual / iStock
ISBN 978-1-78984-319-4
Emerging Trends in M
echatronics


Emerging Trends in MechatronicsEdited by Aydin Azizi
Published in London, United Kingdom


Supporting open minds since 2005

Emerging Trends in Mechatronicshttp://dx.doi.org/10.5772/intechopen.81944Edited by Aydin Azizi
ContributorsMohammadreza Koopialipoor, Amin Noorbakhsh, Shahin Zareie, Abolghassem Zabihollah, Izzat Al-Darraji, Ali Kılıç, Sadettin Kapucu, Yan Ran, Shengyong Zhang, Genbao Zhang, Xinlong Li, Erika Ottaviano, Pierluigi Rea, Ľuboslav Straka, Gabriel Dittrich, Valery Kokovin, Kanstantsin Miatliuk, Lefteris Katrantzis, Vassilis Moulianitis, M.Shahria Alam
© The Editor(s) and the Author(s) 2019The rights of the editor(s) and the author(s) have been asserted in accordance with the Copyright, Designs and Patents Act 1988. All rights to the book as a whole are reserved by INTECHOPEN LIMITED. The book as a whole (compilation) cannot be reproduced, distributed or used for commercial or non-commercial purposes without INTECHOPEN LIMITED’s written permission. Enquiries concerning the use of the book should be directed to INTECHOPEN LIMITED rights and permissions department ([email protected]).Violations are liable to prosecution under the governing Copyright Law.
Individual chapters of this publication are distributed under the terms of the Creative Commons Attribution - NonCommercial 4.0 International which permits use, distribution and reproduction of the individual chapters for non-commercial purposes, provided the original author(s) and source publication are appropriately acknowledged. More details and guidelines concerning content reuse and adaptation can be found at http://www.intechopen.com/copyright-policy.html.
NoticeStatements and opinions expressed in the chapters are these of the individual contributors and not necessarily those of the editors or publisher. No responsibility is accepted for the accuracy of information contained in the published chapters. The publisher assumes no responsibility for any damage or injury to persons or property arising out of the use of any materials, instructions, methods or ideas contained in the book.
First published in London, United Kingdom, 2019 by IntechOpenIntechOpen is the global imprint of INTECHOPEN LIMITED, registered in England and Wales, registration number: 11086078, 7th floor, 10 Lower Thames Street, London, EC3R 6AF, United KingdomPrinted in Croatia
British Library Cataloguing-in-Publication DataA catalogue record for this book is available from the British Library
Additional hard and PDF copies can be obtained from [email protected]
Emerging Trends in MechatronicsEdited by Aydin Azizip. cm.Print ISBN 978-1-78984-319-4Online ISBN 978-1-78984-320-0eBook (PDF) ISBN 978-1-83968-505-7
An electronic version of this book is freely available, thanks to the support of libraries working with Knowledge Unlatched. KU is a collaborative initiative designed to make high quality books Open Access for the public good. More information about the initiative and links to the Open Access version can be found at www.knowledgeunlatched.org

Selection of our books indexed in the Book Citation Index in Web of Science™ Core Collection (BKCI)
Interested in publishing with us? Contact [email protected]
Numbers displayed above are based on latest data collected. For more information visit www.intechopen.com
4,600+ Open access books available
151Countries delivered to
12.2%Contributors from top 500 universities
Our authors are among the
Top 1%most cited scientists
119,000+International authors and editors
135M+ Downloads
We are IntechOpen,the world’s leading publisher of
Open Access booksBuilt by scientists, for scientists


Meet the editor
Prof. Aydin Azizi holds a PhD degree in Mechanical Engineer-ing and currently serves as an assistant professor and research focal point of the Research Council of Oman at the German University of Technology in Oman where he conducts the Sie-mens Mechatronic Systems Certification Program as an official Siemens-certified mechatronics instructor. His current research focuses on investigating and developing novel techniques to
model, control, and optimize complex systems. Prof. Azizi’s areas of expertise include control and automation, artificial intelligence (AI), and simulation tech-niques. Prof. Azizi is the recipient of the National Research Award of Oman for his AI-focused research, DELL EMC’s “Envision the Future” completion award in IoT for “Automated Irrigation System,” and “Exceptional Talent” recognition by the British Royal Academy of Engineering.

Contents
Preface III
Chapter 1 1Intelligent Control System of Generated Electrical Pulses at Discharge Machiningby Ľuboslav Straka and Gabriel Dittrich
Chapter 2 27Conceptual Design Evaluation of Mechatronic Systemsby Eleftherios Katrantzis, Vassilis C. Moulianitis and Kanstantsin Miatliuk
Chapter 3 51Mechatronics for the Design of Inspection Robotic Systemsby Pierluigi Rea and Erika Ottaviano
Chapter 4 63Interaction of Mechatronic Modules in Distributed Technological Installationsby Valery A. Kokovin
Chapter 5 75Impact Analysis of MR-Laminated Composite Structuresby Abolghassem Zabihollah, Jalil Naji and Shahin Zareie
Chapter 6 89Applications of Artificial Intelligence Techniques in Optimizing Drillingby Mohammadreza Koopialipoor and Amin Noorbakhsh
Chapter 7 119Design and Analysis of SMA-Based Tendon for Marine Structuresby Shahin Zareie and Abolghassem Zabihollah
Chapter 8 129The Recent Advances in Magnetorheological Fluids-Based Applicationsby Shahin Zareie and Abolghassem Zabihollah
Chapter 9 151Hysteresis Behavior of Pre-Strained Shape Memory Alloy Wires Subject to Cyclic Loadings: An Experimental Investigationby Shahin Zareie and Abolghassem Zabihollah

Contents
Preface XIII
Chapter 1 1Intelligent Control System of Generated Electrical Pulses at Discharge Machiningby Ľuboslav Straka and Gabriel Dittrich
Chapter 2 27Conceptual Design Evaluation of Mechatronic Systemsby Eleftherios Katrantzis, Vassilis C. Moulianitis and Kanstantsin Miatliuk
Chapter 3 51Mechatronics for the Design of Inspection Robotic Systemsby Pierluigi Rea and Erika Ottaviano
Chapter 4 63Interaction of Mechatronic Modules in Distributed Technological Installationsby Valery A. Kokovin
Chapter 5 75Impact Analysis of MR-Laminated Composite Structuresby Abolghassem Zabihollah, Jalil Naji and Shahin Zareie
Chapter 6 89Applications of Artificial Intelligence Techniques in Optimizing Drillingby Mohammadreza Koopialipoor and Amin Noorbakhsh
Chapter 7 119Design and Analysis of SMA-Based Tendon for Marine Structuresby Shahin Zareie and Abolghassem Zabihollah
Chapter 8 129The Recent Advances in Magnetorheological Fluids-Based Applicationsby Shahin Zareie and Abolghassem Zabihollah
Chapter 9 151Hysteresis Behavior of Pre-Strained Shape Memory Alloy Wires Subject to Cyclic Loadings: An Experimental Investigationby Shahin Zareie and Abolghassem Zabihollah

XII
Chapter 10 163Interactional Modeling and Optimized PD Impedance Control Design for Robust Safe Fingertip Graspingby Izzat Al-Darraji, Ali Kılıç and Sadettin Kapucu
Chapter 11 191Research on Key Quality Characteristics of Electromechanical Product Based on Meta-Action Unitby Yan Ran, Xinlong Li, Shengyong Zhang and Genbao Zhang
Preface
Mechatronics is the combination of mechanical, electrical and electronics, control and automation, and computer engineering. The main research task of mecha-tronics is the design, control, and optimization of advanced devices, products, and hybrid systems utilizing the concepts found in all these fields. In general, thepurpose of this special issue is to help better understand how mechatronics will impact on the practice and research of developing advanced techniques to model, control, and optimize complex systems. The special issue presents recent advancesin mechatronics and related technologies, including: automatic control, robotics, agent-based systems, smart manufacturing, and Industry 4.0. The selected top-ics give an overview of the state of the art and present new research results and prospects for the future development of the interdisciplinary field of mechatronicsystems. This special issue provides up-to-date and useful knowledge for research-ers and engineers involved in mechatronics and related fields.
Aydin AziziGerman University of Technology in Oman

II
Chapter 10 163Interactional Modeling and Optimized PD Impedance Control Designfor Robust Safe Fingertip Graspingby Izzat Al-Darraji, Ali Kılıç and Sadettin Kapucu
Chapter 11 191Research on Key Quality Characteristics of Electromechanical ProductBased on Meta-Action Unitby Yan Ran, Xinlong Li, Shengyong Zhang and Genbao Zhang
Preface
Mechatronics is the combination of mechanical, electrical and electronics, control and automation, and computer engineering. The main research task of mecha-tronics is the design, control, and optimization of advanced devices, products, and hybrid systems utilizing the concepts found in all these fields. In general, the purpose of this special issue is to help better understand how mechatronics will impact on the practice and research of developing advanced techniques to model, control, and optimize complex systems. The special issue presents recent advances in mechatronics and related technologies, including: automatic control, robotics, agent-based systems, smart manufacturing, and Industry 4.0. The selected top-ics give an overview of the state of the art and present new research results and prospects for the future development of the interdisciplinary field of mechatronic systems. This special issue provides up-to-date and useful knowledge for research-ers and engineers involved in mechatronics and related fields.
Aydin AziziGerman University of Technology in Oman

Chapter 1
Intelligent Control System ofGenerated Electrical Pulses atDischarge MachiningĽuboslav Straka and Gabriel Dittrich
Abstract
The book chapter provides a comprehensive set of knowledge in the field ofintelligent control of generated electrical impulses for wire electrical dischargemachining. With the designed intelligent electrical pulse control system, the stabilityof the electroerosion process, as well as the increased surface quality after wire elec-trical discharge machining (WEDM), can be significantly enhanced compared tostandard impulse control systems. The aim of the book chapter is also to point out theimportance of monitoring in addition to the established power characteristics ofgenerated electrical pulses, such as voltage and current, as well as other performanceparameters. The research was mainly focused on those parameters that have a signif-icant impact on the quality of the machined surface. The own’s theoretical and knowl-edge base was designed to enrich the new approach in increasing the geometricaccuracy of the machined surface, as well as the overall efficiency of the electroerosionprocess for WEDM through intelligent control of generated electrical pulses.
Keywords: adaptive system, acoustic emission, automation, control system,discharge machining, pulse generator, spark, quality
1. Introduction
The current trend in the development of mechanical engineering carries signs ofcomplexity and dynamism. At the same time, it is increasingly influenced by newscientific and technical knowledge and requirements for their rapid deployment.For the production of high-precision components of state-of-the-art and highly-sophisticated technical equipment, fully automated production systems and pro-gressive manufacturing technologies are often used. In most cases, an integral partof them is a management system that manages demanding technological processes.Application of the given system provides a suitable precondition for ensuring therequired high quality of manufactured products.
Another, not less significant trend at present is the focus on the development ofscientific and technical principles of modern engineering production. At the sametime, links with classical teachings are being sought, with emphasis on their directuse in technical practice. This trend is also aided by statistical, optimization andsimulation methods. These have been used only in the past in the field of mechan-ical engineering for the solution of partial technological tasks. For example, theyallowed a basic selection of technological process variants.
1

The current rapid development of computer technology creates wide scope forthe use of mathematical methods in both theoretical and practical technologicaltasks. Cybernetic methods, probabilistic logic, mathematical modeling and simula-tion of production processes are used in connection with the development of com-puter technologies. All of this increases the demands on the degree of exactness ofthe formulation of knowledge, as well as the efficiency and quality of technologicalsolutions, which aim to save the work of engineers, technicians and workers.
In addition, the continuous development of modern mechanical engineeringplaces increased demands on the introduction of advanced production methods,advanced production facilities and their control systems. Particular attention is paidto machining processes in which, in particular, the mechanical properties of theworkpiece and the tool do not impose almost any limits. These are, in particular,machining methods in which the degree of machinability of a material is dependentonly on physical properties such as e.g. thermal and electrical conductivity, meltingtemperature, atomic valence and the like. As already mentioned, their essential partis computer support. A computer-aided production process has a huge advantage inthat the human factor of poor product quality is almost excluded. In this case, thequality of the machined surface depends directly on the design of the machine, itssoftware management and the setting of technological and process parameters.
Undoubtedly these processes include WEDM, where the decisive link with theprimary impact on the quality of the machined surface is the electrical pulse gener-ator. Nowadays, various types of electrical pulse generators are used for WEDM,the vast majority of which control performance parameters to maximize perfor-mance. It is exactly the new type of generator of electrical impulses applicable in theconditions of the electroerosion process which is described by Qudeiri et al. [1]. Inthe control algorithm of a given type of electric pulse generator, there is absolutelyno criterion relating to the geometric accuracy of the machined surface. ResearchersYan and Lin [2] in turn dealt with the development of a new type of pulse generatorwhich, unlike the previous type, is not oriented to maximize performance, butminimize the surface roughness of the machined surface. A similar type of pulsegenerator is also described by Świercz and Świercz [3]. However, even in this case,there is no qualitative criterion for the geometric accuracy of the machined surface.Researchers Barik and Rao [4] participated in the development of a special type ofelectrical pulse generator designed for electrical discharge machining in laboratoryconditions. Although their newly developed generator allows to set the operatingparameters of the electric pulse generator according to the specific quality require-ments of the machined surface, the criterion of geometric accuracy of the machinedsurface is missing again.
Thus, it is clear from the above overview that insufficient attention is paid to thedevelopment of electrical pulse generators with a focus on the geometric accuracy ofthe machined surface. Therefore, the aim of this chapter of the book is to contributeto the database of existing knowledge in the field of intelligent system design forprecise control of generated electrical pulses for WEDMwith the focus on maximiz-ing the geometric accuracy of the machined surface. These findings are intended tohelp improve the quality of components produced by the progressive WEDM tech-nology, the practical application of which is described in detail in Chapter 2. This isbased on the physical nature of the material removal described in detail in Chapter 3.Chapter 4 deals with the current state of electrical discharge parameter control duringWEDM, which highlights the current deficiencies of current approaches in the con-trol of generated electrical pulses. Chapter 5 describes possible approaches to elimi-nate tool electrode vibration duringWEDM, by applying measures regardingtechnological and process parameters. It also points to the application of one of theacceptable options that concerns the innovation of an intelligent control system for
2
Emerging Trends in Mechatronics
generated electrical pulses during the electroerosion process. Further, based on ananalysis of current modern approaches in the construction of electrical pulse genera-tors used for WEDM, detailed in Chapter 6, an adaptive control system for generatedelectrical pulses was designed duringWEDM. This innovated control system forgenerated electrical pulses, designed to increase the geometric accuracy of themachined surface for WEDM, is described in detail in the Chapter 7.
2. Application of progressive technologies in technical practice
As already mentioned in the introduction, modern engineering production cur-rently places high demands on the mechanical properties of the materials used. Theemphasis is mainly on their high strength, hardness and toughness. Therefore,materials such as various types of high-strength and heat-resistant alloys, carbides,fiber-reinforced composite materials, stelites, ceramic materials and advancedcomposite tooling materials, etc., are at the forefront. At the same time, with the useof these high-strength materials, the demands on accuracy and also on the perfor-mance of machine tools and equipment increase. These facts necessitate the devel-opment and deployment of machining methods that allow high material removalwhile achieving high quality machined surfaces. In this respect, there are someadvantages to those machining methods in which there is no mechanical separationof the material particles. The application of these progressive machining methods totechnical practice is particularly accentuated by the fact that not only the mechan-ical properties of the material, but also other properties such as thermal and elec-trical conductivity, melting temperature, atomic valency, density and the like,determine the machinability limits. Another not less important reason forimplementing progressive machining methods is the complicated geometricalshapes of the workpiece, which often require demanding manufacturing processes.This results in long machining times, the use of special tools, special fixtures and thelike. These are usually very expensive. A perfect control system is needed to meet allthe above requirements. Standard processes for managing production processes arealready inadequate today. Especially those who can adequately adapt to the currentsituation and the needs of the machining process are entering the forefront.
One of the progressively developing technologies in the field of machiningprocess management is electrical discharge machining (EDM). Moreover, theessence of the production of components with the application of this progressivetechnology is based on the fact that the mechanical properties of the machinedmaterial do not impose almost any limits on its machining. The only limiting factorfor the machinability of these materials is their appropriate chemical and physicalproperties. This technology is principally based on the use of thermal energy towhich the electrical discharge generated between the two electrodes is transformed,of which the first electrode represents the tool and the second workpiece. It is amachining process in which material removal occurs through cyclically repeatedelectrical discharges. Through these, the microscopic particles in the form of beadsare removed from the material by melting and subsequent evaporation in conjunc-tion with high local temperature. It moves at a level 10,000°C. However, theelectroerosion process must be precisely controlled by a reliable control system.
3. Physical nature of material removal for WEDM
To ensure precise management of the electroerosion process during WEDM, it isessential to base it on its physical principle. The physical principle of material
3
Intelligent Control System of Generated Electrical Pulses at Discharge MachiningDOI: http://dx.doi.org/10.5772/intechopen.88454

removal for WEDM can be regarded as a relatively challenging and complicatedprocess. Its essence lies in the formation of a discharge between two electrodes (tool—workpiece) either in very thin gas, in air, or in gas at normal temperature andpressure, or in a dielectric fluid, i. e. in a fluid with high electrical resistance.However, the classical electrical discharges that occur between the two electrodes(tool—workpiece) in the gas dielectric have relatively little effect. Therefore, suchan environment is not quite ideal for the needs of precision and high-performancemachining. In this regard, the application of fluid dielectric media is much moreadvantageous. These dielectrics significantly increase the effect of electrical dis-charges between the electrodes (tool—workpiece). Electrically charged particles,electrons and ions are the active agents in the erosion of material particles from thesurface of both electrodes. They are formed as a product in the ionization process.Subsequently, in the electric field, they acquire the kinetic energy that, along withthe output work, is passed on the surface of both electrodes. The shape and size ofthe eroded metal particles from the material being machined, as well as the size andshape of the resulting crater (Figure 1) depend not only on the polarity of theelectrodes, but also on the particular application of the technological parameters.
By default, 10�3 až 10�5 mm3 of material is removed by WEDM during a singledischarge cycle by electroerosion. Its size can be empirically determined by therelationship (1):
Vi ¼ K �Wi (1)
where, Vi (mm3) is the volume of material taken, K (mm3.J�1) is the propor-tionality factor for cathode and anode, Wi (J) is the discharge energy.
As mentioned above, the shape and size of the crater formed in both electrodesduring one discharge cycle depends mainly on the magnitude of the applied dis-charge energy. This is given by the specific setting of technological parameters. Thetime course of individual discharges is characterized by several indicators. These areindicators relating to the discharge current I (A), the discharge voltage U (V) andthe duration of the individual discharges ton (μs), as well as the breaks toff (μs)between discharges. The events that take place between the two electrodes duringthe electroerosion process are comprehensively described the volt-ampere charac-teristic. This is shown in Figure 2.
The total volume of VT, material taken from both electrodes during theelectroerosion process is directly dependent on the magnitude of the transmitted
Figure 1.The shape and size of the crater formed during one discharge cycle. Vi—volume of material taken, h—depth ofcrater, d—crater diameter.
4
Emerging Trends in Mechatronics
energyWe. This in turn results in a series of cyclically repeating electrical dischargesbetween the electrodes (tool—workpiece) over time t. The total discharge energyWe transmitted during a series of discharge cycles can be empirically determined bythe relationship (2):
We ¼ðT
0
U tð Þ � I tð Þdt (2)
where, We (J) is the total discharge energy, U(t) (V) is the electrode dischargevoltage at time t, I(t) (A) is the maximum discharge current at time t,T (μs) is theduration of one period of electrical discharge.
By deriving the relation (2), the amount of energy transmitted during onedischarge cycle can then be empirically determined (3):
We ¼ Ie �Ue � ton (3)
where, Ie (A) is the average discharge current, Ue (V) is the average dischargevoltage on the electrodes, ton (μs) is the duration of discharge during one dischargecycle (delayed generator operation).
In order to complete all the parameters of the electroerosion process related toone discharge cycle, it is also necessary to empirically determine the magnitude ofthe average discharge current Ie and the discharge voltage Ue between the elec-trodes. These values can be determined based on the relationship (4) for Ie and therelation (5) for Ue:
Ie ¼ 1te
ð
0te
I tð Þdt (4)
Ue ¼ 1te
ð
0te
U tð Þdt (5)
where, I(t) (A) is the maximum discharge current (A), te (μs) is the currentdischarge time (generator operation).
Based on these and other parameters of the electroerosion process, the total amountof material taken per time unit t can then be empirically determined by relation (6):
QT ¼ k � r � f � μ �We ¼ k � r � f � μ �ðT
0
U tð Þ � I tð Þdt (6)
Figure 2.Volt-ampere characteristic of one discharge cycle during the electroerosion process.
5
Intelligent Control System of Generated Electrical Pulses at Discharge MachiningDOI: http://dx.doi.org/10.5772/intechopen.88454

where, QT (mm3�s�1) is the total amount of material withdrawn per time unit t,k is the factor of proportionality for cathode and anode, r is the efficiency ofelectrical discharge, f (s�1) is the frequency of electrical discharges, μ is the effi-ciency of the discharge generator.
Another not less important parameter in specifying electroerosion processparameters is the discharge period td. This characterizes the overall efficiency of onedischarge cycle between the electrodes. It is empirically determined as a proportionof the duration of the electrical discharge ton during one discharge cycle, that is, thetime between the generator on and off and the period of time T, that is, the timeinterval between two consecutive generator starts. Its value can be determined byrelation (7):
td ¼ tonT
¼ tonton þ toff
(7)
where, td is the discharge period, ton (μs) is the duration of the discharge duringone discharge cycle (delayed generator operation), toff (μs) is the break timebetween two consecutive discharges,T (μs) is the electric discharge period time.
Figure 3 describes the effect of the discharge period td on the machined surfacequality for WEDM in terms of the roughness parameters Ra and Rz.
In addition, by using the discharge period td, we can empirically express theoverall efficiency of one discharge cycle between the electrodes duringelectroerosion, we can also quantify individual types of electrical discharges. Its
Figure 3.Effect of discharge period td in the range of 50–75% on the machined surface quality forWEDM in terms ofparameters Ra and Rz.
Electrical discharge parameters Type of discharge
Electric spark Short term electric arc
Total discharge duration ti (μs) Short time (0.1 až 10�2) Long time (>0.1)
Time usage of discharge period td Low value (0.03 až 0.2) High value (0.02 až 1)
Discharge frequency High value Low value
Current density at the dischargepoint (A.mm�2)
Approx. 106 A.mm�2 102–103 A.mm�2
The discharge channel temperature(°C)
High (over 10,000) Low (in the range of 3300–3600)
Energy individual discharges We (J) Low (10�5–10�1) High (approx. 102)
Practical use for WEDM High quality machined surface(finishing)
Low quality of machinedsurface (rouhing)
Table 1.Basic property specification of stationary and non-stationary type of discharge.
6
Emerging Trends in Mechatronics
value makes it easier to identify the type of electric arc, i.e. whether it is stationaryelectric spark or nonstationary short term electric arc. At the same time, its value isto some extent influenced by the total amount of QT of the withdrawn material pertime unit t, as well as the resulting quality of the machined surface.
It can be seen from Table 1 that precise control of the individual electricaldischarge parameters between the two electrodes during a single discharge cycle hasa significant impact on the quality of the machined surface for WEDM as well as theoverall efficiency of the electroerosion process.
4. Current state in the field of electric discharge parameter control forWEDM
From the point of view of achieving the high quality of the machined surface forWEDM as well as the high overall efficiency of the electroerosion process, thedischarge process must be precisely software controlled. The current trend in thedevelopment of electrical pulse generators is mainly focused on control systems thatdo not measure effective voltage, but separately the duration of each discharge.These times are summed and the intensity of the electric discharge is regulatedaccordingly. This data is then used to control the actuator, while the response timeand magnitude of the servo motion correspond to that in the working gap(Figure 4).
Recently, mainly used so-called alternating electric pulse generators. There arealso generators of electrical impulses in which is voltage with the same polaritysupplied between tool electrode and workpiece. This causes the ions to pass in onedirection, causing increased corrosion of the eroded material. However, if the elec-trical voltage polarity is alternated with a certain frequency, this effect is suppressedand corrosion does not occur. Moreover, the practical advantage of applying thesetypes of pulse generators is a narrower working gap. This type of generator finds itsapplication especially in the erosion of carbide alloys.
As mentioned above, the process of controlling electrical impulses duringWEDM is in some cases based on predetermined mathematical models. Importantpioneers in this area were Scott et al. [5]. In particular, they focused their researchon modeling performance parameters for electroerosion machining in various con-ditions and modes. In their research, they also found that there is no single combi-nation of levels of important factors that can be optimal at all times. Research in thefield was also addressed by Tarng et al. [6, 7]. They then formulated mathematicalmodels that allow predicting the achieved quality of the machined surfacedepending on the setting of the electric discharge parameters using simulation andoptimization elements. Researchers Sarkar et al. [8] have devoted a substantial part
Figure 4.Controls of actuators for WEDM based on the system for monitoring the duration of individual discharge cycles.(a) Monitoring the effective voltage in the gap and (b) evaluation of the time duration of the discharge.
7
Intelligent Control System of Generated Electrical Pulses at Discharge MachiningDOI: http://dx.doi.org/10.5772/intechopen.88454

of their research to the mathematical modeling of the achieved surface quality atWEDM depending on the current electrical discharge parameters using neuralnetworks. A detailed study of the electrical discharge performance parametersduring WEDM based on their mathematical modeling was done by Puri andBhattacharyya [9]. The areas of modeling of electrical discharge parameters, con-sidering the polarity change of electrodes during WEDM, have been researched byLiao and Yub [10]. At the same Mahapatra and Patnaik [11] they described in detailthe possibilities of using the nonlinear modeling method to optimize these parame-ters. A specific area of electroerosion process control has been studied by Jin et al.[12]. In their research, they have developed a combined structural model thatdescribes the use of thermal energy, including a balance of the effects of vibrationon the stability of the electric arc. In addition, the model also included high tem-perature effects due to high-power electrical discharges. Yan et al. [13, 14]described a new approach in electrical discharge parameters optimization duringelectrical discharge machining based on selected performance characteristics suchas maximum discharge current I (A), maximum electrical discharge voltage U (V),discharge duration during one discharge cycle ton (μs) and the duration of the breakbetween discharges toff (μs). All these parameters have been optimized with regardto the quality and efficiency of the electroerosion process, as well as to minimizewear on the tool electrode. The physical aspect of the electroerosion process wasaddressed by Kopac [15]. In his experimental research, he tested various powerparameters of the electric arc with respect to the content of electrically conductiveparts in the discharge channel during the electroerosion process. He found that withthe increasing share of electrically conductive parts in the discharge channel duringthe electroerosion process, its performance and productivity increased. At the sametime, it points out that the main electrical parameters of the electric arc during theelectroerosion process have the smallest influence on the crater size after the elec-tric discharge of the maximum discharge voltage U. Only its crater shape changeswith its size. The study of vibration of the tool electrode due to electrical dischargesduring the electroerosion process was investigated by Shahruz [16]. They foundthat tool electrode vibration has a significant contribution to the geometric inaccu-racy of the machined surface after WEDM. They also argue in their study that thehigh tool electrode tension forces near critical values have a positive effect onreducing the amplitude of the wire electrode vibration during the electroerosionprocess, but cannot completely eliminate them. The vibration of the tool electrodewas also investigated by Altpeter and Roberto [17]. In particular, their research wassubstantiated by the fact that the issue of damping tool electrode vibration duringWEDM has been poorly addressed in the past. The shape and size of the cratersafter the individual electrical discharges during the WEDM were dealt with byHewidy and Gokler [18, 19]. They tried to describe mathematically the influence ofthe magnitude of the discharge energy during the electroerosion process on the sizeand shape of the craters. They found that higher values of maximum dischargecurrent I (A) and duration of discharge during one discharge cycle ton (μs) contrib-ute to increase in crater size.
From the above overview, it is clear that several experimental investigationshave been conducted in the field of electrical discharge between the two electrodesduring one discharge cycle. Despite the increasing emphasis on the complexity oflearning about the set of electrical discharge characteristics during WEDM, there isstill a lack of comprehensive identification of their interconnections. At the sametime, there are no suggestions for minimizing the adverse effect of electrical dis-charges on the quality of the machined surface after WEDM in terms of geometricaccuracy.
8
Emerging Trends in Mechatronics
5. Elimination of tool electrode vibration for WEDM
During the duration of the individual electrical discharges, due to the preciseguiding of the tool electrode, it is necessary to adequately tension it with the forceFw (N). It is normally selected in the range of 5–25 N. Furthermore, it is necessaryto charge the tool electrode with electrical impulses, enwrap it with a dielectric fluidand because of its wear and tear it is constantly renewed. To be able to move withsuch a delicate and labile tool as a few tenths of a millimeter of a thin wire electrode,very precise and sensitive guide are needed. In Figure 5, a part of the electroerosionCNC machine can be seen, which provides accurate guidance of the wire electrode.
The tool electrode tensioning and guiding system in the CNC electroerosiveequipment consists of a supply section that grips, clamps, feeds, and controls thewire Furthermore, from the working part that guides the tool electrode through theworking zone, where it is washed with dielectric fluid, supplied with electric cur-rent and subsequently eroded. The lead electrode guidance system is terminated bya drain portion, which retracts the electrode, rechecks it, and wraps it onto the coil.
As already mentioned, in addition to the inaccuracy in the wiring of the wireelectrode, its deflection from a straight position causes forces that arise due to thecyclic action of the electrical discharges between the two electrodes [20]. The rulesapplies that the greater the thickness of machined material, the greater the deflec-tion. Partial compensation for this adverse event is carried out by special measures.In particular, the inclusion of counter force in conjunction with a system thatensures optimum tension of the tool electrode. However, neither of these measureshas a sufficient effect.
In addition to the thickness of the material being machined, the choice of theoptimum tensioning force also adapts to the intensity of the electrical discharge, thetype of material of the workpiece, the type of tool electrode material and its diam-eter, the properties of the dielectric fluid, and the like. In particular, wire electrodetension compensation serves to minimize its sag in the middle due to the cyclicaction of electrical discharges with varying intensity [21]. In Figure 6, an extremedeflection of the tool electrode during the elektroerosion process can be observed as
Figure 5.Tool electrode tensioning and guiding system during the electroerosion process.
9
Intelligent Control System of Generated Electrical Pulses at Discharge MachiningDOI: http://dx.doi.org/10.5772/intechopen.88454

a result of the inappropriate selection of the compensation force size in itsstretching.
As a general rule, the higher the value of the tool electrode compensation forcewhen it is tensioned reduces the vibration amplitude. This also leads to a reduction ofthe working gap, thus achieving a higher accuracy of the machined surface forWEDM. Ideally, the value of the tool electrode compensation force should be chosento approach the material tensile strength limit [22]. However, the limit valuemust notbe exceeded during the electroerosion process. Otherwise, the tool electrode willbreak. Tool electrodes with a strength in the range of 400–2000 N.mm�2 are used asstandard. Tool electrodes with a strength of up to 490 N.mm�2 are called soft, toolelectrodes with a strength of between 490 and 900 N.mm�2 are called semi-hard andtool electrodes with a strength above 900 N.mm�2 are called hard. Figure 7 shows theimpact strength (hardness) of the wire tool electrode on its deflection in theelectroerosion machining process when applying a constant tension force.
With increasing material thickness, it is necessary to increase the value of thetensioning force Fw of the tool electrode in order to eliminate vibrations. Thisallows, as already mentioned, a higher tensile strength value of the tool electrodematerial used or its increasing diameter. However, too high values of the toolelectrode tension force have an adverse effect on the performance and productivityof the electroerosion process. This can be seen from the following graphical depen-dence on Figure 8.
From this graphical dependence, it can be seen that increasing the magnitude ofthe compensating force Fw when tensioning the tool electrode is in terms of pro-ductivity it has meaning only to a certain extent. When it is exceeded, there is asignificant drop in the electroerosion process productivity.
Figure 6.Extreme deflection of the tool electrode due to the application of an improperly selected value of thecompensating force during its tensioning.
10
Emerging Trends in Mechatronics
Thus, it is clear from the foregoing that when applying the critical values of thecompensating force Fw when the wire tool electrode is being tensioned, the pro-ductivity of the electroerosion process will be even lower. On the other hand, as thevalue increases, the vibration amplitude of the tool electrode is substantiallyreduced, resulting in greater geometric accuracy of the machined surface afterWEDM [23]. Since the tensile strength of the wire tool electrode material is alimiting factor in the tension force selection, the choice of material type is alsoimportant [24]. By default, a single-component compact tool electrode is selectedfor WEDM. Materials such as Cu, Ms., Mo and the like are used. In the past, purecopper was used quite often as a tool electrode material, mainly because of its highelectrical conductivity, but also in its relatively simple production. However, asignificant drawback of the application of pure copper to the production of wiretool electrodes is its very low tensile strength [25]. Therefore, the Cu tool electrodeswere later replaced with brass. Practical application results have shown that thepresence of Zn in the tool electrode material significantly reduces the risk of
Figure 7.Effect of hardness of wire tool electrode material on its deflection during electrical discharge machining.
Figure 8.The dependence of the electroerosion process productivity on the value of the compensation force Fw when thetool electrode is stretched.
11
Intelligent Control System of Generated Electrical Pulses at Discharge MachiningDOI: http://dx.doi.org/10.5772/intechopen.88454

breakage. This allows the application of higher values of compensation force Fw.Also suitable for producing tool wire electrodes is aluminum brass. This material ischaracterized by a tensile strength of 1200 N.mm�2, without any adverse effect onits elongation. Although these types of tool electrode materials are less prone todamage, their usefulness in practice is relatively limited. The tooling electrodes,which are based on Mo, are used where very high tensile strength and very smallwire diameter are required. In addition to the high tensile strength, this materialalso has a high melting point. A significant disadvantage of the application of thismaterial is its high cost. The tungsten tool electrodes have an even greater tensilestrength and a higher melting point than molybdenum. From an economic point ofview, this type of material is applicable only to very small diameters (≤0.05 mm) oftool electrodes [26].
As mentioned, the presence of Zn in the tool electrode material has a positiveimpact on its mechanical properties. However, the practical use of single-component tool electrodes with a Zn content above 40% is inefficient for economicreasons. Therefore, multi-component, for example coated electrodes have beendeveloped for the application of higher tool electrode tensioning forces, allowinghigher zinc content on the electrode surface while maintaining a homogeneous core.These tool electrodes are particularly useful when specific material requirementsare required because of the high geometric accuracy of the machined surface afterWEDM. In this respect, the high tensile strength of the material as well as its goodelectrical conductivity are decisive.
For this purpose, multi-component tool electrodes are used, the core of which isCu, Ms. or steel and coated with pure Zn or Ms. with a zinc content of 50%.Figure 9 shows selected combinations of multi-component tool electrodes that areused in practice for special operations. This is particularly the case when increaseddemands are placed on the quality of the machined surface after WEDM in terms ofgeometric accuracy.
These composite wires make it possible to combine traditional materials that arerelatively inexpensive with expensive materials to achieve the unique properties ofwire tool electrodes [27]. However, the efficiency of these coated tool electrodes islimited by the thickness of the coating which is relatively thin. The standard rangesfrom 5 to 10 μm. A special case consists of three-component tool electrodes, whosecore is a steel wire. It is coated with a layer of copper and brass with 50% zinccontent. The coated tool electrodes allow the application of relatively high tensionforces Fw while maintaining an acceptable electroerosion process productivity.
Figure 9.Selected combinations of multi-component tool electrodes used for WEDM in the case of increased qualityrequirements for the machined surface.
12
Emerging Trends in Mechatronics
Their significant disadvantage, compared to single-component compact tool elec-trodes, is again too high a price. Table 2 provides an overview of the properties ofcomposite multi-component tool electrodes, including their practical application forspecific purposes.
Based on this review, it is evident that composite multi-component tool elec-trodes provide a number of advantages over conventional single-component com-pact electrodes. The decisive advantage, however, is their higher tensile strength,which allows the application of higher tension forces Fw. In this way, the amplitudeof the vibration of the tool electrode can be substantially reduced, thereby achievinga significantly higher quality of the machined surface in terms of its geometricaccuracy. All this can be achieved while maintaining the acceptable productivity ofthe electroerosion process [28]. But the problem is their high price. Therefore, fromthe point of view of economic efficiency for WEDM in practice, the standardcompact single-component tool electrodes continue to be used. However, theirlimiting factor is the relatively low tensile strength. Therefore, no further significantimprovements can be expected in this respect while maintaining an acceptable priceof the applied material. It is therefore necessary to draw attention to other possibil-ities of increasing the geometric accuracy of the machined surface after WEDM.One of the acceptable options is to apply an innovative intelligent control system forgenerated electrical pulses during the electroerosion process.
6. Analysis of current approaches in the construction of electrical pulsegenerators used for WEDM
In the past, dependent generators were often used as a source of impulses In thepast, dependent generators were often used as a source of impulses. Their runningconsists in repeated recharging and discharging the capacitor. With this controlsystem discharges the capacitor is normally powered from a DC voltage source,which is connected in parallel to the circuit. Discharging the capacitor occurs whenthe voltage reaches a breakover value. The size of the breakover voltage dependsmainly on the contamination of the dielectric and on the electrode distance. Subse-quently, the control system instructs the servo drive to maintain the requiredworking gap size based on the evaluation of the voltage conditions at the discharge
Type of specific application Recommended wireelectrode composition
The advantage ofpractical application
Power machining (high MRR) • Steel wire coated Msand Cu
• Cu wire with Ms coating• Galvanized brass wire
• Better rinsability• A higher wire electrode
feed rate
Very small workpiece thickness • Steel wire coated with Msand Cu
• Graphite coated wire
• Higher resistance tobreaking the wire
• Better rinsability
Carbide machining and hardlymachinable alloys
• Steel wire coated with Msand Cu
• Cu wire with Ms coating
• Higher resistance tobreaking the wire
• Higher output energy
Machining under different angles so-called conical machining
• Steel wire coated with Msand Cu
• Ms alloy
• Higher resistance tobreaking the wire
• Increased wire elasticity
Table 2.Basic properties of composite multi-component tool electrodes and their practical application in specific cases ofWEDM.
13
Intelligent Control System of Generated Electrical Pulses at Discharge MachiningDOI: http://dx.doi.org/10.5772/intechopen.88454
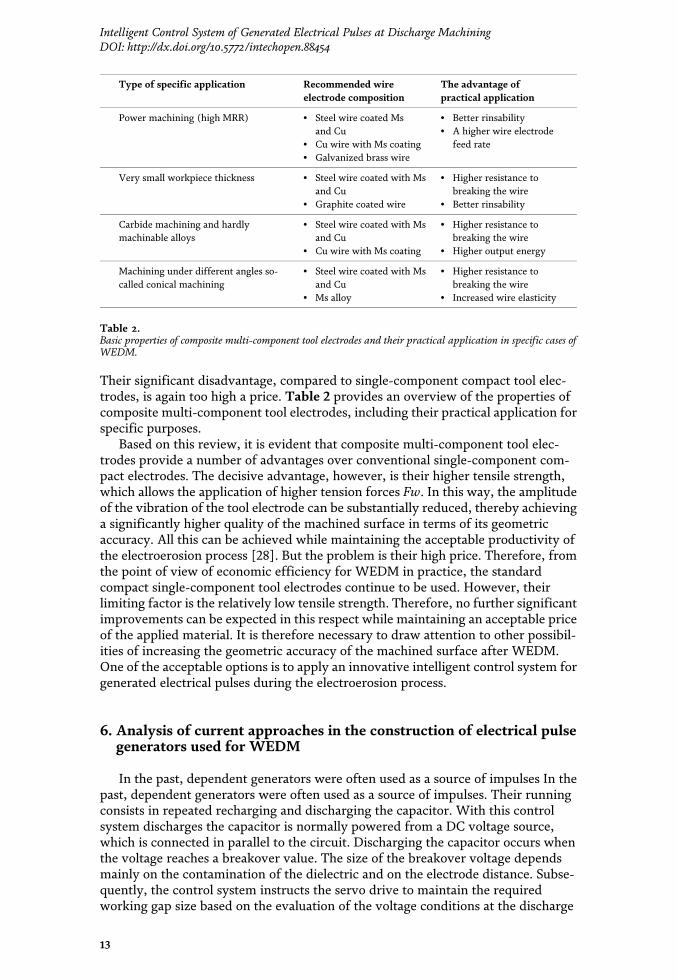
breakage. This allows the application of higher values of compensation force Fw.Also suitable for producing tool wire electrodes is aluminum brass. This material ischaracterized by a tensile strength of 1200 N.mm�2, without any adverse effect onits elongation. Although these types of tool electrode materials are less prone todamage, their usefulness in practice is relatively limited. The tooling electrodes,which are based on Mo, are used where very high tensile strength and very smallwire diameter are required. In addition to the high tensile strength, this materialalso has a high melting point. A significant disadvantage of the application of thismaterial is its high cost. The tungsten tool electrodes have an even greater tensilestrength and a higher melting point than molybdenum. From an economic point ofview, this type of material is applicable only to very small diameters (≤0.05 mm) oftool electrodes [26].
As mentioned, the presence of Zn in the tool electrode material has a positiveimpact on its mechanical properties. However, the practical use of single-component tool electrodes with a Zn content above 40% is inefficient for economicreasons. Therefore, multi-component, for example coated electrodes have beendeveloped for the application of higher tool electrode tensioning forces, allowinghigher zinc content on the electrode surface while maintaining a homogeneous core.These tool electrodes are particularly useful when specific material requirementsare required because of the high geometric accuracy of the machined surface afterWEDM. In this respect, the high tensile strength of the material as well as its goodelectrical conductivity are decisive.
For this purpose, multi-component tool electrodes are used, the core of which isCu, Ms. or steel and coated with pure Zn or Ms. with a zinc content of 50%.Figure 9 shows selected combinations of multi-component tool electrodes that areused in practice for special operations. This is particularly the case when increaseddemands are placed on the quality of the machined surface after WEDM in terms ofgeometric accuracy.
These composite wires make it possible to combine traditional materials that arerelatively inexpensive with expensive materials to achieve the unique properties ofwire tool electrodes [27]. However, the efficiency of these coated tool electrodes islimited by the thickness of the coating which is relatively thin. The standard rangesfrom 5 to 10 μm. A special case consists of three-component tool electrodes, whosecore is a steel wire. It is coated with a layer of copper and brass with 50% zinccontent. The coated tool electrodes allow the application of relatively high tensionforces Fw while maintaining an acceptable electroerosion process productivity.
Figure 9.Selected combinations of multi-component tool electrodes used for WEDM in the case of increased qualityrequirements for the machined surface.
12
Emerging Trends in Mechatronics
Their significant disadvantage, compared to single-component compact tool elec-trodes, is again too high a price. Table 2 provides an overview of the properties ofcomposite multi-component tool electrodes, including their practical application forspecific purposes.
Based on this review, it is evident that composite multi-component tool elec-trodes provide a number of advantages over conventional single-component com-pact electrodes. The decisive advantage, however, is their higher tensile strength,which allows the application of higher tension forces Fw. In this way, the amplitudeof the vibration of the tool electrode can be substantially reduced, thereby achievinga significantly higher quality of the machined surface in terms of its geometricaccuracy. All this can be achieved while maintaining the acceptable productivity ofthe electroerosion process [28]. But the problem is their high price. Therefore, fromthe point of view of economic efficiency for WEDM in practice, the standardcompact single-component tool electrodes continue to be used. However, theirlimiting factor is the relatively low tensile strength. Therefore, no further significantimprovements can be expected in this respect while maintaining an acceptable priceof the applied material. It is therefore necessary to draw attention to other possibil-ities of increasing the geometric accuracy of the machined surface after WEDM.One of the acceptable options is to apply an innovative intelligent control system forgenerated electrical pulses during the electroerosion process.
6. Analysis of current approaches in the construction of electrical pulsegenerators used for WEDM
In the past, dependent generators were often used as a source of impulses In thepast, dependent generators were often used as a source of impulses. Their runningconsists in repeated recharging and discharging the capacitor. With this controlsystem discharges the capacitor is normally powered from a DC voltage source,which is connected in parallel to the circuit. Discharging the capacitor occurs whenthe voltage reaches a breakover value. The size of the breakover voltage dependsmainly on the contamination of the dielectric and on the electrode distance. Subse-quently, the control system instructs the servo drive to maintain the requiredworking gap size based on the evaluation of the voltage conditions at the discharge
Type of specific application Recommended wireelectrode composition
The advantage ofpractical application
Power machining (high MRR) • Steel wire coated Msand Cu
• Cu wire with Ms coating• Galvanized brass wire
• Better rinsability• A higher wire electrode
feed rate
Very small workpiece thickness • Steel wire coated with Msand Cu
• Graphite coated wire
• Higher resistance tobreaking the wire
• Better rinsability
Carbide machining and hardlymachinable alloys
• Steel wire coated with Msand Cu
• Cu wire with Ms coating
• Higher resistance tobreaking the wire
• Higher output energy
Machining under different angles so-called conical machining
• Steel wire coated with Msand Cu
• Ms alloy
• Higher resistance tobreaking the wire
• Increased wire elasticity
Table 2.Basic properties of composite multi-component tool electrodes and their practical application in specific cases ofWEDM.
13
Intelligent Control System of Generated Electrical Pulses at Discharge MachiningDOI: http://dx.doi.org/10.5772/intechopen.88454

location. Changing the time ratios within each discharge also changes their fre-quency and total discharge energy. From this comes the term “dependent pulsegenerators.”
Thus, it is clear from the above principle that these types of pulse generatorsallow very short discharges to be produced, while the discharge duration ti is 10
�4–
10�7. These are relatively simple construction equipment. For these types of pulsegenerators, it is required to connect the workpiece as an anode and a tool electrodeas a cathode. This type of connection is used because of the need for less materialloss from the tool electrode during the electroerosion process. By using a DC powersource in a given circuit, the ions are only moved in one direction. This provides asuitable precondition for the formation of corrosion of the eroded particles, which isconsidered an undesirable phenomenon. In addition, a significant disadvantage ofthe above-mentioned types of electrical pulse generators is the limited control of theshape and frequency of the discharges, low machining productivity, but also arelatively high wear of the tool electrode [29]. Therefore, these types of electricalpulse generators are no longer used in modern electroerosive equipment.
New types of electrical pulse generators are constantly being developed to con-tinually improve production quality and productivity. These allow, for example, avariable selection of individual electrical discharge parameters, regardless of theactual ratios in the working gap. In addition, the new types of electrical pulsegenerators have a much longer discharge time than the dependent generators, whilelowering the operating voltage. Some types even allow changing the polarity of thedischarges during the electroerosion process. In these types of electrical pulse gen-erators, ion conductivity predominates, with the workpiece being normally engagedas a cathode and a tool such as an anode. They are also referred to as independentgenerators because they allow variable variations in the electrical discharge pulseamplitudes, their polarity, frequency, and so on, regardless of the current situationin the working gap. In technical practice, there are several types of independentgenerators. For example, a rotary generator. It represents a dynamo that is poweredby an asynchronous motor. An essential part of this type of generator is also asemiconductor diode. Its task is to prevent the breakove in the opposite direction. Inthis type of generator, the tool electrode in the circuit engages as an anode and theworkpiece as a cathode. Figure 10 shows a schematic diagram of an independentelectrical pulse generator of a rotating member electroerosive equipment includingits volt-ampere characteristic.
These types of independent generators allow relatively high performance, i. j.high values of material removal rate (MRR up to 5000 mm3.min�1) at constantfrequency of electrical discharges. Therefore, in practice, they are mainly used forroughing operations. However, for the finishing operations, an additional RL gen-erator is required, which is essentially their main disadvantage.
Figure 10.Scheme of an independent rotary member electrical pulse generator and its volt-ampere characteristic.
14
Emerging Trends in Mechatronics
Higher levels are represented by semiconductor generators. Thanks to the use ofsemiconductor elements, their main advantage is high reliability, but in particularthe possibility to change the parameters of electric discharge in a wide range ofvalues. They allow changing frequencies in the range of 50–500 Hz. Their basicstructural element is the semiconductor pulse generator, the so-called multivibrator(MV), which supplies pulses to the amplifier Z. This then drives the amplifiedpulses power transistors T1, T2. Their number determines the amount of currentrequired to be delivered to the discharge location. The frequency of the electricalpulses and their power parameters is determined by the multivibrator. Figure 11shows a schematic of an independent generator of electrical impulses electroerosiveequipment with semiconductor devices.
Microcomputer controlled generators are currently the most widely used type ofindependent electrical pulse generator used in state of the art electroerosionmachines. These independent semiconductor generators are considered secondgeneration generators. Their main advantage is the application of alternating elec-tric voltage to the discharge, resulting in a reduction of the working gap and theassociated reduction in the volume of material withdrawn. They allow a wide rangeof electrical discharge parameters to be set, with the frequency range of the electri-cal discharges varying from 0.5 to 50 kHz. The main advantage of the practicalapplication of this type of independent electric pulse generator is the demonstrablyless heat affected zone of the eroded area. At the same time, its application cansignificantly reduce the extent of corrosive effects occurring during theelectroerosion process. Figure 12 shows a diagram of an electroerosion equipmentelectrical pulse generator that is controlled by a microcomputer.
Figure 11.Schematic of a semiconductor independent electric pulse generator used in modern electroerosion machines.
Figure 12.A diagram of an electrical pulse generator controlled by a microcomputer.
15
Intelligent Control System of Generated Electrical Pulses at Discharge MachiningDOI: http://dx.doi.org/10.5772/intechopen.88454
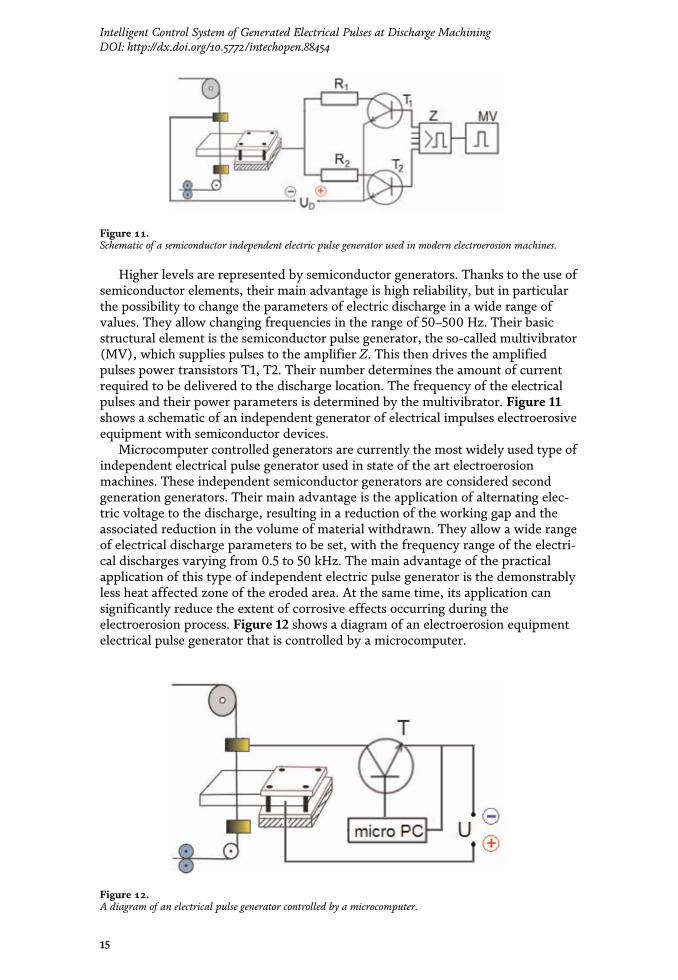
location. Changing the time ratios within each discharge also changes their fre-quency and total discharge energy. From this comes the term “dependent pulsegenerators.”
Thus, it is clear from the above principle that these types of pulse generatorsallow very short discharges to be produced, while the discharge duration ti is 10
�4–
10�7. These are relatively simple construction equipment. For these types of pulsegenerators, it is required to connect the workpiece as an anode and a tool electrodeas a cathode. This type of connection is used because of the need for less materialloss from the tool electrode during the electroerosion process. By using a DC powersource in a given circuit, the ions are only moved in one direction. This provides asuitable precondition for the formation of corrosion of the eroded particles, which isconsidered an undesirable phenomenon. In addition, a significant disadvantage ofthe above-mentioned types of electrical pulse generators is the limited control of theshape and frequency of the discharges, low machining productivity, but also arelatively high wear of the tool electrode [29]. Therefore, these types of electricalpulse generators are no longer used in modern electroerosive equipment.
New types of electrical pulse generators are constantly being developed to con-tinually improve production quality and productivity. These allow, for example, avariable selection of individual electrical discharge parameters, regardless of theactual ratios in the working gap. In addition, the new types of electrical pulsegenerators have a much longer discharge time than the dependent generators, whilelowering the operating voltage. Some types even allow changing the polarity of thedischarges during the electroerosion process. In these types of electrical pulse gen-erators, ion conductivity predominates, with the workpiece being normally engagedas a cathode and a tool such as an anode. They are also referred to as independentgenerators because they allow variable variations in the electrical discharge pulseamplitudes, their polarity, frequency, and so on, regardless of the current situationin the working gap. In technical practice, there are several types of independentgenerators. For example, a rotary generator. It represents a dynamo that is poweredby an asynchronous motor. An essential part of this type of generator is also asemiconductor diode. Its task is to prevent the breakove in the opposite direction. Inthis type of generator, the tool electrode in the circuit engages as an anode and theworkpiece as a cathode. Figure 10 shows a schematic diagram of an independentelectrical pulse generator of a rotating member electroerosive equipment includingits volt-ampere characteristic.
These types of independent generators allow relatively high performance, i. j.high values of material removal rate (MRR up to 5000 mm3.min�1) at constantfrequency of electrical discharges. Therefore, in practice, they are mainly used forroughing operations. However, for the finishing operations, an additional RL gen-erator is required, which is essentially their main disadvantage.
Figure 10.Scheme of an independent rotary member electrical pulse generator and its volt-ampere characteristic.
14
Emerging Trends in Mechatronics
Higher levels are represented by semiconductor generators. Thanks to the use ofsemiconductor elements, their main advantage is high reliability, but in particularthe possibility to change the parameters of electric discharge in a wide range ofvalues. They allow changing frequencies in the range of 50–500 Hz. Their basicstructural element is the semiconductor pulse generator, the so-called multivibrator(MV), which supplies pulses to the amplifier Z. This then drives the amplifiedpulses power transistors T1, T2. Their number determines the amount of currentrequired to be delivered to the discharge location. The frequency of the electricalpulses and their power parameters is determined by the multivibrator. Figure 11shows a schematic of an independent generator of electrical impulses electroerosiveequipment with semiconductor devices.
Microcomputer controlled generators are currently the most widely used type ofindependent electrical pulse generator used in state of the art electroerosionmachines. These independent semiconductor generators are considered secondgeneration generators. Their main advantage is the application of alternating elec-tric voltage to the discharge, resulting in a reduction of the working gap and theassociated reduction in the volume of material withdrawn. They allow a wide rangeof electrical discharge parameters to be set, with the frequency range of the electri-cal discharges varying from 0.5 to 50 kHz. The main advantage of the practicalapplication of this type of independent electric pulse generator is the demonstrablyless heat affected zone of the eroded area. At the same time, its application cansignificantly reduce the extent of corrosive effects occurring during theelectroerosion process. Figure 12 shows a diagram of an electroerosion equipmentelectrical pulse generator that is controlled by a microcomputer.
Figure 11.Schematic of a semiconductor independent electric pulse generator used in modern electroerosion machines.
Figure 12.A diagram of an electrical pulse generator controlled by a microcomputer.
15
Intelligent Control System of Generated Electrical Pulses at Discharge MachiningDOI: http://dx.doi.org/10.5772/intechopen.88454

7. Adaptive control system of generated electrical pulses for WEDM
In practice, there are several cases where all of the above possibilities have beenused to increase the geometric accuracy of the machined surface in terms of theapplication of the specific properties of the wire tool electrodes for WEDM. How-ever, despite the application of modern control systems of generated electricalpulses, not all of the expected requirements for the achieved surface finish in termsof geometric accuracy are always met. In this case, one option is to modify thecontrol system of generated electrical pulses. However, it should be pointed out thatthis is a substantial intervention in the traditionally used system of generatedelectrical impulses during the electroerosion process.
Another of the requirements for WEDM is, in addition to achieving high qualitymachined surface in terms of geometric accuracy, also increasing the performanceof the electroerosion process. These goals can only be met with the help of highlysophisticated online monitoring systems. At present, information that is derivedfrom the actual value of the electrical discharge parameters is used to control theelectroerosion process. In particular, the size of the voltage, current and workinggap are monitored. However, setting the current value of these parameters does nottake into account all the phenomena that occur in the working gap. They result inthe formation of wire electrode vibrations [30]. However, the direct measurementof the amplitude size of the vibration of the wire tool electrode in real life conditionsof the electroerosive machine is a problem. One solution is to measure it throughone of the indirect methods. Subsequent inclusion of a given parameter as one of themonitored parameters during theWEDM in the form of an input parameter into theprocess control of generated electric pulses will allow for a new dimension in thefield of increasing the productivity of the electroerosion process and the achievedsurface quality. At the same time, by monitoring the parameter, a substantialincrease in the level of intelligent adaptive control WEDM can be achieved [31].With its help, it is also possible to detect and then by appropriately adjusting thegenerated electrical pulses to eliminate the occurrence of unwanted electrical dis-charges that increase the amplitude of the wire electrode vibration. These informa-tions are very valuable because it allows the use the strategy of an adaptive electricaldischarge control to eliminate the adverse impact of inappropriate electrical dis-charge parameter settings. Improper setting of electrical discharge parametersresults in a loss of electroerosion process stability, a decrease in productivity forWEDM, but also a deterioration in the quality of the machined surface. Since astable electroerosion process is characterized by a constant and uniform vibration ofthe wire tool electrode with very low amplitude, it is necessary that this deviation atthe point of contact of the electrode with the workpiece is regarded as one of theregulatory parameters that ensures the stability of the electroerosion process.
As mentioned above, due to the generation of electrical discharges with inap-propriate parameter settings, wire tool electrode vibrations occur. During theelectroerosion process, the thin wire electrode primarily vibrates in the X and Ydirections. The magnitude of its vibration amplitude is directly subordinated to thefrequency and intensity of the generated electrical pulses. Figure 13 shows theamplitude and direction of vibration of the wire tool electrode during theelectroerosion process.
The individual parameters of the generated electrical pulses are currently setwith respect to achieving the highest possible efficiency and productivity of theelectroerosion process. However, these parameters do not take into account thevibration of the wire tool electrode, which has a significant contribution to thegeometric inaccuracy of the machined surface.
16
Emerging Trends in Mechatronics
As mentioned above, the magnitude of the vibration amplitude of the wire toolelectrode is dependent on the size of the wire tensioning force and the currentelectrical discharge parameters. Of these, priority is given to the frequency ofgenerated electrical discharges. However, based on the results of several investiga-tions, it has been shown that the vibration of the wire electrode in the X axisdirection becomes slightly higher than the Y axis vibration [32]. However, in termsof consequences, the vibration of the wire electrode in the X axis direction has asignificantly lower effect on the geometric inaccuracy of the machined surfacebecause they are generated in the feed direction. However, the problem is thevibrations that are generated transversely to the wire electrode feed, i. j. in the Yaxis direction. Based on the experimental investigations carried out, it has also beenshown that the magnitude of the vibration amplitude of the tool electrode is notdirectly proportional to the discharge frequency. As can be seen from the graph inFigure 14, its maximum value is reached when applying the critical frequency ofgenerated electrical discharges.
However, the critical frequency of the generated electrical discharges, in addi-tion to the electrical discharge parameters, also depends on other parameters, suchas the thickness of the material being machined, the diameter of the wire electrode,
Figure 13.Amplitude and direction of vibration of the wire tool electrode during WEDM.
Figure 14.Dependence of vibration amplitude of wire tool electrode on frequency of generated electrical discharges duringWEDM.
17
Intelligent Control System of Generated Electrical Pulses at Discharge MachiningDOI: http://dx.doi.org/10.5772/intechopen.88454
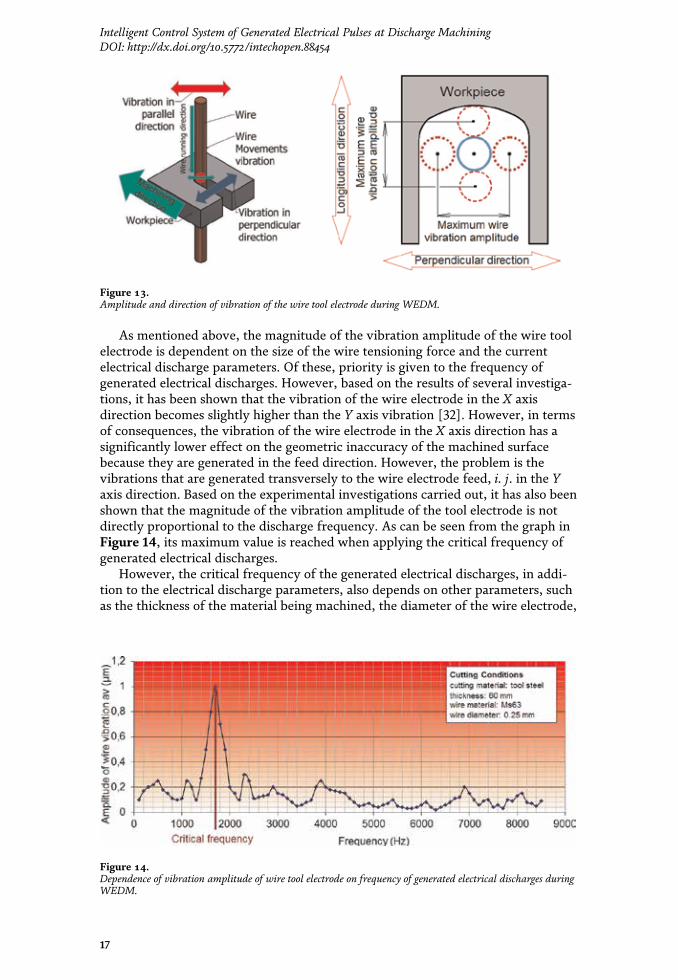
7. Adaptive control system of generated electrical pulses for WEDM
In practice, there are several cases where all of the above possibilities have beenused to increase the geometric accuracy of the machined surface in terms of theapplication of the specific properties of the wire tool electrodes for WEDM. How-ever, despite the application of modern control systems of generated electricalpulses, not all of the expected requirements for the achieved surface finish in termsof geometric accuracy are always met. In this case, one option is to modify thecontrol system of generated electrical pulses. However, it should be pointed out thatthis is a substantial intervention in the traditionally used system of generatedelectrical impulses during the electroerosion process.
Another of the requirements for WEDM is, in addition to achieving high qualitymachined surface in terms of geometric accuracy, also increasing the performanceof the electroerosion process. These goals can only be met with the help of highlysophisticated online monitoring systems. At present, information that is derivedfrom the actual value of the electrical discharge parameters is used to control theelectroerosion process. In particular, the size of the voltage, current and workinggap are monitored. However, setting the current value of these parameters does nottake into account all the phenomena that occur in the working gap. They result inthe formation of wire electrode vibrations [30]. However, the direct measurementof the amplitude size of the vibration of the wire tool electrode in real life conditionsof the electroerosive machine is a problem. One solution is to measure it throughone of the indirect methods. Subsequent inclusion of a given parameter as one of themonitored parameters during theWEDM in the form of an input parameter into theprocess control of generated electric pulses will allow for a new dimension in thefield of increasing the productivity of the electroerosion process and the achievedsurface quality. At the same time, by monitoring the parameter, a substantialincrease in the level of intelligent adaptive control WEDM can be achieved [31].With its help, it is also possible to detect and then by appropriately adjusting thegenerated electrical pulses to eliminate the occurrence of unwanted electrical dis-charges that increase the amplitude of the wire electrode vibration. These informa-tions are very valuable because it allows the use the strategy of an adaptive electricaldischarge control to eliminate the adverse impact of inappropriate electrical dis-charge parameter settings. Improper setting of electrical discharge parametersresults in a loss of electroerosion process stability, a decrease in productivity forWEDM, but also a deterioration in the quality of the machined surface. Since astable electroerosion process is characterized by a constant and uniform vibration ofthe wire tool electrode with very low amplitude, it is necessary that this deviation atthe point of contact of the electrode with the workpiece is regarded as one of theregulatory parameters that ensures the stability of the electroerosion process.
As mentioned above, due to the generation of electrical discharges with inap-propriate parameter settings, wire tool electrode vibrations occur. During theelectroerosion process, the thin wire electrode primarily vibrates in the X and Ydirections. The magnitude of its vibration amplitude is directly subordinated to thefrequency and intensity of the generated electrical pulses. Figure 13 shows theamplitude and direction of vibration of the wire tool electrode during theelectroerosion process.
The individual parameters of the generated electrical pulses are currently setwith respect to achieving the highest possible efficiency and productivity of theelectroerosion process. However, these parameters do not take into account thevibration of the wire tool electrode, which has a significant contribution to thegeometric inaccuracy of the machined surface.
16
Emerging Trends in Mechatronics
As mentioned above, the magnitude of the vibration amplitude of the wire toolelectrode is dependent on the size of the wire tensioning force and the currentelectrical discharge parameters. Of these, priority is given to the frequency ofgenerated electrical discharges. However, based on the results of several investiga-tions, it has been shown that the vibration of the wire electrode in the X axisdirection becomes slightly higher than the Y axis vibration [32]. However, in termsof consequences, the vibration of the wire electrode in the X axis direction has asignificantly lower effect on the geometric inaccuracy of the machined surfacebecause they are generated in the feed direction. However, the problem is thevibrations that are generated transversely to the wire electrode feed, i. j. in the Yaxis direction. Based on the experimental investigations carried out, it has also beenshown that the magnitude of the vibration amplitude of the tool electrode is notdirectly proportional to the discharge frequency. As can be seen from the graph inFigure 14, its maximum value is reached when applying the critical frequency ofgenerated electrical discharges.
However, the critical frequency of the generated electrical discharges, in addi-tion to the electrical discharge parameters, also depends on other parameters, suchas the thickness of the material being machined, the diameter of the wire electrode,
Figure 13.Amplitude and direction of vibration of the wire tool electrode during WEDM.
Figure 14.Dependence of vibration amplitude of wire tool electrode on frequency of generated electrical discharges duringWEDM.
17
Intelligent Control System of Generated Electrical Pulses at Discharge MachiningDOI: http://dx.doi.org/10.5772/intechopen.88454

its tension force, and many other parameters. Therefore, the critical frequency ofgenerated electrical discharges during WEDM cannot be implicitly determined.
Since the critical frequency of vibration of the wire tool electrode during theelectroerosion process cannot be implicitly determined, the only way to identify it isto monitor the magnitude of the vibration amplitude of the tool electrode It ispossible to apply a number of methods to continuously measure the magnitude ofthe vibration amplitude of a wire electrode during the electroerosion process. Eachof these methods has a number of advantages, but also disadvantages. One suitableindirect method for measuring the vibration amplitude of a wire electrode duringan electroerosion process that is also applicable to electroerosion machines is themethod of acoustic emission signals. Its value can be accurately determined inpractice using suitable sensors (Figure 15).
An indirect measurement of the vibration amplitude of the tool electrode duringWEDM requires a separate approach, since a thin wire is used as a tool in thismachining method. The decisive factor in the indirect measurement of the vibrationamplitude of the tool electrode is the appropriate positioning of the sensors. Barotet al. [33] research has been conducted in this area who presented a contactlessindirect method of measuring the amplitude of the tool electrode vibration byacoustic emission (AE). This is based on comparing the relative intensities of theelectromagnetic discharge signals measured by the Hall sensors. However, thismethod has its limitations because of the need for a magnetic field concentrator tocompensate for exponential signal attenuation. At the same time, it requires com-plicated processing of high frequency electromagnetic signals, which is additionallyto be obtained at speeds of up to 30 MHz. Another type of indirect measurement ofvibration amplitude of the tool electrode was applied by Okada et al. [34]. The highaccuracy of the measurement of the given parameter was achieved by distributingthe discharge energy in the wire electrode during WEDM together with direct high-speed digital monitoring of the working gap size. However, this measurementmethod is only applicable in laboratory conditions. Its application in realelectroerosion machine conditions during production is very complicated andtherefore impractical.
A special concept of indirect measurement of the vibration amplitude of the toolelectrode was performed by Kozochkin et al. [35], and Mahardika et al. [36].Measurement of the vibration amplitude of the tool electrode was performed byinduced discharge with respect to the velocity of the acoustic wave propagated inthe machined material (Figure 16).
Figure 15.The principle of indirect measurement of the vibration amplitude of a wire tool electrode during theelectroerosion process.
18
Emerging Trends in Mechatronics
Smith and Koshy [37] in this indirect method of measuring the amplitude of thetool electrode vibration, they used sensors with a resonance frequency of 20 MHz.However, the measurements performed have shown that this method is only suit-able for individual isolated electrical discharges. However, for cyclically repeateddischarges, the acoustic waves overlap each other. This results in an unreliableestimate of time delays, which is again impractical for real operation underelectroerosion machine conditions.
Another suitable method for indirectly measuring the vibration amplitude of atool electrode during WEDM appears to be a method of measuring acoustic emis-sion propagating in a tool wire electrode. Figure 17 demonstrates the appropriatelocation of the sensors to measure the AE propagated in the tool during WEDM.
The sensors AE may be disposed at one of the ends of the wire tool electrodenear the guide rollers or on both at the same time. Since there are cases during
Figure 16.Measuring the vibration amplitude of the tool electrode by means of an acoustic wave propagating in themachined material.
Figure 17.Measuring the amplitude of the vibration of the tool wire electrode through an acoustic wave propagating in thetool during WEDM.
19
Intelligent Control System of Generated Electrical Pulses at Discharge MachiningDOI: http://dx.doi.org/10.5772/intechopen.88454

electrical discharge machining, where the amplitude of the vibration of the wireelectrode at one of its ends is slightly increased due to the high thickness of thematerial being machined or the specific values of the electric discharge parametersettings, it is preferable to install sensors at both the top and bottom of the leadelectrode. In a case of only one sensor is applied either at the top or bottom of thewire lead, we could observe distorted values. In this indirect measurement method,electromagnetic interference (EMI) overlap may occur in some cases with the AEsignals being sensed. However, this is not a disturbing element in this case, since inboth cases it is essentially a noise.
As the decisive criterion for the validity of the recorded data is the location ofthe sensors, it is necessary to consider the alternative of the AE combination ofsensors for the complexity of the solution. In addition, if some research points tosome of the advantages of locating the sensors on the wire electrode guide, other onthe machined material. In Figure 18, a combined way of positioning sensors for AEmeasurement can be seen. Sensor no. 1 is located on an electroerosion machine inthe region of the upper guide of the tool electrode. Sensor no. 2 is located on theworkpiece.
However, based on the results of several researches, it was shown that sensor no.1 placed in the upper guide electrode guide area, indicated more reliable results, assensor no. 2 placed on the workpiece. At the same time, it is preferable to install AEsensors in the area of the wire tool electrode in terms of practical application. If theAE sensor is located on the workpiece, it must always be re-installed after eachworkpiece positioning.
However, based on the results of several researches, it was shown that sensor no.1 placed in the upper conduction of electrode area, indicated more reliable results,as sensor no. 2 placed on the workpiece. These systems allow relatively effectivedetermination of the optimal parameters of the electroerosion process with respectto the required quality of the machined surface. The design of the adaptive controlsystem is implemented based on the principle of self-organization using methodsand elements of artificial intelligence. Figure 19 shows a schematic diagram of theconnection of AE sensors to an adaptive electroerosion machine that will eliminateunwanted tool electrode vibrations during WEDM.
Figure 18.Method of combined positioning of sensors for measuring AE during WEDM.
20
Emerging Trends in Mechatronics
The signals received from the AE sensors will be transmitted to the ACD con-verter. Subsequently, the modified information will be imported into the controlsystem of the electroerosion machine. Based on this input information, it adjusts theelectrical discharge parameters by increasing or decreasing their frequency andintensity to minimize unwanted tool electrode vibration.
At the same time, the characteristic feature of the adaptive system for control-ling the frequency and intensity of electric discharge during WEDM is the possibil-ity of using optimization techniques based on process algorithms. It is appropriateto apply algorithms that guarantee high convergence in the process of identifyingthe optimum. To ensure the ideal functionality of the control system of generatedelectrical pulses, there is a need for a mechanism to be implemented in the system toenable the desired selection of the optimization criterion. This means that in realoperation would be possible to choose a priority optimization criteria focused onachieving high quality machined surface, high productivity electroerosion process,high efficiency electroerosion process, eventually their combination. To do this, anexpert system based on a large information database is needed. Its suitable connec-tion with the CNC control system of the electroerosion machine would enableefficient operation not only in serial but also piece production.
8. Conclusion
The aim of the book chapter “Intelligent control system of generated electricalpulses at discharge machining” is to provide a comprehensive set of knowledge inthe field of intelligent control of generated electrical impulses for WEDM. As isgenerally known, generated electrical impulses with inappropriate parameters havea negative impact not only on the quality of the machined surface but also on theoverall efficiency of the electroerosion process. In addition, since many inputparameters change during WEDM, the electroerosion process may become unstableat any time. However, by integrating state-of-the-art monitoring and adaptivecontrol technologies in the field of electroerosion process, not only process stability
Figure 19.Principal block diagram of the proposed adaptive system to eliminate unwanted vibrations of the wire toolelectrode during WEDM.
21
Intelligent Control System of Generated Electrical Pulses at Discharge MachiningDOI: http://dx.doi.org/10.5772/intechopen.88454

and performance, but also the quality of the machined surface can be substantiallyincreased. The application of an intelligent control system for generated electricalpulses during WEDM based on electrical discharge input information can effec-tively prevent the occurrence of an unstable condition or stop the electroerosionprocess. Although a large number of input factors enter the electroerosion process,the implementation of an intelligent control system for generated electrical pulses ispossible through electronic signals. In the case of electroerosion equipment nor-mally produced, the electric discharges generated are controlled on the basis ofactual conditions in the working gap. The control system of a traditional CNCelectroerosion machine adjusts the performance characteristics of the pulse genera-tor by measuring the average values of electrical voltage and current in the workinggap according to predetermined reference values. However, in order to meet thedemanding criteria imposed on the quality of the machined surface in terms ofachieved geometric accuracy, monitoring of only the mentioned parameters isinsufficient. Therefore, the book chapter highlights the importance of monitoring inaddition to the established process characteristics such as voltage and current, or thesize of the working gap, and the importance of monitoring other process character-istics. Due to the existence of deficiencies reflecting the lack of geometric accuracyof the machined surface, a phenomenon has been identified that causes the poorquality. It is a tool electrode vibration. Although modern electroerosion machinesare equipped with algorithms that can to some extent eliminate this unwantedphenomenon, but not at a level that completely eliminates it. Since it has beenshown, based on the results of several studies, that the maximum variation inflatness of the machined surface is largely due to the maximum amplitude ofvibration of the tool electrode, it is necessary to look for ways to eliminate it. Basedon the results of experimental research, it has also been demonstrated that themaximum vibration amplitude of the wire tool electrode is achieved with a specificcombination of several factors. However, these cannot be precisely determined. Theonly solution for identifying its size is to apply one of the measurement methods.The book chapter describes in detail the indirect method of measuring the ampli-tude of the tool electrode vibration through AE. At the same time it describespossible ways of installing sensors, as well as structure of interconnection of indi-vidual components of proposed system. A characteristic feature of the proposedintelligent control system performance parameters of electric discharge duringWEDM is its flexibility and openness to the real conditions of practice. Based on anextensive database of information, as well as a rapid and precise exchange ofinformation with an external environment, the system will enable theelectroerosion process to be managed with respect to the optimum operation of theelectroerosive device according to the individually selected optimization criteria.
Acknowledgements
The authors would like to thank the grant agency for supporting research workthe projects VEGA 1/0205/19.
Conflict of interest
The authors declare no conflicts of interests.
22
Emerging Trends in Mechatronics
Author details
Ľuboslav Straka* and Gabriel DittrichDepartment of Automotive and Manufacturing Technologies, Faculty ofManufacturing Technologies of the Technical University of Kosice with a seat inPrešov, Presov, Slovakia
*Address all correspondence to: [email protected]
©2020TheAuthor(s). Licensee IntechOpen.Distributed under the terms of theCreativeCommonsAttribution -NonCommercial 4.0 License (https://creativecommons.org/licenses/by-nc/4.0/),which permits use, distribution and reproduction fornon-commercial purposes, provided the original is properly cited. –NC
23
Intelligent Control System of Generated Electrical Pulses at Discharge MachiningDOI: http://dx.doi.org/10.5772/intechopen.88454

References
[1] Qudeiri JEA, Saleh A, Ziout A,Mourad AHI, Abidi MH, Elkaseer A.Advanced electric discharge machiningof stainless steels: Assessment of thestate of the art, gaps and futureprospect. Materials. 2019;12:907
[2] Yan MT, Lin TC. Development of apulse generator for rough cutting of oil-based micro wire-EDM. ISEM XVIII.Procedia CIRP. 2016;42:709-714
[3] Świercz DO, Świercz R. EDM—
Analyses of current and voltagewaveforms. Mechanik. 2017;2:1-3
[4] Barik SK, Rao PS. Design of pulsecircuit of EDM diesinker. InternationalResearch Journal of Engineering andTechnology. 2016;3(5):2762-2765
[5] Scott D, Boyina S, Rajurkar KP.Analysis and optimization of parametercombination in wire electrical dischargemachining. International Journal ofProduction Research. 1991;29:2189-2207
[6] Su JC, Kao JY, Tarng YS.Optimization of the electrical dischargemachining process using a GA-basedneural network. Journal of AdvancedManufacturing Technology. 2004;24:81-90
[7] Tarng YS, Ma SC, Chung LK.Determination of optimal cuttingparameters in wire-eletrical dischargemachining. International Journal ofMachine Tools and Manufacture. 1995;35:1435-1443
[8] Sarkar S, Sekh M, Mitra S,Bhattacharyya B. Modeling andoptimization of wire electrical dischargemachining of γ-TiAl in trim cuttingoperation. Journal of MaterialProcessing Technology. 2007;205:376-387
[9] Puri AB, Bhattacharyya B. Ananalysis and optimization of the
geometrical inaccuracy due to wire lagphenomenon in WEDM. InternationalJournal of Machine Tools &Manufacture. 2003;43:151-159
[10] Liao YS, Yub YP. Study of specificdischarge energy in WEDM and itsapplication. International Journal ofMachine Tools & Manufacture. 2006;44:1373-1380
[11] Mahapatra S, Patnaik A. Parametricoptimization of wire electrical dischargemachining (WEDM) process usingTaguchi method. Journal of the BrazilianSociety of Mechanical Sciences andEngineering. 2006;28:422-429
[12] Jin Y, Kesheng W, Tao Y, MinglunF. Reliable multi-objective optimizationof high-speed WEDM process based onGaussian process regression.International Journal of Machine Tools& Manufacture. 2008;48:47-60
[13] Yan BH, Tsai HC, Huang FY, LongL. Chorng. Examination of wireelectrical discharge machining ofAl2O3p/6061Al composites.International Journal of Machine Tools& Manufacture. 2005;45:251-259
[14] Yan MT, Lai YP. Surface qualityimprovement of wire-EDM using a fine-finish power supply. InternationalJournal of Machine Tools &Manufacture. 2007;47:1686-1694
[15] Kopac J. High precision machiningon high speed machines. Journal ofAchievements in Materials andManufacturing Engineering. 2007;24(1):405-412
[16] Shahruz SM. Vibration of wires usedin electro-discharge machining. Journalof Sound and Vibration. 2003;266
[17] Altpeter F, Roberto P. Relevanttopics in wire electrical discharge
24
Emerging Trends in Mechatronics
machining control. Journal of MaterialsProcessing Technology. 2004;149:147-151
[18] Gokler MI, Ozanozgu AM.Experimental investigation of effects ofcutting parameters on surface roughnessin the WEDM process. InternationalJournal of Machine Tools &Manufacture. 2000;40:1831-1848
[19] Hewidy MS, El-Taweel TA, El-SaftyMF. Modelling the machiningparameters of wire electrical dischargemachining of Inconel 601 using RSM.Journal of Materials ProcessingTechnology. 2005;169:328-336
[20] Hašová S, Straka L’. Design andverification of software for simulationof selected quality indicators ofmachined surface after WEDM.Academic Journal of ManufacturingEngineering. 2016;14(2):13-20
[21] Mičietová A, Neslušan M, ČillikováM. Influence of surface geometry andstructure after non-conventionalmethods of parting on the followingmilling operations. ManufacturingTechnology. 2013;13:199-204
[22] Ferdinandov N et al. Increasing theheat-resistance of X210Cr12 steel bysurface melting with arc discharge invacuum. In: Metal 2018, 27thInternational Conference on Metallurgyand Materials, Brno. 2018.pp. 1097-1102
[23] Straka L’, Čorný I, Piteľ J. Predictionof the geometrical accuracy of themachined surface of the tool steel ENX30WCrV9-3 after electrical dischargemachining with CuZn37 wire electrode.Metals. 2017;7(11):1-19
[24] Panda A et al. Considering thestrength aspects of the material selectionfor the production of plasticcomponents using the FDM method.MM Science Journal. 2018;2018(12):2669-2672
[25] Straka L’, Čorný I, Piteľ J, Hašová S.Statistical approach to optimize theprocess parameters of HAZ of tool steelEN X32CrMoV12-28 after die-sinkingEDM with SF-Cu electrode. Metals.2017;7(2):1-22
[26] Zhang W, Wang X. Simulation ofthe inventory cost for rotable spare withfleet size impact. Academic Journal ofManufacturing Engineering. 2017;15(4):124-132
[27] Straka L’, Hašová S. Prediction ofthe heat-affected zone of tool steel ENX37CrMoV5-1 after die-sinkingelectrical discharge machining.Proceedings of the Institution ofMechanical Engineers Part B: Journal ofEngineering Manufacture. 2016;9:1-12
[28] Swiercz R et al. Optimization ofmachining parameters of electricaldischarge machining tool steel 1.2713. In:AIP Conference Proceedings, EM 2018,13th International ConferenceElectromachining 2018, Bydgoszcz.2018. Article no. 020032
[29] Salcedo AT, Arbizu PI, Perez CJL.Analytical modelling of energy densityand optimization of the EDMmachiningparameters of inconel 600. Metals. 2017;7(5):166
[30] Wang X. An experimental study ofthe effect of ultrasonic vibration assistedwire sawing on surface roughness of SiCsingle crystal. Academic Journal ofManufacturing Engineering. 2017;15(4):6-12
[31]Melnik YA et al. On adaptive controlfor electrical discharge machining usingvibroacoustic emission. Technologies.2018;6(4):96
[32] Habib S, Okada A. Experimentalinvestigation on wire vibration duringfine wire electrical discharge machiningprocess. International Journal ofAdvanced Manufacturing Technology.2016;84:2265-2276
25
Intelligent Control System of Generated Electrical Pulses at Discharge MachiningDOI: http://dx.doi.org/10.5772/intechopen.88454

[33] Barot RS, Desai KP, Raval HK.Experimental investigations andmonitoring electrical dischargemachining of Incoloy 800. Journal ofManufacturing Engineering. 2017;12(4):196-202
[34] Okada A, Uno Y, Nakazawa M,Yamauchi T. Evaluations of sparkdistribution and wire vibration in wireEDM by high-speed observation. CIRPAnnals—Manufacturing Technology.2010;59:231-234
[35] Kozochkin MP, Grigor’ev SN,Okun’kova AA, Porvatov AN.Monitoring of electric dischargemachining by means of acousticemission. Russian Engineering Research.2016;36(3):244-248
[36] Mahardika M, Mitsui K, Taha Z.Acoustic emission signals in the micro-EDM of PCD. Advanced MaterialsResearch. 2008;33-37:1181-1186
[37] Smith C, Koshy P. Applications ofacoustic mapping in electrical dischargemachining. CIRP Annals—Manufacturing Technology. 2013;62:171-174
26
Emerging Trends in Mechatronics
Chapter 2
Conceptual Design Evaluation ofMechatronic SystemsEleftherios Katrantzis, Vassilis C. Moulianitisand Kanstantsin Miatliuk
Abstract
The definition of the conceptual design phase has been expressed in manydifferent phrasings, but all of them lead to the same conclusion. The conceptualdesign phase is of the highest importance during the design process, due to the factthat many crucial decisions concerning the progress of the design need to be takenwith very little to none information and knowledge about the design object. Thisimplies to very high uncertainty about the effects that these decisions will have lateron. During the conceptual design of a mechatronic system, the system to bedesigned is modeled, and several solutions (alternatives) to the design problem aregenerated and evaluated so that the most fitting one to the design specifications andrequirements is chosen. The purpose of this chapter is to mention some of the mostwidely used methods of system modeling, mainly through hierarchical representa-tions of their subsystems, and also to present a method for the generation andevaluation of the design alternatives.
Keywords: conceptual design, mechatronic design, hierarchical modeling,concept evaluation, mechatronic abilities, Choquet integral, criterion interactions
1. Introduction
The current mechatronic systems acquire very advanced capabilities based onthe evolution of the mechatronics enabling technologies and the mechatronic designmethodology. The enhanced intelligence of the mechatronic systems and theincreased complexity are identified; however, these changes drive to completelynew characteristics and capabilities of mechatronic systems supporting the newgeneration of production systems, e.g., these devices evolved from the simplemonitoring to self-optimizing their performance. On top of that, mechatronicsenhanced the application domains from manufacturing to biomechatronics andmicromechatronics.
The development of mechatronic products and systems requires concurrent,multidisciplinary, and integrated design approaches. This chapter deals withmethods and models used during the mechatronic design and more specifically withthe design evaluation. A method for concept generation and evaluation is presented.The criteria used as well as the mathematical foundations of the method will bepresented and analyzed. More specifically, the mechatronic criteria based on themechatronic abilities as well as their scoring will be described using a systematicapproach. Aggregation of the new criteria will be performed using a nonlinear fuzzy
27

integral. The use of the mechatronic design index in a chosen application task willbe presented.
The next section of this chapter is a two-part state of the art. First, the concep-tual design of mechatronic systems and different techniques and approaches for thesystem modeling and representation during this phase are discussed. Later, the stateof the art concerning concept evaluation methodologies and indexes is presented. Amethod for concept evaluation is proposed in Section 3 of the chapter. In the finalsection, an exemplary case study of the conceptual design phase of a mechatronicobject is presented and discussed in the Conclusions section.
2. State of the art
2.1 System modeling and hierarchical representations
Conceptual model creation of a mechatronic object to be designed is the actualtask for industrial production systems that usually operate with modern CAD/CAMsystems [1–4]. According to [1], in the object life cycle, the conceptual design ismade just before the phase of creating the detailed design, when the object’s con-crete mathematical model is created and numeric calculations are realized.
Nowadays, there are many definitions of conceptual design and correspondingmethods and models that are used at the conceptual design phase analyzed in [5].An opinion given by Hudspeth [5] is that conceptual design is more about what aproduct might be or do and how it might meet the expectations of the manufacturerand the customer. M. J. French defines conceptual design as the phase of the designprocess when the statement of the problem and generation of a broad solution to itin the form of schemes is performed [6].
The US Department of Transportation’s FLH Project Development and DesignManual [7] states that conceptual studies (CS) are typically initiated as needed tosupport the design planning and programming process. The CS phase identifies,defines, and considers sufficient courses of action (i.e., engineering concepts) toaddress the design needs and deficiencies initially identified during the planningprocess. This phase advances a project proposed in the program to a point when it issufficiently described, defined, and scoped to enable the preliminary design andtechnical engineering activities to begin. The CS studies and preliminary designphases are performed in conjunction and concurrently with the environmentalprocess, which evaluates environmental impacts of the engineering proposalsresulting from the conceptual studies and preliminary design phases.
Functional modeling technology was researched and applied to represent conceptdesign knowledge by [8, 9] presented a function-behavior-structure (FBS) ontologyrepresentation process for concept design in different domains and emphasized thereasoning mechanism with the FBS ontology for knowledge representation.
Borgo et al. [10] proposed an ontological characterization of artifact behaviorand function to capture the informal meanings of these concepts in the engineeringpractice and characterize them as part of a foundational ontology. The function-cell-behavior-structure (FCBS) model to better comprehend representation andreuse of design knowledge in conceptual design was proposed by Gu [11]. A hierar-chical two-layer concept is given here, i.e., two knowledge-representing layers—theprinciple layer and the physical layer—are presented in the FCBS model. Theprinciple layer is utilized here to represent the principle knowledge. Case modelingis employed in the physical layer to integrate the structural information and behav-ioral performances of the existing devices that apply the design principlesrepresented by the functional knowledge cells (FKCs).
28
Emerging Trends in Mechatronics
A formal definition of the concept design and a conceptual model linking con-cepts related to design projects are proposed by Ralph and Wand [12]. Their defi-nition of design incorporates seven elements: agent, object, environment, goals,primitives, requirements, and constraints. The design project conceptual model isbased, here, on the view that projects are temporal trajectories of work systems thatinclude human agents who work to design systems for stakeholders and useresources and tools to accomplish this task. Ralph and Wand [12] demonstrate howthese two conceptualizations can be useful by showing that (1) the definition ofdesign can be used to classify design knowledge and (2) the conceptual model canbe used to classify design approaches.
An approach for using hierarchical models in the design of mechatronic systemsis presented by Hehenberger in [13]. To master the mechatronic design approach, ahierarchical design process is proposed. The models cover the different views on asystem as well as the different degrees of detailing. The utilization and propercombination of solution principles from different domains of mechatronics allow anextended variety and quality of principal solutions, where hierarchical models serveas very important tools for complex design tasks. Analysis of different mechatronicdesign concepts is also conducted in the work. The approach is demonstrated bystudying the activities during the design process of synchronous machines.
Another approach used in mechatronic design is knowledge-based engineering(KBE) described by Sobieszczanski-Sobieski in [14]. The main structures forextended KBE application are design process and design models. The models con-tain specific aspects such as product structure as a whole and its fragments, engi-neering calculations, and analysis with ability of integration with external systems,design requirements, and decision-making processes. This object-oriented approachmakes it possible to speed up the process of generating the source code of designmodels from the extended KBE and supports multidisciplinary design optimization.Knowledge-based hybrid intelligent systems, namely, imperialist competitive algo-rithm, artificial neural networks, genetic algorithms, and particle swarm optimiza-tion, are also used in tunnel design and construction processes and described in [15].
Mathematical models used in design and modeling of mechanical structures ofmechatronic systems are described in [16]. The examples of car suspension systemmodeling were presented in this work. The approach of interactive design andproduction evaluating of a manufacturing cell is described in [17].
The use of hierarchical system (HS) formal construction and HS coordinationtechnology in conceptual design of mechatronic objects is proposed and describedby Miatliuk [18].
2.2 Concept evaluation and generation
The mechatronic design quotient (MDQ) [19–21] was proposed as a multicriterionmeasure for assisting decision-making in mechatronic design. In MDQ seven criteriawere incorporated: meeting task requirements, reliability, intelligence, matching,control friendliness, efficiency, and cost. These criteria are aggregated by means ofthe Choquet Integral—a nonlinear fuzzy integral that can be used for assistingdecision-making with interactive criteria [22]. Guidelines for the concept evaluationusing these criteria were presented in [21], where four alternatives of an industrialfish cutting machine were evaluated using a hierarchical classification of the afore-mentioned criteria and the Choquet integral as the aggregator.
The mechatronic multicriteria profile (MMP) [23] includes five main criteria(machine intelligence quotient, reliability, complexity, flexibility, and cost of man-ufacture and production) for the mechatronic concept evaluation. The MMPcriteria are defined in such a way that the assessment of the alternatives with
29
Conceptual Design Evaluation of Mechatronic SystemsDOI: http://dx.doi.org/10.5772/intechopen.88643

respect to each criterion results from measurable sizes and does not depend entirelyon the designer’s judgment and experience. In [23], the proposed method is appliedto the conceptual design of a visual servoing system for a 6-DOF robotic manipula-tor, and the Choquet nonlinear fuzzy integral is used for the aggregation of thecriteria. Three different aggregation techniques, the Choquet integral, the Sugenointegral, and a fuzzy-based neural network, were tested and compared for thedesign evaluation of a quadrotor mechatronic system [24].
The mechatronic index vector (MIV) introduced in [2] consists of three criteria,intelligence, flexibility, and complexity. The attributes of every criterion are ana-lyzed and formulated. The intelligence level of a system is determined by its controlfunctions, and the structure for information processing of mechatronic systems isused to model intelligence. A technique to measure the flexibility of manufacturingsystems was used for the estimation of the flexibility of a mechatronic product. Thevarious types of flexibility were classified in three main categories, namely, productflexibility, operation flexibility, and capacity flexibility. The complexity wasmodeled using seven elements. Various models for aggregating the criteria wereproposed and compared including t-norms, averaging operators [2], and the dis-crete Choquet integral [25].
Ferreira [26] proposed a decision support tool based on a neural network toprovide suggestions for early design decisions based on previous solutions. In thesame manner, the mechatronic design indicator (MDI) was proposed [27] as aperformance indicator based on a neuronal network of radial basis functions.
In [28], Moulianitis proposed a new mechatronic index for the evaluation ofalternatives. The proposed criteria that make up the mechatronic index were mainlyextracted from the collective knowledge presented in the multi annual roadmap(MAR) for robotics in Europe [29] and adapted by considering the recent advance-ments in mechatronics. The discrete Choquet integral is used for the aggregation ofthe evaluation scores, while also taking into account the correlations betweencriteria. The criteria and the aggregation method of the mechatronic index arepresented in detail in the following sections.
In recent years, some research has been focused in the automated generation ofsystem architecture concepts for mechatronic design problems. In [30], an auto-mated generation and evaluation method for feasible and ranked physical architec-tures is proposed. First, the components that can realize specified system functionsare identified and combined with the use of a unified knowledge model anddynamic programming methods. Then, the criteria are realized, and the systemarchitectures are evaluated based on the technique for order preference by similar-ity to an ideal solution (TOPSIS).
An integrated principle solution synthesis method which achieves the automatedsynthesis of multidisciplinary principle solutions but also solves the undesiredphysical conflicts among synthesized solutions was proposed in [31].
In [32], a model-based research approach for an integrated conceptual designevaluation of mechatronic systems using SysML software is proposed and applied tothe design of a two-wheel differential drive robot to find the optimal combinationof component alternatives for specific evaluation goals.
3. Concept evaluation in mechatronic design
In this section, the necessary steps for concept evaluation are presented anddescribed. The process is described in terms of a flowchart in Figure 1.
The definition of the design specifications and requirements is a perquisite for amore complete evaluation. The designer can also capitalize on a well-defined set of
30
Emerging Trends in Mechatronics
requirements and specifications in order to generate functional concepts that willlater be evaluated. In order for the evaluation to take place, four steps are necessary.The criteria that are to be used for the evaluation of the alternatives must be chosenand defined. Then, the weights (importance) of the said criteria must be decided, aswell as the interactions between them. The design alternatives are then evaluatedwith respect to each criterion, and those scores are aggregated using a discreteChoquet integral in order for the final scoring values to be derived. The alternativewith the highest score is considered to be the most suitable to the design problem,given the specific requirements and other design environment characteristics(design team experience, knowledge, etc.). At this point, the designer has thechoice to select the alternative that will be further developed during the detaileddesign phase or to review some of the previous step and reevaluate the designalternatives. The steps presented in Figure 1 are presented in more detail inthe following paragraphs. The final section of this chapter is an exemplary casestudy where the proposed evaluation method is used for the evaluation of amechatronic system.
3.1 Design specifications
In the early stage of defining the mechatronic system/product to be designed,the engineering specifications and constraints are determined. The quality functiondeployment (QFD) is a well-known and widely used method for deriving the designspecifications and constraints by realizing customers’ needs and requirements. In[33], the classification of design specifications to demands and wishes is proposed,and, by extension, the further grading of wishes is based on their importance overthe design process. The determination and the recording of design specifications areof great importance to the concept generation and evaluation processes. During theconcept generation process, design specifications and constraints can help thedesigner to easily recognize any unfeasible concepts that will not satisfy the mini-mum requirements, while during the concept evaluation process, the designer can
Figure 1.The proposed evaluation process during the conceptual design phase.
31
Conceptual Design Evaluation of Mechatronic SystemsDOI: http://dx.doi.org/10.5772/intechopen.88643
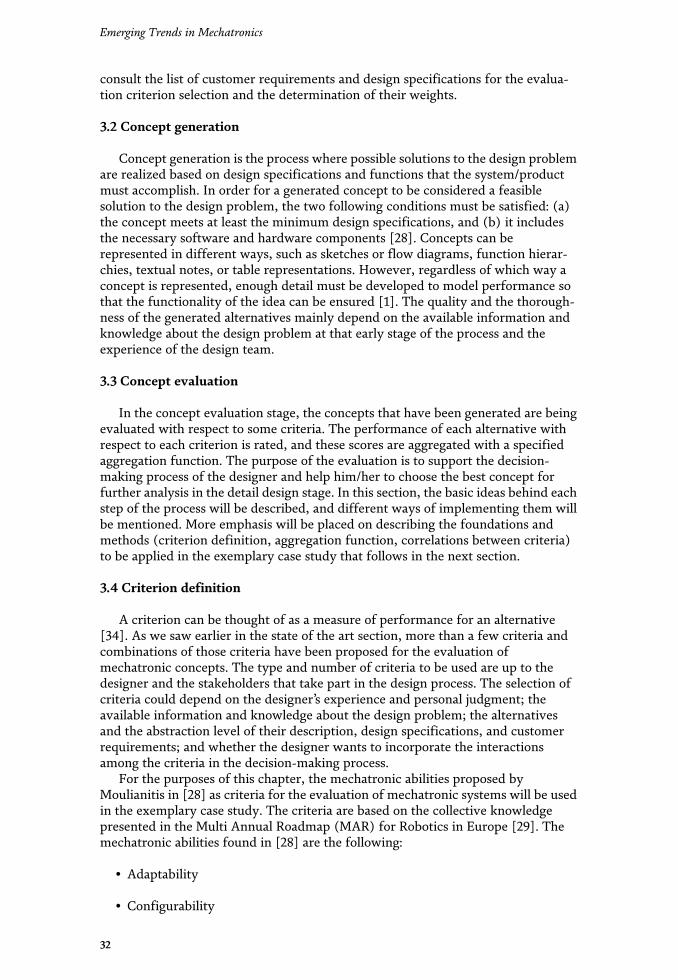
consult the list of customer requirements and design specifications for the evalua-tion criterion selection and the determination of their weights.
3.2 Concept generation
Concept generation is the process where possible solutions to the design problemare realized based on design specifications and functions that the system/productmust accomplish. In order for a generated concept to be considered a feasiblesolution to the design problem, the two following conditions must be satisfied: (a)the concept meets at least the minimum design specifications, and (b) it includesthe necessary software and hardware components [28]. Concepts can berepresented in different ways, such as sketches or flow diagrams, function hierar-chies, textual notes, or table representations. However, regardless of which way aconcept is represented, enough detail must be developed to model performance sothat the functionality of the idea can be ensured [1]. The quality and the thorough-ness of the generated alternatives mainly depend on the available information andknowledge about the design problem at that early stage of the process and theexperience of the design team.
3.3 Concept evaluation
In the concept evaluation stage, the concepts that have been generated are beingevaluated with respect to some criteria. The performance of each alternative withrespect to each criterion is rated, and these scores are aggregated with a specifiedaggregation function. The purpose of the evaluation is to support the decision-making process of the designer and help him/her to choose the best concept forfurther analysis in the detail design stage. In this section, the basic ideas behind eachstep of the process will be described, and different ways of implementing them willbe mentioned. More emphasis will be placed on describing the foundations andmethods (criterion definition, aggregation function, correlations between criteria)to be applied in the exemplary case study that follows in the next section.
3.4 Criterion definition
A criterion can be thought of as a measure of performance for an alternative[34]. As we saw earlier in the state of the art section, more than a few criteria andcombinations of those criteria have been proposed for the evaluation ofmechatronic concepts. The type and number of criteria to be used are up to thedesigner and the stakeholders that take part in the design process. The selection ofcriteria could depend on the designer’s experience and personal judgment; theavailable information and knowledge about the design problem; the alternativesand the abstraction level of their description, design specifications, and customerrequirements; and whether the designer wants to incorporate the interactionsamong the criteria in the decision-making process.
For the purposes of this chapter, the mechatronic abilities proposed byMoulianitis in [28] as criteria for the evaluation of mechatronic systems will be usedin the exemplary case study. The criteria are based on the collective knowledgepresented in the Multi Annual Roadmap (MAR) for Robotics in Europe [29]. Themechatronic abilities found in [28] are the following:
• Adaptability
• Configurability
32
Emerging Trends in Mechatronics
• Decisional autonomy
• Dependability
• Interaction ability
• Motion ability
• Perception ability
Abilities provide a basis for setting performance metrics and for applicationproviders to specify desired levels of system performance [29]. These ability levelsare adapted to mechatronic criteria, and a scoring scale for concept evaluation withrespect to these criteria is presented [28]. Different scaling types for scoring andevaluation of criteria have been proposed, and the dispute concerning the superior-ity among them has been discussed in [35]. The way the criteria are mapped toscoring methods affects the evaluation results, meaning that a suitable mappingcould lead to more realistic results. However, this work is outside the scope of thischapter and is left for future work.
For the scoring of alternatives, it is assumed that the progression of the levelsadvances the characteristics of the system linearly, so a linear interpolation is usedto map each level to a score. The criteria are scaled in the same universe ofdiscourse, with the lowest possible value being equal to zero and the highest possi-ble equal to one. The scores of the intermediate levels are assigned linearly betweenzero and one. In the following, the scaling of the criteria according to [28], as well asshort descriptions of the criteria, is provided.
3.4.1 Adaptability
Fricke [36] defined adaptability as the ability of a system to adapt in order todeliver intended function ability under varying conditions by changing the valuesof the design parameters either actively (online) or passively (off-line). In [29],adaptability is defined as the ability of the system to adapt itself to different workscenarios and different environments and conditions. Adaptability is often mixedwith configurability and decisional autonomy but is differentiated byconfigurability in the sense that adaptation is mostly devoted to the parameterchange rather than to the structure change. The difference between autonomousdecision and adaptation is that adaptation takes place over time based on an accu-mulation of experience, while decisional autonomy is a result of environmentalperception by means of sensors and cognitive mechanisms.
Adaptability can be broken down to five ability levels, starting from Level 0when the system has no ability to adapt and reaching up to Level 4 when the processof adaptation is carried out by multiple agents. In the three intermediate levels, thesystem behavior is self-evaluated, and the need for parameter adaptation is recog-nized (Level 1), and in addition, individual parameters can be altered based on localperformance assessment (Level 3), and in Level 4 the adaptation concerns multipleparameter changes. The levels of adaptability and the scaling for the scoring of eachlevel are presented in Table 1.
3.4.2 Configurability
Configurability is the ability of a system to alter its configuration to performdifferent tasks. As it is stated in [29], configurability must be carefully distinguished
33
Conceptual Design Evaluation of Mechatronic SystemsDOI: http://dx.doi.org/10.5772/intechopen.88643

from adaptability and decisional autonomy which relate to how a robot systemalters its responses (adaptability) and how it changes its behavior as it performs anoperating cycle. At the highest level (Level 4) of configurability, the system is ableto sense changes in its environment’s conditions that are not pre-programmed andalter its configuration in response to those changes. At the lowest levels, the systemhas a single and non-alterable configuration (Level 0), and at Level 1 the user isresponsible for the definition of the system configuration at the beginning of eachcycle of operations. As we go up to Level 3, the system can alter its configurationautonomously from a predetermined set of alternative built-in configurations, andin Level 4 the system is able to alter its configuration in response to changingconditions that are not pre-programmed or predetermined. The score scaling foreach configurability level is shown in Table 2.
3.4.3 Decisional autonomy
A feature of many mechatronic systems is the devolution of functional respon-sibility to the system, freeing the operator or user to pay attention on the higher-level functions associated with the deployment and applicability of the system [37].In order to enhance the decisional autonomy of a system, it should be equipped withheuristics, machine learning capabilities, logic tools, etc. The same as before, theleveling starts from Level 0 for systems with no ability to take decisions, and it goesup as the system enhances its ability to take decisions. At first, the system is fullydependent on user decisions (Level 1), the system makes decisions to choose itsbehavior from a predefined set of alternatives based on basic sensing and userinputs (Level 2), and at Level 3 the system is able to process the inputs from the userand the sensing unit and makes decisions continuously, while in Level 4 moment-to-moment decisions about the environment are taken. Level 5 introduces an inter-nal model of the environment to the system in order to support the system’sdecision-making process, and when in Level 6, the sequence of predefined subtasksis decided in a way, so it accomplishes a higher-level task. Level 7 means that thesystem can adapt its behavior to accommodate task constraints, and Level 8
Adaptability level Normalized score
0 0
1 0.25
2 0.5
3 0.75
4 1
Table 1.Levels and scaling for adaptability.
Configurability level Normalized score
0 0
1 0.25
2 0.5
3 0.75
4 1
Table 2.Levels and scaling for configurability.
34
Emerging Trends in Mechatronics
translates to the alteration of the strategy as the system gathers new informationand knowledge about the environment. In the two higher levels, decisions aboutactions are altered within the time frame of dynamic events that occur inside theenvironment (Level 9), and in Level 10, system compensation in real-time events isenabled by the alteration of the tasks themselves. The levels and the correspondingscores are presented in Table 3.
3.4.4 Dependability
Dependability of mechatronic units is defined as the qualitative and quantitativeassessment of the degree of performance, reliability, and safety taking into consid-eration all relevant influencing factors [38]. The higher the level of dependability ofa system, the more reliable this system is. Seven levels of dependability are definedas follows. At Level 0, there is no system ability to predict any failures. At Level 1,dependability is measured only by estimations of the mean time between failures,and the system has no real ability to detect or prevent those failures. At Level 2, thesystem has the ability to diagnose a failure and enter safe mode operation, while atLevel 3 the system is able to diagnose a number of failures and recover from aproportion of them. If the system has the added ability to predict the consequencesto its tasks caused by the diagnosed failures, then it has reached Level 4. At Level 5,the system can communicate its failures to other systems in order to rearrange theaggregate sequence of tasks and keep its mission dependable, and as we reach Level6, the system is able to predict a failure and act to prevent it. Dependability levelsand scores are presented in Table 4.
3.4.5 Interaction ability
It is the ability of a system to interact physically, cognitively, and socially eitherwith users, operators, or other systems around it [29]. In the concept of humanadaptive mechatronics (HAM) [39], the goal is to design a mechatronic system thatincludes the user in the control loop and modifies the functions and the structure ofuser-machine interface to improve the human’s operational skills. Interactivity isconsidered in most of the modern mechatronic systems to facilitate either the
Decisional autonomy level Normalized score
0 0
1 0.1
2 0.2
3 0.3
4 0.4
5 0.5
6 0.6
7 0.7
8 0.8
9 0.9
10 1
Table 3.Levels and scaling for decisional autonomy.
35
Conceptual Design Evaluation of Mechatronic SystemsDOI: http://dx.doi.org/10.5772/intechopen.88643

operation or the maintenance and repair. Six levels were used for the modeling ofinteraction ability. Level 0 entails that no ability for interaction exists. The lowestlevel where human-system interactions are present is Level 1, where the operationof the system can be interrupted at any time by the user. When human-machineinteraction is possible even if the user and the system are isolated, we are at Level 2,and if the system’s workspace is divided into safe and unsafe zone for humaninteraction, then Level 3 of interaction ability is reached. At Level 4, human-systemsynergy is considered, while the system checks for dangerous motions or forces thatcould be harmful to the human. At the highest level, that is, Level 5, recognition ofthe conditions under which the system should have a safe mode behavior based ondetection of uncertainty is enabled. Interaction ability levels and their scoring arepresented in Table 5.
3.4.6 Motion ability
In [28], motion ability is considered to categorize the different types of motioncontrol. Open-source 3D printers are systems with Level 1 motion ability, whilerobotic vacuum cleaners are presenting abilities up to Level 5. Motion ability levelsand the scores are presented in Table 6. At the lowest level (Level 0), the systempresents no motion ability. As we go up to Level 1, the system accomplishespredefined motions in a sequence using open-loop control, while the use of closed-loop control for motion in a predefined manner is considered to be at Level 2 ofmotion ability. Level 3 offers the ability for constrained position or force optionsintegrated to the motion control, while a reactive motion describes Level 4. Opti-mization of a set of parameters and planning of its motion based on said optimiza-tion translate to Level 5 of motion ability.
Dependability level Normalized score
0 0
1 0.17
2 0.33
3 0.5
4 0.67
5 0.83
6 1
Table 4.Levels and scaling for dependability.
Interaction ability level Normalized score
0 0
1 0.2
2 0.4
3 0.6
4 0.8
5 1
Table 5.Levels and normalized values for interaction ability [10].
36
Emerging Trends in Mechatronics
3.4.7 Perception ability
In order for mechatronic systems to be capable of operation in unstructured,dynamic environments, multiple sensors and methods for sensor fusion and envi-ronment recognition are integrated into them [40]. The perception ability of asystem is associated with its ability to understand and sense its working environ-ment. The leveling of the perception ability extends to eight levels in total. The samewith all the previous mechatronic abilities, Level 0 means that there is no ability toperceive data. If critical data are collected using sensors and the behavior of thesystem is directly altered, then the system is at Level 1 of perception ability. If thecollected data are first processed and the behavior of the system is then indirectlyaltered, we are at Level 2. At Level 3, multiple sensors are being used to create aunified model of the surrounding environment, while at Level 4 system is able toextract features of the environment by sensing only a region of it. Being a Level 5system goes with the ability to process the sensing data in order to extract informa-tion features that help with better environment interpretation. At Level 6 objectsare identified using an object model, and at the highest level, Level 7, processed dataare used in order to infer about properties of the environment. Perception abilitylevels and their scoring are given in Table 7.
3.4.8 Criteria weights
Criteria weights express the designer’s preference for the importance of eachcriterion in the assessment of the alternatives. Various methods for assigningweights to criteria have been proposed in the relevant literature [1, 33, 34, 41]. The
Motion ability level Normalized score
0 0
1 0.17
2 0.4
3 0.6
4 0.8
5 1
Table 6.Levels and scores for motion ability [10].
Perception ability level Normalized score
0 0
1 0.14
2 0.29
3 0.43
4 0.57
5 0.71
6 0.86
7 1
Table 7.Levels and normalized scores for perception ability [10].
37
Conceptual Design Evaluation of Mechatronic SystemsDOI: http://dx.doi.org/10.5772/intechopen.88643

most commonly used weight assignment technique for concept evaluation in themechatronic design process is the direct rating of each criterion weight by thedecision-makers (direct rating, point allocation, numerical scale) [1, 41, 42]. Theeigenvector method, proposed by Saaty in [43], is a simple method that usespairwise comparisons and ratings between criteria in order to formulate the weightof each individual criterion. In [34, 41], the reader can find a more in-depth analysisof different weight rating methods and how to choose the most suitable methoddepending on the decision problem. In the process of assigning values to criteriaweights, the design team should make an effort to consider the design specificationsand customer requirements and try to reflect them on the assigned values.
3.5 Criteria correlations and aggregation method
Choquet integral is a nonlinear fuzzy integral, which has been proposed andused for the aggregation of interacting criteria [22]. The integral allows for thedesigner to incorporate interactions into the evaluation process by providingweighting factors (weights) both for the criteria and the correlations between eachsubset of criteria. Considering the set of criteria X ¼ x1; x2;…; xnf g, the concept of afuzzy measure [44] is defined.
A fuzzy measure on the set X of criteria is a set function μ : P Xð Þ ! 0; 1½ �satisfying the following axioms:
i. μ ∅ð Þ ¼ 0 and μ Xð Þ ¼ 1
ii.A⊂B⊂C implies μ Αð Þ≤ μ Βð Þ.
In this context, μ Αð Þ represents the weight of importance of criterion A [22]. Byexpressing the weighting factors of each subset of criteria, the interactions betweencriteria can be taken into account during the aggregation. Four types of interactionsbetween criteria are presented in this chapter. A positive interaction (or correlation)means that a good score in criterion xi implies a good score in criterion xj and viceversa, while a negative correlation between interacting criteria means that a goodscore in criterion xi implies a bad score in criterion xj and vice versa. If a criterion hasa veto effect on the evaluation process, a bad score in criterion xi results in a badglobal score. A pass effect, on the other hand, implies that a good score in criterion xiresults in a good global score. In Table 8, the four types of interactions betweencriteria and the relations between their weighting factors are presented.
Given the set of criteria X and the fuzzy measure μ, the Choquet integral of afunction f : X ! 0; 1½ � with respect to μ is defined by [23]
Cμ ¼ Cμ f x1ð Þ;…; f xnð Þð Þ≔Xni¼1
f x ið Þ� �� f x i�1ð Þ
� �� �μ Α ið Þ� �� �
(1)
Interaction Relation
Positive correlation μ xi; xj� �
< μ xið Þ þ μ xj� �
Negative correlation μ xi; xj� �
> μ xið Þ þ μ xj� �
Veto effect μ Tð Þ≈0 if T ⊂X � xif gPass effect μ Tð Þ≈ 1 if T ⊂X, xi ∈T
Table 8.Correlations between criteria.
38
Emerging Trends in Mechatronics
where :ð Þ ið Þ indicates that the indices have been permuted so that 0≤ f x1ð Þ≤…≤ f xnð Þ≤ 1, f x 0ð Þ
� � ¼ 0, and A ið Þ ¼ x ið Þ;…; x nð Þ� �
:
or equally [45]
Cμ ¼Xni¼1
f x ið Þ� �
μ Α ið Þ� �� μ Α iþ1ð Þ
� �� �(2)
where :ð Þ ið Þ indicates that the indices have been permuted so that the criteriavalues are sorted in ascending order, such that 0≤ f x1ð Þ≤…≤ f xnð Þ≤ 1,A ið Þ ¼ x ið Þ;…; x nð Þ
� �, and A nþ1ð Þ ¼ 0.
Marichal [45] also proposed an axiomatic characterization of the integral tomotivate its use in applications. The expression he ended up with is the Choquetintegral in terms of the Mobius representation:
Cμ ¼Xi∈N
a ið Þ ∙ f x ið Þ� �þ
Xi;jf g⊆N
a i; jð Þ ∙ f x ið Þ� �
∧ f x jð Þ� �� �þ… (3)
where a ið Þ ¼ μ ið Þ and a i; jð Þ ¼ μ i; jð Þ � μ ið Þ þ μ jð Þ½ �.
4. Case study: automated BMP system
The proposed method is used for the concept evaluation of an automatedbiomethane potential (BMP) measurement system. Before the presentation of theevaluation of the system, it should be mentioned that all the scoring values ofalternatives, the criteria weights, and the criteria correlation weights were givenintuitively by the authors of this chapter. This is not ideal, since the design teamshould strive for a more analytic and objective approach to the evaluation process.However, the study of the cognitive mechanisms that take place during the evalua-tion and the consideration of different ways of scoring criteria and criteria weightsis left for future work. The purpose of this chapter is to focus more on the generalmethodology for concept evaluation and not so on its specifics.
Production of biogas from different organic materials is an interesting source ofrenewable energy. The biomethane potential (BMP) of these materials has to bedetermined to get insight in design parameters for anaerobic digesters [46]. The testis conducted by placing an active inoculum and a sample of a substrate in a sealedcontainer vessel and measuring the amount of the gas produced [47]. The basicsteps followed in a BMP test are:
1.The substrate and the inoculum are placed in the sealed reactor vessel.
2.Stirring (not continuous) and heating (the temperature is held constant in therange 20–90°C, depending on the test mixture) of the test mixture to enhancebiogas production. The production of biogas starts at this step and continuousuntil the end of the experiment.
3.Absorption of CO2. The biogas is transferred to a reactor vessel containing(liquid) NaOH. This allows for the dissolution of the CO2 in the NaOHsolution, and the remaining gas volume is representative of the CH4 present inthe biogas.
39
Conceptual Design Evaluation of Mechatronic SystemsDOI: http://dx.doi.org/10.5772/intechopen.88643

4.Gas flow measurement. The CH4 is transferred to the flow measurementsystem. The volume of gas produced in a specific time interval is quantified,usually under the fluid displacement principle.
5.Data analysis and reporting.
An average BMP test can last for more than 30 days, during which the test systemmust run without disruptions. The BMP test can be done manually, where humaninterference in 24-h intervals is needed in order for the gas flow measurement to takeplace. The whole process can also be automated, where no human interaction isneeded for the gas flow measurement, and the analysis and representation of theresults take place in real time during the experimental process. Two commercialproducts that automate the BMP test are the AMPTS II by Bioprocess Control Sys-tems [48] and the Biogas Batch Fermentation System by Ritter [49]. The followingscheme represents the basic functions that need to be accomplished for the automa-tion of the process. The functions presented in the scheme in Figure 2 are incorpo-rated in both products (AMPTS II and Biogas Batch Fermentation System).
In Figures 3 and 4, the two products are presented in relation to the schemegiven in Figure 2. They accomplish the same functions but with slightly differentcomponents and working principles.
Figure 2.Subfunctions and flows of material and energy of an automated BMP system.
Figure 3.The AMPTS II system by bioprocess control [48].
40
Emerging Trends in Mechatronics
The agitation in the case of the AMPTS is accomplished with an overhead stirrerwith a special airtight cap that allows for the stirring of the mixture with a stirringrod coupled to the actuator. Ritter used an overhead stirrer, but the couplingbetween the actuator and the stirring rod is accomplished with a magnetic coupling.Ritter utilized a heating oven for the temperature control of the mixture, while inAMPTS II a water bath is used. For the ultralow gas flow measurement (ULGFM),Bioprocess Control uses their patented gas flow cell meter which operates based onthe liquid displacement and buoyancy working principles, as well as the Hall effect.Ritter’s gas flowmeter is based on the same operating principles but utilizes thetipping bucket effect in combination with a Hall effect sensor. For the normaliza-tion of the measurement results, a temperature and a barometric pressure sensor arebeing used. The user can control the speed and the movement direction of theactuator motors through the software.
The main requirements considered by the design team are that the system canreliably operate for the whole duration of the experiment (more than 30 days), thetemperature of the mixture inside the reactor vessel is held constant at aprespecified temperature, it offers an automated and accurate flow measurementmethod, its components and subsystems are gastight in order for the gas to be ableto travel through the system without any leakages, and finally the results arepresented to the user via a software UI.
After the listing of the design requirements, the design team proceeds with thegeneration of alternative concepts. For the facilitation of concept generation, thesystem could be modeled in various ways, such as the scheme shown in Figure 5. InTable 9, the information about the mechatronic system is presented in terms ofenergy, material, and information flows [1].
By studying existing automated BMP systems, the design team attempted tomodel the basic functions of any automated BMP measuring system as a flowchart.This flowchart representation of the system functions is meant to be representativeof any automated BMP measurement system and help the design team with thebetter understanding of the system to be designed.
In [28], a design tree with the subfunctions of a mechatronic object, morespecifically an educational firefighting robot, is presented. A representation of theautomated BMP system in a manner similar to that design tree is presented inFigure 5.
Figure 4.The biogas batch fermentation system by Ritter [49].
41
Conceptual Design Evaluation of Mechatronic SystemsDOI: http://dx.doi.org/10.5772/intechopen.88643

The component and component categories that are considered in the design treein Figure 5 are the following:
• Sensing: For temperature control inside the reactor vessel, pressure recordingand gas measurement.
• Information processing: Software that is responsible for the actuator andtemperature control, the data logging and processing of flow measurementvalues, and the calculation and representation of the experimental results.
• Power components: The power supply of the actuators, the heating elements,and the control and software electronics.
• Work components: The components that produce some kind of work.Mechanical work by the agitation actuators and thermal work by the heatingelements.
• Mechanical components: For the casing and structural support of the system,the tubing connections, the vessels (reactor vessel, absorption unit), the stirrer,the airtight components, and the mechanical parts contained within the flowmeasurement sensor.
• Ultralow gas flow measurement: Working principles incorporated within thegas flow measurement system. In reality, the design of an ultralow gas flowmeasurement system could be considered by itself as a distinct mechatronicdesign problem.
Energy flow Material flow Information flow
Transformation of electrical power tokinetic energy (agitation)
Flow of gas mixturesthrough the system
Temperature, pressure, and flowsensing
Transformation of electrical power tothermal energy
Agitation of mixture inthe reactor vessels
Control of actuators
Control of heating element
Flow sensor data processing andresult representation
Table 9.Energy, material, and information flow representation of the automated BMP system.
Figure 5.Design tree for automated BMP measurement system.
42
Emerging Trends in Mechatronics
• Communication: For the inter process communications between the softwareand the rest subsystems (actuators, heater, sensors).
Based on the classification of components considered in the design tree of thesystem (Figure 5) and the subsystems considered in the flowchart representation ofthe system (Figure 2), the design team came up with a first set of alternativeconcepts for the automated BMP system. The alternative components consideredare presented in Table 10.
As it can be seen in Table 10, not all subsystems and components were takeninto account in the generation of possible solutions, but this does not mean that thebasic requirements of the system are not met by the alternatives that have beenchosen. As mentioned in previous sections, the quality and completeness of thesolutions depend to a large extent on the available information and knowledgeabout the design object and the design team experience. It should also be borne inmind that the evaluation of the solutions is an iterative process, the purpose ofwhich is to support the design team in the decision-making processes during theconceptual design phase.
Based on the data of Table 11, there are 4� 3� 24 ¼ 192 possible design solu-tions. The study of the procedures for reducing the number of solutions lies outsidethe scope of this chapter and is left for future work. However, some of the factorsthat may play an important role in rejecting some alternatives without requiring athorough evaluation process are outlined. The factors are as follows.
• The design team is not familiar with relevant technology [28].
• The assembly/communication between some components is unacceptablycomplicated or even impossible.
• The cost of some alternatives is too high.
• Some alternatives have already been realized by competitors, and they are notconsidered innovative enough.
• The alternative does not satisfy the basic system/product requirements.
• The time frame for the design process does not allow for the exhaustiveevaluation of the alternatives, and a decision must be made quickly.
Agitation system Heatingsystem
Temperaturesensors
Ultralow gas flowmeasurement(ULGFM)
Communication
1. Actuator: stepper,DC brushed/brushless, servo2. Stirrer: overheadcoupled stirrer,magnetic stirrer
3. Waterbathheater4.Heatingoven5. Siliconjacketheater
6. Resistancethermometerdetector (RTD)7. Thermocouple
8. Liquiddisplacement andbuoyancy and Hallsensor9. Liquiddisplacement andoptical sensor
10. Direct, wiredbetween software andsubsystems11. Radio frequency(Wi-Fi) betweensoftware and subsystems
Table 10.Automated BMP measurement system alternatives based on system subfunctions.
43
Conceptual Design Evaluation of Mechatronic SystemsDOI: http://dx.doi.org/10.5772/intechopen.88643

In the same manner, if an alternative presents really low cost and complexityand the design team is very familiar with the relevant technology, it could be chosenfor further development along with the alternatives that will be chosen after theevaluation process. The design team came up with the three design alternativesDAk k ¼ 1, 2, 3ð ) presented in Table 11.
Each design alternative uses a different type of actuator for the stirring of themixture. In DA1 and DA2, a brushed DC motor and a brushless DC motor, respec-tively, are used. A stepper motor with the additional components for the open-loopcontrol of the system is being utilized in DA3. As for the other agitation compo-nents, DA1 and DA2 are using an overhead stirrer which is coupled with the motorwith a linear coupling, e.g., helix coupler, while the third alternative makes use of amagnetic coupling between the actuator and the stirrer. The three design alterna-tives realize the heating of the mixture inside the reaction vessels in three differentways. The two first alternatives, i.e., DA1 and DA2, use a water bath and a heatingoven, respectively, for the heating of the mixture, while in DA3 a silicon rubberheater (etch foil heater) is chosen for the heating purposes. Thermocouples (DA1)and a RTD sensor (DA2, DA3) are chosen as alternative solutions for temperaturesensing inside the reactor vessel. The two alternatives that the design team came upwith for the realization of the ultralow gas flow measurement system are presentedin Figure 6.
The first alternative for the ULGFMS, presented in Figure 6a and used in designalternatives DA1 and DA3, utilizes the liquid displacement discipline and with theuse of an optical sensor is able to calculate the flow of the produced gas. As gas
Designalternatives
DA1 DA2 DA3
Actuator DC brushed DC brushless Stepper
Stirrer Overhead with linearcoupling
Overhead with linear coupling Magnetic
Heating Water bath Heating oven Silicon jacket
Temperaturesensors
Thermocouple RTD RTD
ULGFM Liquid displacementand optical sensor
Liquid displacement andbuoyancy and Hall sensor
Liquid displacementand optical sensor
Communication Wired connections Wired connections Radio frequencies(Wi-Fi)
Table 11.Three design alternatives selected for evaluation by the design team.
Figure 6.Ultralow flow measurement alternatives. (a) The liquid displacement discipline. (b) The tipping bucketmechanism.
44
Emerging Trends in Mechatronics
enters the chamber, pressure arises, and the liquid level inside the chamber risesuntil it reaches the point where the optical sensor is pointed at. The sensor recordsthe phenomenon, and the gas is then released from the system, the liquid leveldrops again, and the process repeats itself. By calibrating the system so that weknow the exact gas volume needed for the liquid to reach the optical sensor’s leveland recording the number of times it reaches that level in a given time interval, wecan estimate the gas flow. The second alternative presented in Figure 6b andutilized in design alternative DA2 makes use of a tipping bucket mechanism. Abucket-like chamber is placed inside a container packed with a liquid. Gas bubblesenter the bucket, and when enough of them have gathered, the bucket tips becauseof the buoyancy. During the tipping motion, a Hall sensor records the phenomenon,and the gas is released. As we can see, the second alternative is very similar to thefirst one. Finally, for the first two alternatives DA1 and DA2, the communicationbetween its subsystems will all be achieved via physical (wired) communicationprotocols and hardware components, while the third DA3 alternative is using radiofrequencies, namely, Wi-Fi communication between its subsystems.
The next step of the conceptual design phase involves the selection of theappropriate criteria for the evaluation of the design alternatives, the determinationof their weights, and the interactions between them. In the example of the auto-mated BMP system, five criteria from the total of seven presented in the previoussection are considered for the evaluation, along with the cost and complexitycriteria. For the cost criterion, the material resources and man-hours required forthe development of the system are estimated. Complexity mainly describes thefamiliarity of the design team with specific technologies, and complex design pro-cess will be based on that fact. It should be noted that higher scores on cost andcomplexity criteria translate to fewer resources needed for the development of theproduct and also to less complex designs. The score of each alternative with respectto each criterion is shown in Table 12.
The fuzzy measures that represent the weight of each criterion are presented inTable 13. Three values were chosen to specify the importance of each criterion0:05;0:105;0:160ð Þ, with each one corresponding to low, medium, and highimportance, respectively. As it is stated in [28], a choice of very low and/or veryhigh values limits the ability to define the correlations between criteria. For exam-ple, assuming a low importance equal to μ x1ð Þ ¼ 0:01 and a high importance equalto μ x2ð Þ ¼ 0:20, then the positive correlation among them is impossible to bedefined since the following constraints must be true: μ x1ð Þ þ μ x2ð Þ> μ x1; x2ð Þ andμ x1; x2ð Þ> μ x2ð Þ.
The design team wanted to reward systems that display low cost and complex-ity, and so the two criteria are negatively correlated. The same thinking applies to
Criteria (xi) DA1 DA2 DA3
1. Configurability 0.01 0.05 0.3
2. Dependability 0.17 0.17 0.17
3. Interaction ability 0.2 0.2 0.3
4. Motion ability 0.25 0.3 0.17
5. Perception 0.14 0.14 0.14
6. Cost 0.5 0.2 0.4
7. Complexity 0.4 0.3 0.3
Table 12.Evaluation scores.
45
Conceptual Design Evaluation of Mechatronic SystemsDOI: http://dx.doi.org/10.5772/intechopen.88643

two other negative correlations between complexity/configurability and cost/configurability. A system with great configurability allows for the user to customizethe BMP system easier and faster, which translates to higher interaction abilitylevels, and thus, the two criteria are positively correlated. All interactions and thecorresponding weights are presented in Table 14.
The final evaluation scores of each alternative are presented in Table 15. Theevaluation scores are the Choquet integral values that were calculated based onEq. (3). Alternative DA3 scored the highest score, while DA1 and DA2 came upsecond and third, respectively, as it is shown below. DA1 and DA3 present similarperformance characteristics, with DA1 having a marginal lead in cost and complex-ity performance but falls short on configurability performance.
5. Conclusions
In this chapter, some well-known methods for the conceptual analysis andevaluation during the mechatronic design process are discussed, and a method forthe evaluation of generated design alternatives is proposed. The proposed designcriteria, which were derived from the multi annual roadmap in robotics in Europe,were presented in [28]. Four interactions between criteria are presented and theChoquet integral along with the two additive fuzzy measures used for dealing withthe aggregation of the evaluation scores.
Criteria (xi) Weight (μ xið Þ)1. Configurability μ x1ð Þ ¼ 0:16
2. Dependability μ x2ð Þ ¼ 0:05
3. Interaction ability μ x3ð Þ ¼ 0:105
4. Motion ability μ x4ð Þ ¼ 0:05
5. Perception μ x5ð Þ ¼ 0:05
6. Cost μ x6ð Þ ¼ 0:16
7. Complexity μ x7ð Þ ¼ 0:16
Table 13.Criteria weights.
Criteria xi; xj� �
Interaction Set weight μ xi; xj� �Þ�
Cost/complexity Negative μ x6; x7ð Þ ¼ 0:45
Complexity/configurability Negative μ x1; x7ð Þ ¼ 0:40
Interaction ability/configurability Positive μ x1; x3ð Þ ¼ 0:20
Cost/configurability Negative μ x1; x6ð Þ ¼ 0:35
Table 14.Criteria correlations and set weights.
Design alternatives DA1 DA2 DA3
Evaluation scores 0.2995 0.1960 0.3205
Table 15.Choquet values of the alternative scores.
46
Emerging Trends in Mechatronics
The most useful outcomes of this chapter are as follows. (i) The modeling of thesystem can lead to a better understanding of the problem and make the evaluationprocess easier and more accurate. (ii) The proposed mechatronic abilities can beutilized in a number of different situations. However, the score scaling of thecriteria needs to be further investigated. (iii) The proposed method is there tosupport the design team on the selection of the most suitable design alternative. Theevaluation process and the results obtained from it are dependent on the experienceof the design team, the number of people participating in the evaluation, and theavailable knowledge at the time the decision is made.
Acknowledgements
This research has been co-financed by the European Union and Greek nationalfunds through the Operational Programme for Competitiveness, Entrepreneurshipand Innovation, under the call RESEARCH-CREATE-INNOVATE (project code:T1EDK-03148).
Author details
Eleftherios Katrantzis1*, Vassilis C. Moulianitis1 and Kanstantsin Miatliuk2
1 Department of Product and Systems Design Engineering, University of theAegean, Ermoupoli, Syros, Greece
2 Department of Automatic Control and Robotics, Bialystok University ofTechnology, Bialystok, Poland
*Address all correspondence to: [email protected]
© 2020TheAuthor(s). Licensee IntechOpen.Distributed under the terms of theCreativeCommonsAttribution -NonCommercial 4.0 License (https://creativecommons.org/licenses/by-nc/4.0/),which permits use, distribution and reproduction fornon-commercial purposes, provided the original is properly cited. –NC
47
Conceptual Design Evaluation of Mechatronic SystemsDOI: http://dx.doi.org/10.5772/intechopen.88643

References
[1] Ullman D. The Mechanical DesignProcess. 1992
[2] Moulianitis VC, Aspragathos NA,Dentsoras AJ. A model for conceptevaluation in design—An application tomechatronics design of robot grippers.Mechatronics. 2004;14(6):599-622
[3] Shigley JE, Mischke CR. MechanicalDesign Engineering Handbook. Elsevier;2013
[4] Johnson J. Designing with the Mindin Mind Well-Known User InterfaceDesign Rules; 2012
[5] Hudspeth M. Conceptual design inproduct data management. Des. Eng.Technol. News Deskt. Engineering.
[6] French MJ. Conceptual Design forEngineers. London: Springer London;2013
[7] FLH. Project Development andDesign Manual. US Department ofTransportation; 2014 [online].Available from: https://flh.fhwa.dot.gov/resources/
[8] Bryant CR, Stone RB, McAdams DA.Automated Concept Generation fromthe Functional Basis of Design. 2001;573:1-24. Available from: search.informit.com.au
[9] Gero JS, Kannengiesser U. Afunction-behavior-structure ontology ofprocesses, in artificial intelligence forengineering design. Analysis andManufacturing: AIEDAM. 2007;21(4):379-391
[10] Borgo S, Carrara M, Garbacz P,Vermaas PE. A formal ontologicalperspective on the behaviors andfunctions of technical artifacts. ArtificialIntelligence for Engineering Design,Analysis and Manufacturing. 2009;23(1):3-21
[11] Gu CC, Hu J, Peng YH, Li S. FCBSmodel for functional knowledgerepresentation in conceptual design.Journal of Engineering Design. Aug.2012;23(8):577-596
[12] Ralph P, Wand Y. A proposal fora formal definition of the designconcept. Lecture Notes in BusinessInformation Processing (LNBIP). 2009;14:103-136
[13] Hehenberger P, Poltschak F,Zeman K, Amrhein W. Hierarchicaldesign models in the mechatronicproduct development process ofsynchronous machines. Mechatronics.Dec. 2010;20(8):864-875
[14] Sobieszczanski-Sobieski J, Morris A,van Tooren MJL. MultidisciplinaryDesign Optimization Supported byKnowledge Based Engineering. 2015
[15] Koopialipoor M, Fallah A,Armaghani DJ, Azizi A, Mohamad ET.Three hybrid intelligent models inestimating flyrock distance resultingfrom blasting. EngineeringComputations. Jan. 2019;35(1):243-256
[16] Azizi A, P. Y.-C.-B. A. of the S. S. Of,and U. Mechanical Structures:Mathematical Modeling, Springer; 2019K
[17] Azizi A, Ghafoorpoor Yazdi P,Hashemipour M. Interactive design ofstorage unit utilizing virtual reality andergonomic framework for productionoptimization in manufacturing industry.International Journal on InteractiveDesign and Manufacturing. Mar. 2019;13(1):373-381
[18] Miatliuk K. Conceptual Design ofMechatronic Systems. 2017
[19] De Silva CW, Behbahani S. A designparadigm for mechatronic systems.Mechatronics. 2013;23(8):960-966
48
Emerging Trends in Mechatronics
[20] Behbahani S, de Silva CW. System-based and concurrent design of a smartmechatronic system using the conceptof mechatronic design quotient (MDQ).IEEE/ASME Transactions onMechatronics. 2008;13(1):14-21
[21] Behbahani S, de Silva CW.Mechatronic design quotient as the basisof a new multicriteria mechatronicdesign methodology. IEEE/ASMETransactions on Mechatronics. Apr.2007;12(2):227-232
[22] Grabisch M. The application offuzzy integrals in multicriteria decisionmaking. European Journal ofOperational Research. 1996;89(3):445-456
[23] Mohebbi A, Achiche S, Baron L.Mechatronic multicriteria profile(MMP) for conceptual design of arobotic visual servoing system. In:Volume 3: Engineering Systems; HeatTransfer and Thermal Engineering;Materials and Tribology; Mechatronics;Robotics, 2014. p. V003T15A015
[24] Mohebbi A, Achiche S, Baron L.Multi-criteria fuzzy decision support forconceptual evaluation in design ofmechatronic systems: A quadrotordesign case study. Research inEngineering Design. Jul. 2018;29(3):329-349
[25] Moulianitis VC, Aspragathos NA.Design evaluation with mechatronicsindex using the discrete choquetintegral. IFAC Proceedings. Jan. 2010;39(16):348-353
[26] Ferreira IML, Gil PJS. Applicationand performance analysis of neuralnetworks for decision support inconceptual design. Expert Systems withApplications. 2012;39(9):7701-7708
[27] Hammadi M, Choley JY, Penas O,Riviere A, Louati J, Haddar M. A newmulti-criteria indicator for mechatronicsystem performance evaluation in
preliminary design level. In: 2012 9thFrance-Japan & 7th Europe-AsiaCongress on Mechatronics(MECATRONICS)/13th InternationalWorkshop on Research and Educationin Mechatronics (REM). 2012.pp. 409-416
[28] Moulianitis VC, Zachiotis G-AD,Aspragathos NA. A new index based onmechatronics abilities for the conceptualdesign evaluation. Mechatronics. Feb.2018;49:67-76
[29] SPARC. Robotics 2020 Multi-Annual Roadmap MAR ICT-24 ii; 2015
[30] Chen R, Liu Y, Fan H, Zhao J, Ye X.An integrated approach for automatedphysical architecture generation andmulti-criteria evaluation for complexproduct design. Journal of EngineeringDesign. Mar. 2019;30(2–3):63-101
[31] Qi J, Hu J, Peng Y-H. An integratedprinciple solution synthesis method inmulti-disciplinary mechatronic productconceptual design. ConcurrentEngineering. 2018;26(4):341-354
[32] Chami M, Bruel JM. Towards anintegrated conceptual design evaluationof mechatronic systems: The SysDICEapproach. Procedia Computer Science.2015;51(1):650-659
[33] Pahl G, Beitz W. EngineeringDesign: A Systematic Approach; 2013
[34] Sen P, Yang J-B. Multiple CriteriaDecision Support in EngineeringDesign; 2011
[35] Ishizaka A, Labib A. Review of themain developments in the analytichierarchy process. Expert Systems withApplications. 2011;38(11):14336-14345
[36] Fricke E, Schulz AP. Design forchangeability (DfC): Principles toenable changes in systems throughouttheir entire lifecycle. SystemsEngineering. 2005;8(4):342-359
49
Conceptual Design Evaluation of Mechatronic SystemsDOI: http://dx.doi.org/10.5772/intechopen.88643

[37] Bradley D. Mechatronics andintelligent systems. 2005. pp. 395-400
[38] Kochs H-D, Petersen J. AFramework for DependabilityEvaluation of Mechatronic Units; 2004
[39] Yu H. Overview of human adaptivemechatronics. Mathematics andComputers in Business and Economics.2008:152-157
[40] Luo RC, Chou YC, Chen O.Multisensor fusion and integration:Algorithms, applications, and futureresearch directions. In: Proceedings ofthe 2007 IEEE International Conferenceon Mechatronics and Automation,ICMA. Vol. 2007. 2007. pp. 1986-1991
[41] Hwang C-L, Yoon K. Methods forMultiple Attribute Decision Making.Berlin, Heidelberg: Springer; 2012.pp. 58-191
[42] Bottomley PA, Doyle JR, Green RH.Testing the reliability of weightelicitation methods: Direct rating versuspoint allocation. Journal of MarketingResearch. 2003;37(4):508-513
[43] Saaty TL. A scaling method forpriorities in hierarchical structures.Journal of Mathematical Psychology.1986;13:65-75
[44] Sugeno M. Theory of FuzzyIntegrals and its Application. 1972
[45] Marichal J-L. An axiomaticapproach of the discrete Choquetintegral as a tool to aggregate interactingcriteria. IEEE Transactions on FuzzySystems. 2000;8(6)
[46] Holliger C et al. Towards astandardization of biomethane potentialtests. Water Science and Technology.2016;74(11):2515-2522
[47] Angelidaki I et al. Defining thebiomethane potential (BMP) of solidorganic wastes and energy crops: A
proposed protocol for batch assays.Water Science and Technology. Mar.2009;59(5):927-934
[48] Bioprocess Control. AMPTS II—Methane potential analysis tool[Online]. Available from: https://www.bioprocesscontrol.com/products/ampts-ii/ [Accessed: 01-Jun-2019]
[49] Ritter. Biogas Batch FermentationSystem [Online]. Available from:https://www.ritter.de/en/products/biogas-batch-fermentation-system/[Accessed: 01-Jun-2019]
50
Emerging Trends in Mechatronics
51
Chapter 3
Mechatronics for the Design of Inspection Robotic SystemsPierluigi Rea and Erika Ottaviano
Abstract
Recent trends show how mobile robots are being widely used in security and inspection tasks. This chapter reports the requirements, characteristics, and development of mobile robotic systems for security and inspection tasks to dem-onstrate the feasibility of mechatronic solutions for inspection of sites of interest. The development of such systems can be exploited as a modular plug-in kit to be installed on a mobile system, with the aim to be used for inspection and monitoring, introducing high efficiency, quality, and repeatability in the addressed sector. The interoperability of sensors with wireless communication constitutes a smart sensor toolkit and a smart sensor network with powerful functions to be used efficiently for inspection purposes. A tele-operated robot will be taken as case of study; it is controlled by mobile phone and equipped with internal and external sensors, which are efficiently managed by the designed mechatronic control scheme.
Keywords: mechatronics, hybrid leg-wheel locomotion, inspection, interoperability, low-cost monitoring
1. Introduction
Robotics applied to inspection and home security is becoming a reality in recent years. Moreover, with the spread diffusion and popularity of robots in everyday life, their use is enormously increased in recent years [1–4]. Soft computing and artificial intelligence are successfully used for machinery control and robotic and engineering applications [5–7]. The integration of nonlinear system with com-munication technology has led smart and secure industry and home become reality. Therefore, robots may play an important role in such environments.
In addition, indoor inspection, surveillance, and home security are becoming critical issues at this time to organizing a smart and secure place to live and/or work [8, 9]. Advances in closed-circuit TV (CCTV) technology are turning video surveil-lance equipment into the most valuable loss prevention tool. Such technology can be considered as a safe and secure tool, which is nowadays available for either indus-trial, commercial or residential applications. The use of inspection and surveillance systems can alert users for threatening situations worsen, as well as for providing an important record of events, such as inspection of a production plants or build-ings, for verification of structural and/or electrical components. However, in most of the conventional systems for surveillance, only fixed cameras and fixed infrared cameras are used. Therefore, drawbacks are related to problems in viewing all video streams at the same time or tracking a moving object through a mobile device due to the object dynamics and limited network bandwidth. In order to overcome these

Emerging Trends in Mechatronics
52
limitations, an increasing number of systems have been developed for automatic inspection; they are equipped with sensors allowing the exploration of a building, as reported in [10].
Inspection and monitoring systems are apparently the only tools that are easy to use and manage; in fact, they hide drawbacks such as high purchase and mainte-nance costs as well as significant financial commitment related to data management and processing. In addition, interoperability and integration with other devices could be a problem; those factors may greatly influence the wide spreading of those systems. In order to enhance the use of these technologies, new solutions have been explored dealing with the concept of robotic and automatic survey using low-cost technology [11]. More specifically, the use of a robotic platform may drastically reduce the time and cost needed for a relief, if compared to a classical approach. Moreover, the use of a low-cost technology, both for the mechanical design of the mobile robot and the onboard sensors, allows the wide spreading of the robotic system and substitution in the case of damages or if the robot is lost. In addition, the developed technology may allow the interoperability of the system and integra-tion in the industrial environment by taking advantage of Industry 4.0.
2. Requirements and solutions for surveillance and inspection robotic systems within Industry 4.0
Surveillance and automatic inspection tasks require a careful analysis to identify basic requirements and appropriate solutions, as it is represented schematically in Figure 1. A first basic requirement is related to the mobility issue, which deals with the site to inspect, that is, buildings, industrial plants, or other indoor environment. Indoor and outdoor inspections often require different solutions, either ground or aerial ones. They have in common the need to have a relatively small sized mobile robot that can travel across a large variety of scenarios.
Mobile robots can be classified according to their type of locomotion. Walking systems are well suited for unstructured environment because they can ensure stability and adaptability to a wide range of situations, but they are mechanically
Figure 1. Flowchart of the main requirements and solutions for a mechatronic design of inspection robotic systems.
53
Mechatronics for the Design of Inspection Robotic SystemsDOI: http://dx.doi.org/10.5772/intechopen.88489
complex requiring high power and control efforts [12]. Wheeled locomotion instead is the most efficient solution on flat surfaces [13]. In fact, wheeled or tracked robots are the optimal solution for well-structured environment and quite regular terrain. In off-road, their mobility is often very limited and highly depends on the type of environment and the dimension of the obstacles. Hybrid mobile robots have been developed to combine advantages of legged- and wheeled-/tracked-locomotion types; therefore, lately they are preferred for a large variety of scenarios and applications. Very often the mechanisms used for the locomotion (legs, articulated wheels) should be synthetized ad hoc [14, 15]. A proper model of the mechanical system has to be developed for programming and communication issues [16, 17].
A classification of three types can be made referring to navigation modes, namely, pure teleoperation, safeguarded teleoperation, and autonomous naviga-tion, according to the task and overall budget. The choice depends on the applica-tion and the environment. The sensorization is strictly related to the navigation type and the level of sophistication of the inspection. It is possible to classify sensors as internal and external ones. The internal ones give the robot mobility control and navigation capabilities. They can be proximity sensors, encoders, GPS, accelerometers, gyroscopes, magnetic compasses, and tilt and shock sensors. External sensors are related to a specific task; for the inspection and surveillance application, the sensors considered can be cameras, thermal cameras, laser, light, temperature, gas, smoke, oxygen, humidity, sound, and ultrasound. Hardware and software reliability deals with the end user/application of the robot. In fact, this issue has to be set at very early stage of the design process since it is related to opera-tion, maintenance, failure prevention, and intervention.
Communication tools are essential for localization, navigation, or data transmis-sion [16, 17]. In addition to wired and wireless communication, a great challenge is the interoperability with any automatic and robotic system with other devices, such as home automation and security system in industrial plants according to Industry 4.0. This issue is specifically related to the application for surveillance, inspection, and maintenance for structures and infrastructures and in industrial environment, also related to sustainability [18, 19]. Recently, the term Industry 5.0 has been intro-duced in 2015; comparing with Industry 4.0, which is being considered as the latest
Figure 2. A scheme for the levels in Industry 4.0 organization and interoperability of robotic systems in industrial environment.
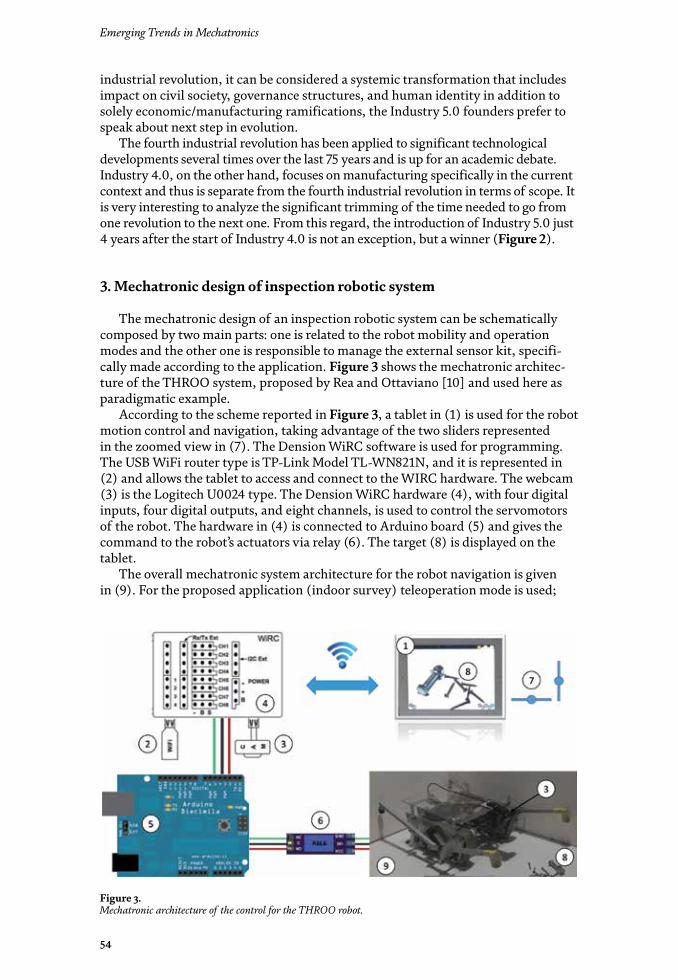
Emerging Trends in Mechatronics
54
industrial revolution, it can be considered a systemic transformation that includes impact on civil society, governance structures, and human identity in addition to solely economic/manufacturing ramifications, the Industry 5.0 founders prefer to speak about next step in evolution.
The fourth industrial revolution has been applied to significant technological developments several times over the last 75 years and is up for an academic debate. Industry 4.0, on the other hand, focuses on manufacturing specifically in the current context and thus is separate from the fourth industrial revolution in terms of scope. It is very interesting to analyze the significant trimming of the time needed to go from one revolution to the next one. From this regard, the introduction of Industry 5.0 just 4 years after the start of Industry 4.0 is not an exception, but a winner (Figure 2).
3. Mechatronic design of inspection robotic system
The mechatronic design of an inspection robotic system can be schematically composed by two main parts: one is related to the robot mobility and operation modes and the other one is responsible to manage the external sensor kit, specifi-cally made according to the application. Figure 3 shows the mechatronic architec-ture of the THROO system, proposed by Rea and Ottaviano [10] and used here as paradigmatic example.
According to the scheme reported in Figure 3, a tablet in (1) is used for the robot motion control and navigation, taking advantage of the two sliders represented in the zoomed view in (7). The Dension WiRC software is used for programming. The USB WiFi router type is TP-Link Model TL-WN821N, and it is represented in (2) and allows the tablet to access and connect to the WIRC hardware. The webcam (3) is the Logitech U0024 type. The Dension WiRC hardware (4), with four digital inputs, four digital outputs, and eight channels, is used to control the servomotors of the robot. The hardware in (4) is connected to Arduino board (5) and gives the command to the robot’s actuators via relay (6). The target (8) is displayed on the tablet.
The overall mechatronic system architecture for the robot navigation is given in (9). For the proposed application (indoor survey) teleoperation mode is used;
Figure 3. Mechatronic architecture of the control for the THROO robot.
55
Mechatronics for the Design of Inspection Robotic SystemsDOI: http://dx.doi.org/10.5772/intechopen.88489
therefore, when the robot in Figure 4 moves, the internal sensor suite is used to help the user to understand the environment and guide the robot to the path or a close target. In particular, in Figure 4, label (2) is for the electronic board equipped with accelerometer, gravity and gyroscope sensors, GPS sensor, magnetic field, and acceleration sensors. The front camera view for navigation is displayed as (3). External sensors are used for inspection and monitoring tasks. More specifically, in Figure 4, label (1) is used for the thermal infrared camera FLIR ThermaCAM S40, and the 3D scan is the Xbox Kinect shown in (4), provided with an infrared sensor and two additional micro cameras.
Examples and applications of industrial and nonindustrial applications are reported in [20, 21]. An overall layout for the system is given in Figure 5, in which the main components may be recognized, mainly the robot in (2) with external and internal sensors, operating (3) and monitoring (5) (6) systems, and the power
Figure 4. Sensor installation on the inspection robot.
Figure 5. Overview of the proposed mechatronic/robotic system.

Emerging Trends in Mechatronics
56
supply (6); label (1) represents the target. Figure 6 shows the control architecture to operate the robot and a representation of the interoperation with the equipment onboard.
The use of this kind of control system solution offers several advantages, which can be summarized as follows:
1. Low cost—Arduino boards are relatively low cost, if compared to other microcontroller platforms. They may enable diffusion and affordable cost of the overall system.
2. The Python software runs on Windows, Macintosh OS X, and Linux operating systems. Most microcontroller systems are limited to Windows.
3. Simple, clear programming environment—the programming environment is easy to use for beginners, yet flexible enough for advanced users to take advantage of as well.
4. Open-source and extensible software—the software is made available as open source tools, suitable for extension by experienced programmers. The language can be expanded through C++ libraries.
5. Open-source and extensible hardware—the plans for the modules are pub-lished under a Creative Commons license, so experienced circuit designers can make their own version of the module, extending it and improving it. Even relatively inexperienced users can build the breadboard version of the module in order to understand how it works and save money.
CANopen is a CAN-based communication system. It comprises higher-layer protocols and profile specifications. CANopen has been developed as a standardized embedded network with highly flexible configuration capabilities. It was designed originally for motion-oriented machine control systems, such as handling systems.
Figure 6. A scheme for the control architecture.
57
Mechatronics for the Design of Inspection Robotic SystemsDOI: http://dx.doi.org/10.5772/intechopen.88489
Today, it is used in various application fields, such as medical equipment, off-road vehicles, maritime electronics, railway applications, or building automation. In order to obtain this low-cost control system, the advantages of using Arduino with CANopen for data transmission have been combined. This was possible using a PiCAN 2 breadboard interface card that allows Raspberry to send commands via CANopen.
Table 1 summarizes the main features of the proposed system. The integration of sensors and its management has been a subject of research activity in different domains [3, 4, 22–24]. An industrial network laboratory prototype has been pro-posed by Leão et al. [25] in which several kits have been implemented.
4. Cases of study
The THROO system has been proposed here as a paradigmatic example of a mechatronic solution for the design. Applications reported here refer to indoor sur-veys. Figure 7 shows the robot operation during an indoor inspection. In particular, thermal detection of an electrical component is carried out. The interoperability of the sensors onboard with navigation sensorization is managed by the control board and the WiRC controller.
Parameter description Specification
Robot system
Hybrid mobile robot THROO Size (L × H × W) 300 (550) × 140 × 400 mm
Mass 4.5 kg no batteries
Max speed Up to 0.5 m/s
Actuation DC 24 V 12 Nm 24 W
DOFs 2 (track), 1 (legs)
Max step size 100 mm
Internal sensors Range Resolution Power
PSH accelerometer (Intel Inc.) 0–39.227 0.01 (0.024%) 0.006 mA
PSH gyroscope sensor (Intel Inc.)
0–34.907 0.002 (0.005%) 6.1 mA
PSH gravity sensor (Intel Inc.) 0–19.613 0.005 (0.024%) 0.006 mA
PSH magn. field sensor (Intel Inc.)
0–800 0.5 (0.062%) 0.1 mA
PSH lin. accel. sensor (Intel Inc.) 0–19.613 0.005 (0.024%) 0.006 mA
External sensors Model
Thermal camera (FLIR) ThermaCAM S40
Front camera (Logitech) U0024 type
3D scan (Xbox) Kinect
Communication
USB WiFi router TP-Link Model TL-WN821N
Control station
No. monitors 2
No. computers/CPU 2
Table 1. System specifications.

Emerging Trends in Mechatronics
58
Figure 8. Photo sequence of data acquisition during a survey.
Figure 8 shows an indoor survey in which an indoor wall element made of limestone rock is analyzed, as reported in [11]. All the acquired data is monitored on two screens as shown in Figure 8 and stored in a PC for further analysis and reconstruction.
Figure 7. Photo sequence of an experimental test of data acquisition.
59
Mechatronics for the Design of Inspection Robotic SystemsDOI: http://dx.doi.org/10.5772/intechopen.88489
5. Conclusion
In this chapter, we have proposed the main requirements and related items for a mechatronic design of an inspection and surveillance robotic system. The mecha-tronics and control scheme proposed here might constitute a solution for a broad range of scenarios spacing from home security and inspection of industrial sites, brownfields, historical sites, or sites dangerous or difficult to access by operators. As a paradigmatic example, a hybrid robot is presented here, and experimental tests are reported to show the engineering feasibility of the system and interoperability of the mobile hybrid robot equipped with sensors that allow real-time multiple acquisition and storage. The robot equipment is composed by external and internal sensors, for example, gyroscope, accelerometer, inclinometer, thermal camera, and 3D motion capture system.
Conflict of interest
The authors declare no conflict of interest.
Author details
Pierluigi Rea and Erika Ottaviano*Department of Civil and Mechanical Engineering, University of Cassino and Southern Lazio, Cassino, FR, Italy
*Address all correspondence to: [email protected]
© 2020 The Author(s). Licensee IntechOpen. Distributed under the terms of the Creative Commons Attribution - NonCommercial 4.0 License (https://creativecommons.org/licenses/by-nc/4.0/), which permits use, distribution and reproduction for non-commercial purposes, provided the original is properly cited.

60
Emerging Trends in Mechatronics
[1] Balaguer C, Montero R, Victores JG, Martínez S, Jardón A. Towards fully automated tunnel inspection: A survey and future trends. In: The 31st International Symposium on Automation and Robotics in Construction and Mining ISARC. Sydney, keynote lecture; 2014. pp. 19-33
[2] Castelli G, Ottaviano E, Rea P. A Cartesian cable-suspended robot for improving end-users’ mobility in an urban environment. Robotics and Computer-Integrated Manufacturing. 2014;30(3):335-343
[3] Rea P, Ottaviano E, Conte M, D’Aguanno A, De Carolis D. The design of a novel tilt seat for inversion therapy. International Journal of Imaging and Robotics. 2013;11(3):1-10
[4] Rea P, Ottaviano E, Castelli G. A procedure for the design of novel assisting devices for the sit-to-stand. Journal of Bionic Engineering. 2013;10(4):488-496. ISSN: 1672-6529
[5] Azizi A. Modern manufacturing. In: Applications of Artificial Intelligence Techniques in Industry. Springer Briefs in Applied Sciences and Technology. Singapore: Springer; 2019. pp. 7-17. DOI: 10.1007/978-981-13-2640-0_2
[6] Azizi A, Ghafoorpoor YP, Hashemipour M. Interactive design of storage unit utilizing virtual reality and ergonomic framework for production optimization in manufacturing industry. International Journal on Interactive Design and Manufacturing. 2019;13(1):373-381. Article in press. ISSN: 1955-2513 (Print) 1955-2505 (Online)
[7] Azizi A. Introducing a novel hybrid artificial intelligence algorithm to optimize network of industrial applications in modern
manufacturing. Complexity. 2017;2017:8728209
[8] Borja R, de la Pinta JR, Álvarez A, Maestre JM. Integration of service robots in the smart home by means of UPnP: A surveillance robot case study. Robotics and Autonomous Systems. 2013;61:153-160
[9] Tseng C-C, Lin C-L, Shih B-Y, Chen C-Y. SIP-enabled surveillance patrol robot. Robotics and Computer-Integrated Manufacturing. 2013;29:394-399
[10] Rea P, Ottaviano E. Design and development of an inspection robotic system for indoor applications. Robotics and Computer-Integrated Manufacturing. 2018;49:143-151
[11] Rea P, Pelliccio A, Ottaviano E, Saccucci M. The heritage management and preservation using the mechatronic survey. International Journal of Architectural Heritage. 2017;11(8):1121-1132
[12] Figliolini G, Rea P, Conte M. Mechanical design of a novel biped climbing and walking robot. In: ROMANSY 2010, 18th CISM-IFToMM Symposium on Robot Design, Dynamics, and Control. Udine, Italy; 2010. pp. 199-206
[13] Siegwart R, Nourbakhsh IR. Introduction to Autonomous Mobile Robots. Cambridge, Massachusetts: A Bradford Book, The MIT Press; 2004
[14] Borràs J, Thomas F, Ottaviano E, Ceccarelli M. A reconfigurable 5-DoF 5-SPU parallel platform. In: Jian S Dai, Matteo Zoppi, Xianwen Kong editors. Proc. of the ASME/IFToMM Int. Conf. on Reconfigurable Mechanisms and Robots. London, UK: Springer; 2009. Article no. 5173892. pp. 617-623
References
61
Mechatronics for the Design of Inspection Robotic SystemsDOI: http://dx.doi.org/10.5772/intechopen.88489
[15] Figliolini G, Rea P, Angeles J. The synthesis of the axodes of RCCC linkages. Journal of Mechanisms and Robotics. 2016;8(2):021011. DOI: 10.1115/1.4031950. ISSN: 19424302
[16] Azizi A, Yazdi PG. Mechanical structures: Mathematical modeling. In: Computer-Based Analysis of the Stochastic Stability of Mechanical Structures Driven by White and Colored Noise. Singapore: Springer; 2019. pp. 37-59
[17] Azizi A, Yazdi PG. Modeling and control of the effect of the noise on the mechanical structures. In: Computer-Based Analysis of the Stochastic Stability of Mechanical Structures Driven by White and Colored Noise. Singapore: Springer; 2019. pp. 75-93
[18] Ghafoorpoor PG, Yazdi P, Azizi A, Hashemipour M. A hybrid methodology for validation of optimization solutions effects on manufacturing sustainability with time study and simulation approach for SMEs. Sustainability. 2019;11(5):1454
[19] Yazdi PG, Azizi A, Hashemipour M. An empirical investigation of the relationship between overall equipment efficiency (OEE) and manufacturing sustainability in industry 4.0 with time study approach. Sustainability (Switzerland). 2018;10(9):3031
[20] Figliolini G, Rea P. Overall design of Ca.U.M.Ha. Robotic hand for harvesting horticulture products. Robotica. 2006;24(3):329-331
[21] Ottaviano E, Ceccarelli M, Castelli G. Experimental results of a 3-DOF parallel manipulator as an earthquake motion simulator. In: Proc. of the ASME Design Engineering Technical Conference; Salt Lake City: Cambridge University Press; Code 64323 2004. Vol. 2A, pp. 215-222. ISSN: 0263-5747. (in print)
[22] Figliolini G, Rea P. Ca.U.M.Ha. robotic hand (cassino-underactuated-multifinger-hand). In: IEEE/ASME International Conference on Advanced Intelligent Mechatronics; Zurich: AIM; 2007. Article number 4412562
[23] Thomas F, Ottaviano E, Ros L, Ceccarelli M. Performance analysis of a 3-2-1 pose estimation device. IEEE Transactions on Robotics. 2005;21(3):288-297
[24] Sorli M, Figliolini G, Pastorelli S, Rea P. Experimental identification and validation of a pneumatic positioning servo-system. Power Transmission and Motion Control, Bath, PTCM. 2005;2005:365-378
[25] Leão CP, Soares FO, Machado JM, Seabra E, Rodrigues H. Design and development of an industrial network laboratory. International Journal of Emerging Technologies in Learning (iJET). 2011;6(2):21-26

63
Chapter 4
Interaction of Mechatronic Modules in Distributed Technological InstallationsValery A. Kokovin
Abstract
The article deals with the interaction of mechatronic devices in real time through events and messages. The interaction of distributed network devices is necessary to coordinate their work, including synchronization when implementing a distributed algorithm. The approach in the development of a distributed control system (DCS) for mechatronic devices based on the IEC 61499 standard has been analyzed. Using only a LAN for interaction purposes is not always justified, since messages transmitted over a LAN do not provide transmission determinism. To eliminate this problem, a fast local network is needed, which would not utilize resources of the main computer and hardware (e.g., based on the model of terminal machines) to carry out a network communication. It is proposed to implement LAN controllers on the field-programmable gate array (FPGA) platform. Data-strobe coding (DS coding) with a signal level of LVDS was used for keeping the transmit-ted data intact and improving the overall reliability of the systems.
Keywords: real-time interaction, mechatronic devices, IEC 61499 standard, distributed control systems, field-programmable gate array, a distributed algorithm
1. Introduction
Technological process automation of large industrial or scientific complexes, where there is a large territorial and algorithmic distribution, is related to the development of network systems that provide interaction of individual technologi-cal installations. Usually, a telecommunications system acts as the abovementioned network system. In the general case, each installation executes its own part of a given algorithm, operating in an autonomous mode, after which it sends results to other installations. Algorithm execution can result in some informational data, materials, products, etc. A majority of industrial complexes work according to these technologies. Another case is when the result of a distributed technological system work is created by majority of technological subsystems together in real time and the technological processes are related.
The development of technology process management systems is related to building a model through input parameters and current process state parameter formalization. Real-time management of linked, territorial, and algorithmically distributed technology systems with parallel processes is pretty challenging. Additional difficulties appear when linked mechatronic devices that form mecha-tronic systems are used as an executive object.

Emerging Trends in Mechatronics
64
Mechatronic components (MCs) can be defined as devices that combine precise mechanical units with electronic computing and management components, inter-face, and power modules. Such combination allows implementing new features that extend existing functions of the device. At the same time, all mechatronic units work on general task defined for all units. Over the past decades, the MC definition has significantly expanded, and mechatronics became an interdisciplinary industry that can include such disciplines as telecom, robotics, power electronics, etc.
MCs are most commonly used in industries where there are requirements like executing mechanisms’ precise positioning, computers’ fast response on internal and external events, increased reliability, and limited dimensions.
Very often electronic control components of MC are called embedded control system, which assumes completeness and self-sufficiency of these systems and uses software for running it. Modern MUs that are used in distributed systems have high-performance computers that work within OS environment with support of all common network protocols.
At this moment, MUs and MCs are commonly used as distributed process system (DPS) automation object. All major requirements to MCs as DPS objects are described in article [1]. MCs must have:
• Signal (event) and data interface for interacting with other MDs
• Managed process parameters I/O interface
• Dataset for keeping managed object state
• Manage algorithm for this object.
The chapter is organized as follows. Section 2 provides an analysis of work related to the design of distributed control systems (DCSs) based on the standards IEC 61131-3 [2] and IEC 61499 [3]. Section 3 discusses hardware and software solu-tions for the implementation of the interaction of mechatronic components. Finally, the conclusion is given in Section 4.
2. Interaction of mechatronic modules in distributed technological systems based on IEC 61131-3 and IEC 61499 standards
2.1 Centralized mechatronic objects control based on standard IEC 61131-3
The IEC 61131-3 [2] standard plays a big role in the automation of technologi-cal systems that contain mechatronic blocks. The establishment of this standard allowed unifying development languages of managing applications for program-mable logic controller (PLC), which allowed to port developed projects to PLCs manufactured by various vendors. One of graphical languages described by the standard is function block diagram (FBD) language. This language uses the FB concept, which represents part of the program managing code and has an input and output interfaces. The FB interface has special entry calls—event inputs. FBs are combined into chains using interfaces. One of the disadvantages of the FBD language is that a random FB cannot be invoked from a chain.
The PLC software development technology based on the IEC 61131-3 standard is designed for centralized management, which means that direct interaction of separate PLCs is carried through the central computer. This disadvantage makes it significantly more difficult to develop applications for DCSs. When a new PLC is
65
Interaction of Mechatronic Modules in Distributed Technological InstallationsDOI: http://dx.doi.org/10.5772/intechopen.88059
added to the management system or there is a change of PLC interaction algorithm, the central computer program must be changed. Therefore, configuration and scaling of such systems requires sophisticated procedures and takes significant amount of time. Besides that, there is no way to interact directly with distributed technological systems, MCs.
New developments in microelectronics and circuitry allow eliminating some of dis-advantages. Thus using a system on a chip (SoC) technology, Altera (Intel) company offered to realize PLC on a crystal, by connecting high-performance dual-core ARM processor and field-programmable gate array (FPGA). This allowed processing of input events in parallel and configuring managing application algorithm remotely [4].
2.2 Distributed control systems on standard IEC 61499
In 2005, a new standard IEC 61499 [4] has been established, which defines a new way of building distributed technological process management systems. The IEC 61499 architecture is based on IEC 61131-3 definitions and uses FBs with extended interface abilities. One of the main FB extensions is an event interface, which allows defining FB execution order explicitly. Each FB can contain several encapsulated algorithms that cannot be accessed from other FBs.
A management system, based on IEC 61499, represents a set of devices that interact with each other using communication network. The management system implements functions described with applications. These applications can be distributed between several devices that can be represented by PLCs, program-mable automation controllers (PACs) [5], and digital computers based on FPGA [6] platform. Each device consists of one or several resources. Resource is a functional unit that can manage its operations independently, including algorithm execution. An application is represented by several linked FBs that can be executed on differ-ent resources and management system devices.
IEC 614999 FB is an independent program unit that can be created, tested, and used separately from other FBs [3, 7]. The IEC 61499 standard defines three types of blocks: basic function block, service interface function block (mechatronic devices interact using these blocks), and composite function block (contains chain of FBs). Figure 1 shows the IEC 61499 application model that consists of three FBs combined into one network that is used for events and data flows. FBs can be in cer-tain states, set by function algorithm of the FB. Transfer from one state to another can be triggered by an event, received from a neighbor FB.
The main advantage of designing management systems based on the IEC 61499 standard is simplicity of reconfiguration, flexibility, and reduced development time, reusing developed components and scalability. Article [8] analyzes features of this method of developing distributed technological systems, its advantages and
Figure 1. IEC 61499 application model.

Emerging Trends in Mechatronics
66
disadvantages. For keeping backward compatibility while moving from developing managing applications based on PLC IEC 61131-3 to applications based on IEC 61499, there is a methodology based on web technologies [9]. The main goal set in that article is to keep the identity of application behavior when launched on the IEC 61499 platform.
The DPS stability is defined by distinctness of executing applications. The IEC 61499 standard defines FB as an abstract model, which allows various FB behavior interpreta-tions. Article [10] analyzes FB execution models. The standards sections related to the base FB semantics describe a situation, when only one FB can be active at any period of time within one network. This limitation allows to develop execution models in two directions: serial and cyclic (by analogy with PLC cyclic processing) models.
However, the evolution of multiprocessor and multicore computers allows run-ning a parallel model. Article [11] contains suggestions about running such models. Besides, a parallel-type model can be implemented on FPGAs with the ability to use real parallelism, which is very important for mechatronic systems that are critical to the response time to incoming events.
Article [12] defines the Intelligent Mechatronic Component (IMC) and describes the conditions of using such components in DPS based on IEC 61499. Any IMC can contain the following elements:
• Be a mechatronic device, thus to represent a physical functional device with sensors, actuators, and electronic circuits
• An integrated control device, which is a computing device that includes interfaces to sensors, actuators, and communication networks, for interaction with other IMCs
• Software with data support and control logic for implementing automation functions of IEC 61499 standard
Most of the works related to the development of automation projects based on IEC 61499 are of research in nature. Despite the obvious advantages of the standard (described earlier) in the design of distributed control systems, widespread imple-mentation in the industry has not yet happened. Article [13] describes problems of the standard that prevent it from being fully used: semantic problems, the lack of well-developed design methodologies, restrictions on the use of various execution models, and others. There is also a lack of integrated design methodologies that facili-tate component-based design throughout the design cycle of automation systems [12].
The standard is being developed, and its individual provisions are being clarified. For practical use, the IEC 61499 compliance profile [14] is issued and constantly updated. There are commercial development tools for creating projects that meet the IEC 61499 standard. The most well-known project is ISaGRAF [15], in the form of a design support tool (workbench), which works with both the IEC 61131-3 and IEC 61499 standards. The nxtSTUDIO commercial system project [16] focuses exclusively on IEC 61499 and allows combining a distributed control system with HMI/SCADA. In addition, nxtSTUDIO makes it possible to automate the process of building communi-cation channels between controllers of mechatronic devices of a distributed system.
3. Hardware and software solutions for organizing interaction of mechatronic components using local networks
The development of microelectronics and information technology allows creating miniature computers with low power consumption and high performance,
67
Interaction of Mechatronic Modules in Distributed Technological InstallationsDOI: http://dx.doi.org/10.5772/intechopen.88059
which can be embedded not only in technological systems but also in individual ele-ments of these systems, including mechatronic devices. This feature, as mentioned above, makes it possible to create intelligent subsystems combined by a global or local communication network.
The concept of the Internet of Things (IoT) [17], successfully introduced into production, gave an impetus to the development of a new direction that unites robots or robotic devices using network technologies. This direction, called the Internet of Robotic Things (IoRT), is aimed at implementing robotic technologies, by extend-ing the functionality of IoT devices. In [18], the IoRT concept is presented, which emphasizes the tremendous flexibility in developing and implementing new applica-tions for networked robotics while achieving the goal of providing distributed com-puting resources as the main utility. In these network associations (IoT and IoRT), the term “Internet” can be interpreted as a global association of computer networks that use TCP/IP protocols when interacting with each other. In addition, the partici-pants of network associations use a huge variety of interfaces and protocols when receiving information from sensors and transmitting control signals to actuators.
By analogy with the network associations of functional devices given above, we can speak about the Internet of Mechatronic Components, a subset of which is IoRT. On the other hand, in distributed technological systems among the partici-pants, there can be not only MCs but also, for example, self-sufficient electrical devices with integrated intelligence, that is, devices that do not include mechanics. Self-sufficiency means the ability of devices to solve independently a part of a distributed technological problem delegated to them, but which need to exchange information with other participants through the formation of events or messages. Conditionally, such devices can be called functional network connectivity (FNC).
3.1 FNC-embedded computer
Article [19] presents a methodology for creating a prototype intelligent power electronic converter (iPEC) with the ability to remotely control and interact with other DPS devices. In the developed iPEC prototype, the power module implements the function of a powerful generator of infra-low-frequency voltage. This generator can be used to power equipment (piezoelectric elements) for ultrasonic cleaning of parts or for solving geophysical tasks (cleaning of wells). An example of iPEC-type device use can be found in article [20]. This article presents solution of the technological problem of the formation of a uniform effect of ultrasonic vibrations in a liquid medium on the processed. To solve the problem, it is proposed to use a whole matrix of distributed ultrasound transducers placed in a certain way. Control signals arriving at the transducers are formed in such a way that areas with low and high pressure of the ultrasonic field arise, which causes the occurrence of direc-tional flows and contributes to the cleaning of products. Drivers of control signals are subject to stringent requirements for response time.
The given example shows the need to create a universal built-in control module, both as part of MCs and as part of other DPS participants, that could provide execu-tion of the following main tasks:
• Global network communication task
• Local network communication task
• Management task for the implementation of the built-in algorithm
• Sensor data processing task

Emerging Trends in Mechatronics
68
In a distributed technological system, participants called as FNCs can be used as independent technological subsystems, or they can be clustered, by analogy with the composite function block (IEC 61499). On this basis, the interaction of individual FNCs can be carried out over several communication networks—global and local. The global network is available to all exchange participants, and the local network is available only to cluster devices. When interacting over a local network, an additional requirement is added—the determinism of the transmitted events and messages.
The interaction of DPS devices is necessary to coordinate their work, including synchronization when implementing a distributed algorithm. Article [19] justifies the use of the hybrid configuration of the computational control part of FNC-type devices. A device can contain several different computators, based on various cal-culation models. These can be computators implemented on processors with ARM architecture [21] and on the FPGA platform. Sharing two different computers gives the most flexible functionality.
Important benefits of using ARM controllers in FNC are high performance and low power consumption. This makes it possible to build a universal-embedded computer for both stationary technological systems and mobile ones. For example, in computers based on the Smart Mobility ARChitecture (SMARC) standard [22], ARM controllers are widely used.
ARM controllers used in the FNC solve the following tasks: communication over a global network, downloading computer configurations, implementing an embedded algorithm, implementing cloud technologies, video processing of objects for machine vision, etc. Global network controllers must support TCP/IP protocols, which are typically present in modern embedded computers. The exchange between mobile autonomous objects, for example, automatic guided vehicle (AGV) [23], requires a wireless network controller as part of the network module.
The ideology of random access to the network is not suitable for solving the problem of interaction between FNC-cluster devices, since it is impossible to ensure the determinism of message delivery. Therefore, a fast local network is needed, which would not utilize resources of the microcontroller and hardware (e.g., based on the model of finite automata) to carry out a network exchange. Also, it is necessary to use a special encoding at the signal level when transmit-ting events and messages, for keeping the transmitted data intact and improving the overall reliability of the systems. Controllers of such a network are usually implemented on the FPGA platform. When creating equipment based on FPGA for technological installations of the accelerator complex [24], the implementa-tion of the exchange based on data-strobe coding (DS coding) network signals with the signal level LVDS [25] showed a good result. LVDS levels have high noise immunity and energy efficiency. DS coding allows you to transfer data at high speeds without first agreeing the speeds between the calculators of the two devices. At a speed of 100 Mb/s, the length of the communication line can be within 30 m. DS coding has been successfully applied in the aerospace industry within the framework of the SpaceWire standard, where increased requirements are applied to the reliability of transmitted data [26]. Another option for orga-nizing a local network can be using the MIL-1553 interface. Article [27] describes a network for transmitting events and messages for technological subsystems of the accelerator complex.
Figure 2 shows an example of the simplified structure of the FNC computer, which includes support for communication over local and global networks. The computer contains:
69
Interaction of Mechatronic Modules in Distributed Technological InstallationsDOI: http://dx.doi.org/10.5772/intechopen.88059
• ARM controller for wired and wireless networking with other members of the global network
• LAN controller on the FPGA platform
• FPGA signal level converters to LVDS levels (DS links).
FPGA FNC-embedded computer receives events (EV1.EVn) that must be trans-ferred to other FNCs of the cluster. Figure 2 does not show network support for the lower level of the sensors. Thus, we can conclude that, for full-fledged work as part of a distributed technological system, each FNC should have at least three levels of network support.
3.2 Communication network configuration
The choice of the type and number of communication networks in DPS is determined by many factors: the technological problem to be solved, the network configuration chosen, geographical distribution of the interacting subsystems, and so on. Article [28] justifies a circular network configuration consisting of series-connected MCs. Serial network is formed using a single duplex DS link. Messages are transmitted sequentially from one MC to another using a DS interface and can have a broadcast status or contain the address of a particular MC. To control the
Figure 2. FNC-embedded computer.

Emerging Trends in Mechatronics
70
passage of messages, the last MC is connected to the first. The advantages of a ring serial network are as follows:
• DS link of each MC is a network repeater and amplifier that allows you to maintain a high speed with a large number of mechatronic devices.
• It is possible to control the transmitted message for accuracy and transmission time upon return after passing through the entire network.
• Message transmission time is strictly determined.
Figure 3 shows the structure of a distributed technological system with two communication networks—global and local. Each FNC device may be a specific functional technological unit. It can be a mechatronic module, individual compo-nents of a robotic system, or a power converter. The devices FNC2, FNC2.1, FNC2.2, and FNC2.3 and FNC4, FNC4.1, and FNC4.2 are clustered.
Each FNC device has access to the global network to perform tasks that require access to common databases: reconfiguration, transfer of measured process param-eters or video data, and so on. Only FNC1, FNC2, FNC3, and FNC4 exchange event control via the global network. Devices within clusters transmit messages sequen-tially within the cluster.
4. Conclusion
Intellectualization of mechatronic devices allows expanding the functionality of technological systems. The intelligence of the MCs is provided by the increased com-putational performance of the controllers, the additional real-time video processing capability, and high sensory sensitivity. Many algorithmic problems that were previ-ously solved with the involvement of a centralized computer can now be solved at the level of the mechatronic component itself. The increased intelligence of the MCs adds increased requirements for organizing the design of distributed control sys-tems, complicating the solution of the problem of interaction of distributed techno-logical subsystems. A rather long implementation of the IEC 61499 standard showed
Figure 3. FNC networks.
71
Interaction of Mechatronic Modules in Distributed Technological InstallationsDOI: http://dx.doi.org/10.5772/intechopen.88059
Author details
Valery A. KokovinState University “Dubna” Branch “Protvino”, Moscow region, Russia
*Address all correspondence to: [email protected]
the complexity of the problem to be solved. The development of mechatronic components as network devices goes toward the unification of embedded computers on the proposed computing and communication services. Standards for the design of distributed control systems are being implemented, which determine the ideology of the interaction of a distributed algorithm of a technological problem.
© 2020 The Author(s). Licensee IntechOpen. Distributed under the terms of the Creative Commons Attribution - NonCommercial 4.0 License (https://creativecommons.org/licenses/by-nc/4.0/), which permits use, distribution and reproduction for non-commercial purposes, provided the original is properly cited.

72
Emerging Trends in Mechatronics
References
[1] Panjaitan S, Frey G. Functional control objects in distributed automation systems. IFAC Proceedings Volumes. 2007;40(3):259-264
[2] International Standard IEC 61131-3 (edition 2.0): Programmable Controllers/International Electrotechnical Commission; Geneva; 2003. p. 230
[3] International Standard IEC 61499. Function blocks for industrial-process measurement and control systems. Part 1: Architecture/International Electrotechnical Commission; Geneva; 2005. p. 245
[4] Integrating PLC Systems on a Single FPGA or SoC. Available from: https://www.intel.com/content/dam/www/programmable/us/en/pdfs/literature/po/ss-plc-on-a-single-chip.pdf [Accessed: 28 May 2019]
[5] Programmable Automation Controller. Available from: http://www.cannonautomata-products.com/programmable-automation-controller.html [Accessed: 28 May 2019]
[6] O’Sullivan D, Heffernan D. VHDL architecture for IEC 61499 function blocks. IET Computers and Digital Techniques. 2010;4(6):515-524
[7] Dubinin V, Vyatkin V. On definition of a formal model for IEC 61499 function blocks. EURASIP Journal Embedded Systems. 2008;2008:1-10
[8] Vyatkin V. IEC 61499 as enabler of distributed and intelligent automation: State of the art review. IEEE Transactions on Industrial Informatics. 2011;7(4):768-781
[9] Dai W, Dubinin VN, Vyatkin V. Migration from PLC to IEC 61499 using semantic web technologies. IEEE Transactions on Systems, Man, and Cybernetics. 2013;44(3):277-291
[10] Vyatkin V. The IEC 61499 standard and its semantics. IEEE Industrial Electronics Magazine. 2009;3:40-48
[11] Vyatkin V, Dubinin V, Ferrarini LM, Veber C. Alternatives for execution semantics of IEC61499. In: 5th IEEE Conference on Industrial Informatics; Vienna; 2007. pp. 1151-1156
[12] Pang C, Vyatkin V. IEC 61499 function block implementation of intelligent mechatronic component. In: 8th IEEE Conference on Industrial Informatics (INDIN 2010); 2010. pp. 1124-1129
[13] Thramboulidis K. IEC 61499 in factory automation. Advances in Computer, Information, and Systems Sciences, and Engineering. 2006: 115-124. Available from: https://doi.org/10.1007/1-4020-5261-8
[14] IEC 61499 Compliance Profile for Feasibility Demonstrations. Available from: https://www.holobloc.com/doc/ita/index.htm [Accessed: 28 May 2019]
[15] ISaGRAF Technology. Available from: https://www.rockwellautomation.com/global/detail.page?pagetitle=Isagraf&content_type=tech_data&docid=209076c017d6dd586c895e9e3a4856e4&redirect_type=tld&redirect_url=www.isagraf.com [Accessed: 28 May 2019]
[16] nxtSTUDIO. Available from: https://www.nxtcontrol.com/en/engineering/ [Accessed: 28 May 2019]
[17] Javed B, Iqbal MW, Abbas H. Internet of things (IoT) design considerations for developers and manufacturers. ICC2017
[18] Ray PP. Internet of robotic things: Concept technologies and challenges. IEEE Access. 2017;4:9489-9500
73
Interaction of Mechatronic Modules in Distributed Technological InstallationsDOI: http://dx.doi.org/10.5772/intechopen.88059
[19] Kokovin V, Diagilev V, Halik J, Uvaysova S. Intelligent power electronic converter for wired and wireless distributed applications. In: Proceedings of the IEEE International Conference SED-2019; 23-24 April 2019; Prague: IEEE; 2019. (in the press)
[20] Dostanko AP, Avakov SM, Ageev OA. Tekhnologicheskie Kompleksy Integrirovannykh Protsessov Proizvodstva Izdeliy Elektroniki [Technological Systems Integrated Production Processes of Electronics Products]. Belorusskaya nauka: Minsk; 2016. pp. 5-25
[21] Available from: https://www.arm.com/ [Accessed: 28 May 2019]
[22] Smart Mobility ARChitecture Hardware Specification. Available from: https://sget.org/standards/smarc/ [Accessed: 28 May 2019]
[23] Available from: http://www.roboticautomation.com.au/agvs [Accessed: 28 May 2019]
[24] Kalinin AY, Kokovin VA, Kryshkin VI, Skvortsov VV. An absolute intensity beam monitor. Instruments and Experimental Techniques. 2016;59(4):536-358
[25] ANSI/TIA/EIA-644-1995. Electrical characteristics of low voltage differential signaling (LVDS) interface circuits; 1995
[26] SpaceWire Standard. ECSS—Space Engineering. “SpaceWire—Links, nodes, routers and networks.” ECSS-E-ST-50-12C; Rev1 Draft D; November 2014
[27] Komarov V, Antonichev G, Kim L, Kokovin V, et al. Modernization of U-70 general timing system. In: Proceedings of ICALEPCS-2005; Geneva, Switzerland; 10-14 October 2005
[28] Kokovin VA, Evsikov AA. Event-related interaction of mechatronic
modules in distributed technological installations. Mechanical Engineering Research and Education. 2018;5:12

75
Chapter 5
Impact Analysis of MR-Laminated Composite StructuresAbolghassem Zabihollah, Jalil Naji and Shahin Zareie
Abstract
Laminated composite structures are being used in many applications, includ-ing aerospace, automobiles, and civil engineering applications, due to their high stiffness to weight ratio. However, composite structures suffer from low ductility and sufficient flexibility to resist against dynamic, particularly impact loadings. Recently, a new generation of laminated composite structures has been developed in which some layers have been filled fully or partially with magnetorheological (MR) fluids; hereafter we call them MR-laminated structures. The present article investi-gates the effects of MR fluid layers on vibration characteristics and specifically on impact loadings of the laminated composite beams. Experimental works have been conducted to study the dynamic performance of the MR-laminated beams.
Keywords: laminated composite, MR fluid, vibration, impact
1. Introduction
Laminated composite materials, due to their unique characteristics such as high strength-to-weight ratio, high corrosion and impact resistance, and excellent fatigue strength, are being widely used in aerospace, automobiles, and recently civil engineering applications [1–7]. However, composite structures are highly vulnerable for failure under dynamic loading and, most importantly, impact loads. In the past few years, elements of smart and functional materials have been added to the conventional composite structures to develop a new generation of the lami-nated composite structures [8]. Researchers have proposed and test many types of smart materials, including piezoelectric, shape memory alloys, fiber optics, and electrorheological (ER) and magnetorheological (MR) fluids, to add the required features, such as controllability, and improve the performance for specific applica-tions [9–14]. These structures have the capability to adapt their response to external stimuli such as load or environmental changes. These new structures have opened new challenges in research communities. The use of MR fluids in composite struc-tures is relatively new as embedding fluids inside a rigid, laminated structure may raise many challenges in fabrication. Figure 1 shows a typical MR-laminated beam in which some layers are partially replaced by segments of MR fluid. Yalcintas and Dai [15] investigated the dynamic vibration response of three-layered MR and ER adaptive beams both theoretically and experimentally.
Sapiński et al. [16, 17] explored vibration control capabilities of a three-layered cantilever beam with MR fluid and developed FEM model to describe the phe-nomena in MR fluid layer during transverse vibration of the beam. Sapiński et al. [18] proposed a finite element (FE) model by using ANSYS for sandwich beam

Emerging Trends in Mechatronics
76
incorporating MR fluid. Rajamohan et al. [19] investigated the properties of a three-layer MR beam. The governing equations of MR adaptive beam were formulated in the finite element form and also by Ritz method. Ramamoorthy et al. [20] investi-gated vibration responses of a partially treated laminated composite plate integrated with MR fluid segment. The governing differential equations of motion for partially treated laminated plate with MR are presented in finite element formulation. Payganeh et al. [21] theoretically investigated free vibrational behavior of a sandwich panel with composite sheets and MR layer. They studied effects of length and width of sheet and also core thickness on frequency. Aguib et al. [22] experimentally and numerically studied the vibrational response of a MR elastomer sandwich beam sub-jected to harmonic excitation. They studied the effect of the intensity of the current flowing through a magnet coil on several dynamic factors. Naji et al. [23] employed generalized layerwise theory to overcome this challenge and passed behind constant shear deformation assumption in MR layer that is mainly used for vibration analysis of MR beam. Based on layerwise theory, FEM formulation was developed for simula-tion of MR beam, and results were verified by experimental test. Naji et al. [24, 25] presented a distinctive and innovative formulation for shear modulus of MR fluid. Most recently, Momeni et al. [26, 27] developed a finite element model to investigate the vibration response of MR-laminated beams with multiple MR layers through the thickness of the laminated beam with uniform and tapered cross sections.
The present work intends to study the vibration response of MR-laminated beam with emphasis on impact loadings. The mathematical modeling of MR-laminated beam is similar to the work done by present authors in previous publications [23, 24, 26, 27]. However, here, the modeling has been used mainly to study the effects of impact loading, although for more clarification, basic results for natural vibration have also been provided. Some experimental works have been conducted to illus-trate the performance of the MR-laminated beam under practical impact loadings.
2. Review the modeling laminated composite beams with layerwise displacement theory
In brief, laminated composite plates are composed of individual layers, which have been stacked together, usually by hand-layup techniques. Individual layers are composed of fibers, which have been derationed according to property require-ment, and matrix, which serves as binder of fibers and transfers the loads to the fibers. Changing the orientation of the fibers optimizes the composite material for strength, stiffness, fatigue, heat, and moisture resistance. Modeling laminated com-posite structures for conventional applications mainly is conducted by considering the stacked layers as one single layer. The equivalent single-layer (ESL) theories assume continuous displacement through the thickness of the laminate. In general, the stiffness of the adjacent layers in the laminates is not equal; thus, it results in discontinuity in transverse stress through the thickness, which is contrary to the equilibrium of the interlaminar stresses as stated by ESL. In general, ESL theories
Figure 1. MR-laminated beam.
77
Impact Analysis of MR-Laminated Composite StructuresDOI: http://dx.doi.org/10.5772/intechopen.86466
provide acceptable results for relatively thin laminate. For thick laminate and laminate with material and/or geometric inhomogeneities, such as MR-laminated beams, the ESL theories lead to erroneous results for all stresses.
In smart-laminated structures, due to the material and geometric inhomogene-ities through thickness, including MR-laminated beams, it is required to acquire an accurate evaluation of strain–stress at the ply level. Interlaminar stresses can lead to delamination and failure of the laminate at loads that are much lower than the failure strength predicted by the ESL theories.
The accurate modeling of interlaminar stress field in composite laminates requires the displacement field to be piecewise continuous through the thickness direction. Researchers in composite communities have proposed and developed a variety of displacement models to provide sufficient accuracy for interlaminar stresses in composite structures. Layerwise displacement theory developed by Reddy [28] developed a layerwise theory based on the piecewise displacement through the laminate thickness.
The layerwise formulation has the capability to address local through-the-thickness effect, such as the evolution of complicated stress–strain fields in MR-laminated composite structures and interfacial phenomena between the differ-ent embedded layers. In this work, the layerwise displacement theory has been used for modeling MR-laminated beam.
The displacement field for a laminated beam based on the layerwise theory is obtained by considering the axial and through-the-thickness displacements as
u (x, z, t) = ∑ I=1
N
U I (x, t) Φ I (z) , w (x, z, t) = ∑ I=1
N
W I (x, t) Φ I (z) Φ I (z) = [1 − ζ ζ] (1)
where u and w are displacements along x- and z-directions, respectively. N denotes the total number of nodes through the thickness. The ratio ζ is defined as ζ = z/h, in which h represents the thickness of each discrete layer. Interpolation functions Φ (z) are defined between any two adjacent layers. For thin laminate, displacements in z-direction between layers are negligible, so w(x,z,t) = Wo(x,t).
2.1 Finite element formulation
For many applications, closed-form solution for MR-laminated beams is either not available or very complex. Therefore, most of the computations are based on finite element models. Finite element formulation has been obtained by incorporating the local in-plane approximations for the state variables introduced in Eq. (1) as follows:
U I = ∑ i=1
Nn
U I i (x) ϕ i (x) (2)
where Nn is the number of nodes and ϕ i (x) are the interpolation functions along the length of the beam, respectively. For details on finite element modeling of composite structures based on layerwise theory, one may refer to the work done by the present author in Ref. [8].
3. Fundamentals of magnetorheological (MR) fluids
Magnetorheological (MR) fluid is a class of new intelligent materials, which rheological characteristics such as the viscosity, elasticity and plasticity change rapidly (in order of milliseconds) subject to the applied magnetic field as shown in Figure 2. By applying a magnetic field, the particles create columnar structures

Emerging Trends in Mechatronics
78
parallel to the applied field and these chain-like structures restrict the flow of the fluid, requiring minimum shear stress for the flow to be initiated. Upon removing the magnetic field, the fluid returns to its original status, very fast.
Overall, MRF is composed of a carrier fluid, such as silicone oil, and iron particles, which are dispersed in the fluid [29, 30]. Each of the components plays a significant role in the characteristic of MRF.
3.1 Ferromagnetic particles
There are two types of ferromagnetic materials, used in MRFs: the soft material and the hard material [31]. The applied magnetic field intensity (H) and the mag-netization of the material (B) are two parameters that show the difference between the two kinds of materials.
Figure 3 shows the H-B hysteresis loops of the soft and hard materials. It is noted that the soft ferromagnetic material has lower remanence and coercivity [32].
The shape of the magneto-soft particles is spherical with a diameter ranging between 1 and 10 μm . One of the most widely used soft materials is carbonyl iron, and that can take up to 50% of the volume of MRF [32]. In order to improve the MRF’s dynamic behavior, iron-cobalt and iron-nickel alloys can be used instead of conventional carbonyl iron particles. However, they are more expensive [32].
The hard magnetic material can be made of chromium dioxide (CrO2), which shows high coercivity and remanence. The size of dispersed CrO2 is between 0.1 and 10 𝜇𝜇m , and it can be easily oriented under the influence of magnetic fields [32].
Figure 3. The comparison between the soft and hard ferromagnetic materials [33].
Figure 2. Structure of MR fluids (a) without magnetic field, (b) with magnetic field, and (c) with magnetic field and shear force.
79
Impact Analysis of MR-Laminated Composite StructuresDOI: http://dx.doi.org/10.5772/intechopen.86466
It mixes with the soft magnetic material to enhance the rheological behavior and provide more stability to the MRF [32].
3.2 Carrier liquids
The second component of MRF is a carrier liquid providing the continuous medium for the ferromagnetic particles [32]. Although all types of fluids are suitable for this purpose, Ashour et al. [13] recommended a fluid with a viscosity ranging between 0.01 and 1 N/m2 [32]. Silicon oil and synthetic oil are samples of suitable carrier fluids [32]. Table 1 provides the samples of carrier fluids with their specifications. As noted in Table 1, water is the suitable fluid, which can carry iron particles up to 41% of volume. Hydrocarbon oil and silicone can have the suspended particles between 22 and 36% of the volume.
3.3 Stabilizers
The third element of the MRF is a stabilizer, which are “polymers (surfactants) in nonpolar media.” The main roles of the materials as stabilizer are to retain the iron alloy particles suspended in the MRF, extend the service life of the smart fluid, and increase its reliability [32, 35]. There are three types of stabilizers—the agglom-erative, the sedimental, and the thermal [32]—as briefly described below:
1.An agglomerative stabilizer is used to prevent the formation of aggregates between the iron particles. Agglomeration usually occurs due to the van der Waals’ interactions between the iron particles in the MRF, causing the ferromagnetic particles to stick together. In MRF applications, surfactants should be selected in accordance with the type and concentration of particles. In fine-dispersed con-centrations, when the iron particles fill up to 50% of the volume, ionic or nonionic surfactants are recommended. In lower concentrations of iron particles, which only occupy up to 10% of the volume, gel-like stabilizers are also suggested [32].
2.A sedimental stabilizer is employed to prohibit the iron particles from settling down as a result of gravity which decreases the effectiveness of MRFs [32]. The gel-forming and nonionic surfactants, as the sedimental stabilizer, are used to be added to the fluid carrier [35].
3.A thermal stabilizer is utilized to stabilize MRF over a wide temperature range particularly for the long-term applications at high temperature.
Since then, MR fluids have been utilized in various applications, including dampers, brakes and clutches, polishing devices, hydraulic valves, seals, and flex-ible fixtures. Recently, the application of MR fluids in vibration control has been
Commercial MRF Percent iron by volume Carrier fluid Density (g/cm3)
MRF-122-2ES 22 Hydrocarbon oil 2.38
MRF-132 AD 32 Hydrocarbon oil 3.09
MRF-336AG 36 Silicone oil 3.45
MRF-241ES 41 Water 3.86
Table 1. Properties of commercial MRFs [34].

Emerging Trends in Mechatronics
80
attracted by many researchers. However, due to the nature of MR fluids, it is very difficult to integrate them with thin-laminated composite structures.
4. Governing equation of MR-laminated beams
Using the displacement field given in Eq. (1) and following a finite element procedure for each element, the governing equation of motion of MR-laminated beam in the matrix form is defined as
[ m e ] { d ¨ } i + [ k e (B, f) ] {d} i = { f e } (3)
where [me] and [ke] are the element mass and stiffness matrices, respectively, and {f e} is the element force vector. One may note that when using layerwise displacement theory, depending on the number of layers in the laminate, each node may have many degrees of freedom.
Considering axial displacement given in Eq. (2), the generalized equation of motion of the MR-laminated beam can be obtained by assembling the mass, stiff-ness matrices, and the force vector as
[M] { d ¨ } + [K (B, f) ] {d} = {F} (4)
where [M] and [K] are the MR-laminated beam mass and stiffness matrices, respectively, {F} is the force vector, and [d] is the displacement vector.
It should be noted that the stiffness matrix is a complex value since it is the sum-mation of the stiffness matrix of the laminated layer [Kc] and the stiffness matrix of the MR fluid [KMR(B, f)]:
[K (B, f) ] = [ K c ] + [ K MR (B, f) ] (5)
One important feature in Eq. (4) is the structural damping which is included in the stiffness matrix. For the sake of simplicity, the complex mathematical modeling is neglected here; however, complete details are available in Ref. [23].
5. Experimental setup for vibration and impact tests
In order to conduct experimental test for MR beams, it is essential to provide a uniform magnetic field all over the beam. For the current work, an electromagnet device shown in Figure 4, which was previously fabricated by the current authors at Sharif University of Technology, is used. The length of poles (gap) is 240 mm. The space between the poles (gap) is 40 mm. To ensure that enough magnetic strength is provided, each arm of the electromagnet has 1000 wound turns of copper wire 1.2 mm in diameter. A Hall effect Gauss meter, (Kanetec-TM701) with a suitable probe (TM-701PRB), was used to measure the magnetic flux generated by the electromagnet. The MR fluid selected for this study was MRF-132DG manufactured by Lord Corporation. For more details of the devices, one may consult Ref. [23].
5.1 Modal test
In order to perform modal tests, first a laminated composite plate (800 × 800 mm) made of glass fiber has been fabricated. Glass fiber composite is chosen as its magnetic permeability is zero. The plate was then cut into several strips
81
Impact Analysis of MR-Laminated Composite StructuresDOI: http://dx.doi.org/10.5772/intechopen.86466
(250 × 30 × 2.0 mm) by water jet to make beams. We used two similar beam strips as top and bottom faces and make a box beam with a 2.4 mm gap between two strips for MR fluid. Therefore, the total thickness of the MR-laminated beam became 4.4 mm. In order to maintain the uniform gap and hold the fluid between two strips, 2.4 mm thick spacer was glued on the inside face of one strip. Some mechanical properties of the glass fiber layers are given as follows:
Density = 200 g/m3, E1 = E2 = 15.5 GPa, G12 = G21 = 6.5 GPa, ρ = 1650 kg/m3.
In this work, the complex shear modulus of the MR fluid as function of mag-netic field and driving frequency has been considered from the results of the work done by Naji et al. [10].
To study the effects of magnetic field on modal response of the MR-laminated beams, different magnetic fields, from 0 to 2000 Gauss, have been applied to the specimens.
5.2 Impact tests
To conduct the impact tests, the same electromagnet as described in Section 5.1 has been used. However, for impact tests, the specimens are fabricated as box-aluminum beam with length 400 mm and width 30 mm filled by MR fluid. The thickness of each aluminum layer and MR layer was 1 mm. The density of alumi-num was 2700 kg/m3 and that of the MR fluid was 3500 kg/m3.
The impact tests were performed by dropping a 5.0 g mass from different heights (0.5, 1.0, and 1.5 m) on the tip of the MR-aluminum cantilever beam. In order to investigate the effect of magnetic field on the impact response of the MR-aluminum beam, the impact tests have been repeated for three levels of mag-netic fields, 0, 1000, and 2000 Gauss.
6. Results
In the following two subsections, the analytical results and experimental ones followed by brief explanations are provided.
6.1 Modal tests
The results obtained by analytical approach described in Section 4 and the results extracted from the experimental work are given in Table 2. The first three
Figure 4. Experimental setup.

Emerging Trends in Mechatronics
82
natural frequencies which were extracted from the peak of vibration response spectrum subject to three levels of magnetic fields are compared with analytical ones.
As it is shown, the analytical results provide sufficient agreement with experi-mental ones for most of the cases.
An important feature that one may conclude from these results is noting that intensifying magnetic field increases the natural frequencies of the MR beams.
Increasing the natural frequencies of MR beams by increasing the magnetic field can be explained by noting that increasing magnetic field increases the stiffness of the MR fluid, which leads to increasing the total stiffness of the MR beam and, in turn, increasing the natural frequencies. However, an exception is shifting the fundamental frequency of the MR beam after 800 Gauss, which is in contradic-tion with intuitive sense. To interpret this phenomenon, one may note that the loss factor at high magnetic field jumps up dramatically [10], so increasing damping is dominated by increasing stiffness of MR fluid, and higher damping dictates vibra-tion behavior.
6.2 Effects of the MR layer thickness
In order to investigate the effect of MR fluid thickness on the modal response of the MR beams, the first three modes have been computed for different thickness ratios of the MR layer to base material under different applied magnetic fields. The results are given in Table 3, where h1 is the thickness of composite laminated which
Magnetic field (Gauss) Mode Experimental freq. (Hz) Analytical results
freq. (Hz)
0 1 11.0 11.70
2 66.5 68.10
3 185.5 187.36
400 1 11.5 12.03
2 68.5 69.73
3 187.0 191.49
800 1 12.0 12.39
2 70.0 71.96
3 190.5 192.79
1200 1 11.5 11.76
2 71.5 73.00
3 192.0 194.50
1600 1 11.0 11.165
2 73.0 75.34
3 193.0 197.83
2000 1 10.0 10.18
2 75.5 78.67
3 194.5 198.58
Table 2. Experimental and analytical natural frequencies of MR beam.
83
Impact Analysis of MR-Laminated Composite StructuresDOI: http://dx.doi.org/10.5772/intechopen.86466
is a summation of the upper and lower layers and h2 is the thickness of MR fluid in middle layer.
The results generally demonstrate that increase in thickness of the MR layer decreases the natural frequencies of all the three modes. This is because in general, the stiffness of MR fluid is lower than the stiffness of the base composite material.
Mode Magnetic field (Gauss)
Natural frequencies of five modes for three different magnetic fields
h2/h1 = 1/4 h2/h1 = 1/2 h2/h1 = 1 h2/h1 = 2
Mode 1 0 9.588 9.432 9.261 9.071
1000 14.381 12.913 12.758 12.308
2000 10.826 9.537 9.611 9.934
Mode 2 0 40.349 36.217 33.051 30.624
1000 44.550 40.574 37.539 34.566
2000 46.026 43.417 41.308 40.204
Mode 3 0 89.108 77.951 68.818 61.086
1000 99.501 86.666 76.320 68.195
2000 101.465 89.037 88.784 81.006
Table 3. Effect of layer ratio on the natural frequencies of MR-laminated beam.
Figure 5. Impact test for dropping mass from 0.5 m.
Figure 6. Impact test for dropping mass from 1.0 m.

Emerging Trends in Mechatronics
84
6.3 Impact tests
The MR-aluminum beams are subjected to dropping mass as described in Section 5.2. The results for dropping mass from 0.5 m on the tip of the MR beam subject to different magnetic fields are shown in Figure 5. As it is observed, increas-ing the magnetic field makes the MR beam stiffer and thus reduces sharply the settling time.
The impact test results for dropping mass from 1.0 to 1.5 m on the tip of the MR beam for different magnetic fields is shown in Figures 6 and 7, where once again it is realized that increasing magnetic field reduces the settling time of the beam response.
To study the effect of magnetic field on the response of the MR beam subject to different impact loads, 1000 Gauss of magnetic field is applied to the MR beam, and its response of different dropping heights is measured and shown in Figure 8. As it is observed, increasing the level of impact force increases the amplitude of oscillation.
7. Conclusions
The effect of magnetic field on the vibration and impact responses of the MR beams has been investigated. For modeling purposes, the layerwise displacement theory was employed to overcome some challenges in the modeling of MR beams.
Figure 7. Impact test for dropping mass from 1.5 m.
Figure 8. Impact test for different dropping heights at 1000 Gauss.
85
Impact Analysis of MR-Laminated Composite StructuresDOI: http://dx.doi.org/10.5772/intechopen.86466
Author details
Abolghassem Zabihollah*, Jalil Naji and Shahin ZareieSchool of Science and Engineering, Sharif University of Technology, International Campus, Kish Island, Iran
*Address all correspondence to: [email protected]
The MR-laminated composite beams in which the top and bottom layers are made of glass-fiber laminated composites and the middle layer, is filled with MR fluids. Experimental tests have been conducted to validate the analytical results and show the performance of the MR-laminated beam for different magnetic fields. It was observed that increasing the magnetic field up to 800 Gauss increases the natural frequencies of the MR-laminated beam. However, beyond the 800 Gauss, the fundamental frequency of the MR-laminated beam begins to drop. The influence of MR layer thickness on the vibration behavior of MR-laminated beam was exam-ined. Adding thickness of the MR layer affected decreases the natural frequencies of the first three modes.
In another study, a three-layered aluminum beam composed of aluminum layers at the top and bottom and the middle layer filled with MR fluid has been investigated for impact loadings. It was realized that increasing the magnetic field reduces the settling time of vibration for MR-aluminum beam. Also, for a constant magnetic field, increasing the level of impact load leads to increasing the amplitude of vibration as it was expected.
Acknowledgements
The authors wish to thank the partial support provided by the Sharif University of Technology, International Campus, on Kish Island.
© 2020 The Author(s). Licensee IntechOpen. Distributed under the terms of the Creative Commons Attribution - NonCommercial 4.0 License (https://creativecommons.org/licenses/by-nc/4.0/), which permits use, distribution and reproduction for non-commercial purposes, provided the original is properly cited.

86
Emerging Trends in Mechatronics
References
[1] Fattahi SJ, Zabihollah A, Zareie S. Vibration monitoring of wind turbine blade using fiber bragg grating. Wind Engineering. Dec 2010;34(6):721-731
[2] Zareie S, Zabihollah A, Azizi A. Buckling control of morphing composite airfoil structure using multi-stable laminate by piezoelectric sensors/actuators. Proceedings of SPIE-The International Society for Optical Engineering. 2011;7978
[3] Zareie S, Zabihollah A, Azizi A. Buckling control of morphing composite airfoil structure using multi-stable laminate by piezoelectric sensors/actuators. In: SPIE Smart Structures and Materials + Nondestructive Evaluation and Health Monitoring. 2011
[4] Pol MH, Zabihollah A, Zareie S, Liaghat G. Effects of nano-particles concentration on dynamic response of laminated nanocomposite beam/nano daleliu koncentracijos itaka dinaminei nanokompozicinio laminuoto strypo reakcijai. Mechanika. 2013;19(1):53-58
[5] Zabihollah A, Zareie S, Latifi-Navid M, Ghaffari H. Effects of ply-drop off on forced vibraion response of non-uniform thickness laminated composite beams. In: IEEE Toronto International Conference. Vol. 71. 2009. pp. 176-181
[6] Pol MH, Zabihollah A, Zareie S, Liaghat G. On dynamic response of laminated nanocomposite beam/Nano daleliu koncentracijos itaka dinaminei nanokompozicinio laminuoto strypo reakcijai. Mechanika. 2013;19(1):53-58
[7] Zabihollah A, Zareie S. Optimal design of adaptive laminated beam using layerwise finite element. Journal of Sensors. 2011;2011
[8] Zabihollah A. Analysis, Design Optimization and Vibration Suppression
of Smart Laminated Beams. Concordia University; 2007
[9] Powell LA, Hu W, Wereley NM. Magnetorheological fluid composites synthesized for helicopter landing gear applications. Journal of Intelligent Material Systems and Structures. Jun 2013;24(9):1043-1048
[10] Sung K-G, Choi S-B, Lee H-G, Min K-W, Lee S-H. Performance comparison of MR dampers with three different working modes: Shear, flow and mixed mode. International Journal of Modern Physics B. 2005;19(07n09):1556-1562
[11] Naji J, Zabihollah A, Behzad M. Vibration characteristics of laminated composite beams with magnetorheological layer using layerwise theory. Mechanics of Advanced Materials and Structures. 2017:1-10
[12] Skalski Pawełand Kalita K. Role of magnetorheological fluids and elastomers in Today’s world. Acta Mechanica et Automatica. 2017;11(4):267-274
[13] Cheng M, Chen Z. Semi-active helicopter ground resonance suppression using magnetorheological technology. In: ASME 2017 Conference on Smart Materials, Adaptive Stru-ctures and Intelligent Systems. 2017. p. V002T03A015
[14] Azizi A, Durali L, Rad FP, Zareie S. Control of vibration suppression of a smart beam by pizoelectric elements. In: 2nd International Conference on Environmental and Computer Science, ICECS. 2009. p. 2009
[15] Yalcintas M, Dai H. Vibration suppression capabilities of magnetorheological materials based adaptive structures. Smart Materials and Structures. 2003;13(1):1-11
87
Impact Analysis of MR-Laminated Composite StructuresDOI: http://dx.doi.org/10.5772/intechopen.86466
[16] Sapiński B, Snamina J. Vibration control capabilities of a cantilever beam with a magnetorheological fluid. Mechanics. 2008;27:70-75
[17] Sapiński B, Snamina J, Romaszko M. The influence of a magnetic field on vibration parameters of a cantilever sandwich beam with embedded MR fluid. Acta Mechanica et Automatica. 2012;6(1):53-56
[18] Sapiński B, Horak W, Szczęch M. Investigation of MR fluids in the oscillatory squeeze mode. Acta Mechanica. 2013;7(2):111-116
[19] Rajamohan V, Sedaghati R, Rakheja S. Vibration analysis of a multi-layer beam containing magnetorheological fluid. Smart Materials and Structures. 2009;19(1):15013
[20] Ramamoorthy M, Rajamohan V, AK J. Vibration analysis of a partially treated laminated composite magnetorheological fluid sandwich plate. Journal of Vibration and Control. 2016;22(3):869-895
[21] Payganeh G, Malekzadeh K, Malek-Mohammadi H. Free vibration of sandwich panels with smart magneto-rheological layers and flexible cores. Journal of Solid Mechanics. 2016;8(1):12-30
[22] Aguib S, Nour A, Djedid T, Bossis G, Chikh N. Forced transverse vibration of composite sandwich beam with magnetorheological elastomer core. Journal of Mechanical Science and Technology. 2016;30(1):15-24
[23] Naji J, Zabihollah A, Behzad M. Vibration behavior of laminated composite beams integrated with magnetorheological fluid layer. Journal of Mechanics. 2017;33(4):417-425
[24] Naji J, Zabihollah A, Behzad M. Vibration characteristics of laminated composite beams with
magnetorheological layer using layerwise theory. Mechanics of Advanced Materials and Structures. 2018;25(3):202-211
[25] Naji J, Zabihollah A, Behzad M. Layerwise theory in modeling of magnetorheological laminated beams and identification of magnetorheological fluid. Mechanics Research Communications. 2016;77:50-59
[26] Momeni S, Zabihollah A, Behzad M. Development of an accurate finite element model for N-layer MR-laminated beams using a layerwise theory. Mechanics of Advanced Materials and Structures. 2018;25(13):1148-1155
[27] Momeni S, Zabihollah A, Behzad M. A finite element model for tapered laminated beams incorporated with magnetorheological fluid using a layerwise model under random excitations. Mechanics of Advanced Materials and Structures. 2018:1-8
[28] Reddy JN. Mechanics of Laminated Plates: Theory and Analysis. Boca Raton, FL: CRC Press; 1997
[29] Iqbal MF. Application of Magneto-Rheological Dampers to Control Dynamic Response of Buildings. Concordia University; 2009
[30] Chu SY, Soong TT, Reinhorn AM. Active, Hybrid and Semi-Active Structural Control—A Design and Implementation Handbook. John Wiley & Sons; 2005. ISBN: 978-0-470-01352-6
[31] Bardzokas DI, Filshtinsky ML, Filshtinsky LA. Mathematical Methods in Electro-Magneto-Elasticity. Springer: Science & Business Media; 2007. Vol. 32. pp. 373-388
[32] Ashour ON, Kinder D, Giurgiutiu V, Rogers CA. Manufacturing and characterization of magnetorheological

Emerging Trends in Mechatronics
88
fluids. Smart Materials and Structures. 1997;97:174-184
[33] Lee DC, Smith DK, Heitsch AT, Korgel BA. Colloidal magnetic nanocrystals: Synthesis, properties and applications. Annual Reports Section “C” (Physical Chemistry). 2007;103:351-402
[34] Carlson JD. MR fluids and devices in the real world. International Journal of Modern Physics B. 2005;19(07n09):1463-1470
[35] Ashour O, Rogers CA, Kordonsky W. Magnetorheological fluids: Materials, characterization, and devices. Journal of Intelligent Material Systems and Structures. 1996;7(2):123-130
Chapter 6
Applications of ArtificialIntelligence Techniques inOptimizing DrillingMohammadreza Koopialipoor and Amin Noorbakhsh
Abstract
Artificial intelligence has transformed the industrial operations. One of the impor-tant applications of artificial intelligence is reducing the computational costs of opti-mization. Various algorithms based on their assumptions to solve problems have beenpresented and investigated, each of which having assumptions to solve the problems.In this chapter, firstly, the concept of optimization is fully explained. Then, an artifi-cial bee colony (ABC) algorithm is used on a case study in the drilling industry. Thisalgorithm optimizes the problem of study in combination with ANNmodeling. At theend, various models are fully developed and discussed. The results of the algorithmshow that by better understanding the drilling data, the conditions can be improved.
Keywords: optimization, ROP, ABC algorithm, prediction, ANN
1. Introduction
Optimization is the process of setting decision variable values in such a way thatthe objective in question is optimized. The optimal solution is a set of decisionvariables that maximizes or minimizes the objective function while satisfying theconstraints. In general, optimal solution is obtained when the corresponding valuesof the decision variables yield the best value of the objective function, while satis-fying all the model constraints.
Apart from the gradient-based optimization methods, some new optimizationmethods have also been proposed that help solve complex problems. In the availableclassifications, these methods are recognized as “intelligent optimization,” “optimi-zation and evolutionary computing,” or “intelligent search.” One of the advantagesof these algorithms is that they can find the optimal point without any need to useobjective function derivatives. Moreover, compared to the gradient-based methods,they are less likely to be trapped in local optima.
Optimization algorithms are classified into two types: exact algorithms andapproximate algorithms. Exact algorithms are capable of precisely finding optimalsolutions, but they are not applicable for complicated optimization problems, andtheir solution time increases exponentially in such problems. Approximate algo-rithms can find close-to-optimal solutions for difficult optimization problemswithin a short period of time [1].
There are two types of approximate algorithms: heuristics and metaheuristics.Two main shortcomings of the heuristic algorithms are (1) high possibility of
89

being trapped into local optima and (2) performance degradation in practicalapplications on complex problems. Metaheuristic algorithms are introduced toeliminate the problems associated with heuristic algorithms. In fact, metaheuristicalgorithms are approximate optimization algorithms that enjoy specificmechanisms to exit local optima and can be applied on an extensive range ofoptimization problems.
2. Methodology
2.1 Optimization model
The decision-making process consists of three steps: problem formulation,problem modeling, and problem optimization. A variety of optimization models areactually applied to formulate and solve decision-making problems (Figure 1). Themost successful models used in this regard include mathematical programming andconstraint programming models.
2.2 Optimization method
The optimization methods are presented in Figure 2. Since the problem iscomplicated, exact or approximate methods are used to solve it. The exactmethods provide optimal solutions and guarantee optimality. Approximatemethods lead to favorable and near-optimal solutions, but they do notguarantee optimality.
Figure 1.Optimization models.
90
Emerging Trends in Mechatronics
3. Theoretical foundations
3.1 Theoretical foundations of optimization
Any problem in the real world has the potential to be formulated as an optimi-zation problem. Generally, all optimization problems with explicit objectives can beexpressed as nonlinearly constrained optimization problem as presented in Eq. (1).
max or min f xð Þ, x ¼ x1; x2;…; xnð ÞT ∈Rn
Subject to ϕj xð Þ ¼ 0, j ¼ 1, 2,…,M
ψk xð Þ≤0, k ¼ 1, 2,…, N
(1)
where f xð Þ, ϕj xð Þ, and ψk xð Þ are the scalar functions of the column vector x. The xielements of the vector x are the design variables, or the decision variables, that couldbe either continuous, discrete, or mixed of the two. The vector x is often referred to asthe decision vector, which varies in an n-dimensional space Rn. The function f (x) iscalled the objective function or the energy function. The objective function is calledthe cost function in minimization problems and fitness function in maximizationproblems. Moreover, ϕj xð Þ are constraints in terms of M equalities and ψk xð Þ areconstraints in terms of N inequalities. Thus, in general, we will have a total of M + Nconstraints. The space spanned by the decision variables is known as the search space,and the space spanned by the objective function value is called the solution space. Theoptimization problem maps the search space on the solution space.
3.1.1 Norms
For a vector v, p-norm is denoted by vk kp and defined as Eq. (2).
vk kp ¼ ∑n
i¼1vij jp
� �1 p=(2)
Figure 2.Optimization methods.
91
Applications of Artificial Intelligence Techniques in Optimizing DrillingDOI: http://dx.doi.org/10.5772/intechopen.85398

where p is a positive integer. According to this definition, one can understandthat a p-norm satisfies the following conditions: k vk k≥0 for all k vk k ¼ 0 if and onlyif v = 0. This shows the nonnegativeness of p-norm. In addition, for each realnumber α, we have the scaling condition αvk k ¼ α vk k. Three most commonly usednorms are 1-, 2-, and infinity norms, when p is equal to 1, 2, and ∞, respectively.
3.1.2 Eigenvalues and eigenvectors
The eigenvectors for a square matrix A½ �n�n are defined as Eq. (3).
A� λIð Þu ¼ 0 (3)
where I is a unitary matrix with the same size as A. All the nontrivial solutionsare obtained from Eq. (4).
a11 � λ a12
a21 a22 � λ⋯
a1n
a2n⋮ ⋮ ⋱ ⋮an1 an2 ⋯ ann � λ
26664
37775 ¼ 0 det A� λIj j ¼ 0 (4)
which can be written as a polynomial in form of Eq. (4).
λn þ αn�1λn�1 þ…þ α1λþ α0 ¼ λ� λ1ð Þ λ� λ2ð Þ… λ� λnð Þ ¼ 0 (5)
where λi are eigenvalues and could be complex numbers as well. For eacheigenvalue λi, we have a corresponding eigenvector ui, whose direction can bedefined uniquely, but the eigenvector length will not be unique, since anynonzero multiple of vector u can satisfy Eq. (3) and can thus be considered as aneigenvector.
3.1.3 Spectral radius of the matrix
The spectral radius of a square matrix is another important concepts associatedwith eigenvalues of matrices. Assuming that λi are eigenvalues of the square matrix A,the spectral radius of the matrix ρ Að Þ will be defined as Eq. (6).
ρ Að Þ ¼ max λij jf g (6)
which is equal to the maximum absolute value of all eigenvectors. Geometricallyspeaking, if we draw all the eigenvalues of matrix A on a complex plane and thendraw a circle on the plane, in such a way that it encloses all the eigenvalues, then theminimum radius of such a circle is referred to as the spectral radius. Spectral radiusis useful in determining the stability or instability of iterative algorithms.
3.1.4 Hessian matrix
The gradient vector of a multivariate function f (x) is defined according to Eq. (7),
G1 xð Þ � ∇f xð Þ � ∂f=∂x1; ∂f=∂x2;…; ∂f=∂xnð ÞT (7)
where x ¼ x1; x2;…; xnð Þ is a vector. Since ∇f xð Þis a linear function, it is definedas the vector constant k, and the linear function is generated from Eq. (8).
92
Emerging Trends in Mechatronics
f xð Þ ¼ kTxþ b (8)
where b is a vector constant.Second derivative of a general function f (x) of a matrix n � n is called the
Hessian matrix,
G2 xð Þ ¼ ∇2f xð Þ ¼∂2f=∂x21 ⋯ ∂
2f=∂x1∂xn
⋮ ⋱ ⋮∂2f=∂xn∂x1 ⋯ ∂
2f=∂x2n
0B@
1CA (9)
3.1.5 Convexity
Linear programming problems are usually classified according to the convexityof their defining functions. Geometrically speaking, an object is called convex whenfor any two points within the object, every point on the straight line connectingthem also lies within the object (Figure 3). Mathematically, a set S∈Rn within thespace of a real vector is called a convex set when Eq. (10) holds true.
txþ 1� tð Þy∈ S, ∀ x; yð Þ∈ S, t∈ 0; 1½ � (10)
A function f xð Þ defined on the convex set Ω is called convex if and only if:
f αxþ βyð Þ≤ f αxð Þ þ f βyð Þ, ∀ x; yð Þ∈Ωα≥0, β≥0, αþ β ¼ 1
(11)
An interesting feature of the convex function f is that it ensures that the gradient
at a pointdfdx
����x ∗¼ o approaches zero. In this case, x ∗ is an absolute minimum point
for f.
3.1.6 Optimality criteria
Mathematical programming includes several concepts. Here, we will first intro-duce three related concepts: feasible solution, strong local maximum, and weaklocal maximum.
Figure 3.Convex object (a) and nonconvex object (b).
93
Applications of Artificial Intelligence Techniques in Optimizing DrillingDOI: http://dx.doi.org/10.5772/intechopen.85398
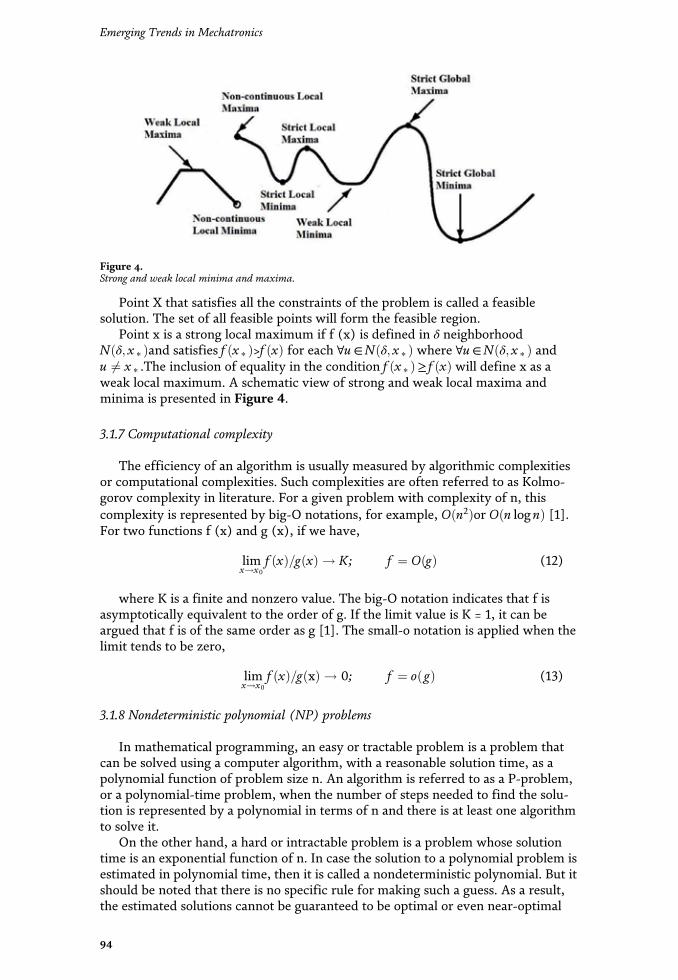
Point X that satisfies all the constraints of the problem is called a feasiblesolution. The set of all feasible points will form the feasible region.
Point x is a strong local maximum if f (x) is defined in δ neighborhoodN δ; x ∗ð Þand satisfies f x ∗ð Þ>f xð Þ for each ∀u∈N δ; x ∗ð Þ where ∀u∈N δ; x ∗ð Þ andu 6¼ x ∗ .The inclusion of equality in the condition f x ∗ð Þ≥ f xð Þ will define x as aweak local maximum. A schematic view of strong and weak local maxima andminima is presented in Figure 4.
3.1.7 Computational complexity
The efficiency of an algorithm is usually measured by algorithmic complexitiesor computational complexities. Such complexities are often referred to as Kolmo-gorov complexity in literature. For a given problem with complexity of n, thiscomplexity is represented by big-O notations, for example, O n2ð Þor O n log nð Þ [1].For two functions f (x) and g (x), if we have,
limx!x0
f xð Þ=g xð Þ ! K; f ¼ O gð Þ (12)
where K is a finite and nonzero value. The big-O notation indicates that f isasymptotically equivalent to the order of g. If the limit value is K = 1, it can beargued that f is of the same order as g [1]. The small-o notation is applied when thelimit tends to be zero,
limx!x0
f xð Þ=g xð Þ ! 0; f ¼ o gð Þ (13)
3.1.8 Nondeterministic polynomial (NP) problems
In mathematical programming, an easy or tractable problem is a problem thatcan be solved using a computer algorithm, with a reasonable solution time, as apolynomial function of problem size n. An algorithm is referred to as a P-problem,or a polynomial-time problem, when the number of steps needed to find the solu-tion is represented by a polynomial in terms of n and there is at least one algorithmto solve it.
On the other hand, a hard or intractable problem is a problem whose solutiontime is an exponential function of n. In case the solution to a polynomial problem isestimated in polynomial time, then it is called a nondeterministic polynomial. But itshould be noted that there is no specific rule for making such a guess. As a result,the estimated solutions cannot be guaranteed to be optimal or even near-optimal
Figure 4.Strong and weak local minima and maxima.
94
Emerging Trends in Mechatronics
solutions. In fact, there is no specific algorithm for solving hard-NP problems, andonly approximate or heuristic solutions are applicable. Therefore, heuristic andmetaheuristic methods can provide us the near-optimal/suboptimal responses withacceptable accuracy.
A given problem can be called NP-complete if it is actually an NP-hard problem,and other NP problems can be reduced to it using certain reduction algorithms. Thereduction algorithm has a polynomial time. The traveling salesman problem can becounted as an example of NP-hard problem, which aims to find the shortest route orthe lowest traveling cost to visit all n cities once and then return to the starting city.
3.2 Theoretical foundations of metaheuristic optimization
Two opposite criteria should be taken into account in development of ametaheuristic algorithm: (1) exploration of the search space and (2) exploitation ofthe best solution (Figure 5).
Promising areas are specified by good solutions obtained. In intensification, thepromising regions are explored accurately to find better solutions. In diversifica-tion, attempts are made to make sure that all regions of the search space areexplored.
In the exploration approach, random algorithms are the best algorithms forsearching. Random algorithms generate a random solution in each iteration andcompletely exploit the search space in this way.
3.2.1 Representation
The simulation of any metaheuristic algorithm requires an encoding method. Inother words, the problem statement procedure is referred to as representation.Encoding plays a major role in the productivity and efficiency of any metaheuristicalgorithm and is recognized as a necessary step in the algorithm. Additionally, therepresentation efficiency depends on the search operators (neighborhood, recom-bination, etc.). In fact, when defining a representation, we first need to rememberhow the problem is evaluated and how the search operator will work. A represen-tation needs to have the following characteristics:
Completeness: It is one of the main characteristics of representation; in the sensethat all the solutions of a given problem need to be represented.
Connectivity: It means that a search path must exist between any two solutionsin the search space.
Efficiency: Representation should be easily available to search operators.Representations can be divided into two types in terms of their structure: linear
and nonlinear. In this study, linear representation has been used. Some linearrepresentations include the following:
Binary encoding: It is performed using binary alphabets.Continuous encoding: In continuous optimization problems, encoding is
performed based on real numbers.Discrete encoding: It is used for discrete optimization problems such as the
assignment problem.
Figure 5.Metaheuristic algorithm design space.
95
Applications of Artificial Intelligence Techniques in Optimizing DrillingDOI: http://dx.doi.org/10.5772/intechopen.85398
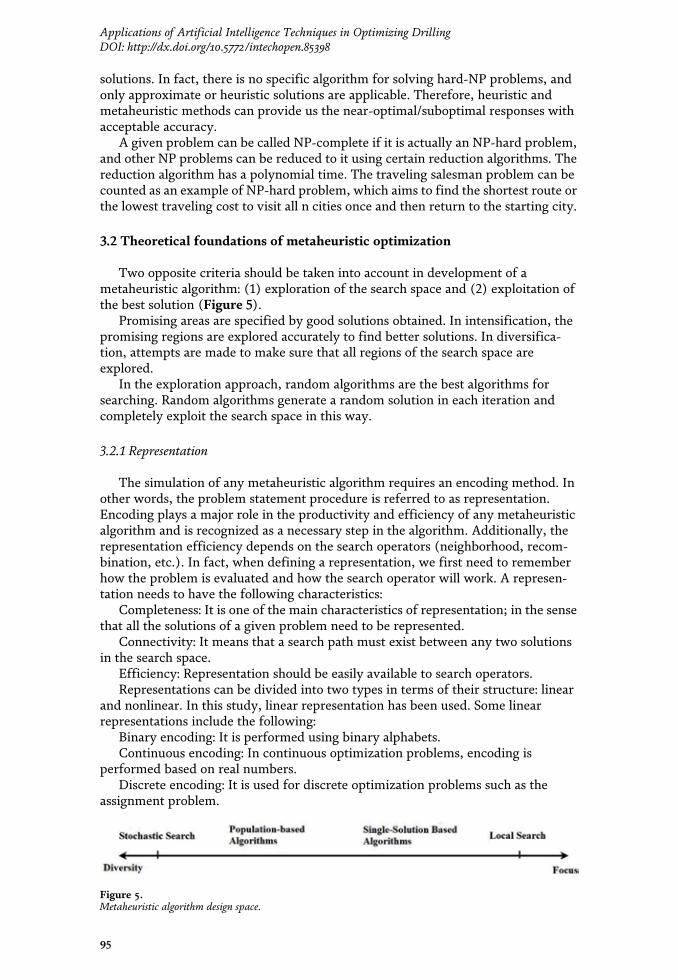
Point X that satisfies all the constraints of the problem is called a feasiblesolution. The set of all feasible points will form the feasible region.
Point x is a strong local maximum if f (x) is defined in δ neighborhoodN δ; x ∗ð Þand satisfies f x ∗ð Þ>f xð Þ for each ∀u∈N δ; x ∗ð Þ where ∀u∈N δ; x ∗ð Þ andu 6¼ x ∗ .The inclusion of equality in the condition f x ∗ð Þ≥ f xð Þ will define x as aweak local maximum. A schematic view of strong and weak local maxima andminima is presented in Figure 4.
3.1.7 Computational complexity
The efficiency of an algorithm is usually measured by algorithmic complexitiesor computational complexities. Such complexities are often referred to as Kolmo-gorov complexity in literature. For a given problem with complexity of n, thiscomplexity is represented by big-O notations, for example, O n2ð Þor O n log nð Þ [1].For two functions f (x) and g (x), if we have,
limx!x0
f xð Þ=g xð Þ ! K; f ¼ O gð Þ (12)
where K is a finite and nonzero value. The big-O notation indicates that f isasymptotically equivalent to the order of g. If the limit value is K = 1, it can beargued that f is of the same order as g [1]. The small-o notation is applied when thelimit tends to be zero,
limx!x0
f xð Þ=g xð Þ ! 0; f ¼ o gð Þ (13)
3.1.8 Nondeterministic polynomial (NP) problems
In mathematical programming, an easy or tractable problem is a problem thatcan be solved using a computer algorithm, with a reasonable solution time, as apolynomial function of problem size n. An algorithm is referred to as a P-problem,or a polynomial-time problem, when the number of steps needed to find the solu-tion is represented by a polynomial in terms of n and there is at least one algorithmto solve it.
On the other hand, a hard or intractable problem is a problem whose solutiontime is an exponential function of n. In case the solution to a polynomial problem isestimated in polynomial time, then it is called a nondeterministic polynomial. But itshould be noted that there is no specific rule for making such a guess. As a result,the estimated solutions cannot be guaranteed to be optimal or even near-optimal
Figure 4.Strong and weak local minima and maxima.
94
Emerging Trends in Mechatronics
solutions. In fact, there is no specific algorithm for solving hard-NP problems, andonly approximate or heuristic solutions are applicable. Therefore, heuristic andmetaheuristic methods can provide us the near-optimal/suboptimal responses withacceptable accuracy.
A given problem can be called NP-complete if it is actually an NP-hard problem,and other NP problems can be reduced to it using certain reduction algorithms. Thereduction algorithm has a polynomial time. The traveling salesman problem can becounted as an example of NP-hard problem, which aims to find the shortest route orthe lowest traveling cost to visit all n cities once and then return to the starting city.
3.2 Theoretical foundations of metaheuristic optimization
Two opposite criteria should be taken into account in development of ametaheuristic algorithm: (1) exploration of the search space and (2) exploitation ofthe best solution (Figure 5).
Promising areas are specified by good solutions obtained. In intensification, thepromising regions are explored accurately to find better solutions. In diversifica-tion, attempts are made to make sure that all regions of the search space areexplored.
In the exploration approach, random algorithms are the best algorithms forsearching. Random algorithms generate a random solution in each iteration andcompletely exploit the search space in this way.
3.2.1 Representation
The simulation of any metaheuristic algorithm requires an encoding method. Inother words, the problem statement procedure is referred to as representation.Encoding plays a major role in the productivity and efficiency of any metaheuristicalgorithm and is recognized as a necessary step in the algorithm. Additionally, therepresentation efficiency depends on the search operators (neighborhood, recom-bination, etc.). In fact, when defining a representation, we first need to rememberhow the problem is evaluated and how the search operator will work. A represen-tation needs to have the following characteristics:
Completeness: It is one of the main characteristics of representation; in the sensethat all the solutions of a given problem need to be represented.
Connectivity: It means that a search path must exist between any two solutionsin the search space.
Efficiency: Representation should be easily available to search operators.Representations can be divided into two types in terms of their structure: linear
and nonlinear. In this study, linear representation has been used. Some linearrepresentations include the following:
Binary encoding: It is performed using binary alphabets.Continuous encoding: In continuous optimization problems, encoding is
performed based on real numbers.Discrete encoding: It is used for discrete optimization problems such as the
assignment problem.
Figure 5.Metaheuristic algorithm design space.
95
Applications of Artificial Intelligence Techniques in Optimizing DrillingDOI: http://dx.doi.org/10.5772/intechopen.85398

Permutation encoding: It is used in problems where the objective is to find apermutation.
Random Key: This type of encoding converts real numbers into a permutation.Diploid representation: In the diploid representation, two values are considered
for each subset of the decision vector.
3.2.2 Objective function
The objective function generates a real number for any solution in the searchspace. This number describes the quality or the fitness of the solution. The objectivefunction is an important element in development of a metaheuristic algorithm thatdirects the search toward the best solution. If the objective function is wronglydefined, it will generate unacceptable solutions. In the present work, the objectivefunction is maximization of drilling penetration rate.
3.2.3 Constraint
Constraint handling is another critical issue for the efficient design ofmetaheuristic algorithms. In fact, many continuous or discrete optimization prob-lems are constrained. As mentioned earlier, constraints might be linear or nonlinear,equal or unequal. Constraints can mostly be applied to the decision variables orobjective function. Some constraint handling strategies are presented in this section;these strategies can be categorized as follows:
Reject strategy: In this approach, infeasible solutions are rejected, and only thefeasible ones are taken into account.
Penalizing strategy: In this strategy, infeasible solutions obtained during thesearch process are preserved in the search space. This strategy is the most popularstrategy used to handle constraints. This strategy uses the penalizing strategy totransform problems with constraints into a problem with no constraint.
Repairing strategy: In this strategy, infeasible solutions turn into feasible solutions.Preserving strategy: In this strategy, specific operators are used to generate
feasible solutions alone.
3.2.4 Search strategy
Search strategy is of particular importance in metaheuristic algorithms. Thisstrategy carries out the search process without using the derivative of the problem.Some of the leading search models are listed below.
Golden Section search: This is a technique used to find the extremum (maximumand minimum) of a unimodal function by narrowing the range of values insidewhich the extremum is known to exist.
Random search: Random search is a numerical optimization method indepen-dent of the gradient and hence can be used for noncontinuous or nondifferentiablefunctions.
Nelder-Mead method: The Nelder-Mead method, also known as downhill sim-plex, is usually used for nonlinear optimization. This method is a numerical methodthat can converge to nonstationary points.
3.2.5 Classification of metaheuristic algorithms
The criteria used for classification of metaheuristic algorithms are as follows:Nature-inspired vs. nonnature inspiration: Many of the metaheuristic algorithms
are inspired by natural processes. Evolutionary algorithms and artificial immune
96
Emerging Trends in Mechatronics
systems, ranging from biological behavior of bee, social behavior of bird flocking,and physical behavior of materials in simulated annealing to human-sociopoliticalbehavior in imperialist competitive algorithm, belong to these nature-inspiredalgorithms.
Memory usage versus memoryless methods: Some metaheuristic algorithmsare memoryless. These algorithms do not store data dynamically duringsearch time. Simulated annealing lies in this category of algorithms, while someother metaheuristic algorithms use information explored during the searchprocess. Short-term and long-term memory used in tabu search algorithm are ofthis type.
Deterministic or stochastic: Deterministic metaheuristic algorithms solve opti-mization problems through deterministic decision-making (such as local search andtabu search). In stochastic metaheuristic algorithms, several stochastic rules areapplied to searching. In deterministic algorithms, the initial solution leads to thegeneration of a final solution similar to the initial one.
Population-based vs. single-point search algorithms: Single-point algorithms(such as simulated annealing) direct and transmit a single solution throughout thesearch process, while population-based algorithms (such as particle swarm optimi-zation) will involve the whole solution population. Single-point search algorithmsapply an exploitive approach; these algorithms have the power to concentratesearching on the local space. Population-based algorithms have exploratory trajec-tory and allow for more diversified exploration of the search space.
Iterative or greedy approach: In iterative algorithms, the search starts with aninitial set of solutions (population), and the solutions vary in each iteration. Ingreedy algorithms, the search begins with a null solution, and a decision variable isdetermined at each step until the final solution is obtained. Most metaheuristicalgorithms follow an iterative approach.
4. Review of literature
In this section, firstly, a brief explanation of some of the mostly usedmetaheuristic algorithms is provided. Next, previous works dealing with predictionand optimization of penetration rate performed by various authors are introduced.
4.1 Literature on metaheuristic optimization
The optimization literature changed dramatically with the advent ofmetaheuristic algorithms in the 1960s. Alan Turing might be the first to use heuris-tic algorithms. During the Second World War, Alan Turing and Gordon Welchmanmanaged to design the Bambe machine and finally crack the German Enigmamachine in 1940. In 1948, he managed to get a patent for his ideas in the fieldof intelligent machinery, machine learning, neural network, and evolutionaryalgorithms.
4.1.1 Genetic algorithm
The genetic algorithm that was developed by John Holland et al. during1960–1970 is a biological evolutionary model inspired by Charles Darwin’s naturalselection and survival of the fittest. Holland was the first to use crossover, recom-bination, mutation, and selection in comparative studies and artificial systems [2].Figures 6 and 7 indicate the application of crossover and mutation operators.
97
Applications of Artificial Intelligence Techniques in Optimizing DrillingDOI: http://dx.doi.org/10.5772/intechopen.85398

4.1.2 Simulated annealing algorithm
Patrick et al. developed a simulated annealing algorithm to solve optimizationproblems. When steel is cooled, it develops into a crystallized structure with mini-mum energy and larger crystalline sizes, and the defects of steel structure aredecreased (Figure 8) [3].
The search technique used in this algorithm is a movement-based search, whichstarts from an initial guess at high temperatures and the system cools down with agradual decrease in temperature. A new movement or solution is accepted if it isbetter. Otherwise, it will be accepted as a probable solution so that the system canbe freed from the local optima trap [3].
4.1.3 Tabu search algorithm
Tabu search was discovered by Glover [4]. It is a memory-based search strategythat searches the memory history as an integrative element. Two important pointsshould be taken into account in this search: (1) how to efficiently use memory and(2) how to integrate the algorithm into other algorithms to develop a superioralgorithm. Tabu search is the centralized local search algorithm that uses memory toavoid potential cycles of local solutions to increase search efficiency.
In the algorithm running stages, recent attempts (memory history) are recordedand listed as tabu, such that new solutions should avoid those available in the tabulist. Tabu list is one of the most important concepts in the tabu search method andrecords the search moves as a recent history, so that any new move must avoid the
Figure 6.The schematic view of crossover at a random point [2].
Figure 7.The schematic view of mutation at a random point [2].
98
Emerging Trends in Mechatronics
previous move list. This will also lead to time saving because the previous move isnot repeated [4].
4.1.4 Ant colony optimization
When ants find a food source, they use pheromones to mark the food source andthe trails to and from it. As more ants cross the same path, that path turns into apreferred path (Figure 9). Thus, several preferred paths will emerge during the
Figure 9.Ant preferred trail formation process.
Figure 8.Simulated annealing search technique.
99
Applications of Artificial Intelligence Techniques in Optimizing DrillingDOI: http://dx.doi.org/10.5772/intechopen.85398
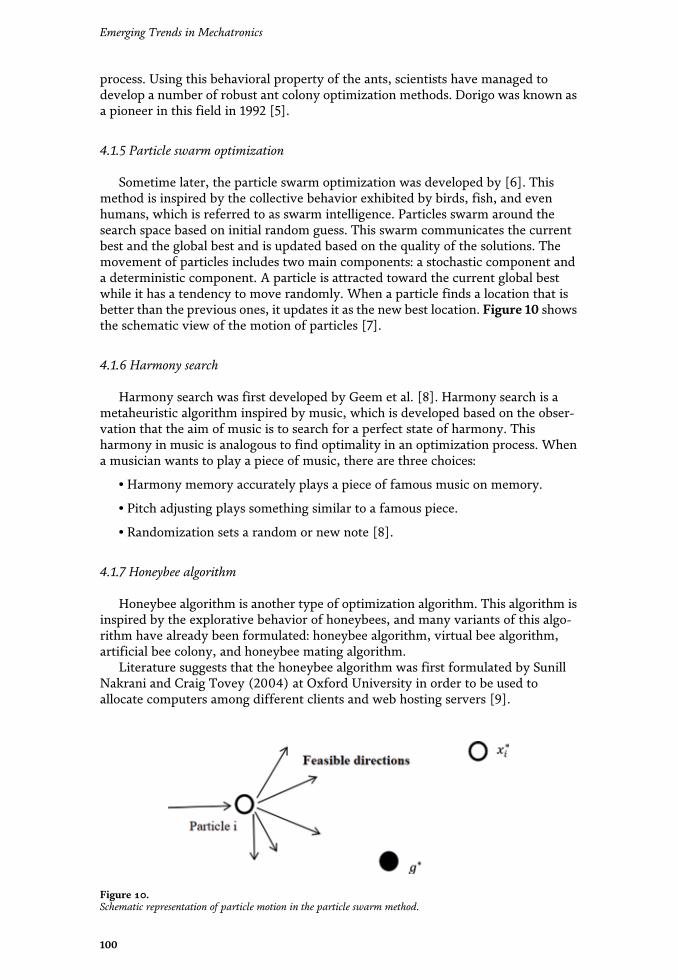
process. Using this behavioral property of the ants, scientists have managed todevelop a number of robust ant colony optimization methods. Dorigo was known asa pioneer in this field in 1992 [5].
4.1.5 Particle swarm optimization
Sometime later, the particle swarm optimization was developed by [6]. Thismethod is inspired by the collective behavior exhibited by birds, fish, and evenhumans, which is referred to as swarm intelligence. Particles swarm around thesearch space based on initial random guess. This swarm communicates the currentbest and the global best and is updated based on the quality of the solutions. Themovement of particles includes two main components: a stochastic component anda deterministic component. A particle is attracted toward the current global bestwhile it has a tendency to move randomly. When a particle finds a location that isbetter than the previous ones, it updates it as the new best location. Figure 10 showsthe schematic view of the motion of particles [7].
4.1.6 Harmony search
Harmony search was first developed by Geem et al. [8]. Harmony search is ametaheuristic algorithm inspired by music, which is developed based on the obser-vation that the aim of music is to search for a perfect state of harmony. Thisharmony in music is analogous to find optimality in an optimization process. Whena musician wants to play a piece of music, there are three choices:
• Harmony memory accurately plays a piece of famous music on memory.
• Pitch adjusting plays something similar to a famous piece.
• Randomization sets a random or new note [8].
4.1.7 Honeybee algorithm
Honeybee algorithm is another type of optimization algorithm. This algorithm isinspired by the explorative behavior of honeybees, and many variants of this algo-rithm have already been formulated: honeybee algorithm, virtual bee algorithm,artificial bee colony, and honeybee mating algorithm.
Literature suggests that the honeybee algorithm was first formulated by SunillNakrani and Craig Tovey (2004) at Oxford University in order to be used toallocate computers among different clients and web hosting servers [9].
Figure 10.Schematic representation of particle motion in the particle swarm method.
100
Emerging Trends in Mechatronics
4.1.8 Big Bang-Big Crunch
Big Bang-Big Crunch was first presented by Erol and Eksin [10]. This approachrelies on theories of the evolution of the universe, namely the Big Bang-Big Crunchevolution theory. In the Big Bang phase, energy dissipation causes a state of disorderor chaos, and randomization is known as the principal feature of this stage. In theBig Crunch stage, however, the randomly distributed particles are drawn into anorder [10].
4.1.9 Firefly algorithm
The Firefly algorithm was developed by Yang [11] at Cambridge Universitybased on idealization of the flashing characteristics of fireflies. In order to developthe algorithm, the following three idealized rules are used:
All fireflies are unisex, such that a firefly will be attracted to other fireflies,regardless of their gender.
Attractiveness is proportional to its desired brightness, hence for any of the twoflashing fireflies, the less brighter firefly will move toward the more brighter one.
The brightness of a firefly can be determined by the landscape of the objectivefunction [11].
4.1.10 Imperialist competitive algorithm
The imperialist competitive algorithm was developed by Atashpaz Gargari andLucas in 2007. Drawing on mathematical modeling of sociopolitical evolution pro-cess, this algorithm provides an approach to solving mathematical optimizationproblems. During the imperialist competition, weak empires lose their power grad-ually and are finally eliminated. The imperialist competition makes it possible for usto reach a point where there is only one empire left in the world. This comes torealization when the imperialist competitive algorithm reaches the optimal point ofthe objective function and stops [12].
4.1.11 Cuckoo search
Cuckoo search is an optimization algorithm developed by Yang and Deb in 2009.This algorithm is inspired by the obligate brood parasitism of some cuckoo speciesby laying their eggs in the nests of other host birds. The following idealized rules areused for more simplicity:
Each cuckoo lays egg once at a time and puts it in a randomly selected nest.The best nests with high-quality eggs will carry over to the next generation.The number of hosts nests is fixed, and the egg laid by a cuckoo can be discov-
ered by the host bird with a probability P a ∈ (0,1). In this case, the host bird willeither dump the eggs or just leaves the nest to build a new one somewhere else [13].
4.1.12 Bat algorithm
The bat algorithm is a metaheuristic optimization algorithm developed by Yang[14]. This algorithm is based on the echolocation behavior of microbats with vary-ing pulse rates of emission and loudness. Echolocation is a biological sound trackingsystem that is used by bats and some other animals, such as dolphins. By idealiza-tion of some of the echolocation features, one can develop various bat-inspiredalgorithms:
101
Applications of Artificial Intelligence Techniques in Optimizing DrillingDOI: http://dx.doi.org/10.5772/intechopen.85398

All bats use echolocation to sense distance, and they also “know” the differencebetween food/prey and background barriers in some magical way.
Bats fly randomly with velocity vi at position xi with a fixed frequency f min,varying wavelength λ and loudness A0 to search for prey. They can automaticallyadjust the wavelength (or frequency) of their emitted pulses and adjust the rate ofpulse emission r ∈ [0, 1], depending on the proximity of their target.
Although loudness may vary in many ways, it is assumed that loudness varia-tions range from a large (positive) A0 to a minimum constant value Amin [14].
4.1.13 Charged system search
Charged system search was presented by Kaveh and Talatahari [15] for optimi-zation of mathematical model. Each search agent is referred to as a charged particle,which behaves like a charged sphere with a known radius and a charge proportionalto the quality of the produced solution. Thus, the particles are able to exert force onone another and cause other particles move. In addition, exploitation of particle’sprevious velocity as a consideration of the particle’s past performance can be effec-tive in changing the particle position. Newtonian mechanic rules were used toprecisely determine these changes from the rules used here provided some sort ofbalance between the algorithm power at the conclusion and search stage [15].
4.1.14 Krill herd algorithm
The krill herd algorithm was proposed by Gandomi and Alavi [16] to optimizethe mathematical model. This algorithm is classified as a swarm intelligence algo-rithm. This algorithm is inspired by the herding behavior of krill swarms in theprocess of food finding. In the krill herd algorithm, minimum distance of the krillindividual from food and from the highest density of the herd is considered as theobjective functions for krill movement. The specific location of the individual krillvaries with time depending on the following three actions: movement induced byother krill individuals; foraging activity; and random diffusion (Figure 11).
Figure 11.The effect of neighbors and herd center on the movement of krill [16].
102
Emerging Trends in Mechatronics
4.1.15 Dolphin echolocation
Dolphin echolocation was first proposed by Kaveh and Farhoudi as a new opti-mization method. Scientists believe that dolphins are ranked second (after humans)in terms of smartness and intelligence. This optimization method was developedaccording to echolocation ability of dolphins [17].
4.2 Literature on drilling operations
Drilling operations lead to significant costs during the development of oil andgas fields. Therefore, drilling optimization can decrease the costs of a project andhence increase the profit earned from the oil and gas production. In most of thestudies, rate of penetration (ROP) has been considered as the objective function ofthe optimization process. ROP depends on many factors including well depth,formation characteristics, mud properties, rotational speed of the drill string, etc.Several studies have been conducted to gain a profound insight into the effectiveparameters on ROP. Maurer [18] introduced an equation for ROP, in which it wasaccounted for rock cratering mechanisms of roller-cone bits. Galle and Woods [19]proposed a mathematical model for estimating ROP, where formation type, weighton bit, rotational speed of bit, and bit tooth wear were taken as input parameters.Mechem and Fullerton [20] proposed a model with input variables of formationdrilling ability, well depth, weight on bit, bit rotational speed, mud pressure, anddrilling hydraulics. Bourgoyne and Young [21] used multiple regression analysis todevelop an analytical model and also investigated the effects of depth, strength, andcompaction of the formation, bit diameter, weight on bit, rotational speed of bit, bitwear, and hydraulic interactions associated with drilling. Bourgoyne and Young[21] introduced a technic for selection of optimum values for weight on bit, rota-tional speed, bit hydraulics, and calculation of formation pressure through multipleregression analysis of drilling data. Tanseu [22] developed a new method of ROPand bit life optimization based on the interaction of raw data, regression, and anoptimization method, using the parameters of bit rotational speed, weight on bit,and hydraulic horsepower. Al-Betairi et al. [23] used multiple regression analysis foroptimization of ROP as a function of controllable and uncontrollable variables. Theyalso studied the correlation coefficients and multicollinearity sensitivity of the dril-ling parameters. Maidla and Ohara [24] introduced a computer software for opti-mum selection of roller-cone bit type, bit rotational speed, weight on bit, and bitwearing for minimizing drilling costs. Hemphill and Clark [25] studied the effect ofmud chemistry on ROP through tests conducted with different types of PDC bitsand drilling muds. Fear [26] conducted a series of studies using geological and mudlogging data and bit properties in order to develop a correlation for estimating ROP.Ritto et al. [27] introduced a new approach for optimization of ROP as a function ofrotational speed at the top and the initial reaction force at the bit, vibration, stress,and fatigue limit of the dynamical system. Alum and Egbon [28] conducted a seriesof studies, which led to the conclusion that pressure loss in the annulus is the onlyparameter that affects ROP significantly, and finally, they proposed an analyticalmodel for estimation of ROP based on the model introduced by Bourgoyne andYoung. Ping et al. [29] utilized shuffled frog leaping algorithm to optimize ROP as afunction of bit rotational velocity, weight on bit, and flow rate. Hankins et al. [30]optimized drilling process of already drilled wells with variables of weight on bit,rotational velocity, bit properties, and hydraulics to minimize drilling costs.Shishavan et al. [31] studied a preliminary managed pressure case to minimize theassociated risk and decrease the drilling costs. Wang and Salehi [32] used artificialintelligence for prediction of optimum mud hydraulics during drilling operations
103
Applications of Artificial Intelligence Techniques in Optimizing DrillingDOI: http://dx.doi.org/10.5772/intechopen.85398

and performed sensitivity analysis using forward regression. A variety ofartificial intelligence works have recently been conducted in civil and oilengineering [33–36].
In the following sections, a new approach was used for prediction and optimi-zation of ROP, based on artificial neural network (ANN). According to the authors’knowledge, ANN application on ROP optimization has not been widely used byprevious studies. The variables used in this study were well depth (D), weight onbit (WOB), bit rotational velocity (N), the ratio of yield point to plastic viscosity(Yp/PV), and the ratio of 10 min gel strength to 10 s gel strength (10MGS/10SGS).Using ANN technic, several models were developed for prediction of ROP, and thebest one was selected according to their performances. Then, an artificial bee colony(ABC) algorithm was used for optimization of ROP based on the selected ANNpredictive model, and the drilling parameters were evaluated to determine theireffects on ROP.
5. Methodology of the problem of the case study
In the present work, it is aimed to apply neural networks in combination withartificial bee colony (ABC) algorithm on a real case of penetration rate predictionand optimization. The basic definitions regarding the problem of study are providedin the nest subsections. Then, the case used in our work is explained. At the end,ABC algorithm used in the optimization process is described.
5.1 Hydrocarbon reservoir
Hydrocarbon is the general term used for any substance, which is composed ofhydrogen and carbon. From clothing to energy, there are different areas in whichhydrocarbons serve as the main material. Hydrocarbons are usually extracted fromreservoirs located deep in the formation of the earth’s crust. Underground hydro-carbon reservoirs, which are also known as oil and gas reservoirs, have beenexploited since more than one and half a century ago. And there have been severaldevelopments in technologies associated with oil and gas industry [37, 38].
The term hydrocarbon reservoir is used for a large volume of rock containinghydrocarbon either in oil or gas form, which is usually found in deep formation inthe earth. This type of reservoir is far different from what most of people imaginewhen they think about. A hydrocarbon reservoir is not a tank or something likethat. In fact, it is a rock having numerous pores, which make it capable of storingfluid. There are two types of hydrocarbon reservoirs: conventional andunconventional [39].
A conventional reservoir consists of porous and permeable rock, which isbounded by an impermeable rock, usually called cap rock. Due to the high pressurein the deep layers, the fluid in the reservoir rock tends to move out of the rocktoward lower depths, which usually have lower pressures. The role of cap rock is toseal the rock in order to prevent the hydrocarbon from migrating to low-pressuredepths.
Conventional reservoirs were the only type of exploited hydrocarbon reservoirsuntil the recent years. As the conventional reserves became rare and depleted, oiland gas industries started to study the feasibility of production from unconven-tional reservoirs. Thanks to the recent developments in the related technologies,production of hydrocarbon from unconventional reservoirs has been started indifferent locations of the earth. The major difference between conventional andunconventional reservoirs is that in unconventional reservoirs, there is no
104
Emerging Trends in Mechatronics
traditional placement of reservoir and cap rock. The reservoir rock has highĸporosity, but because of low permeability, the fluid cannot move out of itand is entrapped into the rock. Since the example of the present work dealswith a conventional reservoir, we avoid discussing more about unconventionalreservoirs.
In order to produce oil and gas from a reservoir, at the first step, it is required tofind a location in which hydrocarbon is accumulated in such a large volume that itcan be exploited in an economic way. This exploration step is typically done usingseismic technics. In the next step, the location with high probability of havinghydrocarbon storage is drilled. The drilled well is called exploration well, and if itreaches a relatively large amount of hydrocarbon, more wells are drilled afterpreparing a field development plan. The production of the reservoir continues untilthe production rate falls below an economic criterion, which is usually defined asnet present value.
Due to the high pressure of the reservoir rock, the hydrocarbon tends to movetoward a lower pressurized region. In order to exploit the entrapped hydrocarbonand providing a flow path, one or more wells are needed. The well is drilled deepinto the rocks, and after passing the cap rock, it reaches the reservoir rock. Then,due to the pressure difference between the rock and surface, the hydrocarbons startto move from the reservoir to the surface through the drilled well. Sometimes thepressure difference is not so large that the fluid can reach the surface. In these cases,some technics, called artificial lift methods, are used to increase the energy fordelivering the fluid to higher altitude. After extraction of hydrocarbon, it isdelivered to treatment facilities and the next steps are designed according to theproducer company’s plan.
5.2 Drilling operations
As mentioned above, exploitation of oil and gas reservoirs typically consists ofthe three types of operation: exploration, drilling, and production. The drillingphase involves costly operations, which consume a high portion of the capitalexpenditure of the field development. Therefore, optimizing the operations associ-ated with drilling can reduce the investments significantly, increasing the net pre-sent value of the project [40].
In the early years of oil and gas industry, the wells were drilled using percussiontable tools. These technics became inefficient as demand for drilling deep and hencemore pressurized formations increased. In the early twentieth century, rotary dril-ling technic was introduced to oil and gas industries and it paved the way fordrilling faster and deeper wells.
Rotary drilling simply defines the process in which a sharp bit penetrates intothe rock due to its weight and rotational movement [41]. Rotary drilling systemcomprises prime movers, hoisting equipment, rotary equipment, and circulatingequipment, all of which mounted on a rig. The prime mover, usually a diesel engine,provides the power required for the whole rig. Hoisting system is responsible forraising and lowering the drill string in and out of the hole. Rotary equipmentsupports the rotation of the drill bit by transforming electrical power to rotationalmovement. In order to transport the cuttings to the surface and also to cool the bit,the circulation equipment provides mud flow that is directed into the drill stringdown to the bit and returns to surface transporting the debris accumulated in thebottom of the hole.
One of the important factors in drilling process is rate of penetration, which isusually measured in terms of meter per minute or foot per minute. This parametershows how fast the drilling process has been done, and thus, how much cost has
105
Applications of Artificial Intelligence Techniques in Optimizing DrillingDOI: http://dx.doi.org/10.5772/intechopen.85398

been reduced. Through the survey of previous studies, a series of parameters wereidentified as having significant effect on rate of penetration during drilling opera-tions. These parameters include rotation speed of the bit, weight on the bit, shut-inpipe pressure, mud circulation rate, yield point and plastic viscosity of the mud, andmud gel strength. In the following, each parameter is briefly described.
Bit rotation speed: In a drilling process, the bit is rotated using rotary table ortop drive system. The rotation of the bit is usually measured in rotation perminute (rpm).
Weight on the bit: In order to provide the required downward force for pene-trating into the rock, several drill collars are installed before the bit. The parameteris generally called weight on bit (WOB) and measured in thousand of pounds (Klb).
Standpipe pressure: Standpipe pressure (SPP) refers to the total pressure lossdue to fluid friction. In detail, SPP is the summation of pressure losses in drill string,annulus, bottom hole assembly, and across the bit. The unit for measuring the SPP ispounds per square inch (psi).
Mud flow rate: In order to lubricate and cool down the bit under drillingprocess, a mixture of additives mixed in water or oil, which, respectively, are calledwater-based and oil-based drilling mud, is pumped through the drill pipe down tothe bit. Drilling mud also cleans up the bottomhole by transporting the cuttings upto the surface. It also helps penetration rate as it passes bit nozzles and penetratesthe rock as a water jet system. Mud flow rate is often expressed in gallons perminute (gpm).
Mud yield point: Yield point, which is usually expressed in lbf/100 ft2, is anindicator for determining the resistance of a fluid to movement. It is a parameter ofBingham plastic model, which is equal to shear stress at zero shear rate. As attrac-tive force among the colloidal particle increases, the mud needs more force to move;hence the yield point is considered higher.
Mud plastic viscosity: Plastic viscosity of the mud is determined by the slope ofthe shear stress vs. shear rate plot. Higher plastic viscosity indicates more viscousfluid and vice versa. The unit for measurement of plastic viscosity is centipoises.
Mud gel strength: Gel strength is the term that defines the shear stress mea-sured at low shear rate after the drilling mud has been static for a certain period oftime, which is 10 s and 10 min in API standard. It indicates ability of the drillingmud to suspend drill solid and weighting material when circulation is ceased. It ismeasured in lbf/100 ft2 in petroleum engineering applications.
5.3 Case study
In the present study, a data set obtained from a drilling process in a gas fieldlocated in the south of Iran was used. The depth of the well was 4235, which wasdrilled with one run of roller-cone bit and three runs of PDC bit. The IADC code ofthe roller-cone bit was 435 M, and PDC bits had codes of M332, M433, and M322.Roller-cone bit was used for about 20% and PDC bits for 80% of the drilled depth.In detail, roller-cone bit was used for the depth interval of 1016–1647 m, PDC(M332) was used for depth interval of 1647–2330 m, PDC (M433) was used fordepth interval of 2330–3665 m, and finally, the depth between 3665 and 4235 m wasdrilled by PDC (M322).
The data set consists of 3180 samples, which were taken every 1 meter ofpenetration from 1016 to 4235 m. The recorded variables included well depth (D),rotation speed of bit (N), weight on bit (WOB), shut-in pipe pressure (SPP), fluidrate (Q), mud weight (MW), the ratio of yield point to plastic viscosity (Yp/PV),and the ratio of 10 min gel strength to 10 s gel strength (10MGS/10SGS). Thestatistical summary of the data points is gathered in Table 1.
106
Emerging Trends in Mechatronics
5.4 General description of artificial bee Colony
This algorithm was developed by Karaboga [42] and mimics the behavior of beeswhen they search for nectar of flowers. In a hive of bees, there are three differenttypes of bees: scouts, employed bees, and onlookers. The scout bees start a randomsearch of the surrounding environment in order to find flowers that secrete nectar.After finding the flowers, they keep the location in their memory. Then, they returnto the hive and share their information about their findings through a process calledwaggle dance. Next, the other group, called employed bees, starts finding theflowers based on the information obtained from the scouts in order to exploit thenectar of the flowers. The number of employed bees is equal to number of foodsources. The third group of bees are called onlookers, which remain in the hivewaiting for the return of the employed bees in order to exchange information and
Parameter (unit) Minimumvalue
Maximumvalue
Meanvalue
Well depth (m) 1016 4235 2636
Rotation speed of bit (rpm) 91.38 192.00 150.72
Weight on bit (Klb) 1.02 43.26 21.59
Shut-in pipe pressure (psi) 898.98 4085.82 2502.61
Fluid rate (gpm/day) 726.92 1054.75 865.17
The ratio of yield point to plastic viscosity 0.96 2.09 1.49
The ratio of 10 min gel strength to 10 s gel strength 1.13 1.50 1.27
Table 1.Statistical summary of input data.
Figure 12.Typical flowchart of ABC algorithm.
107
Applications of Artificial Intelligence Techniques in Optimizing DrillingDOI: http://dx.doi.org/10.5772/intechopen.85398

select the best source based on the dances (fitness of the candidates). In addition,the employed bees of an abandoned food site serves as a scout bee.
Considering an objective function, f xð Þ, the probability of a food source to bechosen by an onlooker can be expressed as [42]:
Pi ¼ F xið Þ∑S
j¼1F xið Þ
(14)
where S indicates the number of food sources and F xð Þ represents the amount ofnectar at location x. The intake efficiency is defined as F=τ, in which τ representsthe time consumed at the food source. If in a predefined number of iterations, afood source is tried with no improvement, then the employed bees dedicated tothis location become scout and hence start searching the new food sources in arandom manner.
ABC algorithm has been used in different engineering problems including wellplacement optimization of petroleum reservoirs [43], optimization of waterdischarge in dams [44], data classification [45], and machine scheduling [46].More description on the ABC algorithm can be found in other references [47–50].A typical flowchart of ABC algorithm is shown in Figure 12.
6. Result and discussion
6.1 Prediction
In the present research, an ANN model was developed to predict the ROP as afunction of effective parameters. The neural network is widely used in variousengineering fields [51–60]. In order to train the network, three training functionswere used including Levenberg-Markvart (LM), scaled conjugate gradient (SCG),and one-step secant (OSS). The number of hidden layers in the network was onesince according to Hornik et al. [61], one hidden layer is capable of solving any typeof nonlinear function. The number of neurons in the hidden layer was anotherparameter to be set. Several equations have been proposed by different authorsto determine the optimum number of neurons in a hidden layer, which arerepresented in Table 2. Ni and No indicate the number of input and output vari-ables, respectively.
Using the values obtained by equations of Table 2, several ANN models weredeveloped with neurons of 2–16. Then, the models were compared in terms of R2
and RMSE, and the best model was selected [69, 70, 56, 71]. The comparison wasdone through the method proposed by Zorlu et al. [72]. In this method, the R2 andRMSE of each enveloped model are calculated. Next, the networks are assigned aninteger number according to their R2 and RMSE value, in the way that the betterresult acquires higher number. For example, if the number of models is equal to 8,the model having the best (highest) R2 value acquires 8, and the model having theworst model acquires the value of 1. This procedure also is repeated based on RMSEcomparison. Then, the two numbers assigned to each model are summed up, and atotal score is obtained for each model. Finally, the model acquiring the highest totalvalue is determined as the best model for the problem of study.
In the present article, three types of learning functions were used for training thenetwork, results of which are presented in Tables 3–5. According to the tables, LM,SCG, and OSS functions acquired the best results, respectively. In order to design an
108
Emerging Trends in Mechatronics
accurate model, the best model of each function was compared. The results ofcomparison are shown in Figures 13 and 14. As can be seen, the best model of LMfunction yielded better performance. Thus, this function was selected for designingan ANN for prediction and optimization of ROP.
Relationships Reference
≤ 2� Ni + 1 [62]
(Ni + N0)/2 [63]
2þN0�Niþ0:5 N0� N02þNið Þ�3
NiþN0
[64]
2Ni/3 [65]ffiffiffiffiffiffiffiffiffiffiffiffiffiffiffiffiffiNi �N0
p[66]
2Ni [67, 68]
Table 2.The equations for determining the optimum number of neurons in a hidden layer.
Model no. Neuron no. Train Test Train rating Test rating Total rank
R2 RMSE R2 RMSE R2 RMSE R2 RMSE
1 2 0.839 0.1040 0.816 0.1076 1 1 1 1 4
2 4 0.899 0.0821 0.885 0.0893 5 6 4 4 19
3 6 0.902 0.0850 0.897 0.0818 6 4 8 8 26
4 8 0.882 0.0897 0.884 0.0886 2 2 3 5 12
5 10 0.893 0.0868 0.887 0.0910 4 3 5 2 14
6 12 0.892 0.0827 0.875 0.0907 3 5 2 3 13
7 14 0.908 0.0800 0.892 0.0885 7 7 6 6 26
8 16 0.912 0.0779 0.893 0.0863 8 8 7 7 30
Table 3.The results of the developed ANN models based on LM function.
Model no. Neuron no. Train Test Train rating Test rating Total rank
R2 RMSE R2 RMSE R2 RMSE R2 RMSE
1 2 0.798 0.1159 0.824 0.1002 1 1 3 4 9
2 4 0.820 0.1092 0.815 0.1083 4 4 2 2 12
3 6 0.809 0.1127 0.839 0.0949 2 2 6 8 16
4 8 0.841 0.1035 0.831 0.0993 6 6 4 5 21
5 10 0.827 0.1076 0.846 0.0982 5 5 7 7 24
6 12 0.814 0.1093 0.810 0.1093 3 3 1 1 8
7 14 0.853 0.0984 0.837 0.1065 8 8 5 3 24
8 16 0.849 0.1006 0.860 0.0985 7 7 8 6 28
Table 4.The results of the developed ANN models based on SCG function.
109
Applications of Artificial Intelligence Techniques in Optimizing DrillingDOI: http://dx.doi.org/10.5772/intechopen.85398

Model no. Neuron no. Train Test Train rating Test rating Total rank
R2 RMSE R2 RMSE R2 RMSE R2 RMSE
1 2 0.815 0.1128 0.807 0.1033 2 2 4 5 13
2 4 0.811 0.1089 0.781 0.1254 1 4 1 1 7
3 6 0.829 0.1072 0.791 0.1086 5 6 2 3 16
4 8 0.816 0.1113 0.843 0.0976 3 3 8 7 21
5 10 0.837 0.1128 0.792 0.1057 7 2 3 4 16
6 12 0.822 0.1085 0.828 0.0971 4 5 5 8 22
7 14 0.849 0.0996 0.836 0.1098 8 8 6 2 24
8 16 0.832 0.1055 0.840 0.1006 6 7 7 6 26
Table 5.The results of the developed ANN models based on OSS function.
Figure 13.The results of R2 for LM, SCG, and OSS functions.
Figure 14.The results of RMSE for LM, SCG, and OSS functions.
110
Emerging Trends in Mechatronics
6.2 Optimization
In the previous section, an ANN was developed for prediction of ROP using theinput data. As mentioned, selecting the most accurate predictive model can signif-icantly affect the performance of optimization. In this section, the performance ofthe optimization algorithm is evaluated. Then, the ANN model obtained in theprevious section is incorporated in the optimization algorithm to optimize theeffective parameters for maximizing the penetration rate.
6.3 Evaluation of optimization algorithm
In this section, the best ANN model obtained in the previous section wasselected for optimization of ROP using ABC algorithm. In order to evaluate theperformance of ABC, two functions were used for minimization by ABC:
F1 xð Þ ¼ 1þ x1 þ x2 þ 1ð Þ2 19� 14x1 þ 3x21 � 14x2 þ 6x1x2 þ 3x22� �h i
� 30þ 2x1 � 3x2ð Þ2 18� 32x1 þ 12x21 þ 48x2 � 36x1x2 þ 27x22� �h i (15)
The range of variations of x1 and x2 are (�2, 2). Also, the optimal value of thisfunction at the point (1�, 0) is 3.
This function is plotted in Figure 15. The ABC algorithm was used for findingminimum point of the above mentioned function, and the values of �0.33559 and�0.52311 were obtained for Eq. (15). The performance of ABC in finding theminimum point is illustrated in Figure 16.
6.4 Optimization of ROP in petroleum wells
In this section, the ANN predictive model was used for optimization of param-eters effective on ROP. Since the well depth increases during drilling, it was notconsidered as a decision variable. Hence, the parameters of ROP were optimized in
Figure 15.Function of Eq. (6) plotted in Cartesian coordinates.
111
Applications of Artificial Intelligence Techniques in Optimizing DrillingDOI: http://dx.doi.org/10.5772/intechopen.85398

some specific depths. It makes sense in the way that the parameters cannot beoptimized in each meter of penetration.
The ABC algorithm was used for optimization of ROP effective parameters.After a series of sensitivity analysis, it was concluded that the efficient number ofpopulation and iterations are 40 and 500, respectively. Three depths on whichoptimization applied were 2000, 2500, and 3000. The results of optimization in theselected depths are provided in Tables 6–8.
As can be seen, in each selected depth, value of ROP was increased by about20–30%. Therefore, by combining artificial intelligence and optimization, suitable
Figure 16.Evaluation of ABC algorithm for Eq. (6).
Parameter Unit Initial value Optimum value
WOB Klb 23.8 17.4
N rpm 181 149
SPP psi 2181.4 2783.6
Q bbl/day 901.67 848
Yp/PV — 1.545 1.34
10MGS/10SGS — 1.33 1.16
ROP m/h 16.77 21.66
Table 6.Comparison of real and optimized values for depth of 2000 m.
Parameter Unit Initial value Optimum value
WOB Klb 15.4 21.6
N rpm 157 162
SPP psi 2531.5 2481.3
Q bbl/day 898.45 790
Yp/PV — 2.09 1.76
10MGS/10SGS — 1.2 1.09
ROP m/h 18.52 22.85
Table 7.Comparison of real and optimized values for depth of 2500 m.
112
Emerging Trends in Mechatronics
patterns for ROP in an oil well in order to increase penetration and reduce costs canbe created.
6.5 Conclusion and summary
In this chapter, firstly, the basics of optimization are explained to solve prob-lems. Then, an application of neural network combined with ABC algorithm wasused for prediction of rate of penetration in a gas well. The data were collected froma gas field located in south of Iran. Seven input parameters were selected as inputdata to develop a predictive ANN model. For this purpose, three learning functionswere compared, and LM function was selected as the best function for designing thepredictive model. Next, an ABC algorithm was employed to optimize the effectiveparameters of ROP for maximizing the penetration rate. Three scenarios wereselected for considering the well depth in optimization process. Then, the bestmodels for the depths of 2000, 2500, and 3000 m were obtained, and the resultsshowed 20–30% of improvement in penetration rate.
According to the results of the test, it was concluded that the proposed model is apowerful tool for prediction and optimization of rate of penetration during drillingprocess. Since the drilling process involves numerous effective parameters, it isalmost infeasible to explicitly take into account each parameter. Therefore, use ofANN seems very useful in this complex problem and it helps to predict and opti-mize the penetration rate in a short period of time and without heavy computationalcosts.
Parameter Unit Initial value Optimum value
WOB Klb 21.9 25.5
N rpm 142 153
SPP psi 2854.7 2927.5
Q bbl/day 851.7 816
Yp/PV — 1.428 1.59
10MGS/10SGS — 1.25 1.11
ROP m/h 13.94 17.30
Table 8.Comparison of real and optimized values for depth of 3000 m.
113
Applications of Artificial Intelligence Techniques in Optimizing DrillingDOI: http://dx.doi.org/10.5772/intechopen.85398

Author details
Mohammadreza Koopialipoor1* and Amin Noorbakhsh2
1 Faculty of Civil and Environmental Engineering, Amirkabir University ofTechnology, Tehran, Iran
2 Department of Petroleum Engineering, Amirkabir University of Technology,Tehran, Iran
*Address all correspondence to: [email protected]
© 2020TheAuthor(s). Licensee IntechOpen.Distributed under the terms of theCreativeCommonsAttribution -NonCommercial 4.0 License (https://creativecommons.org/licenses/by-nc/4.0/),which permits use, distribution and reproduction fornon-commercial purposes, provided the original is properly cited. –NC
114
Emerging Trends in Mechatronics
References
[1] Azizi A. Introducing a novel hybridartificial intelligence algorithm tooptimize network of industrialapplications in modern manufacturing.Complexity. 2017:18. https://doi.org/10.1155/2017/8728209
[2] Holland JH. Genetic algorithms.Scientific American. 1992;267:66-73
[3] Kirkpatrick S, Gelatt CD, Vecchi MP.Optimization by simulated annealing.Science (80-). 1983;220:671-680
[4] Glover F. Tabu search—Part I. ORSAJournal on Computing. 1989;1:190-206
[5] Dorigo M, Birattari M. Ant colonyoptimization. In: Encyclopedia ofMachine Learning. Springer; 2011.pp. 36-39
[6] James K, Eberhart R. A newoptimizer using particle swarm theory.In: Proceedings of the IEEE sixthinternational symposium on micromachine and human science.1995;34:39-43
[7] Kennedy J. Particle swarmoptimization. In: Encyclopedia ofMachine Learning. Springer; 2011.pp. 760-766
[8] Geem ZW, Kim JH, Loganathan GV.A new heuristic optimization algorithm:Harmony search. SIMULATION. 2001;76:60-68
[9] Yang X-S. Metaheuristicoptimization. Scholarpedia. 2011;6:11472
[10] Erol OK, Eksin I. A newoptimization method: Big bang–bigcrunch. Advances in EngineeringSoftware. 2006;37:106-111
[11] Yang X-S. Firefly algorithms formultimodal optimization. In:International Symposium on StochasticAlgorithms. Springer; 2009. pp. 169-178
[12] Atashpaz-Gargari E, Lucas C.Imperialist competitive algorithm: Analgorithm for optimization inspired byimperialistic competition. In:Evolutionary Computation, 2007. CEC2007. IEEE Congress on. IEEE; 2007.pp. 4661-4667
[13] Yang X-S, Deb S. Cuckoo search:Recent advances and applications.Neural Computing and Applications.2014;24:169-174
[14] Yang X-S. A new metaheuristic bat-inspired algorithm. In: Nature InspiredCooperative Strategies for Optimization(NICSO 2010). Springer; 2010.pp. 65-74
[15] Kaveh A, Talatahari S. A novelheuristic optimization method: Chargedsystem search. Acta Mechanica. 2010;213:267-289
[16] Gandomi AH, Alavi AH. Krill herd:A new bio-inspired optimizationalgorithm. Communications inNonlinear Science and NumericalSimulation. 2012;17:4831-4845
[17] Kaveh A, Farhoudi N. A newoptimization method: Dolphinecholocation. Advances in EngineeringSoftware. 2013;59:53-70
[18] Maurer WC. The“ perfect-cleaning”theory of rotary drilling. Journal ofPetroleum Technology. 1962;14:1-270
[19] Galle EM, Woods HB. Best constantweight and rotary speed for rotaryrock bits. In: Drilling and ProductionPractice. Society of PetroleumEngineers: American PetroleumInstitute; 1963
[20] Mechem OE, Fullerton HB Jr.Computers invade the rig floor. Oil andGas Journal. 1965;1:14
[21] Bourgoyne AT Jr, Young FS Jr. Amultiple regression approach to optimal
115
Applications of Artificial Intelligence Techniques in Optimizing DrillingDOI: http://dx.doi.org/10.5772/intechopen.85398

drilling and abnormal pressuredetection. Society of PetroleumEngineers Journal. 1974;14:371-384
[22] Tansev E. A heuristic approach todrilling optimization. In: Fall Meeting ofthe Society of Petroleum Engineers ofAIME. Society of Petroleum Engineers;1975
[23] Al-Betairi EA, Moussa MM, Al-Otaibi S. Multiple regression approachto optimize drilling operations in theArabian gulf area. SPE DrillingEngineering. 1988;3:83-88
[24] Maidla EE, Ohara S. Fieldverification of drilling models andcomputerized selection of drill bit,WOB, and drillstring rotation. SPEDrilling Engineering. 1991;6:189-195
[25] Hemphill T, Clark RK. The effects ofpdc bit selection and mud chemistry ondrilling rates in shale. SPE Drilling andCompletion. 1994;9:176-184
[26] Fear MJ. How to improve rate ofpenetration in field operations. SPEDrilling and Completion. 1999;14:42-49
[27] Ritto TG, Soize C, Sampaio R.Robust optimization of the rate ofpenetration of a drill-string using astochastic nonlinear dynamical model.Computational Mechanics. 2010;45:415-427
[28] Alum MA, Egbon F. Semi-analyticalmodels on the effect of drilling fluidproperties on rate of penetration (ROP).In: Nigeria Annual InternationalConference and Exhibition. Society ofPetroleum Engineers; 2011
[29] Yi P, Kumar A, Samuel R. Realtimerate of penetration optimization usingthe shuffled frog leaping algorithm.Journal of Energy ResourcesTechnology. 2015;137:32902
[30] Hankins D, Salehi S, Karbalaei SalehF. An integrated approach for drillingoptimization using advanced drilling
optimizer. Journal of PetroleumEngineering. 2015;2015:12. http://dx.doi.org/10.1155/2015/281276
[31] Asgharzadeh Shishavan R, HubbellC, Perez H, et al. Combined rate ofpenetration and pressure regulation fordrilling optimization by use of high-speed telemetry. SPE Drilling andCompletion. 2015;30:17-26
[32] Wang Y, Salehi S. Application ofreal-time field data to optimize drillinghydraulics using neural networkapproach. Journal of Energy ResourcesTechnology. 2015;137:62903
[33] Koopialipoor M, Armaghani DJ,Hedayat A, et al. Applying varioushybrid intelligent systems to evaluateand predict slope stability under staticand dynamic conditions. SoftComputing. 2018;34:1-17
[34] Koopialipoor M, Armaghani DJ,Haghighi M, Ghaleini EN. A neuro-genetic predictive model to approximateoverbreak induced by drilling andblasting operation in tunnels. Bulletin ofEngineering Geology and theEnvironment. 2017;33:1-10
[35] Hasanipanah M, Armaghani DJ,Amnieh HB, et al. A risk-basedtechnique to analyze Flyrock resultsthrough rock engineering system.Geotechnical and GeologicalEngineering. 2018;34:1-14
[36] Koopialipoor M, Nikouei SS, MartoA, et al. Predicting tunnel boringmachine performance through a newmodel based on the group method ofdata handling. Bulletin of EngineeringGeology and the Environment. 2018;34:1-15
[37] Bradley HB. Petroleum EngineeringHandbook. Society of PetroleumEngineers; 1987
[38] Pirson SJ. Oil Reservoir Engineering.RE Krieger Publishing Company; 1977
116
Emerging Trends in Mechatronics
[39] Ahmed T. Reservoir EngineeringHandbook. Elsevier; 2006
[40] Bourgoyne AT, Millheim KK,Chenevert ME, Young FS. AppliedDrilling Engineering. Society ofPetroleum Engineers; 1986
[41] Mitchell RF, Miska SZ.Fundamentals of Drilling Engineering.Society of Petroleum Engineers; 2017
[42] Karaboga D. An Idea Based onHoney Bee Swarm for NumericalOptimization. Technical Report-tr06,Erciyes University, Engineering Faculty,Computer Engineering Department;2005
[43] Nozohour-leilabady B,Fazelabdolabadi B. On the application ofartificial bee colony (ABC) algorithmfor optimization of well placements infractured reservoirs; efficiencycomparison with the particle swarmoptimization (PSO) methodology.Petroleum. 2016;2:79-89
[44] Ahmad A, Razali SFM, MohamedZS, El-shafie A. The application ofartificial bee colony and gravitationalsearch algorithm in reservoiroptimization. Water ResourcesManagement. 2016;30:2497-2516
[45] Zhang C, Ouyang D, Ning J. Anartificial bee colony approach forclustering. Expert Systems withApplications. 2010;37:4761-4767
[46] Rodriguez FJ, García-Martínez C,Blum C, Lozano M. An artificial beecolony algorithm for the unrelatedparallel machines scheduling problem.In: International Conference on ParallelProblem Solving from Nature. Springer;2012. pp. 143-152
[47] Koopialipoor M, Ghaleini EN,Haghighi M, et al. Overbreak predictionand optimization in tunnel usingneural network and bee colonytechniques. Engineering Computations.2018;34:1-12
[48] Gordan B, Koopialipoor M,Clementking A, et al. Estimating andoptimizing safety factors of retainingwall through neural network and beecolony techniques. EngineeringComputations. 2018;34:1-10
[49] Koopialipoor M, Fallah A,Armaghani DJ, et al. Three hybridintelligent models in estimating flyrockdistance resulting from blasting.Engineering Computations. 2018;34:1-14
[50] Ghaleini EN, Koopialipoor M,Momenzadeh M, et al. A combination ofartificial bee colony and neural networkfor approximating the safety factor ofretaining walls. EngineeringComputations. 2018;35:1-12
[51] Azizi A, Yazdi PG, Humairi AA.Design and fabrication of intelligentmaterial handling system in modernmanufacturing with industry 4.0approaches. International Robotics &Automation Journal. 2018;4:186-195
[52] Azizi A, Entessari F, Osgouie KG,Rashnoodi AR. Introducing neuralnetworks as a computational intelligenttechnique. In: Applied Mechanics andMaterials. Trans Tech Publications;2014. pp. 369-374
[53] Osgouie KG, Azizi A. Optimizingfuzzy logic controller for diabetes type Iby genetic algorithm. In: Computer andAutomation Engineering (ICCAE), 2010the 2nd International Conference on.Trans Tech Publications: IEEE; 2010.pp. 4-8
[54] Azizi A. Hybrid artificialintelligence optimization technique. In:Applications of Artificial IntelligenceTechniques in Industry 4.0. Trans TechPublications: Springer; 2019. pp. 27-47
[55] Azizi A, Seifipour N. Modeling ofdermal wound healing-remodeling phaseby neural networks. In: Computer Scienceand Information Technology-Spring
117
Applications of Artificial Intelligence Techniques in Optimizing DrillingDOI: http://dx.doi.org/10.5772/intechopen.85398

Conference, 2009. IACSITSC’09.International Association of. Trans TechPublications: IEEE; 2009. pp. 447-450
[56] Koopialipoor M, Murlidhar BR,Hedayat A, et al. The use of newintelligent techniques in designingretaining walls. EngineeringComputations. 2019;35:1-12
[57] Zhao Y, Noorbakhsh A,Koopialipoor M, et al. A newmethodology for optimization andprediction of rate of penetration duringdrilling operations. EngineeringComputations. 2019;35:1-9
[58] Liao X, Khandelwal M, Yang H,et al. Effects of a proper featureselection on prediction and optimizationof drilling rate using intelligenttechniques. Engineering Computations.2019;35:1-12
[59] Azizi A, Vatankhah Barenji A,Hashmipour M. Optimizing radiofrequency identification networkplanning through ring probabilistic logicneurons. Advances in MechanicalEngineering. 2016;8:1687814016663476
[60] Azizi A. RFID network planning. In:Applications of Artificial IntelligenceTechniques in Industry 4.0. Springer;2019. pp. 19-25
[61] Hornik K, Stinchcombe M, WhiteH. Multilayer feedforward networks areuniversal approximators. NeuralNetworks. 1989;2:359-366
[62] Hecht-Nielsen R. Kolmogorov’smapping neural network existencetheorem. In: Proceedings of theInternational Joint Conference in NeuralNetworks. IEES press; 1989. pp. 11-14
[63] Ripley BD. Statistical aspects ofneural networks. In: Networks Chaos—Statistical Probabilistic Aspects.Chapman & Hall; Vol. 50. 1993.pp. 40-123
[64] Paola JD. Neural NetworkClassification of Multispectral Imagery.USA: Master Tezi, Univ Arizona; 1994
[65] Wang C. A Theory ofGeneralization in Learning Machineswith Neural Network Applications.University of PennsylvaniaPhiladelphia, PA, USA: 1994
[66] Masters T. Practical NeuralNetwork Recipes in C++. MorganKaufmann; 1993
[67] Kanellopoulos I, Wilkinson GG.Strategies and best practice for neuralnetwork image classification.International Journal of Remote Sensing.1997;18:711-725
[68] Kaastra I, Boyd M. Designing aneural network for forecasting financialand economic time series.Neurocomputing. 1996;10:215-236
[69] Ashkzari A, Azizi A. Introducinggenetic algorithm as an intelligentoptimization technique. In: AppliedMechanics and Materials. Trans TechPublications; 2014. pp. 793-797
[70] Azizi A. Applications of ArtificialIntelligence Techniques in Industry 4.0.Springer; 2018
[71] Koopialipoor M, Fahimifar A,Ghaleini EN, et al. Development of anew hybrid ANN for solving ageotechnical problem related to tunnelboring machine performance.Engineering Computations. 2019;35:1-13
[72] Zorlu K, Gokceoglu C, Ocakoglu F,et al. Prediction of uniaxial compressivestrength of sandstones usingpetrography-based models. EngineeringGeology. 2008;96:141-158
118
Emerging Trends in Mechatronics
Chapter 7
Design and Analysis of SMA-BasedTendon for Marine StructuresShahin Zareie and Abolghassem Zabihollah
Abstract
A tension-leg platform (TLP), as an offshore structure, is a vertically mooredfloating structure, connecting to tendon groups, fixed to subsea by foundations, toeliminate its vertical movements. TLPs are subjected to various non-deterministicloadings, including winds, currents, and ground motions, keeping the tendons underongoing cyclic tensions. The powerful loads can affect the characteristics of tendonsand cause permanent deformation. As a result of exceeding the strain beyond theelastic phase of the tendons, it makes unbalancing on the floated TLPs. Shape mem-ory alloy (SMA)-based tendons due to their superelasticity properties may potentiallyresolve such problem in TLP structures. In the present work, performance andfunctionality of SMAwire, as the main component of SMA-based tendon under cyclicloading, have been experimentally investigated. It shows a significant enhancementin recovering large deformation and reduces the amount of permanent deformation.
Keywords: tension-leg platform, shape memory alloy, tendon, the superelasticity,cyclic load
1. Introduction
Marine and offshore structures are the key elements in energy supply chains inmodern communities. A wide range of offshore structures including fixed andfloated platforms, particularly tension-leg platform (TLP), are used to discover,extract, and transport the fossil fuel from seas and oceans.
According to the depth of the sea or oceans, proper offshore structures arechosen. For instance, for the depth between 300 and 1500 m, TLPs are the opti-mized platforms. TLPs are classes of floating offshore structures, fixed by a tendonto the seabed, as presented in Figure 1 [2]. Tendons prevent vertical movementsunder tough external loadings from periodic, such as day-to-day winds and cur-rents, to nonperiodic, like hurricanes and earthquakes [3–5]. Each of those loadingscan put the integrity of the TLPs at risk.
In order to prevent any instability and damage, the applied loads should beprioritized with respect to the intensity. One of the most hazardous loadings isseismic activities, which can affect the integrity directly or indirectly by generatingpowerful loads, called the tsunamis. In TLPs, the seismic load’s effect can be trans-ferred by tendons to the main structures; hence, any damage or residual deforma-tion in tendons makes the whole structure unbalanced and unstable.
In order to enhance the dynamic behavior of the tendons, the ideal tendonsshould be able to recover the original shape after experiencing large deformation
119

and be able to absorb the energy of seismic activities [6–10]. With respect to thesedesired outcomes, the shape memory alloy (SMA) is an ideal alternative to replacethe conventional materials for making tendons, as shown in Figure 2.
An SMA is a class of smart materials with unique properties to return originalshape by applying heat after removing the load, called shape memory effect (SME)or only removing loads, called superelasticity (SE). The SME and SE’s state dependson the applied straining and working temperature. In both the SME and SE, theSMA is capable of dissipating the energy of the external loads. Overall, SMAs in theSE state are much popular than the SME mode, due to the simplicity of use and noneed for any external source of heat. Nowadays, SMA-based applications areextensively used in many engineering applications, such as aerospace, automotive,civil infrastructure, and particularly, marine and offshore structures [6, 9–13].
The suggested SMA-based tendons are composed of SMA wires. The functional-ity of SMA wires under long-term cyclic loading is a crucial parameter to use forTLPs. In this study, the performance of the SMA wires is evaluated by exposingunder cyclic loading.
Figure 1.The schematic diagram of TLP with SMA-based tendons taken from [1].
Figure 2.The schematic diagram of the SMA-based tendon and its components taken from.
120
Emerging Trends in Mechatronics
2. Shape memory alloy
The simplified constitutive law of superplastic SMA can be expressed by [14]:
σ εð Þ ¼ E ε� εT� �
(1)
where σ, E, ε, and εT are the stress, the Young modules of SMA, the strain, andthe phase transformation strain, respectively.
The Young modulus of SMA is given by [14]:
E ¼ EA þ ζ EM � EAð Þ (2)
where ξ denotes the phase transformation volume fraction. EM and EA are theYoung modulus in the Martensite phase and the Young modulus in the Austenitephase, as presented in Figure 3.
In the loading phase, εT is given by [14]:
εT ¼ ζεTL (3)
In the unloading phase, εT is given by
εT ¼ ζεULT (4)
In Eqs. (3) and (4), εTL and εTUL denote the maximum phase transformation strainfrom Martensite to the Austenite and maximum phase transformation strain fromMartensite to the Austenite from Austenite to Martensite, respectively.
The relation between εTUL and εTL is expressed by [14]:
εTUL ¼ εTL þσms � σaf
EA� σmf � σas
EM(5)
Figure 3.The schematic diagram of strain-stress behavior of the shape memory alloy.
121
Design and Analysis of SMA-Based Tendon for Marine StructuresDOI: http://dx.doi.org/10.5772/intechopen.88451

where σms and σmf are the Martensite phase start stress to the Martensite phasefinish stress, correspondingly. Similarly, σas and σaf denote the Austenite phase startstress and Austenite phase finish stress. These stresses are displayed in Figure 3.
2.1 Energy dissipation
One of the main advantages of SMA tendon is the energy dissipation capacity.To compute this, the hysteresis response of the SMA is divided into elements, asshown in Figure 4. The energy dissipation of each element is expressed by
Energytotal ¼Xn�1
i¼1
0:5 Fi þ Fi�1ð Þ Di �Di�1ð Þ (6)
where Fi and Di stand the force and displacement of i-node in i-th element.The total energy dissipation capacity of SMA is the sum of all energy dissipation
capacity in each element.
3. Experimental configuration
In order to apply the dynamic cyclic load on the SMA wire, the MTS model 370.5in the University of British Columbia, Okanagan Campus is used. It is a loadingframe machine with an ability of 500 kN loading capacity. This machine is aprogrammable system equipped with sensor, actuators, control system, and soft-ware to run and collect data. This system and its accessories are displayed inFigure 5.
3.1 Shape memory alloy
Nowadays, among the different alloys for SMAs, nickel-titanium or Nitinol(NiTi) is one of the most common SMAs. In the present study, NiTi fabricated byConfluent Medical Technologies Company is used. The SMA specimen with
Figure 4.The schematic diagram of the hysteresis response.
122
Emerging Trends in Mechatronics
0.75 mm radius and 560 mm length is kept between the top and the bottom gripperof the MTS loading frame machine by two supportive steel plates. In order toperform the experimental tests, two specimens with 0 and 1.7% applied prestrainedare used.
The mechanical properties are given in Table 1. It is observed that the density,the melting point, the coefficient of thermal expansion, the ultimate tensilestrength, and the total elongation are 1310°C, 6.5 g/cm3, 41 GPa, �1070 MPa, and�10%, correspondingly.
4. Results
To simulate the effect of the long-term loading on the SMA specimens with andwithout applied prestraining, 1000 cyclic loads with the period of 1.4 s and theamplitude of 20 mm, as shown in Figure 6, are applied by the MTS loading framemachine.
Physical properties Value
Melting point (°C) 1310
Density (g/cm3) 6.5
Modulus of elasticity (GPa) 41
Coefficient of thermal expansion (\°C) 11 � 10�6
Ultimate tensile strength (MPa) �1070
Total elongation �10%
Straight length (mm) 560
Radius (mm) 1.5
Table 1.The characteristics of NiTi shape memory alloy.
Figure 5.The MTS model 370.5 in the UBC and its accessories.
123
Design and Analysis of SMA-Based Tendon for Marine StructuresDOI: http://dx.doi.org/10.5772/intechopen.88451

The hysteresis responses of the SMA specimens are displayed in Figure 7. Asseen, the strain-stress behavior of the SMA wires is a remarkable change underloading. It is found that the areas inside of hysteresis responses, representing energydissipation capacities, decrease in both kinds of SMA specimens.
Another finding is the residual strain of the SMA specimen. It is noted that theresidual strain of the SMA specimen without applying prestrained appears andchanges up under cyclic loading. However, he prestrained SMA specimen is capableof fully recovering the original shape after exposing to the long-term cyclic loadings.
Figure 6.1/1000 of applied cyclic loading by the MTS machine.
Figure 7.Hysteresis response of the SMA along 1000 cyclic loadings.
Figure 8.The energy dissipation capacity of SMA specimens along 1000 cyclic loadings.
124
Emerging Trends in Mechatronics
Figure 8 illustrates the contrast energy dissipation capacity between the SMAspecimens. It is seen that the energy dissipation of the SMA without appliedprestraining decreases significantly from 2.29 to 0.58 J after subjected 500 cyclicloadings and reaches 0.54 J after 1000 cyclic loadings. Under the same loadingprotocol, this amount in the SMA specimen with 1.7% prestrained reduces from2.27 to 0.69 J exposed to 500 cyclic loadings and changes down to 0.56 J under 1000cyclic loadings. This comparison shows that the rate of reduction in the energyabsorption capacity of the 0% prestrained SMA wire win the first 500 cyclic is muchmore than the 1.7% prestrained SMA wire. Between 500 cycles and 1000 cycles, thesimilar drop in the energy absorption capacity in both specimens is observed.
The recovery ability is the next studied parameter in the 0% prestrained SMAspecimen, as presented in Figure 9. Between 0-500 cyclic loading, the residualstrain changes up from 0 to 2% strain of the initial strain and changes up to 3 %.As seen, a remarkable drop in the recovery ability of the SMA in the first 500 cyclicloadings. In the last 500 cyclic loadings, the steady decrease in recovery ability isobserved.
5. Conclusion
This study shows that the SMA-based tendon is an ideal alternative over theconventional tendon of TLPs. It can recover the original shape up to 4% of initiallength. The effect of cyclic loading on SMA wires, as the main component of theSMA-based tendons of TLP, has been examined through experimental tests.
The main outcomes of the paper are as follows:
1.The SMA wire with and without applying prestrain can absorb the remarkableenergy of external excitations. However, the degradation in SMA can decreasethe energy dissipation capacity under long-term loadings. Hence, at least, thesafety factor of the two should be determined due to the effect of thedegradation in SMAs. It covers the reduction in that capacity during long-termloadings.
2. It is also suggested to consider the residual deformation while the system isdesigned; another solution is to apply the restraining. This action prevents toform any residual deformation in SMA-based tendon.
Figure 9.The residual strain of the SMA specimen with 0% prestrained.
125
Design and Analysis of SMA-Based Tendon for Marine StructuresDOI: http://dx.doi.org/10.5772/intechopen.88451

For the future study, the effect of a wide range of loading’s frequencies andamplitudes on the performance of the SMA-based tendons is suggested.
Acknowledgements
This research received funding from the Green Construction Research andTraining Center (GCRTC) and Desmond Schumann Memorial Award. The authorswish to thank the University of British Columbia, Okanagan Campus, for the tech-nical support. The authors also wish to thank Mr. Kyle Charles as a research engi-neer and ex-manager lab for his valuable help in the experimental tests at theapplied laboratory for advanced materials and structures at the University of BritishColumbia Okanagan Campus and M. Daghighi for the help received.
Author details
Shahin Zareie1* and Abolghassem Zabihollah2
1 School of Engineering, The University of British Columbia, Kelowna, BC, Canada
2 School of Science and Engineering, Sharif University of Technology,International Campus, Kish Island, Iran
*Address all correspondence to: [email protected]
© 2020TheAuthor(s). Licensee IntechOpen.Distributed under the terms of theCreativeCommonsAttribution -NonCommercial 4.0 License (https://creativecommons.org/licenses/by-nc/4.0/),which permits use, distribution and reproduction fornon-commercial purposes, provided the original is properly cited. –NC
126
Emerging Trends in Mechatronics
References
[1] Gagani A, Krauklis A,Echtermeyer AT. Anisotropic fluiddiffusion in carbon fiber reinforcedcomposite rods: Experimental,analytical and numerical study. MarineStructures. 2018;59:47-59
[2] Bhaskara Rao DS, Panneer Selvam R.Response analysis of tension-basedtension leg platform under irregularwaves. China Ocean Engineering. 2016;30(4):603-614
[3] Guo J, Wu J, Guo J, Jiang Z. Adamage identification approach foroffshore jacket platforms using partialmodal results and artificial neuralnetworks. Applied Sciences. 2018;8(11):2173
[4] Wang S, Li H, Han J, et al. Damagedetection of an offshore jacket structurefrom partial modal information:Numerical study. In: The Seventh ISOPEPacific/Asia Offshore MechanicsSymposium; 2006
[5] Asgarian B, Aghaeidoost V,Shokrgozar HR. Damage detection ofjacket type offshore platforms using rateof signal energy using wavelet packettransform. Marine Structures. 2016;45:1-21
[6] Zareie S, Mirzai N, Alam MS,Seethlaer RJ. A dynamic analysis of anovel shape memory alloy-basedbracing system. In: CSCE 2017; 2017
[7] Zareie S, Mirzai N, Alam MS,Seethlaer RJ. An introduction andmodeling of novel shape memory alloy-based bracing. In: CSCE 2017; 2017
[8] Aryan H, Ghassemieh M. Asuperelastic protective technique formitigating the effects of vertical andhorizontal seismic excitations onhighway bridges. Journal of IntelligentMaterial Systems and Structures. 2017;28(12):1533-1552
[9] Zareie S, Alam MS, Seethaler RJ,Zabihollah A, Effect of cyclic loads onSMA-based component of cable-stayedbridge. In: 7th International SpecialtyConference on Engineering Mechanicsand Materials; 2019
[10] Zareie S, Alam MS, Seethaler RJ,Zabihollah A. An experimental study ofSMA wire for tendons of a tension legplatform. In: 5th Annual EngineeringGraduate Symposium; 2019
[11] Zareie S, Alam MS, Seethaler RJ,Zabihollah A. Effect of shape memoryalloy-magnetorheological fluid-basedstructural control system on the marinestructure using nonlinear time-historyanalysis. Applied Ocean Research. Oct 12019;91:101836
[12] Aryan H, Ghassemieh M. Mitigationof vertical and horizontal seismicexcitations on bridges utilizing shapememory alloy system. AdvancedMaterials Research. 2014;831:90-94
[13] Mirzai N, Attarnejad R.Performance of EBFs equipped with aninnovative shape memory alloy damper.Scientia Iranica. 2018. DOI: 10.24200/sci.2018.50990.1955
[14] Zuo X-B, Li A-Q, Sun X-H. Optimaldesign of shape memory alloy damperfor cable vibration control. Journal ofVibration and Control. 2009;15(6):897-921
127
Design and Analysis of SMA-Based Tendon for Marine StructuresDOI: http://dx.doi.org/10.5772/intechopen.88451

Chapter 8
The Recent Advances inMagnetorheological Fluids-BasedApplicationsShahin Zareie and Abolghassem Zabihollah
Abstract
The magnetorheological fluids (MRF) are a generation of smart fluids with theability to alter their variable viscosity. Moreover, the state of the MRF can beswitched from the semisolid to the fluid phase and vice versa upon applying orremoving the magnetic field. The fast response and the controllability are the mainfeatures of the MRF-based systems, which make them suitable for applications withhigh sensitivity and controllability requirements. Nowadays, MRF-based systemsare rapidly growing and widely being used in many industries such as civil, aero-space, and automotive. This study presents a comprehensive review to investigatethe fundamentals of MRF and manufacturing and applications of MRF-basedsystems. According to the existing works and current and future demands forMRF-based systems, the trend for future research in this field is recommended.
Keywords: magnetorheological fluids, variable viscosity, civil, aerospace,automotive, MRF-based systems, applications
1. Introduction
The magnetorheological fluids (MRF) are a generation of smart fluids with theability to alter their viscosity. Moreover, the state of the MRF can be switched fromthe semisolid to the fluid phase and vice versa upon applying or removing themagnetic field. The fast response and the controllability are the main features of theMRF-based systems, which make them suitable for applications with high sensitiv-ity and controllability requirements. MRF-based systems are rapidly growing andwidely being used in many industries such as civil, aerospace, and automotive. Thischapter tends to review the fundamental concepts followed by the most recentdevelopments in MRF-based systems. The discovery of magnetorheological fluid(MRF) goes back to 70 years ago by Rabinov [1] at the US National Bureau ofStandards. Since then, hundreds of patents and research articles have beenpublished every year.
MRF is a fluid composed of a carrier fluid, such as silicone oil and iron particles,which are dispersed in the fluid [2, 3], with an ability to alter its basic characteristicsand viscosity, when subjected to the magnetic field. [4]. Upon applying a magneticfield, the tiny polarizable particles in MRF make chains between two poles, asshown in Figure 1 [6]. The chains resist movement up to a certain breaking point(yielding point), which is a function of the strength of the magnetic field [6, 7].
129

In other words, the response of MRF is similar to non-Newtonian fluids, as shownin Figure 2.
2. Modeling and operational modes of MRF systems
The behavior of MRF may be described by the Bingham plasticity model [1, 2].The model is expressed by:
τ < τyield ! y: ¼ 0 (1)
τ≥ τyield ! τ ¼ τyield sgn y:ð Þ þ μ y: (2)
where τyield, τ, _y, and μ are the yielding stress, the shear stress, the strain rate,and the viscosity, respectively [1].
MRF systems operate in three basic modes, valve mode, shear mode, andsqueeze mode, as shown in Figure 3.
In the following subsection, a brief description of each mode is provided.
2.1 MRF flow mode
The flow mode is the most common operational mode of MRF. Figure 4 shows asimplified geometry of the flow mode. In order to obtain an in-depth understanding
Figure 1.The effect of magnetic field on polarization of MRFs [5].
Figure 2.The relation between shear stress and strain rate of Bingham fluid and Newtonian fluid [8].
Figure 3.The operation modes: (1) flow mode, (2) direct shear mode, (3) squeeze mode [9].
130
Emerging Trends in Mechatronics
of the damping pressure supplied by MRF in this mode, one may relate the pressuredue to the fluid viscosity Pτð Þ and the controllable pressure Pη
� �.
The total damping pressure can be calculated by [10]:
P ¼ Pη þ Pτ (3)
where Pτ and Pτ for a Newtonian fluid are expressed by [10]:
Pη ¼ 12QηLwg3
� �Pτ ¼
C τyLg
(4)
where L and w denote the length and width of parallel plates, respectively. Theterm g is the gap between two plates. η and Q are the plastic viscosity and the fluidflow, correspondingly. C is a constant value and τy is the field-dependent yield stress.
2.1.1 MRF shear mode
The total amount of force in the shear mode between the two plates (asillustrated in Figure 5) is computed by [10]:
F ¼ Fη þ Fτ (5)
where the viscous shear force, Fη, and magnetic-dependent shear force, Fτð Þ, arerepresented by [10]:
Fη ¼ ηSAg
, Fτ ¼ τyLW (6)
where g, A, S, and η indicate the gap between the two plates, the area of theplate, and the relative velocity between the plates, respectively. τy, L, andW denotethe field-dependent yield stress and the width and length of the upper plate.
2.2 MRF squeeze mode
The squeeze mode occurs in two cases: compression and tension. In this study,the compressive mode of the MRF between the two plates is considered, and as a
Figure 4.The valve mode of MRF [10].
Figure 5.The shear mode of MRF [1].
131
The Recent Advances in Magnetorheological Fluids-Based ApplicationsDOI: http://dx.doi.org/10.5772/intechopen.86178

result, the fluid moves between the plates as displayed in Figure 6 [11]. The totalamount of force in the squeeze mode is estimated by [11]:
Fs ¼ �πR4
46μ _hh3
þ 3ρ€h5h
� 15ρ _h2
14h2
!(7)
where R, h, μ, €h, _h, and ρ are the plate radius, the distance between the twoparallel plates, the viscosity of the MRF, the gap acceleration, the gap speed, and thedensity of the MRF, respectively.
3. MRF-based applications
Based on MRF characteristics, many devices have been developed. A summaryof MRF-based devices is presented in Figure 7.
3.1 MRF dampers
MRF devices exhibit outstanding properties, including the large force capacity,the low voltage and the low electric current requirement, fast response, the simpleinteraction between the electrical current, the damping force, the adaptive rheo-logical properties, the high viscous damping coefficient, easy controllability, and
Figure 6.The squeeze mode of the MRF [1].
Figure 7.The summary of MRF devices.
132
Emerging Trends in Mechatronics
adaptive damping [12–16, 17–21]. MRF dampers are being used widely in the aero-space industry [22], seismic protection [2, 23], and vehicle suspension systems [24].The core idea of designing simplified MRF dampers derived from hydraulic cylinderdamper structures [10, 25]. MRF dampers have been developed based on the threebasic operational modes of MRF systems.
3.1.1 MRF damper in flow mode
The most common MRF dampers are the mono-tube, the twin-tube, and thedouble-ended, as represented in Figures 8–10, respectively [26, 27]. The workingprinciple of the mono-tube MRF damper as illustrated in Figure 8 is based onstoring pressurized gas in an accumulator located at the bottom of the damper.
Figure 9 schematically shows the working principles of a twin-tube MRFdamper. The outer and inner cylinders are separated by two channels holdingpressurized gas. The outer cylinder acts as an accumulator. Contrast to the mono-tube MRF damper, there are two valves: the control valve and foot valve. Thefunction of the foot valve is to control the flow of oil to pass into the gas chamber orto extract the oil from the accumulator [10, 25, 28].
Figure 10 depicts the double-ended MRF damper, which is derived from themono-tube MRF damper [10, 29, 30]. Two equal diameter rods are connected fromthe ends of the housing to the piston. It is worth noting that in double-ended MRF
Figure 8.Schematic diagram of mono-tube MRF damper [9].
Figure 10.Schematic diagram of the double-ended MR MRF damper [9].
Figure 9.Schematic diagram of the twin-tube MRF damper [9].
133
The Recent Advances in Magnetorheological Fluids-Based ApplicationsDOI: http://dx.doi.org/10.5772/intechopen.86178

damper, the accumulator is not required as long as the volume in the cylinderremains constant while the piston and rod are moving. However, sometimes a smallaccumulator is used for thermal expansion [30, 31].
3.1.2 MRF dampers in shear mode
Shear mode-based dampers are less common than flow mode dampers [32].They are mostly used to damp rotational vibration. Similar to the flow mode-basedMRF damper, these types of dampers work as a passive system in the absence of themagnetic field. The system can be categorized into translational linear motion,rotational disk motion, and rotational drum motion [32].
3.1.3 Linear damper
Figure 11 illustrates a linear shear mode damper which is composed of twoparallel plates: a fixed plate at the bottom and a moving one at the top. The twoplates are separated by a layer of MRF with thickness d [32]. The linear force Fð Þbetween the two plates can be approximated by:
F ¼ τLb (8)
where τ, L, and b are the shear stress, length, and width, respectively.
3.1.4 Rotary drum damper
The schematic diagram of a rotary drum damper is shown in Figure 12. Thesystem is made of two concentric cylinders where the outer cylinder is heldstationary and the inner cylinder rotates [32].
The damping torque Tð Þ is computed by [32]:
T ¼ 2πr2Lτrθ (9)
where L.r, and τrθ are the cylinder length, the radius coordinate, and the shearstress tensor, respectively.
3.1.5 Rotary disk damper
A diagram of a rotary disk damper is shown in Figure 13 which is composed oftwo disks: a fixed disk at the bottom and a rotating one at the top. The requiredtorque to rotate the top disk is calculated by [32]:
Figure 11.The linear shear mode damper [32].
134
Emerging Trends in Mechatronics
T ¼ 2πðR
0
r2τzθdr (10)
where R indicates the radius of the top disk and τzθ is the shear stress tensor in zθplane.
The MRF damper in the shear mode provides a relative small force. However,the system prevents to form any solidification.
3.2 MRF damper in squeeze mode
Recently, due to the large force/displacement ratio, design and development ofMRF dampers based on the squeeze mode have been attracted by researchers [17].Figure 14 shows the schematic diagram of a damper using the squeeze mode.
In contrast to the flow and the shear mode dampers, the research works in thesqueeze mode dampers are very rare [17]. The total force of the top disk iscalculated by [17]:
Figure 12.The schematic diagram of rotary drum damper [32].
Figure 13.The schematic diagram of rotary disk damper [32].
135
The Recent Advances in Magnetorheological Fluids-Based ApplicationsDOI: http://dx.doi.org/10.5772/intechopen.86178

F ¼ 2πðR
R1
rp rð Þdr (11)
where r and p rð Þ are the radius of the cylindrical boundary condition and thetotal pressure of the upper disk, respectively:
p rð Þ ¼ pη rð Þ þ pMR rð Þ (12)
where pη rð Þ and pMR rð Þ indicate the viscous pressure and the pressure consider-ing the MRF effect, respectively. The supplied force is a function of the gap size, theMRF type, and the magnetic field intensity [17]. This damper can generate consid-erable damping forces while experiencing small displacements. The fundamentalbehavior of the MRF squeeze mode dampers is not well understood and needs to bemore explored. In addition, cavitation effect needs to be considered carefully whendesigning squeeze mode dampers, as presented in Table 1 [18].
3.3 MRF machining fixtures
Fixtures are important devices to precisely locate the parts during machining[20]. To respond to the demands for holding free-form parts in place efficiently,adaptive or modular fixtures have been developed. Practically, many fixtures maybe required to hold all arts in desired locations [20, 21, 33].
Recently, phase-changing materials, such as MRF, become of interest in devel-oping flexible fixtures, due to their fast response and reversibility without temper-ature change [20]. Due to the very low yield stress of MRF (�100 kPa), the highestclamping forces are obtained in the squeeze mode configuration [20]. Figures 15and 16 show two of MRF-based fixtures based on the squeeze mode developed forturbine blades.
3.4 MRF clutches
Another important MRF application is intelligent clutches [35, 36] that provide awide torque transmissibility range upon the applied magnetic field. The long-term
Figure 14.Schematic diagram of MRF damper in squeeze mode [19].
136
Emerging Trends in Mechatronics
stability, short reaction time, and good controllability are the main features of MRFclutches [37]. They are promising candidates to be replaced with conventionaltorque converters and hydraulic starting clutches to enhance the robustness [38].
There are two types of smart clutches as illustrated in Figure 17: disk MRFclutches and bell MRF clutches. They are composed of a rotor, a shaft, a coil, MRF, asmall gap, and input and output components [35].
In the disk shape clutch, as in all other MRF devices, there are two states: thesemisolid state and the liquid state [37]. In the semisolid state, the maximum shearstress is expressed by:
τr ¼ τy:srR0
(13)
where τy, sr, and R are maximum shear stress, the radius of the shaft, and theradius of the disk, respectively.
System Type Advantages Disadvantages
MRF damper(flow mode)
Mono-tubedamper
Easy to manufacture Required accumulator, verysensitive to any failure
Double-endeddamper
Less sensitive to failure Required accumulator, morecomplex to manufacture
Twin-tubedamper
No accumulator, less sensitive More complex tomanufacture
MRF damper (squeezemode)
Considerable damping force in smalldisplacement
Possible cavitation, notcommon
MRF damper (shear mode) Prevent solidification of MRF Small relative force (torque)
MRF brake Rapid response, high torque or force High cost. Dependent uponrotational speed
MRF clutch Disk MRC Wide torque transmissibility range Homogeneity of the MRF,unpredictable behavior
Bell MRC Wide torque transmissibility range Homogeneity of the MRF,unpredictable behavior
Multi-plateMRC
Faster response time, less complex,light and compact design
Self-heating, relatively highenergy consumption
MRF polishing Cause to polish surfaces smoothly Not much effective on hardmagnetic materials
MRF valve system Less friction, fast responses,nonmoving parts, simple electricalcircuit
Required extra power
Pneumatic with MRF Stable and accurate motion control Required extra power
MRF seals Simple mechanism, high seal, and lowmaintenance required
Not effective in high rotaryspeed
MRF fixture Fixing irregular-shaped objective Not common
Composite with MRF Adaptable damping and stiffness Added extra weight andrequired extra power
MRF polishing Cause to polish surfaces smoothly Not much effective on hardmagnetic materials
Table 1.The summary of advantages and disadvantages of MRF-based system.
137
The Recent Advances in Magnetorheological Fluids-Based ApplicationsDOI: http://dx.doi.org/10.5772/intechopen.86178

Tmax, S ¼ πτy, sR0
4 � R4
2R0(14)
In the liquid state, shear stress is computed by:
τ rð Þ ¼ τy,d þ η ω2 � ω1ð Þ rs
� �(15)
Figure 15.The MRF-flexible-fixture prototype [34].
Figure 16.The MRF-flexible-fixture prototype [20].
Figure 17.Disk and bell MRF clutches [39].
138
Emerging Trends in Mechatronics
where τy,d, η, ω2, and ω1 represent the maximum shear stress, the dynamicviscosity, the angular velocity in disk 2, and angular velocity of disk 1, respectively.
The maximum torque transmitted in the liquid state in a simplified format isdetermined by:
Tmax,L ¼ πτy,d R30 � R3
i
� � 23
(16)
In the bell-shaped MRCs, the torque of the semisolid state can be given by:
Tmax,S ¼ π= 2Lτ y;sð Þ� �� �
Ri þ Roð Þ2 (17)
where L, R0, and Ri are the thickness of MRF, radius of input rotor, and radius ofoutput rotor, respectively.
In the liquid state, torque is described by [37]:
Tmax,L ¼ π= 2Lτ y;dð Þ� �� �
Ri þ Roð Þ2 (18)
The major problem in the development of this application is the difference of thedensity between iron particles and the carrier oil [38]. Micron-sized ferrousparticles move outward faster under very high centrifugal forces. Therefore, thehomogeneity of the MRF is disturbed leading to an unpredictable behavior MRC[38]. This effect has been studied by many researchers [40, 41]. In order to over-come this problem, a MRF sponge has been introduced to enhance the homogeneityof MRF in the MRC at high speeds [38].
A multi-plate MRC as shown in Figure 18 has been introduced by Kavlicogluet al. [42]. It is composed of 43 plates on the rotor to reduce misalignment anddistribute the MRF inside the MRC more accurately [42]. Experimental andanalytical works proved that the magnitude of the velocity did not affect theperformance of the MRC.
The disadvantage of MRF clutches are mainly the high power required toactivate the MRF and self-heating while transmitting torque from the drive side tothe power off side [35].
Briefly, the comparison between different clutches is conducted and presented.It is observed that both Disk MRC and Bell MRC exhibit a wide range of torquetransmissibility. It is worth noting that MRF behavior is unpredictable and thedistribution of MRF is not uniform in these systems. However, multi-plate MRC iseasy to manufacture, and its response is notably fast.
Figure 18.Multi-plate MRC [39].
139
The Recent Advances in Magnetorheological Fluids-Based ApplicationsDOI: http://dx.doi.org/10.5772/intechopen.86178

3.5 MRF polishing
Another application of MRFs is polishing or finishing based on the magnetic-assisted hydrodynamic polishing [19]. This application can be applied to plastics,optical glasses, ceramics, and complex optical devices, such as spheres. MRFpolishing typically provides less surface damage compared to the conventionalmethod [43].
Figures 19 and 20 depict the operational mechanism of theMRF polishing. Asshown, theMRF fills the small gap between theworkpiece and themoving wall. Themagnetic field changes the viscosity and transforms it into the semisolid state [19]. Themovingwall causes a profile of shear stress through theMRF layer resulting in polishingthe surface of the work piece [45]. The removal rate (R) can be expressed by [43]:
R ¼ KPV (19)
whereK, P, andV are the Preston coefficient, the pressure, and the velocity betweenthe work piece and theMR fluid and thematerials’ removal rate, respectively [46].
The positive and negative consequences of the MRF-based polishing systems areshown inTable 1. It is found that the system can polish the sensitive surface smoothly.However, the system is not effective for polishing the solid magnetic surface.
3.6 MRF valves
One of the novel applications of MRF is the MRF-based valves [47–49], particu-larly small-size valves [50]. Figure 21 exhibits the MRF-based valve schematicallyproposed by Imaduddin et al. [50].
Figure 19.The schematic diagram of MRF polishing device [44].
Figure 20.Schematic working mechanism of MRF polishing [19].
140
Emerging Trends in Mechatronics
Three structural configurations of MRF valves are annular, radial, and mixedannular and radial gaps [50]. Figure 21 illustrates a mixed annular and radial gapMRF valve. The pressure drop Δpð Þ of the MRF valve is expressed by [50]:
ΔP ¼ ΔPviscous þ ΔPyield (20)
The pressure drop has two parts: the pressure drop pviscous� �
due to fluid viscosity
and pressure drop Δpyeild� �
from field-dependent yield stress [50]. Δpviscous� �
is
computed by:
ΔPviscous ¼ 6ηQLπRd3
(21)
where Q , L, d, and R represent the base fluid viscosity, the flow rate, the annularchannel length of the valve, the valve gaps, and the channel radius, respectively.
Δpyeild is computed by:
ΔPyeild ¼ cτ Bð ÞLd
(22)
where the coefficient τ Bð Þð Þ represents the field-dependent yield stress value, Lis the annular channel length, and d is the gap size. The flow-velocity profile c iswritten by [50]:
c ¼ 2:07 þ 12Qη
12Qηþ 0:8πRd2τ Bð Þ (23)
The strengths and weaknesses of the MRF valve system are illustrated inTable 1. It is observed that the MRF valves provide fast response, less friction, andsimple electrical circuit for actuation.
3.7 The MRF brake
MRFs are also used to develop the new type of the braking system and can bereplaced with conventional systems. The MRF brake has a high potential to decreasethe transmitted torque rapidly subjected to external magnetic fields [51]. In an MRFbrake system, the MRF is located between the outer cylinder and the inner rotatingcylinder [19]. By energizing solenoid coil, the MRF supplies the resistance shear
Figure 21.Schematic diagram of the MRF valve with annular and radial gaps [50].
141
The Recent Advances in Magnetorheological Fluids-Based ApplicationsDOI: http://dx.doi.org/10.5772/intechopen.86178

force in milliseconds against the torque of the shaft. By removing the magneticfield, the inner cylinder rotates freely [52]. The schematic diagram of the MRFbrake is presented in Figure 22. The MRF brakes are available in various differentshapes, such as drums, disks, and T-shaped rotors [19]. Recently, Sukhwani et al.[53] proposed a new type of the brake based on MR grease. However, their pro-posed brake provided lower breaking capacity than that of the existing MRF breaks.
The MRF brake system has the capability to supply a huge amount of force(torque).
3.8 MRF seals
The sealing of machinery, such as vacuuming equipment, is a significant chal-lenge in the industry [19, 44]. The MRF is considered as a potential technology forsealing pressures up to 3300 kPa [54, 55]. Kanno et al. [54] suggested a one-step sealfor a rotary shaft, as illustrated in Figure 23 schematically. The system was tested ata rotational speed of 1000 rpm with two different sizes of gaps (1–1.7, 0.06–0.5 mm). The major benefits of the system are its ease of operation, good sealingcapacity, and low maintenance requirements. Kordonsky et al. [56] studied differ-ent intensities of the magnetic fields for different shaft rotation speeds. The studyshowed that critical pressure is proportionally related to the square of the appliedmagnetic field strength. Fujita et al. [57] showed that the burst pressure of the seal isa function of size and the volume fraction of MRFs.
As displayed in Table 1, the MRF seal needs the external electric power to beactuated, and the performance is not efficient in the rotary movements. However,the working mechanism of MRF seal is simple with a low maintenance.
3.9 Pneumatic motion control with the MRF technology
One of the major challenges in pneumatics systems is the accuracy of servomotion control due to the high compression of air, as the working fluid [58]. Thereare two conventional methods including the airflow regulation and the pneumaticbraking for motion control. However, the complexity of these systems is a majorchallenge. Recently, MRF brakes are being used to enhance the motion control ofpneumatic actuators (PAMC), as displayed in Figure 24 [44]. The system is com-posed of a pneumatic actuator in parallel with an MRF brake to improve the systemperformance and functionality due to directional control and complexity of servo
Figure 22.The typical MRF brake [51].
142
Emerging Trends in Mechatronics
mechanism [58]. Moreover, the MRF can be used as the pneumatic rotary actuatorto control rotary motion and velocities [44, 59–61, 74].
The pneumatic with MRF-based control movement provides higher accuracy.However, the system needs the external power for activation.
3.10 MRFs embedded in composite structures
Composite structures are gaining interest in many industries, including civil,transportation, and aerospace due to their excellent mechanical properties, particu-larly the strength to weight ratio [62–68]. In many applications, the compositestructures are exposed to excessive vibration resulting to instability andunpredicted failure. In order to suppress the vibration in composite structures,different methods including passive, semi-active, and active vibration controls havebeen developed [41, 69–72].
Naji et al. [73] studied the dynamic behavior of a laminate composite beamintegrated with an MRF layer, as shown in Figure 25. The study showed thatmagnetic fields in the range of 0–1600 Gauss reduce the maximum displacementand increase the natural frequency. The MRF composite has potential applicationsin aerospace, civil infrastructures, and automobile industries to suppress the exces-sive vibrations and\or control the sound propagation, as presented in Table 1 [69].
Figure 23.Schematic diagram of one-step MRF seal [19].
Figure 24.Schematic diagram of MRF pneumatic motion control [58].
143
The Recent Advances in Magnetorheological Fluids-Based ApplicationsDOI: http://dx.doi.org/10.5772/intechopen.86178

It is noted that adding MRF to laminated composite structures slightly increases theweight of the element.
4. Chapter summary
In this paper, the basic knowledge of MRF and its spectacular characteristicsparticularly the switching phases between the semisolid state and fluid state viachanging the viscosity of MRF has been concisely discussed.
According to the existing works, MRF has been found to be an excellent candi-date to be replaced with the conventional fluid in the fluid-based systems. In brief,MRF-based systems improve the performance and functionality of control systemsfor many applications, particularly in the followings aspects:
1. Controllability: MRF-based systems provide precise output control due to thevariable viscosity of MRF and switching between the semisolid and the fluidphases upon application of the magnetic field.
2. Fast response: reaction of MRF-based systems to the applied magnetic field isin the scale of milliseconds, thus making them suitable candidates to be usedfor real-time control applications.
3. Extensive applications: MRF-based control systems have found extensiveapplications in a wide range of industries, including civil, aerospace, andautomobiles to enhance the performance and functionality of the systems toachieve the desired outputs.
Acknowledgements
Help received from M. Daghighi is much appreciated.
Figure 25.Schematic diagram of an adaptive MRF-laminated composite beam [73].
144
Emerging Trends in Mechatronics
Author details
Shahin Zareie* and Abolghassem ZabihollahSchool of Science and Engineering, Sharif University of Technology,International Campus, Iran
*Address all correspondence to: [email protected]
©2020TheAuthor(s). Licensee IntechOpen.Distributed under the terms of theCreativeCommonsAttribution -NonCommercial 4.0 License (https://creativecommons.org/licenses/by-nc/4.0/),which permits use, distribution and reproduction fornon-commercial purposes, provided the original is properly cited. –NC
145
The Recent Advances in Magnetorheological Fluids-Based ApplicationsDOI: http://dx.doi.org/10.5772/intechopen.86178

References
[1] Rabinow J. Themagnetic fluid clutch.AIEETrans. 1948;67:1308-1315
[2] Iqbal MF. Application of magneto-rheological dampers to control dynamicresponse of buildings. ConcordiaUniversity; 2009
[3] Chu SY, Soong TT, Reinhorn AM.Active, Hybrid and Semi-ActiveStructural Control—A Design andImplementation Handbook. John Wiley& Sons; 2005. ISBN: 978-0-470-01352-6
[4] Yazid IIM, Mazlan SA, Kikuchi T,Zamzuri H, Imaduddin F. Design ofmagnetorheological damper with acombination of shear and squeezemodes. Materials and Design. 2014;54:87-95
[5] Sapiński B, Filuś J. Analysis ofparametric models of MR linear damper.Journal of Theoretical and AppliedMechanics. 2003;41(2):215-240
[6] Esteki K. Developing New Analyticaland numerical models for Mr Fluiddampers and their application to seismicdesign of buildings. The Department ofBuilding, Civil, and EnvironmentalEngineering, Concordia University;2014
[7] Yang S, Li S, Wang X, GordaninejadF, Hitchcock G. A hysteresis model formagneto-rheological damper.International Journal of NonlinearSciences and Numerical Simulation.2005;6(2):139-144
[8] Grunwald A. Design andOptimization of MagnetostrictiveActuator. Dublin City University; 2007
[9] Xiaocong Z, Xingjian J, Li C.Magnetorheological fluid dampers: Areview on structure design and analysis.Journal of Intelligent Material Systemsand Structures. 2012;23(8):839-873
[10] Poynor JC. Innovative Designs forMagneto-Rheological Dampers. VirginiaPolytechnic Institute and StateUniversity. Virginia Tech; 2001
[11] McIntyre EC. Compression of SmartMaterials: Squeeze Flow ofElectrorheological andMagnetorheological Fluids. ProQuest;2008
[12] Sternberg A, Zemp R, de la Llera JC.Multiphysics behavior of a magneto-rheological damper and experimentalvalidation. Engineering Structures.2014;69:194-205
[13] Luu M, Martinez-Rodrigo MD,Zabel V, Könke C. Semi-activemagnetorheological dampers forreducing response of high-speed railwaybridges. Control Engineering Practice.2014;32:147-160
[14] Nguyen Q-H, Choi S-B. Optimaldesign of a vehicle magnetorheologicaldamper considering the damping forceand dynamic range. Smart Materials andStructures. 2008;18(1):15013
[15] De Vicente J, Klingenberg DJ,Hidalgo-Alvarez R. Magnetorheologicalfluids: A review. Soft Matter. 2011;7(8):3701-3710
[16] Jiang Z, Christenson R. Acomparison of 200 kN magneto-rheological damper models for use inreal-time hybrid simulation pretesting.Smart Materials and Structures. 2011;20(6):65011
[17] FarjoudA, Cavey R, AhmadianM,CraftM.Magneto-rheological fluidbehavior in squeezemode. SmartMaterialsand Structures. 2009;18(9):95001
[18] Boelter R, Janocha H. Design rulesfor MR fluid actuators in different
146
Emerging Trends in Mechatronics
working modes. In: Smart Structuresand Materials. Passive Damping andIsolation. International Society forOptics and Photonics; 9 May, 1997;3045:148-160
[19] Hajalilou A, Mazlan SA, Lavvafi H,Shameli K. Magnetorheological FluidApplications. In: Field Responsive Fluidsas Smart Materials. Springer; 2016.pp. 67-81
[20] Tang X, Zhang X, Tao R. Flexiblefixture device with magneto-rheologicalfluids. Journal of Intelligent MaterialSystems and Structures. 1999;10(9):690-694
[21] Trappey JC, Liu CR. A literaturesurvey of fixture design automation.International Journal of AdvancedManufacturing Technology. 1990;5(3):240-255
[22] Batterbee DC, Sims ND, Stanway R,Wolejsza Z. Magnetorheological landinggear: 1. A design methodology. SmartMaterials and Structures. 2007;16(6):2429
[23] Dominguez A, Sedaghati R, StiharuI. Modeling and application of MRdampers in semi-adaptive structures.Computers and Structures. 2008;86(3):407-415
[24] Carlson JD. MR fluids and devices inthe real world. International Journal ofModern Physics B. 2005;19(07n09):1463-1470
[25] Gillespie T. Development ofsemi-active damper for heavy off-road military vehicles.Masters Abstracts International. 2006;45(04)
[26] Reichert BA. Application ofMagnetorheological Dampers for VehicleSeat Suspensions. Virginia PolytechnicInstitute and State University. VirginiaTech; 1997
[27] Ebrahimi B. Development of HybridElectromagnetic Dampers for VehicleSuspension Systems. University ofWaterloo; 2009
[28] Goncalves FD. Characterizing thebehavior of magnetorheological fluids athigh velocities and high shear rates.Virginia Polytechnic Institute and StateUniversity; 2005
[29] Norris JA, Ahmadian M. Behavior ofmagneto-rheological fluids subject toimpact and shock loading. In: ASME2003 International MechanicalEngineering Congress and Exposition;2003. pp. 199-204
[30] Abu-Ein SQ, Fayyad SM, MomaniW, Al-Alawin A, Momani M.Experimental investigation of using MRfluids in automobiles suspensionsystems. Research Journal of AppliedSciences, Engineering and Technology.2010;2(2):159-163
[31] Wang Q, Ahmadian M, Chen Z. Anovel double-piston magnetorheologicaldamper for space truss structuresvibration suppression. Shock andVibration. 2014;2014
[32] Wereley NM, Cho JU, Choi YT,Choi SB. Magnetorheological dampersin shear mode. Smart Materials andStructures. 2007;17(1):15022
[33] Arzanpour S, Fung J, Mills JK,CleghornWL. Flexible fixture designwith applications to assembly of sheetmetal automotive body parts. AssemblyAutomation. 2006;26(2):143-153
[34] Ma J, Zhang D, Wu B, Luo M, Liu Y.Stability improvement and vibrationsuppression of the thin-walled workpiecein milling process via magnetorheologicalfluid flexible fixture. The InternationalJournal of Advanced ManufacturingTechnology. 1 Feb, 2017;88(5-8):1231-1242
147
The Recent Advances in Magnetorheological Fluids-Based ApplicationsDOI: http://dx.doi.org/10.5772/intechopen.86178

[35] Jackel M, Kloepfer J, Matthias M,Seipel B. The novel MRF-ball-clutchdesign a MRF-safety-clutch for hightorque applications. Journal of Physics:Conference Series. 2013;412(1):12051
[36] Najmaei N, Asadian A, KermaniMR, Patel RV. Magneto-rheologicalactuators for haptic devices: Design,modeling, control, and validation of aprototype clutch. In: Robotics andAutomation (ICRA), 2015 IEEEInternational Conference; 2015.pp. 207-212
[37] Lampe D, Thess A, Dotzauer C.MRF-clutch-design considerations andperformance. Transition. 1998;3:10
[38] Neelakantan VA, Washington GN.Modeling and reduction of centrifugingin magnetorheological (MR)transmission clutches for automotiveapplications. Journal of IntelligentMaterial Systems and Structures. 2005;16(9):703-711
[39] Xu X, Zeng C. Notice of retractiondesign of a magneto-rheological fluidclutch based on electromagnetic finiteelement analysis. In: 2nd InternationalConference on Computer Engineeringand Technology. IEEE; 2010. Vol. 5, pp.V5-182
[40] Bansbach EA. Torque TransferApparatus Using MagnetorheologicalFluids. Google Patents, 1998
[41] Gopalswamy S, Jones GL.Magnetorheological TransmissionClutch. Google Patents; 1998
[42] Kavlicoglu BM, Gordaninejad F,Evrensel CA, Cobanoglu N, Liu Y, FuchsA, et al. High-torquemagnetorheological fluid clutch. In:Smart Structures and Materials.International Society for Optics andPhotonics. Damping and Isolation.27 Jun 2002;4697:393-401
[43] Kordonski W, Golini D. Progressupdate in magnetorheological finishing.International Journal of Modern PhysicsB. 1999;13(14n16):2205-2212
[44] Wang J, Meng G.Magnetorheological fluid devices:principles, characteristics andapplications in mechanical engineering.Proceedings of the Institution ofMechanical Engineers, Part L: Journal ofMaterials: Design and Applications.2001;215(3):165-174
[45] Jacobs SD. Manipulating mechanicsand chemistry in precision opticsfinishing. Science and Technology ofAdvanced Materials. 2007;8(3):153-157
[46] Jain VK, Sidpara A, Sankar MR, DasM. Nano-finishing techniques: A review.Proceedings of the Institution ofMechanical Engineers, Part C: Journal ofMechanical Engineering Science. 2012;226(2):327-346
[47] Manoharan V. Magneto-RheologicalFluid Device as Artificial Feel ForceSystem On Aircraft Control Stick.Dissertations and Theses. 2016.Available from: https://commons.erau.edu/edt/225
[48] Muzakkir SM, Hirani H. Amagnetorheological fluid based designof variable valve timing system forinternal combustion engine usingaxiomatic design. International Journalof Current Innovation Research. 2015;5(2):603-612
[49] Yoo J-H, Wereley NM. Design of ahigh-efficiency magnetorheologicalvalve. Journal of Intelligent MaterialSystems and Structures. 2002;13(10):679-685
[50] Imaduddin F, Mazlan SA, ZamzuriH, Yazid II. Design and performanceanalysis of a compactmagnetorheological valve with multipleannular and radial gaps. Journal of
148
Emerging Trends in Mechatronics
Intelligent Material Systems andStructures. Jun 2015;26(9):1038-1049
[51] Huang J, Zhang JQ, Yang Y, WeiYQ. Analysis and design of a cylindricalmagneto-rheological fluid brake. Journalof Materials Processing Technology.2002;129(1):559-562
[52] Huang J, Wang H, Ling J, Wei YQ,Zhang JQ. Research on chain-model ofthe transmission mechanical property ofthe magnetorheological fluids. Mach.Des. Manuf. Eng. 2001;30(2):3-7
[53] Sukhwani VK, Hirani H. Acomparative study ofmagnetorheological-fluid-brake andmagnetorheological-grease-brake.Tribology. Online. 2008;3(1):31-35
[54] Kanno T, Kouda Y, Takeishi Y,Minagawa T, Yamamoto Y. Preparation ofmagnetic fluid having active-gasresistance andultra-lowvapor pressure formagnetic fluid vacuum seals. TribologyInternational. 1997;30(9):701-705
[55] Browne AL, Johnson NL, Barvosa-Carter W, McKnight GP, Keefe AC,Henry CP. Active Material Based SealAssemblies. Google Patents; 2012
[56] Kordonsky W. Elements anddevices based on magnetorheologicaleffect. Journal of Intelligent MaterialSystems and Structures. 1993;4(1):65-69
[57] Fujita T, Yoshimura K, Seki Y,Dodbiba G, Miyazaki T, Numakura S.Characterization of magnetorheologicalsuspension for seal. Journal ofIntelligent Material Systems andStructures. 1999;10(10):770-774
[58] Jolly MR. Pneumatic motion controlusing magnetorheological technology.In: Smart Structures and Materials.Industrial and Commercial Applicationsof Smart Structures Technologies.International Society for Optics andPhotonics. 14 Jun 2001;4332:300-308
[59] Alam M, Choudhury IA, Bin MamatA. Mechanism and design analysis ofarticulated ankle foot orthoses for drop-foot. The Scientific World Journal. 2014;2014:14. Article ID 867869. Availablefrom: https://doi.org/10.1155/2014/867869
[60] Zhu X, Jing X, Cheng L. Amagnetorheological fluid embeddedpneumatic vibration isolator allowingindependently adjustable stiffness anddamping. Smart Materials andStructures. 2011;20(8):85025
[61] Mikułowski GM, Holnicki-Szulc J.Adaptive landing gear concept feedbackcontrol validation. Smart Materials andStructures. 2007;16(6):2146
[62] Zareie S, Zabihollah A. A failurecontrol method for smart compositemorphing airfoil by piezoelectricactuator. Transactions of the CanadianSociety for Mechanical Engineering.2011;35(3):369-381
[63] Hosseiny SA, Jakobsen J. Localfatigue behavior in tapered areas oflarge offshore wind turbine blades. In:IOP Conference Series: MaterialsScience and Engineering. IOPPublishing; Jul 2016;139(1):012022
[64] Pol MH, Zabihollah A, Zareie S,Liaghat G. Effects of nano-particlesconcentration on dynamic response oflaminated nanocomposite beam/Nanodaleliu koncentracijos itaka dinamineinanokompozicinio laminuoto stryporeakcijai. Mechanika. 2013;19(1):53-58
[65] Fattahi SJ, Zabihollah A, Zareie S.Vibration monitoring of wind turbineblade using fiber bragg grating. WindEngineering. 2010;34(6)
[66] Zabihollah A, Momeni S, GhafariAS. Effects of nanoparticles on theimprovement of the dynamic responseof nonuniform-thickness laminated
149
The Recent Advances in Magnetorheological Fluids-Based ApplicationsDOI: http://dx.doi.org/10.5772/intechopen.86178

composite beams. Journal of MechanicalScience and Technology. 1 Jun 2016;30(1):121-125
[67] Zabihollah A, Zareie S. Optimaldesign of adaptive laminated beamusing layerwise finite element. Journalof Sensors. 2011;2011:8. Article ID240341. Available from: https://doi.org/10.1155/2011/240341
[68] Zareie S, Zabihollah A. A failurecontrol method for smart compositemorphing airfoil by piezoelectricactuator. Transactions of the CanadianSociety for Mechanical Engineering.2011;35(3)
[69] Manoharan R, Vasudevan R,Jeevanantham AK. Dynamiccharacterization of a laminatedcomposite magnetorheological fluidsandwich plate. Smart Materials andStructures. 2014;23(2):25022
[70] Lim SH, Prusty BG, Pearce G, KellyD, Thomson RS. Study ofmagnetorheological fluids towardssmart energy absorption of compositestructures for crashworthiness.Mechanics of Advanced Materials andStructures. 2016;23(5):538-544
[71] Rajamohan V, Rakheja S, SedaghatiR. Vibration analysis of a partiallytreated multi-layer beam withmagnetorheological fluid. Journal ofSound and Vibration. 2010;329(17):3451-3469
[72] Zabihollah A, Ghafari AS, YadegariA, Rashidi D. Effects of MR-fluid onlow-velocity impact response of MR-laminated beams. In: AIP ConferenceProceedings. Vol. 1858, No. 1; 2017.p. 40004
[73] Naji J, Zabihollah A, Behzad M.Vibration characteristics of laminatedcomposite beams withmagnetorheological layer usinglayerwise theory. Mechanics of
Advanced Materials and Structures.2018;25(3):202-211. DOI: 10.1080/15376494.2016.1255819
[74] Lee H-G, Sang-Hyun K-WM,Chung L, Lee S-K, Lee M-K, Hwang J-S,et al. Pneumatic motion control usingmagnetorheological technology. Journalof Intelligent Material Systems andStructures. 2007;18(19):1111-1120
150
Emerging Trends in Mechatronics
151
Chapter 9
Hysteresis Behavior of Pre-Strained Shape Memory Alloy Wires Subject to Cyclic Loadings: An Experimental InvestigationShahin Zareie and Abolghassem Zabihollah
Abstract
Shape memory alloys (SMAs) are a class of smart materials with the ability to recover their initial shape after releasing the applied load and experiencing a relatively large amount of strain. However, sequential loading and unloading which is an unavoidable issue in many applications significantly reduces the strain recov-ery of SMA wires. In the present work, experimental tests have been performed to study the pre-strain effect of SMA wires on hysteresis behavior of SMA under cyclic loadings. The effects of cyclic loading on austenite and martensite properties have been investigated. SMA wires with diameter of 1.5 mm and length of 560 mm subjected to about 1000 cycles show about 3 mm residual deformation, which is approximately equal to 0.5% residual strain. It is observed that applying 1.7% pre-strain on the SMA wire fully eliminates the residual strain due to cyclic loading.
Keywords: shape memory alloy, cyclic loading, pre-strained, residual deformation
1. Introduction
Stability and failure control of structures are of the major challenges for civil structures in which the loading conditions are cyclic in nature, including harbor and offshore structures. In the past decades, a variety of active control mechanisms have been developed to ensure the stability of such structures [1]. However, active control mechanisms are relatively complex, requiring expensive and professional maintenance which are not always accessible. Therefore, for many structures, passive stability control mechanisms are preferred. Shape memory alloys (SMAs), due to their unique ability to recover their initial shape after releasing the applied load, are promising materials for energy absorption and ensuring the stability of structure under relatively large strain [2–7]. However, it is understood that the cyclic loading may highly influence the strain recovery property, superelasticity, of SMAs [8]. This phenomenon has been widely investigated by researchers in smart structure communities.
Zhang et al. [9] developed a low cycle fatigue criterion for superelasticity of SMAs considering thermomechanical coupling. They concluded that increas-ing strain rate decreases the fatigue lifetime in SMAs. A micromechanical model to describe the cyclic deformation of polycrystalline NiTi under different

Emerging Trends in Mechatronics
152
thermomechanical conditions has been proposed by [10]. Wang et al. [11] proposed a novel structural building element integrated with SMA material to show the capability of SMA-based element in re-centering and energy dissipation of the structure after severe displacement.
Chemisky et al. [12] proposed an analytical model to describe the effects of cyclic loading at high temperature on SMAs behavior. Recently, remarkable researches have been performed to study the different parameters related to cyclic loadings on SMAs’ behavior. Kan et al. [13] studied the effect of strain rate on uniaxial deformation of NiTi. Soul et al. [14] investigated the effect of loading frequency on the damping capacity of NiTi wires and concluded that loading frequency above 0.01 Hz significantly reduces the damping capacity of SMA wires. Des Roches et al. [15] evaluated the change in superelasticity of bar and wires made of NiTi under cyclic loading.
The present work aims to investigate the effects of pre-strained SMA wires under cyclic loading conditions on force-displacement behavior, particularly austenite and martensite phases, of SMAs. Experimental tests have been conducted to study the effect of the number of cycles, frequency of loading, and the pre-straining on hysteresis behavior of SMA wires under cyclic loadings.
2. Modeling superelasticity effect of SMA
When the temperature is equal to or greater than the austenitic finish tempera-ture ( T ≥ A f ), SMA materials exhibit the superelasticity effect. Figure 1 shows the stress-strain curve for loading and unloading of an SMA material. In the loading phase, there are two parts: linear and plastic, whereas in the unloading process, the material exhibits three portions, huge stress reduction with negligible strain reduction, huge strain reduction with a small amount of stress, and finally linear stress-strain reduction. It is noted that the area under the stress-strain curve describes the energy dissipation property of the SMA when loading and unloading. For an SMA rod with cross section ( A ) subjected to the axial loading ( F ), the stress
Figure 1. The schematic diagram of the superelasticity in SMA.
153
Hysteresis Behavior of Pre-Strained Shape Memory Alloy Wires Subject to Cyclic Loadings:…DOI: http://dx.doi.org/10.5772/intechopen.88452
is given by σ = F / A . Neglecting thermal expansion, the stress-strain of the SMA rod is computed as [16, 17]:
σ − σ 0 = E (ε − ε 0 ) + Ω (ξ − ξ 0 ) (1)
where 0 ≤ ξ ≤ 1 indicates martensite fraction which is equal to zero for fully austenite phase and 1 for fully martensite. The term Ω is the transformation coeffi-cient. Considering initial state as σ 0 = ε 0 = 0 , ξ 0 = 0 and noting that after full phase transformation the material returns to zero stress, the transformation coefficient may be defined as a function of residual strain, Ω = E ε r . Therefore, the stress-strain relations for SMA can be expressed as:
σ − σ 0 = E (ε − ε 0 ) + ε r E (ξ − ξ 0 ) (2)
Eq. (2) can be modified for each region, for example, in the linear elastic region where the material is in full austenite phase ( ξ = 0 ); Eq. (2) is given as:
σ = ε r 𝜀𝜀E (3)
where E A indicates the modulus of elasticity in austenite phase; similarly, for linear unloading stage where the material is in full martensite phase, modulus of elasticity is defined by E M . For other regions, modulus of elasticity is a combination of E A and E M as the following [16, 17]:
E = E A + ( E M − E A ) ξ (4)
Further unloading beyond this point produces a linear elastic behavior to zero stress-strain. For further description on stress-strain relationships for superelastic-ity effect, one may refer to the book written by [16]. However, one may note that in the above expression, the effect of the number of loading/unloading cycles and pre-straining is not taken into consideration. The following sections provide a thorough study, particularly experimentally, on the effects of cyclic loading and pre-straining on stress-strain behavior of SMA materials.
3. Experimental tests
Experimental tests have been conducted using a universal testing machine—MTS model 370.5 with 500 kN loading capacity, 150 mm dynamic stroke, and 0.1–1 Hz loading frequency as shown in Figure 2. The SMA wire specimen of 560 mm length with 1.5 mm diameter made of NiTi has been subjected to cyclic tensile loadings. The material properties of NiTi wire, manufactured by Confluent Medical Technologies Company, are given in Table 1. Due to the small diameter of the specimen, each plate is clamped by the top and bottom grippers of the MTS loading machine, as shown in Figure 3. Loading frequencies, initial tensile load, loading rates, and the number of cycles have been predefined in the MTS machine for each test.
3.1 Single cycle loading and unloading test
In order to determine the force-displacement response curve for SMA specimen, a NiTi wire described above has been tested at room temperature with a quasi-static loading/unloading, with the period of 20 s and maximum amplitude 12 mm, as

Emerging Trends in Mechatronics
154
Figure 3. The experimental setup for griping the SMA specimen.
presented in Figure 4. Then, the test specimen is subjected to a cyclic load with 1000 cycles in which the period and maximum amplitude for the first cycle is 1.4 s and 20 mm, correspondingly, as shown in Figure 5. After completing 1000 cycles, the specimen is subjected again to the quasi-static load given in Figure 4. The force-displacement behavior of the specimen under the first quasi-static load and after
Figure 2. The MTS loading frame machine and its accessories.
Physical properties Value
Melting point (°C) 1310
Density (g/cm3) 6.5
Electrical resistivity (μ ohm-cm) 82
Modulus of elasticity (GPa) 41–75
Coefficient of thermal expansion (/°C) 11 × 10−6
Ultimate tensile strength (MPa) ~1070
Total elongation ~10%
Straight length (mm) 560
Diameter (mm) 1.5
Table 1. The properties of NiTi shape memory alloy.
155
Hysteresis Behavior of Pre-Strained Shape Memory Alloy Wires Subject to Cyclic Loadings:…DOI: http://dx.doi.org/10.5772/intechopen.88452
1000 load cycles are shown in Figure 6, in which 0 cycle stands for the quasi-static loading described in Figure 4. After 1000 load cycles, two major impacts on the force-displacement curve of SMA are realized, a significant reduction on hysteresis which, in turn, results in reduction in energy absorption, and reduction in mate-rial properties, E A and E M . Reduction in material properties is mainly due to the degradation phenomena of SMA. The effect of cyclic loading/unloading on material properties, E A and E M , are presented as a correction factor of the ratio of E after 1000 cycle ( E 1000 ) and E when the specimen is subjected to a single quasi-static load ( E 0 ), in Figure 6. After 1000 cycles, E A shows 18% reduction, whereas E M 33% compared to the initial single quasi-static loading condition.
Figure 4. The quasi-static loading/unloading on the SMA specimen by MTS machine.
Figure 5. The first loading cycle on SMA specimen in cyclic loading.
Figure 6. The effect of cyclic loading on force-displacement.

Emerging Trends in Mechatronics
156
3.2 Effect of pre-straining on SMA properties
Long-term stability and performance of civil structures under dynamic loadings is an essential feature for many applications. Therefore, structural designers do not tolerate the change in structural strength and stability. As it was realized in the previous section, cyclic load results in a significant reduction in material properties and, in turn, a reduction in the stability and loading characteristics of SMA-based structural elements.
In order to mitigate the negative effect of cyclic loading on SMA-based elements, 10 mm initial displacement is applied to the SMA wire, which is far beyond the elas-tic displacement region, and 10 mm is approximately equal to 1.7% pre-strain. The hysteresis response of 1.7% pre-strained SMA wire subjected to the loading proto-col, as presented in Figure 5, after 1000 cycles, is given in Figure 7. Comparison of Figure 7 and Figure 6 exhibits that pre-straining SMA eliminates the residual deformation occurred after 1000 cyclic load/unloading.
Figure 8 provides the comparison between E A and E M of the specimen after applying 1000 cyclic loads. It is noted that pre-straining improves the value of E A from 82% at 0% pre-strain to 52% at 1.7% pre-straining the specimen. However, 1.7% pre-straining completely return the value of E M from 67% at 0% to its initial state.
Figure 7. The hysteresis response of 1.7% pre-strain specimen after applied 1000 cycles.
Figure 8. The effect of applied cyclic loading on characteristics of 0 and 1.7% pre-strain specimen.
157
Hysteresis Behavior of Pre-Strained Shape Memory Alloy Wires Subject to Cyclic Loadings:…DOI: http://dx.doi.org/10.5772/intechopen.88452
3.3 Effect of pre-straining and sequentially increasing load on SMA properties
Sequentially increasing loadings is a common loading profile for many civil applications including offshore structures, requiring a thorough understanding of the response of structures under such loading profile. In this section, two specimens are exposed to a sequentially increasing quasi-static loading protocol as presented in Figure 9. It composes of four cycles with 20 s period and arbitrary amplitude of 11.61 mm, (called loading sequence (LS) 1), 13.58 mm (called loading sequence (LS) 2), 17.51 mm (called loading sequence (LS) 3), and 19.48 mm (called loading sequence (LS) 4), respectively. Two parameters, namely, E A and E M , have been studied again under this loading protocol. Then, the loading profile is repeated for 1000 cycles, and the response of the specimens is recorded. Similar to the constant loading profile, it is observed that cyclic load leads to a significant reduction in material properties, E A and E M . In another experiment, the specimens are subjected to 1.7% pre-straining where it revealed a significant improvement in the material properties. As shown in Figure 10, applying a value of 1.7% , pre-strain changes the value of the correction factor E A1000 / E A0 from 62% (for the first period) to 81% (for the fourth period) to 52 and 72% , correspondingly. In a similar observation, applying a value of 1.7% , pre-straining changes the value of the correction factor E M1000 / E M0 from 67 to 54% .
Figure 9. The loading protocol for 0 and 1.7% pre-strain specimen.
Figure 10. The effect of cyclic loading on EA of 0 and 1.7% pre-strain specimen.

Emerging Trends in Mechatronics
158
Figure 11. The effect of cyclic loading on EM of 0 and 1.7% pre-strain specimen.
4. Correction factor for stress-strain of SMA under cyclic loadings
Close study of force-displacement curves for SMA specimen subjected to cyclic loading, and pre-straining reveals that the number of cycles and pre-straining significantly influences the predetermined stress-strain behavior of SMA-based structural elements. In many applications the structure undergoes dynamic loadings, requiring an accurate yet practical estimation of the effect of loading conditions, on the performance and functionality of the structure for long-term usage. According to the present experimental results, practical correction factors are introduced to estimate the effects of cyclic. According to the present experi-mental results, it is realized that the change in E M and E A is a function of correc-tion factors relating cyclic loading, pre-straining, and initial material properties as the following:
E A ′′ = f (α, β, E A ) , E M ′′ = f ( α ′ , β ′ , E M ) (5)
where α and α ′ are the correction factors relating E A1000 / E A0 and E M1000 / E M0 . Similarly β and β ′ are correction factors relating E A1000 at 1.7% pre-straining / E A1000 at 0% pre-straining and E M1000 at 1.7% pre-straining/ E M1000 at 0% pre-straining. The terms E A ′′ and E M ′′ indicate corrected value for E A and E M as a result of cyclic loading and pre-straining. Accordingly, the functions relating E A ′′ to E A and E M ′′ to E M can be estimated as:
E A ′′ = 𝛼𝛼𝛼𝛼 E A , E M ′′ = α ′ β ′ E M (6)
The correction factors, 𝛼𝛼𝛼𝛼 and α ′ β ′ are presented in Figures 10 and 11. The values for α and α ′ are given in Figure 12.
As observed in the conventional specimen ( 0% pre-straining), β and β ′ are assumed 1. Hence, Eq. (6) is now modified to:
E A ′′ = α E A , E M ′′ = α ′ E M (7)
where α ≈ 0.6 − 0.81 and α ′ ≈ 0.6 − 1.2 .In the case of applied 1.7 % pre-straining, coefficients in Eq. (6) can be calculated
by 𝛼𝛼𝛼𝛼 ≈ 0.45–0.8 and α ′ β ′ ≈ 0.56 − 0.98 .
159
Hysteresis Behavior of Pre-Strained Shape Memory Alloy Wires Subject to Cyclic Loadings:…DOI: http://dx.doi.org/10.5772/intechopen.88452
Considering the effects of cyclic loading and pre-straining on stress-strain behavior of SMA wires, Figure 13(a) is now modified to Figure 13(b), where one may realize a significant reduction in critical stress-strain points as well as changes in residual strain after cyclic loading.
Figure 12. The effect of applied cyclic loading on EA and EM.
Figure 13. The effect of cyclic loading (a) 0% pre-strained SMA (b) 1.7% pre-strained SMA on EA and EM.
Emerging Trends in Mechatronics
160
5. Conclusions
The effects of cyclic loading and pre-straining on stress-strain behavior of SMA wires have been investigated. Several experimental tests have been conducted to study the effects of the number of cycles and pre-straining on strain recovery and modulus of elasticity of SMA wires. Correction factors have been provided to encounter the effects of cyclic loads and pre-straining on stress-strain behavior of SMA wires. It is observed that cyclic loading may lead to huge residual strain and reduces the strain recovery feature of SMA. However, pre-straining SMA for only 1.7% significantly improves the reduction in strain recovery of SMA as a result of cyclic loading.
Acknowledgements
This research received funding from the Green Construction Research and Training Center (GCRTC). The authors wish to thank the University of British Columbia-Okanagan Campus, for the technical support. The authors also wish to thank Mr. Kyle Charles as a research engineer and ex lab manager for his valuable help in experimental tests at the applied laboratory for advanced materials and structures at the University of British Columbia-Okanagan Campus.
Author details
Shahin Zareie1* and Abolghassem Zabihollah2
1 School of Engineering, The University of British Columbia, Kelowna, BC, Canada
2 School of Science and Engineering, Sharif University of Technology, International Campus, Kish Island, Iran
*Address all correspondence to: [email protected]
© 2020 The Author(s). Licensee IntechOpen. Distributed under the terms of the Creative Commons Attribution - NonCommercial 4.0 License (https://creativecommons.org/licenses/by-nc/4.0/), which permits use, distribution and reproduction for non-commercial purposes, provided the original is properly cited.
161
Hysteresis Behavior of Pre-Strained Shape Memory Alloy Wires Subject to Cyclic Loadings:…DOI: http://dx.doi.org/10.5772/intechopen.88452
References
[1] Aryan H, Ghassemieh M. A superelastic protective technique for mitigating the effects of vertical and horizontal seismic excitations on highway bridges. Journal of Intelligent Material Systems and Structures. 2017;28(12):1533-1552
[2] Zareie S, Mirzai N, Alam MS, Seethlaer RJ. A dynamic analysis of a novel shape memory alloy-based bracing system. In: CSCE 2017; 2017
[3] Zareie S, Mirzai N, Alam MS, Seethlaer RJ. An introduction and modeling of novel shape memory alloy-based bracing. In: CSCE 2017; 2017
[4] Zareie S, Alam MS, Seethaler RJ, Zabihollah A. An experimental study of SMA wire for tendons of a tension leg platform. In: 5th Annual Engineering Graduate Symposium; 2019
[5] Zareie S, Shahria Alam M, Seethlaer RJ, Zabihollah A. Effect of shape memory alloy-magnetorheological fluid-based structural control system on the marine structure using nonlinear time-history analysis. Journal of Applied Ocean Research. 2019;91:101836
[6] Zareie S, Shahria Alam M, Seethlaer RJ, Zabihollah A. An experimental study of SMA wire for tendons of a tension leg platform. In: 5th Annual Engineering Graduate Symposium; 2019
[7] Zareie S, Alam MS, Seethaler RJ, Zabihollah A. Effect of cyclic loads on SMA-based component of cable-stayed bridge. In: 7th International Specialty Conference on Engineering Mechanics and Materials; 2019
[8] Miyazaki S, Imai T, Igo Y, Otsuka K. Effect of cyclic deformation on the pseudoelasticity characteristics of Ti-Ni alloys. Metallurgical Transactions A. 1986;17(1):115-120
[9] Zhang Y, Zhu J, Moumni Z, Van Herpen A, Zhang W. Energy-based fatigue model for shape memory alloys including thermomechanical coupling. Smart Materials and Structures. 2016;25(3):35042
[10] Yu C, Kang G, Kan Q , Song D. A micromechanical constitutive model based on crystal plasticity for thermo-mechanical cyclic deformation of NiTi shape memory alloys. International Journal of Plasticity. 2013;44:161-191
[11] Wang W, Chan T-M, Shao H, Chen Y. Cyclic behavior of connections equipped with NiTi shape memory alloy and steel tendons between H-shaped beam to CHS column. Engineering Structures. 2015;88:37-50
[12] Chemisky Y, Chatzigeorgiou G, Kumar P, Lagoudas DC. A constitutive model for cyclic actuation of high-temperature shape memory alloys. Mechanics of Materials. 2014;68:120-136
[13] Kan Q , Yu C, Kang G, Li J, Yan W. Experimental observations on rate-dependent cyclic deformation of super-elastic NiTi shape memory alloy. Mechanics of Materials. 2016;97:48-58
[14] Soul H, Isalgue A, Yawny A, Torra V, Lovey FC. Pseudoelastic fatigue of NiTi wires: Frequency and size effects on damping capacity. Smart Materials and Structures. 2010;19(8):85006
[15] DesRoches R, McCormick J, Delemont M. Cyclic properties of superelastic shape memory alloy wires and bars. Journal of Structural Engineering. 2004;130(1):38-46
[16] Leo DJ. Engineering Analysis of Smart Material Systems. John Wiley & Sons; 2007

Emerging Trends in Mechatronics
162
[17] Zuo X-B, Li A-Q , Sun W, Sun X-H. Optimal design of shape memory alloy damper for cable vibration control. Journal of Vibration and Control. 2009;15(6):897-921
Chapter 10
Interactional Modeling andOptimized PD Impedance ControlDesign for Robust Safe FingertipGraspingIzzat Al-Darraji, Ali Kılıç and Sadettin Kapucu
Abstract
Dynamic and robust control of fingertip grasping is essential in robotic handmanipulation. This study introduces detailed kinematic and dynamic mathematicalmodeling of a two-fingered robotic hand, which can easily be extended to a multi-fingered robotic hand and its control. The Lagrangian technique is applied as acommon procedure to obtain the complete nonlinear dynamic model. Fingertipgrasping is considered in developing the detailed model. The computed torquecontroller of six proportional derivative (PD) controllers, which use the rotationangle of the joint variables, is proposed to linearize the hand model and to establishtrajectory tracking. An impedance controller of optimized gains is suggested in thecontrol loop to regulate the impedance of the robotic hand during the interactionwith the grasped object in order to provide safe grasping. In this impedance con-troller, the gains are designed by applying a genetic algorithm to reach minimumcontact position and velocity errors. The robustness against disturbances is achievedwithin the overall control loop. A computer program using MATLAB is used tosimulate, monitor, and test the interactional model and the designed controllers.
Keywords: modeling robotic hand, optimized impedance controller,linearization the dynamics of robotic hand, fingertip grasping, Lyapunov stability,Lagrange technique
1. Introduction
A recent research on service robotics has shown that there is an environmentalreaction on major applications [1]. The robotic hand is the main interactive part ofthe environment with the service robotics [2, 3]. Grasping operation [4] has beenused explicitly in robotic hand during the interactive period which represents theprocess of holding objects via two stages: free motion and constrained motion. Freemotion is the moving of fingers before detecting the grasped object, and theconstrained motion is the state of fingers when the object is detected. The commonpurpose in grasping is to handle unknown objects. Thus, finding both a model systemand a control algorithm to deal with non-predefined objects is essential in a robotichand. Regarding modeling, interactional modeling is the demand to perform aspecific control algorithm. With interactional modeling, the contact force between
163

the robotic hand and the grasped objects has obtained without needing their prop-erties. In control point of view, the robotic hand holds an object by its fingers andmoves the object to another place. In this case, there are different modes of opera-tion which can be listed as before holding the grasped object, holding the graspedobject, and moving the robotic hand while holding the grasped object. The aim ateach mode is distinct to the others and has to respond to the operation assigned.Thus, the multitude of various goals which have to be achieved with regard to thevarious operations presents an interesting scenario in the control of a robotic hand.
Generally, it is essential to obtain the modeling of a multi-fingered robotic handbefore implementing a specific model-based control algorithm. Arimoto et al. [5]presented a two-fingertip grasping model to control the rolling contact between thefingertips and the grasped object. Arimoto et al. derived the model through the useof the Euler-Lagrange equation with respect to the geometry of the fingertips whichis represented by the arc length of a fingertip. Corrales et al. [6] developed a modelfor a three-fingered robotic hand; in their study the transmission of fingertip con-tact force from the hand to the grasped object is considered. Boughdiri et al. [7]discussed the issue of modeling a multi-fingered robotic hand as a first step, beforedesigning controllers. They considered free motion only, without the constraints ofgrasped objects. In a proceeding work, Boughdiri et al. later [8] considered theconstraints of grasped objects and the coupling between fingers in grasping tasks.
In the control scenario of a robotic-environment interaction, there is generallyalso a similar case of a robotic hand-grasped object interaction; force tracking isnecessary to obtain appropriate and safe contacts. In force tracking, three mainposition-force controllers are introduced: stiffness control, hybrid position/forcecontrol, and impedance control [9]. Among the above three controllers, impedancecontrol presents an integrated process to constrained manipulators [10]. Theimpedance controller is introduced by Hogan in 1985 to set the dynamic conductbetween the motion of the robot end-effector and the contact force with the envi-ronment, instead of regarding the control of motion and force individually [11, 12].Chen et al. [13] derived impedance controller for an elastic joint-type robotic handin Cartesian and joint spaces. Chen et al. focused on the compensation of gravityand managing the parameter of uncertainties. Huang et al. [14] proposed theimpedance controller for grasping by two fingers to deal with the problem ofdropping objects when grasping by one finger. Zhang et al. [15] proposed an adap-tive impedance controller with friction compensation to track forces of the multi-fingered robotic hand.
However, the synthesis of impedance control design continues to exist as a majorchallenge in the performance advancement of robotic hand in order to provide safeand robust grasping. Besides this, the greatest problems in robotic hand-graspedobject interaction are the existence of nonlinearity in the dynamic system, dealingwith different grasped objects, disturbances, and interference. In the previousstudies, the aforementioned problems have not taken in consideration. The aim ofthis paper is to treat these problems using interactional modeling and the designgains of impedance control. The action of the suggested control expression is toprovide a fingertip interactional robust control algorithm that takes into account thedynamics of the robotic hand under unknown contact conditions. To accomplishthis, we propose first to linearize the dynamics on the level of position-trackingcontroller through six PD controllers. When executed, the calculated gains of thedesigned PD controllers result in zero steady errors without overshoot. Second,through an impedance controller, the interactional fingertips’ force is regulated bythe robotic hand’s impedance. The gains of the impedance are designed based ongenetic algorithm. As a result, the introduced control expression enables the posi-tion and velocity of fingertips to be controlled simultaneously without changing
164
Emerging Trends in Mechatronics
over control subspace. This control expression avoids selecting between differentcontrollers which causes indirect control and consumption of high energy. Theoperation and the robustness of the presented control expression are approved byMATLAB/Simulink in several tests.
The rest of the chapter is organized as follows. In Section 2, the mathematicalrepresentation of kinematics and dynamics of the robotic hand with environmentinteraction is derived and explained. In Section 3, the overall controllers of positiontracking and impedance control are designed. In addition, the suggested procedureof obtaining optimum values of impedance gains using genetic algorithm isexplained. In Section 4, following the joint path and fingertip position is tested.Then, the robustness of the system is examined. Finally, the conclusions of thisstudy are presented in Section 5.
2. Mathematical model
The models of a robotic hand system are the mathematical equations thatdescribe all the contact forces and motion of the fingers at any time [16]. Thesemodels are essential for grasping and manipulation operations which include kine-matics, dynamics, and contacts between the fingers and the environment. A multi-fingered robotic hand with an existing grasped object has a complex structure.Thus, deriving the mathematical representation is not a simple task. In this section,the mathematical representation for a two-fingered robotic hand with an environ-ment is developed. Changing the orientation of the robotic hand with respect to theinertial (earth) frame during manipulation operation is considered in this analysis.
2.1 Reference frames
The system is a two-fingered robotic hand that can adjust fingertip grasp forcesby the torque of actuators in the joints. Each finger includes three joints (MCP, PIP,and DIP) and three rigid phalanges (proximal, intermediate, and distal). Themotion of the finger actuates through the torque in the joints. The variables i ¼ 1, 2and j ¼ 1, 2, 3 represent the index of the finger and the joint, respectively. Theanalysis is based on the four main reference frames: finger frames Oij, hand baseframe Ohb, fingertip contact point frames Otipi, and inertia frame Oe as shown inFigure 1. The joints MCP, PIP, and DIP are located at Oi1, Oi2, and Oi3,respectively. The length Lij represents the distance from Oij to Oi jþ1ð Þ. The angle ofrotation θij around zj�1 associates with the ith phalanx and jth joint. The coordinateframe Oij is attached in order to express the coordinates of any point on thephalanges as a result of the motion of θij. In our case, expressing the motion of thefingertip points ðxtip1, ytip1, ztip1Þ and ðxtip2, ytip2, ztip2Þ is the primary interest. Theframe Ohb is defined to switch between the motions of the fingertips with respect tothe base of the hand through matrices. The frames Otipi are defined to represent thecontact points between the fingertips and the environment. Finally, the inertialframe Oe which is assumed at Ohb is assigned to represent the orientation of therobotic hand with respect to the earth.
The result of orienting the robotic hand with respect to the earth coordinates isexpressed by defining the three rotation angles roll, pitch, and yaw (RPY). Inwhich, roll is (α: around xhb-axis), pitch is (γ: around yhb-axis), and yaw is(φ: around zhb-axis). Mathematical representation of rotation about a fixed axis(earth frame) can be expressed by a specified sequence of multiplying the free
165
Interactional Modeling and Optimized PD Impedance Control Design for Robust Safe Fingertip…DOI: http://dx.doi.org/10.5772/intechopen.85531
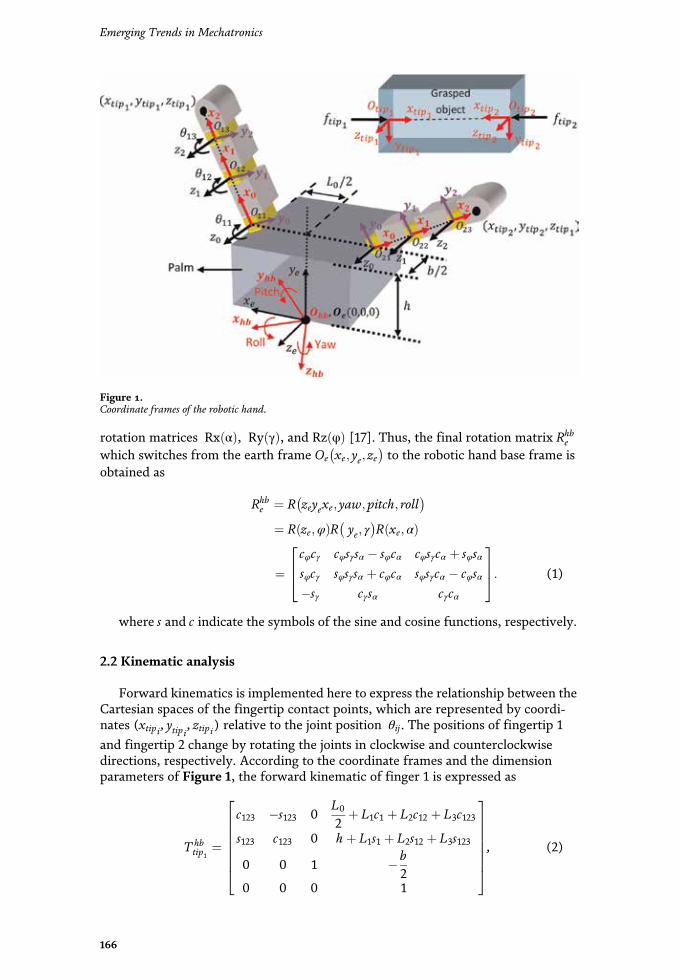
rotation matrices Rx αð Þ, Ry γð Þ, and Rz φð Þ [17]. Thus, the final rotation matrix Rhbe
which switches from the earth frame Oe xe; ye; ze� �
to the robotic hand base frame isobtained as
Rhbe ¼ R zeyexe; yaw; pitch; roll
� �
¼ R ze;φð ÞR ye; γ� �
R xe; αð Þ
¼cφcγ cφsγsα � sφcα cφsγcα þ sφsαsφcγ sφsγsα þ cφcα sφsγcα � cφsα�sγ cγsα cγcα
264
375: (1)
where s and c indicate the symbols of the sine and cosine functions, respectively.
2.2 Kinematic analysis
Forward kinematics is implemented here to express the relationship between theCartesian spaces of the fingertip contact points, which are represented by coordi-nates (xtipi, ytipi, ztipi) relative to the joint position θij. The positions of fingertip 1and fingertip 2 change by rotating the joints in clockwise and counterclockwisedirections, respectively. According to the coordinate frames and the dimensionparameters of Figure 1, the forward kinematic of finger 1 is expressed as
T hbtip1
¼
c123 �s123 0L0
2þ L1c1 þ L2c12 þ L3c123
s123 c123 0 hþ L1s1 þ L2s12 þ L3s123
0 0 1 � b2
0 0 0 1
26666664
37777775, (2)
Figure 1.Coordinate frames of the robotic hand.
166
Emerging Trends in Mechatronics
and the forward kinematic of finger 2 is
T hbtip2
¼
c123 �s123 0 �L0
2� L1c1 � L2c12 � L3c123
s123 c123 0 hþ L1s1 þ L2s12 þ L3s123
0 0 1 � b2
0 0 0 1
266666664
377777775: (3)
where L0 and b are the length and the width of the palm shown in Figure 1,respectively. In Eqs. (2) and (3) and the rest of equations in this study, thedenotation c1, s1, c12, s12, c123, and s123 represents cos θ1, sin θ1, cos θ1 þ θ2ð Þ,sin θ1 þ θ2ð Þ, cos θ1 þ θ2 þ θ3ð Þ, and sin θ1 þ θ2 þ θ2ð Þ, respectively. To control theposition of the three links, the joint variables θi1, θi2, θi3 are calculated using inversekinematic as
θi2 ¼ π � cos �1L1
2 þ L22 � xtipi
2 � ytipi2
2L1L2, (4)
θi1 ¼ tan �1ytipixtipi
� cos �1xtipi
2 þ ytipi2 þ L1
2 � L22
2l1ffiffiffiffiffiffiffiffiffiffiffiffiffiffiffiffiffiffiffiffiffiffiffiffiffixtipi
2 þ ytipi2
q , (5)
θi3 ¼ φie � θ1 � θ2: (6)
where φie is the angle of distal phalanx with respect to the axis yi2. Next, theJacobian matrix for each finger is obtained based on the forward kinematic equa-tions, which were derived from Eqs. (2) and (3) as
Jfinger1 ¼�L1s1 � L2s12 � L3s123 �L2s12 � L3s123 �L3s123
L1c1 þ L2c12 þ L3c123 L2c12 þ L3c123 L3c123
0 0 0
2664
3775, (7)
and
Jfinger2 ¼L1s1 þ L2s12 þ L3s123 L2s12 þ L3s123 L3s123
L1c1 þ L2c12 þ L3c123 L2c12 þ L3c123 L3c123
0 0 0
264
375, (8)
The robotic hand transforms the generated torque by each joint to the wrenchesexerted on the grasped object through the following Jacobian matrix:
Jhand ¼Jfinger1 0
0 Jfinger2
" #: (9)
2.3 Contact interaction
A contact interaction, which uses contact behavior between rigid fingertips anda flexible grasped object, is proposed in this study (see Figure 2). The graspedobject is assumed as a linear spring of stiffness kobject. Hence, each fingertip exerts aforce on the grasped object as
167
Interactional Modeling and Optimized PD Impedance Control Design for Robust Safe Fingertip…DOI: http://dx.doi.org/10.5772/intechopen.85531

f tipx, i ¼ kobject xtipx, i � xobjectx, i� �
, (10)
f tipy, i ¼ kobject ytipy, i � yobjecty, i
� �, (11)
f tipz, i ¼ kobject ztipz, i � zobjectz, i� �
: (12)
where xobjecti , yobjecti , and zobjecti are the coordinate points of the grasped object.The current and the desired location of the fingertips are denoted by (xtipi , ytipi , ztipi)and (xdi , ydi , zdi), respectively.
2.4 Dynamics of robotic hand
The motion equations are derived to describe the dynamics of the robotic handwhen interacting with the grasped object; the explained fingertip forces inEqs. (10)–(12) are involved in the dynamic equation. When ignoring friction, eachfinger in free motion can be described by the following general motion equation:
Mfinger1 q1� �
€q1 þDfinger1 q1; _q1� �
_q1 þGfinger1 q1� � ¼ τfinger1 , (13)
Mfinger2 q2� �
€q2 þDfinger2 q2; _q2� �
_q2 þGfinger2 q2� � ¼ τfinger2 , (14)
where qi ∈R3 is the general coordinate vector, Mfingeri qi� �
is the 3� 3 inertiamatrix, Dfingeri qi; _qi
� �is the 3-vector which involves forces of centrifugal and
Coriolis, Gfingeri qi� �
is the vector of the gravitational force, and τfingeri is the vector ofthe input torque at joints. When the fingertips are interacting with the graspedobject (see Figure 2), then Eqs. (13) and (14) become
Mfinger1 q1� �
€q1 þDfinger1 q1; _q1� �
_q1 þ Gfinger1 q1� � ¼ τfinger1 � JTfinger1Ftip1 , (15)
Mfinger2 q2� �
€q2 þDfinger2 q2; _q2� �
_q2 þ Gfinger2 q2� � ¼ τfinger2 � JTfinger2Ftip2 , (16)
Figure 2.Side view of fingertip contact interaction system on the x-axis.
168
Emerging Trends in Mechatronics
where Jfingeri is the Jacobian matrix (see Subsection 2.2) and Ftipi is the externalforce 3-vector with expression value:
Ftip1 ¼ f tipx,1 f tipy,1 f tipz,1
h iTand Ftip2 ¼ f tipx,2 f tipy,2 f tipz,2
h iT;
to derive Eqs. (15) and (16), the Lagrange equations of motion are used. For eachfinger manipulator, the equation of motion is given by [18]
ddt
∂T∂ _θ j
� ∂T∂θj
¼ Q j þ Tj: (17)
where T is the total kinetic energy of the finger manipulator, Qj is the potentialenergy, and Tj is the external torques. The x-y coordinates are representedaccording to the assigned frames of Figure 1. The velocities of the mass centers forthe phalanges are important to find the kinetic energy. For proximal phalanx, theposition of the mass center with respect to MP joint is represented by
x1 ¼ d1c1,
y1 ¼ d1s1;
the position of the mass center of intermediate phalanx with respect to MP jointis represented by
x2 ¼ L1c1 þ d2c12
y2 ¼ L1s1 þ d2s12;
and the position of the mass center of distal phalanx with respect to MP joint isrepresented by
x3 ¼ L1c1 þ L2c12 þ d3c123,
y3 ¼ L1s1 þ l2s12 þ d3s123,
where di is the distance to the center of mass which is assumed in the middle ofthe phalanx. The total kinetic energy of the finger in Eq. (17) is expressed by thefollowing equation:
T ¼ 12m1 _x1
2 þ _y12
� �þ 12I1 _θ1
2 þ 12m2 _x2
2 þ _y22
� �þ 12I2 _θ1 þ _θ2� �2
þ 12m3 _x3
2 þ _y32
� �þ 12I3 _θ1 þ _θ2 þ _θ3� �2
,(18)
and to obtain the kinetic energy, the above formulas (x1,y1,x2,y2,x3,y3) aredifferentiated with time. Lagrangian equations according to Eq. (17) are
ddt
∂T∂ _θ1
� ∂T∂θ1
¼ Q1 þ T1, (19)
ddt
∂T∂ _θ2
� ∂T∂θ2
¼ Q2 þ T2, (20)
ddt
∂T∂ _θ3
� ∂T∂θ3
¼ Q3 þ T3, (21)
169
Interactional Modeling and Optimized PD Impedance Control Design for Robust Safe Fingertip…DOI: http://dx.doi.org/10.5772/intechopen.85531

where
Q1 ¼ F1∂ r!1
∂θ1þ F2
∂ r!2
∂θ1þ F3
∂ r!3
∂θ1, (22)
Q2 ¼ F1∂ r!1
∂θ2þ F2
∂ r!2
∂θ2þ F3
∂ r!3
∂θ2, (23)
Q3 ¼ F1∂ r!1
∂θ3þ F2
∂ r!2
∂θ3þ F3
∂ r!3
∂θ3: (24)
The procedure for calculating Qi is shown in Appendix A. Thus, Eqs. (22)–(24)become
Q1 ¼ �m1 gd1 cos θ1 �m2 gl1 cos θ1 �m2 gd2 cos θ1 þ θ2ð Þ �m3 gl1 cos θ1�m3 gl2 cos θ1 þ θ2ð Þ �m3 gd3 cos θ1 þ θ2 þ θ3ð Þ, (25)
Q2 ¼ �m2 gd2 cos θ1 þ θ2ð Þ �m3 gl2 cos θ1 þ θ2ð Þm3 gd3 cos θ1 þ θ2 þ θ3ð Þ, (26)
Q3 ¼ �m3 gd3 cos θ1 þ θ2 þ θ3ð Þ; (27)
by using the kinetic energy in Eq. (18) and the potential energy in Eqs. (25)–(27), it results that Eqs. (19)–(21) after being rearranged in a matrix form result in
m11 m12 m13
m21 m22 m23
m31 m32 m33
264
375
€θ i1€θ i2€θ i3
264
375þ
d11 d12 d13d21 d22 d23d31 d32 d33
264
375
_θ i1_θ i2_θ i3
264
375þ
gi1gi2gi3
264
375 ¼ τf ingeri � JTfingeriFtipi :
(28)
The formula of matrices’ elements in Eq. (28) is listed in Appendix A. FromEqs. (15) and (16), the overall dynamics of robotic hand can be constituted as
Mhand q1; q2� � €q1
€q2
� �þDhand q1; _q1; q2; _q2
� � _q1_q2
� �þGhand q1; q2
� � ¼ τhand � Ftips,
(29)
with the following matrix forms;
Mhand ¼Mfinger1 q1
� �0
0 Mfinger2 q2� �
" #,
Dhand ¼Dfinger1 q1; _q1
� �0
0 Dfinger2 q2; _q2� �
" #,
Ghand ¼Gfinger1 q1
� �
Gfinger2 q2� �
" #,
τhand ¼τfinger1τfinger2
" #,
Ftips ¼ JThandFtip1
Ftip2
" #:
170
Emerging Trends in Mechatronics
Thus, the six motion equations are presented by rearranging Eq. (29) to result in
€q1€q2
� �¼ Mhand q1; q2
� ��1 �Dhand q1; _q1; q2; _q2� � _q1
_q2
� ��Ghand q1; q2
� �þ τhand � Ftips
� �: (30)
The desired finger configuration in joint space can be obtained by solving theabove equation, which will be explained later in Section 3.1 for designing theposition-tracking controller.
3. Controller design
The derived mathematical representation is applied using MATLAB/Simulink toimplement the proposed controllers and the tests of this study. The parameters ofthe model, which are used in Simulink, are shown in Table 1. The overall control-lers of the robotic hand are depicted as a complete block diagram in Figure 3. In thefollowing sections, the design of the controllers is described in detailed.
3.1 Position tracking
Recently, a variant of the PD controller explicitly has been considered in thecontrol of nonlinear system where the aim is to make the system follow a specifictrajectory [19–22]. The joint angle controller shown in Figure 3 is the innerfeedforward loop which presents the effect of the input torque on the error inEq. (30). The detailed block diagram of this controller is shown in Figure 4. Thetracking error is formed by subtracting the joint angle vector (qi) from the desiredjoint angle vector (qdi) as below:
ei tð Þ ¼ qdi tð Þ � qi tð Þ: (31)
The objective is to minimize this error at any time, by differentiating Eq. (31)twice, solving for €q1 ; €q2
� �in Eq. (30), and rearranging the results in terms of the
input torque that yields the following computed torque control equation:
τhand ¼ Mhand€qd1€qd2
" #� €e1
€e2
� � !þDhand þGhand þ Ftips, (32)
Parameter Value Parameter Value
L1 50 mm L3 20 mm
d1 25 mm d3 10 mm
m1 34 g m3 12 g
I1 7083 g.mm2 I3 400 g.mm2
L2 30 mm h 100 mm
d2 15 mm b 50 mm
m2 15 g L0 70 mm
I2 1125 g.mm2
Table 1.Robotic hand model parameters.
171
Interactional Modeling and Optimized PD Impedance Control Design for Robust Safe Fingertip…DOI: http://dx.doi.org/10.5772/intechopen.85531

where €ei is the control input which is selected as six PD controllers with thefollowing feedback:
€ei ¼ �Kvi _ei � Kpiei, (33)
where Kvi ¼ diag kvif g and Kpi ¼ diag kpi� �
; hence, the robotic hand inputbecomes
τhand ¼ Mhand€qd1€qd2
" #þ Kv1 _e1 þ Kp1e1
Kv2 _e2 þ Kp2e2
" # !þDhand þGhand þ Ftips: (34)
Figure 3.Block diagram of the complete robotic hand controllers.
Figure 4.PD joint angle controller for each finger.
172
Emerging Trends in Mechatronics
The system can be stabilized in Eq. (34) by a proper design of PD controller totrack the error error tð Þ to zero. In which, the input torque at joints results in thetrajectory of reaching the grasped object. According to Eq. (33), the typical transferfunction of the error dynamic in closed-loop approach is
error sð Þw sð Þ ¼ 1
s2 þ kvsþ kp, (35)
where w is the disturbance. Thus, the system is stable for all positive values of kvand kp. Comparing Eq. (35) with the standard second-order polynomial term(s2 þ 2λωnsþ ω2
n), we get
kpi ¼ ω2n,
kvi ¼ 2λωn:
The design of gains is selected for the closed-loop time constant (0:1s); thus
ωn ¼ 10:1
¼ 10,
kp ¼ ωn2 ¼ 100,
kv ¼ 2ωn ¼ 20
where ωn and λ are the natural frequency and the damping coefficient,respectively.
The stability of robustness analysis by Lyapunov’s direct method is implementedhere to verify the ability of applying the proposed PD controller in real situationswhere unmodeled disturbances are included in the actual robotic hand. The effectof unmodeled disturbances in robotic manipulator can be represented by replacingthe PD controller gain matrices with matrices of nonlinear gains [23]. Consideringthe nonlinear matrices gains, the robotic hand input in Eq. (34) becomes
τhand ¼ Mhand€qd1€qd2
" #þ Kv1 e1ð Þ _e1 þ Kp1 e1ð Þe1
Kv2 e2ð Þ _e2 þ Kp2 e2ð Þe2
" # !þDhand þGhand þ Ftips, (36)
where Kpi eið Þ ¼ diag kpi eið Þ� �and Kvi eið Þ ¼ diag kvi eið Þf g are the nonlinear
proportional gain matrix and the nonlinear derivative gain matrix, respectively.Combining Eq. (32) with Eq. (36), the equation of the closed loop becomes
ddt
e1e2_e1_e2
26664
37775 ¼
_e1_e2
�Kv1 e1ð Þ _e1 � Kp1 e1ð Þe1�Kv2 e2ð Þ _e2 � Kp2 e2ð Þe2
266664
377775: (37)
The stability of Eq. (32) together with Eq. (36) is assumed if there exists ρ.0with the following inequality sentences:
kpi eið Þ≥ ρ,
kvi eið Þ≥ ρ:
The stability analysis is implemented by proposing the following Lyapunovfunction:
173
Interactional Modeling and Optimized PD Impedance Control Design for Robust Safe Fingertip…DOI: http://dx.doi.org/10.5772/intechopen.85531

V ¼ 12_e1T _e1 þ 1
2_e2T _e2 þ
ðe10ε1
T Kp1 ε1ð Þ þ β1Kv1 ε1ð Þ� �dε1 þ
ðe20ε2
T Kp2 ε2ð Þ þ β2Kv2 ε2ð Þ� �dε2
þ β1e1T _e1 þ β2e2
T _e2 :
(38)
Considering the smallest eigenvalues λsi, the limit of βi satisfies
λs1 Kv1 ε1ð Þf g. β1 .0,
λs2 Kv2 ε2ð Þf g. β2 .0;
thus
kvj 1 εj1� �� β1
2.0,
kvj 2 εj2� �� β2
2.0,
where j ¼ 1,…, 3. Since β1, β2 .0 and kpj 1 εj1� �
, kpj 2 εj2� �
≥ ρ; thus
kpj 1 εj1� �þ β1kvj 1 εj1
� �� β12
2≥ ρ, (39)
kpj2 εj2� �þ β2kvj2 εj2
� �� β22
2≥ ρ: (40)
Then, Eq. (38) becomes
V ¼ 12
_e1 þ β1e1ð ÞT _e1 þ β1e1ð Þ þ 12
_e2 þ β2e2ð ÞT _e2 þ β2e2ð Þ
þðe10ε1
T Kp1 ε1ð Þ þ β1Kv1 ε1ð Þ � β12
2I
� �dε1þ
ðe20ε2
T Kp2 ε2ð Þ þ β2Kv2 ε2ð Þ � β22
2I
� �dε2.
(41)
The first two terms of Lyapunov function are positive. Regarding the third andthe fourth terms, according to Eqs. (39) and (40), we have
ðej10ε1 kpj 1 εj1
� �þ β1kvj 1 εj1� �� β1
2
2
� �dε1 ≥
12ρ ej1�� ��2, (42)
ðej20
ε2 kpj2 εj2� �þ β2kvj2 εj2
� �� β22
2
� �dε2 ≥
12ρ ej2�� ��2; (43)
thusðej10
ε1 kpj 1 εj1� �þ β1kvj 1 εj1
� �� β12
2
� �dε1 ! ∞ when ej1
�� ��! ∞, (44)
ðej20
ε2 kpj 2 εj2� �þ β2kvj 2 εj2
� �� β22
2
� �dε2 ! ∞ when ej2
�� ��! ∞: (45)
Equations (44) and (45) result in
ðe10ε1
T Kp1 ε1ð Þ þ β1Kv1 ε1ð Þ � β12
2
� �dε1 ≥
12ρ e1k k2, (46)
174
Emerging Trends in Mechatronics
ðe20ε2
T Kp2 ε2ð Þ þ β2Kv2 ε2ð Þ � β22
2
� �dε2 ≥
12ρ e2k k2, (47)
and
ðe10ε1
T Kp1 ε1ð Þ þ β1Kv1 ε1ð Þ � β12
2
� �dε1 ! ∞ when e1k k ! ∞, (48)
ðe20ε2
T Kp2 ε2ð Þ þ β2Kv2 ε2ð Þ � β22
2
� �dε2 ! ∞ when e2k k ! ∞: (49)
Hence, the Lyapunov function presented in Eq. (38) is globally positive defini-tive function.
Taking the derivative of Eq. (38) with respect to time, we get
_V ¼ _e1T€e1 þ _e2T€e2 þ e1T Kp1 e1ð Þ þ β1Kv1 e1ð Þ� �_e1 þ e2T Kp2 e2ð Þ þ β2Kv2 e2ð Þ� �
_e2 þ β1 _e1T _e1
þ β1e1T€e1 þ β2 _e2
T _e2 þ β2e2T€e2
(50)
Finally, using the rule of Leibnitz for representation, the integrals in differenti-ation form and Substituting Eq. (37) in (50) yield
_V ¼ � _e1T Kv1 e1ð Þ � β1I½ � _e1 � _e2T Kv2 e2ð Þ � β2I½ � _e2 � β1e1TKp1 e1ð Þe1 � β2e2
TKp2 e2ð Þe2,(51)
for all positive values of gain matrices Kv1 e1ð Þ, Kv2 e2ð Þ, Kp1 e1ð Þ,and Kp2 e2ð Þ;Eq. (51) is globally negative function. Then
_V ,0:
In this way, the system is globally exponential stabile.
3.2 Impedance controller
The PD impedance controller has been widely applied in modern researches forcontrolling the interaction with the environment [24, 25]. The fundamental princi-ple of the implemented impedance control in this study is that the fingers shouldtrack a motion trajectory, and adjust the mechanical impedance of the robotic hand.The mechanical impedance of the robotic hand is defined in terms of velocity andposition as
Zhand ¼Ftipi sð Þ_X sð Þ , (52)
sZhand ¼Ftipi sð ÞX sð Þ : (53)
By virtue of the above two equations, the fingertip contact force Ftipi gives theessential property of regulating the position and velocity of the contact pointsbetween the fingertips and the grasped object. This regulating behavior is obtainedby two PD controllers as shown in Figure 3. In the first PD controller, the position isregulated by
175
Interactional Modeling and Optimized PD Impedance Control Design for Robust Safe Fingertip…DOI: http://dx.doi.org/10.5772/intechopen.85531

ΔXstiffness ¼ KF1Ftipi , (54)
where KF1 is the matrix of the proportional gain of the controller and thevelocity is regulated by
Δ _Xdamping ¼ KF2Ftipi , (55)
where KF2 is the matrix of the controller’s derivative gain. The regulated positionand velocity of Eqs. (54) and (55) are integrated in the impedance control loop withanother PD controller of proportional gain matrix K0
p and derivative gain matrix K0v
in order to adjust the damping of the robotic hand during grasping operationaccording to the following equation:
τimp ¼ JT K0p ΔXD þ K 0
vΔ _XD
� �, (56)
where
ΔXD ¼ XD � X � ΔXstiffness,
and
Δ _XD ¼ _XD � _X � Δ _Xdamping:
Hence, the contact forces are regulated in joint space, and the robotic hand canadapt the collision of the fingers with the grasped objects.
The application of Lyapunov function technique determines the conditions ofstability of impedance controller [26]. In the forward kinematic model, the equa-tions of fingers are
Xi ¼ f qi� �
, (57)
_Xi ¼ Jfingeri _qi: (58)
On the other hand, the errors are given as
ℶi ¼ qi � qid, (59)
ℵi ℶið Þ ¼ Xi qi� �� Xid, (60)
where ℶi, ℵi ℶið Þ, and i are the error of joint angle, the error in task space, and theindex of finger (i ¼ 1, 2), respectively. Consider the constrained dynamics of thetwo fingers in Eqs. (15) and (16) for the control torque in Eq. (56). ApplyingEqs. (59) and (60), the error dynamic equation of each finger becomes
Mfinger1 ℶ1ð Þ€ℶ1 þDfinger1 ℶ1; _ℶ1� �
_ℶ1 þ Gfinger1 ℶ1ð Þ þ JTfinger1 K0p þ K0
pKF1Ke þ K0vKF2Ke þ Ke
h iℵ1 ℶ1ð Þ
þ JTfinger1K0v_ℵ1 ℶ1ð Þ ¼ 0,
(61)
Mfinger2 ℶ2ð Þ€ℶ2 þDfinger2 ℶ2; _ℶ2� �
_ℶ2 þGfinger2 ℶ2ð Þ þ JTfinger2 K0p þ K0
pKF1Ke þ K0vKF2Ke þ Ke
h iℵ2 ℶ2ð Þ
þ JTfinger2K0v_ℵ2 ℶ2ð Þ ¼ 0,
(62)
176
Emerging Trends in Mechatronics
where Ke is the stiffness matrix of the fingertip/grasped object. In order to findthe potential energy P ℶið Þ and the dissipation function D ℶið Þ, compare Eqs. (61)and (62) with the following Lagrangian’s equations of total kinetic energy T:
ddt
∂T∂ _ℶi
� �� ∂T∂ℶi
þ ∂P∂ℶi
þ ∂D∂ _ℶi
¼ 0; (63)
then, we get
∂P∂ℶ1
¼ K0p þ K0
pKF1Ke þ K0vKF2Ke þ Ke
h iℵ1 ℶ1ð Þ, (64)
∂D∂ _ℶ1
¼ K0v_ℵ1 ℶ1ð Þ, (65)
∂P∂ℶ2
¼ K0p þ K 0
pKF1Ke þ K0vKF2Ke þ Ke
h iℵ2 ℶ2ð Þ, (66)
∂D∂ _ℶ2
¼ K0v_ℵ2 ℶ2ð Þ, (67)
T ℶ1; _ℶ1� � ¼ 1
2_ℶ1
TMfinger1 ℶ1ð Þ _ℶ1, (68)
T ℶ2; _ℶ2� � ¼ 1
2_ℶ2
TMfinger2 ℶ2ð Þ _ℶ2: (69)
The error dynamics in Eqs. (61) and (62) is asymptotically stable if the followingcandidate Lyapunov function
V ℶ; _ℶ� � ¼ T ℶ1; _ℶ1
� �þ T ℶ2; _ℶ2� �þ P ℶ1ð Þ þ P ℶ2ð Þ (70)
satisfies the following conditions:
V ℶ; _ℶ� �
is positive,
_V ℶ; _ℶ� �
is negative:
The derivative of Eq. (70) is
ddt
V ℶ; _ℶ� � ¼ dT ℶ1ð Þ
dtþ dT ℶ2ð Þ
dtþ dP ℶ1ð Þ
dtþ dP ℶ2ð Þ
dt,
_V ℶ; _ℶ� � ¼ _ℶ1
TMfinger1
€ℶ1 þ _ℶ1T dMfinger1
dt
_ℶ1
2þ _ℶ2
TMfinger2
€ℶ2 þ _ℶ2T dMfinger2
dt
_ℶ2
2
þ _ℶ1T
K0p þ K0
pKF1Ke þ K0vKF2Ke þ Ke
h iℵ1 ℶ1ð Þ
� �
þ _ℶ2T
K0p þ K0
pKF1Ke þ K0vKF2Ke þ Ke
h iℵ2 ℶ2ð Þ
� �:
(71)
Equations (61) and (62) can be rearranged as below
Mfinger1 ℶ1ð Þ€ℶ1 þDfinger1 ℶ1; _ℶ1� �
_ℶ1 þGfinger1 ℶ1ð Þ
þ JTfinger1 K0p þ K0
pKF1Ke þ K0vKF2Ke þ Ke
h iℵ1 ℶ1ð Þ ¼ �JTfinger1K
0v_ℵ1 ℶ1ð Þ,
(72)
177
Interactional Modeling and Optimized PD Impedance Control Design for Robust Safe Fingertip…DOI: http://dx.doi.org/10.5772/intechopen.85531

Mfinger2 ℶ2ð Þ€ℶ2 þDfinger2 ℶ2; _ℶ2� �
_ℶ2 þ Gfinger2 ℶ2ð Þ
þ JTfinger2 K0p þ K0
pKF1Ke þ K0vKF2Ke þ Ke
h iℵ2 ℶ2ð Þ ¼ �JTfinger2K
0v_ℵ2 ℶ2ð Þ,
(73)
By substituting Eqs. (72) and (73) in Eq. (71) and applying the relations inEqs. (57)–(60), it yields
_V ℶ; _ℶ� � ¼ � _ℵ1
Tℶ1ð ÞK0
v_ℵ1 ℶ1ð Þ � _ℵ2
Tℶ2ð ÞK0
v_ℵ2 ℶ2ð Þ: (74)
Hence, the robotic hand system is asymptotically stable under the followingboundaries:
2K 0p þ 2K0
pKF1ke þ 2K0vKF2ke þ 2ke
h i.0,
K0v .0,
or
K0v .0:
3.3 Gains design using genetic algorithm
Genetic algorithm is a well-known optimization procedure for complex prob-lems which ascertains optimum values for different systems [27]. The genetic algo-rithm is written to find the optimum impedance gains. The code takes the calculateddata from the robotic hand Simulink model to compute impedance’s gains. How-ever, the detailed genetic algorithm that is applied in the design of the gains can bedefined by the following proceedings:
(1) Generate a number of solutions. This represents the random number of popu-lation which includes the gains KF1, KF2, K0
p, and K 0v of the impedance controller of
Figure 3. These gains are the individual of population.(2) Fitness function. During the running of the program, the fitness is evaluated
for each individual in the population. In this study, the objective of the fitnessfunction is to minimize the errors ΔXD and Δ _XD of Eq. (56) as below:
Errortracking ¼ 0:05ΔXD þ 0:05Δ _XD þ 0:1tr1 þ 0:1ts1 þ 0:1do1 þ 0:1tr2 þ 0:1ts2þ0:1do2 þ 0:1tr3 þ 0:1ts3 þ 0:1do3 ,
(75)
where trj , tsj , and doj are the rising time, the settling time, and the overshoot,respectively, for each error signal (j ¼ 1, 2, 3).
(3) Create the next generation [28]. At each step, genetic algorithm implementsthe following three rules to create a new generation of the recent population:
• Individuals called parents are selected by the selection rules, and then thepopulation of the next generation is obtained by contributing the parents.
• Two parents are combined to generate children by crossover rules for the nextgeneration.
• Children are formed by mutation rules. The process of forming children isdependent on applying random changes on the individual parents.
178
Emerging Trends in Mechatronics
(4) Setting the genetic algorithm. The following parameters are used for setting theproposed genetic algorithm in this study: the number of generations = 80, the size ofpopulation = 30, and the range of gains are KF1min ¼ 0, KF1max ¼ 50, KF2min ¼ 0,KF2max ¼ 50, Kpmin ¼ 0, Kpmax ¼ 50, KVmin ¼ 0, KVmax ¼ 50.
4. Simulation results
The obtained interactional model was applied in the simulation to verify thedesigned controllers through three tests as follows:
• Test 1: Following a specific joint path.
• Test 2: Following fingertip position.
• Test 3: Robustness of the controllers.
The Simulink model is implemented using MATLAB as shown in Figure 5.
4.1 Following a specific joint path
This test is focused on position-tracking performance of joints. We assumed thetwo fingers are in initial position (θij ¼ 0) and the joints should follow the followingpath:
θijd ¼ 0:2 sin πt:
The simulation result explained in Figure 6 shows that the designed position-tracking controller can follow a specific path with zero steady error and withoutovershoot. A unit step input function of amplitude 20° is implemented to check thistracking error, and the response of the controllers is more detailed as shown inFigure 7.
Figure 5.The Simulink model of the robot hand.
179
Interactional Modeling and Optimized PD Impedance Control Design for Robust Safe Fingertip…DOI: http://dx.doi.org/10.5772/intechopen.85531

Figure 6.Joint tracking of sine wave path.
Figure 7.Tracking errors of finger 1 joints.
180
Emerging Trends in Mechatronics
4.2 Following fingertip position
The second test is implemented to monitor the operation of the designedimpedance controller in task space. We assumed the initial position of the fingertip1 is (135, 100, �25 mm) and it has to reach the position (115, 153.7, �25 mm). Theposition of the grasped object is assumed at xobject1 ¼ 118mm, yobject1 ¼ 152:7mm,zobject1 ¼ �25. The result of the optimization process of the impedance controller isobtained as KF1 ¼ 1:8089, KF2 ¼ 1, KP ¼ 1, KV ¼ 1. At these gains, as shown inFigure 8, the percentage error of position and velocity are 0.6 and 0%, respectively.Regarding the fingertip contact force represented in Figure 9, the overall designedcontrollers have given the essential property of contact without overshoot.
For comparison purposes, another study is implemented without consideringthe impedance controller in the overall control loop, i.e., KF1 ¼ 0, KF2 ¼ 0,KP ¼ 0, KV ¼ 0. The results showed that the fingertip position error reaches 0.69%,but the main side effect was of the fingertip velocity error which reached 100% (seeFigure 10). In turn, the fingertip contacts the grasped object with high value oferror in velocity; this situation causes unsafe grasping. As a result, the proposedoverall controller has minimized the velocity error to 0% thanks to the proposedimpedance controller with genetic algorithm.
4.3 System robustness
The robustness of the designed controllers is checked in this section. This test isimplemented within the same parameters of the desired position and object location
Figure 8.Motion of fingertip 1 with impedance controller.
181
Interactional Modeling and Optimized PD Impedance Control Design for Robust Safe Fingertip…DOI: http://dx.doi.org/10.5772/intechopen.85531

Figure 10.Motion of fingertip 1 without impedance controller.
Figure 9.Fingertip contact force with the grasped object.
182
Emerging Trends in Mechatronics
in the test of Section 4.2. The disturbances on the robotic hand cause change of thefingertip contact forces. Here, we assumed that the disturbances result in a contactforce with a white Gaussian noise [29–32] shown in Figure 11. The Gaussian noisemodel is generated using block AWGN channel in Simulink. The position of theAWGN channel is shown in Figure 5. The parameters of white Gaussian noise areset as shown in Figure 12. The designed controllers have achieved the functionalityof rejecting the disturbances and kept the motion of the finger as shown inFigure 13.
Figure 11.Contact force signal with a white Gaussian noise.
Figure 12.Parameters of the applied white Gaussian noise.
183
Interactional Modeling and Optimized PD Impedance Control Design for Robust Safe Fingertip…DOI: http://dx.doi.org/10.5772/intechopen.85531

5. Conclusion
Grasping by two fingertips plays a distinctive role in its performance related torobotic hand-environment interaction. A mathematical model including thedynamic equation has been derived based on the Lagrange technique. The couplingbetween two fingers and the fingertip contacts with unknown grasped objects hasbeen presented in this model. The performance of the derived model is confirmedwhen a designed based model controller is implemented in Simulink. A computedtorque controller of six PD controllers has been implemented to control the rotationof joints. The impedance controller is applied to operate as the outer loop of theoverall control system. This controller allowed the regulation of the fingertip con-tact forces without overshoot response, which is essential for safe grasping, espe-cially in holding fragile objects. Besides this, the impedance gains have beenobtained using a genetic algorithm with a new behavior of improving the responseof the position and velocity errors. The applied genetic algorithm method hasminimized the position error and the velocity error while keeping the operation ofthe overall control system. The robot finger has been ordered to follow a specificjoint path and fingertip position grasping; the results of simulations have achieved atypical accomplishment of trajectory tracking. Finally, the overall controllers haveshown a perfect rejection of disturbances in terms of fingertip contact force. As afuture work, it is recommended to apply the proposed controllers of this study tomobile manipulator for grasping and manipulation objects.
Figure 13.Response of the designed controllers to the disturbances.
184
Emerging Trends in Mechatronics
Appendix A. Calculating the representation of Qi,
Let
F1!¼ �m1 g j
!, F2!¼ �m2 g j
!, F3!¼ �m3 g j
!,
and
r!1 ¼ x1 i! þ y1 j
!, r!2 ¼ x2 i
! þ y2 j!, r!3 ¼ x3 i
! þ y3 j!:
Then
r!1 ¼ d1 cos θ1 i! þ d1 sin θ1 j
!,
r2!¼ L1 cos θ1 þ d2 cos θ1 þ θ2ð Þð Þ i! þ L1 sin θ1 þ d2 sin θ1 þ θ2ð Þð Þ j!,
r!3 ¼ L1 cos θ1 þ L2 cos θ1 þ θ2ð Þ þ d3 cos θ1 þ θ2 þ θ3ð Þð Þ i!
þ L1 sin θ1 þ L2 sin θ1 þ θ2ð Þ þ d3 sin θ1 þ θ2 þ θ3ð Þð Þ j!:
The partial derivatives of ri! with respect to θi are
∂ r!1
∂θ1¼ �d1 sin θ1 i
! þ d1 cos θ1 j!,
∂ r!1
∂θ2¼ 0,
∂ r!1
∂θ3¼ 0,
∂ r!2
∂θ1¼ �L1 sin θ1 � d2 sin θ1 þ θ2ð Þ½ � i! þ L1 cos θ1 þ d2 cos θ1 þ θ2ð Þ½ � j!,
∂ r!2
∂θ2¼ �d2 sin θ1 þ θ2ð Þ i! þ d2 cos θ1 þ θ2ð Þ j!,
∂ r!2
∂θ3¼ 0,
∂ r!3
∂θ1¼ �L1 sin θ1 � L2 sin θ1 þ θ2ð Þ � d3 sin θ1 þ θ2 þ θ3ð Þð Þ i!
þ L1 cos θ1 þ L2 cos θ1 þ θ2ð Þ þ d3 cos θ1 þ θ2 þ θ3ð Þð Þ j!,∂ r!3
∂θ2¼ �L2 sin θ1 þ θ2ð Þ � d3 sin θ1 þ θ2 þ θ3ð Þð Þ i! þ L2 cos θ1 þ θ2ð Þ þ d3 cos θ1 þ θ2 þ θ3ð Þð Þ j!,
∂ r!3
∂θ3¼ �d3 sin θ1 þ θ2 þ θ3ð Þ i! þ d3 cos θ1 þ θ2 þ θ3ð ÞÞ j!,
The matrices’ elements in Eq. (28) are
m11 ¼ m1d12 þ I1 þm2L1
2 þm2d22 þ 2m2L1d2 cos θ2 þ I2 þm3L1
2 þm3L22
þ 2m3L1L2 cos θ2 þ 2m3L1d3 cos θ2 þ θ3ð Þ þ 2m3L2d3 cos θ3 þm3d32 þ I3,
m12 ¼ m2d22 þm2L1d2 cos θ2 þ I2 þm3L1L2 cos θ2 þm3L1d3 cos θ2 þ θ3ð Þ þ 2m3L2
2
þ 2m3L2d3 cos θ3 þm3d32 þ I3,
185
Interactional Modeling and Optimized PD Impedance Control Design for Robust Safe Fingertip…DOI: http://dx.doi.org/10.5772/intechopen.85531

m13 ¼ m3L1d3 cos θ2 þ θ3ð Þ þm3L2d3 cos θ3 þm3d32 þ I3,
m21 ¼ m2d22 þm2L1d2 cos θ2 þ I2 þm3L1L2 cos θ2 þm3L1d3 cos θ2 þ θ3ð Þ
þ2m3L2d3 cos θ3 þ 2m3L22 þm3d3
2 þ I3,
m22 ¼ m2d22 þ I2 þm3L2
2 þ 2m3L2d3 cos θ3 þm3d32 þ I3,
m23 ¼ m3L2d3 cos θ3 þm3d32 þ I3,
m31 ¼ m3L1d3 cos θ2 þ θ3ð Þ þm3L2d3 cos θ3 þm3d32 þ I3,
m32 ¼ m3L2d3 cos θ3 þm3d32 þ I3,
m33 ¼ m3d32 þ I3,
d11 ¼ �2m2L1d2 sin θ2 _θ2 � 2m3L1L2 sin θ2 _θ2 � 2m3L1d3 sin θ2 þ θ3ð Þ _θ2�2m3L1d3 sin θ2 þ θ3ð Þ _θ3 � 2m3L2d3 sin θ3 _θ3,
d12 ¼ �m2L1d2 sin θ2 _θ2 �m3L1L2 sin θ2 _θ2 �m3L1d3 sin θ2 þ θ3ð Þ _θ2�m3L1d3 sin θ2 þ θ3ð Þ _θ3 � 2m3L2d3 sin θ3 _θ3 �m3L1d3 sin θ2 þ θ3ð Þ _θ3,
d13 ¼ �m3L1d3 sin θ2 þ θ3ð Þ _θ3 �m3L2d3 sin θ3 _θ3,
d21 ¼ �m2L1d2 sin θ2 _θ2 �m3L1L2 sin θ2 _θ2 �m3L1d3 sin θ2 þ θ3ð Þ _θ2 þ _θ3� �
�2m3L2d3 sin θ3 _θ3 þm2L1d2 sin θ2 _θ1 þm2L1d2 sin θ2 _θ2 þm3L1L2 sin θ2 _θ1þ m3L1d3 sin θ2 þ θ3ð Þ _θ1 þm3L1L2 sin θ2 _θ2 þm3L1d3 sin θ2 þ θ3ð Þ _θ2 þm3L1d3 sin θ2 þ θ3ð Þ _θ3,
d22 ¼ �2m3L2d3 sin θ3 _θ3,
d23 ¼ �m3L2d3 sin θ3 _θ3,
d31 ¼ �m3L1d3 sin θ2 þ θ3ð Þ _θ2 þ _θ3� ��m3L2d3 sin θ3 _θ3 þm3L1d3 sin θ2 þ θ3ð Þ _θ1
þm3L2d3 sin θ3 _θ1 þm3L1d3 sin θ2 þ θ3ð Þ _θ2 þ 2m3L2d3 sin θ3 _θ2þm3L1d3 sin θ2 þ θ3ð Þ _θ3 þm3L2d3 sin θ3 _θ3,
d32 ¼ �m3L2d3 sin θ3 _θ3 þm3L2d3 sin θ3 _θ2 þm3L2d3 sin θ3 _θ3,
d33 ¼ 0,
g1 ¼ m1 gd1 cos θ1 þm2 gL1 cos θ1 þm2 gd2 cos θ1 þ θ2ð Þ þm3 gL1 cos θ1þm3 gL2 cos θ1 þ θ2ð Þ þm3 gd3 cos θ1 þ θ2 þ θ3ð Þ,
g2 ¼ m2 gd2 cos θ1 þ θ2ð Þ þm3 gL2 cos θ1 þ θ2ð Þ þm3 gd3 cos θ1 þ θ2 þ θ3ð Þ,g3 ¼ m3 gd3 cos θ1 þ θ2 þ θ3ð Þ,
186
Emerging Trends in Mechatronics
Author details
Izzat Al-Darraji1,2*, Ali Kılıç1 and Sadettin Kapucu1
1 Mechanical Engineering Department, University of Gaziantep, Gaziantep, Turkey
2 Automated Manufacturing Department, University of Baghdad, Baghdad, Iraq
*Address all correspondence to: [email protected]
©2020TheAuthor(s). Licensee IntechOpen.Distributed under the terms of theCreativeCommonsAttribution -NonCommercial 4.0 License (https://creativecommons.org/licenses/by-nc/4.0/),which permits use, distribution and reproduction fornon-commercial purposes, provided the original is properly cited. –NC
187
Interactional Modeling and Optimized PD Impedance Control Design for Robust Safe Fingertip…DOI: http://dx.doi.org/10.5772/intechopen.85531

References
[1] Goodrich MA, Schultz AC. Human–robot interaction: A survey. Foundationsand Trends in Human–ComputerInteraction. 2008;1:203-275
[2] Green SA et al. Human-robotcollaboration: A literature review andaugmented reality approach in design.International Journal of AdvancedRobotic Systems. 2008;5:1-18
[3] Ramaswamy CVV, Deborah AS. Asurvey of robotic hand-arm systems.International Journal of ComputerApplications. 2015;109:26-31
[4] Cutkosky MR. Robotic grasping andfine manipulation. Boston, MA:Springer; 1985
[5] Arimoto S et al. Modeling and controlfor 2-D grasping of an object witharbitrary shape under rolling contact.SICE Journal of Control, Measurement,and System Integration. 2009;2:379-386
[6] Corrales JA. et al. Modeling andsimulation of a multi-fingered robotichand for grasping tasks. In: 11thInternational Conference on ControlAutomation Robotics & Vision.Singapore; 2010. pp. 1577-1582
[7] Boughdiri R, et al. Dynamic modelingof a multi-fingered robot hand in freemotion. In: Eighth International Multi-Conference on Systems, Signals &Devices. Sousse; 2011. pp. 1-7
[8] Boughdiri R et al. Dynamic modelingand control of a multi-fingered robothand for grasping task. Procedia Engineering. 2012;41:923-931
[9] Lewis FL et al. Robot manipulatorcontrol: Theory and practice. New York,USA: CRC Press Publisher. 2003
[10] Lu WS, Meng QH. Impedancecontrol with adaptation for roboticmanipulators. IEEE Transactions on
Robotics and Automation. 1991;7:408-415
[11] Hogan N. Impedance control: Anapproach to manipulation: Part I-III.ASME Journal of Dynamic Systems,Measurement, and Control. 1985;107:1-24
[12] Hogan N. Stable execution ofcontact tasks using impedance control.In: Proceedings of IEEE InternationalConference on Robotics andAutomation, Raleigh, NC, USA; 1987.pp. 1047-1054. DOI:10.1109/ROBOT.1987.1087854
[13] Chen Z, et al. Experimental study onimpedance control for the five-fingerdexterous robot hand DLR-HIT II. In:2010 IEEE/RSJ International Conferenceon Intelligent Robots and Systems;Taipei, 2010. pp. 5867-5874. DOI:10.1109/IROS.2010.5649356
[14] Huang J et al. Method of graspingcontrol by computing internal andexternal impedances for two robotfingers, and its application toadmittance control of a robot hand-armsystem. International Journal ofAdvanced Robotic Systems. 2014;12:1-11
[15] Zhang T et al. Development andexperimental evaluation of multi-fingered robot hand with adaptiveimpedance control for unknownenvironment grasping. Robotica. 2016;34:1168-1185
[16] Murray RM et al. MathematicalIntroduction to Robotic Manipulation.USA: CRC Press; 1994
[17] Bruyninckx H. Robot Kinematicsand Dynamics. Leuven, Belgium:Katholieke Universiteit Leuven,Department of Mechanical Engineering;2010
188
Emerging Trends in Mechatronics
[18] Fabien B. Analytical SystemDynamics Modeling and Simulation.New York, USA: Springer US; 2009
[19] Rubio JJ. Robust feedbacklinearization for nonlinear processescontrol. ISA Transactions. 2018. DOI:10.1016/j.isatra.2018.01.017
[20] Aguilar-Ibañez C. Stabilization ofthe PVTOL aircraft based on a slidingmode and a saturation function.International Journal of Robust andNonlinear Control. 2017;27:4541-4553
[21] Rubio JJ et al. Control of twoelectrical plants. Asian Journal ofControl. 2017;20:1504-1518. DOI:10.1002/asjc.1640
[22] Aguilar-Ibañez C, Sira-Ramirez,Hebertt, Acosta, JÁ. Stability of activedisturbance rejection control foruncertain systems: A Lyapunovperspective: An ADRC StabilityAnalysis.. International Journal ofRobust and Nonlinear Control. 2017;27:4541-4553. DOI: 10.1002/rnc.3812
[23] Llama MA et al. Stable computed-torque control of robot manipulators viafuzzy self-tuning. IEEE Transactions onSystems, Man, and Cybernetics Part B(Cybernetics). 2000;30:143-150
[24] Santos WMD, Siqueira AAG.Impedance control of a rotary serieselastic actuator for knee rehabilitation.IFAC Proceedings Volumes. 2014;47:4801-4806
[25] Zhao Y et al. Impedance control andperformance measure of series elasticactuators. IEEE Transactions onIndustrial Electronics. 2018;65:2817-2827
[26] Mehdi H, Boubaker O. Stiffness andimpedance control using Lyapunovtheory for robot-aided rehabilitation.International Journal of Social Robotics.2012;4:107-119
[27] Gen M, Cheng R. GeneticAlgorithms and Engineering Design.New York, USA:Wiley; 1997
[28] Sivanandam SN, Deepa SN.Introduction to Genetic Algorithms.Berlin: Springer; 2008
[29] Azizi A. Computer-based analysis ofthe stochastic stability of mechanicalstructures driven by white and colorednoise. Sustainability (Switzerland).2018;10(10):3419
[30] Azizi A, Yazdi PG. White noise:Applications and mathematicalmodeling. In: Computer-Based Analysisof the Stochastic Stability of MechanicalStructures Driven byWhite and ColoredNoise. Singapore: Springer; 2019.pp. 25-36
[31] Azizi A, Yazdi PG. Modeling andcontrol of the effect of the noise on themechanical structures. In: Computer-Based Analysis of the StochasticStability of Mechanical StructuresDriven by White and Colored Noise.Singapore: Springer; 2019. pp. 75-93
[32] Azizi A, Yazdi PG. Introduction tonoise and its applications. In: Computer-Based Analysis of the StochasticStability of Mechanical StructuresDriven by White and Colored Noise
189
Interactional Modeling and Optimized PD Impedance Control Design for Robust Safe Fingertip…DOI: http://dx.doi.org/10.5772/intechopen.85531

Chapter 11
Research on Key QualityCharacteristics ofElectromechanical Product Basedon Meta-Action UnitYan Ran, Xinlong Li, Shengyong Zhang and Genbao Zhang
Abstract
Electromechanical products have many quality characteristics, representingtheir quality. In addition, there are long-existed quality problems of electrome-chanical products, such as poor accuracy, short precision life, large fluctuations inperformance, frequently failing, and so on. Based on meta-action unit (MU) forelectromechanical products, this book chapter proposes a key quality characteristiccontrol method, which provides theoretical and technical support for essentiallyguaranteeing the complete machine’s quality. The formation mechanisms of MU’sfour key quality characteristics (precision, precision life, performance stability,and reliability) are studied. Moreover, we introduce an overview of key qualitycharacteristic control methods based on MU. The complex large system researchmethod of “decomposition-analysis-synthesis” is adopted to study these key scienceproblems.
Keywords: key quality characteristics, electromechanical product, meta-action unit
1. Introduction
The construction of industrial modernization cannot be separated from theelectromechanical integration [1]. Electromechanical products play an extremelyimportant role in the current society. The technical level of electromechanicalproducts determines the development level of the national economy and alsodirectly reflects the country’s manufacturing capacity, scientific and technologicalstrength, economic strength, international competitiveness, and other comprehen-sive national strengths [2]. Poor quality of electromechanical products will not onlybring economic losses to enterprises but also seriously affect the internationalmarket competitiveness of products and, more seriously, the overall image andeconomic strength of the country. Therefore, accelerating the development of elec-tromechanical products and improving the quality of products are of vital signifi-cance for the national economic construction, national defense security, and socialstability.
There are many quality indexes of electromechanical products. Among them,the four indexes (precision, precision life, performance stability, and reliability) arethe most concerned by users, which together constitute the key quality
191

characteristics of electromechanical products and decisively affect the market com-petitiveness of electromechanical products. Therefore, in order to occupy a place inthe competitive high-end market, we must first improve the level of these keyquality characteristics [3]. Therefore, carrying out a research into the electrome-chanical product quality control technology, especially, the quality of its key fea-tures, is extremely important. However, it is very difficult to control the quality ofcomplex electromechanical products, not only for its complex structure but also forits working process, a dynamic process composed of many motions. The commonlyused structural decomposition methods are mostly the static research based on thequality characteristics of parts in the design process. At the same time, there is a lotof uncertainty and coupling in the process of motion, which makes the dynamicquality characteristics greatly different from the static ones. In view of these prob-lems, this paper puts forward the research idea of quality characteristic controltechnology of electromechanical product based on MU [4].
2. Literature review
There are many quality characteristics of electromechanical products, but its keycharacteristics mainly include precision, precision life, performance stability, andreliability, which comprehensively reflect the availability of the product. At pre-sent, the analysis of precision is quite common for the stages of design, manufac-ture, and operation of electromechanical products, but the research of precision life,performance stability, and reliability is few.
The precision of electromechanical products includes geometric accuracy,motion accuracy, transmission accuracy, position accuracy, etc., among which geo-metric accuracy is the basis and guarantee of other precisions. There are manystudies on the precision of electromechanical products. Enterprises pay more atten-tion to the precision of electromechanical products, especially for machine tools.Sata et al. put forward a method to improve machining accuracy of machiningcenter through computer control compensation earlier [5]. Ceglarek et al. used thestate space model to model the stream of variation (SOV) of the multi-stagemanufacturing system, described the errors of process parameters and productquality characteristics with the vector tolerance, and applied it in automobile body-in-white assembly and automobile engine cylinder head machining [6]. Zeyuanet al. carried out simulation and experimental research on geometric error detec-tion, identification, and compensation of translational axis of NC machine tools bytwo geometric error-modeling methods [7]. Li et al. summarized the characteristicsof the existing error compensation methods and discussed the future developmentdirection of improving the spatial positioning accuracy of five-axis CNC machinetools [8]. Yongwei et al. proposed a method for predicting the motion accuracy ofCNC machine tools based on the time-series deep learning network [9].
The research on precision life mainly focuses on the working stage of electro-mechanical products, and the research object mainly focuses on the precision life ofservo feed system (such as screw pair, etc.). Min et al. carried out a simulation testof the precision retaining ability degradation of the ball screw pair to achieve a fastprediction of the life of the ball screw pair [10]. Liping et al. conducted a grayprediction of the rotary precision life of the spindle of CNC lathe [11]. Linlin studiedthe precision retaining ability of servo feed system of CNC machine tool and its testmethod [12]. Hu et al. proposed a vibration aging process parameter selectionmethod based on modal analysis and harmonious response analysis to improve theprecision life of large basic parts of CNC machine tools in view of the nonstandardphenomenon of vibration aging process in domestic manufacturing enterprises [13].
192
Emerging Trends in Mechatronics
Shijun et al. analyzed the influence of axial load on friction torque of ball screw pairthrough experiments and pointed out that the pre-tightening force plays a leadingrole in the fluctuation of friction torque of ball screw pair [14].
The research on performance stability mainly focuses on the research of perfor-mance index and parameter design. Saitou et al. summarized the developmenthistory of structural design and optimization of mechanical products and optimizedthe parameters to achieve the purpose of improving the stability of its performance[15]. Ta et al. studied the influence of friction on sliding stability of multibodysystems [16]. Caro et al. improved the robust design method based on the sensitivearea and proposed the comprehensive robust design method of mechanism devia-tion [17]. The size of the mechanism was calculated according to the performancerobustness index, and the optimal deviation of the mechanism was calculated usingthe comprehensive deviation method. Gao et al. analyzed the robustness androbustness estimation of the product quality features [18]. They established amathematical model based on minimum sensitivity region estimation (MSRE) forthe robust optimization of the product quality features. Hui et al. constructed adual-inertia feed system model based on the sensitivity of the closed-loop transferfunction and analyzed the influence of the change of feed system stiffness on thestability of motion accuracy [19].
The research on reliability mainly focuses on reliability design, assembly reli-ability control, and fault diagnosis technology. Based on the shortcomings of tradi-tional stress-strength interference model, Zhang et al. modeled the reliability from adynamic perspective [20]. Pinghua et al. studied the assembly reliability controltechnology of electromechanical products based on fault modeling of motion unit toimprove the reliability of assembly process [21]. Genbao et al. proposed the assem-bly process and technology driven by reliability and used the dynamic Bayesianmethod to model and control the assembly process [22]. Assaf and Dugan proposeda diagnostic method for large systems using monitors and sensors for reliabilityanalysis by optimizing the diagnostic decision tree (DDTs) [23]. Yu et al. proposed afault maintenance strategy for field equipment of assembly system [24]. Andaccording to the differences in reliability design of different types of equipment, acomprehensive maintenance mode was introduced to ensure the reliability of auto-matic docking assembly of large aircraft parts. Qinghu et al. carried out a systematicanalysis and prediction modeling research on the main failure mechanism andfailure evolution rule of key components of the power transmission system [25].
Quality characteristic control is a comprehensive technical control activity basedon decoupling or prediction of quality characteristic, including analysis of qualitycharacteristic at each granularity and adjustment of influencing factors. Moreover,according to quality fluctuation, quality characteristic is under control. Haifengstudied the coupling mapping relation of quality characteristics of complex electro-mechanical products [26]. Then, combined with axiomatic design principle, theyproposed the idea of decoupling design of quality characteristics of complex elec-tromechanical products and presented the decoupling control model in the processof quality characteristic mapping of complex electromechanical products. Xianghuaproposed a multiscale collaborative and intelligent quality control method for keyparts of air separation equipment including the air compressor, the turbineexpander, and the whole machine and conducted an in-depth research on couplingmapping and collaborative control of quality characteristics of large-scale air sepa-ration equipment from the whole machine to each part at all scales [27]. Nadastudied the quality prediction in the design process of manufacturing system,constructed a basic framework on the basis of the manufacturing system configu-ration parameters to evaluate the quality of the products, and constructed a com-prehensive evaluation model of system configuration based on quality by analytic
193
Research on Key Quality Characteristics of Electromechanical Product Based on Meta-Action UnitDOI: http://dx.doi.org/10.5772/intechopen.89481

hierarchy process (AHP), which can transform the structural parameters ofmanufacturing system into configuration capability indexes and then predict andcontrol them [28]. Xianlin conducted an in-depth research on the quality charac-teristic prevention and control key technologies such as the quality characteristicevolution mechanism, coupling and decoupling control, timing data prediction,immune diagnosis, and control in the manufacturing process of electromechanicalproducts [29]. In order to solve the coupling problem in quality characteristicpredictive control, Zhentao established a quality characteristic predictivedecoupling model based on predictive control theory [30]. Yang et al. establishedand solved the predictive control model based on particle swarm optimizationalgorithm and support vector machine on the basis of analyzing the characteristicsof multiprocess and multistage product quality prediction control and realized theglobal optimization of multistage product quality prediction and related processparameters [31].
3. Findings
Through the analysis of the above research status, it can be seen that the follow-ing main problems exist in the quality characteristic control of electromechanicalproducts at present.
Traditional quality control is mainly based on the quality control of parts, pre-cisely, the precision, However, the combination with the function of parts is farfrom the expectance. Particularly, general electromechanical products exist for therealization of a certain motion function, and the overall functional failure of theproduct is caused by the inability to realize the basic motion function. Therefore,quality control should be placed in the basic level of motion, as long as the basicmotion function is normal and the overall function of the product is guaranteed.Starting from the quality control of MUs, the quality control of the whole machineis realized through the quality control of the unit level. This control mode is moresimple and effective, which does not need to simplify the model and is conducive tothe accomplishment of refined quality control.
In terms of the key quality characteristic control technology, there are manyresearches on the pure precision but few achievements on the precision life, per-formance stability, reliability, and their coupling control. In fact, the quality gap ofelectromechanical products at present mainly lies in the aspects of precision life,performance stability, and reliability, among which reliability is the biggest bottle-neck of electromechanical products. How to improve the precision life, perfor-mance stability, and reliability of electromechanical products as soon as possible isan urgent problem to be solved in the manufacturing industry.
4. Formation mechanisms of MU’s four key quality characteristics
Meta-action unit (MU) is a kind of basic action unit of electromechanicalproducts decomposed in accordance with failure model analysis (FMA) structuraldecomposition method. It has the specific function of independently completingthe specified movement or operation. Compared with other decomposition units,MU is more suitable for quality and reliability analysis. However, the complexquality characteristics are reflected not only in the MU’s motion accuracy but also inits precision life, performance stability, reliability, and other aspects. So it is neces-sary to conduct an in-depth study on the formation mechanism of each qualitycharacteristic.
194
Emerging Trends in Mechatronics
The quality characteristics of electromechanical products are very numerous,generally including 12 aspects, i.e., functional compliance, performance stability,application reliability, precision retaining ability, technology primacy, cost econ-omy, esthetic appearance, maintenance convenience, and service timeliness, char-acter uniqueness, security assurance, perception satisfaction, etc., which lead to theresultant diversity of MU’s quality characteristics. During the research process, thekey quality characteristics need to be extracted from the perspective of the user’srequirements and the fault distribution. At the same time, as the smallest motionunit decomposed from electromechanical products, most of MUs’ quality charac-teristics are dynamic; therefore, it is necessary to conduct an in-depth study on theirformation mechanism and extract the characteristic indicators of each key qualitycharacteristic from the perspective of motion. Moreover, to expand the amount ofthe sample data, the corresponding models are established and applied to the simi-larity determination of MUs.
4.1 Formation mechanism of the MU motion accuracy
Accuracy is the degree to which actual geometric parameters conform to idealones, and their deviation values are often defined as errors. The accuracy of elec-tromechanical products generally includes geometric accuracy, motion accuracy,transmission accuracy, and positioning accuracy [32]. For MUs, the accuracy refersto the motion accuracy of the output part that implements the meta-action. More-over, the movement accuracy of the unit actuator is also affected by the manufac-ture and assembly errors of other parts in the unit (support, transmission, andfasteners). For example, as the actuator of the rack moves the MU, the translationaccuracy of the rack is the only measure indicator. In the actual situation, there aremany kinds of error sources that affect the motion accuracy of the MU actuators.Actually, the formation process of the accuracy is also the transmission process ofthe errors.
4.1.1 The MU motion accuracy
For translation and rotation MU, the motion accuracy of the actuator alsoincludes translation and rotation accuracy. The corresponding translation accuracyindicators of the actuator mainly include positioning accuracy, repeat positioningaccuracy, reverse error, moving straightness (trajectory), moving parallelism (tra-jectory), and resolution (minimum translation increment). The rotation accuracyindicators include positioning accuracy, repeat positioning accuracy, indexingaccuracy, reverse error, rotation face fluctuation (radial and end faces), and rota-tion fluctuation (axial).
The motion accuracy of the unit actuator is also affected by the geometric andassembly accuracy of the various parts in the unit. The geometric accuracy of thepart includes the geometric position and shape accuracy, expressed as static errorssuch as size, position, and shape. According to ISO230-1:1996 and GB/T1800.1-2009 “Limit and fit Part 1: The basis of tolerance, deviation and fit,” thesize and position error of the MU actuator refers to the defects in the design,manufacture, and assembly process, which cause the MU actuator (output mem-ber) deviating from the ideal size and position. It mainly includes distance dimen-sion error, diameter dimension error, angular dimension error, parallelism,coaxiality, verticality, position, symmetry, and round and full runout. The geomet-ric shape error of the MU actuator refers to the deviation between the actual andideal shape after machining, which is set as a machining range of the normal
195
Research on Key Quality Characteristics of Electromechanical Product Based on Meta-Action UnitDOI: http://dx.doi.org/10.5772/intechopen.89481

distribution and mainly includes straightness, flatness, roundness, cylindricity, lineprofile, and surface profile.
4.1.2 Error model of the MU motion accuracy
4.1.2.1 Topology structure description of electromechanical product
The electromechanical product is a kind of multibody system, a completeabstract and effective description of general complicated mechanical system, whichis the optimal mode of analyzing and researching complicated mechanical system[33–35]. The multibody kinematic theory is used to establish the synthetic spacemotion error model of the MU actuator in this chapter.
An MU is regarded as a body, and there is only a single degree-of-freedomrelative motion with the constraint type of translation or rotation. The motion ofelectromechanical products, open or closed loop, aims to accomplish acorresponding function. Because closed-loop motion can be converted as open withspecific constraint, the topological structure for general electromechanical productsis expressed as follows (Figure 1). The inertial reference system and MU areregarded as different bodies. Then the bodies are numbered in turn along thedirection away, according to the natural growth sequence, from one branch toanother (each branch accomplishing its corresponding function).
The low-order body array is used to describe the topological structure of themultibody system [36], which can be obtained by the following calculation formula (1).The optional body Bk is any typical body in the system, and the sequence number ofits n-th lower-order body is defined as
Ln kð Þ ¼ j (1)
where L is the low-order body operator and body Bk is the n-th high-order bodyof body B j (Table 1). Ln kð Þ ¼ L Ln�1 kð Þ� �
, L0 kð Þ ¼ k, and Ln kð Þ ¼ 0. Moreover,when body B j is the adjacent lower-order body of body Bk, L kð Þ ¼ j.
4.1.2.2 Motion error characteristic matrix of adjacent MUs
According to the MU motion of the electromechanical product in the actualworking process, the description method of multibody system error is used to study
Figure 1.The topological structure diagram of electromechanical products based on MUs.
196
Emerging Trends in Mechatronics
the motion error of the MU actuator (Figure 2). Pk, PIk, and PE
k are the actualposition vector, the ideal position vector, and the position error vector of the originQk of the body Bk motion reference coordinate system in its low-order body B j,respectively; and Dk, DI
k, and DEk are the actual displacement vector, the ideal
displacement vector, and the displacement error vector of the origin Ok of body Bkreference coordinate system.
From the kinematic point of view, the errors of MU actuators are divided intotwo categories. One is the errors that happened in the motion reference coordinateof MU (body Bk), described with the position (static) error vector PE
k and theposition error feature (transformation) matrix TPE
jk . Another is the motion processerror (translation or rotation) of the MU (body Bk) relative to the actual motionreference coordinate, described with the translation (motion) error vector DE
k(linear or angular displacement) and the motion error feature (transformation)matrix TDE
jk .
4.1.2.2.1 Motion error characteristic matrix from translation MU to translation MU
When the MU (body Bk) translates xDjk, yDjk, and zDjk along the X-axis, Y-axis, and
Z-axis relative to its adjacent MU (lower-order body B j), its actuator’s translation
k 1 2 3 4 5 6 7 ⋯ m mþ 1 ⋯ n
L0 kð Þ 1 2 3 4 5 6 7 ⋯ m mþ 1 ⋯ n
L1 kð Þ 0 1 1 3 1 5 6 ⋯ m� 1 6 ⋯ n� 1
L2 kð Þ 0 0 0 1 0 1 5 ⋯ m� 2 5 ⋯ n� 2
L3 kð Þ 0 0 0 0 0 0 1 ⋯ m� 3 1 ⋯ n� 3
Lm kð Þ 0 0 0 0 0 0 0 0 0 0 0 0
Ln kð Þ 0 0 0 0 0 0 0 0 0 0 0 0
Table 1.The low-order bodies of electromechanical products based on MU.
Figure 2.The relative motion sketch of adjacent MUs.
197
Research on Key Quality Characteristics of Electromechanical Product Based on Meta-Action UnitDOI: http://dx.doi.org/10.5772/intechopen.89481

matrices and translation error feature matrices can be expressed, respectively, asfollows:
TDjk xð Þ ¼
1 0 0 xDjk0 1 0 0
0 0 1 0
0 0 0 1
2666664
3777775,TDE
jk Δxð Þ ¼
1 0 0 ΔxDEjk0 1 0 0
0 0 1 0
0 0 0 1
2666664
3777775
TDjk yð Þ ¼
1 0 0 0
0 1 0 yDjk0 0 1 0
0 0 0 1
2666664
3777775,TDE
jk Δy� � ¼
1 0 0 0
0 1 0 ΔyDEjk0 0 1 0
0 0 0 1
2666664
3777775
TDjk zð Þ ¼
1 0 0 0
0 1 0 0
0 0 1 zDjk0 0 0 1
2666664
3777775,TDE
jk Δzð Þ ¼
1 0 0 0
0 1 0 0
0 0 1 ΔzDEjk0 0 0 1
2666664
3777775
4.1.2.2.2 Motion error characteristic matrix from rotation MU to rotation MU
When the MU (body Bk) rotates αDjk, βDjk, and γDjk (the Euler angle or the Karl
single angle of the coordinate system k relative to the coordinate system j) along theX-axis, Y-axis, and Z-axis relative to its adjacent MU (lower-order body B j), itsactuator’s rotation matrices and rotation error feature matrices can be expressed,respectively, as follows:
TDjk αð Þ ¼
1 0 0 0
0 cos αDjk � sin αDjk 0
0 sin αDjk cos αDjk 0
0 0 0 1
2666664
3777775,TDE
jk Δαð Þ ¼
1 0 0 0
0 cos ΔαDEjk � sin ΔαDEjk 0
0 sin ΔαDEjk cos ΔαDEjk 0
0 0 0 1
2666664
3777775
TDjk βð Þ ¼
cos βDjk 0 sin βDjk 0
0 1 0 0
� sin βDjk 0 cos βDjk 0
0 0 0 1
2666664
3777775,TDE
jk Δβð Þ ¼
cos ΔβDjk 0 sin ΔβDjk 0
0 1 0 0
� sin ΔβDjk 0 cos ΔβDjk 0
0 0 0 1
2666664
3777775
TDjk γð Þ ¼
cos γDjk � sin γDjk 0 0
sin γDjk cos γDjk 0 0
0 0 1 0
0 0 0 1
2666664
3777775,TDE
jk Δγð Þ ¼
cos ΔγDjk � sin ΔγDjk 0 0
sin ΔγDjk cos ΔγDjk 0 0
0 0 1 0
0 0 0 1
2666664
3777775
Motion error characteristic matrix of synthetic motion at the MU (body Bk)translates first and then rotates relative to its adjacent MU (low-order body B j).The specific motion order is translating xDjk, y
Djk, and zDjk along the X-axis, Y-axis, and
198
Emerging Trends in Mechatronics
Z-axis and rotating αDjk along the X-axis, βDjk along the Y-axis, and γDjk along the Z-axis,
and the ideal motion feature matrix of the unit actuator can be expressed as
TDjk ¼ TD
jk xð ÞTDjk yð ÞTD
jk zð ÞTDjk αð ÞTD
jk βð ÞTDjk γð Þ (2)
The motion error feature matrix of the unit actuator is expressed as
TDEjk ¼ TDE
jk Δxð ÞTDEjk Δyð ÞTDE
jk Δzð ÞTDEjk Δαð ÞTDE
jk Δβð ÞTDEjk Δγð Þ (3)
The position and position error feature matrix are expressed as
TPjk ¼ TP
jk xð ÞTPjk yð ÞTP
jk zð ÞTPjk αð ÞTP
jk βð ÞTPjk γð Þ (4)
TPEjk ¼ TPE
jk Δxð ÞTPEjk Δyð ÞTPE
jk Δzð ÞTPEjk Δαð ÞTPE
jk Δβð ÞTPEjk Δγð Þ (5)
4.1.2.3 Actual characteristic matrix of MUs
According to the geometric description method above, the actual feature (trans-formation) matrix of the MU actuator in the multibody system is obtained as
Tjk ¼ TPjkT
PEjk T
DjkT
DEjk (6)
where Tjk, TPjk, T
PEjk , T
Djk, and TDE
jk are the actual position, the ideal position, thestatic error, the ideal motion, and the motion error feature matrix of the MUactuator, respectively.
4.1.2.4 Integrated space motion errors of MUs
Set the homogeneous coordinates of the MU (body B j) on any point W in sub-coordinate system Oj � X jY jZ j as
W j ¼ wxj wyj wzj 1� �T (7)
Thus, the ideal homogeneous coordinates of the point W in subcoordinate sys-tem Oj � X jY jZ j is obtained as
WIk ¼
Yu¼1
u¼n,Ln kð Þ¼0
TPLu kð ÞLu�1 kð ÞT
DLu kð ÞLu�1 kð Þ
24
35�1 Yt¼1
t¼n,Ln jð Þ¼0
TPLt jð ÞLt�1 jð ÞT
DLt jð ÞLt�1 jð Þ
24
35W j
(8)
The actual homogeneous coordinates of the point W in subcoordinate systemOj � X jY jZ j is
Wk ¼ wxkwykwzk1� �T Yu¼1
u¼n,Ln kð Þ¼0
TLu kð ÞLu�1 kð Þ
24
35�1 Yt¼1
t¼n,Ln jð Þ¼0
TLt jð ÞLt�1 jð Þ
24
35 (9)
In the process of MU working (actuator moving), the error between ideal andactual motion position of point W is expressed as
199
Research on Key Quality Characteristics of Electromechanical Product Based on Meta-Action UnitDOI: http://dx.doi.org/10.5772/intechopen.89481

E ¼ ePx ePy ePz 0� �T
¼ WIk �Wk
¼Yu¼1
u¼n,Ln kð Þ¼0
TPLu kð ÞLu�1 kð ÞT
DLu kð ÞLu�1 kð Þ
24
35�1 Yt¼1
t¼n,Ln jð Þ¼0
TPLu jð ÞLu�1 jð ÞT
DLu jð ÞLu�1 jð Þ
24
35W j
�Yu¼1
u¼n,Ln kð Þ¼0
TLu kð ÞLu�1 kð Þ
24
35�1 Yt¼1
t¼n,Ln jð Þ¼0
TLu jð ÞLu�1 jð Þ
24
35W j
(10)
Equation (10) is the comprehensive spatial motion error model of MU actuatorsfor general electromechanical products.
4.2 Formation mechanism of the MU precision life
In the process of electromechanical product working, MUs are influenced byvarious changing indicators, e.g., increase in ambient temperature, wear on partsurface, and change of load or force. These indicators cause the variation of the MUaccuracy [37, 38].
The general formation process of MU accuracy faults is shown in Figure 3. AfterMU moving for a period of time, its accuracy variation reaches the designed accu-racy variation limit (Ymax or Ymin). Its specific variation law f(t) is as follows.
4.2.1 Initial stage
MU is working at an expectation accuracy a0 (producing accuracy). For aspecific MU, because of the influence of its initial state and working condition,a0 has a certain dispersion, following the distribution law f að Þ.
4.2.2 Stable stage
After MU working stably for a period of time Ta, the influence reaches enoughdegree to cause the variation of MU accuracy. Because of the considerable degree of
Figure 3.The general forming process of the MU accuracy failure.
200
Emerging Trends in Mechatronics
randomness of the uncertainty influencing factors, the stable operating time Taobeys a random distribution f Tað Þ.
4.2.3 Degradation stage
MU accuracy reaches Ylim at a speed v, and faults happen, where v is a randomfactor obeying distribution law F(v), so operating time without faults T is also arandom factor obeying f(t).
During the moving process, MU is affected by various factors, e.g., friction,environment, and changing working conditions. Its accuracy variation rate v can beregarded as a normal distribution:
f vð Þ ¼ 1σv
ffiffiffiffiffi2π
p e� v�vð Þ2
2σ2v (11)
where f(v) is the probability density function of accuracy variation, v representsthe average rate of accuracy variation process, and σv is the mean square error ofrate accuracy variation.
For a specific MU, if its initial accuracy is a known value a0, obeying a randomdistribution and its stable accuracy stage is finished, that is,Ta = 0, and then itsaccuracy variation is obtained as (e.g., linear correlation)
Y ¼ a0 þ vt (12)
As is shown in Figure 3, before accuracy reaching the limitation, Y=Ylim, itsoperating time without failure is the precision life (accuracy retention time), whichis the function of speed v:
T ¼ Y0lim
v(13)
Finally, its accuracy reliability is expressed as
R ¼ P t≤Tð Þ ¼ Pðv≤ Y0lim
tk Y0lim
tk
��������Þ¼ Φð Y0lim
t � σv k vσv
vσv
��������
�������� (14)
4.3 Formation mechanism of the MU performance stability
The performance stability of MUs refers to the ability of maintaining the per-formance of the MU or the variation range of output quality characteristic (dynamiccharacteristic) minimal with the uncertainty factor while satisfying various con-straints. It means that the output value Y fluctuates around the input-output linearrelationship and the smaller the fluctuation, the better the stability.
4.3.1 Performance stability evaluation of MUs
4.3.1.1 The dynamic tracking errors and steady errors
The performances of MUs are real-time and dynamic, and its output qualitycharacteristic fluctuates with input parameters. That is, there is a correspondingobjective value for each input signal. At the same time, the fluctuation needs to beas small as possible. This characteristic is defined as a dynamic characteristic.
201
Research on Key Quality Characteristics of Electromechanical Product Based on Meta-Action UnitDOI: http://dx.doi.org/10.5772/intechopen.89481

The dynamic state in the process of MU motion is divided into transient andstead. Dynamic tracking errors mean the deviation between the actual value y(t)and expected value yIdeal of the MU quality characteristic indicator of each transientstate. Steady errors refer to the fluctuation amplitude Δ of the deviation betweenthe actual value y(t > T) and expected value yIdeal of the MU quality characteristicunder steady state after moving for a time T. To guarantee enough high-performance stability, there are two premises for them:
δmax ¼ y tð Þ � yIdeal�� ��
max ≤ δIdeal
Δmax ¼ y t>Tð Þ � yIdeal�� ��
max � y t>Tð Þ � yIdeal�� ��
min ≤ δIdeal
((15)
4.3.1.2 The signal/noise ratio
The indicator of signal/noise ratio (SNR) [39] (Eq. 16) proposed by Prof.Taguchi is applied to evaluate the MU dynamic performance stability in this section.Generally, the greater the SNR value, the better the stability, which indicates thatthe noise is low even if the signal is strong:
η ¼ PS
PN(16)
where PS and PN represent the power of signal and noise, respectively.For the dynamic characteristic, the objective value m is not a constant but a
variable determined according to the variation of signal M output characteristicy = α + Mβ + ε (Figure 4), where ε reflects the degree of interference. Moreover, thevariation of output characteristic is set as a normal distribution N(0,δ2).
As is shown in Figure 4, the SNR of dynamic characteristic y is defined as
η ¼ β2
σ2(17)
where β2 is the measure of signal sensitivity, and δ2 is the fluctuation rate(deviation) of amplitude, which is used to evaluate the stability of MU.
For a specific MU quality indicator q1, the greater the signal/noise ratio η1, themore stable the quality indicator. Its weight (the contribution rate of this qualityindicator to quality instability) is expressed as
λl ¼ 1ηl ∗
Pmj¼1
1η j
(18)
4.3.2 Clearance formation mechanism of MUs
The clearance is one of the main factors causing noise of MU and influencing theperformance stability of complete machine [40]. However, in real engineering
Figure 4.The sketch of dynamic characteristic.
202
Emerging Trends in Mechatronics
application, the MU clearance is inevitable. It happens in the inner compositionparts of MUs, e.g., the clearance between the large piston and the inner wall of themandrel in the piston moving unit and the meshing clearance between the racktranslating unit and the gear rotating unit (Figure 5).
The clearance between MUs includes the static clearance of geometric size andthe dynamic clearance under a moving state. As is shown in Figure 5, they aremainly caused by three aspects:
1.A regular clearance reserved due to the motion fit design of the MU.
2.The uncertainty factors in the MU design and manufacturing process.The error will be caused to form clearance.
3.The uncertainty factors in the process of operating, e.g., vibration, friction,wear, etc., cause the irregular clearance.
4.4 Formation mechanism of the MU reliability
The MU reliability refers to the ability to accomplish specific machine motionprecisely, timely, and coordinately under a specified time and condition and main-tain all quality characteristics within the allowable range. Its quantification indica-tor, the probability, is known as reliability.
4.4.1 Reliability indicators of MUs
4.4.1.1 The MU reliability
The MU reliability refers to the probability of output quality characteristicparameters being in the allowable range at a specified time (period). Suppose thatoutput characteristic parameter, e.g., accuracy, precision life, performance stability,etc., is random variable Y(t). According to the design requirement, output qualitycharacteristic parameter is controlled within the range of [Ymin, Ymax]. The MUreliability is defined as the probability P that happens:
R ¼ P Ymaxmin½ � (19)
Figure 5.Clearances between MUs resulting from (a) assembly, (b) design, and (c) wear.
203
Research on Key Quality Characteristics of Electromechanical Product Based on Meta-Action UnitDOI: http://dx.doi.org/10.5772/intechopen.89481

Its corresponding failure probability F is expressed as
F ¼ 1� R ¼ 1� P Ymaxmin½ � (20)
Taking the motion accuracy (motion error) of the MU as an example, its motionaccuracy reliability is the probability of its motion output error within the maxi-mum allowable error range:
R ¼ P emaxmin½ � (21)
For a specific MU, its error obeys a normal distribution, and its reliability isderived as
R ¼ P emin ≤E≤ emaxð Þ¼ P E≤ emaxð Þ � P E≤ eminð Þ
¼ Φemax � μ
σ
� ��Φ
emin � μ
σ
� � (22)
4.4.1.2 The mission reliability of complete machine system
Because multiple different missions of the upper motion units are accomplishedby the input and output of multiple MUs, from the perspective of the missionreliability, the mission reliability of the complete machine system of electrome-chanical products is an organic combination of the MU motion reliability(Figure 6), which is expressed as follows:
RW ¼Xni¼1
αiRAi (23)
4.4.2 Failure mechanism of MUs
The MU failure analysis mainly includes three aspects: the failure stress, thefailure mechanism, and the failure mode. To highlight the key points, we mainlyanalyze them from the perspective of the motion function.
4.4.2.1 The failure stress
The failure stress is the physical condition causing the MU failure, mainlyincluding the working and environment stress. The working stress refers to the
Figure 6.The mission reliability model of (a) MU and (b) complete machine system.
204
Emerging Trends in Mechatronics
necessary stress to motivate MU to achieve a basic motion function, e.g., pressure,thrust, bending torque, etc.; the environment stress refers to MU’s external workingenvironment conditions and its interaction between the internal parts, e.g., tem-perature, humidity, dust, noise, vibration, friction, impact force, etc.
Taking the end-toothed disk indexing turntable function unit as an example, weanalyzed the failure stress of each decomposition MU (Table 2).
4.4.2.2 The failure mechanism
The MU quality uncertainty includes gradual and emergent uncertainty; fur-thermore, corresponding failures are gradual and emergent. When they happen,their certain performance parameter reaches or exceeds the threshold, caused bythe MU uncertainty. If an MU performance parameter changes at the beginning ofworking process without a stable stage, the failure that happened is defined as agradual failure. If the MU performance parameter suddenly reaches or exceeds thethreshold in an instant with an infinite speed, the failure that happened is defined asan emergent failure. The gradual failure is also called as wear failure, mainlyincluding:
A. Functional abnormality due to the MU wear deformation, e.g., worm gearMU rotation difficulty, loose, vibration, large clearance, etc.; B. function
Function unit Motion unit MU Failure stress
End-tootheddisk indexingturntable
Turntableascending anddescending
Piston moving Hydraulic oil (hydraulic pressure, cleanliness),turntable weight, concentricity, cylindricity,burrs, clearances, assembly stress
End-tootheddisk moving upand down
Weight of the turntable and tool, cutting forceand load
Turntablerotating
Motor rotating Temperature, cutting fluid
Worm rotating Temperature, load, wear, axial thrust, cyclicload stress, vibration, concentricity
Worm gearrotating
Temperature, load, wear, shear stress
Gear shaftrotating
Load torque, fatigue, radial load
Upper toothrotating
Load torque, wear
Revolving bodyrotating
Cutting liquid, load
Pallet clampingand loosening
Spring pinmoving
Vibration, precision
Spring shrinking Load, fatigue
Piston moving Hydraulic oil (hydraulic pressure, cleanliness),load, concentricity, cylindricity, burrs,clearance, assembly stress
Pull rod moving Pull stress, vibration
Pull clawmoving up anddown
Pull stress, assembly stress, fatigue, vibration,precision
Table 2.The failure stress analysis of end-toothed disk indexing turntable function unit.
205
Research on Key Quality Characteristics of Electromechanical Product Based on Meta-Action UnitDOI: http://dx.doi.org/10.5772/intechopen.89481

abnormality due to the deformation or fracture caused by fatigue, e.g., gear toothfracture of gear rotation MU; C. deformation and fracture due to corrosion; D.deformation due to yielding; E. deformation, cracking, and fracture due to deterio-ration of the polymer; F. obstacles caused by wear-induced debris; G. abnormalrotation and heat caused by deterioration of oil; H. abnormal movement due to theincorporation of rust, peeling paint, and peeling plating.
The formation mechanisms of the typical MU failures are shown in Table 3.
5. Key quality characteristic control methods based on the MU
On the basis of studying the key quality characteristics of MUs and the couplingrelationship of the complete machine quality characteristics, it is necessary to unit-ize and aggregate the MUs’ quality characteristic according to the “decomposition-analysis-synthesis” analysis method of the large system control theory [41]. Thewhole machine quality prediction method is studied from bottom to top, the qualitycharacteristic state space model is constructed, and the predictive control algorithmis derived to achieve the comprehensive prediction and control of the completemachine quality characteristics.
5.1 Multiple generalized operator model of complex large systems
The whole working process of electromechanical products is achieved andaccomplished via various orderly units. Therefore, the whole control process of thecomplete machine quality characteristic system can be decomposed into severalquality control sub-processes of units and regarded as a linear system. To better
Failurereason
Failure mechanism Cause analysis
Wear Wear generally happens in the relativemotion part of MUs. The friction factorincreases gradually in the initial wear stage,accompanied by heat, which eventuallycauses melting
The influence factors include mainly thematerials in contact with each other, thesurface contact pressure, the wear rate, andthe lubricating oil
Fatigue The MU undergoes a wavelike stress duringthe movement, and its effect accumulatescontinuously and develops into a damageafter a certain number of iterations
Internal force caused by vibration, rotation,intermittent motion, etc.External force due to roughness of theexternal contact surface
Vibration Different degree vibrations happen duringthe MU motion. Some of them cause failureof the MU and are defined as “failure”vibration
Vibrations determined by the MU structuralcharacteristics, such as meshing vibration ofgears, etc.
Yielding Deformation exceeds the elasticity limit ofthe material to produce unrecoverableplastic deformation
Under long time stress or stress much higherthan the elasticity limit, plastic deformationis produced
Impact When the MU structure material property isbrittle, with an excessive impact load, thevisible deformation, e.g., extension orbending, is caused under one shot, especiallyat the stress concentration
This kind of damage suddenly is caused witha large loss, which is mainly determined bythe material basic properties. The reasonsinclude the choice of materials, the stressconcentration structure, the imperfectfunction of the buffer mechanism, etc.
Table 3.Formation mechanisms of typical MU failures.
206
Emerging Trends in Mechatronics
understand the decomposition and aggregation relationship between the qualitycharacteristics of the upper and lower units, corresponding to the quality charac-teristic coupling relationship model based on the FMA tree, the multiple generalizedoperator model of the complete machine large system [42] is established combininggeneralized operator model of complete machine system and the generalized oper-ator relationship model of units (Figure 7).
The power input of the complete machine system is decomposed into the units’output, which is transmitted through the same layer and then aggregated to thecomplete system.
5.1.1 Generalized operator model of units
1.The first-layer generalized operator model of the complete machine systemcan be expressed as
YW ≐KW �ð ÞUW (24)
Figure 7.The multilayer generalized operator model of complete machine.
207
Research on Key Quality Characteristics of Electromechanical Product Based on Meta-Action UnitDOI: http://dx.doi.org/10.5772/intechopen.89481

whereUW and YW are the total input and output of the complete machine system,respectively, and KW �ð Þ is the macro generalized operator of coarse granularity.
2.The second-layer generalized operator model of the function units can beexpressed as
YFi ≐KFi �ð ÞUFi ,YF j ≐KF j �ð ÞUF j , i, j ¼ 1, 2,⋯, n (25)
where UFi and YFi are the input and output of function unit Fi, respectively, andKFi �ð Þ is its generalized operator.
3.The third-layer generalized operator model of the motion units can beexpressed as
YMi ≐KMi �ð ÞUMi ,YM j ≐KM j �ð ÞUM j , i, j ¼ 1, 2,⋯, n (26)
where UMi and YMi are the input and output of motion unit Mi respectively, andKMi �ð Þis its generalized operator.
4.The fourth generalized operator model of the MUs can be expressed as
YAi ≐KAi �ð ÞUAi ,YA j ≐KA j �ð ÞUA j , i, j ¼ 1, 2,⋯, n (27)
where UAi and YAi are the input and output of MU Ai and KAi �ð Þ is itsgeneralized operator.
5.1.2 Relationship model of generalized operators
5.1.2.1 Relationship model of vertical generalized operators
a. According to the function and mission of the unit, the total input of thecomplete machine system is distributed down to the corresponding unit ofthe next layer to form its input. Therefore, the input between units fromdifferent layers is the effective allocation of the complete machine systeminput, and the downward vertical relationship model can be expressed as
UFi ≐RFi↓ �ð ÞUW , i ¼ 1, 2,⋯, n
UMi ≐RMi↓ �ð ÞUFi , i ¼ 1, 2,⋯, n
UAi ≐RAi↓ �ð ÞUMi , i ¼ 1, 2,⋯, n
8><>:
(28)
where R↓ �ð Þ is the downward vertical relationship operator.
b. The output (quality characteristics) of the unit is aggregated to the completemachine system to form its total output (quality characteristics). Therefore,YW is the order integration of the unit output, and the upward verticalrelationship model can be expressed as
YW ≐RF j↑ �ð ÞYF j , j ¼ 1, 2,⋯, n
YFi ≐RM j↑ �ð ÞYM j , j ¼ 1, 2,⋯, n
YMi ≐RA j↑ �ð ÞYA j , j ¼ 1, 2,⋯, n
8>><>>:
(29)
where R↑ �ð Þ is the upward vertical relationship operator.
208
Emerging Trends in Mechatronics
5.1.2.2 Relationship model of horizontal generalized operators
UF j ≐ rFi,F j �ð ÞYFi , i, j ¼ 1, 2,⋯, n
UM j ≐ rMi,M j �ð ÞYMi , i, j ¼ 1, 2,⋯, n
UA j ≐ rAi,A j �ð ÞYAi , i, j ¼ 1, 2,⋯, n
8>><>>:
(30)
where rAi,A j �ð Þ is the horizontal relationship operator of MU Ai and Aj.
5.2 Multilayer state space model of quality characteristics
According to the quality characteristic mapping model based on the FMA tree,the large system of the complete electromechanical product is decomposed intoseveral units. To predict and control the quality characteristics of different hierar-chical units, the corresponding granularity required is different. The structuralfeatures of the multilayer state space model system, decomposition-analysis-syn-thesis, can combine the microscopic quality characteristics of each unit and themacroscopic large system to control the quality characteristics more accurately.Therefore, referring to the multigeneralized operator model of the large-scalesystem, the multilayer state space model of the quality characteristic of thecomplete machine is established step by step as follows [43, 44].
5.2.1 Decomposition
According to the qualitative model, the quantitative equations of multilayer statespace model of the complete machine quality characteristics are set as follows:
MI :xWI ¼ AW
I xWI þ BWI uWI
yWI ¼ CWI xWI þDW
I uWI
8<: MFi
II :_xFiII ¼ AFi
II xFiII þ BFi
II uFiII
yFiII ¼ CFi
II xFiII þDFi
II uFiII
(
MF j
II :_xF j
II ¼ AF j
II xF j
II þ BF j
II uF j
II
yF j
II ¼ CF j
II xF j
II þDF j
II uF j
II
8<: MMi
III :_xMiIII ¼ AMi
III xMiIII þ BMi
III uMiIII
yMiIII ¼ CMi
III xMiIII þDMi
III uMiIII
(,
MMj
III :_xM j
III ¼ AM j
III xM j
III þ BM j
III uM j
III
yM j
III ¼ CM j
III xM j
III þDM j
III uM j
III
8<: MAi
IV :_xAiIV ¼ AAi
IVxAiIV þ BAi
IVuAiIV
yAiIV ¼ CAi
IVxAiIV þDAi
IVuAiIV
8<:
MA j
IV :_xA j
IV ¼ AA j
IVxA j
IV þ BA j
IVuA j
IV
yA j
IV ¼ CA j
IVxA j
IV þDA j
IVuA j
IV
8<:
where y tð Þ is the output variable, y ¼ y1, y2,⋯, ym� �T; x tð Þ is the state variable,
x ¼ x1, x2,⋯, xnð ÞT; and u tð Þ is the input variable, u ¼ u1, u2,⋯, urð ÞT. A is theobject (system) matrix describing the characteristics of the controlled object:
A ¼ aij� �
n�n ¼
a11 a12 ⋯ a1na21 a22 ⋯ a2n⋮ ⋮ ⋱ ⋮an1 an2 ⋯ ann
26664
37775 (31)
B is the control matrix describing the characteristics of the control mechanism:
209
Research on Key Quality Characteristics of Electromechanical Product Based on Meta-Action UnitDOI: http://dx.doi.org/10.5772/intechopen.89481

B ¼ bij� �
n�r ¼
b11 b12 ⋯ b1rb21 b22 ⋯ b2r⋮ ⋮ ⋱ ⋮bn1 bn2 ⋯ bnr
26664
37775 (32)
C is the observing matrix describing the characteristics of the observing device:
C ¼ cij� �
m�n ¼
c11 c12 ⋯ c1nc21 c22 ⋯ c2n⋮ ⋮ ⋱ ⋮cm1 cm2 ⋯ cmn
26664
37775 (33)
D is the observing matrix describing the characteristics of the observing device:
D ¼ dij� �
m�r ¼
d11 d12 ⋯ d1rd21 d22 ⋯ d2r⋮ ⋮ ⋱ ⋮dm1 dm2 ⋯ dmr
26664
37775 (34)
5.2.2 Synthesis
Because the complete electromechanical products are composed of a series ofunits, according to the research on coupling and decoupling technology based onMUs, the spatial state variables of the complete product can be expressed as theweighted sum of that of some function units. Furthermore, the spatial state vari-ables of function units can be expressed as the weighted sum of that of some motionunits. Finally, the spatial state variables of motion units can be expressed as theweighted sum of that of some MUs. The specific model can be expressed as
xWI ¼ wixFiII þ wjx
F j
II
xFiII ¼ wix
MiIII þ wjx
M j
III
xMiIII ¼ wix
AiIV þ wjx
A j
IV
8>><>>:
(35)
6. Discussion
With the increase of structure complexity of electromechanical products, thequality control of electromechanical products by parts is too complicated, and itsquality control becomes significantly difficult. The control method based on MUsprovides a good idea properly analyzing the formation mechanism of the keyquality characteristics (precision, precision life, performance stability, and reliabil-ity) of electromechanical products is studied based on MUs. On the one hand, dueto the appropriate granularity, it is more convenient for quality control; on the otherhand, because the meta-action decomposition method is a dynamic decompositionprocess of electromechanical products, the quality characteristics of electrome-chanical products can be controlled by the four key quality characteristics (theprecision, the precision life, the stability, the reliability) of the quality of the controlMUs. It makes up for the deficiency of traditional control methods.
210
Emerging Trends in Mechatronics
7. Conclusions and prospects
The research shows that it is adaptive and feasible to study the formationmechanism of key quality characteristics and quality control through the proposedanalysis method based on the meta-action theory. MU has specific functions andcan independently complete the specified motion or operation, which is moresuitable for quality and reliability analysis. In this paper, the forming mechanism ofMU’s four key quality characteristics (the accuracy, the precision life, the perfor-mance stability, the reliability) is deeply studied, and its parameter expressionmodel is obtained. The model of quality characteristic state space of unit isestablished; based on that, the basic principle of predictive control and the formingmechanism of the quality characteristics of MUs are analyzed and clarified. Startingfrom the quality control of MUs, the quality control of the whole machine isaccomplished through the quality control of the unit level. This control mode ismore simple, effective, and conducive to the accomplishment of refined qualitycontrol.
Due to a variety of electromechanical products, different functions and theirimplementation processes are complex. On the one hand, the data acquisition ofMU quality index is very difficult. On the other hand, the factors influencing thequality uncertainty are various. Moreover, the meta-action theory also has certainlimitations up to now, and some deficiencies exist here. Thus, we plan to furtherimprove the following research work in the future:
1. In the follow-up study, the quality characteristic database of meta-action unitsshould be continuously increased through various channels such as collectingprocess data or conducting meta-action unit tests so as to better verify thetheoretical methods.
2.This paper only studies the four key quality characteristics (the reliability, theprecision, the precision life, the performance stability). In order to make thelater quality prediction and control more accurate, it can be considered toincrease the research of quality characteristics such as usability.
Acknowledgements
This work is financially supported by the National Natural Science Foundationof China (No. 51705048; 51835001) and the National Major Scientific and Techno-logical Special Project for “High-grade CNC and Basic Manufacturing Equipment”of China (2018ZX04032-001; 2016ZX04004-005).
211
Research on Key Quality Characteristics of Electromechanical Product Based on Meta-Action UnitDOI: http://dx.doi.org/10.5772/intechopen.89481

Author details
Yan Ran, Xinlong Li, Shengyong Zhang and Genbao ZhangChongqing University, China
*Address all correspondence to: [email protected]
©2020TheAuthor(s). Licensee IntechOpen.Distributed under the terms of theCreativeCommonsAttribution -NonCommercial 4.0 License (https://creativecommons.org/licenses/by-nc/4.0/),which permits use, distribution and reproduction fornon-commercial purposes, provided the original is properly cited. –NC
212
Emerging Trends in Mechatronics
References
[1] Yan Z, Liuyong S, Liu Shihao HS.Exploration and practice ofelectromechanical integration talenttraining mode based on social needs.Natural Science Journal of HainanUniversity. 2014;32:389-393. DOI:10.15886/j.cnki.hdxbzkb.2014.04.017
[2] Feng Z. Study on OrganizationalStructure Optimization Design of Xi’anDongfeng Instrument and MetersFactory. Xian: Northwest University;2012
[3] Zhang G, Jihong P, Ren Xianlin CHG.Research on reliability analysistechnology of typical meta-action unitsof NC machine tools. ComputerIntegrated Manufacturing Systems.2011;17:151-158
[4] Mengsheng Y. Research onReliability Analysis Technology ofTypical Meta-Action Units of NCMachine Tools. Chongqing: ChongqingUniversity; 2018
[5] Sata T, Takeuchi Y, Okubo N.Improvement of working accuracy of amachining center by computer controlcompensation. In: Tobias SA, editor.Proceedings of the SeventeenthInternational Machine Tool Design andResearch Conference; 20–24 September1976; Birmingham. London: MacmillanEducation UK; 1977. pp. 93-99 10.1007/978-1-349-81484-8_12
[6] Ceglarek D, Shi J, SM W. Fixturefailure diagnosis for autobody assemblyusing pattern recognition. ASME Journalof Engineering for Industry. 1996;118:55-66. DOI: 10.1115/1.2803648
[7] Zeyuan D, Li J, Xinjun L, Mei Bin CJ.Experimental study on the effectivenessof two different geometric errormodeling methods for machine tools.Journal of Mechanical Engineering.2019;55:137-147. DOI: 10.3901/JME.2019.05.137
[8] Li J, Fugui X, Xinjun L, Mei Bin DZ.Analysis on the research status ofvolumetric positioning accuracyimprovement methods for five-axis NCmachine tools. Journal of MechanicalEngineering. 2017;53:113-128. DOI:10.3901/JME.2017.07.113
[9] Yongwei Y, Liuqing D, YiXiaobo CG. Prediction method of NCmachine tools’ motion precision basedon sequential deep learning.Transactions of the Chinese Society ofAgricultural Engineering. 2019;50:421-426. DOI: 10.6041/j.issn.1000-1298.2019.01.049
[10] Min W, Rui S, Wei Z, Deshun K,Shuang Z. Accelerated degradation testmethod for accuracy stability ofprecision ball screws. Journal of BeijingUniversity of Technology. 2016;42:1629-1633. DOI: 10.6041/j.issn.1000-1298.2019.01.049
[11] Liping Z, Yenong L, Yang Q. Grayprediction about of the spindle rotationaccuracy of CNC lathe. Machine Tooland Hydraulics. 2016;44:93-97. DOI:10.3969/j.issn.1001–3881.2016.21.022
[12] Linlin Y. Study on AccuracyStability Testing of Servo Feed Systemon CNC Machine tool. Hangzhou: Zhejiang University; 2014
[13] Hu M, Yu CW, Zhang J, Zhao W,Cun H, Yuan S. Accuracy stability forlarge machine tool body. Journal ofXi’an Jiaotong University. 2014;48:65-73. DOI: 10.7652/xjtuxb201406012
[14] Kang XM, Fu WP, Wang DC, Li T,Wang SJ. Analysis and testing of axialload effects on ball Screw’s frictiontorque fluctuations. Noise and VibrationControl. 2010;30:57-61. DOI: 10.3969/j.issn.1006-1355.2010.02.057
[15] Saitou K, Izui K, Nishiwaki S, et al.A survey of structural optimization in
213
Research on Key Quality Characteristics of Electromechanical Product Based on Meta-Action UnitDOI: http://dx.doi.org/10.5772/intechopen.89481

mechanical product development.Journal of Computing & InformationScience in Engineering. 2005;5(3):214-226. DOI: 10.1115/1.2013290
[16] Ta TN, Hwang YL, Horng JH. Theinfluence of friction force on slidingstability of controlled multibodysystems—CNC machine tool. JurnalTribologi. 2018;19:107-120
[17] Caro S, Bennis F, Wenger P.Tolerance synthesis of mechanisms:A robust design approach. 2010;127(1):339-348
[18] Gao YC, Feng YX, Tan JR. Productquality characteristics robustoptimization design based on minimumsensitivity region estimation. ComputerIntegrated Manufacturing Systems.2010;16:897-904
[19] Hui L, Huang Y, Huijie ZH. Effectsof transmission stiffness variations onthe dynamic accuracy consistency ofCNC feed drive systems. Journal ofMechanical Engineering. 2014;23:128-133. DOI: 10.3901/JME.2014.23.128
[20] Zhang X, Gao H, Huang H-Z, Li Y-F, Mi J. Dynamic reliability modeling forsystem analysis under complex load.Reliability Engineering and SystemSafety. 2018;180:345-351. DOI: 10.1016/j.ress.2018.07.025
[21] Pinghua J, Guangquan H, Yan R,Xiao Liming LZ. Reliability controlmethod of assembly process of productsbased on motion unit fault model.Journal of Central South University(Science Technology). 2018;9:2197-2205. DOI: 10.11817/j.issn.1672-7207.2018.09.012
[22] Zhang G, Liu J, Ge H. Modeling andanalysis for assembly reliability basedon dynamic Bayesian networks. ChineseJournal of Mechanical Engineering.2012;23:211-215. DOI: 10.3969/j.issn.1004-132X.2012.02.019
[23] Assaf T, Dugan JB. Diagnosis basedon reliability analysis using monitorsand sensors. Reliability Engineering andSystem Safety. 2008;93:509-521. DOI:10.1016 /j.ress.2006.10.024
[24] Yu FJ, Ke YL, Ying Z. Decision onfailure maintenance for aircraftautomatic join-assembly system.Computer Integrated ManufacturingSystems. 2009;15:1823-1830
[25] Qinghu Z. Fault PrognosticsTechnologies Research for KeyComponents of Mechanical Power andTransmission Systems. Changsha:National University of DefenseTechnology; 2010
[26] Haifeng Z. Coupling andDecoupling Control of Complex ProductQuality Characteristics. Chongqing:Chongqing University; 2010
[27] Xianghua A. The Theory andApplication of Multi-Scale Intelligentand Cooperative Quality Control forKey Parts of Large Air SeparationEquipment. China: Zhejiang University;2011
[28] Nada OAA. Quality Prediction inManufacturing System Design. Canada:University of Windsor; 2016
[29] Xianlin R. Research on the KeyTechnology of Quality CharacteristicPrevention and Control ofElectromechanical Products. China:Chingqing University; 2011
[30] Zhentao S. Research of Couplingand Prediction Control of MultipleQuality Characteristics. University ofElectronic Science and Technology ofChina; 2016
[31] Yang JP, Wang WL, Kang J, Mi SF.Research on multi-phased productquality predictive control method basedon PSO-SVM. Journal of DalianNationalities University. 2013;15:37-41.
214
Emerging Trends in Mechatronics
DOI: 10.3969/j.issn.1009-315X.2013.01.009
[32] He Z, Zou Feng ZY. Study andapplication on the integration of qualityEmerging Trends in Mechatronics toolsbased on QFD. Modul Mach TOOLModular Machine Tool & AutomaticManufacturing Technique. 2006:196-199, 102. DOI: 10.3969/j.issn.1001-2265.2006. 04 01.031
[33] Houston RL. Multibody SystemDynamics. Vol. 1. Tianjing: TianjinUniversity Press; 1987
[34] Yangmin L. Kinematics analysis ofmultibody system of loader workingmechanism. Journal of South ChinaUniversity of Technology. 1996;24(2):84-91
[35] Jinwei F. Establishing spatial errormodel of CNC machine tool by usingmultibody system kinematics theory.Journal of Beijing University ofTechnology. 1999;25(2):38-44
[36] Shiping L. In: National University ofDefense Technology, editor. Researchon Precision Modeling and ErrorCompensation Method for Multi-AxisCNC Machine Tools. Changsha; 2002
[37] Li C, Yu Lijiyi PA. Precision andReliability of CNC Machine Tools.Mechanical Industry Press; 1987
[38] Hegadekatte V, Huber N, Kraft O.Finite element based simulation of drysliding wear. Modelling and Simulationin Materials Science and Engineering.2005;13(1):57-75
[39] Taguchi G, Elsayed EA, Hsiang TC.Quality Engineering in ProductionSystem. New York: McGraw Hill; 1986
[40] Tasora A, Prati E, Silvestri M.Experimental investigation of clearanceeffects in a revolute joint. In:Proceedings of the AIMETA
International Tribology Conference;Rome, Italy: 2004. pp. 14-17
[41] Xuyan T, Wang Cong GY. LargeSystem Control Theory. Beijing: BeijingUniversity of Posts andTelecommunications Press; 2005
[42] Liu Dianting LM. Study on multi-layer generalized operator model ofgreen product design and itsoptimization under uncertainty.Machinery Design & Manufacture.2014;5:267-269, 272. DOI: 10.3969/j.issn.1001-3997.2014.05.081
[43] Mokeev AV. Description of thedigital filter by the state space method.International Siberian Conference onControl & Communications IEEE. 2009.DOI:10.1109/SIBCON.2009.5044842
[44] Aiyan W, Guangping Z. Research ofmulti-layer intelligent modelingmethod. Computer Science. 2014;41:253-257, 285. DOI: 10.3969/j.issn.1002-137X.2014.03.054
215
Research on Key Quality Characteristics of Electromechanical Product Based on Meta-Action UnitDOI: http://dx.doi.org/10.5772/intechopen.89481

Emerging Trends in MechatronicsEdited by Aydin Azizi
Edited by Aydin Azizi
Mechatronics is a multidisciplinary branch of engineering combining mechanical, electrical and electronics, control and automation, and computer engineering
fields. The main research task of mechatronics is design, control, and optimization of advanced devices, products, and hybrid systems utilizing the concepts found in all these fields. The purpose of this special issue is to help better understand how mechatronics will impact on the practice and research of developing advanced
techniques to model, control, and optimize complex systems. The special issue presents recent advances in mechatronics and related technologies. The selected topics give an overview of the state of the art and present new research results and prospects for the
future development of the interdisciplinary field of mechatronic systems.
Published in London, UK
© 2019 IntechOpen © jntvisual / iStock
ISBN 978-1-78984-319-4
Emerging Trends in M
echatronics
ISBN 978-1-83968-505-7