EMERGING PROBLEMS AND IRT-BASED OPERATIONAL SOLUTIONS IN LARGE-SCALE PROGRAMS OF STUDENT...
18
53 EMERGING PROBLEMS AND IRT-BASED OPERATIONAL SOLUTIONS IN LARGE-SCALE PROGRAMS OF STUDENT ASSESSMENT: THE ITALIAN CASE RENATO MICELI UNIVERSITY OF TORINO UNIVERSITY OF VALLE D’AOSTA DAVIDE MARENGO UNIVERSITY OF TORINO GIORGIA MOLINENGO UNIVERSITY OF TORINO UNIVERSITY OF VALLE D’AOSTA MICHELE SETTANNI UNIVERSITY OF TORINO The main aim of this study is to present a set of IRT-based operational solutions aimed at dealing with specific measurement issues emerging from a national-level large-scale program for the assessment of student achievement. In particular, we focused on specific problems related to measurement invariance and test dimensionality. Analyses were performed on data from the Italian 8th-grade math examinations implemented by INVALSI. Results indicated only negligible differential item functioning in the examined tests, while minor indications of multidimensionality emerged. The chosen analytical approach represents a practical and economical solution for the validation of problematic large-scale response data. Key words: Item response theory; Achievement test; Large-scale assessment; Differential item func- tioning; Test dimensionality. Correspondence concerning this article should be addressed to Davide Marengo, Department of Psychology, University of Torino, Via Verdi 10, 10124 Torino (TO), Italy. Email: [email protected] Over the last decades, a growing number of countries have implemented large-scale as- sessment programs (LSAP) as instruments aimed at supplying information about public poli- cies related to the education system. The purpose of such programs is usually twofold: (1) to monitor students’ proficiency in key areas such as reading, mathematics, and science, (2) to provide reliable school-level accountability measures of students’ educational outcomes (Shepard, 2003). Additionally, LSAPs can also provide class-level diagnostic tools to improve teaching programs (Nagy, 2000). By setting up specific quality standards, some countries also use LSAPs as high- stakes tests having direct consequences on students (i.e., by contributing to their graduation, promo- tion to the next grade, or admission to post-secondary education), on schools (i.e., by influencing TPM Vol. 22, No. 1, March 2015 – 53-70 – doi:10.4473/TPM22.1.5 – © 2015 Cises
Transcript of EMERGING PROBLEMS AND IRT-BASED OPERATIONAL SOLUTIONS IN LARGE-SCALE PROGRAMS OF STUDENT...
53
EMERGING PROBLEMS
AND IRT-BASED OPERATIONAL SOLUTIONS
IN LARGE-SCALE PROGRAMS
OF STUDENT ASSESSMENT: THE ITALIAN CASE
RENATO MICELI UNIVERSITY OF TORINO
UNIVERSITY OF VALLE D’AOSTA
DAVIDE MARENGO UNIVERSITY OF TORINO
GIORGIA MOLINENGO UNIVERSITY OF TORINO
UNIVERSITY OF VALLE D’AOSTA
MICHELE SETTANNI UNIVERSITY OF TORINO
The main aim of this study is to present a set of IRT-based operational solutions aimed at dealing with specific measurement issues emerging from a national-level large-scale program for the assessment of student achievement. In particular, we focused on specific problems related to measurement invariance and test dimensionality. Analyses were performed on data from the Italian 8th-grade math examinations implemented by INVALSI. Results indicated only negligible differential item functioning in the examined tests, while minor indications of multidimensionality emerged. The chosen analytical approach represents a practical and economical solution for the validation of problematic large-scale response data.
Key words: Item response theory; Achievement test; Large-scale assessment; Differential item func-tioning; Test dimensionality.
Correspondence concerning this article should be addressed to Davide Marengo, Department of Psychology, University of Torino, Via Verdi 10, 10124 Torino (TO), Italy. Email: [email protected]
Over the last decades, a growing number of countries have implemented large-scale as-
sessment programs (LSAP) as instruments aimed at supplying information about public poli-
cies related to the education system. The purpose of such programs is usually twofold: (1) to
monitor students’ proficiency in key areas such as reading, mathematics, and science, (2) to provide
reliable school-level accountability measures of students’ educational outcomes (Shepard, 2003).
Additionally, LSAPs can also provide class-level diagnostic tools to improve teaching programs
(Nagy, 2000). By setting up specific quality standards, some countries also use LSAPs as high-
stakes tests having direct consequences on students (i.e., by contributing to their graduation, promo-
tion to the next grade, or admission to post-secondary education), on schools (i.e., by influencing
TPM Vol. 22, No. 1, March 2015 – 53-70 – doi:10.4473/TPM22.1.5 – © 2015 Cises
TPM Vol. 22, No. 1, March 2015
53-70
© 2015 Cises
Miceli, R., Marengo, D.,
Molinengo, G., & Settanni, M. Measurement issues in large-scale assessment
54
decisions on their budgets) and ultimately on teachers (i.e., by granting individual monetary re-
wards) (Heubert & Hauser, 1999; Paris, Lawton, Turner, & Roth, 1991). Collected data is analyzed
by both national and international institutions to reveal trends and to track progress of public poli-
cies (ISTAT, 2012; NCES, 2012; OECD, 2012); data is also used by researchers to build scientific
evidence about tests (Kreiner, 2011; Verhelst, 2012), testing procedures, and distributions of the
outcomes in the studied populations (Klieme & Baumert, 2001; Liu & Wilson, 2009; Zwick & Er-
cikan, 1989).
Some authors have pointed out the scarcity of attention toward issues of validity and reli-
ability of measurement when analyzing the data (Goldstein, 2004; Kreiner, 2011), often in favor
of socio-politically relevant interpretations (De Lange, 2007; Goldstein, 1995). The use of results
to construct “value added” indicators of school performance has also been put to question, espe-
cially when reliable methods for pooling data over time are not implemented in the programs
(Kane & Staiger, 2002).
Even in Italy, following a major reform of the Italian public education system in 2003, an
extended program for the evaluation of the public education system was introduced. The pro-
gram, which is developed and implemented in schools by the Italian National Institute for the
Evaluation of the Education System (INVALSI), has no direct financial impact on schools’ budget
or teachers’ salary; still, its introduction has met strong opposition from teachers and school ad-
ministrators, and every year raises public debate when the test is implemented. Starting from
2008, the Italian LSAP has also included a state-wide examination investigating 8th graders’ pro-
ficiency in mathematics, which is presented as part of the compulsory state exam marking the end
of the lower-secondary cycle of education. In Italy, the 8th-grade evaluation is particularly relevant
because it is done at the end of the national school curriculum: starting from grade 9, in fact, Italian
students attend secondary schools with different curricula, thus rendering comparisons in terms of
academic achievement more difficult.
The collected data are analyzed by INVALSI researchers not only to obtain individual
student scores and aggregated school and classroom scores, but also to study the functioning of
the employed tests. Results of these analyses are published in publicly available annual reports.
Nonetheless, when examining published documentation, some critical issues emerge.
A relevant issue related to the INVALSI reports is the lack of analyses concerning dimen-
sionality of the tests. Indeed, in order to make fair comparisons across relevant subpopulations of
examinees test items should be designed to measure the same constructs (Messick, 1995). This is
not always the case: test items intended to measure a unidimensional trait often have found to
measure even other traits (Hambleton & Swaminathan, 1985; Reckase, 1979). One of the most
relevant consequences of treating a multidimensional test as a unidimensional one is that an uncon-
trolled bias is introduced in the ranking of examinees according to their test score (Walker & Beret-
vas, 2003). For these reasons, investigating the factor structure is needed in order to provide fun-
damental evidence of validity (Haladyna & Rodriguez, 2013). As regards INVALSI, two possible
sources of violations of the unidimensionality assumption need to be considered: math content do-
mains and item response format. With respect to item content, INVALSI tests include items assess-
ing mathematical proficiency on four different content domains (equally represented). However,
given the low number of items per domain and in line with the substantial one-dimensional concep-
tualization of math ability (Ekmekci, 2013), the test is not supposed to furnish multiple scores. Still,
TPM Vol. 22, No. 1, March 2015
53-70
© 2015 Cises
Miceli, R., Marengo, D.,
Molinengo, G., & Settanni, M. Measurement issues in large-scale assessment
55
the presence of relevant indications of multidimensionality linked to content domains would put
into question the construct validity of the instrument and the interpretability of the obtained scores.
An additional critical point with INVALSI LSAP is the lack of documentation on test good-
ness of fit to a measurement model. This kind of investigation has become over the years the stan-
dard in the evaluation of large-scale assessment programs (for a review, see Wendt, Bos, & Goy,
2011). Even INVALSI researchers sometimes refer to IRT-based analyses in their reports (e.g.,
Samejima’s Graded Response model; Rasch, 1960/1980, model for dichotomous data). Still, their
application of measurement models is partial and nonsystematic. The resulting lack of many funda-
mental statistics (among others, the students’ ability estimates and fit indices) does not allow to accu-
rately evaluate the instruments’ quality (Bond & Fox, 2007; Linacre, 2009a), the measurement in-
variance of the items, and the adequacy of the targeting of the items to relevant subpopulations,
which are fundamental properties for LSAPs (AERA, APA, & NCME, 1999; Dorans, 2004). Con-
cerning measurement invariance, many authors have pointed out the existence of interaction effect
between specific item and examinees’ characteristics introducing biases in the measurement process
underlying the administration of standardized tests. With regard to item-format differences, for ex-
ample, findings indicate the existence of a gender-effect favoring male examinees on multiple-choice
items (Ben-Shakhar & Sinai, 1991; Walstad & Robinson, 1997), while constructed-response items
are often found to advantage female examinees (Arthur & Everaert, 2012; DeMars, 2000). Concern-
ing item content domains, specific advantages have been documented for males on measurement
tasks (Innabi & Dodeen, 2006) and problems requiring spatial skills (Gallagher et al., 2000). Viola-
tions of measurement invariance have also been shown to emerge in math standardized tests when
comparing groups characterized by different levels of writing and reading proficiency (Martiniello,
2009). The existence of significant differences in functioning of the tests across relevant subpopula-
tions of examinees would compromise the use of test scores for comparison purposes and ultimately
cast doubts on the fairness of high-stake decisions taken on account of test results.
In order to overcome these limitations, further analyses on collected data are needed. In
light of these considerations, we conducted the present study with the following aims: (a) estima-
tion of both students’ ability and item difficulty parameters within the IRT framework and fit analy-
sis; (b) examination of measurement invariance across relevant subsets of individuals and items; (c)
examination of test dimensionality. In the official documentation for the tests, analyses are only
performed on a random sample, even if census-level data is available. As an added value of this
study, for the specific purpose of analyses related to aims (a) and (b), census-level data were used.
In order to reach the study goals, we performed a preliminary inspection of datasets aimed at the
identification of potentially problematic response patterns, followed by a data cleaning procedure.
DATA SOURCES
Participants
Data were obtained by filling in an online request through the INVALSI institutional site.
Provided data consisted of the total tested student population which had undertaken the INVALSI
standardized math tests for the years 2008 to 2011 in their basic unedited version and with no ex-
tra time added for test completion (2008: N = 497,720; 2009: N = 511,882; 2010: N = 488,884;
2011: N = 523,111).
TPM Vol. 22, No. 1, March 2015
53-70
© 2015 Cises
Miceli, R., Marengo, D.,
Molinengo, G., & Settanni, M. Measurement issues in large-scale assessment
56
Test Administration and Evaluation
The INVALSI tests are administered in the classrooms by school teachers, who, together
with the school principal, form the exam commission. Due to specific regulations concerning the
8th-grade state exam, the presence in the classrooms of external observers during the administra-
tion of the tests is not allowed.
The impact of the test on the exam’s final grade has changed over the years. For 2008
only the test posed no real stake for the students, while for the year 2009 the exam commissions
were granted a discretionary power on the degree of its impact on the final grade. Due to this pe-
culiar testing condition, data for the year 2009 was expected to be particularly problematic and
thus given special attention in the analyses. Starting from 2010, the score obtained by students on
the INVALSI booklets has contributed to the exam’s final grade.
The INVALSI Math Booklets
The INVALSI math booklets are intended to assess students’ proficiency across multiple
math content and cognitive domains; for the development of the tests, INVALSI admittedly fol-
lowed the math assessment framework proposed for the IEA-TIMSS 2003 tests (INVALSI, 2008),
with minor differences in the definition and number of the domains. Students’ proficiency is evalu-
ated across four math domains: Relations and functions (RF), Numbers (N), Geometry (GEO)
(redefined in 2009 as Space and figures, SF); Measures, data, and predictions (MDP) (redefined
in 2011 as Data and predictions, DP). Nonetheless, the tests are developed and scored by IN-
VALSI under the assumption of being substantively unidimensional.
The booklets are presented as mixed-format tests including closed-ended, multiple-choice
(MC) items and both open-ended and closed constructed-response (CR) questions. Over the years,
two types of Multiple-Choice items have been used: Simple MC items (1 correct option, 3 dis-
tractors) and Multiple True-False MC items (organized as bundles of 3-4 True-False items sharing
a common stimulus). Three types of CR items were used: Short answer CR (items which require
a short response, usually in numerical form), Brief CR (items which generally require the student
to provide both a short answer and document its solution steps) and Extended CR (organized as
bundles of Short-Answer CR sharing a common stimulus). Since 2008, INVALSI has progres-
sively revised the structure of the math booklets by increasing the total number of items (2008:
22; 2009: 21; 2010: 27; 2011: 29). It is worthy to note that, since the total number of items is in
general quite low, limited information for the individual diagnosis is collected. As a result, the
reliability of the test score is expected to be compromised.
Item Scoring
Over the years, INVALSI has provided teachers with slightly different scoring instruc-
tions for the tests. Inconsistencies among the years concerned specifically the scoring rubrics of
items comprising multiple questions sharing a common passage/stimulus, such as Brief CR items
and item bundles. Two scoring rubrics have been proposed for brief CR items: a 2-point rating-
scale rubric (INVALSI, 2008); an alternative rubric, separately scoring each subquestion as an
TPM Vol. 22, No. 1, March 2015
53-70
© 2015 Cises
Miceli, R., Marengo, D.,
Molinengo, G., & Settanni, M. Measurement issues in large-scale assessment
57
autonomous dichotomous item (INVALSI, 2011). Similar differences were observed across years
also in the scoring of item-bundles.
In order to prevent potential violations of the assumption of local independence concerning
items sharing a common passage/stimulus (Testlet items; Wainer & Kiely, 1987), we chose to em-
ploy a rating-scale rubric for both Brief CR items and item bundles; preliminary estimation with the
Rating Scale model (Andrich, 1978), however, revealed significant disorder in the item difficulty
thresholds, suggesting the need for more accurate analyses aiming at evaluating the functioning of
the scoring structure of the items (e.g., by estimating the Partial Credit model; Masters, 1982). In
order to temporarily overcome this issue and achieve congruence across years, the following revi-
sion of the scoring rubrics in a dichotomous form was implemented in this study:
1) Simple MC: a score of 1 was assigned to students indicating the correct option, other-
wise a score of 0 was assigned;
2) Short answer CR: a score of 1 was assigned to students providing the correct answer,
otherwise a score of 0 was assigned;
3) Multiple True-False MC or Short Answer CR items: item bundles of k items were
scored 1 for a number of correct responses ≥ k-1, otherwise were scored 0;
4) Brief CR: a score of 1 was awarded to students providing both the correct answer and
its explanation or solution steps, otherwise a score of 0 was assigned.
A distinction was also made in the scoring procedure between the following responses to items:
5) Invalid responses and omitted responses were scored 0;
6) As suggested by many authors (e.g., Oshima, 1994), unreached items (items that stu-
dents were not able to complete in the time given) were excluded from the analyses by scoring
them as nonadministered items.
METHODS AND ANALYSES
Data Cleaning
In the annual technical reports for the tests, INVALSI has openly discussed the existence
of cheating behaviours during the administration of the tests (INVALSI, 2008, 2009, 2010,
2011). The existence of similar aberrant behaviors represents a relevant source of distortion in the
data. Unfortunately, the large size of the datasets and the by-design lack of information concern-
ing students’ prior achievements does not allow the implementation of detailed cheating detection
analyses on the data, like those proposed by many authors (Jacob & Levitt, 2003; Van der Linden
& Sotaridona, 2006; Wollack, 2004). In order to achieve the proposed study aims, however, rea-
sonably clean data is required. Consequently, a set of preliminary analyses aimed at identifying
and removing both problematic observations and items from the datasets was performed on popu-
lation data by implementing a composite procedure employing both model-free and Rasch-
related methods.1 As a result of the preliminary analyses, the examined person and item data was
categorized according to the following threefold classification: a) biased data having a degrading
effect on subsequent analyses; b) problematic or unproductive data not expected to have a de-
grading effect on analyses; c) “clean,” productive data.
TPM Vol. 22, No. 1, March 2015
53-70
© 2015 Cises
Miceli, R., Marengo, D.,
Molinengo, G., & Settanni, M. Measurement issues in large-scale assessment
58
By referencing the classification above, the specific procedures and the criteria adopted in
the preliminary analyses and the subsequent data cleaning procedure are reported in the Appendix.
Item and Student Performance Measuring
For each year of administration, the estimation of the final Rasch item parameters was
performed by implementing the analyses on clean data only (category “C” of the classification).
For the purpose of the estimation of the final person parameter analyses were performed on a
dataset including both “B” and “C” response data by anchoring the previously estimated item dif-
ficulty parameters. Reliability (Cronbach’s alpha, Rasch person reliability), residual-based mean-
square fit statistics (infit and outfit), discrimination2 and point-biserial correlation coefficients
(rpb) were also computed and examined.
Item Parameter Invariance
The existence of differential item functioning (DIF) in the booklets was examined by
grouping examinees on the basis of gender and citizenship status (Italian, non-Italian students
with EU citizenship, non-Italian citizenship with extra EU citizenship).
Differential bundle functioning (DBF) was also investigated by comparing the groups on
different subsets of item bundled respectively by response format (MC vs. CR) and math content
domain (RF, N, GEO/SF, MDP/DP). These item characteristics have been shown by some au-
thors to be a potential source of DIF on math items when controlling in particular for gender
(Garner & Engelhard, 1999; Liu & Wilson, 2009) and writing and reading proficiency (Adams &
Le, 2009). Concerning the latter, for the purpose of this study our hypothesis is that students with
foreign citizenship status might exhibit differential performances on items characterized by dif-
ferent levels of linguistic requirements (e.g., CR vs. MC items).
The existence of differential functioning on single items or item bundles was deemed
significant when meeting the following criteria: Significant Mantel-Haenszel statistics and DIF
contrast ≥ 0.43 logit units (as suggested by Zwick, Thayer, & Lewis, 1999). In order to further
ensure significance of results, the percentage of DIF identified over the total number of per-
formed tests was compared to a nominal Type 1 error rate of 5%, which represents the threshold
under which we expect DIF/DBF in the test to be due to chance alone. A percentage higher than
the accepted error rate was considered a conclusive criterion for the presence of significant DIF
in the booklets.
Dimensionality Analysis
In order to identify the presence in the booklets of potential violations of Rasch unidi-
mensionality, principal component analyses (PCA) were performed on the standardized person-
by-item residuals as obtained by implementing the Rasch model for dichotomous data. Perform-
ing PCA on standardized residuals is a common technique widely used in Rasch analyses to in-
vestigate the presence of latent factors in the variance not accounted by the model’s person and
TPM Vol. 22, No. 1, March 2015
53-70
© 2015 Cises
Miceli, R., Marengo, D.,
Molinengo, G., & Settanni, M. Measurement issues in large-scale assessment
59
item parameters. A large eigenvalue on the first contrast of the PCA is considered as a potential
indicator of existence of a secondary dimension influencing examinees’ responses on the items,
while low values can be interpreted as a sign of randomness in the variance of the residuals.
Based on simulated data, some authors have suggested an eigenvalue as high as 1.9 on the first
contrast as the cut-off point which for larger values may indicate perturbation of test unidimen-
sionality (for test of approximately 20 items; Raiche, 2005), while others have indicated a more
stringent value of 1.4 (Smith & Miao, 1994). According to another well-known rule of thumb, the
eigenvalue of the contrast can inform about the approximate number of items in the potential sub-
dimension (Bond & Fox, 2007), with a two items dimension being the lowest number for a sub-
stantive violation of the model assumption (Linacre, 2009a).
Some authors suggest that the inclusion in a test of items characterized by different re-
sponse formats can introduce a potential source of multidimensionality in the measurement process
(Sykes, Hou, Hanson, & Wang, 2002; Wainer, Wang, & Thissen, 1994); similar findings have been
reported concerning the inclusion in the same booklet of items investigating different content do-
mains (Abedi, 1997). In light of these considerations, an additional set of analyses was carried out
in this study to further examine the dimensionality of the tests; specifically, for each of the four
math booklets under focus, the fit to the data of the unidimensional Rasch model (D1) was com-
pared with the fit of two alternative and competing multidimensional models respectively modeling
students’ math ability with two latent dimensions (D2) related to the item response formats (MC vs
CR), and four latent dimensions (D4) related to the math domains investigated by the items. Both
the D2 and D4 models were implemented with the Multidimensional Random Coefficient Multi-
nomial Logit Model (MRCMLM; Adams, Wilson, & Wang, 1997). The modeled dimensions were
implemented as an intercorrelated unidimensional latent trait sharing no common item with the
other dimensions (an example of “between items” multidimensionality; Adams et al., 1997); for the
purpose of this study, the variances of the modeled dimensions were set as free parameters of the
model, while the item parameters were constrained to have a mean of 0.
Estimation of both the unidimensional (D1) and multidimensional (D2, D4) models was
performed in Conquest 3.0 (Adams, Wu, Haldane, & Sun, 2012) using the marginal maximum
likelihood (MML) estimation method; convergence criteria were set to 0.0001 for both deviance
and parameter change. For the purpose of the estimation of the four dimension model, Montecarlo
integration was used. Due to the computing limit of our version of the software, for each year of
administration analyses were performed on a randomly generated sample of 3,000 students strati-
fied on gender and macroarea of residence.
The models were compared by testing significance of the G2 likelihood-ratio statistic (Briggs
& Wilson, 2003; Kline, 2005) and by examining both the AIC (Akaike, 1974) and BIC (Schwarz,
1978) information-based fit indices. The adequacy of the models was also compared by examining
the latent trait correlations of the estimated dimensions and the reliability of the relative measures.
RESULTS
Data Cleaning
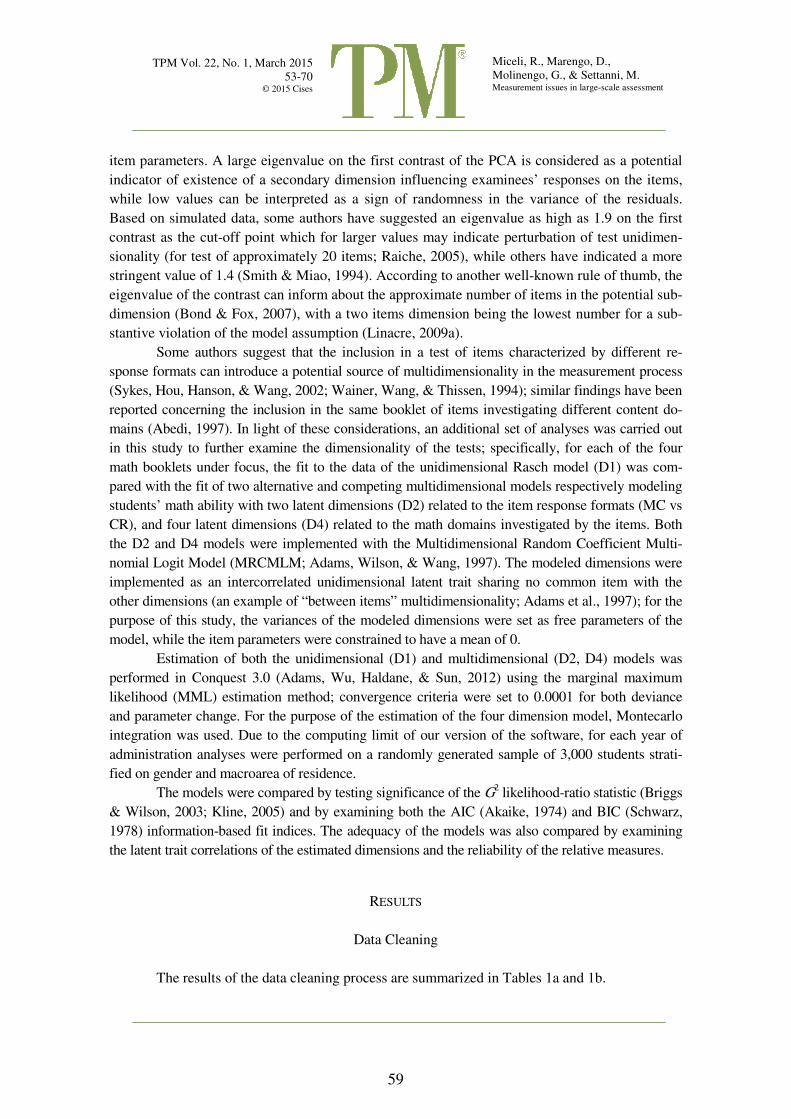
The results of the data cleaning process are summarized in Tables 1a and 1b.
TPM Vol. 22, No. 1, March 2015
53-70
© 2015 Cises
Miceli, R., Marengo, D.,
Molinengo, G., & Settanni, M. Measurement issues in large-scale assessment
60
TABLE 1A
Cleaning process: Classification of response data by year of administration of the tests
2008 2009
Students Item Students Item
N % N N % N
A 51536 10.36 0 146067 28.53 0
B 16392 3.29 0 14158 2.77 0
C 429792 86.35 22 351657 68.70 21
Total 497720 100.00 22 511882 100.00 21
Note. A: “biased” response data; B: “unproductive” response data; C: “clean” response data.
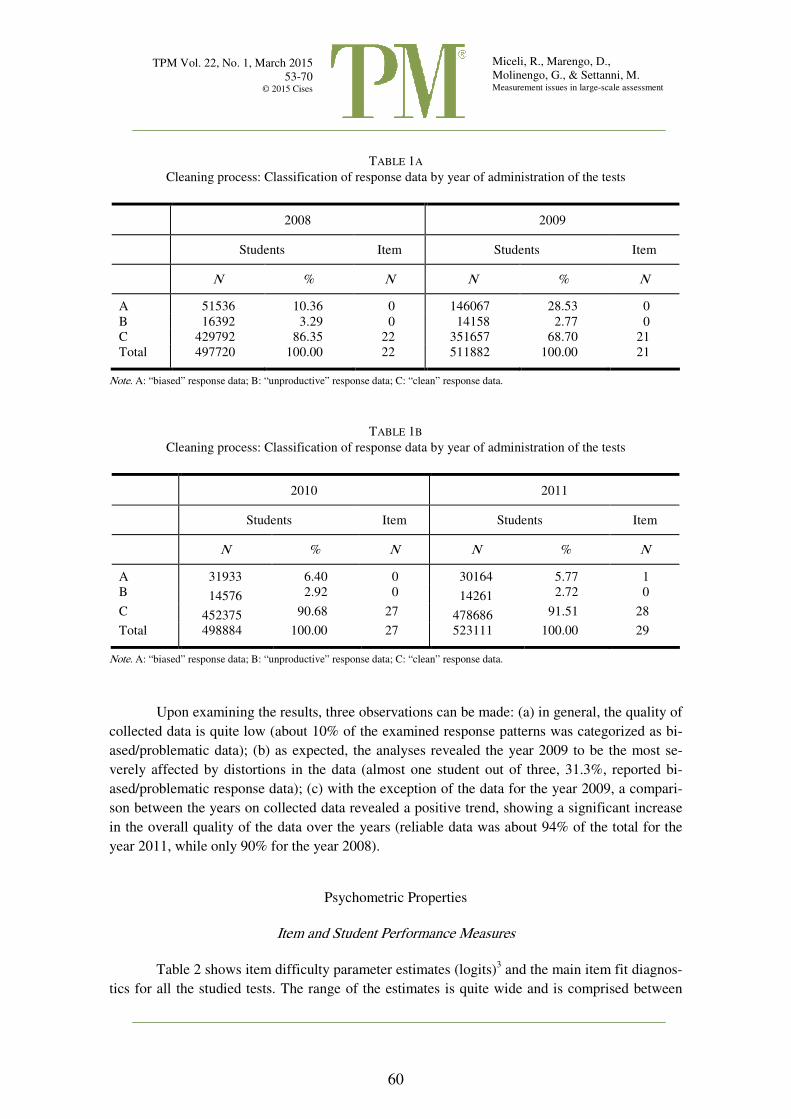
TABLE 1B
Cleaning process: Classification of response data by year of administration of the tests
2010 2011
Students Item Students Item
N % N N % N
A 31933 6.40 0 30164 5.77 1
B 14576 2.92 0 14261 2.72 0
C 452375 90.68 27 478686 91.51 28
Total 498884 100.00 27 523111 100.00 29
Note. A: “biased” response data; B: “unproductive” response data; C: “clean” response data.
Upon examining the results, three observations can be made: (a) in general, the quality of
collected data is quite low (about 10% of the examined response patterns was categorized as bi-
ased/problematic data); (b) as expected, the analyses revealed the year 2009 to be the most se-
verely affected by distortions in the data (almost one student out of three, 31.3%, reported bi-
ased/problematic response data); (c) with the exception of the data for the year 2009, a compari-
son between the years on collected data revealed a positive trend, showing a significant increase
in the overall quality of the data over the years (reliable data was about 94% of the total for the
year 2011, while only 90% for the year 2008).
Psychometric Properties
Item and Student Performance Measures
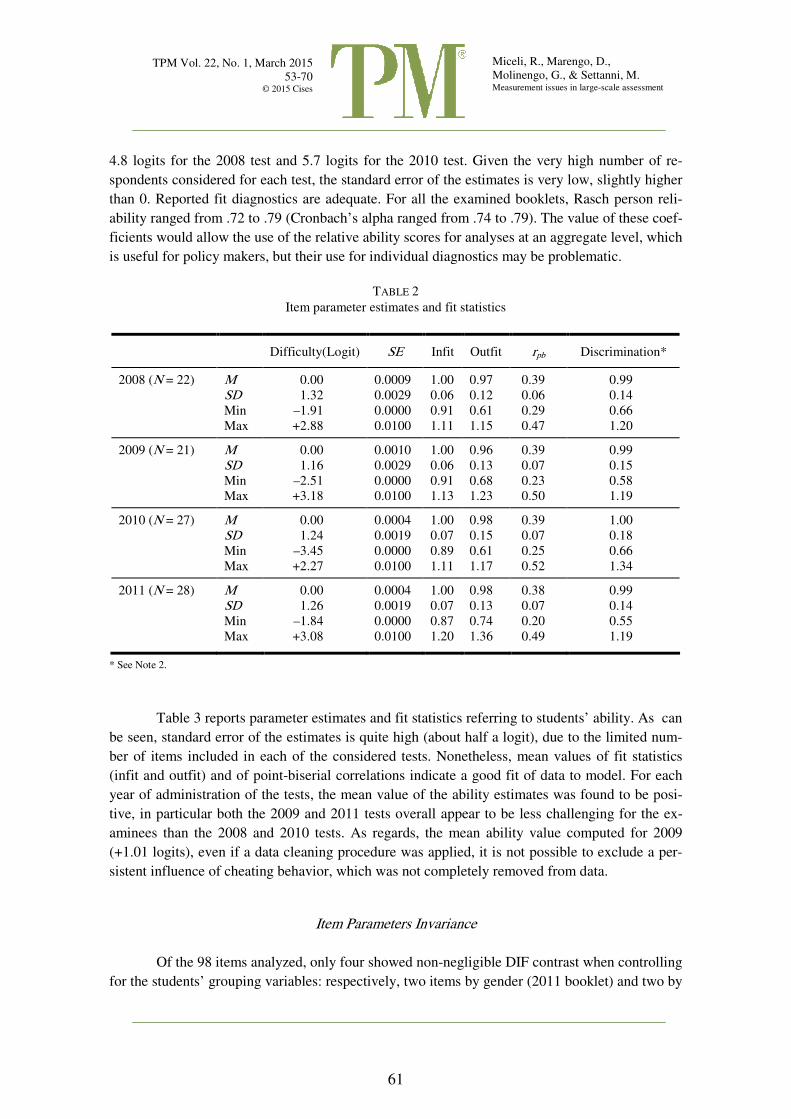
Table 2 shows item difficulty parameter estimates (logits)3 and the main item fit diagnos-
tics for all the studied tests. The range of the estimates is quite wide and is comprised between
TPM Vol. 22, No. 1, March 2015
53-70
© 2015 Cises
Miceli, R., Marengo, D.,
Molinengo, G., & Settanni, M. Measurement issues in large-scale assessment
61
4.8 logits for the 2008 test and 5.7 logits for the 2010 test. Given the very high number of re-
spondents considered for each test, the standard error of the estimates is very low, slightly higher
than 0. Reported fit diagnostics are adequate. For all the examined booklets, Rasch person reli-
ability ranged from .72 to .79 (Cronbach’s alpha ranged from .74 to .79). The value of these coef-
ficients would allow the use of the relative ability scores for analyses at an aggregate level, which
is useful for policy makers, but their use for individual diagnostics may be problematic.
TABLE 2
Item parameter estimates and fit statistics
Difficulty(Logit) SE Infit Outfit rpb Discrimination*
2008 (N = 22) M 0.00 0.0009 1.00 0.97 0.39 0.99
SD 1.32 0.0029 0.06 0.12 0.06 0.14
Min –1.91 0.0000 0.91 0.61 0.29 0.66
Max +2.88 0.0100 1.11 1.15 0.47 1.20
2009 (N = 21) M 0.00 0.0010 1.00 0.96 0.39 0.99
SD 1.16 0.0029 0.06 0.13 0.07 0.15
Min –2.51 0.0000 0.91 0.68 0.23 0.58
Max +3.18 0.0100 1.13 1.23 0.50 1.19
2010 (N = 27) M 0.00 0.0004 1.00 0.98 0.39 1.00
SD 1.24 0.0019 0.07 0.15 0.07 0.18
Min –3.45 0.0000 0.89 0.61 0.25 0.66
Max +2.27 0.0100 1.11 1.17 0.52 1.34
2011 (N = 28) M 0.00 0.0004 1.00 0.98 0.38 0.99
SD 1.26 0.0019 0.07 0.13 0.07 0.14
Min –1.84 0.0000 0.87 0.74 0.20 0.55
Max +3.08 0.0100 1.20 1.36 0.49 1.19
* See Note 2.
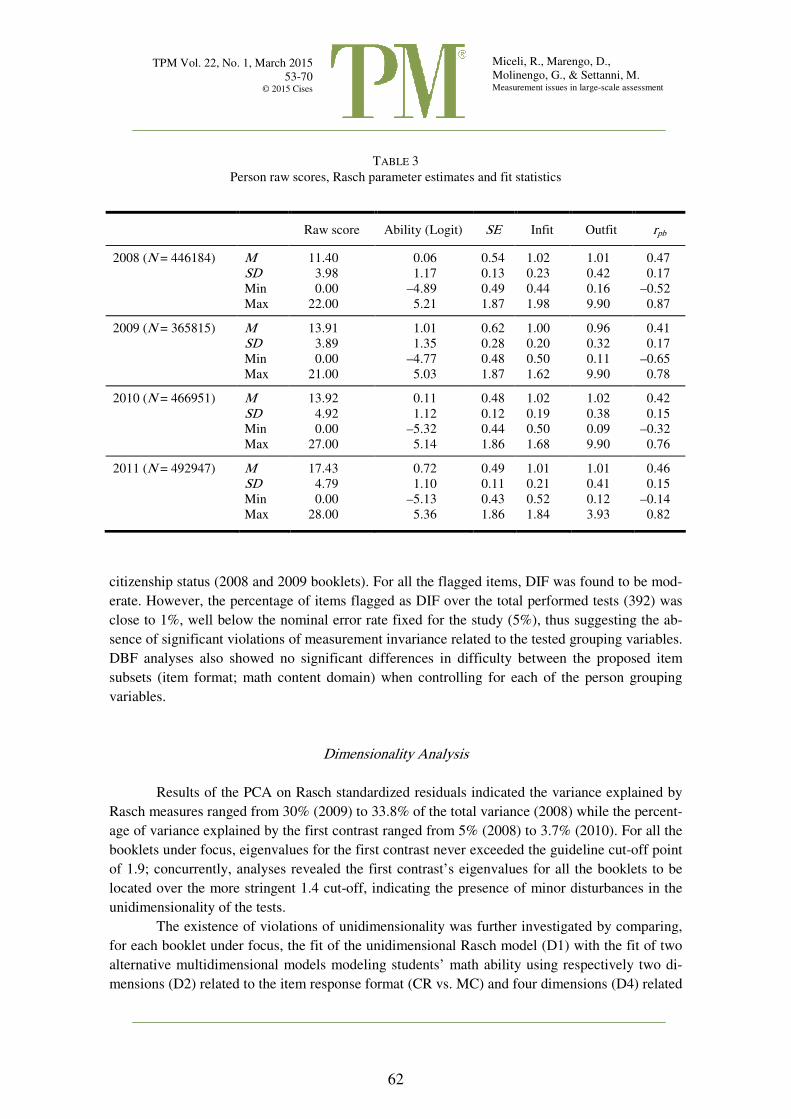
Table 3 reports parameter estimates and fit statistics referring to students’ ability. As can
be seen, standard error of the estimates is quite high (about half a logit), due to the limited num-
ber of items included in each of the considered tests. Nonetheless, mean values of fit statistics
(infit and outfit) and of point-biserial correlations indicate a good fit of data to model. For each
year of administration of the tests, the mean value of the ability estimates was found to be posi-
tive, in particular both the 2009 and 2011 tests overall appear to be less challenging for the ex-
aminees than the 2008 and 2010 tests. As regards, the mean ability value computed for 2009
(+1.01 logits), even if a data cleaning procedure was applied, it is not possible to exclude a per-
sistent influence of cheating behavior, which was not completely removed from data.
Item Parameters Invariance
Of the 98 items analyzed, only four showed non-negligible DIF contrast when controlling
for the students’ grouping variables: respectively, two items by gender (2011 booklet) and two by
TPM Vol. 22, No. 1, March 2015
53-70
© 2015 Cises
Miceli, R., Marengo, D.,
Molinengo, G., & Settanni, M. Measurement issues in large-scale assessment
62
TABLE 3
Person raw scores, Rasch parameter estimates and fit statistics
citizenship status (2008 and 2009 booklets). For all the flagged items, DIF was found to be mod-
erate. However, the percentage of items flagged as DIF over the total performed tests (392) was
close to 1%, well below the nominal error rate fixed for the study (5%), thus suggesting the ab-
sence of significant violations of measurement invariance related to the tested grouping variables.
DBF analyses also showed no significant differences in difficulty between the proposed item
subsets (item format; math content domain) when controlling for each of the person grouping
variables.
Dimensionality Analysis
Results of the PCA on Rasch standardized residuals indicated the variance explained by
Rasch measures ranged from 30% (2009) to 33.8% of the total variance (2008) while the percent-
age of variance explained by the first contrast ranged from 5% (2008) to 3.7% (2010). For all the
booklets under focus, eigenvalues for the first contrast never exceeded the guideline cut-off point
of 1.9; concurrently, analyses revealed the first contrast’s eigenvalues for all the booklets to be
located over the more stringent 1.4 cut-off, indicating the presence of minor disturbances in the
unidimensionality of the tests.
The existence of violations of unidimensionality was further investigated by comparing,
for each booklet under focus, the fit of the unidimensional Rasch model (D1) with the fit of two
alternative multidimensional models modeling students’ math ability using respectively two di-
mensions (D2) related to the item response format (CR vs. MC) and four dimensions (D4) related
Raw score Ability (Logit) SE Infit Outfit rpb
2008 (N = 446184) M 11.40 0.06 0.54 1.02 1.01 0.47
SD 3.98 1.17 0.13 0.23 0.42 0.17
Min 0.00 –4.89 0.49 0.44 0.16 –0.52
Max 22.00 5.21 1.87 1.98 9.90 0.87
2009 (N = 365815) M 13.91 1.01 0.62 1.00 0.96 0.41
SD 3.89 1.35 0.28 0.20 0.32 0.17
Min 0.00 –4.77 0.48 0.50 0.11 –0.65
Max 21.00 5.03 1.87 1.62 9.90 0.78
2010 (N = 466951) M 13.92 0.11 0.48 1.02 1.02 0.42
SD 4.92 1.12 0.12 0.19 0.38 0.15
Min 0.00 –5.32 0.44 0.50 0.09 –0.32
Max 27.00 5.14 1.86 1.68 9.90 0.76
2011 (N = 492947) M 17.43 0.72 0.49 1.01 1.01 0.46
SD 4.79 1.10 0.11 0.21 0.41 0.15
Min 0.00 –5.13 0.43 0.52 0.12 –0.14
Max 28.00 5.36 1.86 1.84 3.93 0.82

TPM Vol. 22, No. 1, March 2015
53-70
© 2015 Cises
Miceli, R., Marengo, D.,
Molinengo, G., & Settanni, M. Measurement issues in large-scale assessment
63
to the items’ math content domains. For each of the four booklets analyzed, the fit statistics for
the three models are reported in Tables 4a and 4b.
TABLE 4A
Model fit statistics for the D1, D2, and D4 models: years 2008-2009
(*) LR Test p-value = Likelihood Ratio Test p-value.
TABLE 4B
Model fit statistics for the D1, D2, and D4 models: years 2010-2011
(*) LR Test p-value = Likelihood Ratio Test p-value.
For all the booklets, the significance of the LR ratio tests supports the rejection of the
null hypothesis of equality of the fit of the unidimensional model (D1) and respectively the D2
and D4 multidimensional model, the former providing the worst fit to the data in all the testing
conditions. By comparing the –2log-likelihood statistics for the three models, however, the con-
trast between the D1 and both the D2 and D4 models was revealed to be generally quite low, the
largest contrast being respectively 551.3 when comparing the D1-D2 models (2008 booklet), and
229.0 when comparing the D1-D4 models (2011 booklet). Moreover, an analysis of the BIC sta-
tistics for the three models indicates the D4 model as the one providing the poorest fit to the data
for two out of four of the booklets examined (years 2008 and 2010). As regards specifically the
2011 booklet, analyses performed by including the previously removed item yielded comparable
results. The correlations between the latent traits modelled with the multidimensional models
(D2, D4) were also examined: in general, the correlations’ values were > + .80; only two excep-
tions to this rule emerged, concerning respectively the D2 and D4 models: the MC-CR correla-
2008 booklet 2009 booklet
Model D1 D2 D4 D1 D2 D4
–2*log-likelihood 72420.9 71869.6 72378.2 67575.8 67447.9 67460.9
Parameters 23 25 32 22 24 31
LR Test p-value (*) – < 1.00E-16 2.45E-06 – < 1.00E-16 < 1.00E-16
AIC 72466.9 71919.6 72442.2 67619.8 67495.9 67522.9
BIC 72605.0 72069.6 72634.4 67751.9 67640.0 67709.1
2010 booklet 2011 booklet
Model D1 D2 D4 D1 D2 D4
–2*log-likelihood 90560.8 90430.9 90512.9 88316.9 88100.4 88087.9
Model Parameters 28 30 37 29 31 38
LR Test p-value (*) – < 1.00E-16 2.67E-07 – < 1.00E-16 < 1.00E-16
AIC 90616.8 90490.9 90586.9 88374.4 88162.4 88163.9
BIC 90784.9 90671.1 90809.1 88549.0 88348.6 88392.1
TPM Vol. 22, No. 1, March 2015
53-70
© 2015 Cises
Miceli, R., Marengo, D.,
Molinengo, G., & Settanni, M. Measurement issues in large-scale assessment
64
tion for the 2008 booklet (rMC-CR = + .63); the DP-SF math domains correlation for the 2011
booklet (rDP-SF = + .75). The intercorrelations between the ability measures estimated with the
multidimensional models (D2, D4) were also generally strong, with some minor exceptions: con-
cerning the D2 model, the MC-CR estimates correlation for the 2008 booklet was as low as + .38;
concerning the D4 model, the correlation between the students’ ability estimates on the DP and
SF domains for the years 2009, 2010 and 2011 was respectively + 0.34, + 0.43, and + 0.32.
DISCUSSION
The main aim of the present study was to present problems emerging from a large-scale as-
sessment of achievement and to propose possible ways to deal with them in an IRT-framework. For
this purpose we employed the data from the Italian large-scale assessment program implemented by
INVALSI from 2008 to 2011. In particular we focused on the following issues: 1. measurement and
fit analysis of item and persons involved in the program; 2. item measurement invariance; 3. di-
mensionality.
As regards the first point, we conducted an in-depth analysis of item and person charac-
teristics, focusing on the data-model fit and reliability. In order to avoid biases, the most prob-
lematic response pattern were excluded from the analyses. The results show that all the items but
one employed in the tests present adequate fit to the measurement model and reliability. Even the
students generally showed good fit to the model, confirming the overall adequacy of the testing
procedure implemented by INVALSI. Nonetheless, we observed some relevant variations over
the years with respect to the relationship between test difficulty and average student ability.
These variations could be due to different factors whose relative impact is difficult to examine
(e.g., change in “true” student ability over the years, different administration procedure, different
relevance of the test ― the test passed from low- to high-stakes status), in particular for the lack
of a linking procedure design.
The low reliability of the person estimates is also worthy of note: given the relevancy of the
test, which is part of a high-stakes examination, a high discriminating power is required. Measures
with low reliability do not allow to accurately distinguish between different levels of math achieve-
ment at individual level. Hence, caution should be applied in interpreting differences among exami-
nees. A possible solution would be adding further items to the test and/or increasing the number of
items allowing partial-credit scoring. Though optimal in principle, the solution of adding items is
not easily compatible with test time limits.
Measurement invariance was analyzed for both single items and items bundled according
to item format and content domain. The results of these analyses indicate the absence of significant
differential functioning of the employed items and item bundles, when controlling for gender and
citizenship status. These results indicate that the measures obtained from the different subpopula-
tions are unbiased and comparable with each other. This is a not such an obvious point, given the
presence of relevant variations between some of the considered subpopulations: in particular, the
lack of differential item functioning linked to gender, which is frequently reported in literature,
represents a further indication of the suitability of the tests to the general population.
With respect to the dimensionality, several analyses were conducted to test the unidimen-
sionality of the measured construct. From a purely statistical point of view, the results of the
TPM Vol. 22, No. 1, March 2015
53-70
© 2015 Cises
Miceli, R., Marengo, D.,
Molinengo, G., & Settanni, M. Measurement issues in large-scale assessment
65
analyses indicate that by modelling the students’ ability in a multidimensional framework a sig-
nificant but moderate increase in fit over the unidimensional model can be obtained for all the
booklets examined. However, the high correlations observed between the multiple ability dimen-
sions of the multidimensional models indicate the latent structure of the booklets to be compati-
ble with a unidimensional measurement approach. From a practical standpoint, thus, while show-
ing relatively poorer performance on the data, the unidimensional model can be considered an
adequate and generally preferable choice for the analysis of response data from these booklets.
As a whole, findings on the INVALSI booklets are congruent with those observed concerning
other similarly structured achievement tests (Brandt, 2008; Li, Jiao, & Lissitz, 2012).
Nonetheless, some minor threats to the unidimensionality of the booklets emerged from the
dimensionality analyses. Specifically, the results indicate particular attention should be dedicated in
the construction of the tests concerning the inclusion of both MC and CR items in the same book-
lets. In this study, CR items were found on average to be more difficult than MC items; some au-
thors suggest that a potential source of multidimensionality for mixed-format tests is related to the
fact that CR and MC items are often designed to tap different levels of cognitive ability, an element
which may introduce a problematic interaction between ability and item format in the measurement
process (Wang, 2002). Another specific difference between MC and CR items which may produce
multidimensionality in mixed-format tests relates to the fact that MC items allow for the use of
guessing strategies, while CR items do not (Ercikan et al., 1998). By employing the Rasch model
instead of a more complex IRT model (i.e., the three-parameter logistic model; Birnbaum, 1968),
this characteristic was not taken into account in the analyses; as a result, the increase in fit observed
using the two-dimensional model could be partially related to this decision.
In this work, we analyzed different standardized tests administered in consecutive years. It
would be very useful for both scholars and policymakers to analyze the math proficiency trends.
Unfortunately, the lack of implementation by INVALSI of an appropriate design (e.g., a common-
item approach) in the construction of tests makes it impossible to perform a straightforward proce-
dure to link the tests; due to this issue, relevant information concerning the relative difficulty of the
tests across years is missing, ultimately compromising the use of results to monitor change in
school performances over the years.
STRENGTHS AND LIMITATIONS
This study presents a set of operational solutions to face some of the difficulties emerging
from a national-level assessment program. More specifically, we have developed a multi-stage
evaluation protocol which can be employed to assess the quality of standardized tests adminis-
tered under suboptimal conditions. By employing a combination of exploratory and confirmatory
analytic approaches, the protocol allows for an in-depth evaluation of the psychometric properties
of the examined tests and the impact on the measurement process of multiple potential sources of
test bias commonly found in standardized achievement tests. As a preliminary step, the protocol
also includes a composite data cleaning procedure aimed at detecting a wide range of problematic
response behaviors, making it especially useful for the analysis of test data coming from high-
stakes examinations. As an added value, in this study analyses were performed on population-
level data collected in the context of the INVALSI program, thus validating a large amount of
data only scarcely investigated by researchers due to its well-known issues. Having analyzed in a
TPM Vol. 22, No. 1, March 2015
53-70
© 2015 Cises
Miceli, R., Marengo, D.,
Molinengo, G., & Settanni, M. Measurement issues in large-scale assessment
66
homogenous way data from four years and having assessed the validity of these tests, this study
also represents a preliminary step toward the construction of an item-bank useful for the devel-
opment of computer adaptive tests (Miceli & Molinengo, 2005).
The present study nonetheless suffers from some limitations. One specific issue concerns
the lack of implementation of an inferential method for the detection of cheating behaviors, which
is mainly related to the absence of detailed data on students’ prior academic achievement. Another
issue is related to the lack of in-depth analyses examining the rating structure of the polytomous
items included in the booklets, that is, by using the Partial Credit model (Masters, 1982), and item
bundles, that is, by using the Rasch Testlet model (Wang & Wilson, 2005). These latter aspects,
along with the implementation of a tentative linking procedure for the tests, are currently under fo-
cus in specific investigations whose results will be presented in future individual publications.
NOTES
1. Unless otherwise specified, Rasch analyses were performed using Winsteps (Linacre, 2009b) and all
other analyses were performed using SAS 9.2 (SAS Institute, Cary NC). 2. For item parameters, a discrimination index is reported by the Winsteps software as part of the output
generated after the estimation of the Rasch model in its basic form; it is computed as an estimate of the discrimination parameter as would be obtained by implementing the 2-PL model (Birnbaum, 1968) on the data. It should not be interpreted as a parameter of the model.
3. The employed software (Winsteps) constraints the mean of the item difficulties to 0. 4. (see Appendix). For a categorical distribution with K possible classes, the Gini heterogeneity coeffi-
cient is defined as
∑1
2-1 GK
k
kf=
=
where fk represents the relative frequency of the kth class; the Gini coefficient ranges from 0 (lowest het-
erogeneity) to (K-1)/K (highest heterogeneity). For each classroom, the average of the Gini coefficients as obtained on polytomous response data for all the items in the tests was computed. As a result, a rough estimate of the degree of classroom-level similarity of students’ responses to the each examined test was obtained.
ACKNOWLEDGMENTS
The present work is dedicated to the memory of Professor Silvia Ciairano. Her sudden and premature death
has deprived us all of a generous and greatly valued colleague who relentlessly contributed to the realiza-
tion of many research projects, even though often far from her specific research area, as in the case of this
specific study. The authors would also like to thank the Italian National Institute for the Evaluation of the
Education System (INVALSI), and in particular Dr. Roberto Ricci and Dr. Patrizia Falzetti, for their effec-
tive support.
REFERENCES
Abedi, J. (1997). Dimensionality of NAEP subscale scores in mathematics (CSE Technical Report No. 428). Los Angeles, CA: CRESST/University of California.
Adams, R. J., Wilson, M. R., & Wang, W. (1997). The multidimensional random coefficients multinomial logit model. Applied Psychological Measurement, 21, 1-23. doi:10.1177/0146621697211001
Adams, R. J., & Le, L. (2009). Effects of student reading proficiency on PISA mathematics items – A DIF study across Countries. Paper presented at the PISA Research Conference 2009, Kiel, Germany.

TPM Vol. 22, No. 1, March 2015
53-70
© 2015 Cises
Miceli, R., Marengo, D.,
Molinengo, G., & Settanni, M. Measurement issues in large-scale assessment
67
Adams, R. J., Wu, M. L., Haldane, S., & Sun, X. X. (2012). Conquest 3.0: Generalised item response mod-elling software [Computer Software]. Camberwell, AU: Australian Council for Educational Rese-arch.
Akaike, H. (1974). A new look at the statistical model identification. IEEE Transactions on Automatic Control, 19, 716-723. doi:10.1109/TAC.1974.1100705
AERA (American Educational Research Association), APA (American Psychological Association), & NCME (National Council on Measurement in Education) (1999). Standards for educational and psychological testing. Washington, DC: AERA.
Andrich, D. (1978). A rating formulation for ordered response categories. Psychometrika, 43, 561-573. doi:10.1007/BF02293814
Arthur, N., & Everaert, P. (2012). Gender and performance in accounting examinations: Exploring the impact of examination format. Accounting Education, 21, 471-487. doi:10.1080/09639284.2011.650447
Ben‐Shakhar, G., & Sinai, Y. (1991). Gender differences in multiple‐choice tests: The role of differential guessing tendencies. Journal of Educational Measurement, 28, 23-35. doi:10.1111/j.1745-3984. 1991.tb00341.x
Birnbaum, A. (1968). Some latent trait models and their uses in inferring an examinee’s ability. In F. M. Lord & M. R. Novick (Eds.), Statistical theories of mental test scores (pp. 397-478). Reading, MA: Addison-Wesley.
Bond, T. G., & Fox, C. M. (2007). Applying the Rasch model: Fundamental measurement in the human sciences (2nd ed.). Mahwah, NJ: Erlbaum. doi:10.4324/9781410614575
Briggs, D. C., & Wilson, M. (2003). An introduction to multidimensional measurement using Rasch mod-els. Journal of Applied Measurement, 4, 87-100.
Brandt, S. (2008). Estimation of a Rasch model including subdimensions. IERI Monograph Series, 1, 51-69.
De Lange, J. (2007). Large-scale assessment and mathematics education. In F. K. Lester, Jr. (Ed.), Second handbook of research on mathematics teaching and learning: A project of the National Council of Teachers of Mathematics (pp. 1111-1142). Charlotte, NC: Information Age.
DeMars, C. E. (2000). Test stakes and item format interactions. Applied Measurement in Education, 13, 55-77. doi:10.1207/s15324818ame1301_3
Dorans, N. J. (2004). Using subpopulation invariance to assess test score equity. Journal of Educational Measurement, 41, 43-68. doi:10.1111/j.1745-3984.2004.tb01158.x
Ekmekci, A. (2013). Mathematical literacy assessment design: A dimensionality analysis of Programme for In-ternational Student Assessment (PISA) mathematics framework (Doctoral dissertation). University of Texas at Austin, Austin, TX. Retrieved from http://repositories.lib.utexas.edu/bitstream/handle/ 2152/21338/EKMEKCI-DISSERTATION-2013.pdf?sequence=1
Ercikan, K., Sehwarz, R. D., Julian, M. W., Burket, G. R., Weber, M. M., & Link, V. (1998). Calibration and scoring of tests with multiple-choice and constructed-response item types. Journal of Educa-tional Measurement, 35, 137-154. doi:10.1111/j.1745-3984.1998.tb00531.x
Gallagher, A. M., De Lisi, R., Holst, P. C., McGillicuddy-De Lisi, A. V., Morely, M., & Cahalan, C. (2000). Gender differences in advanced mathematical problem solving. Journal of Experimental Child Psy-chology, 75, 165-190. doi:10.1006/jecp.1999.2532
Garner, M., & Engelhard, J. G. (1999). Gender differences in performance on multiple-choice and con-structed response mathematics items. Applied Measurement in Education, 12, 29-51. doi:10.1207/ s15324818ame1201_3
Gini, C. (1955). Variabilità e mutabilità [Variability and mutability]. In E. Pizetti & T. Salvemini (Eds.), Memorie di metodologia statistica. Roma, Italy: Libreria Eredi Virgilio Veschi. (Reprinted from Va-riabilità e mutabilità. Contributo allo studio delle distribuzioni e delle relazioni statistiche, by C. Gi-ni, 1912, Bologna, Italy: C. Cuppini).
Goldstein, H. (1995). Interpreting international comparisons of student achievement. Paris, France: UNESCO. Goldstein, H. (2004). International comparisons of student attainment: Some issues arising from the PISA
study. Assessment in Education, 11, 319-330. doi:10.1080/0969594042000304618 Haladyna, T. M., & Rodriguez, M. C. (2013). Developing and validating test items. London, UK: Routle-
dge. doi:10.4324/9780203850381 Hambleton, R. K., & Swaminathan, H. (1985). Item response theory: Principles and applications. Boston,
MA: Kluwer. doi:10.1007/978-94-017-1988-9 Heubert, J. P. & Hauser, R. M. (1999). High stakes: Testing for tracking, promotion, and graduation. A re-
port of the National Research Council. Washington, DC: National Academy Press. Innabi, H., & Dodeen, H. (2006). Content analysis of gender‐related differential item functioning TIMSS
items in mathematics in Jordan. School Science and Mathematics, 106, 328-337. doi:10.1111/j. 1949-8594.2006.tb17753.x
INVALSI (National Institute for the Evaluation of the Education System). (2008). La prova nazionale al termine del primo ciclo. Aspetti operativi e prime valutazioni sugli apprendimenti degli studenti [The national examination at the end of lower secondary education. Operational aspects and pre-
TPM Vol. 22, No. 1, March 2015
53-70
© 2015 Cises
Miceli, R., Marengo, D.,
Molinengo, G., & Settanni, M. Measurement issues in large-scale assessment
68
liminary analysis of students’ learning achievement]. Retrieved from http://www.invalsi.it/Esami DiStato/documenti/Rapporto_master_31_10_2008_finale.pdf
INVALSI (National Institute for the Evaluation of the Education System). (2009). Prova nazionale 2009. Prime analisi [The national examination 2009. Preliminary analyses]. Retrieved from: http://www. invalsi.it/areadati/Esami_Stato/2008-2009/Rapporto_PN_ver_11.5.pdf
INVALSI (National Institute for the Evaluation of the Education System). (2010). Prova nazionale 2010. Prime analisi. [The national examination 2010. Preliminary analyses]. Retrieved from: http://www. invalsi.it/areadati/Esami_Stato/2009-2010/Rapporto_Prova_nazionale_2009_2010.pdf
INVALSI (National Institute for the Evaluation of the Education System). (2011). La rilevazione degli ap-prendimenti A.S. 2010/2011 [The national examination of students’ learning achievement, school year 2010/2011]. Retrieved from: http://www.invalsi.it/esamidistato1011/documenti/Rapporto_SNV %202010-11_e_Prova_nazionale_2011.pdf
ISTAT (Italian National Institute of Statistics). (2012). Rapporto annuale 2012: La situazione del Paese [Annual report 2012: The state of the country]. Retrieved from: http://www.istat.it/it/files/2012/05/ Rapporto-annuale-2012.pdf
Jacob, B. A., & Levitt, S. D. (2003). Rotten apples: An investigation of the prevalence and predictors of teacher cheating. The Quarterly Journal of Economics, 118, 843-877. doi:10.1162/00335530360698441
Kane, T. J., & Staiger, D. O. (2002). The promise and pitfalls of using imprecise school accountability measures. Journal of Economic Perspectives, 16, 91-114. doi:10.1257/089533002320950993
Klieme, E., & Baumert, J. (2001). Identifying national cultures of mathematics education: Analysis of cog-nitive demands and differential item functioning in TIMSS. European Journal of Psychology of Education, 15, 385-402. doi:10.1007/BF03173189
Kline, R. B. (2005). Principles and practices of structural equation modeling (2nd ed.). New York, NY: Guilford Press.
Kreiner, S. (2011). Is the foundation under PISA solid? A critical look at the scaling model underlying in-ternational comparisons of student attainment (Research Report No. 11). University of Copenhagen, Denmark, Department of Biostatistics. Retrieved from https://ifsv.sund.ku.dk/biostat/biostat_ annu-alreport/images/c/ca/ResearchReport-2011-1.pdf
Li, Y., Jiao, H., & Lissitz, R.W. (2012). Applying multidimensional IRT models in validating test dimen-sionality: An example of K-12 large-scale science assessment. Journal of Applied Testing Techno-logy, 13, 1-27.
Linacre, J. M. (2009a). A user’s guide to WINSTEPS-MINISTEP: Rasch-model computer programs. Chi-cago, IL: Winsteps.com.
Linacre, J. M. (2009b). WINSTEPS (Version 3.69.1.10 ) [Computer Software]. Chicago, IL: Winsteps.com. Liu, O. L., & Wilson, M. (2009). Gender differences and similarities in PISA 2003 mathematics: A com-
parison between the United States and Hong Kong. International Journal of Testing, 9, 20-40. doi:10.1080/15305050902733547
Martiniello, M. (2009). Linguistic complexity, schematic representations, and differential item functioning for English language learners in math tests. Educational Assessment, 14, 160-179. doi:10.1080/ 10627190903422906
Masters, G. N. (1982). A Rasch model for partial credit scoring. Psychometrika, 47, 149-174. doi:10. 1007/BF02296272
Miceli, R., & Molinengo, G. (2005). Somministrazione di test computerizzati di tipo adattivo. Un’applicazione del modello di misurazione di Rasch [Administration of computerized and adaptive tests: An appilica-tion of the Rasch model]. TPM – Testing Psicometria Metodologia, 12, 131-149.
Messick, S. (1995). Validity of psychological assessment: Validation of inferences from persons’ responses and performances as scientific inquiry into score meaning. American Psychologist, 50, 741. doi:10. 1037/0003-066X.50.9.741
Morice, E. (1971). Dizionario di statistica [Dictionary of statistics]. Milano, Italy: ISEDI. Nagy, P. (2000). The three roles of assessment: Gatekeeping, accountability, and instructional diagnosis.
Canadian Journal of Education, 25, 262-279. doi:10.2307/1585850 NCES (National Center for Education Statistics). (2012). Digest of education statistics 2011 (NCES Publica-
tion No. 2012001). Retrieved from: http://nces.ed.gov/pubsearch/pubsinfo.asp?pubid=2012001 OECD (Organisation for Economic Co-operation and Development). (2012). Education at a Glance 2012:
OECD indicators. Paris, France: Author. Retrieved from http://www.oecd.org/edu/eag2012.htm Oshima, T. C. (1994). The effect of speededness on parameter estimation in item response theory. Journal
of Educational Measurement, 31, 200-219. doi:10.1111/j.1745-3984.1994.tb00443.x Paris, S. G., Lawton, T. A., Turner, J. C., & Roth, J. L. (1991). A developmental perspective on standardized
achievement testing. Educational Researcher, 20, 12-20. doi:10.3102/0013189X020005012 Raiche, G., (2005). Critical eigenvalue sizes in standardized residual principal components analysis. Rasch
Measurement Transactions, 19, 1012. Rasch, G. (1960/1980). Probabilistic models for some intelligence and attainment tests. Chicago, IL: Uni-
versity of Chicago Press.
TPM Vol. 22, No. 1, March 2015
53-70
© 2015 Cises
Miceli, R., Marengo, D.,
Molinengo, G., & Settanni, M. Measurement issues in large-scale assessment
69
Reckase, M. D. (1979). Unifactor latent trait models applied to multifactor tests: Results and implications. Journal of Educational and Behavioral Statistics, 4, 207-230. doi:10.3102/10769986004003207
Schwarz, G. E. (1978). Estimating the dimension of a model. Annals of Statistics, 6, 461-464. doi:10.1214/ aos/1176344136
Shepard, L. A. (2003). Reconsidering large-scale assessment to heighten its relevance to learning. In J. M. Atkin & J. E. Coffey (Eds.), Everyday assessment in the science classroom (pp. 121-146). Arling-ton, VA: National Science Teachers Association.
Smith, R. M., & Miao, C. Y. (1994). Assessing unidimensionality for Rasch measurement. In M. Wilson (Ed.), Objective measurement: Theory into practice (Vol. 2, pp. 316-327). Greenwich, CT: Ablex.
Sykes, R. C., Hou, L-L., Hanson, B., & Wang, Z. (2002, April). Multidimensionality and the equating of a mixed-format math examination. Paper presented at the annual meeting of the National Council on Measurement in Education, New Orleans, LA.
Van der Linden, W. J., & Sotaridona, L. S.(2006). Detecting answer copying when the regular response process follows a known response model. Journal of Educational and Behavioral Statistics, 31, 283-304. doi:10.3102/10769986031003283
Verhelst, N. D. (2012). Profile analysis: A closer look at the PISA 2000 reading data. Scandinavian Journal of Educational Research, 56, 315-332. doi:10.1080/00313831.2011.583937
Wainer, H., & Kiely, G. L. (1987). Item clusters and computerized adaptive testing: A case for testlets. Journal of Educational Measurement, 24, 185-201. doi:10.1111/j.1745-3984.1987.tb00274.x
Wainer, H., Wang, X-B., & Thissen, D. (1994). How well can we compare scores on test forms that are constructed by examinees’ choice? Journal of Educational Measurement, 31, 183-199. doi:10.1111/ j.1745-3984.1994.tb00442.x
Walker, C. M., & Beretvas, S. N. (2003). Comparing multidimensional and unidimensional proficiency classifications: Multidimensional IRT as a diagnostic aid. Journal of Educational Measurement, 40, 255-275. doi:10.1111/j.1745-3984.2003.tb01107.x
Walstad, W., & Robinson, D. (1997) Differential item functioning and male-female differences on multiple choice tests in economics. Journal of Economic Education, 28, 155-171. doi:10.1080/0022048970 9595917
Wang, W. C., & Wilson, M. (2005). The Rasch Testlet Model. Applied Psychological Measurement, 29, 126-149. doi:10.1177/0146621604271053
Wang, Z. (2002). Comparison of different item types in terms of latent trait in mathematics assessment (Doctoral dissertation). Retrieved from http://hdl.handle.net/2429/12796
Wendt, H., Bos, W., & Goy, M. (2011). On applications of Rasch models in international comparative large-scale assessments: A historical review. Educational Research and Evaluation, 17, 419-446. doi:10.1080/13803611.2011.634582
Wollack, J. A. (2004). Detecting answer copying on high stakes tests. The Bar Examiner, 73, 35-45. Zwick, R., & Ercikan, K. (1989). Analysis of differential item functioning in the NAEP history assessment.
Journal of Educational Measurement, 26, 55-66. doi:10.1111/j.1745-3984.1989.tb00318.x Zwick, R., Thayer, D. T., Lewis, C. (1999). An empirical bayes approach to Mantel-Haenszel DIF analysis.
Journal of Educational Measurement, 36, 1-28. doi:10.1111/j.1745-3984.1999.tb00543.x
TPM Vol. 22, No. 1, March 2015
53-70
© 2015 Cises
Miceli, R., Marengo, D.,
Molinengo, G., & Settanni, M. Measurement issues in large-scale assessment
70
APPENDIX
Data Cleaning Procedure
By referencing the classification presented in section titled “Data cleaning,” in the pre-
sent section are reported in detail the specific procedures and criteria employed to perform the
preliminary analyses on response data and the subsequent data cleaning process.
Preliminary analyses were conducted in two phases. Firstly, the datasets were inspected
to identify and categorize potentially problematic data according to the following criteria.
A. Biased data having a degrading effect on subsequent analyses:
• observations from the same classroom sharing an identical polytomous response pat-
tern;
• observations from the same classroom sharing an identical dichotomous response pat-
tern, only if the classroom reported a value of the Gini indicator (Gini, 1912/1955; Morice, 1971)
below the national-level average;4
• observations for which the score on the five most difficult items was found to be
higher than the score on the five easiest items.
B. Problematic or unproductive data not expected to have a degrading effect on analyses:
• observations characterized by a large amount of missing data (Valid responses < 5);
• observations characterized by 0 or full score patterns.
Early inspection of the distribution of the Gini indicator analyses revealed data from year
2009 to be the especially problematic. In order to deal with this issue, for the year 2009 only, re-
sponse data from classrooms reporting values < .25 on the Gini indicator was categorized as se-
verely biased (Category A).
As a result of the first step of the preliminary analyses, all response patterns classified in
the A and B categories were removed from the datasets.
The second step of the analyses involved several iterative estimations of the Rasch model
on the remaining dichotomous response data. After each step of the iterative process, misfitting
persons and items were selected and removed from the datasets in keeping with increasingly
stringent criteria of quality. The cleaning process was stopped when the remaining data was
found to be congruent with the following criteria (see also note 2):
• person statistics: mean square infit ≤ 2; mean square outfit ≤ 2; point-biserial correla-
tion > 0.1;
• item statistics: 0.5 ≤ mean square infit ≤ 1.5; 0.5 ≤ mean square outfit ≤ 1.5; point-
biserial correlation > 0.2; 0.5 ≤ discrimination (see note 2) ≤ 1.5.
Misfitting items which failed to meet the criteria reported above were considered as “bi-
ased” data (category A). Response patterns showing an infit value > 2.0 were considered as “bi-
ased” data (category A); all the remaining response patterns were considered as “problematic/
unproductive” data (category B) when meeting the following criteria: mean square outfit < 2.5;
point-biserial correlation > 0.