ANNUAL REP(IRT 1985
120
EUROPEAN COMMUNITIES (IBSEBUATI(Il{ (lF TRAI{SP(lRT MARKETS t$ffiffi$,Ffiv ANNUAL REP(IRT 1985 Published by the Directorate-General for Transport Commission of the European Communities - 200, rue de la Loi, 1049 Brussels Supplement to the "SCAD BULLETIN" - D/TRANS/EN I
-
Upload
khangminh22 -
Category
Documents
-
view
4 -
download
0
Transcript of ANNUAL REP(IRT 1985

EUROPEAN COMMUNITIES
(IBSEBUATI(Il{ (lF TRAI{SP(lRT MARKETS
t$ffiffi$,Ffiv
ANNUAL REP(IRT
1985
Published by the Directorate-General for TransportCommission of the European Communities - 200, rue de la Loi, 1049 Brussels
Supplement to the "SCAD BULLETIN" - D/TRANS/EN
I
Phil
Text Box
ANNUAL REPORT
1985
Manuscript finished in August 1986

Luxembourg: office for official Publications of the European comnrunities, 1gg6
tsBN 92-8:25-6535-1
Catalogue number: CB-46-86-953-EN-C
Reproduction authorized, in whole or in part, provlded the source is acknowledged.
Printed in Belgium

:::::Y:::3:=::=:::= 133:=1y:*=T:31:
The "Europa Transport" publications present a substantial part of thestatistical information on the international intra-Communitytransport of goods collected under the "Market Observation System".
Three reports are published :
- Analysis and Forecasts- Annual Report- Market DeveloPments.
The contents of the following "Annual Report 1985" are as follows 3
Chapter I : General Assessment and Prospects4U g no$ee.
C'hapter 2 : Bogd_
2.I. Intra EUR-10 international road activity in f9852.2, Detailed analysis of the intra EUR-10 international
road haulage market in 19842.3. Cross-trades, an analysis of the multilateral intra
EUR-lo international road haulage market in 1984 andI985
2.4. Traffic with Spain and Portugal (tonnages)2.5. TransPort InquirY SurveYs2.6. Cost indices2.7. Price indices.
Chapter 3 : Inland_ldaterways_
3.1 . and 3.2. :Inland Waterways transport activity ( 1985 )
3.3. Inland Waterways transport by commodity groups3.4. Inland Waterways transport by transport market3.5. Fleet develoPments3.6. Inland waterways transport by flag3.7 . TransPort inquirY survey3.8. Cost and Price indices.
Chapter 4 : Rail_
4.L and 4.2. !fntra EUR-10 international activity in 1985
4.3. SPain and Portugal4.4. RailwaY Tariff Indices
Chapter 5 : Combined TransPort
5.1. Container transPort ( 1985 )5.2. Piggy-back transPort (1985)
Chapter6:3ModesrnEra Eur-10 tonnages (fgga) by 24 commodities
ChapterT:3ModegrnTr6 Eun-lo tonnages international (r984)modal share bv relation


1.1
EHAPTNR 1
General market assessment and prospects - All modes
Volumes of International transport within the Comnunity
In 1985 total intra-Community transport went up by 1 - 1?. Thisouteome is a little disappointing after the strong growth(+6.4t) in the previous year, particularly taking into accountthe general economic situation being slightly better than inI9B4: GDP growth ar EUR-10 level went up from +2.2 to +2.3t.
The evolution by mode titas very different. International roadtraffic developed in line with the expectations: +4-9Ecompared to +4.7t in 1984. Rail and inland waterways, horvever,could not maintain the grovtth rates reeorded in the previousyear.
fn the case of rail the growth was only 2,4*, but this must beregarded as still fairly satisfying after the exceptionalstiong growth (+f5*) in 1984. Rail activity is closely linkedto the development of basie industries tike steel, coal andchemicals. The figures reflect that the strong recovery ofthese industries in 1984 has been followed by a less expansiveperiod.
The inlan<l waterway sector depends, just like rail, stronglyon the evolution in certain basic seetors of the economy.Nevertheless, the evolution of ttater traffic has been quitedifferent from rail, ruhich is mainly caused by the exeeptionalunfavourable weather conditions for this mode. The strongfrost in the first quarter of 1985 made navigation impossiblefor some time on a part of the network. Secondly, theextremely low water levels on the Rhine in the last quartercaused an additional loss of traffic. The final outcome ofthese effects is a decrease in international traffic by 3.2tcornpared to 1984.

YearMode
1980 1981 1982 1983 r984 1985(provisionerl )
RoadRailI.W.
168.178.6
190.5
169.77A.2
r83 .6
r7461
176
739
r80.560.4
182.5
18969
t9:l
OR5o
198.37r.2
185. B
TotaL 437.2 423.5 4L2.9 423.4 450.5R 455.3
Table 1.1
Table 1.1
Revised f i.gures.
Annual EUR-IO tonnaqe flows b'l mode of transDort(mlo tonnes,
Table I.2 Annual qrowth rates - EUR-IO l:onnage flows (?!).
Differential grow'th ratesotal growth rate )t
YearMode
reqo/7e 1981/80 reB2/8L ree3 / 82 1e84/83 reas /84(provisiorral )
RoadRailI.W.
+ 3.35.7
- 2.O
+ o.9lo"73.6
+ 2.9j.2.73.6
+ 3.31.4
+ 3.2
+ IT.7 Rr!t. o1.2
++
+ 4.9+ 2.4
3.2
TOTAI - 4.7 3.1 2.5 + 2.5 + 1;.4 R + 1.1
YearMode
r98C' /79 1e8r/80 LeB2/ Br t983/82 1984/83 L985/84(provisiorral )
RoadRailI.lf.
+ 4.O5.0l. .3
+ 4.O- 7.6- 0.5
+ 5.4-10. 2
1.1
+ 0.83.9
+ 0.7
- 1.7 R+ u.6 R
- :1.2 R
++
3.81.34.3

L.2 Modal splil
Table !.4, which gives the annual modal split development,shows the increasing market share of road - mostly at the ex-pense of rail in the period L979 till 1983. In this respect,1984 \^/as an exceptional year, but in 1985 the trend picked upagain - no$r at the expense of inland navigation. For the firsttime in history inland waterways lost its first position inthe competition between modes in EUR-10 internationaltraffic. Taking into account that inland rrtater\tays only existsin traffic between 5 of the 10 Member States (D, F, NL, B, L),it must be noted that this mode is still leading in the partof Europe where a v.raterway infrastructure is available ( seechapter 7).
Table 1.4 tvlodal split evolution (EUR-10)
Year Road t RaiI t r.w. t Total *
r9801981t9a219831984r985
(provis. )
38.440.142..342.642.O43.6
18. 616.6L4.914.315.415.6
43.643.342.843. r42.640.8
too100100100r00r00
1.3 Forecast for 1986 (eqn-rO international transpod
The trend in road traffic with ever increasing growth ratessince Lg82 (see table 1.2) is expected to continue. The growtttin rait traffic is expected to be the same as in 1985 whilefor inland waterways a recovery is foreseen after the drop inactivity of last year. Growth of total activity is expected tobe 5.2*', which is fairly close to the +6.4t registered in1984.
Mode Tonnage 1985(mio tonnes )
Forecastedgrowth rate (t)
Expectedvolumes 1986(mio tonnes)
RoadRailI.W.
r987L
185
32I
+ 7.I+ 2.5+ 4.L
2L2.473. O
193.4
Total 455.3 + 5.2 478.8


CHAPTER 2
ROAD
Contents
The contents of Chapter 2 can be summarized as follows :
$
$
2.L2.2
2.3
Intra EUR-IO international road activity in 1985Detailed analysis of the intra EUR-10 internationalroad haulage market in 1984eross-trades, dD analysis of the multilateral intraEUR-IO international road haulage market in 1984 and1985.Traffic with Spain and Portugal - tonnages.Transport Inquiry surveysCost Indices RoadPrice Indices Road.
$ 2.4 :$ 2.s :$ z.e 3
$ z.z :
2.L Intra EUR-10 international road activity in 1985
2.1.1 Introduction
International road transport between the Member Statescontinued to grow strongly in 1985 and the increase isprovisionally estimated to have been 4.9*. This increase isilmost identical to the previous year (+4.7*) and follows fromsimilar increases in industrial production (+3.2* in 1985against 2.72 in 1984). Road transport resumed its traditionalposition as being the mode with the highest growth rate.
The growth of traffic between the Member States was fairlyuniform and the usual higher growth for the peripheral MemberStates only occurred for outward Irish traffic; indeed bothinward and outward Greek traffic actually fell in 1985. Outwardtraffic from Germany continued to grow more strongly thaninward traffic but France, Netherlands and Denmark all hadfaster growth of inward traffic in 1985.
Annual data for 1985 at Coilununity level from the Road Directiveis only available several months after the completion of thisReport. However, pending an extension of the Directive tosupply simple quarterly data more quickly, comments on L985continue therefore to be based on national sources.
2.L.2 Analvsis by country of hauliers
German hauliers
German hauliers performance in 1985 continued to be reasonablysuccessful. Overall traffic to and from Germany rose by 5.4t(7.9t outwards, 2.9* inwards) and the German hauliers share ofthis traffic was more or less maintained (sfight drop in theoutward direction). Consequently German hauliers carryingsoverall were up 5.0t, almost exactly the Community average.
German outward traffic to all Member States grew by more than6? except for Greece (5t down) and UK (only 3t uP); the largestincrease wai to Denmark (up 138). The German share of outwardtraffic however fell slightly on all relations except Denmarkand UK; tonnage carried by German hauliers to Denmark rose over2L*.

German haulier:s share of inward traffic from F'rance and ltat.yfell so that tonnage carried was virtually unehanged despiter 2tand 3.5t inereases in total tonnage respectiv€rl.y. fn the casrgof inward traffic from Belgium and Netherlandsr, total tonnaEeincreased by 3.5E in each ease, and with an increasing Germanshare, tonnages carried by German hauliers rose about 58.
French hauliers
Accordingly to French Customs sourees traffic to and fromFranee gre\r more than the Community average (8.49 inwards, 5.28outwards ) . Ilowever ae the French share of this traf f ic fel I lclfalmost 1* (inwards) and by almost 2* (outwards), the growth oftonnage carried by Prench hauliers was less than the Communitl/average.
The growth of in'lrard traffic from Germany was up more that IIqiand on this relation French hauliers increased tonnage by 1413,however on the relation with Netherlands and B;elgium/Luxembourggrowth of tonnage ty Prench hauliers was 5-6E less than thegrowth of total tonnage.
For outward traffic the share of French hauliers fell on the,German, Dutch and Belgian/tletherlands relationLs and on theGerman relation tonnage carried by French haul.iers actuallyfell 2* despite a 4Z incrcase in total tonnager carried.
ftalian hauliers
Aceording to Italian foreign trade data, 1985 was a very badyear for ftalian hauliers. Whereas total inward and outwardtonnage increased by over 4*, tonnages carried by ltalianhauliers fetl (down 3t inwards, dorvn 9t or:twards). Consequen.,Lllythe ftalian share fell from 34t to 31.5* in thLe inwarddirection, ancl even faster from 48t t"o 42t in the outwarddirection. The fall in the outward direction is even moredramatic when one reealls that the ltalian share was 568 in1983,
For inward traffic, Italian hauliers inereased their tonnageand share the traffic with Germany and Denmark, but on theimprortant Frerrch relation, Italian hauliers share fell from :35tto 32\, Italian hauliers \dere particularly struck by the sha:rpfall in the Greek market.
For outward traffic, Italian hauliers sav/ their share reducedon all relations and only on the Dutch relation did Italianhauliers manaqe to increase their tonnage,
t0

Dutch hauliers
The data analysed here are from the Centraal Bureau voor deStatistiek (eeS) which cover both Dutch and other hauliers; theresults however have to be treated with some caution beeause ofthe high proportion of "nationality unknortn". Improved coveragehas also been given to the relation with Belgiun/Luxembourg in1985, but comparable L984 figures are not available.
Ignoring the Belgium/Luxembourg relation, Dutch hauliers had avery positive year in tonnage terms (not necessarily in profits(see Chapter X). Not only did total traffic increase by 9.2tinwards and 6.ft outwards, but the Dutch hauliers increasedtheir market share on all relations. The improved Dutch sharewas particularly noticeable on the relations with France (up 3tin eaeh direction) and with t-lK (up 3t inwards, up 6E outwards);indeed on the IJK relation there has been a steady andsubstantial increase in the Dutch share since L982.
According to the Bel.gian/Luxembourg sources, there was a 17tdrop in total tonnage from the Netherlands (a figure to betreated with some reserve) and a lot inerease in total tonnageto the Netherlands. In 1985, the Dutch had 76* of the outwardtraffic and 65t of the inward traffie according to Dutchsources, comparable figures for 1984 are not available.
Belgian and Luxembourg hauliers
The Belgian./Luxembourg foreign trade data eontains nosubdivision by nationaLity of hauliers (subdivision expected asfrom 1988). Information on Belgian and Luxembourg hauliers isthus only available for 1985 frorn the partner countriesconeerned.
In the case of the German market it is possibte to distinguishbetween the traffie with Belgium and with Luxembourg. Themarket between Belgiurn and Germany grew by just over 5t, butwith a slight fall in market share, tonnage earried by Belgianhauliers grew by 5t. The market between Luxembourg and Germanygrevr by 9t and with the Luxembourg share increasing by 2t, theLuxembourg hauliers had a very good year, tonnage carriedincreasing by over 13*.
The French market grew by 7.5t and with an increasing share,Belgian and Luxembourg hauliers increased their tonnage carriedby over 11E.On ttre Italian market, Belgian and Luxemtrourg hauliers obtainedmost of the small extra tonnage avaiblable on outward trafficand recorded a substantial improvement on inward traffic(+23E).Data for the Dutch market are only available for 1985, thisshowed that Belgian and Luxembourg hauliers had 242 of theinward tonnage and 353 of the outward tonnage.From this information, it appears that 1985 was again quite asuceessful year for Belgian and Luxembourg hauliers.
il

United Kingdom hauliers
The analysis here relates to the Road Goods vehicle survey onRo-Ro ferries to mainland Europe, this however" only relates tovehicle movements and not tonnages.
The total number of vehicle movements rose by llE, the largestincrease sinee f982. The main increase however was inunaecompanied trairers (up 168) for which the nationality isnot recorded. For powered vehieles, the overall increase r,,ras 58trut uK registered vehicles fell ?.* and foreignr registeredvehicles rose 11*. uK registered vehicles only'had 4ot of themarket in 1985.
Data from this survey gives country of port ofi destination ofthe ferry serviee but not of the goods vehiclers. on this basis,the small traffic to Denmark/Germany ports showed the larges'tincrease (up over 60t) and among the major destinations trafficto Belgian ports (up early 108) inereased fast.er than that toFrench ports (up 7.5S) and Dutch ports (up 38). Although thisdata is available for powered vehicles and una,ecompaniedtrailers separately, the porvered vehiele data is not publishradsplit by UK/other registered vehicles and ports of dest-ination.
Irish hauliers
Information is taken from frish sources on total outward Ro-lRotraffic (i.e. excluding traffic with or via Northern freland)and also excluding company owned trailer traffic. Recentexperience shorvs that the ratio of inward/outward traffic isparticularly volatile for the Irish market and care must betherefore exercised in interpretinq these results for the whoLefrish market.
Outward Ro-Ro traffic showed a substantial fall of 22* in 19{15completel.y offsetting the substantial advanee made in L984,.Weak results $tere obtained on all relations especially on theiItalian (down 32*1, Benelux (down 258) and the important trKmarket (down 27*1. The importance of UK as a clestinationcontinued to decline to 40E of all tonnage.
t2

Danish hauliers
Information from Danish foreign trade sources sh6r.{s the growthof inward traffic by road continuing to increase by almost 10tin 1985, however outward traffic continued to fall stightly, byalmost 2*.
Traffic with Germany continued to account for 60? of Danishintra-eommunity road transport, and the changes in f985 weresimilar to the total traffic, i.e. up f 2E for inr*ard trafficfrom Germany and down 3t for outward traffic to Germany.According to German sources, however, the Danish hauliers lostabout 3.5t of the total market in eaeh direction so thattonnage carried by Danish hauliers was virtually unchanged.
Danish hauliers also had poor performanee on the Freneh market,but a 108 increase in Danish powered vehicles was observed onthe Ro-Ro ferries with UK.
Altogether it would seem a rather disappointing year forDanish harrl iers .
Greek hauliers
According to Greek sources, traffic with other Member Statesfell by 2t in 1985.
Traffic between Greece and Germ&try, which accounts for justover half of total Greek traffic with the Conununity, fell by ltaccording to Greek sources (by almost 6* according to Germansources), and carryings by Greek hauliers fell by over 10E dueto a substantial increase in cross-trading (essentiallyJugoslavian and Austrian vehicles) according to German sources.
Traffic with Italy declined (outward traffic by 2I*' inward by48) so that the exceptional growth of the previous year was notheld. According to ftalian sourees, Greek hauliers did evenhrorse.
Traffic with Netherlands (ttre third largest market) advanced28.
1qg5 was thus a rather disappointing year for Greek hauliers.
l3

2.2 Detaile :rnational road
-
haulage market in 1984
2,2.L Introduction
As explained earlier, the data currently ilvailable for 1985are taken from many different sources and do not permit adetailed structural analysis to be carrie<l out with suffjLcientconsistency and reliability.
The most extensive comparable data currenltly available reil"ateto those collected for the Road Statistical Directive for1984.
Note that: a) bilateral traffic is eovered by the Directivebut that cross-trade tra:Efic is not(= traffic by haulier from l4ember State Abetween Member State B and Member State C).
b) Tonnages for Italian hau.l"iers relate toforeign trade statisticsl thetonne-kilometres have been estimated assumingthat the average distanee to each Member:State is the same as that of the haulier:sfrom the partner country,,
c) Tonnages for Luxembourg hauliers relate to1982 since the 1983 and 1984 figures from thebGctive have not yet beren delivered to thesoEc.
Tkm for Luxembourg hauliers are estimat€:sbased on 1982 Statec statistics.
d) 1981 and 1982 datas for llrench hauliers (forboth national and interniltional traffic) havebeen revised on basis of correcting factorssupplied by the Freneh M:Lnistry of Transport.
e) The figures for the UK are particularlysensitive to the problem of unaccompanieidsemi-trailers whieh are rrot recorded in theroad Directive statisties and shouldconsequently be treated with some reser\te.Further ltK-traffic across the llorthernIreland/Republic of lreland land boundar:y isexcluded, this exaggerates the apparent shareof lrish hauliers both to UK and EUR-IO total( taute z.s, .
2.2.2 Intra EUR-10 international road traffic - Tonnages
IAl+

o
H
f&l
(r)dpf- (Ylr{o
rn(Yfrf
lndpoi\o\9.
@GI(Yt
dpol
rn
I
04(\o\f
<f dPv1 @
rf!rv)rn
lo dPl\o ol$.l$lFl(f)I
l@lc'I'lc\t
I
dp(\
I
df{c.l
df
(t
Fl d{tfF
o$
l-t dPlN delor mlrn f\lo dl- il-t Nl$tl:
g,(t
r- dPc{|n(r) .
$
Yt dpt\ F{
(Y)sf
Y) dp)f4
oI
ndP)Olio
r.
$dPn\orn
I
c0 dpN 0r)
(Yl(n
Fl dPF-
rnoI
F{ dP(Y) Fl
c4
I
f\ olp(\l faQ\r
ro
vo
F{ dP@(r,
ccGI
-{ dPD tf)N.
@
-{ dpr1 ON.
\0
O otPn(Y)l') .
(\l
Jl dptrO
$t
I
I
ndPrr) rfFl .
|rlFl
Y) dpootf
!
n4 dp
r-I
tndpOr |Y)lr}
@oo
t]HH
sf dpl|N
oFtI
ndpnol-
I
Ndpo\o$I
-r dpnrn@(rlFl
odpF{
r.rnI
ndpn()O.
t\tI
@dpF4 \g
c(\l
I
F{ d0|f}Fl@
r-I
V
(\l dpF{ tOF..
Fl
sdpYt ln<l
-{ dP\orn
I
\dPtroO.
lrl
t\ dPflon
cDe{
\0 cpooo
rn dpr... on.rnAI
\0 dpO\9\t
I
r\ dpNT\
rosf
NdpF{OC0.
\olrJ
r.l
l- dP01 Flt\.
(Y)
ndp+@(l.
@
I
tn )dpO\g
C)
I
FdpfoOo
\9
OdPF{O
ornF{
I I
vdp@(n<f.
F4N
E
dpo(\lf4o\
F
O o\Pnoro
CF{-{
tr dPOrn3
(Y)
I
l dp$c\l
r-
Ndpoc\lO.
nI
mdp<fotNo
rn
B o'P
F{
I
dpOr
o(rt
ca(\lFl dpo
o \o dpO(YlC.i .
o'orrl
t{n
OdPorfF-
f-
odpcc0n.sf
N
! d\oc} t\lt\. (Il
I
OdPO\gtc oN
l'- dP
@
I
\l"dpnF{ro. \t
ndp+ (Y,
@
Fi o\Plnc\no.sf
odpf- Or
c!
r- dP\r (\lO.
sf$ro
H
f- dPc0 \0@.
(flif
\dPr) tfO.
Otn
dpi+
\9N
13o
dpoo
nN
in n d,oNFI13. t-
(\I
ndprno|rlt\l
odprn@N. o
I
CdPN6nn.
@(v)
Fr dPo(n
ln Fl
fq
(v) dpO lfi
mo
I
cc dpCGIo\.
(nrf
I
+dPtr (tr
Y)
Al dpNc!6.
Orro
ndpN\TtOo
o'I
f- dP$(\lo o
-{ OfiocNo(\t
Ndp$FtN.
$I
\o d\oooo
@dor\ (\r\o
olF4rn
o
!dp{rn11 .
c0
odpFi OlF{.
C-
I
t, dp\rrn
(Y)
a{
|ndp|noF{.
mc0
Ndpn(Y)n. o
NdprD$lJ.) o
FdpNFl
s(Y)
I
Fl dPsfo\p. rfN
I
F{ dPm$no.oFl
F{ dPrn (Y)
OD
Nt.$
8/E
/Ea fr H
Ft1r a0 Fl
Xdg,H
X g,(9
Itrot&i
(n@o\
coco
.Fl+,
Aoodp
ogrd
rr601
t{d
go+JIU
otl
o.dlt{l+{t!k+,
IUl{o+J.d
.o
IUco*JdIho+Jc
.!+JoE{
aFII F]ol zc.ll Ztool E{F{l.ol odt oEI o
l5

F{dp\f
$
\oco$\fc{
lCn o\Pls srlFtl@tnlFlI
l(')dpl\o c\rF;I
l-l dPl3\r\s
lO oY
lF.t tl
18il-
lrn dt
lsql-T
lo4 ot
l3
l-.. l-:l$ o\p
lN rflF{ .
lF{ c0
I
l,-l dpFn6l$'lr-lNI
lro opI'o @
lil*
(5
odpco c\lC\. (\
N dtoItl Fl
FlI
\dp{tr)-t rf
(\l
VdPt\ \g
rc
$dcl'l \C
rn
l-
Fl dP-l ()
()r{
I
\o o\po
$I
u') o\oFrnn.$
llOderit. r+Gl .Fl\ln
Ndp
N.
F{ dp$ (\lFl .
o
\dp)r-N. o
r{
n o\P<f sf
(f)
I
Fl 0Prf)()
r\
(f)@() 6dp
Fi
I
I')@
O.Nln
Fl
H
odp(Y)FI
FlolI
FdPs(aF.{
NI
F{ dPn0@rirFl
odpNC
o\o.-{
O o\Prn
rntf
I
\o dpA()tn
\fr!
I
I I
It oPnf-1p.o
t\II
c{ dp
^l r-.qf.
q o\P
t\Sn
$I
Fdp-r$<f
\0
-l dir]lr-N.
ltl oPln(\ln4
r.
\0 0pooOFl
rr dpln0[ NN oomI
!) dpaoo(\I
.9dpto\io\(\i
Fl
oro$
nn
nN n
n I I
vn
a
odpO'@@.(Y) \t
e4
O o\onr\otl .cm
Fl
-f olicF.{ f-\0.
(\Ir{
tdp{(t{..NFI
11 o\P(tt O\$o
$GI
mdpc)
C)\t)
O o\Pl.c rf}
olo'
dpo
c\l dpC\l \of'' i(f, !il
Fl
Fl dPr-$f-.Fi \9
N o[cY)o|
{rn
C otlcrn F.c
Fl
ndp+o'nFl
16r dplc \clF{ .
lqlF
I
cnaprO Oi
trl(!t
sdpC)
(}oFi
@dpNCON
lt) rdPt>
rc)
I
$dpt'. O\1Q.NrfN
H
to deooF4 .(\l F{
-{ .l\Dq€n.NO
Fl
Ndpir) Fl
(rl0r)
<f.rnFl
t) df,lN Crl'
t.(\lrn
odpc\t @
,{o
@dp|n\c(Y)
tndp6(f,1'). (\
(n
F{ cPno\oS.o(\
f.
ca d€rtr oGl .tf \0
I
\9 dpOi GlrfN Cr)
ndp'\d{o
odpf- \9ol.\n(}
F{
o d\ornlnco
\o(\lI
Fi dPfo@]1|)o
\c
rr) dpo\0r-I
-l dP\f ,-l
@(\I
Fl oPN()
C)rf
CC otpf* FlQp.n/) FlFI
\ O\P
9, 1'-t')OFI
I
Fl dFOr-c,NFI
I
m d\cFl \fC.<f (\l
o,: d0FI\|'!f.(Y) O
U] o\Pr-$Or. o
oil dpFrilF{t
@GI
odp\o
6GI
Fl o\P
$(\F.
@
odpN u'l
r()ll
tf dpln(\l0c.oo-t
8/H
Fltr) F]
v FlEH
14o x(, (o
i]5l
flil
:l:t-'"13€ l-ifl1"olodl"..t lo
ilflIl.o
rhclo,
:l:d lrd-i losl'
3l'-l I,+]l
TI
:l
il
IIrtfrlzoF
ooo
t6

orl
x
t- dP@ln\0.@\0r{
\r dprf ctrrn.$c\|
dp
GI
I
o\0rn
ln
dpco
tno
dprn
FII
dp(7)
Oc{
dprf
u')I
dp(\I
c0ri
dp\0
I
&()
f- oP$rn
AI
(Y)
foC)
ril
F{
I
dpotn(\i
dp I
dprn
\tLt^;
O\Pr\tn
dp\0
c/)
O\P
c.)
\0
Vo
F.{ O\P
SO'o\.o.,
dpc.,l
oic.)
dpo o\oco
(r)Fl
(\l o\PrnoN
I
dpoo(\I
oo(\II
dpcc\I
l-{g.H
rf dpv1 co
r-C\l
O\P
c-
\0F1
dp$@
I
dptr\0\9
I
dpCl
<fI
dp
otf,
I
dpo(\lI
vodpo\oc\
O(n
cdp<fd-to
F{
n@n60
oFlI
odp3Fl<f
@N
rf dprf \O
ao
I
cd9NFIJl .
c0GI
<t d,po'o<r.I
@dst4 \0
c0GI
rJ") dp\t (Yttc.mo
F]
rn dfo|f)an.
\o
NC\Iil}.N(fJ
FlI
ro dpln(\l$
Ot
I
ncen.{c\lFiI
C0 d\oN(nln
C'Fl
ooom
04 o\ctr$
F'
C d'Pnrnlo.{c{
(\ cl\o!fo'!il rn
,n dp
tr.n\9
3dpnolY)\ln
-lsf
odpsf ccN.
!fFl
tc dpFl
Fl
I
t\ o\o'{o ao o\pcc (\lv\oro
t-{z
OdPc\r@01roO'
SdP\Ol
oil
Fdpn4 u')nalC\l
I
rf o\o\o \osf.<fd
I
odpOFi
GIFl
I
t, dpqa
I
!n d\o$l r-
@
\r dp\o (')
ril
VoPFq)reF{ C\
H
!q dFoi\ o\o.(\l rn
odptr (\l
:il @
\dpn@t1
rdN
\dp\r\lFloi
n-i
OdPOF{\r
@
,r, oYl+cc
I
F{ o\oc0 c\l
GiI
r) dprq@c0|r)
3dp>NN
Fl
tt{
lndp(n frOr.\r Ft
N o\oo'01sfNc0
I
ndpt\ c0n.Nc\I
ndp($r36
Lf')
Fl
\o o\P
-l@J.) .
rnI
c0 dpooca
Ft dPO|nc\I
01I
t odpc)oO,.cn(YiFl
-l d0Nr-N.n$
GI
ndp-{@Nn6l
F{
I
-'l do-{ Glio.N:f
n o\p$c{S (rt
r\,f*r.t
CdPrOFtn 6
I
00 o\PF{ Fl
r-sI
C o\oO F{oFl@
I
N o\oJ.) Fl!.) .
ctF{
Fdp0nrt$m(Y)N
8/E
/Efir H
F]A E t
v: &l-{
Xo (,It,O
f,EI-l
1!l!l
;l"l:ls.rJlOOl-lklolcfilo'.t lc010(l)l'.1}{ l{J
1l,l:^lhl9
ll!l;hlopl
l\rCla'olo'
.Fl lF{
fil*.{ ldoto
;t"t',ilfil
?l8lilEI
!l v)trlv
F+
ooI
l7

ra]"te--2. A Shares of the market held hauliers from EUR-10 onintra EtI -10 internat ournevs
Tonnages
MemberlState
IN+OUT=Total tchangere84 / 1983
Share ?;
t_982 1983 1984
D
F
I
I\.IL
B
r,f82)
TIK
I RI,
DK
GR
18 854 + 18 687 =
13 878 + 14 544 =
6831+ 7560=
22 674 + 24 103 =
13 722 + 19 451 =
1154+ 1053=
2146+ la€rz =
657 + 669 =
2O75 + 3OI7=
575 + 637 =
37 541
28 422
L4 391
46 777
33 173
2 207
4 008
L 326
5 092
L 2T2
+ 3.3
+ 6.8
1.9
+ 5.2
+ 9.0
NA
+ o.B
4.2
1.4
+11.3
22.r 21.9 2r.6
16.7 16.O 16.3
a.2 B.B 8.3
26.9 26.7 26.q
LB.2 18.3 19.0
L.4 (r.g) (r.3)
2.2 2.4 2.3
0.7 0.8 0.8
2.9 3.1 2.9
0.6 0.7 4.7
EIJR-IO 82 566 + 91 583 = ]-74 L49 + 4.7 100 lo0 roc)
l8

Table 2.1 shows an overall inerease of +4.7t of the tonnagemoved in 1984, comPared with 1983.
Significant increases were noted for traffic to Belgium, fromFrance and from Greece; flows concerning following l4ember Statescontrasted strongly by direction, namely:
traffic to I +I1.38from I - 5.2*
to DK + B.3Efrom DK 2.18
to IRL -l-7.ltfrom IRL +18.18
Tables 2,.2 and 2.3 lead to the results of table 2.4 ruhere themarket share, p€F Member State of haulier, is expressed for 3
eonsecutive years.
For 1ct84, Irish, Danish, Italian and eritish hauliers lostmarket share. Greek, Belgian and French hauliers improved theirmarket share.
The detail, by transport relation, is given in table 2.5.
t9

Table 2.5 Percentage share of traffic (in tonnes) held byfrom "origin" Member states (1 ) (2 )
hau-Liers
Since tabLe 2.5 onJ-y relates to "bilateral" traffic, the sum ofthe shares of traffic held by hauliers from the "origin" and"destination" country is necessarily 10Ot; hence the sharerg oftraffic by hauliers from "the desti.nation" country can beobtained by subtracting the share held by ttre "origin" coulnrtryin table 2.5 frorn 100t. Example D hauliers have 56t of thetraffic fsom F to D and 4Ot of the EUR-10 tr:affic to D (inr9B4 ) .
(l- ) Italian, Dani.sh andand Luxemt)ourg; intraffic for these 3
(:21 This tabler includes
Greek data give no breal:down between Belgiumcompiling the marginal EtrR-tO totals, threMember States is assumecl to be with Bel'gium.
revised French figures for 82.
Year D F I NL B L UK IRL DK GRTotal
EUR - IO
D B28384
585254
555455
303l31
545351
:'34354L
502232
414L43
1413I4
444343
F a283B4
393B44
bI5655
JU323t
JU403B
55 bI6266
bq
13
2t2328
564666
___-E'-4344
I a283a4
5b5653
535350
4Y4435
495042
IJ6B64
4l5950
414L39
bJ6961
---------55-555l
NL 82B3B4
t5/)75
686B68
65957
4 ta7675
7A 4b5258
U
23t6
bI6263
LIL214
747373
B a2B384
>l5B5B
596464
6461"62
J53736
4t U
tl6
U
2To
ZL2627
U
o0
505252
L a28384
2E 2L 59 62 0 ----3il
UK a28384
tv756B
555249
5b574B
IL6655
9+9897
luu LI1619
+43
+45261
535149
IRL a283B4
It8367
Y18597
5t6143
r008369
r0()lo0100
898890
U
400
r00loo
888688
DK a28384
t57572
a0B783
l37776
3J3436
t67259
999999
IUU86
100
tv698I
757673
GR 828384
899192
597568
bU2326
659093
IUUloor00
6l93B6
403633
786059
EUR-IO 82B3B4
59596,0
5A5959
595555
JJ3433
5t5755
5I 6t6263
201923
4U4L42
J53B38
535353
'20

Table 2.6. Outward/Inward tonnage ratios by country of haulier
Member Stateof haulier
Ratio OUT/INLs82 | roer I rsea
DFINLB(L)UKIRLDKGR
.95
.901. 66t. 091. 48
.91
.a7
.751. 58r. 0l
.93
.94L.42r. 06L.54(.sr1.91.67
L.62.98
.99r. 051. rl1. 06r. 42(.er)
.a7L. 02t. 451. 1r
EUR-IO L. L2 l. 11 t.ll
Table 2.6 shows the ratio of outward/inward tonnages bycountry of hauLier. A high ratio indicates difficulties inobtaining backhauls, a ratio close to 1.O indicateswell-balanced traffic and a low ratio that hauliers have tomake empty journeys outwards to obtain return loads. Itshould be noted tirat this is a rather "simple" indicabor whichignores both the fact that specialized vehicles may not find
"iituOt" backhauls and the fict that the volume/weight ratios
may be different in the two directions'
The results of Table 2.6 show that the overall outward/inwardratio remaj-ns very stable at 1.11 but that the spread ofratios around thi; average has been much reduced (unweightedstandard deviation is o. rg compared to o.33 in L9B2 and 0.32in r9B3)r i.€. the very high ratios of Italy' Belgian andDenmark have been reduced (especialty Italy) in l9B4 and thevery low ratio of Ireland has increased'
compared with 1983, the main changes of the ouT/IN-ratios wereas follows:
Member State C'lrange 84/83 ExpJ-anation
F +0. l1 + L2. Bt outwards
I -0.31 + l-2.62 inwards12' 18 outrrtards
B -o.12 + 14.6t inwards
IRL +0. 35 20.7* inwards+ 20.38 outwards
DK -0. 17 + 5.18 inwards5.4t outwards
GR +0. I3 + lB.2t outwards
2l

Shares of the road haulage market held by' own accountoperators
The results from the Road Statistical Directive give abreakdown between "hire and revuard" and "own-account,,operators.Table 2.7. gives the share, in tonnes, for own-accounthaul iers .The Italian foreign trade data does not contain such abreakdown.
Table 2.7. Share of market held by own-account operators onintra-community journeys (x '000 tonnls).
This table shows a recovery of the own-account share (af.terthe 1983 deep point) mainly due to the French and Belgianoperators. A decline of own-account share for rrish ope:ratorscan also be seen.
2.2.3 Intra EUR-IO international road traffic - Tonnes kilometersThe analysis carried out in section 2.2.2 can be repeated fortonnes-kilometers (e.9. table 2.8 cortesprlnds to table 2.,r).
MemberState
Inwardsfrom
EUR-IOr984
Outwardsto
EUR-101984
Totalr984
Share in tof own account
resrl]gezlrgegllqealttDFINLBLUKIRLDKGR
3 8063 333
NA3 1964 BT4
NA355270r56
o
3 2053 768
NA4 0046 520
NAL97171336
o
7 0117 101
NA7 200
11 334NA
55244r492
o
l_9.518.4
NAL7.634.4
NAL2 "935.311 .8
o
r8.920. o
NA16.533.9
15.143.8l2.r
o
18.718.4
NA15.030.8
NAL2.640.110. r
0
18.725 "O
]NA1.5 ,43,4.2
]NA
r,3 .8313,3
,9 "7
rl
EUR-10 15 930 l8 20L 34 131 2L.3 2L.2 19 .6 2"L,7
22

oI&fr:
F{ dP\oqJ(Y) .ol\oF{
F{ d€<f f'o\o\oc)
l- d'9(Y) (Yl
@.ro sfF{l
\o dp@f-o\.(\ rr
'* di?
F.l iflrn .looI
Or d\ofo rnrn
sf
lF. dplo\ Ol-tlcf) rn
I l$;oY
\(
c
l$
lo dP
1(\r otlf- .lFf Fll-tll
odpo cf,(vt .$|.n@
x(5
odp\0 \or-
GI
-rdp3@N.
A
^l
ndpt\c'\oitrn
I
!) dpt\ FlN. o
I
t\ dpDF{
oI
mdpotn(\It
Adpol04
ol
i'q dpoot*I
odpo(\l
\0I
In d0c{\ott.-fO
I
l(o
<f dpOtn^l
.AO\
3dpnon
@
Y) d0
'|o\rl .rn+
!dp300\I. ('l
r{
tr dP\\0o
c0 dptf \9
|nFl
ndp\0
c0(\lI
ndptY, c-^
\0
I
t\l dpol sfn-.ot@
+
Flg.H
(\l dprnmc4
I
ndpsorn(\II
N Or\o3\otf,
I
\dpNrnrn$
ndp(ft
$\oI
tt) dprDo'olFlI
Otl(Y) .
o(r,
\o o\P
o\FInD.@I
odprnOlr}
r-
fdp{ON.-{O
F{
!dPnFl{@
I
\dp<rmr).
t\
\dP
F{(Y)
$dP oooFl
\g dorro'f-
l')dpsf(')ln.
I
\dpo\0
(nfo
rf dpN(\ID.$cl
Fl
Gl olofn F{
rf
(l.dP{rn
GIsr
dp(Y)
orI
rf-l o\o-l lnN
rn
Fdp oatn(\I
d olPO
otnI
oderf, orn
c0
c{ dpOrnlli.O.i F{
v) .lP51 @
nott ol\?n\orD
-toI
't) o\P
n.-lO
r- dPIY) A
roF.l
c0 dpFl l.fl
(ft
\odp(r}
$F{I
(\t dpF4 \C
\0(n
cdpJl Fl
oI
(\l oP@(nO.oo
z
rn op\t orO.u) t--
\dpt' Gl(l..-{ Gl
rq dp
n.I
ndpnsr!.-{ (f,
NdprJl F-
(Yt
I
3dPrcor\
+Fl dPln F1(\l .
<f
ln dpn04
Nt
@dP\oo$c\o
H
(7) dpoC\l\0.r$ sf
:.) dpnt{Nn u')
Y) dp{on.N\O
(\I
rr) do3Flc.-{c)
GI
o(\t
Fl dPOr$rf.
fo
\00n
dpGI
o
F$
n dc,rno|Y).
o'(?)
I
Ft CpF lfr
\9 Gl
tti
(f, dpt- rfsf,.rf \o
t\ dpN(f}n<r (r)
Ndp3r'N.NO
Jl dpt(\ln.r0 r{
Fi
SdPFGI
nD dpO\OF.
rn
fn dpf-O
t-I
r{ dPc^\9GI v
I
l* dp\0@
I
f- dPFl Al
\9ro
a
lo dptr ftn@
Ndpnot\onf*
I
Ndp\oJ.)'nc{
Ndp-{Olc.N\T
0\ cp|nr\N.
<f dP+rn<l|. o
I
lndpno \0
c0
I
(n otptf (t
F{ (Y)
I
odp@\gOr o
rn dptf cc
N()N
8/tr
/EFr H
F]E Fl
XF]&H
vo &(9
I
at{o+Joto..{x
Ioocco1)
c
OE-AXt+.t lJr+{
r00! '.{UEOXIg(npc
td o\Fl
(o
!q+JoI.A9
o/d1rh5O-t+Jo.d>F.l O.A! oto
F.l 'lCdcctuo..J <r+J6.!oCFtt{Ot{+, aucoH>
cGI
()Fl.o.U
E
23

oI
H
sdp@04@Or-
l.f dP[no[9.P@I
lco dpFn (nlCO 't- rf'
I
lco dplol [email protected]."oI
l(?) dplo@[email protected]*@I ls:
lcO dl@ r'l:(f" l-:
lrrr o\p
lC4 l-l\o .
loI
Iro dplo rn
lo "iITlo,r dplfn C-l(hlcc n'
l'g,(9
\o dpsf (.)\9.
oI
\dptrO
rfFlI
n o\o\t*
tifI
t\ dpsoN.
tn
I
01dpC0 Ft
oI
(Y) d{cr6
$dp(r) orn
$dpFl f*
rirnI
(7) dpocoN.'+O
I
vo
rf dptf (rlf-.
$
n o\Prf (7)
N.F1
cdc\l.FlN. o
n oY)
<l' t*o
dpoF(YlI
o.(\ $dPSFJFl .
r--
rn dpr-\o
I
!o dpN$
IFI
ro dpf- (\l\1Q.F{lf}
l-{&H
\o o\p(Yr 1(YlNI
Y) dp(r\0rf(\l
F{ dPLn (n
0r)Fl
ndp\\0
rnrn
4 0\pl'n
$u.}I
lo
I
odpoYc\
I
I odo{al\l .
o\I
V
rf dprn r\(r)
I
)dPN(Y)rf.
@I
rf dp
g}.(\I
C o\oo\oF{.
N
c0 d€tn!+
sf
^l
\r dpooo
Fl dP lC.l dPr\ tnl (Y)jl J,I T
-1 dp
'{ t\\0\oC\
$oPoo@
'.1
otrn
NYl
o |n I IG}l\l
fi
tndpt\ l-(\l .Fl f-
CdPCmD.-l \O
F o\oso\9
rf dP!) \0n.
rnoil
<f oP
ttc4
(ft doooui
o \odp$oCn
o O o\Pm(\lrn.<f€
z
FdpOFlF.(f) t\
N o\oFl f-
Fa rn
<f dPtl (f,!
c1
d\ot\o
f- -{ d\o
rc)I
vdpl'- F{
ln$
n orpoorn
vdp\0 roFl .
(\I
$ d\dF{ lt)
(l'l
I
C0 o\ocl'ttof-6
H
\o dp\0 \oOGl Ft
codptlr1 \Olo.N\9
odpm\oO.Fl CO
cr)
odpFl \Cvo.
\o,{
(\l dp(\t (Y'r-
Fl.n
Ndpmrntf)$
odpo\\0
t*
CC oN)$ \c)r\osl,I
rf doNON.F(V)
ri
ft{
r- dPo'QOr.F{$
O o\ogFlNNO
n oYr+t*I
rq dpcc Cr)toFl tl^r
N@$sf
(\I
(f) 0[oOOtc4
r-
qf dp
?lrlr.'I
Odpn\oFl(n
O\ dp.o?c)(Y)
f- o\PNf4C0oCFI
a
sdpJl roO.Nf\I
r| dPNr-t0NO
I
\dp\c-{ (\l
Nrn{o
I
\odp!O rn
N
cc dpd@
f/)
odpr{Oln(\l
@dprnF$l o
Fl
Or o\P\00csI
(Y) d9otnoo.
8/E
/E o F{ HFlz tr FI
XF1gH
vA
&(,
{I
-!
ot\l
op6E{
:,r., ItaI"{IolrdlolF{lclal
l+{
o
k+)co(J
ot+J
q
aot{o+Joooka!z.OE'd )(,-{ +,a.00E'.1
t1
pi1trofl).Fl Cl.lr o\t0 -tor:t{0!r:o0A'.{
+Jo:,r+{ oT{ i,rd()t.+, do
-t (Jru t:cdo'.{ \f{J ql.d o\Enlt.oh+J(tg0)H>{
AA:q

cd
I
t{
t-- dpr- Gltir@\O
@ oYr@r'NrCC fr)
.1
n d\oOF{
F{
I
l'.. dpnoO\g
co dpc{@l\.rn F{
lq
l*I
In- o[olo \olf- .
l-t (\
I lx;lf- d\c
l(f) ^llNl^TI
lc4 dplFl \g
FTI
l\o dplrg r"tI frl!tJ1 Cft
I
(,
t$dp-l
(r)A
F{
C\I
tr dP3o'.-|t
F@
3 o\PNO
@rn
I
ndp+rn\0GI
\dpli f*
r.o(7)
Ndp oo@I
odp\<l(Y)
F.l clftc{@|.1|J.
FlFl
I
a
odp\o o,$
@F{
:cdp3\occN
l1dpJrc)
Y) o\ooc0N.
r{.Fl
3dpnFl
FlFl
@o
I cdp-{ (Y)
m(v)I
odp!il c{oFr$
r-.1
+
Flg,H
\o o\p
-{ el
foC\I
Ndp(f)
c-)(f)
I
-t o\9noo,F{
I
$dp oooF{
ndp$rn
fn
I
cdpr.o oorn
I c0 dp(f.{roI
r.o dpOFIF{. c
GI
odpocc1.. \t
(\I
$dPF{ Olc!F{m
I
]c\gF{.
co(f)
t, d\o1rnr-co,.{
rn dpFl tO
oFl
<f ol{o$o'n. oI
\odplJl fr
r-.1
t\I
Fl dOc{o'Fl .(7) (\l
t-{
(a 0[oc\o.\c
Ndp
or-
;dp1.\ot)
\0FiI
-.{ dpfo\oFlI
OoPc\o\OP
c)
otnGI
I
odpoGl
@
F{ dPoolnI
Odo(Y) o(n
r-
n
t'- dPo{ rrc\IF{ lf,
ao olco$noFt t$
-{ dpvsrN{r-
io ndp-r t--1 .
(\I
odpca
ril
I
OdPnFl
o,I
nt dolnc4Fosf (\l
Flz
CG dFrnoCNFIC
-c dpr.rn<f.
$I
'1dp\(ft(r
rlGII
@dPrn foro.cc
Nrt dp3r-
@I
ndp|r}
F'c.t
I
\dplc r+
F
C ol\o
ot
I
@dp\0 Gl(tt .(Y) Fi
H
f- d\o(Yl $rn(\l \c
ndpl-OccNt+
-1
$ o\P(\l c\l3fAc{
c\I
m o\F
o\c4oC\I(\I
Nt1 da\srO.
FlFi
<f dpNr$
o(\II
!dp3oln.
I
13@oC\lI
f\ o\P
$F{O.@ol
ltl
\c .AoIr' cssf.GrO
tl ctp
'osNN(\I
I
o\dpLnoqf.Ft (\l
N cfP
N.3\r(!
N<f
tr d0$!$n.
(\lI
'|@oc\lrfI
-.{ dprf r-N.
c|t.I
edpoil \0
@I
o.dpCC -lN.O-l
c
$dP(' ca$.N\9
rdpNOr(\l
I
ndptOri.sl. (Y)
!n dP3sf.g'{l"
n/) odptl CO
N. oI
!n#N\O
c0C\I
I
ndpnct']}.\0I
F.l dPF{licc.
Ndp<f tn!.no
81/o
/Ec fr{ H
F]E F]
XF]g,H
Ma&(,
oI
&r.1
ri'f
;lrdlolFrl(+{
t{P
U
A)
+J
c,!(l')
+J
.)h(Jt{
A.!^OE..r #F{ +J
(d0E
.cxtrom
.Fi @+Jo.t6 Fl
F4
t{O
g.F4
trCooq,..{+J(J5
.F1 ArHor+.{ >dot{+J d0
r.{ rO
dcgroU.rf tS+J C!rdo\CFtt{oti.p6coH>'
r{
(\or-{.odE-t
25

Table 2.11. tonne-kilometres achieved by country of haulier oninternational intra EIJR-10 traffic (:r mio tkm).
Member States Inward + outward1983 1984
I
t change:84/83
Share E
1983 1984fI
D
FrNLR
L( 82)IJKIRLDKGR
T6L62r3428I 5491151158785
4393449
546390227tA
16780151r 5152231625510053
4393 511
494391225r6
+3.8+I2.€)-l .7+7.5
+14.4NA+l .8-9.5+0.3-7.4
20.216.819 .4r8 .911.0o.54.3a.74.53.4
19 .9)L7.9)18. l.19. 3l
11.9)o. 5;
4.2t,o.6;4.613.C)
EUR-I0 80035 84300 +5.3 loo 100
Table 2.I2. * share of own account operators of traffic expresserd intonnes-kilometres (x mio tkm).
The same pattern as for the tonnes (see tabJ.e 2.7\ can bernoted. The decline of own-account share for Irish operat.orsis even sharper in tonnes-kilometres than in tonnes.
Member States Inwards Outwards IMP. + EXP .,
Own account:t share Own Ac.1983 19€t4
DFINLBLUKIRLDKGR
107 3905
NAs33
1318NA
22520
123o
9r9l2B6
NAr204L799
NA118
2326L
o
r9922T9L
NAt7373117
TTTA
34343
384o
1r.911.5
NA1r.627.I
NA8.5
r6.1lo.5
0
I1. .91,4f . 5
NA10.731..o
NA9).88.79.8CI
EUR-10 4L97 5610 9807 13.1 14i.3
26

2.3 Cross-trades, an analysis of the multilateral intra EUR-IOI?Ireiffinai=oaA-Trat 19-65--
2.3.L Introduction
2. 3.2
As explained in note a) of Section 2.2.L, the Directive onlyrelates to bilateral journeys between Member States.Multilateral journeys are allowed under Conrnunity Quotaauthorizations (which then are valid for the whole of EUR-10)or in other specific cases.
The Commission has extensive data on the Community QuotaStatistics (a brief analysis was published in the f9B3 AnnualReport) and is seeking comprehensive information on othertypes of multilateral journeys through an extension to theDirective.
The rapid increase in the number of Conrnunity Quotaauthorizati-on since l9B4 and the further substantial increaseduring the transitional phase in preparation for a marketwithout quantitative restrictions by L992' prompts a widerexamination of these statistics in the context of the wholeroad haulage market.
Importance of cross-trades carrj-ed under Community Quotaauthorizations
The number of Community Quota authorizations which only grews rowf!-d[iiTi!-tfi'5-E5?Tt-T96[''f]ilfr@F?ffi1i0:a in 1e84 to5268 in 1985 and 7437 in f986. These increases stemmed fromthe Council decision of December 1984 to increase the numberof authorizations by 3Ot in 1985 and I5t for each of thefollowing 4 years; an additional boost occured in 1986 due tothe adhesion of Spain and Portugal to the Conrnunity.
As the criteria for the allocation of authorizations betweenI{ember States depends, particularly, on tonne-kilometres' theanalysis presented here relates principally totonnL-t<ilometres and not to tonnes as was published in theI9B3 Annual Report. Further it is more appropriate to examinethe share of Conrnunity Quota authorizations in all "hire andreward" movements in terms of tonne-kilometres as the averagedistance under a Conrnunity Quota authorization is about twicethat of all movements. Table 2.13 shows the main results fortonne-kilometres for 1984 together with estimated results forr985.
21

Table 2.13 Intra EUR-10 international road trafficJllfonetreaL
Total bilateralsof which
own account
Hire and Reward bilaterals
Cross-trades (underCommunitl Quota)
Total Hire and Reward
of which
Total under Community Quota
r984(mio )
1985( estimate )('ooo mio)
84 300
-12 098
72 202
+l-642
73 844
720
B9
-13
76
+27A
10
t of Total Hire and Reward
Total under Community Ouota
Cross-trades underCommunity Ouota
10.5E
2.2*
13t
N. A.
I of Total under CommunityQuotaCross-trades 2r.38 N.A.
28

2.3.3 Cross-trades under Communily Quota authorizatlons by ltlemberffi6;----Table 2.14 shows the breakdown of the various tonne-kilometrefigures for hire and reward movements in L984 by nationalityof haulier.
Table 2.14
1984 TONNE-KILOI'MTRES INTERNATIONAL IMRA-COMI'TUNITYTFEffiA-EailEE n;FlToffiEEresf
Menrberstate ofhaulier
T-km achieve.-nr6Gm?F€C-
)O
E$;e-eomm.Quota
authorizat.Bi Iatera I Cross-trade Tota I
D
F
I
NL
B
L
UK
IRL
DK
GR
r4792
t2922
L3047
14518
6936
323
3168
45r
3529
25L6
63
158
2
726
439
LL2
60
3I
51
o
1485 5
1 3080
I 3049
L5244
7375
435
3228
482
3580
25L6
r640
854
1165
1194
810
L76
637
t2tLO22
l0l
EUR 10 7 2202 L642 7 3844 7720
Notes: Luxembourg p = provi-sional, L9B2 data
29

The following table 2.I5 expresses the rrasults in percerntageterms.
Table 2.15 Percentage of movements by type 198,4
MemberStateofhaulier
Cross-tradesas * of allComm. Quotamovements
Comm. Quotamovements asof all H. &movements
tR.
eross-trades as tof all Hire andReward movements
D
F
I
NL
B
L
UK
IRL
DK
GR
3.8t
18.58
o.2*
60.8t
54. 3t
63.4t
9.4*
2s.88
5.08
0t
11.0t
6. st
8.98
7.8t
11.0t
40. 5t
19.78
25. lt28.5t
4.08
o.4t
L.2*
0. 18
4.8t
6.08
25.7*,
I .9t
6.4t
r .4t
0t
EUR-IO 21.3t 10. 5t 2.2*
30

The results show that Member States fall into 4 groups.
i) L: over 25*ii) NL, B, IRL: about 5Eiii) F, UK, DK: about 1,5tiv) D, I, GR: less than 0.5t
The exceptionally high figure for Luxembourg is due to thesmall geographical size of the country which makes somecross-trading essential. The high figures for NL, B and IRLare due to the relatively small geographical size and positionof NL and B and, in the case of IRL, the ease of picking uploads for the uK while returning from the eontinent. Theresults for D, I and GR shows that the hauliers are not reallyinterested in cross-trading.
Finally in Table 2.16 the stability of this criteria in recentyears is examined.
Table 2.L6
PERCENTAGE OF CROSS-TRADE MOVEMENTS BY MEMBER STATE OF HAULIERS
MemberState ofhaulier
Tonnes T-km
L982 1983 I984 1983 1984
D
F
I
NL
B
L
UK
IRL
DK
GR
3.4
14. O
0.5
53.5
50.1
38 .4
1r.9
22.2
6.5
0
2.9
13.9
0.4
55.7
44.6
45.3
L2.6
20.3
5.4
o
3.1
L4.6
0.3
57.3
54.4
50.1
LL.7
25.O
6.2
o
3.5
t6.7
0.3
58.4
48.7
59.9
LO.2
22.8
5.1
o
3.8
18. 5
o.2
60.8
54.3
63.4
9.4
25.4
5.0
o
EUR IO 22.L 22.O 23.2 20.3 2r.3
The results show that the proportion of cross-trading hasbeen very stable in recent years, admittedly a period inwhich the number of authorizations was stable. It will bevery interesting to see whether this percentage and thepercentages for individual Member States change when the ful1results for 1985 become available, i.e. will the 30t generalincrease in authorizations in 1985 have been used to promotecross-trading.
JI

2.3.4 Cross-trades under Communlty Quota authorizations by llember@ns -
The figures in Table 2.L3 for hire and reward hauliers canalso be broken down by Member States of loading (orunloading) . The breakdown by trlember States of loading :Ls givenin Table 2.L7 and a table j.n percentage termsr sj-milar toTable 2.L5, is gj-ven in Table 2.18. In both Tables 2.I',7 and2.18 the figures for EUR-10 are, of necessityr the same asTable 2.14 and respectively.
Table 2.L7 1984 Tonne-kilometres internati"onal i-ntra-Comnrun:LtylEl=e ana rew ;E:frTIffiAEFEsf*
Memberstate ofloading
AII movementsHauliers fronr Member State of
Us j-nqy
CommunjityQuotel
Authori-zat.loading unload. cross-trades total
D
F
I
NL
B
L
UK
IRL
DK
GR
7560
7001
6855
7953
3924
L79
I 589
223
L976
1313
9651
7315
6961
3494
409L
239
t 307
6l
556
354
328
272
477
L49
288
7
63
I
43
7
L7539
14588
L4293
lrr968303
425
2959
292
2575
167 4
l8r8
1101i
22411
693
7 2C\
54
34"2
5-l
584
6''l
EUR-10 38573 33629 L642 73444 7720
JI

Table 2.18 Percentage.of movements by Member State of loading bytype 1984 (tonne-kilometres)
MemberState ofloading
Cross-tradesas t of allComm. Quotamovements
Comm. Ouotamovements asI of all H&Rmovements
Cross-trades as* of all Hireand Rewardmovements
D
F
I
NL
B
L
UK
IRL
DK
GR
rB. OE
24.7*
20.9*
2r.52
40.0t
13. Ot
16.58
14. oE
7.42
10.4t
10.4t
7.52
15.7*
6.2*
8.7*
t2.7*
12.92
19.5*
22.7*
4. O8
I .9t
r .98
3. 3t
I .3t
3. st
1.5t
2.rz
2.72
r.7z
0.4t
EUR-10 2t .38 10. 58 2.22
There is much more variation between Member States in thepercentages shown in Table 2.I5 than in Table 2.L8; thisapplies to all three colums of percentages. This impliesthat whereas there is a wide variation in the propensityof hauliers of different nationalities to carry outcross-trades, the geographical spread of the cross-trademovements is more even.
JJ

2.4. Traffic with Spain and Portugal - Tonnages
As in the previous section, the analysis :Ls restricted tc>bilateral traffic, i.e. cross-trade traffjlc is excluded.
2.4.1. Traffic with Spain (E)
Table z.Lg Tonnages carried by EUR-10 and Spanish hauliers to arndfrom Spain (000's tonnes)
f ) Hauli-er of the partner country.
Total traffic between EUR-IO and Spain is thus estimated to haveincreased by 7E from 1983 to 1984, a little higher than theintra-EUR-lO growth rate (up 4.7*)t this is in considerable conl[rastto the previous year where the growth of traffic between EUR-IO andSpain (up 21t) was much higher than the intra-EUR-IO growth rate (up3.58). The share of EUR-10 hauliers in the market with Spain hasremained stable at 38t. If, however, one excludes the substant:Laltraffic with F, then the share of EUR-10 hauliers in the market withspain has fallen from 49? (in 1982 and 1983) to ,47t (in 1984).
Bilateralrelation
1982 1983 l98rl r985
Hauliers from Hauliers from Hauliers from Hauliers from
EUR-10 11 E
EUR-10 11 E
EUR-10 1) E
EUR.10 11 E
D-EF-EI-ENL -EB-EL-EUK -EIRL-EDK -EGR -E
604T29L
331r2034r
104
48t
506R2737R25IR259R2t8R
45R277R
20R9R1R
7381535
406t2l335
rt22T42I
575350r
252333276
34349
2815I
7A2I 563
462158398
1051l46
2
6953552
247389293
37439
23l6I
N. A.N. A.N. A.N. A.N. A.N.A.N. A.N.A.N. A.N. A.
8053785
2984383L4
24490
20t4
3
TotalGrowth rates
2440 4323R 33L2+17t
5364R+242
3527+6?
5732+7t
N. A.N. A.
6191-F8g
Total aIlhaul iers 7163R 8676R 925') N. A.
Growth rates + 2Lt + 7rt N. A.
34

2.4.2. Traffic with Portugal (P)
Table 2.2O Tonnage carried by EUR-10 and Portuguese hauliers to andfrom Portugal (OOO's tonnes)
Bilateralrelation
1983 1984
Hauliers from Hauliers from
EUR-10 Portugal EUR-10 Portugal
D-PF-PI-PNL -PB-PL-PUK -PIRL-PDK -PGR -P
66252
8028
0
110
L2o
110l-76
761931I
24
2
67296
9132
0
5070
r332r4
742335I
36
3
Total 449 439 498 519
of whichto Portugal
from Portugal
266
r83
22L
2LA
249
209
265
254
Total
Growth rates to Portugal84/Ag from Portugal
+11t +18*
+9t+148
+20t+17t
Total traffic bet\teen EUR-IO and Portugal rose from 888.000tonnes to 1.O17.OOO tonnes (up f5t) from 1983 to 1984. Whilethis was smaller than the growth from 1982 to 1983 (up 24*),it\^ras still well ahead of the intra-EUR-lO growth rate (up 4.78)and that between EtrR-lO and Spain (up 7t).
35
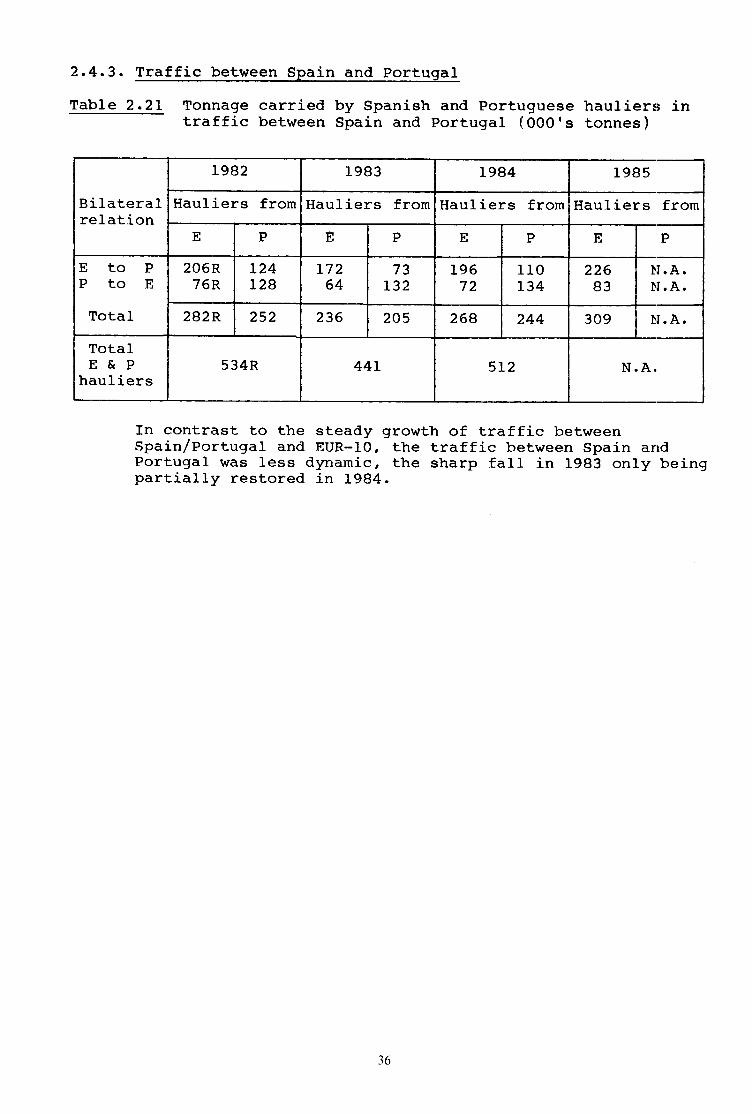
2,4.3. Traffic between Spain and Portugal
TabIe 2.21 Tonnage carried by Spanish and Portr:guese hauliers intraffic between Spain and portugal (IOOO,s tonnes)
In contrast to the steady growth of traffic betweenSpain/Portugal and EUR-10, the traffic between Spain andPortugal $ras less dynamic, the sharp fall. in 1983 only beingpartially restored in 1984.
Bilateralrelation
L982 1983 r984 1985
Hauliers from Hauliers from Hauliers from Hauliers from
E P E P E P E P
EtoPPtoE
Total
206R76R
124r28
17264
73r32
19672
1.101_34
22683
}I.4.TI.4,.
282P. 252 236 205 268 2t44 309 trtr. A.
TotalE&P
hauliers534R 44I 5L2 N. A.
36

2.5
2.5.r
2.5.2
Transport Inquiry Surveys - Road
Introduction
The main aim of the quarterly surveys with road hauliers isto collect within the shortest time possible informationabout the changes that are at work in road transport(border-crossing transport EC-10) .
The survey does not only reflect changes in the level ofroad transport activity during the previous quarter, butalso looks forward into the next quarter. A1so, a series ofkey-indicators are published, which reflect the workingconditions in road transport firms.
Unlike real statistical figures, the ones published in thechapter merely reflect opinions and only indicate a trend.
Transport activity
In 1985, wittr the exception of the first and third quarter,the balance-of-opinions figure indicates an increase inactivity compared to the previous year (EC-IO level).
At the level of individual countries, exceptions are France,United Kingdom and Greece, where the volumes carried inl-985, were lower than in L984.
Graph 2.1. Activity level of firms, expressed as thebalance-of-opinions (g difference between + and -answers )
-1
37

2.5.3. Economic_igdlcetgrs
Three economie indicators
- recruitment,cash-fIow,investment.
a) Recruitment
are part of the survey 3
In comparison to f984, ttre 1q85 recruitment of drivershas increased.
Graph 2.2. Number of firms deelaring to have recruited drivers
24%
23%
22%
21y"
20r
192
182
172
162
'l5z
'l4I
132
12I
112
38

Analysis of the quarterly figures for 1985 reveals !
. in conparison with the Previous year, and for each of thefour quartersr the number of firms having recrui.teddrivers has been higher (at EC-10 level),
. the number of firms, reporting an imPortant increase inthe recruitment of drivers are those from theNetherlands, Belgium, Luxemburg and Denmark'
b) Cash-flow ploblens
During the tthole of f985 the number of firms havingreported cash-flow problems was the same as the yearbefore. However, during the last semester of 1985 thisnumber had improved to be lower than the year before.
Graph 2.3 * of firms declaring cash-flow problems
44z,
43z,
40z.
49',4
48'l
477.
467.
45z.
42%
4'l?t
39z.
38:l
37y.
1984
36z.
35"t
39
1 985

These overall figures result from divergent movements in thedifferent l4ember-States. fn 5 l4ember States the eash-flo'wposition has improved (Germany, Italy, United-Kingdom,Denmark, Greece), while French hauliers reported an incr,easein cash-florv problems during the first se:mester of 1985.
c) Investment
For the year 1985 the t of firms reporting investmentactivity is about the same as the year before (on ave:rage37.5t ) . only in Italy ( 28.5t ) , Belgium (qZ.S*l , Luxernburg(48.3t) and f)enmark (55.8*) more firms have invested 'Lhanit was the case the year before.
Graph 2.4. E of firms havinq invested
3E7'
t--
1 985
-r- D
't9E4
34r
32r
427.
40

2.6. Cost Indices Road
In 1985 detailed data were gathered from 7 Member States,Greece, Ireland and Italy are not included. Fuel cost andtotal cost have been examined separately in the quarterlyreports. Some more key cost categories are examined in 1985annual report, such as wage, repairs, depreciation, taxes andinterest.
The table befow (taule 2.22.) gives the percentage costchanges for the last years.
Table 2.22.
NC = national currency
Infla-tionin NC
Wagesin NC
Re-pairsin NC
Depre-ciationin NC
TaxesinNC
Inte-restin NC
Fuelin NC
Totalcostsin NC
Totalcostsin ECU
D838485
2.52.6l.B
3.22.72.7
2.92.22.2
2.23.42.9
0.00.00.0
- 6.7-r1.9
2.8
- 4.45.9
- 6.5
1.11.90.5
2.92.93.0
NL 83B4B5
2.92.4L.7
0.62.36.4
3.01.82.4
2.15.52.7
0.8o.20.r
- 4.O- 4.9
7.2
t.7- 4.4
3.7
o.71.33.4
0.52.O6.0
B/L
B3B485
7.L5.44.O
4.76.52.L
4.35.63.4
9.32.69.3
0.54.5o.o
L.7- 1.0- 3.1
8.60.0
- 4.O
5.I3.6r.6
1.98.12.5
F83a485
9.26.84.7
r1.85.47.3
6.78.08.7
11 .4r0.09.3
8.4o.71.5
- 1.31.7
- 4.5
1.1LO.2
- 6.1
8.77.O1.0
2.67.93.4
UK 83B485
5.34.55.7
4.55.05.6
5.25.85.4
2.74.55.2
22.98.17.O
0.00.0
43.3
- o.7LL.29.4
4.36.05.3
3.3o.22.O
DK 83B485
6.05.63.6
o.o7.1o.7
5.98.72.4
6.38.23.9
o.70.o
-0.8
- 6.9r0. o
-16.6
- 9.74.8
- 8.7
-0.87.L
- L.4
-1 .89.4
-1.1
AIal

2.6,L. Development of the different costs in national currency in1985 by Menber State
Wages in NCBecause of the economic crisis, vrages have only shown aninsignificant rise in Denmark with rather small increases inBelgium and Germany. Against this there wr3re significantrises in the United Kingdom, although below the rate ofinflation, but above all in Netherlands and France.
Repairs in NCIn 1985 repair costs grew slightly in Germany, Denmark an<lNetherlands. In comparison to I January Itr82 (f00), the costof repairs has shown the greatest increase in France ( f ag,,I atI January 1986) compared to the ottrer Member States.
Depreciation in NCDepreciation costs have shown a significanii increase in Franceand Belgium and to a lesser extent, althou<Jh substantial, inthe United Kingdom. Against I January L9A2 (10O) France andBelgium have shown the strongest increase, being + 46.5t :rnd+ 48.2t respectively.
Taxes in NCffie unffii-xingdom registered a significanll increase in t;rxes(+ 78) with a slight increase in France (+ f.5*). Denrnarlc isthe only country which showed a slight fal.[ (- O.Bt). In allthe other Member States, taxes remained unchanged or showeid aslight variation upwards.
fnterest in NCffiingdomin-.erestcostss}rowe<lastrongincrease(+ 43.3t) (*) but this was the first major rise since L98'.r,.In the Netherlands the rise vrras + 7.22. Orrerall, however,, allthe Member States showed a fal1 in interest charges varyirrgfrom - 16.68 (Denmark) to - 2.A* (Germany),
Fuel in NCffiGITTn the dollar resulted in a fall :Ln fuel costsvarying from - 8.79 to - 3.7* in nearly all Member States.,The United Kingdom was the only country whjlch showed a risle infuel costs of + 9.42.
Total Costs in NCffiost strongly in the united Kingdom (+ 5.3*)and to a lesser extent in the Netherlands l:+ 3.4t).With the exception of Denmark where costs jiell by I.4*, al.lother Member States showed only a slight rjlse.
Total costs in ECUffis in ECU rose most strongly in theNetherlands (+ 6t) with the other countries showing rises ofbetween 3.4t and 2t. Only in Denmark did total costs fall.(- r.lt) in ECU.
TTT-me cost evoLution presented here is based on a comparisor:rbetween the situation dates l.l.'85 and I.1.'86. As theinterest rates in the United Kingdom showed great fluctuat.ionsover short periods, it can happen that a peak-value iscompared with a dip. The annual average varies rnuch less.
42

2.7 Price indices Road
The analysis of the quarterly price indices is done each quarter inthe "Market Developments" report.
2.7.L AnaLysis of the annual increase of price in ECU by Member State inrv6l
Table 2.23
Price indice 1985ffi by relationby direction
outhrard backhaul
Average forhaulier fromMember State
DDF (T)DDIDDNLDDBL
+++
1 .8t2.2*I .8t2.92+
+ 2.4*2.522.OZ1 .5t
+++
+ I .5t2.r*r.5t4.5E
+++
+ 2.2* D
FFDFFIFFNLFFBL
+ 4.9*4.083 .9t5.22
+++
++++
4. 5E3.9t3 .386. 1t
+ 5 .8t4.2t4.6t4.72
+++
+ 4.72 F
IIDIIFIINLI IBL
0. 5t0. 5t1.OtL.2*
+++
1.7t3.221 .43o. ot
++ 0.3t
2.422.OZ2.r*
++
+ 0.18 I
NLNLDNLNLFNLNLINLNLBL
+++
0.8to. 7tI .8to. 3t+
+ o. 5to.2*o.2*r.3t+
+ l.0t+ I.3t+ 4.0t- 0.9t
+ 1.Og NL
BLBLDBLBLFBLBLIBLBLNL
3.6t3.1t6. 5t4.0t
+++
2.IZ2.Ots.8to.9t
+++
8.8t5.727 .2*9.9E
+++
+ 1.2t BL
GRGRDGRGRFGRGRIGRGRNLGRGRBL
+ 7 .925 .482.LZ6.7ts .6t
+
++
+ 7.424.326.3t7.8t4. 3t
+
++
+++++
7 .723 .482.6*6.0t6. 5t.
+ 6.0t GR
(1) DDF means a German haulier on the reLation Germany-France andFrance-Germany.
43

Germany
Priee indices in ECIJ in I9B5 increased on all the relations anclall the directions. The increase is lorser than in 1984.
France
Price in<iices in FCU in 1c)85 increased faster thanl4ember State except Greece. Priees increased more1984. Priees did not deerease on any relation.
inin
any other1985 tharr in
Italy
The forvest increase of the overall averaqe pricr: indices in ECII ofall the l4ember States has been recorded in ftal\f (+O.ft). It shouldbe remembered, however, that there hras a particr.rlarly large increasein 1984 of 8.8?. Prices decreased slightty on the relation vritlrGermany, due t-o the outward price deerease of 1.72.
Netherlands
Priee indices in llCll are very stable. The larger;t increase releites tothe NL NL I outward direetion, and amounts only to 2.I2.
Belgium/Luxembourg
Price indices in ECIJ decreased very mueh in rel:ltion with Germanyiespecially the backhaul relation (-8.8*). For the other relations,the i.ncrease is rather high. I)ue to the <leerease of the price jlndexon the Cerman relation, the overall averaqe price increase is stilllow.
Greece
Overall average prices increased more in Greece than in the otherl,lember States. However, in 1984, Greece was the only t"lember Sterte torecord an overall decline. Prices decreased onJ.y on one relatj-on,Greece with Italy. The biqgest increase of all llhe rqlation of alll.,lember States has been recorded in the relation Greeee-Germany.,
44

2.7.2 Comparison between the level of the backhaul price andthe tonnages transported.
Table 2.24
Relation Haul.Price backh.
Tonnages by haulierfrom origin country(u".roultns) in 1984outward backhaul
backhaul Share oftotalmarket
Price outw.L9B4
outward
DF DF
90.694.L
4935522L
65974258
L ,34O,82
54,89245 , 1lE
DI D
I95. r90.8
269432r5
290r2L93
1r 080r68
50,85t49 , L5Z
DNL D
NL97.987. 5
532912 311
4018LL77L
O,75o,96
27,96272,O42
DBL D
BL94 .494.3
44375120
43874292
O,990,84
48,3925r,618
FI Fr
93 .893 .3
30962492
2496254L
0r8lL,02
52 ,63247,372
FNL FNL
104. 57r.3
7742595
t 199L732
1,55O,67
3L ,32268,68*
FBL FBL
96.099.5
4L679018
53296403
L,28O,7L
38, rlt61, ggE
INL INL
100.080.8
338957
732630
2,l-'lO,66
40,27t59,732
IBL IBL
92.O86.5
457792
477629
1,05O,79
39,61t60, 39E
NLBL NLBL
90.8LO2.2
74654539
81472444
1r 09o ,54
69, 09t3O, 91t
GRDGRFGRIGRNLGRBL
GRGRGRGRGR
]-69.7r45 .8L75.9L62.8175 .8
35245
13564I9
28032
1r79435
O,80O,7IO,87L ,47L r84
45

2.7.3 Evolution in 1985 of cost and ice indices
The table below gives, bY Member State,average levels for 1985 with f984, andboth cost and price indices in ECU.
Table 2.25
the comparison of thefor' 1984 with 1983 0f
D F NL B/L
84/83 e5/84 84/83 8s/84 84/83 s5/84 84/83 8s/84
pricecost
+ 3.3t3.2*+
+ 2.2*+ 3.08
+ 3.99+ 5.4t
+ 4.7t+ 3.4t
+ 1.0t+ 1.7t
+ I.ot+ 6.Ot
+ 3 .8t4.2*+
++
1..2*2.5t
difference + 0.1t - 0.8t - 1.5* + 1.3t - 0.7t 5 .0t - 0.4t - l.3t
France is the only Member State where costs increased less thanprices during 1985, but was also the only Member State where costsincreased less than prices during the two previous years.
Only in the Netherlands costs increased much more ttran prices.ln Lhe other Member States, prices and costs evol.utions are very'close.
46

2.7.4 Comparison of the evolu!.ion of the leYel 9f thebackhaul priCe in geU with the outward price
Table 2.26
Relation Haul. L982 1983 1984 1985
DF DF
86.794.6
88.396. O
90,694.L
89,796,6
DI DI
94.988.4
95.788.8
95, I90.8
94,792,7
DNL D
NL98.687. I
98. r86.9
97,987.5
97,388, 3
DBL DBL
98.291 .6
97.493.7
9'l ,494.3
9"1 ,990,8
FI FI
94.485.7
93.489.5
93 .893.3
96 r288, 3
FNL FNL
LO7.772.3
106.77L.5
104. 57r.3
105, 372,5
FBL FBL
94.L93.4
97.3LO7.6
96.099.5
93,91O3, I
INL INL
100.681.5
LTs.282.1
r00.080.8
103,693,3
IBL IBL
84.288. O
9A.788.6
92.O86.5
94,O8-l ,6
NLBL NLBL
99.286.9
93.595.6
90.7LO2.2
89,611r,4
GRDGRFGRIGRNLGRBL
GRGRGRGRGR
r53.6139.5181 .8134.8156 .4
L69.7145. Bl-75.9L62.4r75.8
170,3142,6r92,'ll-60,2179,4
Only on the Italy-Germany relation, the average increasedduring ttrree coniecutive years. On the opposite, ttte averagedecreised during three consecutive years only on theGermany-Netherlands rel ation .
4l


EHAPTER 3
Inl and v/aterv/ays
3. I. Introduetion
3.1.1. The data and the summary of the contents
Statistical data reproduced in this issue were provided by thestatistical offices of Franee, Belgium, the Federal Republicof Germany and the ltretherlands. The data coincide with thosepresented on the basis of the Statistical Directives forinland transport to the Statistical Office of the EuropeanCommunity (Eurostat). Figures on Rhine traffic, includingprices, v/ere provided by the Central Rhine Commission. Data oneost and price developments are submitted by the EconomicBureau for Road and l{aterway transport (E.B.W. - Ryswyk - NL)and by the Institut pour le Transport par Batellerie (I.T.B.-Brussels). Additional information for France was obtained fromthe Office National de 1a tdavigation in Paris.
The analysis contains a comParison between 1985 and 1984 andbetween lq85 and 1979. This is done in order to provide aninsight in the developments since the start of the presentcrisis in the inland rdaterway seetor.
The tables and graphs give rather detailed information. Theanalysis concentrates on the most relevant items only"
The contents of chapter 3 can be summarized as follows:
$ g.f. : overall clevelopments of the trafficS l.Z : developments on a eountry by country basis$ g.: : developments by commodities$ :.a : developments by transport market
(nnine and North/south)$ g.S : fleet developments and (over)capacityS 3.6 : flag shares$ g.z : transport inquiry survey{ 3.8 : developments in costs and prices.
49
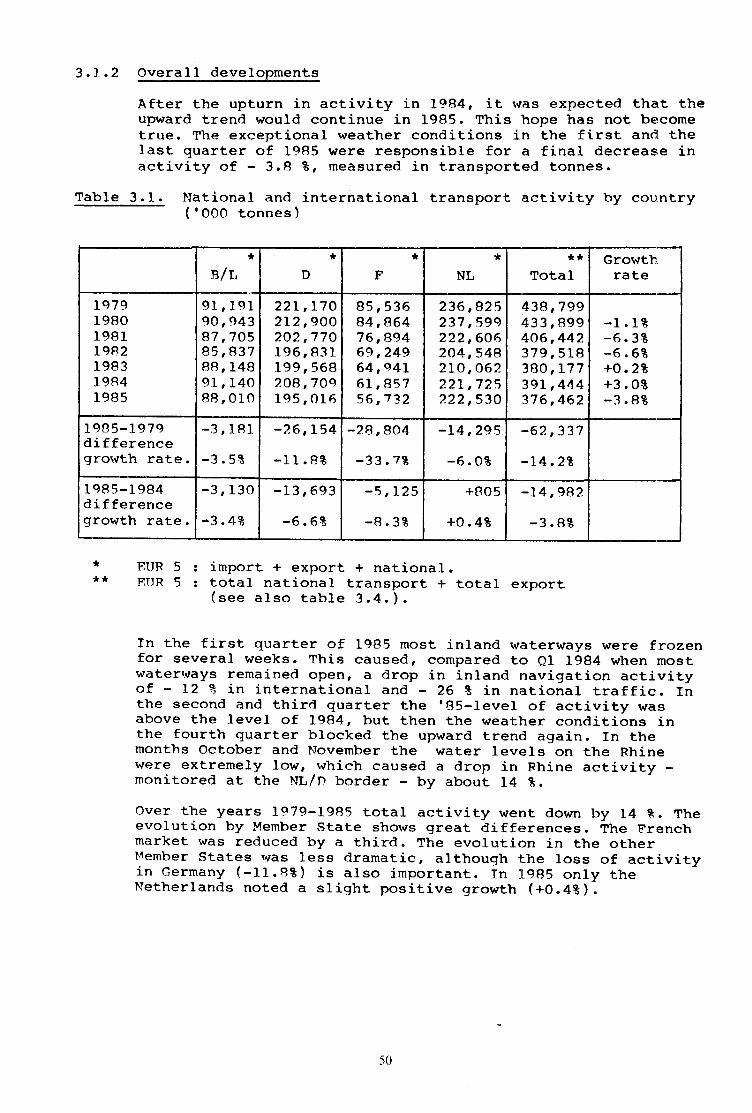
3.1..2 Overall developments
After the upturn in activity in 1984, it rvas expected thac theupward trend would continue in 1985. This hope has not be,cometrue. The exceptional weather conditions in the first and thelast quarter of 1985 were responsible for a final deereas,e inactivity of - 3.8 B, measured in transported tonnes.
Table 3.1. National and international transport activity by country('ooo tonnes)
B/t"*
D
* *F
*NL
**Total
Growthrate
t9791980198rI 982r98319841985
91,19190,94387,70585,83788, 14891, l4O88, 010
22I,L702L2,9OO2O2,77O195, 83 I199, 568208, 70c,195, OL6
85,53684,86476,89469,24964,o4161,85756,t32
236,825237,599222 ,6062O4,5482ro,06222L,725222,530
438,799433,899406,4423 79, 518380, 17739r,44437 6 ,462
-1-6-6+O+3-3
IB3t6E2*,08B?
I c)85-197Cdi ffereneegrowth rate.
-3, l8l
-3.58
-26,I54
-r I .8t-28,9O4
-33.7*
-L4 '295-6. O*
-62,337
-14. 2t
I 98 5-1 984d i fferencegrowth rate.
-3, r3O
-3.4ts
-13,693
-6.6E
-5,r25
-8.3t
+805
+o.48
.14,982
-3.8E
***
ETIRNTIR
5:5:
import + export + national.total national transport + total e:xport(see also table 3.4.).
In the first quarter of 1985 most inland wiatertrays were frozenfor several weeks. This eaused, compared to el r9g4 when rnostwaterways remained open, a drop in inland rravigatiotr 6slfvit|of - 12 t in international and - 26 t in national traffic,, rnthe second and third quarter the ,85-level of activity wasabove the level of 1984, but then the weather eonditions rLnthe fourth guarter blocked the upward tren<i again. In themonths october and November the $rater levels on the Rhine:were extremely low, rvhich caused a drop in Fhine activity -monitored at the NLID border - by about 14 g.
over the years 1979-1985 total activity \rent down by 14 *. Theevolution by Member state shorvs great differences. The Frernchmarket was reduced by a third. The evolution in the otherMember states rnras less dramatic, although the loss of acti.vityin Germany (-11.83) is also important. In lL9g5 only theNetherlands noted a sliqht positive growth (+O.4t).
50

Developments in tonne/kilometers shorv a slightfy differentpicture, see table 3.2. In tkm the total EUR-5 transportactivity in '85 was only 7.8t belorv the '7q level .
Table 3.2. National and international activity (*) by country('ooo,ooo tkm)
B/T' D F NL TotalGrowthrate
r9791980I98 1
19821eR3t9B41c8 5
5,9O85,8535,4424,9584,9345,2O15, 015
50, qB751,4355O,O1O49 ,4Ol49, IOO51,99648, lB3
11,898l2 , 15111,0681o,226
9 ,4478,880B, 394
33,47233 ,478,3r,79231r 3fr332,28r33,59332,736
ro2,265l-a2,9l-798,3L295,94895,76299,67O94 ,328
+0.6*-4.52-2.42-O .2e6+4. l*-5.3*
t 985-l C79di fferenceqrowth rate
-893
-15.18
-2,8O4
-5.5t
-3,504
-25.4*
-736
-2.2t
-7,937
-7. Bt
I 985-l S84differenceqrowEh rate
-185
-3 .68
-3, 8l 3
-7.32
-48.6
-5.5*
-857
-2.F*
-5,342
-5 .4t
(*) activity = import + export + national + transittdistances as far as convered rvithin the mentionedl'lember State.
l.R.: As the national statistics used in table 3.2 take into accountonly the distances as far as covered in the Member State, onemust be careful with the interpretation by country. Forinstance, a major port like Antwerp is very close to the Dutchborder therefore an increase of exports from Antwerp to lll, + D
will eontribute very little to the Belgium transportstatistics but much more to the Dutch.
5I

Table 3.3.
3.1.3 Development by market
By market, national transport and international transporll,which is split in international Rhine traffic and North/fiouthtraffic, the developments ean be summarized as in table 3.3.
I'Tational and international transport by market( '000 tonnes), lq85
National
Tnternational
Rhine( Nr,/oborder )
morth/South
part of total i.w. transport s1 .8t 35.5-t 12.72
1985-1984 tonnes qained or lostgror{th rate
-8, 82L-4.42
-e;,648-4.8E
-243-o. 5t
t9B5-1979 tonnes lostgrowth rate
-52,23L-2r.54
-2,983-2t.2&
-4 ,5O2-8.88
This table shows clearly that the loss of transport since '79is concentrated in the national markets (- 2f .58). The lo'weraetivity in the building industry is to a large extentresponsible for this dorvnward trend in national traffic.
Rhine traffic monitored at the NL/D border was significarrtlydown in'85 (-4.8t), mainly as a result of. the extremely lowwater levels during the last quarter.
It must be noted that the so-called "traditional Rhinetraffic" as reeorded by the CCR on an observation of totarlRhine activity between Antwerp and Basel, decreased even more(-5.5*, see table 3.lf). Also over the period 1979-1985 tlhedecrease in traditional Rhine traffic is stronger (-g.et) thanmeasured at the NL/D border (-2.22). The conclusion is that-traffic on the relation Rotterdam - Ruhr area, which dorflitnatestraffic at the NL/D border, developed relatively better t.hanthe rest of the Rhine market.
North-south traffic was about stabte in 1gg5 (-o.5?).Comparing the evolution of the North-South market over theperiod I979-L985 with traditional Rhine tr,affice w€ findroughly the same growth rates -8.88 and -8.6? respectivel.y.
52

3.2 Inland water$ta trans rt on a eountry- -eountr basis
Tabte 3.4 presents: tonnage figures for r9B4 and 1985, thetonnage gained or lost and gro\./th rates for each bilateralrelation and for national traffic.
Table 3.4. Inland htaterways: tonnes carried, national andinrernationat lntr5]6ffi6ffiaffic ('OOO tonnes)
TO
FROM
R/t' D F NLTotalout-going
Totaloutq. &
nation.
R/L
19841985differencegrowth rate
22,O1321,47r
-542-2.5*
11,238g, 433
-1,805-16. rB
3,7353,455
-2AO-7. 5t
]-4,L5714 ,647
+49O+3.5t
29,13027,535-1, 595-s.5t
51, 14349,006-2,r37-4.2*
D
1984I 985differencegrowth rate
I1,72610, 12 5-1 ,601
-13.6*
70,23463,715-6 , 519-9. 3t
3, 1003,095
-5-o.2*
29,59525,554-4,O4r
-r3.6?
44,42L38,774-5 ,647
-t2.72
I 14,655l-o2 ,489-L2,168-to. 6?
F
1984I 985differeneegrowth rate
3 ,4783, 189
-249-8.3*
l.O,4328,994
-l ,438'-r3.88
33,76330, 45 5-3, 3OB
-9.8*
3, R593,863
+4+0.1t
17 ,169l.6,046-L,723-9.7?,
5t,53246, 501-5,031-9.7*
NL
19841985di ffereneegrowth rate
24,79325,690
+897+3.6t
72 ,38474, 100+1 ,716+2.4\
3 ,49O3,681
+191+5.5E
7 3 ,44774,995+1, 548+2. 18
loo, 667103,47r+2,8O4+2.8t
L74,114r7B ,468
+4 ,352+2.5*
Totalingoing
1984r985differencegrowth rate
39,99739, OO4
-993-2.52
94,O5492,527-r,527-I .6E
10,32510,231
-94-0.98
47,6Lr44,064-3 ,547-7.42
191, gB7185 ,826
-6 , 161-3.2*
Totalingoing
&
national
1c-)84I 985differencegrorvth rate
62,0106A ,47 5+I,535-2.5*
t64,2BB]-56,242-9, 046-4.92
44, 08840, 686
3,4O2-7.7t
t2l,05g119,059-1,999-r.6E
3g]- ,444376,462-r4.982-3 .88
Total international intracommunity traffic was down by 3.2t.All toE3ffi-iiiffiing and ingoing traffic of the MemberStates showed a deerease, with exception of the exports fromthe Netherlands (+2.88). The biggest decrease was noted inGerman exports (-5.6 mio ti -L2.7t). Further analyses willshow that this very important fall in activity wasconcentrated in Uuiltting materials and coal (see tables 3.7,3.10 and 3. 13 ) .
53

Domestie transport
The big markets in national transport are the Dutch an<l thLeGerman: both 70 mio tonnes in 1985. Since then the evolutionhas been different. In the following years national traffic inthe ltretherlands was up by 5.0E and 2.1* respectively, toarrive at 75 mio t. in 1985. The Cerman mar.ket hrent sharplydorvn in'85: -9.3t or -6.5 mio ton, which brou_cJht the total at64 mio t. This divergency is remarkable beeause the Germaneconomy as a whole did quite well compared to the Duteh. Afurther analysis will be given in the next paragraphs.
The small Belgian market shor,red a limited decrease (-2.58) in'85. Taking into account the upswing that r,\i'as noted in l9B4(+9.7t), the total outcome for this market is still quitegood.
The evolution of the Freneh national market for inlan<lrrraterway transport can only be described as dramatic. yearafter year losses of about lo-* p.a. are noted. The timeseries of annual decreases (fsge -9.7*, ,gZ -Il.Bg,'83 - 9.6E,'84 -8.0t, '85 -9.3*) gives no reason to believethat the upturn in the trend is near.
3.3 Inland waterway transport by commodities
3.3. f l.!a jor commodities
The four commodities most relevant to inland rr/ater transportare:
- building materials (wst 0) ) These four NST groups eover- ores and metal waste (NSf 4) ) l/q of total inlan<l- petroleum.products (uSt 3) ) water$ray transport.- and coal (usr Z) )
A fifth seetor of the economy with major importance for thismode of transport is the agrieultural sector: NST O+1.
on request of the European organisations of inland waterwa.ytransporters is the agricultural sector from norv on inelud,edin the analysis by commodity, see table 3.10.A. Thecommodities mentioned above, inclucling NST o+1, cover g5g oftotal national and international inland vraterway transport..
54

Table 3.5. Inland Waterways : tonnes of NST 6, 4, 3 and 2 carriedin international and national traffic ('OOO tonnes)
NST
6 (sand,gravel )
4(ore)
3(oi1 )
2( coal )
Total
L979I9BO1981L9B2r9831984r985
176, r05L74,O97157,551139,358L37,484L39,597L29,704
45,92843, 10540, 30839,80937 ,83444 ,22745,L74
81,83676,92369,96068,7357 L ,2O567 ,06268,464
32 ,37937 ,06437,9O538, 30734,94038,L7933, 197
336,248331, 1893O5,824286,2O928L,463289,065276,529
1985-r979differencegrowth rate
-46,4OL-26.33
-754-r.6t
-L3 ,372-16.3t
+808+2.52
-5g,7rg-17.8t
r985-1984differencegrowth rate
-9,893-7.1E
+947+2.It
+L,4O2+2.18
-4,992-r3.lt
-L2 ,536-4.32
Table 3.6. Strare of NST 6, 4,3 and 2 in total national andinternational inland waterway transport
NST
6 (sand,gravet )
4(ore)
3(oir )
2( coal )
Tot'al
L979r980l98lL982r983r9841985
40.lE40.1838.8E36.7236.2235.7t34. 58
r0.5t9.9t9.9E
10.58r0.0tII.3Tr2.0t
18.7?L7.7*L7.22r8. 1t18.78I7.1E18.2E
7 .428.5E9. 3t
r0.1t9.229.6t8. Bt
7 6.6*76.3275.2275.4274.0273.8t73.42
55

Despite the declining activity in the buil.ding industry, thegroup building materials (most of it being sand and gravel ) isstill by far the most important (34.5E) followed by oilproducts (18.2t).
The groups ores and agricultural products share the thiritposition. !'rith a total tonnage of 45.2 and 45.4 mio trespectively, these groups represent each 12 t of the totalmarket.
Comparing total transport by commodity 1985-1979 we see t'hateoal and ore remained stable, oil $rent down proportionall.ywith the total market, but sand and gravel, rvent dorvn more thanproportionally. So it is mainly the recession in the buil.dingindustry that eaused the decline in inlancl navigationactivity.
3.3.2 NST 6: Building naterials
After the decrease in transport of building materials in theperiod I979-L982, the market seemed to have stabilised irr theyears 1982-1984 (taUte 3.5). However, in 1"985 a new decreasecan be noted.
The decline in international transport manifested itself onall. the main reliTi6iFTE*lle 3.7), with an exeeption for: NLto B. (+t3.3t or +1.1 mio t). Total international liST 6traffic went down by S.6E (-4.2 mio t).
As sand and gravel transport is mainly short distance traffic,the national markets are more important than the inter-nati6iilfr6ugt.ly 2/3 of this commodity is moved as nationaltraffic. The national markets of B, F and NL were all sli-ghtlydown, wittr an average decrease in the order of 2*. Only j-nGermany a real drop in national activity (- 15.1*) was notedand also exports from and imports to Germany lrere considerablydown. At this moment it is not clear to what extent thisconsiderable loss of traffic has been eaused by a deereasingactivity in the German building industry, or by a shift j-n themodal split. Road traffic has probabl,y taken over a part ofthe activity, but another possible explanatory factor could bethat in the last guarter of '85 (low vrater) some movements ofsand and gravel were postponed till beginrring of '85.
56

Table 3.7. Inland waterways: tonnes of NST 6 (Sand, gravel, etc.)carried in national traffic and on bilateral relations('ooo tonnes).
>"I B/L D F NLTotal
outgoing
B/L
L9841985differencegrowttr rate
4,4794,4r4
-65-r.5t
L,L23734
-389-34.62
753810+57
+7.6*
7 ,O576 ,626
-431-6.rt
g, 9338,170
-763-8. 5t
D
1984t-985differencegrowth rate
r,809L ,526
-283-15.68
27 ,3L623,t79-4 , L37
-15 . lt
418356-62
-14.88
17,oo2L4,4L8-2,584
-15.2t
19,22916, 300-2,929
-L5.22
F
1984r9B5differencegrowth rate
L96100-96
-49.0t
7,4386, 198
-L,24O-L6.72
]-6,o22L5 ,552
-470-2.92
L,32L1,301
-20-1.5t
9,3207,599
-L,72L-18. 5t
NL
19841985differencegrowth rate
8, 6069,752
+L,L46+I3. 3t
2,2992,424+L25
+5.4E
202158-44
-2r.8t
43, lgl42, L56_1, o35-2.42
11,107L2,334+L,227
+11.0t
TotaIingoing
r9841985differencegrowth rate
LO ,97 61r,378
+402+3.7E
10,8009 ,356
-1, 504-r3.8t
L,373r,324
-49-3.6E
25, 38022 ,345-3,035
-r2.0t
49, 59944 ,4O3-4,L86-8.6t
57

3.3.3 NST 4: Ores and metal waste
After four years of continuing decrease total transport ofNST 4 swung up in 1984 by 16.9E, together with an addiLionalgrowth of 2.18 in 1985 the level of activity is now back onthe level of L979.
Table 3.8. Inland waterways: tonnes of NST 4 (,ores, etc. ) car:ried innational traffic and on bilateral relations('000 tonnes) .
\roFROM \ B/L D F NL
TotaIout€toing
B/L
r984l9B5differencegrowth rate
L,67Ll,6gB
+L7+I.0t
704686-18
-2.62
76tO615
-145-19. lE
t932L6+23
+11.9t
L ,657L ,5L7-140
-8.4E
D
r984r985differencegrowth rate
249L72
-117-40. 5E
2,4O32,4O5
+2+o. I8
424415-9
-2.L2
350358.+g
+2.3*
r,063945
..1 r8-r1.1E
F
r984r985differencegrowth rate
l97
-L2-63.1t -63.6t
It4
-7
L2578
-47-37.62
2L7
+t5+7508
322a-4
-r2. 5t
NL
19841985differencegrowth rate
2,003r,817-186
-9.3t
33,7L434,945+I,23L+3.78
1,030L,2O7
+L77+L7.22
529544+15
+2.8t
36,7 4737,969+L,.222+3. 3E
Totalingoing
r9841985differencegrowth rate
2,3LLL,996-315
-13.6t
34 ,42935, 635+L,206+3.5t
2,2r42 ,237
+23+1.0t
545591+46
+8.4E
39 ,,4gg40,,459
+960+2,,4*
Table 3.8 shows that there is only one traffic relation ofreal importance: NL- D., which covers 77* of total NST 4transport. It was again this relation that was mainlyresponsi.ble for the rather positive outcome in 1985 '
58

3.3.4 NST 3: Petroleum products
Total activity on the tanker market did not change much(+2.18) in 1985: international traffic was slightly down(-O.Zt) and the sum of national transport was 4.58 up.However, a more detailed examination of table 3.9 showsstriking differences by Member State. For instance in outgoingtraffic Belgium recorded a drop of 2.3 mio t (-34.8t), whilethe Netherlands recorded a similar growth z t 2.3 mio t(+ro.2E ) .
The most surprising evolution in national traffic is the jumpin tanker activity in the Netherlands: * 3.2 mio t (+46.38).This sharp increase is probably caused by a combination of twoeffects: (a) an inerease of oil consumption in NL and
(b) substitution of imports by domestic production.Consumption can go up suddenly if for instance potter stationsdecide to switch from natural gaz to oi]. (A number of powerstations in NL is equipped for both types of fuet ) . secondly,it seems that production in the NL refineries went up onbehalf of the Belgian refineries, which is reflected in theexport figures of the 2 countries, see also $ 3.4.3.
Table 3.9. Inland waterhtayss tonnes of NST 3 (oil prod., etc.)carried in national traffic and on bilateral relations('O0O tonnes).
\roFROM
\B/L D F NL
Totaloutgoing
B/L
L9841985differencegrowth rate
5,6036,r24+52L
+9.38
4,2242,57L
-1,653-39. r8
161181+20
+L2.4*
2,297L,607-690
-30. o*
6 ,6824,359
-2,323-34.8t
D
19841985differencegrowth rate
420404-16
-3 .8t
]-6,67215,643-r,o29-6.2*
343377+34
+9.98
74L546
-195-26.32
1,504L,327-L77
-11.8t
F
19841985differencegrowth rate
752
+45+643t
953959
+6+0.68
6,5345 ,42r
-1,1r3-17.0t
3322
-1r-33.3t
9931,033
+40+4.0t
NL
1984r985differencegrowth rate
5,5386,8r0
+L,272+23 . Ot
L6,2O717,]-60
+953+5.9t
352342+30
+8.5t
6,97710, 205+3,228
+46.3*
22,O9724,352+2,255
+I0.28
Totalingoing
r984r985differencegrowth rate
5,9657,266
+I,3Ol+21 .88
2L,38420,690
-6942*-3
856940+84
+9.8t
3,0712,L75
-896-29.2*
3L,27631,071
-205-0.78
59

3.3.5 NST 2z Solid mineral fuels
All taken together, 1985 htas a bad year for the carriers rcfcoal. Total activity dropped by 13.lt. The decrease occurredboth in national and in international traffic (-11.7t).
The evolution by relation indicates that coal imported fr',cmoverseas is gaining market share at the expense of coalproduction in the community. German coal exports (communi.'eyproduction) dropped by 28.0t, while German imports via Be:neluxports went up by 12.3*.
Table 3.10. Inland waterways: tonnes of NST 2 (coal, etc.) carri.,ed innational traffic and on bilateral rel.ations('ooo tonnes).
\roFROM \ B/L D F NL
TotarIoutgoi.:nq
B/L
r9841985differencegrowth rate
3,0372,749
-288-9.5*
608938
+330+54.3t
91r81+90
+99,08
237260+23
+9.7*
9316L,37'')
+44"3+47.32
D
L9841985differencegrowth rate
L,26L702
-559-44.32
L2,206LL,237
-969-7.92
1,4381,450
+L2+0"8t
3,8112,537
-L,274-33 .43
6, 51.t04 ,68'9
-1 , 82t1-28.0t;
F
19841985differencegrowth rate
10l0
o0t
9761
-36-37.18
5,52r3,252
-2,269-41. lt
197
+11+57.98
L21.,6
Tf tB
-4;8-38.1t;
NL
1984r985differencegrowEh rate
973737
-236-24.32
3, I593,34L+L82
+5 .88
453510+57
+12 " 68
5,2595,2L5
+43-0.8t
4 , 5€154, 5€f l8
+.3+0.1t;
Totalingoing
I9841985differencegrowth rate
2 ,244r ,449
-795-35.48
3,8644,34O
+476+12.38
1,9822, L4L
+159+8. O8
4,0672,8O4
-r,263-3r .0t
L2, L57IO,73t,4-L ,42t3
-11.7t;
As far as national transport is concerned, the collapse of theFrench market is the most striking eventz -41.18(t) or -2r.llmio t. The fatl in coal traffic explains 2/g of the total -Lossof activity in French inland waterway transport in 1985. It- isnot clear to what extent the increased competition of therrailways or the continuing switch to nuclear po\rer areresponsible for this phenomenon.
60

3.3.6 NST 0*l: Agricultural products
Agricultural products like cereals and animal foods areimportant commodities for inland navigation. The agriculturalsector generates 128 of total inland water\^ray traffic.
Table 3.10A Inland waterways: tonnes of NST 0+1 (agriculturalproducts) carried in national traffic and on bil,ateralrelations. ('000 tonnes).
\roFROM \ B/L D F NL
Totaloutgoing
B/L
I9841985differencegrowth rate
2,5632,54O
-23-0.98
1,109l, 143
+34+3.1t
673448
-225-33.4t
L,424L,886+462
+32.4*
3,2063 ,477+27L
+8. 5E
D
19841985differencegrowth rate
1,580869
-711-45.0t
3 ,3323,264
-68-2.0t
767B+2
+2.6*
1,4r81,553
+135+9. 5*
3,0742,5OO
-574-18. 7t
F
1984r985differencegrowth rate
L,9782,L68
+190+9.6E
I ,6392,24L
+6O2+36.7t
4,O894,573
+484+tl .8t
r, 7032,232+529
+31.18
5 ,3206 ,64r
+1,321+24.82
NL
19841985differencegrowth rate
2 ,4382 ,406
-32-1.38
8,5L47,828-686
-8.1*
399377-22
-s. 5t
L2,89611,901-1,095-8.5t
ll,35l10, 61 I
-740-6. 5t
Totalingoing
19841985differencegrowth rate
5,9965,443-553
-9.2*
LL,262Lr,2l2
-50-0.4t
l, 140903
-245-21.3t
4,5455,67L
+l,126+24.82
22,95L23,229
+278+1.2t
Total transported volumes of these commodities remained about stablein 1985, but looking at the different relations it appears t-hat thereis an evolution to substitute grain and animal fodder imported fromoverseas by conrmunity production. This follows from the fact thatFrench exports (=French production) \{ere up (+1.3 mio t), while Dutchexports (=imports from overseas) were down (-O.z mio t) and alsodomestic transport in NL, which is mainly traffic from the ports toconsumers in the hinterland, was down by 1.1 mio t. Given the newtrend in European agricultural policy this change is likety to be ofa structural nature.
6l
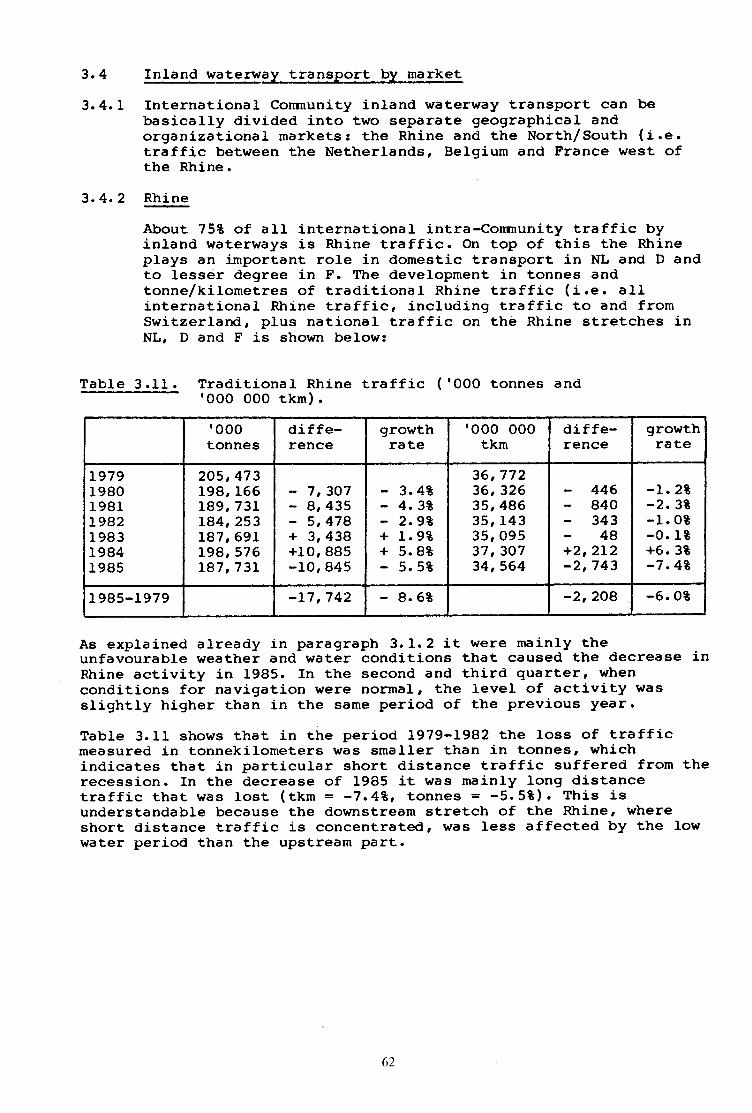
3.4
3.4. r
3.4.2
Inland waten^ray transport by market
International Conmunity inland waterway transPort can bebasically divided into thro separate geographical andorganizational markets: the Rhine and the North/South (i.e.traffic between the Netherlands, Belgium and France west ofthe Rhine.
Rhine
About 75E of alI international intra-Conmunity traffic bl'inland htaterways is Rhine traffic. On top of this the Rhi.neplays an irnportant role in domestic transport in NL and D andto lesser degree in F. The development i.n tonnes andtonne/kilometres of traditional Rhine traffic (i.e. altinternational Rhine traffic, including traffic to and fromSwitzerland, plus national traffic on the Rhine stretcheer 1nNL, D and F is shown below:
Table 3.11. Traditional Rhine traffic ('00O tonnes and'ooo ooo tkm).
'000tonnes
diffe-rence
growthrate
'000 000tkm
diffe-rence
growth:r'a te
L9791980I 98lL9B21983l9841985
205, 47 3198,166189, 731L84,253L87,69r198, 576Lg7,73L
' 7,3O7- 8r 435- 5,478+ 3,438+10,885-10,845
3.48- 4.3E
2.9*+ 1.9*+ 5.88
5.58
36,77it36,32635,49635,14335, 09!i37,30i134, 5611
44684034348
+2,2I2-2,743
-1.. 28-2!.3t-1.. o*-c|.13+€;.3t-i,.4*
1985-1979 -r7,742 - 8.6t '2,2oe -6;. Ot
As explained already in paragraph 3.L.2 it were nnainly theunfavourable weather and water conditions that caused the decrease inRhine activity in 1985. In the second and third cluarter, whenconditions for navi.gation were normal, the level of activity wasstightly higher than in the same period of the pr:evious year.
Table 3.11 shows that in the perj.od 1979-1982 thei loss of traffi.cmeasured in tonnekilometers was smaller than in tonnes, whichindicates that in particular short distance traffic suffered frctm therecession. In the decrease of 1985 it was mainly long distancetraffic that rrras lost (tXm = -7.4*o tonnes = -5.!i*). This isunderstandable because the downstream stretch of the Rtrine, whereshort distance traffic is concentrated, r/as less affected by thet lowwater period than the upstream part.
62

The traffic registered at the German/Dutch border is a goodindicator for the international Rhine market. A commottitybreakdown by direction is given in tables 3.12 and 3.13.
Table 3.12. fnternational Rhine traffic passing Emmerieh/f,oUitnupstream f'000 t)
Table 3.13. International Rhine traffic passing Emmerich/f,oUittrdownstream ('000 t)
1984 r985 Di fference growth
Total 89, BoB 89, 018 -790 + 7.9*
NSTChapters
0) agrieulturalf ) produets2 coal3 oil products4 ore5 steel products6 sand, qravel7 fertilizerI chem. products9 maehineryretc.
2,1966 r1954 ,432
23, 55535,9384,L373, 1O52,8945,591l, 055
2,O996 ,4944,g7g
22,LgL37,L644,O482,9602,8345,2421, Ol8
97301
+ 546-1,384+1,226
89r45
60449
37
- 4.42- 4.4*+12.3E
5 .9*+ 3.4*- 2.1*- 4.7*- r.gt-14. st
3. 5E
1984 1q85 Difference growthrate
Total 47,166 41,308 -5,858 + 9.6?
\TSTChapters
0)r)23456789
agriculturalproductseoaloil productsoresteel produetssand, gravelfertil izetchem. productsmachinery, ete.
1,94O| ,4415,9241, l9l
6206 ,432
2A,7862, 1183,9672,747
1,638l, 5153,712L,O27
6736 ,437
I8,2t2L,7733 ,6782,643
302+74-2,212
164+53+5-2,574
345289r04
-15.6E+ 5.1*-37.3*-13.88+ B.5t+ 0.1*-L2.4*-16. 3t- 7.3t
3.8t
6l

3.4.3.
Comparing the results for upstream and do'ivnstream traffir:striking differenees emerge. Upstream traffic, whichrepresents roughly 2/3 of total traffic, remained stalrle, butdownstream traific was sharply downr -L2.48 or - 5.8 mio t.This loss was eoncentrated in-2 commoditi.es: coal (-Z.Z rnio t)and sand and gravel (-Z.A mio t). A probable explanatiorx forthe drop in coal is the ongoing substitution of German coal bycheaper coal imported from overseas ($ 3.3.5). fn line withthis hypothesis we see that upstream traffic of imported coal,NL-D, rras up by 12.32.
NST 6 is the major commodity in downstream Rhine traffic:.Large quantities of these goods are produced both on theupsiream stretch of the Rhine around the F/D border and 'cn thelower part just upstream from the NL/D border. Ldr$equantities of Rhine gravel are shipped to the building{ndustries in NL and B. I{owever, these irrdustries ean also besuppl,ied by alternative sources: productj.on from the Meuse orin some eases from the North sea. Illhen water levels on theRhine go down and transportat-i.on eosts gar up accordingly, theconsumers of Rhine gravel tend to switch temporarily to thecheapest alternative source. So, the drop in dorvnstream sandand gravel transport is felt to be mainly of an incidentalnatuie, caused by the low water levels in the last quart-er of1985.
North-South
North-South consists of the network of rivers and eana1s westof the Rhine between the Netherlands, Belgium and France. Byeommodity group the market situation changed between 1984 and1985 as follows :
Table 3.14. North-Soudh traffic ('OOO tonnes)
1984 1985 D:i f ference gror,lthrate
Total 46,886 46,643 243 - 0,,5t
NSTChapters
O) agriculturalf ) products2 coal3 oil products4 ore5 steel produets6 sand, gravel7 fertilizer8 chem. productsI machinery, etc.
5,2583,7681,2467,9242,5541,9r7
L6,5I71,8874,3261,489
4,9563,746l, 3606 ,6533, O501,753
L5 ,29O2,L245,744r,967
3A222
+ ll4-r,27L+ 496
t64-L,227+ 237+1,418+ 478,
5,, 7t- 0,, 6E+ 9,. l8-16,, O*+19,4*- 8,, 6B
7,,4t+I2,6*+32 ,88+32.1t
64

North-South traffic as a whole remained about stabl.e in1985. (-0.5?). Important losses of traffic in oil products(-16.08) and sand and gravel (-7.4*) were eompensated byincreases in chemieal products, ores and machinery"
fn trying to explain why North-South traffic of oil productswas so sharply down, one must take into account also theevolution of the domestic markets in NL and B. (tat,te 3.9),trecause commercially these 3 markets are closely linked. Irihenfor instance an oil eompany with refineries both in Antr.rerpand Rotterdam, decides to reallocate parts of production fromone refinery to another, or when important consumers switchfrom one supplier to another, this can cause directly asrvitch from international to domestie transport or viceversa. In other words, domestic transport in B and NL andIr'lorth-South traffic are 3 components of the same market;ehanqes from one component to another ean take placeirrespective of the evolution of demand for oil products inthe Benelux.
Benelux Transport of oil produets ('OOO tonnes)
market components 1984 1985 grorvth rate
Belgium domesticNetherlands domestiet'trorth-South ( 1)
5,6036,9777,924
6 ,12410, 2056,653
+ 9. 3E46.3t16.0t
+
Total Benelux market 20,5O4 22,982 + 12.18
As the table indicates, demand for oil products by inlandhrater\,rays in the Benelux was 12.18 up.
Ftj--ffi?th-South tankers traffic tretween France and the Benelux isnegl igible .
65

3.5 Fleet developments
The evolution of demand has been highlighted in the prevr-ousparagraphs.In this paragraph the development of the supply side, i.e. thefleet is given.As a reference it is recalled that total demand in 1985 was- 14.28 below the level of 1979 measured i-n tonnes and - 7.8tin tkm.
3.5.1 Total fleet
Table 3.15 strows the size of the total fleet and by MemberState - in number of vessels and carrying capacity - atvarious dates.
Table 3.15. Fleet developments; total fleet in n.umber of vessels andcarrying capacity ('000 tonnes)
*) The French authorities report that in addition to this thelicences of 410 vessels, which did not take part in carg<:transport in 1985, were suspended. These licences will onlybe renewed if the national Survey Committee provides a newcertificate to prove that the vessels are still- fit fornavigation.
1.r..L979
1.1 .1985
t .1.1986
1986-L979
Growth86-79
1986-1985
GrowthB6-85
Total: vesselscarryingcapacity
l-9,397
13,171
16,982
L2,839
l-6,696
L2,BO4
-2,7OL
-367
-r3.9*
-2.A2
-246
-35
-1 .7t
-0. 3t
B : vesselscarryingcapacity
3,32r
1,955
2 ,603
I,756
2,5]--3
L,729
-808
-226
-24.32
-11.68
-90
-27
-3.5t-1. 5t
L : vesselscarryingcapacity
20
L2
T7
L2
l8
1l
-2
-t-10. ot
-8.3t
+1
-1
-F5.98
-8.3t
D : vesselscarryingcapacity
4,23O
3, 859
3,222
3,295
3,143
3,277
-1,087
-542
-25.7*
-15.18
-79
-18
"2.5*
-0.58
F : vesselscarryingcapacity
5,525
2 ,6L8
4,769
2 ,329
4,729
2,308
-796
-310
-r4.4*
-11 .8t-40*
-2L
.-0.88
-0.9tNL : vessels
carryingcapacity
6, 3ol
4,727
6,371
5 ,447
6,293
5,479
-8
+752
-0. 1t
+15.91
-74
+32
-2 .4*
-Fl .0t
66

In f985 the capacity of the fleet went sliqhtly down (- 0.3t),which brouqht the capacity on the level of - 2.8E compared to1979. This figure is the result of two opposite tendencies: onthe one hand the fleets of Belgium, Luxembourg, Cermany andFrance decreased by 13.2t, on the other hand the capacity ofthe Dutch fleet increased by 15.9E.
Consequently, the relative shares of the national fleets inthe total fleet changed considerably over the years, as isshown in table 3.16.
Table 3.16. National shares in total fleet capacity
1 .1.1979 1.1.1986 di fference
BLDFNL
14.8t0. 1t
29.3819. 9*35.9t
r,3. s.to.1t
25.6*r8. 0t42.8*
-1 .380.08
-3.78-r .9t+6.9*
3.5.2 Dutch and German fleets
The remarkable difference between the development of the twobiggest fleets (nr, and O) has been investigated in moredetail , see table 3.17.
Table 3.17. Breakdown of fleet developments, 1979-1986.
period 197q-1986 Netherlandscapacity x 'OOO t
Germanycapacity x 'OOO t
total fleet, 1.I.L979 4,727 3, 859
1. scrappings2. new buildings
balance (2-f)
3s6 (r) 1_ B*)+ 5e2 (2\ (+r3s)
+ 236 (+ sE)
s56 (-r48 )+ 2BS (+ 7?)
- 27r (- 78)
4. exports5. imports
balance (5-4)
- 3es (- 8*)+ eor (+ret)
+ 506 (+rrt)
- sr4 (-r3E)+ 2L2 (+ 68)
- 302 (- 8E)
Total development + 742 (+168) s73 (-1s* )
(1 ) includingservice "
(2) includingin 1985.
62'OOO tonnesin 1985.14,000 tonnes
reported as "taken out of
"brought back into service"
having been
reported as
6l

The "scrap and build balance" for the two f'leets reflects theinfluence of the German scrapping scheme at" one hand and theDutch investment premiums on new buil.lings at the other hand.tlowever, the balance of imports and exportsi turns out to b,eeven more important. More than 50* of the capacity-reduct-ionof the German fleet is caused by export of (over)capacity,Although there are no precise figures available, it is knownthat most of these ships were exported to t"he Netherlands, On
a smaller scale ships were also sold from Elelgium and Franceto the Netherlands. So, about 2/3 of the flutch fleetexpansion results from a ehange of flag.
3.5.3 Overcapagity
In the two previotts issues of the Annual R€lport an estimaltewas made of the overeaPacity in the inland navigation sect'or.The calculations ltere based on the assumpti.on that 1979 was ayear with a reasonable equilibrium between supply and dema,ndin,l, secon<lly, that the average productivity inerease could beset at lE per annum. As expressed in the previous AnnualReport it was felt that the annual producti"vity inerease rc:ouldpossibly be higher.
On request of the European Commission, EBt{ in Rijswijk carriedout, recently, a global study to qet a better insight in Lheevolution of productivity. On the basis oli a great number ofdetailed trip reports of Dutch dry cargo vessels operating onboth national antl international markets, it was possible toanalyse the evolution of trip components e"q. loading timei,sailing time, unloading time, load faetors,, daily workinghours, etc. The prelimitrary conclusion is that the averageincrease of procluctivity over the period f98O-1985 was in theorder of 38 per annum I If this figure is adopted as anaverage for the nuropean fleet, it is foun<t that theovercapacity, starting from 1979 as a base year, is nOw morethan 20t.
Table 3.18. Estimated overeapaeity of the total :fleet
development sinee 1979 1. I .1986
demand (t/tm)supply (t. carrying
capacity)
-7.82
-2.8*
balancepro<l " incr. ( E* /year)
-5. O*+18.08
estimated overcaPac itY +23. OE
This outeome coincides reasonably wellmore detailed ealeulations carried outCommission in the past.
witlh the results o':E
by the Central Rhine
68

3.6 InIand waterwgl transport by flag
Not all the 1984 and l9B5 data on the share of the f'leet ofeach of the l4ember States in inland hraterway transport is asyet available. Therefore, data from I983r), based on tonnescarried, are presented here in order to give dn insight intraffic on each of the inland waterrray transport markets.
Flag shares on national and international markets
In table 3. 19 flag shares are given for national transport'international transports, ingoing and outgoing traffic andtotal transport, including transit traffic ofBelgium/Luxembourg, Germany, France and the Netherlands. Inaddition to the traffic shares of each country, the share isgiven for other carriers ("0"). Under this heading, vessels ofSwiss and East bloc nationalities are the most important.
3.6. I
Table 3.19. Inland waterwayss national and internatlonal traffic intonnes; share by nationality of the vessel, L982 (g)
1 1 Source: Eurostat.
nationa lityof thevessel
nationa Itra ffic
tinternationa I
tra ffict
outgoingtra ffic
t]-n90Ingtra ffic
ttotal traffic
( incl . t.ransit )E
BlL
B/LDFNL
89.40.4o.57.72.O
33. 46.95.3
49.64,4
34.99.84.8
44.26.3
32. r4.75.6
53.93.7
45, 95,35.4
39. 44.0
D
B/LDFNLo
1. t88. 20.17.O3.6
5.932.5r.9
46. 5L3. 2
7.52r. o2.r
54.415.0
5.238. 5I.7
42.3L2.3
4.549.0
1.933.4TL.2
F
B/LDFNL
0.1o.2
99.10. I0.5
25.831. 4L7 .915. 09.9
L2. L
43.015.815.014. I
34.9L6.425,918.44.4
8.415.85A.74.48.7
NL
B/LDFNLo
1.30.30.1
98.00.3
13. 721, a2.4
54.37.8
L2,726.52.r
50.28.5
15. Br1.8
3. r63.06.3
11. I15. 5
2.O64.85.9
69

As becomes clear from the table, national traffic is in tlhehands of transporters of that same country. In France an<i theNetherlands national transporters carry out almost 100t ofdomestic transport. In Belgium and Germany this flagshar,e isclose to 90*. The Dutch are the only foreign transporterswith an appreciable share in domestic markets of other MemberStates (7 to gt in B and D).
fn international transport the Dutch fleet holds a very strongposition. Not only do Dutch vessels carry 54.3t of Dutehinternational traffic, they also are the main transporter inBelgium (49.5t) and German (+e.S*) international traffic.This important market share is held in ingoing as well as inoutgoing traffic.
fn German and Belgian international traffi.c national carriershold important marketshares of about a third of the tonnatlfetransported.
on the - relatively small - French international inlandwaterr^ray transport market German carriers hold the bigges'tshare (31.48), this represents, in partieular, outgoing Rlhinetraffic.
Figures on market shares in total international traffic, lbasedon tonnes carried, as well as in international P.hine ship;ping,are presented in tabl e 3.2O. Compared to the previous yeiarthe Dutch market share in total transport inereased frorn ,45.0tEo 47.42.
Table 3.20. Flag shares in total international transport andinternational transport by market, 1983 (t)
FlagTotal international
traffic t )(tonnes )
Rhinetraffic 2)
( tonnes )
worth/Souttltraffic 31(tonnes) *
B/LDFNLo
15.3E23.9*4. O8
47.429.4*
7 .4*29.2*2.L*
51.1310. 2t
38.6E2.9t8.2*
45.6*4.7*
r1 source: Eurostat.?l l4onitored at NL/D border. Souree: CBS.J) Based on national statistics of l[L and F.
70

3.7 Transport Inquiry Survev
The results of opinion surveys carried out among r^taterhtayoperators on the Rhine an<l the North/South network give aquiek insight into effects of the economic depression on theinland $raterr.ray sector.
On the Rhine, these surveys are conducted by the Central RhineCommission among 22 shipowner companies and cooperatives ofprivate operators.
on the North/south, the Economic Bureau for road and water$raytransport (r:.B.w., Netherlands), and the Institut pour leTransport par Batellerie (I.T.8., Belgium) collect informationamong a panel of owner/operators and shipowners on behalf ofthe Commission. The Office National de la rdavigation (O.N.W.,France) also supplies important information.
3.7.1 Rhine
The downgoing trend in Rhine traffic, which started in 1980,reversed in the second half of 1983. Al1 quarters of 1984recorded a positive grotrth. The severe frost in the firstquarter of 1985 caused a dip in the upward trend, whieh seemedto be of an incidental nature given the growth in thesubsequent quarters. But then again (Oa gS) tfre weatherconditions caused a fall in Rhine activity.
Table 3.21. Traditional Rhine traffic ('OOO tonnes and '000,000 tkm)
'oootonnes
1984
'000tonnes
1985Change*
'00o, oo0tkm1984
'00o,000tkm1985
Change*
Quarter
I234
47,7O452,rO950,15448,609
40,98552,52A52 ,33441,892
-14.1t+0.8t+4.4t
-13.8E
B,7289, 9139,6778, 989
7 ,498ro, oolLO,O926,973
-14.1t+ 0.9*+ 4.3*-22.4*
Total 198, 576 rB7,73i. -5.5t 37,307 34,564 - 7.4?
* compared to the same quarter of the previous year'
The r*ater levels in the last quarter of 1985 were so low thattraffic on the upstream stretch of the Rhine came even to astand still during a certain period. Long distance traffie wasmore affected than short distanee, which is reflected in aloss of -22.4t in tkm compared to -I3.8t in tonnes.Despite the decrease in Rhine traffic in l9B5 (-5.5t intonnes) it is felt that the underlying economic trend is stillslightly positive.
7l

3.7 ,2 North/South
T{aiting time on the bourses is one of the lcest indicators ofactivity on the North/South market for dry bull< cargo.Transport of oil products is free from bou:rse-interventiorr.The same applies for sand and gravel transport originatinq inthe Netherlands and for a number of large bulk traneports onthe relation NL-B.
The following table shows the evolution of waiting days bytraffic relation. For the total of }lorth/South traffic th<:level of waiting time for the year 1985 showed not muehdifference compared to the previous year. Only in the last:quarter a sharp reduction of waiting times was noted on alLlrelations, which seems surprising consider:Lng that the lerrelof demand in North/South traffic did not c'hange. The extrademand for ships in Rhine traffic ir Q4 'B!i (lorv vrater lerrelseause a reduetion of the average loading faetor, which iscompensated by using more ships) is seen as the explanator:yvariable in this case. fn particular bigge:r ships werediverted from worth/South to the Rhine marlcet.
lbble 3.22. Orarterly atrerage of raiting days in international Nrrth-South trafficbv traffic relaticrr.
ltaffic relatiqt ol 02 o3 Q,4 Yearly average
1) NL F 19821983rgu19851986
10.111.514.3L4.2l7.l
16.618.820.119.3
20.or7.6t6.218.0
15.O8.9
11.413:e
15.414.2I,9.I16.3
2)l{,-B 1982198319&t19851986
4.712.7L2.513.5to.9
lo.913.3L2.212:e
L4.712.914.o13:6
13.38.4
lo.74.7
rl.9tl.812.3|2.2
3)B-F I9g2r983r984r985r985
5.87.57.7
to.lro.9
6.07.77.57.8
4.28.48.19.9
6.14.77.O7.9
6.57.L7.6t:,
4) B-!U, t94321983L9U19851986
rlt8.9
ro.78.8
...8.7
r0:6
nlu8.7
11.3
9.56.98.5t:u
rl,8.7
1.O.3
s) F B+lrL 1982l'c'831984r985l986
9.220.919.O18.718.3
18.ot7.o19.619.1
16.12r.o22.426.6
12.516.218.610.3
1.4.ot-8.8:ro.o1.8.7
T?re general feeling of the transporters about ttre rErket sitr:atj.qr (balance ofqinicrs cn dsrard, utilisaticr of capa.city ard forecast of actilvity) changedqradrnlly orrer ttre year 1985. Fnxn very negative (f984) the balarpe of qinicnschx:qed to leas negative or even slightly positive to*ards tlle tnd of 1985.
72

3.8. Cost and price indices
Cost and price indices were presented for the first time inthe Annual Report 1983. In 1984 the system \^ras furtherdeveloped. In I9B5 minor improvements have been made.
Alt indices are on the basis 1.1.1979 = 100. This year hadbeen chosen by the CCR as a base year for Rhine marketobservation, because it is considered to be the latest yearwith equilibrium between supply and demand.
Some of the tabLes and graphs that are summarized andcommented here, have already been presented in the quarterlyreports No. lB and 20.
3.8.1. Methodology
Cost_iqdices_are calculated for four shiptypes :
ships having a carrying capacity of 350 tonnesiships having a carrying capacity of 600 tonnes;ships having a carrying capacity of 1200 tonnesi
- pusher units.
When the previous reports were presented, cost informationfor pusher units was not yet available. These cost indiceswere therefore based on the costs of big motorvessels(22OO tonnes). The results of a detailed study on costs ofpusher units became available in 1985. The corrected resultsover the period 1979-1985 are included in the graphs andtables presented in this report. As a consequence, totalcosts for Rhine traffic had to be revised slightly upwards.
The cost indices are calculated following a given coststructure in the base year (f.f.1982). The following costelements are taken into account :
- wages,- capital,
fue1,- other costs.
On waiting days the following assumptions were made :
Rhine : I d-y,N/S : 10 days.
The calculations are based on the actual cost developments on47 international traffic relations representing totalinternational water\./ay transport in the Community. Byweighting the various relations and cost elements, costindices are found for each of the bilateral traffic relationsbetween Member States and for the North-South and Rhineinland waterway transport markets.
The information is collected twice a year, on I,January and1 July.
t)

Price indices for the Blt."= are collected by the CCR incooperation with the Arbeitsgemeinschaft. The data areprovided by 22 transport organizations, that means: most ofthe big ship owner companies and some cooperatives of srnalloperators. These organizations are respo,nsible for 50 t-o 6Otof the total tonnage moved.
Price indices for international North-South traffic areEoTrEcTed'6v new (nijswiJxT and' Trs TeiuEsErs)l -rh-einformation is obtained from both shippers and transportrers.Some 200 mainly small transport firms provide information forthis part of the market observation system.
3,8.2. Overall cost development and by market ( j.n ECU)
Over the last years the cost development in inland navigationhas been dom'inated by the evolution of fuel costs. Thehighest level for these costs was recorded on I.1.1985. Sincethen fuel costs started to decrease gradually. A real fall ofoil prices emerged shortly after 1.1.1986 (not yet showrr infig. 3.1 ) .
Figure 3.1. : Overall cost indices by element (nnine + North-tiouth)in ECU.
tirq.n co3r5 ,/ Fiits 0€ r€tson€L / r€iEon xosttncArlli. calsrs / couls 0€ cirlti../ tirtti-rosr€nFU€L COSIS / COr.'tS Df CiRnnnnr / li€ttsr(rFKostEn0r)€l cosTs / arrt€s corJtt / rr€tltG€ rosl€n
ulU'az
?
?ar 980
Itt?3
r 929
5
{t
I
4l
TI
?3{| 981
l7
4l
2g
4l
2t
tt27
2tr905
ll
?3198{
It
?tl98l
t5
?t| 98?
74

After an increase of overall cost of 4.3t in 1984, costsincreased by 2.9* in 1985. The slight decrease in fuel costswas more than compensated by increasing labour costs andother costs.
Ttrese "other costs" represent mainly services provided to thetransporter, such as: repairs, maintenancer port fees,insurance, etc. fhis is now the fastest growing costcomponent.
Table 3.23.: Cost indices by elements and by market1.1.1985, L.7.1985, 1.r.1986 in ECU (r,r.L979 = 100).
Market Cost elements 1.1. t9B5 1.7.1985 1. r.1986
Overall\,IageScapitalfuelother costs
150L22268r39
r53L22261140
r58L22258145
total costs L52 r52 r55
Rhinewagescapitalfuelother costs
r52L2527Lr43
154L26263L43
160L26263r48
total costs L57 L57 r60
North/Southwagescapitalfuelother costs
148lr8264135
l5l116259r35
156115250r39
total costs L43 r44 L47
Capital costs tended to go down, in particular in North-Southtraffic. The decreasing interest rates and the low investmentlevel in the sector are the explanatory factors for thisphenomenon.
Since L979 total costs increased slightly more in Rhinetraffic (+60) than in North-south (+a71, mainly because theboom in oil prices had a greater impact on Rhine costs (Rtrinetraffic is in general more fuel consuming per tkm). No\,'r thatoil prices are going down it is to be expected that thedifference in cost level will become less.
75

Total cost development by nationaLity of the carrier
If costs are monitored in national curren,cy, bi9 differencesappear between cost developments by flag, mainly due todifferences in inflation rates in the period L979-L984.However in I9B5 the evolution was in all Member Statesconcerned about the same, namely a stabilisation oftotal costs.
Figure 3.2.: Overall cost indices in national currency
3.8.3.
ll
l2ltt979
Inby
Table 3.24.
F!F
II
,Iu)frJoU.alz
3ILD
',.. ' l'.,/.. )2/
al ?l a5 a, ?t
lz3tt25rlr98. t38S t986
s,rzSr
r 980
t tt r! 13 t, It
tzt4r23tr?5tr98r l9S? 1983
the following Lable cost increases in 1985 are broken <1ownnationality of the carrier.
: Total cost indices by nationality of the carrier :innational currency (f.f.L979 = 100).
at
..:l,l..a'/
?'.2
B (er) D (DM) F ( rn') NL (nrr,)
I.1.1985r .7. r9851.1.1986
L49L52150
r39141140
r85191190
145L46L44
Increase 1985 +0.5t +I. tt +2.9* -0.58
/o
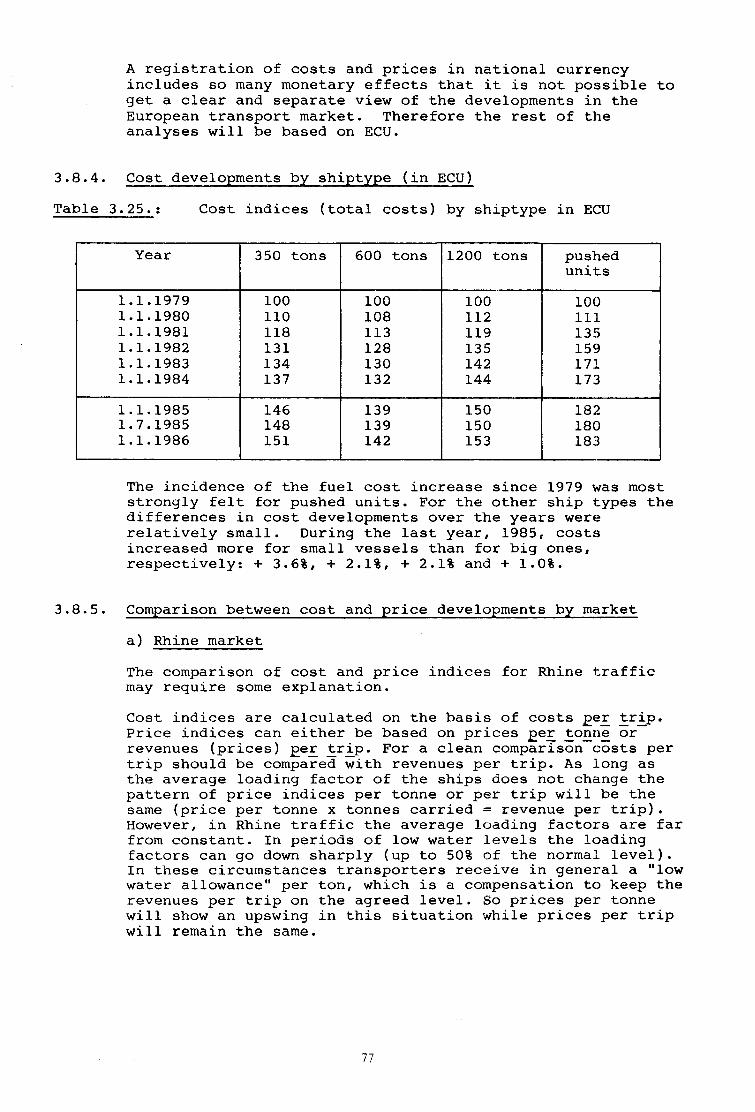
A registration of costs and prices in national currencyincludes so many monetary effects that it is not possible toget a clear and separate view of the developments in theEuropean transport market. Therefore the rest of theanalyses will be based on ECU.
3.8.4. Cost developments by shiptype (in ECU)
Table 3.25. t Cost indices (total costs) by shiptype in ECU
Year 350 tons 600 tons 1200 tons pushedunits
1.1 . r979I . r .1980I .1.19811.1.1982t.1.1983r. I.1984
100lt0118t3rL34L37
100108113L2ar30L32
100LL2119r35L42L44
r00lrlr35r5917rL73
1.1L.71.1
1985r9851986
L46r48t5t
r39r39L42
150150r53
r82180r83
3.8.5.
The incidence of the fuel cost increase since L979 !,/as moststrongly felt for pushed units. For the other ship types thedifferences in cost developments over the years wererelatively small. During the last year, 1985, costsincreased more for small vessels than for big ones,respectively: + 3.6t, + 2,L2, * 2.It and + 1.0t.
Comparison between cost and price developments by market
a) Rhine market
The comparison of cost and price indices for Rhine trafficmay require some explanation.
Cost indices are calculated on the basis of costs per trip.Price indices can either be based on prices per tonne orrevenues (prices) per trip. For a clean comparison costs pertrip should be compared with revenues per trip. As long asthe average loading factor of the ships cioes not change thepattern of price indices per tonne or per trip will be thesame (price per tonne x tonnes carried = revenue per trip).However, in Rhine traffic the average lclading factors are farfrom constant. In periods of low water levels the loadingfactors can go down sharply (up to 5Ot of the normal level).In these circumstances transporters receive in general a "lo!vwater allowance" per ton, which is a compensation to keep therevenues per trip on the agreed leveI. So prices per tonnewill show an upswing in this situation while prices per tripwill remain the same.
17

But there is a second effect that has to be taken intoaccount. Reduced load factors imply that more ships areneeded to keep the normal cargo flow going' So an increase, indemand is felt in the market which causes a further upwardpressure on prices. Consequentlyr not only prices per tonne,but also revenues per trip will go up - alt;hough to a muchlesser degree - in such periods.
In figure 3.3 price indices per trip and per tonne arepresented for dry and liquid cargo and compared to theevolution of costs in Rhine traf f ic as a whrole.
.]qigg-._:_.3.s_ Cost and price developments for Rhine traffic in ECU
LtoID cr6o / rtcxnDt8f,r Llqrl&3 / lirx|-lltrc
t : Fis ffi FrJslb?',l*7Elii5E;' '+"[y cal60 / tfirittlt€3 *lJ.3 | r|]qlxr.irttsA. pric! Fr tort/rir 9. t./Prtis Dro t.8. pric. Fr tri/prir p. vofq!/Prtt3 p.o F$rtcoslt/cours/rosr€n
i', \x
\-\. -v"v'
P'ltqrn:i
Ul-rt(J
a-z2
a,
23r!t85
2l
2tt93a
2a
al2t
al?ral?t1900 l98t
The above-presented graph strows clearlylow-water-effect in the last guarter ofsimilar occured in Q4 83.
Lhe strong1985. Something
;'r 2t.
-
-----l''.
78
The cost/price ratio of 1979 has been ehosen as the referencelevel, beeause this year is considered as a year withequilibriun between demand and supply on the Rhine market.The downgoing demand in 1980, and the overcapacity thatresulted thereof, caused a sharp fall in prices both in dryand liquid cargo.
fn dry cargo the situation deteriorated further in the period198I-1983. In 1983 profitability reached its lowest point,with prices dorvn to 90 white costs had gone up to 150. sincethen the situation has improved slightly and gradually.Prices in liquid cargo had recovered partly already towardsthe end of 1981. Since then the evolution of prices runs moreor less parallel with the evolution of costs.
General remarks
The cost indices are based on a detailed study - earried outin 1982 - eoncerning the cost structure and the produetivityof different types of inland navigation enterprises. Sincethen the periodical changes in cost elements (fuel , rntages,etc.) have lreen applied on the costs per trip calculated forthe base year, but possible changes in the productivity werenot taken into aceount so far. In 1985 the EBW on behalf ofthe Commission earried out a global study on theproductivity-evolution for motorvessels in dry cargo. Thebutcome indicates an average productivity increase (moretrips as a result of shorter turn around times longer workinghours and other factors) of about 38 per annum. It isintended to introduce in the future a correction factor forpro<luctivity changes in the calculation of eost indices.
t9

b) North-South market
In international North-South traffic there are different:market regimes, which results in different pricedevelopments.
* The market for liquid cargo is free, as it is on theRhine. The same applies for most of the sand and grave.Ltransports.
* The rest of dry cargo is in principle subject to a tor-l:r der61e system, although there are excepti,oni for certain.transports between NL and B. prices in this regulatedmarket are fixed after negotiations bet'ween representaiLivesof transporters and shippers in the tariff committees, orby transporters unilaterally.
Figure 3.4.: Cost and price developments for i,:nternationalNorth-South traffic, in ECU.
prl cesclrry cargo
/':.,_-.- -:
at
ar
./r-
r'/ t///
/
-/
ll t6
t?trt98?
-- crosts
pri cesLiqrid
./ ,'t''
,ttut- rt',t'. -.i-.
t'iprl cessiard ardgrnaveL
.-- -- - )'--"- -
rtlefr
| 929
g2
laltl 900
J2 It
t?f,| 901
?t 2t
rl21'I 984
6
tl
?, 2t
?3arl9s5 I t€r6
80

Prices in the free segment of the North-South market showroughly the same pattern as on the Rhine. The lowest point inprices compared to costs was reached at the end of 1983.Since then prices developed parallel with costs or tended torj-se slightly more.
Prices in liquid cargo showed an upswing at the end of 1985.The extra demand for tankers in Rhine traffic in this period(low water) wiII have played a role. So, probably theupswing will turn out to be of a temporarily nature.
As the prices in the regulated market are currently moreattractive for ttre transporters than on the free market, theovercapacity in dry cargo vessels tends to concentrate on thewaiting lists of the tour de r6le-systems (including the tourde r6le systems for domestic transport in NL and B). Thisleads to an increase of waiting times, see $ a.Z.Z., whichhas a similar negative effect on the profitability as the lowprices on the free markets.
8l


EHAPTER 4
RAIL
4.r Introduetion
4.2
After the reversal of the dor^rngoing trend in 1984 (+fsE or 9million tonnes), 1985 shorved a further small increase of 2.4*or I 7OO OO0 tonnes. The increase expected for 1986 is +2.5*.
Intra EUR-IO international rail activity
Table 4.1 gives the EtlR-l0 matrix of tonnages moved by rail.
Ingoing data have been ehosen for all countries except for theUI( where exporting figures of the partner country have beenused (due to a laek of split of the IJI( ingoing data).
fn the table Belgium and Luxembourg have been taken togetherfor the sake of conformity with what has been done in theehapters on road and inland waterways.
As far as freland is concerned, the only international railtraffic is between Ireland and Northern lreland. On thisrelation no information has been communicated.
The main traffic flows run bett.teen Germany, .France, Italy andBelgium/Luxemburg, follorved by the Netherlands. Of theseflows, international traffic to and from Gerrnany (+1.a6 miotonnesi +4.44), nelgium/Luxemburg (+2.52 mio tonnes ; +7.1t)the Netherlands (O.SZ mio tonnesi +69t) increased, whileFrench (-f.So mio tonnes; -4.34) and rtalian (-0.3e miotonnesr -1.7t) international traffic decreased.
83
n- c\llo'\0 sf loF.' FlrnrY) Ftl$
illE F1
rf@o
o\c dP d0t.o f\ Fl-{ rn (\l+.++Ft lnl\o-t Cltrc."F(r dlifi
-l r0
?1ll
Fl cc
o+J.0t{
+J
ot{b
d0
qcc|!aocoP
oo
().Ar{.1t{r(tt{+.)
Fl."1,dl{Fl(o
tro
.Fl+Jtdgfio+,tr
.Fl
C)
IK
fL
dt.|+J
H
r1
ori
rdF,
l-l
(lr-l
tlF
E-
cc,or (f,mo| .O\ cr) C\i
ooFiOi+
lc{ c\l olFs$ .
rrFrtnlo cclF{ F.l I
16.(f,ol-{ \9
looolt-
'
ltntn Ol$r* .l.il *f Il*.* -l+
lco $ r-lc\r \0lO F{ \gIlr-. ccl-t '-t *
Ir.O -t cloto .
lt--t,I!I
lNo |.nl\0 0!
lo'Rl+
loo -r \O\Of* .l(\
+
@r-<'C0@ .Sf-tN€|t,F{\oF +
(,
stnoc@Fl
+
:olc\(\1
o'F.{
I
t'\OON(\I o
I
stnc)rrc\+
moorn(\+
oo III
FIFlO
o+
III
(Y, Or \C[n !+F{ Ft Gl
I
Xa
F('o0Co' .\00co
(n+
qolo!CC .
\o
+
nFoO\O .
(f)
+
N+Of-+
Tr(f)o$cG
c)l't+
III
I loocllc'fFllr +
\o \0 0t01 tt f-OF{Gl
Fl
I
H
III
III
III
III
III
!Il
III iti I
II
ol\o()Ff C .Fl Fi fn
I
NGIO$(fl .Netrn
I
-tc\oStr9 .$tStn
+
qfooN(\I
r-Fi
I
t-Osf
o'(\I
oIII
III
c)or!oornca+
)oo(?)
\0
I
cclooC0F .G@N
I
Fl
cc
ln00(7) <(\l$!$
ro rn+
J]\OONOntOF{O\C
+
3tnOrr-3o\c-l F,l
+
n\oc!r\ rn .ro,r-
+
r .1.
t'\oo3r-n$d
N<ftn
+
\oc10msr .r-'F.{
+
III
t\coot') (\l .r-ol
I
3(f)0o!S@+
otF.\C$c{c\t \o r\@oFiF{+
Fl,a
\OF{O\0@ .otf*O,Fl r-.1
I
!rfC\\o .vtn@
Fl
+
<footrg .$\fF{
F{
I
III
c<f(){r\t'O 0n
+
ooJoFlc+
III
Cr.'OFf.
(Y)
I
\o\O|.n
+
Or$al@f- .Qf-Gl
$$+
l-{
-{@CIJ]Fi .$oorn \o
+
>cqoi.) \03-l ,+
lC r-I
!II
r.)f-O-.{ \0 .ntno
+
F(NOrt r-nO (Yl Ft
Fi Fl+
0000FltC .NFll-
(\I
+
Fr ^l
lCn\o .(N(N
.f
ro(?)o(\I
+
Gl\oorn$\o o., (\rn rnF{ F.{ |
f.
coctoO\g$oln\c\0 |
Y!@ONsf: tl^r O
FliF{
I
0\oonlr) .n iif f--{ Fl
+
N S.Cc0 \co@oltr}ro
I
c0c|l.}.
\ctn
+
t-m I
II
(lGI()Fl Gl
\9"{.F
fDFI()
r\sf
I
cf) cc c)(\i F{1r)ocoro rnF{F{ |
(t
Fl
1
t;(T
III
o\ooN\O .>rff-tl fa
I
FrnOnr(r .Nmsl.N(\t
+
o\f-Onorn .o<"clor
n<r+
FFOnt ctFi Cn \O
rq (fr+
|n@oool
F{ fnf/)
+
III
c\t\0()S\9rf, rir ||l)
c')
t-
@olJl'.l.
$Fi
+
tof\ f* \Csf lfr .c\l Gl r\fo <.tf-l+
8/e
/E
gtndpccG
\ftndpe6Fq
$rnd9qJ@
H
{tndpsccFlz
cf In dPc0 cc
Flm
vtndpFsl if rn dl
Flg.H
V rO o\ot3 0c
Ma
$mo\0trq)
tr(t
vtndp@c0
&Fl -r
84
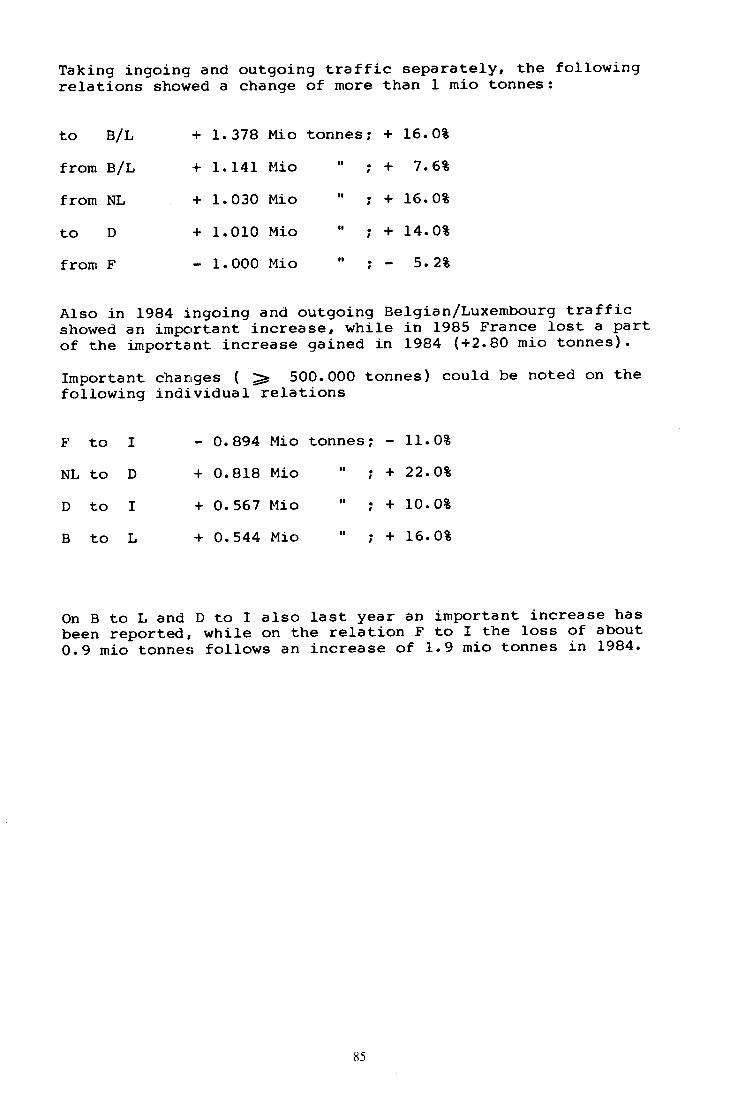
Taking ingoing and outgoing traffic separatelyr the followingrelations showed a change of more than I mio tonnes 3
ro B/L
from B/L
from NL
toD
from F
FtoI
NLto D
DtOI
BtoL
OnBtoLandbeen reported,0. 9 mio tonne€i
O.894 Mio tonnes; lt.Ot
0.818Mio " ,+22.020.567 Mio " r + I0.0t
0.544 Mio " r + 16.0t
D to I also last Year anwhile on the relation Ffollows an increase of
important increase hasto I the loss of about
1.9 mio tonnes in 1984.
1.378 Mio
1.141 Mio
1.030 Mio
1.010 Mio
1.0O0 Mio
tonnes ill .
t
16. ot
7.6*
16.0t
14.0t
5.22
i*
ii
t
Also in 1984 ingoing and outgoing Belgian/Luxembourg trafficshowed an imtrrcrrtant increase, while in l9B5 France lost a partof the imporlant increase gained in 1984 (+2.80 mio tonnes).
Important charrges ( > 5OO.000 tonnes) could be noted on thefollowing indi.vidual relations
85

The overall developments during the year, excludingB :==::L, were as follows
quarter Igrowth rate -l-.5a5 /84
rI+3.7
rrr-2.7
IV+4.f,
The improvements on the relation NL -
- D, but also onthe relation B ---+ Dp were realized during the fourthquarter in particular (+48,q, and +158 respeetively),follorring low water levels on the Rhine, whieh madeinland waterway transport on that link more diffieult andmore expensive. On these two relations rail transported6001000 tonnes more during that quarter than the prevj-ousyear, ,r'hile inland navigation lost I.2 Mio tonnes duri.ngthe same period.
4.3 Spain and Portugal
In this issue of the annual report, dat,a on rail traf{:icbetrveen the EUR-IO and Spain and Portugal are publisherdfor the first time. In the following table data oningoing anrl outgoing traffic between the EUR-10 and Spainand Portugal are given.
Table 4.2 Rait traffic between the nUR-lt) and Spain anrilPortugal , in 1985, ( in 'O00 to:nnes )
Total rail traffic between the rberian peninsula and t-heTen is very small; only between Greece and the other nineMember l3tates is less traf fic carried by rail. g4Z ofthis traffic is with Spain and only G* with portugal.outgoinq traffic is 40? of total traffic and ingoing 6Ot.About half of total traffic is going to and cominq fromGermany, fol loryed by France ( 20* ) , Bel g j_um/t uxemburg(r0S) and rtaly (8?).
\'"froma
n Pfrom
ton P
.TOTAL
E P
DFINLRlLUKIRLDKGR
4067927
640
N.A.
I
L4I
I70I
N. A.
o
DFINLF/LUKIRLDKGR
348207
B739
L32
":o'15
o
l12L13
oI
br:4.
754246r4445
138N. A.
l5I
252930
c)
2N. A.
o
Total 55e 40 Total 828 46 I 383 B6
86

4.4 Railway Tariff Indices
4.4.L Coverage
Tariff surveys are being carried out in Germany, France,Italy, Belgium and the Netherlands. The four railways agreedon the method of a "basket" of representative commoditiesdefined for eaeh directed relation from actual traffic datafor the reference period (1981). The indices are based on theofficial tariffs, expressed in railway francs. The, sometimesimportant, rebates on the official tariff given in practiceare therefore not reflected in the indices.
4.4.2 Priee developments by relation
The quarterly data are nolt being published in the MarketDevelopment reports taking 31 December 19Bl as 100. For 1984the following price developments could be noted:
traffic relationindex
increase (t)in 198531.12.1984 31.12.1985
DtoFDtOID to llILD to R/L
T2T115114117
L26125115t25
4.17.80.96.4
FtoFtoFtoFto
DINI,B/L
r2lt44L2p,134
130155133r43
7.47.63.96.7
ItoftoItofto
DFNLR/L
r40t34r45
115151l4tr46
7.95.2o.7
NLtoD!.IL to F
NLTOIIIL to R/L
112117122t28
tit128136
3.44.96,3
R/LB/rR/LRlL
toDtoFtoIto NL
L22r33136t24
tiz145130
ela6.64.8
6/

Important priee inerease of more than 7* coulil be noted on therelations Italy to and from France and Germanlr to ftaly andFrance to Germany. On some relations to and fr:omBelgium/Lux€mbourg price increases of more than 6* eould benoted: to and from France, to Italy and to thei Netherlands.
In general these increases could be explained by inflation r:atesin the two countries in the relation and in, jrf any, transitcountries. Flowever, oh certain relations freicJht price inereaseseem higher than average inflation, for instance NL to B/1, andF to D, while on other links increases are clearly lower thanaverage inflation in the countries eoneerned, like in I to B/L.
88

CHAPTER 5
COI',IBINED TRANSPORT
5.1 Container transport l9B5
The data in paragraph 5.1.1 to 5.1.3 have been establishedhrith the assistance of Intercontainer (soci6t6 internationalepour le transport par transcontainers); an enterprise owned by25 European railways companies for the international carriageof containers.These data cover container movements by rail in Europe whichis a wider area than the Conmunity.From paragraph 5.I.4 onwards, data are reproduced onintraconmunity transports of containers by rail as they arecollected through the Statistical Directive RaiI.In both cases it is unknown which share of total containertraffic is combined roaC,'raiI traffic as distinct from purerail transport.
5.1.1. After dropping for two years and a recovery in 1983, 1984 and1985 are years of sustained growth for Intercontainertraffic. The details of this development are shown in thefollowing table.
Table 5.1 Development of total container traffic by rail(in rEL)(*)year tra ffic in/decrea se grolrrth rate
r9B019BrL9821983L984r9B5
811,500783,7507tB, 500760,750924, 7509O4,75O
27,75065, 25O42, OOO64, OOO
80, ooo
3.488. 3*5. 8t8.4t9.7*
In TEU-km the development in 1985 was even better, as is shownin the followinq table.
Table 5.2 Development of total container traffic by rail(in '000 O0O TEU-km)
year tra ffic in/decrease growth rate
I9BO1981L9821983L9A41985
623.7605.9556.2606.7662.9749. L
r7.8- 49.7+ 50.5+ 56.2+ 86.2
+ 6.1*- 2.9*- 8.2*+ 9.18+ 9.38+11. 3*
( * ) TEU: T\renty f eet equ j.va Ient unit.
89

Traffic to and from the ports remains by far the mostimportant container traffic. In the following table thedevelopment of the various types of container traffic aresholun.
Table 5.3 Container traffic broken down by sector, in TEtl andshare of each sector
However, the maritime container traffic is slowly decreas.ingin share, while continental traffic is increasing inimportance every year.
5.I.2. The following table shows the Intercontainer traffic byrelation.
yearcontainer traffic
to and fromthe ports
continentaltra ffic
UK + Ireland USSR,
number I nurnber t number t number t1981L9821983I 984I 985
467 000424 500444 500478 0005r3 000
59.659.158.458.056.7
250 750245 000264 500293 000330 000
32. O
34.134.835.536.5
4L 50033 75031 50032 00037 500
5.34.74.L3.94.2
24 50015 00020 00022 0oo24 AOA
3.12,L2.62.72.6
90

***l-".*lo^*lrr*l .nNdpor t.rt F{lF{ orlc{ $ (nl\9 r- @l (n $ o(rr @ .l .lr- o\ .lO.| (Y) .l ro rfo-ll Sl-r3l -$l '-I-{-r+l rlNN+l +l 53+llrl
Gtodp(n \g lr')otnr-l
NF{olor I
"-o*1.-*lr.n*l-r*C0 O @l{ ot O\l@ @ -llOr -.1 @c\ (n .lO r- .l-t \g .lO o\
-t@l^t31.-Iltn Ro\ or +lsf ro +lc\r $ +lF- o +ll--l
|r|Nrn@c{
rn@rno+
^**l.r*1..*lr**r- sf u.)lrn d ctlol (n r$l-{ rn \r{ f- .l-l -{ .1 F{ .l-{ -lcol $l ol o\F{ Fl F{l Nl (Yrl Ol+l+l+l+ttl
@$dpomo@t-
sf-{ C.l sf
+
o-*l(\t \o (Ytlrn \0 .l
$l- - *lI
,-*l^.*l*-*l..,**In F{ Ol@ (n C\l(f) ol oll@ \g o\c! ro .lc\ \o .ltn -{ .lt- o
-{l \gl -tl roO $ Oll e{l-l (a \Ol F{ (nc! e.l +l -{l +l +l*l I
O sl, dP@OF{(no
r.\rFrNc\m+
o l"=
--$l^'tlft (Y) dPlo] -l dplsf Or dPr-(nf-llnln|'oltn@\OC\ (\t .l-t tn .l\g c) .
sfl \ol \gFll {lO sf -l| | c.llN c.l +| +ltl
CO \S dPOr f- Oto@
r-FlFF{NC.r+l" f"'
co.', t ..,*loo*l^.*r-, sf @lO @ @l(') ro \gl=f r- \O\Ot- .lr-o .lO<f .lsfol
ol\o Fl nl F{r\ F | \O olrn \g lco (n+l-r -r +lN N +lcf, (n +
ttl
tllco \O dplF r- dpl @ -{ dplto F ol-J tn @l Fr O\ Ollr-rn .l crt .l \9@l--Rl :l r-*I tl sfl r.-@+ttil
|;I;l-.il
tlo ro dpl{ ro dpl\o F dp-r \O OIO c! Ol:f ot Frf- ro .l-t -t .l\0 r-F{l (rll Aro rn l(n @ \gltO N -l-{-{ ll F{lC\(\l+| +l
tl
llll-r ro mlo o opl ro lir dplor o\ r-l(\l F{ cll O r- \Olc\.f .l N .l Oc0 .
I Rl 9l -o^| +l r.l oo tll+l.,',-*lrr*l l.r*l^ -*1. **l-- *l-o*lot*l o\.',dp\o ch $l-{ \o c)l l-r c.r olro r- c)lo o\ o\l-r oll(Y) F.r olo\ (Y) r-l @ FJ (f)$ (y) .lo -r .l In or .lF, o .lo o| .l .l!s tn .l .l @ r-rnl ml | | r-l @l otl \ol sf I rol (\@'o l-r+-tl hf \o l@\g loO I sflF{co$l tol (r)\g."."'|l^..*l l^^*l^^'l--*l 'l ?l 'l ::+*"-*l l-**l-r*lr-*l.o*l lo^*lt-*l .o..,dp-r o ol lo o c\lo @ -tl@ c{ sf lsf r. ol l-{ -{ sf lr) rn ol @ ro \o{ -{ .lt l.$ o .lo\ \0 .l@ F .l-r <n .l l-t to .l-r .l o <19l I ol 'ol ol @l I tol -rl (\r- <n r-l l@ (n o,llc\ rn 6hl(o \9 otl -t tnl I rol rOl (Y) -t sf-*l l-{o'+l *l--*l ?l I Il ,l sf\o+
l-OdPrn@Otro@ oF{ O\ (Y)
olrr+Fl
\0 dpFIO@ o
F{
+
@dpsf \oo
ro(\ (\lN+
odpo@
r-I
sr dp\f sfot-
(\ Fl-{l
rn dpOF{@
@o\0m+
(\ dp@ro
Fl(n\0sf+
ro dpOr f-o
@o\ (f)
+
$roslFl cD crj @
Hroo@E{
sf@
tn@
rn@
x(,
sf@
ro@
rn@
vo
sf@
rO@
sf rn@@
F1&H
@
ro@
rn@
V
{@
ro@
ro@
Fl
trl
sf@
rn@
ro@
Flz
rif@
rn@
ro@
H
\r@
ln@
ro@
h
sf@
rn@
<| rrt@@
o
+JO.Fo
€cd6c)ri,ooFl
a
F]FrHot{o
EJtr
Lo.A+)(d
Flok
'oo
.F4r+{q-{
dt{+,
oF{
I!"pH
t{oq.A(!p
otl0)+JdH
1rn
oF.o(0
Ei
9l
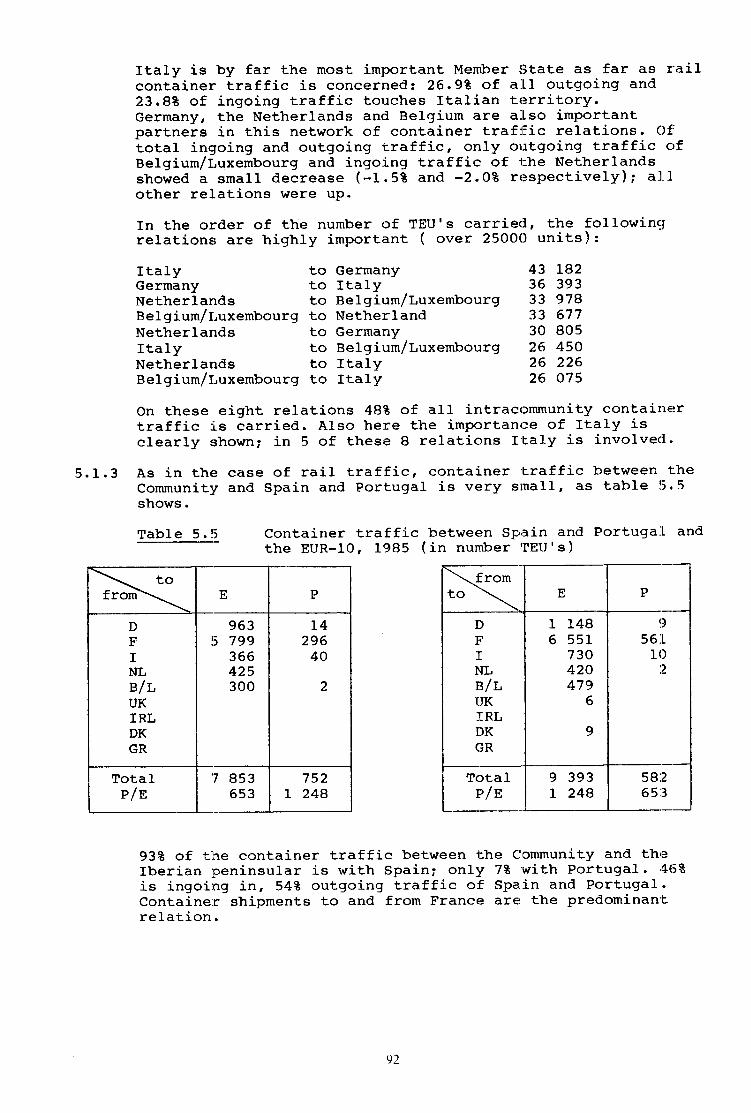
Italy is by far the most important Member litate as far as railcontainer traffic is concernedz 26.9t of a-11 outgoing and23.8t of ingoing traffic touches Italian territory.Germany, the Netherlands and Belgium are a-Lso importantpartners in this network of container traftFic relations. Oftotal ingoing and outgoing traf f ic, only or"rtgoing traf fic ofBelgium/Luxembourg and ingoing traffic of the Netherlandsshowed a small decrease (-1"5S and -2.0t rr:spectively); al-1other relations were up.
In the order of the number of TEU's carrie<l, t|e followingJrelations are highly important ( over 25000 units):
Italy to GermanY 43 LB2Germany to Italy 36 393Netherlands to Belgium/Luxembourg 33 978Belgium/Luxembourg to Netherland 33 677Netherlands to Germany 30 805Italy to Belgium/Luxembourg 26 45ONetherlands to ItalY 26 226Belgium/Luxembourg to ltaly 26 O75
On these eight relations 48t of all intracommunity containertraffic is carried. Also here the importance of Italy isclearly shown; in 5 of these g relations I't.aly is involve<l"
5.1.3 As in theCommunityshows.
Table 5.5
tofrom E P
DFINLB/LUKIRLDKGR
9635 799
366425300
I4296
40
2
TotalPlE
7 453653
752| 248
case of rail traffic, containertraffic between theand Spain and Portugal is very small, as table !i.5
Container traffic between Spiain and Portuga-l andthe EUR-10, 1985 ( in number 'IEU' s )
fromto E P
DFINLB/LI'KIRLDKGR
I6
r48551730420479
6
9
1)
56rIO
i2
TotalP/E
9 393L 248
5E:265:3
93* of ttr1e container traffic between ttre C,ommunity and t}teIberian nreninsular is with Spain; only 7t 'with Portugal . '46Eis ingoing in, 542 outgoing traffic of Spain and Portugal.Container shipments to and from France are the predominanrtrelation.
92

AIso between Spain and Portugal the number of containerstransported is very small.
5,1.4 FJ-gures are also available from the Council statisticalDirective RaiI. The figures relate to national andinternational contaj.ner traffic in number of containers, fu1l.and empty, and in tonnage by Member State. Because not aII thefigures for 1985 are availdble, tables 5.6 and 5.7 show theinformation for 1983 and 1984 starting with the number ofcontainers transported.
Table 5.6
To avoid double countings in the case of transit only thetotal number of containtrs loaded is gi.ven. Because of thedifference in source these figures are not comparable with thefigure for total in/outgoing intercontainer traffic in table5.4.
Number of containers ( loaded + empty)transported by rail (x f 000), 1983, 1984.
(")
CountryNational trafflc Internatlonal traffic
(Ioading + transit)
1983 1984 growth t t983 1984 grot/Yth t
F.R. G.
France
Ita ly
Netherlands
Belgium
Luxembourg
UnitedKrngdom
Ireland
Danmark
Greece
453
449
121
6l
93
2
904
104
34
499
438
264
B7
103
2
820
r08
37
9.8
2.5
118. 2
29.9
10.8
o.0
- 9.3
3.8
8.8
208
l04
B4
63
108
0
I
33
I
223
l16
128
69
LT2
o
34
1
7.2
r1.5
52.4
9.5
3.7
0.0
3.3
0.0
EUR-10 2 22L 2 359 6.2 4r9 * 495 * 15.4
93

For 1985, the following data are availabler:
Table 5.7 Number of containers (loadedt + empty)transported by rail (x I O00), 1985.
The tonnage transported in these containers is shown in thefollowing tables.
Table 5.8 Tonnage transported with con,tainers by rail-('ooo tonnes), 1983 , L984.
Country Nationaltraffic
Growthrate
Internat.ionaltraf fiic
Growthrate
Germany
France
Belgium
Luxembourg
Danmark
Greece
528
436
109
3
39
+ 0.58
0.5t
5.8t
50.0t
5.4t
+
+
+
24L
L22
LL2
0
29
2
0.88
17.38
0.o*
0. o*
L4.7*
50.0*
Sub-totaI Ir15 + 3.2* 318 (*) + 6.9*
CountryNational traffic International traffic
(loading + transit)
l9B3 1984 growth I r983 1984 growth tF. R. G.
France
Italy
Netherlands
Belgium
Luxembourg
UnitedKingdom
Ireland
Danmark
Greece
3 143
3 340
I 884
575
862
19
10
I399
113
350
3 613
3 532
2 029
897
949
27
9
1
92L
246
381
15 .0
5.7
7.7
56. O
t_o. I42.r
4.6
11.9
8.9
2 325
L 697
L 497
783
L 529
I
L2
379
1l
2 502
I 899
I 7r5
882
L 495
I
337
13
7.6
r1.9
14. 5
L2.6
2.2
0.0
LL.2
18.2
EUR-IO 2L 684 22 594 4.2 5 632* 6 232* r0. 7
(*) see table 5.3.
94

For f985, the following data are available:
Table 5.9 Tonnage transported \tith containers by rail('OOO tonnes), 1985
on the broad lines, these figures show a less positivepicture for 1985 than the information obtained fromintercontainer. This could imply that Intercontainer trasincreased its market share of the total number of containermovements by rail which \^ras, in 1984, 94.72.
(*) see table 5.3.
Country Nationaltraffic
Growthrate
Internationaltraffic
Growthrate
Germany
France
Belgium
Luxembourg
Danmark
Greeee
2 827
3 589
I 0L4
37
409
+ 5.9t
+ 1.5t
+ 6.8t
+ 37.0t
+ 7.32
2 730
L 928
r 458
2
359
22
+ 9.1t
+ 1.5t
4.92
+ 50.0t
5.2t
+ 50.0t
Sub total 8 876 + 4.4t 3 819 (*) + 5.4t
95

5.2 Piggy-back transport
The data in paragraph 5.2.I have been establiehed withassistance of U.I.R.R. (Union internationale des Soci6t6s detransport combin6 rail/route). Paragraph ,5.2.2 presenta dataobtained through the Statistical Directive Rail.
5.2.L The data are based on the number of units despatched by the"organizing" comlnnyl i.€. the number of semi-trailers,swap-bodies or road trains €tc. carried bly rail wagons.
The increase in piggy-back which started :in the fourth quarter1983 after a slump period of one year and a half, and whrichcontinued i.n 1984 further lmproved in 19815, except durin,g thef irst quarter. The quarterly growth f igures related to t.hesame guarter of last year rrrere as follows:
Q1: 2*t QZz +5t; O3:+88r Q4!+17t.Over the year, the number of despatches increased by 7t as isshown in the following table.
Table 5.lO Number of despatches in international piggy-backtransport by country of despatch
Country of despatch
Units despatched Growth rate
1984 1985 UNITS (r)
D (Kombiverkehr)
r' (Novatrans)
I (Novatrans+ Ferpac+ Hupac* Cemat)
NL (Trailstar)
B (rnw1
UK (Novatrans)
68
9
57
5
L4
5
940
222
041
814
913
874
74
I
61
5
I5
7
308
883
857
o78
890
o94
5 368
339
8164
736
977
L 220
7.8
--3.7
8.4
-r.4.5
6.6
20.8
Tota I r.61 804 L73 110 11 306 7.O
96

with the exception of a part of Novatrans business andTrailstar all companies show impressive growth figures. l9g5figures on intra-Community relations are shown in thefollowing table.
Table 5.Il EUR-10 piggyback traffic, 1985, (number ofdespatches )
ToFrom
D F I NL B/L UK TOTAL
D
F
I
NL
B/L
UK
3
32
I
087
999
585
151
379
5 662
480
64
33 575
5 244
3
11
6
506
097
725
679
3
3 727
I 017
881
153I1
47
7 L54
35 6s0
9 262
60 695
4 09r
12 728
6 749
EUR-10 37 822 5 585 60 L4'1, 4 409 13 051 7 20L L23 2L5
rlAs the table shows, fiaty is by far ttre most important partnerin intracorwnunity piggyback transport; about half of allintracommunity traffic goes to or comes from Italy (60 0O0 and51 O00 despatches respectively). of total rtalian ingoing andoutgoing traffic, more than 5Ot has its origin or destinationin Germany which makes the relation Italy-Germany by far themost imlrcrtant: 54t of all intracommunity piggyback transportis carried out on that relation. If we add the relationttaly-france, about 11 OOO shipments, then we observe that 62tof all piggyback traffic is transalpine traffic, or more than2OO shipments per day
5.2.2. Also the Statistical Directive Rail presents data on piggybacktransport, but a complete data set is only available for 1984and earlier. For 1985, the relevant information is onlyavailable for Germany, France and Belgium.
Therefore, in table 5.L2 and 5,13 the developments in 1984 and1983 will be shownrwhich will put the t985 results, presentedin the preceding paragraph in perspective. Detailed comparisonis not possible because the sources are different.
97

Tables 5.L2 and 5.13 show the number of railway $tagons loadedwith road goods vehicles (lorries, trailers, semi-traile:rs,;;"p bodiei) in national and international traffic by Member
States and the tonnage transported.
Table 5.12 Units transported by piggyback (number ofrailway wag-ons loaaLa-wiifr 'oad
goods vehir:les)r1983 and f984.
CountryNational- traffic International traff.ic
(loading + transit)growtlhrate
growthrate
21.5t
13. 5t
82 "72
4l_.3t
r3"4t
85 667
40 447
82 733
r0 900
13 099
70 49L
35 625
45 279
7 7L9
11 549
6.2*
2.OZ
rr8.2t
75.4t
298 843
rl8 344
22 4L9
0
42
2AL 411
120 820
10 273
0
17r
F. R. G.
France
Italy
Netherlands
Belgium
L43 473439 6444L2 675
Table 5. 13 Tonnage transPorted1983 and 1984.
by pigg:Yback ( 'OOO tonrnes ) ,
National traffic International traff:ic(lorading * transit)
growthrate
2'l .El*
15.7t
14. tlt
32. !t8
18. !it
479
974
179
263
372
47L
845
o27
198
314
279
891
2L3
0
0
7.42
2.5*
-L7 .32
98s
939
258
o
I
F. R. G.
France
Italy
Nettrerlands
Belgium
98

Data from the rail statistical Directive for 1985 areavailable for some countries: France, Germany and Belgium.As far as units transported are concerned the followingfigures are available:
Table 5.I4 Units transported by piggyback (number ofrailway rragons loaded with road goods vehicles),1985.
In tonnage terms the picture is as follows:
Table 5.15 Tonnage transported by piggyback ('O00 tonnes)1985.
Also here there is a certain difference to be noted betweenthe figures from the statistical directive, which concernintra-community traffic, and the U.I.R.R. figures which relatealso to traffic to and from third countries.
In IgA4, 3.8 million tonnes \^rere shipped by combined road/railtransport. Given total international rail transport in thatyear (eg.S mio tonnes), combined transport has a market shareof 5.6t.Compared to international road transport (189.O mio tonnes in19Ba), the market share of combined road/rail transport isabout 2.0t.
Country National traffic International traffic
r985 Growth rate r9B5 Growth rate
F.R.G.
France
Belgium
308
L28
r43
592
746
+ 3.lta.7*+
94
43
13
075
243
259
+ 9.88
6.92
t.2*
+
+
Sub-total 437 52r + 4.9* L2L 453 + 8.6E
Country National traffic International traffic
I_985 Growth rate r985 Growth rate
F. R. G.
France
Belgium
4
2
395
o59
35
+
+
2.72
8.9E
2
tL72
095
407
+ 15.6t
+ 10.9E
+ 9.42
Sub-totaI 6 449 + 5.2* 2 A77 + 14.6t
99

On speci-fic markets, this share is higher, in particular onthe relations to and from Italy through the Alps. In L984,4.3 mio tonnes were shipped to and from Italy in combinedtransport. Compared to rail (22.7 mio tonnes) the marketshare is about 2O*, while compared to road (30.0 mio tonn€s)r,the market share reaches 14.6t. For the calculation of totalroad transport to and from ltaly, cross-traders were not talleni"nto consideration.
r00

6.1
CHAPTER 6
INTRA EUR-10 ToNNAGES (1984) EY 24 COMMODITY GROUPS
Introduction
Whereas the analysis of commodity flows at Conununity level hasalmost exclusively been at the level of the 10 NST chapters,the availability of results from the statistical directives atthe level of |-he 24 NST groups now permits a more detailedanalysis. It is unlikely that the M.O.S. system will movedirectly to the 24 NST group for analysis and forecastingpurposes, but since the tO NST Chapters are somewhat broad, theexamination presented here may give some insight into aguitable intermediate level between I0 NsT chapters and 24 NSTGroups for analytical work.
Note that a) Road. Tonnage relate to bilateral movementsonlt. Tonnages for Luxembourg hauliers relate toL9A2 and ttre split of the 10 NST chapters forItalian hauliers (which are based on foreigntrade data) into the 24 NST has been madepro-rata to those of the from all other MemberStates.
b) Rail. Tonnages reported in the inward directionFused for all Member States except UK wherepartner Member State outward tonnage is used.
c) Tonnages reported in the inward direction areused.
Analvsis by 24 NST GrouPs
Table 6.I
6.2
The principal results are sfuown in Table 6.1 which give thetonnlges and percentage of each of the 24 NST commodity groupsfor each mode of transport and for all 3 modes together.
In intra-Community traffic only 2 of the 24 NST groups havemore than lot of Lhe total namely Group 15 (crude andmanufactured minerals) with 16.2t and Group 11 (iron ore, ironand steel waste and blast furnace dust) with 10.6*. There arehowever 4 other groups with more than 88, Group 6 (foodstuffsand animal foaaei), Group 10 (petroleum products), Group 13(metal products) and Group 18 (chemicals other than coalchemicals and tar). 6 groups have less than 1*, namely Groups3, 5, g, L7, 19 and 21 and should thus be considered forcombination in any future realignment of the NST.
l0l

6.3
Considering the separate modes,then quite di.fferent commod.i.tygroups emerge as the most important, i.e.:Road 14.0t Group 6 (foodstuffs and animal fodder)
L2,7* croup 18 (chenicals other than coal chemicralsand tar)
lf.3t Group t5 (crude and manufactured minerals)
Rail 2A.92 Group 13 (metal products)13.9t croup 8 (sotid mineral fuels)I3.8* Group 1l (iron ore, iron and steel waste and
blast furnace dust)13 . 6t Gr:oup 24 (miscel lanous arti,cles )
Inland 24.4t Group 6 (foodstuffs and arrimal fodder)Fffiays IB.l-* Group 11 (iron ore, iron and steel waste arnd
blast furnace dust)16.5t Gr:oup 10 (petroleum products)
It may also be seen that rail and inland r,taterttays areconcentrated in just a few commodity groups whereas road isrmuch more diverse. This can be quantified asl follows:
Road Rail Irrlandwatter\rays
Tota.l
4 largestcommodity groups
47.9* 62.2t 65 .4t 44.7t;
10 smallestcommodity groups I .5t 3 .68 2.O* 8. 6tr
Dominance of different modes for 24 NST Groqp
Using the tonnages in Table 6.1, the percentage carried by eacttmode for each of the 24 NST commodity groups can be evaluated.These results are shown in Table 6.2. From llable 6.2 one cansee the the highest dominance occurs as foll:ows:
Road 96* Group 23 (leather, textile, clothing, othe:r'manufactured articl.es )
Rail 4Ot Group 24 (miscellanous articles)Inland 98t Group 9 (crude petroleum) rr
FEEffiays 87t Group 10 (petroleum producto)
* the volume of crude petroleum moved by the 3 modes is verysmall, so this is why a second "highest dominance" has berengiven.
102

More generally, $re can group the 24 NST commodity groups into anumber of categories.
Road
Rail
InIandWaterways
High competition: NST groups 8rL3,16,I-9,24
It is also interesting to summarize the tonnages involved inthese 4 categories, figures are in 000's tonnes.
InlandRoad Rail waterway Tota1
RoadRailInland 2 60t 30182 L9622 132953 LA2757WaterwayHigh Competition 34209 36627 34875 1o57ll
Total r74L36 694a7 191000 434623
Thus 63S of the road tonnage and about 708 of the inlandwaterway tonnage occurs for those commodity grouPs where themode concerned has at least 6Ot of the market. 538 of the railtonnage oecurs for those cornmodity groups for which there is"high competition", w:hereas only 2Ot of road and I8t of inlandwaterhray tonnage falls in this "high competition" category.
The results show that rail operates in markets which are highlycompetitive whereas road and inland waterways have large"captive" markets.
103

Table 5.1
lq84 INTRA EUR-10 TONNAGES ('O0O tonnes)
Groupsof
goodsRoad
tRail
tI.W.
t3 Modes
Shiare
I23456789
1011L213t4l516l718t9202L222324
2 0r5 L.28 122 4.7
840 0.56 138 3.53 833 2.2
24 4L1 14.02 LB6 1.33 502 2.O
3 0.03 L47 1.81 868 1.1
840 0.515 279 8.810 630 6. It9 725 11.32 393 1.4
3q8 0.222 153 L2.7I 730 1.09 726 5.52 432 1.44 205 2.4
L7 255 9.911 305 6.5
845 5.5823 I.2392 0.6687 1.0137 0.2131 3.1309 0.4646 13.916 0.O
632 2,3570 13.825L 0.45L7 20.922r 1.8888 5.6756 4.0111 0.2930 5.7284 0.40ro 4.3109 0.220r 0.3597 0.9424 13.6
19
14I32
0r9 4.'7118 0. :L
o 0.032L O.2261 0. t)
190 4. :3
457 2.',.'261 6.,1743 0.,4513 16. t5
526 18..[095 2.'l654 6.:L612 l./l602 24 ,l963 3. t5
998 0.524O 5.,*r42 0.6163 0.6183 0. :[49 0.t)
235 0.:[855 l. !5
4L2
3134
511
246
6
10II
14 8799 063L 2327 1464 031
34 7326 952
25 409762
36 29245 q646 186
4L 45014 46370 2t5L2 LL2I 507
36 3233 156
13 8992 7244 455
r8 08723 584
3.42.r0.31.60' .98.01.65.8Qt.28.4
10,.6L.49' .53.3
I6,.22.80r .38.4(J'. 73.20' .6l.o4.25.4
Total I74 136 100 69 487 IOO 191 000 100 434 623 L00
104

Table 6,2
1984 INTRA EUR-IO TONNAGESbroken down by 24 commodity groupsShare (t) by mode per commodity
Groupsof
goodsRoad Rail I.W.
I2345
t39068B695
269
32l0
3
61Io42
67
7031
65
2464
8 L4 38 4A
I10
o9
24
9887
11L2
4t4
2L4
7582
13 37 35 2A
L415
7328
96
1866
I6 20 23 57
L71819
266155
Il1
9
662836
202L222324
7989949648
22453
40
I7I1
L2
Total 40 16 44
105
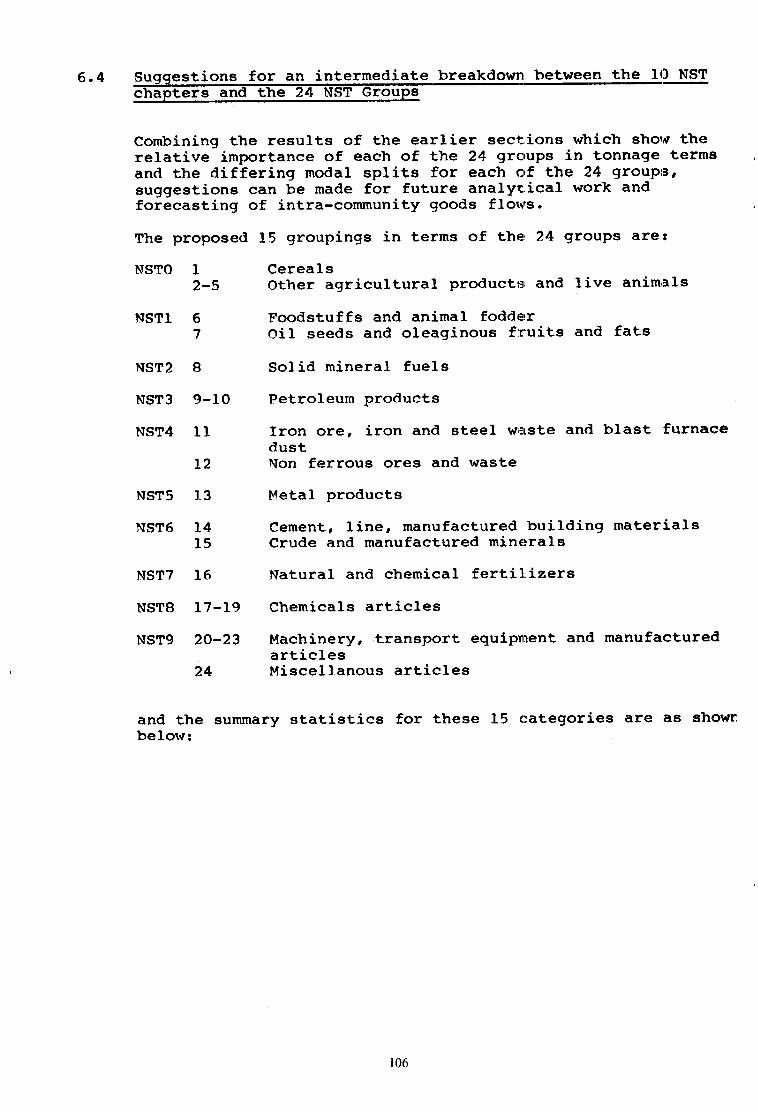
6.4 Suqqestions for an intermediate breakdownL between the 10 NSTCJiapters and the 24 NST GrouPs
Combining the results of the earlier sect,ions which shor'v therelative importance of each of the 24 groups in tonnage termsand the <tiffering nodal splits for each of the 24 grouprs,suggestions can be made for future analyt.ieal work andforecasting of intra-community goods flonrs.
The proposed 15 groupings in terms of ther 24 groups are!
NSTO 12-5
NST1 67
L2
NST5 13
NST6 T415
CerealsOther agricultural productsr and live animials
Foodstuffs and animal fodderrOif seeds and oleaginous fruits and fats
NST2 I Solid mineral fuels
NST3 9-IO Petroleurn Produets
NST4 1I Iron ore, iron and steel wetste and blast furnacedustNon ferrous ores and waste
Metal products
eement, line, manufaetured building mater:ialsCrude and manufactured minerals
NSTT 16 Natural and chemical fertil"izers
NSTB L7-19 Chemicals articles
NST$ 20-23 Machinery, transport equipnnent and manufacturedarticles
24 Miscellanous artieles
and the sunmary statistics for these 15 categories are as showrbelow:
106

1984 INTRA EtR-tO IoNNAGES (,000 tonnes)
cate-gory
NSTgroup( s) Road Rail
fnlandWaterways Total t
I
2
3
4
5
6
7
I
9
IO
1l
L2
t3
L4
I5
I
2 5
6
7
I
9 10
tl
L2
13
L4
I5
r.6
L7 19
20 23
24
2 015(13r)
18 933(88r )
24 4LL(70r)
2 186(31r)
3 502(14r)
3 150(er )
I 868(48 )
840(r4r)
15 279(37r)
lo 630(73r)
19 725(28r)
2 393(20r)
24 28L(5er)
33 618(86s )
II 305(48r)
3 84s(26t)
2 039(rot)
2 l3r(6s )
309(5t)
9 646(3et)
I 648(48 )
9 570(21t)
25L(48)
14 5rZ(3st)
1 22L(es)
3 888(6r )
2 756(23r)
4 325(11r)
3 917(1or)
9 424(4or )
9 0r9(61r)
500(2r)
I r90(24t1
4 457(64r )
L2 262(48r)
32 256(87r )
34 526(7sr)
5 095(82r )
11 654(28r)
2 6L2(18r)
46 602(66r )
6 963(s7r)
L2 380(308)
I 630(4r )
2 855(12r)
L4 879( roos )
2L 472( ro0r )
34 732( roor )
6 952( 100r )
25 409( l-oor )
37 054( loor )
45 964( 1008 )
6 186( 100r )
4L 450( r00* )
L4 463( r00r )
70 2L5( roor )
L2 LL2( 100r )
40 786( 100r )
39 165( 100r )
23 584( roos )
3.4
4.9
8.0
1.6
5.8
8. 5
10.6
I 4
9. 5
3.
15.
3
2
2.8
9.4
9.0
5.4
TOTAI L74 136(40r)
69 487(re*1
191 000(44r )
434 623( roos )
100
t07

Groups of goods
Groupso{
goods
NST/R'Chepter
NST/RIgroups
Deecriptbn
1 0 01 Cereals
2 02,03 Potato€s, other fresh or frozen lruit and vegetables
3 00,06 Live animals, sugar be€t
4 05 Wood andcort
5 04,09 Textiles, textile altbles and man-nnade fibres, dher raw anrimal and
vegetable materbls
6 1 1 1, 12, 13,
14,16,17Foodsilufts and animal fodder
7 18 Oil soeds and olaaginous lruits and hts
I 2 21,2.,23 Solid mineral tuels
9 3 3'l Crud€ p€toleum
10 32,33,34 Petroleum podt cts
't1 4 41,46 lron ore, iron and stsol waste atd blasl furnace dud
12 45 Non-fenous or€s and wasto
13 5 5r,52,53,9{, 55;56
M€tal prcdwts
14 6 e4,69 Cernent, lime, rnarufaclured buitsing rnaterbls
15 61, 62, 63,65
Crude and manuiactured minerals
16 7 71,72 Natural and chemical fedilizers
17 I 83 Coal chemkals, tar
18 81, 82, 89 Chemknls otherthan coal chemi:als and tar
19 84 Paper pup and waste pap€r
n I 91, 92, 93 Trarspod oquiprnent, tnachinery, appaftrtus, engines, whether or not
assembled, and pads thereof
21 94 Manufactures of mstal
22 95 Glass, glassware, ceramic products
a 96,97 Loather, textile, clothing other manutfactured anicbs
24 99 M iscellaneous articles
' Published by the StatistiFl Offico of the European Communilies (French versbn 1968).
108

CHAPTER 7
International Intra EUR-10 tonnages
3 Modes Road+Rail+Inland Waterways year 1984
7.L lntrgdgctignl. Road contains the bilateral trafic as described in
introduction 2.2.L (points a) b) c) e)) and point (f)of table 2.5.1984 is the latest year available.
2. RaiI as developped in chapter 4, ingoing data have beenretained for all Member States except for the UK wherereporting figures of the partner country have beenused. Tonnages to and from Belgium and Luxembourg havebeen splitted.
3. I.W. ingoing data have been retained.
7.2 Total international traffic bv relation: 3 modes
The figures for 1984 for each relation and the evolution on 1983are given in Table 7.L. The total differs from that given inChapter I and the nodal chapters since the road covers bilateralonly (as Section 2.2) and a slightly different basis is used forinland lratervrays. The effect of these differences is tounderstate tbe percentages by road (these are gi.ven in Table7.2) and to overestimate those for rail and inland waterways.
A summary table, Table 7.3, has also been prepared groupingrelations into 3 groupe:
A) Intra DTFTNLTB and LB) Relations with IC) Other relations.
109
oFI
&pFI
F\ dPol O\Ln.o\(Do
c{ dpo\ [email protected] r\\0
Ndpqfo\olONNI
O oPlsf (')lt\ .lo col$lF{l
ofor sf(t\oor)
(Y) oPF{ O\\|9.\o@
(\ dpO\@tfo$sl
@dpr-lioF-.
@
@ dpl(rl F{l'{lc! dprno
(\t
rf dp!nFCtt .!n\9r4rf
&(,
(\ dpFrsrf.rf!
ordpF{o
o$
N clp(Y)ol(Yl .
o
(Yt dpF{ \C)
f-
c! dp$('r(\I
@dpN(Yt
CN(n
Fl dPt-rn@
I
(\t dp(n \tr,
(VI
Dde:0tn:)..{ ro
vc0dP\0 F{@o(\tn
C\ o\Plnln(Yl r
@
r\o dpO\tn(\.
\0
@dp\00rnor{
ot dp$Ot(\.
(fl
ro dp(v) $
rn
(v) dpoo$I
(7t deFl (O
(7)
I
i'D d:o$lforf \o
A&H
sf dpsr c\t
()F{
I
rn op|n0\FFtI
Ndp\0\o
sfI
F{ dP(n|J1
a0(Y)
\^o dp
FtnI
|ndp(Y) C,\0.
C\I
C0 oPFt \t)
@(\
,{ dPro F{:D.
f-I
v!)
CpdPC\lrl(r).(\ o\
$
o't fF\\9o\.Fl tO
(\t dp
to.Flo
I
O€l0(\ ..c)|.-.fn
odpf\@sfo
ci!
(\ rn dpr-orn.rnol
\0dporolif. (\
I
oit d9$l r-
\o$
til dpdrf(\.(D\o
F]
F{ dPr,l Flol(nc)
Fl
\o dpsftno\
@
\0 0pF.l Ol
tt)I
lndpr-@g.
tn
(\ dpOl -{lir.sf otrt
OdPFl c,
orn
Ddp,o (\it\ ol
N
Ot o\P
\o\go\.(tF(\ F{
@dP(\ (\\9Or Ft
mdPt\\o().NC{
Fl
o\dp@-lcq.\o\ocn
or dpo@c\ t-
o4
or dp@rf(\.
o
q)dp
Fl
I
@dPF{ (nc!.
rn(\
o\ l\ dpi) -lin F{iDd
Flz
F{ dP\0 f!\o.@|r)sf
$dp@ l-.(\t .\9 rf
I
(\l dp\0\otf.F{ fO
I
rn dp\0 \0f- C{c!l
rn dprn (Y!(4.
(YlI
sf d9\0 (\lfo.
rn
(a dpF{ (Yl
o
F{ dP\ON(Yl r
rn
rn .pC\ \C,
a
Lo
() o\P.rf \0.C -l(D
H
(DdPfO Ft(Y) .
ON
\rdpo\F{\0.(Yl F{F{ (\
$dpo@(\oc!o
(\l
md9
(Yl(\
(n dpsf -tO.Fl \9
ol
ln dp(Y) o
tflc{
odpo\Nc\.@
(f) dpor \c)|Jr).
(o
rN dpn(V}r)@In F{
tt{
\9 d9O\ F{\o.@$
Fl dPF{@
\0$I
F{ cfpC)-lFo@(n
rn dpooO.(n r\(\l
rt dpt\ tnOl .(\
I
Ndpor$O.F{ dPoc!
o(\
F{ dP\0 tt)Oil .
\0I
OdP\of-o\
foP{@.9.t\ (YlJ')
odp(Ylr4@.$c!(\
cfl dpF(\(Y) .
mlnI
odpo4 u'lrn.F{ O\ot
\0 dp
OoFlo(\ll
f- dP@\OO.(Ylo
I
r\o dpd\F-@.
|rl
(\t dpsf \0
r\Flt
c{ dproo(ft ro
I
(\t dp(Yl F{$.
\dp.ors11 .nrnn
o B{ H z 4 l1vp
dxH
Xo &Ilt oll! F{
lril
oIrlzzoE{
ooo
ll0
dp
c.A
(rI@o\
o
rJa-1
o
oqo
$@or
-{ lF{.lr-ll.tol3ilra.l
fll'oooo
(n
Fl
ot{o
r{r
€o
oE
oooco1J
o+JoF{

or-{
&Da-1
$N\$o\@NOD -l Sf
lc.l ct A1...lco @ a'l
l$NNI
l0O r. Ot;;l'lnoolo . .Fn sf -rlc{ r\I
l-f c,l 1.l. . .F.@$l:f -t rn
I
looolo ..lrnotoItf $ -{I
lo co c'tl. . o
l$o\ol00
I
lF{()orb-;loI
100 r0 rol.[.no$lc0
I
lf- cO r9
l+;I'
looorlo\tn$rr, -t
$I
(,
$@ooot\ c{
Nq)oD-{>ol
rDr-o-{@n
nlnoo(ntl
coo{O\D-l
oooo cooc coo tt-lO
O(?'
'|
OC\On<rO-{
Xa
ooo\0$f\N
:(Y)O
lC F{\(\300Dc{\(\
O-lO>(\tl
o$o3CnIl F{
cooo )oo) 300 300) NOOco\'0
-t
FlxH
oooo oooc cooc-l
coo3
f,oof,{
loo foo)-.t
oooc coo ooooF{
XD
\O@\o
O$iffi)\o
OsfO\olP-l
0$o\r\\ol
oc.roo(Y)tr
t@(nvotc{P-l
coo30nrn
300) oooo oo()o Dc0\S
)o@
Fl
c0Or(n
i'Or rO(\toFt
t\ @ C"l
r) tY) 6l{c{(Yr
tC c,t On\0tr
\sfOrnrSFfn\g
NOo<ftnoNT\
30()3-.1
coo
+oFor-InnF{Ol
coo {rn(Y)\o(\N\gFf
torCri$$-i0O Fl tO
l'. Fl (\l
-l C.,l \On(V)Fl
sf\00{@nsr
ov@o c\l oNT\
lC -{ F{
Nsf(?tsl' tf)
l0tnrrnC{F{D-l
30oc co() -l C\ r\
orn@n F{ sl"
tlz
FrO6\rn$o(n\o
o\0lr|
'rf\(\nul
N@oo(no(n
c@c{O\gF\f \$
O\('f@
oNt\\fc\c{
nt-o\(\ltl
cC)oc{NOo>(\tr
nFc)n\ot\
N@O)tn$(rn
H
(nt-of\ olss ro
N@o{@$ro
.osroo(n\(\
F{0\O
oo{. ro
nInocoNr-
{ooto\(\
3()03-t
q\90
NT\DFI
(f\0c)tlot\
-{O\Ooo$ro
F{
NOIrO
o\$\Osf(')F{
nr-o$tn\(\
.o\0@nlnoS-{$
{-l@
c<ftnONF{
@tor\mrf-in$
t$f-n(')otl
cc)oc l- (r) oNr-o
-toc)>(\tr
\oG1o\0n-J.) (\ -l
rl
00$\tnf\+F.l(Q
coonr\\(\
DOGI\$@
Dtor.DOoV)-ltn
Do\o.iDo\0rTC\N
<f\oonooOF{d)
noF(rrnofn
lc or (Yt
roOrnlt -l
Nc0c)l) -{D-{
ot\otJ.)
c@orD\o
/ o Fxt Hdz @
MFl&H
t(o &(, &oPF{ftl
O-l .O'.1 FOo.&&H
olclol
El
:l
EI
(\l
r-(u
F{
oE{
lll

Table 7.3
--
Tonnases (000's) and modal 9b9-Ie--9{ of relations ' L984
Tonnages (0OO's)
Road Rail I.W.TOTAL
Intra
D /F/NLIB/LL2a477 45768 190285(35.2t) (12.6t) (52.2t1
36,t530 (83.6* )( 1008 )
Relationswi.th I
30024 2L67L O
(58. rt) (4r.9t) (ot)5:t695 ( 11. 98 )
( 1008 )
Otherrelations
15651 2041 2039(79.3t) (rO.4t) (IO.3t)
1t731 (4. 5t )( loor )
TotalIntra-EUR-10
L74L52 69480 L92324(39.91) (r5.98) (44.2*l
4359s6 (IoOt)( roor )
lt2

Table '7.3 clearly shows a number of results.
i) 5 out of 6 intra-EUR-to tonnage movements occur betweenthe r'5n N.vt. continental Europe bloc (O/f/N["/B/L)(GrouP R)
ii) 5 out of 7 of the remaining intra EUR-IO tonnagemovements occrtr in relations with Italy (Group B)
iii) only I of 20 intra-FlI-IR-1O tonnage movements involves UK,IRL,, fiK and GR (Croup C) (road excludes unaccompaniedtrailers )
iv) Inland waterrilays (52.2e) dominates Group A
v) Road and Rail are equally represented in Group B
vi) Road (79.3*) dominates croup e (in reality it is greaterthan this since the figures in this group relating toI.I{. are either "stranqe" (e.g. D/UK, barges carried onlarger vessels across the lforth Sea) or "very strange"(e.9. D/rRr").
ll3

Anne:r
SOURCES
(a) Road Opinion Survev - Enqu3te de Conioncture iRoute -Koni unkturerlrebunq Stra8enverkehr
B Institut du Tranaport routierDK Danmarks StatistikD IFO (Institut fUr Wirtschaftsforschung)F Centre de Productivit6 des TransportscR Ethniki Statistiki Ypiresia (National StarListical office)IRL University College, DublinI Centro Studi sui Sigtemi di TrasportoL Service central de la Statistique et des lBtudes 6conomiq'ueeNL Economisch Bureau voor het Weg- en WatervervoerUK Department of Transport
(b)
Bundegverband des Deutschen GUterfernverkrehrg (BDF) €.V.Comit6 national routierEconomisch Bureau voor het Weg- en WatervlervoerInstituut voor Wegtransportf6d6ration des CornnergantE du Grand-Duch€Road Haulage Association Ltd.Landeforeningen Danske Vongmaend
(c)
Institut du Transport routierBIG (BUndesanstalt fUr den G0terfernverke]nr)MinistEre des TranaportsCentro Studi sui Sistemi di TrasportoMinigtEre des TransportsNIWO (Nederlandsche Internationale Wegvervoer Organisati,re)CBS (Centraal Bureau voor de Statietiek)
(d) land watenra inion sur ure Voiers
DFNI,BLUKDK
BDFILNL
RhineNorth-South
Central Rhine CommiseionB Institut pour le Tran8portNL Bconomisch Bureau voor het
par BatellerieWe{t- en $laterverv'oer
Btenertre
n4

(e) I.W. Cost Survey - Indices de cofits V.N. : Kostenereglg
NL Economisch Bureau voor het Weg- en Watervervoerin collaboration with :
F Office national de la navigationB Institut pour le transport par BatelterieD Bundesverband der deutschen Bi.nnenschiffahrt
(f) Rail Tariff Indlces - Indices des tarifs du Rail - Tarifindizesrur oen El_senbahnverkehr
D DB (Deutsche Bundesbahn)F SNCF (Soci6t6 nationale des chemins de fer francais)I FS (Azienda autonoma delle Ferrovie dello StatolITL NS (Nederlandse Spoorwegen)B NMBs/sNcB (soci6t6 Nationate des Chemins de fer betges)
(9) gombined Transport - Tlansports combin6s - Kombinierter Verkehr
rntercontainer (container traffic - trafic conteneuris6 -Containerverkehr)Interunit (piggy-Uack - Ferroutage - Huckepack)
(h) Eoad Tonpaqes - Tonnaqe de la Route - straBg{lquterverkehr
D KBA-BAG Kraftfahrt-Bundesamtes und der Bundesanstalt f0rden GUterfernverketrr
F Ministlre des Transports - Service des Transports routiersR-2
I Ministerio dei Trasporti - Dir. generale pOCNL CBS - Centraal Bureau voor de StatistiekB/L INS - Institut national de StatistiquesUK GSS - Department of TransportIRL University College, DubtinDK Danmarks StatistikcR Ethniki Statistiki ypiresia
(i) I.W. Tonnaqes - Tonnages des Voies Naviqables - Binnenschiffahrt-quterverkehr
ONI Office national de NavigationCCR Commission Centrale pour la Navigation du RhinsoEc/oscE/sAEc (Luxembourg) - Directive/nicrrtlinie go/tr19
RaiI Tonnaqes - Tonnaqes Rail - EisenbahnqUterverkehr
soEc/oscs/sAEc (luxembourg) - Directive/nichtrinie 80/ttzz
SPECIAL THANKS TO THE SOEC(Statistical Office of the European Community)REMERCIEMENT TOUT PARTICULIER A L'OSCE
(oteice Statistique des Communaut6s Europ6ennes)BESONDERER DANK GILT DEM SAEG
(Statistisches Amt der Europ5ischen Gemeinschaften
ll5


European Communities - Commission
Annual rcport - 1985
Luxembourg: Office for Official Publications of the European Communities
1986 - 115 p - 21.0 X 29.7 cm
DA, DE, EN, ES, FR, IT, NL
rsBN 92-825-653S-r
Catalogue number: CB-46-86-953-EN-C
-Price (excluding VAT) in Luxembourg
ECU 6,80 - BFR 300 - DR 940 - rRL 4.80 - UKL 4.30 - USD 7.00
The Annual Report of the European Commission's Observation of the TransportMarkets System, published under the umbrella title of "EUROPA TRANSPORT"contains a comprehensive review of recent developments in the international intra-Community goods transport market. The presentation of the publication is by mode oftransport and there are individual chapters on the three modes which are covered bythe system, i.e. road, railand inland waterways. There is also a general marketappraisalof international transport developments within the Community and its short-termprospects.

Venta y suscripcionesSales and
' 9"lg og abonnement ' Verkauf und Abonnement . IltrrA4oerg xor ouv6pop€gsubscriptions ' vente et abonnements ' Vendita e abbonamentiVerkoop en abonnementen ' Venda e assinaturas
BELGIOUE/BELGIE FRANCE
Rue de la MontagneBte 1 1/Bus 'l 1
10O0 Bruxelles/ l OOO
34lBergstraat 34
Brussel
Moniteur belge / Belgisch StaatsbladRue de Louvain 40-42 I Leuvensestraat 40_42I000 Bruxelles/ 'l 000 BrusselTet.5120026CCP/ Postrekening OOO-20O5 SO2 -27Sou s-d 6p6ts /Age ntsch a ppen:
Librairie europ6enne/Europese BoekhandelRue de la Loi 244/Wetstraat 244i O40 Bruxelles/'l 040 Brussel
CREDOC
Service de vente en France des publicationsdes Communaut6s europ6ennesJournal officiel26, rue Desaix75732 Paris Cedex 15T6r. (1) 45 78 6'l 39
IRELAND
Government Publications Sales OfficeSun Alliance HouseMolesworth StreetDublin 2Tel. 71 03 09
or by posl
Stationery OfficeSt Martin's HouseWaterloo RoadDublin 4Tel. 68 90 66
ITALIA
PORTUGAL
lmprensa NacionalAv. Francisco Manuel de Melo, 5P - 1O00 LisboaTel. 65 39 96
Distribuidora Livros Bertrand Lda.Grupo Bertrand, SARLRua das Terras dos Vales. 4-AApart. 37P-27OO Amadora CODEXTel. 493 90 50 - 494 87 88Telex 15798 BERDIS
UNITED KINGDOM
HM Stationery OfficeHMSO Publications Centre51 Nine Elms LaneLondon SWB sDRTel. (01) 21 1 56 56
Sub-agent:
Alan Armstrong & Associates Ltd72 Park RoadLondon NW1 4SHTel. (O1) 123 39 02Telex 297635 AAALTD G
SCHWEIZ/SUISSE/SVIZZERA
DANMARK
Schultz EF-publikationerMontergade 191116 Kobenhavn KTlf: (01) 141195Girokonto2O0 .]195
BB DEUTSCHLAND
Eundesanzeiger VerlagBreite StraBePostfach 1O80065OO0 Kciln 1
rel. (O2211 2029-OFernschreibe r;ANZEIGER BONN 8 882 595Telecopierer:20 29 278
GREECE
G.C. Eleftheroudakis SAInlernational Bookstore4 Nikis Street105 63 Athensfel. 322 22 55Telex 219410 ELEF
Sub-agent for Northern Greece
Molho's BookstoreThe Business Bookshop10 Tsimiski StreerThessalonikiTel. 275 21 1
Telex 4.]2885 LIMO
ESPANA
Boletin Oficial del Estadofrafalgar 27E-28010 MadridTel. {91) 446 60 00
Mundi-Prensa Libros. S.A.Castell6 3 7E-28001 MadridTel. {91) 43 1 33 99 (Libros)
431 32 22 (Suscripciones)435 36 37 (Direccion)
T6lex 4937O-MPLI-E
Licosa SpaVia Lamarmora, 45Casella poslale 55250 121 FienzeTel. 57 97 51Telex 570466 LICOSA I
ccP 343 509
Subagenti:
Libreria scientifica Lucio de BiasioVia Meravigli, I620 123 MilanoTel. 80 76 79
Libreria TassiVia A. Farnese, 28OO 192 RomaTel. 31 05 90
Libreria giuridicaVia 12 Ottobre. 172/R16 121 GenovaTel. 59 56 93
Librairie Payot- AEIOU 6, rue Grenus
rz | | beneveT6t. 31 89 50ccP 12-236
GRAND-DUCHE DE LUXEMBOURG
Office des publications officieltesdes Communaut6s europeennes2, rue MercierL-2985 LuxembourgT6t. 49 92 B1T6lex PUBOF LU 1324 t)ccP 19190-81CC bancaire BIL B-109/6003/200Messageries Paul Kraus1 1 , rue Christophe PlantinL-2339 Luxembourgr6t. 48 21 31T6lex 2515ccP 49242-63
NEDERLAND
Staatsdrukkerij- en uitgeverijbedrijfChristoffel PlantijnstraatPostbus 2O01425OO EA's-GravenhageTel. (07O) 78 99 1 1
UNITED STATES OF AMERICA
European Community InformationService2lO0 M Street, NW5Urte /u /Washington, DC 2OO37Tet. \2021 862 95OO
CANADA
Renouf Publishing Co.. Ltd61 Sparks StreetOttawaOntario KlP 5R1Tel. Toll Free 1 (8OO) 267 4164Ottawa Region (6i3) 238 8985 6Telex 053-4936
JAPAN
Kinokuniya Company Ltd1 7-7 Shinjuku 3-ChomeShiniuku-kuTokyo 1 60-91Tel. 103) 354 O 1 31
Journal DepartmentPO Box 55 ChitoseTokyo 1 56Tel. (03) 439 0124

Price (excluding VAT) in LuxembourgECU 6,80 BFR 3oO DR 940 IRL 4.80 UKL 4.30 USD 7'00
OFFICE FOR OFFICIAL PUBLICATIONS
OF THE EUROPEAN COMMUNITIES
L-2985 Luxembourg
r s B N '1 a - I e 5 - b 5 3 5 - l,
,ilill