
Karoline_Faust_PhD_thesis.pdf - Lab of Microbial Systems ...

ORIGINAL RESEARCH ARTICLEpublished: 19 August 2014
doi: 10.3389/fmicb.2014.00407
Emergence of microbial networks as response to hostileenvironmentsDario Madeo 1, Luis R. Comolli 2 and Chiara Mocenni 1*
1 Department of Information Engineering and Mathematics, University of Siena, Siena, Italy2 Structural Biology and Imaging Department, Life Sciences Division, Lawrence Berkeley National Laboratory, Berkeley, CA, USA
Edited by:
Lisa Y. Stein, University of Alberta,Canada
Reviewed by:
Elisa Michelini, University ofBologna, ItalyJorge Passamani Zubelli, IMPA,Brazil
*Correspondence:
Chiara Mocenni, Department ofInformation Engineering andMathematics, University of Siena,via Roma 56, 53100 Siena, Italye-mail: [email protected]
The majority of microorganisms live in complex communities under varying conditions.One pivotal question in evolutionary biology is the emergence of cooperative traits andtheir sustainment in altered environments or in the presence of free-riders. Co-occurrencepatterns in the spatial distribution of biofilms can help define species’ identities, andsystems biology tools are revealing networks of interacting microorganisms. However,networks of inter-dependencies involving micro-organisms in the planktonic phase maybe just as important, with the added complexity that they are not bounded in space. Anintegrated approach linking imaging, “Omics” and modeling has the potential to enablenew hypothesis and working models. In order to understand how cooperation can emergeand be maintained without abilities like memory or recognition we use evolutionary gametheory as the natural framework to model cell-cell interactions arising from evolutivedecisions. We consider a finite population distributed in a spatial domain (biofilm), anddivided into two interacting classes with different traits. This interaction can be weightedby distance, and produces physical connections between two elements allowing them toexchange finite amounts of energy and matter. Available strategies to each individual ofone class in the population are the propensities or “willingness” to connect any individualof the other class. Following evolutionary game theory, we propose a mathematical modelwhich explains the patterns of connections which emerge when individuals are able to findconnection strategies that asymptotically optimize their fitness. The process explains theformation of a network for efficiently exchanging energy and matter among individuals andthus ensuring their survival in hostile environments.
Keywords: microbial communities, bacterial social networks, evolutionary games, graph theory, evolutive
decisions, hostile environmental conditions
1. INTRODUCTIONHow spatial and temporal organization in cell-cell interactionsare achieved remains largely elusive. The central hypothesis ofthis unique topic is that a broad range of interactions and con-nections forming networks across species define strategies forco-evolution, and the display of adaptive strategies from micro-bial networks as a response to altered environments (Ben-Jacoband Cohen, 1997; Ben-Jacob et al., 2000; Dwyer et al., 2008).These are questions of great interest in a rapidly evolving area ofscience.
Surfaces concentrate nutrients, and it is generally assumedthat planktonic cells were the first to take advantage of the cat-alytic and protective advantages offered by surfaces—a first stepin the development of biofilms. Likely the first complex systemsto achieve homeostasis in response to fluctuations in the primitiveEarth environment, biofilms facilitated the development of com-plex interactions between individual cells and the developmentof signaling pathways and chemotactic motility (Hall-Stoodleyet al., 2004; Fuhrman, 2009; Gure, 2009; Shimoyama et al., 2009).Interactions between two species of microbes that affect theircoexistence and evolution have been studied in a laboratorysystem of two species (Hansen et al., 2009). Direct cell-cell
interspecies interactions have been reported for laboratory cul-tures (Dubey and Ben-Yehuda, 2011) and for intact microbes innatural communities (Comolli and Banfield, 2014).
New metagenomics data from environmental microbial com-munities (e.g., Wrighton et al., 2012; Kantor et al., 2013) isshowing that novel, small microorganisms lack the full metabolicpotential to have a truly independent lifestyle. In other work(Baker et al., 2010; Comolli and Banfield, 2014) linking genomicsand imaging, one novel nanoarchaea named ARMAN has beenfound establishing connections with archaea of different species.Therefore, we start with microbes of different classes or speciesassuming they lack the full metabolic potential necessary for sur-vival under certain conditions; we also assume the two speciescomplement the needs of each other, so that individual of onespecies seek the complement provided by individuals of the otherspecies.
Evolutionary game theory (Weibull, 1995; Hofbauer andSigmund, 1998; Nowak, 2006b) provides a rather intuitive frame-work to model interactions and decisions among co-evolvingmembers of a population. It has been successfully used todescribe relevant mechanisms of cooperation in biology (Nowak,2006a; Frey, 2010) as the result of collective behavior induced by
www.frontiersin.org August 2014 | Volume 5 | Article 407 | 1

Madeo et al. Emergence of microbial networks
altruistic decisions, which allows a population to increase its ownfitness.
The present study is an attempt to model the activation of con-nections among the members of a population of microorganismsaccounting for the new findings on microbial communities for-mation. Starting from evolutionary game theory we are interestedin understanding the conditions (for the simplified variables andparameters of our model) allowing the onset of cooperative inter-action between two or more individuals, and their sustainment inthe most efficient networks. Specifically the formation of suitablephysical connections will eventually allow them to exchange a cer-tain amount of energy and matter. The activation of links amongmicroorganisms gives rise to the formation of a network, whichincreases the probability that any single individual and the wholepopulation will survive.
The proposed approach is based on a recent paper (Madeoand Mocenni, under revision) where evolutionary game theoryis extended to model the behavior of a finite population in whichmembers are organized according to a network of relationshipsbetween them, such as friendship, spatial proximity, sharing, etc.The model introduced in that paper describes decisions of singleindividuals rather than average strategies of the whole population,and provides a natural tool to deal with the problem of con-nection formation among couples of bacteria from a single-cellfitness perspective—we will use the term “bacteria” for simplic-ity, but they could also be archaea or protists. The main ideamotivating the present paper is that two microorganisms estab-lish a connection when it provides a significant gain to both.This paradigm assumes that two classes of bacteria with differ-ent biological characteristics are present in the system, and underaverse environmental conditions members of one class may needto access resources that only the individuals of the other class areable to produce, and viceversa.
In terms of game theory the propensity of a bacterium toestablish a connection with another one is a behavioral strat-egy, namely a game strategy. Each strategy provides a certainpayoff which accounts for natural constraints, such as distanceand available energy. A connection strategy becomes effec-tive if both involved individuals take an enough great advan-tage from it. This process can be described as a game whereavailable strategies to the players are decisions to connect.Evolutionary games and the replicator equations introducedin Madeo and Mocenni (under revision) provide the mathe-matical models allowing us to follow the system dynamics ofconnections of a single bacterium and network formation ata global level. As a result, if the environmental conditions arefavorable, the bacteria spend their energy only on survivingand reproducing. To the contrary, under averse conditions theyacquire/transfer a certain amount of available energy from/to theconnected bacteria. A similar phenomenon is the well knownmechanism of coordinated motion and aggregation shown bythe starving amoeba Dictyostelium discoideum (Eichinger andNoegel, 2003). Moreover, we assume that the bacteria are notallowed to move. Indeed, in the present work we are mainlyfocused on introducing a methodology that will be leverage infuture works, and where the models will be compared withexperimental data.
The approach proposed in this paper implicitly incorporatesmechanisms of cell-cell recognition underlying interspecies inter-actions, and uses theory and modeling to show the emergence ofcounterintuitive patterns resulting, for example, from long termcommunication mechanisms. Our results show that the formednetworks optimize the use of the available energy produced andexchanged between microorganisms. We also find conditions orregions of the parameter space which clearly enable or preventefficient outcomes.
The paper is organized as follows: Section 2 describes the com-ponents of the mathematical model, such as bacteria, decisionsand payoffs, the model equations, and the basic mechanisms ofnetwork formation. In Section 3 theoretical and experimentalresults are reported. The results obtained are discussed in Section4. Finally, Section 5. reports a detailed technical description ofthe evolutionary game which is assumed to be the basis of systemdynamics.
2. MATERIALS AND METHODSIn this section we introduce the mathematical model describ-ing the mechanism for which the individuals of a populationof bacteria are able to make the decision of establishing recip-rocal connections aimed at maximizing their probability of sur-vival in a hostile environment. More precisely, cooperation yieldsthe activation of a physical connection between two or moreorganisms, such as the extensions visible in Figure 1 where theCryogenic-electron microscopy image of a biofilm revealing theexistence of connections among archaea of different species arereported.
2.1. INDIVIDUALS, STRATEGIES, DECISIONS, AND REWARDSWe assume that a population of N bacteria is located in a spa-tial domain and that it is composed of two subclasses. The classesdiffer only for genetic and phenotypic characteristics, and not fortheir members behavior or decisions. Elements of different classescan create links to exchange genetic material, proteins, metabolicintermediates, etc. The formation of links is assumed to stem fromthe need to obtain elements allowing bacteria to better resist hos-tile external conditions (Ben-Jacob et al., 2000). Analogously twoelements of the same class are not allowed to create any link.The original conditions are restored once the external situationbecomes favorable again and the bacteria are able to reproduce.
In order to be willing to create a link, a microorganism musthave enough (finite) available energy to exchange with one ormore organisms of another class. The level of energy that bacteriadecide to share depends on how averse the environmental condi-tions are. Moreover, energy transfer is dissipative, because a partof the energy is lost due to distance and effort of linking.
The model developed in this paper assumes that the connec-tions are bilateral; although, one can allow monodirectional linksas explained in Section 2.3.
The processes and assumptions described above can be mod-eled by introducing the following variables:
• V is the set of all considered bacteria (|V| = N);• V1 ⊂ V and V2 ⊂ V are the subclasses, where V = V1 ∪ V2
and V1 ∩ V2 = ∅;
Frontiers in Microbiology | Terrestrial Microbiology August 2014 | Volume 5 | Article 407 | 2

Madeo et al. Emergence of microbial networks
FIGURE 1 | Cryogenic-electron microscopy image of a small region of a
biofilm. In red, a 50-voxel-thick slice through a tomographic reconstructionoverlaid onto a one-voxel-thick slice in gray scale. There is a round cell atthe center and what appears to be an extension from a different cell typeinto it from the bottom, and another at the top. Previous work (see Bakeret al., 2010 and references therein) established they belong to differentspecies of archaea. Arrows indicate tubular extensions or appendagesconnecting the microbial cell in the center to microbial cells of differentspecies. This is established by their typical, clearly different cell walls. Formore information see Comolli and Banfield (2014) in this Special Topic.
• ρv,w > 0 is the distance between bacteria v and w;• Tv > 0 is the maximum amount of energy that organism v can
transfer to others.
The decision of an individual to establish a connection with otherindividuals is modeled using an evolutive game. In the game theplayers (bacteria) are allowed to choose a strategy in set S . Thestrategies available to each player consist of the will of beingconnected to another player. The number of feasible strategiesto each player is N and we can state a relationship of equiva-lence between players and strategies. For simplicity of notation,we indicate players and strategies by means of their labels, thusV = S = {1, . . . , N}, and, when needed, players will be labeledby the letters v, w, . . . and their strategies by the symbols sv,sw, . . . . For example, if player v ∈ V uses strategy sv ∈ S withv �= sv, he wishes to connect to player w ∈ V , which is such that
FIGURE 2 | Mechanism of network formation in the population of
bacteria: couples of individuals may decide to reciprocally share a
certain amount of energy in order to be able to resist environmental
disturbances.
w = sv. On the contrary, if v = sv, then v is connected only tohimself. Since self energy transfers are not meaningful, circularconnections correspond to the activation of any connection.
Consider two individuals, v ∈ V1 and w ∈ V2, and supposethat v chooses pure strategy sv ∈ S and w chooses pure strategysw ∈ S . At this point, v will receive energy from w if and only ifsv = w and sw = v. The same holds for w. This means that indi-vidual v is effectively connected to w if and only if w is also willingto be connected to v.
A pictorial representation of the physical mechanismsdescribed by the model is reported in Figure 2.
The effective energy E(w, v) received by v when it is connectedto w depends on the reciprocal decisions of the two individualsto be connected and on their physical distance. More specifically,energy is defined by:
E(w, v) = Twγ (ρv,w), (1)
where γ (ρ) is a monotonically decreasing function allowingto quantify the effective available energy after dissipation dueto distance. Although multiple specifications are possible, theproperties that γ (ρ) should satisfy are the following:
(i) γ (ρ) ≥ 0 ∀ρ ∈ [0, +∞);(ii) γ ′(ρ) ≤ 0 ∀ρ ∈ [0, +∞);
(iii) γ (0) = 1;(iv) γ ( + ∞) = 0.
Moreover, E(w, v) = 0 if v and w belong to the same set.Notice that since Tv is generally different from Tw, E(w, v)
can be different from E(v, w), i.e., the two individuals may earndifferent rewards from connection.
To develop the model equations describing the biologicalmechanism of cooperation, we assume that the members of thepopulation are allowed to play suitable games, the strategies ofwhich are the propensity to form connections. The members ofthe population will be interchangeably called individuals, bacteriaor players.
2.2. THE REPLICATOR EQUATION OF CONNECTIONSThe state variable of the model is the propensity xv,sv of a player toconnect to another player. More specifically, the quantity xv,sv can
www.frontiersin.org August 2014 | Volume 5 | Article 407 | 3

Madeo et al. Emergence of microbial networks
be read as a percentage indicating the share of energy that playerv is available to transfer to player w. According to our previousnotation, we can also indicate the second player w as the strategythat player v adopts when he is looking for a connection with him(w = sv). The distribution of strategies of a single individual v ofthe population is accounted by vector
xv = (xv,1, . . . , xv,N ),
where
N∑sv=1
xv,sv = 1 ∧ xv,sv ∈ [0, 1] ∀v, sv.
In general, xv,sv �= xsv,v, because two individuals starting theprocess of connection are allowed to independently choose theamount of sharable energy—although both are required to sharea minimum energy to make effective connections.
An individual can decide to share his energy with more thanone, at which point the vector representing strategy distributionxv may include components strictly less than 1. In this case, it iscalled mixed strategy distribution. On the other hand, solutionswith N − 1 null and only one unitary component are called purestrategies in the underlying game. It is clear to see that mixedstrategies include pure strategies.
From a biological point of view pure and mixed strategies indi-cate that an individual is willing to connect with strictly one ormore bacteria, respectively.
The complete distribution of the chosen strategies for thewhole population is represented by the variable
X = (x1, . . . , xN ),
which includes N2 components, namely xv,sv . There are N com-ponents for each bacterium belonging to each of the two classesV1 and V2.
The above statements allowed us to define the reward, orpayoff, pGv,sv
, obtained by player v when it connects to sv, asfollows:
pGv,sv= E(sv, v)xsv,v, (2)
where the superscript G indicates the presence of a graph.Consequently, the average payoff for player v over the graph is:
φGv =
N∑sv = 1
xv,sv pGv,sv. (3)
According to the well known theory on evolutionary games(Weibull, 1995; Hofbauer and Sigmund, 1998) and to the sametheory extended to networked populations (Madeo and Mocenni,under revision), we can write the replicator equation of the gameaccounting for the graph under construction by bacteria. Thisequation describes the evolution over time of the distribution ofpure/mixed strategy vectors xv, and reads as follows:
xv,sv = xv,sv (pGv,sv− φG
v ). (4)
The corresponding Cauchy problem can be obtained fromEquation (4) by setting an additional constraint on initial con-ditions, namely xv,sv (t = 0) = x0
v,sv. It is well known from the
theory on ordinary differential equations (ODEs), that this prob-lem has a unique solution, xv,sv (t), t ∈ [0, T], In the specificsystem developed here this solution represents the evolution overtime of the distribution of the propensities of each bacterium tobe connected to any other bacterium present in the systems. Someexamples of the evolution of these variables over time are shownin Figure 6 reported below and in Supplementary Movie 1.
2.3. THE GRAPH TOPOLOGYThe solution X(t) = (x1, . . . , xN ) of Equation (4) allows us tocalculate the effective connection graph GE(t), by defining itsadjacency matrix AE(t) = {aE
v,w(t)}v,w∈V as follows:
aEv,w(t) =
{1 if xv,sv (t) > η ∧ xw,sw (t) > η
0 otherwise, (5)
where sv = w, sw = v and η ∈ [0, 1] is a given threshold.The model can also be developed assuming that the effective
connection graph GE(t) is directed, in order to take into accountmonodirectional connections, arising, for example, when bac-terium v shares energy with w, but w does not send anything back.Indeed, one can rewrite graph (5) as follows:
aEv,w(t) =
{1 if xv,sv (t) > η
0 otherwise, (6)
where sv = w. The latter approach goes beyond the scope of thepresent study, and in the following we only use the bidirectionalgraph defined by Equation (5).
The parameter η in Equation (5) represents the thresholdabove which the will to connect becomes an effective link. Froma mathematical point of view η is a way of selecting optimal con-nections, but it also has an interesting biological interpretationbecause it is correlated to the maximum number of connectionsthat a bacteria is allowed to have. Suppose that bacterium v is themost connected in the graph, and let nv be the number of its con-nections. Then there are at least nv components xv,sv of vector xv
greater than η. Since the sum of all these components is at most 1,each of them is at least 1
nvand hence η < 1
nv. Thus, η is inversely
correlated to the number of connections of the most connectedbacterium in the graph.
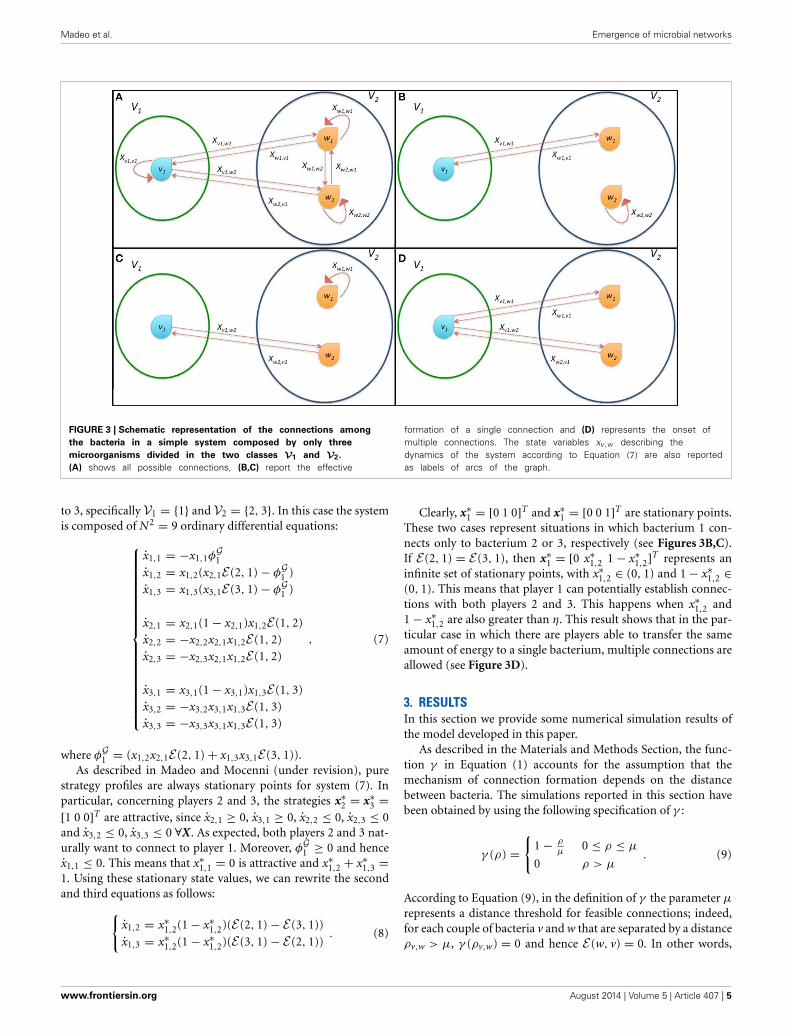
In order to ease the explanation of the model and the mech-anism of link formation we report a schematic representationof possible connections and state variables for a prototypicalsystem composed by the two sets V1 = {v1} and V2 = {w1, w2}in Figure 3A. This system is deeply analyzed in the followingSubsection 2.3.1.
2.3.1. The system of equations for a simple caseHere we report some theoretical results obtained by developingthe mathematical model for a simple example involving N = 3bacteria divided into 2 classes, in particular, V1 = {v1} and V2 ={w1, w2}), as shown by Figure 3. For the sake of simplicity in thefollowing equations the individuals are simply enumerated from 1
Frontiers in Microbiology | Terrestrial Microbiology August 2014 | Volume 5 | Article 407 | 4
Madeo et al. Emergence of microbial networks
FIGURE 3 | Schematic representation of the connections among
the bacteria in a simple system composed by only three
microorganisms divided in the two classes V1 and V2.
(A) shows all possible connections, (B,C) report the effective
formation of a single connection and (D) represents the onset ofmultiple connections. The state variables xv,w describing thedynamics of the system according to Equation (7) are also reportedas labels of arcs of the graph.
to 3, specifically V1 = {1} and V2 = {2, 3}. In this case the systemis composed of N2 = 9 ordinary differential equations:
⎧⎪⎪⎪⎪⎪⎪⎪⎪⎪⎪⎪⎪⎪⎪⎪⎪⎪⎪⎨⎪⎪⎪⎪⎪⎪⎪⎪⎪⎪⎪⎪⎪⎪⎪⎪⎪⎪⎩
x1,1 = −x1,1φG1
x1,2 = x1,2(x2,1E(2, 1) − φG1 )
x1,3 = x1,3(x3,1E(3, 1) − φG1 )
x2,1 = x2,1(1 − x2,1)x1,2E(1, 2)x2,2 = −x2,2x2,1x1,2E(1, 2)x2,3 = −x2,3x2,1x1,2E(1, 2)
x3,1 = x3,1(1 − x3,1)x1,3E(1, 3)x3,2 = −x3,2x3,1x1,3E(1, 3)x3,3 = −x3,3x3,1x1,3E(1, 3)
, (7)
where φG1 = (x1,2x2,1E(2, 1) + x1,3x3,1E(3, 1)).
As described in Madeo and Mocenni (under revision), purestrategy profiles are always stationary points for system (7). Inparticular, concerning players 2 and 3, the strategies x∗
2 = x∗3 =
[1 0 0]T are attractive, since x2,1 ≥ 0, x3,1 ≥ 0, x2,2 ≤ 0, x2,3 ≤ 0and x3,2 ≤ 0, x3,3 ≤ 0 ∀X. As expected, both players 2 and 3 nat-urally want to connect to player 1. Moreover, φG
1 ≥ 0 and hencex1,1 ≤ 0. This means that x∗
1,1 = 0 is attractive and x∗1,2 + x∗
1,3 =1. Using these stationary state values, we can rewrite the secondand third equations as follows:{
x1,2 = x∗1,2(1 − x∗
1,2)(E(2, 1) − E(3, 1))
x1,3 = x∗1,2(1 − x∗
1,2)(E(3, 1) − E(2, 1)). (8)
Clearly, x∗1 = [0 1 0]T and x∗
1 = [0 0 1]T are stationary points.These two cases represent situations in which bacterium 1 con-nects only to bacterium 2 or 3, respectively (see Figures 3B,C).If E(2, 1) = E(3, 1), then x∗
1 = [0 x∗1,2 1 − x∗
1,2]T represents aninfinite set of stationary points, with x∗
1,2 ∈ (0, 1) and 1 − x∗1,2 ∈
(0, 1). This means that player 1 can potentially establish connec-tions with both players 2 and 3. This happens when x∗
1,2 and1 − x∗
1,2 are also greater than η. This result shows that in the par-ticular case in which there are players able to transfer the sameamount of energy to a single bacterium, multiple connections areallowed (see Figure 3D).
3. RESULTSIn this section we provide some numerical simulation results ofthe model developed in this paper.
As described in the Materials and Methods Section, the func-tion γ in Equation (1) accounts for the assumption that themechanism of connection formation depends on the distancebetween bacteria. The simulations reported in this section havebeen obtained by using the following specification of γ :
γ (ρ) ={
1 − ρμ
0 ≤ ρ ≤ μ
0 ρ > μ. (9)
According to Equation (9), in the definition of γ the parameter μ
represents a distance threshold for feasible connections; indeed,for each couple of bacteria v and w that are separated by a distanceρv,w > μ, γ (ρv,w) = 0 and hence E(w, v) = 0. In other words,
www.frontiersin.org August 2014 | Volume 5 | Article 407 | 5

Madeo et al. Emergence of microbial networks
connections over distances greater than μ do not allow any energyexchange and are thus not convenient.
In order to evaluate quantitatively the simulation results weintroduce the following indicator of efficiency:
IG(t) =∑N
v = 1
∑Nsv = 1
pGv,sv∑Nv = 1 maxz E(v, z)
, (10)
where vs are all the connected bacteria and z are all bacteria.The indicator evaluates the instantaneous ratio between the totalpayoff of connected bacteria and the total energy available to bac-teria for establishing connections. Notice that the IG changesover time. The payoff and the number of connected bacteria varyin time.
3.1. EXPERIMENTAL RESULTSThe results of several numerical experiments developed over apopulation of 30 bacteria organized into two different classesare reported. The energy available to each bacterium is assignedrandomly at the beginning of the simulation.
The net energy E that each bacterium is available to sharewith other bacteria is initial energy T scaled by distance throughγ . In other words, this quantity represents the energy that each
bacterium is available to send (sender) to another bacterium(receiver). Sender and receiver bacteria are reported as rowsand columns of the grid shown in Figure 4, respectively. Thestars indicate the presence of a connection among bacteria thathas been permanently established according to the mechanismsdescribed by Equation (5).
It is interesting to note that effective connections are possi-ble only when both linked bacteria have enough available energyto share with the other. The antisymmetric parts of the matrixare not involved in the mechanism of energy sharing becausethe connections are allowed only among individuals belonging todifferent classes.
When the steady state is reached, we find the presence of effec-tive stable connections reported in Figure 5 for a run with 30bacteria over 100 time steps. The colors of the nodes correspondto the value of the payoff described by Equation (2), calculatedat the steady state. With parameter values η = 0.2 and μ = 0.2,we can see that some bacteria are able to activate multiple con-nections. Connections involving more than 3 bacteria are alsopossible for different values of the parameters, as reported by thefollowing figures. The interplay between Figures 4 and 5 is shownby Supplementary Movie 1, where the dynamics is reproduced,and the onset of links can be followed over time (left inset of the
FIGURE 4 | Energy initially available for exchange among a network
of 30 bacteria. Each bacterium has a quantity of energy available itwants to transfer to the others and it will be allowed to receive anamount of energy from them. These two energies are represented bydifferent colors in the rows and columns of the grid. For example,bacterium 23 wants to share a large amount of energy with bacterium
1; on the contrary, the quantity of energy that bacterium 1 is availableto transfer to bacterium 23 is much lower. Nonethelss, the twobacteria will be able to establish an effective connection, although withdifferent intensities, because the corresponding state variables x1,23 andx23,1 lie above threshold η. The stars correspond to effectiveconnections and energy exchanges.
Frontiers in Microbiology | Terrestrial Microbiology August 2014 | Volume 5 | Article 407 | 6

Madeo et al. Emergence of microbial networks
FIGURE 5 | Final configuration of the network composed of 30 bacteria at
steady state (t = 100). Bacteria belonging to the two classes arerepresented by different shapes, such as squares and circles. The colorassociated to each bacterium represents the effective quantity of energy it
receives thanks to the established connections. Multiple connections arepresent, for example bacteria 3 and 23 established connections with bacteria29–18 and 1–10, respectively. See also Supplementary Movie 1, which reportsthe whole dynamics and provides the connection between Figures 4 and 5.
movie). The inset on the right part of the movie reports the statevariable xv,w for each bacterium.
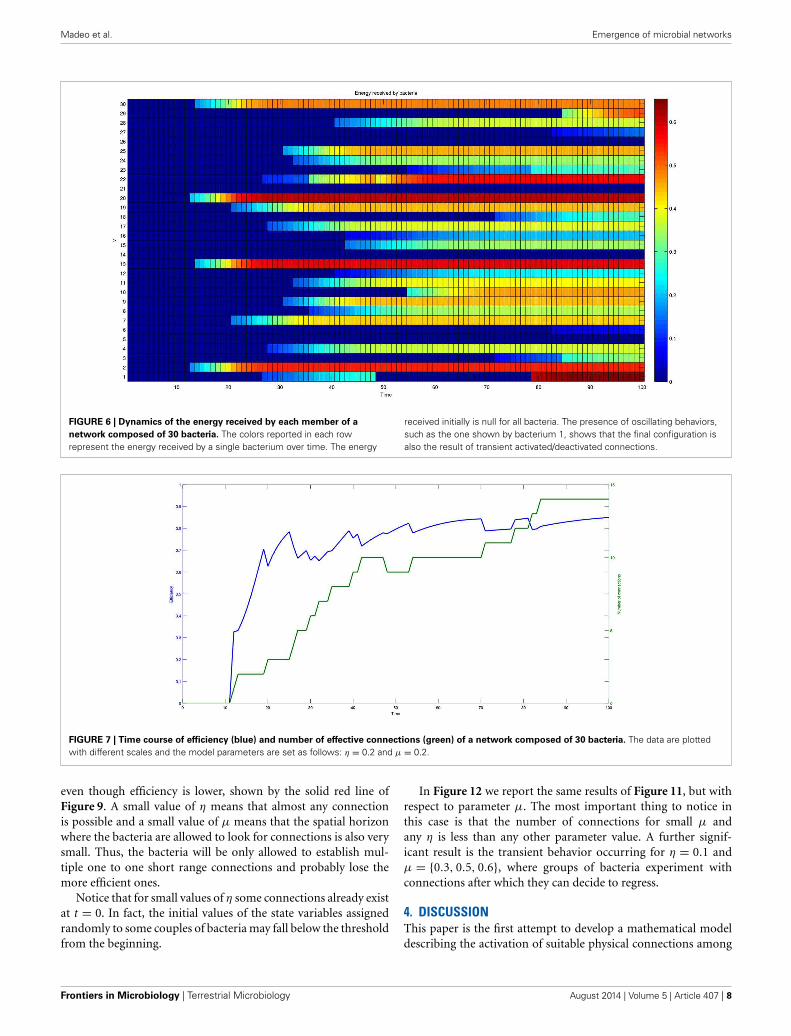
Furthermore, the complete dynamics of the energy received byeach bacterium is reported in Figure 6.
Figure 7 shows the values of the efficiency indicator (10)and the number of connections arising in the evolutive process.Both efficiency and number of connections have a monotonicallyincreasing and saturating dynamics, showing that the processreaches a steady state quite fast.
More details on the state variables and solutions of Equation(4) are provided in Figure 8. In particular, the time courseof the dynamics of two bacteria is reported and compared tothreshold η. One can observe that the first link between thetwo bacteria is formed at approximately t = 70, when bothvariables exceed threshold η. Nevertheless, the connection isremoved later on at approximately t = 125, when one of thetwo components falls below the threshold. It is interesting tonote that the bacteria try to activate several connections beforethey are able to reach a steady state, i.e., a stable and permanentconfiguration.
Figure 9 shows the time course of the efficiency indicator on atime interval of 400 time instants for different values of parame-ter η. The increase of efficiency over time indicates that the systemis moving toward a more efficient state. Moreover, for small val-ues of μ (solid lines) efficiency is higher for larger ηs, while forlarge values of μ (dashed lines) the asymptotic values reachedby efficiency are independent of η. Recall that μ is related tothe amplitude of the spatial region to which each bacterium isallowed to look for connections with others. The independenceof the final configuration of the network on parameter η sponta-neously resulting from the model is very important because thereare presently no guidelines for choosing appropriate values of thethreshold η.
Another significant result emerging from the inspection ofFigure 9 is that for small μs values of η exist for which efficiency
increases more quickly. In particular, for η = 0.5, the asymptoticstable value of efficiency is reached much faster than for any othervalue.
The inset of Figure 9 reports the histogram of the differ-ent kinds of connections that can be established by bacte-ria with respect to η and for different μ. As one can see,for small μ multiple connections are feasible while for highμs only one to one connections are effectively possible. Asmentioned system efficiency reduces for small values of μ
the system efficiency reduces. This result confirms that singleconnections are more efficient and robust. One should also con-sider that in these present simulations we assume to have onlytwo classes of bacteria, and multiple connections would involvemore that one bacterium belonging to the same class, i.e., pro-viding the same information content. In this sense, it seemsobvious that single connections are more efficient than multi-ple ones. Future works will be devoted to compare the solu-tion provided by the proposed model with optimal connectionnetworks.
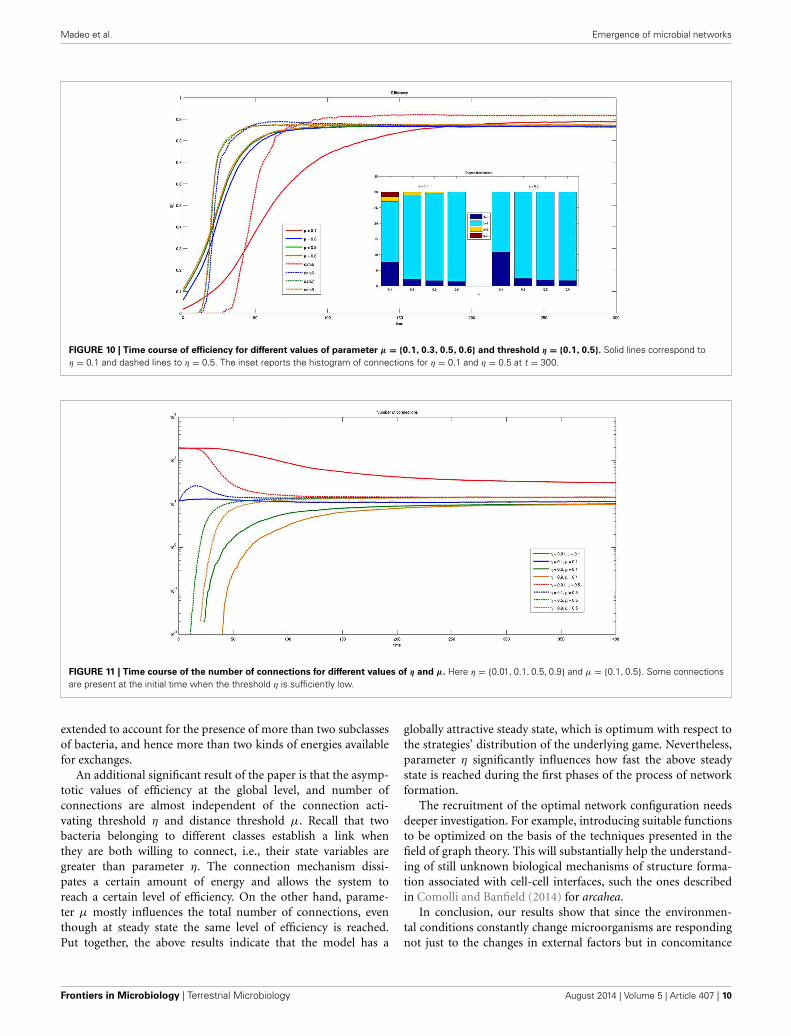
In Figure 10 the values of efficiency are reported as a functionof time for different values of parameter μ. Notice that in this caseboth the efficiency and its derivative are independent on param-eter μ except for μ = 0.1. The curves have the same dynamicsfor μ = {0.3, 0.5, 0.6}, while for μ = 0.1 the system takes moretime to reach steady state. This mechanism is even stronger forsmaller ηs, reported as solid lines in the figure. Moreover, in thelatter case, the inset of Figure 10 shows that for small η bacteriaare allowed to establish multiple connections with approximatelythe same efficiency.
Figure 11 reports the time course of the number of connec-tions for different values of η and μ, where solid lines correspondto small and dashed lines to large values of μ, respectively. It isworthwhile to note that the number of connections is indepen-dent on both parameters η and μ except for the case of η = 0.01and μ = 0.1. In this case the number of connections is higher,
www.frontiersin.org August 2014 | Volume 5 | Article 407 | 7
Madeo et al. Emergence of microbial networks
FIGURE 6 | Dynamics of the energy received by each member of a
network composed of 30 bacteria. The colors reported in each rowrepresent the energy received by a single bacterium over time. The energy
received initially is null for all bacteria. The presence of oscillating behaviors,such as the one shown by bacterium 1, shows that the final configuration isalso the result of transient activated/deactivated connections.
FIGURE 7 | Time course of efficiency (blue) and number of effective connections (green) of a network composed of 30 bacteria. The data are plottedwith different scales and the model parameters are set as follows: η = 0.2 and μ = 0.2.
even though efficiency is lower, shown by the solid red line ofFigure 9. A small value of η means that almost any connectionis possible and a small value of μ means that the spatial horizonwhere the bacteria are allowed to look for connections is also verysmall. Thus, the bacteria will be only allowed to establish mul-tiple one to one short range connections and probably lose themore efficient ones.
Notice that for small values of η some connections already existat t = 0. In fact, the initial values of the state variables assignedrandomly to some couples of bacteria may fall below the thresholdfrom the beginning.
In Figure 12 we report the same results of Figure 11, but withrespect to parameter μ. The most important thing to notice inthis case is that the number of connections for small μ andany η is less than any other parameter value. A further signif-icant result is the transient behavior occurring for η = 0.1 andμ = {0.3, 0.5, 0.6}, where groups of bacteria experiment withconnections after which they can decide to regress.
4. DISCUSSIONThis paper is the first attempt to develop a mathematical modeldescribing the activation of suitable physical connections among
Frontiers in Microbiology | Terrestrial Microbiology August 2014 | Volume 5 | Article 407 | 8

Madeo et al. Emergence of microbial networks
FIGURE 8 | Time course of two components xv,w (t) (red) and
xw,v (t) (blue) of the system state X(t). When both components aregreater than η (dashed black line), a link between v and w is
formed. The link disappears when component xv,w (t) falls below thethreshold η. This transient behavior is in agreement with the resultsshown in Figure 6.
FIGURE 9 | Time course of efficiency for different values of threshold η = {0.01, 0.1, 0.5, 0.9} and parameter μ = {0.1, 0.5}. Solid lines correspond toμ = 0.1 and dashed lines to μ = 0.5. The inset reports the histogram of connections for μ = 0.1 and μ = 0.5 at t = 200.
two or more bacteria experiencing hostile environmental con-ditions. Contrary to standard ways of interpreting collaborationand clustering among groups or subgroups of bacteria, the modelproposed in this study describes a mechanism based on the strate-gies of individual players. Instead of interpreting patterns as aresult of macroscopic and collective behavior involving a largepart of the population of bacteria, our model allows two or morebacteria to make the decision of connecting to another specificbacterium of a different species.
An important result of this work is that bacteria (microor-ganisms) prefer one to one rather than multiple connectionsbecause the first ones are more efficient, optimal and robust.This fact reproduces what has been experimentally observed inbiofilms, where interspecies interactions do not produce a “com-mon good” such as the constituents of biofilm architecture, but
all associations are cell-to-cell (see Comolli and Banfield, 2014).In our framework, these connections result from spontaneousco-evolutive dynamics of groups of bacteria, and are the naturalconsequence of the basic assumptions under evolutionary gametheory. Thus, the fact that we did not need to include any addi-tional a priori assumption or information in the model to obtainthe above results suggests our model captures a fundamentalaspect of microbial life within biofilms.
When environmental conditions are very averse, and microor-ganisms need the recruitment of diversified biological compo-nents such as metabolites, proteins, defense mechanisms, nucleicacids, etc. (see Mitri et al., 2011), we may suppose that each com-ponent is provided by a bacterium belonging to a particular class.At this point, we expect that multiple connections will be moreefficient than one-to-one. The present work can be powerfully
www.frontiersin.org August 2014 | Volume 5 | Article 407 | 9
Madeo et al. Emergence of microbial networks
FIGURE 10 | Time course of efficiency for different values of parameter μ = {0.1, 0.3, 0.5, 0.6} and threshold η = {0.1, 0.5}. Solid lines correspond toη = 0.1 and dashed lines to η = 0.5. The inset reports the histogram of connections for η = 0.1 and η = 0.5 at t = 300.
FIGURE 11 | Time course of the number of connections for different values of η and μ. Here η = {0.01, 0.1, 0.5, 0.9} and μ = {0.1, 0.5}. Some connectionsare present at the initial time when the threshold η is sufficiently low.
extended to account for the presence of more than two subclassesof bacteria, and hence more than two kinds of energies availablefor exchanges.
An additional significant result of the paper is that the asymp-totic values of efficiency at the global level, and number ofconnections are almost independent of the connection acti-vating threshold η and distance threshold μ. Recall that twobacteria belonging to different classes establish a link whenthey are both willing to connect, i.e., their state variables aregreater than parameter η. The connection mechanism dissi-pates a certain amount of energy and allows the system toreach a certain level of efficiency. On the other hand, parame-ter μ mostly influences the total number of connections, eventhough at steady state the same level of efficiency is reached.Put together, the above results indicate that the model has a
globally attractive steady state, which is optimum with respect tothe strategies’ distribution of the underlying game. Nevertheless,parameter η significantly influences how fast the above steadystate is reached during the first phases of the process of networkformation.
The recruitment of the optimal network configuration needsdeeper investigation. For example, introducing suitable functionsto be optimized on the basis of the techniques presented in thefield of graph theory. This will substantially help the understand-ing of still unknown biological mechanisms of structure forma-tion associated with cell-cell interfaces, such the ones describedin Comolli and Banfield (2014) for arcahea.
In conclusion, our results show that since the environmen-tal conditions constantly change microorganisms are respondingnot just to the changes in external factors but in concomitance
Frontiers in Microbiology | Terrestrial Microbiology August 2014 | Volume 5 | Article 407 | 10

Madeo et al. Emergence of microbial networks
FIGURE 12 | Time course of the number of connections for different values of η and μ. Here η = {0.1, 0.5} and μ = {0.1, 0.3, 0.5, 0.6}.The presence ofinitial connections and transient behavior are evident for η = 0.1.
with the changes adopted by the entire system of microbes. Thenetwork thus provides a mechanism of resilience and robust-ness. In addition, the network of connections we show, linkingorganisms across a dynamic range of physical connections, shouldprovide the basis for linked evolutionary changes under pressurefrom a changing environment.
AUTHOR CONTRIBUTIONSLuis R. Comolli, Dario Madeo, and Chiara Mocenni contributedto the original motivation, ideas, and exploration of modelingstrategies for the study. Dario Madeo and Chiara Mocenni workedon conceptualization, development and analysis of the mathe-matical model, and performed numerical simulations. Luis R.Comolli, Dario Madeo, and Chiara Mocenni analyzed the resultsand their conceptualization. Luis R. Comolli, Dario Madeo,and Chiara Mocenni contributed equally to the writing of themanuscript.
FUNDINGThe study is partially funded by the project “EvolutionaryGames on Networks for Modeling Complex Biological and Socio-Economic Phenomena” financed by CNPq (Program Sciencewithout Borders, N. 401795/2013-6).
ACKNOWLEDGMENTChiara Mocenni and Dario Madeo acknowledge Prof. MustafaKhammash for the fruitful discussions on systems biology.
SUPPLEMENTARY MATERIALThe Supplementary Material for this article can be found onlineat: http://www.frontiersin.org/journal/10.3389/fmicb.2014.
00407/abstract
REFERENCESBaker, B. J., Comolli, L. R., Dick, G. J., Hauser, L., Land, M., VerBerkmoes, N. C.,
et al. (2010). Enigmatic, ultra-small uncultivated archaea. Proc. Natl. Acad. Sci.U.S.A. 107, 8806–8811. doi: 10.1073/pnas.0914470107
Ben-Jacob, E., and Cohen, I. (1997). “Cooperative formation of bacterial patterns,”in Bacteria as Multicellular Organisms, eds J. A. Shapiro and M. Dworkin (NewYork, NY: Oxford University Press), 394–416.
Ben-Jacob, E., Cohen, I., and Golding, I. (2000). Bacterial cooperative organi-zation under antibiotic stress. Physica A 282, 247–282. doi: 10.1016/S0378-4371(00)00093-5
Comolli, L. R., and Banfield, J. F. (2014). Inter-species interconnections in acidmine drainage microbial communities. Front. Microbiol. 5:367. doi: 10.3389/fmicb.2014.00367
Dubey, G. P., and Ben-Yehuda, S. S. (2011). Intercellular nanotubes medi-ate bacterial communication. Cell 144, 590–600. doi: 10.1016/j.cell.2011.01.015
Dwyer, D., Kohanski, M., and Collins, J. (2008). Networking opportunities forbacteria. Cell 135, 1153–1156. doi: 10.1016/j.cell.2008.12.016
Eichinger, L., and Noegel, A. A. (2003). Crawling into a new era-the dictyosteliumgenome project. EMBO J. 22, 1941–1946. doi: 10.1093/emboj/cdg214
Frey, E. (2010). Evolutionary game theory: theoretical concepts and appli-cations to microbial communities. Physica A 389, 4265–4298. doi:10.1016/j.physa.2010.02.047
Fuhrman, J. A. (2009). Microbial community structure and its functional implica-tions. Nature 459, 193–198. doi: 10.1038/nature08058
Gure, T. (2009). Driving biofuels from field to fuel tank. Cell 138, 9–12. doi:10.1016/j.cell.2009.06.038
Hall-Stoodley, L., Costerton, J. W., and Stoodley, P. (2004). Bacterial biofilms: fromthe natural environment to infectious diseases. Nat. Rev. Microbiol. 2, 95–108.doi: 10.1038/nrmicro821
Hansen, S. K., Rainey, P. B., Haagensen, J. A. J., and Molin, S. (2009). Evolutionof species interactions in a biofilm community. Nature 445, 533–536. doi:10.1038/nature05514
Hofbauer, J., and Sigmund, K. (1998). Evolutionary Games andPopulation Dynamics. Cambridge: Cambridge University Press. doi:10.1017/CBO9781139173179
Kantor, R. S., Wrighton, K. C., Handley, K. M., Sharon, I., Hug, L. A., Castelle,C. J., et al. (2013). Small genomes and sparse metabolisms of sediment-associated bacteria from four candidate phyla. mBio 4, e708–e713. doi:10.1128/mBio.00708-13
Mitri, S., Xavier, J. B., and Foster, K. R. (2011). Social evolution in mul-tispecies biofilms. Proc. Natl. Acad. Sci. U.S.A. 108, 10839–10846. doi:10.1073/pnas.1100292108
Nowak, M. A. (2006a). Five rules for the evolution of cooperation. Science 314,1560–1563. doi: 10.1126/science.1133755
Nowak M. A. (2006b). Evolutionary Game Theory, Exploring the Equations of Life.Cambridge, MA: Harward University Press.
www.frontiersin.org August 2014 | Volume 5 | Article 407 | 11

Madeo et al. Emergence of microbial networks
Shimoyama, T., Kato, S., Ishii, S., and Watanabe, K. (2009). Flagellummediates symbiosis. Science 23, 1574. doi: 10.1126/science.1170086
Weibull, J. W. (1995). Evolutionary Game Theory. Cambridge: MIT Press.Wrighton, K. C., Thomas, B. C., Sharon, I., Miller, C. S., Castelle, C. J.,
VerBerkmoes, N. C., et al. (2012). Fermentation, hydrogen, and sulfurmetabolism in multiple uncultivated bacterial phyla. Science 337, 1661–1665.doi: 10.1126/science.1224041
Conflict of Interest Statement: The authors declare that the research was con-ducted in the absence of any commercial or financial relationships that could beconstrued as a potential conflict of interest.
Received: 08 April 2014; accepted: 18 July 2014; published online: 19 August 2014.Citation: Madeo D, Comolli LR and Mocenni C (2014) Emergence of microbial net-works as response to hostile environments. Front. Microbiol. 5:407. doi: 10.3389/fmicb.2014.00407This article was submitted to Terrestrial Microbiology, a section of the journal Frontiersin Microbiology.Copyright © 2014 Madeo, Comolli and Mocenni. This is an open-access article dis-tributed under the terms of the Creative Commons Attribution License (CC BY). Theuse, distribution or reproduction in other forums is permitted, provided the originalauthor(s) or licensor are credited and that the original publication in this jour-nal is cited, in accordance with accepted academic practice. No use, distribution orreproduction is permitted which does not comply with these terms.
Frontiers in Microbiology | Terrestrial Microbiology August 2014 | Volume 5 | Article 407 | 12

Madeo et al. Emergence of microbial networks
5. APPENDIXThe details of the game underlying the model presented in theMaterials and Methods Section are provided. In particular, thestrategies of the game correspond to the willingness of the play-ers to become connected to one or more other players. For thisreason, the payoffs of the game are calculated on the basis of theenergy that each player is allowed to share. Thereupon, the payoffsas well as energy are functions of time.
5.1 CALCULATING THE PAYOFFS OF THE GAMEAccording to the approach proposed in Madeo and Mocenni(under revision), we need a matricial definition of payoff func-tions pGv,sv
and φGv in order to describe the model using the
replicator equation on a networked population. To this aim,we define the payoff obtained by v when he plays with w andstrategies used are sv and sw, respectively:
bv,wsv,sw
={E(w, v) if v = sw ∧ w = sv
0 otherwise. (A11)
In other words, player v will earn a payoff (energy) when playingwith player w if and only if both v and w decide to connect to eachother(i.e., sv = w and sw = v). The total payoff (energy) obtainedby player v ∈ Vi is defined as the sum of all energy obtained fromplayers w �∈ Vi. Namely:
πv(s1, . . . , sN ) =∑w �∈Vi
bv,wsv,sw
. (A12)
In the model developed in this paper, pure strategies are chosen byplayers that are willing to connect to only one other player, whilemixed strategies are such that eventually an individual will shareits energy with more than one individual. Notice that in this casesharing all the available energy with only one player correspondsto adoption of a pure strategy. The pure strategy sv of player vcan be described by the unitary vector esv = (0, . . . , 1, . . . , 0),where 1 is placed at the sv-th position. Using Equation (A11),
we can define the payoff matrix for each couple of bacteriav and w:
Bv,w = {bv,ws,r }s,r=1,...,N . (A13)
Thereafter, we can make use of Equation (A13) to rewriteEquation (A12) in a matricial fashion:
πv(s1, . . . , sN ) = πv(es1 , . . . , esN ) =∑w �∈Vi
eTsv
Bv,wesw , (A14)
where eTsv
Bv,wesw = bv,wsv,sw .
Mixed strategies describe how player v distributes his energy.This distribution is described by vector xv = (xv,1, . . . , xv,N ),where xv,sv ∈ [0, 1] and
∑Nsv=1 xv,sv = 1. Practically, xv,sv repre-
sents the percentage of Tv that v wants to share with sv �= v. xv,sv
can be also read as the propensity of v to create a link with a playerw = sv. xv,sv ∈ [0, 1], for which v = sv, is the fraction of energythat v does not share. In this case xv,v can also be read as thepropensity of v to remain unlinked. The previous notation allowsus to calculate the payoff, hereafter indicated by pGv,sv
, that playerv obtains when he decides to use pure strategy sv against a playerthat uses mixed strategy xw:
pGv,sv= πv(x1, . . . , esv , . . . xN ) =
∑w �∈Vi
eTsv
Bv,wxw, (A15)
where the superscript G indicates the presence of a graph of possi-ble connections. The model developed in this paper will be mainlyused to recover the graph topology.
The average payoff obtained by player v when it plays a mixedstrategy xv is:
φGv = πv(x1, . . . , xv, . . . xN )
=N∑
sv=1
xv,sv pGv,sv=
∑w �∈Vi
xTv Bv,wxw.
(A16)
www.frontiersin.org August 2014 | Volume 5 | Article 407 | 13
Copyright © 2022 FDOKUMEN