Embracing Change, Building on Our Mission - Bunge
118
2018 Annual Report Embracing Change, Building on Our Mission
-
Upload
khangminh22 -
Category
Documents
-
view
1 -
download
0
Transcript of Embracing Change, Building on Our Mission - Bunge

Embracing C
hange, Building on O
ur Mission 2018 A
nnual Report
2018 Annual Report
Embracing Change, Building on Our Mission
A letter from Kathleen Hyle, Non-Executive Board Chair2018 was a year of significant change for Bunge. We faced challenges, and at the same time had some notable achievements. We also took action to place the company on a better footing for the future.
Our industry faced several headwinds. These included an uncertain global trade environment, macroeconomic pressures and weather-related issues in key regions. Operational and risk management missteps also negatively impacted the company. However, we worked hard to navigate these issues, as we have throughout our 200-year history.

We are not satisfied with our 2018 results. We have the global footprint, assets and team to perform better. We have made a number of changes to position Bunge for sustainable growth. Despite near-term challenges, growth in global population and incomes, in global trade, and in demand for protein and oils makes our mission of connecting harvests to homes all the more crucial — now and in the future.
We have refreshed our Board by adding six new members, appointing new committee chairs and a new Board Chair. We also formed the Strategic Review Committee to conduct a comprehensive assessment of our portfolio, focused on enhancing long-term shareholder value. The Committee is reviewing each of Bunge’s individual businesses and our capital allocation priorities.
In December, we announced that Soren Schroder would step down as CEO. In January, we named Board member Gregory A. Heckman as Bunge’s Acting CEO. Greg has more than 30 years of experience in agribusiness and food and ingredients, and we are fortunate to have his leadership during this interim period. Greg’s fresh perspective, deep industry knowledge and experience are already driving progress.
At this writing, we continue our global process to identify our next CEO. We have also made key changes in the leadership of our Agribusiness segment and sharpened our focus on risk management. Looking back, we can be proud of our accomplishments in 2018.
Loders Croklaan Acquisition and IntegrationIn March, we closed the acquisition of Loders Croklaan. This reinforced our position as a global leader in B2B edible oils. We have made good progress integrating Loders into our B2B oils business. Synergies to date are tracking well against plan, and we have already begun to see the benefits of this powerful combination. In 2019, we expect further synergies from cross-selling and the integration of the logistics supply chain.
Cost SavingsWe remained focused on cost discipline in 2018 — and will continue to emphasize this in 2019. This focus is integral to Bunge’s culture of continuous improvement. We are ahead of schedule on cost savings from the Global Competitiveness Program, with approximately $200 million captured over the past 18 months. This year, we will accelerate consolidation of certain functions globally through a shared service model.
InnovationAcross the company, we continued to invest in innovation in 2018 to remain at the forefront of our industry. One example is our collaboration with IBM to leverage geospatial data to improve our crop forecasting models. In addition, our corporate venture capital arm, Bunge Ventures, invests in
01
emerging companies and products that have the potential to disrupt the food and agriculture value chain. These investments hold promise to solve our customers’ pain points, drive changes to business models, lower costs and unlock new growth markets.
SustainabilityIn 2018, we continued to pursue long-term CO₂, water, and waste reduction goals in our facilities. We have also increased the traceability and verification of key supply chains, including palm oil and soy. Through industry efforts such as the Soft Commodities Forum, we helped effect change on the ground. Our commitment to sustainability, governance and transparency remained strong, with an engaged board committee and active communication of our initiatives and standards.
Throughout our history, Bunge has adapted in the face of change. In 2019, we will continue that rich tradition as we work to drive success for the company and for our customers. I am proud of the work that our employees do every day, and I am proud to be associated with this company. Thank you for your continued support of Bunge.
Sincerely, Kathleen Hyle Non-Executive Board Chair
We have made a number of changes to position Bunge for sustainable growth.
2018 Bunge Annual Report

A letter from Gregory A. Heckman, Acting CEO
• Driving operational performance means streamlining decision making to be more responsive to market trends and opportunities, increasing accountability, partnering with customers to expand our opportunity set, and sharing best practices across geographies. In short, we are empowering employees across the globe to better anticipate customer needs, and to address them.
• Optimizing the portfolio involves identifying and emphasizing the businesses where our investment of time and resources will be most impactful. That means businesses where we have a top market position or are confident we will reach that goal within a reasonable time frame. We’ll examine strategic alternatives, including exiting businesses, where we don’t think we can meet that threshold on the right timeline. Ultimately, this work will help us to create a more focused portfolio poised to deliver greater value for shareholders.
• In terms of capital allocation, we will incorporate learnings from our past investments to improve returns on our capital expenditures, while also prioritizing our use of working capital. This, along with optimizing the portfolio, will help us to maintain a strong balance sheet.
• Improving our financial discipline means we will continue to reduce costs and boost efficiency, following our work to date to capture $200 million of savings from the Global Competitiveness Program. We achieved this milestone a year ahead of schedule, and we’re not done yet. As this work continues, it is with the understanding that the cost reduction activities we undertake must not impact the quality and safety standards that are hallmarks of Bunge.
I became Acting CEO of Bunge in January 2019, after joining the Board last fall.
Shortly after taking this role, I laid out four strategic priorities for 2019: Driving operational performance, optimizing the portfolio, implementing a more rigorous capital allocation framework, and improving our financial discipline.
These priorities will guide our decisions going forward.
02 2018 Bunge Annual Report

We recognize that meeting our commitments is paramount, and one of the changes we have made this year is our approach to earnings guidance. We will now provide a directional outlook for the company as a whole, based on prevailing market conditions, rather than trying to predict future earnings based on external factors that we don’t control. We have also strengthened our risk management capabilities with the recent appointment of new leadership. Managing physical flows, and the inherent risk that comes with them, will continue to be a core competency for us.
Bunge has been a leader in grains and oilseeds for two centuries. With the changes we have made and will make going forward, we will be better positioned to capitalize on the fundamental tailwinds driving long-term growth in our industry, and to build on our global leadership position.
We are the world’s largest producer and exporter of soy products, and the breadth and depth of our global asset base would be difficult to replicate. Our portfolio includes
32 port terminals, 51 oilseed processing plants, more than 160 grain silos and 119 production facilities. Our relationships with more than 70,000 farmers span over 60 countries. Our commitment to safety, sustainability and corporate responsibility is core to our culture, and our 31,000 knowledgeable employees are dedicated to serving our customers and eager to succeed. Our portfolio and our people, along with solid long-term market fundamentals, provide the basis for my confidence in Bunge’s long-term earnings power and growth potential.
In sum, there is great strength in Bunge’s asset portfolio and global network. I’m impressed by the expertise of our employees and their work to drive our business forward. I’m inspired by our mission to connect farmers and consumers, and to ensure that food and feed products move safely and efficiently from where they’re grown to where they’re needed. I’m encouraged by our investments in assets like Loders Croklaan, which enhance our value-added food and ingredients portfolio, help us to reach new customers and generate additional sales opportunities and deeper relationships with existing customers.
It’s clear we have work to do, and we recognize that for investors, Bunge is a “show-me story.” But we are moving with focus and speed. And we look forward to demonstrating our progress.
Sincerely, Gregory A. Heckman Acting Chief Executive Officer
Our portfolio includes 32 port terminals, 51 oilseed processing plants, more than 160 grain silos and 119 production facilities.
04032018 Bunge Annual Report

Financial Highlights
Earnings Per Share1
U.S. GAAP Adjusted
(US$)
$5.01
2016
$4.67
2016
$1.94
$0.89
2017 2017 20182018
$1.64
$2.72
1. Adjusted Earnings Per Share, Return on Invested Capital ("ROIC"), and Funds from Operations, Adjusted ("Adjusted FFO") are non-GAAP financial measures. Reconciliations to the most comparable U.S. GAAP financial measures are provided on page 7.
04
Return on Invested Capital1
7.4%
2016
8.6%
2016
4.4%5.0%
2017 2018
5.2%6.5%
2017 2018
Adjusted for certain gains & charges
Adjusted for certain gains & charges and excludes Sugar & Bioenergy segment
Locations by Facility Type
Grain origin/infrastructure
Port terminal
Oilseed processing plant
Edible oil facility
Grain milling facility
2018 Bunge Annual Report

Cash Flows from Operations1
$0.4
2016
$1.5
2016
$(2.0) $(1.3)
2017 2018
$0.9 $1.1
2017 2018
Cash Dividends Declared Per Common Share
(US$)Cash provided by (used for) operating activities
Funds from Operations, Adjusted
(US$ in billions)
$1.64
2016
$1.80$1.96
2017 2018
2018 Bunge Annual Report 05

ROIC Reconciliation Excludes certain gains & charges Excludes certain gains & charges and Sugar & Bioenergy
Year Ended December 31 (US$ in Millions) 2016 2017 2018
Income from continuing operations before income tax $996 $996 $230 $230 $456 $456
Interest expense 234 234 263 263 339 339
Certain (gains) & charges (43) (43) 141 141 144 144
Sugar & Bioenergy EBIT, adjusted - (51) - (3) - 105
Operating income before income tax $1,187 $1,136 $634 $631 $939 $1,044
Tax Rate 24% 23% 13% 13% 26% 22%
Return $908 $872 $550 $549 $696 $814
Average total captial1 $12,213 $10,130 $12,548 $10,654 $13,894 $12.467
ROIC 7.4% 8.6% 4.4% 5.2% 5.0% 6.5%
1. Trailing four-quarter average of total equity plus total debt
Non-GAAP Reconciliation Notes
Adjusted Earnings Per Share Reconciliation Net income (loss) per common share-diluted (excluding certain gains & charges and discontinued operations) to net income (loss) per common share-diluted
Year ended December 31 (US$) 2016 2017 2018
Continuing operations:
Net income (loss) per common share-diluted adjusted (excluding certain gains & charges and discontinued operations) $4.67 $1.94 $2.72
Certain gains & charges 0.40 (1.05) (1.15)
Net income (loss) per common share — continuing operations 5.07 0.89 1.57
Discontinued operations: (0.06) - 0.07
Net income (loss) per common share-diluted $5.01 $0.89 $1.64
Adjusted FFO Reconciliation Cash provided by (used for) operating activities to Adjusted FFO
Year ended December 31 (US$ in Millions) 2016 2017 2018
Cash provided by (used for) operating activities $446 ($1,975) ($1.264)
Foreign exchange (loss) gain on debt (80) (21) (139)
Working capital changes 1,111 2,880 2,492
Adjusted FFO $1,477 $884 $1,089
06 2018 Bunge Annual Report
29MAR201300314706
UNITED STATES SECURITIES AND EXCHANGE COMMISSIONWashington, DC 20549
FORM 10-K� ANNUAL REPORT PURSUANT TO SECTION 13 OR 15(d) OF THE SECURITIES EXCHANGE ACT OF 1934
For the fiscal year ended December 31, 2018Or
� TRANSITION REPORT PURSUANT TO SECTION 13 OR 15(d) OF THE SECURITIES EXCHANGE ACT OF 1934For the transition period from to
Commission File Number 001-16625
BUNGE LIMITED(Exact name of registrant as specified in its charter)
(State or other jurisdiction of incorporation or organization)Bermuda
(IRS Employer Identification No.)98-0231912
(Address of principal executive offices)50 Main Street
White Plains, New York USA(Zip Code)
10606(Registrant’s telephone number, including area code)
(914) 684-2800Securities registered pursuant to Section 12(b) of the Act:
Title of each classCommon Shares, par value $.01 per shareName of each exchange on which registered
New York Stock ExchangeSecurities registered pursuant to Section 12(g) of the Act: None
Indicate by check mark if the registrant is a well-known seasoned issuer, as defined in Rule 405 of the SecuritiesAct. Yes � No �
Indicate by check mark if the registrant is not required to file reports pursuant to Section 13 or Section 15(d) of theSecurities Act. Yes � No �
Indicate by check mark whether the registrant (1) has filed all reports required to be filed by Section 13 or 15(d) of theSecurities Exchange Act of 1934 during the preceding 12 months (or for such shorter period that the registrant wasrequired to file such reports), and (2) has been subject to such filing requirements for the past 90 days. Yes � No �
Indicate by check mark whether the registrant has submitted electronically every Interactive Data File required to besubmitted pursuant to Rule 405 of Regulation S-T (§232.405 of this chapter) during the preceding 12 months (or for suchshorter period that the registrant was required to submit such files). Yes � No �
Indicate by check mark if disclosure of delinquent filers pursuant to Item 405 of Regulation S-K is not contained herein,and will not be contained, to the best of registrant’s knowledge, in definitive proxy or information statements incorporatedby reference in Part III of this Form 10-K or any amendment to this Form 10-K. �
Indicate by check mark whether the registrant is a large accelerated filer, an accelerated filer, a non-accelerated filer, or asmaller reporting company. See the definitions of ‘‘large accelerated filer,’’ ‘‘accelerated filer,’’ and ‘‘smaller reportingcompany’’ in Rule 12b-2 of the Exchange Act:
Large Accelerated filer � Accelerated filer � Non-accelerated filer � Smaller reporting company � Emerginggrowth company �
If an emerging growth company, indicate by check mark if the registrant has elected not to use the extended transitionperiod for complying with any new or revised financial accounting standards provided pursuant to Section 13(a) of theExchange Act. �
Indicate by check mark whether the registrant is a shell company (as defined in Rule 12b-2 of the Act). Yes � No �
The aggregate market value of registrant’s common shares held by non-affiliates, based upon the closing price of ourcommon shares on the last business day of the registrant’s most recently completed second fiscal quarter, June 29, 2018,as reported by the New York Stock Exchange, was approximately $9,792 million. Common shares held by executive officersand directors and persons who own 10% or more of the issued and outstanding common shares have been excluded sincesuch persons may be deemed affiliates. This determination of affiliate status is not a determination for any other purpose.
As of February 15, 2019, 141,118,189 Common Shares, par value $.01 per share, were issued and outstanding.
DOCUMENTS INCORPORATED BY REFERENCE
Portions of the proxy statement for the 2019 Annual General Meeting of Shareholders to be held on May 23, 2019 areincorporated by reference into Part III.


i
TABLE OF CONTENTS
PAGE
PART I
Item 1. Business . . . . . . . . . . . . . . . . . . . . . . . . . . . . . . . . . . . . . . . . . . . . . . . . . . . . . . . . . . . . . . . . . . . . . . . . . . . . . . . . . . . . . . . . . . . . . . . . . . . . . . . . . . . . . . . . . . . . . . . . . . . . . . . . . . . . . . 1
Item 1A. Risk Factors . . . . . . . . . . . . . . . . . . . . . . . . . . . . . . . . . . . . . . . . . . . . . . . . . . . . . . . . . . . . . . . . . . . . . . . . . . . . . . . . . . . . . . . . . . . . . . . . . . . . . . . . . . . . . . . . . . . . . . . . . . . . . . . . . 9
Item 1B. Unresolved Staff Comments . . . . . . . . . . . . . . . . . . . . . . . . . . . . . . . . . . . . . . . . . . . . . . . . . . . . . . . . . . . . . . . . . . . . . . . . . . . . . . . . . . . . . . . . . . . . . . . . . . . . . . . . . . . . 15
Item 2. Properties . . . . . . . . . . . . . . . . . . . . . . . . . . . . . . . . . . . . . . . . . . . . . . . . . . . . . . . . . . . . . . . . . . . . . . . . . . . . . . . . . . . . . . . . . . . . . . . . . . . . . . . . . . . . . . . . . . . . . . . . . . . . . . . . . . . . 15
Item 3. Legal Proceedings . . . . . . . . . . . . . . . . . . . . . . . . . . . . . . . . . . . . . . . . . . . . . . . . . . . . . . . . . . . . . . . . . . . . . . . . . . . . . . . . . . . . . . . . . . . . . . . . . . . . . . . . . . . . . . . . . . . . . . . . . 16
Item 4. Mine Safety Disclosures . . . . . . . . . . . . . . . . . . . . . . . . . . . . . . . . . . . . . . . . . . . . . . . . . . . . . . . . . . . . . . . . . . . . . . . . . . . . . . . . . . . . . . . . . . . . . . . . . . . . . . . . . . . . . . . . . 16
PART II
Item 5. Market for Registrant’s Common Equity, Related Stockholder Matters and Issuer Purchases of EquitySecurities. . . . . . . . . . . . . . . . . . . . . . . . . . . . . . . . . . . . . . . . . . . . . . . . . . . . . . . . . . . . . . . . . . . . . . . . . . . . . . . . . . . . . . . . . . . . . . . . . . . . . . . . . . . . . . . . . . . . . . . . . . . . . . . . . . 17
Item 6. Selected Financial Data . . . . . . . . . . . . . . . . . . . . . . . . . . . . . . . . . . . . . . . . . . . . . . . . . . . . . . . . . . . . . . . . . . . . . . . . . . . . . . . . . . . . . . . . . . . . . . . . . . . . . . . . . . . . . . . . . . 19
Item 7. Management’s Discussion and Analysis of Financial Condition and Results of Operations. . . . . . . . . . . . . . . . . . . . . . . . . . . 20
Item 7A. Quantitative and Qualitative Disclosures About Market Risk . . . . . . . . . . . . . . . . . . . . . . . . . . . . . . . . . . . . . . . . . . . . . . . . . . . . . . . . . . . . . . . . . . 39
Item 8. Financial Statements and Supplementary Data. . . . . . . . . . . . . . . . . . . . . . . . . . . . . . . . . . . . . . . . . . . . . . . . . . . . . . . . . . . . . . . . . . . . . . . . . . . . . . . . . . . . 42
Item 9. Changes in and Disagreements with Accountants on Accounting and Financial Disclosure . . . . . . . . . . . . . . . . . . . . . . . . . 42
Item 9A. Controls and Procedures. . . . . . . . . . . . . . . . . . . . . . . . . . . . . . . . . . . . . . . . . . . . . . . . . . . . . . . . . . . . . . . . . . . . . . . . . . . . . . . . . . . . . . . . . . . . . . . . . . . . . . . . . . . . . . . . . 42
Item 9B. Other Information . . . . . . . . . . . . . . . . . . . . . . . . . . . . . . . . . . . . . . . . . . . . . . . . . . . . . . . . . . . . . . . . . . . . . . . . . . . . . . . . . . . . . . . . . . . . . . . . . . . . . . . . . . . . . . . . . . . . . . . . . . 45
PART III
Item 10. Directors, Executive Officers, and Corporate Governance. . . . . . . . . . . . . . . . . . . . . . . . . . . . . . . . . . . . . . . . . . . . . . . . . . . . . . . . . . . . . . . . . . . . . . . 45
Item 11. Executive Compensation . . . . . . . . . . . . . . . . . . . . . . . . . . . . . . . . . . . . . . . . . . . . . . . . . . . . . . . . . . . . . . . . . . . . . . . . . . . . . . . . . . . . . . . . . . . . . . . . . . . . . . . . . . . . . . . . . 45
Item 12. Security Ownership of Certain Beneficial Owners and Management and Related Stockholder Matters. . . . . . . . . . . 45
Item 13. Certain Relationships and Related Transactions, and Director Independence . . . . . . . . . . . . . . . . . . . . . . . . . . . . . . . . . . . . . . . . . . . . 45
Item 14. Principal Accounting Fees and Services . . . . . . . . . . . . . . . . . . . . . . . . . . . . . . . . . . . . . . . . . . . . . . . . . . . . . . . . . . . . . . . . . . . . . . . . . . . . . . . . . . . . . . . . . . . . . 45
PART IV
Item 15. Exhibits, Financial Statement Schedules . . . . . . . . . . . . . . . . . . . . . . . . . . . . . . . . . . . . . . . . . . . . . . . . . . . . . . . . . . . . . . . . . . . . . . . . . . . . . . . . . . . . . . . . . . . . . 46
Schedule II – Valuation and Qualifying Accounts . . . . . . . . . . . . . . . . . . . . . . . . . . . . . . . . . . . . . . . . . . . . . . . . . . . . . . . . . . . . . . . . . . . . . . . . . . . . . . . . . . . . . . . . . . . . . . . . . E-1
INDEX TO CONSOLIDATED FINANCIAL STATEMENTS . . . . . . . . . . . . . . . . . . . . . . . . . . . . . . . . . . . . . . . . . . . . . . . . . . . . . . . . . . . . . . . . . . . . . . . . . . . . . . . . . . . . . . . . F-1
SIGNATURES. . . . . . . . . . . . . . . . . . . . . . . . . . . . . . . . . . . . . . . . . . . . . . . . . . . . . . . . . . . . . . . . . . . . . . . . . . . . . . . . . . . . . . . . . . . . . . . . . . . . . . . . . . . . . . . . . . . . . . . . . . . . . . . . . . . . . . . . . . . . . . . . S-1
2018 Bunge Annual Report i

ii
CAUTIONARY STATEMENT REGARDING FORWARD LOOKING STATEMENTSThe Private Securities Litigation Reform Act of 1995 provides a • our ability to achieve the efficiencies, savings and other‘‘safe harbor’’ for forward looking statements to encourage benefits anticipated from our cost reduction, margincompanies to provide prospective information to investors. This improvement, operational excellence and other businessAnnual Report on Form 10-K includes forward looking optimization initiatives;statements that reflect our current expectations and projections
• industry conditions, including fluctuations in supply, demandabout our future results, performance, prospects andand prices for agricultural commodities and other rawopportunities. Forward looking statements include allmaterials and products that we sell and use in our business,statements that are not historical in nature. We have tried tofluctuations in energy and freight costs and competitiveidentify these forward looking statements by using wordsdevelopments in our industries;including ‘‘may,’’ ‘‘will,’’ ‘‘should,’’ ‘‘could,’’ ‘‘expect,’’ ‘‘anticipate,’’
‘‘believe,’’ ‘‘plan,’’ ‘‘intend,’’ ‘‘estimate,’’ ‘‘continue’’ and similar• weather conditions and the impact of crop and animalexpressions. These forward looking statements are subject to a
disease on our business;number of risks, uncertainties, assumptions and other factorsthat could cause our actual results, performance, prospects or
• global and regional economic, agricultural, financial andopportunities to differ materially from those expressed in, orcommodities market, political, social and health conditions;implied by, these forward looking statements. These factors
include the risks, uncertainties, trends and other factors • the outcome of our strategic review process;discussed under the headings ‘‘Item 1A. Risk Factors,’’ as wellas ‘‘Item 1. Business,’’ ‘‘Item 7. Management’s Discussion and • the effectiveness of our risk management strategies;Analysis of Financial Condition and Results of Operations,’’ andelsewhere in this Annual Report on Form 10-K, including: • operational risks, including industrial accidents, natural
disasters and cybersecurity incidents: and• changes in governmental policies and laws affecting our
business, including agricultural and trade policies and • other factors affecting our business generally.environmental, tax and biofuels regulation;
In light of these risks, uncertainties and assumptions, you• our capital allocation plans, funding needs and financing should not place undue reliance on any forward looking
sources; statements contained in this Annual Report on Form 10-K.Additional risks that we may currently deem immaterial or that
• changes in foreign exchange policy or rates; are not presently known to us could also cause the forwardlooking events discussed in this Annual Report on Form 10-K
• the outcome of pending regulatory and legal proceedings; not to occur. Except as otherwise required by federal securitieslaw, we undertake no obligation to publicly update or revise• our ability to complete, integrate and benefit fromany forward looking statements, whether as a result of newacquisitions, divestitures, joint ventures and strategicinformation, future events, changed circumstances or any otheralliances;reason after the date of this Annual Report on Form 10-K.
ii 2018 Bunge Annual Report

1
Our Sugar and Bioenergy segment produces and sells sugarPART I and ethanol derived from sugarcane, as well as energy derivedfrom the sugar and ethanol production process, through ourITEM 1. BUSINESSoperations in Brazil.
References in this Annual Report on Form 10-K to ‘‘BungeOur Fertilizer segment is involved in producing, blending andLimited,’’ ‘‘Bunge,’’ ‘‘the Company,’’ ‘‘we,’’ ‘‘us’’ and ‘‘our’’ refer todistributing fertilizer products for the agricultural industry inBunge Limited and its consolidated subsidiaries, unless theSouth America, with operations and retail distribution activitiescontext otherwise indicates.in Argentina, Uruguay and Paraguay, and port facilities inArgentina and Brazil.
BUSINESS OVERVIEW
2018 Summary Operating Highlights. In our AgribusinessWe are a leading global agribusiness and food company with segment in 2018, we continued our focus on improving theintegrated operations that stretch from the farm to consumer efficiency and operations of our global network of integratedfoods. We believe we are a leading: assets with a combination of productivity and maintenance
investments, including substantially completing the upgrade of• global oilseed processor and producer of vegetable oils and an existing oilseed processing plant in Italy. In our Food and
protein meals, based on processing capacity; Ingredients businesses, we completed the acquisition of a 70%ownership interest in IOI Loders Croklaan, creating a leading• global grain processor, based on volume;solutions provider in business to business (‘‘B2B’’) oils andaccelerating the growth of our value-added oils business, and• seller of packaged vegetable oils worldwide, based on sales;the acquisition of two corn mills in the United States, whichenabled Bunge to expand its value-added product offering in• producer and seller of wheat flours and bakery mixes andNorth America. In the Sugar and Bioenergy segment, we exiteddry milled corn products in North and South America, basedfrom our renewable oils joint venture in Brazil and exited ouron volume; andinternational sugar trading operations. Additionally, we made
• producer of sugar and ethanol in Brazil, based on volume. continued progress on our Global Competitiveness Programthat was launched in 2017 to improve our cost position and
We conduct our operations in five segments: Agribusiness, deliver increased value to shareholders.Edible Oil Products, Milling Products, Sugar and Bioenergy, andFertilizer. We refer to the Edible Oil Products and Milling HISTORY AND CORPORATE INFORMATIONProducts segments collectively as our Food and Ingredientsbusinesses. Key elements of our corporate strategy include Bunge Limited is a limited liability company formed under theenhancing our global expertise and footprint in grains and laws of Bermuda. We are registered with the Registrar ofoilseeds in a capital-efficient way through targeted investments Companies in Bermuda under registration number EC20791.and strategic partnerships, partnering with customers to We trace our history back to 1818 when we were founded as adevelop products, services and solutions that meet today’s and trading company in Amsterdam, The Netherlands. We are afuture needs in food and feed applications, and maximizing holding company and substantially all of our operations arereturns and profitability through a strong focus on cost conducted through our subsidiaries. Our principal executiveefficiency and continuous improvement. Our strategy is aligned offices and corporate headquarters are located at 50 Mainwith long-term global macroeconomic and consumer growth Street, White Plains, New York, 10606, United States of Americatrends, including a commitment to sustainability. and our telephone number is (914) 684-2800. Our registered
office is located at 2 Church Street, Hamilton, HM 11,Our Agribusiness segment is an integrated, global business Bermuda.principally involved in the purchase, storage, transportation,processing and sale of agricultural commodities and
AGRIBUSINESScommodity products. Our Agribusiness operations and assetsare located in North and South America, Europe and Overview. Our Agribusiness segment is an integrated, globalAsia-Pacific, and we have merchandising and distribution business involved in the purchase, storage, transport,offices throughout the world. processing and sale of agricultural commodities and
commodity products while managing risk across variousOur Food and Ingredients businesses consist of two reportable product lines. The principal agricultural commodities that webusiness segments: Edible Oil Products and Milling Products. handle in this segment are oilseeds, primarily soybeans,The Edible Oil Products segment includes businesses that sell rapeseed, canola and sunflower seed, and grains, primarilyvegetable oils and fats, including cooking oils, shortenings, wheat and corn. We process oilseeds into vegetable oils andmargarines, mayonnaise and specialty ingredients. The Milling protein meals, principally for the food, animal feed andProducts segment includes businesses that sell wheat flours, biodiesel industries, through a global network of facilities. Ourbakery mixes, corn-based products and rice. The operations footprint is well balanced, with approximately 33% of ourand assets of our Edible Oil Products segment are primarily processing capacity located in South America, 27% in Northlocated in North and South America, Europe and Asia-Pacific America, 26% in Europe and 14% in Asia-Pacific.and the operations and assets of our Milling Products segmentare located in North and South America.
2018 Bunge Annual Report 1

2
Customers. We sell agricultural commodities and processed Competition. Due to their commodity nature, markets for ourcommodity products to customers throughout the world. The products are highly competitive and subject to productprincipal purchasers of our oilseeds, grains and oilseed meal substitution. Competition is principally based on price, quality,are animal feed manufacturers, livestock producers, wheat and product and service offerings and geographic location. Majorcorn millers and other oilseed processors. As a result, our competitors include but are not limited to: The Archer Danielsagribusiness operations generally benefit from global demand Midland Co. (‘‘ADM’’), Cargill Incorporated (‘‘Cargill’’), Louisfor protein, primarily poultry and pork products. The principal Dreyfus Group (‘‘Louis Dreyfus’’), Glencore International PLC,purchasers of the unrefined vegetable oils produced in this Wilmar International Limited (‘‘Wilmar’’) and COFCOsegment are our own Food and Ingredients businesses and International (‘‘COFCO’’).third-party edible oil processing companies, which use theseoils as raw materials in the production of edible oil products FOOD AND INGREDIENTSfor the food service, food processor and retail markets. Inaddition, we sell oil products for various non-food uses, Overview. Our Food and Ingredients businesses include twoincluding industrial applications and the production of reportable business segments: Edible Oil Products and Millingbiodiesel. Products. We primarily sell our products to three customer
types or market channels: food processors, food serviceDistribution and Logistics. We have developed an extensive companies and retail outlets. The principal raw materials usedglobal logistics network to transport our products, including in our Food and Ingredients businesses are various crude andtrucks, railcars, river barges and ocean freight vessels. Typically, further processed vegetable oils and fats in our Edible Oilwe either lease the transportation assets or contract with third Products segment, and wheat, corn and rice in our Millingparties for these services. To better serve our customer base Products segment. These raw materials are mostly agriculturaland develop our global distribution and logistics capabilities, commodities that we either produce or purchase from thirdwe own or operate either directly or through joint venture parties. We believe that our global integrated business modelarrangements, various port terminal facilities globally, including enables us to realize synergies between our Agribusiness andin Brazil, Argentina, the United States, Canada, Russia, Ukraine, Food and Ingredients operations through raw materialPoland, Vietnam and Australia. procurement, logistics, risk management and co-location of
industrial facilities, enabling us to supply customers withFinancial Services and Activities. We also offer various financial reliable, high quality products on a global basis. As many ofservices, principally trade structured finance and financial risk the products we sell in our Food & Ingredients businesses aremanagement services for customers and other third parties. staple foods or ingredients, these businesses benefit fromOur trade structured finance operations leverage our macro population and income growth rates generally.international trade flows to generate trade finance derived Additionally, our Food and Ingredients businesses are focusedliquidity in emerging markets for third parties. Our financial risk on capitalizing on growing global consumer food trends,management services include structuring and marketing risk including a desire for less processed, healthier foods, interestmanagement products to enable agricultural producers and in new flavors and increases in snacking and eating outsideend users of commodities to manage their commodity price the home.risk exposures. We also engage in trading of foreign exchangeand other financial instruments in our financial services
Edible Oil Productsbusiness. Additionally, in Brazil, we provide financing servicesto farmers from whom we purchase soybeans and other
Products. Our edible oil products include packaged and bulkagricultural commodities. Our farmer financing activities are an oils and fats, including cooking oils, shortenings, margarines,integral part of our grain and oilseed origination activities as mayonnaise and other products derived from the vegetable oilthey help assure the annual supply of raw materials for our refining process. We primarily use soybean, sunflower,Brazilian agribusiness operations. rapeseed and canola oil that we produce in our Agribusiness
segment oilseed processing operations as raw materials in thisBiodiesel. We own and operate biodiesel facilities in Europebusiness. We also refine and fractionate palm oil, palm kerneland Brazil and have equity method investments in biodieseloil, coconut oil, and shea butter, and blend and refine olive oil.producers in Europe and Argentina. This business isAdditionally, we produce specialty ingredients such as lecithincomplementary to our core Agribusiness operations as in eachderived from vegetable oils, which is used as an emulsifier in acase we supply some of the raw materials (refined or partiallybroad range of food products. We are a leading seller ofrefined vegetable oil) used in their production processes.packaged vegetable oils worldwide, based on sales. We haveedible oil refining and packaging facilities in North America,Raw Materials. We purchase oilseeds and grains either directlySouth America, Europe and Asia-Pacific. Our edible oilfrom farmers or indirectly through intermediaries. Although theproducts business is largely B2B focused in North America,availability and price of agricultural commodities may, in anywhile in South America, Europe and Asia-Pacific it comprises agiven year, be affected by unpredictable factors such asmix of B2B and business to consumer (‘‘B2C’’) offerings.weather, government programs and policies and farmer
planting and selling decisions, our operations in major cropOn March 1, 2018, we completed the acquisition of a 70%growing regions globally have enabled us to source adequateownership interest in IOI Loders Croklaan (‘‘Loders’’). Theraw materials for our operational needs.resulting Bunge Loders Croklaan business has enabled us toexpand our customer value proposition with a full range of
2 2018 Bunge Annual Report

3
tropical and seed oils, leading innovation and application and manufacturers, many of which are leading brand owners incapabilities, a larger global footprint, and an integrated value their product categories.chain focused on sustainability. Bunge Loders Croklaan
Competition. Competition is based on a number of factors,products are used in a variety of applications, fromincluding price, raw material procurement, distributionconfectionary and bakery to culinary uses and infant nutritioncapabilities and cost structure, brand recognition, productproducts.quality, innovation, technical support, new productintroductions, composition and nutritional value and advertisingIn Brazil, our retail edible oil brands include Soya, the leadingand promotion. Our products may compete with widelyconsumer packaged vegetable oil brand, as well as Primor andadvertised, well-known, branded products, as well as privateSalada. We are also a leading producer in the Brazilianlabel and customized products. Our principal competitors in themargarine market with our brands Delicia and Primor, as wellEdible Oil Products segment include, but are not limited to:as in mayonnaise with our Soya, Primor and Salada brands. WeADM, AAK AB, Cargill, Fuji Oil Co. Ltd. and Wilmar, as well asare also a leading supplier of shortenings to the foodlocal competitors in each region.processor market. We also produce processed tomato and
other staple food products, including sauces, condiments andseasonings in Brazil under several brand names. Milling Products
In the United States and Canada, we offer food manufacturers, Products. Our Milling Products segment activities include thebakeries and foodservice operators high quality solutions to fit production and sale of a variety of wheat flours and bakerytheir goals, such as delivering desired tastes and textures, or mixes in Brazil and Mexico, corn-based products in the Unitedreducing trans-fats or saturated fats in their products. Our States and Mexico derived from both the dry and wet cornproducts include trans-fat free high oleic canola oil that is low milling processes and milled rice products in the United Statesin saturated fats and high oleic soybean oil that is highly stable and Brazil.and trans-fat free. We have also developed proprietary fiber
Our brands in Brazil include Suprema, Soberana, Primor andaddition processes that allow bakery and food processorPredileta wheat flours and Gradina, and Pre-Mescla bakerycustomers to achieve significant reductions in saturated fats inpremixes. Our wheat flour and bakery mix brands in Mexicoshortenings. We also offer expeller pressed and physicallyinclude Espiga, Esponja, Francesera, Chulita, Galletera andrefined oils to food service customers under the brand WholePastelera. Our corn milling products consist primarily ofHarvest and produce margarines and buttery spreads, includingdry-milled corn meals and flours, wet-milled masa and flours,our leading brand Country Premium, for food service, foodflaking and brewer’s grits, as well as soy-fortified corn meal,processor and retail private label customers. The Bunge Loderscorn-soy blend and other similar products. As part of our cornCroklaan product line also includes a variety of products forportfolio, we also sell whole grain and fiber ingredients. In thebakery and confectionary customers.United States, we offer in our portfolio ancient grains, such as
In Europe, we are a leader in consumer packaged vegetable quinoa and millet. We also produce a range of extrudedoils, which are sold in various geographies under brand names products that include die cut pellets for the snack foodincluding Venusz, Floriol, Kujawski, Olek, Unisol, Ideal, Oleina, industry. Additionally, we offer non-GMO products in theMaslenitsa, Oliwier, Salat Rozumnitsa and Komili, and a leader in United States, including corn varieties. We mill and sell bulkmargarines, including our brand names Smakowita, Maslo and packaged rice in the United States and sell branded riceRosline, Masmix, Optima, Deli Reform, Keiju, Evesol, Linco, in Brazil under the Primor brand.Gottgott, Suvela and Finuu. We are also a significant B2B oils
In January 2018, we acquired two corn mills in the Unitedsupplier in the Western European foodservice channel. InStates (‘‘Minsa USA’’), from Grupo Minsa, S.A.B. de C.V. Theaddition, the Bunge Loders Croklaan product line also includesacquisition of Minsa USA enabled Bunge to expand its value-a variety of products for the confectionary and bakeryadded product offering in grain based functional flours (masa)industries.and continue to build on our milling B2B businesses in North
In Asia, we offer a range of consumer and B2B products. In America.India, our consumer brands include Dalda, Ginni and Chambal
Customers. The primary customers for our wheat millingin edible oils; Dalda and Gagan in vanaspati; and Masterline inproducts are food processing, bakery and food serviceprofessional bakery fats. In China, we offer consumer edible oilcompanies. The primary customers for our corn millingproducts under the Dou Wei Jia brand. The Bunge Lodersproducts are companies in the food-processing sector, such asCroklaan product line also includes bakery, culinary,cereal, snack, bakery and brewing companies, as well as theconfectionary and infant nutrition product offerings.U.S. Government for humanitarian assistance programs. Our
Customers. Our customers include baked goods companies, rice milling business sells to customers in the food service andsnack food producers, confectioners, restaurant chains, food processing channels, as well as to export markets.foodservice operators, infant nutrition companies and other
Competition. Competition is based on a variety of factors,food manufacturers who use vegetable oils and shortenings asincluding price, raw material procurement, brand recognition,ingredients in their operations, as well as grocery chains,product quality, nutritional profile, dietary trends andwholesalers, distributors and other retailers who sell todistribution capabilities. In Brazil, our major competitors are M.consumers under our brand names or under private labels.Dias Branco, J. Macedo and Moinho Anaconda, as well asThese customers include global and national food processors
2018 Bunge Annual Report 3

4
many small regional producers. Our major competitors in North Our sugarcane planting and harvesting processes areAmerican corn milling include Cargill, Didion Inc., SEMO substantially mechanized. Mechanized harvesting does notMilling, LLC, Life Line Foods, LLC and Gruma S.A.B. de C.V. require burning of the cane prior to harvesting, significantlyOur major competitors in our U.S. rice milling business include reducing the environmental impact when compared to manualADM and Farmers’ Rice Cooperative. Our major competitors in harvesting, and resulting in improved soil conditions.Mexico include Elizondo Agroalimentos, S.A. de C.V., Molinera
Logistics. Harvested sugarcane is loaded onto trucks andde Mexico S.A. de C.V. and Grupo Trimex S.A.trailers and transported to our mills. Since the sucrose contentof the sugarcane begins to degrade rapidly after harvesting, weSUGAR AND BIOENERGYseek to minimize the time and distance between the cutting ofthe cane and its delivery to our mills for processing.Overview. We are a leading, integrated producer of sugar and
ethanol in Brazil. We own and operate eight sugarcane mills inProducts. Our mills allow us to produce ethanol, sugar andBrazil, the world’s largest producer and exporter of sugar. As ofelectricity, as further described below. At mills that produceDecember 31, 2018, our mills had a total crushing capacity ofboth sugar and ethanol, we can adjust our production mixapproximately 22 million metric tons per year. Sugarcane,within certain capacity limits between ethanol and sugar, aswhich is the raw material that we use to produce sugar andwell as, for certain mills, between different types of sugar (rawethanol, is supplied by a combination of our own plantationsand crystal) and ethanol (hydrous and anhydrous). The abilityand third-party farmers. Additionally, through cogenerationto adjust our production mix allows us to respond to changesfacilities at our sugarcane mills, we produce electricity from thein customer demand and market prices.burning of sugarcane bagasse (the fibrous portion of the
sugarcane that remains after the extraction of sugarcane juice) Sugar. Our current maximum sugar production capacity isin boilers, which enables our mills to meet their energy 6,050 metric tons per day, which in a season of 5,000 hours ofrequirements. Any surplus electricity is sold to the local grid or milling, results in an annual maximum production capacity ofother large third-party users of electricity. approximately 1.3 million metric tons of sugar. We produce two
types of sugar: very high polarity (‘‘VHP’’) raw sugar and crystalIn 2018, we exited our international sugar trading operations sugar. VHP sugar is similar to the raw sugar traded on majorand renewable oils joint venture in Brazil and continue to commodities exchanges, including the standard NY11 contract,explore alternatives to reduce our exposure to the Brazilian and is sold almost exclusively for export. Crystal sugar is asugarcane milling business, such as an initial public offering, non-refined white sugar and is principally sold domestically insale, joint venture or other alternatives. The nature and timing Brazil.of any potential outcome or transaction is uncertain andcannot be predicted. Over the past several years we have also Ethanol. Our current maximum ethanol production capacity isfocused on improving the efficiency and lowering the operating 6,240 cubic meters per day, which in a season of 5,000 hourscosts of this business. of milling, results in an annual maximum production capacity
of 1.3 million cubic meters of ethanol. We produce and sell twoRaw Materials. Sugarcane is our principal raw material in this types of ethanol: hydrous and anhydrous. Hydrous ethanol issegment and we both produce it and procure it through third- consumed directly as a transport fuel, while anhydrous ethanolparty supply contracts. The annual harvesting cycle in Brazil is blended with gasoline in transport fuels.typically begins in late March/early April and ends in lateNovember/early December. Once planted, sugarcane is Electricity. We generate electricity from burning sugarcaneharvested for five to seven years on average, but the yield bagasse in our mills. As of December 31, 2018, our totaldecreases with each harvest over the life cycle of the cane. As installed cogeneration capacity was approximately 322a result, after this period, old sugarcane plants are typically megawatts, with approximately 126 megawatts available forremoved, and the area is replanted. The quality and yield of the resale to third parties after supplying our mills’ energyharvested cane are also affected by factors such as soil quality, requirements, representing up to approximately 600,000moisture topography, weather and agricultural practices. megawatt hours of electricity available for resale depending
upon sugar mill production and cogeneration unit performanceOur mills are supplied with sugarcane grown on approximately and availability.325,000 hectares of land. This land represents approximately9,000 hectares of land that we own, 234,000 hectares of land Customers. The sugar we produce at our mills is sold in boththat we manage under agricultural partnership arrangements the Brazilian domestic and export markets. Our domesticand 82,000 hectares of land farmed by third-party farmers. In customers are primarily in the confectionary and food2018, approximately 71% of our total milled sugarcane came processing industries. The ethanol we produce is primarily soldfrom our owned or managed plantations and 29% was to customers for use in the Brazilian domestic market to meetpurchased from third-party suppliers. Payments under the the demand for fuel. We also export sugar and ethanol in theagricultural partnership agreements and third-party supply international market.contracts are based on a formula, which factors in the volume
Other. We have a minority investment in a U.S. corn basedof sugarcane per hectare, sucrose content of the sugarcaneethanol production facility and a 50% interest in a joint ventureand market prices for sugarcane, which are set by Consecana,that produces corn based ethanol in Argentina. In June 2018,the state of Sao Paulo sugarcane, sugar and ethanol council.we sold our interest in a joint venture for the development andproduction of renewable oils and feed ingredients in Brazil.
4 2018 Bunge Annual Report

5
Competition. We compete with other sugar and ethanol outlined to meet this goal include improving efficiency andproducers in Brazil and internationally, and in the global market scalability by simplifying organizational structures, streamliningwith beet sugar processors, producers of other sweeteners, and processes and consolidating back office functions globally, andother biofuels producers. The industry is highly competitive, adopting a zero-based budgeting process that will targetwith raw material procurement, cost structure, selling price and excess costs in specific budget categories. The GCPdistribution capabilities being important competitive factors. supplements other cost reduction and strategic initiativesOur major competitors in Brazil include Cosan Limited/ Raizen, designed to enhance the efficiency and performance ourSao Martinho S.A. and Biosev (Louis Dreyfus). Our major business. The implementation of these activities is expected tointernational competitors include British Sugar PLC, Sudzucker generate the $250 million of reduced overhead costs by theAG, Cargill, Tereos S.A., Sucden S.A., ED&F Man Limited and end of 2019 and to further benefit us in 2020. Additionally, weCOFCO. intend to apply the strategies and insights gained from the
GCP to develop additional opportunities to reduce costs andincrease efficiency in other areas of our business. For moreFERTILIZERinformation see Note 2—Global Competitiveness Program to our
Overview. Through our operations in Argentina, Uruguay and consolidated financial statements included as part of thisParaguay, we produce, blend and distribute a range of liquid Annual Report on Form 10-K.and dry NPK fertilizers, including nitrogen-based liquid andsolid phosphate fertilizers. NPK refers to nitrogen (N), RISK MANAGEMENTphosphate (P) and potassium (K), the main components ofchemical fertilizers, used for crop production primarily of Risk management is a fundamental aspect of our business.soybeans, corn and wheat. Our operations in Argentina, Engaging in the hedging of risk exposures and anticipatingUruguay and Paraguay are closely linked to our grain market developments are critical to protect and enhance ourorigination activities as we supply fertilizer to producers who return on assets. As such, we are active in derivative marketssupply us with grain. In Brazil, we operate a port terminal in for agricultural commodities, energy, ocean freight, foreignthe Port of Santos that discharges and handles imported currency and interest rates. We seek to leverage the marketfertilizers for third parties through our subsidiary Termag and insights that we gain through our global operations across ourprovides logistics and support services. Our Brazilian grain businesses by actively managing our physical and financialoperations also supply third-party produced fertilizer to farmers positions on a daily basis. See ‘‘Item 7A. Quantitative andthrough barter agreements with the farmers. Qualitative Disclosures About Market Risk’’
Products and Services. We offer a complete fertilizer portfolio, INSURANCEincluding SSP, ammonia and ammonium thiosulfate that weproduce, as well as monoammonium phosphate (‘‘MAP’’), In each country where we conduct business, our operationsdiammonium phosphate, triple supersphosphate, urea, and assets are subject to varying degrees of risk andurea-ammonium nitrate, ammonium sulfate and potassium uncertainty. We insure our businesses and assets in eachchloride that we purchase from third parties and resell. We country in a manner that we deem appropriate for a companymarket our products under the Bunge brand, as well as the of our size and activities, based on an analysis of the relativeSolmix brand for liquid fertilizers. risks and costs. We believe that our geographic dispersion of
assets helps mitigate risk to our business from an adverseRaw Materials. Our main raw materials in this segment are event affecting a specific facility; however, if we were to incur aconcentrated phosphate rock, sulfuric acid, natural gas and significant loss or liability for which we were not insured in fullsulphur. The prices of fertilizer raw materials are typically based or in part, it could have a materially adverse effect on ouron international prices that reflect global supply and demand business, financial condition and results of operations.factors and global transportation and other logistics costs. Eachof these fertilizer raw materials is readily available in the
OPERATING SEGMENTS AND GEOGRAPHIC AREASinternational market from multiple sources.
We have included financial information about our reportableCompetition. Competition is based on a number of factors,segments and our operations by geographic area in Note 27—including delivered price, product offering and quality, location,Segment Information to our consolidated financial statementaccess to raw materials, production efficiency and customerincluded as part of this Annual Report on Form 10-K.service, including, in some cases, customer financing terms.
Our main competitors in our fertilizer operations in ArgentinaRESEARCH AND DEVELOPMENT, INNOVATION, PATENTS ANDare Nutrien Ltd. (Agrium/ASP), YPF S.A., Profertil S.A., COFCOLICENSES(Nidera B.V.), Yara International ASA and Louis Dreyfus.
Our research and development activities are focused onGLOBAL COMPETITIVENESS PROGRAM developing products and improving processes that will drive
growth or otherwise add value to our core business operations.In July 2017, we announced a global competitiveness programIn our Food and Ingredients business, we have 17 research(‘‘GCP’’) to improve our cost position and deliver increasedand development centers globally to support productvalue to shareholders. When fully implemented, the GCP isdevelopment and enhancement. Additionally, Bunge Ventures,expected to reduce overhead costs by approximatelyour corporate venture capital unit, invests in start-ups and$250 million annually. The key elements of the GCP strategy
2018 Bunge Annual Report 5

6
other early stage companies that are developing new use in certain protected areas, forestry reserve requirements,technologies relevant to our industries. limitations on the burning of sugarcane and water use.
Additionally, from time-to-time, agricultural productionWe own trademarks, patents and licenses covering certain of shortfalls in certain regions and growing demand forour products and manufacturing processes. However, neither agricultural commodities for feed, food and fuel use haveour business as a whole nor any segment is dependent on any caused prices for relevant agricultural commodities to rise.specific trademark, patent or license. High commodity prices and regional crop shortfalls have led,
and in the future may lead, governments to impose priceSEASONALITY controls, tariffs, export restrictions and other measures
designed to assure adequate domestic supplies and/or mitigateIn our Agribusiness segment, while there is a degree of price increases in their domestic markets, as well as increaseseasonality in the growing season and procurement of our the scrutiny of competitive conditions in their markets.principal raw materials, such as oilseeds and grains, wetypically do not experience material fluctuations in volume Many countries globally are using and producing biofuels asbetween the first and second half of the year since we are alternatives to traditional fossil fuels. Biofuels convert crops,geographically diversified between the northern and southern such as sugarcane, corn, soybeans, palm, rapeseed or canolahemispheres, and we sell and distribute products throughout and other oilseeds, into ethanol or biodiesel to extend, enhancethe year. However, the first quarter of the year has generally or substitute for fossil fuels. Production of biofuels hasbeen our weakest in terms of financial results due to the increased significantly in the last decade in response to bothtiming of the North and South American oilseed harvests as periods of high fossil fuel prices and to government incentivesthe North American harvest peaks in the third and fourth to produce biofuels offered in many countries, including thequarters and the South American harvest peaks in the second United States, Brazil, Argentina and several South East Asianquarter, and thus our North and South American grain and European countries. Furthermore, in several countries,merchandising and oilseed processing activities are generally governmental authorities are mandating biofuels use inat lower levels during the first quarter. transport fuel at specified levels. As such, the markets for
agricultural commodities used in the production of biofuelsIn our Food and Ingredients businesses, demand for certain of have become increasingly affected by the growth of theour food items may be influenced by holidays and other annual biofuels industry and related legislation.events.
ENVIRONMENTAL MATTERS AND SUSTAINABILITYWe experience seasonality in our Sugar and Bioenergy segmentas a result of the Brazilian sugarcane growing cycle. In the We incorporate a commitment to sustainability into many of theCenter-South of Brazil, where most of our mills are located, the areas of our business; from how we plan and develop oursugarcane harvesting period typically begins in late March/ strategic goals and operate our facilities, to how we doearly April and ends in late November/early December. This business with our suppliers and customers and engage withcreates fluctuations in our sugar and ethanol inventories, which our communities. Our philosophy is to ‘‘Act, Conserve andusually peak in December to cover sales between crop Engage’’ and our efforts include policies and initiatives toharvests. These factors result in earnings being weighted reduce deforestation, conserve resources in our operations andtowards the second half of the year. This segment is also engage across our sector to address the sustainabilityimpacted by the yield development of the sugarcane crops over challenges in the agribusiness and food value chain, such asthe course of the crop year with sugar content reaching its the impacts of agricultural production on environmentalhighest level in the middle of the crop. As a result of the above resources.factors, there may be significant variations in our results ofoperations from one quarter to another. We are subject to various environmental protection and
occupational health and safety laws and regulations in theIn our Fertilizer segment, we are subject to seasonal trends countries in which we operate, and we incur costs to complybased on the South American agricultural growing cycle as with these requirements. Compliance with applicable laws andfarmers typically purchase the bulk of their fertilizer needs in regulations relating to environmental matters has not had athe second half of the year. material financial or competitive effect on our business.
However, due to our extensive operations across multipleGOVERNMENT REGULATION industries and jurisdictions globally, we are exposed to the risk
of claims and liabilities under these laws and regulations.We are subject to a variety of laws and regulations in each of Violation can result in substantial fines, administrativethe countries in which we operate which govern various sanctions, criminal penalties, revocations of operating permitsaspects of our business, including general business regulations and/or shutdowns of our facilities.as well as those governing the manufacturing, handling,storage, transport, marketing and sale of our products. These Additionally, our business could be affected in the future byinclude laws and regulations relating to facility licensing and regulation or taxation of greenhouse gas emissions or policiespermitting, food and feed safety, handling and production of related to national emission reduction plans. It is difficult toregulated substances, nutritional and labeling requirements, assess the potential impact of any resulting regulation ofglobal trade compliance and other matters. Our operations and greenhouse gas emissions. Potential consequences couldthose of our suppliers are also subject to restrictions on land
6 2018 Bunge Annual Report

7
include increased energy, transportation and raw material EXECUTIVE OFFICERS AND KEY EMPLOYEES OF THE COMPANYcosts, and we may be required to make additional investments
Set forth below is certain information concerning the executiveto modify our facilities, equipment and processes. As a result,officers and key employees of the company.the effects of additional climate change regulatory initiatives
could have adverse impacts on our business and results ofNAME POSITIONoperations. Physical effects of climate change, including shifts
in agricultural production areas and climatic volatility, could in Gregory A. Heckman Acting Chief Executive Officerthe long-term result in incidents of stranded physical assets. Todd Bastean President, North America
Thomas M. Boehlert Executive Vice President - Chief FinancialWe believe the breadth and diversification of our global assetOfficernetwork, as well as our participation in global trade of
Deborah Borg Executive Vice President - Chief Humanagricultural commodities, help to mitigate these risks.Resources and Communications Officer
Robert Coviello Executive Vice President - Chief Growth andEMPLOYEES Strategy Officer
Christos Dimopoulous President, AgribusinessAs of December 31, 2018, we had approximately 31,000 Gordon Hardie President, Food & Ingredientsemployees. Many of our employees are represented by labor David G. Kabbes Executive Vice President - Corporate Affairs and
Chief Legal Officerunions, and their employment is governed by collectivePierre Mauger President, Europe and Asiabargaining agreements. In general, we consider our employeeRaul Padilla President, South America and Sugar & Bioenergyrelations to be good.Brian Zachman President, Global Risk Management
AVAILABLE INFORMATION Gregory A. Heckman, 56. Mr. Heckman was appointed ActingChief Executive Officer in January 2019. He joined our Board of
Our website address is www.bunge.com. Through the Directors in October 2018 and continues to serve as a Board‘‘Investors: SEC Filings’’ section of our website, it is possible to member. Mr. Heckman is the founding partner of Flatwateraccess our periodic report filings with the Securities and Partners, a private investment firm, and has over 30 years ofExchange Commission (‘‘SEC’’) pursuant to Section 13(a) or experience in the agriculture, energy and food processing15(d) of the Securities Exchange Act of 1934, as amended (the industries. He served as Chief Executive Officer of The Gavilon‘‘Exchange Act’’), including our Annual Report on Form 10-K, Group from 2008 to 2015. Prior to Gavilon, he served as Chiefquarterly reports on Form 10-Q and current reports on Operating Officer of ConAgra Foods Commercial Products andForm 8-K, and any amendments to those reports. Also, filings President and Chief Operating Officer of ConAgra Trade Group.made pursuant to Section 16 of the Exchange Act with the SEC Mr. Heckman serves on the Board of Directors of OCI N.V. andby our executive officers, directors and other reporting persons on the Advisory Board of JBS USA. He holds a B.S. inwith respect to our common shares are made available through agricultural economics and marketing from the University ofour website. Our periodic reports and amendments and the Illinois at Urbana-Champaign.Section 16 filings are available through our website free ofcharge as soon as reasonably practicable after such report, Todd Bastean, 52. Mr. Bastean has served as President, Northamendment or filing is electronically filed with or furnished to America since January 2018. Prior to that, he served as Chiefthe SEC. Executive Officer, Bunge North America since June 2013. He
started his career at Bunge in 1994 and became ChiefThrough the ‘‘Investors: Governance’’ section of our website Financial Officer of Bunge North America in 2010. Before(www.bunge.com), it is also possible to access copies of the assuming that role, he served as Vice President and Generalcharters for our Audit Committee, Compensation Committee, Manager of Bunge North America’s Milling and BiofuelsFinance and Risk Policy Committee, Corporate Governance and business units, and as Vice President and Chief AdministrativeNominations Committee, Sustainability and Corporate Officer of its Grain and Milling business units. He also heldResponsibility Committee and Strategic Review Committee. Our positions in strategic planning and auditing. Prior to joiningCorporate Governance Guidelines and our Code of Conduct are Bunge, he worked for KPMG Peat Marwick. Mr. Bastean holdsalso available on our website. Each of these documents is also a B.S. in Accounting from Western Illinois University.made available free of charge through our website.
Thomas M. Boehlert, 59. Mr. Boehlert joined Bunge in JanuaryThe foregoing information regarding our website and its 2017. Previously, he was Chief Executive Officer, President andcontent is for your convenience only. The information contained a Director of First Nickel Inc. from 2011 to 2015. First Nickelin or connected to our website is not deemed to be entered Canadian receivership in August 2015. Prior to that, heincorporated by reference in this report or filed with the SEC. was Chief Financial Officer for Kinross Gold Corporation from
2006 to 2011 and served as Chief Financial Officer for severalIn addition, the SEC maintains a website that contains reports, energy companies, including Texas Genco, Direct Energy andproxy and information statements, and other information Sithe Energies, Inc. Previously, Mr. Boehlert spent 14 years inregarding issuers where you may obtain a copy of all of the banking with Credit Suisse, where his focus was on the electricmaterials we file publicly with SEC. The SEC website address is power, natural resources and infrastructure sectors, and wherewww.sec.gov. he built and headed the firm’s London-based project finance
business covering Europe, Africa and the Middle East. Hestarted his career as an auditor at a KPMG predecessor firm in
2018 Bunge Annual Report 7

8
1983. Mr. Boehlert is a Certified Public Accountant and holds a January 2018. He became General Counsel and ManagingB.A. in Accounting from Indiana University and an M.B.A. in Director, Corporate Affairs in February 2015 after serving asFinance from New York University. Senior Vice President, Corporate and Legal Affairs for Bunge
North America since 2000, where he oversaw the legal,Deborah Borg, 42. Ms. Borg joined Bunge in January 2016. She government and industry affairs, communications, foreign tradejoined Bunge from Dow Chemical, where she served as support and environmental functions. Prior to joining Bunge inPresident Dow USA, a role in which she was responsible for 2000, he was Executive Vice President, Secretary and Generalregional business strategy and external relationships with Counsel at Purina Mills, a corporate attorney at Kochcustomers, government organizations and joint venture Industries, Inc., a partner at Schiff Hardin & Waite and anpartners. She started her career at Dow in 2000 as Human associate at Thompson Coburn. He received a bachelor’sResources Manager for Australia / New Zealand and went on degree in business from Quincy University and a law degreeto hold regional and business HR roles in Asia, Europe and from the University of Illinois.North America. She also served as Global HR Director,Marketing and Sales, and led the Human Capital Planning and Pierre Mauger, 46. Mr. Mauger has served as President, EuropeDevelopment function for Dow focusing on talent acquisition, and Asia since January 2018. Prior to that he served as Chiefretention, diversity and development. Previously, Ms. Borg Development Officer since September 2013, when he joinedserved in HR and talent development roles with General Bunge. Prior to joining Bunge, Mr. Mauger was a partner atMotors Australia. She holds a Bachelor of Business McKinsey & Company, where he led the firm’s agricultureManagement in Human Resources and a Master in Training service line in Europe, the Middle East and Africa from 2009 toand Change Management from Victoria University, Australia. 2013, overseeing client relationships with leading global
companies in the commodity processing and trading,Robert Coviello, 50. Mr. Coviello has served as Executive Vice agrochemicals and fertilizer sectors, as well as withPresident and Chief Growth and Strategy Officer since January governments. Prior to that, he served as a partner in the firm’s2019. Prior to that he served as Managing Director, Southeast consumer goods practice. He joined McKinsey as an associateAsia and China from 2016 to 2018. Prior to that he held a in 2000. Mr. Mauger previously worked as an auditor at Nestlevariety of commercial leadership positions for Bunge in Asia, and KPMG. He holds a B.Sc. in Economics and BusinessEurope and the United States. Prior to joining Bunge in 2003, Finance from Brunel University in the United Kingdom and anhe served in commercial and trading roles at Cargill. He holds M.B.A. from INSEAD.a bachelor’s degree from Dartmouth College and an M.B.A.from Harvard Business School. Raul Padilla, 63. Mr. Padilla has served as President, South
America and President, Sugar and Bioenergy since JanuaryChristos Dimopoulos, 45. Mr. Dimopoulos has served as 2018. Prior to that he served as Chief Executive Officer ofPresident, Agribusiness since October 2018. Prior to that he Bunge Brazil and Managing Director, Sugar and Bioenergyserved most recently as Senior Vice President, Global Grains since 2014. Prior to that, he served as Managing Director,and Oilseeds since December 2017. He joined the company in Bunge Global Agribusiness and Chief Executive Officer, Bunge2004 as a grain trader and subsequently held a variety of roles Product Lines since July 2010. Prior to that, he was Chiefof increasing responsibility in the Agribusiness segment. Prior Executive Officer of Bunge Argentina since 1999, having joinedto Bunge, Mr. Dimopoulos held roles in Europe and the United the company in 1997 as Commercial Director. Mr. Padilla hasStates with Tradigrain and Intrade Risk Management. He holds over 30 years of experience in the oilseed processing and graina bachelor’s degree in Business Management and Marketing handling industries in Argentina, beginning his career with Lafrom HEC Lausanne in Switzerland. Plata Cereal in 1977. He has served as President of the
Argentine National Oilseed Crushers Association, ViceGordon Hardie, 55. Mr. Hardie has served as President, Food &President of the International Association of Seed Crushers andIngredients since January 2018. Prior to that, he served asDirector of the Buenos Aires Cereal Exchange and the RosarioManaging Director, Food & Ingredients since July 2011. Prior toFutures Exchange. Mr. Padilla is a graduate of the University ofjoining Bunge, Mr. Hardie founded Morningside Partners, aBuenos Aires.corporate strategy and M&A advisory firm focused on the food
and beverage industries in 2009. Prior to that, from 2003 to Brian Zachman, 47. Mr. Zachman joined the Company in2009, he led the Fresh Baking Division of Goodman Fielder Ltd, January 2019 as President of Global Risk Management. Prior tothe leading producer of bakery brands in Australia and New that, he held portfolio management positions focused onZealand, and held leadership roles at companies in a variety of agricultural commodity derivatives since 2012, most recentlyinternational markets, including as Group General Manager, with Millennium Limited Partners since 2014 and prior to thatMarketing at Southcorp Wines; Vice President, Asia-Pacific, with SAC Capital from 2012 to 2014. Mr. Zachman previouslyMiddle East and Africa at Fosters Group International; and worked at Bunge from 1999 to 2012, serving in a number ofRegional Director, Americas & Asia-Pacific at Pernod Ricard. commercial and trading roles within Agribusiness. Prior to that,He holds a Bachelor’s degree in European Language and he held various commercial and merchant roles with CargillPsychology from the National University of Ireland, University and ConAgra. Mr. Zachman holds a Bachelor of Arts inCollege Cork and an M.B.A. from the University College Dublin, Economics from the University of Minnesota-Duluth.Michael Smurfit Graduate School of Business.
David G. Kabbes, 56. Mr. Kabbes has served as Executive VicePresident—Corporate Affairs and Chief Legal Officer since
8 2018 Bunge Annual Report

9
We are subject to fluctuations in agricultural commodity andITEM 1A. RISK FACTORSother raw material prices, energy prices and other factors
RISK FACTORS outside of our control that could adversely affect ouroperating results.Our business, financial condition or results of operations could
be materially adversely affected by any of the risks and Prices for agricultural commodities and their by-products,uncertainties described below. Additional risks not presently including, among others, soybeans, corn, wheat, sugar andknown to us, or that we currently deem immaterial, may also ethanol, like those of other commodities, are often volatile andimpair our financial condition and business operations. See sensitive to local and international changes in supply and demand‘‘Cautionary Statement Regarding Forward Looking Statements.’’ caused by factors outside of our control, including farmer planting
and selling decisions, currency fluctuations, governmentRISKS RELATING TO OUR BUSINESS AND INDUSTRIES agriculture programs and policies, global inventory levels, demand
for biofuels, weather and crop conditions and demand for andAdverse weather conditions, including as a result of climatesupply of, competing commodities and substitutes. These factorschange, may adversely affect the availability, quality andmay cause volatility in our operating results.price of agricultural commodities and agricultural commodity
products, as well as our operations and operating results. Our fertilizer business may also be adversely affected byfluctuations in the prices of agricultural commodities and fertilizerAdverse weather conditions have historically caused volatility inraw materials that are caused by market factors beyond ourthe agricultural commodity industry and consequently in ourcontrol. Increases in fertilizer prices due to higher raw materialoperating results by causing crop failures or significantlycosts have in the past and could in the future adversely affectreduced harvests, which may affect the supply and pricing ofdemand for our fertilizer products. Additionally, as a result ofthe agricultural commodities that we sell and use in ourcompetitive conditions in our Food and Ingredients and Fertilizerbusiness, reduce demand for our fertilizer products andsegments, we may not be able to recoup increases in rawnegatively affect the creditworthiness of agricultural producersmaterial costs through increases in sales prices for our products,who do business with us.which may adversely affect our profitability.
Additionally, our sugar production depends on the volume andAdditionally, our operating costs and the selling prices of certainsucrose content of the sugarcane that we cultivate or that isof our products are sensitive to changes in energy prices. Oursupplied to us by third-party growers. Both sugarcane cropindustrial operations utilize significant amounts of electricity,yields and sucrose content depend significantly on weathernatural gas and coal, and our transportation operations areconditions, such as rainfall and prevailing temperatures, whichdependent upon diesel fuel and other petroleum-based products.can vary substantially. Adverse weather conditions can alsoSignificant increases in the cost of these items and currencyimpair our ability to harvest and transport sugarcane to ourfluctuations could adversely affect our operating costs and results.mills, leading to decreased productivity and higher productionWe also sell certain biofuel products, such as ethanol andcosts. As a result, unfavorable weather conditions have hadbiodiesel, which are closely related to, or may be substituted for,and could in the future have a material adverse effect on ourpetroleum products. As a result, the selling prices of ethanol andsugar operations.biodiesel can be impacted by the selling prices of oil, gasoline
Severe adverse weather conditions, such as hurricanes or and diesel fuel. In turn, the selling prices of the agriculturalsevere storms, may also result in extensive property damage, commodities and commodity products that we sell, such as cornextended business interruption, personal injuries and other loss and vegetable oils that are used as feedstocks for biofuels, areand damage to us. Our operations also rely on dependable and also sensitive to changes in the market price for biofuels, andefficient transportation services. A disruption in transportation consequently world petroleum prices as well. Prices for petroleumservices, as a result of weather conditions or otherwise, may products and biofuels are affected by market factors andalso significantly adversely impact our operations. government fuel policies, over which we have no control. Lower
prices for oil, gasoline or diesel fuel could result in decreasedAdditionally, the potential physical impacts of climate change selling prices for ethanol, biodiesel and their raw materials, whichare uncertain and may vary by region. These potential effects could adversely affect our revenues and operating results.could include changes in rainfall patterns, water shortages, Additionally, the prices of sugar and sugarcane-based ethanol arechanging sea levels, changing storm patterns and intensities, also correlated, and, therefore, a decline in world sugar pricesand changing temperature levels that could adversely impact may also adversely affect the selling price of the ethanol weour costs and business operations, the location, costs and produce in Brazil.competitiveness of global agricultural commodity productionand related storage and processing facilities and the supply We may be adversely affected by a shortage of sugarcane orand demand for agricultural commodities. These effects could by high sugarcane costs.be material to our results of operations, liquidity or capital
Sugarcane is our principal raw material used in the productionresources.of ethanol and sugar. Our ability to secure an adequate supplyof sugarcane depends on our ability to negotiate and maintainsatisfactory land rights and supply contracts with third parties.Currently, approximately 94% of the land we use for sugarcanesupply is not owned by us, with such land typically managed
2018 Bunge Annual Report 9

10
through agricultural partnership agreements having an average We are subject to global and regional economic downturnsremaining term of five years. We cannot guarantee that these and related risks.agreements will be renewed after their respective terms or that
The level of demand for our products is affected by global andany such renewals will be on terms and conditions satisfactoryregional demographic and macroeconomic conditions, includingto us. A significant shortage of sugarcane supply or increase inpopulation growth rates and changes in standards of living. Athe cost of available sugarcane, including as a result of thesignificant downturn in global economic growth, or recessionarytermination of our partnership or supply contracts or theconditions in major geographic regions, may lead to reducedinability to enter into alternative arrangements on economicdemand for agricultural commodities and food products, whichterms, would likely have an adverse effect on our business andcould adversely affect our business and results of operations.financial performance, and such effect could be material.
Additionally, weak global economic conditions and adverseWe face intense competition in each of our businesses. conditions in global financial and capital markets, including
constraints on the availability of credit, have in the past adverselyWe face significant competition in each of our businesses andaffected, and may in the future adversely affect, the financialwe have numerous competitors, some of which are larger,condition and creditworthiness of some of our customers,more diversified and have greater financial resources than wesuppliers and other counterparties, which in turn may negativelyhave. Additionally, in recent years we have experiencedimpact our financial condition and results of operations. Seeregional Agribusiness competitors entering new geographies‘‘Item 7. Management’s Discussion and Analysis of Financialwhere previously they did not compete with us and certainCondition and Results of Operations’’ and ‘‘Item 7A. Quantitativecustomers seeking to procure certain commodities directlyand Qualitative Disclosures About Market Risk’’ for morerather than through historical suppliers such as us. As many ofinformation.the products we sell are global commodities, the markets for
our products are highly price competitive, and in many cases For example, Brazil has experienced significant politicalalso sensitive to product substitution. Additionally, the uncertainty in recent years due to high profile politicalgeographic location of assets can competitively advantage or corruption scandals, the impeachment of a former presidentdisadvantage us with respect to our competitors in certain and general uncertainty regarding the recent election of a newregions. We also face competition from changing technologies president. Additionally, Brazil’s economy has been slowlyand shifting industry practices, such as increased on farm recovering from a severe downturn in 2015 and 2016. Thestorage of crops in several regions which allow producers to depressed and uncertain economic and political environment inretain commodities for extended periods and increase price Brazil has adversely affected consumer confidence levels andpressure on purchasers such as us. To compete effectively, we spending, which has led to reduced demand for products inmust continuously focus on improving efficiency in our our Food and Ingredients businesses in the country. The paceproduction and distribution operations, developing and offering of economic improvement is uncertain, and there can be noproducts that meet customer needs, optimizing our geographic assurance that economic and political conditions will notpresence in key markets, and developing and maintaining continue to affect market and consumer confidence orappropriate market share and customer relationships. We also deteriorate further in the near term. Additionally, a slowdown incompete for talent in our industries, particularly commercial China’s economy over a prolonged period could lead topersonnel. Competition could cause us to lose market share reduced global demand for agricultural commodities. To theand talented employees, exit certain lines of business, increase extent that such economic and political conditions negativelymarketing or other expenditures, increase our raw material impact consumer and business confidence and consumptioncosts or reduce pricing, each of which could have an adverse patterns or volumes, our business and results of operationseffect on our business and profitability. could be significantly and adversely affected.
We are vulnerable to the effects of supply and demand We are subject to economic, political and other risks of doingimbalances in our industries. business globally and in emerging markets.
Historically, the market for some agricultural commodities and We are a global business with a substantial majority of ourfertilizer products has been cyclical, with periods of high demand assets and operations located outside the United States. Inand capacity utilization stimulating new plant investment and the addition, our business strategies may involve expanding oraddition of incremental processing or production capacity by developing our business in emerging market regions, includingindustry participants to meet the demand. The timing and extent Eastern Europe, Asia-Pacific, the Middle East and Africa. Dueof this expansion may then produce excess supply conditions in to the international nature of our business, we are exposed tothe market, which, until the supply/demand balance is again various risks of international operations, including:restored, negatively impacts product prices and operating results.During times of reduced market demand, we may suspend or • adverse trade policies or trade barriers on agriculturalreduce production at some of our facilities. The extent to which commodities and commodity products;we efficiently manage available capacity at our facilities will affect
• inflation and hyperinflation and adverse economic effectsour profitability.resulting from governmental attempts to control inflation,such as imposition of wage and price controls and higherinterest rates;
10 2018 Bunge Annual Report

11
• changes in laws and regulations or their interpretation or Government policies and regulations affecting the agriculturalenforcement in the countries where we operate, such as tax sector and related industries could adversely affect ourlaws, including the risk of future adverse tax regulations operations and profitability.relating to our status as a Bermuda company;
Agricultural commodity production and trade flows are• difficulties in enforcing agreements or judgments and significantly affected by government policies and regulations.
collecting receivables in foreign jurisdictions; Governmental policies affecting the agricultural industry, such astaxes, tariffs, duties, subsidies, import and export restrictions, price
• exchange controls or other currency restrictions and controls on agricultural commodities and energy policieslimitations on the movement of funds, such as on the (including biofuels mandates), can influence industry profitability,remittance of dividends by subsidiaries; the planting of certain crops versus other uses of agricultural
resources, the location and size of crop production, whether• inadequate infrastructure and logistics challenges;unprocessed or processed commodity products are traded and
• sovereign risk and risk of government intervention, including the volume and types of imports and exports. Additionally,through expropriation, or regulation of the economy or regulation of financial markets and instruments in the Unitednatural resources, including restrictions on foreign ownership States and internationally may create uncertainty as these lawsof land or other assets; are adopted and implemented and may impose significant
additional risks and costs that could impact our risk management• the requirement to comply with a wide variety of laws and practices. Further, increases in food and fertilizer prices have in
regulations that apply to international operations, including, the past resulted in increased scrutiny of our industries underwithout limitation, economic sanctions regulations, labor antitrust and competition laws in various jurisdictions and increaselaws, import and export regulations, anti-corruption and the risk that these laws could be interpreted, administered oranti-bribery laws, as well as other laws or regulations enforced in a manner that could affect our operations or imposediscussed in this ‘‘Item 1A. Risk Factors’’ section; liability on us in a manner that could have a material adverse
effect on our operating results and financial condition. Future• challenges in maintaining an effective internal controlgovernmental policies, regulations or actions affecting ourenvironment with operations in multiple internationalindustries may adversely affect the supply of, demand for andlocations, including language differences, varying levels ofprices of our products restrict our ability to do business in existingU.S. Generally Accepted Accounting Principles (‘‘U.S. GAAP’’)and target markets, engage in risk management activities andexpertise in international locations and multiple financialotherwise cause our financial results to suffer.information systems; and
Finally, international trade disputes can adversely affect• labor disruptions, civil unrest, significant political instability,agricultural commodity trade flows by limiting or disrupting tradewars or other armed conflict or acts of terrorism.between countries or regions. For example, a trade dispute
These risks could adversely affect our operations, business between the U.S. and China that began in 2018 has led to bothstrategies and operating results. countries implementing tariffs on imported goods from the other,
including on imports of U.S. soybeans into China. This has led toAs a result of our international operations, we are also exposed significant volatility in commodity prices, disruptions in historicalto currency exchange rate fluctuations. Changes in exchange trade flows and shifts in planting patterns in the U.S. and Southrates between the U.S. dollar and other currencies, particularly America, which have presented challenges and uncertainties forthe Brazilian real, the euro and other foreign currencies affect our business. We cannot predict the effects that future tradeour revenues and expenses that are denominated in local policy or the terms of any negotiated trade agreements and theircurrencies, affect farm economics in those regions and may impact on our business could have. Additionally, failure to resolvealso have a negative impact on the value of our assets located the trade dispute between the countries may also lead tooutside of the United States. unexpected operating difficulties in China, enhanced regulatory
scrutiny in China, greater difficulty transferring funds, or negativeAdditionally, there continues to be a great deal of uncertaintycurrency impacts.regarding U.S. and global trade policies for companies with
multinational operations like ours. In recent years there hasWe may not realize the anticipated benefits of acquisitions,been an increase in populism and nationalism in variousdivestitures or joint ventures.countries around the world and consequently historical free
trade principles are being challenged. For example, the U.S. We have been an active acquirer of other companies, and wegovernment has indicated its intent to adopt a new approach have joint ventures with several partners. Part of our strategyto trade policy and in some cases to renegotiate, or potentially involves acquisitions, alliances and joint ventures designed toterminate, certain existing bilateral or multi-lateral trade expand or optimize our portfolio of businesses. Our ability toagreements. As we continue to operate our business globally, benefit from acquisitions, joint ventures and alliances dependsour success will depend, in part, on the nature and extent of on many factors, including our ability to identify suitableany such changes and our how well we are able to anticipate, prospects, access funding sources on acceptable terms,respond to and effectively manage any such changes. negotiate favorable transaction terms and successfully
consummate and integrate any businesses we acquire. Inaddition, we are currently undertaking a strategic review of ourbusinesses in order to identify opportunities to enhance
2018 Bunge Annual Report 11

12
shareholder value and may decide as a result of that process reporting and operations. As a result, we face certain operating,or otherwise, from time to time, to divest certain of our assets financial and other risks relating to these investments, includingor businesses by selling them or entering into joint ventures. risks related to the financial strength of our joint venture partnersOur ability to successfully complete a divestiture will depend or their willingness to provide adequate funding for the jointon, among other things, our ability to identify buyers that are venture, having differing objectives from our partners, the inabilityprepared to acquire such assets or businesses on acceptable to implement some actions with respect to the joint venture’sterms and to adjust and optimize our retained businesses activities that we may believe are favorable if the joint venturefollowing the divestiture. partner does not agree, compliance risks relating to actions of the
joint venture or our partners and the risk that we will be unableOur acquisition, joint venture or divestiture activities may to resolve disputes with the joint venture partner. As a result,involve unanticipated delays, costs and other problems. If we these investments may contribute significantly less thanencounter unexpected problems with acquisitions, joint anticipated to our earnings and cash flows.ventures or divestitures, our senior management may berequired to divert attention away from other aspects of our We are subject to industry and other risks that couldbusinesses to address these problems. Additionally, we may fail adversely affect our reputation and financial results.to consummate proposed acquisitions, joint ventures or
We are subject to food and feed industry risks which include, butdivestitures, after incurring expenses and devoting substantialare not limited to, spoilage, contamination, tampering or otherresources, including management time, to such transactions.adulteration of products, product liability claims and recalls. We
Acquisitions also pose the risk that we may be exposed to are also subject to shifts in customer and consumer preferencessuccessor liability relating to actions by an acquired company and and concerns regarding the outbreak of disease associated withits management before the acquisition. The due diligence we livestock and poultry, including avian or swine influenza. Theseconduct in connection with an acquisition, the controls and risks could not only adversely affect our business and operatingpolicies we implement at acquired companies and any contractual results but also our corporate reputation.guarantees or indemnities that we receive from the sellers of
As a company whose products comprise staple food and feedacquired companies, may not be sufficient to protect us from, orproducts sold globally as well as ingredients included in trustedcompensate us for, actual liabilities. A material liability associatedfood brands of our customers, maintaining a good corporatewith an acquisition could adversely affect our reputation andreputation is critical to our continued success. Reputational valueresults of operations and reduce the benefits of the acquisition.is based in large part on perceptions, which can shift rapidly inAdditionally, acquisitions involve other risks, such as differingresponse to negative incidents. The failure or alleged failure tolevels of management and internal control effectiveness at themaintain high standards for quality, safety, integrity, environmentalacquired entities, systems integration risks, the risk of impairmentsustainability and social responsibility, including with respect tocharges relating to goodwill and intangible assets recorded inraw materials and services obtained from suppliers, even if untrue,connection with acquisitions, the risk of significant accountingmay result in tangible effects, such as reduced demand for ourcharges and expenses resulting from the completion andproducts, disruptions to our operations, increased costs and lossintegration of a sizable acquisition, the need to fund increasedof market share to competitors. Our reputation and results ofcapital expenditures and working capital requirements, our abilityoperations could also be adversely impacted by changingto retain and motivate employees of acquired entities, complianceconsumer preferences and perceptions relating to some of theand reputational risks and other unanticipated problems andproducts we sell, such as with regard to the quantity and type ofliabilities.fats, sugars and grains consumed as well as concerns regarding
Divestitures may also expose us to potential liabilities or claims for genetically modified crops. Failure to anticipate, adapt or respondindemnification, as we may be required to retain certain liabilities effectively to these trends or issues may result in material adverseor indemnify buyers for certain matters, including environmental effects on our business, financial condition, and results ofor litigation matters, associated with the assets or businesses that operations.we sell. The magnitude of any such retained liability orindemnification obligation may be difficult to quantify at the time We are subject to laws and regulations globally, includingof the transaction, and its cost to us could ultimately exceed the environmental, health and safety regulations. We may beproceeds we receive for the divested assets or businesses. subject to substantial costs, liabilities and other adverseDivestitures also have other inherent risks, including possible effects on our business relating to these matters.delays in closing transactions (including potential difficulties in
Due to our global business operations, we are required toobtaining regulatory approvals), the risk of lower-than-expectedcomply with numerous laws and regulations in the countriessales proceeds for the divested businesses and unexpected costswhere we operate. These include general business regulations,or other difficulties associated with the separation of thesuch as with respect to taxes, accounting, anti-corruption andbusinesses to be sold from our information technology and otherfair competition, as well as those relating to the manufacturing,systems and management processes, including the loss of keytransport and sale of our products, including environmentalpersonnel. Additionally, expected cost savings or other anticipatedregulations. In addition to liabilities arising out of our currentefficiencies or benefits from divestitures may also be difficult toand future operations for which we have ongoing processes toachieve or maximize.manage compliance with regulatory obligations, we may be
Additionally, we have several joint ventures and investments subject to environmental liabilities for past operations atwhere we may have limited control over governance, financial current facilities and in some cases to liabilities for past
12 2018 Bunge Annual Report

13
operations at facilities that we no longer own or operate. We supply and demand for agricultural commodities. In addition,may also be subject to liabilities for operations of acquired any collateral held by us as part of these financing transactionscompanies. Our industrial activities can also result in serious may not be sufficient to fully protect us from loss.accidents that could result in personal injuries, facility
We are a capital intensive business and depend on cashshutdowns, reputational harm to our business and/or theprovided by our operations as well as access to externalexpenditure of significant amounts to remediate safety issuesfinancing to operate and grow our business.or repair damaged facilities. We may incur material costs or
liabilities to comply with environmental, health and safetyWe require significant amounts of capital to operate ourrequirements. Any failure to comply with applicable laws andbusiness and fund capital expenditures. Our working capitalregulations may subject us to fines, penalties and otherneeds are directly affected by the prices of agriculturalliabilities, as well as damage to our reputation.commodities, with increases in commodity prices generallycausing increases in our borrowing levels. We are also requiredIn addition, continued government and public emphasis into make substantial capital expenditures to maintain, upgradecountries where we operate on environmental issues, includingand expand our extensive network of storage facilities,climate change, conservation and natural resource management,processing plants, refineries, mills, logistics assets and otherhave resulted in and could result in new or more stringent formsfacilities to keep pace with competitive developments,of regulatory oversight or other limitations on the agriculturaltechnological advances and safety and environmentalindustry, including increased environmental controls, land-usestandards. Furthermore, the expansion of our business andrestrictions affecting us or our suppliers and other conditions thatpursuit of acquisitions or other business opportunities maycould have a material adverse effect on our business, reputation,require us to have access to significant amounts of capital. Iffinancial condition and results of operations. For example, certainwe are unable to generate sufficient cash flows or raiseaspects of our business and the larger food production chainsufficient external financing on attractive terms to fund thesegenerate carbon emissions. The imposition of regulatoryactivities, including as a result of a tightening in the globalrestrictions on greenhouse gas emissions, which may includecredit markets, we may be forced to limit our operations andlimitations on greenhouse gas emissions, other restrictions ongrowth plans, which may adversely impact our competitivenessindustrial operations, taxes or fees on greenhouse gas emissionsand, therefore, our results of operations.and other measures, could affect land-use decisions, the cost of
agricultural production and the cost and means of processing andAs of December 31, 2018, we had $4,515 million of unused andtransporting of our products, which could adversely affect ouravailable borrowing capacity under various committedbusiness, cash flows and results of operations.long-term credit facilities and $5,372 million in total debt. Ourdebt levels could limit our ability to obtain additional financing,We are exposed to credit and counterparty risk relating tolimit our flexibility in planning for, or reacting to, changes inour customers in the ordinary course of business. Inthe markets in which we compete, place us at a competitiveparticular, we advance capital and provide other financingdisadvantage compared to our competitors that are lessarrangements to farmers in Brazil and, as a result, ourleveraged than we are and require us to dedicate more cashbusiness and financial results may be adversely affected ifon a relative basis to servicing our debt and less to developingthese farmers are unable to repay the capital advanced toour business. This may limit our ability to run our business andthem.use our resources in the manner in which we would like.
We have various credit terms with customers, and our Furthermore, difficult conditions in global credit or financialcustomers have varying degrees of creditworthiness, which markets generally could adversely impact our ability toexposes us to the risk of non-payment or other default under refinance maturing debt or the cost or other terms of suchour contracts and other arrangements with them. In the event refinancing, as well as adversely affect the financial position ofthat we experience significant defaults on their payment the lenders with whom we do business, which may reduce ourobligations to us, our financial condition, results of operations ability to obtain financing for our operations. See ‘‘Item 7.or cash flows could be materially and adversely affected. Management’s Discussion and Analysis of Financial Condition
and Results of Operations – Liquidity and Capital Resources’’In Brazil, where there have been limited third-party financingsources available to farmers, we provide financing to farmers Access to credit markets and pricing of company debt is alsofrom whom we purchase soybeans and other agricultural dependent on maintaining appropriate credit ratings, and onecommodities through prepaid commodity purchase contracts of our financial objectives has been to maintain an investmentand advances, which are generally intended to be short-term in grade credit rating. In connection with the IOI Loders Croklaannature and are typically secured by the farmer’s crop and a acquisition, we incurred additional debt to fund the acquisition.mortgage on the farmer’s land and other assets to provide a The combination of this increase in our indebtedness, coupledmeans of repayment in the potential event of crop failure or with challenging financial results over the past two years inshortfall. At December 31, 2018 and 2017, respectively, we had part due to adverse and volatile industry conditions, as well asapproximately $609 million and $817 million in outstanding a chief executive officer leadership transition announced at theprepaid commodity purchase contracts and advances to end of 2018, have led Moody’s and Fitch Ratings to downgradefarmers. We are exposed to the risk that the underlying crop our credit rating to Baa3 and BBB- with a stable outlook inwill be insufficient to satisfy a farmer’s obligation under the December 2018 and January 2019, respectively. Additionally,financing arrangements as a result of weather and crop S&P has lowered the outlook on our BBB credit rating fromgrowing conditions, and other factors that influence the price, stable to negative. While our debt agreements do not have any
2018 Bunge Annual Report 13

14
credit rating downgrade triggers that would accelerate the implementation of the GCP presents significant organizationalmaturity of our debt, further reductions in our credit ratings design and other challenges. We may not achieve or sustain thewould increase our borrowing costs and, depending on their targeted benefits under the GCP or we may not achieve themseverity, impede our ability to obtain credit facilities or access within our expected timetable. Unexpected delays, increased costs,the capital markets in the future on favorable terms, as well as adverse effects on our internal control environment, inability toimpair our ability to compete effectively relative to competitors retain and motivate employees, or other challenges arising fromwith higher credit ratings. these initiatives could adversely affect our ability to realize the
anticipated savings or other intended benefits of these activities.In addition, some of our credit facilities, interest rate derivatives Additionally, the scope of the GCP requires a substantial amountand commercial agreements use LIBOR (London Inter-Bank of management and operational resources to implement itOffered Rate) as the benchmark rate. LIBOR has recently been effectively. These and related demands on our resources maythe subject of international reform proposals and it is expected divert the company’s attention from our ongoing businessthat LIBOR will be discontinued or modified by the end of 2021. operations, which could also impact our competitive position.At this time, it is not possible to predict the effect that thesedevelopments, any discontinuance, modification or other reforms The loss of or a disruption in our manufacturing andto LIBOR, or the establishment of alternative reference rates may distribution operations or other operations and systems couldhave on LIBOR, other benchmark rates or floating rate debt adversely affect our business.instruments. While certain of our credit facilities contain LIBOR
We are engaged in manufacturing and distribution activities onalternative provisions, the use of alternative reference rates ora global scale, and our business depends on our ability toother reforms could cause the interest rate on our borrowings toexecute and monitor, on a daily basis, a significant number ofbe materially different than expected. These developments maytransactions across numerous markets or geographies. As acause us to renegotiate some of these agreements. We willresult, we are subject to the risks inherent in such activities,continue to monitor market developments related to LIBOR’sincluding industrial accidents, environmental events, fires,modification or discontinuance.explosions, strikes and other labor or industrial disputes, and
Our risk management strategies may not be effective. disruptions in logistics or information systems, as well asnatural disasters, pandemics, acts of terrorism and other
Our business is affected by fluctuations in agricultural external factors over which we have no control. While wecommodity prices, transportation costs, energy prices, interest insure ourselves against many of these types of risks inrates and foreign currency exchange rates. We engage in accordance with industry standards, our level of insurance mayhedging transactions to manage these risks. However, our not cover all losses. The potential effects of these conditionsexposures may not always be fully hedged, and our hedging could have a material adverse effect on our business, results ofstrategies may not be successful in minimizing our exposure to operations and financial condition.these fluctuations. In addition, our risk management strategiesmay seek to position our overall portfolio relative to expected Our information technology systems, processes and sites maymarket movements. While we have implemented a broad range suffer interruptions, security breaches or failures that mayof risk monitoring and control procedures and policies to adversely affect our ability to conduct our business.mitigate potential losses, they may not in all cases be
We rely on certain key information technology systems, some ofsuccessful in anticipating a significant risk exposure andwhich are dependent on services provided by third parties, toprotecting us from losses that have the potential to impair ourprovide critical data and services for internal and external users,financial position. See ‘‘Item 7A. Quantitative and Qualitativeincluding procurement and inventory management, transactionDisclosures About Market Risk’’processing, financial, commercial and operational data, human
We may not be able to achieve the efficiencies, savings and resources management, legal and tax compliance and otherother benefits anticipated from our cost reduction, margin information and processes necessary to operate and manage ourimprovement and other business optimization initiatives. business. Increased social engineering threats and more
sophisticated computer crime, including advanced persistentWe are continually implementing programs throughout the threats, pose a potential risk to the security of our informationcompany to reduce costs, increase efficiencies and enhance our technology systems, networks and services. Our informationbusiness. Initiatives currently in process or implemented in the technology and infrastructure may experience attacks by hackers,past several years include the rationalization of manufacturing breaches or other failures or disruptions that could compromiseoperations globally, including the closing of facilities, the our systems and the information stored there. While we haveimplementation of an operational improvement program in our implemented security measures and disaster recovery plansFood and Ingredients businesses, and the launch of the Global designed to protect the security and continuity of our networksCompetitiveness Program (‘‘GCP’’) announced in July 2017. The and critical systems, these measures may not adequately preventgoal of the GCP is to improve our cost position and deliver adverse events such as breaches or failures from occurring orincreased value to shareholders by achieving $250 million of cost mitigate their severity if they do occur. If our informationsavings over the course of the program. It is anticipated that technology systems are breached, damaged or fail to functionaggregate total pre-tax cash charges attributable to the GCP will properly due to any number of causes, such as security breachesbe in the range of approximately $200 million to $300 million, or cyber based attacks, systems implementation difficulties,which primarily relate to severance and other employee benefit catastrophic events or power outages, and our security,costs and costs related to professional services. The successful contingency disaster recovery or other risk mitigation plans do not
14 2018 Bunge Annual Report

15
effectively mitigate these occurrences on a timely basis, we may courts in Bermuda will enforce judgments obtained in otherexperience a material disruption in our ability to manage our jurisdictions, including the United States, against us or ourbusiness operations and produce financial reports, as well as directors or officers under the securities laws of those jurisdictionssignificant costs and lost business opportunities until they are or entertain actions in Bermuda against us or our directors orremediated. We may also be subject to legal claims or officers under the securities laws of other jurisdictions.proceedings, liability under laws that protect the privacy of
Our bye-laws restrict shareholders from bringing legal actionpersonal information, potential regulatory penalties and damage toagainst our officers and directors.our reputation. These impacts may adversely impact our business,
results of operations and financial condition, as well as ourOur bye-laws contain a broad waiver by our shareholders ofcompetitive position.any claim or right of action, both individually and on our behalf,against any of our officers or directors. The waiver applies toChanges in tax laws or exposure to additional tax liabilitiesany action taken by an officer or director, or the failure of ancould have a material impact on our financial condition andofficer or director to take any action, in the performance of hisresults of operationsor her duties, except with respect to any matter involving any
We are subject to income taxes as well as non-income taxes in fraud or dishonesty on the part of the officer or director. Thisvarious jurisdictions throughout the world. Tax authorities may waiver limits the right of shareholders to assert claims againstdisagree with certain positions we have taken and assess our officers and directors unless the act, or failure to act,additional taxes, along with interest and penalties. We regularly involves fraud or dishonesty.assess the likely outcomes of these audits and assessments in
We have anti-takeover provisions in our bye-laws that mayorder to assess the appropriateness of our tax assets anddiscourage a change of control.liabilities. However, the calculation of such liabilities involves
significant judgment in the interpretation of complex taxOur bye-laws contain provisions that could make it moreregulations in many jurisdictions. Therefore, any dispute with adifficult for a third party to acquire us without the consent oftaxing authority may result in a payment or outcome that isour Board of Directors. These provisions provide for:significantly different from current estimates. There can be no
assurance that we will accurately predict the outcomes of • directors to be removed without cause at any special generalthese audits and the actual outcomes of these audits could meeting only upon the affirmative vote of at least 66% of allhave a material impact on our consolidated earnings and votes attaching to all shares then in issue entitling thefinancial condition in the periods in which they are recognized. holder to attend and vote on the resolution;
Additionally, changes in tax laws could materially impact our • restrictions on the time period in which directors may betax rate and the monetization of recoverable tax assets nominated;(indirect tax credits). Furthermore, the recent efforts in
• our Board of Directors to determine the powers, preferencescorporate tax transparency by the Organization of Economicand rights of our preference shares and to issue theCooperation and Development (‘‘OECD’’) resulting in additionalpreference shares without shareholder approval; andmandated disclosures will likely cause additional scrutiny on
the Company’s tax positions and potentially increased tax• an affirmative vote of at least 66% of all votes attaching toliabilities.
all shares then in issue entitling the holder to attend andvote on the resolution for some business combinationRISKS RELATING TO OUR COMMON SHAREStransactions, which have not been approved by our Board of
We are a Bermuda company, and it may be difficult to Directors.enforce judgments against us and our directors and executive
These provisions, as well as any additional anti-takeoverofficers.measures our Board of Directors could adopt in the future,
We are a Bermuda exempted company. As a result, the rights of could make it more difficult for a third party to acquire us,holders of our common shares will be governed by Bermuda law even if the third party’s offer may be considered beneficial byand our memorandum of association and bye-laws. The rights of many shareholders. As a result, shareholders may be limited inshareholders under Bermuda law may differ from the rights of their ability to obtain a premium for their shares.shareholders of companies or corporations incorporated in otherjurisdictions, including the United States. Several of our directors ITEM 1B. UNRESOLVED STAFF COMMENTSand some of our officers are non-residents of the United States,
Not applicable.and a substantial portion of our assets and the assets of thosedirectors and officers are located outside the United States. As a
ITEM 2. PROPERTIESresult, it may be difficult to effect service of process on thosepersons in the United States or to enforce in the U.S. judgments The following tables provide information on our principalobtained in U.S. courts against us or those persons based on civil operating facilities as of December 31, 2018.liability provisions of the U.S. securities laws. It is doubtful whether
2018 Bunge Annual Report 15

16
FACILITIES BY BUSINESS AREA Other
Our corporate headquarters in White Plains, New York,AGGREGATE DAILY AGGREGATEoccupies approximately 66,300 square feet of space under aPRODUCTION STORAGElease that expires in June 2025. We also own or lease other(metric tons) CAPACITY CAPACITYoffice space for our operations worldwide.
Business AreaWe believe that our facilities are adequate to address our
Agribusiness 155,412 16,289,648 operational requirements.Food and Ingredients 94,054 2,214,860
ITEM 3. LEGAL PROCEEDINGSSugar and Bioenergy 11,474 636,248
We are subject to various legal proceedings and risks globallyFertilizer 2,235 1,100,100in the course of our business, including claims, suits, andgovernment investigations or proceedings involvingFACILITIES BY GEOGRAPHIC REGIONcompetition, tax, labor and employment, environmental,commercial disputes and other matters. Although we cannotAGGREGATE DAILY AGGREGATEaccurately predict the amount of any liability that mayPRODUCTION STORAGEultimately arise with respect to any of these matters, we make(metric tons) CAPACITY CAPACITYprovisions for potential liabilities when we deem them probable
Region and reasonably estimable. These provisions are based oncurrent information and legal advice and are adjusted fromNorth America 82,386 6,176,026time to time according to developments. We do not expect the
South America 86,831 10,345,069 outcome of these proceedings, net of established reserves, tohave a material adverse effect on our financial condition orEurope 62,367 2,587,112results of operations. Due to their inherent uncertainty,
Asia-Pacific 31,591 1,132,649 however, there can be no assurance as to the ultimateoutcome of current or future litigation, proceedings,
Agribusiness investigations or claims and it is possible that a resolution ofone or more such proceedings could result in judgments,In our Agribusiness segment, we have 167 commodity storageawards, fines and penalties that could adversely affect ourfacilities globally that are located close to agriculturalbusiness, consolidated financial position, results of operations,production areas or export locations. We also have 51 oilseedor cash flows in a particular period.processing plants globally. We have 37 merchandising,
distribution, and administrative offices throughout the world. For a discussion of certain legal and tax matters relating toArgentina and Brazil, see Notes 14 – Income Taxes and 21 –
Food and Ingredients Commitments and Contingencies to our consolidated financialstatement included as part of this Annual Report onIn our Food and Ingredients businesses, we have 119 refining,Form 10-K. Additionally, we are a party to a large number ofpackaging and milling facilities throughout the world. We alsolabor and civil claims relating to our Brazilian operations. Wehave 118 commodity storage facilities globally that are locatedhave reserved an aggregate of $70 million and $66 million forclose to food and ingredient locations. In addition, to facilitatelabor and civil claims, respectively, as of December 31, 2018.distribution in Brazil, we operate eight distribution centers.The labor claims primarily relate to dismissals, severance,health and safety, salary adjustments and supplementarySugar and Bioenergyretirement benefits. The civil claims relate to various legal
In our Sugar and Bioenergy segment, we have eight sugarcane proceedings and disputes, including disputes with suppliersmills, all of which are located in Brazil within close proximity to and customers and include approximately 126 million Braziliansugarcane production areas. We also manage land through reais (approximately $33 million as of December 31, 2018)agricultural partnership agreements for the cultivation of related to a legacy environmental claim in Brazil.sugarcane as described under ‘‘Item 1. Business—Sugar andBioenergy.’’ ITEM 4. MINE SAFETY DISCLOSURES
Not applicable.Fertilizer
In our Fertilizer segment, we operate three fertilizer processingand blending plants in Argentina and fertilizer ports in Braziland Argentina.
16 2018 Bunge Annual Report
17
business prospects and other factors our Board of DirectorsPART II deems relevant.
ITEM 5. MARKET FOR REGISTRANT’S COMMON Under Bermuda law, a company’s board of directors may notEQUITY, RELATED STOCKHOLDER MATTERS AND declare or pay dividends from time to time if there areISSUER PURCHASES OF EQUITY SECURITIES reasonable grounds for believing that the company is, or would
after the payment be, unable to pay its liabilities as they(a) Market Informationbecome due or that the realizable value of its assets would
Our common shares trade on the New York Stock Exchange thereby be less than of its liabilities. Under our bye-laws, eachunder the ticker symbol ‘‘BG’’. common share is entitled to dividends if, as and when
dividends are declared by our Board of Directors, subject to(b) Approximate Number of Holders of Common Stock any preferred dividend right of the holders of any preference
shares. There are no restrictions on our ability to transfer fundsTo our knowledge, based on information provided by (other than funds denominated in Bermuda dollars) in or out ofComputershare Investor Services LLC, our transfer agent, as of Bermuda or to pay dividends to U.S. residents who are holdersDecember 31, 2018, we had 141,111,081 common shares of our common shares.outstanding, which were held by approximately 74 registeredholders. We paid quarterly dividends on our common shares of $0.46
per share in the first two quarters of 2018 and $0.50 per share(c) Dividends in the last two quarters of 2018. We paid quarterly dividends
on our common shares of $0.42 per share in the first twoWe have historically paid and expect to continue to pay cash quarters of 2017 and $0.46 per share in the last two quartersdividends to holders of our common shares on a quarterly of 2017. On December 6, 2018, we declared a regular quarterlybasis. In addition, holders of our 4.875% cumulative convertible cash dividend of $0.50 per share payable on March 4, 2019 toperpetual preference shares are entitled to annual dividends shareholders of record on February 19, 2019.per share in the amount of $4.875 per year payable quarterly,when, as and if declared by the Board of Directors in (d) Securities Authorized for Issuance Under Equityaccordance with the terms of these shares. Any future Compensation Plansdetermination to pay dividends will, subject to the provisions ofBermuda law, be at the discretion of our Board of Directors The following table sets forth certain information, as ofand will depend upon then existing conditions, including our December 31, 2018, with respect to our equity compensationfinancial condition, results of operations, contractual and other plans.relevant legal or regulatory restrictions, capital requirements,
(a) (b) (c)WEIGHTED-AVERAGE NUMBER OF SECURITIESEXERCISE PRICE PER REMAINING AVAILABLE FOR
NUMBER OF SECURITIES SHARE OF FUTURE ISSUANCE UNDERTO BE ISSUED UPON OUTSTANDING EQUITY COMPENSATION
EXERCISE OF OPTIONS, PLANS (EXCLUDINGOUTSTANDING OPTIONS, WARRANTS SECURITIES REFLECTED IN
Plan category WARRANTS AND RIGHTS AND RIGHTS COLUMN (A))
Equity compensation plans approved by shareholders(1) . . . . . . . . . . . . . . . . . . . . . . . . . 6,039,761(2) $70.93(3) 2,782,828(4)
(1) Includes our 2016 Equity Incentive Plan, 2009 Equity Incentive Plan, Equity Incentive Plan, 2007 Non-Employee Directors’ Equity Incentive Plan and 2017 Non-Employee Directors’Equity Incentive Plan.
(2) Includes non-statutory stock options outstanding of 81,800, 4,139,402 and 1,818,559 common shares under our Equity Incentive Plan, 2009 Equity Incentive Plan and 2016 EquityIncentive Plan, respectively.
(3) Calculated based on non-statutory stock options outstanding under our 2016 Equity Incentive Plan, 2009 Equity Incentive Plan and Equity Incentive Plan. This number excludesoutstanding time-based restricted stock unit and performance-based restricted stock unit awards under the 2016 Equity Incentive Plan, 2009 Equity Incentive Plan and restricted anddeferred restricted stock unit awards under the 2007 Non-Employee Directors’ Equity Incentive Plan and 2017 Non-Employee Directors’ Equity Incentive Plan.
(4) Includes dividend equivalents payable in common shares. Shares available under our 2016 Equity Incentive Plan may be used for any type of award authorized under the plan.Awards under the plan may be in the form of statutory or non-statutory stock options, restricted stock units (including performance-based) or other awards that are based on thevalue of our common shares. Our 2016 Equity Incentive Plan provides that the maximum number of common shares issuable under the plan is 5,800,000, subject to adjustment inaccordance with the terms of the plan. This number also includes shares available for future issuance under our 2017 Non-Employee Directors’ Equity Incentive Plan. Our 2017Non-Employee Directors’ Equity Incentive Plan provides that the maximum number of common shares issuable under the plan may not exceed 120,000, subject to adjustment inaccordance with the terms of the plan. No additional awards may be granted under the Equity Incentive Plan and the Non-Employee Directors’ Equity Incentive Plan.
2018 Bunge Annual Report 17

9MAR201922564302
18
(e) Performance Graph the quarter ended December 31, 2018. The graph sets thebeginning value of our common shares and the Indices at $100
The performance graph shown below compares the quarterly and assumes that all dividends are reinvested. All Index valueschange in cumulative total shareholder return on our common are weighted by the capitalization of the companies included inshares with the Standard & Poor’s (S&P) 500 Stock Index and the Index.the S&P Food Products Index from December 31, 2013 through
Comparison of 5 Year Cumulative Total Return
0
40
20
60
80
100
120
140
160
180
200
Bunge, Ltd. S&P 500 Index - Total Return S&P Food Products
Dec-1
3
Mar
-14
Jun-
14
Sep-1
4
Dec-1
4
Mar
-15
Jun-
15
Sep-1
5
Dec-1
5
Mar
-16
Jun-
16
Sep-1
6
Dec-1
6
Mar
-18
Jun-
18
Sep-1
8
Dec-1
8
Mar
-17
Jun-
17
Sep-1
7
Dec-1
7
(f) Purchases of Equity Securities by Registrant and 2015 with the repurchase of 2,460,600 common shares forAffiliated Purchasers $200 million.
In May 2015, we established a new program for the repurchase Any repurchases may be made from time to time through aof up to $500 million of our issued and outstanding common variety of means, including in the open market, in privatelyshares. The program has no expiration date. Bunge did not negotiated transactions or through other means as determinedrepurchase any common shares during the year ended by us, and in compliance with applicable legal requirements.December 31, 2018. Total repurchases under the program from The timing and number of any shares repurchased will dependits inception in May 2015 through December 31, 2018 were on a variety of factors, including share price and market4,707,440 shares for $300 million. Bunge completed the conditions, and the program may be suspended orprevious program of $975 million during the first quarter of discontinued at any time at our discretion.
18 2018 Bunge Annual Report

19
Our consolidated financial statements are prepared in U.S.ITEM 6. SELECTED FINANCIAL DATAdollars and in accordance with U.S. GAAP. The selected
The following table sets forth our selected historical historical financial information as of and for the years endedconsolidated financial information for each of the five periods December 31, 2018, 2017, 2016, 2015 and 2014 are derivedindicated. You should read this information together with from our audited consolidated financial statements and related‘‘Item 7. Management’s Discussion and Analysis of Financial notes.Condition and Results of Operations’’ and with the consolidatedfinancial statements and notes to the consolidated financialstatements included as part of this Annual Report onForm 10-K.
YEAR ENDED DECEMBER 31,(US$ in millions) 2018 2017 2016 2015 2014
Consolidated Statements of Income Data:Net sales . . . . . . . . . . . . . . . . . . . . . . . . . . . . . . . . . . . . . . . . . . . . . . . . . . . . . . . . . . . . . . . . . . . . . . . . . . . . . . . . . . $ 45,743 $ 45,794 $ 42,679 $ 43,455 $ 57,161Cost of goods sold . . . . . . . . . . . . . . . . . . . . . . . . . . . . . . . . . . . . . . . . . . . . . . . . . . . . . . . . . . . . . . . . . . . . . . (43,477) (44,029) (40,269) (40,761) (54,540)
Gross profit . . . . . . . . . . . . . . . . . . . . . . . . . . . . . . . . . . . . . . . . . . . . . . . . . . . . . . . . . . . . . . . . . . . . . . . . . . . . . . . 2,266 1,765 2,410 2,694 2,621Selling, general and administrative expenses . . . . . . . . . . . . . . . . . . . . . . . . . . . . . . . . . . . . (1,423) (1,437) (1,284) (1,430) (1,689)Interest income . . . . . . . . . . . . . . . . . . . . . . . . . . . . . . . . . . . . . . . . . . . . . . . . . . . . . . . . . . . . . . . . . . . . . . . . . 31 38 51 43 87Interest expense . . . . . . . . . . . . . . . . . . . . . . . . . . . . . . . . . . . . . . . . . . . . . . . . . . . . . . . . . . . . . . . . . . . . . . . . (339) (263) (234) (258) (347)Foreign exchange gains (losses) . . . . . . . . . . . . . . . . . . . . . . . . . . . . . . . . . . . . . . . . . . . . . . . . . . . . . (101) 95 (8) (8) 47Other income (expense) - net . . . . . . . . . . . . . . . . . . . . . . . . . . . . . . . . . . . . . . . . . . . . . . . . . . . . . . . 48 40 10 (24) 15Gain (loss) on disposition of equity interests and sale of assets . . . . . . . . . . . . . (26) 9 122 47 —Equity investment impairments . . . . . . . . . . . . . . . . . . . . . . . . . . . . . . . . . . . . . . . . . . . . . . . . . . . . . — (17) (59) — —Goodwill and intangible impairments . . . . . . . . . . . . . . . . . . . . . . . . . . . . . . . . . . . . . . . . . . . . . . — — (12) (13) —
Income from continuing operations before income tax . . . . . . . . . . . . . . . . . . . . . . . . 456 230 996 1,051 734Income tax (expense) benefit . . . . . . . . . . . . . . . . . . . . . . . . . . . . . . . . . . . . . . . . . . . . . . . . . . . . . . . . (179) (56) (220) (296) (249)
Income from continuing operations . . . . . . . . . . . . . . . . . . . . . . . . . . . . . . . . . . . . . . . . . . . . . . . . . 277 174 776 755 485Income (loss) from discontinued operations, net of tax . . . . . . . . . . . . . . . . . . . . . . . 10 — (9) 35 32
Net income . . . . . . . . . . . . . . . . . . . . . . . . . . . . . . . . . . . . . . . . . . . . . . . . . . . . . . . . . . . . . . . . . . . . . . . . . . . . . . . 287 174 767 790 517Net loss (income) attributable to noncontrolling interests . . . . . . . . . . . . . . . . . . . . (20) (14) (22) 1 (2)
Net income attributable to Bunge . . . . . . . . . . . . . . . . . . . . . . . . . . . . . . . . . . . . . . . . . . . . . . . . . . 267 160 745 791 515Convertible preference share dividends and other obligations . . . . . . . . . . . . . . . (34) (34) (36) (53) (48)
Net income available to Bunge common shareholders . . . . . . . . . . . . . . . . . . . . . . . . . $ 233 $ 126 $ 709 $ 738 $ 467
YEAR ENDED DECEMBER 31,(US$, except outstanding share data) 2018 2017 2016 2015 2014
Per Share Data:Earnings per common share - basicNet income (loss) from continuing operations . . . . . . . . . . . . . . . . . . . . . . . . . . . . . . . . . . . $ 1.58 $ 0.90 $ 5.13 $ 4.90 $ 2.98Net income (loss) from discontinued operations . . . . . . . . . . . . . . . . . . . . . . . . . . . . . . . . 0.07 — (0.06) 0.24 0.22
Net income (loss) to Bunge common shareholders . . . . . . . . . . . . . . . . . . . . . . . . . . . . . . $ 1.65 $ 0.90 $ 5.07 $ 5.14 $ 3.20
Earnings per common share - dilutedNet income (loss) from continuing operations . . . . . . . . . . . . . . . . . . . . . . . . . . . . . . . . . . . $ 1.57 $ 0.89 $ 5.07 $ 4.84 $ 2.96Net income (loss) from discontinued operations . . . . . . . . . . . . . . . . . . . . . . . . . . . . . . . . 0.07 — (0.06) 0.23 0.21
Net income (loss) to Bunge common shareholders . . . . . . . . . . . . . . . . . . . . . . . . . . . . . . $ 1.64 $ 0.89 $ 5.01 $ 5.07 $ 3.17
Cash dividends declared per common share . . . . . . . . . . . . . . . . . . . . . . . . . . . . . . . . . . . . . . $ 1.96 $ 1.80 $ 1.64 $ 1.48 $ 1.32
Weighted-average common shares outstanding - basic . . . . . . . . . . . . . . . . . . . . . . . . 140,968,980 140,365,549 139,845,124 143,671,546 146,209,508Weighted-average common shares outstanding - diluted . . . . . . . . . . . . . . . . . . . . . . 141,703,783 141,265,077 148,226,475 152,238,967 147,230,778
2018 Bunge Annual Report 19

20
DECEMBER 31,(US$ in millions) 2018 2017 2016 2015 2014
Consolidated Balance Sheet Data:Cash and cash equivalents . . . . . . . . . . . . . . . . . . . . . . . . . . . . . . . . . . . . . . . . . . . . . . . . . . . . . . . . . . . . $ 389 $ 601 $ 934 $ 411 $ 362Inventories(1) . . . . . . . . . . . . . . . . . . . . . . . . . . . . . . . . . . . . . . . . . . . . . . . . . . . . . . . . . . . . . . . . . . . . . . . . . . . . . 5,871 5,074 4,773 4,466 5,554Working capital(2) . . . . . . . . . . . . . . . . . . . . . . . . . . . . . . . . . . . . . . . . . . . . . . . . . . . . . . . . . . . . . . . . . . . . . . . 3,896 4,188 3,408 3,576 4,377Total assets . . . . . . . . . . . . . . . . . . . . . . . . . . . . . . . . . . . . . . . . . . . . . . . . . . . . . . . . . . . . . . . . . . . . . . . . . . . . . . . 19,425 18,871 19,188 17,914 21,425Short-term debt, including current portion of long-term debt . . . . . . . . . . . . . . . 1,169 319 1,195 1,517 1,002Long-term debt . . . . . . . . . . . . . . . . . . . . . . . . . . . . . . . . . . . . . . . . . . . . . . . . . . . . . . . . . . . . . . . . . . . . . . . . . . 4,203 4,160 3,069 2,926 2,848Convertible perpetual preference shares(3) . . . . . . . . . . . . . . . . . . . . . . . . . . . . . . . . . . . . . . . 690 690 690 690 690Common shares and additional paid-in-capital . . . . . . . . . . . . . . . . . . . . . . . . . . . . . . . . . . 5,279 5,227 5,144 5,106 5,054Total equity . . . . . . . . . . . . . . . . . . . . . . . . . . . . . . . . . . . . . . . . . . . . . . . . . . . . . . . . . . . . . . . . . . . . . . . . . . . . . . 6,378 7,357 7,343 6,652 8,690
YEAR ENDED DECEMBER 31,(in millions of metric tons) 2018 2017 2016 2015 2014
Other Data:Volumes:Agribusiness . . . . . . . . . . . . . . . . . . . . . . . . . . . . . . . . . . . . . . . . . . . . . . . . . . . . . . . . . . . . . . . . . . . . . . . . . . . . . . 146.3 142.9 134.6 134.1 138.7
Edible Oil Products . . . . . . . . . . . . . . . . . . . . . . . . . . . . . . . . . . . . . . . . . . . . . . . . . . . . . . . . . . . . . . . . . . 9.0 7.7 7.0 6.8 6.9Milling Products . . . . . . . . . . . . . . . . . . . . . . . . . . . . . . . . . . . . . . . . . . . . . . . . . . . . . . . . . . . . . . . . . . . . . . . 4.6 4.5 4.5 4.2 4.5
Total Food and Ingredients . . . . . . . . . . . . . . . . . . . . . . . . . . . . . . . . . . . . . . . . . . . . . . . . . . . . . . . . . . . 13.6 12.2 11.5 11.0 11.4Sugar and Bioenergy . . . . . . . . . . . . . . . . . . . . . . . . . . . . . . . . . . . . . . . . . . . . . . . . . . . . . . . . . . . . . . . . . . . 6.5 9.4 8.8 10.4 9.7Fertilizer . . . . . . . . . . . . . . . . . . . . . . . . . . . . . . . . . . . . . . . . . . . . . . . . . . . . . . . . . . . . . . . . . . . . . . . . . . . . . . . . . . 1.3 1.3 1.3 1.0 1.1
(1) Included in inventories were readily marketable inventories of $4,532 million, $4,056 million, $3,855 million, $3,666 million and $4,409 million at December 31, 2018, 2017, 2016,2015 and 2014, respectively. Readily marketable inventories are agricultural commodity inventories, such as soybeans, soybean meal, soybean oil, corn and wheat that are readilyconvertible to cash because of their commodity characteristics, widely available markets and international pricing mechanisms.
(2) Working capital is calculated as current assets less current liabilities.
(3) Bunge has 6,899,683 4.875% cumulative convertible perpetual preference shares outstanding. Each cumulative convertible preference share has an initial liquidation preference of$100 per share plus accumulated and unpaid dividends up to a maximum of an additional $25 per share. As a result of adjustments made to the initial conversion price because cashdividends paid on Bunge Limited’s common shares exceeded certain specified thresholds, each cumulative convertible preference share is convertible, at the holder’s option, at anytime, into approximately 1.1918 Bunge Limited common shares (8,223,042 Bunge Limited common shares), subject to certain additional anti-dilution adjustments.
OPERATING RESULTSITEM 7. MANAGEMENT’S DISCUSSION ANDANALYSIS OF FINANCIAL CONDITION AND
FACTORS AFFECTING OPERATING RESULTSRESULTS OF OPERATIONS
Bunge Limited, a Bermuda company, together with itsThe following should be read in conjunction with ‘‘Cautionarysubsidiaries, is a leading global agribusiness and foodStatement Regarding Forward Looking Statements’’ and ourcompany with integrated operations that stretch from the farmcombined consolidated financial statements and notes theretoto consumer foods. The commodity nature of the Company’sincluded in Item 15 of this Annual Report on Form 10-K.principal products, as well as regional and global supply anddemand variations that occur as an inherent part of theNon-U.S. GAAP Financial Measuresbusiness, make volumes an important operating measure.Accordingly, information is included in ‘‘Segment Results’’ thatTotal segment earnings before interest and taxes (‘‘EBIT’’) is ansummarizes certain items in our consolidated statements ofoperating performance measure used by Bunge’s managementincome and volumes by reportable segment. The common unitto evaluate segment operating activities. Bunge’s managementof measure for all reported volumes is metric tons. Abelieves total segment EBIT is a useful measure of operatingdescription of reported volumes for each reportable segmentprofitability, since the measure allows for an evaluation of thehas also been included in the discussion of key factorsperformance of its segments without regard to its financingaffecting results of operations in each of our businessmethods or capital structure. In addition, EBIT is a financialsegments as discussed below.measure that is widely used by analysts and investors in
Bunge’s industries. Total Segment EBIT is a non-U.S. GAAPAgribusinessfinancial measure and is not intended to replace net income
attributable to Bunge, the most directly comparable U.S. GAAPIn the Agribusiness segment, we purchase, store, transport,financial measure.process and sell agricultural commodities and commodityproducts. Profitability in this segment is affected by theavailability and market prices of agricultural commodities andprocessed commodity products and the availability and costs ofenergy, transportation and logistics services. Profitability in our
20 2018 Bunge Annual Report

21
oilseed processing operations is also impacted by volumes Food and Ingredientsprocured, processed and sold and by capacity utilization rates.
In the Food and Ingredients businesses, which consist of ourAvailability of agricultural commodities is affected by manyEdible Oil Products and Milling Products segments, ourfactors, including weather, farmer planting and sellingoperating results are affected by changes in the prices of rawdecisions, plant diseases, governmental policies, andmaterials, such as crude vegetable oils and grains, the mix ofagricultural sector economic conditions. Reported volumes inproducts that we sell, changes in consumer eating habits,this segment primarily reflect (i) grains and oilseeds originatedchanges in per capita income, consumer purchasing powerfrom farmers, cooperatives or other aggregators and fromlevels, availability of credit to customers, governmental dietarywhich ‘‘origination margins’’ are earned; (ii) oilseeds processedguidelines and policies, changes in regional economicin our oilseed processing facilities and from which ‘‘crushingconditions and the general competitive environment in ourmargins’’ are earned, representing the margin from themarkets. Raw material inputs to our production processes inindustrial separation of the oilseed into its protein meal andthe Edible Oil Products and Milling Products segments arevegetable oil components, both of which are separatelargely sourced at market prices from our Agribusinesscommodity products; and (iii) third party sales of grains,segment. Reported volumes in these segments reflect third-oilseeds and related commodity products merchandisedparty sales of our finished products and, as such, include thethrough our distribution businesses and from whichsales of products derived from raw materials sourced from the‘‘distribution margins’’ are earned. The foregoing subsegmentAgribusiness segment as well as from third-parties. The unit ofvolumes may overlap as they produce separate margin capturemeasure for these volumes is metric tons as these businessesopportunities. For example, oilseeds procured in our Southare linked to the commodity raw materials, which are theirAmerican grain origination activities may be processed in ourprimary inputs.oilseed processing facilities in Asia-Pacific and will be reflected
at both points within the segment. As such, these reportedvolumes do not represent solely volumes of net sales to third- Sugar and Bioenergyparties, but rather where margin is earned, appropriately
The Sugar and Bioenergy segment is an integrated businessreflecting their contribution to our global network’s capacitywhich primarily includes the procurement and growing ofutilization and profitability.sugarcane and the production of sugar, ethanol and electricity
Demand for our purchased and processed agribusiness in our eight mills in Brazil.products is affected by many factors, including global and
Profitability in this segment is affected by the availability andregional economic conditions, changes in per capita income,quality of sugarcane, which impacts our capacity utilizationthe financial condition of customers and customer access torates and the amount of sugar that can be extracted from thecredit, worldwide consumption of food products, particularlysugarcane, and by market prices of sugar and ethanol.pork and poultry, population growth rates, relative prices ofAvailability and quality of sugarcane is affected by manysubstitute agricultural products, outbreaks of diseasefactors, including weather, geographical factors such as soilassociated with livestock and poultry, and demand forquality and topography, and agricultural practices. Oncerenewable fuels produced from agricultural commodities andplanted, sugarcane may be harvested for several continuouscommodity products.years, but the yield decreases with each subsequent harvest.
We expect that the factors described above will continue to As a result, the current optimum economic cycle is generallyaffect global supply and demand for our Agribusiness products five to seven consecutive harvests, depending on location. Wefor the foreseeable future. We also expect that, from time to own and/or have partnership agreements to manage farmlandtime, imbalances will likely exist between oilseed processing on which we grow and harvest sugarcane. We also purchasecapacity and demand for oilseed products in certain regions, sugarcane from third parties. Prices of sugarcane in Brazil arewhich impacts our decisions regarding whether, when and established by Consecana, the state of Sao Paulo sugarcane,where to purchase, store, transport, process or sell these sugar and ethanol council, and are based on the sucrosecommodities, including whether to change the location of or content of the cane and the market prices of sugar andadjust our own oilseed processing capacity. ethanol. Demand for our products is affected by such factors
as changes in global or regional economic conditions, theAdditionally, price fluctuations and availability of commodities financial condition of customers and customer access to credit,may cause fluctuations in our working capital, such as worldwide consumption of food products, population growthinventories, accounts receivable and borrowings over the rates, changes in per capita income and demand for andcourse of a given year. For example, increased availability of governmental support of renewable fuels produced fromcommodities at harvest times often causes fluctuations in our agricultural commodities, including sugarcane. We expect thatinventories and borrowings. Increases in agricultural commodity these factors will continue to affect supply and demand for ourprices will also generally cause our cash flow requirements to sugar and bioenergy products in the foreseeable future.increase as our operations require increased use of cash to Reported volumes in this segment reflect third-party sales ofacquire inventories and fund daily settlement requirements on sugar and ethanol.exchange traded futures that we use to hedge our physicalinventories.
2018 Bunge Annual Report 21

22
Fertilizer repayment in the foreseeable future are consideredpermanently invested and as such are treated as analogous to
In the Fertilizer segment, demand for our products is affected equity for accounting purposes. As a result, any foreignby the profitability of the agricultural sectors we serve, the currency translation gains or losses on such permanentlyavailability of credit to farmers, agricultural commodity prices, invested intercompany loans are reported in accumulated otherthe types of crops planted, the number of acres planted, the comprehensive income (loss) in our consolidated balancequality of the land under cultivation and weather-related issues sheets. In contrast, foreign currency translation gains or lossesaffecting the success of the harvests. Our profitability is on intercompany loans that are not of a permanent nature areimpacted by international selling prices for fertilizers and recorded in our consolidated statements of income as foreignfertilizer raw materials, such as phosphate, sulfur, ammonia and exchange gains (losses).urea, ocean freight rates and other import costs, as well asimport volumes at the port facilities we manage. As our Income Taxesoperations are in South America, primarily Argentina, ourresults in this segment are typically seasonal, with fertilizer As a Bermuda exempted company, we are not subject tosales normally concentrated in the third and fourth quarters of income taxes on income in our jurisdiction of incorporation.the year due to the timing of the South American agricultural However, our subsidiaries, which operate in multiple taxcycle. Reported volumes in this segment reflect third-party jurisdictions, are subject to income taxes at various statutorysales of our finished products. rates ranging from 0% to 35%. The jurisdictions that
significantly impact our effective tax rate are Brazil, the UnitedIn addition to these industry related factors which impact our States, Argentina and Bermuda. Determination of taxablebusiness areas, our results of operations in all business areas income requires the interpretation of related and often complexand segments are affected by the following factors: tax laws and regulations in each jurisdiction where we operate
and the use of estimates and assumptions regarding futureForeign Currency Exchange Rates events.
Due to the global nature of our operations, our operating RESULTS OF OPERATIONSresults can be materially impacted by foreign currencyexchange rates. Both translation of our foreign subsidiaries’ 2018 Overviewfinancial statements and foreign currency transactions canaffect our results. On a monthly basis, for subsidiaries whose For the year ended December 31, 2018, net income attributablefunctional currency is a currency other than the U.S. dollar, to Bunge increased by $107 million to $267 million fromsubsidiary statements of income and cash flows must be $160 million in 2017. This increase resulted primarily fromtranslated into U.S. dollars for consolidation purposes based on higher total segment EBIT of $301 million, particularly inweighted-average exchange rates in each monthly period. As a Agribusiness, as described below, and was partially offset byresult, fluctuations of local currencies compared to the U.S. higher interest and income tax expenses.dollar during each monthly period impact our consolidatedstatements of income and cash flows for each reported period Income tax expense was $179 million in 2018, compared to(per quarter and year-to-date) and also affect comparisons income tax expense of $56 million in 2017. The effective taxbetween those reported periods. Subsidiary balance sheets are rate for 2018 was 39% compared to 24% in 2017. The highertranslated using exchange rates as of the balance sheet date effective tax rate for 2018 was primarily due to unfavorablewith the resulting translation adjustments reported in our earnings mix, coupled with an income tax charge of $48 millionconsolidated balance sheets as a component of accumulated for valuation allowances established in Brazil and China.other comprehensive income (loss). Included in other
Total segment EBIT of $737 million in 2018 increased fromcomprehensive income for the years ended December 31, 2018,$436 million in 2017. EBIT for 2018 included $51 million of2017, and 2016 were foreign currency net translation gainsseverance, employee benefit and other program costs related(losses) of $(1,125) million, $203 million and $713 million,to our Global Competitiveness Program (‘‘GCP’’), $9 million ofrespectively, resulting from the translation of our foreignseverance and other employee benefit costs related to othersubsidiaries’ assets and liabilities.industrial initiatives, $10 million of restructuring charges in our
Additionally, we record transaction gains or losses on monetary industrial sugar operations in Brazil, and $10 million of indirectassets and liabilities that are not denominated in the functional tax credits in Brazil. In addition, EBIT included $10 million ofcurrency of the entity. These amounts are remeasured into asset impairment charges in Europe relating to port assets.their respective functional currencies at exchange rates as of EBIT also included $29 million of losses on the disposition ofthe balance sheet date, with the resulting gains or losses equity interests in Brazil and Asia, $19 million of acquisitionincluded in the entity’s statement of income and, therefore, in fees, and a $24 million loss on the extinguishment of debt.our consolidated statements of income as foreign exchange EBIT for 2017 included $55 million of severance, employeegains (losses). benefit and other program costs related to our GCP, $35 million
of severance and other employee benefit costs related to otherWe primarily use a combination of equity and intercompany industrial initiatives, $22 million of restructuring charges in ourloans to finance our subsidiaries. Intercompany loans that are industrial sugar operations in Brazil, and $16 million of indirectof a long-term investment nature with no intention of tax credits in our industrial sugar operations in Brazil. In
22 2018 Bunge Annual Report

23
addition, EBIT included $20 million of asset impairment charges operations, driven by lower international sugar prices fromin Asia and Europe relating to feedmill and port assets, higher global supply and weaker demand, as well as lower$17 million of impairment charges related to our palm oil volumes and higher costs due to the impact of severe weatheraffiliate in Indonesia and our renewable oils affiliate in Brazil, in Brazil. Results in our trading and merchandising businessand impairment charges of $7 million of intangible assets. EBIT were also lower as we exited this business during the year.also included $9 million of gains on the disposition of equity
Fertilizer Segment EBIT increased $36 million, primarily due tointerests in Brazil and $9 million of acquisition fees.stronger margins in Argentina resulting from the recovery of
Agribusiness Segment EBIT increased in 2018 by $389 million international fertilizer prices.to $645 million, primarily due to higher soy crush margins in allregions driven by favorable market dynamics and reduced Segment Resultssoybean production in Argentina due to a drought. Additionally,better results in our ocean freight activities contributed to the Bunge has five reportable segments-Agribusiness, Edible Oilimproved results. Products, Milling Products, Sugar and Bioenergy, and Fertilizer-
which are organized based upon similar economicEdible Oil Products Segment EBIT decreased $4 million to characteristics and are similar in nature of products and$122 million in 2018 from $126 million in 2017. Increases to services offered, the nature of production processes, the typegross profit from the acquisition of Loders and higher gross and class of customer, and distribution methods. Theprofit in Europe from higher volumes and improved margins for Agribusiness segment is characterized by both inputs andmargarine were more than offset by weaker margins in Brazil outputs being agricultural commodities and thus high volumefrom our packaged oil business as continued high availability and low margin. The Edible Oil Products segment involves theof oils from the strong crushing environment pressured retail manufacturing and marketing of products derived fromsales as well as higher SG&A resulting from recent vegetable oils. The Milling Products segment involves theacquisitions. manufacturing and marketing of products derived primarily
from wheat and corn. The Sugar and Bioenergy segmentMilling Products Segment EBIT increased by $27 million to primarily involves sugarcane growing and milling in Brazil and$90 million in 2018 driven primarily by higher volumes and the sale of sugar, ethanol and electricity produced in our mills,margins in Mexico, the acquisition of Minsa USA, and lower as well as corn-based ethanol investments and relatedcosts in Brazil. activities. The Fertilizer segment includes the activities of our
port operations in Brazil and Argentina and blending andSugar and Bioenergy Segment EBIT decreased by $123 million. distribution operations in Argentina.The lower results were primarily in our sugarcane milling
A summary of certain items in our consolidated statements of income and volumes by reportable segment for the periodsindicated is set forth below.
YEAR ENDED DECEMBER 31,(US$ in millions) 2018 2017 2016
Volume (in thousands of metric tons):Agribusiness . . . . . . . . . . . . . . . . . . . . . . . . . . . . . . . . . . . . . . . . . . . . . . . . . . . . . . . . . . . . . . . . . . . . . . . . . . . . . . . . . . . . . . . . . . . . . . . . . . . . . . . . . . . . . . . . . . . . . . . . . . . . . . . . . . . . . . . . . . . . 146,309 142,855 134,605Edible Oil Products . . . . . . . . . . . . . . . . . . . . . . . . . . . . . . . . . . . . . . . . . . . . . . . . . . . . . . . . . . . . . . . . . . . . . . . . . . . . . . . . . . . . . . . . . . . . . . . . . . . . . . . . . . . . . . . . . . . . . . . . . . . . . . . . . . . . 9,024 7,731 6,989Milling Products . . . . . . . . . . . . . . . . . . . . . . . . . . . . . . . . . . . . . . . . . . . . . . . . . . . . . . . . . . . . . . . . . . . . . . . . . . . . . . . . . . . . . . . . . . . . . . . . . . . . . . . . . . . . . . . . . . . . . . . . . . . . . . . . . . . . . . . . 4,604 4,460 4,498Sugar and Bioenergy . . . . . . . . . . . . . . . . . . . . . . . . . . . . . . . . . . . . . . . . . . . . . . . . . . . . . . . . . . . . . . . . . . . . . . . . . . . . . . . . . . . . . . . . . . . . . . . . . . . . . . . . . . . . . . . . . . . . . . . . . . . . . . . . . . 6,509 9,389 8,847Fertilizer . . . . . . . . . . . . . . . . . . . . . . . . . . . . . . . . . . . . . . . . . . . . . . . . . . . . . . . . . . . . . . . . . . . . . . . . . . . . . . . . . . . . . . . . . . . . . . . . . . . . . . . . . . . . . . . . . . . . . . . . . . . . . . . . . . . . . . . . . . . . . . . . 1,328 1,329 1,272
Net sales:Agribusiness . . . . . . . . . . . . . . . . . . . . . . . . . . . . . . . . . . . . . . . . . . . . . . . . . . . . . . . . . . . . . . . . . . . . . . . . . . . . . . . . . . . . . . . . . . . . . . . . . . . . . . . . . . . . . . . . . . . . . . . . . . . . . . . . . . . . . . . . . . . . $ 32,206 $ 31,741 $ 30,061Edible Oil Products . . . . . . . . . . . . . . . . . . . . . . . . . . . . . . . . . . . . . . . . . . . . . . . . . . . . . . . . . . . . . . . . . . . . . . . . . . . . . . . . . . . . . . . . . . . . . . . . . . . . . . . . . . . . . . . . . . . . . . . . . . . . . . . . . . . . 9,129 8,018 6,859Milling Products . . . . . . . . . . . . . . . . . . . . . . . . . . . . . . . . . . . . . . . . . . . . . . . . . . . . . . . . . . . . . . . . . . . . . . . . . . . . . . . . . . . . . . . . . . . . . . . . . . . . . . . . . . . . . . . . . . . . . . . . . . . . . . . . . . . . . . . . 1,691 1,575 1,647Sugar and Bioenergy . . . . . . . . . . . . . . . . . . . . . . . . . . . . . . . . . . . . . . . . . . . . . . . . . . . . . . . . . . . . . . . . . . . . . . . . . . . . . . . . . . . . . . . . . . . . . . . . . . . . . . . . . . . . . . . . . . . . . . . . . . . . . . . . . . 2,257 4,054 3,709Fertilizer . . . . . . . . . . . . . . . . . . . . . . . . . . . . . . . . . . . . . . . . . . . . . . . . . . . . . . . . . . . . . . . . . . . . . . . . . . . . . . . . . . . . . . . . . . . . . . . . . . . . . . . . . . . . . . . . . . . . . . . . . . . . . . . . . . . . . . . . . . . . . . . . 460 406 403
Total . . . . . . . . . . . . . . . . . . . . . . . . . . . . . . . . . . . . . . . . . . . . . . . . . . . . . . . . . . . . . . . . . . . . . . . . . . . . . . . . . . . . . . . . . . . . . . . . . . . . . . . . . . . . . . . . . . . . . . . . . . . . . . . . . . . . . . . . . . . . . . . . . . . $ 45,743 $ 45,794 $ 42,679
Cost of goods sold:Agribusiness . . . . . . . . . . . . . . . . . . . . . . . . . . . . . . . . . . . . . . . . . . . . . . . . . . . . . . . . . . . . . . . . . . . . . . . . . . . . . . . . . . . . . . . . . . . . . . . . . . . . . . . . . . . . . . . . . . . . . . . . . . . . . . . . . . . . . . . . . . . . $(30,772) $(30,808) $(28,571)Edible Oil Products . . . . . . . . . . . . . . . . . . . . . . . . . . . . . . . . . . . . . . . . . . . . . . . . . . . . . . . . . . . . . . . . . . . . . . . . . . . . . . . . . . . . . . . . . . . . . . . . . . . . . . . . . . . . . . . . . . . . . . . . . . . . . . . . . . . . (8,575) (7,519) (6,420)Milling Products . . . . . . . . . . . . . . . . . . . . . . . . . . . . . . . . . . . . . . . . . . . . . . . . . . . . . . . . . . . . . . . . . . . . . . . . . . . . . . . . . . . . . . . . . . . . . . . . . . . . . . . . . . . . . . . . . . . . . . . . . . . . . . . . . . . . . . . . (1,464) (1,366) (1,378)Sugar and Bioenergy . . . . . . . . . . . . . . . . . . . . . . . . . . . . . . . . . . . . . . . . . . . . . . . . . . . . . . . . . . . . . . . . . . . . . . . . . . . . . . . . . . . . . . . . . . . . . . . . . . . . . . . . . . . . . . . . . . . . . . . . . . . . . . . . . . (2,276) (3,955) (3,550)Fertilizer . . . . . . . . . . . . . . . . . . . . . . . . . . . . . . . . . . . . . . . . . . . . . . . . . . . . . . . . . . . . . . . . . . . . . . . . . . . . . . . . . . . . . . . . . . . . . . . . . . . . . . . . . . . . . . . . . . . . . . . . . . . . . . . . . . . . . . . . . . . . . . . . (390) (381) (350)
Total . . . . . . . . . . . . . . . . . . . . . . . . . . . . . . . . . . . . . . . . . . . . . . . . . . . . . . . . . . . . . . . . . . . . . . . . . . . . . . . . . . . . . . . . . . . . . . . . . . . . . . . . . . . . . . . . . . . . . . . . . . . . . . . . . . . . . . . . . . . . . . . . . . . $(43,477) $(44,029) $(40,269)
2018 Bunge Annual Report 23

24
YEAR ENDED DECEMBER 31,(US$ in millions) 2018 2017 2016
Gross profit (loss):Agribusiness . . . . . . . . . . . . . . . . . . . . . . . . . . . . . . . . . . . . . . . . . . . . . . . . . . . . . . . . . . . . . . . . . . . . . . . . . . . . . . . . . . . . . . . . . . . . . . . . . . . . . . . . . . . . . . . . . . . . . . . . . . . . . . . . . . . . . . . . . . . . $ 1,434 $ 933 $ 1,490Edible Oil Products . . . . . . . . . . . . . . . . . . . . . . . . . . . . . . . . . . . . . . . . . . . . . . . . . . . . . . . . . . . . . . . . . . . . . . . . . . . . . . . . . . . . . . . . . . . . . . . . . . . . . . . . . . . . . . . . . . . . . . . . . . . . . . . . . . . . 554 499 439Milling Products . . . . . . . . . . . . . . . . . . . . . . . . . . . . . . . . . . . . . . . . . . . . . . . . . . . . . . . . . . . . . . . . . . . . . . . . . . . . . . . . . . . . . . . . . . . . . . . . . . . . . . . . . . . . . . . . . . . . . . . . . . . . . . . . . . . . . . . . 227 209 269Sugar and Bioenergy . . . . . . . . . . . . . . . . . . . . . . . . . . . . . . . . . . . . . . . . . . . . . . . . . . . . . . . . . . . . . . . . . . . . . . . . . . . . . . . . . . . . . . . . . . . . . . . . . . . . . . . . . . . . . . . . . . . . . . . . . . . . . . . . . . (19) 99 159Fertilizer . . . . . . . . . . . . . . . . . . . . . . . . . . . . . . . . . . . . . . . . . . . . . . . . . . . . . . . . . . . . . . . . . . . . . . . . . . . . . . . . . . . . . . . . . . . . . . . . . . . . . . . . . . . . . . . . . . . . . . . . . . . . . . . . . . . . . . . . . . . . . . . . 70 25 53
Total . . . . . . . . . . . . . . . . . . . . . . . . . . . . . . . . . . . . . . . . . . . . . . . . . . . . . . . . . . . . . . . . . . . . . . . . . . . . . . . . . . . . . . . . . . . . . . . . . . . . . . . . . . . . . . . . . . . . . . . . . . . . . . . . . . . . . . . . . . . . . . . . . . . $ 2,266 $ 1,765 $ 2,410
Selling, general & administrative expenses:Agribusiness . . . . . . . . . . . . . . . . . . . . . . . . . . . . . . . . . . . . . . . . . . . . . . . . . . . . . . . . . . . . . . . . . . . . . . . . . . . . . . . . . . . . . . . . . . . . . . . . . . . . . . . . . . . . . . . . . . . . . . . . . . . . . . . . . . . . . . . . . . . . $ (740) $ (805) $ (704)Edible Oil Products . . . . . . . . . . . . . . . . . . . . . . . . . . . . . . . . . . . . . . . . . . . . . . . . . . . . . . . . . . . . . . . . . . . . . . . . . . . . . . . . . . . . . . . . . . . . . . . . . . . . . . . . . . . . . . . . . . . . . . . . . . . . . . . . . . . . (412) (361) (320)Milling Products . . . . . . . . . . . . . . . . . . . . . . . . . . . . . . . . . . . . . . . . . . . . . . . . . . . . . . . . . . . . . . . . . . . . . . . . . . . . . . . . . . . . . . . . . . . . . . . . . . . . . . . . . . . . . . . . . . . . . . . . . . . . . . . . . . . . . . . . (136) (138) (127)Sugar and Bioenergy . . . . . . . . . . . . . . . . . . . . . . . . . . . . . . . . . . . . . . . . . . . . . . . . . . . . . . . . . . . . . . . . . . . . . . . . . . . . . . . . . . . . . . . . . . . . . . . . . . . . . . . . . . . . . . . . . . . . . . . . . . . . . . . . . . (112) (114) (112)Fertilizer . . . . . . . . . . . . . . . . . . . . . . . . . . . . . . . . . . . . . . . . . . . . . . . . . . . . . . . . . . . . . . . . . . . . . . . . . . . . . . . . . . . . . . . . . . . . . . . . . . . . . . . . . . . . . . . . . . . . . . . . . . . . . . . . . . . . . . . . . . . . . . . . (23) (19) (21)
Total . . . . . . . . . . . . . . . . . . . . . . . . . . . . . . . . . . . . . . . . . . . . . . . . . . . . . . . . . . . . . . . . . . . . . . . . . . . . . . . . . . . . . . . . . . . . . . . . . . . . . . . . . . . . . . . . . . . . . . . . . . . . . . . . . . . . . . . . . . . . . . . . . . . $ (1,423) $ (1,437) $ (1,284)
Foreign exchange gain (loss):Agribusiness . . . . . . . . . . . . . . . . . . . . . . . . . . . . . . . . . . . . . . . . . . . . . . . . . . . . . . . . . . . . . . . . . . . . . . . . . . . . . . . . . . . . . . . . . . . . . . . . . . . . . . . . . . . . . . . . . . . . . . . . . . . . . . . . . . . . . . . . . . . . $ (104) $ 85 $ (7)Edible Oil Products . . . . . . . . . . . . . . . . . . . . . . . . . . . . . . . . . . . . . . . . . . . . . . . . . . . . . . . . . . . . . . . . . . . . . . . . . . . . . . . . . . . . . . . . . . . . . . . . . . . . . . . . . . . . . . . . . . . . . . . . . . . . . . . . . . . . - 3 (1)Milling Products . . . . . . . . . . . . . . . . . . . . . . . . . . . . . . . . . . . . . . . . . . . . . . . . . . . . . . . . . . . . . . . . . . . . . . . . . . . . . . . . . . . . . . . . . . . . . . . . . . . . . . . . . . . . . . . . . . . . . . . . . . . . . . . . . . . . . . . . 2 (3) (7)Sugar and Bioenergy . . . . . . . . . . . . . . . . . . . . . . . . . . . . . . . . . . . . . . . . . . . . . . . . . . . . . . . . . . . . . . . . . . . . . . . . . . . . . . . . . . . . . . . . . . . . . . . . . . . . . . . . . . . . . . . . . . . . . . . . . . . . . . . . . . 7 11 9Fertilizer . . . . . . . . . . . . . . . . . . . . . . . . . . . . . . . . . . . . . . . . . . . . . . . . . . . . . . . . . . . . . . . . . . . . . . . . . . . . . . . . . . . . . . . . . . . . . . . . . . . . . . . . . . . . . . . . . . . . . . . . . . . . . . . . . . . . . . . . . . . . . . . . (6) (1) (2)
Total . . . . . . . . . . . . . . . . . . . . . . . . . . . . . . . . . . . . . . . . . . . . . . . . . . . . . . . . . . . . . . . . . . . . . . . . . . . . . . . . . . . . . . . . . . . . . . . . . . . . . . . . . . . . . . . . . . . . . . . . . . . . . . . . . . . . . . . . . . . . . . . . . . . $ (101) $ 95 $ (8)
EBIT attributable to noncontrolling interests:(1)
Agribusiness . . . . . . . . . . . . . . . . . . . . . . . . . . . . . . . . . . . . . . . . . . . . . . . . . . . . . . . . . . . . . . . . . . . . . . . . . . . . . . . . . . . . . . . . . . . . . . . . . . . . . . . . . . . . . . . . . . . . . . . . . . . . . . . . . . . . . . . . . . . . $ (14) $ (9) $ (21)Edible Oil Products . . . . . . . . . . . . . . . . . . . . . . . . . . . . . . . . . . . . . . . . . . . . . . . . . . . . . . . . . . . . . . . . . . . . . . . . . . . . . . . . . . . . . . . . . . . . . . . . . . . . . . . . . . . . . . . . . . . . . . . . . . . . . . . . . . . . (12) (8) (13)Milling Products . . . . . . . . . . . . . . . . . . . . . . . . . . . . . . . . . . . . . . . . . . . . . . . . . . . . . . . . . . . . . . . . . . . . . . . . . . . . . . . . . . . . . . . . . . . . . . . . . . . . . . . . . . . . . . . . . . . . . . . . . . . . . . . . . . . . . . . . - - -Sugar and Bioenergy . . . . . . . . . . . . . . . . . . . . . . . . . . . . . . . . . . . . . . . . . . . . . . . . . . . . . . . . . . . . . . . . . . . . . . . . . . . . . . . . . . . . . . . . . . . . . . . . . . . . . . . . . . . . . . . . . . . . . . . . . . . . . . . . . . 1 - -Fertilizer . . . . . . . . . . . . . . . . . . . . . . . . . . . . . . . . . . . . . . . . . . . . . . . . . . . . . . . . . . . . . . . . . . . . . . . . . . . . . . . . . . . . . . . . . . . . . . . . . . . . . . . . . . . . . . . . . . . . . . . . . . . . . . . . . . . . . . . . . . . . . . . . (2) (2) (2)
Total . . . . . . . . . . . . . . . . . . . . . . . . . . . . . . . . . . . . . . . . . . . . . . . . . . . . . . . . . . . . . . . . . . . . . . . . . . . . . . . . . . . . . . . . . . . . . . . . . . . . . . . . . . . . . . . . . . . . . . . . . . . . . . . . . . . . . . . . . . . . . . . . . . . $ (27) $ (19) $ (36)
Other income (expense):Agribusiness . . . . . . . . . . . . . . . . . . . . . . . . . . . . . . . . . . . . . . . . . . . . . . . . . . . . . . . . . . . . . . . . . . . . . . . . . . . . . . . . . . . . . . . . . . . . . . . . . . . . . . . . . . . . . . . . . . . . . . . . . . . . . . . . . . . . . . . . . . . . $ 79 $ 56 $ 22Edible Oil Products . . . . . . . . . . . . . . . . . . . . . . . . . . . . . . . . . . . . . . . . . . . . . . . . . . . . . . . . . . . . . . . . . . . . . . . . . . . . . . . . . . . . . . . . . . . . . . . . . . . . . . . . . . . . . . . . . . . . . . . . . . . . . . . . . . . . (8) (7) 7Milling Products . . . . . . . . . . . . . . . . . . . . . . . . . . . . . . . . . . . . . . . . . . . . . . . . . . . . . . . . . . . . . . . . . . . . . . . . . . . . . . . . . . . . . . . . . . . . . . . . . . . . . . . . . . . . . . . . . . . . . . . . . . . . . . . . . . . . . . . . (3) (5) (4)Sugar and Bioenergy . . . . . . . . . . . . . . . . . . . . . . . . . . . . . . . . . . . . . . . . . . . . . . . . . . . . . . . . . . . . . . . . . . . . . . . . . . . . . . . . . . . . . . . . . . . . . . . . . . . . . . . . . . . . . . . . . . . . . . . . . . . . . . . . . . 4 (4) (16)Fertilizer . . . . . . . . . . . . . . . . . . . . . . . . . . . . . . . . . . . . . . . . . . . . . . . . . . . . . . . . . . . . . . . . . . . . . . . . . . . . . . . . . . . . . . . . . . . . . . . . . . . . . . . . . . . . . . . . . . . . . . . . . . . . . . . . . . . . . . . . . . . . . . . . - - 1Unallocated . . . . . . . . . . . . . . . . . . . . . . . . . . . . . . . . . . . . . . . . . . . . . . . . . . . . . . . . . . . . . . . . . . . . . . . . . . . . . . . . . . . . . . . . . . . . . . . . . . . . . . . . . . . . . . . . . . . . . . . . . . . . . . . . . . . . . . . . . . . . . (24) - -
Total . . . . . . . . . . . . . . . . . . . . . . . . . . . . . . . . . . . . . . . . . . . . . . . . . . . . . . . . . . . . . . . . . . . . . . . . . . . . . . . . . . . . . . . . . . . . . . . . . . . . . . . . . . . . . . . . . . . . . . . . . . . . . . . . . . . . . . . . . . . . . . . . . . . $ 48 $ 40 $ 10
Gain (loss), net on disposition of equity interests - Agribusiness . . . . . . . . . . . . . . . . . . . . . . . . . . . . . . . . . . . . . . . . . . . . . . . . . . . . . . . . . . . . . . . . . . . . . . . $ (10) $ 9 $ 122
Equity investment impairment - Agribusiness . . . . . . . . . . . . . . . . . . . . . . . . . . . . . . . . . . . . . . . . . . . . . . . . . . . . . . . . . . . . . . . . . . . . . . . . . . . . . . . . . . . . . . . . . . . . . . . . $ - $ (13) $ (15)
Intangible asset impairment - Agribusiness . . . . . . . . . . . . . . . . . . . . . . . . . . . . . . . . . . . . . . . . . . . . . . . . . . . . . . . . . . . . . . . . . . . . . . . . . . . . . . . . . . . . . . . . . . . . . . . . . . . $ - $ - $ (12)
Loss on disposition of equity interest - Sugar and Bioenergy . . . . . . . . . . . . . . . . . . . . . . . . . . . . . . . . . . . . . . . . . . . . . . . . . . . . . . . . . . . . . . . . . . . . . . . . . . . . $ (16) $ - $ -
Equity investment impairment - Sugar and Bioenergy . . . . . . . . . . . . . . . . . . . . . . . . . . . . . . . . . . . . . . . . . . . . . . . . . . . . . . . . . . . . . . . . . . . . . . . . . . . . . . . . . . . . . $ - $ (4) $ (44)
Segment EBIT:(1)
Agribusiness . . . . . . . . . . . . . . . . . . . . . . . . . . . . . . . . . . . . . . . . . . . . . . . . . . . . . . . . . . . . . . . . . . . . . . . . . . . . . . . . . . . . . . . . . . . . . . . . . . . . . . . . . . . . . . . . . . . . . . . . . . . . . . . . . . . . . . . . . . . . $ 645 $ 256 $ 875Edible Oil Products . . . . . . . . . . . . . . . . . . . . . . . . . . . . . . . . . . . . . . . . . . . . . . . . . . . . . . . . . . . . . . . . . . . . . . . . . . . . . . . . . . . . . . . . . . . . . . . . . . . . . . . . . . . . . . . . . . . . . . . . . . . . . . . . . . . . 122 126 112Milling Products . . . . . . . . . . . . . . . . . . . . . . . . . . . . . . . . . . . . . . . . . . . . . . . . . . . . . . . . . . . . . . . . . . . . . . . . . . . . . . . . . . . . . . . . . . . . . . . . . . . . . . . . . . . . . . . . . . . . . . . . . . . . . . . . . . . . . . . . 90 63 131Sugar and Bioenergy . . . . . . . . . . . . . . . . . . . . . . . . . . . . . . . . . . . . . . . . . . . . . . . . . . . . . . . . . . . . . . . . . . . . . . . . . . . . . . . . . . . . . . . . . . . . . . . . . . . . . . . . . . . . . . . . . . . . . . . . . . . . . . . . . . (135) (12) (4)Fertilizer . . . . . . . . . . . . . . . . . . . . . . . . . . . . . . . . . . . . . . . . . . . . . . . . . . . . . . . . . . . . . . . . . . . . . . . . . . . . . . . . . . . . . . . . . . . . . . . . . . . . . . . . . . . . . . . . . . . . . . . . . . . . . . . . . . . . . . . . . . . . . . . . 39 3 29Unallocated . . . . . . . . . . . . . . . . . . . . . . . . . . . . . . . . . . . . . . . . . . . . . . . . . . . . . . . . . . . . . . . . . . . . . . . . . . . . . . . . . . . . . . . . . . . . . . . . . . . . . . . . . . . . . . . . . . . . . . . . . . . . . . . . . . . . . . . . . . . . . (24) - -
Total . . . . . . . . . . . . . . . . . . . . . . . . . . . . . . . . . . . . . . . . . . . . . . . . . . . . . . . . . . . . . . . . . . . . . . . . . . . . . . . . . . . . . . . . . . . . . . . . . . . . . . . . . . . . . . . . . . . . . . . . . . . . . . . . . . . . . . . . . . . . . . . . . . . $ 737 $ 436 $ 1,143
24 2018 Bunge Annual Report

25
YEAR ENDED DECEMBER 31,(US$ in millions) 2018 2017 2016
Depreciation, depletion and amortization:Agribusiness . . . . . . . . . . . . . . . . . . . . . . . . . . . . . . . . . . . . . . . . . . . . . . . . . . . . . . . . . . . . . . . . . . . . . . . . . . . . . . . . . . . . . . . . . . . . . . . . . . . . . . . . . . . . . . . . . . . . . . . . . . . . . . . . . . . . . . . . . . . . $ (257) $ (267) $ (236)Edible Oil Products . . . . . . . . . . . . . . . . . . . . . . . . . . . . . . . . . . . . . . . . . . . . . . . . . . . . . . . . . . . . . . . . . . . . . . . . . . . . . . . . . . . . . . . . . . . . . . . . . . . . . . . . . . . . . . . . . . . . . . . . . . . . . . . . . . . . (153) (105) (94)Milling Products . . . . . . . . . . . . . . . . . . . . . . . . . . . . . . . . . . . . . . . . . . . . . . . . . . . . . . . . . . . . . . . . . . . . . . . . . . . . . . . . . . . . . . . . . . . . . . . . . . . . . . . . . . . . . . . . . . . . . . . . . . . . . . . . . . . . . . . . (58) (61) (62)Sugar and Bioenergy . . . . . . . . . . . . . . . . . . . . . . . . . . . . . . . . . . . . . . . . . . . . . . . . . . . . . . . . . . . . . . . . . . . . . . . . . . . . . . . . . . . . . . . . . . . . . . . . . . . . . . . . . . . . . . . . . . . . . . . . . . . . . . . . . . (146) (164) (143)Fertilizer . . . . . . . . . . . . . . . . . . . . . . . . . . . . . . . . . . . . . . . . . . . . . . . . . . . . . . . . . . . . . . . . . . . . . . . . . . . . . . . . . . . . . . . . . . . . . . . . . . . . . . . . . . . . . . . . . . . . . . . . . . . . . . . . . . . . . . . . . . . . . . . . (8) (12) (12)
Total . . . . . . . . . . . . . . . . . . . . . . . . . . . . . . . . . . . . . . . . . . . . . . . . . . . . . . . . . . . . . . . . . . . . . . . . . . . . . . . . . . . . . . . . . . . . . . . . . . . . . . . . . . . . . . . . . . . . . . . . . . . . . . . . . . . . . . . . . . . . . . . . . . . $ (622) $ (609) $ (547)
Net income attributable to Bunge . . . . . . . . . . . . . . . . . . . . . . . . . . . . . . . . . . . . . . . . . . . . . . . . . . . . . . . . . . . . . . . . . . . . . . . . . . . . . . . . . . . . . . . . . . . . . . . . . . . . . . . . . . . . . . . $ 267 $ 160 $ 745
(1) We refer to our earnings before interest and taxes in each of our segments as ‘‘Segment EBIT’’. Total Segment EBIT is an operating performance measure used by Bunge’smanagement to evaluate its segments’ operating activities. Total segment EBIT is a non-U.S. GAAP financial measure and is not intended to replace net income attributable to Bunge,the most directly comparable U.S. GAAP financial measure. Bunge’s management believes segment EBIT is a useful measure of its segments’ operating profitability, since the measureallows for an evaluation of the performance of its segments without regard to its financing methods or capital structure. In addition, EBIT is a financial measure that is widely used byanalysts and investors in Bunge’s industries. Total segment EBIT excludes EBIT attributable to noncontrolling interests and is not a measure of consolidated operating results underU.S. GAAP and should not be considered as an alternative to net income attributable to Bunge or any other measure of consolidated operating results under U.S. GAAP.
A reconciliation of net income attributable to Bunge to Total Segment EBIT follows:
YEAR ENDED DECEMBER 31,(US$ in millions) 2018 2017 2016
Net income attributable to Bunge . . . . . . . . . . . . . . . . . . . . . . . . . . . . . . . . . . . . . . . . . . . . . . . . . . . . . . . . . . . . . . . . . . . . . . . . . . . . . . . . . . . . . . . . . . . . . . . . . . . . . . . . . . . . . . . . $267 $160 $ 745Interest income . . . . . . . . . . . . . . . . . . . . . . . . . . . . . . . . . . . . . . . . . . . . . . . . . . . . . . . . . . . . . . . . . . . . . . . . . . . . . . . . . . . . . . . . . . . . . . . . . . . . . . . . . . . . . . . . . . . . . . . . . . . . . . . . . . . . . . . (31) (38) (51)Interest expense . . . . . . . . . . . . . . . . . . . . . . . . . . . . . . . . . . . . . . . . . . . . . . . . . . . . . . . . . . . . . . . . . . . . . . . . . . . . . . . . . . . . . . . . . . . . . . . . . . . . . . . . . . . . . . . . . . . . . . . . . . . . . . . . . . . . . . 339 263 234Income tax expense . . . . . . . . . . . . . . . . . . . . . . . . . . . . . . . . . . . . . . . . . . . . . . . . . . . . . . . . . . . . . . . . . . . . . . . . . . . . . . . . . . . . . . . . . . . . . . . . . . . . . . . . . . . . . . . . . . . . . . . . . . . . . . . . . 179 56 220(Income) loss from discontinued operations . . . . . . . . . . . . . . . . . . . . . . . . . . . . . . . . . . . . . . . . . . . . . . . . . . . . . . . . . . . . . . . . . . . . . . . . . . . . . . . . . . . . . . . . . . . . . . . . . . . (10) - 9Noncontrolling interests’ share of interest and tax . . . . . . . . . . . . . . . . . . . . . . . . . . . . . . . . . . . . . . . . . . . . . . . . . . . . . . . . . . . . . . . . . . . . . . . . . . . . . . . . . . . . . . . . . . (7) (5) (14)
Total segment EBIT . . . . . . . . . . . . . . . . . . . . . . . . . . . . . . . . . . . . . . . . . . . . . . . . . . . . . . . . . . . . . . . . . . . . . . . . . . . . . . . . . . . . . . . . . . . . . . . . . . . . . . . . . . . . . . . . . . . . . . . . . . . . . . . . . . $737 $436 $1,143
2018 Compared to 2017 Cost of goods sold in 2018 was relatively flat compared to2017, with decreases, primarily in our South American and U.S.
Net Income Attributable to Bunge. For the year ended grain origination businesses, mainly due to lower averageDecember 31, 2018, net income attributable to Bunge prices, and oilseed processing businesses in Argentina, mainlyincreased by $107 million to $267 million from $160 million in due to lower volumes, being offset by higher costs in our grain2017. This increase resulted primarily from higher total segment and oilseed trading and distribution business, mainly due toEBIT of $301 million, particularly in Agribusiness, partially offset higher volumes.by higher interest and income tax expenses.
Gross profit increased to $1,434 million in 2018, fromIncome Tax Expense. In the year ended December 31, 2018, $933 million in 2017. The increase was mainly due to higherincome tax expense was $179 million compared to income tax soy crush margins in all regions primarily driven by strongexpense of $56 million in 2017. The effective tax rate for 2018 global soymeal demand, combined with reduced supply due towas 39% compared to 24% for 2017. The higher effective tax the drought in Argentina.rate for 2018 was primarily due to unfavorable earnings mix,coupled with an income tax charge of $48 million for valuation SG&A expenses decreased $65 million to $740 million in 2018,allowances established in Brazil and China. which represented an 8% decrease from $805 million last year.
The decrease was primarily attributable to savings from theAgribusiness Segment. Agribusiness segment net sales GCP and lower expenses due to the depreciation of theincreased by 1% to $32.2 billion in 2018, compared to Argentine peso and Brazilian real against the U.S. dollar. SG&A$31.7 billion in 2017, mostly aligned with the overall volume expenses in 2017 also included $17 million of credit reserves inincrease of 2% year over year. Higher volumes and prices in Brazil, $7 million of impairment charges, primarily of intangibleour oilseed and grain trading and distribution businesses, assets related to patents, and $7 million of transaction relatedmainly in Europe and Asia, and in our oilseed processing costs associated with the acquisition of two oilseed processingactivities in Europe, Asia, and the U.S. were partially offset by facilities in Europe.lower prices in our grain origination businesses in the U.S.resulting from an international trade dispute between the U.S. Foreign exchange results in 2018 were losses of $104 million,and China, and lower volumes in our oilseed processing compared to gains of $85 million in 2017. Results for 2018activities in Argentina, due to reduced soybean production were primarily driven by the impact of the devaluation of theresulting from adverse weather conditions.
2018 Bunge Annual Report 25

26
Argentine peso on U.S. dollar denominated debt in Argentina SG&A expenses were essentially flat with $136 million in 2018to fund operations. compared to $138 million in 2017, as added costs associated
with the Minsa USA acquisition were offset by lower costs inOther income (expenses) – net was income of $79 million in Brazil due to the deprecation of the Brazilian real against the2018, compared to income of $56 million in 2017. The increase U.S. dollar and savings from GCP.was primarily due to improved results from equity methodinvestments in Asia and income earned from financial services. Segment EBIT increased to $90 million in 2018 from $63 million
in 2017 primarily due to better results in the U.S. and lowerSegment EBIT increased by $389 million in 2018 to industrial costs and SG&A in Brazil.$645 million, from $256 million in 2017. The increase was
Sugar and Bioenergy Segment. Sugar and Bioenergy segmentmainly due to higher soy crush margins, partially offset bynet sales decreased to $2,257 million in 2018 compared toforeign exchange losses.$4,054 million in 2017. The 44% decrease in sales was driven
Edible Oil Products Segment. Edible oil products segment net by lower sales volumes primarily in trading and merchandisingsales increased by 14% in 2018 to $9.1 billion, compared to resulting from exiting our international trading and$8.0 billion in 2017, resulting primarily from a 17% increase in merchandising business and lower global prices of sugar. Ourvolumes, driven by our acquisition of Loders in March 2018 sugarcane milling volumes and yields were negatively impactedand the full year impact of production facilities in Europe by drought conditions during the first half of the year, followedacquired in 2017. This was partially offset by lower prices in by excessive rain in the fourth quarter of 2018.Brazil due to high stocks of soybean oil in the domestic marketresulting from the strong soy crushing environment. Cost of goods sold decreased by 42% to $2,276 million in 2018
compared to $3,955 million in 2017, which is substantially inCost of goods sold in 2018 increased 14% compared to 2017, line with the decrease in net sales. 2018 results also includedwhich is in line with the increase in net sales noted above, and $10 million of restructuring charges compared to $22 million ofprimarily driven by the impact of the recent acquisitions. restructuring charges in 2017 related to our industrial
operations, as well as $3 million in indirect tax credits in 2018,Gross profit in 2018 increased to $554 million compared to compared to $16 million in 2017.$499 million in 2017. The increase was primarily due to thecontribution to results by Loders and higher volumes and Gross profit was a loss of $19 million in 2018, compared toimproved margins for margarine in Europe, which was partially income of $99 million in 2017, primarily in our sugarcaneoffset by lower margins in our Brazilian packaged oil business. milling operations, due to lower sugar sales volumes and a
decrease in sugar prices and margins globally, and lowerSG&A expenses increased by 14% to $412 million in 2018 results in our international trading and merchandising businesscompared with $361 million in the same period a year ago. The as we exited this business during 2018.increase was primarily related to the acquisition of Loders,including $19 million of integration costs. These increases were SG&A expenses decreased by $2 million to $112 million in 2018partially offset by lower costs in all other regions from GCP from $114 million in 2017, primarily due to the favorable impactand the depreciation of the Brazilian real against the U.S. of the depreciation of the Brazilian real against the U.S. dollar,dollar. partially offset by higher employee separation and professional
services costs related to our GCP.Segment EBIT decreased to $122 million in 2018, from$126 million in 2017. Increased gross profit primarily from the Foreign currency results in 2018 were gains of $7 millionacquisition of Loders was more than offset by weaker margins compared to $11 million in 2017. These results relate primarilyin Brazil and higher SG&A and other expenses. to gains on foreign currency hedges on forward sales
positions.Milling Products Segment. Milling products segment net salesincreased 7% to $1,691 million in 2018 compared to Other income (expenses) – net was income of $4 million in$1,575 million in 2017. The increase was due to higher volumes 2018, compared to expense of $4 million in 2017, which isin Brazil and Mexico driven by increased demand in various primarily associated with results in our equity methodmarket segments, and higher prices in Mexico, as well as the investments.acquisition of Minsa USA in the first quarter of 2018.
Segment EBIT decreased to a loss of $135 million in 2018 fromCost of goods sold in 2018 increased 7% to $1,464 million a loss of $12 million in 2017, primarily due to lower volumes,compared to $1,366 million in 2017, which is in line with the global sugar prices and margins, the exiting of ourincrease in net sales noted above and primarily driven by the international sugar trading activities and a $16 million loss onacquisition of Minsa USA, partially offset by lower costs and the sale of an equity investment in Brazil.favorable foreign currency translation impact in Brazil.
Fertilizer Segment. Fertilizer segment net sales increased toGross profit increased by 9% to $227 million in 2018, up from $460 million in 2018, compared to $406 million in 2017,$209 million in 2017. The increase was primarily due to the primarily due to higher international fertilizer prices, partiallyacquisition of Minsa USA and lower industrial costs in Brazil. offset by lower volumes in our port activities in Brazil.
26 2018 Bunge Annual Report

27
Cost of goods sold in 2018 were $390 million compared to 2017 Compared to 2016$381 million in 2017. The increase was primarily due to the
Net Income Attributable to Bunge. For the year endedhigher costs of imported fertilizer inventories, partially offset byDecember 31, 2017, net income attributable to Bungethe impact of industrial cost reduction initiatives. Cost of goodsdecreased by $585 million to $160 million from $745 million insold in 2018 included $1 million of severance and other2016. This decrease resulted primarily from a decrease in totalemployee benefit costs, compared to $13 million in 2017.segment EBIT of $707 million, particularly in Agribusiness,
Gross profit increased by $45 million to $70 million in 2018, partially offset by decreases in losses from discontinuedfrom $25 million in 2017. The increase was primarily due to operations and income tax expense.higher margins in Argentina, benefits from our restructuring
Income Tax Expense. In the year ended December 31, 2017,activities and lower severance and other employee benefitincome tax expense was $56 million compared to income taxcosts.expense of $220 million in 2016. The effective tax rate for 2017was 24% compared to 22% for 2016. The higher tax rate inSG&A expenses increased by $4 million to $23 million in 20182017 was primarily due to an income tax charge recognized infrom $19 million in 2017. SG&A expenses in 2017 benefitedthe U.S. from newly enacted tax reform of $60 million, anfrom an insurance recovery and gains on sales of assets.income tax charge due to a tax rate change in Argentina for
Foreign exchange results for 2018 were a loss of $6 million $6 million and a valuation allowance recognized in Europe forcompared to a loss of $1 million in 2017. Results for 2018 $26 million. This was partly offset by an income tax benefit ofrelate primarily to foreign currency hedges in the first six $32 million for a favorable resolution of income tax matters inmonths of the year for the import of inventories. Asia-Pacific, an income tax benefit of $17 million related to a
prior year tax election in South America, and the release of aSegment EBIT increased by $36 million to $39 million in 2018 valuation allowance in Asia-Pacific for $6 million. The 2016from $3 million in 2017. The increase was primarily due to effective tax rate of 22% was driven primarily by certainstronger margins in Argentina. discrete items including an income tax benefit of $60 million
recorded for a change in estimate resulting from a tax electionUnallocated. Unallocated segment EBIT of $24 million in 2018 for North America, a release of valuation allowance for Sugarrelates to the loss on extinguishment of debt, which was entities of $19 million, and an income tax benefit of $11 millionrecorded in other income (expense). See Note 17—Long-Term recorded for income tax refund claims in Europe, partiallyDebt and Credit Facilities, to our consolidated financial offset by an income tax charge of $56 million recorded for anstatements included in this Annual Report on Form 10-K for uncertain tax position related to Asia-Pacific. Excluding themore information. effect of these discrete items noted above, our effective tax
rate for 2017, and 2016 was 8% and 26%, respectively. TheInterest. A summary of consolidated interest income andreduction in the effective tax rate from 2016 to 2017, afterexpense follows:taking into account the discrete tax items noted above, isprimarily attributable to favorable earnings mix on a lower base
YEAR ENDED DECEMBER 31,of pretax income and due to other net favorable discrete items,
(US$ in millions) 2018 2017recognized primarily in the fourth quarter of 2017.
Interest income $ 31 $ 38Agribusiness Segment. Agribusiness segment net salesInterest expense (339) (263)increased by 6% to $31.7 billion in 2017, compared to$30.1 billion in 2016, aligned with the overall volumes increaseInterest income decreased by $7 million to $31 million in 2018of 6% compared to 2016. Higher volumes in Brazil due tocompared to $38 million in 2017, primarily related to lowerlarger soybean and corn crops, increased crush volumes inoutstanding balances and lower interest rates, primarily inEurope due to our new crush plant in Ukraine which startedBrazil. Interest expense increased $76 million to $339 million inoperations in the second quarter of 2016, and the acquisition2018 from $263 million in 2017, primarily due to higher averageof two oilseed crushing facilities in Western Europe in the firstdebt balances associated with funding the Loders acquisitionquarter of 2017 led to the increase in net sales compared toand higher working capital needs, as well as higher interest2016.rates. These increases were partially offset by the reversal of
interest related to ICMS tax credits in Brazil.Cost of goods sold increased by 8%, aligned with the increasesin volumes noted above. In addition, cost of goods sold forDiscontinued Operations. Income from discontinued operations2017, was impacted by $16 million of impairment charges of(retail fertilizer business in Brazil) in 2018 was $10 million,long-lived assets in Asia-Pacific and Europe, $12 million ofcompared to nil in 2017. The income for 2018 was mainlyseverance and other employee benefit costs related to ourcomprised of a gain on the final settlement from the liquidationindustrial productivity initiatives, higher industrial costs andof an entity in 2004, foreign exchange gains due to thedepreciation from the recent acquisitions in Europe and a 9%depreciation of the Brazilian real, and the recovery of bad debtappreciation of the Brazilian real against the U.S. dollar in 2017provisions, partially offset by an $11 million charge related tocompared to 2016.the final settlement on the sale of the Brazilian retail fertilizer
business in 2013.
2018 Bunge Annual Report 27

28
Gross profit decreased to $933 million in 2017, from $1.5 billion $6 million of severance and employee benefit costs related toin 2016, primarily driven by lower margins in our grain industrial productivity initiatives.origination, oilseed processing and trading and distribution
Gross profit in 2017 increased to $499 million compared tobusinesses from slow farmer selling, reduced demand for$439 million in 2016. The increase was primarily driven bysoybean meal, strong competition, fewer risk managementstronger margins in Brazil and increases in volumes in Europeopportunities and severance and employee benefit costsfrom our recent acquisitions, offset in part by severance andrelated to industrial productivity initiatives.other employee benefit costs and lower refining and packaging
SG&A expenses increased $101 million to $805 million in 2017, margins in the U.S.which represented a 14% increase from $704 million in the
SG&A expenses increased by 13% to $361 million in 2017same period last year. This increase included $37 million ofcompared with $320 million in the same period a year ago. TheGCP costs, related primarily to severance and other employeeincrease includes severance and other employee benefit costsbenefit costs, added general and administrative expenses inof $10 million related to our GCP and acquisition related costsEurope related to new acquisitions and a 9% appreciation ofof $9 million. Additionally, there were increased general andthe Brazilian real against the U.S. dollar in 2016. Additionally,administrative expenses associated with our recent acquisitions.there was a $17 million credit adjustment in Brazil, $7 million of
impairment charges, primarily of intangible assets related toForeign currency results in 2017 were income of $3 million,patents, and $7 million of transaction related costs associatedcompared to loss of $1 million in 2016 related to foreignwith the acquisition of two oilseed processing facilities incurrency gains on debt and derivative instruments and hedges.Europe.
Other income (expenses) – net was expense of $7 million inForeign currency results in 2017 were gains of $85 million,2017, compared to income of $7 million in 2016. Included incompared to losses of $7 million in 2016. These results wereOther income (expenses) – net in 2016 is an $11 million gainprimarily driven by gains on U.S. dollar-denominated loans torecorded on the disposition of assets in Europe.fund operations and foreign currency gains realized due to the
appreciation of the Chinese renminbi in our oilseed processingSegment EBIT increased to $126 million in 2017, up frombusiness in Asia.$112 million in 2016, primarily from higher margins andvolumes in our Brazil business and increased volumes due toOther income (expenses) – net was income of $56 million inacquisitions in Argentina and Europe, partially offset by2017, compared to income of $22 million in 2016. Results forseverance and other employee benefit costs related to our GCPthe year ended 2017 included income earned in our Financialand industrial productivity initiatives and acquisition relatedServices Group, offset by a $13 million impairment of our palmcosts of $9 million.oil affiliate in Indonesia. Results for the year ended 2016
included impairment and restructuring charges of $27 millionMilling Products Segment. Milling products segment net sales
on our palm oil affiliate in Indonesia and intangible assets decreased 4% to $1.6 billion in 2017. Higher volumes in therelated to aquaculture and other patents. U.S. were primarily offset by weak macro-economic conditions
and pressure from the record wheat crop in Brazil compared toSegment EBIT decreased by $619 million primarily driven by2016.our grain origination business, which was impacted by weaker
margins, primarily due to slow farmer selling, strong Cost of goods sold were $1.4 billion in 2017, aligned with 2016.competition and logistics commitments in South America and Cost of goods sold in 2017 was impacted by $4 million ofweaker results in our soybean processing facilities in most severance and other employee benefit costs related toregions. Also, contributing to lower EBIT were severance, industrial productivity initiatives and 2016 included a recoveryemployee benefit and other program costs related to our of $14 million in Brazilian import taxes paid in prior years.Global Competitiveness Program (‘‘GCP’’), impairment charges,transaction costs related to the acquisition of two oilseed Gross profit decreased by 22% to $209 million in 2017, downcrushing facilities in Western Europe and the increase of from $269 million in 2016, primarily due to increasedgeneral and administrative expenses for recent acquisitions. competition and competitive pricing in Brazil that reduced
margins as well as an unfavorable product mix in Mexico.Edible Oil Products Segment. Edible oil products segment netsales increased by 17% in 2017 to $8.0 billion, compared to SG&A expenses increased to $138 million in 2017 from$6.9 billion in 2016, resulting primarily from an 11% increase in $127 million, primarily due to the 9% appreciation of thevolumes, driven by our acquisitions of two edible oil production Brazilian real against the U.S. dollar compared to 2016 andfacilities in Europe, the recent acquisition of an edible oil employee severance and other employee benefit costs relatedproduction facility in Argentina and increased volumes in to our GCP.Asia-Pacific and Brazil.
Segment EBIT decreased to $63 million in 2017 fromCost of goods sold in 2017 increased 17% compared to 2016, $131 million in 2016 as a result of lower gross profit driven bywhich is in line with the increase in net sales noted above, and continued weak economic conditions and lower demand forprimarily driven by the impact of the recent acquisitions in higher value wheat products in Brazil and Mexico andEurope and Argentina and increased volumes in Asia-Pacific severance and other employee benefit costs related to our GCPand Brazil compared to 2016. Additionally, 2017 included
28 2018 Bunge Annual Report

29
and other industrial productivity initiatives. In addition, 2016 raw material costs and severance and other employee benefitincluded a recovery of $14 million in Brazilian import taxes paid costs.in prior years.
Segment EBIT decreased by $26 million to $3 million in 2017from $29 million in the same period a year ago, higher volumesSugar and Bioenergy Segment. Sugar and Bioenergy segmentin our Brazil port operations were more than offset by lowernet sales increased to $4.1 billion in 2017 compared tomargins in 2017 and $13 million of severance and other$3.7 billion in the same period last year. The 9% increase inemployee benefit costs related to a production facility insales was primarily driven by higher sugar sales volumes in ourArgentina. In addition, 2016 included a reversal of a naturaltrading and distribution business and a 9% appreciation of thegas tariff reserve of $11 million due to an Argentine SupremeBrazilian real against the U.S. dollar which positively impactedcourt decision.domestic sales of sugar and ethanol in Brazil when converted
into U.S. dollar.Interest. A summary of consolidated interest income andexpense for the periods indicated follows:Cost of goods sold increased 11% in 2017 compared to the
same period 2016, primarily due to higher sales volumes andYEAR ENDED DECEMBER 31,the appreciation of the Brazilian real compared to the U.S.
(US$ in millions) 2017 2016dollar. Results for 2017 also included $21 million of severanceand restructuring charges related to our industrial operations Interest income $ 38 $ 51and $16 million of indirect tax credits. Interest expense (263) (234)
Gross profit decreased to $99 million in 2017 from the Interest income decreased by $13 million to $38 million in 2017$159 million reported in 2016. Higher sales volumes and compared to $51 million in 2016, primarily related to lower$16 million related to indirect tax credits were more than offset average cash and cash equivalents balances. Interest expenseby lower sugar and ethanol sales prices and $21 million in increased $29 million to $263 million in 2017 from $234 millionseverance and restructuring charges. in 2016, primarily due to higher average debt balances, higher
variable interest rates, and an increase in the duration of ourSG&A expenses increased by 3% to $114 million in 2017 from debt portfolio.$112 million in the comparable period 2016, primarily due to$4 million of severance and other employee benefit costs Discontinued Operations. Income (loss) from discontinuedrelated to our GCP and the appreciation of the Brazilian real operations (retail fertilizer business in Brazil) in 2017 was nilcompared to the U.S. dollar. compared to a loss of $9 million in 2016. Recovery of bad debt
provisions and interest received from customers in litigationForeign currency results in 2017 were $11 million compared to offset ongoing administrative expenses and foreign currency$9 million in the same period 2016. These results relate losses.primarily to gains on foreign currency hedges.
LIQUIDITY AND CAPITAL RESOURCESOther income (expenses) – net was expense of $4 million in2017, compared to expense of $16 million in 2016 related to Liquidityresults in our joint venture for the production of renewable oils
Our main financial objectives are to prudently manage financialin Brazil.risks, ensure consistent access to liquidity and minimize cost ofcapital in order to efficiently finance our business and maintainSegment EBIT decreased to a loss $12 million in 2017 from abalance sheet strength. We generally finance our ongoingloss of $4 million in 2016, as higher sugar sales volumes alongoperations with cash flows generated from operations, issuancewith foreign currency gains and indirect tax credits were moreof commercial paper, borrowings under various bilateral andthan offset by lower sugar and ethanol sales prices, $22 millionsyndicated revolving credit facilities, term loans and proceedsin severance and restructuring charges related to our industrialfrom the issuance of senior notes. Acquisitions and long-livedoperations, and $4 million of severance and other employeeassets are generally financed with a combination of equity andbenefit costs related to our GCP.long-term debt.
Fertilizer Segment. Fertilizer segment net sales increased toOur current ratio, which is a widely used measure of liquidity$406 million in 2017, compared to $403 million in 2016,and is defined as current assets divided by current liabilities,primarily due to higher volumes in our Brazil port operationswas 1.54 and 1.67 at December 31, 2018 and 2017,compared to 2016.respectively.
Cost of goods sold in 2017 were $381 million compared toCash and Cash Equivalents. Cash and cash equivalents were$350 million in 2016. Cost of goods sold in 2017 included$389 million at December 31, 2018 and $601 million at$13 million of severance and other employee benefit costsDecember 31, 2017. Cash balances are managed in accordancerelated to a production facility in Argentina. In addition, 2016with our investment policy, the objectives of which are toincluded a reversal of a natural gas tariff reserve of $11 millionpreserve the principal value of our cash assets, maintain a highdue to an Argentine Supreme court decision.degree of liquidity and deliver competitive returns subject to
Gross profit decreased by $28 million to $25 million in 2017, prevailing market conditions. Cash balances are invested infrom $53 million in the comparable period 2016. The decrease short-term deposits with highly rated financial institutions andwas primarily driven by lower margins in Argentina from higher in U.S. government securities.
2018 Bunge Annual Report 29

30
Readily Marketable Inventories (‘‘RMI’’). RMI are agricultural loans made to Bunge Limited and its subsidiaries. Certain ofcommodity inventories, such as soybeans, soybean meal, Bunge Limited’s 100% owned finance subsidiaries, Bungesoybean oil, corn, wheat, and sugar that are readily convertible Limited Finance Corp., Bunge Finance Europe B.V. and Bungeto cash because of their commodity characteristics, widely Asset Funding Corp., fund the master trust with short andavailable markets and international pricing mechanisms. Total long-term debt obtained from third parties, including throughRMI reported at fair value were $4,532 million and our commercial paper program and certain credit facilities, as$4,056 million at December 31, 2018 and December 31, 2017, well as the issuance of senior notes. Borrowings by theserespectively (see Note 5 – Inventories, to our consolidated finance subsidiaries carry full, unconditional guarantees byfinancial statements included as part of this Annual Report on Bunge Limited.Form 10-K).
Revolving Credit Facilities. At December 31, 2018, we hadFinancing Arrangements and Outstanding Indebtedness. We $5,015 million of aggregate committed borrowing capacityconduct most of our financing activities through a centralized under our commercial paper program and various revolvingfinancing structure that provides the company efficient access bilateral and syndicated credit facilities, of which $4,515 millionto debt and capital markets. This structure includes a master was unused and available. The following table summarizestrust, the primary assets of which consist of intercompany these facilities as of the periods presented:
TOTAL COMMITTEDCAPACITY BORROWINGS OUTSTANDING
COMMERCIAL PAPER PROGRAM DECEMBER 31, DECEMBER 31, DECEMBER 31,AND REVOLVING CREDIT FACILITIES MATURITIES 2018 2018 2017
Commercial Paper . . . . . . . . . . . . . . . . . . . . . . . . . . . . . . . . . . . . . . . . . . . . . . . . . . . . . . . . . . . . . . . . . . . . . . . . . . . . . . . . . . . . . . . . . . . . . . 2023 $ 600 $ - $ -Long-Term Revolving Credit Facilities(1) . . . . . . . . . . . . . . . . . . . . . . . . . . . . . . . . . . . . . . . . . . . . . . . . . . . . . . . . . . . . . . . . . . . 2020 - 2023 4,415 500 -
Total . . . . . . . . . . . . . . . . . . . . . . . . . . . . . . . . . . . . . . . . . . . . . . . . . . . . . . . . . . . . . . . . . . . . . . . . . . . . . . . . . . . . . . . . . . . . . . . . . . . . . . . . . . . . . . . $5,015 $ 500 $ -
(1) Borrowings under the revolving credit facilities that have maturities greater than one year from the date of the consolidated balance sheets are classified as long-term debt,consistent with the long-term maturity of the underlying facilities. However, individual borrowings under the revolving credit facilities are generally short-term in nature, bear interestat variable rates and can be repaid or renewed as each such individual borrowing matures.
On December 14, 2018, we entered into an unsecured approval, we may request an increase, in an amount not to$1,100 million five-year syndicated revolving credit agreement exceed $100 million, to the revolving credit facility(the ‘‘Credit Agreement’’) with certain lenders party thereto commitments pursuant to an accordion provision set forth inmaturing December 14, 2023. We have the option to request an the revolving credit facility. There were no borrowingsextension of the maturity date of the Credit Agreement for two outstanding under the facility at December 31, 2018.additional one-year periods, subject to the consent of the
We had $500 million of borrowings outstanding atlenders. The Credit Agreement replaced the then existingDecember 31, 2018 under our $1,750 million unsecured$1,100 million five-year revolving credit agreement, dated as ofsyndicated revolving credit facility with certain lenders partyNovember 20, 2014, which was terminated by us in accordancethereto maturing December 12, 2020 (the ‘‘2020 Facility’’).with its terms. Borrowings under the Credit Agreement willBorrowings under the 2020 Facility bear interest at LIBOR plusbear interest at LIBOR plus a margin, which will vary froma margin, which will vary from 0.30% to 1.30% per annum,1.00% to 1.625%, based on the credit ratings of our seniorbased on the credit ratings of our senior long-term unsecuredlong-term unsecured debt (‘‘Rating Level’’). Amounts under thedebt. We also pay a fee that varies from 0.10% to 0.40% perCredit Agreement that remain undrawn are subject to aannum, based on the utilization of the 2020 Facility. Amountscommitment fee at rates ranging from 0.09% to 0.225%, varyingunder the 2020 Facility that remain undrawn are subject to abased on the Rating Level. We may, from time-to-time, requestcommitment fee payable quarterly in arrears at a rate of 35%one or more of the existing lenders or new lenders to increaseof the margin specified above, which varies based on thethe total commitments under the Credit Agreement by up torating level at each quarterly payment date. We may, from time$200 million pursuant to an accordion provision. Atto time, with the consent of the facility agent, request one orDecember 31, 2018, we had no borrowings outstanding undermore of the existing lenders or new lenders to increase thethe Credit Agreement.total commitments under the 2020 Facility by up to $250 million
On May 1, 2018, in connection with our previously announced pursuant to an accordion provision. We have the option tostrategy to reduce our exposure to the sugar milling business request an extension of the maturity date of the 2020 Facilityin Brazil, we entered into an unsecured $700 million, five-year for two additional one-year periods, subject to the consent ofrevolving credit facility, which upon fulfillment of certain the lenders.conditions is convertible into a non-recourse secured term loan
We had no borrowings outstanding at December 31, 2018facility with our sugar milling business as the borrower. Thisunder our unsecured $865 million revolving credit facility,facility provides financial flexibility to fund our sugar millingmaturing September 6, 2022 (the ‘‘2022 Facility’’). Borrowingsbusiness on a stand-alone basis. Additionally, subject to lender
30 2018 Bunge Annual Report

31
under the 2022 Facility bear interest at LIBOR plus a margin, Liquidity Facility. The Liquidity Facility is our only revolvingwhich will vary from 1.00% to 1.75% per annum, based on the credit facility that requires lenders to maintain minimum creditcredit ratings of our senior long-term unsecured debt. Amounts ratings.under the 2022 Facility that remain undrawn are subject to a
In addition to committed credit facilities, from time to time,commitment fee payable quarterly based on the averagethrough our financing subsidiaries, we enter into bilateralundrawn portion of the 2022 Facility at rates ranging fromshort-term credit lines as necessary based on our financing0.125% to 0.275%, based on the credit ratings of our seniorrequirements. At December 31, 2018 there were no borrowingslong-term unsecured debt.outstanding under these bilateral short-term credit lines.
Our commercial paper program is supported by committedShort and long-term debt. Our short and long-term debtback-up bank credit lines (the ‘‘Liquidity Facility’’) equal to theincreased by $893 million at December 31, 2018 fromamount of the commercial paper program provided by lendingDecember 31, 2017, primarily due to funding the acquisition ofinstitutions that are required to be rated at least A-1 byLoders. For the year ended December 31, 2018, our averageStandard & Poor’s and P-1 by Moody’s Investor Services. Theshort and long-term debt outstanding was approximatelycost of borrowing under the Liquidity Facility would typically be$6,929 million compared to approximately $5,455 million for thehigher than the cost of issuance under our commercial paperyear ended December 31, 2017, primarily due to funding theprogram. On December 14, 2018 we amended our unsecuredacquisition of Loders and higher average working capital$600 million five-year Liquidity Facility with certain lendersfinancing requirements, driven by higher average globalparty thereto and extended its term to December 14, 2023. Wecommodity prices. Our long-term debt outstanding balancehave the option to request an extension of the expiration datewas $4,622 million at December 31, 2018 compared toof the Liquidity Agreement for two additional one-year periods,$4,175 million at December 31, 2017. The following tablesubject to the consent of the lenders. At December 31, 2018,summarizes our short-term debt activity at December 31, 2018.no borrowings were outstanding under the commercial paper
program and no borrowings were outstanding under the
WEIGHTED WEIGHTEDAVERAGE HIGHEST AVERAGE
OUTSTANDING INTEREST BALANCE AVERAGE INTERESTBALANCE AT RATE AT OUTSTANDING BALANCE RATE
DECEMBER 31, DECEMBER 31, DURING DURING DURING(US$ in millions) 2018 2018(1) 2018(1) 2018(1) 2018(1)
Bank Borrowings . . . . . . . . . . . . . . . . . . . . . . . . . . . . . . . . . . . . . . . . . . . . . . . . . . . . . . . . . . . . . . . . . . . . . . $750 6.98% $2,327 $1,332 4.82%Commercial Paper . . . . . . . . . . . . . . . . . . . . . . . . . . . . . . . . . . . . . . . . . . . . . . . . . . . . . . . . . . . . . . . . . . . - - 598 449 2.41%
Total . . . . . . . . . . . . . . . . . . . . . . . . . . . . . . . . . . . . . . . . . . . . . . . . . . . . . . . . . . . . . . . . . . . . . . . . . . . . . . . . . . . . . $750 6.98% $2,925 $1,781 4.21%
(1) Includes $136 million of local currency borrowings in certain Central and Eastern European, and South American countries at a weighted average interest rate of 23.61% as ofDecember 31, 2018.
On September 10, 2018, we completed the sale and issuance net proceeds of the offering were approximately $594 millionof $600 million aggregate principal amount of 4.35% unsecured after deducting underwriting commissions and estimatedsenior notes due March 15, 2024. The senior notes are fully offering expenses. We used the net proceeds from this offering,and unconditionally guaranteed by Bunge Limited. The offering together with available cash, to fund a tender offer andwas made pursuant to a registration statement filed with the redemption of our $600 million aggregate principal amount ofU.S. Securities and Exchange Commission. Interest on the 8.50% senior notes due 2019, which resulted in a loss onsenior notes is payable semi-annually in arrears in March and extinguishment of debt of approximately $24 million related toSeptember of each year, commencing on March 15, 2019. The make-whole payments.
2018 Bunge Annual Report 31

32
The following table summarizes our short and long-term debt: could impede our ability to obtain credit facilities or access thecapital markets in the future on competitive terms. Asignificant increase in our borrowing costs could impair ourDECEMBER 31,ability to compete effectively in our business relative to(US$ in millions) 2018 2017competitors with higher credit ratings.
Short-term debt:(1)
Short-term debt(2) $ 750 $ 304 Our credit facilities and certain senior notes require us toCurrent portion of long-term debt 419 15 comply with specified financial covenants, including minimum
net worth, minimum current ratio, a maximum debt toTotal short-term debt 1,169 319capitalization ratio, and limitations on secured indebtedness.Long-term debt:We were in compliance with these covenants as ofRevolving credit facility expiring 2020 500 -December 31, 2018.Term loan due 2019 - three-month Yen LIBOR plus
0.75% (Tranche A) 258 253Trade Receivable Securitization Program. We initially entered into
Term loan due 2019 - fixed Yen interest rate ofour trade receivable securitization program (the ‘‘Program’’) in
0.96% (Tranche B) 54 53June 2011, which provides us with an additional source of
Term loan due 2019 - three-month LIBOR plus 1.30%liquidity. On May 26, 2016, Bunge and certain of its
(Tranche C) 85 85subsidiaries renewed and amended the $700 million trade
8.50% Senior Notes due 2019 - 599receivables securitization program, which terminates on
3.50% Senior Notes due 2020 498 497May 26, 2021. However, each committed purchaser’s
3.00% Senior Notes due 2022 397 396commitment to fund trade receivables sold under the Program
1.85% Senior Notes due 2023 - Euro 916 960will terminate on May 26, 2019 unless extended in accordance
4.35% Senior Notes due 2024 595 -with the terms of the receivables transfer agreement. On
3.25% Senior Notes due 2026 695 694February 19, 2019, we exercised a portion of the $300 million
3.75% Senior Notes due 2027 594 593accordion feature under this Program to increase the aggregate
Other 30 45size of the facility by $100 million to an aggregate of
Subtotal 4,622 4,175 $800 million and extended the committed purchasers’Less: Current portion of long-term debt (419) (15) commitment to fund trade receivables under the Program until
May 26, 2020.Total long-term debt(3) 4,203 4,160
Total debt $5,372 $4,479DECEMBER 31,
(US$ in millions) 2018 2017(1) Includes secured debt of $9 million and $5 million at December 31, 2018 andDecember 31, 2017, respectively. Receivables sold which were derecognized from
Bunge’s balance sheet $826 $810(2) Includes $136 million and $179 million of local currency borrowings in certain Centraland Eastern European, South American, African and Asia-Pacific countries at a weighted
Deferred purchase price included in other currentaverage interest rate of 23.61% and 15.03% as of December 31, 2018 and December 31,assets $128 $1072017, respectively.
(3) Includes secured debt of $17 million and $24 million at December 31, 2018 andThe table below summarizes the cash flows and discounts ofDecember 31, 2017, respectively.
our trade receivables associated with the Program. ServicingCredit Ratings. Bunge’s debt ratings and outlook by major fees under the Program were not significant in any period.credit rating agencies at December 31, 2018 were as follows:
YEARS ENDED DECEMBER 31,SHORT-TERM LONG-TERM (US$ in millions) 2018 2017 2016
DEBT(1) DEBT OUTLOOKGross receivables sold $9,803 $10,022 $9,405
Standard & Poor’s(2) A-1 BBB StableProceeds received in cash related toMoody’s P-1 Baa3 Stable
transfer of receivables $9,484 $ 9,734 $9,197Fitch(2) F1 BBB Negative
Cash collections from customers on(1) Short-term rating applies only to Bunge Asset Funding Corp., the issuer under ourreceivables previously sold $9,173 $ 9,659 $9,176commercial paper program.
(2) In January 2019, Standard & Poor’s lowered the outlook on our long-term debt BBB Discounts related to gross receivablescredit rating to negative, and Fitch downgraded our long-term debt credit rating to BBB- sold included in SG&A $ 14 $ 9 $ 6with a stable outlook.
Non-cash activity for the program in the reporting period isOur debt agreements do not have any credit rating downgraderepresented by the difference between gross receivables soldtriggers that would accelerate maturity of our debt. However,and cash collections from customers on receivables previouslycredit rating downgrades would increase our borrowing costssold.under our credit facilities and, depending on their severity,
32 2018 Bunge Annual Report
33
Our risk of loss following the sale of the trade receivables is conversion price because cash dividends paid on Bungelimited to the deferred purchase price receivable (the ‘‘DPP’’), Limited’s common shares exceeded certain specifiedwhich at December 31, 2018 and 2017 had a fair value of thresholds, each convertible perpetual preference share is$128 million and $107 million, respectively, and is included in convertible, at the holder’s option, at any time into 1.1918other current assets in our consolidated balance sheets (see Bunge Limited common shares, based on the conversion priceNote 18 - Trade Receivables Securitization Program, to our of $83.9096 per share, subject to certain additional anti-dilutionconsolidated financial statements included as part of this adjustments (which represents 8,223,042 Bunge LimitedAnnual Report on Form 10-K). The DPP will be repaid in cash common shares at December 31, 2018). At any time, if theas receivables are collected, generally within 30 days. closing price of our common shares equals or exceeds 130% ofDelinquencies and credit losses on trade receivables sold the conversion price for 20 trading days during any consecutiveunder the Program during the years ended December 31, 2018, 30 trading days (including the last trading day of such period),2017 and 2016 were insignificant. we may elect to cause the convertible perpetual preference
shares to be automatically converted into Bunge LimitedInterest Rate Swap Agreements. We may use interest rate swaps common shares at the then-prevailing conversion price. Theas hedging instruments and record the swaps at fair value in convertible perpetual preference shares are not redeemable bythe consolidated balance sheets with changes in fair value us at any time.recorded contemporaneously in earnings. Additionally, thecarrying amount of the associated debt is adjusted through Cash Flowsearnings for changes in the fair value due to changes inbenchmark interest rates. Our cash flows from operations vary depending on, among
other items, the market prices and timing of the purchase andEquity. Total equity is set forth in the following table: sale of our inventories. Generally, during periods when
commodity prices are rising, our Agribusiness operationsDECEMBER 31, require increased use of cash to support working capital to
(US$ in millions) 2018 2017 acquire inventories and fund daily settlement requirements onexchange traded futures that we use to minimize price riskConvertible perpetual preference shares $ 690 $ 690related to the purchase and sale of our inventories.Common shares 1 1
Additional paid-in capital 5,278 5,2262018 Compared to 2017. In 2018, our cash and cash
Retained earnings 8,059 8,081equivalents, and restricted cash decreased by $212 million,
Accumulated other comprehensive income (6,935) (5,930)compared to a decrease of $333 million in 2017.
Treasury shares, at cost (2018 and 2017 - 12,882,313) (920) (920)
Total Bunge shareholders’ equity 6,173 7,148 Cash used for operating activities was $1,264 million for theNoncontrolling interests 205 209 year ended December 31, 2018 compared to cash used for
operating activities of $1,975 million for the year endedTotal equity $ 6,378 $ 7,357December 31, 2017. Net cash outflows from operating activitieswas lower for the year ended December 31, 2018, primarily due
Total Bunge shareholders’ equity was $6,173 million at to the lower use of cash associated with beneficial interests inDecember 31, 2018 compared to $7,148 million at securitized trade receivables and higher net income duringDecember 31, 2017. The decrease in Bunge shareholders’ 2018, partially offset by the increased working capitalequity during the year ended December 31, 2018 was primarily requirements compared to the year ended December 31, 2017.due to $1,090 million of cumulative translation losses and Cash provided by (used for) operating activities for all periods$276 million and $34 million of declared dividends to common presented reflects the adoption of ASU 2016-15, Statement ofand preferred shareholders, respectively, partially offset by Cash Flows (Topic 230), Classification of Certain Cash Receipts$267 million net income attributable to Bunge and $99 million and Cash Payments (a consensus of the Emerging Issues Taskof unrealized gains associated with hedging activities. Force), which changed the presentation of cash flows in
relation to our trade receivables securitization program.Noncontrolling interest decreased to $205 million at Particularly impacted are the cash receipts from payments onDecember 31, 2018 from $209 million at December 31, 2017 the deferred purchase price, which are now classified as cashprimarily due to the effects of currency translation, as well as inflows from investing activities, whereas previously they weredividends paid and returns of capital to non-controlling interest classified as inflows from operating activities.holders, partially offset by income attributable to ournoncontrolling interest entities. Certain of our non-U.S. operating subsidiaries are primarily
funded with U.S. dollar-denominated debt, while currency riskAt December 31, 2018, we had 6,899,683 4.875% cumulative is hedged with U.S. dollar-denominated assets. The functionalconvertible perpetual preference shares outstanding with an currency of our operating subsidiaries is generally the localaggregate liquidation preference of $690 million. Each currency. The financial statements of our subsidiaries areconvertible perpetual preference share has an initial liquidation calculated in the functional currency, and when the localpreference of $100, which will be adjusted for any accumulated currency is the functional currency, translated into U.S. dollar.and unpaid dividends. The convertible perpetual preference U.S. dollar-denominated loans are remeasured into theirshares carry an annual dividend of $4.875 per share payable respective functional currencies at exchange rates at thequarterly. As a result of adjustments made to the initial applicable balance sheet date. Also, certain of our U.S. dollar
2018 Bunge Annual Report 33

34
functional operating subsidiaries outside the U.S. are partially Cash provided by financing activities was $631 million in thefunded with local currency borrowings, while the currency risk year ended December 31, 2018, compared to cash used foris hedged with local currency denominated assets. Local financing activities of $180 million for the year endedcurrency loans in U.S. dollar functional currency subsidiaries December 31, 2017. The net increase of $956 million inoutside the U.S. are remeasured into U.S. dollars at the borrowings in 2018 was primarily related to the funding ofexchange rate on the applicable balance sheet date. The acquisitions, financing capital expenditures and fundingresulting gain or loss is included in our consolidated working capital needs. In addition, we paid dividends ofstatements of income as foreign exchange gains or losses. For $305 million to our common shareholders and holders of ourthe years ended December 31, 2018 and December 31, 2017, convertible preference shares. In 2017, dividends paid to ourwe recorded foreign currency losses of $139 million and common shareholders and holders of our convertible$21 million, respectively, which were included as adjustments preference shares were $281 million.to reconcile net income to cash used for operating activities in
2017 Compared to 2016. In 2017, our cash and cashthe line item ‘‘Foreign exchange (gain) loss on net debt’’ in ourequivalents, and restricted cash decreased by $333 million,consolidated statements of cash flows. This adjustment iscompared to an increase of $525 million in 2016.required as these gains or losses are non-cash items that arise
from financing activities and therefore will have no impact onCash used for our operating activities was $1,975 million forcash flows from operations.the year ended December 31, 2017, compared to cash providedby operating activities was $446 million for the year endedCash provided by investing activities was $410 million for theDecember 31, 2016. Net cash inflows from operating activitiesyear ended December 31, 2018 compared to cash provided bywas lower for the year ended December 31, 2017, primarily dueinvesting activities of $1,819 million for the year endedto lower net income, including adjustments for non-cash items,December 31, 2017. During 2018, payments were made forand increased working capital needs compared to the yearcapital expenditures of $493 million, primarily related toended December 31, 2016. Cash provided by (used for)replanting of sugarcane for our industrial sugar business inoperating activities for all periods presented reflects theBrazil and the upgrade of our crush facility in Italy, as well asadoption of ASU 2016-15, Statement of Cash Flows (Topic 230),other capital projects at various facilities. In addition, weClassification of Certain Cash Receipts and Cash Payments (aacquired Loders for $908 million, net of cash acquired, andconsensus of the Emerging Issues Task Force), which changedMinsa USA for $73 million, net of cash acquired. Further,the presentation of cash flows in relation to our tradepayments were made for investments of $1,184 million,receivables securitization program. Particularly impacted are theprimarily related to deposits, treasuries and bonds in Southcash receipts from payments on the deferred purchase price,America related to financial services, which were substantiallywhich are now classified as cash inflows from investingoffset by proceeds from such investments of $1,098 million.activities, whereas previously they were classified as inflowsCash provided by investing activities was primarily associatedfrom operating activities.with proceeds of $1,888 million from beneficial interests in
securitized trade receivables (due to the change in accountingCertain of our non-U.S. operating subsidiaries are primarilydescribed above), as well as cash inflows related to settlementsfunded with U.S. dollar-denominated debt, while currency riskof net investment hedges of $66 million in the year endedis hedged with U.S. dollar-denominated assets. The functionalDecember 31, 2018, primarily driven by the depreciation of thecurrency of our operating subsidiaries is generally the localBrazilian real relative to the U.S. dollar in 2018. During 2017,currency. The financial statements of our subsidiaries arepayments were made for capital expenditures of $662 million,calculated in the functional currency, and when the localprimarily related to the upgrade and expansion of an exportcurrency is the functional currency, translated into U.S. dollar.terminal in the U.S., replanting of sugarcane for our industrialU.S. dollar-denominated loans are remeasured into theirsugar business, the expansion of a crushing facility in Brazilrespective functional currencies at exchange rates at theand the upgrade of our crush facility in Italy. In addition, weapplicable balance sheet date. Also, certain of our U.S. dollaracquired two oilseed processing plants in the Netherlands andfunctional operating subsidiaries outside the U.S. are partiallyFrance for $318 million, an edible oils business in Argentina forfunded with local currency borrowings, while the currency risk$26 million and an olive oil and seed oil producer in Turkey foris hedged with local currency denominated assets. Local$23 million, net of cash acquired. Additionally, we had cashcurrency loans in U.S. dollar functional currency subsidiariesoutflows related to settlements of net investment hedges ofoutside the U.S. are remeasured into U.S. dollars at the$20 million, primarily driven by the appreciation of the Brazilianexchange rate at the applicable balance sheet date. Thereal relative to the US dollar in 2017, and payments forresulting gain or loss is included in our consolidatedinvestments in affiliates relating to our G3, SB Oils and Tapajosstatements of income as foreign exchange gains or losses. Forjoint ventures, as well as the acquisition of a non-controllingthe years ended December 31, 2017 and December 31, 2016,stake in Agricola Alvorada, a Brazilian agribusiness companywe recorded foreign currency losses of $21 million and lossesduring 2017. Proceeds from and payments for investmentsof $80 million, respectively, which were included asincluded primarily purchases and sales of short-termadjustments to reconcile net income to cash used for operatinginvestments. Cash provided by investing activities was primarilyactivities in the line item ‘‘Foreign exchange (gain) loss on netassociated with proceeds of $2,981 million from beneficialdebt’’ in our consolidated statements of cash flows. Thisinterests in securitized trade receivables.adjustment is required because the cash flow impacts of thesegains or losses are non-cash items and will represent financing
34 2018 Bunge Annual Report

35
activities when the subsidiary repays the underlying debt and short-term in nature. The ability of our counterparties to repaytherefore will have no impact on cash flows from operations. these amounts is affected by agricultural economic conditions
in the relevant geography, which are, in turn, affected byCash provided by investing activities was $1,819 million for the commodity prices, currency exchange rates, crop input costsyear ended December 31, 2017 compared to $534 million for and crop quality and yields. As a result, these arrangementsthe year ended December 31, 2016. During 2017, payments are typically secured, including by a farmer’s crop and, in manywere made for capital expenditures of $662 million, primarily cases, land and other assets. In the event of counterpartyrelated to the upgrade and expansion of an export terminal in default, we generally initiate legal proceedings to recover thethe U.S., replanting of sugarcane for our industrial sugar defaulted amounts. However, the legal recovery processbusiness, the expansion of a crushing facility in Brazil and the through the judicial system is a long-term process, generallyupgrade of our crush facility in Italy. In addition, we acquired spanning a number of years. Additionally, we may seek totwo oilseed processing plants in the Netherlands and France renegotiate certain terms of our contract with the defaultingfor $318 million, an edible oils business in Argentina for supplier in order to accelerate recovery of amounts owed.$26 million and an olive oil and seed oil producer in Turkey for$23 million, net of cash acquired. We had cash outflows related Because Brazilian farmer credit exposures are denominated into settlements of net investment hedges of $20 million in the local currency, reported values are impacted by movements inyear ended December 31, 2017, primarily driven by the the value of the Brazilian real when translated into U.S. dollars.appreciation of the Brazilian real relative to the US dollar in From December 31, 2017 to December 31, 2018, the Brazilian2017. Proceeds from and payments for investments included real depreciated by approximately 17%, decreasing the reportedprimarily purchases and sales of short-term investments. These farmer credit exposure balances when translated into U.S.payments were offset by proceeds of $2,981 million from dollars.beneficial interests in securitized trade receivables. Investments
We periodically evaluate the collectability of our farmerin affiliates included additional investments primarily in our G3,receivables and record allowances if we determine thatSB Oils and Tapajos joint ventures, as well as the acquisition ofcollection is doubtful. We base our determination of thea non-controlling stake in Agricola Alvorada, a Brazilianallowance on analyses of credit quality of individual accounts,agribusiness company. During 2016, payments were made forconsidering also the economic and financial condition of thecapital expenditures of $784 million, primarily related tofarming industry and other market conditions as well as thereplanting of sugarcane and maintenance and improvementsvalue of any collateral related to amounts owed. Wefor our industrial sugar business in Brazil, upgrade andcontinuously review defaulted farmer receivables forexpansion of an export terminal in the United States,impairment on an individual account basis. We consider allconstruction of a wheat milling facility in Brazil, the expansionaccounts in legal collections processes to be defaulted andof a port facility in Ukraine and the construction of oilseedpast due. For such accounts, we determine the allowance forprocessing plants in Ukraine and Asia-Pacific. In addition, weuncollectible amounts based on the fair value of the associatedacquired, for $34 million, Walter Rau Neusser, a vegetable oilcollateral, net of estimated costs to sell. For all renegotiatedblends producer for large-scale commercial customers, basedaccounts (current and past due), we consider changes in farmin Germany. We had cash outflows related to settlements of neteconomic conditions and other market conditions, our historicalinvestment hedges of $375 million, primarily driven by theexperience related to renegotiated accounts and the fair valueappreciation of the Brazilian real relative to the US dollar inof collateral in determining the allowance for doubtful2016. Proceeds from and payments for investments includedaccounts.primarily purchases and sales of certain marketable securities
and other short term investments. These payments were offsetSecured Advances to Suppliers and Prepaid Commodity Contracts.by proceeds of $1,458 million from beneficial interests inWe purchase soybeans through prepaid commodity purchasesecuritized trade receivables. Investments in affiliates in 2016contracts (advance cash payments to suppliers againstincluded additional investments in SB Oils and G3.contractual obligations to deliver specified quantities ofsoybeans in the future) and secured advances to suppliersCash used for financing activities was $180 million in the year(advances to suppliers against commitments to deliverended December 31, 2017, compared to $488 million for thesoybeans in the future), primarily in Brazil. These financingyear ended December 31, 2016. Dividends paid to our commonarrangements are typically secured by the farmer’s future cropshareholders and holders of our convertible preference sharesand mortgages on the farmer’s land, buildings and equipment,were $281 million and $257 million for the years endedand are generally settled after the farmer’s crop is harvestedDecember 31, 2017 and 2016, respectively. In connection withand sold.our common share repurchase program, in 2017, we did not
repurchase common shares and in 2016, we purchasedInterest earned on secured advances to suppliers of3,296,230 of our common shares at a cost of $200 million.$30 million, $44 million and $38 million for the years endedDecember 31, 2018, 2017 and 2016, respectively, is included in
Brazilian Farmer Credit net sales in the consolidated statements of income.
Background. We advance collateralized funds to counterparties The table below shows details of prepaid commodity contracts(farmers and crop resellers), primarily in Brazil, to secure and secured advances to suppliers outstanding at our Brazilianmostly soybean origination for our soybean processing operations as of the dates indicated. See Note 6 - Otherfacilities. These activities are generally intended to be
Current Assets and Note 12 - Other Non-Current Assets, to our
2018 Bunge Annual Report 35

36
the related financings which have maturity dates through 2034. There are no recourseconsolidated financial statements included as part of thisprovisions or collateral that would enable us to recover any amounts paid under theseAnnual Report on Form 10-K for more information.guarantees. In addition, one of our subsidiaries has guaranteed the obligations of two ofits affiliates and in connection therewith has secured its guarantee obligations through a
DECEMBER 31, pledge of one of its affiliate’s shares plus loans receivable from the affiliate to the(US$ in millions) 2018 2017 financial institutions in the event that the guaranteed obligations are enforced. Based on
the amounts drawn under such debt facilities at December 31, 2018, our potentialPrepaid commodity contracts $199 $216 liability was $141 million and we have recorded a $17 million obligation related to theseSecured advances to suppliers (current) 248 406 guarantees.
Total (current) 447 622 (2) We have issued guarantees to certain third parties related to performance of ourunconsolidated affiliates. The terms of the guarantees are equal to the completion dateCommodities not yet priced(1) (6) (46)of a port terminal which is expected to be completed in 2020. There are no recourse
Net 441 576 provisions or collateral that would enable us to recover any amounts paid under theseSecured advances to suppliers (non-current) 162 195 guarantees. At December 31, 2018, our maximum potential future payments under these
guarantees was $70 million, and no obligation has been recorded related to theseTotal (current and non-current) $603 $771guarantees.
Allowance for uncollectible amounts (current and (3) We have issued guarantees to certain financial institutions which are party to certainnon-current) $ (70) $ (65) operating lease arrangements for railcars and barges. These guarantees provide for a
minimum residual value to be received by the lessor at conclusion of the lease term.These leases expire at various dates from 2019 through 2024. At December 31, 2018, our(1) Commodities delivered by suppliers that are yet to be priced are reflected atrecorded obligation related to these guarantees was $1 million.prevailing market prices at December 31, 2018 and December 31, 2017, respectively.
We have provided a Guaranty to the Director of the IllinoisCapital ExpendituresDepartment of Agriculture as Trustee for Bunge NorthAmerica, Inc. (‘‘BNA’’), an indirect wholly-owned subsidiary,Our cash payments made for capital expenditures werewhich guarantees all amounts due and owing by BNA, to grain$493 million, $662 million and $784 million for the years endedproducers and/or depositors in the State of Illinois who haveDecember 31, 2018, 2017 and 2016, respectively. We intend todelivered commodities to BNA’s Illinois facilities.make capital expenditures of approximately $550 million in
2019. Our priorities for 2019 capital expenditures areIn addition, we have provided full and unconditional parentproductivity, maintenance, compliance and growth projects firstlevel guarantees of the outstanding indebtedness under certain(where we expect to use approximately 80% of our fundscredit facilities entered into and senior notes issued by, ourallocated to capital expenditures), followed by projects relatedsubsidiaries. At December 31, 2018, our consolidated balanceto sugar planting and associated maintenance. We intend tosheet includes debt with a carrying amount of $5,011 millionfund these capital expenditures primarily with cash flows fromrelated to these guarantees. This debt includes the senioroperations.notes issued by two of our 100% owned finance subsidiaries,Bunge Limited Finance Corp. and Bunge Finance Europe B.V.
OFF-BALANCE SHEET ARRANGEMENTSThere are largely no restrictions on the ability of Bunge LimitedFinance Corp. and Bunge Finance Europe B.V. or any otherGuaranteesBunge subsidiary to transfer funds to Bunge Limited.
We have issued or were party to the following guarantees atDecember 31, 2018:
MAXIMUM POTENTIAL(US$ in millions) FUTURE PAYMENTS
Unconsolidated affiliates guarantee(1)(2) $288Residual value guarantee(3) 269
Total $557
(1) We have issued guarantees to certain financial institutions related to debt of certainof our unconsolidated affiliates. The terms of the guarantees are equal to the terms of
36 2018 Bunge Annual Report

37
CONTRACTUAL OBLIGATIONS
The following table summarizes our scheduled contractual obligations and their expected maturities at December 31, 2018, andthe effect such obligations are expected to have on our liquidity and cash flows in the future periods indicated.
PAYMENTS DUE BY PERIOD
2024 AND(US$ in millions) Total 2019 2020 - 2021 2022 - 2023 THEREAFTER
Short-term debt . . . . . . . . . . . . . . . . . . . . . . . . . . . . . . . . . . . . . . . . . . . . . . . . . . . . . . . . . . . . . . . . . . . . . . . . . . . . . . . . . . . . . . . . . . . . . . . . $ 750 $ 750 $ - $ - $ -Long-term debt(1) . . . . . . . . . . . . . . . . . . . . . . . . . . . . . . . . . . . . . . . . . . . . . . . . . . . . . . . . . . . . . . . . . . . . . . . . . . . . . . . . . . . . . . . . . . . . . . 4,672 423 1,030 1,328 1,891Variable interest rate obligations . . . . . . . . . . . . . . . . . . . . . . . . . . . . . . . . . . . . . . . . . . . . . . . . . . . . . . . . . . . . . . . . . . . . . . . . . . 37 21 16 - -Interest obligations on fixed rate debt . . . . . . . . . . . . . . . . . . . . . . . . . . . . . . . . . . . . . . . . . . . . . . . . . . . . . . . . . . . . . . . . . . . 671 124 220 177 150Non-cancelable lease obligations(2) . . . . . . . . . . . . . . . . . . . . . . . . . . . . . . . . . . . . . . . . . . . . . . . . . . . . . . . . . . . . . . . . . . . . . . . . 557 134 191 106 126Capital commitments . . . . . . . . . . . . . . . . . . . . . . . . . . . . . . . . . . . . . . . . . . . . . . . . . . . . . . . . . . . . . . . . . . . . . . . . . . . . . . . . . . . . . . . . . 57 57 - - -Freight supply agreements(3) . . . . . . . . . . . . . . . . . . . . . . . . . . . . . . . . . . . . . . . . . . . . . . . . . . . . . . . . . . . . . . . . . . . . . . . . . . . . . . . . 686 214 231 176 65Inventory purchase commitments . . . . . . . . . . . . . . . . . . . . . . . . . . . . . . . . . . . . . . . . . . . . . . . . . . . . . . . . . . . . . . . . . . . . . . . . . . 225 218 7 - -Power supply purchase commitments . . . . . . . . . . . . . . . . . . . . . . . . . . . . . . . . . . . . . . . . . . . . . . . . . . . . . . . . . . . . . . . . . . . . . 70 59 10 1 -
Total contractual cash obligations(4)(5) . . . . . . . . . . . . . . . . . . . . . . . . . . . . . . . . . . . . . . . . . . . . . . . . . . . . . . . . . . . . . . . . . . . . $7,725 $2,000 $1,705 $1,788 $2,232
(1) Excludes components of long-term debt attributable to fair value hedge accounting of $29 million and deferred financing fees and unamortized premiums of $21 million.
(2) Represents future minimum payments under non-cancelable leases with initial term of one year or more. Minimum lease payments have not been reduced by minimum subleaseincome receipts of $43 million due in future periods under non-cancelable subleases.
(3) In the ordinary course of business, we enter into purchase commitments for time on ocean freight vessels and freight service on railroad lines for the purpose of transportingagricultural commodities. In addition, we sell time on these ocean freight vessels when excess freight capacity is available. These agreements range from two months toapproximately seven years in the case of ocean freight vessels and approximately eight years in the case of railroad services. Actual amounts paid under these contracts may differdue to the variable components of these agreements and the amount of income earned by us on the sale of excess capacity. The railroad freight services agreements require aminimum monthly payment regardless of the actual level of freight services used by us. The costs of our freight supply agreements are typically passed through to our customers as acomponent of the prices we charge for our products. However, changes in the market value of freight compared to the rates at which we have contracted for freight may affectmargins on the sales of agricultural commodities.
(4) Does not include estimated payments of liabilities associated with uncertain income tax positions. As of December 31, 2018, Bunge had tax liabilities of $120 million, includinginterest and penalties. At this time, we are unable to make a reasonably reliable estimate of the timing of payments in individual years in connection with these tax liabilities;therefore, such amounts are not included in the above contractual obligation table. See Note 14 – Income Taxes to our consolidated financial statements.
(5) Does not include obligations for pension and postretirement benefits for which we expect to make employer contributions of $26 million in 2019.
In addition, we have entered into partnership agreements for CRITICAL ACCOUNTING POLICIES AND ESTIMATESthe production of sugarcane. These agreements have an
The Company’s accounting policies are more fully described inaverage remaining life of five years and cover approximatelyNote 1 – Nature of Business, Basis of Presentation, and234,000 hectares of land under cultivation. Amounts owedSignificant Accounting Policies to our consolidated financialunder these agreements are dependent on several variablesstatements included as part of this Annual Report onincluding the quantity of sugarcane produced per hectare, theForm 10-K. As disclosed in Note 1, the preparation of financialtotal recoverable sugar (‘‘ATR’’) per ton of sugarcane producedstatements in conformity with U.S. GAAP requires managementand the price for each kilogram of ATR as determined byto make substantial judgment or estimation in their applicationConsecana, the state of Sao Paulo sugarcane, sugar andthat may significantly affect reported amounts in the financialethanol council. During the years ended December 31, 2018,statements and accompanying notes. Actual results could differ2017 and 2016, Bunge made payments related to thesesignificantly from those estimates. The Company believes thatagreements of $84 million, $105 million and $89 million,the following discussion addresses the Company’s most criticalrespectively, for advances on future production. $56 million,accounting policies, which are those that are most important to$69 million and $64 million were included in cost of goods soldthe portrayal of the Company’s financial condition and resultsin the consolidated statements of income for the years endedof operations and require management’s most difficult,December 31, 2018, 2017 and 2016, respectively.subjective and complex judgments.
Employee Benefit PlansInventories and Derivatives
We expect to contribute $20 million to our defined benefitOur RMI, forward purchase and sale contracts on RMI, andpension plans and $6 million to our postretirement benefitexchange traded futures and options are primarily valued atplans in 2019.fair value. RMI are freely-traded, have quoted market prices,may be sold without significant additional processing and have
2018 Bunge Annual Report 37

38
predictable and insignificant disposal costs. We estimate fair external resources, including published information concerningvalues of commodity inventories and forward purchase and Brazilian land values by region. For determination of thesale contracts on these inventories based on exchange-quoted valuation allowances for renegotiated amounts, we considerprices, adjusted for differences in local markets. Certain historical experience with the individual farmers, currentinventories may utilize significant unobservable data related to weather and crop conditions, as well as the fair value oflocal market adjustments to determine fair value. The non-crop collateral.significant unobservable inputs for RMI and physically settled
For both classes, a long-term receivable from farmers in Brazilforward purchase and sale contracts relate to certainis considered impaired, based on current information andmanagement estimations regarding costs of transportation andevents, if we determine it to be probable that all amounts dueother local market or location-related adjustments, primarilyunder the original terms of the receivable will not be collected.freight related adjustments in the interior of Brazil and the lackRecognition of interest income on secured advances to farmersof market corroborated information in Canada. In bothis suspended once the farmer defaults on the originallysituations, we use proprietary information such as purchasescheduled delivery of agricultural commodities as the collectionand sale contracts and contracted prices to value freight,of future income is determined not to be probable. Nopremiums and discounts in our contracts. Changes in the fairadditional interest income is accrued from the point of defaultvalues of these inventories and contracts are recognized in ouruntil ultimate recovery, where amounts collected are creditedconsolidated statements of income as a component of cost offirst against the receivable and then to any unrecognizedgoods sold. If we used different methods or factors to estimateinterest income.fair values, amounts reported as inventories and unrealized
gains and losses on derivative contracts in the consolidatedbalance sheets and cost of goods sold could differ. GoodwillAdditionally, if market conditions change subsequent to
Goodwill is tested for impairment annually in the fourthyear-end, amounts reported in future periods as inventories,quarter, or whenever events or changes in circumstancesunrealized gains and losses on derivative contracts and cost ofindicate that the carrying value may not be fully recoverable.goods sold could differ.The estimated fair value of each reporting unit is compared tothe carrying value of the net assets assigned to that reportingAllowances for Uncollectible Accountsunit. The fair value of reporting units is determined using adiscounted cash flow model with estimates of future cashAccounts receivable and secured advances to suppliers areflows based on internal forecasts of revenues and expensesstated at the historical carrying amounts net of write-offs and(the income approach). Estimates based on market earningsallowances for uncollectible accounts. We establish anmultiples of peer companies identified for the reporting unitallowance for uncollectible trade accounts receivable and(the market approach) may also be used, where available.secured advances to farmers based on historical experience,Critical estimates in the determination of fair value under thefarming, economic and other market conditions as well asincome approach include, but are not limited to, assumptionsspecific identified customer collection issues. Uncollectibleabout variables such as commodity prices, crop and relatedaccounts are written off when a settlement is reached for anthroughput and production volumes, profitability, future capitalamount that is less than the outstanding historical balance orexpenditures and discount rates, all of which are subject to awhen we have determined that collection of the balance ishigh degree of judgment.unlikely.
During the fourth quarter of 2018, we performed our annualWe follow the accounting guidance on the disclosure of theimpairment assessment and determined that the estimated faircredit quality of financing receivables and the allowance forvalues of our goodwill reporting units were substantially incredit losses which requires information to be disclosed atexcess of each of their carrying values. However, futuredisaggregated levels, defined as portfolio segments andgoodwill impairment tests could result in a charge to earnings.classes. Based upon an analysis of credit losses and risk
factors to be considered in determining the allowance forcredit losses, we have determined that the long-term Property, Plant and Equipment and Other Finite-Livedreceivables from farmers in Brazil are a single portfolio Intangible Assetssegment.
Long-lived assets include property, plant and equipment andWe evaluate this single portfolio segment by class of other finite-lived intangible assets. When facts andreceivables, which is defined as a level of information (below a circumstances indicate that the carrying values of property,portfolio segment) in which the receivables have the same plant and equipment assets may be impaired, an evaluation ofinitial measurement attribute and a similar method for recoverability is performed by comparing the carrying value ofassessing and monitoring risk. We have identified accounts in the assets to the undiscounted projected future cash flows tolegal collection processes and renegotiated amounts as classes be generated by such assets. If it appears that the carryingof long-term receivables from farmers. Valuation allowances for value of our assets is not recoverable, we recognize anaccounts in legal collection processes are determined by us on impairment loss as a charge against results of operations. Ourindividual accounts based on the fair value of the collateral judgments related to the expected useful lives of property,provided as security for the secured advance or credit sale. The plant and equipment assets and our ability to realizefair value is determined using a combination of internal and undiscounted cash flows in excess of the carrying amount of
38 2018 Bunge Annual Report

39
such assets are affected by factors such as the ongoing the revaluation of deferred tax assets and liabilities, and themaintenance of the assets, changes in economic conditions accrual of incremental withholding taxes on future repatriationand changes in operating performance. As we assess the of earnings to the United States.ongoing expected cash flows and carrying amounts of our
In the fourth quarter of 2018, Bunge completed its analysis ofproperty, plant and equipment assets, changes in these factorsthe impact of the Tax Act in conjunction with filing of its 2017could cause us to realize material impairment charges. WeU.S. income tax return, assessment of additional documentationrecorded impairment charges of $16 million for the year endedto determine the Transition Tax, and analysis of U.S. TreasuryDecember 31, 2018 primarily related to the impairment of aguidance on the Tax Act. As a result, Bunge recorded a taxport in Poland and various machinery and equipment in Brazil.benefit of $26 million, primarily related to our ability to utilizeadditional foreign tax credits to offset future repatriation ofContingenciesearnings to the United States.
We are a party to a large number of claims and lawsuits,primarily non-income tax and labor claims in Brazil and Recoverable Taxesnon-income tax claims in Argentina, and have accrued our
We evaluate the collectability of our recoverable taxes andestimates of the probable costs to resolve these claims. Theserecord allowances if we determine that collection is doubtful.estimates have been developed in consultation with in-houseRecoverable taxes include value-added taxes paid upon theand outside counsel and are based on an analysis of potentialacquisition of property, plant and equipment, raw materials andresults, assuming a combination of litigation and settlementtaxable services and other transactional taxes, which can bestrategies. Future results of operations for any particularrecovered in cash or as compensation against income taxes, orquarterly or annual period could be materially affected byother taxes we may owe, primarily in Brazil. Management’schanges in our assumptions or the effectiveness of ourassumption about the collectability of recoverable taxesstrategies relating to these proceedings. For more informationrequires significant judgment because it involves anon tax and labor claims in Brazil, see ‘‘Item 3. Legalassessment of the ability and willingness of the applicableProceedings’’federal or local government to refund the taxes. The balance ofthese allowances fluctuates depending on the sales activity ofIncome Taxesexisting inventories, purchases of new inventories, percentagesof export sales, seasonality, changes in applicable tax rates,We record valuation allowances to reduce our deferred taxcash payment by the applicable government agencies andassets to the amount that we are likely to realize. We considercompensation of outstanding balances against income orprojections of future taxable income and prudent tax planningcertain other taxes owed to the applicable governments. Atstrategies to assess the need for and the amount of theDecember 31, 2018 and 2017, the allowance for recoverablevaluation allowances. If we determine that we can realize ataxes was $37 million and $39 million, respectively. We continuedeferred tax asset in excess of our net recorded amount, weto monitor the economic environment and events taking placedecrease the valuation allowance, thereby decreasing incomein the applicable countries and in cases where we determinetax expense. Conversely, if we determine that we are unable tothat recovery is doubtful, recoverable taxes are reduced byrealize all or part of our net deferred tax asset, we increase theallowances for the estimated unrecoverable amounts.valuation allowance, thereby increasing income tax expense.
We apply a ‘‘more likely than not’’ threshold to the recognition NEW ACCOUNTING PRONOUNCEMENTSand de-recognition of tax benefits. Accordingly, we recognizethe amount of tax benefit that has a greater than 50 percent See Note 1 – Nature of Business, Basis of Presentation, andlikelihood of being ultimately realized upon settlement. The Significant Accounting Policies to our consolidated financialcalculation of our uncertain tax positions involves complexities statements included as part of this Annual Report onin the application of intricate tax regulations in a multitude of Form 10-K.jurisdictions across our global operations. Future changes injudgment related to the ultimate resolution of unrecognized tax ITEM 7A. QUANTITATIVE AND QUALITATIVEbenefits will affect the earnings in the quarter of such change. DISCLOSURES ABOUT MARKET RISKAt December 31, 2018 and 2017, we had recorded uncertaintax positions of $120 million and $106 million, respectively, in RISK MANAGEMENTour consolidated balance sheets. For additional information on
As a result of our global activities, we are exposed to changesincome taxes, please refer to Note 14 – Income Taxes to ourin, among other things, agricultural commodity prices,consolidated financial statements included as part of thistransportation costs, foreign currency exchange rates, interestAnnual Report on Form 10-K.rates and energy costs which may affect our results of
On December 22, 2017, H.R. 1, commonly known as the ‘‘Tax operations and financial position. We actively monitor andCuts and Jobs Act’’ (the ‘‘Tax Act’’) was signed into U.S. law. manage these various market risks associated with ourAs a result of the Tax Act and in accordance with SEC Staff business activities. Our risk management decisions take placeAccounting Bulletin 118 (‘‘SAB 118’’), Bunge recognized a in various locations, but exposure limits are centrally set andprovisional tax expense of $60 million in the fourth quarter of monitored, operating under a global governance framework.2017 related to the one-time transition tax (‘‘Transition Tax’’), Additionally, our Board of Directors’ Finance and Risk Policy
2018 Bunge Annual Report 39

40
Committee oversees our global market risk governance various materials, many of which are agricultural commodities,framework, including risk management policies and limits. including: soybeans, soybean oil, soybean meal, palm oil,
softseeds (including sunflower seed, rapeseed and canola) andWe use derivative instruments for the purpose of managing the related oil and meal derived from them, wheat, barley, sheaexposures associated with commodity prices, transportation nut, and corn. In addition, we grow and purchase sugarcane tocosts, foreign currency exchange rates, interest rates and produce sugar, ethanol and electricity. Agricultural commoditiesenergy costs and for positioning our overall portfolio relative to are subject to price fluctuations due to a number ofexpected market movements in accordance with established unpredictable factors that may create price risk. As describedpolicies and procedures. We enter into derivative instruments above, we are also subject to the risk of counterpartyprimarily with commodity exchanges in the case of commodity non-performance under forward purchase or sale contracts.futures and options, major financial institutions, or approved From time to time, we have experienced instances ofexchange clearing shipping companies in the case of ocean counterparty non-performance, as a result of significantfreight. While these derivative instruments are subject to declines in counterparty profitability under these contracts duefluctuations in value, for hedged exposures those fluctuations to significant movements in commodity prices between theare generally offset by the changes in fair value of the time the contracts were executed and the contractual forwardunderlying exposures. The derivative instruments that we use delivery period.for hedging purposes are intended to reduce the volatility onour results of operations; however, they can occasionally result We enter into various derivative contracts with the primaryin earnings volatility, which may be material. See Note 15 – objective of managing our exposure to adverse priceFinancial Instruments and Fair Value Measurements to our movements in the agricultural commodities used and producedconsolidated financial statements included as part of this in our business operations. We have established policies thatAnnual Report on Form 10-K for a more detailed discussion of limit the amount of unhedged fixed price agriculturalour use of derivative instruments. commodity positions permissible for our operating companies,
which are generally a combination of volumetric andvalue-at-risk (‘‘VaR’’) limits. We measure and review our netCREDIT AND COUNTERPARTY RISKcommodities position on a daily basis. We also employ stress
Through our normal business activities, we are subject to testing techniques in order to quantify our exposures to pricesignificant credit and counterparty risks that arise through and liquidity risks under non-normal or event driven marketnormal commercial sales and purchases, including forward conditions.commitments to buy or sell, and through various other OTC
Our daily net agricultural commodity position consists ofderivative instruments that we utilize to manage risks inherentinventory, forward purchase and sale contracts, and OTC andin our business activities. We define credit and counterpartyexchange traded derivative instruments, including those usedrisk as a potential financial loss due to the failure of ato hedge portions of our production requirements. The faircounterparty to honor its obligations. The exposure is measuredvalue of that position is a summation of the fair valuesbased upon several factors, including unpaid accountscalculated for each agricultural commodity by valuing all of ourreceivable from counterparties and unrealized gains fromcommodity positions at quoted market prices for the periodforward cash contracts as well as OTC derivative instruments.where available or utilizing a close proxy. VaR is calculated onCredit and counterparty risk also includes sovereign credit risk.the net position and monitored at the 95% confidence interval.We actively monitor credit and counterparty risk throughIn addition, scenario analysis and stress testing are performed.regular review of exposures and credit analysis by regionalFor example, one measure of market risk is estimated as thecredit teams, as well as a review by global and corporatepotential loss in fair value resulting from a hypothetical 10%committees which monitor counterparty performance. Weadverse change in prices. The results of this analysis, whichrecord provisions for counterparty losses from time to time as amay differ from actual results, are as follows:result of our credit and counterparty analysis.
During periods of tight conditions in global credit markets, YEAR ENDED YEAR ENDEDdownturns in regional or global economic conditions, and/or DECEMBER 31, 2018 DECEMBER 31, 2017significant price volatility, credit and counterparty risks are
FAIR MARKET FAIR MARKETheightened. This increased risk is monitored through, among(US$ in millions) VALUE RISK VALUE RISKother things, exposure reporting, increased communication with
key counterparties, management reviews and specific focus on Highest daily aggregatedcounterparties or groups of counterparties that we may position value . . . . . . . . . . . . . . . . . $2,131 $(213) $ 685 $(69)determine as high risk. In addition, we have limited exposures Lowest daily aggregatedand limits in certain cases and reduced our use of position value . . . . . . . . . . . . . . . . . (624) (62) (711) (71)non-exchange cleared derivative instruments.
OCEAN FREIGHT RISKCOMMODITIES RISK
Ocean freight represents a significant portion of our operatingWe operate in many areas of the food industry, from costs. The market price for ocean freight varies depending onagricultural raw materials to the production and sale of the supply and demand for ocean vessels, global economicbranded food products. As a result, we purchase and produce conditions, and other factors. We enter into time charter
40 2018 Bunge Annual Report
41
agreements for time on ocean freight vessels based on to take mitigating actions. During the second quarter of 2018,forecasted requirements for the purpose of transporting it was determined that Argentina’s economy should beagricultural commodities. Our time charter agreements considered highly inflationary, and as such, beginning ongenerally have terms ranging from two months to July 1, 2018, our Argentine subsidiaries changed theirapproximately seven years. We use financial derivatives, functional currency to the U.S. Dollar. This change in functionalgenerally freight forward agreements, to hedge portions of our currency did not have a material impact on our consolidatedocean freight costs. The ocean freight derivatives are included financial statements.in other current assets and other current liabilities on theconsolidated balance sheets at fair value. INTEREST RATE RISK
We have debt in fixed and floating rate instruments. We areENERGY RISKexposed to market risk due to changes in interest rates. We
We purchase various energy commodities such as electricity, may enter into interest rate swap agreements to manage ournatural gas and bunker fuel, that are used to operate our interest rate exposure related to our debt portfolio.manufacturing facilities and ocean freight vessels. We produce
The aggregate fair value of our short and long-term debt,ethanol as a part of our sugar milling operations and we alsobased on market yields at December 31, 2018, wasrefine and produce biofuels. The energy commodities are$5,334 million with a carrying value of $5,372 million.subject to price risk. We use financial derivatives, including
exchange traded and OTC swaps and options for variousA hypothetical 100 basis point increase in the interest yields onpurposes, to manage our exposure to volatility in energy costsour senior note debt at December 31, 2018 would result in aand market prices. These energy derivatives are included indecrease of approximately $74 million in the fair value of ourother current assets and other current liabilities on thedebt. Similarly, a decrease of 100 basis points in the interestconsolidated balance sheets at fair value.yields on our debt at December 31, 2018 would cause anincrease of approximately $63 million in the fair value of ourCURRENCY RISKdebt.
Our global operations require active participation in foreignA hypothetical 1% change in LIBOR would result in a changeexchange markets. Our primary foreign currency exposures areof approximately $39 million in our interest expense on ourthe Brazilian real, Canadian dollar, the Euro, and the Chinesevariable rate debt at December 31, 2018. Some of our variableyuan/renminbi. To reduce the risk arising from foreign exchangerate debt is denominated in currencies other than in U.S.rate fluctuations, we enter into derivative instruments, such asdollars and is indexed to non-U.S. dollar-based interest rateforeign currency forward contracts, swaps and options. Theindices, such as EURIBOR and TJLP and certain benchmarkchanges in market value of such contracts have a highrates in local bank markets. As such, the hypothetical 1%correlation to the price changes in the related currencychange in interest rate ignores the potential impact of anyexposures. The potential loss in fair value for such net currencycurrency movements. See ‘‘Risk Factors—We are a capitalposition resulting from a hypothetical 10% adverse change inintensive business and depend on cash provided by ourforeign currency exchange rates as of December 31, 2018 wasoperations as well as access to external financing to operate andnot material.grow our business’’ for a discussion of certain risks related toLIBOR.When determining our exposure, we exclude intercompany
loans that are deemed to be permanently invested. TheDerivative Instrumentsrepayments of permanently invested intercompany loans are
not planned or anticipated in the foreseeable future andForeign Exchange Derivatives. We use a combination of foreigntherefore, are treated as analogous to equity for accountingexchange forward, swap, futures and option contracts inpurposes. As a result, the foreign exchange gains and lossescertain of our operations to mitigate the risk from exchangeon these borrowings are excluded from the determination ofrate fluctuations in connection with certain commercial andnet income and recorded as a component of accumulatedbalance sheet exposures. The foreign exchange forward swapother comprehensive income (loss) in the consolidated balanceand option contracts may be designated as cash flow or fairsheets. Included in other comprehensive income (loss) arevalue hedges. We may also use net investment hedges toforeign currency gains (losses) of $(344) million and $16 millionpartially offset the translation adjustments arising from thefor the years ended December 31, 2018 and 2017, respectively,remeasurement of our investment in certain of our foreignrelated to permanently invested intercompany loans.subsidiaries.
We have significant operations in Argentina and, up untilWe assess, both at the inception of the hedge and on anJune 30, 2018, had utilized the official exchange rate of theongoing basis, whether the derivatives that are used in hedgeArgentine peso published by the Argentine government for itstransactions are highly effective in offsetting changes in thecommercial transactions and re-measurement purposes ofhedged items.financial statements. Argentina has experienced negative
economic trends, as evidenced by multiple periods ofInterest Rate Derivatives. Interest rate derivatives used by us as
increasing inflation rates, devaluation of the peso, and hedging instruments are recorded at fair value in theincreasing borrowing rates, requiring the Argentine government consolidated balance sheets with changes in fair value
2018 Bunge Annual Report 41

42
recorded contemporaneously in earnings. Certain of these statements included as part of this Annual Report onswap agreements may be designated as fair value hedges. The Form 10-K.carrying amount of the associated hedged debt is also adjustedthrough earnings for changes in the fair value arising from ITEM 8. FINANCIAL STATEMENTS ANDchanges in benchmark interest rates. We may enter into SUPPLEMENTARY DATAinterest rate swap agreements for the purpose of managingcertain of our interest rate exposures. We may also enter into Our financial statements and related schedule required by thisinterest rate basis swap agreements that do not qualify as item are contained on pages F-1 through F-47 and onhedges for accounting purposes. The impact of changes in fair page E-1 included as part of this Annual Report on Form 10-K.value of these instruments is primarily presented in interest See Item 15(a) for a listing of financial statements provided.expense.
ITEM 9. CHANGES IN AND DISAGREEMENTSCommodity Derivatives. We use derivative instruments to WITH ACCOUNTANTS ON ACCOUNTING ANDprimarily manage exposure to movements associated with
FINANCIAL DISCLOSUREagricultural commodity prices. We generally use exchangetraded futures and options contracts to minimize the effects of None.changes in the prices of agricultural commodities onagricultural commodity inventories and forward purchase and
ITEM 9A. CONTROLS AND PROCEDURESsale contracts but may also from time to time enter into OTCcommodity transactions, including swaps, which are settled in
DISCLOSURE CONTROLS AND PROCEDUREScash at maturity or termination based on exchange-quotedfutures prices. Changes in fair values of exchange traded As of December 31, 2018, we carried out an evaluation, underfutures contracts representing the unrealized gains and/or the supervision and with the participation of our management,losses on these instruments are settled daily generally through including our Acting Chief Executive Officer and Chief Financialour 100% owned futures clearing subsidiary. Forward purchase Officer, of the effectiveness of the design and operation of ourand sale contracts are primarily settled through delivery of ‘‘disclosure controls and procedures,’’ as that term is defined inagricultural commodities. While we consider these exchange Exchange Act Rules 13a-15(e) and 15d-15(e). Based upon thattraded futures and forward purchase and sale contracts to be evaluation, our Acting Chief Executive Officer and Chiefeffective economic hedges, we do not designate or account for Financial Officer have concluded that our disclosure controlsthe majority of our commodity contracts as hedges. Changes in and procedures were effective at a reasonable assurance levelfair values of these contracts and related RMI are included in as of the end of the fiscal year covered by this Annual ReportCost of goods sold in the consolidated statements of income. on Form 10-K.The forward contracts require performance of both us and thecontract counterparty in future periods. Contracts to purchase
MANAGEMENT’S REPORT ON INTERNAL CONTROL OVERagricultural commodities generally relate to current or futureFINANCIAL REPORTINGcrop years for delivery periods quoted by regulated commodity
exchanges. Contracts for the sale of agricultural commodities Bunge Limited’s management is responsible for establishinggenerally do not extend beyond one future crop cycle. and maintaining adequate internal control over financial
reporting, as such term is defined in Exchange ActOcean Freight Derivatives. We use derivative instrumentsRules 13a-15(f). Bunge Limited’s internal control over financialreferred to as freight forward agreements, or FFAs, and FFAreporting is designed to provide reasonable assuranceoptions to hedge portions of our current and anticipated oceanregarding the reliability of financial reporting and thefreight costs. Changes in the fair values of ocean freightpreparation of financial statements for external purposes inderivatives are recorded in Cost of goods sold.accordance with U.S. Generally Accepted AccountingPrinciples.Energy Derivatives. We use derivative instruments for various
purposes including to manage our exposure to volatility inUnder the supervision and with the participation ofenergy costs and our exposure to market prices in relation tomanagement, including our Acting Chief Executive Officer andthe sale of biofuels. Our operations use substantial amounts ofChief Financial Officer, we conducted an evaluation of theenergy, including natural gas, coal and fuel oil, includingeffectiveness of our internal control over financial reporting asbunker fuel. Changes in the fair values of energy derivativesof the end of the fiscal year covered by this annual reportare recorded in Cost of goods sold.based on the framework in Internal Control – IntegratedFramework (2013) issued by the Committee of SponsoringOther Derivatives. We may also enter into other derivatives,Organizations of the Treadway Commission or COSO. We haveincluding credit default swaps and equity derivatives toexcluded Bunge Loders Croklaan (‘‘BLC’’) from our assessmentmanage exposure to credit risk and broader macroeconomicof internal control over financial reporting as of December 31,risks, respectively. The impact of changes in fair value of these2018 because we completed the acquisition of BLC during theinstruments is presented in Cost of goods sold.2018 fiscal year. BLC is a 70% owned subsidiary, whose total
For more information, see Note 15 - Financial Instruments and assets and total revenues excluded from our assessment ofFair Value Measurements to our consolidated financial internal control over financial reporting represent 8% and 3%,
42 2018 Bunge Annual Report

43
respectively, of the related consolidated financial statement disclosure controls or our internal control over financialamounts as of and for the year ended December 31, 2018. reporting will prevent or detect all errors and all fraud. A
control system, no matter how well designed and operated, canBased on this assessment, management concluded that Bunge provide only reasonable, not absolute, assurance that theLimited’s internal control over financial reporting was effective control system’s objectives will be met. The design of a controlas of the end of the fiscal year covered by this annual report. system must reflect the fact that there are resource constraints,
and the benefits of controls must be considered relative toDeloitte & Touche LLP, the independent registered public their costs. Further, because of the inherent limitations in allaccounting firm that has audited and reported on Bunge control systems, no evaluation of controls can provide absoluteLimited’s consolidated financial statements included in this assurance that misstatements due to error or fraud will notannual report, has issued its written attestation report on occur or that all control issues and instances of fraud, if any,Bunge Limited’s internal control over financial reporting, which within the company have been detected. These inherentis included in this Annual Report on Form 10-K. limitations include the realities that judgments in decision-
making can be faulty and that breakdowns can occur becauseCHANGES IN INTERNAL CONTROL OVER FINANCIAL of simple error or mistake. Controls may also be circumventedREPORTING by the individual acts of some persons, by collusion of two or
more people or by management override of the controls. TheThere has been no change in our internal control over financial design of any system of controls is based in part on certainreporting during the fourth fiscal quarter ended December 31, assumptions about the likelihood of future events, and there2018 that has materially affected, or is reasonably likely to can be no assurance that any design will succeed in achievingmaterially affect, our internal control over financial reporting. its stated goals under all potential future conditions. Projections
of any evaluation of controls effectiveness to future periods areInherent Limitations on Effectiveness of Controls subject to risks. Over time, controls may become inadequate
because of changes in conditions or deterioration in theOur management, including our Acting Chief Executive Officer degree of compliance with policies or procedures.and our Chief Financial Officer, does not expect that our
2018 Bunge Annual Report 43
44
REPORT OF INDEPENDENT REGISTERED PUBLIC ACCOUNTING FIRM
To the Shareholders and the Board of Directors ofBunge Limited
OPINION ON INTERNAL CONTROL OVER FINANCIAL REPORTING
We have audited the internal control over financial reporting of Bunge Limited and subsidiaries (the ‘‘Company’’) as ofDecember 31, 2018, based on criteria established in Internal Control-Integrated Framework (2013) issued by the Committee ofSponsoring Organizations of the Treadway Commission (COSO). In our opinion, the Company maintained, in all material respects,effective internal control over financial reporting as of December 31, 2018, based on the criteria established in Internal Control-Integrated Framework (2013) issued by COSO.
We have also audited, in accordance with the standards of the Public Company Accounting Oversight Board (United States)(PCAOB), the consolidated financial statements and financial statement schedule as of and for the year ended December 31, 2018of the Company and our report dated February 22, 2019 expressed an unqualified opinion on the consolidated financialstatements and financial statement schedule.
As described in Management’s Report on Internal Control over Financial Reporting, management excluded from its assessmentthe internal control over financial reporting at Bunge Loders Croklaan (‘‘BLC’’), which was acquired on February 28, 2018 andwhose financial statements constitute 8% and 3%, respectively, of the total assets and total revenues of consolidated financialstatement amounts as of and for the year ended December 31, 2018. Accordingly, our audit did not include the internal controlover financial reporting at BLC.
BASIS FOR OPINION
The Company’s management is responsible for maintaining effective internal control over financial reporting and for itsassessment of the effectiveness of internal control over financial reporting, included in the accompanying Management’s Reporton Internal Control over Financial Reporting. Our responsibility is to express an opinion on the Company’s internal control overfinancial reporting based on our audit. We are a public accounting firm registered with the PCAOB and are required to beindependent with respect to the Company in accordance with the U.S. federal securities laws and the applicable rules andregulations of the Securities and Exchange Commission and the PCAOB.
We conducted our audit in accordance with the standards of the PCAOB. Those standards require that we plan and perform theaudit to obtain reasonable assurance about whether effective internal control over financial reporting was maintained in allmaterial respects. Our audit included obtaining an understanding of internal control over financial reporting, assessing the riskthat a material weakness exists, testing and evaluating the design and operating effectiveness of internal control based on theassessed risk, and performing such other procedures as we considered necessary in the circumstances. We believe that our auditprovides a reasonable basis for our opinion.
DEFINITION AND LIMITATIONS OF INTERNAL CONTROL OVER FINANCIAL REPORTING
A company’s internal control over financial reporting is a process designed to provide reasonable assurance regarding thereliability of financial reporting and the preparation of financial statements for external purposes in accordance with generallyaccepted accounting principles. A company’s internal control over financial reporting includes those policies and procedures that(1) pertain to the maintenance of records that, in reasonable detail, accurately and fairly reflect the transactions and dispositionsof the assets of the company; (2) provide reasonable assurance that transactions are recorded as necessary to permit preparationof financial statements in accordance with generally accepted accounting principles, and that receipts and expenditures of thecompany are being made only in accordance with authorizations of management and directors of the company; and (3) providereasonable assurance regarding prevention or timely detection of unauthorized acquisition, use, or disposition of the company’sassets that could have a material effect on the financial statements.
Because of the inherent limitations, internal control over financial reporting may not prevent or detect misstatements. Also,projections of any evaluation of the effectiveness to future periods are subject to the risk that the controls may becomeinadequate because of changes in conditions, or that the degree of compliance with the policies or procedures may deteriorate.
/s/ Deloitte & Touche LLP
New York, New YorkFebruary 22, 2019
44 2018 Bunge Annual Report

45
ITEM 9B. OTHER INFORMATION ITEM 12. SECURITY OWNERSHIP OF CERTAINBENEFICIAL OWNERS AND MANAGEMENT AND
None. RELATED STOCKHOLDER MATTERS
We will provide information that is responsive to this Item 12 inPART III our definitive proxy statement for our 2019 Annual GeneralMeeting of Shareholders under the caption ‘‘Share OwnershipInformation required by Items 10, 11, 12, 13 and 14 of Part III isof Directors, Executive Officers and Principal Shareholders’’ andomitted from this Annual Report on Form 10-K and will be filedpossibly elsewhere therein. That information is incorporated inin a definitive proxy statement for our 2017 Annual Generalthis Item 12 by reference. The information required by this itemMeeting of Shareholders.with respect to our equity compensation plan information isfound in Part II of this Annual Report on Form 10-K under the
ITEM 10. DIRECTORS, EXECUTIVE OFFICERS, caption ‘‘Item 5. Market for Registrant’s Common Equity,AND CORPORATE GOVERNANCE Related Stockholder Matters and Issuer Purchases of Equity
Securities – Securities Authorized for Issuance Under EquityWe will provide information that is responsive to this Item 10 in Compensation Plans,’’ which information is incorporated hereinour definitive proxy statement for our 2019 Annual General by reference.Meeting of Shareholders under the captions ‘‘Election ofDirectors,’’ ‘‘Section 16(a) Beneficial Ownership Reporting
ITEM 13. CERTAIN RELATIONSHIPS ANDCompliance,’’ ‘‘Corporate Governance – Board Meetings andRELATED TRANSACTIONS, AND DIRECTORCommittees – Audit Committee,’’ ‘‘Corporate Governance –INDEPENDENCEBoard Composition and Independence,’’ ‘‘Audit Committee
Report,’’ ‘‘Corporate Governance – Corporate GovernanceWe will provide information that is responsive to this Item 13 inGuidelines and Code of Conduct’’ and possibly elsewhereour definitive proxy statement for our 2019 Annual Generaltherein. That information is incorporated in this Item 10 byMeeting of Shareholders under the captions ‘‘Corporatereference. The information required by this item with respect toGovernance – Board Composition and Independence,’’ ‘‘Certainour executive officers and key employees is found in Part I ofRelationships and Related Party Transactions’’ and possiblythis Annual Report on Form 10-K under the caption ‘‘Item 1.elsewhere therein. That information is incorporated in thisBusiness – Executive Officers and Key Employees of theItem 13 by reference.Company,’’ which information is incorporated herein by
reference.ITEM 14. PRINCIPAL ACCOUNTING FEES ANDSERVICESITEM 11. EXECUTIVE COMPENSATIONWe will provide information that is responsive to this Item 14 inWe will provide information that is responsive to this Item 11 inour definitive proxy statement for our 2019 Annual Generalour definitive proxy statement for our 2019 Annual GeneralMeeting of Shareholders under the caption ‘‘Appointment ofMeeting of Shareholders under the captions ‘‘ExecutiveIndependent Auditor’’ and possibly elsewhere therein. ThatCompensation,’’ ‘‘Director Compensation,’’ ‘‘Compensationinformation is incorporated in this Item 14 by reference.Committee Report,’’ and possibly elsewhere therein. That
information is incorporated in this Item 11 by reference.
2018 Bunge Annual Report 45

46
PART IV
See ‘‘Index to Exhibits’’ set forth below.ITEM 15. EXHIBITS, FINANCIAL STATEMENTSCHEDULES EXHIBIT
NUMBER DESCRIPTION
a. (1) (2) Financial Statements and Financial 3.1 Memorandum of Association (incorporated by reference fromStatement Schedules the Registrant’s Form F-1 (No. 333-65026) filed July 13, 2001)
3.2 Certificate of Deposit of Memorandum of Increase of ShareSee ‘‘Index to Consolidated FinancialCapital (incorporated by reference from the Registrant’sStatements’’ on page F-1 and FinancialForm 10-Q filed August 11, 2008)Statement Schedule II—Valuation and
Qualifying Accounts on page E-1 of this 3.3 Bye-laws, amended and restated as of May 25, 2016Annual Report on Form 10-K. (incorporated by reference from the Registrant’s Form 10-K
filed on February 28, 2017)a. (3) Exhibits4.1 Form of Common Share Certificate (incorporated by reference
The exhibits listed in the accompanying from the Registrant’s Form 10-K filed March 3, 2008)index to exhibits are filed or incorporated by
4.2 Certificate of Designation of 4.875% Cumulative Convertiblereference as part of this Form 10-K.Perpetual Preference Shares (incorporated by reference fromthe Registrant’s Form 8-K filed November 20, 2006)Certain of the agreements filed as exhibits
to this Form 10-K contain representations 4.3 Form of 4.875% Cumulative Convertible Perpetual Preferenceand warranties by the parties to the Share Certificate (incorporated by reference from theagreements that have been made solely for Registrant’s Form 8-K filed November 20, 2006)the benefit of the parties to the agreement,
4.4 The instruments defining the rights of holders of the long-termwhich may have been included in the
debt securities of Bunge and its subsidiaries are omittedagreement for the purpose of allocating risk
pursuant to Item 601(b)(4)(iii) of Regulation S-K. Bunge herebybetween the parties rather than establishing
agrees to furnish copies of these instruments to the Securitiesmatters as facts and may have been
and Exchange Commission upon requestqualified by disclosures that were made to
10.1 Fifth Amended and Restated Pooling Agreement, dated as ofthe parties in connection with theJune 28, 2004, among Bunge Funding Inc., Bunge Managementnegotiation of these agreements and notServices Inc., as Servicer, and The Bank of New York Mellon, asnecessarily reflected in the agreements.Trustee (incorporated by reference from the Registrant’sAccordingly, the representations andForm 10-K filed February 27, 2012)warranties contained in these agreements
may not describe the actual state of affairs 10.2 Fifth Amended and Restated Series 2000-1 Supplement, datedof Bunge Limited or its subsidiaries as of the as of June 28, 2004, among Bunge Funding Inc., Bungedate that these representations and Management Services, Inc., as Servicer, Cooperatieve Centralewarranties were made or at any other time. Raiffeisen-Boerenleenbank B.A., ‘‘Rabobank International,’’Investors should not rely on these New York Branch, as Letter of Credit Agent, JPMorgan Chaserepresentations and warranties as Bank, N.A., as Administrative Agent, The Bank of New Yorkstatements of fact. Additional information Mellon, as Collateral Agent and Trustee, and Bunge Assetabout Bunge Limited and its subsidiaries Funding Corp., as Series 2000-1 Purchaser (incorporated bymay be found elsewhere in this Annual reference from the Registrant’s Form 10-K filed February 27,Report on Form 10-K and Bunge Limited’s 2012)other public filings, which are available
10.3 Credit Agreement, dated September 6, 2017, among Bungewithout charge through the SEC’s website atLimited Finance Corp., as Borrower, CoBank ACB, aswww.sec.gov.Administrative Agent and Lead Arranger, and certain lendersparty thereto (incorporated by reference from the Registrant’sForm 8-K filed on September 7, 2017)
10.4 Guaranty, dated as of September 6, 2017, between BungeLimited, as Guarantor, and CoBank ACB, as AdministrativeAgent (incorporated by reference from the Registrant’sForm 8-K filed on September 7, 2017)
46 2018 Bunge Annual Report

47
EXHIBIT EXHIBITNUMBER DESCRIPTION NUMBER DESCRIPTION
10.5 Facility Agreement, dated as of December 12, 2017, among 10.11 Twelfth Amendment to the Receivables Transfer Agreement,Bunge Finance Europe B.V., as Borrower, ABN AMRO Bank N.V., dated October 31, 2017, among Bunge Securitization B.V., asBNP Paribas, Credit Agricole Corporate and Investment Bank, Seller, Koninklijke Bunge B.V., as Master Servicer, the personsHSBC Bank PLC and ING Bank N.V., as Arrangers, ABN AMRO from time to time party thereto as Conduit Purchasers, theBank N.V., as Agent and certain lenders party thereto persons from time to time party thereto as Committed(incorporated by reference from the Registrant’s Form 8-K filed Purchasers, the persons from time to time party thereto ason December 12, 2017) Purchaser Agents, Cooperatieve Rabobank U.A., as
Administrative Agent and Purchaser Agent, and Bunge Limited,10.6 Guaranty, dated as of December 12, 2017, by Bunge Limited,as Performance Undertaking Provider (incorporated byas Guarantor, to ABN AMRO Bank N.V., as Agent under thereference from the Registrant’s Form 10-K filed onFacility Agreement (incorporated by reference from theFebruary 23, 2018)Registrant’s Form 8-K filed on December 12, 2017)
10.12* Thirteenth Amendment to the Receivables Transfer Agreement,10.7 Eighth Amendment to and Restatement of the Receivablesdated January 12, 2018, among Bunge Securitization B.V., asTransfer Agreement, dated May 26, 2016, among BungeSeller, Koninklijke Bunge B.V., as Master Servicer, BungeSecuritization B.V., as Seller, Koninklijke Bunge B.V. (f/k/aLimited, as Performance Undertaking Provider, andBunge Finance B.V.), as Master Servicer, the persons from timeCooperatieve Rabobank U.A., as Administrative Agent,to time party thereto as Conduit Purchasers, the persons fromCommitted Purchaser and Purchaser Agent on behalf of thetime to time party thereto as Committed Purchasers, theother Committed Purchasers, the other Purchaser Agents andpersons from time to time party thereto as Purchaser Agents,the Conduit PurchasersCooperatieve Rabobank U.A. (f/k/a Centrale Raiffeisen-
Boerenleenbank B.A.), as Administrative Agent and Purchaser 10.13* Fourteenth Amendment to the Receivables Transfer Agreement,Agent, and Bunge Limited, as Performance Undertaking dated February 19, 2019, among Bunge Securitization B.V., asProvider (incorporated by reference from the Registrant’s Seller, Koninklijke Bunge B.V., as Master Servicer, BungeForm 10-Q filed on July 28, 2016) Limited, as Performance Undertaking Provider, and
Cooperatieve Rabobank U.A., as Administrative Agent,10.8 Ninth Amendment to the Receivables Transfer Agreement,Committed Purchaser and Purchaser Agent on behalf of thedated June 30, 2016, among Bunge Securitization B.V., asother Committed Purchasers, the other Purchaser Agents andSeller, Koninklijke Bunge B.V., as Master Servicer, the personsthe Conduit Purchasersfrom time to time party thereto as Conduit Purchasers, the
persons from time to time party thereto as Committed 10.14 Amendment to and Restatement of the Servicing Agreement,Purchasers, the persons from time to time party thereto as dated May 26, 2016, among Bunge Securitization B.V., as Seller,Purchaser Agents, Cooperatieve Rabobank U.A., as Bunge North America Capital, Inc., as U.S. IntermediateAdministrative Agent and Purchaser Agent, and Bunge Limited, Transferor, Cooperatieve Rabobank U.A., as Italianas Performance Undertaking Provider (incorporated by Intermediate Transferor, Koninklijke Bunge B.V., as Masterreference from the Registrant’s Form 10-Q filed on July 28, Servicer, the persons named therein as Sub-Servicers, and2016) Cooperatieve Rabobank U.A., as Administrative Agent
(incorporated by reference from the Registrant’s form 10-K10.9 Tenth Amendment to the Receivables Transfer Agreement,filed on February 28, 2017)dated October 11, 2016, among Bunge Securitization B.V., as
Seller, Koninklijke Bunge B.V., as Master Servicer, the persons 10.15 Performance and Indemnity Agreement, dated June 1, 2011,from time to time party thereto as Conduit Purchasers, the between Bunge Limited, as Performance Undertaking Providerpersons from time to time party thereto as Committed and Cooperatieve Centrale Raiffeisen-Boerenleenbank B.A., asPurchasers, the persons from time to time party thereto as Administrative Agent (incorporated by reference from thePurchaser Agents, Cooperatieve Rabobank U.A., as Registrant’s Form 10-Q filed on August 9, 2011)Administrative Agent and Purchaser Agent, and Bunge Limited, 10.16 First Amendment to Performance and Indemnity Agreement,as Performance Undertaking Provider (incorporated by dated May 24, 2012, between Bunge Limited, as Performancereference from the Registrant’s Form 10-K filed on Undertaking Provider and Cooperatieve Centrale Raiffeisen-February 28, 2017) Boerenleenbank B.A., as Administrative Agent (incorporated by
10.10 Eleventh Amendment to the Receivables Transfer Agreement, reference from the Registrant’s Form 10-Q filed on August 1,dated May 31, 2017, among Bunge Securitization B.V., as Seller, 2012)Koninklijke Bunge B.V., as Master Servicer, the persons from 10.17 Subordinated Loan Agreement, dated June 1, 2011, amongtime to time party thereto as Conduit Purchasers, the persons Bunge Finance B.V., as Subordinated Lender, Bungefrom time to time party thereto as Committed Purchasers, the Securitization B.V., as Seller, Bunge Finance B.V., as Masterpersons from time to time party thereto as Purchaser Agents, Servicer, and Cooperatieve Centrale Raiffeisen-Cooperatieve Rabobank U.A., as Administrative Agent and Boerenleenbank B.A., as Administrative Agent (incorporated byPurchaser Agent, and Bunge Limited, as Performance reference from the Registrant’s Form 10-Q filed on August 9,Undertaking Provider (incorporated by reference from the 2011)Registrant’s Form 10-K filed on February 23, 2018)
2018 Bunge Annual Report 47

48
EXHIBIT EXHIBITNUMBER DESCRIPTION NUMBER DESCRIPTION
++10.18 U.S. Receivables Purchase Agreement, dated June 1, 2011, 10.26 Second Amended and Restated Pre-Export Facility Agreement,among Bunge North America, Inc., Bunge Oils, Inc., Bunge dated August 1, 2018, among the Pre-Export Borrowers partyNorth America (East), LLC, Bunge Milling, Inc., Bunge North thereto, the Pre-Export Lenders party thereto, Sumitomo MitsuiAmerica (OPD West), Inc., each as a Seller, respectively, Bunge Banking Corporation, as Pre-Export Administrative Agent, andFinance B.V., as Seller Agent, and Bunge North America Banco Rabobank International Brasil S.A., as Pre-ExportCapital, Inc., as the Buyer (incorporated by reference from the Collateral Agent (incorporated by reference to the Pre-ExportRegistrant’s Form 10-Q filed on August 9, 2011) Facility Agreement from the Registrant’s Form 8-K filed on
May 3, 2018) NTD: While the original Amended and Restated10.19 First Amendment to U.S. Receivables Purchase Agreement,Pre-Export Facility Agreement was included in the May 3, 2018dated June 15, 2012, among Bunge North America, Inc., BungeForm 8-K, it was determined that the Second Amended andOils, Inc., Bunge North America (East), LLC, BungeRestated Pre-Export Facility Agreement dated August 1, 2018Milling, Inc., Bunge North America (OPD West), Inc., each as awas not material.Seller, respectively, Bunge Finance B.V., as Seller Agent, and
Bunge North America Capital, Inc., as the Buyer (incorporated 10.27 Thirteenth Amended and Restated Liquidity Agreement, datedby reference from the Registrant’s Form 10-Q filed on as of December 14, 2018, among Bunge Asset Funding Corp.,August 1, 2012) the financial institutions party thereto, Citibank, N.A., as
Syndication Agent, BNP Paribas, Mizuho Bank, Ltd., Sumitomo10.20 Second Amendment to the U.S. Receivables PurchaseMitsui Banking Corporation and U.S. Bank National Association,Agreement, dated June 30, 2016, among Bunge Northas Co-Documentation Agents, and JPMorgan Chase Bank, N.A.,America, Inc., Bunge Oils, Inc., Bunge North Americaas Administrative Agent (incorporated by reference from the(East), LLC, Bunge Milling, Inc., Bunge North America (OPDRegistrant’s Form 8-K filed December 17, 2018)West), Inc., each as a Seller, respectively, Koninklijke
Bunge B.V., as Seller Agent, Bunge North America Capital, Inc., 10.28 Annex X, dated as of December 14, 2018 (incorporated byas the Buyer, and Cooperatieve Rabobank U.A., as reference from the Registrant’s Form 8-K filed onAdministrative Agent (incorporated by reference from the December 17, 2018)Registrant’s Form 10-K filed on February 28, 2017) 10.29 Ninth Amended and Restated Guaranty, dated as of
++10.21 U.S. Intermediate Transfer Agreement, dated June 1, 2011, December 14, 2018, by Bunge Limited, as Guarantor, toamong Bunge North America Capital, Inc., as the Transferor, Cooperatieve Rabobank U.A., New York Branch, in its capacityBunge Finance B.V., as the Transferor Agent, and Bunge as Letter of Credit Agent, and the Letter of Credit BanksSecuritization B.V., as the Transferee (incorporated by named therein (incorporated by reference from thereference from the Registrant’s Form 10-Q filed on August 9, Registrant’s Form 8-K filed on December 17, 2018)2011) 10.30 Revolving Credit Agreement, dated as December 14, 2018,
10.22 First Amendment to U.S. Intermediate Transfer Agreement, among Bunge Limited Finance Corp., as Borrower,dated June 15, 2012, among Bunge North America Citibank, N.A., as Syndication Agent, BNP Paribas, MizuhoCapital, Inc., as the Transferor, Bunge Finance B.V., as the Bank, Ltd., Sumitomo Mitsui Banking Corporation and U.S. BankTransferor Agent, and Bunge Securitization B.V., as the National Association, as Co-Documentation Agents, JPMorganTransferee (incorporated by reference from the Registrant’s Chase Bank, N.A., as Administrative Agent, and certain lendersForm 10-Q filed on August 1, 2012) party thereto (incorporated by reference from the Registrant’s
Form 8-K filed on December 17, 2018)10.23 Revolving Credit Agreement, dated May 1, 2018, among BungeLimited Finance Corp., as Revolving Borrower, Sumitomo Mitsui 10.31 Guaranty, dated as of December 14, 2018, by Bunge Limited,Banking Corporation, as Revolving Administrative Agent, and as Guarantor, to JPMorgan Chase Bank, N.A., as Administrativecertain Revolving Lenders party thereto (incorporated by Agent under the Revolving Credit Agreement (incorporated byreference from the Registrant’s Form 8-K filed on May 3, 2018) reference from the Registrant’s Form 8-K filed on
December 17, 2018)10.24 Guaranty, dated May 1, 2018, by Bunge Limited, as Guarantor,to Sumitomo Mitsui Banking Corporation, as Revolving 10.32 Bunge Limited Equity Incentive Plan (Amended and Restated asAdministrative Agent for the benefit of the Revolving of December 31, 2008) (incorporated by reference from theAdministrative agent and the Revolving Lenders (incorporated Registrant’s Form 10-K filed March 2, 2009)by reference from the Registrant’s Form 8-K filed on May 3, 10.33 Form of Nonqualified Stock Option Award Agreement (effective2018) as of 2005) under the Bunge Limited Equity Incentive Plan
10.25 Framework Agreement, dated May 1, 2018, among Bunge (incorporated by reference from the Registrant’s Form 10-KLimited, Bunge Limited Finance Corp., as Revolving Borrower, filed March 15, 2006)the Pre-Export Borrowers party thereto, Sumitomo Mitsui 10.34 Bunge Limited 2009 Equity Incentive Plan (incorporated byBanking Corporation, as Revolving Administrative Agent and reference from the Registrant’s Definitive Proxy StatementPre-Export Administrative Agent, certain Revolving Lenders filed April 11, 2014)party thereto and certain Pre-Export Lenders party thereto
10.35 Form of Nonqualified Stock Option Award Agreement under the(incorporated by reference from the Registrant’s Form 8-K filed2009 Bunge Limited Equity Incentive Plan (incorporated byon May 3, 2018)reference from the Registrant’s Form 10-K filed March 1, 2011)
48 2018 Bunge Annual Report
49
EXHIBIT EXHIBITNUMBER DESCRIPTION NUMBER DESCRIPTION
10.36 Form of Restricted Stock Unit Award Agreement under the 2009 10.52 Offer Letter, dated as of September 24, 2010, for Raul PadillaBunge Limited Equity Incentive Plan (incorporated by reference (incorporated by reference from the Registrant’s Form 10-Qfrom the Registrant’s Form 10-K filed March 1, 2011) filed on November 9, 2011)
10.37 Form of Performance Based Restricted Stock Unit-Target EPS 10.53 Employment Agreement, dated as of February 6, 2013,Award Agreement under the 2009 Bunge Limited Equity between Bunge Limited and Soren Schroder (incorporated byIncentive Plan (incorporated by reference from the Registrant’s reference from the Registrant’s Form 8-K filed February 7,Form 10-K filed March 1, 2011) 2013)
10.38 Bunge Limited 2016 Equity Incentive Plan (incorporated by 10.54 Offer Letter, dated as of December 7, 2016, for Thomasreference from the Registrant’s Definitive Proxy Statement Boehlert (incorporated by reference from the Registrant’sfiled April 15, 2016) Form 10-K filed February 28, 2017)
10.39 Form of Global Stock Option Agreement under the 2016 Bunge 10.55 Form of Executive Change of Control Agreement (incorporatedLimited Equity Incentive Plan (incorporated by reference from by reference from the Registrant’s Form 10-Q filedthe Registrant’s Form 10-K filed February 28, 2017) November 1, 2017)
10.40 Form of Global Restricted Stock Unit Agreement under the 10.56* Separation Agreement, dated as of December 13, 2018,2016 Bunge Limited Equity Incentive Plan (for RSUs subject to between Bunge Limited and Soren Schroderpro rata vesting) (incorporated by reference from the 10.57 Cooperation Agreement, dated October 31, 2018 by and amongRegistrant’s Form 10-K filed February 28, 2017) Bunge Limited, Continental Grain Company and Paul Fribourg
10.41 Form of Global Restricted Stock Unit Agreement under the (incorporated by reference from the Registrant’s Form 8-K filed2016 Bunge Limited Equity Incentive Plan (for RSUs subject to October 31, 2018)cliff vesting) (incorporated by reference from the Registrant’s 10.58 Cooperation Agreement, dated October 31, 2018 by and amongForm 10-K filed February 28, 2017) Bunge Limited, D.E. Shaw Valence Portfolios, L.L.C and
10.42 Form of Global Performance Unit Agreement under the 2016 D. E. Shaw Oculus Portfolios, L.L.C. (incorporated by referenceBunge Limited Equity Incentive Plan (incorporated by reference from the Registrant’s Form 8-K filed October 31, 2018)from the Registrant’s Form 10-K filed February 28, 2017) 21.1* Subsidiaries of the Registrant
10.43 Bunge Limited 2017 Non-Employee Directors Equity Incentive 23.1* Consent of Deloitte & Touche LLPPlan (incorporated by reference from the Registrant’s
31.1* Certification of Bunge Limited’s Acting Chief Executive OfficerDefinitive Proxy Statement filed April 13, 2017)pursuant to Section 302 of the Sarbanes Oxley Act
10.44 Form of Restricted Stock Unit Award Agreement under the31.2* Certification of Bunge Limited’s Chief Financial OfficerBunge Limited 2017 Non-Employee Directors Equity Incentive
pursuant to Section 302 of the Sarbanes Oxley ActPlan (incorporated by reference from the Registrant’sForm 10-K filed February 23, 2018 32.1* Certification of Bunge Limited’s Acting Chief Executive Officer
pursuant to Section 906 of the Sarbanes Oxley Act10.45 Bunge Excess Benefit Plan (Amended and Restated as ofJanuary 1, 2009) (incorporated by reference from the 32.2* Certification of Bunge Limited’s Chief Financial OfficerRegistrant’s Form 10-K filed March 2, 2009) pursuant to Section 906 of the Sarbanes Oxley Act
10.46 Bunge Excess Contribution Plan (Amended and Restated as of 101* The following financial information from Bunge Limited’sJanuary 1, 2009) (incorporated by reference from the Annual Report on Form 10-K for the fiscal year endedRegistrant’s Form 10-K filed March 2, 2009) December 31, 2018 formatted in Extensible Business Reporting
Language (XBRL): (i) the Consolidated Statements of Income,10.47 Bunge U.S. SERP (Amended and Restated as of January 1, 2011)(ii) the Consolidated Balance Sheets, (iii) the Consolidated(incorporated by reference from the Registrant’s Form 10-KStatements of Cash Flows, (iv) the Consolidated Statements offiled March 1, 2011)Shareholders’ Equity, (v) the Notes to the Consolidated
10.48 Bunge Limited Employee Deferred Compensation Plan Financial Statements and (vi) Schedule II—Valuation and(effective January 1, 2008) (incorporated by reference from Qualifying Accountsthe Registrant’s Form 10-K filed March 2, 2009)
* Filed herewith.10.49 Bunge Limited Annual Incentive Plan (effective January 1,
++ Portions of this exhibit have been omitted and filed separately with the Securities2011) (incorporated by reference from the Registrant’sand Exchange Commission as part of an application for confidential treatment pursuantDefinitive Proxy Statement filed April 16, 2010)to Rule 24b-2 of the Securities Exchange Act of 1934, as amended.
10.50 Description of Non-Employee Directors’ Compensation(effective as of January 1, 2014)
10.51 Offer Letter, dated as of June 14, 2011, for Gordon Hardie(incorporated by reference from the Registrant’s Form 10-Qfiled on August 9, 2011)
2018 Bunge Annual Report 49
(This page has been left blank intentionally.)

E-1
BUNGE LIMITEDSCHEDULE II – VALUATION AND QUALIFYING ACCOUNTS(US$ IN MILLIONS)
BALANCE AT CHARGED TO CHARGED TO BALANCEBEGINNING OF COSTS AND OTHER DEDUCTIONS AT END OF
DESCRIPTION PERIOD EXPENSES ACCOUNTS(b) FROM RESERVES PERIOD
FOR THE YEAR ENDED DECEMBER 31, 2016Allowances for doubtful accounts(a) . . . . . . . . . . . . . . . . . . . . . . . . . . . . . . . . . . . . . . . . . . . . . . . . . . $210 45 15 (58)(c) $212Allowances for secured advances to suppliers . . . . . . . . . . . . . . . . . . . . . . . . . . . . . . . . . . . . . $ 42 1 9 (2) $ 50Allowances for recoverable taxes . . . . . . . . . . . . . . . . . . . . . . . . . . . . . . . . . . . . . . . . . . . . . . . . . . . . $ 32 162 1 (160) $ 35Income tax valuation allowances . . . . . . . . . . . . . . . . . . . . . . . . . . . . . . . . . . . . . . . . . . . . . . . . . . . . . $798 (44) 85 – $839FOR THE YEAR ENDED DECEMBER 31, 2017Allowances for doubtful accounts(a) . . . . . . . . . . . . . . . . . . . . . . . . . . . . . . . . . . . . . . . . . . . . . . . . . . $212 42 (1) (70)(c) $183Allowances for secured advances to suppliers . . . . . . . . . . . . . . . . . . . . . . . . . . . . . . . . . . . . . $ 50 20 – (5) $ 65Allowances for recoverable taxes . . . . . . . . . . . . . . . . . . . . . . . . . . . . . . . . . . . . . . . . . . . . . . . . . . . . $ 35 12 (1) (7) $ 39Income tax valuation allowances . . . . . . . . . . . . . . . . . . . . . . . . . . . . . . . . . . . . . . . . . . . . . . . . . . . . . $839 43 18 – $900FOR THE YEAR ENDED DECEMBER 31, 2018Allowances for doubtful accounts(a) . . . . . . . . . . . . . . . . . . . . . . . . . . . . . . . . . . . . . . . . . . . . . . . . . . $183 56 (18) (36)(c) $185Allowances for secured advances to suppliers . . . . . . . . . . . . . . . . . . . . . . . . . . . . . . . . . . . . . $ 65 21 (10) (6) $ 70Allowances for recoverable taxes . . . . . . . . . . . . . . . . . . . . . . . . . . . . . . . . . . . . . . . . . . . . . . . . . . . . $ 39 6 (5) (3) $ 37Income tax valuation allowances . . . . . . . . . . . . . . . . . . . . . . . . . . . . . . . . . . . . . . . . . . . . . . . . . . . . . $900 114 (98) (150) $766
(a) Includes allowance for doubtful accounts for current and non-current trade accounts receivables.
(b) Consists primarily of foreign currency translation adjustments.
(c) Include write-offs of uncollectible accounts and recoveries.
2018 Bunge Annual Report E-1

(This page has been left blank intentionally.)

F-1
INDEX TO CONSOLIDATED FINANCIAL STATEMENTS
PAGE
Consolidated Financial StatementsReport of Independent Registered Public Accounting Firm . . . . . . . . . . . . . . . . . . . . . . . . . . . . . . . . . . . . . . . . . . . . . . . . . . . . . . . . . . . . . . . . . . . . . . . . . . . . . . . . . . . . . . . . . . . . . . . . . . . . . . . . . . . . . . . . . . . . . . . F-2Consolidated Statements of Income for the Years Ended December 31, 2018, 2017 and 2016 . . . . . . . . . . . . . . . . . . . . . . . . . . . . . . . . . . . . . . . . . . . . . . . . . . . . . . . . . . . . . . . . . . . . . . . . . . . F-3Consolidated Statements of Comprehensive Income (Loss) for the Years Ended December 31, 2018, 2017 and 2016 . . . . . . . . . . . . . . . . . . . . . . . . . . . . . . . . . . . . . . . . . . . . . . F-4Consolidated Balance Sheets at December 31, 2018 and 2017 . . . . . . . . . . . . . . . . . . . . . . . . . . . . . . . . . . . . . . . . . . . . . . . . . . . . . . . . . . . . . . . . . . . . . . . . . . . . . . . . . . . . . . . . . . . . . . . . . . . . . . . . . . . . . . . . . . F-5Consolidated Statements of Cash Flows for the Years Ended December 31, 2018, 2017 and 2016 . . . . . . . . . . . . . . . . . . . . . . . . . . . . . . . . . . . . . . . . . . . . . . . . . . . . . . . . . . . . . . . . . . . . . . F-6Consolidated Statements of Changes in Equity and Redeemable Noncontrolling Interests for the Years Ended December 31, 2018, 2017 and 2016 . . . . . . . F-7Notes to the Consolidated Financial Statements . . . . . . . . . . . . . . . . . . . . . . . . . . . . . . . . . . . . . . . . . . . . . . . . . . . . . . . . . . . . . . . . . . . . . . . . . . . . . . . . . . . . . . . . . . . . . . . . . . . . . . . . . . . . . . . . . . . . . . . . . . . . . . . . . . . . F-8
2018 Bunge Annual Report F-1

F-2
REPORT OF INDEPENDENT REGISTERED PUBLIC ACCOUNTING FIRM
To the Shareholders and the Board of Directors ofBunge Limited
OPINION ON THE FINANCIAL STATEMENTS
We have audited the accompanying consolidated balance sheets of Bunge Limited and subsidiaries (the ‘‘Company’’) as ofDecember 31, 2018 and 2017, and the related consolidated statements of income, comprehensive income (loss), changes in equityand redeemable noncontrolling interests, and cash flows, for each of the three years in the period ended December 31, 2018, andthe related notes and the schedules listed in the Index at Item 15 (collectively referred to as the ‘‘financial statements’’). In ouropinion, such consolidated financial statements present fairly, in all material respects, the financial position of Bunge Limited andsubsidiaries as of December 31, 2018 and 2017, and the results of their operations and their cash flows for each of the threeyears in the period ended December 31, 2018, in conformity with accounting principles generally accepted in the United States ofAmerica.
We have also audited, in accordance with the standards of the Public Company Accounting Oversight Board (United States)(PCAOB), the Company’s internal control over financial reporting as of December 31, 2018, based on the criteria established inInternal Control – Integrated Framework (2013) issued by the Committee of Sponsoring Organizations of the Treadway Commissionand our report dated February 22, 2019 expressed an unqualified opinion on the Company’s internal control over financialreporting.
BASIS FOR OPINION
These financial statements are the responsibility of the Company’s management. Our responsibility is to express an opinion on theCompany’s financial statements based on our audits. We are a public accounting firm registered with the PCAOB and arerequired to be independent with respect to the Company in accordance with the U.S. federal securities laws and the applicablerules and regulations of the Securities and Exchange Commission and the PCAOB.
We conducted our audits in accordance with the standards of the PCAOB. Those standards require that we plan and perform theaudit to obtain reasonable assurance about whether the financial statements are free of material misstatement, whether due toerror or fraud. Our audits included performing procedures to assess the risks of material misstatement of the financial statements,whether due to error or fraud, and performing procedures that respond to those risks. Such procedures included examining, on atest basis, evidence regarding the amounts and disclosures in the financial statements. Our audits also included evaluating theaccounting principles used and significant estimates made by management, as well as evaluating the overall presentation of thefinancial statements. We believe that our audits provide a reasonable basis for our opinion.
/s/ Deloitte & Touche LLP
New York, New YorkFebruary 22, 2019We have served as the Company’s auditor since 2002.
F-2 2018 Bunge Annual Report

F-3
PART I FINANCIAL INFORMATIONITEM 1. FINANCIAL STATEMENTS
BUNGE LIMITED AND SUBSIDIARIESCONSOLIDATED STATEMENTS OF INCOME
YEAR ENDED DECEMBER 31,(U.S. dollars in millions, except per share data) 2018 2017 2016
Net sales . . . . . . . . . . . . . . . . . . . . . . . . . . . . . . . . . . . . . . . . . . . . . . . . . . . . . . . . . . . . . . . . . . . . . . . . . . . . . . . . . . . . . . . . . . . . . . . . . . . . . . . . . . . . . . . . . . . . . . . . . . . . . . . . . . . . . . . . . . . . . . . . $ 45,743 $ 45,794 $ 42,679Cost of goods sold . . . . . . . . . . . . . . . . . . . . . . . . . . . . . . . . . . . . . . . . . . . . . . . . . . . . . . . . . . . . . . . . . . . . . . . . . . . . . . . . . . . . . . . . . . . . . . . . . . . . . . . . . . . . . . . . . . . . . . . . . . . . . . . . . . . . . (43,477) (44,029) (40,269)
Gross profit . . . . . . . . . . . . . . . . . . . . . . . . . . . . . . . . . . . . . . . . . . . . . . . . . . . . . . . . . . . . . . . . . . . . . . . . . . . . . . . . . . . . . . . . . . . . . . . . . . . . . . . . . . . . . . . . . . . . . . . . . . . . . . . . . . . . . . . . . . . . 2,266 1,765 2,410Selling, general and administrative expenses . . . . . . . . . . . . . . . . . . . . . . . . . . . . . . . . . . . . . . . . . . . . . . . . . . . . . . . . . . . . . . . . . . . . . . . . . . . . . . . . . . . . . . . . . . . . . . . . . . (1,423) (1,437) (1,284)Interest income . . . . . . . . . . . . . . . . . . . . . . . . . . . . . . . . . . . . . . . . . . . . . . . . . . . . . . . . . . . . . . . . . . . . . . . . . . . . . . . . . . . . . . . . . . . . . . . . . . . . . . . . . . . . . . . . . . . . . . . . . . . . . . . . . . . . . . . . 31 38 51Interest expense . . . . . . . . . . . . . . . . . . . . . . . . . . . . . . . . . . . . . . . . . . . . . . . . . . . . . . . . . . . . . . . . . . . . . . . . . . . . . . . . . . . . . . . . . . . . . . . . . . . . . . . . . . . . . . . . . . . . . . . . . . . . . . . . . . . . . . . (339) (263) (234)Foreign exchange gains (losses) . . . . . . . . . . . . . . . . . . . . . . . . . . . . . . . . . . . . . . . . . . . . . . . . . . . . . . . . . . . . . . . . . . . . . . . . . . . . . . . . . . . . . . . . . . . . . . . . . . . . . . . . . . . . . . . . . . . . (101) 95 (8)Other income (expense) – net . . . . . . . . . . . . . . . . . . . . . . . . . . . . . . . . . . . . . . . . . . . . . . . . . . . . . . . . . . . . . . . . . . . . . . . . . . . . . . . . . . . . . . . . . . . . . . . . . . . . . . . . . . . . . . . . . . . . . . 48 40 10Gain (loss), net on disposition of equity interests/subsidiaries . . . . . . . . . . . . . . . . . . . . . . . . . . . . . . . . . . . . . . . . . . . . . . . . . . . . . . . . . . . . . . . . . . . . . . . . . . . . (26) 9 122Equity investment impairments . . . . . . . . . . . . . . . . . . . . . . . . . . . . . . . . . . . . . . . . . . . . . . . . . . . . . . . . . . . . . . . . . . . . . . . . . . . . . . . . . . . . . . . . . . . . . . . . . . . . . . . . . . . . . . . . . . . . - (17) (59)Goodwill and intangible impairments . . . . . . . . . . . . . . . . . . . . . . . . . . . . . . . . . . . . . . . . . . . . . . . . . . . . . . . . . . . . . . . . . . . . . . . . . . . . . . . . . . . . . . . . . . . . . . . . . . . . . . . . . . . . . - - (12)
Income (loss) from continuing operations before income tax . . . . . . . . . . . . . . . . . . . . . . . . . . . . . . . . . . . . . . . . . . . . . . . . . . . . . . . . . . . . . . . . . . . . . . . . . . . 456 230 996Income tax (expense) benefit . . . . . . . . . . . . . . . . . . . . . . . . . . . . . . . . . . . . . . . . . . . . . . . . . . . . . . . . . . . . . . . . . . . . . . . . . . . . . . . . . . . . . . . . . . . . . . . . . . . . . . . . . . . . . . . . . . . . . . (179) (56) (220)
Income (loss) from continuing operations . . . . . . . . . . . . . . . . . . . . . . . . . . . . . . . . . . . . . . . . . . . . . . . . . . . . . . . . . . . . . . . . . . . . . . . . . . . . . . . . . . . . . . . . . . . . . . . . . . . . . 277 174 776Income (loss) from discontinued operations, net of tax . . . . . . . . . . . . . . . . . . . . . . . . . . . . . . . . . . . . . . . . . . . . . . . . . . . . . . . . . . . . . . . . . . . . . . . . . . . . . . . . . . . . . 10 - (9)
Net income (loss) . . . . . . . . . . . . . . . . . . . . . . . . . . . . . . . . . . . . . . . . . . . . . . . . . . . . . . . . . . . . . . . . . . . . . . . . . . . . . . . . . . . . . . . . . . . . . . . . . . . . . . . . . . . . . . . . . . . . . . . . . . . . . . . . . . . . . 287 174 767Net (income) loss attributable to noncontrolling interests and redeemable noncontrolling interests . . . . . . . . . . . . . . . . . . . . . . . . . . . . . (20) (14) (22)
Net income (loss) attributable to Bunge . . . . . . . . . . . . . . . . . . . . . . . . . . . . . . . . . . . . . . . . . . . . . . . . . . . . . . . . . . . . . . . . . . . . . . . . . . . . . . . . . . . . . . . . . . . . . . . . . . . . . . . 267 160 745Convertible preference share dividends and other obligations . . . . . . . . . . . . . . . . . . . . . . . . . . . . . . . . . . . . . . . . . . . . . . . . . . . . . . . . . . . . . . . . . . . . . . . . . . . . . (34) (34) (36)
Net income (loss) available to Bunge common shareholders . . . . . . . . . . . . . . . . . . . . . . . . . . . . . . . . . . . . . . . . . . . . . . . . . . . . . . . . . . . . . . . . . . . . . . . . . . . . . $ 233 $ 126 $ 709
Earnings (loss) per common share – basic (Note 24)Net income (loss) from continuing operations . . . . . . . . . . . . . . . . . . . . . . . . . . . . . . . . . . . . . . . . . . . . . . . . . . . . . . . . . . . . . . . . . . . . . . . . . . . . . . . . . . . . . . . . . . . . . . . . . . $ 1.58 $ 0.90 $ 5.13Net income (loss) from discontinued operations . . . . . . . . . . . . . . . . . . . . . . . . . . . . . . . . . . . . . . . . . . . . . . . . . . . . . . . . . . . . . . . . . . . . . . . . . . . . . . . . . . . . . . . . . . . . . . . 0.07 - (0.06)
Net income (loss) attributable to Bunge common shareholders . . . . . . . . . . . . . . . . . . . . . . . . . . . . . . . . . . . . . . . . . . . . . . . . . . . . . . . . . . . . . . . . . . . . . . . . . . . . $ 1.65 $ 0.90 $ 5.07
Earnings (loss) per common share – diluted (Note 24)Net income (loss) from continuing operations . . . . . . . . . . . . . . . . . . . . . . . . . . . . . . . . . . . . . . . . . . . . . . . . . . . . . . . . . . . . . . . . . . . . . . . . . . . . . . . . . . . . . . . . . . . . . . . . . . $ 1.57 $ 0.89 $ 5.07Net income (loss) from discontinued operations . . . . . . . . . . . . . . . . . . . . . . . . . . . . . . . . . . . . . . . . . . . . . . . . . . . . . . . . . . . . . . . . . . . . . . . . . . . . . . . . . . . . . . . . . . . . . . . 0.07 - (0.06)
Net income (loss) attributable to Bunge common shareholders . . . . . . . . . . . . . . . . . . . . . . . . . . . . . . . . . . . . . . . . . . . . . . . . . . . . . . . . . . . . . . . . . . . . . . . . . . . . $ 1.64 $ 0.89 $ 5.01
The accompanying notes are an integral part of these consolidated financial statements.
2018 Bunge Annual Report F-3

F-4
BUNGE LIMITED AND SUBSIDIARIESCONSOLIDATED STATEMENTS OF COMPREHENSIVE INCOME (LOSS)
YEAR ENDED DECEMBER 31,(U.S. dollars in millions) 2018 2017 2016
Net income (loss) . . . . . . . . . . . . . . . . . . . . . . . . . . . . . . . . . . . . . . . . . . . . . . . . . . . . . . . . . . . . . . . . . . . . . . . . . . . . . . . . . . . . . . . . . . . . . . . . . . . . . . . . . . . . . . . . . . . . . . . . . . . . . . . . . . . . . . . . . . . . $ 287 $ 174 $ 767Other comprehensive income (loss):
Foreign exchange translation adjustment(1) . . . . . . . . . . . . . . . . . . . . . . . . . . . . . . . . . . . . . . . . . . . . . . . . . . . . . . . . . . . . . . . . . . . . . . . . . . . . . . . . . . . . . . . . . . . . . . . . . . . . . . . . . (1,125) 203 713Unrealized gains (losses) on designated hedges, net of tax (expense) benefit of $1, $(1), and nil . . . . . . . . . . . . . . . . . . . . . . . . . . . . . . . . . . . 99 (105) (305)Unrealized gains (losses) on investments, net of tax (expense) benefit of nil, $(1), and nil . . . . . . . . . . . . . . . . . . . . . . . . . . . . . . . . . . . . . . . . . . . — 2 —Reclassification of realized net losses (gains) to net income, net of tax expense (benefit) of $2, $2, and nil . . . . . . . . . . . . . . . . . . . . . 2 (41) (11)Pension adjustment, net of tax (expense) benefit of $4, $(4), and $4 . . . . . . . . . . . . . . . . . . . . . . . . . . . . . . . . . . . . . . . . . . . . . . . . . . . . . . . . . . . . . . . . . . . . . . . (16) 5 (11)
Total other comprehensive income (loss) . . . . . . . . . . . . . . . . . . . . . . . . . . . . . . . . . . . . . . . . . . . . . . . . . . . . . . . . . . . . . . . . . . . . . . . . . . . . . . . . . . . . . . . . . . . . . . . . . . . . . . . . . . . . . . (1,040) 64 386
Total comprehensive income (loss) . . . . . . . . . . . . . . . . . . . . . . . . . . . . . . . . . . . . . . . . . . . . . . . . . . . . . . . . . . . . . . . . . . . . . . . . . . . . . . . . . . . . . . . . . . . . . . . . . . . . . . . . . . . . . . . . . . . . . . (753) 238 1,153Less: comprehensive (income) loss attributable to noncontrolling interests and redeemable noncontrolling interests . . . . . . . . . . 14 (30) (26)
Total comprehensive income (loss) attributable to Bunge . . . . . . . . . . . . . . . . . . . . . . . . . . . . . . . . . . . . . . . . . . . . . . . . . . . . . . . . . . . . . . . . . . . . . . . . . . . . . . . . . . . . . . $ (739) $ 208 $ 1,127
(1) 2018 Includes the release of cumulative translation adjustments upon the disposition of the Company’s foreign subsidiaries and equity-method investments of $29 million, which isrecorded in Other income (expense)—net in the consolidated statements of income.
The accompanying notes are an integral part of these consolidated financial statements.
F-4 2018 Bunge Annual Report

F-5
BUNGE LIMITED AND SUBSIDIARIESCONSOLIDATED BALANCE SHEETS
December 31, December 31,(U.S. dollars in millions, except share data) 2018 2017
ASSETSCurrent assets:
Cash and cash equivalents . . . . . . . . . . . . . . . . . . . . . . . . . . . . . . . . . . . . . . . . . . . . . . . . . . . . . . . . . . . . . . . . . . . . . . . . . . . . . . . . . . . . . . . . . . . . . . . . . . . . . . . . . . . . . . . . . . . . . . . . . . $ 389 $ 601Trade accounts receivable (less allowances of $113 and $107) (Note 18) . . . . . . . . . . . . . . . . . . . . . . . . . . . . . . . . . . . . . . . . . . . . . . . . . . . . . . . . . . . . . . . 1,637 1,501Inventories (Note 5) . . . . . . . . . . . . . . . . . . . . . . . . . . . . . . . . . . . . . . . . . . . . . . . . . . . . . . . . . . . . . . . . . . . . . . . . . . . . . . . . . . . . . . . . . . . . . . . . . . . . . . . . . . . . . . . . . . . . . . . . . . . . . . . . . . 5,871 5,074Other current assets (Note 6) . . . . . . . . . . . . . . . . . . . . . . . . . . . . . . . . . . . . . . . . . . . . . . . . . . . . . . . . . . . . . . . . . . . . . . . . . . . . . . . . . . . . . . . . . . . . . . . . . . . . . . . . . . . . . . . . . . . . . . 3,171 3,227
Total current assets . . . . . . . . . . . . . . . . . . . . . . . . . . . . . . . . . . . . . . . . . . . . . . . . . . . . . . . . . . . . . . . . . . . . . . . . . . . . . . . . . . . . . . . . . . . . . . . . . . . . . . . . . . . . . . . . . . . . . . . . . . . . . . . . . . . . . 11,068 10,403Property, plant and equipment, net (Note 7) . . . . . . . . . . . . . . . . . . . . . . . . . . . . . . . . . . . . . . . . . . . . . . . . . . . . . . . . . . . . . . . . . . . . . . . . . . . . . . . . . . . . . . . . . . . . . . . . . . . . . 5,201 5,310Goodwill (Note 8) . . . . . . . . . . . . . . . . . . . . . . . . . . . . . . . . . . . . . . . . . . . . . . . . . . . . . . . . . . . . . . . . . . . . . . . . . . . . . . . . . . . . . . . . . . . . . . . . . . . . . . . . . . . . . . . . . . . . . . . . . . . . . . . . . . . . . . . . 727 515Other intangible assets, net (Note 9) . . . . . . . . . . . . . . . . . . . . . . . . . . . . . . . . . . . . . . . . . . . . . . . . . . . . . . . . . . . . . . . . . . . . . . . . . . . . . . . . . . . . . . . . . . . . . . . . . . . . . . . . . . . . . . . 697 323Investments in affiliates (Note 11) . . . . . . . . . . . . . . . . . . . . . . . . . . . . . . . . . . . . . . . . . . . . . . . . . . . . . . . . . . . . . . . . . . . . . . . . . . . . . . . . . . . . . . . . . . . . . . . . . . . . . . . . . . . . . . . . . . 451 461Deferred income taxes (Note 14) . . . . . . . . . . . . . . . . . . . . . . . . . . . . . . . . . . . . . . . . . . . . . . . . . . . . . . . . . . . . . . . . . . . . . . . . . . . . . . . . . . . . . . . . . . . . . . . . . . . . . . . . . . . . . . . . . . . . 458 516Time deposits under trade structured finance program (Note 4) . . . . . . . . . . . . . . . . . . . . . . . . . . . . . . . . . . . . . . . . . . . . . . . . . . . . . . . . . . . . . . . . . . . . . . . . . . . . - 315Other non-current assets (Note 12) . . . . . . . . . . . . . . . . . . . . . . . . . . . . . . . . . . . . . . . . . . . . . . . . . . . . . . . . . . . . . . . . . . . . . . . . . . . . . . . . . . . . . . . . . . . . . . . . . . . . . . . . . . . . . . . . . 823 1,028
Total assets . . . . . . . . . . . . . . . . . . . . . . . . . . . . . . . . . . . . . . . . . . . . . . . . . . . . . . . . . . . . . . . . . . . . . . . . . . . . . . . . . . . . . . . . . . . . . . . . . . . . . . . . . . . . . . . . . . . . . . . . . . . . . . . . . . . . . . . . . . . . . . . $19,425 $18,871
LIABILITIES AND EQUITYCurrent liabilities:
Short-term debt (Note 16) . . . . . . . . . . . . . . . . . . . . . . . . . . . . . . . . . . . . . . . . . . . . . . . . . . . . . . . . . . . . . . . . . . . . . . . . . . . . . . . . . . . . . . . . . . . . . . . . . . . . . . . . . . . . . . . . . . . . . . . . . . $ 750 $ 304Current portion of long-term debt (Note 17) . . . . . . . . . . . . . . . . . . . . . . . . . . . . . . . . . . . . . . . . . . . . . . . . . . . . . . . . . . . . . . . . . . . . . . . . . . . . . . . . . . . . . . . . . . . . . . . . . . . 419 15Letter of credit obligations under trade structured finance program (Note 4) . . . . . . . . . . . . . . . . . . . . . . . . . . . . . . . . . . . . . . . . . . . . . . . . . . . . . . . . - 315Trade accounts payable (includes $441 and $583 carried at fair value) . . . . . . . . . . . . . . . . . . . . . . . . . . . . . . . . . . . . . . . . . . . . . . . . . . . . . . . . . . . . . . . . . 3,501 3,395Other current liabilities (Note 13) . . . . . . . . . . . . . . . . . . . . . . . . . . . . . . . . . . . . . . . . . . . . . . . . . . . . . . . . . . . . . . . . . . . . . . . . . . . . . . . . . . . . . . . . . . . . . . . . . . . . . . . . . . . . . . . . 2,502 2,186
Total current liabilities . . . . . . . . . . . . . . . . . . . . . . . . . . . . . . . . . . . . . . . . . . . . . . . . . . . . . . . . . . . . . . . . . . . . . . . . . . . . . . . . . . . . . . . . . . . . . . . . . . . . . . . . . . . . . . . . . . . . . . . . . . . . . . . . . 7,172 6,215Long-term debt (Note 17) . . . . . . . . . . . . . . . . . . . . . . . . . . . . . . . . . . . . . . . . . . . . . . . . . . . . . . . . . . . . . . . . . . . . . . . . . . . . . . . . . . . . . . . . . . . . . . . . . . . . . . . . . . . . . . . . . . . . . . . . . . . . . 4,203 4,160Deferred income taxes (Note 14) . . . . . . . . . . . . . . . . . . . . . . . . . . . . . . . . . . . . . . . . . . . . . . . . . . . . . . . . . . . . . . . . . . . . . . . . . . . . . . . . . . . . . . . . . . . . . . . . . . . . . . . . . . . . . . . . . . . . 356 223Other non-current liabilities . . . . . . . . . . . . . . . . . . . . . . . . . . . . . . . . . . . . . . . . . . . . . . . . . . . . . . . . . . . . . . . . . . . . . . . . . . . . . . . . . . . . . . . . . . . . . . . . . . . . . . . . . . . . . . . . . . . . . . . . . . 892 916Commitments and contingencies (Note 21)Redeemable noncontrolling interests (Note 22) . . . . . . . . . . . . . . . . . . . . . . . . . . . . . . . . . . . . . . . . . . . . . . . . . . . . . . . . . . . . . . . . . . . . . . . . . . . . . . . . . . . . . . . . . . . . . . . . 424 -Equity (Note 23):
Convertible perpetual preference shares, par value $.01; authorized, issued and outstanding: 2018 - 6,899,683 sharesand 2017 - 6,899,700 shares (liquidation preference $100 per share) . . . . . . . . . . . . . . . . . . . . . . . . . . . . . . . . . . . . . . . . . . . . . . . . . . . . . . . . . . . . . . . . . 690 690
Common shares, par value $.01; authorized - 400,000,000 shares; issued and outstanding: 2018 - 141,111,081 shares,2017 - 140,646,829 shares . . . . . . . . . . . . . . . . . . . . . . . . . . . . . . . . . . . . . . . . . . . . . . . . . . . . . . . . . . . . . . . . . . . . . . . . . . . . . . . . . . . . . . . . . . . . . . . . . . . . . . . . . . . . . . . . . . . . . . . 1 1
Additional paid-in capital . . . . . . . . . . . . . . . . . . . . . . . . . . . . . . . . . . . . . . . . . . . . . . . . . . . . . . . . . . . . . . . . . . . . . . . . . . . . . . . . . . . . . . . . . . . . . . . . . . . . . . . . . . . . . . . . . . . . . . . . . . . 5,278 5,226Retained earnings . . . . . . . . . . . . . . . . . . . . . . . . . . . . . . . . . . . . . . . . . . . . . . . . . . . . . . . . . . . . . . . . . . . . . . . . . . . . . . . . . . . . . . . . . . . . . . . . . . . . . . . . . . . . . . . . . . . . . . . . . . . . . . . . . . . . . 8,059 8,081Accumulated other comprehensive income (loss) (Note 23) . . . . . . . . . . . . . . . . . . . . . . . . . . . . . . . . . . . . . . . . . . . . . . . . . . . . . . . . . . . . . . . . . . . . . . . . . . . . . . . . (6,935) (5,930)Treasury shares, at cost - 2018 and 2017 - 12,882,313 shares . . . . . . . . . . . . . . . . . . . . . . . . . . . . . . . . . . . . . . . . . . . . . . . . . . . . . . . . . . . . . . . . . . . . . . . . . . . . . (920) (920)
Total Bunge shareholders’ equity . . . . . . . . . . . . . . . . . . . . . . . . . . . . . . . . . . . . . . . . . . . . . . . . . . . . . . . . . . . . . . . . . . . . . . . . . . . . . . . . . . . . . . . . . . . . . . . . . . . . . . . . . . . . . . . 6,173 7,148Noncontrolling interests . . . . . . . . . . . . . . . . . . . . . . . . . . . . . . . . . . . . . . . . . . . . . . . . . . . . . . . . . . . . . . . . . . . . . . . . . . . . . . . . . . . . . . . . . . . . . . . . . . . . . . . . . . . . . . . . . . . . . . . . . . . . . 205 209
Total equity . . . . . . . . . . . . . . . . . . . . . . . . . . . . . . . . . . . . . . . . . . . . . . . . . . . . . . . . . . . . . . . . . . . . . . . . . . . . . . . . . . . . . . . . . . . . . . . . . . . . . . . . . . . . . . . . . . . . . . . . . . . . . . . . . . . . . . . . . . . . 6,378 7,357
Total liabilities and equity . . . . . . . . . . . . . . . . . . . . . . . . . . . . . . . . . . . . . . . . . . . . . . . . . . . . . . . . . . . . . . . . . . . . . . . . . . . . . . . . . . . . . . . . . . . . . . . . . . . . . . . . . . . . . . . . . . . . . . . . . . . $19,425 $18,871
The accompanying notes are an integral part of these consolidated financial statements.
2018 Bunge Annual Report F-5
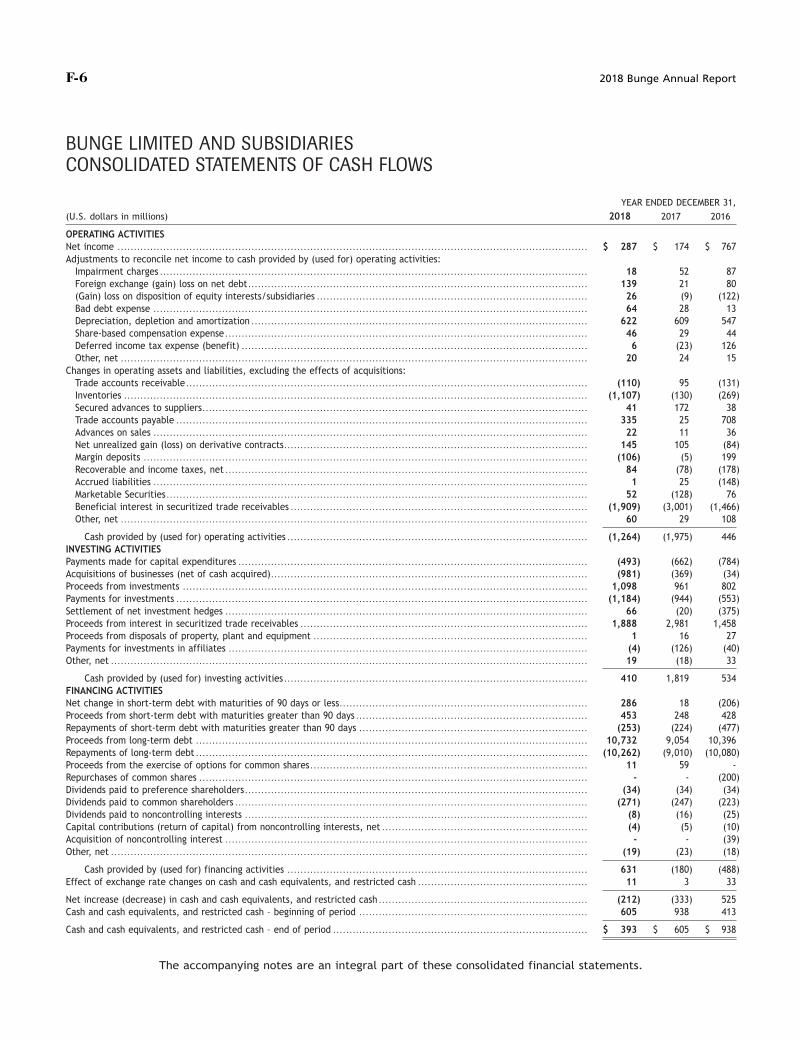
F-6
BUNGE LIMITED AND SUBSIDIARIESCONSOLIDATED STATEMENTS OF CASH FLOWS
YEAR ENDED DECEMBER 31,
(U.S. dollars in millions) 2018 2017 2016
OPERATING ACTIVITIESNet income . . . . . . . . . . . . . . . . . . . . . . . . . . . . . . . . . . . . . . . . . . . . . . . . . . . . . . . . . . . . . . . . . . . . . . . . . . . . . . . . . . . . . . . . . . . . . . . . . . . . . . . . . . . . . . . . . . . . . . . . . . . . . . . . . . . . . . . . . . . . . . . . $ 287 $ 174 $ 767Adjustments to reconcile net income to cash provided by (used for) operating activities:
Impairment charges . . . . . . . . . . . . . . . . . . . . . . . . . . . . . . . . . . . . . . . . . . . . . . . . . . . . . . . . . . . . . . . . . . . . . . . . . . . . . . . . . . . . . . . . . . . . . . . . . . . . . . . . . . . . . . . . . . . . . . . . . . . . . . . . . . . 18 52 87Foreign exchange (gain) loss on net debt . . . . . . . . . . . . . . . . . . . . . . . . . . . . . . . . . . . . . . . . . . . . . . . . . . . . . . . . . . . . . . . . . . . . . . . . . . . . . . . . . . . . . . . . . . . . . . . . . . . . . . . . 139 21 80(Gain) loss on disposition of equity interests/subsidiaries . . . . . . . . . . . . . . . . . . . . . . . . . . . . . . . . . . . . . . . . . . . . . . . . . . . . . . . . . . . . . . . . . . . . . . . . . . . . . . . . . . . 26 (9) (122)Bad debt expense . . . . . . . . . . . . . . . . . . . . . . . . . . . . . . . . . . . . . . . . . . . . . . . . . . . . . . . . . . . . . . . . . . . . . . . . . . . . . . . . . . . . . . . . . . . . . . . . . . . . . . . . . . . . . . . . . . . . . . . . . . . . . . . . . . . . . 64 28 13Depreciation, depletion and amortization . . . . . . . . . . . . . . . . . . . . . . . . . . . . . . . . . . . . . . . . . . . . . . . . . . . . . . . . . . . . . . . . . . . . . . . . . . . . . . . . . . . . . . . . . . . . . . . . . . . . . . . 622 609 547Share-based compensation expense . . . . . . . . . . . . . . . . . . . . . . . . . . . . . . . . . . . . . . . . . . . . . . . . . . . . . . . . . . . . . . . . . . . . . . . . . . . . . . . . . . . . . . . . . . . . . . . . . . . . . . . . . . . . . . . 46 29 44Deferred income tax expense (benefit) . . . . . . . . . . . . . . . . . . . . . . . . . . . . . . . . . . . . . . . . . . . . . . . . . . . . . . . . . . . . . . . . . . . . . . . . . . . . . . . . . . . . . . . . . . . . . . . . . . . . . . . . . . 6 (23) 126Other, net . . . . . . . . . . . . . . . . . . . . . . . . . . . . . . . . . . . . . . . . . . . . . . . . . . . . . . . . . . . . . . . . . . . . . . . . . . . . . . . . . . . . . . . . . . . . . . . . . . . . . . . . . . . . . . . . . . . . . . . . . . . . . . . . . . . . . . . . . . . . . . . 20 24 15
Changes in operating assets and liabilities, excluding the effects of acquisitions:Trade accounts receivable . . . . . . . . . . . . . . . . . . . . . . . . . . . . . . . . . . . . . . . . . . . . . . . . . . . . . . . . . . . . . . . . . . . . . . . . . . . . . . . . . . . . . . . . . . . . . . . . . . . . . . . . . . . . . . . . . . . . . . . . . . . (110) 95 (131)Inventories . . . . . . . . . . . . . . . . . . . . . . . . . . . . . . . . . . . . . . . . . . . . . . . . . . . . . . . . . . . . . . . . . . . . . . . . . . . . . . . . . . . . . . . . . . . . . . . . . . . . . . . . . . . . . . . . . . . . . . . . . . . . . . . . . . . . . . . . . . . . . . (1,107) (130) (269)Secured advances to suppliers . . . . . . . . . . . . . . . . . . . . . . . . . . . . . . . . . . . . . . . . . . . . . . . . . . . . . . . . . . . . . . . . . . . . . . . . . . . . . . . . . . . . . . . . . . . . . . . . . . . . . . . . . . . . . . . . . . . . . . 41 172 38Trade accounts payable . . . . . . . . . . . . . . . . . . . . . . . . . . . . . . . . . . . . . . . . . . . . . . . . . . . . . . . . . . . . . . . . . . . . . . . . . . . . . . . . . . . . . . . . . . . . . . . . . . . . . . . . . . . . . . . . . . . . . . . . . . . . . . 335 25 708Advances on sales . . . . . . . . . . . . . . . . . . . . . . . . . . . . . . . . . . . . . . . . . . . . . . . . . . . . . . . . . . . . . . . . . . . . . . . . . . . . . . . . . . . . . . . . . . . . . . . . . . . . . . . . . . . . . . . . . . . . . . . . . . . . . . . . . . . . . 22 11 36Net unrealized gain (loss) on derivative contracts . . . . . . . . . . . . . . . . . . . . . . . . . . . . . . . . . . . . . . . . . . . . . . . . . . . . . . . . . . . . . . . . . . . . . . . . . . . . . . . . . . . . . . . . . . . . . 145 105 (84)Margin deposits . . . . . . . . . . . . . . . . . . . . . . . . . . . . . . . . . . . . . . . . . . . . . . . . . . . . . . . . . . . . . . . . . . . . . . . . . . . . . . . . . . . . . . . . . . . . . . . . . . . . . . . . . . . . . . . . . . . . . . . . . . . . . . . . . . . . . . . . (106) (5) 199Recoverable and income taxes, net . . . . . . . . . . . . . . . . . . . . . . . . . . . . . . . . . . . . . . . . . . . . . . . . . . . . . . . . . . . . . . . . . . . . . . . . . . . . . . . . . . . . . . . . . . . . . . . . . . . . . . . . . . . . . . . 84 (78) (178)Accrued liabilities . . . . . . . . . . . . . . . . . . . . . . . . . . . . . . . . . . . . . . . . . . . . . . . . . . . . . . . . . . . . . . . . . . . . . . . . . . . . . . . . . . . . . . . . . . . . . . . . . . . . . . . . . . . . . . . . . . . . . . . . . . . . . . . . . . . . . 1 25 (148)Marketable Securities . . . . . . . . . . . . . . . . . . . . . . . . . . . . . . . . . . . . . . . . . . . . . . . . . . . . . . . . . . . . . . . . . . . . . . . . . . . . . . . . . . . . . . . . . . . . . . . . . . . . . . . . . . . . . . . . . . . . . . . . . . . . . . . . . 52 (128) 76Beneficial interest in securitized trade receivables . . . . . . . . . . . . . . . . . . . . . . . . . . . . . . . . . . . . . . . . . . . . . . . . . . . . . . . . . . . . . . . . . . . . . . . . . . . . . . . . . . . . . . . . . . . (1,909) (3,001) (1,466)Other, net . . . . . . . . . . . . . . . . . . . . . . . . . . . . . . . . . . . . . . . . . . . . . . . . . . . . . . . . . . . . . . . . . . . . . . . . . . . . . . . . . . . . . . . . . . . . . . . . . . . . . . . . . . . . . . . . . . . . . . . . . . . . . . . . . . . . . . . . . . . . . . . 60 29 108
Cash provided by (used for) operating activities . . . . . . . . . . . . . . . . . . . . . . . . . . . . . . . . . . . . . . . . . . . . . . . . . . . . . . . . . . . . . . . . . . . . . . . . . . . . . . . . . . . . . . . . . . . . (1,264) (1,975) 446INVESTING ACTIVITIESPayments made for capital expenditures . . . . . . . . . . . . . . . . . . . . . . . . . . . . . . . . . . . . . . . . . . . . . . . . . . . . . . . . . . . . . . . . . . . . . . . . . . . . . . . . . . . . . . . . . . . . . . . . . . . . . . . . . . . (493) (662) (784)Acquisitions of businesses (net of cash acquired) . . . . . . . . . . . . . . . . . . . . . . . . . . . . . . . . . . . . . . . . . . . . . . . . . . . . . . . . . . . . . . . . . . . . . . . . . . . . . . . . . . . . . . . . . . . . . . . . . (981) (369) (34)Proceeds from investments . . . . . . . . . . . . . . . . . . . . . . . . . . . . . . . . . . . . . . . . . . . . . . . . . . . . . . . . . . . . . . . . . . . . . . . . . . . . . . . . . . . . . . . . . . . . . . . . . . . . . . . . . . . . . . . . . . . . . . . . . . . . 1,098 961 802Payments for investments . . . . . . . . . . . . . . . . . . . . . . . . . . . . . . . . . . . . . . . . . . . . . . . . . . . . . . . . . . . . . . . . . . . . . . . . . . . . . . . . . . . . . . . . . . . . . . . . . . . . . . . . . . . . . . . . . . . . . . . . . . . . . . (1,184) (944) (553)Settlement of net investment hedges . . . . . . . . . . . . . . . . . . . . . . . . . . . . . . . . . . . . . . . . . . . . . . . . . . . . . . . . . . . . . . . . . . . . . . . . . . . . . . . . . . . . . . . . . . . . . . . . . . . . . . . . . . . . . . . 66 (20) (375)Proceeds from interest in securitized trade receivables . . . . . . . . . . . . . . . . . . . . . . . . . . . . . . . . . . . . . . . . . . . . . . . . . . . . . . . . . . . . . . . . . . . . . . . . . . . . . . . . . . . . . . . . 1,888 2,981 1,458Proceeds from disposals of property, plant and equipment . . . . . . . . . . . . . . . . . . . . . . . . . . . . . . . . . . . . . . . . . . . . . . . . . . . . . . . . . . . . . . . . . . . . . . . . . . . . . . . . . . . . 1 16 27Payments for investments in affiliates . . . . . . . . . . . . . . . . . . . . . . . . . . . . . . . . . . . . . . . . . . . . . . . . . . . . . . . . . . . . . . . . . . . . . . . . . . . . . . . . . . . . . . . . . . . . . . . . . . . . . . . . . . . . . . (4) (126) (40)Other, net . . . . . . . . . . . . . . . . . . . . . . . . . . . . . . . . . . . . . . . . . . . . . . . . . . . . . . . . . . . . . . . . . . . . . . . . . . . . . . . . . . . . . . . . . . . . . . . . . . . . . . . . . . . . . . . . . . . . . . . . . . . . . . . . . . . . . . . . . . . . . . . . . . 19 (18) 33
Cash provided by (used for) investing activities . . . . . . . . . . . . . . . . . . . . . . . . . . . . . . . . . . . . . . . . . . . . . . . . . . . . . . . . . . . . . . . . . . . . . . . . . . . . . . . . . . . . . . . . . . . . . 410 1,819 534FINANCING ACTIVITIESNet change in short-term debt with maturities of 90 days or less . . . . . . . . . . . . . . . . . . . . . . . . . . . . . . . . . . . . . . . . . . . . . . . . . . . . . . . . . . . . . . . . . . . . . . . . . . . . 286 18 (206)Proceeds from short-term debt with maturities greater than 90 days . . . . . . . . . . . . . . . . . . . . . . . . . . . . . . . . . . . . . . . . . . . . . . . . . . . . . . . . . . . . . . . . . . . . . . . 453 248 428Repayments of short-term debt with maturities greater than 90 days . . . . . . . . . . . . . . . . . . . . . . . . . . . . . . . . . . . . . . . . . . . . . . . . . . . . . . . . . . . . . . . . . . . . . . (253) (224) (477)Proceeds from long-term debt . . . . . . . . . . . . . . . . . . . . . . . . . . . . . . . . . . . . . . . . . . . . . . . . . . . . . . . . . . . . . . . . . . . . . . . . . . . . . . . . . . . . . . . . . . . . . . . . . . . . . . . . . . . . . . . . . . . . . . . . 10,732 9,054 10,396Repayments of long-term debt . . . . . . . . . . . . . . . . . . . . . . . . . . . . . . . . . . . . . . . . . . . . . . . . . . . . . . . . . . . . . . . . . . . . . . . . . . . . . . . . . . . . . . . . . . . . . . . . . . . . . . . . . . . . . . . . . . . . . . . . (10,262) (9,010) (10,080)Proceeds from the exercise of options for common shares . . . . . . . . . . . . . . . . . . . . . . . . . . . . . . . . . . . . . . . . . . . . . . . . . . . . . . . . . . . . . . . . . . . . . . . . . . . . . . . . . . . . . 11 59 -Repurchases of common shares . . . . . . . . . . . . . . . . . . . . . . . . . . . . . . . . . . . . . . . . . . . . . . . . . . . . . . . . . . . . . . . . . . . . . . . . . . . . . . . . . . . . . . . . . . . . . . . . . . . . . . . . . . . . . . . . . . . . . . . - - (200)Dividends paid to preference shareholders . . . . . . . . . . . . . . . . . . . . . . . . . . . . . . . . . . . . . . . . . . . . . . . . . . . . . . . . . . . . . . . . . . . . . . . . . . . . . . . . . . . . . . . . . . . . . . . . . . . . . . . . . (34) (34) (34)Dividends paid to common shareholders . . . . . . . . . . . . . . . . . . . . . . . . . . . . . . . . . . . . . . . . . . . . . . . . . . . . . . . . . . . . . . . . . . . . . . . . . . . . . . . . . . . . . . . . . . . . . . . . . . . . . . . . . . . . (271) (247) (223)Dividends paid to noncontrolling interests . . . . . . . . . . . . . . . . . . . . . . . . . . . . . . . . . . . . . . . . . . . . . . . . . . . . . . . . . . . . . . . . . . . . . . . . . . . . . . . . . . . . . . . . . . . . . . . . . . . . . . . . . (8) (16) (25)Capital contributions (return of capital) from noncontrolling interests, net . . . . . . . . . . . . . . . . . . . . . . . . . . . . . . . . . . . . . . . . . . . . . . . . . . . . . . . . . . . . . . . (4) (5) (10)Acquisition of noncontrolling interest . . . . . . . . . . . . . . . . . . . . . . . . . . . . . . . . . . . . . . . . . . . . . . . . . . . . . . . . . . . . . . . . . . . . . . . . . . . . . . . . . . . . . . . . . . . . . . . . . . . . . . . . . . . . . . . - - (39)Other, net . . . . . . . . . . . . . . . . . . . . . . . . . . . . . . . . . . . . . . . . . . . . . . . . . . . . . . . . . . . . . . . . . . . . . . . . . . . . . . . . . . . . . . . . . . . . . . . . . . . . . . . . . . . . . . . . . . . . . . . . . . . . . . . . . . . . . . . . . . . . . . . . . . (19) (23) (18)
Cash provided by (used for) financing activities . . . . . . . . . . . . . . . . . . . . . . . . . . . . . . . . . . . . . . . . . . . . . . . . . . . . . . . . . . . . . . . . . . . . . . . . . . . . . . . . . . . . . . . . . . . . 631 (180) (488)Effect of exchange rate changes on cash and cash equivalents, and restricted cash . . . . . . . . . . . . . . . . . . . . . . . . . . . . . . . . . . . . . . . . . . . . . . . . . . . . 11 3 33
Net increase (decrease) in cash and cash equivalents, and restricted cash . . . . . . . . . . . . . . . . . . . . . . . . . . . . . . . . . . . . . . . . . . . . . . . . . . . . . . . . . . . . . . . . (212) (333) 525Cash and cash equivalents, and restricted cash – beginning of period . . . . . . . . . . . . . . . . . . . . . . . . . . . . . . . . . . . . . . . . . . . . . . . . . . . . . . . . . . . . . . . . . . . . . . 605 938 413
Cash and cash equivalents, and restricted cash – end of period . . . . . . . . . . . . . . . . . . . . . . . . . . . . . . . . . . . . . . . . . . . . . . . . . . . . . . . . . . . . . . . . . . . . . . . . . . . . . . $ 393 $ 605 $ 938
The accompanying notes are an integral part of these consolidated financial statements.
F-6 2018 Bunge Annual Report

F-7
BUNGE LIMITED AND SUBSIDIARIESCONSOLIDATED STATEMENTS OF CHANGES IN EQUITY AND REDEEMABLENONCONTROLLING INTERESTS
ACCUMULATEDCONVERTIBLE
REDEEMABLE ADDITIONAL OTHERPREFERENCE SHARES COMMON SHARES
NONCONTROLLING PAID-IN RETAINED COMPREHENSIVE TREASURY NONCONTROLLING TOTAL(U.S. dollars in millions, except share data) INTERESTS SHARES AMOUNT SHARES AMOUNT CAPITAL EARNINGS INCOME (LOSS) SHARES INTERESTS EQUITY
Balance, January 1, 2016 . . . . . . . . . . . . . . . . . . . . . . . . . . . . . . $ 37 6,900,000 $ 690 142,483,467 $ 1 $ 5,105 $ 7,725 $ (6,360) $ (720) $ 211 $ 6,652Net income (loss) . . . . . . . . . . . . . . . . . . . . . . . . . . . . . . . . . . . . . . . 1 - - - - - 745 - - 22 767Accretion of noncontrolling interests . . . . . . . . . . . . . . . . 2 - - - - (2) - - - - (2)Other comprehensive income (loss) . . . . . . . . . . . . . . . . . . (1) - - - - - - 382 - 4 386Dividends on common shares . . . . . . . . . . . . . . . . . . . . . . . . . - - - - - - (228) - - - (228)Dividends on preference shares . . . . . . . . . . . . . . . . . . . . . . - - - - - - (34) - - - (34)Dividends to noncontrolling interests on subsidiary
common stock . . . . . . . . . . . . . . . . . . . . . . . . . . . . . . . . . . . . . . . . - - - - - - - - - (25) (25)Noncontrolling decrease from redemption . . . . . . . . . . - - - - - - - - - (6) (6)Acquisition of Noncontrolling interest . . . . . . . . . . . . . . . (39) - - - - (2) - - - 19 17Deconsolidation of a subsidiary . . . . . . . . . . . . . . . . . . . . . . . - - - - - - - - - (26) (26)Share-based compensation expense . . . . . . . . . . . . . . . . . . - - - - - 44 - - - - 44Repurchase of common shares . . . . . . . . . . . . . . . . . . . . . . . . - - - (3,296,230) - - - - (200) - (200)Issuance of common shares . . . . . . . . . . . . . . . . . . . . . . . . . . . - - - 313,625 - (2) - - - - (2)
Balance, December 31, 2016 . . . . . . . . . . . . . . . . . . . . . . . . . . $ - 6,900,000 $ 690 139,500,862 $ 1 $ 5,143 $ 8,208 $ (5,978) $ (920) $ 199 $ 7,343Net income (loss) . . . . . . . . . . . . . . . . . . . . . . . . . . . . . . . . . . . . . . . - - - - - - 160 - - 14 174Other comprehensive income (loss) . . . . . . . . . . . . . . . . . . - - - - - - - 48 - 16 64Dividends on common shares . . . . . . . . . . . . . . . . . . . . . . . . . - - - - - - (253) - - - (253)Dividends on preference shares . . . . . . . . . . . . . . . . . . . . . . - - - - - - (34) - - - (34)Dividends to noncontrolling interests on subsidiary
common stock . . . . . . . . . . . . . . . . . . . . . . . . . . . . . . . . . . . . . . . . - - - - - - - - - (15) (15)Noncontrolling decrease from redemption . . . . . . . . . . - - - - - - - - - (5) (5)Share-based compensation expense . . . . . . . . . . . . . . . . . . - - - - - 29 - - - - 29Issuance of (conversion to) common shares . . . . . . . . . - (300) - 1,145,967 - 54 - - - - 54
Balance, December 31, 2017 . . . . . . . . . . . . . . . . . . . . . . . . . . $ - 6,899,700 $ 690 140,646,829 $ 1 $ 5,226 $ 8,081 $ (5,930) $ (920) $ 209 $ 7,357Net income (loss) . . . . . . . . . . . . . . . . . . . . . . . . . . . . . . . . . . . . . . . 1 - - - - - 267 - - 19 286Other comprehensive income (loss) . . . . . . . . . . . . . . . . . . (27) - - - - - - (1,005) - (8) (1,013)Dividends on common shares . . . . . . . . . . . . . . . . . . . . . . . . . - - - - - - (276) - - - (276)Dividends on preference shares . . . . . . . . . . . . . . . . . . . . . . - - - - - - (34) - - - (34)Dividends to noncontrolling interests on subsidiary
common stock . . . . . . . . . . . . . . . . . . . . . . . . . . . . . . . . . . . . . . . . - - - - - - - - - (8) (8)Noncontrolling decrease from redemption . . . . . . . . . . - - - - - - - - - (4) (4)Acquisition of Noncontrolling interest . . . . . . . . . . . . . . . 450 - - - - - - - - - -Deconsolidation of a subsidiary . . . . . . . . . . . . . . . . . . . . . . . - - - - - - - - - (3) (3)Share-based compensation expense . . . . . . . . . . . . . . . . . . - - - - - 46 - - - - 46Impact of new accounting standards(1) . . . . . . . . . . . . . . . - - - - - - 21 - - - 21Issuance of (conversion to) common shares . . . . . . . . . - (17) - 464,252 - 6 - - - - 6
Balance, December 31, 2018 . . . . . . . . . . . . . . . . . . . . . . . . $ 424 6,899,683 $ 690 141,111,081 $ 1 $ 5,278 $ 8,059 $ (6,935) $ (920) $ 205 $ 6,378
(1) See Note 1 for further details
The accompanying notes are an integral part of these consolidated financial statements.
2018 Bunge Annual Report F-7

F-8
from third parties to be processed at its eight mills in Brazil to1. NATURE OF BUSINESS, BASIS OF PRESENTATION, ANDproduce sugar, ethanol and electricity. The Sugar andSIGNIFICANT ACCOUNTING POLICIESBioenergy segment also sells sugar and ethanol in bothBrazilian domestic and export markets.Description of Business – Bunge Limited, a Bermuda company,
together with its consolidated subsidiaries and variable interest Fertilizer – Bunge’s Fertilizer segment operates in Argentina,entities (‘‘VIEs’’) in which it is considered the primary Uruguay and Paraguay, where it produces, blends andbeneficiary, through which its businesses are conducted distributes a range of liquid and dry NPK fertilizers, including(collectively ‘‘Bunge’’ or ‘‘the Company’’), is a leading global nitrogen-based liquid and solid phosphate fertilizers. Bunge’sagribusiness and food company. Bunge’s common shares trade operations in Argentina are closely linked to its grainon the New York Stock Exchange under the ticker symbol origination activities as it supplies fertilizer to producers who‘‘BG.’’ Bunge operates in five reportable segments: supply the Company with grain. This segment also includesAgribusiness, Edible Oil Products, Milling Products, Sugar and port operations in Brazil.Bioenergy, and Fertilizer.
Basis of Presentation – The consolidated financial statementsAgribusiness – Bunge’s Agribusiness segment is an integrated, are prepared in conformity with accounting principles generallyglobal business involved in the purchase, storage, transport, accepted in the United States of America (‘‘U.S. GAAP’’). Theprocessing and sale of agricultural commodities and accounting policies used to prepare these financial statementscommodity products. Bunge’s agribusiness operations and are the same as those used to prepare the consolidatedassets are located in North America, South America, Europe financial statements in prior years except as described in theseand Asia-Pacific with merchandising and distribution offices notes or for the adoption of new standards as outlined below.throughout the world.
Discontinued Operations – In determining whether a disposalBunge’s Agribusiness segment also participates in related group should be presented as discontinued operations, Bungefinancial activities, such as offering trade structured finance, makes a determination of whether such a group beingwhich leverages its international trade flows, providing risk disposed of comprises a component of the entity, or a group ofmanagement services to customers by assisting them with components of the entity, that represents a strategic shift thatmanaging price exposure to agricultural commodities, trading has, or will have, a major effect on the Company’s operationsof foreign exchange and other financial instruments and and financial results. If these determinations are madeinvesting in start-up and high growth companies through its affirmatively, the results of operations of the group beingcorporate venture capital unit. disposed of (as well as any gain or loss on the disposal
transaction) are aggregated for separate presentation apartEdible Oil products – Bunge’s Edible Oil Products segmentfrom the continuing operations of the Company for all periodsproduces and sells edible oil products, such as packaged andpresented in the consolidated financial statements.bulk oils and fats, shortenings, margarine, mayonnaise and
other products derived from the vegetable oil refining process, Principles of Consolidation – The accompanying consolidatedas well as refines and fractionates palm oil, palm kernel oil, financial statements include the accounts of Bunge, itscoconut oil, and shea butter. Bunge’s edible oil products subsidiaries and VIEs in which Bunge is considered to be theoperations are located in North America, South America, primary beneficiary, and as a result, include the assets,Europe and Asia-Pacific. liabilities, revenues and expenses of all entities over which
Bunge exercises control. Equity investments in which BungeMilling products – Bunge’s Milling Products segment includeshas the ability to exercise significant influence but does notwheat, corn and rice milling businesses, which purchase wheat,control are accounted for by the equity method of accounting.corn and rice directly from farmers and dealers and processInvestments in which Bunge does not exercise significantthem into milled products for food processors, bakeries,influence are accounted for at cost, or fair value if that isbrewers, snack food producers and other customers. Bunge’sreadily determinable. Intercompany accounts and transactionswheat milling activities are primarily in Mexico and Brazil. Cornare eliminated. An enterprise is determined to be the primaryand rice milling activities are in the United States and Mexico.beneficiary if it has a controlling financial interest, defined as(a) the power to direct the activities of a VIE that mostSugar and Bioenergy – Bunge’s Sugar and Bioenergy segmentsignificantly impact the VIE’s business and (b) the obligation toincludes its sugar and ethanol production in Brazil, andabsorb losses of or the right to receive benefits from the VIEcorn-based ethanol production investments. This segment is anthat could potentially be significant to the VIE’s operations.integrated business involved in the growing and harvesting ofPerformance of that analysis requires the exercise of judgment.sugarcane primarily from land managed through agriculturalThe VIE and consolidation assessments are revisited upon thepartnership agreements and additional sourcing of sugarcaneoccurrence of relevant reconsideration events.
F-8 2018 Bunge Annual Report
BUNGE LIMITED AND SUBSIDIARIESNOTES TO THE CONSOLIDATED FINANCIAL STATEMENTS

F-9
currencies at exchange rates in effect at the balance sheet1. NATURE OF BUSINESS, BASIS OF PRESENTATION, ANDdate. The resulting exchange gain or loss is included inSIGNIFICANT ACCOUNTING POLICIES (Continued)Bunge’s consolidated statements of income as foreignexchange gain (loss) unless the remeasurement gain or lossNoncontrolling interests in subsidiaries related to Bunge’srelates to an intercompany transaction that is of a long-termownership interests of less than 100% are reported asinvestment nature and for which settlement is not planned orNoncontrolling interests or Redeemable noncontrolling interestsanticipated in the foreseeable future. Gains or losses arisingin the consolidated balance sheets. The noncontrollingfrom translation of such transactions are reported as aownership interests in Bunge’s earnings, net of tax, is reportedcomponent of accumulated other comprehensive income (loss)as Net (income) loss attributable to noncontrolling interestsin Bunge’s consolidated balance sheets.and redeemable noncontrolling interests in the consolidated
statements of income.Cash and Cash Equivalents – Cash and cash equivalentsinclude time deposits and readily marketable securities withReclassifications – Certain prior year amounts have beenoriginal maturity dates of three months or less at the time ofreclassified to conform to current year presentation.acquisition.
Use of Estimates – The preparation of consolidated financialTrade Accounts Receivable and Secured Advances tostatements in conformity with U.S. GAAP requires Bunge toSuppliers – Trade accounts receivable and secured advancesmake estimates and assumptions that affect the amountsto suppliers are stated at their historical carrying amounts netreported in the financial statements and notes. Actual resultsof write-offs and allowances for uncollectible accounts. Bungecould differ from those estimates.establishes an allowance for uncollectible trade accounts
Translation of Foreign Currency Financial receivable and secured advances to farmers based on historicalStatements – Bunge’s reporting currency is the U.S. dollar. experience, farming economics and other market conditions asThe functional currency of the majority of Bunge’s foreign well as specific customer collection issues. Uncollectiblesubsidiaries is their local currency and, as such, amounts accounts are written off when a settlement is reached for anincluded in the consolidated statements of income, amount below the outstanding historical balance or whencomprehensive income (loss), cash flows and changes in Bunge has determined that collection is unlikely.equity are translated using average exchange rates during each
Secured advances to suppliers bear interest at contractualperiod. Assets and liabilities are translated at period-endrates which reflect current market interest rates at the time ofexchange rates and resulting foreign currency translationthe transaction. There are no deferred fees or costs associatedadjustments are recorded in the consolidated balance sheetswith these receivables. As a result, there are no imputedas a component of accumulated other comprehensive incomeinterest amounts to be amortized under the interest method.(loss). However, in accordance with U.S. GAAP, if a foreignInterest income is calculated based on the terms of theentity’s economy is determined to be highly inflationary, thenindividual agreements and is recognized on an accrual basis.such foreign entity’s financial statements shall be remeasured
as if the functional currency were the reporting currency.Bunge follows accounting guidance on the disclosure of thecredit quality of financing receivables and the allowance forBunge has significant operations in Argentina and, up untilcredit losses, which requires information to be disclosed atJune 30, 2018, it had utilized the official exchange rate of thedisaggregated levels, defined as portfolio segments andArgentine peso published by the Argentine government for itsclasses.commercial transactions and remeasurement purposes of
financial statements. Argentina has experienced negativeUnder this guidance, a class of receivables is consideredeconomic trends, as evidenced by multiple periods ofimpaired, based on current information and events, if Bungeincreasing inflation rates, devaluation of the peso, anddetermines it probable that all amounts due under the originalincreasing borrowing rates, requiring the Argentine governmentterms of the receivable will not be collected. Recognition ofto take mitigating actions. During the second quarter of 2018,interest income is suspended once the borrower defaults onit was determined that Argentina’s economy should bethe originally scheduled delivery of agricultural commodities asconsidered highly inflationary, and as such, beginning onthe collection of future income is determined not to beJuly 1, 2018, Bunge’s Argentine subsidiaries changed theirprobable. No additional interest income is accrued from thefunctional currency to the U.S. Dollar. This change in functionalpoint of default until ultimate recovery, at which time amountscurrency did not have a material impact on Bunge’scollected are credited first against the receivable and then toconsolidated financial statements.any unrecognized interest income.
Foreign Currency Transactions – Monetary assets andInventories – Readily marketable inventories (‘‘RMI’’) areliabilities denominated in currencies other than the functionalagricultural commodity inventories, such as soybeans, soybeancurrency are remeasured into their respective functional
2018 Bunge Annual Report F-9
BUNGE LIMITED AND SUBSIDIARIESNOTES TO THE CONSOLIDATED FINANCIAL STATEMENTS
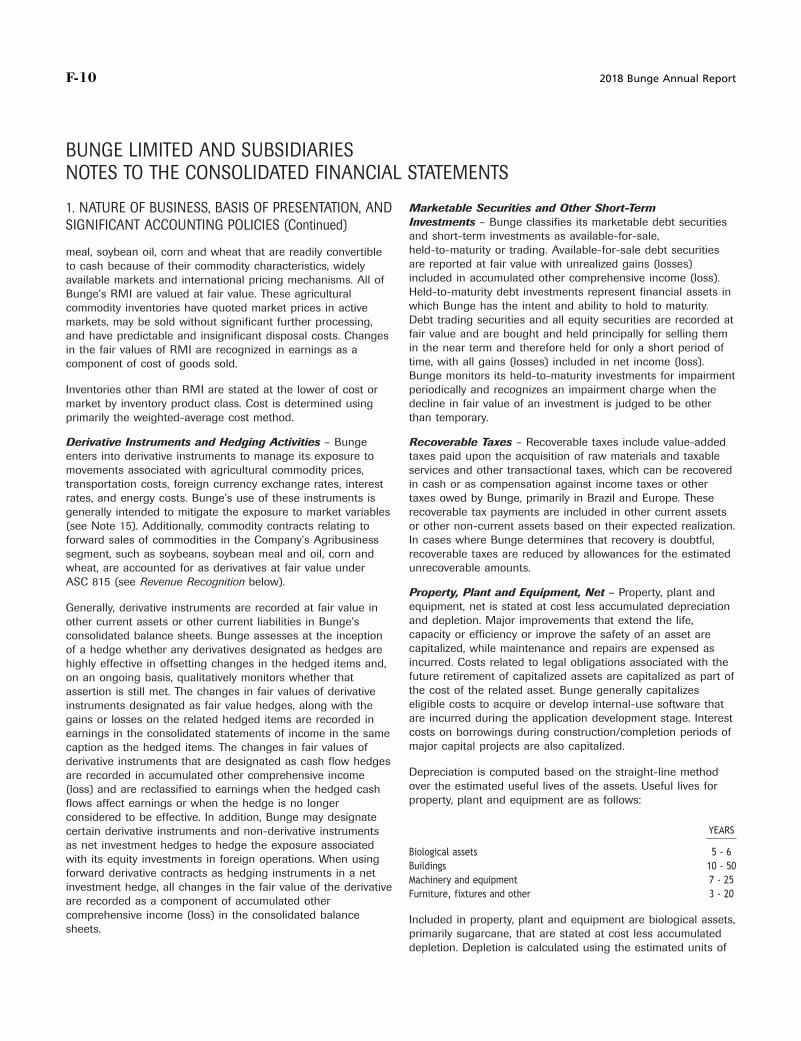
F-10
Marketable Securities and Other Short-Term1. NATURE OF BUSINESS, BASIS OF PRESENTATION, ANDInvestments – Bunge classifies its marketable debt securitiesSIGNIFICANT ACCOUNTING POLICIES (Continued)and short-term investments as available-for-sale,held-to-maturity or trading. Available-for-sale debt securitiesmeal, soybean oil, corn and wheat that are readily convertibleare reported at fair value with unrealized gains (losses)to cash because of their commodity characteristics, widelyincluded in accumulated other comprehensive income (loss).available markets and international pricing mechanisms. All ofHeld-to-maturity debt investments represent financial assets inBunge’s RMI are valued at fair value. These agriculturalwhich Bunge has the intent and ability to hold to maturity.commodity inventories have quoted market prices in activeDebt trading securities and all equity securities are recorded atmarkets, may be sold without significant further processing,fair value and are bought and held principally for selling themand have predictable and insignificant disposal costs. Changesin the near term and therefore held for only a short period ofin the fair values of RMI are recognized in earnings as atime, with all gains (losses) included in net income (loss).component of cost of goods sold.Bunge monitors its held-to-maturity investments for impairment
Inventories other than RMI are stated at the lower of cost or periodically and recognizes an impairment charge when themarket by inventory product class. Cost is determined using decline in fair value of an investment is judged to be otherprimarily the weighted-average cost method. than temporary.
Derivative Instruments and Hedging Activities – Bunge Recoverable Taxes – Recoverable taxes include value-addedenters into derivative instruments to manage its exposure to taxes paid upon the acquisition of raw materials and taxablemovements associated with agricultural commodity prices, services and other transactional taxes, which can be recoveredtransportation costs, foreign currency exchange rates, interest in cash or as compensation against income taxes or otherrates, and energy costs. Bunge’s use of these instruments is taxes owed by Bunge, primarily in Brazil and Europe. Thesegenerally intended to mitigate the exposure to market variables recoverable tax payments are included in other current assets(see Note 15). Additionally, commodity contracts relating to or other non-current assets based on their expected realization.forward sales of commodities in the Company’s Agribusiness In cases where Bunge determines that recovery is doubtful,segment, such as soybeans, soybean meal and oil, corn and recoverable taxes are reduced by allowances for the estimatedwheat, are accounted for as derivatives at fair value under unrecoverable amounts.ASC 815 (see Revenue Recognition below).
Property, Plant and Equipment, Net – Property, plant andequipment, net is stated at cost less accumulated depreciationGenerally, derivative instruments are recorded at fair value inand depletion. Major improvements that extend the life,other current assets or other current liabilities in Bunge’scapacity or efficiency or improve the safety of an asset areconsolidated balance sheets. Bunge assesses at the inceptioncapitalized, while maintenance and repairs are expensed asof a hedge whether any derivatives designated as hedges areincurred. Costs related to legal obligations associated with thehighly effective in offsetting changes in the hedged items and,future retirement of capitalized assets are capitalized as part ofon an ongoing basis, qualitatively monitors whether thatthe cost of the related asset. Bunge generally capitalizesassertion is still met. The changes in fair values of derivativeeligible costs to acquire or develop internal-use software thatinstruments designated as fair value hedges, along with theare incurred during the application development stage. Interestgains or losses on the related hedged items are recorded incosts on borrowings during construction/completion periods ofearnings in the consolidated statements of income in the samemajor capital projects are also capitalized.caption as the hedged items. The changes in fair values of
derivative instruments that are designated as cash flow hedgesDepreciation is computed based on the straight-line methodare recorded in accumulated other comprehensive incomeover the estimated useful lives of the assets. Useful lives for(loss) and are reclassified to earnings when the hedged cashproperty, plant and equipment are as follows:flows affect earnings or when the hedge is no longer
considered to be effective. In addition, Bunge may designateYEARScertain derivative instruments and non-derivative instruments
as net investment hedges to hedge the exposure associatedBiological assets 5 - 6
with its equity investments in foreign operations. When usingBuildings 10 - 50
forward derivative contracts as hedging instruments in a netMachinery and equipment 7 - 25
investment hedge, all changes in the fair value of the derivativeFurniture, fixtures and other 3 - 20
are recorded as a component of accumulated othercomprehensive income (loss) in the consolidated balance Included in property, plant and equipment are biological assets,sheets. primarily sugarcane, that are stated at cost less accumulated
depletion. Depletion is calculated using the estimated units of
F-10 2018 Bunge Annual Report
BUNGE LIMITED AND SUBSIDIARIESNOTES TO THE CONSOLIDATED FINANCIAL STATEMENTS

F-11
potential decline in value may be other than temporary. Bunge1. NATURE OF BUSINESS, BASIS OF PRESENTATION, ANDconsiders various factors in determining whether to recognizeSIGNIFICANT ACCOUNTING POLICIES (Continued)an impairment charge, including the length of time that the fairvalue of the investment is expected to be below its carryingproduction based on the remaining useful life of the growingvalue, the financial condition, operating performance andsugarcane.near-term prospects of the affiliate and Bunge’s intent and
Goodwill – Goodwill represents the cost in excess of the fair ability to hold the investment for a period of time sufficient tovalue of net assets acquired in a business acquisition. Goodwill allow for recovery of the fair value. (see Note 10 and 11).is not amortized but is tested annually for impairment or
Revenue Recognition – The Company’s revenue comprisesbetween annual tests if events or circumstances indicatesales from commodity contracts that are accounted for underpotential impairment. Bunge’s annual impairment testing isASC 815, Derivatives and Hedging (ASC 815) and sales of othergenerally performed during the fourth quarter of its fiscal year.products and services that are accounted for under ASC 606,
Goodwill is tested for impairment at the reporting unit level, Revenue from Contracts with Customers (ASC 606). Additionalwhich has been determined to be the Company’s operating information about the Company’s revenues can be found insegments or one level below the operating segments in certain Note 19.instances (see Note 8).
Revenue from commodity contracts (ASC 815) – Revenue fromOther Intangible Assets – Finite lived intangible assets commodity contracts primarily relates to forward sales ofinclude primarily trademarks, customer relationships and lists, commodities in the Company’s Agribusiness segment, such asport facility usage rights, and patents that are amortized on a soybeans, soybean meal and oil, corn and wheat, which arestraight-line basis over their contractual or legal lives (see accounted for as derivatives at fair value under ASC 815. TheseNote 9) or their estimated useful lives where such lives are not forward sales meet the definition of a derivative under ASC 815determined by law or contract. as they have an underlying (e.g. the price of soybeans), a
notional amount (e.g. metric tons), no initial net investment andImpairment of Property, Plant and Equipment and Finite can be net settled since the commodity is readily convertible toLived Intangible Assets – Bunge reviews its property, plant cash. Bunge does not apply the normal purchase and normaland equipment and finite-lived intangible assets for impairment sale exception available under ASC 815 to these contracts.whenever events or changes in circumstances indicate that Certain of the Company’s sales in its Edible Oil Products,carrying amounts may not be recoverable. Bunge bases its Milling Products, and Sugar and Bioenergy segments alsoevaluation of recoverability on such indicators as the nature, qualify as derivatives, primarily sales of commodities like bulkfuture economic benefits, and geographic locations of the soybean and canola oil, and sugar.assets, historical or future profitability measures, and otherexternal market conditions. If these indicators result in the Revenue from commodity contracts is recognized in Net salesexpected non-recoverability of the carrying amount of an asset for the contracted amount when the contracts are settled at aor asset group, Bunge evaluates potential impairment using point in time by transferring control of the commodity to theundiscounted estimated future cash flows. If such customer, similarly to revenue recognized from contracts withundiscounted future cash flows during the asset’s remaining customers under ASC 606. From inception through settlement,useful life are below its carrying value, a loss is recognized for these forward sales arrangements are recorded at fair valuethe shortfall, measured by the present value of the estimated under ASC 815 with unrealized gains and losses recognized infuture cash flows or by third-party appraisals. Bunge records Cost of goods sold and carried on the consolidated balanceimpairments related to property, plant and equipment and sheet as Current assets (see Note 6) or Current liabilities (seefinite-lived intangible assets used in the processing of its Note 13), respectively. Further information about the fair valueproducts in cost of goods sold in its consolidated statements of of these contracts is presented in the Note 15.income. Any impairment of marketing or brand assets is
Revenue from contracts with customers (ASC 606) – Revenue fromrecognized in selling, general and administrative expenses incontracts with customers accounted for under ASC 606 isthe consolidated statements of income (see Note 10).primarily generated in the Company’s Edible Oil Products,
Property, plant and equipment and other finite-lived intangible Milling Products, Sugar and Bioenergy and Fertilizer segmentsassets to be sold or otherwise disposed of are reported at the through the sale of refined edible oil-based products such aslower of carrying amount or fair value less cost to sell. packaged vegetable oils, shortenings, margarines and
mayonnaise; milled grain products such as wheat flours, bakeryInvestments in Affiliates – Bunge has investments in various mixes, corn-based products, and rice; certain sugar andunconsolidated joint ventures accounted for using the equity bioenergy products; and fertilizer products. These sales aremethod or cost method. Bunge reviews its investments accounted for under ASC 606 as these sales arrangements doannually or when an event or circumstances indicate that a not meet the aforementioned criteria to be considered
2018 Bunge Annual Report F-11
BUNGE LIMITED AND SUBSIDIARIESNOTES TO THE CONSOLIDATED FINANCIAL STATEMENTS

F-12
Additionally, the Company recognizes revenue in the1. NATURE OF BUSINESS, BASIS OF PRESENTATION, ANDAgribusiness segment from ocean freight and port servicesSIGNIFICANT ACCOUNTING POLICIES (Continued)over time as the related services are performed. Performanceobligations are typically completed within a fiscal quarter andderivatives under ASC 815. These revenues are measuredany unearned revenue or accrued revenues are not material.based on consideration specified in a contract with a customer,
and exclude sales taxes, discounts related to promotionalShare-Based Compensation – Bunge maintains equityprograms and amounts collected on behalf of third parties. Theincentive plans for its employees and non-employee directorsCompany recognizes revenue from these contracts at a point in(see Note 25). Bunge accounts for share-based compensationtime when it satisfies a performance obligation by transferringbased on the grant date fair value. Share-based compensationcontrol of a product to a customer, generally when legal titleexpense is recognized on a straight-line basis over theand risks and rewards transfer to the customer. Sales termsrequisite service period.provide for transfer of title either at the time and point of
shipment or at the time and point of delivery and acceptance Income Taxes – Income tax expenses and benefits areof the product being sold. In contracts that do not specify the recognized based on the tax laws and regulations in thetiming of transfer of legal title or transfer of significant risks jurisdictions in which Bunge’s subsidiaries operate. Underand rewards of ownership, judgment is required in determining Bermuda law, Bunge is not required to pay taxes in Bermudathe timing of transfer of control. In such cases, the Company on either income or capital gains. The provision for incomeconsiders standard business practices and the relevant laws taxes includes income taxes currently payable and deferredand regulations applicable to the transaction to determine income taxes arising as a result of temporary differenceswhen legal title or the significant risks and rewards of between the carrying amounts of existing assets and liabilitiesownership are transferred. in Bunge’s financial statements and their respective tax bases.
Deferred tax assets are reduced by valuation allowances ifThe transaction price is generally allocated to performancecurrent evidence does not suggest that the deferred tax assetobligations on a relative standalone selling price basis.will be realized. Accrued interest and penalties related toStandalone selling prices are estimated based on observableunrecognized tax benefits are recognized in income taxdata of the Company’s sales of such products and services to(expense) benefit in the consolidated statements of incomesimilar customers and in similar circumstances on a standalone(see Note 14).basis. In assessing whether to allocate variable consideration to
a specific part of the contract, the Company considers the Research and Development – Research and developmentnature of the variable payment and whether it relates costs are expensed as incurred. Research and developmentspecifically to its efforts to satisfy a specific part of the expenses were $15 million, $20 million and $17 million for thecontract. Variable consideration is generally known upon years ended December 31, 2018, 2017 and 2016, respectively.satisfaction of the performance obligation.
New Accounting Pronouncements – In February 2016, theTaxes assessed by a governmental authority that are both FASB issued ASU 2016-02, Leases (Topic 842). Under the newimposed on and concurrent with a specific revenue producing provisions, all lessees will be reported on the balance sheet astransaction, that are collected by the Company from a a right-of-use asset and a liability for the obligation to makecustomer, are excluded from revenue. payments except for leases with a term of 12 months or less.
The standard is effective for Bunge starting January 1, 2019.Shipping and handling costs associated with outbound freight During 2018, the FASB issued additional implementationafter control over a product has transferred to a customer are guidance and practical expedients in ASU 2018-01, Leasesaccounted for as a fulfillment cost and are included in Cost of (Topic 842): Land Easement Practical Expedient for Transition togoods sold. Topic 842, ASU 2018-10, Codification Improvements to
Topic 842, Leases, ASU 2018-11, Leases (Topic 842): TargetedWarranties provided to customers are primarily assurance-type
Improvements, and ASU 2018-20, Leases (Topic 842): Narrow-warranties on the fitness of purpose and merchantability of the
Scope Improvements for Lessors. Bunge has elected theCompany’s goods and services. The Company does not provide amended transition approach provided by ASU 2018-11, whichservice-type warranties to customers. allows entities to apply the guidance as of the date of initial
application. Upon adoption the Company expects to recordPayment is generally due at the time of shipment or delivery, ornew right-of-use assets and lease liabilities associated withwithin a specified time frame after shipment or delivery, whichoperating leases of approximately $930 million andis generally 30-60 days. The Company’s contracts generally$900 million, respectively. The Company does not expectprovide customers the right to reject any products that do notsignificant impacts to its consolidated statement ofmeet agreed quality specifications. Product returns and refundscomprehensive income, consolidated statement of cash flows,are not material.
F-12 2018 Bunge Annual Report
BUNGE LIMITED AND SUBSIDIARIESNOTES TO THE CONSOLIDATED FINANCIAL STATEMENTS

F-13
(Topic 606), Narrow-Scope Improvements and Practical1. NATURE OF BUSINESS, BASIS OF PRESENTATION, ANDExpedients, and ASU 2016-20, Technical Corrections andSIGNIFICANT ACCOUNTING POLICIES (Continued)Improvements to Topic 606, Revenue from Contracts withCustomers, to improve the guidance. The Company adopted theor consolidated statement of changes in equity andstandard on January 1, 2018 under the modified retrospectiveredeemable noncontrolling interests.approach, applying it only to contracts open as of that date.
In February 2018, the Financial Accounting Standards Board The impact of adopting the standard has not resulted in a(‘‘FASB’’) issued ASU 2018-02, Income Statement – Reporting change in accounting treatment for any of the Company’sComprehensive Income (Topic 220) – Reclassification of Certain revenue streams, except for ocean freight voyage charterTax Effects from Accumulated Other Comprehensive Income. services. Under ASC 605, the Company recognized revenueThis ASU allows a reclassification from accumulated other and the related cost of goods sold upon loading of the goodscomprehensive income to retained earnings for stranded tax onto the vessel, which generally coincides with receipt ofeffects resulting from the Tax Cuts and Jobs Act (‘‘Tax Act’’). payment by the customer. Under ASC 606, the revenue and theConsequently, the ASU eliminates the stranded tax effects related cost of goods sold will instead be recognized over timeresulting from the Tax Act and will improve the usefulness of as the voyages occur and the related expenses are incurred,information reported to financial statement users. However, respectively. As a result of this change in timing, the adoptionbecause this ASU only relates to the reclassification of the of the standard resulted in a cumulative-effect adjustment toincome tax effects of the Tax Act, the underlying guidance that opening retained earnings that was not material.requires that the effect of a change in tax laws or rates be
Upon the adoption of ASU 2016-01, Financial Instruments –included in income from continuing operations is not affected.Overall (Subtopic 825-10), Recognition and Measurement ofASU 2018-02 will be effective for Bunge starting January 1,Financial Assets and Financial Liabilities, the Company has made2019. The adoption of this ASU is not expected to have aa cumulative effect adjustment to reclassify the unrealizedmaterial impact on Bunge’s consolidated financial statements.gains/(losses) of equity investments classified as available for
In June 2016, the FASB issued ASU 2016-13, Financial sale from accumulated other comprehensive income (loss) toInstruments – Credit Losses (Topic 326), which introduces a opening retained earnings that was not material.new accounting model, referred to as the current expected
Upon the adoption of ASU 2016-15, Statement of Cash Flowscredit losses (CECL) model, for estimating credit losses on(Topic 230), Classification of Certain Cash Receipts and Cashcertain financial instruments and expands the disclosurePayments (a consensus of the Emerging Issues Task Force), therequirements for estimating such credit losses. Under the newCompany has changed its presentation of cash flows inmodel, an entity is required to estimate the credit lossesrelation to the Company’s trade receivables securitizationexpected over the life of an exposure (or pool of exposures).program. Particularly impacted are the cash receipts fromThe guidance also amends the current impairment model forpayments on the deferred purchase price, which are nowdebt securities classified as available-for-sale securities. Theclassified as cash inflows from investing activities, whereasnew guidance will be effective for fiscal years beginning afterpreviously they were classified as inflows from operatingDecember 15, 2019, including interim periods within thoseactivities. This ASU has been applied retrospectively and as afiscal years. Early adoption is permitted. Bunge is evaluatingresult, $2,981 million and $1,458 million have been reclassifiedthe impact of this standard on its consolidated financialfrom cash provided by (used for) operating activities to cashstatements.provided by (used for) investing activities in the consolidated
Recently Adopted Accounting Pronouncements – In statement of cash flows for the years ended December 31,May 2014, the FASB amended ASC (Topic 605) Revenue 2017 and 2016, respectively. See Note 18 for additionalRecognition and created ASC (Topic 606), Revenue from information on the trade receivables securitization program.Contracts with Customers. The core principle of the guidance is
Subsequent to the Company’s initial adoption of ASU 2016-15,that an entity should recognize revenue to depict the transferadditional interpretative guidance was released by the SEC inof promised goods or services to customers in an amount thatthe third quarter of 2018 that clarifies the method to be usedreflects the consideration to which the entity expects to befor calculating the cash received from payments on theentitled in exchange for those goods or services. During 2016,deferred purchase price. This additional guidance indicatedthe FASB issued additional implementation guidance andthat an entity must evaluate daily transaction activity topractical expedients in ASU 2016-08, Revenue from Contractscalculate the value of cash received from payments on thewith Customers (Topic 606), Principal versus Agentdeferred purchase price. The company has applied thisConsiderations (Reporting Revenue Gross versus Net),guidance on a retrospective basis, effective with the Form 10-QASU 2016-10, Revenue from Contracts with Customersfor the quarterly period ended September 30, 2018, which(Topic 606), Identifying Performance Obligations and Licensing,
ASU 2016-12, Revenue from Contracts with Customers
2018 Bunge Annual Report F-13
BUNGE LIMITED AND SUBSIDIARIESNOTES TO THE CONSOLIDATED FINANCIAL STATEMENTS

F-14
and other postretirement benefits. Effective for 2018 and all1. NATURE OF BUSINESS, BASIS OF PRESENTATION, ANDprior periods presented, service cost is included in the sameSIGNIFICANT ACCOUNTING POLICIES (Continued)income statement line item as other compensation costsarising from services rendered during the period, while otherresulted in additional reclassification of cash inflows fromcomponents of net periodic benefit pension cost are nowoperating activities to cash inflows from investing activities.presented separately in Other income (expense), net. The
Upon the adoption of ASU 2016-18, Statement of Cash Flows reclassifications associated with the adoption of this ASU did(Topic 230), Restricted Cash (a consensus of the Emerging not have a material impact on Bunge’s consolidated financialIssues Task Force), the Company has changed the way it statements.presents restricted cash in the statement of cash flows.Effective for 2018, and all prior periods presented, restricted 2. GLOBAL COMPETITIVENESS PROGRAMcash is included with cash and cash equivalents whenreconciling the beginning-of-period and end-of-period total In July 2017, Bunge announced a comprehensive globalamounts shown on the statement of cash flows. The following competitiveness program to improve its cost position andtable provides a reconciliation of cash, cash equivalents, and deliver increased value to shareholders (the ‘‘Globalrestricted cash reported within the consolidated balance sheet Competitiveness Program’’ or ‘‘GCP’’). When fully implemented,that sums to the total of the same such amounts shown in the the GCP is expected to reduce the Company’s overhead costsconsolidated statement of cash flows. by approximately $250 million annually. The Company identified
key elements of its strategy to meet this goal, includingDECEMBER 31, adopting a zero-based budgeting process that will target
excess costs in specific budget categories and improving(US$ in millions) 2018 2017 2016efficiency and scalability by simplifying organizational
Cash and cash equivalents . . . . . . . . . . . . . . . . . . . . . . . . . . . . . . . . . $389 $601 $934 structures, streamlining processes and consolidating backRestricted cash included in other current assets . . . . . 4 4 4 office functions globally. As part of the GCP, Bunge offered a
voluntary early retirement program to certain U.S. basedTotal cash, cash equivalents, and restricted cashsalaried employees. Costs associated with the early retirementshown in the statement of cash flows . . . . . . . . . . . . . $393 $605 $938program are reflected in severance and other employee benefitcosts for the year ended December 31, 2017. In conjunctionUpon the adoption of ASU 2017-07, Compensation – Retirementwith the GCP, the Company has implemented other costBenefits (Topic 715): Improving the Presentation of Net Periodicreduction and strategic initiatives to enhance the efficiency andPension Cost and Net Periodic Postretirement Benefit Cost, theperformance of the Company’s business.Company has changed the presentation of net periodic benefit
cost related to its employer sponsored defined benefit plans
The table below sets forth, by type and segment, the costs recorded for the GCP and other associated initiatives:
YEAR ENDED DECEMBER 31,
2018 2017
SEVERANCE SEVERANCEAND OTHER CONSULTING AND OTHER CONSULTINGEMPLOYEE AND OTHER TOTAL EMPLOYEE AND OTHER TOTALBENEFIT PROFESSIONAL PROGRAM PROGRAM BENEFIT PROFESSIONAL PROGRAM PROGRAM
(US$ in millions) COSTS SERVICES COSTS COSTS COSTS SERVICES COSTS COSTS
Agribusiness Segment . . . . . . . . . . . . . . . . . . . . . . . . . . . . . . . . . . . . . . . . . $15 $18 $ 6 $39 $39 $10 $ - $49Edible Oils Segment . . . . . . . . . . . . . . . . . . . . . . . . . . . . . . . . . . . . . . . . . . . 2 4 1 7 12 4 - 16Milling Segment . . . . . . . . . . . . . . . . . . . . . . . . . . . . . . . . . . . . . . . . . . . . . . . . 1 3 - 4 6 1 - 7Sugar and Bioenergy Segment . . . . . . . . . . . . . . . . . . . . . . . . . . . . . . . 2 4 1 7 1 3 - 4Fertilizer Segment . . . . . . . . . . . . . . . . . . . . . . . . . . . . . . . . . . . . . . . . . . . . . 2 1 - 3 1 - - 1
Total . . . . . . . . . . . . . . . . . . . . . . . . . . . . . . . . . . . . . . . . . . . . . . . . . . . . . . . . . . . . . . $22 $30 $ 8 $60 $59 $18 $ - $77
F-14 2018 Bunge Annual Report
BUNGE LIMITED AND SUBSIDIARIESNOTES TO THE CONSOLIDATED FINANCIAL STATEMENTS

F-15
2. GLOBAL COMPETITIVENESS PROGRAM (Continued) 3. BUSINESS ACQUISITIONS AND DISPOSTIONS
In addition to the above charges, for the year ended AcquisitionsDecember 31, 2017, $13 million of severance and other
On March 1, 2018 (‘‘the acquisition date’’), Bunge acquired aemployee benefit costs were recorded related to other70% ownership interest in IOI Loders Croklaan (‘‘Loders’’) fromindustrial productivity initiatives. For the year endedIOI Corporation Berhad (‘‘IOI’’) for $980 million in cash. TheDecember 31, 2018 and 2017 costs recorded above, $9 milliontransaction expands Bunge’s value-added capabilities, reach,and $35 million, respectively, were recorded in Cost of goodsand scale across core geographies to establish Bunge as asold and $51 million and $55 million, respectively, wereglobal leader in business-to-business (or ‘‘B2B’’) oil solutions.recorded in Selling, general and administrative expenses.The Loders portfolio includes a full range of palm and tropical
Bunge’s liability associated with the GCP and other associated oil-derived products with strength in confectionery, bakery andinitiatives is primarily comprised of accruals for severance and infant nutrition applications.other employee benefit costs. The following table sets forth the
The following table summarizes the allocation of the fair valuesactivity affecting the liability for severance and other employeeof the assets acquired and liabilities assumed at the acquisitionbenefit costs related to the GCP and other associateddate, as included in Bunge’s consolidated balance sheet:initiatives, which is recorded in ‘‘Other current liabilities’’ on the
consolidated balance sheet.(US$ in millions)
SEVERANCE Cash and cash equivalents $ 82AND OTHER Accounts receivable 146EMPLOYEE Inventories 406
(US$ in millions) BENEFIT COSTS Other current assets 66Property, plant and equipment 411Balance at December 31, 2016 $ -Intangible assets 464Charges incurred 72Goodwill 242Cash payments (17)
Pension liability(1) (10) Total assets 1,817Accounts payable (109)Balance at December 31, 2017 $ 45Other current liabilities (100)Charges incurred 22Deferred income taxes (143)Cash payments (64)Noncurrent liabilities (35)
Balance at December 31, 2018 $ 3Total liabilities (387)
Redeemable noncontrolling interest (450)(1) Included in severance and other employee benefit costs for the year ended
Net assets acquired $ 980December 31, 2017 is approximately $10 million of additional pension expense incurredas part of the voluntary early retirement program. This amount is accrued with the totalBunge pension liability in ‘‘Other noncurrent liabilities’’ in the consolidated balance
The $242 million of goodwill recognized was assigned to thesheet.Edible Oil Products segment. The goodwill recognized isprimarily attributable to expected synergies and the assembledIn addition to the cash charges described above, theworkforce of Loders. None of the goodwill is expected to beCompany’s restructuring initiatives may include the sale ordeductible for income tax purposes.disposal of long-lived assets and rationalization of certain
investments. As Bunge continues to review its opportunities,The fair value of the identifiable intangible assets wascertain charges may be recorded in earnings, includingdetermined primarily using the ‘‘income approach,’’ whichcharges related to the disposal of assets or investments. Forrequires a forecast of all the expected future cash flows eitherthe year ended December 31, 2018 and 2017, $39 million andusing the multi-period excess earnings method or the$45 million, respectively, of such charges have been incurred.relief-from-royalty method. Some of the more significantSee Note 10 for additional details of these and otherassumptions inherent in the development of intangible assetimpairment charges.values include: the amount and timing of projected future cashflows, the discount rate selected to measure the risks inherentin the future cash flows, and the assessment of the intangibleasset’s life cycle, as well as other factors.
2018 Bunge Annual Report F-15
BUNGE LIMITED AND SUBSIDIARIESNOTES TO THE CONSOLIDATED FINANCIAL STATEMENTS

F-16
December 31, 2018 was also adjusted to exclude $19 million of3. BUSINESS ACQUISITIONS AND DISPOSTIONSacquisition and integration related costs incurred in 2018, while(Continued)2017 supplemental pro forma income from continuingoperations was adjusted to include these charges.The following table provides the details of intangible assets
acquired, by major class and weighted average useful life:Supplemental pro forma financial information is not necessarilyindicative of the Company’s actual results of operations if the(US$ in millions) USEFUL LIFEacquisition had been completed at the date indicated, nor is it
Customer relationships 15 years $265 necessarily an indication of future operating results. AmountsIntellectual property 10 years 120 do not include any operating efficiencies or cost savings thatTrade names 15 years 51 the Company believes are achievable.Favorable leases 38 years 26Other various 2
Other acquisitionsTotal intangible assets $464
On January 30, 2018, Bunge acquired Minsa Corporation (‘‘MinsaUSA’’) for $75 million. As a result of the transaction, BungeThe fair value in the opening balance sheet of the 30%acquired two corn mills in the United States. The purchase priceredeemable noncontrolling interest in Loders was estimated toallocation resulted in $37 million allocated to property, plant andbe $450 million. The fair value was estimated based on 30% ofequipment, $20 million to finite-lived intangible assets, $(1) millionthe total equity value of Loders based on the transaction priceto other net assets and liabilities, and $19 million to goodwill, allfor the 70% stake in Loders, considering the cash paid and therecorded in the Milling Products segment.value of the put/call provisions. See Note 22 for more
information related to this redeemable noncontrolling interest.On February 28, 2017, Bunge acquired two oilseed processingplants and related operations in the Netherlands and FranceSince March 1, 2018, goodwill decreased by $21 million relatedpursuant to an agreement with Cargill, Inc. Bunge paid a totalto post-closing adjustments to the purchase price.purchase price of approximately $322 million. The purchaseprice allocation resulted in $109 million allocated to property,The amounts of revenue and earnings of Loders included inplant and equipment, $103 million to other net assets andBunge’s consolidated statement of income from the acquisitionliabilities and $7 million to finite-lived intangible assets. Thedate to December 31, 2018 is as follows:transaction also resulted in $103 million of goodwill allocatedto Bunge’s agribusiness operations.(US$ in millions)
Net sales $1,331 DispositionsIncome (loss) from continuing operations $ 3
On November 30, 2016, Bunge closed on the disposition of aThe following represents the unaudited supplemental pro forma 50% ownership interest in its Terminal Fronteira Norteresults of the combined entity as if Loders was acquired on Logistica S.A. port terminal (‘‘TFN’’) in Brazil to AmaggiJanuary 1, 2017: Exportacao E Importacao Ltda. for total consideration in cash
of approximately $145 million, which resulted in a gain ofYEAR ENDED $90 million. As a result of this transaction, Bunge accounted
DECEMBER 31, for its remaining 50% interest in the TFN joint venture as anequity method investment.(US$ in millions) 2018 2017
Net sales $46,047 $47,588 On November 30, 2016, Bunge and Wilmar InternationalIncome (loss) from continuing operations $ 298 $ 129 Limited (‘‘Wilmar’’) completed the formation of a joint venture
in Vietnam in which Wilmar will invest into Bunge’s crushThe supplemental pro forma amounts for income from operations in Vietnam, creating a three-party joint venture withcontinuing operations above have been adjusted to reflect Bunge and Wilmar as equal 45% shareholders and Quangadditional depreciation and amortization that would have been Dung, a leading soybean meal distributor in Vietnam, retainingcharged assuming the fair value adjustments to property, plant its existing 10% stake in the operations. Bunge receivedand equipment and intangible assets had been applied on $33 million cash in consideration for its 45% share of interestJanuary 1, 2017. Additionally, these amounts were also in Bunge’s crush operations. This transaction resulted in a gainadjusted to reflect additional interest expense on the $1 billion of $30 million. As a result of this transaction, Bunge accountedof senior notes issued in connection with the acquisition, as if for the joint venture as an equity method investment.such issuance occurred on January 1, 2017. Supplemental proforma income from continuing operations for the year ended
F-16 2018 Bunge Annual Report
BUNGE LIMITED AND SUBSIDIARIESNOTES TO THE CONSOLIDATED FINANCIAL STATEMENTS

F-17
pricing mechanisms. All other inventories are carried at lower4. TRADE STRUCTURED FINANCE PROGRAMof cost or net realizable value.
Bunge engages in various trade structured finance activities toDECEMBER 31,leverage the value of its trade flows across its operating
(US$ in millions) 2018 2017regions. For the years ended December 31, 2018 and 2017, netreturns from these activities were $30 million and $33 million,
Agribusiness(1) $4,551 $4,022respectively, and were included as a reduction of cost of goodsEdible Oil Products(2) 742 458
sold in the accompanying consolidated statements of income.Milling Products 220 196
These activities include programs under which Bunge generallySugar and Bioenergy(3) 280 333
obtains U.S. dollar-denominated letters of credit (‘‘LCs’’) (eachFertilizer 78 65
based on an underlying commodity trade flow) from financialTotal $5,871 $5,074institutions and time deposits denominated in either the local
currency of the financial institutions’ counterparties or in U.S.(1) Includes RMI of $4,365 million and $3,865 million at December 31, 2018 and 2017,dollars, as well as foreign exchange forward contracts, andrespectively. Of these amounts $3,300 million and $2,694 million can be attributable toother programs in which trade related payables are set-offmerchandising activities at December 31, 2018 and 2017, respectively.
against receivables, all of which are subject to legally(2) Includes RMI of $88 million and $115 million at December 31, 2018 and 2017,enforceable set-off agreements. The assets and liabilitiesrespectively.related to the program are reflected in the consolidated
balance sheets as Time deposits under trade structured finance (3) Includes RMI of $79 million and $76 million at December 31, 2018 and 2017,respectively. Of these amounts, $74 million and $73 million can be attributable toprogram and Letter of credit obligations under trade structuredmerchandising activities at December 31, 2018 and 2017, respectively.finance program, respectively. The fair values approximated the
carrying amount of the related financial instruments and are allLevel 2 measurements. 6. OTHER CURRENT ASSETS
As of December 31, 2018 and 2017, receivables and trade Other current assets consist of the following:payables of nil and $1,196 million, respectively, and timedeposits and LCs of $4,729 million and $6,321 million, DECEMBER 31,respectively, were presented net on the consolidated balance
(US$ in millions) 2018 2017sheets as the criteria of ASC 210-20, Offsetting, had been met.At December 31, 2018 and 2017, time deposits, including those Unrealized gains on derivative contracts, at fair value $1,071 $ 910presented on a net basis, carried weighted-average interest Prepaid commodity contracts(1) 253 282rates of 3.76% and 2.98%, respectively. During the years ended Secured advances to suppliers, net(2) 257 412December 31, 2018, 2017 and 2016, total net proceeds from Recoverable taxes, net 500 488issuances of LCs were $4,657 million, $8,174 million and Margin deposits 348 258$7,191 million, respectively. These cash inflows are offset by the Marketable securities, at fair value and otherrelated cash outflows resulting from placement of the time short-term investments 162 213deposits and repayment of the LCs. All cash flows related to Deferred purchase price receivable, at fair value(3) 128 107the programs are included in operating activities in the Income taxes receivable 102 192consolidated statements of cash flows. Prepaid expenses 165 125
Other 185 240
5. INVENTORIES Total $3,171 $3,227
(1) Prepaid commodity contracts represent advance payments against contracts forInventories by segment are presented below. Readilyfuture delivery of specified quantities of agricultural commodities.marketable inventories (‘‘RMI’’) are agricultural commodity
inventories, such as soybeans, soybean meal, soybean oil, corn (2) Bunge provides cash advances to suppliers, primarily Brazilian farmers of soybeansand wheat, carried at fair value because of their commodity and sugarcane, to finance a portion of the suppliers’ production costs. Bunge does not
bear any of the costs or operational risks associated with the related growing crops. Thecharacteristics, widely available markets, and internationaladvances are largely collateralized by future crops and physical assets of the suppliers,carry a local market interest rate, and settle when the farmer’s crop is harvested andsold. The secured advances to farmers are reported net of allowances of $1 million and$1 million at December 31, 2018 and December 31, 2017, respectively. Interest earnedon secured advances to suppliers of $30 million, $44 million and $38 million, for theyears ended December 31, 2018, 2017 and 2016, respectively, is included in net sales inthe consolidated statements of income.
(3) Deferred purchase price receivable represents additional credit support for theinvestment conduits in Bunge’s accounts receivables sales program (see Note 18).
2018 Bunge Annual Report F-17
BUNGE LIMITED AND SUBSIDIARIESNOTES TO THE CONSOLIDATED FINANCIAL STATEMENTS

F-18
Bunge’s capital expenditures amounted to $490 million,6. OTHER CURRENT ASSETS (Continued)$633 million, and $810 million during the years ended 2018,2017 and 2016, respectively. Included in these capitalizedMarketable Securities and Other Short-Term Investments. Bungeexpenditures was capitalized interest on construction ininvests in foreign government securities, corporate debtprogress of $4 million, $6 million, and $9 million for the yearssecurities, deposits, and other securities. The following is aended December 31, 2018, 2017 and 2016, respectively.summary of amounts recorded in the consolidated balanceDepreciation and depletion expense was $565 million,sheets for marketable securities and other short-term$580 million and $517 million for the years endedinvestments.December 31, 2018, 2017 and 2016, respectively.
DECEMBER 31,
8. GOODWILL(US$ in millions) 2018 2017
Foreign government securities $ 55 $145 Bunge performs its annual goodwill impairment testing in theCorporate debt securities 91 59 fourth quarter of each year. Step 1 of the goodwill impairmentCertificate of deposits/time deposits 15 - test compares the fair value of Bunge’s reporting units toOther 1 9 which goodwill has been allocated to the carrying values of
those reporting units. The fair value of reporting units isTotal marketable securities and other short-termdetermined using a discounted cash flow model with estimatesinvestments $162 $213of future cash flows based on internal forecasts of revenuesand expenses (the income approach). Estimates based on
As of December 31, 2018, total marketable securities and other market earnings multiples of peer companies identified for theshort-term investments includes $144 million that are recorded reporting unit (the market approach) may also be used, whereat fair value and $18 million as other short-term investments. available. Critical estimates in the determination of fair valueAs of December 31, 2017, total marketable securities and other under the income approach include, but are not limited to,short-term investments includes $3 million of assets classified assumptions about variables such as commodity prices, cropas available for sale, $209 million, as trading and $1 million as and related throughput and production volumes, profitability,other short-term investments. Due to the short-term nature of future capital expenditures and discount rates, all of which arethese investments, carrying value approximates fair value. subject to a high degree of judgment.
7. PROPERTY, PLANT AND EQUIPMENT
Property, plant and equipment consist of the following:
DECEMBER 31,(US$ in millions) 2018 2017
Land $ 403 $ 390Biological assets 663 709Buildings 2,139 2,116Machinery and equipment 5,664 5,601Furniture, fixtures and other 581 579Construction in progress 435 517
Gross book value 9,885 9,912Less: accumulated depreciation and depletion (4,684) (4,602)
Total property, plant and equipment, net $ 5,201 $ 5,310
F-18 2018 Bunge Annual Report
BUNGE LIMITED AND SUBSIDIARIESNOTES TO THE CONSOLIDATED FINANCIAL STATEMENTS

F-19
8. GOODWILL (Continued)
Changes in the carrying value of goodwill by segment for the years ended December 31, 2018 and 2017 are as follows:
EDIBLE OIL MILLING SUGAR AND(US$ in millions) AGRIBUSINESS PRODUCTS PRODUCTS BIOENERGY FERTILIZER TOTAL
Goodwill, gross of impairments . . . . . . . . . . . . . . . . . . . . . . . . . . . . . . . . . . . . . . . . . . . . . . . . . . . . $ 128 $ 91 $ 171 $ 514 $1 $ 905Accumulated impairment losses . . . . . . . . . . . . . . . . . . . . . . . . . . . . . . . . . . . . . . . . . . . . . . . . . . . . (2) (13) (3) (514) - (532)
Balance, December 31, 2016, net . . . . . . . . . . . . . . . . . . . . . . . . . . . . . . . . . . . . . . . . . . . . . . . 126 78 168 - 1 373
Goodwill acquired(1) . . . . . . . . . . . . . . . . . . . . . . . . . . . . . . . . . . . . . . . . . . . . . . . . . . . . . . . . . . . . . . . . . . . 103 8 - - - 111Foreign currency translation . . . . . . . . . . . . . . . . . . . . . . . . . . . . . . . . . . . . . . . . . . . . . . . . . . . . . . . . 22 8 1 - - 31
Goodwill, gross of impairments . . . . . . . . . . . . . . . . . . . . . . . . . . . . . . . . . . . . . . . . . . . . . . . . . . . . 253 107 172 514 1 1,047Accumulated impairment losses . . . . . . . . . . . . . . . . . . . . . . . . . . . . . . . . . . . . . . . . . . . . . . . . . . . . (2) (13) (3) (514) - (532)
Balance, December 31, 2017, net . . . . . . . . . . . . . . . . . . . . . . . . . . . . . . . . . . . . . . . . . . . . . . . 251 94 169 - 1 515
Goodwill acquired(2) . . . . . . . . . . . . . . . . . . . . . . . . . . . . . . . . . . . . . . . . . . . . . . . . . . . . . . . . . . . . . . . . . . — 242 19 - - 261Foreign currency translation . . . . . . . . . . . . . . . . . . . . . . . . . . . . . . . . . . . . . . . . . . . . . . . . . . . . . . (18) (18) (13) - - (49)
Goodwill, gross of impairments . . . . . . . . . . . . . . . . . . . . . . . . . . . . . . . . . . . . . . . . . . . . . . . . . . . 235 331 178 514 1 1,259Accumulated impairment losses . . . . . . . . . . . . . . . . . . . . . . . . . . . . . . . . . . . . . . . . . . . . . . . . . . (2) (13) (3) (514) - (532)
Balance, December 31, 2018, net . . . . . . . . . . . . . . . . . . . . . . . . . . . . . . . . . . . . . . . . . . . . . . . $233 $318 $175 $ — $1 $ 727
(1) Agribusiness goodwill relates to the 2017 acquisition of two oilseed processing plants and related operations in the Netherlands and France pursuant to an agreement with Cargill.
(2) Edible Oils goodwill relates to the Loders acquisition and the Milling Products goodwill relates to the Minsa USA acquisition. See Note 3 for complete business acquisition details.
and $28 million of other intangible assets, as part of the Loders9. OTHER INTANGIBLE ASSETSand Minsa USA acquisitions. Bunge allocated $465 million tothe Edible Oils segment and $20 million to the Milling segment.Other intangible assets are all finite-lived and consist of theFinite lives of these intangibles range from 10 to 38 years.following:
DECEMBER 31, In 2017, Bunge acquired $21 million of brands and trademarks,(US$ in millions) 2018 2017 and $11 million other intangible assets. Bunge allocated
$24 million to the Edible Oils segment and $8 million to theGross carrying amount: Agribusiness segment. Finite lives of these intangibles rangeTrademarks/brands $ 235 $ 211 from 3 to 27 years.Licenses 12 7Port rights 141 155 Amortization expense was $57 million, $29 million andCustomer Relationships 372 106 $31 million for the years ended December 31, 2018, 2017Patents 135 23 and 2016, respectively. The estimated annual futureOther 95 71 amortization expense is $60 million for 2019 through 2023.
990 573Accumulated amortization: 10. IMPAIRMENTSTrademarks/brands (106) (109)Licenses (10) (5) For the year ended December 31, 2018, Bunge recordedPort rights (37) (31) pre-tax, impairment charges of $18 million, of which $7 million,Customer Relationships (54) (34) $10 million and $1 million are recorded in selling, general andPatents (32) (22) administrative expenses, cost of goods sold and other incomeOther (54) (49) (expense) – net, respectively, in its consolidated statement of
income. These amounts are primarily made up of $10 million(293) (250)relating to the impairment of property, plant and equipment atOther intangible assets, net $ 697 $ 323a port in Poland in the Agribusiness segment, and a $6 millionwrite-off of various machinery and equipment in Brazil, of
In 2018, Bunge acquired $282 million of customer relationships,$120 million of patents, $55 million of brands and trademarks
2018 Bunge Annual Report F-19
BUNGE LIMITED AND SUBSIDIARIESNOTES TO THE CONSOLIDATED FINANCIAL STATEMENTS

F-20
venture with Louis Dreyfus Company and Aceitera General10. IMPAIRMENTS (Continued)Deheza S.A. (‘‘AGD’’), in Paraguay.
which $5 million related to the Sugar and Bioenergy segmentG3 Global Holding GP Inc. – Bunge has a 25% ownershipand $1 million to Agribusiness.interest in G3 Global Holding GP Inc., a joint venture with
For the year ended December 31, 2017, Bunge recorded Saudi Agricultural and Livestock Investment Company thatpre-tax, impairment charges of $52 million, of which operates grain facilities in Canada.$19 million, $16 million and $17 million are in selling, general
Navegacoes Unidas Tapajos S.A. (‘‘Tapajos’’) – Bunge has a 50%and administrative expenses, cost of goods sold and otherownership interest in Tapajos, a joint venture with the Amaggiincome (expense) – net, respectively, in its consolidatedExportacao E Importacao to operate inland waterwaystatement of income. These amounts are primarily made up oftransportation between the municipalities of Itaituba and$25 million relating to the impairment of property, plant andBarcarena, Brazil. The Tapajos complex is mainly dedicated toequipment of feedmills in China, a port in Poland and variousexporting soybeans and grains from Brazil.machinery and equipment in Brazil primarily in the
Agribusiness segment, $17 million that relates to theTerminais do Graneis do Guaruja (‘‘TGG’’) – Bunge has a 57%impairment of two investments in affiliates in the Agribusinessownership interest in TGG, a joint venture with Amaggiand Sugar and Bioenergy segments, and $7 million that relatesInternational Ltd. to operate a port terminal in Santos, Brazil,to an intangible asset impairment of patents.for the reception, storage and shipment of solid bulk cargoes.
For the year ended December 31, 2016, Bunge recorded Terminal Fronteira Norte Logıstica S.A.(‘‘TFN’’) – Bunge has a 50%pre-tax, impairment charges of $87 million, of which $9 million, ownership interest in TFN, a joint venture with Amaggi$6 million and $72 million are in cost of goods sold, selling, Exportacao E Importacao to operate a port terminal ingeneral and administrative expenses and other income Barcarena, Brazil. The TFN complex is mainly dedicated to(expense) – net, respectively, in its consolidated statement of exporting soybean and corn from Brazil.income. These amounts are primarily made up of $44 millionthat relates to the impairment of an investment in affiliate and Terminal 6 S.A. and Terminal 6 Industrial S.A. – Bunge has a jointother investments in the Sugar and Bioenergy segment, venture, Terminal 6 S.A., in Argentina with AGD for the$15 million that relates to the impairment of an investment in operation of a port facility located in the Santa Fe province ofaffiliate in the Agribusiness segment, $12 million that relates to Argentina. Bunge is also a party to a second joint venture withan intangible asset impairment of aquaculture patents and AGD, Terminal 6 Industrial S.A., that operates a crushing facility$9 million that relates to a property, plant and equipment located adjacent to the port facility. Bunge owns 40% and 50%,impairment of an Argentina fertilizer plant. respectively, of these joint ventures.
The fair values of the assets were determined utilizing Vietnam Agribusiness Holdings Ptd. Ltd. – Bunge and Wilmardiscounted future expected cash flows, and in the case of the International Limited (‘‘Wilmar’’) formed a joint venture in 2016equity method investment, net market value based on broker in Vietnam in which Wilmar invested into Bunge’s crushquotes of similar assets. operations in Vietnam, creating a three-party joint venture with
Bunge and Wilmar as equal 45% shareholders and QuangDung, a leading soybean meal distributor in Vietnam, retaining11. INVESTMENTS IN AFFILIATESits existing 10% stake in the operations.
Bunge participates in various unconsolidated joint ventures andSugar and Bioenergyother investments accounted for using the equity method.
Certain equity method investments at December 31, 2018 areProMaiz – Bunge has a 50% ownership interest in a corn wetdescribed below. Bunge allocates equity in earnings ofmilling facility joint venture with AGD in Argentina for theaffiliates to its reporting segments.production of ethanol.
Agribusiness Southwest Iowa Renewable Energy, LLC (‘‘SIRE’’) – Bunge has a25% ownership interest in SIRE. The other owners are primarily
Agricola Alvorada S.A. – Bunge has a 37% ownership interest in agricultural producers located in Southwest Iowa. SIREan agribusiness company in Brazil which complements its grain operates an ethanol plant near Bunge’s oilseed processingorigination business. facility in Council Bluffs, Iowa.
Complejo Agroindustrial Angostura S.A. (‘‘CAIASA’’) – Bunge has a33.3% ownership interest in an oilseed processing facility joint
F-20 2018 Bunge Annual Report
BUNGE LIMITED AND SUBSIDIARIESNOTES TO THE CONSOLIDATED FINANCIAL STATEMENTS

F-21
2017 was $215 million and $253 million, respectively. The table12. OTHER NON-CURRENT ASSETSbelow summarizes Bunge’s recorded investment in long-termreceivables from farmers in Brazil and the related allowanceOther non-current assets consist of the following:amounts.
DECEMBER 31, DECEMBER 31, 2018 DECEMBER 31, 2017(US$ in millions) 2018 2017
RECORDED RECORDED
(US$ in millions) INVESTMENT ALLOWANCE INVESTMENT ALLOWANCERecoverable taxes, net(1) $112 $ 155For which an allowance hasJudicial deposits(1) 115 140
been provided:Other long-term receivables 8 12Legal collection process(1) $105 $ 89 $ 98 $ 91
Income taxes receivable(1) 221 307 Renegotiated amounts(2) 17 17 25 22Long-term investments 91 66 For which no allowance has
been provided:Affiliate loans receivable 29 24Legal collection process(1) 51 - 76 -
Long-term receivables from farmers in Brazil, net(1) 93 131 Renegotiated amounts(2) 10 - 17 -Other long-term receivables 16 - 28 -Other 154 193
Total $199 $106 $244 $113Total $823 $1,028
(1) All amounts in legal process are considered past due upon initiation of legal action.(1) These non-current assets arise primarily from Bunge’s Brazilian operations and their
(2) All renegotiated amounts are current on repayment terms.realization could take several years.
The table below summarizes the activity in the allowance forRecoverable taxes, net – Recoverable taxes are reported net ofdoubtful accounts related to long-term receivables fromallowances of $27 million and $28 million at December 31,farmers in Brazil.2018 and 2017, respectively.
Judicial deposits – Judicial deposits are funds that Bunge has DECEMBER 31,placed on deposit with the courts in Brazil. These funds are (US$ in millions) 2018 2017held in judicial escrow relating to certain legal proceedings
Beginning balance $113 $109pending legal resolution and bear interest at the SELIC rate,Bad debt provisions 20 19which is the benchmark rate of the Brazilian central bank.Recoveries (8) (12)Write-offs (2) (1)Income taxes receivable – Income taxes receivable includesForeign currency translation (17) (2)overpayments of current income taxes plus accrued interest.
These income tax prepayments are expected to be utilized for Ending balance $106 $113settlement of future income tax obligations. Income taxesreceivable in Brazil bear interest at the SELIC rate.
13. OTHER CURRENT LIABILITIESAffiliate loans receivable – Affiliate loans receivable, are primarilyinterest-bearing receivables from unconsolidated affiliates with
Other current liabilities consist of the following:a remaining maturity of greater than one year.
DECEMBER 31,Long-term receivables from farmers in Brazil, net – Bunge provides(US$ in millions) 2018 2017financing to farmers in Brazil, primarily through secured
advances against farmer commitments to deliver agriculturalAccrued liabilities $ 618 $ 606
commodities (primarily soybeans) upon harvest of theUnrealized losses on derivative contracts at fair value 1,192 897
then-current year’s crop and through credit sales of fertilizer toAdvances on sales 405 406
farmers. Certain of such long-term receivables from farmersOther 287 277
are originally recorded in other current assets as prepaidTotal $2,502 $2,186commodity contracts or secured advances to suppliers (see
Note 6) and reclassified to other non-current assets whencollection issues with farmers arise and amounts become past
14. INCOME TAXESdue and resolution of matters is expected to take more thanone year.
Bunge operates globally and is subject to the tax laws andregulations of numerous tax jurisdictions and authorities, asThe average recorded investment in long-term receivables fromwell as tax agreements and treaties among these jurisdictions.farmers in Brazil for the years ended December 31, 2018 and
2018 Bunge Annual Report F-21
BUNGE LIMITED AND SUBSIDIARIESNOTES TO THE CONSOLIDATED FINANCIAL STATEMENTS

F-22
Reconciliation of the income tax expense (benefit) if computed14. INCOME TAXES (Continued)at the U.S. Federal income tax rate to Bunge’s reported income
Bunge’s income tax provision is impacted by, among other tax expense (benefit) is as follows:factors, changes in tax laws, regulations, agreements andtreaties, currency exchange rates, and Bunge’s profitability in YEAR ENDED DECEMBER 31,each taxing jurisdiction. (US$ in millions) 2018 2017 2016
Income from operations before income tax $456 $230 $996Bunge has elected to use the U.S. federal income tax rate toIncome tax rate 21% 35% 35%reconcile the actual provision for income taxes.
Income tax expense at the U.S. Federal tax rate 96 80 348The components of income from operations before income tax
Adjustments to derive effective tax rate:are as follows:
Foreign earnings taxed at different statutoryrates 24 (38) (73)
YEAR ENDED DECEMBER 31, Valuation allowances 114 43 (44)(US$ in millions) 2018 2017 2016 Fiscal incentives(1) (43) (42) (34)
Foreign exchange on monetary items 24 (9) 5United States $233 $ 21 $102Tax rate changes 4 (62) 4Non-United States 223 209 894Non-deductible expenses 8 27 3
Total $456 $230 $996 Uncertain tax positions 22 (48) 89Deferred balance adjustments — (4) —
The components of the income tax expense (benefit) are: Equity distributions, net (31) — —Transition tax (15) 105 —Tax exempt investments — (14) (12)YEAR ENDED DECEMBER 31,Tax credits (5) (8) (89)(US$ in millions) 2018 2017 2016Incremental tax on future distributions (26) 27 —
Current: State taxes 8 (4) 5United States $ 33 $ 45 $ (76) Other (1) 3 18Non-United States 140 34 170
Income tax (benefit) expense $179 $ 56 $220173 79 94
(1) Fiscal incentives predominantly relate to investment incentives in Brazil that areDeferred:exempt from Brazilian income tax.United States 4 20 38
Non-United States 2 (43) 88
6 (23) 126
Total $179 $ 56 $ 220
F-22 2018 Bunge Annual Report
BUNGE LIMITED AND SUBSIDIARIESNOTES TO THE CONSOLIDATED FINANCIAL STATEMENTS

F-23
portion or all of its deferred tax assets will be realized. The14. INCOME TAXES (Continued)ultimate realization of deferred tax assets depends primarily onBunge’s ability to generate sufficient timely future income ofThe primary components of the deferred tax assets andthe appropriate character in the appropriate taxing jurisdiction.liabilities and the related valuation allowances are as follows:
As of December 31, 2018 and 2017, Bunge has recordedDECEMBER 31,valuation allowances of $766 million and $900 million,(US$ in millions) 2018 2017respectively. The net decrease of $134 million is due to a
Deferred income tax assets: current year increase of $114 million, offset by a derecognitionNet operating loss carryforwards $ 781 $ 964 of $150 million related primarily to certain net operating lossesEmployee benefits 116 106 in Brazil, which are considered to be remote, along with foreignTax credit carryforwards 12 13 currency translation of $98 million.Inventories — 50
Unrecognized Tax Benefits — ASC Topic 740 requires applying aAccrued expenses and other 340 388‘‘more likely than not’’ threshold to the recognition and
Total deferred tax assets 1,249 1,521de-recognition of tax benefits. Accordingly, Bunge recognizes the
Less valuation allowances (766) (900)amount of tax benefit that has a greater than 50 percent
Deferred tax assets, net of valuation allowance 483 621 likelihood of being ultimately realized upon settlement. AtDecember 31, 2018 and 2017, respectively, Bunge had recordedDeferred income tax liabilities:unrecognized tax benefits of $120 million and $99 million in otherProperty, plant and equipment 233 251non-current liabilities and $0 million and $7 million in currentUndistributed earnings of affiliates 6 35liabilities in its consolidated balance sheets. During 2018, 2017Investments 16 17and 2016, respectively, Bunge recognized $(4) million, $(9) millionIntangibles 100 24and $10 million of interest and penalty charges in income taxInventories 26 —expense (benefit) in the consolidated statements of income. At
Total deferred tax liabilities 381 327 December 31, 2018 and 2017, respectively, Bunge had includedNet deferred tax assets $ 102 $ 294 accrued interest and penalties of $23 million and $27 million
within the related tax liability line in the consolidated balancesheets. A reconciliation of the beginning and ending amount ofBunge has provided a deferred tax liability totaling $6 million andunrecognized tax benefits follows:$35 million as of December 31, 2018 and 2017, respectively for
withholding taxes (and state income taxes) imposed on previously(US$ in millions) 2018 2017 2016taxed earnings expected to be repatriated in the future. As of
December 31, 2018, Bunge has determined it has unremitted Balance at January 1, $421 $409 $ 51earnings that are considered to be indefinitely reinvested of Additions based on tax positions related to theapproximately $136 million and accordingly, no provision for current year 41 34 9income taxes has been made. If these earnings were distributed Additions based on acquisitions — — 2in the form of dividends or otherwise, Bunge would be subject to Additions based on tax positions related to priorincome taxes in the form of withholding taxes to the recipient for years 21 13 374an amount of approximately $27 million. Reductions for tax positions of prior years (54) (43) —
Settlement or clarification from tax authorities (1) — (1)At December 31, 2018, Bunge’s pre-tax loss carryforwards totaled
Expiration of statute of limitations (19) (32) (9)$2,909 million, of which $2,340 million have no expiration,
Foreign currency translation (19) 40 (17)including loss carryforwards of $1,434 million in Brazil. While loss
Balance at December 31, $390 $421 $409carryforwards in Brazil can be carried forward indefinitely, annualutilization is limited to 30% of taxable income calculated on anentity by entity basis as Brazil tax law does not provide for a Bunge believes that it is reasonably possible that approximatelyconsolidated return concept. As a result, realization of these $40 million of its unrecognized tax benefits may be recognizedcarryforwards may take in excess of five years. by the end of 2019 as a result of a lapse of the statute of
limitations or resolution with the tax authorities.The remaining tax loss carryforwards expire at various periodsbeginning in 2018 through the year 2037. Bunge, through its subsidiaries, files income tax returns in the
United States (federal and various states) and non-UnitedIncome Tax Valuation Allowances — Bunge records valuation States jurisdictions. The table below reflects the tax years forallowances when current evidence does not suggest that some
2018 Bunge Annual Report F-23
BUNGE LIMITED AND SUBSIDIARIESNOTES TO THE CONSOLIDATED FINANCIAL STATEMENTS

F-24
additional foreign tax credits to offset future repatriation of14. INCOME TAXES (Continued)earnings to the United States.
which Bunge is subject to income tax examinations by taxBunge has elected to account for any Global Intangibleauthorities:Low-Taxed Income (‘‘GILTI’’) inclusion as a current period
OPEN TAX YEARS expense when incurred.
North America 2013 - 2018South America 2007 - 2018 15. FINANCIAL INSTRUMENTS AND FAIR VALUEEurope 2006 - 2018 MEASUREMENTSAsia-Pacific 2004 - 2018
Bunge’s various financial instruments include certainAs of December 31, 2018, Bunge’s Brazilian subsidiaries have components of working capital such as cash and cashreceived income tax and penalty assessments through 2014 of equivalents, trade accounts receivable and trade accountsapproximately 4,284 million Brazilian reais (approximately payable. Additionally, Bunge uses short and long-term debt to$1,106 million), plus applicable interest on the outstanding fund operating requirements. Cash and cash equivalents, tradeamount. Bunge has recorded unrecognized tax benefits related accounts receivable, trade accounts payable, and short-termto these assessments of 34 million Brazilian reais debt are stated at their carrying value, which is a reasonable(approximately $9 million) as of December 31, 2018. estimate of fair value. See Note 4 for trade structured finance
program, Note 18 for deferred purchase price receivableIn addition, as of December 31, 2018, Bunge’s Argentinerelated to sales of trade receivables, Note 12 for long-termsubsidiary had received income tax assessments relating to 2006receivables from farmers in Brazil, net and other long-termthrough 2009 of approximately 1,276 million Argentine pesosinvestments, Note 17 for long-term debt, Note 10 for other(approximately $34 million), plus applicable interest on thenon-recurring fair value measurements and Note 19 foroutstanding amount of approximately 4,246 million Argentineemployee benefit plans. Bunge’s financial instruments alsopesos (approximately $113 million). Bunge anticipates that the taxinclude derivative instruments and marketable securities, whichauthorities will examine fiscal years 2010-2013, although no noticeare stated at fair value.has been rendered to Bunge’s Argentine subsidiary.
Fair value is the expected price that would be received for anManagement, in consultation with external legal advisors, believesasset or paid to transfer a liability (an exit price) in thethat it is more likely than not that Bunge will prevail on theprincipal or most advantageous market for the asset or liabilityproposed assessments (with exception of unrecognized tax benefitin an orderly transaction between market participants on thediscussed above) in Brazil and Argentina and intends tomeasurement date. Bunge determines the fair values of itsvigorously defend its position against these assessments.readily marketable inventories, derivatives, and certain otherassets based on the fair value hierarchy, which requires anBunge made cash income tax payments, net of refundsentity to maximize the use of observable inputs and minimizereceived, of $(1) million, $89 million and $144 million during thethe use of unobservable inputs when measuring fair value.years ended December 31, 2018, 2017, and 2016 respectively.Observable inputs are inputs based on market data obtainedfrom sources independent of Bunge that reflect theOn December 22, 2017, H.R. 1, commonly known as the ‘‘Taxassumptions market participants would use in pricing the assetCuts and Jobs Act’’ (the ‘‘Tax Act’’) was signed into U.S. law.or liability. Unobservable inputs are inputs that are developedAs a result of the Tax Act and in accordance with SEC Staffbased on the best information available in circumstances thatAccounting Bulletin 118 (‘‘SAB 118’’), Bunge recognized areflect Bunge’s own assumptions based on market data and onprovisional tax expense of $60 million in the fourth quarter ofassumptions that market participants would use in pricing the2017 related to the one-time transition tax (‘‘Transition Tax’’),asset or liability. The fair value standard describes three levelsthe revaluation of deferred tax assets and liabilities, and thewithin its hierarchy that may be used to measure fair value.accrual of incremental withholding taxes on future repatriation
of earnings to the United States.Level 1: Quoted prices (unadjusted) in active markets foridentical assets or liabilities. Level 1 assets and liabilitiesIn the fourth quarter of 2018, Bunge completed its analysis ofinclude exchange traded derivative contracts.the impact of the Tax Act in conjunction with filing of its 2017
U.S. income tax return, assessment of additional documentationLevel 2: Observable inputs, including Level 1 prices (adjusted),to determine the Transition Tax, and analysis of U.S. Treasuryquoted prices for similar assets or liabilities, quoted prices inguidance on the Tax Act. As a result, Bunge recorded a taxmarkets that are less active than traded exchanges and otherbenefit of $26 million, primarily related to the ability to utilizeinputs that are observable or can be corroborated byobservable market data for substantially the full term of the
F-24 2018 Bunge Annual Report
BUNGE LIMITED AND SUBSIDIARIESNOTES TO THE CONSOLIDATED FINANCIAL STATEMENTS

F-25
inputs, judgments are required when evaluating both quantitative15. FINANCIAL INSTRUMENTS AND FAIR VALUEand qualitative factors in the determination of significance forMEASUREMENTS (Continued)purposes of fair value level classification and disclosure. Level 3assets and liabilities include assets and liabilities whose value isassets or liabilities. Level 2 assets and liabilities include readilydetermined using proprietary pricing models, discounted cash flowmarketable inventories and over-the-counter (‘‘OTC’’)methodologies or similar techniques; as well as, assets andcommodity purchase and sale contracts and other OTCliabilities for which the determination of fair value requiresderivatives whose value is determined using pricing modelssignificant management judgment or estimation. Bunge believes awith inputs that are generally based on exchange tradedchange in these inputs would not result in a significant change inprices, adjusted for location specific inputs that are primarilythe fair values.observable in the market or can be derived principally from or
corroborated by observable market data.The majority of Bunge’s exchange traded agriculturalcommodity futures are settled daily generally through itsLevel 3: Unobservable inputs that are supported by little or noclearing subsidiary and, therefore, such futures are notmarket activity and that are a significant component of the fairincluded in the table below. Assets and liabilities are classifiedvalue of the assets or liabilities. In evaluating the significance ofin their entirety based on the lowest level of input that is afair value inputs, Bunge considers items that individually or whensignificant component of the fair value measurement. Theaggregated with other inputs, generally represent more than 10%lowest level of input is considered Level 3.of the fair value of the assets or liabilities. For such identified
The following table sets forth, by level, Bunge’s assets and liabilities that were accounted for at fair value on a recurring basis.
FAIR VALUE MEASUREMENTS AT REPORTING DATE
DECEMBER 31, 2018 DECEMBER 31, 2017
(US$ in millions) LEVEL 1 LEVEL 2 LEVEL 3 TOTAL LEVEL 1 LEVEL 2 LEVEL 3 TOTAL
Assets:Readily marketable inventories (Note 5) . . . . . . . . . . . . . . . . . . . . . . . . . . . . . . . . . . . . . . . . . . . . . . . . . . . . . $ - $4,286 $246 $4,532 $ - $3,691 $365 $4,056Unrealized gain on designated derivative contracts(1):
Interest rate . . . . . . . . . . . . . . . . . . . . . . . . . . . . . . . . . . . . . . . . . . . . . . . . . . . . . . . . . . . . . . . . . . . . . . . . . . . . . . . . . . . . . . - 4 - 4 - - - -Foreign exchange . . . . . . . . . . . . . . . . . . . . . . . . . . . . . . . . . . . . . . . . . . . . . . . . . . . . . . . . . . . . . . . . . . . . . . . . . . . . . . . - 6 - 6 - 18 - 18
Unrealized gain on undesignated derivative contracts(1):Interest rate . . . . . . . . . . . . . . . . . . . . . . . . . . . . . . . . . . . . . . . . . . . . . . . . . . . . . . . . . . . . . . . . . . . . . . . . . . . . . . . . . . . . . . - 2 - 2 - 4 - 4Foreign exchange . . . . . . . . . . . . . . . . . . . . . . . . . . . . . . . . . . . . . . . . . . . . . . . . . . . . . . . . . . . . . . . . . . . . . . . . . . . . . . . - 467 - 467 - 321 - 321Commodities . . . . . . . . . . . . . . . . . . . . . . . . . . . . . . . . . . . . . . . . . . . . . . . . . . . . . . . . . . . . . . . . . . . . . . . . . . . . . . . . . . . . . 128 407 18 553 115 389 19 523Freight . . . . . . . . . . . . . . . . . . . . . . . . . . . . . . . . . . . . . . . . . . . . . . . . . . . . . . . . . . . . . . . . . . . . . . . . . . . . . . . . . . . . . . . . . . . . . 6 - 6 12 18 - 8 26Energy . . . . . . . . . . . . . . . . . . . . . . . . . . . . . . . . . . . . . . . . . . . . . . . . . . . . . . . . . . . . . . . . . . . . . . . . . . . . . . . . . . . . . . . . . . . . . 30 - - 30 18 - - 18
Deferred purchase price receivable (Note 18) . . . . . . . . . . . . . . . . . . . . . . . . . . . . . . . . . . . . . . . . . . . . . . - 128 - 128 - 107 - 107Other(2) . . . . . . . . . . . . . . . . . . . . . . . . . . . . . . . . . . . . . . . . . . . . . . . . . . . . . . . . . . . . . . . . . . . . . . . . . . . . . . . . . . . . . . . . . . . . . . . 67 98 - 165 15 234 - 249
Total assets . . . . . . . . . . . . . . . . . . . . . . . . . . . . . . . . . . . . . . . . . . . . . . . . . . . . . . . . . . . . . . . . . . . . . . . . . . . . . . . . . . . . . . . . . $231 $5,398 $270 $5,899 $166 $4,764 $392 $5,322
Liabilities:Trade accounts payable(3) . . . . . . . . . . . . . . . . . . . . . . . . . . . . . . . . . . . . . . . . . . . . . . . . . . . . . . . . . . . . . . . . . . . . . . . . $ - $ 394 $ 47 $ 441 $ - $ 467 $116 $ 583Unrealized loss on designated derivative contracts(4):
Interest rate . . . . . . . . . . . . . . . . . . . . . . . . . . . . . . . . . . . . . . . . . . . . . . . . . . . . . . . . . . . . . . . . . . . . . . . . . . . . . . . . . . . . . . - 33 - 33 - 31 - 31Foreign exchange . . . . . . . . . . . . . . . . . . . . . . . . . . . . . . . . . . . . . . . . . . . . . . . . . . . . . . . . . . . . . . . . . . . . . . . . . . . . . . . - 32 - 32 - 2 - 2
Unrealized loss on undesignated derivative contracts(4):Interest rate . . . . . . . . . . . . . . . . . . . . . . . . . . . . . . . . . . . . . . . . . . . . . . . . . . . . . . . . . . . . . . . . . . . . . . . . . . . . . . . . . . . . . . - 9 - 9 - 1 - 1Foreign exchange . . . . . . . . . . . . . . . . . . . . . . . . . . . . . . . . . . . . . . . . . . . . . . . . . . . . . . . . . . . . . . . . . . . . . . . . . . . . . . . - 467 - 467 1 430 - 431Commodities . . . . . . . . . . . . . . . . . . . . . . . . . . . . . . . . . . . . . . . . . . . . . . . . . . . . . . . . . . . . . . . . . . . . . . . . . . . . . . . . . . . . . 152 446 23 621 141 271 20 432Freight . . . . . . . . . . . . . . . . . . . . . . . . . . . . . . . . . . . . . . . . . . . . . . . . . . . . . . . . . . . . . . . . . . . . . . . . . . . . . . . . . . . . . . . . . . . . . 13 - 6 19 15 - 3 18Energy . . . . . . . . . . . . . . . . . . . . . . . . . . . . . . . . . . . . . . . . . . . . . . . . . . . . . . . . . . . . . . . . . . . . . . . . . . . . . . . . . . . . . . . . . . . . . 43 - 1 44 9 2 2 13
Total liabilities . . . . . . . . . . . . . . . . . . . . . . . . . . . . . . . . . . . . . . . . . . . . . . . . . . . . . . . . . . . . . . . . . . . . . . . . . . . . . . . . . . . . . $208 $1,381 $ 77 $1,666 $166 $1,204 $141 $1,511
(1) Unrealized gains on designated and undesignated derivative contracts are generally included in other current assets. There were $3 million and $0 million included in othernon-current assets at December 31, 2018 and December 31, 2017, respectively.
2018 Bunge Annual Report F-25
BUNGE LIMITED AND SUBSIDIARIESNOTES TO THE CONSOLIDATED FINANCIAL STATEMENTS

F-26
15. FINANCIAL INSTRUMENTS AND FAIR VALUE MEASUREMENTS (Continued)
(2) Other includes the fair values of marketable securities and investments in other current assets and other non-current assets.
(3) These payables are hybrid financial instruments for which Bunge has elected the fair value option.
(4) Unrealized losses on designated and undesignated derivative contracts are generally included in other current liabilities. There were $33 million and $31 million included in othernon-current liabilities at December 31, 2018 and December 31, 2017, respectively.
Derivatives – Exchange traded futures and options contracts out of Level 1 occur infrequently. Transfers into Level 1 wouldand exchange cleared contracts are valued based on generally only be expected to occur when an exchange clearedunadjusted quoted prices in active markets and are classified derivative contract historically valued using a valuation modelwithin Level 1. Bunge’s forward commodity purchase and sale as the result of a lack of observable inputs becomescontracts are classified as derivatives along with other OTC sufficiently observable, resulting in the valuation price beingderivative instruments relating primarily to freight, energy, essentially the exchange traded price. There were no significantforeign exchange and interest rates, and are classified within transfers into or out of Level 1 during the periods presented.Level 2 or Level 3 as described below. Bunge estimates fair
Readily marketable inventories – RMI reported at fair value arevalues based on exchange quoted prices, adjusted asvalued based on commodity futures exchange quotations,appropriate for differences in local markets. These differencesbroker or dealer quotations, or market transactions in eitherare generally valued using inputs from broker or dealerlisted or OTC markets with appropriate adjustments forquotations, or market transactions in either the listed or OTCdifferences in local markets where Bunge’s inventories aremarkets. In such cases, these derivative contracts are classifiedlocated. In such cases, the inventory is classified within Level 2.within Level 2.Certain inventories may utilize significant unobservable datarelated to local market adjustments to determine fair value. InOTC derivative contracts include swaps, options and structuredsuch cases, the inventory is classified as Level 3.transactions that are fair valued are generally determined using
quantitative models that require the use of multiple marketIf Bunge used different methods or factors to determine fairinputs including quoted prices for similar assets or liabilities invalues, amounts reported as unrealized gains and losses onactive markets, quoted prices for identical or similar assets orderivative contracts and RMI at fair value in the consolidatedliabilities in markets which are not highly active, otherbalance sheets and consolidated statements of income couldobservable inputs relevant to the asset or liability, and marketdiffer. Additionally, if market conditions change subsequent toinputs corroborated by correlation or other means. Thesethe reporting date, amounts reported in future periods asvaluation models include inputs such as interest rates, pricesunrealized gains and losses on derivative contracts and RMI atand indices to generate continuous yield or pricing curves andfair value in the consolidated balance sheets and consolidatedvolatility factors. Where observable inputs are available forstatements of income could differ.substantially the full term of the asset or liability, the
instrument is categorized in Level 2. Certain OTC derivativesLevel 3 Measurements – Transfers in and/or out of Level 3trade in less active markets with less availability of pricingrepresent existing assets or liabilities that were eitherinformation and certain structured transactions can requirepreviously categorized as a higher level for which the inputs tointernally developed model inputs that might not be observablethe model became unobservable or assets and liabilities thatin or corroborated by the market. When unobservable inputswere previously classified as Level 3 for which the lowesthave a significant impact on the measurement of fair value, thesignificant input became observable during the period. Bunge’sinstrument is categorized in Level 3. In addition, except forpolicy regarding the timing of transfers between levels is toexchange cleared instruments, Bunge is exposed to loss in therecord the transfers at the beginning of the reporting period.event of the non-performance by counterparties on OTC
derivative instruments and forward purchase and sale Level 3 Derivatives – Level 3 derivative instruments utilize bothcontracts. Adjustments may be made based on Bunge’s market observable and unobservable inputs within the fairestimate of the potential loss in the event of counterparty value measurements. These inputs include commodity prices,non-performance. Bunge did not have significant adjustments price volatility, interest rates, volumes and locations.related to non-performance by counterparties at December 31,2018 or 2017.
Exchange traded or cleared derivative contracts are classifiedin Level 1, thus transfers of assets and liabilities into and/or
F-26 2018 Bunge Annual Report
BUNGE LIMITED AND SUBSIDIARIESNOTES TO THE CONSOLIDATED FINANCIAL STATEMENTS

F-27
YEAR ENDED DECEMBER 31, 201715. FINANCIAL INSTRUMENTS AND FAIR VALUETRADE
READILY ACCOUNTSMEASUREMENTS (Continued)DERIVATIVES, MARKETABLE RECEIVABLE/
(US$ in millions) NET(1) INVENTORIES(1) PAYABLE, NET(1) TOTAL
Level 3 Readily marketable inventories and other – The significant Balance, January 1,2017 $ (51) $ 237 $ (44) $ 142unobservable inputs resulting in Level 3 classification for RMI,
Total gains and lossesphysically settled forward purchase and sale contracts, and (realized/unrealized)included in cost oftrade accounts receivable and payable, net, relate to certaingoods sold (31) 142 13 124
management estimations regarding costs of transportation and Purchases 11 1,551 (469) 1,093Sales - (2,041) - (2,041)other local market or location-related adjustments, primarilyIssuances (7) - - (7)
freight related adjustments in the interior of Brazil and the lack Settlements 67 - 441 508Transfers into Level 3 (9) 701 (59) 633of market corroborated information in Canada. In bothTransfers out of Level 3 22 (225) 2 (201)
situations, Bunge uses proprietary information such asBalance,
purchase and sale contracts and contracted prices to value December 31, 2017 $ 2 $ 365 $(116) $ 251
freight, premiums and discounts in its contracts. Movements in(1) Derivatives, net, readily marketable inventories, and trade accounts receivable/the price of these unobservable inputs alone would not have apayable net, includes gains/(losses) of $1 million, $11 million and $0 million,
material effect on Bunge’s financial statements as these respectively, that are attributable to the change in unrealized gains/(losses) relating toLevel 3 assets and liabilities still held at December 31, 2017.contracts do not typically exceed one future crop cycle.
The tables below present reconciliations for assets and Derivative Instruments and Hedging Activitiesliabilities measured at fair value on a recurring basis using
Hedge accounting derivatives – Bunge uses derivatives insignificant unobservable inputs (Level 3) during the yearsqualifying hedge accounting relationships to manage certain ofended December 31, 2018 and 2017. These instruments wereits interest rate and foreign currency risks. In executing thesevalued using pricing models that management believes reflecthedge strategies, Bunge primarily relies on the shortcut andthe assumptions that would be used by a marketplacecritical terms match methods in designing its hedgeparticipant.accounting strategy, which results in little to no net earnings
YEAR ENDED DECEMBER 31, 2018 impact for these hedge relationships. Bunge monitors theseTRADE relationships on a quarterly basis and will perform a
READILY ACCOUNTSquantitative analysis to validate the assertion that the hedgesDERIVATIVES, MARKETABLE RECEIVABLE/
(US$ in millions) NET(1) INVENTORIES(1) PAYABLE, NET(1) TOTAL are highly effective if there are changes to the hedged item orBalance, January 1, hedging derivative.
2018 $ 2 $ 365 $ (116) $ 251Total gains and losses
Fair value hedges of interest rate risk – For certain long-term debt(realized/unrealized)included in cost of that is issued at a fixed rate, Bunge enters into interest rategoods sold (11) 144 26 159
Purchases 12 1,770 (294) 1,488 swaps to effectively convert the fixed interest rate to a variableSales - (2,585) - (2,585) interest rate. These swaps may be for the full term of the debtIssuances (11) - - (11)Settlements 13 - 434 447 or for only a part of the term. As Bunge applies the shortcutTransfers into Level 3 (10) 774 (79) 685 method for all its interest rate hedges on long term debt, theTransfers out of Level 3 (1) (222) (18) (241)
notional amount of the swap is equal to the amortized costBalance,December 31, 2018 $ (6) $ 246 $ (47) $ 193 basis of the hedged debt. The net impact of hedge accounting
for interest rate swaps is recognized in interest expense.(1) Derivatives, net, readily marketable inventories, and trade accounts receivable/payable net, include gains/(losses) of $(24) million, $72 million and $0 million,
Fair value hedges of currency risk – For certain borrowings thatrespectively, that are attributable to the change in unrealized gains/(losses) relating toLevel 3 assets and liabilities still held at December 31, 2018. are not in the functional currency of the reporting entity
issuing them, Bunge enters into cross currency swaps toconvert the risk to the functional currency of the entity. Thechanges in currency risk on the derivative go to foreignexchange gains (losses), whereas, the coupon on the swapgoes to interest expense. Changes in basis risk are held inaccumulated other comprehensive income (loss) until realizedthrough the coupon.
Cash flow hedges of currency risk – Bunge manages currencyrisk on certain forecasted purchases and sales, and selling,general and administrative expenses with currency forwards.
2018 Bunge Annual Report F-27
BUNGE LIMITED AND SUBSIDIARIESNOTES TO THE CONSOLIDATED FINANCIAL STATEMENTS

F-28
hedge its exposure to a variety of market risks it incurs in the15. FINANCIAL INSTRUMENTS AND FAIR VALUEnormal course of operations.MEASUREMENTS (Continued)
Interest rate derivatives are used to hedge exposures to theThe change in the value of the forward is classified inCompany’s financial instrument portfolios and debt issuances.accumulated other comprehensive income (loss) until theThe impact of changes in fair value of these instruments istransaction affects earnings, at which time the change in valueprimarily presented in Interest expense.of the currency forward is reclassified to sales, cost of goods
sold or selling, general and administrative expenses. TheseCurrency derivatives are used to hedge the balance sheet andhedges mature at various times through June 2019. Of thecommercial exposures that arise from the Company’s globalamount currently in accumulated other comprehensive incomeoperations. The impact of changes in fair value of these(loss), $2 million is expected to be reclassified to earnings ininstruments is presented in Cost of goods sold when hedgingthe next twelve months.commercial exposures and Foreign exchange gains (losses)when hedging monetary exposures.Net investment hedges – Bunge hedges the currency risk of
certain of its foreign subsidiaries with currency forwards andAgricultural commodity derivatives are used to manage theintercompany loans for which the currency risk is remeasuredCompany’s inventory and forward purchase and salesthrough accumulated other comprehensive income (loss). Forcontracts. Contracts to purchase agricultural commoditiescurrency forwards, the forward method is used. The change ingenerally relate to current or future crop years for deliverythe value of the forward is classified in accumulated otherperiods quoted by regulated commodity exchanges. Contractscomprehensive income (loss) until the transaction affectsfor the sale of agricultural commodities generally do not extendearnings.beyond one future crop cycle. The impact of changes in fairvalue of these instruments is presented in Cost of goods sold.The table below provides information about the balance sheet
values of hedged items and the notional amount of derivativesBunge uses derivative instruments referred to as forwardused in hedging strategies.freight agreements (‘‘FFA’’) and FFA options to hedge portionsof its current and anticipated ocean freight costs. The impactDECEMBER 31,
(US$ in millions) 2018 2017 of changes in fair value of these instruments is presented inHedging instrument type: Cost of goods sold.Fair value hedges of interest rate risk
Carrying value of hedged debt $2,229 $2,071Bunge uses energy derivative instruments to manage itsCumulative adjustment to long-term debt from
application of hedge accounting $ (29) $ (31) exposure to volatility in energy costs. Hedges may be enteredInterest rate swap - notional amount $2,266 $2,109Fair value hedges of currency risk into for natural gas, electricity, coal and fuel oil, including
Carrying value of hedged debt $ 312 $ - bunker fuel. The impact of changes in fair value of theseCumulative adjustment to long-term debt fromapplication of hedge accounting $ - $ - instruments is presented in Cost of goods sold.
Cross currency swap - notional amount $ 313 $ -Cash flow hedges of currency risk
Foreign currency forward - notional amount $ 50 $ 237 The Company may also enter into other derivatives, includingNet investment hedges credit default swaps and equity derivatives to manage exposureForeign currency forward - notional amount $1,888 $1,000
Carrying value of non-derivative hedging instrument $ 912 $ 725 to credit risk and broader macroeconomic risks, respectively.The impact of changes in fair value of these instruments is
In addition to using derivatives in qualifying hedge presented in Cost of goods sold.relationships, Bunge enters into derivatives to economically
F-28 2018 Bunge Annual Report
BUNGE LIMITED AND SUBSIDIARIESNOTES TO THE CONSOLIDATED FINANCIAL STATEMENTS

F-29
15. FINANCIAL INSTRUMENTS AND FAIR VALUE MEASUREMENTS (Continued)
The table below summarizes the volume of economic derivatives as of December 31, 2018 and 2017. For those contracts tradedbilaterally through the over-the-counter markets (e.g., forwards, forward rate agreements (‘‘FRA’’) and swaps), the gross position isprovided. For exchange traded (e.g., futures, FFAs and options) and cleared positions (e.g., energy swaps), the net position isprovided.
DECEMBER 31,
2018 2017 UNIT OF(US$ in millions) LONG (SHORT) LONG (SHORT) MEASURE
Interest rateSwapsa . . . . . . . . . . . . . . . . . . . . . . . . . . . . . . . . . . . . . . . . . . . . . . . . . . . . . . . . . . . . . . . . . . . . . . . . . . . . . . . . $ 3,349 $ (111) $ 2,317 $ (1,236) $ NotionalFutures . . . . . . . . . . . . . . . . . . . . . . . . . . . . . . . . . . . . . . . . . . . . . . . . . . . . . . . . . . . . . . . . . . . . . . . . . . . . . . . $ - $ - $ - $ (2) $ NotionalFRAs . . . . . . . . . . . . . . . . . . . . . . . . . . . . . . . . . . . . . . . . . . . . . . . . . . . . . . . . . . . . . . . . . . . . . . . . . . . . . . . . . . . $ 139 $ (149) $ 375 $ - $ NotionalCurrencyForwards . . . . . . . . . . . . . . . . . . . . . . . . . . . . . . . . . . . . . . . . . . . . . . . . . . . . . . . . . . . . . . . . . . . . . . . . . . . . . $ 13,713 $ (13,701) $ 9,784 $ (9,668) $ NotionalSwaps . . . . . . . . . . . . . . . . . . . . . . . . . . . . . . . . . . . . . . . . . . . . . . . . . . . . . . . . . . . . . . . . . . . . . . . . . . . . . . . . . $ 127 $ (535) $ 192 $ (148) $ NotionalFutures . . . . . . . . . . . . . . . . . . . . . . . . . . . . . . . . . . . . . . . . . . . . . . . . . . . . . . . . . . . . . . . . . . . . . . . . . . . . . . . $ - $ (16) $ - $ (58) $ NotionalOptions . . . . . . . . . . . . . . . . . . . . . . . . . . . . . . . . . . . . . . . . . . . . . . . . . . . . . . . . . . . . . . . . . . . . . . . . . . . . . . . $ 869 $ (919) $ 521 $ (471) DeltaAgricultural commoditiesForwards . . . . . . . . . . . . . . . . . . . . . . . . . . . . . . . . . . . . . . . . . . . . . . . . . . . . . . . . . . . . . . . . . . . . . . . . . . . . . 25,523,840 (29,314,930) 23,438,004 (30,055,331) Metric TonsSwaps . . . . . . . . . . . . . . . . . . . . . . . . . . . . . . . . . . . . . . . . . . . . . . . . . . . . . . . . . . . . . . . . . . . . . . . . . . . . . . . . . - (9,908,728) 65,045 (5,279,181) Metric TonsFutures . . . . . . . . . . . . . . . . . . . . . . . . . . . . . . . . . . . . . . . . . . . . . . . . . . . . . . . . . . . . . . . . . . . . . . . . . . . . . . . 4,136,525 - 4,520,267 - Metric TonsOptions . . . . . . . . . . . . . . . . . . . . . . . . . . . . . . . . . . . . . . . . . . . . . . . . . . . . . . . . . . . . . . . . . . . . . . . . . . . . . . . 718,709 - 828,296 - Metric TonsOcean freightFFA . . . . . . . . . . . . . . . . . . . . . . . . . . . . . . . . . . . . . . . . . . . . . . . . . . . . . . . . . . . . . . . . . . . . . . . . . . . . . . . . . . . . - (90) - (3,617) Hire DaysFFA options . . . . . . . . . . . . . . . . . . . . . . . . . . . . . . . . . . . . . . . . . . . . . . . . . . . . . . . . . . . . . . . . . . . . . . . . . . 302 - 892 - Hire DaysNatural gasSwaps . . . . . . . . . . . . . . . . . . . . . . . . . . . . . . . . . . . . . . . . . . . . . . . . . . . . . . . . . . . . . . . . . . . . . . . . . . . . . . . . . 1,205,687 - 3,519,668 - MMBtusFutures . . . . . . . . . . . . . . . . . . . . . . . . . . . . . . . . . . . . . . . . . . . . . . . . . . . . . . . . . . . . . . . . . . . . . . . . . . . . . . . 2,268,190 - 2,691,350 - MMBtusEnergy - otherForwards . . . . . . . . . . . . . . . . . . . . . . . . . . . . . . . . . . . . . . . . . . . . . . . . . . . . . . . . . . . . . . . . . . . . . . . . . . . . . 5,536,290 - 5,534,290 - Metric TonsFutures . . . . . . . . . . . . . . . . . . . . . . . . . . . . . . . . . . . . . . . . . . . . . . . . . . . . . . . . . . . . . . . . . . . . . . . . . . . . . . . - (29,367) 1,394 - Metric TonsSwaps . . . . . . . . . . . . . . . . . . . . . . . . . . . . . . . . . . . . . . . . . . . . . . . . . . . . . . . . . . . . . . . . . . . . . . . . . . . . . . . . . 188,800 - 223,600 - Metric TonsOtherSwaps and futures . . . . . . . . . . . . . . . . . . . . . . . . . . . . . . . . . . . . . . . . . . . . . . . . . . . . . . . . . . . . . . . . . $ 52 $ - $ - $ - $ Notional
2018 Bunge Annual Report F-29
BUNGE LIMITED AND SUBSIDIARIESNOTES TO THE CONSOLIDATED FINANCIAL STATEMENTS

F-30
15. FINANCIAL INSTRUMENTS AND FAIR VALUE MEASUREMENTS (Continued)
The Effect of Derivative Instruments and Hedge Accounting on the Consolidated Statements of Income
The table below summarizes the net effect of derivative instruments and hedge accounting on the consolidated statements ofincome for the years ended December 31, 2018, 2017 and 2016.
GAIN (LOSS) RECOGNIZED ININCOME ON DERIVATIVE INSTRUMENTS
YEAR ENDED DECEMBER 31,
(US$ in millions) 2018 2017 2016
Income statement classification Type of derivativeNet salesHedge accounting . . . . . . . . . . . . . . . . . . . . . . . . . . . . . . . . . . . . . . . . . . . . . . . . . . Foreign currency . . . . . . . . . . . . . . . . . . . . . . . . . . . . . . . . . . . . . . . . . . . . $ (2) $ - $ -Cost of goods soldHedge accounting . . . . . . . . . . . . . . . . . . . . . . . . . . . . . . . . . . . . . . . . . . . . . . . . . . Foreign currency . . . . . . . . . . . . . . . . . . . . . . . . . . . . . . . . . . . . . . . . . . . . $ 1 $ - $ -Economic hedges . . . . . . . . . . . . . . . . . . . . . . . . . . . . . . . . . . . . . . . . . . . . . . . . . . . Foreign currency . . . . . . . . . . . . . . . . . . . . . . . . . . . . . . . . . . . . . . . . . . . . (220) (1) 772
Commodities . . . . . . . . . . . . . . . . . . . . . . . . . . . . . . . . . . . . . . . . . . . . . . . . . 506 676 (618)Other(1) . . . . . . . . . . . . . . . . . . . . . . . . . . . . . . . . . . . . . . . . . . . . . . . . . . . . . . . . (25) 9 27
Total Cost of goods sold . . . . . . . . . . . . . . . . . . . . . . . . . . . . . . . . . . . . . . . . . . . . . . . . . . . . . . . . . . . . . . . . . . . . . . . . . . . . . . . . . . . . . . . . . . . . . . . . . . . . . . . . . . . . . $ 262 $ 684 $ 181
Interest expenseHedge accounting . . . . . . . . . . . . . . . . . . . . . . . . . . . . . . . . . . . . . . . . . . . . . . . . . . Interest rate . . . . . . . . . . . . . . . . . . . . . . . . . . . . . . . . . . . . . . . . . . . . . . . . . . $ (6) $ 13 $ 5Economic hedges . . . . . . . . . . . . . . . . . . . . . . . . . . . . . . . . . . . . . . . . . . . . . . . . . . . Interest rate . . . . . . . . . . . . . . . . . . . . . . . . . . . . . . . . . . . . . . . . . . . . . . . . . . (1) - (4)
Total Interest expense . . . . . . . . . . . . . . . . . . . . . . . . . . . . . . . . . . . . . . . . . . . . . . . . . . . . . . . . . . . . . . . . . . . . . . . . . . . . . . . . . . . . . . . . . . . . . . . . . . . . . . . . . . . . . . . $ (7) $ 13 $ 1
Foreign exchange gains (losses)Hedge accounting . . . . . . . . . . . . . . . . . . . . . . . . . . . . . . . . . . . . . . . . . . . . . . . . . . Foreign currency . . . . . . . . . . . . . . . . . . . . . . . . . . . . . . . . . . . . . . . . . . . . $ (10) $ - $ -Economic hedges . . . . . . . . . . . . . . . . . . . . . . . . . . . . . . . . . . . . . . . . . . . . . . . . . . . Foreign currency . . . . . . . . . . . . . . . . . . . . . . . . . . . . . . . . . . . . . . . . . . . . $ 34 $ 22 $ 267
Total Foreign exchange gains (losses) . . . . . . . . . . . . . . . . . . . . . . . . . . . . . . . . . . . . . . . . . . . . . . . . . . . . . . . . . . . . . . . . . . . . . . . . . . . . . . . . . . . . . . . . . . . . $ 24 $ 22 $ 267
Other comprehensive income (loss)Gains and losses on derivatives used as cash flow hedges of foreign currency risk included in other
comprehensive income (loss) during the period . . . . . . . . . . . . . . . . . . . . . . . . . . . . . . . . . . . . . . . . . . . . . . . . . . . . . . . . . . . . . . . . . . . . . . . . . . . . . . . . . $ (2) $ 14 $ 48Gains and losses on derivatives used as net investment hedges included in other comprehensive income (loss)
during the period . . . . . . . . . . . . . . . . . . . . . . . . . . . . . . . . . . . . . . . . . . . . . . . . . . . . . . . . . . . . . . . . . . . . . . . . . . . . . . . . . . . . . . . . . . . . . . . . . . . . . . . . . . . . . . . . . . . . . . . $ 48 $ (8) $(394)Foreign currency gains and losses on intercompany loans used as net investment hedges included in other
comprehensive income (loss) during the period . . . . . . . . . . . . . . . . . . . . . . . . . . . . . . . . . . . . . . . . . . . . . . . . . . . . . . . . . . . . . . . . . . . . . . . . . . . . . . . . . $ 52 $(111) $ 41Gains and losses on derivatives used as fair value hedges of foreign currency risk included in other
comprehensive income (loss) during the period . . . . . . . . . . . . . . . . . . . . . . . . . . . . . . . . . . . . . . . . . . . . . . . . . . . . . . . . . . . . . . . . . . . . . . . . . . . . . . . . . $ 1 $ - $ -
Amounts released from accumulated other comprehensive income (loss) during the periodCash flow hedge of foreign currency risk . . . . . . . . . . . . . . . . . . . . . . . . . . . . . . . . . . . . . . . . . . . . . . . . . . . . . . . . . . . . . . . . . . . . . . . . . . . . . . . . . . . . . . . . . . . . $ - $ 37 $ 16
Total . . . . . . . . . . . . . . . . . . . . . . . . . . . . . . . . . . . . . . . . . . . . . . . . . . . . . . . . . . . . . . . . . . . . . . . . . . . . . . . . . . . . . . . . . . . . . . . . . . . . . . . . . . . . . . . . . . . . . . . . . . . . . . . . . . . . . . . . . . $ - $ 37 $ 16
(1) Other includes the results from freight, energy and other derivatives.
F-30 2018 Bunge Annual Report
BUNGE LIMITED AND SUBSIDIARIESNOTES TO THE CONSOLIDATED FINANCIAL STATEMENTS

F-31
16. SHORT-TERM DEBT AND CREDIT FACILITIES 17. LONG-TERM DEBT AND CREDIT FACILITIES
Bunge’s short-term borrowings are typically sourced from Long-term debt obligations are summarized below.various banking institutions and the U.S. commercial paper
DECEMBER 31,market. Bunge also borrows from time to time in local(US$ in millions) 2018 2017currencies in various foreign jurisdictions. Interest expense
includes facility commitment fees, amortization of deferred Revolving credit facility expiring 2020 $ 500 $ -financing costs, and charges on certain lending transactions, Term loan due 2019 - three-month Yen LIBOR plusincluding certain intercompany loans and foreign currency 0.75% (Tranche A) 258 253conversions in Brazil. The weighted-average interest rate on Term loan due 2019 - fixed Yen interest rate of 0.96%short-term borrowings at December 31, 2018 and 2017 was (Tranche B) 54 536.98% and 9.84%, respectively. Term loan due 2019 - three-month LIBOR plus 1.30%
(Tranche C) 85 858.50% Senior Notes due 2019 - 599DECEMBER 31,3.50% Senior Notes due 2020 498 497(US$ in millions) 2018 20173.00% Senior Notes due 2022 397 396
Lines of credit: 1.85% Senior Notes due 2023 - Euro 916 960Unsecured, variable interest rates from 1.60% to 66.00% $750 $304 4.35% Senior Notes due 2024 595 -
3.25% Senior Notes due 2026 695 694Total short-term debt(1) $750 $3043.75% Senior Notes due 2027 594 593Other 30 45
(1) Includes $136 million and $179 million of local currency borrowings in certain Centraland Eastern European, South American, African and Asia-Pacific countries at a weighted Subtotal 4,622 4,175average interest rate of 23.61% and 15.03% as of December 31, 2018 and December 31, Less: Current portion of long-term debt (419) (15)2017, respectively.
Total long-term debt(1) $4,203 $4,160
Bunge’s commercial paper program is supported by an(1) Includes secured debt of $17 million and $24 million at December 31, 2018 andidentical amount of committed back up bank credit lines (theDecember 31, 2017, respectively.
‘‘Liquidity Facility’’) provided by banks that are rated at leastA-1 by Standard & Poor’s Financial Services and P-1 by The fair values of long-term debt, including current portion areMoody’s Investors Service. On December 14, 2018, Bunge calculated based on interest rates currently available onamended its unsecured $600 million five-year Liquidity Facility comparable maturities to companies with credit standingwith certain lenders party thereto and extended its term to similar to that of Bunge. The carrying amounts and fair valuesDecember 14, 2023. The cost of borrowing under the Liquidity of long-term debt are as follows:Facility would typically be higher than the cost of issuing underBunge’s commercial paper program. At December 31, 2018 and DECEMBER 31, 2018 DECEMBER 31, 2017December 31, 2017, Bunge had no borrowings outstanding FAIR FAIRunder the commercial paper program and no borrowings under CARRYING VALUE CARRYING VALUEthe Liquidity Facility. (US$ in millions) VALUE (LEVEL 2) VALUE (LEVEL 2)
Long-term debt,In addition to the committed facilities discussed above, fromincluding currenttime-to-time, Bunge Limited and/or its financing subsidiaries portion $ 4,622 $ 4,584 $ 4,175 $ 4,337
enter into uncommitted bilateral short-term credit lines asnecessary based on its financing requirements. At
On December 14, 2018, Bunge entered into an unsecuredDecember 31, 2018 and 2017, there were no borrowings$1,100 million five-year syndicated revolving credit agreementoutstanding under these bilateral short-term credit lines. Loans(the ‘‘Credit Agreement’’) with certain lenders party theretounder such credit lines are non-callable by the respectivematuring December 14, 2023. Bunge has the option to requestlenders. In addition, Bunge’s operating companies hadan extension of the maturity date of the Credit Agreement for$750 million in short-term borrowings outstanding from localtwo additional one-year periods, subject to the consent of thebank lines of credit at December 31, 2018 to support workinglenders. The Credit Agreement replaced the then existingcapital requirements.$1,100 million five-year revolving credit agreement, dated as ofNovember 20, 2014, which was terminated by the Company inaccordance with its terms. Borrowings under the CreditAgreement will bear interest at LIBOR plus a margin, whichwill vary from 1.00% to 1.625%, based on the credit ratings of
2018 Bunge Annual Report F-31
BUNGE LIMITED AND SUBSIDIARIESNOTES TO THE CONSOLIDATED FINANCIAL STATEMENTS

F-32
Principal Maturities – Principal maturities of long-term debt at17. LONG-TERM DEBT AND CREDIT FACILITIESDecember 31, 2018 are as follows:(Continued)(US$ in millions)
Bunge’s senior long-term unsecured debt (‘‘Rating Level’’).2019 $ 423Amounts under the Credit Agreement that remain undrawn are2020 1,017subject to a commitment fee at rates ranging from 0.09% to2021 130.225%, varying based on the Rating Level. Bunge may, from2022 407time-to-time, request one or more of the existing lenders or2023 921new lenders to increase the total commitments under the Thereafter 1,891
Credit Agreement by up to $200 million pursuant to anTotal(1) $4,672accordion provision. At December 31, 2018, Bunge had no
borrowings outstanding under the Credit Agreement.(1) Excludes components of long-term debt attributable to fair value hedge accountingof $29 million and deferred financing fees and unamortized premiums of $21 million.
On September 10, 2018, Bunge completed the sale andissuance of $600 million aggregate principal amount of 4.35% Bunge’s credit facilities and certain senior notes require it tounsecured senior notes due March 15, 2024. The senior notes comply with specified financial covenants related to minimumare fully and unconditionally guaranteed by Bunge Limited. net worth, minimum current ratio, a maximum debt toInterest on the senior notes is payable semi-annually in arrears capitalization ratio, and limitations on secured indebtedness.in March and September of each year, commencing on Bunge was in compliance with these covenants atMarch 15, 2019. The net proceeds of the offering were December 31, 2018.approximately $594 million after deducting underwritingcommissions and estimated offering expenses. Bunge used the During the years ended December 31, 2018, 2017 and 2016,net proceeds from this offering, together with available cash, to Bunge paid interest, net of interest capitalized, of $306 million,fund a tender offer and redemption of the $600 million $236 million and $234 million, respectively.aggregate principal amount of 8.50% senior notes due 2019,which resulted in a loss on extinguishment of debt of 18. TRADE RECEIVABLES SECURITIZATION PROGRAMapproximately $24 million related to make-whole payments.
Bunge and certain of its subsidiaries participate in a tradeOn May 1, 2018, in connection with Bunge’s previouslyreceivables securitization program (the ‘‘Program’’) with aannounced strategy to reduce its exposure to the sugar millingfinancial institution, as administrative agent, and certainbusiness in Brazil, Bunge entered into an unsecuredcommercial paper conduit purchasers and committed$700 million, five-year revolving credit facility, which uponpurchasers (collectively, the ‘‘Purchasers’’) that provides forfulfillment of certain conditions is convertible into afunding of up to $700 million against receivables sold into thenon-recourse secured term loan facility with the Company’sProgram. The Program is designed to enhance Bunge’ssugar milling business as the borrower. This facility providesfinancial flexibility by providing an additional source of liquidityfinancial flexibility to fund the sugar milling business on afor its operations. In connection with the Program, certain ofstand-alone basis. Additionally, subject to lender approval,Bunge’s U.S. and non-U.S. subsidiaries that originate tradeBunge may request an increase, in an amount not to exceedreceivables may sell eligible receivables in their entirety on a$100 million, to the revolving credit facility commitmentsrevolving basis to a consolidated bankruptcy remote specialpursuant to an accordion provision set forth in the revolvingpurpose entity, Bunge Securitization B.V. (‘‘BSBV’’) formedcredit facility. Bunge had no borrowings outstanding under theunder the laws of the Netherlands. BSBV in turn sells suchrevolving credit facility at December 31, 2018.purchased trade receivables to the administrative agent (actingon behalf of the Purchasers) pursuant to a receivables transferAt December 31, 2018, Bunge had $4,515 million of unusedagreement. In connection with these sales of accountsand available borrowing capacity under its committedreceivable, Bunge receives a portion of the proceeds up frontlong-term credit facilities with a number of lending institutions.and an additional amount upon the collection of the underlying
Certain land, property, equipment and investments in receivables, which is expected to be generally between 10%consolidated subsidiaries having a net carrying value of and 15% of the aggregate amount of receivables sold throughapproximately $52 million at December 31, 2018 have been the Program.mortgaged or otherwise collateralized against long-term debt of
Koninklijke Bunge B.V., a wholly owned subsidiary of Bunge,$26 million at December 31, 2018.acts as master servicer, responsible for servicing and collectingthe accounts receivable for the Program. The Programterminates on May 26, 2021. The trade receivables sold under
F-32 2018 Bunge Annual Report
BUNGE LIMITED AND SUBSIDIARIESNOTES TO THE CONSOLIDATED FINANCIAL STATEMENTS

F-33
pension plans covering substantially all employees of the18. TRADE RECEIVABLES SECURITIZATION PROGRAMsubsidiaries. The plans provide benefits based primarily on(Continued)participants’ salary and length of service. The funding policiesfor Bunge’s defined benefit pension plans are determined inthe program are subject to specified eligibility criteria, includingaccordance with statutory funding requirements. The mosteligible currencies, and country and obligor concentrationsignificant defined benefit plan is in the United States.limits. On February 19, 2019, Bunge exercised a portion of the
$300 million accordion feature under this program to increaseCertain United States and Brazilian-based subsidiaries ofthe aggregate size of the facility by $100 million to anBunge have benefit plans to provide certain postretirementaggregate of $800 million.healthcare benefits to eligible retired employees of those
DECEMBER 31, subsidiaries. The plans require minimum retiree contributions(US$ in millions) 2018 2017 and define the maximum amount the subsidiaries will be
obligated to pay under the plans. Bunge’s policy is to fundReceivables sold which were derecognized fromthese costs as they become payable.Bunge’s balance sheet $826 $810
Deferred purchase price included in other current Plan amendments and pension liability adjustment – In 2018,assets $128 $107 Bunge’s Swiss defined benefit pension plan changed its local
pension provider, resulting in a change to its conversion rate.The table below summarizes the cash flows and discounts of This plan amendment resulted in a $13 million increase inBunge’s trade receivables associated with the Program. benefit obligation as of year ended December 31, 2018.Servicing fees under the Program were not significant in any
On September 19, 2017, Bunge approved changes to certainperiod.U.S. defined benefit pension plans. These changes freeze the
YEARS ENDED DECEMBER 31, Plans for future benefit accruals effective January 1, 2023, and(US$ in millions) 2018 2017 2016 these Plans are closed for participation for employees hired onGross receivables sold $9,803 $10,022 $9,405 or after January 1, 2018. As a result, Bunge recognized a
curtailment gain associated with the Plans’ freeze and as such,Proceeds received in cash related tothe projected benefit obligations for these Plans weretransfer of receivables $9,484 $ 9,734 $9,197remeasured as of September 30, 2017. At September 30, 2017,
Cash collections from customers on a $31 million pension curtailment gain and $18 millionreceivables previously sold $9,173 $ 9,659 $9,176 remeasurement loss were recognized and recorded in other
comprehensive income.Discounts related to gross receivables soldincluded in SG&A $ 14 $ 9 $ 6
In addition, in 2017, the Company offered a voluntary earlyretirement program to qualifying U.S. based salaried
Non-cash activity for the program in the reporting period is employees. The employees that accepted the offer received anrepresented by the difference between gross receivables sold enhanced retirement benefit in the defined benefit pensionand cash collections from customers on receivables previously plans. The Company incurred $10 million of additional definedsold. benefit expenses relating to the program as of December 31,
2017, which are reflected in the tables below.Bunge’s risk of loss following the sale of the trade receivablesis limited to the deferred purchase price (the ‘‘DPP’’) and is Cost of Benefit Plans – Service cost is recognized in a periodincluded in other current assets in the consolidated balance determined as the actuarial present value of benefits attributedsheets (see Note 6). The DPP will be repaid in cash as by the pension benefit formula to services rendered byreceivables are collected, generally within 30 days. employees during that period. Interest cost is the amountDelinquencies and credit losses on trade receivables sold recognized in a period determined as the increase in theunder the Program during the years ended December 31, 2018, projected benefit obligation due to the passage of time. The2017 and 2016 were insignificant. expected return on plan assets is determined based on the
expected long-term rate of return on plan assets and the19. EMPLOYEE BENEFIT PLANS market-related value of plan assets. Amortization of net loss
represents the recognition in net periodic cost over severalperiods of amounts previously recognized in otherCertain United States, Canadian, European, Asian andcomprehensive income.Brazilian-based subsidiaries of Bunge sponsor defined benefit
2018 Bunge Annual Report F-33
BUNGE LIMITED AND SUBSIDIARIESNOTES TO THE CONSOLIDATED FINANCIAL STATEMENTS

F-34
The weighted-average actuarial assumptions used in19. EMPLOYEE BENEFIT PLANS (Continued)determining the benefit obligation under the defined benefitpension and postretirement benefit plans are as follows:The components of net periodic benefit costs are as follows for
defined benefit pension plans and postretirement benefit plans:POSTRETIREMENT
PENSION BENEFITS BENEFITSPOSTRETIREMENTDECEMBER 31, DECEMBER 31,PENSION BENEFITS BENEFITS
DECEMBER 31, DECEMBER 31, 2018 2017 2018 2017(US$ in millions) 2018 2017 2016 2018 2017 2016
Discount rate 3.7% 3.4% 8.3% 9.0%Increase in futureService cost $39 $ 33 $ 32 $ - $ - $ -
compensation levels 3.2% 3.2% N/A N/AInterest cost 40 36 35 5 8 7Expected return on plan assets (57) (46) (44) - - -
The weighted-average actuarial assumptions used inAmortization of prior service cost 1 - - - - -determining the net periodic benefit cost under the definedAmortization of net loss 9 10 10 - - -benefit pension and postretirement benefit plans are as follows:Curtailment (gain) (2) - - - - -
Settlement loss recognized 4 - - - - -POSTRETIREMENTSpecial termination benefit - 9 1 - - -
PENSION BENEFITS BENEFITSNet periodic benefit costs $34 $ 42 $ 34 $ 5 $ 8 $ 7
DECEMBER 31, DECEMBER 31,
2018 2017 2016 2018 2017 2016Assumptions used in Pension Calculations – At December 31,2018, for measurement purposes related to postretirement Discount rate 3.4% 4.0% 4.2% 9.0% 10.8% 11.4%benefit plans, an 7.7% annual rate of increase in the per capita Expected long-term rate of returncost of covered healthcare benefits was assumed for 2018, on assets 6.0% 6.2% 6.4% N/A N/A N/Adecreasing to 7.4% by 2038, remaining at that level thereafter. Increase in future compensationAt December 31, 2017, for measurement purposes related to levels 3.2% 3.2% 3.3% N/A N/A N/Apostretirement benefit plans, an 8.4% annual rate of increase inthe per capita cost of covered healthcare benefits was The sponsoring subsidiaries select the expected long-term rateassumed for 2017, decreasing to 8.1% by 2038, remaining at of return on assets in consultation with their investmentthat level thereafter. advisors and actuaries. These rates are intended to reflect the
average rates of earnings expected on the funds invested or toA one-percentage point change in assumed healthcare cost be invested to provide required plan benefits. The plans aretrend rates would have the following effects: assumed to continue in effect as long as assets are expected
to be invested.ONE-PERCENTAGE ONE-PERCENTAGE
In estimating the expected long-term rate of return on assets,(US$ in millions) POINT INCREASE POINT DECREASEappropriate consideration is given to historical performance for
Effect on total service and interest the major asset classes held, or anticipated to be held, by thecost $ - $ - applicable plan trusts and to current forecasts of future rates
Effect on postretirement benefit of return for those asset classes. Cash flows and expenses areobligation $4 $(4) taken into consideration to the extent that the expected returns
would be affected by them. As assets are generally held inqualified trusts, anticipated returns are not reduced for taxes.
Plan Transfers In and Out – As a result of the March 1, 2018Loders acquisition, there was a transfer into Bunge’s definedbenefit pension plan resulting in a $211 million increase inbenefit obligation and $181 million increase in the fair value ofplan assets during the year ended December 31, 2018. Therewere no significant transfers into or out of Bunge’s employeebenefit plans during the year ended December 31, 2017.
F-34 2018 Bunge Annual Report
BUNGE LIMITED AND SUBSIDIARIESNOTES TO THE CONSOLIDATED FINANCIAL STATEMENTS

F-35
Pension Benefit Obligations and Funded Status – The following19. EMPLOYEE BENEFIT PLANS (Continued)table sets forth in aggregate the changes in the defined
For the year ended December 31, 2018, there were settlements benefit pension and postretirement benefit plans’ benefitto Bunge’s Swiss defined benefit pension plan as a result of obligations, assets and funded status at December 31, 2018the GCP, resulting in a $28 million decrease in benefit and 2017. A measurement date of December 31 was used forobligation and changing to a defined contribution plan, all plans.resulting in a $27 million decrease in benefit obligation. Therewere no significant settlements in Bunge’s employee benefitplans during the year ended December 31, 2017.
POSTRETIREMENTPENSION BENEFITS BENEFITS
DECEMBER 31, DECEMBER 31,
(US$ in millions) 2018 2017 2018 2017
Change in benefit obligations:Benefit obligation at the beginning of year . . . . . . . . . . . . . . . . . . . . . . . . . . . . . . . . . . . . . . . . . . . . . . . . . . . . . . . . . . . . . . . . . . . . . . . . . . . . . . . . . . . . $1,073 $ 941 $ 67 $ 74Service cost . . . . . . . . . . . . . . . . . . . . . . . . . . . . . . . . . . . . . . . . . . . . . . . . . . . . . . . . . . . . . . . . . . . . . . . . . . . . . . . . . . . . . . . . . . . . . . . . . . . . . . . . . . . . . . . . . . . . . . . . . . . . 39 33 - -Interest cost . . . . . . . . . . . . . . . . . . . . . . . . . . . . . . . . . . . . . . . . . . . . . . . . . . . . . . . . . . . . . . . . . . . . . . . . . . . . . . . . . . . . . . . . . . . . . . . . . . . . . . . . . . . . . . . . . . . . . . . . . . . 40 36 5 8Plan amendments . . . . . . . . . . . . . . . . . . . . . . . . . . . . . . . . . . . . . . . . . . . . . . . . . . . . . . . . . . . . . . . . . . . . . . . . . . . . . . . . . . . . . . . . . . . . . . . . . . . . . . . . . . . . . . . . . . . . . 16 1 - -Plan curtailments . . . . . . . . . . . . . . . . . . . . . . . . . . . . . . . . . . . . . . . . . . . . . . . . . . . . . . . . . . . . . . . . . . . . . . . . . . . . . . . . . . . . . . . . . . . . . . . . . . . . . . . . . . . . . . . . . . . . . (2) (32) - -Special termination benefits . . . . . . . . . . . . . . . . . . . . . . . . . . . . . . . . . . . . . . . . . . . . . . . . . . . . . . . . . . . . . . . . . . . . . . . . . . . . . . . . . . . . . . . . . . . . . . . . . . . . . . . - 9 - -Actuarial (gain) loss, net . . . . . . . . . . . . . . . . . . . . . . . . . . . . . . . . . . . . . . . . . . . . . . . . . . . . . . . . . . . . . . . . . . . . . . . . . . . . . . . . . . . . . . . . . . . . . . . . . . . . . . . . . . . (84) 100 1 (11)Employee contributions . . . . . . . . . . . . . . . . . . . . . . . . . . . . . . . . . . . . . . . . . . . . . . . . . . . . . . . . . . . . . . . . . . . . . . . . . . . . . . . . . . . . . . . . . . . . . . . . . . . . . . . . . . . . . 3 6 1 1Net transfers in (out) . . . . . . . . . . . . . . . . . . . . . . . . . . . . . . . . . . . . . . . . . . . . . . . . . . . . . . . . . . . . . . . . . . . . . . . . . . . . . . . . . . . . . . . . . . . . . . . . . . . . . . . . . . . . . . . . 213 3 - -Plan settlements . . . . . . . . . . . . . . . . . . . . . . . . . . . . . . . . . . . . . . . . . . . . . . . . . . . . . . . . . . . . . . . . . . . . . . . . . . . . . . . . . . . . . . . . . . . . . . . . . . . . . . . . . . . . . . . . . . . . . . (55) - - -Benefits paid . . . . . . . . . . . . . . . . . . . . . . . . . . . . . . . . . . . . . . . . . . . . . . . . . . . . . . . . . . . . . . . . . . . . . . . . . . . . . . . . . . . . . . . . . . . . . . . . . . . . . . . . . . . . . . . . . . . . . . . . . . (40) (35) (7) (4)Expenses paid . . . . . . . . . . . . . . . . . . . . . . . . . . . . . . . . . . . . . . . . . . . . . . . . . . . . . . . . . . . . . . . . . . . . . . . . . . . . . . . . . . . . . . . . . . . . . . . . . . . . . . . . . . . . . . . . . . . . . . . . . (3) (4) - -Impact of foreign exchange rates . . . . . . . . . . . . . . . . . . . . . . . . . . . . . . . . . . . . . . . . . . . . . . . . . . . . . . . . . . . . . . . . . . . . . . . . . . . . . . . . . . . . . . . . . . . . . . . . . (8) 15 (8) (1)
Benefit obligation at the end of year . . . . . . . . . . . . . . . . . . . . . . . . . . . . . . . . . . . . . . . . . . . . . . . . . . . . . . . . . . . . . . . . . . . . . . . . . . . . . . . . . . . . . . . . . . . . $1,192 $1,073 $ 59 $ 67
Change in plan assets:Fair value of plan assets at the beginning of year . . . . . . . . . . . . . . . . . . . . . . . . . . . . . . . . . . . . . . . . . . . . . . . . . . . . . . . . . . . . . . . . . . . . . . . . . . . . $ 896 $ 740 $ - $ -Actual return on plan assets . . . . . . . . . . . . . . . . . . . . . . . . . . . . . . . . . . . . . . . . . . . . . . . . . . . . . . . . . . . . . . . . . . . . . . . . . . . . . . . . . . . . . . . . . . . . . . . . . . . . . . . (36) 102 - -Employer contributions . . . . . . . . . . . . . . . . . . . . . . . . . . . . . . . . . . . . . . . . . . . . . . . . . . . . . . . . . . . . . . . . . . . . . . . . . . . . . . . . . . . . . . . . . . . . . . . . . . . . . . . . . . . . . . 18 77 6 3Employee contributions . . . . . . . . . . . . . . . . . . . . . . . . . . . . . . . . . . . . . . . . . . . . . . . . . . . . . . . . . . . . . . . . . . . . . . . . . . . . . . . . . . . . . . . . . . . . . . . . . . . . . . . . . . . . . 3 6 1 1Net transfers in (out) . . . . . . . . . . . . . . . . . . . . . . . . . . . . . . . . . . . . . . . . . . . . . . . . . . . . . . . . . . . . . . . . . . . . . . . . . . . . . . . . . . . . . . . . . . . . . . . . . . . . . . . . . . . . . . . . 181 - - -Plan settlements . . . . . . . . . . . . . . . . . . . . . . . . . . . . . . . . . . . . . . . . . . . . . . . . . . . . . . . . . . . . . . . . . . . . . . . . . . . . . . . . . . . . . . . . . . . . . . . . . . . . . . . . . . . . . . . . . . . . . . (55) - - -Benefits paid . . . . . . . . . . . . . . . . . . . . . . . . . . . . . . . . . . . . . . . . . . . . . . . . . . . . . . . . . . . . . . . . . . . . . . . . . . . . . . . . . . . . . . . . . . . . . . . . . . . . . . . . . . . . . . . . . . . . . . . . . . (40) (35) (7) (4)Expenses paid . . . . . . . . . . . . . . . . . . . . . . . . . . . . . . . . . . . . . . . . . . . . . . . . . . . . . . . . . . . . . . . . . . . . . . . . . . . . . . . . . . . . . . . . . . . . . . . . . . . . . . . . . . . . . . . . . . . . . . . . . (3) (4) - -Impact of foreign exchange rates . . . . . . . . . . . . . . . . . . . . . . . . . . . . . . . . . . . . . . . . . . . . . . . . . . . . . . . . . . . . . . . . . . . . . . . . . . . . . . . . . . . . . . . . . . . . . . . . . (7) 10 - -
Fair value of plan assets at the end of year . . . . . . . . . . . . . . . . . . . . . . . . . . . . . . . . . . . . . . . . . . . . . . . . . . . . . . . . . . . . . . . . . . . . . . . . . . . . . . . . . . . $ 957 $ 896 $ - $ -
Funded (unfunded) status and net amounts recognized:Plan assets (less than) in excess of benefit obligation . . . . . . . . . . . . . . . . . . . . . . . . . . . . . . . . . . . . . . . . . . . . . . . . . . . . . . . . . . . . . . . . . . . . . . . $ (235) $ (177) $(59) $(67)
Net (liability) asset recognized in the balance sheet . . . . . . . . . . . . . . . . . . . . . . . . . . . . . . . . . . . . . . . . . . . . . . . . . . . . . . . . . . . . . . . . . . . . . . . . $ (235) $ (177) $(59) $(67)
Amounts recognized in the balance sheet consist of:Non-current assets . . . . . . . . . . . . . . . . . . . . . . . . . . . . . . . . . . . . . . . . . . . . . . . . . . . . . . . . . . . . . . . . . . . . . . . . . . . . . . . . . . . . . . . . . . . . . . . . . . . . . . . . . . . . . . . . . . . $ 11 $ 18 $ - $ -Current liabilities . . . . . . . . . . . . . . . . . . . . . . . . . . . . . . . . . . . . . . . . . . . . . . . . . . . . . . . . . . . . . . . . . . . . . . . . . . . . . . . . . . . . . . . . . . . . . . . . . . . . . . . . . . . . . . . . . . . . . (6) (6) (6) (7)Non-current liabilities . . . . . . . . . . . . . . . . . . . . . . . . . . . . . . . . . . . . . . . . . . . . . . . . . . . . . . . . . . . . . . . . . . . . . . . . . . . . . . . . . . . . . . . . . . . . . . . . . . . . . . . . . . . . . . . (240) (189) (53) (60)
Net liability recognized . . . . . . . . . . . . . . . . . . . . . . . . . . . . . . . . . . . . . . . . . . . . . . . . . . . . . . . . . . . . . . . . . . . . . . . . . . . . . . . . . . . . . . . . . . . . . . . . . . . . . . . . . . . . . $ (235) $ (177) $(59) $(67)
2018 Bunge Annual Report F-35
BUNGE LIMITED AND SUBSIDIARIESNOTES TO THE CONSOLIDATED FINANCIAL STATEMENTS

F-36
The accumulated benefit obligation for the defined pension19. EMPLOYEE BENEFIT PLANS (Continued)benefit plans, respectively, was $1,122 million at December 31,
Included in accumulated other comprehensive income (loss) for 2018 and $1,011 million at December 31, 2017. The followingpension benefits at December 31, 2018 are the following table summarizes information relating to aggregated definedamounts that have not yet been recognized in net periodic benefit pension plans with an accumulated benefit obligation inbenefit costs: unrecognized prior service credit of $10 million excess of plan assets:($8 million, net of tax) and unrecognized actuarial loss of$188 million ($142 million, net of tax). PENSION BENEFITS
DECEMBER 31,Included in accumulated other comprehensive income (loss) for
(US$ in millions) 2018 2017postretirement healthcare benefits at December 31, 2018 arethe following amounts that have not yet been recognized in net Projected benefit obligation $978 $827periodic benefit costs: unrecognized prior service credit of Accumulated benefit obligation $938 $789$1 million ($1 million, net of tax), and unrecognized actuarial Fair value of plan assets $758 $651loss of $3 million ($2 million, net of tax).
Pension Benefit Plan Assets – The objectives of the plans’ trustBunge has aggregated certain defined benefit pension plans funds are to sufficiently diversify plan assets to maintain awith projected benefit obligations in excess of fair value of plan reasonable level of risk without imprudently sacrificing returns,assets with pension plans that have fair value of plan assets in with a target asset allocation of approximately 60% fixedexcess of projected benefit obligations. The following table income securities and approximately 40% equities. Bungeprovides aggregated information about pension plans with a implements its investment strategy through a combination ofprojected benefit obligation in excess of plan assets: indexed mutual funds and a proprietary portfolio of fixed
income securities. Bunge’s policy is not to invest plan assets inPENSION BENEFITS Bunge Limited shares. Plan investments are stated at fair value.
DECEMBER 31, For a further definition of fair value and the associated fairvalue levels, refer to Note 15.(US$ in millions) 2018 2017
Projected benefit obligation $1,073 $937Fair value of plan assets $ 827 $742
The fair values of Bunge’s defined benefit pension plans’ assets at the measurement date, by category, are as follows:
DECEMBER 31, 2018
QUOTED PRICESIN ACTIVE SIGNIFICANT SIGNIFICANT
MARKETS FOR OBSERVABLE UNOBSERVABLEIDENTICAL ASSETS INPUTS INPUTS
(US$ in millions) TOTAL (LEVEL 1) (LEVEL 2) (LEVEL 3)
Cash . . . . . . . . . . . . . . . . . . . . . . . . . . . . . . . . . . . . . . . . . . . . . . . . . . . . . . . . . . . . . . . . . . . . . . . . . . . . . . . . . . . . . . . . . . . . . . . . . . . . . . . . $ 16 $ 16 $ - $ -Equities:
Mutual funds(1) . . . . . . . . . . . . . . . . . . . . . . . . . . . . . . . . . . . . . . . . . . . . . . . . . . . . . . . . . . . . . . . . . . . . . . . . . . . . . . . . . . . . . . . . 363 362 1 -Fixed income securities:
Mutual funds(2) . . . . . . . . . . . . . . . . . . . . . . . . . . . . . . . . . . . . . . . . . . . . . . . . . . . . . . . . . . . . . . . . . . . . . . . . . . . . . . . . . . . . . . . . 536 498 38 -Others(3) . . . . . . . . . . . . . . . . . . . . . . . . . . . . . . . . . . . . . . . . . . . . . . . . . . . . . . . . . . . . . . . . . . . . . . . . . . . . . . . . . . . . . . . . . . . . . . . . . . . 42 6 20 16
Total . . . . . . . . . . . . . . . . . . . . . . . . . . . . . . . . . . . . . . . . . . . . . . . . . . . . . . . . . . . . . . . . . . . . . . . . . . . . . . . . . . . . . . . . . . . . . . . . . . . . . . . $957 $882 $59 $16
F-36 2018 Bunge Annual Report
BUNGE LIMITED AND SUBSIDIARIESNOTES TO THE CONSOLIDATED FINANCIAL STATEMENTS
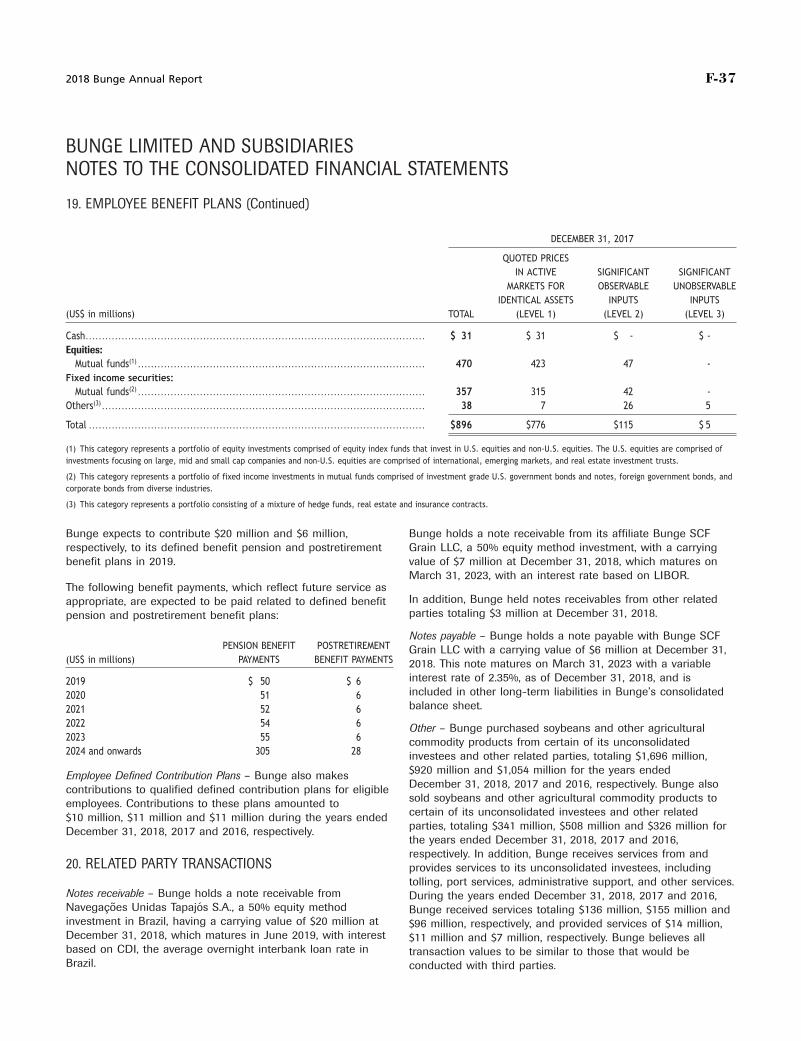
F-37
19. EMPLOYEE BENEFIT PLANS (Continued)
DECEMBER 31, 2017
QUOTED PRICESIN ACTIVE SIGNIFICANT SIGNIFICANT
MARKETS FOR OBSERVABLE UNOBSERVABLEIDENTICAL ASSETS INPUTS INPUTS
(US$ in millions) TOTAL (LEVEL 1) (LEVEL 2) (LEVEL 3)
Cash . . . . . . . . . . . . . . . . . . . . . . . . . . . . . . . . . . . . . . . . . . . . . . . . . . . . . . . . . . . . . . . . . . . . . . . . . . . . . . . . . . . . . . . . . . . . . . . . . . . . . . . . $ 31 $ 31 $ - $ -Equities:
Mutual funds(1) . . . . . . . . . . . . . . . . . . . . . . . . . . . . . . . . . . . . . . . . . . . . . . . . . . . . . . . . . . . . . . . . . . . . . . . . . . . . . . . . . . . . . . . . 470 423 47 -Fixed income securities:
Mutual funds(2) . . . . . . . . . . . . . . . . . . . . . . . . . . . . . . . . . . . . . . . . . . . . . . . . . . . . . . . . . . . . . . . . . . . . . . . . . . . . . . . . . . . . . . . . 357 315 42 -Others(3) . . . . . . . . . . . . . . . . . . . . . . . . . . . . . . . . . . . . . . . . . . . . . . . . . . . . . . . . . . . . . . . . . . . . . . . . . . . . . . . . . . . . . . . . . . . . . . . . . . . 38 7 26 5
Total . . . . . . . . . . . . . . . . . . . . . . . . . . . . . . . . . . . . . . . . . . . . . . . . . . . . . . . . . . . . . . . . . . . . . . . . . . . . . . . . . . . . . . . . . . . . . . . . . . . . . . . $896 $776 $115 $ 5
(1) This category represents a portfolio of equity investments comprised of equity index funds that invest in U.S. equities and non-U.S. equities. The U.S. equities are comprised ofinvestments focusing on large, mid and small cap companies and non-U.S. equities are comprised of international, emerging markets, and real estate investment trusts.
(2) This category represents a portfolio of fixed income investments in mutual funds comprised of investment grade U.S. government bonds and notes, foreign government bonds, andcorporate bonds from diverse industries.
(3) This category represents a portfolio consisting of a mixture of hedge funds, real estate and insurance contracts.
Bunge expects to contribute $20 million and $6 million, Bunge holds a note receivable from its affiliate Bunge SCFrespectively, to its defined benefit pension and postretirement Grain LLC, a 50% equity method investment, with a carryingbenefit plans in 2019. value of $7 million at December 31, 2018, which matures on
March 31, 2023, with an interest rate based on LIBOR.The following benefit payments, which reflect future service as
In addition, Bunge held notes receivables from other relatedappropriate, are expected to be paid related to defined benefitparties totaling $3 million at December 31, 2018.pension and postretirement benefit plans:
Notes payable – Bunge holds a note payable with Bunge SCFPENSION BENEFIT POSTRETIREMENT Grain LLC with a carrying value of $6 million at December 31,
(US$ in millions) PAYMENTS BENEFIT PAYMENTS 2018. This note matures on March 31, 2023 with a variableinterest rate of 2.35%, as of December 31, 2018, and is2019 $ 50 $ 6included in other long-term liabilities in Bunge’s consolidated2020 51 6balance sheet.2021 52 6
2022 54 6 Other – Bunge purchased soybeans and other agricultural2023 55 6 commodity products from certain of its unconsolidated2024 and onwards 305 28 investees and other related parties, totaling $1,696 million,
$920 million and $1,054 million for the years endedEmployee Defined Contribution Plans – Bunge also makesDecember 31, 2018, 2017 and 2016, respectively. Bunge alsocontributions to qualified defined contribution plans for eligiblesold soybeans and other agricultural commodity products toemployees. Contributions to these plans amounted tocertain of its unconsolidated investees and other related$10 million, $11 million and $11 million during the years endedparties, totaling $341 million, $508 million and $326 million forDecember 31, 2018, 2017 and 2016, respectively.the years ended December 31, 2018, 2017 and 2016,respectively. In addition, Bunge receives services from and
20. RELATED PARTY TRANSACTIONS provides services to its unconsolidated investees, includingtolling, port services, administrative support, and other services.
Notes receivable – Bunge holds a note receivable from During the years ended December 31, 2018, 2017 and 2016,Navegacoes Unidas Tapajos S.A., a 50% equity method Bunge received services totaling $136 million, $155 million andinvestment in Brazil, having a carrying value of $20 million at $96 million, respectively, and provided services of $14 million,December 31, 2018, which matures in June 2019, with interest $11 million and $7 million, respectively. Bunge believes allbased on CDI, the average overnight interbank loan rate in transaction values to be similar to those that would beBrazil. conducted with third parties.
2018 Bunge Annual Report F-37
BUNGE LIMITED AND SUBSIDIARIESNOTES TO THE CONSOLIDATED FINANCIAL STATEMENTS
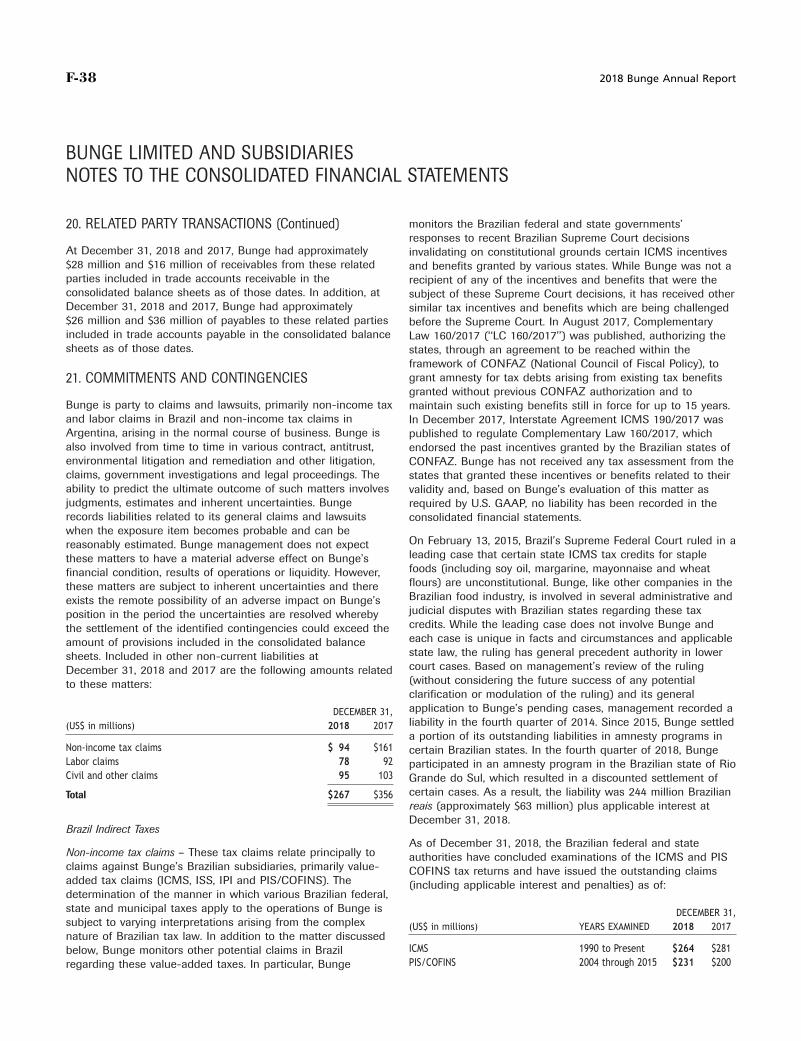
F-38
monitors the Brazilian federal and state governments’20. RELATED PARTY TRANSACTIONS (Continued)responses to recent Brazilian Supreme Court decisions
At December 31, 2018 and 2017, Bunge had approximately invalidating on constitutional grounds certain ICMS incentives$28 million and $16 million of receivables from these related and benefits granted by various states. While Bunge was not aparties included in trade accounts receivable in the recipient of any of the incentives and benefits that were theconsolidated balance sheets as of those dates. In addition, at subject of these Supreme Court decisions, it has received otherDecember 31, 2018 and 2017, Bunge had approximately similar tax incentives and benefits which are being challenged$26 million and $36 million of payables to these related parties before the Supreme Court. In August 2017, Complementaryincluded in trade accounts payable in the consolidated balance Law 160/2017 (‘‘LC 160/2017’’) was published, authorizing thesheets as of those dates. states, through an agreement to be reached within the
framework of CONFAZ (National Council of Fiscal Policy), togrant amnesty for tax debts arising from existing tax benefits21. COMMITMENTS AND CONTINGENCIESgranted without previous CONFAZ authorization and to
Bunge is party to claims and lawsuits, primarily non-income tax maintain such existing benefits still in force for up to 15 years.and labor claims in Brazil and non-income tax claims in In December 2017, Interstate Agreement ICMS 190/2017 wasArgentina, arising in the normal course of business. Bunge is published to regulate Complementary Law 160/2017, whichalso involved from time to time in various contract, antitrust, endorsed the past incentives granted by the Brazilian states ofenvironmental litigation and remediation and other litigation, CONFAZ. Bunge has not received any tax assessment from theclaims, government investigations and legal proceedings. The states that granted these incentives or benefits related to theirability to predict the ultimate outcome of such matters involves validity and, based on Bunge’s evaluation of this matter asjudgments, estimates and inherent uncertainties. Bunge required by U.S. GAAP, no liability has been recorded in therecords liabilities related to its general claims and lawsuits consolidated financial statements.when the exposure item becomes probable and can be
On February 13, 2015, Brazil’s Supreme Federal Court ruled in areasonably estimated. Bunge management does not expectleading case that certain state ICMS tax credits for staplethese matters to have a material adverse effect on Bunge’sfoods (including soy oil, margarine, mayonnaise and wheatfinancial condition, results of operations or liquidity. However,flours) are unconstitutional. Bunge, like other companies in thethese matters are subject to inherent uncertainties and thereBrazilian food industry, is involved in several administrative andexists the remote possibility of an adverse impact on Bunge’sjudicial disputes with Brazilian states regarding these taxposition in the period the uncertainties are resolved wherebycredits. While the leading case does not involve Bunge andthe settlement of the identified contingencies could exceed theeach case is unique in facts and circumstances and applicableamount of provisions included in the consolidated balancestate law, the ruling has general precedent authority in lowersheets. Included in other non-current liabilities atcourt cases. Based on management’s review of the rulingDecember 31, 2018 and 2017 are the following amounts related(without considering the future success of any potentialto these matters:clarification or modulation of the ruling) and its generalapplication to Bunge’s pending cases, management recorded aDECEMBER 31,liability in the fourth quarter of 2014. Since 2015, Bunge settled(US$ in millions) 2018 2017a portion of its outstanding liabilities in amnesty programs in
Non-income tax claims $ 94 $161 certain Brazilian states. In the fourth quarter of 2018, BungeLabor claims 78 92 participated in an amnesty program in the Brazilian state of RioCivil and other claims 95 103 Grande do Sul, which resulted in a discounted settlement of
certain cases. As a result, the liability was 244 million BrazilianTotal $267 $356reais (approximately $63 million) plus applicable interest atDecember 31, 2018.
Brazil Indirect TaxesAs of December 31, 2018, the Brazilian federal and state
Non-income tax claims – These tax claims relate principally to authorities have concluded examinations of the ICMS and PISclaims against Bunge’s Brazilian subsidiaries, primarily value- COFINS tax returns and have issued the outstanding claimsadded tax claims (ICMS, ISS, IPI and PIS/COFINS). The (including applicable interest and penalties) as of:determination of the manner in which various Brazilian federal,state and municipal taxes apply to the operations of Bunge is DECEMBER 31,subject to varying interpretations arising from the complex (US$ in millions) YEARS EXAMINED 2018 2017nature of Brazilian tax law. In addition to the matter discussed
ICMS 1990 to Present $264 $281below, Bunge monitors other potential claims in BrazilPIS/COFINS 2004 through 2015 $231 $200regarding these value-added taxes. In particular, Bunge
F-38 2018 Bunge Annual Report
BUNGE LIMITED AND SUBSIDIARIESNOTES TO THE CONSOLIDATED FINANCIAL STATEMENTS

F-39
Guarantees – Bunge has issued or was a party to the following21. COMMITMENTS AND CONTINGENCIES (Continued)guarantees at December 31, 2018:
Argentina Export Tax
MAXIMUMSince 2010, the Argentine tax authorities have been conductingPOTENTIALa review of income and other taxes paid by exporters and
FUTUREprocessors of cereals and other agricultural commodities in the(US$ in millions) PAYMENTScountry. In that regard, the Company has been subject to a
number of assessments, proceedings, and claims related to its Unconsolidated affiliates guarantee(1)(2) $ 288activities. During 2011, Bunge’s subsidiary in Argentina paid Residual value guarantee(3) 269$112 million of accrued export tax obligations under protest
Total $557and preserved its rights with respect to such payment. In 2012,the Argentine tax authorities further assessed interest on these (1) Bunge has issued guarantees to certain financial institutions related to debt ofpayments, which as of December 31, 2018, totaled certain of its unconsolidated affiliates. The terms of the guarantees are equal to theapproximately $292 million. In 2012, the Argentine government terms of the related financings which have maturity dates through 2034. There are no
recourse provisions or collateral that would enable Bunge to recover any amounts paidsuspended Bunge’s Argentine subsidiary from a registry ofunder these guarantees. In addition, a Bunge subsidiary has guaranteed the obligations ofgrain traders. While the suspension has not had a materialtwo of its affiliates and in connection therewith has secured its guarantee obligationsadverse effect on Bunge’s business in Argentina, these actionsthrough a pledge of one of its affiliate’s shares plus loans receivable from the affiliate to
have resulted in additional administrative requirements and the financial institutions in the event that the guaranteed obligations are enforced.increased logistical costs on domestic grain shipments within Based on the amounts drawn under such debt facilities at December 31, 2018, Bunge’sArgentina. Bunge is challenging these actions in the Argentine potential liability was $141 million, and it has recorded a $17 million obligation related
to these guarantees.courts.(2) Bunge has issued guarantees to certain third parties related to performance of its
Labor claims – The labor claims are principally claims againstunconsolidated affiliates. The terms of the guarantees are equal to the completion date
Bunge’s Brazilian subsidiaries. The labor claims primarily relate of a port terminal which is expected to be completed in 2020. There are no recourseto dismissals, severance, health and safety, salary adjustments provisions or collateral that would enable Bunge to recover any amounts paid under
these guarantees. At December 31, 2018, Bunge’s maximum potential future paymentsand supplementary retirement benefits.under these guarantees was $70 million, and no obligation has been recorded related to
Civil and other claims – The civil and other claims relate to these guarantees.
various disputes with third parties, including suppliers and (3) Bunge has issued guarantees to certain financial institutions which are party tocustomers. certain operating lease arrangements for railcars and barges. These guarantees provide
for a minimum residual value to be received by the lessor at conclusion of the leaseDuring the first quarter of 2017, Bunge received a notice from term. These leases expire at various dates from 2019 through 2024. At December 31,the Brazilian Administrative Council for Economic Defense 2018, Bunge’s recorded obligation related to these guarantees was $1 million.
(‘‘CADE’’) initiating an administrative proceeding against itsBunge Limited has provided a Guaranty to the Director of theBrazilian subsidiary and two of its employees, certain of itsIllinois Department of Agriculture as Trustee for Bunge Northformer employees, several other companies in the BrazilianAmerica, Inc. (‘‘BNA’’), an indirect wholly-owned subsidiary,wheat milling industry, and others for alleged anticompetitivewhich guarantees all amounts due and owing by BNA, to grainactivities in the north and northeast of Brazil. Additionally, inproducers and/or depositors in the State of Illinois who havethe second quarter of 2018, Bunge received a notification fromdelivered commodities to BNA’s Illinois facilities.CADE that it has extended the scope of an existing
administrative proceeding relating to alleged anticompetitive In addition, Bunge Limited has provided full and unconditionalpractices in the Rio Grande port in Brazil to include certain of parent level guarantees of the outstanding indebtedness underBunge’s Brazilian subsidiaries and certain former employees of certain credit facilities entered into and senior notes issued bythose subsidiaries. Bunge is defending against these actions; its subsidiaries. At December 31, 2018, Bunge’s consolidatedhowever, the proceedings are at an early stage and Bunge balance sheet includes debt with a carrying amount ofcannot, at this time, reasonably predict the ultimate outcome of $5,011 million related to these guarantees. This debt includesthe proceedings or sanctions, if any, which may be imposed. the senior notes issued by two of Bunge’s 100% owned finance
subsidiaries, Bunge Limited Finance Corp. and Bunge FinanceEurope B.V. There are largely no restrictions on the ability ofBunge Limited Finance Corp. and Bunge Finance Europe B.V.or any other Bunge subsidiary to transfer funds to BungeLimited.
Freight Supply Agreements – In the ordinary course of business,Bunge enters into time charter agreements for the use ofocean freight vessels and freight service on railroad lines for
2018 Bunge Annual Report F-39
BUNGE LIMITED AND SUBSIDIARIESNOTES TO THE CONSOLIDATED FINANCIAL STATEMENTS

F-40
arrangement with the Loders’ minority shareholder and may be21. COMMITMENTS AND CONTINGENCIES (Continued)required or elect to purchase the additional 30% ownership
the purpose of transporting agricultural commodities. In interest in Loders within a specified time frame.addition, Bunge sells the right to use these ocean freight
The Company classifies these redeemable equity securitiesvessels when excess freight capacity is available. Theseoutside of permanent stockholders’ equity as the equityagreements generally range from two months to approximatelysecurities are redeemable at the option of the holder. Theseven years, in the case of ocean freight vessels, depending oncarrying amount of redeemable noncontrolling interests is themarket conditions, and approximately eight years in the case ofgreater of: (i) the initial carrying amount, increased orrailroad services. Future minimum payment obligations duedecreased for the noncontrolling interests’ share of net incomeunder these agreements as of December 31, 2018 are asor loss, equity capital contributions and distributions or (ii) thefollows:redemption value. Any resulting increases in the redemption
OCEAN MINIMUM amount, in excess of the initial carrying amount, increased orFREIGHT RAILROAD PAYMENT decreased for the noncontrolling interests’ share of net income
(US$ in millions) VESSELS SERVICES OBLIGATIONS or loss, equity capital contributions and distributions, areaffected by corresponding charges against retained earnings.
2019 $172 $ 42 $214 Additionally, any such charges to retained earnings will affect2020 and 2021 176 55 231 net income (loss) available to Bunge common shareholders as2022 and 2023 121 55 176 part of Bunge’s calculation of earnings per common share.2024 and thereafter 37 28 65
In July 2012, Bunge and Nutre Farming B.V. entered into a jointTotal $506 $180 $686venture agreement whereby Bunge acquired a 55% interest ina newly formed oilseed processing venture in its agribusinessActual amounts paid under these contracts may differ due tosegment in Eastern Europe. Bunge consolidates the venture inthe variable components of these agreements and the amountits consolidated financial statements. In conjunction with theof income earned on the sales of excess capacity. Theformation of the venture, Bunge entered into an agreement toagreements for the freight service on railroad lines require aacquire the remaining 45% interest at either Bunge’s or theminimum monthly payment regardless of the actual level ofnoncontrolling interest holder’s option in the future. Thefreight services used by Bunge. The costs of Bunge’s freightexercise date and price of the option were reasonablysupply agreements are typically passed through to thedeterminable. As a result, Bunge had classified thecustomers as a component of the prices charged for itsnoncontrolling interest as redeemable noncontrolling interest inproducts.its consolidated balance sheet as of December 31, 2012.During the second quarter of 2016, Bunge exercised its callAlso in the ordinary course of business, Bunge enters intooption for the remaining 45% interest in the joint venture forre-let agreements related to ocean freight vessels. Such re-letapproximately $39 million. The transaction was concluded inagreements are similar to sub-leases. Bunge receivedSeptember 2016.approximately $155 million during the year ended
December 31, 2018 under such re-let agreements.23. EQUITY
In reviewing the impact of ASC 606, the Company alsoconsidered the impact of the adoption of ASU 2016-02, Leases Share Repurchase Program – In May 2015, Bunge established a(Topic 842), which is effective January 1, 2019, on the hiring of new program for the repurchase of up to $500 million ofthe vessels and has concluded that these contracts are leases Bunge’s issued and outstanding common shares. The programin the scope of the guidance (see Note 1 for further has no expiration date. Bunge did not repurchase any commoninformation on the impact of the adoption of new accounting shares during the year ended December 31, 2018. Totalpronouncements). repurchases under the program from its inception in May 2015
through December 31, 2018 were 4,707,440 shares forCommitments – At December 31, 2018, Bunge had$300 million.approximately $225 million of purchase commitments related to
its inventories, $70 million of power supply contracts and Cumulative Convertible Perpetual Preference Shares – Bunge has$57 million of contractual commitments related to construction 6,899,683, 4.875% cumulative convertible perpetual preferencein progress. shares (convertible preference shares), par value $0.01
outstanding at December 31, 2018. Each convertible preference22. REDEEMABLE NONCONTROLLING INTERESTS share has an initial liquidation preference of $100 per share
plus accumulated unpaid dividends up to a maximum of anIn connection with the acquisition of a 70% ownership interest additional $25 per share. As a result of adjustments made toin Loders, the Company has entered into a put/call the initial conversion price because cash dividends paid on
F-40 2018 Bunge Annual Report
BUNGE LIMITED AND SUBSIDIARIESNOTES TO THE CONSOLIDATED FINANCIAL STATEMENTS
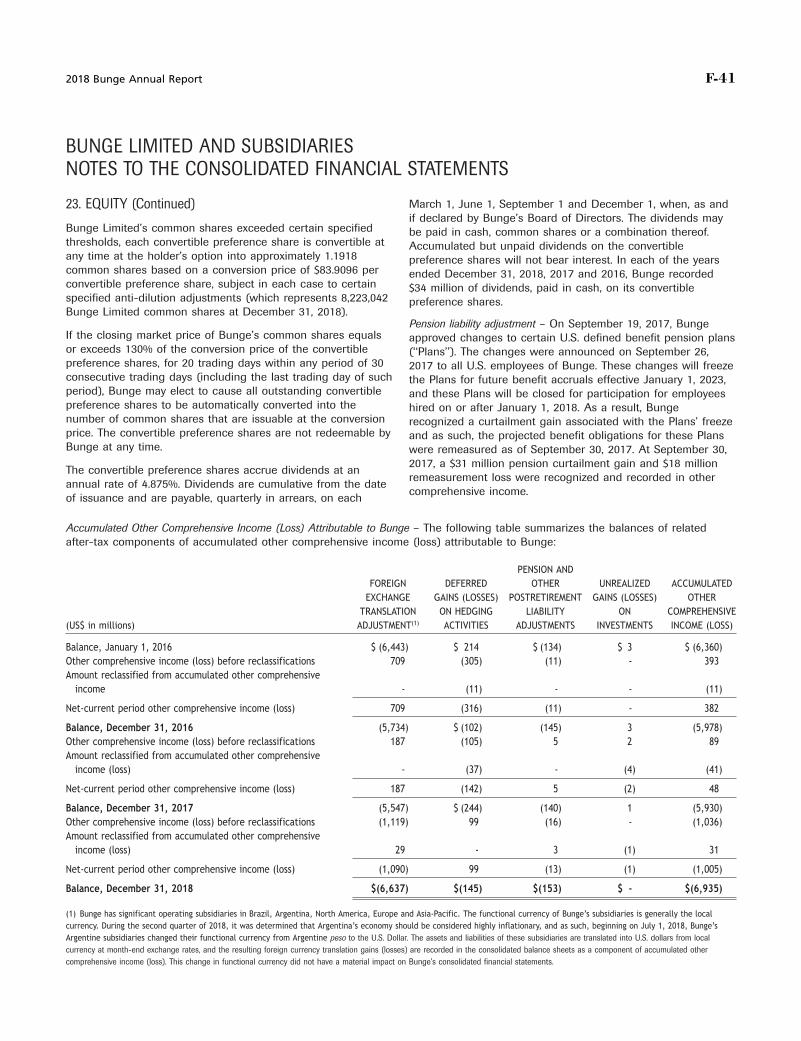
F-41
March 1, June 1, September 1 and December 1, when, as and23. EQUITY (Continued)if declared by Bunge’s Board of Directors. The dividends may
Bunge Limited’s common shares exceeded certain specified be paid in cash, common shares or a combination thereof.thresholds, each convertible preference share is convertible at Accumulated but unpaid dividends on the convertibleany time at the holder’s option into approximately 1.1918 preference shares will not bear interest. In each of the yearscommon shares based on a conversion price of $83.9096 per ended December 31, 2018, 2017 and 2016, Bunge recordedconvertible preference share, subject in each case to certain $34 million of dividends, paid in cash, on its convertiblespecified anti-dilution adjustments (which represents 8,223,042 preference shares.Bunge Limited common shares at December 31, 2018).
Pension liability adjustment – On September 19, 2017, BungeIf the closing market price of Bunge’s common shares equals approved changes to certain U.S. defined benefit pension plansor exceeds 130% of the conversion price of the convertible (‘‘Plans’’). The changes were announced on September 26,preference shares, for 20 trading days within any period of 30 2017 to all U.S. employees of Bunge. These changes will freezeconsecutive trading days (including the last trading day of such the Plans for future benefit accruals effective January 1, 2023,period), Bunge may elect to cause all outstanding convertible and these Plans will be closed for participation for employeespreference shares to be automatically converted into the hired on or after January 1, 2018. As a result, Bungenumber of common shares that are issuable at the conversion recognized a curtailment gain associated with the Plans’ freezeprice. The convertible preference shares are not redeemable by and as such, the projected benefit obligations for these PlansBunge at any time. were remeasured as of September 30, 2017. At September 30,
2017, a $31 million pension curtailment gain and $18 millionThe convertible preference shares accrue dividends at anremeasurement loss were recognized and recorded in otherannual rate of 4.875%. Dividends are cumulative from the datecomprehensive income.of issuance and are payable, quarterly in arrears, on each
Accumulated Other Comprehensive Income (Loss) Attributable to Bunge – The following table summarizes the balances of relatedafter-tax components of accumulated other comprehensive income (loss) attributable to Bunge:
PENSION ANDFOREIGN DEFERRED OTHER UNREALIZED ACCUMULATED
EXCHANGE GAINS (LOSSES) POSTRETIREMENT GAINS (LOSSES) OTHERTRANSLATION ON HEDGING LIABILITY ON COMPREHENSIVE
(US$ in millions) ADJUSTMENT(1) ACTIVITIES ADJUSTMENTS INVESTMENTS INCOME (LOSS)
Balance, January 1, 2016 $ (6,443) $ 214 $ (134) $ 3 $ (6,360)Other comprehensive income (loss) before reclassifications 709 (305) (11) - 393Amount reclassified from accumulated other comprehensive
income - (11) - - (11)
Net-current period other comprehensive income (loss) 709 (316) (11) - 382
Balance, December 31, 2016 (5,734) $ (102) (145) 3 (5,978)Other comprehensive income (loss) before reclassifications 187 (105) 5 2 89Amount reclassified from accumulated other comprehensive
income (loss) - (37) - (4) (41)
Net-current period other comprehensive income (loss) 187 (142) 5 (2) 48
Balance, December 31, 2017 (5,547) $ (244) (140) 1 (5,930)Other comprehensive income (loss) before reclassifications (1,119) 99 (16) - (1,036)Amount reclassified from accumulated other comprehensive
income (loss) 29 - 3 (1) 31
Net-current period other comprehensive income (loss) (1,090) 99 (13) (1) (1,005)
Balance, December 31, 2018 $(6,637) $(145) $(153) $ - $(6,935)
(1) Bunge has significant operating subsidiaries in Brazil, Argentina, North America, Europe and Asia-Pacific. The functional currency of Bunge’s subsidiaries is generally the localcurrency. During the second quarter of 2018, it was determined that Argentina’s economy should be considered highly inflationary, and as such, beginning on July 1, 2018, Bunge’sArgentine subsidiaries changed their functional currency from Argentine peso to the U.S. Dollar. The assets and liabilities of these subsidiaries are translated into U.S. dollars from localcurrency at month-end exchange rates, and the resulting foreign currency translation gains (losses) are recorded in the consolidated balance sheets as a component of accumulated othercomprehensive income (loss). This change in functional currency did not have a material impact on Bunge’s consolidated financial statements.
2018 Bunge Annual Report F-41
BUNGE LIMITED AND SUBSIDIARIESNOTES TO THE CONSOLIDATED FINANCIAL STATEMENTS

F-42
may have required Bunge to purchase the remaining shares of an oilseed processing24. EARNINGS PER COMMON SHAREoperation in Central and Eastern Europe. As further discussed in Note 22, during thesecond quarter of 2016 Bunge exercised its call option for their 45% interest in the joint
The following table sets forth the computation of basic and venture for approximately $39 million. The transaction concluded in September 2016.diluted earnings per common share: Accretion for the respective periods includes the effect of losses incurred by the
operations for the year ended December 31, 2016.
(US$ in millions, except for YEAR ENDED DECEMBER 31, (2) The weighted-average common shares outstanding-diluted excludes approximatelyshare data) 2018 2017 2016 4 million, 4 million and 4 million stock options and contingently issuable restricted stock
units, which were not dilutive and not included in the computation of earnings per shareIncome from continuingfor the years ended December 31, 2018, 2017 and 2016, respectively.operations $ 277 $ 174 $ 776
Net (income) attributable to (3) Weighted-average common share outstanding-diluted for the years endednoncontrolling interests (20) (14) (22) December 31, 2018 and 2017 excludes approximately 8 million weighted-average common
shares that are issuable upon conversion of the convertible preference shares that wereIncome from continuingnot dilutive and not included in the weighted-average number of common sharesoperations attributable tooutstanding, respectively.Bunge 257 160 754
Other redeemable obligations(1) — — (2)Convertible preference share 25. SHARE-BASED COMPENSATIONdividends (34) (34) (34)Income (loss) from discontinued
For the years ended December 31, 2018, 2017 and 2016, Bungeoperations, net of tax 10 – (9)recognized approximately $46 million, $29 million andNet income available to Bunge$44 million, respectively, of total compensation expense forcommon shareholders – Basic 233 126 709
Add back convertible preference awards classified as equity awards related to its stock optionshare dividends – – 34 and restricted stock unit awards.
Net income available to BungeIn 2018 and 2017, Bunge granted equity awards under thecommon shareholders –
Diluted $ 233 $ 126 $ 743 2016 Equity Incentive Plan (the ‘‘2016 EIP’’), a shareholderapproved plan. Under the 2016 EIP, the CompensationWeighted-average number ofCommittee of Bunge’s Board of Directors may grant equitycommon shares outstanding:based awards to officers, employees, consultants andBasic 140,968,980 140,365,549 139,845,124
Effect of dilutive shares: independent contractors in the form of stock options, restricted– stock options and awards(2) 734,803 899,528 441,521 stock units (performance based or time-vested) or other equity– convertible preference based awards. The 2016 EIP replaced the 2009 Equity Incentive
shares(3) – – 7,939,830Plan (the ‘‘2009 EIP’’), also a shareholder approved plan, under
Diluted 141,703,783 141,265,077 148,226,475 which, beginning May 26, 2016, no further awards may begranted. Shares issued under the 2016 EIP may consist, inBasic earnings (loss) per
common share: whole or in part, of authorized and unissued shares, treasuryNet income (loss) from shares or shares reacquired by the Company in any manner, or
continuing operations $ 1.58 $ 0.90 $ 5.13 a combination thereof.Net income (loss) from
discontinued operations 0.07 – (0.06) (i) Stock Option Awards – Options to purchase Bunge LimitedNet income (loss) attributable common shares are granted with an exercise price equal to the
to Bunge common grant date fair market value of Bunge common stock, vest overshareholders – basic $ 1.65 $ 0.90 $ 5.07
service periods that generally range from one to three years,Diluted earnings (loss) per and expire 10 years from the date of grant. Vesting may be
common share: accelerated in certain circumstances as provided in the plansNet income (loss) from or associated award agreements. Grant date fair value iscontinuing operations $ 1.57 $ 0.89 $ 5.07
recognized as compensation expense on a straight-line basisNet income (loss) fromfor option grants.discontinued operations 0.07 – (0.06)
Net income (loss) attributable (ii) Restricted Stock Units – Restricted stock units (‘‘RSUs’’)to Bunge commongive recipients the right to receive shares of Bunge commonshareholders – diluted $ 1.64 $ 0.89 $ 5.01stock upon the lapse of related restrictions determined by theCompensation Committee. Restrictions on RSUs may be based(1) Accretion of redeemable noncontrolling interest of $0 million, $0 million andon continued service by the recipient through the designated$2 million for the years ended December 31, 2018, 2017 and 2016, respectively, related
to a non-fair value variable put arrangement whereby the noncontrolling interest holder term and/or based on the achievement of certain performance
F-42 2018 Bunge Annual Report
BUNGE LIMITED AND SUBSIDIARIESNOTES TO THE CONSOLIDATED FINANCIAL STATEMENTS

F-43
outstanding based on historical experience and giving25. SHARE-BASED COMPENSATION (Continued)consideration for the contractual terms, vesting periods and
targets. These targets may be financial or market-based, and expectations of future employee behavior. The risk-free interestthe number of units actually earned varies based on the level rate is based on U.S. Treasury zero-coupon bonds with a termof achievement of predefined goals. Compensation expense is equal to the expected option term of the respective grants andrecognized on a straight-line basis over the vesting period for grant dates.restricted stock units. RSUs generally vest over periods rangingfrom one to three years. Vesting may be accelerated under DECEMBER 31,certain circumstances as defined in the plans or associated ASSUMPTIONS: 2018 2017 2016award agreements. RSUs are generally settled in shares of
Expected option term (in years) 6.31 5.86 5.67Bunge common stock upon satisfaction of the applicableExpected dividend yield 2.44% 2.09% 3.04%vesting terms. Where share settlement may be prohibited underExpected volatility 25.57% 24.85% 26.06%local law, RSUs are settled in cash. At the time of settlement, aRisk-free interest rate 2.75% 2.21% 1.41%participant holding a vested restricted stock unit will also be
entitled to receive corresponding accrued dividend equivalentA summary of option activity under the plans for the yearshare payments.ended December 31, 2018 is presented below:
Bunge has also established the Bunge Limited 2017WEIGHTED-Non-Employee Directors’ Equity Incentive Plan (the ‘‘2017
WEIGHTED- AVERAGEDirectors’ Plan’’), a shareholder approved plan. Under the 2017AVERAGE REMAINING AGGREGATEDirectors’ Plan, the Compensation Committee may grant equityEXERCISE CONTRACTUAL INTRINSICbased awards to non-employee directors of Bunge Limited.
OPTIONS SHARES PRICE TERM (YEARS) VALUEAwards may consist of restricted stock, restricted stock units,deferred restricted stock units and non-statutory stock options.
Outstanding atThe 2017 Directors’ Plan replaced the 2007 Non-EmployeeJanuary 1, 2018 6,216,570 $ 71.88Directors Equity Incentive Plan, under which no further awards
Granted 718,500 $ 75.99may be granted.Exercised (222,844) $ 54.79Forfeited or expired (589,922) $ 92.47Restricted Stock Units – Restricted stock units granted to
non-employee directors generally vest on the first anniversary Outstanding atof the grant date, provided the director continues to serve on December 31, 2018 6,122,304 $70.93 5.52 $4the Board until such date, and are settled in shares of Bunge
Exercisable atLimited common stock. At the time of settlement, a participantDecember 31, 2018 4,347,213 $70.34 4.38 $3holding a vested restricted stock unit is also entitled to receive
corresponding accrued dividend equivalent share payments.The weighted-average grant date fair value of options granted
The fair value of each stock option granted under any of during the years ended December 31, 2018, 2017 and 2016Bunge’s equity incentive plans is estimated on the grant date was $16.75, $17.13 and $8.86, respectively. The total intrinsicusing the Black Scholes Merton option pricing model. value of options exercised during the years endedAssumptions for the prior three years are noted in the December 31, 2018, 2017 and 2016 was approximatelyfollowing table. The expected volatility of Bunge’s common $4 million, $11 million and $1 million, respectively. The excessshares is a weighted average of historical volatility calculated tax benefit classified as a financing cash flow was notusing the daily closing price of Bunge’s shares up to the grant significant for any of the periods presented.date and implied volatilities on open option contracts on
At December 31, 2018, $12 million of total unrecognizedBunge’s stock as of the grant date. Bunge uses historicalcompensation cost related to non-vested stock options grantedemployee exercise behavior for valuation purposes. Theunder the equity incentive plan is expected to be recognizedexpected option term of granted options represents the periodover the next two years.of time that the granted options are expected to be
2018 Bunge Annual Report F-43
BUNGE LIMITED AND SUBSIDIARIESNOTES TO THE CONSOLIDATED FINANCIAL STATEMENTS

F-44
non-cancelable operating leases with initial term of one year or25. SHARE-BASED COMPENSATION (Continued)more at December 31, 2018 are as follows:
A summary of restricted stock unit activity under Bunge’s plansMINIMUM LEASE
for the year ended December 31, 2018 is presented below.(US$ in millions) PAYMENTS
WEIGHTED-AVERAGE 2019 $134GRANT-DATE 2020 107
RESTRICTED STOCK UNITS SHARES FAIR VALUE 2021 842022 58Restricted stock units at January 1,2023 482018 1,704,004 $66.81Thereafter 126Granted 823,435 $75.06
Vested/issued(2) (314,267) $75.93 Total(1) $557Forfeited/cancelled(2) (339,879) $69.65
(1) Minimum lease payments have not been reduced by minimum sublease incomeRestricted stock units at December 31,receipts of $43 million due in future periods under non-cancelable subleases.
2018(1) 1,873,293 $69.29Net rent expense under non-cancelable operating leases is as
(1) Includes accrued unvested dividends, which are payable in Bunge’s common shares follows:upon vesting of underlying restricted stock units.
(2) During the year ended December 31, 2018, Bunge issued 241,055 common shares, net YEAR ENDED DECEMBER 31,of common shares withheld to cover taxes, including related common shares representing (US$ in millions) 2018 2017(1) 2016accrued dividends, with a weighted-average fair value of $75.93 per share. During theyear ended December 31, 2018, 87,284 performance-based restricted stock units vested. Rent expense $158 $175 $213During the year ended December 31, 2018, Bunge canceled approximately 78,710 shares Sublease income (10) (9) (9)related to performance-based restricted stock unit awards that did not vest due tonon-achievement of performance targets. Net rent expense $148 $166 $204
(1) In preparing the year-end financial statements as of December 31, 2018, theThe fair value of RSU awards is determined based on theCompany discovered and corrected an immaterial error impacting the amount of rentmarket value of the Company’s shares on the grant date. Theexpense disclosed in the table above. As a result, rent expense for the year endedweighted-average grant date fair value of restricted stock unitsDecember 31, 2017 decreased by $76 million compared to what was previously reported
granted during the years ended December 31, 2018, 2017 and in this table. This misstatement only applies to the amount disclosed in the table above2016 was $75.06, $76.79 and $51.42, respectively. and did not have any impact on the consolidated statement of income for 2017.
At December 31, 2018, there was approximately $45 million of In addition, Bunge enters into agricultural partnershiptotal unrecognized compensation cost related to restricted agreements for the production of sugarcane. These agreementsstock units granted under the equity incentive plans, which is have an average remaining life of five years and coverexpected to be recognized over the next two years. The total approximately 234,000 hectares of land under cultivation.fair value of restricted stock units vested during the year ended Amounts owed under these agreements are dependent onDecember 31, 2018 was approximately $24 million. several variables, including the quantity of sugarcane produced
per hectare, the total recoverable sugar (‘‘ATR’’) per ton ofCommon Shares Reserved for Share-Based Awards – The 2017sugarcane produced, and the price for each kilogram of ATRDirectors’ Plan and the 2016 EIP provide that 120,000 andas determined by Consecana, the state of Sao Paulo5,800,000 common shares, respectively, are to be reserved forsugarcane, sugar and ethanol council. During the years endedgrants of stock options, restricted stock units and other awardsDecember 31, 2018, 2017 and 2016, Bunge made paymentsunder the plans. At December 31, 2018, 76,163 and 2,706,665related to these agreements of $84 million, $105 million andcommon shares were available for future grants under the$89 million, respectively, for advances on future production.2017 Directors’ Plan and the 2016 EIP, respectively. No sharesAdditionally, $56 million, $69 million and $64 million wereare currently available for grant under any other Bunge Limitedincluded in cost of goods sold in the consolidated statementsequity incentive plan.of income for the years ended December 31, 2018, 2017 and2016, respectively.26. LEASE COMMITMENTSIn February 2016, the FASB issued ASU 2016-02, Leases (Topic
Bunge routinely leases storage facilities, transportation 842). Under the new provisions, all lessees will be reported onequipment and office facilities under operating leases. Future the balance sheet as a right-of-use asset and a liability for theminimum lease payments by year and in the aggregate under obligation to make payments except for leases with a term of
12 months or less. The standard is effective for Bunge starting
F-44 2018 Bunge Annual Report
BUNGE LIMITED AND SUBSIDIARIESNOTES TO THE CONSOLIDATED FINANCIAL STATEMENTS

F-45
and low margin. The Edible Oil Products segment involves the26. LEASE COMMITMENTS (Continued)processing, production and marketing of products derived from
January 1, 2019 (see to Note 1 for further discussion on the vegetable oils. The Milling Products segment involves theimpact of the adoption of this accounting standard). processing, production and marketing of products derived
primarily from wheat and corn. The Sugar and Bioenergy27. SEGMENT INFORMATION segment primarily involves sugarcane growing and milling in
Brazil, as well as sugarcane-based ethanol production andBunge has five reportable segments—Agribusiness, Edible Oilcorn-based ethanol investments and related activities.Products, Milling Products, Sugar and Bioenergy, and Fertilizer,Following the classification of the Brazilian fertilizer distributionwhich are organized based upon similar economicand North American fertilizer businesses as discontinuedcharacteristics and are similar in nature of products andoperations, the activities of the Fertilizer segment include itsservices offered, the nature of production processes, and theport operations in Brazil and Argentina and its blending andtype and class of customer and distribution methods. Theretail operations in Argentina.Agribusiness segment is characterized by both inputs and
outputs being agricultural commodities and thus high volume
The ‘‘Discontinued Operations & Unallocated’’ column in the following table contains the reconciliation between the totals forreportable segments and Bunge consolidated totals, which consist primarily of amounts attributable to discontinued operations,corporate items not allocated to the operating segments, and inter-segment eliminations. Transfers between the segments aregenerally valued at market. The segment revenues generated from these transfers are shown in the following table as ‘‘Inter-segment revenues.’’
EDIBLE DISCONTINUEDOIL MILLING SUGAR AND OPERATIONS &
(US$ in millions) AGRIBUSINESS PRODUCTS PRODUCTS BIOENERGY FERTILIZER UNALLOCATED(1) TOTAL
2018Net sales to external customers . . . . . . . . . . . . . . . . . . . . . . . . . . . . . . . . . . . . . . . . . $32,206 $9,129 $1,691 $2,257 $460 $ - $45,743Inter-segment revenues . . . . . . . . . . . . . . . . . . . . . . . . . . . . . . . . . . . . . . . . . . . . . . . . . . . 4,641 161 - 19 2 (4,823) -Foreign exchange gains (losses) . . . . . . . . . . . . . . . . . . . . . . . . . . . . . . . . . . . . . . . . . (104) - 2 7 (6) - (101)Noncontrolling interests(1) . . . . . . . . . . . . . . . . . . . . . . . . . . . . . . . . . . . . . . . . . . . . . . . . (14) (12) - 1 (2) 7 (20)Other income (expense) - net . . . . . . . . . . . . . . . . . . . . . . . . . . . . . . . . . . . . . . . . . . . 79 (8) (3) 4 - (24) 48Segment EBIT(3) . . . . . . . . . . . . . . . . . . . . . . . . . . . . . . . . . . . . . . . . . . . . . . . . . . . . . . . . . . . . . . 645 122 90 (135) 39 (24) 737Discontinued operations(2) . . . . . . . . . . . . . . . . . . . . . . . . . . . . . . . . . . . . . . . . . . . . . . . . - - - - - 10 10Depreciation, depletion and amortization . . . . . . . . . . . . . . . . . . . . . . . . . . . . (257) (153) (58) (146) (8) - (622)Investments in affiliates . . . . . . . . . . . . . . . . . . . . . . . . . . . . . . . . . . . . . . . . . . . . . . . . . . 406 - - 45 - - 451Total assets . . . . . . . . . . . . . . . . . . . . . . . . . . . . . . . . . . . . . . . . . . . . . . . . . . . . . . . . . . . . . . . . . . . 11,865 3,940 1,448 1,681 330 161 19,425Capital expenditures . . . . . . . . . . . . . . . . . . . . . . . . . . . . . . . . . . . . . . . . . . . . . . . . . . . . . . . 219 129 23 110 5 7 4932017Net sales to external customers . . . . . . . . . . . . . . . . . . . . . . . . . . . . . . . . . . . . . . . . . $ 31,741 $ 8,018 $ 1,575 $ 4,054 $ 406 $ - $ 45,794Inter-segment revenues . . . . . . . . . . . . . . . . . . . . . . . . . . . . . . . . . . . . . . . . . . . . . . . . . . . 4,323 154 5 45 4 (4,531) -Foreign exchange gains (losses) . . . . . . . . . . . . . . . . . . . . . . . . . . . . . . . . . . . . . . . . . 85 3 (3) 11 (1) - 95Noncontrolling interests(1) . . . . . . . . . . . . . . . . . . . . . . . . . . . . . . . . . . . . . . . . . . . . . . . . (9) (8) - - (2) 5 (14)Other income (expense) - net . . . . . . . . . . . . . . . . . . . . . . . . . . . . . . . . . . . . . . . . . . . 56 (7) (5) (4) - - 40Segment EBIT(4) . . . . . . . . . . . . . . . . . . . . . . . . . . . . . . . . . . . . . . . . . . . . . . . . . . . . . . . . . . . . . . 256 126 63 (12) 3 - 436Discontinued operations(2) . . . . . . . . . . . . . . . . . . . . . . . . . . . . . . . . . . . . . . . . . . . . . . . . - - - - - - -Depreciation, depletion and amortization . . . . . . . . . . . . . . . . . . . . . . . . . . . . (267) (105) (61) (164) (12) - (609)Investments in affiliates . . . . . . . . . . . . . . . . . . . . . . . . . . . . . . . . . . . . . . . . . . . . . . . . . . 411 - - 50 - - 461Total assets . . . . . . . . . . . . . . . . . . . . . . . . . . . . . . . . . . . . . . . . . . . . . . . . . . . . . . . . . . . . . . . . . . . 12,094 2,610 1,460 2,195 330 182 18,871Capital expenditures . . . . . . . . . . . . . . . . . . . . . . . . . . . . . . . . . . . . . . . . . . . . . . . . . . . . . . . 318 136 45 139 9 15 6622016Net sales to external customers . . . . . . . . . . . . . . . . . . . . . . . . . . . . . . . . . . . . . . . . . $ 30,061 $ 6,859 $ 1,647 $ 3,709 $ 403 $ - $ 42,679Inter-segment revenues . . . . . . . . . . . . . . . . . . . . . . . . . . . . . . . . . . . . . . . . . . . . . . . . . . . 3,867 115 9 13 - (4,004) -Foreign exchange gains (losses) . . . . . . . . . . . . . . . . . . . . . . . . . . . . . . . . . . . . . . . . . (7) (1) (7) 9 (2) - (8)Noncontrolling interests(1) . . . . . . . . . . . . . . . . . . . . . . . . . . . . . . . . . . . . . . . . . . . . . . . . (21) (13) - - (2) 14 (22)Other income (expense) - net . . . . . . . . . . . . . . . . . . . . . . . . . . . . . . . . . . . . . . . . . . . 22 7 (4) (16) 1 - 10Segment EBIT(5) . . . . . . . . . . . . . . . . . . . . . . . . . . . . . . . . . . . . . . . . . . . . . . . . . . . . . . . . . . . . . . 875 112 131 (4) 29 - 1,143Discontinued operations(2) . . . . . . . . . . . . . . . . . . . . . . . . . . . . . . . . . . . . . . . . . . . . . . . . - - - - - (9) (9)Depreciation, depletion and amortization . . . . . . . . . . . . . . . . . . . . . . . . . . . . (236) (94) (62) (143) (12) - (547)Investments in affiliates . . . . . . . . . . . . . . . . . . . . . . . . . . . . . . . . . . . . . . . . . . . . . . . . . . 325 - - 48 - - 373Total assets . . . . . . . . . . . . . . . . . . . . . . . . . . . . . . . . . . . . . . . . . . . . . . . . . . . . . . . . . . . . . . . . . . . 12,159 2,329 1,444 2,754 318 184 19,188Capital expenditures . . . . . . . . . . . . . . . . . . . . . . . . . . . . . . . . . . . . . . . . . . . . . . . . . . . . . . . 421 108 75 131 16 33 784
2018 Bunge Annual Report F-45
BUNGE LIMITED AND SUBSIDIARIESNOTES TO THE CONSOLIDATED FINANCIAL STATEMENTS

F-46
27. SEGMENT INFORMATION (Continued)(1) Includes the noncontrolling interests’ share of interest and tax to reconcile to consolidated noncontrolling interests.
(2) Represents net income (loss) from discontinued operations.
(3) 2018 EBIT includes a $16 million loss in the Sugar & Bioenergy segment and a $10 million loss in the Agribusiness segment, due to the dispositions of certain equity investments,which are recorded in other income (expense)-net. In addition, Bunge recorded pre-tax, impairment charges of $18 million, of which $7 million, $10 million and $1 million are inselling, general and administrative expenses, cost of goods sold and other income (expense)-net, respectively. Of these pre-tax impairment charges, $12 million was allocated toAgribusiness, $5 million to Sugar and Bioenergy and $1 million to Edible Oil Products.
(4) 2017 EBIT includes a $9 million gain related to the disposition of a subsidiary in the Agribusiness segment in Brazil, which is recorded in other income (expense)-net. In addition,Bunge recorded pre-tax, impairment charges of $52 million, of which $19 million, $16 million and $17 million are in selling, general and administrative expenses, cost of goods soldand other income (expense)-net, respectively. Of these pre-tax impairment charges, $41 million was allocated to Agribusiness, $7 million to Sugar and Bioenergy, $3 million to EdibleOil Products, and $1 million to Milling Products.
(5) 2016 EBIT includes $122 million of gains related to disposition of equity interest in operations in Agribusiness, recorded in other income (expense)-net. In addition, Bunge recordedpre-tax impairment charges of $72 million, $9 million and $6 million in other income (expense)-net, cost of goods sold and selling, general and administrative expenses, respectively.Of these pre-tax impairment charges, $46 million was allocated to Sugar and Bioenergy, $29 million to Agribusiness, $9 million to Fertilizer, $2 million Edible Oils and $1 million toMilling Products.
Total segment earnings before interest and taxes (‘‘EBIT’’) is an Geographic area information for net sales to externaloperating performance measure used by Bunge’s management customers, determined based on the location of the subsidiaryto evaluate segment operating activities. Bunge’s management making the sale, and long-lived assets follows:believes total segment EBIT is a useful measure of operating
YEAR ENDED DECEMBER 31,profitability, since the measure allows for an evaluation of the(US$ in millions) 2018 2017 2016performance of its segments without regard to its financing
methods or capital structure. In addition, EBIT is a financial Net sales to external customers:measure that is widely used by analysts and investors in Europe $17,802 $16,313 $14,238
United States 9,955 10,128 10,239Bunge’s industries.Asia-Pacific 8,651 8,613 7,843
A reconciliation of total segment EBIT to net income Brazil 5,553 7,040 6,604Argentina 1,166 1,433 1,406attributable to Bunge follows:Canada 1,216 1,114 1,120Rest of world 1,400 1,153 1,229YEAR ENDED DECEMBER 31,
(US$ in millions) 2018 2017 2016 Total $45,743 $45,794 $42,679
Total segment EBIT from continuingoperations $ 737 $ 436 $1,143 YEAR ENDED DECEMBER 31,
Interest income 31 38 51 (US$ in millions) 2018 2017 2016Interest expense (339) (263) (234)
Long-lived assets(1):Income tax (expense) benefit (179) (56) (220)Brazil $1,994 $2,406 $2,452Income (loss) from discontinuedUnited States 1,561 1,267 1,249operations, net of tax 10 - (9)Europe 1,912 1,485 1,107Noncontrolling interests’ share ofAsia-Pacific 679 483 505interest and tax 7 5 14Canada 401 440 378Net income attributable to Bunge $ 267 $ 160 $ 745 Argentina 161 216 189Rest of world 382 341 320
Net sales by product group to external customers were as Total $7,090 $6,638 $6,200follows:
(1) Long-lived assets include property, plant and equipment, net, goodwill and otherYEAR ENDED DECEMBER 31, intangible assets, net, investments in affiliates and non-current assets held for sale.
(US$ in millions) 2018 2017 2016
Agricultural Commodity Products $32,206 $31,741 $30,061Edible Oil Products 9,129 8,018 6,859Wheat Milling Products 1,037 988 1,079Corn Milling Products 654 587 568Sugar and Bioenergy Products 2,257 4,054 3,709Fertilizer Products 460 406 403
Total $45,743 $45,794 $42,679
F-46 2018 Bunge Annual Report
BUNGE LIMITED AND SUBSIDIARIESNOTES TO THE CONSOLIDATED FINANCIAL STATEMENTS

F-47
27. SEGMENT INFORMATION (Continued)
The Company’s revenue comprises sales from commodity contracts that are accounted for under ASC 815, Derivatives andHedging and sales of other products and services that are accounted for under ASC 606, Revenue from Contracts with Customers.The following tables provide a disaggregation of net sales to external customers between sales from contracts with customersand sales from other arrangements:
TWELVE MONTHS ENDED DECEMBER 31, 2018
EDIBLEOIL MILLING SUGAR AND
(US$ in millions) AGRIBUSINESS PRODUCTS PRODUCTS BIOENERGY FERTILIZER TOTAL
Sales from other arrangements . . . . . . . . . . . . . . . . . . . . . . . . . . . . . . . . . . . . . . . . . . . . . . . . . . . . $31,040 $1,818 $ 65 $1,568 $ - $34,491Sales from contracts with customers . . . . . . . . . . . . . . . . . . . . . . . . . . . . . . . . . . . . . . . . . . . . . 1,166 7,311 1,626 689 460 11,252
Net sales to external customers . . . . . . . . . . . . . . . . . . . . . . . . . . . . . . . . . . . . . . . . . . . . . . . . . . . $32,206 $9,129 $1,691 $2,257 $460 $45,743
28. QUARTERLY FINANCIAL INFORMATION (UNAUDITED)
QUARTER
(US$ in millions, except per share data) FIRST SECOND THIRD FOURTH YEAR
2018Net sales . . . . . . . . . . . . . . . . . . . . . . . . . . . . . . . . . . . . . . . . . . . . . . . . . . . . . . . . . . . . . . . . . . . . . . . . . . . . . . . . . . . . . . . . . . . . . . . . . . . . . . . . . . . . . . . . . . . . . . . $ 10,641 $ 12,147 $ 11,412 $ 11,543 $ 45,743Gross profit . . . . . . . . . . . . . . . . . . . . . . . . . . . . . . . . . . . . . . . . . . . . . . . . . . . . . . . . . . . . . . . . . . . . . . . . . . . . . . . . . . . . . . . . . . . . . . . . . . . . . . . . . . . . . . . . . . . . 384 542 918 422 2,266Income (loss) from continuing operations . . . . . . . . . . . . . . . . . . . . . . . . . . . . . . . . . . . . . . . . . . . . . . . . . . . . . . . . . . . . . . . . . . . . . . . . . . . . . . . . (17) (17) 367 (56) 277Income (loss) from discontinued operations, net of tax . . . . . . . . . . . . . . . . . . . . . . . . . . . . . . . . . . . . . . . . . . . . . . . . . . . . . . . . . . . . . . . . (2) 7 7 (2) 10Net income (loss). . . . . . . . . . . . . . . . . . . . . . . . . . . . . . . . . . . . . . . . . . . . . . . . . . . . . . . . . . . . . . . . . . . . . . . . . . . . . . . . . . . . . . . . . . . . . . . . . . . . . . . . . . . . . (19) (10) 374 (58) 287Net income (loss) attributable to Bunge . . . . . . . . . . . . . . . . . . . . . . . . . . . . . . . . . . . . . . . . . . . . . . . . . . . . . . . . . . . . . . . . . . . . . . . . . . . . . . . . . . (21) (12) 365 (65) 267Earnings (loss) per common share - basic(1)
Net income (loss) from continuing operations . . . . . . . . . . . . . . . . . . . . . . . . . . . . . . . . . . . . . . . . . . . . . . . . . . . . . . . . . . . . . . . . . . . . . . . . . . . $ (0.20) $ (0.20) $ 2.48 $ (0.51) $ 1.58Net income (loss) from discontinued operations . . . . . . . . . . . . . . . . . . . . . . . . . . . . . . . . . . . . . . . . . . . . . . . . . . . . . . . . . . . . . . . . . . . . . . . . (0.01) 0.05 0.05 (0.01) 0.07
Net income (loss) attributable to Bunge common shareholders . . . . . . . . . . . . . . . . . . . . . . . . . . . . . . . . . . . . . . . . . . . . . . . . . . . . . . $ (0.21) $ (0.15) $ 2.53 $ (0.52) $ 1.65
Earnings (loss) per common share - diluted(1)
Net income (loss) from continuing operations . . . . . . . . . . . . . . . . . . . . . . . . . . . . . . . . . . . . . . . . . . . . . . . . . . . . . . . . . . . . . . . . . . . . . . . . . . . $ (0.20) $ (0.20) $ 2.39 $ (0.51) $ 1.57Net income (loss) from discontinued operations . . . . . . . . . . . . . . . . . . . . . . . . . . . . . . . . . . . . . . . . . . . . . . . . . . . . . . . . . . . . . . . . . . . . . . . . (0.01) 0.05 0.05 (0.01) 0.07
Net income (loss) attributable to Bunge common shareholders . . . . . . . . . . . . . . . . . . . . . . . . . . . . . . . . . . . . . . . . . . . . . . . . . . . . . . $ (0.21) $ (0.15) $ 2.44 $ (0.52) $ 1.64
2017Net sales . . . . . . . . . . . . . . . . . . . . . . . . . . . . . . . . . . . . . . . . . . . . . . . . . . . . . . . . . . . . . . . . . . . . . . . . . . . . . . . . . . . . . . . . . . . . . . . . . . . . . . . . . . . . . . . . . . . . . . . $ 11,121 $ 11,645 $ 11,423 $ 11,605 $ 45,794Gross profit . . . . . . . . . . . . . . . . . . . . . . . . . . . . . . . . . . . . . . . . . . . . . . . . . . . . . . . . . . . . . . . . . . . . . . . . . . . . . . . . . . . . . . . . . . . . . . . . . . . . . . . . . . . . . . . . . . . . 460 354 489 462 1,765Income (loss) from continuing operations . . . . . . . . . . . . . . . . . . . . . . . . . . . . . . . . . . . . . . . . . . . . . . . . . . . . . . . . . . . . . . . . . . . . . . . . . . . . . . . . 54 81 92 (53) 174Income (loss) from discontinued operations, net of tax . . . . . . . . . . . . . . . . . . . . . . . . . . . . . . . . . . . . . . . . . . . . . . . . . . . . . . . . . . . . . . . . (6) 6 - - -Net income (loss). . . . . . . . . . . . . . . . . . . . . . . . . . . . . . . . . . . . . . . . . . . . . . . . . . . . . . . . . . . . . . . . . . . . . . . . . . . . . . . . . . . . . . . . . . . . . . . . . . . . . . . . . . . . . 48 87 92 (53) 174Net income (loss) attributable to Bunge . . . . . . . . . . . . . . . . . . . . . . . . . . . . . . . . . . . . . . . . . . . . . . . . . . . . . . . . . . . . . . . . . . . . . . . . . . . . . . . . . . 47 81 92 (60) 160Earnings (loss) per common share - basic(1)
Net income (loss) from continuing operations . . . . . . . . . . . . . . . . . . . . . . . . . . . . . . . . . . . . . . . . . . . . . . . . . . . . . . . . . . . . . . . . . . . . . . . . . . . $ 0.31 $ 0.48 $ 0.59 $ (0.48) $ 0.90Net income (loss) from discontinued operations . . . . . . . . . . . . . . . . . . . . . . . . . . . . . . . . . . . . . . . . . . . . . . . . . . . . . . . . . . . . . . . . . . . . . . . . (0.04) 0.04 - - -
Net income (loss) attributable to Bunge common shareholders . . . . . . . . . . . . . . . . . . . . . . . . . . . . . . . . . . . . . . . . . . . . . . . . . . . . . . $ 0.27 $ 0.52 $ 0.59 $ (0.48) $ 0.90
Earnings (loss) per common share - diluted(1)
Net income (loss) from continuing operations . . . . . . . . . . . . . . . . . . . . . . . . . . . . . . . . . . . . . . . . . . . . . . . . . . . . . . . . . . . . . . . . . . . . . . . . . . . $ 0.31 $ 0.48 $ 0.59 $ (0.48) $ 0.89Net income (loss) from discontinued operations . . . . . . . . . . . . . . . . . . . . . . . . . . . . . . . . . . . . . . . . . . . . . . . . . . . . . . . . . . . . . . . . . . . . . . . . (0.04) 0.03 - - -
Net income (loss) attributable to Bunge common shareholders . . . . . . . . . . . . . . . . . . . . . . . . . . . . . . . . . . . . . . . . . . . . . . . . . . . . . . $ 0.27 $ 0.51 $ 0.59 $ (0.48) $ 0.89
(1) Earnings per share attributable to Bunge common shareholders for both basic and diluted is computed independently for each period presented. As a result, the sum of thequarterly earnings per share for the years ended December 31, 2018 and 2017 may not equal the total computed for the year.
2018 Bunge Annual Report F-47
BUNGE LIMITED AND SUBSIDIARIESNOTES TO THE CONSOLIDATED FINANCIAL STATEMENTS

(This page has been left blank intentionally.)
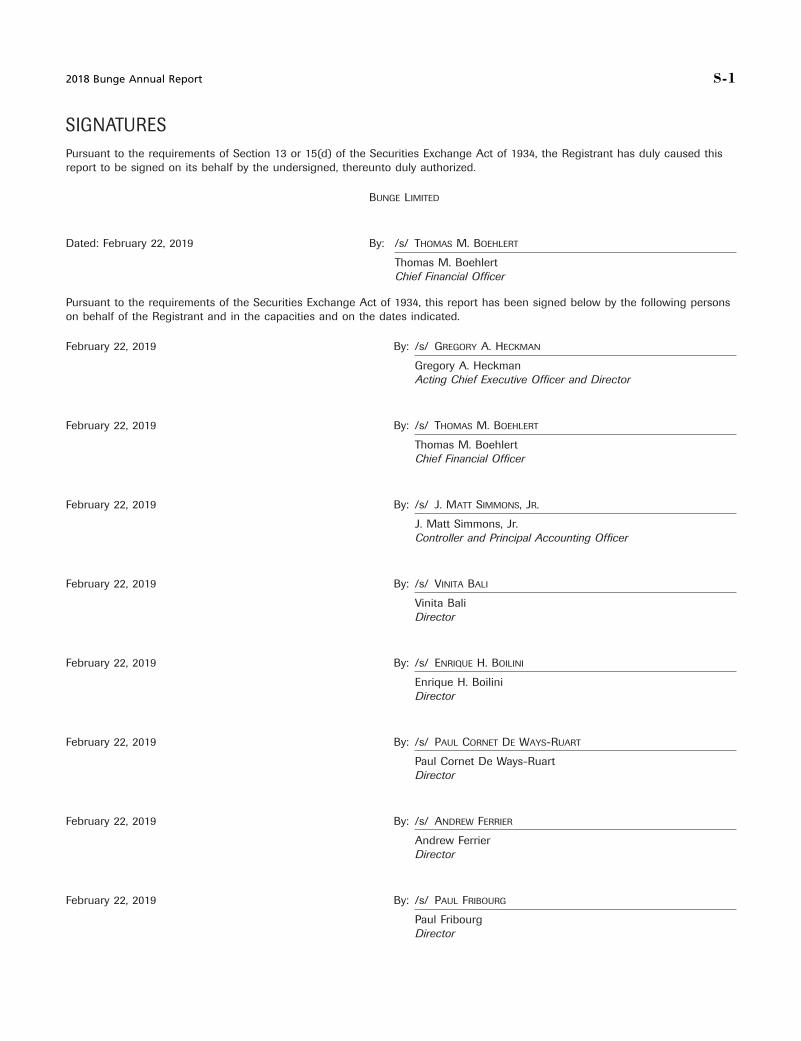
S-1
SIGNATURESPursuant to the requirements of Section 13 or 15(d) of the Securities Exchange Act of 1934, the Registrant has duly caused thisreport to be signed on its behalf by the undersigned, thereunto duly authorized.
BUNGE LIMITED
Dated: February 22, 2019 By: /s/ THOMAS M. BOEHLERT
Thomas M. BoehlertChief Financial Officer
Pursuant to the requirements of the Securities Exchange Act of 1934, this report has been signed below by the following personson behalf of the Registrant and in the capacities and on the dates indicated.
February 22, 2019 By: /s/ GREGORY A. HECKMAN
Gregory A. HeckmanActing Chief Executive Officer and Director
February 22, 2019 By: /s/ THOMAS M. BOEHLERT
Thomas M. BoehlertChief Financial Officer
February 22, 2019 By: /s/ J. MATT SIMMONS, JR.
J. Matt Simmons, Jr.Controller and Principal Accounting Officer
February 22, 2019 By: /s/ VINITA BALI
Vinita BaliDirector
February 22, 2019 By: /s/ ENRIQUE H. BOILINI
Enrique H. BoiliniDirector
February 22, 2019 By: /s/ PAUL CORNET DE WAYS-RUART
Paul Cornet De Ways-RuartDirector
February 22, 2019 By: /s/ ANDREW FERRIER
Andrew FerrierDirector
February 22, 2019 By: /s/ PAUL FRIBOURG
Paul FribourgDirector
2018 Bunge Annual Report S-1

S-2
February 22, 2019 By: /s/ KATHLEEN W. HYLE
Kathleen W. HyleDirector and Chair of the Board of Directors
February 22, 2019 By: /s/ L. PATRICK LUPO
L. Patrick LupoDirector
February 22, 2019 By: /s/ JOHN E. MCGLADE
John E. McGladeDirector
February 22, 2019 By: /s/ HENRY W. WINSHIP
Henry W. WinshipDirector
February 22, 2019 By: /s/ MARK N. ZENUK
Mark N. ZenukDirector
S-2 2018 Bunge Annual Report


26MAR200813571231

Corporate OfficeBunge Limited 50 Main Street White Plains, NY 10606 U.S.A. 914-684-2800
Contact InformationCorporate and Investor Relations914-684-3243
Board of DirectorsKathleen Hyle, ChairErnest G. BachrachVinita BaliEnrique H. BoiliniCarol M. BrownerAndrew FerrierPaul J. FribourgJ. Erik FyrwaldGregory A. Heckman, Director and Acting CEOL. Patrick LupoJohn E. McGladeHenry W. WinshipMark Zenuk
Shareholder Websitewww.computershare.com/investor
Investor InformationCopies of the company’s annual report, filed with the Securities and Exchange Commission (SEC) on Form 10-K, and other SEC filings can be obtained free of charge on our website at www.bunge.com or by contacting our Investor Relations department.
Shareholder Information
Stock ListingNew York Stock Exchange
Transfer AgentComputershare, Inc.P.O. Box 50500Louisville, KY 40233-5000U.S.A.
U.S. Shareholders Toll-Free800-851-9677
Shareholders Outside the U.S.201-680-6578
TDD for Hearing-Impaired U.S. Shareholders800-952-9245
TDD for Hearing-Impaired Shareholders Outside the U.S.201-680-6610
Annual MeetingThe annual meeting will be held on May 23, 2019, at 10:00 a.m. at the Sofitel Hotel, 45 West 44th Street, New York, NY 10036, U.S.A. See the proxy statement for additional information.
Independent Auditors Deloitte & Touche LLP
www.bunge.com

50 Main Street White Plains, NY 10606 U.S.A.
bunge.com