Elevated expression and polymorphisms of SOCS3 influence patient response to antiviral therapy in...
10
doi:10.1136/gut.2007.129478 2008;57;507-515; originally published online 19 Sep 2007; Gut M Persico, M Capasso, R Russo, E Persico, L Crocè, C Tiribelli and A Iolascon therapy in chronic hepatitis C SOCS3 influence patient response to antiviral Elevated expression and polymorphisms of http://gut.bmj.com/cgi/content/full/57/4/507 Updated information and services can be found at: These include: Data supplement http://gut.bmj.com/cgi/content/full/gut.2007.129478/DC1 "web only table" References http://gut.bmj.com/cgi/content/full/57/4/507#otherarticles 1 online articles that cite this article can be accessed at: http://gut.bmj.com/cgi/content/full/57/4/507#BIBL This article cites 47 articles, 14 of which can be accessed free at: service Email alerting the top right corner of the article Receive free email alerts when new articles cite this article - sign up in the box at Notes http://journals.bmj.com/cgi/reprintform To order reprints of this article go to: http://journals.bmj.com/subscriptions/ go to: Gut To subscribe to on 24 March 2008 gut.bmj.com Downloaded from
-
Upload
independent -
Category
Documents
-
view
0 -
download
0
Transcript of Elevated expression and polymorphisms of SOCS3 influence patient response to antiviral therapy in...
doi:10.1136/gut.2007.129478 2008;57;507-515; originally published online 19 Sep 2007; Gut
M Persico, M Capasso, R Russo, E Persico, L Crocè, C Tiribelli and A Iolascon
therapy in chronic hepatitis CSOCS3 influence patient response to antiviral Elevated expression and polymorphisms of
http://gut.bmj.com/cgi/content/full/57/4/507Updated information and services can be found at:
These include:
Data supplement http://gut.bmj.com/cgi/content/full/gut.2007.129478/DC1
"web only table"
References
http://gut.bmj.com/cgi/content/full/57/4/507#otherarticles1 online articles that cite this article can be accessed at:
http://gut.bmj.com/cgi/content/full/57/4/507#BIBLThis article cites 47 articles, 14 of which can be accessed free at:
serviceEmail alerting
the top right corner of the article Receive free email alerts when new articles cite this article - sign up in the box at
Notes
http://journals.bmj.com/cgi/reprintformTo order reprints of this article go to:
http://journals.bmj.com/subscriptions/ go to: GutTo subscribe to
on 24 March 2008 gut.bmj.comDownloaded from
Elevated expression and polymorphisms of SOCS3influence patient response to antiviral therapy inchronic hepatitis C
M Persico,1 M Capasso,2 R Russo,2 E Persico,1 L Croce,3 C Tiribelli,3 A Iolascon2
c An additional table ispublished online only at http://gut.bmj.com/content/vol57/issue4
1 Internal Medicine andHepatology Unit, SecondUniversity of Naples, Italy;2 University Federico II ofNaples, CEINGE–BiotecnologieAvanzate, Naples, Italy; 3 CentroStudi Fegato, Trieste, Italy
Correspondence to:Professor A Iolascon, UniversityFederico II of Naples, CEINGEBiotecnologie Avanzate s.c.ar.l.,Via Comunale Margherita 482,80145, Naples, Italy; [email protected]
MP and MC contributed equally.
Revised 17 August 2007Accepted 22 August 2007Published Online First19 September 2007
ABSTRACTBackground: The response to antiviral therapy of chronichepatitis C virus (HCV) infection is determined byvirological, environmental and genetic factors.Objective: The hypothesis was tested that the expres-sion of specific genes and their haplotype frequencies candifferentiate between non-responders (NRs) and sus-tained virological responders (SVRs) to antiviral treatment.Methods: A methodological approach based on mole-cular marker discovery and validation was used to studythe genes influencing the antiviral treatment in lympho-blastoid cell lines from 74 genotype 1b HCV patients (44from Southern Italy and 30 from Northern Italy) treatedwith pegylated interferon (IFN) a and ribavirin.Furthermore, an association study was performed, testingthree single nucleotide polymorphisms (SNPs) of sup-pressor of cytokine signalling 3 (SOCS3) in 162 NR and184 SVR subjects (SOCS3 28464 A/C (rs12952093),24874 A/G (rs4969170) and 1383 A/G, (rs4969168)).Results: SOCS3 basal expression levels were significantlyincreased in two independent sets of NR groups(p,0.05). A highly significant association was foundbetween NRs and both the positively associatedhaplotype (OR = 2.01, 95% CI 1.45 to 2.79, p = 0.0002)and the negatively associated haplotype (OR = 0.56, 95%CI 0.42 to 0.76, p = 0.0014). In particular, the SOCS324874 AA genotype was strongly associated with failureof antiviral therapy (OR = 4.00, 95% CI 2.09 to 7.66,p = 0.0003) and the AA genotype carriers had signifi-cantly higher SOCS3 mRNA and protein levels (p,0.05).Conclusions: Basal levels of SOCS3, an inhibitor of theIFNa-induced Janus kinase–signal transducer and acti-vator of transcription pathways, and its genetic poly-morphisms influence the outcome of antiviral treatment.SOCS3 thus represents a novel blood biomarker for the apriori prediction of treatment response.
Worldwide, approximately 170 million people arechronically infected with the hepatitis C virus(HCV). As chronic hepatitis C is associated with asignificantly elevated risk for the development ofliver cirrhosis and its sequelae, successful treatmentof this infection is of the utmost importance. Sincethe early 1990s, a variety of interferon (IFN) a-based regimens have been used to treat chronicHCV infection.1 The combination of pegylated(PEG)-IFNa and ribavirin is the best availabletherapy, although outcomes in genotype-1-infectedpatients remain suboptimal, with about 40–50%experiencing a sustained virological response; whilein patients infected with genotype HCV-2 andHCV-3, these rates exceed 80%.2 3 Treatmentresponses can be predicted more reliably at week
12 of therapy, with patients who fail to experiencea 2-log10 reduction in HCV RNA levels frombaseline having a (3% chance of a sustainedvirological response.4 Due to significant drug costsand toxicity, there is tremendous interest infinding more effective ways to predict treatmentresponses.
Although the viral genotype is the majordeterminant of treatment responses in HCV-infected patients, genetic host factors have alsobeen shown to influence the treatment response.Gene and protein expression and associationstudies have been performed on sets of patientsthat have included different viral genotypes andtreatments. For instance, abnormal tumour necro-sis factor a (TNFa), interleukin (IL) 10, IFNa
receptor 1 (IFNAR1) and myxovirus resistanceprotein A (MxA) levels,5–8 and inheritance offunctional genetic variants of these genes havebeen demonstrated to influence response to IFNa
therapy.9–12
Furthermore, there have been no studies carriedout on circulating blood that have included onlyHCV patients with the same viral genotype andantiviral treatment and that have used a metho-dological approach based on molecular markerdiscovery and validation. For these reasons, wehave tested the blood basal expression of a largenumber of genes, including inhibitors of the IFNa-induced Janus kinase–signal transducer and activa-tor of transcription (JAK–STAT) pathway (sup-pressor of cytokine signalling 1 (SOCS1), SOCS2,SOCS3, protein inhibitor of activated STAT1(PIAS1), PIAS3 and small ubiquitin-like modifier1 (SUMO1)), genes associated with the failure ofIFNa treatment (TNFa, IL10, IFNc, IFNAR1, IL1b,IL6 and IL8) and IFNa-induced antiviral effectors(MxA and oligoadenylate synthetase 2 (OAS2)),13–15
using two independent sets (one from Naples inthe South of Italy and another from Trieste in theNorth of Italy) of HCV genotype-1 patients treatedwith PEG-IFNa and ribavirin. Only the SOCS3gene was highly expressed in both sets of patientswho had failed antiviral therapy.
There are no literature data demonstrating anyassociation between single nucleotide polymorph-isms (SNPs) of SOCS3 and the resistance toantiviral treatment. In order to strengthen thehypothesis that SOCS3 is a marker that is useful topredict antiviral treatment efficacy, we investi-gated SOCS3 haplotypes and correlated thesehaplotypes with selected outcome parameters ina cohort of Caucasian patients with chronichepatitis C, in comparison with a carefully selected
Hepatitis
Gut 2008;57:507–515. doi:10.1136/gut.2007.129478 507
on 24 March 2008 gut.bmj.comDownloaded from
control population. Furthermore, we evaluated the relationshipbetween variation in SOCS3 expression and different genotypesof SOCS3 24874 SNP.
Our findings provide evidence that blood basal SOCS3overexpression and gene haplotypes, carrying a functionalSNP, are associated with a negative response to antiviraltherapy in chronic HCV genotype-1.
PATIENTS AND METHODS
PatientsOverall, 346 patients with chronic hepatitis C infection wereincluded in the study (table 1).
All of these were of Caucasian origin and they were recruitedfrom two Italian university hospitals. The inclusion criteriawere: elevated alanine aminotransferase (ALT) levels during theprevious 6 months; HCV antibodies; HCV RNA; genotype 1;and no history of alcohol abuse. Exclusion criteria were: HCVantibodies with genotypes 2 or 3; other hepatitis viruses; alcoholabuse (.20 mg/day in women, and .30 mg/day in men in the5 years before enrolment), evaluated according to Reid16; historyof drug abuse; and a positive HIV test. Markers of hepatitis Bvirus and HIV infection were tested using commerciallyavailable ELISAs (Abbott Laboratories. Abbott Park, IL).
Liver biopsies and histologyThe hepatic percutaneous biopsies were performed with Surecut17G needles, via the intercostal route using an echo-assistedmethod. Liver specimens were used for histological examinationif they were at least 1.5 cm long and contained .5 portalspaces. The specimens were fixed in formalin, embedded inparaffin and stained with H&E, Red Sirius, ubiquitin, trichromeand Prussian blue. Biopsies were evaluated by the Ishak score.17
RNA preparation and HCV RNA determinationRNA preparation and HCV RNA qualitative determinationhave been performed as previously described.18 HCV RNA hasbeen quantified according to the Cobas Monitor test (version 2,Roche Diagnostics, Milan, Italy).
HCV genotypingHCV genotypes have been determined as previously described.18
All of the patients included in this study were genotype 1infected.
Antiviral therapyAll of the patients included in this study received their firstcourse of antiviral therapy and were treated for 48 weeks withPEG-IFNa in combination with ribavirin, according to currentconsensus protocols. The virological response to therapy wasassessed via measurements of HCV RNA at baseline, at12 weeks and 48 weeks during treatment, and 24 weeks aftertreatment ended. According to the qualitative HCV RNAresults, the patients were defined as either sustained virologicalresponders (SVRs) (no detectable HCV RNA after 48 weeks oftreatment and 6 months afterwards) or non-responders (NRs)(including viral breakthrough, and virological non-response,with the continued presence of HCV RNA at the end oftreatment).19 The patients who relapsed at the end of thetreatment were not included in this study. According to therespective study protocols, the treatment was discontinued invirological non-responders at week 12 of therapy, based on apositive quantitative HCV RNA test.
Healthy control populationOur control population comprised 281 Caucasian subjects(table 1). In all of the control subjects, chronic hepatitis Cwas excluded by a negative anti-HCV assay (Abbott,Wiesbaden, Germany), and none of the patients had clinicalor biochemical signs of acute HCV infection. The controls werenot significantly different from the HCV patients with respectto age and gender. The study was approved by the EthicsCommittee of the Second University of Naples, and patientsgave their informed consent.
Generation of cell lines from HCV patients, RNA isolation andreverse transcriptionNinety-one (61 from Naples and 30 from Trieste) treatment-naıve patients were studied prospectively prior to the antiviraltherapy. Epstein–Barr virus-transformed lymphoblastoid celllines (EBV-LCLs) were generated from the peripheral bloodmononuclear cells (PBMCs) of these patients. Generation ofEBV-LCLs and total cellular RNA extraction and reversetranscription were performed as previously described.20
Quantitative real-time PCR analysisQuantitative real-time (QRT)-PCR was performed using theSYBR Green PCR Master Mix with the Applied BiosystemModel 7900HT Sequence Detection System. The primers weredesigned by the Primer Express 2.1 program (AppliedBiosystems, Branchberg, NJ). b-Actin (forward 59-CGTGCTGCTGACCGAGG-39, reverse 59-GAAGGTCTCAAACATGATCTGGGT-39) and glyceraldehyde phosphate dehydrogenase(GAPDH; forward 59-CCACATCGCTCAGACACCAT-39,reverse 59-AGTTAAAAGCAGCCCTGGTGAC-39) were usedas internal controls. Relative gene expressions were calculatedby using the 22DDCt method, as previously described.21
Western blottingHarvested cells were washed three times with ice-coldphosphate-buffered saline (PBS) and homogenised with extrac-tion ice-cold buffer for the cytosolic fraction at 4uC (10 mMHEPES, pH 7.9, 1.5 mM MgCl2, 1 mM EDTA, 0.5 mMdithiothreitol (DTT), 10% (v/v) glycerol and a completeprotease inhibitor cocktail (Roche, Milan, Italy)). Proteinextract concentrations were determined by the Bradford assay(BioRad, Milan, Italy). A 30 mg aliquot of the cytosolic lysateswas loaded onto 12% polyacrylamide gels according to the
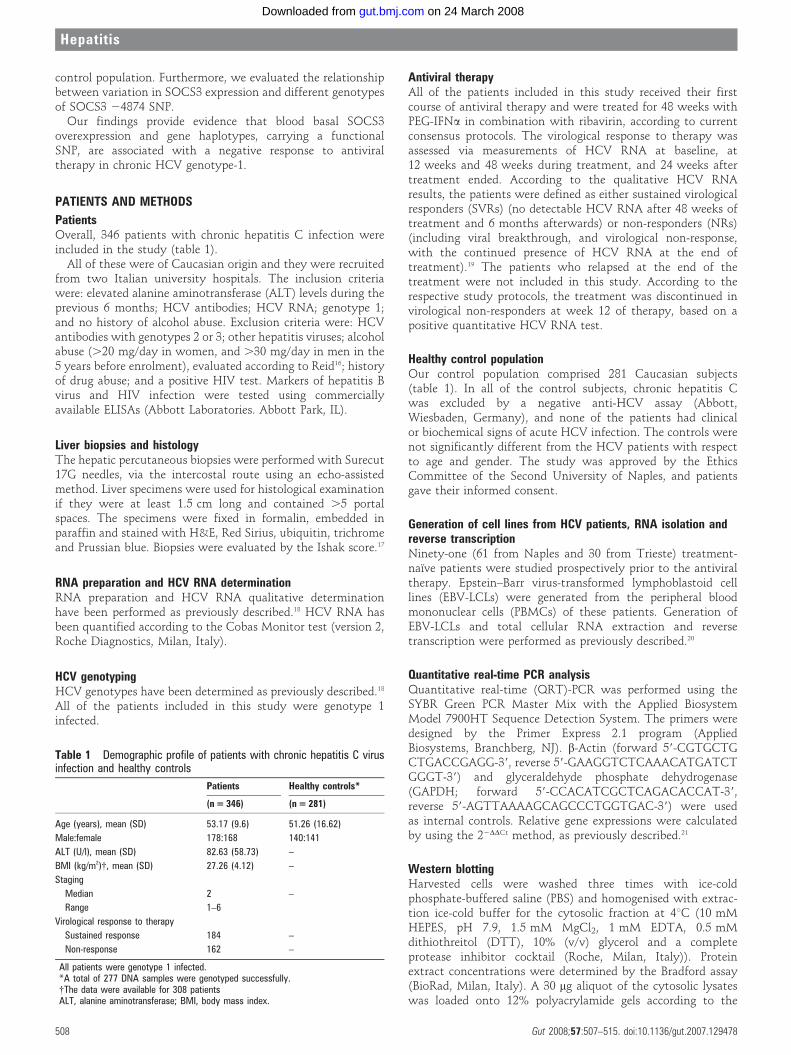
Table 1 Demographic profile of patients with chronic hepatitis C virusinfection and healthy controls
Patients Healthy controls*
(n = 346) (n = 281)
Age (years), mean (SD) 53.17 (9.6) 51.26 (16.62)
Male:female 178:168 140:141
ALT (U/l), mean (SD) 82.63 (58.73) –
BMI (kg/m2){, mean (SD) 27.26 (4.12) –
Staging
Median 2 –
Range 1–6
Virological response to therapy
Sustained response 184 –
Non-response 162 –
All patients were genotype 1 infected.*A total of 277 DNA samples were genotyped successfully.{The data were available for 308 patientsALT, alanine aminotransferase; BMI, body mass index.
Hepatitis
508 Gut 2008;57:507–515. doi:10.1136/gut.2007.129478
on 24 March 2008 gut.bmj.comDownloaded from
method of Laemmli,22 and Western blotting (WB) wasperformed as described,23 with a specific commercial mouseanti-SOCS3 antibody (1:500) (BioLegend, San Diego, CA),mouse anti-STAT1 and mouse anti-pSTAT1 (1:200) (SantaCruz Biotechnology, Santa Cruz, CA). A mouse anti-b-actinantibody (1:1.000) (Sigma Aldrich, Milan, Italy) was used as thecontrol for equal loading.
Semiquantitative analysis of protein expression was per-formed. The bands were quantified by densitometry to obtainan integral optical density (OD) value, which then wasnormalised with respect to the b-actin value.
SNP analysisGenomic DNA was prepared using the Wizard Genomic DNApurification kit (Promega Coorporation, Madison, WI). ThreeSNPs were selected from the NCBI dbSNP Home Page from,10 kb upstream of the SOCS3 gene and throughout the gene.The SNPs that had been validated by several methods accordingto dbSNP and that had a minor allele frequency (MAF) .10%were chosen as priority. They were: rs12952093, rs4969170 andrs4969168. The genotyping of SNP rs4969170 was performedwith the TaqMan SNP Genotyping Assay (Applied Biosystems,Branchberg, NJ). This SNP was amplified using the TaqManUniversal PCR protocol (95uC for 10 min, followed by 40 cyclesat 92uC for 15 s, and 60uC for 1 min). The plates were thenplaced in a 7900HT Fast Real Time PCR System, where thefluorescence intensity in each well of the plate was read usingthe SDS 2.1 program. For the other two SNPs, rs12952093 andrs4969168, the genotyping was performed with direct sequen-cing. Briefly, a 341 bp fragment of the SOCS3 promoter regionand a 383 bp fragment of the SOCS3 39 untranslated region(UTR) were amplified from genomic DNA by PCR in a 50 mlvolume with Master Mix 2.5X (Eppendorf, Hamburg,Germany). The oligonucleotide primers were designed fromthe sequence of the promoter and 39UTRs of human SOCS3(forward 59-AACCTGGAGCATGTGAACTG-39, reverse 59-GGCAAACACCGTCTCTACCT-39; forward 59-TGGGACAGGGAGCATTTAAG-39, reverse 59-ATCCTGGTGACATGCTCCTC-39). The PCR products were checked by DNA agarose gelelectrophoresis.
Direct sequencing was performed using the Dye TerminatorCycle Sequencing FS Ready Reaction Kit (Perkin–Elmer AppliedBiosystems) and a 373A DNA sequencer (Applied Biosystems,Branchberg, NJ).
Statistical analysis
Gene and protein expression analysisFor QRT-PCR data, the mean fold change = 22(average DDCt) wascalculated using the mean difference in the DCt between thegenes and the internal control.21 The DCt was calculated usingthe differences in the mean Ct between selected genes and theinternal control. The error bars in the histograms weredetermined by the SEM difference of the DCt values, so thatthe tops of the error bars correspond to (mean fold change) 6(2SEM – 1). The significances of the protein and gene expressiondifferences were determined using the Mann–Whitney test.Statistical significance was established at p,0.05.
Haplotype analysisFor each gene SNP, the allele frequencies were defined, andtesting for Hardy–Weinberg equilibrium was performed.Haplotypes at the gene locus were defined using the modified
estimation-maximisation algorithm implemented in theHaploview software package.24
A comparison of the genotype, haplotype and allele frequenciesbetween the groups was performed using the x2 test. In the case ofmultiple tests, the significance levels were adjusted according tothe Bonferroni method. Thus, the p value for a test became kp,where k was the number of hypotheses being tested. Odds ratios(ORs) and 95% CIs were calculated to assess the relative diseaserisk conferred by a specific allele, haplotype and genotype.
RESULTS
Basal expression of host genetic factors related to the failure ofIFNa therapy in two independent sets of HCV patientsIn the effort to identify genes whose expression is correlated toantiviral response in HCV genotype 1b-infected patients, weselected six genes inhibitors of the JAK–STAT pathway(SOCS1, SOCS2, SOCS3, PIAS1, PIAS3 and SUMO1), sevencytokine genes associated with the failure of IFNa treatment(TNFa, IL10, IFNc, IFNAR1, IL1b, IL6 and IL8) and two IFNa-induced antiviral effectors (MxA and OAS2)13–15 (Supplementarytable 1s), and we analysed their expression in the EBV-LCLsfrom the PBMCs of HCV patients. Of a total of 91 patients, 17were excluded because they had relapsed at the end of thetreatment.
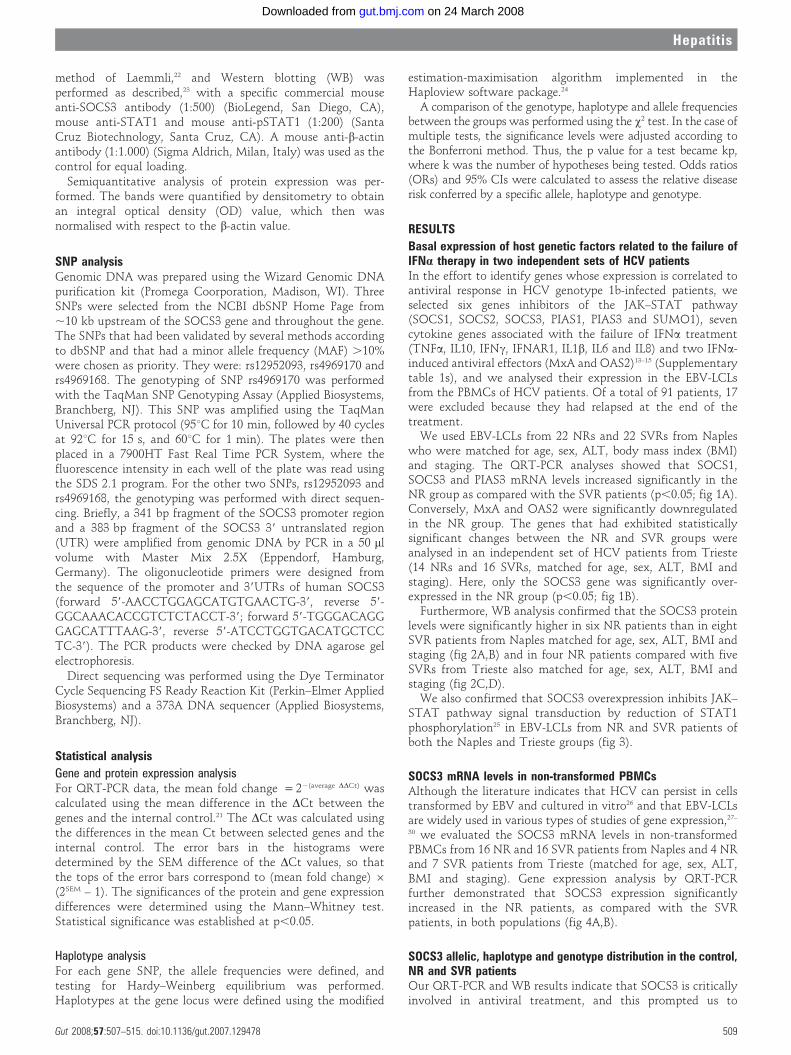
We used EBV-LCLs from 22 NRs and 22 SVRs from Napleswho were matched for age, sex, ALT, body mass index (BMI)and staging. The QRT-PCR analyses showed that SOCS1,SOCS3 and PIAS3 mRNA levels increased significantly in theNR group as compared with the SVR patients (p,0.05; fig 1A).Conversely, MxA and OAS2 were significantly downregulatedin the NR group. The genes that had exhibited statisticallysignificant changes between the NR and SVR groups wereanalysed in an independent set of HCV patients from Trieste(14 NRs and 16 SVRs, matched for age, sex, ALT, BMI andstaging). Here, only the SOCS3 gene was significantly over-expressed in the NR group (p,0.05; fig 1B).
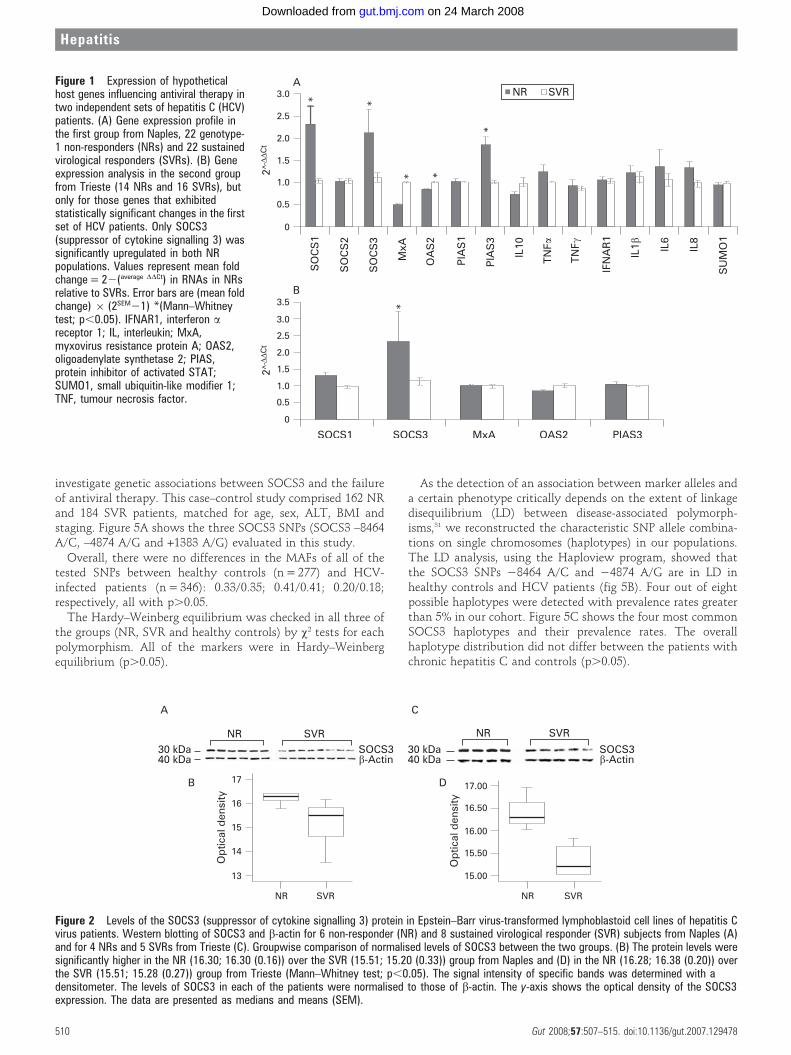
Furthermore, WB analysis confirmed that the SOCS3 proteinlevels were significantly higher in six NR patients than in eightSVR patients from Naples matched for age, sex, ALT, BMI andstaging (fig 2A,B) and in four NR patients compared with fiveSVRs from Trieste also matched for age, sex, ALT, BMI andstaging (fig 2C,D).
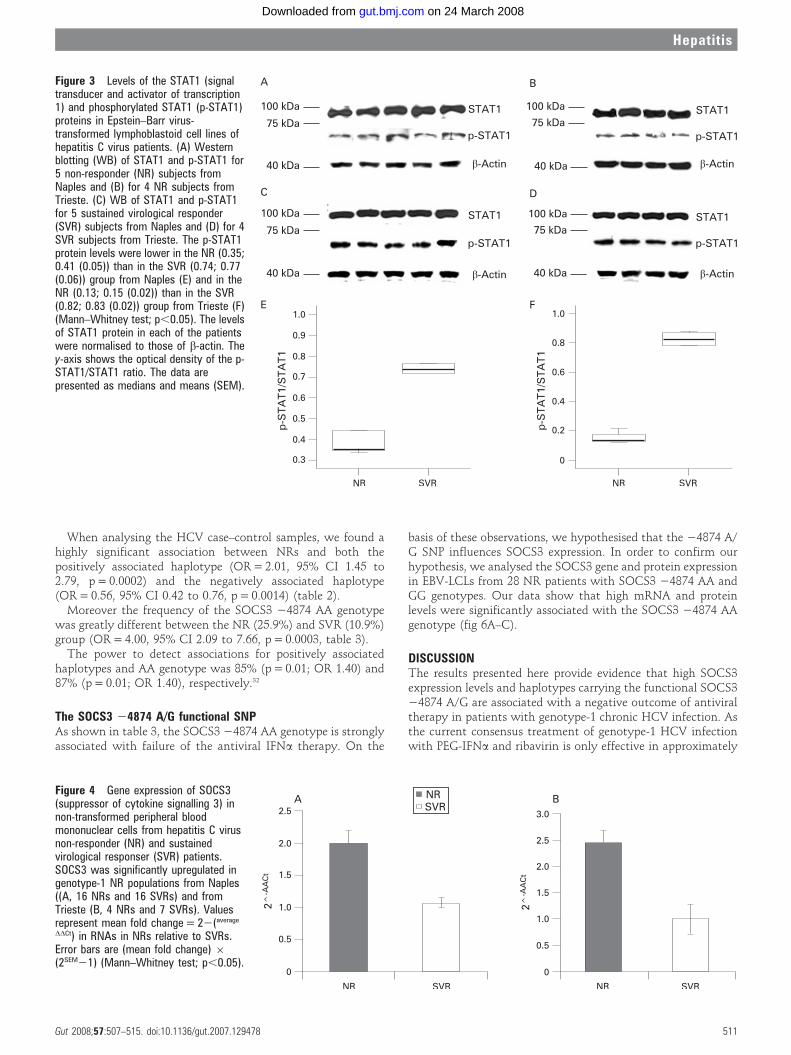
We also confirmed that SOCS3 overexpression inhibits JAK–STAT pathway signal transduction by reduction of STAT1phosphorylation25 in EBV-LCLs from NR and SVR patients ofboth the Naples and Trieste groups (fig 3).
SOCS3 mRNA levels in non-transformed PBMCsAlthough the literature indicates that HCV can persist in cellstransformed by EBV and cultured in vitro26 and that EBV-LCLsare widely used in various types of studies of gene expression,27–
30 we evaluated the SOCS3 mRNA levels in non-transformedPBMCs from 16 NR and 16 SVR patients from Naples and 4 NRand 7 SVR patients from Trieste (matched for age, sex, ALT,BMI and staging). Gene expression analysis by QRT-PCRfurther demonstrated that SOCS3 expression significantlyincreased in the NR patients, as compared with the SVRpatients, in both populations (fig 4A,B).
SOCS3 allelic, haplotype and genotype distribution in the control,NR and SVR patientsOur QRT-PCR and WB results indicate that SOCS3 is criticallyinvolved in antiviral treatment, and this prompted us to
Hepatitis
Gut 2008;57:507–515. doi:10.1136/gut.2007.129478 509
on 24 March 2008 gut.bmj.comDownloaded from
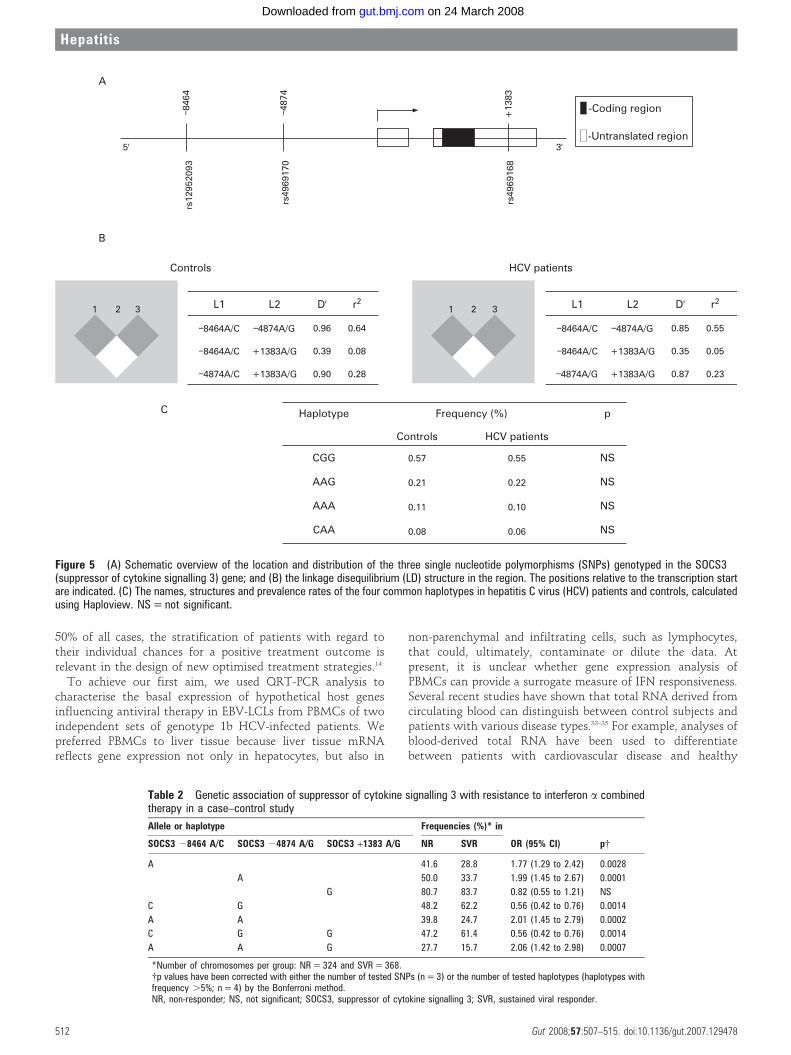
investigate genetic associations between SOCS3 and the failureof antiviral therapy. This case–control study comprised 162 NRand 184 SVR patients, matched for age, sex, ALT, BMI andstaging. Figure 5A shows the three SOCS3 SNPs (SOCS3 –8464A/C, –4874 A/G and +1383 A/G) evaluated in this study.
Overall, there were no differences in the MAFs of all of thetested SNPs between healthy controls (n = 277) and HCV-infected patients (n = 346): 0.33/0.35; 0.41/0.41; 0.20/0.18;respectively, all with p.0.05.
The Hardy–Weinberg equilibrium was checked in all three ofthe groups (NR, SVR and healthy controls) by x2 tests for eachpolymorphism. All of the markers were in Hardy–Weinbergequilibrium (p.0.05).
As the detection of an association between marker alleles anda certain phenotype critically depends on the extent of linkagedisequilibrium (LD) between disease-associated polymorph-isms,31 we reconstructed the characteristic SNP allele combina-tions on single chromosomes (haplotypes) in our populations.The LD analysis, using the Haploview program, showed thatthe SOCS3 SNPs 28464 A/C and 24874 A/G are in LD inhealthy controls and HCV patients (fig 5B). Four out of eightpossible haplotypes were detected with prevalence rates greaterthan 5% in our cohort. Figure 5C shows the four most commonSOCS3 haplotypes and their prevalence rates. The overallhaplotype distribution did not differ between the patients withchronic hepatitis C and controls (p.0.05).
Figure 1 Expression of hypotheticalhost genes influencing antiviral therapy intwo independent sets of hepatitis C (HCV)patients. (A) Gene expression profile inthe first group from Naples, 22 genotype-1 non-responders (NRs) and 22 sustainedvirological responders (SVRs). (B) Geneexpression analysis in the second groupfrom Trieste (14 NRs and 16 SVRs), butonly for those genes that exhibitedstatistically significant changes in the firstset of HCV patients. Only SOCS3(suppressor of cytokine signalling 3) wassignificantly upregulated in both NRpopulations. Values represent mean foldchange = 22(average DDCt) in RNAs in NRsrelative to SVRs. Error bars are (mean foldchange) 6 (2SEM21) *(Mann–Whitneytest; p,0.05). IFNAR1, interferon areceptor 1; IL, interleukin; MxA,myxovirus resistance protein A; OAS2,oligoadenylate synthetase 2; PIAS,protein inhibitor of activated STAT;SUMO1, small ubiquitin-like modifier 1;TNF, tumour necrosis factor.
Figure 2 Levels of the SOCS3 (suppressor of cytokine signalling 3) protein in Epstein–Barr virus-transformed lymphoblastoid cell lines of hepatitis Cvirus patients. Western blotting of SOCS3 and b-actin for 6 non-responder (NR) and 8 sustained virological responder (SVR) subjects from Naples (A)and for 4 NRs and 5 SVRs from Trieste (C). Groupwise comparison of normalised levels of SOCS3 between the two groups. (B) The protein levels weresignificantly higher in the NR (16.30; 16.30 (0.16)) over the SVR (15.51; 15.20 (0.33)) group from Naples and (D) in the NR (16.28; 16.38 (0.20)) overthe SVR (15.51; 15.28 (0.27)) group from Trieste (Mann–Whitney test; p,0.05). The signal intensity of specific bands was determined with adensitometer. The levels of SOCS3 in each of the patients were normalised to those of b-actin. The y-axis shows the optical density of the SOCS3expression. The data are presented as medians and means (SEM).
Hepatitis
510 Gut 2008;57:507–515. doi:10.1136/gut.2007.129478
on 24 March 2008 gut.bmj.comDownloaded from
When analysing the HCV case–control samples, we found ahighly significant association between NRs and both thepositively associated haplotype (OR = 2.01, 95% CI 1.45 to2.79, p = 0.0002) and the negatively associated haplotype(OR = 0.56, 95% CI 0.42 to 0.76, p = 0.0014) (table 2).
Moreover the frequency of the SOCS3 24874 AA genotypewas greatly different between the NR (25.9%) and SVR (10.9%)group (OR = 4.00, 95% CI 2.09 to 7.66, p = 0.0003, table 3).
The power to detect associations for positively associatedhaplotypes and AA genotype was 85% (p = 0.01; OR 1.40) and87% (p = 0.01; OR 1.40), respectively.32
The SOCS3 24874 A/G functional SNPAs shown in table 3, the SOCS3 24874 AA genotype is stronglyassociated with failure of the antiviral IFNa therapy. On the
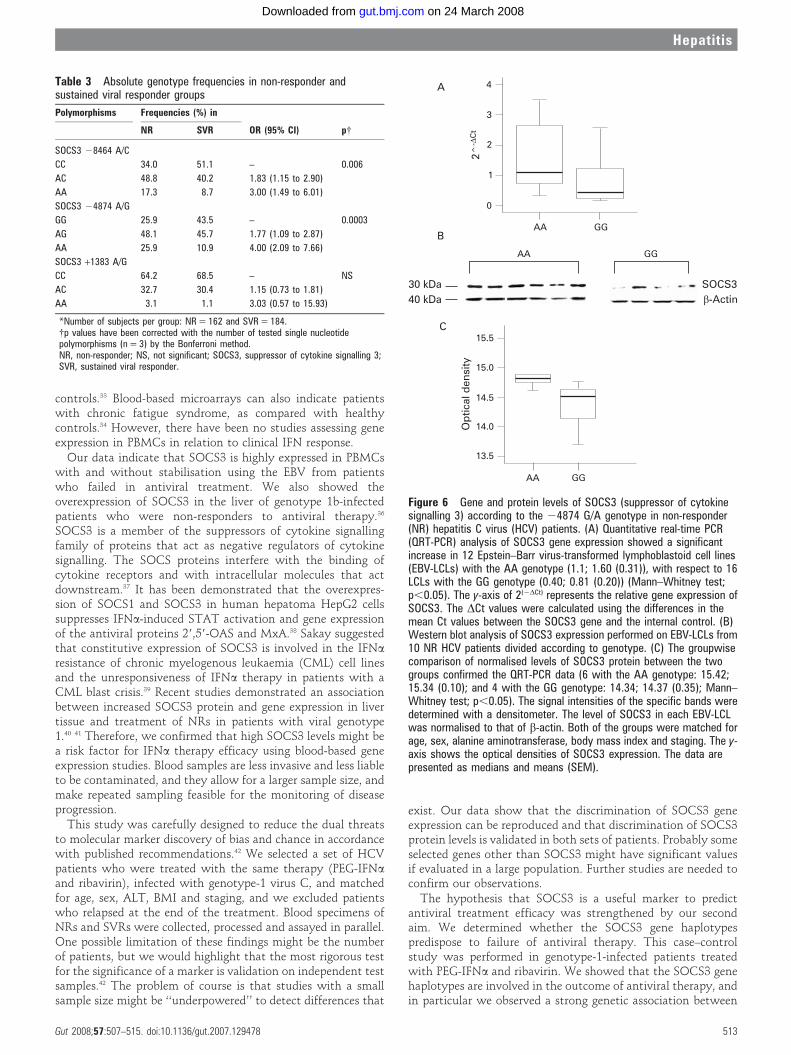
basis of these observations, we hypothesised that the 24874 A/G SNP influences SOCS3 expression. In order to confirm ourhypothesis, we analysed the SOCS3 gene and protein expressionin EBV-LCLs from 28 NR patients with SOCS3 24874 AA andGG genotypes. Our data show that high mRNA and proteinlevels were significantly associated with the SOCS3 24874 AAgenotype (fig 6A–C).
DISCUSSIONThe results presented here provide evidence that high SOCS3expression levels and haplotypes carrying the functional SOCS324874 A/G are associated with a negative outcome of antiviraltherapy in patients with genotype-1 chronic HCV infection. Asthe current consensus treatment of genotype-1 HCV infectionwith PEG-IFNa and ribavirin is only effective in approximately
Figure 3 Levels of the STAT1 (signaltransducer and activator of transcription1) and phosphorylated STAT1 (p-STAT1)proteins in Epstein–Barr virus-transformed lymphoblastoid cell lines ofhepatitis C virus patients. (A) Westernblotting (WB) of STAT1 and p-STAT1 for5 non-responder (NR) subjects fromNaples and (B) for 4 NR subjects fromTrieste. (C) WB of STAT1 and p-STAT1for 5 sustained virological responder(SVR) subjects from Naples and (D) for 4SVR subjects from Trieste. The p-STAT1protein levels were lower in the NR (0.35;0.41 (0.05)) than in the SVR (0.74; 0.77(0.06)) group from Naples (E) and in theNR (0.13; 0.15 (0.02)) than in the SVR(0.82; 0.83 (0.02)) group from Trieste (F)(Mann–Whitney test; p,0.05). The levelsof STAT1 protein in each of the patientswere normalised to those of b-actin. They-axis shows the optical density of the p-STAT1/STAT1 ratio. The data arepresented as medians and means (SEM).
Figure 4 Gene expression of SOCS3(suppressor of cytokine signalling 3) innon-transformed peripheral bloodmononuclear cells from hepatitis C virusnon-responder (NR) and sustainedvirological responser (SVR) patients.SOCS3 was significantly upregulated ingenotype-1 NR populations from Naples((A, 16 NRs and 16 SVRs) and fromTrieste (B, 4 NRs and 7 SVRs). Valuesrepresent mean fold change = 22(average
DDCt) in RNAs in NRs relative to SVRs.Error bars are (mean fold change) 6(2SEM21) (Mann–Whitney test; p,0.05).
Hepatitis
Gut 2008;57:507–515. doi:10.1136/gut.2007.129478 511
on 24 March 2008 gut.bmj.comDownloaded from
50% of all cases, the stratification of patients with regard totheir individual chances for a positive treatment outcome isrelevant in the design of new optimised treatment strategies.14
To achieve our first aim, we used QRT-PCR analysis tocharacterise the basal expression of hypothetical host genesinfluencing antiviral therapy in EBV-LCLs from PBMCs of twoindependent sets of genotype 1b HCV-infected patients. Wepreferred PBMCs to liver tissue because liver tissue mRNAreflects gene expression not only in hepatocytes, but also in
non-parenchymal and infiltrating cells, such as lymphocytes,that could, ultimately, contaminate or dilute the data. Atpresent, it is unclear whether gene expression analysis ofPBMCs can provide a surrogate measure of IFN responsiveness.Several recent studies have shown that total RNA derived fromcirculating blood can distinguish between control subjects andpatients with various disease types.33–35 For example, analyses ofblood-derived total RNA have been used to differentiatebetween patients with cardiovascular disease and healthy
Figure 5 (A) Schematic overview of the location and distribution of the three single nucleotide polymorphisms (SNPs) genotyped in the SOCS3(suppressor of cytokine signalling 3) gene; and (B) the linkage disequilibrium (LD) structure in the region. The positions relative to the transcription startare indicated. (C) The names, structures and prevalence rates of the four common haplotypes in hepatitis C virus (HCV) patients and controls, calculatedusing Haploview. NS = not significant.
Table 2 Genetic association of suppressor of cytokine signalling 3 with resistance to interferon a combinedtherapy in a case–control study
Allele or haplotype Frequencies (%)* in
OR (95% CI) p{SOCS3 28464 A/C SOCS3 24874 A/G SOCS3 +1383 A/G NR SVR
A 41.6 28.8 1.77 (1.29 to 2.42) 0.0028
A 50.0 33.7 1.99 (1.45 to 2.67) 0.0001
G 80.7 83.7 0.82 (0.55 to 1.21) NS
C G 48.2 62.2 0.56 (0.42 to 0.76) 0.0014
A A 39.8 24.7 2.01 (1.45 to 2.79) 0.0002
C G G 47.2 61.4 0.56 (0.42 to 0.76) 0.0014
A A G 27.7 15.7 2.06 (1.42 to 2.98) 0.0007
*Number of chromosomes per group: NR = 324 and SVR = 368.{p values have been corrected with either the number of tested SNPs (n = 3) or the number of tested haplotypes (haplotypes withfrequency .5%; n = 4) by the Bonferroni method.NR, non-responder; NS, not significant; SOCS3, suppressor of cytokine signalling 3; SVR, sustained viral responder.
Hepatitis
512 Gut 2008;57:507–515. doi:10.1136/gut.2007.129478
on 24 March 2008 gut.bmj.comDownloaded from
controls.33 Blood-based microarrays can also indicate patientswith chronic fatigue syndrome, as compared with healthycontrols.34 However, there have been no studies assessing geneexpression in PBMCs in relation to clinical IFN response.
Our data indicate that SOCS3 is highly expressed in PBMCswith and without stabilisation using the EBV from patientswho failed in antiviral treatment. We also showed theoverexpression of SOCS3 in the liver of genotype 1b-infectedpatients who were non-responders to antiviral therapy.36
SOCS3 is a member of the suppressors of cytokine signallingfamily of proteins that act as negative regulators of cytokinesignalling. The SOCS proteins interfere with the binding ofcytokine receptors and with intracellular molecules that actdownstream.37 It has been demonstrated that the overexpres-sion of SOCS1 and SOCS3 in human hepatoma HepG2 cellssuppresses IFNa-induced STAT activation and gene expressionof the antiviral proteins 29,59-OAS and MxA.38 Sakay suggestedthat constitutive expression of SOCS3 is involved in the IFNa
resistance of chronic myelogenous leukaemia (CML) cell linesand the unresponsiveness of IFNa therapy in patients with aCML blast crisis.39 Recent studies demonstrated an associationbetween increased SOCS3 protein and gene expression in livertissue and treatment of NRs in patients with viral genotype1.40 41 Therefore, we confirmed that high SOCS3 levels might bea risk factor for IFNa therapy efficacy using blood-based geneexpression studies. Blood samples are less invasive and less liableto be contaminated, and they allow for a larger sample size, andmake repeated sampling feasible for the monitoring of diseaseprogression.
This study was carefully designed to reduce the dual threatsto molecular marker discovery of bias and chance in accordancewith published recommendations.42 We selected a set of HCVpatients who were treated with the same therapy (PEG-IFNa
and ribavirin), infected with genotype-1 virus C, and matchedfor age, sex, ALT, BMI and staging, and we excluded patientswho relapsed at the end of the treatment. Blood specimens ofNRs and SVRs were collected, processed and assayed in parallel.One possible limitation of these findings might be the numberof patients, but we would highlight that the most rigorous testfor the significance of a marker is validation on independent testsamples.42 The problem of course is that studies with a smallsample size might be ‘‘underpowered’’ to detect differences that
exist. Our data show that the discrimination of SOCS3 geneexpression can be reproduced and that discrimination of SOCS3protein levels is validated in both sets of patients. Probably someselected genes other than SOCS3 might have significant valuesif evaluated in a large population. Further studies are needed toconfirm our observations.
The hypothesis that SOCS3 is a useful marker to predictantiviral treatment efficacy was strengthened by our secondaim. We determined whether the SOCS3 gene haplotypespredispose to failure of antiviral therapy. This case–controlstudy was performed in genotype-1-infected patients treatedwith PEG-IFNa and ribavirin. We showed that the SOCS3 genehaplotypes are involved in the outcome of antiviral therapy, andin particular we observed a strong genetic association between
Table 3 Absolute genotype frequencies in non-responder andsustained viral responder groups
Polymorphisms Frequencies (%) in
OR (95% CI) p{NR SVR
SOCS3 28464 A/C
CC 34.0 51.1 – 0.006
AC 48.8 40.2 1.83 (1.15 to 2.90)
AA 17.3 8.7 3.00 (1.49 to 6.01)
SOCS3 24874 A/G
GG 25.9 43.5 – 0.0003
AG 48.1 45.7 1.77 (1.09 to 2.87)
AA 25.9 10.9 4.00 (2.09 to 7.66)
SOCS3 +1383 A/G
CC 64.2 68.5 – NS
AC 32.7 30.4 1.15 (0.73 to 1.81)
AA 3.1 1.1 3.03 (0.57 to 15.93)
*Number of subjects per group: NR = 162 and SVR = 184.{p values have been corrected with the number of tested single nucleotidepolymorphisms (n = 3) by the Bonferroni method.NR, non-responder; NS, not significant; SOCS3, suppressor of cytokine signalling 3;SVR, sustained viral responder.
Figure 6 Gene and protein levels of SOCS3 (suppressor of cytokinesignalling 3) according to the 24874 G/A genotype in non-responder(NR) hepatitis C virus (HCV) patients. (A) Quantitative real-time PCR(QRT-PCR) analysis of SOCS3 gene expression showed a significantincrease in 12 Epstein–Barr virus-transformed lymphoblastoid cell lines(EBV-LCLs) with the AA genotype (1.1; 1.60 (0.31)), with respect to 16LCLs with the GG genotype (0.40; 0.81 (0.20)) (Mann–Whitney test;p,0.05). The y-axis of 2(2DCt) represents the relative gene expression ofSOCS3. The DCt values were calculated using the differences in themean Ct values between the SOCS3 gene and the internal control. (B)Western blot analysis of SOCS3 expression performed on EBV-LCLs from10 NR HCV patients divided according to genotype. (C) The groupwisecomparison of normalised levels of SOCS3 protein between the twogroups confirmed the QRT-PCR data (6 with the AA genotype: 15.42;15.34 (0.10); and 4 with the GG genotype: 14.34; 14.37 (0.35); Mann–Whitney test; p,0.05). The signal intensities of the specific bands weredetermined with a densitometer. The level of SOCS3 in each EBV-LCLwas normalised to that of b-actin. Both of the groups were matched forage, sex, alanine aminotransferase, body mass index and staging. The y-axis shows the optical densities of SOCS3 expression. The data arepresented as medians and means (SEM).
Hepatitis
Gut 2008;57:507–515. doi:10.1136/gut.2007.129478 513
on 24 March 2008 gut.bmj.comDownloaded from
haplotypes carrying the SOCS3 24874 A allele and resistance totherapy. This could be due to increased SOCS3 protein and geneexpression being associated with the 24874 AA genotype.Therefore, specific gene haplotypes of SOCS3 could predispose tothe overproduction of the protein, and so to antiviral therapyresistance. Interrogation of the Genomatix program43 predicted thatthe SOCS3 24874 A/G polymorphism is included in the bindingregion of two transcription factors, AML1/CBFA2 (RUNX1) andPURa. In particular, the allelic G form could bind both, while theallelic A form could bind only RUNX1. This suggests a functionalrole for the SOCS3 24878 A/G SNP, and further functional studiesare in progress to validate this hypothesis.
To date, there have been few studies that have documentedgenetic associations related to SOCS3. Only genetic associationbetween atopic dermatitis and increased whole-body insulinsensitivity, and polymorphisms in the SOCS3 gene have beenshown.44 45 There are no data concerning the associationbetween the SOCS3 genetic variants and antiviral treatmentefficacy. Several studies have demonstrated the associationbetween cytokine functional polymorphisms and antiviraltreatment.9–11 46 For the first time, we report here a geneticassociation of SOCS3 with the outcome of antiviral therapy.
Furthermore, as the use of single SNPs in many currentassociation studies has little possibility to detect genotype–phenotype correlations, it has been recommended that the overallsequence variations of candidate genes be assessed via haplotypeanalysis.31 This is particularly true for cohorts of patients withinfectious diseases, such as chronic hepatitis C, that do notinclude family members who can provide phase information ongenotypes.31 47 Thus a major aim of our study was to use theSOCS3 haplotype information in an HCV study population.Using a powerful and precise statistical approach to infer thesehaplotypes from our population genotype data, we identified fourcommon haplotypes with a prevalence of more than 5% inpatients with hepatitis C and in our control population.
One possible limitation of these findings is the need toconfirm the genetic association in independent sets of patientsand controls who originate from another country. Therefore,further studies are needed to confirm that our observations doindeed apply to other patient populations.
In conclusion, we have shown that SOCS3 is consistentlyhighly expressed in chronic HCV genotype 1 patients with anegative response to antiviral combination therapy, and thatspecific haplotypes of the SOCS3 gene are significantlyassociated with the failure of the treatment. We suggest thatSOCS3 has an important role in this antiviral treatment, at leastin an Italian population. We also suggest that SOCS3 and thepathways that it regulates are important targets for futureinvestigations towards the development of new therapies andmore effective ways of predicting treatment responses.
Funding: AIRC, MURST-PRIN, OPEN foundation, Ministero Sanita and Telethon
Competing interests: None.
REFERENCES1. Poynard T, Yuen MF, Ratziu V, et al. Viral hepatitis C. Lancet 2003;362:2095–100.2. Siebert U, Sroczynski G, Rossol S, et al. Cost effectiveness of PEG-interferon-a-2b
plus ribavirin versus interferon-a-2b plus ribavirin for initial treatment of chronichepatitis C. Gut 2003;52:425–32.
3. Fried MW, Shiffman ML, Reddy KR, et al. PEG-interferon-a-2a plus ribavirin forchronic hepatitis C virus infection. N Engl J Med 2002;347:975–82.
4. Ferenci P, Fried MW, Shiffman ML, et al. Predicting sustained virological responsesin chronic hepatitis C patients treated with PEG-interferon-a-2a (40 kDa)/ribavirin.J Hepatol 2005;43:425–33.
5. Larrea E, Garcia N, Qian C, et al. Tumor necrosis factor alpha gene expression andthe response to interferon in chronic hepatitis C. Hepatology 1996;23:210–7.
6. Kuzushita N, Hayashi N, Katayama K, et al. High levels of serum interleukin-10 areassociated with a poor response to interferon treatment in patients with chronichepatitis C. Scand J Gastroenterol 1997;32:169–74.
7. Mathai J, Shimoda K, Banner BF, et al. IFN-a receptor mRNA expression in a UnitedStates sample with predominantly genotype 1a/I chronic hepatitis C liver biopsiescorrelates with response to IFN therapy. J Interferon Cytokine Res 1999;19:1011–8.
8. Antonelli G, Simeoni E, Turriziani O, et al. Correlation of interferon-inducedexpression of MxA mRNA in peripheral blood mononuclear cells with the response ofpatients with chronic active hepatitis C to IFN-a therapy. J Interferon Cytokine Res1999;19:243–51.
9. Neuman MG, Benhamou JP, Malkiewicz IM, et al. Cytokines as predictors forsustained response and as markers for immunomodulation in patients with chronichepatitis C. Clin Biochem 2001;34:173–82.
10. Yee LJ, Tang J, Gibson AW, et al. Interleukin 10 polymorphisms as predictors ofsustained response in antiviral therapy for chronic hepatitis C infection. Hepatology2001;33:708–12.
11. Matsuyama N, Mishiro S, Sugimoto M, et al. The dinucleotide microsatellitepolymorphism of the IFNAR1 gene promoter correlates with responsiveness ofhepatitis C patients to interferon. Hepatol Res 2003;25:221–5.
12. Hijikata M, Ohta Y, Mishiro S. Identification of a single nucleotide polymorphism inthe MxA gene promoter (G/T at nt –88) correlated with the response of hepatitis Cpatients to interferon. Intervirology 2000;43:124–7.
13. Wormald S, Hilton DJ. Inhibitors of cytokine signal transduction. J Biol Chem2004;279:821–4.
14. Gao B, Hong F, Radaeva S. Host factors and failure of interferon-a treatment inhepatitis C virus. Hepatology 2004;39:880–90.
15. Feld JJ, Hoofnagle JH. Mechanism of action of interferon and ribavirin in treatmentof hepatitis C. Nature 2005;436:967–72.
16. Reid MC, Guo Z, Van Ness PH, et al. Are commonly ordered lab tests useful screensfor alcohol disorders in older male veterans receiving primary care. Subst Abuse2005;26:25–32.
17. Ishak K, Baptista A, Bianchi L, et al. Histological grading and staging of chronichepatitis. J Hepatol 1995;22:696–9.
18. Persico M, Capasso M, Persico E, et al. Interleukin-10 –1082 GG polymorphisminfluences the occurrence and the clinical characteristics of hepatitis C virus infection.J Hepatol 2006;45:779–85.
19. Lindsay K. Introduction to therapy of hepatitis C. Hepatology 2002;36:S114–20.20. Capasso M, Avvisati RA, Piscopo C, et al. Cytokine gene polymorphisms in Italian
preterm infants: association between interleukin-10 –1082 G/A polymorphism andrespiratory distress syndrome. Pediatr Res 2007;61:313–7.
21. Livak KJ and Schmitteng TD. Analysis of relative gene expression data using real-time quantitative PCR and the 2(–Delta Delta C(T)). Methods 2001;25:402–8.
22. Laemmli UK. Cleavage of structural proteins during the assembly of the head ofbacteriophage T4. Nature 1970;227:680–5.
23. Towbin H, Staehelin T, Gordon J. Electrophoretic transfer of proteins frompolyacrylamide gels to nitrocellulose sheets: procedure and some applications. ProcNatl Acad Sci USA 1979;76:4350–4.
24. Barrett JC, Fry B, Maller J, Daly MJ. Haploview: analysis and visualization of LD andhaplotype maps. Bioinformatics 2005;21:263–5.
25. Bode JG, Ludwig S, Ehrhardt C, et al. IFN-alpha antagonistic activity of HCV coreprotein involves induction of suppressor of cytokine signaling-3. FASEB J2003;17:488–90.
26. Cheng JL, Liu BL, Zhang Y, et al. Hepatitis C virus in human B lymphocytestransformed by Epstein–Barr virus in vitro by in situ reverse transcriptase-polymerasechain reaction. World J Gastroenterol 2001;7:370–5.
27. Wroblewski JM, Copple A, Batson LP, et al. Cell surface phenotyping and cytokineproduction of Epstein–Barr virus (EBV)-transformed lymphoblastoid cell lines (LCLs).J Immunol Methods 2002;264:19–28.
28. Klein SC, Kube D, Abts H, et al. Promotion of IL8, IL10, TNF-a and TNF-b productionby EBV infection. Leuk Res 1996;20:633–6.
29. Haas CS, Creighton CJ, Pi X, et al. Identification of genes modulated in rheumatoidarthritis using complementary DNA microarray analysis of lymphoblastoid B cell linesfrom disease-discordant monozygotic twins. Arthritis Rheum 2006;54:2047–60.
30. Hu VW, Frank BC, Heine S, et al. Gene expression profiling of lymphoblastoid celllines from monozygotic twins discordant in severity of autism reveals differentialregulation of neurologically relevant genes. BMC Genomics 2006;7:118.
31. Tiret L, Poirier O, Nicaud V, et al. Heterogeneity of linkage disequilibrium in humangenes has implications for association studies of common diseases. Hum Mol Genet2002;11:419–29.
32. Skol AD, Scott LJ, Abecasis GR, et al. Joint analysis is more efficient thanreplication-based analysis for two-stage genome-wide association studies. Nat Genet2006;38:209–13.
33. Ma J, Liew CC. Gene profiling identifies secreted protein transcripts from peripheralblood cells in coronary artery disease. J Mol Cell Cardiol 2003;35:993–8.
34. Whistler T, Unger ER, Nisenbaum R, et al. Integration of gene expression, clinical,and epidemiologic data to characterize chronic fatigue syndrome. J Transl Med2003;1:10.
35. Bull TM, Coldren CD, Moore M, et al. Gene microarray analysis of peripheralblood cells in pulmonary arterial hypertension. Am J Respir Crit Care Med2004;170:911–9.
36. Persico M, Capasso M, Persico E, et al. Suppressor of cytokine signaling 3 (SOCS3)expression and hepatitis C virus-related chronic hepatitis: insulin resistance andresponse to antiviral therapy. Hepatology 2007;46:1009–15.
Hepatitis
514 Gut 2008;57:507–515. doi:10.1136/gut.2007.129478
on 24 March 2008 gut.bmj.comDownloaded from
37. Krebs DL, Hilton DJ. SOCS proteins: negative regulators of cytokine signalling. StemCells 2001;19:378–87.
38. Vlotides G, Sorensen AS, Kopp F, et al. SOCS-1 and SOCS-3 inhibit IFN-a-inducedexpression of the antiviral proteins 2,5-OAS and MxA. Biochem Biophys Res Commun2004;320:1007–14.
39. Sakai I, Takeuchi K, Yamauchi H, et al. Constitutive expression of SOCS3 confersresistance to IFN-a in chronic myelogenous leukemia cells. Blood 2002;100:2926–31.
40. Walsh MJ, Jonsson JR, Richardson MM, et al. Non-response to antiviral therapy isassociated with obesity and increased hepatic expression of suppressor of cytokinesignalling 3 (SOCS-3) in patients with chronic hepatitis C, viral genotype 1. Gut2006;55:529–35.
41. Huang Y, Feld JJ, Sapp RK, et al. Defective hepatic response to interferon andactivation of suppressor of cytokine signaling 3 in chronic hepatitis C.Gastroenterology 2007;132:733–44.
42. Ransohoff DF. Bias as a threat to the validity of cancer molecular-marker research.Nat Rev Cancer 2005;5:142–9.
43. Cartharius K, Frech K, Grote K, et al. MatInspector and beyond: promoteranalysis based on transcription factor binding sites. Bioinformatics 2005;21:2933–42.
44. Ekelund E, Saaf A, Tengvall-Linder M, et al. Elevated expression and geneticassociation links the SOCS3 gene to atopic dermatitis. Am J Hum Genet2006;78:1060–5.
45. Gylvin T, Nolsoe R, Hansen T, et al. Mutation analysis of suppressor of cytokinesignalling 3, a candidate gene in type 1 diabetes and insulin sensitivity. Diabetologia2004;47:1273–7.
46. Huang Y, Yang H, Borg BB, et al. A functional SNP of interferon-gamma gene isimportant for interferon-alpha-induced and spontaneous recovery from hepatitis Cvirus infection. Proc Natl Acad Sci USA 2007;104:985–90.
47. Stephens JC, Schneider JA, Tanguay DA, et al. Haplotype variation and linkagedisequilibrium in 313 human genes. Science 2001;293:489–93.
Robin Spiller, editor
An unusual ultrasound diagnosis ofright lower quadrant abdominal pain
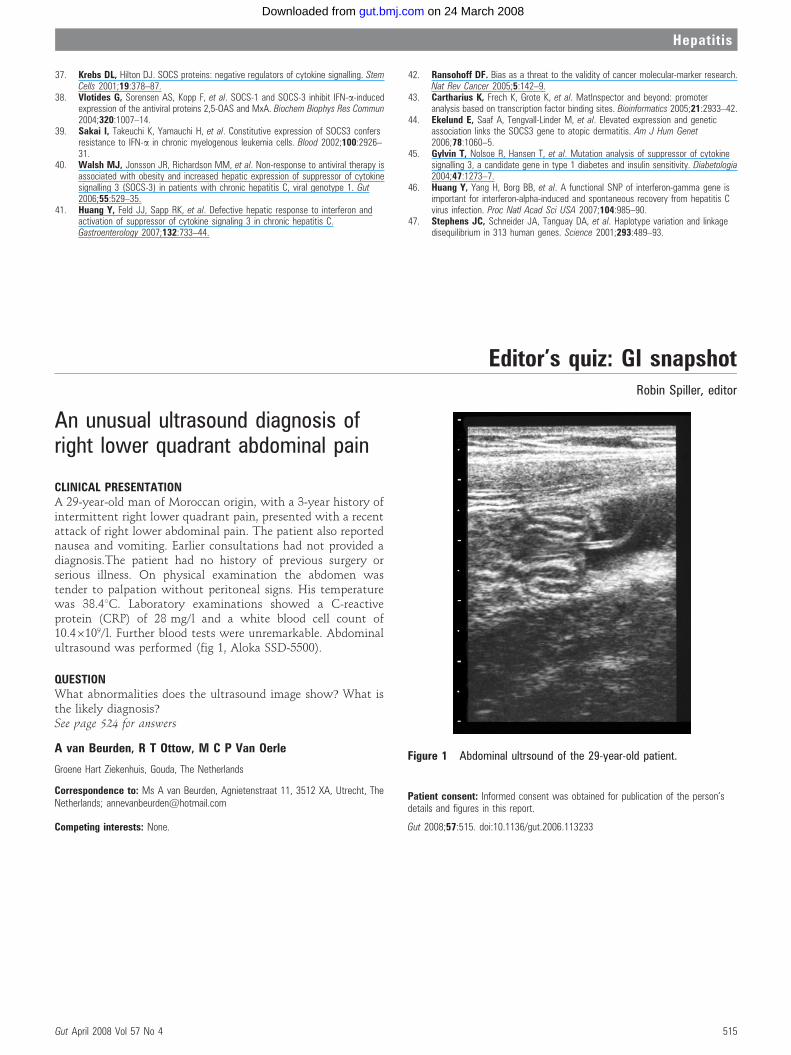
CLINICAL PRESENTATIONA 29-year-old man of Moroccan origin, with a 3-year history ofintermittent right lower quadrant pain, presented with a recentattack of right lower abdominal pain. The patient also reportednausea and vomiting. Earlier consultations had not provided adiagnosis.The patient had no history of previous surgery orserious illness. On physical examination the abdomen wastender to palpation without peritoneal signs. His temperaturewas 38.4uC. Laboratory examinations showed a C-reactiveprotein (CRP) of 28 mg/l and a white blood cell count of10.46109/l. Further blood tests were unremarkable. Abdominalultrasound was performed (fig 1, Aloka SSD-5500).
QUESTIONWhat abnormalities does the ultrasound image show? What isthe likely diagnosis?See page 524 for answers
A van Beurden, R T Ottow, M C P Van Oerle
Groene Hart Ziekenhuis, Gouda, The Netherlands
Correspondence to: Ms A van Beurden, Agnietenstraat 11, 3512 XA, Utrecht, TheNetherlands; [email protected]
Competing interests: None.
Patient consent: Informed consent was obtained for publication of the person’sdetails and figures in this report.
Gut 2008;57:515. doi:10.1136/gut.2006.113233
Figure 1 Abdominal ultrsound of the 29-year-old patient.
Editor’s quiz: GI snapshot
Hepatitis
Gut April 2008 Vol 57 No 4 515
on 24 March 2008 gut.bmj.comDownloaded from