Sublethal Antibiotic Treatment Leads to Multidrug Resistance via Radical-Induced Mutagenesis
Upload
independentCategory
view
0download
0
Electron Crystallography Reveals Plasticity within the DrugBinding Site of the Small Multidrug Transporter EmrE
Vladimir M. Korkhov and Christopher G. Tate⁎Vladimir M. Korkhov: ; Christopher G. Tate: [email protected]
MRC Laboratory of Molecular Biology, Hills Road, Cambridge, CB2 0QH, UK.
AbstractEmrE is a Small Multidrug Resistance transporter (SMR) family member that mediates countertransport of protons and hydrophobic cationic drugs such as tetraphenylphosphonium (TPP+),ethidium, propidium and dequalinium. It is thought that the selectivity of the drug binding site inEmrE is defined by two negatively charged glutamate residues within a hydrophobic pocket formedfrom six of the α-helices, three from each monomer of the asymmetric EmrE homodimer. It is notapparent how such a binding pocket accommodates drugs of various sizes and shapes or whether theconformational changes that occur upon drug binding are identical for drugs of diverse chemicalnature. Here, using electron cryomicroscopy of EmrE two-dimensional crystals we have determinedprojection structures of EmrE bound to three structurally different planar drugs, ethidium, propidiumand dequalinium. Using image analysis and rigorous comparisons between these density maps andthe density maps of the ligand-free and TPP+-bound forms of EmrE, we identify regions within thetransporter that adapt differentially depending on the type of ligand bound. We show that all threeplanar drugs bind at the same pocket within the protein as TPP+. Furthermore, our analysis indicatesthat, while retaining the overall fold of the protein, binding of the planar drugs is accompanied bysmall rearrangements of the transmembrane domains that are different to those that occur whenTPP+ binds. The regions in the EmrE dimer that are remodelled surround the drug binding site andinclude transmembrane domains from both monomers.
Keywordsmultidrug resistance; membrane protein; structure; conformation
IntroductionEmrE is an Escherichia coli Small Multidrug Resistance (SMR) protein that couples inwardtranslocation of two protons with the counter-transport of a broad range of hydrophobic cations,such as tetraphenylphosphonium (TPP+), ethidium and methyl viologen. EmrE contains 110amino acids that form four transmembrane (TM) α-helices. A low resolution (7.5 Å) projectionstructure and 3D structure of EmrE in complex with its substrate TPP+ have been determinedby electron cryomicroscopy (cryo-EM) of two-dimensional (2-D) crystals. The structure
© 2008 Elsevier Ltd.This document may be redistributed and reused, subject to certain conditions.
⁎Corresponding author. Fax: +44 1223 213556. [email protected] document was posted here by permission of the publisher. At the time of deposit, it included all changes made during peer review,copyediting, and publishing. The U.S. National Library of Medicine is responsible for all links within the document and for incorporatingany publisher-supplied amendments or retractions issued subsequently. The published journal article, guaranteed to be such by Elsevier,is available for free, on ScienceDirect.
Sponsored document fromJournal of Molecular Biology
Published as: J Mol Biol. 2008 April 04; 377(4): 1094–1103.
Sponsored Docum
ent Sponsored D
ocument
Sponsored Docum
ent

revealed that EmrE is composed of eight helices arranged as an asymmetric dimer within themembrane. The dimeric arrangement of EmrE was corroborated by analyticalultracentrifugation and substrate binding studies. EmrE has been proposed to adopt a dualtopology configuration in the bacterial membrane, based on the low-resolution structuralinformation, GFP/PhoA fusion-based topology mapping and mutagenesis, although this hasbeen disputed based mainly on cross linking data. The low-resolution cryo-EM structurerevealed the position of TPP+ in the middle of an eight-helix transmembrane bundle. Basedupon cryo-EM data and evolutionary constraints, a model for EmrE has been built; the modelis supported by extensive mutagenesis studies that identified residues likely to be involved insubstrate binding.
To achieve multi-specific drug binding and transport EmrE has evolved a hydrophobic pocketwith a pair of negatively charged glutamic acid residues (Glu14), which are crucial for directtransporter–ligand interactions, substrate translocation and coupling to the transmembraneproton gradient. By analogy with the soluble multidrug binding proteins QacR and BmrR, thebinding site of EmrE could be assumed not to require a perfect stereochemical fit with thedrugs, which is believed to be a common principle in all multidrug binding proteins. Bindingof hydrophobic cations to EmrE is therefore thought to be via non-specific hydrophobicinteractions and the ionic forces between the two E14 residues and the delocalized positivecharge of the drug. Such a ‘simple’ binding pocket would reduce the evolutionary constraintson the protein and ensure broad substrate specificity. However, it is not clear how the bindingof EmrE can accommodate drugs of different sizes and shapes, and whether differentconformational changes are required.
We have, therefore, used cryo-EM of 2-D crystals to determine the projection structures ofEmrE bound to three different substrates to address this question. Comparison of theseprojections with those obtained previously, with and without TPP+ bound, shows that themultidrug binding site of EmrE is flexible and adopts distinct conformations dependent on thenature of the substrate.
ResultsCrystallization of EmrE with various substrates
EmrE was previously crystallized by dialysis in the presence of lipids to form 2-D crystalseither with or without bound TPP+, a high-affinity substrate that binds to EmrE with an affinityof 2 nM7. All the previously obtained projection maps and the low-resolution 3D structure ofEmrE were determined using these 2-D crystals. To gain insights into the mechanismsunderlying the substrate promiscuity of EmrE, it was critical to gather structural data on itscomplexes with other drugs. Therefore, three different substrates were chosen to investigateproperties of the EmrE drug binding pocket. Ethidium (Eth+), propidium (PP2+) anddequalinium (DQ2+) all differ structurally from TPP+ by being predominantly planar moleculesrather than tetrahedral (Fig. 1a). Eth+ contains a planar triple aromatic ring system and, althoughPP2+ is very similar to Eth+, it contains a second tertiary amine and therefore carries a 2+charge. Finally, DQ2+ has two planar cationic ‘head groups’ separated by an aliphatic C10linker.
Radioligand competition binding assays showed that each of the ligands possesses micro- orsubmicromolar affinity for EmrE, with Ki values for Eth+, PP2+ and DQ2+ of 1.0 μM, 19 nMand 83 nM, respectively (Fig. 1b). Crystallisation trials were therefore performed in thepresence of either excess Eth+, PP2+ or DQ2+ to obtain 2-D crystals of the various EmrE–substrate complexes. Crystals of the Eth+-bound form of EmrE were of reasonable quality,although they were not as good as TPP+–EmrE crystals. However, the inclusion of eitherPP2+ or DQ2+ during 2-D crystallizations resulted in either extremely poorly ordered crystals
Korkhov and Tate Page 2
Published as: J Mol Biol. 2008 April 04; 377(4): 1094–1103.
Sponsored Docum
ent Sponsored D
ocument
Sponsored Docum
ent

or large unordered vesicles, both unsuitable for structure determination. We speculated thatthe reason for this disorder was due to the amphipathic nature of PP2+ and DQ2+, which resultedin them partitioning into the lipid bilayer and disrupting the molecular interactions necessaryfor 2-D crystal formation. We therefore had to use substrate exchange to substitute the TPP+
in 2-D crystals of the TPP+–EmrE complex for either PP2+ or DQ2+. Ligand exchange wasaccomplished by dialyzing 2-D crystals of TPP+-bound EmrE against a 1000-fold excess ofbuffer containing either PP2+ or DQ2+ for 5 h. The extent of the ligand exchange was estimatedby using [3H]TPP bound to EmrE 2-D crystals during the exchange reaction. Only 1–3% ofradioactive TPP+ remained bound to the 2-D crystals of EmrE after a 5 h incubation followinga 1000-fold dilution of the 2-D crystals when the dialysis buffer contained either PP2+ orDQ2+ (Fig. 1c), suggesting that the structural data would be dominated (> 97%) bycontributions from EmrE bound to the exchanged ligand. Under the conditions used for theligand exchange, equilibrium was nearly reached, but longer incubations could have resultedin a further deterioration of crystallinity, so exchange reactions were limited to 5 h.
Projection structures of ethidium-, propidium- and dequalinium-bound EmrEThe crystals obtained in the presence of Eth+ were smaller than the TPP+-bound crystal form,but reasonably well ordered, judged by optical diffraction of the cryo-EM micrographs andfurther image processing. The projection structure was obtained by merging data from the 12best images. The resolution of the projection structure extended to 7 Å, comparable to that ofthe previously determined EmrE projections with and without TPP+ (Fig. 2a, Table 1).
The crystals that underwent ligand exchange (PP2+- and DQ2+-bound crystal forms) weremorphologically indistinguishable from the parental TPP+-bound EmrE 2-D crystals.However, image processing revealed that the substrate exchange procedure led to distortionswithin the crystals and, subsequently, to loss of their quality. Most of the imaged EmrE 2-Dcrystals suffered fragmentation and were rendered unsuitable for structural work. Wehypothesise that the disruption of the crystal lattice was largely due to partitioning of thePP2+ or DQ2+ into the lipid bilayer and disrupting EmrE crystal contacts, although we cannotfully discount contributions from an additional conformational change accompanying thebinding of PP2+ or DQ2+. Only a small proportion of crystalline areas within a few of theobserved 2-D crystals remained sufficiently ordered for further processing. To obtain theprojection structures for PP2+- and DQ2+-bound forms of EmrE, 7 and 5 images were merged,respectively (Fig. 2b and c, Table 1). Despite the strong effects of ligand exchange on thecrystallinity of the specimen, the PP2+–EmrE and DQ2+–EmrE projection maps containedreliable information at 8–9 Å (Table 1): the effective resolution thresholds for both projectionmaps were 8.2 Å. All three projection structures obtained from Eth+-, PP2+- and DQ2+-boundEmrE crystals had p2 symmetry, identical to the TPP+-bound crystals.
Averaged projection structures of EmrE bound to mono- and bivalent planar substratesAt the resolution of the projection maps obtained, all secondary structure features seen in thehigher resolution projections of EmrE were clearly resolved (Fig. 2). The repetitive unit in thecrystals was the crystallographic tetramer (coloured either blue or red in each of the maps inFig. 2), but previous work shows that the minimal functional unit for substrate binding is thedimer. Careful inspection clearly revealed small differences between the two halves of thetetramer related by two fold non-crystallographic symmetry of EmrE in each of the projectionmaps. These discrepancies between the dimers were more pronounced in the density mapsobtained with PP2+ and DQ2+, where only a limited amount of data was available. To improvefurther the resolution of the asymmetric dimer, the two dimers in the crystallographic tetramerwere averaged using the MRC software for electron micrograph analysis, as described in“Materials and Methods”. The resulting averaged maps calculated from the data and mergedto 7 Å are shown in Fig. 3. Evident from the red contours in Fig. 3, the asymmetry within the
Korkhov and Tate Page 3
Published as: J Mol Biol. 2008 April 04; 377(4): 1094–1103.
Sponsored Docum
ent Sponsored D
ocument
Sponsored Docum
ent

crystallographic tetramer was highest in the PP2+-bound EmrE projection map, although thedata extended to about the same resolution as that for the DQ2+-bound form (Table 2, “RMSmirr.”).
The three projection structures of EmrE were superficially similar to each other and to thoseobtained previously (Fig. 3). In order to quantitatively assess the similarity between all ligand-bound (TPP+ and planar drugs) and ligand-free (apo-) EmrE projection maps, we alsocalculated the averaged dimer TPP+–EmrE map from the p2-symmetrised projectionstructure (as described under “Materials and Methods”; Fig. 4b, Table 2). The apo form (Fig.4a) did not require averaging, because the projection maps from which it was derived were inspace group c222 that contains a crystallographic in-plane 2-fold relating the two asymmetricdimers in the tetramer. Thus, interpolation and averaging served two purposes, improving thesignal/noise level in the resulting projection structures and, more importantly, allowing thedirect comparisons of the projection maps calculated from 2-D crystals with either p2 (TPP+,Eth+, PP2+ and DQ2+) or c222 symmetry (apo-EmrE).
The resolution at which the comparisons of all maps could be performed was limited by theresolution of the DQ2+-bound EmrE map (effective resolution threshold of 8.2 Å). To choosean optimal resolution, we merged and averaged all five maps at 7, 8, 9 and 10 Å. We thendetermined the “RMS difference” (the RMS deviation of the total density from the averagedensity in the map; Table 2) for difference maps between each projection map and the TPP+–EmrE. We found that the RMS deviations, and therefore the experimental error, were lowestat 9 Å for all planar ligand-bound EmrE projection maps. Therefore, all maps were comparedand cross-correlated at 9 Å resolution. The maps of TPP+–EmrE, Eth+–EmrE and apo-EmrEcontained structural information below that threshold, and were compared separately at 7 Åresolution.
Detailed comparisons between projection mapsComparisons were made between all the projection maps and plotted at either 9 Å resolution(Fig. 4) or, where the data allowed, at 7 Å resolution (Fig. 5). Table 3 provides the cross-correlation coefficients for all the comparisons. From these data it is clear that there are threedistinct projection structures, namely apo-EmrE, TPP+-bound EmrE and planar drug-boundEmrE. The differences between apo-EmrE and TPP+–EmrE have been previously describedand are reproduced in Fig. 4b, with the large negative density peak at the B2/C2 boundaryrepresenting bound TPP+. Figure 4c–e show similar negative peaks, which are likely torepresent either Eth+, PP2+ or DQ2+ in each case. In addition, there are density differences ineach of the different density maps for Eth+, PP2+ and DQ2+ in the C1 area, suggestive of amovement of this helix, as seen upon TPP+ binding, although there appears to be an increasein the magnitude of the movement when planar drugs are bound, compared to TPP+ (Fig. 4f–h).
Additional changes are seen in the areas A3, D3 and D4 of the 7 Å resolution map ‘Eth+ minusTPP+’ (Fig. 5c). These changes are associated with the helices that form the substrate bindingpocket, whereas there appear to be fewer and smaller density changes associated with the pairof helices in squares B&C, 4&5. These two helices may represent helix 4, one from eachmonomer, and are notable in that they are about 9 Å apart centre to centre along their wholelength and so probably represent a strong and stable association; in addition, being separatedfrom the ligand binding pocket, it is unlikely they are contributing to any conformationalchange during ligand binding.
Korkhov and Tate Page 4
Published as: J Mol Biol. 2008 April 04; 377(4): 1094–1103.
Sponsored Docum
ent Sponsored D
ocument
Sponsored Docum
ent

DiscussionVersatile recognition of diverse chemical structures is a feature of the multidrug bindingproteins and transporters. Most of what we know about the structural basis of multi-specificdrug recognition comes from the structural studies on the soluble multidrug binding proteins,such as BmrR and QacR, and from the X-ray structures of the multidrug transporter of theRND family member, AcrB (several other putative multidrug transporter structures have beensolved, albeit without any substrates bound). The structures of these proteins revealed largedrug binding sites containing discrete subsites in which different drugs can bind. In some cases,binding of several drugs was shown to occur simultaneously, leading to a ‘cross-talk’ betweenthe ligands and their binding sites. Importantly, in all cases where multidrug binding proteinsor transporters were co-crystallized with the drugs, recognition of different drugs by the samebinding site was associated with little, if any, difference in the conformational state of theprotein.
The drug binding site of EmrE is formed by the transmembrane domains of the protein. Thisputs several evolutionary constraints on the EmrE drug binding site: (i) there must be at leasttwo orientations of the substrate binding site (inward- and outward-facing orientation), withdifferent affinities for the substrates, allowing substrate translocation across the bacterial innermembrane; (ii) inherently, this implies a certain degree of flexibility of the protein; (iii)specificity for multiple drugs must be combined with strong coupling to the H+-gradient,preventing ‘leaky’ passage of ions or small molecules. Maintaining these three conditionswould present a challenge for a small protein like EmrE with a large pocket containing multiplediscrete binding sites for different classes of drugs.
Here, using cryo-EM we show that, to accommodate drugs with planar and tetrahedralgeometry, EmrE undergoes distinct conformational rearrangements. The structural changesare similar for mono- and bivalent planar drugs (Eth+ and PP2+, respectively). We are able toidentify the position of the bound ligand in all three new projection structures at 9 Å resolution(confirmed for Eth+–EmrE down to 7 Å resolution), confirming that there are no subsites fordifferent substrates in the EmrE binding site. Furthermore, we identify three regionssurrounding the drug binding site, which change in response to binding of planar drugs(Eth+, PP2+ and DQ2+) in a way different from the changes upon TPP+ binding. Remodelledregions of the protein include transmembrane helices in area A2 and B3, as well as the junctionbetween helices at the boundary between areas 2 and 3. The peak corresponding to movementof the helix in area C1 is broadened in the planar drug–EmrE projection structures, althoughits position is not greatly changed. This may indicate intrinsic flexibility of this region of theprotein, a property that may be necessary for drug binding and translocation across themembrane. The precise nature of the conformational changes will remain unresolved until 3Dstructures at higher resolution become available.
Our findings indicate that in contrast to other multidrug binding proteins, rather than having alarge cavity with discrete niches for different substrates, EmrE has evolved a binding site thatis remodelled dependent on the geometry of the substrate. Remodelling is achieved by subtlechanges in the structure of the protein, resulting in altered positions of the transmembranedomains within the projection structures.
Materials and MethodsProtein expression and purification
Expression and purification of EmrE was performed as described previously. Briefly, E. colimembranes containing 6xHis-tagged EmrE were solubilized with dodecylmaltoside (DDM,Glycon, Germany). The protein was then purified using a 3-step procedure that included
Korkhov and Tate Page 5
Published as: J Mol Biol. 2008 April 04; 377(4): 1094–1103.
Sponsored Docum
ent Sponsored D
ocument
Sponsored Docum
ent

NiNTA-agarose (Qiagen), gel filtration (Superdex 200, Amersham) and anion exchange (PI,Poros). Purity of the protein preparations was assessed by SDS-PAGE.
Radioligand binding assaysTo quantify the efficiency of ligand exchange at the 2-D crystals, radioligand binding assayswere used. For that purpose, the 2-D crystals obtained with TPP+ were subjected to dialysisagainst a low pH buffer (pH 5), to remove bound TPP+. A saturating amount of the resulting2-D crystals was mixed with [3H]TPP+ (final concentration 400 nM; Amersham) in thecrystallization buffer (Tris pH 7.5, NaCl 100 mM, ethylenediaminetetraacetic acid (EDTA)1 mM). The mix was diluted 1000-fold with the crystallization buffer in the absence and in thepresence of propidium iodide (15 μM) or dequalinium (50 μM). After 5 h incubation at 22 °C,1 ml of the diluted mix was filtered though GF/B filter (Millipore) and washed with ice-coldbuffer. Liquid scintillant was added and radioactivity bound to the filter was counted. Non-specific binding was determined by adding 100 μM cold TPP+ (Sigma). Competition bindingassays were performed as described previously.
2-D crystallizationCrystallization of tubular crystals of EmrE in complex with ethidium bromide was performedessentially as that for the TPP+-bound form. EmrE at concentration of 0.5–1 mg/ml was mixedwith dimyristoylphosphatidylcholine (DMPC; Avanti Polar Lipids) at lipid to protein ratios of0.3–0.4. Crystallization was performed in a dialysis cassette (Slide-a-lyzer, 10 kDa cut-off,0.1–0.5 ml, Pierce) for a week, with a daily buffer exchange (pH 7.5) with a buffer containing1 mM ethidium bromide.
Ligand exchangeTo obtain the crystals of EmrE bound to propidium iodide and dequalinium, the TPP+-boundEmrE crystals were employed. A suspension of the TPP+–EmrE crystals (100 μl, 1 mg/mlprotein concentration, 200 nM TPP+) was dialysed for 5 h at 22 °C against a 1000-fold excessof the same buffer containing the desired ligand (50 μM propidium or 15 μM dequalinium;Sigma). The concentrations of propidium and dequalinium were well above the determinedKi values (2632 times and 181 times, respectively) for binding to EmrE. A 1000-fold dilutionof the TPP+ in the crystal suspension dilutes it to 10-fold below its Kd to optimise ligandexchange. In Fig. 1c, this would mean equilibrium would have been reached if the amountof 3H-TPP+ left bound was 3.5 dpm, whereas after exchange the amount left bound whenexchanged for propidium was 105 dpm and 35 dpm in the presence of unlabelled TPP+ ordequalinium. Longer incubations were avoided to prevent deterioration of the crystals.
Electron microscopyCrystals were deposited onto glow-discharged carbon-coated electron microscopy grids,blotted, washed with a solution containing 2% glucose, blotted again, and plunged into liquidnitrogen. The frozen grids were loaded onto a liquid nitrogen-cooled Gatan 626 cryostage andanalysed by low-dose cryo-EM techniques (10–15 e Å− 2) on a Technai F20 electronmicroscope at an accelerating voltage of 200 keV. Images were collected with flood beamillumination at a magnification of 50,000×–58,000×. The quality of the images was assessedby optical diffraction. The best images were digitized using the MRC KZA scanner with a6 μm step size. Image processing was performed using the MRC package. Projection structureswere built according to previously described procedures, using MRC software. Averaging ofthe asymmetric dimers within the crystallographic tetramer was done using INTERPO, aprogram for image interpolation. In brief, the p2 maps were rotated by approximately 17°(slightly different angles were used for each map; Table 2), to enable assignment of anorthogonal (90°) coordinate system to each projection map. This allowed the direct comparison
Korkhov and Tate Page 6
Published as: J Mol Biol. 2008 April 04; 377(4): 1094–1103.
Sponsored Docum
ent Sponsored D
ocument
Sponsored Docum
ent
of maps from either p2 or c222 crystal forms. An area corresponding to the EmrEcrystallographic tetramer was cut out from each map using LABEL, and then the same programwas used to create a mirror image of the cut out image. TWOFILE was then used to calculatedifference maps between the two mirror images. Iterative adjustment of the angle of rotationand the position of the cut out region was performed until the lowest RMS deviation of themirror difference map was reached (“RMS mirr.”; Table 2). The procedure was repeated withall projection maps merged at 7, 8, 9 and 10 Å resolution. TWOFILE was then used to comparethe averaged projection maps at corresponding resolutions; each projection map was scaled toobtain minimal RMS of the difference map (“RMS diff.”; Table 2). Cross-correlation of thedifference maps was performed with the mean density values, using the equation: σ = (A·B)/sqrt(A2·B2), where A and B are mean densities of the two correlated difference maps;multiplication of images required for the cross-correlation calculation was done usingTWOFILE.
AcknowledgementsWe thank R. Henderson for help and advice throughout this work. VMK is a recipient of a FEBS Long-term Fellowship.
References1. Yerushalmi H. Schuldiner S. A common binding site for substrates and protons in EmrE, an ion-coupled
multidrug transporter. FEBS Lett. 2000;476:93–97. [PubMed: 10878258]2. Yerushalmi H. Lebendiker M. Schuldiner S. EmrE, an Escherichia coli 12-kDa multidrug transporter,
exchanges toxic cations and H+ and is soluble in organic solvents. J. Biol. Chem. 1995;270:6856–6863. [PubMed: 7896833]
3. Tate C.G. Kunji E.R. Lebendiker M. Schuldiner S. The projection structure of EmrE, a proton-linkedmultidrug transporter from Escherichia coli, at 7 Å resolution. EMBO J. 2001;20:77–81. [PubMed:11226157]
4. Arkin I.T. Russ W.P. Lebendiker M. Schuldiner S. Determining the secondary structure and orientationof EmrE, a multi-drug transporter, indicates a transmembrane four-helix bundle. Biochemistry1996;35:7233–7238. [PubMed: 8679552]
5. Ubarretxena-Belandia I. Baldwin J.M. Schuldiner S. Tate C.G. Three-dimensional structure of thebacterial multidrug transporter EmrE shows it is an asymmetric homodimer. EMBO J. 2003;22:6175–6181. [PubMed: 14633977]
6. Butler P.J. Ubarretxena-Belandia I. Warne T. Tate C.G. The Escherichia coli multidrug transporterEmrE is a dimer in the detergent-solubilised state. J. Mol. Biol. 2004;340:797–808. [PubMed:15223321]
7. Ubarretxena-Belandia I. Tate C.G. New insights into the structure and oligomeric state of the bacterialmultidrug transporter EmrE: an unusual asymmetric homo-dimer. FEBS Lett. 2004;564:234–238.[PubMed: 15111102]
8. Rapp M. Seppala S. Granseth E. von Heijne G. Emulating membrane protein evolution by rationaldesign. Science 2007;315:1282–1284. [PubMed: 17255477]
9. Schuldiner S. When biochemistry meets structural biology: the cautionary tale of EmrE. TrendsBiochem. Sci. 2007;32:252–258. [PubMed: 17452106]
10. Fleishman S.J. Harrington S.E. Enosh A. Halperin D. Tate C.G. Ben-Tal N. Quasi-symmetry in thecryo-EM structure of EmrE provides the key to modeling its transmembrane domain. J. Mol. Biol.2006;364:54–67. [PubMed: 17005200]
11. Gutman N. Steiner-Mordoch S. Schuldiner S. An amino acid cluster around the essential Glu-14 ispart of the substrate- and proton-binding domain of EmrE, a multidrug transporter from Escherichiacoli. J. Biol. Chem. 2003;278:16082–16087. [PubMed: 12590142]
12. Muth T.R. Schuldiner S. A membrane-embedded glutamate is required for ligand binding to themultidrug transporter EmrE. EMBO J. 2000;19:234–240. [PubMed: 10637227]
13. Higgins C.F. Multiple molecular mechanisms for multidrug resistance transporters. Nature2007;446:749–757. [PubMed: 17429392]
Korkhov and Tate Page 7
Published as: J Mol Biol. 2008 April 04; 377(4): 1094–1103.
Sponsored Docum
ent Sponsored D
ocument
Sponsored Docum
ent

14. Schumacher M.A. Miller M.C. Grkovic S. Brown M.H. Skurray R.A. Brennan R.G. Structuralmechanisms of QacR induction and multidrug recognition. Science 2001;294:2158–2163. [PubMed:11739955]
15. Heldwein E.E. Brennan R.G. Crystal structure of the transcription activator BmrR bound to DNAand a drug. Nature 2001;409:378–382. [PubMed: 11201751]
16. Tate C.G. Ubarretxena-Belandia I. Baldwin J.M. Conformational changes in the multidrug transporterEmrE associated with substrate binding. J. Mol. Biol. 2003;332:229–242. [PubMed: 12946360]
17. Crowther R.A. Henderson R. Smith J.M. MRC image processing programs. J. Struct. Biol.1996;116:9–16. [PubMed: 8742717]
18. Dawson R.J. Locher K.P. Structure of a bacterial multidrug ABC transporter. Nature 2006;443:180–185. [PubMed: 16943773]
19. Locher K.P. Lee A.T. Rees D.C. The E. coli BtuCD structure: a framework for ABC transporterarchitecture and mechanism. Science 2002;296:1091–1098. [PubMed: 12004122]
20. Yu E.W. McDermott G. Zgurskaya H.I. Nikaido H. Koshland D.E. Structural basis of multiple drug-binding capacity of the AcrB multidrug efflux pump. Science 2003;300:976–980. [PubMed:12738864]
21. Schumacher M.A. Miller M.C. Brennan R.G. Structural mechanism of the simultaneous binding oftwo drugs to a multidrug-binding protein. EMBO J. 2004;23:2923–2930. [PubMed: 15257299]
22. Henderson R. Cattermole D. McMullan G. Scotcher S. Fordham M. Amos W.B. Faruqi A.R.Digitisation of electron microscope films: six useful tests applied to three film scanners.Ultramicroscopy 2007;107:73–80. [PubMed: 16872749]
23. Cheng Y. Prusoff W.H. Relationship between the inhibition constant (K1) and the concentration ofinhibitor which causes 50 per cent inhibition (I50) of an enzymatic reaction. Biochem. Pharmacol.1973;22:3099–3108. [PubMed: 4202581]
Korkhov and Tate Page 8
Published as: J Mol Biol. 2008 April 04; 377(4): 1094–1103.
Sponsored Docum
ent Sponsored D
ocument
Sponsored Docum
ent

Fig. 1.Substrates used for EmrE 2-D crystallization. (a) Chemical structures of the three substrates:ethidium (Eth+), propidium (PP2+) and dequalinium (DQ2+); tetraphenylphoshonium (TPP+)is shown for comparison. (b) Competition curves confirm that the chosen substrates havemicromolar or submicromolar affinities for EmrE. The data shown are from a singlerepresentative [3H]TPP+ displacement experiment, performed on detergent-solubilized EmrEcontaining a final [3H]TPP+ concentration of 6 nM. IC50 values were used to estimate the Kiof the competitors using Cheng–Prusoff equation, with a Kd of TPP+ binding of 2.4 nM:IC50 values were 1.8 μM, 33 nM and 147 nM for Eth+, PP2+ and DQ2+ respectively,corresponding to Ki values of 1.0 ± 0.9 μM, 19 ± 4 nM and 83 ± 9 nM. (c) Exchange of [3H]
Korkhov and Tate Page 9
Published as: J Mol Biol. 2008 April 04; 377(4): 1094–1103.
Sponsored Docum
ent Sponsored D
ocument
Sponsored Docum
ent
TPP+ bound to 2-D crystals for unlabeled substrates. Residual [3H]TPP+ bound to EmrE wasmeasured (n = 3) after a 1000-fold dilution and 5 h incubation with and without propidium anddequalinium; error bars represent the SEM.
Korkhov and Tate Page 10
Published as: J Mol Biol. 2008 April 04; 377(4): 1094–1103.
Sponsored Docum
ent Sponsored D
ocument
Sponsored Docum
ent

Fig. 2.The projection maps of planar drug-bound EmrE. (a–c) The 2-D crystals of EmrE bound to anindicated drug were subjected to cryo-EM and image analysis, as described under “Materialsand Methods” (Eth+,ethidium; PP2+, propidium; DQ2+, dequalinium). The projection mapswere plotted using NPO, with contours ranging from − 500 to 500, with a step of 25; the 0contour is omitted. The crystallographic asymmetric unit consists of a tetramer composed oftwo asymmetric dimers related by an in-plane 2-fold axis. One tetramer is coloured red andthe other blue.
Korkhov and Tate Page 11
Published as: J Mol Biol. 2008 April 04; 377(4): 1094–1103.
Sponsored Docum
ent Sponsored D
ocument
Sponsored Docum
ent

Fig. 3.Averaged projection maps of EmrE with bound TPP+ and three different planar drugs. (a–d)Maps of the density corresponding to the EmrE tetramer bound to indicated drugs, after imageinterpolation and averaging of the two halves of the non-crystallographic tetramer. The redcoloured contours in the right half of each map show the differences between the two dimerswithin a tetramer (the difference maps were obtained by subtraction of the mirror images, asdescribed in “Materials and Methods”). The coordinate grid imposed on the projection maps(x-axis: a–d; y-axis: 1–5) is arbitrary, although the x = 0 line coincides with the in-plane non-crystallographic 2-fold axis used in the averaging procedure.
Korkhov and Tate Page 12
Published as: J Mol Biol. 2008 April 04; 377(4): 1094–1103.
Sponsored Docum
ent Sponsored D
ocument
Sponsored Docum
ent

Fig. 4.Comparison between the averaged projection structures of ligand-free and planar drug-boundEmrE. (a) Density map of the apo form of EmrE, truncated to 9 Å resolution, calculated fromthe apo-EmrE projection obtained by imaging 2-D crystals of space group c222. (b) Projectionmap of TPP+–EmrE, truncated to 9 Å, is contoured in black. Solid red contours correspond tothe densities above 0 level in the difference map made by subtracting the TPP+–EmrE densityfrom the apo-EmrE density; the 0 contour is omitted. Dotted blue contours correspond tonegative densities in the same difference map. (c–e) Projection maps of Eth+-, PP2+- andDQ2+-bound EmrE, respectively, and corresponding apo-EmrE difference maps are contouredas in b. Resolution of each map 9 Å. (f–h) Comparison between the TPP+- and the planar drug-bound EmrE. Projection maps at 9 Å of Eth+-, PP2+- and DQ2+-bound EmrE, respectively, arecontoured in black. Solid red and dotted blue contours correspond to positive and negativedensities in the difference maps between planar ligand-bound EmrE and TPP+–EmrE maps (asin c–e).
Korkhov and Tate Page 13
Published as: J Mol Biol. 2008 April 04; 377(4): 1094–1103.
Sponsored Docum
ent Sponsored D
ocument
Sponsored Docum
ent

Fig. 5.Comparison of the three different conformational states of EmrE at higher (7 Å) resolution. (a,b) The projection maps of EmrE bound to either TPP+ or Eth+ and the differences betweenthese maps and the apo-EmrE are shown with the same representation as in Fig. 4b and c. (c)Differences between Eth+ and TPP+-bound EmrE are shown with the same representation asin Fig. 4f. Resolution of all the maps is 7 Å.
Korkhov and Tate Page 14
Published as: J Mol Biol. 2008 April 04; 377(4): 1094–1103.
Sponsored Docum
ent Sponsored D
ocument
Sponsored Docum
ent
Sponsored Docum
ent Sponsored D
ocument
Sponsored Docum
ent
Korkhov and Tate Page 15
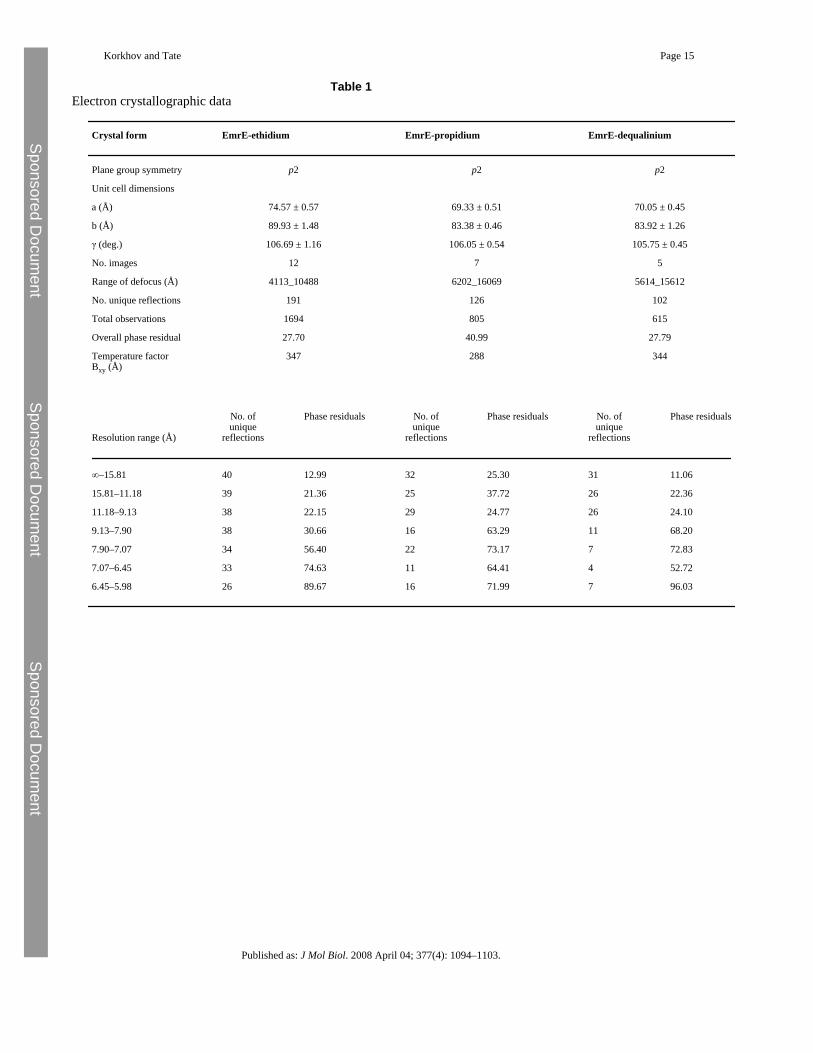
Table 1Electron crystallographic data
Crystal form EmrE-ethidium EmrE-propidium EmrE-dequalinium
Plane group symmetry p2 p2 p2
Unit cell dimensions
a (Å) 74.57 ± 0.57 69.33 ± 0.51 70.05 ± 0.45
b (Å) 89.93 ± 1.48 83.38 ± 0.46 83.92 ± 1.26
γ (deg.) 106.69 ± 1.16 106.05 ± 0.54 105.75 ± 0.45
No. images 12 7 5
Range of defocus (Å) 4113_10488 6202_16069 5614_15612
No. unique reflections 191 126 102
Total observations 1694 805 615
Overall phase residual 27.70 40.99 27.79
Temperature factorBxy (Å)
347 288 344
Resolution range (Å)
No. ofunique
reflections
Phase residuals No. ofunique
reflections
Phase residuals No. ofunique
reflections
Phase residuals
∞–15.81 40 12.99 32 25.30 31 11.06
15.81–11.18 39 21.36 25 37.72 26 22.36
11.18–9.13 38 22.15 29 24.77 26 24.10
9.13–7.90 38 30.66 16 63.29 11 68.20
7.90–7.07 34 56.40 22 73.17 7 72.83
7.07–6.45 33 74.63 11 64.41 4 52.72
6.45–5.98 26 89.67 16 71.99 7 96.03
Published as: J Mol Biol. 2008 April 04; 377(4): 1094–1103.
Sponsored Docum
ent Sponsored D
ocument
Sponsored Docum
ent
Korkhov and Tate Page 16
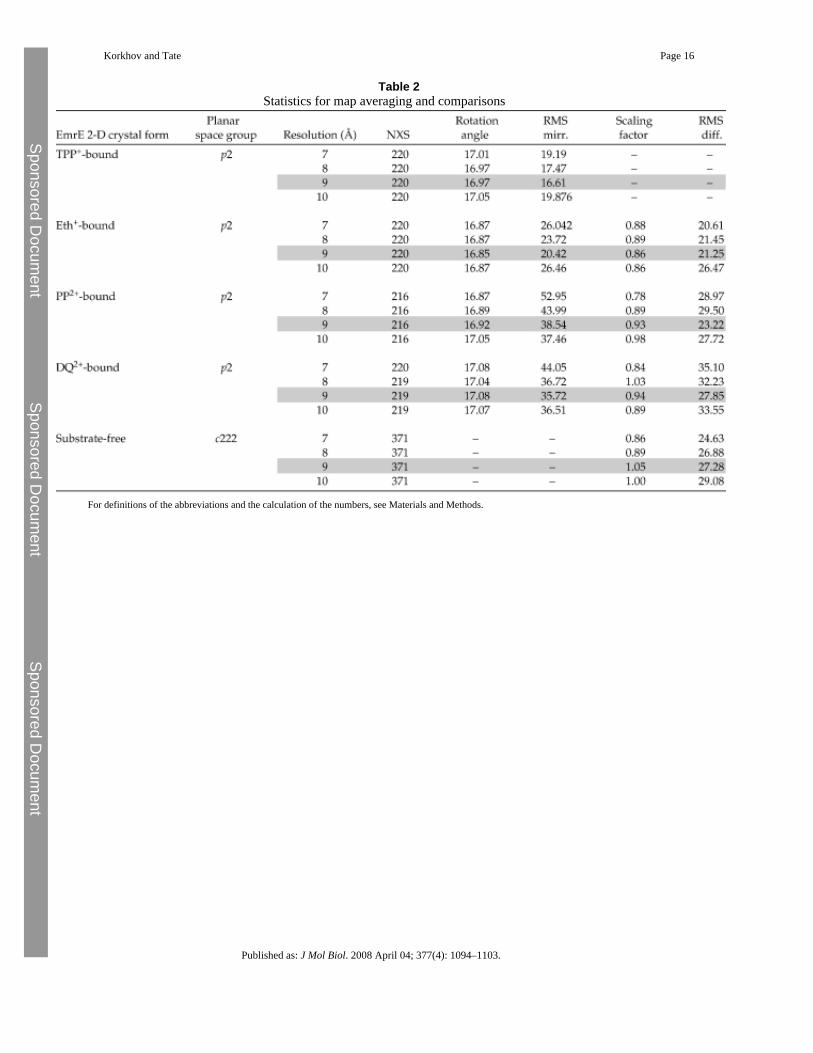
Table 2Statistics for map averaging and comparisons
For definitions of the abbreviations and the calculation of the numbers, see Materials and Methods.
Published as: J Mol Biol. 2008 April 04; 377(4): 1094–1103.

Sponsored Docum
ent Sponsored D
ocument
Sponsored Docum
ent
Korkhov and Tate Page 17
Table 3Cross-correlation coefficients for the comparison of all possible combinations ofdifference maps
Abbreviations used here: A, T, E, P and D stand for apo-EmrE, TPP+, ethidium, propidium and dequalinium, respectively; thus ‘A-T’ indicates the
difference density map calculated by subtracting the density for TPP+-bound EmrE from the density for apo-EmrE.aCross-correlation coefficients determined using the difference maps calculated at 7 Å resolution are shown in parentheses.
Published as: J Mol Biol. 2008 April 04; 377(4): 1094–1103.
Copyright © 2022 FDOKUMEN