
Electrical Estimation &Energy Auditing - Binils.com
156
1 GOVERNMENT OF TAMILNADU DIRECTORATE OF TECHNICAL EDUCATION CHENNAI – 600 025 STATE PROJECT COORDINATION UNIT Diploma in Electrical and Electronics Engineering Course Code: 1020 M – Scheme e-TEXTBOOK on ELECTRICAL ESTIMATION AND ENERGY AUDITING for V Semester DEEE Convenor for EEE Discipline: Er.R.Anbukarasi ME., Principal, Tamilnadu Polytechnic College, Madurai, 625011. Team Members for Electrical Estimation &Energy Auditing 1. Mrs.V.Thenmozhi M.E HOD i/c /EEE, Government Polytechnic College, Melur. 2. Mrs.G.Jeyalakshmi M.E HOD i/c /EEE, KLN Polytechnic College Madurai. 3. Mrs.R.Deepa M.E, Sr. Lecturer/EEE KLN Polytechnic College Madurai. . Validated by Dr.V.Saravanan Associate Professor, Department of Electrical and Electronics Engineering, Thiagarajar College of Engineering, Madurai. , www.binils.com Anna University, Polytechnic & Schools www.binils.com
-
Upload
khangminh22 -
Category
Documents
-
view
0 -
download
0
Transcript of Electrical Estimation &Energy Auditing - Binils.com

1
GOVERNMENT OF TAMILNADU DIRECTORATE OF TECHNICAL EDUCATION
CHENNAI – 600 025
STATE PROJECT COORDINATION UNIT Diploma in Electrical and Electronics Engineering
Course Code: 1020 M – Scheme
e-TEXTBOOK on
ELECTRICAL ESTIMATION AND ENERGY AUDITING
for V Semester DEEE
Convenor for EEE Discipline: Er.R.Anbukarasi ME., Principal, Tamilnadu Polytechnic College, Madurai, 625011. Team Members for Electrical Estimation &Energy Auditing
1. Mrs.V.Thenmozhi M.E HOD i/c /EEE, Government Polytechnic College, Melur. 2. Mrs.G.Jeyalakshmi M.E HOD i/c /EEE, KLN Polytechnic College Madurai. 3. Mrs.R.Deepa M.E, Sr. Lecturer/EEE KLN Polytechnic College Madurai. .
Validated by Dr.V.Saravanan Associate Professor, Department of Electrical and Electronics Engineering, Thiagarajar College of Engineering, Madurai.
,
www.binils.com
Anna University, Polytechnic & Schools www.binils.com

2
M SCHEME SYLLABUS- V SEMESTER
www.binils.com
Anna University, Polytechnic & Schools www.binils.com

3
www.binils.com
Anna University, Polytechnic & Schools www.binils.com

4
UNIT-1 SYSTEMS OF INTERNAL WIRING AND EARTHING Need of electrical symbols In case of electrical installations and circuits, may be very difficult to draw the drawing and write the electrical components and instruments. The graphical symbols are used to indicate the electrical equipment and components.
Electrical Symbols
www.binils.com
Anna University, Polytechnic & Schools www.binils.com

5
www.binils.com
Anna University, Polytechnic & Schools www.binils.com

6
www.binils.com
Anna University, Polytechnic & Schools www.binils.com

7
INDIAN ELECTRICITY RULES (1956) Rule: 28 VOLTAGES Voltage- The difference of potential measured in volts between any two conductors or between any part of either conductor and the earth as measured by a suitable voltmeter and said to be LOW- Where the voltage does not exceed 250 volts under normal conditions MEDIUM- Where the voltage does not exceed 650 volts under normal conditions HIGH- Where the voltage does not exceed 22000 volts under normal conditions EXTRA HIGH-When the voltage exceeds 22000 volts. Rule: 30 Service Lines and apparatus on consumer premises (1) The supplier shall ensure that all eclectic supply lines, wires , fittings and apparatus
belonging to him or under his control which are on a consumer’s premises are in a safe condition and in all respects fit for supplying energy , and the supplier shall take due precautions to avoid danger arising on such premises from such supply lines, wires , fittings and apparatus
(2) Service line placed for the supplier on the premises of a consumer which are underground or which are accessible shall be so insulated and protected by the supplier as to be secured under all ordinary conditions against electrical, mechanical, chemical or other injury to the insulation.
(3) The consumer shall, also as far as circumstances permit, take precautions for the safe custody of the equipment on his premises belonging to the supplier.
(4) The consumer shall also ensure that the installation under his control is maintained in a safe condition.
Rule: 31 CUT OUT CONSUMER’S PREMISES (1) The supplier shall provide a suitable cut out in each conductor of every line other than an
earthed or earthed neutral conductor or the earthed external conductor of a concentric cable with in a consumer’s premises in an accessible position. Such cut out shall be contained within adequately enclosed fire- proof receptacle.
Where more than one consumer is supplied through a common service (2) The owner of every electric supply line, other than the earthed or neutral conductor of
concentric cable, shall protect it by suitable cut out. Rule: 46 PERIODICAL INSPECTION AND TESTING OF CONSUMER’S INSTALLATION
(1) (a) where an installation is already connected to the supply system of the supplier every such installation shall be periodically inspected and tested at intervals not exceeding five years either by the inspector or by the supplier as may be directed by state government in this behalf or in the case of installations in mines, oil fields and railways, by the central government.
(b) where the supplier is directed by the central or the state government, as the case may be, inspect and test the installation he shall report on the condition of the installation to the consumer concerned in a form approved by the inspector and shall submit a copy of such report to the inspector.
www.binils.com
Anna University, Polytechnic & Schools www.binils.com

8
(2) (a) The fees for such inspection and test shall be determined by the central or the state government as the case may be , in the case of such class of consumers and shall be payable by the consumers in advance.
(b) In the event of the failure of any consumer to pay the fees on or before the date specified in the fee-notice supply to the installation of such consumer shall be liable to be disconnected under the direction of the inspector. Such disconnection, however, shall not be made by the supplier, without giving to the consumer seven clear days’ notice in writing of his intension to do so. (3) Notwithstanding the provisions of this rule the consumer shall at all times be solely
responsible for the maintenance of his installation in such conditions as to be free from danger. GENERAL CONDITIONS RELATING TO SUPPLY AND USE OF ENERGY
Rule: 47 testing a consumer’s installation:
(1) ssss Rule 54: DECLARED VOLTAGE OF SUPPLY TO CONSUMER Except with the written consent of the consumer or the previous sanction of the state government a supplier shall not permit the voltage at the point of commencement of supply as defined under rule 58 to vary from the declared voltage by more than 5 percent in the case of low or medium voltage or by more than 12 ½ percent in the case of high or extra high voltage. Rule 55: DECLARED FREQUENCY OF SUPPLY TO CONSUMER Except with the written consent of the consumer or with the previous sanction of the state government a supplier shall not permit the frequency of an alternating current supply to vary from the declared frequency by more than 3 percent.
Rule 56: SEALING OF METERS AND CUT OUTS (1) A supplier may affix one or more seals to any cutout and to any meter, a maximum demand
indicator, or other apparatus placed upon a consumer’s premises in accordance with section 26, and no person other than the supplier shall break any such seat.
(2) The consumer shall use all reasonable means in his power to ensure that no such seal is broken otherwise than by the supplier
(3) The word “supplier” shall for the purpose of this rule include a state government when any meter maximum demand indicator or other apparatus is placed upon a consumer’s premises by such government.
Rule 57: METERS, MAXIMUM DEMAND INDICATORS ANDTOTHER APPARATUS ON CONSUMER’S PREMISES. (1) Any meter, or maximum demand indicator or other apparatus placed upon a consumer’s
premises in accordance with section 26 shall ne of appropriate capacity and shall be deemed to be correct it. Its limits or error not exceed 3 per cent above or below absolute accuracy at all loads in excess of one – tenth of full load and up to full load.
(2) No meter shall register at no load. (3) Every supplier shall provide and maintain in proper condition such suitable apparatus as may be
prescribed or approved by the inspector for the examination, testing and regulation of meters
www.binils.com
Anna University, Polytechnic & Schools www.binils.com

9
used or intended to be used in connection with the supply of energy. Provided that the supplier may with the approval of the inspector and shall, if required by the inspector enter into a joint arrangement with any other suppler for the purpose aforesaid. (4) Every supplier shall examine, test and regulate all meters, maximum demand and other
apparatus for ascertaining the amount of energy supplied before their first installation at the consumer’s premises and at such other intervals as may be directed by the state government in this behalf.
(5) Every supplier shall maintain a register of metres, showing the date of the last test the error recorded at the time of the test, the limit of accuracy after adjustment and final test, the date of installation, withdrawal, reinstallation etc, for the examination of the inspector or his authorized representative.
Rule 77: CLEARANCES ABOVE GROUND OF THE LOWEST CONDUCTOR. (1) No conductor of an overhead line, including service lines , erected across a street shall at any
part thereof be at height less than: (a) For low or medium voltage lines …19 ft.(5.791 m) (b) For high voltage lines …20 ft.(6.096 m) (2) No conductor of an overhead line including service lines erected along any street shall at any
part thereof be at a height less than : (a) For low and medium voltage lines …18 ft.(5.486 m) (b) For high voltage lines …19 ft.(5.791 m)
(3) No conductor of an overhead line including service lines, erected elsewhere than along cr. across any street shall be at a height less than:
(a) For low, medium and high voltage lines up to and including 11,000 volts, if bare …15 ft. (4.572 m)
(c) For low, medium and high voltage lines up to and including 11,000 volts if insulated …13 ft.(3.963 m)
(d) For high voltage lines above 11,000 volts. …17 ft.(5.182 m) (4) For extra high voltage lines the clearance above ground shall not be less than
17 ft. (5.182 m) plus 1 foot (0.3048 m) for every 33,000 volts.
Provide that the minimum clearance along or across any street shall not be less that 20 ft.(6.096 m) Rule: 79 CLEARANCES FROM BUILDINGS OF LOW AND MEDIUM VOLTAGE LINES AND SERVICE LINES. (1) where a low or medium voltage overhead line passes above or adjacent to or terminates on
any building, the following minimum clearances from any accessible point, on the basis of maximum sag, shall be observed: a) For any flat roof, open balcony, verandah roof and lean – to – roof –
((i) When the line passes above the building, a vertical clearance of 8 feet (2.439 m) from the highest point, and (ii) When the line passes adjacent to the building, a horizontal clearance of 4 feet (1.219 m) from the nearest point, and
(b) For pitched roof.
www.binils.com
Anna University, Polytechnic & Schools www.binils.com

10
(i) When the line passes above the building , a vertical clearance of 8 feet (2.439 m) immediately under the lines, and
(c) when the line passes adjacent to the building, a horizontal clearance of 4 feet (1.219 m) (2) any conductor so situated as to have a clearance less than that specified in sub-rule (i) shall
be adequately insulated and shall be attached by means of metal clips at suitable intervals to a bare earthed bearer wire having a breaking strength of not less than 7.00 Ibs (317.51 kg)
(3) The horizontal clearance shall be measured when the line is at maximum deflection from the vertical due to wind pressure.
Rule: 87 LINES CROSSING OR APPROACHING EACH OTHER (1) where an overhead line across or is in proximity to any telecommunication line , the owner
of the overhead line shall protect it in a manner laid down In the code of practice of the power and Telecommunication co – ordination committee.
(2) When it is intended to erect a telecommunication line which will cross or be in proximity to an overhead line, the person proposing to erect such telecommunication line shall give notice in writing of his intention to the owner of the overhead line and the owner of the overhead line shall, within twenty – one days of receiving such notice, provide the protection referred to in sub – rule (1).
(3) Where an overhead line crosses or is in proximity to an overhead line belonging to another person, the owner of the line which was last erected shall so protect it as to guard against the possibility of its coming in to contact with the other overhead line.
(4) A person erecting or proposing to erect an overhead line may require the owner of the other overhead line to provide the protection referred to in sub rule (3) with in twenty one days of the receipt of the notice in that behalf.
(5) In all cases referred to in the preceding sub-rules the expanses of making the guarding arrangement shall be borne by the person whose line was last erected.
(6) Where two lines cross, the crossing shall be made as nearly at right angles as the nature of the case admits.
(7) The guarding arrangement shall ordinarily be carried out by the owner of the supports on which it is made and he shall be responsible for its efficient maintenance.
(8) All work required to be done by or under this rule shall be carried out to the satisfactions of the inspector.
Rule: 88 GUARDING (1) Where guarding is required under these rules, the provisions of sub-rules (2) to (4) shall
apply (2) Every guard-wire shall be connected with earth at each point at which its electrical continuity
is broken. (3) Every guard -wire shall have an actual breaking strength of not less than
635.02kg.(1,4000Ibs.) and if made of iron or steel, shall be galvanized. (4) Every guard-wire of cross connected system of guard wires, shall have sufficient current
carrying capacity to ensure the rendering dead, without risk of fusing of the guard wire or wires till the contact of any line wire has been removed.
(5) Lines crossing trolley - wires, in the case of a crossing over a trolley wire the guarding shall fulfill the following conditions, namely.
www.binils.com
Anna University, Polytechnic & Schools www.binils.com

11
(a) Where there is only on trolley- wire, two guard wires shall be erected as in diagram 24.1 (b) Where there are two trolley- wires and the distance between them does not exceed
0.381metre (15 inches) , two guard wires shall be erected as in diagram 24.1 (ii). (c) Where there two trolley wires and the distance between them does not exceed 0.38metre (15
inches)but does not exceed 1.219 metres (48 inches),three guard wires shall be erected as in diagram 24.1 (iii)
(d) Where there are two trolley -wires and the distance between them exceeds 1.219metres (48 inches) each trolley wire , shall ne separately guarded as in diagram 24.1 (iv).
(e) The rise of trolley boom shall be so limited that if the trolley leaves the trolley wire, it shall not foul the guard wire : and
(f) Where a telegraph line is liable to fall or be blown down upon an arm, stay wire or span wire and so slide down upon a trolley wire , guard hooks shall be provided to prevent such sliding.
Wiring systems The switch gear and switches should be placed on the live or phase wire, The second
terminal of the switch should be connected to the lamp or appliance. The neutral should be connected to lamp directly. The fuse should be placed in live or phase wire,
Based on general principles of wiring it is very important to select the proper type of wiring. The following factors are to be considered for selection of wiring system.
a) Durability: - It must be durable. It should be of proper specifications, life and for type of building. b) Safety: - Safety is very important. For instance in factory where lot of fuses are produced, cleat or
casing capping wiring will not be suitable. Battern wiring will not be suitable for fire hazards such as in palest factory, petrol pumps, and oil refineries.
c) Appearance: - The main aspect is appearance is it should not spoil the beauty of the building. d) Cost:- The cost is an important factor but it will have to be ignored while selecting the type of wiring
to be applied in a particular building e) Accessibility: - The type of wiring should be so selected that its extension or renewal should be
suitable. f) Maintenance cost: - This amounts to low maintenance cost. g) Position of location of electrical points:- It is most important for providing maximum convenience for
operation.
Diagram -A
20.32 cm 20.32 cm
min 60.96cm
20.32 cm 20.32 cm
min 60.96cm
Diagram -D
20.32 cm 20.32 cm
min 60.96cm
min 60.96cmmin 60.96cm
20.32 cm
20.32 cm
uptoDiagram -B
31.8 cm
min 60.96cmmin 60.96cm
20.32 cm
20.32 cm
Diagram -c
over 31.8 cm
over 1.219 m
www.binils.com
Anna University, Polytechnic & Schools www.binils.com

12
Methods of representation for wiring diagram
Looping Back system and joint box system and Tree system Various types of wiring system.
a) Tree system b) Joint box system c) Looping system
Tree system
This is one of the various systems of distribution of electrical energy in a building. In this system smaller branches are taken from the main branch. A fuse is mooted at the commencement of each branch. This system is now not used due to following disadvantages.
The voltage across all the lamps does not remain the same A number of joints are involved in every circuit. The fuse are not at one place Fault location is difficult.
a) Joint Box system
In this the connections to electrical points are gives through joints made in joint boxes by means of suitable connectors or joint cut outs. Since phase neutral wires and earth wires are run throughout the length of wiring at the required places a junction box is installed. Tappings are taken out through this box. Box is covered with an inspection cover. Advantages Cost of Wiring is saved
www.binils.com
Anna University, Polytechnic & Schools www.binils.com

13
Disadvantages 1. Fault location is difficult. 2. Require skilled labour 3. May not give good look. 4. Short circuit (or) Loose connections may occur.
b) Looping system
In this system when a connection is required for a lamp through switch, the feeding conductor is looped in by bringing if direct to the terminal of the switch. Then it carried again to the next switch from the same terminal. The switch and light feeds are carried round the circuit in a series of loops from one point to another until the last point on the circuit is reached. The phase wire is looped in from one switch to other, a like the same neutral wire is looped in from one point to another within the same sub circuits.
Advantages 1. No junction boxes required 2. Connection are accessible 3. Fault location is easy.
Disadvantages 1. Cable required is more 2. So voltage drop and copper losses are mole.
Types of internal wiring:- 1. Cleat wiring 2. Wooden casing and capping wiring. 3. CTS (or) Batton wiring. 4. Lead sheathed (or) metal sheathed wiring. 5. Surface conduit wiring. 6. Concealed conduit wiring.
www.binils.com
Anna University, Polytechnic & Schools www.binils.com

14
1. Cleat wiring
In this system cables are supported and gripped between porcelain cleats 10mm above the wall or cetin. The porcelain cleats are made in two halves, one is base which is grooved and the other is cap which is put over the base. The cleat is screwed on wooden plugs (gutties). The regular intervals between gutties are 30 cm to 60 cm apart screw used are of size 38 mm lengths. Two wires should not be placed is one groove. The cables in grooves should not be way tight and shall not be very loose. Advantages:-
1. Installation and dismantling is easy and thick. 2. Inspection work is easy as they are within sight. 3. Very cheap, can be re used. 4. Inspection alteration and addition can be made easily. 5. They can be installed on damp walls. 6. Unskilled electrician can do the job.
Disadvantages:- 1. Not good looking 2. It is a temporary system and life is low. 3. As the wires are exposed, it is subjected to mechanical injury. 4. The wires being exposed, which lowers the insulation resistance and causes leakage of current due to dampers, dirt
www.binils.com
Anna University, Polytechnic & Schools www.binils.com

15
1. Wooden casing and capping wiring
This is one of the earliest systems of wiring. This is very suitable for low voltage installations. VIR wires of PVC insulated wires are placed in the grooves of the wood casing. The casing consuls of U shaped grooves into which the wires are laid in such a way that wires of opposite polarity are laid in different grooves. The casing is covered by a rectangular strip of the same width as that is called capping. Capping is fitted with the help of screws. Casing and capping is made up of seasoned teak woods with varnishing. This system s should not be used in damp places. Joints can be provided by using straight joints, tee joints, Right angled joint and corner joints.
Advantages
1. Cheap. 2. Short circuiting chances are minimized due to separate grooves. 3. Inspection of wires is easy and easy to install. 4. It is fee from condensation since stud conduits are affected by condensation of moisture.
Disadvantages
1. There is risk of wire. 2. Cannot be used in damp places. 3. It does not give good look. 4. Highly slewed carpenters are required.
1. PVC Casing and capping wiring
Casing is made up of plastic material like polyvinyl chlorides and capping is of same material and used to cover casing. Casing is fixed to the wall with the help of wooden (or) PVC plugs and wood screws.
www.binils.com
Anna University, Polytechnic & Schools www.binils.com

16
Advantages 1. Cheap. 2. Short circuit chances are minimized. 3. Inspection wires are easy. Easy to install. 4. Unskilled electrician can do. 5. It can be used even in case if damp saturation for a limited period.
Disadvantages 1. Cannot be used at damp places. 2. It does not give good look. 3. Shorter life.
4. CTS or T.R.S or Battern wiring It is suitable for low voltage installations in residential and office buildings. It is not suitable where the wiring is exposed to Sun or rain. It is suitable where acids and alkalies are to be present. The cables are covered on seasonal teak wood and well varnished teak wood batterns. The wires are fixed on the Battern by means of tinned bract aluminum link clips already fixed. The link clips are placed at an interval of 10 cm. The batterns are fixed to the walls or ceiling by means of gutties or wooden plugs. In the case where the wiring is subject to damage, the wiring should be covered with sheet metal protective covering or the portions of wiring should be connected into concealed wiring system.
Advantages
Easy to install, Cheaper, Nice appearance, fairly long life. Disadvantages
Cannot be used in places where wiring is exposed to sun of rain. There is risk of fire to if cannot be used at fire hazards.
5. Lead sheathed or metal sheathed wiring The conductors having insulated covering of VIR are covered with an outer sheath of lead or lead alloy. The metal sheath provides toughness and gives protection to the cable against mechanical injury dampness and atmosphere corrosion. The lead sheathed cables should be run on well seasoned and straight teak wood batterns. The cables are fixed by means of clips. The width of wooden battern may vary with the number of wires to carry. The cables are taken through a conduit pipe while passing through walls or ceiling. The conduit should be properly laid so that the cables enter them straight without binding. Advantages
1. It can be used in places exposed to sun or rain. 2. It can also used in damp situation. 3. Longer life. 4. Gives a fairly good look. 5. Since the cables are sheathed earth continuity is maintained properly.
Disadvantages 1. Costly. 2. If proper earthing is not done and insulation is damaged. 3. Skilled labor is required. 4. It may not be suitable where chemical corrosion may occur.
www.binils.com
Anna University, Polytechnic & Schools www.binils.com
17
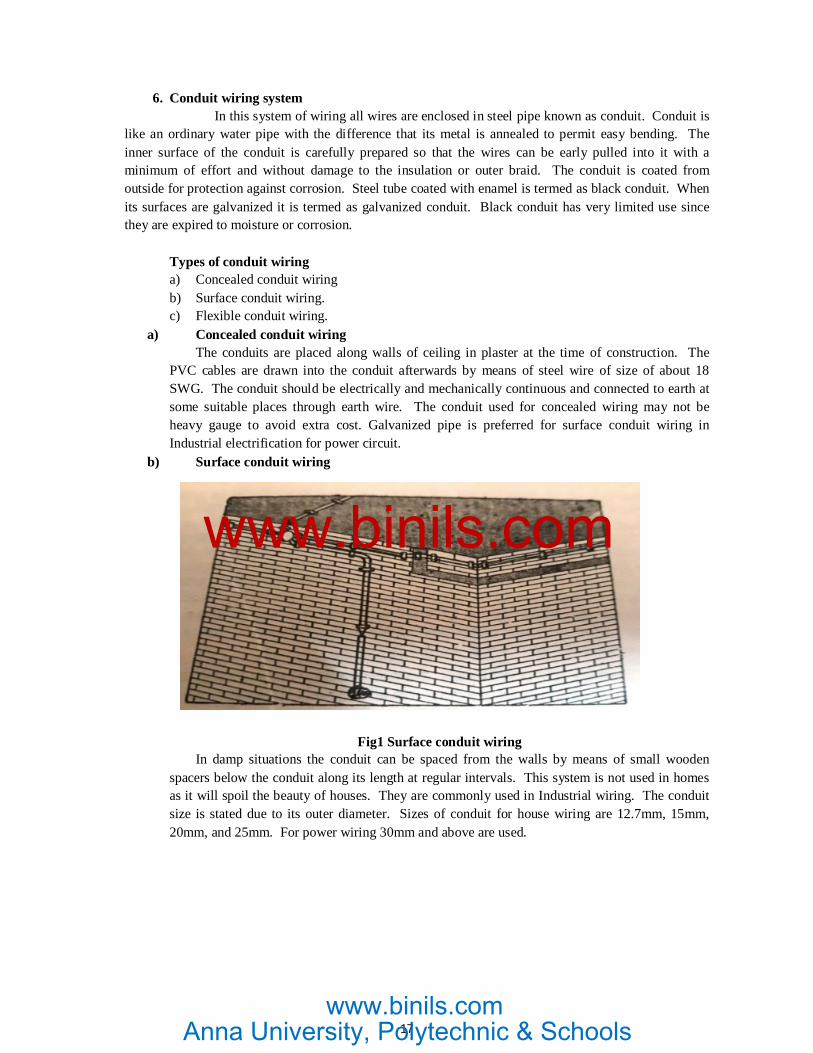
6. Conduit wiring system In this system of wiring all wires are enclosed in steel pipe known as conduit. Conduit is like an ordinary water pipe with the difference that its metal is annealed to permit easy bending. The inner surface of the conduit is carefully prepared so that the wires can be early pulled into it with a minimum of effort and without damage to the insulation or outer braid. The conduit is coated from outside for protection against corrosion. Steel tube coated with enamel is termed as black conduit. When its surfaces are galvanized it is termed as galvanized conduit. Black conduit has very limited use since they are expired to moisture or corrosion.
Types of conduit wiring a) Concealed conduit wiring b) Surface conduit wiring. c) Flexible conduit wiring.
a) Concealed conduit wiring The conduits are placed along walls of ceiling in plaster at the time of construction. The PVC cables are drawn into the conduit afterwards by means of steel wire of size of about 18 SWG. The conduit should be electrically and mechanically continuous and connected to earth at some suitable places through earth wire. The conduit used for concealed wiring may not be heavy gauge to avoid extra cost. Galvanized pipe is preferred for surface conduit wiring in Industrial electrification for power circuit.
b) Surface conduit wiring
Fig1 Surface conduit wiring In damp situations the conduit can be spaced from the walls by means of small wooden spacers below the conduit along its length at regular intervals. This system is not used in homes as it will spoil the beauty of houses. They are commonly used in Industrial wiring. The conduit size is stated due to its outer diameter. Sizes of conduit for house wiring are 12.7mm, 15mm, 20mm, and 25mm. For power wiring 30mm and above are used.
www.binils.com
Anna University, Polytechnic & Schools www.binils.com

18
a) Flexible conduit wiring
Fig2 Flexible conduit wiring
Purpose of this is to provide mechanical protection to cables between rigid conduit and machine or other object. It is used for connecting rigid conduit with machine terminal box in case of motor wiring, energy meter and main switch etc.
4.5 Service connections
a) Distribution The power from the generating stations is transmitted to sub stations from where it is transmitted to the places of utility by means of distribution lines known as Distributors. The lines which brings electrical power from supplies to consumer is called
b) Service connection Consumer is gives connections from the nearest pole of distributor. The service connection terminates at the point where the supply conductors enter the meter. It is the responsibility of distributor (or) supplies to install, maintain for supply up to the energy meter. Beyond energy meter the responsibility goes to consumer. The service line is terminated at supplier’s main board which is the property of supplier and the consumer has no accession it.
c) Meter board (or) Service board The service line is provided with fuse kit kats before it enters into the meter for protection against extra high voltage or line surges. The board on which the cutout, meter link and the meter are fitted is called service board. Responsibility of electrical fittings and accessories beyond the meter is consumer. The meter is sealed by the supplies.
d) Service conductors or service cables Service connections are given either by base conductors from nearest pole up to consumer premises or by weather proof cables (Aluminum or copper). The size of service conductor depends upon the consumer load and the distance from the poles. Voltages drop in the conductors should be considered for selection of conductors. 4.6 Types of service connections
Two types of service connections a) Overhead service connection b) Underground service connection
This may be single phase or 3 phase for Bulk consumption of energy HT service can be aviated. Electricity rules
www.binils.com
Anna University, Polytechnic & Schools www.binils.com

19
A) overhead service connection
When the distance is less than 45 minutes from the distributor’s poles, PVC or weather proof cable is used. When it is more than 45mts. Base OH conductors (ACSR or Aluminium loud drawn copper) are used for service lines. An over head service line is given to a single storey building by using PVC or weather proof cable is connected along with GI wire of 8 SWG between pole and the consumer end. In consumer end GI pipe is raised above the roof of the building as per the requirements stated is IE rules The wire is clamped along with the GI wire and enters through the GI pipe. Connections are made by means of cable through GI pipe is bent down ward to prevent the entry of rainwater.
B) UG cable service connection
This system is preferred for load above 20kw for this a cable box is fitted to the service poles by means of M.S channel of size 16mm X 25mm and bolts and nuts. The cable is carried from the cable box fitted on pole to another cable box fitted on service board. First the cable is draw along the pole to ground, then in the French of one meter deep and lastly vertical along the wall to the cable box at consumer end. GI pipe is used to carry the wire and French is of 3mts from the ground in order to save it from the ground in order to save it from mechanical damage at both places. The overhead line conductors are held to the pole with four shackle insulators. The shackle insulators are bolted to the pole in verified
www.binils.com
Anna University, Polytechnic & Schools www.binils.com

20
configuration with earth conductor at top and neutral at bottom. The UG main is necessary when the building (or) places is to be kept neat and to maintain the beauty of the places. Protection of electrical installation against overload short circuit earth fault When fault due to overload, short circuit or earth fault occurs, the temperature of a wire increases, which may cause breakdown because of damage to insulation .The conductor itself may get hot enough to start a fire when excessive amperes flow through it. It is therefore most important to limit the amperes to a maximum safe value for particular type and size of wire .A protective device is a sort of safety valve of electrical circuit. The provision of protective device is therefore most important for protection of electrical equipment. Overload protection If the value of current through the wire increases beyond the rated value it will result in overloading a wire .The insulation of wire is damaged, the current is called overload current. It is necessary to prevent a wire against overloading as the wire under overload will get heated up and ultimately burn down and break the circuit. Overloading of a wire or a cable in house wiring and small industries can be prevented by employing ‘fuse’ in the circuit. The fuse should operate (melt) as and when the current exceeds the rated value of the wire. Types of fuse 1. Kit-kat type fuse holder or Rewirable fuse unit 2. Cartridge type fuse unit 3. H R C (High rupturing capacity) fuse unit Short-circuit protection When wires of different phases or phase and neutral touch one another and make contact due to damage of insulation between conductors or between conductor and earth the excessive current many times more than the rated value will flow. This condition providing the above mentioned circumstances is called short circuit. To prevent damage to the wires of the circuit and to prevent outbreak of fire, fuse or MCB’s(Miniature Circuit Breaker) are provided to break the short circuit current. Fuses are quit satisfactory when current are small and where Small and where instantaneous protection is required against dead short circuit. Earth fault and effects of earth fault When one of the phase wire makes contact with earth or any other conducting material which is earthed, a short circuit exists between the phase wire and earth leading to the same consequences as that of short circuit between phase wire and neutral.
Fig3 Earth fault and effects of earth fault
www.binils.com
Anna University, Polytechnic & Schools www.binils.com

21
The earth fault occurs when the insulation of a current carrying wire is damaged and it comes in contact with earth wire or with a component which is earthed .The second cause of earth fault is when insulation inside the appliance is damaged and the current carrying wire comes in contact with appliance .The appliance is supported to be earthed. The earth faults cause a very large current to flow the earth wire. The earth wire in effect ultimately provides a short circuit between the phase and the neutral at the substation through the earth or between phase wire and earth. Electric shock Electric shock is observed by the human body by touching the line wire, or repairing the distribution system without switching off the supply. The ultimate effect of electric shock may be death. When the line wire touches the body, current flows through the body to earth. Due to this the heart and respirators organs may cease to functioning. The result of electric shock on human body causes.
1. Damaging the heart to small pieces and stopping of breathing. 2. Stopping of breathing causes blockade in nervous system. 3. Over heating or burning due to be sparking.
EFFECTS OF ELECTRIC SHOCK A) Factors on which Electric shock depends.
1. Current strength The effect of current on the human body system is an under
Milli amps mA Effect 1 to 8 mA Perceptible but not pain full (just bearable) 81 to15 mA Pain full shock (Muscular control is not lost) 15 to20 mA Painful shock (Muscular control lost) 20 to 50 mA Severe muscular contraction (Breathing will be difficult) 50 to100 mA possible death (no remedy) 200 mA and above certain death. Heart damages, burns...
2. The body resistance
Body resistance differs to persons and upon conditions. For dry Body - 70000Ω to 100000 Ω/sq.cm Wet Body - 700Ω to 1000 Ω/sq.cm Average body resistance - 5000 Ω when dry 1000Ω when wet
3. Frequency of current
For low frequency shock is more severe and dangerous and direct current shock is most severe
4. Path taken by the current through the body
If the path of leakage current is not involving with chest of heart survival is possible. But if it involved with heart severe burns or wounds may cause depends upon the value of current.
5. Duration of the contact
If it is more time, it will be dangerous.
www.binils.com
Anna University, Polytechnic & Schools www.binils.com

22
6. Area of contact.
Resistance decreases with the area of contact with the live part and the contact pressure. The accident is fatal in such situations.
Action to be taken if a person is getting an electric shock.
1. Switch off the circuit. If it is not possible make arrangements to stop the power through EB or other ways try to disconnect the person from the supply by anyway.
2. Make attempt to free the person from contact with line wire after protecting oneself with any dry insulating material.
3. To free the person from live wire stand on a dry plant, stool, table or any other insulating object and pull the man away from the mains.
4. The live wire can be pulled or pushed away by using a dry bamboo or stick. 5. Send the person to doctor. 6. If the person is unconscious and not breathing start giving artificial respiration without any
delay.
1) First aid for Electric shock 1. Electrical Installation to be checked periodically. 2. Equipment may be made up of Bakelite materials. 3. Never handle equipments with wet hands or standing on a wet floor. 4. Always avoid using adopters to connect several appliances to one outlet. 5. Put switch off and pull out the socket after used. 6. Never used appliance when they are at damage conditions. 7. Replace the broken parts immediately. 8. We correct rating of fuses. 9. Before replacing a blown fuse, always put off the main switch. 10. Check whether all the equipments are properly earthed.
Never tamper with any live apparatus. Treatment for electric shock B) Cure of Electric shock If the person affected by electric shock becomes unconscious, stops breathing but his heart functioning the most urgent and immediate cure is artificial respirators. It must be continued until the person starts breathy normally. There is several method of artificial respiration. Method I – Artificial respiration
1. Lay the patient on his stomach with his hand face to one side. Free the neck from clothing and throat way to be clear. Remove false teeth tobacco--- in the mouth.
2. Kneel over him (or) side and place the palms of your hands flat
www.binils.com
Anna University, Polytechnic & Schools www.binils.com

23
in the small of his back and touching the finger spread out on each side of body 3. Forward gradually over the patient bungling the weight of your body by pressing for a second.
Release the pressure for 3 seconds but without lifting your hands. 4. Repeat and relax the pressure for about 12 to 15 times per minute. 5. The patient should be kept worm with blankets or coats and hot water bottles applied to the
feet. 6. Do not give any liquid until the patient is conscious.
2) Method-2
When the patient has burns on his chest or anywhere on front side then the patient must not laid on his front. In this method first loosen the clothes around the chest and stomach and place a rolled up coat or pillow beneath the shoulders. So the head falls backward. The main process of artificial respiration is to expand and contract his chest to draw the all and expel if out. Kneel in the position as shown in fig and hold the patient just below the elbows and draw his hand over his head until they are horizontal. Keep the position for 2 seconds bow bring the patients hands so as to compress his chest by bringing them down and keep repeating the two motions at the same rate.
3) Mouth to mouth respiration method
This method is applied when the patient has suffered chest injuries
1. Insert thumb of your left hand between victims (patients) teeth.
2. Hold the jaw upward so that the head is fitted backwards.
3. Close Victims nostrils with your right hand.
4. Take a deep breath and place your mouth tightly over victims’ mouth and your thumb. 5. Blow force fully enough to make victims chest raises. 6. Repeat if for 3 or 4 seconds 7. We hand kerchief or cloth to prevent direct transmission of germs.
4) Mouth to Nose method
1. Place the victim on his back 2. Clear his mouth and throat. 3. Till has head back by holding lower jaw clear the air passage. 4. Take deep breath of fresh air. 5. Place mouth over the victim’s nose and hold the mouth closing.
www.binils.com
Anna University, Polytechnic & Schools www.binils.com

24
6. Blow into nose. 7. Remove mouth. 8. Continue the process for 12 times per minute.
Fire Hazard:
In case of a breakdown of insulation over the wires, it always results in generation of heat and increase of temperature near about the fault. If there is faulty earth there is no isolation of circuit due to fault current, then the fault continues to persist which further increases the temperature of the surrounding and if the temperature reaches ignition point, the insulation starts burning and the fire breaks out. The earthing or bonding is most necessary to avoid the fire hazard.
ELCB
Earth leakage circuit breaker is also called as Residual current circuit breaker (RCCB)
It is used for protection of earth leakage. This is arranged to operate very quickly when extremely low leakage current flows. So protection against electric shock is higher than a fuse or MCB. This device defects the earth leakage current and disconnects the supply when the current reaches the predetermined value. It consults of an operating coil and a trip mechanism which contacts the supply to the circuit. Two supply wires of phase and neutral are fed to separate windings of a small transformer and another winding controls the tripping mechanism. The contacts are normally made closed and open when it tripped. When earth leakage occurs the currents are unbalanced and when it reaches the rated tripping current, the tripping mechanism operates and disconnects the circuit. It results manually after operation and cannot be reset of fault current exists. Test button a provided for testing the trip mechanism to ensure the satisfactory working of component. This ELCB can be placed near the main board to protect whole installation. Overview of bus bar trunking and cable tray Bus bar trunking system (BBT System) BBT or Bus Bar Trunking system is a replacement to traditional cable and panel distribution .MCB, MCCB in BBT is plug-in component as bus is extended to consumer area.
www.binils.com
Anna University, Polytechnic & Schools www.binils.com

25
Three phase incomer from generator or a source at first comes to a three phase bus bar by cable or wire, then circuit breaker or other device connection is made with cable from bus bar, circuit breaker/protection device and bus bar stays in the panel board. Load is out side in use area, connected with cable from circuit breaker/protection device. So bus bar is receiving and supplying power by cable or wire. But with bus bar trunking system, there is no cable or wire at all. There is no panel. Bus bar is extended through the use area. A circuit breaker/protection device can just plug in the bus bar trunking and connect load from the circuit breaker.
Fig4(4 pictures)
www.binils.com
Anna University, Polytechnic & Schools www.binils.com

26
Cable tray In the electrical wiring of building, a cable tray system is used to support insulated electric cables used for power distribution and communication. Cable trays are used as an alternative to open wiring or electrical conduit systems, and commonly used for cable management in commercial and industrial construction.
Fig5 cable tray Earthing Earthing:- The term earthing means connecting the neutral point of a supply or the non current carrying metal parts to the general mass of earth by wire of negligible resistance. It by passes the immediate discharges of electrical energy without danger. It provides the body of equipment to zero potential and avoid shock to the operators.
Need for earthing or necessity of earthing
1. To avoid electric shock to human body. 2. To avoid risk of fire due to earth leakage current through unwanted path. 3. To maintain line voltage constant.
www.binils.com
Anna University, Polytechnic & Schools www.binils.com

27
4. To ensure that no current carrying conductor rises to a potential with respect to earth than its designed insulation.
5. To protect all equipment’s from lightning, surges.
Soil resistivity It is a measure of how much the soil resistance the flow of electricity. Soil resistivity testing is the process of measuring a volume of soil to determine the conductivity of the soil. Soil resistivity is expressed in ohm-meter or ohm-centimeter Earth electrode It is a GI or copper plate placed in the earth. For small installations one electrode is sufficient but several electrodes may be required for high power installations. If more than one is used they are put together in parallel. For larger installations nets of earth electrodes separated by 12 to15 meters are provided and all are inter connected together to form a common earthing system. For power wiring two separate and distinct earth connections is made. 1.1 Methods of Earthing
i) Earthing through a water mains. ii) Wire or strip Earthing iii) Rod Earthing. iv) Pipe Earthing. v) Plate Earthing
i) Earthing through a water mains:- It is ensured that the water pipe is of iron and electrically continuous then only the water mains can be used for earth connections. Normally this method is not advisable. ii) Wire of strip Earthing:-
The copper of wire of 5 SWG or a copper strip cross section not less than 25mm X 1.6mm is used as earth wire. The wire or strip is barried in horizontal trenches of depth enough to maintain Earthing process. The depth will be 8 to 15 meter depending upon moisture content of soil. Length of wire or strip to be enough to reduce the earth resistance. If move than one strip is used they can be laid either in parallel trenches or radial trenches. This method is used where difficult to dry pits of required depth due to rocky soil.
iii) Rod Earthing:- Solid rod of 12.5 mm dia of copper, 19mm of galvanized iron or a hollow GI pipe of 25mm is placed vertically in to the earth up to 5 to 6m depth. This method is suitable for sandy earth. This method is cheaper. The earth wire is carried through the pipe to ground for the solid rods the wire is to be tied with small clamps.
www.binils.com
Anna University, Polytechnic & Schools www.binils.com

28
IV) Pipe Earthing:-
This method is very common and best system of earthing. A pipe of required diameter is used to carry the fault current. Size of pipe is depending on the current to be carried and type of soil. As per ISI specifications for ordinary soil 38mm dia and 2m length is used. The pipe must be placed in a wet ground. The depth is depending upon the soil. As per ISI specifications pipe should be placed at a depth of 4.75 m. The pipe is tapered at the bottom. The charcoal and salt are filled in that pit in alternate layers up to 2m and 15cm around the pipe. The pipes drilled with holes so that water poured from top is made to spread in the layers. At the top a cement concrete work is made for the protection. A funnel with wire mesh is provided in the concrete work to pour the water. The pipe to which funnel is connected is further connected to main earthing pipe. 3 to 4 buckets of water should be put into the funnel. Another GI pipe is taken from the funnel towards outside for its connection to earth wire. The SWG / 14SWG Earth wire from GI pipe of 19mm dia should be carried in a GI pipe of dia 12.7mm at a depth of about 60cm below the ground.
www.binils.com
Anna University, Polytechnic & Schools www.binils.com

29
V) Plate Earthing:-
In this method Earthing is done by embedding GI or copper plate. Size of plate is 60 x 60 cm x 3.18mm for copper plate. Due to higher cost copper is not used mainly.4m deep pit is dug and the earth electrode is placed vertically. The space around the plate is filled with charcoal and salt of 15cm thickness. The plate is connected with GI pipe of 12.7mm dia for carrying GI earth wire for connection to earth electrode. Earth wire bolted to the earth plate with nut, bolt washer and GI thimbles. There are all must be copper for copper plating and GI for galvanized plating. The pit is connected with a pipe for pouring water for the purpose of increasing dampness and moisture to reduce resistance. The cement work is covered with iron plate for penodic opening. It is better to have an independence earth plate for domestic applications. The diagram shows the details of all. Methods of improving earth resistance The main principle regarding earth resistance is that the earth resistance should be low enough to cause flow of current sufficient to operate the protective device. The value of earth resistance does not remain constant but changes with the weather, it depends upon the moisture content of the soil and is maximum during dry season. As a general rule, the lower the value of earth resistance better
www.binils.com
Anna University, Polytechnic & Schools www.binils.com

30
Methods of improving earth resistance 1. Use longer ground rods 2. Chemically treat the soil 3. Use multiple ground rods General requirement of earthing Components parts needed for earthings are 1 .Earth electrode 2. Main earthing terminals or bars 3. Earthing conductors 4. Protective conductors 5. Equipotential bonding conductors 6. Electrically independent earth electrodes for special system (clean earth) 7. Accessories and termination fittings, bonding, welding kits and other materials. Size of earth continuity conductor The conductor by means of which the metal body of an equipment or appliance is connected to earth is known as ‘earth continuity conductor (E.C.C). The earth continuity can be ensured either through metal conduit, metal sheathing of metal sheathed cables or by a special earth continuity conductor. The cross section of the earth continuity conductor should not be either less than 2.9mm2 (14SWG) or half of the installation conductor size.
2.6 Difference between neutral and earth
Neutral wire
Earth wire
1 2 3 4 5
This is connected to the neutral point of transformer which is earthed at sub station Slight potential exists Unbalanced current flows Return current passes through the load Provide single phase supply
This is a solid earth at the sub stations Zero potential No current flow Fault current only flows Protect from electric chokes
www.binils.com
Anna University, Polytechnic & Schools www.binils.com

31
REVIEW QUESTIONS:
Unit I PART A & PART B
1. Draw the conventional symbol of the following electrical apparatus.
a. Main switch for power b. OH line c. Fluorescent lamp d. Ceiling fan
2. Draw the conventional symbol of the following electrical apparatus.
a. Bell b. Line crossing c. Socket outlet 5 amps d. Shielded cable
3. Write down the relevant I.E rules with reference for the following:
a. Voltage b. Line crossing or approaching each other.
4. Write down the relevant I.E rules with reference for the following:
a. Cutout in Consumer Premises b. Testing of Consumers Installation.
5. Distinguish between surface and concealed conduit wiring.
6. What is an Electric Shock?
7. State the reasons why fuses are provided on the line wire and not on the neutral wire.
8. Write any five ISI specifications pertaining or earthing of domestic installation.
9. What is the different between Neutral and Earth wire?
10. Explain the Earth resistance?
11. Explain the Joint box System wiring.
12. Explain the how over head service connection given to consumer.
13. State and explain the effect of electric shock.
14. Describe the method of pipe earthing.
15. Describe the method of measuring the resistance between the conductor and earth in installation.
16. Explain the test to locate the open circuit fault in U.G. Cable.
17. State the points to be considered for selecting a particular type of wiring.
18. List the power rating of any 5 important electrical appliances used in houses.
19. Write a note on materials used as a fuse element.
20 Describe the method of Plate Earthing.
21. Mention the value of earth resistance and factors on which it depends on.
24. What is meant by wiring & explain any two methods of wiring?
25. Explain any two types of fuses used in electrical installation?
26. What is service connection? Explain how underground service connections are given to the
consumer?
27. What are the various types of wiring used in wiring installation? Explain any two briefly.
28. What are the factors to be considered while determining the size of conductors?
29. State the difference between Neutral and Earth wires?
30. What is meant by testing of installation? Explain any one method of the testing?
31. Explain the points to be remembered while providing earth.
www.binils.com
Anna University, Polytechnic & Schools www.binils.com

32
32. Write a note on guidelines for installation of switches, lights &fans in domestic wiring.
33. Distinguish between earth wire and neutral wire.
PART C
1. Explain in detail Looping Back, Joint Box and Tree systems with diagrams.
2. Explain the requirements of a good earthing system.
3. Explain the various factors to be considered in selecting the wire size of conductors /cables used for
domestic installation.
4. State the importance of insulation resistance .Explain insulation resistance test between earth and
conductor and between conductors.
5. Discuss the procedure of proper selection of fuses.
6. What is ELCB? Explain the details about the working of ELCB.
7. Discuss the importance of earthing of domestic fitting and appliances.
8. Explain in detail about the industrial Earthing.
9. Discuss the procedure of earthing in pole Mounted Substation and Distribution Sub-station Earthing.
10. What are the types of service connection? Discuss in detail and rules in regulation for providing
service connections.
11. Discuss the rules as per ISI for the insulation of Switches, Socket outlet, Lights, Fans, Fuses and
Earthing or Appliances and Electrical Machine.
www.binils.com
Anna University, Polytechnic & Schools www.binils.com

33
UNIT II -DOMESTIC AND INDUSTRIAL ESTIMATE: CONTENTS: General requirement of electrical installations for residential, commercial and industrial-Lighting and power sub circuits-diversity factor for sub circuits-locations of outlets, control switches, main board and distribution boards-Permissible voltage drops and size of wires-Steps to be followed in preparing electrical estimate. Estimate the quantity of material required in electrical installation for 1.Small residential building/flat 2. Factory lighting scheme 3. Computer centre having 10 computers, a/c unit, UPS, light and fan. 4Street light service having 12 lamp light fitting. 5WorFkshop with one number of 3 phase, 15 HP induction motor. 6.Small workshop with 3 or 4 machines . 1. Types of electrical installations: 1. Domestic wiring installation. 2. Industrial wiring installation. 2. ELECTRICAL INSTALLATION IN BUILDINGS.
a) Domestic wiring:
1. (a) Balance of circuit in 3 phase supply wiring should be arranged beforehand.
(b)Under no circumstances, wires of two different phases shall be run in one pipe except in case of
wires of all three phases with or without neutral combination.
(c)Generally only one and the same phase should be allowed in one room.
2. Conductors to be of aluminum. The smallest aluminum conductor for the wiring or circuit shall have a
normal cross sectional area of not less than 1.5 sq.mm.
3. The minimum size of aluminum conductor for power wiring shall be 4 sq.mm .The size of aluminum
conductor for power wiring for geysers shall be 6 mm2. The minimum size of conductor for Air
conditioners shall be 10 mm2.
b) Rating of points:
(a) Light points in residential and non- residential buildings shall be rated as 60 W.
(b) Ceiling fan/table fan rated at 60 W. Exhaust fan at 100W.
(c) Socket outlet 5 Amp points shall be rated as 100 w.
(d) 15 Amp socket outlet point for general use to be rated at 1000 watts, for geysers 2000 watts, for A.C.
3000 W.
c) Height level of SB’s etc.
(a) Light points, junction boxes hanging lights from floor level to be 2.5 mtr. To 3.0 mtr.
(b) Fans 2.75 mtr .from floor level and minimum of 0.30 mtr from ceiling.
(c) Light plug, power plug, telephone socket, inter-com socket, T.V. socket to be 0.25 mtr. above floor.
(d) Bed light 0.30 mtr. from floor level.
(e) Bed side switch1.0 mtr. from floor level.
(f) Minimum height of switch board from floor to be 1.5 mtr.
(g) Power plug in bath room 2.0 mtr. From floor if it is plug.
www.binils.com
Anna University, Polytechnic & Schools www.binils.com

34
(h) Power plug alone (without switch) to be 2.5 mtr. From floor and switch to be 1.5 mtr. above floor if it
is for geyser or air conditioner.
(i) Bulk head fitting 3.0 mtr /2.5 mtr. from floor level.
(j) Call bell 2.5 mtr. To 3.0 mtr. Above floor.
(k) Push button for call bell to be 1.5 mtr or 1.00 mtr. from floor in case of Bed side bell push. 3. Diversity factor for sub circuits The maximum current which is likely to flow in a circuit, compared with the sum of the current-
ratings of the current consuming appliances connected to that circuit is known as diversity of the
circuit.
The maximum current which is likely to flow in a circuit expressed as percentage of sum of the
current ratings of all the current consuming appliances connected to that circuit is known as
diversity factor of the circuit. In other words, the percentage between total installed load and the
load consumed at one time is expressed as percentage is known as diversity factor of the circuit.
In case of a large building or commercial buildings etc., if a fault on a particular circuit or sub-
circuit occurs, only that circuit /sub-circuit goes out of order and not the main circuit controlling
several sub-circuits. The supply to other sub-circuits is not interrupted in that case.
The main supply is diversified into several sub-circuits. Each sub-circuit has its individual
control. The main circuit has a control for the whole installation.
It is therefore important that the main load should be diversified into various circuits and sub-
circuits to have better and effective functioning of the electrical system.
Diversification also enables maintenance, repair or extension on certain part without having to
switch of the whole installation. Only the faulty circuits will be switched off and other circuits
will function uninterrupted.
Sub-circuits are fed from a distribution board. The diversity factor is allowable for installation of
lighting, sockets, heating and cooking appliances in domestic, residential hotels, hostels etc.,
(A)For lighting/Fan/5 ampere socket points, a maximum of 10 electrical points or a load of 800
watts is one sub circuit.
(B)For power sub-circuit, a point feeding a 15 ampere socket outlet rated at 1000 watts is one sub
circuit.
4. STEPS TO BE FOLLOWED IN CARRYING OUT THE ESTIMATE: While calculating the material and cost of wiring a house, the following sequence should be adopted in
case of casing. Capping and conduit system of wiring.
(a) DRAWING INSTALLATION PLAN: The plan of the building is drawn on a suitable scale and
electrical points, switch board, location of main board, energy meter, main switch and distribution board
www.binils.com
Anna University, Polytechnic & Schools www.binils.com

35
etc., are marked on the plan through specified symbols. The path of wiring showing connection to each
point is marketed by drawing a little thick single line. (Refer IS: 375-1951).
(b)CALCULATIONS FOR TOTAL CONNECTED LOAD IN AMPERES: The primary aim of
calculating the connected load in the building is to ascertain the size and rating of service cables energy
meter and rating of main switch.
(c)SELECTION AND RATING OF MAIN SWITCH AND SUB MAIN SWITCH: Once the load is
available, the main switch and energy meter(if required to be calculated)can be very conveniently selected
as the main switches are available in the local market on the basis of current rating and number of
poles. The current ratings of main switches are already explained separately.
(d)SELECTION AND RATING OF MAIN DISTRIBUTION BOARD: The main distribution board is
a fuse box where different sub circuits covering the building are connected .The selection is based on
number of electrical points to be covered in the building including power sockets of 15 amperes rating.
(e)ASSUMPTIONS: The conditions which are not specified in the question may be assumed for instance
location of main board in verandah can be assumed to be half or one meter inside .The height of the
building may also be assumed if it is not specified. Assumptions made by the estimator will form basis of
calculations for estimating the material.
(f)CALCULATIONS FOR LENGTH OF CASING CAPPING OR CONDUIT PIPE: To avoid
delicacy in ascertaining the length of conduit pipe ,this calculation should be very carefully made
otherwise there is every possibility that some lengths may be calculated more than once .The conduit
pipe may be calculated in three stages to avoid duplicity.
STAGE (1) the conduit installed from switch boards up to horizontal run including from main switch or
DB to HR.
STAGE (2) the conduit on walls running parallel to floor i.e. the HR (Horizontal run) running below
ceiling.
STAGE (3) the conduit installed between HR and ceiling, along ceiling, and ceiling to last point on HR.
The conduit pipe calculated in three stages is put together, totaled and 10 % wastage included to a certain
total length of conduit required for the building.
(g) CALCULATION FOR LENGTH OF EARTH WIRE AND NEUTRAL WIRE: The phase wire
and neutral wire is calculated sub circuit wise, for instance
Sub circuit No.1: Phase wire neutral wire
Sub circuit No.2: Phase wire Neutral wire
And so on covering all sub circuits in the building and finally total of phase and neutral is made and
10% wastage taken to ascertain total length of wire required for wiring the building.
(h)CALCULATION FOR LENGTH EARTH WIRE: The earth wire for casing capping and batten
wiring is laid on the batten along with other wires but in the case of conduit wiring ,no separate earth wire
is installed along the conduit .The conduit pipe being of iron is made to serve as earth wire. All earth
www.binils.com
Anna University, Polytechnic & Schools www.binils.com

36
terminals of socket outlet are connected with conduit pipe within the switch board using a thimble and a
small piece of earth wire.
(i) PREPARING MATERIAL TABLE: The material table should be prepared with complete
specification of each item.
5. LOCATIONS OF OUTLETS, CONTROL SWITCHES, MAIN BOARD AND DISTRIBUTION
BOARDS The meter board, main switch board, main distribution board should be installed only in dry situations
which is not exposed to sun or rain. These are normally located in covered verandah of a house or in the
room where there is no verandah. But privacy must be considered in selecting the location for meter
board, main board etc., as the meter reader shall be visiting the house regularly.
The wiring of main switch, fuses, and distribution boards should be very clear so that they are easily
traceable while locating the faults.
It is preferred that the service main is installed from the nearest supply pole by a weatherproof cable to be
connected with the consumer’s internal wiring via the energy meter.
The service line which includes weather proof cable, support wire, pole clamp and other equipment
should reach from the nearest supply pole up to energy meter.
a) ENERGY METER: The energy meter should be installed at a place which is easily accessible to the
consumer as well as to the meter reader .The height of the meter should be 0.25 mtr. higher than that of
switch board i.e. 1.75 mtr. above floor.
b) MAIN SWITCH: The purpose of the main switch is to isolate the supply to the building .It is
normally installed very close to the energy meter and should be readily accessible to the consumer. The
fuses are also provided inside the main switch to interrupt the supply due to short circuit current that may
occur.
c) DISTRIBUTION BOARD: The supply is given to main switch and then to main distribution board
for the purpose of distribution of electrical to various portions of the house through sub circuits .Every
sub circuit (consisting of not more than 10 electrical light /fan/ 5 ampere socket points or 800 watts load)
is protected by its individual fuse or MCB.
d) SOCKET OUTLET: 1.Only 3 pin, 5 Amp. Socket outlets are to be used in all light and fan sub
circuits and 3 pin, 15 Amp socket outlet are used for all power circuits. All socket outlets are to be
controlled by individual switches, which are to be located immediate adjacent to it
2. In case an appliance requiring the use of socket outlet of rating higher than 15 Amp, it is to be
connected through a double pole switch of appropriate rating .No socket outlet of 15 Amperes rating is
to be provided in the Bathroom at a height less than 2.0 mtr. from floor.
3. The 15 Amp sockets must be provided for kitchen for heater etc., and in Bathroom for geyser. The
other locations where 15 Amp, socket should be provided are living room for room heater, bed room and
in rear verandah if required.
www.binils.com
Anna University, Polytechnic & Schools www.binils.com

37
e) LIGHT POINTS: The light should be so place that these are most convenient in their utility and
control. The numbers of light points are determined from the size of the room or hall, if the room is of
average size, the light points should be located on the walls half meter below ceiling, If the room is large
or in case of halls the light should be located on ceiling and walls. The main requirement is that the light
points installed should provide uniform illumination and minimum glare.
f)FANS: The room of average size should have only one fan but the larger rooms serving as drawing and
dining rooms, two fans may be used. In halls, the average space from one fan to other should be
approximately 4 m i.e. 16 square meters floor area per fan. The ceiling fans should be installed at an
average height of 2.75 meters from floor. The connection to ceiling fans should be given through ceiling
roses installed close to fan books.
2. The ceiling fan should not be installed in kitchens, bathrooms, toilets and small stores.
3. The exhaust fan should be installed in big halls and big cook houses about half meter below ceiling .It
should be installed in kitchen.
g) EARTH WIRE INSTALLATION: Earthing means, the direct connection of all the metal noncurrent
carrying parts of electrical equipment such as metallic, frame work , electric motor body ,main switch,
distribution board, earth terminal of socket outlet ,metallic covering of cables and conduit pipe etc.to
earth plate. The earth plate is buried in the ground which has a good electrical connection to the
surrounding earth. This is all done to avoid electric shock to human body and to avoid risk of fire due to
earth leakage current through unwanted path.
4. All appliances which are given connection through the socket outlet such as table fan cooking heaters,
geysers, refrigerators, washing machines etc. should be earthed through the earth terminal of the socket
outlet.
h) SWITCH BOARDS:
1. The switch boards should be convenient to operate and adequately located. The switch board must be
provided inside a room close to the entry door so that there is no difficulty in switching on the light
during night time. The height of switch board should be 1.5 meter.
2. It is important to note that the switches and fuse should be inserted in the line conductor and not in the
neutral conductor.
6. SELECTION OF WIRES:
All the time of electrical installation of house wiring, every care is taken to select suitable size of wire
depending upon the specified load in the circuit which determines the size of the wire:
(1) Minimum size of cable or insulated wire for mechanical reasons.
(2) Voltage drop.
(3) Current carrying capacity.
(4) Type of insulation used i.e. VIR, PVC, and TRS etc.
(5) Grade i.e. 250 volts, 500 volts, 660 volts grade etc.
www.binils.com
Anna University, Polytechnic & Schools www.binils.com

38
The size of wires for sub - circuit should be so selected that there is very little voltage drop at the
consumer’s premises from point of entry of circuit to the farthest point. The voltage drop should not be
more than 3 percent of the voltage at the main switch board under normal conditions .Since use of copper
has gone very costly for general purposes, an aluminum conductor cable of 1/1.40 mm. (1 is stand and
1.40 m is the diameter of conductor) size is used as a minimum size for an ordinary sub circuit. The cross
sectional area of 1/1.40 mm conductor cable is 1.5 mm2 and current carrying capacity of this conductor is
10 amperes which is enough to carry a load of one sub circuit involving 10 points or 800 watts load.
The size of wire for wiring a 15 ampere socket-outlet should be as under:
For 15 Amp. Socket –outlet in kitchen = the wire of size 4mm2 or 1/2.24 mm aluminum
conductor single Core.
For 15 Amp .socket outlet = the wire of size 6 mm2 or 1/2.80 al. conductor single core.
6. SUB CIRCUITS 1.From the energy meter ,supply is taken to the main switch from the main switch, the supply it taken to the fuse box known as distribution board.(Fuse box is installed only if the number of electrical points in a house exceeds ten)for distribution of supply into sub circuits through the fuses. 2. The main disadvantage of this type of connection is that in case of short circuit in any part of the building, the fuse will melt and disconnect supply to the whole building. Another disadvantage of eliminating distribution box is that if the total points in the house are more, the voltage available at the farthest end will be low due to voltage drop as the single pair of wires (phase and neutral) will connect all the electrical points. For this reason, it is always a practice to divide the wiring into sub circuits by adding a fuse box. 3. The phase is supplied to the main switch through fuse kit-kats and energy meter. Two sub main switches are installed each for power (15 Amps.) sub circuits and lighting sub circuits. From sub main switches separate distribution boards are installed. The diagram shown here provides answer to the first part of problem. 8. Mounting levels of the Accessories and cables as Recommended in B.I.S and NEC. 1. Height of main and branch distribution boards should be not more than 1.5 m from the floor level.
A front clearance of 1 m should also be provided.
2. All the lighting fittings shall be at a height of not less than 2.25 m from the floor or 0.5m from ceiling.
3. A switch board shall be installed at any height 1.5m above the floor level.
4. Socket-outlets shall be installed either 1m or 1.3m above the floor as desired.
5. The clearance between the Battern point of the ceiling fan and the floor shall be not less than 0.3m.The
minimum clearance between the ceiling and the plane of the blades of the fan shall not be less
than 300mm.
www.binils.com
Anna University, Polytechnic & Schools www.binils.com

39
6. The cables shall be run at any desired height from the ground level, and while passing through the
floors in the case of wood casing and capping and T.R.S wiring, it shall be carried in heavy gauge conduit
1.5m above floor level.
9. ESTIMATION OF WIRING INSTALLATIONS. Estimating means to determine the quantities of various items required to execute a job and to assess the cost of the execution.
a) The various steps to form an estimate are:
i) Chalk out a list of items and quantities required. ii) Draw the installation plan.
iii) Assess the exact number of workman required to complete the job and after consulting the schedule of labour rates add the labour cost to the estimate under preparation. It should be noted that number of workman required is depended upon the time fixed to complete the service
iv) Add supervision charges and executor’s profit. v) In case of Govt. organizations, where the work is to be executed by the contractor, the tenders are
floated only after correctly specifying the description of each item, to avoid any misunderstanding while execution.
b) Procedure to be followed while Estimating for internal Electrification. 1. Select i) System of wiring ii) Method of wiring. 2. Particulars of load i) Total load ii) Total current. iii) Designing current. 3. Calculate No.of sub-circuits, based on the above. 4. Distribution point in circuit. 5. Layout (i) Line diagram (ii) Flow diagram (iii) Photographic view diagrams. 6. Size of cable, (i) From Central Distribution Board (CDB) (ii) In sub-circuit. 7. Rating of Main switch. 8. Rating of Distribution box. 9. Size and length of conduits. 10. Size and length of cable required from DB to load points based on voltage drop calculations. 11. Cost of materials including CST, ST, and Scand transport. 12. Labour for wiring. 13. Tool charges if any. 14. Overhead charges, contingencies etc., 15. Special fittings if any. General guidelines for Conducting Estimates The place where the service connections from nearest pole are to be received should be selected carefully. The place should be covered to provide protection to the energy metre against rain, sun and mechanical damage. Generally, energy meter, main switch and main distribution board are installed close to each other and near the commencement of supply. The wires for wiring connection to main switch and distribution board should be of rating based on total load requirements in the buildings as these wires are to withstand the entire load in the building. The conductor used beyond distribution board in the whole of the building is of the same size i.e.1.5sq.mm or 1/1.40 mm for aluminum conductor cable. Every sub circuit should commence from distribution fuse board.
www.binils.com
Anna University, Polytechnic & Schools www.binils.com

40
Every line i.e. phase wire should be protected by a fuse of suitable rating based on load. The height of main board (the board comprising main switch and distribution board), switch board and metre board are to be installed so that its centre is 1.5 metres above the floor. The earth terminals of all 3 pin plugs and socket outlets i.e. the earth pins are connected permanently to the earth wire. Sufficient number of socket outlets is to be provided at suitable places in all rooms so as to avoid long lengths of flexible cords. All socket outlets are to be controlled by individual switches which are to be located immediate adjacent to it. The two pin, socket outlets are not to be used as per I.S.S. In bath rooms, the height of socket-outlet should not be less than 1.5metre in any case. In kitchens, one light and one 15 amp. Socket is to be provided for general use. All ceiling fans are to be hung 2.75 metres above the floor, unless otherwise specified. Each sub circuit is not to have more than a total of ten points of light, fan and 5 ampere socket outlets. The load on each sub circuit is to be restricted to 800watts. In no case, more than two 15 ampere sub circuits totaling a maximum load of 3000w should be put on one sub circuit. 14SWG, GI wire is to be used as earth wire. In large buildings where 3 phases 4 wire supply is to be given, the load is to be distributed equally on all the phases. The switches are installed on phase line only. The two way switches are to be provided for halls, stair cases and bed rooms. The height of ceiling for a normal residential building may be taken as 3.5 metres for estimation purposes. The height of ceiling for large halls may be assumed to be 4 metres.
ESTIMATION -I HOUSE WIRING
1. A residential single bed room flat is to be electrified with PVC conduit concealed type of wiring. Estimate the quantity of materials required with specifications. The details of the electrical fittings are as follows:
SI.no Name of the Room Size No.of tube
light points No.of ceiling fan
No .of ordinary light points
No.of plug points
1 Hall 5.0m*6.0m 2 1 2 2 2 Bed Room 4.0m*4.0m 1 1 1 1 3 Kitchen 4.0m*2.0m 1 1 1 4 Bath Room 1.5m*1.5m - - 1 1(power) 5 Toilet 1.5m*1.5m - - 1 -
Decide the number of sub-circuits to be used according to Indian Electricity Rules. Draw the necessary plan of the flat and show the position of the fittings and switch boards. Draw the single line wiring diagram. Assume necessary data as per IE rules and mention them clearly. SOLUTION: 1. Assumptions:- 1. Single phase supply230v, AC, 2. Type of wiring: PVC Conduit concealed wiring. 3. Height of ceiling: 3.5m 4. POWER FACTOR =0.8. 5. Height of switch board, main board= 1.5m from floor
www.binils.com
Anna University, Polytechnic & Schools www.binils.com

41
www.binils.com
Anna University, Polytechnic & Schools www.binils.com

42
2. CALCULATION OF LOAD, SUB CIRCUIT.
Hall TL(40w) L(60W) F(60W) Plug (100)
Power Plug(1000W)
Total Watts
No.of Sub circuits
Hall 2 2 1 2 - 460 Sub circuit(1) Kitchen 1 1 - 2 - 300 Sub circuit(2) Bedroom 1 1 1 1 - 260 Sub circuit(3)
Bathroom - 1 - - -
60
Toilet - 1 - - - 60 Bath room 1 1000 Sub circuit(4) Total load 4 6 2 5 1 2140W 4 sub circuits
Since the total load is 2140 W, single phase supply is enough for 18 points, 4 no’s of sub circuit is enough.
CALCULATION OF LINE CURRENT, SIZE OF MAIN SWITCH, MCB, DB Line current = = = 11.630 A *Hence with the total current is approximately 12A, Main switch16A, 250V, DPIC can be selected.
*For all sub circuits the current is below 10A, we can select 1.5 Sq mm copper conductors for entire
wiring.
*For 4 sub circuit, 4Way, 250V, 6A, DB is required with 6A MCB
4. LENGTH CALCULATION OF PVC CONDUIT PIPE (19MM).
Location Horizontal
run Vertical run Ceiling run Total
For sub circuit(1) DB to SB1 DB to SB2
5
(3X1.5)+ (5*0.5)
6+2.5
17.5
For sub circuit (2) MB to SB3
1+2 1.5+1.5+ (3*0.5) 2M 9.5
For sub circuit(3) MB to SB4 SB4 toSB5
2+4+2
1.5+1.5 1.5+(5*0.5)
4+2+2
23
For sub circuit(4) MB toSB6(power plug)
2+4+2 1.5+1 --- 10.5
Total 22 60.5 +6.0 66.5= 70
Therefore required length of PVC conduit pipe = 70m 5. Length of copper conductor required = 3X PVC length= 3X 70 =210m 6. Length of earth wire standard 8 SWG =length of PVC=70m
www.binils.com
Anna University, Polytechnic & Schools www.binils.com

43
7. ESTIMATION REQUIRED. S.NO MATERIAL WITH SPECIFICATIONS QUATITY
1. Double pole iron clad main switch -16 A , 250V grade 1 2. Distribution box 4 way, 250 V 1 3. MCB 6 A,250V 1 4. PVC CONDUIT PIPE(19MM). 70 m 5. 1.5 Sq mm copper conductor(3/0.737)mm 210m 6. Earth wire standard 8 SWG 70 m 7. Batten holder 6 8. Ceiling rose PVC type 6A,250 V 3 9. Plug socket with switches 3 pin, 5A,250 V 3 10. 19 mm PVC conduit elbow 2 11. 19 mm PVC conduit Bend 10 12. Flush type Switches 5A,250V 17 13. Flush type switches 15 A, 250 V 1 14. Plug socket with switches 15 A, 250 V 1 15. Earthing set 1 16. PVC conduit junction box singlway,2 way,3 way 7 each 17. Teak wood board (30X20)cm size 4 18. Teak wood board (15X10) cm 1
ESTIMATION 2 FACTORY LIGHTING SCHEME (Electrical estimate for lighting scheme of a workshop floor area.) 2. A factory of size 20 m*20 m is to be illuminated, so as to get the illumination of 20 lux at working plane .Estimate cost for wiring, assuming necessary data as per IE rules. (use twin tube lights of each 40 w) Solution: 1. Assumptions: 1. Area of room 20 mX20 m=400 sq m 2. Illumination required =20 lux 3. Deprecation factor= 0.7 4. Coefficient of utilization= 0.4 5. Efficiency of lamps=10.5 lumen/watt 6. Three phase 4 wire system is needed. 7. Height of ceiling=4m 8. Fluorescent twin tube light sets to be hang below ceiling =1m
www.binils.com
Anna University, Polytechnic & Schools www.binils.com
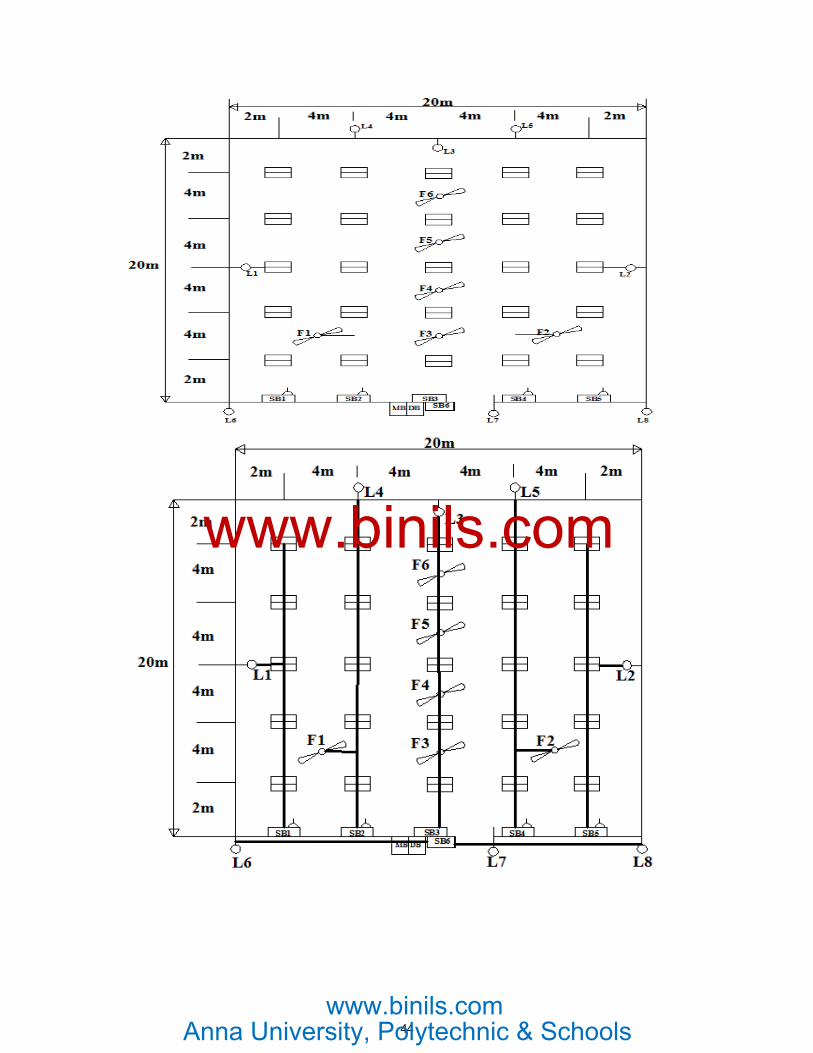
44
www.binils.com
Anna University, Polytechnic & Schools www.binils.com

45
3. CALCULATION OF LOAD Total illumination required = = 28571 lumens. Wattage required = = =2721watts
If we select 80 w lamps =2721/80 =34 lamps. For room size 20 m*20 m we can select the lamps with space between lamps=2X2m. The load can be distributed as: In each bay =5 lamps, Totally 5 bays, 1. Therefore total lamps= 5X5 =25 twin tube lights of each 80w = 25 * 80 = 2000w 2. In all four side walls four numbers of lamps of 100w =4X100w =400w 3. In front side entrance three numbers of 100w lamps =3X100 =300w 4. In back side wall one lamp of 100w =1X100 =100w 5. Fan at center 3rd bay four numbers =4X60w =240w 6. At front entrance two number of fans =2X60w =120w 7. At each switch point plug point =4X100 =400w Total load =3560w The default location of each lamp, reference sketch is shown below. Phase Switch
Board
Twin Tube Light 80W
Fan 60W
Plug Point 100W
Lamp Point
Total Load in watts
Sub Circuit
R
SB 5
-
1
1 600
1
SB2 5 1 1 1 660 2 Y
SB3
5
4
-
1
740
1
SB6 -- -- -- 3 300 2
B
SB4
5
1
1
1
660
1
SB5 5 - 1 1 600 2
Total
25 6 4 8 3560w
1) For the main switch: - 3 phase connections Total load current = = =6.4A With factor of safety 2, we can select 15A, 500V rate ICTP (TPN) Main switch 2) Therefore we can select one number of 3phase 4wire wire DB box with cut out fuses. 3) We can select three phase, 6way, ICDB, 4000V 4) For each phase MCB can be calculated as = =6A We can select 10A, MCB, 250V grade for connectivity all the three phases. 5) For all wiring (surface type wiring) the C.I Conduit can be used 25.4mm heavy gauge conduit can be used.
www.binils.com
Anna University, Polytechnic & Schools www.binils.com

46
6) For earthing 8 SWG Hand drawn base copper wire can be used. (Fill three phases having 2 sub circuits, therefore we can select) SB1 = (5X80) + (1X100) + (1X100) = 600 SB2 = (5X80) + (1X100) + (1X60) + (1X100) = 660 SB3 = (5X80) + (4X60) + (1X100) = 740 SB4 = (5X80) + (1X60) + (1X100) + (1X100) = 660 SB5 = (5X80) +1X100 + 1X100 = 600 SB6 = 3X100 = 300 7).Conduit pipe calculation Ceiling height=4m, since all the tube lights, fans, lamps are having 1.5 m from ceiling for VR multiple with 1.5m by no. of points
Location HR VR CR Total
DB to SB1
8
1.5+1.5+(6X1) 20
37
DB to SB2
4 1.5+1.5+(7X1) 20 34
DB to SB3 0.5
1.5+1.5+(10X1) 20 33.5
DB to SB4
4 1.5+1.5+(7X1) 20 34
DB to SB5
8 1.5+1.5+(6X1) 20 37
DB to SB6
20 1.5+(3X1) _ 24.5
Total 200m
Approx: 200m Length of conduit pipe =200m+10% wastage =220m 8).Length of Aluminum conductor =Length of PVCX3 For all the phases, the size of PVC Al copper cable can be calculated as
i) For connecting MB to DB= 1.5mm2(3/0.737) single core cable can be used =1.5mx3=5m ii) For all other connections Total copper conductor =220X3 = 660m
Add 10% wastage =660+66 =726m say 730m 9). Earth wire 8 SGW =1X Length of PVC =220m 10).MATERIAL REQUIRED. S.NO MATERIAL WITH SPECIFICATIONS QUATITY
1. 3phase,500V, 32A,TPIC main switch 1 2. Distribution box DPIC 15A 6 way with MCB 1 3. 6 Sq mm copper conductor(3/0.737)mm
5m
4. 1.5mm2(3/0.737)single core cable 730m 5. GI - CONDUIT PIPE (25mm). 220 m
www.binils.com
Anna University, Polytechnic & Schools www.binils.com

47
6. 3 Pin socket 5A 4 7. Earth wire standard 8 SWG 220m 8. Batten holder 6 9. Ceiling rose PVC type 6A,250 V 6 10. Plug socket with switches 3 pin, 5A,250 V 8 11. 25 mm GI conduit elbow 2 12. 25 mm GIC conduit Bend 10 13. Flush type Switches 5A,250V 43 14. Twin tube light fittings 25 15. Lamp holders 8 16. Pipe Earthing set 2 17. PVC conduit junction box singlway,2 way,3 way 7 each 18. Teak wood board (30X20)cm size 4 19. Teak wood board (10X10) cm 8
ESTIMATION NO.3 COMPUTER CENTRE WIRING 3. Estimate the quantity of materials required for wiring a computer centre of size 10mX6mX4m having the following loads. Computer -10nos, Tube light-10 nos, A/C unit-2 nos, UPS-5KVA -1 no, Ceiling fan-4 nos, Plug points -8 nos Draw the installation plan, single line diagram and estimate the quantity of materials required. Assume the necessary data as per IE rules and mention the same. Solution:
1. Assumptions: i) Power supply system- 3 phase system ii) Power factor- 0.8 iii) Type of wiring –Surface conduit wiring iv) Height of main board -1.5m above ground v) Height of switch board for computers -1m vi) Height of PVC conduit horizontal run =1m vii) Height of PVC wiring for AC -2.5 m
www.binils.com
Anna University, Polytechnic & Schools www.binils.com

48
www.binils.com
Anna University, Polytechnic & Schools www.binils.com

49
2. LOAD CALCULATIONS SL.NO LOAD QTY POWER
IN WATTS
TOTAL WATTS
CURRENT PHASE SUB CIRCUIT
1 A/C-1.5 tonne 2 1500 3000 9A each R 2 nos (A/C I -1 A/C II-2)
2 UPS-5 KVA 1 5000 5000 22A Y 3 nos (C1 to C3 -1 C4 To C7 -2 C8 to C10 -3)
3 Tube light 8 40 320 3A B
2 no (SB1 &SB4 -1 SB2& SB3-2) 4 Fan 4 60 240 3A
5 Plug point 8 100 800 3A
6 Total 9360
Since the total load exceeds 2000w, we have to use 3 Phase supply system.
3. LOAD CURRENT CALCULATION:(Main switch, DB) Line current = = =17A Therefore we can select 3 phase, 64A, 500V, TPIC main switch with factor of safety 2. We can select 3 phase, 64A, 6 way, distribution boards with isolators for connecting 3 phases as in dia.
To connect computer with UPS we required 4 way DB with 6A MCB with 32A ICDP To connect A/C machines with R phase we required 2nos of 9A MCB with 32A ICDP To connect light loads we required 2nos of 6A MCB. with 16A ICDP
4. Selection of size of conductor: i) Since the total load current is 17A with factor of safety 2 we can select 6 mm2, 7/1.06 copper conductor for main board to DB. ii) For A/C machine connections since the current is 9A with safety factor 2 i.e. (9X2=18A) we can select 4 mm2 (7/0.737) copper conductor. iii) For computer circuit I& II since the load current is 9A with safety factor 2 i.e. (9X2=18A) we can select 4mm2 (7/0.737) copper conductor. iii) For light loads since load current is 3Awith safety factor 2 i.e. (3X2=6A) we can select 1.5 mm2 i.e. (3/737) copper conductor.
www.binils.com
Anna University, Polytechnic & Schools www.binils.com

50
5. Calculation of length of PVC conduit (25.4mm) location Hori run
In m Vert. Run In m
Ceiling run In m
Total With10% wastage total length in m
Size of conductor
Total length= Length of conduit X3
From main board to DB 1
1 -- --- 1 1.5 say2m
6 mm2 2X 3=6 Say6m
From DB to AC 1
2.5+15+2.5 1.5+1.5 -- 23 112.5 Say 115
4 mm2
115X3=345m
From DB to AC 2
2.5+15+7.5
1.5+1.5 -- 28
From DB to UPS
1
1.5+1.5
--- 4
UPS to comp ckt I C1 to C4
1+10+10.5 1 22.5
From UPS to comp ckt II C5 to C8
1+15+10+1.5
1 --- 28.5
From UPS to comp ckt II C9 to C10
1+4.5 1 --- 6.5
From DB to light load 1 (SB1)
2.5+7.5+ 1.5+(8X0.5)+ 1.5
13.5+2.5+5 37 37+36=73 =say 75m
1.5 mm2 75X3=225m
From DB to light load 2 (SB2)
2.5+2.5 1.5+1.5+ (9X0.5)
23.5 36
Total 192m 192 Therefore total length of conduit pipe =192m= say 200m Therefore total length of 4 sq mm conductor =345m
Therefore total length of 6 sq mm conductor =6m Length of copper conductor 1.5sq mm required = 225m
7. Length of earth wire standard 8 SWG GI (for double earthing) = length of PVC X 2 = 200 X 2 = 400m
EARTH BITS OF PIPE EARTHING =2 NOS
www.binils.com
Anna University, Polytechnic & Schools www.binils.com

51
7. MATERIALS REQUIRED. S.NO MATERIAL WITH SPECIFICATIONS QUATITY
1. 3phase,500V, 32A,TPIC main switch 1 2. Distribution box 3 phase,6 way, 32A with isolator with MCB16A-2no,
6A-2no,
1
3. Distribution box 4 way,32A,250V with isolator with 32A,250V double pole MCB
1
4. PVC CONDUIT PIPE (25MM). 200 m 5. 3.5 Sq mm copper conductor(3/0.737)mm
6 sq mm copper conductor 4 sq mm copper conductor
225m 10m 345m
6. Earth wire standard 8 SWG 400m 7. Batten holder 6 8. Ceiling rose PVC type 6A,250 V 4 9. Plug socket with switches 3 pin, 5A,250 V 8 10. 25 mm PVC conduit elbow 2 11. 25 mm PVC conduit Bend 10 12. Flush type Switches 5A,250V 20 13. Flush type switches 15 A, 250 V 1 14. Plug socket with switches 15 A, 250 V 20 15. Pipe Earthing set 2 16. PVC conduit junction box singlway,2 way,3 way 7 each 17. Teak wood board (30X20)cm size 4 18. Teak wood board (10X10) cm 10
ESTIMATION 4 –STREET LIGHTING 4. In a street there are 12 tubular lamp posts of height 7m with a span of 30 m. Each post has one 4 feet tube with outdoor type fittings. Estimate the materials required and draw the installation plan. Solution: - Height of post - 7m , Span - 30m, No. of post - 12 1. Assumptions 1. One no switch 15A, 250V, is provided at post No: 1 to control all 12 lamps. 2. Supply to this MS is taken from nearest pillar box 8m away. 3. The pillar box height is at 0.5m above ground. 4. The service cable is run 1.0m below ground. 5. MS is placed 1.35m above ground. 6.1/6 of post height i.e. 1.166m is below the ground. 7. Coping for the post is done above the ground for a height of 0.7m. 8. We can use 2 are 1mm2(1/1.2) copper cable. 9. All 12 lamps are at one side. 10. Four feet water tight tube lighting to be used.
www.binils.com
Anna University, Polytechnic & Schools www.binils.com

52
www.binils.com
Anna University, Polytechnic & Schools www.binils.com

53
2. CALCULATION OF LOAD, CURRENT, MAIN SWITCH, SIZE OF CONDUCTOR. Calculation of load: No of lamps=12 Power of each lamp=40watts Voltage of the system=230v Power factor=0.8 Line current = = = 2.6 A Maximum load current with factor of safety = 2 x 2.6 = 5.2A Current through each lamp= = 0.2A 3. Therefore we can select the main switch of rating 16A, 600V grade DPIC main switch. Size of cable: *Since total load current is 5.2A, we can select 4mm2 twin core copper cable to minimize the voltage drop for connecting MS from pillar to all lamps.
www.binils.com
Anna University, Polytechnic & Schools www.binils.com
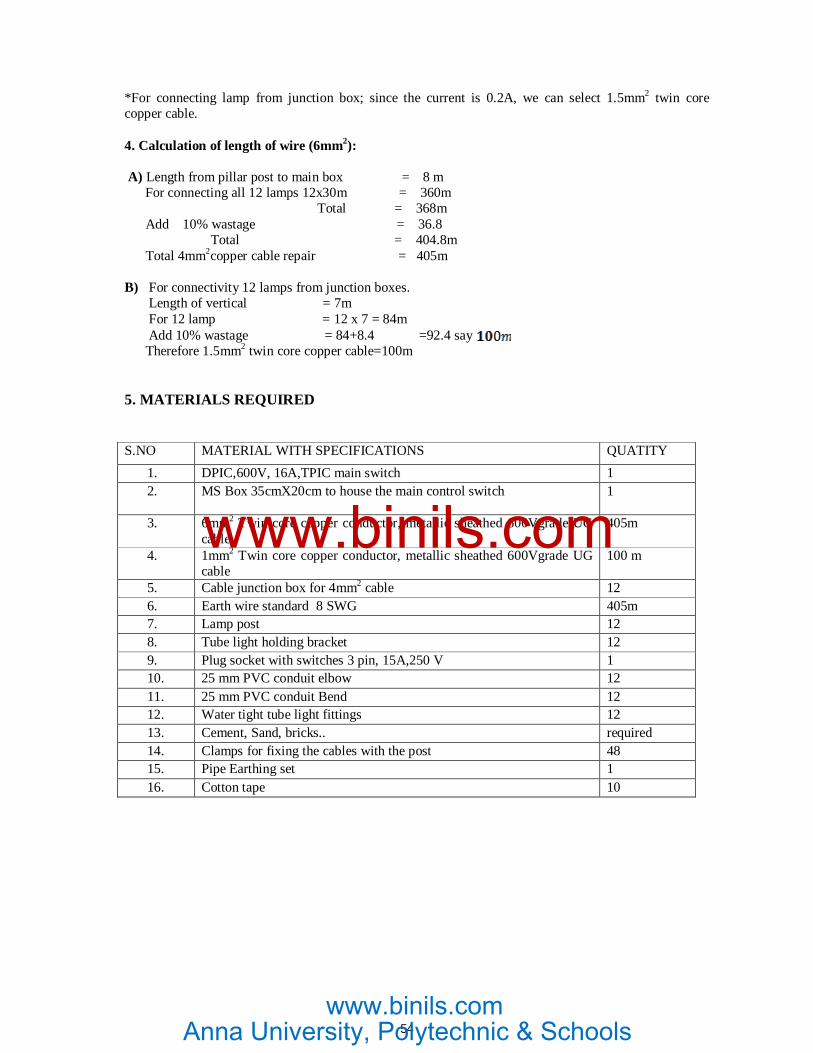
54
*For connecting lamp from junction box; since the current is 0.2A, we can select 1.5mm2 twin core copper cable. 4. Calculation of length of wire (6mm2): A) Length from pillar post to main box = 8 m For connecting all 12 lamps 12x30m = 360m Total = 368m Add 10% wastage = 36.8 Total = 404.8m Total 4mm2copper cable repair = 405m B) For connectivity 12 lamps from junction boxes. Length of vertical = 7m For 12 lamp = 12 x 7 = 84m Add 10% wastage = 84+8.4 =92.4 say Therefore 1.5mm2 twin core copper cable=100m 5. MATERIALS REQUIRED S.NO MATERIAL WITH SPECIFICATIONS QUATITY
1. DPIC,600V, 16A,TPIC main switch 1 2. MS Box 35cmX20cm to house the main control switch
1
3. 6mm2 Twin core copper conductor, metallic sheathed 600Vgrade UG cable
405m
4. 1mm2 Twin core copper conductor, metallic sheathed 600Vgrade UG cable
100 m
5. Cable junction box for 4mm2 cable 12 6. Earth wire standard 8 SWG 405m 7. Lamp post 12 8. Tube light holding bracket 12 9. Plug socket with switches 3 pin, 15A,250 V 1 10. 25 mm PVC conduit elbow 12 11. 25 mm PVC conduit Bend 12 12. Water tight tube light fittings 12 13. Cement, Sand, bricks.. required 14. Clamps for fixing the cables with the post 48 15. Pipe Earthing set 1 16. Cotton tape 10
www.binils.com
Anna University, Polytechnic & Schools www.binils.com

55
ESTIMATION 5. SMALL WORKSHOP (5) In a workshop of size 25mx10m a 3φ, 15 HP 400V 3phase induction motor is to be installed. Assume the necessary data. Prepare estimation table for the same and draw installation plan, single line diagram. Solution:- (1)Assumptions:- 1. Height of main switch board and starter = 1.5m above ground 2. Height of horizontal run=2.5m, above ground. 3. Type of wiring surface conduit types. 4. Supply 3φ, 400V system. 5. Motor is to be installed 0.5m above ground. 6. Assume efficiency of motor to be 85 % and power factor 0.8.
www.binils.com
Anna University, Polytechnic & Schools www.binils.com

56
(2) Calculation of load current. Line current = = = 23.41A Considering factor of safety as 2. IL = will be = 2 x 23.4 = 46.8A Therefore we can select 60A, 3 phase, and TPN Main switch. (3) Selection and rating of motor switch. As the total load including 50% over load will be 34 A we can select 45 A TPIC motor main switch to be at control board. (4) Selection of starter: We can select star delta starter for connecting the motor. (5)Selection and rating of conductor: Since the maximum current is to be 34A (Considering 50% over load current) we can select PVC, 660V grade 6sq.mm Copper conductor.
www.binils.com
Anna University, Polytechnic & Schools www.binils.com

57
(6) Selection of conductor for main switch to sub main switch:- For connecting main switch board to sub main board we can select 25 mm2 (7 /2.24 mm) dia aluminum conductors, 660V grade. The same size of flexible conduit can be used for connecting energy meter with main switch. (7) Selection and size of conduit pipe: Maximum six wires are to be taken from starter to the motor, therefore we can select 30 mm dia heavy gauge galvanized iron conduit pipe. (8) Calculation of conduit pipe
Location HR VR Total MB to control board 20 1+1 22m From motor starter to floor -- 1.5
3.5 Floor to bottom trench 0.25
Along the trench 1m From bottom to floor 0.25 From floor to top foundation 0.5m
Total Add 10% wastage
25.5 +2.5 =28m
(9)Flexible conduit for connecting: Energy meter to main switch =0.5m Main switch to starter =0.5m Motor foundation to terminals =0.75m ----------------- Total = 1.75m say 2m (10) Calculation of PVC ALUMINIUM Conductor. From MB to motor = 28 x 3 = 84m Flexible conduit = 3 x 2 = 6m Total = 90m Add 10% wastage = 90+9 = 99m Say=100m (11) Calculation of length of earth wire (8 SGW GI) Length of earth wire required = 2 x length of conduit including flexible conduit = 2 x 30m
www.binils.com
Anna University, Polytechnic & Schools www.binils.com
58
(12) MATERIAL REQUIRED S.NO MATERIAL WITH SPECIFICATIONS QUATITY
1. TDPIC,600V, 60A,TPIC main switch 1 2. TPIC motor switch 45A,500V 1 3. 25mm2 single core copper conductor, PVC insulated 600Vgrade 100m 4. 6mm2 single core copper conductor PVC insulated 600Vgrade 2 m 5. Heavy gauge conduit 30 mm dia 12 6. Earth wire standard 8 SWG 60m 7. Flexible conduit (30mm) 12 8. Pipe Earthing set 2 9. Conduit bend, saddles 10 10. Flexible conduit (33mm) 2m 11. Iron clad board for mounting starter and MS 1 12. Conduit coupler 5 13. Wooden screws 30mm required 14. Conduit junction box 2 15. Cotton tape 1
ESTIMATION NO 6 - INDUSTRIAL POWER WIRING 6. A small workshop of size 10mX6mx4m height is to be provided with the following machines. Draw the installation plan making the location of various motors and also mark the path of power wiring connections to each machine from main distribution board. List out the quantity of materials required.
Shaper machine 5HP
Lathe machine 3HP
Grinder machine 1HP
Drilling machine 1HP
SOLUTION; 1.ASSUMPTIONS: 1. Three phase supply, 400V, AC is needed 2. Type of wiring : Heavy gauge conduit wiring 3. Height of ceiling : 3.5 m above ground. 4.Height of main switch=1.5m above floor 5.Hight of motors erected=0.5m above ground. 6. Power factor=0.8 7.Effeciency of the machines=90%
www.binils.com
Anna University, Polytechnic & Schools www.binils.com
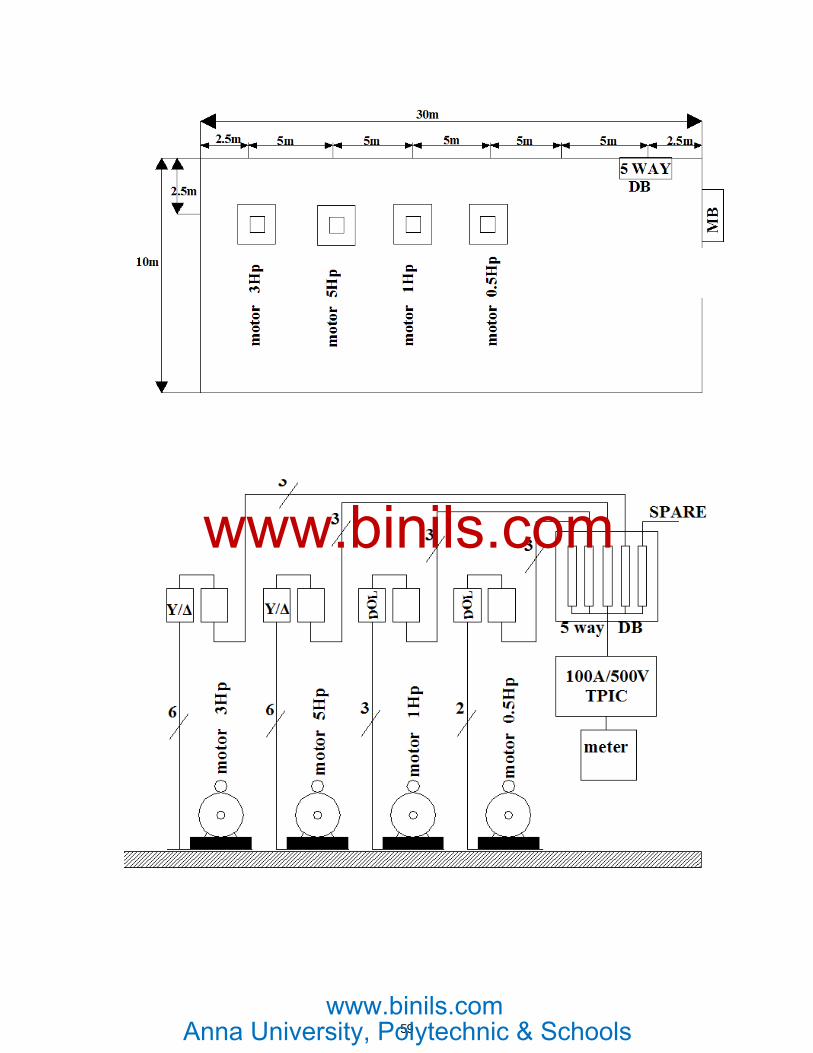
59
www.binils.com
Anna University, Polytechnic & Schools www.binils.com

60
2. CALCULATION OF CONNECTED LOAD, SUB CIRCUITS, TOTAL POWER…
Load In HP
In Watts= Hp X 735.6
Load current in A
Safety factor
max. current in A
Size of M.S
Sub circuits
Size of copper conductor
Shaper machine
5 3678 7.4 A 2 14 16A TPIC M.S
Sub main circuit I
4 Sq mm
Lathe machine
3 2207 4.5 2 9 16A TPIC M.S
Sub main circuit 2
4 Sq mm
Grinder machine
1 736 1.5 2 3 16A TPIC M.S
Sub main circuit I
4 Sq mm
Drilling machine
1 367.8 1.5 2 3 16A TPICM.S
Sub main circuit 2
4 Sq mm
Total 29A 62 A TPIC M.S
6Sq mm
3. CALCULATION OF LINE CURRENT &SIZE OF MAIN SWITCH, MCB, DB, DISTRIBUTION BOX. Line current = = THEREFORE WE CAN SELECT 16A IRON CLAD TRIPLE POLE MAINSWITCH- 4 nos 32A IRON CLAD TRIPLE POLE MAINSWITCH- 1 nos FOR TOTAL MAIN SWITCH 64A IRON CLAD TRIPLE POLE MAINSWITCH- 1 no SUB MAIN DISTRIBUTION BOARDS FOR TWO SUB MAIN CIRCUITS-2 nos
4. Calculation of MS rigid conduit pipe
location Hori run in m Vertical run in m
Total +10% wastage
From main panel to DB 2.5+2.5 1 4
From DB to lathe 1 20 1.5+0.5+0.5+1 23.5=Say24
From DB to grinding machine
15 1.5+0.5+0.5+1 18.5 Say 20m
DB to shaping machine 25+2.5 1.5+0.5+0.5+1 Say31m
From DB to drilling machine 10 1.5+0.5+0.5+1 13.5 Say 14m
Flexible conduit DB to Conduit mouth Motor switch to starter Starter to motor terminals
1m 2m 2m
5+0.5=5.5 Say 6m
Total 93m + 6m(flexible)
www.binils.com
Anna University, Polytechnic & Schools www.binils.com

61
Therefore total length of conduit pipe = 93m Length of flexible conduit = 6m
Therefore total length of 6 sq mm conductor for MB to DB= 1 x 3=3m 5. Length of 4 sq mm copper conductor required = 3X PVC length= 3X 93 =279m=300m 6. Length of earth wire standard 8 SWG = Two distinct earth wiring to be needed for machine earthing. = length of PVC (93m) X 2 =186m EARTH BITS OF Plate Earthing =2 NOS 7. MATERIALS REQUIRED S.NO MATERIAL WITH SPECIFICATIONS QUATITY
1. Triple pole iron clad main switch -32 A , 500V grade 1 2. Distribution box iron clad (power)6 way,30 A,500 V 1 3. Triple pole motor main switch TPIC 16A ,500V 4 4. Heavy gauge Conduit Pipe (25mm). 93 m 5. 4 Sq mm copper conductor(1/2.24)mm dia PVC insulated single core
660 V grade aluminium conductor 300m
6. Earth wire standard 8 SWG GI 186 m 7. 6 Sq mm copper conductor(1/2.80)mm dia PVC insulated single core
660 V grade aluminum conductor 3m
8. Earth bit plate earthing set 2 9. Iron clad board for mounting main switch and DB mild steel
30cmX45cm 1
10. 25 mm PVC conduit junction box 6 11. 25 mm PVC conduit Bend 10 12. Flexible conduit 25 mm 6m 13. Iron clad board for mounting main switch and starter mild steel
45cmX165cm 4
14. Bolt and nuts 50 15. Earthing set 1 16. Caution board 1 17. Shock treatment chart 1
www.binils.com
Anna University, Polytechnic & Schools www.binils.com

62
REVIEW QUESTIONS
PART A & B 1. What are the types of electrical installations?
2. What is the size of smallest aluminum conductor for the wiring or circuit?
3. What is the minimum size of aluminum conductor for power wiring?
4. What is the size of aluminum conductor for power wiring for geysers?
5. What is the rating of Light points in residential and non- residential buildings?
6. What is the rating of Ceiling fan/table fan, Exhaust fan?
7. What is the rating of Socket Outlet?
8. What is Diversity factor for sub circuits?
9. What are the steps to be followed in carrying out the electrical estimation?
10. Name the factors which determine the size of the wire?
11. Enumerate mounting levels of the accessories and cables as recommended in BIS and NEC.
12. What is meant by estimation of wiring installations?
13. What are the Procedures to be followed while estimating for internal electrification?
14. Give some General guidelines for Conducting Estimates.
15. How sub circuits can be classified? What is the advantage of sub circuits?
16. What is the height of switchboard to be installed?
17. What are the locations of control switches, main boards and distribution boards?
18. What are the three stages of calculating conduit pipe length?
19. How the rating of energy meter, distribution board and sub circuits can be calculated?
20. What is the necessity of earthing?
PART C
1. A residential building is to be electrified with surface PVC conduit concealed type of wiring.
Give the schedule of material .The details of fittings are as follows:
Name of the
Room
Size No.of Tube
lights
No .of
Fans
No.of ordinary
Lamps
No.of Plugs
Drawing Room 5m*6m 2 1 1 1
Kitchen 2m*4m 1 1 - 1
Bed Room 4m*4m 1 1 1 1
Bath Room 1m*1m - - 1 1 power
plug
Toilet 1m*1m - - 1 -
2. A factory of size 20 m*20 m is to be illuminated, so as to get the illumination of 20 lux at working plane .Estimate cost for wiring, assuming necessary data as per IE rules. (Use twin tube lights of each
www.binils.com
Anna University, Polytechnic & Schools www.binils.com

63
40 w).Decide the number of lights, sub-circuits to be used according to Indian Electricity Rules. Draw the necessary plan of the factory and show the position of the fittings and switch boards. 3. Estimate the quantity of materials required for wiring a computer centre of size 10 m *6 m *4 m height
having the following electrical load.
Number of Computer system : 10 nos No. of Scanner: 1 no
No. of Tube light fitting : 10 nos No. of Printer: 2 no
No.of Ceiling Fan : 04 nos UPS : 5 KVA
Window model A/C Unit 1.5 ton: 2 nos.
Draw a suitable installation plan ,single line wiring diagram and estimate the quantity of materials required with specification .Type of wiring proposed is concealed conduit system .Assume necessary data as per IE Rules and mention them clearly 4. In a street, 12 tubular lamp posts of height 7 mts, are to be erected with a span of 30 mts. Each lamp
posts are to be fitted with one 4 feet tube light without door type fittings. Estimate the quantity of
materials required for the installation by assuming suitable data. Underground cable may be used for the
connection lamps the post.
5. A Workshop of size 25m*10m.A 15 HP, 400 V, 50 Hz induction motor has to be installed for running
a saw mill. Estimate the quantity of materials required with their specification .Assume surface metal
conduit wiring and necessary data as per the IE rules.
6. A small workshop of size 10mX6mx4m height is to be provided with the following machines. Draw the installation plan making the location of various motors and also mark the path of power wiring connections to each machine from main distribution board. List out the quantity of materials required.
Shaper machine 5HP
Lathe machine 3HP
Grinder machine 1HP
Drilling machine 1HP
www.binils.com
Anna University, Polytechnic & Schools www.binils.com

64
UNIT-III ENERGY MANAGEMENT & AUDIT AND ELECTRICAL SYSTEM
Objectives: After completion of this chapter the student will know about these: A. Energy Management & Audit: Definition, Energy audit- need, Types of energy audit, Energy
management (audit) approach-understanding energy costs, Bench marking, Energy performance, Matching energy use to requirement, Maximizing system efficiencies, Optimizing the input energy requirements, Fuel and energy substitution, Energy audit instruments
3.1 Definition & Objectives of Energy Management “Energy saved is twice the energy generated. The fundamental goal of energy management is to produce goods and provide services with the least cost and least environmental effect. The term energy management means many things to many people. One definition of energy management is:
“The judicious and effective use of energy to maximize profits (minimize costs) and enhance competitive positions”
(Cape Hart, Turner and Kennedy, Guide to Energy Management Fairmont press inc. 1997)
Another comprehensive definition is “The strategy of adjusting and optimizing energy, using systems and procedures so as to reduce energy requirements per unit of output while holding constant or reducing total costs of producing the output from these systems” The objective of Energy Management is to achieve and maintain optimum energy procurement and utilization, throughout the organization and:
To minimize energy costs / waste without affecting production & quality To minimize environmental effects.
3.2. Energy Audit: Types And Methodology Energy Audit is the key to a systematic approach for decision-making in the area of energy management. It attempts to balance the total energy inputs with its use, and serves to identify all the energy streams in a facility. It quantifies energy usage according to its discrete.
www.binils.com
Anna University, Polytechnic & Schools www.binils.com
65
As per the Energy Conservation Act, 2001, Energy Audit is defined as “The verification, monitoring and analysis of use of energy including submission of technical report containing recommendations for improving energy efficiency with cost benefit analysis and an action plan to reduce energy consumption”. 3.2.1 Need for Energy Audit In any industry, the three top operating expenses are often found to be energy (both electrical and thermal), labour and materials. If one were to relate to the manageability of the cost or potential cost savings in each of the above components, energy would invariably emerge as a top ranker, and thus energy management function constitutes a strategic area for cost reduction. Energy Audit will help to understand more about the ways energy and fuel are used in any industry, and help in identifying the areas where waste can occur and where scope for improvement exists.
The Energy Audit would give a positive orientation to the energy cost reduction, preventive maintenance and quality control programmes which are vital for production and utility activities. Such an audit programme will help to keep focus on variations which occur in the energy costs, availability and reliability of supply of energy, decide on appropriate energy mix, identify energy conservation technologies, retrofit for energy conservation equipment etc. In general, Energy Audit is the translation of conservation ideas into realities, by lending technically feasible solutions with economic and other organizational considerations within a specified time frame.
The primary objective of Energy Audit is to determine ways to reduce energy consumption per unit of product output or to lower operating costs. Energy Audit provides a “ bench-mark” (Reference point) for managing energy in the organization and also provides the basis for planning a more effective use of energy throughout the organization. 3.2.2 Type of Energy Audit The type of Energy Audit to be performed depends on:
- Function and type of industry - Depth to which final audit is needed, and - Potential and magnitude of cost reduction desired
Thus Energy Audit can be classified into the following two types.
i) Preliminary Audit ii) Detailed Audit
3.2.3 Preliminary Energy Audit Methodology Preliminary energy audit is a relatively quick exercise to:
i. Establish energy consumption in the organization ii. Estimate the scope for saving
a. Identify the most likely (and the easiest areas for attention b. Identify immediate (especially no-/low-cost) improvements/ savings c. Set a ‘reference point’ d. Identify areas for more detailed study/measurement e. Preliminary energy audit uses existing, or easily obtained data
www.binils.com
Anna University, Polytechnic & Schools www.binils.com

66
3.2.4 Detailed Energy Audit approach A comprehensive audit provides a detailed energy project implementation plan for a facility, since it evaluates all major energy using systems. This type of audit offers the most accurate estimate of energy savings and cost. It considers the interactive effects of all projects, accounts for the energy use of all major equipment, and includes detailed energy cost saving calculations and project cost. In a comprehensive audit, one of the key elements is the energy balance. This is based on an inventory of energy using systems, assumptions of current operating conditions and calculations of energy use. This estimated use is then compared to utility bill charges.
Detailed energy auditing is carried out in three phases: Phase I, II and III.
Phase I - Pre Audit Phase Phase II - Audit Phase Phase III - Post Audit Phase
A Guide for Conducting Energy Audit at a Glance Industry-to-industry, the methodology of Energy Audits needs to be flexible.
A comprehensive ten-step methodology for conduct of Energy Audit at field level is presented below. Energy Manager and Energy Auditor may follow these steps to start with and add/change as per their needs and industry types.
www.binils.com
Anna University, Polytechnic & Schools www.binils.com

67
Ten Steps Methodology for Detailed Energy Audit Step
PLAN OF ACTION
PURPOSE / RESULTS
No
Phase I –Pre Audit Phase
Step 1 • Plan and organise • Resource planning, Establish/organize a • Walk through Audit
• Energy audit team
• Informal Interview with Organize Instruments & time frame Energy Manager, Production • Macro Data collection (suitable to type of / Plant Manager industry.) • Familiarization of process/plant activities • First hand observation & Assessment of
Step 2
• Conduct of brief meeting /
•
current level operation and practices
Building up cooperation
awareness programme with • Issue questionnaire for each department all divisional heads and • Orientation, awareness creation persons concerned (2-3 hrs.)
Step 3
Phase II –Audit Phase • Primary data gathering, • Historic data analysis, Baseline data
Process Flow Diagram, & collection Energy Utility Diagram • Prepare process flow charts
• All service utilities system diagram (Example: Single line power distribution diagram, water, compressed air & steam
• distribution.
Design, operating data and schedule of operation • Annual Energy Bill and energy consumption pattern (Refer manual, log sheet, name plate,
Step 4
• Conduct
survey and
•
interview) Measurements :
monitoring Motor survey, Insulation, and Lighting
survey with portable instruments for collection of more and accurate data. Confirm and compare operating data with
Step 5
• Conduct of detailed trials design data.
• Trials/Experiments:
/experiments for selected energy guzzlers - 24 hours power monitoring (MD, PF, kWh etc.).
- Load variations trends in pumps, fan
www.binils.com
Anna University, Polytechnic & Schools www.binils.com

68
compressors etc. - Boiler/Efficiency trials for (4 – 8 hours) - Furnace Efficiency trials Equipments Performance experiments etc
Step6 • Analysis of energy use • Energy and Material balance & energy
Step 7
loss/waste analysis
• Identification and • Identification & Consolidation ENCON development of Energy measures Conservation (ENCON) Conceive, develop, and refine ideas
opportunities Review the previous ideas suggested by unit personal Review the previous ideas suggested by
energy audit if any
Use brainstorming and value analysis
techniques
Contact vendors for new/efficient technology
Step 8 • Cost benefit analysis
• Assess technical feasibility, economic
viability and prioritization of ENCON options for implementation
• Select the most promising projects • Prioritise by low, medium, long term
measures Step9
• Reporting & Presentation to • Documentation, Report Presentation to the the Top Management top Management.
Phase III –Post Audit phase
Step10 • Implementation and Follow- Assist and Implement ENCON recommendation
Up measures and Monitor the performance Action plan, Schedule for implementation Follow-up and periodic review
www.binils.com
Anna University, Polytechnic & Schools www.binils.com

69
Phase I –Pre Audit Phase Activities A structured methodology to carry out an energy audit is necessary for efficient working. An initial study of the site should always be carried out, as the planning of the procedures necessary for an audit is most important. Initial Site Visit and Preparation Required for Detailed Auditing An initial site visit may take one day and gives the Energy Auditor/Engineer an opportunity to meet the personnel concerned, to familiarize him with the site and to assess the procedures necessary to carry out the energy audit.
During the initial site visit the Energy Auditor/Engineer should carry out the following actions: - • Discuss with the site’s senior management the aims of the energy audit. • Discuss economic guidelines associated with the recommendations of the audit. • Analyze the major energy consumption data with the relevant personnel. • Obtain site drawings where available – building layout, steam distribution, compressed
air distribution, electricity distribution etc. • Tour the site accompanied by engineering/production The main aims of this visit are: - • To finalize Energy Audit team • To identify the main energy consuming areas/plant items to be surveyed during the audit. • To identify any existing instrumentation/ additional metering required. • To decide whether any meters will have to be installed prior to the audit e.g. kWh, steam,
oil or gas meters. • To identify the instrumentation required for carrying out the audit.
To plan with time frame To collect macro data on plant energy resources, major energy consuming centers To create awareness through meetings/ programme
Phase II- Detailed Energy Audit Activities Depending on the nature and complexity of the site, a comprehensive audit can take from several weeks to several months to complete. Detailed studies to establish, and investigate, energy and material balances for specific plant departments or items of process equipment are carried out. Whenever possible, checks of plant operations are carried out over extended periods of time, at nights and at weekends as well as during normal daytime working hours, to ensure that nothing is overlooked.
The audit report will include a description of energy inputs and product outputs by major department or by major processing function, and will evaluate the efficiency of each step of the manufacturing process. Means of improving these efficiencies will be listed, and at least a preliminary assessment of the cost of the improvements will be made to indicate the expected payback on any capital investment needed. The audit report should conclude with specific recommendations for detailed engineering studies and feasibility analyses, which must then be performed to justify the implementation of those conservation measures that require investments.
www.binils.com
Anna University, Polytechnic & Schools www.binils.com

70
The information to be collected during the detailed audit includes: - 1. Energy consumption by type of energy, by department, by major items of process
equipment, by end-use 2. Material balance data (raw materials, intermediate and final products, recycled
Materials, use of scrap or waste products, production of by-products for re-use in other industries, etc.)
3. Energy cost and tariff data 4. Process and material flow diagrams 5. Generation and distribution of site services (e.g. compressed air, steam). 6. Sources of energy supply (e.g. electricity from the grid or self-generation) 7. Potential for fuel substitution, process modifications, and the use of co-generation
systems (combined heat and power generation). 8. Energy Management procedures and energy awareness training programs within the
establishment. Existing baseline information and reports are useful to get consumption pattern, production cost and productivity levels in terms of product per raw material inputs. The audit team should collect the following baseline data:
- Technology, processes used and equipment details - Capacity utilization - Amount & type of input materials used - Water consumption - Fuel Consumption - Electrical energy consumption - Steam consumption - Other inputs such as compressed air, cooling water etc - Quantity & type of wastes generated - Percentage rejection / reprocessing - Efficiencies / yield
DATA COLLECTION HINTS It is important to plan additional data gathering carefully. Here are some basic tips to avoid wasting time and effort:
• measurement systems should be easy to use and provide the information to the accuracy that is needed, not the accuracy that is technically possible
• measurement equipment can be inexpensive (flow rates using a bucket and stopwatch) • the quality of the data must be such that the correct conclusions are drawn (what grade of
product is on, is the production normal etc) • Define how frequent data collection should be to account for process variations. • measurement exercises over abnormal workload periods (such as startup and shutdowns) • design values can be taken where measurements are difficult (cooling water through heat
exchanger)
www.binils.com
Anna University, Polytechnic & Schools www.binils.com

71
Draw process flow diagram and list process steps; identify waste streams and obvious energy wastage An overview of unit operations, important process steps, areas of material and energy use and sources of waste generation should be gathered and should be represented in a flowchart as shown in the figure below. Existing drawings, records and shop floor walk through will help in making this flow chart. Simultaneously the team should identify the various inputs & output streams at each process step. Example: A flowchart of Penicillin-G manufacturing is given in the figure3.1 below. Note that waste stream (Mycelium) and obvious energy wastes such as condensate drained and steam leakages have been identified in this flow chart The audit focus area depends on several issues like consumption of input resources, energy efficiency potential, impact of process step on entire process or intensity of waste generation / energy consumption. In the above process, the unit operations such as germinator, pre-fermentor, fermentor, and extraction are the major conservation potential areas identified.
PENICILLIN-G FERMENTATION
Energy Steam, Air, Cooling water
GERMINATOR Chilled water
Condensate
Raw Material Seed Inoculation Raw Material
Steam, Air, Cooling water Chilled water
Condensate Steam, Air, Cooling water
Chilled water
Condensate
PREFERMENTOR
FERMENTOR
Raw Material
Steam Leak
Raw Material
Chilled Brine NON FILTERED BROTH TANK
Mycelium Waste
Compressed Air, Treated FILTER PRESS to ETP Water, Raw Water Stream
Mother liquor to Extraction Impurities with Waste
Steam, Air, Cooling water
EXTRACTION Water to ETP
Chilled water, Brine Stream
Condensate Penicillin-G
Figure 3.1
www.binils.com
Anna University, Polytechnic & Schools www.binils.com

72
Identification of Energy Conservation Opportunities Fuel substitution: Identifying the appropriate fuel for efficient energy conversion Energy generation : Identifying Efficiency opportunities in energy conversion equipment/utility such as captive power generation, steam generation in boilers, thermic fluid heating, optimal loading of DG sets, minimum excess air combustion with boilers/thermic fluid heating, optimizing existing efficiencies, efficient energy conversion equipment, biomass gasifiers, Cogeneration, high efficiency DG sets, etc. Energy distribution: Identifying Efficiency opportunities network such as transformers, cables, switchgears and power factor improvement in electrical systems and chilled water, cooling water, hot water, compressed air, Etc. Energy usage by processes: This is where the major opportunity for improvement and many of them are hidden. Process analysis is useful tool for process integration measures. Technical and Economic feasibility The technical feasibility should address the following issues
• Technology availability, space, skilled manpower, reliability, service etc • The impact of energy efficiency measure on safety, quality, production or process. • The maintenance requirements and spares availability
The Economic viability often becomes the key parameter for the management acceptance. The economic analysis can be conducted by using a variety of methods. Example: Pay back method, Internal Rate of Return method, Net Present Value method etc. For low investment short duration measures, which have attractive economic viability, simplest of the methods, payback is usually sufficient. A sample worksheet for assessing economic feasibility is provided below:
Sample Worksheet for Economic Feasibility Name of Energy Efficiency Measure 1. Investment 2. Annual operating costs 3. Annual savings
• Equipments • Cost of capital • Thermal Energy • Civil works • Maintenance • Electrical Energy • Instrumentation • Manpower • Raw material • Auxiliaries • Energy • Waste disposal
Net Savings /Year (Rs./year) • Depreciation
in months Payback period = (Annual savings-annual operating costs) = (Investment/net savings/year) x 12
www.binils.com
Anna University, Polytechnic & Schools www.binils.com

73
Classification of Energy Conservation Measures Based on energy audit and analyses of the plant, a number of potential energy saving projects may be identified. These may be classified into three categories: 1. Low cost – high return; 2. Medium cost – medium return; 3. High cost – high return Normally the low cost – high return projects receive priority. Other projects have to be analyzed, engineered and budgeted for implementation in a phased manner. Projects relating to energy cascading and process changes almost always involve high costs coupled with high returns, and may require careful scrutiny before funds can be committed. These projects are generally complex and may require long lead times before they can be implemented. Refer Table 3.1 for project priority guidelines.
TABLE 3.1 PROJECT PRIORITY GUIDELINE
Priority Economical Technical Risk /
Feasibility Feasibility Feasibility A – Good Well defined and Existing technology No Risk/
attractive adequate Highly feasible B -May be Well defined and only Existing technology Minor operating
marginally acceptable may be updated, risk/May be lack of confirmation feasible
C –Held Poorly defined and Existing technology Doubtful marginally unacceptable is inadequate
D –No Clearly not attractive Need major Not feasible breakthrough
3.3 Energy Audit Reporting Format After successfully carried out energy audit energy manager/energy auditor should report to the top management for effective communication and implementation. A typical energy audit reporting contents and format are given below. The following format is applicable for most of the industries. However the format can be suitably modified for specific requirement applicable for a particular type of industry.
www.binils.com
Anna University, Polytechnic & Schools www.binils.com

74
Report on
DETAILED ENERGY AUDIT
TABLE OF CONTENTS
i. Acknowledgement ii. Executive Summary Energy Audit Options at a glance & Recommendations 1.0 Introduction about the plant 1.1 General Plant details and descriptions 1.2 Energy Audit Team 1.3 Component of production cost (Raw materials, energy, chemicals,
manpower, overhead, others) 1.4 Major Energy use and Areas 2.0 Production Process Description 2.1 Brief description of manufacturing process 2.2 Process flow diagram and Major Unit operations 2.3 Major Raw material Inputs, Quantity and Costs 3.0 Energy and Utility System Description 3.1 List of Utilities 3.2 Brief Description of each utility 3.2.1 Electricity 3.2.2 Steam 3.2.3 Water 3.2.4 Compressed air 3.2.5 Chilled water 3.2.6 Cooling water
www.binils.com
Anna University, Polytechnic & Schools www.binils.com

75
4.0 Detailed Process flow diagram and Energy& Material balance 4.1 Flow chart showing flow rate, temperature, pressures of all input-
output streams 4.2 Water balance for entire industry 5.0 Energy efficiency in utility and process systems 5.1 Specific Energy consumption 5.2 Boiler efficiency assessment 5.3 Thermic Fluid Heater performance assessment 5.4 Furnace efficiency Analysis 5.5 Cooling water system performance assessment 5.6 DG set performance assessment 5.7 Refrigeration system performance 5.8 Compressed air system performance 5.9 Electric motor load analysis 5.10 Lighting system 6.0 Energy Conservation Options & Recommendations 6.1 List of options in terms of No cost/ Low Cost, Medium cost and high
investment Cost, Annual Energy & Cost savings, and payback 6.2 Implementation plan for energy saving measures/Projects ANNEXURE A1. List of Energy Audit Worksheets A2. List of instruments A3. List of Vendors and Other Technical details
www.binils.com
Anna University, Polytechnic & Schools www.binils.com

76
The following Worksheets (refer Table 3.2 & Table 3.3) can be used as guidance for energy audit assessment and reporting.
TABLE 3.2 SUMMARY OF ENERGY SAVING RECOMMENDATIONS
S.No. Energy Saving Annual Annual Capital Simple Recommendations Energy (Fuel Savings Investment Payback & (Rs. Lakhs) (Rs. Lakhs) period Electricity) Savings (kWh/MT (or) kl/MT) 1
2
3
4
Total
TABLE 3.3 TYPES AND PRIORITY OF ENERGY SAVING MEASURES Type of Energy Annual Annual Saving Options Electricity Savings Priority /Fuel savings kWh/MT (or) (Rs. Lakhs) kl /MT A No Investment (Immediate)
- Operational Improvement
- Housekeeping
B Low Investment (Short to Medium Term)
- Controls - Equipment
Modification - Process change
C High Investment
(Long Term) - Energy efficient
Devices - Product
modification - Technology
Change
www.binils.com
Anna University, Polytechnic & Schools www.binils.com

77
Reporting Format for Energy Conservation Recommendations
A: Title of Recommendation : Combine DG set cooling tower with main
cooling tower B: Description of Existing System : Main cooling tower is operating with 30% of its and its operation Capacity. The rated cooling water flow is 5000
m3/ hr. Two cooling water pumps are in operation Continuously with 50% of its rated capacity. A separate cooling tower is also operating for DG Set operation continuously. C: Description of Proposed system : The DG Set cooling water flow is only 240 m3/h. and its operation By adding this flow into the main cooling tower,
will eliminate the need for a separate cooling tower operation for DG set, besides improving The % loading of main cooling tower. It is suggested to stop the DG set cooling tower Operation. D: Energy Saving Calculations Capacity of main cooling tower = 5000 m3/ hr Temp across cooling tower (design) = 8 oC Present capacity = 3000 m3/hr Temperature across cooling = 4 oC tower(operating) % loading of main cooling tower = (3000 x 4)/(5000 x 8) = 30% Capacity of DG Set cooling tower = 240 m3/hr Temp across the tower = 5oC Heat Load (240x1000 x 1x 5) = 1200,000 K. Cal/ hrs.
Power drawn by the DG set cooling tower No of pumps and its rating = 2 nos x 7.5 kW No of fans and its rating = 2 Nos x 22 kW Power consumption@ 80% load = (22 x2 +7.5 x2) x.80 = 47 kW Additional power required for main = (66.67 x 6) / (102 x 0.55) = 7 kW cooling tower for additional water flow of 240m3/h (66.67 l/s) with 6 kg/cm2 Net Energy savings = 47 – 7 = 40 kW E: Cost Benefits
Annual Energy Saving Potential = 40kWx 8400hr = 3,36,000 Units/Year Annual Cost Savings = 3,36,000 xRs.4.00 = Rs.13.4 Lakh per year Investment (Only cost of piping) = Rs 1.5Lakhs Simple Payback Period = Less than 2 months
www.binils.com
Anna University, Polytechnic & Schools www.binils.com

78
3.4 Understanding Energy Costs
Understanding energy cost is vital factor for awareness creation and saving calculation. In many industries sufficient meters may not be available to measure all the energy used. In such cases, invoices for fuels and electricity will be useful. The annual company balance sheet is the other sources where fuel cost and power are given with production related information.
Energy invoices can be used for the following purposes:
They provide a record of energy purchased in a given year, which gives a base-line for future reference Energy invoices may indicate the potential for savings when related to production requirements or to air conditioning requirements/space heating etc. When electricity is purchased on the basis of maximum demand tariff they can suggest where savings are most likely to be made. In later years invoices can be used to quantify the energy and cost savings made through energy conservation measures.
A wide variety of fuels are available for thermal energy supply. Few are listed below
Fuel Costs
Fuel oil Low Sulphur Heavy Stock (LSHS) Light Diesel Oil (LDO) Liquefied Petroleum Gas (LPG) Coal Lignite Wood etc. Energy Charges, kWh
(i.e., how much electricity is consumed?) Power factor Charge, P.F
(i.e., Real power use versus apparent power use factor)
Fuel is purchased in Tons or Kiloliters. Availability, cost and quality are the main
three factors that should be considered while purchasing. The following factors should be taken into account during procurement of fuels for energy efficiency and economics.
• Price at source, transport charge, type of transport • Quality of fuel (contaminations, moisture etc) • Energy content (calorific value)
Power Costs
Electricity price in India not only varies from State to State, but also city to city and consumer to consumer though it does the same work everywhere. Many factors are involved in deciding final cost of purchased electricity such as:
• Maximum demand charges, kVA (i.e. How fast the electricity is used?
)
www.binils.com
Anna University, Polytechnic & Schools www.binils.com

79
• Other incentives and penalties applied from time to time • High tension tariff and low tension tariff rate changes • Slab rate cost and its variation • Type of tariff clause and rate for various categories such as commercial, residential,
industrial, Government, agricultural, etc. • Tariff rate for developed and underdeveloped area/States • Tax holiday for new projects
Example: Purchased energy Bill
A typical summary of energy purchased in an industry based on the invoices
Table 3.4 Type of energy Original units Unit Cost Monthly Bill Rs. Electricity 5,00,000 kWh Rs.4.00/kWh 20,00,000 Fuel oil 200 kl Rs.10,000/ kl 20,00,000 Coal 1000 tons Rs.2,000/ton 20,00,000 Total 60,00,000
Unfortunately the different forms of energy are sold in different units e.g. kWh of electricity, liters of fuel oil, tone of coal. To allow comparison of energy quantities these must be converted to a common unit of energy such as kWh, Giga joules, k Cal etc.
Electricity (1 kWh) = 860 k Cal/kWh (0.0036 GJ) Heavy fuel oil (Gross calorific value, GCV) =10000 k Cal/ liter ( 0.0411 GJ/ liter) Coal (Gross calorific value, GCV) =4000 k Cal/ kg ( 28 GJ/ton)
3.5 Benchmarking and Energy Performance
Benchmarking of energy consumption internally (historical / trend analysis) and externally (across similar industries) are two powerful tools for performance assessment and logical evolution of avenues for improvement. Historical data well documented helps to bring out energy consumption and cost trends month-wise / day-wise. Trend analysis of energy consumption, cost, relevant production features, specific energy consumption, help to understand effects of capacity utilization on energy use efficiency and costs on a broader scale.
www.binils.com
Anna University, Polytechnic & Schools www.binils.com

80
External benchmarking relates to inter-unit comparison across a group of similar units. However, it would be important to ascertain similarities, as otherwise findings can be grossly misleading. Few comparative factors, which need to be looked into while benchmarking externally are:
• Scale of operation • Vintage of technology • Raw material specifications and quality • Product specifications and quality
Benchmarking energy performance permits • Quantification of fixed and variable energy consumption trends vis-à-vis production
levels • Comparison of the industry energy performance with respect to various production
levels (capacity utilization) • Identification of best practices (based on the external benchmarking data) • Scope and margin available for energy consumption and cost reduction • Basis for monitoring and target setting exercises.
The benchmark parameters can be: • Gross production related
E.g. kWh/MT clinker or cement produced (cement plant) E.g. kWh/kg yarn produced (Textile unit) E.g. kWh/MT, k Cal/kg, paper produced (Paper plant) E.g. k Cal/kWh Power produced (Heat rate of a power plant) E.g. Million kilo cal /MT Urea or Ammonia (Fertilizer plant) E.g. kWh/MT of liquid metal output (in a foundry)
• Equipment / utility related
E.g. kW/ton of refrigeration (on Air conditioning plant) E.g. % thermal efficiency of a boiler plant E.g. % cooling tower effectiveness in a cooling tower E.g. kWh/NM3 of compressed air generated E.g. kWh /liter in a diesel power generation plant.
While such benchmarks are referred to, related crucial process parameters need mentioning for meaningful comparison among peers. For instance, in the above case:
• For a cement plant – type of cement, Blaine number (fineness) i.e. Portland and process used (wet/dry) are to be reported alongside kWh/MT figure.
• For a textile unit – average count, type of yarn i.e. polyester/cotton, is to be reported along side kWh/square meter.
• For a paper plant – paper type, raw material (recycling extent), GSM quality is some important factors to be reported along with kWh/MT, k Cal / Kg figures.
• For a power plant / cogeneration plant – plant % loading, condenser vacuum, inlet cooling water temperature, would be important factors to be mentioned alongside heat rate (k Cal / kWh).
• For a fertilizer plant – capacity utilization(%) and on-stream factor are two inputs worth comparing while mentioning specific energy consumption
www.binils.com
Anna University, Polytechnic & Schools www.binils.com

81
• For a foundry unit – melt output, furnace type, composition (mild steel, high carbon steel/cast iron etc.) raw material mix, number or power trips could be some useful operating parameters to be reported while mentioning specific energy consumption data.
• For an Air conditioning (A/c) plant – Chilled water temperature level and refrigeration load (TR) are crucial for comparing kW/TR.
• For a boiler plant – fuel quality, type, steam pressure, temperature, flow, are useful comparators alongside thermal efficiency and more importantly, whether thermal efficiency is on gross calorific value basis or net calorific value basis or whether the computation is by direct method or indirect heat loss method, may mean a lot in benchmarking exercise for meaningful comparison.
• Cooling tower effectiveness – ambient air wet/dry bulb temperature, relative humidity, air and circulating water flows are required to be reported to make meaningful sense.
• Compressed air specific power consumption – is to be compared at similar inlet air temperature and pressure of generation.
• Diesel power plant performance – is to be compared at similar loading %, steady run condition etc.
Plant Energy Performance Plant energy performance (PEP) is the measure of whether a plant is now using more
or less energy to manufacture its products than it did in the past: a measure of how well the energy management programme is doing. It compares the change in energy consumption from one year to the other considering production output. Plant energy performance monitoring compares plant energy use at a reference year with the subsequent years to determine the improvement that has been made.
However, a plant production output may vary from year to year and the output has a significant bearing on plant energy use. For a meaningful comparison, it is necessary to determine the energy that would have been required to produce this year production output, if the plant had operated in the same way as it did during the reference year. This calculated value can then be compared with the actual value to determine the improvement or deterioration that has taken place since the reference year. Production factor
Production factor is used to determine the energy that would have been required to produce this year’s production output if the plant had operated in the same way as it did in the reference year. It is the ratio of production in the current year to that in the reference year.
Reference Year Equivalent Energy Use The reference year’s energy use that would have been used to produce the current
year’s production output may be called the “reference year energy use equivalent” or “reference year equivalent” for short. The reference year equivalent is obtained by multiplying the reference year energy use by the production factor (obtained above) Reference year equivalent = Reference year energy use x Production factor
www.binils.com
Anna University, Polytechnic & Schools www.binils.com

82
The improvement or deterioration from the reference year is called “energy performance” and is a measure of the plant’s energy management progress. It is the reduction or increase in the current year’s energy use over the reference, and is calculated by subtracting the current year’s energy use from the reference year equivalent. The result is divided by the reference year equivalent and multiplied by 100 to obtain a percentage.
The energy performance is the percentage of energy saved at the current rate of use
compared to the reference year rate of use. The greater the improvement, the higher the number will be. Monthly Energy Performance
Experience however, has shown that once a plant has started measuring yearly energy performance, management wants more frequent performance information in order to monitor and control energy use on an on-going basis. PEP can just as easily be used for monthly reporting as yearly reporting. 3.6 Matching Energy Usage to Requirement
Mismatch between equipment capacity and user requirement often leads to inefficiencies due to part load operations, wastages etc. Worst case design, is a designer’s characteristic, while optimization is the energy manager’s mandate and many situations present themselves towards an exercise involving graceful matching of energy equipment capacity to end-use needs. Some examples being:
• Eliminate throttling of a pump by impeller trimming, resizing pump, installing variable speed drives
• Eliminate damper operations in fans by impeller trimming, installing variable speed drives, pulley diameter modification for belt drives, fan resizing for better efficiency.
• Moderation of chilled water temperature for process chilling needs • Recovery of energy lost in control valve pressure drops by back pressure/turbine
adoption • Adoption of task lighting in place of less effective area lighting
3.7 Maximizing System Efficiency
Once the energy usage and sources are matched properly, the next step is to operate the equipment efficiently through best practices in operation and maintenance as well as judicious technology adoption. Some illustrations in this context are:
• Eliminate steam leakages by trap improvements • Maximize condensate recovery • Adopt combustion controls for maximizing combustion efficiency • Replace pumps, fans, air compressors, refrigeration compressors, boilers, furnaces,
heaters and other energy consuming equipment, wherever significant energy efficiency margins exist.
www.binils.com
Anna University, Polytechnic & Schools www.binils.com

83
Optimizing the Input Energy Requirements
Consequent upon fine- tuning the energy use practices, attention is accorded to considerations for minimizing energy input requirements. The range of measures could include:
• Shuffling of compressors to match needs. • Periodic review of insulation thickness • Identify potential for heat exchanger networking and process integration. • Optimization of transformer operation with respect to load.
3.8 Fuel and Energy Substitution Fuel substitution: Substituting existing fossil fuel with more efficient and less cost/less polluting fuel such as natural gas, biogas and locally available agro-residues.
Energy is an important input in the production. There are two ways to reduce energy dependency; energy conservation and substitution.
Fuel substitution has taken place in all the major sectors of the Indian economy. Kerosene and Liquefied Petroleum Gas (LPG) have substituted soft coke in residential use. Few examples of fuel substitution
Natural gas is increasingly the fuel of choice as fuel and feedstock in the fertilizer, petrochemicals, Power and sponge iron industries. Replacement of coal by coconut shells, rice husk etc. Replacement of LDO by LSHS
Few examples of energy substitution
Replacement of electric heaters by steam heaters Replacement of steam based hot water by solar systems
Case Study: Example on Fuel Substitution A textile process industry replaced old fuel oil fired thermic fluid heater with agro fuel fired heater. The economics of the project are given below: A: Title of Recommendation : Use of Agro Fuel (coconut chips) in place of Furnace oil in a Boiler
B: Description of Existing System : A thermic fluid heater with furnace oil currently. and its operation In the same plant a coconut chip fired boiler is Operating continuously with good performance. C: Description of Proposed system : It was suggested to replace the oil fired thermic and its operation fluid heater with coconut chip fired boiler as the company has the facilities for handling coconut
D: Energy Saving Calculations Chip fired system.
www.binils.com
Anna University, Polytechnic & Schools www.binils.com

84
Old System Type of fuel Firing : Furnace Oil fired heater GCV : 10,200 k Cal/kg Avg. Thermal Efficiency : 82% Heat Duty : 15 lakh k Cal / hour Operating Hours : 25 days x 12 month x 24 hours = 7,200 hrs. Annual Fuel Cost : Rs.130 lakh (7200 x 1800 Rs. /hr.) Modified System Type of fuel saving = Coconut chips fired Heater GCV = 4200 k Cal/kg Average Thermal Efficiency = 72 % Heat Duty = 15 lakh k Cal / hour Annual Operating Cost = 7200 x 700 Rs / hrs. = 50 lakh Annual Savings = 130 - 50 = Rs.80 lakh. Additional Auxiliary Power + Manpower Cost = Rs. 10 lakh Net Annual Saving = Rs. 70lakh Investment for New Coconut Fired heater = Rs.35 lakh
Simple payback period = 6 months 3.9 Energy Audit Instruments
The requirement for an energy audit such as identification and quantification of energy necessitates measurements; these measurements require the use of instruments. These instruments must be portable, durable, easy to operate and relatively inexpensive. The parameters generally monitored during energy audit may include the following:
Basic Electrical Parameters in AC &DC systems – Voltage (V), Current (I), Power factor, Active power (kW), apparent power (demand) (kVA), Reactive power (kVAr), Energy consumption (kWh), Frequency (Hz), Harmonics, etc.
Parameters of importance other than electrical such as temperature & heat flow, radiation, air and gas flow, liquid flow, revolutions per minute (RPM), air velocity, noise and vibration, dust concentration, Total Dissolved Solids (TDS), pH, moisture content, relative humidity, flue gas analysis – CO2, O2, CO, SOx , NOx , combustion efficiency etc. Key instruments for energy audit are listed below.
The operating instructions for all instruments must be understood and staff should familiarize themselves with the instruments and their operation prior to actual audit use.
www.binils.com
Anna University, Polytechnic & Schools www.binils.com

85
Electrical Measuring Instruments:
These are instruments for measuring major electrical parameters such as kVA, kW, PF, Hertz, kVAr, Amps and Volts. In addition some of these instruments also measure harmonics.
These instruments are applied on-line i.e on running motors without any need to stop the motor. Instant measurements can be taken with hand-held meters, while more advanced ones facilitates cumulative readings with print outs at specified intervals.
Combustion analyzer:
This instrument has in- built chemical cells which measure various gases such as O2, CO, NOX and SOX.
Fuel Efficiency Monitor:
This measures oxygen and temperature of the flue gas. Calorific values of common fuels are fed into the microprocessor which calculates the combustion efficiency.
Fyrite:
A hand bellow pump draws the flue gas sample into the solution inside the fyrite. A chemical reaction changes the liquid volume revealing the amount of gas. A separate fyrite can be used for O2 and CO2 measurement.
www.binils.com
Anna University, Polytechnic & Schools www.binils.com

86
Contact thermometer:
These are thermocouples which measures for example flue gas, hot air, hot water temperatures by insertion of probe into the stream.
For surface temperature, a leaf type probe is used with the same instrument.
Infrared Thermometer:
This is a non-contact type measurement which when directed at a heat source directly gives the temperature read out. This instrument is useful for measuring hot spots in furnaces, surface temperatures etc.
Pilot Tube and manometer:
Air velocity in ducts can be measured using a pilot tube and inclined manometer for further calculation of flows.
Water flow meter:
This non-contact flow measuring device using Doppler Effect / Ultra sonic principle. There is a transmitter and receiver which are positioned on opposite sides of the pipe. The meter directly gives the flow. Water and other fluid flows can be easily measured with this meter.
www.binils.com
Anna University, Polytechnic & Schools www.binils.com

87
Speed Measurements:
In any audit exercise speed measurements are critical as they may change with frequency, belt slip and loading.
A simple tachometer is a contact type instrument which can be used where direct access is possible.
More sophisticated and safer ones are non contact instruments such as stroboscopes.
Tachometer Stroboscope
Leak Detectors:
Ultrasonic instruments are available which can be used to detect leaks of compressed air and other gases which are normally not possible to detect with human abilities.
Lux meters:
Illumination levels are measured with a lux meter. It consists of a photo cell which senses the light output, converts to electrical impulses which are calibrated as lux.
www.binils.com
Anna University, Polytechnic & Schools www.binils.com

88
3.2 ELECTRICAL SYSTEM 3.10. Introduction Electric power supply system in a country comprises of generating units that produce electricity, high voltage transmission lines that transport electricity over long distances, distribution lines that deliver the electricity to consumers. Substations that connect the pieces to each other and energy control centers to coordinate the operation of the components.
The Figure 3.1 shows a simple electric supply system with transmission and distribution network and linkages from electricity sources to end-user.
Fig 3.1 Typical Electric Power Supply Systems The primary function of transmission and distribution equipment is to transfer power economically and reliably from one location to another.
Conductors in the form of wires and cables strung on towers and poles carry the high voltage, AC electric current. A large number of copper or aluminum conductors are used to form the transmission path. The resistance of the long-distance transmission conductors is to be minimized. Energy loss in transmission lines is wasted in the form of I2R losses.
Capacitors are used to correct power factor by causing the current to lead the voltage. When the AC currents are kept in phase with the voltage, operating efficiency of the system is maintained at a high level.
Circuit-interrupting devices are switches, relays, circuit breakers, and fuses. Each of these devices is designed to carry and interrupt certain levels of current. Making and breaking the current carrying conductors in the transmission path with a minimum of arcing is one of the most important characteristics of this device. Relays sense abnormal voltages, currents, and frequency and operate to protect the system.
Transformers are placed at strategic locations throughout the system to minimize power losses in the T&D system. They are used to change the voltage level from low-to-high in step-up transformers and from high-to-low in step-down units.
The power source to end user energy efficiency link is a key factor, which influences the energy input at the source of supply. If we consider the electricity flow from generation to the user in terms of cascade energy efficiency, typical cascade efficiency profile from generation to 11 – 33 kV user industry will be as below:
www.binils.com
Anna University, Polytechnic & Schools www.binils.com

89
After power generation at the plant it is transmitted and distributed over a wide network. The standard technical losses are around 17 % in India (Efficiency = 83%).
Hence one unit saved in the end user is equivalent to two units generated in the power plant. (1Unit / 0.5Eff = 2 Units) 3.11. ELECTRICITY BILLING
The electricity billing by utilities for medium & large enterprises, in High Tension (HT) category, is often done on two-part tariff structure, i.e. one part for capacity (or demand) drawn and the second part for actual energy drawn during the billing cycle. Capacity or demand is in kVA (apparent power) or kW terms. The reactive energy (i.e.) kVArh drawn by the service is also Recorded and billed for in some utilities, because this would affect the load on the utility. Accordingly, utility charges for maximum demand, active energy and reactive power drawn (as reflected by the power factor) in its billing structure. In addition, other fixed and variable expenses are also levied. The tariff structure generally includes the following components: 3.2.2 Maximum demand Charges
These charges relate to maximum demand registered during month/billing period and corresponding rate of utility. 3.2.3 Energy Charges These charges relate to energy (kilowatt hours) consumed during month / billing period and corresponding rates, often levied in slabs of use rates. Some utilities now charge on the basis of apparent energy (kVAh), which is a vector sum of kWh and kVArh. 3.2.4 Power factor penalty or bonus rates, as levied by most utilities, are to contain reactive power drawn from grid. 3.2.5 Fuel cost adjustment charges as levied by some utilities are to adjust the increasing fuel expenses over a base reference value. 3.2.6 Electricity duty charges levied w.r.t units consumed. 3.2.7 Meter rentals 3.2.8 Lighting and fan power consumption is often at higher rates, levied sometimes on slab basis or on actual metering basis. 3.2.9 Time of Day (TOD) rates like peak and non-peak hours are also prevalent in tariff structure provisions of some utilities. 3.2.10 Penalty for exceeding contract demand 3.2.11 Surcharge if metering is at LT side in some of the utilities
Analysis of utility bill data and monitoring its trends helps energy manager to identify ways for electricity bill reduction through available provisions in tariff framework, apart from energy budgeting. The utility employs an electromagnetic or electronic trivector meter, for billing purposes. The minimum outputs from the electromagnetic meters are
www.binils.com
Anna University, Polytechnic & Schools www.binils.com

90
Maximum demand registered during the month, which is measured in preset time intervals (say of 30 minute duration) and this is reset at the end of every billing cycle. Active energy in kWh during billing cycle Reactive energy in kVArh during billing cycle and Apparent energy in kVAh during billing cycle
It is important to note that while maximum demand is recorded, it is not the
instantaneous demand drawn, the time integrated demand over the predefined recording cycle. Example: In an industry, if the drawl over a recording cycle of 30 minutes is:
2500 kVA for 4 minutes 3600 kVA for 12 minutes 4100 kVA for 6 minutes 3800 kVA for 8 minutes
The MD recorder will be computing MD =
= 3606.7 kVA
The month’s maximum demand will be the highest among such demand values recorded over the month. The meter registers only if the value exceeds the previous maximum demand value and thus, even if, average maximum demand is low, the industry / facility has to pay for the maximum demand charges for the highest value registered during the month, even if it occurs for just one recording cycle duration i.e., 30 minutes during whole of the month. A typical demand curve is shown in Figure 3.3
Figure 3.3 Demand Curve
As can be seen from the Figure 3.3 above the demand varies from time to time. The demand is measured over predetermined time interval and averaged out for that interval as shown by the horizontal dotted line. Of late most electricity boards have changed over from conventional electromechanical trivector meters to electronic meters, which have some excellent provisions that can help the utility as well as the industry. These provisions include Substantial memory for logging and recording all relevant events High accuracy up to 0.2 classes, Amenability to time of day tariffs Tamper detection / recording. Measurement of harmonics and Total Harmonic Distortion (THD) Long service life due to absence of moving parts, Amenability for remote data access/downloads
www.binils.com
Anna University, Polytechnic & Schools www.binils.com

91
TABLE 1.1 PURCHASED ELECTRICAL ENERGY TREND Month MD
Billing
Total Energ
y Energy MD Energy
PF PF
Total
Average
& Recorded
Demand*
Consumption
Consumption
Charge
Charge
Penalty
/ Bill
s Cost Year kVA kVA kWh
During Peak
Rs./kVA
Rs./kWh
Rebate Rs. Rs.
Rs./kWh
Hours (kWh)
Jan. Feb. ……. ……. ……. Dec.
Trend analysis of purchased electricity and cost components can help the industry to identify key result areas for bill reduction within the utility tariff available framework along the following lines. 3.12 Electrical Load Management and Maximum Demand Control
a) Need for Electrical Load Management The growth in the electricity use and diversity of end user has led to shortfalls in capacity to meet demand. As capacity addition is costly and only a long time prospect, better load management at user end helps to minimize peak demands as well as better utilization of power plant capacities. The utilities (State Electricity Boards) use power tariff structure to influence end user in better load management through measures like time of use tariffs, penalties on exceeding allowed maximum demand, night tariff concessions etc. Load management is a powerful means of efficiency improvement both for end user as well as utility.
www.binils.com
Anna University, Polytechnic & Schools www.binils.com

92
As the demand charges constitute a considerable portion of the electricity bill, from user angle too there is a need for integrated load management to effectively control the maximum demand.
b) Step By Step Approach for Maximum Demand Control 1. Load Curve Generation Presenting the load demand of a consumer against time of the day is known as a ‘load curve’. If it is plotted for the 24 hours of a single day, it is known as an ‘hourly load curve’ and if daily demands plotted over a month, it is called daily load curves. A typical hourly load curve for an engineering industry is shown in Figure 3.4. These types of curves are useful in predicting patterns of drawl, peaks and valleys and energy use trend in a section or in an industry or in a distribution network as the case may be.
Figure 3.4 Maximum Demand (Daily Load Curve, Hourly kVA)
2. Rescheduling of Loads Rescheduling of large electric loads and equipment operations, in different shifts can be planned and implemented to minimize the simultaneous maximum demand. For this purpose, it is advisable to prepare an operation flow chart and a process chart. Analyzing these charts and with an integrated approach, it would be possible to reschedule the operations and running equipment in such a way as to improve the load factor which in turn reduces the maximum demand. 3. Storage of Products/in process material/ process utilities like refrigeration It is possible to reduce the maximum demand by building up storage capacity of products/ materials, water, chilled water / hot water, using electricity during off peak periods. Off peak hour operations also help to save energy due to favorable conditions such as lower ambient temperature etc.
Example: Ice bank system is used in milk & dairy industry. Ice is made in lean period and used in peak load period and thus maximum demand is reduced.
www.binils.com
Anna University, Polytechnic & Schools www.binils.com

93
4. Shedding of Non-Essential Loads When the maximum demand tends to reach preset limit, shedding some of non-essential loads temporarily can help to reduce it. It is possible to install direct demand monitoring systems, which will switch off non-essential loads when a preset demand is reached. Simple systems give an alarm, and the loads are shed manually. Sophisticated microprocessor controlled systems are also available, which provide a wide variety of control options like:
Accurate prediction of demand Graphical display of present load, available load, demand limit Visual and audible alarm Automatic load shedding in a predetermined sequence Automatic restoration of load Recording and metering
iii) Operation of Captive Generation and Diesel Generation Sets
When diesel generation sets are used to supplement the power supplied by the electric utilities, it is advisable to connect the D.G. sets for durations when demand reaches the peak value. This would reduce the load demand to a considerable extent and minimize the demand charges. 6. Reactive Power Compensation The maximum demand can also be reduced at the plant level by using capacitor banks and maintaining the optimum power factor. Capacitor banks are available with microprocessor based control systems. These systems switch on and off the capacitor banks to maintain the desired Power factor of system and optimize maximum demand thereby. 3.13. Power Factor Improvement and Benefits a) Power factor Basics In all industrial electrical distribution systems, the major loads are resistive and inductive. Resistive loads are incandescent lighting and resistance heating. In case of pure resistive loads, the voltage (V), current (I), resistance (R) relations are linearly related, i.e. V = I x R and Power (kW) = V x I Typical inductive loads are A.C. Motors, induction furnaces, transformers and ballast-type lighting. Inductive loads require two kinds of power: a) Active (or working) power to perform the work and is measured in kW (Kilo Watts). b) Reactive power to create and maintain electro-magnetic fields and is measured in kVAr (Kilo Volt-Amperes Reactive). The vector sum of the active power and reactive power make up the total (or apparent) power used. This is the power generated to perform a given amount of work. Total Power is measured in kVA (Kilo Volts-Amperes)
www.binils.com
Anna University, Polytechnic & Schools www.binils.com

94
Figure 3.4. KW, kVA and kVAr Vector
The active power in kW and the reactive power required are 90° apart
vectorically in a pure inductive circuit i.e., reactive power kVAr lagging the active kV. The vector sum of the two is called the apparent power or kVA, as illustrated above and the kVA reflects the actual electrical load on distribution system.
The ratio of kW to kVA is called the power factor, which is always less than or equal to unity. Theoretically, when electric utilities supply power, if all loads have unity power factor, maximum power can be transferred for the same distribution system capacity. However, as the loads are inductive in nature, with the power factor ranging from 0.2 to 0.8, the electrical distribution network is stressed for capacity at low power factors, so it is needed to improve the power factor. c) Improving Power Factor The solution to improve the power factor is to add power factor correction capacitors to the plant power distribution sys-tem. They act as reactive power generators, and provide the needed reactive power to accomplish kW of work. This reduces the amount of reactive power, D Reactive power Active power A O θ θ1
Θ2 apparent power after capacitor added C Apparent power Before capacitor added
B Fig 3.5 Power factor before and after Improvement As in fig OA is active power of the load in kW. AB is reactive power required in kVAr AD is reactive power taken by capacitor in kVAr AC is reactive power drawn after capacitor added in kVAr OB is apparent power before capacitor added in kVA OC is apparent power after capacitor added
www.binils.com
Anna University, Polytechnic & Schools www.binils.com

95
As from fig 3.5.it is clearly shown that the reactive power is drawn from AB to AC After adding capacitor. Thus power factor can be improved. d) The advantages of PF improvement by capacitor addition
• Reactive component of the network is reduced and so also the total current in the system from the source end.
• I2R power losses are reduced in the system because of reduction in current. • Voltage level at the load end is increased. • KVA loading on the source generators as also reduces. • A high power factor can help in utilizing the full capacity of your electrical
system. e).Cost benefits of PF improvement
While costs of PF improvement are in terms of investment needs for capacitor addition the benefits to be quantified for feasibility analysis are:
• Reduced kVA (Maximum demand) charges in utility bill • Reduced distribution losses (KWH) within the plant network • Better voltage at motor terminals and improved performance of motors • A high power factor eliminates penalty charges imposed when operating with
a low power factor • Investment on system facilities such as transformers, cables, switchgears etc
for delivering load is reduced. 3.14. Selection and location of capacitors There are two methods in finding the rating of power factor correction capacitor. 1) Direct relation for capacitor sizing. KVAr Rating = kW [tan φ1 – tan φ2] Where kVAr rating is the size of the capacitor needed, kW is the average power drawn, tan φ1 is the trigonometric ratio for the present power factor, and tan φ2 is the trigonometric ratio for the desired PF. φ1 = Existing (Cos-1 PF1) and φ2 = Improved (Cos-1 PF2) 2) Alternatively the Table 1.2 can be used for capacitor sizing. The figures given in table are the multiplication factors which are to be multiplied with the input power (kW) to give the kVAr of capacitance required to improve present power factor to a new desired power factor. Example: The utility bill shows an average power factor of 0.72 with an average kW of 627. How much kVAr is required to improve the power factor to .95? Using formula Cos Φ1 = 0.72, tan Φ1 = 0.963 Cos Φ2 = 0.95, tan Φ2 = 0.329 KVAr required = P (tanφ1 - tanφ2) = 627 (0.964 – 0.329) = 98 kVAr
www.binils.com
Anna University, Polytechnic & Schools www.binils.com

96
Using table (see Table 1)
• Locate 0.72 (original power factor) in column (1). • Read across desired power factor to 0.95 columns. We find 0.635
multiplier • Multiply 627 (average kW) by 0.635 = 398 kVAr. • Install 400 kVAr to improve power factor to 95%.
www.binils.com
Anna University, Polytechnic & Schools www.binils.com

97
3.15. Location of Capacitors The primary purpose of capacitors is to reduce the maximum demand. Additional benefits are derived by capacitor location. The Figure 3.6 indicates typical capacitor locations. Maximum benefit of capacitors is derived by locating them as close as possible to the load. At this location, its kVAr are confined to the smallest possible segment, decreasing the load current. This, in turn, will reduce power losses of the system substantially. Power losses are proportional to the square of the current. When power losses are reduced, voltage at the motor increases; thus, motor performance also increases. • Locations C1A, C1B and C1C of Figure 3.6 indicate three different arrangements at the load. Note that in all three locations extra switches are not required, since the capacitor is either switched with the motor starter or the breaker before the starter. Case C1A is recommended for new installation, since the maximum benefit is derived and the size of the motor thermal protector is reduced. In Case C1B, as in Case C1A, the capacitor is energized only when the motor is in operation. Case C1B is recommended in cases where the installation already exists and the thermal protector does not need to be re-sized. In position C1C, the capacitor is permanently connected to the circuit but does not require a separate switch, since capacitor can be disconnected by the breaker before the starter.
Figure3.6. Typical capacitor locations
It should be noted that the rating of the capacitor should not be greater than the
no-load magnetizing kVAr of the motor. If this condition exists, damaging over voltage or transient torques can occur. This is why most motor manufacturers specify maximum capacitor ratings to be applied to specific motors.
www.binils.com
Anna University, Polytechnic & Schools www.binils.com

98
The next preference for capacitor locations is at locations C2 and C3. In these locations, a breaker or switch will be required. Location C4 requires a high volt-age breaker. The advantage of locating capacitors at power centers or feeders is that they can be grouped together. When several motors are running intermittently, the capacitors are per-mitted to be on line all the time, reducing the total power regardless of load.
From energy efficiency point of view, capacitor location at receiving substation only helps the utility in loss reduction. Locating capacitors at tail end will help to reduce loss reduction within the plants distribution network as well and directly benefit the user by reduced consumption. Reduction in the distribution loss % in kWh when tail end power factor is raised from PF1 to a new power factor PF2.
Capacitors for Other Loads The other types of load requiring capacitor application include induction
furnaces, induction heaters and arc welding transformers etc. The capacitors are normally supplied with control gear for the application of induction furnaces and induction heating furnaces. The PF of arc furnaces experiences a wide variation over melting cycle as it changes from 0.7 at starting to 0.9 at the end of the cycle. Power factor for welding transformers is corrected by connecting capacitors across the primary winding of the transformers, as the normal PF would be in the range of 0.35.
3.16. Performance Assessment of Power Factor Capacitors
1. Voltage effects Ideally capacitor voltage rating is to match the supply voltage. If the supply
voltage is lower, the reactive kVAr produced will be the ratio V12 /V2
2 where V1 is the actual supply voltage, V2 is the rated voltage. On the other hand, if the supply voltage exceeds rated voltage, the life of the capacitor is adversely affected. 2. Material of capacitors:
Power factor capacitors are available in various types by dielectric material used as; paper/ polypropylene etc. The watt loss per kVAr as well as life vary with respect to the choice of the dielectric material and hence is a factor to be considered while selection.
3. Connections
Shunt capacitor connections are adopted for almost all industry / end user applications, while series capacitors are adopted for voltage boosting in distribution networks. 4. Operational performance of capacitors
This can be made by monitoring capacitor charging current vis- a- vis the rated charging current. Capacity of fused elements can be replenished as per requirements. Portable analyzers can be used for measuring kVAr delivered as well as charging current. Capacitors consume 0.2 to 6.0 Watt per kVAr, which is negligible in comparison to benefits.
Some checks that need to be adopted in use of capacitors are: • Nameplates can be misleading with respect to ratings. It is good to check by charging currents. • Capacitor boxes may contain only insulated compound and insulated terminals with no capacitor elements inside.
www.binils.com
Anna University, Polytechnic & Schools www.binils.com

99
Capacitors for single phase motor starting and those used for lighting circuits for volt-age boost, are not power factor capacitor units and these cannot withstand power sys-tem conditions
3.17. DISTRIBUTION AND TRANSFORMER LOSSES a) Transformers A transformer can accept energy at one voltage and deliver it at another voltage.
This permits electrical energy to be generated at relatively low voltages and transmitted at high voltages and low currents, thus reducing line losses and voltage drop.
Transformers consist of two or more coils that are electrically insulated, but magnetically linked. The primary coil is connected to the power source and the secondary coil connects to the load. The turn’s ratio is the ratio between the numbers of turns on the secondary to the turns on the primary. Voltage regulation of a transformer is the percent increase in voltage from full load to no load.
b) Transformer Losses and Efficiency The efficiency varies anywhere between 96 to 99 percent. The efficiency of the
transformers not only depends on the design, but also, on the effective operating load.
Transformer losses consist of two parts: No-load loss and Load loss • No-load loss (also called core loss) is the power consumed to sustain the
magnetic field in the transformer's steel core. Core loss occurs whenever the transformer is energized; core loss does not vary with load. Core losses are caused by two factors: hysteresis and eddy current losses. Hysteresis loss is that energy lost by reversing the magnetic field in the core as the magnetizing AC rises and falls and reverses direction. Eddy current loss is a result of induced currents circulating in the core.
• Load loss (also called copper loss) is associated with full-load current flow in
the trans-former windings. Copper loss is power lost in the primary and secondary windings of a transformer due to the ohmic resistance of the windings. Copper loss varies with the square of the load current. (P = I2R).
www.binils.com
Anna University, Polytechnic & Schools www.binils.com

100
Transformer losses as a percentage of loads are given in the Figure 3.7.
Figure3.7. Transformer loss Vs % Load For a given transformer, the manufacturer can supply values for no-load loss,
PNO-LOAD, and load loss, PLOAD. The total transformer loss, PTOTAL, at any load level can then be calculated from:
PTOTAL = PNO-LOAD + (% Load/100)2 x PLOAD Where transformer loading is known, the actual transformers loss at given load
can be computed as: = No load loss + [ ] 2 x full load loss
2. Voltage Fluctuation Control A control of voltage in a transformer is important due to frequent changes in supply voltage level. Whenever the supply voltage is less than the optimal value, there is a chance of nuisance tripping of voltage sensitive devices. The voltage regulation in transformers is done by altering the voltage transformation ratio with the help of tapping. There are two methods of tap changing facility available: Off-circuit tap changer and On load tap changer a) On load tap changer (OLTC)
The voltage levels can be varied without isolating the connected load to the transformer. To minimise the magnetization losses and to reduce the nuisance tripping of the plant, the main transformer (the transformer that receives supply from the grid) should be provided with On Load Tap Changing facility at design stage. The downstream distribution transformers can be provided with off-circuit tap changer. The On-load gear can be put in auto mode or manually depending on the requirement. OLTC can be arranged for transformers of size 250 kVA
www.binils.com
Anna University, Polytechnic & Schools www.binils.com

101
onwards. However, the necessity of OLTC below 1000 kVA can be considered after calculating the cost economics b) Off-circuit tap changer It is a device fitted in the transformer, which is used to vary the voltage transformation ratio. Here the voltage levels can be varied only after isolating the primary voltage of the transformer. 3. Parallel Operation of Transformers The design of Power Control Centre (PCC) and Motor Control Centre (MCC) of any new plant should have the provision of operating two or more transformers in parallel. Additional switchgears and bus couplers should be provided at design stage.
Whenever two transformers are operating in parallel, both should be technically identical in all aspects and more importantly should have the same impedance level. This will minimize the circulating current between transformers.
Where the load is fluctuating in nature, it is preferable to have more than one transformer running in parallel, so that the load can be optimized by sharing the load between transformers. The transformers can be operated close to the maximum efficiency range by this operation. 4. System Distribution Losses In an electrical system often the constant no load losses and the variable load losses are to be assessed alongside, over long reference duration, towards energy loss estimation.
Identifying and calculating the sum of the individual contributing loss components is a challenging one, requiring extensive experience and knowledge of all the factors impacting the operating efficiencies of each of these components.
For example the cable losses in any industrial plant will be up to 6 percent depending on the size and complexity of the distribution system. Note that all of these are current dependent, and can be readily mitigated by any technique that reduces facility current load. Various losses in distribution equipments may be in in circuit breakers, Generators, switchgears, reactors, transformers, starters, cables, rectifiers….. In system distribution loss optimization, the various options available include: 1. Relocating transformers and sub-stations near to load centers 2. Re-routing and re-conducting such feeders and lines where the losses / voltage drops are higher. 3. Power factor improvement by incorporating capacitors at load end. 4. Optimum loading of transformers in the system. 5. Opting for lower resistance All Aluminum Alloy Conductors (AAAC) in place of conventional Aluminum Cored Steel Reinforced (ACSR) lines 6. Minimizing losses due to weak links in distribution network such as jumpers, loose contacts, and old brittle conductors.
www.binils.com
Anna University, Polytechnic & Schools www.binils.com

102
REVIEW QUESTIONS
PART A & B 1. Define Energy management. 2. How energy management can be maintained? 3. What is meant by energy audit? 4. Enumerate the needs for energy audit. 5. What are the types of energy audit? 6. What is meant by benchmarking of energy consumption? 7. What are the factors to be considered while bench marking? 8. Enumerate Bench marking parameters. 9. What is plant energy performance? 10. Determine production factor. 11. Explain maximizing system efficiency 12. What are the measures for optimizing the input energy requirement? 13. Name some energy audit instruments. 14. Define power factor. 15. How the power factor can be improved? 16. What are the advantages of improving power factor? 17. Explain the cost benefits PF improvement. 18. What are the performance assessments of power factor capacitors? 19. Explain the Power factor ratio. 20. What is transformer? What are the types of transformer? 21. Explain power transformer and distribution transformer. 22. Explain how the ratings of transformer to be fixed. 23. Discuss the various losses occurring a transformer
PART C 1. Explain briefly the types of energy audit. 2. Explain the methodology of detailed energy audit. 3. Draw the process flow diagram and list process steps. 4. Explain the identification process of energy conservation opportunities. 5. Explain the process of understanding energy costs. 6. Explain bench marking of energy consumption. 7. Explain the plant energy performance in detail. 8. Explain how we can identify the matching energy usage to requirement. 9. What are the typical billing components of the two-part tariff structure of industrial utility? 10. Explain briefly the electricity tariff. 11. Explain the step by step approach for maximum demand control 12. Briefly explain the power factor improvements in electrical distribution system 13. Explain the selection and location of capacitor in power factor improving in electrical distribution system.
www.binils.com
Anna University, Polytechnic & Schools www.binils.com

103
14. Explain how performance assessment of power factor capacitors can be achieved. 15. Explain the ways to reduce distribution and transformer losses.
www.binils.com
Anna University, Polytechnic & Schools www.binils.com
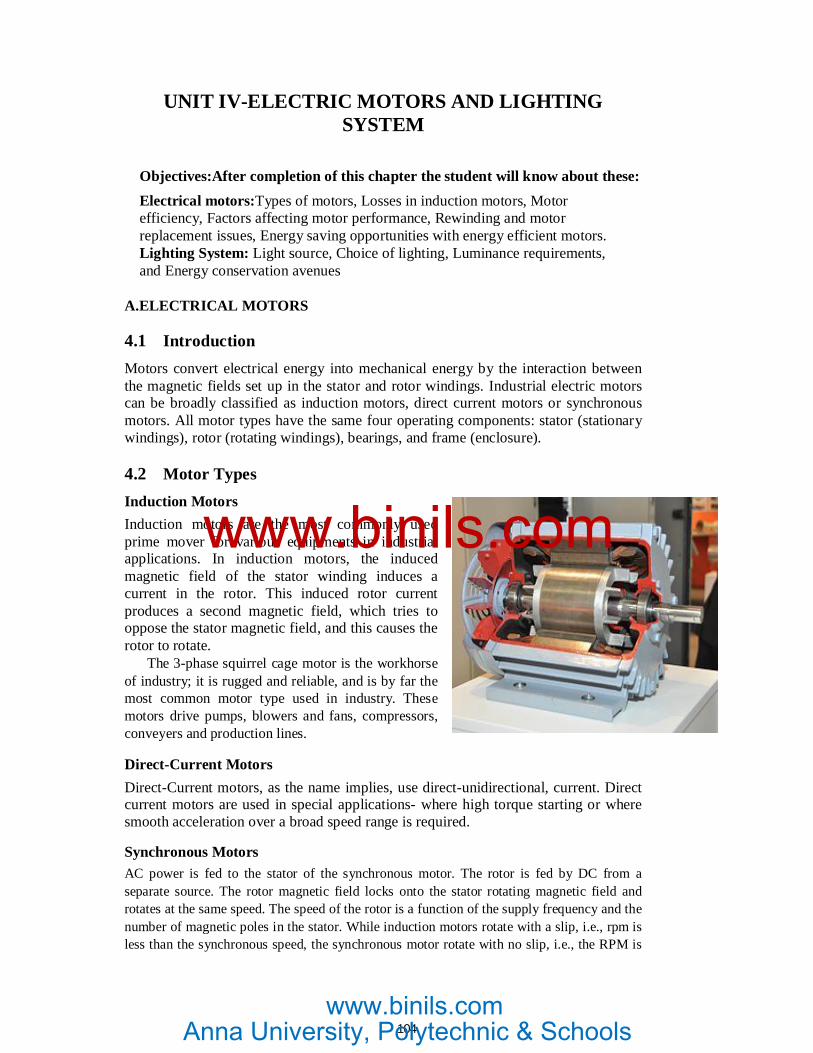
104
UNIT IV-ELECTRIC MOTORS AND LIGHTING SYSTEM
Objectives:After completion of this chapter the student will know about these: Electrical motors:Types of motors, Losses in induction motors, Motor efficiency, Factors affecting motor performance, Rewinding and motor replacement issues, Energy saving opportunities with energy efficient motors. Lighting System: Light source, Choice of lighting, Luminance requirements, and Energy conservation avenues
A.ELECTRICAL MOTORS 4.1 Introduction Motors convert electrical energy into mechanical energy by the interaction between the magnetic fields set up in the stator and rotor windings. Industrial electric motors can be broadly classified as induction motors, direct current motors or synchronous motors. All motor types have the same four operating components: stator (stationary windings), rotor (rotating windings), bearings, and frame (enclosure). 4.2 Motor Types Induction Motors Induction motors are the most commonly used prime mover for various equipments in industrial applications. In induction motors, the induced magnetic field of the stator winding induces a current in the rotor. This induced rotor current produces a second magnetic field, which tries to oppose the stator magnetic field, and this causes the rotor to rotate.
The 3-phase squirrel cage motor is the workhorse of industry; it is rugged and reliable, and is by far the most common motor type used in industry. These motors drive pumps, blowers and fans, compressors, conveyers and production lines. Direct-Current Motors Direct-Current motors, as the name implies, use direct-unidirectional, current. Direct current motors are used in special applications- where high torque starting or where smooth acceleration over a broad speed range is required. Synchronous Motors AC power is fed to the stator of the synchronous motor. The rotor is fed by DC from a separate source. The rotor magnetic field locks onto the stator rotating magnetic field and rotates at the same speed. The speed of the rotor is a function of the supply frequency and the number of magnetic poles in the stator. While induction motors rotate with a slip, i.e., rpm is less than the synchronous speed, the synchronous motor rotate with no slip, i.e., the RPM is
www.binils.com
Anna University, Polytechnic & Schools www.binils.com

105
same as the synchronous speed governed by supply frequency and number of poles. The slip energy is provided by the D.C. excitation power 4.2.1. Motor Characteristics Motor Speed The speed of a motor is the number of revolutions in a given time frame, typically revolutions per minute (RPM). The speed of an AC motor depends on the frequency of the input power and the number of poles for which the motor is wound. The synchronous speed in RPM is given by the following equation, where the frequency is in hertz or cycles per second: Synchronous Speed (RPM) =120 × Frequency
No. of Poles
Indian motors have synchronous speeds like 3000 / 1500 / 1000 / 750 / 600 / 500 / 375 RPM corresponding to no. of poles being 2, 4, 6, 8, 10, 12, 16 (always even) and given the mains frequency of 50 cycles / sec.
The actual speed, with which the motor operates, will be less than the synchronous speed. The difference between synchronous and full load speed is called slip and is measured in per-cent. It is calculated using this equation:
Slip (%) = Synchronous Speed – Full Load Rated Speed × 100 Synchronous Speed
As per relation stated above, the speed of an AC motor is determined by the
number of motor poles and by the input frequency. It can also be seen that theoretically speed of an AC motor can be varied infinitely by changing the frequency. Manufacturer's guidelines should be referred for practical limits to speed variation. With the addition of a Variable Frequency Drive (VFD), the speed of the motor can be decreased as well as increased. Power Factor The power factor of the motor is given as: Power Factor = Cos φ = KW÷KVA
As the load on the motor comes down, the magnitude of the active current reduces. However, there is no corresponding reduction in the magnetizing current, which is proportional to supply voltage with the result that the motor power factor reduces, with a reduction in applied load. Induction motors, especially those operating below their rated capacity, are the main reason for low power factor in electric systems. 4.3. Losses in induction motors: The major losses in the motors are iron losses and winding losses.
The iron losses are dependent on the thickness of the core stamping ,applied voltage and frequency where as the winding losses are sensitive to the current flow in the motor winding ,quality of power supply i.e. unbalanced voltage , voltage variations, harmonics winding temperature etc.. Motor losses can be minimized by
www.binils.com
Anna University, Polytechnic & Schools www.binils.com

106
1. Increasing the thickness of the copper wires wound around the core of the motor. This reduces both the electrical resistance losses in the wires and the temperature at which the motor operates. 2. Using more and thinner high-quality steel sheets for the main fixed and rotating parts of the motor. This also minimizes electrical losses. 3. Narrowing the air gap between the spinning and stationary motor components, increasing the strength of its magnetic field. This lets the motor deliver the same output using less power.
4.4. Motor Efficiency Two important attributes relating to efficiency of electricity use by A.C. Induction motors are efficiency (η), defined as the ratio of the mechanical energy delivered at the rotating shaft to the electrical energy input at its terminals, and power factor (PF). Motors, like other inductive loads, are characterized by power factors less than one. As a result, the total current draw needed to deliver the same real power is higher than for a load characterized by a higher PF. An important effect of operating with a PF less than one is that resistance losses in wiring upstream of the motor will be higher, since these are proportional to the square of the current. Thus, both a high value for η and a PF close to unity are desired for efficient overall operation in a plant. Squirrel cage motors are normally more efficient than slip-ring motors, and higher-speed motors are normally more efficient than lower-speed motors. Efficiency is also a function of motor temperature. Totally-enclosed, fan-cooled (TEFC) motors are more efficient than screen-protected, drip-proof (SPDP) motors. Also, as with most equipment, motor efficiency increases with the rated capacity.
The efficiency of a motor is determined by intrinsic losses that can be reduced only by changes in motor design. Intrinsic losses are of two types: fixed losses - independent of motor load, and variable losses - dependent on load.
Fixed losses consist of magnetic core losses and friction and windage losses. Magnetic core losses (sometimes called iron losses) consist of eddy current and hysteresis losses in the stator. They vary with the core material and geometry and with input voltage.
Friction and windage losses are caused by friction in the bearings of the motor and aerodynamic losses associated with the ventilation fan and other rotating parts.
Variable losses consist of resistance losses in the stator and in the rotor and miscellaneous stray losses. Resistance to current flow in the stator and rotor result in heat generation that is proportional to the resistance of the material and the square of the current (I2R). Stray losses arise from a variety of sources and are difficult to either measure directly or to calculate, but are generally proportional to the square of the rotor current. 4.5. Factors affecting motor performance: Voltage unbalance: The design of an electric motor calls for a balanced 3-phase supply for efficient operation .A voltage unbalance leads to the flow of an additional negative sequence current in the motors resulting temperature rise in the windings will increase the losses and the motors capacity will reduce.
www.binils.com
Anna University, Polytechnic & Schools www.binils.com

107
The unbalanced input voltage causes increased load unbalance in motors. That the unbalanced no load current is 35% at a voltage unbalance of 3.0%, the unbalanced full load current is 33% at 5% voltage unbalance and the losses are increased by 33% at 5.0% voltage unbalance . The operation of motor at above the 5.0% voltage is not recommended. Voltage variation: At reduced input voltage the motor output will reduce and the losses will increase .the copper losses increases by square of dv/dt. The torque is proportional to the square of the voltage and is proportional to the slip. When the voltage decreases the torque decreases and for maintaining the torque, slip increase increases i.e., speed falls. Harmonics: The harmonics current depending on their frequency will cause additional rotating magnetic fields in the motor. These magnetic fields rotate in the same direction or in the opposite direction based on the frequencies. The 5th harmonic creates a counter –rotating field, whereas the 7th harmonic creates a rotating field beyond the motors synchronous speed. The resulting torque pulsating causes wear and tear on couplings and bearings .since the speed is fixed,the energy contained in these harmonics is dissipated as extra heat ,resulting in premature ageing .Harmonics currents are also induced in to the rotor causing further excess heating .the additional heat reduces the rotor /stator air gap, reducing the efficiency even further .variable speed devices causes their own range of problems. They tend to be sensitive to dips, causing disruption of synchronized manufacturing lines. They often installed some distance from the motor and, cause voltage spikes due to the sharp voltage rise times. Special care has to be taken at start-up of motors after a voltage dip when the motor is normally operating at close to full load .the extra heat from the inrush current at start-up may cause the motor to fail. optimizing sizing of motors should be take in to account that the motor has been designed to run at the maximum efficiency at about 70-80% load , frequency of voltage dips and time , one can afford to wait to resume motor operation. The harmonics can be suppressed by the use of necessary filters along with voltage stabilizer. Starting characteristics: In DOL starter, the starting current is about 5-6 times of full load current whereas for star –delta starter current is approximately 2-3 times .In star-delta starter, the voltage applied across the phase will be √3 times of the line voltage during starting. Hence star delta starter are always preferred especially when a large number of motors are to be started within a short time span so that the maximum demand can be controlled to a great extent. Load factor: All the motors are designed for maximum efficiency at full load. As the load factor decreases, motor efficiency decreases and power factor will come down substantially leading to increased distribution losses .Idle running of motors not only consume energy but also reduce the power factor .the calculation for replacing the existing 40hp medium scale industry. The payback period is about 23 months with a saving of Rs.1, 395 per month life time gain is about Rs.1.263lakhs.
www.binils.com
Anna University, Polytechnic & Schools www.binils.com

108
Speed: For the same input power motors with high speed generally have a higher efficiency and higher factor than motors with lower rated speeds. In a bakery, the mixer motor is multi- speed designed for 72/36 rpm. the motor runs for about 5 minutes at a lower sped and 40 minutes at higher speed with an efficiency below 85% . Alternative if a single speed motor is used and operated through variable frequency drive, the efficiency can be improved to about 89 to 91%. Single winding multi-speed motors are generally more efficient than two winding multi-speed motors and savings in energy is possible by operating on high speed wherever possible. Duty cycle Where the load is widely varying with large number of starts and stops, use of non-duty cycle motors consume more energy compared to duty cycle motor. During normal operation duty cycle motors consume more energy than non-duty cycle motors which are designed for high full-load efficiency. To minimize energy loss, the duty cycle motor should well match with its intended duty. The high torque motor is able to accelerate with less torque and has lower energy loss during acceleration whereas standard motor has more energy loss. But during steady running condition, standard motors are more efficient than high torque motors. Combining both acceleration losses and load losses in a duty cycle, the high torque motor is the best energy choice in spite of having a lower efficiency during normal operation. Rewinding of motor Generally as the motor winding fails, the motors are get rewound. While rewinding to remove the winding motor stator assembly is being heated for easy removal of winding. The heating of stator core will damage the varnish between the stator core stampings. The resistance of stamping decreases, which will increase the eddy current losses and the core, gets heated up. As the insulating varnish melts, the thickness of stamping reduces the resistance of magnetic path and will increase the eddy current loss, which is Proportional Square of the thickness. Maintenance and overhauling of motors The motors used are of totally enclosed fan cooling (TEFC) type. The fan is used for extracting the heat from the stator winding and rotor. Along with the incoming air in to the motor through fan dust particles are also enters into the motor and stick on the windings. Then the heat disposal of the winding reduces which over heat the winding. To overcome this dust deposit problem it is suggested to do the overhauling of motor i.e., opening of the rotor and stator, cleaning with the compressed air, varnishing the stator winding and rotor, etc. The overhauling period depends on the nature of duty of motor, surrounding conditions, etc. for example in sugar industries, all the motor have to be overhauled at-least annually once.
www.binils.com
Anna University, Polytechnic & Schools www.binils.com

109
Some of energy conservation measures for improving the performance of motors are:
i. At 10% voltage drop. The motor torque reduces by 19% the current increases by 11% of fl current and motor efficiency reduces by 1.1%
ii. The unbalanced input voltage at motor terminals cause negative sequence current in motor winding which cause heating of winding and also generate negative torque. at 3.0 voltage unbalanced no load current increases by 35% ,the full current increases by 20% the motor losses are increases by 9.8%[refer figure] and the motor capacity reduces by 25%
iii. In some instances due to single phasing the motor capacity will reduce by about half .In a star connected motor two phases will be overloaded and temperature of winding increases whereas in delta connection one winding will get overhead and temperature of winding increases.
iv. The increased motor winding and bearing temperature cause more losses in motors v. the harmonic currents depending on their frequency will causes additional rotating
magnetic fields in the motor these magnet fields rotate in the same direction or in the opposite direction based on the frequency the magnetic field created by 5th, 11th, 17th, 23th, ….. Harmonics is negative phase sequence and will develop the reverse torque. The other even harmonics have positive sequence these harmonics in the network system cause more losses in the motor.
vi. At low load factor, the motor efficiency and motor efficiency and power factor vii. Will be poor. Use of DELSTAR STARTER where the load factor of motor is less
than 50% star Delta starter work as a star delta starter during start up. During starting it works on star and after the pre-set time it will convert to delta. Further whenever the load on the motors is less than 50% the starter will change over from delta to star mode. In the star mode is less than 50% the starter will change over from delta to star mode. In the star mode the voltage applied to each phase will √3 times of the current as compared to delta mode. Therefore in DELTASTAR STARTER the I2R losses will be reduced by 3 times .if the load on motor increases above 50%this starter will change the mode from star to delta.
viii. Whenever possible ,higher speed motors must be used .single winding multi-speed motors are generally more efficient than two winding multi sped motors and saving in energy is possible by operating on high speed motors could be used in place of multi speed motors and saving in energy is possible by operating on high speed whenever possible.
ix. Larger the motor, more efficient it would be and higher is the power factor . there could be a sizable savings if one larger motor could be used in place of multiple number of smaller motors if it is convenient.
x. Where the load is widely varying with larger number of starts and stops the use of non duty cycle motor consume more energy compared to duty cycle motor. The high torque motor is able to accelerate with less torque and lower energy loss during acceleration whereas standard motor has more energy loss. But during steady running condition standard motors are more efficient than high torque motors. Combining both acceleration losses and load losses in a duty cycle, the high torque motors is the best energy choice in spite of having a lower efficiency during normal operation.
xi. Generally as the motor winding fails, the motors are get rewound. While removing the stator winding motor stator assembly is being heated for easy removal of winding
www.binils.com
Anna University, Polytechnic & Schools www.binils.com

110
.the heated of stator core will damaged the varnish between the stator core stampings, the resistance of stampings decrease, which will increase the eddy current losses and the core gets heated up.
xii. While rewinding of motor to reduce the cost of winding, conductors of lower size is being used in motor. This will increase the resistance of the winding and reduce the output capacity.50% conductor size reduction will increase the stator losses by 300% and the capacity is decreased by75%.
xiii. The motor used are of totally enclosed fan cooling [TEFC] type the fan in used for extracting the heat from the stator winding and rotor .Along with the incoming air into the motor thought fan dust particles are also enters into the motor and stick on the windings. Then the heat disposal of the winding reduces which over heat the winding .To overcome this dust deposit problem it is suggested to do the regular overhauling of motor. i.e. opening of the rotor and stator cleaning with the compressed air, vanishing the stator winding and rotor, etc,,.. periodic overhauling of motor is essential.
xiv. Use of energy efficient motors whose efficiency are high at optimized load factors.
4.6. Rewinding Effects on Energy Efficiency & motor replacement issues. It is common practice in industry to rewind burnt-out motors. The population of rewound motors in some industries exceeds 50 % of the total population. Careful rewinding can some-times maintain motor efficiency at previous levels, but in most cases, losses in efficiency result. Rewinding can affect a number of factors that contribute to deteriorated motor efficiency: winding and slot design, winding material, insulation performance, and operating temperature. For example, a common problem occurs when heat is applied to strip old windings: the insulation between laminations can be damaged, thereby increasing eddy current losses. A change in the air gap may affect power factor and output torque.
However, if proper measures are taken, motor efficiency can be maintained, and in some cases increased, after rewinding. Efficiency can be improved by changing the winding design, though the power factor could be affected in the process. Using wires of greater cross section, slot size permitting, would reduce stator losses thereby increasing efficiency. However, it is generally recommended that the original design of the motor be preserved during the rewind, unless there are specific, load-related reasons for redesign.
The impact of rewinding on motor efficiency and power factor can be easily assessed if the no-load losses of a motor are known before and after rewinding. Maintaining documentation of no-load losses and no-load speed from the time of purchase of each motor can facilitate assessing this impact.
For example, comparison of no load current and stator resistance per phase of a rewound motor with the original no-load current and stator resistance at the same voltage can be one of the indicators to assess the efficacy of rewinding.
www.binils.com
Anna University, Polytechnic & Schools www.binils.com

111
Making the right motor decision: Rewind, repair, or replace
When a motor fails, weigh these factors to make the best choice.
When a motor burns out, do you rewind it or replace it? “If the motor is a standard motor (i.e., off the shelf) of 25 hp or less, we will replace bearings but will not rewind, as the cost of bearings replacement is significantly lower than that of a new motor. If the motor is greater than 25 hp and standard then we will replace bearings, and we also will rewind if the cost is less than 60% of the cost of a new premium efficiency motor.”
. If the magnetic core of a failed motor is undamaged and appropriate procedures are followed, a rewound motor will retain its original efficiency. Properly repaired, a “standard” efficiency motor will have its original “standard” efficiency, and an energy-efficient (EE) motor will have its original high efficiency.
On the other hand, those times when a motor has failed are also opportunities to upgrade motor efficiency. Especially if the failed motor is 10 or more years old — perhaps with unknown efficiency, and possibly having been improperly rewound in the past — you will want to seriously consider all the options, and look into the economics of replacing it with a new EE motor.
THE PAYBACK ISSUE
The more horsepower a motor delivers, and the more hours per year it runs, the greater the operating cost and the more important the motor’s efficiency turns out to be. Small motors, and motors that are used infrequently or only for short periods, don’t cost a lot to run even if they are inefficient. But when a large horsepower motor operates for thousands of hours per year, the operating cost is substantial. And, that motor’s efficiency can have a significant effect on the company’s bottom line.
If a standard efficiency motor has failed, you face a dilemma: Should you spend so much to have the motor rewound, and keep the operating cost the same — or potentially higher? Or should you spend significantly more than X rupees for a new EE motor, and reduce the operating cost? It is possible to arrive at rational answers to these questions by doing some simple calculations.
STATOR CORE DAMAGE
Induction motors employ an armature that rotates within a fixed stator, with a small air gap between the two. A typical motor stator is shown below.
Typical induction motor stator
www.binils.com
Anna University, Polytechnic & Schools www.binils.com

112
It consists of a core of stacked, insulated, iron laminations, with windings of insulated copper wire filling the slots in the core. In this example, those parts of the windings which extend beyond the core are laced in place. In some motors the windings are held in place with varnish or epoxy resin.
Motors fail for various reasons. A frequent cause is breakdown of the stator winding insulation due to repeated motor overheating, extreme one-time heating (possibly caused by loss of one of the three electrical phases), or water entering the motor. Normally, failure due to breakdown of stator winding insulation does not damage the core, and the core can be rewound if the old winding is carefully removed.
Bearing failure is another cause of motor failure, and when a motor fails for this reason the core is often damaged by the armature rubbing against the stator iron and burring the edges of the laminations. A stator with this kind of damage cannot normally be repaired without altering motor performance characteristics, and if that is the case, the motor should be discarded.
Whatever the cause of a motor’s failure, it is important that the stator’s iron core be carefully inspected for damage before rewinding is attempted. Rewinding a damaged core results not only in reduced motor efficiency, but also in higher motor temperature — increasing the likelihood of yet another motor failure.
STRIPPING THE STATOR WINDINGS
Before a stator core can be rewound, the original windings must be removed. There are various ways of doing this. Many motors — especially those in which the windings are just laced in place — can be easily “dry stripped” or “cold stripped.” Here, the ends of the windings are cut off and the wires within the slots are simply pushed out.
Where dry stripping is impractical, there are two alternatives:
Chemical stripping (which is rarely done these days because of concerns about employee safety and the environment), and
www.binils.com
Anna University, Polytechnic & Schools www.binils.com

113
heating the stator in an oven to loosen the old windings.
Heating the stator core to too high a temperature during this “burnout” process damages the core and results in a less efficient motor. Fortunately, it is now possible to conduct proper thermostatically-controlled burnouts of motor stators ranging in size from less than a horsepower to as large as 200 or 300 horsepower. If efficiency must be maintained because operating cost is high, and if the stator needs to be heated in order to be stripped, ask your rewinder to have the burnout done using thermostatically-controlled equipment.
THE TIME ISSUE
Production downtime can be extremely costly, and having an important motor burn out will sometimes shut down a production line. Having a motor rewound often takes less than 24 hours. Acquiring a new replacement motor is likely to take longer. Island shops have been known to work all night to repair a critical motor so the customer’s production line can be up and running the next morning. All of this needs to be considered when making the decision to repair or replace.
SPECIAL WINDINGS
One circumstance where motor rewinding is invaluable is where the failed motor is of non-standard size or operating characteristics, and an off-the-shelf replacement is not available. Another is where non-standard windings would be beneficial. Ordinarily, you want the motor rewinder to reproduce the original windings exactly: same wire size, same number of turns, same (or higher) insulation temperature rating. There are special circumstances, however, where a modified rewind can actually improve things. One concerns motors (often older motors) where the manufacturer did not completely fill the stator slots with wire. Here, the improvement involves keeping the number of turns the same but increasing the wire size — thereby cutting losses, increasing the efficiency of the motor, and reducing its operating temperature. Another special circumstance concerns the abnormal voltage conditions found in some plants. If the supply voltage to a 208-240 volt motor is only 200 volts, the motor will overheat at full load. One remedy is to raise the supply voltage. Another is to rewind the motor in such a way that it becomes a 200 volt motor operating on 200 volts.
GETTING TO KNOW YOUR MOTOR REWINDER
When having a motor rewound, it makes sense to discuss your expectations and the planned rewind process with repair shop personnel. Sometimes motor efficiency is not an important consideration; at other times it is. Where efficiency is important, agreement on a procedure similar to the following helps ensure that the rewound motor will be as efficient as before:
1. The stator core will be carefully inspected for damage before the windings are stripped. If damage is evident, no further work will be done until you and repair personnel have had a chance to discuss the matter.
www.binils.com
Anna University, Polytechnic & Schools www.binils.com

114
2. The old windings will either be cold stripped, or stripped after baking in a temperature-controlled oven at a set point temperature no higher than 650°F.
3. The new windings will have the same number of turns as the original windings, and will use wire having the same (or higher) insulation temperature rating. This wire will either have the same gauge as the original, or parallel wires will be used which together have the same total cross-sectional area of copper.
4. The original bearings will be replaced with new bearings of the same type.
4.7.Energy-Efficient Motors & energy saving opportunities. Energy-efficient motors (EEM) are the ones in which, design improvements are incorporated specifically to increase operating efficiency over motors of standard design (see Figure4.1). Design improvements focus on reducing intrinsic motor losses. Improvements include the use of lower-loss silicon steel, a longer core (to increase active material), thicker wires (to reduce resistance), thinner laminations, smaller air gap between stator and rotor, copper instead of aluminum bars in the rotor, superior bearings and a smaller fan, etc.
Energy-efficient motors now available in India operate with efficiencies that are
typically 3 to 4 percentage points higher than standard motors. In keeping with the stipulations of the BIS, energy-efficient motors are designed to operate without loss in
www.binils.com
Anna University, Polytechnic & Schools www.binils.com

115
efficiency at loads between 75 % and 100 % of rated capacity. This may result in major benefits in varying load applications. The power factor is about the same or may be higher than for standard motors. Furthermore, energy efficient motors have lower operating temperatures and noise levels, greater ability to accelerate higher-inertia loads, and are less affected by supply voltage fluctuations.
Measures adopted for energy efficiency address each loss specifically as under: Stator and Rotor I2R Losses These losses are major losses and typically account for 55% to 60% of the total losses. I2R losses are heating losses resulting from current passing through stator and rotor conductors. I2R losses are the function of a conductor resistance, the square of current. Resistance of conductor is a function of conductor material, length and cross sectional area. The suitable selection of copper conductor size will reduce the resistance. Reducing the motor current is most readily accomplished by decreasing the magnetizing component of current. This involves lowering the operating flux density and possible shortening of air gap. Rotor I2R losses are a function of the rotor conductors (usually aluminum) and the rotor slip. Utilization of copper conductors will reduce the winding resistance. Motor operation closer to synchronous speed will also reduce rotor I2R losses. Core Losses Core losses are those found in the stator-rotor magnetic steel and are due to hysteresis effect and eddy current effect during 50 Hz magnetization of the core material. These losses are independent of load and account for 20 – 25 % of the total losses.
The hysteresis losses which are a function of flux density, are be reduced by utilizing low-loss grade of silicon steel laminations. The reduction of flux density is achieved by suitable Increase in the core length of stator and rotor. Eddy current losses are generated by circulating current within the core steel laminations. These are reduced by using thinner laminations.
Friction and Windage Losses Friction and windage losses results from bearing friction, windage and circulating air through the motor and account for 8 – 12 % of total losses. These losses are independent of load. The
Reduction in heat generated by stator and rotor losses permits the use of smaller fan. The windage losses also reduce with the diameter of fan leading to reduction in windage losses.
Stray Load-Losses These losses vary according to square of the load current and are caused by leakage flux induced by load currents in the laminations and account for 4 to 5 % of total losses. These losses are reduced by careful selection of slot numbers, tooth/slot geometry and air gap.
Energy efficient motors cover a wide range of ratings and the full load efficiencies are higher by 3 to 7 %. The mounting dimensions are also maintained as per IS1231 to enable easy replacement.
www.binils.com
Anna University, Polytechnic & Schools www.binils.com

116
As a result of the modifications to improve performance, the costs of energy-efficient motors are higher than those of standard motors. The higher cost will often be paid back rapidly in saved operating costs, particularly in new applications or end-of-life motor replacements. In cases where existing motors have not reached the end of their useful life, the economics will be less clearly positive.
Because the favorable economics of energy-efficient motors are based on savings in operating costs, there may be certain cases which are generally economically ill-suited to energy-efficient motors. These include highly intermittent duty or special torque applications such as hoists and cranes, traction drives, punch presses, machine tools, and centrifuges. In addition, energy, efficient designs of multi-speed motors are generally not available. Furthermore, energy efficient motors are not yet available for many special applications, e.g. for flame-proof operation in oil-field or fire pumps or for very low speed applications (below 750 rpm). Also, most energy-efficient motors produced today are designed only for continuous duty cycle operation.
Given the tendency of over sizing on the one hand and ground realities like ; voltage, frequency variations, efficacy of rewinding in case of a burnout, on the other hand, benefits of EEM's can be achieved only by careful selection, implementation, operation and maintenance efforts of energy managers.
A summary of energy efficiency improvements in EEMs is given in the Table 4.1
TABLE 4.1 ENERGY EFFICIENT MOTORS
Power Loss Area Efficiency Improvement 1. Iron Use of thinner gauge, lower loss core steel reduces eddy current losses. Longer
core adds more steel to the design, which reduces losses due to lower operating flux densities.
2. Stator I2R Use of more copper and larger conductors increases cross sectional area of stator Windings. This lowers resistance (R) of the windings and reduces losses due to Current flow (I).
3. Rotor I2R Use of larger rotor conductor bars increases size of cross section, lowering Conductor resistance (R) and losses due to current flow (I).
4. Friction & Windage Use of low loss fan design reduces losses due to air movement.
5. Stray Load Loss Use of optimized design and strict quality control procedures minimizes stray Load losses.
www.binils.com
Anna University, Polytechnic & Schools www.binils.com

117
LIGHTING SYSTEM Introduction Lighting is an essential service in all the industries. The power consumption by the industrial lighting varies between 2 to 10% of the total power depending on the type of industry. Innovation and continuous improvement in the field of lighting, has given rise to tremendous energy saving opportunities in this area.
Lighting is an area, which provides a major scope to achieve energy efficiency at the design stage, by incorporation of modern energy efficient lamps, luminaires and gears, apart from good operational practices. 4.9 Basic Terms in Lighting System and Features Light Source -Lamps Lamp is equipment, which produces light. The most commonly used lamps are described briefly as follows: Incandescent lamps: Incandescent lamps produce light by means of a filament heated to incandescence by the flow of electric current through it. The principal parts of an incandescent lamp, also known as GLS (General Lighting Service) lamp include the filament, the bulb, the fill gas and the cap. Reflector lamps: Reflector lamps are basically incandescent, provided with a high quality internal mirror, which follows exactly the parabolic shape of the lamp. The reflector is resistant to corrosion, thus making the lamp maintenance free and output efficient. Gas discharge lamps: The light from a gas discharge lamp is produced by the excitation of gas contained in either a tubular or elliptical outer bulb.
The most commonly used discharge lamps are as follows: - Fluorescent tube lamps (FTL) - Compact Fluorescent Lamps (CFL) - Mercury Vapour Lamps - Sodium Vapour Lamps - Metal Halide Lamps
Luminaire Luminaire is a device that distributes filters or transforms the light emitted from one or more lamps. The luminaire includes all the parts necessary for fixing and protecting the lamps, except the lamps themselves. In some cases, luminaires also include the necessary circuit auxiliaries, together with the means for connecting them to the electric supply. The basic physical principles used in optical luminaire are reflection, absorption, transmission and refraction.
www.binils.com
Anna University, Polytechnic & Schools www.binils.com

118
Control Gear The gears used in the lighting equipment are as follows: Ballast: A current limiting device, to counter negative resistance characteristics of any discharge lamps. In case of fluorescent lamps, it aids the initial voltage build-up, required for starting. Igniters: These are used for starting high intensity Metal Halide and Sodium vapour lamps. Illuminance This is the quotient of the luminous flux incident on an element of the surface at a point of surface containing the point, by the area of that element.
The lighting level produced by a lighting installation is usually qualified by the illuminance produced on a specified plane. In most cases, this plane is the major plane of the tasks in the interior and is commonly called the working plane. The illuminance provided by an installation affects both the performance of the tasks and the appearance of the space. Lux (lx) This is the illuminance produced by a luminous flux of one lumen, uniformly distributed over a surface area of one square metre. One lux is equal to one lumen per square meter. Luminous Efficacy (lm/W) This is the ratio of luminous flux emitted by a lamp to the power consumed by the lamp. It is a reflection of efficiency of energy conversion from electricity to light form. Colour Rendering Index (RI) Is a measure of the degree to which the colors of surfaces illuminated by a given light source confirm to those of the same surfaces under a reference illuminant; suitable allowance having been made for the state of Chromatic adaptation. 4.10. Choice of lighting The Table shows the various types of lamp available along with their features.
TABLE 4.10.1 LUMINOUS PERFORMANCE CHARACTERISTICS OF COMMONLY USED LUMINARIES
Lumens / Watt Color Typical Type of Lamp Range Avg. Rendering Typical Application Life
Index (hours)
Incandescent 8–18 14 Excellent Homes, restaurants, 1000 general lighting, emergency lighting
Fluorescent Lamps 46–60 50 Good w.r.t. Offices, shops, 5000 coating hospitals, homes
www.binils.com
Anna University, Polytechnic & Schools www.binils.com

119
4.11. Luminance Requirements Recommendations on Illuminance Scale of Illuminance: The minimum illuminance for all non-working interiors, has
been mentioned as 20 Lux (as per IS 3646). A factor of approximately 1.5 represents the smallest significant difference in subjective effect of illuminance. Therefore, the following scale of illuminances is recommended.
20–30–50–75–100–150–200–300–500–750 –1000 –1500 –2000, … Lux
Illuminance ranges: Because circumstances may be significantly different for different
interiors used for the same application or for different conditions for the same kind of activity, a range of illuminances is recommended for each type of interior or activity intended of a single value of illuminance. Each range consists of three successive steps of the recommended scale of illuminances. For working interiors the middle value (R) of each range represents the recommended service illuminance that would be used unless one or more of the factors mentioned below apply.
The higher value (H) of the range should be used at exceptional cases where low
reflectance’s or contrasts are present in the task, errors are costly to rectify, visual work is critical, accuracy or higher productivity is of great importance and the visual capacity of the worker makes it necessary.
Similarly, lower value (L) of the range may be used when reflectance or contrasts are unusually high, speed & accuracy is not important and the task is executed only occasionally.
Compact fluorescent 40–70 60 Very good Hotels, shops, 8000–10000 lamps (CFL) homes, offices
High pressure 44–57 50 Fair General lighting in 5000 mercury (HPMV) factories, garages,
car parking, flood lighting
Halogen lamps 18–24 20 Excellent Display, flood 2000–4000 lighting, stadium exhibition grounds, construction areas
High pressure sodium 67–121 90 Fair General lighting 6000–12000 (HPSV) SON in factories, ware
houses, street lighting
Low pressure sodium 101–175 150 Poor Roadways, tunnels, 6000–12000 (LPSV) SOX canals, street lighting
www.binils.com
Anna University, Polytechnic & Schools www.binils.com

120
Recommended Illumination The following Table gives the recommended illuminance range for different tasks and activities for chemical sector. The values are related to the visual requirements of the task, to user's satisfaction, to practical experience and to the need for cost effective use of energy. (Source IS 3646 (Part I) : 1992).
For recommended illumination in other sectors, reader may refer Illuminating Engineers Society Recommendations Handbook
Chemicals
Petroleum, Chemical and Petrochemical works Exterior walkways, platforms, stairs and ladders 30–50–100Exterior pump and valve areas 50–100–150Pump and compressor houses 100–150–200Process plant with remote control 30–50–100Process plant requiring occasional manual intervention 50–100–150Permanently occupied work stations in process plant 150–200–300Control rooms for process plant 200–300–500
Pharmaceuticals Manufacturer and Fine chemicals Manufacturer Pharmaceutical manufacturer Grinding, granulating, mixing, drying, tableting, 300–500–750sterilizing, washing, preparation of solutions, filling, capping, wrapping, hardening
Fine chemical manufacturers Exterior walkways, platforms, stairs and ladders 30–50–100Process plant 50–100–150Fine chemical finishing 300–500–750Inspection 300–500–750Soap manufacture General area 200–300–500Automatic processes 100–200–300Control panels 200–300–500Machines 200–300–500
www.binils.com
Anna University, Polytechnic & Schools www.binils.com

121
Paint works General 200–300–500 Automatic processes 150–200–300 Control panels 200–300–500 Special batch mixing 500–750–1000 Colour matching 750–100–1500
4.12. ENERGY CONSERVATION AVENUES
A step-by-step approach for assessing energy efficiency of lighting system is given below: Step–1: Inventories the Lighting System elements & transformers in the facility as per following typical format (Table – 4.12.1 and 4.12.2).
TABLE 4.12.1 DEVICE RATING, POPULATION AND USE PROFILE
S. No. Plant Lighting Rating in Watts Population No. of hours Location Device & Lamp & Ballast Numbers / Day Ballast Type
TABLE 4.12.2 LIGHTING TRANSFORMER / RATING AND POPULATION PROFILE:
S. No. Plant Lighting Numbers Meter Provisions Available Location Transformer Installed Volts / Amps / kW / Energy Rating (kVA)
In case of distribution boards (instead of transformers) being available, fuse ratings may be inventoried along the above pattern in place of transformer kVA.
Step–2: With the aid of a lux meter, measure and document the lux levels at various plant locations at working level, as daytime lux and night time lux values alongside the number of lamps "ON" during measurement.
www.binils.com
Anna University, Polytechnic & Schools www.binils.com

122
Step–3: With the aid of portable load analyzer, measure and document the voltage, current, power factor and power consumption at various input points, namely the distribution boards or the lighting voltage transformers at the same as that of the lighting level audit.
Step–4: Compare the measured lux values with standard values as reference and identify locations as under lit and over lit areas.
Step–5: Collect and analyze the failure rates of lamps, ballasts and the actual life expectancy levels from the past data.
Step–6: Based on careful assessment and evaluation, bring out improvement options, which could include:
Maximize sunlight use through use of transparent roof sheets, north light roof, etc.
Examine scope for replacements of lamps by more energy efficient lamps, with due
consideration to luminaire, color rendering index, lux level as well as expected life comparison.
Replace conventional magnetic ballasts by more energy efficient ballasts, with due
consideration to life and power factor apart from watt loss.
Select interior colures for light reflection. Modify layout for optimum lighting.
Providing individual / group controls for lighting for energy efficiency such as:
On / off type voltage regulation type (for illuminance control) Group control switches / units Occupancy sensors Photocell controls Timer operated controls Pager operated controls Computerized lighting control programs
Install input voltage regulators / controllers for energy efficiency as well as longer life
expectancy for lamps where higher voltages, fluctuations are expected. Replace energy efficient displays like LED's in place of lamp type displays in control
panels / instrumentation areas, etc.
4.19. Case Examples Energy Efficient Replacement Options The lamp efficacy is the ratio of light output in lumens to power input to lamps in watts. Over the years development in lamp technology has led to improvements in efficacy of lamps. However, the low efficacy lamps, such as incandescent bulbs, still constitute a major share of the lighting load. High efficacy gas discharge lamps suitable for different types of applications offer appreciable scope for energy conservation. Typical energy efficient replacement options, along with the per cent energy saving, are given in Table-4.19.1
www.binils.com
Anna University, Polytechnic & Schools www.binils.com

123
TABLE 4.19.1 SAVINGS BY USE OF HIGH EFFICACY LAMPS
Lamp type Power saving Sector
Existing Proposed Watts %
Domestic/Commercial GLS 100 W *CFL 25 W 75 75
Industry GLS 13 W *CFL 9 W 4 31 GLS 200 W Blended 160 W 40 20 TL 40 W TLD 36 W 4 10
Industry/Commercial HPMV 250 W HPSV 150 W 100 37 HPMV 400 W HPSV 250 W 150 35
* Wattages of CFL includes energy consumption in ballasts.
Energy Saving Potential in Street Lighting The energy saving potential, in typical cases of replacement of inefficient lamps with efficient lamps in street lighting is given in the Table 4.19.2
TABLE 4.19.2 SAVING POTENTIAL BY USE OF HIGH EFFICACY LAMPS FOR STREET LIGHTING
Existing lamp Replaced units Saving
Type W Life Type W Life W %
GLS 200 1000 ML 160 5000 40 7
GLS 300 1000 ML 250 5000 50 17
TL 2 X 40 5000 TL 2 X 36 5000 8 6
HPMV 125 5000 HPSV 70 12000 25 44
HPMV 250 5000 HPSV 150 12000 100 40
HPMV 400 5000 HPSV 250 12000 150 38
4.20. Some Good Practices in Lighting Installation of energy efficient fluorescent lamps in place of "Conventional" fluorescent lamps. Energy efficient lamps are based on the highly sophisticated tri-phosphor fluorescent powder technology. They offer excellent colour rendering properties in addition to the very high luminous efficacy. Installation of Compact Fluorescent Lamps (CFL's) in place of incandescent lamps. Compact fluorescent lamps are generally considered best for replacement of lower wattage incandescent lamps. These lamps have efficacy ranging from 55 to 65 lumens/Watt. The aver-age rated lamp life is 10,000 hours, which is 10 times longer than that of a normal incandescent
www.binils.com
Anna University, Polytechnic & Schools www.binils.com

124
lamps. CFL's are highly suitable for places such as Living rooms, Hotel lounges, Bars, Restaurants, Pathways, Building entrances, Corridors, etc. Installation of metal halide lamps in place of mercury / sodium vapour lamps. Metal halide lamps provide high color rendering index when compared with mercury & sodium vapour lamps. These lamps offer efficient white light. Hence, metal halide is the choice for colour critical applications where, higher illumination levels are required. These lamps are highly suitable for applications such as assembly line, inspection areas, painting shops, etc. It is recommended to install metal halide lamps where colour rendering is more critical. Installation of High Pressure Sodium Vapour (HPSV) lamps for applications where colour rendering is not critical. High pressure sodium vapour (HPSV) lamps offer more efficacies. But the colour rendering property of HPSV is very low. Hence, it is recommended to install HPSV lamps for applications such street lighting, yard lighting, etc. Installation of LED panel indicator lamps in place of filament lamps. Panel indicator lamps are used widely in industries for monitoring, fault indication, signaling, etc. Conventionally filament lamps are used for the purpose, which has got the following disadvantages: High energy consumption (15 W/lamp)
Failure of lamps is high (Operating life less than 1,000 hours) Very sensitive to the voltage fluctuations Recently, the conventional filament lamps are being replaced with Light Emitting Diodes (LEDs). The LEDs have the following merits over the filament lamps.
- Lesser power consumption (Less than 1 W/lamp) - Withstand high voltage fluctuation in the power supply. - Longer operating life (more than 1,00,000 hours)
It is recommended to install LEDs for panel indicator lamps at the design stage. Light distribution Energy efficiency cannot be obtained by mere selection of more efficient lamps alone. Efficient luminaires along with the lamp of high efficacy achieve the optimum efficiency. Mirror-optic luminaires with a high output ratio and bat-wing light distribution can save energy.
For achieving better efficiency, luminaires that are having light distribution characteristics appropriate for the task interior should be selected. The luminaires fitted with a lamp should ensure that discomfort glare and veiling reflections are minimized. Installation of suitable luminaires depends upon the height - Low, Medium & High Bay. Luminaires for high intensity dis-charge lamp are classified as follows: • Low bay, for heights less than 5 metres. • Medium bay, for heights between 5 – 7 metres. • High bay, for heights greater than 7 metres.
www.binils.com
Anna University, Polytechnic & Schools www.binils.com

125
System layout and fixing of the luminaries play a major role in achieving energy
efficiency. This also varies from application to application. Hence, fixing the luminaries at optimum height and usage of mirror optic luminaries leads to energy efficiency. Light Control The simplest and the most widely used form of controlling a lighting installation is "On-Off" switch. The initial investment for this set up is extremely low, but the resulting operational costs may be high. This does not provide the flexibility to control the lighting, where it is not required.
Hence, a flexible lighting system has to be provided, which will offer switch-off or reduction in lighting level, when not needed. The following light control systems can be adopted at design stage: Grouping of lighting system, to provide greater flexibility in lighting control Grouping of lighting system, which can be controlled manually or by timer control. Installation of microprocessor based controllers Another modern method is usage of microprocessor / infrared controlled dimming or switching circuits. The lighting control can be obtained by using logic units located in the ceiling, which can take pre-programme commands and activate specified lighting circuits. Advanced lighting control system uses movement detectors or lighting sensors, to feed signals to the controllers. Optimum usage of day lighting Whenever the orientation of a building permits, day lighting can be used in combination with electric lighting. This should not introduce glare or a severe imbalance of brightness in visual environment. Usage of day lighting (in offices/air conditioned halls) will have to be very limited, because the air conditioning load will increase on account of the increased solar heat dissipation into the area. In many cases, a switching method, to enable reduction of electric light in the window zones during certain hours, has to be designed. Installation of "exclusive" transformer for lighting In most of the industries, lighting load varies between 2 to 10%. Most of the problems faced by the lighting equipment and the "gears" is due to the "voltage" fluctuations. Hence, the lighting equipment has to be isolated from the power feeders. This provides a better voltage regulation for the lighting. This will reduce the voltage related problems, which in turn increases the efficiency of the lighting system. Installation of servo stabilizer for lighting feeder Wherever, installation of exclusive transformer for lighting is not economically attractive, servo stabilizer can be installed for the lighting feeders. This will provide stabilized voltage for the lighting equipment. The performance of "gears" such as chokes, ballasts, will also improve due to the stabilized voltage.
This set up also provides, the option to optimize the voltage level fed to the lighting feeder. In many plants, during the non-peaking hours, the voltage levels are on the higher side. During this period, voltage can be optimized, without any significant drop in the illumination level.
www.binils.com
Anna University, Polytechnic & Schools www.binils.com

126
Installation of high frequency (HF) electronic ballasts in place of conventional ballasts New high frequency (28–32 kHz) electronic ballasts have the following advantages over the traditional magnetic ballasts: Energy savings up to 35% Less heat dissipation, which reduces the air conditioning load? 4.1 Lights instantly 4.2 Improved power factor 4.3 Operates in low voltage load 4.4 Less in weight 4.5 Increases the life of lamp
The advantage of HF electronic ballasts, outweigh the initial investment (higher costs when compared with conventional ballast). In the past the failure rate of electronic ballast in Indian Industries was high. Recently, many manufacturers have improved the design of the ballast leading to drastic improvement in their reliability. The life of the electronic ballast is high especially when, used in a lighting circuit fitted with a automatic voltage stabilizer. The Table 4.20.1 gives the type of luminaire, gear and controls used in different areas of industry. TABLE 4.20.1 TYPES OF LUMINAIRE WITH THEIR GEAR AND CONTROLS USED IN DIFFERENT INDUSTRIAL LOCATIONS Location Source Luminaire Gear Controls Plant HID / FTL Industrial rail reflector : Conventional / low Manual / electronic
High bay Loss electronic Medium bay ballast Low bay
Office FTL / CFL FTL/CFL Electronic/low Manual/auto loss
Yard HID Flood light Suitable Manual Road peripherals HID / PL Street light luminaire Suitable Manual
www.binils.com
Anna University, Polytechnic & Schools www.binils.com

127
Unit IV
REVIEW QUESTIONS
Part A & Bs 1. What is meant by motor? How industrial motors can be classified? 2. Explain direct current motors. 3. Write short notes on Synchronous motors. 4. Define motor efficiency 5. What are the factors to be decided for selecting high efficiency motors? 6. What is the relation between the speed and frequency of an induction motors 7. List the losses in induction motors and their expected percentage out of the total losses. 8. What are the factors that affect the motor efficiency of rewinding? 9. What is meant by motor load survey? 10. What is meant by lighting? 11. What are the types of commonly used lamps? 12. Define luminous efficiency. 13. Define illuminance. 14. Define Colour rendering index. 15. What is lux? 16. What are control gears? 17. What is the function of ballast in a lighting system? 18. What are the advantages of LED lamp over incandescent lamps? Part C 1. Explain briefly the types of motors used in industries. 2. Explain the different types of losses that affect the motor efficiency. 3. Describe the factors affecting the performance and energy efficiency of motors. 4. Explain the rewinding effects on energy efficiency of motors. 5. Enumerate the energy saving opportunities with energy efficient motors. 6. Explain the three main types of light sources. 7. Explain how the lighting system can be choosing? 8. What are the energy conservation avenues in lighting system? 9. Compare luminance efficiency of different lamps. 10. Explain why CFL is used for energy efficient light source?
www.binils.com
Anna University, Polytechnic & Schools www.binils.com

128
UNIT-V DG SET SYSTEM&ENERGY EFFICIENT
TECHNOLOGIES IN ELECTRICAL SYSTEM
5A.OBJECTIVE: Diesel Generating system: Factors affecting selection, Energy performance assessment of diesel conservation avenues 5B.OBJECTIVE: Energy Efficient Technologies in Electrical Systems: Maximum demand controllers, Automatic power factor controllers, Energy efficient motors, Soft starters with energy saver, Variable speed drives, Energy efficient transformers, Electronic ballast, Occupancy sensors, Energy efficient lighting controls, Energy saving potential of each technology 5.1 Introduction Diesel engine is the prime mover, which drives an alternator to produce electrical energy. In the diesel engine, air is drawn into the cylinder and is compressed to a high ratio (14:1 to 25:1). During this compression, the air is heated to a temperature of 700–900°C. A metered quantity of diesel fuel is then injected into the cylinder, which ignites spontaneously because of the high temperature. Hence, the diesel engine is also known as compression ignition (CI) engine.
DG set can be classified according to cycle type as: two stroke and four stroke. However, the bulk of IC engines use the four stroke cycle. Let us look at the principle of operation of the four-stroke diesel engine. Four Strokes - Diesel Engine The 4 stroke operations in a diesel engine are: induction stroke, compression stroke, ignition and power stroke and exhaust stroke.
1st: Induction stroke - while the inlet valve is open, the descending piston draws in fresh air.
2nd: Compression stroke - while the valves are closed, the air is compressed to a pressure
of up to 25 bar. 3rd: Ignition and power stroke - fuel is injected, while the valves are closed (fuel injection
actually starts at the end of the previous stroke), the fuel ignites spontaneously and the piston is forced downwards by the combustion gases.
4th: Exhaust stroke - the exhaust valve is open and the rising piston discharges the spent gases from the cylinder.
www.binils.com
Anna University, Polytechnic & Schools www.binils.com

129
Since power is developed during only one stroke, the single cylinder four-stroke engine has a low degree of uniformity. Smoother running is obtained with multi cylinder engines because the cranks are staggered in relation to one another on the crankshaft. There are many variations of engine configuration, for example. 4 or 6 cylinder, in-line, horizontally opposed, vee or radial configurations. DG Set as a System A diesel generating set should be considered as a system since its successful operation depends on the well-matched performance of the components, namely:
3.2 The diesel engine and its accessories. 3.3 The AC Generator. 3.4 The control systems and switchgear. 3.5 The foundation and power house civil works. 3.6 The connected load with its own components like heating, motor drives, lighting
etc. It is necessary to select the components with highest efficiency and operate them at their
Optimum efficiency levels to conserve energy in this system.
Fig 9.2 DG Set System Selection Considerations To make a decision on the type of engine, which is most suitable for a specific application, several factors need to be considered. The two most important factors are: power and speed of the engine.
The power requirement is determined by the maximum load. The engine power rating should be 10 – 20 % more than the power demand by the end use. This prevents overloading the machine by absorbing extra load during starting of motors or switching of some types of lighting systems or when wear and tear on the equipment pushes up its power consumption.
Speed is measured at the output shaft and given in revolutions per minute (RPM). An engine will operate over a range of speeds, with diesel engines typically running at lower
www.binils.com
Anna University, Polytechnic & Schools www.binils.com

130
Speeds (1300 – 3000 RPM). There will be an optimum speed at which fuel efficiency will be greatest. Engines should be run as closely as possible to their rated speed to avoid poor efficiency and to prevent build up of engine deposits due to incomplete combustion - which will lead to higher maintenance and running costs. To determine the speed requirement of an engine, one has to again look at the requirement of the load.
For some applications, the speed of the engine is not critical, but for other applications such as a generator, it is important to get a good speed match. If a good match can be obtained, direct coupling of engine and generator is possible; if not, then some form of gearing will be necessary - a gearbox or belt system, which will add to the cost and reduce the efficiency.
There are various other factors that have to be considered, when choosing an engine for a given application. These include the following: cooling system, abnormal environmental conditions (dust, dirt, etc.), fuel quality, speed governing (fixed or variable speed), poor maintenance, control system, starting equipment, drive type, ambient temperature, altitude, humidity, etc.
Suppliers or manufacturers literature will specify the required information when purchasing an engine. The efficiency of an engine depends on various factors, for example, load factor (percentage of full load), engine size, and engine type. Diesel Generator Captive Power Plants Diesel engine power plants are most frequently used in small power (captive non-utility) systems. The main reason for their extensive use is the higher efficiency of the diesel engines com-pared with gas turbines and small steam turbines in the output range considered. In applications requiring low captive power, without much requirement of process steam, the ideal method of power generation would be by installing diesel generator plants. The fuels burnt in diesel engines range from light distillates to residual fuel oils. Most frequently used diesel engine sizes are between the range 4 to 15 MW. For continuous operation, low speed diesel engine is more cost-effective than high speed diesel engine. Advantages of adopting Diesel Power Plants are: 1 Low installation cost 2 Short delivery periods and installation period 3 Higher efficiency (as high as 43 – 45 %) 4 More efficient plant performance under part loads 5 Suitable for different type of fuels such as low sulphur heavy stock and heavy fuel oil in case of large capacities. 6 Minimum cooling water requirements, 7 Adopted with air cooled heat exchanger in areas where water is not available 8 Short start up time
A brief comparison of different types of captive power plants (combined gas turbine and
steam turbine, conventional steam plant and diesel engine power plant) is given in Table 9.1. It can be seen from the Table that captive diesel plant wins over the other two in terms of thermal efficiency, capital cost, space requirements, auxiliary power consumption, plant load factor etc.
www.binils.com
Anna University, Polytechnic & Schools www.binils.com
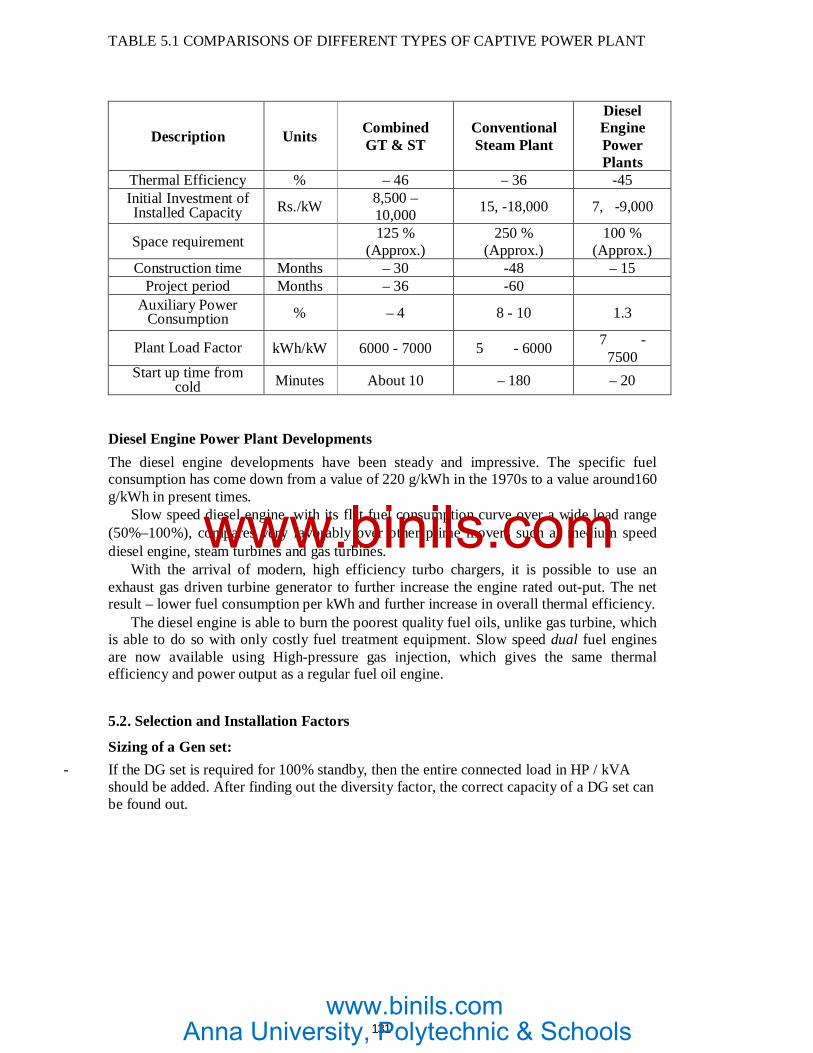
131
TABLE 5.1 COMPARISONS OF DIFFERENT TYPES OF CAPTIVE POWER PLANT
Description Units Combined GT & ST
Conventional Steam Plant
Diesel Engine Power Plants
Thermal Efficiency % – 46 – 36 -45 Initial Investment of Installed Capacity Rs./kW 8,500 –
10,000 15, -18,000 7, -9,000
Space requirement 125 % (Approx.)
250 % (Approx.)
100 % (Approx.)
Construction time Months – 30 -48 – 15 Project period Months – 36 -60
Auxiliary Power Consumption % – 4 8 - 10 1.3
Plant Load Factor kWh/kW 6000 - 7000 5 - 6000 7 -7500
Start up time from cold Minutes About 10 – 180 – 20
Diesel Engine Power Plant Developments The diesel engine developments have been steady and impressive. The specific fuel consumption has come down from a value of 220 g/kWh in the 1970s to a value around160 g/kWh in present times.
Slow speed diesel engine, with its flat fuel consumption curve over a wide load range (50%–100%), compares very favorably over other prime movers such as medium speed diesel engine, steam turbines and gas turbines.
With the arrival of modern, high efficiency turbo chargers, it is possible to use an exhaust gas driven turbine generator to further increase the engine rated out-put. The net result – lower fuel consumption per kWh and further increase in overall thermal efficiency.
The diesel engine is able to burn the poorest quality fuel oils, unlike gas turbine, which is able to do so with only costly fuel treatment equipment. Slow speed dual fuel engines are now available using High-pressure gas injection, which gives the same thermal efficiency and power output as a regular fuel oil engine.
5.2. Selection and Installation Factors Sizing of a Gen set:
- If the DG set is required for 100% standby, then the entire connected load in HP / kVA should be added. After finding out the diversity factor, the correct capacity of a DG set can be found out.
www.binils.com
Anna University, Polytechnic & Schools www.binils.com

132
Example : Connected Load 650 kW Diversity Factor 0.54 (Demand / connected load) Max. Demand 650 x 0.54 = 350 kW% Loading 70 Set rating 350/0.7 = 500 kW At 0.8 PF, rating 625 kVA
iv) For an existing installation, record the current, voltage and power factors (kWh / kVAh) reading at the main bus-bar of the system at every half-an-hour interval for a period of 2–3 days and during this period the factory should be having its normal operations. The non-essential loads should be switched off to find the realistic current taken for running essential equipment. This will give a fair idea about the current taken from which the rating of the set can be calculated.
For existing installation:
kVA √3 V I kVA Rating kVA / Load Factor where Load factor
Average kVA / Maximum kVA
• For a new installation, an approximate method of estimating the capacity of a DG set is to add full load currents of all the proposed loads to be run in DG set. Then, applying a diversity factor depending on the industry, process involved and guidelines obtained from other similar units, correct capacity can be arrived at. High Speed Engine or Slow/Medium Speed Engine The normal accepted definition of high speed engine is 1500 rpm. The high speed sets have been developed in India, whereas the slow speed engines of higher capacities are often
www.binils.com
Anna University, Polytechnic & Schools www.binils.com

133
imported. The other features and comparison between high and medium / slow speed engines are mentioned below:
Factor Slow speed engine
High speed engine
Break mean effective pressure - therefore Low High wear and tear and consumption of spares Weight to power ratio- therefore sturdiness More Less and life Space High Less
Type of use Continuous use
Intermittent use
Period between overhauls* 8000 hours 3200 Direct operating cost (includes lubricating Less High oils, filters etc. * Typical recommendations from manufacturers
Keeping the above factors and available capacities of DG set in mind, the cost of economics for both the engines should be worked out before arriving at a decision.
www.binils.com
Anna University, Polytechnic & Schools www.binils.com

134
Capacity Combinations From the point of view of space, operation, maintenance and initial capital investment, it is certainly economical to go in for one large DG set than two or more DG sets in parallel. Two or more DG sets running in parallel can be a advantage as only the short-fall in power–depending upon the extent of power cut prevailing - needs to filled up. Also, flexibility of operation is increased since one DG set can be stopped, while the other DG set is generating at least 50% of the power requirement. Another advantage is that one DG set can become 100% standby during lean and low power-cut periods. Air Cooling Vs. Water Cooling The general feeling has been that a water cooled DG set is better than an air cooled set, as most users are worried about the overheating of engines during summer months. This is to some extent is true and precautions have to be taken to ensure that the cooling water temperature does not exceed the prescribed limits. However, from performance and maintenance point of view, water and air cooled sets are equally good except that proper care should be taken to ensure cross ventilation so that as much cool air as possible is circulated through the radiator to keep its cooling water temperature within limits. While, it may be possible to have air cooled engines in the lower capacities, it will be necessary to go in for water cooled engines in larger capacities to ensure that the engine does not get over-heated during summer months. Safety Features It is advisable to have short circuit, over load and earth fault protection on all the DG sets. However, in case of smaller capacity DG sets, this may become uneconomical. Hence, it is strongly recommended to install a circuit protection. Other safety equipment like high temperature, low lube oil pressure cut-outs should be provided, so that in the event of any of these abnormalities, the engine would stop and prevent damage. It is also essential to pro-vide reverse power relay when DG sets are to run in parallel to avoid back feeding from one alternator to another. Parallel Operation with Grid Running the DG set in parallel with the mains from the supply undertakings can be done in consultation with concerned electricity authorities. However, some supply undertakings ask the consumer to give an undertaking that the DG set will not be run in parallel with their supply. The reasons stated are that the grid is an infinite bus and paralleling a small capacity DG set would involve operational risks despite normal protections like reverse power relay, voltage and frequency relays. Maximum Single Load on DG Set The starting current of squirrel cage induction motors is as much as six times the rated current for a few seconds with direct-on-line starters. In practice, it has been found that the starting cur-rent value should not exceed 200 % of the full load capacity of the alternator. The voltage and frequency throughout the motor starting interval recovers and reaches rated values usually much before the motor has picked up full speed.
www.binils.com
Anna University, Polytechnic & Schools www.binils.com

135
In general, the HP of the largest motor that can be started with direct on line starting is about 50 % of the kVA rating of the generating set. On the other hand, the capacity of the induction motor can be increased, if the type of starting is changed over to star delta or to auto transformer starter, and with this starting the HP of the largest motor can be up to 75 % of the kVA of Gen set. Unbalanced Load Effects It is always recommended to have the load as much balanced as possible, since unbalanced loads can cause heating of the alternator, which may result in unbalanced output voltages. The maximum unbalanced load between phases should not exceed 10 % of the capacity of the generating sets. Neutral Earthing The electricity rules clearly specify that two independent earths to the body and neutral should be provided to give adequate protection to the equipment in case of an earth fault, and also to drain away any leakage of potential from the equipment to the earth for safe working. Site Condition Effects on Performance Debating Site condition with respect to altitude, intake temperature and cooling water temperature der-ate diesel engine output as shown in following Tables: 5.2 and 5.3. TABLE 5.2 ALTITUDE AND INTAKE TEMPERATURE CORRECTIONS Correction Factors for Engine Output
Altitude Correction Temperature Correction
Altitude Meters over MSL
Non Super Charged
Super ChargedIntake °C Correction Factor
610 0.980 0.980 32 1.000 915 0.935 0.950 35 0.986 1220 0.895 0.915 38 0.974 1525 0.855 0.882 41 0.962 1830 0.820 0.850 43 0.950 2130 0.780 0.820 46 0.937 2450 0.745 0.790 49 0.925 2750 0.712 0.765 52 0.913 3050 0.680 0.740 54 0.900 3660 0.612 0.685 4270 0.550 0.630 4880 0.494 0.580
TABLE 5.3 DERATING DUE TO AIR INTER COOLER WATER INLET TEMPERATURE
Water Temperature °C Flow % De rating %
25 100 0 30 125 3 35 166 5 40 166 8
www.binils.com
Anna University, Polytechnic & Schools www.binils.com

136
5.3. Operational Factors Load Pattern & DG Set Capacity The average load can be easily assessed by logging the current drawn at the main switchboard on an average day. The 'over load' has a different meaning when referred to the D.G. set. Overloads, which appear insignificant and harmless on electricity board supply, may become detrimental to a D.G. set, and hence overload on D.G. set should be carefully analyzed. Diesel engines are designed for 10% overload for 1 hour in every 12 hours of operation. The A.C. generators are designed to meet 50% overload for 15 seconds as specified by standards. The D.G. sets selection should be such that the overloads are within the above specified limits. It would be ideal to connect steady loads on DG set to ensure good performance. Alongside alternator loading, the engine loading in terms of kW or BHP, needs to be maintained above 50%. Ideally, the engine and alternator loading conditions are both to be achieved towards high efficiency. Engine manufacturers offer curves indicating % Engine Loading Vs fuel Consumption in grams/BHP. Optimal engine loading corresponding to best operating point is desirable for energy efficiency.
Alternators are sized for kVA rating with highest efficiency attainable at a loading of around 70% and more. Manufacturers’ curves can be referred to for best efficiency point and corresponding kW and kVA loading values. Sequencing of Loads The captive diesel generating set has certain limits in handling the transient loads. This applies to both kW (as reflected on the engine) and kVA (as reflected on the generator). In this context, the base load that exists before the application of transient load brings down the transient load handling capability, and in case of A.C. generators, it increases the transient voltage dip. Hence, great care is required in sequencing the load on D.G. sets. It is advisable to start the load with highest transient kVA first followed by other loads in the descending order of the starting kVA. This will lead to optimum sizing and better utilization of transient load handling capacity of D.G. set. Load Pattern In many cases, the load will not be constant throughout the day. If there is substantial variation in load, then consideration should be given for parallel operation of D.G. sets. In such a situation, additional D.G. set(s) are to be switched on when load increases. The typical case may be an establishment demanding substantially different powers in first, second and third shifts. By parallel operation, D.G. sets can be run at optimum operating points or near about, for optimum fuel consumption and additionally, flexibility is built into the system. This scheme can be also be applied where loads can be segregated as critical and non-critical loads to provide standby power to critical load in the captive power system. Load Characteristics Some of the load characteristics influence efficient use of D.G. set. These characteristics are entirely load dependent and cannot be controlled by the D.G. set. The extent of detrimental influence of these characteristics can be reduced in several cases. Power Factor: The load power factor is entirely dependent on the load. The A.C. generator is designed for the power factor of 0.8 lag as specified by standards. Lower power factor demands higher excitation currents and results in increased losses. Over sizing A.C. generators for operation at lower power factors results in lower operating efficiency and higher costs. The economical alternative is to provide power factor improvement capacitors.
www.binils.com
Anna University, Polytechnic & Schools www.binils.com

137
Unbalanced Load: Unbalanced loads on A.C. generator leads to unbalanced set of voltages and additional heating in A.C. generator. When other connected loads like motor loads are fed with unbalanced set of voltages additional losses occur in the motors as well. Hence, the load on the A.C. generators should be balanced as far as possible. Where single phase loads are predominant, consideration should be given for procuring single phase A.C. generator. Transient Loading: On many occasions to contain transient voltage dip arising due to transient load application, a specially designed generator may have to be selected. Many times an unstandard combination of engine and A.C. generator may have to be procured. Such a combination ensures that the prime mover is not unnecessarily over sized which adds to capital cost and running cost. Special Loads: Special loads like rectifier / thyristor loads, welding loads, furnace loads need an application check. The manufacturer of diesel engine and AC generator should be consulted for proper recommendation so that desired utilization of DG set is achieved without any problem. In certain cases of loads, which are sensitive to voltage, frequency regulation, voltage wave form, consideration should be given to segregate the loads, and feed it by a dedicated power supply which usually assumes the form of DG motor driven generator set. Such an alternative ensures that special design of AC generator is restricted to that portion of the load which requires high purity rather than increasing the price of the D.G. set by specially designed AC generator for complete load. Waste Heat Recovery in DG Sets A typical energy balance in a DG set indicates following break-up:
Input 100% Thermal Energy Outputs 35% Electrical Output Alternator Losses 33% Stack Loss through Flue Gases 24% Coolant Losses Radiation Losses
Among these, stack losses through flue gases or the exhaust flue gas losses on account
of existing flue gas temperature of 350°C to 550°C, constitute the major area of concern towards operational economy. It would be realistic to assess the Waste Heat Recovery (WHR) potential in relation to quantity, temperature margin, in kcals/Hour as: Potential WHR = (kWh Output/Hour) x (8 kg Gases / kWh Output) x 0.25 kcal/ kg°C x (t g – 180°C)
Where, tg is the gas temperature after Turbocharger, (the criteria being that limiting exit gas temperature cannot be less than 180°C, to avoid acid dew point corrosion), 0.25 being the specific heat of flue gases and kWh output being the actual average unit generation from the set per hour. For an 1100 KVA set, at 800 KW loading, and with 480°C exhaust gas temperature, the waste heat potential works out to: 800 kWh x 8 kg gas generation / kWh output x 0.25 k Cal /kg°C x (480 – 180), i.e., 4,80,000 k Cal /hr
www.binils.com
Anna University, Polytechnic & Schools www.binils.com

138
While the above method yields only the potential for heat recovery, the actual realizable
potential depends upon various factors and if applied judiciously, a well configured waste heat recovery system can tremendously boost the economics of captive DG power generation. The factors affecting Waste Heat Recovery from flue Gases are: • DG Set loading, temperature of exhaust gases • Hours of operation and • Back pressure on the DG set • Consistent DG set loading (to over 60% of rating) would ensure a reasonable exit flue gas quantity and temperature. Fluctuations and gross under loading of DG set results in erratic flue gas quantity and temperature profile at entry to heat recovery unit, thereby leading to possible cold end corrosion and other problems. TABLE 5.4 TYPICAL FLUE GAS TEMPERATURES AND FLOW PATTERN IN A 5-MW DG SET AT VARIOUS LOADS
100% Load 11.84 kgs/Sec 370°C 90% Load
10.80 kgs/Sec 350°C
70% Load
9.08 kgs/Sec 330°C
60% Load
7.50 kgs/Sec 325°C
If the normal load is 60%, the flue gas parameters for waste heat recovery unit would be 320°C inlet temperature, 180°C outlet temperature and 27180 kgs/Hour gas flows. At 90% loading, however, values would be 355°C and 32,400 kgs / Hour, respectively
Number of hours of operation of the DG Set has an influence on the thermal performance of waste heat Recovery unit. With continuous DG Set operations, cost benefits are favorable.
Back pressure in the gas path caused by additional pressure drop in waste heat
recovery unit is another key factor. Generally, the maximum back pressure allowed is around 250–300 mm WC and the heat recovery unit should have a pressure drop lower than that. Choice of convective waste heat recovery systems with adequate heat transfer area are known to provide reliable service.
The configuration of heat recovery system and the choice of steam parameters can be
judiciously selected with reference to the specific industry (site) requirements. Much good work has taken place in Indian Industry regarding waste heat recovery and one interesting configuration, deployed is installation of waste heat boiler in flue gas path along with a vapour absorption chiller, to produce 8°C chilled water working on steam from waste heat.
The favorable incentives offered by Government of India for energy efficient equipment and technologies (100% depreciation at the end of first year), make the waste heat recovery option. Payback period is only about 2 years
www.binils.com
Anna University, Polytechnic & Schools www.binils.com

139
5.4 Energy Performance Assessment of DG Sets Routine energy efficiency assessment of DG sets on shop floor involves following typical steps: - Ensure reliability of all instruments used for trial. - Collect technical literature, characteristics, and specifications of the plant. - Conduct a 2 hour trial on the DG set, ensuring a steady load, wherein the following mea-surements are logged at 15 minutes intervals. Fuel consumption (by dip level or by flow meter) Amps, volts, PF, kW, kWh Intake air temperature, Relative Humidity (RH) Intake cooling water temperature Cylinder-wise exhaust temperature (as an indication of engine loading)
Turbocharger RPM (as an indication of loading on engine) Charge air pressure (as an indication of engine loading) Cooling water temperature before and after charge air cooler (as an indication of cool-er
performance) Stack gas temperature before and after turbocharger (as an indication of turbocharger
performance) - The fuel oil/diesel analysis is referred to from an oil company data. - Analysis: The trial data is to be analyzed with respect to:
Average alternator loading. Average engine loading. Percentage loading on alternator. Percentage loading on engine. Specific power generation kWh/liter. Comments on Turbocharger performance based on RPM and gas temperature difference. Comments on charge air cooler performance.
• Comments on load distribution among various cylinders (based on exhaust temperature, the temperature to be 5% of mean and high/low values indicate disturbed condition). • Comments on housekeeping issues like drip leakages, insulation, vibrations, etc. A format as shown in the Table 9.5 is useful for monitoring the performance
www.binils.com
Anna University, Polytechnic & Schools www.binils.com
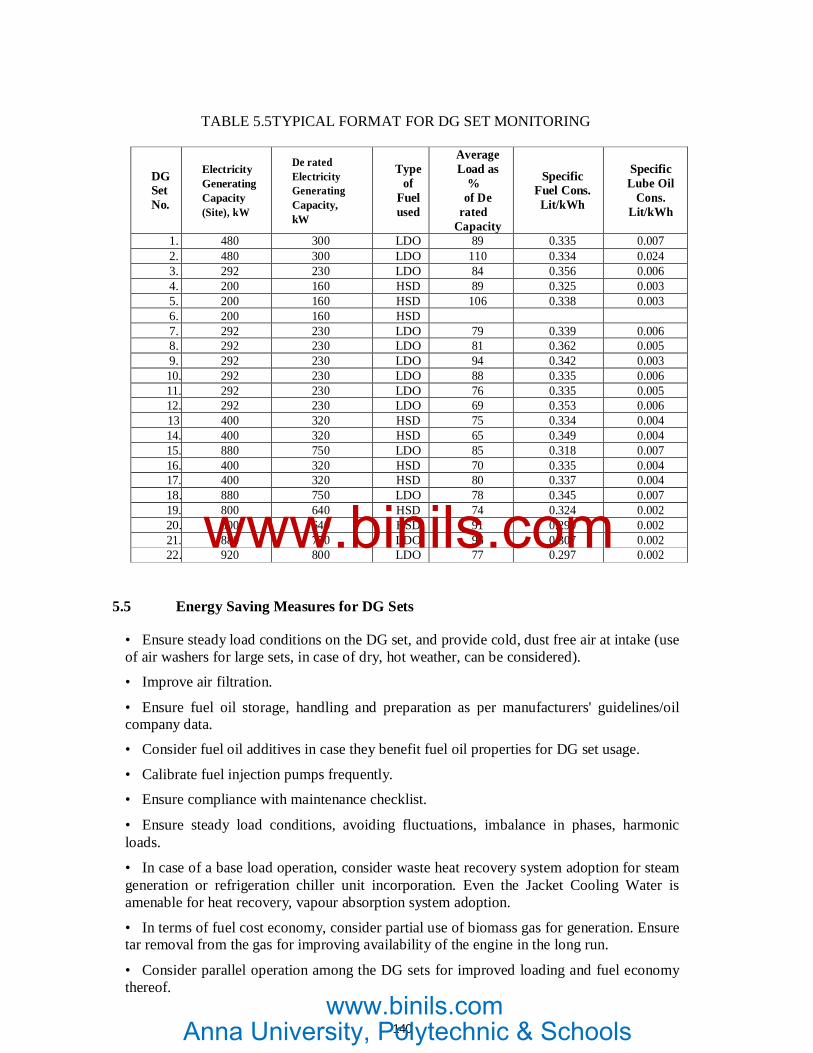
140
TABLE 5.5TYPICAL FORMAT FOR DG SET MONITORING
DG Set No.
Electricity Generating Capacity (Site), kW
De rated Electricity Generating Capacity, kW
Type of
Fuel used
Average Load as
% of De
rated Capacity
Specific Fuel Cons.
Lit/kWh
Specific Lube Oil
Cons. Lit/kWh
1. 480 300 LDO 89 0.335 0.007 2. 480 300 LDO 110 0.334 0.024 3. 292 230 LDO 84 0.356 0.006 4. 200 160 HSD 89 0.325 0.003 5. 200 160 HSD 106 0.338 0.003 6. 200 160 HSD 7. 292 230 LDO 79 0.339 0.006 8. 292 230 LDO 81 0.362 0.005 9. 292 230 LDO 94 0.342 0.003 10. 292 230 LDO 88 0.335 0.006 11. 292 230 LDO 76 0.335 0.005 12. 292 230 LDO 69 0.353 0.006 13 400 320 HSD 75 0.334 0.004 14. 400 320 HSD 65 0.349 0.004 15. 880 750 LDO 85 0.318 0.007 16. 400 320 HSD 70 0.335 0.004 17. 400 320 HSD 80 0.337 0.004 18. 880 750 LDO 78 0.345 0.007 19. 800 640 HSD 74 0.324 0.002 20. 800 640 HSD 91 0.290 0.002 21. 880 750 LDO 96 0.307 0.002 22. 920 800 LDO 77 0.297 0.002
5.5 Energy Saving Measures for DG Sets
• Ensure steady load conditions on the DG set, and provide cold, dust free air at intake (use of air washers for large sets, in case of dry, hot weather, can be considered). • Improve air filtration. • Ensure fuel oil storage, handling and preparation as per manufacturers' guidelines/oil company data. • Consider fuel oil additives in case they benefit fuel oil properties for DG set usage. • Calibrate fuel injection pumps frequently. • Ensure compliance with maintenance checklist. • Ensure steady load conditions, avoiding fluctuations, imbalance in phases, harmonic loads. • In case of a base load operation, consider waste heat recovery system adoption for steam generation or refrigeration chiller unit incorporation. Even the Jacket Cooling Water is amenable for heat recovery, vapour absorption system adoption. • In terms of fuel cost economy, consider partial use of biomass gas for generation. Ensure tar removal from the gas for improving availability of the engine in the long run. • Consider parallel operation among the DG sets for improved loading and fuel economy thereof.
www.binils.com
Anna University, Polytechnic & Schools www.binils.com

141
• Carryout regular field trials to monitor DG set performance, and maintenance planning as per requirements.
5B. ENERGY EFFICIENT TECHNOLOGIES IN ELECTRICAL SYSTEM 5.6. Maximum Demand Controllers High-tension (HT) consumers have to pay a maximum demand charge in addition to the usual charge for the number of units consumed. This charge is usually based on the highest amount of power used during some period (say 30 minutes) during the metering month. The maximum demand charge often represents a large proportion of the total bill and may be based on only one isolated 30 minute episode of high power use.
Considerable savings can be realized by monitoring power use and turning off or reducing non-essential loads during such periods of high power use.
Maximum Demand Controller (See Figure10.1) is a device designed to meet the need of industries conscious of the value of load management. Alarm is sounded when demand approaches a preset value. If corrective action is not taken, the controller switches off non-essential loads in a logical sequence. This sequence is predetermined by the user and is programmed jointly by the user and the supplier of the device. The plant equipments selected for the load management are stopped and restarted as per the desired load profile. Demand control scheme is implemented by using suitable control contactors. Audio and visual annunciations could also be used.
Figure 5.6 Energy Efficient Motor
www.binils.com
Anna University, Polytechnic & Schools www.binils.com

142
5.7 Automatic Power Factor Controllers Various types of automatic power factor controls are available with relay / microprocessor logic. Two of the most common controls are: Voltage Control and kVAr Control Voltage Control
Voltage alone can be used as a source of intelligence when the switched capacitors are applied at point where the circuit voltage decreases as circuit load increases. Generally, where they are applied the voltage should decrease as circuit load increases and the drop in voltage should be around 4 – 5 % with increasing load.
Voltage is the most common type of intelligence used in substation applications, when maintaining a particular voltage is of prime importance. This type of control is independent of load cycle. During light load time and low source voltage, this may give leading PF at the sub-station, which is to be taken note of. KILOVAR Control Kilo var sensitive controls (see Figure 5.7) are used at locations where the voltage level is closely regulated and not avail-able as a control variable. The capacitors can be switched to respond to a decreasing power factor as a result of change in system loading. This type of control can also be used to avoid penalty on low power factor by adding capacitors in steps as the system power factor begins to lag behind the desired value. Kilo var control requires two inputs - current and voltage from the incoming feeder, which are fed to the PF correction mechanism, either the microprocessor or the relay.
Figure 5.7 KILOVAR Control
www.binils.com
Anna University, Polytechnic & Schools www.binils.com

143
Automatic Power Factor Control Relay It controls the power factor of the installation by giving signals to switch on or off power factor correction capacitors. Relay is the brain of control circuit and needs contactors of appropriate rating for switching on/off the capacitors.
There is a built-in power factor transducer, which measures the power factor of the installation and converts it to a DC voltage of appropriate polarity. This is compared with a reference voltage, which can be set by means of a knob calibrated in terms of power factor.
When the power factor falls below setting, the capacitors are switched on in sequence. The relays are provided with First in First out (FIFO) and First in Last Out (FILO) sequence. The capacitors controlled by the relay must be of the same rating and they are switched on/off in linear sequence. To prevent over correction hunting, a dead band is provided. This setting deter-mines the range of phase angle over which the relay does not respond; only when the PF goes beyond this range, the relay acts. When the load is low, the effect of the capacitors is more pronounced and may lead to hunting. Under current blocking (low current cut out) shuts off the relay, switching off all capacitors one by one in sequence, when load current is below setting. Special timing sequences ensure that capacitors are fully discharged before they are switched in. This avoids dangerous over voltage transient. The solid state indicating lamps (LEDS) dis-play various functions that the operator should know and also and indicate each capacitor switching stage. Intelligent Power Factor Controller (IPFC) This controller determines the rating of capacitance connected in each step during the first hour of its operation and stores them in memory. Based on this measurement, the IPFC switches on the most appropriate steps, thus eliminating the hunting problems normally associated with capacitor switching. 5.8 Energy efficient motor Minimizing Watts Loss in Motors Improvement in motor efficiency can be achieved without compromising motor performance at higher cost within the limits of existing design and manufacturing technology From the Table 10.1, it can be seen any improvement in motor efficiency must result from reducing the Watts losses. In terms of the existing state of electric motor technology, a reduction in watts losses can achieved in various ways. All of these changes to reduce motor losses are possible with existing motor and manufacturing technology. They would, however, require additional materials and/or the use of higher quality materials and improved manufacturing processes resulting in increased motor cost. Simply Stated: REDUCED LOSSES = IMPROVED EFFICIENCY
www.binils.com
Anna University, Polytechnic & Schools www.binils.com

144
TABLE 5.9 WATT LOSS ARE A AND EFFICIENCY IMPROVEMENT
Watts Loss Area Efficiency Improvement
Iron Use of thinner gauge, lower loss core steel reduces eddy current losses. Longer core adds more steel to the design, which reduces losses due to lower operating flux densities.
Stator I2 R Use of more copper and larger conductors increases cross sectional area of stator windings. This lowers resistance (R) of the windings and reduces losses due to current flow (I).
Rotor I2 R Use of larger rotor conductor bars increases size of cross section, lowering conductor resistance (R) and losses due to current flow (I).
Friction & Windage Use of low loss fan design reduces losses due to air movement.
Stray Load Loss Use of optimized design and strict quality control procedures minimizes stray load losses.
Technical aspects of Energy Efficient Motors
Thus energy-efficient electric motors reduce energy losses through improved design, better materials,
and improved manufacturing techniques. Replacing a motor may be justifiable solely on the electricity cost savings derived from an energy-efficient replacement. This is true if the motor runs continuously, power rates are high, the motor is oversized for the application, or its nominal efficiency has been reduced by damage or previous rewinds.
Figure 5.10 Efficiency Range for Standard and High Efficiency Motors
www.binils.com
Anna University, Polytechnic & Schools www.binils.com

145
Energy-efficient motors last longer, and may require less maintenance. At lower temperatures, bearing grease lasts longer; required time between re-greasing increases. Lower temperatures translate to long lasting insulation. Generally, motor life doubles for each 10°C reduction in operating temperature. Select energy-efficient motors with a 1.15 service factor, and design for operation at 85% of the rated motor load. Electrical power problems, especially poor incoming power quality can affect the operation of energy-efficient motors. Speed control is crucial in some applications. In poly phase induction motors, slip is a measure of motor winding losses. The lower the slip, the higher the efficiency. Less slippage in energy efficient motors results in speeds about 1% faster than in standard counterparts. Starting torque for efficient motors may be lower than for standard motors. Facility managers should be careful when applying efficient motors to high torque applications. 5.11 Soft Starter When starting, AC Induction motor develops more torque than is required at full speed. This stress is transferred to the mechanical trans-mission system resulting in excessive wear and premature failure of chains, belts, gears, mechanical seals, etc. Additionally, rapid acceleration also has a massive impact on electricity supply charges with high inrush currents drawing +600% of the normal run current.
The use of Star Delta only provides a partial solution to the problem. Should the motor slow down during the transition period, the high peaks can be repeated and can even exceed direct on line current.
Figure 5.12 Soft Starter: Starting current, Stress profile during starting Soft starter provides a reliable and economical solution to these problems by delivering a
controlled release of power to the motor, thereby providing smooth, step less acceleration and deceleration. Motor life will be extended as damage to windings and bearings is reduced.
www.binils.com
Anna University, Polytechnic & Schools www.binils.com

146
Soft Start & Soft Stop is built into 3 phase units, providing controlled starting and
stopping with a selection of ramp times and current limit settings to suit all applications. Advantages of Soft Start – Less mechanical stress – Improved power factor. – Lower maximum demand. – Less mechanical maintenance 5.12 Variable Speed Drives Speed Control of Induction Motors Induction motor is the workhorse of the industry. It is cheap rugged and provides high power to weight ratio. On account of high cost-implications and limitations of D.C. System, induction motors are preferred for variable speed application, the speed of which can be varied by changing the supply frequency. The speed can also be varied through a number of other means, including, varying the input voltage, varying the resistance of the rotor circuit, using multi speed windings, using Scherbius or Kramer drives, using mechanical means such as gears and pulleys and eddy-current or fluid coupling, or by using rotary or static voltage and frequency converters. Variable Frequency Drive The VFD operates on a simple principle. The rotational speed of an AC induction motor depends on the number of poles in that stator and the frequency of the applied AC power. Although the number of poles in an induction motor cannot be altered easily, variable speed can be achieved through a variation in frequency. The VFD rectifies standard 50 cycle AC line power to DC, then synthesizes the DC to a variable frequency AC output.
Motors connected to VFD provide variable speed mechanical output with high efficiency. These devices are capable of up to a 9:1 speed reduction ratio (11 percent of full speed), and a 3:1 speed increase (300 percent of full speed).
In recent years, the technology of AC variable frequency drives (VFD) has evolved into highly sophisticated digital microprocessor control, along with high switching frequency IGBTs (Insulated Gate Bi Polar Transistors) power devices. This has led to significantly advanced capabilities from the ease of programmability to expanded diagnostics. The two most significant benefits from the evolution in technology have been that of cost and reliability, in addition to the significant reduction in physical size. Variable Torque vs. Constant Torque Variable speed drives, and the loads that are applied to, can generally be divided into two groups: constant torque and variable torque. The energy savings potential of variable torque applications is much greater than that of constant torque applications. Constant torque loads include vibrating conveyors, punch presses, rock crushers, machine tools, and other applications where the drive follows a constant V/Hz ratio. Variable torque loads include centrifugal pumps and fans, which make up the majority of HVAC applications.
www.binils.com
Anna University, Polytechnic & Schools www.binils.com

147
Why Variable Torque Loads Offer Greatest Energy Savings In variable torque applications, the torque required varies with the square of the speed, and the horsepower required varies with the cube of the speed, resulting in a large reduction of horse-power for even a small reduction in speed. The motor will consume only 25% as much energy at 50% speed than it will at 100% speed. This is referred to as the Affinity Laws, which define the relationships between speed, flow, torque, and horsepower. The following laws illustrate these relationships: ❖ Flow is proportional to speed ❖ Head is proportional to (speed)2 ❖ Torque is proportional to (speed)2 ❖ Power is proportional to (speed)3
Tighter process control with variable speed drives No other AC motor control method compares to variable speed drives when it comes to accurate process control. Full-voltage (across the line) starters can only run the motor at full speed, and soft starts and reduced voltage soft starters can only gradually ramp the motor up to full speed, and back down to shutdown. Variable speed drives, on the other hand, can be programmed to run the motor at a precise speed, to stop at a precise position, or to apply a specific amount of torque.
In fact, modern AC variable speed drives are very close to the DC drive in terms of fast torque response and speed accuracy. However, AC motors are much more reliable and afford-able than DC motors, making them far more prevalent.
Most drives used in the field utilize Volts/Hertz type control, which means they provide open-loop operation. These drives are unable to retrieve feedback from the process, but are sufficient for the majority of variable speed drive applications. Many open-loop variable speed drives do offer slip compensation though, which enables the drive to measure its out-put current and estimate the difference in actual speed and the set point (the programmed input value). The drive will then automatically adjust itself towards the set point based on this estimation.
Most variable torque drives have Proportional Integral Differential (PID) capability for fan and pump applications, which allow the drive to hold the set point based on actual feedback from the process, rather than relying on estimation. A transducer or transmitter is used to detect process variables such as pressure levels, liquid flow rate, air flow rate, or liquid level. Then the signal is sent to a PLC (Programmable Logic Controllers), which communicates the feedback from the process to the drive. The variable speed drive uses this continual feedback to adjust itself to hold the set point.
High levels of accuracy for other applications can also be achieved through drives that offer closed-loop operation. Closed-loop operation can be accomplished with either a field-oriented vector drive, or a sensor less vector drive. The field-oriented vector drive obtains process feedback from an encoder, which measures and transmits to the drive the speed and/or rate of the process, such as a conveyor, machine tool, or extruder. The drive then adjusts itself accordingly to sustain the programmed speed, rate, torque, and/or position.
www.binils.com
Anna University, Polytechnic & Schools www.binils.com

148
Extended equipment life and reduced maintenance Single-speed starting methods start motors abruptly, subjecting the motor to a high starting torque and to current surges that are up to 10 times the full-load current. Variable speed drives, on the other hand, gradually ramp the motor up to operating speed to lessen mechanical and electrical stress, reducing maintenance and repair costs, and extending the life of the motor and the driven equipment.
Soft starts, or reduced-voltage soft starters (RVSS), are also able to step a motor up gradually, but drives can be programmed to ramp up the motor much more gradually and smoothly, and can operate the motor at less than full speed to decrease wear and tear. Variable speed drives can also run a motor in specialized patterns to further minimize mechanical and electrical stress. For example, an S-curve pattern can be applied to a conveyor application for smoother control, which reduces the backlash that can occur when a conveyor is accelerating or decelerating.
Typical full-load efficiencies are 95% and higher. High power units are still more efficient. The efficiency of VSDs generally decreases with speed but since the torque requirement also decreases with speed for many VSD applications, the absolute loss is often not very significant. The power factor of a VSD drops drastically with speed, but at low power requirement the absolute kVAr requirement is low, so the loss is also generally not significant. In a suitable operating environment, frequency controllers are relatively reliable and need little maintenance. A disadvantage of static converters is the generation of harmonics in the supply, which reduces motor efficiency and reduces motor output - in some cases it may necessitate using a motor with a higher rating. Eddy Current Drives This method employs an eddy-current clutch to vary the output speed. The clutch consists of a primary member coupled to the shaft of the motor and a freely revolving secondary member coupled to the load shaft. The secondary member is separately excited using a DC field winding. The motor starts with the load at rest and a DC excitation is provided to the secondary member, which induces eddy-currents in the primary member.
Figure 5.13Eddy Current Drives
www.binils.com
Anna University, Polytechnic & Schools www.binils.com

149
The interaction of the fluxes produced by the two currents gives rise to a torque at the load shaft. By varying the DC excitation the output speed can be varied to match the load requirements. The major disadvantage of this system is relatively poor efficiency particularly at low speeds. Slip Power Recovery Systems Slip power recovery is a more efficient alternative speed control mechanism for use with slip-ring motors. In essence, a slip power recovery system varies the rotor voltage to control speed, but instead of dissipating power through resistors, the excess power is collected from the slip rings and returned as mechanical power to the shaft or as electrical power back to the supply line. Because of the relatively sophisticated equipment needed, slip power recovery tends to be economical only in relatively high power applications and where the motor speed range is 1:5 or less. Fluid Coupling Fluid coupling is one way of applying varying speeds to the driven equipment, without changing the speed of the motor. Construction Fluid couplings (see Figure 10.8) work on the hydrodynamic principle. Inside every fluid coupling are two basic elements – the impeller and the runner and together they constitute the working circuit. One can imagine the impeller as a centrifugal pump and the runner as a turbine. The impeller and the rotor are bowl shaped and have large number of radial vanes. They are suitably enclosed in a casing, facing each other with an air gap. The impeller is connected to the prime mover while the rotor has a shaft bolted to it. This shaft is further connected to the driven equipment through a suitable arrangement.
Thin mineral oil of low viscosity and good-lubricating qualities is filled in the fluid coupling from the filling plug provided on its body. A fusible plug is provided on the fluid coupling which blows off and drains out oil from the coupling in case of sustained overloading.
Figure 5.14 Fluid Coupling
www.binils.com
Anna University, Polytechnic & Schools www.binils.com

150
Operating Principle There is no mechanical inter-connection between the impeller and the rotor and the power is Transmitted by virtue of the fluid filled in the coupling. When the impeller is rotated by the prime mover, the fluid flows out radially and then axially under the action of centrifugal force. It then crosses the air gap to the runner and is directed towards the bowl axis and back to the impeller. To enable the fluid to flow from impeller to rotor it is essential that there is difference in head between the two and thus it is essential that there is difference in RPM known as slip between the two. Slip is an important and inherent characteristic of a fluid coupling resulting in several desired advantages. As the slip increases, more and more fluid can be transferred. However when the rotor is at a standstill, maximum fluid is transmitted from impeller to rotor and maximum torque is transmitted from the coupling. This maximum torque is the limiting torque. The fluid coupling also acts as a torque limiter. Characteristics Fluid coupling has a centrifugal characteristic during starting thus enabling no-load start up of prime mover, which is of great importance. The slipping characteristic of fluid coupling pro-vides a wide range of choice of power transmission characteristics. By varying the quantity of oil filled in the fluid coupling, the normal torque transmitting capacity can be varied. The maximum torque or limiting torque of the fluid coupling can also be set to a pre-determined safe value by adjusting the oil filling. The fluid coupling has the same characteristics in both directions of rotation. 5.13 Energy Efficient Transformers Most energy loss in dry-type transformers occurs through heat or vibration from the core. The new high-efficiency transformers minimize these losses. The conventional transformer is made up of a silicon alloyed iron (grain oriented) core. The iron loss of any transformer depends on the type of core used in the transformer. However the latest technology is to use amorphous material - a metallic glass alloy for the core (see Figure 10.9). The expected reduction in energy loss over conventional (Si Fe core) transformers is roughly around 70%, which is quite significant. By using an amorphous core- with unique physical and magnetic properties- these new type of transformers have increased efficiencies even at low loads – 98.5% efficiency at 35% load.
Electrical distribution transformers made with amorphous metal cores provide excellent opportunity to conserve energy right from the installation. Though these transformers are a little costlier than conventional iron core transformers, the overall benefit towards energy savings will compensate for the higher initial investment. At present amorphous metal core transformers are available up to 1600 kVA.
www.binils.com
Anna University, Polytechnic & Schools www.binils.com

151
Figure 5.15 1600 kVA Amorphous Core Transformer 5.14 Electronic Ballast Role of Ballast In an electric circuit the ballast acts as a stabilizer. Fluorescent lamp is an electric discharge lamp. The two electrodes are separated inside a tube with no apparent connection between them. When sufficient voltage is impressed on these electrodes, electrons are driven from one electrode and attracted to the other. The current flow takes place through an atmosphere of low-pressure mercury vapour.
Since the fluorescent lamps cannot produce light by direct connection to the power source, they need an ancillary circuit and device to get started and remain illuminated. The auxilary Circuit housed in a casing is known as ballast.
Conventional Vs Electronic Ballasts The conventional ballasts make use of the kick caused by sudden physical disruption of current in an inductive circuit to produce the high voltage required for starting The lamp and then rely on reactive voltage drop in the ballast to reduce the voltage applied across the lamp. On account of the mechanical switch (starter) and low resistance of filament when cold the uncontrolled filament current, generally tend to go beyond the limits specified by Indian standard specifications. With high values of current and flux densities the operational losses and temperature rise are on the higher side in conventional choke.
www.binils.com
Anna University, Polytechnic & Schools www.binils.com

152
Figure 5.16 Electronic Ballasts
The high frequency electronic ballast overcomes the above drawbacks. The basic functions of electronic ballast are: - To ignite the lamp - To stabilize the gas discharge - To supply the power to the lamp
The electronic ballasts (see Figure 10.10) make use of modern power semi-conductor devices for their operation. The circuit components form a tuned circuit to deliver power to the lamp at a high resonant frequency (in the vicinity of 25 kHz) and voltage is regulated through an in-built feedback mechanism. It is now well established that the fluorescent lamp efficiency in the kHz range is higher than those attainable at low frequencies. At lower frequencies (50 or 60 Hz) the electron density in the lamp is proportional to the instantaneous value of the current because the ionization state in the tube is able to follow the instantaneous variations in the current. At higher Frequencies (kHz range), the ionization state cannot follow the instantaneous variations of the current and hence the ionization density is approximately a constant, proportional to the RMS (Root Mean Square) value of the current. Another significant benefit resulting from this phenomenon is the absence of stroboscopic effect, thereby significantly improving the quality of light output.
One of largest advantages of electronic ballast is the enormous energy savings it pro-vides. This is achieved in two ways. The first is its amazingly low internal core loss, quite unlike old fashioned magnetic ballasts. And second is increased light output due to the excitation of the lamp phosphors with high frequency. If the period of frequency of excitation is smaller than the light retention time constant for the gas in the lamp, the gas will stay ionized and, therefore, produce light continuously. This phenomenon along with continued persistence of the phosphors at high frequency will improve light output from 8–12 percent. This is possible only with high frequency electronic ballast. 5.15 Energy Efficient Lighting Controls Occupancy Sensors Occupancy-linked control can be achieved using infra-red, acoustic, ultrasonic or microwave sensors, which detect either movement or noise in room spaces. These sensors switch lighting on when occupancy is detected, and off again after a set time period, when no occupancy movement detected. They are designed to override manual switches and to prevent a situation where lighting is left on in unoccupied spaces. With this type of system it is important to incorporate a built-in time delay, since occupants often remain still or quiet for short periods and do not appreciate being plunged into darkness if not constantly moving around.
www.binils.com
Anna University, Polytechnic & Schools www.binils.com

153
Timed Based Control Timed-turnoff switches are the least expensive type of automatic lighting control. In some cases, their low cost and ease of installation makes it desirable to use them where more efficient controls would be too expensive (see Figure).
Figure 5.17 Timed Based Control
Types and Features The oldest and most common type of timed-turnoff switch is the "dial timer," a spring-wound mechanical timer that is set by twisting the knob to the desired time. Typical units of this type are vulnerable to damage because the shaft is weak and the knob is not securely attached to the shaft. Some spring-wound units make an annoying ticking sound as they operate. Newer types of timed-turnoff switches are completely electronic and silent. Electronic switches can be made much more rugged than the spring-wound dial timer. These units typically have a spring-loaded toggle switch that turns on the circuit for a preset time interval. Some electronic models provide a choice of time intervals, which you select by adjusting a knob located behind the faceplate. Most models allow occupants to turn off the lights manually. Some models allow occupants to keep the lights on, overriding the timer. Timed-turnoff switches are available with a wide range of time spans. The choice of time span is a compromise. Shorter time spans waste less energy but increase the probability that the lights will turn off while someone is in the space. Dial timers allow the occupant to set the time span, but this is not likely to be done with a view toward optimizing efficiency. For most applications, the best choice is an electronic unit that allows the engineering staff to set a fixed time interval behind the cover plate. Daylight Linked Control Photoelectric cells can be used either simply to switch lighting on and off, or for dimming. They may be mounted either externally or internally. It is however important to incorporate time delays into the control system to avoid repeated rapid switching caused, for example, by fast moving clouds. By using an internally mounted photoelectric dimming control system, it is possible to ensure that the sum of daylight and electric lighting always reaches the design level by sensing the total light in the controlled area and adjusting the output of the electric lighting accordingly. If daylight alone is able to meet the design requirements, then the electric lighting can be turned off. The energy saving potential of dimming control is greater than a simple photoelectric switching system. Dimming control is also more likely to be acceptable to room occupants.
www.binils.com
Anna University, Polytechnic & Schools www.binils.com

154
Localized Switching Localized switching should be used in applications which contain large spaces. Local switches give individual occupants control over their visual environment and also facilitate energy savings. By using localized switching it is possible to turn off artificial lighting in specific areas, while still operating it in other areas where it is required, a situation which is impossible if the lighting for an entire space is controlled from a single switch.
www.binils.com
Anna University, Polytechnic & Schools www.binils.com

155
REVIEW QUESTIONS
PART A & PART B
1. What is diesel engine?
2. How DG set can be classified?
3. What are the four strokes of four stroke engine?
4. Draw the block diagram of a DG set.
5. What are the advantages of adopting diesel power plants?
6. What are the factors to be considered for the selecting and installing a DG set?
7. What are the steps to be followed for routine energy efficiency assessment?
8. What is the energy saving measures for DG sets?
9. What are the components of a DG set?
10. What are the factors affecting waste heat recovery from flue gases in DG sets?
11. What is maximum demand controller?
12. What are the commonly used automatic power factor controllers?
13. What is Intelligent Power Factor Controllers?
14. What are the advantages of using energy efficient motors?
15. How energy efficient motors reduces losses.
16. Name the technical aspects of energy efficient motors.
17. What are the advantages of soft starting of motors?
18. Draw the graph between efficiency range for standard and energy efficiency motors.
19. Explain slip power recovery systems.
20. What are the losses that reduced by energy efficient transformers.
21. Differentiate conventional vs electronic ballasts.
22. What are electronic ballasts?
23. What are the drawbacks that overcome by electronic ballasts?
24. Name some energy efficient lighting controls.
25. Explain the ways to reduce transformer losses
PART C
1. Explain the principle of four stroke engine.
2. Explain briefly the selection and installation factors of a DG set.
3. Explain briefly the operating factors of a DG set.
4. Explain in detail the energy performance assessment of DG set.
5. Explain the energy saving measures in an industrial DG set.
6. Explain the operation of maximum demand indicator.
7. Explain two types voltage control and KVAR control automatic power factor controllers.
www.binils.com
Anna University, Polytechnic & Schools www.binils.com

156
8. Explain briefly how the energy efficient motors reduce losses.
9. Explain the operations of variable speed drives.
10. Explain how variable torque loads offer energy savings with variable speed drives.
11. Explain how the fluid coupling varies the speed of the motor.
12. Explain in detail the energy efficient transformers. 13. Explain in detail the energy efficient lighting controls
www.binils.com
Anna University, Polytechnic & Schools www.binils.com