LA SENTENCIA C-579 DE 2013 Y LA DOCTRINA DE LA SUSTITUCIÓN DE LA CONSTITUCIÓN
Upload
independentCategory
view
0download
0
Inter-American Development Bank Banco Interamericano de Desarrollo
Latin American Research Network Red de Centros de Investigación
Research Network Working paper #R-488
The Elasticity of Substitution in Demand for Non-Tradable Goods in Bolivia
by
Gover Barja Daza* Javier Monterrey Arce**
Sergio Villarroel Böhrt***
* Universidad Católica Boliviana ** National Institute of Statistics, Bolivia
*** Ministry of Economic Development, Bolivia
February 2005

Cataloging-in-Publication data provided by the Inter-American Development Bank Felipe Herrera Library Barja Daza, Gover.
The elasticity of substitution in demand for non-tradable goods in Bolivia / by Gover Barja Daza, Javier Monterrey Arce, Sergio Villarroel Böhrt.
p. cm. (Research Network Working papers ; R-488) Includes bibliographical references. 1. Substitute products--Bolivia. 2. Commercial products—Bolivia. 3. Substitution
(Economics). I. Monterrey Arce, Javier. II. Villarroel Böhrt, Sergio. III. Inter-American Development Bank. Research Dept. IV. Latin American Research Network. V. Title. VI. Series.
381 E675--dc22 ©2005 Inter-American Development Bank 1300 New York Avenue, N.W. Washington, DC 20577 The views and interpretations in this document are those of the authors and should not be attributed to the Inter-American Development Bank, or to any individual acting on its behalf. The Research Department (RES) produces a quarterly newsletter, IDEA (Ideas for Development in the Americas), as well as working papers and books on diverse economic issues. To obtain a complete list of RES publications, and read or download them please visit our web site at: http://www.iadb.org/res
2

Abstract
This paper uses a CES function to estimate the constant elasticity of substitution in consumption for non-tradables relative to tradables in a dependent economy framework. The methodology for generating data on real consumption of tradable and non-tradable goods, real prices of tradable and non-tradable goods and real absorption is based on the Bolivian Input-Output Matrix, producing quarterly data for the period 1990.1 to 2002.4. The data identify Bolivia as a country highly open to trade, with an average ratio of 55 percent in the value of exports and imports relative to GDP, non-tradable production accounting for 52 percent of GDP, and differences in the behavior of the internal and external real exchange rates. The HEGY test is used to identify and separate out seasonal unit roots in the data. A cointegration relationship was found between real absorption, the non-tradable to tradable consumption ratio and the non-tradable to tradable price ratio, suggesting inelasticity of substitution.
3

4

1. Introduction In developing countries there is considerable interest in learning the elasticity of substitution in
the demand for non-tradable goods relative to tradable goods. This elasticity is known to play a
critical role in the analysis of several key economic phenomena that affect macroeconomic
structure. The elasticity of substitution in demand is a measure of the extent to which the
consumption of non-tradable goods substitutes for the consumption of tradable goods, for a given
utility level. The extent to which non-tradables and tradables substitute for each other in
consumption helps to explain the consumer response to changing relative prices between non-
tradable and tradable goods (the real exchange rate) by adjusting the combination or mix of non-
tradable and tradable goods that are consumed.
A substantial literature in open-economy macroeconomics has shown that the elasticity of
substitution in the demand for non-tradable relative to tradable goods is an important determinant
of the short-run response of the real exchange rate to shocks affecting the economy, and that in
turn the real exchange-rate response is critical in determining the responses of macroeconomic
variables to those same shocks.
Understanding the elasticity of substitution in demand for non-tradables relative to
tradables is crucial in several areas. These include the following: 1. The response of the trade balance and the current account to terms-of-trade
shocks (the Harberger-Laursen-Metzler effect) or more generally the response
of the external accounts, consumption, saving and investment to terms-of-
trade shocks (Ostry and Reinhart, 1992; Mendoza, 1995; and Engel and
Kletzer, 1989).
2. The analysis of deviations from real interest rate parity (Dornbusch, 1983).
3. The business cycle dynamics of emerging economies facing devaluation risk
(Calvo and Végh, 1993; and Mendoza and Uribe, 2000).
4. Sudden Stops of capital inflows into emerging markets driven by borrowing
constraints and liability dollarization (Aghion, Baccheta and Banerjee, 2002;
and Mendoza, 2002).
5. The effects of Sudden Stops on the real exchange rate and fiscal sustainability
(Calvo, Izquierdo and Talvi, 2002).
5

6. The long-run real effects of economic reform (Fernández de Córdoba and
Kehoe, 2000).
7. The home bias in investment portfolios of the residents of industrial nations
(Baxter, Jermann and King, 1998).
Despite the central role that the elasticity of substitution for demand of non-tradables
plays in many areas of international macroeconomics, there is little empirical work showing
estimates of the value of this elasticity in developing countries. The objective of this paper is to
provide an estimate of the elasticity of substitution in the demand for non-tradable relative to
tradable goods for Bolivia.
Following this introduction, the second section explains the research methodology and
strategy used, and the third section implements the methodology for producing the time-series
data required for analysis and econometric estimation. The fourth section estimates the elasticity
of substitution for the Bolivian case based on cointegration and an error correction model.
Finally, the fifth section summarizes the findings and their implications.
2. Research Methodology and Strategy 2.1 Methodology Consider an open economy with constant elasticity-of-substitution preferences with respect to
the consumption of tradables (CT) and non-tradables (CN): U(C(CT,CN)), where U(.) could be
the standard constant-relative-risk aversion utility function in terms of the composite good C(.),
and C(.) is a CES aggregator of CT and CN. In this environment and without need of full
characterization of the utility function, utility maximization by households subject to a standard
budget constraint can be expressed in the following form:
Maximize: [ω(CTt)-η + (1-ω)(CNt)-η]-1/η
Subject to: PTt*CTt + PNt*CNt = Mt
The parameter η determines the elasticity of substitution between consumption of
tradable goods and consumption of non-tradable goods, which is given by v = 1/(1+η); which is
given by v = 1/(1+ η); ω is the standard CES weighing factor; PT is the price of tradable goods;
PN is the price of non-tradable goods; M is a budget constraint; and t is time.
6

Solving the maximization problem yields the following optimality condition for the
allocation of consumption across CT and CN:
CNt/CTt = [(ω/(1- ω))*(PNt/PTt)]-1/(η+1)
This is the key relationship that must be used to produce the estimates of v. Using logarithms, the
condition discussed above reduces to the following log-linear testable relationships:
ln(rt) = a0 + a1 ln(pt)
where α0 = -v ln(ω/(1- ω)) and α1 = -v
and
ln(nt) = ß0 + ß1 ln(pt)
where β0 = -v ln(ω/(1- ω)) and ß1 = -(v+1) where p is the relative price of non-tradable goods in units of tradable goods (p= PN/PT), which
is our definition of real exchange rate. Given that consumption data can be measured in real and
current prices (NCN=PN*RCN and NCT=PT*RCT), r is the non-tradable to tradable real
consumption ratio (RCN/RCT) and n is the non-tradable to tradable nominal consumption ratio
(NCN/NCT). It should be noted from the relationships discussed above that ß1 = a1 + 1 must
hold.
In a more general framework, the choice behavior of non-tradable in relation to tradable
goods will depend upon total absorption as well as relative prices. The dependent economy
model originally introduced by Salter and Swan, and presented in Agenor and Montiel (1996),
suggests the following relationships:
AT = AT(p, A), 0<dAT/dA<1 dAT/dp>0
and
AN = AN(p, A), 0<dAN/dA=1-dAT/dA<1 dAN/dp<0
where A is total absorption, AT is demand for tradable goods and AN is demand for non-tradable
goods. Thus the above testable relationship can be expanded in order to control for potential
expenditure effects in the following way:
ln(rt) = a0 + a1 ln(pt) + a2 ln(A)
7

2.2 Data Collection Procedures Econometric estimation of the above log-linear relationships requires nominal and real time-
series data for prices and consumption of non-tradables and tradables. There are three standard
approaches that have been proposed for breaking down macroeconomic and price data into
tradables and non-tradables: the National Accounts Procedure, the Expenditure Survey
Procedure and the Consumer Price Index Procedure. While the existence of three procedures
implies that three sets of measures could be used for validation, in practice the value of using
more than one procedure depends on data availability, with the hope that at least one procedure
can be fully performed. The rest of this section explains each of the three procedures.
National Accounts Procedure This procedure requires gathering data from National Accounts by decomposition of the
components of aggregate demand and supply in terms of the major sectors of economic activity.
Data for the following items are needed both at current prices (N) and at constant prices (R) for
each sector i (i = n sectors): Gross production (NYi and RYi), exports (NXi and RXi), imports
(NIMi and RIMi) and private consumption (NCi and RCi).
The data are used to determine which sectors represent non-tradable goods and which
sectors represent tradable goods. To do this, exports and imports data at current prices are added
up to measure total trade in each sector: NTTi=NXi+NIMi. Total trade and gross production data
at current prices are then used to compute, by sector, ratios of total trade to gross output:
TTYi=NTTi/NYi. Threshold values z are selected for this ratio, where z = 0.01,0.05, or 0.1. A
sector i is then classified as part of the tradable goods industry (according to threshold z) if
TTYi> z; otherwise the sector is classified as part of the non-tradable goods industry.
After the major industrial sectors have been classified as tradable or non-tradable, private
consumption data are used to create measures of consumption expenditures on tradable and non-
tradable goods and the corresponding prices. Data at current prices are used to define “nominal”
consumption of tradable NCT and non-tradable NCN. The data at constant prices are used to
define “real” consumption of tradable and non-tradables, RCT and RCN, respectively.
Finally, the combined nominal and real data are used to construct implicit deflators that
represent the price indices of tradable and non-tradable goods as PT=NCT/RCT and
8

PN=NCN/RCN. These indices have the same base year as the data at constant prices gathered
from the National Accounts.
Expenditure Survey Procedure This procedure requires current and constant prices data from either National Accounts or an
Expenditure Survey for the following variables: private consumption of non-durable goods
(NCNDUR and RCNDUR), private consumption of services (NCSER and RCSER) and private
consumption of durable goods (NCDUR and RCDUR). The procedure is based on the assumption
that consumption of services is identical to the total consumption of non-tradables and that
consumption of non-durable and/or durable goods represents the total consumption of tradables.
The robustness of this assumption needs to be evaluated by examining the total trade
ratios computed by the National Accounts Procedure. The procedure adopts three alternative
definitions of tradable consumption at current prices: NCT1 (NCNDUR), NCT2 (NCDUR) or
NCT3 (NCNDUR+NCDUR), and one definition of non-tradable consumption at current prices:
NCN (NCSER). Accordingly, there are three alternative definitions of real tradable consumption
RCT1 (RCNDUR), RCT2 (RCDUR) or RCT3 (RCNDUR+RCDUR) and one definition of real
non-tradable consumption RCN (RCSER). These generated time-series can be used to construct
implicit deflators that represent prices of tradables and non-tradables. The price of non-tradables
is PN=NCN/RCN, and there are three alternative definitions of the price of tradables
(PT1=NCT1/RCT1, PT2=NCT2/RCT2, PT3=NCT3/RCT3).
CPI Procedure The CPI procedure takes advantage of the direct, final consumer price data collected in the
process of computing the consumer price index. Time-series data for two price indexes need to
be retrieved: the CPI for durables (PD) and the CPI for services (PS). The procedure is based on
the assumptions that the price of durables is equal to the price of tradables and that the price of
services is equal to the price of non-tradables. The robustness of this assumption needs to be
evaluated by examining the total trade ratios computed by the national accounts procedure.
The drawback of the CPI procedure is that corresponding data for consumption
expenditures are generally not available. The weights of the CPI are derived and revised using
infrequent expenditure surveys, but the recurrent surveys on which CPI data are based are price
9

surveys, not expenditure surveys. Hence, the data on consumption of services and durables
gathered for the expenditure survey procedure can be used as proxies.
3. The Bolivian Data The source for the national accounts data used in the research is the quarterly Input-Output
Matrix (IOM), processed and produced by the Instituto Nacional de Estadística (INE). The IOM
has the following structure:
Table 1. Structure of the Bolivian Input-Output Matrix
XX MM DM IP MG OT Product/Industry 1 2 3..…35 CIP CH CGT FK VE EE DT 1 2 …. …. 35 CIR ZZ VA Note: XX = Gross Production Value CGT = Final Consumption of Public Adm. MM = Imports at CIF values FK = Gross Formation of Fixe d Capital DM = Import Tariffs VE = Stock Variation IP = Indirect Taxes EE = Exports OT = Total Supply CIR = Sector Intermediate Co nsumption CIP = Intermediate Consumption VA = Sector Value Added CH = Final Household Consumption ZZ = Sector Production MG = Commerce and Transportation Margins DT = Final Demand Source: Instituto Nacional de Estadística.
Data in the IOM are divided into 35 products/sectors: 1) non-industrial agricultural
products; 2) industrial agricultural products; 3) coca leaf; 4) cattle products; 5) forestry, hunting
and fishing; 6) crude oil and natural gas; 7) metal and non-metal minerals; 8) fresh and processed
meats; 9) milk products; 10) mill and bakery products; 11) sugar and confectionery products; 12)
miscellaneous food products; 13) beverages; 14) processed tobacco; 15) textiles, clothing and
leather products; 16) wood and wood products; 17) paper and paper products; 18) chemical
10

substances and products; 19) petroleum refinery products; 20) non-metal mineral products; 21)
basic metal products; 22) metal products, machinery and equipment; 23) miscellaneous
manufactured products; 24) electricity, gas and water; 25) construction and public works; 26)
commerce; 27) storage and transportation; 28) communications; 29) financial services; 30)
services to firms; 31) housing property; 32) social, personal and community services; 33) hotels
and restaurants; 34) household services; and 35) public administration services.
INE produces the IOM on a quarterly basis, and time series (base 1990) for all of its
components are available from 1990 to the fourth quarter of 2002 in nominal and real terms. In
other words, 52 observations are available for each of the variables and sectors that make up the
IOM. This includes gross production (NY and RY), exports (NX and RX), imports (NM and RM)
and private household consumption (NC and RC). Data on exports appear as EE in the demand
quadrant (right side) of the IOM. Data for imports appear as MM in the supply quadrant (left
side) of the IOM. The column next to imports in the IOM (DM) was added to imports to
approximate values at market prices. Price deflators for each sector and variable are obtained
dividing quarterly nominal and real IOM data.
The IOM matrix is neither an “industry-industry” nor a “product-product” type; it is
instead the combination of both: “product-industry.” A discussion of the basis for the structure
and definitions of variables are found in the Bolivian IOM methodological document (INE,
2000). Summary statistics based on the IOM are published by INE under the title “Producto
Interno Bruto Trimestral.” These statistics include data on macroeconomic aggregates and sector
aggregates, nominal terms, real terms and price deflators. There is also the traditional Anuario
Estadístico that contains annual GDP by type of expenditure, GDP by sectors and price deflators,
among other general economic information, which is also available on the Internet.
The following steps describe the computations based on the national accounts procedure
described above: Step 1: Computation of total trade in each sector in nominal terms NTT = NX + NM + DM and
computation of sector ratios of nominal total trade to nominal gross output TTY = NTT/NY.
Step 2: Classification of each sector as tradable or non-tradable according to a threshold value z.
The classification uses the criteria of defining a sector as tradable if TTY > z, and non-tradable
otherwise. Three values of z were used, z = 0.01, 0.05 and 0.1. This way a non-tradable sector
11

was characterized by a very low (close to zero) proportion of exports and imports compared to its
gross production. Visual inspection of each figure led to the classification of each sector as
tradable or non-tradable. Table 2 presents the final classification.
Table 2. Bolivian Tradable and Non-Tradable Goods Industries
Tradable Goods Industries Non-Tradable Goods Industries 1 Non-industrial agricultural products For z<=0.01: 2 Industrial agricultural products 24 Electricity, gas and water 3 Coca leaf 25 Construction and public works 5 Forestry, hunting and fishing 26 Commerce 6 Crude oil and natural gas 31 Housing property 7 Metal and non-metal minerals 34 Household services 9 Milk products 35 Public administration services 10 Mill and bakery products 11 Sugar and confectionery products In addition, for 0.01<z<=0.05: 12 Miscellaneous food products 4 Cattle products 14 Processed tobacco 8 Fresh and processed meats 15 Textiles, clothing and leather products 32 Social, personal and community services 16 Wood and wood products 17 Paper and paper products In addition, for 0.05<z<=0.10: 18 Chemical substances and products 13 Beverages 19 Petroleum refinery products 29 Financial services 20 Non-metal mineral products 30 Services to firms 21 Basic metal products
22 Metal products, machinery, equipment
23 Miscellaneous manufactured products
27 Storage and transportation
28 Communications
33 Hotels and restaurants
A total of 12 sectors out of the 35 were classified as non-tradable: six under the threshold
criteria of strictly z<=0.01, three more under z<=0.05 and three more sectors under z<=0.10. The
inequality sign is not strict, however, given the observed behavior of the sector ratios over time.
There are cases in which some points in time are below z<=0.05, but most points are below
z<=0.01. In other cases, some points in time are below z<=0.05 and others above z>0.10, but
12

most of the observations fall in the range 0.05<z<=0.10. In these special cases, the study adopted
the classification criteria according to the range where most of the observations lay, regardless of
period of time.
Once the classification was defined, the research study proceeded only for the case of 12
non-tradable sectors corresponding to z<=0.10. Figure 1 shows the share of non-tradable goods
sectors in GDP; on average they account for 52 percent of GDP (minimum of 47 percent and
maximum of 58 percent). Figure 2 summarizes the ratio of exports plus imports to gross
production for the economy as a whole, showing the increasing degree of openness of the
Bolivian economy to an average of about 55 percent until 1999, when the economy experienced
an external shock and was forced into recession.
Figure 1.
Non-Tradable Goods Sectors' Share of GDP
0%
10%
20%
30%
40%
50%
60%
70%
80%
90%
100%
1990
1990
1991
1992
1993
1993
1994
1995
1996
1996
1997
1998
1999
1999
2000
2001
2002
2002
Source : Calculations based on disaggregated Input-Output Matrix Data.
13

Figure 2.Ratio of Exports plus Imports to Gross Production
45%
50%
55%
60%
65%
70%
75%19
90
1990
1991
1992
1993
1993
1994
1995
1996
1996
1997
1998
1999
1999
2000
2001
2002
2002
Source : Calculations based on disaggregated Input-Output Matrix Data.
Step 3: Computation of the nominal consumption of tradable (NCT) as the sum of the
nominal consumption of sectors defined as tradable. Computation of the nominal private
consumption of non-tradable (NCN) as the sum of the nominal consumption of sectors defined as
non-tradable. Computation of the real consumption of tradable (RCT) as the sum of the real
consumption of sectors defined as tradable. Computation of the real consumption of non-
tradables (RCN) as the sum of the real consumption of sectors defined as non-tradable.
Figure 3 shows the time series of real consumption of tradables and non-tradables, both
showing a similar tendency to increase over time, although the latter with greater volatility.
Figure 4 is the ratio of non-tradable consumption relative to global consumption
RCN/(RCN+RCT), showing that non-tradable real consumption averaged a 34 percent share of
global consumption (minimum of 31 percent and maximum of 38 percent).
14

Figure 3.Real Consumption of Tradables
and Non-Tradables
800000
1200000
1600000
2000000
2400000
2800000
3200000
1990
1991
1992
1993
1994
1995
1996
1997
1998
1999
2000
2001
2002
Real consumption of non-tradables Real consumption of tradables
Source : Computation based on disaggregated Input-Output Matrix Data.
Figure 4.Ratio of Non-Tradable Consumption
Relative to Global Consumption
0.10
0.20
0.30
0.40
0.50
0.60
1990
1990
1991
1992
1993
1993
1994
1995
1996
1996
1997
1998
1999
1999
2000
2001
2002
2002
Source : Calculations based on disaggregated Input-Output Matrix Data.
15

Step 4: Computation of the ratio of non-tradable to tradable consumption in nominal
terms N=NCN/NCT and real terms R=RCN/RCT. Figures 5 and 6 show the time series of these
ratios. These are the variables of interest as they reflect the choice behavior between tradable and
non-tradable in Bolivian demand.
Figure 5.Ratio of Non-Tradable to Tradable Consumption
in Real Terms
0.2
0.3
0.4
0.5
0.6
0.7
0.8
1990
1990
1991
1992
1993
1993
1994
1995
1996
1996
1997
1998
1999
1999
2000
2001
2002
2002
Source : Calculations based on disaggregated Input-Output Matrix Data.
Figure 6.Ratio of Non-Tradable to Tradable Consumption
in Nominal Terms
0.2
0.3
0.4
0.5
0.6
0.7
0.8
1990
1990
1991
1992
1993
1993
1994
1995
1996
1996
1997
1998
1999
1999
2000
2001
2002
2002
Source : Calculations based on disaggregated Input-Output Matrix Data.
16
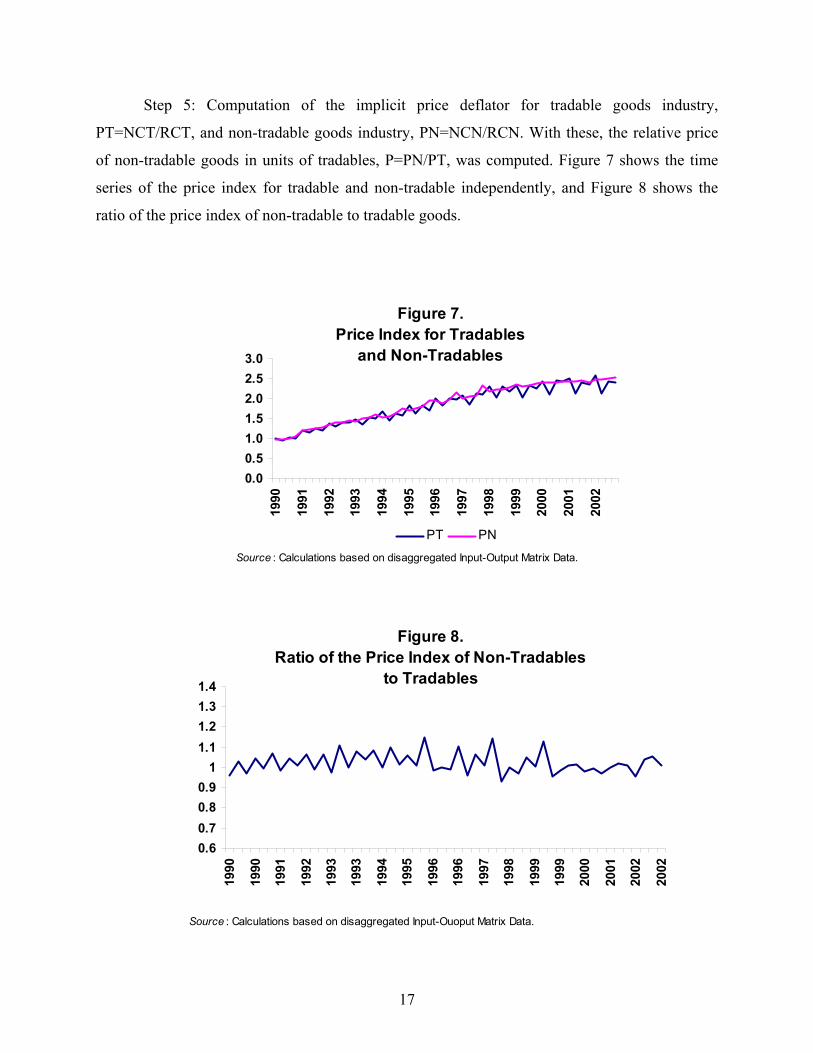
Step 5: Computation of the implicit price deflator for tradable goods industry,
PT=NCT/RCT, and non-tradable goods industry, PN=NCN/RCN. With these, the relative price
of non-tradable goods in units of tradables, P=PN/PT, was computed. Figure 7 shows the time
series of the price index for tradable and non-tradable independently, and Figure 8 shows the
ratio of the price index of non-tradable to tradable goods.
Figure 7.Price Index for Tradables
and Non-Tradables
0.00.51.01.52.02.53.0
1990
1991
1992
1993
1994
1995
1996
1997
1998
1999
2000
2001
2002
PT PN
Source : Calculations based on disaggregated Input-Output Matrix Data.
Figure 8.Ratio of the Price Index of Non-Tradables
to Tradables
0.60.70.80.9
11.11.21.31.4
1990
1990
1991
1992
1993
1993
1994
1995
1996
1996
1997
1998
1999
1999
2000
2001
2002
2002
Source : Calculations based on disaggregated Input-Ouoput Matrix Data.
17

The variable P (real exchange rate) is of interest in explaining the consumption ratio; it
corresponds to the main macroeconomic signal given for the choice decision in demand. Seen
independently, both series PT and PN present a long-term tendency to increase, characterized by
dominant short-term volatility around a changing mean. The ratio P shows that on average the
real exchange rate has been fluctuating around one during the decade (minimum of 0.93 for
depreciation and maximum of 1.15 for appreciation).
The expenditure survey procedure (method 2) and the CPI procedure (method 3) are
presented in Appendices 1 and 3, respectively. Both explain the source of data, assumptions and
computations. Figure 9 summarizes the output from these methods in computing the real
exchange rate index and compares them to the national accounts procedure presented here
(method 1). These methods for determining the real exchange rate can also be referred to as
“internal” because they are strictly based on domestic data and therefore reflect domestic
structure. The real exchange rate is more often computed from data that reflect price behavior
and nominal exchange rates of countries with which a home has trade relations. These can be
referred to as “external” real exchange rates. The Bolivian Central Bank computes real
equilibrium exchange rate (REER) and the government’s Unit of Economic and Social Policy
Analysis computes the multilateral real exchange rate index (MRERI). The time series of these
other measures are also included in Figure 9, which were adjusted to a common 1990 base.
Figure 9.Comparison between Internal and External
Real Exchange Rates
0.700.750.800.850.900.951.001.051.101.151.20
1990 1991 1992 1993 1994 1995 1996 1997 1998 1999 2000 2001 2002
Methodology 1 Met.2-Tradable=Non-DurableMet.2-Tradable=Durable Met.2-Tradable=Non-Dur+DurMethology 3 MRERIREER
Source : Calculations based on disaggregated Input-Output Matrix Data, Bolivian Central Bank and the Unit of Economic and Social Policy Analysis.
18

Several observations can be derived from Figure 9. The different methods for computing
the real exchange rate seem to present both divergence and convergence in some aspects. The
rates computed by internal methods 2 and external methods REER and MRERI have moved
together in the same direction, particularly after 1993. The rate computed by method 3 has also
moved together in the same direction with method 2 and external methods, but only since 1995.
However, method 2 and method 3 indicate that the real exchange rate has appreciated during the
period, while the external methods indicate that it has mostly depreciated (MRERI) and strongly
depreciated (REER) during the period, although the latter individually shows a tendency towards
appreciation since 1995. Method 1 shows a real exchange rate fluctuating around one but in
opposite movement as compared to all other methods, at least until 1998. While internal methods
2 and 3 suggest an appreciated rate during the period, external methods suggest the opposite of a
depreciated rate during the period, and method 1 suggests neither. As explained by Hinkle and
Nsengiyuoma (1999), however, internal and external methods of computing the exchange rate do
not necessarily have to move in the same direction.
4. Econometric Procedure and Elasticity Estimation 4.1 Statistical Properties of Data The following figures present the raw quarterly time-series data of interest generated from the
Bolivian Input-Output Matrix (IOM), where LR is the log of the real consumption ratio of non-
tradable relative to tradable goods, LP is the log of the price ratio of non-tradable relative to
tradable goods and LA is the log of real absorption. Visual inspection shows high volatility in the
data, particularly LR and LP, which may be due to seasonal effects alone or most probably a
combination of seasonal effects and errors in variables. The latter might be related to INE’s
procedures in building the quarterly IOM given quarterly data constraints, resulting in the
introduction of systematic rather than random measurement errors.
Seasonal differencing is often used to remove non-stationarity in seasonal data. In this
case the quarterly difference operator is ∆4yt=yt-yt-4. Table 3 presents the standard ADF test
applied to the quarterly difference of the data. While all three variables are non-stationary in
levels, only LA is stationary in first differences, and LR and LP are stationary under quarterly
seasonal differencing. The fact that ∆4 LR and ∆4 LP are stationary implies that these time series
contain a non-seasonal unit root, a biannual unit root, an annual unit root, or a combination of
19

two of these types of unit roots or all three types of unit roots. Use of the HEGY procedure
introduced by Hylleberg et al. (1990) is appropriate to discern which types of unit roots are
contained in the data.
Table 3. ADF Unit Root Tests
Variable Specification Lag length ADF statistic Stationarity None 7 -1.55 Non-stationary
LR Constant 7 -0.28 Non-stationary Constant, trend 7 -1.3 Non-stationary
None 6 -0.88 Non-stationary LP Constant 6 -1.39 Non-stationary
Constant, trend 6 -2.33 Non-stationary None 5 1.24 Non-stationary
LA Constant 5 -1.71 Non-stationary Constant, trend 5 -1.37 Non-stationary
None 4 -2.63*** Stationary ∆4 LR Constant 4 -3.06** Stationary
Constant, trend 4 -3.17 Non-stationary None 4 -4.37*** Stationary
∆4 LP Constant 4 -4.33*** Stationary Constant, trend 4 -4.36*** Stationary
None 5 -1.37 Non-stationary ∆4 LA Constant 5 -1.55 Non-stationary
Constant, trend 5 -1.69 Non-stationary None 2 -7.53*** Stationary
∆1 LA Constant 2 -8.93*** Stationary Constant, trend 2 -9.28*** Stationary
Notes: (*), (**) and (***) denotes rejection of the null hypothesis of unit root at 10%, 5% and 1% respectively. Except for ∆1 LA, the lag length was selected by the Akaike Information Criterion (AIC). In all cases a shorter lag length was enough to produce white noise residuals. AIC suggests four lags for the case of ∆1 LA, when stationarity is accepted at 5% level only when the specification does not contain constant or constant and trend. Source: Authors’ calculations.
Traditional unit root and cointegration tests were developed for non-seasonal or zero
frequency data, which could also be applied to quarterly data if it is proven that unit roots at
other frequencies are not present (half frequency or biannual unit root and one fourth frequency
20

of annual unit root). It is important to notice that the elasticity of interest in this study
corresponds to the long-run equilibrium relationship between LR and LP; that is, it is strictly a
non-seasonal or zero frequency relationship in the data. The quarterly difference operator ∆4 = (I-
L4) can be decomposed as
(I-L4) = (I-L)(I+L)(I+L2) = (I-L)(I+L+L2+L3) which has four roots, one at zero frequency, one at two cycles per year and two complex pairs at
one cycle per year. The HEGY procedure consists of the following testable regression model,
which can be estimated by OLS,
y4t = µt + p1y1,t-1 + p2y2,t-1 + p3y3,t-2 + p4y3,t-1 + (lags of y4t) + et where
y1t = (I+L)(I+L2)yt = yt + yt-1 + yt-2 + yt-3
y2t = -(I-L)(I+L2)yt = -(yt - yt-1 + yt-2 - yt-3)
y3t = -(I-L)(I+L)yt = -(I-L2)yt = -(yt - yt-2)
y4t ≡ ∆4yt=yt-yt-4
µt = constant, trend and seasonal dummies
Lags of y4t are included to ensure white noise residuals
et = i.i.d. residuals.
Based on the HEGY regression the following hypothesis can be tested using critical
values computed by Hylleberg et al.:
HA: p1=0 or non-seasonal unit root
HB: p2=0 or biannual unit root
HC: p3=p4=0 or annual unit root
21

Table 4.2 presents estimated statistics from application of the HEGY regression to the LR and
LP data. In the case of LR there is a consistent failure to reject HA, HB and HC, implying unit
roots at all frequencies. In the case of LP there is consistent failure to reject HA, and HB, while
HC is not rejected only when the model contains seasonal dummies.
Table 4. HEGY Testing Procedure for Seasonal Unit Roots
“t” “t” “t” “t” “F” Lag length π1=0 π2=0 π3=0 π4=0 π3= π4=0
LR None 0 -1.47 -1.43 -1.97** 1.09 2.56* C 0 -0.06 -1.41 -1.94** 1.08 2.49* C, t 0 -1.43 -1.4 -1.75* 1.12 2.19 C, q1 q2 q3 0 -0.07 -1.65 -2.98 0.36 4.47 C, t, q1 q2 q3 0 -1.02 -1.7 -2.85 0.47 4.15 LP None 0 -1.28 -1.28 -2.62* -0.16 3.47** C 0 -2.2 -1.26 -2.70**** -0.1 3.67** c, t 0 -3.02 -1.19 -2.63*** -0.09 3.47** c, q1 q2 q3 0 -1.68 -1.56 -2.83 -0.21 4.04 c, t, q1 q2 q3 0 -2.38 -1.75 -2.81 -0.01 3.96 Notes: Critical values where obtained from the HEGY tables for n=48. For the HEGY “t” test (*), (**), (***) and (****) denote rejection of the null hypothesis at 10%, 5%, 2.5% and 1%, respectively. For the HEGY “F' test (*), (**), (***) and (****) denotes rejection of the null hypothesis at 90%, 95%, 97.5% and 99% respectively. Residuals of all regressions are white noise and approximately normally distributed without the addition of lags of yt4. The q are seasonal dummies. Source: Authors’ calculations.
Elasticity Estimation One way to proceed from here is to estimate a relationship between LR and LP by OLS and then
test the residuals for unit roots at all frequencies. If these residuals are stationary at zero
frequency, then the estimated regression would correspond to a long-run relationship. This
approach is suggested by Hylleberg et al. when the cointegrating coefficients are known,
although one may think that known means previously estimated. The following was the
estimated regression:
22

LR = -0.63 – 0.69 LP + Residuals
t = (-70.66)(-4.13)
R2 = 0.25
Table 5 presents the unit root test using the HEGY procedure. Failure to reject the null of
p1=0, which corresponds to the zero frequency, indicates there is no long-run relationship
between LR and LP, at least when no other explanatory variables are included in the model.
However, the null of p2=0 was rejected at the 5 percent level (cases when dummies were not
included), implying the above equation is recognized as a valid cointegrating relationship at the
biannual frequency. One problem with this procedure is that the presence of unit roots and
cointegration at different frequencies in the data may not produce consistent OLS estimates of
the coefficients; it is unclear which coefficient would be chosen by the static regression.
Table 5. HEGY Testing Procedure for Seasonal Unit Roots on Residuals
“t” “t” “t” “t” “F” Lag length π1=0 π2=0 π3=0 π4=0 π3= π4=0
Residuals None 0 -0.61 -2.35*** -2.39*** 0.14 2.87* C 0 -0.45 -2.25** -2.35*** 0.22 2.79* C, t 0 -1.26 -2.27*** -2.28*** 0.25 2.63* C, q1 q2 q3 0 -1.45 -2.23 -3.35* -0.21 5.78* C, t, q1 q2 q3 0 -1.73 -2.22 -3.34* -0.16 5.71*
Notes: For the HEGY “t” test (*), (**), (***) and (****) denotes rejection of the null hypothesis at 10%, 5%, 2.5% and 1%, respectively. For the HEGY “F” test (*), (**), (***) and (****) denotes rejection of the null hypothesis at 90%, 95%, 97.5% and 99%, respectively. Residuals of all regressions are white noise and approximately normally distributed without the addition of lags of yt4. The q are seasonal dummies. Source: Authors’ calculations.
An alternative strategy, also suggested by Hylleberg et al., is to filter out the unit root
components other than the one of interest and apply the standard Johansen cointegration test to
the filtered series. The filter to remove seasonal roots would be
(I-L4)/(I-L)yt = (I+L+L2+L3) yt = y1t where y1t is the filtered series calculated above. The filtered series for LR and LP are LR1 and
LP1, as shown in Figures 10 and 11.
23
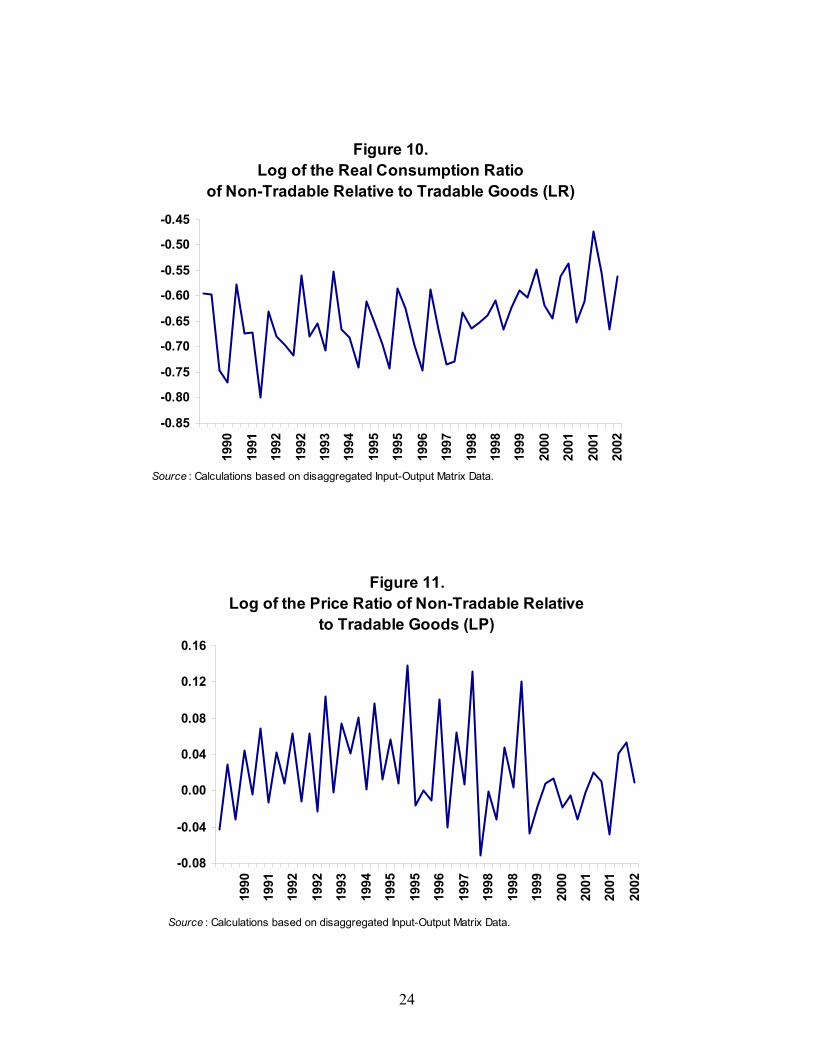
Figure 10.Log of the Real Consumption Ratio
of Non-Tradable Relative to Tradable Goods (LR)
-0.85
-0.80
-0.75
-0.70
-0.65
-0.60
-0.55
-0.50
-0.4519
90
1991
1992
1992
1993
1994
1995
1995
1996
1997
1998
1998
1999
2000
2001
2001
2002
Source : Calculations based on disaggregated Input-Output Matrix Data.
Figure 11.Log of the Price Ratio of Non-Tradable Relative
to Tradable Goods (LP)
-0.08
-0.04
0.00
0.04
0.08
0.12
0.16
1990
1991
1992
1992
1993
1994
1995
1995
1996
1997
1998
1998
1999
2000
2001
2001
2002
Source : Calculations based on disaggregated Input-Output Matrix Data.
24

Testing for cointegration requires the following steps: 1) Unit root testing is necessary in
order to verify if the series are integrated of first order I(1); this was performed using the
Augmented Dickey-Fuller test (ADF) and the HEGY test. Notice that by construction LR1 and
LP1 are I(1) series and LA was determined I(1). Now it is possible to estimate cointegrating
relationships between LR1, LP1 and LA. 2) It is necessary to establish the lag order of the co-
integration test; this is done using the Akaike Information Criterion. 3) Perform the cointegration
test if the time series are I(1), using the optimum lag and considering different assumptions
regarding trend and intercept.
The process involves estimating the following unrestricted VAR:
yt = A1 yt-1 + A2 yt-2 + ……… + Ap yt-p + Bxt + et
in order to compute: Π = ∑ (Ai – I) and Γi = -∑ Aj where yt is a k-vector of non-stationary I(1) variables, xt is a d-vector of deterministic variables
and et is a vector of innovations. The following are the Trace statistic (computed for the null
hypothesis of r co-integrating relations against the alternative of k co-integrating relations) and
the Maximum Eigenvalue statistic (computed for the null hypothesis of r co-integrating relations
against the alternative of r+1 co-integrating relations):
LRtr (r|k) = -T ∑log(1-λi) LRmax (r|r+1) = -T log(1-λr+1)
The variables LR1, LA and LP1 were determined to be I(1) time series. An important issue was
whether these variables were cointegrated—that is, if there is a linear combination of LR1, LP1
and LA that is stationary. If these variables were cointegrated, then the linear combination would
express the long-term relationship among them.
Table 6 presents the cointegration test results and the coefficients of long-run
relationships among the variables of interest. Model i) corresponds to a test between LR1 and
LP1 alone, finding no cointegration. Models ii) and iii) correspond to tests among LR1, LP1 and
LA where the hypothesis of no cointegration (r=0) is rejected at the 1 percent level. The
difference between these last models is the inclusion or exclusion of a time trend in the
cointegrating equation, which has an important impact on the estimated coefficients of LA and
25

LP1. In model ii) the elasticity of LA is not significant and the elasticity of LP1 is above one. In
model iii) the elasticity of LA is significant and the coefficient of LP1 is below one.
Table 6. Johansen Cointegration Test
H0: Variables and Specification
Lag length rank=r
Trace Statistic
Max-Eigen Statistic
Normalized Coefficients
i) LR1, LP1 r = 0 8.42 8.41 c in CE and 1 r <= 1 0.01 0.01 c in VAR
No cointegration
ii) LR1, LA, LP1 r = 0 44.01** 29.16** LR1 LA LP1 c in CE and 7 r <= 1 14.85 14 1 -0.24 1.60 c in VAR r <= 2 0.84 0.84 (-1.13) (4.18) iii) LR1, LA, LP1 r = 0 76.76** 51.44** LR1 LA LP1 t c, t in CE and 7 r <= 1 25.32* 17.61 1 1.29 0.72 -0.017 c in VAR r <= 2 7.7 7.7 (9.36) (9.07)(12.85) Notes: (*) and (**) indicates significance at the 5% and 1% level respectively. The lag length was determined by the Akaike Information Criterion. CE is cointegrating equation, VAR is vector autoregression. Source: Authors’ calculations.
To solve this issue and select a final model, a standard ADF test was performed on the
residuals generated from the estimated cointegrating equations. Table 7 shows that residuals
from both estimated cointegrating equations are stationary when no constant or trends are
introduced into the test specification and the lag length is determined by AIC. The difference is
that residuals from the cointegrating equation of model iii) are stationary at 1 percent, and of
model ii) at 5 percent. A second difference is that in the first case stationarity is consistent with
other lag order criteria, while the second is not.
26

Table 7. ADF Unit Root Tests on Residuals of Estimated Cointegrating Equations
Variable Specification Lag length ADF statistic Stationarity None 5 (AIC, SC) -2.68*** Stationary at 1% Constant 5 (AIC, SC) -2.91* Stationary at 10%
Residuals of CE, model iii)
Constant, trend 5 (AIC, SC) -2.86 Non-Stationary None 2 (AIC) 2.41** Stationary at 5% Constant 2 (AIC) -2.29 Non-Stationary
Residuals of CE, model ii)
Constant, trend 2 (AIC) -2.3 Non-Stationary None 1 (SC) 1.80* Stationary at 10% Constant 1 (SC) -1.7 Non-Stationary
Residuals of CE, model ii)
Constant, trend 1 (SC) -1.76 Non-Stationary Notes: AIC is Akaike Information Criterion and SC is Schwarz Information Criterion.(*), (**) and (***) denotes rejection of the null hypothesis of unit root at 10%, 5% and 1% respectively. Source: Authors’ calculations.
Considering all of the above tests, we conclude that model iii) is the proper model
because of its statistical precision. Appendix 6 presents the corresponding full error correction of
model iii), where the estimated long term equilibrium relationship is
LR1 = 16.99 – 0.72 LP1 – 1.29 LA + 0.017 t.
This result suggests on average an elasticity of substitution of 0.72 in the consumption of non-
tradables relative to tradables. In terms of the quality of the error-correction model, Appendix F
presents data on the residual autocorrelations that show white noise (with the possible exception
of one cross-correlation at lag 10). The Portmanteau test suggests rejection of the null of no
residual autocorrelation starting at lag 8 (which is not consistent with the previous data); the LM
test, however, suggests failure to reject the null of no serial correlation. Regarding normality of
residuals there is failure to reject the null of zero skewness. Nonetheless, there is rejection of the
null of normally behaved kurtosis. That is, the distribution of residuals is symmetric but short
tailed.
Overall, the Jarque-Bera test rejects the null that residuals are multivariate normal, which
may be explained by the small sample size; however, it calls into question the validity of test
statistics based on the assumption of normality.
27

5. Conclusions
1. Three cut-off criteria were used to identify tradable from non-tradable sectors
in the Bolivian economy. Out of the 35 sectors contained in the Bolivian Input-
Output Matrix, six were identified as non-tradable by the criterion of z<=0.01,
three more by z<=0.05 and three more by z<=0.10, where z is the proportion of
exports plus imports to GDP. The study concentrated on the latter case of twelve
non-tradable sectors.
2. For the period of study (1990.1 to 2002.4), non-tradable goods industries
represent on average 52 percent of GDP, and the economy’s degree of openness
has on average fluctuated around 55 percent, which confirms other studies (such
as Agenor and Montiel, 1999).
3. For exchange rate policy purposes, the conflicting behavior of internal and
external real exchange rates indexes (due to different calculation methodologies)
must be taken into account in order to avoid pervasive effects on internal
consumption and production decisions, which confirms other studies (Hinkle and
Nsengiyumoa, 1999).
4. Cointegration at zero frequency was found among the time series of real
consumption ratio, price ratio (real exchange rate) and real absorption, implying
the existence of a long-term equilibrium relationship among these variable, as
predicted by theory. The corresponding error correction model also supports the
existence of a correction mechanism in that the dependent variable (consumption
ratio) will adjust according to the discrepancy between its current and equilibrium
values.
5. Theory would suggest that depreciation of the real exchange rate, measured by
the ratio of non-tradable prices relative to tradable prices, would discourage
consumption of tradable goods and encourage consumption of non-tradable
goods. The data support this result, expressed by the negative sign of the
28

coefficient of the real exchange rate when used as an explanatory variable for the
behavior of the ratio of consumption of non-tradable relative to tradable goods. It
has also been found that when the economy’s absorption increases, it has the
effect of discouraging consumption of non-tradable in favor of tradable goods.
6. The constant elasticity of substitution in consumption of non-tradable relative
to tradable goods has been found to have a value of 0.72 on average, implying
low-substitution behavior or inelasticity.
29

References Agénor, P.R., and P.J. Montiel. 1999. Development Macroeconomics. Second edition. Princeton,
United States: Princeton University Press.
Aghion, P., P. Bacchetta and A. Banerjee. 2000. “Currency Crises and Monetary Policy with
Credit Constraints.” Cambridge, United States: Harvard University, Department of
Economics. Mimeographed document.
Banerjee, A., et al. 1994. Co-Integration, Error-Correction, and the Econometric Analysis of
Non-Stationary Data. Advanced Texts in Econometrics. Oxford, United Kingdom:
Oxford University Press.
Baxter, M., U. Jermann and R.G. King. 1998. “Non-Traded Goods, Non-Traded Factors and
International Non-Diversification.” Journal of International Economics 44(2): 211-229.
Calvo, G.A., and C.A. Végh. 1993. “Exchange Rate Based Stabilization under Imperfect
Credibility.” In: H. Frisch and A. Worgotter, editors. Proceedings from IEA Conference
on Open Economy Macroeconomics. London, United Kingdom: Macmillan.
Calvo, G.A., A. Izquierdo and E. Talvi. 2002. “Sudden Stops, the Real Exchange Rate and Fiscal
Sustainability: Argentina’s Lessons.” Washington, DC, United States: Inter-American
Development Bank, Research Department. Mimeographed document.
Dornbusch, R. 1983. “Real Interest Rates, Home Goods, and Optimal External Borrowing.”
Journal of Political Economy 91: 141-53.
Engel, C., and K. Keltzer. 1989. “Saving and Investment in an Open Economy with Non-Traded
Goods.” International Economic Review 30: 735-52.
Fernández de Cordoba, G., and T.J. Kehoe. 2000. “Capital Flows and Real Exchange Rate
Fluctuations Following Spain’s Entry into the European Community.” Journal of
International Economics 51(1): 49-78.
Ferrufino, R. 1992. “El Tipo de Cambio Real en el Período Post-Estabilización en Bolivia.”
Análisis Económico. Volumen 5.
Hinkle, L.E., and F. Nsengiyumoa. 1999. “The Two-Good Internal RER for Tradables and
Nontradables.” In: L.E. Hinkle and P.J. Montiel, editors. Exchange Rate Misalignment.
Oxford, United Kingdom: Oxford University Press.
Hylleberg, S., et al. 1990. “Seasonal Integration and Cointegration.” Journal of Econometrics 44:
215-238.
30

Instituto Nacional de Estadística (INE). 2000. “Metodología de Elaboración de Insumo
Producto.”
http://www.ine.gov.bo/01METODOLOGIA%20INSUMO%20PRODUCTO.pdf
Lora, O., and W. Orellana. 2000. “Tipo de Cambio Real de Equilibrio: Un Análisis del Caso
Boliviano en los Ultimos Años.” Revista de Análisis 3(1).
Mendoza, E.G. 1995. “The Terms of Trade, the Real Exchange Rate and Economic
Fluctuations.” International Economic Review 36(1): 101-37.
----. 2000. “On the Instability of Variance Decompositions of the Real Exchange Rate Across
Exchange-Rate Regimes: Evidence from Mexico and the United States.” NBER Working
Paper 7768. Cambridge, United States: National Bureau of Economic Research.
----. 2002. “Credit, Prices, and Crashes: Business Cycles with a Sudden Stop.” In: J. Frankel and
S. Edwards, editors. Preventing Currency Crises in Emerging Markets. Chicago, United
States: University of Chicago Press.
Mendoza, E.G., and M. Uribe. 2000. “Devaluation Risk and the Business-Cycle Implications of
Exchange Rate Management.” Carnegie-Rochester Conference Series on Public Policy
53: 239-296.
Ostry, J.D., and C.M. Reinhart. 1992. “Private Saving and Terms-of-Trade Shocks.” IMF Staff
Papers 39: 495-517.
Ramírez, P. 1991. “Análisis de los Determinantes del Tipo de Cambio Real de Equilibrio en
Bolivia.” Documento de Trabajo 06/91. La Paz, Bolivia: Universidad Católica Boliviana,
Instituto de Investigaciones Socio Económicas.
Villarroel, S. 2002. “Resource Reallocation within the National Production System: A View
from the Perspective of Tradables and Non-Tradables.” La Paz, Bolivia: Universidad
Católica Boliviana. Masters thesis.
31

Appendix A. Expenditure Survey Procedure Private household consumption data are available in the Bolivian national accounts under a
product classification with eight groups and 32 subgroups of goods. The classification and
weights used come from the EPF applied to the private household consumption data from
national accounts. The EPF is the Household Budget Survey made in 1990 with the purpose of
building the basic structure of private household consumption of goods and services. The survey
was conducted in the four main Bolivian cities. The definition of private household consumption,
based on the EPF structure, is the same as that used in the IOM.
Private household consumption data, based on the 1990 EPF structure, are available at
current and constant prices, from 1988 to 2002, at an annual frequency. Annual time series of
price deflator series can also be obtained for the data based on the EPF structure, from 1990 to
2000.
The following steps describe the computations made at each point in time.
Step 1: The private household consumption data, based on the EPF, was
reclassified into service and durable goods, obtaining non-durable goods by
difference. The consumption of each service good was defined as consumption of
a non-tradable, and all of the non-tradable were added to produce a time series of
consumption of non-tradable goods. The consumption of each durable and non-
durable good was defined as a tradable good, and then all tradable goods were
added to produce a time series of consumption of tradable goods. All of these
computations were done in nominal and real terms.
Step 2: Given that both series can be computed in nominal and real terms, then
price deflators for tradable and non-tradable were computed, as well as the price
ratio.
Step 3: Given that the time series produced are annual and short in length, then
these are used as reference data to check the quality of data produced by the first
methodology or national accounts procedure. The following figures compare the
annual series of nominal and real consumption of tradables and non-tradable
goods computed by the first and second methodologies.
32

Appendix B. Comparing Annual Series Produced by First and Second Methodologies
Figure B.1.Nominal Consumption of Tradables:
Comparison between Methodologies 1 and 2
0
5000
10000
15000
20000
25000
30000
35000
1990
1991
1992
1993
1994
1995
1996
1997
1998
1999
2000
2001
2002
Mill
ions
of B
s.
Met.1-Nom. Cons. Tradable Met.2-NCT-Tradable=Non-DurableMet.2-NCT-Tradable=Durable Met2.-NCT-Tradable=Non-Durable+Durable
Source : Based on disaggregated Input-Output Matrix and private household consumption data.
Figure B.2.Nominal Consumption of Non-Tradables:
Comparison between Methodologies 1 and 2
0
5000
10000
15000
20000
25000
1990
1991
1992
1993
1994
1995
1996
1997
1998
1999
2000
2001
2002
Mill
ions
of B
s.
Met.1-Nom. Cons. Nontradable Met.2-Nom. Cons. Nontradable
Source : Based on disaggregated Input-Output Matrix and private household consumption data.
33

Figure B.3.Real Consumption of Tradables:
Comparison between Methodologies 1 and 2
0
2000
4000
6000
8000
10000
12000
14000
1990
1991
1992
1993
1994
1995
1996
1997
1998
1999
2000
2001
2002
Mill
ions
of B
s.
Met.1-Real Cons. Tradable Met.2-RCT-Tradable=Non-DurableMet.2-RCT-Tradable=Durable Met.2-RCT-Tradable=Non-Durable+Durable
Source : Based on disaggregated Input-Output Matrix and private household consumption data.
Figure B.4.Real Consumption of Non-Tradables:
Comparison between Methodologies 1 and 2
0100020003000400050006000700080009000
1990
1991
1992
1993
1994
1995
1996
1997
1998
1999
2000
2001
2002
Mill
ions
of B
s.
Met.1-Real Cons. Nontradable Met.2-Real Cons. Nontradable
Source : Based on disaggregated Input-Output Matrix and private household consumption data.
34

Appendix C. Consumer Price Index Procedure The consumer price index (CPI, base year 1991) is computed by INE using the traditional
methodology of the Laspeyres Index, based on a basket of goods and services classified into
several levels of disaggregation: 9 chapters, 25 groups, 57 subgroups and a number of goods and
services that varies by cities (257 in La Paz, 224 in El Alto, 258 in Cochabamba and 244 in Santa
Cruz). The CPI covers the four largest Bolivian cities, which are home to most of the urban
population. The basic basket for goods and services used in the CPI comes from the Household
Budget Survey of 1990. Complementing that, another survey of specification was conducted in
1991 in order to define a detailed description of each good and service. The CPI time series is
available on a monthly basis, for the coverage mentioned above, from 1991 to 2002, for each of
the levels of classification: chapters, groups, subgroups and goods.
The CPI procedure for this research required reclassification of the CPI into a CPI of
durables and CPI of services. The first is then defined as CPI for tradable and the second as CPI
for non-tradable. These series are then used to produce the price ratio of non-tradable to tradable
goods. These series were produced monthly from 1991 to present (base 1991) and transformed to
quarterly and annual time series, which were used only as reference.
All goods listed in the CPI basket have also been classified into two groups by INE,
tradable and non-tradable, allowing the production of price indexes for tradable and non-
tradable, and therefore their price ratio. INE’s definitions of tradable and non-tradable are the
following: (i) non-tradables are all goods whose characteristics (highly perishable, high
transportation costs, tariff barriers and specific to the local culture) determine that they do not
trade in international markets and therefore correspond to those produced and consumed in the
domestic market; (ii) tradables are all goods whose characteristics determine that they can be
easily traded in international markets. These time series are available on a monthly basis and
were transformed to quarterly and annual series to be used only as reference.
35
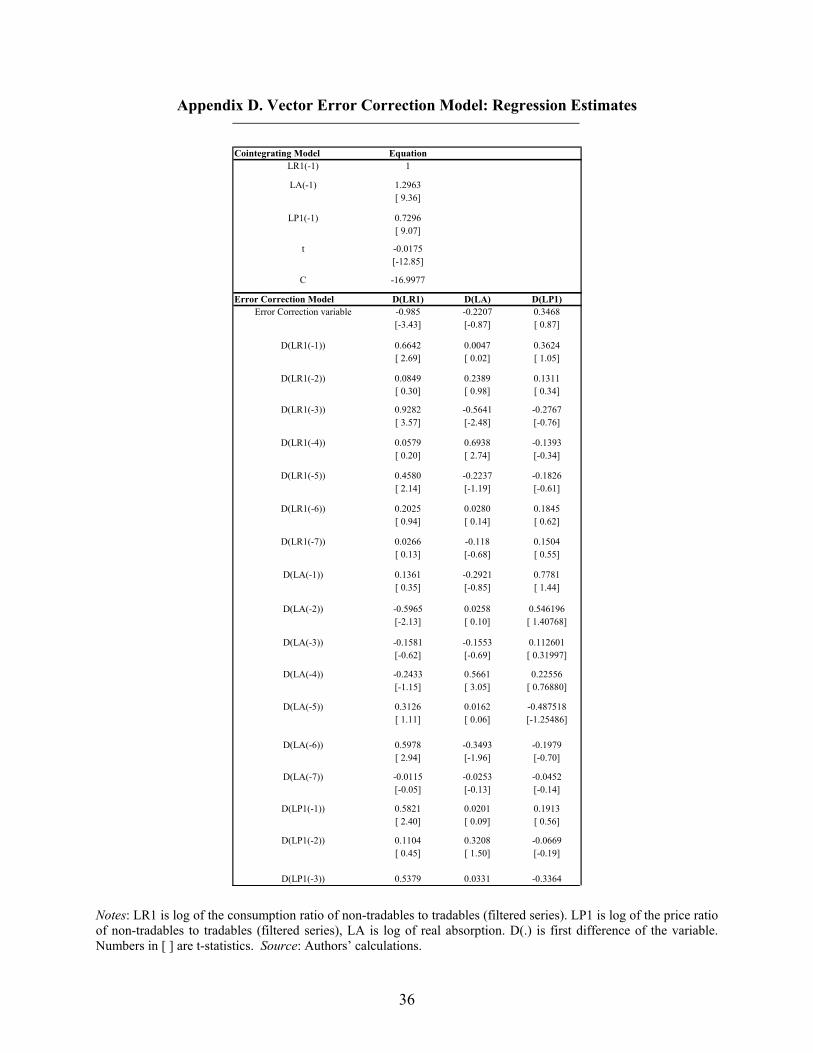
Appendix D. Vector Error Correction Model: Regression Estimates
Cointegrating Model EquationLR1(-1) 1
LA(-1) 1.2963[ 9.36]
LP1(-1) 0.7296[ 9.07]
t -0.0175[-12.85]
C -16.9977
Error Correction Model D(LR1) D(LA) D(LP1)Error Correction variable -0.985 -0.2207 0.3468
[-3.43] [-0.87] [ 0.87]
D(LR1(-1)) 0.6642 0.0047 0.3624[ 2.69] [ 0.02] [ 1.05]
D(LR1(-2)) 0.0849 0.2389 0.1311[ 0.30] [ 0.98] [ 0.34]
D(LR1(-3)) 0.9282 -0.5641 -0.2767[ 3.57] [-2.48] [-0.76]
D(LR1(-4)) 0.0579 0.6938 -0.1393[ 0.20] [ 2.74] [-0.34]
D(LR1(-5)) 0.4580 -0.2237 -0.1826[ 2.14] [-1.19] [-0.61]
D(LR1(-6)) 0.2025 0.0280 0.1845[ 0.94] [ 0.14] [ 0.62]
D(LR1(-7)) 0.0266 -0.118 0.1504[ 0.13] [-0.68] [ 0.55]
D(LA(-1)) 0.1361 -0.2921 0.7781[ 0.35] [-0.85] [ 1.44]
D(LA(-2)) -0.5965 0.0258 0.546196[-2.13] [ 0.10] [ 1.40768]
D(LA(-3)) -0.1581 -0.1553 0.112601[-0.62] [-0.69] [ 0.31997]
D(LA(-4)) -0.2433 0.5661 0.22556[-1.15] [ 3.05] [ 0.76880]
D(LA(-5)) 0.3126 0.0162 -0.487518[ 1.11] [ 0.06] [-1.25486]
D(LA(-6)) 0.5978 -0.3493 -0.1979[ 2.94] [-1.96] [-0.70]
D(LA(-7)) -0.0115 -0.0253 -0.0452[-0.05] [-0.13] [-0.14]
D(LP1(-1)) 0.5821 0.0201 0.1913[ 2.40] [ 0.09] [ 0.56]
D(LP1(-2)) 0.1104 0.3208 -0.0669[ 0.45] [ 1.50] [-0.19]
D(LP1(-3)) 0.5379 0.0331 -0.3364 Notes: LR1 is log of the consumption ratio of non-tradables to tradables (filtered series). LP1 is log of the price ratio of non-tradables to tradables (filtered series), LA is log of real absorption. D(.) is first difference of the variable. Numbers in [ ] are t-statistics. Source: Authors’ calculations.
36

Appendix E. Vector Error Correction Normality Tests
Component Skewness Chi-sq df Prob. 1 0.0532 0.0193 1 0.8893 2 -0.0375 0.0096 1 0.9219 3 -0.0362 0.0089 1 0.9245
Joint 0.0379 3 0.9981
Component Kurtosis Chi-sq df Prob. 1 0.3623 11.8852 1 0.0006 2 0.5054 10.6308 1 0.0011 3 0.5478 10.2722 1 0.0014
Joint 32.7883 3 0
Component Jarque-Bera Df Prob. 1 11.9046 2 0.0026 2 10.6404 2 0.0049 3 10.2812 2 0.0059
Joint 32.8262 6 0 Notes: H0: residuals are multivariate normal. Source: Authors’ calculations.
37

Appendix F. Vector Error Correction Residual Tests for Autocorrelation
Portmanteau Tests Serial Correlation LM Tests Lags Q-Stat Prob. Adj Q-Stat Prob. df Lags LM-Stat Prob
1 7.5285 - 7.7167 - - 1 10.6446 0.3009 2 9.3931 - 9.677 - - 2 2.6206 0.9775 3 15.6082 - 16.3827 - - 3 4.1958 0.8981 4 23.7536 - 25.4086 - - 4 12.6460 0.1793 5 34.7186 - 37.8966 - - 5 10.1486 0.3386 6 41.5068 - 45.8485 - - 6 6.0869 0.7312 7 43.8592 - 48.6852 - - 7 2.5395 0.9798 8 48.7925 0.0000 54.8144 0 9 8 4.5868 0.8687 9 56.2027 0.0000 64.3088 0 18 9 7.227 0.6135
10 62.9200 0.0001 73.1929 0 27 10 6.8692 0.6507 11 68.0098 0.0010 80.149 0 36 11 6.2750 0.7121 12 78.8898 0.0013 95.5311 0 45 12 10.0875 0.3434 13 90.5699 0.0013 112.6341 0 54 13 10.7665 0.2921 14 100.5259 0.0019 127.7524 0 63 14 12.3757 0.1929 15 111.0290 0.0022 144.3151 0 72 15 13.7854 0.1302 16 117.5279 0.0050 154.9732 0 81 16 15.3509 0.0817 17 121.7047 0.0146 162.1086 0 90 17 10.879 0.2841 18 126.4706 0.0327 170.6042 0 99 18 8.6441 0.4708 19 128.4555 0.0874 174.3035 0.0001 108 19 6.5865 0.6801 20 129.9762 0.1943 177.2724 0.0003 117 20 4.1991 0.8978
Notes: For the Portmanteau tests H0: no residual autocorrelation up to lag h. The test is valid only for four lags larger than the VAR lag order, and df is degrees of freedom for (approximate) chi-square. For the Serial Correlation LM tests H0: no residual autocorrelation at to order h. Probs from chi-square with 9 df. Source: Authors’ calculations. The authors wish to thank Bolivia’s Instituto Nacional de Estadística for helpful access to their quarterly input-output matrix database. Errors are our own.
38
Copyright © 2022 FDOKUMEN