Efficacy of an internet-based learning module and small-group debriefing on trainees' attitudes and...
10
Academic Medicine, Vol. 90, No. 3 / March 2015 345 Research Report Substance use disorders (SUDs), 1 particularly those involving prescription opioid analgesics, 2 have resulted in an epidemic of morbidity and mortality in the United States and globally. 3,4 More than an estimated 100,000 deaths and $400 billion in health and social costs per year in the United States have been directly attributed to the use of drugs and alcohol. 4–6 Introduction Because primary care physicians regularly see patients with, or at risk for, SUDs, they play a key role in prevention and intervention. 7–10 Whereas heath care providers are adequately prepared to diagnose and treat the medical consequences of SUDs, they are far less likely to screen for and treat the disorders themselves. 9,11–13 Multiple reasons may account for this lack of screening, 14,15 including inadequate education in detection, counseling, and referral in medical schools and residency programs 9,15–18 ; negative attitudes towards substance abusers 19–22 ; and a lack of confidence in treatment efficacy. 23,24 Hence, new evidence-based educational interventions for trainees and primary care physicians are needed to facilitate the learning and application of screening and counseling skills. Previous studies of a variety of educational interventions have shown improved knowledge, attitudes, and/ or skills in medical trainees and other health care providers related to screening and counseling patients with SUDs. 25–31 However, these approaches have not been widely adopted, and the time required to add them to existing curricula would be prohibitive. Internet-based learning (IBL) has the potential for reaching large numbers of learners with both fewer logistical barriers than other educational formats and comparable or superior effectiveness and efficiency. 32–34 Recent studies found that specific communication skills in residents improved after using media-rich IBL modules. 35,36 These IBL modules were designed to appeal to different learning styles, incorporating text, videos, and questions for self-reflection into an easily navigable format. The current study used a similar media-rich IBL module that was designed specifically to improve the communication skills of primary care physicians during screenings and brief counseling sessions with patients with SUDs. 37–39 We randomized groups of residents and medical students from Acad Med. 2015;90:345–354. First published online October 7, 2014 doi: 10.1097/ACM.0000000000000506 Abstract Purpose To examine whether an Internet-based learning module and small-group debriefing can improve medical trainees’ attitudes and communication skills toward patients with substance use disorders (SUDs). Method In 2011–2012, 129 internal and family medicine residents and 370 medical students at two medical schools participated in a cluster randomized controlled trial, which assessed the effect of adding a two-part intervention to the SUDs curricula. The intervention included a self-directed, media-rich Internet-based learning module and a small-group, faculty-led debriefing. Primary study outcomes were changes in self-assessed attitudes in the intervention group (I-group) compared with those in the control group (C-group) (i.e., a difference of differences). For residents, the authors used real-time, Web-based interviews of standardized patients to assess changes in communication skills. Statistical analyses, conducted separately for residents and students, included hierarchical linear modeling, adjusted for site, participant type, cluster, and individual scores at baseline. Results The authors found no significant differences between the I- and C-groups in attitudes for residents or students at baseline. Compared with those in the C-group, residents, but not students, in the I-group had more positive attitudes toward treatment efficacy and self- efficacy at follow-up (P < .006). Likewise, compared with residents in the C-group, residents in the I-group received higher scores on screening and counseling skills during the standardized patient interview at follow-up (P = .0009). Conclusions This intervention produced improved attitudes and communication skills toward patients with SUDs among residents. Enhanced attitudes and skills may result in improved care for these patients. Please see the end of this article for information about the authors. Correspondence should be addressed to Dr. Lanken, 843 Gates Pavilion, Hospital of the University of Pennsylvania, 3400 Spruce St., Philadelphia, PA 19104; telephone: (215) 662-3247; e-mail: paul. [email protected]. Efficacy of an Internet-Based Learning Module and Small-Group Debriefing on Trainees’ Attitudes and Communication Skills Toward Patients With Substance Use Disorders: Results of a Cluster Randomized Controlled Trial Paul N. Lanken, MD, Dennis H. Novack, MD, Christof Daetwyler, MD, Robert Gallop, PhD, J. Richard Landis, PhD, Jennifer Lapin, PhD, Geetha A. Subramaniam, MD, and Barbara A. Schindler, MD Supplemental digital content for this article is available at http://links.lww.com/ACADMED/A234.
Transcript of Efficacy of an internet-based learning module and small-group debriefing on trainees' attitudes and...

Academic Medicine, Vol. 90, No. 3 / March 2015 345
Research Report
Substance use disorders (SUDs),1 particularly those involving prescription opioid analgesics,2 have resulted in an epidemic of morbidity and mortality in the United States and globally.3,4 More than an estimated 100,000 deaths and $400 billion in health and social costs per year in the United States have been directly attributed to the use of drugs and alcohol.4–6
Introduction
Because primary care physicians regularly see patients with, or at risk for, SUDs,
they play a key role in prevention and intervention.7–10 Whereas heath care providers are adequately prepared to diagnose and treat the medical consequences of SUDs, they are far less likely to screen for and treat the disorders themselves.9,11–13 Multiple reasons may account for this lack of screening,14,15 including inadequate education in detection, counseling, and referral in medical schools and residency programs9,15–18; negative attitudes towards substance abusers19–22; and a lack of confidence in treatment efficacy.23,24 Hence, new evidence-based educational interventions for trainees and primary care physicians are needed to facilitate the learning and application of screening and counseling skills.
Previous studies of a variety of educational interventions have shown improved knowledge, attitudes, and/or skills in medical trainees and other health care providers related to screening and counseling patients with SUDs.25–31
However, these approaches have not been widely adopted, and the time required to add them to existing curricula would be prohibitive.
Internet-based learning (IBL) has the potential for reaching large numbers of learners with both fewer logistical barriers than other educational formats and comparable or superior effectiveness and efficiency.32–34 Recent studies found that specific communication skills in residents improved after using media-rich IBL modules.35,36 These IBL modules were designed to appeal to different learning styles, incorporating text, videos, and questions for self-reflection into an easily navigable format.
The current study used a similar media-rich IBL module that was designed specifically to improve the communication skills of primary care physicians during screenings and brief counseling sessions with patients with SUDs.37–39 We randomized groups of residents and medical students from
Acad Med. 2015;90:345–354.First published online October 7, 2014doi: 10.1097/ACM.0000000000000506
Abstract
PurposeTo examine whether an Internet-based learning module and small-group debriefing can improve medical trainees’ attitudes and communication skills toward patients with substance use disorders (SUDs).
MethodIn 2011–2012, 129 internal and family medicine residents and 370 medical students at two medical schools participated in a cluster randomized controlled trial, which assessed the effect of adding a two-part intervention to the SUDs curricula. The intervention included a self-directed, media-rich Internet-based learning module and
a small-group, faculty-led debriefing. Primary study outcomes were changes in self-assessed attitudes in the intervention group (I-group) compared with those in the control group (C-group) (i.e., a difference of differences). For residents, the authors used real-time, Web-based interviews of standardized patients to assess changes in communication skills. Statistical analyses, conducted separately for residents and students, included hierarchical linear modeling, adjusted for site, participant type, cluster, and individual scores at baseline.
ResultsThe authors found no significant differences between the I- and C-groups
in attitudes for residents or students at baseline. Compared with those in the C-group, residents, but not students, in the I-group had more positive attitudes toward treatment efficacy and self-efficacy at follow-up (P < .006). Likewise, compared with residents in the C-group, residents in the I-group received higher scores on screening and counseling skills during the standardized patient interview at follow-up (P = .0009).
ConclusionsThis intervention produced improved attitudes and communication skills toward patients with SUDs among residents. Enhanced attitudes and skills may result in improved care for these patients.
Please see the end of this article for information about the authors.
Correspondence should be addressed to Dr. Lanken, 843 Gates Pavilion, Hospital of the University of Pennsylvania, 3400 Spruce St., Philadelphia, PA 19104; telephone: (215) 662-3247; e-mail: [email protected].
Efficacy of an Internet-Based Learning Module and Small-Group Debriefing on Trainees’ Attitudes and Communication Skills Toward Patients With Substance Use Disorders: Results of a Cluster Randomized Controlled TrialPaul N. Lanken, MD, Dennis H. Novack, MD, Christof Daetwyler, MD, Robert Gallop, PhD, J. Richard Landis, PhD, Jennifer Lapin, PhD, Geetha A. Subramaniam, MD, and Barbara A. Schindler, MD
Supplemental digital content for this article is available at http://links.lww.com/ACADMED/A234.

Research Report
Academic Medicine, Vol. 90, No. 3 / March 2015346
two institutions into either a control group (C-group) that received the usual SUDs curriculum or an intervention group (I-group) that received the study intervention in addition to the usual curriculum. The intervention consisted of a self-directed visit to the IBL module followed by a small-group debriefing. We hypothesized that, compared with those in the C-group, those in the I-group would express more positive attitudes toward patients with SUDs, treatment efficacy, and self-efficacy and, for residents specifically, improved communication skills.
Method
We used a cluster randomized controlled trial design comparing the I-group with the C-group.
Study population
We enrolled residents and medical students over 11 months (August 2011 to June 2012) from two medical schools (Perelman School of Medicine at the University of Pennsylvania [Penn] and Drexel University College of Medicine [Drexel]) and their affiliated residency programs.
The residents were postgraduate years 2, 3, and 4 (PGY2, PGY3, and PGY4) in categorical internal medicine, primary care internal medicine, internal medicine–pediatrics, and family medicine residency programs affiliated with Penn and PGY1 and PGY2 residents in the internal medicine residency program affiliated with Drexel. We invited all residents to participate who were assigned to the same two-week or longer block of time in the same outpatient rotations during the enrollment period. We excluded residents whose schedules did not fit the block format, who previously had participated in the study, or whose outpatient clinics were at the Veterans Administration Medical Center.
We invited all second- (MS2) and third-year (MS3) medical students at Penn who were in their family medicine clerkship and all third-year (MS3) medical students at Drexel in the ambulatory block of their internal medicine clerkship during the enrollment period.
All residents or medical students on each of these rotations at the same time were assigned to the same cluster and randomized to either an I- or C-group together.
The institutional review boards at the University of Pennsylvania and Drexel University and the U.S. Office of Management and Budget reviewed and approved the protocol. All participants gave informed consent. Residents received retail gift cards as incentives for their participation.
Study groups
The C-group was exposed to the usual ambulatory medicine curricula. During this study, these curricula included no formal teaching sessions specifically related to SUDs. To minimize potential contamination, participants in the C-group were asked to refrain from talking to those in the I-group about the intervention and from visiting the IBL module Web site that was in the public domain.
In addition to the usual SUDs curriculum, the I-group participated in a two-part intervention: (1) a self-directed viewing of the hourlong National Institute on Drug Abuse (NIDA)-supported substance abuse IBL module37–39; and (2) participation in an hourlong, faculty-facilitated, semistructured small-group debriefing. During this debriefing, participants discussed their experiences viewing the module as well as their prior experiences with patients with SUDs professionally and personally.
Study protocol for residents
The protocol’s order of events for residents was (1) informed consent; (2) presurvey (in paper format) (see Supplemental Digital Appendix 1); (3) real-time online interview of a standardized patient (SP) (Case 1)40,41; (4) disclosure of randomization result for given cluster; (5) access to IBL module for I-group; (6) faculty-facilitated debriefing for I-group using a semistructured format (see Supplemental Digital Appendix 2 for the facilitator’s guide); (7) postsurvey (in paper format); and (8) real-time online interview of an SP (Case 2) with immediate feedback. See Supplemental Digital Appendix 3 for additional details related to the study protocol for residents. (All supplemental digital appendices and tables are available at http://links.lww.com/ACADMED/A234).
A single experienced SP trainer who was unaware of the randomization status of the residents scored both the Case 1 and Case 2 interviews using the same 23-item checklist (see Supplemental Digital
Appendix 4) by reviewing the digital recordings of the interviews.
Study protocol for medical students
A similar protocol was used for students, including a presurvey (see Supplemental Digital Appendix 5) and postsurvey (both in paper format). The order of events for the students was the same as for the residents with the following exceptions: (1) No SP interviews were done; (2) debriefings for the I-group were held during the second or third week of the rotation/block; (3) Drexel students at remote sites participated in the debriefings via videoconference; (4) students completed postsurveys close to the last day of their four-week clerkship, one to two weeks later than did residents; and (5) because the surveys were part of a self-evaluation of each medical school’s curriculum, students could indicate on their completed surveys if they refused to allow their results to be used for research.
Surveys
The surveys (see Supplemental Digital Appendices 1 and 5) had five sections (I–V) as follows: Section I, demographics and baseline variables; II, attitudes, communication skills, and knowledge related to SUDs; III, attitudes toward personal characteristics of patients with SUDs and toward SUDs treatment efficacy; IV, additional baseline variables; and V, Jefferson Scale of Physician Empathy (JSPE).42
The first 12 items in Section III were originally part of a survey for medical students from the NIDA Centers of Excellence (COE) initiative.39 These 12 items were taken from prior validated surveys by Chappel et al43 and others44 or created by several of the current study’s investigators (D.H.N., P.N.L., B.A.S.) using a modified nominal group process.45 Except for the JSPE in Section V, we also created the remaining items in this survey using the same group process. The surveys demonstrated good reliability with a Cronbach alpha of 0.894.
Outcomes
We used a “difference of differences” approach to measure outcomes. Using this method, we compared the paired differences of survey outcomes before and after the intervention for individual participants in the I-group versus those at the same time points for individuals

Research Report
Academic Medicine, Vol. 90, No. 3 / March 2015 347
in the C-group. The study’s primary outcomes for both residents and medical students were changes in self-assessed attitudes toward personal characteristics of patients with SUDs, treatment efficacy, and self-efficacy. A secondary outcome for residents only were changes in communication skills as assessed by their performance on paired interviews of single-station SPs with SUDs.
Factor analyses and outcomes scales
We performed two principal components analyses with varimax rotation. The initial analysis was done on the first 12 items of Section III and used 1,340 records representing a cross-sectional sample of medical students in eight medical schools involved in the NIDA COE initiative.39 This analysis identified two factors—attitudes toward personal characteristics of patients with SUDs (Factor 1) and efficacy of treatment of SUDs (Factor 2) (see Supplemental Digital Table 1). We a priori selected changes in these factors as two primary outcomes of the study.
We performed a second factor analysis on all of the items in Section II (29 items) using 389 baseline surveys from medical students in our current study. Five factors identified by this analysis reflected attitudes and self-assessed communication skills—the importance of screening for SUDs (Factor 3) and self-efficacy (Factors 4, 5, 6, 7).46 We a priori selected changes in these five factors as additional primary outcomes. These five factors plus the two factors derived from Section III yielded a total of seven factors (see Supplemental Digital Table 1). We applied this seven-factor structure to both students’ and residents’ responses (because the factor analysis of residents alone did not converge). Finally, we added an eighth outcome variable, called “Treatment Efficacy Expanded.” It was exploratory in nature and based on the content expertise of the investigators. The variable included all four items of Factor 2 (see Supplemental Digital Table 1) plus item 13 in Section III (see Supplemental Digital Appendix 2). Thus, the study had a total of eight primary outcome variables, referred to as scales.
Statistical analyses
Cluster randomization. Cluster randomization was performed electronically in permuted blocks according to site (Penn or Drexel),
participant status (resident or medical student), and time period (the first five months or the final six months of the study). The randomization software was designed to keep the number of participants in the I- and C-groups at each school approximately balanced during the two time periods.
Sample size and power calculations. Us- ing standard methods,47,48 we derived formulas for power estimation for nested models. We estimated power to detect a significant difference between the I- and C-groups using the following parameters: (1) alpha = 0.05; (2) sample size per cluster = 10; (3) number of clusters per group = 6 (i.e., a total of 12 clusters in both arms of the study); (4) standardized effect size (i.e., the mean difference of differences in adjusted scores between the I- and C-groups divided by their pooled standard deviation) = 0.4 to 0.8 in increments of 0.1; and (5) within-cluster correlation ranging 0.1 to 0.4 in increments of 0.05. Based on these parameters, for an assumed within-cluster correlation ≤ 0.15, the study had at least 80% power to detect an effect size of 0.75 or larger based on a total sample size of 120 (12 clusters with 10 participants per cluster). This represents a moderate-to-large effect size.49 (Observed within-cluster correlation coefficients were < 0.15 [the assumed value] and ranged from 0.01 to 0.12 for residents and 0.004 to 0.07 for medical students, varying by survey factor and participant type).
Outcome measures and statistical tests. As described previously, the study had eight primary outcomes that represented changes in the eight survey-derived scales in paired pre- and postsurveys of participants in the I-group compared with analogous changes of those in the C-group. Although we assumed a P value < .05 as being significant for the sample size calculations, we applied a Bonferroni correction for eight multiple comparisons, corresponding to the eight primary outcomes, so that the corrected P value for statistical significance of each of the eight outcome scales was < .0062 (= 0.05/8).
Because the scales consisted of survey items with binary or Likert scales with different ranges (e.g., 1–4, 1–5, 0–6, and 1–10), we rescaled responses to all items on a 0–1 scale expressed in hundredths. We calculated differences by subtracting an individual
participant’s normalized score for each scale on the presurvey from the score for the same scale in the postsurvey (i.e., paired postsurvey minus presurvey), such that a positive difference (or positive effect size) would represent an improvement (e.g., a more positive attitude).
We used a modified intention-to-treat analysis—that is, the analyses included all participants who had completed a paired pre- and postsurvey. To deal with incomplete survey data, we only included in the analysis the results of scales in which the participant had completed at least 75% of the individual survey items that made up the respective scale.50 The implemented analytical framework (referred to as a hierarchical linear model [HLM]) adjusted for school (site), within-cluster correlation, and baseline individual scores for each scale to produce an estimated difference between pre- and postsurveys for the I-group and for the C-group. For each of the eight scales, we tested the difference of these differences for statistical significance and calculated standardized effect sizes by dividing the adjusted mean difference estimate by the pooled standard deviation.49
As a secondary outcome for residents, we calculated the changes in SP interview checklist scores by subtracting each individual resident’s score for Case 1 from her or his score for Case 2, so that a positive change represented improvement. One point was assigned for each of the 23 items in the checklist (i.e., the items were equally weighted), and the range of possible raw scores was 0 to 23. We assigned a fraction of a point for partial completion of selected items. We rescaled these scores to correspond to the 0–1 scale used for the survey results. We then adjusted the normalized changes within the groups for site and cluster and the resident’s baseline score for the Case 1 interview. We used HLM to test for changes between the I- and C-groups (i.e., the difference of differences).
We used the Fisher exact test or chi-square test to compare binary and categorical baseline variables and an independent-sample t test for continuous variables between the I- and C-groups. All P values were two sided. To conduct all statistical testing, we used SAS software 9.2 (SAS Institute Inc, Cary, North Carolina).

Research Report
Academic Medicine, Vol. 90, No. 3 / March 2015348
Tabl
e 1
Res
iden
ts’ B
asel
ine
(Pre
surv
ey)
and
Fo
llo
w-u
p (
Post
surv
ey)
Surv
ey S
core
s an
d W
ith
in-G
rou
p D
iffe
ren
ces
in S
core
s B
etw
een
B
asel
ine
and
Fo
llo
w-u
p S
urv
eys
(Po
stsu
rvey
Sco
re −
Pre
surv
ey S
core
) fo
r th
e In
terv
enti
on
(n
= 6
5) a
nd
Co
ntr
ol (
n =
64)
G
rou
ps,
Au
gu
st 2
011
to J
un
e 20
12a,
b
Ou
tco
me
scale
c
Base
lin
e s
core
Foll
ow
-up
sco
reC
han
ge i
n s
core
s b
etw
een
base
lin
e a
nd
fo
llo
w-u
p
I-g
rou
p,
mean
(SD
)C
-gro
up
, m
ean
(SD
)P
valu
ed
I-g
rou
p,
mean
(S
D)
C-g
rou
p,
mean
(S
D)
P
valu
ed
I-g
rou
p,
mean
(SD
) [e
std
iff]
e
P v
alu
e
(eff
ect
si
ze)f
C-g
rou
p,
mean
(SD
) [e
std
iff]
e
P v
alu
e
(eff
ect
si
ze)f
1. V
iew
of
patie
nt’s
pers
onal
ch
arac
teris
tics
0.57
0 (0
.137
)0.
605
(0.1
28)
.13
0.58
3 (0
.143
)0.
617
(0.1
28)
.17
0.01
3 (0
.083
) [0
.008
].4
5 (0
.10)
0.01
1 (0
.076
) [0
.015
].1
8 (0
.20)
2. T
reat
men
t ef
ficac
y ba
sic
0.71
0 (0
.091
)0.
743
(0.1
23)
.083
0.75
6 (0
.102
)0.
745
(0.1
25)
.57
0.04
6 (0
.108
) [0
.041
].0
01
(0
.38)
0.00
1 (0
.087
) [0
.008
].5
1 (0
.09)
3. Im
port
ance
of
scre
enin
g an
d co
unse
ling
0.83
7 (0
.134
)0.
864
(0.1
03)
.21
0.87
2 (0
.114
)0.
852
(0.1
16)
.34
0.03
5 (0
.110
) [0
.026
].0
7 (0
.24)
−0.
012
(0.1
23)
[−0.
005]
.72
(−0.
04)
4. C
onfid
ence
: abl
e to
mak
e a
diff
eren
ce0.
459
(0.1
48)
0.48
2 (0
.177
).4
20.
602
(0.1
32)
0.51
3 (0
.186
).0
02
0.14
3 (0
.167
) [0
.140
]< .001
(0
.84)
0.03
1 (0
.166
) [0
.044
].0
52
(0.2
7)
5. C
onfid
ence
: abi
lity,
kn
owle
dge,
and
ski
lls0.
503
(0.1
21)
0.51
9 (0
.145
).5
10.
628
(0.1
03)
0.52
2 (0
.153
)< .001
0.12
5 (0
.132
) [0
.118
]< .001
(0
.89)
0.00
3 (0
.111
) [0
.006
].7
0 (0
.05)
6. P
repa
red
to d
iscu
ss a
nd
coun
sel r
e: t
obac
co o
r al
coho
l
0.68
3 (0
.147
)0.
728
(0.1
41)
.08
0.75
9 (0
.141
)0.
702
(0.1
65)
.037
0.07
6 (0
.152
) [0
.066
]< .001
(0
.43)
−0.
027
(0.1
32)
[−0.
018]
.30
(−0.
14)
7. P
repa
red
to d
iscu
ss a
nd
coun
sel r
e: p
resc
riptio
n or
ill
icit
drug
s
0.48
2 (0
.159
)0.
505
(0.1
97)
.46
0.62
8 (0
.132
)0.
530
(0.1
88)
.0009
0.14
6 (0
.204
) [0
.139
]< .001
(0
.68)
0.02
4 (0
.157
) [0
.033
].1
5 (0
.21)
8. T
reat
men
t ef
ficac
y ex
pand
edg
0.70
7 (0
.094
)0.
744
(0.1
21)
.056
0.76
1 (0
.101
)0.
733
(0.1
26)
.17
0.05
4 (0
.114
) [0
.047
]< .001
(0
.41)
−0.
010
(0.0
83)
[−0.
004]
.76
(−0.
05)
Abb
revi
atio
ns: I
-gro
up in
dica
tes
inte
rven
tion
grou
p; C
-gro
up, c
ontr
ol g
roup
; SD
, sta
ndar
d de
viat
ion;
est
diff
, es
timat
ed d
iffer
ence
; re,
rel
ated
to.
a Incl
udes
pos
tgra
duat
e ye
ar 2
, 3, a
nd 4
res
iden
ts in
cat
egor
ical
inte
rnal
med
icin
e, p
rimar
y ca
re in
tern
al m
edic
ine,
in
tern
al m
edic
ine–
pedi
atric
s, a
nd f
amily
med
icin
e re
side
ncy
prog
ram
s af
filia
ted
with
the
Per
elm
an S
choo
l of
Med
icin
e
at t
he U
nive
rsity
of
Penn
sylv
ania
and
pos
tgra
duat
e ye
ar 1
and
2 r
esid
ents
in t
he in
tern
al m
edic
ine
resi
denc
y pr
ogra
m
affil
iate
d w
ith D
rexe
l Uni
vers
ity C
olle
ge o
f M
edic
ine,
who
met
enr
ollm
ent
crite
ria (s
ee M
etho
d fo
r de
tails
). b R
aw L
iker
t sc
ale
resp
onse
s to
sur
vey
ques
tions
wer
e re
scal
ed t
o be
bet
wee
n 0
and
1 (s
ee M
etho
d fo
r de
tails
). c S
ee S
uppl
emen
tal D
igita
l Tab
le 1
for
the
sur
vey
item
s th
at c
ompo
se e
ach
fact
or a
nd S
uppl
emen
tal D
igita
l App
endi
x 1
fo
r th
e sp
ecifi
c ite
ms
as w
ritte
n in
the
sur
vey
(bot
h av
aila
ble
at h
ttp:
//lin
ks.lw
w.c
om/A
CA
DM
ED/A
234)
. d
P va
lues
of
the
diff
eren
ces
betw
een
the
I- an
d C
-gro
ups
on t
he p
resu
rvey
or
post
surv
ey s
core
s. P
val
ues
in b
old
are
si
gnifi
cant
aft
er B
onfe
rron
i cor
rect
ion
(P <
.006
). e E
stim
ated
diff
eren
ce o
f w
ithin
-gro
up m
ean
chan
ge in
pos
tsur
vey
scor
e m
inus
pre
surv
ey s
core
aft
er a
djus
tmen
t fo
r
indi
vidu
al’s
base
line
(pre
surv
ey) s
core
. f P
val
ues
of t
he a
djus
ted
diff
eren
ce e
stim
ates
with
in g
roup
s. P
val
ues
and
effe
ct s
izes
in b
old
are
sign
ifica
nt a
fter
Bo
nfer
roni
cor
rect
ion
(P <
.006
). Se
e M
etho
d fo
r de
finiti
on a
nd e
stim
ated
mag
nitu
de o
f ef
fect
siz
es.
g See
Met
hod
for
the
surv
ey it
ems
that
com
pose
out
com
e sc
ale
8 an
d Su
pple
men
tal D
igita
l App
endi
x 1
for
the
sp
ecifi
c ite
ms
as w
ritte
n in
the
sur
vey.

Research Report
Academic Medicine, Vol. 90, No. 3 / March 2015 349
Results
Residents
Participants and baseline characteristics. Of the 153 residents available to participate, we enrolled 133 (86.9%) and randomized them into 24 clusters with 67 residents in the I-group and 24 clusters with 66 residents in the C-group. Of the 133 enrolled residents, 129 (97.0%) completed both the pre- and postsurveys (see Supplemental Digital Figure 1). We found no statistically significant differences between the I- and C-groups in demographic and other baseline characteristics (see Supplemental Digital Table 2). (All supplemental digital figures and tables are available at http://links.lww.com/ACADMED/A234).
Survey-related outcomes. We found no significant differences between the I- and C-groups in the mean scores for any of the eight outcome scales on the presurvey (baseline survey) (see Table 1).
In the within-group analysis, we found highly significant changes in six of the eight scales for the I-group with moderate-to-large standardized effect sizes (see Table 1). In contrast, for the C-group, within-group changes in all eight scales were not significant.
In the between-group analysis, we found highly significant changes in five of the eight scales (P < .006), representing moderate-to-large effect sizes (see Table 2). Changes in four of these scales reflected increased self-efficacy, whereas changes in the fifth reflected a more positive attitude toward treatment efficacy. We found no interaction effects (i.e., site-by-intervention). When we repeated the analysis after excluding participants who did not receive the full intervention, results (not shown) were similar to those of the complete resident study group.
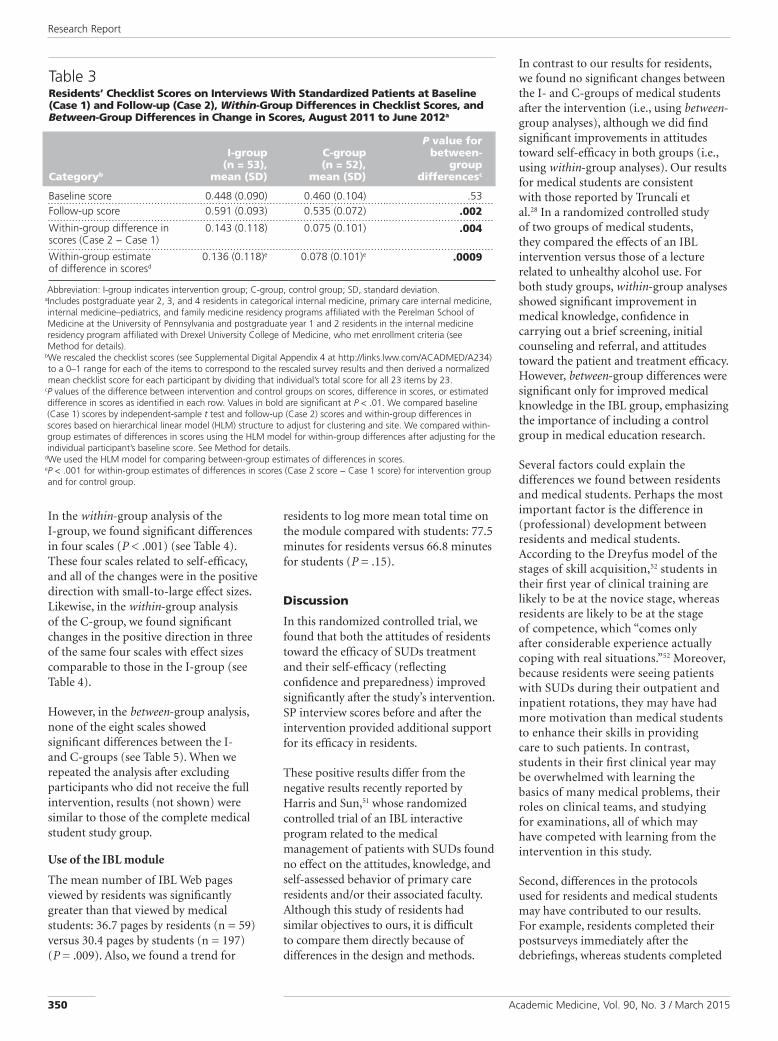
SP interview-related outcome. At baseline, checklist scores for the Case 1 interviews were not significantly different between the I- and C-groups (see Table 3). The within-group changes in both the I- and C-groups showed highly significant differences compared with the baseline scores (see Table 3). The changes in both groups’ scores were in the positive direction, indicating an improvement in the controls that was independent of the intervention. The effect size was 1.15 for the I-group and 0.77 for the C-group. The within-group change represented an
additional 3 points for the I-group and an additional 2 points for the C-group on the mean raw checklist scores.
In the between-group analysis, we found a highly significant positive difference in the I-group scores, indicating improved communication skills, compared with the C-group scores (see Table 3). This change represented an effect size of 0.72 and an additional 1.33 points on the checklist.
Medical students
Participants and baseline characteristics. Of the 392 medical students available to participate, we enrolled 382 (97.4%) and randomized them into 12 clusters with 205 students
in the I-group and 10 clusters with 177 students in the C-group. Of the 382 enrolled students, 370 (96.9%) completed both the pre- and postsurveys (see Supplemental Digital Figure 2). We found no statistically significant differences between the I- and C-groups in demographic and other baseline characteristics, except that the I-group had more MS2s and fewer MS3s than the C-group (see Supplemental Digital Table 3).
Survey-related outcomes. We found no significant differences between the I- and C-groups in the baseline scores for the eight scales on the presurveys (see Table 4).
Table 2Residents’ Between-Group Differences in Change in Scores Between Baseline and Follow-up Surveys (Postsurvey Score − Presurvey Score) for the Intervention (n = 65) and Control (n = 64) Groups, August 2011 to June 2012a
Outcome scaleb
Change in scores
Difference of differences, mean
(pooled SD)cP
valuedEffect size (Cohen d)e
1. View of patient’s personal characteristics
−0.007 (0.080) .67 −0.08
2. Treatment efficacy basic 0.033 (0.099) .051 0.33
3. Importance of screening and counseling
0.031 (0.116) .12 0.26
4. Confidence: able to make a difference
0.096 (0.166) .003 0.58
5. Confidence: ability, knowledge, and skills
0.113 (0.122) < .0001 0.92
6. Prepared to discuss and counsel re: tobacco or alcohol
0.083 (0.143) .001 0.58
7. Prepared to discuss and counsel re: prescription or illicit drugs
0.106 (0.183) .002 0.58
8. Treatment efficacy expandedf
0.051 (0.100) .004 0.51
Abbreviations: SD indicates standard deviation; re, related to. a Includes postgraduate year 2, 3, and 4 residents in categorical internal medicine, primary care internal medicine, internal medicine–pediatrics, and family medicine residency programs affiliated with the Perelman School of Medicine at the University of Pennsylvania and postgraduate year 1 and 2 residents in the internal medicine residency program affiliated with Drexel University College of Medicine, who met enrollment criteria (see Method for details).
b See Supplemental Digital Table 1 for the survey items that compose each factor and Supplemental Digital Appendix 1 for the specific items as written in the survey (both available at http://links.lww.com/ACADMED/A234).
c The difference between change in mean score of the intervention group and change in mean score of the control group from pre- to postsurvey, adjusted for cluster, site, and baseline value on presurvey. These differences of differences were calculated using the estimated differences for each outcome scale and subtracting estimated differences for the control group from estimated differences for the intervention group (estimated differences are in brackets in the fifth and sixth columns of data, excluding P values, in Table 1). A positive value indicates improvement from pre- to postsurvey. Raw Likert scale responses to survey questions were rescaled to be between 0 and 1 (see Method for details).
d Statistical significance between change in mean score of the intervention group and change in mean score of the control group from pre- to postsurvey. Values in bold are significant after Bonferroni correction (P < .006).
e Effect size (Cohen d) is the difference between change in mean score of the intervention group and change in mean score of the control group from pre- to postsurvey divided by the pooled standard deviation of the difference. Effect sizes of 0.5 to 0.9 are regarded as moderate to large.49 Values in bold correspond to P values that are significant after Bonferroni correction (P < .006).
f See Method for the survey items that compose outcome scale 8 and Supplemental Digital Appendix 1 for the specific items as written in the survey.
Research Report
Academic Medicine, Vol. 90, No. 3 / March 2015350
In the within-group analysis of the I-group, we found significant differences in four scales (P < .001) (see Table 4). These four scales related to self-efficacy, and all of the changes were in the positive direction with small-to-large effect sizes. Likewise, in the within-group analysis of the C-group, we found significant changes in the positive direction in three of the same four scales with effect sizes comparable to those in the I-group (see Table 4).
However, in the between-group analysis, none of the eight scales showed significant differences between the I- and C-groups (see Table 5). When we repeated the analysis after excluding participants who did not receive the full intervention, results (not shown) were similar to those of the complete medical student study group.
Use of the IBL module
The mean number of IBL Web pages viewed by residents was significantly greater than that viewed by medical students: 36.7 pages by residents (n = 59) versus 30.4 pages by students (n = 197) (P = .009). Also, we found a trend for
residents to log more mean total time on the module compared with students: 77.5 minutes for residents versus 66.8 minutes for students (P = .15).
Discussion
In this randomized controlled trial, we found that both the attitudes of residents toward the efficacy of SUDs treatment and their self-efficacy (reflecting confidence and preparedness) improved significantly after the study’s intervention. SP interview scores before and after the intervention provided additional support for its efficacy in residents.
These positive results differ from the negative results recently reported by Harris and Sun,51 whose randomized controlled trial of an IBL interactive program related to the medical management of patients with SUDs found no effect on the attitudes, knowledge, and self-assessed behavior of primary care residents and/or their associated faculty. Although this study of residents had similar objectives to ours, it is difficult to compare them directly because of differences in the design and methods.
In contrast to our results for residents, we found no significant changes between the I- and C-groups of medical students after the intervention (i.e., using between-group analyses), although we did find significant improvements in attitudes toward self-efficacy in both groups (i.e., using within-group analyses). Our results for medical students are consistent with those reported by Truncali et al.28 In a randomized controlled study of two groups of medical students, they compared the effects of an IBL intervention versus those of a lecture related to unhealthy alcohol use. For both study groups, within-group analyses showed significant improvement in medical knowledge, confidence in carrying out a brief screening, initial counseling and referral, and attitudes toward the patient and treatment efficacy. However, between-group differences were significant only for improved medical knowledge in the IBL group, emphasizing the importance of including a control group in medical education research.
Several factors could explain the differences we found between residents and medical students. Perhaps the most important factor is the difference in (professional) development between residents and medical students. According to the Dreyfus model of the stages of skill acquisition,52 students in their first year of clinical training are likely to be at the novice stage, whereas residents are likely to be at the stage of competence, which “comes only after considerable experience actually coping with real situations.”52 Moreover, because residents were seeing patients with SUDs during their outpatient and inpatient rotations, they may have had more motivation than medical students to enhance their skills in providing care to such patients. In contrast, students in their first clinical year may be overwhelmed with learning the basics of many medical problems, their roles on clinical teams, and studying for examinations, all of which may have competed with learning from the intervention in this study.
Second, differences in the protocols used for residents and medical students may have contributed to our results. For example, residents completed their postsurveys immediately after the debriefings, whereas students completed
Table 3Residents’ Checklist Scores on Interviews With Standardized Patients at Baseline (Case 1) and Follow-up (Case 2), Within-Group Differences in Checklist Scores, and Between-Group Differences in Change in Scores, August 2011 to June 2012a
Categoryb
I-group (n = 53),
mean (SD)
C-group (n = 52),
mean (SD)
P value for between-
group differencesc
Baseline score 0.448 (0.090) 0.460 (0.104) .53Follow-up score 0.591 (0.093) 0.535 (0.072) .002
Within-group difference in scores (Case 2 − Case 1)
0.143 (0.118) 0.075 (0.101) .004
Within-group estimate of difference in scoresd
0.136 (0.118)e 0.078 (0.101)e .0009
Abbreviation: I-group indicates intervention group; C-group, control group; SD, standard deviation. a Includes postgraduate year 2, 3, and 4 residents in categorical internal medicine, primary care internal medicine, internal medicine–pediatrics, and family medicine residency programs affiliated with the Perelman School of Medicine at the University of Pennsylvania and postgraduate year 1 and 2 residents in the internal medicine residency program affiliated with Drexel University College of Medicine, who met enrollment criteria (see Method for details).
b We rescaled the checklist scores (see Supplemental Digital Appendix 4 at http://links.lww.com/ACADMED/A234) to a 0–1 range for each of the items to correspond to the rescaled survey results and then derived a normalized mean checklist score for each participant by dividing that individual’s total score for all 23 items by 23.
c P values of the difference between intervention and control groups on scores, difference in scores, or estimated difference in scores as identified in each row. Values in bold are significant at P < .01. We compared baseline (Case 1) scores by independent-sample t test and follow-up (Case 2) scores and within-group differences in scores based on hierarchical linear model (HLM) structure to adjust for clustering and site. We compared within-group estimates of differences in scores using the HLM model for within-group differences after adjusting for the individual participant’s baseline score. See Method for details.
d We used the HLM model for comparing between-group estimates of differences in scores. e P < .001 for within-group estimates of differences in scores (Case 2 score − Case 1 score) for intervention group and for control group.

Research Report
Academic Medicine, Vol. 90, No. 3 / March 2015 351
Tabl
e 4
Med
ical
Stu
den
ts’ B
asel
ine
(Pre
surv
ey)
and
Fo
llo
w-u
p (
Post
surv
ey)
Surv
ey S
core
s an
d W
ith
in-G
rou
p
Dif
fere
nce
s in
Sco
res
Bet
wee
n B
asel
ine
and
Fo
llo
w-u
p S
urv
eys
(Po
stsu
rvey
Sco
re −
Pre
surv
ey S
core
)
for
the
Inte
rven
tio
n (
n =
200
) an
d C
on
tro
l (n
= 1
70)
Gro
up
s, A
ug
ust
201
1 to
Ju
ne
2012
a,b
Ou
tco
me s
cale
c
Base
lin
e s
core
Foll
ow
-up
sco
reC
han
ge i
n s
core
s b
etw
een
base
lin
e a
nd
fo
llo
w-u
p
I-g
rou
p,
mean
(S
D)
C-g
rou
p,
mean
(S
D)
P v
alu
ed
I-g
rou
p,
mean
(S
D)
C-g
rou
p,
mean
(SD
)P
valu
ed
I-g
rou
p, m
ean
(S
D)
[est
dif
f]e
P v
alu
e
(eff
ect
si
ze)f
C-g
rou
p,
mean
(SD
) [e
std
iff]
e
P v
alu
e
(eff
ect
si
ze)f
1. V
iew
of
patie
nt’s
pers
onal
cha
ract
eris
tics
0.62
2 (0
.135
)0.
635
(0.1
28)
.35
0.62
5 (0
.149
)0.
650
(0.1
31)
.099
0.00
3 (0
.100
) [0
.003
].7
5 (0
.03)
0.01
4 (0
.099
) [0
.016
].0
72
(0.1
6)2.
Tre
atm
ent
effic
acy
basi
c0.
754
(0.1
22)
0.74
2 (0
.117
).3
20.
766
(0.1
29)
0.74
7 (0
.129
).1
50.
012
(0.1
25)
[0.0
132]
.11
(0.1
1)0.
005
(0.1
25)
[0.0
006]
.94
(0.0
05)
3. Im
port
ance
of
scr
eeni
ng a
nd
coun
selin
g
0.87
6 (0
.125
)0.
861
(0.1
20)
.27
0.85
2 (0
.136
)0.
861
(0.1
20)
.56
−0.
023
(0.1
31)
[−0.
019]
.041
(−
0.14
)−
0.00
1 (0
.116
) [−
0.00
2].8
3 (−
0.02
)
4. C
onfid
ence
: abl
e to
m
ake
a di
ffer
ence
0.47
6 (0
.213
)0.
482
(0.1
96)
.78
0.54
3 (0
.202
)0.
534
(0.1
79)
.67
0.06
7 (0
.192
) [0
.064
]< .001
(0
.33)
0.05
2 (0
.188
) [0
.052
]< .006
(0
.28)
5. C
onfid
ence
: abi
lity,
kn
owle
dge,
and
ski
lls0.
490
(0.1
56)
0.49
2 (0
.168
).9
40.
595
(0.1
38)
0.56
5 (0
.143
).0
460.
105
(0.1
36)
[0.1
08]
< .001
(0.7
9)
0.07
4 (0
.131
) [0
.080
]< .001
(0
.61)
6. P
repa
red
to d
iscu
ss
and
coun
sel r
e:
toba
cco
or a
lcoh
ol
0.67
0 (0
.189
)0.
679
(0.1
69)
.63
0.73
3 (0
.184
)0.
729
(0.1
49)
.82
0.06
3 (0
.221
) [0
.065
]< .001
(0.2
9)
0.05
0 (0
.164
) [0
.058
]< .001
(0
.35)
7. P
repa
red
to d
iscu
ss
and
coun
sel r
e:
pres
crip
tion
or il
licit
drug
s
0.49
1 (0
.206
)0.
501
(0.2
25)
.67
0.56
8 (0
.185
)0.
533
(0.1
83)
.07
0.07
7 (0
.219
) [0
.079
]< .001
(0
.36)
0.03
2 (0
.184
) [0
.039
].0
47
(0.2
11)
8. T
reat
men
t ef
ficac
y ex
pand
edg
0.75
0 (0
.122
)0.
739
(0.1
16)
.39
0.76
4 (0
.129
)0.
746
(0.1
25)
.19
0.01
4 (0
.118
) [0
.014
].0
63
(0.1
2)0.
007
(0.1
14)
[0.0
04]
.64
(0.0
4)
Abb
revi
atio
ns: I
-gro
up in
dica
tes
inte
rven
tion
grou
p; C
-gro
up, c
ontr
ol g
roup
; SD
, sta
ndar
d de
viat
ion;
est
diff
, es
timat
ed d
iffer
ence
; re,
rel
ated
to.
a Incl
udes
all
seco
nd-
(MS2
) and
thi
rd-y
ear
(MS3
) med
ical
stu
dent
s at
Per
elm
an S
choo
l of
Med
icin
e at
the
U
nive
rsity
of
Penn
sylv
ania
who
wer
e in
the
ir fa
mily
med
icin
e cl
erks
hip
and
all t
hird
-yea
r (M
S3) m
edic
al
stud
ents
at
Dre
xel U
nive
rsity
Col
lege
of
Med
icin
e in
the
am
bula
tory
blo
ck o
f th
eir
inte
rnal
med
icin
e
cler
kshi
p du
ring
the
enro
llmen
t pe
riod
(see
Met
hod
for
deta
ils).
b Raw
Lik
ert
scal
e re
spon
ses
to s
urve
y qu
estio
ns w
ere
resc
aled
to
be b
etw
een
0 an
d 1
(see
Met
hod
for
deta
ils).
c See
Sup
plem
enta
l Dig
ital T
able
1 f
or t
he s
urve
y ite
ms
that
com
pose
eac
h fa
ctor
and
Sup
plem
enta
l Dig
ital
App
endi
x 5
for
the
spec
ific
item
s as
writ
ten
in t
he s
urve
y (b
oth
avai
labl
e at
htt
p://l
inks
.lww
.com
/AC
AD
MED
/A23
4).
d P v
alue
s of
the
diff
eren
ces
betw
een
the
I- an
d C
-gro
ups
on t
he p
resu
rvey
or
post
surv
ey s
core
s. P
val
ues
in
bold
are
sig
nific
ant
afte
r Bo
nfer
roni
cor
rect
ion
(P <
.006
). e E
stim
ated
diff
eren
ce o
f w
ithin
-gro
up m
ean
chan
ge in
pos
tsur
vey
scor
e m
inus
pre
surv
ey s
core
aft
er a
djus
tmen
t
for
indi
vidu
al’s
base
line
(pre
surv
ey) s
core
. f P
val
ues
of t
he a
djus
ted
diff
eren
ce e
stim
ates
with
in g
roup
s. P
val
ues
and
effe
ct s
izes
in b
old
are
sign
ifica
nt a
fter
Bo
nfer
roni
cor
rect
ion
(P <
.006
). Se
e M
etho
d fo
r de
finiti
on a
nd e
stim
ated
mag
nitu
de o
f ef
fect
siz
es.
g See
Met
hod
for
the
surv
ey it
ems
that
com
pose
out
com
e sc
ale
8 an
d Su
pple
men
tal D
igita
l App
endi
x 5
for
the
sp
ecifi
c ite
ms
as w
ritte
n in
the
sur
vey.

Research Report
Academic Medicine, Vol. 90, No. 3 / March 2015352
theirs one or two weeks later, at the end of their clerkship/block. Positive attitudes may have dissipated in students who were likely focused on their imminent clerkship examinations. Also, only residents were exposed to a baseline SP interview (Case 1). Although the SP in Case 1 did not provide explicit feedback to the residents, that experience may have increased their motivation by suggesting that their communication skills needed improvement. In addition, the debriefings for residents and students differed in a number of aspects: (1) generally, debriefings for the residents were smaller (e.g., having 4–8 residents or fewer) than those for students, which had 14 to 20 students; (2) some students at
Drexel affiliates joined the debriefings by videoconference; and (3) facilitators often had prior working relationships with the residents but not with the students. As a result, the facilitators may have had more personal interactions with the residents during the debriefings, and their influence as respected role models and credible clinician–educators may have been greater.
Finally, the residents may have used the module more effectively than the students, as suggested by the differences in usage metrics.
Our results have several limitations. First, generalizability may be limited
because we conducted the study at two medical schools with relatively extensive formal preclinical educational curricula related to SUDs. Furthermore, we did not evaluate the long-term sustained changes in residents’ attitudes and communication skills after the intervention. Nor did we assess the positive effects of enhanced attitudes on the residents’ clinical performance (e.g., the screening and referral of patients with SUDs in their clinics).53 Finally, we did not assess the effects of the intervention on patient outcomes in the residents’ practices.53 This limitation is especially important because some have questioned the efficacy of current screening–brief intervention–referral methods when applied to non-alcohol-related SUDs.54–56
Nonetheless, in other studies of residents, changes in confidence were associated with improvements in the screening and counseling of patients with SUDs,57,58 greater treatment optimism (i.e., possibly reflecting attitudes toward treatment efficacy and self-efficacy) correlated with more thorough screening practices,57 and interactions with SPs in objective structured clinical examinations predicted clinical performance.59
Our study also has a number of strengths. First, we used a cluster randomized controlled trial study design to rigorously assess outcomes by using a difference of differences approach. Second, because we studied two distinct populations of medical trainees with the same intervention and primary outcomes, we could identify the difference in the effects of the intervention on the two populations. Third, our sampling method included two medical schools with high response rates (> 84% of residents and > 94% of students), resulting in a large sample size. Fourth, we used two methods of assessment for the residents (i.e., a subjective assessment using the pre-/postsurveys and an objective assessment using the pre-/post-SP interviews), both of which yielded positive results, providing complementary support of the intervention’s efficacy in this population. Finally, we used an HLM analysis to take into account the clustered and hierarchical nature of the study design and to adjust for differences in baseline scores of individual participants.
Table 5Medical Students’ Between-Group Differences in Change in Scores Between Baseline and Follow-up Surveys (Postsurvey Score − Presurvey Score) for the Intervention (n = 200) and Control (n = 170) Groups, August 2011 to June 2012a
Outcome scaleb
Change in scores
Difference of differences, mean
(pooled SD)cP
valuedEffect size (Cohen d)e
1. View of patient’s personal characteristics
−0.014 (0.099) .25 −0.14
2. Treatment efficacy basic 0.013 (0.125) .29 0.10
3. Importance of screening and counseling
−0.018 (0.124) .20 −0.14
4. Confidence: able to make a difference
0.011 (0.190) .61 0.06
5. Confidence: ability, knowledge, and skills
0.029 (0.133) .06 0.22
6. Prepared to discuss and counsel re: tobacco or alcohol
0.007 (0.197) .68 0.04
7. Prepared to discuss and counsel re: prescription or illicit drugs
0.040 (0.204) .12 0.20
8. Treatment efficacy expandedf
0.011 (0.116) .33 0.09
Abbreviations: SD indicates standard deviation; re, related to. a Includes all second- (MS2) and third-year (MS3) medical students at Perelman School of Medicine at the University of Pennsylvania who were in their family medicine clerkship and all third-year (MS3) medical students at Drexel University College of Medicine in the ambulatory block of their internal medicine clerkship during the enrollment period (see Method for details).
b See Supplemental Digital Table 1 for the survey items that compose each factor and Supplemental Digital Appendix 1 for the specific items as written in the survey (both available at http://links.lww.com/ACADMED/A234).
c The difference between change in mean score of the intervention group and change in mean score of the control group from pre- to postsurvey, adjusted for cluster, site, and baseline value on presurvey. These differences of differences were calculated using the estimated differences for each outcome scale and subtracting estimated differences for the control group from estimated differences for the intervention group (estimated differences are in brackets in fifth and sixth columns of data, excluding P values, in Table 4). A positive value indicates improvement from pre- to postsurvey. Raw Likert scale responses to survey questions were rescaled to be between 0 and 1 (see Method for details).
d Statistical significance between change in mean score of the intervention group and change in mean score of the control group from pre- to postsurvey. Statistical significance after Bonferroni correction requires P < .006.
e Effect size (Cohen d) is the difference between change in mean score of the intervention group and change in mean score of the control group from pre- to postsurvey divided by the pooled standard deviation of the difference. Effect sizes < 0.25 can be regarded as small.49
f See Method for the survey items that compose outcome scale 8 and Supplemental Digital Appendix 1 for the specific items as written in the survey.

Research Report
Academic Medicine, Vol. 90, No. 3 / March 2015 353
As noted before, a number of factors may have contributed to the greater efficacy of the intervention in the resident versus the student group, including stage of professional development, smaller discussion groups in the resident cohort, and the initial exposure of residents to SPs, which may have triggered resident reflection and motivation to improve their attitudes and skills. These findings indicate that educators should not assume the efficacy of an educational intervention in one group of trainees (i.e., medical students during clerkships) given its efficacy in trainees at other stages of professional development (i.e., residents). Accordingly, educators must take into account the stage of professional development and associated level of competence of trainees when considering how and when to introduce new educational interventions or initiatives. Educational interventions are complicated, and this study highlights the need to study them to maximize knowledge, attitude, and behavioral change in learners.
In conclusion, we find our results with the residents promising—a relatively brief intervention produced robust changes (i.e., showing moderate-to-large effect sizes) in their attitudes and communication skills. Furthermore, having the study’s IBL module in the public domain37–39 makes it widely available for use in internal medicine and family medicine residency programs. We hypothesize that enhanced attitudes and communication skills in residents will result in practice changes and improved medical care of patients with SUDs. Future studies with practice-based and patient-centered outcomes are needed to explore this hypothesis.
Acknowledgments: The authors wish to thank Carol Chou, MD, Joanne Connell, MD, Carmen Guerra, MD, MSCE, Mary Ann Kuzma-Thompson, MD, Katherine Margo, MD, Richard Neill, MD, Matthew H. Rusk, MD, and Joseph Straton, MD, for serving as facilitators for the debriefings; Arnold Smolen, PhD, Gregory McGee, and George E. Zeiset of the College of Medicine of Drexel University; Jeffrey Jaeger, MD, Ted Barrell, and the staff at the Clinical Research Computing Unit of the Perelman School of Medicine at the University of Pennsylvania; the staff at the National Institute on Drug Abuse and JBS International, Inc., for their advice and support; Felecia Myers and Sandra Kaplan for their contributions as research coordinators; Mohammadreza Hojat, PhD, for permission to
use the Jefferson Scale of Physician Empathy; and Judy Shea, PhD, for her critical review of the study design and manuscript.
Funding/Support: National Institutes of Health, National Institute on Drug Abuse, contract no. NIH HHSN271200900021C.
Other disclosures: None reported.
Ethical approval: This research study was reviewed and approved by the institutional review boards of the University of Pennsylvania and Drexel University.
Disclaimer: The content is solely the responsibility of the authors and does not necessarily represent the official views of the National Institute on Drug Abuse or the National
Institutes of Health.
Dr. Lanken is associate dean for professionalism and humanism and professor of medicine and medical ethics and health policy, Perelman School of Medicine at the University of Pennsylvania, Philadelphia, Pennsylvania.
Dr. Novack is associate dean for medical education and professor of medicine, Drexel University College of Medicine, Philadelphia, Pennsylvania.
Dr. Daetwyler is associate professor of family medicine and community and preventive medicine and developer of online resources for medical education, Drexel University College of Medicine, Philadelphia, Pennsylvania.
Dr. Gallop is instructor in biostatistics, West Chester University, West Chester, Pennsylvania.
Dr. Landis is professor and director, Division of Biostatistics, Department of Biostatistics and Epidemiology, and faculty director, Clinical Research Computing Unit, Perelman School of Medicine at the University of Pennsylvania, Philadelphia, Pennsylvania.
Dr. Lapin is director of graduate medical education evaluation and research, Office of Evaluation and Assessment, Perelman School of Medicine at the University of Pennsylvania, Philadelphia, Pennsylvania.
Dr. Subramaniam is team leader and medical officer, Center for Clinical Trials Network, National Institute on Drug Abuse, Bethesda, Maryland.
Dr. Schindler was vice dean for educational and academic affairs, Drexel University College of Medicine, at the time this study was conducted. She remains professor of psychiatry and pediatrics, Drexel University College of Medicine, Philadelphia, Pennsylvania.
References 1 American Psychiatric Association. Diagnostic
and Statistical Manual of Mental Disorders. 4th ed. Washington, DC: American Psychiatric Association; 2000.
2 Jones CM, Mack KA, Paulozzi LJ. Pharmaceutical overdose deaths, United States, 2010. JAMA. 2013;309:657–659.
3 U.S. Burden of Disease Collaborators. The state of US health, 1990–2010: Burden of diseases, injuries, and risk factors. JAMA. 2013;310:591–608.
4 Rehm J, Mathers C, Popova S, Thavorncharoensap M, Teerawattananon Y, Patra J. Global burden of disease and injury and economic cost attributable to alcohol use and alcohol-use disorders. Lancet. 2009;373:2223–2233.
5 National Drug Intelligence Center. National Threat Assessment: The Economic Impact of Illicit Drug Use on American Society. Washington, DC: United States Department of Justice; 2011.
6 Friedmann PD. Alcohol use in adults. N Engl J Med. 2013;368:365–373.
7 Institute of Medicine. Committee on Crossing the Quality Chasm: Adaptation to Mental Health and Addictive Disorders. Improving the Quality of Health Care for Mental and Substance-Use Conditions. Washington, DC: National Academies Press; 2006.
8 Fleming MF, Barry KL, Manwell LB, Johnson K, London R. Brief physician advice for problem alcohol drinkers. A randomized controlled trial in community-based primary care practices. JAMA. 1997;277:1039–1045.
9 O’Connor PG, Nyquist JG, McLellan AT. Integrating addiction medicine into graduate medical education in primary care: The time has come. Ann Intern Med. 2011;154:56–59.
10 Moyer VA. Screening and behavioral counseling interventions in primary care to reduce alcohol misuse: U.S. Preventive Services Task Force recommendation statement. Ann Intern Med. 2013;159:210–218.
11 McLellan AT, Meyers K. Contemporary addiction treatment: A review of systems problems for adults and adolescents. Biol Psychiatry. 2004;56:764–770.
12 Saitz R, Mulvey KP, Plough A, Samet JH. Physician unawareness of serious substance abuse. Am J Drug Alcohol Abuse. 1997;23:343–354.
13 McKnight-Eily LR, Liu Y, Brewer RD, et al. Vital signs: Communication between health professionals and their patients about alcohol use—44 states and the District of Columbia, 2011. MMWR Morb Mortal Wkly Rep. 2014;63:16–22.
14 Yoast RA, Wilford BB, Hayashi SW. Encouraging physicians to screen for and intervene in substance use disorders: Obstacles and strategies for change. J Addict Dis. 2008;27:77–97.
15 Miller NS, Sheppard LM, Colenda CC, Magen J. Why physicians are unprepared to treat patients who have alcohol- and drug-related disorders. Acad Med. 2001;76:410–418.
16 Waldstein SR, Neumann SA, Drossman DA, Novack DH. Teaching psychosomatic (biopsychosocial) medicine in United States medical schools: Survey findings. Psychosom Med. 2001;63:335–343.
17 Wyatt SA, Dekker MA. Improving physician and medical student education in substance use disorders. J Am Osteopath Assoc. 2007;107:ES27–ES38.
18 Wood E, Samet JH, Volkow ND. Physician education in addiction medicine. JAMA. 2013;310:1673–1674.
19 Kerker BD, Horwitz SM, Leventhal JM. Patients’ characteristics and providers’ attitudes: Predictors of screening pregnant women for illicit substance use. Child Abuse Negl. 2004;28:209–223.

Research Report
Academic Medicine, Vol. 90, No. 3 / March 2015354
20 Lindberg M, Vergara C, Wild-Wesley R, Gruman C. Physicians-in-training attitudes toward caring for and working with patients with alcohol and drug abuse diagnoses. South Med J. 2006;99:28–35.
21 Saitz R, Friedmann PD, Sullivan LM, et al. Professional satisfaction experienced when caring for substance-abusing patients: Faculty and resident physician perspectives. J Gen Intern Med. 2002;17:373–376.
22 Ding L, Landon BE, Wilson IB, Wong MD, Shapiro MF, Cleary PD. Predictors and consequences of negative physician attitudes toward HIV-infected injection drug users. Arch Intern Med. 2005;165:618–623.
23 McLellan AT, Lewis DC, O’Brien CP, Kleber HD. Drug dependence, a chronic medical illness: Implications for treatment, insurance, and outcomes evaluation. JAMA. 2000;284:1689–1695.
24 Johnson TP, Booth AL, Johnson P. Physician beliefs about substance misuse and its treatment: Findings from a U.S. survey of primary care practitioners. Subst Use Misuse. 2005;40:1071–1084.
25 Walters ST, Matson SA, Baer JS, Ziedonis DM. Effectiveness of workshop training for psychosocial addiction treatments: A systematic review. J Subst Abuse Treat. 2005;29:283–293.
26 Matthews J, Kadish W, Barrett SV, Mazor K, Field D, Jonassen J. The impact of a brief interclerkship about substance abuse on medical students’ skills. Acad Med. 2002;77:419–426.
27 Chappel JN, Veach TL. Effect of a course on students’ attitudes toward substance abuse and its treatment. J Med Educ. 1987;62:394–400.
28 Truncali A, Lee JD, Ark TK, et al. Teaching physicians to address unhealthy alcohol use: A randomized controlled trial assessing the effect of a Web-based module on medical student performance. J Subst Abuse Treat. 2011;40:203–213.
29 Shafer MS, Rhode R, Chong J. Using distance education to promote the transfer of motivational interviewing skills among behavioral health professionals. J Subst Abuse Treat. 2004;26:141–148.
30 Barone EJ, Huggett KN, Lofgreen AS. Investigation of students’ attitudes about patients with substance use disorders before and after completing an online curricular module. Ann Behav Sci Med Educ. 2011;17:10–13.
31 Parish SJ, Ramaswamy M, Stein MR, Kachur EK, Arnsten JH. Teaching about substance abuse with objective structured clinical exams. J Gen Intern Med. 2006;21:453–459.
32 Chumley-Jones HS, Dobbie A, Alford CL. Web-based learning: Sound educational method or hype? A review of the evaluation
literature. Acad Med. 2002;77(10 suppl):S86–S93.
33 Cook DA, Levinson AJ, Garside S, Dupras DM, Erwin PJ, Montori VM. Internet-based learning in the health professions: A meta-analysis. JAMA. 2008;300:1181–1196.
34 Cook DA, Levinson AJ, Garside S, Dupras DM, Erwin PJ, Montori VM. Instructional design variations in Internet-based learning for health professions education: A systematic review and meta-analysis. Acad Med. 2010;85:909–922.
35 Spagnoletti CL, Bui T, Fischer GS, Gonzaga AMR, Rubio DM, Arnold RM. Implementation and evaluation of a Web-based communication skills learning tool for training internal medicine interns in patient–doctor communication. J Commun Healthc. 2009;2:159–172.
36 Daetwyler CJ, Cohen DG, Gracely E, Novack DH. eLearning to enhance physician patient communication: A pilot test of “doc.com” and “WebEncounter” in teaching bad news delivery. Med Teach. 2010;32:e381–e390.
37 Daetwyler CJ, Schindler BA, Parran T. The Clinical Assessment of Substance Use Disorders. MedEdPORTAL. 2012. https://www.mededportal.org/publication/9110. Accessed August 25, 2014.
38 Schindler BA, Parran T. DEMO module 30: The Clinical Assessment of Substance Use Disorders. Revised October 14, 2011. http://webcampus.drexelmed.edu/doccom/user/. Accessed July 29, 2014.
39 National Institute on Drug Abuse. Centers of Excellence (COE) for Physician Information. Revised June 2012. http://www.drugabuse.gov/nidamed/centers-excellence. Accessed July 29, 2014.
40 Novack DH, Cohen D, Peitzman SJ, Beadenkopf S, Gracely E, Morris J. A pilot test of WebOSCE: A system for assessing trainees’ clinical skills via teleconference. Med Teach. 2002;24:483–487.
41 Clever SL, Novack DH, Cohen DG, Levinson W. Evaluating surgeons’ informed decision making skills: Pilot test using a videoconferenced standardised patient. Med Educ. 2003;37:1094–1099.
42 Hojat M. Empathy in Patient Care: Antecedents, Development, Measurement, and Outcomes. New York, NY: Springer; 2007.
43 Chappel JN, Veach TL, Krug RS. The substance abuse attitude survey: An instrument for measuring attitudes. J Stud Alcohol. 1985;46:48–52.
44 Karam-Hage M, Nerenberg L, Brower KJ. Modifying residents’ professional attitudes about substance abuse treatment and training. Am J Addict. 2001;10:40–47.
45 Jones J, Hunter D. Consensus methods for medical and health services research. BMJ. 1995;311:376–380.
46 Bandura A, ed. Self-Efficacy in Changing Societies. Cambridge, UK: Cambridge University Press; 1995.
47 Diggle PJ, Heagerty P, Liang K-Y, Zeger SL. Analysis of Longitudinal Data. 2nd ed. New York, NY: Oxford University Press; 2002.
48 Ahn C, Overall JE, Tonidandel S. Sample size and power calculations in repeated measurement analysis. Comput Methods Programs Biomed. 2001;64:121–124.
49 Cohen J. Statistical Power Analysis for the Behavioral Sciences. 2nd ed. New York, NY: Academic Press; 1988.
50 American Educational Research Association; American Psychological Association; National Council on Measurement in Education. The Standards for Educational and Psychological Testing. 2nd ed. Washington, DC: American Educational Research Association; 1999.
51 Harris JM Jr, Sun H. A randomized trial of two e-learning strategies for teaching substance abuse management skills to physicians. Acad Med. 2013;88:1357–1362.
52 Dreyfus SE, Dreyfus HL. A Five-Stage Model of the Mental Activities Involved in Directed Skill Acquisition. Washington, DC: Operations Research Center, University of California, Berkeley; 1980.
53 Kirkpatrick DL, Kirkpatrick JD. Evaluating Training Programs: The Four Levels. 3rd ed. San Francisco, Calif: Berrett-Koehler; 2006.
54 Hingson R, Compton WM. Screening and brief intervention and referral to treatment for drug use in primary care: Back to the drawing board. JAMA. 2014;312:488–489.
55 Roy-Byrne P, Bumgardner K, Krupski A, et al. Brief intervention for problem drug use in safety-net primary care settings: A randomized clinical trial. JAMA. 2014;312:492–501.
56 Saitz R, Palfai TP, Cheng DM, et al. Screening and brief intervention for drug use in primary care: The ASPIRE randomized clinical trial. JAMA. 2014;312:502–513.
57 Gunderson EW, Levin FR, Smith L. Screening and intervention for alcohol and illicit drug abuse: A survey of internal medicine housestaff. J Addict Dis. 2005;24:1–18.
58 Hettema JE, Ratanawongsa N, Manuel JK, et al. A SBIRT curriculum for medical residents: Development of a performance feedback tool to build learner confidence. Subst Abus. 2012;33:241–250.
59 Vallevand A, Violato C. A predictive and construct validity study of a high-stakes objective clinical examination for assessing the clinical competence of international medical graduates. Teach Learn Med. 2012;24:168–176.