Efficacy and tolerability of initial combination therapy with vildagliptin and pioglitazone compared...
11
ORIGINAL ARTICLE doi: 10.1111/j.1463-1326.2006.00698.x Efficacy and tolerability of initial combination therapy with vildagliptin and pioglitazone compared with component monotherapy in patients with type 2 diabetes J. Rosenstock, 1 S. W. Kim, 2 M. A. Baron, 3 R.-P. Camisasca, 4 F. Cressier, 4 A. Couturier 3 and S. Dejager 3 1 Dallas Diabetes and Endocrine Center, Dallas, TX, USA 2 Division of Endrocrinology and Metabolism, Department of Internal Medicine, Kangbuk Samsung Hospital, Sungkyunkwan University School of Medicine, Seoul, Korea 3 Novartis Pharmaceuticals Corporation, East Hanover, NJ, USA 4 Novartis Pharma AG, Basel, Switzerland Aim: The aim of this study was to compare efficacy and tolerability of initial combination therapy with vildagliptin/ pioglitazone to component monotherapy. Methods: This 24-week, multicentre, randomized, double-blind, active-controlled study assessed the effects of the dipeptidyl peptidase-4 inhibitor vildagliptin (100 mg q.d.), pioglitazone (30 mg q.d.) and vildagliptin combined with pioglitazone (100/30 mg q.d. or 50/15 mg q.d.) in 607 drug-naive patients with type 2 diabetes (T2DM). The primary outcome measure was change from baseline in HbA 1c in patients receiving initial combination therapy compared with pioglitazone monotherapy. Results: After 24-week treatment, adjusted mean changes in HbA 1c from baseline (approximately 8.7%) in patients receiving pioglitazone monotherapy, 50/15 mg combination, 100/30 mg combination and vildagliptin monotherapy were ÿ1.4 0.1%, ÿ1.7 0.1%, ÿ1.9 0.1% and ÿ1.1 0.1% respectively. Both low-dose and high-dose combi- nations were significantly more efficacious than pioglitazone alone (p ¼ 0.039 and p < 0.001 respectively). Adjusted mean changes in fasting plasma glucose were ÿ1.9 0.2, ÿ2.4 0.2, ÿ2.8 0.2 and ÿ1.3 0.2 mmol/l respectively, and both combination groups were significantly more effective than pioglitazone monotherapy (p ¼ 0.022 and p < 0.001 respectively). The overall incidence of adverse events ranged from 45.8% in the low-dose com- bination to 51.6% in the pioglitazone monotherapy group. The incidence of peripheral oedema was highest in patients receiving pioglitazone monotherapy (9.3%) and lowest in those receiving low-dose combination (3.5%). One mild hypoglycaemic event was reported by one patient receiving high-dose combination and one patient receiving vildagliptin monotherapy. Conclusions: First-line treatment with vildagliptin/pioglitazone combination in patients with T2DM provides better glycaemic control than either monotherapy component yet has minimal risk of hypoglycaemia and a tolerability profile comparable with component monotherapy. Keywords: dipeptidyl peptidase-4, HbA 1c , incretin hormones, pioglitazone Received 7 November 2006; returned for revision 17 November 2006; revised version accepted 23 November 2006 Correspondence: Sylvie Dejager, MD, PhD, Novartis Pharmaceuticals Corporation, One Health Plaza, East Hanover, NJ 07936, USA. E-mail: [email protected] # 2007 Novartis Journal Compilation # 2007 Blackwell Publishing Ltd Diabetes, Obesity and Metabolism, 9, 2007, 175–185 j 175
Transcript of Efficacy and tolerability of initial combination therapy with vildagliptin and pioglitazone compared...
OR I G I N A L A R T I C L E doi: 10.1111/j.1463-1326.2006.00698.x
Efficacy and tolerability of initial combination therapy with
vildagliptin and pioglitazone compared with component
monotherapy in patients with type 2 diabetes
J. Rosenstock,1 S. W. Kim,2 M. A. Baron,3 R.-P. Camisasca,4 F. Cressier,4
A. Couturier3 and S. Dejager3
1Dallas Diabetes and Endocrine Center, Dallas, TX, USA2Division of Endrocrinology and Metabolism, Department of Internal Medicine, Kangbuk Samsung Hospital,
Sungkyunkwan University School of Medicine, Seoul, Korea3Novartis Pharmaceuticals Corporation, East Hanover, NJ, USA4Novartis Pharma AG, Basel, Switzerland
Aim: The aim of this study was to compare efficacy and tolerability of initial combination therapy with vildagliptin/
pioglitazone to component monotherapy.
Methods: This 24-week, multicentre, randomized, double-blind, active-controlled study assessed the effects of the
dipeptidyl peptidase-4 inhibitor vildagliptin (100 mg q.d.), pioglitazone (30 mg q.d.) and vildagliptin combined with
pioglitazone (100/30 mg q.d. or 50/15 mg q.d.) in 607 drug-naive patients with type 2 diabetes (T2DM). The primary
outcome measure was change from baseline in HbA1c in patients receiving initial combination therapy compared
with pioglitazone monotherapy.
Results: After 24-week treatment, adjusted mean changes in HbA1c from baseline (approximately 8.7%) in patients
receiving pioglitazone monotherapy, 50/15 mg combination, 100/30 mg combination and vildagliptin monotherapy
were �1.4 � 0.1%, �1.7 � 0.1%, �1.9 � 0.1% and �1.1 � 0.1% respectively. Both low-dose and high-dose combi-
nations were significantly more efficacious than pioglitazone alone (p ¼ 0.039 and p < 0.001 respectively).
Adjusted mean changes in fasting plasma glucose were �1.9 � 0.2, �2.4 � 0.2, �2.8 � 0.2 and �1.3 � 0.2 mmol/l
respectively, and both combination groups were significantly more effective than pioglitazone monotherapy (p ¼0.022 and p < 0.001 respectively). The overall incidence of adverse events ranged from 45.8% in the low-dose com-
bination to 51.6% in the pioglitazone monotherapy group. The incidence of peripheral oedema was highest in
patients receiving pioglitazone monotherapy (9.3%) and lowest in those receiving low-dose combination (3.5%).
One mild hypoglycaemic event was reported by one patient receiving high-dose combination and one patient
receiving vildagliptin monotherapy.
Conclusions: First-line treatment with vildagliptin/pioglitazone combination in patients with T2DM provides better
glycaemic control than either monotherapy component yet has minimal risk of hypoglycaemia and a tolerability profile
comparable with component monotherapy.
Keywords: dipeptidyl peptidase-4, HbA1c, incretin hormones, pioglitazone
Received 7 November 2006; returned for revision 17 November 2006; revised version accepted 23 November 2006
Correspondence:
Sylvie Dejager, MD, PhD, Novartis Pharmaceuticals Corporation, One Health Plaza, East Hanover, NJ 07936, USA.
E-mail:
# 2007 Novartis
Journal Compilation # 2007 Blackwell Publishing LtdDiabetes, Obesity and Metabolism, 9, 2007, 175–185 j 175

Introduction
The clinical benefits of good glycaemic control are well
established [1]. However, the traditional stepwise
approach beginning with diet and exercise and sequen-
tially adding and titrating does not address the multifac-
torial nature of T2DM and the critical value of early
intervention to avoid progressive beta-cell failure [2].
The most recent modification of the American Diabetes
Association (ADA) recommendations goes beyond the
evidence-based target HbA1c of less than 7% for diabe-
tes populations at large and calls for individualized
goals for patients to attempt to achieve a HbA1c target as
close to normal as possible without significant hypo-
glycaemia and/or unwanted adverse events (AEs) [3].
This recommendation implies that patients with T2DM
will require multiple pharmacological combinations
much earlier to accomplish these goals, with careful
therapy selection to avoid AEs and hypoglycaemia.
Indeed, most recent guidelines for the pharmacological
management of T2DM have become more aggressive,
with specific recommendations on the progressive use of
combination strategies if HbA1c remains more than 7%
in an attempt to attain and sustain the increasingly strin-
gent glycaemic targets [4].
However, clinical inertia with failure to advance therapy
despite persistently elevated HbA1c levels above target has
been a major problem [5,6], but perhaps the increasing
use of combination therapy as a first-line intervention in
T2DM may facilitate resolution of this compliance issue.
Initial combination therapy using two Oral Antidiabetic
Drug (OAD) with complementary mechanisms of action is
an alternative approach that may provide better or more
sustainedglycaemiccontrol,orallowtheuseof lowerdoses
of the component OADs to minimize any dose-related AEs.
Vildagliptin is a selective dipeptidyl peptidase (DPP)-4
inhibitor that improves glycaemic control in patients with
T2DM by increasing both a- and b-cell responsiveness to
glucose [7,8]. Vildagliptin has been shown to decrease
HbA1c when given as monotherapy [9,10] or in combina-
tion with metformin [11], but its effects in combination
with a thiazolidinedione (TZD) remain to be determined.
The present study compared the efficacy and tolerabil-
ity of initial combination therapy with vildagliptin,
which improves islet function, and the TZD pioglitazone,
which enhances insulin sensitivity, to the monotherapy
components. For the monotherapy arms, doses of 100 mg
q.d. for vildagliptin and 30 mg q.d. for pioglitazone were
chosen and compared with the combination of vildaglip-
tin/pioglitazone (100/30 mg q.d.) and to a low-dose com-
bination of 50/15 mg q.d.
Methods
Study Design
This was a 24-week, double-blind, randomized, active-
controlled, parallel-group study conducted at 145 centres
in eight countries, including the United States, four coun-
tries in Europe and three in Asia. Eligible patients were
randomized to receive vildagliptin 100 mg q.d. (n ¼ 154),
pioglitazone 30 mg q.d. (n ¼ 161), or a vildagliptin/pio-
glitazone combination of 100/30 mg q.d. (‘high dose’, n ¼148) or 50/15 mg q.d. (‘low dose’, n ¼ 144). The doses of
pioglitazone used were selected based on those recom-
mended (for either monotherapy or combination with
a sulfonylurea or metformin) in the prescribing informa-
tion. Treatment blinding was maintained with a double-
dummy technique.
Study Population
The study enrolled patients diagnosed with T2DM and
who had HbA1c between 7.5 and 11.0% at screening
while receiving no pharmacological treatment for at
least 12 weeks prior to screening and no OAD for more
than three consecutive months at any time in the past.
Male and female patients aged 18–80 years, body mass
index (BMI) range of 22–45 kg/m2 and with FPG <15
mmol/l were eligible to participate.
Patients were excluded if they had a history of type 1 or
secondary forms of diabetes, acute metabolic diabetic
complications, myocardial infarction, unstable angina
or coronary artery bypass surgery within the previous 6
months, congestive heart failure, liver disease such as
cirrhosis or chronic active hepatitis, or any contraindica-
tions and warnings according to the country-specific
label for pioglitazone. Patients with any of the following
laboratory abnormalities were also excluded: alanine
aminotransferase or aspartate aminotransferase >2.5
times the upper limit of normal (ULN); direct bilirubin
>1.3 times the ULN; serum creatinine levels >220
mmol/l, clinically significant abnormal TSH or fasting tri-
glycerides (TGs) >7.9 mmol/l.
Study Assessments
HbA1c, fasting plasma glucose (FPG), body weight and
vital signs were measured at each study visit. Standard
haematology and biochemistry laboratory assessments
were made at each visit except week 16. Fasting lipid
profiles and free fatty acids (FFA) were measured, and
ECGs were performed at screening (week �2) and at
OA j Vildagliptin/TZD initial combination J. Rosenstock et al.
176 j Diabetes, Obesity and Metabolism, 9, 2007, 175–185# 2007 Novartis
Journal Compilation # 2007 Blackwell Publishing Ltd
weeks 0, 12 and 24. Standard breakfast meal tests (500
kcal; 60% CHO, 30% fat and 10% protein) were per-
formed at week 0 and week 24 or study endpoint for
assessment of prandial glucose control and b-cell func-
tion in patients agreeing to participate (approximately
19% of randomized patients). Insulin secretory rate
(ISR) was calculated by deconvolution of plasma C-pep-
tide levels [12]. The 2-h area under the curve (AUC) for
ISR and glucose were calculated with the trapezoidal
method, and the ratio of ISR AUC to glucose AUC was
used as a measure of b-cell function.
All AEs were recorded. Patients were provided with glu-
cose monitoring devices and supplies and instructed on
their use. Hypoglycaemia was defined as symptoms sug-
gestive of low blood glucose confirmed by self-monitored
blood glucose (SMBG) measurement <3.1 mmol/l plasma
glucose equivalent. Severe hypoglycaemia was defined as
any episode requiring the assistance of another party.
All laboratory assessments were made by a central lab-
oratory (Covance-US, Indianapolis, IN, USA) with stan-
dardized and validated procedures according to Good
Laboratory Practice. HbA1c was measured using ion
exchange high-performance liquid chromatography.
Data Analysis
The primary efficacy variable was the change from base-
line in HbA1c at study endpoint in the intention-to-treat
(ITT) population using last observation carried forward
for patients who discontinued early. The ITT pop-
ulation comprises all patients who received at least one
dose of study medication and for whom a baseline and
at least one postbaseline efficacy assessment was avail-
able. Secondary efficacy parameters included changes
in FPG, fasting plasma lipids and body weight. Changes
from baseline in primary and secondary endpoints were
analysed using an analysis of variance (ANCOVA) model,
with treatment and pooled centre as the classification
variables and baseline value as the covariate. The pri-
mary comparisons were made to test for superiority of
the vildagliptin/pioglitazone combination (100/30 mg
q.d.) to pioglitazone monotherapy. Secondary compar-
isons were made to test for superiority of the vilda-
gliptin/pioglitazone combination (100/30 mg q.d.) to
vildagliptin monotherapy and for superiority of the low-
dose combination (50/15 mg q.d.) to pioglitazone (30 mg
q.d.) monotherapy. Chi-square tests were performed to
compare the percentage of patients achieving ADA tar-
get HbA1c level at endpoint. Repeated measures ANCO-
VAs were performed to determine the significance of the
between-group differences in HbA1c. Comparability of
baseline characteristics across treatment groups was
assessed by F test for continuous variables and by
Cochran–Mantel–Haenszel chi-square test for categori-
cal variables.
Ethics and Good Clinical Practice
All the participants provided written informed consent.
The protocol was approved by the independent ethics
committee/institutional review board at each study site,
and the study was conducted in accordance with the Dec-
laration of Helsinki, using Good Clinical Practice.
Results
Patients Studied
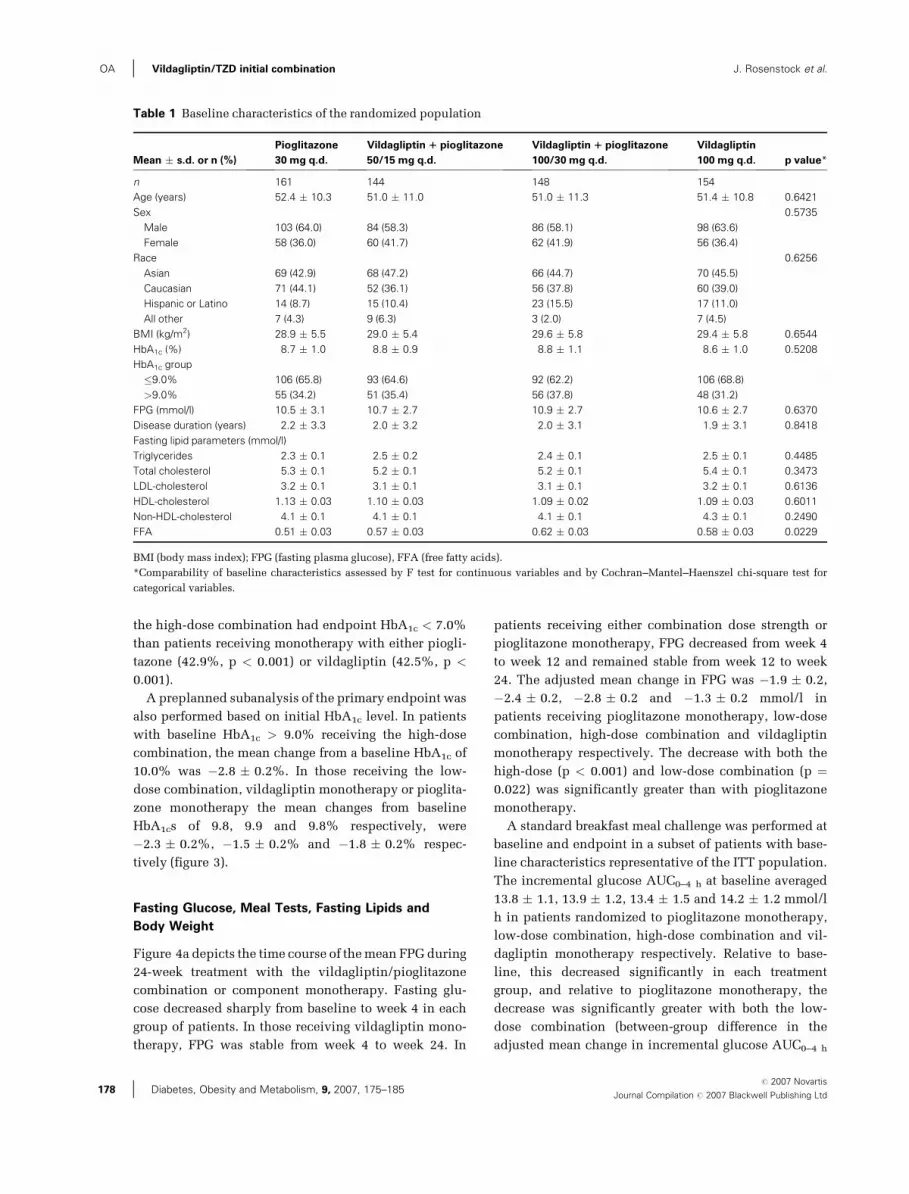
A total of 607 patients were randomized, and 592 com-
prised the ITT population. Table 1 reports the demo-
graphic and baseline metabolic characteristics of the
randomized population and figure 1 summarizes dispo-
sition of patients from screening through study endpoint.
The groups were well balanced, with HbA1c averaging
8.7% and FPG averaging 10.7 mmol/l, with a mean age
of 51.5 years and disease duration of 2.1 years in the
combined cohort. More than two-third of the patients
(70.2%) presented with an HbA1c above 8% and 35%,
with an HbA1c above 9%. Reflecting the location of
study centres, participants were predominantly Asian
(45%) or Caucasian (approximately 40%). Patients were
on average overweight, with a mean BMI of 29.2 kg/m2,
and a mean waist circumference of approximately 97 cm.
The study was completed by �80% of patients in each
treatment group (figure 1).
Efficacy
Figure 2 depicts the time course of the mean HbA1c dur-
ing 24-week treatment (panel A), and the percentage of
patients achieving ADA-recommended target level of
HbA1c (<7.0%) at study endpoint (panel B). Mean
HbA1c decreased progressively during the first 16 weeks
of treatment then tended to remain stable from week 16
to week 24 in each treatment group. The adjusted mean
reduction in HbA1c from baseline to endpoint was signifi-
cantly greater in patients receiving either the 100/30 mg
combination (�1.9 � 0.1%, p < 0.001) or the 50/15 mg
combination (�1.7 � 0.1%, p ¼ 0.039) than in patients
receiving pioglitazone monotherapy (�1.4 � 0.1%). The
adjusted mean change in HbA1c in patients receiving
vildagliptin monotherapy was �1.1 � 0.1% (p < 0.001
vs. 100/30 mg). As illustrated in figure 2b, a signifi-
cantly higher percentage of patients (65.0%) receiving
J. Rosenstock et al. Vildagliptin/TZD initial combination j OA
# 2007 Novartis
Journal Compilation # 2007 Blackwell Publishing LtdDiabetes, Obesity and Metabolism, 9, 2007, 175–185 j 177
the high-dose combination had endpoint HbA1c < 7.0%
than patients receiving monotherapy with either piogli-
tazone (42.9%, p < 0.001) or vildagliptin (42.5%, p <
0.001).
A preplanned subanalysis of the primary endpoint was
also performed based on initial HbA1c level. In patients
with baseline HbA1c > 9.0% receiving the high-dose
combination, the mean change from a baseline HbA1c of
10.0% was �2.8 � 0.2%. In those receiving the low-
dose combination, vildagliptin monotherapy or pioglita-
zone monotherapy the mean changes from baseline
HbA1cs of 9.8, 9.9 and 9.8% respectively, were
�2.3 � 0.2%, �1.5 � 0.2% and �1.8 � 0.2% respec-
tively (figure 3).
Fasting Glucose, Meal Tests, Fasting Lipids and
Body Weight
Figure 4a depicts the time course of the mean FPG during
24-week treatment with the vildagliptin/pioglitazone
combination or component monotherapy. Fasting glu-
cose decreased sharply from baseline to week 4 in each
group of patients. In those receiving vildagliptin mono-
therapy, FPG was stable from week 4 to week 24. In
patients receiving either combination dose strength or
pioglitazone monotherapy, FPG decreased from week 4
to week 12 and remained stable from week 12 to week
24. The adjusted mean change in FPG was �1.9 � 0.2,
�2.4 � 0.2, �2.8 � 0.2 and �1.3 � 0.2 mmol/l in
patients receiving pioglitazone monotherapy, low-dose
combination, high-dose combination and vildagliptin
monotherapy respectively. The decrease with both the
high-dose (p < 0.001) and low-dose combination (p ¼0.022) was significantly greater than with pioglitazone
monotherapy.
A standard breakfast meal challenge was performed at
baseline and endpoint in a subset of patients with base-
line characteristics representative of the ITT population.
The incremental glucose AUC0–4 h at baseline averaged
13.8 � 1.1, 13.9 � 1.2, 13.4 � 1.5 and 14.2 � 1.2 mmol/l
h in patients randomized to pioglitazone monotherapy,
low-dose combination, high-dose combination and vil-
dagliptin monotherapy respectively. Relative to base-
line, this decreased significantly in each treatment
group, and relative to pioglitazone monotherapy, the
decrease was significantly greater with both the low-
dose combination (between-group difference in the
adjusted mean change in incremental glucose AUC0–4 h
Table 1 Baseline characteristics of the randomized population
Mean � s.d. or n (%)
Pioglitazone
30 mg q.d.
Vildagliptin 1 pioglitazone
50/15 mg q.d.
Vildagliptin 1 pioglitazone
100/30 mg q.d.
Vildagliptin
100 mg q.d. p value*
n 161 144 148 154
Age (years) 52.4 � 10.3 51.0 � 11.0 51.0 � 11.3 51.4 � 10.8 0.6421
Sex 0.5735
Male 103 (64.0) 84 (58.3) 86 (58.1) 98 (63.6)
Female 58 (36.0) 60 (41.7) 62 (41.9) 56 (36.4)
Race 0.6256
Asian 69 (42.9) 68 (47.2) 66 (44.7) 70 (45.5)
Caucasian 71 (44.1) 52 (36.1) 56 (37.8) 60 (39.0)
Hispanic or Latino 14 (8.7) 15 (10.4) 23 (15.5) 17 (11.0)
All other 7 (4.3) 9 (6.3) 3 (2.0) 7 (4.5)
BMI (kg/m2) 28.9 � 5.5 29.0 � 5.4 29.6 � 5.8 29.4 � 5.8 0.6544
HbA1c (%) 8.7 � 1.0 8.8 � 0.9 8.8 � 1.1 8.6 � 1.0 0.5208
HbA1c group
�9.0% 106 (65.8) 93 (64.6) 92 (62.2) 106 (68.8)
>9.0% 55 (34.2) 51 (35.4) 56 (37.8) 48 (31.2)
FPG (mmol/l) 10.5 � 3.1 10.7 � 2.7 10.9 � 2.7 10.6 � 2.7 0.6370
Disease duration (years) 2.2 � 3.3 2.0 � 3.2 2.0 � 3.1 1.9 � 3.1 0.8418
Fasting lipid parameters (mmol/l)
Triglycerides 2.3 � 0.1 2.5 � 0.2 2.4 � 0.1 2.5 � 0.1 0.4485
Total cholesterol 5.3 � 0.1 5.2 � 0.1 5.2 � 0.1 5.4 � 0.1 0.3473
LDL-cholesterol 3.2 � 0.1 3.1 � 0.1 3.1 � 0.1 3.2 � 0.1 0.6136
HDL-cholesterol 1.13 � 0.03 1.10 � 0.03 1.09 � 0.02 1.09 � 0.03 0.6011
Non-HDL-cholesterol 4.1 � 0.1 4.1 � 0.1 4.1 � 0.1 4.3 � 0.1 0.2490
FFA 0.51 � 0.03 0.57 � 0.03 0.62 � 0.03 0.58 � 0.03 0.0229
BMI (body mass index); FPG (fasting plasma glucose), FFA (free fatty acids).
*Comparability of baseline characteristics assessed by F test for continuous variables and by Cochran–Mantel–Haenszel chi-square test for
categorical variables.
OA j Vildagliptin/TZD initial combination J. Rosenstock et al.
178 j Diabetes, Obesity and Metabolism, 9, 2007, 175–185# 2007 Novartis
Journal Compilation # 2007 Blackwell Publishing Ltd

¼ �3.8 � 1.6 mmol/l h, p ¼ 0.024) and the high-dose
combination (�5.2 � 1.3 mmol/l h, p < 0.001).
Figure 4 also depicts the adjusted mean changes in
peak prandial glucose excursions (panel B) and the b-cell
function index (insulin secretory rate AUC0–2 h O glu-
cose AUC0–2 h, panel C) during the standard meal tests.
The peak prandial glucose excursion was significantly
decreased relative to baseline in each treatment group,
and relative to pioglitazone monotherapy, the peak
prandial glucose excursion was significantly decreased
in patients receiving low-dose (�1.1 � 0.5 mmol/l, p ¼0.017) or high-dose (�2.0 � 0.4 mmol/l, p < 0.001) com-
bination treatment. Beta-cell function improved relative
to baseline in patients receiving vildagliptin mono-
therapy and both combination treatment groups. Rela-
tive to pioglitazone monotherapy, b-cell function was
significantly increased in patients receiving the low-
dose combination (þ8.0 � 3.7 pmol/min/m2/mmol/l,
p ¼ 0.046), but the between-treatment difference (com-
bination – pioglitazone) in the adjusted mean change in
the b-cell function index was not statistically significant
for the 100/30 mg combination treatment group
(5.5 � 4.1 pmol/min/m2/mmol/l, p ¼ 0.196).
Table 2 reports the changes in fasting lipid parameters
observed during 24-week treatment with vildagliptin,
pioglitazone, low-dose and high-dose combination.
Monotherapy with pioglitazone decreased fasting TG
(�13.4%), but increased HDL-cholesterol (þ17.5%) and
LDL-cholesterol (þ9.1%). Monotherapy with vildagliptin
decreased fasting TG (�5.8%) and increased HDL-choles-
terol (þ7.7%). Low-dose combination therapy decreased
TG (�4.8%) and increased HDL-cholesterol (þ10.6%).
All other changes in lipids in these three treatment arms
were minimal (less than 3% change from baseline). The
high-dose combination improved all fasting lipid param-
eters relative to baseline, and relative to pioglitazone
monotherapy, the 100/30 mg combination elicited signif-
icantly greater decreases in total cholesterol (between-
group difference ¼ �5.6 � 1.8%, p < 0.001), LDL
(between-group difference ¼ �10.5 � 4.9%, p ¼ 0.033)
and non-HDL-cholesterol (between-group difference ¼�6.8 � 2.5% p ¼ 0.008). In addition, small decreases in
Assessed for eligibility(n=1284)
Randomized(n=607)
AE (n=9, 5.6%)ALV (n=1,0.5%)UTE (n=4, 2.5%)PV (n=4, 2.5%)PWC (n=5,3.1%)LFU (n=5, 3.1%)Adm(n=0, 0.0%)
AE (n=7, 4.7%)ALV (n=0, 0.0%)UTE (n=2, 1.4%)PV (n=2, 1.4%)PWC (n=5, 3.4%)LFU (n=2, 1.4%)Adm(n=1, 0.7%)
AE (n=8, 5.6%)ALV (n=1, 0.7%)UTE (n=3, 2.1%)PV (n=2, 1.4%)PWC (n=10, 6.9%)LFU (n=5, 3.5%)Adm(n=0, 0.0%)
AE (n=4, 2.6%)ALV (n=1, 0.6%)UTE (n=1, 0.6%)PV (n=1, 0.6%)PWC (n=5, 3.2%)LFU (n=5, 3.2%)Adm(n=1, 0.6%)
Allocated to :Pio30 mg q.d., n=161Safety population, n=161ITT population, n=157
Allocated to :Vilda/Pio100/30, n=148Safety population, n=148ITT population, n=146
Allocated to :Vilda/Pio50/15, n=144Safety population, n=144ITT population, n=139
Allocated to:Vilda100 mg q.d., n=154Safety population, n=153ITT population, n=150
Completed(n=133, 82.6%)
Completed(n=129, 87.2%)
Completed(n=115, 79.9%)
Completed(n=136, 88.3%)
Excluded (n=677)Did not meetinclusion criteria (n=624)Declined to participate (n=36)Other (n=17)
Abbreviations: AE= adverse event; ALV= abnormal laboratory value; UTE= unsatisfactory therapeutic event; PV= protocol violationPWC= patient withdrew consent; LFU= lost to follow-up; Adm= administrative problems
Fig. 1 Disposition of patients from screening through completion. ITT, intention-to-treat ; AE, adverse event; ALV, abnor-
mal laboratory value; UTE, unsatisfactory therapeutic event; PV, protocol violation; PWC, patient withdrew consent; LFU,
lost to follow up; Adm, administrative problems.
J. Rosenstock et al. Vildagliptin/TZD initial combination j OA
# 2007 Novartis
Journal Compilation # 2007 Blackwell Publishing LtdDiabetes, Obesity and Metabolism, 9, 2007, 175–185 j 179

FFA levels were observed in each treatment group, with
the largest improvements being observed in the high-dose
combination group (�10%) and the pioglitazone mono-
therapy group (�5%).
Body weight did not change from a mean baseline of
82 kg to endpoint in patients receiving vildagliptin mono-
therapy (þ0.2 � 0.3 kg), but increased similarly in patients
receiving pioglitazone monotherapy (þ1.5 � 0.3 kg) and
low-dose combination therapy (þ1.4 � 0.3 kg) from base-
lines of 81 and 80 kg, respectively. The increase from base-
line (82 kg) in body weight in patients receiving the 100/30
mg combination (þ2.1 � 0.3 kg) was also not significantly
different from the pioglitazone monotherapy group
(between-group difference ¼ 0.7 � 0.5 kg).
Tolerability
During the 24-week study, all the treatments appeared to
be well tolerated. Table 3 reports the number and percent-
age of patients experiencing the most common specific
AEs. The most frequently reported AEs in the study were
weight gain, headache and peripheral oedema. The AEs of
weight gain and oedema were less common in patients
receiving the low-dose combination than in those receiv-
ing pioglitazone monotherapy. In addition, these AEs
were less common on vildagliptin monotherapy com-
pared with pioglitazone monotherapy. Further, in a pre-
defined analysis, increases in weight of more than 10%
from baseline were observed in 2.1% of patients in the
low-dose combination group and in 3.7% of patients in
the pioglitazone monotherapy group. The majority of AEs
reported were classified as mild or moderate and unre-
lated to study medication. AEs led to discontinuation in
2.6% of patients receiving vildagliptin monotherapy,
6.8% of patients receiving pioglitazone monotherapy,
and 6.3% and 4.7% of patients receiving the low-dose
and high-dose combination regimens respectively.
Hypoglycaemia was limited to one mild event (SMBG
>2.8 mmol/l) in one patient each (0.7%) receiving high-
dose combination and vildagliptin monotherapy, both
precipitated by a missed meal. In addition, one patient
6.0
7.0
8.0
9.0
–4 0 4 8 12 16 20 24Time (Week)
Mea
n H
bA1c
(%)
Pioglitazone 30mg q.d.Vilda/pio 100/30mg q.d.Vilda/pio 50/15mg q.d.Vildagliptin 100mg q.d.
42.9
65.0
53.6
42.5
20
30
40
50
60
70
80
Per c
ent a
chie
ve ta
rget
Pioglitazone 30mg q.d.Vilda/pio 100/30mg q.d.Vilda/pio 50/15mg q.d.Vildagliptin 100mg q.d.
(b)
(a)
***
***
****** ***
Fig. 2 (a) Mean (�s.e.) HbA1c during 24-week treatment
with vildagliptin (100 mg q.d., open circles, n ¼ 150 at base-
line, 136 at week 24), pioglitazone (30 mg q.d., open squares,
n ¼ 157 at baseline, 135 at week 24) or vildagliptin com-
bined with pioglitazone at doses of 100/30 mg q.d. (closed
triangles, n ¼ 146 at baseline, 128 at week 24) or 50/15 mg
q.d. (closed diamonds, n ¼ 139 at baseline, 114 at week 24)
in drug-naive patients with T2DM. ***p < 0.001 for vilda-
gliptin/pioglitazone (vilda/pio) 100/30 mg q.d. vs. pioglita-
zone monotherapy. p values for vildagliptin/pioglitazone 50/
15 mg q.d. vs. pioglitazone monotherapy at weeks 4, 12, 16
and 24 were 0.039, 0.003, 0.006 and 0.020 respectively. (b)
Percentage of patients achieving endpoint HbA1c < 7.0%.
Pioglitazone monotherapy (30 mg q.d., open bars, n ¼ 157);
high-dose vildagliptin/pioglitazone combination (100/30 mg
q.d., checkered bars, n ¼ 146); low-dose vildagliptin/piogli-
tazone combination (50/15 mg q.d., hatched bars, n ¼ 139);
vildagliptin monotherapy (100 mg q.d., closed bars, n ¼150). ***p < 0.001 combo vs. either monotherapy.
–3.5
–3.0
–2.5
–2.0
–1.5
–1.0
–0.5
0.0
Mea
n ch
ange
in H
bA1c
(%)
Pioglitazone 30mg q.d.Vilda/pio 100/30mg q.d.
Vilda/pio 50/15mg q.d.Vildagliptin 100mg q.d.
***
Fig. 3 Mean change from baseline to endpoint in HbA1c in
patients with baseline HbA1c > 9.0%. Pioglitazone mono-
therapy (30 mg q.d., open bars, n ¼ 54); high-dose vilda-
gliptin/pioglitazone (vilda/pio) combination (100/30 mg
q.d., checkered bars, n ¼ 54); low-dose vildagliptin/piogli-
tazone combination (50/15 mg q.d., hatched bars, n ¼ 49);
vildagliptin monotherapy (100 mg q.d., closed bars, n ¼ 46).
***p < 0.001 combo vs. pioglitazone monotherapy.
OA j Vildagliptin/TZD initial combination J. Rosenstock et al.
180 j Diabetes, Obesity and Metabolism, 9, 2007, 175–185# 2007 Novartis
Journal Compilation # 2007 Blackwell Publishing Ltd

in the pioglitazone monotherapy presented an asymp-
tomatic low blood glucose level after strenuous exercise.
Severe AEs were infrequent in all treatment groups,
with no apparent relation to treatment or dose of combi-
nation therapy.
No major changes or consistent trends over time were
observed for any haematological, biochemical, urinalysis
parameter or vital signs, and the frequency of treatment-
emergent ECG abnormalities was low and comparable in
all treatment groups.
7.0
8.0
9.0
10.0
11.0
–4 0 4 8 12 16 20 24
Time (Week)
Mea
n FP
G (m
mol
/l)
Pioglitazone30mg q.d.
Vilda/pio 100/30mg q.d.
Vilda/pio 50/15mg q.d.
Vildagliptin 100mg q.d.
Pioglitazone 30mg q.d.
Vilda/pio 100/30mg q.d.Vilda/pio 50/15mg q.d.
Vildagliptin 100mg q.d.
–4.0
–3.0
–2.0
–1.0
0.0
Adj
uste
d m
ean
chan
ge (m
mol
/l)
(b) (c)
0
3
6
9
12
15
Adj
uste
d m
ean
chan
ge(p
mol
/min
/m2/
mm
ol/l) *
*
***
Peak glucose excursion –cell function
(a)
***
*** *** ***
Fig. 4 (a) Mean (�s.e.) FPG during 24-week treatment with vildagliptin (100 mg q.d., open circles, n ¼ 150 at baseline, 135
at week 24), pioglitazone (30 mg q.d., open squares, n ¼ 157 at baseline, 134 at week 24), or vildagliptin combined with
pioglitazone at doses of 100/30 mg q.d. (closed triangles, n ¼ 146 at baseline, 128 at week 24) or 50/15 mg q.d. (closed dia-
monds, n ¼ 139 at baseline, 116 at week 24) in drug-naive patients with T2DM. ***p < 0.001 for vildagliptin/pioglitazone
(vilda/pio) 100/30 mg q.d. vs. pioglitazone monotherapy. p values for vildagliptin/pioglitazone 50/15 mg q.d. vs. pioglita-
zone monotherapy at weeks 4, 12, 16 and 24 were 0.030, 0.017, 0.040 and 0.036 respectively. (b) Adjusted mean (�s.e.)
change in peak prandial glucose excursion during meal tests after 24-week treatment with pioglitazone monotherapy (30
mg q.d., open bars, n ¼ 26), low-dose vildagliptin/pioglitazone combination (50/15 mg q.d., hatched bars, n ¼ 27), high-dose
vildagliptin/pioglitazone combination (100/30 mg q.d., checkered bars, n ¼ 27) or vildagliptin monotherapy (100 mg q.d.,
closed bars, n ¼ 32). *p < 0.05, ***p < 0.001 combo vs. pioglitazone monotherapy. (c) Adjusted mean (�s.e.) change in b-cell
function index (insulin secretory rate AUC0–120 O glucose AUC0–120) excursion during meal tests after 24-week treatment with
pioglitazone monotherapy (30 mg q.d., open bars, n ¼ 9), low-dose vildagliptin/pioglitazone combination (50/15 mg q.d.,
hatched bars, n ¼ 11), high-dose vildagliptin/pioglitazone combination (100/30 mg q.d., checkered bars, n ¼ 11) or vilda-
gliptin monotherapy (100 mg q.d., closed bars, n ¼ 10). *p < 0.05 vs. pioglitazone monotherapy.
J. Rosenstock et al. Vildagliptin/TZD initial combination j OA
# 2007 Novartis
Journal Compilation # 2007 Blackwell Publishing LtdDiabetes, Obesity and Metabolism, 9, 2007, 175–185 j 181

Discussion
The present study is the first to examine the effects of
initial combination therapy with a DPP-4 inhibitor and
a TZD as first-line therapy in treatment-naive patients
with T2DM. From a theoretical standpoint, combining
vildagliptin, which improves both a- [7] and b-cell func-
tion [8], and pioglitazone, which enhances peripheral
insulin action [13], is an attractive and logical therapeutic
approach. Indeed, preclinical studies in Zucker fatty rats
showed that this combination fully normalized glucose
tolerance when given at doses that were essentially inef-
fective as monotherapy [14]. Thus, the present findings
that first-line treatment with vildagliptin and pioglitazone
Table 2 Fasting lipid parameters
Mean � s.e. n
Adjusted mean
per cent change
Between-group difference
(combination – pioglitazone) p value
Triglycerides
Vildagliptin/pioglitazone 100/30 mg q.d. 144 �18.1 � 2.9 �4.7 � 4.1 0.252
Vilda/Pio 50/15 mg q.d. 136 �4.8 � 3.6 8.9 � 5.0 0.073
Vildagliptin 100 mg q.d. 146 �5.8 � 3.1
Pioglitazone 30 mg q.d. 155 �13.4 � 2.8
Total cholesterol
Vilda/Pio 100/30 mg q.d. 144 �3.1 � 1.3 �5.6 � 1.8 0.001
Vilda/Pio 50/15 mg q.d. 136 1.0 � 1.3 �1.4 � 1.8 0.448
Vildagliptin 100 mg q.d. 146 �1.7 � 1.3
Pioglitazone 30 mg q.d. 155 2.5 � 1.2
LDL-cholesterol
Vilda/Pio 100/30 mg q.d. 129 �1.4 � 3.6 �10.5 � 4.9 0.033
Vilda/Pio 50/15 mg q.d. 122 1.9 � 3.8 �7.1 � 5.1 0.164
Vildagliptin 100 mg q.d. 138 �0.4 � 2.1
Pioglitazone 30 mg q.d. 146 9.1 � 3.4
HDL-cholesterol
Vilda/Pio 100/30 mg q.d. 140 12.1 � 2.1 �5.4 � 2.9 0.058
Vilda/Pio 50/15 mg q.d. 133 10.6 � 2.0 �7.1 � 2.7 0.009
Vildagliptin 100 mg q.d. 147 7.7 � 1.8
Pioglitazone 30 mg q.d. 151 17.5 � 2.0
Non-HDL-cholesterol
Vilda/Pio 100/30 mg q.d. 140 �7.1 � 1.8 �6.8 � 2.5 0.008
Vilda/Pio 50/15 mg q.d. 133 �1.2 � 2.0 �0.8 � 2.7 0.759
Vildagliptin 100 mg q.d. 146 �3.6 � 1.5
Pioglitazone 30 mg q.d. 151 �0.3 � 1.8
FFA
Vilda/pio 100/30 mg q.d. 60 �9.9 � 8.7 �4.9 � 12.3 0.689
Vilda/pio 50/15 mg q.d. 55 �2.5 � 9.4 �1.4 � 12.6 0.911
Vildagliptin 100 mg q.d. 53 �3.0 � 12.1
Pioglitazone 30 mg q.d. 61 �5.0 � 8.8
Vilda/pio, vildagliptin/pioglitazone; FFA, free fatty acids.
Table 3 Common adverse events (AEs occurring in >3% of any treatment group)
n (%)
Pioglitazone 30 mg
q.d., n 5 161
Vildagliptin 1 pioglitazone
50/15 mg q.d., n5 144
Vildagliptin 1 pioglitazone
100/30 mg q.d., n 5 148
Vildagliptin 100 mg
q.d., n5 153
Any AE 83 (51.5) 66 (45.8) 75 (50.7) 78 (51.0)
Weight increased 8 (5.0) 3 (2.1) 11 (7.4) 1 (0.7)
Headache 5 (3.1) 5 (3.5) 9 (6.1) 5 (3.3)
Peripheral oedema 15 (9.3) 5 (3.5) 9 (6.1) 8 (5.2)
Dizziness 8 (5.0) 3 (2.1) 7 (4.7) 9 (5.9)
Upper respiratory
tract infection
7 (4.3) 5 (3.5) 6 (4.1) 6 (3.9)
Asthenia 2 (1.2) 4 (2.8) 5 (3.4) 3 (2.0)
Nasopharyngitis 6 (3.7) 4 (2.8) 4 (2.7) 4 (2.6)
OA j Vildagliptin/TZD initial combination J. Rosenstock et al.
182 j Diabetes, Obesity and Metabolism, 9, 2007, 175–185# 2007 Novartis
Journal Compilation # 2007 Blackwell Publishing Ltd
(both in high- and low-dose combination) provided better
glycaemic control than the individual component mono-
therapy, essentially confirmed the prediction of an
enhanced glucose-lowering effect by combining the two
approaches. Most notably, despite a relatively high base-
line HbA1c (>8% in 70% of the patients), the high-dose
combination allowed 65% of patients to achieve the
ADA-recommended target level of HbA1c of <7.0% with
minimal hypoglycaemia (<1%) and with no increase in
body weight relative to pioglitazone monotherapy after
24-week treatment. There were also significant improve-
ments in total, LDL and non-HDL-cholesterol levels
with the high-dose combination relative to pioglitazone
monotherapy. In line with the potential for DPP-4 inhi-
bition to offer a novel approach to reducing cardiovas-
cular risk in patients with T2DM, it has also been shown
that 4-week treatment with vildagliptin significantly
decreased postprandial lipaemia [15]. Conclusions
regarding the influence of the vildagliptin/pioglitazone
combination on the overall cardiovascular-risk profile
will require further investigation.
This study also explored whether the dose-related AEs
of pioglitazone (e.g. oedema and weight gain) could be
avoided by using a lower dose of the TZD combined with
vildagliptin. As expected, it was found that, indeed, the
low-dose combination (vildagliptin 50 mg/pioglitazone
15 mg) elicited a significantly greater reduction in HbA1c
(�1.7%) than did pioglitazone monotherapy with 30 mg
(�1.4%) with fewer AEs of peripheral oedema (3.5 vs.
9.3%) and ‘weight increased’ (2.1 vs. 5%).
Given the contribution of both insulin resistance and
islet dysfunction to the development and progression of
T2DM [16], combining an insulin sensitizer-like pioglita-
zone and an agent such as vildagliptin, which improvesa-
and b-cell function, is a rational approach. One mecha-
nistic advantage this offers is that as shown in the present
study, there is no increase in hypoglycaemia, as seen
when insulin secretagogues are combined with insulin
sensitizers [17,18] because the insulinotropic effects of
vildagliptin are glucose dependent [19]. Also, unlike sul-
fonylureas, vildagliptin reduces inappropriate postmeal
glucagon secretion in patients with T2DM [7], which con-
tributes significantly to vildagliptin-mediated reductions
of postprandial hyperglycaemia [15]. This reduces the
‘demand’ for insulin, mitigating insulin resistance and
thus increasing measures of insulin sensitivity as
reported recently, both in drug-naive [20,21] and in met-
formin-treated patients [22].
The mechanism by which TZD activation of PPAR
gamma receptors reduces insulin resistance is now rela-
tively well understood [23]. Correcting lipotoxicity by
reducing FFA production and TG deposition in target tis-
sues, TZDs improve both hepatic and peripheral insulin
sensitivity [24]. Animal studies haveshownthatTZDsalso
decrease islet TG content [25], and this is the proposed
mechanism by which TZDs may improve islet function
[26]. Thus, multiple mechanisms are brought into play
with the combination of a DPP-4 inhibitor and a TZD and
allow better glycaemic control without hypoglycaemia.
Althougha stepwiseapproach to treatment startingwith
diet and exercise, addition and titration of a single oral
agent, then addition of a second agent is most commonly
used, success with this approach is often less than desired.
Clinical inertia leads to a progressive cycle of treatment
failure, with patients frequently failing to achieve or main-
tain therapeutic goals [5,6,27]. Further, findings from the
Epidemiology of Diabetes Interventions and Complica-
tions (EDIC) study of participants in the Diabetes Control
and Complications Trial (DCCT) emphasizes the critical
value of early and aggressive glycaemic control that results
in sustained benefits on diabetes complications [28]. Of
course, these findings need to be replicated in patients
with T2DM, but it is clear that there are good reasons to
make every attempt to get patients to glycaemic targets as
early and as safely as possible. Initial combination therapy
with a DPP-4 inhibitor and a TZD appears to hold consid-
erable promise in this regard.
In summary, first-line treatment with vildagliptin/pio-
glitazone (both high- and low-dose regimens) provided
better glycaemic control than each component monother-
apy with minimal hypoglycaemia. The high-dose combi-
nation (100/30 mg q.d.) allowed 65% of patients to
achieve target HbA1c < 7%, with a tolerability profile
comparable with pioglitazone (30 mg q.d.) mono-
therapy. The low-dose combination (50/15 mg q.d.) pro-
vided both efficacy and tolerability benefit over
pioglitazone 30 mg q.d. Thus, we conclude that the ini-
tial combination of vildagliptin, a highly selective DPP-
4 inhibitor suitable for once daily dosing, and the TZD
pioglitazone, simultaneously addresses the multiple
defects in T2DM through addressing complementary
mechanisms and appears to be an effective means to
achieving good glycaemic control while attenuating
drug-related AEs.
Acknowledgments
The authors acknowledge the investigators and staff at
the 145 participating sites, the operational support from
Yasmina Amiour, and the editorial assistance of, and help-
ful discussion with Beth Dunning Lower, PhD. This study
was funded by Novartis Pharmaceuticals Corporation. A
list of investigators is provided in the Appendix. This trial
(NCT00101803) is registered with ClinicalTrials.gov.
J. Rosenstock et al. Vildagliptin/TZD initial combination j OA
# 2007 Novartis
Journal Compilation # 2007 Blackwell Publishing LtdDiabetes, Obesity and Metabolism, 9, 2007, 175–185 j 183

References
1 United Kingdom Prospective Diabetes Study (UKPDS)
Group. Intensive blood-glucose control with sulphony-
lureas or insulin compared with conventional treatment
and risk of complications in patients with type 2 diabe-
tes (UKPDS 33). Lancet 1998; 352: 837–853.
2 Riddle MC, Rosenstock J. Oral monotherapy and combi-
nation therapy. In: Cefalu WT, Gerich JE, LeRoith D
eds. The CADRE Handbook of Diabetes Management.
New York: Medical Information Press, 2004; 127–144.
3 American Diabetes Association. American Diabetes
Association (ADA) guidelines: clinical practice recom-
mendations. Diabetes Care 2006; 29 (Suppl. 1): S1–S85.
4 Nathan DM, Buse JB, Davidson MB et al. Management
of hyperglycemia in type 2 diabetes: a consensus algo-
rithm for the initiation and adjustment of therapy. A
consensus statement from the American Diabetes Asso-
ciation and the European Association for the Study of
Diabetes. Diabetes Care 2006; 29: 1963–1972.
5 Brown JB, Nichols GA, Perry A. The burden of treat-
ment failure in type 2 diabetes. Diabetes Care 2004; 27:
1535–1540.
6 Shah BR, Hux JE, Laupacis A, Zinman B, van WC. Clin-
ical inertia in response to inadequate glycemic control:
do specialists differ from primary care physicians? Dia-
betes Care 2005; 28: 600–606.
7 Ahren B, Landin-Olsson M, Jansson P-A, Svenson M,
Holmes D, Schweizer A. Inhibition of dipeptidyl pepti-
dase-4 reduces glycemia, sustains insulin levels and
reduces glucagon levels in type 2 diabetes. J Clin Endo-
crinol Metab 2004; 89: 2078–2084.
8 Mari A, Sallas WM, He YL et al. Vildagliptin, a dipep-
tidyl peptidase-IV inhibitor, improves model-assessed
b-cell function in patients with type 2 diabetes. J Clin
Endocrinol Metab 2005; 90: 4888–4894.
9 Ristic S, Byiers S, Foley J, Holmes D. Improved glycae-
mic control with dipeptidyl peptidase-4 inhibition in
patients with type 2 diabetes: vildagliptin (LAF237)
dose response. Diabetes Obes Metab 2005; 7: 692–698.
10 Pratley RE, Jauffret-Kamel S, Galbreath E, Holmes D.
Twelve-week monotherapy with the DPP-4 inhibitor
vildagliptin improves glycemic control in subjects with
type 2 diabetes. Horm Metab Res 2006; 38: 423–428.
11 Ahren B, Gomis R, Standl E, Mills D, Schweizer A.
Twelve- and 52-week efficacy of the dipeptidyl pepti-
dase IV inhibitor LAF237 in metformin-treated patients
with type 2 diabetes. Diabetes Care 2004; 27: 2874–
2880.
12 van Cauter E, Mestrez F, Sturis J, Polonsky KS. Estima-
tion of insulin secretion rates from C-peptide levels.
Comparison of individual and standard kinetic parame-
ters for C-peptide clearance. Diabetes 1992; 41: 368–
377.
13 Roden M, Laakso M, Johns D et al. Long-term effects of
pioglitazone and metformin on insulin sensitivity in
patients with Type 2 diabetes mellitus. Diabet Med
2005; 22: 1101–1106.
14 Burkey BF, Li X, Bolognese L et al. Combination treat-
ment of a DPP-IV inhibitor NVP-LA237 with pioglita-
zone completely normalized glucose tolerance in adult
obese zucker rats. Diabetes 2002; 51 (Suppl. 2): A338–
A339.
15 Matikainen N, Manttari S, Schweizer A et al. Vilda-
gliptin therapy reduces postprandial intestinal tri-
glyceride-rich lipoprotein particles in patients with
type 2 diabetes. Diabetologia 2006; 49: 2049–2057.
16 Kahn SE. The relative contributions of insulin resis-
tance and beta-cell dysfunction to the pathophysiology
of Type 2 diabetes. Diabetologia 2003; 46: 3–19.
17 Roberts VL, Stewart J, Issa M, Lake B, Melis R. Triple
therapy with glimepiride in patients with type 2 diabe-
tes mellitus inadequately controlled by metformin and
a thiazolidinedione: results of a 30-week, randomized,
double-blind, placebo-controlled, parallel-group study.
Clin Ther 2005; 27: 1535–1547.
18 Rosenstock J, Shen SG, Gatlin MR, Foley JE. Combina-
tion therapy with nateglinide and a thiazolidinedione
improves glycemic control in type 2 diabetes. Diabetes
Care 2002; 25: 1529–1533.
19 Mari A, Sallas WM, He YL, Watson C, Ligueros-Saylan
M, Foley JE. LAF237 is a DPP-4 inhibitor that improves
model-assessed b-cell function in drug-naive patients
with type 2 diabetes. Diabetologia 2004; 47 (Suppl. 1):
A284–A285.
20 D’Alessio DA, Watson CE, He YL et al. Restoration of
an acute insulin response to glucose (AIRg) in drug-
naıve patients with type diabetes (T2DM) by 3-month
treatment with vildagliptin. Diabetes 2006; 55 (Suppl. 1):
A108.
21 Radikova Z, Azuma K, Thomas E et al. Metabolic ef-
fects of incretin hormones I. Diabetologia 2006; 49: 401.
22 Ahren B, Pacini G, Foley JE, Schweizer A. Improved
meal-related b-cell function and insulin sensitivity by
the dipeptidyl peptidase-IV inhibitor vildagliptin in
metformin-treated patients with type 2 diabetes over
1year. Diabetes Care 2005; 28: 1936–1940.
23 Yki-Jarvinen H. Thiazolidinediones. N Engl J Med
2004; 351: 1106–1118.
24 Bajaj M, Suraamornkul S, Hardies LJ, Pratipanawatr T,
DeFronzo RA. Plasma resistin concentration, hepatic fat
content, and hepatic and peripheral insulin resistance
in pioglitazone-treated type II diabetic patients. Int J
Obes Relat Metab Disord 2004; 28: 783–789.
25 Matsui J, Terauchi Y, Kubota N et al. Pioglitazone
reduces islet triglyceride content and restores impaired
glucose-stimulated insulin secretion in heterozygous per-
oxisome proliferator-activated receptor-gamma-deficient
mice on a high-fat diet. Diabetes 2004; 53: 2844–2854.
26 Del Prato S, Marchetti P. Targeting insulin resistance
and beta-cell dysfunction: the role of thiazolidine-
diones. Diabetes Technol Ther 2004; 6: 719–731.
OA j Vildagliptin/TZD initial combination J. Rosenstock et al.
184 j Diabetes, Obesity and Metabolism, 9, 2007, 175–185# 2007 Novartis
Journal Compilation # 2007 Blackwell Publishing Ltd
27 Saydah SH, Fradkin J, Cowie CC. Poor control of risk
factors for vascular disease among adults with pre-
viously diagnosed diabetes. JAMA 2004; 291: 335–342.
28 Writing Team for the Diabetes Control Trial. Sustained
effect of intensive treatment of type 1 diabetes mellitus
on development and progression of diabetic nephropathy:
the Epidemiology of Diabetes Interventions and Com-
plications (EDIC) study. JAMA 2003; 290: 2159–2167.
Appendix
List of Investigators
Czech Republic: Dr Stepan Svacina, Dr Zdenek Pistek, Dr
Zdena Pavlovka, Dr Eva Talasova, Dr Marie Hornackova.
India: Dr Mohan Y. Badgandi, Dr Rakesh Sahay, Dr Nikhil
Tandon, Dr C. S. Yagnik. Italy: Prof. Francesco Dotta, Dr
Mario Sprovieri, Dr Cecilia Invitti, Prof. Antonio Tiengo,
Dr Walter Donadon, Dr Ezio Degli Esposti, Dr Luigi Scian-
gula, Prof. Diego Geroldi. Korea: Prof. Moon-Kyu Lee,
Prof. Kun-Ho Yoon, Prof. Bong-Soo Cha, Prof. Jeong-Taek
Woo, Prof. Sun-Woo Kim, Prof. In-Ju Kim, Prof. Jeong-
Hyun Park, Prof. Dong-Seop Choi, Prof. Sung-Woo Park,
Prof. Kyung-Soo Ko, Prof. Sei-Hyun Baik, Prof. Hyoung-
Woo Lee, Dr Hye-Soon Kim, Prof. Tae-Sun Park, Prof.
Hak-Chul Jang. Slovakia: Dr Jaroslav Fabry, Dr Marian
Hranai, Dr Emil Martinka, Dr Marek Macko, Dr Jarmila
Okapcova, Dr Milan Behuncik. Taiwan: Dr Yi-Jen Hung,
Dr Chao-Hung Wang, Dr Chwen-Tzuei Chang, Dr Rue-
Tsuan Liu, Dr Chuen-Den Tseng, Dr Chien-Wen Chou,
Dr Ming-Chia Hsieh. United Kingdom: Dr Paul Goozee,
Dr Mary A. Whitehead, Dr Dennis M. Allin, Dr Najib See-
dat, Dr Barry Glekin, Dr Arun Baksi, Dr John Calvert, Dr
Hugh Jones. Dr John Langan, Dr Geoffrey Butcher. USA:
Dr Martin Lester, Dr Spencer B. Jones, Dr Andrew
Ahmann, Dr Arthur B. Pitterman, Dr John J. Champlin,
Dr Puneet Narayan, Dr Marc S. Rendell, Dr Sriranga V.
Prasad, Dr Kashif Latif, Dr Richard H. Egelhof, Dr Nay-
nesh R. Patel, Dr Anne M. Reddy, Dr Berto Zamora, Dr
Scott W. Yates, Dr Julio Rosenstock, Dr Jayaram B. Naidu,
Dr Hartmut Koelsch, Dr Lawrence Alder, Dr Jane E. Moss-
berg, Dr Robert S. Lipetz, Dr Richard M. Glover, Dr Gary A.
Tarshis, Dr Jewel A. Stevens, Dr Steven K. Elliott, Dr John
A. Mallory, Dr Alan D. Forker, Dr Daniel J. Suiter, Dr Thad
Clements, Dr Luis E. Morales, Dr James R. Shoemaker, Dr
Gary A. Erdy, Dr James E. Gutmann, Dr David C. Subich,
Dr Jeff Aalberg, Dr Alan V. Safdi, Dr Stephanie Young, Dr
Timothy L. Jackson, Dr Richard Kelly, Dr Marwan N. Sab-
bagh, Dr Harry S. Studdard, Dr Gregory Smith, Dr Richard
B. Christensen, Dr Paul W. Davis, Dr John G. Spangler, Dr
Timothy E. Folse, Dr Jane E. Rohlf, Dr Patrick Ogilvie, Dr
Michael W. Lin, Dr Ronald Sockolov, Dr John Gaffney, Dr
Mariusz Jerzy Klin, Dr Jill M. Constantine, Dr Antoinette
A. Pragalos, Dr Sherwyn L. Schwartz, Dr Larry L. Doehr-
ing, Dr Paula Springer, Dr Lyndon E. Mansfield, Dr V.
Jerome Mirkil, Dr Jerry R. Mitchell, Dr Kimy Charani, Dr
John W. McGettigan, Dr Andre Burton, Dr Ellis R. Levin,
Dr Michael Delphia, Dr Samuel T. Verzosa, Dr Michael A.
Azorr, Dr Eli Ipp, Dr Mario A. Henriquez, Dr Angelique
Barreto, Dr Floyd Willis, Dr John Earl, Dr Sajjad A. Savul,
Dr John Reinhardt, Dr Alexander White, Dr David M. Wit-
kin, Dr Ronald J. Sell, Dr Christopher J. Superczynski, Dr
Tracy T. Phillips, Dr Charles W. Knight, Dr Burton W.
Lazar, Dr Beth Koestler, Dr John Mageli, Dr Daniel B.
Sheerer, Dr John J. Eck, Dr Gregory A. Ledger, Dr Corey
G. Anderson, Dr Martin VanCleef, Dr Rafael Canadas, Dr
Joel N. Diamond, Dr Fatima Phillips.
J. Rosenstock et al. Vildagliptin/TZD initial combination j OA
# 2007 Novartis
Journal Compilation # 2007 Blackwell Publishing LtdDiabetes, Obesity and Metabolism, 9, 2007, 175–185 j 185