Effet Bystander en Radiobiologie et Hadronthérapie - Archive ...
178
HAL Id: tel-02503932 https://hal.archives-ouvertes.fr/tel-02503932 Submitted on 12 Mar 2020 HAL is a multi-disciplinary open access archive for the deposit and dissemination of sci- entific research documents, whether they are pub- lished or not. The documents may come from teaching and research institutions in France or abroad, or from public or private research centers. L’archive ouverte pluridisciplinaire HAL, est destinée au dépôt et à la diffusion de documents scientifiques de niveau recherche, publiés ou non, émanant des établissements d’enseignement et de recherche français ou étrangers, des laboratoires publics ou privés. Effet Bystander en Radiobiologie et Hadronthérapie François Chevalier To cite this version: François Chevalier. Effet Bystander en Radiobiologie et Hadronthérapie. Cancer. Paris Saclay, 2015. tel-02503932
-
Upload
khangminh22 -
Category
Documents
-
view
0 -
download
0
Transcript of Effet Bystander en Radiobiologie et Hadronthérapie - Archive ...
HAL Id: tel-02503932https://hal.archives-ouvertes.fr/tel-02503932
Submitted on 12 Mar 2020
HAL is a multi-disciplinary open accessarchive for the deposit and dissemination of sci-entific research documents, whether they are pub-lished or not. The documents may come fromteaching and research institutions in France orabroad, or from public or private research centers.
L’archive ouverte pluridisciplinaire HAL, estdestinée au dépôt et à la diffusion de documentsscientifiques de niveau recherche, publiés ou non,émanant des établissements d’enseignement et derecherche français ou étrangers, des laboratoirespublics ou privés.
Effet Bystander en Radiobiologie et HadronthérapieFrançois Chevalier
To cite this version:François Chevalier. Effet Bystander en Radiobiologie et Hadronthérapie. Cancer. Paris Saclay, 2015.�tel-02503932�

d’après [1–3]
Mémoire
présenté par
Monsieur François CHEVALIER
Le 3 février 2015
en vue de l’obtention du diplôme de l’
HABILITATION A DIRIGER DES RECHERCHES
« Effet Bystander en
Radiobiologie et Hadronthérapie »
Jury :
Président : Professeur F. Confalonieri (Université Paris Sud Orsay)Rapporteurs : Docteur F. Leteurtre, HDR (CEA)
Docteur C. Hirtz, HDR (CHRU Montpellier)Docteur J. Armengaud, HDR (Directeur de Recherche CEA)
Examinateur : Docteur J.- L. Lefaix, HDR (CEA)
Laboratoired’accueil
et de rechercheavec les ions accélérés

Effet Bystander en Radiobiologie et Hadronthérapie
HDR François Chevalier Page 2
Effet Bystander en Radiobiologie et Hadronthérapie
HDR François Chevalier Page 3
Table des matières
Coordonnées..............................................................................................5
Parcours...................................................................................................6
Encadrement .............................................................................................7
Enseignement ............................................................................................7
Rayonnement.............................................................................................8
Liste des publications ...................................................................................9
1 - Activités de Recherche : Doctorat - Post-doctorats .......................................... 12
1.1 - Doctorat : Biochimie de la β-lactoglobuline modifiée par glycation ..................... 13
1.1.1 - Caractérisation des protéines modifiées .............................................. 13
1.1.2 - Etude des propriétés techno-fonctionnelles des protéines modifiées ............. 14
1.1.3 - Etude des propriétés biologiques des protéines modifiées ......................... 15
1.1.4 - Sélection de publications du doctorat ................................................. 16
1.2 - Post-Doctorat 1 : Carence en phosphate chez des écotypes d’Arabidopsis thaliana 39
1.2.1 - Architecture racinaire en réponse à la carence en phosphate ..................... 39
1.2.2 - Analyse protéomique de la variabilité naturelle ...................................... 39
1.2.3 - Analyse protéomique de la réponse à la carence en phosphate .................. 40
1.2.4 - Sélection de publications du Post-doctorat 1......................................... 40
1.3 - Post-Doctorat 2 : Analyse de la qualité de laits après différents traitements.......... 68
1.3.1 - Analyse de la qualité du lait après traitement thermique............................ 68
1.3.2 - Analyse du lait de jument après coagulation enzymatique ......................... 69
1.3.3 - Analyse du lait maternel et implication des enzymes endogènes ................. 69
1.3.4 - Sélection de publications du Post-doctorat 2......................................... 70
2 - Activités de Recherche au CEA .................................................................107
2.1 - Responsable de la plateforme de protéomique de l’iRCM..............................107
2.1.1 - Développement technologique en analyse protéomique ..........................107
2.1.2 - Analyse protéomique de la voie des micro-ARNs dans la cancérogénèse......108
2.1.3 - Analyse protéomique d’un effet bystander radio-induit.............................109
2.1.4 - Sélection de publications...............................................................109
2.2 - Chercheur en radiobiologie au LARIA.....................................................137
3 - Projet de Recherche .............................................................................138
3.1 - Contexte.......................................................................................139
3.1.1 - Radiobiologie des hadrons dans ARCHADE ........................................139
3.1.2 - De l’intérêt des ions accélérés en radiothérapie ....................................140

Effet Bystander en Radiobiologie et Hadronthérapie
HDR François Chevalier Page 4
3.1.3 - Radiothérapie conventionnelle et hadronthérapie ..................................142
3.1.4 - Un TPS pour l’hadronthérapie.........................................................143
3.1.5 - Notification d’un « RIBE » à des faibles doses......................................144
3.1.6 - Implication du « RIBE » en radiothérapie ............................................145
3.2 - L’effet bystander : mécanismes cellulaires décrits.......................................147
3.3 - Un modèle biologique in vitro en 3D.......................................................149
3.4 - Plan scientifique du projet de recherche ..................................................150
3.4.1 - Questionnement / étapes clés.........................................................150
3.4.2 - Plan d’expériences......................................................................151
3.4.3 - Irradiation par différents types de rayonnements ionisants........................152
3.5 - Méthodes d’analyse et aspects “protéomiques” de l’effet de voisinage...............152
3.6 - Critères biologiques .........................................................................152
3.6.1 - Radiotoxicité cellulaire et clonogénicité ..............................................153
3.6.2 - Formation et réparation des lésions de l’ADN.......................................153
3.6.3 - Apoptose radio-induite et sénescence ...............................................154
3.6.4 - Stress oxydatif cellulaire ...............................................................154
3.6.5 - Inflammation et sécrétion de facteurs solubles......................................154
3.6.6 - Expression différentielle et modifications post-traductionnelles des protéines..155
3.6.7 - Dégradation des protéines de la matrice extracellulaire du cartilage ............156
3.7 - Résultats escomptés ........................................................................156
3.8 - Conclusions - Perspectives.................................................................156
3.9 - Références....................................................................................171
Effet Bystander en Radiobiologie et Hadronthérapie
HDR François Chevalier Page 5
Coordonnées
François CHEVALIER
Age : 40 ansDate de naissance : 30 octobre 1974Lieu de naissance : Clermont-Ferrand (63)Nationalité : Française
Adresse professionnelle :
Commissariat à l’Energie AtomiqueLARIA (Laboratoire d’accueil et de recherche avecdes ions accélérés) DSV- iRCMGANILBd Becquerel14070 Caen Cedex 5Tel : 02 31 45 48 [email protected]@ganil.fr
Effet Bystander en Radiobiologie et Hadronthérapie
HDR François Chevalier Page 6
Parcours
1992 : Baccalauréat, série D (Ussel)
1994 : BTS Biotechnologie (Le Puy en Velay)
1995 : L3 : Biochimie (La Rochelle)
1996 : Master 1 Biochimie (La Rochelle)
1996-1997 : Master 2 “Activité biologique des substances naturelles”
MNHN de Paris mention assez-bien
Sujet : Clonage et expression d’une carboxylestérase humaine
Lieu : Service d'Oncologie, Rhône-Poulenc Rorer à Vitry-sur-Seine
1998-2001 : Doctorat de biochimie de l’Université de Bordeaux I
Soutenance le 24 octobre 2001 mention très honorable
Sujet : Propriétés techno-fonctionnelles et biologiques de la bêta-lactoglobuline modifiée par
la réaction de Maillard
Lieu : LEIMA, INRA à Nantes
2001-2005 : Post-Doctorat 1 en analyses protéomiques
Sujet : Analyse protéomique de la variabilité naturelle chez Arabidopsis
Lieu : Unité de Protéomique de l’INRA à Montpellier
2006-2007 : Post-Doctorat 2 en analyses protéomiques
Projet : Analyse protéomique de la qualité du lait
Lieu : Dept Food Nutritional Science, University College Cork, Irlande
Depuis 2007 : Chercheur en Radiobiologie et analyses protéomiques
Lieu : plateforme protéomique, iRCM, CEA de Fontenay-aux-Roses (2007-2013)
Lieu : LARIA, iRCM, CEA de Caen (depuis 2013)
Effet Bystander en Radiobiologie et Hadronthérapie
HDR François Chevalier Page 7
Encadrement
Etudiants en Master 2
Novembre 1998 - juin 1999Master 2 de Biologie Cellulaire Université de Nantes (Stéphanie Prigent)Sujet : Glycation de la caséine bêta : propriétés physico-chimiques, fonctionnelles et biologiques desdérivés obtenus
Juin - septembre 2002Master 2 de Biologie Cellulaire, Université de Montpellier II (Mickaël Pata)Sujet : Analyse morphologique de la réponse racinaire en condition de carence en phosphate dedifférents écotypes d’Arabidopsis thaliana
Avril - juin 2003Master 2 de Biologie Cellulaire, Université de Caen (Samuel Barteau)Sujet : Analyse protéomique de la réponse à la carence en phosphate chez différents écotypesd’Arabidopsis thaliana
Juin - juillet 2003Master 2 de Biologie Moléculaire et Cellulaire (Anne-Dominique Devauchelle)Sujet : Analyse protéomique racinaire de différents écotypes d’Arabidopsis thaliana : étude de laréponse en condition de carence en phosphate, étude de la variabilité naturelle inter-écotypes
Etudiants en thèse
2006-2007Co-encadrant de doctorat University College Cork (Emmanuele Armaforte)Sujet : Innovative separation techniques for the evaluation of the quality of food products
Co-encadrant de doctorat à 25% (Daniela Voigt)Sujet : Effect of high-pressure treatment on proteolysis in mature blue-veined cheese
Personnel technique
Gestion de techniciens de laboratoire en biochimie des protéines et protéomique2000-2001 : Marie-Georgette Nicolas (50%)2001-2004 : Valérie Rofidal (50%)2007-2013 : Jordane Dépagne (100%)
Enseignement
2014 : Cours de radiobiologie sur l’effet Bystander radio-induit (2h)Etudiants en M2 « Imagerie médicale »Faculté de médecine de Caen
Effet Bystander en Radiobiologie et Hadronthérapie
HDR François Chevalier Page 8
Rayonnement
Critique scientifique de revues internationales
- Proteomics- Proteomic Insights- Proteome Science- PlosOne- Planta- Mutation Research- Journal of Proteomics- Journal of Proteome Research- Journal of Food Processing & Technology- Journal of Food engineering- Journal of Dairy Science- Journal of Dairy Research- Journal of Agricultural and Food Chemistry- International Dairy Journal- Analytical biochemistry
Société savante
Membre de la SFEAP (Société Française d'Electrophorèse et d'Analyse Protéomique)Membre de l’HUPO (Human Proteome Organisation)
Distinctions Scientifiques
1998-2001 Bourse de thèse, Ministère de la recherche (MENRT)2001-2004 Lauréat de la bourse de post-doc GVE (Growth, vigour, environment -
molecular breeding for plant growth and yield, funded under the FP5-LIFEQUALITY of the European Commission)
2006-2007 Lauréat de la bourse de post-doc FIRM (Food Institutional ResearchMeasure, funded by the Irish Government under the National DevelopmentPlan)
2007 : Best Poster Award (category 4 : Nutritional and Health Care)Cork University Hospital Annual Research DayUniversity College Cork, Cork, Ireland 15 June 2007
Effet Bystander en Radiobiologie et Hadronthérapie
HDR François Chevalier Page 9
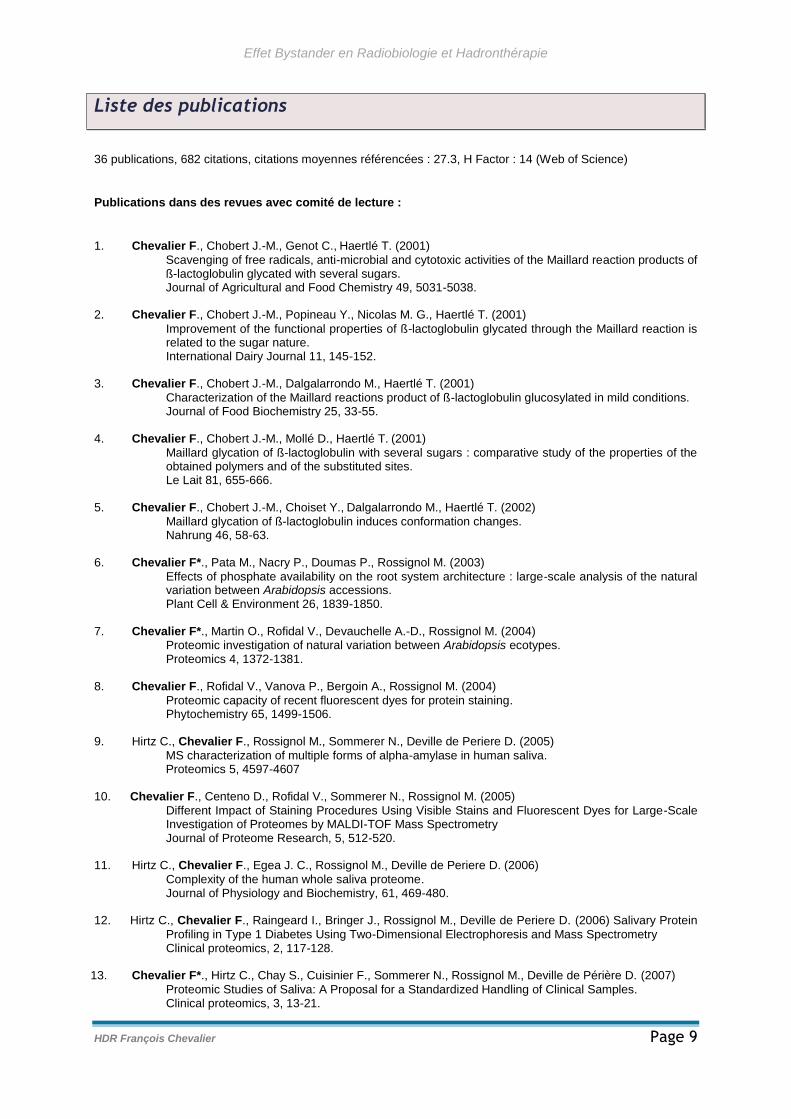
Liste des publications
36 publications, 682 citations, citations moyennes référencées : 27.3, H Factor : 14 (Web of Science)
Publications dans des revues avec comité de lecture :
1. Chevalier F., Chobert J.-M., Genot C., Haertlé T. (2001)Scavenging of free radicals, anti-microbial and cytotoxic activities of the Maillard reaction products ofß-lactoglobulin glycated with several sugars.Journal of Agricultural and Food Chemistry 49, 5031-5038.
2. Chevalier F., Chobert J.-M., Popineau Y., Nicolas M. G., Haertlé T. (2001)Improvement of the functional properties of ß-lactoglobulin glycated through the Maillard reaction isrelated to the sugar nature.International Dairy Journal 11, 145-152.
3. Chevalier F., Chobert J.-M., Dalgalarrondo M., Haertlé T. (2001)Characterization of the Maillard reactions product of ß-lactoglobulin glucosylated in mild conditions.Journal of Food Biochemistry 25, 33-55.
4. Chevalier F., Chobert J.-M., Mollé D., Haertlé T. (2001)Maillard glycation of ß-lactoglobulin with several sugars : comparative study of the properties of theobtained polymers and of the substituted sites.Le Lait 81, 655-666.
5. Chevalier F., Chobert J.-M., Choiset Y., Dalgalarrondo M., Haertlé T. (2002)Maillard glycation of ß-lactoglobulin induces conformation changes.Nahrung 46, 58-63.
6. Chevalier F*., Pata M., Nacry P., Doumas P., Rossignol M. (2003)Effects of phosphate availability on the root system architecture : large-scale analysis of the naturalvariation between Arabidopsis accessions.Plant Cell & Environment 26, 1839-1850.
7. Chevalier F*., Martin O., Rofidal V., Devauchelle A.-D., Rossignol M. (2004)Proteomic investigation of natural variation between Arabidopsis ecotypes.Proteomics 4, 1372-1381.
8. Chevalier F., Rofidal V., Vanova P., Bergoin A., Rossignol M. (2004)Proteomic capacity of recent fluorescent dyes for protein staining.Phytochemistry 65, 1499-1506.
9. Hirtz C., Chevalier F., Rossignol M., Sommerer N., Deville de Periere D. (2005)MS characterization of multiple forms of alpha-amylase in human saliva.Proteomics 5, 4597-4607
10. Chevalier F., Centeno D., Rofidal V., Sommerer N., Rossignol M. (2005)Different Impact of Staining Procedures Using Visible Stains and Fluorescent Dyes for Large-ScaleInvestigation of Proteomes by MALDI-TOF Mass SpectrometryJournal of Proteome Research, 5, 512-520.
11. Hirtz C., Chevalier F., Egea J. C., Rossignol M., Deville de Periere D. (2006)Complexity of the human whole saliva proteome.Journal of Physiology and Biochemistry, 61, 469-480.
12. Hirtz C., Chevalier F., Raingeard I., Bringer J., Rossignol M., Deville de Periere D. (2006) Salivary ProteinProfiling in Type 1 Diabetes Using Two-Dimensional Electrophoresis and Mass SpectrometryClinical proteomics, 2, 117-128.
13. Chevalier F*., Hirtz C., Chay S., Cuisinier F., Sommerer N., Rossignol M., Deville de Périère D. (2007)Proteomic Studies of Saliva: A Proposal for a Standardized Handling of Clinical Samples.Clinical proteomics, 3, 13-21.
Effet Bystander en Radiobiologie et Hadronthérapie
HDR François Chevalier Page 10
14. Lodaite K., Chevalier F., Armaforte E. and Kelly A. L. (2009)Effect of high-pressure homogenization on rheological properties of rennet-induced skim milk andstandardized milk gelsJournal of Dairy Research, 76 (3), 294-300.
15. Chevalier F*., Hirtz C., Sommerer N., Kelly A. L. (2009)Use of reducing/non-reducing two-dimensional electrophoresis for the study of disulphide-mediatedinteractions between proteins in raw and heated bovine milkJournal of Agricultural and Food Chemistry, 57, 5948-5955.
16. Voigt D. D., Chevalier F., Qian M., Kelly A. L. (2010)Effect of high-pressure treatment on microbiology, proteolysis, lipolysis and levels of flavourcompounds in mature blue-veined cheeseInnovative Food Science and Emerging Technologies, 11, 68-77.
17. Chevalier F*. (2010)Highlights on the capacities of “Gel-based” proteomicsProteome Science 2010, 8:23 on Biomed Central
18. Chevalier F*. and Kelly A. L. (2010)Proteomic quantification of disulfide-linked polymers in raw and heated bovine milkJournal of Agricultural and Food Chemistry, 58, 7437–7444.
19. Armaforte E., Curran E., Huppertz T., Ryan C. A., Caboni M. F., O’Connor P., Hirtz C., Sommerer N.,Chevalier F., Kelly A. L. (2010)Proteins and proteolysis in pre-term and term human milk and possible implications for infantformulaeInternational Dairy Journal, 20, 715-723.
20. Chevalier F*. (2010)Standard dyes for total protein staining in gel-based proteomic analysisMaterials, 3(10), 4784-4792. Special Issue "Advances in Dyes and Pigments"
21. Laulier C., Barascu A., Guirouilh-Barbat J., Pennarun G., Le Chalony C., Chevalier F., Palierne G.,Bertrand P., Verbavatz J.- M. and Lopez B. S. (2011)Bcl-2 inhibits nuclear homologous recombination by localizing BRCA1 to the endomembranesCancer research, 71(10), 3590-3602.
22. Chevalier F*. and Rossignol M.Proteomic analysis of Arabidopsis thaliana ecotypes with contrasted root architecture in response tophosphate deficiency (2011)Journal of Plant Physiology 168(16), 1885-1890.
23. Voigt D. D., Chevalier F., Donaghy J. A., Patterson M. F., Qian M., Kelly A. L.Effect of high-pressure treatment of milk for cheese manufacture on proteolysis, lipolysis, textureand functionality of Cheddar cheese during ripening (2012)Innovative Food Science and Emerging Technologies 13, 23-30.
24. Chevalier F*., Depagne J., Hem S., Chevillard S., Bensimon J., Bertrand P., and Lebeau J. (2012)Accumulation of Cyclophilin A isoforms in conditioned medium of irradiated breast cancer cellsProteomics, 12(11): 1756–1766.
25. Peric D., Labarre J., Chevalier F*., and Rousselet G. (2012)Impairing the micro-RNA pathway induces proteome modifications characterized by size bias andenrichment in anti-oxidant proteins.Proteomics, 12(13): 2295–2302.
26. Dépagne J., Chevalier F*. (2012)Technical updates to basic proteins focalization using IPG stripsProteome Science 10:54 on Biomed Central
Effet Bystander en Radiobiologie et Hadronthérapie
HDR François Chevalier Page 11
27. Uniacke-Lowe T., Chevalier F*., Hem S., Fox P. F. and Mulvihill D. M. (2013)Proteomic comparison of Equine and Bovine Milk Systems on Renneting.Journal of Agricultural and Food Chemistry, 61, 2839-2850.
28. Chevalier F*., Hamdi D. H., Saintigny Y. and Lefaix J.- L. (2014)Proteomic overview and perspectives of the Radiation-Induced Bystander EffectsMutation Research/ Reviews in Mutation Research in press
29. Saintigny Y., Cruet-Hennequart S., Hamdi D. H., Chevalier F. and Lefaix J.- L. (2015)Impact of therapeutic irradiation on healthy articular cartilageRadiation Research in press
Chapitres d’ouvrage :
1. Chevalier F., Chobert J.-M., Haertlé T. (2002)Interfacial properties of glycated ß-lactoglobulin.In "Recent Advances in Agricultural and Food Chemistry", Research Signpost.
2. Chevalier F., Rofidal V., Rossignol M. (2007)Visible and fluorescent staining of two-dimensional gels.In " Plant Proteomics : Methods in Molecular Biology ", Humana Press, USA.Methods Mol Biol. 355, 145-156
3. Chevalier F*. (2011)What future for “Gel-based proteomic” approaches? In: Giselle C. Rancourt (Eds), " Proteomics:Methods, Applications and Limitations", pp 31-52 Series: Protein Biochemistry, Synthesis, Structureand Cellular Functions Nova Science Publishers, Inc. Hauppauge NY 11788-3619 USA
4. Chevalier F*. (2011)Analytical Methods: Electrophoresis. In: Fuquay JW, Fox PF and McSweeney PLH (eds.),Encyclopedia of Dairy Sciences, Second Edition, vol. 1, pp. 185–192. San Diego: Academic Press.
5. Chevalier F*., Sommerer N. (2011)Analytical Methods: Mass Spectrometric Methods. In: Fuquay JW, Fox PF and McSweeney PLH(eds.), Encyclopedia of Dairy Sciences, Second Edition, vol. 1, pp. 198–205. San Diego: AcademicPress.
6. Chevalier F*. (2011)Milk Proteins : Proteomics. In: Fuquay JW, Fox PF and McSweeney PLH (eds.), Encyclopedia ofDairy Sciences, Second Edition, vol. 3, pp. 843–847. San Diego: Academic Press.
7. Chevalier F*., Chicheportiche A, Daynac M., Depagne J., Bertrand P. Boussin F., Mouthon M.- A. (2012)Identification of factors involved in neurogenesis recovery following irradiation of the adult mousesubventricular zone, a preliminary study.In "Proteomics”, InTech Publisher
* : corresponding author
Présentations scientifiques / Participation à des Congrès :
Une trentaine de participation à des congrès nationaux ou internationaux sous forme d’affiche ou de présentationorale.
Effet Bystander en Radiobiologie et Hadronthérapie
HDR François Chevalier Page 12
1 - Activités de Recherche : Doctorat - Post-doctorats
Avant-propos
Depuis mon doctorat, et jusqu’à maintenant, mes activités de recherche ont eu pour fil conducteur
l’analyse biochimique des relations structures/fonctions des protéines après modification ou en
mélanges complexes en réponse à un stress dans des domaines aussi variés que la biologie
végétale, l’agroalimentaire ou la cancérologie et la médecine.
Lors de mon doctorat, J’ai étudié une protéine modèle du lait, la bêta-lactoglobuline, après traitement
thermique ou modification chimique. Ses propriétés physico-chimiques et biologiques, sa structure et
ses capacités fonctionnelles ont été modulées en vue de son utilisation dans l’industrie
agroalimentaire. Ayant par la suite totalement changé de thématique, la connaissance sur le sujet a
évolué et l’état des lieux actuel n’est pas évoqué dans le texte.
En post-doctorat, j’ai analysé les mécanismes moléculaires gouvernant la réponse à la carence en
phosphate chez Arabidopsis thaliana en fonction des écotypes de cette plante. L’avènement de
l’étude de mélanges complexes de protéines par électrophorèse bidimensionnelle m’a permis de
mettre en évidence des profils caractéristiques entre écotypes et conditions de culture. J’ai ensuite
appliqué cette technologie lors de mon second post-doctorat pour étudier la qualité du lait et les
associations entre protéines laitières après traitement thermique.
Mon activité de recherche actuelle en radiobiologie vise à mettre en évidence des réponses cellulaires
caractéristiques à différents types de rayonnements ionisants. Les protéines du métabolisme cellulaire
ou les protéines sécrétées en réponse à un stress sont analysées par différents outils de radiobiologie
et de biochimie des protéines et protéomique. Plus particulièrement, le projet proposé porte sur l’étude
des effets indirects des rayonnements ionisants et leurs conséquences sur les tissus sains en utilisant
un modèle 3D de cartilage reconstitué.
Afin de donner une vision d’ensemble des recherches menées lors de mon doctorat, de mes deux
contrats postdoctoraux et dans le cadre de mon activité de recherche au CEA, j’ai choisi de présenter
d’une part, un résumé des résultats obtenus et, d’autre part, une sélection des principaux articles
scientifiques correspondant, publiés dans des journaux internationaux avec comité de lecture et dans
lesquels j’apparais comme premier auteur, ou principal auteur de l’étude.
Effet Bystander en Radiobiologie et Hadronthérapie
HDR François Chevalier Page 13
1.1 - Doctorat : Biochimie de la β-lactoglobuline modifiée par glycation
Le travail réalisé au cours de ma thèse consistait à modifier par la réaction de Maillard une protéine
alimentaire et à étudier l’influence des composés formés sur les caractéristiques physico-chimiques et
structurales de la protéine. L’objectif était d’améliorer les propriétés techno-fonctionnelles et de
générer de nouvelles fonctions biologiques aux protéines et peptides modifiés. Depuis sa première
description en 1912 par L. C. Maillard, la réaction du même nom fait l’objet de nombreuses recherches
dans le domaine des sciences des aliments. Une grande quantité de publications scientifiques a été
rédigée sur la réaction complexe entre les composés aminés et les sucres réducteurs. De nombreux
composés ont été identifiés afin de mieux appréhender les mécanismes de dégradation et de
polymérisation des sucres et des composés aminés ainsi que la formation d’arômes. Bien que cette
réaction soit couramment rencontrée lors de processus industriels et dans la cuisson des aliments,
son influence sur les propriétés fonctionnelles et la valeur nutritive des protéines alimentaires ainsi
modifiées est encore assez mal connue.
1.1.1 - Caractérisation des protéines modifiées
1.1.1.1 - Caractérisation physico-chimiqueLa glycation de la béta-lactoglobuline (BLG) par différents sucres a permis d’étudier l’influence de la
nature du sucre sur l’avancée de la réaction de Maillard lors d’un chauffage de 72 heures à 60°C. Les
sucres utilisés ont induit différents taux de glycation en fonction de leur nature chimique.
Le lactose, un diholoside, a conduit au plus faible taux (35%) de modification de la BLG. Les hexoses
(galactose, glucose et rhamnose) ont conduit à un taux intermédiaire d’environ 40 %. Le plus fort taux
de modification a été obtenu avec les pentoses pour respectivement 60 % et 68 % de glycation en
présence d’arabinose et de ribose. Une diminution du point isoélectrique a été observée,
proportionnelle au taux de glycation. Plus le taux de glycation était élevé, plus les points isoélectriques
étaient acides et homogènes.
1.1.1.2 - Caractérisation structuraleL’analyse de la composition en acides aminés des échantillons de BLG modifiée par le glucose
pendant différentes périodes a montré que d’autres acides aminés que la lysine pouvaient être
modifiés au cours de la réaction de Maillard. En plus de la lysine, la tyrosine, l’arginine et l’histidine ont
semblé être modifiées par le glucose ou par des sous-produits de la réaction.
Des études par spectrométrie de masse ont permis de mettre en évidence sept sites de glycation de
la BLG (les lysines 14, 47, 69, 75, 100 et 135 et la leucine 1) en fonction du sucre utilisé. Un, trois,
quatre et six sites ont ainsi été observés pour la BLG modifiée respectivement par le rhamnose, le
galactose, le lactose ou le glucose.
L’analyse des hydrolysats trypsiques de la BLG modifiée par le glucose a par ailleurs révélé que
l’arginine 40 et la lysine 14 ne sont pas des sites préférentiels de glycation ; ces expériences ont aussi
montré que la lysine 70 est modifiée au cours du chauffage avant la lysine 69. Ces résultats ont été
Effet Bystander en Radiobiologie et Hadronthérapie
HDR François Chevalier Page 14
interprétés par la localisation différente de ces acides aminés au sein de la structure tridimensionnelle
de la BLG.
Les techniques de dichroïsme circulaire, de microcalorimétrie et d’hydrolyse pepsique ont été utilisées
afin d’évaluer la conformation de la protéine modifiée par les différents sucres. Ces trois techniques
ont révélé que le traitement thermique (72 heures à 60°C) n’induisait pas de modifications
conformationnelles fondamentales de la BLG en absence de sucre. En présence de sucres, la
modification de la conformation de la protéine était proportionnelle au taux de glycation. D’après les
résultats des hydrolyses pepsiques, la glycation par l’arabinose ou le ribose a dénaturé à plus de 65
% la BLG. 57 % et 38 % de dénaturation ont été observés avec la BLG modifiée respectivement en
présence de galactose / glucose et en présence de rhamnose / lactose.
1.1.1.3 - Comportement vis-à-vis de l’association – polymérisationDes polymères ont été mis en évidence dans les échantillons de BLG modifiée par le glucose. L’étude
de la nature des liaisons intervenant dans la stabilisation de ces polymères a révélé la présence de
pontages covalents induits par les sucres.
Selon le sucre utilisé, différents types de liaisons ont été impliqués dans la stabilisation des
polymères. Tous les polymères de BLG modifiée par le ribose ou l’arabinose ont été stabilisés par des
pontages covalents.
Dans le cas de la BLG modifiée par le galactose, le glucose ou le rhamnose, des ponts disulfures, des
interactions hydrophobes et des pontages covalents ont semblé être impliqués dans la stabilisation de
ces polymères. Seule la BLG modifiée par le lactose n’a pas présenté de pontages covalents induits
par les sucres ; seuls des ponts disulfures ont été identifiés dans cet échantillon.
1.1.2 - Etude des propriétés techno-fonctionnelles des protéines modifiées
Une amélioration de la stabilité thermique, des propriétés émulsifiantes et moussantes a été observée
en utilisant les protéines modifiées dans certaines conditions de pH ou de température. Les
échantillons les plus modifiés ont présenté la meilleure solubilité à la suite d’un traitement thermique.
La fixation de sucre à la surface de la protéine, par modification de la charge globale, et par
augmentation des possibilités d’hydratation, a ainsi amélioré la stabilité thermique de la bêta-
lactoglobuline. Le maintien des propriétés émulsifiantes obtenues avec les protéines les plus
modifiées lors du changement de pH de 7,0 à 5,0 était sûrement lié en grande partie à la solubilité de
ces échantillons aux différents pH.
Un taux de modification moyen (obtenu avec le glucose ou le galactose) a présenté le meilleur
compromis pour obtenir des mousses stables avec un faible drainage. Un taux de modification élevé
déstabilise la mousse (en partie à cause de la déstructuration de la protéine) et un taux de
modification faible augmente le drainage.
Effet Bystander en Radiobiologie et Hadronthérapie
HDR François Chevalier Page 15
1.1.3 - Etude des propriétés biologiques des protéines modifiées
1.1.3.1 - Susceptibilité à l’hydrolyse pepsique et trypsique de la BLG native ou modifiée par laréaction de Maillard
La susceptibilité des différents échantillons de BLG à l’hydrolyse pepsique ou trypsique était
directement liée au taux de modification par la réaction de Maillard. Une quantité variable de peptides
a donc été obtenue en fonction des échantillons testés. Plus la protéine était modifiée, plus elle était
sensible à l’hydrolyse pepsique et moins elle était sensible à l’hydrolyse trypsique.
1.1.3.2 - Tests d’activité antiradicalaireDes activités antiradicalaires ont été observées dans les échantillons de BLG modifiée par la réaction
de Maillard, alors que les protéines non modifiées (BLG native ou chauffée, SAB) ont présenté une
faible aptitude à capter les radicaux libres. Cette activité était liée au taux de modification (plus la
protéine est modifiée, plus son activité antiradicalaire est forte) et à la nature du sucre utilisé pour
modifier la protéine (pour une même quantité de groupe NH2 réactif, la modification de la BLG par le
ribose a induit une plus forte activité antiradicalaire que la modification de la BLG par le lactose).
L’hydrolyse des échantillons de BLG modifiée par la réaction de Maillard a diminué leur activité
antiradicalaire. Cependant, celle-ci était tout de même maintenue à un niveau supérieur à celui des
échantillons de BLG non modifiée, révélant la capacité des protéines modifiées à capter les radicaux
libres même après leur hydrolyse.
1.1.3.3 - Tests d’activité cytotoxiqueLa réaction de Maillard est connue pour induire des composés mutagènes et cytotoxiques au cours de
la fabrication et de la cuisson des aliments. Les composés avancés de la réaction de Maillard et les
amines hétérocycliques sont certainement impliqués dans ces propriétés. De tels composés n’ont pas
semblé être formés dans les conditions de réaction utilisées pour modifier la BLG puisque aucune
différence de cytotoxicité n’a pu être observée entre la protéine non modifiée et la protéine modifiée.
Le traitement thermique relativement doux utilisé (72 heures à 60°C) n’a donc pas semblé générer
l’apparition de composés mutagènes et/ou toxiques pour les cellules.
Effet Bystander en Radiobiologie et Hadronthérapie
HDR François Chevalier Page 16
1.1.4 - Sélection de publications du doctorat
Chevalier F., Chobert J.-M., Choiset Y., Dalgalarrondo M., Haertlé T. (2002)
Maillard glycation of ß-lactoglobulin induces conformation changes.
Nahrung 46, 58-63.
Chevalier F., Chobert J.-M., Popineau Y., Nicolas M. G., Haertlé T. (2001)
Improvement of the functional properties of ß-lactoglobulin glycated through the Maillard reaction is
related to the sugar nature.
International Dairy Journal 11, 145-152.
Chevalier F., Chobert J.-M., Genot C., Haertlé T. (2001)
Scavenging of free radicals, anti-microbial and cytotoxic activities of the Maillard reaction products of
ß-lactoglobulin glycated with several sugars.
Journal of Agricultural and Food Chemistry 49, 5031-5038.
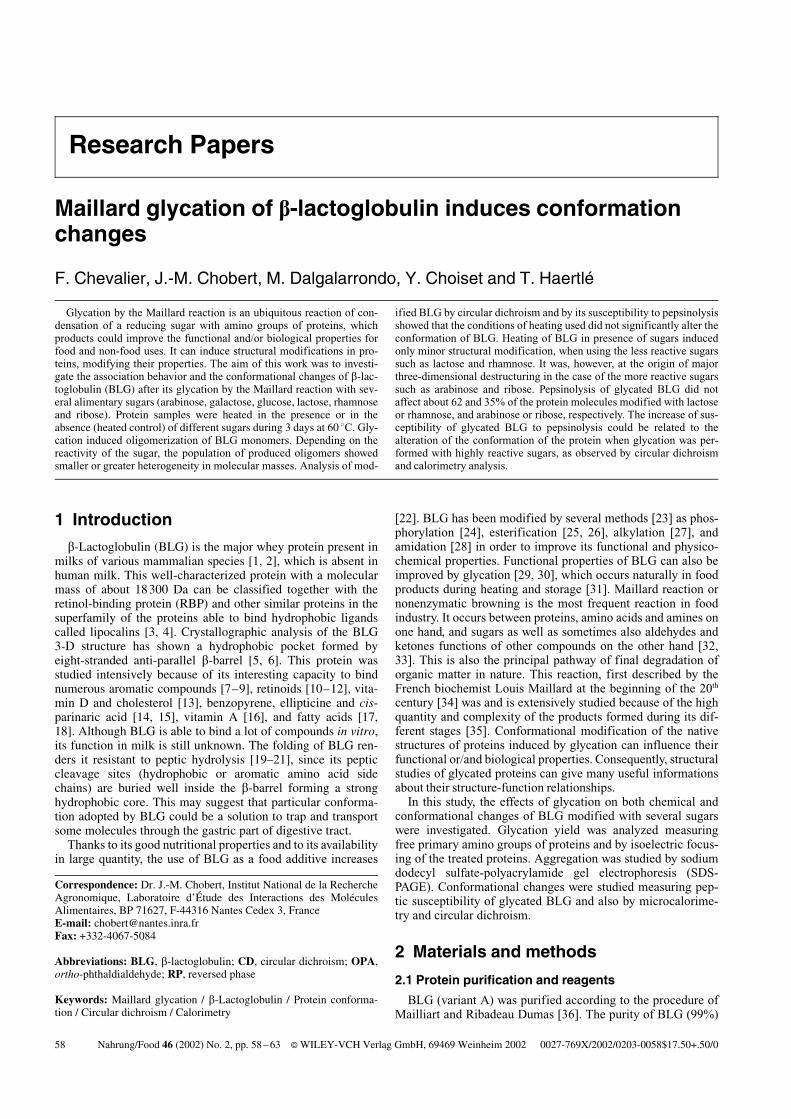
Maillard glycation of b-lactoglobulin induces conformationchanges
F. Chevalier, J.-M. Chobert, M. Dalgalarrondo, Y. Choiset and T. HaertlØ
1 Introduction
b-Lactoglobulin (BLG) is the major whey protein present inmilks of various mammalian species [1, 2], which is absent inhuman milk. This well-characterized protein with a molecularmass of about 18300 Da can be classified together with theretinol-binding protein (RBP) and other similar proteins in thesuperfamily of the proteins able to bind hydrophobic ligandscalled lipocalins [3, 4]. Crystallographic analysis of the BLG3-D structure has shown a hydrophobic pocket formed byeight-stranded anti-parallel b-barrel [5, 6]. This protein wasstudied intensively because of its interesting capacity to bindnumerous aromatic compounds [7–9], retinoids [10–12], vita-min D and cholesterol [13], benzopyrene, ellipticine and cis-parinaric acid [14, 15], vitamin A [16], and fatty acids [17,18]. Although BLG is able to bind a lot of compounds in vitro,its function in milk is still unknown. The folding of BLG ren-ders it resistant to peptic hydrolysis [19–21], since its pepticcleavage sites (hydrophobic or aromatic amino acid sidechains) are buried well inside the b-barrel forming a stronghydrophobic core. This may suggest that particular conforma-tion adopted by BLG could be a solution to trap and transportsome molecules through the gastric part of digestive tract.
Thanks to its good nutritional properties and to its availabilityin large quantity, the use of BLG as a food additive increases
[22]. BLG has been modified by several methods [23] as phos-phorylation [24], esterification [25, 26], alkylation [27], andamidation [28] in order to improve its functional and physico-chemical properties. Functional properties of BLG can also beimproved by glycation [29, 30], which occurs naturally in foodproducts during heating and storage [31]. Maillard reaction ornonenzymatic browning is the most frequent reaction in foodindustry. It occurs between proteins, amino acids and amines onone hand, and sugars as well as sometimes also aldehydes andketones functions of other compounds on the other hand [32,33]. This is also the principal pathway of final degradation oforganic matter in nature. This reaction, first described by theFrench biochemist Louis Maillard at the beginning of the 20th
century [34] was and is extensively studied because of the highquantity and complexity of the products formed during its dif-ferent stages [35]. Conformational modification of the nativestructures of proteins induced by glycation can influence theirfunctional or/and biological properties. Consequently, structuralstudies of glycated proteins can give many useful informationsabout their structure-function relationships.
In this study, the effects of glycation on both chemical andconformational changes of BLG modified with several sugarswere investigated. Glycation yield was analyzed measuringfree primary amino groups of proteins and by isoelectric focus-ing of the treated proteins. Aggregation was studied by sodiumdodecyl sulfate-polyacrylamide gel electrophoresis (SDS-PAGE). Conformational changes were studied measuring pep-tic susceptibility of glycated BLG and also by microcalorime-try and circular dichroism.
2 Materials and methods
2.1 Protein purification and reagents
BLG (variant A) was purified according to the procedure ofMailliart and Ribadeau Dumas [36]. The purity of BLG (99%)
58 Nahrung/Food 46 (2002) No. 2, pp. 58 – 63 i WILEY-VCH Verlag GmbH, 69469 Weinheim 2002 0027-769X/2002/0203-0058$17.50+.50/0
Glycation by the Maillard reaction is an ubiquitous reaction of con-densation of a reducing sugar with amino groups of proteins, whichproducts could improve the functional and/or biological properties forfood and non-food uses. It can induce structural modifications in pro-teins, modifying their properties. The aim of this work was to investi-gate the association behavior and the conformational changes of b-lac-toglobulin (BLG) after its glycation by the Maillard reaction with sev-eral alimentary sugars (arabinose, galactose, glucose, lactose, rhamnoseand ribose). Protein samples were heated in the presence or in theabsence (heated control) of different sugars during 3 days at 60 8C. Gly-cation induced oligomerization of BLG monomers. Depending on thereactivity of the sugar, the population of produced oligomers showedsmaller or greater heterogeneity in molecular masses. Analysis of mod-
ified BLG by circular dichroism and by its susceptibility to pepsinolysisshowed that the conditions of heating used did not significantly alter theconformation of BLG. Heating of BLG in presence of sugars inducedonly minor structural modification, when using the less reactive sugarssuch as lactose and rhamnose. It was, however, at the origin of majorthree-dimensional destructuring in the case of the more reactive sugarssuch as arabinose and ribose. Pepsinolysis of glycated BLG did notaffect about 62 and 35% of the protein molecules modified with lactoseor rhamnose, and arabinose or ribose, respectively. The increase of sus-ceptibility of glycated BLG to pepsinolysis could be related to thealteration of the conformation of the protein when glycation was per-formed with highly reactive sugars, as observed by circular dichroismand calorimetry analysis.
Correspondence: Dr. J.-M. Chobert, Institut National de la RechercheAgronomique, Laboratoire d’Étude des Interactions des MolØculesAlimentaires, BP 71627, F-44316 Nantes Cedex 3, FranceE-mail: [email protected]: +332-4067-5084
Abbreviations: BLG, b-lactoglobulin; CD, circular dichroism; OPA,ortho-phthaldialdehyde; RP, reversed phase
Keywords: Maillard glycation / b-Lactoglobulin / Protein conforma-tion / Circular dichroism / Calorimetry
Research Papers
Maillard glycation of b-lactoglobulin
Nahrung/Food 46 (2002) No. 2, pp. 58 – 63 59
was assessed by reversed phase-high performance liquid chro-matography (RP-HPLC). d-Arabinose, d-galactose, d-glucose,d-lactose, d-rhamnose, d-ribose monohydrates and porcinepepsin were obtained from Sigma Chemical Co. (St. Louis,MO, USA). All other reagents were of analytical grade.
2.2 Glycation experiments
BLG (0.217 mm) and the different sugars (0.217 m) weredissolved in 0.1 m phosphate buffer, pH 6.5. After filtration on0.22 lm acetate cellulose filters (Millipore, Bedford, MA,USA), mixtures of protein and sugar were put in well-cappedflasks and heated in a water bath at 608C for 72 h. This mildheat treatment limited self-aggregation of BLG. All experi-ments were performed under strictly anaerobic and sterile con-ditions, all media were purged and saturated with N2. Afterheating, the different fractions were dialyzed against distilledwater, freeze-dried, and stored at –20 8C. BLG heated withoutsugar (heated control) was named “heated BLG”, and BLGheated in the presence of sugar was named “glycated BLG”.
2.3 Determination of available amino groups
The quantity of available amino groups was determined bythe modified ortho-phthaldialdehyde (OPA) method [37]. TheOPA reagent was prepared daily by mixing 40 mg of OPA(dissolved in 1 mL of methanol), 50 mL of 0.1 m sodiumborate buffer, pH 9.3, 100 mg of N-dimethyl-2-mercaptoethyl-ammonium chloride (DMMAC), and 1.25 mL of 20% w/wSDS in water. Fifty lL of protein solution (2 g/L in 50 mm
sodium phosphate buffer, pH 7.8) was added to 1 mL of OPAreagent. The absorbency was read at 340 nm after a minimaldelay of 5 min. A calibration curve was obtained by using0.25–2.00 mm l-leucine as a standard.
2.4 SDS-PAGE
SDS-PAGE was performed using a Mini Protean II gel elec-trophoresis apparatus (Bio-Rad, Richmond, CA, USA) asdescribed by Laemmli [38]. Isoelectric focusing was per-formed in the pH range 3–6 on ready-to-use isoelectric focus-ing gels (Servalyt Precotes, Serva, Heidelberg, Germany).
2.5 Hydrolysis of BLG by porcine pepsin
BLG (2 mg/mL or 0.11 mm) was dissolved in 10 mM gly-cine-HCl, pH 2.5. Porcine pepsin, previously solubilized indistilled water (1 mg/mL) was added to the reaction mixture atan enzyme/substrate molar ratio of 1/100. The mixture wasincubated at 378C and at intervals, the reaction was stopped bythe addition of 1 volume of 2 m Tris-HCl, pH 8.8, and thehydrolysates were stored at 48C before analysis.
2.6 RP-HPLC
The HPLC equipment consisted of a WatersTM 2690 Separa-tion Module system with an integrated solvent, a sample man-agement platform and a photodiode array detector Model 996.The HPLC system was driven by a Milleniumm32 program(Waters, Milford, MA, USA). Peptic peptides of BLG and gly-cated BLG were separated by RP-HPLC on a Symmetry 300AC18 column (3.9 mm6150 mm; Waters) equilibrated in 80%solvent A (0.11% TFA in H2O) and 20% solvent B (80% aceto-nitrile, 19.91% H2O, 0.09% TFA, v/v/v). Elution was per-formed with linear gradient from 80% to 0% solvent A for 28min. The temperature of the column and solvents was main-tained at 308C. The flow rate was 0.6 ml/min. Eluted peaks
were detected by UV-absorbency (214 nm). Peak area corre-sponding to the non hydrolyzed form of the protein was calcu-lated. All results were reported to the peak area of the nonhydrolyzed sample, which represents 100%.
2.7 Circular dichroism (CD) spectroscopy
CD spectra were recorded using a Jobin Yvon CD 6 dichro-graph equipped with a thermostated cell holder. The cylindri-cal cells used had a path length of 0.01 cm in the far-UVregion (185–260 nm) and of 1 cm in the near-UV region(250–320 nm). An average of five scans was recorded in thefar-UV region and one scan was recorded in the near-UVregion. All spectra were obtained at 258C using a BLG con-centration of 2 mg/mL (or 0.11 mm) in a 10 mm glycine-HClbuffer, pH 2.5. BLG concentration was determined by thebicinchoninic acid (BCA) method (Pierce, Rockford, JL, USA)with bovine serum albumin as a standard. The baseline spec-trum of buffer was subtracted from each spectrum and theresultant values were converted into molar ellipticity (H). Themethod of Provencher and Glockner [39] was used to estimatethe a-helix and b-sheet content of native and heated BLG.
2.8 Calorimetry
The calorimetric measurements were carried out with thehigh-sensitivity differential scanning microcalorimeter (MCSSystem, Microcal) within the temperature range of 5–1108Cat the heating rate of 1 K/min and excess pressure 1.2 atm. Pro-tein samples (2 mg/mL or 0.11 mm) were dissolved in 10 mm
glycine-HCl buffer, pH 2.5.
3 Results and discussion
3.1 Determination of the yield of glycation
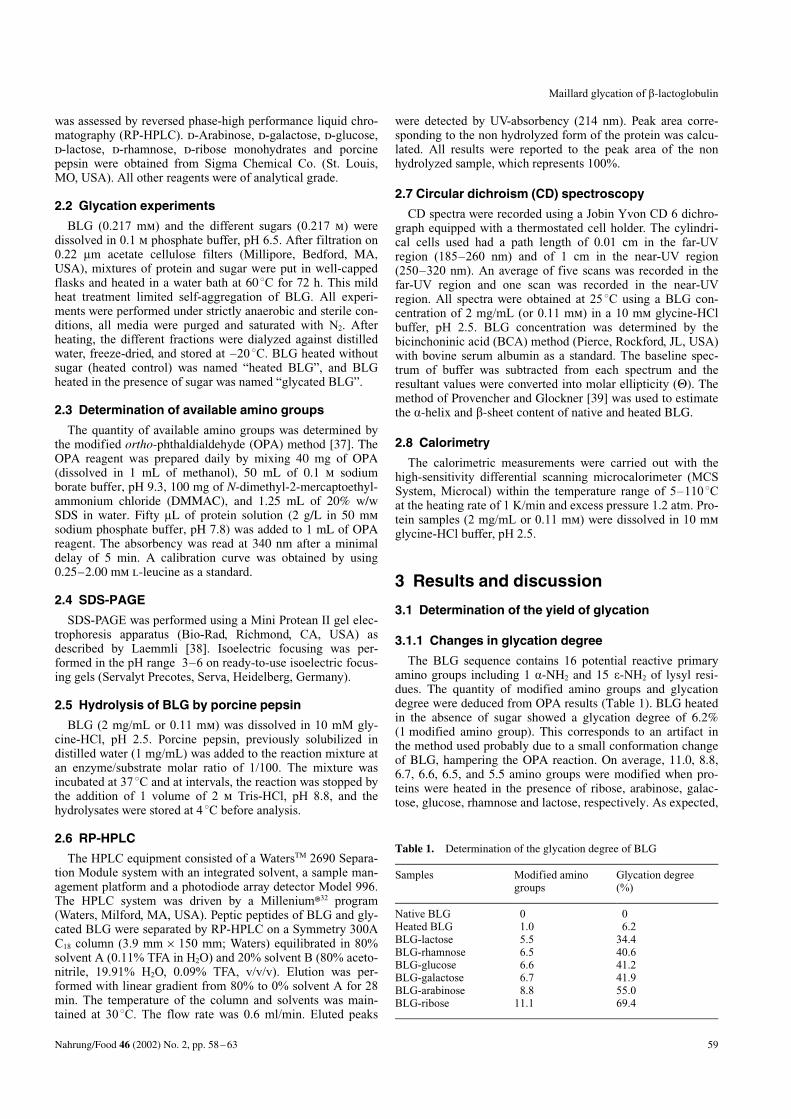
3.1.1 Changes in glycation degree
The BLG sequence contains 16 potential reactive primaryamino groups including 1 a-NH2 and 15 e-NH2 of lysyl resi-dues. The quantity of modified amino groups and glycationdegree were deduced from OPA results (Table 1). BLG heatedin the absence of sugar showed a glycation degree of 6.2%(1 modified amino group). This corresponds to an artifact inthe method used probably due to a small conformation changeof BLG, hampering the OPA reaction. On average, 11.0, 8.8,6.7, 6.6, 6.5, and 5.5 amino groups were modified when pro-teins were heated in the presence of ribose, arabinose, galac-tose, glucose, rhamnose and lactose, respectively. As expected,
Table 1. Determination of the glycation degree of BLG
Samples Modified aminogroups
Glycation degree(%)
Native BLG 0 0Heated BLG 1.0 6.2BLG-lactose 5.5 34.4BLG-rhamnose 6.5 40.6BLG-glucose 6.6 41.2BLG-galactose 6.7 41.9BLG-arabinose 8.8 55.0BLG-ribose 11.1 69.4
Chevalier et al.
60 Nahrung/Food 46 (2002) No. 2, pp. 58 – 63
the modification degree was in direct relation with the sugarsize and reactivity [40, 41]. The shorter the carbon backboneof the sugar, the more open chain form exists and the morereactive is the sugar towards the amino groups of proteins [30,42].
3.1.2 Changes in the global net charge (pHi)
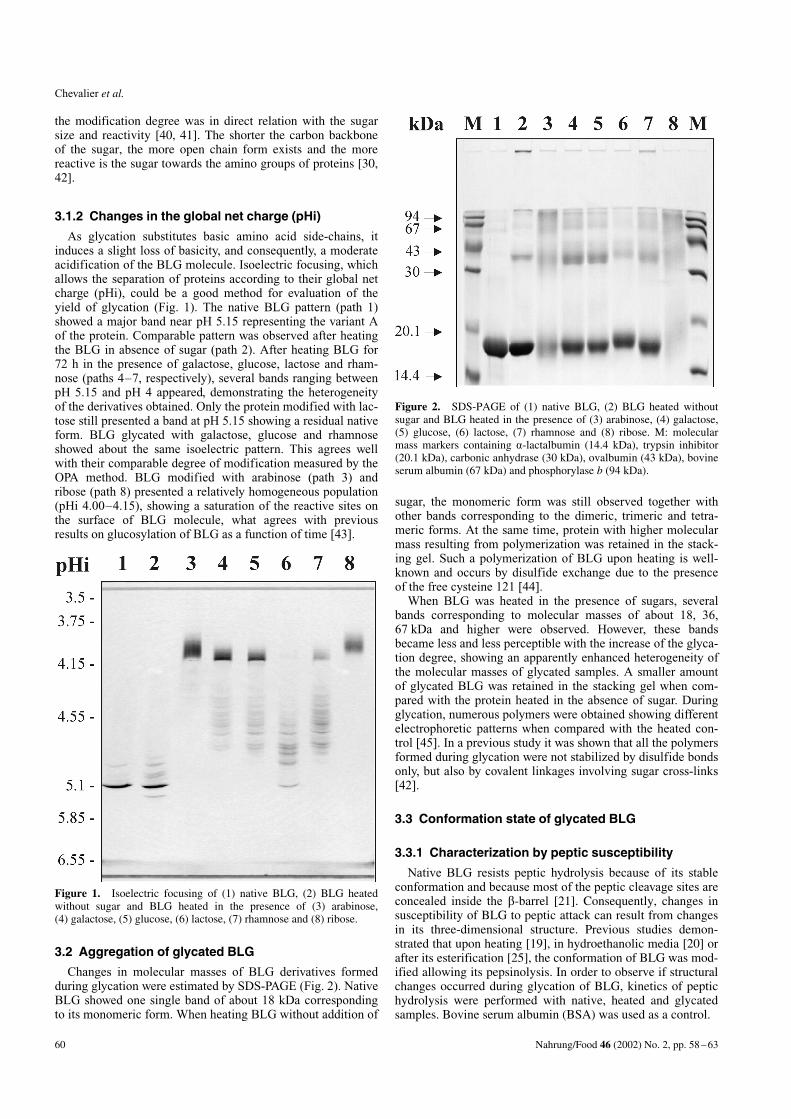
As glycation substitutes basic amino acid side-chains, itinduces a slight loss of basicity, and consequently, a moderateacidification of the BLG molecule. Isoelectric focusing, whichallows the separation of proteins according to their global netcharge (pHi), could be a good method for evaluation of theyield of glycation (Fig. 1). The native BLG pattern (path 1)showed a major band near pH 5.15 representing the variant Aof the protein. Comparable pattern was observed after heatingthe BLG in absence of sugar (path 2). After heating BLG for72 h in the presence of galactose, glucose, lactose and rham-nose (paths 4–7, respectively), several bands ranging betweenpH 5.15 and pH 4 appeared, demonstrating the heterogeneityof the derivatives obtained. Only the protein modified with lac-tose still presented a band at pH 5.15 showing a residual nativeform. BLG glycated with galactose, glucose and rhamnoseshowed about the same isoelectric pattern. This agrees wellwith their comparable degree of modification measured by theOPA method. BLG modified with arabinose (path 3) andribose (path 8) presented a relatively homogeneous population(pHi 4.00–4.15), showing a saturation of the reactive sites onthe surface of BLG molecule, what agrees with previousresults on glucosylation of BLG as a function of time [43].
3.2 Aggregation of glycated BLG
Changes in molecular masses of BLG derivatives formedduring glycation were estimated by SDS-PAGE (Fig. 2). NativeBLG showed one single band of about 18 kDa correspondingto its monomeric form. When heating BLG without addition of
sugar, the monomeric form was still observed together withother bands corresponding to the dimeric, trimeric and tetra-meric forms. At the same time, protein with higher molecularmass resulting from polymerization was retained in the stack-ing gel. Such a polymerization of BLG upon heating is well-known and occurs by disulfide exchange due to the presenceof the free cysteine 121 [44].
When BLG was heated in the presence of sugars, severalbands corresponding to molecular masses of about 18, 36,67 kDa and higher were observed. However, these bandsbecame less and less perceptible with the increase of the glyca-tion degree, showing an apparently enhanced heterogeneity ofthe molecular masses of glycated samples. A smaller amountof glycated BLG was retained in the stacking gel when com-pared with the protein heated in the absence of sugar. Duringglycation, numerous polymers were obtained showing differentelectrophoretic patterns when compared with the heated con-trol [45]. In a previous study it was shown that all the polymersformed during glycation were not stabilized by disulfide bondsonly, but also by covalent linkages involving sugar cross-links[42].
3.3 Conformation state of glycated BLG
3.3.1 Characterization by peptic susceptibility
Native BLG resists peptic hydrolysis because of its stableconformation and because most of the peptic cleavage sites areconcealed inside the b-barrel [21]. Consequently, changes insusceptibility of BLG to peptic attack can result from changesin its three-dimensional structure. Previous studies demon-strated that upon heating [19], in hydroethanolic media [20] orafter its esterification [25], the conformation of BLG was mod-ified allowing its pepsinolysis. In order to observe if structuralchanges occurred during glycation of BLG, kinetics of peptichydrolysis were performed with native, heated and glycatedsamples. Bovine serum albumin (BSA) was used as a control.
Figure 1. Isoelectric focusing of (1) native BLG, (2) BLG heatedwithout sugar and BLG heated in the presence of (3) arabinose,(4) galactose, (5) glucose, (6) lactose, (7) rhamnose and (8) ribose.
Figure 2. SDS-PAGE of (1) native BLG, (2) BLG heated withoutsugar and BLG heated in the presence of (3) arabinose, (4) galactose,(5) glucose, (6) lactose, (7) rhamnose and (8) ribose. M: molecularmass markers containing a-lactalbumin (14.4 kDa), trypsin inhibitor(20.1 kDa), carbonic anhydrase (30 kDa), ovalbumin (43 kDa), bovineserum albumin (67 kDa) and phosphorylase b (94 kDa).

Maillard glycation of b-lactoglobulin
Nahrung/Food 46 (2002) No. 2, pp. 58 – 63 61
After 150 min hydrolysis, only 10% of native BLG washydrolyzed showing a high resistance of the protein to this pro-tease (Fig. 3). When BLG was preheated for 72 h at 608C(heated control), about 15% of the protein was hydrolyzed dur-ing the first 30 min, then a plateau was reached. Consequently,only 5% of protein were denatured during preheating whencompared to the native sample. In case of all glycated samples,pepsin hydrolysis progressed rapidly in the first 30 min. Afterglycation of BLG with lactose or rhamnose, 62% of proteinwere still unhydrolyzed after 150 min incubation. About 43% ofBLG glycated with galactose or glucose and about 35% of BLGglycated with arabinose or ribose were still unhydrolyzed after150 min incubation. From the results of peptic lysis as a methodto follow the denaturation of glycated proteins, it can be con-cluded that BLG aliquots modified with lactose and rhamnosewere the less denatured (38% of hydrolysis), aliquots modifiedwith glucose and galactose were moderately denatured (57% ofhydrolysis) and those modified with arabinose and ribose werethe most denatured (65% of hydrolysis). Apparently the intensi-ties of denaturation (corresponding to the percentage of hydro-lyzed proteins) are directly related to glycation degree, showingthe influence of glycation in destabilization of the native confor-mation of BLG in an aqueous medium, what agrees well withthe results of Morgan et al. [46, 47].
3.3.2 Characterization of glycation-induced BLGfolding changes by CD
3.3.2.1 Near-UV CD
The near-UV CD signal is due to the chirality of the envir-onment of the side chain of aromatic amino acids such as tryp-tophan, tyrosine and phenylalanine, as well as of disulfidebonds. A characteristic profile was observed in the case ofnative BLG (Fig. 4A). Two minima observed at about 262 and269 nm in near-UV CD spectrum are due to phenylalanyl resi-dues and the two characteristic deep minima observed at 286and 293 nm involve tryptophanyl residues of proteins [48, 49].In the case of BLG, these minima are due to Trp19 [50]. Afterheating BLG at 608C for 3 days, a decrease of intensity of twominima at 286 and 293 nm was observed, which agrees well
with results of Manderson et al. [50]. Such changes in CDspectra result probably from the changes in the environment ofTrp19. BLG samples modified with galactose (D), glucose (E),lactose (F) and rhamnose (G) showed similar profiles in thenear-UV region when compared with heated BLG. However,the intensity of two minima observed at 286 and 293 nmdecreased for each sample with some slight differences in itsextent. CD profile of the less glycated sample modified withlactose was relatively similar to what was observed with nativeprotein at 286 nm, but showed a decrease in the intensity ofthe minimum at 293 nm. These results correlate well with dataof peptic hydrolysis showing that these samples conservedtheir tertiary structure relatively well. However, no significantdifferences could be observed, by near-UV spectra analysis,between samples modified with lactose and rhamnose andthose modified with galactose and glucose. Unfortunately, CDspectra of BLG modified with arabinose (C) and ribose (H)were not interpretable because of a total loss of information inthe near-UV region. The profiles obtained could be explainedeither by a disappearance of the tertiary structure of the gly-cated proteins and/or by the presence of chromophores result-ing from the Maillard reactions, which interfered strongly withCD spectra of aromatic amino acid moieties.
3.3.2.2 Far-UV CD
Far-UV CD signal arises from the peptide bonds absorptionand reflects the secondary structure of proteins. According tothe method of Provencher and Glockner [39], native BLG
Figure 3. Time course of peptic hydrolysis of (0) native BLG,(f) heated BLG, (f and dashed line) BSA and BLG heated in the pre-sence of (h) arabinose, (j) galactose, (9) glucose, (F) lactose,(H) rhamnose and (J) ribose.
Figure 4. Near-UV CD spectra of native BLG (solid line in A anddashed line in B–H), (B) heated BLG and BLG heated in the presenceof (C) arabinose, (D) galactose, (E) glucose, (F) lactose, (G) rhamnoseand (H) ribose.
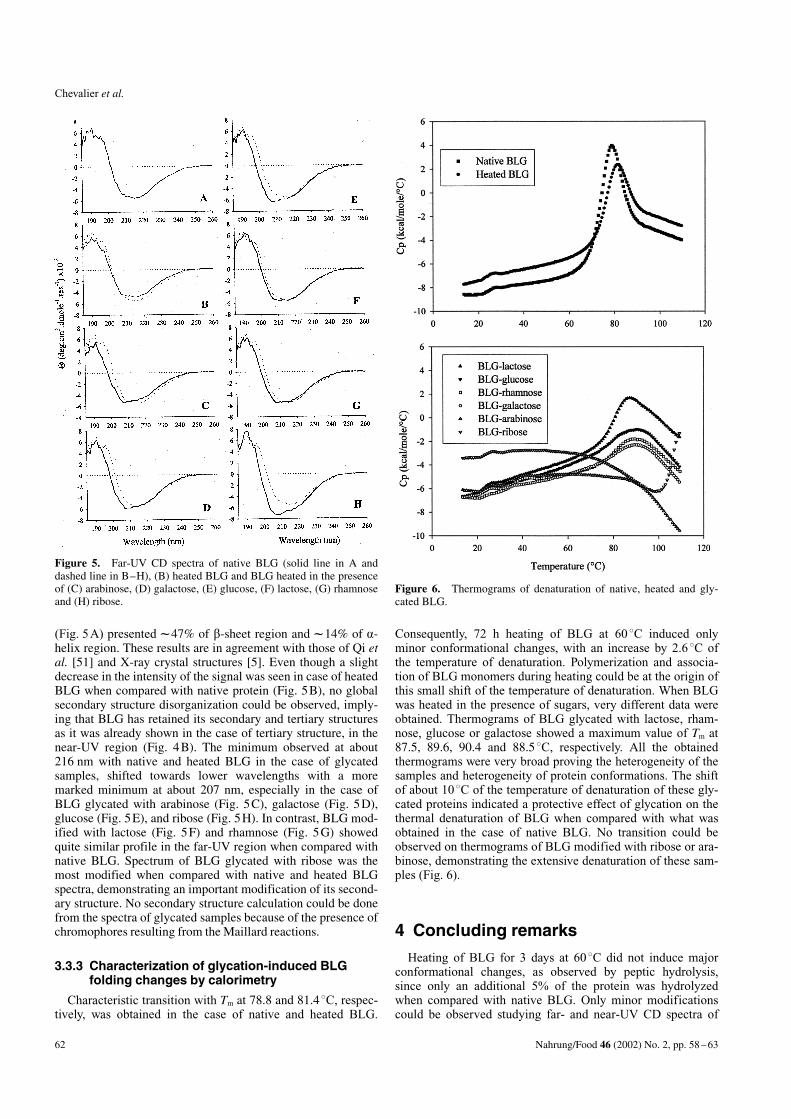
Chevalier et al.
62 Nahrung/Food 46 (2002) No. 2, pp. 58 – 63
(Fig. 5A) presented l47% of b-sheet region and l14% of a-helix region. These results are in agreement with those of Qi etal. [51] and X-ray crystal structures [5]. Even though a slightdecrease in the intensity of the signal was seen in case of heatedBLG when compared with native protein (Fig. 5B), no globalsecondary structure disorganization could be observed, imply-ing that BLG has retained its secondary and tertiary structuresas it was already shown in the case of tertiary structure, in thenear-UV region (Fig. 4B). The minimum observed at about216 nm with native and heated BLG in the case of glycatedsamples, shifted towards lower wavelengths with a moremarked minimum at about 207 nm, especially in the case ofBLG glycated with arabinose (Fig. 5C), galactose (Fig. 5D),glucose (Fig. 5E), and ribose (Fig. 5H). In contrast, BLG mod-ified with lactose (Fig. 5F) and rhamnose (Fig. 5G) showedquite similar profile in the far-UV region when compared withnative BLG. Spectrum of BLG glycated with ribose was themost modified when compared with native and heated BLGspectra, demonstrating an important modification of its second-ary structure. No secondary structure calculation could be donefrom the spectra of glycated samples because of the presence ofchromophores resulting from the Maillard reactions.
3.3.3 Characterization of glycation-induced BLGfolding changes by calorimetry
Characteristic transition with Tm at 78.8 and 81.48C, respec-tively, was obtained in the case of native and heated BLG.
Consequently, 72 h heating of BLG at 608C induced onlyminor conformational changes, with an increase by 2.68C ofthe temperature of denaturation. Polymerization and associa-tion of BLG monomers during heating could be at the origin ofthis small shift of the temperature of denaturation. When BLGwas heated in the presence of sugars, very different data wereobtained. Thermograms of BLG glycated with lactose, rham-nose, glucose or galactose showed a maximum value of Tm at87.5, 89.6, 90.4 and 88.58C, respectively. All the obtainedthermograms were very broad proving the heterogeneity of thesamples and heterogeneity of protein conformations. The shiftof about 108C of the temperature of denaturation of these gly-cated proteins indicated a protective effect of glycation on thethermal denaturation of BLG when compared with what wasobtained in the case of native BLG. No transition could beobserved on thermograms of BLG modified with ribose or ara-binose, demonstrating the extensive denaturation of these sam-ples (Fig. 6).
4 Concluding remarks
Heating of BLG for 3 days at 608C did not induce majorconformational changes, as observed by peptic hydrolysis,since only an additional 5% of the protein was hydrolyzedwhen compared with native BLG. Only minor modificationscould be observed studying far- and near-UV CD spectra of
Figure 5. Far-UV CD spectra of native BLG (solid line in A anddashed line in B–H), (B) heated BLG and BLG heated in the presenceof (C) arabinose, (D) galactose, (E) glucose, (F) lactose, (G) rhamnoseand (H) ribose.
Figure 6. Thermograms of denaturation of native, heated and gly-cated BLG.
Maillard glycation of b-lactoglobulin
Nahrung/Food 46 (2002) No. 2, pp. 58 – 63 63
these proteins. Nevertheless, some changes in aggregationbehavior was observed by SDS-PAGE, showing polymerizationof BLG after heating. When BLG was heated in the presenceof sugars, larger structural modifications were observeddepending on the sugar used. Conformational modification ofBLG was related with the degree of glycation. The higher thereactivity of the sugar, the more denaturation was observed forthe glycated protein. According to peptic hydrolysis data, near-and far-UV CD spectra and microcalorimetry analysis, pro-teins modified with ribose or arabinose (the most reactivesugars) showed important conformational changes. In contrast,proteins modified with lactose or rhamnose (the less reactivesugars) showed quite similar three-dimensional structureswhen compared with native BLG. According to previous work[42] and as shown by SDS-PAGE, glycation of BLG inducedpolymerization of protein monomers. Moreover, as observedby calorimetry analysis, Maillard glycation increased the tem-perature of denaturation of proteins glycated with galactose,glucose, lactose or rhamnose. These results correlate well withthose obtained in a previous study of functional properties ofglycated BLG [30], which demonstrated the importance of thesugar used for the improvement of emulsifying and foamingproperties of the derivatives. Additionally, this work showedthe difficulty to interpret the structural analysis of glycatedsamples by spectral methods, especially because of the hetero-geneity of the Maillard products obtained and because of for-mation of powerful chromophores during the Maillard reac-tions.
The authors thank Marie-Georgette Nicolas for BLG purifica-tion. The funding by a fellowship from the Minist�re de laRecherche et de la Technologie to François Chevalier isacknowledged. The funding of this work by INRA and theRØgion Pays de Loire in the scope of the VANAM program“Interactions molØculaires et activitØs biologiques” is alsogratefully acknowledged.
5 References[1] Godovac-Zimmermann, J., Conti, A., Sheil, M., Napolitano, L.,
Biol. Chem. Hoppe-Seyler 1990, 371, 871–879.[2] Godovac-Zimmermann, J., Krause, I., Buchberger, J., Weiss, G.,
Klostermeyer, H., Biol. Chem. Hoppe-Seyler 1990, 371, 255–260.
[3] Monaco, H. L., Zanotti, G., Biopolymers 1992, 32, 457–465.[4] Sansom, C. E., North, A. C., Sawyer, L., Biochim. Biophys. Acta
1994, 1208, 247–255.[5] Papiz, M. Z., Sawyer, L., Eliopoulos, E. E., North, A. C. T., Find-
lay, J. B. C., Sivaprasadrao, R., Jones, T. A., Newcomer, M. E.,Kraulis, P. J., Nature 1986, 324, 383–385.
[6] Brownlow, S., Morais Cabral, J. H., Cooper, R., Flower, D. R.,Yewdall, S. J., Polikarpov, I., North, A. C., Sawyer, L., Structure1997, 5, 481–495.
[7] Farrel, Jr., H. M., Behe, M. J., Enyeart, J. A., J. Dairy Sci. 1987,70, 252–258.
[8] O’Neill, T. H., Kinsella, J. E., J. Agric. Food Chem. 1987, 35,770–774.
[9] Pelletier, E., Sostmann, K., Guichard, E., J. Agric. Food Chem.1998, 46, 1506–1509.
[10] Dufour, E., HaertlØ, T., Biochim. Biophys. Acta 1991, 1079, 316–320.
[11] Cho, Y., Batt, C. A., Sawyer, L., J. Biol. Chem. 1994, 269,11102–11107.
[12] Wang, Q., Allen, J. C., Swaisgood, H. E., J. Dairy Sci. 1997, 80,1047–1053.
[13] Wang, Q., Allen, J. C., Swaisgood, H. E., J. Dairy Sci. 1997, 80,1054–1059.
[14] Dodin, G., Andrieux, M., al Kabbani, H., Eur. J. Biochem. 1990,193, 697–700.
[15] Dufour, E., Roger, P., HaertlØ, T., J. Prot. Chem. 1992, 11, 645–652.
[16] Hemley, R., Kohler, B. E., Siviski, P., Biophys. J. 1979, 28, 447–455.
[17] Frapin, D., Dufour, E., HaertlØ, T., J. Prot. Chem. 1993, 12, 443–449.
[18] Narayan, M., Berliner, L. J., Prot. Sci. 1998, 7, 150–157.[19] Reddy, M., Kella, N. K. D., Kinsella, J. E., J. Agric. Food Chem.
1988, 36, 737–741.[20] Dalgalarrondo, M., Dufour, E., Chobert, J.-M., Bertrand-Harb,
C., HaertlØ, T., Int. Dairy J. 1995, 5, 1–14.[21] Guo, M. R., Fox, P. F., Flynn, A., Kindstedt, P. S., J. Dairy Sci.
1995, 78, 2336–2344.[22] Smithers, G. W., Ballard, F. J., Copeland, A. D., de Silva, K. J., J.
Dairy Sci. 1996, 79, 1454–1459.[23] HaertlØ, T., Chobert, J.-M., J. Food Biochem. 1999, 23, 367–407.[24] Sitohy, M., Chobert, J.-M., HaertlØ, T., J. Agric. Food Chem.
1995, 43, 59–62.[25] Chobert, J.-M., Briand, L., Grinberg, Y. V., HaertlØ, T., Biochim.
Biophys. Acta 1995, 1248, 261–269.[26] Sitohy, M., Chobert, J.-M., HaertlØ, T., Nahrung/Food 2001, 45,
87–93.[27] Kitabatake, N., Cuq, J. L., Cheftel, J. C., J. Agric. Food Chem.
1985, 33, 125–130.[28] Mattarella, N. L., Richardson, T., J. Agric. Food Chem. 1983, 31,
972–978.[29] Aoki, T., Kitahata, K., Fukumoto., T., Sugimoto, Y., Ibrahim, H.
R., Kimura, T., Kato, Y., Matsuda, T., Food Res. Int. 1997, 30,401–406.
[30] Chevalier, F., Chobert, J.-M., Popineau, Y., Nicolas, M.-G.,HaertlØ, T., Int. Dairy J. 2001, 11, 145–152.
[31] Ledl, F., Schleicher, E., Angew. Chem. Int. 1990, 29, 565–594.[32] Ames, J. M., Trends Food Sci. Technol. 1990, 1, 150–154.[33] Chuyen,, N. V., Adv. Exp. Med. Biol. 1998, 434, 213–235.[34] Maillard, L. C., C. R. Acad. Sci. 1912, 154, 66–68.[35] Friedman, M., J. Agric. Food Chem. 1996, 44, 631–653.[36] Mailliart, P., Ribadeau Dumas, B., J. Food Sci. 1988, 53, 743–
752.[37] Frister, H., Meisel, H., Schlimme, E., Fresenius Z. Anal. Chem.
1988, 330, 631–633.[38] Laemmli, U. K., Nature 1970, 227, 680–685.[39] Provencher, S. W., Glockner, J., Biochemistry 1981, 20, 33–37.[40] Prabhakaram, M., Ortwerth, B. J., Anal. Biochem. 1994, 216,
305–312.[41] Nacka, F., Chobert, J.-M., Burova, T., LØonil, J., HaertlØ, T., J.
Prot. Chem. 1998, 17, 495–503.[42] Chevalier, F., Chobert, J.-M., MollØ, D., HaertlØ, T., Lait 2001,
81, 651–666.[43] Chevalier, F., Chobert, J.-M., Dalgalarrondo, M., HaertlØ, T., J.
Food Biochem. 2001, 25, 33–55.[44] Dunnil, P., Green, D. W., J. Mol. Biol. 1965, 15, 147–151.[45] Bouhallab, S., Morgan, F., Henry, G., MollØ, D., LØonil, J., J.
Agric. Food Chem. 1999, 47, 1489–1494.[46] Morgan, F., MollØ, D., Henry, G., VØnien, A., LØonil, J., Peltre,
G., Levieux, D., Maubois, J.-L., Bouhallab, S., Int. J. Food Sci.Technol. 1999, 34, 429–435.
[47] Morgan, F., VØnien, A., Bouhallab, S., MollØ, D., LØonil, J., Pel-tre, G., Levieux, D., J. Agric. Food Chem. 1999, 47, 4543–4548.
[48] Strickland, E. H., CRC Crit. Rev. Biochem. 1974, 2, 113–175.[49] Kahn, P. C., Methods Enzymol. 1979, 61, 339–378.[50] Manderson, G. A., Creamer, L. K., Hardman, M. J., J. Agric.
Food Chem. 1999, 47, 4557–4567.[51] Qi, X. L., Holt, C., McNulty, D., Clarke, D. T., Brownlow, S.,
Jones, G. R., Biochem. J. 1997, 324, 341–346.
Received May 25, 2001Accepted August 29, 2001
International Dairy Journal 11 (2001) 145–152
Improvement of functional properties of b-lactoglobulin glycatedthrough the Maillard reaction is related to the nature of the sugar$
Fran-cois Chevaliera, Jean-Marc Choberta,*, Yves Popineaub, Marie Georgette Nicolasa,Thomas Haertl!ea
aLaboratoire d’ !Etude des Interactions des Mol !ecules Alimentaires, Institut National de la Recherche Agronomique, BP 71627,
44316 Nantes Cedex 3, FrancebLaboratoire de Biochimie et de Technologie des Prot !eines, Institut National de la Recherche Agronomique, BP 71627, 44316 Nantes Cedex 3, France
Received 24 October 2000; accepted 2 March 2001
Abstract
The improvement of functional properties of proteins available in large quantity using non-toxic chemical modifications is of agreat interest for the food industry. In this study, the Maillard reaction was used to improve the functional properties (solubility,heat stability, emulsifying and foaming properties) of b-lactoglobulin (BLG) glycated with several sugars (arabinose, galactose,glucose, lactose, rhamnose or ribose). Protein samples were heated in the presence or absence (heated control) of different sugars for
three days at 608C. Subsequent glycation induced a modification of the solubility profile shifting minimum solubility towards moreacidic pH. Glycated proteins exhibited a better thermal stability when heated at pH 5 as compared to native or heated control.Glycation of BLG with arabinose or ribose (the most reactive sugars) improved its emulsifying properties. Foaming properties were
better when BLG was glycated with glucose or galactose (moderately reactive sugars). These results suggest that the nature of thesugar is an essential factor for improving the functional properties of glycated proteins by processes of Maillard reaction. # 2001Elsevier Science Ltd. All rights reserved.
Keywords: Glycation; Maillard reactions; b-lactoglobulin; Functional properties
1. Introduction
Whey issued from cheese and casein manufacturingcontains approximately 20% of all milk proteins. Itrepresents a rich and varied mixture of secreted proteinswith wide-ranging chemical, physical and functionalproperties (Smithers, Ballard, Copeland, & de Silva,1996). Due to their beneficial functional properties,whey proteins are used as ingredients in many industrialfood products (Cheftel & Lorient, 1982). According toKinsella and Whitehead (1989), functional properties offoods can be explained by the relation of intrinsicproperty of proteins (amino acid composition anddisposition, flexibility, net charge, molecular size, con-formation, hydrophobicity, etc.), and extrinsic factors
(method of preparation and storage, temperature, pH,modification process, etc.).Numerous attempts were made to further improve the
functional properties of whey proteins through physical,chemical and/or enzymatic treatments (Haertl!e &Chobert, 1999). Many studies were carried out with b-lactoglobulin (BLG), the major whey protein. Focusingon the improvement of solubility, heat stability, foamingproperties and emulsifying properties, this protein hasbeen conjugated with ester (Mattarella & Richardson,1983; Sitohy, Chobert, & Haertl!e, 2001), gluconic ormelibionic acids (Kitabatake, Cuq, & Cheftel, 1985),carbohydrates (Waniska & Kinsella, 1988; Bertrand-Harb, Charrier, Dalgalarrondo, Chobert, & Haertl!e,1990) and phosphoric acid (Sitohy, Chobert, & Haertl!e,1995; Sitohy, Chobert, Popineau, & Haertl!e, 1995).However, most of these methods utilize toxic chemical
products and are not permitted for potential industrialapplications. Recently, some attempts were made toimprove the functional properties of BLG by theconjugation of glucose-6-phosphate (Aoki et al., 1997).
$A part of this work was presented at the ‘‘Milk Protein
Conference’’, March 30–April 2 2000, Vinstra, Norway.
*Corresponding author. Tel.: +33-240-67-5085; fax: +33-240-67-
5084.
E-mail address: [email protected] (J.-M. Chobert).
0958-6946/01/$ - see front matter # 2001 Elsevier Science Ltd. All rights reserved.
PII: S 0 9 5 8 - 6 9 4 6 ( 0 1 ) 0 0 0 4 0 - 1
The Maillard reaction, or non-enzymatic browning,occurs frequently during industrial processing and indomestic cooking for the enhancement of colour, aromaand flavour (O’Brien & Morrissey, 1989; Chuyen, 1998;Ames, 1998). This reaction was first described by theFrench biochemist Louis Maillard at the beginning ofthe 20th century (Maillard, 1912). It consists of acondensation of the reducing sugar with the e-aminogroup of lysyl residues of proteins and results in the so-called Amadori product via the formation of a Schiff’sbase and the Amadori rearrangement (Ledl & Schlei-cher, 1990; Friedman, 1996). Through this reaction, theconjugation of the sugar to the protein does not requirechemical catalysis, but just heating in order to acceleratethe spontaneous reaction. Well-controlled Maillardreaction can thus be a good method for proteinprocessing in food industry.The aim of this study was to check how the functional
properties of BLG glycated with several common sugarsevolve. Solubility, heat stability, emulsifying and foam-ing properties of modified proteins were investigated atdifferent pHs, temperatures and heating times.
2. Material and methods
2.1. Protein purification
b-Lactoglobulin (BLG), variant A was purified fromfresh milk as described by Mailliart and RibadeauDumas (1988). The purity of BLG (99%) was assessedby RP-HPLC.
2.2. Reagents
d-Arabinose, d-galactose, d-glucose, d-lactose, d-rhamnose and d-ribose monohydrates were obtainedfrom Sigma Chemical Co. (St Louis, MO, USA). Allother reagents were of analytical grade.
2.3. Glycation experiments
BLG (4mgmL�1 or 0.217mmol L�1) and the differ-ent sugars (0.217mol L�1) were dissolved in 0.1mol L�1
phosphate buffer, pH 6.5. After filtration on 0.22 mmacetate cellulose filters (Millipore), mixtures of proteinand sugars were put in tightly-capped flasks and heatedin a water bath at 608C for 72 h. All experiments wereperformed under strictly anaerobic and sterile condi-tions, all media were purged and saturated with N2.After heating, the different fractions were dialysed for36 h at 48C against distilled water to remove unreactedsugars, freeze-dried, and stored at �208C. BLG heatedwithout sugar (heated control) was named ‘‘heatedBLG’’, and BLG heated in the presence of sugar wasnamed ‘‘glycated BLG’’.
2.4. Determination of available amino groups
The quantity of available amino groups was deter-mined by the modified ortho-phthaldialdehyde (OPA)method (Frister, Meisel, & Schlimme, 1988). The OPAreagent was prepared daily by mixing 40mg of OPA(dissolved in 1mL of methanol), 50mL of 0.1mol L�1
sodium borate buffer, pH 9.3, 100mg of N-dimethyl-2-mercaptoethylammonium chloride (DMMAC), and1.25mL of 20% (w/w) SDS in water. 50 mL of proteinsolution (2 gL�1 in 50mmol L�1 sodium phosphatebuffer, pH 7.8) was added to 1mL of OPA reagent.The absorbance was read at 340 nm after a minimaldelay of 5min. A calibration curve was obtained byusing 0.25–2mmol L�1
l-leucine as a standard.
2.5. Solubility
Native, heated and glycated BLG were diluted indistilled water (2mgmL�1). The pH of the solution wasthen adjusted from 2 to 10 using concentrated HCl orNaOH. Samples were centrifuged for 15min (Sigma 201centrifuge) at 15 000 g. Protein content in the super-natant was determined by the bicinchoninic acid (BCA)method (Pierce) with bovine serum albumin as astandard. Solubility was expressed as a percentage ofprotein content in supernatant to the total proteincontent. All experiments were performed at roomtemperature (258C).
2.6. Heat stability
Native, heated and glycated BLG were diluted(2mgmL�1), in 0.1mol L�1 sodium acetate buffer atpH 4, 4.5 and 5, and in 0.1mol L�1 sodium phosphatebuffer for pH 7. After solubilization in the appropriatebuffer, samples were heated in a water bath at differenttemperatures (25–908C) for up to 1 h. After heating,samples were cooled for 15min at 48C and centrifugedfor 15min at 15 000 g in order to precipitate aggregates.UV absorbance (280 nm) of the supernatant wasmeasured to estimate protein concentration, and wascompared with that of the corresponding untreatedsample.
2.7. Emulsifying properties
Native, heated and glycated BLG were diluted(2mgmL�1), in 0.1mol L�1 sodium acetate buffer, pH5, or in 0.1mol L�1 sodium phosphate buffer, pH 7. Oil-in-water emulsions were prepared with protein solutionand purified sunflower oil with a constant oil volumefraction of 15%. Emulsion premixes were preparedusing the rotor stator system Polytron PT3000 (Kine-matica, Littau, Switzerland) equipped with a 12mmhead working at 20 000 rpm for 30 s. Homogenisation of
F. Chevalier et al. / International Dairy Journal 11 (2001) 145–152146
the coarse emulsions was then achieved with a pressurevalve homogeniser (Stansted Fluid Power, Stansted,UK). The emulsion (20mL) was allowed to recirculatein the homogeniser for 90 s at a flow rate of120mLmin�1 and at a pressure of 50 bar. Afteremulsification, 1mL of the emulsion was diluted in9mL of 0.1% SDS. The oil droplet size distribution wasestimated by laser light scattering using a MalvernMastersizer 3600 (Malvern Instruments, Malvern, UK).The system was equipped with a lens of 45mm focallength and the manufacturer presentation code 0503 wasselected to take into account the oil refractive index. Thevolume-surface mean diameter of the oil droplets sizedistribution (d3:2 in mm) was recorded. All d3:2 resultsrepresent a mean value of three determinations.
2.8. Foaming properties
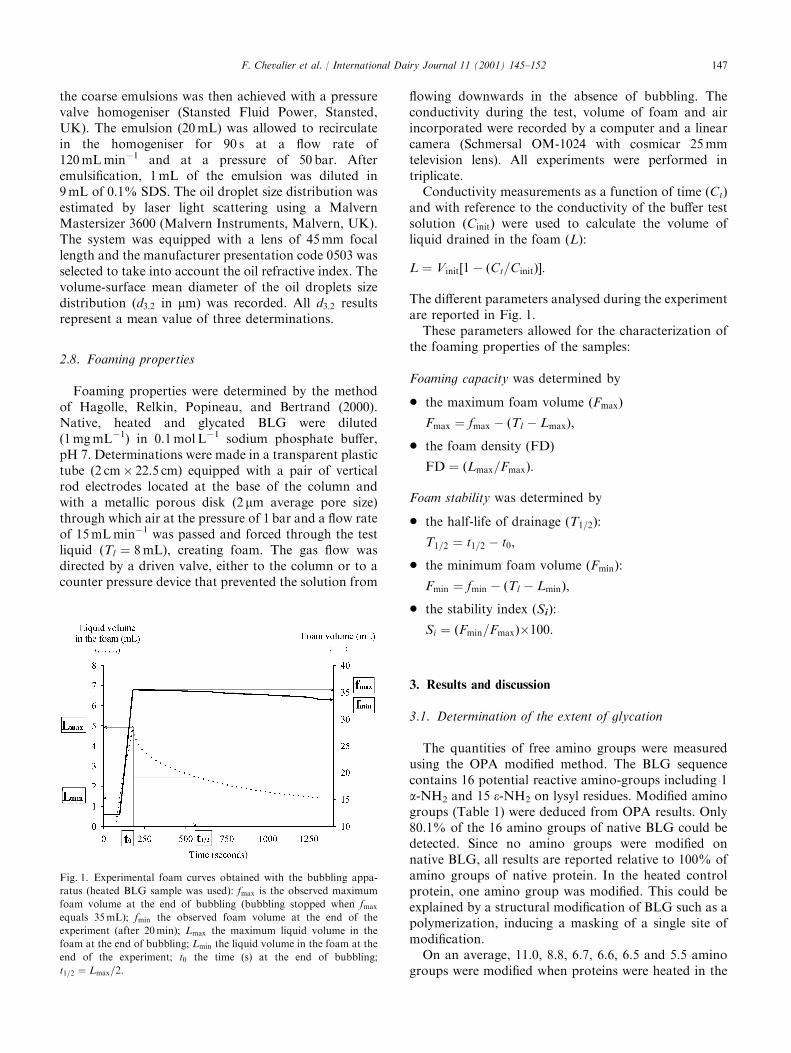
Foaming properties were determined by the methodof Hagolle, Relkin, Popineau, and Bertrand (2000).Native, heated and glycated BLG were diluted(1mgmL�1) in 0.1mol L�1 sodium phosphate buffer,pH 7. Determinations were made in a transparent plastictube (2 cm� 22.5 cm) equipped with a pair of verticalrod electrodes located at the base of the column andwith a metallic porous disk (2 mm average pore size)through which air at the pressure of 1 bar and a flow rateof 15mLmin�1 was passed and forced through the testliquid (Tl ¼ 8mL), creating foam. The gas flow wasdirected by a driven valve, either to the column or to acounter pressure device that prevented the solution from
flowing downwards in the absence of bubbling. Theconductivity during the test, volume of foam and airincorporated were recorded by a computer and a linearcamera (Schmersal OM-1024 with cosmicar 25mmtelevision lens). All experiments were performed intriplicate.Conductivity measurements as a function of time ðCtÞ
and with reference to the conductivity of the buffer testsolution ðCinitÞ were used to calculate the volume ofliquid drained in the foam ðLÞ:
L ¼ Vinit½1� ðCt=CinitÞ�:
The different parameters analysed during the experimentare reported in Fig. 1.These parameters allowed for the characterization of
the foaming properties of the samples:
Foaming capacity was determined by
* the maximum foam volume ðFmaxÞ
Fmax ¼ fmax � ðTl � LmaxÞ;
* the foam density ðFDÞ
FD ¼ ðLmax=FmaxÞ:
Foam stability was determined by
* the half-life of drainage ðT1=2Þ:
T1=2 ¼ t1=2 � t0;
* the minimum foam volume ðFminÞ:
Fmin ¼ fmin � ðTl � LminÞ;
* the stability index ðSiÞ:
Si ¼ ðFmin=FmaxÞ�100:
3. Results and discussion
3.1. Determination of the extent of glycation
The quantities of free amino groups were measuredusing the OPA modified method. The BLG sequencecontains 16 potential reactive amino-groups including 1a-NH2 and 15 e-NH2 on lysyl residues. Modified aminogroups (Table 1) were deduced from OPA results. Only80.1% of the 16 amino groups of native BLG could bedetected. Since no amino groups were modified onnative BLG, all results are reported relative to 100% ofamino groups of native protein. In the heated controlprotein, one amino group was modified. This could beexplained by a structural modification of BLG such as apolymerization, inducing a masking of a single site ofmodification.On an average, 11.0, 8.8, 6.7, 6.6, 6.5 and 5.5 amino
groups were modified when proteins were heated in the
Fig. 1. Experimental foam curves obtained with the bubbling appa-
ratus (heated BLG sample was used): fmax is the observed maximum
foam volume at the end of bubbling (bubbling stopped when fmaxequals 35mL); fmin the observed foam volume at the end of the
experiment (after 20min); Lmax the maximum liquid volume in the
foam at the end of bubbling; Lmin the liquid volume in the foam at the
end of the experiment; t0 the time (s) at the end of bubbling;
t1=2 ¼ Lmax=2.
F. Chevalier et al. / International Dairy Journal 11 (2001) 145–152 147
presence of ribose, arabinose, galactose, glucose, rham-nose and lactose, respectively.As expected, the modification degree was in direct
relation with the sugar size (Prabhakaram & Ortwerth,1994; Nacka, Chobert, Burova, L!eonil, & Haertl!e,1998). The shorter the carbonic chain of the sugar is,the more open chain forms exist and the more reactive isthe sugar with the amino groups of proteins.
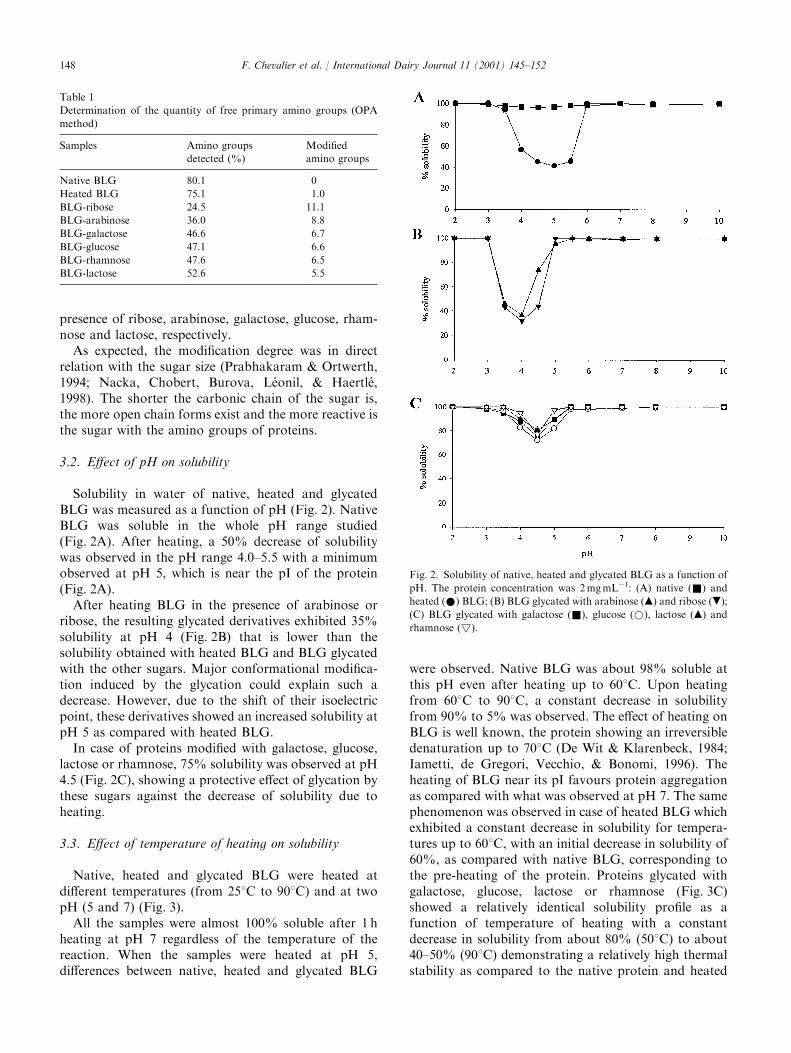
3.2. Effect of pH on solubility
Solubility in water of native, heated and glycatedBLG was measured as a function of pH (Fig. 2). NativeBLG was soluble in the whole pH range studied(Fig. 2A). After heating, a 50% decrease of solubilitywas observed in the pH range 4.0–5.5 with a minimumobserved at pH 5, which is near the pI of the protein(Fig. 2A).After heating BLG in the presence of arabinose or
ribose, the resulting glycated derivatives exhibited 35%solubility at pH 4 (Fig. 2B) that is lower than thesolubility obtained with heated BLG and BLG glycatedwith the other sugars. Major conformational modifica-tion induced by the glycation could explain such adecrease. However, due to the shift of their isoelectricpoint, these derivatives showed an increased solubility atpH 5 as compared with heated BLG.In case of proteins modified with galactose, glucose,
lactose or rhamnose, 75% solubility was observed at pH4.5 (Fig. 2C), showing a protective effect of glycation bythese sugars against the decrease of solubility due toheating.
3.3. Effect of temperature of heating on solubility
Native, heated and glycated BLG were heated atdifferent temperatures (from 258C to 908C) and at twopH (5 and 7) (Fig. 3).All the samples were almost 100% soluble after 1 h
heating at pH 7 regardless of the temperature of thereaction. When the samples were heated at pH 5,differences between native, heated and glycated BLG
were observed. Native BLG was about 98% soluble atthis pH even after heating up to 608C. Upon heatingfrom 608C to 908C, a constant decrease in solubilityfrom 90% to 5% was observed. The effect of heating onBLG is well known, the protein showing an irreversibledenaturation up to 708C (De Wit & Klarenbeck, 1984;Iametti, de Gregori, Vecchio, & Bonomi, 1996). Theheating of BLG near its pI favours protein aggregationas compared with what was observed at pH 7. The samephenomenon was observed in case of heated BLG whichexhibited a constant decrease in solubility for tempera-tures up to 608C, with an initial decrease in solubility of60%, as compared with native BLG, corresponding tothe pre-heating of the protein. Proteins glycated withgalactose, glucose, lactose or rhamnose (Fig. 3C)showed a relatively identical solubility profile as afunction of temperature of heating with a constantdecrease in solubility from about 80% (508C) to about40–50% (908C) demonstrating a relatively high thermalstability as compared to the native protein and heated
Table 1
Determination of the quantity of free primary amino groups (OPA
method)
Samples Amino groups
detected (%)
Modified
amino groups
Native BLG 80.1 0
Heated BLG 75.1 1.0
BLG-ribose 24.5 11.1
BLG-arabinose 36.0 8.8
BLG-galactose 46.6 6.7
BLG-glucose 47.1 6.6
BLG-rhamnose 47.6 6.5
BLG-lactose 52.6 5.5
Fig. 2. Solubility of native, heated and glycated BLG as a function of
pH. The protein concentration was 2mgmL�1: (A) native (&) and
heated (*) BLG; (B) BLG glycated with arabinose (m) and ribose (.);
(C) BLG glycated with galactose (&), glucose (*), lactose (m) and
rhamnose (!).
F. Chevalier et al. / International Dairy Journal 11 (2001) 145–152148
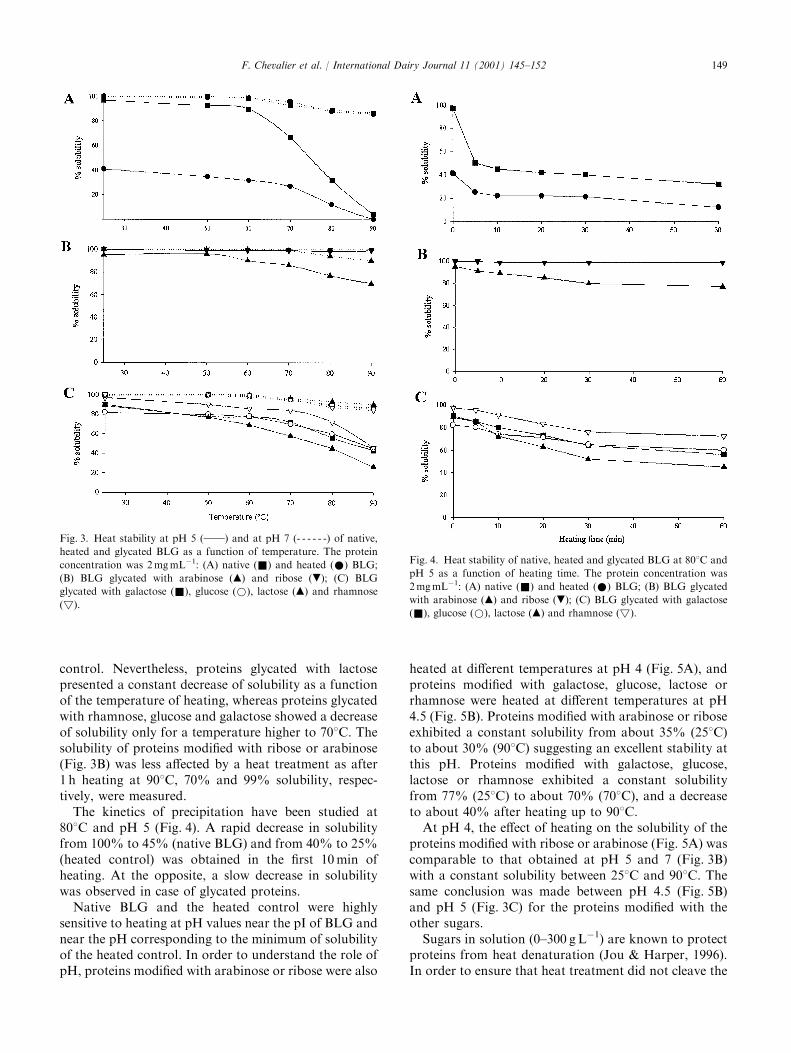
control. Nevertheless, proteins glycated with lactosepresented a constant decrease of solubility as a functionof the temperature of heating, whereas proteins glycatedwith rhamnose, glucose and galactose showed a decreaseof solubility only for a temperature higher to 708C. Thesolubility of proteins modified with ribose or arabinose(Fig. 3B) was less affected by a heat treatment as after1 h heating at 908C, 70% and 99% solubility, respec-tively, were measured.The kinetics of precipitation have been studied at
808C and pH 5 (Fig. 4). A rapid decrease in solubilityfrom 100% to 45% (native BLG) and from 40% to 25%(heated control) was obtained in the first 10min ofheating. At the opposite, a slow decrease in solubilitywas observed in case of glycated proteins.Native BLG and the heated control were highly
sensitive to heating at pH values near the pI of BLG andnear the pH corresponding to the minimum of solubilityof the heated control. In order to understand the role ofpH, proteins modified with arabinose or ribose were also
heated at different temperatures at pH 4 (Fig. 5A), andproteins modified with galactose, glucose, lactose orrhamnose were heated at different temperatures at pH4.5 (Fig. 5B). Proteins modified with arabinose or riboseexhibited a constant solubility from about 35% (258C)to about 30% (908C) suggesting an excellent stability atthis pH. Proteins modified with galactose, glucose,lactose or rhamnose exhibited a constant solubilityfrom 77% (258C) to about 70% (708C), and a decreaseto about 40% after heating up to 908C.At pH 4, the effect of heating on the solubility of the
proteins modified with ribose or arabinose (Fig. 5A) wascomparable to that obtained at pH 5 and 7 (Fig. 3B)with a constant solubility between 258C and 908C. Thesame conclusion was made between pH 4.5 (Fig. 5B)and pH 5 (Fig. 3C) for the proteins modified with theother sugars.Sugars in solution (0–300 gL�1) are known to protect
proteins from heat denaturation (Jou & Harper, 1996).In order to ensure that heat treatment did not cleave the
Fig. 3. Heat stability at pH 5 (}}) and at pH 7 (- - - - - -) of native,
heated and glycated BLG as a function of temperature. The protein
concentration was 2mgmL�1: (A) native (&) and heated (*) BLG;
(B) BLG glycated with arabinose (m) and ribose (.); (C) BLG
glycated with galactose (&), glucose (*), lactose (m) and rhamnose
(!).
Fig. 4. Heat stability of native, heated and glycated BLG at 808C and
pH 5 as a function of heating time. The protein concentration was
2mgmL�1: (A) native (&) and heated (*) BLG; (B) BLG glycated
with arabinose (m) and ribose (.); (C) BLG glycated with galactose
(&), glucose (*), lactose (m) and rhamnose (!).
F. Chevalier et al. / International Dairy Journal 11 (2001) 145–152 149
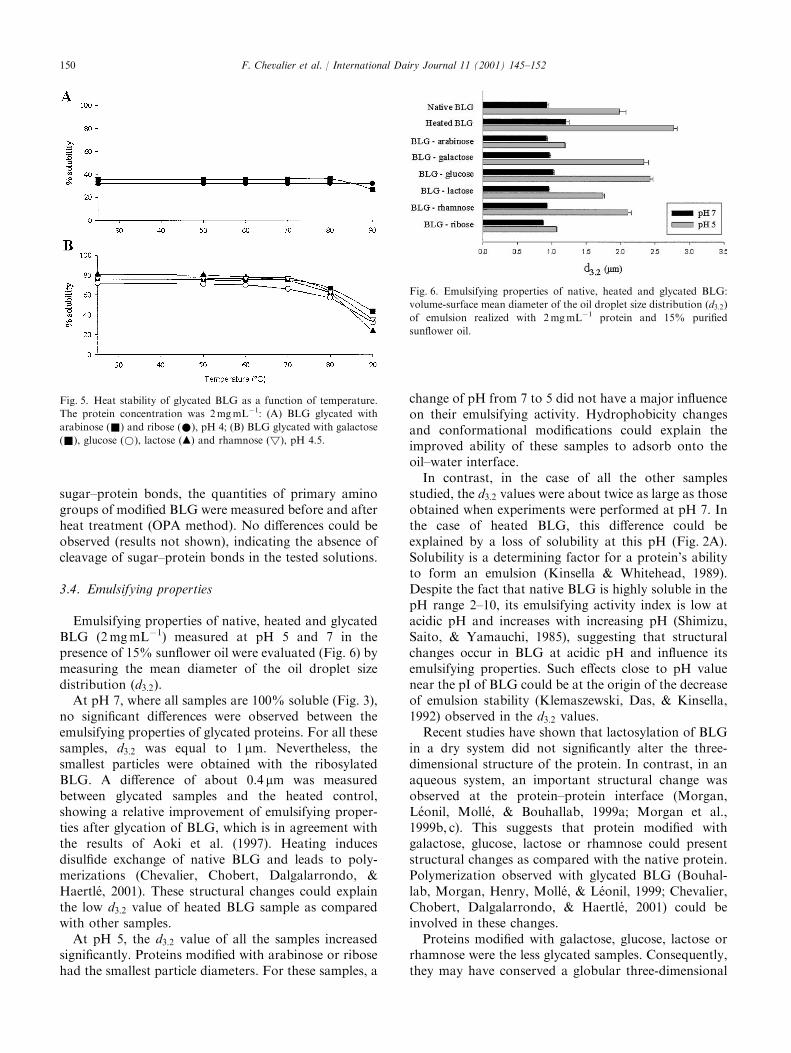
sugar–protein bonds, the quantities of primary aminogroups of modified BLG were measured before and afterheat treatment (OPA method). No differences could beobserved (results not shown), indicating the absence ofcleavage of sugar–protein bonds in the tested solutions.
3.4. Emulsifying properties
Emulsifying properties of native, heated and glycatedBLG (2mgmL�1) measured at pH 5 and 7 in thepresence of 15% sunflower oil were evaluated (Fig. 6) bymeasuring the mean diameter of the oil droplet sizedistribution ðd3:2Þ.At pH 7, where all samples are 100% soluble (Fig. 3),
no significant differences were observed between theemulsifying properties of glycated proteins. For all thesesamples, d3:2 was equal to 1 mm. Nevertheless, thesmallest particles were obtained with the ribosylatedBLG. A difference of about 0.4 mm was measuredbetween glycated samples and the heated control,showing a relative improvement of emulsifying proper-ties after glycation of BLG, which is in agreement withthe results of Aoki et al. (1997). Heating inducesdisulfide exchange of native BLG and leads to poly-merizations (Chevalier, Chobert, Dalgalarrondo, &Haertl!e, 2001). These structural changes could explainthe low d3:2 value of heated BLG sample as comparedwith other samples.At pH 5, the d3:2 value of all the samples increased
significantly. Proteins modified with arabinose or ribosehad the smallest particle diameters. For these samples, a
change of pH from 7 to 5 did not have a major influenceon their emulsifying activity. Hydrophobicity changesand conformational modifications could explain theimproved ability of these samples to adsorb onto theoil–water interface.In contrast, in the case of all the other samples
studied, the d3:2 values were about twice as large as thoseobtained when experiments were performed at pH 7. Inthe case of heated BLG, this difference could beexplained by a loss of solubility at this pH (Fig. 2A).Solubility is a determining factor for a protein’s abilityto form an emulsion (Kinsella & Whitehead, 1989).Despite the fact that native BLG is highly soluble in thepH range 2–10, its emulsifying activity index is low atacidic pH and increases with increasing pH (Shimizu,Saito, & Yamauchi, 1985), suggesting that structuralchanges occur in BLG at acidic pH and influence itsemulsifying properties. Such effects close to pH valuenear the pI of BLG could be at the origin of the decreaseof emulsion stability (Klemaszewski, Das, & Kinsella,1992) observed in the d3:2 values.Recent studies have shown that lactosylation of BLG
in a dry system did not significantly alter the three-dimensional structure of the protein. In contrast, in anaqueous system, an important structural change wasobserved at the protein–protein interface (Morgan,L!eonil, Moll!e, & Bouhallab, 1999a; Morgan et al.,1999b, c). This suggests that protein modified withgalactose, glucose, lactose or rhamnose could presentstructural changes as compared with the native protein.Polymerization observed with glycated BLG (Bouhal-lab, Morgan, Henry, Moll!e, & L!eonil, 1999; Chevalier,Chobert, Dalgalarrondo, & Haertl!e, 2001) could beinvolved in these changes.Proteins modified with galactose, glucose, lactose or
rhamnose were the less glycated samples. Consequently,they may have conserved a globular three-dimensional
Fig. 5. Heat stability of glycated BLG as a function of temperature.
The protein concentration was 2mgmL�1: (A) BLG glycated with
arabinose (&) and ribose (*), pH 4; (B) BLG glycated with galactose
(&), glucose (*), lactose (m) and rhamnose (!), pH 4.5.
Fig. 6. Emulsifying properties of native, heated and glycated BLG:
volume-surface mean diameter of the oil droplet size distribution ðd3:2Þof emulsion realized with 2mgmL�1 protein and 15% purified
sunflower oil.
F. Chevalier et al. / International Dairy Journal 11 (2001) 145–152150
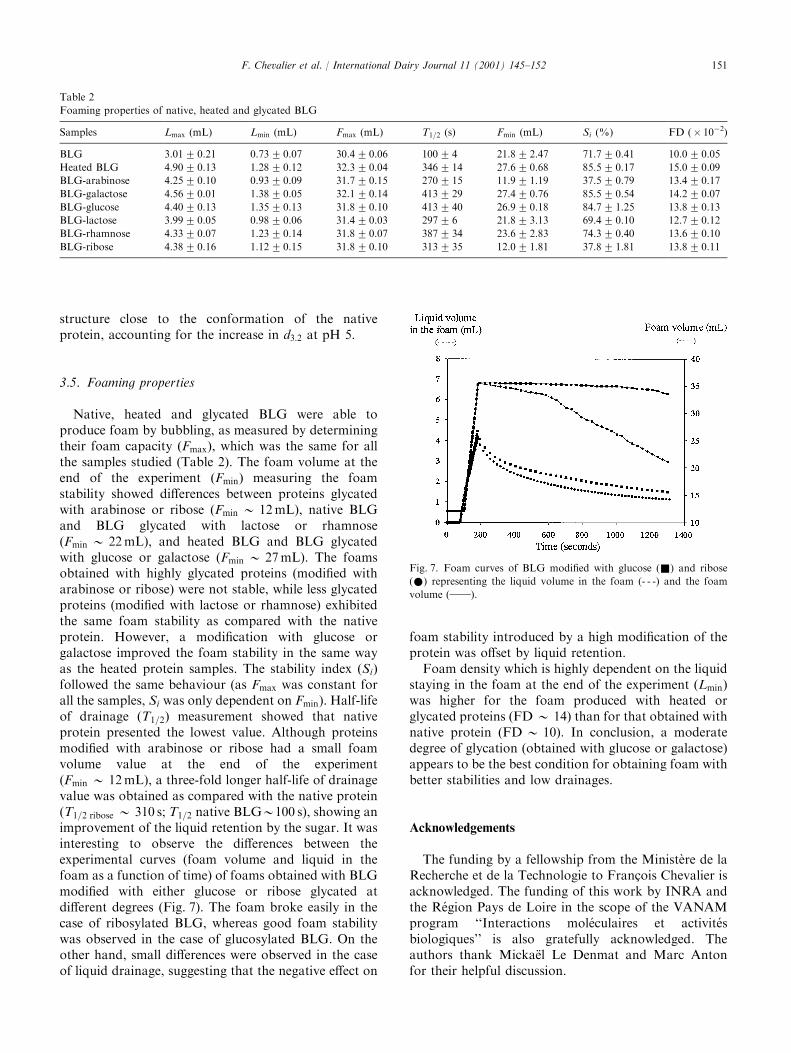
structure close to the conformation of the nativeprotein, accounting for the increase in d3:2 at pH 5.
3.5. Foaming properties
Native, heated and glycated BLG were able toproduce foam by bubbling, as measured by determiningtheir foam capacity ðFmaxÞ, which was the same for allthe samples studied (Table 2). The foam volume at theend of the experiment ðFminÞ measuring the foamstability showed differences between proteins glycatedwith arabinose or ribose ðFmin � 12mL), native BLGand BLG glycated with lactose or rhamnose(Fmin � 22mL), and heated BLG and BLG glycatedwith glucose or galactose (Fmin � 27mL). The foamsobtained with highly glycated proteins (modified witharabinose or ribose) were not stable, while less glycatedproteins (modified with lactose or rhamnose) exhibitedthe same foam stability as compared with the nativeprotein. However, a modification with glucose orgalactose improved the foam stability in the same wayas the heated protein samples. The stability index ðSiÞfollowed the same behaviour (as Fmax was constant forall the samples, Si was only dependent on Fmin). Half-lifeof drainage ðT1=2Þ measurement showed that nativeprotein presented the lowest value. Although proteinsmodified with arabinose or ribose had a small foamvolume value at the end of the experiment(Fmin � 12mL), a three-fold longer half-life of drainagevalue was obtained as compared with the native protein(T1=2 ribose � 310 s; T1=2 native BLG�100 s), showing animprovement of the liquid retention by the sugar. It wasinteresting to observe the differences between theexperimental curves (foam volume and liquid in thefoam as a function of time) of foams obtained with BLGmodified with either glucose or ribose glycated atdifferent degrees (Fig. 7). The foam broke easily in thecase of ribosylated BLG, whereas good foam stabilitywas observed in the case of glucosylated BLG. On theother hand, small differences were observed in the caseof liquid drainage, suggesting that the negative effect on
foam stability introduced by a high modification of theprotein was offset by liquid retention.Foam density which is highly dependent on the liquid
staying in the foam at the end of the experiment ðLminÞwas higher for the foam produced with heated orglycated proteins ðFD � 14Þ than for that obtained withnative protein ðFD � 10Þ. In conclusion, a moderatedegree of glycation (obtained with glucose or galactose)appears to be the best condition for obtaining foam withbetter stabilities and low drainages.
Acknowledgements
The funding by a fellowship from the Minist"ere de laRecherche et de la Technologie to Fran-cois Chevalier isacknowledged. The funding of this work by INRA andthe R!egion Pays de Loire in the scope of the VANAMprogram ‘‘Interactions mol!eculaires et activit!esbiologiques’’ is also gratefully acknowledged. Theauthors thank Micka.el Le Denmat and Marc Antonfor their helpful discussion.
Table 2
Foaming properties of native, heated and glycated BLG
Samples Lmax (mL) Lmin (mL) Fmax (mL) T1=2 (s) Fmin (mL) Si (%) FD (� 10�2)
BLG 3.01 0.21 0.73 0.07 30.4 0.06 100 4 21.8 2.47 71.7 0.41 10.0 0.05
Heated BLG 4.90 0.13 1.28 0.12 32.3 0.04 346 14 27.6 0.68 85.5 0.17 15.0 0.09
BLG-arabinose 4.25 0.10 0.93 0.09 31.7 0.15 270 15 11.9 1.19 37.5 0.79 13.4 0.17
BLG-galactose 4.56 0.01 1.38 0.05 32.1 0.14 413 29 27.4 0.76 85.5 0.54 14.2 0.07
BLG-glucose 4.40 0.13 1.35 0.13 31.8 0.10 413 40 26.9 0.18 84.7 1.25 13.8 0.13
BLG-lactose 3.99 0.05 0.98 0.06 31.4 0.03 297 6 21.8 3.13 69.4 0.10 12.7 0.12
BLG-rhamnose 4.33 0.07 1.23 0.14 31.8 0.07 387 34 23.6 2.83 74.3 0.40 13.6 0.10
BLG-ribose 4.38 0.16 1.12 0.15 31.8 0.10 313 35 12.0 1.81 37.8 1.81 13.8 0.11
Fig. 7. Foam curves of BLG modified with glucose (&) and ribose
(*) representing the liquid volume in the foam (- - -) and the foam
volume (}}).
F. Chevalier et al. / International Dairy Journal 11 (2001) 145–152 151
References
Ames, J. M. (1998). Application of the Maillard reaction in the food
industry. Food Chemistry, 62, 431–439.
Aoki, T., Kitahata, K., Fukumoto, T., Sugimoto, Y., Ibrahim, H. R.,
Kimura, T., Kato, Y., & Matsuda, T. (1997). Improvement of
functional properties of b-lactoglobulin by conjugation with
glucose-6-phosphate through the Maillard reaction. Food Research
International, 30, 401–406.
Bertrand-Harb, C., Charrier, B., Dalgalarrondo, M., Chobert, J. M.,
& Haertl!e, T. (1990). Condensation of glycosidic and aromatic
structures on amino groups of b-lactoglobulin B via reductive
alkylation. Solubility and emulsifying properties of the protein
derivatives. Le Lait, 71, 205–215.
Bouhallab, S., Morgan, F., Henry, G., Moll!e, D., & L!eonil, J. (1999).
Formation of stable covalent dimer explains the high solubility at
pH 4.6 of lactose-b-lactoglobulin conjugates heated near neutral
pH. Journal of Agricultural and Food Chemistry, 47, 1489–1494.
Cheftel, J. C., & Lorient, D. (1982). Aspects technologiques. Les
propri!et!es fonctionnelles des proteines laiti"eres et leur am!elioration.
Le Lait, 62, 435–483.
Chevalier, F., Chobert, J. M., Dalgalarrondo, M., & Haertl!e, T.
(2001). Characterization of the Maillard reactions products of b-lactoglobulin glucosylated in mild conditions. Journal of Food
Biochemistry, 25, 33–55.
Chuyen, N. V. (1998). Maillard reaction and food processing.
Application aspects. Advances in Experimental Medicine and
Biology, 434, 213–235.
De Wit, J. N., & Klarenbeek, G. (1984). Effect of various heat
treatments on the structure and stability of whey proteins. Journal
of Dairy Science, 67, 2701–2710.
Friedman, M. (1996). Food browning and its prevention: An overview.
Journal of Agricultural and Food Chemistry, 44, 631–653.
Frister, H., Meisel, H., & Schlimme, E. (1988). OPA method modified
by used of N,N-dimethyl-2-mercaptoethylammoniumchloride as
thiol component. Fresenius Zeitschrift f .ur Analytische Chemie, 330,
631–633.
Haertl!e, T., & Chobert, J. M. (1999). Recent progress in processing of
dairy proteins: A review. Journal of Food Biochemistry, 23, 367–
407.
Hagolle, N., Relkin, P., Popineau, Y., & Bertrand, D. (2000). Study of
the stability of egg white protein-based foams: Effect of heating
protein solution. Journal of the Science of Food and Agriculture, 80,
1245–1252.
Iametti, S., de Gregori, B., Vecchio, G., & Bonomi, F. (1996).
Modifications occur at different structural levels during the heat
denaturation of beta-lactoglobulin. European Journal of Biochem-
istry, 237, 106–112.
Jou, K. D., & Harper, W. J. (1996). Effect of disaccharides on the
thermal properties of whey proteins determined by differential
scanning calorimetry (DSC). Milchwissenschaft, 51, 509–512.
Kinsella, J. E., & Whitehead, D. M. (1989). Protein in whey: Chemical,
physical and functional properties. Advances in Food and Nutrition
Research, 33, 343–438.
Kitabatake, N., Cuq, J. L., & Cheftel, C. (1985). Covalent binding of
glycosyl residues to b-lactoglobulin: Effects on solubility and heat
stability. Journal of Agricultural and Food Chemistry, 33, 125–130.
Klemaszewski, J. L., Das, K. P., & Kinsella, J. E. (1992). Formation
and covalence stability of emulsions stabilized by different milk
proteins. Journal of Food Science, 57, 366–371.
Ledl, F., & Schleicher, E. (1990). New aspects of the Maillard reaction
in foods and in the human body. Angewandte Chemie International
(Edition in English), 29, 565–594.
Maillard, L. C. (1912). Action des amines sur les sucres: Formation des
m!elano.ıdines par voie m!ethodique. Comptes Rendus de l’Acad !emie
des Sciences, 154, 66–68.
Mailliart, P., & Ribadeau Dumas, B. (1988). Preparation of
b-lactoglobulin and b-lactoglobulin-free proteins from whey
retentate by NaCl salting out at low pH. Journal of Food Science,
53,
743–752.
Mattarella, N. L., & Richardson, T. (1983). Physicochemical and
functional properties of positively charged derivatives of bovine
b-lactoglobulin. Journal of Agricultural and Food Chemistry, 31,
972–978.
Morgan, F., L!eonil, J., Moll!e, D., & Bouhallab, S. (1999a).
Modification of bovine b-lactoglobulin by glycation in a powdered
state or in an aqueous solution: Effect on association behavior and
protein conformation. Journal of Agricultural and Food Chemistry,
47, 83–91.
Morgan, F., Moll!e, D., Henry, G., V!enien, A., L!eonil, J., Peltre,
G., Levieux, D., Maubois, J. L., & Bouhallab, S. (1999b).
Glycation of bovine b-lactoglobulin: Effect on the protein
structure.
International Journal of Food Science and Technology, 34,
429–435.
Morgan, F., V!enien, A., Bouhallab, S., Moll!e, D., L!eonil, J., Peltre,
G., & Levieux, D. (1999c). Modification of bovine b-lactoglobulinby glycation in a powdered state or in aqueous solution:
Immunological characterization. Journal of Agricultural and Food
Chemistry, 47, 4543–4548.
Nacka, F., Chobert, J. M., Burova, T., L!eonil, J., & Haertl!e, T. (1998).
Induction of new physicochemical and functional properties by the
glycosylation of whey proteins. Journal of Protein Chemistry, 17,
495–503.
O’Brien, J., & Morrissey, P. A. (1989). Nutritional and toxicological
aspects of the Maillard browning reaction in foods. Critical Review
in Food Science and Nutrition, 28, 211–248.
Prabhakaram, M., & Ortwerth, B. J. (1994). Determination of
glycation crosslinking by the sugar-dependent incorporation of
[14C] lysine into protein. Analytical Biochemistry, 216, 305–312.
Shimizu, M., Saito, M., & Yamauchi, K. (1985). Emulsifying and
structural properties of b-lactoglobulin at different pHs. Agricul-
tural and Biological Chemistry, 49, 189–194.
Sitohy, M., Chobert, J. M., & Haertl!e, T. (1995). Phosphorylation of
b-lactoglobulin under mild conditions. Journal of Agricultural and
Food Chemistry, 43, 59–62.
Sitohy, M., Chobert, J. M., Haertl!e, T. (2001). Simplified short-time
method for the esterification of milk proteins. Milchwissenschaft,
56(3), 127–131.
Sitohy, M., Chobert, J. M., Popineau, Y., & Haertl!e, T. (1995).
Functional properties of b-lactoglobulin phosphorylated in the
presence of different aliphatic amines. Le Lait, 75, 503–512.
Smithers, G. W., Ballard, F. J., Copeland, A. D., & de Silva, K. J.
(1996). Symposium: Advances in dairy foods proceeding and
engineering. New opportunities from the isolation and utilization
of whey proteins. Journal of Dairy Science, 79, 1454–1459.
Waniska, R. D., & Kinsella, J. E. (1988). Foaming and emulsifying
properties of glycosylated b-lactoglobulin. Food Hydrocollo.ıd, 2,
439–449.
F. Chevalier et al. / International Dairy Journal 11 (2001) 145–152152
Scavenging of Free Radicals, Antimicrobial, and Cytotoxic Activitiesof the Maillard Reaction Products of â-Lactoglobulin Glycated withSeveral Sugars
Francois Chevalier, Jean-Marc Chobert,* Claude Genot, and Thomas Haertle
Laboratoire d’EÄ tude des Interactions des Molecules Alimentaires, INRA, B.P. 71627,44316 Nantes Cedex 3, France
The Maillard reaction occurs during many industrial and domestic thermal treatments of foods. Itis widely used because of its role in creating colors, flavors, textures, and other functional propertiesin foodstuffs. Proteins glycated without the use of conventional chemical reagents have improvedtechnofunctional properties such as heat stability, emulsifying, and foaming properties. The presentstudy was carried out to determine the extent to which this reaction can convey antioxidant,antimicrobial, or cytotoxic activities to â-lactoglobulin (BLG) and to its tryptic and peptichydrolysates. BLG was modified with six different sugars in solution at 60 °C. Antiradical propertieswere estimated using a radical scavenging activity test. Antimicrobial activities against differentbacterial strains were studied with a diffusion disk method. Cytotoxic tests were performed usingtwo cell lines and the 3-(4,5-dimethylthiazoyl-2-yl)-2,5-diphenyltetrazolium bromide (MTT) rapidcolorimetric assay. Glycation induced a radical scavenging activity to BLG, the intensity of whichdepended on the sugar used for modification. Proteins modified with ribose and arabinose showedthe highest radical scavenging activities depicted by about 80 and 60% of 2,2-diphenyl-1-picrylhydrazyl (DPPH) absorption decrease at 515 nm. No antimicrobial effect of any glycated formof BLG against Escherichia coli, Bacillus subtilis, Listeria innocua, and Streptococcus mutans wasobserved. The MTT test showed no enhancement of cytotoxicity by modified proteins and peptidesagainst COS-7 and HL-60 cells. Thus, glycated proteins could be used in formulated food as functionalingredients with a radical scavenging activity able to delay deterioration due to oxidation. This usecould be even more advisable considering the lack of toxicity to eukaryotic and prokaryotic cellcultures demonstrated in this work.
Keywords: Free radical scavenger; antimicrobial; cytotoxicity; glycation; â-lactoglobulin
INTRODUCTION
The protein fraction of milk is known to contain manyvaluable components and biologically active substances,which confer special properties for the support of infantdevelopment and growth (1). Many milk-borne bio-activities are latent, requiring proteolytic release ofbioactive peptides from inactive native proteins (2). Milkprotein-derived bioactive peptides include a variety ofsubstances that are potential modulators of variousregulatory processes and reveal multifunctional bio-activities (3). Opioid agonist (4), opioid antagonist (5),inhibitor of angiotensin converting enzyme (ACE) (6, 7),immunomodulator (8), antimicrobial (9, 10), and anti-thrombotic (11) activities have been largely described(12).
â-Lactoglobulin (BLG) is known to contain an ACE-inhibitory sequence (13), but its biological function inmilk is still not well-known (14).
Because many attempts are made to control foodstorage and to preserve food from oxidation and micro-organism contamination, it is interesting to subjectprotein to oxidoreductive modification to see whethernew biological properties could be induced. The Maillard
reaction is one of the major reactions modifying proteinsin food and in nature. The examination of how it caninfluence biological properties of derived proteins andpeptides is of particular interest. This reaction, alsocalled nonenzymatic browning or glycation, was firstdescribed by the French biochemist Louis Maillard atthe beginning of the 20th century (15). It correspondsto a spontaneous reaction between amino groups andreducing compounds. In food, it consists of a condensa-tion of the reducing sugars with essentially the ε-aminogroup of lysyl residues of proteins (16). The Maillardreaction occurs frequently during industrial processing,during prolonged storage, and in domestic cooking (17),enhancing color, aroma, and flavor. The consequencesof this reaction on the biological properties of themodified products have been largely studied on modelsystems, which consist of heating a single amino acidwith a reducing sugar. The Maillard reaction induced(i) antioxidative activity of glucose-glycine (18), xylose-lysine (19), and xylose-arginine reacting systems (20);(ii) antimicrobial activity of xylose-arginine and glucose-histidine systems (21-23) and of glucose-glycine sys-tem (24); (iii) cytotoxic activity of glucose-lysine andfructose-lysine systems (25); and (iv) clastogenic activ-ity of ribose-lysine (26) and glucose-lysine systems(27). Proteins modified by the Maillard reaction can alsopresent some of these properties. For example, lysozyme
* Corresponding author [telephone 33 (0) 2 40 67 50 85; fax33 (0) 2 40 67 50 84; e-mail [email protected]].
5031J. Agric. Food Chem. 2001, 49, 5031−5038
10.1021/jf010549x CCC: $20.00 © 2001 American Chemical SocietyPublished on Web 09/26/2001
modified with dextran by glycation developed a signifi-cant antimicrobial activity against both Gram-negativeand Gram-positive bacteria (28); glycation of casein withglucose or lactose resulted in an enhancement of anti-oxidant activity when compared with native casein (29).
Recent work (30) has shown that functional proper-ties, such as thermal stability and emulsifying andfoaming properties, of BLG modified by the Maillardreaction are improved, depending on the sugar usedduring modification. Glycated BLG used as a foodingredient for its functional properties may also de-crease the oxidative reactions and/or can influencecellular and microorganism growth.
The aim of this study was to determine how glycationof BLG could induce new biological properties whencompared with native protein. Whole glycated BLG andits peptic and tryptic hydrolysates were tested for theirfree radical scavenging, antimicrobial, and cytotoxicproperties.
MATERIALS AND METHODS
Protein Purification. â-Lactoglobulin (variant A) waspurified according to the procedure of Mailliart and RibadeauDumas (31). The purity of BLG (99%) was assessed by RP-HPLC.
Reagents. D-Arabinose, D-galactose, D-glucose, D-lactose,D-rhamnose, D-ribose monohydrates, bovine trypsin TPCK-treated, porcine pepsin, 3-(4,5-dimethylthiazoyl-2-yl)-2,5-diphenyltetrazolium bromide (MTT), and bovine serum albu-min (BSA) were obtained from Sigma Chemical Co. (St. Louis,MO). Escherichia coli HB-101 was from the collection of theInstitute of Microbiology, Bulgarian Academy of Science (Sofia,Bulgaria), Bacillus subtilis ATCC 6633 was from the AmericanType Culture Collection (Rockville, MD), Listeria innocua Fwas from the collection of the Ecole Nationale d’Ingenieur desTechniques des Industries Agricoles et Alimentaires (Nantes,France), and Streptococcus mutans CIP 103220 T was fromthe collection of the Institut Pasteur (Paris, France). All otherreagents were of analytical grade.
Achievement of Modified Proteins. BLG (0.217 mM) andthe different sugars (0.217 M) were dissolved in 0.1 Mphosphate buffer, pH 6.5. After filtration on an acetatecellulose membrane filter (0.22 µm diameter, Millipore),mixtures of protein and sugar were put in well-capped flasksand heated in a water bath at 60 °C for 72 h. This mild heattreatment was chosen to limit autoaggregation of BLG. Allexperiments were performed under strictly anaerobic andsterile conditions; all media were purged and saturated withN2. After heating, the different fractions were dialyzed againstdistilled water, freeze-dried, and stored at -20 °C. BLG heatedwithout sugar (heated control) was named “heated BLG”, andBLG heated in the presence of sugar was named “glycatedBLG” or “BLG-sugar”.
The quantities of free amino groups were measured usingthe OPA modified method (see next section). The BLG se-quence contains 16 potential reactive amino groups including1 R-NH2 and 15 ε-NH2 on lysyl residues. Modified aminogroups were deduced from OPA results. According to previouswork (30, 32), on average, 11.0, 8.8, 6.7, 6.6, 6.5, and 5.5 aminogroups were modified when proteins were heated in thepresence of ribose, arabinose, galactose, glucose, rhamnose,and lactose, respectively.
Determination of Available Amino Groups. The quan-tity of available amino groups was determined according tothe modified o-phthaldialdehyde (OPA) method (33). The OPAreagent was prepared daily by mixing 40 mg of OPA, dissolvedin 1 mL of methanol, 50 mL of 0.1 M sodium borate buffer,pH 9.3, 100 mg of N-dimethyl-2-mercaptoethylammoniumchloride (DMMAC), and 1.25 mL of 20% (w/w) SDS in water.Fifty microliters of protein solution (2 mg/mL in 50 mM sodiumphosphate buffer, pH 7.8) was added to 1 mL of OPA reagent.The absorbance was read at 340 nm after a minimal delay of
5 min. A calibration curve was obtained by using 0.25-2.00mM L-leucine as a standard.
Hydrolysis of BLG. Native, heated, and glycated BLG (2mg/mL or 0.11 mM) were dissolved in 0.2 M acetic acid buffer,pH 2.5, for peptic hydrolysis and in 30 mM ammoniumcarbonate buffer, pH 7.9, for tryptic hydrolysis. Proteinsamples were dissolved in volatile buffers to allow efficientlyophilization without dialysis after hydrolysis. Porcine pepsin,previously solubilized in distilled water (1 mg/mL), was addedto the reaction mixture at an enzyme/substrate (E/S) molarratio of 1:100. Bovine trypsin, previously solubilized in 0.01M HCl (1 mg/mL), was added to the reaction mixture at anE/S molar ratio of 1:100. The mixtures were incubated at 37°C for 120 min. The extent of hydrolysis was controlled by RP-HPLC by measuring the percentage of nonhydrolyzed proteinsbefore freezing at -20 °C, and then hydrolysates were lyoph-ilized.
Reversed Phase High-Performance Liquid Chroma-tography (RP-HPLC). The HPLC equipment consisted of aWaters 2690 separation module system with an integratedsolvent, a sample management platform, and a photodiodearray detector model 996. The HPLC system was driven withthe Millenium32 program (Waters).
Fifty microliters of hydrolyzed and nonhydrolyzed sampleswas separated by RP-HPLC on a Symmetry 300A C18 column(3.9 × 150 mm, Waters) equilibrated in 80% (v/v) solvent A(trifluoroacetic acid/H2O, 0.11:99.89, v/v) and 20% solvent B(acetonitrile/H2O/trifluoroacetic acid, 80:19.91:0.09, v/v/v). Elu-tion was performed with a linear gradient from 80 to 0%solvent A for 30 min. The temperature of the column andsolvent was maintained at 30 °C. The flow rate was 0.6 mL/min. Eluted peaks were detected by UV absorbance (214 nm).Peak area corresponding to the nonhydrolyzed form of theprotein was integrated. All results were reported to the peakarea of the nonhydrolyzed sample that represents 100%.
Antiradical Activity Tests. Free radical scavenging activ-ity was measured by using 2,2-diphenyl-1-picrylhydrazyl(DPPH) as stable free radical. Tests solutions of proteins andpeptides were dissolved in bidistilled H2O at different concen-trations, and 0.1 mL of each sample was mixed with 0.9 mLof 6 × 10⁻⁵ M DPPH in methanol solution.
Kinetics experiments were performed on a Cary 1 UV-visible spectrophotometer. Measures were realized every 30 sduring 30 min with a constant concentration of proteins of 5mg/mL. The decrease in absorbance at 515 nm was recorded.After ∼10 min, a plateau was reached. Reaction was consid-ered to be complete after 30 min.
End point measurements were realized with differentconcentrations of proteins and peptides (varying from 5 to 0.1mg/mL). The mixture of proteins or peptides with DPPH wasleft standing at 25 °C for 30 min, and then absorbance at 515nm was measured.
For all experiments, bidistilled water instead of samplesolution was used as control. Gallic acid (60 µM) was used aspositive free radical scavenger control. All experiments wereperformed in triplicate.
The free radical scavenging activity (R. S. Act.) of a samplewas defined as follows:
Inhibitory concentration 50 (IC50) and inhibitory concentration10 (IC10) correspond to the concentrations of sample necessaryto obtain R. S. Act. values of 50 and 10%, respectively.
Antibacterial Activity Tests. Different bacterial strainswere used for these tests. E. coli and B. subtilis were grownon plate count agar (Biokar), L. innocua F was grown onElliker agar (Biokar), and S. mutans was grown on Columbiaagar (Biokar).
Antibacterial activity was determined according to the diskdiffusion method. Protein and peptide samples were dissolvedin bidistilled water (1 mg/mL), filtered on 0.22 µm membranes(Millipore), and stored at 4 °C. Ampicillin (Oxoid) was usedas a standard.
R. S. Act. ) [1 - (Abs515nm sample/Abs515nm blank)] × 100
5032 J. Agric. Food Chem., Vol. 49, No. 10, 2001 Chevalier et al.
Test solutions (10, 25, or 50 µL) were transferred intoseparate 6 mm diameter paper disks (Whatman No. 1) andleft to dry at room temperature under laminar flux. Distilledwater was used as a blank.
A preculture of the different strains was realized the daybefore the manipulation using brain heart infusion (Biokar).Ten microliters of saturated overnight culture was mixed with10 mL of distilled water and applied at the surface of a Petridish containing the suitable agar medium. Excess of suspen-sion was eliminated, and dishes were left to dry under laminarflux for 5 min. Paper disks containing proteins or peptides wereput at the surface of the inoculated Petri dishes. Finally, Petridishes were incubated at 37 °C (for E. coli, S. mutans, and B.subtilis) or 30 °C (for L. innocua), for 24 or 48 h. Inhibitionzones were observed and measured.
Cytotoxic Activity Tests. Cercopithecus aethiops (monkey,African green) kidney fibroblast COS-7 cells were grown as amonolayer in Dulbecco’s Modified Eagle Media (DMEM; Gibco)supplemented with 10% (v/v) fetal calf serum, penicillin (50units/mL), and streptomycin (50 µg/mL). Exponentially grow-ing cultures were maintained in an atmosphere of 5% CO2/95% relative humidity at 37 °C.
Human promyeloblast cells HL-60 were grown in RoswellPark Memorial Institute (RPMI; Biomedia) supplemented with20% (v/v) fetal calf serum, penicillin (50 units/mL), andstreptomycin (50 µg/mL). Exponentially growing cultures weremaintained in an atmosphere of 5% CO2/95% relative humidityat 37 °C.
Assays were based on the cleavage of the tetrazolium salt(MTT) into a blue product (formazan) by a mitochondrialenzyme (succinate dehydrogenase) (34). The conversion takesplace only in living cells, and the amount of formazan producedis proportional to the number of cells present. The assay isbased on the method of Edmondson et al. (35) with a modifica-tion in the protocol of solubilization of formazan, as follows:a solution of 10% (w/v) SDS in 0.01 M HCl was used insteadof a solution of 0.04 M HCl in 2-propanol in order to limit theuse of toxic chemicals.
Single-cell suspensions were obtained by mechanical de-aggregation of the floating cell line HL-60 and by trypsinationof the monolayer cell line COS-7. Cell lines (50 µL) wereinoculated in 96-well plates at a concentration of 40000 cells/mL (2000 cells/well). Fifty microliters of protein and peptidesamples at different concentrations in culture medium wasadded to each well (columns 4-11). Blanks were realized with100 µL of culture medium (column 2), and control was obtainedwith a mixture of 50 µL of cells (40000 cells/mL) and 50 µL ofculture medium (column 3). All samples and the control weremade in triplicate. After 72 h of incubation at 37 °C, 25 µL ofMTT at 2.5 mg/mL in PBS (phosphate-buffered saline) wasadded to each well. After 4 h of incubation at 37 °C with MTT,100 µL of 10% (w/v) SDS in 0.01 M HCl was added to eachwell. After 24 h of incubation at 37 °C, plates were read at540 nm.
Percentage of cytotoxicity (PC) was calculated as follows:
RESULTS AND DISCUSSION
Hydrolysis by Pepsin and Trypsin: Determina-tion of the Susceptibility to Hydrolysis of Native,Heated, and Glycated BLG. Protein samples werehydrolyzed by trypsin and pepsin during 120 min at 37°C. The quantity of protein left nonhydrolyzed wasdetermined by RP-HPLC. The peak area correspondingto nonhydrolyzed protein was calculated and related tothe peak area of the control without addition of enzyme(Table 1). BSA was used as a positive control ofhydrolysis.
Native BLG and heated BLG were rapidly hydrolyzedby trypsin. Because glycation sites are located on lysyl
and arginyl residues, which are also tryptic cleavagesites, such a modification inhibited tryptic hydrolysis.As expected, and according to previous work (16, 32),glycated BLG resisted to tryptic hydrolysis as a functionof its glycation degree. BLG glycated with ribose, whichwas the most modified sample (11 sites modified of 16possible), presented 97% of protein left nonhydrolyzedafter trypsinolysis. Half the amount of BLG modifiedwith arabinose was still present after trypsinolysis. BLGmodified by other sugars exhibited 13-24% of intactproteins after tryptic action, showing a relatively highsusceptibility to this protease.
Peptic hydrolysis gave completely different results.Native BLG is known to resist peptic hydrolysis due toits particular three-dimensional conformation (36, 37).Only 5% of native BLG was hydrolyzed by pepsin in theconditions used. After 72 h of heating at 60 °C, 85% ofBLG was left nonhydrolyzed, confirming a high stabilityof BLG structure after heating. Pepsin susceptibility ofBLG depended on its glycation degree (38). The mosthydrolyzed sample was the ribosylated form of BLG,which showed only 28% of protein left nonhydrolyzed.
DPPH Test: Effect of Maillard Glycation on theFree Radical Scavenging Activity of BLG. In theseexperiments, DPPH in methanol was used as a freeradical. This compound is stable and allows evaluationof the antiradical activity of samples. In its radical form,DPPH absorbs at 515 nm, and after its reduction by anantiradical compound, its absorption disappears (39).Native, heated, and glycated BLG and their tryptic andpeptic hydrolysates were tested for their free radicalscavenging activities.
Kinetics experiments were realized first to estimatethe time necessary to obtain a relatively stable absor-bency of DPPH after being in contact with the proteinsamples. For all compounds, reaction was very fast inthe first 5 min, and then a plateau was rapidly attained.After 30 min, reaction was considered to be achievedand final points were measured.
Radical scavenging activities, IC50 and IC10, arereported in Figure 1 and Table 2. IC50 and IC10 of nativeBLG, heated BLG, and BSA could not be calculatedbecause the highest concentration used (5 mg/mL) wasnot sufficient to obtain 10% of radical scavengingactivity. This is the reason in Table 2, “>5 mg/mL” isindicated for IC50 and IC10 values of these samples.Radical scavenging activities of nonhydrolyzed nativeproteins and their peptic and tryptic hydrolysates were∼7%, showing a weak antiradical activity of proteinsbefore glycation.
Nonhydrolyzed BLG modified by the Maillard reac-tion showed a marked antiradical scavenging activity(Figure 1). Ribosylated BLG showed the highest radical
PC (%) )[1 - (Abs540nm test wells)/(Abs540nm control wells)] × 100
Table 1. Comparison of Tryptic and Peptic Digestion ofNative, Heated, and Glycated BLG and BSA
residual area of nonhydrolyzed protein (%)
sampleafter peptichydrolysis
after tryptichydrolysis
native BLG 95 7heated BLG 85 3BLG-arabinose 39 48BLG-galactose 40 19BLG-glucose 42 17BLG-lactose 74 13BLG-rhamnose 56 24BLG-ribose 28 97BSA 0 0
Biological Properties of the Maillard Reaction Products of â-Lactoglobulin J. Agric. Food Chem., Vol. 49, No. 10, 2001 5033
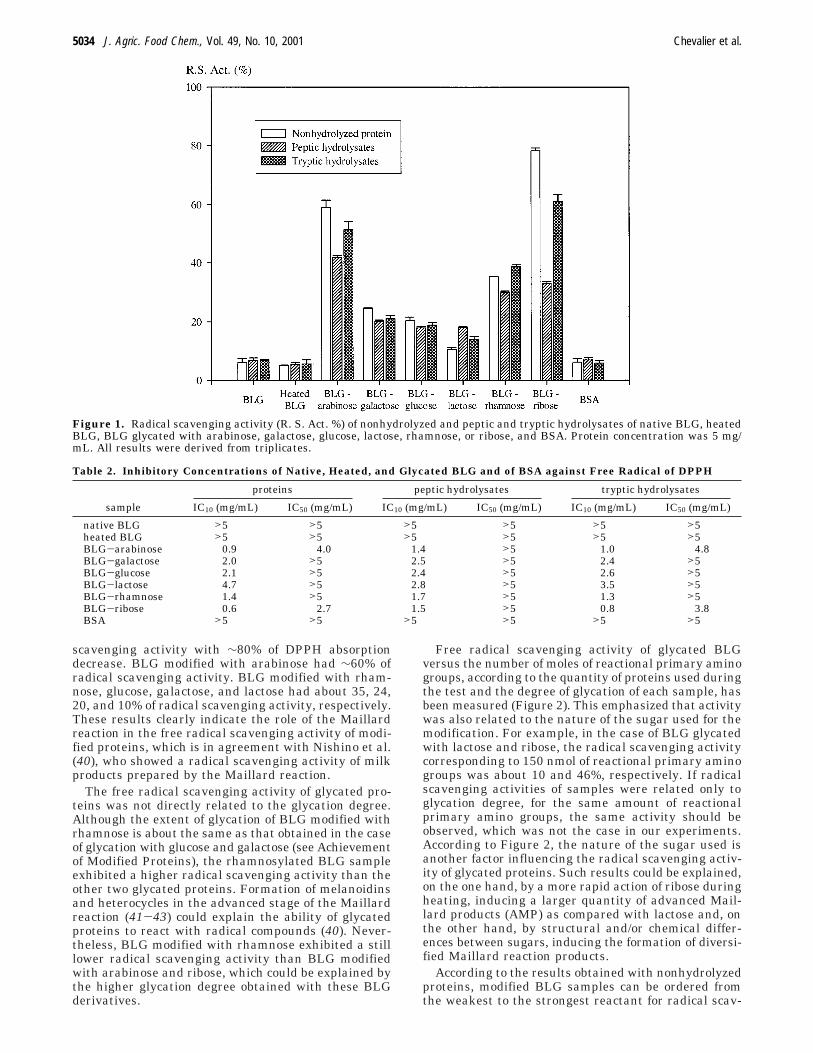
scavenging activity with ∼80% of DPPH absorptiondecrease. BLG modified with arabinose had ∼60% ofradical scavenging activity. BLG modified with rham-nose, glucose, galactose, and lactose had about 35, 24,20, and 10% of radical scavenging activity, respectively.These results clearly indicate the role of the Maillardreaction in the free radical scavenging activity of modi-fied proteins, which is in agreement with Nishino et al.(40), who showed a radical scavenging activity of milkproducts prepared by the Maillard reaction.
The free radical scavenging activity of glycated pro-teins was not directly related to the glycation degree.Although the extent of glycation of BLG modified withrhamnose is about the same as that obtained in the caseof glycation with glucose and galactose (see Achievementof Modified Proteins), the rhamnosylated BLG sampleexhibited a higher radical scavenging activity than theother two glycated proteins. Formation of melanoidinsand heterocycles in the advanced stage of the Maillardreaction (41-43) could explain the ability of glycatedproteins to react with radical compounds (40). Never-theless, BLG modified with rhamnose exhibited a stilllower radical scavenging activity than BLG modifiedwith arabinose and ribose, which could be explained bythe higher glycation degree obtained with these BLGderivatives.
Free radical scavenging activity of glycated BLGversus the number of moles of reactional primary aminogroups, according to the quantity of proteins used duringthe test and the degree of glycation of each sample, hasbeen measured (Figure 2). This emphasized that activitywas also related to the nature of the sugar used for themodification. For example, in the case of BLG glycatedwith lactose and ribose, the radical scavenging activitycorresponding to 150 nmol of reactional primary aminogroups was about 10 and 46%, respectively. If radicalscavenging activities of samples were related only toglycation degree, for the same amount of reactionalprimary amino groups, the same activity should beobserved, which was not the case in our experiments.According to Figure 2, the nature of the sugar used isanother factor influencing the radical scavenging activ-ity of glycated proteins. Such results could be explained,on the one hand, by a more rapid action of ribose duringheating, inducing a larger quantity of advanced Mail-lard products (AMP) as compared with lactose and, onthe other hand, by structural and/or chemical differ-ences between sugars, inducing the formation of diversi-fied Maillard reaction products.
According to the results obtained with nonhydrolyzedproteins, modified BLG samples can be ordered fromthe weakest to the strongest reactant for radical scav-
Figure 1. Radical scavenging activity (R. S. Act. %) of nonhydrolyzed and peptic and tryptic hydrolysates of native BLG, heatedBLG, BLG glycated with arabinose, galactose, glucose, lactose, rhamnose, or ribose, and BSA. Protein concentration was 5 mg/mL. All results were derived from triplicates.
Table 2. Inhibitory Concentrations of Native, Heated, and Glycated BLG and of BSA against Free Radical of DPPH
proteins peptic hydrolysates tryptic hydrolysates
sample IC10 (mg/mL) IC50 (mg/mL) IC10 (mg/mL) IC50 (mg/mL) IC10 (mg/mL) IC50 (mg/mL)
native BLG >5 >5 >5 >5 >5 >5heated BLG >5 >5 >5 >5 >5 >5BLG-arabinose 0.9 4.0 1.4 >5 1.0 4.8BLG-galactose 2.0 >5 2.5 >5 2.4 >5BLG-glucose 2.1 >5 2.4 >5 2.6 >5BLG-lactose 4.7 >5 2.8 >5 3.5 >5BLG-rhamnose 1.4 >5 1.7 >5 1.3 >5BLG-ribose 0.6 2.7 1.5 >5 0.8 3.8BSA >5 >5 >5 >5 >5 >5
5034 J. Agric. Food Chem., Vol. 49, No. 10, 2001 Chevalier et al.

enging activity of DPPH as follows: BLG-lactose <BLG-glucose ≈ BLG-galactose < BLG-rhamnose <BLG-arabinose < BLG-ribose.
The antiradical properties of peptic and tryptic hy-drolysates of modified BLG were also studied to assessthe influence of hydrolysis on radical scavenging activityof glycated proteins. All proteins did not reach the sameextent of hydrolysis as shown by the residual area ofnonhydrolyzed proteins (Table 1). Consequently, threeparameters could influence radical scavenging activ-ity: glycation degree, nature of the sugar (as wasobserved for nonhydrolyzed proteins), and hydrolysisdegree.
In the case of tryptic hydrolysis, only 25% of proteinsremained nonhydrolyzed except for BLG modified witharabinose and ribose. Only minor differences in radicalscavenging activity were observed between whole pro-teins and their tryptic hydrolysates in the case of BLGmodified with galactose, glucose, and rhamnose (Figure1). In contrast, the IC10 of BLG modified with lactosedecreased by 1.2 mg/mL after tryptic hydrolysis (Table2), showing a better radical scavenging activity for thissample. Such a result is difficult to explain because, incontrast, the IC10 of tryptic hydrolysates of BLG modi-fied with glucose and galactose increased by 0.5 and 0.4mg/mL, respectively, as compared with nonhydrolyzedproteins. It could be thought that tryptic hydrolysis ofBLG modified with lactose exposed new antiradicalmoieties previously hidden in the core of the globulinmolecule. In comparison, IC10 and IC50 values of BLGmodified with arabinose and ribose increased by about0.1 and 0.2 mg/mL for IC10 and by 0.8 and 1.1 mg/mLfor IC50. BLG modified with arabinose was nearly 50%hydrolyzed by trypsin, whereas BLG modified withribose was almost not hydrolyzed at all (Table 1). In thiscase, such activity changes could be explained byadditional treatments of these samples during hydroly-sis and lyophilization processes as compared with non-hydrolyzed samples.
These observations were even more pronounced whenglycated BLG was hydrolyzed with pepsin. In this case,IC10 of BLG modified by arabinose and ribose increasedby 0.5 and 0.9 mg/mL, respectively, corresponding to adecrease of about 20 and 45% in radical scavenging
activity (Figure 1). Other glycated samples did not showsuch a decrease. Radical scavenging activity of BLGmodified with rhamnose, galactose, and glucose de-creased by about 5, 4, and 2%, respectively, only.Moreover, an 8% increase of this activity was observedwith BLG modified with lactose, representing a decreaseby 1.9 mg/mL of its IC10.
Nevertheless, even if the radical scavenging activitygenerally decreased after tryptic or peptic hydrolysis ofglycated BLG, it was still higher when compared withthat of nonglycated protein.
Antibiotic Activity: Effect of Glycation of BLGon the Inhibition of Bacterial Growth. Four differ-ent bacteria strains were used to study the antibioticactivity of BLG modified by the Maillard reaction andof its tryptic and peptic hydrolysates. Gram-positive (B.subtilis and S. mutans) and Gram-negative bacteria (E.coli and L. innocua) were used to test a variety ofmorphologically different bacteria.
All of the experiments performed (results not shown)showed that no antibiotic activity against these micro-organisms was present in native, heated, or glycatedBLG and its hydrolysates.
Einarsson (21, 22) and Einarsson et al. (23) observedan inhibition of bacterial growth by Maillard reactionproducts prepared with arginine-glucose, arginine-xylose, and histidine-glucose model systems. Antimi-crobial activity has also been observed in the case oflysozyme modified with dextran by the Maillard reaction(28). Nonmodified lysozyme inhibits the growth of onlyGram-positive bacteria. Conjugation of dextran tolysozyme resulted in an extension of its antimicrobialspectrum to Gram-negative bacteria. Recently, fourbactericidal domains (residues 15-20, 25-40, 78-833,and 92-100) were isolated after tryptic digestion andcharacterized in the bovine BLG (44). In the presentstudy, native BLG did not show any antimicrobialactivity with the techniques used. Only the appearanceof new antimicrobial activity could be expected. Suchan activity is certainly more difficult to induce by anonspecific chemical modification because of the largespectrum of resistance mechanisms in bacteria.
Cytotoxic Activity: Effect of Glycation of BLGon the Inhibition of Cellular Growth. COS-7 andHL-60 cells were used to study the effects of nonhydro-lyzed BLG and of tryptic and peptic hydrolysates of BLGmodified by the Maillard reaction on cellular growthinhibition. BSA, together with its peptic and tryptichydrolysates, was used as nonactive control.
Native BLG, heated BLG, BSA, and BLG modifiedwith arabinose, galactose, glucose, lactose, rhamnose,and ribose were used in concentrations ranging from100 to 0.1 µg/mL. Because BLG modified with arabinose,galactose, lactose, or rhamnose gave very similar resultswhen compared with native or BLG modified withglucose and in order to ensure the clarity of presenta-tion, only the results obtained with native BLG (A),heated BLG (B), BLG glycated by glucose (C) or ribose(D), and BSA (E) are presented in Figure 3.
About 60% of the growth of COS-7 cells was inhibitedwith nonhydrolyzed BLG at the maximum of proteinconcentration used (100 µg/mL). The same was observedwith heated BLG and BLG glycated with glucose. BLGglycated with ribose and BSA exhibited about 40 and15% inhibition, respectively. A dose-concentration ef-fect was observed: the smaller the concentration ofproteins, the lower the inhibition of cellular growth. The
Figure 2. Radical scavenging activity (R. S. Act. %) of BLGglycated with arabinose, galactose, glucose, lactose, rhamnose,or ribose as a function of the number of reactional primaryamino groups of BLG.
Biological Properties of the Maillard Reaction Products of â-Lactoglobulin J. Agric. Food Chem., Vol. 49, No. 10, 2001 5035
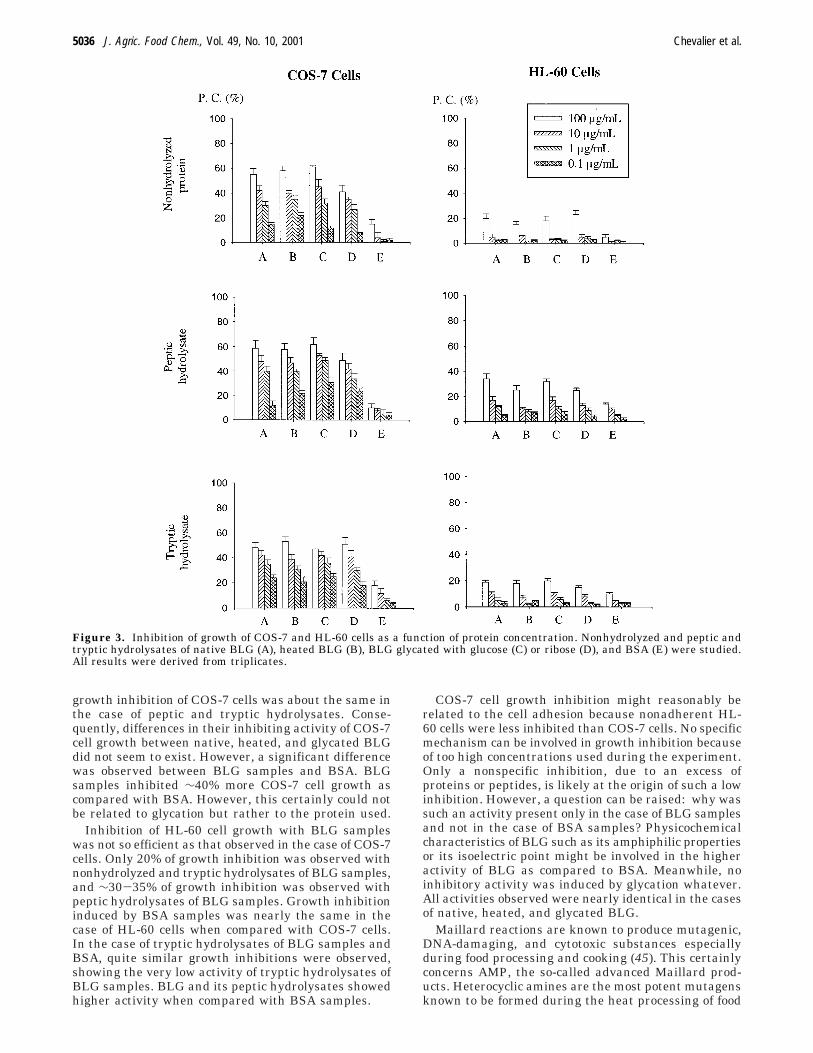
growth inhibition of COS-7 cells was about the same inthe case of peptic and tryptic hydrolysates. Conse-quently, differences in their inhibiting activity of COS-7cell growth between native, heated, and glycated BLGdid not seem to exist. However, a significant differencewas observed between BLG samples and BSA. BLGsamples inhibited ∼40% more COS-7 cell growth ascompared with BSA. However, this certainly could notbe related to glycation but rather to the protein used.
Inhibition of HL-60 cell growth with BLG sampleswas not so efficient as that observed in the case of COS-7cells. Only 20% of growth inhibition was observed withnonhydrolyzed and tryptic hydrolysates of BLG samples,and ∼30-35% of growth inhibition was observed withpeptic hydrolysates of BLG samples. Growth inhibitioninduced by BSA samples was nearly the same in thecase of HL-60 cells when compared with COS-7 cells.In the case of tryptic hydrolysates of BLG samples andBSA, quite similar growth inhibitions were observed,showing the very low activity of tryptic hydrolysates ofBLG samples. BLG and its peptic hydrolysates showedhigher activity when compared with BSA samples.
COS-7 cell growth inhibition might reasonably berelated to the cell adhesion because nonadherent HL-60 cells were less inhibited than COS-7 cells. No specificmechanism can be involved in growth inhibition becauseof too high concentrations used during the experiment.Only a nonspecific inhibition, due to an excess ofproteins or peptides, is likely at the origin of such a lowinhibition. However, a question can be raised: why wassuch an activity present only in the case of BLG samplesand not in the case of BSA samples? Physicochemicalcharacteristics of BLG such as its amphiphilic propertiesor its isoelectric point might be involved in the higheractivity of BLG as compared to BSA. Meanwhile, noinhibitory activity was induced by glycation whatever.All activities observed were nearly identical in the casesof native, heated, and glycated BLG.
Maillard reactions are known to produce mutagenic,DNA-damaging, and cytotoxic substances especiallyduring food processing and cooking (45). This certainlyconcerns AMP, the so-called advanced Maillard prod-ucts. Heterocyclic amines are the most potent mutagensknown to be formed during the heat processing of food
Figure 3. Inhibition of growth of COS-7 and HL-60 cells as a function of protein concentration. Nonhydrolyzed and peptic andtryptic hydrolysates of native BLG (A), heated BLG (B), BLG glycated with glucose (C) or ribose (D), and BSA (E) were studied.All results were derived from triplicates.
5036 J. Agric. Food Chem., Vol. 49, No. 10, 2001 Chevalier et al.

(41). Such compounds should not be formed (at least indetectable quantity) under the conditions used in thepresent study because of the mild heat treatmentapplied (72 h at 60 °C). Consequently, in the case ofearlier studied products, some innocuousness can beexpected.
ABBREVIATIONS USED
ACE, angiotensin converting enzyme; BLG, â-lacto-globulin; DMEM, Dulbecco’s Modified Eagle Media;DPPH, 2,2-diphenyl-1-picrylhydrazyl; MTT, 3-(4,5-di-methylthiazoyl-2-yl) 2,5-diphenyltetrazolium bromide;OPA, orthophthalaldehyde; PBS, phosphate-bufferedsaline; RPMI, Roswell Park Memorial Institute.
ACKNOWLEDGMENT
We thank X. Dousset (ENITIAA, Nantes, France) andO. Reboul (Dental Surgery Faculty, Nantes, France) forthe gift of bacterial strains.
LITERATURE CITED
(1) Meisel, H.; Schlimme, E. Milk proteins: precursors ofbioactive peptides. Trends Food Sci. Technol. 1990, 1,41-43.
(2) Schanbacher, F. L.; Talhouk, R. S.; Murray, F. A.;Gherman, L. I.; Willett, L. B. Milk-borne bioactivepeptides. Int. Dairy J. 1998, 8, 393-403.
(3) Meisel, H. Overview on milk proteins-derived peptides.Int. Dairy J. 1998, 8, 363-373.
(4) Meisel, H. Chemical characterization and opioid activityof an exorphin isolated from in vivo digests of casein.FEBS Lett. 1986, 196, 223-227.
(5) Tani, F.; Iio, K.; Chiba, H.; Yoshikawa, M. Isolation andcharacterization of opioid antagonist peptides derivedfrom human lactoferrin. Agric. Biol. Chem. 1990, 54,1803-1810.
(6) Yamamoto, N. Antihypertensive peptides derived fromfood proteins. Biopolymers 1997, 43, 129-134.
(7) Pihlanto-Leppala, A.; Rokka, T.; Korhonen, H. Angio-tensin I converting enzyme inhibitory peptides derivedfrom bovine milk proteins. Int. Dairy J. 1998, 8, 325-331.
(8) Brantl, V.; Teschemacher, H.; Blasig, J.; Henschen, A.;Lottspeich, F. Opioid activities of â-casomorphins. LifeSci. 1981, 28, 1903-1909.
(9) Zucht, H.-D.; Raida, M.; Adermann, K.; Magert, H.-J.;Forssmann, W.-G. Casocidin-I: a casein-RS2 derivedpeptide exhibits antibacterial activity. FEBS Lett. 1995,372, 185-188.
(10) Dionysius, D. A.; Milne, J. M. Antibacterial peptides ofbovine lactoferrin: purification and characterization. J.Dairy Sci. 1997, 80, 667-674.
(11) Chabance, B.; Jolles, P.; Izquierdo, C.; Mazoyer, E.;Francoual, C.; Drouet, L.; Fiat, A. M. Characterizationof an antithrombotic peptide from κ-casein in newbornplasma after milk ingestion. Br. J. Nutr. 1995, 73, 583-590.
(12) Meisel, H. Biochemical properties of bioactive peptidesderived from milk proteins; potential nutraceuticals forfood and pharmaceutical applications. Livest. Prod. Sci.1997, 50, 125-138.
(13) Mullally, M. M.; Meisel, H.; Fitzgerald, R. J. Identifica-tion of a novel angiotensin-I-converting enzyme inhibi-tory peptide corresponding to a tryptic fragment ofbovine â-lactoglobulin. FEBS Lett. 1997, 402, 99-101.
(14) Sawyer, L.; Brownlow, S.; Polikarpov, I.; Wu, S.-Y.â-lactoglobulin: structural studies, biological clues. Int.Dairy J. 1998, 8, 65-72.
(15) Maillard, L. C. Action des amines sur les sucres:formation des melanoıdines par voie methodique. C. R.Acad. Sci. 1912, 154, 66-68.
(16) Chevalier, F.; Chobert, J. M.; Dalgalarrondo, M.; Haer-tle, T. Characterization of the Maillard reactions productof â-lactoglobulin glucosylated in mild conditions. J.Food Biochem. 2001, 25, 33-55.
(17) Ames, J. M. Control of the Maillard reaction in foodsystems. Trends Food Sci. Technol. 1990, 1, 150-154.
(18) Anese, M.; Nicoli, M. C.; Lerici, C. R. Influence of pHon the oxygen scavenging properties of heat-treatedglucose-glycine systems. Ital. J. Food Sci. 1994, 3, 339-343.
(19) Yen, G.-C.; Hsieh, P.-P. Antioxidative activity andscavenging effects on native oxygen of xylose-lysineMaillard reaction products. J. Sci. Food Agric. 1995, 67,415-420.
(20) Beckel, R. W.; Waller, G. R. Antioxidative arginine-xylose Maillard reaction products: conditions of syn-thesis. J. Food Sci. 1983, 48, 996-997.
(21) Einarsson, H. The effect of time, temperature, pH andreactants on the formation of antibacterial compoundin the Maillard reaction. Lebensm.-Wiss. -Technol. 1987,20, 51-55.
(22) Einarsson, H. The effect of pH and temperature on theantibacterial effect of Maillard reaction products. Leb-ensm.-Wiss. -Technol. 1987, 20, 56-58.
(23) Einarsson, H.; Snygg, B. G.; Eriksson, C. Inhibition ofbacterial growth by Maillard reaction products. J. Agric.Food Chem. 1983, 31, 1043-1047.
(24) Stecchini, M. L.; Giavedoni, P.; Sarais, I.; Lerici, C. R.Antimicrobial activity of Maillard reaction productsagainst Aeromonas hydrophilia. Ital. J. Food Sci. 1993,2, 147-150.
(25) Jing, H.; Kitts, D. D. Comparison of the antioxidativeand cytotoxic properties of glucose-lysine and fructose-lysine Maillard reaction. Food Res. Int. 2000, 33, 509-516.
(26) Vagnarelli, P.; de Sario, A.; Cuzzoni, M. T.; Mazza, P.;de Carli, L. Cytotoxic and clastogenic activity of ribose-lysine browning model system. J. Agric. Food Chem.1991, 39, 2237-2239.
(27) Kitts, D. D.; Wu, C. H.; Stich, H. F.; Powrie, W. D. Effectof glucose-lysine Maillard reaction product on bacterialand mammalian cell mutagenesis. J. Agric. Food Chem.1993, 41, 2353-2358.
(28) Nakamura, S.; Kato, A.; Kobayashi, K. New antimicro-bial characteristics of lysozyme-dextran conjugate. J.Agric. Food Chem. 1991, 39, 647-650.
(29) McGookin, B. J.; Augustin, M. A. Antioxidant activityof casein and Maillard reaction product from casein-sugar mixtures. J. Dairy Res. 1991, 58, 313-320.
(30) Chevalier, F.; Chobert, J. M.; Popineau, Y.; Nicolas, M.G.; Haertle, T. Improvement of the functional propertiesof â-lactoglobulin glycated through the Maillard reactionis related to the sugar nature. Int. Dairy J. 2001, 11,145-152.
(31) Mailliart, P.; Ribadeau Dumas, B. Preparation of â-lac-toglobulin and â-lactoglobulin-free proteins from wheyretentate by NaCl salting out at low pH. J. Food Sci.1988, 53, 743-752.
(32) Chevalier, F.; Chobert, J. M.; Molle, D.; Haertle, T.Maillard glycation of â-lactoglobulin with several sug-ars: Comparative study of the properties of the obtainedpolymers and of the substituted sites. Lait 2001, 81,651-666.
(33) Frister, H.; Meisel, H.; Schlimme, E. OPA methodmodified by used of N,N-dimethyl-2-mercaptoethylam-moniumchloride as thiol component. Fresenius’ Z. Anal.Chem. 1988, 330, 631-633.
(34) Mosmann, T. Rapid colorimetric assay for cellulargrowth and survival: application to proliferation andcytotoxic assays. J. Immunol. Methods 1983, 65, 55-63.
(35) Edmondson, J. M.; Armstrong, L. S.; Martinez, A. O. Arapid and simple MTT-based spectrophotometric assayfor determining drug sensitivity in monolayer cultures.J. Tissue Cult. Methods 1988, 11, 15-17.
Biological Properties of the Maillard Reaction Products of â-Lactoglobulin J. Agric. Food Chem., Vol. 49, No. 10, 2001 5037
(36) Dalgalarrondo, M.; Dufour, E.; Chobert, J. M.; Bertrand-Harb, C.; Haertle, T. Proteolysis of â-lactoglobulin andâ-casein by pepsin in ethanolic media. Int. Dairy J.1995, 5, 1-14.
(37) Guo, M. R.; Fox, P. F.; Flynn, A. Susceptibility ofâ-lactoglobulin and sodium caseinate to proteolysis bypepsin and trypsin. J. Dairy Sci. 1995, 78, 2336-2344.
(38) Chevalier, F.; Chobert, J. M.; Choiset, Y.; Dalgalarrondo,M.; Haertle, T. Maillard glycation of â-lactoglobulininduces conformational changes. Nahrung 2002, 46, inpress.
(39) Brand-Williams, W.; Cuvelier, M. E.; Berset, C. Use offree radical method to evaluate antioxidant activity.Lebensm.-Wiss. -Technol. 1995, 28, 25-30.
(40) Nishino, T.; Shibahara-Sone, H.; Kikuchi-Hayakawa, H.;Ishikawa, F. Transit of radical scavenging activity ofmilk products prepared by Maillard reaction and Lac-tobacillus casei strain Shirota fermentation through thehamster intestine. J. Dairy Sci. 2000, 83, 915-922.
(41) Friedman, M. Food browning and its prevention: anoverview. J. Agric. Food Chem. 1996, 44, 631-653.
(42) Ledl, F.; Schleicher, E. New aspects of the Maillard
reaction in foods and in the human body. Angew. Chem.,Int. Ed. Engl. 1990, 29, 565-594.
(43) Chuyen, N. V. Maillard reaction and food processing.Application aspects. Adv. Exp. Med. Biol. 1998, 434,213-235.
(44) Pellegrini, A.; Dettling, C.; Thomas, U.; Hunziker, P.Isolation and characterization of four bactericidal do-mains in the bovine â-lactoglobulin. Biochim Biophys.Acta 2001, 1526, 131-140.
(45) O’Brien, J.; Morrissey, P. A. Nutritional and toxicologicalaspects of the Maillard browning reaction in foods. C.R. Food Sci. Nutr. 1989, 28, 211-248.
Received for review April 26, 2001. Revised manuscriptreceived July 26, 2001. Accepted August 2, 2001. Funding bya fellowship from the Ministere de la Recherche et de laTechnologie to F.C. is acknowledged. Funding of this work byINRA and the Region Pays de Loire in the scope of the VANAMprogram Interactions Moleculaires et Activites Biologiques isalso gratefully acknowledged.
JF010549X
5038 J. Agric. Food Chem., Vol. 49, No. 10, 2001 Chevalier et al.

Effet Bystander en Radiobiologie et Hadronthérapie
HDR François Chevalier Page 39
1.2 - Post-Doctorat 1 : Carence en phosphate chez des écotypes d’Arabidopsis thaliana
1.2.1 - Architecture racinaire en réponse à la carence en phosphateLa première étape de ce travail consistait à sélectionner des écotypes de la plante modèle
Arabidopsis thaliana ayant une réponse caractéristique à la carence en phosphate (phosphore
inorganique, ou Pi) au niveau de leur architecture racinaire. La plasticité de développement constitue
un composant principal des réponses adaptatives des plantes à la disponibilité des nutriments. Dans
ce travail, nous avons étudié la variation naturelle existant chez Arabidopsis pour les réponses de
croissance à la disponibilité de phosphate. A cette fin, nous avons comparé les effets de la carence en
phosphate pour quatre écotypes communs d’Arabidopsis thaliana. Un ensemble de dix paramètres de
croissance, au niveau de la partie aérienne et du système de racine, a été mesuré. La longueur de la
racine primaire et le nombre de parties latérales se sont avérés être conjointement réduits lors de la
carence en phosphate chez les quatre accessions.
Ces deux paramètres ont été choisis pour examiner un ensemble de 73 accessions provenant de
différents habitats. En condition de carence en phosphate, la moitié des accessions a montré une
réduction de la longueur de la racine primaire et du nombre de racines latérales, 25 % n'étaient pas
sensibles à la disponibilité de phosphate. Pour 25 % des accessions étudiées, la carence en
phosphate n’a affecté qu’un des deux paramètres de croissance sélectionnés, indiquant l'occurrence
de différentes stratégies adaptatives.
1.2.2 - Analyse protéomique de la variabilité naturelleLe premier objectif de ce travail était d'évaluer la capacité des analyses classiques de protéomique
comme outil moléculaire de caractérisation de la biodiversité chez Arabidopsis thaliana. Pour cela, huit
écotypes ont été choisis, provenant d’habitats différents et ayant des réponses contrastées à la
carence en phosphate. Les protéines solubles, extraites des racines, ont été séparées par
électrophorèse bidimensionnelle. Nous avons utilisé des strips de 18 centimètres (pH 4 - 7) pour la
séparation en première dimension et une deuxième dimension couvrant une gamme de poids
moléculaires allant de 15 à 150 kDa. Afin d'obtenir une information aussi quantitative que possible,
des gels ont été colorés avec le bleu de Coomassie colloïdal. La comparaison des cartes
bidimensionnelles a montré que seulement un quart des spots était commun à tous les écotypes. En
outre, l'identification des spots principaux de chaque écotype a montré de grandes différences entre
les fonctions principales de ces protéines. Une classification hiérarchique des protéomes de chaque
écotype a alors été réalisée en fonction de la quantité des spots anonymes. La classification effectuée
avec l’ensemble des spots a regroupé les mêmes écotypes que celle effectuée avec seulement les 25
spots majoritaires, ainsi que celle effectuée avec les fonctions de ces spots majoritaires. Cette étude a
suggéré que la comparaison de protéomes aurait la capacité de démontrer des différences de statut
physiologique entre écotypes. La protéomique classique pourrait ainsi constituer un outil puissant pour
révéler la biodiversité entre les écotypes d'une même espèce.
Effet Bystander en Radiobiologie et Hadronthérapie
HDR François Chevalier Page 40
1.2.3 - Analyse protéomique de la réponse à la carence en phosphate
Comme le phosphate présente une faible disponibilité dans le sol, pour l’acquérir, les plantes ont
développé de nombreuses capacités d’adaptation tant morphologiques que physiologiques.
L’identification et la caractérisation des gènes clés impliqués dans les mécanismes d'adaptation à la
carence en Pi pourraient fournir des indices sur les étapes initiales de la signalisation du Pi.
Une approche par électrophorèse sur gel en deux dimensions a été réalisée afin d’analyser la réponse
protéomique à la carence en phosphate chez Arabidopsis. Deux écotypes ont été sélectionnés grâce
à la réponse contrastée de leur système racinaire en condition limitante en phosphate.
Après séparation et analyse des protéomes, sur les 30 spots modulés par une carence en phosphate,
14 sont augmentés et 10 diminués avec l’écotype Be-0, alors que seulement 13 spots ont été
observés comme régulés à la baisse pour écotype Ll-0. De plus, des réponses systématiques et
opposées à la carence en phosphate ont été observées entre les deux écotypes.
Les 30 protéines exprimées de manière différentielle ont été identifiées par spectrométrie de masse.
Ces protéines sont impliquées pour la plupart dans le stress oxydatif ou le métabolisme des glucides
et des protéines.
Ces résultats suggèrent que la modulation de deux enzymes, l'alcool déshydrogénase et l’aconitate
hydratase, peut contribuer à la stratégie d'adaptation opposée des écotypes Be-0 et Ll-0.
L’analyse approfondie de l’aconitate hydratase a montré une réponse inverse entre les deux écotypes.
Cette protéine, aussi potentiellement impliquée dans l'homéostasie du fer, pourrait contribuer, au
moins indirectement, à l'architecture particulière des racines de ces écotypes en réponse à la carence
en phosphate.
1.2.4 - Sélection de publications du Post-doctorat 1
Chevalier F., Pata M., Nacry P., Doumas P., Rossignol M. (2003)
Effects of phosphate availability on the root system architecture : large-scale analysis of the natural
variation between Arabidopsis accessions.
Plant Cell & Environment 26, 1839-1850.
Chevalier F., Martin O., Rofidal V., Devauchelle A.-D., Rossignol M. (2004)
Proteomic investigation of natural variation between Arabidopsis ecotypes.
Proteomics 4, 1372-1381.
Chevalier F. and Rossignol M.
Proteomic analysis of Arabidopsis thaliana ecotypes with contrasted root architecture in response to
phosphate deficiency (2011)
Journal of Plant Physiology 168(16), 1885-1890.

Plant, Cell and Environment
(2003)
26
, 1839–1850
© 2003 Blackwell Publishing Ltd
1839
Blackwell Science, LtdOxford, UKPCEPlant, Cell and Environment0016-8025Blackwell Science Ltd 2003? 2003
261118391850Original Article
Phosphate and root growth in
Arabidopsis
accessionsF. Chevalier
et al.
Correspondence: Dr François Chevalier. Fax:
+
33 (0)467 525737; e-mail: [email protected]
*
Present address: Laboratoire de Protéomique; UR 1199, INRA; 2place Viala, F-34060 Montpellier Cedex 1, France.
Effects of phosphate availability on the root system architecture: large-scale analysis of the natural variation between
Arabidopsis
accessions
F. CHEVALIER*, M. PATA, P. NACRY, P. DOUMAS & M. ROSSIGNOL*
Laboratoire de Biochimie & Physiologie Moléculaire des Plantes, UMR 5004, INRA/ENSA-M/CNRS/Université Montpellier 2, 2 place Viala, F-34060 Montpellier Cedex 1, France
ABSTRACT
Developmental plasticity is one main adaptative responseof plants to the availability of nutrients. In the presentstudy, the naturally occurring variation existing in
Arabi-dopsis
for the growth responses to phosphate availabilitywas investigated. Initially details of the effects of phosphatestarvation for the four currently used accessions Cvi, Col,Ler and Ws were compared. A set of 10 growth parameters,concerning the aerial part and the root system, was mea-sured in both single-point and time-course experiments.The length of the primary root and the number of lateralswere found to be consistently reduced by phosphate star-vation in all four accessions. These two robust parameterswere selected to further screen a set of 73 accessions orig-inating from a wide range of habitats. One-half of the acces-sions showed also a reduced primary root and less lateralroots when phosphate-starved, and 25% were not respon-sive to phosphate availability. For the last quarter of acces-sions, phosphate starvation was found to affect only one ofthe two growth parameters, indicating the occurrence ofdifferent adaptative strategies. These accessions appear tooffer new tools to investigate the molecular basis of thecorresponding growth responses to phosphate availability.
Key-words
:
Arabidopsis
; accessions; natural variation;phosphate availability; root system architecture.
INTRODUCTION
Re-orientation of growth constitutes one of the mainadaptative responses of plants to changes in nutrient avail-ability. For numerous plant species, this leads to anincreased growth of roots relative to the aerial part. As ageneral consequence, large alterations of the root systemarchitecture are observed (Drew 1975), although differentkinds of modifications occur depending on the nature of the
limiting nutrient and on the plant species. Changesreported in
Arabidopsis
concern, for instance, the growthof the primary root in phosphate-starved plants (William-son
et al
. 2001), the growth of lateral roots in nitrate-, phos-phate- or iron-starved plants (Moog
et al
. 1995; Zhang &Forde 1998; Williamson
et al
. 2001), the density of lateralroots in phosphate- or iron-starved plants (Moog
et al
.1995; Williamson
et al
. 2001), or the formation of root hairsin phosphate- or iron-starved plants (Bate & Lynch 1996;Schmidt & Schikora 2001), whereas phosphate starvationpromotes the formation of proteoid roots in
Lupinus albus
(Johnson, Carroll & Allan 1996), or affects the growthangle of roots in
Phaseolus vulgaris
(Bonser, Lynch &Snapp 1996) while simultaneously altering the growth anddensity of lateral roots (Borch
et al
. 1999).Up to now, the search for the genes controlling such
growth responses to nutrient availability was based mainlyon genetic studies of mutants. In
Arabidopsis
, an impor-tant success was the discovery of the MADS box transcrip-tion factor
ANR1
, involved in the adaptative increase inlateral root elongation in nitrate-rich regions (Zhang &Forde 1998). Selective involvement of hormones in thegrowth responses to nitrate, phosphate and iron availabil-ity was also demonstrated from the behaviour of mutantsaffected in their sensitivity to specific hormones (Schmidt& Schikora 2001; Williamson
et al
. 2001; Linkohr
et al
.2002; Lopez-Bucio
et al
. 2002; Al-Ghazi
et al
. 2003). Onanother hand, relatively little attention was paid to thevariation occurring naturally among accessions as an alter-native way to search for genes having large effects ingrowth responses (Alonso-Blanco & Koornneef 2000). Anotable exception in
Arabidopsis
concerns the character-ization of phosphate acquisition efficiency, a parameterwhich includes, among others, growth responses to phos-phate availability (Narang, Bruene & Altmann 2000;Narang & Altmann 2001). In these studies quite large vari-ations were observed between accessions. However, due tothe limited number of accessions that were characterized,it was not possible to decide whether these variations cor-responded to more or less pronounced responses amongaccessions, or revealed the occurrence of different adapta-tive strategies.
The present study was aimed at investigating the extent
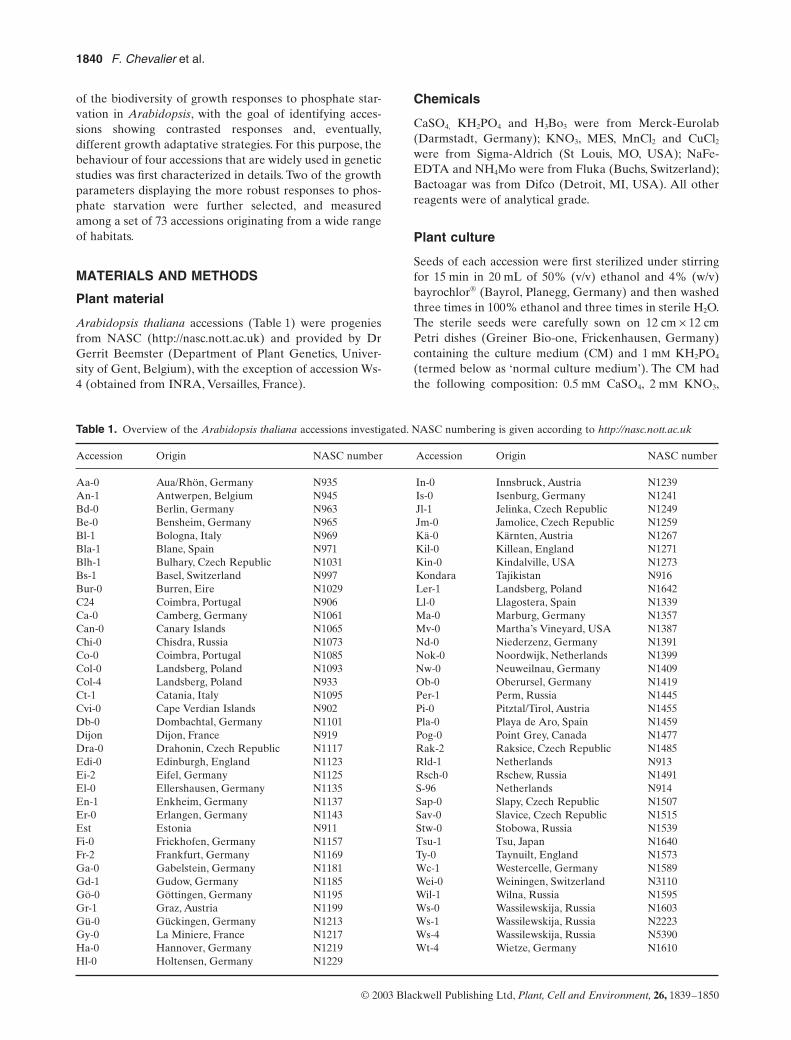
1840
F. Chevalier
et al
.
© 2003 Blackwell Publishing Ltd,
Plant, Cell and Environment,
26,
1839–1850
of the biodiversity of growth responses to phosphate star-vation in
Arabidopsis
, with the goal of identifying acces-sions showing contrasted responses and, eventually,different growth adaptative strategies. For this purpose, thebehaviour of four accessions that are widely used in geneticstudies was first characterized in details. Two of the growthparameters displaying the more robust responses to phos-phate starvation were further selected, and measuredamong a set of 73 accessions originating from a wide rangeof habitats.
MATERIALS AND METHODS
Plant material
Arabidopsis thaliana
accessions (Table 1) were progeniesfrom NASC (http://nasc.nott.ac.uk) and provided by DrGerrit Beemster (Department of Plant Genetics, Univer-sity of Gent, Belgium), with the exception of accession Ws-4 (obtained from INRA, Versailles, France).
Chemicals
CaSO
4,
KH
2
PO
4
and H
3
Bo
3
were from Merck-Eurolab(Darmstadt, Germany); KNO
3
, MES, MnCl
2
and CuCl
2
were from Sigma-Aldrich (St Louis, MO, USA); NaFe-EDTA and NH
4
Mo were from Fluka (Buchs, Switzerland);Bactoagar was from Difco (Detroit, MI, USA). All otherreagents were of analytical grade.
Plant culture
Seeds of each accession were first sterilized under stirringfor 15 min in 20 mL of 50% (v/v) ethanol and 4% (w/v)bayrochlor
®
(Bayrol, Planegg, Germany) and then washedthree times in 100% ethanol and three times in sterile H
2
O.The sterile seeds were carefully sown on 12 cm
¥
12 cmPetri dishes (Greiner Bio-one, Frickenhausen, Germany)containing the culture medium (CM) and 1 m
M
KH
2
PO
4
(termed below as ‘normal culture medium’). The CM hadthe following composition: 0.5 m
M
CaSO
4
, 2 m
M
KNO
3
,
Table 1.
Overview of the
Arabidopsis thaliana
accessions investigated. NASC numbering is given according to
http://nasc.nott.ac.uk
Accession Origin NASC number Accession Origin NASC number
Aa-0 Aua/Rhön, Germany N935 In-0 Innsbruck, Austria N1239An-1 Antwerpen, Belgium N945 Is-0 Isenburg, Germany N1241Bd-0 Berlin, Germany N963 Jl-1 Jelinka, Czech Republic N1249Be-0 Bensheim, Germany N965 Jm-0 Jamolice, Czech Republic N1259Bl-1 Bologna, Italy N969 Kä-0 Kärnten, Austria N1267Bla-1 Blane, Spain N971 Kil-0 Killean, England N1271Blh-1 Bulhary, Czech Republic N1031 Kin-0 Kindalville, USA N1273Bs-1 Basel, Switzerland N997 Kondara Tajikistan N916Bur-0 Burren, Eire N1029 Ler-1 Landsberg, Poland N1642C24 Coimbra, Portugal N906 Ll-0 Llagostera, Spain N1339Ca-0 Camberg, Germany N1061 Ma-0 Marburg, Germany N1357Can-0 Canary Islands N1065 Mv-0 Martha’s Vineyard, USA N1387Chi-0 Chisdra, Russia N1073 Nd-0 Niederzenz, Germany N1391Co-0 Coimbra, Portugal N1085 Nok-0 Noordwijk, Netherlands N1399Col-0 Landsberg, Poland N1093 Nw-0 Neuweilnau, Germany N1409Col-4 Landsberg, Poland N933 Ob-0 Oberursel, Germany N1419Ct-1 Catania, Italy N1095 Per-1 Perm, Russia N1445Cvi-0 Cape Verdian Islands N902 Pi-0 Pitztal/Tirol, Austria N1455Db-0 Dombachtal, Germany N1101 Pla-0 Playa de Aro, Spain N1459Dijon Dijon, France N919 Pog-0 Point Grey, Canada N1477Dra-0 Drahonin, Czech Republic N1117 Rak-2 Raksice, Czech Republic N1485Edi-0 Edinburgh, England N1123 Rld-1 Netherlands N913Ei-2 Eifel, Germany N1125 Rsch-0 Rschew, Russia N1491El-0 Ellershausen, Germany N1135 S-96 Netherlands N914En-1 Enkheim, Germany N1137 Sap-0 Slapy, Czech Republic N1507Er-0 Erlangen, Germany N1143 Sav-0 Slavice, Czech Republic N1515Est Estonia N911 Stw-0 Stobowa, Russia N1539Fi-0 Frickhofen, Germany N1157 Tsu-1 Tsu, Japan N1640Fr-2 Frankfurt, Germany N1169 Ty-0 Taynuilt, England N1573Ga-0 Gabelstein, Germany N1181 Wc-1 Westercelle, Germany N1589Gd-1 Gudow, Germany N1185 Wei-0 Weiningen, Switzerland N3110Gö-0 Göttingen, Germany N1195 Wil-1 Wilna, Russia N1595Gr-1 Graz, Austria N1199 Ws-0 Wassilewskija, Russia N1603Gü-0 Gückingen, Germany N1213 Ws-1 Wassilewskija, Russia N2223Gy-0 La Miniere, France N1217 Ws-4 Wassilewskija, Russia N5390Ha-0 Hannover, Germany N1219 Wt-4 Wietze, Germany N1610Hl-0 Holtensen, Germany N1229
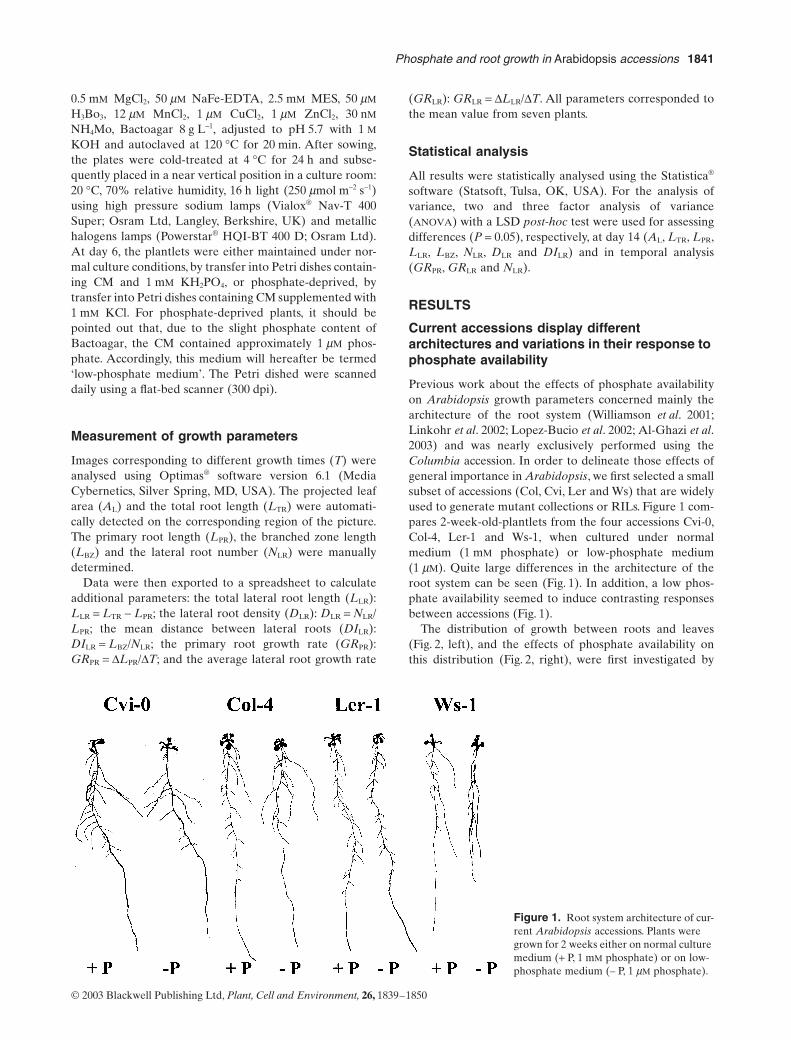
Phosphate and root growth in
Arabidopsis
accessions
1841
© 2003 Blackwell Publishing Ltd,
Plant, Cell and Environment,
26,
1839–1850
0.5 m
M
MgCl
2
, 50
m
M
NaFe-EDTA, 2.5 m
M
MES, 50
m
M
H
3
Bo
3
, 12
m
M
MnCl
2
, 1
m
M
CuCl
2
, 1
m
M
ZnCl
2
, 30 n
M
NH
4
Mo, Bactoagar 8 g L
-
1
, adjusted to pH 5.7 with 1
M
KOH and autoclaved at 120
∞
C for 20 min. After sowing,the plates were cold-treated at 4
∞
C for 24 h and subse-quently placed in a near vertical position in a culture room:20
∞
C, 70% relative humidity, 16 h light (250
m
mol m
-
2
s
-
1
)using high pressure sodium lamps (Vialox
®
Nav-T 400Super; Osram Ltd, Langley, Berkshire, UK) and metallichalogens lamps (Powerstar
®
HQI-BT 400 D; Osram Ltd).At day 6, the plantlets were either maintained under nor-mal culture conditions, by transfer into Petri dishes contain-ing CM and 1 m
M
KH
2
PO
4
, or phosphate-deprived, bytransfer into Petri dishes containing CM supplemented with1 m
M
KCl. For phosphate-deprived plants, it should bepointed out that, due to the slight phosphate content ofBactoagar, the CM contained approximately 1
m
M
phos-phate. Accordingly, this medium will hereafter be termed‘low-phosphate medium’. The Petri dished were scanneddaily using a flat-bed scanner (300 dpi).
Measurement of growth parameters
Images corresponding to different growth times (
T
) wereanalysed using Optimas
®
software version 6.1 (MediaCybernetics, Silver Spring, MD, USA). The projected leafarea (
A
L
) and the total root length (
L
TR
) were automati-cally detected on the corresponding region of the picture.The primary root length (
L
PR
), the branched zone length(
L
BZ
) and the lateral root number (
N
LR
) were manuallydetermined.
Data were then exported to a spreadsheet to calculateadditional parameters: the total lateral root length (
L
LR
):
L
LR
=
L
TR
-
L
PR
; the lateral root density (
D
LR
):
D
LR
=
N
LR
/
L
PR
; the mean distance between lateral roots (
DI
LR
):
DI
LR
=
L
BZ
/
N
LR
; the primary root growth rate (
GR
PR
):
GR
PR
=
D
L
PR
/
D
T
; and the average lateral root growth rate
(
GR
LR
):
GR
LR
=
DLLR/DT. All parameters corresponded tothe mean value from seven plants.
Statistical analysis
All results were statistically analysed using the Statistica®
software (Statsoft, Tulsa, OK, USA). For the analysis ofvariance, two and three factor analysis of variance(ANOVA) with a LSD post-hoc test were used for assessingdifferences (P = 0.05), respectively, at day 14 (AL, LTR, LPR,LLR, LBZ, NLR, DLR and DILR) and in temporal analysis(GRPR, GRLR and NLR).
RESULTS
Current accessions display different architectures and variations in their response to phosphate availability
Previous work about the effects of phosphate availabilityon Arabidopsis growth parameters concerned mainly thearchitecture of the root system (Williamson et al. 2001;Linkohr et al. 2002; Lopez-Bucio et al. 2002; Al-Ghazi et al.2003) and was nearly exclusively performed using theColumbia accession. In order to delineate those effects ofgeneral importance in Arabidopsis, we first selected a smallsubset of accessions (Col, Cvi, Ler and Ws) that are widelyused to generate mutant collections or RILs. Figure 1 com-pares 2-week-old-plantlets from the four accessions Cvi-0,Col-4, Ler-1 and Ws-1, when cultured under normalmedium (1 mM phosphate) or low-phosphate medium(1 mM). Quite large differences in the architecture of theroot system can be seen (Fig. 1). In addition, a low phos-phate availability seemed to induce contrasting responsesbetween accessions (Fig. 1).
The distribution of growth between roots and leaves(Fig. 2, left), and the effects of phosphate availability onthis distribution (Fig. 2, right), were first investigated by
Figure 1. Root system architecture of cur-rent Arabidopsis accessions. Plants were grown for 2 weeks either on normal culture medium (+ P, 1 mM phosphate) or on low-phosphate medium (– P, 1 mM phosphate).
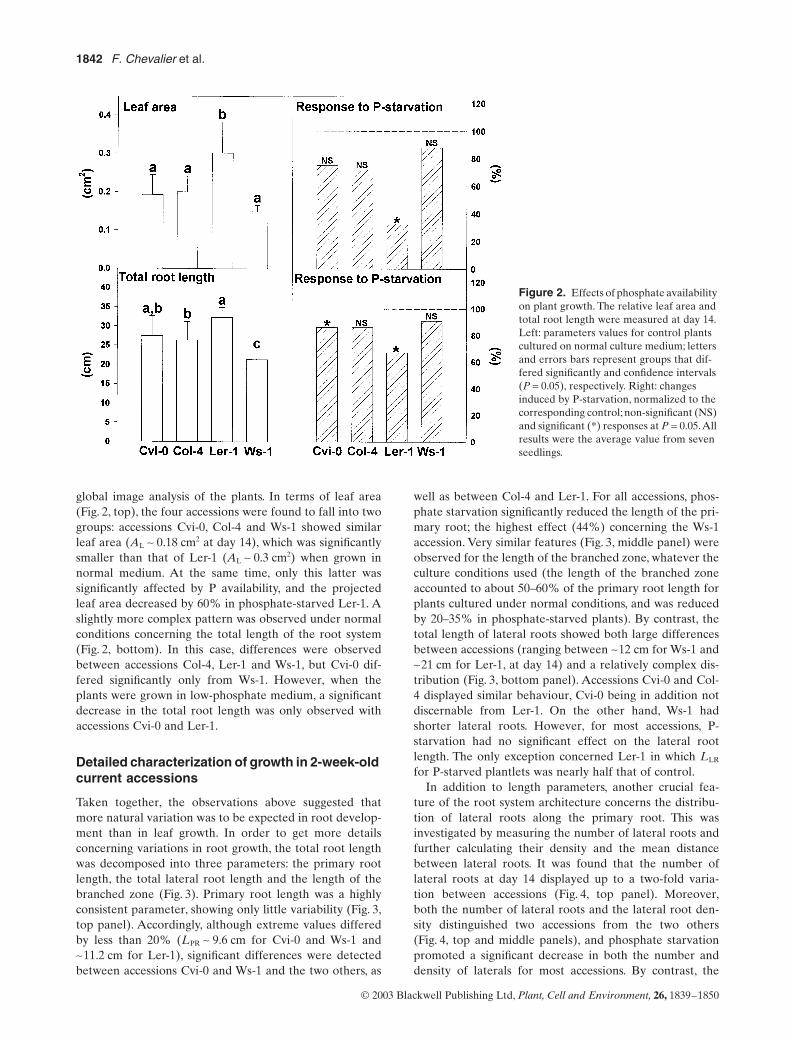
1842 F. Chevalier et al.
© 2003 Blackwell Publishing Ltd, Plant, Cell and Environment, 26, 1839–1850
global image analysis of the plants. In terms of leaf area(Fig. 2, top), the four accessions were found to fall into twogroups: accessions Cvi-0, Col-4 and Ws-1 showed similarleaf area (AL ~ 0.18 cm2 at day 14), which was significantlysmaller than that of Ler-1 (AL ~ 0.3 cm2) when grown innormal medium. At the same time, only this latter wassignificantly affected by P availability, and the projectedleaf area decreased by 60% in phosphate-starved Ler-1. Aslightly more complex pattern was observed under normalconditions concerning the total length of the root system(Fig. 2, bottom). In this case, differences were observedbetween accessions Col-4, Ler-1 and Ws-1, but Cvi-0 dif-fered significantly only from Ws-1. However, when theplants were grown in low-phosphate medium, a significantdecrease in the total root length was only observed withaccessions Cvi-0 and Ler-1.
Detailed characterization of growth in 2-week-old current accessions
Taken together, the observations above suggested thatmore natural variation was to be expected in root develop-ment than in leaf growth. In order to get more detailsconcerning variations in root growth, the total root lengthwas decomposed into three parameters: the primary rootlength, the total lateral root length and the length of thebranched zone (Fig. 3). Primary root length was a highlyconsistent parameter, showing only little variability (Fig. 3,top panel). Accordingly, although extreme values differedby less than 20% (LPR ~ 9.6 cm for Cvi-0 and Ws-1 and~11.2 cm for Ler-1), significant differences were detectedbetween accessions Cvi-0 and Ws-1 and the two others, as
well as between Col-4 and Ler-1. For all accessions, phos-phate starvation significantly reduced the length of the pri-mary root; the highest effect (44%) concerning the Ws-1accession. Very similar features (Fig. 3, middle panel) wereobserved for the length of the branched zone, whatever theculture conditions used (the length of the branched zoneaccounted to about 50–60% of the primary root length forplants cultured under normal conditions, and was reducedby 20–35% in phosphate-starved plants). By contrast, thetotal length of lateral roots showed both large differencesbetween accessions (ranging between ~12 cm for Ws-1 and~21 cm for Ler-1, at day 14) and a relatively complex dis-tribution (Fig. 3, bottom panel). Accessions Cvi-0 and Col-4 displayed similar behaviour, Cvi-0 being in addition notdiscernable from Ler-1. On the other hand, Ws-1 hadshorter lateral roots. However, for most accessions, P-starvation had no significant effect on the lateral rootlength. The only exception concerned Ler-1 in which LLR
for P-starved plantlets was nearly half that of control.In addition to length parameters, another crucial fea-
ture of the root system architecture concerns the distribu-tion of lateral roots along the primary root. This wasinvestigated by measuring the number of lateral roots andfurther calculating their density and the mean distancebetween lateral roots. It was found that the number oflateral roots at day 14 displayed up to a two-fold varia-tion between accessions (Fig. 4, top panel). Moreover,both the number of lateral roots and the lateral root den-sity distinguished two accessions from the two others(Fig. 4, top and middle panels), and phosphate starvationpromoted a significant decrease in both the number anddensity of laterals for most accessions. By contrast, the
Figure 2. Effects of phosphate availability on plant growth. The relative leaf area and total root length were measured at day 14. Left: parameters values for control plants cultured on normal culture medium; letters and errors bars represent groups that dif-fered significantly and confidence intervals (P = 0.05), respectively. Right: changes induced by P-starvation, normalized to the corresponding control; non-significant (NS) and significant (*) responses at P = 0.05. All results were the average value from seven seedlings.
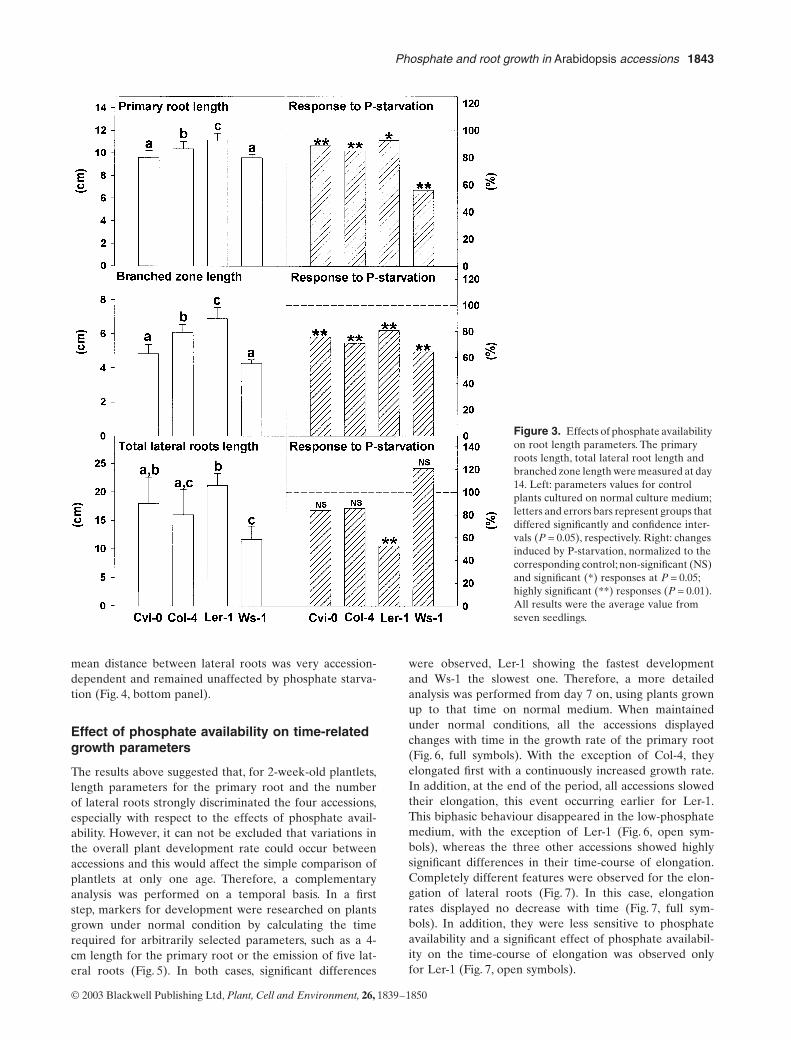
Phosphate and root growth in Arabidopsis accessions 1843
© 2003 Blackwell Publishing Ltd, Plant, Cell and Environment, 26, 1839–1850
mean distance between lateral roots was very accession-dependent and remained unaffected by phosphate starva-tion (Fig. 4, bottom panel).
Effect of phosphate availability on time-related growth parameters
The results above suggested that, for 2-week-old plantlets,length parameters for the primary root and the numberof lateral roots strongly discriminated the four accessions,especially with respect to the effects of phosphate avail-ability. However, it can not be excluded that variations inthe overall plant development rate could occur betweenaccessions and this would affect the simple comparison ofplantlets at only one age. Therefore, a complementaryanalysis was performed on a temporal basis. In a firststep, markers for development were researched on plantsgrown under normal condition by calculating the timerequired for arbitrarily selected parameters, such as a 4-cm length for the primary root or the emission of five lat-eral roots (Fig. 5). In both cases, significant differences
were observed, Ler-1 showing the fastest developmentand Ws-1 the slowest one. Therefore, a more detailedanalysis was performed from day 7 on, using plants grownup to that time on normal medium. When maintainedunder normal conditions, all the accessions displayedchanges with time in the growth rate of the primary root(Fig. 6, full symbols). With the exception of Col-4, theyelongated first with a continuously increased growth rate.In addition, at the end of the period, all accessions slowedtheir elongation, this event occurring earlier for Ler-1.This biphasic behaviour disappeared in the low-phosphatemedium, with the exception of Ler-1 (Fig. 6, open sym-bols), whereas the three other accessions showed highlysignificant differences in their time-course of elongation.Completely different features were observed for the elon-gation of lateral roots (Fig. 7). In this case, elongationrates displayed no decrease with time (Fig. 7, full sym-bols). In addition, they were less sensitive to phosphateavailability and a significant effect of phosphate availabil-ity on the time-course of elongation was observed onlyfor Ler-1 (Fig. 7, open symbols).
Figure 3. Effects of phosphate availability on root length parameters. The primary roots length, total lateral root length and branched zone length were measured at day 14. Left: parameters values for control plants cultured on normal culture medium; letters and errors bars represent groups that differed significantly and confidence inter-vals (P = 0.05), respectively. Right: changes induced by P-starvation, normalized to the corresponding control; non-significant (NS) and significant (*) responses at P = 0.05; highly significant (**) responses (P = 0.01). All results were the average value from seven seedlings.
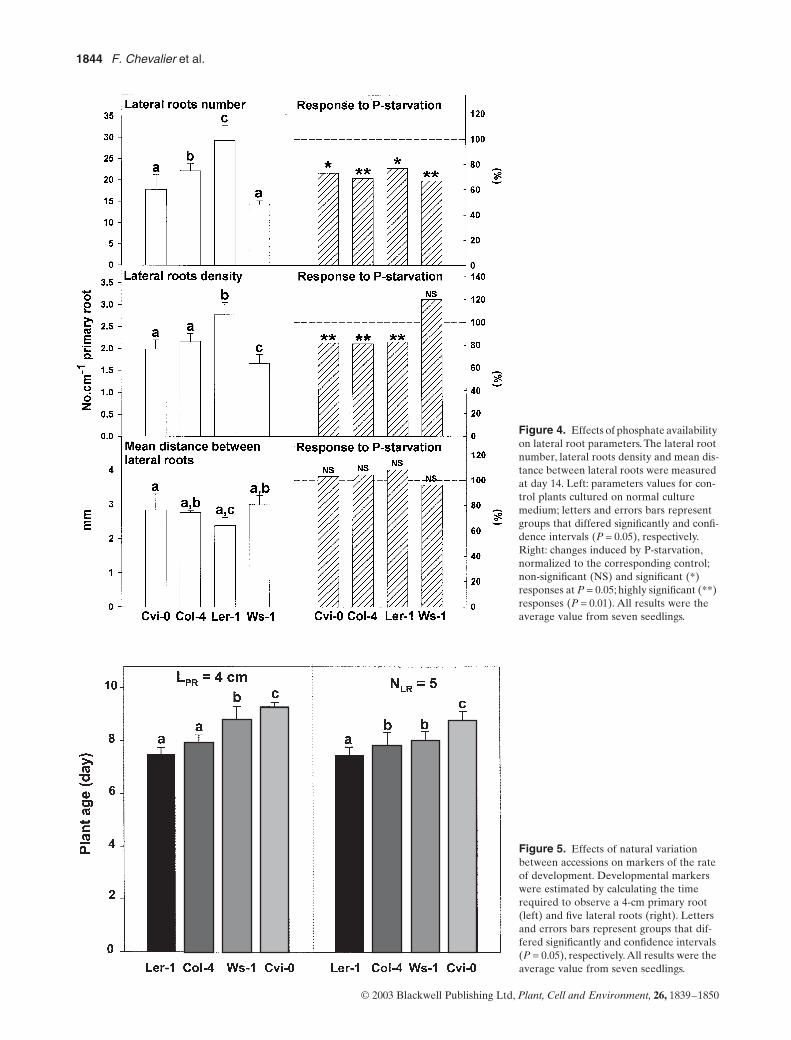
1844 F. Chevalier et al.
© 2003 Blackwell Publishing Ltd, Plant, Cell and Environment, 26, 1839–1850
Figure 4. Effects of phosphate availability on lateral root parameters. The lateral root number, lateral roots density and mean dis-tance between lateral roots were measured at day 14. Left: parameters values for con-trol plants cultured on normal culture medium; letters and errors bars represent groups that differed significantly and confi-dence intervals (P = 0.05), respectively. Right: changes induced by P-starvation, normalized to the corresponding control; non-significant (NS) and significant (*) responses at P = 0.05; highly significant (**) responses (P = 0.01). All results were the average value from seven seedlings.
Figure 5. Effects of natural variation between accessions on markers of the rate of development. Developmental markers were estimated by calculating the time required to observe a 4-cm primary root (left) and five lateral roots (right). Letters and errors bars represent groups that dif-fered significantly and confidence intervals (P = 0.05), respectively. All results were the average value from seven seedlings.
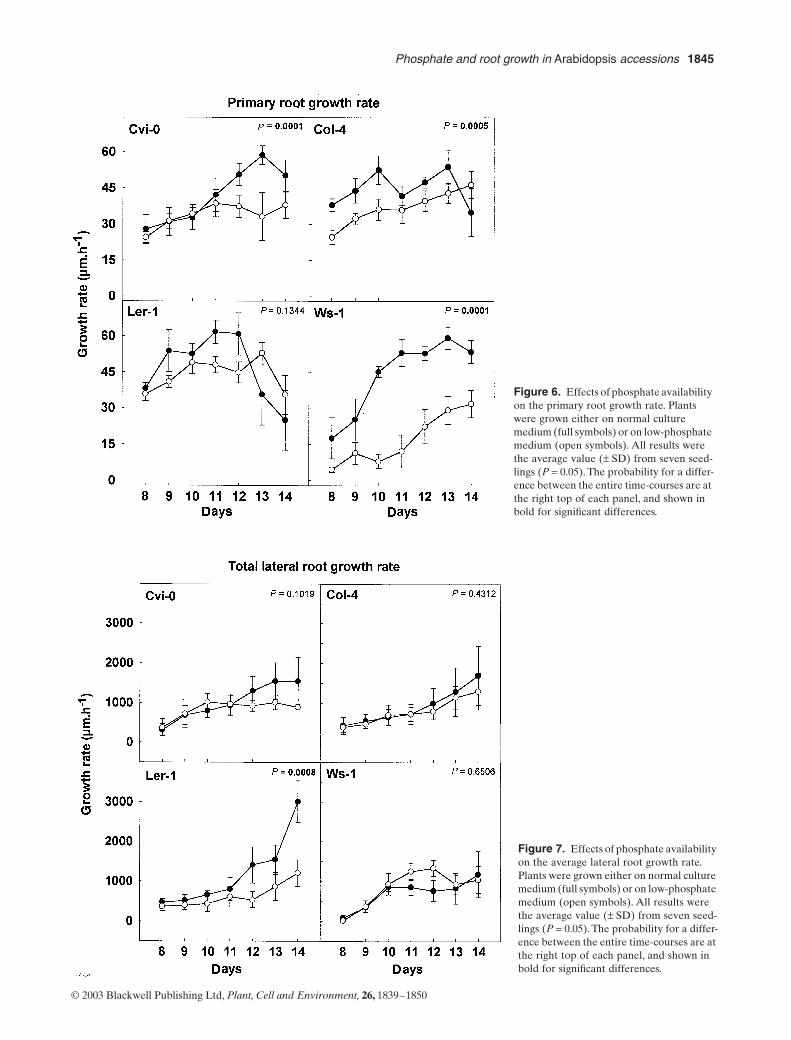
Phosphate and root growth in Arabidopsis accessions 1845
© 2003 Blackwell Publishing Ltd, Plant, Cell and Environment, 26, 1839–1850
Figure 6. Effects of phosphate availability on the primary root growth rate. Plants were grown either on normal culture medium (full symbols) or on low-phosphate medium (open symbols). All results were the average value (± SD) from seven seed-lings (P = 0.05). The probability for a differ-ence between the entire time-courses are at the right top of each panel, and shown in bold for significant differences.
Figure 7. Effects of phosphate availability on the average lateral root growth rate. Plants were grown either on normal culture medium (full symbols) or on low-phosphate medium (open symbols). All results were the average value (± SD) from seven seed-lings (P = 0.05). The probability for a differ-ence between the entire time-courses are at the right top of each panel, and shown in bold for significant differences.
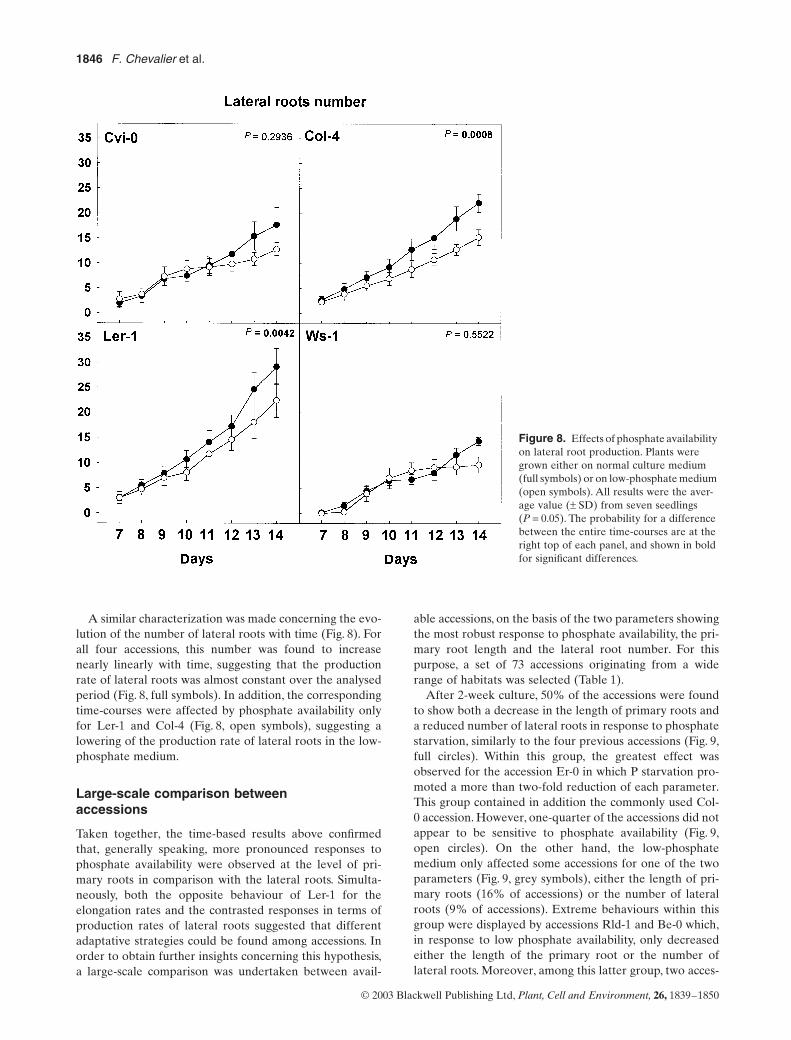
1846 F. Chevalier et al.
© 2003 Blackwell Publishing Ltd, Plant, Cell and Environment, 26, 1839–1850
A similar characterization was made concerning the evo-lution of the number of lateral roots with time (Fig. 8). Forall four accessions, this number was found to increasenearly linearly with time, suggesting that the productionrate of lateral roots was almost constant over the analysedperiod (Fig. 8, full symbols). In addition, the correspondingtime-courses were affected by phosphate availability onlyfor Ler-1 and Col-4 (Fig. 8, open symbols), suggesting alowering of the production rate of lateral roots in the low-phosphate medium.
Large-scale comparison between accessions
Taken together, the time-based results above confirmedthat, generally speaking, more pronounced responses tophosphate availability were observed at the level of pri-mary roots in comparison with the lateral roots. Simulta-neously, both the opposite behaviour of Ler-1 for theelongation rates and the contrasted responses in terms ofproduction rates of lateral roots suggested that differentadaptative strategies could be found among accessions. Inorder to obtain further insights concerning this hypothesis,a large-scale comparison was undertaken between avail-
able accessions, on the basis of the two parameters showingthe most robust response to phosphate availability, the pri-mary root length and the lateral root number. For thispurpose, a set of 73 accessions originating from a widerange of habitats was selected (Table 1).
After 2-week culture, 50% of the accessions were foundto show both a decrease in the length of primary roots anda reduced number of lateral roots in response to phosphatestarvation, similarly to the four previous accessions (Fig. 9,full circles). Within this group, the greatest effect wasobserved for the accession Er-0 in which P starvation pro-moted a more than two-fold reduction of each parameter.This group contained in addition the commonly used Col-0 accession. However, one-quarter of the accessions did notappear to be sensitive to phosphate availability (Fig. 9,open circles). On the other hand, the low-phosphatemedium only affected some accessions for one of the twoparameters (Fig. 9, grey symbols), either the length of pri-mary roots (16% of accessions) or the number of lateralroots (9% of accessions). Extreme behaviours within thisgroup were displayed by accessions Rld-1 and Be-0 which,in response to low phosphate availability, only decreasedeither the length of the primary root or the number oflateral roots. Moreover, among this latter group, two acces-
Figure 8. Effects of phosphate availability on lateral root production. Plants were grown either on normal culture medium (full symbols) or on low-phosphate medium (open symbols). All results were the aver-age value (± SD) from seven seedlings (P = 0.05). The probability for a difference between the entire time-courses are at the right top of each panel, and shown in bold for significant differences.
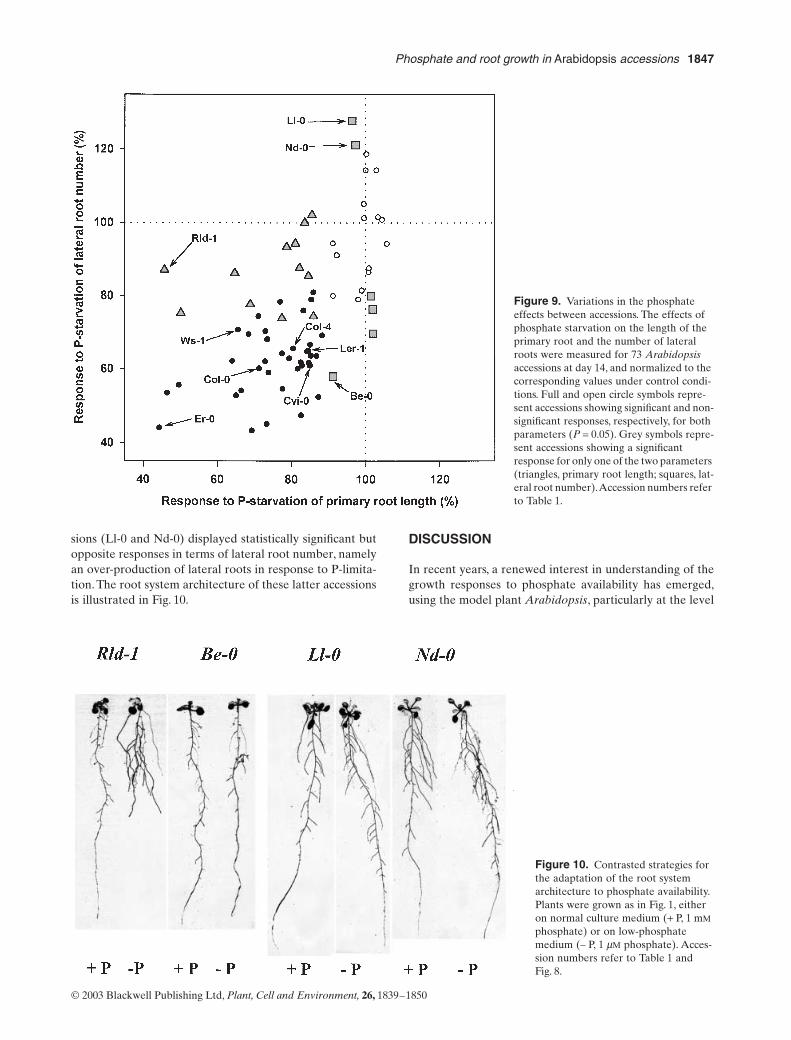
Phosphate and root growth in Arabidopsis accessions 1847
© 2003 Blackwell Publishing Ltd, Plant, Cell and Environment, 26, 1839–1850
sions (Ll-0 and Nd-0) displayed statistically significant butopposite responses in terms of lateral root number, namelyan over-production of lateral roots in response to P-limita-tion. The root system architecture of these latter accessionsis illustrated in Fig. 10.
DISCUSSION
In recent years, a renewed interest in understanding of thegrowth responses to phosphate availability has emerged,using the model plant Arabidopsis, particularly at the level
Figure 9. Variations in the phosphate effects between accessions. The effects of phosphate starvation on the length of the primary root and the number of lateral roots were measured for 73 Arabidopsis accessions at day 14, and normalized to the corresponding values under control condi-tions. Full and open circle symbols repre-sent accessions showing significant and non-significant responses, respectively, for both parameters (P = 0.05). Grey symbols repre-sent accessions showing a significant response for only one of the two parameters (triangles, primary root length; squares, lat-eral root number). Accession numbers refer to Table 1.
Figure 10. Contrasted strategies for the adaptation of the root system architecture to phosphate availability. Plants were grown as in Fig. 1, either on normal culture medium (+ P, 1 mM phosphate) or on low-phosphate medium (– P, 1 mM phosphate). Acces-sion numbers refer to Table 1 and Fig. 8.
1848 F. Chevalier et al.
© 2003 Blackwell Publishing Ltd, Plant, Cell and Environment, 26, 1839–1850
of hormone signalling (Schmidt & Schikora 2001; William-son et al. 2001; Linkohr et al. 2002; Lopez-Bucio et al. 2002;Al-Ghazi et al. 2003). These studies have taken advantageof both the availability of various mutants and of improve-ments in non-invasive image acquisition and analysisdevices, allowing refined quantitative characterization ofthe effects of phosphate on plant growth, and particularlyon the root system architecture. Nevertheless, in somecases, contradictory results were reported. For instance,phosphate starvation was claimed either to reduce or toincrease the number of lateral roots. The origin of suchdiscrepancies is not clear. One tentative explanation is thatdifferent accessions could display different adaptative strat-egies in terms of growth responses to phosphate availabil-ity. In the present study, in order to assess this workinghypothesis, we decided to compare the effects of phosphatestarvation on various Arabidopsis accessions. As no growthparameter could be chosen a priori to screen the accessions,due to the discrepancies between available results, a three-step strategy was selected. First, the growth of a small num-ber of accessions was characterized in detail. These datawere then analysed in order to identify those growthparameters displaying the more discriminant responses tophosphate starvation. Finally a large set of accessions wasscreened using this limited number of robust parameters.For the first step, we selected the four accessions Cvi-0, Col-4, Ler-1 and Ws-1 because they corresponded to accessionspreviously selected to generate both recombinant inbredlines (Lister & Dean 1993; Alonso-Blanco et al. 1998;Alonso-Blanco & Koornneef 2000) and mutant collections(Bechtold, Ellis & Pelletier 1993; Martienssen 1998; Wis-man et al. 1998; Tissier et al. 1999).
Currently used accessions display large and robust variations in root growth
Quite large variations among accessions concerning theplant size and the leaf number of the rosette have previ-ously been reported in Arabidopsis (Karlsson, Sills & Nien-huis 1993; Li, Suzuki & Hara 1998), suggesting thatvariations could also be expected concerning the leaf sur-face. Here, by monitoring the growth of aerial parts fromthe projected leaf area, Ler-1 was indeed found to displaya superior growth, but the three other accessions wereindistinguishable. As previous parameters describing thegrowth of aerial parts have been shown to be very sensitiveto environmental factors (Karlsson et al. 1993), this sug-gests that our in vitro culture conditions would trigger weakvariations concerning leaves. Therefore, more attention wasgiven to characterize the root growth in greater detail.
By contrast, much more variation was observed concern-ing the root system. For the primary root, the two acces-sions Ws-1 and Cvi-0 showed similar length but differedfrom both Col-4 and Ler-1. More generally, each of the fourlength parameters (LTR, LPR, LLR and LBZ) classified theaccessions into three significantly different groups, thegrouping of accessions depending in addition on the param-eters. Similarly, all three parameters used to describe the
contribution of lateral roots to the root system architecture(NLR, DLR and DILR) also classified the accessions into threeother significantly different groups. Furthermore, whenlooking at growth rate parameters, three kinds of time-course were observed, both for the primary root and totallateral roots. As the parameters included both raw data andderived traits, it is important to note that these variationsemerged from all the independently measured parameters(LTR, LPR, LBZ and NLR), indicating an intrinsic diversity.Previous work has already pointed to such variations whenconsidering different accessions. For instance, Krannitz,Aarssen & Lefebvre (1991) compared 25 accessions andshowed that the total root length differed by up to 70%,whereas Lopez-Bucio et al. 2002) reported smaller differ-ences among four accessions. Therefore, the 50% variationquoted here among four accessions, is in quite good agree-ment with published data, allowing for the differences inculture conditions. Similar conclusions can be derived forother parameters (such as the primary root, lateral rootlengths or lateral root density) from comparisons with thedata of Lopez-Bucio et al. 2002). Finally, in time-coursestudies, Beemster et al. (2002) demonstrated the occurrenceof very large variations for the elongation rate of the pri-mary root (up to 370% at day 9, among a set of 18 acces-sions grown under continuous light and in the presence ofsucrose). In the present work, in which the plants experi-enced a photoperiod and the medium lacked sucrose, vari-ations below 120% were observed at day 9, but this ratioincreased to 380% later on. Therefore, the fact that,although performed under different environmental condi-tions, all of these studies still led to similar conclusionssuggests that the occurrence of very large variations in boththe growth and architecture of the root system constitutesa robust response among Arabidopsis accessions, in con-trast to that observed for leaf growth. In addition, the acces-sions selected here to illustrate currently used accessionsappeared to be also easily distinguishable with respect toroot-related features.
Phosphate availability consistently affects the length of the primary root and the number of lateral roots in all the currently used accessions
The effects of phosphate availability were investigated bycomparing plants cultured on a sufficient medium (1 mM
phosphate) with plants grown on a low-phosphate medium(approximately 1 mM phosphate). According to phosphateavailability, very little variation between accessions wasobserved for global parameters such as total leaf area ortotal root length, although, for the four accessions studied,the root length seemed to be more subject to variationthan the leaf area. Much more variation emerged whenlooking at more specific root parameters. For the fouraccessions, both the length of the primary root, the lengthof the branched zone and the number of lateral roots werefound to be significantly reduced in low-phosphatemedium. On the other hand, the time-course of elongation

Phosphate and root growth in Arabidopsis accessions 1849
© 2003 Blackwell Publishing Ltd, Plant, Cell and Environment, 26, 1839–1850
was affected by phosphate for three of the four accessionsin the case of the primary root, but only Ler-1 was sensi-tive to phosphate level in terms of both total lateral rootlength and their time-course of elongation. As the totallength of lateral roots constitutes an average parameter, itcan not be ruled out that significant responses might beobserved when measuring the length of individual roots,thus taking into account a possible role of root age. Inaddition, as the accessions were shown to differ in theiroverall rate of development, the response to phosphateavailability might also simply reflect such differences.However, although both Ler-1 and Col-4 displayed similarand fast growth for the primary root, only Col-4 showed atime-course response that was sensitive to phosphate. Asimilar disconnection between intrinsic development fea-tures and the effect of phosphate availability on time-course responses was observed for the lateral root produc-tion rate. Therefore, taken together, all the observationsabove suggest that the parameters related to the length ofthe primary root and to the number of lateral roots areamong the most discriminant parameters concerning theresponse to phosphate availability. These conclusions arein full agreement with those from all the previously pub-lished studies demonstrating that phosphate starvationreduces the length of the primary root (Williamson et al.2001; Linkohr et al. 2002; Lopez-Bucio et al. 2002; Al-Ghazi et al. 2003). A reduction in the number of lateralroots in low-phosphate medium was also shown in mostprevious studies (Williamson et al. 2001; Linkohr et al.2002; Al-Ghazi et al. 2003) with the exception of that byLopez-Bucio et al. (2002).
As, in addition, the measurement of the two parametersLPR and NLR is straightforward and easier to achieve thanthat of other parameters that also appeared to be sensitiveto phosphate availability in all or most accessions, such asthe length of the branched zone or the density of lateralroots, LPR and NLR were further selected to screen thebehaviour of a large collection of accessions with respect tophosphate availability. In terms of screening strategy, itcould be pointed out that the choice to select very discrim-inant parameters might limit the observation of variationsbetween accessions, and that less stringent parameterscould lead to evidence of other variations. In this view, itcan not be excluded that other accessions than those iden-tified here could constitute privileged material with whichto further investigate the molecular basis of adaptativeresponses to phosphate starvation. Finally, it should be alsoemphasized that, for the four accessions cultured undernormal medium, a very strong correlation (with coefficientsranging between 0.96 and 0.99) could be calculatedbetween the primary root length and the number of lateralroots. Therefore, the use of two possibly linked parameterscould be hypothesized a priori to introduce a bias. Thesubsequent observation that, for one-quarter of the analy-sed accessions, only one of the two parameters was affectedby phosphate starvation suggests that the number of lateralroots is probably not directly linked to the length of theprimary root.
Not all accessions display the same adaptative strategy according to phosphate availability
In order to assess the variation between accessions on alarger scale, we selected a set of 73 accessions originatingfrom 18 countries, corresponding mostly to European andAmerican continental stations, in addition to four insularstations. Large amplitudes of variations, by factors of 2.4and 2.9 for the effects on the primary root length and lateralroot number, respectively, were observed for the two mea-sured parameters in response to phosphate availability. Inaddition, half the accessions displayed the same behaviouras the currently used accessions above, showing that thesimultaneous reduction of the growth of the primary rootand of the number of lateral roots constitutes a mainadaptative response to phosphate starvation in Arabidop-sis. Interestingly, other accessions showed only one of thetwo responses. Furthermore, some accessions showed aninverse response. In this way, phosphate starvation appearscapable of having either null or negative effects on theprimary root, whereas it can have either null, negative orpositive effects on the lateral root number. In terms ofregulation, these results together suggest that the controlof root growth by phosphate availability is not linked tothat of branching, although both pathways are likely toshare some initial signalling steps. Finally, no clear correla-tion was found between the geographical origin of acces-sions and their behaviour.
Up to now, current approaches to elucidate the molecu-lar basis for phenotypic plasticity relied almost exclusivelyon the search for mutants not displaying the wild-typeadaptative response. It can be emphasized that the charac-terization of clear-cut differential responses between acces-sions has the capacity to open new routes for theidentification of both large-effect genes and favourableallelic variations (Alonso-Blanco & Koornneef 2000). Inthis respect, several of the accessions studied here couldconstitute convenient parents to generate populations thatwould be suitable for the analysis of the developmentalplasticity in response to phosphate availability.
ACKNOWLEDGMENTS
The authors are grateful to H. Baudot for valuable assis-tance. This work was supported by the EU research pro-gram Quality of Life and Management of Living Resources(contract QLK5-CT-2001–01871).
REFERENCES
Al-Ghazi Y., Muller B., Pinloche S., Tranbarger T.J., Nacry P.,Rossignol M., Tardieu F. & Doumas P. (2003) Temporalresponses of Arabidopsis root architecture to phosphate. starva-tion: evidences for the involvement of auxin signalling. Plant,Cell & Environment 26, 1053–1066.
Alonso-Blanco C. & Koornneef M. (2000) Naturally occurringvariation in Arabidopsis: an underexploited resource for plantgenetics. Trends in Plant Sciences 5, 22–29.
Alonso-Blanco C., Peeters A.J., Koornneef M., Lister C., Dean C.,

1850 F. Chevalier et al.
© 2003 Blackwell Publishing Ltd, Plant, Cell and Environment, 26, 1839–1850
van den Bosch N., Pot J. & Kuiper M.T. (1998) Development ofan AFLP based linkage map of Ler, Col and Cvi Arabidopsisthaliana accessions and construction of a Ler/Cvi recombinantinbred line population. Plant Journal 14, 259–271.
Bates T.R. & Lynch J.P. (1996) Stimulation of root hair elongationin Arabidopsis thaliana by low phosphorus availability. Plant,Cell and Environment 19, 529–538.
Bechtold N., Ellis J. & Pelletier G. (1993) In planta Agrobacteriummediated gene transfer by infiltration of adult Arabidopsisthaliana plants. Comptes Rendus Academie des Sciences Paris316, 1194–1199.
Beemster G.T., De Vusser K., De Tavernier E., De Bock K. & InzeD. (2002) Variation in growth rate between Arabidopsisaccessions is correlated with cell division and A-type cyclin-dependent kinase activity. Plant Physiology 129, 854–864.
Bonser A.M., Lynch J.P. & Snapp S. (1996) Effect of phosphorusdeficiency on growth angle of basal roots in Phaseolus vulgaris.New Phytologist 132, 281–288.
Borch K., Bouma T.J., Lynch J.P. & Brown K.M. (1999) Ethylene:a regulator of root architectural responses to soil phosphorusavailability. Plant, Cell and Environment 22, 425–431.
Drew M.C. (1975) Comparison of the effects of a localized supplyof phosphate, nitrate, ammonium and potassium on the growthof seminal root system, and shoot, in barley. New Phytologist 75,479–490.
Johnson J.F., Carroll P.V. & Allan D.L. (1996) Phosphorus defi-ciency in Lupinus albus. Plant Physiology 112, 31–41.
Karlsson B.H., Sills G.R. & Nienhuis J. (1993) Effects of photope-riod and vernalization on the number of leaves at flowering in32 Arabidopsis thaliana (Brassicaceae) accessions. AmericanJournal of Botany 80, 646–648.
Krannitz P.G., Aarssen L.W. & Lefebvre D.D. (1991) Relation-ship between physiological and morphological attributes relatedto phosphate uptake in 25 genotypes of Arabidopsis thaliana.Plant and Soil 133, 169–175.
Li B., Suzuki J.I. & Hara T. (1998) Latitudinal variation in plantsize and relative growth rate in Arabidopsis thaliana. Oecologia115, 293–301.
Linkohr B.I., Williamson L.C., Fitter A.H. & Leyser H.M. (2002)Nitrate and phosphate availability and distribution have differ-ent effects on root system architecture of Arabidopsis. PlantJournal 29, 751–760.
Lister C. & Dean C. (1993) Recombinant inbred lines for mapping
RFLP and phenotypic markers in Arabidopsis thaliana. PlantJournal 4, 745–750.
Lopez-Bucio J., Hernandez-Abreu E., Sanchez-Calderon L.,Nieto-Jacobo M.F., Simpson J. & Herrera-Estrella L. (2002)Phosphate availability alters architecture and causes changes inhormone sensitivity in the Arabidopsis root system. Plant Phys-iology 129, 244–256.
Martienssen R. (1998) Functional genomics: probing plant genefunction and expression with transposons. Proceedings of theNational Academy of Sciences of the USA 95, 2021–2026.
Moog P.R., van der Kooij T.A.W., Brüggemann W., SchiefelbeinJ.W. & Kuiper P.J.C. (1995) Responses to iron deficiency inArabidopsis thaliana: the turbo iron reductase does not dependon the formation of root hairs and transfer cells. Planta 195, 503–513.
Narang R.A. & Altmann T. (2001) Phosphate acquisition heterosisin Arabidopsis thaliana: a morphological and physiological anal-ysis. Plant and Soil 234, 91–97.
Narang R.A., Bruene A. & Altmann T. (2000) Analysis of phos-phate acquisition efficiency in different Arabidopsis accessions.Plant Physiology 124, 1786–1799.
Schmidt W. & Schikora A. (2001) Different pathways are involvedin phosphate and iron stress-induced alterations of root epider-mal cell development. Plant Physiology 125, 2078–2084.
Tissier A.F., Marillonnet S., Klimyuk V., Patel K., Torres M.A.,Murphy G. & Jones J.D. (1999) Multiple independent defectivesuppressor-mutator transposon insertions in Arabidopsis: a toolfor functional genomics. Plant Cell 11, 1841–1852.
Williamson L.C., Ribrioux S.P., Fitter A.H. & Leyser H.M. (2001)Phosphate availability regulates root system architecture in Ara-bidopsis. Plant Physiology 126, 875–882.
Wisman E., Hartmann U., Sagasser M., Baumann E., Palme K.,Hahlbrock K., Saedler H. & Weisshaar B. (1998) Knock-outmutants from an En-1 mutagenized Arabidopsis thaliana popu-lation generate phenylpropanoid biosynthesis phenotypes. Pro-ceedings of the National Academy of Sciences of the USA 95,12432–12437.
Zhang H. & Forde B.G. (1998) An Arabidopsis MADS box genethat controls nutrient-induced changes in root architecture. Sci-ence 279, 407–409.
Received 25 March 2003; received in revised form 3 July 2003;accepted for publication 3 July 2003
Proteomic investigation of natural variation betweenArabidopsis ecotypes
François Chevalier, Olivier Martin, Valérie Rofidal, Anne-Dominique Devauchelle,Samuel Barteau, Nicolas Sommerer and Michel Rossignol
Laboratoire de Protéomique, INRA, Montpellier, France
Two-dimensional (2-D) gel electrophoresis and peptide mass fingerprinting were used toinvestigate the natural variation in the proteome among 8 Arabidopsis thaliana ecotypes,of which 3 were previously shown to display atypical responses to environmental stress.Comparison of 2-D maps demonstrated that only one-quarter of spots was shared by allaccessions. On the other hand, only 15% of the 25 majors spots accounting for half thetotal protein amount could be classified as major spots in all ecotypes. Identification ofthese major spots demonstrated large differences between the major functions detected.Accordingly, the proteomes appeared to reveal important variations in terms of functionbetween ecotypes. Hierarchical clustering of proteomes according to either the amount ofall anonymous spots, that of the 25 major spots or the functions of these major spots identi-fied the same classes of ecotypes, and grouped the three atypical ecotypes. It is proposedthat proteome comparison has the capacity to evidence differences in the physiologicalstatus of ecotypes. Results are discussed with respect to the possibility to infer such differ-ences from limited comparisons of major proteins. It is concluded that classical proteomicscould constitute a powerful tool to mine the biodiversity between ecotypes of a single plantspecies.
Keywords: Arabidopsis ecotypes / Hierarchical clustering / Peptide mass fingerprinting / Two-dimen-sional gel electrophoresis
Received 6/10/03Revised 19/1/04Accepted 21/1/04
1372 Proteomics 2004, 4, 1372–1381
1 Introduction
Proteomics is becoming an essential field to investigateplant growth and evolution. Very early, the explorationof proteome was successfully used to characterize therelationships between populations [1–4]. In recent years,such approaches allowed the establishment of distancesfor instance between different species of the Brassica-ceae family [5], various wheat cultivars [6], or oriental andAmerican ginseng [7]. On the other hand, to date, littleattention was paid to the natural variation occurringamong plant ecotypes by opposition to recent works inanimal field [8, 9]. However, biodiversity constitutes a
high potential resource for searching genes of interest, asit is well established for the model plant Arabidopsis thali-ana [10–12]. On this model, large differences betweenecotypes were observed for a variety of features such as,for instance, light and hormone sensitivity [13], seed size[14], the light-dependent hypocotyls growth [15], or thegrowth rate [16]. In a previous study on Arabidopsis rootsystem architecture, we recently demonstrated that,whereas a majority of ecotypes responds to phosphatestarvation by decreasing both growth of the primary rootand initiation of lateral roots, other ecotypes use only oneof these responses [17].
The present work was undertaken to explore the poten-tial of proteomics to investigate natural variation withinArabidopsis ecotypes. For this purpose we selected asmall number of ecotypes encompassing the four onesmost commonly used in genetic or genomic studiesand a variant from one of them as a control for closegenetic distance (all of the five displaying the majorresponse to phosphate starvation), as well as threeecotypes showing alternative responses to phosphate
Correspondence: Dr. François Chevalier, UR 1199 – Laboratoirede Protéomique, INRA, 2 place Viala, F-34060 Montpellier Cedex1, FranceE-mail: [email protected]: 133-4-9961-3014
Abbreviations: MP, major protein; TGS, Tris-Glycine – SDS buf-fer
2004 WILEY-VCH Verlag GmbH & Co. KGaA, Weinheim www.proteomics-journal.de
DOI 10.1002/pmic.200300750
Proteomics 2004, 4, 1372–1381 Proteomics and plant biodiversity 1373
starvation. Classical 2-DE and MALDI-TOF-MS wereused to compare the distances between the proteomesof these ecotypes, with special emphasis to the pro-teins accounting for the majority of the protein amountin each ecotype.
2 Materials and methods
2.1 Plant material, culture conditions, andchemicals
Arabidopsis thaliana ecotypes Ws-1, Cvi-0, Col-0, Col-4,Ler-1, Be-0, and Ll-0 (Table 1) were progenies from NASC(http://nasc.nott.ac.uk). Plants were grown under hydro-ponic conditions [18] for 42 days before sample harvest.Urea, phosphoric acid, and acetic acid were from VWR(Fontenay-ss-Bois, France); CHAPS, Triton X-100, iodo-acetamide, bromophenol blue and Comassie blue werefrom Sigma-Aldrich (St. Louis, MO, USA); glycerol, SDS,DTT, TGS, and Tris were from Euromedex (Mundolshein,France). IPG strips and buffer were from Amersham Bio-sciences (Buckinghamshire, UK), and acrylamide fromBio-Rad (Hercules, CA, USA).
Table 1. Origin of selected Arabidopsis thaliana ecotypes(http://nasc.nott.ac.uk)
Ecotype NASC No. Origin
Col-0 N1093 Columbia (USA)Col-4 N933 Columbia (USA)Be-0 N965 Bensheim (Germany)Ll-0 N1339 Llagostera (Spain)Rld-1 N 913 Netherlands (Koornneef group)Cvi-0 N902 Cape Verdian IslandsWs-1 N2223 Wassilewskija (Russia)Ler-1 N1642 Landsberg (Poland)
2.2 Protein extraction
For each ecotype, one root sample corresponding tomore than 150 root systems was grinded in liquid nitro-gen, and the fine powder was mixed with 90% v/vacetone, 10% v/v TCA solution (100% w/v) and 0.07%v/v 2-mercaptoethanol. After incubation at 2207C for30 min, insoluble material was pelleted at 42 0006gwith a TL 100 ultracentrifuge using a TLA 100.3 rotor(Beckman Coulter, Palo Alto, CA, USA). Pellets werewashed three times with pure acetone containing0.07% v/v 2-mercaptoethanol, air-dried, and solubilizedin buffer containing 9 M urea, 4% w/v CHAPS, 0.05% v/vTriton X-100, and 65 mM DTT. Protein amount was esti-mated using the Bradford method. All manipulationswere performed at 47C.
2.3 Two-dimensional electrophoresis
For each ecotype sample, 2-DE was performed in tripli-cate from the same extract using 18 cm linear pH 4–7IPG strips. 200 mg protein samples were supplementedwith 0.5% v/v IPG buffer pH 4–7 and 0.002% w/v bromo-phenol blue. Strips were hydrated directly with proteinsolution. Isoelectric focusing was performed using anIPG-Phor device until 100 000 kV?h21. Before the seconddimension, the strips were reduced (50 mM Tris-HCl,pH 8.8, 6 M urea, 30% v/v glycerol, 2% w/v SDS, 130 mM
DTT) and alkylated in the same buffer containing 130 mM
iodoacetamide instead DTT for 15 min. Strips were thenembedded using 0.6% w/v low-melt agarose in runningbuffer containing traces of bromophenol blue on the top ofa 11% acrylamide gel. SDS-PAGE was carried out, using a2-D electrophoresis DALT system, at 15 mA per gel over-night at 107C. Gels were stained using colloidal Coomassieblue [19]. Images from stained gels were digitalized at300 dpi with a GS 710 densitometer (Bio-Rad, Hercules,CA, USA) and analyzed using the Progenesis software(Nonlinear Dynamics, Newcastle upon Tyne, UK). Gel tripli-cates were matched to create an average gel with spotspresent at least on two of the three gels. Average gels cor-responding to the different Arabidopsis ecotypes werecompared and spots of interest were selected for subse-quent protein identification by MALDI-TOF-MS analysis.
2.4 Protein identification by MALDI-TOF-MS
Spots were picked from preparative gels (500 mg proteins)using a spot picker robot (Perkin Elmer, Wellesley, MA,USA). Acrylamide pieces were collected in 96-well micro-plates with 50 mL acetic acid (1% v/v). Pieces of gel werethen washed using a Multiprobe II robot (Perkin Elmer)in several steps with water, 25 mM ammonium carbonate,and acetonitrile. Proteins were digested with trypsin(12.5 mg/mL in 25 mM ammonium carbonate). Super-natants were mixed with equal volumes of matrix solution(a-cyano-4-hydroxycinnamic acid) and spotted onto tar-gets. Peptide mass fingerprints were acquired using aBiflex III mass spectrometer (Bruker Daltonics, Bremen,Germany). Spectra were calibrated internally and anno-tated automatically. The MASCOTsearch engine software(Matrix Science, London, UK) was used to search NCBInrdatabase. The following parameters were used for data-base search: mass tolerance of 100 ppm, a minimum offour matched peptides and one miscleavage allowed.
2.5 Data analysis
Protein amount in each spot was estimated from its vol-ume after normalization with respect to the total volumeof all spots detected in the gel. Euclidean or Manhattan
2004 WILEY-VCH Verlag GmbH & Co. KGaA, Weinheim www.proteomics-journal.de
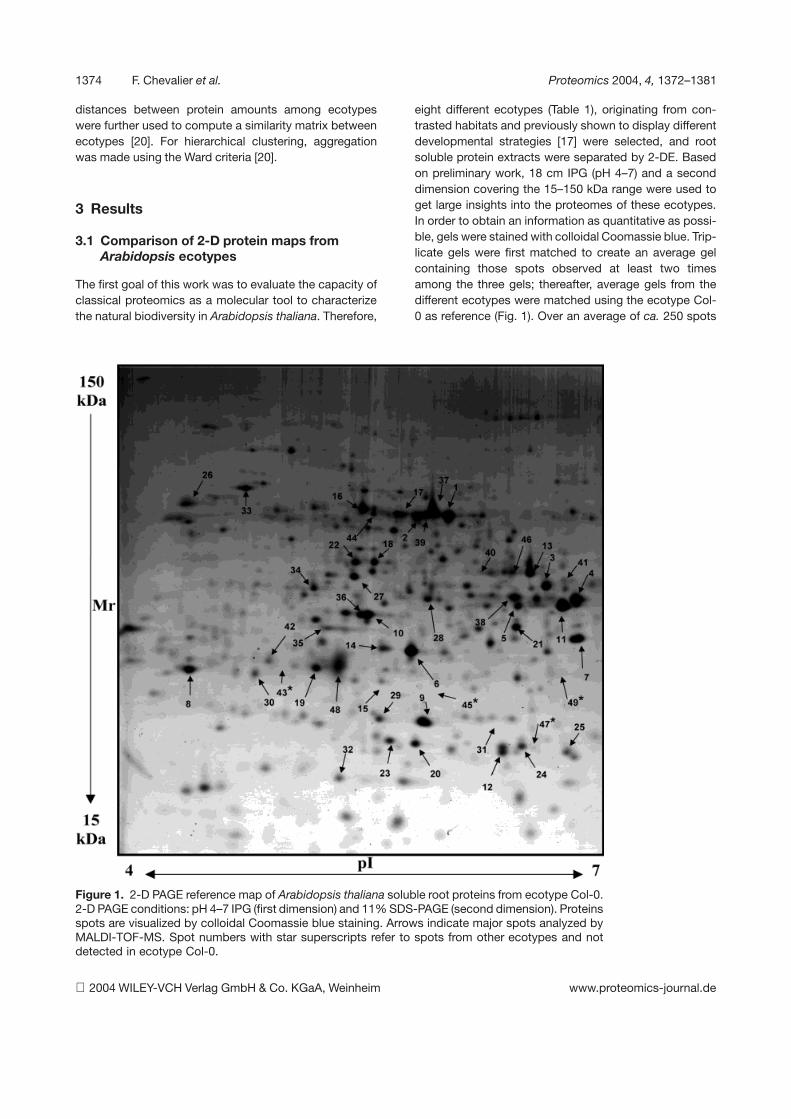
1374 F. Chevalier et al. Proteomics 2004, 4, 1372–1381
distances between protein amounts among ecotypeswere further used to compute a similarity matrix betweenecotypes [20]. For hierarchical clustering, aggregationwas made using the Ward criteria [20].
3 Results
3.1 Comparison of 2-D protein maps fromArabidopsis ecotypes
The first goal of this work was to evaluate the capacity ofclassical proteomics as a molecular tool to characterizethe natural biodiversity in Arabidopsis thaliana. Therefore,
eight different ecotypes (Table 1), originating from con-trasted habitats and previously shown to display differentdevelopmental strategies [17] were selected, and rootsoluble protein extracts were separated by 2-DE. Basedon preliminary work, 18 cm IPG (pH 4–7) and a seconddimension covering the 15–150 kDa range were used toget large insights into the proteomes of these ecotypes.In order to obtain an information as quantitative as possi-ble, gels were stained with colloidal Coomassie blue. Trip-licate gels were first matched to create an average gelcontaining those spots observed at least two timesamong the three gels; thereafter, average gels from thedifferent ecotypes were matched using the ecotype Col-0 as reference (Fig. 1). Over an average of ca. 250 spots
Figure 1. 2-D PAGE reference map of Arabidopsis thaliana soluble root proteins from ecotype Col-0.2-D PAGE conditions: pH 4–7 IPG (first dimension) and 11% SDS-PAGE (second dimension). Proteinsspots are visualized by colloidal Coomassie blue staining. Arrows indicate major spots analyzed byMALDI-TOF-MS. Spot numbers with star superscripts refer to spots from other ecotypes and notdetected in ecotype Col-0.
2004 WILEY-VCH Verlag GmbH & Co. KGaA, Weinheim www.proteomics-journal.de

Proteomics 2004, 4, 1372–1381 Proteomics and plant biodiversity 1375
for each ecotype, one-quarter was found in all the eco-types (Fig. 2), and half of them was shared by at least75% of ecotypes. On the other hand, about 10% of allspots appeared to be specific for one ecotype.
Figure 2. Distribution of spots according to the numberof ecotypes where they were detected.
As simple gel comparison seemed to reveal specificfeatures between the proteomes of Arabidopsis eco-types, a classification was made by hierarchical cluster-ing (Fig. 3a). For this purpose, the amount of each spotwas estimated by its normalized volume as obtained byimage analysis. Euclidian distances were then computedfor all spots to build the similarity matrix for ecotypes,and clustering was performed using the Ward’s methodto link the variables. A first cluster corresponding to thetwo closest ecotypes was observed for Col-0 and Col-4.Another cluster grouped the ecotypes Be-0 and Ll-0, aswell as the ecotype Rld-1, whereas the three last eco-types defined a third cluster.
3.2 Comparison of Arabidopsis ecotypes fromtheir major protein patterns
Above comparison of total 2-D maps indicated both theoccurrence of contrasted proteomes between ecotypesand proximity between some of them. Additional analysisshowed that the 25 most abundant spots from each Ara-bidopsis ecotype cumulated half the total protein amountdetected on the pI and MW range investigated (50.2% 6
6.0% of the total signal computed by image analysis). In afirst attempt to get more insights into the molecular basisof this structure, focus was given on these major proteins(MPs). Over the eight ecotypes, the 25 MPs from eachdefined a total subset of 49 differently matching spotsaccounting individually for between 0.7% and 6.7% ofthe total protein amount in their respective 2-D map.
Figure 3. Classification of the proteomes from the eightecotypes. Hierarchical clustering was performed using(a), (b), (d) the Euclidian distance or (c) the Manhattan dis-tance as metric and the Ward criterion for linkage. (a) Spotabundance (all spots); (b), (c) abundance of MP spots;(d) function of MP spots.
Only 15% of these spots was ranked as MPs in all eco-types and one-half contributed to the MPs in half or morethe ecotypes, indicating the occurrence of large differ-ences in expression level throughout the ecotypes (Fig. 4).Simultaneously, one-quarter of the MPs was not detectedin at least another ecotype, whereas the remaining wasobserved at lower abundance and not classified as MP.
2004 WILEY-VCH Verlag GmbH & Co. KGaA, Weinheim www.proteomics-journal.de
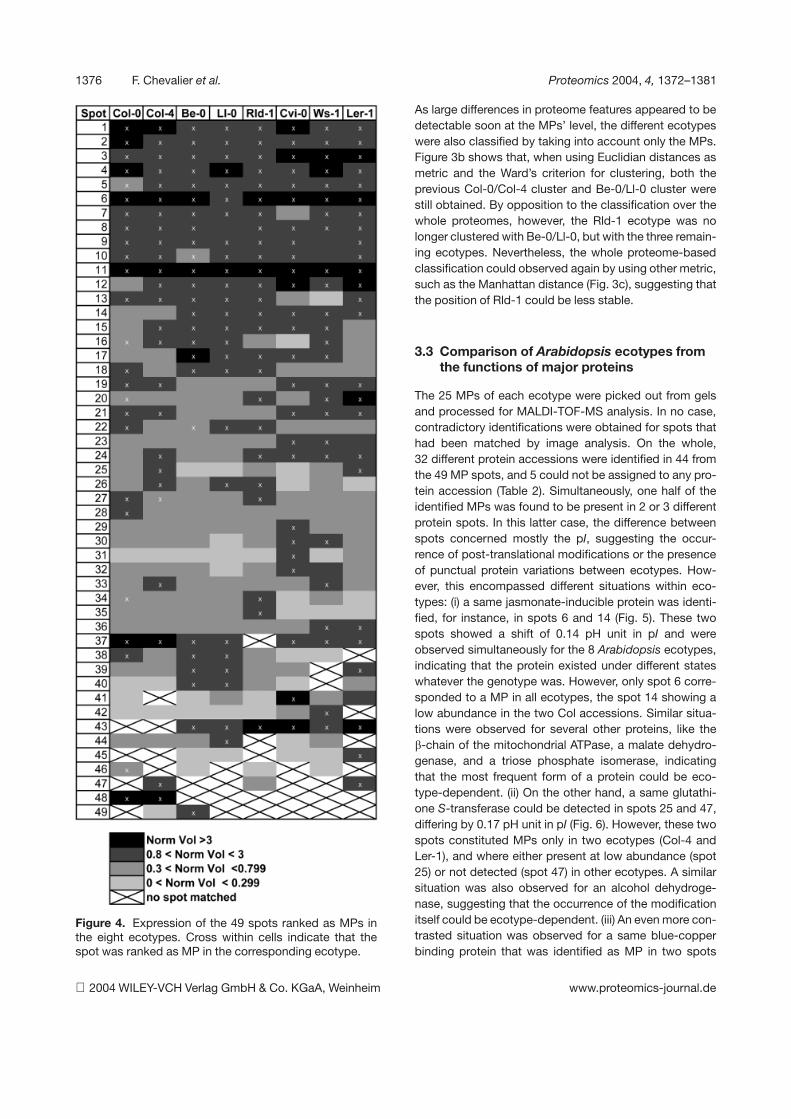
1376 F. Chevalier et al. Proteomics 2004, 4, 1372–1381
Figure 4. Expression of the 49 spots ranked as MPs inthe eight ecotypes. Cross within cells indicate that thespot was ranked as MP in the corresponding ecotype.
As large differences in proteome features appeared to bedetectable soon at the MPs’ level, the different ecotypeswere also classified by taking into account only the MPs.Figure 3b shows that, when using Euclidian distances asmetric and the Ward’s criterion for clustering, both theprevious Col-0/Col-4 cluster and Be-0/Ll-0 cluster werestill obtained. By opposition to the classification over thewhole proteomes, however, the Rld-1 ecotype was nolonger clustered with Be-0/Ll-0, but with the three remain-ing ecotypes. Nevertheless, the whole proteome-basedclassification could observed again by using other metric,such as the Manhattan distance (Fig. 3c), suggesting thatthe position of Rld-1 could be less stable.
3.3 Comparison of Arabidopsis ecotypes fromthe functions of major proteins
The 25 MPs of each ecotype were picked out from gelsand processed for MALDI-TOF-MS analysis. In no case,contradictory identifications were obtained for spots thathad been matched by image analysis. On the whole,32 different protein accessions were identified in 44 fromthe 49 MP spots, and 5 could not be assigned to any pro-tein accession (Table 2). Simultaneously, one half of theidentified MPs was found to be present in 2 or 3 differentprotein spots. In this latter case, the difference betweenspots concerned mostly the pI, suggesting the occur-rence of post-translational modifications or the presenceof punctual protein variations between ecotypes. How-ever, this encompassed different situations within eco-types: (i) a same jasmonate-inducible protein was identi-fied, for instance, in spots 6 and 14 (Fig. 5). These twospots showed a shift of 0.14 pH unit in pI and wereobserved simultaneously for the 8 Arabidopsis ecotypes,indicating that the protein existed under different stateswhatever the genotype was. However, only spot 6 corre-sponded to a MP in all ecotypes, the spot 14 showing alow abundance in the two Col accessions. Similar situa-tions were observed for several other proteins, like theb-chain of the mitochondrial ATPase, a malate dehydro-genase, and a triose phosphate isomerase, indicatingthat the most frequent form of a protein could be eco-type-dependent. (ii) On the other hand, a same glutathi-one S-transferase could be detected in spots 25 and 47,differing by 0.17 pH unit in pI (Fig. 6). However, these twospots constituted MPs only in two ecotypes (Col-4 andLer-1), and where either present at low abundance (spot25) or not detected (spot 47) in other ecotypes. A similarsituation was also observed for an alcohol dehydroge-nase, suggesting that the occurrence of the modificationitself could be ecotype-dependent. (iii) An even more con-trasted situation was observed for a same blue-copperbinding protein that was identified as MP in two spots
2004 WILEY-VCH Verlag GmbH & Co. KGaA, Weinheim www.proteomics-journal.de
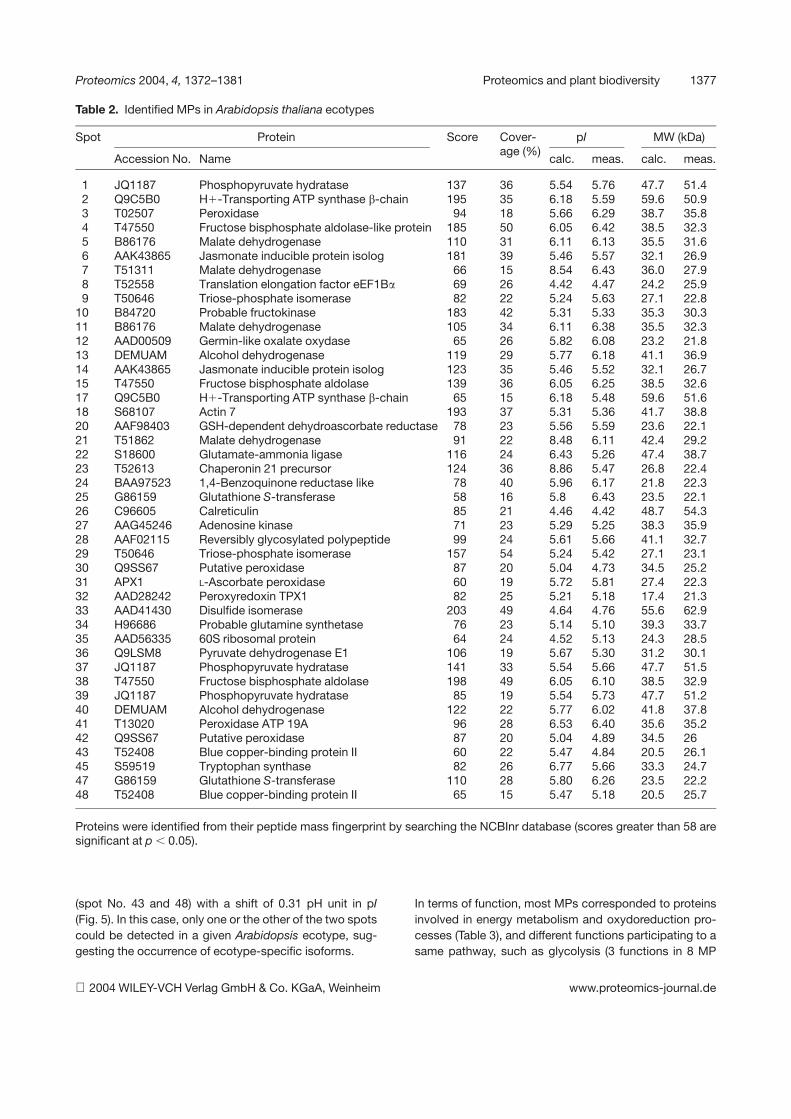
Proteomics 2004, 4, 1372–1381 Proteomics and plant biodiversity 1377
Table 2. Identified MPs in Arabidopsis thaliana ecotypes
Spot Protein Score Cover-age (%)
pI MW (kDa)
Accession No. Name calc. meas. calc. meas.
1 JQ1187 Phosphopyruvate hydratase 137 36 5.54 5.76 47.7 51.42 Q9C5B0 H1-Transporting ATP synthase b-chain 195 35 6.18 5.59 59.6 50.93 T02507 Peroxidase 94 18 5.66 6.29 38.7 35.84 T47550 Fructose bisphosphate aldolase-like protein 185 50 6.05 6.42 38.5 32.35 B86176 Malate dehydrogenase 110 31 6.11 6.13 35.5 31.66 AAK43865 Jasmonate inducible protein isolog 181 39 5.46 5.57 32.1 26.97 T51311 Malate dehydrogenase 66 15 8.54 6.43 36.0 27.98 T52558 Translation elongation factor eEF1Ba 69 26 4.42 4.47 24.2 25.99 T50646 Triose-phosphate isomerase 82 22 5.24 5.63 27.1 22.8
10 B84720 Probable fructokinase 183 42 5.31 5.33 35.3 30.311 B86176 Malate dehydrogenase 105 34 6.11 6.38 35.5 32.312 AAD00509 Germin-like oxalate oxydase 65 26 5.82 6.08 23.2 21.813 DEMUAM Alcohol dehydrogenase 119 29 5.77 6.18 41.1 36.914 AAK43865 Jasmonate inducible protein isolog 123 35 5.46 5.52 32.1 26.715 T47550 Fructose bisphosphate aldolase 139 36 6.05 6.25 38.5 32.617 Q9C5B0 H1-Transporting ATP synthase b-chain 65 15 6.18 5.48 59.6 51.618 S68107 Actin 7 193 37 5.31 5.36 41.7 38.820 AAF98403 GSH-dependent dehydroascorbate reductase 78 23 5.56 5.59 23.6 22.121 T51862 Malate dehydrogenase 91 22 8.48 6.11 42.4 29.222 S18600 Glutamate-ammonia ligase 116 24 6.43 5.26 47.4 38.723 T52613 Chaperonin 21 precursor 124 36 8.86 5.47 26.8 22.424 BAA97523 1,4-Benzoquinone reductase like 78 40 5.96 6.17 21.8 22.325 G86159 Glutathione S-transferase 58 16 5.8 6.43 23.5 22.126 C96605 Calreticulin 85 21 4.46 4.42 48.7 54.327 AAG45246 Adenosine kinase 71 23 5.29 5.25 38.3 35.928 AAF02115 Reversibly glycosylated polypeptide 99 24 5.61 5.66 41.1 32.729 T50646 Triose-phosphate isomerase 157 54 5.24 5.42 27.1 23.130 Q9SS67 Putative peroxidase 87 20 5.04 4.73 34.5 25.231 APX1 L-Ascorbate peroxidase 60 19 5.72 5.81 27.4 22.332 AAD28242 Peroxyredoxin TPX1 82 25 5.21 5.18 17.4 21.333 AAD41430 Disulfide isomerase 203 49 4.64 4.76 55.6 62.934 H96686 Probable glutamine synthetase 76 23 5.14 5.10 39.3 33.735 AAD56335 60S ribosomal protein 64 24 4.52 5.13 24.3 28.536 Q9LSM8 Pyruvate dehydrogenase E1 106 19 5.67 5.30 31.2 30.137 JQ1187 Phosphopyruvate hydratase 141 33 5.54 5.66 47.7 51.538 T47550 Fructose bisphosphate aldolase 198 49 6.05 6.10 38.5 32.939 JQ1187 Phosphopyruvate hydratase 85 19 5.54 5.73 47.7 51.240 DEMUAM Alcohol dehydrogenase 122 22 5.77 6.02 41.8 37.841 T13020 Peroxidase ATP 19A 96 28 6.53 6.40 35.6 35.242 Q9SS67 Putative peroxidase 87 20 5.04 4.89 34.5 2643 T52408 Blue copper-binding protein II 60 22 5.47 4.84 20.5 26.145 S59519 Tryptophan synthase 82 26 6.77 5.66 33.3 24.747 G86159 Glutathione S-transferase 110 28 5.80 6.26 23.5 22.248 T52408 Blue copper-binding protein II 65 15 5.47 5.18 20.5 25.7
Proteins were identified from their peptide mass fingerprint by searching the NCBInr database (scores greater than 58 aresignificant at p , 0.05).
(spot No. 43 and 48) with a shift of 0.31 pH unit in pI(Fig. 5). In this case, only one or the other of the two spotscould be detected in a given Arabidopsis ecotype, sug-gesting the occurrence of ecotype-specific isoforms.
In terms of function, most MPs corresponded to proteinsinvolved in energy metabolism and oxydoreduction pro-cesses (Table 3), and different functions participating to asame pathway, such as glycolysis (3 functions in 8 MP
2004 WILEY-VCH Verlag GmbH & Co. KGaA, Weinheim www.proteomics-journal.de
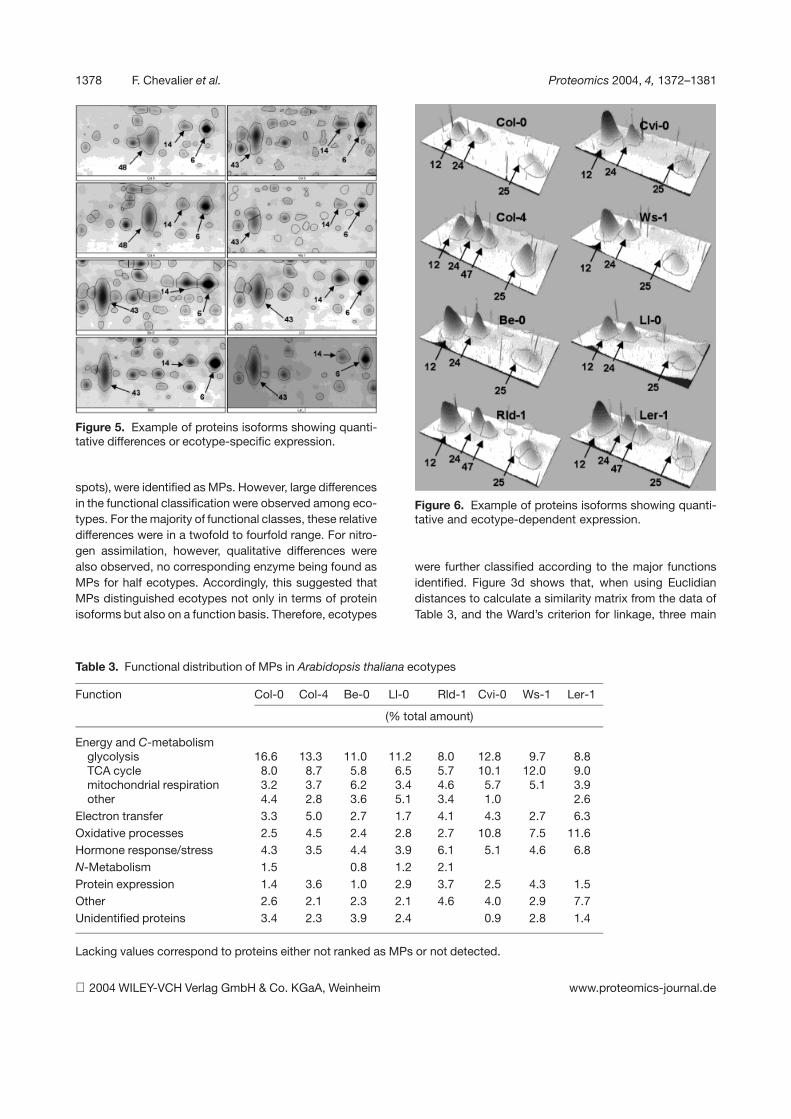
1378 F. Chevalier et al. Proteomics 2004, 4, 1372–1381
Figure 5. Example of proteins isoforms showing quanti-tative differences or ecotype-specific expression.
spots), were identified as MPs. However, large differencesin the functional classification were observed among eco-types. For the majority of functional classes, these relativedifferences were in a twofold to fourfold range. For nitro-gen assimilation, however, qualitative differences werealso observed, no corresponding enzyme being found asMPs for half ecotypes. Accordingly, this suggested thatMPs distinguished ecotypes not only in terms of proteinisoforms but also on a function basis. Therefore, ecotypes
Figure 6. Example of proteins isoforms showing quanti-tative and ecotype-dependent expression.
were further classified according to the major functionsidentified. Figure 3d shows that, when using Euclidiandistances to calculate a similarity matrix from the data ofTable 3, and the Ward’s criterion for linkage, three main
Table 3. Functional distribution of MPs in Arabidopsis thaliana ecotypes
Function Col-0 Col-4 Be-0 Ll-0 Rld-1 Cvi-0 Ws-1 Ler-1
(% total amount)
Energy and C-metabolismglycolysis 16.6 13.3 11.0 11.2 8.0 12.8 9.7 8.8TCA cycle 8.0 8.7 5.8 6.5 5.7 10.1 12.0 9.0mitochondrial respiration 3.2 3.7 6.2 3.4 4.6 5.7 5.1 3.9other 4.4 2.8 3.6 5.1 3.4 1.0 2.6
Electron transfer 3.3 5.0 2.7 1.7 4.1 4.3 2.7 6.3Oxidative processes 2.5 4.5 2.4 2.8 2.7 10.8 7.5 11.6Hormone response/stress 4.3 3.5 4.4 3.9 6.1 5.1 4.6 6.8N-Metabolism 1.5 0.8 1.2 2.1Protein expression 1.4 3.6 1.0 2.9 3.7 2.5 4.3 1.5Other 2.6 2.1 2.3 2.1 4.6 4.0 2.9 7.7Unidentified proteins 3.4 2.3 3.9 2.4 0.9 2.8 1.4
Lacking values correspond to proteins either not ranked as MPs or not detected.
2004 WILEY-VCH Verlag GmbH & Co. KGaA, Weinheim www.proteomics-journal.de

Proteomics 2004, 4, 1372–1381 Proteomics and plant biodiversity 1379
clusters could be obtained. Furthermore, this tree wasalmost identical to those obtained when classifying eco-types on the basis of their whole proteome (Fig. 3a) oraccording to the anonymous MP subset (Figs. 3b, c).
4 Discussion
To date, little effort was devoted to investigate the differ-ences eventually observed between proteomes of eco-types from a same plant species. Even in the case ofthe model plant Arabidopsis thaliana, the only availabledata concern a pair of ecotypes that was included intoan inter-species comparison within the Brassicaceaefamily, with no attempt to identify proteins [3]. Therefore,presently available data do not allow to decipher, forinstance, whether eventual differences between ecotypesoriginate from the expression of different ecotype-specificisoforms of proteins showing the same function or fromthe differential expression of proteins with different func-tions.
4.1 Different Arabidopsis ecotypes displaycontrasted proteomes
In the present work, two main series of evidences wereobtained arguing for the existence of large differences be-tween the proteomes of the eight Arabidopsis ecotypesanalyzed.(i) In terms of protein patterns, gel comparison demon-strated first that at least one-third of the spots was notdetected in half the accessions. On the other hand, rank-ing the spots in terms of MPs showed that only one-quar-ter of these constituted MPs in all the ecotypes, severalMPs for one ecotype displaying lower abundance orbeing not detected in others. Further identification ofMPs gave examples for different types of variations, towhich quantitative differences were also superimposed:simultaneous expression of the different spots in all theecotypes, expression of one or two forms of the proteinin all ecotypes, whereas another form was ecotype-de-pendent, or exclusive expression of one form of the pro-tein in an ecotype-specific manner. Therefore, collec-tively, these results demonstrate the occurrence of a qual-itative and quantitative plasticity of the protein profilesbetween ecotypes which concerns both low-abundanceand high-abundance proteins. The nature of these differ-ences was not investigated here and could be hypothe-sized to rely as well on post-translational modificationsas on allelic variations for those proteins identifying thesame accession. Overall, very little information is present-ly available concerning the variations in proteome amongArabidopsis ecotypes, more extensive information being
available for some other plant species. Using metricsbased on the presence or absence of spots, the two Ara-bidopsis ecotypes Landsberg and Columbia were shownto be first merged together when compared to other spe-cies from the Brassicaceae family [5]. For maritime pine[4], plants from seven origins were compared, and lessthan 20% of spots was observed simultaneously in allpatterns. However, in none of these works, a specificanalysis according to the protein abundance was made.Accordingly, our results both constitute a novel exampleof the proteome plasticity among plant ecotypes and givethe first evidences that the major proteins could contrib-ute strongly to the variations observed. Colloidal Coo-massie blue staining of 2-DE gels is known to favor thevisualization of abundant proteins. Therefore, as the pro-teins ranked here as MPs constituted half of the amountof this subset, the accumulation of MPs is likely to have amajor cost for the cell. Accordingly, it can be speculatedwhether, beside the selection of isoforms or allelic formsconferring a superiority with respect to some functions,the variations demonstrated in the proteomes of ecotypesreveal also physiological re-equilibrations.(ii) In terms of functions associated to MPs, large varia-tions were also observed, mostly as quantitative differ-ences, showing that not the same abundant proteins areaccumulated in all ecotypes. Actually, whenever morethan one-quarter of MPs was not detected in some eco-types, for most of them the same accession was identi-fied in other spots indicating the occurrence of isoformsor protein modifications. On the other hand, in severalcases, given functions were highly expressed in someecotypes, but minor in others. A striking example con-cerns the alcohol dehydrogenase function, that constitu-tes a major function in two MP spots for Ll-0 ecotype(where it cumulates 3.7% of the total protein amount),but a minor function in Ws-1 ecotype (0.1% of the total).Such amplitude suggests the occurrence of strong func-tional variations between ecotypes. Moreover, the factthat several of the major functions participate to thesame pathway support the hypothesis that the plasticityof the proteome reveals different physiological equili-briums between ecotypes. For instance, in terms of MPs,Cvi-0 ecotype appears to dedicate 13% of its proteinamount to glycolysis and 27-fold less to nitrogen assimi-lation, whereas this ratio is 7 times lower for Rld-1 eco-type. In terms of experimental strategy, it should beemphasized that, although a small proportion of proteinswas characterized here, the conclusions derived can beassumed to be robust as it is unlikely that such ratio couldbe strongly modified by the identification of minor pro-teins. However, it should be also noticed that the fivespots that could not be identified from their peptidemass fingerprint contribute substantially to the variationbetween ecotypes (3.9% of the total protein amount in
2004 WILEY-VCH Verlag GmbH & Co. KGaA, Weinheim www.proteomics-journal.de
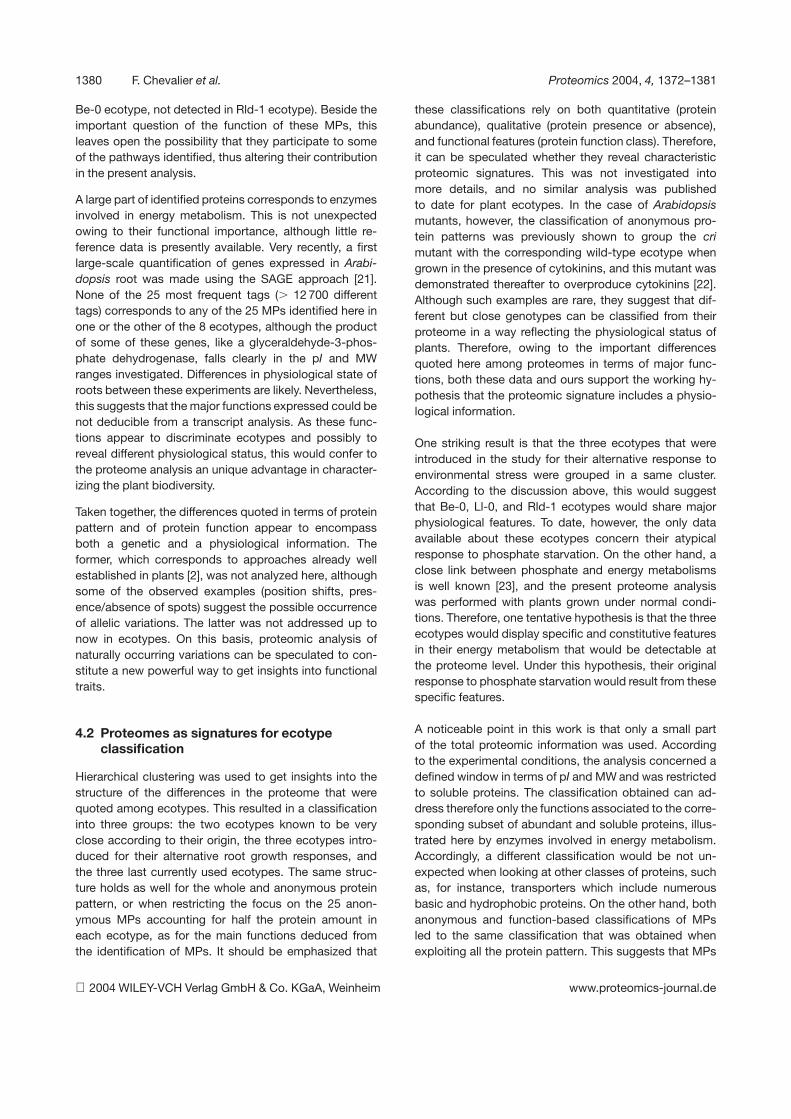
1380 F. Chevalier et al. Proteomics 2004, 4, 1372–1381
Be-0 ecotype, not detected in Rld-1 ecotype). Beside theimportant question of the function of these MPs, thisleaves open the possibility that they participate to someof the pathways identified, thus altering their contributionin the present analysis.
A large part of identified proteins corresponds to enzymesinvolved in energy metabolism. This is not unexpectedowing to their functional importance, although little re-ference data is presently available. Very recently, a firstlarge-scale quantification of genes expressed in Arabi-dopsis root was made using the SAGE approach [21].None of the 25 most frequent tags (. 12 700 differenttags) corresponds to any of the 25 MPs identified here inone or the other of the 8 ecotypes, although the productof some of these genes, like a glyceraldehyde-3-phos-phate dehydrogenase, falls clearly in the pI and MWranges investigated. Differences in physiological state ofroots between these experiments are likely. Nevertheless,this suggests that the major functions expressed could benot deducible from a transcript analysis. As these func-tions appear to discriminate ecotypes and possibly toreveal different physiological status, this would confer tothe proteome analysis an unique advantage in character-izing the plant biodiversity.
Taken together, the differences quoted in terms of proteinpattern and of protein function appear to encompassboth a genetic and a physiological information. Theformer, which corresponds to approaches already wellestablished in plants [2], was not analyzed here, althoughsome of the observed examples (position shifts, pres-ence/absence of spots) suggest the possible occurrenceof allelic variations. The latter was not addressed up tonow in ecotypes. On this basis, proteomic analysis ofnaturally occurring variations can be speculated to con-stitute a new powerful way to get insights into functionaltraits.
4.2 Proteomes as signatures for ecotypeclassification
Hierarchical clustering was used to get insights into thestructure of the differences in the proteome that werequoted among ecotypes. This resulted in a classificationinto three groups: the two ecotypes known to be veryclose according to their origin, the three ecotypes intro-duced for their alternative root growth responses, andthe three last currently used ecotypes. The same struc-ture holds as well for the whole and anonymous proteinpattern, or when restricting the focus on the 25 anon-ymous MPs accounting for half the protein amount ineach ecotype, as for the main functions deduced fromthe identification of MPs. It should be emphasized that
these classifications rely on both quantitative (proteinabundance), qualitative (protein presence or absence),and functional features (protein function class). Therefore,it can be speculated whether they reveal characteristicproteomic signatures. This was not investigated intomore details, and no similar analysis was publishedto date for plant ecotypes. In the case of Arabidopsismutants, however, the classification of anonymous pro-tein patterns was previously shown to group the crimutant with the corresponding wild-type ecotype whengrown in the presence of cytokinins, and this mutant wasdemonstrated thereafter to overproduce cytokinins [22].Although such examples are rare, they suggest that dif-ferent but close genotypes can be classified from theirproteome in a way reflecting the physiological status ofplants. Therefore, owing to the important differencesquoted here among proteomes in terms of major func-tions, both these data and ours support the working hy-pothesis that the proteomic signature includes a physio-logical information.
One striking result is that the three ecotypes that wereintroduced in the study for their alternative response toenvironmental stress were grouped in a same cluster.According to the discussion above, this would suggestthat Be-0, Ll-0, and Rld-1 ecotypes would share majorphysiological features. To date, however, the only dataavailable about these ecotypes concern their atypicalresponse to phosphate starvation. On the other hand, aclose link between phosphate and energy metabolismsis well known [23], and the present proteome analysiswas performed with plants grown under normal condi-tions. Therefore, one tentative hypothesis is that the threeecotypes would display specific and constitutive featuresin their energy metabolism that would be detectable atthe proteome level. Under this hypothesis, their originalresponse to phosphate starvation would result from thesespecific features.
A noticeable point in this work is that only a small partof the total proteomic information was used. Accordingto the experimental conditions, the analysis concerned adefined window in terms of pI and MW and was restrictedto soluble proteins. The classification obtained can ad-dress therefore only the functions associated to the corre-sponding subset of abundant and soluble proteins, illus-trated here by enzymes involved in energy metabolism.Accordingly, a different classification would be not un-expected when looking at other classes of proteins, suchas, for instance, transporters which include numerousbasic and hydrophobic proteins. On the other hand, bothanonymous and function-based classifications of MPsled to the same classification that was obtained whenexploiting all the protein pattern. This suggests that MPs
2004 WILEY-VCH Verlag GmbH & Co. KGaA, Weinheim www.proteomics-journal.de

Proteomics 2004, 4, 1372–1381 Proteomics and plant biodiversity 1381
would be responsible for a main part of variations be-tween ecotypes, and that an analysis focusing on a lim-ited number of proteins bearing major functions mayhave the capacity to reveal specific features of the pro-teomes. No attempt was made here to assess thesepoints, for instance by changing the number of MPsselected and the proportion of the total protein amounttaken into account to classify the proteomes. Furtherwork remains therefore required to rationalize a generalstrategy suitable for large-scale classification of ecotypesfrom a limited but detailed characterization of proteomes.
In conclusion, we report here a first use of proteomicsto investigate variations between Arabidopsis ecotypes.The result obtained demonstrate that the differences inthe proteomes originate both from the expression of dif-ferent ecotype-specific isoforms of proteins showing thesame function and from the differential expression of pro-teins with different functions. Furthermore, the approachappears to have the capacity to discriminate ecotypesand to generate a classification according to their physio-logical status, directly from the features of their major pro-teins. Owing to the throughput of the present proteomictechnology and to the hundreds of ecotypes available forArabidopsis, it can be speculated that such proteomicapproach will constitute a robust tool for mining the natu-ral biodiversity in plants.
This work was supported by the EU research programQuality of Life and Management of Living Resources (con-tract QLK5-CT-2001-01871) and by the Proteome Plat-form of the Montpellier-LR Génopole.
5 References
[1] De Vienne, D., Burstin, J., Gerber, S., Leonardi, A. et al.,Heredity 1996, 76, 166–177.
[2] Thiellement, H., Bahrman, N., Damerval, C., Plomion, C. etal., Electrophoresis 1999, 20, 2013–2326.
[3] Burstin, J., de Vienne, D., Dubreuil, P., Damerval, C., Theor.Appl. Genet. 1994, 89, 943–950.
[4] Bahrman, N., Zivy, M., Damerval, C., Baradat, P., Theor.Appl. Genet. 1994, 88, 407–411.
[5] Marquès, K., Sarazin, B., Chané-Favre, L., Zivy, M., Thielle-ment, H., Proteomics 2001, 11, 1457–1462.
[6] Jacobsen, S., Nesic, L., Petersen, M., Sondergaard, I., Elec-trophoresis 2001, 22, 1242–1245.
[7] Lum, J. H., Fung, K. L., Cheung, P. Y., Wong, M., S. et al.,Proteomics 2002, 2, 1123–1130.
[8] Fullaondo, A., Vicario, A., Aguirre, A., Barrena, I., Salazar, A.,Heredity 2001, 87, 266–272.
[9] Mosquera, E., López, J. L., Alvarez, G., Heredity 2003, 90,432–442.
[10] Pigliucci, M., Trends Plant. Sci. 1998, 3, 485–489.
[11] Alonso-Blanco, C., Koornneef, M., Trends Plant. Sci. 2000,5, 22–29.
[12] Mitchell-Olds, T., Trends Ecol. Evol. 2001, 16, 693–700.
[13] Maloof, J. N., Borevitz, J. O., Dabi, T., Lutes, J. et al., Nat.Genet. 2001, 29, 441–446.
[14] Alonso-Blanco, C., Blankestijn-de Vries, H., Hanhart, C. J.,Koornneef, M., Proc. Natl. Acad. Sci. USA 1999, 96, 4710–4717.
[15] Pepper, A. E., Corbett, R. W., Kang, N., Plant Cell. Environ.2002, 25, 591–600.
[16] Beemster, G. T., De Vusser, K., De Tavernier, E., De Bock, K.,Inze, D., Plant Physiol. 2002, 129, 854–864.
[17] Chevalier, F., Pata, M., Nacry, P., Doumas, P., Rossignol, M.,Plant Cell. Environ. 2003, 26, 1839–1850.
[18] Lejay, L., Tillard, P., Lepetit, M., Olive, F. D. et al., Plant J.1999, 18, 509–519.
[19] Schele, C., Lamer, S., Pan, Z., Li, X. P. et al., Electrophoresis1998, 19, 918–927.
[20] Hartigan, J. A., Clustering Algorithms, Wiley, New York 1975.
[21] Eckman, D. R., Lorenz, W. W., Przybyla, A. E., Wolfe, N. L.,Dean, J. F. D., Plant Physiol. 2003, 133, 1397–1406.
[22] Santoni, V., Delarue, M., Caboche, M., Bellini, C., Planta1997, 202, 62–69.
[23] Plaxton, W. C., in: Lynch, J. P., Deikman, J. (Eds.), Phos-phorus in Plant Biology, ASPP, Rockville, USA 1998,229–241.
2004 WILEY-VCH Verlag GmbH & Co. KGaA, Weinheim www.proteomics-journal.de
Author's personal copy
Journal of Plant Physiology 168 (2011) 1885– 1890
Contents lists available at ScienceDirect
Journal of Plant Physiology
jou rn al h o mepage: www.elsev ier .de / jp lph
Proteomic analysis of Arabidopsis thaliana ecotypes with contrasted rootarchitecture in response to phosphate deficiency
Franc ois Chevaliera,b,∗, Michel Rossignola
a INRA UR 1199, Protéomique Fonctionnelle, Place Viala, 34060 Montpellier, Cedex 2, Franceb CEA DSV/iRCM, Plateforme de Protéomique, Route du Panorama, 92265 Fontenay-aux-Roses, Cedex, France
a r t i c l e i n f o
Article history:Received 8 March 2011Received in revised form 16 May 2011Accepted 21 May 2011
Keywords:AconitaseEcotypesPhosphate deficiencyProteomics
a b s t r a c t
Owing to a weak availability in soil, plants have developed numerous morphological, physiologicaland biochemical adaptations to acquire phosphate (Pi). Identification and characterisation of key genesinvolved in the initial steps of Pi-signalling might provide clues about the regulation of the complexPi deficiency adaptation mechanism. A two-dimensional gel electrophoresis approach was performedto investigate proteome responses to Pi starvation in Arabidopsis. Two ecotypes were selected accord-ing to contrasting responses of their root system architecture to low availability of Pi. Thirty proteinspots were shown to be affected by Pi deficiency. Fourteen proteins appeared to be up-regulated and tendown-regulated with ecotype Be-0, wheras only thirteen proteins were observed as down-regulated forecotype Ll-0. Furthermore, systematic and opposite responses to Pi deficiency were observed betweenthe two ecotypes. The sequences of these 30 differentially expressed protein spots were identified usingmass spectrometry, and most of the proteins were involved in oxidative stress, carbohydrate and pro-teins metabolism. The results suggested that the modulation of alcohol dehydrogenase, malic enzymeand aconitate hydratase may contribute to the contrasted adaptation strategy to Pi deficiency of Be-0 andLl-0 ecotypes. A focus on aconitate hydratase highlighted a complex reverse response of the pattern ofcorresponding spots between the two ecotypes. This protein, also potentially involved in iron homeosta-sis, was speculated to contribute, at least indirectly, to the root architecture response of these ecotypes.
© 2011 Elsevier GmbH. All rights reserved.
Introduction
Like nitrogen and potassium, phosphate is one of the threeessential macronutrients of plants. Phosphate is not only a con-stituent of such key cell molecules as ATP, nucleic acids andphospholipids, but also acts as a regulator in many metabolisms,including energy transfer, protein activation, and carbon metabolicprocesses. Because of its low mobility in the soil, inorganicorthophosphate (Pi), the assimilated form of phosphorus, is one ofthe most limiting nutrients for plant growth and crop productivity,and low-Pi availability is a major constraint for plant productivityin alkaline and acid soils (Raghothama and Karthikeyan, 2005). Asdevelopmental plasticity is one main adaptative response of plantsto the availability of nutrients, limitation in Pi induces both molecu-
Abbreviations: TAIR, The Arabidopsis Information Resource; Pi, inorganic phos-phate; 2-DE, two-dimensional electrophoresis.
∗ Corresponding author at: Proteomic Platform, iRCM, CEA, Fontenay aux Roses,France. Tel.: +33 (0)1 46 548 326; fax: +33 (0)1 46 549 138.
E-mail address: [email protected] (F. Chevalier).
lar and developmental adjustment (Fang et al., 2009; Raghothama,1999).
In Arabidopsis, Pi starvation was described to result in anincrease of the size of the root apparatus that could favour Pi uptake(Al-Ghazi et al., 2003). Such responses of the root architecture mayinvolve various modifications, of which several are also triggeredby other stresses. For instance, they may concern the growth ofthe primary root in Pi-starved plants (Chevalier et al., 2003), thegrowth of lateral roots in nitrate-, Pi- or iron-starved plants, thedensity of lateral roots in Pi- or iron-starved plants (Moog et al.,1995; Williamson et al., 2001) or the formation of root hairs in Pi- oriron-starved plants (Bates and Lynch, 1996; Schmidt and Schikora,2001). In other plant species, Pi starvation may promote the for-mation of proteoid roots as in Lupinus albus (Johnson et al., 1996)or affect the growth angle of roots in Phaseolus vulgaris (Bonseret al., 1996) whilst altering simultaneously the growth and densityof lateral roots (Borch et al., 1999).
Several gene and transcription factors were related to Pi starva-tion and plant adaptation (Camacho-Cristóbal et al., 2008; Liu et al.,2009; Richardson, 2009; Ticconi et al., 2009; Wang et al., 2010;Yang et al., 2010; Yuan and Liu, 2008). In a previous work, we anal-ysed the capacity of Arabidopsis ecotypes to develop a specific root
0176-1617/$ – see front matter © 2011 Elsevier GmbH. All rights reserved.doi:10.1016/j.jplph.2011.05.024
Author's personal copy
1886 F. Chevalier, M. Rossignol / Journal of Plant Physiology 168 (2011) 1885– 1890
architecture under low-Pi growth conditions (Chevalier et al.,2003). A wide range of ecotypes was studied and an increase or adecrease in the primary root length and/or the lateral roots numberwere observed, indicating the occurrence of different and con-trasting adaptative strategies. Among all ecotypes analysed, 66%presented a decrease in primary root length and 25% presentedno modification of the primary root length nor of the lateral rootnumber. From the remaining 9%, ecotypes Ll-0 and Be-0 displayedopposite responses, with an increase or a decrease of the lateral rootnumber, respectively, and no change in the primary root length.In addition, under conditions of Pi-deficiency, the decrease in pri-mary root length was proposed to be linked to root Fe toxicity,and the atypical response of accession Ll-0 was associated with anincreased resistance to root Fe toxicity (Ward et al., 2008).
A previous proteomic study using two-dimensional elec-trophoresis (2-DE) and MALDI-TOF mass spectrometry allowed theanalysis of the natural variability at the protein level, with a specialfocus on proteins accounting for the majority of the protein amountin each ecotype (Chevalier et al., 2004a; Chevalier, 2010). The pro-teomes appeared to reveal important variations in terms of functionbetween the 5 studied ecotypes under normal growth conditions,without any stress. It was proposed that proteomic comparison hasthe capacity to evidence differences in the physiological status ofecotypes.
In this work, in order to further analyse key proteins involvedin plant adaptation to Pi-deficiency, we compared ecotypes Ll-0and Be-0, previously shown to be very close in terms of global pro-teome but distant in terms of their root system under low-Pi growthconditions. A gel-based proteomic strategy was used for total sol-uble proteins from hydroponic roots of the two ecotypes grownon control or Pi-deficient medium. Several spots appeared to dis-play opposite responses between the two ecotypes, and a specificemphasis was proposed for aconitase hydratase, which seemed tobe characteristic of contrasted ecotype responses to Pi starvation.
Materials and methods
Plant material and culture conditions
Arabidopsis ecotypes Be-0 and Ll-0 were progenies from NASC(http://nasc.nott.ac.uk). Plants were grown under hydroponic con-ditions as previously described (Lejay et al., 1999) at the vegetativestage with complete medium for 6 weeks and then again withcomplete medium (control) or with Pi deficiency medium (treated)during the last 8 days before sample harvest.
Protein extraction
A TCA/acetone extraction protocol was used to extract and sol-ubilise proteins from plant root as previously described (Chevalieret al., 2004b). Briefly, for each ecotype and growth condition, rootsample corresponding to more than 150 root systems was groundin liquid nitrogen, and the fine powder was mixed with precipita-tion solution (90% acetone, 10% TCA and 0.07% 2-mercaptoethanol).After incubation at −20 ◦C, insoluble material was pelleted at42,000 × g with a TL 100 ultracentrifuge using a TLA 100.3 rotor(Beckman Coulter, CA, USA). Pellets were washed with acetone con-taining 0.07% 2-mercatoethanol (v/v), air-dried and solubilised inbuffer containing 9 M urea, 4% CHAPS (w/v), 0.05% Triton X100 (v/v)and 65 mM DTT. Protein level was estimated using the Bradfordmethod. All manipulations were performed on ice.
Two-dimensional electrophoresis
For each ecotype sample, 2-DE was performed as previouslydescribed (Chevalier et al., 2004a). Triplicate gels with 18 cm linear
pH 4–7 IPG strips for the first dimension and 12% acrylamide gelfor the second dimension were used. Protein samples (200 �g) wereloaded on each gel and gels were stained using colloidal Coomassieblue (Chevalier et al., 2004b, 2007).
Image analysis
Images from stained gels were digitalized at 300 dpi with aGS 710 densitometer (Biorad, Hercules, CA, USA) and analysedusing the Samespots software v4.0 (Non-linear Dynamics, UK). Geltriplicates were grouped to create an analysis with the 12 gels cor-responding to 2 ecotypes and 2 growth conditions. Spots of eachecotypes were compared between control and Pi deficiency growthconditions. A multivariate statistical analysis was performed usingthe statistic mode of the Samespots software v4.0 (Non-linearDynamics, UK). Spots with significant differences between controland Pi deficiency growth conditions (Anova t-test, p < 0.05) werefirst selected for each ecotypes separately. Then, only spots with aq value <0.05 and a power >0.8 were finally selected for subsequentprotein identification by MALDI-TOF MS analysis.
Protein identification by MALDI-TOF MS
Spots were picked from preparative gels (500 �g proteins) usinga spot picker robot (Perkin Elmer, Wellesley, MA, USA) as previouslydescribed (Chevalier et al., 2006). Briefly, acrylamide pieces werecollected in microplates with acetic acid 1% (v/v). Pieces of gel werewashed using a Multiprobe II robot (Perkin Elmer, Wellesley, MA,USA) with water, 25 mM ammonium carbonate and acetonitrile.Proteins were digested with trypsin (12.5 �g/ml in 25 mM ammo-nium carbonate), mixed with �-cyano-4-hydroxy-cinnamic acidand spotted onto MALDI targets. Peptide mass fingerprints wereacquired using a Biflex III mass spectrometer (Bruker Daltonics,Bremen, Germany). Spectra were calibrated internally and anno-tated automatically. The MASCOT search engine software (MatrixScience, London, UK) was used to search NCBInr database. The fol-lowing parameters were used for database search: mass toleranceof 100 ppm, a minimum of four matched peptides and one missedcleavage allowed.
Results and discussion
Proteomic variations in responses to Pi-deficiency
Root system architecture was analysed on a set of Arabidop-sis ecotypes (Chevalier et al., 2003). These ecotypes have adaptedto strongly contrasting growth conditions and thus display highlyvariable growth characteristics (Table 1). Dramatic differences ingrowth and architecture were observed within the first few weeksafter germination and several parameters were compared, suchas primary root length, lateral root number, lateral root length,leaf area or primary root growth rate. It appeared that the lengthof the primary root and the number of laterals were two robustparameters to discriminate accessions. Be-0 and Ll-0 ecotypes wereselected as they displayed differential and atypical root architec-ture, with no modification of the primary root length, combinedwith a decrease or an increase of the lateral root number, respec-tively (Chevalier et al., 2003).
Quantitative changes in root proteins were analysed by compar-ing the proteomic map of ecotypes under two growth conditions(normal hydroponic medium, or Pi deficiency medium). A total of465 proteins were detected on colloidal Coomassie blue stained2D-PAGE gels using Non-linear Samespots software. To analysethe Pi-responsive proteins, significant differences in spot volumebetween control and “treated” samples were assessed and protein
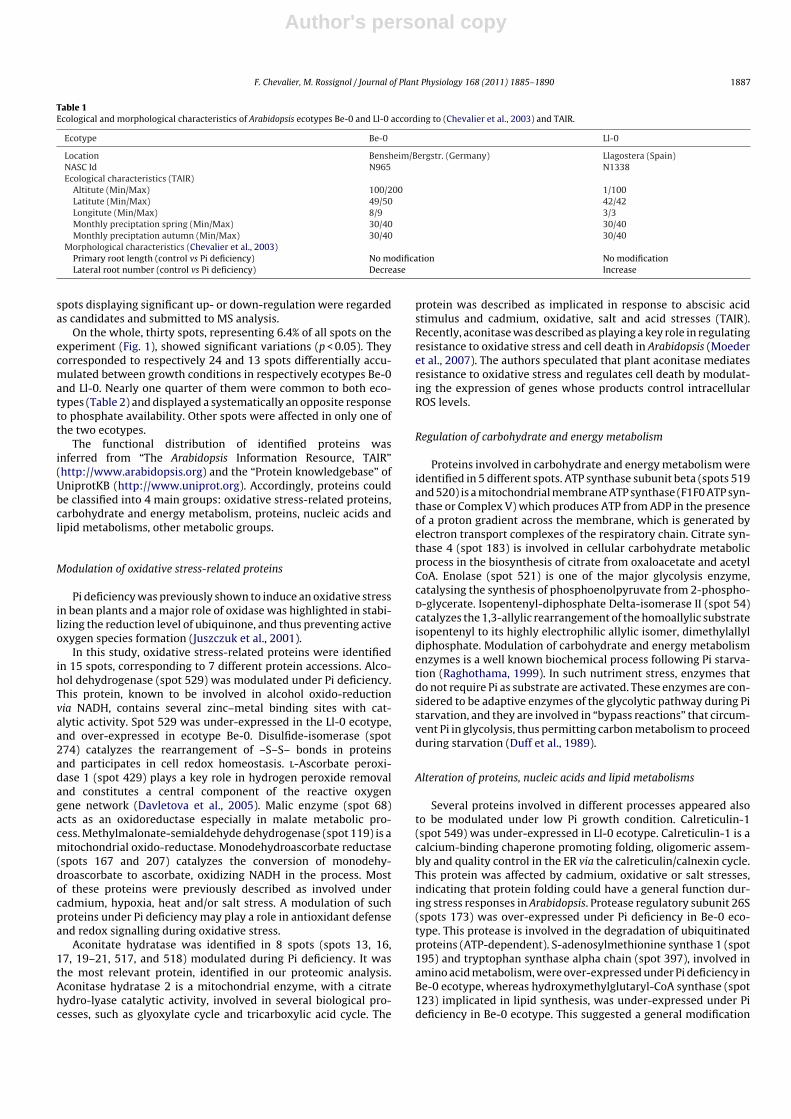
Author's personal copy
F. Chevalier, M. Rossignol / Journal of Plant Physiology 168 (2011) 1885– 1890 1887
Table 1Ecological and morphological characteristics of Arabidopsis ecotypes Be-0 and Ll-0 according to (Chevalier et al., 2003) and TAIR.
Ecotype Be-0 Ll-0
Location Bensheim/Bergstr. (Germany) Llagostera (Spain)NASC Id N965 N1338Ecological characteristics (TAIR)
Altitute (Min/Max) 100/200 1/100Latitute (Min/Max) 49/50 42/42Longitute (Min/Max) 8/9 3/3Monthly preciptation spring (Min/Max) 30/40 30/40Monthly preciptation autumn (Min/Max) 30/40 30/40
Morphological characteristics (Chevalier et al., 2003)Primary root length (control vs Pi deficiency) No modification No modificationLateral root number (control vs Pi deficiency) Decrease Increase
spots displaying significant up- or down-regulation were regardedas candidates and submitted to MS analysis.
On the whole, thirty spots, representing 6.4% of all spots on theexperiment (Fig. 1), showed significant variations (p < 0.05). Theycorresponded to respectively 24 and 13 spots differentially accu-mulated between growth conditions in respectively ecotypes Be-0and Ll-0. Nearly one quarter of them were common to both eco-types (Table 2) and displayed a systematically an opposite responseto phosphate availability. Other spots were affected in only one ofthe two ecotypes.
The functional distribution of identified proteins wasinferred from “The Arabidopsis Information Resource, TAIR”(http://www.arabidopsis.org) and the “Protein knowledgebase” ofUniprotKB (http://www.uniprot.org). Accordingly, proteins couldbe classified into 4 main groups: oxidative stress-related proteins,carbohydrate and energy metabolism, proteins, nucleic acids andlipid metabolisms, other metabolic groups.
Modulation of oxidative stress-related proteins
Pi deficiency was previously shown to induce an oxidative stressin bean plants and a major role of oxidase was highlighted in stabi-lizing the reduction level of ubiquinone, and thus preventing activeoxygen species formation (Juszczuk et al., 2001).
In this study, oxidative stress-related proteins were identifiedin 15 spots, corresponding to 7 different protein accessions. Alco-hol dehydrogenase (spot 529) was modulated under Pi deficiency.This protein, known to be involved in alcohol oxido-reductionvia NADH, contains several zinc–metal binding sites with cat-alytic activity. Spot 529 was under-expressed in the Ll-0 ecotype,and over-expressed in ecotype Be-0. Disulfide-isomerase (spot274) catalyzes the rearrangement of –S–S– bonds in proteinsand participates in cell redox homeostasis. l-Ascorbate peroxi-dase 1 (spot 429) plays a key role in hydrogen peroxide removaland constitutes a central component of the reactive oxygengene network (Davletova et al., 2005). Malic enzyme (spot 68)acts as an oxidoreductase especially in malate metabolic pro-cess. Methylmalonate-semialdehyde dehydrogenase (spot 119) is amitochondrial oxido-reductase. Monodehydroascorbate reductase(spots 167 and 207) catalyzes the conversion of monodehy-droascorbate to ascorbate, oxidizing NADH in the process. Mostof these proteins were previously described as involved undercadmium, hypoxia, heat and/or salt stress. A modulation of suchproteins under Pi deficiency may play a role in antioxidant defenseand redox signalling during oxidative stress.
Aconitate hydratase was identified in 8 spots (spots 13, 16,17, 19–21, 517, and 518) modulated during Pi deficiency. It wasthe most relevant protein, identified in our proteomic analysis.Aconitase hydratase 2 is a mitochondrial enzyme, with a citratehydro-lyase catalytic activity, involved in several biological pro-cesses, such as glyoxylate cycle and tricarboxylic acid cycle. The
protein was described as implicated in response to abscisic acidstimulus and cadmium, oxidative, salt and acid stresses (TAIR).Recently, aconitase was described as playing a key role in regulatingresistance to oxidative stress and cell death in Arabidopsis (Moederet al., 2007). The authors speculated that plant aconitase mediatesresistance to oxidative stress and regulates cell death by modulat-ing the expression of genes whose products control intracellularROS levels.
Regulation of carbohydrate and energy metabolism
Proteins involved in carbohydrate and energy metabolism wereidentified in 5 different spots. ATP synthase subunit beta (spots 519and 520) is a mitochondrial membrane ATP synthase (F1F0 ATP syn-thase or Complex V) which produces ATP from ADP in the presenceof a proton gradient across the membrane, which is generated byelectron transport complexes of the respiratory chain. Citrate syn-thase 4 (spot 183) is involved in cellular carbohydrate metabolicprocess in the biosynthesis of citrate from oxaloacetate and acetylCoA. Enolase (spot 521) is one of the major glycolysis enzyme,catalysing the synthesis of phosphoenolpyruvate from 2-phospho-d-glycerate. Isopentenyl-diphosphate Delta-isomerase II (spot 54)catalyzes the 1,3-allylic rearrangement of the homoallylic substrateisopentenyl to its highly electrophilic allylic isomer, dimethylallyldiphosphate. Modulation of carbohydrate and energy metabolismenzymes is a well known biochemical process following Pi starva-tion (Raghothama, 1999). In such nutriment stress, enzymes thatdo not require Pi as substrate are activated. These enzymes are con-sidered to be adaptive enzymes of the glycolytic pathway during Pistarvation, and they are involved in “bypass reactions” that circum-vent Pi in glycolysis, thus permitting carbon metabolism to proceedduring starvation (Duff et al., 1989).
Alteration of proteins, nucleic acids and lipid metabolisms
Several proteins involved in different processes appeared alsoto be modulated under low Pi growth condition. Calreticulin-1(spot 549) was under-expressed in Ll-0 ecotype. Calreticulin-1 is acalcium-binding chaperone promoting folding, oligomeric assem-bly and quality control in the ER via the calreticulin/calnexin cycle.This protein was affected by cadmium, oxidative or salt stresses,indicating that protein folding could have a general function dur-ing stress responses in Arabidopsis. Protease regulatory subunit 26S(spots 173) was over-expressed under Pi deficiency in Be-0 eco-type. This protease is involved in the degradation of ubiquitinatedproteins (ATP-dependent). S-adenosylmethionine synthase 1 (spot195) and tryptophan synthase alpha chain (spot 397), involved inamino acid metabolism, were over-expressed under Pi deficiency inBe-0 ecotype, whereas hydroxymethylglutaryl-CoA synthase (spot123) implicated in lipid synthesis, was under-expressed under Pideficiency in Be-0 ecotype. This suggested a general modification
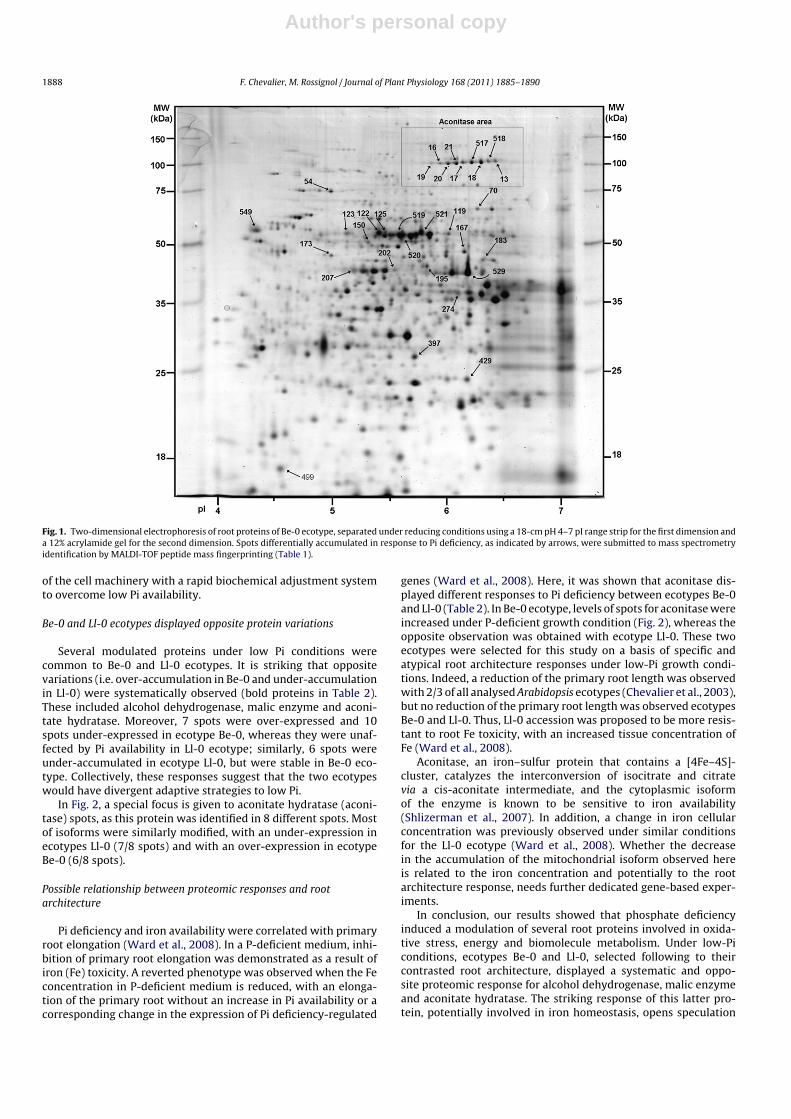
Author's personal copy
1888 F. Chevalier, M. Rossignol / Journal of Plant Physiology 168 (2011) 1885– 1890
Fig. 1. Two-dimensional electrophoresis of root proteins of Be-0 ecotype, separated under reducing conditions using a 18-cm pH 4–7 pI range strip for the first dimension anda 12% acrylamide gel for the second dimension. Spots differentially accumulated in response to Pi deficiency, as indicated by arrows, were submitted to mass spectrometryidentification by MALDI-TOF peptide mass fingerprinting (Table 1).
of the cell machinery with a rapid biochemical adjustment systemto overcome low Pi availability.
Be-0 and Ll-0 ecotypes displayed opposite protein variations
Several modulated proteins under low Pi conditions werecommon to Be-0 and Ll-0 ecotypes. It is striking that oppositevariations (i.e. over-accumulation in Be-0 and under-accumulationin Ll-0) were systematically observed (bold proteins in Table 2).These included alcohol dehydrogenase, malic enzyme and aconi-tate hydratase. Moreover, 7 spots were over-expressed and 10spots under-expressed in ecotype Be-0, whereas they were unaf-fected by Pi availability in Ll-0 ecotype; similarly, 6 spots wereunder-accumulated in ecotype Ll-0, but were stable in Be-0 eco-type. Collectively, these responses suggest that the two ecotypeswould have divergent adaptive strategies to low Pi.
In Fig. 2, a special focus is given to aconitate hydratase (aconi-tase) spots, as this protein was identified in 8 different spots. Mostof isoforms were similarly modified, with an under-expression inecotypes Ll-0 (7/8 spots) and with an over-expression in ecotypeBe-0 (6/8 spots).
Possible relationship between proteomic responses and rootarchitecture
Pi deficiency and iron availability were correlated with primaryroot elongation (Ward et al., 2008). In a P-deficient medium, inhi-bition of primary root elongation was demonstrated as a result ofiron (Fe) toxicity. A reverted phenotype was observed when the Feconcentration in P-deficient medium is reduced, with an elonga-tion of the primary root without an increase in Pi availability or acorresponding change in the expression of Pi deficiency-regulated
genes (Ward et al., 2008). Here, it was shown that aconitase dis-played different responses to Pi deficiency between ecotypes Be-0and Ll-0 (Table 2). In Be-0 ecotype, levels of spots for aconitase wereincreased under P-deficient growth condition (Fig. 2), whereas theopposite observation was obtained with ecotype Ll-0. These twoecotypes were selected for this study on a basis of specific andatypical root architecture responses under low-Pi growth condi-tions. Indeed, a reduction of the primary root length was observedwith 2/3 of all analysed Arabidopsis ecotypes (Chevalier et al., 2003),but no reduction of the primary root length was observed ecotypesBe-0 and Ll-0. Thus, Ll-0 accession was proposed to be more resis-tant to root Fe toxicity, with an increased tissue concentration ofFe (Ward et al., 2008).
Aconitase, an iron–sulfur protein that contains a [4Fe–4S]-cluster, catalyzes the interconversion of isocitrate and citratevia a cis-aconitate intermediate, and the cytoplasmic isoformof the enzyme is known to be sensitive to iron availability(Shlizerman et al., 2007). In addition, a change in iron cellularconcentration was previously observed under similar conditionsfor the Ll-0 ecotype (Ward et al., 2008). Whether the decreasein the accumulation of the mitochondrial isoform observed hereis related to the iron concentration and potentially to the rootarchitecture response, needs further dedicated gene-based exper-iments.
In conclusion, our results showed that phosphate deficiencyinduced a modulation of several root proteins involved in oxida-tive stress, energy and biomolecule metabolism. Under low-Piconditions, ecotypes Be-0 and Ll-0, selected following to theircontrasted root architecture, displayed a systematic and oppo-site proteomic response for alcohol dehydrogenase, malic enzymeand aconitate hydratase. The striking response of this latter pro-tein, potentially involved in iron homeostasis, opens speculation
Author's personal copy
F. Chevalier, M. Rossignol / Journal of Plant Physiology 168 (2011) 1885– 1890 1889
Table 2Identified root proteins from Arabidopsis ecotypes Be-0 and Ll-0 showing significant changes in abundance between control and Pi deficiency growth conditions. *+, spotsover-accumulated in low Pi condition; −, spots under-accumulated in low Pi conditions. **Bold, proteins with opposite response to low Pi between Be-0 and Ll-0 ecotypes.
Metabolic group Spot Protein name** No accession Mol mass (kDa) pI Be-0* Ll-0*
Theor. Obs. Theor. Obs. Diff. Anova (p) Diff. Anova (p)
Oxidative stressrelated proteins
529 Alcoholdehydrogenase
P06525 41.18 42.10 5.83 6.19 +1.238 0.042 −1.284 0.015
274 Disulfide-isomerase A6 O22263 37.17 36.23 5.65 6.03 −1.123 0.041429 l-Ascorbate peroxidase
1Q05431 27.43 24.39 5.72 6.18 +2.467 0.001
70 Malic enzyme Q9LYG3 64.41 66.00 6.01 6.27 +1.718 0.003 −1.460 0.034119 Methylmalonate-
semialdehydedehydrogenase
Q0WM29 63.02 54.69 8.46 6.00 −1.530 0.019
167 Monodehydroascorbatereductase
P92947 47.64 47.60 5.79 6.16 +1.835 0.000
207 Monodehydroascorbatereductase isoform 4
Q93WJ8 47.48 43.14 5.25 5.19 −2.124 0.041
13 Aconitate hydratase 2 Q9SIB9 99.74 108.57 5.86 6.43 +1.674 0.04316 Aconitate hydratase 2 Q9SIB9 99.74 106.21 5.86 5.92 +1.935 0.001 −1.911 0.01617 Aconitate hydratase 2 Q9SIB9 99.74 105.68 5.86 6.15 +1.529 0.009 −1.540 0.00619 Aconitate hydratase 2 Q9SIB9 99.74 105.06 5.86 5.87 +2.470 0.003 −1.615 0.04020 Aconitate hydratase 2 Q9SIB9 99.74 103.95 5.86 6.01 +1.710 0.007 −1.877 0.00321 Aconitate hydratase 2 Q9SIB9 99.74 103.97 5.86 6.09 +1.642 0.002 −1.815 0.001
517 Aconitate hydratase 2 Q9SIB9 99.74 105.41 5.86 6.22 −1.523 0.022518 Aconitate hydratase 2 Q9SIB9 99.74 108.28 5.86 6.39 −1.868 0.025
Carbohydrateand energymetabolism
519 ATP synthase subunitbeta
P19023 54.06 53.34 5.19 5.60 −1.840 0.011
520 ATP synthase subunitbeta-1
P83483 54.22 53.33 5.37 5.61 −1.879 0.000
183 Citrate synthase 4 P20115 50.84 45.60 5.99 6.31 +1.663 0.016521 Enolase P25696 47.72 54.78 5.54 5.78 −1.479 0.003
54 Isopentenyl-diphosphateDelta-isomerase II
Q42553 32.61 74.12 6.10 5.35 −1.808 0.001
Protein, nucleicacid and lipidmetabolism
549 Calreticulin-1 O04151 46.16 57.49 4.42 4.40 −1.844 0.000173 26S protease
regulatory subunit 6Ahomolog A
Q9SEI2 47.48 46.87 4.91 5.00 +1.728 0.005
195 S-adenosylmethioninesynthase 1
P49612 39.94 44.00 6.45 5.83 +2.368 0.001
397 Tryptophan synthasealpha chain
Q42529 33.20 27.20 6.76 5.72 +1.676 0.002
123 Hydroxymethylglutaryl-CoAsynthase
P54873 51.09 54.64 5.98 5.13 −1.591 0.003
Others 122 F28N24.3 protein Q9LP57 51.43 54.61 9.03 5.41 −1.903 0.000125 F28N24.3 protein Q9LP57 51.43 54.27 9.03 5.46 −1.612 0.000150 Tubulin
alpha-3/alpha-5 chainP20363 49.65 50.49 4.95 5.32 −1.517 0.021
202 Actin-8 Q96293 41.86 43.52 5.37 5.56 −1.486 0.008499 Uncharacterized
proteinO80858 16.94 16.90 4.92 4.56 −1.359 0.001
Fig. 2. Comparison of “aconitase area” from Fig. 1 for Be-0 and Ll-0 ecotypes, in response to Pi deficiency. Spots identified as aconitase were indicated by arrows (Table 2).
Author's personal copy
1890 F. Chevalier, M. Rossignol / Journal of Plant Physiology 168 (2011) 1885– 1890
about its contribution to the root architecture response of theseecotypes.
Acknowledgements
F.C. was supported by fellowships from the EU research programQuality of Life and Management of Living Resources (contract QLK5-CT-2001–01871).
The authors thank the members of their laboratories for valu-able discussions, Hugues Baudot for seed amplification and plantgrowth, Samuel Barteau and Anne-Dominique Devauchelle fortechnical support in proteomic, Delphine Centeno and Valérie Rofi-dal for technical support in mass spectrometry, Nicolas Sommererfor expertise in mass spectrometry, Olivier Martin for expertise inbio-statistics and Prof. Alan L. Kelly from University College Corkfor valuable comments.
References
Al-Ghazi Y, Muller B, Pinloche S, Tranbarger TJ, Nacry P, Rossignol M, et al.Temporal responses of Arabidopsis root architecture to phosphate starvation:evidence for the involvement of auxin signalling. Plant Cell and Environment2003;26:1053–66.
Bates TR, Lynch JP. Stimulation of root hair elongation in Arabidopsis thaliana by lowphosphorus availability. Plant Cell and Environment 1996;19:529–38.
Bonser AM, Lynch J, Snapp S. Effect of phosphorus deficiency on growth angle ofbasal roots in Phaseolus vulgaris. New Phytologist 1996;132:281–8.
Borch K, Bouma TJ, Lynch JP, Brown KM. Ethylene: a regulator of root architec-tural responses to soil phosphorus availability. Plant Cell and Environment1999;22:425–31.
Camacho-Cristóbal JJ, Rexach J, Conéjéro G, Al-Ghazi Y, Nacry P, Doumas P. PRD, anArabidopsis AINTEGUMENTA-like gene, is involved in root architectural changesin response to phosphate starvation. Planta 2008;228:511–22.
Chevalier F, Pata M, Nacry P, Doumas P, Rossignol M. Effects of phosphate availabilityon the root system architecture: large-scale analysis of the natural variationbetween Arabidopsis accessions. Plant Cell and Environment 2003;26:1839–50.
Chevalier F, Martin O, Rofidal V, Devauchelle AD, Barteau S, Sommerer N, et al.Proteomic investigation of natural variation between Arabidopsis ecotypes. Pro-teomics 2004a;4:1372–81.
Chevalier F, Rofidal V, Vanova P, Bergoin A, Rossignol M. Proteomic capacityof recent fluorescent dyes for protein staining. Phytochemistry 2004b;65:1499–506.
Chevalier F, Centeno D, Rofidal V, Tauzin M, Martin O, Sommerer N, et al. Differentimpact of staining procedures using visible stains and fluorescent dyes for large-scale investigation of proteomes by MALDI-TOF mass spectrometry. Journal ofProteome Research 2006;5:512–20.
Chevalier F, Rofidal V, Rossignol M. Visible and fluorescent staining of two-dimensional gels. Methods in Molecular Biology 2007:145–56.
Chevalier F. Highlights on the capacities of gel-based proteomics. Proteome Science2010;8:23.
Davletova S, Rizhsky L, Liang H, Shengqiang Z, Oliver DJ, Coutu J, et al. Cytosolic ascor-bate peroxidase 1 is a central component of the reactive oxygen gene networkof Arabidopsis. Plant Cell 2005;17:268–81.
Duff SM, Moorhead GB, Lefebvre DD, Plaxton WC. Phosphate starvation induciblebypasses of adenylate and phosphate dependent glycolytic enzymes in Brassicanigra suspension cells. Plant Physiology 1989;90:1275–8.
Fang ZY, Shao C, Meng YJ, Wu P, Chen M. Phosphate signaling in Arabidopsis andOryza sativa. Plant Science 2009;176:170–80.
Johnson JF, Vance CP, Allan DL. Phosphorus deficiency in Lupinus albus—alteredlateral root development and enhanced expression of phosphoenolpyruvatecarboxylase. Plant Physiology 1996;112:31–41.
Juszczuk I, Malusa E, Rychter A. Oxidative stress during phosphate deficiencyin roots of bean plants (Phaseolus vulgaris L.). Journal of Plant Physiology2001;158:1299–305.
Lejay L, Tillard P, Lepetit M, Olive FD, Filleur S, Daniel-Vedele F, et al. Molecularand functional regulation of two NO3-uptake systems by N- and C-status ofArabidopsis plants. Plant Journal 1999;18:509–19.
Liu H, Yang HX, Wu CM, Feng JJ, Liu X, Qin HJ, et al. Overexpressing HRS1 confershypersensitivity to low phosphate-elicited inhibition of primary root growth inArabidopsis thaliana. Journal of Integrative Plant Biology 2009;51:382–92.
Moeder W, Del Pozo O, Navarre DA, Martin GB, Klessig DF. Aconitase plays a rolein regulating resistance to oxidative stress and cell death in Arabidopsis andNicotiana benthamiana. Plant Molecular Biology 2007;63:273–87.
Moog PR, Vanderkooij TAW, Bruggemann W, Schiefelbein JW, Kuiper PJC. Responsesto iron-deficiency in Arabidopsis thaliana—the turbo iron reductase does notdepend on the formation of root hairs and transfer cells. Planta 1995:505–13.
Raghothama KG. Phosphate F acquisition. Annual Review of Plant Physiology andPlant Molecular Biology 1999;50:665–93.
Raghothama KG, Karthikeyan AS. Phosphate acquisition. Plant and Soil2005;274:37–49.
Richardson AE. Regulating the phosphorus nutrition of plants: molecular biologymeeting agronomic needs. Plant and Soil 2009;322:17–24.
Schmidt W, Schikora A. Different pathways are involved in phosphate and ironstress-induced alterations of root epidermal cell development. Plant Physiology2001;125:2078–84.
Shlizerman L, Marsh K, Blumwald E, Sadka A. Iron-shortage-induced increase in citricacid content and reduction of cytosolic aconitase activity in Citrus fruit vesiclesand calli. Plant Physiology 2007;131:72–9.
Ticconi CA, Lucero RD, Sakhonwasee S, Adamson AW, Creff A, Nussaume L, et al. ER-resident proteins PDR2 and LPR1 mediate the developmental response of rootmeristems to phosphate availability. Proceedings of the National Academy ofSciences of the United States of America 2009;106:14174–9.
Wang XM, Du GK, Meng YJ, Li YY, Wu P, Yi KK. The function of LPR1 is controlledby an element in the promoter and is independent of SUMO E3 ligase SIZ1in response to low Pi stress in Arabidopsis thaliana. Plant and Cell Physiology2010;51:380–94.
Ward JT, Lahner B, Yakubova E, Salt DE, Raghothama KG. The effect of iron on theprimary root elongation of Arabidopsis during phosphate deficiency. Plant Phys-iology 2008;147:1181–91.
Williamson LC, Ribrioux S, Fitter AH, Leyser HMO. Phosphate availability regulatesroot system architecture in Arabidopsis. Plant Physiology 2001;126:875–82.
Yang M, Ding GD, Shi L, Feng J, Xu FS, Meng JL. Quantitative trait loci for root mor-phology in response to low phosphorus stress in Brassica napus. Theoretical andApplied Genetics 2010;121:181–93.
Yuan H, Liu D. Signaling components involved in plant responses to phosphatestarvation. Journal of Integrative Plant Biology 2008;50:849–59.
Effet Bystander en Radiobiologie et Hadronthérapie
HDR François Chevalier Page 68
1.3 - Post-Doctorat 2 : Analyse de la qualité de laits après différents traitements
Ce contrat post-doctoral à l’University College of Cork était financé dans le cadre d’une mission
gouvernementale Irlandaise du « Department of Agriculture and Food » pour le projet FIRM (Food
Institutional Research Measure). Le laboratoire d’Alan Kelly avait pour mission l’analyse de la qualité
du lait et des produits laitiers par des outils protéomiques.
1.3.1 - Analyse de la qualité du lait après traitement thermique
Ce projet était articulé autour de cinq objectifs visant à caractériser le lait et les produits laitiers ayant
subi différents traitements physiques (chaleur, haute pression), chimiques et enzymatiques.
La première étape consistait à caractériser le protéome typique du lait de vache cru ou chauffé. A cet
effet, une étude cinétique de lait chauffé à 90°C pendant 30 minutes a été réalisée. Afin de
comprendre les interactions qui se produisent entre les protéines du lait suite à un traitement
thermique, des échantillons de lait chauffés ont été incubés avec des agents réducteurs avant et/ou
après isoélectrofocalisation des protéines, ce qui constitue la première étape de l'électrophorèse
bidimensionnelle. Les protéines clés qui sont censées interagir pendant le traitement thermique sont la
bêta-lactoglobuline et la caséine kappa. Ces deux protéines présentent des résidus cysteil libres qui
peuvent interagir suite à un traitement thermique et ainsi former des hétérodimères. Dans cette
analyse, les cartes du protéome de lait non chauffé et chauffé à 90°C ont été comparées en fonction
des trois conditions de séparation afin d’observer la présence d’interactions entre protéines,
principalement par des liaisons dissulfures. Un petit nombre de protéines en grande abondance sont
caractéristiques du protéome du lait cru. Certains complexes protéiques réticulés ont été observés
dans des conditions natives/non chauffées par électrophorèse bidimensionnelle. Lorsque le lait
écrémé a été chauffé à 90ºC pendant 10 minutes, la quantité de protéines natives de lactosérum a
diminué en parallèle avec une augmentation de complexes, y compris hétéropolymères très
complexes, par exemple, des polymères caséines/protéines de lactosérum contenant de multiples
espèces. La stratégie d'analyse utilisée dans cette étude révèle que de nombreuses interactions font
intervenir des ponts disulfures.
Les polymères ainsi formés ont ensuite été quantifiés : en condition native, 18% de alpha S2-caséine,
25% de β-lactoglobuline, et 46% de kappa-caséine sont impliqués dans des complexes. Après
traitement thermique à 90 °C pendant 30 minutes, une grande quantité de sérum albumine, de β-
lactoglobuline et la kappa-caséine sont sous forme de polymères. En effet, homo-polymères et hétéro-
polymères de kappa caséine et d’alpha-S2-caséine ont été identifiés par spectrométrie de masse. La
quantité des spots correspondant aux monomères de kappa-caséine diminue progressivement avec
le temps de chauffage à 90 °C, avec une plus grande proportion pour les points isoélectriques acides.
Effet Bystander en Radiobiologie et Hadronthérapie
HDR François Chevalier Page 69
1.3.2 - Analyse du lait de jument après coagulation enzymatique
Un deuxième projet a été mené en collaboration avec Therese Uniacke-Lowe et le Prof. P. F. Fox sur
la caractérisation du lait de jument pendant sa coagulation par électrophorèse bidimensionnelle en
comparaison avec les résultats obtenus avec du lait de vache.
La coagulation du lait de vache induite par la présure est un mécanisme complexe dans lequel la
chymosine hydrolyse spécifiquement la κ-caséine, une protéine responsable de la stabilité de la
micelle de caséine. Dans le lait équin, ce mécanisme n'était pas encore clair et la cible protéique de la
chymosine restait inconnue.
Pour connaitre les protéines impliquées, l’étude de la capacité de coagulation du lait équin par la
chymosine a été réalisée par analyse protéomique comparative en utilisant le lait bovin comme
contrôle. L’analyse par RP-HPLC de laits bovin et équin a montré la libération de plusieurs peptides
suite à une incubation avec la chymosine. Les principaux peptides obtenus à partir de lait équin ont
été identifiés par spectrométrie de masse comme des fragments de β-caséine. L’analyse effectuée
par l'électrophorèse bidimensionnelle a confirmé que la β-caséine équine était la principale cible de la
chymosine après 24 h à 30°C et pH 6,5. De plus, l’analyse de ces gels d’électrophorèse a permis une
bonne séparation des différentes protéines du lait équin avec, pour la première fois, l’observation de la
gamme d'isoformes de κ-caséine équine. En comparaison avec le lait de vache, les isoformes de κ-
caséine de lait équin ne semblent pas impliquées dans la coagulation du lait induite par la chymosine.
De plus, l'intensité des spots de β-caséine équine a diminué après l'addition de la chymosine, mais à
un rythme plus lent que la κ-caséine bovine.
1.3.3 - Analyse du lait maternel et implication des enzymes endogènes
La compréhension des différences entre le système de protéines du lait maternel et celui du lait de
vache est crucial pour permettre le développement de préparations pour nourrissons.
Dans cette étude, les protéines de lait de vache et une préparation pour nourrisson d'origine bovine
ont été comparées par électrophorèses 1D et 2D avec les protéines du lait maternel produit pour les
nourrissons nés prématurément ou à terme.
La distribution des protéines de la préparation pour nourrissons diffère significativement de celle des
autres types de lait. L’analyse du protéome du lait humain pour prématurés a montré une réduction
des niveaux de caséines béta et d’alpha S et une augmentation de peptides issus de ces protéines.
De plus, le lait pour prématurés contient une concentration plus élevée en azote total et de la
plasmine, en accord avec les données protéomiques. Ces résultats suggèrent un mécanisme
physiologique qui permet d’ajuster l’expression d’enzymes ou de certaines protéines pour améliorer la
digestibilité des protéines pour des prématurés. Cette observation pourra faciliter la conception des
préparations pour nourrissons, plus proche du lait maternel, en particulier pour les enfants
prématurés.

Effet Bystander en Radiobiologie et Hadronthérapie
HDR François Chevalier Page 70
1.3.4 - Sélection de publications du Post-doctorat 2
Chevalier F., Hirtz C., Sommerer N., Kelly A. L. (2009)
Use of reducing/non-reducing two-dimensional electrophoresis for the study of disulphide-mediated
interactions between proteins in raw and heated bovine milk
Journal of Agricultural and Food Chemistry, 57, 5948-5955.
Chevalier F. and Kelly A. L. (2010)
Proteomic quantification of disulfide-linked polymers in raw and heated bovine milk
Journal of Agricultural and Food Chemistry, 58, 7437–7444.
Armaforte E., Curran E., Huppertz T., Ryan C. A., Caboni M. F., O’Connor P., Hirtz C., Sommerer N.,
Chevalier F., Kelly A. L.
Proteins and proteolysis in pre-term and term human milk and possible implications for infant
formulae (2010) International Dairy Journal, 20, 715-723.
Uniacke-Lowe T., Chevalier F., Hem S., Fox P. F. and Mulvihill D. M. (2013)
Proteomic comparison of Equine and Bovine Milk Systems on Renneting.
Journal of Agricultural and Food Chemistry, 61, 2839-2850.
pubs.acs.org/JAFC Published on Web 06/15/2009 © 2009 American Chemical Society
5948 J. Agric. Food Chem. 2009, 57, 5948–5955
DOI:10.1021/jf900518n
Use of Reducing/Nonreducing Two-DimensionalElectrophoresis for the Study of Disulfide-Mediated
Interactions between Proteins in Raw and Heated Bovine Milk
FRANC-OIS CHEVALIER,*,† CHRISTOPHE HIRTZ,§ NICOLAS SOMMERER,§ AND
ALAN L. KELLY†
†Department of Food and Nutritional Sciences, University College Cork, Cork, Ireland, and§Proteomic Platform, INRA, Montpellier, France
The composition and interactions of proteins in bovine milk, and modifications resulting from milk
storage and processing, are complex and incompletely understood. Analysis of the milk proteome
can elucidate milk protein expression, structure, interaction, and modifications. Raw milk was
analyzed by two-dimensional electrophoresis (isolelectric focusing followed by sodium dodecyl
sulfate-polyacrylamide gel electrophoresis) under reducing and nonreducing, or combined, condi-
tions, followed by mass spectrometry of separated protein spots; a small number of high-abundance
proteins, that is, caseins (RS1-, RS2-, β-, κ-, and γ-), β-lactoglobulin, R-lactalbumin, and serum
albumin, represented the vast majority of protein spots on the two-dimensional electrophoretograms
of raw milk samples, but some cross-linked protein complexes (mainly homopolymers of κ-casein
and RS2-casein but also some heteropolymeric complexes) were resolved under native/unheated
conditions. When skim milk was heated to 90 �C for up to 10 min, the level of native whey proteins
decreased in parallel with an increase in disulfide-linked complexes, including very complex
heteropolymers, for example, casein/whey protein polymers containing multiple species. The
analysis strategy used in this study reveals numerous disulfide-mediated interactions and can be
proposed to analyze reduction/oxidation of milk and dairy product proteins following processing
treatments applied for processing and storage.
KEYWORDS: Milk proteins; proteome; interactome; disulfide bridges; heat treatment; mass spectro-metry
INTRODUCTION
Heat treatment is applied in the processing of milk for bothhygienic and technological reasons and is today an essentialoperation in commercial dairy processes to provide acceptablesafety and shelf life of dairy products. As a consequence of heattreatment, milk proteinsmay undergo structural changes, such asunfolding and aggregation. Heat treatment of milk at >70 �Cresults in a number of physicochemical changes in the milkconstituents, in particular, denaturation of whey proteins andthe formation of hydrophobic interactions or disulfide-bondedaggregates with casein micelles, particularly through interactionswith κ-casein. Such protein-protein interactions can significantlyaffect the stability of milk and contribute to heat-inducedcoagulation of the milk. Numerous studies have been performedon model systems to elucidate the mechanism of interactionsbetween milk proteins after heat treatment (1-5).
Zittle et al. (6) provided the first conclusive evidence of com-plex formation between β-lactoglobulin (β-LG) and κ-casein(κ-CN). Sawyer et al. (7) demonstrated the involvement of thiol
groups and suggested that the free thiol group ofβ-LG is involvedin the interaction and that intermolecular disulfide bondsare formed between κ-CN and β-LG. Subsequent investiga-tions have tended to focus on determining the types of bon-ding involved in complex formation and the stoichiometry ofthe complexes formed (5, 8-16). Sawyer (7) and McKenzie etal. (17) showed that the self-aggregation of β-LG was limitedwhen κ-CN was present and suggested that κ-CN formscomplexes with intermediate species of aggregated β-LG.In contrast, Euber and Brunner (14) reported that the aggre-gation of β-LG is not a prerequisite for interaction with κ-CN.Cho et al. (5) examined the interaction of β-LG with κ-CNusing a “natural” κ-CN isolated without reduction or chroma-tography. Only denatured β-LG interacted with κ-CN (18), andmany of the possible pathways involved in the aggregation ofβ-LG with κ-CN were elucidated. It has been proposed that,on heating β-LG and κ-CN, the free thiol group of β-LGis exposed, which initiates a series of reactions with otherdenatured molecules of β-LG or with κ-CN. The products for-med depend on the ratio of κ-CN to β-LG and included 1:1β-LG-κ-CN complexes and a range of large heterogeneousaggregates that were held together by disulfide bonds and/orhydrophobic interactions (7, 19-21).
*Author to whom correspondence should be addressed [telephone+33 (0)146 548 326; fax +33 (0)146 549 138; e-mail [email protected]].
Dow
nloa
ded
by C
EA
CO
NSO
RT
IA F
RA
NC
E o
n Ju
ly 1
, 200
9Pu
blis
hed
on J
une
15, 2
009
on h
ttp://
pubs
.acs
.org
| do
i: 10
.102
1/jf
9005
18n
Article J. Agric. Food Chem., Vol. 57, No. 13, 2009 5949
Milk is considerably more complex than purified proteinmodel systems. Although β-LG is the major whey protein inbovine milk, several other whey proteins with free thiol groupsand/or disulfide bonds are present, such as serum albumin and R-lactalbumin (22). Of the caseins, both κ-CN and RS2-CN havedisulfide bonds, and therefore both could participate in thiol-disulfide interchange reactions (23). As a consequence, manymore thiol-disulfide interaction pathways exist, and the separa-tion and the analysis of the reaction products increase in complex-ity. Despite this, it appears that reactions between β-LG and κ-CNsimilar to those observed in themodel systems occur inheatedmilk, although, as expected, other denatured whey proteins arealso involved in complex formation (11, 15, 16, 24-29).
Tools for the study of proteins and protein-protein interac-tions in complex systems have developed significantly in recentyears with the introduction of proteomic tools, such as two-dimensional electrophoresis combined with mass spectrometryfor the identification of specific separated proteins (30-32). Anumber of recent studies have applied two-dimensional electro-phoretic separation approaches to the study of protein-proteininteractions in heated milk systems, most often using sodiumdodecyl sulfate-polyacrylamide gels under nonreducing andreducing conditions as the two dimensions for the separation ofproteins, particularly disulfide-bonded complexes (18, 33-35).Fewer studies have used the classic proteomic strategy of separa-tion on the basis of isoelectric point (isoelectric focusing) followedby SDS-PAGEunder reducing conditions (36), although thismayyield information significantly different from that obtainedthrough the previous approach mentioned.
The objective of this study was to investigate the interactionsbetween proteins in raw skim milk and milk heated underlaboratory conditions to identify the principal pathways andcomplexes involved, using proteomic approaches to proteinseparation and identification.
MATERIALS AND METHODS
Milk Samples and Reagents. Fresh bulk cow’s milk was obtainedfrom a dairy farm in Cork. The milk was warmed to 50 �C and skimmedusing a pilot-scale cream separator (final fat content of <0.1%, w/w).Sodiumazide (0.02%,w/v) and a protease inhibitor cocktail, one tablet for10 mL of milk (Complete Mini EDTA-free, Roche Diagnostics,Mannheim, Germany), were added to the fresh skimmilk before analysis.Phosphoric and acetic acids were obtained from VWR (Ballycoolin,Dublin, Ireland); glycerol, urea, SDS, DTT, CHAPS, Triton X-100,iodoacetamide, bromophenol blue, and Coomassie blue were obtainedfrom Sigma-Aldrich (St. Louis, MO); acrylamide was obtained fromBio-Rad (Hercules, CA).
Heat Treatment and Protein Preparation. Aliquots (2 mL) of skimmilk were placed in glass tubes (1.5 cm diameter) with a parafilm cap andheated in a water bath at 90 �C for 30 min and then cooled rapidly in icedwater and stored at -20 �C until analyzed. Following thawing, heat-treated milk samples were diluted (1/10) according to the method ofChevalier et al. (37) in 9 M urea, 4% CHAPS, w/v, and 0.05% Triton X-100, v/v, with (reduced samples) or without (unreduced samples) 65 mMDTT. The protein content of the solubilized samples was estimated usingthe Bradford method (38).
Analytical Two-Dimensional Electrophoresis. Precast 7-cm strips,pH range 4-7, or 17-cm strips, pH range 4-7 or 3-10 (Bio-Rad), asappropriate,were rehydrated in the presence of 100μg (7-cmstrips) or 300μg(17-cm strips) of milk protein. Isoelectric focusing was carried out using aProtean IEF Cell (Bio-Rad) isoelectric focusing system until 50 kV h-1. Thestrips were then incubated in the first equilibration solution [50 mM Tris-HCl, pH 8.8, 6 M urea, 30% (v/v) glycerol, 2% (w/v) SDS] with 130 mMDTT (reduced samples) or without DTT (unreduced samples) and then inthe second equilibration solution [50 mM Tris-HCl, pH 8.8, 6 M urea,30% (v/v) glycerol, 2% (w/v) SDS] with 130 mM iodoacetamide (reducedsamples) or without iodoacetamide (unreduced samples). Strips were then
embedded using 0.6% (w/v) low-melt agarose on the top of the acryl-amide gel. SDS-PAGE was carried out on a 10-18% acrylamide gradientSDS-polyacrylamide gel (produced using a model 485 Gradient Former,Bio-Rad), using aCriterionDodecaCell electrophoresis unit (Bio-Rad).Gelswere stained with colloidal Coomassie blue (39) and scanned to images,which were digitized with a GS 800 densitometer (Bio-Rad) and analyzedusing PDQuest software v.7.3.1 (Bio-Rad).
Preparative Two-Dimensional Electrophoresis. Precast 17-cmstrips pH 4-7 or pH 3-10 L (Bio-Rad) were rehydrated with 300 μg ofprotein samples, and isoelectric focusing was carried as described above.The strips were incubated in the first equilibrated solution with DTT(reduced samples) or without DTT (unreduced samples) and then in theSDS solution with iodoactamide. SDS-PAGE was carried out on linear12.5% SDS-polyacrylamide gels, using the Criterion Dodeca Cell elec-trophoresis unit (Bio-Rad). Gels were stained with colloidal Coomassieblue (39), and imageswere digitized with aGS 800 densitometer (Bio-Rad)and analyzed using PDQuest software v.7.3.1 (Bio-Rad).
Image Analysis. An averaged gel experiment was performed withanalytical two-dimensional electrophoresis gels using the gels of controlunheatedmilk as reference with the PDQuest software (Bio-Rad). At leastthree experimental repetitions of each sample were used in this analysis.For each sample, the same gel areas were selected and compared. The spotvolume was determined as percentage of total volume of all spots onrespective gels.
MALDI-TOF and TOF/TOF Analysis. Spots were analyzedaccording to themethod of Chevalier et al. (40). Briefly, spots were excisedfrom preparative two-dimensional electrophoresis gels by hand andprocessed using a Packard Multiprobe II liquid-handling robot (Perkin-Elmer, Courtaboeuf, France). After successive washings with water,25 mM ammonium bicarbonate, acetonitrile/25 mM ammonium bicarbo-nate (1:1, v/v), and acetonitrile, gel fragments were dried at 37 �C. Proteindigestion was carried out at 37 �C for 5 h following addition of 0.125 μg oftrypsin (sequencing grade, modified, Promega, Charboni�eres, France),and resulting fragments were extracted twice with 50 μL of acetonitrile/water (1:1, v/v) containing 0.1% trifluoroacetic acid for 15 min. Pooledsupernatants were concentrated with a Speedvac to a final volume of ca.20 μL. Peptides were simultaneously desalted and concentrated with C18Zip-Tipmicrocolumns to a final volume of 3 μL, an aliquot of each samplewas mixed (1/1) with the R-cyano-4-hydroxycinnamic acid matrix at halfsaturation in acetonitrile/water (1:1, v/v), and themixturewas immediatelyspotted on the MALDI target by the Multiprobe II robot. Mass spectrawere recorded in the reflector mode on a UltraFlex IIMALDI-TOF/TOFmass spectrometer (Bruker Daltonics, Bremen, Germany). Automaticannotation of monoisotopic masses was performed using Bruker’sSNAPTM procedure. The MASCOT search engine software (MatrixScience, London, U.K.) was used to search the NCBInr database. Thefollowing parameters were used: mass tolerance of 30 ppm, a minimum offive peptidesmatching to the protein, carbamidomethylation of cysteine asfixedmodification, oxidation ofmethionine as variablemodifications, andone missed cleavage allowed. MALDI-TOF/TOF experiments wereperformed under LID conditions with the LIFT cell voltage parametersset at 19.0 kV for a final acceleration of 29.5 kV (reflector voltage) and apressure in the LIFT cell around 4 � 10-7 mbar. MASCOT parameterswere adjusted as follows: parent ion mass tolerance of 20 ppm, fragmention mass tolerance of 100 ppm.
Nano-LCMSAnalysis. Stained protein spots weremanually excised,washed, digested with trypsin as above, and extracted using formic acidinstead of trifluoroactetic acid. Protein digests were analyzed using an iontrap mass spectrometer (Esquire HCT plus; Bruker Daltonics) coupled toa nanochromatography system (HPLC 1200, Agilent) interfaced with anHPLC-Chip system (Chip Cube, Agilent). MS/MS data were searchedagainst National Center for Biotechnology Information (NCBI) andMSDB databases using Mascot software with the following parameters:parent and fragment ion mass tolerance of 0.6 Da for doubly and triplycharged peptides.
RESULTS AND DISCUSSION
Reducing Two-Dimensional Electrophoresis Analysis of Raw
Skim Milk Proteins: Reference Proteomic Map. A two-dimen-sional electrophoretogram of raw milk (Figure 1) highlighted the
Dow
nloa
ded
by C
EA
CO
NSO
RT
IA F
RA
NC
E o
n Ju
ly 1
, 200
9Pu
blis
hed
on J
une
15, 2
009
on h
ttp://
pubs
.acs
.org
| do
i: 10
.102
1/jf
9005
18n
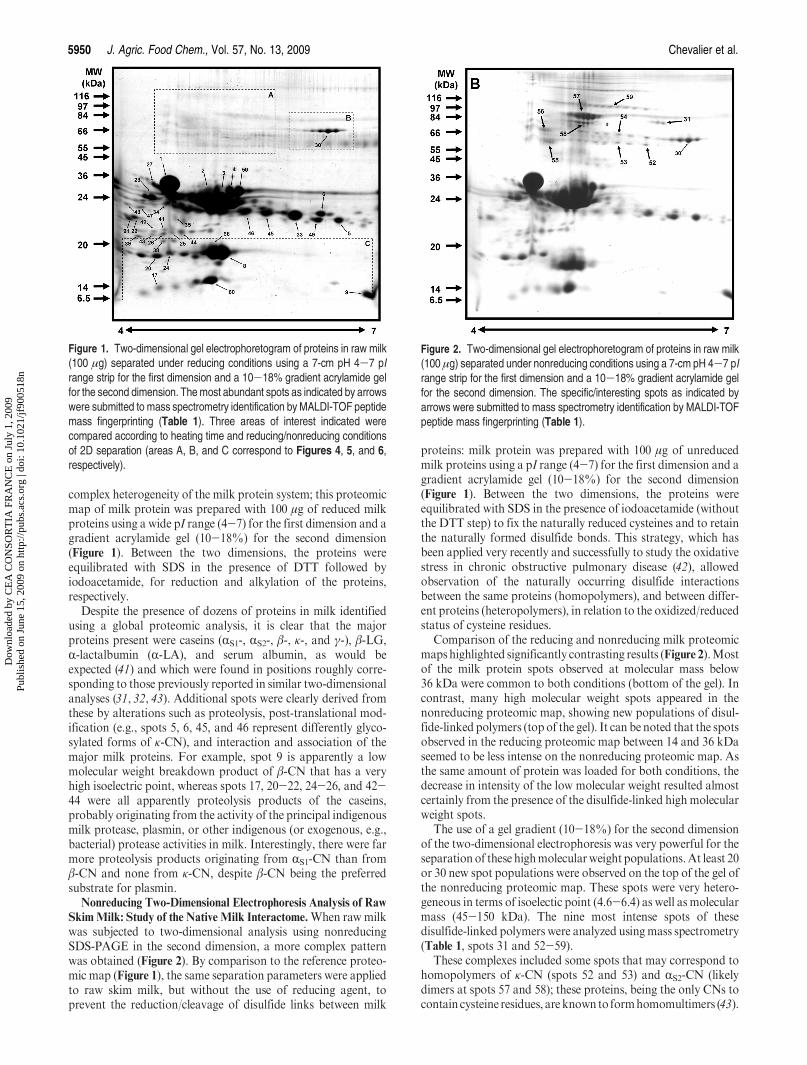
5950 J. Agric. Food Chem., Vol. 57, No. 13, 2009 Chevalier et al.
complex heterogeneity of the milk protein system; this proteomicmap of milk protein was prepared with 100 μg of reduced milkproteins using a wide pI range (4-7) for the first dimension and agradient acrylamide gel (10-18%) for the second dimension(Figure 1). Between the two dimensions, the proteins wereequilibrated with SDS in the presence of DTT followed byiodoacetamide, for reduction and alkylation of the proteins,respectively.
Despite the presence of dozens of proteins in milk identifiedusing a global proteomic analysis, it is clear that the majorproteins present were caseins (RS1-, RS2-, β-, κ-, and γ-), β-LG,R-lactalbumin (R-LA), and serum albumin, as would beexpected (41) and which were found in positions roughly corre-sponding to those previously reported in similar two-dimensionalanalyses (31, 32, 43). Additional spots were clearly derived fromthese by alterations such as proteolysis, post-translational mod-ification (e.g., spots 5, 6, 45, and 46 represent differently glyco-sylated forms of κ-CN), and interaction and association of themajor milk proteins. For example, spot 9 is apparently a lowmolecular weight breakdown product of β-CN that has a veryhigh isoelectric point, whereas spots 17, 20-22, 24-26, and 42-44 were all apparently proteolysis products of the caseins,probably originating from the activity of the principal indigenousmilk protease, plasmin, or other indigenous (or exogenous, e.g.,bacterial) protease activities in milk. Interestingly, there were farmore proteolysis products originating from RS1-CN than fromβ-CN and none from κ-CN, despite β-CN being the preferredsubstrate for plasmin.
Nonreducing Two-Dimensional Electrophoresis Analysis of Raw
SkimMilk: Study of the Native Milk Interactome.When rawmilkwas subjected to two-dimensional analysis using nonreducingSDS-PAGE in the second dimension, a more complex patternwas obtained (Figure 2). By comparison to the reference proteo-mic map (Figure 1), the same separation parameters were appliedto raw skim milk, but without the use of reducing agent, toprevent the reduction/cleavage of disulfide links between milk
proteins: milk protein was prepared with 100 μg of unreducedmilk proteins using a pI range (4-7) for the first dimension and agradient acrylamide gel (10-18%) for the second dimension(Figure 1). Between the two dimensions, the proteins wereequilibrated with SDS in the presence of iodoacetamide (withoutthe DTT step) to fix the naturally reduced cysteines and to retainthe naturally formed disulfide bonds. This strategy, which hasbeen applied very recently and successfully to study the oxidativestress in chronic obstructive pulmonary disease (42), allowedobservation of the naturally occurring disulfide interactionsbetween the same proteins (homopolymers), and between differ-ent proteins (heteropolymers), in relation to the oxidized/reducedstatus of cysteine residues.
Comparison of the reducing and nonreducing milk proteomicmapshighlighted significantly contrasting results (Figure 2).Mostof the milk protein spots observed at molecular mass below36 kDa were common to both conditions (bottom of the gel). Incontrast, many high molecular weight spots appeared in thenonreducing proteomic map, showing new populations of disul-fide-linked polymers (top of the gel). It can be noted that the spotsobserved in the reducing proteomic map between 14 and 36 kDaseemed to be less intense on the nonreducing proteomic map. Asthe same amount of protein was loaded for both conditions, thedecrease in intensity of the low molecular weight resulted almostcertainly from the presence of the disulfide-linked high molecularweight spots.
The use of a gel gradient (10-18%) for the second dimensionof the two-dimensional electrophoresis was very powerful for theseparation of these highmolecularweight populations.At least 20or 30 new spot populations were observed on the top of the gel ofthe nonreducing proteomic map. These spots were very hetero-geneous in terms of isoelectic point (4.6-6.4) as well as molecularmass (45-150 kDa). The nine most intense spots of thesedisulfide-linked polymers were analyzed usingmass spectrometry(Table 1, spots 31 and 52-59).
These complexes included some spots that may correspond tohomopolymers of κ-CN (spots 52 and 53) and RS2-CN (likelydimers at spots 57 and 58); these proteins, being the only CNs tocontain cysteine residues, are known to formhomomultimers (43).
Figure 1. Two-dimensional gel electrophoretogram of proteins in raw milk(100 μg) separated under reducing conditions using a 7-cm pH 4-7 pIrange strip for the first dimension and a 10-18% gradient acrylamide gelfor the second dimension. Themost abundant spots as indicated by arrowswere submitted to mass spectrometry identification by MALDI-TOF peptidemass fingerprinting (Table 1). Three areas of interest indicated werecompared according to heating time and reducing/nonreducing conditionsof 2D separation (areas A, B, and C correspond to Figures 4, 5, and 6,respectively).
Figure 2. Two-dimensional gel electrophoretogram of proteins in raw milk(100 μg) separated under nonreducing conditions using a 7-cm pH 4-7 pIrange strip for the first dimension and a 10-18% gradient acrylamide gelfor the second dimension. The specific/interesting spots as indicated byarrows were submitted to mass spectrometry identification by MALDI-TOFpeptide mass fingerprinting (Table 1).
Dow
nloa
ded
by C
EA
CO
NSO
RT
IA F
RA
NC
E o
n Ju
ly 1
, 200
9Pu
blis
hed
on J
une
15, 2
009
on h
ttp://
pubs
.acs
.org
| do
i: 10
.102
1/jf
9005
18n
Article J. Agric. Food Chem., Vol. 57, No. 13, 2009 5951
Several heteropolymers consisting of various milk proteins atleast in part disulfide-linkedwere also found, including complexesofRS2/κ-CN (spot 54),RS1-/RS2/κ-CN (spots 55 and 56),RS1-/RS2/κ-CN/ β-Lg (spot 59), and RS2/β-CN/serum albumin (spot 31), ofdifferent molecular weights and pI values, depending presumablyon the glycosylated and phosphorylated forms of the CN
involved. It can be noted that new proteins species were alsoidentified in some of these complexes, including phenylethanola-mine N-methyltransferase and R-actin 2 (spot 55), showing thecomplexity of the heteropolymeric complexes observed usingsuch nonreducing two-dimensional electrophoresis. The observa-tion of these stable complexes under “native-like” separation
Table 1. Principal Species Identified in Heated and Unheated Bovine Milk Samples by IEF/SDS-PAGE followed by (a) MALDI MS-PMF, (b) MALDI TOF/TOF, or (c)Nano-LC-MS/MSa
MALDI-TOF (a) MALDI-TOF/TOF (b) nano-LC-MS/MS (c)
spot
MWb
theor/obsd
pI theor/
obsdcidentified
protein
accession
no.dMascot
score
%
coverage
peptide
mass
Mascot
score sequence score
matching
peptides
1 22.97/27.3 4.91/4.61 RS1-casein P02662 84.4 31.8
2 23.58/23.52 5.13/4.98 β-casein P02666 39 15.6
3 23.58/21.95 5.13/5.29 β-casein P02666 52.4 19.2
4 24.35/28.31 8.34/5.21 RS2-casein P02663 77.9 26.1 250 9
5 18.97/20.82 5.93/6.59 κ-casein O02782 33 31.1
6 18.97/21.26 5.93/6.34 κ-casein O02782 31.9 27 139 2
8 18.28/18.27 4.83/5.16 β-lactoglobulin P02754 55.7 44.4 461 10
9 23.58/14.2 5.13/6.95 β-casein P02666 55.6 21.9 55 3
17 22.97/13.87 4.91/4.36 RS1-casein P02662 32 21.5
20 23.58/17.92 5.13/4.46 β-casein P02666 2061.81 44.9 FQSEEQQQ-
TEDELQDK
21 22.97/20.88 4.91/4.03 RS1-casein P02662 41.9 36.9
22 22.97/20.75 4.91/4.12 RS1-casein P02662 42 26.2
24 23.58/18.39 5.13/4.60 β-casein P02666 2061.81 44.9 FQSEEQQQ-
TEDELQDK
25 22.97/19.93 4.91/4.61 RS1-casein P02662 69.8 24.3
26 22.97/19.80 4.91/4.54 RS1-casein P02662 56.6 24.3
27 22.97/31.09 4.91/4.34 RS1-casein P02662 61.2 31.8
28 22.97/24.40 4.91/4.40 RS1-casein P02662 87.1 33.2
30 66.43/65.11 5.6/6.39 serum albumin P02769 85.3 16 923 19
31 24.35/70.32 8.34/6.18 RS2-casein P02663 49.1 18
31 66.43/70.32 5.6/6.18 serum albumin P02769 39.9 12.5
31 23.58/70.32 5.13/6.18 β-casein P02666 20.6 28.1
33 18.97/21.15 5.93/6.01 κ-casein O02782 28.7 30.5 1752.955 41.95 HPHPHLSFM-
AIPPKK
198 3
34 22.97/21.80 4.91/4.56 RS1-casein P02662 51.5 24.3
35 22.97/20.94 4.91/4.64 RS1-casein P02662 67.4 31.8
38 23.58/19.22 5.13/4.54 β-casein P02666 1029.54 36.35 HKEMPFPK
39 22.97/19.33 4.91/4.18 RS1-casein P02662 41.5 16.8
41 22.97/20.06 4.91/4.55 RS1-casein P02662 45.4 22.4
42 22.97/19.92 4.91/4.44 RS1-casein P02662 51.5 24.3
43 22.97/19.66 4.91/4.42 RS1-casein P02662 37.9 22.4
44 22.97/19.95 4.91/4.71 RS1-casein P02662 54.5 22.4
45 18.97/21.20 5.93/5.63 κ-casein O02782 27.5 30.5
46 18.97/21.28 5.93/5.38 κ-casein O02782 27.9 42.4 102 3
47 24.35/21.53 8.34/4.26 RS2-casein P02663 35.4 15.7
48 24.35/21.72 8.34/4.07 RS2-casein P02663 37.4 15.7
49 18.97/20.74 5.93/6.19 κ-casein O02782 40 1
50 24.35/28.94 8.34/5.32 RS2-casein P02663 264 7
52 18.97/55.27 5.93/5.98 κ-casein O02782 171 3
53 18.97/56.66 5.93/5.63 κ-casein O02782 120 1
54 18.97/61.37 5.93/5.65 κ-casein O02782 120 2
54 24.35/61.37 8.34/5.65 RS2-casein P02663 83 4
55 41.77/56.38 5.24/4.81 R-actin 2 P62739 362 7
55 24.35/56.38 8.34/4.81 RS2-casein P02663 95 3
55 18.97/56.38 5.93/4.81 κ-casein O02782 61 1
55 22.97/56.38 4.91/4.81 RS1- casein P02662 43 1
55 30.92/56.38 5.91/4.81 phenylethanol
amine
N-methyl-
transferase
P10938 41 1
56 22.97/65.11 4.91/4.71 RS1-casein P02662 193 3
56 24.35/65.11 8.34/4.71 RS2-casein P02663 146 5
56 18.97/65.11 5.93/4.71 κ-casein O02782 109 2
57 24.35/76.90 8.34/5.22 RS2-casein P02663 68.5 24.8
57 24.35/76.90 8.34/5.22 RS2-casein P02663 251 7
58 24.35/70.85 8.34/5.21 RS2-casein P02663 112 2
Dow
nloa
ded
by C
EA
CO
NSO
RT
IA F
RA
NC
E o
n Ju
ly 1
, 200
9Pu
blis
hed
on J
une
15, 2
009
on h
ttp://
pubs
.acs
.org
| do
i: 10
.102
1/jf
9005
18n
5952 J. Agric. Food Chem., Vol. 57, No. 13, 2009 Chevalier et al.
conditions (i.e., without ionic detergents or reducing agents) mayreveal natural interactions betweenmilk proteins with a potentialbiological function, still unknown. The interaction of wheyproteins (i.e., especially β-LG) and caseins (RS1-/RS2/κ-/β-CN)at themicellar surface can explain, at least in part, the initiation ofa three-dimensional gel matrix during ultrahigh-temperaturetreatment involving whey proteins and caseins (44).
Nonreducing versus Reducing Two-Dimensional Electrophoresis
of Heated Milk: Analysis of Heat-Induced Interactions. The
changes in milk during heating at 90 �C for up to 30 min wereanalyzed by two-dimensional electrophoresis under three differ-ent sets of conditions of treatment (the principle is schematicallydescribed inFigure 3): 2DER/R corresponds to samples analyzedunder reducing conditions in both dimensions (i.e., all disulfidebonds were reduced during the full analysis, and complexes wereresolved into their constituent proteins); 2DENR/R correspondsto samples reduced only after isoelectric focusing (i.e., disulfide-bonded complexes resolved during IEF, but the bonds were
Table 1. Continued
MALDI-TOF (a) MALDI-TOF/TOF (b) nano-LC-MS/MS (c)
spot
MWb
theor/obsd
pI theor/
obsdcidentified
protein
accession
no.dMascot
score
%
coverage
peptide
mass
Mascot
score sequence score
matching
peptides
59 18.28/89.38 4.83/5.55 β-lactoglobulin P02754 202 4
59 22.97/89.38 4.91/5.55 RS1- casein P02662 181 3
59 18.97/89.38 5.93/5.55 κ-casein O02782 175 3
59 24.35/89.38 8.34/5.55 RS2-casein P02663 140 4
60 14.19/14.73 4.8/5.04 R-lactalbumin P00711 252 5
61 18.28/18.50 4.83/6.73 β-lactoglobulin P02754 420 8
62 18.28/18.50 4.83/6.95 β-lactoglobulin P02754 486 10
63 18.97/21.15 5.93/6.73 κ-casein O02782 138 2
64 18.97/21.15 5.93/6.95 κ-casein O02782 117 1
65 66.43/65.32 5.6/6.73 serum albumin P02769 977 21
66 66.43/65.32 5.6/6.95 serum albumin P02769 979 22
67 18.28/18.50 4.83/6.32 β-lactoglobulin P02754 285 7
68 18.28/18.27 4.99/5.16 β-lactoglobulin P02754 415 9aSpot numbers correspond to Figures 1, 2, 4, 5, 6, and 7. bObserved molecular mass from the gel (kDa)/theoretical molecular mass (kDa, calculated from the primary amino
acid sequence using sequence analysis tools). cObserved isoelectric point from the gel/theoretical isoelectric point (calculated from the primary amino acid sequence usingsequence analysis tools). dAccession number in the Swiss-Prot database.
Figure 3. Schematic representation of the 2DE R/R, NR/R, and NR/NR strategies of analysis and the resulting expected results concerning the spotscharacteristic modification in term of isoelectric point and molecular weight. Milk samples were first diluted with solubilization buffer containing DTT (top panel,reduced samples) or without DTT (middle and bottom panel, unreduced samples) and then separated through 2D electrophoresis. Three samples conditionswere set up to analyze and compare disulfide bridge exchanges (according to Miller et al. 2004): (a) samples completely reduced before and during 2-dimensional electrophoresis (top panel); (b) samples unreduced before 2-dimensional electrophoresis and reduced only after isoelectric focusing (middlepanel); (c) samples unreduced before and during 2-dimensional electrophoresis (bottom panel).
Dow
nloa
ded
by C
EA
CO
NSO
RT
IA F
RA
NC
E o
n Ju
ly 1
, 200
9Pu
blis
hed
on J
une
15, 2
009
on h
ttp://
pubs
.acs
.org
| do
i: 10
.102
1/jf
9005
18n
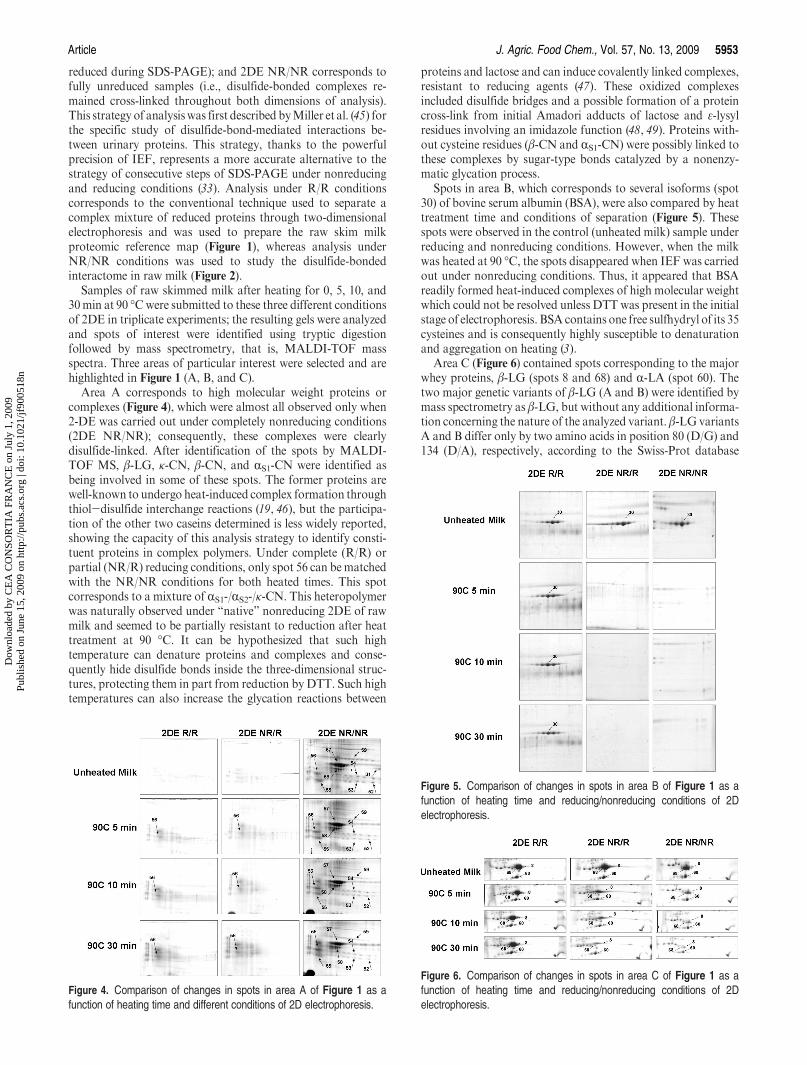
Article J. Agric. Food Chem., Vol. 57, No. 13, 2009 5953
reduced during SDS-PAGE); and 2DE NR/NR corresponds tofully unreduced samples (i.e., disulfide-bonded complexes re-mained cross-linked throughout both dimensions of analysis).This strategy of analysiswas first described byMiller et al. (45) forthe specific study of disulfide-bond-mediated interactions be-tween urinary proteins. This strategy, thanks to the powerfulprecision of IEF, represents a more accurate alternative to thestrategy of consecutive steps of SDS-PAGE under nonreducingand reducing conditions (33). Analysis under R/R conditionscorresponds to the conventional technique used to separate acomplex mixture of reduced proteins through two-dimensionalelectrophoresis and was used to prepare the raw skim milkproteomic reference map (Figure 1), whereas analysis underNR/NR conditions was used to study the disulfide-bondedinteractome in raw milk (Figure 2).
Samples of raw skimmed milk after heating for 0, 5, 10, and30min at 90 �Cwere submitted to these three different conditionsof 2DE in triplicate experiments; the resulting gels were analyzedand spots of interest were identified using tryptic digestionfollowed by mass spectrometry, that is, MALDI-TOF massspectra. Three areas of particular interest were selected and arehighlighted in Figure 1 (A, B, and C).
Area A corresponds to high molecular weight proteins orcomplexes (Figure 4), which were almost all observed only when2-DE was carried out under completely nonreducing conditions(2DE NR/NR); consequently, these complexes were clearlydisulfide-linked. After identification of the spots by MALDI-TOF MS, β-LG, κ-CN, β-CN, and RS1-CN were identified asbeing involved in some of these spots. The former proteins arewell-known to undergo heat-induced complex formation throughthiol-disulfide interchange reactions (19, 46), but the participa-tion of the other two caseins determined is less widely reported,showing the capacity of this analysis strategy to identify consti-tuent proteins in complex polymers. Under complete (R/R) orpartial (NR/R) reducing conditions, only spot 56 can bematchedwith the NR/NR conditions for both heated times. This spotcorresponds to a mixture of RS1-/RS2-/κ-CN. This heteropolymerwas naturally observed under “native” nonreducing 2DE of rawmilk and seemed to be partially resistant to reduction after heattreatment at 90 �C. It can be hypothesized that such hightemperature can denature proteins and complexes and conse-quently hide disulfide bonds inside the three-dimensional struc-tures, protecting them in part from reduction byDTT. Such hightemperatures can also increase the glycation reactions between
proteins and lactose and can induce covalently linked complexes,resistant to reducing agents (47). These oxidized complexesincluded disulfide bridges and a possible formation of a proteincross-link from initial Amadori adducts of lactose and ε-lysylresidues involving an imidazole function (48, 49). Proteins with-out cysteine residues (β-CN and RS1-CN) were possibly linked tothese complexes by sugar-type bonds catalyzed by a nonenzy-matic glycation process.
Spots in area B, which corresponds to several isoforms (spot30) of bovine serum albumin (BSA), were also compared by heattreatment time and conditions of separation (Figure 5). Thesespots were observed in the control (unheated milk) sample underreducing and nonreducing conditions. However, when the milkwas heated at 90 �C, the spots disappeared when IEF was carriedout under nonreducing conditions. Thus, it appeared that BSAreadily formed heat-induced complexes of high molecular weightwhich could not be resolved unless DTT was present in the initialstage of electrophoresis. BSA contains one free sulfhydryl of its 35cysteines and is consequently highly susceptible to denaturationand aggregation on heating (3).
Area C (Figure 6) contained spots corresponding to the majorwhey proteins, β-LG (spots 8 and 68) and R-LA (spot 60). Thetwo major genetic variants of β-LG (A and B) were identified bymass spectrometry as β-LG, but without any additional informa-tion concerning the nature of the analyzed variant. β-LG variantsA and B differ only by two amino acids in position 80 (D/G) and134 (D/A), respectively, according to the Swiss-Prot database
Figure 4. Comparison of changes in spots in area A of Figure 1 as afunction of heating time and different conditions of 2D electrophoresis.
Figure 5. Comparison of changes in spots in area B of Figure 1 as afunction of heating time and reducing/nonreducing conditions of 2Delectrophoresis.
Figure 6. Comparison of changes in spots in area C of Figure 1 as afunction of heating time and reducing/nonreducing conditions of 2Delectrophoresis.
Dow
nloa
ded
by C
EA
CO
NSO
RT
IA F
RA
NC
E o
n Ju
ly 1
, 200
9Pu
blis
hed
on J
une
15, 2
009
on h
ttp://
pubs
.acs
.org
| do
i: 10
.102
1/jf
9005
18n
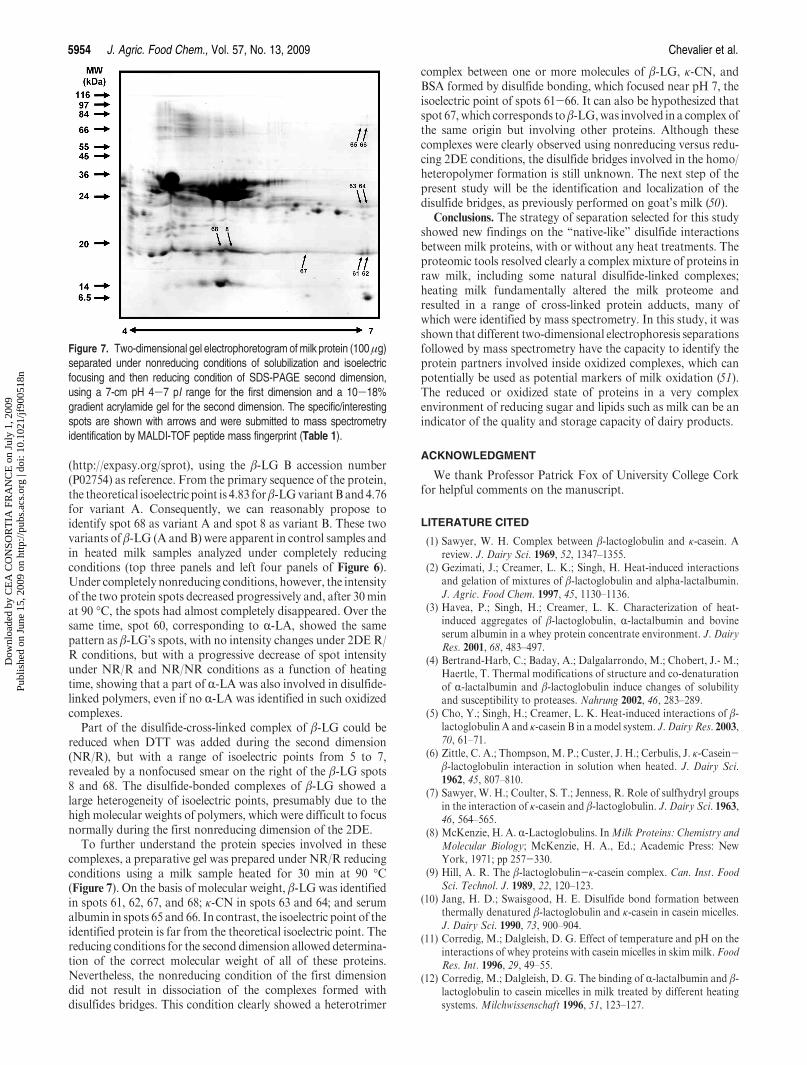
5954 J. Agric. Food Chem., Vol. 57, No. 13, 2009 Chevalier et al.
(http://expasy.org/sprot), using the β-LG B accession number(P02754) as reference. From the primary sequence of the protein,the theoretical isoelectric point is 4.83 forβ-LGvariant B and 4.76for variant A. Consequently, we can reasonably propose toidentify spot 68 as variant A and spot 8 as variant B. These twovariants of β-LG (A and B) were apparent in control samples andin heated milk samples analyzed under completely reducingconditions (top three panels and left four panels of Figure 6).Under completely nonreducing conditions, however, the intensityof the two protein spots decreased progressively and, after 30minat 90 �C, the spots had almost completely disappeared. Over thesame time, spot 60, corresponding to R-LA, showed the samepattern as β-LG’s spots, with no intensity changes under 2DE R/R conditions, but with a progressive decrease of spot intensityunder NR/R and NR/NR conditions as a function of heatingtime, showing that a part of R-LA was also involved in disulfide-linked polymers, even if no R-LA was identified in such oxidizedcomplexes.
Part of the disulfide-cross-linked complex of β-LG could bereduced when DTT was added during the second dimension(NR/R), but with a range of isoelectric points from 5 to 7,revealed by a nonfocused smear on the right of the β-LG spots8 and 68. The disulfide-bonded complexes of β-LG showed alarge heterogeneity of isoelectric points, presumably due to thehigh molecular weights of polymers, which were difficult to focusnormally during the first nonreducing dimension of the 2DE.
To further understand the protein species involved in thesecomplexes, a preparative gel was prepared under NR/R reducingconditions using a milk sample heated for 30 min at 90 �C(Figure 7). On the basis of molecular weight, β-LG was identifiedin spots 61, 62, 67, and 68; κ-CN in spots 63 and 64; and serumalbumin in spots 65 and 66. In contrast, the isoelectric point of theidentified protein is far from the theoretical isoelectric point. Thereducing conditions for the second dimension allowed determina-tion of the correct molecular weight of all of these proteins.Nevertheless, the nonreducing condition of the first dimensiondid not result in dissociation of the complexes formed withdisulfides bridges. This condition clearly showed a heterotrimer
complex between one or more molecules of β-LG, κ-CN, andBSA formed by disulfide bonding, which focused near pH 7, theisoelectric point of spots 61-66. It can also be hypothesized thatspot 67, which corresponds toβ-LG,was involved in a complex ofthe same origin but involving other proteins. Although thesecomplexes were clearly observed using nonreducing versus redu-cing 2DE conditions, the disulfide bridges involved in the homo/heteropolymer formation is still unknown. The next step of thepresent study will be the identification and localization of thedisulfide bridges, as previously performed on goat’s milk (50).
Conclusions. The strategy of separation selected for this studyshowed new findings on the “native-like” disulfide interactionsbetween milk proteins, with or without any heat treatments. Theproteomic tools resolved clearly a complex mixture of proteins inraw milk, including some natural disulfide-linked complexes;heating milk fundamentally altered the milk proteome andresulted in a range of cross-linked protein adducts, many ofwhich were identified by mass spectrometry. In this study, it wasshown that different two-dimensional electrophoresis separationsfollowed by mass spectrometry have the capacity to identify theprotein partners involved inside oxidized complexes, which canpotentially be used as potential markers of milk oxidation (51).The reduced or oxidized state of proteins in a very complexenvironment of reducing sugar and lipids such as milk can be anindicator of the quality and storage capacity of dairy products.
ACKNOWLEDGMENT
We thank Professor Patrick Fox of University College Corkfor helpful comments on the manuscript.
LITERATURE CITED
(1) Sawyer, W. H. Complex between β-lactoglobulin and κ-casein. Areview. J. Dairy Sci. 1969, 52, 1347–1355.
(2) Gezimati, J.; Creamer, L. K.; Singh, H. Heat-induced interactionsand gelation of mixtures of β-lactoglobulin and alpha-lactalbumin.J. Agric. Food Chem. 1997, 45, 1130–1136.
(3) Havea, P.; Singh, H.; Creamer, L. K. Characterization of heat-induced aggregates of β-lactoglobulin, R-lactalbumin and bovineserum albumin in a whey protein concentrate environment. J. DairyRes. 2001, 68, 483–497.
(4) Bertrand-Harb, C.; Baday, A.; Dalgalarrondo, M.; Chobert, J.- M.;Haertle, T. Thermal modifications of structure and co-denaturationof R-lactalbumin and β-lactoglobulin induce changes of solubilityand susceptibility to proteases. Nahrung 2002, 46, 283–289.
(5) Cho, Y.; Singh, H.; Creamer, L. K. Heat-induced interactions of β-lactoglobulin A and κ-casein B in amodel system. J. Dairy Res. 2003,70, 61–71.
(6) Zittle, C. A.; Thompson, M. P.; Custer, J. H.; Cerbulis, J. κ-Casein-β-lactoglobulin interaction in solution when heated. J. Dairy Sci.1962, 45, 807–810.
(7) Sawyer, W. H.; Coulter, S. T.; Jenness, R. Role of sulfhydryl groupsin the interaction of κ-casein and β-lactoglobulin. J. Dairy Sci. 1963,46, 564–565.
(8) McKenzie, H. A. R-Lactoglobulins. InMilk Proteins: Chemistry andMolecular Biology; McKenzie, H. A., Ed.; Academic Press: NewYork, 1971; pp 257-330.
(9) Hill, A. R. The β-lactoglobulin-κ-casein complex. Can. Inst. FoodSci. Technol. J. 1989, 22, 120–123.
(10) Jang, H. D.; Swaisgood, H. E. Disulfide bond formation betweenthermally denatured β-lactoglobulin and κ-casein in casein micelles.J. Dairy Sci. 1990, 73, 900–904.
(11) Corredig, M.; Dalgleish, D. G. Effect of temperature and pH on theinteractions of whey proteins with casein micelles in skim milk. FoodRes. Int. 1996, 29, 49–55.
(12) Corredig, M.; Dalgleish, D. G. The binding of R-lactalbumin and β-lactoglobulin to casein micelles in milk treated by different heatingsystems. Milchwissenschaft 1996, 51, 123–127.
Figure 7. Two-dimensional gel electrophoretogram ofmilk protein (100μg)separated under nonreducing conditions of solubilization and isoelectricfocusing and then reducing condition of SDS-PAGE second dimension,using a 7-cm pH 4-7 pI range for the first dimension and a 10-18%gradient acrylamide gel for the second dimension. The specific/interestingspots are shown with arrows and were submitted to mass spectrometryidentification by MALDI-TOF peptide mass fingerprint (Table 1).
Dow
nloa
ded
by C
EA
CO
NSO
RT
IA F
RA
NC
E o
n Ju
ly 1
, 200
9Pu
blis
hed
on J
une
15, 2
009
on h
ttp://
pubs
.acs
.org
| do
i: 10
.102
1/jf
9005
18n
Article J. Agric. Food Chem., Vol. 57, No. 13, 2009 5955
(13) Corredig, M.; Dalgleish, D. G. The mechanisms of the heatinducedinteraction of whey proteins with casein micelles inmilk. Int. Dairy J.1999, 9, 233–236.
(14) Euber, J. R.; Brunner, J. R. Interaction of κ-casein with immobilizedβ-lactoglobulin. J. Dairy Sci. 1982, 65, 2384–2387.
(15) Anema, S. G.; Li, Y. Effect of pH on the association of denaturedwhey proteins with casein micelles in heated reconstituted skimmilk.J. Agric. Food Chem. 2003, 51, 1640–1646.
(16) Anema, S. G.; Li, Y. Association of denatured whey proteins withcasein micelles in heated reconstituted skim milk and its effect oncasein micelle size. J. Dairy Res. 2003, 70, 73–83.
(17) McKenzie, G. H.; Norton, R. S.; Sawyer, W. H. Heat-inducedinteraction of β-lactoglobulin and κ-casein. J. Dairy Res. 1971, 38,343–351.
(18) Creamer, L. K.; Bienvenue, A.; Nilsson, H.; Paulsson, M.; vanWanroij, M.; Lowe, E. K.; Anema, S. G.; Boland, M. J.; Jim�enez-Flores, R. Heat-induced redistribution of disulfide bonds in milkproteins. 1. Bovine R-lactoglobulin. J. Agric. Food Chem. 2004, 52,7660–7668.
(19) Lowe, E. K.; Anema, S. G.; Bienvenue, A.; Boland, M. J.; Creamer,L. K.; Jimenez-Flores, R. Heat-induced redistribution of disulfidebonds inmilk proteins. 2. Disulfide bonding patterns between bovineβ-lactoglobulin and κ-casein. J. Agric. Food Chem. 2004, 52, 7669–7680.
(20) Jang, H. D.; Swaisgood, E. Disulphide bond formation betweenthermally denatured β-lactoglobulin and κ-casein in casein micelles.J. Dairy Sci. 1990, 73, 900–904.
(21) Livney, Y. D.; Dalgleish, D. G. Specificity of disulphide bondformation during thermal aggregation in solutions of β-lactoglobu-lin B and κ-casein A. J. Agric. Food Chem. 2004, 52, 5527–5532.
(22) Swaisgood, H. E. Chemistry of the caseins. In Advanced DairyChemistry. s1. Proteins; Fox, P. F., Ed.; Elsevier Applied Science:London, U.K., 1992; pp 63-110.
(23) Rasmussen, L. K.; Johnsen, L. B.; Tsiora, A.; Sørensen, E. S.;Thomsen, J. K.; Nielsen, N. C.; Jakobsen, H. J.; Petersen, T. E.Disulphide-linked caseins and casein micelles. Int. Dairy J. 1999, 9,215–218.
(24) Guyomarc’h, F.; Law, A. J. R.; Dalgleish, D. G. Formation ofsoluble and micelle-bound protein aggregates in heated milk. J.Agric. Food Chem. 2003, 51, 4652–4660.
(25) Smits, P.; van Brouwershaven, J. H. Heat-induced association of β-lactoglobulin and casein micelles. J. Dairy Res. 1980, 47, 313–325.
(26) Singh, H.; Creamer, L. K. Denaturation, aggregation and heatstability of milk protein during the manufacture of skim milkpowder. J. Dairy Res. 1991, 58, 269–283.
(27) Vasbinder, A. J.; de Kruif, C. G. Casein-whey protein interactionsin heated milk: the influence of pH. Int. Dairy J. 2003, 13, 669–677.
(28) Nabhan, M. A.; Girardet, J. M.; Campagna, S.; Gaillard, J. L.; LeRoux, Y. Isolation and characterization of copolymers of β-lacto-globulin, R-lactalbumin, κ-casein, and RS1-casein generated bypressurization and thermal treatment of raw milk. J. Dairy Sci.2004, 87, 3614–3622.
(29) Oldfield, D. J.; Singh, H.; Taylor, M. W. Kinetics of heat-inducedwhey protein denaturation and aggregation in skim milks withadjusted whey protein concentration. J. Dairy Res. 2005, 72, 369–378.
(30) Galvani, M.; Hamdan, M.; Righetti, P. G. Two-dimensional gelelectrophoresis/matrix-assisted laser desorption/ionization massspectrometry of a milk powder. Rapid Commun. Mass Spectrom.2000, 14, 1889–1897.
(31) Holland, J. W.; Deeth, H. C.; Alewood, P. F. Proteomic analysis ofκ-casein micro-heterogeneity. Proteomics 2004, 4, 743–752.
(32) Holland, J. W.; Deeth, H. C.; Alewood, P. F. Resolution andcharacterisation of multiple isoforms of bovine κ-casein by 2-DEfollowing a reversible cysteine-tagging enrichment strategy. Proteo-mics 2006, 6, 3087–3095.
(33) Patel, H. A.; Singh, H.; Anema, S. G.; Creamer, L. K. Effects of heatand high hydrostatic pressure treatments on disulphide bondinginterchanges among the proteins in skim milk. J. Agric. Food Chem.2006, 54, 3409–3420.
(34) Creamer, L. K.; Bienvenue, A.; Nilsson, H.; Paulsson, M.; vanWanroij, M.; Lowe, E. K.; Anema, S. G.; Boland, M. J.; Jim�enez-Flores, R. Heat-induced redistribution of disulphide bonds in milkproteins. 1. Bovine β-lactoglobulin. J. Agric. Food Chem. 2004, 52,7660–7668.
(35) Livney, Y. D.; Dalgleish, D. G. Specificity of disulfide bondformation during thermal aggregation in solutions of β-lactoglobu-lin B and κ-casein A. J. Agric. Food Chem. 2004, 52, 5527–5532.
(36) Yamada,M.;Murakami, K.;Wallingford, J. C.; Yuki, Y. Identifica-tion of low-abundance proteins of bovine colostral and mature milkusing two-dimensional electrophoresis followed by microsequencingand mass spectrometry. Electrophoresis 2002, 23, 1153–1160.
(37) Chevalier, F.; Martin, O.; Rofidal, V.; Devauchelle, A. -D.; Ros-signol, M. Proteomic investigation of natural variation betweenArabidopsis ecotypes. Proteomics 2004, 4, 1372–1381.
(38) Bradford, M. M. A rapid and sensitive method for the quantitationof microgram quantities of protein utilizing the principle of protein-dye binding. Anal. Biochem. 1976, 72, 248–254.
(39) Chevalier, F.; Rofidal, V.; Vanova, P.; Bergoin, A.; Rossignol, M.Proteomic capacity of recent fluorescent dyes for protein staining.Phytochemistry 2004, 65, 1499–1506.
(40) Chevalier, F.; Centeno, D.; Rofidal, V.; Tauzin, M.; Sommerer, N.;Rossignol, M. Differential capacity of visible stains and fluorescentdyes for large-scale investigation of proteomes by MALDI-TOFMS. J. Proteome Res. 2006, 5, 512–520.
(41) Fox, P. F.; McSweeney, P. L. H. Dairy Chemistry and Biochemistry;Blackie Academic and Professional Publishers: London, U.K., 1998.
(42) Lehtonen, S. T.; Ohlmeier, S.; Kaarteenaho-Wiik, R.; Harju, T.;P::a::akk
::o, P.; Soini, Y.; Kinnula, V. L. Does the oxidative stress in
chronic obstructive pulmonary disease cause thioredoxin/peroxire-doxin oxidation? Antioxid. Redox. Signal. 2008, 10, 813–819.
(43) Holland, J. W.; Deeth, H. C.; Alewood, P. F. Analysis of disulphidelinkages in bovine κ-casein oligomers using two-dimensional elec-trophoresis. Electrophoresis 2008, 29, 2402–2410.
(44) Datta, N.; Deeth, H. C. Age gelation of UHT milk: a review. FoodBioprod. Proc. 2001, 79, 197–210.
(45) Miller, I.; Teinfalt, M.; Leschnik, M.; Wait, R.; Gemeiner, M. Non-reducing two-dimensional gel electrophoresis for the detection of BenceJones proteins in serum and urine. Proteomics 2004, 4, 257–260.
(46) Considine, T.; Patel, H. A.; Anema, S. G.; Singh, H.; Creamer, L. K.Interactions of milk proteins during heat and high hydrostaticpressure treatments;a review. Innovative Food Sci. Emerg. Technol.2007, 8, 1–23.
(47) Chevalier, F.; Chobert, J.-M.; Moll�e, D.; Haertl�e, T. Maillardglycation of β-lactoglobulin with several sugars: comparative studyof the properties of the obtained polymers and of the substitutedsites. Lait 2001, 81, 655–666.
(48) Chevalier, F.; Chobert, J.-M.; Dalgalarrondo, M.; Haertl�e, T.Characterization of the Maillard reactions product of β-lactoglobu-lin glucosylated inmild conditions. J. Food Biochem. 2001, 25, 33–55.
(49) Pongor, S.; Ulrich, P. C.; Bencsath, F. A.; Cerami, A. Aging ofproteins: isolation and identification of a fluorescent chromophorefrom the reaction of polypeptides with glucose.Proc. Natl. Acad. Sci.U.S.A. 1984, 81, 2684–2688.
(50) Henry, G.;Moll�e, D.;Morgan, F.; Fauquant, J.; Bouhallab, S. Heat-induced covalent complex between casein micelles and β-lactoglo-bulin from goat’s milk: identification of an involved disulfide bond.J. Agric. Food Chem. 2002, 50, 185–191.
(51) Wait, R.; Begum, S.; Brambilla, D.; Carabelli, A. M.; Conserva, F.;Rocco Guerini, A.; Eberini, I.; Ballerio, R.; Gemeiner, M.; Miller, I.;Gianazza, E. Redox options in two-dimensional electrophoresis.Amino Acids 2005, 28, 239–272.
Received February 13, 2009. Revised manuscript received April 29,
2009. Accepted May 13, 2009. Funding for this research was provided
under the National Development Plan 2007-2013, through the Food
Institutional Research Measure, administered by the Department of
Agriculture, Fisheries and Food, Ireland. This work was also supported
by the Proteomic Platform of Montpellier-LR Genopole.
Dow
nloa
ded
by C
EA
CO
NSO
RT
IA F
RA
NC
E o
n Ju
ly 1
, 200
9Pu
blis
hed
on J
une
15, 2
009
on h
ttp://
pubs
.acs
.org
| do
i: 10
.102
1/jf
9005
18n
pubs.acs.org/JAFCPublished on Web 05/26/2010© 2010 American Chemical Society
J. Agric. Food Chem. 2010, 58, 7437–7444 7437
DOI:10.1021/jf1010879
Proteomic Quantification of Disulfide-Linked Polymers inRaw and Heated Bovine Milk
FRANC-OIS CHEVALIER*,†,‡ AND ALAN L. KELLY†
†School of Food and Nutritional Sciences, University College Cork, Cork, Ireland, and‡Proteomic Platform, CEA, Fontenay aux Roses, France
Disulfide bond formation between milk protein molecules was quantified in raw and heated bovine
milk using reducing and nonreducing two-dimensional electrophoresis. Analysis of protein profiles in
raw milk indicated that 18% of RS2-casein, 25% of β-lactoglobulin, and 46% of κ-casein molecules
were involved in disulfide-linked complexes (calculated through differences in spot volumes on two-
dimensional electrophoretograms under reducing and nonreducing conditions), whereas levels of
RS1- and β-caseins were similar under both conditions. Following heat treatment at 90 �C for 30 min,
spot volumes of serum albumin, β-lactoglobulin, and κ-casein decreased by 85%, 75%, and 75%,
respectively, with the formation of several spots on nonreducing gels corresponding to polymers.
Homopolymers and heteropolymers of κ-casein and RS2-casein were identified by mass spectro-
metry in raw milk samples; polymers involving only RS2-casein or only κ-casein accounted for 43%
and 12% of the total polymers present, respectively. In addition, 45% of polymers in raw milk
involved RS2-casein in association with other proteins as heteropolymers, indicating the key role of
this protein in intermolecular disulfide bridging between proteins in raw milk. The intensity of
monomeric κ-casein spots decreased progressively with heating time at 90 �C, with greatest
changes in spots with acidic isoelectric points. Interactions and association of milk proteins via
disulfide bridges are discussed in relation to the proteins involved and their potential protective
function against formation of fibril aggregates.
KEYWORDS: Milk proteome; polymer quantification; interactome; heat treatment; disulfide bridges;mass spectrometry
INTRODUCTION
One of the major objectives of dairy biochemistry is under-standing of functional and biological properties of biomolecules.For this purpose, the techniquesmostwidely used to visualize andanalyze proteins are SDS-PAGE and two-dimensional electro-phoresis (2DE) under denaturing conditions. Milk proteins havebeen analyzed extensively using proteomic tools (1-13). Based ontwo independent biochemical characteristics of proteins, 2DEcombines isoelectric focusing (IEF), which separates proteinsaccording to their isoelectric point (related to amino acid char-acteristics, i.e., acid/basic/neutral), and SDS-PAGE, whichseparates them further according to their molecular mass. Atpresent, 2DE allows simultaneous detection and quantificationof up to thousands of protein spots in the same gel (14, 15).Combined with subsequent mass spectrometry analysis, 2DEoffers the possibility of identifying proteins and comparing iso-form abundance and posttranslational modifications (16-19).
Despite numerous proteomic studies analyzing milk proteins,many questions concerning milk protein expression, modifica-tion, and interactions remain unanswered.Milk is a very complexfluid secretion, composed of a colloidal emulsion of fat globulesand casein micelles in a water-based fluid containing soluble
proteins, lactose, and many trace elements such as vitamins andminerals (20). In this biological system, caseins are organized andstabilized in micelles (21-23). The biological function of thecaseins is largely nutritional; casein micelles serve as calcium-transport vesicles, providing young mammals with a concen-trated, yet soluble, form of calcium as well as essential aminoacids (24). Another biological function of caseins was describedrecently (25), where these proteins can act as chaperones toprotect proteins against aberrant aggregations, including forma-tion of amyloid fibrils, when exposed to stress conditions such aselevated temperature or reducing environment (26-29).
During processing, bovine milk is submitted to several physicaltreatments, especially homogenization and pasteurization. Theseprocesses are well-known to induce modifications in proteinorganizations (30-32). Heat treatment of milk results in a numberof physicochemical changes in the milk constituents, in particular,denaturation of whey proteins, leading to hydrophobic interac-tions or disulfide-bonded aggregation with κ-casein at the surfaceof casein micelles (31-35). Two disulfide bridges and a freesulfhydryl group present in the native structure of thewhey proteinβ-lactoglobulin seem to play a critical role in its heat-inducedinteractions with κ-casein (36-42). Patel et al. (43) recentlydeveloped a system based on a two-dimensional PAGE methodto explore the differences in the irreversible disulfide bond changesamong the milk proteins after heat pressure treatments. They
*To whom correspondence should be addressed. Tel: þ33 (0)146548 326. Fax: þ33 (0)146 549 138. E-mail: [email protected].
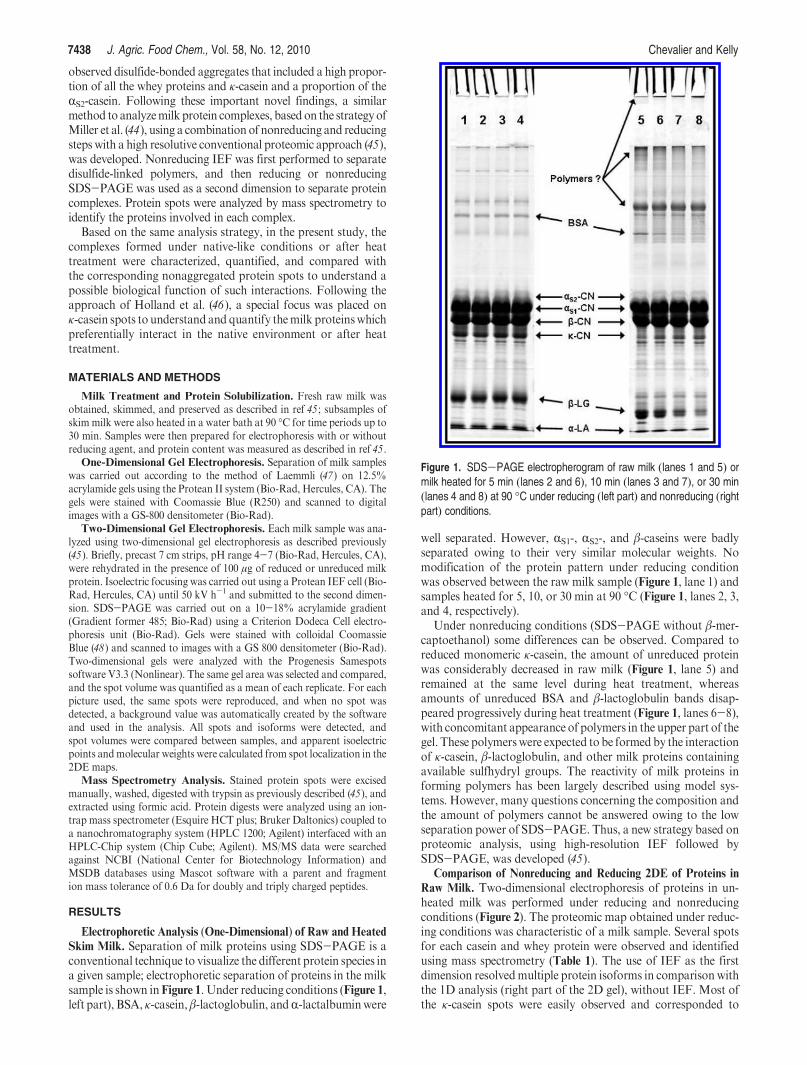
7438 J. Agric. Food Chem., Vol. 58, No. 12, 2010 Chevalier and Kelly
observed disulfide-bonded aggregates that included a high propor-tion of all the whey proteins and κ-casein and a proportion of theRS2-casein. Following these important novel findings, a similarmethod to analyzemilk protein complexes, basedon the strategyofMiller et al. (44), using a combination of nonreducing and reducingsteps with a high resolutive conventional proteomic approach (45),was developed. Nonreducing IEF was first performed to separatedisulfide-linked polymers, and then reducing or nonreducingSDS-PAGE was used as a second dimension to separate proteincomplexes. Protein spots were analyzed by mass spectrometry toidentify the proteins involved in each complex.
Based on the same analysis strategy, in the present study, thecomplexes formed under native-like conditions or after heattreatment were characterized, quantified, and compared withthe corresponding nonaggregated protein spots to understand apossible biological function of such interactions. Following theapproach of Holland et al. (46), a special focus was placed onκ-casein spots to understand and quantify themilk proteinswhichpreferentially interact in the native environment or after heattreatment.
MATERIALS AND METHODS
Milk Treatment and Protein Solubilization. Fresh raw milk wasobtained, skimmed, and preserved as described in ref 45; subsamples ofskimmilk were also heated in a water bath at 90 �C for time periods up to30 min. Samples were then prepared for electrophoresis with or withoutreducing agent, and protein content was measured as described in ref 45.
One-Dimensional Gel Electrophoresis. Separation of milk sampleswas carried out according to the method of Laemmli (47) on 12.5%acrylamide gels using the Protean II system (Bio-Rad, Hercules, CA). Thegels were stained with Coomassie Blue (R250) and scanned to digitalimages with a GS-800 densitometer (Bio-Rad).
Two-Dimensional Gel Electrophoresis. Each milk sample was ana-lyzed using two-dimensional gel electrophoresis as described previously(45). Briefly, precast 7 cm strips, pH range 4-7 (Bio-Rad, Hercules, CA),were rehydrated in the presence of 100 μg of reduced or unreduced milkprotein. Isoelectric focusing was carried out using a Protean IEF cell (Bio-Rad, Hercules, CA) until 50 kV h-1 and submitted to the second dimen-sion. SDS-PAGE was carried out on a 10-18% acrylamide gradient(Gradient former 485; Bio-Rad) using a Criterion Dodeca Cell electro-phoresis unit (Bio-Rad). Gels were stained with colloidal CoomassieBlue (48) and scanned to images with a GS 800 densitometer (Bio-Rad).Two-dimensional gels were analyzed with the Progenesis Samespotssoftware V3.3 (Nonlinear). The same gel area was selected and compared,and the spot volume was quantified as a mean of each replicate. For eachpicture used, the same spots were reproduced, and when no spot wasdetected, a background value was automatically created by the softwareand used in the analysis. All spots and isoforms were detected, andspot volumes were compared between samples, and apparent isoelectricpoints andmolecular weights were calculated from spot localization in the2DE maps.
Mass Spectrometry Analysis. Stained protein spots were excisedmanually, washed, digested with trypsin as previously described (45), andextracted using formic acid. Protein digests were analyzed using an ion-trap mass spectrometer (Esquire HCT plus; Bruker Daltonics) coupled toa nanochromatography system (HPLC 1200; Agilent) interfaced with anHPLC-Chip system (Chip Cube; Agilent). MS/MS data were searchedagainst NCBI (National Center for Biotechnology Information) andMSDB databases using Mascot software with a parent and fragmention mass tolerance of 0.6 Da for doubly and triply charged peptides.
RESULTS
Electrophoretic Analysis (One-Dimensional) of Raw and Heated
Skim Milk. Separation of milk proteins using SDS-PAGE is aconventional technique to visualize the different protein species ina given sample; electrophoretic separation of proteins in the milksample is shown inFigure 1. Under reducing conditions (Figure 1,left part), BSA, κ-casein,β-lactoglobulin, andR-lactalbuminwere
well separated. However, RS1-, RS2-, and β-caseins were badlyseparated owing to their very similar molecular weights. Nomodification of the protein pattern under reducing conditionwas observed between the raw milk sample (Figure 1, lane 1) andsamples heated for 5, 10, or 30 min at 90 �C (Figure 1, lanes 2, 3,and 4, respectively).
Under nonreducing conditions (SDS-PAGE without β-mer-captoethanol) some differences can be observed. Compared toreduced monomeric κ-casein, the amount of unreduced proteinwas considerably decreased in raw milk (Figure 1, lane 5) andremained at the same level during heat treatment, whereasamounts of unreduced BSA and β-lactoglobulin bands disap-peared progressively during heat treatment (Figure 1, lanes 6-8),with concomitant appearance of polymers in the upper part of thegel. These polymerswere expected to be formed by the interactionof κ-casein, β-lactoglobulin, and other milk proteins containingavailable sulfhydryl groups. The reactivity of milk proteins informing polymers has been largely described using model sys-tems. However, many questions concerning the composition andthe amount of polymers cannot be answered owing to the lowseparation power of SDS-PAGE. Thus, a new strategy based onproteomic analysis, using high-resolution IEF followed bySDS-PAGE, was developed (45).
Comparison of Nonreducing and Reducing 2DE of Proteins in
Raw Milk. Two-dimensional electrophoresis of proteins in un-heated milk was performed under reducing and nonreducingconditions (Figure 2). The proteomic map obtained under reduc-ing conditions was characteristic of a milk sample. Several spotsfor each casein and whey protein were observed and identifiedusing mass spectrometry (Table 1). The use of IEF as the firstdimension resolvedmultiple protein isoforms in comparison withthe 1D analysis (right part of the 2D gel), without IEF. Most ofthe κ-casein spots were easily observed and corresponded to
Figure 1. SDS-PAGE electropherogram of raw milk (lanes 1 and 5) ormilk heated for 5 min (lanes 2 and 6), 10 min (lanes 3 and 7), or 30 min(lanes 4 and 8) at 90 �C under reducing (left part) and nonreducing (rightpart) conditions.
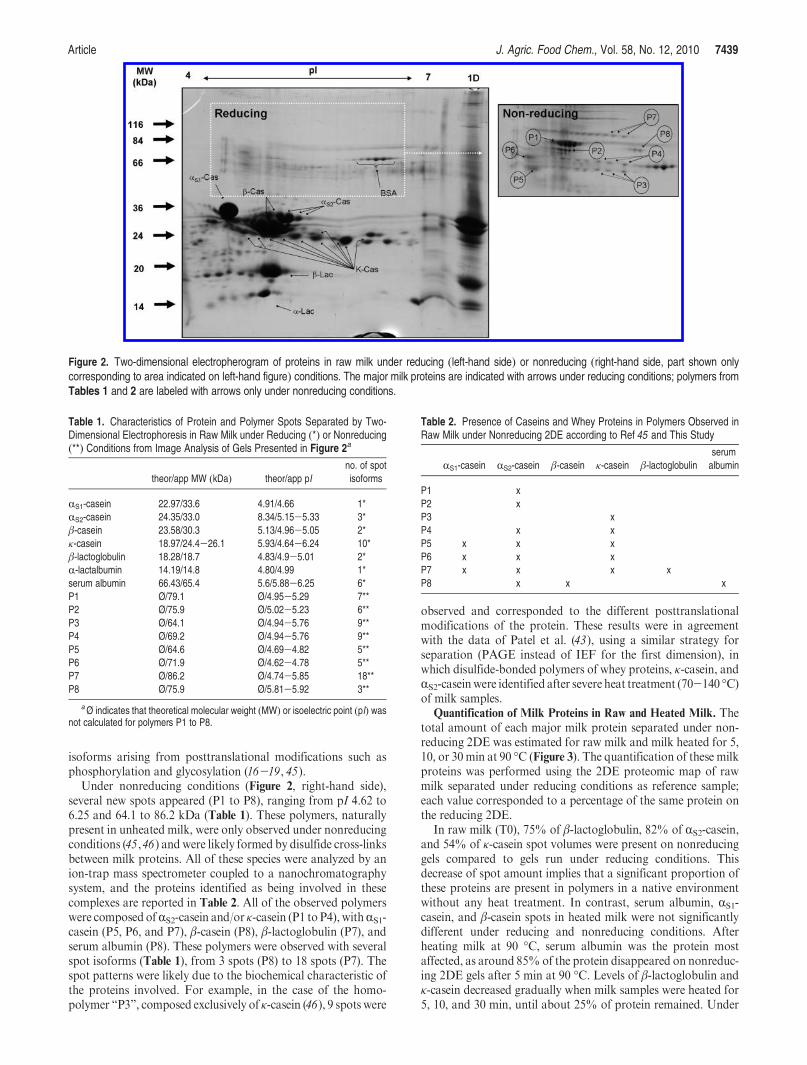
Article J. Agric. Food Chem., Vol. 58, No. 12, 2010 7439
isoforms arising from posttranslational modifications such asphosphorylation and glycosylation (16-19, 45).
Under nonreducing conditions (Figure 2, right-hand side),several new spots appeared (P1 to P8), ranging from pI 4.62 to6.25 and 64.1 to 86.2 kDa (Table 1). These polymers, naturallypresent in unheated milk, were only observed under nonreducingconditions (45,46) and were likely formed by disulfide cross-linksbetween milk proteins. All of these species were analyzed by anion-trap mass spectrometer coupled to a nanochromatographysystem, and the proteins identified as being involved in thesecomplexes are reported in Table 2. All of the observed polymerswere composed ofRS2-casein and/or κ-casein (P1 to P4), withRS1-casein (P5, P6, and P7), β-casein (P8), β-lactoglobulin (P7), andserum albumin (P8). These polymers were observed with severalspot isoforms (Table 1), from 3 spots (P8) to 18 spots (P7). Thespot patterns were likely due to the biochemical characteristic ofthe proteins involved. For example, in the case of the homo-polymer “P3”, composed exclusively of κ-casein (46), 9 spots were
observed and corresponded to the different posttranslationalmodifications of the protein. These results were in agreementwith the data of Patel et al. (43), using a similar strategy forseparation (PAGE instead of IEF for the first dimension), inwhich disulfide-bonded polymers of whey proteins, κ-casein, andRS2-caseinwere identified after severe heat treatment (70-140 �C)of milk samples.
Quantification of Milk Proteins in Raw and Heated Milk. Thetotal amount of each major milk protein separated under non-reducing 2DE was estimated for raw milk and milk heated for 5,10, or 30min at 90 �C (Figure 3). The quantification of these milkproteins was performed using the 2DE proteomic map of rawmilk separated under reducing conditions as reference sample;each value corresponded to a percentage of the same protein onthe reducing 2DE.
In raw milk (T0), 75% of β-lactoglobulin, 82% of RS2-casein,and 54% of κ-casein spot volumes were present on nonreducinggels compared to gels run under reducing conditions. Thisdecrease of spot amount implies that a significant proportion ofthese proteins are present in polymers in a native environmentwithout any heat treatment. In contrast, serum albumin, RS1-casein, and β-casein spots in heated milk were not significantlydifferent under reducing and nonreducing conditions. Afterheating milk at 90 �C, serum albumin was the protein mostaffected, as around 85%of the protein disappeared on nonreduc-ing 2DE gels after 5 min at 90 �C. Levels of β-lactoglobulin andκ-casein decreased gradually when milk samples were heated for5, 10, and 30 min, until about 25% of protein remained. Under
Figure 2. Two-dimensional electropherogram of proteins in raw milk under reducing (left-hand side) or nonreducing (right-hand side, part shown onlycorresponding to area indicated on left-hand figure) conditions. The major milk proteins are indicated with arrows under reducing conditions; polymers fromTables 1 and 2 are labeled with arrows only under nonreducing conditions.
Table 1. Characteristics of Protein and Polymer Spots Separated by Two-Dimensional Electrophoresis in Raw Milk under Reducing (*) or Nonreducing(**) Conditions from Image Analysis of Gels Presented in Figure 2a
theor/app MW (kDa) theor/app pI
no. of spot
isoforms
RS1-casein 22.97/33.6 4.91/4.66 1*
RS2-casein 24.35/33.0 8.34/5.15-5.33 3*
β-casein 23.58/30.3 5.13/4.96-5.05 2*
κ-casein 18.97/24.4-26.1 5.93/4.64-6.24 10*
β-lactoglobulin 18.28/18.7 4.83/4.9-5.01 2*
R-lactalbumin 14.19/14.8 4.80/4.99 1*
serum albumin 66.43/65.4 5.6/5.88-6.25 6*
P1 Ø/79.1 Ø/4.95-5.29 7**
P2 Ø/75.9 Ø/5.02-5.23 6**
P3 Ø/64.1 Ø/4.94-5.76 9**
P4 Ø/69.2 Ø/4.94-5.76 9**
P5 Ø/64.6 Ø/4.69-4.82 5**
P6 Ø/71.9 Ø/4.62-4.78 5**
P7 Ø/86.2 Ø/4.74-5.85 18**
P8 Ø/75.9 Ø/5.81-5.92 3**
aØ indicates that theoretical molecular weight (MW) or isoelectric point (pI) wasnot calculated for polymers P1 to P8.
Table 2. Presence of Caseins and Whey Proteins in Polymers Observed inRaw Milk under Nonreducing 2DE according to Ref 45 and This Study
RS1-casein RS2-casein β-casein κ-casein β-lactoglobulinserum
albumin
P1 x
P2 x
P3 x
P4 x x
P5 x x x
P6 x x x
P7 x x x x
P8 x x x
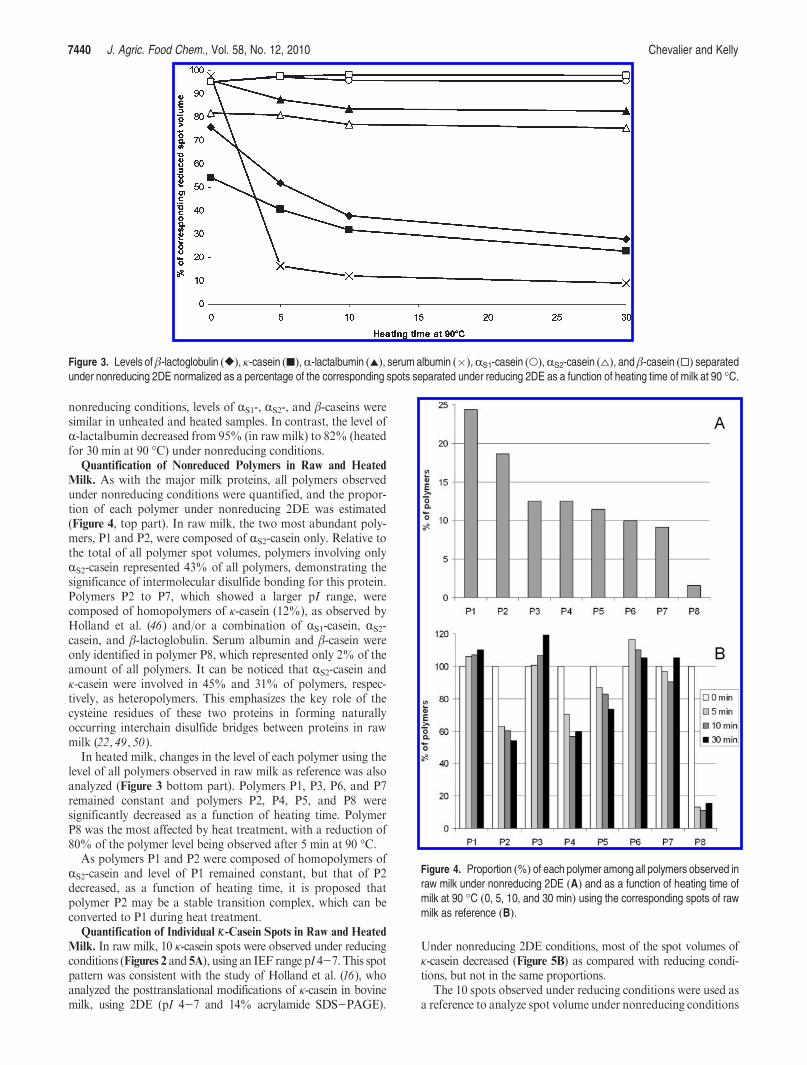
7440 J. Agric. Food Chem., Vol. 58, No. 12, 2010 Chevalier and Kelly
nonreducing conditions, levels of RS1-, RS2-, and β-caseins weresimilar in unheated and heated samples. In contrast, the level ofR-lactalbumin decreased from 95% (in rawmilk) to 82% (heatedfor 30 min at 90 �C) under nonreducing conditions.
Quantification of Nonreduced Polymers in Raw and Heated
Milk. As with the major milk proteins, all polymers observedunder nonreducing conditions were quantified, and the propor-tion of each polymer under nonreducing 2DE was estimated(Figure 4, top part). In raw milk, the two most abundant poly-mers, P1 and P2, were composed of RS2-casein only. Relative tothe total of all polymer spot volumes, polymers involving onlyRS2-casein represented 43% of all polymers, demonstrating thesignificance of intermolecular disulfide bonding for this protein.Polymers P2 to P7, which showed a larger pI range, werecomposed of homopolymers of κ-casein (12%), as observed byHolland et al. (46) and/or a combination of RS1-casein, RS2-casein, and β-lactoglobulin. Serum albumin and β-casein wereonly identified in polymer P8, which represented only 2% of theamount of all polymers. It can be noticed that RS2-casein andκ-casein were involved in 45% and 31% of polymers, respec-tively, as heteropolymers. This emphasizes the key role of thecysteine residues of these two proteins in forming naturallyoccurring interchain disulfide bridges between proteins in rawmilk (22, 49, 50).
In heated milk, changes in the level of each polymer using thelevel of all polymers observed in raw milk as reference was alsoanalyzed (Figure 3 bottom part). Polymers P1, P3, P6, and P7remained constant and polymers P2, P4, P5, and P8 weresignificantly decreased as a function of heating time. PolymerP8 was the most affected by heat treatment, with a reduction of80% of the polymer level being observed after 5 min at 90 �C.
As polymers P1 and P2 were composed of homopolymers ofRS2-casein and level of P1 remained constant, but that of P2decreased, as a function of heating time, it is proposed thatpolymer P2 may be a stable transition complex, which can beconverted to P1 during heat treatment.
Quantification of Individual K-Casein Spots in Raw and Heated
Milk. In raw milk, 10 κ-casein spots were observed under reducingconditions (Figures 2 and 5A), using an IEF range pI 4-7. This spotpattern was consistent with the study of Holland et al. (16), whoanalyzed the posttranslational modifications of κ-casein in bovinemilk, using 2DE (pI 4-7 and 14% acrylamide SDS-PAGE).
Under nonreducing 2DE conditions, most of the spot volumes ofκ-casein decreased (Figure 5B) as compared with reducing condi-tions, but not in the same proportions.
The 10 spots observed under reducing conditions were used asa reference to analyze spot volume under nonreducing conditions
Figure 3. Levels ofβ-lactoglobulin ([), κ-casein (9),R-lactalbumin (2), serum albumin (�),RS1-casein (O),RS2-casein (4), andβ-casein (0) separatedunder nonreducing 2DE normalized as a percentage of the corresponding spots separated under reducing 2DE as a function of heating time of milk at 90 �C.
Figure 4. Proportion (%) of each polymer among all polymers observed inraw milk under nonreducing 2DE (A) and as a function of heating time ofmilk at 90 �C (0, 5, 10, and 30 min) using the corresponding spots of rawmilk as reference (B).
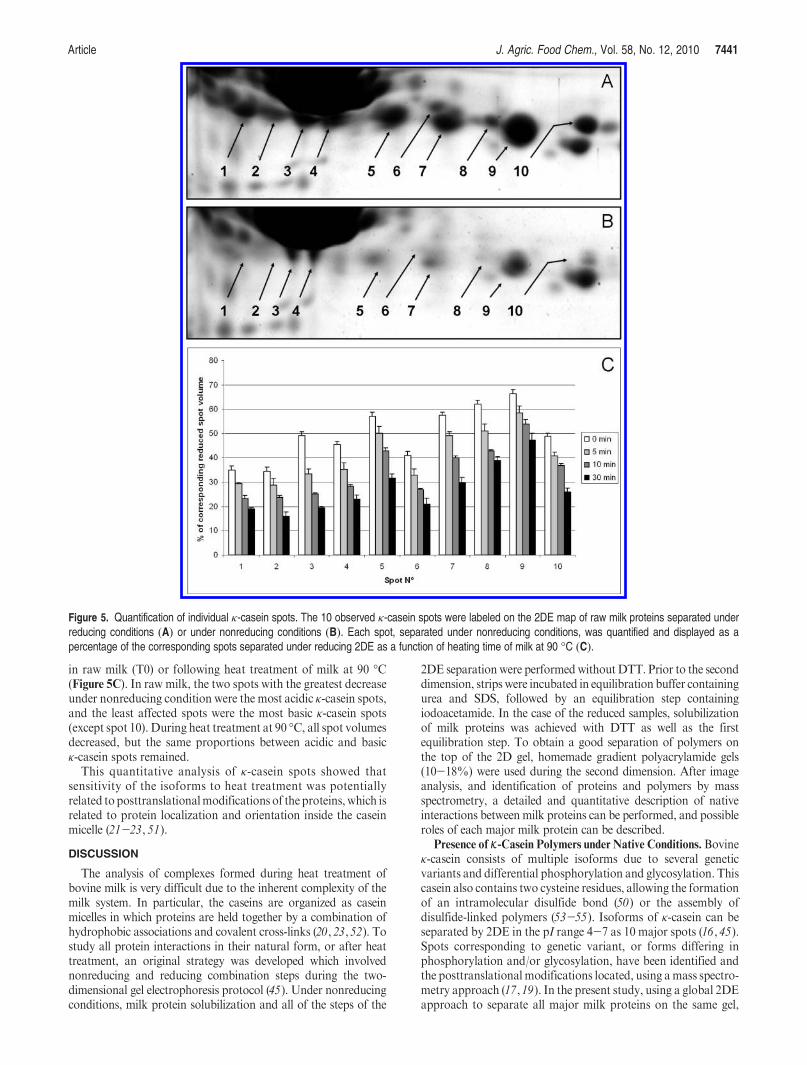
Article J. Agric. Food Chem., Vol. 58, No. 12, 2010 7441
in raw milk (T0) or following heat treatment of milk at 90 �C(Figure 5C). In raw milk, the two spots with the greatest decreaseunder nonreducing condition were the most acidic κ-casein spots,and the least affected spots were the most basic κ-casein spots(except spot 10). During heat treatment at 90 �C, all spot volumesdecreased, but the same proportions between acidic and basicκ-casein spots remained.
This quantitative analysis of κ-casein spots showed thatsensitivity of the isoforms to heat treatment was potentiallyrelated to posttranslationalmodifications of the proteins, which isrelated to protein localization and orientation inside the caseinmicelle (21-23, 51).
DISCUSSION
The analysis of complexes formed during heat treatment ofbovine milk is very difficult due to the inherent complexity of themilk system. In particular, the caseins are organized as caseinmicelles in which proteins are held together by a combination ofhydrophobic associations and covalent cross-links (20,23,52). Tostudy all protein interactions in their natural form, or after heattreatment, an original strategy was developed which involvednonreducing and reducing combination steps during the two-dimensional gel electrophoresis protocol (45). Under nonreducingconditions, milk protein solubilization and all of the steps of the
2DE separation were performedwithoutDTT. Prior to the seconddimension, strips were incubated in equilibration buffer containingurea and SDS, followed by an equilibration step containingiodoacetamide. In the case of the reduced samples, solubilizationof milk proteins was achieved with DTT as well as the firstequilibration step. To obtain a good separation of polymers onthe top of the 2D gel, homemade gradient polyacrylamide gels(10-18%) were used during the second dimension. After imageanalysis, and identification of proteins and polymers by massspectrometry, a detailed and quantitative description of nativeinteractions between milk proteins can be performed, and possibleroles of each major milk protein can be described.
Presence of K-Casein Polymers under Native Conditions. Bovineκ-casein consists of multiple isoforms due to several geneticvariants and differential phosphorylation and glycosylation. Thiscasein also contains two cysteine residues, allowing the formationof an intramolecular disulfide bond (50) or the assembly ofdisulfide-linked polymers (53-55). Isoforms of κ-casein can beseparated by 2DE in the pI range 4-7 as 10 major spots (16,45).Spots corresponding to genetic variant, or forms differing inphosphorylation and/or glycosylation, have been identified andthe posttranslational modifications located, using amass spectro-metry approach (17,19). In the present study, using a global 2DEapproach to separate all major milk proteins on the same gel,
Figure 5. Quantification of individual κ-casein spots. The 10 observed κ-casein spots were labeled on the 2DE map of raw milk proteins separated underreducing conditions (A) or under nonreducing conditions (B). Each spot, separated under nonreducing conditions, was quantified and displayed as apercentage of the corresponding spots separated under reducing 2DE as a function of heating time of milk at 90 �C (C).
7442 J. Agric. Food Chem., Vol. 58, No. 12, 2010 Chevalier and Kelly
10 spots of monomeric κ-casein were observed under reducingconditions (Figures 2 and 5) ranging from pI 4.6 to pI 6.2. Undernonreducing conditions, the intensity of most spots was de-creased, showing the presence of polymers. Image analysisfocused on monomeric κ-casein revealed that the most acidicspots were highly involved in polymer formation (Figure 5C).These spots corresponded to the proteins with a complex patternof posttranslational modifications. The most acidic spots ob-served on a 2DE gel of milk are reported to have three glycosyla-tions and one phosphorylation site (16). According to the spotvolume quantification, it seemed that such posttranslationalmodifications increased oligomerization of κ-casein. Phosphory-lation and glycosylation modified the charge of κ-casein, asobserved on a 2DE gel by a shift in isoelectric points.
As previously described for the tau protein with self-assemblymodification into paired helical filaments (56), phosphorylationcould also generate structural modifications of κ-casein inside thecasein micelle, inducing a potential higher reactivity of cysteineresidues to form interchain disulfide polymers. Oligopolymers ofκ-casein were observed on 2DE gels of bovine milk undernonreducing conditions (46). Trains of spots corresponding tomonomers to hexamers were observed as a result of the participa-tion of different glycoforms and phosphoforms in oligomerformation. In this study, the polymers were observed at the samemolecular weight range as in ref 46, but sometimes with a morecomplex protein composition (Figure 2 and Table 2).
This strategy of analysis not only focused on identification ofκ-casein polymers but also allowed the complete study of all speciesinvolved in polymer formation. In agreement with ref46, κ-caseinwas observed in polymers P3, P4, and P7, but RS2-casein was alsoidentified in polymer P4, and a mixture of RS2-casein, RS1-casein,and β-lactoglobulin was identified in polymer P7. No polymer ofRS2-casein and κ-casein has been described previously. Disulfide-linked homopolymers of RS2-casein and homopolymers ofκ-casein have been observed under various environments andtreatments (50,57). As no disulfide linkage between proteins wasanalyzed and identified bymass spectrometry, it is not possible todistinguish between heteropolymers and a mixture of homopo-lymers inside the same spot. Nevertheless, only single and well-separated spots were excised and analyzed by mass spectrometry(Figure 2). As all analyzed and quantified polymers displayed acharacteristic pattern (Table 1), it is unlikely that two differenthomopolymers can be identified inside the same spot, even if thiscannot be totally excluded. In addition, RS2-casein has been shownto display an increased accessibility and ability to form complexesinvolving κ-casein and whey proteins after high-pressure treat-ment (43, 58). Thus, there is substantial evidence for the capacityof κ-casein andRS2-casein to form disulfide-linked heteropolymers.
Involvement of rS2-Casein in Native Milk Polymers.Of the fourcaseins, only RS2-casein and κ-casein contain cysteines. Of these,RS2-casein naturally occurs as monomers and dimers in bovinemilk (59). In the present study, the two major polymers observedunder nonreducing 2DE corresponded to homopolymers ofRS2-casein, representing 43% of all polymers observed in rawmilk. SinceRS2-casein contains two cysteine residues (amino acids36 and 40), a dimer could be linked by one or two disulfidebridges. If two monomers are linked by one intermoleculardisulfide bridge, free cysteine residues remain and can react withother proteins to form several kind of polymers. In this study,several proteins in raw milk containing cysteine residues, i.e.,κ-casein, β-lactoglobulin, and serum albumin (Table 2), wereidentified inside complexes involving RS2-casein. Using a similarapproach, Bouguyon et al. (52) observed several homopolymersand heteropolymers involving rat or mouse RS-casein, β-casein,and κ-casein linked by disulfide bridges. As observed in Figure 3,
only a low percentage of monomeric RS2-casein was involved inpolymers, but this amount was enough to promote disulfide-linked polymers under native conditions. Interactions betweencasein in micelles are governed mainly by a balance of attractivehydrophobic interactions and electrostatic repulsion (21), butdisulfide bridges between caseins are now considered to help incontributing to stabilization of the casein micelle (22, 23).
Interaction of Whey Proteins with the Casein Micelle during
Heat Treatment. κ-Casein is located mainly at the micelle surface,where it plays a role in regulating micelle size and in maintainingthem in suspension in milk (21). The peripheral location ofκ-casein in the micelle stabilizes the protein and acts as a bridgeto link proteins of the whey fraction and caseins hidden inside themicelle. In this study, β-lactoglobulin was identified in polymerP7 in rawmilk samples, mixed with κ-casein, RS1-casein, and RS2-casein. Serum albumin was also identified in polymer P8, mixedwithRS2-casein and β-casein (Table 2). AsRS2-casein and κ-caseinare the only caseins which contain cysteines, RS1-casein andβ-caseinwere not linked to the other proteins bydisulfides bridgesbut possibly by other bonds such as glycation cross-links (60) orstrong ionic/hydrophobic interactions, not brokenbySDSduringelectrophoresis. Levels of monomeric β-lactoglobulin and serumalbumin decreased rapidly with heating time (Figures 1 and 3),probably through the formation of polymers involving caseinsand whey proteins (32-34,61-63). Polymer formation involvingβ-lactoglobulin and κ-casein has been studied extensively for40 years under a huge variety of environments and treat-ments (38,64-68). However, according to the present study, onlya few detectable polymers contained whey proteins (P7 and P8),and these represented only 11% of the polymers observed on the2D gels of raw milk samples under nonreducing conditions(Figure 4). Using a nonreducing/reducing discontinuous strategy(nonreduced isoelectric focusing and then reduced SDS-PAGE),wepreviously showed the presenceof large polymers composedofserum albumin, κ-casein, and β-lactoglobulin in milk heated at90 �C (45). Using such a strategy, proteins were visualized on the2D gel as polymers were reduced to monomers. In the presentstudy, polymers were only observed under nonreducing condi-tions, and larger polymers/aggregates, which were not able toenter the second dimension gel, cannot be visualized and quanti-fied. A gradient gel (10-18% acrylamide) was used as seconddimension to reduce this problem, but this limitation still remainsfor polymers greater than 200 kDa.
Interactions of Caseins To Prevent Formation of Fibrils: A
Possible Biological Mechanism. Under nonreducing condi-tions, RS2-casein and κ-casein were associated in milk ashomodimers and/or heterodimers or multimers (this studyand refs 22, 46, 49, 50, 53, 54, and 57). Under physiologicalconditions, caseins have little secondary or tertiary structure withextensive regions of disordered structure (20-22, 51). Theseproteins are organized and stabilizedwith calcium insidemicelles,but under stress conditions such as heat treatment or a reducingenvironment, associations between caseins can be disrupted, andproteins can adopt amyloid fibril structures associated withdegenerative diseases (26-28, 69-72). Native κ-casein is orga-nized as a series of disulfide-bonded polymers (46), ranging fromdimers to octamers and above. When cysteine residues arechemically modified to prevent disulfide bond formation (byreduction and carboxymethylation), κ-casein increases in molec-ular weight and shows a tendency toward self-association, inparticular the formation of fibrillar structures (70).
Of the caseins,RS2-casein is the least abundant and perhaps themost difficult to isolate in a pure form. Consequently, it has beenthe least studied.After reduction of disulfide bridges,RS2-casein isparticularly susceptible to fibril formation under physiological
Article J. Agric. Food Chem., Vol. 58, No. 12, 2010 7443
conditions (27). Consequently, self-associations and interactionsbetween caseins inside the casein micelle can prevent suchaberrant fibrillar structures.
In conclusion, RS2-casein and κ-casein in raw milk were shownto participate in a complex pattern of homopolymers andheteropolymers in association with the other caseins and wheyproteins under native-like nonreducing conditions, and RS2-case-in was the milk protein most implicated in polymer establishmentand heterogeneity. Only a small proportion of RS2-casein waspresent in polymers, but this corresponded to a large proportionof all polymers identified. This protein appeared as a platformwhich was able to connect several milk proteins using disulfidebonds and probably other kinds of links with cysteine-freeproteins. The technical strategy using two-dimensional electro-phoresis under reducing and nonreducing conditions was veryuseful in revealing the partners involved in polymers, but it alsoshowed the limit of gel-based electrophoresis, which was noteffective in analysis of large complexes. Posttranslational modi-ficationof κ-casein increased its sensitivity to oligomerization, butfurther study is required to further define the role of the protein inpolymer formation. All major milk proteins appeared to interact,suggesting a very intricate system inside casein micelles andbetween caseins and whey proteins. Prevention against aberrantfibril structures of caseins is proposed to explain at least in partmilk protein interactions and polymer stability.
ACKNOWLEDGMENT
The authors thank Professor Patrick Fox ofUniversityCollegeCork for helpful comments on the manuscript.
LITERATURE CITED
(1) O’Donnell, R.; Holland, J. W.; Deeth, H. C.; Alewood, P. Milkproteomics. Int. Dairy J. 2004, 14 (12), 1013–1023.
(2) Gagnaire, V.; Jardin, J.; Jan, G.; Lortal, S. Invited review: Proteo-mics of milk and bacteria used in fermented dairy products: Fromqualitative to quantitative advances. J. Dairy Sci. 2009, 92 (3), 811–825.
(3) Kuckova, S.; Crhova, M.; Vankova, L.; Hnizda, A.; Hynek, R.;Kodicek, M. Towards proteomic analysis of milk proteins inhistorical building materials. Int. J. Mass Spectrom. 2009, 284(1-3), 42–46.
(4) Manso, M. A.; Leonil, J.; Jan, G.; Gagnaire, V. Application ofproteomics to the characterisation of milk and dairy products. Int.Dairy J. 2005, 15 (6-9), 845–855.
(5) Cavaletto, M.; Giuffrida, M. G.; Conti, A., Milk fat globulemembrane components;A proteomic approach. In Bioactive Com-ponents of Milk; Springer-Verlag: Berlin, 2008; Vol. 606, pp 129-141.
(6) Bertino, E.; Coscia, A.; Testa, T.; Boni, L.; Maiorca, D.; Dileo, L.;Giuffrida, G.; Fortunato, D.; Conti, A.; Fabris, C. Proteomicsanalysis of human milk fat globule membrane proteins. Pediatr.Res. 2005, 58 (2), 374.
(7) Boehmer, J. L.; Bannerman, D. D.; Shefcheck, K.; Ward, J. L.Proteomic analysis of differentially expressed proteins in bovinemilkduring experimentally induced Escherichia colimastitis. J. Dairy Sci.2008, 91 (11), 4206–4218.
(8) Mange, A.; Bellet, V.; Tuaillon, E.; de Perre, P. V.; Solassol, J.Comprehensive proteomic analysis of the human milk proteome:Contribution of protein fractionation. J. Chromatogr., Sect. B: Anal.Technol. Biomed. Life Sci. 2008, 876 (2), 252–256.
(9) Pampel, L. W.; Duboc, P.; Vidal, K.; Gysler, C.; Bhou-Habib, G.;van den Broek, P. Proteomics in the food industry: Development of ahigh-throughput system for the expression of bioactive milk pro-teins. Abstr. Pap. Am. Chem. Soc. 2002, 224, 233-BIOT.
(10) Reinhardt, T. A.; Lippolis, J. D. Bovine milk fat globule membraneproteome. J. Dairy Res. 2006, 73 (4), 406–416.
(11) Ruhlen, R. L.; Sauter, E. R. Proteomics of nipple aspirate fluid,breast cyst fluid, milk, and colostrum. Proteomics Clin. Appl. 2007,1 (8), 845–852.
(12) Vanderghem, C.; Blecker, C.; Danthine, S.; Deroanne, C.; Haubruge,E.; Guillonneau, F.; De Pauw, E.; Francis, F. Proteome analysis of thebovine milk fat globule: Enhancement of membrane purification. Int.Dairy J. 2008, 18 (9), 885–893.
(13) Yamada,M.;Murakami, K.;Wallingford, J. C.; Yuki, Y. Identifica-tion of low-abundance proteins of bovine colostral and mature milkusing two-dimensional electrophoresis followed by microsequencingand mass spectrometry. Electrophoresis 2002, 23 (7-8), 1153–1160.
(14) Galvani, M.; Hamdan, M.; Righetti, P. G. Two-dimensional gelelectrophoresis/matrix-assisted laser desorption/ionisation massspectrometry of a milk powder. Rapid Commun. Mass Spectrom.2000, 14 (20), 1889–1897.
(15) Gorg, A.; Weiss, W.; Dunn, M. J. Current two-dimensional electro-phoresis technology for proteomics. Proteomics 2004, 4 (12), 3665–3685.
(16) Holland, J. W.; Deeth, H. C.; Alewood, P. F. Proteomic analysis ofK-casein micro-heterogeneity. Proteomics 2004, 4 (3), 743–752.
(17) Holland, J. W.; Deeth, H. C.; Alewood, P. F. Analysis of O-glyco-sylation site occupancy in bovine kappa-casein glycoforms separatedby two-dimensional gel electrophoresis. Proteomics 2005, 5 (4), 990–1002.
(18) Holland, J. W.; Deeth, H. C.; Alewood, P. F. Resolution andcharacterisation of multiple isoforms of bovine kappa-casein by2-DE following a reversible cysteine-tagging enrichment strategy.Proteomics 2006, 6 (10), 3087–3095.
(19) Poth, A.G.; Deeth, H. C.; Alewood, P. F.; Holland, J.W.Analysis ofthe human casein phosphoproteome by 2-D electrophoresis andMALDI-TOF/TOF MS reveals new phosphoforms. J. ProteomeRes. 2008, 7 (11), 5017–5027.
(20) Holt, C. Structure and stability of bovine casein micelles. Adv.Protein Chem. 1992, 43, 63–151.
(21) Horne, D. S. Casein interactions: Casting light on the black boxes,the structure in dairy products. Int. Dairy J. 1998, 8 (3), 171–177.
(22) Rasmussen, L. K.; Johnsen, L. B.; Tsiora, A.; Sorensen, E. S.;Thomsen, J. K.; Nielsen, N. C.; Jakobsen, H. J.; Petersen, T. E.Disulphide-linked caseins and casein micelles. Int. Dairy J. 1999,9 (3-6), 215–218.
(23) Creamer, L. K.; Plowman, J. E.; Liddell, M. J.; Smith, M. H.; Hill,J. P. Micelle stability: kappa-casein structure and function. J. DairySci. 1998, 81 (11), 3004–3012.
(24) Fox, P. F.; McSweeney, P. L. H., Milk proteins. In Dairy Chemistryand Biochemistry, Professional, B. A. a., ed.; Springer-Verlag: London,1998; pp 150-169.
(25) Morgan, P. E.; Treweek, T.M.; Lindner, R. A.; Price,W. E.; Carver,J. A. Casein proteins as molecular chaperones. J. Agric. Food Chem.2005, 53 (7), 2670–2683.
(26) Thorn, D. C.; Meehan, S.; Sunde, M.; Rekas, A.; Gras, S. L.;MacPhee, C. E.; Dobson, C. M.; Wilson, M. R.; Carver, J. A.Amyloid fibril formation by bovine milk kappa-casein and itsinhibition by the molecular chaperones alpha(s-) and beta-casein.Biochemistry 2005, 44 (51), 17027–17036.
(27) Thorn, D. C.; Ecroyd, H.; Sunde,M.; Poon, S.; Carver, J. A. Amyloidfibril formation by bovine milk alpha(s2)-casein occurs under physio-logical conditions yet is prevented by its natural counterpart, alpha-(s1)-casein. Biochemistry 2008, 47 (12), 3926–3936.
(28) Thorn, D. C.; Ecroyd, H.; Carver, J. A. The two-faced nature of milkcasein proteins: Amyloid fibril formation and chaperone-like activ-ity. Aust. J. Dairy Technol. 2009, 64 (1), 34–40.
(29) O’Kennedy, B. T.; Mounsey, J. S. Control of heat-induced aggrega-tion of whey proteins using casein. J. Agric. Food Chem. 2006, 54(15), 5637–5642.
(30) Oldfield, D. J.; Singh, H.; Taylor, M. W. Kinetics of heat-inducedwhey protein denaturation and aggregation in skim milks withadjusted whey protein concentration. J. Dairy Res. 2005, 72 (3),369–378.
(31) Guyomarc’h, F.; Law, A. J. R.; Dalgleish, D. G. Formation ofsoluble and micelle-bound protein aggregates in heated milk.J. Agric. Food Chem. 2003, 51 (16), 4652–4660.
(32) Corredig, M.; Dalgleish, D. G. The mechanisms of the heat-inducedinteraction of whey proteins with casein micelles in milk. Int. Dairy J.1999, 9 (3-6), 233–236.
7444 J. Agric. Food Chem., Vol. 58, No. 12, 2010 Chevalier and Kelly
(33) Anema, S.G.; Li, Y.M.Association of denaturedwhey proteins withcasein micelles in heated reconstituted skim milk and its effect oncasein micelle size. J. Dairy Res. 2003, 70 (1), 73–83.
(34) Vasbinder, A. J.; de Kruif, C. G. Casein-whey protein interactions inheated milk: The influence of pH. Int. Dairy J. 2003, 13 (8), 669–677.
(35) Corredig, M.; Dalgleish, D. G. Effect of temperature and pH on theinteractions of whey proteins with casein micelles in skim milk. FoodRes. Int. 1996, 29 (1), 49–55.
(36) Swaisgood, H. E.; Brunner, J. R.; Lillevik, H. A. Physical parametersof k-casein from cows milk. Biochemistry 1964, 3 (11), 1616.
(37) Heth, A. A.; Swaisgood, H. E. Examination of casein micellestructure by a method for reversible covalent immobilization.J. Dairy Sci. 1982, 65 (11), 2047–2054.
(38) McKenzie, G. H.; Norton, R. S.; Sawyer, W. H. Heat-inducedinteraction of beta-lactoglobulin and kappa-casein. J. Dairy Res.1971, 38 (3), 343.
(39) Haque, Z.; Kinsella, J. E. Interaction between heated kappa-caseinand beta-lactoglobulin;Predominance of hydrophobic interactionsin the initial-stages of complex-formation. J. Dairy Res. 1988, 55 (1),67–80.
(40) Hae, D. J.; Swaisgood, H. E. Disulfide bond formation betweenthermally denatured beta-lactoglobulin and kappa-casein in caseinmicelles. J. Dairy Sci. 1990, 73 (4), 900–904.
(41) Cho, Y. H.; Singh, H.; Creamer, L. K. Heat-induced interactions ofbeta-lactoglobulin A and kappa-casein B in a model system. J. DairyRes. 2003, 70 (1), 61–71.
(42) Livney, Y. D.; Dalgleish, D. G. Specificity of disulfide bondformation during thermal aggregation in solutions of beta-lactoglo-bulin B and kappa-casein A. J. Agric. Food Chem. 2004, 52 (17),5527–5532.
(43) Patel, H. A.; Singh, H.; Anema, S. G.; Creamer, L. K. Effects of heatand high hydrostatic pressure treatments on disulfide bondinginterchanges among the proteins in skim milk. J. Agric. Food Chem.2006, 54 (9), 3409–3420.
(44) Miller, I.; Teinfalt, M.; Leschnik, M.; Wait, R.; Gemeiner, M.Nonreducing two-dimensional gel electrophoresis for the detectionof Bence Jones proteins in serum and urine. Proteomics 2004, 4 (1),257–260.
(45) Chevalier, F.; Hirtz, C.; Sommerer, N.; Kelly, A. L. Use of reducing/nonreducing two-dimensional electrophoresis for the study of disul-fide-mediated interactions between proteins in raw and heatedbovine milk. J. Agric. Food Chem. 2009, 57 (13), 5948–5955.
(46) Holland, J. W.; Deeth, H. C.; Alewood, P. F. Analysis of disulphidelinkages in bovine kappa-casein oligomers using two-dimensionalelectrophoresis. Electrophoresis 2008, 29 (11), 2402–2410.
(47) Laemmli, U. K. Cleavage of structural proteins during assembly ofhead of bacteriophage-T4. Nature 1970, 227 (5259), 680.
(48) Chevalier, F.; Rofidal, V.; Vanova, P.; Bergoin, A.; Rossignol, M.Proteomic capacity of recent fluorescent dyes for protein staining.Phytochemistry 2004, 65 (11), 1499–1506.
(49) Talbot, B.; Waugh, D. F. Micelle-forming characteristics of mono-meric and covalent polymeric kappa-caseins. Biochemistry 1970, 9(14), 2807.
(50) Rasmussen, L. K.; Hojrup, P.; Petersen, T. E. Disulfide arrangementin bovine caseins;Localization of intrachain disulfide bridges inmonomers of kappa-casein and alpha(s2)-casein from bovine-milk.J. Dairy Res. 1994, 61 (4), 485–493.
(51) Dalgleish, D. G. Casein micelles as colloids: Surface structures andstabilities. J. Dairy Sci. 1998, 81 (11), 3013–3018.
(52) Bouguyon, E.; Beauvallet, C.; Huet, J. C.; Chanat, E. Disulphidebonds in casein micelle from milk. Biochem. Biophys. Res. Commun.2006, 343 (2), 450–458.
(53) Groves, M. L.; Dower, H. J.; Farrell, H. M. Reexamination of thepolymeric distributions of kappa-casein isolated from bovine-milk.J. Protein Chem. 1992, 11 (1), 21–28.
(54) Rasmussen, L. K.; Hojrup, P.; Petersen, T. E. The multimericstructure and disulfide-bonding pattern of bovine kappa-casein.Eur. J. Biochem. 1992, 207 (1), 215–222.
(55) Groves, M. L.; Wickham, E. D.; Farrell, H. M. Environmentaleffects on disulfide bonding patterns of bovine kappa-casein.J. Protein Chem. 1998, 17 (2), 73–84.
(56) Mandelkow, E. M.; Schweers, O.; Drewes, G.; Biernat, J.; Gustke,N.; Trinczek, B.; Mandelkow, E. Structure, microtubule interac-tions, and phosphorylation of tau protein. In Neurobiology ofAlzheimer’s Disease; Wurtman, R. J., Corkin, S., Growdon, J. H.,Nitsch, R. M., Eds.; 1996; Vol. 777, pp 96-106.
(57) Rasmussen, L. K.; Petersen, T. E. Purification of disulfide-linkedalpha-s2-casein and kappa-casein from bovine-milk. J. Dairy Res.1991, 58 (2), 187–193.
(58) Considine, T.; Patel, H. A.; Anema, S. G.; Singh, H.; Creamer, L. K.Interactions of milk proteins during heat and high hydrostaticpressure treatments;A review. Innovative Food Sci. EmergingTechnol. 2007, 8 (1), 1–23.
(59) Annan, W. D.; Manson, W. A fractionation of alphas-caseincomplex of bovine milk. J. Dairy Res. 1969, 36 (2), 259–268.
(60) Chevalier, F.; Chobert, J. M.; Molle, D.; Haertle, T. Maillardglycation of beta-lactoglobulin with several sugars: Comparativestudy of the properties of the obtained polymers and of thesubstituted sites. Lait 2001, 81 (5), 651–666.
(61) Lucey, J. A.; Tamehana, M.; Singh, H.; Munro, P. A. Effect ofinteractions between denatured whey proteins and casein micelles onthe formation and rheological properties of acid skim milk gels.J. Dairy Res. 1998, 65 (4), 555–567.
(62) Donato, L.; Guyomarc’h, F.; Amiot, S.; Dalgleish, D. G. Formationof whey protein/kappa-casein complexes in heated milk: Preferentialreaction of whey protein with kappa-casein in the caseinmicelles. Int.Dairy J. 2007, 17 (10), 1161–1167.
(63) Donato, L.; Guyomarc’H, F. Formation and properties of the wheyprotein/kappa-casein complexes in heated skim milk;A review.Dairy Sci. Technol. 2009, 89 (1), 3–29.
(64) Zittle, C. A.; Custer, J. H.; Cerbulis, J.; Thompson, M. P. Kappa-casein-beta-lactoglobulin interaction in solution when heated. J.Dairy Sci. 1962, 45 (7), 807.
(65) Creamer, L. K.; Bienvenue, A.; Nilsson, H.; Paulsson,M.; vanWanroij,M.; Lowe, E.K.; Anema, S.G.; Boland,M. J.; Jimenez-Flores, R.Heat-induced redistribution of disulfide bonds in milk proteins. 1. Bovinebeta-lactoglobulin. J. Agric. Food Chem. 2004, 52 (25), 7660–7668.
(66) Lowe, E. K.; Anema, S. G.; Bienvenue, A.; Boland, M. J.; Creamer,L. K.; Jimenez-Flores, R. Heat-induced redistribution of disulfidebonds inmilk proteins. 2. Disulfide bonding patterns between bovinebeta-lactoglobulin and kappa-casein. J. Agric. Food Chem. 2004,52 (25), 7669–7680.
(67) Sawyer, W. H.; Jenness, R.; Coulter, S. T. Role of sulfhydryl groupsin interaction of k-casein and beta-lactoglobulin. J. Dairy Sci. 1963,46 (6), 564.
(68) Sawyer, W. H. Complex between beta-lactoglobulin and kappa-casein. A review. J. Dairy Sci. 1969, 52 (9), 1347.
(69) Uversky, V. N.; Fink, A. L. Conformational constraints for amyloidfibrillation: the importance of being unfolded. Biochim. Biophys.Acta 2004, 1698 (2), 131–153.
(70) Farrell, H. M.; Cooke, P. H.; Wickham, E. D.; Piotrowski, E. G.;Hoagland, P. D. Environmental influences on bovine kappa-casein:Reduction and conversion to fibrillar (amyloid) structures. J. ProteinChem. 2003, 22 (3), 259–273.
(71) Lencki, R. W. Evidence for fibril-like structure in bovine caseinmicelles. J. Dairy Sci. 2007, 90 (1), 75–89.
(72) Sokolovski, M.; Sheynis, T.; Kolusheva, S.; Jelinek, R. Membraneinteractions and lipid binding of casein oligomers and early aggre-gates. Biochim. Biophys. Acta 2008, 1778 (10), 2341–2349.
Received for review March 23, 2010. Revised manuscript received May
6, 2010. AcceptedMay 07, 2010. Funding for this research was provided
under the National Development Plan 2007-2013, through the Food
Institutional Research Measure, administered by the Department of
Agriculture, Fisheries and Food, Ireland. The work was also partly
supported by the Proteomic Platform of Montpellier-LR Genopole.

lable at ScienceDirect
International Dairy Journal 20 (2010) 715e723
Contents lists avai
International Dairy Journal
journal homepage: www.elsevier .com/locate/ idairyj
Proteins and proteolysis in pre-term and term human milk and possibleimplications for infant formulae
Emanuele Armaforte a,c, Erika Curran a, Thom Huppertz a,d, C. Anthony Ryan b, Maria F. Caboni c,Paula M. O’Connor e, R. Paul Ross e, Christophe Hirtz f, Nicolas Sommerer f, François Chevalier a,g,Alan L. Kelly a,*
aDepartment of Food and Nutritional Sciences, University College, Cork, IrelandbCork University Maternity Hospital, Department of Paediatrics and Child Health, University College, Cork, IrelandcDepartment of Food Science, University of Bologna, Cesena, ItalydNIZO food research, Ede, The NetherlandseMoorepark Food Research Centre, Fermoy, Irelandf Proteomic Platform, UR1199, INRA, Montpellier, Franceg Proteomic Platform, CEA-FAR/DSV-IRCM, Fontenay aux Roses, France
a r t i c l e i n f o
Article history:Received 15 November 2009Received in revised form4 March 2010Accepted 8 March 2010
* Corresponding author. Tel.: þ353 21 4902810/490E-mail address: [email protected] (A.L. Kelly).
0958-6946/$ e see front matter � 2010 Elsevier Ltd.doi:10.1016/j.idairyj.2010.03.008
a b s t r a c t
Understanding the differences between the protein system of human milk and bovine milk is critical inthe development of infant formulae. In this study, the proteins of bovine milk and a bovine-based whey-dominant infant formula were compared with those of human milk for infants born prematurely (pre-term) or at full term (term). The protein distribution of infant formula differed significantly from that ofeither type of human milk. A proteomic comparison between pre-term and term human milk showeda reduction of levels of b-casein and as-casein and appearance of additional products, corresponding tolow molecular weight hydrolysis products of the caseins, in pre-term milk. Pre-term milk samples alsohad higher total nitrogen concentration and plasmin activity, consistent with the proteomic data. Theseresults suggest the operation of a physiological mechanism that may adjust enzyme and/or proteinexpression to modify protein digestibility, and may facilitate design of infant formulae, closer to maternalmilk, particularly for premature infants.
� 2010 Elsevier Ltd. All rights reserved.
1. Introduction
Human milk has long been recognized as the optimal form ofnutrition for the newborn period (Work Group on Breastfeeding,1997). Human milk contains a wide array of proteins thatcontribute to its unique qualities and that provide biologicalactivities, ranging from antimicrobial effects to immunostimulatoryfunctions. In addition, they provide adequate amounts of essentialamino acids to growing infants (Jensen, 1995).
Although casein is the principal class of protein in milk frommost species, this is not the case for human milk. Caseins in humanmilk comprise 10e50% of total protein, and whey proteins accountfor the remainder (Kunz & Lönnerdal, 1989). The contents of caseinand whey proteins change profoundly in early lactation. In fact,during the first days of lactation and in milk from mothers deliv-ering prematurely, the concentration of whey proteins is very high,
3405; fax: þ353 21 4270001.
All rights reserved.
whereas casein is virtually undetectable (Kunz & Lönnerdal, 1990,1992). Subsequently, casein synthesis commences in themammary gland and casein concentration increases, whereas theconcentration of total whey proteins decreases, partially because ofan increased volume of milk being produced. As a result, caseinconstitutes a progressively larger proportion of humanmilk proteinwith increasing duration of lactation after birth (Conti, Giuffrida, &Cavaletto, 2007; Kunz & Lönnerdal, 1989) and there is no “fixed”ratio of whey to casein in human milk (Lönnerdal, 2003). Humanmilk does not contain b-lactoglobulin or as2-casein.
Human milk has a high non-protein nitrogen (NPN) content(20e25% of total nitrogen) and is generally considered to provideadequate protein and nitrogen for the term infant. The concentra-tion of NPN is higher in human milk than that in bovine milk;however, the proportion of NPN in infant formulae is variable,ranging from 5 to 16% in bovine-based formulae (Rudloff & Kunz,1997). For human milk, it has been shown that, in early lactation,the absolute amount of NPN, such as creatinine, creatine, urea, freeamino acids and small peptides, is significantly greater in pre-termmilk than term milk (Atkinson, Anderson, & Bryan, 1980). It is
E. Armaforte et al. / International Dairy Journal 20 (2010) 715e723716
generally believed that the free amino acids and peptides in NPNshould bemore readily available to the neonate than intact proteins(Atkinson, Schnurr, Donovan, & Lonnerdal, 1989).
Human milk contains active enzymes, hormones and essentialnutrients aswell as live cells that remainviable in the infant stomachup to 4 h after ingestion. Storrs and Hull (1956) suggested thatproteolytic enzymes may provide the breast-fed infant with signif-icant digestive assistance immediately after birth and a subsequentstudy by Heyndrickx (1963) showed that there are higher levels ofproteolytic enzymes in human milk than in bovine milk.
The main proteolytic enzyme in humanmilk is plasmin. Plasminactivity in milk is controlled by the availability of its precursorplasminogen (PA) and by the levels of plasminogen activators andinhibitors; plasmin is produced by either of two families of serineproteinases encoded by different genes, i.e., urokinase-type plas-minogen activators (u-PA) and tissue-type plasminogen activators(t-PA) (Heegaard et al., 1997). The presence of the plasminogenactivation system in human milk was first described by Astrup andSterndorff (1953). Subsequent investigations have demonstratedproteolytic activity attributed to plasmin activity and the presenceof plasminogen activators in colostrum and mature milk (Korycka-Dahl, Ribadeau Dumas, Chene, & Martal, 1983). As in bovine milk,plasmin is involved in the hydrolysis of proteins of human milk(Ferranti et al., 2004). Human milk obtained 6e7 days post-partumcontained 4.8� 4.2 and 12.4� 9.9 UmL�1 of plasmin and plas-minogen-derived activity, respectively (Korycka-Dahl et al., 1983).The final plasmin activity of milk and, subsequently, hydrolysis ofmilk casein depends not only on the amount of plasminogen and PAbut also on the level of inhibitors.
Whereas themultiple benefits of breast-feeding for human childhealth are well known and breast-feeding is strongly supported asthe ideal form of infant feeding, infant formulae are intended toserve as a substitute for breast milk for infants who cannot bebreast-fed, or should not receive breast milk, or for whom breastmilk is not available (as stated by the World Health Organization:Thirty-Ninth World Health Assembly; Guidelines concerning themain health and socioeconomic circumstances in which infantshave to be fed on breast-milk substitutes). The adequacy of infantformula composition should be determined by a comparing effectson physiological (e.g., growth patterns), biochemical (e.g., plasmamarkers) and functional (e.g., immune responses) parameters ininfants fed formulae with those found in populations of healthy,exclusively breast-fed infants, taking into account the high variablecomposition of breast milk. The composition of infant formulaeshould serve to meet the particular nutritional requirements and topromote normal growth and development of the infants for whomthey are intended (Koletzko et al., 2005).
This paper describes a detailed biochemical comparison ofhuman milk samples with the aim of investigating differences intotal protein content and plasmin activity between samples comingfrom mothers who gave birth to premature or mature babies.Characterization of the typical human milk proteome and a pro-teomic comparison of pre-term and term milk was carried outusing two-dimensional electrophoresis followed by mass spec-trometry. Moreover, a commercial infant formula and bovine milkwere analyzed by two-dimensional electrophoresis to understandfactors relevant to the composition of infant formulae.
2. Material and methods
2.1. Collection of milk samples
Human milk samples were collected at the Erinville Hospital,Cork, Ireland, over a 24 month period, For human milk, seven termmilk samples were collected within 4 weeks after the colostral
period from lactating mothers with full-term infants born after 38weeks of gestation, and seven pre-term milk samples werecollected from mothers with infants born between 30 and 37completed weeks of pregnancy. Both term and pre-term humanmilk sample were collected with an electrical pump (Medela,McHenry, IL, USA). Ethical approval for the study was granted bythe Cork University Hospitals Research Ethics Committee, andconsent was subsequently obtained on this basis from all partici-pants in the study. Human milk samples were centrifuged at10,000� g for 15 min to remove fat, cell and debris and then frozenat �80 �C and thawed at refrigeration temperature overnightbefore analysis. Low-heat skim milk powder (NILAC) was obtainedfromNIZO food research (Ede, The Netherlands). The low-heat skimmilk powder contained w34% protein, w60% lactose and <1% fat.A powdered sample of a bovine-based whey-dominant first-agecommercial infant formula was bought. The powder containedw11% protein, with the caseins and whey proteins at a ratio ofw40:60. In addition, the powder contained w26% fat and w58%carbohydrate.
2.2. One- and two-dimensional electrophoresis
Analytical SDS-PAGE electrophoresis of human milk sampleswas carried out according to the method of Laemmli (1970) ona 12.5% acrylamide gel using the Protean II system (Bio-Rad,Hercules, CA) under reducing conditions. The gels were stainedwith Coomassie blue (R250) and digitalized at 300 dpi with a GS-800 densitometer (Bio-Rad, Hercules, CA, USA).
Analytical 2D gel electrophoresis was carried out with 100 mg ofprotein (7.5 mL of pre-term or term human milk samples) using7-cm strips and a linear pH gradient from 3 to 10 (Bio-Rad), andpreparative 2D gel analysis was carried with 350 mg of protein(25 mL of human milk or 30 mL or 10 mL of reconstituted infantformula or bovine milk respectively) using 17-cm strips and linearpH gradient 3e10 (Bio-Rad). Milk samples were mixed with solu-bilization buffer (9 M urea, 4% CHAPS, 0.05% Triton X100 and 65 mM
dithiothreitol (DTT)). Subsequently, 7 or 17-cm strips (with a linearpH gradient from 3 to 10) were rehydrated in the above solution.Isoelectric focusing was carried out according to the method ofChevalier, Hirtz, Sommerer, and Kelly (2009). The strips were thenembedded using 0.6% (w/v), low-melt agarose on the top of a 12.5%acrylamide gel and SDS-PAGE was carried out using a Criterion�
Dodeca Cell electrophoresis unit (Bio-Rad) for 7-cm strips and witha Protean� II xi Cell electrophoresis unit (Bio-Rad) for 17-cm strips.Gels were stained using colloidal Coomassie blue (Chevalier,Rofidal, Vanova, Bergoin, & Rossignol, 2004) and stained gelswere digitized at 300 dpi using a GS-800 densitometer (Bio-Rad).
2.3. Image analysis of SDS-PAGE electrophoretograms of humanmilk samples
Images of analytical SDS-PAGE gels were analyzedwith QuantityOne software (Bio-Rad, Hercules, CA, USA) and gel images fromtwo-dimensional analysis were analyzed with PD Quest software(Bio-Rad, Hercules, CA, USA). All human milk samples wereanalyzed in triplicate and the replicates were used to provide anaveraged gel. All the averaged gels were compared to evaluatedifferences between samples belonging to the same group, andbetween the two groups (pre-term and term). The same gel regionswere selected and compared, and spot volume was determined asa percentage of total volume of all spots on respective gels. Thecomplete pattern (including all spots) was used for qualitative andquantitative analysis. Qualitative analysis identified specific spotspresent only in one group, while quantitative analysis determinedspots with over- or under-expression (>2-fold difference).
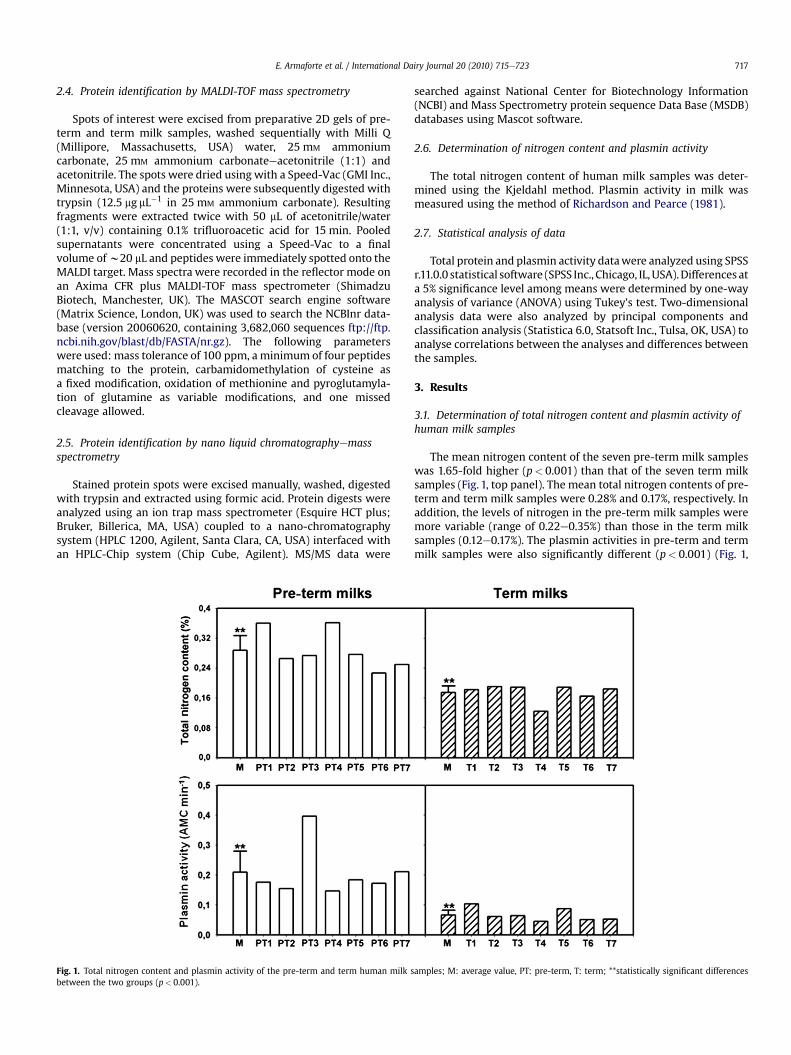
E. Armaforte et al. / International Dairy Journal 20 (2010) 715e723 717
2.4. Protein identification by MALDI-TOF mass spectrometry
Spots of interest were excised from preparative 2D gels of pre-term and term milk samples, washed sequentially with Milli Q(Millipore, Massachusetts, USA) water, 25 mM ammoniumcarbonate, 25 mM ammonium carbonateeacetonitrile (1:1) andacetonitrile. The spots were dried using with a Speed-Vac (GMI Inc.,Minnesota, USA) and the proteins were subsequently digested withtrypsin (12.5 mg mL�1 in 25 mM ammonium carbonate). Resultingfragments were extracted twice with 50 mL of acetonitrile/water(1:1, v/v) containing 0.1% trifluoroacetic acid for 15 min. Pooledsupernatants were concentrated using a Speed-Vac to a finalvolume ofw20 mL and peptides were immediately spotted onto theMALDI target. Mass spectra were recorded in the reflector mode onan Axima CFR plus MALDI-TOF mass spectrometer (ShimadzuBiotech, Manchester, UK). The MASCOT search engine software(Matrix Science, London, UK) was used to search the NCBInr data-base (version 20060620, containing 3,682,060 sequences ftp://ftp.ncbi.nih.gov/blast/db/FASTA/nr.gz). The following parameterswere used: mass tolerance of 100 ppm, a minimum of four peptidesmatching to the protein, carbamidomethylation of cysteine asa fixed modification, oxidation of methionine and pyroglutamyla-tion of glutamine as variable modifications, and one missedcleavage allowed.
2.5. Protein identification by nano liquid chromatographyemassspectrometry
Stained protein spots were excised manually, washed, digestedwith trypsin and extracted using formic acid. Protein digests wereanalyzed using an ion trap mass spectrometer (Esquire HCT plus;Bruker, Billerica, MA, USA) coupled to a nano-chromatographysystem (HPLC 1200, Agilent, Santa Clara, CA, USA) interfaced withan HPLC-Chip system (Chip Cube, Agilent). MS/MS data were
Fig. 1. Total nitrogen content and plasmin activity of the pre-term and term human milk sbetween the two groups (p< 0.001).
searched against National Center for Biotechnology Information(NCBI) and Mass Spectrometry protein sequence Data Base (MSDB)databases using Mascot software.
2.6. Determination of nitrogen content and plasmin activity
The total nitrogen content of human milk samples was deter-mined using the Kjeldahl method. Plasmin activity in milk wasmeasured using the method of Richardson and Pearce (1981).
2.7. Statistical analysis of data
Total protein and plasmin activity datawere analyzed using SPSSr.11.0.0 statistical software (SPSS Inc., Chicago, IL, USA).Differences ata 5% significance level among means were determined by one-wayanalysis of variance (ANOVA) using Tukey’s test. Two-dimensionalanalysis data were also analyzed by principal components andclassification analysis (Statistica 6.0, Statsoft Inc., Tulsa, OK, USA) toanalyse correlations between the analyses and differences betweenthe samples.
3. Results
3.1. Determination of total nitrogen content and plasmin activity ofhuman milk samples
The mean nitrogen content of the seven pre-term milk sampleswas 1.65-fold higher (p< 0.001) than that of the seven term milksamples (Fig. 1, top panel). The mean total nitrogen contents of pre-term and term milk samples were 0.28% and 0.17%, respectively. Inaddition, the levels of nitrogen in the pre-term milk samples weremore variable (range of 0.22e0.35%) than those in the term milksamples (0.12e0.17%). The plasmin activities in pre-term and termmilk samples were also significantly different (p< 0.001) (Fig. 1,
amples; M: average value, PT: pre-term, T: term; **statistically significant differences
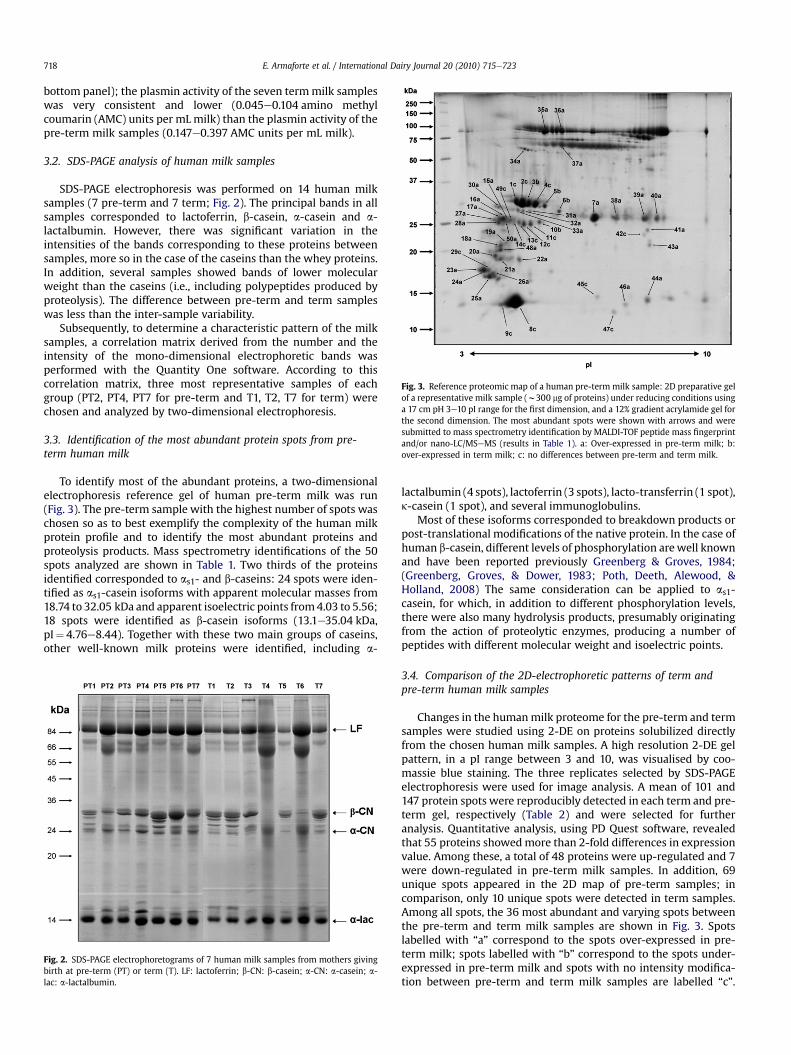
Fig. 3. Reference proteomic map of a human pre-term milk sample: 2D preparative gelof a representative milk sample (w300 mg of proteins) under reducing conditions usinga 17 cm pH 3e10 pI range for the first dimension, and a 12% gradient acrylamide gel forthe second dimension. The most abundant spots were shown with arrows and weresubmitted to mass spectrometry identification by MALDI-TOF peptide mass fingerprintand/or nano-LC/MSeMS (results in Table 1). a: Over-expressed in pre-term milk; b:over-expressed in term milk; c: no differences between pre-term and term milk.
E. Armaforte et al. / International Dairy Journal 20 (2010) 715e723718
bottom panel); the plasmin activity of the seven termmilk sampleswas very consistent and lower (0.045e0.104 amino methylcoumarin (AMC) units per mLmilk) than the plasmin activity of thepre-term milk samples (0.147e0.397 AMC units per mL milk).
3.2. SDS-PAGE analysis of human milk samples
SDS-PAGE electrophoresis was performed on 14 human milksamples (7 pre-term and 7 term; Fig. 2). The principal bands in allsamples corresponded to lactoferrin, b-casein, a-casein and a-lactalbumin. However, there was significant variation in theintensities of the bands corresponding to these proteins betweensamples, more so in the case of the caseins than the whey proteins.In addition, several samples showed bands of lower molecularweight than the caseins (i.e., including polypeptides produced byproteolysis). The difference between pre-term and term sampleswas less than the inter-sample variability.
Subsequently, to determine a characteristic pattern of the milksamples, a correlation matrix derived from the number and theintensity of the mono-dimensional electrophoretic bands wasperformed with the Quantity One software. According to thiscorrelation matrix, three most representative samples of eachgroup (PT2, PT4, PT7 for pre-term and T1, T2, T7 for term) werechosen and analyzed by two-dimensional electrophoresis.
3.3. Identification of the most abundant protein spots from pre-term human milk
To identify most of the abundant proteins, a two-dimensionalelectrophoresis reference gel of human pre-term milk was run(Fig. 3). The pre-term sample with the highest number of spots waschosen so as to best exemplify the complexity of the human milkprotein profile and to identify the most abundant proteins andproteolysis products. Mass spectrometry identifications of the 50spots analyzed are shown in Table 1. Two thirds of the proteinsidentified corresponded to as1- and b-caseins: 24 spots were iden-tified as as1-casein isoforms with apparent molecular masses from18.74 to 32.05 kDa and apparent isoelectric points from4.03 to 5.56;18 spots were identified as b-casein isoforms (13.1e35.04 kDa,pI¼ 4.76e8.44). Together with these two main groups of caseins,other well-known milk proteins were identified, including a-
Fig. 2. SDS-PAGE electrophoretograms of 7 human milk samples from mothers givingbirth at pre-term (PT) or term (T). LF: lactoferrin; b-CN: b-casein; a-CN: a-casein; a-lac: a-lactalbumin.
lactalbumin (4 spots), lactoferrin (3 spots), lacto-transferrin (1 spot),k-casein (1 spot), and several immunoglobulins.
Most of these isoforms corresponded to breakdown products orpost-translational modifications of the native protein. In the case ofhuman b-casein, different levels of phosphorylation arewell knownand have been reported previously Greenberg & Groves, 1984;(Greenberg, Groves, & Dower, 1983; Poth, Deeth, Alewood, &Holland, 2008) The same consideration can be applied to as1-casein, for which, in addition to different phosphorylation levels,there were also many hydrolysis products, presumably originatingfrom the action of proteolytic enzymes, producing a number ofpeptides with different molecular weight and isoelectric points.
3.4. Comparison of the 2D-electrophoretic patterns of term andpre-term human milk samples
Changes in the humanmilk proteome for the pre-term and termsamples were studied using 2-DE on proteins solubilized directlyfrom the chosen human milk samples. A high resolution 2-DE gelpattern, in a pI range between 3 and 10, was visualised by coo-massie blue staining. The three replicates selected by SDS-PAGEelectrophoresis were used for image analysis. A mean of 101 and147 protein spots were reproducibly detected in each term and pre-term gel, respectively (Table 2) and were selected for furtheranalysis. Quantitative analysis, using PD Quest software, revealedthat 55 proteins showedmore than 2-fold differences in expressionvalue. Among these, a total of 48 proteins were up-regulated and 7were down-regulated in pre-term milk samples. In addition, 69unique spots appeared in the 2D map of pre-term samples; incomparison, only 10 unique spots were detected in term samples.Among all spots, the 36 most abundant and varying spots betweenthe pre-term and term milk samples are shown in Fig. 3. Spotslabelled with “a” correspond to the spots over-expressed in pre-term milk; spots labelled with “b” correspond to the spots under-expressed in pre-term milk and spots with no intensity modifica-tion between pre-term and term milk samples are labelled “c”.
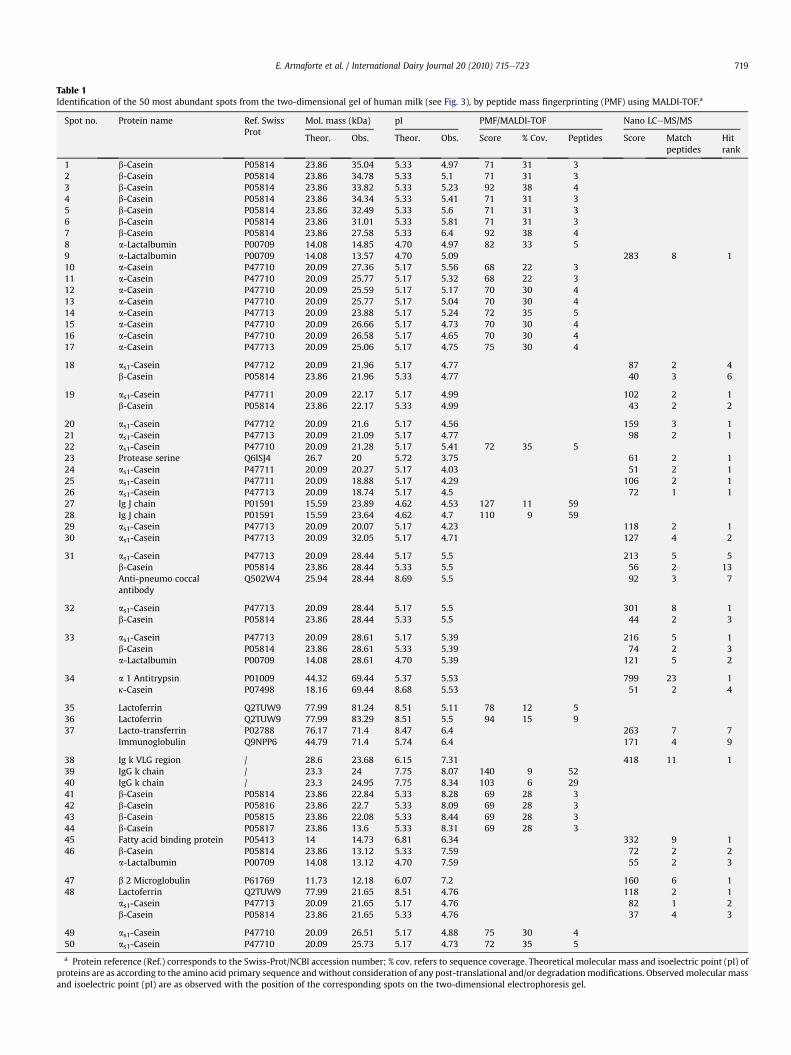
Table 1Identification of the 50 most abundant spots from the two-dimensional gel of human milk (see Fig. 3), by peptide mass fingerprinting (PMF) using MALDI-TOF.a
Spot no. Protein name Ref. SwissProt
Mol. mass (kDa) pI PMF/MALDI-TOF Nano LCeMS/MS
Theor. Obs. Theor. Obs. Score % Cov. Peptides Score Matchpeptides
Hitrank
1 b-Casein P05814 23.86 35.04 5.33 4.97 71 31 32 b-Casein P05814 23.86 34.78 5.33 5.1 71 31 33 b-Casein P05814 23.86 33.82 5.33 5.23 92 38 44 b-Casein P05814 23.86 34.34 5.33 5.41 71 31 35 b-Casein P05814 23.86 32.49 5.33 5.6 71 31 36 b-Casein P05814 23.86 31.01 5.33 5.81 71 31 37 b-Casein P05814 23.86 27.58 5.33 6.4 92 38 48 a-Lactalbumin P00709 14.08 14.85 4.70 4.97 82 33 59 a-Lactalbumin P00709 14.08 13.57 4.70 5.09 283 8 110 a-Casein P47710 20.09 27.36 5.17 5.56 68 22 311 a-Casein P47710 20.09 25.77 5.17 5.32 68 22 312 a-Casein P47710 20.09 25.59 5.17 5.17 70 30 413 a-Casein P47710 20.09 25.77 5.17 5.04 70 30 414 a-Casein P47713 20.09 23.88 5.17 5.24 72 35 515 a-Casein P47710 20.09 26.66 5.17 4.73 70 30 416 a-Casein P47710 20.09 26.58 5.17 4.65 70 30 417 a-Casein P47713 20.09 25.06 5.17 4.75 75 30 4
18 as1-Casein P47712 20.09 21.96 5.17 4.77 87 2 4b-Casein P05814 23.86 21.96 5.33 4.77 40 3 6
19 as1-Casein P47711 20.09 22.17 5.17 4.99 102 2 1b-Casein P05814 23.86 22.17 5.33 4.99 43 2 2
20 as1-Casein P47712 20.09 21.6 5.17 4.56 159 3 121 as1-Casein P47713 20.09 21.09 5.17 4.77 98 2 122 as1-Casein P47710 20.09 21.28 5.17 5.41 72 35 523 Protease serine Q6ISJ4 26.7 20 5.72 3.75 61 2 124 as1-Casein P47711 20.09 20.27 5.17 4.03 51 2 125 as1-Casein P47711 20.09 18.88 5.17 4.29 106 2 126 as1-Casein P47713 20.09 18.74 5.17 4.5 72 1 127 Ig J chain P01591 15.59 23.89 4.62 4.53 127 11 5928 Ig J chain P01591 15.59 23.64 4.62 4.7 110 9 5929 as1-Casein P47713 20.09 20.07 5.17 4.23 118 2 130 as1-Casein P47713 20.09 32.05 5.17 4.71 127 4 2
31 as1-Casein P47713 20.09 28.44 5.17 5.5 213 5 5b-Casein P05814 23.86 28.44 5.33 5.5 56 2 13Anti-pneumo coccalantibody
Q502W4 25.94 28.44 8.69 5.5 92 3 7
32 as1-Casein P47713 20.09 28.44 5.17 5.5 301 8 1b-Casein P05814 23.86 28.44 5.33 5.5 44 2 3
33 as1-Casein P47713 20.09 28.61 5.17 5.39 216 5 1b-Casein P05814 23.86 28.61 5.33 5.39 74 2 3a-Lactalbumin P00709 14.08 28.61 4.70 5.39 121 5 2
34 a 1 Antitrypsin P01009 44.32 69.44 5.37 5.53 799 23 1k-Casein P07498 18.16 69.44 8.68 5.53 51 2 4
35 Lactoferrin Q2TUW9 77.99 81.24 8.51 5.11 78 12 536 Lactoferrin Q2TUW9 77.99 83.29 8.51 5.5 94 15 937 Lacto-transferrin P02788 76.17 71.4 8.47 6.4 263 7 7
Immunoglobulin Q9NPP6 44.79 71.4 5.74 6.4 171 4 9
38 Ig k VLG region / 28.6 23.68 6.15 7.31 418 11 139 IgG k chain / 23.3 24 7.75 8.07 140 9 5240 IgG k chain / 23.3 24.95 7.75 8.34 103 6 2941 b-Casein P05814 23.86 22.84 5.33 8.28 69 28 342 b-Casein P05816 23.86 22.7 5.33 8.09 69 28 343 b-Casein P05815 23.86 22.08 5.33 8.44 69 28 344 b-Casein P05817 23.86 13.6 5.33 8.31 69 28 345 Fatty acid binding protein P05413 14 14.73 6.81 6.34 332 9 146 b-Casein P05814 23.86 13.12 5.33 7.59 72 2 2
a-Lactalbumin P00709 14.08 13.12 4.70 7.59 55 2 3
47 b 2 Microglobulin P61769 11.73 12.18 6.07 7.2 160 6 148 Lactoferrin Q2TUW9 77.99 21.65 8.51 4.76 118 2 1
as1-Casein P47713 20.09 21.65 5.17 4.76 82 1 2b-Casein P05814 23.86 21.65 5.33 4.76 37 4 3
49 as1-Casein P47710 20.09 26.51 5.17 4.88 75 30 450 as1-Casein P47710 20.09 25.73 5.17 4.73 72 35 5
a Protein reference (Ref.) corresponds to the Swiss-Prot/NCBI accession number; % cov. refers to sequence coverage. Theoretical molecular mass and isoelectric point (pI) ofproteins are as according to the amino acid primary sequence andwithout consideration of any post-translational and/or degradationmodifications. Observedmolecular massand isoelectric point (pI) are as observed with the position of the corresponding spots on the two-dimensional electrophoresis gel.
E. Armaforte et al. / International Dairy Journal 20 (2010) 715e723 719
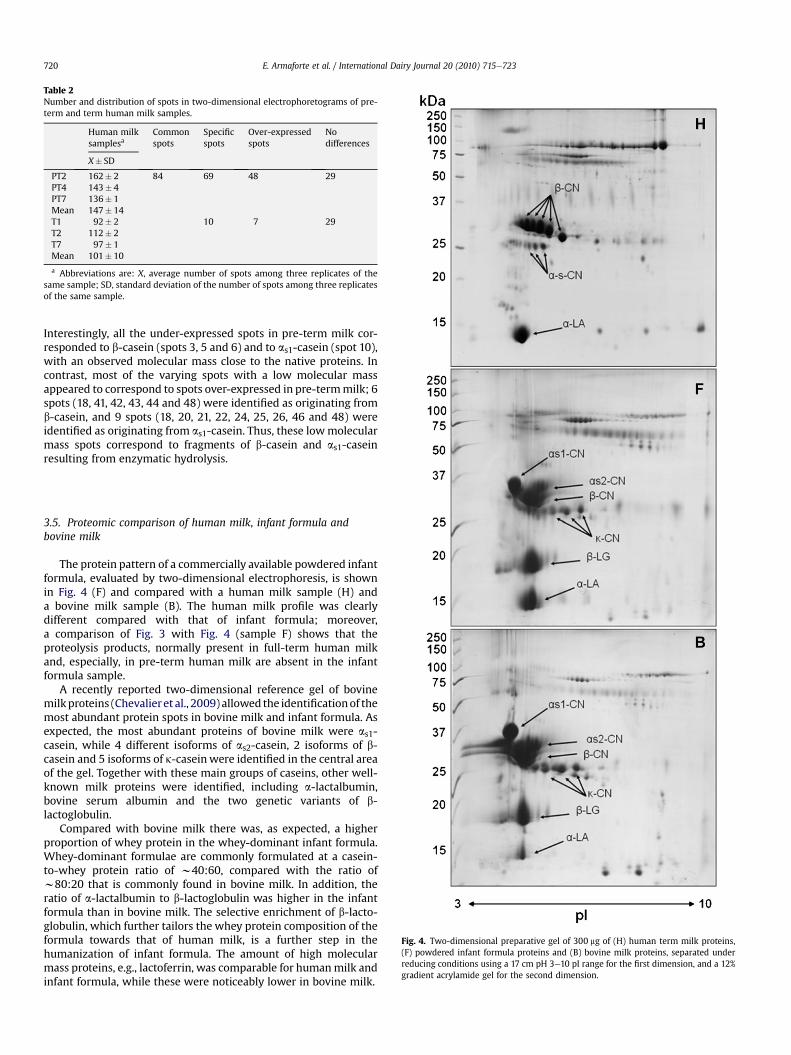
Table 2Number and distribution of spots in two-dimensional electrophoretograms of pre-term and term human milk samples.
Human milksamplesa
Commonspots
Specificspots
Over-expressedspots
Nodifferences
X� SD
PT2 162� 2 84 69 48 29PT4 143� 4PT7 136� 1Mean 147� 14T1 92� 2 10 7 29T2 112� 2T7 97� 1Mean 101� 10
a Abbreviations are: X, average number of spots among three replicates of thesame sample; SD, standard deviation of the number of spots among three replicatesof the same sample.
E. Armaforte et al. / International Dairy Journal 20 (2010) 715e723720
Interestingly, all the under-expressed spots in pre-term milk cor-responded to b-casein (spots 3, 5 and 6) and to as1-casein (spot 10),with an observed molecular mass close to the native proteins. Incontrast, most of the varying spots with a low molecular massappeared to correspond to spots over-expressed in pre-termmilk; 6spots (18, 41, 42, 43, 44 and 48) were identified as originating fromb-casein, and 9 spots (18, 20, 21, 22, 24, 25, 26, 46 and 48) wereidentified as originating from as1-casein. Thus, these lowmolecularmass spots correspond to fragments of b-casein and as1-caseinresulting from enzymatic hydrolysis.
Fig. 4. Two-dimensional preparative gel of 300 mg of (H) human term milk proteins,(F) powdered infant formula proteins and (B) bovine milk proteins, separated underreducing conditions using a 17 cm pH 3e10 pI range for the first dimension, and a 12%gradient acrylamide gel for the second dimension.
3.5. Proteomic comparison of human milk, infant formula andbovine milk
The protein pattern of a commercially available powdered infantformula, evaluated by two-dimensional electrophoresis, is shownin Fig. 4 (F) and compared with a human milk sample (H) anda bovine milk sample (B). The human milk profile was clearlydifferent compared with that of infant formula; moreover,a comparison of Fig. 3 with Fig. 4 (sample F) shows that theproteolysis products, normally present in full-term human milkand, especially, in pre-term human milk are absent in the infantformula sample.
A recently reported two-dimensional reference gel of bovinemilkproteins (Chevalieret al., 2009) allowed the identificationof themost abundant protein spots in bovine milk and infant formula. Asexpected, the most abundant proteins of bovine milk were as1-casein, while 4 different isoforms of as2-casein, 2 isoforms of b-casein and 5 isoforms of k-caseinwere identified in the central areaof the gel. Together with these main groups of caseins, other well-known milk proteins were identified, including a-lactalbumin,bovine serum albumin and the two genetic variants of b-lactoglobulin.
Compared with bovine milk there was, as expected, a higherproportion of whey protein in the whey-dominant infant formula.Whey-dominant formulae are commonly formulated at a casein-to-whey protein ratio of w40:60, compared with the ratio ofw80:20 that is commonly found in bovine milk. In addition, theratio of a-lactalbumin to b-lactoglobulin was higher in the infantformula than in bovine milk. The selective enrichment of b-lacto-globulin, which further tailors the whey protein composition of theformula towards that of human milk, is a further step in thehumanization of infant formula. The amount of high molecularmass proteins, e.g., lactoferrin, was comparable for humanmilk andinfant formula, while these were noticeably lower in bovine milk.

E. Armaforte et al. / International Dairy Journal 20 (2010) 715e723 721
4. Discussion
Comparative proteomics, as well as biochemical and enzymaticmeasurements, were initially used to investigate the modulation ofproteins in milk frommothers who gave birth to pre-term and full-term babies. The differences in total nitrogen content wereconsistent with those reported by Atkinson et al. (1980), i.e., thatthe total protein concentration of breast milk from women deliv-ering prematurely was considerably higher than that of milk fromwomen delivering at term. It was hypothesized that a higherprotein concentration can benefit the premature infant with itsrapid catch-up growth and high protein requirement.
Atkinson et al. (1980) also reported that the peptides found inhuman milk may be indigenous constituents of breast milk or maybe formed in expressed milk through the proteolytic action ofnative enzymes in the milk. Building on these findings, this paperreports, for the first time, increased plasmin activity in milk frommothers delivering prematurely (Fig. 1). Milk proteases present inbreast milk, including plasmin, are capable of hydrolysing b-caseinin milk (Ferranti et al., 2004; Greenberg & Groves, 1984; Okamoto,Horie, Nagamatsu, & Yamamoto, 1981) and could contribute to thecomplement-inhibitory activity of human milk (Ogundele, 1999).This study contributes new information about the protein compo-sition of humanmilk, underlining the key role of plasmin: its higherlevel in milk for premature infants results in more extensivehydrolysis of protein, leading to the production of small peptideswhich could facilitate the digestion process.
One-dimensional electrophoretic data showed a more complexpattern for pre-term milk samples than for term milk, consistentwith the plasmin activity results. Higher plasmin activity andhigher nitrogen content thus result in higher rates of hydrolysis ofprotein, which results in the formation of lower-molecular masspolypeptides and peptides. The level of the main protein band of a-lactalbumin showed no particular differences between the twogroups. The stable concentration of a-lactalbumin is due to its rolein the synthesis of lactose, which, in turn, is linkedwith the osmoticpressure of blood in the mammary gland. This may explain thesimilar concentration of a-lactalbumin in pre-term and termhuman milk samples (Fig. 2). In contrast, the casein spots were
Fig. 5. Comparison between pre-term and term milk samples: 2D analytical gels of a represeof proteins) under reducing conditions using a 7 cm pH 3e10 pI range for the first dimens
more intense in the term samples; this could again be a result of thehigher proteolytic activity of pre-term samples.
Identification of the spots of interest further elucidated theprotein fraction of human milk. The first consideration is related tothe breakdown products, present mainly in the pre-term milksamples (Fig. 5), which are mostly polypeptide fragments derivedfrom as1- and b-caseins (Table 2). This observation is complemen-tary to a previous study that reported that b-casein was the mainsource of small peptides by proteolytic action in human milk(Ferranti et al., 2004). In that study, trichloroacetic acid (TCA) wasused to precipitate casein and separate peptides frommilk and thenliquid chromatographyemass spectrometry and tandem massspectrometry were used for the separation and identification of thepeptides. In the present study, milk was analyzed directly withoutadditional extraction or enrichment steps and the proteins wereseparated using two-dimensional electrophoresis. These differ-ences in the experimental methods have a great influence on thedetermination of proteolysis products from proteins. Firstly, the useof TCA for the purification of peptides and reverse-phase HPLC forthe separation gave rise to peptide populations with a molecularmass that was too low to be resolved on a SDS-PAGE gel. On theother hand, two-dimensional electrophoresis allowed direct anal-ysis of the native proteins preferentially hydrolysed by plasmin andthe resulting polypeptides. Then, in pre-term human milk, plasmincan hydrolyse both as1-casein and b-casein (Ferranti et al., 2004),and yields polypeptides from both as1-casein and b-caseins andsmall peptides from b-casein (Ferranti et al., 2004). Moreover,Ferranti et al. (2004) reported that, in term milk, the amount ofcomparatively shorter peptides was higher compared with those ofgreater size, which indicates a higher quantitative and qualitativelevel of hydrolysis by plasmin; also, as1-casein-derived peptides,which are few in pre-term milk, were more abundant in termmilk.In bovine milk, proteolytic enzymes, and especially plasmin, pref-erentially hydrolyse b-casein (Fox & Kelly, 2005), but in humanmilkthis proteolytic activity is apparently carried out on both as1-caseinand b-casein.
The quantitative data from the image analysis highlighted thatpre-term milk samples were also richer in immunoglobulins andantibodies, making stronger the hypothesis of milk “naturally
ntative term milk sample (A) and a representative pre-term milk sample (B) (w100 mgion, and a 12% gradient acrylamide gel for the second dimension.
E. Armaforte et al. / International Dairy Journal 20 (2010) 715e723722
enriched” in proteins andpeptides but also in bio-active compoundswhich are able to protect pre-term infants during early life.
The two-dimensional electrophoretic protein profile of bovinemilk was found to be remarkably different from that of humanmilk.As expected, the most abundant proteins in the bovine milk pro-teome were as1-casein, as2-casein, b-casein (which are grouped inthe same area of the gel) and the two genetic variants of b-lacto-globulin, while a-lactalbumin and high molecular mass proteinsare present in low concentration (Fig. 4, sample B). In human milk,the most abundant protein was a-lactalbumin, followed by thegroups of the isoforms of b-caseins and a-caseins, which areresolved separately from each other; moreover, the high molecularmass proteins (mainly lactoferrin) represented an important frac-tion of the total protein content (Fig. 4, sample H). Several isoformsof k-casein are known to be present in bovine milk, while only 1spot was identified as k-casein in human milk (Fig. 3, Table 2). Inhuman milk, and especially in pre-term milk, the action of plasmingives rise to a significant number of hydrolysis products of a- and b-caseins. In the case of bovine milk, inflammation of mammarygland gives rise to higher plasmin activity; high plasmin activityand high concentration of hydrolysis products are undesirable inbovine milk since they are indicators of low quality (Kelly,O’Flaherty, & Fox, 2005). Instead, in human milk, the higheractivity of plasmin in pre-term milk may have an importantnutritional role for low-birth weight infants.
As expected, the qualitative protein profile of infant formulamilk was very similar to that of bovine milk powder, since formulamilk is most often formulated with dairy ingredients, i.e., skimmilkpowder and demineralised whey powder or whey proteinconcentrated. Infant formula based on soy or protein hydrolysatesare available for infant which are allergic to cow milk constituents(Hill, Murch, Rafferty, Wallis, & Green, 2007). From a quantitativepoint of view, it was observed that a higher level of whey proteinwas present in powdered formula than in bovine milk. Theincreased proportion of whey-dominant formula is applied toobtain a casein:whey protein ratio closer to that of humanmilk. Thehigher proportion of a-lactalbumin in the formula than in the skimmilk powder is a further step towards humanization of the infantformula and can be achieved by the inclusion of an a-lactalbumin-enriched whey protein preparation. In addition, a higher level ofhigh molecular mass proteins was observed, most likely toresemble the average human milk protein composition.
Infant formulae are designed to have a quantitative proteinprofile as close to that of human milk as possible; however, thisprotein profile does not always take into account the partial pre-digestion of the protein and, in particular, these formulae do notcontain hydrolysis products of the native human caseins. Formu-lations based solely on protein hydrolysates are readily available forhypoallergenic purpose but the inclusion of partially hydrolysedcasein in formula for neonates is not widely practiced at present.The findings of this study could thus be employed in the furtherimprovement of infant formulae, particularly those for neonatesborn prematurely. The inclusion of partially hydrolysed milkproteins may be useful for preparation of formulae which mimicthe natural human milk as closely as possible. Further study of thecomposition of these low molecular mass peptides and theirpossible physiological and nutritional roles will also be required tooptimally meet the complex nutritional requirements of newborns.
5. Conclusions
The higher total nitrogen content of milk from women deliv-ering prematurely confirms previous reports by other authors, and
a higher content of immunoglobulins and antibodies in that milkwas shown. For the first time, elevated plasmin activity and itsconsequent hydrolysis of caseins in pre-term milk has been eluci-dated. Moreover, the proteomic patterns of pre-term and termmilksamples were investigated in detail and the fifty most abundantproteins identified. The data suggest a physiological response thatadjusts enzyme and/or protein expression to improve milkdigestibility for breast-fed prematurely newborn babies, a findingthat may have relevance for further design of infant formulae fordifferent groups of neonates.
References
Astrup, T., & Sterndorff, I. (1953). A fibrinolytic system in human milk. Proceedings ofthe Society for Experimental Biology and Medicine, 84, 605e609.
Atkinson, S. A., Anderson, G. H., & Bryan, M. H. (1980). Human milk: comparison ofthe nitrogen composition in milk from mothers of premature and full-terminfants. American Journal of Clinical Nutrition, 33, 811e816.
Atkinson, S. A., Schnurr, C. M., Donovan, S. M., & Lonnerdal, B. (1989). The non-protein nitrogen components in human milk: biochemistry and potentialfunctional role. In S. A. Atkinson, & B. Lonnerdal (Eds.), Protein and non-proteinnitrogen in human milk (pp. 117e133). Boca Raton, FL, USA: CRC Press.
Chevalier, F., Hirtz, C., Sommerer, N., & Kelly, A. L. (2009). Use of reducing/nonreducing two-dimensional electrophoresis for the study of disulfide-mediatedinteractions between proteins in raw and heated bovine milk. Journal of Agri-cultural and Food Chemistry, 57, 5948e5955.
Chevalier, F., Rofidal, V., Vanova, P., Bergoin, A., & Rossignol, M. (2004). Proteomiccapacity of recent fluorescent dyes for protein staining. Phytochemistry, 65,1499e1506.
Conti, A., Giuffrida, M. G., & Cavaletto, M. (2007). Proteomics of human milk. InG. L. Hortin (Ed.), Proteomics of human body fluids: Principles, methods andapplications (pp. 437e451). Totowa, NJ, USA: Humana Press.
Ferranti, P., Traisci, M. V., Picariello, G., Nasi, A., Boschi, V., Siervo, M., et al. (2004).Casein proteolysis in human milk: tracing the pattern of casein breakdown andthe formation of potential bioactive peptides. Journal of Dairy Research, 71,74e87.
Fox, P. F., & Kelly, A. L. (2005). Indigenous enzymes in milk: overview and historicalaspects e part 1. International Dairy Journal, 16, 500e516.
Greenberg, R., & Groves, M. L. (1984). Plasmin cleaves human beta-casein.Biochemical and Biophysical Research Communications, 125, 463e468.
Greenberg, R., Groves, M. L., & Dower, H. J. (1983). Human b-casein amino acidsequence and identification of phosphorylation sites. Journal of BiologicalChemistry, 259, 5132e5138.
Heegaard, C. W., Larsen, L. B., Rasmussen, L. K., Højberg, K. E., Petersen, T. E., &Andreasen, P. A. (1997). Plasminogen activation system in human milk. Journalof Pediatric Gastroenterology and Nutrition, 25, 159e166.
Heyndrickx, G. V. (1963). Further investigations on the enzymes in human milk.Pediatrics, 31, 1019.
Hill, D. J., Murch, S. H., Rafferty, K., Wallis, P., & Green, C. J. (2007). The efficacy ofamino acids-based formulas in relieving the symptoms of cow’s milk allergy:a systematic review. Clinical and Experimental Allergy, 37, 808e822.
Jensen, R. G. (1995). Handbook of milk composition. San Diego, USA: Academic Press.Kelly, A. L., O’Flaherty, F., & Fox, P. F. (2005). Indigenous enzymes in milk: a brief
overview of the present state of knowledge. International Dairy Journal, 16,563e572.
Koletzko, B., Baker, S., Cleghorn, G., Neto, U. F., Gopalan, S., Hernell, O., et al. (2005).Global standard for the composition of infant formula: recommendations of anESPGHAN coordinated international expert group. Journal of Pediatric Gastro-enterology and Nutrition, 41, 584e599.
Korycka-Dahl, M., Ribadeau Dumas, B., Chene, N., & Martal, J. (1983). Plasminactivity in milk. Journal of Dairy Science, 66, 704e711.
Kunz, C., & Lönnerdal, B. (1989). Human milk protein: separation of whey proteinsand their analysis by polyacrylamide gradient gel electrophoresis, fast proteinliquid chromatography (FPLC), gel filtration and anion-exchange chromatog-raphy. American Journal of Clinical Nutrition, 49, 464e470.
Kunz, C., & Lönnerdal, B. (1990). Human-milk proteins: analysis of casein and caseinsubunits by anion-exchange chromatography, gel electrophoresis, and specificstaining methods. American Journal of Clinical Nutrition, 51, 37e46.
Kunz, C., & Lönnerdal, B. (1992). Re-evaluation of the whey protein/casein ratio ofhuman milk. Acta Paediatrica, 81, 107e112.
Laemmli, U. K. (1970). Cleavage of structural proteins during the assembly of thehead of bacteriophage T4. Nature, 277, 680e685.
Lönnerdal, B. (2003). Nutritional and physiologic significance of human milkproteins. American Journal of Clinical Nutrition, 77, 1537Se1543S.
Ogundele, M. O. (1999). Inhibitors of complement activity in human breast-milk:a proposed hypothesis of their physiological significance. Mediators of Inflam-mation, 8, 69e75.

E. Armaforte et al. / International Dairy Journal 20 (2010) 715e723 723
Okamoto, U., Horie, N., Nagamatsu, Y., & Yamamoto, J. I. (1981). Plasminogen-acti-vator in human early milk: its partial purification and characterization.Thrombosis and Haemostasis, 45, 121e126.
Poth, A. G., Deeth, H. C., Alewood, P. F., & Holland, J. W. (2008). Analysis of thehuman casein phosphoproteome by 2-D electrophoresis and MALDI-TOF/TOFMS reveals new phosphoforms. Journal of Proteomic Research, 7, 5017e5027.
Richardson, B. C., & Pearce, K. N. (1981). The determination of plasmin in dairyproducts. New Zealand Journal of Dairy Science and Technology, 18, 247e252.
Rudloff, S., & Kunz, C. (1997). Protein and nonprotein nitrogen components inhuman milk, bovine milk, and infant formula: quantitative and qualitativeaspects in infant nutrition. Journal of Pediatric Gastroenterology and Nutrition, 24,328e344.
Storrs, A. B., & Hull, M. E. (1956). Proteolytic enzymes in human and cow milk.Journal of Dairy Science, 39, 1097e1100.
Work Group on Breastfeeding. (1997). American Academy of Pediatrics: breast-feeding and the use of human milk. Pediatrics, 100, 1035e1039.

Proteomic Comparison of Equine and Bovine Milks on RennetingTherese Uniacke-Lowe,† Francois Chevalier,*,†,§ Sonia Hem,# Patrick F. Fox,† and Daniel M. Mulvihill†
†School of Food and Nutritional Sciences, University College, Cork, Ireland§Proteomic Platform, iRCM, CEA, Fontenay aux Roses, France#Proteomic Platform, INRA, Montpellier, France
ABSTRACT: Rennet-induced coagulation of bovine milk is a complex mechanism in which chymosin specifically hydrolyzes κ-casein, the protein responsible for the stability of the casein micelle. In equine milk, this mechanism is still unclear, and theprotein targets of chymosin are unknown. To reveal the proteins involved, the rennetability of equine milk by calf chymosin wasexamined using gel-free and gel-based proteomic analysis and compared to bovine milk. RP-HPLC analysis of bovine and equinemilks showed the release of several peptides following chymosin incubation. The hydrolyses of equine and bovine casein bychymosin were different, and the major peptides produced from equine milk were identified by mass spectrometry as fragmentsof β-casein. Using two-dimensional electrophoresis, equine β-casein was confirmed as the main target of calf chymosin over 24 hat 30 °C and pH 6.5. The gel-based analysis of equine milk discriminated between the different individual proteins and providedinformation on the range of isoforms of each protein as a result of post-translational modifications, as well as positively identifiedfor the first time several isoforms of κ-casein. In comparison to bovine milk, κ-casein isoforms in equine milk were not involved inchymosin-induced coagulation. The intensity of equine β-casein spots decreased following chymosin addition, but at a slower ratethan bovine κ-casein.
KEYWORDS: equine milk, rennet coagulation, κ-casein, proteomic, bovine milk
■ INTRODUCTION
The milk from all species studied to date contains aheterogeneous mixture of proteins within which a few primaryproteins dominate. In bovine milk these proteins are αs1-, αs2-,β-, and κ-caseins, β-lactoglobulin, and α-lactalbumin withrelative proportions of ∼30:10:30:12:10:4, respectively.1
Proportions of these proteins vary greatly among species but,apart from whey acidic protein (WAP), which has beenidentified in several species2 but not in ruminant or humanmilk,3 no major protein, other than one of these families, hasyet been found in the milk of any species. The protein contentof mature equine milk is lower than that of bovine milk, but theprincipal classes of proteins, that is, caseins and whey proteins,are similar in both milks.4−7
The milk proteome is extremely complex due to post-translational modifications of proteins and the presence ofmany genetic variants.8−10 All milk proteins exhibit geneticpolymorphism, usually due to the substitution of one or twoamino acids, which do not have significant effects on proteinfunctionality. Microheterogeneity of milk proteins also resultsfrom post-translational phosphorylation, glycosylation, orproteolysis.Whereas the principal proteins of equine milk have been
fairly well characterized, the presence of κ-casein in equine milkhas been an issue of debate for several years, with severalauthors11−14 reporting its absence. However, other studies15−19
reported its presence, albeit at a low concentration, and Lenasiet al.20 presented the entire cDNA sequence for equine κ-casein.In bovine milk, κ-casein is located predominately on the
surface of casein micelles and plays an important role in theformation, stabilization, and aggregation of the micelles and
alters the manufacturing properties and digestibility of milk.The presence of a glycan moiety in the C-terminal region of κ-casein enhances its ability to stabilize the micelle, byelectrostatic repulsion, and may increase the resistance by theprotein to proteolytic enzymes and high temperatures.21,22 Ithas been reported13 that equine κ-casein is more highlyglycosylated than bovine κ-casein, which could significantlycontribute to equine micelle stability. Ochirkhuyag et al.13 andDoreau and Martin-Rosset23 concluded that the stericstabilization of equine casein micelles by κ-casein may beaided by unphosphorylated β-casein on the surface of themicelle, thus compensating for the low κ-casein content.Chymosin (EC 3.4.23.4) is a neonatal gastric aspartal
proteinase that hydrolyxes the κ-casein of bovine milk into asoluble glycopeptide [caseinomacropeptide (CMP): amino acidresidues 106−169] and an insoluble part (para-κ-casein: aminoacid residues 1−105), which is crucial for the production ofcheese and for the nutrition of newborns.24,25 The non-enzymatic secondary stage of the coagulation of milk bychymosin involves the aggregation and gelation of para-κ-caseinunder the influence of Ca2+.26 Apart from cleavage of thePhe105−Met106 bond of κ-casein, chymosin causes limitedhydrolysis of κ-casein.25 Calf chymosin hydrolyzes the Phe97−Ile98 bond of equine κ-casein19 and slowly hydrolyzes thePhe105−Ile106 bond of human κ-casein.27 Although the CMPsreleased from equine and human κ-casein are less hydrophilicthan bovine CMP, in all species CMP is believed to inhibit
Received: November 5, 2012Revised: February 7, 2013Accepted: February 15, 2013Published: February 15, 2013
Article
pubs.acs.org/JAFC
© 2013 American Chemical Society 2839 dx.doi.org/10.1021/jf3045846 | J. Agric. Food Chem. 2013, 61, 2839−2850
gastric acid secretion following milk intake28−30 and to haveantibacterial activity.31,32 The sequence 97−116 of κ-casein ishighly conserved across species, suggesting that the limitedproteolysis of κ-casein and subsequent coagulation of milk areof major biological significance.28 The other proteins in bovinemilk, αs1-, αs2-, and β-caseins and α-lactalbumin, are hydrolyzedby chymosin but at a much slower rate than κ-casein.33,34
Over the past decade, milk from nonbovine mammals (goat,donkey, horse, and camel) have been studied, generally as ameans of identifying the best substitute for human milk ininfant nutrition.35−37 Milk proteins have been analyzedextensively using proteomic techniques.38 Two-dimensionalelectrophoresis (2-DE) allows simultaneous detection andquantification of several thousand protein spots in the samegel38−40 when combined with mass spectrometry analysis, andit has been used for the separation and characterization of theproteins in bovine milk or colostrum41,42 or for identification ofspecific proteins and isoforms thereof.43−45 To date, analysis ofthe effects of various processing treatments on bovine milkproteins using proteomics has been confined to exploring thechanges in disulfide bonds in milk proteins after heating orpressure treatment.45−48 Caseins in human milk have beenresolved using 2-DE,49 and a proteomic comparison betweenpreterm and term human milk has been reported.50 Recently,Hinz et al.14 compared the milk of several species, includingequine milk, using proteomics. The proteins of equinecolostrum and milk have been analyzed by electrophoreticand immunological methods,39 whereas Egito et al.13
characterized the casein fraction of equine milk using 1- DEand 2-DE of samples purified by anion exchange chromatog-raphy and reverse phase high-performance liquid chromatog-raphy (RP-HPLC). Various mass spectrometric approacheshave been used to characterize the proteins of asinine51−56 andequine17,57,58 milks.The aim of this study was to examine the rennetability of
equine milk by calf chymosin using RP-HPLC and 2-DEfollowed by mass spectrometry with comparative analysis of arenneted bovine milk sample. The presence and implication ofequine κ-casein in equine milk coagulation were alsoinvestigated.
■ MATERIALS AND METHODSMilk Supply. Equine milk was obtained from Orchid’s
Paardenmelkerij (Zeeland, The Netherlands) from a bulksupply collected from five milkings over 24 h, from a herd ofmultiparous New Forest and New Forest/Arabian mares (n >100) in midlactation, physically separated by day from theirfoals. The milk was defatted by centrifugation at 1000g using aSorvall RC 5B centrifuge (Thermo Fisher Scientific Inc.,Waltham, MA, USA) at 20 °C for 20 min, followed by filtrationthrough glass wool to remove fat particles. Raw whole bovinemilk was obtained from a local dairy farm and was defatted bycentrifugation at 2000g for 20 min at 20 °C, followed byfiltration through glass wool. Sodium azide (0.5 g L−1) wasadded to the skimmed milks to prevent microbial growth. Allchemicals used were of reagent grade and obtained from Sigma-Aldrich Chemical Co. (St. Louis, MO, USA).Renneting Equine and Bovine Milks. Skimmed equine
and bovine milks were adjusted to pH 6.5 and tempered at 30°C for 20 min in thin-walled glass tubes in a thermostaticallycontrolled water bath. A 1:10 (v/v) aqueous dilution offermentation-produced chymosin (10 μL mL−1; Maxiren 180;180 international milk-clotting units (IMCU) mL−1; DSM
Food Specialties, Delft, The Netherlands) was added. Aliquots(1 mL) of renneted bovine milk were removed after 4, 10, 15,20, 40, 60, 90, and 240 min and from renneted equine milkafter 20, 30, 60, 90, 120, and 240 min and at 24 h. Rennetedmilk samples were diluted (1:1) immediately with 4%trichloroacetic acid (TCA) in Eppendorf tubes, vortexed for 1min, and then held at 20 °C for 30 min. The samples werecentrifuged at 5000g for 10 min in a microcentrifuge (Sigma 1-15, Sigma Laborzentrifuge, Osterode am Harz, Germany).Supernatants were removed carefully and diluted 1:1 withbuffer (0.1 M bis-Tris, pH 7.0, 8 M urea, 45 mM citrate) to afinal pH of 3.0.59 Samples were filtered through 0.45 μm filters(Millex-HV, PVDF, 13 mm; Millipore Corp., Billerica, MA,USA) prior to injection onto the RP-HPLC column.
RP-HPLC Analysis of Renneted Equine and BovineMilk. RP-HPLC was preformed according to the method ofVasbinder et al.59 for RP-HPLC analysis of CMP. Analysis wascarried out using a Waters 626 nonmetallic HPLC system(Waters Corp., Milford, MA, USA) consisting of a Waters 486UV−vis detector, a Waters 717+ autosampler, a Waters 626pump with a 600S controller, and an online Degasys DG-2410degassing unit (Sanwa Tsusho Co., Tokyo, Japan). A VarianPursuit XRs C18 RP-HPLC column [250 × 4.6 mm, 5 μmparticles size, 300 Å pore size (Varian Inc., Lake Forest, CA,USA)] was used. A wash step of 15 min at 70% solvent Bfollowed by a 15 min equilibration with 85% solvent A wasincluded between analyses of samples.
Identification of κ-Casein in Equine Milk. To determineif equine milk contained κ-casein, skimmed equine milk wasanalyzed by RP-HPLC according to the method of Miranda etal.48 Prior to analysis, the milk was mixed 1:2 (v/v) with 0.1 Mbis-Tris buffer, pH 8.0, containing 8 M urea, 1.3% trisodiumcitrate, and 0.3% DTT. Chromatographic equipment was asdescribed above, and a Microsorb C4 RP-HPLC column (250× 4.6 mm, 300 Å pore size, 5 μm particle size) from Varianmaintained at 40 °C was used. A 20 min wash step with 60%solvent B was included after protein separation followed by 10min at 100% solvent A before injection of subsequent samples.A fraction was collected manually in the κ-casein regionidentified by Miranda et al.,48 precipitated using TCA/acetoneand dephosphorylated as follows: 10 mL of sample was cooledon ice, 750 μL of 100% TCA was added, and the mixture washeld on ice for 2 h. The sample was centrifuged at 10000g for10 min at 4 °C. The supernatant was removed, and 2 mL ofacetone (precooled on ice) was added to the pellet. The samplewas vortexed for 2 min, followed by centrifugation at 10000g(10 min at 4 °C). The supernatant was removed, and the pelletwas washed again with 2 mL of ice-cold acetone; this step wasrepeated once. Finally, the pellet was dissolved in 45 μL ofdistilled water, and 2 μL of 20% SDS was added. Prior toelectrophoresis, two samples (15 μL each) were prepared asfollows: For sample 1, 15 μL was added to 15 μL of a 2×electrophoresis loading buffer. Sample 2 was dephosphorylatedusing the lambda protein phosphatase (lambda PP) and buffersystem from New England Biolabs (Hitchin, Herts., UK); 2 μLof MnCl2, 2 μL of PPase buffer, and 2 μL of phosphatase wereadded to 15 μL of sample, and the mixture was incubatedovernight at 30 °C; 20 μL of single-strength electrophoresisbuffer was added to 20 μL of the dephosphorylated samplesolution. Samples were denatured in denaturing NuPAGEsample buffer60 and separated with a Bis-Tris−MOBS buffersystem (Invitrogen, Paisley, UK). The selected bands were then
Journal of Agricultural and Food Chemistry Article
dx.doi.org/10.1021/jf3045846 | J. Agric. Food Chem. 2013, 61, 2839−28502840
in-gel digested with trypsin and subjected to nano-LC-MS/MSanalysis as described below.Two-Dimensional Electrophoresis Analysis of Ren-
neted Equine and Bovine Milk. Samples of renneted equinemilk were taken at 1, 2, 4, 8, and 24 h. Aliquots of rennetedbovine milk were removed at 2 min intervals up to 16 min andat 20, 24, and 60 min. Renneted milk samples were diluted(1:10) immediately with solubilization buffer [9 M urea, 40 gL−1 3-[(3-cholamidopropyl)dimethylammonio]-1-propanesul-fonate (CHAPS), 5 g L−1 Triton X100, and 65 mMdithiothreitol (DTT)] according to the method of Chevalieret al.49 The protein content of 100 μL of each sample wasdetermined by the Bio-Rad Protein Assay (No. 500-0002, Bio-Rad Laboratories, Hercules, CA, USA), which is based on the
method of Bradford61 and uses bovine serum albumin (BSA) asstandard. Analysis was carried out in at least duplicate at eachtime point for both equine and bovine milks. Analytical 2-DEwas carried out on renneted equine and bovine milks with 100μg of protein using 7 cm immobilized pH gradient (IPG) strips(ReadyStrip, Bio-Rad, Hercules, CA, USA) with a linear pHgradient from 3 to 10 (Bio-Rad), and preparative 2-DE wascarried out on equine and bovine milks with 300 μg of proteinusing 17 cm IPG strips and a linear pH gradient from 3 to 10(Bio-Rad). The 7 or 17 cm IPG strips were rehydrated in theprotein solubilization buffer solution. Isoelectric focusing wascarried out according to the method of Armaforte et al.38 usinga Protean IEF Cell isoelectric focusing system (Bio-Rad). TheIPG strips were then embedded using 6 g L−1 low melting point
Figure 1. C18 RP-HPLC chromatograms of bovine (A) and equine (B) milks renneted with 10 μL mL−1 of 1:10 (v/v) Maxiren 180 at pH 6.5 and30 °C. Fractions a and b were collected for MALDI-TOF MS/MS analysis.
Journal of Agricultural and Food Chemistry Article
dx.doi.org/10.1021/jf3045846 | J. Agric. Food Chem. 2013, 61, 2839−28502841
agarose on top of a 12.5% acrylamide gel, and sodium dodecylsulfate−gel electrophoresis (SDS-PAGE) was carried out usinga Criterion Dodeca Cell electrophoresis unit (Bio-Rad) for the7 cm strips or a Protean II xi Cell electrophoresis unit (Bio-Rad) for the 17 cm strips. Gels were stained using colloidalCoomassie blue as described by Chevalier et al.62 and stainedgels digitized at 300 dpi using a GS-800 densitometer (Bio-Rad).Image Analysis of 2-DE Gels. 2-DE gels were analyzed
using Progenesis SameSpots V. 4.0 image analysis software(Nonlinear Dynamics, Newcastle-upon-Tyne, UK). The samegel area was selected from duplicate gels of each time pointafter rennet addition. Gel areas were compared, and the proteinspot volumes were quantified as a mean of each replicate; spotquantities of all gels were normalized to remove non-expression-related variations in spot intensity as previouslydescribed.63 To normalize the raw protein spot volume, eachspot was expressed relative to the total volume of all spots onthat image. Statistical analysis separated proteins thatsignificantly increased or decreased (p < 0.05) after thetreatments.64
In-Gel Digestion. Protein spots were selected for furtheranalysis from preparative 2-DE and excised using a ∼2 mmdiameter punch; gel pieces were transferred to 1.5 mLEppendorf tubes. The gel spots were washed sequentiallywith Milli-Q water (Millipore Corp., Billerica, MA, USA), 25mM ammonium bicarbonate, acetonitrile/25 mM ammoniumbicarbonate (1:1, v/v), and acetonitrile. Gel fragments weredried using a Speed-Vac (GMI Inc., Ramsey, MN, USA), andthe proteins were digested by the addition of sequencing gradetrypsin (Promega, Charbonnieres, France) at 12.5 μg μL−1 in25 mM ammonium carbonate, which was added on ice. After15 min of gel rehydration, the proteins were digested at 37 °Cfor 2 h. Digested protein fragments were identified either byMALDI-TOF or by nano-LC MS/MS.Protein Identification by MALDI-TOF Mass Spectrom-
etry. Digested protein fragments were extracted by theaddition of 20 μL of 0.1% TFA and sonicated for 15 min.The supernatants were transferred to 500 μL polypropylenemicrocentrifuge tubes. Peptide extraction was carried out by theaddition of 20 μL of a 3:2 (v/v) acetonitrile/TFA solution andsonicated for 15 min. Supernatants were concentrated using aSpeed-Vac to a final volume of 10−20 μL. Peptides weresimultaneously desalted and concentrated using C18 Zip-Tipmicrocolumns, and supernatants were spotted directly on anAnchorChip MALDI target with α-cyano-4-hydroxycinnamicacid matrix solution and allowed to cocrystallize. Crystallizedsamples were washed with 0.1% TFA in water and recrystallizedfrom 6:3:1 (v/v/v) ethanol/acetone/0.1% TFA in water.Peptide mass fingerprinting (PMF) was done using anUltraFlex MALDI-TOF/TOF mass spectrophotometer
(Bruker, Bremen, Germany). The following parameters wereused for the database search: taxonomy restricted to mammalia,one missed cleavage allowed, carbamidomethylation ofcysteines as fixed modification, a mass tolerance of 30 ppmfor the parent ion, and a mass tolerance of 0.6 Da for fragmentions. A minimum of five peptides matching the protein wasused to validate the PMF identification, and peptide wasvalidated if the p value was <0.05.
Protein Identification by Nano-LC Mass Spectrome-try. When low-intensity protein spots could not be identifiedby MALDI-TOF mass spectrometry, nano-LC MS was used.Protein digests were extracted using formic acid and peptideswere analyzed using an ion trap mass spectrometer (EsquireHCT plus; Bruker, Billerica, MA, USA) coupled to ananochromatography system (HPLC 1200, Agilent, SantaClara, CA, USA) interfaced with an HPLC-Chip system(Chip Cube, Agilent). Samples were first loaded onto the 4mm enrichment cartridge at a flow rate of 4 μL min−1 using0.1% formic acid. After preconcentration, peptides wereseparated on the column (75 μm diameter, 43 mm length) ata flow rate of 0.3 μL min−1 using a 15 min linear gradient from3 to 80% acetonitrile in 0.1% formic acid and eluted into themass spectrometer. The tandem mass spectrometer was anEsquire HCT+ (Bruker Daltonik GmBH, Bremen, Germany)operating in positive ion mode. The automated data-dependentacquisition parameters were chosen such that only doubly andtriply charged precursor ions were selected for CID, excludingsingly charged ions. MS/MS raw data were analyzed using DataAnalysis software (Bruker Daltonik GmbH) to generate thepeak lists. MASCOT search engine software (Matrix Science,London, UK) was used to search the Swissprot database(release 20100121). The following parameters were used forthe database search: mass tolerance of 0.6 Da for parent andfragment ions, one missed cleavage allowed, carbamidomethy-lation of cysteines as fixed modification, peptide charge fixed at2+ and 3+, and taxonomy restricted to mammalia. A proteinwas validated once it showed at least one peptide with p < 0.05.
■ RESULTS AND DISCUSSION
RP-HPLC of Renneted Equine and Bovine Milk.Chromatograms of 2% TCA extracts of equine and bovinemilks renneted using Maxiren 180 and analyzed using C18 RP-HPLC are shown in Figure 1. Compared to a control bovinemilk, renneted bovine milk contained peptides eluting at ∼15and ∼16−17.5 min, which increased significantly in heightabout 4 min after rennet addition (Figure 1A) and continued toincrease up to 240 min. Renneted equine milk (Figure 1B) hada different RP-HPLC profile from that of bovine milk, and nopeptides appeared until ∼20 min after rennet addition. Thetime after rennet addition was therefore adjusted for equinemilk, and samples for RP-HPLC were taken for up to 20 h.
Table 1. Mass Spectrometry Results for Fractions a and b from C18 RP-HPLC Analysis of Equine Milk Renneted with Maxiren180 at pH 6.5 and 30 °C; Analysis Carried out Using MALDI-TOF MS/MS
equine protein obsd MW (Da) theor MW (Da) score sequencea amino acidsb
Fraction aβ-casein 2336.289 2336.274 141 L-GPTGELDPATQPIVAVHNPVI-V 203−225β-casein 1593.759 1593.867 48 V-APFPQPVVPYPQ-R 175−188
Fraction bβ-lg I 1677.872 1677.941 61 L-RPTPEDNLEIIL-R 45−58
aCleavage sites indicated by hyphens. bPeptides identified by mass spectrometry include the signal peptide (amino acids 1−15 for β-casein and 1−18for β-lg).
Journal of Agricultural and Food Chemistry Article
dx.doi.org/10.1021/jf3045846 | J. Agric. Food Chem. 2013, 61, 2839−28502842
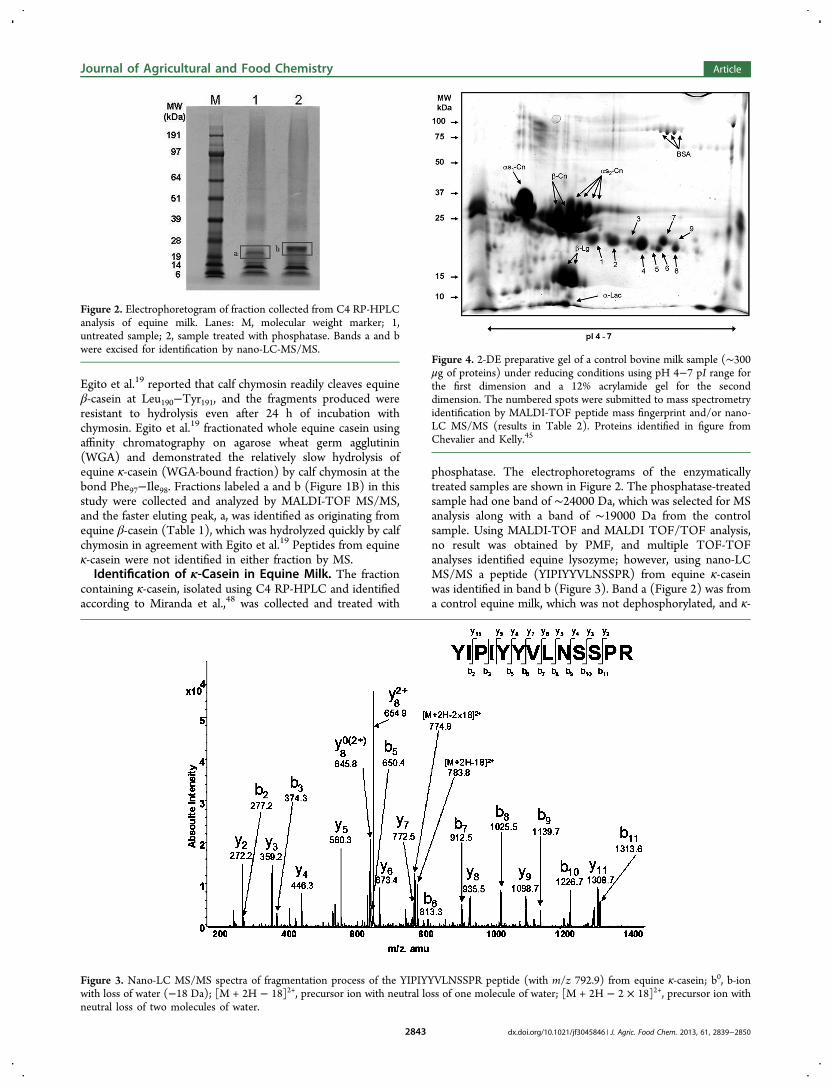
Egito et al.19 reported that calf chymosin readily cleaves equineβ-casein at Leu190−Tyr191, and the fragments produced wereresistant to hydrolysis even after 24 h of incubation withchymosin. Egito et al.19 fractionated whole equine casein usingaffinity chromatography on agarose wheat germ agglutinin(WGA) and demonstrated the relatively slow hydrolysis ofequine κ-casein (WGA-bound fraction) by calf chymosin at thebond Phe97−Ile98. Fractions labeled a and b (Figure 1B) in thisstudy were collected and analyzed by MALDI-TOF MS/MS,and the faster eluting peak, a, was identified as originating fromequine β-casein (Table 1), which was hydrolyzed quickly by calfchymosin in agreement with Egito et al.19 Peptides from equineκ-casein were not identified in either fraction by MS.Identification of κ-Casein in Equine Milk. The fraction
containing κ-casein, isolated using C4 RP-HPLC and identifiedaccording to Miranda et al.,48 was collected and treated with
phosphatase. The electrophoretograms of the enzymaticallytreated samples are shown in Figure 2. The phosphatase-treatedsample had one band of ∼24000 Da, which was selected for MSanalysis along with a band of ∼19000 Da from the controlsample. Using MALDI-TOF and MALDI TOF/TOF analysis,no result was obtained by PMF, and multiple TOF-TOFanalyses identified equine lysozyme; however, using nano-LCMS/MS a peptide (YIPIYYVLNSSPR) from equine κ-caseinwas identified in band b (Figure 3). Band a (Figure 2) was froma control equine milk, which was not dephosphorylated, and κ-
Figure 2. Electrophoretogram of fraction collected from C4 RP-HPLCanalysis of equine milk. Lanes: M, molecular weight marker; 1,untreated sample; 2, sample treated with phosphatase. Bands a and bwere excised for identification by nano-LC-MS/MS.
Figure 3. Nano-LC MS/MS spectra of fragmentation process of the YIPIYYVLNSSPR peptide (with m/z 792.9) from equine κ-casein; b0, b-ionwith loss of water (−18 Da); [M + 2H − 18]2+, precursor ion with neutral loss of one molecule of water; [M + 2H − 2 × 18]2+, precursor ion withneutral loss of two molecules of water.
Figure 4. 2-DE preparative gel of a control bovine milk sample (∼300μg of proteins) under reducing conditions using pH 4−7 pI range forthe first dimension and a 12% acrylamide gel for the seconddimension. The numbered spots were submitted to mass spectrometryidentification by MALDI-TOF peptide mass fingerprint and/or nano-LC MS/MS (results in Table 2). Proteins identified in figure fromChevalier and Kelly.45
Journal of Agricultural and Food Chemistry Article
dx.doi.org/10.1021/jf3045846 | J. Agric. Food Chem. 2013, 61, 2839−28502843
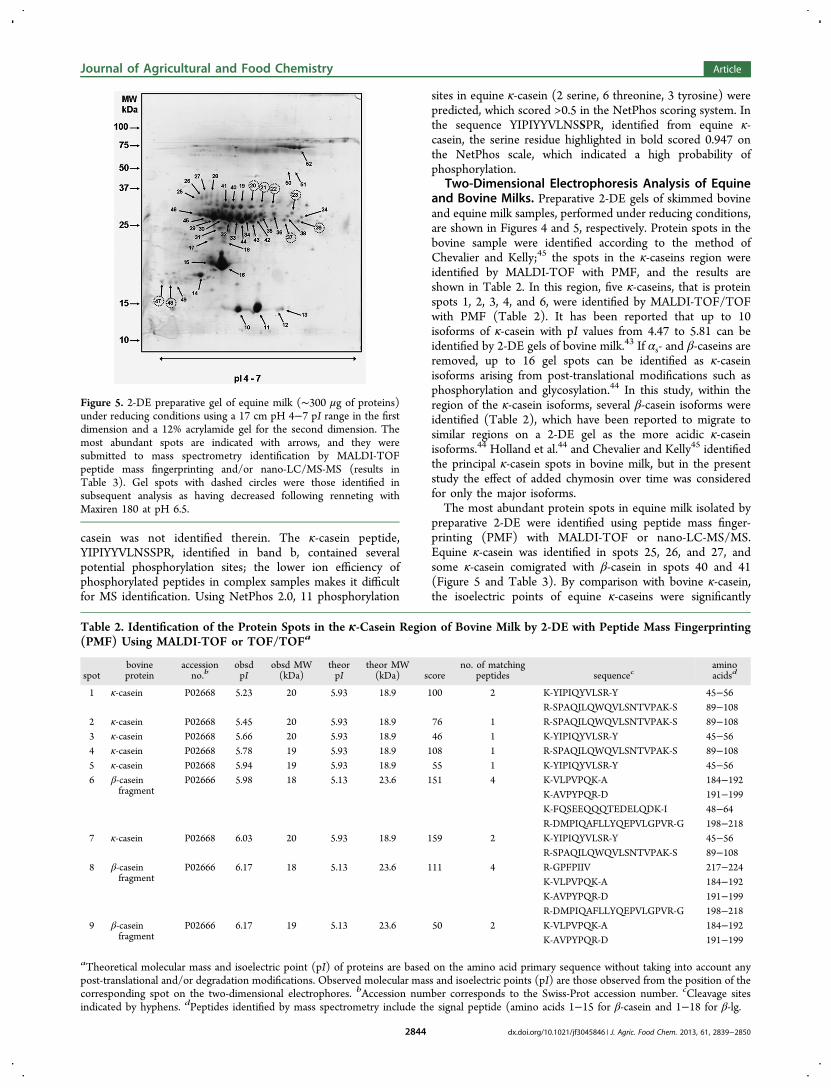
casein was not identified therein. The κ-casein peptide,YIPIYYVLNSSPR, identified in band b, contained severalpotential phosphorylation sites; the lower ion efficiency ofphosphorylated peptides in complex samples makes it difficultfor MS identification. Using NetPhos 2.0, 11 phosphorylation
sites in equine κ-casein (2 serine, 6 threonine, 3 tyrosine) werepredicted, which scored >0.5 in the NetPhos scoring system. Inthe sequence YIPIYYVLNSSPR, identified from equine κ-casein, the serine residue highlighted in bold scored 0.947 onthe NetPhos scale, which indicated a high probability ofphosphorylation.
Two-Dimensional Electrophoresis Analysis of Equineand Bovine Milks. Preparative 2-DE gels of skimmed bovineand equine milk samples, performed under reducing conditions,are shown in Figures 4 and 5, respectively. Protein spots in thebovine sample were identified according to the method ofChevalier and Kelly;45 the spots in the κ-caseins region wereidentified by MALDI-TOF with PMF, and the results areshown in Table 2. In this region, five κ-caseins, that is proteinspots 1, 2, 3, 4, and 6, were identified by MALDI-TOF/TOFwith PMF (Table 2). It has been reported that up to 10isoforms of κ-casein with pI values from 4.47 to 5.81 can beidentified by 2-DE gels of bovine milk.43 If αs- and β-caseins areremoved, up to 16 gel spots can be identified as κ-caseinisoforms arising from post-translational modifications such asphosphorylation and glycosylation.44 In this study, within theregion of the κ-casein isoforms, several β-casein isoforms wereidentified (Table 2), which have been reported to migrate tosimilar regions on a 2-DE gel as the more acidic κ-caseinisoforms.44 Holland et al.44 and Chevalier and Kelly45 identifiedthe principal κ-casein spots in bovine milk, but in the presentstudy the effect of added chymosin over time was consideredfor only the major isoforms.The most abundant protein spots in equine milk isolated by
preparative 2-DE were identified using peptide mass finger-printing (PMF) with MALDI-TOF or nano-LC-MS/MS.Equine κ-casein was identified in spots 25, 26, and 27, andsome κ-casein comigrated with β-casein in spots 40 and 41(Figure 5 and Table 3). By comparison with bovine κ-casein,the isoelectric points of equine κ-caseins were significantly
Figure 5. 2-DE preparative gel of equine milk (∼300 μg of proteins)under reducing conditions using a 17 cm pH 4−7 pI range in the firstdimension and a 12% acrylamide gel for the second dimension. Themost abundant spots are indicated with arrows, and they weresubmitted to mass spectrometry identification by MALDI-TOFpeptide mass fingerprinting and/or nano-LC/MS-MS (results inTable 3). Gel spots with dashed circles were those identified insubsequent analysis as having decreased following renneting withMaxiren 180 at pH 6.5.
Table 2. Identification of the Protein Spots in the κ-Casein Region of Bovine Milk by 2-DE with Peptide Mass Fingerprinting(PMF) Using MALDI-TOF or TOF/TOFa
spotbovineprotein
accessionno.b
obsdpI
obsd MW(kDa)
theorpI
theor MW(kDa) score
no. of matchingpeptides sequencec
aminoacidsd
1 κ-casein P02668 5.23 20 5.93 18.9 100 2 K-YIPIQYVLSR-Y 45−56R-SPAQILQWQVLSNTVPAK-S 89−108
2 κ-casein P02668 5.45 20 5.93 18.9 76 1 R-SPAQILQWQVLSNTVPAK-S 89−1083 κ-casein P02668 5.66 20 5.93 18.9 46 1 K-YIPIQYVLSR-Y 45−564 κ-casein P02668 5.78 19 5.93 18.9 108 1 R-SPAQILQWQVLSNTVPAK-S 89−1085 κ-casein P02668 5.94 19 5.93 18.9 55 1 K-YIPIQYVLSR-Y 45−566 β-casein
fragmentP02666 5.98 18 5.13 23.6 151 4 K-VLPVPQK-A 184−192
K-AVPYPQR-D 191−199K-FQSEEQQQTEDELQDK-I 48−64R-DMPIQAFLLYQEPVLGPVR-G 198−218
7 κ-casein P02668 6.03 20 5.93 18.9 159 2 K-YIPIQYVLSR-Y 45−56R-SPAQILQWQVLSNTVPAK-S 89−108
8 β-caseinfragment
P02666 6.17 18 5.13 23.6 111 4 R-GPFPIIV 217−224K-VLPVPQK-A 184−192K-AVPYPQR-D 191−199R-DMPIQAFLLYQEPVLGPVR-G 198−218
9 β-caseinfragment
P02666 6.17 19 5.13 23.6 50 2 K-VLPVPQK-A 184−192K-AVPYPQR-D 191−199
aTheoretical molecular mass and isoelectric point (pI) of proteins are based on the amino acid primary sequence without taking into account anypost-translational and/or degradation modifications. Observed molecular mass and isoelectric points (pI) are those observed from the position of thecorresponding spot on the two-dimensional electrophores. bAccession number corresponds to the Swiss-Prot accession number. cCleavage sitesindicated by hyphens. dPeptides identified by mass spectrometry include the signal peptide (amino acids 1−15 for β-casein and 1−18 for β-lg.
Journal of Agricultural and Food Chemistry Article
dx.doi.org/10.1021/jf3045846 | J. Agric. Food Chem. 2013, 61, 2839−28502844
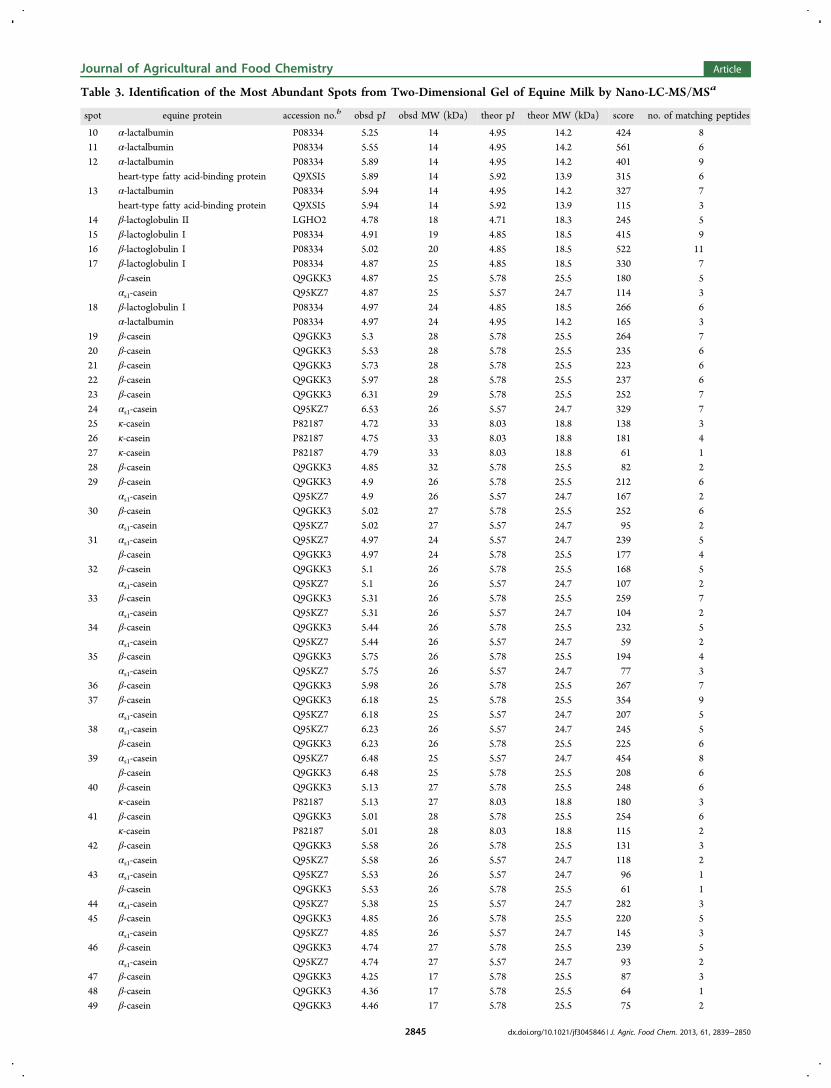
Table 3. Identification of the Most Abundant Spots from Two-Dimensional Gel of Equine Milk by Nano-LC-MS/MSa
spot equine protein accession no.b obsd pI obsd MW (kDa) theor pI theor MW (kDa) score no. of matching peptides
10 α-lactalbumin P08334 5.25 14 4.95 14.2 424 811 α-lactalbumin P08334 5.55 14 4.95 14.2 561 612 α-lactalbumin P08334 5.89 14 4.95 14.2 401 9
heart-type fatty acid-binding protein Q9XSI5 5.89 14 5.92 13.9 315 613 α-lactalbumin P08334 5.94 14 4.95 14.2 327 7
heart-type fatty acid-binding protein Q9XSI5 5.94 14 5.92 13.9 115 314 β-lactoglobulin II LGHO2 4.78 18 4.71 18.3 245 515 β-lactoglobulin I P08334 4.91 19 4.85 18.5 415 916 β-lactoglobulin I P08334 5.02 20 4.85 18.5 522 1117 β-lactoglobulin I P08334 4.87 25 4.85 18.5 330 7
β-casein Q9GKK3 4.87 25 5.78 25.5 180 5αs1-casein Q95KZ7 4.87 25 5.57 24.7 114 3
18 β-lactoglobulin I P08334 4.97 24 4.85 18.5 266 6α-lactalbumin P08334 4.97 24 4.95 14.2 165 3
19 β-casein Q9GKK3 5.3 28 5.78 25.5 264 720 β-casein Q9GKK3 5.53 28 5.78 25.5 235 621 β-casein Q9GKK3 5.73 28 5.78 25.5 223 622 β-casein Q9GKK3 5.97 28 5.78 25.5 237 623 β-casein Q9GKK3 6.31 29 5.78 25.5 252 724 αs1-casein Q95KZ7 6.53 26 5.57 24.7 329 725 κ-casein P82187 4.72 33 8.03 18.8 138 326 κ-casein P82187 4.75 33 8.03 18.8 181 427 κ-casein P82187 4.79 33 8.03 18.8 61 128 β-casein Q9GKK3 4.85 32 5.78 25.5 82 229 β-casein Q9GKK3 4.9 26 5.78 25.5 212 6
αs1-casein Q95KZ7 4.9 26 5.57 24.7 167 230 β-casein Q9GKK3 5.02 27 5.78 25.5 252 6
αs1-casein Q95KZ7 5.02 27 5.57 24.7 95 231 αs1-casein Q95KZ7 4.97 24 5.57 24.7 239 5
β-casein Q9GKK3 4.97 24 5.78 25.5 177 432 β-casein Q9GKK3 5.1 26 5.78 25.5 168 5
αs1-casein Q95KZ7 5.1 26 5.57 24.7 107 233 β-casein Q9GKK3 5.31 26 5.78 25.5 259 7
αs1-casein Q95KZ7 5.31 26 5.57 24.7 104 234 β-casein Q9GKK3 5.44 26 5.78 25.5 232 5
αs1-casein Q95KZ7 5.44 26 5.57 24.7 59 235 β-casein Q9GKK3 5.75 26 5.78 25.5 194 4
αs1-casein Q95KZ7 5.75 26 5.57 24.7 77 336 β-casein Q9GKK3 5.98 26 5.78 25.5 267 737 β-casein Q9GKK3 6.18 25 5.78 25.5 354 9
αs1-casein Q95KZ7 6.18 25 5.57 24.7 207 538 αs1-casein Q95KZ7 6.23 26 5.57 24.7 245 5
β-casein Q9GKK3 6.23 26 5.78 25.5 225 639 αs1-casein Q95KZ7 6.48 25 5.57 24.7 454 8
β-casein Q9GKK3 6.48 25 5.78 25.5 208 640 β-casein Q9GKK3 5.13 27 5.78 25.5 248 6
κ-casein P82187 5.13 27 8.03 18.8 180 341 β-casein Q9GKK3 5.01 28 5.78 25.5 254 6
κ-casein P82187 5.01 28 8.03 18.8 115 242 β-casein Q9GKK3 5.58 26 5.78 25.5 131 3
αs1-casein Q95KZ7 5.58 26 5.57 24.7 118 243 αs1-casein Q95KZ7 5.53 26 5.57 24.7 96 1
β-casein Q9GKK3 5.53 26 5.78 25.5 61 144 αs1-casein Q95KZ7 5.38 25 5.57 24.7 282 345 β-casein Q9GKK3 4.85 26 5.78 25.5 220 5
αs1-casein Q95KZ7 4.85 26 5.57 24.7 145 346 β-casein Q9GKK3 4.74 27 5.78 25.5 239 5
αs1-casein Q95KZ7 4.74 27 5.57 24.7 93 247 β-casein Q9GKK3 4.25 17 5.78 25.5 87 348 β-casein Q9GKK3 4.36 17 5.78 25.5 64 149 β-casein Q9GKK3 4.46 17 5.78 25.5 75 2
Journal of Agricultural and Food Chemistry Article
dx.doi.org/10.1021/jf3045846 | J. Agric. Food Chem. 2013, 61, 2839−28502845
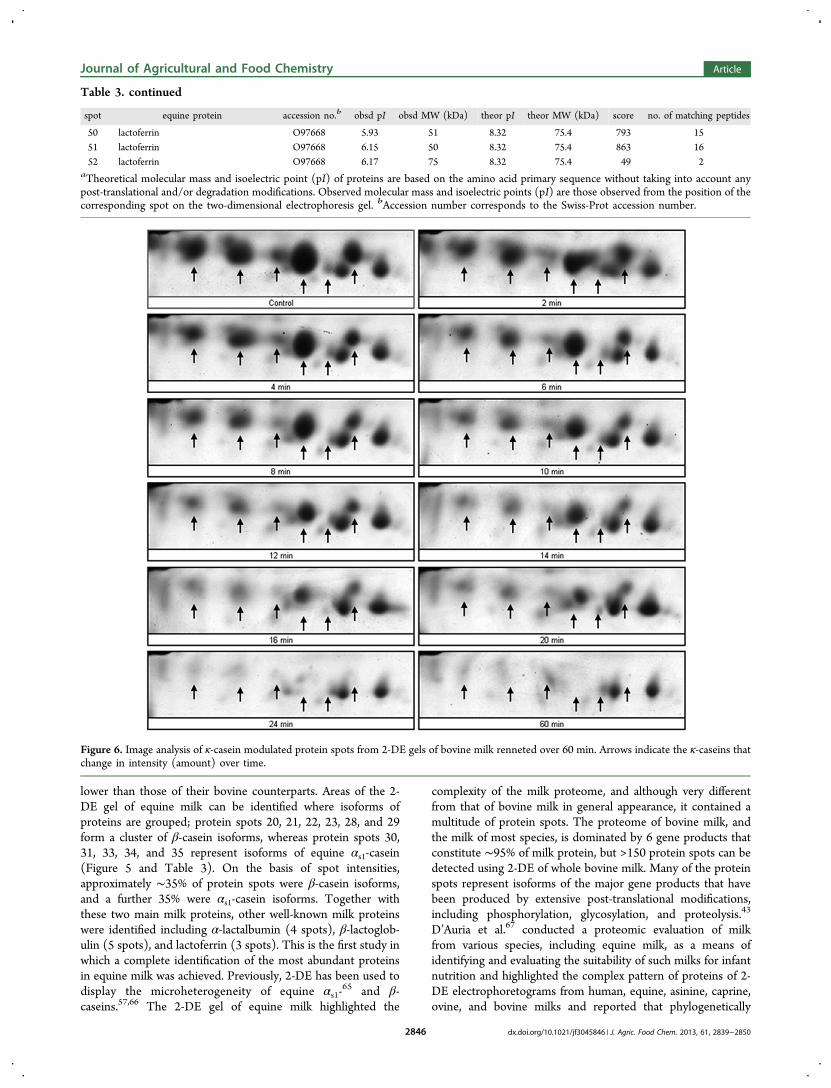
lower than those of their bovine counterparts. Areas of the 2-DE gel of equine milk can be identified where isoforms ofproteins are grouped; protein spots 20, 21, 22, 23, 28, and 29form a cluster of β-casein isoforms, whereas protein spots 30,31, 33, 34, and 35 represent isoforms of equine αs1-casein(Figure 5 and Table 3). On the basis of spot intensities,approximately ∼35% of protein spots were β-casein isoforms,and a further 35% were αs1-casein isoforms. Together withthese two main milk proteins, other well-known milk proteinswere identified including α-lactalbumin (4 spots), β-lactoglob-ulin (5 spots), and lactoferrin (3 spots). This is the first study inwhich a complete identification of the most abundant proteinsin equine milk was achieved. Previously, 2-DE has been used todisplay the microheterogeneity of equine αs1-
65 and β-caseins.57,66 The 2-DE gel of equine milk highlighted the
complexity of the milk proteome, and although very differentfrom that of bovine milk in general appearance, it contained amultitude of protein spots. The proteome of bovine milk, andthe milk of most species, is dominated by 6 gene products thatconstitute ∼95% of milk protein, but >150 protein spots can bedetected using 2-DE of whole bovine milk. Many of the proteinspots represent isoforms of the major gene products that havebeen produced by extensive post-translational modifications,including phosphorylation, glycosylation, and proteolysis.43
D’Auria et al.67 conducted a proteomic evaluation of milkfrom various species, including equine milk, as a means ofidentifying and evaluating the suitability of such milks for infantnutrition and highlighted the complex pattern of proteins of 2-DE electrophoretograms from human, equine, asinine, caprine,ovine, and bovine milks and reported that phylogenetically
Table 3. continued
spot equine protein accession no.b obsd pI obsd MW (kDa) theor pI theor MW (kDa) score no. of matching peptides
50 lactoferrin O97668 5.93 51 8.32 75.4 793 1551 lactoferrin O97668 6.15 50 8.32 75.4 863 1652 lactoferrin O97668 6.17 75 8.32 75.4 49 2
aTheoretical molecular mass and isoelectric point (pI) of proteins are based on the amino acid primary sequence without taking into account anypost-translational and/or degradation modifications. Observed molecular mass and isoelectric points (pI) are those observed from the position of thecorresponding spot on the two-dimensional electrophoresis gel. bAccession number corresponds to the Swiss-Prot accession number.
Figure 6. Image analysis of κ-casein modulated protein spots from 2-DE gels of bovine milk renneted over 60 min. Arrows indicate the κ-caseins thatchange in intensity (amount) over time.
Journal of Agricultural and Food Chemistry Article
dx.doi.org/10.1021/jf3045846 | J. Agric. Food Chem. 2013, 61, 2839−28502846
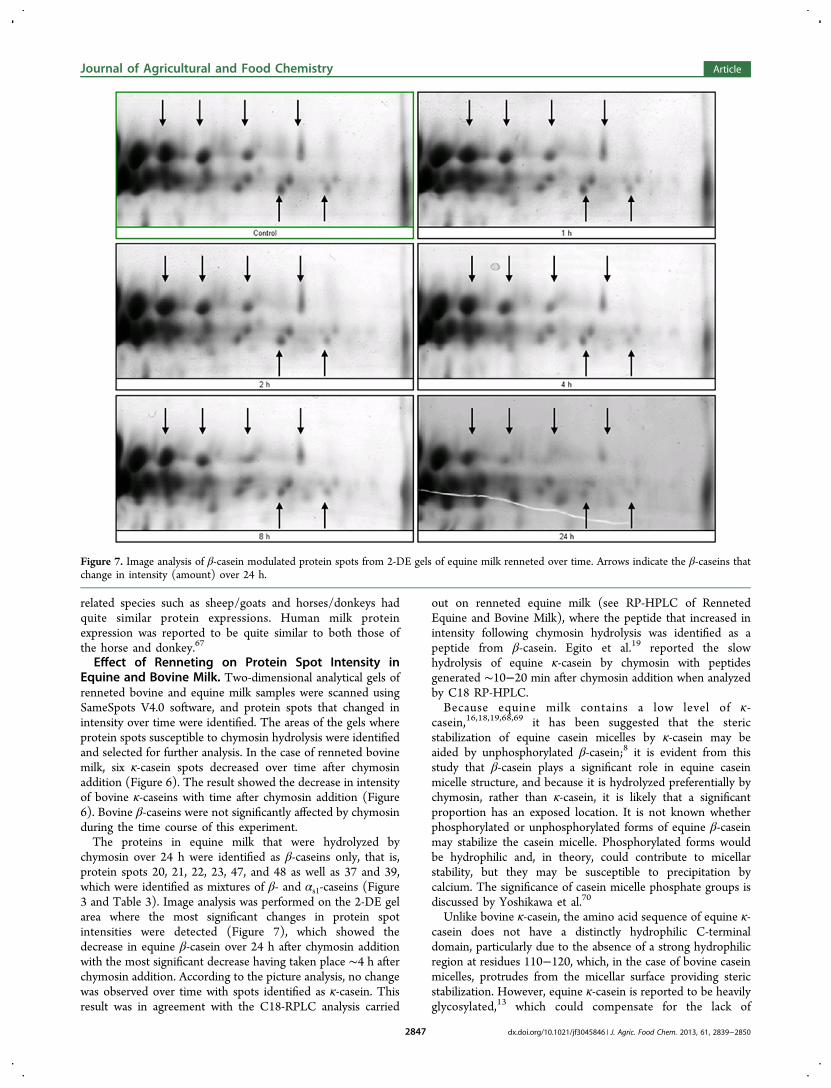
related species such as sheep/goats and horses/donkeys hadquite similar protein expressions. Human milk proteinexpression was reported to be quite similar to both those ofthe horse and donkey.67
Effect of Renneting on Protein Spot Intensity inEquine and Bovine Milk. Two-dimensional analytical gels ofrenneted bovine and equine milk samples were scanned usingSameSpots V4.0 software, and protein spots that changed inintensity over time were identified. The areas of the gels whereprotein spots susceptible to chymosin hydrolysis were identifiedand selected for further analysis. In the case of renneted bovinemilk, six κ-casein spots decreased over time after chymosinaddition (Figure 6). The result showed the decrease in intensityof bovine κ-caseins with time after chymosin addition (Figure6). Bovine β-caseins were not significantly affected by chymosinduring the time course of this experiment.The proteins in equine milk that were hydrolyzed by
chymosin over 24 h were identified as β-caseins only, that is,protein spots 20, 21, 22, 23, 47, and 48 as well as 37 and 39,which were identified as mixtures of β- and αs1-caseins (Figure3 and Table 3). Image analysis was performed on the 2-DE gelarea where the most significant changes in protein spotintensities were detected (Figure 7), which showed thedecrease in equine β-casein over 24 h after chymosin additionwith the most significant decrease having taken place ∼4 h afterchymosin addition. According to the picture analysis, no changewas observed over time with spots identified as κ-casein. Thisresult was in agreement with the C18-RPLC analysis carried
out on renneted equine milk (see RP-HPLC of RennetedEquine and Bovine Milk), where the peptide that increased inintensity following chymosin hydrolysis was identified as apeptide from β-casein. Egito et al.19 reported the slowhydrolysis of equine κ-casein by chymosin with peptidesgenerated ∼10−20 min after chymosin addition when analyzedby C18 RP-HPLC.Because equine milk contains a low level of κ-
casein,16,18,19,68,69 it has been suggested that the stericstabilization of equine casein micelles by κ-casein may beaided by unphosphorylated β-casein;8 it is evident from thisstudy that β-casein plays a significant role in equine caseinmicelle structure, and because it is hydrolyzed preferentially bychymosin, rather than κ-casein, it is likely that a significantproportion has an exposed location. It is not known whetherphosphorylated or unphosphorylated forms of equine β-caseinmay stabilize the casein micelle. Phosphorylated forms wouldbe hydrophilic and, in theory, could contribute to micellarstability, but they may be susceptible to precipitation bycalcium. The significance of casein micelle phosphate groups isdiscussed by Yoshikawa et al.70
Unlike bovine κ-casein, the amino acid sequence of equine κ-casein does not have a distinctly hydrophilic C-terminaldomain, particularly due to the absence of a strong hydrophilicregion at residues 110−120, which, in the case of bovine caseinmicelles, protrudes from the micellar surface providing stericstabilization. However, equine κ-casein is reported to be heavilyglycosylated,13 which could compensate for the lack of
Figure 7. Image analysis of β-casein modulated protein spots from 2-DE gels of equine milk renneted over time. Arrows indicate the β-caseins thatchange in intensity (amount) over 24 h.
Journal of Agricultural and Food Chemistry Article
dx.doi.org/10.1021/jf3045846 | J. Agric. Food Chem. 2013, 61, 2839−28502847
hydrophilic amino acid residues. The high level of glycosylationof equine κ-casein means the molecular mass of equine κ-caseinprior to post-translational modification is ∼18.8 kDa,14 whereasafter post-translational modification it is ∼25.3 kDa,28
suggesting that carbohydrate moieties represent ∼35% oftotal mass of equine κ-casein. For bovine κ-casein, glycosylationincreases the mass of κ-casein by <5%.71 The degree ofglycosylation of κ-casein can have considerable effects on thecolloidal stability of casein micelles.72,73
Conclusion. Isoforms of equine κ-casein were unequivocallyobserved and identified in several spots of a 2-DE map by MS.Also, a peptide from equine κ-casein was separated by C18 RP-HPLC and identified by MS analysis. This study demonstratedthe ability of 2-DE coupled with mass spectrometry and imageanalysis to follow the effects of renneting on milk proteins overtime. 2-DE and MS allowed the simultaneous evaluation of therelative abundance and modification of the endogenousproteins in equine and bovine milk following hydrolysis bycalf chymosin. Equine milk was susceptible to hydrolysis by calfchymosin over 24 h at 30 °C and pH 6.5, but the peptidesproduced were from equine β-casein, which was also confirmedby MS analysis of C18 RP-HPLC peptides. Whereas equine β-casein was hydrolyzed by chymosin, hydrolysis occurred at amuch slower rate compared to that of bovine κ-casein. In thisstudy, equine κ-casein was not susceptible to hydrolysis by calfchymosin. The hydrolysis pattern of equine caseins by calfchymosin is not necessarily unique, and other studies haveshown that the milk of a particular species is preferentiallycoagulated by chymosin from that species.74−79 The isolation ofequine chymosin and its ability to coagulate equine milk as wellas its hydrolysis of equine caseins warrants investigation.
■ AUTHOR INFORMATIONCorresponding Author*Postal address: Proteomic Platform, iRCM, CEA, Fontenayaux Roses, France. Phone: +33 (0)146 548 326. Fax: +33 (0)146 549 138. E-mail: [email protected] authors declare no competing financial interest.
■ REFERENCES(1) Fox, P. F.; McSweeney, P. L. H. Advanced Dairy Chemistry;Springer: Berlin, Germany, 2003.(2) Hajjoubi, S.; Rival-Gervier, S.; Hayes, H.; Floriot, S.; Eggen, A.;Piumi, F.; Chardon, P.; Houdebine, L.-M.; Thepot, D. Ruminantsgenome no longer contains whey acidic protein gene but only apseudogene. Gene 2006, 370, 104−112.(3) Rival-Gervier, S.; Thepot, D.; Jolivet, G.; Houdebine, L.-M. Pigwhey acidic protein gene is surrounded by two ubiquitously expressedgenes. Biochim. Biophys. Acta 2003, 1627, 7−14.(4) Uniacke-Lowe, T.; Fox, P. F. Milk | equid milk. In Encyclopedia ofDairy Sciences, 2nd ed.; Fuquay, J. W., Ed.; Academic Press: San Diego,CA, 2011; pp 518−529.(5) Uniacke-Lowe, T.; Huppertz, T.; Fox, P. F. Equine milk proteins:chemistry, structure and nutritional significance. Int. Dairy J. 2010, 20,609−629.(6) Uniacke-Lowe, T.; Fox, P. F. Equid milk: chemistry, biochemistryand processing. In Food Biochemistry and Food Processing, 2nd ed.;Simpson, B., Ed.; Wiley-Blackwell: Ames, IA, 2012; pp 491−530.(7) Salimei, E.; Fantuz, F. Equid milk for human consumption. Int.Dairy J. 2012, 24, 130−142.(8) Eigel, W. N.; Butler, J. E.; Ernstrom, C. A.; Farrell, H. M., Jr.;Harwalkar, V. R.; Jenness, R.; Whitney, R. M. Nomenclature ofproteins of cow’s milk: fifth revision. J. Dairy Sci. 1984, 67, 1599−1631.
(9) Farrell, H. M., Jr.; Jimenez-Flores, R.; Bleck, G. T.; Brown, E. M.;Butler, J. E.; Creamer, L. K.; Hicks, C. L.; Hollar, C. M.; Ng-Kwai-Hang, K. F.; Swaisgood, H. E. Nomenclature of the proteins of cows’milk, sixth revision. J. Dairy Sci. 2004, 87, 1641−1674.(10) Cunsolo, V.; Muccilli, V.; Saletti, R.; Foti, S. Review:applications of mass spectrometry techniques in the investigation ofmilk proteome. Eur. J. Mass Spectrom. (Chichester, UK) 2011, 17, 305−320.(11) Visser, S.; Jenness, R.; Mullin, R. J. Isolation and characterizationof β- and γ-caseins from horse milk. Biochem. J. 1982, 203, 131−139.(12) Ono, T.; Kohno, H.; Odagiri, S.; Takagi, T. Subunitcomponents of casein micelles from bovine, ovine, caprine and equinemilks. J. Dairy Res. 1989, 56, 61−68.(13) Ochirkhuyag, B.; Chobert, J.-M.; Dalgalarrondo, M.; Haertle, T.Characterization of mare caseins. Identification of α-S1- and α-S2-caseins. Lait 2000, 80, 223−235.(14) Hinz, K.; O’Connor, P. M.; Huppertz, T.; Ross, R. P.; Kelly, A.L. Comparison of the principal proteins in bovine, caprine, buffalo,equine and camel milk. J. Dairy Res. 2012, 79, 185−191.(15) Kotts, C.; Jenness, R. Isolation of κ-casein-like proteins frommilks of various species. J. Dairy Sci. 1976, 59, 816−822.(16) Malacarne, M.; Summer, A.; Formaggioni, P.; Mariani, P.Observations on percentage distribution of the main mare milk caseinsseparated by reversed-phase HPLC. Ann. Fac. Med. Vet., Univ. Parma2000, 20, 143−152.(17) Iametti, B. S.; Tedeschi, G.; Oungre, E.; Bonomi, F. Primarystructure of κ-casein isolated from mares’ milk. J. Dairy Res. 2001, 68,53−61.(18) Egito, A. S.; Miclo, L.; Lopez, C.; Adam, A.; Girardet, J. M.;Gaillard, J. L. Separation and characterization of mares’ milk α(s1)-, β-,κ-caseins, γ-casein-like, and proteose peptone component 5-likepeptides. J. Dairy Sci. 2002, 85, 697−706.(19) Egito, A. S.; Girardet, J.-M.; Miclo, L.; Molle, D.; Humbert, G.;Gaillard, J.-L. Susceptibility of equine κ- and β-caseins to hydrolysis bychymosin. Int. Dairy J. 2001, 11, 885−893.(20) Lenasi, T.; Rogelj, I.; Dovc, P. Characterization of equine cDNAsequences for αS1-, β- and κ-casein. J. Dairy Res. 2003, 70, 29−36.(21) Minkiewicz, P.; Dziuba, J.; Muzinska, B. The contribution of N-acetylneuraminic acid in the stabilization of micellar casein. Pol. J. FoodNutr. Sci. 1993, 2, 39−48.(22) Dziuba, J.; Minkiewicz, P. Influence of glycosylation on micelle-stabilizing ability and biological properties of C-terminal fragments ofcow’s κ-casein. Int. Dairy J. 1996, 6, 1017−1044.(23) Doreau, M.; Martin-Rosset, W. Dairy animals | horse. InEncyclopedia of Dairy Sciences; Roginski, H., Ed.; Elsevier: Oxford, UK,2002; pp 630−637.(24) Mercier, J. C.; Brignon, G.; Ribadeau-Dumas, B. [Primarystructure of bovine κB casein. Complete sequence]. Eur. J. Biochem.1973, 35, 222−235.(25) Crabbe, M. J. C. Rennets: general and molecular aspects. InCheese: Chemistry, Physics and Microbiology; Patrick, F., Fox, P. L. H.M., Eds.; Academic Press: San Diego, CA, 2004; Vol. 1, pp 19−45.(26) Neal A. Bringe, J. E. K. Use of platelet aggregometer to monitorthe chymosin-initiated coagulation of casein micelles. J. Dairy Res.1986, 53, 359−370.(27) Plowman, J. E.; Creamer, L. K.; Liddell, M. J.; Cross, J. J.Structural features of a peptide corresponding to human κ-caseinresidues 84−101 by 1H-nuclear magnetic resonance spectroscopy. J.Dairy Res. 1999, 66, 53−63.(28) Mercier, J. C.; Chobert, J. M.; Addeo, F. Comparative study ofthe amino acid sequences of the caseinomacropeptides from sevenspecies. FEBS Lett. 1976, 72, 208−214.(29) Yvon, M.; Beucher, S.; Guilloteau, P.; Le Huerou-Luron, I.;Corring, T. Effects of caseinomacropeptide (CMP) on digestionregulation. Reprod. Nutr. Dev. 1994, 34, 527−537.(30) Guilloteau, P.; Rome, V.; Delaby, L.; Mendy, F.; Roger, L.;Chayvialle, J. A. Is caseinomacropeptide from milk proteins, aninhibitor of gastric secretion? Regul. Pept. 2010, 159, 129−136.
Journal of Agricultural and Food Chemistry Article
dx.doi.org/10.1021/jf3045846 | J. Agric. Food Chem. 2013, 61, 2839−28502848
(31) Malkoski, M.; Dashper, S. G.; O’Brien-Simpson, N. M.; Talbo,G. H.; Macris, M.; Cross, K. J.; Reynolds, E. C. Kappacin, a novelantibacterial peptide from bovine milk. Antimicrob. Agents Chemother.2001, 45, 2309−2315.(32) Thoma-Worringer, C.; Sørensen, J.; Lopez-Fandino, R. Healtheffects and technological features of caseinomacropeptide. Int. Dairy J.2006, 16, 1324−1333.(33) Carles, C.; Ribadeau Dumas, B. Kinetics of the action ofchymosin (rennin) on a peptide bond of bovine αs1-casein.Comparison of the behaviour of this substrate with that of β- and κo-caseins. FEBS Lett. 1985, 185, 282−286.(34) Miranda, G.; Haze, G.; Scanff, P.; Pelissier, J. P. Hydrolysis of α-lactalbumin by chymosin and pepsin. Effect of conformation and pH.Lait 1989, 69, 451−459.(35) Businco, L.; Giampietro, P. G.; Lucenti, P.; Lucaroni, F.; Pini,C.; Di Felice, G.; Iacovacci, P.; Curadi, C.; Orlandi, M. Allergenicity ofmare’s milk in children with cow’s milk allergy. J. Allergy Clin. Immunol.2000, 105, 1031−1034.(36) Muraro, M. A.; Giampietro, P. G.; Galli, E. Soy formulas andnonbovine milk. Ann. Allergy Asthma Immunol. 2002, 89, 97−101.(37) Restani, P.; Beretta, B.; Fiocchi, A.; Ballabio, C.; Galli, C. L.Cross-reactivity between mammalian proteins. Ann. Allergy AsthmaImmunol. 2002, 89, 11−15.(38) Chevalier, F. Highlights on the capacities of “gel-based”proteomics. Proteome Sci 2010, 8, 23.(39) Galvani, M.; Hamdan, M.; Righetti, P. G. Two-dimensional gelelectrophoresis/matrix-assisted laser desorption/ionisation mass spec-trometry of a milk powder. Rapid Commun. Mass Spectrom. 2000, 14,1889−1897.(40) Gorg, A.; Weiss, W.; Dunn, M. J. Current two-dimensionalelectrophoresis technology for proteomics. Proteomics 2004, 4, 3665−3685.(41) Galvani, M.; Hamdan, M.; Righetti, P. G. Two-dimensional gelelectrophoresis/matrix-assisted laser desorption/ionisation mass spec-trometry of commercial bovine milk. Rapid Commun. Mass Spectrom.2001, 15, 258−264.(42) Lindmark-Mansson, H.; Timgren, A.; Alden, G.; Paulsson, M.Two-dimensional gel electrophoresis of proteins and peptides inbovine milk. Int. Dairy J. 2005, 15, 111−121.(43) Holland, J. W.; Deeth, H. C.; Alewood, P. F. Proteomic analysisof κ-casein micro-heterogeneity. Proteomics 2004, 4, 743−752.(44) Holland, J. W.; Deeth, H. C.; Alewood, P. F. Resolution andcharacterisation of multiple isoforms of bovine κ-casein by 2-DEfollowing a reversible cysteine-tagging enrichment strategy. Proteomics2006, 6, 3087−3095.(45) Chevalier, F.; Kelly, A. L. Proteomic quantification of disulfide-linked polymers in raw and heated bovine milk. J. Agric. Food Chem.2010, 58, 7437−7444.(46) Patel, H. A.; Singh, H.; Anema, S. G.; Creamer, L. K. Effects ofheat and high hydrostatic pressure treatments on disulfide bondinginterchanges among the proteins in skim milk. J. Agric. Food Chem.2006, 54, 3409−3420.(47) Chevalier, F.; Hirtz, C.; Sommerer, N.; Kelly, A. L. Use ofreducing/nonreducing two-dimensional electrophoresis for the studyof disulfide-mediated interactions between proteins in raw and heatedbovine milk. J. Agric. Food Chem. 2009, 57, 5948−5955.(48) Lodaite, K.; Chevalier, F.; Armaforte, E.; Kelly, A. L. Effect ofhigh-pressure homogenisation on rheological properties of rennet-induced skim milk and standardised milk gels. J. Dairy Res. 2009, 76,294−300.(49) Poth, A. G.; Deeth, H. C.; Alewood, P. F.; Holland, J. W.Analysis of the human casein phosphoproteome by 2-D electro-phoresis and MALDI-TOF/TOF MS reveals new phosphoforms. J.Proteome Res. 2008, 7, 5017−5027.(50) Armaforte, E.; Curran, E.; Huppertz, T.; Ryan, C. A.; Caboni, M.F.; O’Connor, P. M.; Ross, R. P.; Hirtz, C.; Sommerer, N.; Chevalier,F.; Kelly, A. L. Proteins and proteolysis in pre-term and term humanmilk and possible implications for infant formulae. Int. Dairy J. 2010,20, 715−723.
(51) Cunsolo, V.; Saletti, R.; Muccilli, V.; Foti, S. Characterization ofthe protein profile of donkey’s milk whey fraction. J. Mass Spectrom.2007, 42, 1162−1174.(52) Cunsolo, V.; Cairone, E.; Fontanini, D.; Criscione, A.; Muccilli,V.; Saletti, R.; Foti, S. Sequence determination of alphas1-caseinisoforms from donkey by mass spectrometric methods. J. MassSpectrom. 2009, 44, 1742−1753.(53) Marletta, D.; Criscione, A.; Cunsolo, V.; Zuccaro, A.; Muccilli,V.; Bordonaro, S.; Guastella, A. M.; D’Urso, G. Protein fractionheterogeneity in donkey’s milk analysed by proteomic methods. Ital. J.Anim. Sci. 2010, 6, 650−652.(54) Chianese, L.; Calabrese, M. G.; Ferranti, P.; Mauriello, R.;Garro, G.; De Simone, C.; Quarto, M.; Addeo, F.; Cosenza, G.;Ramunno, L. Proteomic characterization of donkey milk “caseome”. J.Chromatogr., A 2010, 1217, 4834−4840.(55) Criscione, A.; Cunsolo, V.; Bordonaro, S.; Guastella, A. M.;Saletti, R.; Zuccaro, A.; D’Urso, G.; Marletta, D. Donkeys’ milk proteinfraction investigated by electrophoretic methods and mass spectro-metric analysis. Int. Dairy J. 2009, 19, 190−197.(56) Vincenzetti, S.; Amici, A.; Pucciarelli, S.; Vita, A.; Micozzi, D.;Carpi, F. M.; Polzonetti, V.; Natalini, P.; Polidori, P. A proteomicstudy on donkey milk. Biochem. Anal. Biochem. 2012, 1, 1−8.(57) Girardet, J.-M.; Miclo, L.; Florent, S.; Molle, D.; Gaillard, J.-L.Determination of the phosphorylation level and deamidationsusceptibility of equine β-casein. Proteomics 2006, 6, 3707−3717.(58) Miclo, L.; Girardet, J.-M.; Egito, A. S.; Molle, D.; Martin, P.;Gaillard, J.-L. The primary structure of a low-Mr multiphosphorylatedvariant of β-casein in equine milk. Proteomics 2007, 7, 1327−1335.(59) Vasbinder, A. J.; Rollema, H. S.; De Kruif, C. G. Impairedrennetability of heated milk; study of enzymatic hydrolysis andgelation kinetics. J. Dairy Sci. 2003, 86, 1548−1555.(60) Chevalier, F.; Depagne, J.; Hem, S.; Chevillard, S.; Bensimon, J.;Bertrand, P.; Lebeau, J. Accumulation of cyclophilin A isoforms inconditioned medium of irradiated breast cancer cells. Proteomics 2012,12, 1756−1766.(61) Bradford, M. M. A rapid and sensitive method for thequantitation of microgram quantities of protein utilizing the principleof protein-dye binding. Anal. Biochem. 1976, 72, 248−254.(62) Chevalier, F.; Centeno, D.; Rofidal, V.; Tauzin, M.; Martin, O.;Sommerer, N.; Rossignol, M. Different impact of staining proceduresusing visible stains and fluorescent dyes for large-scale investigation ofproteomes by MALDI-TOF mass spectrometry. J. Proteome Res. 2006,5, 512−520.(63) Peric, D.; Labarre, J.; Chevalier, F.; Rousselet, G. Impairing themicroRNA biogenesis pathway induces proteome modificationscharacterized by size bias and enrichment in antioxidant proteins.Proteomics 2012, 12, 2295−2302.(64) Chevalier, F.; Rossignol, M. Proteomic analysis of Arabidopsisthaliana ecotypes with contrasted root architecture in response tophosphate deficiency. J. Plant Physiol. 2011, 168, 1885−1890.(65) Mateos, A.; Miclo, L.; Molle, D.; Dary, A.; Girardet, J.-M.;Gaillard, J.-L. Equine αS1-casein: characterization of alternative splicingisoforms and determination of phosphorylation levels. J. Dairy Sci.2009, 92, 3604−3615.(66) Mateos, A.; Girardet, J.-M.; Molle, D.; Dary, A.; Miclo, L.;Gaillard, J.-L. Two-dimensional cartography of equine β-casein variantsachieved by isolation of phosphorylation isoforms and control of thedeamidation phenomenon. J. Dairy Sci. 2009, 92, 2389−2399.(67) D’Auria, E.; Agostoni, C.; Giovannini, M.; Riva, E.; Zetterstrom,R.; Fortin, R.; Greppi, G. F.; Bonizzi, L.; Roncada, P. Proteomicevaluation of milk from different mammalian species as a substitute forbreast milk. Acta Paediatr. 2005, 94, 1708−1713.(68) Malacarne, M.; Martuzzi, F.; Summer, A.; Mariani, P. Proteinand fat composition of mare’s milk: some nutritional remarks withreference to human and cow’s milk. Int. Dairy J. 2002, 12, 869−877.(69) Miranda, G.; Mahe, M.-F.; Leroux, C.; Martin, P. Proteomictools to characterize the protein fraction of Equidae milk. Proteomics2004, 4, 2496−2509.
Journal of Agricultural and Food Chemistry Article
dx.doi.org/10.1021/jf3045846 | J. Agric. Food Chem. 2013, 61, 2839−28502849
(70) Yoshikawa, M.; Sasaki, R.; Chiba, H. Effects of chemicalphosphorylation of bovine casein components on the propertiesrelated to casein micelle formation. Agric. Biol. Chem. 1981, 45, 909−914.(71) Vreeman, H. J.; Both, P.; Brinkhuis, J. A.; Van der Spek, C.Purification and some physicochemical properties of bovine κ-casein.Biochim. Biophys. Acta 1977, 491, 93−103.(72) Dziuba, J.; Minkiewicz, P. Influence of glycosylation on micelle-stabilizing ability and biological properties of C-terminal fragments ofcow’s κ-casein. Int. Dairy J. 1996, 6, 1017−1044.(73) Cases, E.; Vidal, V.; Cuq, J. L. Effect of κ-casein deglycosylationon the acid coagulability of milk. J. Food Sci. 2003, 68, 2406−2410.(74) Mulvihill, D. M. Proteolysis of Caseins by Chymosins and Pepsins;National University of Ireland, 1978.(75) Foltmann, B. Gastric proteinases: structure, function, evolutionand mechanism of action. In Essays in Biochemistry; Compbell, P. N.,Marshall, R. D., Eds.; Academic Press: New York, 1981; Vol. 17, pp52−84.(76) Foltmann, B.; Jensen, A. L.; Lønblad, P.; Smidt, E.; Axelsen, N.H. A developmental analysis of the production of chymosin and pepsinin pigs. Comp. Biochem. Physiol. Part B: Comp. Biochem. 1981, 68, 9−13.(77) Wangoh, J.; Farah, Z.; Puhan, Z. Extraction of camel rennet andits comparison with calf rennet extract. Milchwissenschaft 1993, 48,322−325.(78) Kappeler, S. R.; Van den Brink, H. J. M.; Rahbek-Nielsen, H.;Farah, Z.; Puhan, Z.; Hansen, E. B.; Johansen, E. Characterization ofrecombinant camel chymosin reveals superior properties for thecoagulation of bovine and camel milk. Biochem. Biophys. Res. Commun.2006, 342, 647−654.(79) Bela Szecsi, P.; Harboe, M. Chapter 5 − Chymosin. InHandbook of Proteolytic Enzymes; Academic Press: San Diego, CA,2013; pp 37−42.
Journal of Agricultural and Food Chemistry Article
dx.doi.org/10.1021/jf3045846 | J. Agric. Food Chem. 2013, 61, 2839−28502850
Effet Bystander en Radiobiologie et Hadronthérapie
HDR François Chevalier Page 107
2 - Activités de Recherche au CEA
2.1 - Responsable de la plateforme de protéomique de l’iRCM
A mon départ de Fontenay-aux-Roses en juillet 2013, et après 6 années de fonctionnement, la
plateforme de protéomique a été remplacée par une plateforme d’ingénierie des protéines, axée sur le
clonage et l’expression de protéines recombinantes, gérée maintenant par Didier Busso (IR INSERM).
De 2007 à 2013, en tant que responsable titulaire de la plateforme de protéomique du CEA de
Fontenay-aux-Roses, j’ai participé à de nombreux projets de recherche parfois comme expert
technique ou comme principal intervenant. Pendant cette période, la plateforme de protéomique de
l'iRCM a partagé une expertise en biochimie des protéines et en analyse protéomique pour répondre à
des questions fondamentales en radiobiologie. L'équipe de la plate-forme protéomique a développé
une expertise spécifique pour interpréter et valider les données protéomiques à l'aide de logiciels bio-
analytiques spécialisés, tels que le logiciel ProGenesis Samespot.
Depuis la création de la plateforme, 16 projets de laboratoires de l’iRCM ont été réalisés avec
différents modèles biologiques (lignées cellulaires de mammifères, de levures, des tissus, des cellules
souches) et en utilisant un large choix d'expériences telles que l'extraction des protéines et la
quantification, l'immuno-purification, l'électrophorèse bidimensionnelle et western blot.
Les chapitres qui suivent reviennent sur certains développements technologiques en électrophorèse
bidimensionnelle (A1), ainsi que sur des projets réalisés en collaboration avec deux laboratoires de
l’iRCM (A2 et A3) qui ont donné lieu à des publications scientifiques.
2.1.1 - Développement technologique en analyse protéomique
Les méthodes protéomiques permettent l'analyse et la comparaison de toutes les protéines présentes
dans un échantillon biologique choisi. Notre technologie largement basée sur l'électrophorèse
bidimensionnelle permet une quantification précise de l'expression des protéines et modifications
post-traductionnelles, avec le soutien de plateformes externes de spectrométrie de masse pour
l'identification des protéines.
Une attention toute particulière a été portée sur la mise au point de conditions expérimentales
convenables pour la séparation des protéines aux caractéristiques biochimiques extrêmes, et plus
particulièrement aux protéines basiques, réputées difficiles à focaliser par électrophorèse
bidimensionnelle.
Effet Bystander en Radiobiologie et Hadronthérapie
HDR François Chevalier Page 108
Dans cette étude, trois protocoles différents ont été comparés en utilisant des extraits de protéines
issues de cellules MCF7 (lignée cellulaire issue d’un cancer du sein). Le protocole classique de
réhydration « in gel » des protéines a été comparé aux protocoles de chargement des protéines par
« cup loading » ou par « paper-bridge loading » sur des strips de focalisation dans une gamme de pI
de 6-11.
Comme cela était attendu, le protocole de réhydration « in gel » des protéines a présenté de larges
trainées horizontales alors que le protocole « paper-bridge loading » a permis une bonne focalisation
des protéines, mais avec une certaine perte de matériel.
Plusieurs conditions expérimentales ont été comparées afin d’optimiser la focalisation par « cup
loading » et la meilleure séparation a été observée avec des mèches cathodiques complétées avec la
solution de réhydratation et du DTT.
Le protocole « paper-bridge loading » a finalement été analysé en utilisant des échantillons non-
limitant en protéines, telles que les protéines de lait de vache. Dans ce cas, une bonne focalisation a
été obtenue, permettant la visualisation de spots uniques jusque-là non séparés.
2.1.2 - Analyse protéomique de la voie des micro-ARNs dans la cancérogénèse
Cette étude a été réalisée en associant trois équipes scientifiquement et techniquement
complémentaires : Germain Rousselet (Laboratoire de Génétique de la Radiosensibilité, CEA iRCM),
Jean Labarre (Laboratoire de Biologie Intégrative, CEA iBiTecs) et la plateforme de protéomique (CEA
iRCM).
Cette étude visait à mieux comprendre comment la perturbation de micro-ARNs individuels joue un
rôle dans la cancérogenèse.
Dans certaines cellules cancéreuses, l'inhibition globale de la voie de biogenèse des micro-ARNs
(CoGAM : colony growth arrest induced by microprocessor inhibition) conduit à un arrêt de croissance
qui peut être restaurée par la réexpression de certains micro-ARNs individuels tels que miR-20a.
En utilisant une stratégie expérimentale d’analyse globale du protéome cellulaire par gels 2D, nous
avons observé que l'inhibition de la voie de biogenèse des micro-ARNs induit de multiples
changements du profil protéique. En effet, la modification du protéome est caractérisée par une
modification de la taille des protéines exprimées, avec l'induction de protéines de faible poids
moléculaire et une réduction de l’expression de protéines de haut poids moléculaire.
Cette polarisation de la taille a été observée dans les cellules avec CoGAM, dans des cellules CoGAM
résistantes et dans les cellules sensibles à CoGAM secourues par miR-20a. Dans ce cas, l’analyse
des protéines identifiées par spectrométrie de masse a révélé un enrichissement significatif en
protéines impliquées dans la résistance au stress oxydatif. En outre, un traitement par H2O2 chez
Saccharomyces cerevisiae ou dans des cellules de mammifères conduit aussi à une modification du
protéome de même ordre. Nos résultats ont montré le rôle de la taille des protéines comme une
lecture pertinente de modifications du protéome, en particulier dans des conditions de stress telles
que l'inhibition de la voie de la biogenèse des micro-ARNs ou le stress oxydatif.

Effet Bystander en Radiobiologie et Hadronthérapie
HDR François Chevalier Page 109
2.1.3 - Analyse protéomique d’un effet bystander radio-induit
Les protéines sécrétées jouent un rôle clé dans la signalisation et la communication intercellulaire
radio-induite. Les facteurs sécrétés peuvent alors induire une réponse cellulaire proche d’un effet
direct radio-induit, on parle alors d’effet bystander.
En utilisant un modèle in vitro de cellules mammaires, l'objectif de notre travail était d'identifier les
facteurs diffusibles, sécrétés après irradiation gamma et potentiellement impliqués dans la
signalisation intercellulaire.
L'analyse protéomique différentielle des milieux conditionnés a été effectuée en utilisant
l’électrophorèse bidimensionnelle. Cette analyse a entraîné la détection de nombreux spots modulés
de manière significative suivant l'irradiation des cellules. Les protéines correspondantes ont été
identifiées par des approches de type MALDI-TOF MS et LC-MS / MS.
Après analyse des résultats, il est intéressant de noter que cinq isoformes de cyclophiline A ont été
sécrétées spécifiquement dans le milieu conditionné de cellules irradiées. Cette observation a été
confirmée par Western blotting. Ces isoformes diffèrent principalement de par leur point isoélectrique
grâce à des modifications post-traductionnelles, comprenant la suppression partielle de la méthionine
N-terminale, associée à une combinaison d'acétylation et de méthylation.
Le rôle de la protéine est discuté en relation avec son implication potentielle dans les mécanismes de
communications intercellulaires et d’effet bystander.
2.1.4 - Sélection de publications
Dépagne J., Chevalier F.
Technical updates to basic proteins focalization using IPG strips (2012) Proteome
Science 10:54 (6 September 2012)
Peric D., Labarre J., Chevalier F., and Rousselet G.
Impairing the micro-RNA pathway induces proteome modifications characterized by size
bias and enrichment in anti-oxidant proteins. (2012) Proteomics, 12(13): 2295–2302.
Chevalier F., Depagne J., Hem S., Chevillard S., Bensimon J., Bertrand P., and Lebeau J.
Accumulation of Cyclophilin A isoforms in conditioned medium of irradiated breast cancer
cells (2012) Proteomics, 12(11): 1756–1766.
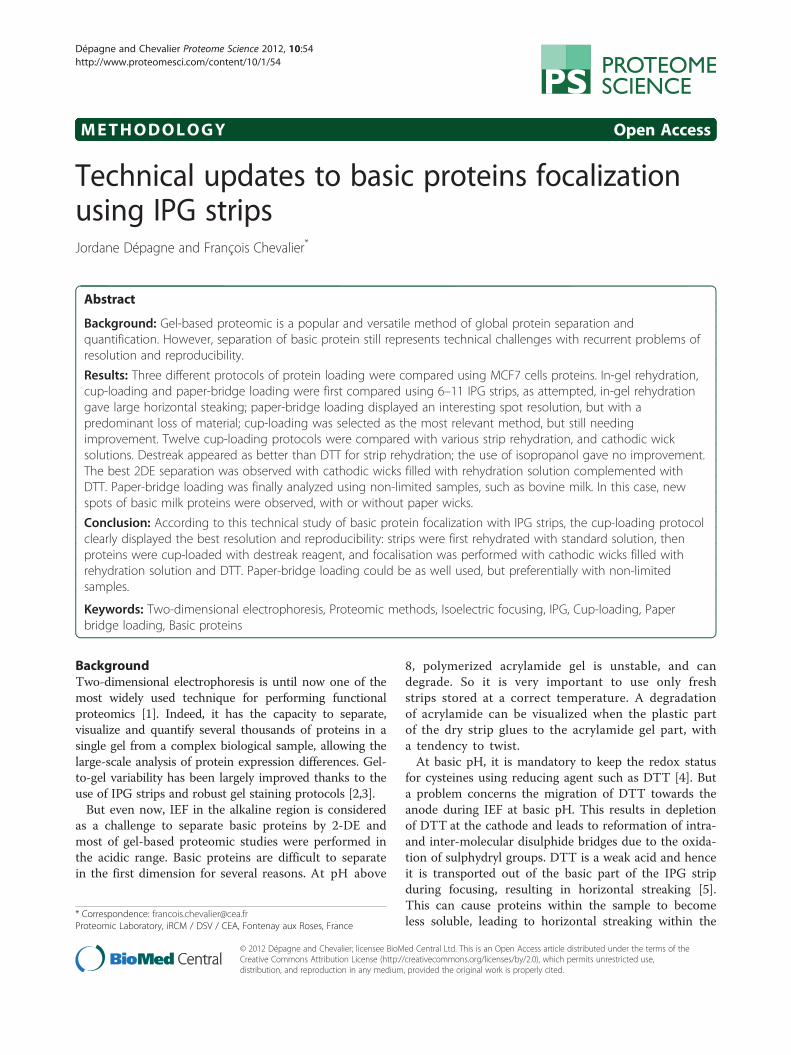
Dépagne and Chevalier Proteome Science 2012, 10:54http://www.proteomesci.com/content/10/1/54
METHODOLOGY Open Access
Technical updates to basic proteins focalizationusing IPG stripsJordane Dépagne and François Chevalier*
Abstract
Background: Gel-based proteomic is a popular and versatile method of global protein separation andquantification. However, separation of basic protein still represents technical challenges with recurrent problems ofresolution and reproducibility.
Results: Three different protocols of protein loading were compared using MCF7 cells proteins. In-gel rehydration,cup-loading and paper-bridge loading were first compared using 6–11 IPG strips, as attempted, in-gel rehydrationgave large horizontal steaking; paper-bridge loading displayed an interesting spot resolution, but with apredominant loss of material; cup-loading was selected as the most relevant method, but still needingimprovement. Twelve cup-loading protocols were compared with various strip rehydration, and cathodic wicksolutions. Destreak appeared as better than DTT for strip rehydration; the use of isopropanol gave no improvement.The best 2DE separation was observed with cathodic wicks filled with rehydration solution complemented withDTT. Paper-bridge loading was finally analyzed using non-limited samples, such as bovine milk. In this case, newspots of basic milk proteins were observed, with or without paper wicks.
Conclusion: According to this technical study of basic protein focalization with IPG strips, the cup-loading protocolclearly displayed the best resolution and reproducibility: strips were first rehydrated with standard solution, thenproteins were cup-loaded with destreak reagent, and focalisation was performed with cathodic wicks filled withrehydration solution and DTT. Paper-bridge loading could be as well used, but preferentially with non-limitedsamples.
Keywords: Two-dimensional electrophoresis, Proteomic methods, Isoelectric focusing, IPG, Cup-loading, Paperbridge loading, Basic proteins
BackgroundTwo-dimensional electrophoresis is until now one of themost widely used technique for performing functionalproteomics [1]. Indeed, it has the capacity to separate,visualize and quantify several thousands of proteins in asingle gel from a complex biological sample, allowing thelarge-scale analysis of protein expression differences. Gel-to-gel variability has been largely improved thanks to theuse of IPG strips and robust gel staining protocols [2,3].But even now, IEF in the alkaline region is considered
as a challenge to separate basic proteins by 2-DE andmost of gel-based proteomic studies were performed inthe acidic range. Basic proteins are difficult to separatein the first dimension for several reasons. At pH above
* Correspondence: [email protected] Laboratory, iRCM / DSV / CEA, Fontenay aux Roses, France
© 2012 Dépagne and Chevalier; licensee BioMCreative Commons Attribution License (http:/distribution, and reproduction in any medium
8, polymerized acrylamide gel is unstable, and candegrade. So it is very important to use only freshstrips stored at a correct temperature. A degradationof acrylamide can be visualized when the plastic partof the dry strip glues to the acrylamide gel part, witha tendency to twist.At basic pH, it is mandatory to keep the redox status
for cysteines using reducing agent such as DTT [4]. Buta problem concerns the migration of DTT towards theanode during IEF at basic pH. This results in depletionof DTT at the cathode and leads to reformation of intra-and inter-molecular disulphide bridges due to the oxida-tion of sulphydryl groups. DTT is a weak acid and henceit is transported out of the basic part of the IPG stripduring focusing, resulting in horizontal streaking [5].This can cause proteins within the sample to becomeless soluble, leading to horizontal streaking within the
ed Central Ltd. This is an Open Access article distributed under the terms of the/creativecommons.org/licenses/by/2.0), which permits unrestricted use,, provided the original work is properly cited.
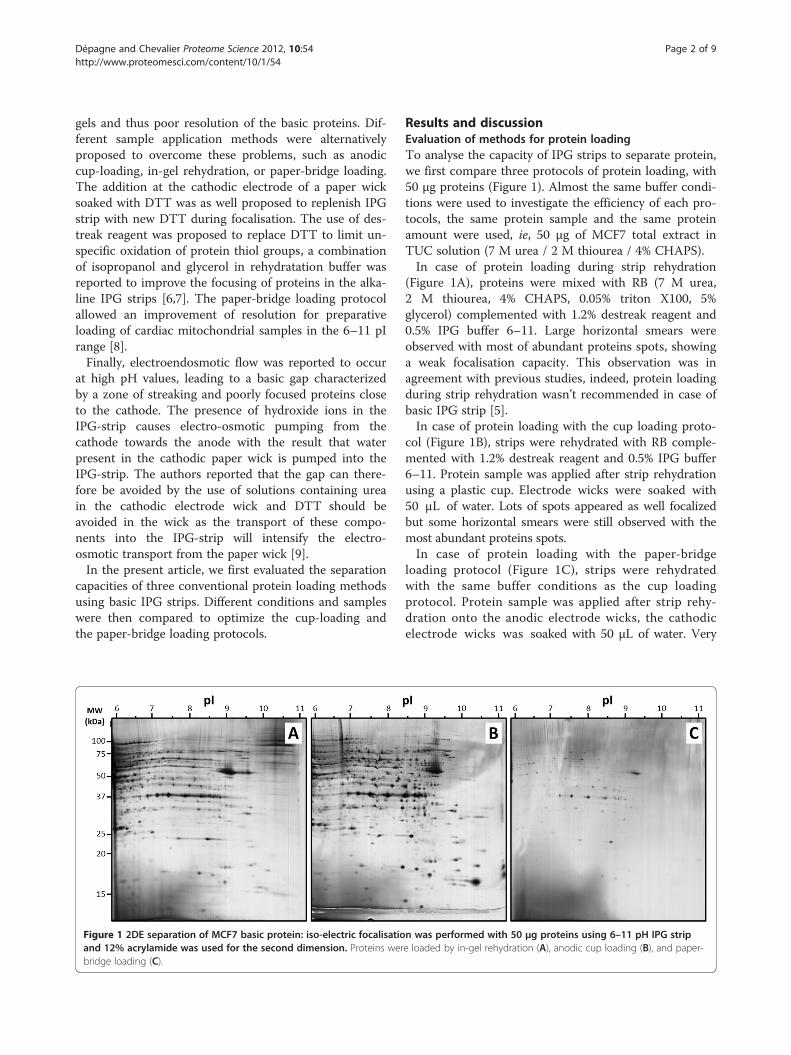
Dépagne and Chevalier Proteome Science 2012, 10:54 Page 2 of 9http://www.proteomesci.com/content/10/1/54
gels and thus poor resolution of the basic proteins. Dif-ferent sample application methods were alternativelyproposed to overcome these problems, such as anodiccup-loading, in-gel rehydration, or paper-bridge loading.The addition at the cathodic electrode of a paper wicksoaked with DTT was as well proposed to replenish IPGstrip with new DTT during focalisation. The use of des-treak reagent was proposed to replace DTT to limit un-specific oxidation of protein thiol groups, a combinationof isopropanol and glycerol in rehydratation buffer wasreported to improve the focusing of proteins in the alka-line IPG strips [6,7]. The paper-bridge loading protocolallowed an improvement of resolution for preparativeloading of cardiac mitochondrial samples in the 6–11 pIrange [8].Finally, electroendosmotic flow was reported to occur
at high pH values, leading to a basic gap characterizedby a zone of streaking and poorly focused proteins closeto the cathode. The presence of hydroxide ions in theIPG-strip causes electro-osmotic pumping from thecathode towards the anode with the result that waterpresent in the cathodic paper wick is pumped into theIPG-strip. The authors reported that the gap can there-fore be avoided by the use of solutions containing ureain the cathodic electrode wick and DTT should beavoided in the wick as the transport of these compo-nents into the IPG-strip will intensify the electro-osmotic transport from the paper wick [9].In the present article, we first evaluated the separation
capacities of three conventional protein loading methodsusing basic IPG strips. Different conditions and sampleswere then compared to optimize the cup-loading andthe paper-bridge loading protocols.
Figure 1 2DE separation of MCF7 basic protein: iso-electric focalisatioand 12% acrylamide was used for the second dimension. Proteins werbridge loading (C).
Results and discussionEvaluation of methods for protein loadingTo analyse the capacity of IPG strips to separate protein,we first compare three protocols of protein loading, with50 μg proteins (Figure 1). Almost the same buffer condi-tions were used to investigate the efficiency of each pro-tocols, the same protein sample and the same proteinamount were used, ie, 50 μg of MCF7 total extract inTUC solution (7 M urea / 2 M thiourea / 4% CHAPS).In case of protein loading during strip rehydration
(Figure 1A), proteins were mixed with RB (7 M urea,2 M thiourea, 4% CHAPS, 0.05% triton X100, 5%glycerol) complemented with 1.2% destreak reagent and0.5% IPG buffer 6–11. Large horizontal smears wereobserved with most of abundant proteins spots, showinga weak focalisation capacity. This observation was inagreement with previous studies, indeed, protein loadingduring strip rehydration wasn’t recommended in case ofbasic IPG strip [5].In case of protein loading with the cup loading proto-
col (Figure 1B), strips were rehydrated with RB comple-mented with 1.2% destreak reagent and 0.5% IPG buffer6–11. Protein sample was applied after strip rehydrationusing a plastic cup. Electrode wicks were soaked with50 μL of water. Lots of spots appeared as well focalizedbut some horizontal smears were still observed with themost abundant proteins spots.In case of protein loading with the paper-bridge
loading protocol (Figure 1C), strips were rehydratedwith the same buffer conditions as the cup loadingprotocol. Protein sample was applied after strip rehy-dration onto the anodic electrode wicks, the cathodicelectrode wicks was soaked with 50 μL of water. Very
n was performed with 50 μg proteins using 6–11 pH IPG stripe loaded by in-gel rehydration (A), anodic cup loading (B), and paper-
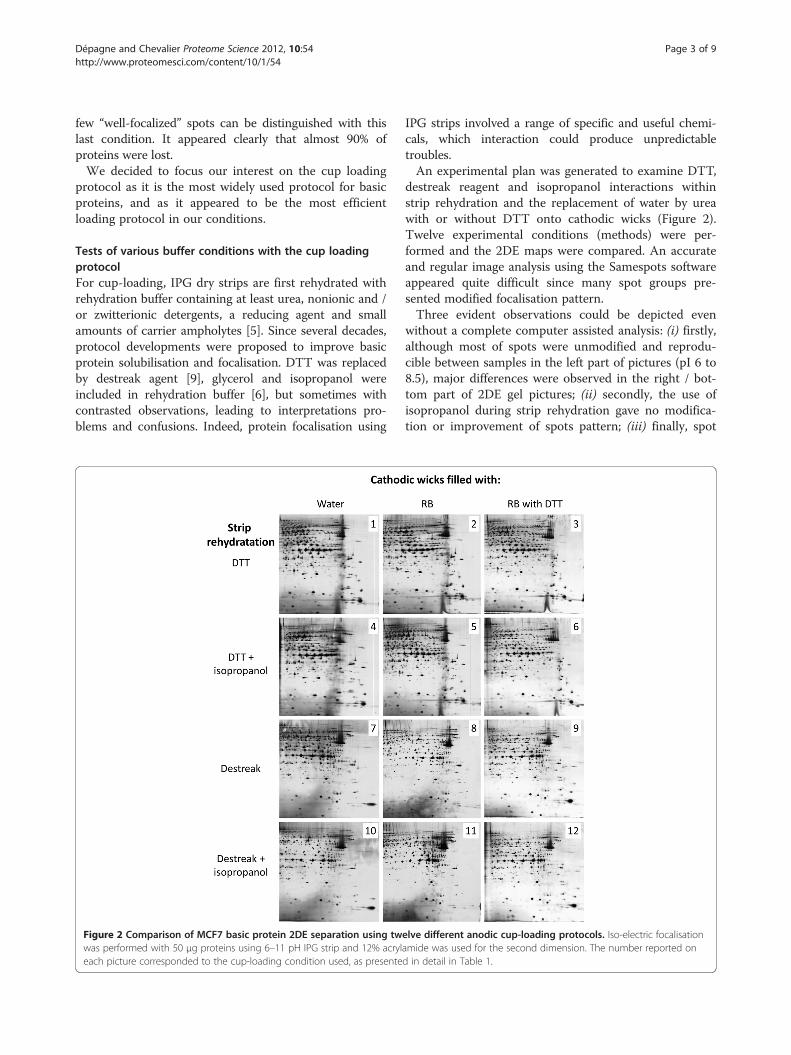
Dépagne and Chevalier Proteome Science 2012, 10:54 Page 3 of 9http://www.proteomesci.com/content/10/1/54
few “well-focalized” spots can be distinguished with thislast condition. It appeared clearly that almost 90% ofproteins were lost.We decided to focus our interest on the cup loading
protocol as it is the most widely used protocol for basicproteins, and as it appeared to be the most efficientloading protocol in our conditions.
Tests of various buffer conditions with the cup loadingprotocolFor cup-loading, IPG dry strips are first rehydrated withrehydration buffer containing at least urea, nonionic and /or zwitterionic detergents, a reducing agent and smallamounts of carrier ampholytes [5]. Since several decades,protocol developments were proposed to improve basicprotein solubilisation and focalisation. DTT was replacedby destreak agent [9], glycerol and isopropanol wereincluded in rehydration buffer [6], but sometimes withcontrasted observations, leading to interpretations pro-blems and confusions. Indeed, protein focalisation using
Figure 2 Comparison of MCF7 basic protein 2DE separation using twwas performed with 50 μg proteins using 6–11 pH IPG strip and 12% acryleach picture corresponded to the cup-loading condition used, as presente
IPG strips involved a range of specific and useful chemi-cals, which interaction could produce unpredictabletroubles.An experimental plan was generated to examine DTT,
destreak reagent and isopropanol interactions withinstrip rehydration and the replacement of water by ureawith or without DTT onto cathodic wicks (Figure 2).Twelve experimental conditions (methods) were per-formed and the 2DE maps were compared. An accurateand regular image analysis using the Samespots softwareappeared quite difficult since many spot groups pre-sented modified focalisation pattern.Three evident observations could be depicted even
without a complete computer assisted analysis: (i) firstly,although most of spots were unmodified and reprodu-cible between samples in the left part of pictures (pI 6 to8.5), major differences were observed in the right / bot-tom part of 2DE gel pictures; (ii) secondly, the use ofisopropanol during strip rehydration gave no modifica-tion or improvement of spots pattern; (iii) finally, spot
elve different anodic cup-loading protocols. Iso-electric focalisationamide was used for the second dimension. The number reported ond in detail in Table 1.
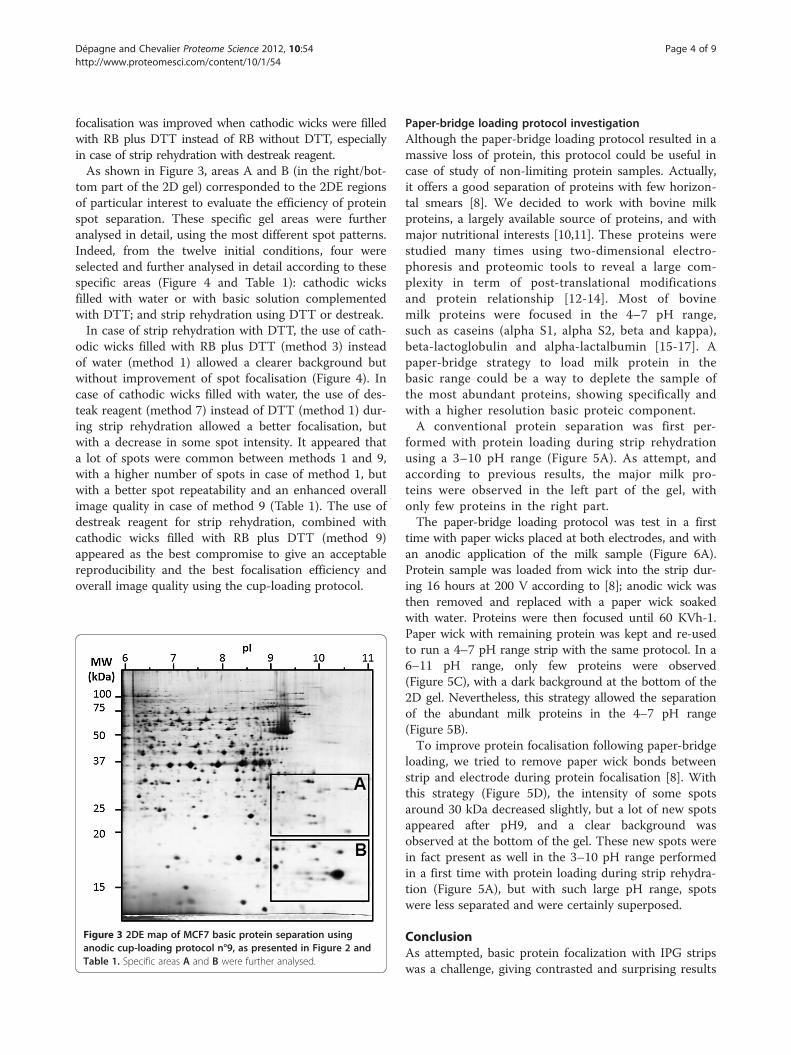
Dépagne and Chevalier Proteome Science 2012, 10:54 Page 4 of 9http://www.proteomesci.com/content/10/1/54
focalisation was improved when cathodic wicks were filledwith RB plus DTT instead of RB without DTT, especiallyin case of strip rehydration with destreak reagent.As shown in Figure 3, areas A and B (in the right/bot-
tom part of the 2D gel) corresponded to the 2DE regionsof particular interest to evaluate the efficiency of proteinspot separation. These specific gel areas were furtheranalysed in detail, using the most different spot patterns.Indeed, from the twelve initial conditions, four wereselected and further analysed in detail according to thesespecific areas (Figure 4 and Table 1): cathodic wicksfilled with water or with basic solution complementedwith DTT; and strip rehydration using DTT or destreak.In case of strip rehydration with DTT, the use of cath-
odic wicks filled with RB plus DTT (method 3) insteadof water (method 1) allowed a clearer background butwithout improvement of spot focalisation (Figure 4). Incase of cathodic wicks filled with water, the use of des-teak reagent (method 7) instead of DTT (method 1) dur-ing strip rehydration allowed a better focalisation, butwith a decrease in some spot intensity. It appeared thata lot of spots were common between methods 1 and 9,with a higher number of spots in case of method 1, butwith a better spot repeatability and an enhanced overallimage quality in case of method 9 (Table 1). The use ofdestreak reagent for strip rehydration, combined withcathodic wicks filled with RB plus DTT (method 9)appeared as the best compromise to give an acceptablereproducibility and the best focalisation efficiency andoverall image quality using the cup-loading protocol.
Figure 3 2DE map of MCF7 basic protein separation usinganodic cup-loading protocol n°9, as presented in Figure 2 andTable 1. Specific areas A and B were further analysed.
Paper-bridge loading protocol investigationAlthough the paper-bridge loading protocol resulted in amassive loss of protein, this protocol could be useful incase of study of non-limiting protein samples. Actually,it offers a good separation of proteins with few horizon-tal smears [8]. We decided to work with bovine milkproteins, a largely available source of proteins, and withmajor nutritional interests [10,11]. These proteins werestudied many times using two-dimensional electro-phoresis and proteomic tools to reveal a large com-plexity in term of post-translational modificationsand protein relationship [12-14]. Most of bovinemilk proteins were focused in the 4–7 pH range,such as caseins (alpha S1, alpha S2, beta and kappa),beta-lactoglobulin and alpha-lactalbumin [15-17]. Apaper-bridge strategy to load milk protein in thebasic range could be a way to deplete the sample ofthe most abundant proteins, showing specifically andwith a higher resolution basic proteic component.A conventional protein separation was first per-
formed with protein loading during strip rehydrationusing a 3–10 pH range (Figure 5A). As attempt, andaccording to previous results, the major milk pro-teins were observed in the left part of the gel, withonly few proteins in the right part.The paper-bridge loading protocol was test in a first
time with paper wicks placed at both electrodes, and withan anodic application of the milk sample (Figure 6A).Protein sample was loaded from wick into the strip dur-ing 16 hours at 200 V according to [8]; anodic wick wasthen removed and replaced with a paper wick soakedwith water. Proteins were then focused until 60 KVh-1.Paper wick with remaining protein was kept and re-usedto run a 4–7 pH range strip with the same protocol. In a6–11 pH range, only few proteins were observed(Figure 5C), with a dark background at the bottom of the2D gel. Nevertheless, this strategy allowed the separationof the abundant milk proteins in the 4–7 pH range(Figure 5B).To improve protein focalisation following paper-bridge
loading, we tried to remove paper wick bonds betweenstrip and electrode during protein focalisation [8]. Withthis strategy (Figure 5D), the intensity of some spotsaround 30 kDa decreased slightly, but a lot of new spotsappeared after pH9, and a clear background wasobserved at the bottom of the gel. These new spots werein fact present as well in the 3–10 pH range performedin a first time with protein loading during strip rehydra-tion (Figure 5A), but with such large pH range, spotswere less separated and were certainly superposed.
ConclusionAs attempted, basic protein focalization with IPG stripswas a challenge, giving contrasted and surprising results
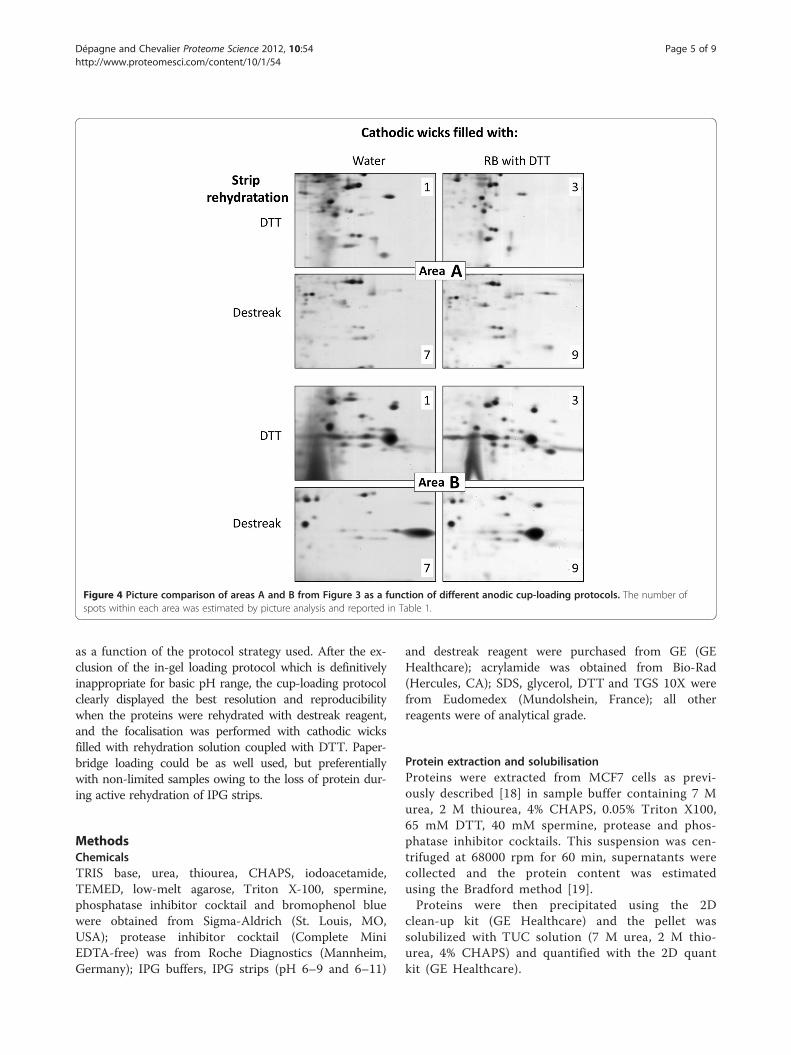
Figure 4 Picture comparison of areas A and B from Figure 3 as a function of different anodic cup-loading protocols. The number ofspots within each area was estimated by picture analysis and reported in Table 1.
Dépagne and Chevalier Proteome Science 2012, 10:54 Page 5 of 9http://www.proteomesci.com/content/10/1/54
as a function of the protocol strategy used. After the ex-clusion of the in-gel loading protocol which is definitivelyinappropriate for basic pH range, the cup-loading protocolclearly displayed the best resolution and reproducibilitywhen the proteins were rehydrated with destreak reagent,and the focalisation was performed with cathodic wicksfilled with rehydration solution coupled with DTT. Paper-bridge loading could be as well used, but preferentiallywith non-limited samples owing to the loss of protein dur-ing active rehydration of IPG strips.
MethodsChemicalsTRIS base, urea, thiourea, CHAPS, iodoacetamide,TEMED, low-melt agarose, Triton X-100, spermine,phosphatase inhibitor cocktail and bromophenol bluewere obtained from Sigma-Aldrich (St. Louis, MO,USA); protease inhibitor cocktail (Complete MiniEDTA-free) was from Roche Diagnostics (Mannheim,Germany); IPG buffers, IPG strips (pH 6–9 and 6–11)
and destreak reagent were purchased from GE (GEHealthcare); acrylamide was obtained from Bio-Rad(Hercules, CA); SDS, glycerol, DTT and TGS 10X werefrom Eudomedex (Mundolshein, France); all otherreagents were of analytical grade.
Protein extraction and solubilisationProteins were extracted from MCF7 cells as previ-ously described [18] in sample buffer containing 7 Murea, 2 M thiourea, 4% CHAPS, 0.05% Triton X100,65 mM DTT, 40 mM spermine, protease and phos-phatase inhibitor cocktails. This suspension was cen-trifuged at 68000 rpm for 60 min, supernatants werecollected and the protein content was estimatedusing the Bradford method [19].Proteins were then precipitated using the 2D
clean-up kit (GE Healthcare) and the pellet wassolubilized with TUC solution (7 M urea, 2 M thio-urea, 4% CHAPS) and quantified with the 2D quantkit (GE Healthcare).
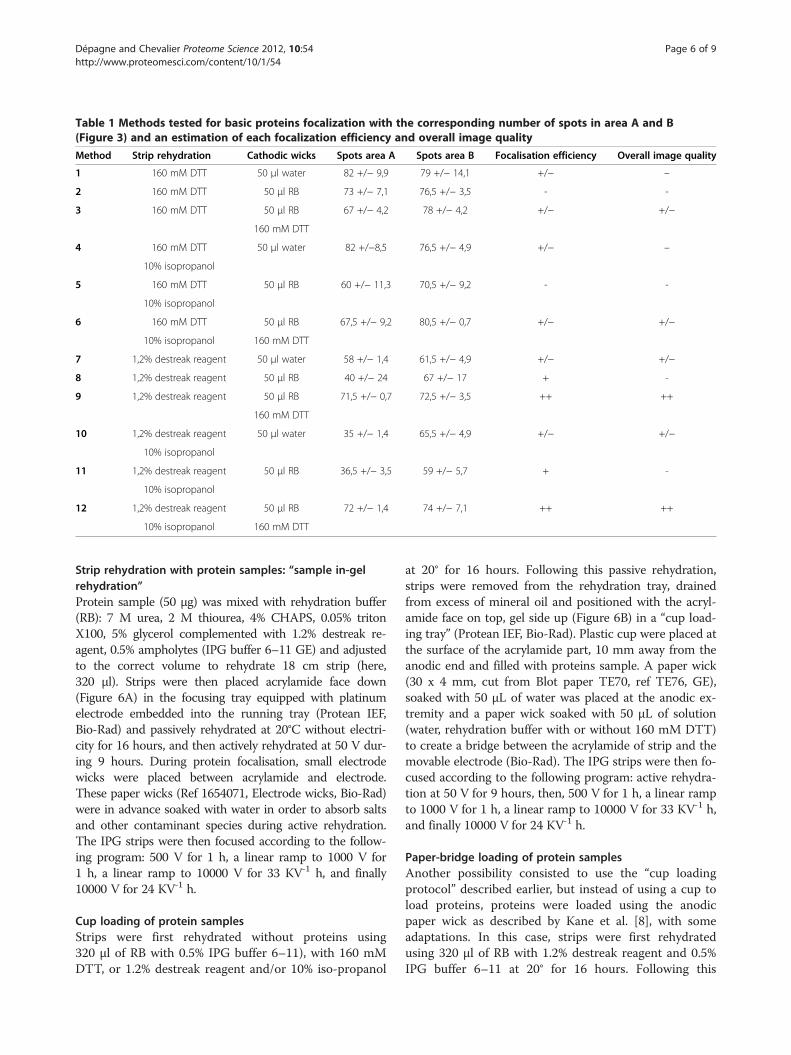
Table 1 Methods tested for basic proteins focalization with the corresponding number of spots in area A and B(Figure 3) and an estimation of each focalization efficiency and overall image quality
Method Strip rehydration Cathodic wicks Spots area A Spots area B Focalisation efficiency Overall image quality
1 160 mM DTT 50 μl water 82 +/− 9,9 79 +/− 14,1 +/− –
2 160 mM DTT 50 μl RB 73 +/− 7,1 76,5 +/− 3,5 - -
3 160 mM DTT 50 μl RB 67 +/− 4,2 78 +/− 4,2 +/− +/−
160 mM DTT
4 160 mM DTT 50 μl water 82 +/−8,5 76,5 +/− 4,9 +/− –
10% isopropanol
5 160 mM DTT 50 μl RB 60 +/− 11,3 70,5 +/− 9,2 - -
10% isopropanol
6 160 mM DTT 50 μl RB 67,5 +/− 9,2 80,5 +/− 0,7 +/− +/−
10% isopropanol 160 mM DTT
7 1,2% destreak reagent 50 μl water 58 +/− 1,4 61,5 +/− 4,9 +/− +/−
8 1,2% destreak reagent 50 μl RB 40 +/− 24 67 +/− 17 + -
9 1,2% destreak reagent 50 μl RB 71,5 +/− 0,7 72,5 +/− 3,5 ++ ++
160 mM DTT
10 1,2% destreak reagent 50 μl water 35 +/− 1,4 65,5 +/− 4,9 +/− +/−
10% isopropanol
11 1,2% destreak reagent 50 μl RB 36,5 +/− 3,5 59 +/− 5,7 + -
10% isopropanol
12 1,2% destreak reagent 50 μl RB 72 +/− 1,4 74 +/− 7,1 ++ ++
10% isopropanol 160 mM DTT
Dépagne and Chevalier Proteome Science 2012, 10:54 Page 6 of 9http://www.proteomesci.com/content/10/1/54
Strip rehydration with protein samples: “sample in-gelrehydration”Protein sample (50 μg) was mixed with rehydration buffer(RB): 7 M urea, 2 M thiourea, 4% CHAPS, 0.05% tritonX100, 5% glycerol complemented with 1.2% destreak re-agent, 0.5% ampholytes (IPG buffer 6–11 GE) and adjustedto the correct volume to rehydrate 18 cm strip (here,320 μl). Strips were then placed acrylamide face down(Figure 6A) in the focusing tray equipped with platinumelectrode embedded into the running tray (Protean IEF,Bio-Rad) and passively rehydrated at 20°C without electri-city for 16 hours, and then actively rehydrated at 50 V dur-ing 9 hours. During protein focalisation, small electrodewicks were placed between acrylamide and electrode.These paper wicks (Ref 1654071, Electrode wicks, Bio-Rad)were in advance soaked with water in order to absorb saltsand other contaminant species during active rehydration.The IPG strips were then focused according to the follow-ing program: 500 V for 1 h, a linear ramp to 1000 V for1 h, a linear ramp to 10000 V for 33 KV-1 h, and finally10000 V for 24 KV-1 h.
Cup loading of protein samplesStrips were first rehydrated without proteins using320 μl of RB with 0.5% IPG buffer 6–11), with 160 mMDTT, or 1.2% destreak reagent and/or 10% iso-propanol
at 20° for 16 hours. Following this passive rehydration,strips were removed from the rehydration tray, drainedfrom excess of mineral oil and positioned with the acryl-amide face on top, gel side up (Figure 6B) in a “cup load-ing tray” (Protean IEF, Bio-Rad). Plastic cup were placed atthe surface of the acrylamide part, 10 mm away from theanodic end and filled with proteins sample. A paper wick(30 x 4 mm, cut from Blot paper TE70, ref TE76, GE),soaked with 50 μL of water was placed at the anodic ex-tremity and a paper wick soaked with 50 μL of solution(water, rehydration buffer with or without 160 mM DTT)to create a bridge between the acrylamide of strip and themovable electrode (Bio-Rad). The IPG strips were then fo-cused according to the following program: active rehydra-tion at 50 V for 9 hours, then, 500 V for 1 h, a linear rampto 1000 V for 1 h, a linear ramp to 10000 V for 33 KV-1 h,and finally 10000 V for 24 KV-1 h.
Paper-bridge loading of protein samplesAnother possibility consisted to use the “cup loadingprotocol” described earlier, but instead of using a cup toload proteins, proteins were loaded using the anodicpaper wick as described by Kane et al. [8], with someadaptations. In this case, strips were first rehydratedusing 320 μl of RB with 1.2% destreak reagent and 0.5%IPG buffer 6–11 at 20° for 16 hours. Following this
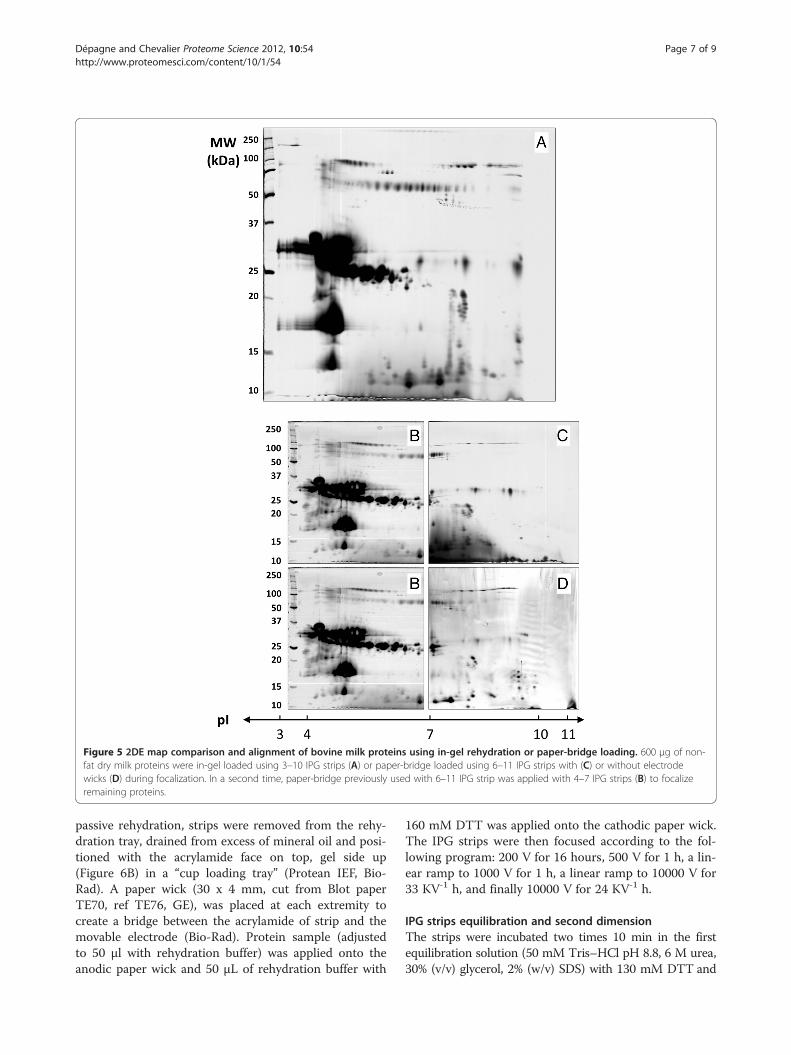
Figure 5 2DE map comparison and alignment of bovine milk proteins using in-gel rehydration or paper-bridge loading. 600 μg of non-fat dry milk proteins were in-gel loaded using 3–10 IPG strips (A) or paper-bridge loaded using 6–11 IPG strips with (C) or without electrodewicks (D) during focalization. In a second time, paper-bridge previously used with 6–11 IPG strip was applied with 4–7 IPG strips (B) to focalizeremaining proteins.
Dépagne and Chevalier Proteome Science 2012, 10:54 Page 7 of 9http://www.proteomesci.com/content/10/1/54
passive rehydration, strips were removed from the rehy-dration tray, drained from excess of mineral oil and posi-tioned with the acrylamide face on top, gel side up(Figure 6B) in a “cup loading tray” (Protean IEF, Bio-Rad). A paper wick (30 x 4 mm, cut from Blot paperTE70, ref TE76, GE), was placed at each extremity tocreate a bridge between the acrylamide of strip and themovable electrode (Bio-Rad). Protein sample (adjustedto 50 μl with rehydration buffer) was applied onto theanodic paper wick and 50 μL of rehydration buffer with
160 mM DTT was applied onto the cathodic paper wick.The IPG strips were then focused according to the fol-lowing program: 200 V for 16 hours, 500 V for 1 h, a lin-ear ramp to 1000 V for 1 h, a linear ramp to 10000 V for33 KV-1 h, and finally 10000 V for 24 KV-1 h.
IPG strips equilibration and second dimensionThe strips were incubated two times 10 min in the firstequilibration solution (50 mM Tris–HCl pH 8.8, 6 M urea,30% (v/v) glycerol, 2% (w/v) SDS) with 130 mM DTT and
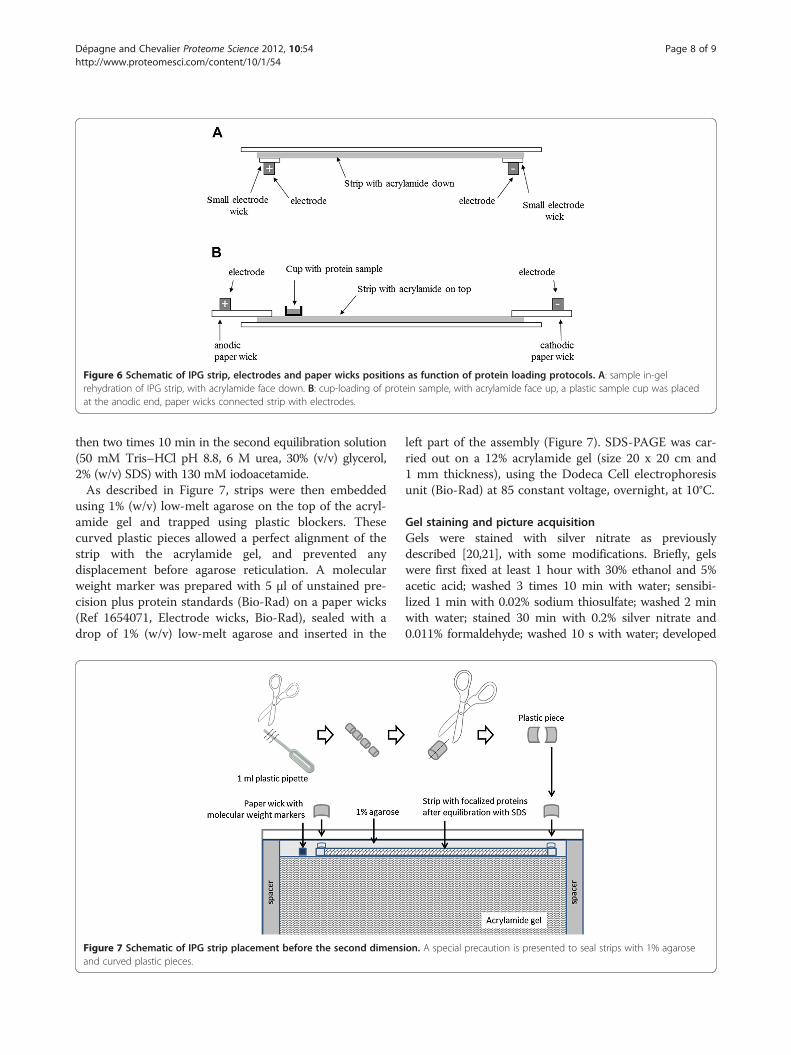
Figure 6 Schematic of IPG strip, electrodes and paper wicks positions as function of protein loading protocols. A: sample in-gelrehydration of IPG strip, with acrylamide face down. B: cup-loading of protein sample, with acrylamide face up, a plastic sample cup was placedat the anodic end, paper wicks connected strip with electrodes.
Dépagne and Chevalier Proteome Science 2012, 10:54 Page 8 of 9http://www.proteomesci.com/content/10/1/54
then two times 10 min in the second equilibration solution(50 mM Tris–HCl pH 8.8, 6 M urea, 30% (v/v) glycerol,2% (w/v) SDS) with 130 mM iodoacetamide.As described in Figure 7, strips were then embedded
using 1% (w/v) low-melt agarose on the top of the acryl-amide gel and trapped using plastic blockers. Thesecurved plastic pieces allowed a perfect alignment of thestrip with the acrylamide gel, and prevented anydisplacement before agarose reticulation. A molecularweight marker was prepared with 5 μl of unstained pre-cision plus protein standards (Bio-Rad) on a paper wicks(Ref 1654071, Electrode wicks, Bio-Rad), sealed with adrop of 1% (w/v) low-melt agarose and inserted in the
Figure 7 Schematic of IPG strip placement before the second dimensand curved plastic pieces.
left part of the assembly (Figure 7). SDS-PAGE was car-ried out on a 12% acrylamide gel (size 20 x 20 cm and1 mm thickness), using the Dodeca Cell electrophoresisunit (Bio-Rad) at 85 constant voltage, overnight, at 10°C.
Gel staining and picture acquisitionGels were stained with silver nitrate as previouslydescribed [20,21], with some modifications. Briefly, gelswere first fixed at least 1 hour with 30% ethanol and 5%acetic acid; washed 3 times 10 min with water; sensibi-lized 1 min with 0.02% sodium thiosulfate; washed 2 minwith water; stained 30 min with 0.2% silver nitrate and0.011% formaldehyde; washed 10 s with water; developed
ion. A special precaution is presented to seal strips with 1% agarose
Dépagne and Chevalier Proteome Science 2012, 10:54 Page 9 of 9http://www.proteomesci.com/content/10/1/54
5 min with 85 mM sodium carbonate, 0.00125% sodiumthiosulfate and 0.011% formaldehyde; stopped with0.33 M TRIS and 1.7% acetic acid; stored with 5% aceticacid with 2% DMSO.Gels were scanned to images right after staining to limit
polychromatic colour of spots. Images were acquired witha GS 800 densitometer (Bio-Rad). After several hours instorage solution, gels were dried between sheets of cello-phane, using the GelAir drying system (Bio-Rad).
Image analysisImages from stained gels were analysed using the Same-spots software v4.5 (Non-linear Dynamics, UK). Gelwere grouped to create an global analysis with all condi-tions. Spots of each samples were compared betweenconditions, and spots were numbered with the same de-tection parameters.
AbbreviationsRB: Rehydration buffer; TUC: Thiourea Urea CHAPS.
Competing interestsThe authors declare that they have no competing interests.
Authors’ contributionsJD and FC performed the experiments. FC designed the experiments andwrote the manuscript. Both authors read and approved the final manuscript.
AcknowledgementsThis work was supported by the Institute of Cellular and MolecularRadiobiology (iRCM, DSV, CEA, Fontenay aux Roses).
Received: 12 July 2012 Accepted: 21 August 2012Published: 6 September 2012
References1. Van den Bergh G, Arckens L: High Resolution Protein Display by Two-
Dimensional Electrophoresis. Curr Anal Chem 2009, 5:106–115.2. Chevalier F: Highlights on the capacities of “Gel-based” proteomics.
Proteome Science 2010, 8:23.3. Rabilloud T, Lelong C: Two-dimensional gel electrophoresis in proteomics:
A tutorial. J Proteomics 2011, 74:1829–1841.4. Luche S, Diemer H, Tastet C, Chevallet M, Van Dorsselaer A, Leize-Wagner E,
Rabilloud T: About thiol derivatization and resolution of basic proteins intwo-dimensional electrophoresis. Proteomics 2004, 4:551–561.
5. Görg A, Drews O, Lück C, Weiland F, Weiss W: 2-DE with IPGs.Electrophoresis 2009, 30:S122–S132.
6. Hoving S, Gerrits B, Voshol H, Müller D, Roberts RC, van Oostrum J:Preparative two-dimensional gel electrophoresis at alkaline pH usingnarrow range immobilized pH gradients. Proteomics 2002, 2:127–134.
7. Olsson I, Larsson K, Palmgren R, Bjellqvist B: Organic disulfides as a meansto generate streak-free two-dimensional maps with narrow range basicimmobilized pH gradient strips as first dimension. Proteomics 2002,2:1630–1632.
8. Kask L, Larsson K, Bjellqvist B: Elimination of basic gaps at high pH valuesin 2-DE. Proteomics 2009, 9:5558–5561.
9. Kane LA, Yung CK, Agnetti G, Neverova I, Van Eyk JE: Optimization of paperbridge loading for 2-DE analysis in the basic pH region: application tothe mitochondrial subproteome. Proteomics 2006, 6:5683–5687.
10. Chevalier F: Analytical Methods | Electrophoresis. In Encyclopedia of DairySciences. San Diego: Academic; 2011:185–192.
11. Fox PF, McSweeney PL: Milk proteins. In Dairy Chemistry and Biochemistry.London: BA; 1998:150–169.
12. Poth AG, Deeth HC, Alewood PF, Holland JW: Analysis of the HumanCasein Phosphoproteome by 2-D Electrophoresis and MALDI-TOF/TOFMS Reveals New Phosphoforms. J Proteome Res 2008, 7:5017–5027.
13. Holland JW, Deeth HC, Alewood PF: Analysis of disulphide linkages inbovine kappa-casein oligomers using two-dimensional electrophoresis.Electrophoresis 2008, 29:2402–2410.
14. Chevalier F, Chobert JM, Dalgalarrondo M, Haertle T: Characterization ofthe Maillard reaction products of beta-lactoglobulin glucosylated in mildconditions. J Food Biochem 2001, 25:33–55.
15. Chevalier F, Hirtz C, Sommerer N, Kelly AL: Use of Reducing/NonreducingTwo-Dimensional Electrophoresis for the Study of Disulfide-MediatedInteractions between Proteins in Raw and Heated Bovine Milk. J AgricFood Chem 2009, 57:5948–5955.
16. Chevalier F, Kelly AL: Proteomic Quantification of Disulfide-LinkedPolymers in Raw and Heated Bovine Milk. J Agric Food Chem 2010,58:7437–7444.
17. Chevalier F: Milk Proteins | Proteomics. In Encyclopedia of Dairy Sciences.San Diego: Academic; 2011:843–847.
18. Chevalier F, Depagne J, Hem S, Chevillard S, Bensimon J, Bertrand P, LebeauJ: Accumulation of Cyclophilin A isoforms in conditioned medium ofirradiated breast cancer cells. Proteomics 2012, 12:1756–1766.
19. Bradford MM: A rapid and sensitive method for the quantitation ofmicrogram quantities of protein utilizing the principle of protein-dyebinding. Anal Biochem 1976, 72:248–254.
20. Chevalier F, Rofidal V, Vanova P, Bergoin A, Rossignol M: Proteomiccapacity of recent fluorescent dyes for protein staining. Phytochemistry2004, 65:1499–1506.
21. Chevalier F, Centeno D, Rofidal V, Tauzin M, Martin O, Sommerer N,Rossignol M: Different impact of staining procedures using visible stainsand fluorescent dyes for large-scale investigation of proteomes byMALDI-TOF mass spectrometry. J Proteome Res 2006, 5:512–520.
doi:10.1186/1477-5956-10-54Cite this article as: Dépagne and Chevalier: Technical updates to basicproteins focalization using IPG strips. Proteome Science 2012 10:54.
Submit your next manuscript to BioMed Centraland take full advantage of:
• Convenient online submission
• Thorough peer review
• No space constraints or color figure charges
• Immediate publication on acceptance
• Inclusion in PubMed, CAS, Scopus and Google Scholar
• Research which is freely available for redistribution
Submit your manuscript at www.biomedcentral.com/submit
Proteomics 2012, 12, 2295–2302 2295DOI 10.1002/pmic.201100461
RESEARCH ARTICLE
Impairing the microRNA biogenesis pathway induces
proteome modifications characterized by size bias and
enrichment in antioxidant proteins
Delphine Peric1, Jean Labarre2, Francois Chevalier3∗,∗∗ and Germain Rousselet1∗
1 CEA, DSV, iRCM, Laboratoire de Genetique de la Radiosensibilite, Fontenay aux Roses, France2 CEA, DSV, iBiTecS, Laboratoire de Biologie Integrative, Gif sur Yvette, France3 CEA, DSV, iRCM, Plateforme de Proteomique, Fontenay aux Roses, France
Perturbation of individual microRNAs, or of the microRNA pathway, plays a role in carcinogen-esis. In certain cancer cells, inhibition of the microRNA biogenesis pathway leads to a growtharrest state (CoGAM for Colony Growth Arrest induced by Microprocessor inhibition), whichcan be rescued by re-expression of individual microRNAs such as miR-20a. We now report thatinhibition of the microRNA biogenesis pathway induced proteome changes characterized by asize bias in differentially expressed proteins, with induction of small proteins and inhibitionof large ones. This size bias was observed in cells undergoing CoGAM, as well as in CoGAM-resistant cells, and in CoGAM-sensitive cells rescued by miR-20a. In this case, GO analysisof induced proteins identified by mass spectrometry revealed a significant enrichment in pro-teins involved in resistance to oxidative stress. In addition, H2O2 treatment of Saccharomycescerevisiae or mammalian cells led to similarly size-biased proteome modifications. Our resultspoint to size bias as a relevant readout of proteome modifications, in particular in conditionsof stress such as inhibition of the microRNA biogenesis pathway or oxidative stress. They alsosuggest research avenues to study the role of the microRNA pathway in proteostasis.
Keywords:
Cell biology / Drosha / Microprocessor / Proteostasis / Stress
Received: September 2, 2011Revised: May 2, 2012
Accepted: May 10, 2012
1 Introduction
MicroRNAs are a family of ∼22 nucleotide RNAs controllinggenome expression by inhibiting translation and/or induc-ing degradation of specific target mRNAs (reviewed in [1]).These small RNAs are encoded in the genome, either in ded-icated polymerase II transcription units, or in the introns ofprotein coding genes. Their biogenesis requires two distinctsteps [2]. In the nucleus, the Microprocessor, a complex com-posed of the RNase III Drosha and its RNA binding partnerDGCR8, excises a stem-loop RNA (pre-miRNA) from the pri-
Correspondence: Dr. Germain Rousselet, Laboratoire Reparationet Transcription dans les cellules Souches, iRCM, CEA, 18 routedu panorama, 92260 Fontenay aux Roses, FranceE-mail: [email protected]: +33-1-4654-8734
Abbreviation: CoGAM, Colony Growth Arrest induced by Micro-processor inhibition
mary transcript (pri-miRNA). After export to the cytoplasm,the loop is removed by the RNase III Dicer, and the maturemiRNA is loaded onto a functional RNA-induced silencingcomplex (RISC). Target mRNAs are then recognized by hy-bridization of the microRNA component of the RISC, leadingto decrease of the encoded protein, generally accompanied bymRNA degradation [3].
It is now established that microRNAs participate in mul-tiple biological functions, in particular in relation to cell dif-ferentiation and proliferation [4]. In addition, deregulation ofmicroRNAs has been observed in tumor tissues and cells [5],and oncogenic [6] or tumor suppressive [7, 8] properties havebeen assigned to specific microRNAs. Therefore, functionalstudies in the context of transformed cells are of primary im-portance to identify cancer-related microRNAs, as well as the
∗Both these authors contributed equally to this work∗∗Additional corresponding author: Dr. Francois Chevalier, E-mail:[email protected]
C© 2012 WILEY-VCH Verlag GmbH & Co. KGaA, Weinheim www.proteomics-journal.com
2296 D. Peric et al. Proteomics 2012, 12, 2295–2302
pathways they control. However, the microRNA pathway isendowed with redundancy, at both structural and functionallevels. As a consequence, inhibition of single microRNAs isoften phenotypically silent [9], which hampers classical re-verse genetics approaches.
As an alternative, we have developed a molecular geneticsapproach combining a specific inhibition of the microRNApathway at large, by inhibiting the Microprocessor, and a com-plementation of the observed phenotypes by re-expressionof individual Microprocessor-independent pre-miRNAs [10].We have used this approach to identify cancer cell lines whoseproliferation depends on the Microprocessor, describing anew phenotype of colony growth arrest that we have calledCoGAM (Colony Growth Arrest induced by Microprocessorinhibition). This phenotype was observed only in certain celllines, where it is characterized by a long-term growth ar-rest with an increase of the fraction of cells in G0/G1 inthe absence of senescence. In CoGAM-resistant cells, Mi-croprocessor inhibition led to an increase of the transformedphenotype, as already established in other tumor models [11].CoGAM could be complemented by re-expression of individ-ual microRNAs, such as miR-20a, showing that it involvedmicroRNA-controlled biological pathways.
In this report, we present the proteomic consequencesof the inhibition of the microRNA biogenesis pathway inCoGAM-resistant and sensitive cells, highlighting a size biasin differentially expressed proteins.
2 Materials and methods
2.1 Cell cultures and treatments
MCF-7 (breast carcinoma) and HCT116 (colon carcinoma)cells were grown and transfected as previously described [10].Cells were selected for at least 14 days before analysis.
2.2 Total protein extraction
Cells were scraped in PBS, washed three times in PBS,and dissolved in proteomic sample buffer (9 M urea, 4%CHAPS, 0.05% Triton-X100, 65 mM DTT and protease in-hibitors (cOmplete, Roche, Meylan, France)). After centrifu-gation at 68 000 rpm for 60 min, supernatants were collected,aliquoted, and stored at −20�C until use. Protein content wasestimated using the Bradford method [12].
2.3 2DE
Analytic 2DE was performed as previously described [13]with three technical replicates. Briefly, precast 18 cm strips,pH range 3–10 NL (GE Healthcare, Velizy, France), wererehydrated in the presence of 250 �g of protein. Isoelec-tric focusing was carried out using a Protean IEF Cell (Bio-
Rad, Hercules, CA, USA) isoelectric focusing system until80 kV h−1. The strips were then incubated in ES1 (50 mMTris-HCl pH 8.8, 6 M urea, 30% (v/v) glycerol, 2% (w/v) SDS)with 130 mM DTT and then in ES1 supplemented with 130mM iodoacetamide. Strips were then embedded using 1%low-melt agarose on top of acrylamide gels. SDS-PAGE wascarried out on a 12% acrylamide gel, using the Dodeca Cellelectrophoresis unit (Bio-Rad). Gels were batch-stained withsilver nitrate [14] with a Dodeca stainer unit (Bio-Rad) andscanned to images that were digitized with a GS 800 densit-ometer (Bio-Rad). Preparative 2DE gels were performed aspreviously described [15] with 500 �g of proteins using theCoomassie colloidal blue staining protocol [16].
2.4 Image analysis
Images from stained gels were digitalized at 300 dpi witha GS 710 densitometer (Bio-Rad) and analyzed using theSamespots software v4.1 (Non-linear Dynamics, UK). Gelreplicates were grouped to create a global analysis with all con-ditions. Quantitative comparisons of spot intensities were an-alyzed using Samespots (v4.1, Nonlinear Dynamics, Durham,NC, USA). Background subtraction and spot intensity nor-malization were automatically performed by Samespots. Amultivariate statistic analysis was performed using the statis-tic mode of the Samespots software v4.1. Spots were consid-ered differentially expressed at p <0.05 (ANOVA t-test). Sta-tistical analysis of the distribution of the molecular weightsof induced and repressed proteins was performed with a one-tailed Wilcoxon rank sum test.
2.5 MALDI-TOF MS analysis
Spots were excised from preparative 2DE gels, and pro-cessed using a Packard Multiprobe II robot (Perkin-Elmer,Courtaboeuf, France). After washing successively with wa-ter, 25 mM ammonium bicarbonate, ACN/25 mM ammo-nium bicarbonate (1:1, v/v), and ACN, gel fragments weredried at 37�C. Protein digestion was carried out at 37�Cfor 5 h following addition of 0.125 �g trypsin (sequencinggrade, modified, Promega, Charbonieres, France), and result-ing fragments were extracted twice with 50 �L ACN/water(1:1, v/v) containing 0.1% TFA for 15 min. Pooled super-natants were concentrated with a speedvac to a final volumeof 20 �L. Peptides were simultaneously desalted and concen-trated with C18 Zip-Tip microcolumns to a final volume of3 �L, an aliquot of each sample was mixed (1/1) with theCHCA matrix at half saturation in ACN/water (1:1, v/v), andthe mixture was immediately spotted on the MALDI targetby the Multiprobe II robot. Mass spectra were recorded inthe reflector mode on a UltraFlex II MALDI-TOF/TOF massspectrometer (Bruker Daltonics, Bremen, Germany). Auto-matic annotation of monoisotopic masses was performedusing Bruker’s SNAPTM procedure. The MASCOT search
C© 2012 WILEY-VCH Verlag GmbH & Co. KGaA, Weinheim www.proteomics-journal.com
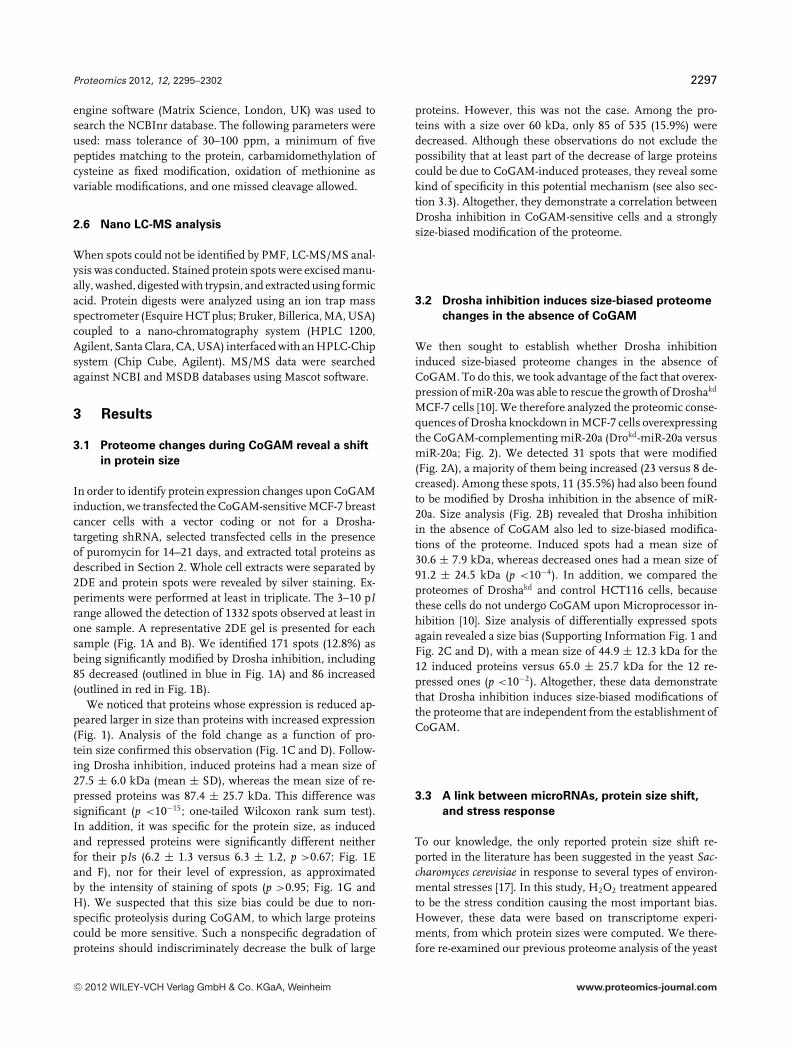
Proteomics 2012, 12, 2295–2302 2297
engine software (Matrix Science, London, UK) was used tosearch the NCBInr database. The following parameters wereused: mass tolerance of 30–100 ppm, a minimum of fivepeptides matching to the protein, carbamidomethylation ofcysteine as fixed modification, oxidation of methionine asvariable modifications, and one missed cleavage allowed.
2.6 Nano LC-MS analysis
When spots could not be identified by PMF, LC-MS/MS anal-ysis was conducted. Stained protein spots were excised manu-ally, washed, digested with trypsin, and extracted using formicacid. Protein digests were analyzed using an ion trap massspectrometer (Esquire HCT plus; Bruker, Billerica, MA, USA)coupled to a nano-chromatography system (HPLC 1200,Agilent, Santa Clara, CA, USA) interfaced with an HPLC-Chipsystem (Chip Cube, Agilent). MS/MS data were searchedagainst NCBI and MSDB databases using Mascot software.
3 Results
3.1 Proteome changes during CoGAM reveal a shift
in protein size
In order to identify protein expression changes upon CoGAMinduction, we transfected the CoGAM-sensitive MCF-7 breastcancer cells with a vector coding or not for a Drosha-targeting shRNA, selected transfected cells in the presenceof puromycin for 14–21 days, and extracted total proteins asdescribed in Section 2. Whole cell extracts were separated by2DE and protein spots were revealed by silver staining. Ex-periments were performed at least in triplicate. The 3–10 pIrange allowed the detection of 1332 spots observed at least inone sample. A representative 2DE gel is presented for eachsample (Fig. 1A and B). We identified 171 spots (12.8%) asbeing significantly modified by Drosha inhibition, including85 decreased (outlined in blue in Fig. 1A) and 86 increased(outlined in red in Fig. 1B).
We noticed that proteins whose expression is reduced ap-peared larger in size than proteins with increased expression(Fig. 1). Analysis of the fold change as a function of pro-tein size confirmed this observation (Fig. 1C and D). Follow-ing Drosha inhibition, induced proteins had a mean size of27.5 ± 6.0 kDa (mean ± SD), whereas the mean size of re-pressed proteins was 87.4 ± 25.7 kDa. This difference wassignificant (p <10−15; one-tailed Wilcoxon rank sum test).In addition, it was specific for the protein size, as inducedand repressed proteins were significantly different neitherfor their pIs (6.2 ± 1.3 versus 6.3 ± 1.2, p >0.67; Fig. 1Eand F), nor for their level of expression, as approximatedby the intensity of staining of spots (p >0.95; Fig. 1G andH). We suspected that this size bias could be due to non-specific proteolysis during CoGAM, to which large proteinscould be more sensitive. Such a nonspecific degradation ofproteins should indiscriminately decrease the bulk of large
proteins. However, this was not the case. Among the pro-teins with a size over 60 kDa, only 85 of 535 (15.9%) weredecreased. Although these observations do not exclude thepossibility that at least part of the decrease of large proteinscould be due to CoGAM-induced proteases, they reveal somekind of specificity in this potential mechanism (see also sec-tion 3.3). Altogether, they demonstrate a correlation betweenDrosha inhibition in CoGAM-sensitive cells and a stronglysize-biased modification of the proteome.
3.2 Drosha inhibition induces size-biased proteome
changes in the absence of CoGAM
We then sought to establish whether Drosha inhibitioninduced size-biased proteome changes in the absence ofCoGAM. To do this, we took advantage of the fact that overex-pression of miR-20a was able to rescue the growth of Droshakd
MCF-7 cells [10]. We therefore analyzed the proteomic conse-quences of Drosha knockdown in MCF-7 cells overexpressingthe CoGAM-complementing miR-20a (Drokd-miR-20a versusmiR-20a; Fig. 2). We detected 31 spots that were modified(Fig. 2A), a majority of them being increased (23 versus 8 de-creased). Among these spots, 11 (35.5%) had also been foundto be modified by Drosha inhibition in the absence of miR-20a. Size analysis (Fig. 2B) revealed that Drosha inhibitionin the absence of CoGAM also led to size-biased modifica-tions of the proteome. Induced spots had a mean size of30.6 ± 7.9 kDa, whereas decreased ones had a mean size of91.2 ± 24.5 kDa (p <10−4). In addition, we compared theproteomes of Droshakd and control HCT116 cells, becausethese cells do not undergo CoGAM upon Microprocessor in-hibition [10]. Size analysis of differentially expressed spotsagain revealed a size bias (Supporting Information Fig. 1 andFig. 2C and D), with a mean size of 44.9 ± 12.3 kDa for the12 induced proteins versus 65.0 ± 25.7 kDa for the 12 re-pressed ones (p <10−2). Altogether, these data demonstratethat Drosha inhibition induces size-biased modifications ofthe proteome that are independent from the establishment ofCoGAM.
3.3 A link between microRNAs, protein size shift,
and stress response
To our knowledge, the only reported protein size shift re-ported in the literature has been suggested in the yeast Sac-charomyces cerevisiae in response to several types of environ-mental stresses [17]. In this study, H2O2 treatment appearedto be the stress condition causing the most important bias.However, these data were based on transcriptome experi-ments, from which protein sizes were computed. We there-fore re-examined our previous proteome analysis of the yeast
C© 2012 WILEY-VCH Verlag GmbH & Co. KGaA, Weinheim www.proteomics-journal.com
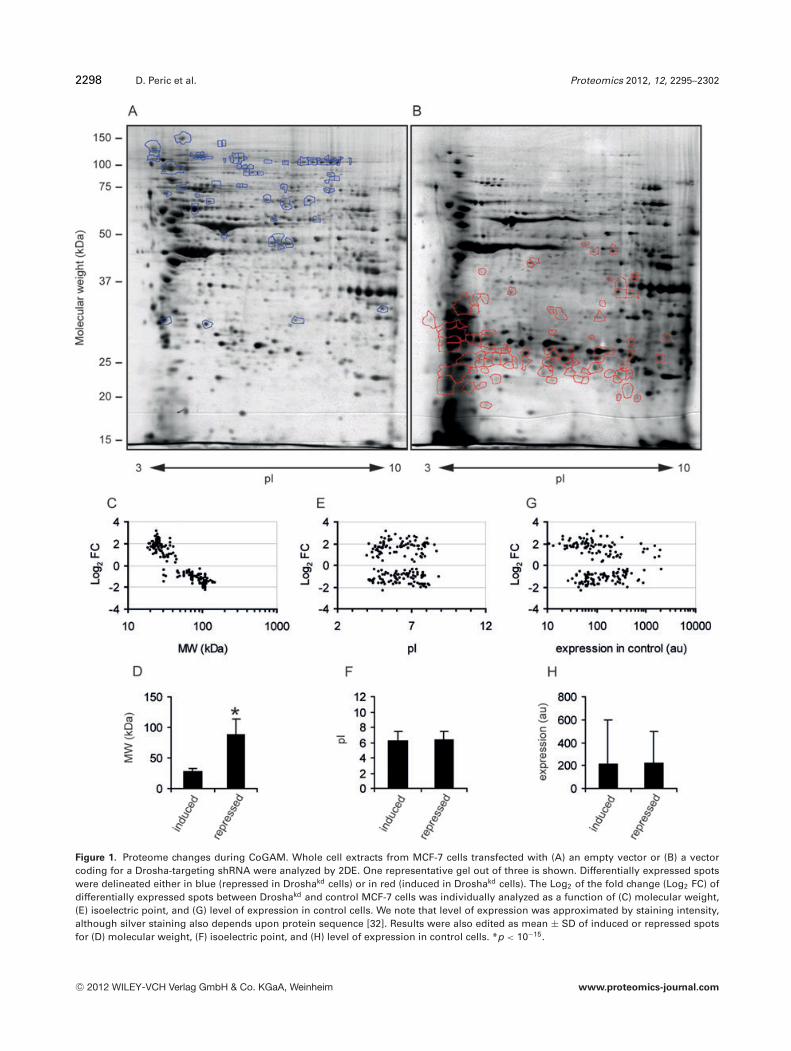
2298 D. Peric et al. Proteomics 2012, 12, 2295–2302
Figure 1. Proteome changes during CoGAM. Whole cell extracts from MCF-7 cells transfected with (A) an empty vector or (B) a vectorcoding for a Drosha-targeting shRNA were analyzed by 2DE. One representative gel out of three is shown. Differentially expressed spotswere delineated either in blue (repressed in Droshakd cells) or in red (induced in Droshakd cells). The Log2 of the fold change (Log2 FC) ofdifferentially expressed spots between Droshakd and control MCF-7 cells was individually analyzed as a function of (C) molecular weight,(E) isoelectric point, and (G) level of expression in control cells. We note that level of expression was approximated by staining intensity,although silver staining also depends upon protein sequence [32]. Results were also edited as mean ± SD of induced or repressed spotsfor (D) molecular weight, (F) isoelectric point, and (H) level of expression in control cells. *p < 10−15.
C© 2012 WILEY-VCH Verlag GmbH & Co. KGaA, Weinheim www.proteomics-journal.com
Proteomics 2012, 12, 2295–2302 2299
Figure 2. Drosha inhibitioninduces a size-biased pro-teome modification in the ab-sence of CoGAM. (A) Wholecell extracts were preparedfrom MCF-7 cells overexpress-ing both a Drosha-targetingshRNA and miR-20a (Micro-processor inhibition withoutCoGAM), and analyzed by 2DE.Numbered spots were signif-icantly increased (circled) ordecreased (non circled) whencompared to cells expressingmiR-20a without Drosha inhi-bition, and were identified bymass spectrometry (Support-ing Information Table S1). (B) ACoGAM-independent size biasin proteome modifications in-duced by Drosha knockdownwas assayed by comparing themean ± SD of the molecularweights of repressed and in-duced spots identified in (A).(C) Whole cell extracts wereprepared from HCT116 cellstransfected with a plasmid ex-pressing or not a Drosha tar-geting shRNA, and comparedby 2DE. The Log2 of the foldchanges of differentially ex-pressed spots (Log2 FC) wasplotted as a function of themolecular weight of the spots.(D) Mean ± SD of the molec-ular weights of induced or re-pressed spots identified in (C).*p <10−2; **p <10−4.
response to H2O2 [18], probing for a potential size shift.Indeed, upon H2O2 treatment, proteins with fold changeshigher than 2 had an average MW of 45.0 ± 24.4 kDa (n =54), compared to an average of 54.6 ± 26.0 kDa (n = 29)for proteins with fold changes under 0.5 (Fig. 3A and B;p <5 × 10⁻²).
We therefore wondered whether the size-biased responsethat we observed upon Drosha inhibition could be interpretedas a stress response. To answer this question, we identi-fied by mass spectrometry the spots that were induced by
Drosha knockdown in the presence of miR-20a (Drokd-miR-20a versus miR-20a; Supporting Information Table S1). Allthe identified proteins (28 of 31) had theoretical MWs thatwere consistent with the observed size of the original spots.This result showed that increased proteins were not prote-olytic fragments from large degraded proteins, demonstrat-ing that, in this setting, the size-biased proteome modifica-tion was not due to proteolysis. Strikingly, out of 18 proteins,three were known to be involved in the cellular response toan oxidative stress by scavenging reactive oxygen species (two
C© 2012 WILEY-VCH Verlag GmbH & Co. KGaA, Weinheim www.proteomics-journal.com

2300 D. Peric et al. Proteomics 2012, 12, 2295–2302
Figure 3. H2O2 induces size-biased proteome modifications in S.cerevisiae and MCF-7 cells. (A) Proteomic data from S. cerevisiaecells treated with 400 �M H2O2 were retrieved from [18] and plot-ted as the Log2 of the fold change (Log2 FC) as a function of theobserved molecular weight for spots with Log2 FC >1 or Log2
FC <−1. (B) The same data as in (A) were analyzed by compar-ing the mean ± SD of the molecular weights of repressed andinduced protein. (C) The theoretical molecular weight of proteinswhose mRNAs were found to be differentially expressed morethan twofold after a 100 �M H2O2 treatment of MCF-7 cells [23]was retrieved from Uniprot. The Log2 of the fold change (Log2
FC) was plotted as a function of this molecular weight. (D) Thedata shown in (C) were analyzed by comparing the mean ± SD ofthe molecular weights of repressed and induced protein. *p <5× 10⁻².
thioredoxin-dependent peroxidases PRDX1 and PRDX3 [19],and the biliverdin reductase BLVRB [20]), one by reducingNADP+ to NADPH (the NADP-dependent isocitrate dehy-drogenase IDH1 [21]), and one as a molecular chaperone (theheat shock protein HSP27 [22]). Western blotting analysisconfirmed induction of HSP27 and PRDX1 proteins (Sup-porting Information Fig. 2). In addition, PRDX3, IDH1, andHSP27 were among the 11 spots that were also found inthe comparison between Drokd and control cells. The statisti-cal significance of this enrichment was tested by performinga GO analysis using DAVID (http://david.abcc.ncifcrf.gov/).Indeed, among the 35 Biological Processes GO terms found tobe significantly enriched (p <5 × 10⁻²), seven concerned the
cellular response to stress (with enrichment folds going from3.72 for “response to stress” to 92.26 for “hydrogen peroxidecatabolic process”), among which six related specifically to ox-idative stress (Supporting Information Table S2). The secondhighly represented biological process was apoptosis inhibi-tion (seven GO terms with enrichment folds going from 4.81for “regulation of cell death” to 11.42 for “anti-apoptosis”).Therefore, the proteome response to Drosha inhibition hascharacteristics of a cellular response to oxidative stress.
Reciprocally, we wondered whether the response of a mam-malian cell to oxidative stress also involved a size bias in dif-ferentially expressed proteins. We therefore analyzed the re-sults of microarray experiments that we performed after H2O2
treatment of MCF-7 cells [23]. For genes identified as beinginduced or repressed more than twofold, we retrieved pre-dicted protein sizes from Uniprot (http://www.uniprot.org/),using the reference isoform when a gene coded for morethan one protein. The mean protein size of induced geneswas 59.7 ± 49.2 kDa (n = 143), and 81.9 ± 80.2 kDa for re-pressed genes (n = 67) (Fig. 3C and D). This size bias wasstatistically significant (p <2 × 10⁻²). We conclude that themammalian cell response to an oxidative stress also involvesa size bias in regulated proteins.
4 Discussion
In this manuscript, we report that impairment of the mi-croRNA biogenesis pathway, obtained by knocking downthe Microprocessor RNase Drosha, resulted in a proteomemodification characterized by a size bias in differentially ex-pressed proteins. Repressed proteins were found to have asignificantly higher mean molecular weight than inducedproteins. This seldom described phenotype was reproduciblein MCF-7 cells undergoing CoGAM, in MCF-7 cells rescuedfor CoGAM, and in the CoGAM-resistant HCT116 cells. Inaddition, such a size bias was also observed in S. cerevisiaeor MCF-7 cells submitted to an oxidative stress. Reciprocally,proteins induced by the inhibition of Drosha included en-zymes involved in reactive oxygen species detoxification andchaperones, leading to a significant enrichment of proteinsannotated as participating in the cell response to an oxidativestress.
During the last decade, the sequencing of genomes fromseveral species, including Homo sapiens, paved the way forglobal in silico analyses of protein length. Significant sizedifferences were reported to correlate with different types ofprotein classification. Morbid genes, i.e. genes whose mu-tations adversely affect health, code for proteins that are onaverage longer than other proteins [24]. Conversely, house-keeping genes have been reported to code for short proteins[25]. More generally, mean protein sizes are different in func-tional classes of proteins characterized in the Clusters of Or-thologous Groups (COG) database [26], or when S. cerevisiaeproteins are grouped according to their biochemical activ-ity [27]. On the other hand, the size of proteins impacts the
C© 2012 WILEY-VCH Verlag GmbH & Co. KGaA, Weinheim www.proteomics-journal.com
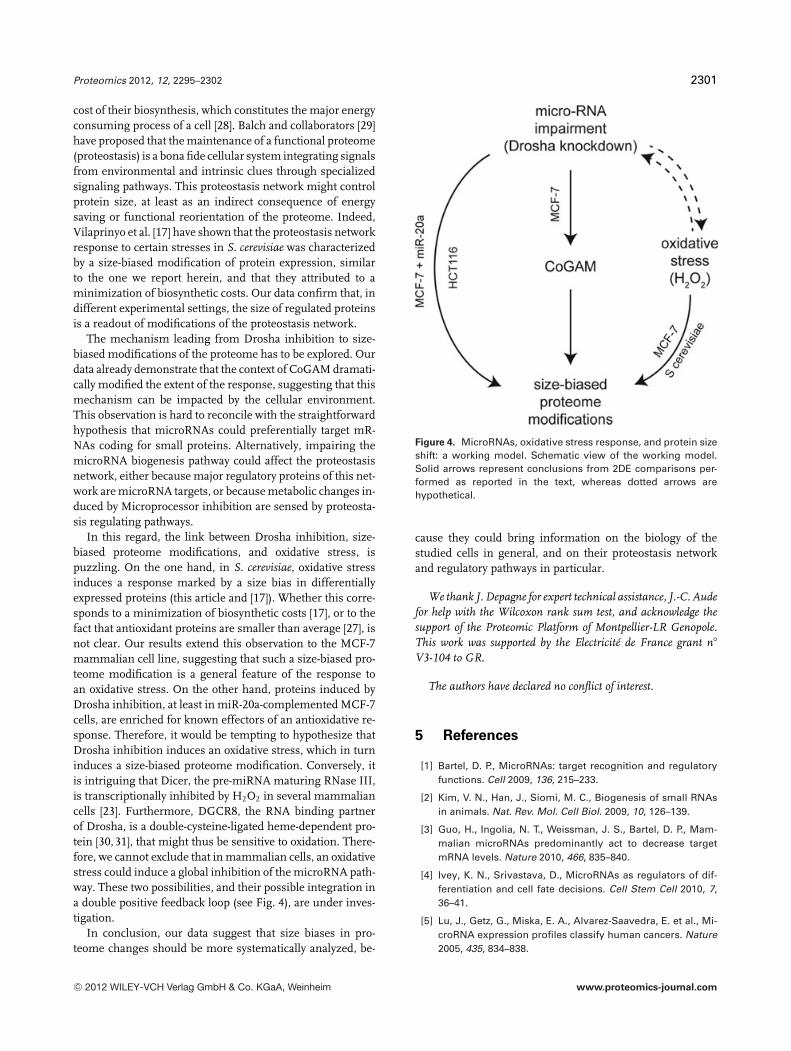
Proteomics 2012, 12, 2295–2302 2301
cost of their biosynthesis, which constitutes the major energyconsuming process of a cell [28]. Balch and collaborators [29]have proposed that the maintenance of a functional proteome(proteostasis) is a bona fide cellular system integrating signalsfrom environmental and intrinsic clues through specializedsignaling pathways. This proteostasis network might controlprotein size, at least as an indirect consequence of energysaving or functional reorientation of the proteome. Indeed,Vilaprinyo et al. [17] have shown that the proteostasis networkresponse to certain stresses in S. cerevisiae was characterizedby a size-biased modification of protein expression, similarto the one we report herein, and that they attributed to aminimization of biosynthetic costs. Our data confirm that, indifferent experimental settings, the size of regulated proteinsis a readout of modifications of the proteostasis network.
The mechanism leading from Drosha inhibition to size-biased modifications of the proteome has to be explored. Ourdata already demonstrate that the context of CoGAM dramati-cally modified the extent of the response, suggesting that thismechanism can be impacted by the cellular environment.This observation is hard to reconcile with the straightforwardhypothesis that microRNAs could preferentially target mR-NAs coding for small proteins. Alternatively, impairing themicroRNA biogenesis pathway could affect the proteostasisnetwork, either because major regulatory proteins of this net-work are microRNA targets, or because metabolic changes in-duced by Microprocessor inhibition are sensed by proteosta-sis regulating pathways.
In this regard, the link between Drosha inhibition, size-biased proteome modifications, and oxidative stress, ispuzzling. On the one hand, in S. cerevisiae, oxidative stressinduces a response marked by a size bias in differentiallyexpressed proteins (this article and [17]). Whether this corre-sponds to a minimization of biosynthetic costs [17], or to thefact that antioxidant proteins are smaller than average [27], isnot clear. Our results extend this observation to the MCF-7mammalian cell line, suggesting that such a size-biased pro-teome modification is a general feature of the response toan oxidative stress. On the other hand, proteins induced byDrosha inhibition, at least in miR-20a-complemented MCF-7cells, are enriched for known effectors of an antioxidative re-sponse. Therefore, it would be tempting to hypothesize thatDrosha inhibition induces an oxidative stress, which in turninduces a size-biased proteome modification. Conversely, itis intriguing that Dicer, the pre-miRNA maturing RNase III,is transcriptionally inhibited by H2O2 in several mammaliancells [23]. Furthermore, DGCR8, the RNA binding partnerof Drosha, is a double-cysteine-ligated heme-dependent pro-tein [30, 31], that might thus be sensitive to oxidation. There-fore, we cannot exclude that in mammalian cells, an oxidativestress could induce a global inhibition of the microRNA path-way. These two possibilities, and their possible integration ina double positive feedback loop (see Fig. 4), are under inves-tigation.
In conclusion, our data suggest that size biases in pro-teome changes should be more systematically analyzed, be-
Figure 4. MicroRNAs, oxidative stress response, and protein sizeshift: a working model. Schematic view of the working model.Solid arrows represent conclusions from 2DE comparisons per-formed as reported in the text, whereas dotted arrows arehypothetical.
cause they could bring information on the biology of thestudied cells in general, and on their proteostasis networkand regulatory pathways in particular.
We thank J. Depagne for expert technical assistance, J.-C. Audefor help with the Wilcoxon rank sum test, and acknowledge thesupport of the Proteomic Platform of Montpellier-LR Genopole.This work was supported by the Electricite de France grant n�
V3-104 to GR.
The authors have declared no conflict of interest.
5 References
[1] Bartel, D. P., MicroRNAs: target recognition and regulatoryfunctions. Cell 2009, 136, 215–233.
[2] Kim, V. N., Han, J., Siomi, M. C., Biogenesis of small RNAsin animals. Nat. Rev. Mol. Cell Biol. 2009, 10, 126–139.
[3] Guo, H., Ingolia, N. T., Weissman, J. S., Bartel, D. P., Mam-malian microRNAs predominantly act to decrease targetmRNA levels. Nature 2010, 466, 835–840.
[4] Ivey, K. N., Srivastava, D., MicroRNAs as regulators of dif-ferentiation and cell fate decisions. Cell Stem Cell 2010, 7,36–41.
[5] Lu, J., Getz, G., Miska, E. A., Alvarez-Saavedra, E. et al., Mi-croRNA expression profiles classify human cancers. Nature2005, 435, 834–838.
C© 2012 WILEY-VCH Verlag GmbH & Co. KGaA, Weinheim www.proteomics-journal.com
2302 D. Peric et al. Proteomics 2012, 12, 2295–2302
[6] He, L., Thomson, J. M., Hemann, M. T., Hernando-Monge, E.et al., A microRNA polycistron as a potential human onco-gene. Nature 2005, 435, 828–833.
[7] Mayr, C., Hemann, M. T., Bartel, D. P., Disrupting the pairingbetween let-7 and Hmga2 enhances oncogenic transforma-tion. Science 2007, 315, 1576–1579.
[8] Welch, C., Chen, Y., Stallings, R. L., MicroRNA-34a functionsas a potential tumor suppressor by inducing apoptosis inneuroblastoma cells. Oncogene 2007, 26, 5017–5022.
[9] Wang, Y., Baskerville, S., Shenoy, A., Babiarz, J. E. et al.,Embryonic stem cell-specific microRNAs regulate the G1-Stransition and promote rapid proliferation. Nat. Genet. 2008,40, 1478–1483.
[10] Peric, D., Chvalova, K., Rousselet, G., Identification ofmicroprocessor-dependent cancer cells allows screening forgrowth-sustaining micro-RNAs. Oncogene 2011, 31, 2039–2048.
[11] Kumar, M. S., Lu, J., Mercer, K. L., Golub, T. R. et al., ImpairedmicroRNA processing enhances cellular transformation andtumorigenesis. Nat. Genet. 2007, 39, 673–677.
[12] Bradford, M. M., A rapid and sensitive method for the quanti-tation of microgram quantities of protein utilizing the princi-ple of protein-dye binding. Anal. Biochem. 1976, 72, 248–254.
[13] Chevalier, F., Highlights on the capacities of “Gel-based”proteomics. Proteome. Sci. 2010, 8, doi: 10.1186/1477-5956-8-23.
[14] Chevalier, F., Centeno, D., Rofidal, V., Tauzin, M. et al., Differ-ent impact of staining procedures using visible stains andfluorescent dyes for large-scale investigation of proteomesby MALDI-TOF mass spectrometry. J. Proteome. Res. 2006,5, 512–520.
[15] Chevalier, F., Hirtz, C., Sommerer, N., Kelly, A. L., Use ofreducing/nonreducing two-dimensional electrophoresis forthe study of disulfide-mediated interactions between pro-teins in raw and heated bovine milk. J. Agric. Food Chem.2009, 57, 5948–5955.
[16] Chevalier, F., Rofidal, V., Rossignol, M., Visible and fluores-cent staining of two-dimensional gels. Methods Mol. Biol.2007, 355, 145–156.
[17] Vilaprinyo, E., Alves, R., Sorribas, A., Minimization of biosyn-thetic costs in adaptive gene expression responses of yeastto environmental changes. PLoS Comput. Biol. 2010, 6,e1000674.
[18] Godon, C., Lagniel, G., Lee, J., Buhler, J. M. et al., The H2O2
stimulon in Saccharomyces cerevisiae. J. Biol. Chem. 1998,273, 22480–22489.
[19] Hall, A., Karplus, P. A., Poole, L. B., Typical 2-Cys peroxiredox-ins – structures, mechanisms and functions. FEBS J. 2009,276, 2469–2477.
[20] Baranano, D. E., Rao, M., Ferris, C. D., Snyder, S. H., Biliverdinreductase: a major physiologic cytoprotectant. Proc. Natl.Acad. Sci. USA 2002, 99, 16093–16098.
[21] Reitman, Z. J., Yan, H., Isocitrate dehydrogenase 1 and 2mutations in cancer: alterations at a crossroads of cellularmetabolism. J. Natl. Cancer Inst. 2010, 102, 932–941.
[22] Arrigo, A. P., Virot, S., Chaufour, S., Firdaus, W. et al., Hsp27consolidates intracellular redox homeostasis by upholdingglutathione in its reduced form and by decreasing iron intra-cellular levels. Antioxid. Redox Signal. 2005, 7, 414–422.
[23] Desaint, S., Luriau, S., Aude, J. C., Rousselet, G. et al., Mam-malian antioxidant defenses are not inducible by H2O2. J.Biol. Chem. 2004, 279, 31157–31163.
[24] Kondrashov, F. A., Ogurtsov, A. Y., Kondrashov, A. S., Bioin-formatical assay of human gene morbidity. Nucleic AcidsRes. 2004, 32, 1731–1737.
[25] Eisenberg, E., Levanon, E. Y., Human housekeeping genesare compact. Trends Genet. 2003, 19, 362–365.
[26] Brocchieri, L., Karlin, S., Protein length in eukaryotic andprokaryotic proteomes. Nucleic Acids Res. 2005, 33, 3390–3400.
[27] Warringer, J., Blomberg, A., Evolutionary constraints onyeast protein size. BMC Evol. Biol. 2006, 6, doi:10.1186/1471-2148-6-61.
[28] Russell, J. B., Cook, G. M., Energetics of bacterial growth:balance of anabolic and catabolic reactions. Microbiol. Rev.1995, 59, 48–62.
[29] Roth, D. M., Balch, W. E., Modeling general proteostasis:proteome balance in health and disease. Curr. Opin. CellBiol. 2011, 23, 126–134.
[30] Faller, M., Matsunaga, M., Yin, S., Loo, J. A. et al., Hemeis involved in microRNA processing. Nat. Struct. Mol. Biol.2007, 14, 23–29.
[31] Barr, I., Smith, A. T., Senturia, R., Chen, Y. et al., DiGeorgecritical region 8 (DGCR8) is a double-cysteine-ligated hemeprotein. J. Biol. Chem. 2011, 286, 16716–16725.
[32] Richert, S., Luche, S., Chevallet, M., Van Dorsselaer, A. et al.,About the mechanism of interference of silver staining withpeptide mass spectrometry. Proteomics 2004, 4, 909–916.
C© 2012 WILEY-VCH Verlag GmbH & Co. KGaA, Weinheim www.proteomics-journal.com
1756 Proteomics 2012, 12, 1756–1766DOI 10.1002/pmic.201100319
RESEARCH ARTICLE
Accumulation of cyclophilin A isoforms in conditioned
medium of irradiated breast cancer cells
Francois Chevalier1, Jordane Depagne1, Sonia Hem2, Sylvie Chevillard3, Julie Bensimon3,Pascale Bertrand1,4 and Jerome Lebeau3
1 CEA, DSV, iRCM Plateforme de Proteomique, Fontenay-aux-Roses, France2 INRA, UR 1199, Laboratoire de Proteomique Fonctionnelle, Montpellier, France3 CEA, DSV, iRCM, SREIT Laboratoire de Cancerologie Experimentale, Fontenay-aux-Roses, France4 CEA, DSV, IRCM, SIGRR, Laboratoire des Mecanismes de la Recombinaison, Fontenay-aux-Roses, France
Secreted proteins play a key role in cell signaling and communication. We recently showedthat ionizing radiations induced a delayed cell death of breast cancer cells, mediated by thedeath receptor pathways through the expression of soluble forms of “death ligands.” Us-ing the same cell model, the objective of our work was the identification of diffusible fac-tors, secreted following cell irradiation, potentially involved in cell death signaling. Differen-tial proteomic analysis of conditioned media using 2DE resulted in detection of numerousspots that were significantly modulated following cell irradiation. The corresponding pro-teins were identified using MALDI-TOF MS and LC-MS/MS approaches. Interestingly, fiveisoforms of cyclophilin A were observed as increased in conditioned medium of irradiatedcells. These isoforms differed in isoelectric points and in accumulation levels. An increaseof cyclophilin A secretion was confirmed by Western blotting of conditioned media of ir-radiated or radiosentive mammary cells. These isoforms displayed an interesting patternof protein maturation and post-translational modifications, including an alternating removal ofN-terminal methionine, associated with a combination of acetylations and methylations. Therole of the protein is discussed in relation with its potential involvement in the mechanisms ofintercells relationships and radiosensitivity.
Keywords:
Breast cancer / Cell biology / Cyclophilin A / Irradiation / Radiosensitivity / Secretome
Received: June 17, 2011Revised: December 16, 2011Accepted: February 21, 2012
1 Introduction
The secretome refers to the global study of proteins that aresecreted by a cell, a tissue, or an organism [1]. Although thesecretome is a potential source suitable for the discovery ofnew therapeutic targets or biomarker candidates, the access to
Correspondence: Dr. Francois Chevalier, CEA, DSV, iRCM, Plate-forme de Proteomique, 92260 Fontenay-aux-Roses, FranceE-mail: [email protected]: +33-146-549-138
Abbreviations: Cc, cytoplasmic extract proteins of control cells;Ci, cytoplasmic extract proteins of irradiated cells; CyPA, cy-clophilin A; IR, ionizing radiation; Sc, conditioned media of con-trol cells; SFM, serum free medium; Si, conditioned media ofirradiated cells; Tc, total extract proteins of control cells; TCA,trichloroacetic acid; Ti, total extract proteins of irradiated cells
secreted proteins using proteomic analysis represents a chal-lenge for three reasons: (i) the very low concentration in theculture media of most secreted proteins makes their analysisdifficult; (ii) their covering and contamination by cytoplas-mic or other normally nonsecreted proteins released follow-ing cell lysis and death; (iii) the use of FCS in culture me-dia, mandatory to most cell lines, interferes with proteomicstechniques [2]. Several technical possibilities were offered toaddress these three problems: (i) the high separation power ofgel-based proteomics methods [3,4], coupled with enrichmenttechniques based on trichloroacetic acid (TCA) precipitationallowed the concentration and the study of secreted proteins[2,5]; (ii) additional control samples (cytoplasmic and total cellextracts) can limit false positive spots during gel picture anal-ysis; (iii) secreted proteins were collected from cells grownwithout FCS in culture media in order to reduce serum pro-tein contamination [6, 7].
C© 2012 WILEY-VCH Verlag GmbH & Co. KGaA, Weinheim www.proteomics-journal.com
Proteomics 2012, 12, 1756–1766 1757
While genetic analyses may provide a list of potentially se-creted proteins, proteome analysis is essential to identify pro-teins actually secreted by cells and tissues under certain con-ditions. Indeed, secreted proteins from cancer cells were ableto control many biological and physiological processes [8].
Cellular exposure to ionizing radiation (IR) can result in thesecretion of soluble factors by irradiated cells [9]. In this case, abystander effects can occur in cells that were never themselvesirradiated but were either in close proximity to irradiatedcells. In vivo, a bystander effect was observed after injectingmice with either neutron irradiated cells [10] or radioactivelylabeled cells [11], mixing these with nonirradiated cells andobserving subsequent effects in the nonirradiated cells.
Following gamma-irradiation, breast tumor displayed aprolonged G2 blockage, accompanied by a mitotic disorderand considered as a frequent mode of cell death [12]. Themechanisms underlying radiation-induced bystander effectsare as yet unclear and the identity of the bystander factors ispartially defined. Several interleukine and cytokine were de-scribed to participate in such bio-cellular mechanisms [13,14],but it is likely that multiple pathways are involved in the by-stander phenomenon, and different cell types respond dif-ferently to bystander signaling. We have shown previouslythat irradiation of mammary tumor cells led to late cell deathby apoptosis. After a 10-Gy irradiation, the proliferative ca-pacity was almost fully inhibited; only few cell clones wereable to emerge, showing the selection of radioresistant cells.This growth inhibition was mediated by the Fas, TRAIL, andTNF-alpha death receptor pathways through the expressionof mains ligands/receptors implicated in these three path-ways. Moreover, we showed that the three ligands were alsoproduced as soluble forms whose secretion can induce thedeath of sensitive cells through a “bystander” type effect [15].
The aim of the present work is focused on the researchand characterization of new diffusible factors during radioin-duced cell death of mammary cancer cells. These diffusiblefactors could be implicated in cell death and potentially asso-ciated with bystander effects. So, using a proteomic strategyspecifically developed for secreted proteins, the goal of thisstudy was the investigation of cell secretome for the identifi-cation of proteomic changes associated with IRs.
According to a gel-based secretomic analysis, several iso-forms of cyclophilin A (CyPA) were observed as specificallyover-expressed in conditioned medium from irradiated cells.Spot isoforms were analyzed by MS, and the level of secretedCyPA was estimated in different mammary cell lines. Ourstudy provides evidence that protein secretion was increasedfollowing irradiation and protein function could be connectedto radiosensibility.
2 Materials and methods
2.1 Cell cultures
T-47D, MCF7, BT-20, ZR-75–1, MDA-MB-157, and MDA-MB-231 cell lines were obtained from the American Type
Culture Collection (Rockville, MD, USA). Cells were main-tained in DMEM, 4.5 g/L glucose, 0.11 g/L sodium pyruvate,glutamate (GlutaMAX 1TM) and pyridoxine, supplementedwith 5% (T-47D, MCF7, and MDA-MB-231), or 10% (BT-20 and MDA-MB-157) FCS, penicillin, streptomycin, andamphotericin B (antibiotic–antimycotic mix) (all from LifeTechnologies, Cergy-Pontoise, France) in 5% CO2 and 95%humidity. Cell proliferation and survival analyses were per-formed in two or more independent experiments, by scoringat least 300 cells each time. Discrimination between viableand dead cells was performed by trypan blue exclusion.
2.2 Irradiation and conditioned medium collection
Cells were plated 48 h prior to irradiation. On day 0 (con-centration of 4 × 10⁶ cells per 75 cm2 flask), cells were 10Gy-irradiated in a serum-free DMEM, using a 137Cs irradia-tion unit at dose rate of 2 Gy/min, and then incubated withfresh medium. Six days after irradiation, the medium wasremoved and the cell layer was washed once with PBS andthrice with serum-free medium (SFM), SFM was added tothe cells for an incubation period of 18 h after which celllayer as well as SFM were collected (Fig. 1). In parallel, non-irradiated cells (concentration of 4 × 10⁵ cells per 75 cm2
flask at day 0, in order to obtain a concentration of 4 × 10⁶
cells per flask at day 6) were similarly treated. Two indepen-dent biological replicates were used for subsequent proteomicanalyses.
2.3 Conditioned medium, cytosolic, and total
protein extraction
Proteins were extracted from conditioned medium by precip-itation. Briefly, SFM with secreted proteins was centrifugedat 10 000 × g for 10 min at 4�C to remove dead cells and largedebris. Proteins were precipitated according to the method ofHirtz et al. applied for secreted salivary proteins [5], with themodification of Chevallet et al. applied for cell secretome [2].
Briefly, secreted proteins in SFM were incubated with 7.5%TCA and 0.1% NLS (N-Lauroyl Sarcosine) at −20�C overnight.The protein suspension was then centrifuged at 42 000 × gfor 10 min at 4�C and the pellet was washed two times withice cold acetone/2-ME (0.07% v/v), centrifuged again as pre-viously, and the final pellet was dried in the air. Proteins wereresuspended in proteomic sample buffer containing 9 M urea,4% CHAPS, 0.05% Triton X-100, 65 mM DTT, and a proteaseinhibitor cocktail (Roche Diagnostics, Meylan, France). Sam-ples were stored at −20�C.
Total proteins were extracted from intact cell as following.Cells were collected following trypsinization and cell pelletswere washed three times in PBS. Half of cells were dissolvedin proteomic sample buffer to obtain the total protein ex-tract. This suspension was centrifuged at 68 000 rpm for60 min, supernatants were collected, aliquoted, and stored
C© 2012 WILEY-VCH Verlag GmbH & Co. KGaA, Weinheim www.proteomics-journal.com
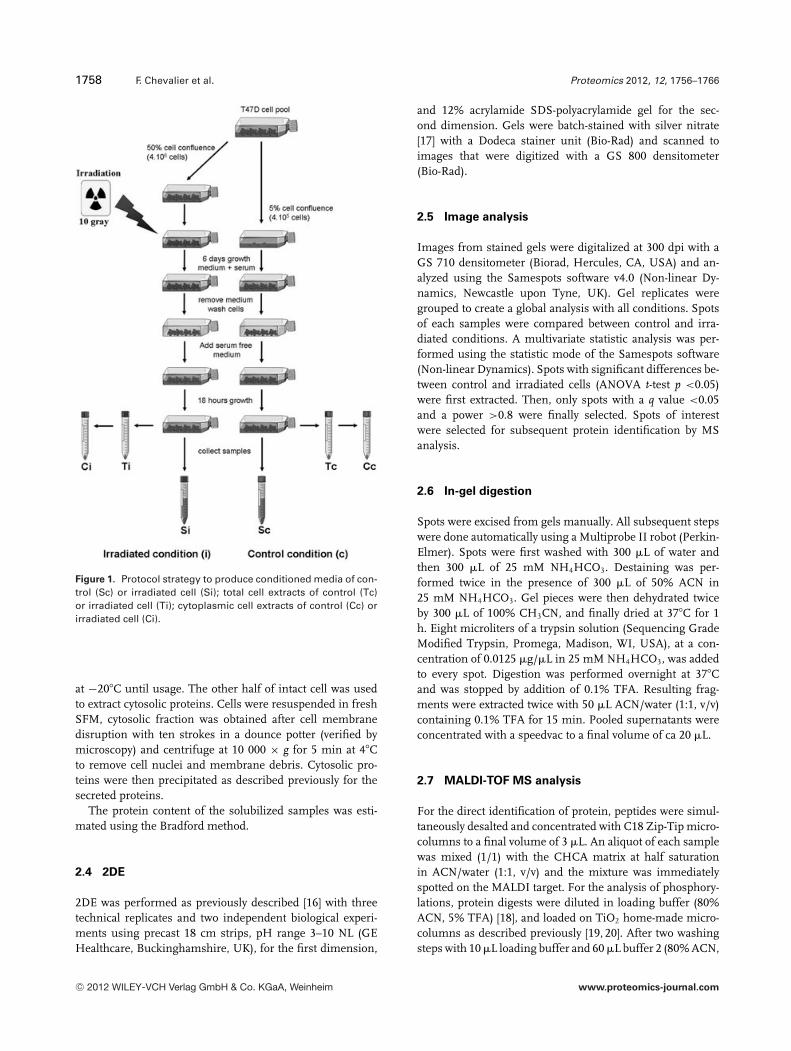
1758 F. Chevalier et al. Proteomics 2012, 12, 1756–1766
Figure 1. Protocol strategy to produce conditioned media of con-trol (Sc) or irradiated cell (Si); total cell extracts of control (Tc)or irradiated cell (Ti); cytoplasmic cell extracts of control (Cc) orirradiated cell (Ci).
at −20�C until usage. The other half of intact cell was usedto extract cytosolic proteins. Cells were resuspended in freshSFM, cytosolic fraction was obtained after cell membranedisruption with ten strokes in a dounce potter (verified bymicroscopy) and centrifuge at 10 000 × g for 5 min at 4�Cto remove cell nuclei and membrane debris. Cytosolic pro-teins were then precipitated as described previously for thesecreted proteins.
The protein content of the solubilized samples was esti-mated using the Bradford method.
2.4 2DE
2DE was performed as previously described [16] with threetechnical replicates and two independent biological experi-ments using precast 18 cm strips, pH range 3–10 NL (GEHealthcare, Buckinghamshire, UK), for the first dimension,
and 12% acrylamide SDS-polyacrylamide gel for the sec-ond dimension. Gels were batch-stained with silver nitrate[17] with a Dodeca stainer unit (Bio-Rad) and scanned toimages that were digitized with a GS 800 densitometer(Bio-Rad).
2.5 Image analysis
Images from stained gels were digitalized at 300 dpi with aGS 710 densitometer (Biorad, Hercules, CA, USA) and an-alyzed using the Samespots software v4.0 (Non-linear Dy-namics, Newcastle upon Tyne, UK). Gel replicates weregrouped to create a global analysis with all conditions. Spotsof each samples were compared between control and irra-diated conditions. A multivariate statistic analysis was per-formed using the statistic mode of the Samespots software(Non-linear Dynamics). Spots with significant differences be-tween control and irradiated cells (ANOVA t-test p <0.05)were first extracted. Then, only spots with a q value <0.05and a power >0.8 were finally selected. Spots of interestwere selected for subsequent protein identification by MSanalysis.
2.6 In-gel digestion
Spots were excised from gels manually. All subsequent stepswere done automatically using a Multiprobe II robot (Perkin-Elmer). Spots were first washed with 300 �L of water andthen 300 �L of 25 mM NH4HCO3. Destaining was per-formed twice in the presence of 300 �L of 50% ACN in25 mM NH4HCO3. Gel pieces were then dehydrated twiceby 300 �L of 100% CH3CN, and finally dried at 37�C for 1h. Eight microliters of a trypsin solution (Sequencing GradeModified Trypsin, Promega, Madison, WI, USA), at a con-centration of 0.0125 �g/�L in 25 mM NH4HCO3, was addedto every spot. Digestion was performed overnight at 37�Cand was stopped by addition of 0.1% TFA. Resulting frag-ments were extracted twice with 50 �L ACN/water (1:1, v/v)containing 0.1% TFA for 15 min. Pooled supernatants wereconcentrated with a speedvac to a final volume of ca 20 �L.
2.7 MALDI-TOF MS analysis
For the direct identification of protein, peptides were simul-taneously desalted and concentrated with C18 Zip-Tip micro-columns to a final volume of 3 �L. An aliquot of each samplewas mixed (1/1) with the CHCA matrix at half saturationin ACN/water (1:1, v/v) and the mixture was immediatelyspotted on the MALDI target. For the analysis of phosphory-lations, protein digests were diluted in loading buffer (80%ACN, 5% TFA) [18], and loaded on TiO2 home-made micro-columns as described previously [19, 20]. After two washingsteps with 10 �L loading buffer and 60 �L buffer 2 (80% ACN,
C© 2012 WILEY-VCH Verlag GmbH & Co. KGaA, Weinheim www.proteomics-journal.com
Proteomics 2012, 12, 1756–1766 1759
1% TFA), phosphopeptides were eluted using 2 �L NH4OH,pH 12 directly onto the MALDI target, then mixed with 1 �Lof DHB matrix (20 g/L) in acetonitrile, water, and phospho-ric acid (50/44/6). In order to identify the proteins, the flowthrough of the TiO2 microcolumns was dried, resuspendedin 2 �L of DHB matrix, and spotted onto the MALDI target.
All mass spectra were recorded in the reflector modeon an UltraFlex II MALDI-TOF/TOF mass spectrometer(Bruker Daltonics, Bremen, Germany). Automatic annota-tion of monoisotopic masses was performed using Bruker’sSNAPTM procedure. Protein identification was achieved us-ing the Mascot search engine (v. 2.2.04; Matrix Science, Lon-don, UK) to query locally the UniProt-SwissProt database(release July 2011). For PMF identification, the followingparameters were used: Homo sapiens for the taxonomy,100 ppm mass accuracy in MS, trypsin as enzyme, onemissed cleavage allowed, carbamidomethylation of Cysteinas fixed modification and acetylation of N-term protein,deamidation of N or Q, and oxidation of Methionines asvariable modification. For the analysis of protein modifica-tions (PMF and MS/MS), mass accuracy was set to 0.5 Dain MS/MS and the following variable modifications wereallowed: acetylation of lysines, Pyro-Glutamylation of N-term E or Q, and methylation of D or E. In PMF, pro-tein was validated once they showed identity with p-value<0.05. After MS/MS, peptides were validated once theyshowed identity or extensive homology (p <0.05) or man-ually checked for validation and assignment of modifiedsites.
2.8 Nano LC-MS/MS analysis
When low-abundant spots could not be identified by PMF,LC-MS/MS analysis was conducted. The sample preparationwas done as above and protein digests were analyzed us-ing a High Capacity ion trap mass spectrometer (EsquireHCT; Bruker Daltonik), interfaced with a nano-HPLC Chip-Cube system (Agilent Technologies, Santa Clara, USA). Thechips contained both the precolumn and the column (Zor-bax 300SB-C18; Agilent Technologies). Samples were firstloaded onto the 4 mm enrichment cartridge at a flow rateof 4 �L/min using 0.1% formic acid. After preconcentra-tion, peptides were separated on the column (75 �m di-ameter, 43 mm length) at a flow rate of 0.3 �L/min us-ing a 15 min linear gradient from 3% to 80% acetonitrilein 0.1% formic acid, and eluted into the mass spectrom-eter. A capillary voltage of 1.8–2.1 kV in the positive ionmode was used together with a dry gas flow rate of 4.5L/min at 250�C. A first full-scan mass spectrum was mea-sured in the 310 m/z to 1800 m/z range, followed by asecond scan at higher resolution to measure precisely themass of the three major ions in the previous scan. Fi-nally, a third scan was performed to acquire the collision-induced MS/MS spectra of the selected ions. MS/MS raw
data were analyzed using Data Analysis software (BrukerDaltonik) to generate the peak lists. The UniProt-SwissProtdatabase (release July 2011) database was queried locallyusing the Mascot search engine (v. 2.2.04; Matrix Science)and the following parameters: H. sapiens for the taxonomy,mass accuracy of 0.6 Da in MS and MS/MS, trypsin as en-zyme, one missed cleavage allowed, carbamidomethylationof Cystein as fixed modification and acetylation of N-termprotein, deamidation of N or Q, and oxidation of Methion-ine as variable modifications. Proteins were validated oncethey showed at least one peptide with identity or extensivehomology (p <0.05).
2.9 1D and 2D Western blotting analysis
For 1D Western blotting analysis, prestained standards (SeeBlue 2, Invitrogen) and protein samples were separated byNuPAGE Novex Bis-Tris gels with MOPS (3-(N-morpholino)propane sulfonic acid) SDS running buffer on 4–12% sep-arating gels (Invitrogen). For 2D Western blotting analysis,proteins were separated as previously described in the Sec-tion 2.4, with some technical adjustments. Briefly, 20 �g ofprotein was first separated with 7 cm pI 3–10 NL precaststrips (GE Healthcare) and then separated on a 12% acry-lamide SDS-polyacrylamide gel, using the Protean 3 elec-trophoresis unit (Bio-Rad). Following 1D or 2D gel sep-aration, proteins were transferred onto PVDF membrane(GE Healthcare) and blocked with 5% skim milk powderin TBS-T (150 mM NaCl, 10 mM Tris-HCl pH 8, 0.05%Tween-20) for 45 min at 20�C. Blots were incubated withanti-CyPA antibody (1:1000, ref 07–313, Millipore) in TBS-T with 1% skim milk powder overnight at 4�C and werewashed 3× for 10 min with TBS-T. The blots were thenincubated with secondary antibodies: HRP-conjugated goatantirabbit antibody (1:10 000, GE Healthcare) in TBS-T with1% skim milk powder for 45 min at 20�C and were washedwith TBS-T. Blots were treated with ECL EZ chemilumines-cence reagent (ATGC) for 1 min before exposure to Hy-perfilms (GE Healthcare) from 1 to 2 min. Films were de-veloped and scanned as JPEGs using a GS 800 Bio-Radscanner.
2.10 RNA extraction and quantitative real-time
RT-PCR
RNA extraction was performed as previously described [15] byTaqman assays (Applied Biosystems, France). The primers:Hs99999904_m1 (CyPA), Hs99999905_m1 (GAPDH), andHs99999903_m1 (ACTG1/beta-actin) were from Applied Bio-sciences. Gene expression was estimated as previously de-scribed [15].
C© 2012 WILEY-VCH Verlag GmbH & Co. KGaA, Weinheim www.proteomics-journal.com
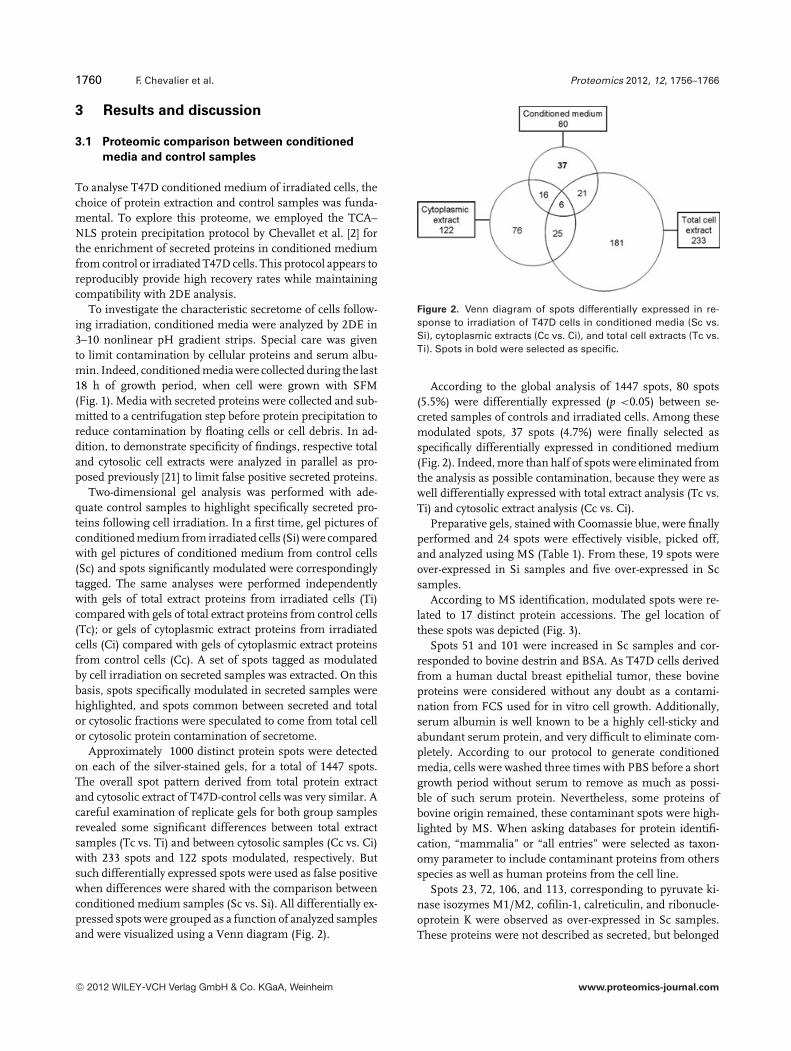
1760 F. Chevalier et al. Proteomics 2012, 12, 1756–1766
3 Results and discussion
3.1 Proteomic comparison between conditioned
media and control samples
To analyse T47D conditioned medium of irradiated cells, thechoice of protein extraction and control samples was funda-mental. To explore this proteome, we employed the TCA–NLS protein precipitation protocol by Chevallet et al. [2] forthe enrichment of secreted proteins in conditioned mediumfrom control or irradiated T47D cells. This protocol appears toreproducibly provide high recovery rates while maintainingcompatibility with 2DE analysis.
To investigate the characteristic secretome of cells follow-ing irradiation, conditioned media were analyzed by 2DE in3–10 nonlinear pH gradient strips. Special care was givento limit contamination by cellular proteins and serum albu-min. Indeed, conditioned media were collected during the last18 h of growth period, when cell were grown with SFM(Fig. 1). Media with secreted proteins were collected and sub-mitted to a centrifugation step before protein precipitation toreduce contamination by floating cells or cell debris. In ad-dition, to demonstrate specificity of findings, respective totaland cytosolic cell extracts were analyzed in parallel as pro-posed previously [21] to limit false positive secreted proteins.
Two-dimensional gel analysis was performed with ade-quate control samples to highlight specifically secreted pro-teins following cell irradiation. In a first time, gel pictures ofconditioned medium from irradiated cells (Si) were comparedwith gel pictures of conditioned medium from control cells(Sc) and spots significantly modulated were correspondinglytagged. The same analyses were performed independentlywith gels of total extract proteins from irradiated cells (Ti)compared with gels of total extract proteins from control cells(Tc); or gels of cytoplasmic extract proteins from irradiatedcells (Ci) compared with gels of cytoplasmic extract proteinsfrom control cells (Cc). A set of spots tagged as modulatedby cell irradiation on secreted samples was extracted. On thisbasis, spots specifically modulated in secreted samples werehighlighted, and spots common between secreted and totalor cytosolic fractions were speculated to come from total cellor cytosolic protein contamination of secretome.
Approximately 1000 distinct protein spots were detectedon each of the silver-stained gels, for a total of 1447 spots.The overall spot pattern derived from total protein extractand cytosolic extract of T47D-control cells was very similar. Acareful examination of replicate gels for both group samplesrevealed some significant differences between total extractsamples (Tc vs. Ti) and between cytosolic samples (Cc vs. Ci)with 233 spots and 122 spots modulated, respectively. Butsuch differentially expressed spots were used as false positivewhen differences were shared with the comparison betweenconditioned medium samples (Sc vs. Si). All differentially ex-pressed spots were grouped as a function of analyzed samplesand were visualized using a Venn diagram (Fig. 2).
Figure 2. Venn diagram of spots differentially expressed in re-sponse to irradiation of T47D cells in conditioned media (Sc vs.Si), cytoplasmic extracts (Cc vs. Ci), and total cell extracts (Tc vs.Ti). Spots in bold were selected as specific.
According to the global analysis of 1447 spots, 80 spots(5.5%) were differentially expressed (p <0.05) between se-creted samples of controls and irradiated cells. Among thesemodulated spots, 37 spots (4.7%) were finally selected asspecifically differentially expressed in conditioned medium(Fig. 2). Indeed, more than half of spots were eliminated fromthe analysis as possible contamination, because they were aswell differentially expressed with total extract analysis (Tc vs.Ti) and cytosolic extract analysis (Cc vs. Ci).
Preparative gels, stained with Coomassie blue, were finallyperformed and 24 spots were effectively visible, picked off,and analyzed using MS (Table 1). From these, 19 spots wereover-expressed in Si samples and five over-expressed in Scsamples.
According to MS identification, modulated spots were re-lated to 17 distinct protein accessions. The gel location ofthese spots was depicted (Fig. 3).
Spots 51 and 101 were increased in Sc samples and cor-responded to bovine destrin and BSA. As T47D cells derivedfrom a human ductal breast epithelial tumor, these bovineproteins were considered without any doubt as a contami-nation from FCS used for in vitro cell growth. Additionally,serum albumin is well known to be a highly cell-sticky andabundant serum protein, and very difficult to eliminate com-pletely. According to our protocol to generate conditionedmedia, cells were washed three times with PBS before a shortgrowth period without serum to remove as much as possi-ble of such serum protein. Nevertheless, some proteins ofbovine origin remained, these contaminant spots were high-lighted by MS. When asking databases for protein identifi-cation, “mammalia” or “all entries” were selected as taxon-omy parameter to include contaminant proteins from othersspecies as well as human proteins from the cell line.
Spots 23, 72, 106, and 113, corresponding to pyruvate ki-nase isozymes M1/M2, cofilin-1, calreticulin, and ribonucle-oprotein K were observed as over-expressed in Sc samples.These proteins were not described as secreted, but belonged
C© 2012 WILEY-VCH Verlag GmbH & Co. KGaA, Weinheim www.proteomics-journal.com
Proteomics 2012, 12, 1756–1766 1761Ta
ble
1.
Pro
tein
sm
od
ula
ted
inT
47D
cells
follo
win
gir
rad
iati
on
Sp
ot
Pro
tein
nam
ea)S
i/Scb
)Fo
ldA
NO
VA
(p)
qva
lue
Pow
erId
enti
fica
tio
nA
cces
sio
nM
atch
ed%
cove
rag
eT
heo
ric
Ob
serv
edT
heo
ric
Ob
serv
edsc
ore
c)p
epti
des
pI
pI
MW
MW
2C
oat
om
erp
rote
inco
mp
lex
Si
4.3
3.07
×10−
061.
62×
10−0
41.
0066
P61
923
15
4.8
4.4
20.3
19.3
5C
ellu
lar
reti
no
icac
id-b
ind
ing
pro
tein
2S
i3.
66.
00×
10−0
62.
08×
10−0
41.
0013
3P
2937
34
285.
46.
515
.714
.4
6G
amm
a-g
luta
myl
-cy
clo
tran
sfer
ase
Si
3.4
5.08
×10
−08
3.18
×10
−05
1.00
324
O75
223
633
8.5
4.5
12.9
21
8T
RA
PP
C3
Si
33.
64×
10−0
61.
62×
10−0
41.
0041
O43
617
14
4.85
4.5
20.2
18.3
11M
yosi
nre
gu
lato
rylig
ht
chai
n12
BS
i2.
93.
62×
10−0
61.
62×
10−0
41.
0015
7O
1495
03
184.
694.
419
.618
.1
1826
Sp
rote
aso
me
no
n-A
TPa
sere
gu
lato
rysu
bu
nit
10
Si
2.6
1.65
×10
−06
1.03
×10
−04
1.00
55O
7583
21
35.
77.
124
.424
.4
19C
yclo
ph
ilin
AS
i2.
55.
95×
10−0
42.
32×
10−0
30.
9910
8*P
6293
713
667.
76.
718
15.8
21G
amm
a-g
luta
myl
-cy
clo
tran
sfer
ase
Si
2.5
3.02
×10
−04
1.45
×10
−03
1.00
271
O75
223
528
5.1
4.5
21.0
21
23P
yru
vate
kin
ase
iso
zym
esM
1/M
2S
c2.
43.
34×
10−0
41.
59×
10−0
31.
0017
8P
1461
84
87.
956.
457
.864
.4
28Pr
ote
aso
me
sub
un
itb
eta
typ
e-2
Si
2.3
4.84
×10
−04
2.09
×10
−03
1.00
54P
4972
11
46.
26.
122
.323
.4
3260
Sac
idic
rib
oso
mal
pro
tein
P0
Si
2.1
1.26
×10
−03
3.83
×10
−03
0.98
303
Q8N
HW
57
235.
76.
234
.336
38G
luta
thio
ne
S-t
ran
sfer
ase
Mu
2S
i2
1.88
×10
−05
3.39
×10
−04
1.00
115
Q03
013
211
67
25.7
25.2
51D
estr
in(b
ovin
e)S
c1.
84.
08×
10−0
38.
83×
10−0
30.
9113
3P
6098
15
218.
17.
618
.517
.372
Co
filin
-1S
c1.
61.
90×
10−0
34.
92×
10−0
30.
9684
*P
2352
88
518.
27.
218
.517
.584
Trio
sep
ho
sph
ate
iso
mer
ase
Si
1.5
8.34
×10
−07
7.26
×10
−05
1.00
147*
P60
174
1572
6.5
726
.626
.3
87C
ellu
lar
reti
no
icac
id-b
ind
ing
pro
tein
2S
i1.
55.
20×
10−0
31.
03×
10−0
20.
8913
3P
2937
34
285.
45.
415
.614
.9
89C
yclo
ph
ilin
AS
i1.
52.
86×
10−0
23.
64×
10−0
20.
8413
6*P
6293
717
787.
77.
418
16.5
92C
yclo
ph
ilin
AS
i1.
57.
44×
10−0
62.
15×
10−0
41.
0013
7*P
6293
717
787.
76.
718
16.5
97C
yclo
ph
ilin
AS
i1.
42.
87×
10−0
36.
22×
10−0
30.
9412
7*P
6293
714
717.
76.
118
16.6
101
Ser
um
alb
um
in(b
ovin
e)S
c1.
49.
16×
10−0
43.
17×
10−0
30.
9916
1P
0276
84
55.
76
66.5
7410
6C
alre
ticu
linva
rian
tS
c1.
31.
77×
10−0
34.
78×
10−0
30.
9789
*Q
53G
7117
524.
34.
146
.976
.311
3H
eter
og
eneo
us
nu
clea
rri
bo
nu
cleo
pro
tein
KS
c1.
68.
96×
10−0
56.
98×
10−0
41.
0046
9P
6197
89
215.
24.
951
68.6
132
Pro
tein
DJ-
1S
i1.
47.
68×
10−0
56.
31×
10−0
41.
0024
8Q
9949
77
316.
35.
819
.923
.915
9C
yclo
ph
ilin
AS
i1.
44.
22×
10−0
39.
13×
10−0
30.
9115
9*P
6293
820
867.
77.
218
16.5
AN
OV
A,q
valu
e,an
dp
ow
erw
ere
ob
tain
edfr
om
imag
ean
alys
isw
ith
the
Sam
esp
ots
soft
war
eu
sin
gth
est
atis
tica
lpac
kag
e.T
he
ob
serv
edM
Wan
dp
Iof
the
diff
eren
tial
lyex
pre
ssed
pro
tein
spo
tsan
dth
eth
eore
tica
lval
ues
of
iden
tifi
edp
rote
ins
are
also
liste
da)
For
each
spo
t,o
nly
the
pro
tein
wit
hth
eh
igh
est
sco
reis
sho
wn
.b
)S
i:S
po
tsin
crea
sed
inth
eco
nd
itio
ned
med
iao
fir
rad
iate
dce
lls,S
c:sp
ots
incr
ease
din
the
con
dit
ion
edm
edia
of
con
tro
l(n
on
irra
dia
ted
)ce
lls.
c)S
core
sw
ith
aste
risk
s(*
)re
ferr
edto
PM
FM
ALD
I-TO
Fid
enti
fica
tio
no
fp
rote
ins;
sco
res
wit
ho
ut
aste
risk
sre
ferr
edto
low
-ab
un
dan
tsp
ots
,id
enti
fied
wit
hn
ano
-LC
-MS
/MS
.
C© 2012 WILEY-VCH Verlag GmbH & Co. KGaA, Weinheim www.proteomics-journal.com
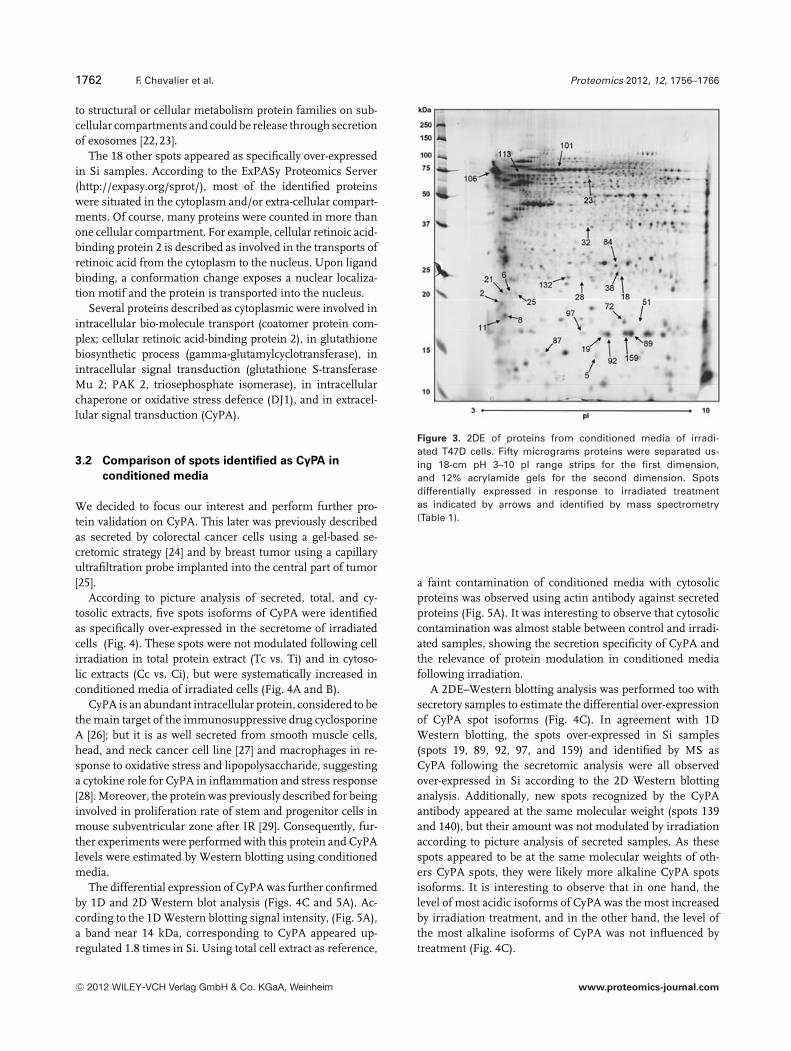
1762 F. Chevalier et al. Proteomics 2012, 12, 1756–1766
to structural or cellular metabolism protein families on sub-cellular compartments and could be release through secretionof exosomes [22, 23].
The 18 other spots appeared as specifically over-expressedin Si samples. According to the ExPASy Proteomics Server(http://expasy.org/sprot/), most of the identified proteinswere situated in the cytoplasm and/or extra-cellular compart-ments. Of course, many proteins were counted in more thanone cellular compartment. For example, cellular retinoic acid-binding protein 2 is described as involved in the transports ofretinoic acid from the cytoplasm to the nucleus. Upon ligandbinding, a conformation change exposes a nuclear localiza-tion motif and the protein is transported into the nucleus.
Several proteins described as cytoplasmic were involved inintracellular bio-molecule transport (coatomer protein com-plex; cellular retinoic acid-binding protein 2), in glutathionebiosynthetic process (gamma-glutamylcyclotransferase), inintracellular signal transduction (glutathione S-transferaseMu 2; PAK 2, triosephosphate isomerase), in intracellularchaperone or oxidative stress defence (DJ1), and in extracel-lular signal transduction (CyPA).
3.2 Comparison of spots identified as CyPA in
conditioned media
We decided to focus our interest and perform further pro-tein validation on CyPA. This later was previously describedas secreted by colorectal cancer cells using a gel-based se-cretomic strategy [24] and by breast tumor using a capillaryultrafiltration probe implanted into the central part of tumor[25].
According to picture analysis of secreted, total, and cy-tosolic extracts, five spots isoforms of CyPA were identifiedas specifically over-expressed in the secretome of irradiatedcells (Fig. 4). These spots were not modulated following cellirradiation in total protein extract (Tc vs. Ti) and in cytoso-lic extracts (Cc vs. Ci), but were systematically increased inconditioned media of irradiated cells (Fig. 4A and B).
CyPA is an abundant intracellular protein, considered to bethe main target of the immunosuppressive drug cyclosporineA [26]; but it is as well secreted from smooth muscle cells,head, and neck cancer cell line [27] and macrophages in re-sponse to oxidative stress and lipopolysaccharide, suggestinga cytokine role for CyPA in inflammation and stress response[28]. Moreover, the protein was previously described for beinginvolved in proliferation rate of stem and progenitor cells inmouse subventricular zone after IR [29]. Consequently, fur-ther experiments were performed with this protein and CyPAlevels were estimated by Western blotting using conditionedmedia.
The differential expression of CyPA was further confirmedby 1D and 2D Western blot analysis (Figs. 4C and 5A). Ac-cording to the 1D Western blotting signal intensity, (Fig. 5A),a band near 14 kDa, corresponding to CyPA appeared up-regulated 1.8 times in Si. Using total cell extract as reference,
Figure 3. 2DE of proteins from conditioned media of irradi-ated T47D cells. Fifty micrograms proteins were separated us-ing 18-cm pH 3–10 pI range strips for the first dimension,and 12% acrylamide gels for the second dimension. Spotsdifferentially expressed in response to irradiated treatmentas indicated by arrows and identified by mass spectrometry(Table 1).
a faint contamination of conditioned media with cytosolicproteins was observed using actin antibody against secretedproteins (Fig. 5A). It was interesting to observe that cytosoliccontamination was almost stable between control and irradi-ated samples, showing the secretion specificity of CyPA andthe relevance of protein modulation in conditioned mediafollowing irradiation.
A 2DE–Western blotting analysis was performed too withsecretory samples to estimate the differential over-expressionof CyPA spot isoforms (Fig. 4C). In agreement with 1DWestern blotting, the spots over-expressed in Si samples(spots 19, 89, 92, 97, and 159) and identified by MS asCyPA following the secretomic analysis were all observedover-expressed in Si according to the 2D Western blottinganalysis. Additionally, new spots recognized by the CyPAantibody appeared at the same molecular weight (spots 139and 140), but their amount was not modulated by irradiationaccording to picture analysis of secreted samples. As thesespots appeared to be at the same molecular weights of oth-ers CyPA spots, they were likely more alkaline CyPA spotsisoforms. It is interesting to observe that in one hand, thelevel of most acidic isoforms of CyPA was the most increasedby irradiation treatment, and in the other hand, the level ofthe most alkaline isoforms of CyPA was not influenced bytreatment (Fig. 4C).
C© 2012 WILEY-VCH Verlag GmbH & Co. KGaA, Weinheim www.proteomics-journal.com
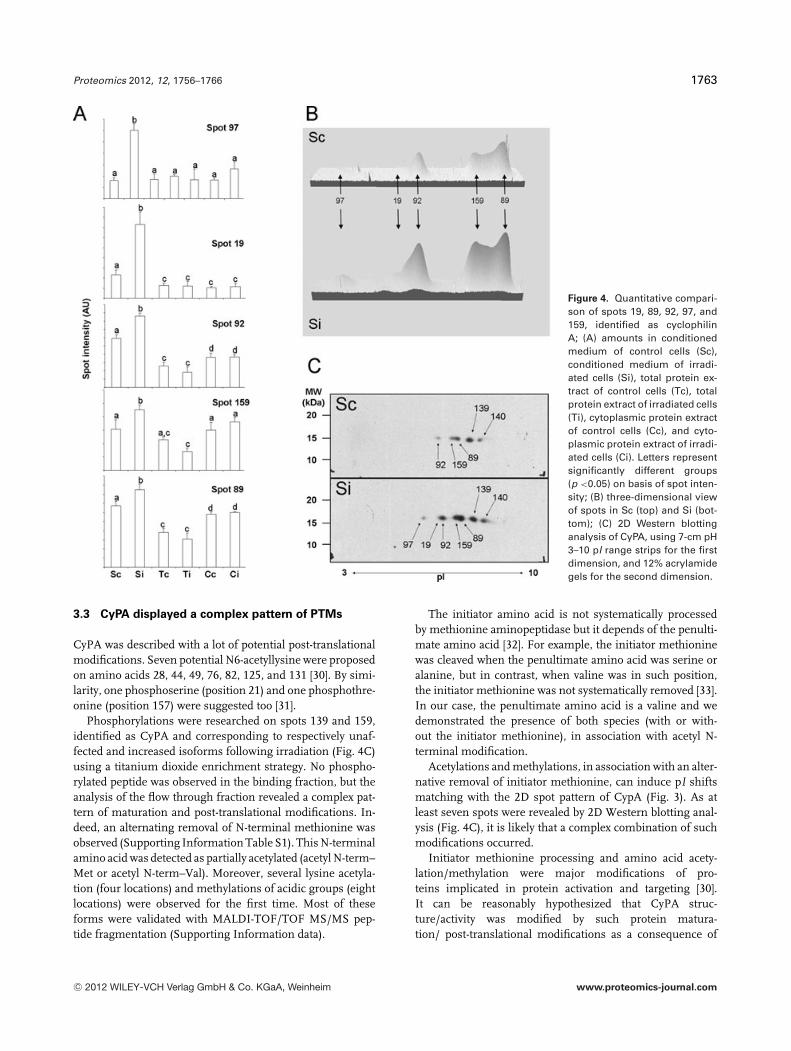
Proteomics 2012, 12, 1756–1766 1763
Figure 4. Quantitative compari-son of spots 19, 89, 92, 97, and159, identified as cyclophilinA; (A) amounts in conditionedmedium of control cells (Sc),conditioned medium of irradi-ated cells (Si), total protein ex-tract of control cells (Tc), totalprotein extract of irradiated cells(Ti), cytoplasmic protein extractof control cells (Cc), and cyto-plasmic protein extract of irradi-ated cells (Ci). Letters representsignificantly different groups(p <0.05) on basis of spot inten-sity; (B) three-dimensional viewof spots in Sc (top) and Si (bot-tom); (C) 2D Western blottinganalysis of CyPA, using 7-cm pH3–10 pI range strips for the firstdimension, and 12% acrylamidegels for the second dimension.
3.3 CyPA displayed a complex pattern of PTMs
CyPA was described with a lot of potential post-translationalmodifications. Seven potential N6-acetyllysine were proposedon amino acids 28, 44, 49, 76, 82, 125, and 131 [30]. By simi-larity, one phosphoserine (position 21) and one phosphothre-onine (position 157) were suggested too [31].
Phosphorylations were researched on spots 139 and 159,identified as CyPA and corresponding to respectively unaf-fected and increased isoforms following irradiation (Fig. 4C)using a titanium dioxide enrichment strategy. No phospho-rylated peptide was observed in the binding fraction, but theanalysis of the flow through fraction revealed a complex pat-tern of maturation and post-translational modifications. In-deed, an alternating removal of N-terminal methionine wasobserved (Supporting Information Table S1). This N-terminalamino acid was detected as partially acetylated (acetyl N-term–Met or acetyl N-term–Val). Moreover, several lysine acetyla-tion (four locations) and methylations of acidic groups (eightlocations) were observed for the first time. Most of theseforms were validated with MALDI-TOF/TOF MS/MS pep-tide fragmentation (Supporting Information data).
The initiator amino acid is not systematically processedby methionine aminopeptidase but it depends of the penulti-mate amino acid [32]. For example, the initiator methioninewas cleaved when the penultimate amino acid was serine oralanine, but in contrast, when valine was in such position,the initiator methionine was not systematically removed [33].In our case, the penultimate amino acid is a valine and wedemonstrated the presence of both species (with or with-out the initiator methionine), in association with acetyl N-terminal modification.
Acetylations and methylations, in association with an alter-native removal of initiator methionine, can induce pI shiftsmatching with the 2D spot pattern of CypA (Fig. 3). As atleast seven spots were revealed by 2D Western blotting anal-ysis (Fig. 4C), it is likely that a complex combination of suchmodifications occurred.
Initiator methionine processing and amino acid acety-lation/methylation were major modifications of pro-teins implicated in protein activation and targeting [30].It can be reasonably hypothesized that CyPA struc-ture/activity was modified by such protein matura-tion/ post-translational modifications as a consequence of
C© 2012 WILEY-VCH Verlag GmbH & Co. KGaA, Weinheim www.proteomics-journal.com
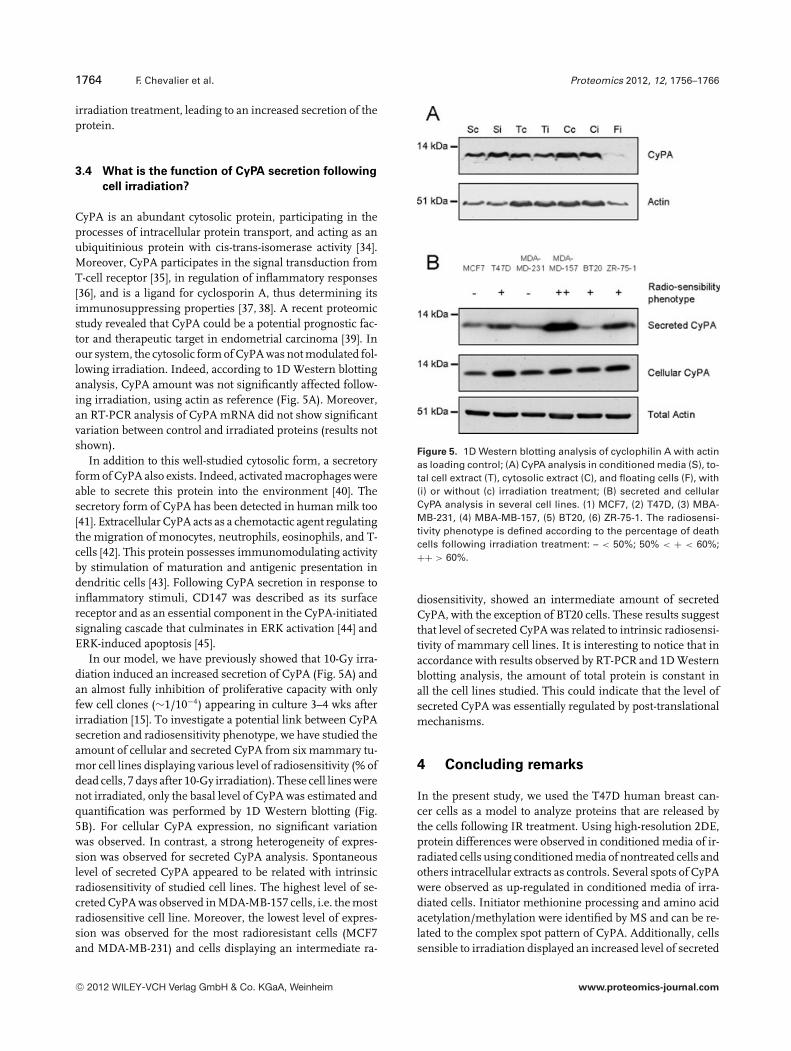
1764 F. Chevalier et al. Proteomics 2012, 12, 1756–1766
irradiation treatment, leading to an increased secretion of theprotein.
3.4 What is the function of CyPA secretion following
cell irradiation?
CyPA is an abundant cytosolic protein, participating in theprocesses of intracellular protein transport, and acting as anubiquitinious protein with cis-trans-isomerase activity [34].Moreover, CyPA participates in the signal transduction fromT-cell receptor [35], in regulation of inflammatory responses[36], and is a ligand for cyclosporin A, thus determining itsimmunosuppressing properties [37, 38]. A recent proteomicstudy revealed that CyPA could be a potential prognostic fac-tor and therapeutic target in endometrial carcinoma [39]. Inour system, the cytosolic form of CyPA was not modulated fol-lowing irradiation. Indeed, according to 1D Western blottinganalysis, CyPA amount was not significantly affected follow-ing irradiation, using actin as reference (Fig. 5A). Moreover,an RT-PCR analysis of CyPA mRNA did not show significantvariation between control and irradiated proteins (results notshown).
In addition to this well-studied cytosolic form, a secretoryform of CyPA also exists. Indeed, activated macrophages wereable to secrete this protein into the environment [40]. Thesecretory form of CyPA has been detected in human milk too[41]. Extracellular CyPA acts as a chemotactic agent regulatingthe migration of monocytes, neutrophils, eosinophils, and T-cells [42]. This protein possesses immunomodulating activityby stimulation of maturation and antigenic presentation indendritic cells [43]. Following CyPA secretion in response toinflammatory stimuli, CD147 was described as its surfacereceptor and as an essential component in the CyPA-initiatedsignaling cascade that culminates in ERK activation [44] andERK-induced apoptosis [45].
In our model, we have previously showed that 10-Gy irra-diation induced an increased secretion of CyPA (Fig. 5A) andan almost fully inhibition of proliferative capacity with onlyfew cell clones (∼1/10−4) appearing in culture 3–4 wks afterirradiation [15]. To investigate a potential link between CyPAsecretion and radiosensitivity phenotype, we have studied theamount of cellular and secreted CyPA from six mammary tu-mor cell lines displaying various level of radiosensitivity (% ofdead cells, 7 days after 10-Gy irradiation). These cell lines werenot irradiated, only the basal level of CyPA was estimated andquantification was performed by 1D Western blotting (Fig.5B). For cellular CyPA expression, no significant variationwas observed. In contrast, a strong heterogeneity of expres-sion was observed for secreted CyPA analysis. Spontaneouslevel of secreted CyPA appeared to be related with intrinsicradiosensitivity of studied cell lines. The highest level of se-creted CyPA was observed in MDA-MB-157 cells, i.e. the mostradiosensitive cell line. Moreover, the lowest level of expres-sion was observed for the most radioresistant cells (MCF7and MDA-MB-231) and cells displaying an intermediate ra-
Figure 5. 1D Western blotting analysis of cyclophilin A with actinas loading control; (A) CyPA analysis in conditioned media (S), to-tal cell extract (T), cytosolic extract (C), and floating cells (F), with(i) or without (c) irradiation treatment; (B) secreted and cellularCyPA analysis in several cell lines. (1) MCF7, (2) T47D, (3) MBA-MB-231, (4) MBA-MB-157, (5) BT20, (6) ZR-75-1. The radiosensi-tivity phenotype is defined according to the percentage of deathcells following irradiation treatment: – < 50%; 50% < + < 60%;++ > 60%.
diosensitivity, showed an intermediate amount of secretedCyPA, with the exception of BT20 cells. These results suggestthat level of secreted CyPA was related to intrinsic radiosensi-tivity of mammary cell lines. It is interesting to notice that inaccordance with results observed by RT-PCR and 1D Westernblotting analysis, the amount of total protein is constant inall the cell lines studied. This could indicate that the level ofsecreted CyPA was essentially regulated by post-translationalmechanisms.
4 Concluding remarks
In the present study, we used the T47D human breast can-cer cells as a model to analyze proteins that are released bythe cells following IR treatment. Using high-resolution 2DE,protein differences were observed in conditioned media of ir-radiated cells using conditioned media of nontreated cells andothers intracellular extracts as controls. Several spots of CyPAwere observed as up-regulated in conditioned media of irra-diated cells. Initiator methionine processing and amino acidacetylation/methylation were identified by MS and can be re-lated to the complex spot pattern of CyPA. Additionally, cellssensible to irradiation displayed an increased level of secreted
C© 2012 WILEY-VCH Verlag GmbH & Co. KGaA, Weinheim www.proteomics-journal.com

Proteomics 2012, 12, 1756–1766 1765
CyPA. Taken together, these results showed that this proteincould be defined as a cytokine, post-translationally regulatedand potentially implicated in the radioinduced apoptotic re-sponse in mammary tumor cells. More generally, our resultsshowed the capacity of our approach to select and identifyproteins released in conditioned medium, the gel-based pro-teomic was as usual of a great interest to reveal differencesbetween spots isoforms and discrete modifications of pro-teomes [3, 46].
This work was supported by the Institute of Cellular and Molec-ular Radiobiology (DSV, CEA) and the Proteomic Platform ofMontpellier-LR Genopole.
The authors have declared no conflict of interest.
5 References
[1] Tjalsma, H., Bolhuis, A., Jongbloed, J. D., Bron, S. et al., Sig-nal peptide-dependent protein transport in Bacillus subtilis:a genome-based survey of the secretome. Microbiol. Mol.Biol. Rev. 2000, 64, 515–547.
[2] Chevallet, M., Diemer, H., Van Dorssealer, A., Villiers, C. et al.,Toward a better analysis of secreted proteins: the example ofthe myeloid cells secretome. Proteomics 2007, 7, 1757–1770.
[3] Chevalier, F., Highlights on the capacities of “gel-based” pro-teomics. Proteome Sci. 2010, 8, 1–10.
[4] Rabilloud, T., Chevallet, M., Luche, S., Lelong, C., Two-dimensional gel electrophoresis in proteomics: past, presentand future. J. Proteomics 2010, 73, 2064–2077.
[5] Hirtz, C., Chevalier, F., Centeno, D., Rofidal, V. et al., MS char-acterization of multiple forms of alpha-amylase in humansaliva. Proteomics 2005, 5, 4597–4607.
[6] Dowling, P., Clynes, M., Conditioned media from cell lines:a complementary model to clinical specimens for the dis-covery of disease-specific biomarkers. Proteomics 2011, 11,794–804.
[7] Skalnikova, H., Motlik, J., Gadher, S. J., Kovarova, H., Map-ping of the secretome of primary isolates of mammaliancells, stem cells and derived cell lines. Proteomics 2011, 11,691–708.
[8] Gromov, P., Gromova, I., Bunkenborg, J., Cabezon, T. et al.,Up-regulated proteins in the fluid bathing the tumour cellmicroenvironment as potential serological markers for earlydetection of cancer of the breast. Mol. Oncol. 2010, 4, 65–89.
[9] Sowa Resat, M. B., Morgan, W. F., Radiation-induced ge-nomic instability: a role for secreted soluble factors in com-municating the radiation response to non-irradiated cells. J.Cell. Biochem. 2004, 92, 1013–1019.
[10] Watson, G. E., Lorimore, S. A., Macdonald, D. A., Wright, E.G., Chromosomal instability in unirradiated cells induced invivo by a bystander effect of ionizing radiation. Cancer Res.2000, 60, 5608–5611.
[11] Xue, L. Y., Butler, N. J., Makrigiorgos, G. M., Adelstein, S.J. et al., Bystander effect produced by radiolabeled tumorcells in vivo. Proc. Natl. Acad. Sci. USA 2002, 99, 13765–13770.
[12] Roninson, I. B., Broude, E. V., Chang, B.-D., If not apopto-sis, then what? Treatment-induced senescence and mitoticcatastrophe in tumor cells. Drug Resistance Updates 2001,4, 303–313.
[13] Hei, T. K., Zhou, H., Chai, Y., Ponnaiya, B. et al., Radiationinduced non-targeted response: mechanism and potentialclinical implications. Curr. Mol. Pharmacol. 2011, 4, 96–105.
[14] Shao, C., Folkard, M., Prise, K. M., Role of TGF-beta1 andnitric oxide in the bystander response of irradiated gliomacells. Oncogene 2008, 27, 434–440.
[15] Luce, A., Courtin, A., Levalois, C., Altmeyer-Morel, S. et al.,Death receptor pathways mediate targeted and non-targetedeffects of ionizing radiations in breast cancer cells. Carcino-genesis 2009, 30, 432–439.
[16] Chevalier, F., Martin, O., Rofidal, V., Devauchelle, A. D.et al., Proteomic investigation of natural variation be-tween Arabidopsis ecotypes. Proteomics 2004, 4, 1372–1381.
[17] Chevalier, F., Centeno, D., Rofidal, V., Tauzin, M. et al., Differ-ent impact of staining procedures using visible stains andfluorescent dyes for large-scale investigation of proteomesby MALDI-TOF mass spectrometry. J. Proteome Res. 2006,5, 512–520.
[18] Imanishi, S. Y., Kochin, V., Ferraris, S. E., de Thonel, A. et al.,Reference-facilitated phosphoproteomics: fast and reliablephosphopeptide validation by microLC-ESI-Q-TOF MS/MS.Mol. Cell Proteomics 2007, 6, 1380–1391.
[19] Hem, S., Rofidal, V., Sommerer, N., Rossignol, M., Novel sub-sets of the Arabidopsis plasmalemma phosphoproteomeidentify phosphorylation sites in secondary active trans-porters. Biochem. Biophys. Res. Commun. 2007, 363, 375–380.
[20] Larsen, M. R., Thingholm, T. E., Jensen, O. N., Roepstorff, P.et al., Highly selective enrichment of phosphorylated pep-tides from peptide mixtures using titanium dioxide micro-columns. Mol. Cell Proteomics 2005, 4, 873–886.
[21] Zwickl, H., Traxler, E., Staettner, S., Parzefall, W. et al., A noveltechnique to specifically analyze the secretome of cells andtissues. Electrophoresis 2005, 26, 2779–2785.
[22] Volmer, M. W., Stuhler, K., Zapatka, M., Schoneck, A. et al.,Differential proteome analysis of conditioned media to de-tect Smad4 regulated secreted biomarkers in colon cancer.Proteomics 2005, 5, 2587–2601.
[23] Raimondo, F., Morosi, L., Chinello, C., Magni, F. et al., Ad-vances in membranous vesicle and exosome proteomics im-proving biological understanding and biomarker discovery.Proteomics 2011, 11, 709–720.
[24] Diehl, H. C., Stuhler, K., Klein-Scory, S., Volmer, M. W. et al.,A catalogue of proteins released by colorectal cancer cellsin vitro as an alternative source for biomarker discovery.Proteomics – Clin. Appl. 2007, 1, 47–61.
[25] Chen, S.-T., Pan, T.-L., Juan, H.-F., Chen, T.-Y. et al., Breasttumor microenvironment: proteomics highlights the treat-ments targeting secretome. J. Proteome Res. 2008, 7, 1379–1387.
[26] Obchoei, S., Wongkhan, S., Wongkham, C., Li, M. et al.,Cyclophilin A: potential functions and therapeutic target
C© 2012 WILEY-VCH Verlag GmbH & Co. KGaA, Weinheim www.proteomics-journal.com
1766 F. Chevalier et al. Proteomics 2012, 12, 1756–1766
for human cancer. Med. Sci. Monit 2009, 15, RA221–RA232.
[27] Ralhan, R., Masui, O., DeSouza, L. V., Matta, A. et al., Iden-tification of proteins secreted by head and neck cancercell lines using LC-MS/MS: strategy for discovery of can-didate serological biomarkers. Proteomics 2011, 11, 2363–2376.
[28] Jin, Z.-G., Lungu, A. O., Xie, L., Wang, M. et al., CyclophilinA is a proinflammatory cytokine that activates endothe-lial cells. Arterioscler. Thromb. Vasc. Biol 2004, 24, 1186–1191.
[29] Osato, K., Sato, Y., Ochiishi, T., Osato, A. et al., Apoptosis-inducing factor deficiency decreases the proliferation rateand protects the subventricular zone against ionizing radia-tion. Cell Death Dis. 2010, 1, e84.
[30] Choudhary, C., Kumar, C., Gnad, F., Nielsen, M. L. et al., Ly-sine acetylation targets protein complexes and co-regulatesmajor cellular functions. Science 2009, 325, 834–840.
[31] Gevaert, K., Staes, A., Van Damme, J., De Groot, S. et al.,Global phosphoproteome analysis on human HepG2 hepa-tocytes using reversed-phase diagonal LC. Proteomics 2005,5, 3589–3599.
[32] Link, A. J., Robison, K., Church, G. M., Comparing the pre-dicted and observed properties of proteins encoded in thegenome of Escherichia coli K-12. Electrophoresis 1997, 18,1259–1313.
[33] Frottin, F., Martinez, A., Peynot, P., Mitra, S. et al., The pro-teomics of N-terminal methionine cleavage. Mol. Cell. Pro-teomics 2006, 5, 2336–2349.
[34] Fischer, G., Bang, H., Mech, C., Determination of enzymaticcatalysis for the cis-trans-isomerization of peptide bindingin proline-containing peptides. Biomed. Biochim. Acta. 1984,43, 1101–1111.
[35] Colgan, J., Asmal, M., Neagu, M., Yu, B. et al., Cyclophilin Aregulates TCR signal strength in CD4+ T cells via a proline-directed conformational switch in Itk. Immunity 2004, 21,189–201.
[36] Arora, K., Gwinn, W. M., Bower, M. A., Watson, A. et al.,Extracellular cyclophilins contribute to the regulation of in-flammatory responses. J. Immunol. 2005, 175, 517–522.
[37] Fruman, D. A., Burakoff, S. J., Bierer, B. E., Immunophilinsin protein folding and immunosuppression. FASEB J. 1994,8, 391–400.
[38] Colgan, J., Asmal, M., Yu, B., Luban, J., Cyclophilin A-deficient mice are resistant to immunosuppression by cy-closporine. J. Immunol. 2005, 174, 6030–6038.
[39] Li, Z., Zhao, X., Bai, S., Wang, Z. et al., Proteomics identifi-cation of cyclophilin A as a potential prognostic factor andtherapeutic target in endometrial carcinoma. Mol. Cell. Pro-teomics 2008, 7, 1810–1823.
[40] Sherry, B., Yarlett, N., Strupp, A., Cerami, A., Identifica-tion of cyclophilin as a proinflammatory secretory prod-uct of lipopolysaccharide-activated macrophages. Proc. Natl.Acad. Sci. USA 1992, 89, 3511–3515.
[41] Spik, G., Haendler, B., Delmas, O., Mariller, C. et al., A novelsecreted cyclophilin-like protein (SCYLP). J. Biol. Chem.1991, 266, 10735–10738.
[42] Xu, Q., Leiva, M. C., Fischkoff, S. A., Handschumacher, R. E.et al., Leukocyte chemotactic activity of cyclophilin. J. Biol.Chem. 1992, 267, 11968–11971.
[43] Bharadwaj, U., Zhang, R., Yang, H., Li, M. et al., Effects ofcyclophilin A on myeloblastic cell line KG-1 derived dendriticlike cells (DLC) through p38 MAP kinase activation. J. Surg.Res. 2005, 127, 29–38.
[44] Yurchenko, V., Zybarth, G., O’Connor, M., Dai, W. W. et al., Ac-tive site residues of cyclophilin A are crucial for its signalingactivity via CD147. J. Biol. Chem. 2002, 277, 22959–22965.
[45] Zhuang, S., Schnellmann, R. G., A death-promoting rolefor extracellular signal-regulated kinase. J. Pharmacol. Exp.Ther. 2006, 319, 991–997.
[46] Rabilloud, T., Vaezzadeh, A. R., Potier, N., Lelong, C. et al.,Power and limitations of electrophoretic separations in pro-teomics strategies. Mass. Spectrom. Rev. 2009, 28, 816–843.
C© 2012 WILEY-VCH Verlag GmbH & Co. KGaA, Weinheim www.proteomics-journal.com
Effet Bystander en Radiobiologie et Hadronthérapie
HDR François Chevalier Page 137
2.2 - Chercheur en radiobiologie au LARIA
En juillet 2013, j’ai rejoint le LARIA, le Laboratoire d’Accueil et de Recherche avec les Ions Accélérés,
situé à Caen, sur le site de l’INB du GANIL (Grand Accélérateur National d’Ions Lourds).
Le LARIA, dirigé par Jean-Louis Lefaix, étudie depuis plusieurs années les effets des radiations
ionisantes de types photons ou hadrons sur les tissus sains, et plus particulièrement sur le cartilage.
En effet, le laboratoire a choisi de développer un modèle en 3D de cartilage sain, associé et comparé
au chondrosarcome, tumeur en première ligne pour l’hadronthérapie ions carbone.
Le cartilage est un tissu naturellement hypoxique car non vascularisé. Le chondrosarcome, qui
représente 20% des tumeurs primitives de l’os, est une tumeur chimio- et radiorésistante du cartilage,
et l’origine de cette résistance, hors hypoxie, est encore aujourd’hui mal connue.
L’alternative à la chirurgie extensive toujours invalidante pour le patient est la radiothérapie par
protons ou ions carbone afin d’allier efficacités balistique et thérapeutique à une tolérance raisonnable
du traitement pour le patient.
Le LARIA étudie les réponses des chondrocytes humains sains et tumoraux aux radiations ionisantes,
en prenant en compte leur microenvironnement, c’est-à-dire dans un modèle de culture en trois
dimensions en biomatériaux (3D) dans des conditions de physioxie au plus proche de la réalité
biologique (~3 à 5% d’oxygène).
Afin de reproduire les conditions de physioxie cellulaire, les cellules sont, d’une part, irradiées en
culture 2D en condition de physioxie naturelle in vivo (~3% O2) comme références internes, puis en
culture 3D en éponge de collagène de type I dans ces mêmes conditions de physioxie. Ce modèle de
culture en 3D permet de restituer in vitro le micro-environnement naturel des cellules et de conserver
leurs capacités de différenciation (chondrocyte vers l’ostéocyte et cellules souches
mésenchymateuses (CSMs) vers les chondrocyte ou les ostéocytes).
Deux principaux axes de recherche sont développés au LARIA :
- l’analyse des effets directs des rayonnements ionisants (rayons X et ions lourds) sur le
modèle 3D de cartilage sain ou tumoral
- l’étude des effets indirects de type bystander des rayonnements ionisants (rayons X et ions
lourds) sur le modèle 3D de cartilage sain ou tumoral
Dans ce contexte, et en accord avec le responsable du laboratoire, j’ai choisi de travailler sur ce
deuxième axe de recherche, sur l’étude d’un effet bystander radio-induit en utilisant des irradiations
par rayons X et ions lourds sur le modèle 3D de cartilage.
Le projet de recherche correspondant à cet axe thématique est développé dans le prochain chapitre.
Effet Bystander en Radiobiologie et Hadronthérapie
HDR François Chevalier Page 138
3 - Projet de Recherche
Avant-propos
Ce projet de recherche fait partie intégrante d’une des thématiques principales du LARIA sur l’analyse
des effets indirects des ions accélérés.
Ce projet est structuré en relation avec la mise en place du projet ARCHADE dans lequel notre équipe
sera impliquée dans la recherche en radiobiologie. Ce projet tient compte des thématiques
scientifiques qui seront liées directement à ce centre de traitement, mais aussi du calendrier de sa
mise en place et de la fonctionnalité des deux systèmes de traitement et de recherche qui y seront
installés. Dans un premier temps, le S2C2, un appareil de traitement par proton-thérapie, sera mis en
place et fonctionnel dès 2017, puis le C400, un prototype de machine dédiée à la recherche en
physique, clinique, radiobiologie et produisant des faisceaux de protons et d’ions carbone à partir de
2020.
De plus, dans le cadre de la rédaction de ce projet, une partie de la réflexion sur la place de l’analyse
protéomique dans ce contexte de recherche a été valorisée sous forme d’un article de revue, publié
dans « Mutation Research : Reviews in Mutation Research ». Pour plus de clarté et pour éviter les
redondances, cet article est inséré en texte intégral dans ce projet, après la page 152.

Effet Bystander en Radiobiologie et Hadronthérapie
HDR François Chevalier Page 139
3.1 - Contexte
3.1.1 - Radiobiologie des hadrons dans ARCHADEPour préparer la mise en place dans les mois prochains d’ARCHADE (Advanced Resource Centre for
Hadrontherapy in Europe), centre européen de protonthérapie et de recherche en hadronthérapie par
ions carbone [4,5], basé à Caen sur le site du GANIL (Fig. 1), le LARIA a développé depuis de
nombreuses années des thématiques de recherche en lien direct avec la radiobiologie des hadrons.
Nous proposons, en particulier, d’étudier l’existence d’un effet « bystander » radio-induit ou RIBE
(Radiation-Induced Bystander Effect) lors de radiothérapie conventionnelle (photons) ou
d’hadronthérapie (radiothérapie par protons et ions carbone) dont le développement est récent et qui
constitue l’une des solutions du futur pour le traitement de certains cancers inopérables, radio-
résistants ou chimio-résistants.
Figure 1 : Vue perspective prévue du bâtiment ARCHADE (en haut) et localisation d’ARCHADE sur le
site du GANIL (en bas).
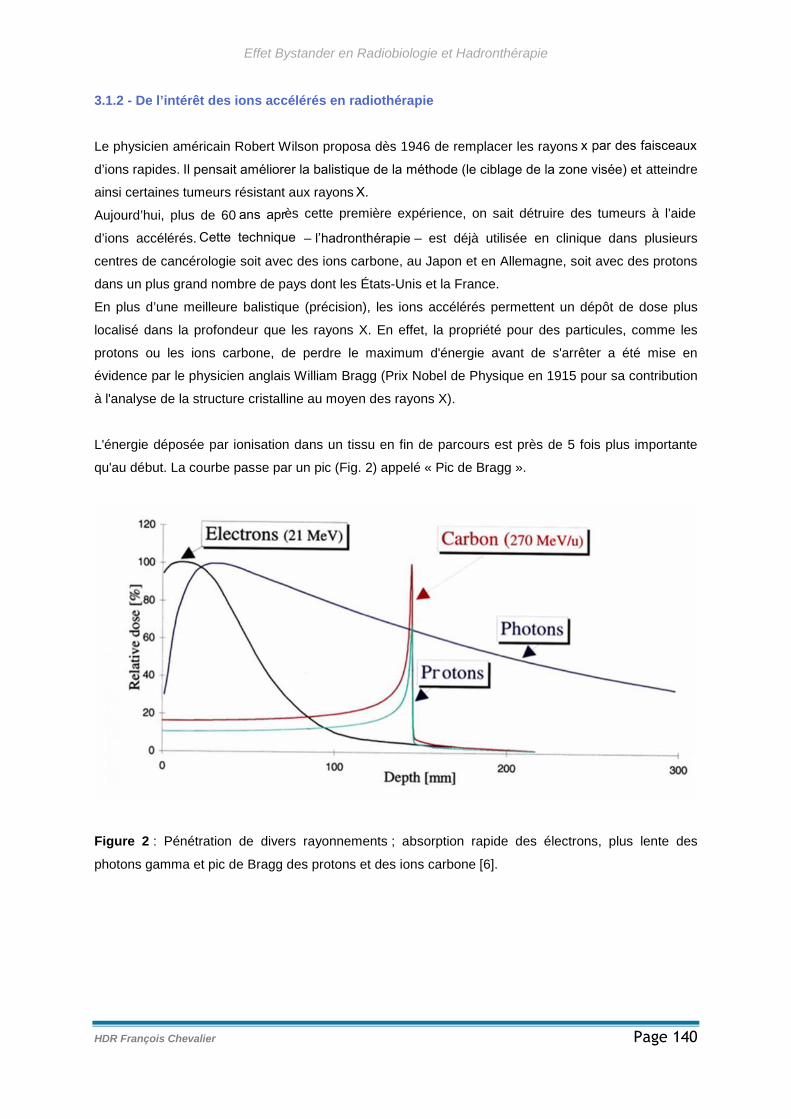
Effet Bystander en Radiobiologie et Hadronthérapie
HDR François Chevalier Page 140
3.1.2 - De l’intérêt des ions accélérés en radiothérapie
Le physicien américain Robert Wilson proposa dès 1946 de remplacer les rayons x par des faisceaux
d’ions rapides. Il pensait améliorer la balistique de la méthode (le ciblage de la zone visée) et atteindre
ainsi certaines tumeurs résistant aux rayons X.
Aujourd’hui, plus de 60 ans après cette première expérience, on sait détruire des tumeurs à l’aide
d’ions accélérés. Cette technique – l’hadronthérapie – est déjà utilisée en clinique dans plusieurs
centres de cancérologie soit avec des ions carbone, au Japon et en Allemagne, soit avec des protons
dans un plus grand nombre de pays dont les États-Unis et la France.
En plus d’une meilleure balistique (précision), les ions accélérés permettent un dépôt de dose plus
localisé dans la profondeur que les rayons X. En effet, la propriété pour des particules, comme les
protons ou les ions carbone, de perdre le maximum d'énergie avant de s'arrêter a été mise en
évidence par le physicien anglais William Bragg (Prix Nobel de Physique en 1915 pour sa contribution
à l'analyse de la structure cristalline au moyen des rayons X).
L'énergie déposée par ionisation dans un tissu en fin de parcours est près de 5 fois plus importante
qu'au début. La courbe passe par un pic (Fig. 2) appelé « Pic de Bragg ».
Figure 2 : Pénétration de divers rayonnements ; absorption rapide des électrons, plus lente des
photons gamma et pic de Bragg des protons et des ions carbone [6].
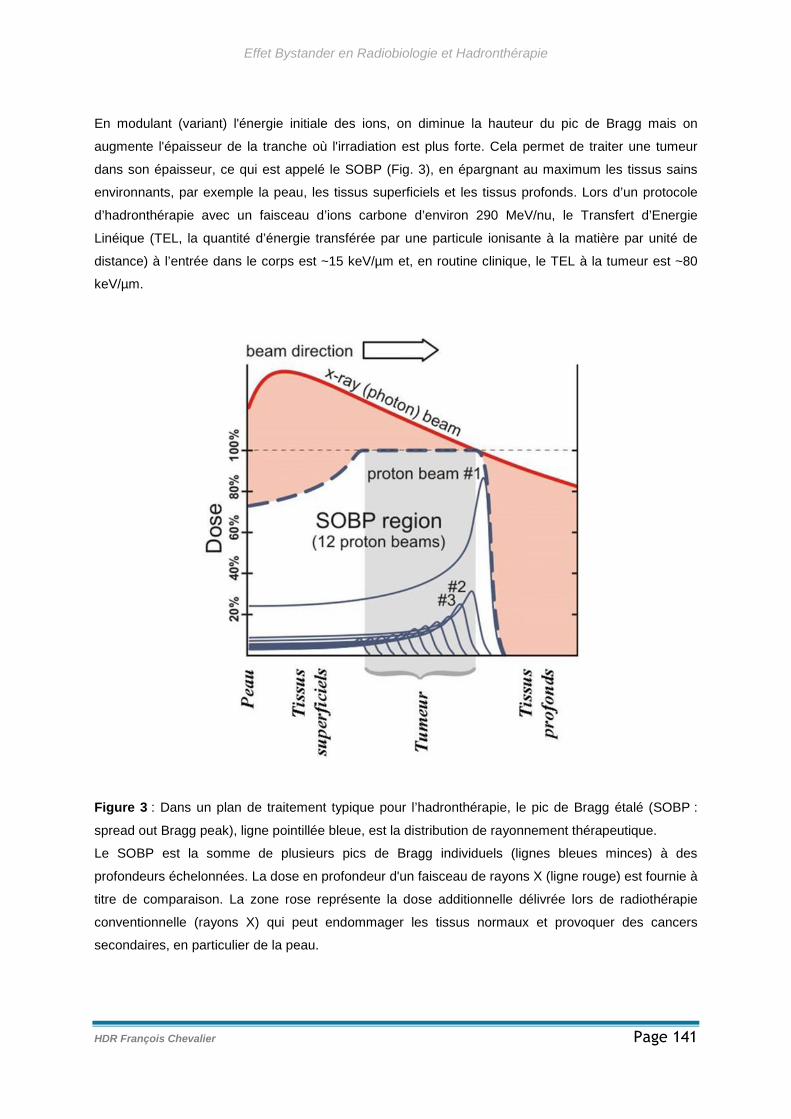
Effet Bystander en Radiobiologie et Hadronthérapie
HDR François Chevalier Page 141
En modulant (variant) l'énergie initiale des ions, on diminue la hauteur du pic de Bragg mais on
augmente l'épaisseur de la tranche où l'irradiation est plus forte. Cela permet de traiter une tumeur
dans son épaisseur, ce qui est appelé le SOBP (Fig. 3), en épargnant au maximum les tissus sains
environnants, par exemple la peau, les tissus superficiels et les tissus profonds. Lors d’un protocole
d’hadronthérapie avec un faisceau d’ions carbone d’environ 290 MeV/nu, le Transfert d’Energie
Linéique (TEL, la quantité d’énergie transférée par une particule ionisante à la matière par unité de
distance) à l’entrée dans le corps est ~15 keV/µm et, en routine clinique, le TEL à la tumeur est ~80
keV/µm.
Figure 3 : Dans un plan de traitement typique pour l’hadronthérapie, le pic de Bragg étalé (SOBP :
spread out Bragg peak), ligne pointillée bleue, est la distribution de rayonnement thérapeutique.
Le SOBP est la somme de plusieurs pics de Bragg individuels (lignes bleues minces) à des
profondeurs échelonnées. La dose en profondeur d'un faisceau de rayons X (ligne rouge) est fournie à
titre de comparaison. La zone rose représente la dose additionnelle délivrée lors de radiothérapie
conventionnelle (rayons X) qui peut endommager les tissus normaux et provoquer des cancers
secondaires, en particulier de la peau.
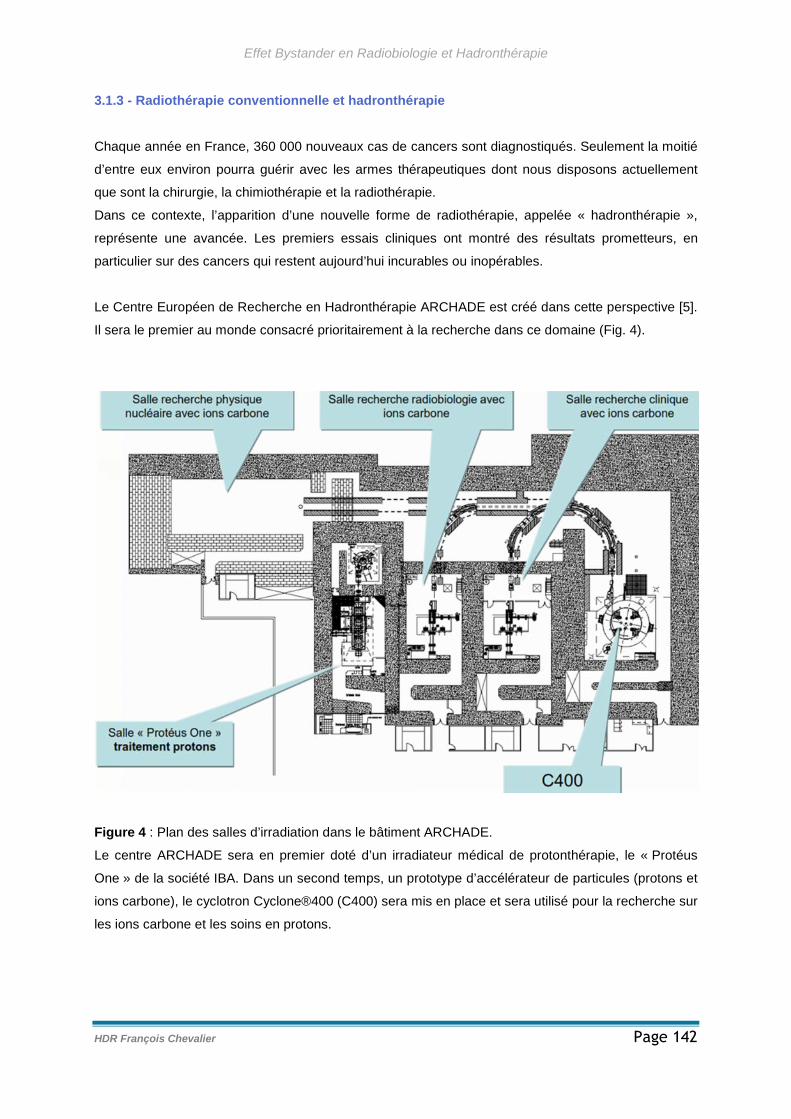
Effet Bystander en Radiobiologie et Hadronthérapie
HDR François Chevalier Page 142
3.1.3 - Radiothérapie conventionnelle et hadronthérapie
Chaque année en France, 360 000 nouveaux cas de cancers sont diagnostiqués. Seulement la moitié
d’entre eux environ pourra guérir avec les armes thérapeutiques dont nous disposons actuellement
que sont la chirurgie, la chimiothérapie et la radiothérapie.
Dans ce contexte, l’apparition d’une nouvelle forme de radiothérapie, appelée « hadronthérapie »,
représente une avancée. Les premiers essais cliniques ont montré des résultats prometteurs, en
particulier sur des cancers qui restent aujourd’hui incurables ou inopérables.
Le Centre Européen de Recherche en Hadronthérapie ARCHADE est créé dans cette perspective [5].
Il sera le premier au monde consacré prioritairement à la recherche dans ce domaine (Fig. 4).
Figure 4 : Plan des salles d’irradiation dans le bâtiment ARCHADE.
Le centre ARCHADE sera en premier doté d’un irradiateur médical de protonthérapie, le « Protéus
One » de la société IBA. Dans un second temps, un prototype d’accélérateur de particules (protons et
ions carbone), le cyclotron Cyclone®400 (C400) sera mis en place et sera utilisé pour la recherche sur
les ions carbone et les soins en protons.
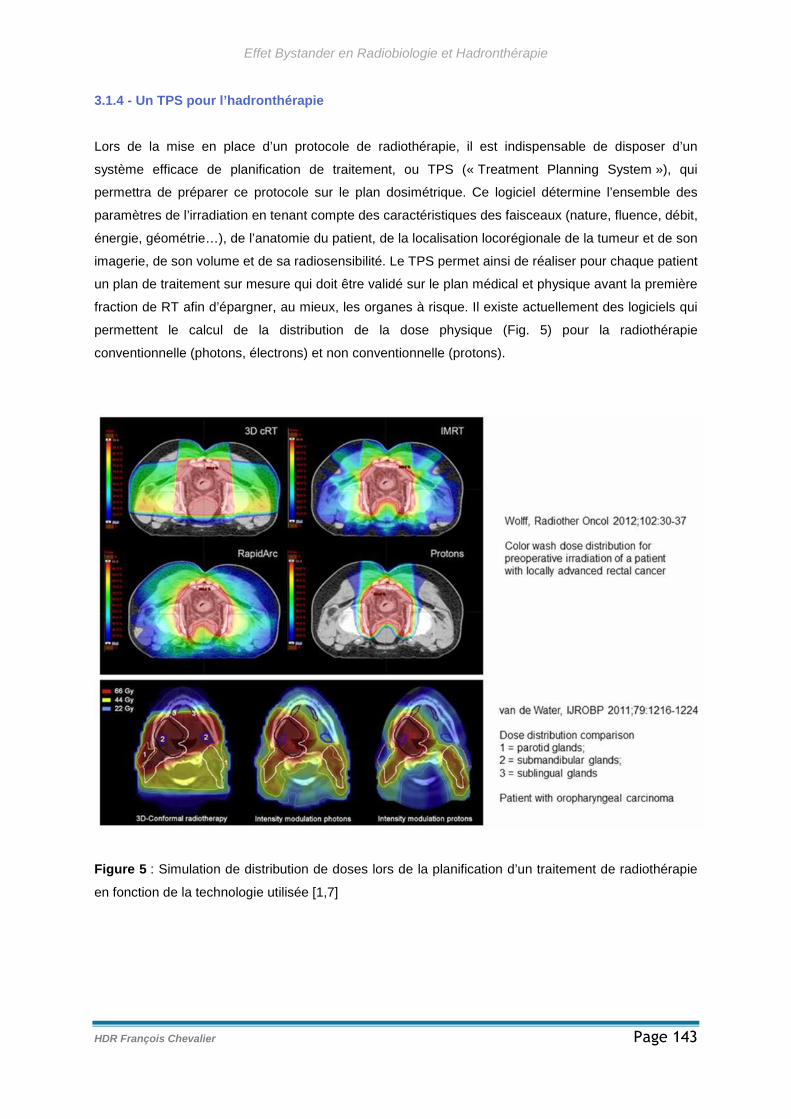
Effet Bystander en Radiobiologie et Hadronthérapie
HDR François Chevalier Page 143
3.1.4 - Un TPS pour l’hadronthérapie
Lors de la mise en place d’un protocole de radiothérapie, il est indispensable de disposer d’un
système efficace de planification de traitement, ou TPS (« Treatment Planning System »), qui
permettra de préparer ce protocole sur le plan dosimétrique. Ce logiciel détermine l’ensemble des
paramètres de l’irradiation en tenant compte des caractéristiques des faisceaux (nature, fluence, débit,
énergie, géométrie…), de l’anatomie du patient, de la localisation locorégionale de la tumeur et de son
imagerie, de son volume et de sa radiosensibilité. Le TPS permet ainsi de réaliser pour chaque patient
un plan de traitement sur mesure qui doit être validé sur le plan médical et physique avant la première
fraction de RT afin d’épargner, au mieux, les organes à risque. Il existe actuellement des logiciels qui
permettent le calcul de la distribution de la dose physique (Fig. 5) pour la radiothérapie
conventionnelle (photons, électrons) et non conventionnelle (protons).
Figure 5 : Simulation de distribution de doses lors de la planification d’un traitement de radiothérapie
en fonction de la technologie utilisée [1,7]
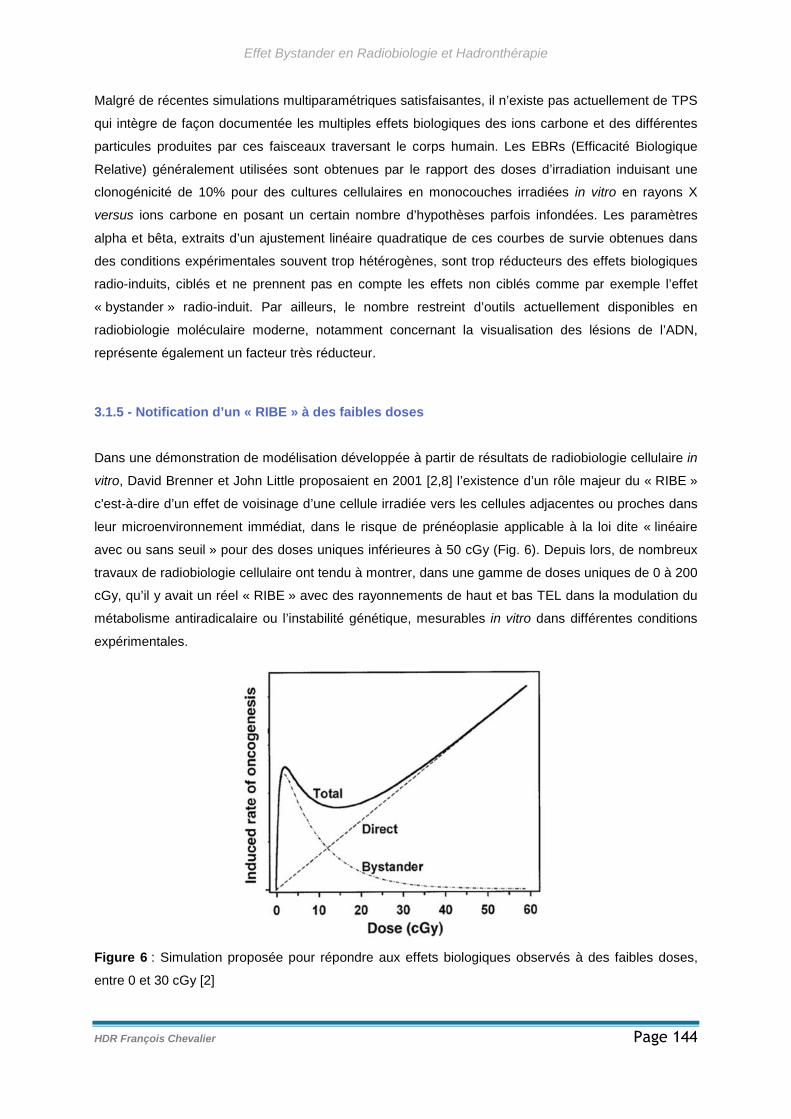
Effet Bystander en Radiobiologie et Hadronthérapie
HDR François Chevalier Page 144
Malgré de récentes simulations multiparamétriques satisfaisantes, il n’existe pas actuellement de TPS
qui intègre de façon documentée les multiples effets biologiques des ions carbone et des différentes
particules produites par ces faisceaux traversant le corps humain. Les EBRs (Efficacité Biologique
Relative) généralement utilisées sont obtenues par le rapport des doses d’irradiation induisant une
clonogénicité de 10% pour des cultures cellulaires en monocouches irradiées in vitro en rayons X
versus ions carbone en posant un certain nombre d’hypothèses parfois infondées. Les paramètres
alpha et bêta, extraits d’un ajustement linéaire quadratique de ces courbes de survie obtenues dans
des conditions expérimentales souvent trop hétérogènes, sont trop réducteurs des effets biologiques
radio-induits, ciblés et ne prennent pas en compte les effets non ciblés comme par exemple l’effet
« bystander » radio-induit. Par ailleurs, le nombre restreint d’outils actuellement disponibles en
radiobiologie moléculaire moderne, notamment concernant la visualisation des lésions de l’ADN,
représente également un facteur très réducteur.
3.1.5 - Notification d’un « RIBE » à des faibles doses
Dans une démonstration de modélisation développée à partir de résultats de radiobiologie cellulaire in
vitro, David Brenner et John Little proposaient en 2001 [2,8] l’existence d’un rôle majeur du « RIBE »
c'est-à-dire d’un effet de voisinage d’une cellule irradiée vers les cellules adjacentes ou proches dans
leur microenvironnement immédiat, dans le risque de prénéoplasie applicable à la loi dite « linéaire
avec ou sans seuil » pour des doses uniques inférieures à 50 cGy (Fig. 6). Depuis lors, de nombreux
travaux de radiobiologie cellulaire ont tendu à montrer, dans une gamme de doses uniques de 0 à 200
cGy, qu’il y avait un réel « RIBE » avec des rayonnements de haut et bas TEL dans la modulation du
métabolisme antiradicalaire ou l’instabilité génétique, mesurables in vitro dans différentes conditions
expérimentales.
Figure 6 : Simulation proposée pour répondre aux effets biologiques observés à des faibles doses,
entre 0 et 30 cGy [2]
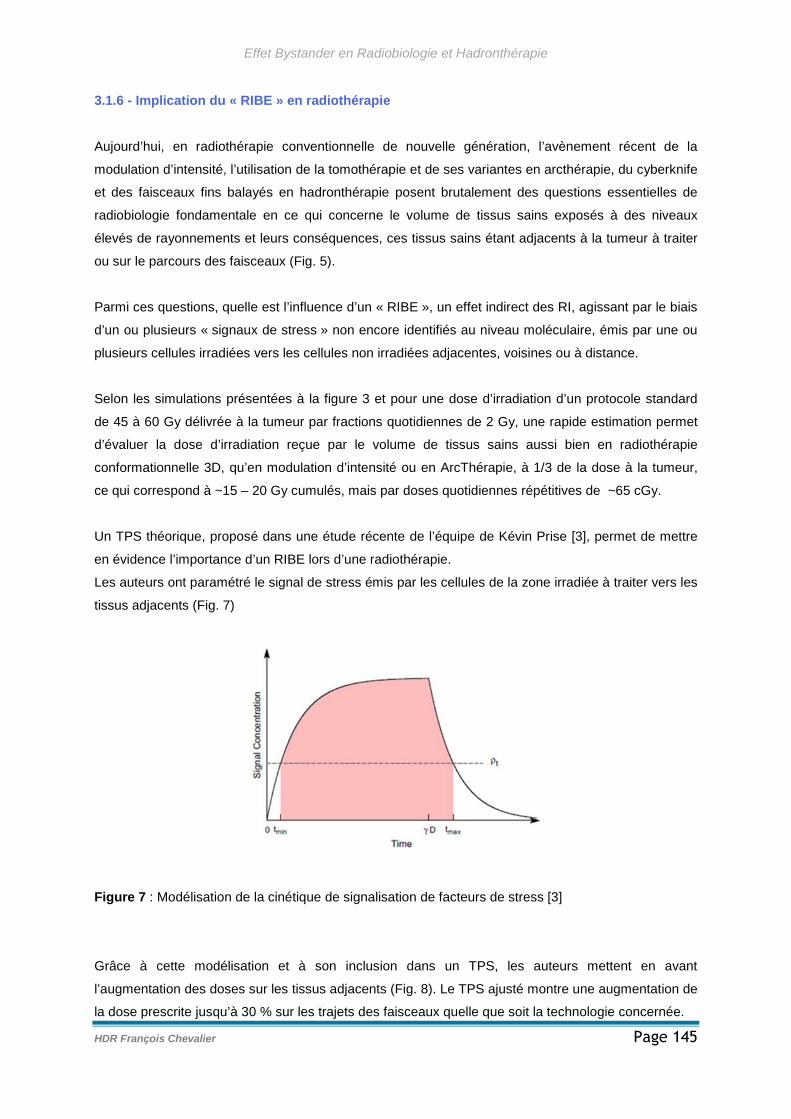
Effet Bystander en Radiobiologie et Hadronthérapie
HDR François Chevalier Page 145
3.1.6 - Implication du « RIBE » en radiothérapie
Aujourd’hui, en radiothérapie conventionnelle de nouvelle génération, l’avènement récent de la
modulation d’intensité, l’utilisation de la tomothérapie et de ses variantes en arcthérapie, du cyberknife
et des faisceaux fins balayés en hadronthérapie posent brutalement des questions essentielles de
radiobiologie fondamentale en ce qui concerne le volume de tissus sains exposés à des niveaux
élevés de rayonnements et leurs conséquences, ces tissus sains étant adjacents à la tumeur à traiter
ou sur le parcours des faisceaux (Fig. 5).
Parmi ces questions, quelle est l’influence d’un « RIBE », un effet indirect des RI, agissant par le biais
d’un ou plusieurs « signaux de stress » non encore identifiés au niveau moléculaire, émis par une ou
plusieurs cellules irradiées vers les cellules non irradiées adjacentes, voisines ou à distance.
Selon les simulations présentées à la figure 3 et pour une dose d’irradiation d’un protocole standard
de 45 à 60 Gy délivrée à la tumeur par fractions quotidiennes de 2 Gy, une rapide estimation permet
d’évaluer la dose d’irradiation reçue par le volume de tissus sains aussi bien en radiothérapie
conformationnelle 3D, qu’en modulation d’intensité ou en ArcThérapie, à 1/3 de la dose à la tumeur,
ce qui correspond à ~15 – 20 Gy cumulés, mais par doses quotidiennes répétitives de ~65 cGy.
Un TPS théorique, proposé dans une étude récente de l’équipe de Kévin Prise [3], permet de mettre
en évidence l’importance d’un RIBE lors d’une radiothérapie.
Les auteurs ont paramétré le signal de stress émis par les cellules de la zone irradiée à traiter vers les
tissus adjacents (Fig. 7)
Figure 7 : Modélisation de la cinétique de signalisation de facteurs de stress [3]
Grâce à cette modélisation et à son inclusion dans un TPS, les auteurs mettent en avant
l’augmentation des doses sur les tissus adjacents (Fig. 8). Le TPS ajusté montre une augmentation de
la dose prescrite jusqu’à 30 % sur les trajets des faisceaux quelle que soit la technologie concernée.
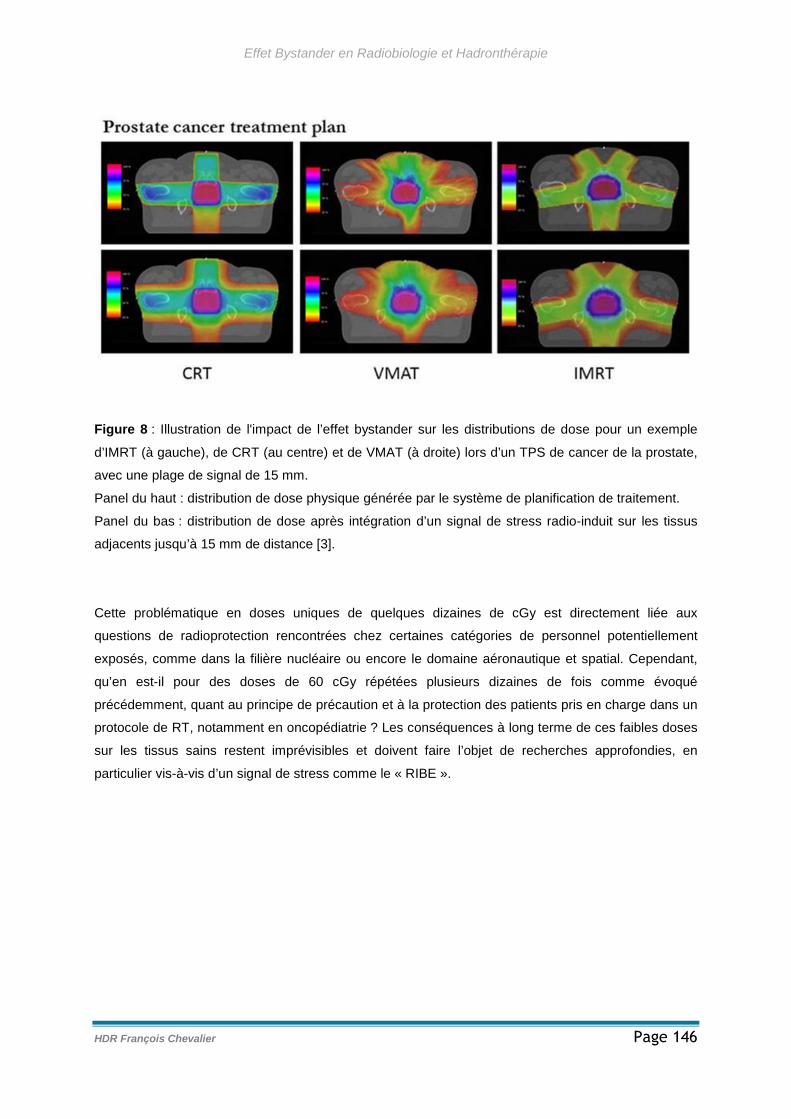
Effet Bystander en Radiobiologie et Hadronthérapie
HDR François Chevalier Page 146
Figure 8 : Illustration de l'impact de l’effet bystander sur les distributions de dose pour un exemple
d’IMRT (à gauche), de CRT (au centre) et de VMAT (à droite) lors d’un TPS de cancer de la prostate,
avec une plage de signal de 15 mm.
Panel du haut : distribution de dose physique générée par le système de planification de traitement.
Panel du bas : distribution de dose après intégration d’un signal de stress radio-induit sur les tissus
adjacents jusqu’à 15 mm de distance [3].
Cette problématique en doses uniques de quelques dizaines de cGy est directement liée aux
questions de radioprotection rencontrées chez certaines catégories de personnel potentiellement
exposés, comme dans la filière nucléaire ou encore le domaine aéronautique et spatial. Cependant,
qu’en est-il pour des doses de 60 cGy répétées plusieurs dizaines de fois comme évoqué
précédemment, quant au principe de précaution et à la protection des patients pris en charge dans un
protocole de RT, notamment en oncopédiatrie ? Les conséquences à long terme de ces faibles doses
sur les tissus sains restent imprévisibles et doivent faire l’objet de recherches approfondies, en
particulier vis-à-vis d’un signal de stress comme le « RIBE ».
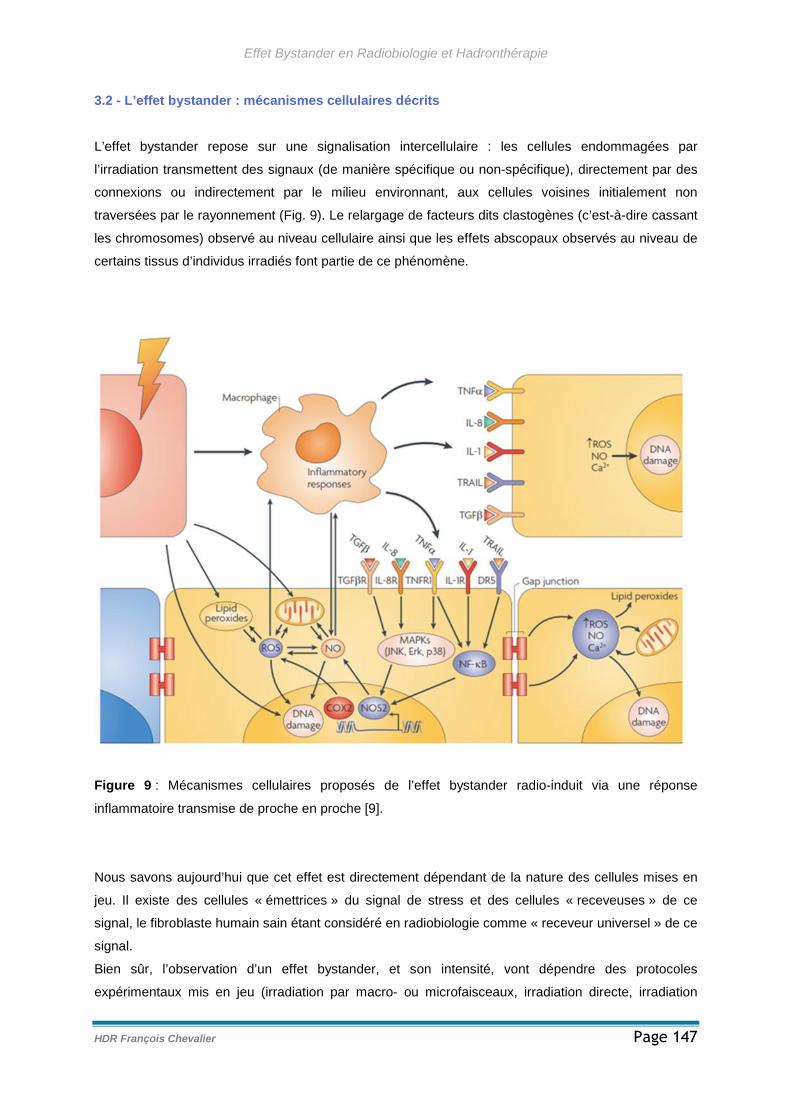
Effet Bystander en Radiobiologie et Hadronthérapie
HDR François Chevalier Page 147
3.2 - L’effet bystander : mécanismes cellulaires décrits
L’effet bystander repose sur une signalisation intercellulaire : les cellules endommagées par
l’irradiation transmettent des signaux (de manière spécifique ou non-spécifique), directement par des
connexions ou indirectement par le milieu environnant, aux cellules voisines initialement non
traversées par le rayonnement (Fig. 9). Le relargage de facteurs dits clastogènes (c’est-à-dire cassant
les chromosomes) observé au niveau cellulaire ainsi que les effets abscopaux observés au niveau de
certains tissus d’individus irradiés font partie de ce phénomène.
Figure 9 : Mécanismes cellulaires proposés de l’effet bystander radio-induit via une réponse
inflammatoire transmise de proche en proche [9].
Nous savons aujourd’hui que cet effet est directement dépendant de la nature des cellules mises en
jeu. Il existe des cellules « émettrices » du signal de stress et des cellules « receveuses » de ce
signal, le fibroblaste humain sain étant considéré en radiobiologie comme « receveur universel » de ce
signal.
Bien sûr, l’observation d’un effet bystander, et son intensité, vont dépendre des protocoles
expérimentaux mis en jeu (irradiation par macro- ou microfaisceaux, irradiation directe, irradiation
Effet Bystander en Radiobiologie et Hadronthérapie
HDR François Chevalier Page 148
partiellement collimatée, ou transfert de milieu conditionné de cellules irradiées sur cellules non
irradiées), de la nature du rayonnement (bas ou haut TEL) et de son énergie, de la dose engagée
voire du débit de dose, du critère d’évaluation de l’effet biologique recherché (lésions à l’ADN,
apoptose, sénescence, instabilité génétique, mort cellulaire, marqueurs spécifiques…), du temps
d’exposition des cellules receveuses au signal de stress (co-culture ou milieu conditionné) ainsi que
de la concentration de ce signal (niveaux de dilutions variables d’un milieu conditionné). Un état des
lieux des différents paramètres expérimentaux influençant la mise en évidence d’un effet bystander
est présenté dans [10].
Depuis la synthèse de l’UNSCEAR en 2006 [11] sur les effets non ciblés des rayonnements ionisants
et sur l’existence du « RIBE » dans la gamme de doses thérapeutiques et du rôle de celui-ci in vitro, il
apparaît que le modèle expérimental a presque toujours été de la culture cellulaire en monocouche en
deux dimensions (2D), ce qui est maintenant considéré comme réducteur et assez éloigné de la
réalité biologique.
Basés sur des conditions d’irradiation mimant au mieux in vitro les conditions d’un protocole de
radiothérapie externe, conditions dérivées du modèle de Suchowerska [12], les récents travaux du
groupe de Kevin Prise [3,9,13–19] publiés ces deux dernières années ont fait fortement progresser la
connaissance du « RIBE » en pratiquant des irradiations partiellement collimatées de cultures de
diverses lignées cellulaires, en rayons X de différentes énergies ([16,17,20–23], irradiation en cuve à
eau thermostatée avec écrans équivalents tissus d’épaisseur variable en amont des cultures
cellulaires, associée à une dosimétrie physique de qualité médicale) avec le développement d’une
modélisation mathématique adaptée [18,24]. Ils ont ainsi pu mettre en évidence notamment la
contribution du « RIBE » sur la mortalité cellulaire radio-induite directe en normoxie (~20% d’oxygène
de l’air), en faisant intervenir différents antagonistes des espèces radicalaires des voies oxygénées et
nitrogénées. Cependant, les résultats de ces travaux souffrent d’incertitudes majeures dans l’aspect
biologique des expériences réalisées sur cellules en phase exponentielle de croissance (densité
d’ensemencement, temps de doublement cellulaire et phases du cycle, pourcentage d’attachement,
fréquence de changement de milieu nutritif), paramètres dont on connaît bien aujourd’hui l’importance
dans toutes les expériences de clonogénicité.
Schématiquement, il est donc encore globalement admis après irradiation en bas TEL que le « RIBE »
in vitro n’est pas mesurable avec des outils moléculaires de la radiobiologie cellulaire moderne autres
que la survie cellulaire voire la recherche de micronoyaux. Par ailleurs, des résultats contradictoires
ont été obtenus in vitro en culture en monocouche après irradiation par des protons médicaux voire
même de très haute énergie, alors que cet effet a été mis en évidence avec des rayonnements de
haut TEL (particules alpha et ions lourds) dans une gamme de 0 à 200 cGy.
Le groupe d’Edouard Azzam, qui travaille depuis longtemps dans ce domaine [25–36], a récemment
montré in vitro des modifications définitives du métabolisme anti-radicalaire dans des cellules non
irradiées, induites par cinq heures de contact avec des cellules irradiées, mesurables dans différentes
conditions expérimentales après vingt cycles cellulaires [30]. Ces résultats étaient confortés par des
Effet Bystander en Radiobiologie et Hadronthérapie
HDR François Chevalier Page 149
expériences similaires à très faibles doses associées à des calculs de micro-dosimétrie et des
simulations mathématiques particulièrement élégantes de fragmentations d’ions à hauts TEL [34].
3.3 - Un modèle biologique in vitro en 3D
Dans la mise en évidence in vitro d’un « RIBE », il apparaît que le modèle expérimental de référence a
toujours été la culture cellulaire en monocouche 2D, même si un modèle de culture 3D « équivalent
peau » avec des kératinocytes et des fibroblastes humains normaux cultivés dans une matrice de
macromolécules est utilisé depuis 2005 sous irradiation par micro-faisceau [37]. Ce modèle
expérimental, devenu par ailleurs le « gold standard » en toxicologie chimique cutanée, s’affranchit
néanmoins du compartiment microvasculaire dont le rôle est pourtant essentiel quant à l’effet des
rayonnements ionisants in vivo (revue dans [38]). Ces études in vitro 2D et 3D ont toujours été
développées dans des conditions de normoxie (~20% de l’oxygène de l’air), bien que cette situation
physicochimique artificielle place les cellules dans une condition artéfactuelle de grande
radiosensibilité au regard de la physioxie naturelle des tissus humains qui est de ~5% ±2% d’O2
(revue dans [39]). En conséquence, à aucun moment ces résultats ne sont directement extrapolables
à l’homme.
Dans l’objectif de reproduire les conditions de microenvironnement naturel, les différents types
cellulaires seront irradiés en culture 2D en condition de physioxie (phase exponentielle et ~3% O2),
modalité de culture qui servira de contrôle interne.
Un modèle de culture en trois dimensions (3D) en biomatériaux (brevet WO2012038668) est
développé au laboratoire depuis plusieurs années afin de reproduire les conditions de physiologie
cellulaire du cartilage articulaire et pouvant être irradié avec des ions lourds sur la ligne D1 du GANIL.
Ce modèle de culture en 3D, proche des nombreux modèles déjà utilisés en radiobiologie avec des
irradiations X, protons et ions accélérés, sera ensuite utilisé avec les outils adaptés [37,40–44]. Ce
modèle propre aux chondrocytes (cartilage reconstruit in vitro en éponge de collagène de type I ; [45])
est utilisé en routine au laboratoire car il permet de restituer in vitro le microenvironnement naturel des
cellules et leurs différenciations respectives (phase exponentielle de croissance et ~3% O2 ; [46,47]).
Par ailleurs, cette étude en culture 3D est l’alternative ou le préalable aujourd’hui incontournable à
toute modélisation in vivo chez le rongeur.
La mise en évidence d’un effet bystander dans des conditions mimant au mieux la réalité biologique
d’un tissu humain est essentielle dans la perspective d’un protocole d’hadronthérapie par ions
carbone ou protons ciblant un sarcome (chordome, ostéo- et chondrosarcomes), tumeur en première
ligne pour l’hadronthérapie [48] et le projet ARCHADE [4,5]. La littérature ne rapporte à ce jour qu’un
seul article relatif à un signal de type bystander émis par des chondrocytes de chondrosarcome dans
des conditions expérimentales en 2D paradoxales (cultures sans CO2) et normoxie [49], sans le
contrôle interne, à savoir les chondrocytes normaux.
Effet Bystander en Radiobiologie et Hadronthérapie
HDR François Chevalier Page 150
3.4 - Plan scientifique du projet de recherche
3.4.1 - Questionnement / étapes clés
Dans le cadre de ce projet de recherche, différentes questions seront posées séquentiellement afin
d’organiser une logique scientifique et de structurer la démarche de recherche.
- Mise en évidence d’un effet bystander en culture 2D
La première question consiste à rechercher et à mettre en évidence un effet bystander dans nos
conditions d’analyse in vitro.
En effet, un tel mécanisme n’a jamais été démontré dans nos conditions opératoires et il reste à
déterminer quelle est la combinaison de paramètres permettant sa réalisation. Pour cela, et pour se
placer dans les conditions les plus favorables, un système de culture en 2D in vitro, développé depuis
peu et permettant la co-culture, sera utilisé et les conditions d’irradiation seront comparées afin
d’observer un effet biologique sur les cellules non-irradiées.
- Analyse d’un effet bystander sur le modèle 3D
Après la mise en évidence d’un effet biologique sur des cellules en 2D, les mêmes conditions seront
appliquées sur le modèle de culture en 3D de cartilage. L’effet bystander sera à nouveau analysé par
différents types de protocoles expérimentaux et une analyse protéomique sera mise en place pour
connaitre les mécanismes mis en jeu.
La plus grande partie des expériences sera réalisée avec ce modèle de culture en 3D, les effets
indirects seront comparés aux effets directs et les sécrétomes seront comparés aux protéomes
cellulaires.
- Rôle de la matrice extracellulaire dans la réponse biologique
Le cartilage est un tissu contenant assez peu de cellules (chondrocytes) et, proportionnellement, une
grande quantité de matrice extracellulaire. Cette matrice, composée principalement de collagène et de
protéoglycans, subit aussi les effets des rayonnements ionisants et les produits de dégradations
peuvent avoir une activité biologique de type bystander vers les tissus voisins non-irradiés. Cet aspect
de recherche sera aussi analysé en collaboration avec des physiciens, spécialistes des effets des
rayonnements ionisants sur la matière.
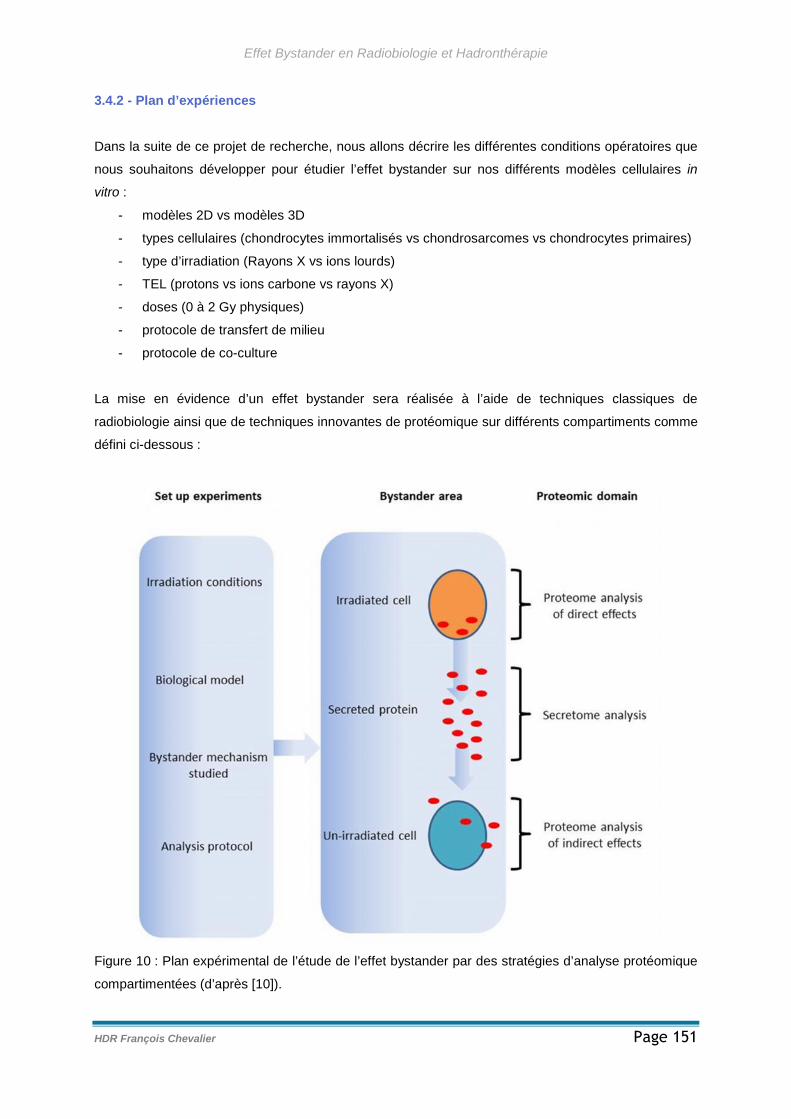
Effet Bystander en Radiobiologie et Hadronthérapie
HDR François Chevalier Page 151
3.4.2 - Plan d’expériences
Dans la suite de ce projet de recherche, nous allons décrire les différentes conditions opératoires que
nous souhaitons développer pour étudier l’effet bystander sur nos différents modèles cellulaires in
vitro :
- modèles 2D vs modèles 3D
- types cellulaires (chondrocytes immortalisés vs chondrosarcomes vs chondrocytes primaires)
- type d’irradiation (Rayons X vs ions lourds)
- TEL (protons vs ions carbone vs rayons X)
- doses (0 à 2 Gy physiques)
- protocole de transfert de milieu
- protocole de co-culture
La mise en évidence d’un effet bystander sera réalisée à l’aide de techniques classiques de
radiobiologie ainsi que de techniques innovantes de protéomique sur différents compartiments comme
défini ci-dessous :
Figure 10 : Plan expérimental de l’étude de l’effet bystander par des stratégies d’analyse protéomique
compartimentées (d’après [10]).
Effet Bystander en Radiobiologie et Hadronthérapie
HDR François Chevalier Page 152
3.4.3 - Irradiation par différents types de rayonnements ionisants
Les irradiations conventionnelles seront réalisées grâce au générateur de rayons X de recherche
obtenu dans le cadre de l’Equipex « RecHadron 2011 ».
La sensibilité des cellules sera explorée dans la gamme des faibles doses en dessous de 50 cGy
(entre 1 et 50 cGy) et jusqu’à 2 Gy pour se placer dans des conditions d’irradiation proches d’une
fraction de radiothérapie.
Les irradiations à hauts TEL seront effectuées au GANIL (ions 13C ~35keV/µm et ions 22Ne ~105
keV/µm) sur les cultures 3D de chondrocytes non irradiées et exposées aux milieux conditionnés de
cultures 3D irradiées.
Ces deux TEL sont le résultat d’un compromis entre, d’une part, le TEL à l’entrée du faisceau d’ions
carbone (~290 MeV/nu) dans le corps (~15 keV/µm) d’un patient lors d’un protocole d’hadronthérapie
et le TEL à la tumeur (~80 keV/µm) et, d’autre part, les caractéristiques et régularités de
programmations des faisceaux d’ions accélérés accessibles au GANIL.
Des irradiations par protons et ions carbone de qualité médicale seront par la suite réalisées avec les
irradiateurs du centre ARCHADE avec respectivement le S2C2 et le C400 lorsqu’ils seront mis en
place.
3.5 - Méthodes d’analyse et aspects “protéomiques” de l’effet de voisinage
Dans le cadre de la rédaction de cette HDR, j’ai été amené à réfléchir sur la place de l’analyse
protéomique comme outil de recherche et de mise en évidence de cet effet bystander.
Dans cet objectif, une revue de la littérature dans le domaine a été rédigée et cet article a été publié
en 2014 [10] dans le journal « Mutation Research : Reviews in Mutation Research ». Cet article est
reproduit en version intégrale à la fin de ce chapitre.
3.6 - Critères biologiques
L’existence d’effets biologiques de type bystander sera explorée en phase avec les dernières
publications du domaine, notamment par des analyses portant sur le stress oxydatif (Western blot) et
les mécanismes de transmission du signal au niveau cellulaire.
La plupart de ces techniques décrites ci-après sont couramment appliquées pour étudier et évaluer les
conséquences des effets directs des rayonnements ionisants. Dans notre cas, ces techniques seront
d’abord utilisées pour étudier les effets bystander (en comparaison des effets directs), mais
nécessiteront certainement une sensibilité adaptée pour mettre en évidence le phénomène.
Les techniques de protéomique seront largement employées, notamment par gel d’électrophorèse en
2D [50] ou par spectrométrie de masse quantitative. L’analyse protéomique est un outil puissant,
Effet Bystander en Radiobiologie et Hadronthérapie
HDR François Chevalier Page 153
permettant de mettre en évidence sans a priori les mécanismes mis en jeu suite à une irradiation, ou
lors d’un effet bystander. Ces technologies, en complément de techniques plus classiques de
radiobiologie, pourront permettre de définir les voies métaboliques impliquées dans la réponse à un
stress, ainsi que les acteurs protéiques mobilisés ou réprimés.
Dans la perspective où aucun effet ne serait mis en évidence dans des cultures de chondrocytes
utilisées comme « receveuses », des cultures de fibroblastes de derme humain pourront être
substituées comme cellules « receveuses » de milieu conditionné, le fibroblaste étant considéré
comme « receveur universel » du « RIBE ».
3.6.1 - Radiotoxicité cellulaire et clonogénicité
L’analyse de la radiotoxicité cellulaire peut être réalisée avec des tests portant sur le métabolisme
cellulaire. La nécrose cellulaire sera évaluée par la mesure de la libération de l’adénylate kinase dans
les milieux de culture par l’utilisation du kit Toxilight. La viabilité cellulaire sera également déterminée
par exclusion au bleu trypan et la clonogénicité, déterminée de manière conventionnelle, sera couplée
à une analyse de la distribution de taille des colonies permettant de mettre en évidence d’éventuelles
pertes de capacité proliférative des cellules irradiées (effets directs) et des cellules bystander (effets
indirects).
Cette étude de radiotoxicité/clonogénicité permettra de définir deux à trois situations caractéristiques
de dose/débit de dose/effet biologique utilisées ci-dessous comme conditions expérimentales.
3.6.2 - Formation et réparation des lésions de l’ADN
La majorité des cassures double brins (CDBs) induites par rayons X est réparée par la voie NHEJ qui
est le mode de prédilection de la réparation en phase G0/G1, alors que la voie HR est favorisée pour
les cellules en phase S/G2. Lorsque des cellules sont irradiées en phases S ou G2, de longs
segments d’ADN simple brin sont formés et recouverts de RPA qui pourrait représenter un unique
«scaffold» pour le recrutement de facteurs comme Rad51 et BRCA1 également impliqués dans les
processus de réparation. La radiosensibilité dépend de l’intégrité des systèmes de détection et de
réparation des lésions de l’ADN impliquant notamment ATR, ATM et DNA-PK. La réponse ATR
dépendante est généralement associée aux lésions de l’ADN induites par des stress réplicatifs. En
raison du stress oxydatif connu après irradiation par rayons X, l’implication de ATR en réponse à la
formation d’adduits de type 8-oxo-G ne peut être exclue et doit être investiguée. ATM est
généralement impliquée dans l’induction des systèmes de réparation, l’arrêt du cycle cellulaire et la
régulation de l’apoptose radio-induite, alors que DNA-PK joue un rôle important dans le processus de
réparation des CDBs par NHEJ.

Effet Bystander en Radiobiologie et Hadronthérapie
HDR François Chevalier Page 154
La production de CDBs sera mesurée directement dans les cellules par l’analyse de la
phosphorylation de l’histone H2AX (foyers gamma-H2AX) par western blot. Les éventuelles
modifications quantitatives ou qualitatives radio-induites des foyers gamma-H2AX seront mesurées
dans les conditions de doses et de débits de doses définies.
3.6.3 - Apoptose radio-induite et sénescence
Parallèlement à la mesure des CDBs de l’ADN, l’impact direct et indirect de l’irradiation sur la survie à
court terme (quelques jours) des modèles cellulaires retenus sera analysé dans les conditions de
doses et de débits de doses définies.
À cet effet, l’apoptose induite sera mesurée par la détection in situ de la fragmentation de l’ADN (In
Situ Cell Death Detection Kit, Roche) mais aussi par la quantification par western blot de marqueurs
spécifiques (caspases).
L’analyse de la sénescence sera réalisée par détermination de l’activité SA-β-galactosidase.
L’induction de la sénescence pourra également être mise en évidence par western blot pour détecter
les niveaux d’expression de p21 et de p16 ainsi que l’expression et la phosphorylation de p53 et
l’expression de la lamine B1. L’apoptose et la sénescence seront mesurées dans les conditions de
doses et de débits de dose définies.
3.6.4 - Stress oxydatif cellulaire
L’excès de stress oxydant dans la cellule à la suite d’une irradiation est un facteur d'inflammation et de
mutagenèse. La production de ERO (Espèce Réactive de l’Oxygène) dans la cellule peut être
contrebalancée par des systèmes de défenses enzymatiques ou non-enzymatiques. La production de
peroxyde d’hydrogène sera mesurée par l’introduction intracytoplasmique d’une sonde fluorescente
CM-H2DCFDA (Invitrogen™). Les cellules ainsi traitées peuvent être analysées par cytométrie en flux
afin de quantifier leur fluorescence qui sera proportionnelle à la quantité d’H2O2 produite. Les
activités des principales enzymes antioxydantes (SOD, catalase, GPx), ainsi que le ratio de glutathion
réduit/oxydé, seront également évalués. En complément, les oxydations des lipides (LPO) et des
protéines (groupements carbonyls) pourront être mesurées. Ces phénomènes oxydatifs seront
mesurés juste après l’irradiation et, à plus long terme, dans les conditions de doses et de débits de
dose définies.
Effet Bystander en Radiobiologie et Hadronthérapie
HDR François Chevalier Page 155
3.6.5 - Inflammation et sécrétion de facteurs solubles
L’inflammation et la transmission intercellulaire d’un signal inflammatoire et/ou bystander sont des
phénomènes complexes et centraux dans la survenue des effets toxiques immédiats lors d’une
irradiation. Le potentiel pro-inflammatoire des rayonnements ionisants devra être évalué dans le
modèle 3D. Le chondrocyte a pour rôle de maintenir un parfait équilibre entre la synthèse et la
dégradation des composants matriciels du cartilage grâce aux cytokines IL-1, IL-6, et TNF-alpha, et
des facteurs de croissance locaux IGF-I, BMPs, et TGF-ß1. La composante inflammatoire de
l’irradiation pourrait modifier la production de cytokines, mais aussi l’équilibre entre l’anabolisme et le
catabolisme, la prolifération et la différenciation cellulaire nécessaires à l’homéostasie du cartilage.
Afin de mesurer les facteurs sécrétés, il est essentiel d’utiliser des méthodes sensibles, quantitatives
et compatibles avec le dosage dans des milieux de culture cellulaire. Pour cela, nous allons
développer trois approches complémentaires :
1. Le système de protéines sur biopuces (RayBio® Biotin Label-based Human Antibody Array.
ref AAH-BLG-1-4) permettant de détecter simultanément les niveaux d'expression de
plusieurs protéines. Ces protéines sont capturées par des anticorps fixés sur une lame de
verre puis révélées par un système chimioluminescent. A l’aide de ce système, nous pourrons
quantifier simultanément en quadriplicate 507 protéines humaines, majoritairement des
chémokines, cytokines et des facteurs de croissance.
2. Le système de dosage Elisa multiplexe MSD (Mesoscale Discovery™,
http://www.mesoscale.com) qui repose sur une combinaison exclusive de détection par
électrochémiluminescence et de plaques 96 puits brevetées. En fait, la détection par
électrochémiluminescence offre une combinaison unique de sensibilité, de gamme dynamique
et de facilité d’utilisation. Pour cela, le lecteur MSD utilise des photodétecteurs ultra-sensibles
et performants afin de collecter et de mesurer quantitativement la lumière émise par les
microplaques. Ce sytème MSD permet la quantification de panels de cytokines/chimiokines
(jusqu’ à 30 analytes) compatibles avec des surnageants de culture en terme de sensibilité.
3. L’analyse différentielle du sécrétome par spectrométrie de masse directe ou par
électrophorèse bidimensionnelle de milieux conditionnés [50] permettra une identification sans
a priori des facteurs sécrétés modulés.
3.6.6 - Expression différentielle et modifications post-traductionnelles des protéines
Un stress génotoxique, tel qu’une irradiation, provoque une réponse cellulaire complexe où de
multiples signaux conduisent à modifier l’expression mais aussi les activités de très nombreuses
protéines soit par une modification de la quantité, soit par la modification de la structure (PTM).
L’expression de protéines impliquées dans les voies métaboliques de réponses aux rayonnements
ionisants sera évaluée par des techniques classiques de protéomique quantitative. L’analyse des
Effet Bystander en Radiobiologie et Hadronthérapie
HDR François Chevalier Page 156
modifications post-traductionnelles des protéines de chondrocytes sains et tumoraux en culture 3D
sera réalisée par une électrophorèse bidimensionnelle permettant de séparer, de visualiser puis
d’identifier par spectrométrie de masse les protéines d’intérêt. De manière comparable, l’analyse
phospho-protéomique permettra d’identifier les phosphorylations des protéines dans les conditions de
doses et de débits de dose définies.
3.6.7 - Dégradation des protéines de la matrice extracellulaire du cartilage
Le traitement d’un chondrosarcome par hadronthérapie peut induire une dégradation partielle du
cartilage sous la forme d’un relargage de fragments peptidiques. De tels fragments peuvent présenter
une activité biologique de type bystander tissu spécifique. Ces fragments moléculaires de protéines de
la matrice extracellulaire du cartilage produits après irradiations par des ions seront analysés en
temps réel par un spectromètre de masse dédié.
3.7 - Résultats escomptés
Les caractéristiques de ce modèle in vitro [3D – physioxie] en font un outil idéal de la radiobiologie
moderne en transposant un organe sain avasculaire humain en un outil in vitro, tout en
s’affranchissant de l’expérimentation animale. Les expériences envisagées au plus proche du
microenvironnement de la physiologie humaine nous permettront de déterminer l’existence avérée ou
non d’un « RIBE » aussi bien sous irradiation par rayons X qu’à des TEL plus élevés.
En première intention, les séries d’expériences seront développées en irradiations par doses uniques.
En deuxième intention, selon les résultats observés et les accessibilités aux temps de faisceaux
dépendant de la programmation des ions délivrés au GANIL ou ultérieurement du Centre ARCHADE,
des séries d’expériences avec des doses répétitives quotidiennes devront être envisagées, afin de
mimer au mieux les conditions d’un protocole de radiothérapie conventionnelle ou non.
Si les données expérimentales obtenues prouvaient l’existence d’un tel effet dans les chondrocytes ou
dans les fibroblastes normaux utilisés comme receveurs, aussi bien après irradiations par rayons X
que par ions de hauts TEL, elles devront être impérativement prises en compte dans la mise au point
et le déroulement d’un protocole de radiothérapie conventionnelle ou non, en raison du risque encouru
sur les tissus sains chez des patients jeunes et notamment pédiatriques. Dans le cas contraire, ces
expériences seraient en cohérence avec le principe de précaution devenu règle d’or en matière de
protection sanitaire des patients.
Effet Bystander en Radiobiologie et Hadronthérapie
HDR François Chevalier Page 157
3.8 - Conclusions - Perspectives
Ce projet de recherche a pour objectif de mieux définir les fondements de référence sous irradiation
par rayons X pour l’hadronbiologie afin de mieux maîtriser les paramètres d’un TPS par ions carbone
et d’envisager sereinement l’utilisation de ce type de faisceau balayé en routine clinique.
L’accumulation de connaissances nouvelles grâce à la réalisation de ce projet, par ailleurs
transposable à d’autres types de tumeurs éligibles pour l’hadronthérapie, devra contribuer à valider ou
non la supériorité curative des ions carbone versus protons pour le traitement de tumeurs dont
l’origine de la radiorésistance avérée est, comme pour le chondrosarcome, totalement inconnue. Par
ailleurs, il est légitime de s’intéresser aux effets des rayons X sur les CSMs, en raison de l’exposition
de celles-ci lors de protocoles de radiothérapie de dernière génération comme l’arcthérapie.
L’exploration simultanée de l’équilibre survie/sénescence et de l’instabilité génétique, associées à une
démarche pertinente en terme de conditions de physioxie et de microenvironnement, permettra de
fournir des données de référence concernant les effets des rayons X sur le caractère multipotent et la
stabilité des CSMs. Ces données permettront également de déterminer si l’irradiation induit des
altérations des capacités des chondrocytes et des CSM à se différencier. La prise en compte de la
physioxie cellulaire, jusqu’ici négligée aussi bien après irradiations en rayons X qu’en protons et ions
carbone, sera particulièrement importante pour des paramètres simples, tels que la clonogénicité,
comme pour des phénomènes complexes telle que la modulation radio-induite de l’expression de
gènes d’intérêt ou encore un effet « bystander ». Les complications de la radiothérapie
conventionnelle sur l’os et le cartilage, chez l’enfant notamment, justifient l’intérêt porté à la
radiosensibilité de ces tissus et de leurs progéniteurs que sont les CSMs de la moelle osseuse. Ces
connaissances nouvelles pourront être à l’origine d’une nouvelle vision de la recherche d’EBRs en
conditions de physioxie cellulaire et de leurs intégrations dans un TPS.
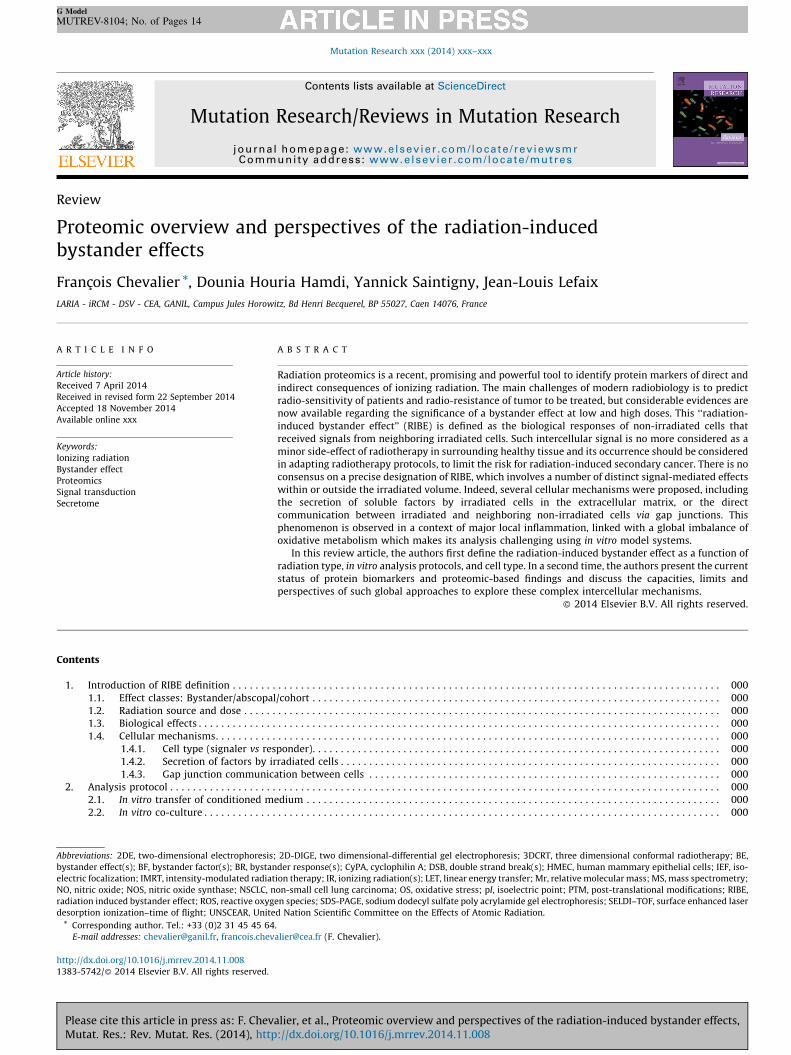
Mutation Research xxx (2014) xxx–xxx
G Model
MUTREV-8104; No. of Pages 14
Review
Proteomic overview and perspectives of the radiation-inducedbystander effects
Francois Chevalier *, Dounia Houria Hamdi, Yannick Saintigny, Jean-Louis Lefaix
LARIA - iRCM - DSV - CEA, GANIL, Campus Jules Horowitz, Bd Henri Becquerel, BP 55027, Caen 14076, France
Contents
1. Introduction of RIBE definition . . . . . . . . . . . . . . . . . . . . . . . . . . . . . . . . . . . . . . . . . . . . . . . . . . . . . . . . . . . . . . . . . . . . . . . . . . . . . . . . . . . . . . 000
1.1. Effect classes: Bystander/abscopal/cohort . . . . . . . . . . . . . . . . . . . . . . . . . . . . . . . . . . . . . . . . . . . . . . . . . . . . . . . . . . . . . . . . . . . . . . . . 000
1.2. Radiation source and dose . . . . . . . . . . . . . . . . . . . . . . . . . . . . . . . . . . . . . . . . . . . . . . . . . . . . . . . . . . . . . . . . . . . . . . . . . . . . . . . . . . . . 000
1.3. Biological effects . . . . . . . . . . . . . . . . . . . . . . . . . . . . . . . . . . . . . . . . . . . . . . . . . . . . . . . . . . . . . . . . . . . . . . . . . . . . . . . . . . . . . . . . . . . . 000
1.4. Cellular mechanisms. . . . . . . . . . . . . . . . . . . . . . . . . . . . . . . . . . . . . . . . . . . . . . . . . . . . . . . . . . . . . . . . . . . . . . . . . . . . . . . . . . . . . . . . . 000
1.4.1. Cell type (signaler vs responder). . . . . . . . . . . . . . . . . . . . . . . . . . . . . . . . . . . . . . . . . . . . . . . . . . . . . . . . . . . . . . . . . . . . . . . . 000
1.4.2. Secretion of factors by irradiated cells . . . . . . . . . . . . . . . . . . . . . . . . . . . . . . . . . . . . . . . . . . . . . . . . . . . . . . . . . . . . . . . . . . . 000
1.4.3. Gap junction communication between cells . . . . . . . . . . . . . . . . . . . . . . . . . . . . . . . . . . . . . . . . . . . . . . . . . . . . . . . . . . . . . . 000
2. Analysis protocol . . . . . . . . . . . . . . . . . . . . . . . . . . . . . . . . . . . . . . . . . . . . . . . . . . . . . . . . . . . . . . . . . . . . . . . . . . . . . . . . . . . . . . . . . . . . . . . . . 000
2.1. In vitro transfer of conditioned medium . . . . . . . . . . . . . . . . . . . . . . . . . . . . . . . . . . . . . . . . . . . . . . . . . . . . . . . . . . . . . . . . . . . . . . . . . 000
2.2. In vitro co-culture . . . . . . . . . . . . . . . . . . . . . . . . . . . . . . . . . . . . . . . . . . . . . . . . . . . . . . . . . . . . . . . . . . . . . . . . . . . . . . . . . . . . . . . . . . . 000
A R T I C L E I N F O
Article history:
Received 7 April 2014
Received in revised form 22 September 2014
Accepted 18 November 2014
Available online xxx
Keywords:
Ionizing radiation
Bystander effect
Proteomics
Signal transduction
Secretome
A B S T R A C T
Radiation proteomics is a recent, promising and powerful tool to identify protein markers of direct and
indirect consequences of ionizing radiation. The main challenges of modern radiobiology is to predict
radio-sensitivity of patients and radio-resistance of tumor to be treated, but considerable evidences are
now available regarding the significance of a bystander effect at low and high doses. This ‘‘radiation-
induced bystander effect’’ (RIBE) is defined as the biological responses of non-irradiated cells that
received signals from neighboring irradiated cells. Such intercellular signal is no more considered as a
minor side-effect of radiotherapy in surrounding healthy tissue and its occurrence should be considered
in adapting radiotherapy protocols, to limit the risk for radiation-induced secondary cancer. There is no
consensus on a precise designation of RIBE, which involves a number of distinct signal-mediated effects
within or outside the irradiated volume. Indeed, several cellular mechanisms were proposed, including
the secretion of soluble factors by irradiated cells in the extracellular matrix, or the direct
communication between irradiated and neighboring non-irradiated cells via gap junctions. This
phenomenon is observed in a context of major local inflammation, linked with a global imbalance of
oxidative metabolism which makes its analysis challenging using in vitro model systems.
In this review article, the authors first define the radiation-induced bystander effect as a function of
radiation type, in vitro analysis protocols, and cell type. In a second time, the authors present the current
status of protein biomarkers and proteomic-based findings and discuss the capacities, limits and
perspectives of such global approaches to explore these complex intercellular mechanisms.
� 2014 Elsevier B.V. All rights reserved.
Abbreviations: 2DE, two-dimensional electrophoresis; 2D-DIGE, two dimensional-differential gel electrophoresis; 3DCRT, three dimensional conformal radiotherapy; BE,
bystander effect(s); BF, bystander factor(s); BR, bystander response(s); CyPA, cyclophilin A; DSB, double strand break(s); HMEC, human mammary epithelial cells; IEF, iso-
electric focalization; IMRT, intensity-modulated radiation therapy; IR, ionizing radiation(s); LET, linear energy transfer; Mr, relative molecular mass; MS, mass spectrometry;
NO, nitric oxide; NOS, nitric oxide synthase; NSCLC, non-small cell lung carcinoma; OS, oxidative stress; pI, isoelectric point; PTM, post-translational modifications; RIBE,
Contents lists available at ScienceDirect
Mutation Research/Reviews in Mutation Research
jo u rn al h om epag e: ww w.els evier .c o m/lo cat e/ rev iew sm rCo mm un i ty ad dr es s : w ww.els evier . co m/lo c ate /mu t r es
radiation induced bystander effect; ROS, reactive oxygen species; SDS-PAGE, sodium dodecyl sulfate poly acrylamide gel electrophoresis; SELDI–TOF, surface enhanced laser
desorption ionization–time of flight; UNSCEAR, United Nation Scientific Committee on the Effects of Atomic Radiation.
* Corresponding author. Tel.: +33 (0)2 31 45 45 64.
E-mail addresses: [email protected], [email protected] (F. Chevalier).
Please cite this article in press as: F. Chevalier, et al., Proteomic overview and perspectives of the radiation-induced bystander effects,Mutat. Res.: Rev. Mutat. Res. (2014), http://dx.doi.org/10.1016/j.mrrev.2014.11.008
http://dx.doi.org/10.1016/j.mrrev.2014.11.008
1383-5742/� 2014 Elsevier B.V. All rights reserved.
F. Chevalier et al. / Mutation Research xxx (2014) xxx–xxx2
G Model
MUTREV-8104; No. of Pages 14
2.3. In vivo protocols . . . . . . . . . . . . . . . . . . . . . . . . . . . . . . . . . . . . . . . . . . . . . . . . . . . . . . . . . . . . . . . . . . . . . . . . . . . . . . . . . . . . . . . . . . . . 000
2.4. Prediction models . . . . . . . . . . . . . . . . . . . . . . . . . . . . . . . . . . . . . . . . . . . . . . . . . . . . . . . . . . . . . . . . . . . . . . . . . . . . . . . . . . . . . . . . . . . 000
3. Proteomic studies of RIBE . . . . . . . . . . . . . . . . . . . . . . . . . . . . . . . . . . . . . . . . . . . . . . . . . . . . . . . . . . . . . . . . . . . . . . . . . . . . . . . . . . . . . . . . . . 000
3.1. Experimental strategy. . . . . . . . . . . . . . . . . . . . . . . . . . . . . . . . . . . . . . . . . . . . . . . . . . . . . . . . . . . . . . . . . . . . . . . . . . . . . . . . . . . . . . . . 000
3.2. Proteomic tools . . . . . . . . . . . . . . . . . . . . . . . . . . . . . . . . . . . . . . . . . . . . . . . . . . . . . . . . . . . . . . . . . . . . . . . . . . . . . . . . . . . . . . . . . . . . . 000
3.2.1. Top-down proteomic approaches . . . . . . . . . . . . . . . . . . . . . . . . . . . . . . . . . . . . . . . . . . . . . . . . . . . . . . . . . . . . . . . . . . . . . . . 000
3.2.2. Bottom-up proteomic approaches. . . . . . . . . . . . . . . . . . . . . . . . . . . . . . . . . . . . . . . . . . . . . . . . . . . . . . . . . . . . . . . . . . . . . . . 000
3.2.3. Protein microarrays approaches . . . . . . . . . . . . . . . . . . . . . . . . . . . . . . . . . . . . . . . . . . . . . . . . . . . . . . . . . . . . . . . . . . . . . . . . 000
3.2.4. Bioinformatics, from proteome to biological endpoints. . . . . . . . . . . . . . . . . . . . . . . . . . . . . . . . . . . . . . . . . . . . . . . . . . . . . . 000
3.3. Publication volume of proteomic and RIBE studies. . . . . . . . . . . . . . . . . . . . . . . . . . . . . . . . . . . . . . . . . . . . . . . . . . . . . . . . . . . . . . . . . 000
3.4. Proteomic studies overview . . . . . . . . . . . . . . . . . . . . . . . . . . . . . . . . . . . . . . . . . . . . . . . . . . . . . . . . . . . . . . . . . . . . . . . . . . . . . . . . . . . 000
3.4.1. MS-based proteomic studies of RIBE . . . . . . . . . . . . . . . . . . . . . . . . . . . . . . . . . . . . . . . . . . . . . . . . . . . . . . . . . . . . . . . . . . . . 000
3.4.2. Gel-based proteomic studies of RIBE . . . . . . . . . . . . . . . . . . . . . . . . . . . . . . . . . . . . . . . . . . . . . . . . . . . . . . . . . . . . . . . . . . . . 000
3.4.3. Protein microarrays approach . . . . . . . . . . . . . . . . . . . . . . . . . . . . . . . . . . . . . . . . . . . . . . . . . . . . . . . . . . . . . . . . . . . . . . . . . . 000
4. RIBE proteomic capacities . . . . . . . . . . . . . . . . . . . . . . . . . . . . . . . . . . . . . . . . . . . . . . . . . . . . . . . . . . . . . . . . . . . . . . . . . . . . . . . . . . . . . . . . . . 000
4.1. RIBE proteomic subdivisions . . . . . . . . . . . . . . . . . . . . . . . . . . . . . . . . . . . . . . . . . . . . . . . . . . . . . . . . . . . . . . . . . . . . . . . . . . . . . . . . . . 000
4.2. Secretome analysis of RIBE. . . . . . . . . . . . . . . . . . . . . . . . . . . . . . . . . . . . . . . . . . . . . . . . . . . . . . . . . . . . . . . . . . . . . . . . . . . . . . . . . . . . 000
4.3. Cellular models to confirm RIBE mechanisms . . . . . . . . . . . . . . . . . . . . . . . . . . . . . . . . . . . . . . . . . . . . . . . . . . . . . . . . . . . . . . . . . . . . . 000
4.4. Applications in medicine and radiotherapy . . . . . . . . . . . . . . . . . . . . . . . . . . . . . . . . . . . . . . . . . . . . . . . . . . . . . . . . . . . . . . . . . . . . . . . 000
5. Conclusion . . . . . . . . . . . . . . . . . . . . . . . . . . . . . . . . . . . . . . . . . . . . . . . . . . . . . . . . . . . . . . . . . . . . . . . . . . . . . . . . . . . . . . . . . . . . . . . . . . . . . . 000
References . . . . . . . . . . . . . . . . . . . . . . . . . . . . . . . . . . . . . . . . . . . . . . . . . . . . . . . . . . . . . . . . . . . . . . . . . . . . . . . . . . . . . . . . . . . . . . . . . . . . . . 000
1. Introduction of RIBE definition
Over the past 25 years, considerable evidence has accumulatedregarding ‘‘radiation-induced bystander effects’’, RIBE, defined as abiological response of non-targeted and non-irradiated cells,neighboring to cells directly traversed by ionizing radiations.Bystander effect (BE) leads to non-irradiated cells injury with abiological response close to the direct response of irradiated cells[1–3].
When cells are exposed to ionizing radiation, a large amount ofenergy is deposed, and many molecules become non-functional. Inthe case of DNA molecules, major damages such as double-strandbreaks are created, and un-repaired or mis-repaired damages leadto multiple chromosomal mutations and cell death. This irradia-tion strategy is the basis of radiotherapy, targeting specifically atumor mass with the irradiator system beam, in order to reducecancer cell viability. Experimental evidence shows that, in additionto this direct and targeted effect of radiation, a side or secondaryeffect is observed within the un-irradiated area. Irradiated cellsrelay a stress signal in the close proximity. Neighboring un-irradiated cells react to this signal, i.e., BE with a specific‘‘bystander response’’ (BR), characteristic of a biological context,but with a close relationship to the biological response typicallyassociated with direct radiation exposure. Bystander responsesand bystander factors (BF) secreted by irradiated cells wereobserved and studied in many physical and biological conditions,in vitro and in vivo. For a complete overview of BE, mostexperiments in this area were broadly reviewed from the years1992 to 2006 in the UNSCEAR report [4], in a special issue ofOncogene in 2003 [5–12], and in several recent publications[1,3,13–20].
1.1. Effect classes: Bystander/abscopal/cohort
As explained by Blyth and Sykes [3], distinctions should bemade between effect classes to define and delimit cell responses toradiations. Within the irradiated volume, irradiated cells commu-nicate a stress signal to non-irradiated cells, i.e., a BE; andirradiated cells also communicate this stress signal to irradiatedcells, i.e., a cohort effect, which can be the same, but mostly maskedby the direct effect of radiation. These bystander and cohort effects,which appear at the same time, need to be considered carefullywhen designing analysis protocols and interpreting bystander
Please cite this article in press as: F. Chevalier, et al., Proteomic overvMutat. Res.: Rev. Mutat. Res. (2014), http://dx.doi.org/10.1016/j.mrr
results, especially with in-vitro models. During exposure of thebody to radiation, an abscopal response can be observed outside ofan irradiated volume, sent by the different irradiated tissues in thedirection of the non-irradiated ones. Of course, such effects,involving a total body response via the blood vessel and immunesystem, is impossible to repeat in vitro.
1.2. Radiation source and dose
According to the quantitative model of Brenner et al. [16], atleast in the case of a-particles, BE are important and dominate theoverall response at doses below 50 cGy. This model transforms theapproach about low-dose responses, which was extrapolated fromintermediate doses and may lead to an underestimation of the risk.The dose-response relationship does not increase with increasingradiation dose [1]. In contrast to direct effects, BR reaches a plateauand become quickly saturated at relatively low doses (50–100 cGy). Such a remarkable dose-dependence response is stillpoorly understood and leads to contradictory results as a functionof irradiation type and doses [3]. Since the complete cellularmechanism of the BE is not elucidated, it is difficult to explain sucha saturated response. A hypothesis can only be proposed with, forexample, a simple on/off response or a secretion limit of BF byirradiated cells.
In addition, BE are dependent on the radiation source andquality, and on the characteristics of the beam used for irradiation(LET, energy, dose rate, dose, etc.). A complete review of the recentin vitro studies of the BE as a function of cell type, radiation type(alpha particle, gamma radiation, X-rays, protons, neutrons, heavyions), end point (chromosomal instability, plating efficiency) andorigin of BE (micro-beam irradiation, medium transfer, etc.) waspublished in 2006 [4] by the United Nation Scientific Committee onthe Effects of Atomic Radiation (UNSCEAR).
1.3. Biological effects
BE are translated at the cell level with numerous endpoints [13]associated with damaging, protective or undetermined conse-quences. Most biological effects are largely considered to bedirectly or indirectly linked with a prominent oxidative stress,inducing genetic instability, related to DNA damages [10,19,21–23,15,24]. An increased frequency of micronuclei formation andsister chromatid exchanges was reported, indicating unrepaired or
iew and perspectives of the radiation-induced bystander effects,ev.2014.11.008
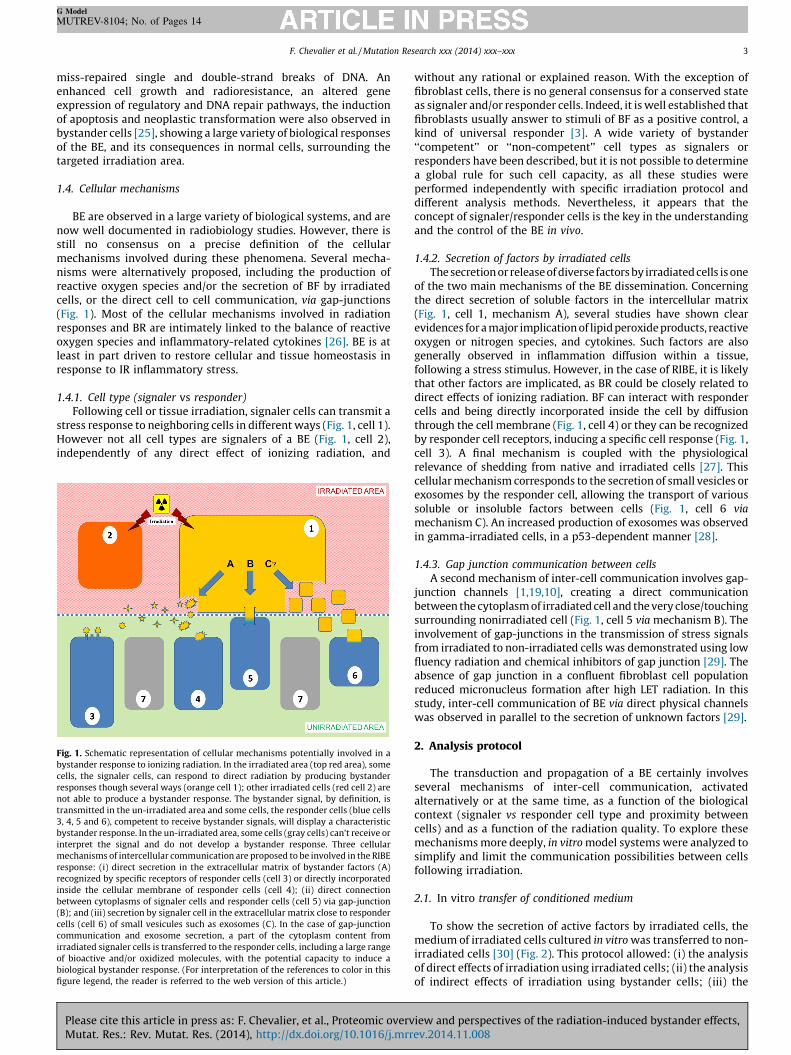
F. Chevalier et al. / Mutation Research xxx (2014) xxx–xxx 3
G Model
MUTREV-8104; No. of Pages 14
miss-repaired single and double-strand breaks of DNA. Anenhanced cell growth and radioresistance, an altered geneexpression of regulatory and DNA repair pathways, the inductionof apoptosis and neoplastic transformation were also observed inbystander cells [25], showing a large variety of biological responsesof the BE, and its consequences in normal cells, surrounding thetargeted irradiation area.
1.4. Cellular mechanisms
BE are observed in a large variety of biological systems, and arenow well documented in radiobiology studies. However, there isstill no consensus on a precise definition of the cellularmechanisms involved during these phenomena. Several mecha-nisms were alternatively proposed, including the production ofreactive oxygen species and/or the secretion of BF by irradiatedcells, or the direct cell to cell communication, via gap-junctions(Fig. 1). Most of the cellular mechanisms involved in radiationresponses and BR are intimately linked to the balance of reactiveoxygen species and inflammatory-related cytokines [26]. BE is atleast in part driven to restore cellular and tissue homeostasis inresponse to IR inflammatory stress.
1.4.1. Cell type (signaler vs responder)
Following cell or tissue irradiation, signaler cells can transmit astress response to neighboring cells in different ways (Fig. 1, cell 1).However not all cell types are signalers of a BE (Fig. 1, cell 2),independently of any direct effect of ionizing radiation, and
Fig. 1. Schematic representation of cellular mechanisms potentially involved in a
bystander response to ionizing radiation. In the irradiated area (top red area), some
cells, the signaler cells, can respond to direct radiation by producing bystander
responses though several ways (orange cell 1); other irradiated cells (red cell 2) are
not able to produce a bystander response. The bystander signal, by definition, is
transmitted in the un-irradiated area and some cells, the responder cells (blue cells
3, 4, 5 and 6), competent to receive bystander signals, will display a characteristic
bystander response. In the un-irradiated area, some cells (gray cells) can’t receive or
interpret the signal and do not develop a bystander response. Three cellular
mechanisms of intercellular communication are proposed to be involved in the RIBE
response: (i) direct secretion in the extracellular matrix of bystander factors (A)
recognized by specific receptors of responder cells (cell 3) or directly incorporated
inside the cellular membrane of responder cells (cell 4); (ii) direct connection
between cytoplasms of signaler cells and responder cells (cell 5) via gap-junction
(B); and (iii) secretion by signaler cell in the extracellular matrix close to responder
cells (cell 6) of small vesicules such as exosomes (C). In the case of gap-junction
communication and exosome secretion, a part of the cytoplasm content from
irradiated signaler cells is transferred to the responder cells, including a large range
of bioactive and/or oxidized molecules, with the potential capacity to induce a
biological bystander response. (For interpretation of the references to color in this
figure legend, the reader is referred to the web version of this article.)
Please cite this article in press as: F. Chevalier, et al., Proteomic overvMutat. Res.: Rev. Mutat. Res. (2014), http://dx.doi.org/10.1016/j.mrr
without any rational or explained reason. With the exception offibroblast cells, there is no general consensus for a conserved stateas signaler and/or responder cells. Indeed, it is well established thatfibroblasts usually answer to stimuli of BF as a positive control, akind of universal responder [3]. A wide variety of bystander‘‘competent’’ or ‘‘non-competent’’ cell types as signalers orresponders have been described, but it is not possible to determinea global rule for such cell capacity, as all these studies wereperformed independently with specific irradiation protocol anddifferent analysis methods. Nevertheless, it appears that theconcept of signaler/responder cells is the key in the understandingand the control of the BE in vivo.
1.4.2. Secretion of factors by irradiated cells
The secretion or release of diverse factors by irradiated cells is oneof the two main mechanisms of the BE dissemination. Concerningthe direct secretion of soluble factors in the intercellular matrix(Fig. 1, cell 1, mechanism A), several studies have shown clearevidences for a major implication of lipid peroxide products, reactiveoxygen or nitrogen species, and cytokines. Such factors are alsogenerally observed in inflammation diffusion within a tissue,following a stress stimulus. However, in the case of RIBE, it is likelythat other factors are implicated, as BR could be closely related todirect effects of ionizing radiation. BF can interact with respondercells and being directly incorporated inside the cell by diffusionthrough the cell membrane (Fig. 1, cell 4) or they can be recognizedby responder cell receptors, inducing a specific cell response (Fig. 1,cell 3). A final mechanism is coupled with the physiologicalrelevance of shedding from native and irradiated cells [27]. Thiscellular mechanism corresponds to the secretion of small vesicles orexosomes by the responder cell, allowing the transport of varioussoluble or insoluble factors between cells (Fig. 1, cell 6 via
mechanism C). An increased production of exosomes was observedin gamma-irradiated cells, in a p53-dependent manner [28].
1.4.3. Gap junction communication between cells
A second mechanism of inter-cell communication involves gap-junction channels [1,19,10], creating a direct communicationbetween the cytoplasm of irradiated cell and the very close/touchingsurrounding nonirradiated cell (Fig. 1, cell 5 via mechanism B). Theinvolvement of gap-junctions in the transmission of stress signalsfrom irradiated to non-irradiated cells was demonstrated using lowfluency radiation and chemical inhibitors of gap junction [29]. Theabsence of gap junction in a confluent fibroblast cell populationreduced micronucleus formation after high LET radiation. In thisstudy, inter-cell communication of BE via direct physical channelswas observed in parallel to the secretion of unknown factors [29].
2. Analysis protocol
The transduction and propagation of a BE certainly involvesseveral mechanisms of inter-cell communication, activatedalternatively or at the same time, as a function of the biologicalcontext (signaler vs responder cell type and proximity betweencells) and as a function of the radiation quality. To explore thesemechanisms more deeply, in vitro model systems were analyzed tosimplify and limit the communication possibilities between cellsfollowing irradiation.
2.1. In vitro transfer of conditioned medium
To show the secretion of active factors by irradiated cells, themedium of irradiated cells cultured in vitro was transferred to non-irradiated cells [30] (Fig. 2). This protocol allowed: (i) the analysisof direct effects of irradiation using irradiated cells; (ii) the analysisof indirect effects of irradiation using bystander cells; (iii) the
iew and perspectives of the radiation-induced bystander effects,ev.2014.11.008
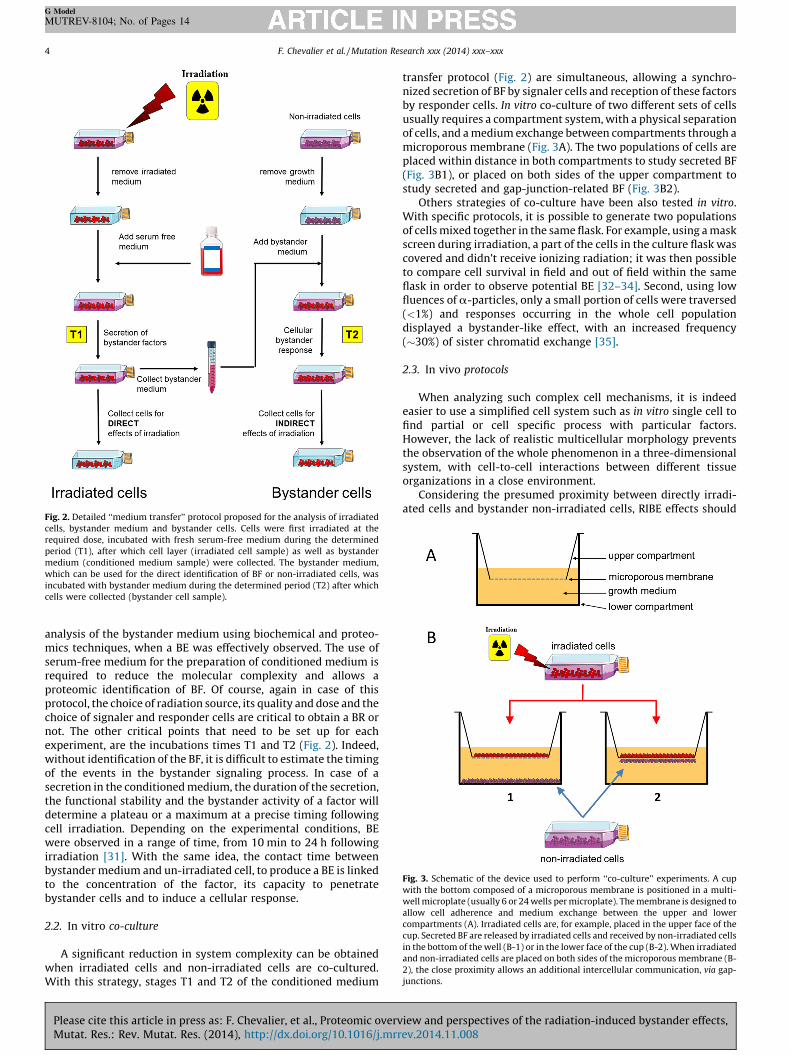
Fig. 2. Detailed ‘‘medium transfer’’ protocol proposed for the analysis of irradiated
cells, bystander medium and bystander cells. Cells were first irradiated at the
required dose, incubated with fresh serum-free medium during the determined
period (T1), after which cell layer (irradiated cell sample) as well as bystander
medium (conditioned medium sample) were collected. The bystander medium,
which can be used for the direct identification of BF or non-irradiated cells, was
incubated with bystander medium during the determined period (T2) after which
cells were collected (bystander cell sample).
Fig. 3. Schematic of the device used to perform ‘‘co-culture’’ experiments. A cup
with the bottom composed of a microporous membrane is positioned in a multi-
well microplate (usually 6 or 24 wells per microplate). The membrane is designed to
allow cell adherence and medium exchange between the upper and lower
compartments (A). Irradiated cells are, for example, placed in the upper face of the
cup. Secreted BF are released by irradiated cells and received by non-irradiated cells
in the bottom of the well (B-1) or in the lower face of the cup (B-2). When irradiated
and non-irradiated cells are placed on both sides of the microporous membrane (B-
2), the close proximity allows an additional intercellular communication, via gap-
junctions.
F. Chevalier et al. / Mutation Research xxx (2014) xxx–xxx4
G Model
MUTREV-8104; No. of Pages 14
analysis of the bystander medium using biochemical and proteo-mics techniques, when a BE was effectively observed. The use ofserum-free medium for the preparation of conditioned medium isrequired to reduce the molecular complexity and allows aproteomic identification of BF. Of course, again in case of thisprotocol, the choice of radiation source, its quality and dose and thechoice of signaler and responder cells are critical to obtain a BR ornot. The other critical points that need to be set up for eachexperiment, are the incubations times T1 and T2 (Fig. 2). Indeed,without identification of the BF, it is difficult to estimate the timingof the events in the bystander signaling process. In case of asecretion in the conditioned medium, the duration of the secretion,the functional stability and the bystander activity of a factor willdetermine a plateau or a maximum at a precise timing followingcell irradiation. Depending on the experimental conditions, BEwere observed in a range of time, from 10 min to 24 h followingirradiation [31]. With the same idea, the contact time betweenbystander medium and un-irradiated cell, to produce a BE is linkedto the concentration of the factor, its capacity to penetratebystander cells and to induce a cellular response.
2.2. In vitro co-culture
A significant reduction in system complexity can be obtainedwhen irradiated cells and non-irradiated cells are co-cultured.With this strategy, stages T1 and T2 of the conditioned medium
Please cite this article in press as: F. Chevalier, et al., Proteomic overvMutat. Res.: Rev. Mutat. Res. (2014), http://dx.doi.org/10.1016/j.mrr
transfer protocol (Fig. 2) are simultaneous, allowing a synchro-nized secretion of BF by signaler cells and reception of these factorsby responder cells. In vitro co-culture of two different sets of cellsusually requires a compartment system, with a physical separationof cells, and a medium exchange between compartments through amicroporous membrane (Fig. 3A). The two populations of cells areplaced within distance in both compartments to study secreted BF(Fig. 3B1), or placed on both sides of the upper compartment tostudy secreted and gap-junction-related BF (Fig. 3B2).
Others strategies of co-culture have been also tested in vitro.With specific protocols, it is possible to generate two populationsof cells mixed together in the same flask. For example, using a maskscreen during irradiation, a part of the cells in the culture flask wascovered and didn’t receive ionizing radiation; it was then possibleto compare cell survival in field and out of field within the sameflask in order to observe potential BE [32–34]. Second, using lowfluences of a-particles, only a small portion of cells were traversed(<1%) and responses occurring in the whole cell populationdisplayed a bystander-like effect, with an increased frequency(�30%) of sister chromatid exchange [35].
2.3. In vivo protocols
When analyzing such complex cell mechanisms, it is indeedeasier to use a simplified cell system such as in vitro single cell tofind partial or cell specific process with particular factors.However, the lack of realistic multicellular morphology preventsthe observation of the whole phenomenon in a three-dimensionalsystem, with cell-to-cell interactions between different tissueorganizations in a close environment.
Considering the presumed proximity between directly irradi-ated cells and bystander non-irradiated cells, RIBE effects should
iew and perspectives of the radiation-induced bystander effects,ev.2014.11.008
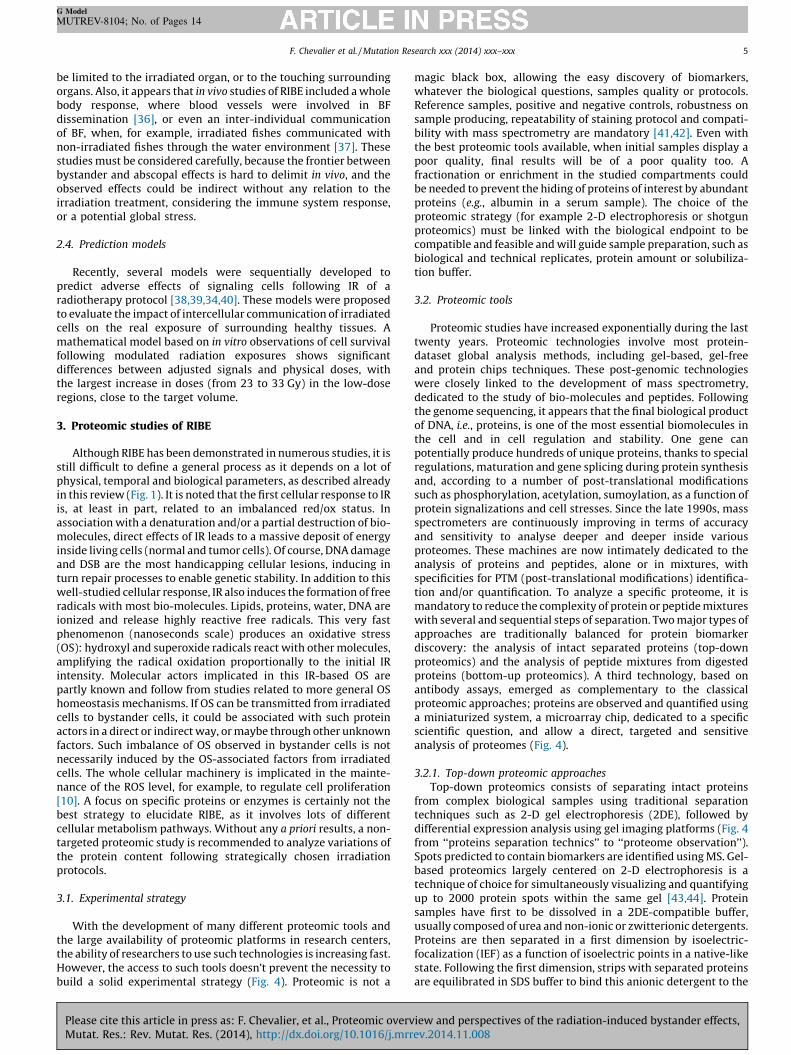
F. Chevalier et al. / Mutation Research xxx (2014) xxx–xxx 5
G Model
MUTREV-8104; No. of Pages 14
be limited to the irradiated organ, or to the touching surroundingorgans. Also, it appears that in vivo studies of RIBE included a wholebody response, where blood vessels were involved in BFdissemination [36], or even an inter-individual communicationof BF, when, for example, irradiated fishes communicated withnon-irradiated fishes through the water environment [37]. Thesestudies must be considered carefully, because the frontier betweenbystander and abscopal effects is hard to delimit in vivo, and theobserved effects could be indirect without any relation to theirradiation treatment, considering the immune system response,or a potential global stress.
2.4. Prediction models
Recently, several models were sequentially developed topredict adverse effects of signaling cells following IR of aradiotherapy protocol [38,39,34,40]. These models were proposedto evaluate the impact of intercellular communication of irradiatedcells on the real exposure of surrounding healthy tissues. Amathematical model based on in vitro observations of cell survivalfollowing modulated radiation exposures shows significantdifferences between adjusted signals and physical doses, withthe largest increase in doses (from 23 to 33 Gy) in the low-doseregions, close to the target volume.
3. Proteomic studies of RIBE
Although RIBE has been demonstrated in numerous studies, it isstill difficult to define a general process as it depends on a lot ofphysical, temporal and biological parameters, as described alreadyin this review (Fig. 1). It is noted that the first cellular response to IRis, at least in part, related to an imbalanced red/ox status. Inassociation with a denaturation and/or a partial destruction of bio-molecules, direct effects of IR leads to a massive deposit of energyinside living cells (normal and tumor cells). Of course, DNA damageand DSB are the most handicapping cellular lesions, inducing inturn repair processes to enable genetic stability. In addition to thiswell-studied cellular response, IR also induces the formation of freeradicals with most bio-molecules. Lipids, proteins, water, DNA areionized and release highly reactive free radicals. This very fastphenomenon (nanoseconds scale) produces an oxidative stress(OS): hydroxyl and superoxide radicals react with other molecules,amplifying the radical oxidation proportionally to the initial IRintensity. Molecular actors implicated in this IR-based OS arepartly known and follow from studies related to more general OShomeostasis mechanisms. If OS can be transmitted from irradiatedcells to bystander cells, it could be associated with such proteinactors in a direct or indirect way, or maybe through other unknownfactors. Such imbalance of OS observed in bystander cells is notnecessarily induced by the OS-associated factors from irradiatedcells. The whole cellular machinery is implicated in the mainte-nance of the ROS level, for example, to regulate cell proliferation[10]. A focus on specific proteins or enzymes is certainly not thebest strategy to elucidate RIBE, as it involves lots of differentcellular metabolism pathways. Without any a priori results, a non-targeted proteomic study is recommended to analyze variations ofthe protein content following strategically chosen irradiationprotocols.
3.1. Experimental strategy
With the development of many different proteomic tools andthe large availability of proteomic platforms in research centers,the ability of researchers to use such technologies is increasing fast.However, the access to such tools doesn’t prevent the necessity tobuild a solid experimental strategy (Fig. 4). Proteomic is not a
Please cite this article in press as: F. Chevalier, et al., Proteomic overvMutat. Res.: Rev. Mutat. Res. (2014), http://dx.doi.org/10.1016/j.mrr
magic black box, allowing the easy discovery of biomarkers,whatever the biological questions, samples quality or protocols.Reference samples, positive and negative controls, robustness onsample producing, repeatability of staining protocol and compati-bility with mass spectrometry are mandatory [41,42]. Even withthe best proteomic tools available, when initial samples display apoor quality, final results will be of a poor quality too. Afractionation or enrichment in the studied compartments couldbe needed to prevent the hiding of proteins of interest by abundantproteins (e.g., albumin in a serum sample). The choice of theproteomic strategy (for example 2-D electrophoresis or shotgunproteomics) must be linked with the biological endpoint to becompatible and feasible and will guide sample preparation, such asbiological and technical replicates, protein amount or solubiliza-tion buffer.
3.2. Proteomic tools
Proteomic studies have increased exponentially during the lasttwenty years. Proteomic technologies involve most protein-dataset global analysis methods, including gel-based, gel-freeand protein chips techniques. These post-genomic technologieswere closely linked to the development of mass spectrometry,dedicated to the study of bio-molecules and peptides. Followingthe genome sequencing, it appears that the final biological productof DNA, i.e., proteins, is one of the most essential biomolecules inthe cell and in cell regulation and stability. One gene canpotentially produce hundreds of unique proteins, thanks to specialregulations, maturation and gene splicing during protein synthesisand, according to a number of post-translational modificationssuch as phosphorylation, acetylation, sumoylation, as a function ofprotein signalizations and cell stresses. Since the late 1990s, massspectrometers are continuously improving in terms of accuracyand sensitivity to analyse deeper and deeper inside variousproteomes. These machines are now intimately dedicated to theanalysis of proteins and peptides, alone or in mixtures, withspecificities for PTM (post-translational modifications) identifica-tion and/or quantification. To analyze a specific proteome, it ismandatory to reduce the complexity of protein or peptide mixtureswith several and sequential steps of separation. Two major types ofapproaches are traditionally balanced for protein biomarkerdiscovery: the analysis of intact separated proteins (top-downproteomics) and the analysis of peptide mixtures from digestedproteins (bottom-up proteomics). A third technology, based onantibody assays, emerged as complementary to the classicalproteomic approaches; proteins are observed and quantified usinga miniaturized system, a microarray chip, dedicated to a specificscientific question, and allow a direct, targeted and sensitiveanalysis of proteomes (Fig. 4).
3.2.1. Top-down proteomic approaches
Top-down proteomics consists of separating intact proteinsfrom complex biological samples using traditional separationtechniques such as 2-D gel electrophoresis (2DE), followed bydifferential expression analysis using gel imaging platforms (Fig. 4from ‘‘proteins separation technics’’ to ‘‘proteome observation’’).Spots predicted to contain biomarkers are identified using MS. Gel-based proteomics largely centered on 2-D electrophoresis is atechnique of choice for simultaneously visualizing and quantifyingup to 2000 protein spots within the same gel [43,44]. Proteinsamples have first to be dissolved in a 2DE-compatible buffer,usually composed of urea and non-ionic or zwitterionic detergents.Proteins are then separated in a first dimension by isoelectric-focalization (IEF) as a function of isoelectric points in a native-likestate. Following the first dimension, strips with separated proteinsare equilibrated in SDS buffer to bind this anionic detergent to the
iew and perspectives of the radiation-induced bystander effects,ev.2014.11.008
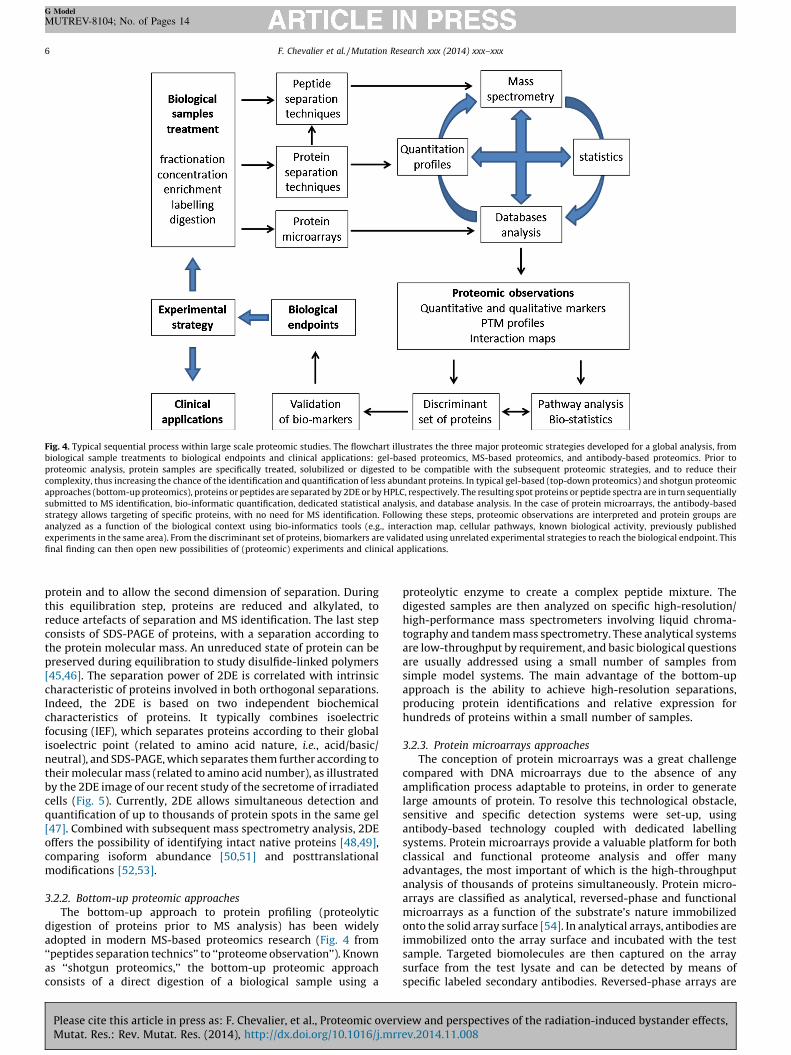
Fig. 4. Typical sequential process within large scale proteomic studies. The flowchart illustrates the three major proteomic strategies developed for a global analysis, from
biological sample treatments to biological endpoints and clinical applications: gel-based proteomics, MS-based proteomics, and antibody-based proteomics. Prior to
proteomic analysis, protein samples are specifically treated, solubilized or digested to be compatible with the subsequent proteomic strategies, and to reduce their
complexity, thus increasing the chance of the identification and quantification of less abundant proteins. In typical gel-based (top-down proteomics) and shotgun proteomic
approaches (bottom-up proteomics), proteins or peptides are separated by 2DE or by HPLC, respectively. The resulting spot proteins or peptide spectra are in turn sequentially
submitted to MS identification, bio-informatic quantification, dedicated statistical analysis, and database analysis. In the case of protein microarrays, the antibody-based
strategy allows targeting of specific proteins, with no need for MS identification. Following these steps, proteomic observations are interpreted and protein groups are
analyzed as a function of the biological context using bio-informatics tools (e.g., interaction map, cellular pathways, known biological activity, previously published
experiments in the same area). From the discriminant set of proteins, biomarkers are validated using unrelated experimental strategies to reach the biological endpoint. This
final finding can then open new possibilities of (proteomic) experiments and clinical applications.
F. Chevalier et al. / Mutation Research xxx (2014) xxx–xxx6
G Model
MUTREV-8104; No. of Pages 14
protein and to allow the second dimension of separation. Duringthis equilibration step, proteins are reduced and alkylated, toreduce artefacts of separation and MS identification. The last stepconsists of SDS-PAGE of proteins, with a separation according tothe protein molecular mass. An unreduced state of protein can bepreserved during equilibration to study disulfide-linked polymers[45,46]. The separation power of 2DE is correlated with intrinsiccharacteristic of proteins involved in both orthogonal separations.Indeed, the 2DE is based on two independent biochemicalcharacteristics of proteins. It typically combines isoelectricfocusing (IEF), which separates proteins according to their globalisoelectric point (related to amino acid nature, i.e., acid/basic/neutral), and SDS-PAGE, which separates them further according totheir molecular mass (related to amino acid number), as illustratedby the 2DE image of our recent study of the secretome of irradiatedcells (Fig. 5). Currently, 2DE allows simultaneous detection andquantification of up to thousands of protein spots in the same gel[47]. Combined with subsequent mass spectrometry analysis, 2DEoffers the possibility of identifying intact native proteins [48,49],comparing isoform abundance [50,51] and posttranslationalmodifications [52,53].
3.2.2. Bottom-up proteomic approaches
The bottom-up approach to protein profiling (proteolyticdigestion of proteins prior to MS analysis) has been widelyadopted in modern MS-based proteomics research (Fig. 4 from‘‘peptides separation technics’’ to ‘‘proteome observation’’). Knownas ‘‘shotgun proteomics,’’ the bottom-up proteomic approachconsists of a direct digestion of a biological sample using a
Please cite this article in press as: F. Chevalier, et al., Proteomic overvMutat. Res.: Rev. Mutat. Res. (2014), http://dx.doi.org/10.1016/j.mrr
proteolytic enzyme to create a complex peptide mixture. Thedigested samples are then analyzed on specific high-resolution/high-performance mass spectrometers involving liquid chroma-tography and tandem mass spectrometry. These analytical systemsare low-throughput by requirement, and basic biological questionsare usually addressed using a small number of samples fromsimple model systems. The main advantage of the bottom-upapproach is the ability to achieve high-resolution separations,producing protein identifications and relative expression forhundreds of proteins within a small number of samples.
3.2.3. Protein microarrays approaches
The conception of protein microarrays was a great challengecompared with DNA microarrays due to the absence of anyamplification process adaptable to proteins, in order to generatelarge amounts of protein. To resolve this technological obstacle,sensitive and specific detection systems were set-up, usingantibody-based technology coupled with dedicated labellingsystems. Protein microarrays provide a valuable platform for bothclassical and functional proteome analysis and offer manyadvantages, the most important of which is the high-throughputanalysis of thousands of proteins simultaneously. Protein micro-arrays are classified as analytical, reversed-phase and functionalmicroarrays as a function of the substrate’s nature immobilizedonto the solid array surface [54]. In analytical arrays, antibodies areimmobilized onto the array surface and incubated with the testsample. Targeted biomolecules are then captured on the arraysurface from the test lysate and can be detected by means ofspecific labeled secondary antibodies. Reversed-phase arrays are
iew and perspectives of the radiation-induced bystander effects,ev.2014.11.008
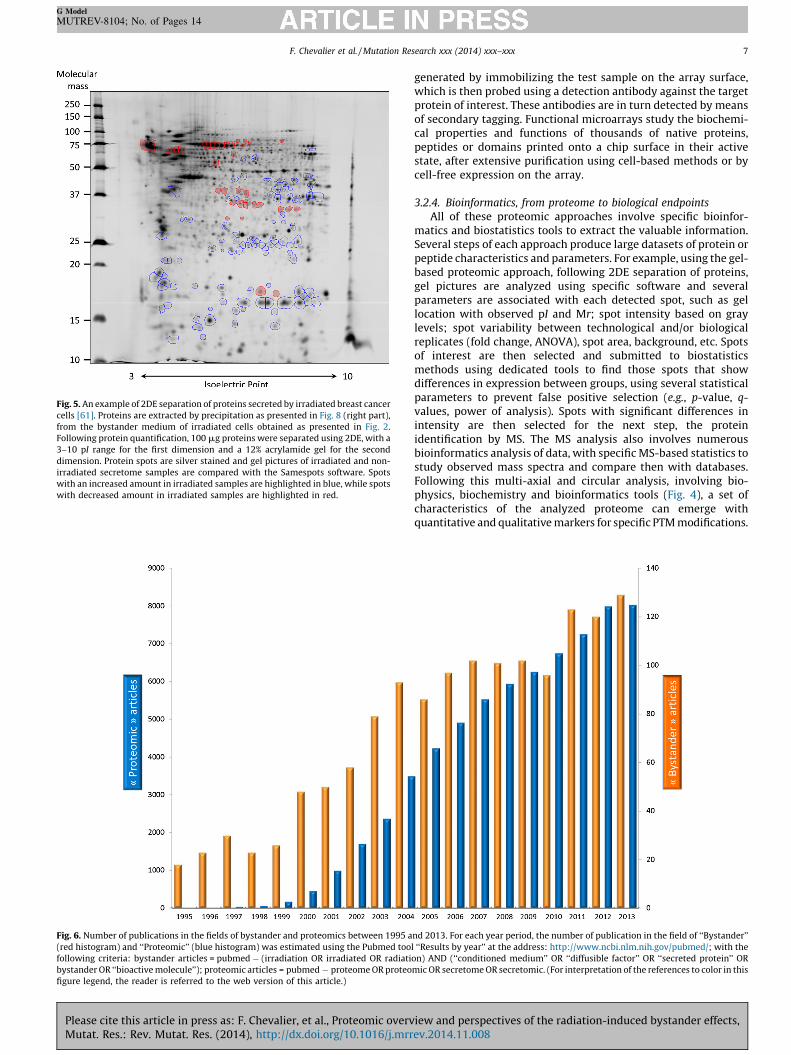
Fig. 5. An example of 2DE separation of proteins secreted by irradiated breast cancer
cells [61]. Proteins are extracted by precipitation as presented in Fig. 8 (right part),
from the bystander medium of irradiated cells obtained as presented in Fig. 2.
Following protein quantification, 100 mg proteins were separated using 2DE, with a
3–10 pI range for the first dimension and a 12% acrylamide gel for the second
dimension. Protein spots are silver stained and gel pictures of irradiated and non-
irradiated secretome samples are compared with the Samespots software. Spots
with an increased amount in irradiated samples are highlighted in blue, while spots
with decreased amount in irradiated samples are highlighted in red.
Fig. 6. Number of publications in the fields of bystander and proteomics between 1995 a
(red histogram) and ‘‘Proteomic’’ (blue histogram) was estimated using the Pubmed too
following criteria: bystander articles = pubmed � (irradiation OR irradiated OR radiati
bystander OR ‘‘bioactive molecule’’); proteomic articles = pubmed � proteome OR proteo
figure legend, the reader is referred to the web version of this article.)
F. Chevalier et al. / Mutation Research xxx (2014) xxx–xxx 7
G Model
MUTREV-8104; No. of Pages 14
Please cite this article in press as: F. Chevalier, et al., Proteomic overvMutat. Res.: Rev. Mutat. Res. (2014), http://dx.doi.org/10.1016/j.mrr
generated by immobilizing the test sample on the array surface,which is then probed using a detection antibody against the targetprotein of interest. These antibodies are in turn detected by meansof secondary tagging. Functional microarrays study the biochemi-cal properties and functions of thousands of native proteins,peptides or domains printed onto a chip surface in their activestate, after extensive purification using cell-based methods or bycell-free expression on the array.
3.2.4. Bioinformatics, from proteome to biological endpoints
All of these proteomic approaches involve specific bioinfor-matics and biostatistics tools to extract the valuable information.Several steps of each approach produce large datasets of protein orpeptide characteristics and parameters. For example, using the gel-based proteomic approach, following 2DE separation of proteins,gel pictures are analyzed using specific software and severalparameters are associated with each detected spot, such as gellocation with observed pI and Mr; spot intensity based on graylevels; spot variability between technological and/or biologicalreplicates (fold change, ANOVA), spot area, background, etc. Spotsof interest are then selected and submitted to biostatisticsmethods using dedicated tools to find those spots that showdifferences in expression between groups, using several statisticalparameters to prevent false positive selection (e.g., p-value, q-values, power of analysis). Spots with significant differences inintensity are then selected for the next step, the proteinidentification by MS. The MS analysis also involves numerousbioinformatics analysis of data, with specific MS-based statistics tostudy observed mass spectra and compare then with databases.Following this multi-axial and circular analysis, involving bio-physics, biochemistry and bioinformatics tools (Fig. 4), a set ofcharacteristics of the analyzed proteome can emerge withquantitative and qualitative markers for specific PTM modifications.
nd 2013. For each year period, the number of publication in the field of ‘‘Bystander’’
l ‘‘Results by year’’ at the address: http://www.ncbi.nlm.nih.gov/pubmed/; with the
on) AND (‘‘conditioned medium’’ OR ‘‘diffusible factor’’ OR ‘‘secreted protein’’ OR
mic OR secretome OR secretomic. (For interpretation of the references to color in this
iew and perspectives of the radiation-induced bystander effects,ev.2014.11.008
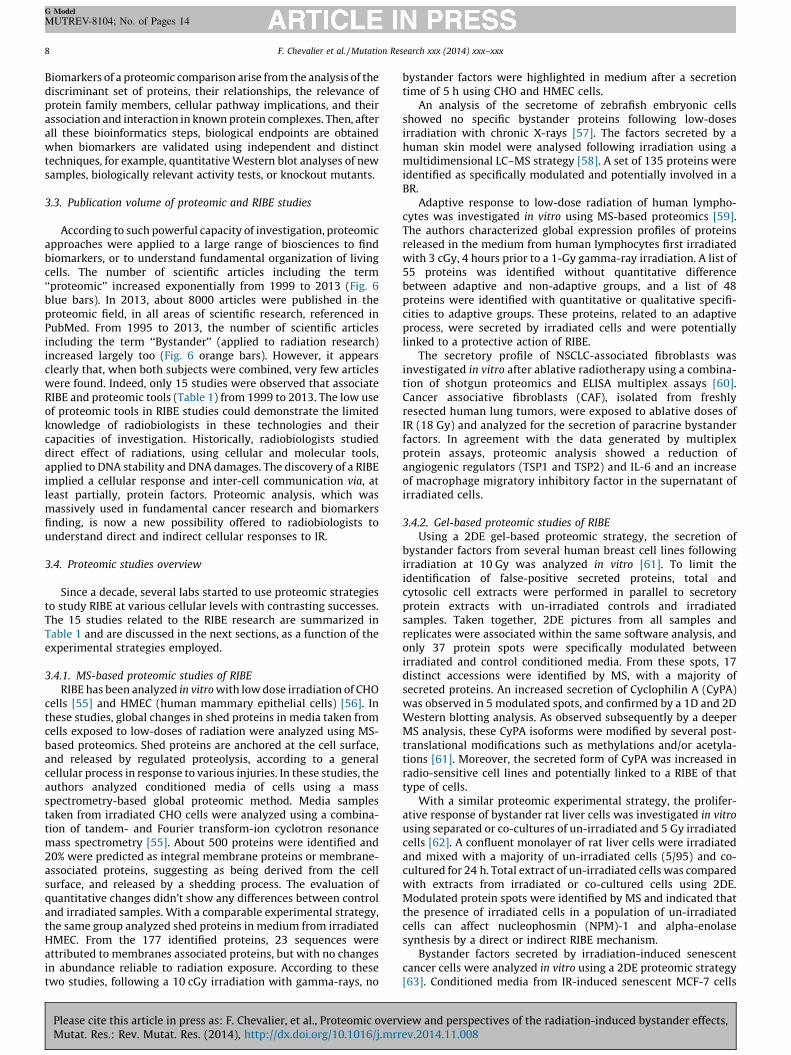
F. Chevalier et al. / Mutation Research xxx (2014) xxx–xxx8
G Model
MUTREV-8104; No. of Pages 14
Biomarkers of a proteomic comparison arise from the analysis of thediscriminant set of proteins, their relationships, the relevance ofprotein family members, cellular pathway implications, and theirassociation and interaction in known protein complexes. Then, afterall these bioinformatics steps, biological endpoints are obtainedwhen biomarkers are validated using independent and distincttechniques, for example, quantitative Western blot analyses of newsamples, biologically relevant activity tests, or knockout mutants.
3.3. Publication volume of proteomic and RIBE studies
According to such powerful capacity of investigation, proteomicapproaches were applied to a large range of biosciences to findbiomarkers, or to understand fundamental organization of livingcells. The number of scientific articles including the term‘‘proteomic’’ increased exponentially from 1999 to 2013 (Fig. 6blue bars). In 2013, about 8000 articles were published in theproteomic field, in all areas of scientific research, referenced inPubMed. From 1995 to 2013, the number of scientific articlesincluding the term ‘‘Bystander’’ (applied to radiation research)increased largely too (Fig. 6 orange bars). However, it appearsclearly that, when both subjects were combined, very few articleswere found. Indeed, only 15 studies were observed that associateRIBE and proteomic tools (Table 1) from 1999 to 2013. The low useof proteomic tools in RIBE studies could demonstrate the limitedknowledge of radiobiologists in these technologies and theircapacities of investigation. Historically, radiobiologists studieddirect effect of radiations, using cellular and molecular tools,applied to DNA stability and DNA damages. The discovery of a RIBEimplied a cellular response and inter-cell communication via, atleast partially, protein factors. Proteomic analysis, which wasmassively used in fundamental cancer research and biomarkersfinding, is now a new possibility offered to radiobiologists tounderstand direct and indirect cellular responses to IR.
3.4. Proteomic studies overview
Since a decade, several labs started to use proteomic strategiesto study RIBE at various cellular levels with contrasting successes.The 15 studies related to the RIBE research are summarized inTable 1 and are discussed in the next sections, as a function of theexperimental strategies employed.
3.4.1. MS-based proteomic studies of RIBE
RIBE has been analyzed in vitro with low dose irradiation of CHOcells [55] and HMEC (human mammary epithelial cells) [56]. Inthese studies, global changes in shed proteins in media taken fromcells exposed to low-doses of radiation were analyzed using MS-based proteomics. Shed proteins are anchored at the cell surface,and released by regulated proteolysis, according to a generalcellular process in response to various injuries. In these studies, theauthors analyzed conditioned media of cells using a massspectrometry-based global proteomic method. Media samplestaken from irradiated CHO cells were analyzed using a combina-tion of tandem- and Fourier transform-ion cyclotron resonancemass spectrometry [55]. About 500 proteins were identified and20% were predicted as integral membrane proteins or membrane-associated proteins, suggesting as being derived from the cellsurface, and released by a shedding process. The evaluation ofquantitative changes didn’t show any differences between controland irradiated samples. With a comparable experimental strategy,the same group analyzed shed proteins in medium from irradiatedHMEC. From the 177 identified proteins, 23 sequences wereattributed to membranes associated proteins, but with no changesin abundance reliable to radiation exposure. According to thesetwo studies, following a 10 cGy irradiation with gamma-rays, no
Please cite this article in press as: F. Chevalier, et al., Proteomic overvMutat. Res.: Rev. Mutat. Res. (2014), http://dx.doi.org/10.1016/j.mrr
bystander factors were highlighted in medium after a secretiontime of 5 h using CHO and HMEC cells.
An analysis of the secretome of zebrafish embryonic cellsshowed no specific bystander proteins following low-dosesirradiation with chronic X-rays [57]. The factors secreted by ahuman skin model were analysed following irradiation using amultidimensional LC–MS strategy [58]. A set of 135 proteins wereidentified as specifically modulated and potentially involved in aBR.
Adaptive response to low-dose radiation of human lympho-cytes was investigated in vitro using MS-based proteomics [59].The authors characterized global expression profiles of proteinsreleased in the medium from human lymphocytes first irradiatedwith 3 cGy, 4 hours prior to a 1-Gy gamma-ray irradiation. A list of55 proteins was identified without quantitative differencebetween adaptive and non-adaptive groups, and a list of 48proteins were identified with quantitative or qualitative specifi-cities to adaptive groups. These proteins, related to an adaptiveprocess, were secreted by irradiated cells and were potentiallylinked to a protective action of RIBE.
The secretory profile of NSCLC-associated fibroblasts wasinvestigated in vitro after ablative radiotherapy using a combina-tion of shotgun proteomics and ELISA multiplex assays [60].Cancer associative fibroblasts (CAF), isolated from freshlyresected human lung tumors, were exposed to ablative doses ofIR (18 Gy) and analyzed for the secretion of paracrine bystanderfactors. In agreement with the data generated by multiplexprotein assays, proteomic analysis showed a reduction ofangiogenic regulators (TSP1 and TSP2) and IL-6 and an increaseof macrophage migratory inhibitory factor in the supernatant ofirradiated cells.
3.4.2. Gel-based proteomic studies of RIBE
Using a 2DE gel-based proteomic strategy, the secretion ofbystander factors from several human breast cell lines followingirradiation at 10 Gy was analyzed in vitro [61]. To limit theidentification of false-positive secreted proteins, total andcytosolic cell extracts were performed in parallel to secretoryprotein extracts with un-irradiated controls and irradiatedsamples. Taken together, 2DE pictures from all samples andreplicates were associated within the same software analysis, andonly 37 protein spots were specifically modulated betweenirradiated and control conditioned media. From these spots, 17distinct accessions were identified by MS, with a majority ofsecreted proteins. An increased secretion of Cyclophilin A (CyPA)was observed in 5 modulated spots, and confirmed by a 1D and 2DWestern blotting analysis. As observed subsequently by a deeperMS analysis, these CyPA isoforms were modified by several post-translational modifications such as methylations and/or acetyla-tions [61]. Moreover, the secreted form of CyPA was increased inradio-sensitive cell lines and potentially linked to a RIBE of thattype of cells.
With a similar proteomic experimental strategy, the prolifer-ative response of bystander rat liver cells was investigated in vitro
using separated or co-cultures of un-irradiated and 5 Gy irradiatedcells [62]. A confluent monolayer of rat liver cells were irradiatedand mixed with a majority of un-irradiated cells (5/95) and co-cultured for 24 h. Total extract of un-irradiated cells was comparedwith extracts from irradiated or co-cultured cells using 2DE.Modulated protein spots were identified by MS and indicated thatthe presence of irradiated cells in a population of un-irradiatedcells can affect nucleophosmin (NPM)-1 and alpha-enolasesynthesis by a direct or indirect RIBE mechanism.
Bystander factors secreted by irradiation-induced senescentcancer cells were analyzed in vitro using a 2DE proteomic strategy[63]. Conditioned media from IR-induced senescent MCF-7 cells
iew and perspectives of the radiation-induced bystander effects,ev.2014.11.008
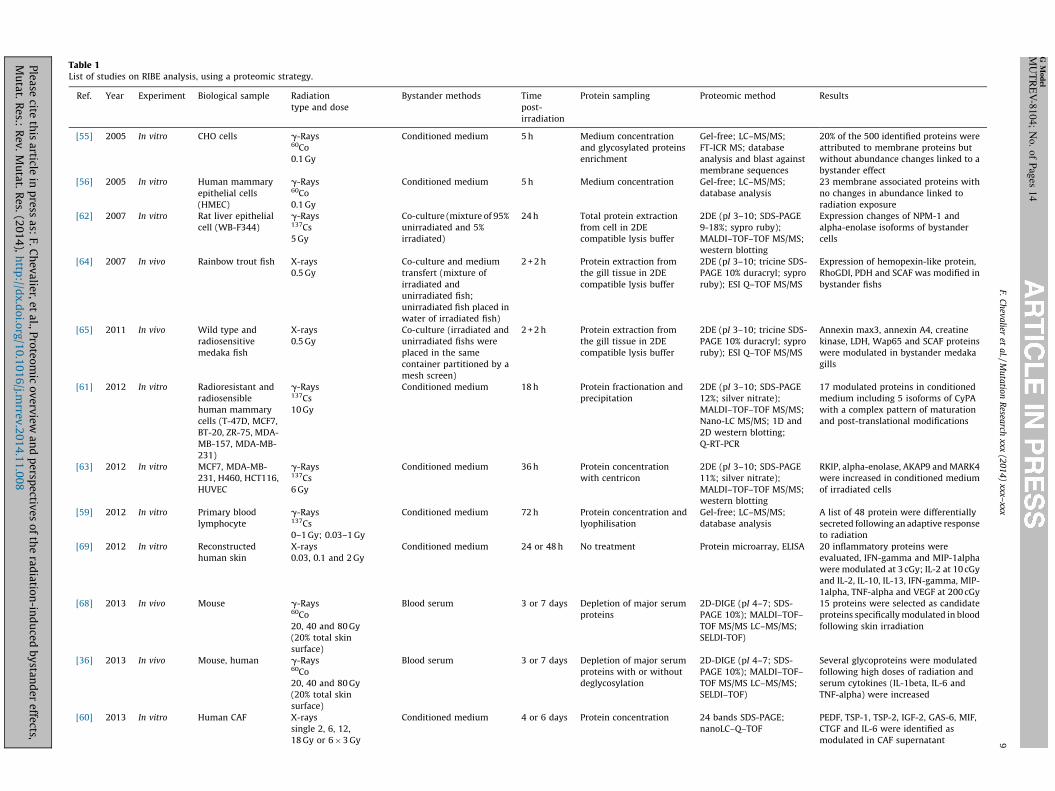
Table 1List of studies on RIBE analysis, using a proteomic strategy.
Ref. Year Experiment Biological sample Radiation
type and dose
Bystander methods Time
post-
irradiation
Protein sampling Proteomic method Results
[55] 2005 In vitro CHO cells g-Rays60Co
0.1 Gy
Conditioned medium 5 h Medium concentration
and glycosylated proteins
enrichment
Gel-free; LC–MS/MS;
FT-ICR MS; database
analysis and blast against
membrane sequences
20% of the 500 identified proteins were
attributed to membrane proteins but
without abundance changes linked to a
bystander effect
[56] 2005 In vitro Human mammary
epithelial cells
(HMEC)
g-Rays60Co
0.1 Gy
Conditioned medium 5 h Medium concentration Gel-free; LC–MS/MS;
database analysis
23 membrane associated proteins with
no changes in abundance linked to
radiation exposure
[62] 2007 In vitro Rat liver epithelial
cell (WB-F344)
g-Rays137Cs
5 Gy
Co-culture (mixture of 95%
unirradiated and 5%
irradiated)
24 h Total protein extraction
from cell in 2DE
compatible lysis buffer
2DE (pI 3–10; SDS-PAGE
9-18%; sypro ruby);
MALDI–TOF–TOF MS/MS;
western blotting
Expression changes of NPM-1 and
alpha-enolase isoforms of bystander
cells
[64] 2007 In vivo Rainbow trout fish X-rays
0.5 Gy
Co-culture and medium
transfert (mixture of
irradiated and
unirradiated fish;
unirradiated fish placed in
water of irradiated fish)
2 + 2 h Protein extraction from
the gill tissue in 2DE
compatible lysis buffer
2DE (pI 3–10; tricine SDS-
PAGE 10% duracryl; sypro
ruby); ESI Q–TOF MS/MS
Expression of hemopexin-like protein,
RhoGDI, PDH and SCAF was modified in
bystander fishs
[65] 2011 In vivo Wild type and
radiosensitive
medaka fish
X-rays
0.5 Gy
Co-culture (irradiated and
unirradiated fishs were
placed in the same
container partitioned by a
mesh screen)
2 + 2 h Protein extraction from
the gill tissue in 2DE
compatible lysis buffer
2DE (pI 3–10; tricine SDS-
PAGE 10% duracryl; sypro
ruby); ESI Q–TOF MS/MS
Annexin max3, annexin A4, creatine
kinase, LDH, Wap65 and SCAF proteins
were modulated in bystander medaka
gills
[61] 2012 In vitro Radioresistant and
radiosensible
human mammary
cells (T-47D, MCF7,
BT-20, ZR-75, MDA-
MB-157, MDA-MB-
231)
g-Rays137Cs
10 Gy
Conditioned medium 18 h Protein fractionation and
precipitation
2DE (pI 3–10; SDS-PAGE
12%; silver nitrate);
MALDI–TOF–TOF MS/MS;
Nano-LC MS/MS; 1D and
2D western blotting;
Q-RT-PCR
17 modulated proteins in conditioned
medium including 5 isoforms of CyPA
with a complex pattern of maturation
and post-translational modifications
[63] 2012 In vitro MCF7, MDA-MB-
231, H460, HCT116,
HUVEC
g-Rays137Cs
6 Gy
Conditioned medium 36 h Protein concentration
with centricon
2DE (pI 3–10; SDS-PAGE
11%; silver nitrate);
MALDI–TOF–TOF MS/MS;
western blotting
RKIP, alpha-enolase, AKAP9 and MARK4
were increased in conditioned medium
of irradiated cells
[59] 2012 In vitro Primary blood
lymphocyte
g-Rays137Cs
0–1 Gy; 0.03–1 Gy
Conditioned medium 72 h Protein concentration and
lyophilisation
Gel-free; LC–MS/MS;
database analysis
A list of 48 protein were differentially
secreted following an adaptive response
to radiation
[69] 2012 In vitro Reconstructed
human skin
X-rays
0.03, 0.1 and 2 Gy
Conditioned medium 24 or 48 h No treatment Protein microarray, ELISA 20 inflammatory proteins were
evaluated, IFN-gamma and MIP-1alpha
were modulated at 3 cGy; IL-2 at 10 cGy
and IL-2, IL-10, IL-13, IFN-gamma, MIP-
1alpha, TNF-alpha and VEGF at 200 cGy
[68] 2013 In vivo Mouse g-Rays60Co
20, 40 and 80 Gy
(20% total skin
surface)
Blood serum 3 or 7 days Depletion of major serum
proteins
2D-DIGE (pI 4–7; SDS-
PAGE 10%); MALDI–TOF–
TOF MS/MS LC–MS/MS;
SELDI-TOF)
15 proteins were selected as candidate
proteins specifically modulated in blood
following skin irradiation
[36] 2013 In vivo Mouse, human g-Rays60Co
20, 40 and 80 Gy
(20% total skin
surface)
Blood serum 3 or 7 days Depletion of major serum
proteins with or without
deglycosylation
2D-DIGE (pI 4–7; SDS-
PAGE 10%); MALDI–TOF–
TOF MS/MS LC–MS/MS;
SELDI–TOF)
Several glycoproteins were modulated
following high doses of radiation and
serum cytokines (IL-1beta, IL-6 and
TNF-alpha) were increased
[60] 2013 In vitro Human CAF X-rays
single 2, 6, 12,
18 Gy or 6�3 Gy
Conditioned medium 4 or 6 days Protein concentration 24 bands SDS-PAGE;
nanoLC–Q–TOF
PEDF, TSP-1, TSP-2, IGF-2, GAS-6, MIF,
CTGF and IL-6 were identified as
modulated in CAF supernatant
F. C
hev
alier
et a
l. /
Mu
tatio
n R
esearch
xxx (2
01
4)
xxx–xxx
9
G M
od
el
MU
TR
EV
-81
04
; N
o.
of
Pag
es 1
4
Ple
ase
cite th
is a
rticle in
pre
ss a
s: F.
Ch
ev
alie
r, e
t a
l., P
rote
om
ic o
ve
rvie
w a
nd
pe
rspe
ctive
s o
f th
e ra
dia
tion
-ind
uce
d b
ysta
nd
er
effe
cts,M
uta
t. R
es.:
Re
v.
Mu
tat.
Re
s. (2
01
4),
http
://dx
.do
i.org
/10
.10
16
/j.mrre
v.2
01
4.1
1.0
08
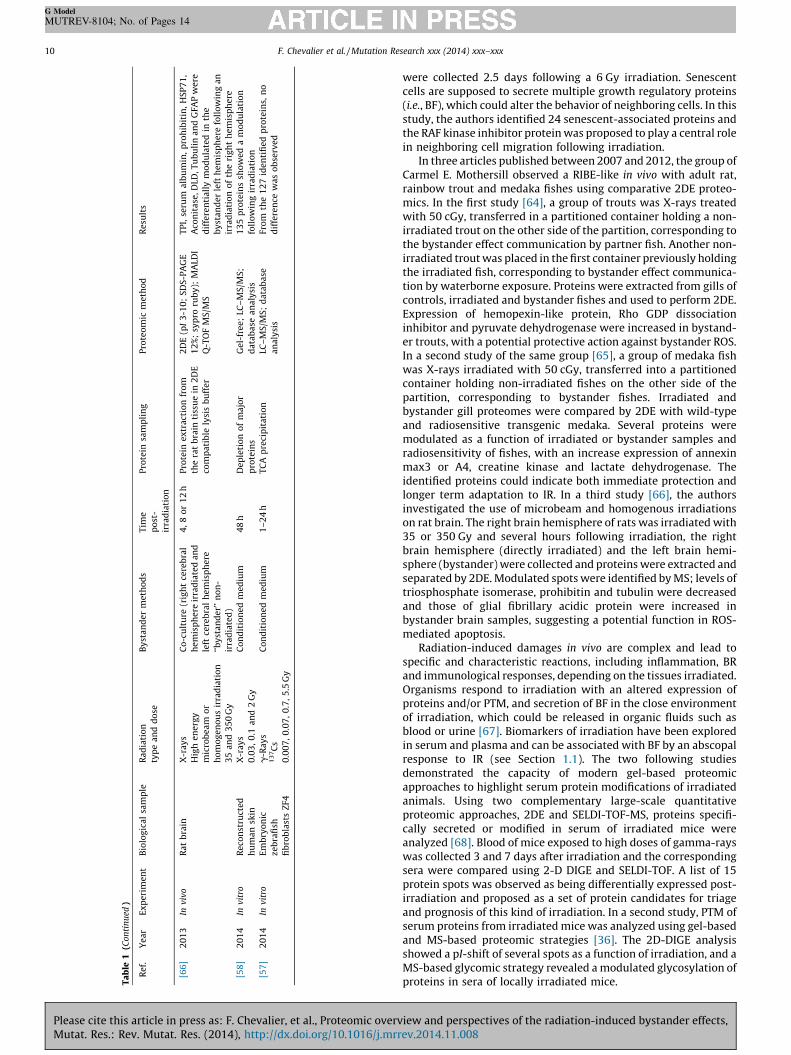
Ta
ble
1(C
on
tin
ued
)
Re
f.Y
ea
rE
xp
eri
me
nt
Bio
log
ica
lsa
mp
leR
ad
iati
on
typ
ea
nd
do
se
By
sta
nd
er
me
tho
ds
Tim
e
po
st-
irra
dia
tio
n
Pro
tein
sam
pli
ng
Pro
teo
mic
me
tho
dR
esu
lts
[66
]2
01
3In
viv
oR
at
bra
inX
-ra
ys
Hig
he
ne
rgy
mic
rob
ea
mo
r
ho
mo
ge
no
us
irra
dia
tio
n
35
an
d3
50
Gy
Co
-cu
ltu
re(r
igh
tce
reb
ral
he
mis
ph
ere
irra
dia
ted
an
d
left
cere
bra
lh
em
isp
he
re
‘‘by
sta
nd
er’
’n
on
-
irra
dia
ted
)
4,
8o
r1
2h
Pro
tein
ex
tra
ctio
nfr
om
the
rat
bra
inti
ssu
ein
2D
E
com
pa
tib
lely
sis
bu
ffe
r
2D
E(p
I3
-10
;S
DS
-PA
GE
12
%;
syp
roru
by
);M
ALD
I
Q-T
OF
MS
/MS
TP
I,se
rum
alb
um
in,
pro
hib
itin
,H
SP
71
,
Aco
nit
ase
,DLD
,Tu
bu
lin
an
dG
FAP
we
re
dif
fere
nti
all
ym
od
ula
ted
inth
e
by
sta
nd
er
left
he
mis
ph
ere
foll
ow
ing
an
irra
dia
tio
no
fth
eri
gh
th
em
isp
he
re
[58
]2
01
4In
vit
roR
eco
nst
ruct
ed
hu
ma
nsk
in
X-r
ay
s
0.0
3,
0.1
an
d2
Gy
Co
nd
itio
ne
dm
ed
ium
48
hD
ep
leti
on
of
ma
jor
pro
tein
s
Ge
l-fr
ee
;LC
–M
S/M
S;
da
tab
ase
an
aly
sis
13
5p
rote
ins
sho
we
da
mo
du
lati
on
foll
ow
ing
irra
dia
tio
n
[57
]2
01
4In
vit
roE
mb
ryo
nic
zeb
rafi
sh
fib
rob
last
sZ
F4
g-R
ay
s1
37C
s
0.0
07
,0
.07
,0
.7,
5.5
Gy
Co
nd
itio
ne
dm
ed
ium
1–
24
hT
CA
pre
cip
ita
tio
nLC
–M
S/M
S;
da
tab
ase
an
aly
sis
Fro
mth
e1
27
ide
nti
fie
dp
rote
ins,
no
dif
fere
nce
wa
so
bse
rve
d
F. Chevalier et al. / Mutation Research xxx (2014) xxx–xxx10
G Model
MUTREV-8104; No. of Pages 14
Please cite this article in press as: F. Chevalier, et al., Proteomic overvMutat. Res.: Rev. Mutat. Res. (2014), http://dx.doi.org/10.1016/j.mrr
were collected 2.5 days following a 6 Gy irradiation. Senescentcells are supposed to secrete multiple growth regulatory proteins(i.e., BF), which could alter the behavior of neighboring cells. In thisstudy, the authors identified 24 senescent-associated proteins andthe RAF kinase inhibitor protein was proposed to play a central rolein neighboring cell migration following irradiation.
In three articles published between 2007 and 2012, the group ofCarmel E. Mothersill observed a RIBE-like in vivo with adult rat,rainbow trout and medaka fishes using comparative 2DE proteo-mics. In the first study [64], a group of trouts was X-rays treatedwith 50 cGy, transferred in a partitioned container holding a non-irradiated trout on the other side of the partition, corresponding tothe bystander effect communication by partner fish. Another non-irradiated trout was placed in the first container previously holdingthe irradiated fish, corresponding to bystander effect communica-tion by waterborne exposure. Proteins were extracted from gills ofcontrols, irradiated and bystander fishes and used to perform 2DE.Expression of hemopexin-like protein, Rho GDP dissociationinhibitor and pyruvate dehydrogenase were increased in bystand-er trouts, with a potential protective action against bystander ROS.In a second study of the same group [65], a group of medaka fishwas X-rays irradiated with 50 cGy, transferred into a partitionedcontainer holding non-irradiated fishes on the other side of thepartition, corresponding to bystander fishes. Irradiated andbystander gill proteomes were compared by 2DE with wild-typeand radiosensitive transgenic medaka. Several proteins weremodulated as a function of irradiated or bystander samples andradiosensitivity of fishes, with an increase expression of annexinmax3 or A4, creatine kinase and lactate dehydrogenase. Theidentified proteins could indicate both immediate protection andlonger term adaptation to IR. In a third study [66], the authorsinvestigated the use of microbeam and homogenous irradiationson rat brain. The right brain hemisphere of rats was irradiated with35 or 350 Gy and several hours following irradiation, the rightbrain hemisphere (directly irradiated) and the left brain hemi-sphere (bystander) were collected and proteins were extracted andseparated by 2DE. Modulated spots were identified by MS; levels oftriosphosphate isomerase, prohibitin and tubulin were decreasedand those of glial fibrillary acidic protein were increased inbystander brain samples, suggesting a potential function in ROS-mediated apoptosis.
Radiation-induced damages in vivo are complex and lead tospecific and characteristic reactions, including inflammation, BRand immunological responses, depending on the tissues irradiated.Organisms respond to irradiation with an altered expression ofproteins and/or PTM, and secretion of BF in the close environmentof irradiation, which could be released in organic fluids such asblood or urine [67]. Biomarkers of irradiation have been exploredin serum and plasma and can be associated with BF by an abscopalresponse to IR (see Section 1.1). The two following studiesdemonstrated the capacity of modern gel-based proteomicapproaches to highlight serum protein modifications of irradiatedanimals. Using two complementary large-scale quantitativeproteomic approaches, 2DE and SELDI-TOF-MS, proteins specifi-cally secreted or modified in serum of irradiated mice wereanalyzed [68]. Blood of mice exposed to high doses of gamma-rayswas collected 3 and 7 days after irradiation and the correspondingsera were compared using 2-D DIGE and SELDI-TOF. A list of 15protein spots was observed as being differentially expressed post-irradiation and proposed as a set of protein candidates for triageand prognosis of this kind of irradiation. In a second study, PTM ofserum proteins from irradiated mice was analyzed using gel-basedand MS-based proteomic strategies [36]. The 2D-DIGE analysisshowed a pI-shift of several spots as a function of irradiation, and aMS-based glycomic strategy revealed a modulated glycosylation ofproteins in sera of locally irradiated mice.
iew and perspectives of the radiation-induced bystander effects,ev.2014.11.008
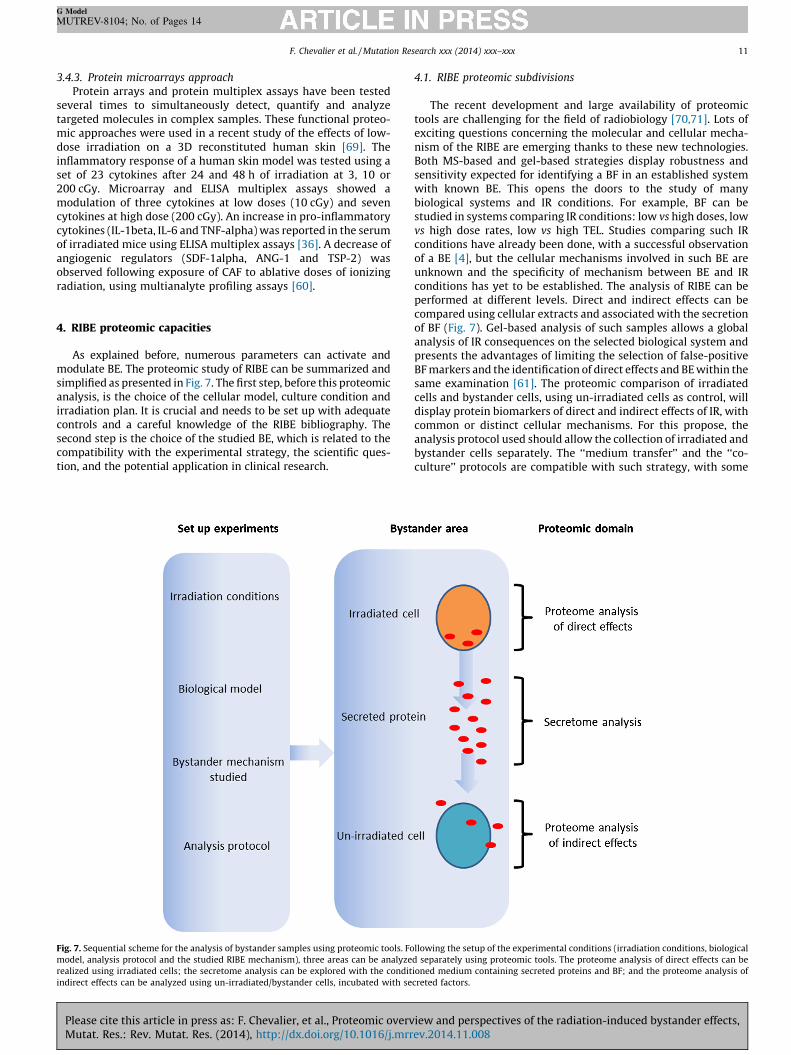
F. Chevalier et al. / Mutation Research xxx (2014) xxx–xxx 11
G Model
MUTREV-8104; No. of Pages 14
3.4.3. Protein microarrays approach
Protein arrays and protein multiplex assays have been testedseveral times to simultaneously detect, quantify and analyzetargeted molecules in complex samples. These functional proteo-mic approaches were used in a recent study of the effects of low-dose irradiation on a 3D reconstituted human skin [69]. Theinflammatory response of a human skin model was tested using aset of 23 cytokines after 24 and 48 h of irradiation at 3, 10 or200 cGy. Microarray and ELISA multiplex assays showed amodulation of three cytokines at low doses (10 cGy) and sevencytokines at high dose (200 cGy). An increase in pro-inflammatorycytokines (IL-1beta, IL-6 and TNF-alpha) was reported in the serumof irradiated mice using ELISA multiplex assays [36]. A decrease ofangiogenic regulators (SDF-1alpha, ANG-1 and TSP-2) wasobserved following exposure of CAF to ablative doses of ionizingradiation, using multianalyte profiling assays [60].
4. RIBE proteomic capacities
As explained before, numerous parameters can activate andmodulate BE. The proteomic study of RIBE can be summarized andsimplified as presented in Fig. 7. The first step, before this proteomicanalysis, is the choice of the cellular model, culture condition andirradiation plan. It is crucial and needs to be set up with adequatecontrols and a careful knowledge of the RIBE bibliography. Thesecond step is the choice of the studied BE, which is related to thecompatibility with the experimental strategy, the scientific ques-tion, and the potential application in clinical research.
Fig. 7. Sequential scheme for the analysis of bystander samples using proteomic tools. Fo
model, analysis protocol and the studied RIBE mechanism), three areas can be analyze
realized using irradiated cells; the secretome analysis can be explored with the condit
indirect effects can be analyzed using un-irradiated/bystander cells, incubated with se
Please cite this article in press as: F. Chevalier, et al., Proteomic overvMutat. Res.: Rev. Mutat. Res. (2014), http://dx.doi.org/10.1016/j.mrr
4.1. RIBE proteomic subdivisions
The recent development and large availability of proteomictools are challenging for the field of radiobiology [70,71]. Lots ofexciting questions concerning the molecular and cellular mecha-nism of the RIBE are emerging thanks to these new technologies.Both MS-based and gel-based strategies display robustness andsensitivity expected for identifying a BF in an established systemwith known BE. This opens the doors to the study of manybiological systems and IR conditions. For example, BF can bestudied in systems comparing IR conditions: low vs high doses, lowvs high dose rates, low vs high TEL. Studies comparing such IRconditions have already been done, with a successful observationof a BE [4], but the cellular mechanisms involved in such BE areunknown and the specificity of mechanism between BE and IRconditions has yet to be established. The analysis of RIBE can beperformed at different levels. Direct and indirect effects can becompared using cellular extracts and associated with the secretionof BF (Fig. 7). Gel-based analysis of such samples allows a globalanalysis of IR consequences on the selected biological system andpresents the advantages of limiting the selection of false-positiveBF markers and the identification of direct effects and BE within thesame examination [61]. The proteomic comparison of irradiatedcells and bystander cells, using un-irradiated cells as control, willdisplay protein biomarkers of direct and indirect effects of IR, withcommon or distinct cellular mechanisms. For this propose, theanalysis protocol used should allow the collection of irradiated andbystander cells separately. The ‘‘medium transfer’’ and the ‘‘co-culture’’ protocols are compatible with such strategy, with some
llowing the setup of the experimental conditions (irradiation conditions, biological
d separately using proteomic tools. The proteome analysis of direct effects can be
ioned medium containing secreted proteins and BF; and the proteome analysis of
creted factors.
iew and perspectives of the radiation-induced bystander effects,ev.2014.11.008
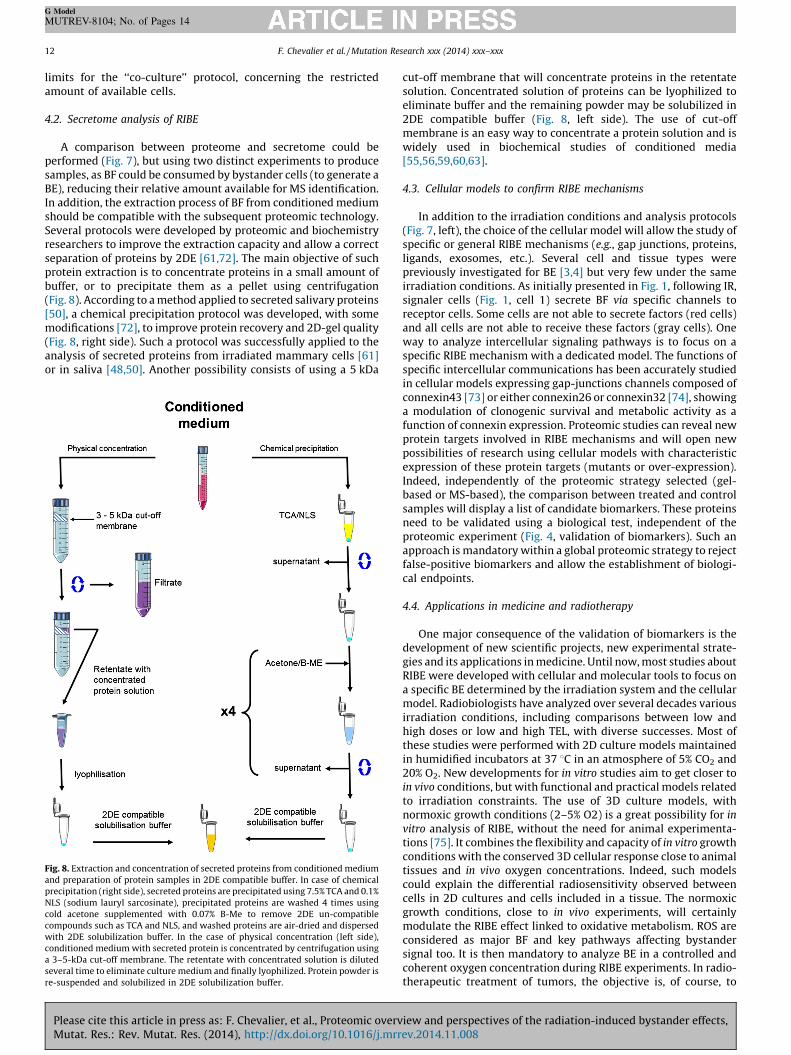
F. Chevalier et al. / Mutation Research xxx (2014) xxx–xxx12
G Model
MUTREV-8104; No. of Pages 14
limits for the ‘‘co-culture’’ protocol, concerning the restrictedamount of available cells.
4.2. Secretome analysis of RIBE
A comparison between proteome and secretome could beperformed (Fig. 7), but using two distinct experiments to producesamples, as BF could be consumed by bystander cells (to generate aBE), reducing their relative amount available for MS identification.In addition, the extraction process of BF from conditioned mediumshould be compatible with the subsequent proteomic technology.Several protocols were developed by proteomic and biochemistryresearchers to improve the extraction capacity and allow a correctseparation of proteins by 2DE [61,72]. The main objective of suchprotein extraction is to concentrate proteins in a small amount ofbuffer, or to precipitate them as a pellet using centrifugation(Fig. 8). According to a method applied to secreted salivary proteins[50], a chemical precipitation protocol was developed, with somemodifications [72], to improve protein recovery and 2D-gel quality(Fig. 8, right side). Such a protocol was successfully applied to theanalysis of secreted proteins from irradiated mammary cells [61]or in saliva [48,50]. Another possibility consists of using a 5 kDa
Fig. 8. Extraction and concentration of secreted proteins from conditioned medium
and preparation of protein samples in 2DE compatible buffer. In case of chemical
precipitation (right side), secreted proteins are precipitated using 7.5% TCA and 0.1%
NLS (sodium lauryl sarcosinate), precipitated proteins are washed 4 times using
cold acetone supplemented with 0.07% B-Me to remove 2DE un-compatible
compounds such as TCA and NLS, and washed proteins are air-dried and dispersed
with 2DE solubilization buffer. In the case of physical concentration (left side),
conditioned medium with secreted protein is concentrated by centrifugation using
a 3–5-kDa cut-off membrane. The retentate with concentrated solution is diluted
several time to eliminate culture medium and finally lyophilized. Protein powder is
re-suspended and solubilized in 2DE solubilization buffer.
Please cite this article in press as: F. Chevalier, et al., Proteomic overvMutat. Res.: Rev. Mutat. Res. (2014), http://dx.doi.org/10.1016/j.mrr
cut-off membrane that will concentrate proteins in the retentatesolution. Concentrated solution of proteins can be lyophilized toeliminate buffer and the remaining powder may be solubilized in2DE compatible buffer (Fig. 8, left side). The use of cut-offmembrane is an easy way to concentrate a protein solution and iswidely used in biochemical studies of conditioned media[55,56,59,60,63].
4.3. Cellular models to confirm RIBE mechanisms
In addition to the irradiation conditions and analysis protocols(Fig. 7, left), the choice of the cellular model will allow the study ofspecific or general RIBE mechanisms (e.g., gap junctions, proteins,ligands, exosomes, etc.). Several cell and tissue types werepreviously investigated for BE [3,4] but very few under the sameirradiation conditions. As initially presented in Fig. 1, following IR,signaler cells (Fig. 1, cell 1) secrete BF via specific channels toreceptor cells. Some cells are not able to secrete factors (red cells)and all cells are not able to receive these factors (gray cells). Oneway to analyze intercellular signaling pathways is to focus on aspecific RIBE mechanism with a dedicated model. The functions ofspecific intercellular communications has been accurately studiedin cellular models expressing gap-junctions channels composed ofconnexin43 [73] or either connexin26 or connexin32 [74], showinga modulation of clonogenic survival and metabolic activity as afunction of connexin expression. Proteomic studies can reveal newprotein targets involved in RIBE mechanisms and will open newpossibilities of research using cellular models with characteristicexpression of these protein targets (mutants or over-expression).Indeed, independently of the proteomic strategy selected (gel-based or MS-based), the comparison between treated and controlsamples will display a list of candidate biomarkers. These proteinsneed to be validated using a biological test, independent of theproteomic experiment (Fig. 4, validation of biomarkers). Such anapproach is mandatory within a global proteomic strategy to rejectfalse-positive biomarkers and allow the establishment of biologi-cal endpoints.
4.4. Applications in medicine and radiotherapy
One major consequence of the validation of biomarkers is thedevelopment of new scientific projects, new experimental strate-gies and its applications in medicine. Until now, most studies aboutRIBE were developed with cellular and molecular tools to focus ona specific BE determined by the irradiation system and the cellularmodel. Radiobiologists have analyzed over several decades variousirradiation conditions, including comparisons between low andhigh doses or low and high TEL, with diverse successes. Most ofthese studies were performed with 2D culture models maintainedin humidified incubators at 37 8C in an atmosphere of 5% CO2 and20% O2. New developments for in vitro studies aim to get closer toin vivo conditions, but with functional and practical models relatedto irradiation constraints. The use of 3D culture models, withnormoxic growth conditions (2–5% O2) is a great possibility for in
vitro analysis of RIBE, without the need for animal experimenta-tions [75]. It combines the flexibility and capacity of in vitro growthconditions with the conserved 3D cellular response close to animaltissues and in vivo oxygen concentrations. Indeed, such modelscould explain the differential radiosensitivity observed betweencells in 2D cultures and cells included in a tissue. The normoxicgrowth conditions, close to in vivo experiments, will certainlymodulate the RIBE effect linked to oxidative metabolism. ROS areconsidered as major BF and key pathways affecting bystandersignal too. It is then mandatory to analyze BE in a controlled andcoherent oxygen concentration during RIBE experiments. In radio-therapeutic treatment of tumors, the objective is, of course, to
iew and perspectives of the radiation-induced bystander effects,ev.2014.11.008
F. Chevalier et al. / Mutation Research xxx (2014) xxx–xxx 13
G Model
MUTREV-8104; No. of Pages 14
maximize BR inside the tumor mass and to limit or prevent BE innormal tissues surrounding tumor cells or in the way of the beam[1]. For this reason, the development of new irradiation protocolswill require a better understanding of RIBE associated with thediscovery of new biomarker targets.
5. Conclusion
Proteomics is a well-established set of technical tools for thestudy and comparison of complex protein mixture. Moreover, RIBE isa largely observed biological mechanism and this non-targetedeffect of exposure to IR is now widely accepted by radiobiologists. Incontrast to research performed in cancer-proteomics, it appearsclearly that the proteomic study of RIBE is only at the first phase ofinvestigation and from a more general point of view, proteomic toolsare still under-used in radiation research [54,67,70,71,76,77]. From afundamental point of view, proteomic tools could reveal generalintercellular communication mechanisms, involving BF secreted byirradiated cells, protein receptors of bystander cells, the involve-ment of direct cell-to-cell communication via gap-junctions, or thesecretion of small vesicles by irradiated cells before cell death. Theobservation of such intercellular communication will allow a bettercontrol of IR delivered during RT, to limit the BE on normal cells andto prevent inflammation processes around the tumor area. With therecent advances in delivery of external beam radiotherapy (3DCRTand IMRT) which enable a precise delivery of high doses of radiationto the tumor, a better treatment of the cancer could be associatedwith a higher risk of BE in the adjacent tissues. This hypothesis couldbe reasonably associated with the use of high LET radiations(hadrontherapy), in which the energy deposition is maximum in thetargeted area. These last generations of radiotherapy treatmentslead to numerous questions concerning the role of RIBE and itsconsequences, showing the huge efforts still needed to control thisintercellular phenomenon.
Conflict of interest statement
The authors declare that there are no conflicts of interest.
References
[1] K.M. Prise, J.M. O’Sullivan, Radiation-induced bystander signalling in cancertherapy, Nat. Rev. Cancer 9 (2009) 351–360, http://dx.doi.org/10.1038/nrc2603.
[2] M. Mancuso, E. Pasquali, P. Giardullo, S. Leonardi, M. Tanori, V. Di Majo, et al., Theradiation bystander effect and its potential implications for human health, Curr.Mol. Med. 12 (2012) 613–624.
[3] B.J. Blyth, P.J. Sykes, Radiation-induced bystander effects: what are they, and howrelevant are they to human radiation exposures? Radiat. Res. 176 (2011) 139–157.
[4] UNSCEAR, Annex C. Non-targeted and Delayed Effects of Exposure to IonizingRadiations, UNSCEAR, 2006.
[5] J.B. Little, W.F. Morgan, Oncogene 22 (2003) 6977, http://dx.doi.org/10.1038/sj.onc.1207045 (Guest Editors).
[6] J.B. Little, Genomic instability and bystander effects: a historical perspective,Oncogene 22 (2003) 6978–6987, http://dx.doi.org/10.1038/sj.onc.1206988.
[7] C. Mothersill, C. Seymour, Radiation-induced bystander effects, carcinogenesisand models, Oncogene 22 (2003) 7028–7033, http://dx.doi.org/10.1038/sj.onc.1206882.
[8] E.J. Hall, T.K. Hei, Genomic instability and bystander effects induced by high-LETradiation, Oncogene 22 (2003) 7034–7042, http://dx.doi.org/10.1038/sj.onc.1206900.
[9] K.M. Prise, M. Folkard, B.D. Michael, Bystander responses induced by low LETradiation, Oncogene 22 (2003) 7043–7049, http://dx.doi.org/10.1038/sj.onc.1206991.
[10] E.I. Azzam, S.M. de Toledo, J.B. Little, Oxidative metabolism, gap junctions and theionizing radiation-induced bystander effect, Oncogene 22 (2003) 7050–7057,http://dx.doi.org/10.1038/sj.onc.1206961.
[11] S.A. Lorimore, P.J. Coates, E.G. Wright, Radiation-induced genomic instability andbystander effects: inter-related nontargeted effects of exposure to ionizing radia-tion, Oncogene 22 (2003) 7058–7069, http://dx.doi.org/10.1038/sj.onc.1207044.
[12] W.F. Morgan, Is there a common mechanism underlying genomic instability,bystander effects and other nontargeted effects of exposure to ionizing radiation?Oncogene 22 (2003) 7094–7099, http://dx.doi.org/10.1038/sj.onc.1206992.
[13] M.A. Chaudhry, Bystander effect: biological endpoints and microarray analysis,Mutat. Res. 597 (2006) 98–112, http://dx.doi.org/10.1016/j.mrfmmm.2005.04.023.
Please cite this article in press as: F. Chevalier, et al., Proteomic overvMutat. Res.: Rev. Mutat. Res. (2014), http://dx.doi.org/10.1016/j.mrr
[14] C. Mothersill, C. Seymour, Radiation-induced bystander effects: past history andfuture directions, Radiat. Res. 155 (2001) 759–767.
[15] E.I. Azzam, J.-P. Jay-Gerin, D. Pain, Ionizing radiation-induced metabolic oxidativestress and prolonged cell injury, Cancer Lett. 327 (2012) 48–60, http://dx.doi.org/10.1016/j.canlet.2011.12.012.
[16] D.J. Brenner, J.B. Little, R.K. Sachs, The bystander effect in radiation oncogenesis: II.A quantitative model, Radiat. Res. 155 (2001) 402–408.
[17] W.F. Morgan, Non-targeted and delayed effects of exposure to ionizing radiation:I. Radiation-induced genomic instability and bystander effects in vitro, Radiat.Res. 159 (2003) 567–580.
[18] W.F. Morgan, Non-targeted and delayed effects of exposure to ionizing radiation:II. Radiation-induced genomic instability and bystander effects in vivo, clasto-genic factors and transgenerational effects, Radiat. Res. 159 (2003) 581–596.
[19] N. Hamada, H. Matsumoto, T. Hara, Y. Kobayashi, Intercellular and intracellularsignaling pathways mediating ionizing radiation-induced bystander effects, J.Radiat. Res. (Tokyo) 48 (2007) 87–95.
[20] C.A. Waldren, Classical radiation biology dogma, bystander effects and paradigmshifts, Hum. Exp. Toxicol. 23 (2004) 95–100.
[21] S.M. de Toledo, N. Asaad, P. Venkatachalam, L. Li, R.W. Howell, D.R. Spitz, et al.,Adaptive responses to low-dose/low-dose-rate gamma rays in normal humanfibroblasts: the role of growth architecture and oxidative metabolism, Radiat. Res.166 (2006) 849–857, http://dx.doi.org/10.1667/RR0640.1.
[22] G. Kashino, K.M. Prise, K. Suzuki, N. Matsuda, S. Kodama, M. Suzuki, et al., Effectivesuppression of bystander effects by DMSO treatment of irradiated CHO cells, J.Radiat. Res. (Tokyo) 48 (2007) 327–333.
[23] M. Buonanno, S.M. de Toledo, D. Pain, E.I. Azzam, Long-term consequences ofradiation-induced bystander effects depend on radiation quality and dose andcorrelate with oxidative stress, Radiat. Res. 175 (2011) 405–415, http://dx.doi.org/10.1667/RR2461.1.
[24] C. Laurent, A. Leduc, I. Pottier, V. Prevost, F. Sichel, J.-L. Lefaix, Dramatic increase inoxidative stress in carbon-irradiated normal human skin fibroblasts, PLoS One 8(2013) e85158, http://dx.doi.org/10.1371/journal.pone.0085158.
[25] Z. Goldberg, B.E. Lehnert, Radiation-induced effects in unirradiated cells: a reviewand implications in cancer, Int. J. Oncol. 21 (2002) 337–349.
[26] D. Schaue, E.L. Kachikwu, W.H. McBride, Cytokines in radiobiological responses: areview, Radiat. Res. 178 (2012) 505–523, http://dx.doi.org/10.1667/RR3031.1.
[27] J. Albanese, N. Dainiak, Modulation of intercellular communication mediated atthe cell surface and on extracellular, plasma membrane-derived vesicles byionizing radiation, Exp. Hematol. 31 (2003) 455–464.
[28] X. Yu, S.L. Harris, A.J. Levine, The regulation of exosome secretion: a novel functionof the p53 protein, Cancer Res. 66 (2006) 4795–4801, http://dx.doi.org/10.1158/0008-5472.CAN-05-4579.
[29] N. Autsavapromporn, M. Suzuki, T. Funayama, N. Usami, I. Plante, Y. Yokota, et al.,Gap junction communication and the propagation of bystander effects induced bymicrobeam irradiation in human fibroblast cultures: the impact of radiationquality, Radiat. Res. (2013), http://dx.doi.org/10.1667/RR3111.1.
[30] L.A. Ryan, R.W. Smith, C.B. Seymour, C.E. Mothersill, Dilution of irradiated cellconditioned medium and the bystander effect, Radiat. Res. 169 (2008) 188–196,http://dx.doi.org/10.1667/RR1141.1.
[31] C. Mothersill, C.B. Seymour, Cell–cell contact during gamma irradiation is notrequired to induce a bystander effect in normal human keratinocytes: evidencefor release during irradiation of a signal controlling survival into the medium,Radiat. Res. 149 (1998) 256, http://dx.doi.org/10.2307/3579958.
[32] K.T. Butterworth, C.K. McGarry, C. Trainor, S.J. McMahon, J.M. O’Sullivan, G.Schettino, et al., Dose, dose-rate and field size effects on cell survival followingexposure to non-uniform radiation fields, Phys. Med. Biol. 57 (2012) 3197–3206,http://dx.doi.org/10.1088/0031-9155/57/10/3197.
[33] K.T. Butterworth, C.K. McGarry, C. Trainor, J.M. O’Sullivan, A.R. Hounsell, K.M.Prise, Out-of-field cell survival following exposure to intensity-modulated radia-tion fields, Int. J. Radiat. Oncol. Biol. Phys. 79 (2011) 1516–1522, http://dx.doi.org/10.1016/j.ijrobp.2010.11.034.
[34] S.J. McMahon, K.T. Butterworth, C. Trainor, C.K. McGarry, J.M. O’Sullivan, G.Schettino, et al., A kinetic-based model of radiation-induced intercellular signal-ling, PLoS One 8 (2013) e54526, http://dx.doi.org/10.1371/journal.pone.0054526.
[35] H. Nagasawa, J.B. Little, Induction of sister chromatid exchanges by extremely lowdoses of alpha-particles, Cancer Res. 52 (1992) 6394–6396.
[36] T. Chaze, M.-C. Slomianny, F. Milliat, G. Tarlet, T. Lefebvre-Darroman, P. Gour-melon, et al., Alteration of the serum N-glycome of mice locally exposed to highdoses of ionizing radiation, Mol. Cell. Proteomics 12 (2013) 283–301, http://dx.doi.org/10.1074/mcp.M111.014639.
[37] C. Mothersill, R.W. Smith, N. Agnihotri, C.B. Seymour, Characterization of aradiation-induced stress response communicated in vivo between zebrafish,Environ. Sci. Technol. 41 (2007) 3382–3387.
[38] M. Partridge, A radiation damage repair model for normal tissues, Phys. Med. Biol.53 (2008) 3595, http://dx.doi.org/10.1088/0031-9155/53/13/014.
[39] S.J. McMahon, K.T. Butterworth, C.K. McGarry, C. Trainor, J.M. O’Sullivan, A.R.Hounsell, et al., A computational model of cellular response to modulated radia-tion fields, Int. J. Radiat. Oncol. 84 (2012) 250–256, http://dx.doi.org/10.1016/j.ijrobp.2011.10.058.
[40] S.J. McMahon, C.K. McGarry, K.T. Butterworth, J.M. O’Sullivan, A.R. Hounsell, K.M.Prise, Implications of intercellular signaling for radiation therapy: a theoreticaldose-planning study, Int. J. Radiat. Oncol. Biol. Phys. 87 (2013) 1148–1154, http://dx.doi.org/10.1016/j.ijrobp.2013.08.021.
[41] F. Chevalier, V. Rofidal, P. Vanova, A. Bergoin, M. Rossignol, Proteomic capacityof recent fluorescent dyes for protein staining, Phytochemistry 65 (2004) 1499–1506.
iew and perspectives of the radiation-induced bystander effects,ev.2014.11.008

F. Chevalier et al. / Mutation Research xxx (2014) xxx–xxx14
G Model
MUTREV-8104; No. of Pages 14
[42] F. Chevalier, D. Centeno, V. Rofidal, M. Tauzin, O. Martin, N. Sommerer, et al.,Different impact of staining procedures using visible stains and fluorescent dyesfor large-scale investigation of proteomes by MALDI–TOF mass spectrometry, J.Proteome Res. 5 (2006) 512–520.
[43] F. Chevalier, Highlights on the capacities of Gel-based proteomics, Proteome Sci. 8(2010) 23.
[44] J. Depagne, F. Chevalier, Technical updates to basic proteins focalization usingIPG strips, Proteome Sci. 10 (2012) 54, http://dx.doi.org/10.1186/1477-5956-10-54.
[45] F. Chevalier, C. Hirtz, N. Sommerer, A.L. Kelly, Use of reducing/nonreducing two-dimensional electrophoresis for the study of disulfide-mediated interactionsbetween proteins in raw and heated bovine milk, J. Agric. Food Chem. 57(2009) 5948–5955.
[46] F. Chevalier, A.L. Kelly, Proteomic quantification of disulfide-linked polymers inraw and heated bovine milk, J. Agric. Food Chem. 58 (2010) 7437–7444.
[47] F. Chevalier, O. Martin, V. Rofidal, A.D. Devauchelle, S. Barteau, N. Sommerer, et al.,Proteomic investigation of natural variation between Arabidopsis ecotypes, Pro-teomics 4 (2004) 1372–1381.
[48] C. Hirtz, F. Chevalier, D. Centeno, J.C. Egea, M. Rossignol, N. Sommerer, et al.,Complexity of the human whole saliva proteome, J. Physiol. Biochem. 61 (2005)469–480.
[49] D. Peric, J. Labarre, F. Chevalier, G. Rousselet, Impairing the microRNA biogenesispathway induces proteome modifications characterized by size bias and enrich-ment in antioxidant proteins, Proteomics 12 (2012) 2295–2302, http://dx.doi.org/10.1002/pmic.201100461.
[50] C. Hirtz, F. Chevalier, D. Centeno, V. Rofidal, J.C. Egea, M. Rossignol, et al., MScharacterization of multiple forms of alpha-amylase in human saliva, Proteomics5 (2005) 4597–4607.
[51] F. Chevalier, M. Rossignol, Proteomic analysis of Arabidopsis thaliana ecotypeswith contrasted root architecture in response to phosphate deficiency, J. PlantPhysiol. (2011), http://dx.doi.org/10.1016/j.jplph.2011.05.024.
[52] E. Armaforte, E. Curran, T. Huppertz, C. Ryan, M. Caboni, P. O’Connor, et al.,Proteins and proteolysis in pre-term and term human milk and possible implica-tions for infant formulae, Int. Dairy J. 20 (2010) 715–723, http://dx.doi.org/10.1016/j.idairyj.2010.03.008.
[53] T. Uniacke-Lowe, F. Chevalier, S. Hem, P.F. Fox, D.M. Mulvihill, Proteomic com-parison of equine and bovine milks on renneting, J. Agric. Food Chem. 61 (2013)2839–2850, http://dx.doi.org/10.1021/jf3045846.
[54] H. Chandra, P.J. Reddy, S. Srivastava, Protein microarrays and novel detectionplatforms, Expert Rev. Proteomics 8 (2011) 61–79, http://dx.doi.org/10.1586/epr.10.99.
[55] M. Ahram, E.F. Strittmatter, M.E. Monroe, J.N. Adkins, J.C. Hunter, J.H. Miller, et al.,Identification of shed proteins from Chinese hamster ovary cells: application ofstatistical confidence using human and mouse protein databases, Proteomics 5(2005) 1815–1826, http://dx.doi.org/10.1002/pmic.200401072.
[56] D.L. Springer, M. Ahram, J.N. Adkins, L.E. Kathmann, J.H. Miller, Characterization ofmedium conditioned by irradiated cells using proteome-wide, high-throughputmass spectrometry, Radiat. Res. 164 (2005) 651–654.
[57] S. Pereira, V. Malard, J.-L. Ravanat, A.-H. Davin, J. Armengaud, N. Foray, et al., Lowdoses of gamma-irradiation induce an early bystander effect in zebrafish cellswhich is sufficient to radioprotect cells, PLoS One 9 (2014) e92974, http://dx.doi.org/10.1371/journal.pone.0092974.
[58] Q. Zhang, M. Matzke, A.A. Schepmoes, R.J. Moore, B.-J. Webb-Robertson, Z. Hu,et al., High and low doses of ionizing radiation induce different secretome profilesin a human skin model, PLoS One 9 (2014) e92332, http://dx.doi.org/10.1371/journal.pone.0092332.
[59] K.N. Rithidech, X. Lai, L. Honikel, P. Reungpatthanaphong, F.A. Witzmann, Identi-fication of proteins secreted into the medium by human lymphocytes irradiatedin vitro with or without adaptive environments, Health Phys. 102 (2012) 39–53,http://dx.doi.org/10.1097/HP.0b013e31822833af.
[60] T. Hellevik, I. Pettersen, V. Berg, J. Bruun, K. Bartnes, L.-T. Busund, et al., Changes inthe secretory profile of NSCLC-associated fibroblasts after ablative radiotherapy:potential impact on angiogenesis and tumor growth, Transl. Oncol. 6 (2013)66–74.
Please cite this article in press as: F. Chevalier, et al., Proteomic overvMutat. Res.: Rev. Mutat. Res. (2014), http://dx.doi.org/10.1016/j.mrr
[61] F. Chevalier, J. Depagne, S. Hem, S. Chevillard, J. Bensimon, P. Bertrand, et al.,Accumulation of cyclophilin A isoforms in conditioned medium of irradiatedbreast cancer cells, Proteomics 12 (2012) 1756–1766, http://dx.doi.org/10.1002/pmic.201100319.
[62] B.I. Gerashchenko, A. Yamagata, K. Oofusa, K. Yoshizato, S.M. de Toledo, R.W.Howell, Proteome analysis of proliferative response of bystander cells adjacent tocells exposed to ionizing radiation, Proteomics 7 (2007) 2000–2008, http://dx.doi.org/10.1002/pmic.200600948.
[63] N.-K. Han, B.C. Kim, H.C. Lee, Y.-J. Lee, M.-J. Park, S.-G. Chi, et al., Secretomeanalysis of ionizing radiation-induced senescent cancer cells reveals that secretedRKIP plays a critical role in neighboring cell migration, Proteomics 12 (2012)2822–2832, http://dx.doi.org/10.1002/pmic.201100419.
[64] R.W. Smith, J. Wang, C.P. Bucking, C.E. Mothersill, C.B. Seymour, Evidence for aprotective response by the gill proteome of rainbow trout exposed to X-rayinduced bystander signals, Proteomics 7 (2007) 4171–4180, http://dx.doi.org/10.1002/pmic.200700573.
[65] R.W. Smith, J. Wang, C.E. Mothersill, T.G. Hinton, K. Aizawa, C.B. Seymour,Proteomic changes in the gills of wild-type and transgenic radiosensitive medakafollowing exposure to direct irradiation and to X-ray induced bystander signals,Biochim. Biophys. Acta 1814 (2011) 290–298, http://dx.doi.org/10.1016/j.bba-pap.2010.11.002.
[66] R.W. Smith, J. Wang, E. Schultke, C.B. Seymour, E. Brauer-Krisch, J.A. Laissue, et al.,Proteomic changes in the rat brain induced by homogenous irradiation and by thebystander effect resulting from high energy synchrotron X-ray microbeams, Int. J.Radiat. Biol. 89 (2013) 118–127, http://dx.doi.org/10.3109/09553002.2013.732252.
[67] O. Guipaud, Serum and plasma proteomics and its possible use as detector andpredictor of radiation diseases, in: D. Leszczynski (Ed.), Radiat. Proteomics,Springer, Netherlands, 2013, pp. 61–86, hhttp://link.springer.com/chapter/10.1007/978-94-007-5896-4_4i (accessed November 29, 2013).
[68] T. Chaze, L. Hornez, C. Chambon, I. Haddad, J. Vinh, J.-P. Peyrat, et al., Serumproteome analysis for profiling predictive protein markers associated with theseverity of skin lesions induced by ionizing radiation, Proteomes 1 (2013) 40–69,http://dx.doi.org/10.3390/proteomes1020040.
[69] S.M. Varnum, D.L. Springer, M.E. Chaffee, K.A. Lien, B.-J.M. Webb-Robertson, K.M.Waters, et al., The effects of low-dose irradiation on inflammatory responseproteins in a 3D reconstituted human skin tissue model, Radiat. Res. 178(2012) 591–599, http://dx.doi.org/10.1667/RR2976.1.
[70] S. Tapio, S. Hornhardt, M. Gomolka, D. Leszczynski, A. Posch, S. Thalhammer, et al.,Use of proteomics in radiobiological research: current state of the art, Radiat.Environ. Biophys. 49 (2010) 1–4, http://dx.doi.org/10.1007/s00411-009-0263-7.
[71] O. Azimzadeh, M.J. Atkinson, S. Tapio, Proteomics in radiation research: presentstatus and future perspectives, Radiat. Environ. Biophys. (2013), http://dx.doi.org/10.1007/s00411-013-0495-4.
[72] M. Chevallet, H. Diemer, A. Van Dorssealer, C. Villiers, T. Rabilloud, Toward abetter analysis of secreted proteins: the example of the myeloid cells secretome,Proteomics 7 (2007) 1757–1770, http://dx.doi.org/10.1002/pmic.200601024.
[73] E.I. Azzam, S.M. de Toledo, J.B. Little, Expression of CONNEXIN43 is highlysensitive to ionizing radiation and other environmental stresses, Cancer Res.63 (2003) 7128–7135.
[74] N. Autsavapromporn, S.M. De Toledo, J.-P. Jay-Gerin, A.L. Harris, E.I. Azzam,Human cell responses to ionizing radiation are differentially affected by theexpressed connexins, J. Radiat. Res. (Tokyo) 54 (2013) 251–259, http://dx.doi.org/10.1093/jrr/rrs099.
[75] A. Carreau, B. El Hafny-Rahbi, A. Matejuk, C. Grillon, C. Kieda, Why is the partialoxygen pressure of human tissues a crucial parameter? Small molecules andhypoxia, J. Cell. Mol. Med. 15 (2011) 1239–1253, http://dx.doi.org/10.1111/j.1582-4934.2011.01258.x.
[76] O. Guipaud, M. Benderitter, Protein biomarkers for radiation exposure: towards aproteomic approach as a new investigation tool, Ann. Ist. Super. Sanita 45 (2009)278–286.
[77] M.J. Atkinson, Radiation treatment effects on the proteome of the tumourmicroenvironment, Adv. Exp. Med. Biol. 990 (2013) 49–60, http://dx.doi.org/10.1007/978-94-007-5896-4_3.
iew and perspectives of the radiation-induced bystander effects,ev.2014.11.008

Effet Bystander en Radiobiologie et Hadronthérapie
HDR François Chevalier Page 171
3.9 - Références
[1] H.A. Wolff, D.M. Wagner, L.-C. Conradi, S. Hennies, M. Ghadimi, C.F. Hess, et al., Irradiationwith protons for the individualized treatment of patients with locally advanced rectal cancer: aplanning study with clinical implications, Radiother. Oncol. J. Eur. Soc. Ther. Radiol. Oncol. 102(2012) 30–37. doi:10.1016/j.radonc.2011.10.018.
[2] D.J. Brenner, J.B. Little, R.K. Sachs, The bystander effect in radiation oncogenesis: II. Aquantitative model, Radiat. Res. 155 (2001) 402–408.
[3] S.J. McMahon, C.K. McGarry, K.T. Butterworth, J.M. O’Sullivan, A.R. Hounsell, K.M. Prise,Implications of Intercellular Signaling for Radiation Therapy: A Theoretical Dose-Planning Study,Int. J. Radiat. Oncol. Biol. Phys. 87 (2013) 1148–1154. doi:10.1016/j.ijrobp.2013.08.021.
[4] Dossier - Cancer : ARCHADE place la Basse-Normandie à la pointe de la recherche, (n.d.).http://www.connexions-normandie.fr/2013/06/20/dossier-cancer-archade-place-la-basse-normandie-a-la-pointe-de-la-recherche/ (accessed December 3, 2014).
[5] Médecine nucléaire à Caen : le projet Archade définitivement lancé - Tendance Ouest, (n.d.).http://www.tendanceouest.com/caen/actualite-80377-medecine-nucleaire-a-caen-le-projet-archade-definitivement-lance.html (accessed December 3, 2014).
[6] D. Schulz-Ertner, C.P. Karger, A. Feuerhake, A. Nikoghosyan, S.E. Combs, O. Jäkel, et al.,Effectiveness of carbon ion radiotherapy in the treatment of skull-base chordomas, Int. J. Radiat.Oncol. Biol. Phys. 68 (2007) 449–457. doi:10.1016/j.ijrobp.2006.12.059.
[7] T.A. van de Water, A.J. Lomax, H.P. Bijl, M.E. de Jong, C. Schilstra, E.B. Hug, et al., Potentialbenefits of scanned intensity-modulated proton therapy versus advanced photon therapy withregard to sparing of the salivary glands in oropharyngeal cancer, Int. J. Radiat. Oncol. Biol.Phys. 79 (2011) 1216–1224. doi:10.1016/j.ijrobp.2010.05.012.
[8] S.G. Sawant, G. Randers-Pehrson, C.R. Geard, D.J. Brenner, E.J. Hall, The bystander effect inradiation oncogenesis: I. Transformation in C3H 10T1/2 cells in vitro can be initiated in theunirradiated neighbors of irradiated cells, Radiat. Res. 155 (2001) 397–401.
[9] K.M. Prise, J.M. O’Sullivan, Radiation-induced bystander signalling in cancer therapy, Nat. Rev.Cancer. 9 (2009) 351–360. doi:10.1038/nrc2603.
[10] F. Chevalier, D.H. Hamdi, Y. Saintigny, J.-L. Lefaix, Proteomic overview and perspectives of theradiation-induced bystander effects, Mutat. Res. Mutat. Res. (n.d.).doi:10.1016/j.mrrev.2014.11.008.
[11] UNSCEAR, Annex C : Non-targeted and delayed effects of exposure to ionizing radiations,2006.
[12] N. Suchowerska, M.A. Ebert, M. Zhang, M. Jackson, In vitro response of tumour cells to non-uniform irradiation, Phys. Med. Biol. 50 (2005) 3041–3051. doi:10.1088/0031-9155/50/13/005.
[13] K.M. Prise, M. Folkard, B.D. Michael, Bystander responses induced by low LET radiation,Oncogene. 22 (2003) 7043–7049. doi:10.1038/sj.onc.1206991.
[14] G. Kashino, K.M. Prise, K. Suzuki, N. Matsuda, S. Kodama, M. Suzuki, et al., Effectivesuppression of bystander effects by DMSO treatment of irradiated CHO cells, J. Radiat. Res.(Tokyo). 48 (2007) 327–333.
[15] C. Shao, M. Folkard, K.M. Prise, Role of TGF-beta1 and nitric oxide in the bystander responseof irradiated glioma cells, Oncogene. 27 (2008) 434–440. doi:10.1038/sj.onc.1210653.
[16] K.T. Butterworth, C.K. McGarry, C. Trainor, J.M. O’Sullivan, A.R. Hounsell, K.M. Prise, Out-of-field cell survival following exposure to intensity-modulated radiation fields, Int. J. Radiat. Oncol.Biol. Phys. 79 (2011) 1516–1522. doi:10.1016/j.ijrobp.2010.11.034.
[17] K.T. Butterworth, C.K. McGarry, C. Trainor, S.J. McMahon, J.M. O’Sullivan, G. Schettino, et al.,Dose, dose-rate and field size effects on cell survival following exposure to non-uniform radiationfields, Phys. Med. Biol. 57 (2012) 3197–3206. doi:10.1088/0031-9155/57/10/3197.
[18] S.J. McMahon, K.T. Butterworth, C.K. McGarry, C. Trainor, J.M. O’Sullivan, A.R. Hounsell, etal., A Computational Model of Cellular Response to Modulated Radiation Fields, Int. J. Radiat.Oncol. 84 (2012) 250–256. doi:10.1016/j.ijrobp.2011.10.058.
[19] S.J. McMahon, K.T. Butterworth, C. Trainor, C.K. McGarry, J.M. O’Sullivan, G. Schettino, et al.,A kinetic-based model of radiation-induced intercellular signalling, PloS One. 8 (2013) e54526.doi:10.1371/journal.pone.0054526.
[20] K.T. Butterworth, C.K. McGarry, B. Clasie, A. Carabe-Fernandez, J. Schuemann, N. Depauw, etal., Relative biological effectiveness (RBE) and out-of-field cell survival responses to passive
Effet Bystander en Radiobiologie et Hadronthérapie
HDR François Chevalier Page 172
scattering and pencil beam scanning proton beam deliveries, Phys. Med. Biol. 57 (2012) 6671–6680. doi:10.1088/0031-9155/57/20/6671.
[21] C. Trainor, K.T. Butterworth, C.K. McGarry, F. Liberante, J.M. O’Sullivan, A.R. Hounsell, et al.,Cell survival responses after exposure to modulated radiation fields, Radiat. Res. 177 (2012)44–51.
[22] C. Trainor, K.T. Butterworth, C.K. McGarry, S.J. McMahon, J.M. O’Sullivan, A.R. Hounsell, etal., DNA damage responses following exposure to modulated radiation fields, PloS One. 7(2012) e43326. doi:10.1371/journal.pone.0043326.
[23] C.K. McGarry, K.T. Butterworth, C. Trainor, S.J. McMahon, J.M. O’Sullivan, K.M. Prise, et al.,In-vitro investigation of out-of-field cell survival following the delivery of conformal, intensity-modulated radiation therapy (IMRT) and volumetric modulated arc therapy (VMAT) plans, Phys.Med. Biol. 57 (2012) 6635–6645. doi:10.1088/0031-9155/57/20/6635.
[24] S.J. McMahon, K.T. Butterworth, C. Trainor, C.K. McGarry, J.M. O’Sullivan, G. Schettino, et al.,A Kinetic-Based Model of Radiation-Induced Intercellular Signalling, PLoS ONE. 8 (2013)e54526. doi:10.1371/journal.pone.0054526.
[25] E.I. Azzam, S.M. de Toledo, J.B. Little, Oxidative metabolism, gap junctions and the ionizingradiation-induced bystander effect, Oncogene. 22 (2003) 7050–7057.doi:10.1038/sj.onc.1206961.
[26] E.I. Azzam, S.M. de Toledo, J.B. Little, Expression of CONNEXIN43 is highly sensitive toionizing radiation and other environmental stresses, Cancer Res. 63 (2003) 7128–7135.
[27] S.M. de Toledo, N. Asaad, P. Venkatachalam, L. Li, R.W. Howell, D.R. Spitz, et al., Adaptiveresponses to low-dose/low-dose-rate gamma rays in normal human fibroblasts: the role ofgrowth architecture and oxidative metabolism, Radiat. Res. 166 (2006) 849–857.doi:10.1667/RR0640.1.
[28] M. Pinto, E.I. Azzam, R.W. Howell, Investigation of adaptive responses in bystander cells in 3Dcultures containing tritium-labeled and unlabeled normal human fibroblasts, Radiat. Res. 174(2010) 216–227. doi:10.1667/RR1866.1.
[29] S.M. de Toledo, M. Buonanno, M. Li, N. Asaad, Y. Qin, G. Gonon, et al., The impact of adaptiveand non-targeted effects in the biological responses to low dose/low fluence ionizing radiation:the modulating effect of linear energy transfer, Health Phys. 100 (2011) 290–292.doi:10.1097/HP.0b013e31820832d8.
[30] M. Buonanno, S.M. de Toledo, D. Pain, E.I. Azzam, Long-term consequences of radiation-induced bystander effects depend on radiation quality and dose and correlate with oxidativestress, Radiat. Res. 175 (2011) 405–415. doi:10.1667/RR2461.1.
[31] J.M. Akudugu, E.I. Azzam, R.W. Howell, Induction of lethal bystander effects in human breastcancer cell cultures by DNA-incorporated Iodine-125 depends on phenotype, Int. J. Radiat. Biol.88 (2012) 1028–1038. doi:10.3109/09553002.2012.683511.
[32] E.I. Azzam, J.-P. Jay-Gerin, D. Pain, Ionizing radiation-induced metabolic oxidative stress andprolonged cell injury, Cancer Lett. 327 (2012) 48–60. doi:10.1016/j.canlet.2011.12.012.
[33] N. Autsavapromporn, S.M. De Toledo, J.-P. Jay-Gerin, A.L. Harris, E.I. Azzam, Human cellresponses to ionizing radiation are differentially affected by the expressed connexins, J. Radiat.Res. (Tokyo). 54 (2013) 251–259. doi:10.1093/jrr/rrs099.
[34] G. Gonon, J.-E. Groetz, S.M. de Toledo, R.W. Howell, M. Fromm, E.I. Azzam, Nontargetedstressful effects in normal human fibroblast cultures exposed to low fluences of high charge, highenergy (HZE) particles: kinetics of biologic responses and significance of secondary radiations,Radiat. Res. 179 (2013) 444–457. doi:10.1667/RR3017.1.
[35] N. Autsavapromporn, M. Suzuki, I. Plante, C. Liu, Y. Uchihori, T.K. Hei, et al., Participation ofgap junction communication in potentially lethal damage repair and DNA damage in humanfibroblasts exposed to low- or high-LET radiation, Mutat. Res. (2013).doi:10.1016/j.mrgentox.2013.07.001.
[36] N. Autsavapromporn, M. Suzuki, T. Funayama, N. Usami, I. Plante, Y. Yokota, et al., GapJunction Communication and the Propagation of Bystander Effects Induced by MicrobeamIrradiation in Human Fibroblast Cultures: The Impact of Radiation Quality, Radiat. Res. (2013).doi:10.1667/RR3111.1.
[37] O.V. Belyakov, S.A. Mitchell, D. Parikh, G. Randers-Pehrson, S.A. Marino, S.A. Amundson, etal., Biological effects in unirradiated human tissue induced by radiation damage up to 1 mmaway, Proc. Natl. Acad. Sci. U. S. A. 102 (2005) 14203–14208. doi:10.1073/pnas.0505020102.
[38] H.J. Park, R.J. Griffin, S. Hui, S.H. Levitt, C.W. Song, Radiation-induced vascular damage intumors: implications of vascular damage in ablative hypofractionated radiotherapy (SBRT andSRS), Radiat. Res. 177 (2012) 311–327.
Effet Bystander en Radiobiologie et Hadronthérapie
HDR François Chevalier Page 173
[39] A. Carreau, B. El Hafny-Rahbi, A. Matejuk, C. Grillon, C. Kieda, Why is the partial oxygenpressure of human tissues a crucial parameter? Small molecules and hypoxia, J. Cell. Mol. Med.15 (2011) 1239–1253. doi:10.1111/j.1582-4934.2011.01258.x.
[40] O.A. Sedelnikova, A. Nakamura, O. Kovalchuk, I. Koturbash, S.A. Mitchell, S.A. Marino, et al.,DNA double-strand breaks form in bystander cells after microbeam irradiation of three-dimensional human tissue models, Cancer Res. 67 (2007) 4295–4302. doi:10.1158/0008-5472.CAN-06-4442.
[41] K. Suzuki, M. Nakashima, S. Yamashita, Dynamics of ionizing radiation-induced DNA damageresponse in reconstituted three-dimensional human skin tissue, Radiat. Res. 174 (2010) 415–423. doi:10.1667/RR2007.1.
[42] T.E. Schmid, G. Dollinger, V. Hable, C. Greubel, O. Zlobinskaya, D. Michalski, et al., Relativebiological effectiveness of pulsed and continuous 20 MeV protons for micronucleus induction in3D human reconstructed skin tissue, Radiother. Oncol. J. Eur. Soc. Ther. Radiol. Oncol. 95(2010) 66–72. doi:10.1016/j.radonc.2010.03.010.
[43] A. Mezentsev, S.A. Amundson, Global gene expression responses to low- or high-doseradiation in a human three-dimensional tissue model, Radiat. Res. 175 (2011) 677–688.doi:10.1667/RR2483.1.
[44] P. Grabham, B. Hu, P. Sharma, C. Geard, Effects of ionizing radiation on three-dimensionalhuman vessel models: differential effects according to radiation quality and cellular development,Radiat. Res. 175 (2011) 21–28. doi:10.1667/RR2289.1.
[45] S. Claus, N. Mayer, E. Aubert-Foucher, H. Chajra, E. Perrier-Groult, J. Lafont, et al., Cartilage-characteristic matrix reconstruction by sequential addition of soluble factors during expansion ofhuman articular chondrocytes and their cultivation in collagen sponges, Tissue Eng. Part CMethods. 18 (2012) 104–112. doi:10.1089/ten.TEC.2011.0259.
[46] L. Basciano, C. Nemos, B. Foliguet, N. de Isla, M. de Carvalho, N. Tran, et al., Long termculture of mesenchymal stem cells in hypoxia promotes a genetic program maintaining theirundifferentiated and multipotent status, BMC Cell Biol. 12 (2011) 12. doi:10.1186/1471-2121-12-12.
[47] C. Némos, L. Basciano, A. Dalloul, [Biological effects and potential applications of mesenchymalstem cell culture under low oxygen pressure], Pathol. Biol. (Paris). 60 (2012) 193–198.doi:10.1016/j.patbio.2011.07.004.
[48] Haute autorité de santé, Hadronthérapie par ions carbone : rapport préliminaire, (2010).http://www.has-sante.fr/portail/jcms/c_934208/fr/hadrontherapie-par-ions-carbone-rapport-preliminaire?xtmc=&xtcr=1.
[49] M. Wakatsuki, N. Magpayo, H. Kawamura, K.D. Held, Differential bystander signaling betweenradioresistant chondrosarcoma cells and fibroblasts after x-ray, proton, iron ion and carbon ionexposures, Int. J. Radiat. Oncol. Biol. Phys. 84 (2012) e103–108.doi:10.1016/j.ijrobp.2012.02.052.
[50] F. Chevalier, J. Depagne, S. Hem, S. Chevillard, J. Bensimon, P. Bertrand, et al., Accumulationof cyclophilin A isoforms in conditioned medium of irradiated breast cancer cells, Proteomics. 12(2012) 1756–1766. doi:10.1002/pmic.201100319.