Effects of water, salt solution and simulated concrete pore solution on the properties of composite...
19
Effects of Water, Salt Solution and Simulated Concrete Pore Solution on the Properties of Composite Matrix Resins Used in Civil Engineering Applications Joannie W. Chin, Khaled Aouadi, Michael R. Haight, William L. Hughes, and Tinh Nguyen Building Materials Division Building and Fire Research Laboratory National Institute of Standards and Technology Gaithersburg, MD 20899 USA Reprinted from Polymer Composites, April 2001, vol. 22, no. 22, pp. 282-298. NOTE: This paper is a contribution of the National Institute of Standards and Technology and is not subject to copyright. NlST CENTENNIAL. National Institute of Standards and Technology Technology Administration, U.S. Department of Commerce
-
Upload
independent -
Category
Documents
-
view
4 -
download
0
Transcript of Effects of water, salt solution and simulated concrete pore solution on the properties of composite...

Effects of Water, Salt Solution and Simulated Concrete Pore Solution on the Properties of Composite Matrix Resins Used in Civil
Engineering Applications
Joannie W. Chin, Khaled Aouadi, Michael R. Haight, William L. Hughes, and Tinh Nguyen Building Materials Division
Building and Fire Research Laboratory National Institute of Standards and Technology
Gaithersburg, MD 20899 USA
Reprinted from Polymer Composites, April 2001, vol. 22, no. 22, pp. 282-298.
NOTE: This paper is a contribution of the National Institute of Standards and Technology and is not subject to copyright.
N l S T C E N T E N N I A L .
National Institute of Standards and Technology Technology Administration, U.S. Department of Commerce

Effects of Water, Salt Solution and Simulated Concrete Pore Solution on the Properties of Composite Matrix
Resins Used in Civil Engineering Applications
JOANNIE W. CHIN*, KHALED AOUADI, MICHAEL R. HAIGHT, WILLLAM L. HUGHES, and TINH NGUYEN
National Institute of Standards and Technology 2 00 Bureau Drive, Stop 8621
Gaithersburg, Maryland 20899
One of the obstacles hindering the acceptance of polymer composites in civil en- gineering applications is the susceptibility of the polymeric matrix: to degradation that is initiated by moisture, temperature, and corrosive chemical environments. The objective of this study was to characterize chemical and physical changes in polymer matrix resins following exposure to these environments. Resin systems studied were vinyl ester and isophthalic polyester, both of which are proposed for use in construction applications. Unreinforced free films were exposed to water, al- kaline and saline environments at ambient and elevated temperatures for extended periods of time. Changes in strength and thermophysical properties were evaluated through tensile testing. dynamic mechanical thermal analysis (DMTA) and thermo- gravimetric analysis (TGA). Chemical degradation of the polymers was character- ized using Fourier transform infrared (FTIR) spectroscopy. Energy dispersive X-ray (EDX) analysis of specimens following exposure was carried out to determine if ion diffusion into the bulk polymer occurred. Only minor changes in the glass transi- tion temperatures of the polymers were observed after prolonged exposure at ele- vated temperature, but more substantial changes were noted in tensile strength, particularly in the case of the isophthalic polyester. Examination of the polymers following immersion in salt solution and alkaline solution showed essentially no ionic penetration into the bulk, with the exception of specimens that were visibly degraded. Spectroscopic analysis of chemical structure prior to and following expo- sure revealed varying degrees of ester hydrolysis.
INTRODUCTION years to 75 years are common for many civil engineer-
t the present time, deterioration of the world's in- A frastructure is motivating the use of advanced materials, such a s fiber-reinforced polymer (FRP) composites, in civil engineering applications. Owing to their high specific strength, light weight. fatigue and corrosion resistance, these materials are candidates for use in primary structures as well as in rehabilita- tion and retrofitting of existing structures. FRP com- posites are also utilized in the reinforcement of con- crete in the form of reinforcing bars and tendons.
Questions concerning the durability of polymer com- posites in the applications described above are a banier to the acceptance of these materials in infkstructure
ing structures such as bridges. At the present time, relatively few studies have been conducted on the long-term effect of moisture, saline and alkaline envi- ronments on polymers such as vinyl ester and poly- ester, which have been touted for use in infi-astruc- ture and other civil applications. It is necessary to understand the mechanisms that govern polymer degradation: not only to optimize material perfor- mance, but also to provide information that can be used in the design of accelerated aging tests.
Although it is one of the key constituents of a fiber- reinforced polymer composite, the polymer matrix is often considered to be the weak link in the FRP sys-
and other civil applications. Expected lifetimes of 50 tem. Polymer composites in outdoor applications are susceptible to photo-initiated oxidation (1) and are
'Corrcspondmg author.
also known to be sensitive to hygrothermal (2). alka- line and saline environments (3).
202 POL YMER COMPOSITES, APRIL 2001, Val. 22, No. 2


Eflects of Water,. Salt Solution and Simulated Concrete
(b) m. 1. Representatbe chemica2 S ~ ~ e S for fa) vinyl ester resin. and (b) isophthalic polyester resin Crosslinkmg with styrene takes p k via t k unsaturated double bonds to form a crosslinked network.
The objective of this study was to systematically study chemical and physical changes in polymer ma- trix composites following exposure to moisture, alka- line and saline conditions at ambient and elevated temperatures. Measurement of physico-chemical prop- erties can yield critical information on the mechanisms of degradation and can be used to model mechanical performance. Data obtained at elevated temperatures are important in d e t e m g the validity of accelerated aging tests in which temperature is used to accelerate degradation. One of the long-term gods of this research is to identify factors that contribute to matrix resin degradation, and to determine if the mechanisms of degradation are altered at elevated temperature.
EXPERIMENTAL
Specimen Preparation
Commercial vinyl ester and isoph thalic polyester (isopolyester) prepolymer resins were selected for this study. Representative chemical structures of the un- crosslinked resins are depicted in m. 1. Vinyl ester specimens were prepared by hand-mixing the resin, a 3% mass fraction of a methyl ethyl ketone peroxide 'MEW) catalyst and a small m o u n t (less than 0.5% nass fraction) of a silicone defoaming agent until horoughly blended. A similar procedure was followed or the isopolyester specimens, except that only 2% nass fraction of the M E W catalyst and no silicone defoamer were used. Because both the vinyl ester and sopolyester resins were already formulated with ac- :elerator and promoter, only the addition of the cata- yst was necessary to initiate crosslinking.
Free films were molded between two acrylic plates o minimize styrene evaporation as well as oxygen in- tibition of the curing process. Poly(ethy1ene tereph- halate) sheets served as release films and also as
spacers for controlling film thickness. Films were al- lowed to gel a t room temperature, followed by a 2 h/150"C postcure. Final film thickness ranged &om 230 pm to 260 pm.
Dogbone-shaped tensile specimens were produced for mechanical testing. The procedure for making dog- bones is similar to that described above for films, ex- cept that a 1.5 mm thick poly(tetrafluoroethy1ene) dogbone mold was used. Specimens were molded rather than machined or punched due to the ten- dency of the resin to crack. The gage section of the dogbone specimens was 4 mm wide and 27 mm long, as shown in Flg. 2, with thickness ranging fi-om 1.3 mm to 1.5 mm.
Exposure Environments
Free films with dimensions 50 mm X 50 mm and dogbone specimens were immersed in distilled water, salt solution (to simulate a seawater environment) and an artificial concrete pore solution (to simulate the al- kaline environment of a cementitious material) for 1300 hours at ambient temperature (nominally 22°C). 60°C and 90°C. Specimens were contained in sealed Pyrex jars; jars containing the 60°C and 90°C speci- mens were placed in circulating air ovens set at the appropriate temperature.
The salt solution was composed of 0.58 mol/L NaCl in distilled water. Concrete pore solution was form- ulated according to the composition described by Christensen et al.. (4) and consists of 0.32 mol/L KOH, 0.17 mol/L NaOH and 0.07 mol/L Ca(OH), in distilled water. The pH of this solution was approximately 13.5. After immersion, samples were dried for one week under vacuum at 35°C prior to thermal, spectro- scopic and tensile measurements, so plasticization by moisture would not contribute to obsexved changes in properties.
'OL YMER COMPOSITES, APRIL 2001, Vol. 22, No. 2 283

Joannie W. Chin, Khaled Aouadi Michael R. H,aight, WiUiam L. Hughes, and
r=3.2 mm
c 6 5 m r n c Flg. 2. Schematic of dogbone specimen used for mechanical testing.
Tinh Nguyen
T 10.5 mm
Uptake Experiments
Vinyl ester and isopolyester films having lateral di- mensions of 25 mm X 25 mm were immersed in dis- tilled water, salt solution and concrete pore solution, which were contained in glass jars at temperature, with each jar containing one specimen. For uptake ex- periments at ambient temperature. films were periodi- cally removed from solution, rinsed with distilled water (in the case of salt solution and concrete pore solutions), blotted d q and weighed on a Mettler AT automatic balance.* Water and solution sorption was calculated as the change in mass with respect to the initial dry mass of the film. Six films of each polymer were tested in each solution. For sorption studies at 60°C the procedure was
similar to the one described above with the exception that the sealed jars were placed in a sand bath main- tained at 60°C 5 2°C. Mass uptake was determined as previously described. Sorption experiments were not carried out at 90°C. because of the difficulty of main- taining the temperature of the solutions in the jars.
Thermal Analysis
Dynamic Mechanid Thermal Analysis (DMTA): 12 mm x 35 mm films were tested in tensile mode in a Rheometxics Solids Analyzer (-A) I1 at a frequency of 10 Hz and a dynamic strain of 0.05%. Analysis was carried out from 30°C to 18OoC, with data being recorded in 2°C increments. During the test, speci- mens were pre-strained to maintain a constant state of tension throughout the experiment and to prevent film buckling. Three samples were analyzed for each polymer and exposure condition. The glass transition temperature was taken as the peak of the loss modu- lus (E) cuwe, in accordance with ASTM D4092.
Differential Scanning Calorimetry (DSC): twelve-mil- ligram to 15-milligram specimens were sealed in alu- minum pans and analyzed in a TA Instruments DSC 2910 differential scanning calorimeter equipped with a
refrigerated cooling system. Analysis was conducted in modulated DSC mode, with a modulation fkequency of 2 1.0"C every 60 s. Specimens were heated from 25°C to 18OOC at a rate of 5.OoC/min. Three samples were analyzed for each polymer and exposure condition.
Thermogravimetric Analysis (TGA): Thermogravi- metric analysis was canied out on a TA Instruments 2950 thermogravimetric analyzer at a heating rate of 5.0°C/min in a nitrogen atmosphere. Mass loss was characterized in the range from 25°C to 400°C. ?srpi- cal sample size was 10 mg and three replicates were analyzed for each polymer and exposure condition.
Fourier Transform Infrared (FTIR) Spectroscopy
Fourier transform infrared (FIIR) analysis was per- formed in transmission mode on a Nicolet Magna-IR 560 infrared spectrometer. Specimens that had been dried under vacuum (as described in the section on Exposure Environments) were pulverized, mixed with dry, spectroscopic grade potassium bromide and pressed into pellets. Spectra were collected in a dry air atmosphere and ratioed to a blank background. One hundred scans were collected and averaged at a reso- lution of 4 cm-l. Changes in peak heights were q u a - tifed by ratioing peaks of interest to the aromatic C-H stretchmg peak at 3027 em-', which corresponds to the benzene rings in the resin structures and is assumed not to be altered by exposure to the aqueous solutions.
Tensile Testing
A custom-designed testing device used for deter- mining tensile strengths of the dogbone specimens consisted of a screw-driven linear actuator equipped with a 227 kg (500 lb) load cell and linear voltage dis- placement transducer (LVDT). Dogbone-shaped speci- mens were secured in machined aluminum grips that conformed to the shape of the dogbone end tabs and were loaded at the rate of 1 mm/s. Four to six repli- cates were tested for each polymer and exposure con- dition. Tensile strengths were normalized to the ulti- mate tensile strengths of the control specimens.
Note: Certaln commercial equipment. instruments. or materials are identifled in this paper ln oder to spedfy the experimental procedure adequately. Such iden- tification is not intended to imply recornlendation or endorsement by MST. nor is it intended to imply that the materials or equipment idenllfied are necessarlIy the best available for this p w .
Energy Dispersive X-ray (EDX) Analysis
To determine if sodium, potassium, calcium or chlo- rine ions from the salt and pore solutions diffused
284 POLYMER COMPOSITES, APRIL 2001, Vol. 22, No. 2

Eflects of Water,,Salt Solution and Simulated Concrete
into the interior of the resin specimens, 25 mm diam- eter rods of vinyl ester and isopolyester were im- mersed in salt solution and pore solution at ambient temperature and 60°C for 60 days. The rods were then scribed and fi-actured, yielding a fresh fracture surface for EDX analysis. Spots at the outermost edge of the sample as well in the interior were analyzed with an IS1 SX-40 scanning electron microscope equipped with a Noran 5402 EDX detector. Analyzed areas were scanned for sodium, potassium, calcium and chlorine.
RESULTS AND DISCUSSION
Sorption Experiments
As shown in F'ig. 3, mass uptake plots for vinyl ester and isopolyester at 22°C in water, salt solution and
concrete pore solution show an initial linear region followed by a region concave to the abscissa. Chin et aZ. have previously presented plots of Mt/& versus t1I2/€ for these materials which are linear up to or be- yond M,/M, = 0.6 (where M, = mass uptake a t time t, M, = equilibrium mass uptake, and e = specimen thickness), thus allowing the sorption to be character- ized as Fickian (5). mure 4 presents mass uptake as a function of time
for vinyl ester and isopolyester in water, salt solution and concrete pore solution at 60°C. The rate of ap- proach to equilibrium is clearly more rapid at 60°C relative to that at 22OC. which is an expected result. In addition to the increased rate of uptake, the equi- librium mass uptake for vinyl ester at 60°C, shown in Table 1, also appears to be slightly higher than that observed at 22"C, even when the standard deviation
0.5
0.4
0.3
0.2
0.1 I I 1 I I I I I I I I I I I I I
0 50 100 150 200 250 300 350 400 450
Time (h) (a)
--.-1--1__
i I
0.7
I 1 i
0.6 --
I
I i i
I I I I I I I I I I
0 100 200 300 400
Time (h) (b)
Fig. 3. M a s s uptake c w s for (a) vinyl ester and (b) isopolyester in water . salt solution A and concrete pore solution I at 22°C (esti- mated standard deviation is 0.05 mass %).
POLYMER COMPOSITES, APRIL 2001, Vol. 22, No. 2 285
Joannie W. Chin, Khaled Aouadi Michael R. Haight, William L. Hughes, and llnh Nguyen
0.1
0.8 I ------I
--
0.1 +- Ob I I I I 1 I I 0 100 200 300 400
Time (h) (a)
0.5 0.4
0.3 0.2 I
0 100 200 300 400
Time (h) (b)
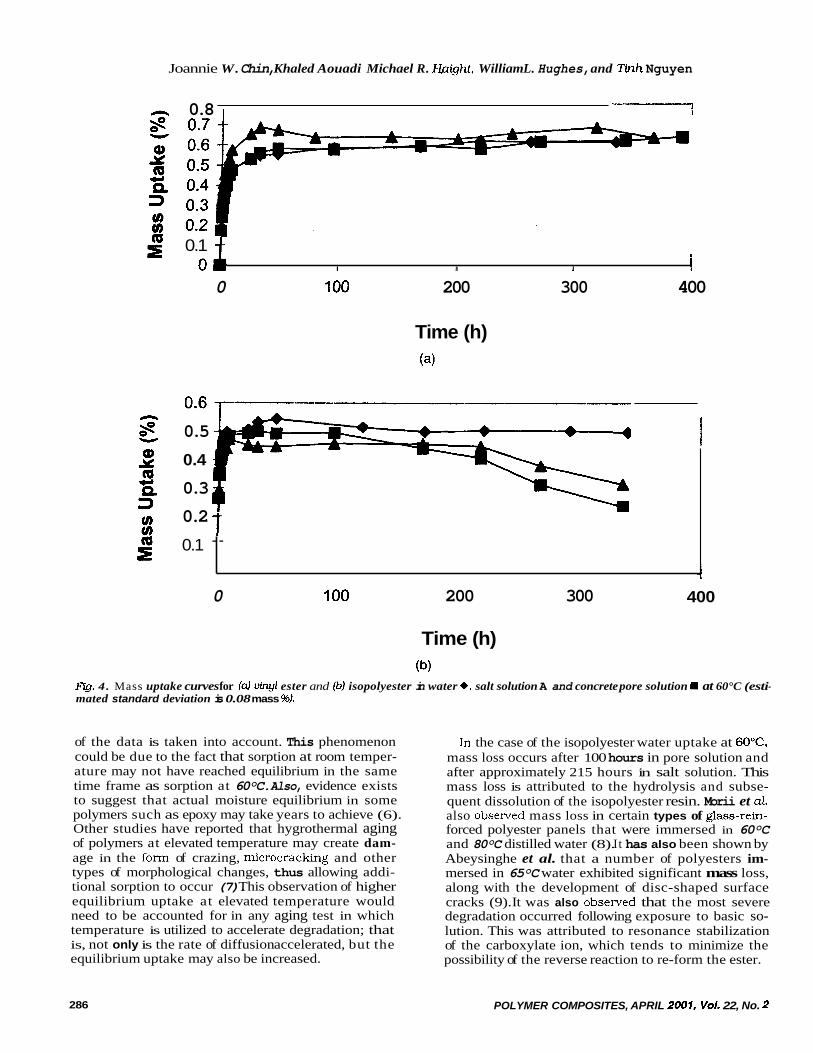
FYg. 4. Mass uptake curves for (a) vinyl ester and (b) isopolyester in water +, salt solution A and concrete pore solution I at 60°C (esti- mated standard deviation is 0.08 mass 46).
of the data is taken into account. This phenomenon could be due to the fact that sorption at room temper- ature may not have reached equilibrium in the same time frame as sorption at 60°C. Also, evidence exists to suggest that actual moisture equilibrium in some polymers such as epoxy may take years to achieve (6). Other studies have reported that hygrothermal aging of polymers at elevated temperature may create dam- age in the form of crazing, microcracking and other types of morphological changes, thus allowing addi- tional sorption to occur (7). This observation of higher equilibrium uptake at elevated temperature would need to be accounted for in any aging test in which temperature is utilized to accelerate degradation; that is, not only is the rate of diffusion accelerated, but the equilibrium uptake may also be increased.
In the case of the isopolyester water uptake at 60°C. mass loss occurs after 100 hours in pore solution and after approximately 215 hours in salt solution. This mass loss is attributed to the hydrolysis and subse- quent dissolution of the isopolyester resin. Morii et d also obsewed mass loss in certain types of glass-rein- forced polyester panels that were immersed in 60°C and 80°C distilled water (8). It has also been shown by Abeysinghe et al. that a number of polyesters im- mersed in 65°C water exhibited significant mass loss, along with the development of disc-shaped surface cracks (9). It was also obsemed that the most severe degradation occurred following exposure to basic so- lution. This was attributed to resonance stabilization of the carboxylate ion, which tends to minimize the possibility of the reverse reaction to re-form the ester.
286 POLYMER COMPOSITES, APRIL 2001, Val. 22, No. 2

Eflects of Water, Salt Solution and Simulated Concrete
Table 1. Equilibrium Mass Uptake for Epoxy, Vinyl Ester and lsopolyester Films (uncertainties are equivalent to one standard deviation).
Matrix Sorbent
~-
Equilibrium Mass Uptake (mass %) 22°C 60°C
Vinyl Ester
lsopolyester
Distilled Water Salt Solution Pore Solution
Distilled Water Salt Solution Pore Solution
0.52 2 0.01 0.55 t 0.01 0.49 2 0.04
0.56 2 0.02 0.55 2 0.03 0.50 2 0.04
0.62 2 0.05 0.69 2 0.04 0.64 2 0.03
0.5 2 0.08 0.45 t 0.10* 0.49 2 0.05”
~ ~ ~~ -~
‘Maximum mass uptake prior to mass I o S .
mure 5 shows an infi-ared spectrum taken of the residue found in the pore solution where an isopoly- ester specimen had been immersed for 30 days at 60°C. The pore solution was fdtered and evaporated onto a zinc selenide crystal and the resulting residue analyzed via attenuated total reflectance-Fourier transform infrared spectroscopy (ATR-FTIR). The peaks shown in the spectrum are clearly indicative of organic material, as the peaks at 3334 cm-l, 1557 cm-’/1420 cm-l(doublet) and 1019 cm-l can be at- tributed to hydrogen bonded 0 - H stretching, carboxy- late stretching (COO-) and 0-H bending, respectively. Two small shoulders on the peak centered at 3334 cm-l fall in the 2900 cm-’ region and provide evidence for C-H stretching.
A similar experiment carried out on vinyl ester showed little or no evidence of organic residue in the pore solution. In general, Vinyl ester has been found to be less susceptible to hydrolysis than polyester, due to the fact that ester functional groups in vinyl esters are terminal and shielded by methyl groups, whereas in isopolyester they are distributed along the
main chain, making them more accessible for reac- tion. In a study of vinyl ester model compounds, Ganem et ul. found that vinyl ester resins are at least one order of magnitude more hydrolytically stable than unsaturated polyesters ( 10).
Thermal Analysis Ffgures 6 and 7 show the glass transition tempera-
tures (Tg) obtained by DMTA of the dried vinyl ester and isopolyester films as a function of immersion time. The standard deviation of the data was esti- mated from a set of 10 replicates to be approximately 2°C.
For vinyl ester, increases in the Tg occurred follow- ing exposure to water, salt solution and pore solu- tion at 60°C and 90°C. In all solutions and tempera- tures, the Tg was obsenred to increase by up to 4°C. Increases in Tg of up to 6°C were also observed for isopolyester following exposure to water, salt solution and pore solution at 60°C and 90°C. This observed increase is consistent with hydrolytic degradation and subsequent dissolution: loss of hydrolyzed low
4000 3500 3000 2500 2000 1500 1000 500
W aven umber (cm‘l) Fig. 5. F77R spectrum of concrete pore solution following immersion of bo-polyester at 60°C.
POL YMER COMPOSITES, APRIL 2001, Vol. 22, No. 2 287

Joannie W. Chin, Khaled Aouadi, Michael R. Haight, william L. Hughes, and Tinh Nguyen
(1D E 117
IAVEIPore/RT j I I 1 --
115 0 20 40 60
Time (weeks)
(a)
Y
f 119
E 117 ta
--
i
f --
I I
c f 127
[ 125
123 + - 3 8 121 - -
119
E 117
- f 115 cn
+ VWater/SO VE/Salt/SO
A VE/Pore/SO
- 0 0 5 10 15
Time (weeks)
(c) Flg. 6. Vinyl ester glass transition temperatures determined by DMTA following exposure to water, salt solution and con- crete pore solution at (a) ambient temperature. (b) 60°C. and (c) 90°C (estimated standard deviation is 2°C).
molecular segments is postulated to lead to embrittle- ment and hence an increase in Tg ( 1 1). Elevated tem- perature pore solution was observed to be extremely corrosive to isopolyester; specimens aged in 90°C pore solution for 10 weeks were too severely degraded for DMT.A analysis.
Comparison of ' E A decomposition profiles is a well- known method of assessing the relative thermo-oxida- tive stability of polymeric materials (12). In particular. mass changes at temperatures between 150°C and
A 1
A 1 APE/Pore/RT
1 c, CP 1277 I ZI a 125
123 T - p e 121
E 119
k 117
115 i5 U J
~ 0
B m
-r I
10 20
Time (weeks)
(b)
+PE/Water/GO 1 8PU&R/60 ! I APE/Pore/GO I I
i 4
i
30
a
I- E :::? g e
PUWater/SO 8 - li; f ~ I ~ [ A P E / P ~ ~ ~ / ~ o I
+ (D
8 115 0 0 5 10 15 -
Time (weeks)
(c) Fig. 7. Isopulyester glass transition temperatures determined by DMTA following exposure to water, salt solution and con- crete pore solution at (4 ambient temperature, [b) 60°C. and (c) 90°C (estimated standard deviation is 2°C).
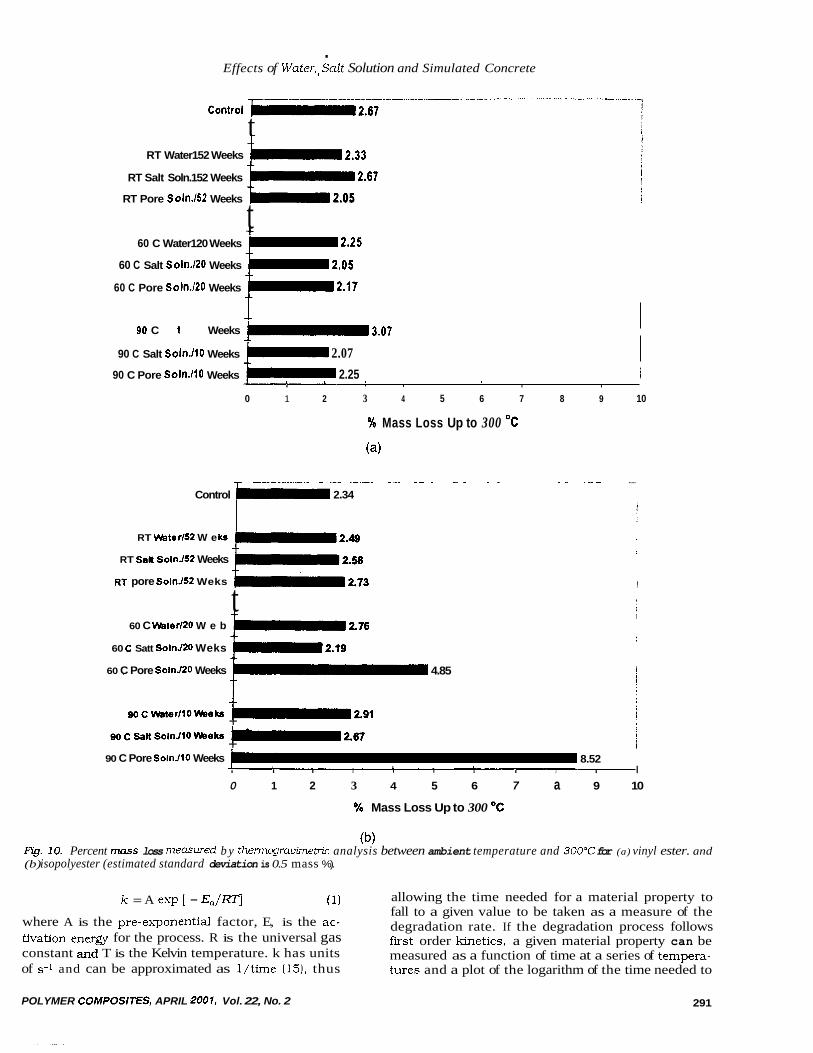
300°C can be correlated to changes in molecular structure and is believed to reflect the extent of matrix- depolymerization which may have occurred ( 13). Above 300°C. mass loss is rapid and severe for almost all organic materials, and is no longer sensitive to pre- vious environmental history.
Figure 8 shows a representative vinyl ester mass loss profile as a firnction of temperature as obtained by TGA. Average total mass loss up to 300°C for three specimens is charted in Rg. IOU (standard deviation
288 POLYMER COMPOSITES, APRIL 2007, Vol. 22, No. 2

Effects of Water,,Salt Solution and Simulated Concrete
96 95
Fig. 8. Representative n;A cu.n)es for vinyl ester controls and speci- mens immersed in (a) water. (b) salt solution and (c) concrete pore I I I
solution.
96 '
95 I I I
0 0
0 100 200 300 400
Tempera tu re ("C)
rn
98 2 97 u)
0 I00 200 300 400
Temperature ("C)
(b)
98 A u) 2 97
95 961----------------1 0
for total mass loss up to 300°C ranges from 0.2% to 0.5% mass fraction). Relative to the control, all ex- posed specimens show slightly greater mass loss beginning at temperatures just above 100°C and con- tinuing throughout the remainder of the analysis. Specimens exposed to 90°C water are observed to un- dergo an increase in the mass loss rate beginning at approximately 270°C. This increased mass loss rate for specimens exposed to 90°C water can also be cor- related to changes observed in the infrared spectrum of this particular specimen, to be discussed later in this paper.
Representative TGA curves for isopolyester are shown in Rg. 9, and the average total mass loss for
100 200 300 400
Temperature ("C)
+ Control RT152 weeks
A 60 C/20 weeks 90 C/lO weeks
Control 9 RT/52 weeks A 60 C/20 weeks
90 C/10 weeks
+ Control RT/52 weeks
* 60 C/20 weeks 90 C/10 weeks
isopolyester up to 300°C is presented in FQ. 1Ob. The mass loss curves show that all exposed specimens ex- hibit slightly higher mass loss relative to the control, beginning at approximately 250°C. In the case of 60°C and 90°C concrete pore solution exposures, mass loss is substantial relative to the control and begins a t lower temperatures. These observations are consistent with degradation of the polymer network structure.
Tensile Testing Normalized tensile strengths (reported as percent-
age of tensile strength retained relative to the control) of vinyl ester and isopolyester specimens as a function of exposure time are shown in Figs. 11 and 12. The
POLYMER COMPOSITES, APRIL 2001, Vol. 22, No. 2 289

Joannie W. Chin, Khaled Aouadi, Michael R. Haight , william L. Hughes, and Tinh Nguyen
I 00
98 8 cn 9 6 1 -
$ 92
0 100 200 300 400
Temperature ("C)
loo - * -
0 98
J 96 8 cn
mens immersed in (a) water. (b)
Flg. 9. Representative TGA curves for isopolyester controls and sped- 92
90 I salt solution, and (e) concrete pore solution. I I 1 I
0 100 200 300 400
Temperature ("C)
0 A I 0 A A
90 I 0 3 00 200 300 400
Temperature ("C)
tensile strength of the vinyl ester control was mea- sured to be 68 MPa, which is comparable to values of 76 MPa to 83 MPa provided by the manufacturer. The isopolyester control had a tensile strength of 55 MPa. which also compares well to the value of 59 MPa re- ported in the product literature. Standard deviation of the unnormalized data is approximately 23%.
An overall decrease in tensile strength with expo- sure time was observed for all environments and tem- peratures. Specimens exposed to elevated tempera- ture pore solution exhibited the most severe tensile
Control RT152 weeks
A 60 C/ZO weeks
Control = RT/52 weeks A 60 C/20 weeks
90 C/10 weeks
Control RT/52 weeks
A 60 C/20 weeks 90 C/10 weeks
strength loss. In the case of isopolyester in 90°C pore solution, specimens were so severely degraded after 10 weeks that they were no longer intact. Degradation in strengths of isopolyester and vinyl ester composites exposed to alkaline environments was also documented by Altizer e t cd (14) and Sonawala and Spontak (3).
To determine the validity of accelerated aging using elevated temperature, a simple Arrhenius analysis was conducted. The Arrhenius relationship expresses the rate constant k of a chemical process as a func- tion of temperature via:
290 POLYMER COMPOSITES, APRIL 2001, Vol. 22, No. 2
. Effects of Water,,Salt Solution and Simulated Concrete
t E l : 6 7
RT Water152 Weeks
RT Salt Soln.152 Weeks
RT Pore Soln.152 Weeks 2.05
t 60 C Water120 Weeks
60 C Salt Soln./2O Weeks
60 C Pore Soln./2O Weeks
90 C Water110 Weeks I-! 3.07
90 C Salt Soln./lO Weeks 1-1 2.07 90 C Pore Soln.ll0 Weeks 2.25 i
I I I I I I I
0 1 2 3 4 5 6 7 8 9 10
% Mass Loss Up to 300 "C
(a>
- _ _ - _ _ _ _ _ _ - - - - - - - - ~ -- .- Control 2.34
RT Wate r/52 W e ks
RT Satt SolnJ52 Weeks
RT pore SolnJ52 Weks
t
4.85
60 C Water120 W e b
60 C Satt SolnJ20 Weks
60 C Pore SolnJ20 Weeks
+ +
.....
I
i
!
1
90 C Pore SolnJlO Weeks 8.52 1 1 1
I I I I I I I I I I I 0 1 2 3 4 5 6 7 a 9 10
% Mass Loss Up to 300 OC
(b) Q. 10. Percent mass loss measwed b y thermogravimetric analysis between ambient temperature and 300°C for (a) vinyl ester. and (b) isopolyester (estimated standard deviation is 0.5 mass %).
allowing the time needed for a material property to fall to a given value to be taken as a measure of the degradation rate. If the degradation process follows fwst order h e t i c s , a given material property can be measured as a function of time at a series of tempera- tures and a plot of the logarithm of the time needed to
k = A exp [ - E,/RT] (1) where A is the pre-exponentid factor, E, is the ac- tivation enera for the process. R is the universal gas constant and T is the Kelvin temperature. k has units of s-1 and can be approximated as l/time (15). thus
POLYMER COMPOSIES, APRIL 2001, Vol. 22, No. 2 291

Joannie W. Chin, Khaled Aouadi Michael R. HGight, William L. Hughes, and Tinh Nguyen
100.0 o-=-r 80.0 I + VE/water/RT
I VElwaterlGO C PEMaterlRT PE/water/6O C
A PElWaterlsO C
0
60.0 4 A , I a i
40.0 1 20.0 1 t
0.0 4 1 i 0 20 40 60
Time (weeks)
(a)
0.0 ! 1
1 I i 0 20 40 60
Time (weeks)
(a)
100.0 80.0 60.0 40.0
20.0
c&------- & 100.0 wF + +
4 /+VE/satt/RT I i I VE/salt/GO C / A VE/saltlSO C 1
$ 60.0 4 U .- 2 ' 40.0 A E E 2
0.0 ! I I
0 20 40 60 l ime (weeks)
(b)
0.0 I I
0 20 40 60 Time (weeks)
(b)
100.0 q p - 1 100.0 80.0
60.0
409
20.0
6 PE/pore/RT PElporelGO C
A PE/pore/sO C
0.0 1 0 20 40 60
l ime (weeks)
0.0 I 0 20 40 60
l ime (weeks)
(c) Fig. 1 1 . Percentage of vinyl ester tensile strength retained fol- lowing exposure to (4 water. (b) salt solution and (c) concrete pore solution at ambient temperature. 60°C and 90°C.
FQ. 12. Percentage of isopolyester tensile strength retained fobwing exposure to (a) water. (b) salt solution, and (c) con- crete pore solution at ambient temperature, 60°C and 90°C.
reach a particular value of the property (equivalent property time) vs. 1 /T will yield a line with slope E,.
Following the procedure used by Proctor et d (16)* Fig. 13 shows Arrhenius plots generated by plotting the natural log of the time to reach 70% of the original tensile strength vs. 1/T. Data obtained for vinyl ester and polyester in water and salt solution could be fit- ted with lines having correlation coefficients of at least 0.95. However, pore solution data for vinyl ester and polyester did not fall on a line, implying that acceler- ated aging methods utilizing temperature as the accel- erating factor may be valid for water and salt solution environments, but not for the harsher pore solution environment e which severe degradation was often observed. It is also pointed out that the slopes of the lines are not equivalent, revealing that degradation of
tensile strength in the various environments have dif- ferent activation energies and follow potentially differ- ent mechanisms. However, the degree of scatter in the tensile strength data makes it diilicult to confirm this hypothesis. Additional study in this area is warranted.
Fourier Transform Infrared Spectroscopy
A number of changes were observed in the infrared spectra of vinyl ester specimens exposed to water, salt solution and pore solution, relative to the controls. Table 2 shows normalized FTIR peak intensities, which were computed by ratioing the height of the peak of interest to the height of the aromatic C-H stretch peak at 3027 cm-' (assuming that this partic- ular functional group is not affected by the exposure conditions in this study). For all exposure conditions
POLYMER COMPOSITES, APRIL 2001, Vol. 22, No. 2 292

s
Efiects of Water,.Salt Solution and Simulated Concrete
5 ,
-1 ! I I 1 1
O.oM5 0.W7 0 . W 0.0031 0.0033 0.0035
5 ,
0.0025 0.0027 0.0029 0.0031 0.0033 0.0035
Fig. 13. Arrhenius plots of tensile strength degradation for (a) vinyl ester. and (b) isopolyester.
and temperatures, a small peak at 3740 cm-' was ob- served following exposure and is tentatively assigned to acid 0-H stretch. All specimens, with the exception of those exposed to 90°C water, showed an increase in the normalized intensity of the 0-H stretching peak at 3473 cm-l, and decreases in the normalized intensi- ties of peaks at 1245 cm-I (C-0 stretching), and 1182 cm-l ((2-0 stretching). Only minor changes were ob- served in the normalized intensity of the C = O peak at 1727 cm-I. These spectral changes are consistent with ester hydrolysis, in which ester functional groups are converted to hydroxyl and carboxylic acid byprod- ucts. A n increase in the concentration of hydroxyl and carboxylic acid groups would also contribute to the increase in intensity of the 0-H stretching peak. However, the lack of significant spectral changes indi- cates that any hydrolysis that occurred is probably minor.
In contrast, significant spectral changes were ob- served in vinyl ester specimens following exposure to 90°C water, shown in Rg. 14 compared to the vinyl ester control, ambient temperature, and 60°C water specimens. The 0-H stretching peak at 3473 cm-' in the control spectrum is greatly diminished after 10 weeks in 90°C water, as are the intensities of the C-H bending peak at 1509 cm-', and the C-O stretching peak at 1182 cm-'. In addition, there is a significant increase in the intensity of the carbonyl stretching peak at 1727 crn-l, and a shift in position of C-0 stretching peaks originally at 1 182 cm-' and 1 108 cm-l to lower wavelengths. The reason for the changes is not known at this time.
A number of spectral changes were also observed for the isopolyester specimens. W u r e 15 shows the spec- trum of isopolyester following exposure to pore solution at ambient temperature, 60°C and 90°C. Significant
POLYMER COMPOSITES, APRIL 2001, Vol. 22, No. 2 293

Jeannie W. Chin, Khaled Aouadi, Michael R. Haight, YiUiam L. Hughes, and Tinh Nguyen
a a 0 cn L
2 2.0 -
Table 2. FTlR Peak Height Ratios for Vinyl Ester Following Exposure to Water, Salt Solution and Pore Solution, Referenced to Aromatic C-H Stretch at 3027 cm-’.
60 ‘C/20 weeks
3473 cm-’ 1727 cm-’ 1245 cm-’ 1182 cm-1 0-H stretch C=O stretch C-O stretch C-0 stretch
Vinyl Ester Control
Wate r/RT/52 weeks Water/6O0C/20 weeks Water/SO”C/l 0 weeks
Salt solution/RT/52 weeks Salt solutio n/60° C/20 weeks Salt solution/9O0C/1 0 weeks
Pore soln./RT/52 weeks Pore soln./6O0C/20 weeks Pore soln./SO”C/l 0 weeks
0.65
0.74 0.73 0.39
0.76 0.77 0.84
0.74 0.73 0.84
1.5
1.4 1.5 2.4
1.4 1.1 1.5
1.4 1.4 1.4
2.4
2.0 2.1 2.0
2.0 1.9 1.9
2.0 2.0 1.8
2.4
2.0 1.9 1.7
2.0 1.9 1.8
2.0 2.0 1.8
5.0 1 I
ambientl52 weeks
a 0 3.0 -,
C I
Wavenumber (cm-’) Fig. 14. Infiaed spectrum of vinyl ester before and after exposure to water at ambient temperature. 60°C and 90°C.
294 POLYMER COMPOSITES, APRIL 2001, Vol. 22, No. 2

4
Eflects of Water, ,Salt Solution and Simulated Concrete
6.0
5.0
4.0
3.0
2.0
1.0
0.0 -
60 OC/20 weeks
I
90 OC/IO weeks
4000 3500 3000 2500 2000 1500 1000 500
Wavenum ber (cm-’) Q. 15. Infrared spectrum of isopolester before and a$er exposure to concrete pore solution at ambient temperature, 60°C and 90°C.
changes are seen in the 60°C and the 90°C spectra, which correspond to the specimens that exhibited the greatest mass loss in the TGA analysis. Changes in- clude a decrease in intensity and broadening of the 0-H stretching peak at 3473 cm-’, a decrease in the intensity of the ester carbonyl peak at 1728 cm-l and the appearance of the carboxylate doublet in the 1584 cm-’ to 1600 cm-’ region. Normalized peak intensities for isopolyester are shown in Table 3. Decreases in the intensities of 0-H stretching, ester C=O stretch- ing and ester C-O stretching peaks are observed for all exposure conditions and become more prominent with increased exposure temperature. As with the vinyl ester specimens exposed to 90°C
water, the decrease in ester functionality paired with the appearance of carboxylate ion are consistent with
ester hydrolysis, which yields carboxylic acid and hy- droxyl by-products. In ionic solution, the carboxylic acid is then converted to the carboxylate salt. Nguyen and Byrd observed the formation of a carboxylate doublet for stearic acid in ionic solution (17). Spectral changes similar to those observed above for isopoly- ester and vinyl ester were also observed by Ghorbel and Valentin for isopolyester and vinyl ester materials following exposure to 60°C water (18).
Energy Dispersive X-ray Analysis (EDX)
Appreciable amounts of sodium, potassium or cal- cium were found only in the interior of the isopolyester specimen exposed to 60°C pore solution for 60 days. No evidence for the ingress of ions was found for any of the other specimens, which showed concentrations
POLYMER COMPOSITES, APRIL 2001, Vol. 22, No. 2 295

e
Joannie W. Chin, Khaled Aouadi Michael R. Haight, Villiam L. Hughes, and Tinh Nguyen
Table 3. FTIR Peak Height Ratios for lsopolyester Following Exposure to Water, Salt Solution and Pore Solution, Referenced to Aromatic C-H Stretch at 3027 cm-’.
3439 cm-’ 1728 cm-1 1298 cm-l 1233 cm-1 11 56 cm-l 0-H stretch C=O stretch C-O stretch C-O stretch C-0 stretch
Polyester Control
Water/RT/52 weeks Water/6O0C/20 weeks Water/90°C/1 0 weeks
Salt solution/RT/52 weeks Salt solution/6O0C/20 weeks Salt soIution/9OoC/1 0 weeks
Pore soln./RT/52 weeks Pore soln./6O0C/20 weeks Pore soln./90°C/1 0 weeks
.88
.23
.23
.18
.19
.19
.31
.25
.17
.24
5.9
3.0 3.5 3.1
4.2 3.5 3.1
5.6 2.7 1.9
2.6
1.8 2.0 1.8
2.2 2.0 1.8
2.5 1.5 1 .o
4.3
2.5 2.9 2.5
3.3 2.9 2.5
4.1 2.2 1.3
4.3
1.9 2.2 2.0
2.3 2.2 1.9
2.7 1.7 1.2
of sodium. potassium and calcium comparable to those of the unexposed control specimens. The pres- ence of sodium, potassium and calcium in the iso- polyester specimen exposed to 60°C pore solution may be attributed to the visible degradation of this particu- lar specimen and the subsequent ingress of ions via surface microcracks. It was shown by Katsuki and Uomoto (19) using electron probe analysis that signifi- cant penetration of sodium ions into fiber-reinforced vinyl ester rods occurred after 120 days in 2 mol/L NaOH. In another study, using atomic absorption spectrometry, Soulier reported that no transport of sodium or chloride ions occurred into fiber-reinforced epoxy composites following immersion in salt solu- tions (20). It should be noted, however, the transport of ions into fiber-reinforced materials will be mecha- nistically different because of the availability of addi- tional pathways for ingress.
SUMMARY
Unreinforced free films of vinyl ester and isophthalic polyester were characterized with D m A , DSC, TGA, FTIR and tensile testing following exposure to water, alkaline and saline environments at ambient and ele- vated temperatures for extended times. Increases in the Tg following exposure were obsenred for both vinyl ester and polyester, which were attributed to hydroly- sis and subsequent dissolution of low molecular seg- ments. Decreases in the tensile strengths of exposed specimens were appreciable, particularly in the isoph- thalic polyester exposed to elevated temperature con- crete pore solution. Arrhenius plots generated by plot- ting log (time to reach 70% of the original tensile strength) vs. 1/T were fitted with lines having correla- tion coefficients of at least 0.95 for water and salt so- lution. This implies that accelerated aging methods utilizing temperature as the accelerating factor are valid for water and salt solution environments, but not for pore solution exposures in which severe resin degradation was observed. Spectroscopic analysis of the resins following exposure revealed varying degrees
of ester hydrolysis. Examination of the polymers with EDX following immersion in salt solution and simu- lated concrete pore solution showed essentially no ionic penetration into the bulk, except when speci- mens were visibly degraded.
ACKNOWLEDGMENTS
The assistance of Eric Byrd (NIST) in carrying out the ATR-FTIR analysis on the pore solution, and Frank Cromer (Virginia Tech Chemistry Department), who performed the EDX analysis, are gratefully ac- knowledged.
REFERENCES
1. S. M. Halliwell, W R A Review Reports, SS, 1 (1992). 2. M. A. French and G. Pritchard, Composites Science and
Technology, 45, 257 (1992). 3. S. P. Sonawala and R J. Spontak, J. Materiais Science,
31, 4745 (1996). 4. B. J. Christensen, T. 0. Mason, and H. M. Jennings, J.
American Ceramic Society, 7s. 939 (1992). 5. J. W. Chin, T. Nguyen, and K. Aouadi, J. Applied Poly-
mer Science, 7 1, 483 (1 999). 6. H. Lee. Materials Research and Standards, November 1963, p. 910.
7. A. Apicella, C. Migliaresi, L. Nicolais, L. Iaccarho, and S. Roccotelli, Composites. 387, 14 (1983).
8. T. Morii, T. Tanimoto, H. Hamada, 2. Maekawa, T. Hi- rano. and K. Kiyosumi. Composites Science and Technol- ogy, 49, 209 (1993).
9. H. P. Abeysinghe, W. Edwards, G. Pritchard, and G. J. Swampillai, Polymer, 23, 1785 (1982).
10. M. Ganem, B. Mortaigne, V. Bellenger, and J. Verdu, Polymer Network Blends. 4, 87 (1994).
11. A. Apicella. C. Migliaresi, L. Nicolais. L. Iaccarino, and S. Roccotelli, Composites, 14(4). 387 (1983).
12. R. B. Prime. in Thermal Characterization of Polymeric
13.
14.
Materials. E. Turi, ed.. Academic Press (1981). L. prim. R. Pollard, R. Shan. C. W. Matropietro. T. R Gentry, L. C. Bank, and A. Barkatt. in High Tempera- ture and Environnmental Effects on Polymeric Compos- ites, ASTM STP 1302. American Society for Testing and Materials ( 1997). S. D. Altizer, P. V. Vijay, H. V. S. GangaRao. N. Dou- glass, and R. Pauer, Proceedings from the Composite Institute’s 51st Annual Conference and Exposition, p. 3-C/1. 1996.
I
296 POL YMER COMPOSITES, APRIL 2001, Vol. 22, No. 2

4
Effects of Water,,Salt Solution and Simulated Concrete
15. W. Nelson, Accelerated Testing: Statistical Models. Test Plans. and Data Analysis, Wiley Interscience, New York
16. B. A. Proctor, D. R. Oakley, and K. L. Litherland, Com- posites, 13(2), 173 (1982).
17. T. Nguyen and E. Byrd, Rmeedings of the 19th Annual Meeting of the Adhesion Society, p. 453, T. C. Ward, ed. ( 1996).
( 1990).
__
POLYMER COMPOSITES, APRIL 2001, Vol. 22, No. 2
18. I. Ghorbel and D. Valentin, Polyn Compos., 14, 324 ( 1993).
19. F. Katsuki and T. Uomoto, Non-metallic (FRP) Reinforce- rnentfor Concrete Structures, p. 82, L. Taerwe, ed., E and FN Spon ( 1995).
20. J. P. Soulier, R. Berruet, A. Chateauminois, B. Chabert, and R. Gauthier, Polymer Communications, 29. 243 (1988).
297