Effects of stocking density on the growth and survival of Oreochromis niloticus cultured in hapas in...
7
African Journal of Agricultural Research Vol. 7(15), pp. 2405-2411, 19 April, 2012 Available online at http://www.academicjournals.org/AJAR DOI: 10.5897/AJAR11.2313 ISSN 1991-637X ©2012 Academic Journals Full Length Research Paper Effects of stocking density on the growth and survival of Oreochromis niloticus cultured in hapas in a concrete tank Elliot Haruna Alhassan*, Emmanuel Delwin Abarike and Christian Larbi Ayisi Department of Fisheries and Aquatic Resources Management, University for Development Studies, P. O. Box TL 1882, Tamale, Ghana. Accepted 12 March, 2012 The study was conducted over a 90 day period to investigate the effects of stocking density on the growth and survival of fry Oreochromis niloticus cultured in hapas in a concrete tank. Fish of average initial weight 0.3 g ± 0.03 were stocked at three different rates: 8, 10 and 12 fish/m 3 corresponding to 56, 70 and 84 fish per hapa. Fish were fed twice daily with powdered pito mash at 10% of the biomass. The average initial weights of the fish varied slightly but not significant (P > 0.05) among all the treatments. At the end of the trial, the average final weights varied significantly (P < 0.05). Fish stocked at 8 m 3 exhibited the highest average weight gain (4.65 ± 0.19 g) whiles; fish stocked at 12 m 3 recorded the lowest average weight gain (2.50 ± 0.27 g). Feed conversion ratio and specific growth rate were not significantly different (P > 0.05) for all treatments. Survival rate were similar (P > 0.05) among treatments. The results demonstrate that increasing rearing density in fry O. niloticus resulted in heterogeneous growth rates. Feed conversion ratios, specific growth and survival rates were not affected by different stocking densities. Key words: Nile tilapia, aquaculture, fish nutrition, fry fish, survival rate. INTRODUCTION The consumption of fish cuts across many ecological races and cultures worldwide. This is because fish improves protein nutrition in that, it has a high biological value in terms of high protein retention and assimilation as compared to other animal protein sources. Fish accounts for about a fifth of world total supply of animal protein and this has risen five folds over the last forty years from 20 million metric tonnes to 98 million metric tones in 1993 and projected to exceed 150 million *Corresponding author. E-mail: [email protected]. Tel: +233243567152. metric tonnes by the year 2010 (Olagunju et al., 2007). In recent times, there have been loud cries about the decline in supply of fish as productions from capture fisheries no longer meet the current demand (Gabriel et al., 2007). However, with this steady decline in capture fisheries, aquaculture is a readily veritable tool in the provision of fish to augment the protein needs of people who depend a lot on supply from capture fisheries (Pillay and Kutty, 2005; Stickney, 2005). According to the FAO (2006), aquaculture has grown into a multi-billion dollar industry. Rapid growth in the aquaculture industry has helped to alleviate some of the human dependence on depleted natural fish stocks. The Nile tilapia, Oreochromis niloticus is a member of the Cichlid family
-
Upload
independent -
Category
Documents
-
view
4 -
download
0
Transcript of Effects of stocking density on the growth and survival of Oreochromis niloticus cultured in hapas in...

African Journal of Agricultural Research Vol. 7(15), pp. 2405-2411, 19 April, 2012 Available online at http://www.academicjournals.org/AJAR DOI: 10.5897/AJAR11.2313 ISSN 1991-637X ©2012 Academic Journals
Full Length Research Paper
Effects of stocking density on the growth and survival of Oreochromis niloticus cultured in hapas in a
concrete tank
Elliot Haruna Alhassan*, Emmanuel Delwin Abarike and Christian Larbi Ayisi
Department of Fisheries and Aquatic Resources Management, University for Development Studies, P. O. Box TL 1882, Tamale, Ghana.
Accepted 12 March, 2012
The study was conducted over a 90 day period to investigate the effects of stocking density on the growth and survival of fry Oreochromis niloticus cultured in hapas in a concrete tank. Fish of average initial weight 0.3 g ± 0.03 were stocked at three different rates: 8, 10 and 12 fish/m
3 corresponding to 56,
70 and 84 fish per hapa. Fish were fed twice daily with powdered pito mash at 10% of the biomass. The average initial weights of the fish varied slightly but not significant (P > 0.05) among all the treatments. At the end of the trial, the average final weights varied significantly (P < 0.05). Fish stocked at 8 m
3
exhibited the highest average weight gain (4.65 ± 0.19 g) whiles; fish stocked at 12 m3 recorded the
lowest average weight gain (2.50 ± 0.27 g). Feed conversion ratio and specific growth rate were not significantly different (P > 0.05) for all treatments. Survival rate were similar (P > 0.05) among treatments. The results demonstrate that increasing rearing density in fry O. niloticus resulted in heterogeneous growth rates. Feed conversion ratios, specific growth and survival rates were not affected by different stocking densities. Key words: Nile tilapia, aquaculture, fish nutrition, fry fish, survival rate.
INTRODUCTION The consumption of fish cuts across many ecological races and cultures worldwide. This is because fish improves protein nutrition in that, it has a high biological value in terms of high protein retention and assimilation as compared to other animal protein sources. Fish accounts for about a fifth of world total supply of animal protein and this has risen five folds over the last forty years from 20 million metric tonnes to 98 million metric tones in 1993 and projected to exceed 150 million *Corresponding author. E-mail: [email protected]. Tel: +233243567152.
metric tonnes by the year 2010 (Olagunju et al., 2007). In recent times, there have been loud cries about the decline in supply of fish as productions from capture fisheries no longer meet the current demand (Gabriel et al., 2007). However, with this steady decline in capture fisheries, aquaculture is a readily veritable tool in the provision of fish to augment the protein needs of people who depend a lot on supply from capture fisheries (Pillay and Kutty, 2005; Stickney, 2005). According to the FAO (2006), aquaculture has grown into a multi-billion dollar industry. Rapid growth in the aquaculture industry has helped to alleviate some of the human dependence on depleted natural fish stocks. The Nile tilapia, Oreochromis niloticus is a member of the Cichlid family

2406 Afr. J. Agric. Res. native to Africa (FAO, 2001) that has been widely cultured due to its culture potentials (for example, wide tolerance for poor environment, prolific breeder and
completes its life cycle in captivity) (El‐Sayed, 1999; Tahoun et al., 2008). About 80% of the species of fish cultured in Ghana is O. niloticus (Hiheglo, 2008). Many small-scale farmers have failed to culture fish because of insufficient knowledge such as stocking fry at too small size and at high density (Edwards and Demaine, 1988). Fish that are kept at high densities exhibit behavioral limitations that influence their growth.
Fish culture activities in many other parts of the world create the need to have adequate knowledge of good stocking to obtain better and healthier yields. Stocking density is an important indicator that determines the economic viability of the production system (Ako et al., 2005; Aksungur et al., 2007). Knowing the best densities for a species is a critical factor for good husbandry practices and creating efficient culture systems. The objectives of the present study therefore was to investigate the effects of stocking densities on growth and survival of O. niloticus reared in “hapas” (mosquito netting sown into a cuboid like structure to contain fish in water) in a concrete tank and evaluate the effects of water quality on different stocking rates of O. niloticus produced in hapas in a concrete tank. MATERIALS AND METHODS The study was conducted in a concrete tank of dimensions 14.15 × 14.15 × 2.67 m at the Fisheries Commission of the Ministry of Food and Agriculture (MOFA), Tamale in the Northern Region of Ghana. Six hapas (that is, each of dimensions 2.5 × 2.8 × 1 m) were mounted in a concrete tank with the aid of nylon ropes tied to the edges of the hapas, stretched and fastened to stones placed at vantage points. Treatment replicates were randomly distributed to the mounted hapas and stocked with fry of O. niloticus harvested from Libga reservoir in the Northern Region. Harvested fry from the wild (that is, from the Libga reservoir) were acclimatized for about a week in the concrete tank and during which time they were fed with “pito mash” (spent sorghum grains from the production of local beer in the 3 Northern regions of Ghana). Pito mash is a by-product from spent sorghum grains which is used in the production of local beer called pito. Pito is produced and consumed extensively in the Upper East and West regions of Ghana as it is used in funerals and festive days and sold everyday everywhere within these two locations. Pito mash as by-product is used as feed for pigs, livestock including poultry and in some case as baits for fish in the wild by fishermen in most parts of the mentioned regions in Ghana. The nutritional composition of pito mash used in this study is shown in Table 3. After acclimatization, the fry of O. niloticus (average initial weight, 0.3 ± 0.03 g; N = 420) were reared for 90 days (January 2010 to April 2011) at three different stocking density groups of 8, 10 and 12 fish/m3 corresponding to 56, 70 and 84 fish per hapa (replicated twice).
The fish were fed twice a day between 0800 to 0900 GMT and
1500 to 1600 GMT with powdered pito mash at 10% of the biomass. Fish from each replicate treatment were randomly sampled and weighed every 2 weeks and returned to the hapas. Their weights were taken with an electronic scale to the nearest 0.01 g after gently blotting with a towel. During sampling, 20% of the stocked fish in each hapa were scooped out with a scoop net and weighed individually and based on the weight gains feed was adjusted accordingly. After the ninety (90) days of culture period, the water level of the tank was reduced to aid in the harvesting of the fish. All the fish in the hapas were weighed individually and the total number of fish in each hapa counted. To determine the growth response and survival, the following parameters were calculated: Feed conversion ratio (FCR) Feed conversion ratio was computed as (Jhingran, 1991):
Total feed given FCR = (1) Total weight gained by fish
Specific growth rate/day (SGR)
Specific growth rate was computed as (SGR):
lnW2 – lnW1
SGR = × 100 (2) T
Where: W1 = initial weight (g) at stocking, W2 = final weight (g) at the end of experiment, InW2 – InW1 = natural logarithms of both the final and initial weight of fish, T = duration (in days) of trial (Adewolu, 2008; Ogunji et al., 2008; Effiong et al., 2009).
Survival rate (SR)
Survival of the fish was monitored to determine the survival rate (SR) of various treatments using the formula (Ogunji et al., 2008):
(3)
Water quality parameters were measured biweekly. Ammonia was measured using the Direct nesslerization method, Nitrite using the „diazotization method‟ and Hydrazine reduction method for Nitrate. Turbidity was measured using a turbidimeter (Model LaMotte 2020), pH was measured using Lovibond 2000 pH meter, „dissolved oxygen‟ with the Crimson OXI 45 m and temperature using a clinical thermometer. Data were represented as arithmetic means of individual weights (±SE). Daily mortalities were noted and survival rates were calculated as mean and cumulative values. The differences including stock density, SGR, FCR and survival rates among groups were analyzed with one-way analyses of variance (ANOVA) and Duncan‟s multiple range tests with SPSS version 16 from windows. Water quality parameters were analyzed using standard methods according to APHA (1985).

Alhassan et al. 2407
Table 1. Parameters calculated on the growth performance at different stocking densities of Oreochromis niloticus (mean ± standard error). Means with same superscript are homogenous.
Parameter Treatment
ANOVA I II III
AIW (g) 0.33±0.003a (p = 0.178) 0.32±0.005
a (p = 0.178) 0.32±0.005
a (p = 0.178) F = 1.857 (p = 0.299)
AFW (g) 4.65 ±0.19a (p = 0.093) 3.80±0.19
b (p = 0.093) 2.50±0.27
c (p = 1.00) F = 2.953 (p = 0.007)
FCR 2.05±0.02a (p = 0.196) 2.27±0.39
a (p = 0.196) 2.30±0.36
a (p = 0.196) F = 2.953 (p = 0.007)
SGR (%) 2.78±0.16a (p = 1.000) 3.16±0.30
a (p = 1.000) 3.10±0.30
a (p = 1.000) F = 81.444 (p = 0.000)
SR (%) 85.00±1.49a (p = 0.405) 83.13±2.09
a (p = 1.000) 86.78±2.38
a (p = 0.405 F = 11.191 (p = 0.041)
Legend: TRT = Treatment, AIW = average initial weight, AFW = average final weight, FCR = feed conversion ratio, SGR = specific growth rate, SR = survival rate and % = percent.
Table 2. Physicochemical parameters monitored during the culture period.
Parameter Unit of measurement Range Mean ± standard error APHA (1985)
Ammonia mg/L
0.02 – 0.26 0.01 ± 0.04 0 – 0.3
Nitrite mg/L
0.001– 0.341 0.147 ± 0.047 0.06 – 0.25
Nitrate mg/L
0.01 – 0.65 0.34 ± 0.09 0 – 1.0
Turbidity NTU 34 – 57 45 ± 3.19 0 - 100
pH - 6.2 – 7.2 6.67 ± 0.11 6.5 – 9.0
Dissolved oxygen mg/L
2.53 – 3.65 3.18 ± 0.16 5 – 8
Temperature ºC 31.1 – 31.8 31.35 ± 0.09 28 – 30
RESULTS The study was carried out from January 2010 to April 2011 in concrete tank culture conditions. Results on the growth performance of fry of O. niloticus (Table 1) indicate that, the average initial weights (AIW) of the test fish varied slightly but not significant (P > 0.05) among all the treatments (TRTs). However, at the end of the trial, the average final weights (AFW) were significantly (P < 0.05) different among the TRTs. Fish in treatment I (TRT I), stocked at 8 m
3, exhibited the highest AFW (4.65 ±
0.19 g) whilst the fish in treatment III (TRT III) stocked 12 m
3 recorded the lowest AFW (2.50 ± 0.27 g). Feed
conversion ration (FCR) were not significantly (P > 0.05) different for fish stocked at different densities. The specific growth rate (SGR) did not vary significantly (P > 0.05) among the TRTs although fish stocked at 10 m
3,
treatment II (TRT II) recorded the highest (3.16 ± 0.30) SGR and fish stocked 8 m
3 recorded the lowest (2.78 ±
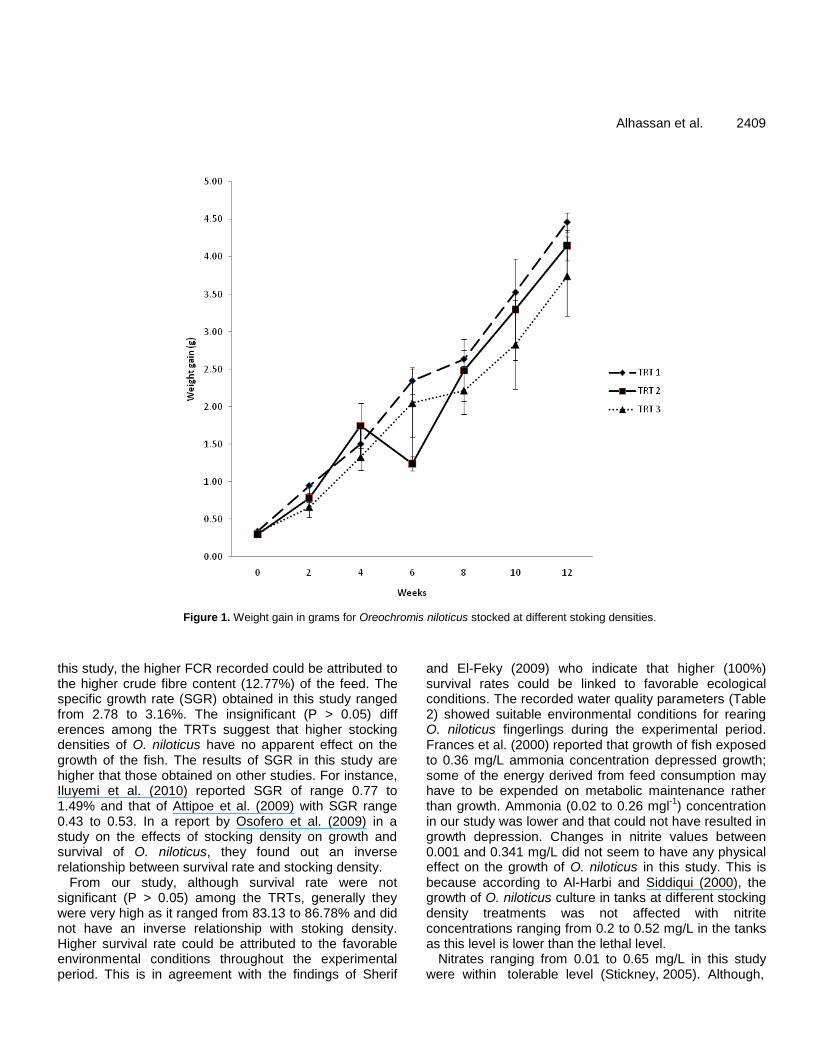
0.16) SGR. From the experiment, although there were no observed significant (P > 0.05) differences among the TRTs in terms of survival, the highest survival rate (SR) of 86.78 ± 2.38 was recorded in TRT III followed by TRT I with 85.00 ± 1.49 and TRT II with 83.13 ± 2.09 was lowest. Growth curves of fish in response to the different
stocking densities over the 12 week experimental period are shown in Figure 1. Growth of fish in treatment (TRT) I was gradual throughout the experimental period.
Fish in treatment (TRT) II showed a gradual increase from the time of stocking till the sixth week of culture where lower weights were recorded. However, higher weight gains were recorded after the sixth week of sampling till the end. Growth of fish in TRT III after the initial week demonstrated a gradual increase from the start to the end but was lower than all the fish in the other treatments. Water quality of the concrete tank The quality of the water in the concrete tank was monitored throughout the study period. In Table 2, ammonia ranged from 0.02 to 0.26 mg/L with a mean of 0.01 ± 0.04 mg/L; nitrite ranged from 0.001 to 0.341 mg/L with a mean of 0.147 ± 0.047 mg/L and nitrate ranged from 0.01 to 0.65 mg/L with a mean of 0.34 ± 0.09 mg/L. Turbidity ranged from 34 to 57 NTU with a mean of 45 ± 3.19 NTU. pH ranged from 6.2 to 7.2 with a mean of 6.67 ± 0.11. Dissolved oxygen ranged from 2.53 to 3.65 mg/L with a mean value of 3.18 ± 0.16 mg/L whiles temperature

2408 Afr. J. Agric. Res.
Table 3. Chemical composition of pito mash.
Type of analysis Pito mash
Dry matter (%) 92.93
Crude protein (%) 28.77
Ether extract (%) 7.81
Crude fibre (%) 12.77
Ash (%) 4.42
Nitrogen-free extract (%) 46.23
*GE (MJ/kg) 17.82
*Gross energy (GE) was calculated using the biological fuel values of 23.64, 39.54 and 17.15 MJ/kg for protein, fat and carbohydrate, respectively according to Ali and Al-Asgall (2001).
ranged from 31.1 to 31.8°C with a mean value of 31.35 ± 0.09°C. DISCUSSION The growth curves of this study demonstrated a gradual phase of growth in all the treatments. However, at points where the treatment growth curves overlapped could be due to sampling error. For instance, growth of fish in TRT II declined in the sixth week rose up in the eight week and assumed a gradual increasing growth till the experiment was terminated. It is likely that during the sixth week of sampling, many of the fish that were sample in TRT II were smaller in size than in the previous sample, hence a recorded decrease in growth. However, it is evident that growth of fish is enhanced at lower stocking densities as demonstrated in TRT I in which growth was higher throughout. This accession gives credence to Yousif (2002) who reported that it is a generally accepted principle, that increasing the number of fish (density) will adversely affect fish growth. The observation; decrease growth rates with increasing stocking density in this study corresponds to observation reported by Breine et al. (1996). Yousif (2002) found that, as the initial fish size was homogeneous and the daily supplies of food were ample, one would expect that the fish within each population/treatment would have slightly different final body sizes. In this study, however, although the initial fish size was homogeneous for all treatment, the stocking density had an effect on the final size among individuals of initially uniform size. Explanation for this can be drawn from Aksungur et al. (2007) who indicated that social interactions through competition for food and/or space can negatively affect fish growth. Moreover, Aksungur et al. (2007) explained that, higher stocking
densities leads to increased stress and that resulting increase in energy requirements causing a reduction in growth rates and food utilization. On the contrary, our findings does not support Osofero et al. (2009) who reported increased fish production with increased stocking density, attributed to good feed quality and favorable physico-chemical conditions.
The ability of fish to convert feed given to biomass (FCR) was not affected with increasing stocking density in this study as was the case of Osofero et al. (2009). This could be explained by the fact that the same feed was administered to the same strain of experimental fish in all treatments in the same water environment. Therefore, the ability of the fish to convert the feed in all the treatment was same. It is also suggestive that higher stocking density does not necessary affect FCR. The FCR of ranged from 2.05 to 2.30 in this study are higher than others. El-Dakar et al. (2008) reported with FCR range of 0.99 to 1.17 for Florida Red Tilapia fed on fig jam by- product (FJB). The FCRs (2.05 to 2.30) in the current study though good, because it is slightly higher than the recommended FCR of 1.5 for aquaculture (Stickney, 1979), they are lower for O. niloticus fed on a commercially prepared diet in a study by Siddiqui et al. (1991) who reported FCR values ranging from 3.7 to 4.9 and Liti et al. (2006) reported FCR for O. niloticus and Clarias gariepinus to range between 3.40 to 4.04. The slight differences could stem from the differences in feed sources, environmental conditions and the particular strain of species used. This explanation is in agreement with Guimaraes et al. (2008) that efficient utilization of diets may vary even within a single species because of the particular strain of fish used and the environmental factors. Ali and Al-Asgall (2001) reported that elevated crude fiber (beyond 10.5%) content for fish diets may exert a negative effect on the digestibility of nutrients. In
Alhassan et al. 2409
Figure 1. Weight gain in grams for Oreochromis niloticus stocked at different stoking densities.
this study, the higher FCR recorded could be attributed to the higher crude fibre content (12.77%) of the feed. The specific growth rate (SGR) obtained in this study ranged from 2.78 to 3.16%. The insignificant (P > 0.05) diff erences among the TRTs suggest that higher stocking densities of O. niloticus have no apparent effect on the growth of the fish. The results of SGR in this study are higher that those obtained on other studies. For instance, Iluyemi et al. (2010) reported SGR of range 0.77 to 1.49% and that of Attipoe et al. (2009) with SGR range 0.43 to 0.53. In a report by Osofero et al. (2009) in a study on the effects of stocking density on growth and survival of O. niloticus, they found out an inverse relationship between survival rate and stocking density.
From our study, although survival rate were not significant (P > 0.05) among the TRTs, generally they were very high as it ranged from 83.13 to 86.78% and did not have an inverse relationship with stoking density. Higher survival rate could be attributed to the favorable environmental conditions throughout the experimental period. This is in agreement with the findings of Sherif
and El-Feky (2009) who indicate that higher (100%) survival rates could be linked to favorable ecological conditions. The recorded water quality parameters (Table 2) showed suitable environmental conditions for rearing O. niloticus fingerlings during the experimental period. Frances et al. (2000) reported that growth of fish exposed to 0.36 mg/L ammonia concentration depressed growth; some of the energy derived from feed consumption may have to be expended on metabolic maintenance rather than growth. Ammonia (0.02 to 0.26 mgl
-1) concentration
in our study was lower and that could not have resulted in growth depression. Changes in nitrite values between 0.001 and 0.341 mg/L did not seem to have any physical effect on the growth of O. niloticus in this study. This is because according to Al-Harbi and Siddiqui (2000), the growth of O. niloticus culture in tanks at different stocking density treatments was not affected with nitrite concentrations ranging from 0.2 to 0.52 mg/L in the tanks as this level is lower than the lethal level.
Nitrates ranging from 0.01 to 0.65 mg/L in this study were within tolerable level (Stickney, 2005). Although,

2410 Afr. J. Agric. Res. turbidity in our experiment was slightly above > 50 reported by Ardjosoediro and Ramnarine (2002) was found to reduce growth rate of the Jamaica Red, there were no observed effects of turbidity (34 to 57 NTU) on growth of O. niloticus in this study. This was because of the periodic replenishment of the water. Changes in pH of 6.2 to 7.2 as recorded in this study were slightly acidic (6.2) to slightly alkaline (7.2). However, El-Sherif and El-Feky (2009) recommended a pH range of 7 (neutral) to 8 (basic) as optimum for the culture of O. niloticus. Growth was not depressed in this study. In a report by Boyd (2005), Tilapias are rather tolerant to low dissolved oxygen, and concentrations of 3 to 4 mg/L apparently are not extremely harmful to them even with long-term exposure. Though the dissolved oxygen range of 2.53 to 3.65 mg/L in this study were lower than the recom-mended level of 5 to 8 mg/L (APHA, 1985) for aquaculture systems, there were no observed apparent effects on the growth of fish because, trial fish consumed feed aggressively at each time of administration. Water temperature ranged from 31.1 to 31.8°C. These values are in the preferred range for optimum growth for Nile Tilapia, O. niloticus (Xu et al., 2005; El-Sherif and El-Feky, 2009).
In conclusion, the results of this study demonstrate that increasing rearing density in fingerlings of O. niloticus result in heterogeneous growth rates. Feed conversion ratios, specific growth rate and survival rates are not affected by stocking densities in this study. In addition, water quality parameters recorded in this study did not affect the growth of fry of O. niloticus adversely.
ACKNOWLEDGMENT
The authors wish to thank the technical staff at the Fisheries Commission, Tamale for their assistance during the experiment. REFERENCES Al-Harbi, AH, Siddiqui, AQ (2000). Effects of tilapia stocking densities
on fish growth and water quality in tanks. Asian Fish. Sci., 13: 391-396.
Adewolu MA (2008). Potentials of sweet potato (Ipomoea batatas) leaf meal as dietary ingredient for Tilapia zillii fingerlings. Pak. J. Nutr., 7(3): 444-449.
Ako HE, Shimizu K, de Lemos L, Tamaru C (2005). Behavioral limitations of high density fish grow-out. World Aquaculture, 36(3): 25-29.
Aksungur N, Aksungur M, Akbulut B, Kutlu I (2007). Effects of stocking density on growth performance, survival and food conversion ratio of Turbot (Psetta maxima) in the net cages on the southeastern coast of the Black Sea. Turkish J. Fish. Aquat. Sci., 7: 147-152.
Ali A, Al-Asgall NA (2001). Effect of feeding different carbohydrate to lipid ratios on the growth performance and body composition of Nile
tilapia (Oreochromis niloticus) fingerlings. Anim. Res., 50: 91-100. American Public Health Association (APHA) (1985). Standard methods
for the examination of water and wastewater. 16th edn. Am. Public
Health Association, Washington DC. Ardjosoediro I, Ramnarine IW (2002). The influence of turbidity on
growth, feed conversion and survivorship of the Jamaica red tilapia strain. Aquaculture, 212: 159-165.
Attipoe FYK, Nelson FK, Abban EK (2009). Evaluation of three diets formulated from local agro-industrial by-products from production of Oreochromis niloticus in earthen ponds. Ghana J. Agric. Sci., 42: 185-191.
Boyd CE (2005). Farm–Level issues in aquaculture certification: Tilapia. Auburn, Alabama.
Breine JJ, Nguenga D, Teugels GG, Ollevier F (1996). A comparative Study on the effect of stocking density and feeding regime on the growth rate of Tialpia cameronensis and Oreochromis niloticus (Cichlidae) in fishculture in Cameroon. Aquat. Living Resour., 9: 51-56.
Edwards P, Demaine H (1988). Rural Aquaculture: Overview and Framework for country reviews. RAP Pub. 1997/36. Rap/fao.Bangkok.
Effiong BN, Sanni A, Fakunle JO (2009). Effect of partial replacement of fishmeal with duckweed (Lemna pauciscostata) meal on the growth performance of Heterobranchus longifilis fingerlings. Report and Opin., 1(3): 76-81.
El-Dakar AY, Abd-Elmonem AI, Shalaby SMM (2008). Evaluation of Fig Jam by-product as an energy source in Florida Red Tilapia, Oreochromis, niloticus x Oreochromis mosambicus diets. Mediterr. Aquaculture J., 1(1): 27-34.
El-Sayed A (1999). Effects of stocking density and feeding levels on growth and feed efficiency of Nile tilapia (Oreochromis niloticus L.) fry. Aquaculture Res. 33: 621–626.
El-Sherif MS, El-Feky AMI (2009). Performance of Nile tilapia (Oreochromis niloticus) fingerlings. I. Effect of pH. Inter. J. Agric. Biolo., 11: 297-300.
FAO (2001). Food and Agriculture Organization of the United Nations: Summary tables of fishery statistics: world aquaculture production by principal species.
FAO (2006). The state of the world fisheries and aquaculture. FAO, Rome, Italy.
Frances J, Nowak BF, Allan GL (2000). Effects of ammonia on fingerlings Silver perch, (Bidyanus bidyanus). Aquaculture, 183: 95-103.
Gabriel UU, Akinrotimi OA, Bekibele, DO, Onunkwo, DN, Anyanwu, PE (2007). Locally produced fish feed: potentials for aquaculture development in Subsaharan Africa. Afri. J. Agric. Res., 2(7): 287-295.
Guimaraes IG, Pezzato LE, Barros MM, Tachibana L (2008). Nutrient digestibility of cereal grain products and by-products in extruded diets for Nile tilapia. J. World Aquaculture Soc., 39(6): 781-789.
Hiheglo PK (2008). Aquaculture in Ghana; prospects, challenges, antidotes andfuture perspectives. Master thesis in international fisheries management. University of Tromso, Norway.
Iluyemi FB, Hanafi MM, Radziah O, Kamarudin MS (2010). Nutrition evaluation of fermented palm kernel cake using red tilapia. Afr. J. Biotechnolo., 9(4): 502-507.
Jhingran VG (1991). Fish and Fisheries of India. 3rd edn. Hindustan
Publishing Co., Delhi, India. Liti DM, Mugo RM, Munguti JM, Waidbacher H (2006). Growth and
economic performance of Nile tilapia (Oreochromis niloticus L.) fed on three brans (maize, wheat and rice) in fertilized ponds. Aquaculture Nutr., 12: 239 - 245. Ogunji J, Toor R, Schulz C, Kloas W (2008). Growth performance, nutrient utilization of Nile tilapia Oreochromis niloticus fed housefly maggot meal (Magmeal) diets. Turkish J. Fish. Aquat. Sci., 8: 141-147.
Osofero SA, Otubusin SO, Daramola JA (2009). Effect of stocking

density on tilapia (Oreochromis niloticus Linnaeus 1757) growth and survival in bamboo – net cages trial. Afr. J. Biotechnolo., 8(7): 1322-1325.
Pillay TVR, Kutty MN (2005). Aquaculture, principles, and practices. 2nd Edn. Blackwell publishing.
Siddiqui AQ, Howlader MS, Adam AE (1991). Effects of water exchange on Oreochromis niloticus L. growth and water quality in outer concrete tanks. Aquaculture, 95: 67-74.
Stickney, RR (1979). Principles of warmwater aquacutlure. Texas: Wiley-Interscience Press, pp.361.
Stickney RR (2005). Aquaculture: An introductory text. CABI, Texas: USA.
Alhassan et al. 2411 Tahoun AM, Ibrahim M, Hammouda YF, Eid MS, Zaki El-Din MMA,
Magouz FI (2008). Effects of age and stocking density on spawning performance of Nile tilpia, Oreochromis niloticus (l.) broodstock reared in hapas. 8th International symposium on tilapia in aquaculture.
Xu JY, Miao XW, Lu Y, Cui SR (2005). Behavioral response of tilapia (Oreochromis niloticus) to acute ammonia stress monitored by computer vision. J. Zhejiang Univ. Sci. B. 6: 812–816.
Yousif OM (2002). The effects of stocking density, water exchange rate, feeding frequency and grading on size hierarchy development in juvenile Nile tilapia, Oreochromis niloticus. Emir. J. Agric. Sci., 14: 45-53.