Effects of Response Format on Diagnostic Assessment of Scholastic Achievement
11
353 Effects of Response Format on Diagnostic Assessment of Scholastic Achievement Menucha Birenbaum, Tel Aviv University Kikumi K. Tatsuoka, Educational Testing Service Yaffa Gutvirtz, High School Ironi Daled, Tel Aviv, Israel The effect of response format on diagnostic as- sessment of students’ performance on an algebra test was investigated. Two sets of parallel, open- ended (OE) items and a set of multiple-choice (MC) items-which were stem-equivalent to one of the OE item sets-were compared using two diagnostic approaches: a &dquo;bug&dquo; analysis and a rule-space analysis. Items with identical format (parallel OE items) were more similar than items with different formats (OE vs. ntC). Index terms: bug analysis, diagnostic assessment, free-response, item format, multiple-choice, rule space. Response formats of assessment measures vary. There are two broad categories of response-constructed response and choice response-with various types of formats sub- sumed under each. In a constructed-response (also known as free-response) format, an ex- aminee is required to generate an answer to an open-ended (OE) item; in a choice-response for- mat, an examinee is required to select one or more answers from a short list of options. The most common item type in this category is the multiple-choice (lvtc) item. Numerous studies have compared the two for- mats with respect to different domains and from different perspectives. (For recent reviews of the literature see Bennett, 1991; Traub & MacRury, 1990.) Response format comparisons have in- cluded theoretical considerations of the cognitive processing requirements of the two formats; empirical investigations concerning the psycho- metric properties of the two formats; examination of interaction effects of factors such as gender, race/ethnicity, test anxiety, test wiseness, and examinees’ attitudes toward the formats; and examination of the effects of format expectancy on test preparation and test performance. Some of the psychometric properties on which the two response formats have been extensively contrasted include item difficulty and test relia- bility (e.g., Martinez, 1991; Oosterhof & Coats, 1984; Traub & MacRury, 1990); construct validi- ty (e.g., Bennett, Rock, Braun, Frye, Spohrer, & Soloway, 1990; Van den Bergh, 1990; Ward, 1982; Ward, Frederiksen, & Carlson, 1980); and predic- tive validity (e.g., Bridgeman, 1991; Bridgeman & Lewis, 1991). Despite strong assertions by cog- nitive theorists regarding the differences between the cognitive demands of the two formats, the empirical studies have yielded only equivocal evi- dence for format effects (Traub & MacRury, 1990). There is little research on the effect of re- sponse formats on the diagnostic assessment of scholastic achievement. However, Birenbaum & Tatsuoka (1987) compared OE and ntc items in an arithmetic procedural task with respect to var- ious criteria, including the average number of different error types per examinee and the diag- nosed sources of misconception. The results in- dicated considerable differences between the two response formats, favoring the OE format for di- agnostic assessment. The present study further examined the effect Downloaded from the Digital Conservancy at the University of Minnesota, http://purl.umn.edu/93227 . May be reproduced with no cost by students and faculty for academic use. Non-academic reproduction requires payment of royalties through the Copyright Clearance Center, http://www.copyright.com/
Transcript of Effects of Response Format on Diagnostic Assessment of Scholastic Achievement

353
Effects of Response Format on DiagnosticAssessment of Scholastic AchievementMenucha Birenbaum, Tel Aviv University
Kikumi K. Tatsuoka, Educational Testing Service
Yaffa Gutvirtz, High School Ironi Daled, Tel Aviv, Israel
The effect of response format on diagnostic as-sessment of students’ performance on an algebratest was investigated. Two sets of parallel, open-ended (OE) items and a set of multiple-choice (MC)items-which were stem-equivalent to one of theOE item sets-were compared using two diagnosticapproaches: a &dquo;bug&dquo; analysis and a rule-spaceanalysis. Items with identical format (parallel OEitems) were more similar than items with differentformats (OE vs. ntC). Index terms: bug analysis,diagnostic assessment, free-response, item format,multiple-choice, rule space.
Response formats of assessment measuresvary. There are two broad categories of
response-constructed response and choice
response-with various types of formats sub-sumed under each. In a constructed-response(also known as free-response) format, an ex-aminee is required to generate an answer to anopen-ended (OE) item; in a choice-response for-mat, an examinee is required to select one or moreanswers from a short list of options. The mostcommon item type in this category is the
multiple-choice (lvtc) item.Numerous studies have compared the two for-
mats with respect to different domains and fromdifferent perspectives. (For recent reviews of theliterature see Bennett, 1991; Traub & MacRury,1990.) Response format comparisons have in-cluded theoretical considerations of the cognitiveprocessing requirements of the two formats;
empirical investigations concerning the psycho-metric properties of the two formats; examinationof interaction effects of factors such as gender,race/ethnicity, test anxiety, test wiseness, andexaminees’ attitudes toward the formats; andexamination of the effects of format expectancyon test preparation and test performance.
Some of the psychometric properties on whichthe two response formats have been extensivelycontrasted include item difficulty and test relia-bility (e.g., Martinez, 1991; Oosterhof & Coats,1984; Traub & MacRury, 1990); construct validi-ty (e.g., Bennett, Rock, Braun, Frye, Spohrer, &
Soloway, 1990; Van den Bergh, 1990; Ward, 1982;Ward, Frederiksen, & Carlson, 1980); and predic-tive validity (e.g., Bridgeman, 1991; Bridgeman& Lewis, 1991). Despite strong assertions by cog-nitive theorists regarding the differences betweenthe cognitive demands of the two formats, theempirical studies have yielded only equivocal evi-dence for format effects (Traub & MacRury,1990).
There is little research on the effect of re-
sponse formats on the diagnostic assessment ofscholastic achievement. However, Birenbaum &Tatsuoka (1987) compared OE and ntc items inan arithmetic procedural task with respect to var-ious criteria, including the average number ofdifferent error types per examinee and the diag-nosed sources of misconception. The results in-dicated considerable differences between the two
response formats, favoring the OE format for di-agnostic assessment.
The present study further examined the effect
Downloaded from the Digital Conservancy at the University of Minnesota, http://purl.umn.edu/93227. May be reproduced with no cost by students and faculty for academic use. Non-academic reproduction
requires payment of royalties through the Copyright Clearance Center, http://www.copyright.com/
354
of response format using additional diagnosticassessment criteria. In this study, comparisonswere made between parallel-stem items withidentical response format (OE) and stem-
equivalent items with different response formats(OE vs. MC). In addition to comparing the diag-nostic results of different formats, parallel OEitems were contrasted to address the issue of
&dquo;bug&dquo; instability (see, e.g., Payne & Squibb,1990; Sleeman, Kelly, Martinak, Ward, & Moore,1989). A bug (or &dquo;mal-rule&dquo;) is an incorrect rulethat an examinee uses to solve a problem. To theextent that bugs are unstable, the diagnosticresults of subsets with the same format or differ-ent formats may be affected. The criteria for ex-
amining the response format effect were: (1) theextent of similarity between the diagnostic resultsfrom each of the three subsets, and (2) the per-cent of matched bugs and matched sources oferrors (task attributes) in the three subsets. Theprocedural task used was the solution of algebraiclinear equations with one unknown. Two diag-nostic approaches were employed: A bug analy-sis (a deterministic approach for identifying themal-rules underlying the examinees’ response pat-terns ; e.g., Brown & Burton, 1978), and a
probabilistic approach-rule space analysis (Tat-suoka, 1983, 1985, 1990, 1991; Tatsuoka & Tat-
suoka, 1987).
Method
Examinees
The sample consisted of 231 8th and 9th
graders (ages 14-15) from a high school in TelAviv that was heterogeneous with respect to mathability and achievement. 57% of the examineeswere girls. The 8th and 9th graders had beengrouped into high (N = 106) and low (N - 125)mathematics achievement groups.
Instruments and Procedures
A 48-item diagnostic test consisting of linearalgebraic equations with one unknown was de-veloped by Gutvirtz (1989), based on a detailedtask analysis that included a procedural network
and a mapping sentence (e.g., Birenbaum &
Shaw, 1985). The test was developed to identifystudents’ bugs in solving linear algebraic equa-tions. 32 OE items were used, and students wereasked to show all work toward the solution. Forthe 16 MC items used, five or six response optionsrepresenting frequent errors were provided. TheMC items followed the OE items. The instructionsfor the MC items did not mention guessing. Toprevent cheating, two forms of the algebra testwere constructed-Form I and Form II. Eachform contained Subsets 1 and 2 (OE items) thatwere parallel in their attributes and Subset 3 (MCitems) that had stems identical to the stems ofthe items in Subset 1. Table 1 shows the three sub-sets for Form I (8 items per subset) and Form II(7 items per subset). The item response theoryand classical test theory difficulty and discrimi-nation indices and Cronbach’s a reliability coeffi-cients of the subsets also are provided in Table 1.
The Bug Analysis
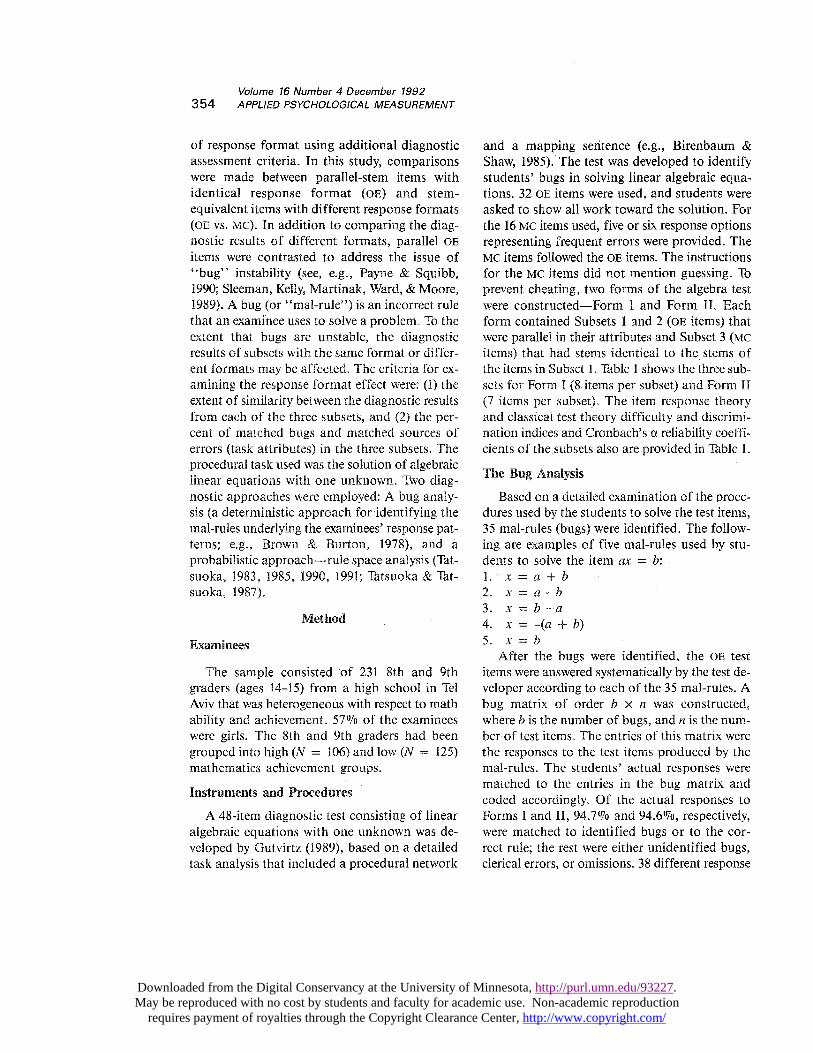
Based on a detailed examination of the proce-dures used by the students to solve the test items,35 mal-rules (bugs) were identified. The follow-ing are examples of five mal-rules used by stu-dents to solve the item cax = b:
After the bugs were identified, the OE testitems were answered systematically by the test de-veloper according to each of the 35 mal-rules. Abug matrix of order b x n was constructed,where b is the number of bugs, and n is the num-ber of test items. The entries of this matrix werethe responses to the test items produced by themal-rules. The students’ actual responses werematched to the entries in the bug matrix andcoded accordingly. Of the actual responses toForms I and II, 94.7% and 94.6%, respectively,were matched to identified bugs or to the cor-rect rule; the rest were either unidentified bugs,clerical errors, or omissions. 38 different response
Downloaded from the Digital Conservancy at the University of Minnesota, http://purl.umn.edu/93227. May be reproduced with no cost by students and faculty for academic use. Non-academic reproduction
requires payment of royalties through the Copyright Clearance Center, http://www.copyright.com/

355
Table 1 -
OE and MC Items of Form I and II, Their IRT Difficulty (b) andDiscrimination (a) Parameter Estimates, Proportion Correct,
( p), and Item-Total Point-Biserial Correlations rpb;s, andCronbach’s Alpha Reliabilities (a) of the Subsets
continued on the next page
Downloaded from the Digital Conservancy at the University of Minnesota, http://purl.umn.edu/93227. May be reproduced with no cost by students and faculty for academic use. Non-academic reproduction
requires payment of royalties through the Copyright Clearance Center, http://www.copyright.com/

356
Table 1, continuedOE and MC Items of Form I and II, Their IRT Difficulty (b) and
Discrimination (a) Parameter Estimates, Proportion Correct,( p), and Item-Total Point-Biserial Correlations rpb;s, and
Cronbach’s Alpha Reliabilities (a) of the Subsets
codes were used-one code indicated correct
responses, one indicated unidentified errors,one indicated clerical errors, and the rest in-dicated the 35 identified bugs. The codes forparallel items then were compared. Matchesand mismatches were counted across the pairsof parallel items for each student, and classi-fied according to the following primarycategories:
A = matched correct (1,1);B = one correct and one error (1,0; 0,1);C = matched bug; andD = unmatched errors (unequal bugs, unidenti-
fied bugs, or clerical errors).
The responses to the MC items were coded
according to a prespecified key in which eachdistractor corresponded to a bug. The codedresponses were matched to those of the stem-
equivalent OE items using the above-mentionedcategories.
The ule-Space Analysis
To conduct a rule-space analysis, the cognitiverequirements of the task (also called attributes)are determined. Then an incidence. matrix Q isconstructed; this matrix indicates which attri-
. butes are involved in solving each item. Q isbinary and of order K x m (the number ofattributes x the number of items). If qkj is the(k, j) element of this matrix (where k indicates an
attribute and j indicates an item), then qkj = 1if item j involves attribute k, and qkj = 0, other-wise. Cognitive patterns represented by unob-servable variables that can be derived from theincidence matrix Q are called knowledge states(or cognitive states or attribute patterns). Booleandescription functions are used to systematicallydetermine those knowledge states and map theminto observable item-score patterns (called idealitem-score patterns; Tatsuoka, 1991; Varadi &
Tatsuoka, 1989). It is assumed that an item canbe answered correctly if and only if all the at-tributes associated with the item have beenmastered. The knowledge states are representedby a list of mastered/not mastered (or &dquo;can/
cannot&dquo;) attributes. The increase of the numberof states is combinatorial, but Boolean algebraprovides the mathematical tools to overcome theproblem of combinatorial explosion.
Once the knowledge states (ideal item-scorepatterns) are obtained, the actual data are con-sidered. The actual item-score patterns of the stu-dents are mapped onto the knowledge states todetermine the ideal item-score pattern closest toeach student’s actual response pattern. This pat-tern classification problem is handled by the rule-space model, which formulates the classifi-cation space and procedures. Item responsetheory (IRT) is used to formulate the classifi-cation space, which is a Cartesian product spaceof IRT ability/proficiency (0) and variable(s) §
Downloaded from the Digital Conservancy at the University of Minnesota, http://purl.umn.edu/93227. May be reproduced with no cost by students and faculty for academic use. Non-academic reproduction
requires payment of royalties through the Copyright Clearance Center, http://www.copyright.com/

357
that measure the unusualness (appropriate-ness/person fit) of item-score patterns (Tatsuoka,1984; Tatsuoka & Linn, 1983). Bayes’ decisionrules are used to classify students into knowledgestates. Once classified, the attributes a given stu-dent is likely to have mastered or failed to mastercan be indicated.
Application of Rule-Space Analysis
Determining the attributes. A set of nine at-tributes was specified, which indicated a possi-ble solution strategy for solving the test items (seeTable 2). These data were used to produce theincidence matrices.
Testing the adequacy of the attribute
matrix. Multiple regression analyses-with itemdifficulties as the dependent variable and the nineattribute vectors of Q as the independentvariables-were performed for the two parallel(OE) subsets and for the two stem-equivalent(ntc) subsets for Forms I and II. The multiple Rasfor the two OE subsets of Form I and II were .94and .92 (RZs adjusted for shrinkage were .88 and.84), respectively. The R 2S for the two stem-
equivalent subsets for Forms I and II were .68and .73 (R 2s adjusted were .40 and .50),respectively.
Computer programs. The HYBIL program(Yamamoto, 1991) was used to estimate the
discrimination (a) and difficulty (b) parametersof the two-parameter IRT logistic model for
the test items (see Table 1). The BUGLIB pro-gram (Varadi & Tatsuoka, 1989) was used toderive the ideal-score patterns corresponding tothe attribute mastery patterns that constitutedthe groups into which the students’ actual re-
sponse patterns were classified. As a result, 42groups (knowledge states) were generated for eachof the two test forms. The same program also wasused for the classification. Each student wasclassified three times based on the three subsetsof items.
Scoring. Scores on the attributes then were
compared across the three subsets. Matches andmismatches were counted across the nine pairsof attributes of the contrasted subsets for eachstudent and classified according to the followingprimary categories:
E = matched mastery (1,1);F = mastery/nonmastery (1,0; 0,1); orG = matched nonmastery (0,0).
Analysis. Phi coefficients (w) were computedfor pairs of attributes from the parallel and stem-equivalent subsets. The significance of the dif-ferences between the coefficients for the pairs wastested using a t test for dependent samples (Hotel-ling, 1940). The knowledge state to whichthe student was classified based on each subsetwas compared across the three analyses, and thenumber of matches in each sample for statesbased on parallel subsets was compared to the
Table 2The Attributes and Relevant Items
Downloaded from the Digital Conservancy at the University of Minnesota, http://purl.umn.edu/93227. May be reproduced with no cost by students and faculty for academic use. Non-academic reproduction
requires payment of royalties through the Copyright Clearance Center, http://www.copyright.com/

358
number of matches based on stem-equivalentsubsets.
Results
Bug Analysis
Table 3 provides an example of bug analysisresults at the individual level. The table containsan individual student’s response vectors on thethree subsets of Form I; 1 denotes the correct
answer, and the letters denote different bugs. OnSubsets 1 and 2 (the two parallel OE subsets), thestudent had seven matched correct responses andone matched bug. Thus, the percentage ofmatched correct responses on parallel items forthis student was 87.5, and the percent of matchedbugs was 12.5. On the stem-equivalent subsets(Subsets 1 and 3), the student had five matchedcorrect responses (62.5%), one matched bug(12.5070), and two one-correct-one-error pairs thataccount for 25 % of the eight paired responses.
Table 4 shows the percentage of matched andnonmatched responses across Subsets 1 and 2 andSubsets 1 and 3 for the total group. On average,78% of the responses to parallel items in the
Table 3
Response Vectors for a Student on the Three Subsetsof Form I (1 Denotes the Correct Answerand the Letters Denote Different Bugs)
Form I group yielded a match (A = 70:5 070matched correct responses and C = 7.5~/0matched bugs). For the OE vs. MC contrast, themean overall match was 64.9% (A = 59% andC = 5.9%). In the Form II group, an average of77.4% of the responses to parallel items yieldeda match (A = 69.3% and C = 8.2%). For theOE vs. MC contrast, the overall match was 70.1%
(A = 65.4% and C = 4.6%).For correct/incorrect scoring, the mean over-
all match of correct (1,1) and incorrect (0,0) re-sponses to parallel items in the Form I group(A + C + D) was ~7.3 070, with the rest of theitem pairs having one correct and one incorrectanswer. Thus, of the incorrect pairs (0,0), an aver-
Table 4Mean (M) and SD of Percentage of Matched Responses on Two Sets of Parallel
(OE/OE) and Stem-Equivalent (OE/MC) Items [A + C = MatchedResponses (1,1; Bug = Bug); C + D = Matched IncorrectResponses in 1/0 Scoring Method (0,0); and A + C + D =
Matched Responses in 1/0 Scoring Method (1,1; 0,0)]
Downloaded from the Digital Conservancy at the University of Minnesota, http://purl.umn.edu/93227. May be reproduced with no cost by students and faculty for academic use. Non-academic reproduction
requires payment of royalties through the Copyright Clearance Center, http://www.copyright.com/

359
age of 44.607o consisted of matched bugs[C/(C + D)]. For the OE vs. MC contrast, themean overall match of correct and incorrect
responses was 79.5 070, with the rest of the itempairs having one correct and one incorrectanswer. Thus, of the incorrect pairs, an averageof 28.8% consisted of matched bugs. For theForm II group, the parallel subsets contrast
yielded a mean of 89% matched responses. Ofthe incorrect pairs, an average of 41.6% werematched bugs. For the OE vs. 1~C contrast, anaverage of 81.8% of the responses matched, and28°70 of the incorrect pairs were matched bugs.
Rule-Space AnalysisTable 5 provides an example of the rule-space
analysis at the individual level, based on theresponses given by the student whose bug analysiswas presented above. Table 5 contains the threevectors of the nine attributes as derived from the
responses to the three subsets. A comparison ofthe two attribute row vectors based on parallelitems (Subsets 1 and 2) indicates that they areidentical. That is, they reflect the same knowledgestate (Knowledge State 2). Of the nine attributes,the student mastered eight; thus, the percentageof matched mastery attributes (1,1) for this stu-dent was 88.9, the percentage of matched non-mastery was 11.1, and the percentage of onemastery and one nonmastery was 0.
This student’s response patterns to the testitems perfectly matched (i.e., had a Mahalanobisdistance I72 of 0.0 from) Knowledge State 2,indicating nonmastery of Attribute 1. The twoattribute row vectors based on stem-equivalent
items (Subsets 1 and 3) matched on five (55.6%)mastered attributes and on one (11.107o) non-mastered attribute. The remaining 33.3% wereclassified into the one mastery and one non-
mastery category. According to the attributemastery pattern based on Subset 3, the student’spattern perfectly matched Knowledge State 16,indicating nonmastery of Attributes 1, 4, 7,and 9.
Table 6 shows the mean and standard devia-tion of percentage of matched and nonmatched
responses across the nine pairs of attributes forForms I and II. For the Form I group, a meanof 83.5% of the attributes based on the parallelsubsets (OE/OE) yielded a match (E = 68.7% formastery and G = 14.8% for nonmastery). Themean overall match for attributes based on thetwo stem-equivalent (OE/MC) subsets was 73.4%(55.8% mastery and 17.7% nonmastery). Thecorrelation between the mastery scores, which isan index of the reliability of these scores, wasr = .71 for the two parallel (OE/OE) subsets andr = .53 for the two stem-equivalent (OE/MC)subsets. For the Form II group, the average matchwas 85.107o based on the parallel subsets (69.5%for mastery and 15.6% for nonmastery). Theaverage match for attributes based on the OE/MCsubsets was 78% (65.5 °~o for mastery and 12.5%for nonmastery). The reliability correlations forthe attributes based on the OE/OE and OE/MCsubsets were r = .76 and .60, respectively.
Table 7 presents the phi coefficients (w) be-tween pairs of attributes from the two OE subsetsand from the OE vs. tvtc subsets. Eight of the ninecomparisons for Form I and five of the nine for
Table 5
Response Vectors on the Nine Attributes From Responses to the ThreeSubsets of Form I for a Student and Mahalanobis Distance (I~2)
in the Rule Space Between the Student’s Point and theCentroid of the Closest Knowledge State
Downloaded from the Digital Conservancy at the University of Minnesota, http://purl.umn.edu/93227. May be reproduced with no cost by students and faculty for academic use. Non-academic reproduction
requires payment of royalties through the Copyright Clearance Center, http://www.copyright.com/

360
Table 6Mean (M) and SD of Percentage of MatchedAttributes Based on Responses to Two Sets ofParallel (OE/OE) and Stem-Equivalent (OE/MC)
Items [E + G = Matched Mastery +Matched Nonmastery (1,1;0,0)]
Form II yielded significant differences-all in onedirection-indicating a higher match on masteryand nonmastery for attributes based on parallelOE items than for those based on stem-equivalentOE vs. MC items.
Finally, the rule-space classification resultsbased on the different subsets were compared. InForm I, 12.8% of the students were classified intothe same knowledge-state group based on theirresponses to the two stem-equivalent (OE vs. MC)subsets; 38.5% were classified into the sameknowledge state group based on their responsesto the two parallel OE subsets. The correspondingresults for Form II were 28.9% for the stem-
equivalent and 42.107o for the parallel subsets.
Discussion
The results of the bug and rule-space analysesyielded similar results with respect to the formateffect. Both analyses indicated a closer similaritybetween the two parallel OE subsets than betweenthe stem-equivalent OE and MC subsets. This wasthe case for the attribute accounts of item dif-ficulties (as indicated by the regression results),for the knowledge state classification results, for
the single attribute mastery level comparisons,and for the response categories at the item level.It also held true for the item difficulties and thesubset reliabilities. On the average, the MC
subsets tended to be more difficult and had lowerinternal consistency reliabilities than the two OEsubsets.
Most MC items were more difficult than theirOE counterparts, which could have resulted fromthe inclusion of common &dquo;bugs&dquo; as distractors.Some students correctly answered the OE versionof an item but incorrectly answered the MCversion-perhaps because they did not bother toengage themselves in the entire &dquo;tedious&dquo;
calculation, but instead tried to take a shortcutby consulting the information in the distractorsand hence fell into the trap of selecting an in-correct answer that seemed reasonable. This
seems more likely than guessing as an explana-tion of the strategy used by students in ap-proaching the Mac items in this study, becauseguessing would have resulted in a higher rate ofcorrect responses for the MC than for the OE
items, which was not the case. The fact thatseveral studies have found MC items to be easierthan their OE counterparts (e.g., Martinez, 1991;Martinez & Katz, 1992; Oosterhof & Coats, 1984)may be explained by the effect of guessing. Thus,the inconclusive results regarding the effect ofresponse format on item difficulty, as noted byTraub & MacRury (1990), may lie in the type ofdistractors, as well as in the type of task beingtested. However, it should be noted that both ex-planations for students’ strategic behavior inanswering MC items would affect the reliabilityof the Mac items-rendering it lower than that ofa stem-equivalent OE set of items, a fact that wasevident in the current study as well as in otherstudies (e.g., Ackerman & Smith, 1988; Biren-baum & Tatsuoka, 1987; Oosterhof & Coats,1984; Zimmerman, Williams, & Symons, 1984).
The issue of format effect on item difficultyand reliability is of little interest if the two for-mats are measuring different abilities or pose dif-ferent information-processing requirements.Much research has been devoted to the issue of
Downloaded from the Digital Conservancy at the University of Minnesota, http://purl.umn.edu/93227. May be reproduced with no cost by students and faculty for academic use. Non-academic reproduction
requires payment of royalties through the Copyright Clearance Center, http://www.copyright.com/

361
Table 7Phi Coefficients (w) for Attribute Pairs Based on Sets ofParallel and Stem-Equivalent Items for Forms I and II
*p < .05; * *p < .01 (2-tailed)
trait-equivalence between OE and MC formats.Based on a comprehensive literature review, Traub& MacRury (1990) concluded that differentabilities seem to be demanded by the two for-mats, but the nature of the difference is not wellunderstood. Evidence from protocol analyses ofstudents solving OE and MC items could providemore insight into the nature of the information-processing requirements of the two formats. Mar-tinez & Katz (1992) incorporated protocolanalyses in their study of constructed figuralresponse and MC items in architecture assess-ment. They concluded that format differences initem statistics occurred when different processeswere used to solve the two item types.
The nature of the different processes involvedin solving MC and OE items needs to be furtherinvestigated. Other areas requiring further studyinclude the extent to which the distinction be-tween two formats is generalizable to other do-
mains, what characterizes the items that requiredifferent processes, and what characterizes thestudents that use the different processes.
However, the present study indicated that the twotypes of formats may lead, in some cases, to dif-ferent diagnoses regarding the student’s mal-rulesor nonmastered attributes. The fact that the
diagnostic inferences from the OE items tendedto be more similar across identical formats with
parallel items than across different formats withstem-identical items suggests that bug instabili-ty is not the cause of the differences in the
diagnostic inferences resulting from the two for-mats. Using Messick’s (1989) definition of con-struct validity as &dquo;an integration of any evidencethat bears on the interpretation or meaning ofthe test scores&dquo; (p. 17), the results of the presentstudy suggest that compared to the MC format,the OE format provides a more valid measure forthe purpose of diagnostic assessment.
Downloaded from the Digital Conservancy at the University of Minnesota, http://purl.umn.edu/93227. May be reproduced with no cost by students and faculty for academic use. Non-academic reproduction
requires payment of royalties through the Copyright Clearance Center, http://www.copyright.com/

362
References
Ackerman, T. A., & Smith, P. (1988). A comparisonof the information provided by essay, multiple-choice, and free-response writing tests. Applied Psy-chological Measurement, 12, 117-128.
Bennett, R. E. (1991). On the meanings of constructedresponse (Research Rep. No. RR-91-63). PrincetonNJ: Educational Testing Service.
Bennett, R. E., Rock, D. A., Braun, H., Frye, D.,Spohrer, J. C., & Soloway, E. (1990). The relation-ship of expert-system scored constrained free-
response items to multiple-choice and open-endeditems. Applied Psychological Measurement, 14,151-162.
Birenbaum, M., & Shaw, D. J. (1985). Task specifica-tion chart: A key to a better understanding of testresults. Journal of Educational Measurement, 22,219-230.
Birenbaum, M., & Tatsuoka, K. K. (1987). Open-endedversus multiple-choice response format—it doesmake a difference. Applied Psychological Measure-ment, 11, 385-395.
Bridgeman, B. (1991). Essays and multiple-choice testsas predictors of college freshman GPA. Research inHigher Education, 32, 319-332.
Bridgeman, B., & Lewis, C. (1991). Sex differences inthe relationship of advanced placement essay and mul-tiple choice scores to grades in college courses
(Research Rep. No. RR-91-48). Princeton NJ:Educational Testing Service.
Brown, J. S., & Burton, R. B. (1978). Diagnosticmodels for procedural bugs in basic mathematicalskills. Cognitive Science, 2, 155-192.
Gutvirtz, Y. (1989). Effects of sex, test anxiety and itemformat on performance on a diagnostic test in
mathematics. Unpublished M.A. thesis, School ofEducation, Tel-Aviv University (in Hebrew).
Hotelling, H. (1940). The selection of variables for usein prediction with some comments on the generalproblem of nuisance parameters. Annals of Mathe-matical Statistics, 11, 271-283.
Martinez, M. (1991). A comparison of multiple-choiceand restricted figural response items. Journal ofEducational Measurement, 28, 131-145.
Martinez, M. E., & Katz, I. R. (1992). Cognitiveprocessing requirements of constructed figural responseand multiple-choice items in architecture assessment(Research Rep. No. RR-92-5). Princeton NJ: Educa-tional Testing Service.
Messick, S. (1989). Validity. In R. L. Linn (Ed.), Educa-tional measurement (3rd ed.; pp. 13-103). New York:Macmillan.
Oosterhof, A. C., & Coats, P. K. (1984). Comparisonof difficulties and reliabilities of quantitative word
problems in completion and multiple-choice itemformats. Applied Psychological Measurement, 8,287-294.
Payne, S. J., & Squibb, H. R. (1990). Algebra mal-rulesand cognitive accounts of error. Cognitive Science,14, 445-481.
Sleeman, D., Kelly, A. E., Martinak, R., Ward, R. D.,& Moore, J. L. (1989). Studies of diagnosis andremediation with high school algebra students. Cog-nitive Science, 13, 551-568.
Tatsuoka, K. K. (1983). Rule-space: An approach fordealing with misconceptions based on item responsetheory. Journal of Educational Measurement, 20,34-38.
Tatsuoka, K. K. (1984). Caution indices based on itemresponse theory. Psychometrika, 49, 95-110.
Tatsuoka, K. K. (1985). A probabilistic model for di-agnosing misconceptions by the pattern classifica-tion approach. Journal of Educational Statistics, 50,55-73.
Tatsuoka, K. K. (1990). Toward an integration of itemresponse theory and cognitive analysis. In N.Frederiksen, R. Glaser, A. Lesgold, & M. C. Shafto
(Eds.), Diagnostic monitoring of skill and knowledgeacquisition (pp. 543-488). Hillsdale NJ: Erlbaum.
Tatsuoka, K. K. (1991). Boolean algebra applied to de-termination of universal set of knowledge states
(Research Rep. No. ONR-1). Princeton NJ: Educa-tional Testing Service.
Tatsuoka, K. K., & Linn, R. L. (1983). Indices fordetecting unusual patterns: Links between two
general approaches and potential applications.Applied Psychological Measurement, 7, 81-96.
Tatsuoka, K. K., & Tatsuoka, M. M. (1987). Bug dis-tribution and pattern classification. Psychometrika,52, 193-206.
Traub, R. E., & MacRury, K. (1990). Antwort-auswahlvs freie-antwort aufgaben bei lernerfolstests [Mul-tiple choice vs. free-response in the testing ofscholastic achievement]. In K. Ingenkamp & R. S.
Jäger (Eds.), Tests und trends 8: Jahrbuch der
pädagogischen diagnostik (pp. 128-159). Weinheim,Germany: Beltz Verlag.
Van den Bergh, H. (1990). On the construct validityof multiple-choice items for reading comprehen-sion. Applied Psychological Measurement, 14, 1-12.
Varadi, F., & Tatsuoka, K. K. (1989). BUGLIB [Unpub-lished computer program]. Trenton NJ.
Ward, W. C. (1982). A comparison of free-responseand multiple-choice forms of verbal aptitude tests.Applied Psychological Measurement, 6, 1-11.
Ward, W. C., Frederiksen, N., & Carlson, S. B. (1980).Construct validity of free-response and machinescorable forms of a test. Journal of EducationalMeasurement, 17, 11-29.
Downloaded from the Digital Conservancy at the University of Minnesota, http://purl.umn.edu/93227. May be reproduced with no cost by students and faculty for academic use. Non-academic reproduction
requires payment of royalties through the Copyright Clearance Center, http://www.copyright.com/

363
Yamamoto, K. (1991). HYBIL: Hybrid model of IRT andlatent classes [Computer program]. Princeton NJ:Educational Testing Service.
Zimmerman, D. W., Williams, R. H., & Symons, D.L. (1984). Empirical estimates of the comparativereliability of matching tests and multiple-choicetests. Journal of Experimental Education, 52, 179-182.
Acknowledgments
The authors thank Maurice Nl. Tatsuoka for his valuablecomments on an earlier draft of the manuscript.coM~cM~ on a~ ~ar~’cr JyTa/i’ <?/’ ~ ~anM~’cn’p~.
Author’s Address
Send requests for reprints or further information toMenucha Birenbaum, Tel-Aviv University, School ofEducation, Ramat-Aviv 69978 Israel or to E-Mail
Downloaded from the Digital Conservancy at the University of Minnesota, http://purl.umn.edu/93227. May be reproduced with no cost by students and faculty for academic use. Non-academic reproduction
requires payment of royalties through the Copyright Clearance Center, http://www.copyright.com/