Rohingya Crisis in Cox's Bazar District, Bangladesh - WHO ...

ORIGINAL ARTICLE
Effects of participatory forest management on livelihood capitalsof the community in Cox’s Bazar, Bangladesh
Abu Saleh Md. Golam Kibria • Mohammed Jashimuddin •
Inoue Makoto
Received: 3 October 2012 / Accepted: 23 March 2013
� The Japanese Forest Society and Springer Japan 2013
Abstract In Cox’s Bazar, Bangladesh, we surveyed 80
households to observe the effects of participatory forestry
(PF) on the livelihood of local participants. We analyzed
the effects on livelihood capitals to compare in two ways:
(1) before and after participation, and (2) participants and
non-participants. In Cox’s Bazar, there were some signifi-
cant changes regarding income sources, but annual income
was little changed after participation in participatory for-
estry. Literacy (about 10 % after participation) and mobile
phone ownership (75 %) were significantly higher than
before. Housing conditions were better (brick walls: 7.5 %;
sun-grass roof: 70 %) than those of non-participants (brick
walls: 0 %; sun-grass roof: 77.5 %). PF ensured legal
rights on forest lands for participants, while non-partici-
pants were illegally living on public forestland. However,
expenses were considerably higher than income; people
were still struggling with poverty and many of them suf-
fered from malnutrition. This ultimately put pressure on all
capital. People had redistributed their available capital to
cope with adversity, and there was a trend toward
involvement in economic activities other than forests. Our
study found that social capital was more influenced by PF
more than other capitals. Due to the involvement with the
PF program, people were feeling much more secure,
women had elevated status, and social relationships
became stronger.
Keywords Before and after � Livelihood � Participants
and non-participants � Participatory forestry
Introduction
The disappearance of natural forests in developing coun-
tries negatively affects the livelihoods of people dependent
on forest products and services (Poore 1986; Brosius 1997;
Maruyama and Morioka 1998). An increase in population
growth and human poverty, the acute shortage of fuel
wood, fodder, and timber, and a continuous decline in the
amount of per capita cultivable land have led to a severe
degradation of the primary forests of Bangladesh (Salam
et al. 1999). Khan et al. (2004) found that a significant
portion of the country’s designated forestland is actually
devoid of trees. About 3.3 % of hill forest areas and 31.9 %
of deciduous forest areas have already been encroached
(Muhammed et al. 2005). Maser (1994) suggested that if
changes are not made, the present limitation will become
future scarcities.
The failure of state-led resource management has dem-
onstrated that there was a need to change state policies and
strategies to involve people living in and near forests
(Hong 2005, cited in Nath and Inoue 2010). Rana et al.
(2007) argued that protection of an environment that is
crucial for sustainable development in Bangladesh cannot
be ensured without the proper management, maintenance,
and expansion of forest resources. Some economists have
argued that the conservation of tropical forests will be
difficult unless the people who use these forests are com-
pensated (Pearce 1996). People’s participation in forestry
A. S. M. G. Kibria (&) � I. Makoto
Laboratory of Global Forest Environmental Studies, Department
of Global Agricultural Sciences, Graduate School of Global
Agriculture and Life Sciences, The University of Tokyo,
Bunkyo, Tokyo 1138657, Japan
e-mail: [email protected]
M. Jashimuddin
Institute of Forestry and Environmental Sciences, University of
Chittagong, Chittagong, Bangladesh
123
J For Res
DOI 10.1007/s10310-013-0403-4

activities started formally in Bangladesh in the 1980s under
forestry extension programs on national forestlands (Rana
et al. 2007).
Muhammed et al. (2005) reported that, during
2000–2003, more than 23,000 individuals benefited from
the final felling of participatory forestry (PF) plantations in
Bangladesh. This work has generated a total of US$5.6
million in government income and US$5.3 million in
participants’ income. Some of the forest-derived products,
such as firewood, vines, or fruit collected for household
consumption, remain a hidden harvest, the value of which
is often difficult for economists to quantify (IIED 1995).
Although PF is now considered as a part of government
and donor orthodoxy in forestry investment, it is not yet
clear what impacts such PF projects have on participants’
livelihoods (Bandyopadhyay and Shyamsundar 2004).
Despite the governmental emphasis and popular support in
Bangladesh, systematic academic research on the role of
PF in the livelihoods of participant farmers has remained
remarkably limited (Khan et al. 2004. Thus, this research
was attempted to analyze the effects of PF on the livelihood
capital of the participants in Cox’s Bazar.
Materials and methods
Conceptual framework
At the household, community, and social levels, the assets
available constitute a stock of capital which can be stored,
accumulated, exchanged, or depleted, and put to work to
generate a flow of income or other benefits (Lipton and
Ravallion 1995; McGregor 1998; Moser 1998).
Natural capital is made up of the natural resource stocks
from which resource flows useful to livelihoods are
derived, including land, water, and other environmental
resources (Booth et al. 1998; Carney 1998).
Improved access to physical or produced capital (basic
infrastructure and the production equipment and means
which enable people to pursue their livelihoods) is an
essential element of strategies to reduce household poverty.
In addition to physical capital, the available financial
resources (including savings, credit, remittances, and pen-
sions) engage them with different livelihood options
(Carney 1998). Both the quantity and quality of labor
resources available to households are subsumed under
human capital by some analysts (e.g., Carney 1998), while
some items noted by Lipton and Ravallion (1995) and
Moser (1998) are treated differently by others. But both
quality and quantity are important to the fulfillment of
productive and reproductive tasks. Although evidence on
the relevance of educational level to farm incomes varies
(e.g., Rodriguez and Smith 1994), the level includes social
relationships at the household, community, and social
levels (Booth et al. 1998). Social capital can be defined as
the features of social organizations that facilitate coordi-
nation and cooperation for mutual benefit of the members
and society as a whole (Putnam 2001).
Households build their livelihoods on the basis of their
assets and available opportunities. Household ‘‘livelihood
assets’’ are augmented through ‘‘entitlements’’ to locally
available capital, such as tree and forest resources (Soussan
et al. 2001). People in the study areas were living on the
forest lands and the main livelihood activity was to extract
forest resources to support both the physical and financial
needs of the families. Different households within the same
locale have diverse levels of household assets. Using the
available five capital assets, people engage in various
livelihood strategies in order to achieve livelihood objec-
tives (DFID 2000; Soussan et al. 2001) in response to the
opportunities arising, level of resource access, risk aver-
sion, and perceived benefits. On this basis, they then
engage in ‘‘livelihood activities’’ (Soussan et al. 2001).
Involving the forest-dependent people in forest manage-
ment and protection, and prohibiting their long traditional
dependence on natural state forests, is likely to change their
livelihoods in various ways. Examining the changes of
livelihood capital after joining to the PF projects will
eventually represent the effects of that forestry manage-
ment approach. The success of a community development
project largely depends on the changes in the livelihoods of
the target group.
Selection of the study area
We selected the Cox’s Bazar district purposively for this
study after discussion with Forest Department officers.
They informed us that the area is a major example of PF
plantations, and that there are several successful plantations
in that area. Moreover, our purpose was to compare 5 years
before the forestry program with 5 years after the program.
We selected the projects which were started in the year
2005–2006. Cox’s Bazar has many plantations within this
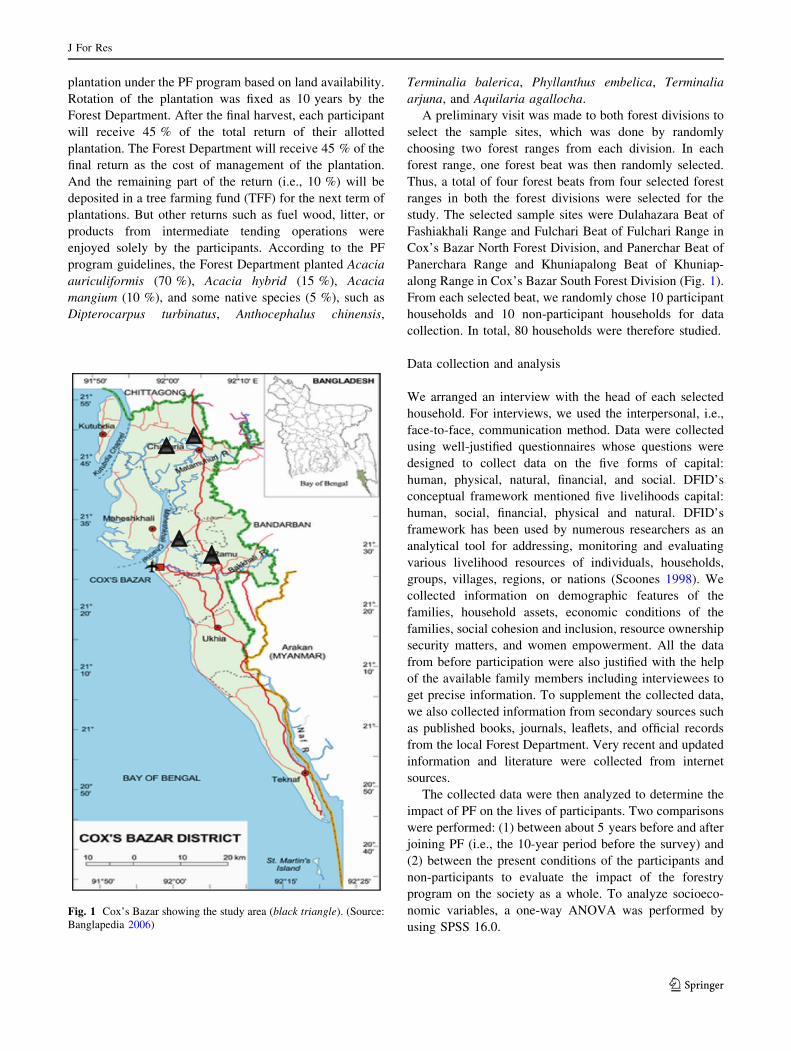
range. The study area lies at 21�350000N and 92�010000E. The
total area of the Cox’s Bazar district is 2,491.86 km2. It is
bounded by the Chittagong district on the north, the Ban-
darban district on the east, and the Bay of Bengal on the
south and west (Wikipedia 2010). The Cox’s Bazar district
consists of two forest divisions: Cox’s Bazar South Forest
Division and Cox’s Bazar North Forest Division, each
comprising 10 forest ranges. The projects studied were
aimed at poor forest-dependent people in engaging in PF to
improve their livelihoods and consequently to reduce the
forest destruction. The Forest Department in Cox’s Bazar
followed the interval of 2 m 9 2 m for planting trees in PF
project areas. Each participant was allotted a 1- or 2-ha
J For Res
123
plantation under the PF program based on land availability.
Rotation of the plantation was fixed as 10 years by the
Forest Department. After the final harvest, each participant
will receive 45 % of the total return of their allotted
plantation. The Forest Department will receive 45 % of the
final return as the cost of management of the plantation.
And the remaining part of the return (i.e., 10 %) will be
deposited in a tree farming fund (TFF) for the next term of
plantations. But other returns such as fuel wood, litter, or
products from intermediate tending operations were
enjoyed solely by the participants. According to the PF
program guidelines, the Forest Department planted Acacia
auriculiformis (70 %), Acacia hybrid (15 %), Acacia
mangium (10 %), and some native species (5 %), such as
Dipterocarpus turbinatus, Anthocephalus chinensis,
Terminalia balerica, Phyllanthus embelica, Terminalia
arjuna, and Aquilaria agallocha.
A preliminary visit was made to both forest divisions to
select the sample sites, which was done by randomly
choosing two forest ranges from each division. In each
forest range, one forest beat was then randomly selected.
Thus, a total of four forest beats from four selected forest
ranges in both the forest divisions were selected for the
study. The selected sample sites were Dulahazara Beat of
Fashiakhali Range and Fulchari Beat of Fulchari Range in
Cox’s Bazar North Forest Division, and Panerchar Beat of
Panerchara Range and Khuniapalong Beat of Khuniap-
along Range in Cox’s Bazar South Forest Division (Fig. 1).
From each selected beat, we randomly chose 10 participant
households and 10 non-participant households for data
collection. In total, 80 households were therefore studied.
Data collection and analysis
We arranged an interview with the head of each selected
household. For interviews, we used the interpersonal, i.e.,
face-to-face, communication method. Data were collected
using well-justified questionnaires whose questions were
designed to collect data on the five forms of capital:
human, physical, natural, financial, and social. DFID’s
conceptual framework mentioned five livelihoods capital:
human, social, financial, physical and natural. DFID’s
framework has been used by numerous researchers as an
analytical tool for addressing, monitoring and evaluating
various livelihood resources of individuals, households,
groups, villages, regions, or nations (Scoones 1998). We
collected information on demographic features of the
families, household assets, economic conditions of the
families, social cohesion and inclusion, resource ownership
security matters, and women empowerment. All the data
from before participation were also justified with the help
of the available family members including interviewees to
get precise information. To supplement the collected data,
we also collected information from secondary sources such
as published books, journals, leaflets, and official records
from the local Forest Department. Very recent and updated
information and literature were collected from internet
sources.
The collected data were then analyzed to determine the
impact of PF on the lives of participants. Two comparisons
were performed: (1) between about 5 years before and after
joining PF (i.e., the 10-year period before the survey) and
(2) between the present conditions of the participants and
non-participants to evaluate the impact of the forestry
program on the society as a whole. To analyze socioeco-
nomic variables, a one-way ANOVA was performed by
using SPSS 16.0.
Fig. 1 Cox’s Bazar showing the study area (black triangle). (Source:
Banglapedia 2006)
J For Res
123
Results
Income sources and expenditures
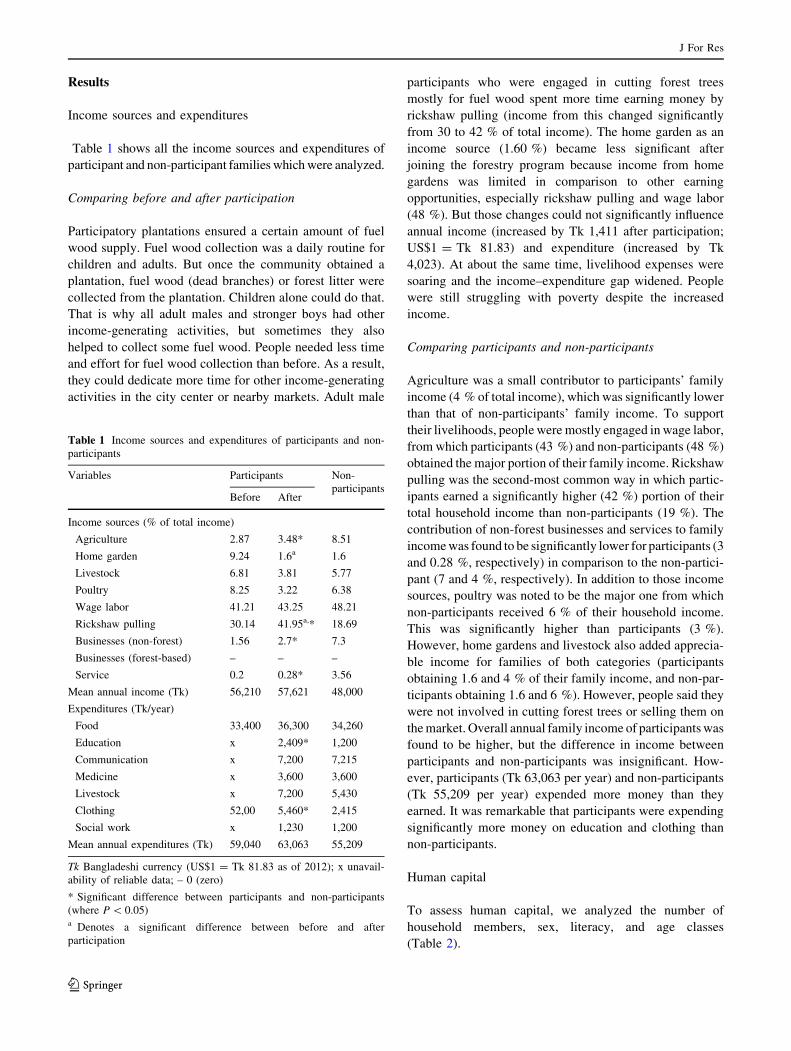
Table 1 shows all the income sources and expenditures of
participant and non-participant families which were analyzed.
Comparing before and after participation
Participatory plantations ensured a certain amount of fuel
wood supply. Fuel wood collection was a daily routine for
children and adults. But once the community obtained a
plantation, fuel wood (dead branches) or forest litter were
collected from the plantation. Children alone could do that.
That is why all adult males and stronger boys had other
income-generating activities, but sometimes they also
helped to collect some fuel wood. People needed less time
and effort for fuel wood collection than before. As a result,
they could dedicate more time for other income-generating
activities in the city center or nearby markets. Adult male
participants who were engaged in cutting forest trees
mostly for fuel wood spent more time earning money by
rickshaw pulling (income from this changed significantly
from 30 to 42 % of total income). The home garden as an
income source (1.60 %) became less significant after
joining the forestry program because income from home
gardens was limited in comparison to other earning
opportunities, especially rickshaw pulling and wage labor
(48 %). But those changes could not significantly influence
annual income (increased by Tk 1,411 after participation;
US$1 = Tk 81.83) and expenditure (increased by Tk
4,023). At about the same time, livelihood expenses were
soaring and the income–expenditure gap widened. People
were still struggling with poverty despite the increased
income.
Comparing participants and non-participants
Agriculture was a small contributor to participants’ family
income (4 % of total income), which was significantly lower
than that of non-participants’ family income. To support
their livelihoods, people were mostly engaged in wage labor,
from which participants (43 %) and non-participants (48 %)
obtained the major portion of their family income. Rickshaw
pulling was the second-most common way in which partic-
ipants earned a significantly higher (42 %) portion of their
total household income than non-participants (19 %). The
contribution of non-forest businesses and services to family
income was found to be significantly lower for participants (3
and 0.28 %, respectively) in comparison to the non-partici-
pant (7 and 4 %, respectively). In addition to those income
sources, poultry was noted to be the major one from which
non-participants received 6 % of their household income.
This was significantly higher than participants (3 %).
However, home gardens and livestock also added apprecia-
ble income for families of both categories (participants
obtaining 1.6 and 4 % of their family income, and non-par-
ticipants obtaining 1.6 and 6 %). However, people said they
were not involved in cutting forest trees or selling them on
the market. Overall annual family income of participants was
found to be higher, but the difference in income between
participants and non-participants was insignificant. How-
ever, participants (Tk 63,063 per year) and non-participants
(Tk 55,209 per year) expended more money than they
earned. It was remarkable that participants were expending
significantly more money on education and clothing than
non-participants.
Human capital
To assess human capital, we analyzed the number of
household members, sex, literacy, and age classes
(Table 2).
Table 1 Income sources and expenditures of participants and non-
participants
Variables Participants Non-
participantsBefore After
Income sources (% of total income)
Agriculture 2.87 3.48* 8.51
Home garden 9.24 1.6a 1.6
Livestock 6.81 3.81 5.77
Poultry 8.25 3.22 6.38
Wage labor 41.21 43.25 48.21
Rickshaw pulling 30.14 41.95a,* 18.69
Businesses (non-forest) 1.56 2.7* 7.3
Businesses (forest-based) – – –
Service 0.2 0.28* 3.56
Mean annual income (Tk) 56,210 57,621 48,000
Expenditures (Tk/year)
Food 33,400 36,300 34,260
Education x 2,409* 1,200
Communication x 7,200 7,215
Medicine x 3,600 3,600
Livestock x 7,200 5,430
Clothing 52,00 5,460* 2,415
Social work x 1,230 1,200
Mean annual expenditures (Tk) 59,040 63,063 55,209
Tk Bangladeshi currency (US$1 = Tk 81.83 as of 2012); x unavail-
ability of reliable data; – 0 (zero)
* Significant difference between participants and non-participants
(where P \ 0.05)a Denotes a significant difference between before and after
participation
J For Res
123
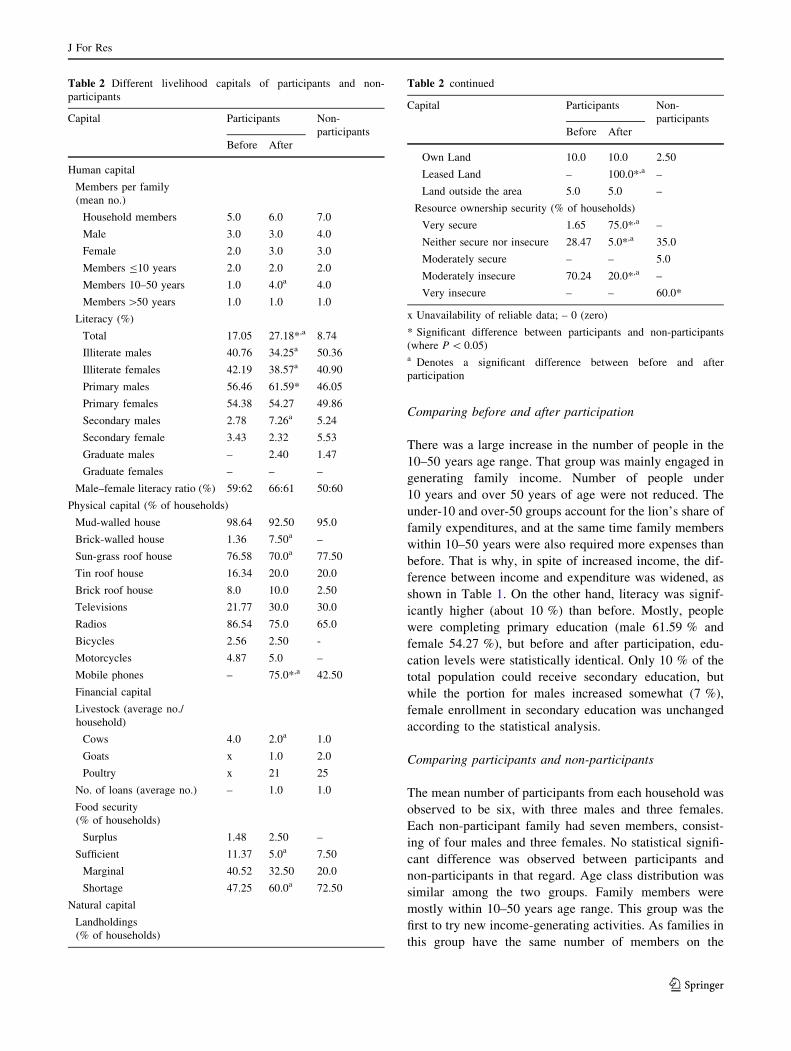
Comparing before and after participation
There was a large increase in the number of people in the
10–50 years age range. That group was mainly engaged in
generating family income. Number of people under
10 years and over 50 years of age were not reduced. The
under-10 and over-50 groups account for the lion’s share of
family expenditures, and at the same time family members
within 10–50 years were also required more expenses than
before. That is why, in spite of increased income, the dif-
ference between income and expenditure was widened, as
shown in Table 1. On the other hand, literacy was signif-
icantly higher (about 10 %) than before. Mostly, people
were completing primary education (male 61.59 % and
female 54.27 %), but before and after participation, edu-
cation levels were statistically identical. Only 10 % of the
total population could receive secondary education, but
while the portion for males increased somewhat (7 %),
female enrollment in secondary education was unchanged
according to the statistical analysis.
Comparing participants and non-participants
The mean number of participants from each household was
observed to be six, with three males and three females.
Each non-participant family had seven members, consist-
ing of four males and three females. No statistical signifi-
cant difference was observed between participants and
non-participants in that regard. Age class distribution was
similar among the two groups. Family members were
mostly within 10–50 years age range. This group was the
first to try new income-generating activities. As families in
this group have the same number of members on the
Table 2 Different livelihood capitals of participants and non-
participants
Capital Participants Non-
participants
Before After
Human capital
Members per family
(mean no.)
Household members 5.0 6.0 7.0
Male 3.0 3.0 4.0
Female 2.0 3.0 3.0
Members B10 years 2.0 2.0 2.0
Members 10–50 years 1.0 4.0a 4.0
Members [50 years 1.0 1.0 1.0
Literacy (%)
Total 17.05 27.18*,a 8.74
Illiterate males 40.76 34.25a 50.36
Illiterate females 42.19 38.57a 40.90
Primary males 56.46 61.59* 46.05
Primary females 54.38 54.27 49.86
Secondary males 2.78 7.26a 5.24
Secondary female 3.43 2.32 5.53
Graduate males – 2.40 1.47
Graduate females – – –
Male–female literacy ratio (%) 59:62 66:61 50:60
Physical capital (% of households)
Mud-walled house 98.64 92.50 95.0
Brick-walled house 1.36 7.50a –
Sun-grass roof house 76.58 70.0a 77.50
Tin roof house 16.34 20.0 20.0
Brick roof house 8.0 10.0 2.50
Televisions 21.77 30.0 30.0
Radios 86.54 75.0 65.0
Bicycles 2.56 2.50 -
Motorcycles 4.87 5.0 –
Mobile phones – 75.0*,a 42.50
Financial capital
Livestock (average no./
household)
Cows 4.0 2.0a 1.0
Goats x 1.0 2.0
Poultry x 21 25
No. of loans (average no.) – 1.0 1.0
Food security
(% of households)
Surplus 1.48 2.50 –
Sufficient 11.37 5.0a 7.50
Marginal 40.52 32.50 20.0
Shortage 47.25 60.0a 72.50
Natural capital
Landholdings
(% of households)
Table 2 continued
Capital Participants Non-
participants
Before After
Own Land 10.0 10.0 2.50
Leased Land – 100.0*,a –
Land outside the area 5.0 5.0 –
Resource ownership security (% of households)
Very secure 1.65 75.0*,a –
Neither secure nor insecure 28.47 5.0*,a 35.0
Moderately secure – – 5.0
Moderately insecure 70.24 20.0*,a –
Very insecure – – 60.0*
x Unavailability of reliable data; – 0 (zero)
* Significant difference between participants and non-participants
(where P \ 0.05)a Denotes a significant difference between before and after
participation
J For Res
123

average, the annual income per family did not vary sig-
nificantly, as illustrated in Table 1.
The literacy rate of participants (27 %) was significantly
higher than that of non-participants (9 %). This reveals that
many underprivileged people had been deprived of edu-
cation. The male and female illiteracy levels were not
found to be significantly different between participants and
non-participants. This was also true for secondary educa-
tion among people in that area. But males of participant
families had a significantly higher primary education
enrollment rate (62 %) than non-participant males (46 %).
However, among participants and non-participants, the
male and female literacy ratios were similar: 66:61 and
50:60, respectively.
From this observation, it is clear that most of the people
in the study area had received primary education. Discus-
sions with the respondents let us know that primary edu-
cation was provided by NGOs (e.g., BRAC) for free. But
many of them received no further education because they
were not financially capable. To meet the basic needs of the
family, small children were sometimes pushed into fuel
wood collection (e.g., dead branches, litter) from the
reserve forests, and many boys who were capable of work
were also sent to work as helpers in hotels or garages, or on
buses.
Physical capital
To determine physical capital, we assessed house condi-
tions, household appliances such as televisions and radios,
motorcycles, bicycles, and mobile phones (Table 2).
Comparing before and after participation
Mud-walled houses were common in the study area, irre-
spective of participation in the forestry program. Though
such types of house owners decreased from 99 to 92 % of
the total households of the area, that reduction was not
significant. After the PF program, people had some sort of
security to live on the state-owned forest lands, and they
started to build permanent houses. And this result demon-
strates that yet many of them were free of the fear of that
kind of security risk. Mobile phone possession increased
greatly among the participants (to 75 %) after participa-
tion. No significant change in ownership rates was found
for other physical possessions. It was also found that some
participants (5 %) had motorcycles from the start. These
physical resources were good indicators that a family was
well off, because income from PF alone was insufficient to
own such expensive items. Increased income may supply
the money to purchase such things, but it is likely that some
well-off people entered the forestry program, which was
not permitted according to the Bangladesh Forest Act,
1927. During participant selection, some biased or illegal
activities may have occurred. Forest Department officials
explained the inclusion of rich people as a measure for
reducing conflicts with influential people and for improv-
ing the security of the whole plantation.
Comparing participants and non-participants
Houses were mostly mud-walled among participants
(92 %) and non-participants (95 %), and the rates for sun-
grass roofs were 70 % for participants and 78 % for non-
participants, while other homes had brick walls with brick
or tin roofs. Ownership rates for televisions and radios,
which are the major means of entertainment among rural
people, showed no significant difference between non-
participants and participants. Mobile phone possession was
statistically higher among the participants (75 %) com-
pared to non-participants (43 %). Very few participants
(5 %) had motorcycles, while non-participants had none.
This reveals that participants were better off than non-
participants. Since there had as yet been no plantation
harvest, it was clear that participant selection was impaired
by some veiled illegal activities.
Financial capital
To measure financial capital and livestock resources, we
examined financial credit sources and food security
(Table 2).
Comparing before and after participation
We observed that people moved away from the depen-
dency on livestock resources after joining the program.
They reduced the number of cows from four to two per
family, which was statistically significant. Raising
domestic animals became expensive due to the increase of
feed cost in recent years. And grazing area was not ade-
quately available. Participants were used to graze their
cattle in the nearby forests, but as those forests were taken
under the PF projects, they had to travel further away from
the house to feed their cattle. In addition, trees planted in
the project area were mostly Acaica spp., and thus the
availability of fodder species was also reduced. Moreover,
people preferred other jobs to earn money. For all these
reasons, keeping cattle was becoming less popular.
The food sufficiency rate was significantly reduced after
participation from 11 to 5 % of households. As a con-
comitant, the portion of households experiencing food
shortages increased from 47 to 60 %. But the number of
households with a marginal or surplus supply of food was
similar before and after participation. Food was expensive
and income was not sufficient to cover all costs. The so-called
J For Res
123

vicious cycle of poverty compelled people to limit their
food consumption.
Comparing participants and non-participants
With regard to financial capital, no significant difference
was found between the two groups of people. Non-partic-
ipants had more livestock than participants. The average
numbers of livestock per household of participants and
non-participants were similar (cows: 2 and 1; goats: 1 and
2; and poultry: 21 and 25, respectively). We noticed that
each household had on average received one loan from
NGOs, irrespective of social status. People in both the
participant and non-participant groups experienced food
shortages (60 and 73 %, respectively). Households with
marginal food security were 33 and 20 % among partici-
pants and non-participants, respectively. Some of the par-
ticipants (5 %) and non-participants (8 %) had sufficient
food. Very few participants (2.5 %) were found to have
surplus amounts, while no non-participant family had sur-
plus food.
Natural capital
To measure natural capital, we examined rights and own-
ership of lands and security of possessing the rights or
ownerships (Table 2).
Comparing before and after participation
All the households acquired certain amounts of land for
planting trees and managing the plantations with the
assistance of the Forest Department. Some participants
(5 %) had their own land outside the project area even
before the start of participatory forestry. This proves that
some rich people were included during participant selec-
tion. People felt much more secure (75 %). However, about
20 % of the participants were somewhat worried because
of their long-term experience with Forest Department
people. But it was evident that the PF program enhanced
feelings of security as it was found that the percentage of
people feeling somewhat insecure declined from 70 to
20 % of total participants. At the same time, that part of
society which was not concerned about the security of land
tenure also declined significantly, from 28 to 5 %.
Comparing participants and non-participants
To assess natural capital, we determined the percentages of
landholdings of the two groups of people. Our study found
that all participants (100 %) were leasing land. In addition
to leased land, some participants also owned some land,
amounting to only 10 % of participants and 2.5 % of non-
participants. But a few participants (5 %) owned land at
outside localities which might be located in their sadar
upazila (district), whereas non-participants had no such
land.
Both groups were living on government forestland,
which raised the constant risk of government intervention
on the land they had settled. They had no other place to go
because they were landless. This uncertainty had been a
perennial source of concern, but the problem was solved
when PF started in that area. From Table 2, it is clear that
75 % of the participants were socially feeling very secure
in terms of land and tree tenure, while no one felt very
insecure. This differed significantly from the feelings of
non-participants, of which 60 % felt highly insecure and no
one felt very secure with their land and tree tenure. Thirty-
five percent of the non-participants felt neither secure nor
insecure, whereas a significantly lower percentage of par-
ticipants (5 %) were recorded under this category. On the
other hand, some participants (20 %) thought that they
were in a moderately insecure position, which was signif-
icantly higher than non-participants who felt the same
(0 %). In general, it can be said that participants felt more
secure about their land and trees, whereas non-participants
showed anxieties.
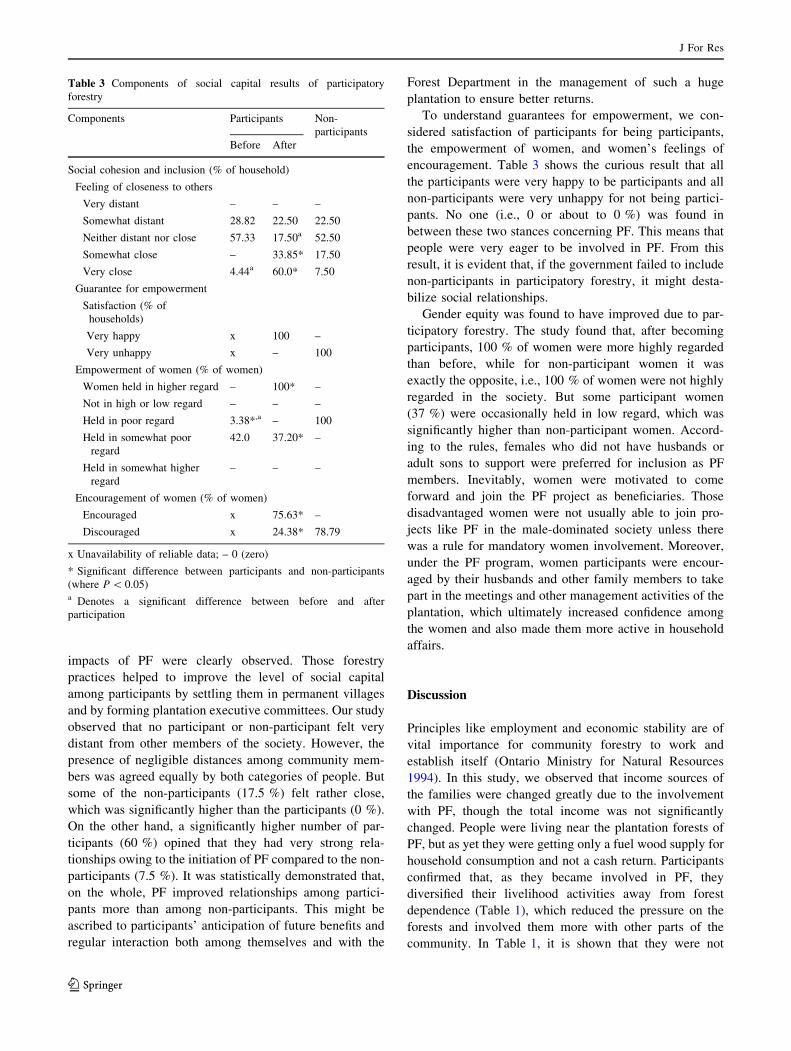
Social capital
In this study for measuring social capital, social cohesion,
and inclusion, we considered security status in terms of
land and trees, as well as empowerment (Table 3).
Comparing before and after participation
Participants who did not care about social cohesion were
significantly reduced, from 57 to 17 %. A large number of
participants (34 %) informed us that they were in a good
relationship. Some participants (4 %) defined the rela-
tionship between them as very close. All female partici-
pants (100 %) were more highly evaluated in their families
and society as a whole. Neglectful attitudes towards
females totally disappeared (0 %) because they were par-
ticipants, while all the non-participant women felt that they
were somehow not well accepted in the society.
Comparing participants and non-participants
The cooperative relationship between the forest governing
authority and the local community may lead to the
improvement of certain social variables. As the final har-
vesting had not yet been done, except for some interme-
diate thinning, in the studied area, the significant impacts of
PF on human, physical, financial, and natural capital were
not distinct, but in the case of social capital, some obvious
J For Res
123
impacts of PF were clearly observed. Those forestry
practices helped to improve the level of social capital
among participants by settling them in permanent villages
and by forming plantation executive committees. Our study
observed that no participant or non-participant felt very
distant from other members of the society. However, the
presence of negligible distances among community mem-
bers was agreed equally by both categories of people. But
some of the non-participants (17.5 %) felt rather close,
which was significantly higher than the participants (0 %).
On the other hand, a significantly higher number of par-
ticipants (60 %) opined that they had very strong rela-
tionships owing to the initiation of PF compared to the non-
participants (7.5 %). It was statistically demonstrated that,
on the whole, PF improved relationships among partici-
pants more than among non-participants. This might be
ascribed to participants’ anticipation of future benefits and
regular interaction both among themselves and with the
Forest Department in the management of such a huge
plantation to ensure better returns.
To understand guarantees for empowerment, we con-
sidered satisfaction of participants for being participants,
the empowerment of women, and women’s feelings of
encouragement. Table 3 shows the curious result that all
the participants were very happy to be participants and all
non-participants were very unhappy for not being partici-
pants. No one (i.e., 0 or about to 0 %) was found in
between these two stances concerning PF. This means that
people were very eager to be involved in PF. From this
result, it is evident that, if the government failed to include
non-participants in participatory forestry, it might desta-
bilize social relationships.
Gender equity was found to have improved due to par-
ticipatory forestry. The study found that, after becoming
participants, 100 % of women were more highly regarded
than before, while for non-participant women it was
exactly the opposite, i.e., 100 % of women were not highly
regarded in the society. But some participant women
(37 %) were occasionally held in low regard, which was
significantly higher than non-participant women. Accord-
ing to the rules, females who did not have husbands or
adult sons to support were preferred for inclusion as PF
members. Inevitably, women were motivated to come
forward and join the PF project as beneficiaries. Those
disadvantaged women were not usually able to join pro-
jects like PF in the male-dominated society unless there
was a rule for mandatory women involvement. Moreover,
under the PF program, women participants were encour-
aged by their husbands and other family members to take
part in the meetings and other management activities of the
plantation, which ultimately increased confidence among
the women and also made them more active in household
affairs.
Discussion
Principles like employment and economic stability are of
vital importance for community forestry to work and
establish itself (Ontario Ministry for Natural Resources
1994). In this study, we observed that income sources of
the families were changed greatly due to the involvement
with PF, though the total income was not significantly
changed. People were living near the plantation forests of
PF, but as yet they were getting only a fuel wood supply for
household consumption and not a cash return. Participants
confirmed that, as they became involved in PF, they
diversified their livelihood activities away from forest
dependence (Table 1), which reduced the pressure on the
forests and involved them more with other parts of the
community. In Table 1, it is shown that they were not
Table 3 Components of social capital results of participatory
forestry
Components Participants Non-
participants
Before After
Social cohesion and inclusion (% of household)
Feeling of closeness to others
Very distant – – –
Somewhat distant 28.82 22.50 22.50
Neither distant nor close 57.33 17.50a 52.50
Somewhat close – 33.85* 17.50
Very close 4.44a 60.0* 7.50
Guarantee for empowerment
Satisfaction (% of
households)
Very happy x 100 –
Very unhappy x – 100
Empowerment of women (% of women)
Women held in higher regard – 100* –
Not in high or low regard – – –
Held in poor regard 3.38*,a – 100
Held in somewhat poor
regard
42.0 37.20* –
Held in somewhat higher
regard
– – –
Encouragement of women (% of women)
Encouraged x 75.63* –
Discouraged x 24.38* 78.79
x Unavailability of reliable data; – 0 (zero)
* Significant difference between participants and non-participants
(where P \ 0.05)a Denotes a significant difference between before and after
participation
J For Res
123
engaged in any tree cutting or selling from forests because
they were frightened of the punishment or exclusion from
the list of participants. However, they were dependent on
forests to meet some household needs, such as leaf litter for
cooking. But everyone blamed some anonymous persons
(refusing to give names) from their societies including non-
participants who were sometimes cutting trees or extracting
sandy hill soils or clearing some parts of the reserve forests
for farming. Whatever the reason for hiding information
regarding forest resource extraction, it is clear that people
were sufficiently aware of legal matters at that time.
The gap between income and expenditure was widened
and poverty was sustained, in spite of increased income
(Table 1). In the course of the last several decades, in
general rural incomes have increased in developing coun-
tries, yet natural forests have been disappearing at a high
rate (Fomete and Vermaat 2001) because of the imbalance
between the income and expenditure. People living in
forest lands were extremely poor, and through this plan-
tation program it was very difficult to completely eradicate
poverty from that society. The World Bank (2003) has
observed that a large number of people suffering from
extreme poverty live on ‘‘fragile’’ lands. Poor people are
concentrated where natural, physical, social, and human
capital are low, and the greatest poverty is experienced
among people in forest-based economies (Mehta and Shah
2003). Our research findings also imply this.
Literacy was significantly increased due to the partici-
pation. Government and NGO initiatives for education may
be the direct cause of this improvement, but by being
participants people got the opportunities to work with
educated Forest Department and NGO people, whose
influence made them aware of the importance of education.
This indirect effect perhaps contributed to the overall
education level of the participant society (Table 2).
Increases in literacy and family income engendered chan-
ges in people’s housing and possessions. People informed
us that, in the meetings with the project authority, as well
as the plantation management, they discussed many things
concerning community development, especially education,
health and sanitation, employment, etc. From those meet-
ings, participants also got to know the sources of funds for
their livelihood development from government and NGOs,
etc., which significantly benefited them.
After participation, mobile phone possession increased
greatly among participants. We also found that some par-
ticipants possessed motorcycles and owned land from the
beginning, even before the start of PF (Table 2). This
reveals that, during participant selection, some richer
people had been included illegally. The Forest Department
explained the reason, saying that the poor and vulnerable
people were not sufficiently capable to protect themselves
from pressures applied by social elites. Participants indi-
cated some discontent over those powerful people, sus-
pecting that they may create problems during the
distribution of the final harvest benefit. Livestock resour-
ces, which are an important source of household income
(SIS 2004), a store of wealth (CAST 2001), and a form of
insurance (Fafchamps and Gavian 1997), were reduced
after participation because of the plantation taking place on
the land previously used for grazing (i.e., degraded forest
land) and the higher prices of animal feed. It was evident
that the PF program enhanced people’s feelings of security
(Table 2). In the society, PF could increase happiness.
Females were actively encouraged to join in PF and work.
Moreover, all female participants were enjoying greater
esteem in the family and society as a whole, while all the
non-participant women were not well treated in the society
(Table 3).
Conclusion
The impacts of PF on human, physical, financial, natural,
and social capital occurred in different magnitudes
depending on the capital type. The trend toward changing
involvement in income-generating activities other than
forest-related sources is a positive impact of PF will ulti-
mately reduce the pressure on the adjacent national reserve
forests. However, the participants blamed other people (not
wishing to name anyone) from their communities, both
participants and non-participants, who were used to harvest
trees, extract sandy hill soils or clear some of the reserved
forest areas for farming. It is clear that just a plantation
allocation by PF will not make notable differences. After
the final harvest, participants will get their shares. Conse-
quently, they will be better off and less dependent on the
forests. Therefore, it is important to include alternative
income generation (AIG) in the PF agenda. Besides this,
although the inclusion of local elites was not well accepted
by participants, they were not inclined to talk about that
during interviews because of fear. The influence of local
influential persons in any PF activity should be closely
monitored and restricted, or else PF will definitely lose its
practical relevance. At the same time, the Forest Depart-
ment should strengthen their activities to protect the nearby
reserve forests.
Acknowledgments We aregrateful to the University Grants Com-
mission of Bangladesh for funding the research. We would also like to
express our deep gratitude to Md. Hossain, Md. Abdur Rahman, and
Md. Rafiqul Islam, ACFs of FD, as well as some anonymous people
of the Forest Department for their assistance during our field work.
J For Res
123
References
Bandyopadhyay S, Shyamsundar P (2004) Fuelwood consumption
and participation in community forestry in India. World Bank
Policy Research Working Paper 3331. The World Bank,
Washington, DC
Banglapedia (2006) Document was found on http://www.
banglapedia.org/HT/C_0364.HTM. Last Accessed 15 Aug 2012
Booth D, Holland J, Hentschel J, Lanjouw P, Herbert A (1998)
Participation and combined methods in African poverty assess-
ment: renewing the agenda. Department for International
Development, Social Development Division, African Division,
London
Brosius JP (1997) Endangered forest, endangered people: environ-
mentalist representations of indigenous knowledge. Hum Ecol
25:47–69
Carney D (1998) Implementing the sustainable rural livelihoods
approach. Paper presented at DFID Natural Resource Advisers
Conference, 5–9 July
CAST (Council for Agricultural Science and Technology) (2001)
Role of animal agriculture in the human food supply. Ames,
USA
DFID (2000) Sustainable livelihoods guidance sheets. Department for
International Development, London
Fafchamps M, Gavian S (1997) The determinants of livestock prices
in Niger. J Afr Econ 6:255–295
Fomete T, Vermaat J (2001) Community forestry and poverty
alleviation in Cameroon. Rural Development Forestry Network.
Network Paper 25 h. Overseas Development Institute, London
Hong HN (2005) Can Gio: Turning mangroves into riches. In: Durst
PB, Brown C, Tacio HD, Ishikawa M (eds) In search of
excellence: exemplary forest management in Asia and the
Pacific. RAP Publication 2005=02, Asia-Pacific Forestry Com-
mission, FAO, Bangkok, Thailand, pp 49–60
IIED (1995) The hidden harvest: the value of wild resources in
agricultural systems. A summary. International Institute of
Environment and Development, London
Khan NA, Choudhury JK, Huda KS (2004) An overview of social
forestry in Bangladesh. Forestry Sector Project, Government of
Bangladesh, Dhaka
Lipton M, Ravallion M (1995) Poverty and policy. In: Behrman J,
Srinavasan TN (eds) Handbook of development economics, vol
3. Elsevier, Amsterdam
Maruyama M, Morioka N (1998) The impact of deforestation in
Brazilian Amazonia: the indigenous people of Rondonia State.
J For Plan 4:71–75
Maser C (1994) Sustainable forestry philosophy, science, and
economics. St Lucie Press, USA
McGregor JA (1998) A poverty of agency: resource management
amongst the poor in Bangladesh. Paper presented to the 5th
Workshop of the European Network of Bangladesh Studies, Bath
Mehta AK, Shah A (2003) Chronic poverty in India: Incidence,
causes and policies. In: Hulme D, Shepherd A (eds) Special issue
on ‘‘Chronic poverty and development policy.’’ W Dev 31:
491–511
Moser CON (1998) The asset vulnerability framework: reassessing
urban Poverty reduction strategies. W Dev 26:1–19
Muhammed N, Koike M, Sajjaduzzaman M, Sophanarith K (2005)
Reckoning social forestry in Bangladesh: policy and plan versus
implementation. Forestry: an International. J For Res
78:373–383
Nath TK, Inoue, M (2010) Impacts of participatory forestry on
livelihoods of ethnic people: experience from Bangladesh. Soc
Nat Resour 23(11):1093–1107
Ontario Ministry for Natural Resources (1994) Partnerships for
community involvement in forestry: a comparative analysis of
community involvement in natural resource management.
Queen’s Printers for Ontario, Sault Ste. Marie
Pearce D (1996) Global environmental value and the tropical forests:
demonstration and capture. In: Adamowicz W, Boxal P, Luckert
M, Phillips W, White W (eds) Forestry, economics and the
environment. CAB International, Wallingford, pp 11–49
Poore D (1986) The vanishing forest: the human consequences of
deforestation. Zed, London
Putnam R (2001) Social capital measurement and consequences. In:
Helliwell JF (ed) The contribution of human and social capital to
sustained economic growth and well-being. Ottawa, Ontario,
pp 117–135
Rana MA, Noguchi T, Muhammed N (2007) Collaborative protected
area management in Bangladesh. Impact of participatory forest
management (PFM) on socio-economic development in Bangla-
desh: a case study in the Madhupur Sal Forest. J For Econ
53:46–56
Rodriguez A, Smith S (1994) A comparison of determinants of urban,
rural and farm poverty in Costa Rica. W Dev 22:381–397
Salam AMD, Noguchi T, Koike M (1999) Present conditions and
prospects of homestead forestry in Bangladesh. Asi Prof
27:523–535
Scoones, I (1998) Sustainable rural livelihoods: a framework for
analysis. IDS Working Paper 72, Institute of Development
Studies 1998
SIS (State Institute of Statistics) (2004) General agricultural census
2001. Result of the agricultural holdings (households) survey.
State Institute of Statistics, Prime Ministry Republic of Turkey
No. 2924, Ankara
Soussan J, Blaikie P, Springate-Baginski O, Chadwick M (2001)
Understanding livelihood processes and dynamics. Livelihood-
Policy Relationship in South Asia Working Paper 1, University
of Leeds, UK
Wikipedia (2010) The online document found on world wide website
http://en.wikipedia.org/wiki/Cox’s_Bazar_District. Last visited
on 17 July 2010
World Bank (2003) World development report 2003: Sustainable
development in a dynamic world: transforming institutions,
growth, and quality of life. The World Bank, Washington, DC.
Oxford University Press, New York
J For Res
123
Copyright © 2022 FDOKUMEN