Effects of forest ownership and change on forest harvest rates, types and trends in northern Maine
10
Effects of forest ownership and change on forest harvest rates, types and trends in northern Maine Suming Jin * , Steven A. Sader 1 Department of Forest Management, 260 Nutting Hall, University of Maine, Orono, ME 04469-5755, United States Received 12 December 2005; received in revised form 1 March 2006; accepted 2 March 2006 Abstract Forest ownership maps from 1994, 2000 and 2004 were analyzed with land cover maps (early 1990s) and forest change detection maps derived from Landsat imagery (1991, 2000, 2004). Between 1994 and 2000, roughly 80% of the Industrial forest ownership in a northern Maine study area changed hands. Approximately 75% of these forestlands were sold to Timber Investment Management Organizations (TIMOs) and 25% to other Industrial owners. Non-Government Organizations (NGOs) and Logger/Short-term Investors (LDs) purchased smaller parcels of forestland from the Industrial and TIMO sellers, from 1994 to 2004. Landsat change detection methods indicated a general trend in landowners’ preference to harvest softwood and softwood–hardwood in the 1980s, softwood–hardwood and hardwood–softwood stands in the 1990s, and nearly a balanced proportion of four forest types between 2000 and 2004; however, these trends varied among individual landowners. Industrial ownership type harvested the highest percentage of forest in the 1980s, but not in the 1990s and early 2000s. The TIMOs and LDs harvested a higher percentage of forest in the 1990s and early 2000s, while the NGOs harvested less. The Non-Industrial Private Forest (NIPF) held more stable ownership through time and had more equal and intermediate harvest rates through time. Forest land that experienced no ownership change had significantly lower harvest rates than land that changed ownership between 1994 and 2000. Given the rates of past harvesting and current composition of forestland, the estimated average forest disturbance rotation on the 2004 Industrial ownership would be 51 years, compared to 70 years for NIPF forestlands. # 2006 Elsevier B.V. All rights reserved. Keywords: Forest ownership type; Ownership change; Forest harvest rate; Forest harvest type; Landsat change detection 1. Introduction Maine is the most heavily forested state in the U.S. with 90% of the land area in forest cover, and 97% of Maine’s forestlands are classified as productive timberland (McWilliams et al., 2005). Maine is unique in that over 95% of this forest is privately owned (Maine Forest Service, 1999; Laustsen et al., 2003). Extensive clearcutting (and salvage logging) occurred in the late 1970s and throughout the 1980s, in the wake of the massive spruce budworm outbreak (Griffith and Alerich, 1996). The Maine Forest Practices Act, implemented in 1991, limited the size of clearcuts (Maine Forest Service, 1995; Hagan and Boone, 1997). Clearcutting steadily declined to less than 5% of total harvested volume by the late 1990s and early 2000s, and partial harvesting became dominant (Maine Forest Service, 1999; McWilliams et al., 2005). The extensive private forests in northern Maine have experienced not only dramatic change in silvicultural harvest practice but also significant ownership changes over the past two decades (Irland, 2000; Maine Forest Service, 1999; Laustsen et al., 2003; McWilliams et al., 2005). In 1988, public concern was aroused by the sale of a large block of Maine timberland, formerly owned by Diamond International Cor- poration, to entities focused on land development (NFLC, 1994). This was unlike previous transactions where timberland was transferred from one large industrial owner to another, and the land remained in ‘‘working forest’’, which was not considered threatening to the long-term production of wood fiber, maintaining mills and woods jobs or providing traditional public recreation access to the private, corporate forest (Phillips, 1993). The Northern Forest Lands Council and its predecessors, the Northern Forest Lands Study and Governors’ Task Force, were created in response to concerns that the large, privately owned northern forest was at grave risk of break-up and land use conversion (NFLC, 1994; NEFA, 2004). The ownership change pattern in Maine reflects the dramatic changes of forest industry in recent years on larger scale. www.elsevier.com/locate/foreco Forest Ecology and Management 228 (2006) 177–186 * Corresponding author. Tel.: +1 540 2573602. E-mail addresses: [email protected] (S. Jin), [email protected] (S.A. Sader). 1 Tel.: 1 207 -5812845; Fax: 1 207 5812875. 0378-1127/$ – see front matter # 2006 Elsevier B.V. All rights reserved. doi:10.1016/j.foreco.2006.03.009
-
Upload
independent -
Category
Documents
-
view
3 -
download
0
Transcript of Effects of forest ownership and change on forest harvest rates, types and trends in northern Maine
Effects of forest ownership and change on forest harvest rates,
types and trends in northern Maine
Suming Jin *, Steven A. Sader 1
Department of Forest Management, 260 Nutting Hall, University of Maine, Orono, ME 04469-5755, United States
Received 12 December 2005; received in revised form 1 March 2006; accepted 2 March 2006
Abstract
Forest ownership maps from 1994, 2000 and 2004 were analyzed with land cover maps (early 1990s) and forest change detection maps derived
from Landsat imagery (1991, 2000, 2004). Between 1994 and 2000, roughly 80% of the Industrial forest ownership in a northern Maine study area
changed hands. Approximately 75% of these forestlands were sold to Timber Investment Management Organizations (TIMOs) and 25% to other
Industrial owners. Non-Government Organizations (NGOs) and Logger/Short-term Investors (LDs) purchased smaller parcels of forestland from
the Industrial and TIMO sellers, from 1994 to 2004. Landsat change detection methods indicated a general trend in landowners’ preference to
harvest softwood and softwood–hardwood in the 1980s, softwood–hardwood and hardwood–softwood stands in the 1990s, and nearly a balanced
proportion of four forest types between 2000 and 2004; however, these trends varied among individual landowners. Industrial ownership type
harvested the highest percentage of forest in the 1980s, but not in the 1990s and early 2000s. The TIMOs and LDs harvested a higher percentage of
forest in the 1990s and early 2000s, while the NGOs harvested less. The Non-Industrial Private Forest (NIPF) held more stable ownership through
time and had more equal and intermediate harvest rates through time. Forest land that experienced no ownership change had significantly lower
harvest rates than land that changed ownership between 1994 and 2000. Given the rates of past harvesting and current composition of forestland,
the estimated average forest disturbance rotation on the 2004 Industrial ownership would be 51 years, compared to 70 years for NIPF forestlands.
# 2006 Elsevier B.V. All rights reserved.
Keywords: Forest ownership type; Ownership change; Forest harvest rate; Forest harvest type; Landsat change detection
www.elsevier.com/locate/foreco
Forest Ecology and Management 228 (2006) 177–186
1. Introduction
Maine is the most heavily forested state in the U.S. with 90%
of the land area in forest cover, and 97% of Maine’s forestlands
are classified as productive timberland (McWilliams et al.,
2005). Maine is unique in that over 95% of this forest is
privately owned (Maine Forest Service, 1999; Laustsen et al.,
2003). Extensive clearcutting (and salvage logging) occurred in
the late 1970s and throughout the 1980s, in the wake of the
massive spruce budworm outbreak (Griffith and Alerich, 1996).
The Maine Forest Practices Act, implemented in 1991, limited
the size of clearcuts (Maine Forest Service, 1995; Hagan and
Boone, 1997). Clearcutting steadily declined to less than 5% of
total harvested volume by the late 1990s and early 2000s, and
partial harvesting became dominant (Maine Forest Service,
1999; McWilliams et al., 2005).
* Corresponding author. Tel.: +1 540 2573602.
E-mail addresses: [email protected] (S. Jin),
[email protected] (S.A. Sader).1 Tel.: 1 207 -5812845; Fax: 1 207 5812875.
0378-1127/$ – see front matter # 2006 Elsevier B.V. All rights reserved.
doi:10.1016/j.foreco.2006.03.009
The extensive private forests in northern Maine have
experienced not only dramatic change in silvicultural harvest
practice but also significant ownership changes over the past
two decades (Irland, 2000; Maine Forest Service, 1999;
Laustsen et al., 2003; McWilliams et al., 2005). In 1988, public
concern was aroused by the sale of a large block of Maine
timberland, formerly owned by Diamond International Cor-
poration, to entities focused on land development (NFLC,
1994). This was unlike previous transactions where timberland
was transferred from one large industrial owner to another, and
the land remained in ‘‘working forest’’, which was not
considered threatening to the long-term production of wood
fiber, maintaining mills and woods jobs or providing traditional
public recreation access to the private, corporate forest
(Phillips, 1993). The Northern Forest Lands Council and its
predecessors, the Northern Forest Lands Study and Governors’
Task Force, were created in response to concerns that the large,
privately owned northern forest was at grave risk of break-up
and land use conversion (NFLC, 1994; NEFA, 2004).
The ownership change pattern in Maine reflects the dramatic
changes of forest industry in recent years on larger scale.
S. Jin, S.A. Sader / Forest Ecology and Management 228 (2006) 177–186178
In New England, large industrial owners dominated forestland
ownership for years. Their management focused on using the
forestland base as a supply for manufacturing facilities.
Beginning in the 1990s, several forest products companies
(industrial) sold their forestland to other types of landowners
(NFLC, 1994; Yin et al., 1998; Irland, 2000; Yale Forest Forum
Review, 2002; McWilliams et al., 2005). For example, two
classes of timberland owners emerged in the 1990s that
previously did not exist. The first was the real estate investment
trusts (REITs), and the second was institutional investors, who
tend to cede forest management responsibilities to timberland
investment management organizations (TIMOs). These orga-
nizations represented financial institutions that were buying and
selling large tracts of timberlands in Maine and elsewhere
(Maine Tree Foundation, 2005, unpublished). Non-government
organizations (NGOs) were a small but emerging buyer in the
late 1990s (Yale Forest Forum Review, 2002; NEFA, 2004).
Because the NIPF, TIMO, REIT, NGO and other landowners do
not own manufacturing facilities, like industrial owners, they
have different incentives and management strategies for their
timberlands. For example, TIMOs and REITs focus primarily
on maximizing the return on their timberland assets (Yale
Forest Forum Review, 2002). In the 2002 Yale Forest Forum
‘‘Institutional Timberland Investment Balancing Ecology,
Finance and the Public Interest’’, Eva Greger, managing
partner of GMO Renewable Resources (a TIMO) emphasized
that the TIMOs are long-term total return investors, and are not
overly focused on annual cash flows from timber sales;
therefore they can time timber markets and make investments in
the land (Yale Forest Forum Review, 2002).
Regardless of the vast tracts of Maine forest being bought
and sold during the 1990s and early 2000s, most of the land has
remained in working forests. Also, the major industrial and
NIPF landowners, and some of the TIMO and REIT landowners
in Maine, have attained forest certification under either the
Scientific Forestry Initiative or Forest Stewardship Council. A
few of the NIPFs have entered into no-development,
conservation easements (Maine Forest Service, 1999; Sader
et al., 2002). However, the dramatic forest ownership changes,
especially in northern Maine, have raised public concerns about
how the new ownership mix will affect future forest
sustainability, and particularly, the traditional recreation access
to the extensive, privately owned forest that Maine citizens have
enjoyed for over 100 years. According to the recent U.S. Forest
Service, Forest Inventory and Analysis (FIA) report (McWil-
liams et al., 2005) ‘‘It is not known how changes in land
ownership in Maine will affect long-term timber management
and availability. There is a need to evaluate the effect of
changes in ownership (e.g. number of small landowners and
shift from industry owners to investors) on timber supply/
availability and the stability of the land based managed actively
for forestry.’’
Harvest rates over time and silvicultural practices (e.g.
partial harvest, clearcut) may have a considerable influence on
forest sustainability (Grigal and Bates, 1997; Larsen, 1995;
McWilliams et al., 2005). Using satellite imagery to evaluate
how different land ownership affects harvest rates and trends
may improve our understanding of current and future forest
composition and structure over multiple ownerships. This is not
easily accomplished in a timely and cost effective manner using
ground based or aerial based methods. Landsat images have
been widely used to map forest cover and monitor forest
disturbances, including harvesting activities (Kushwaha, 1990;
Coppin and Bauer, 1996; Franklin et al., 2000; Cohen et al.,
1998, 2002; Sader et al., 2003). Few studies have examined
forest disturbance in relation to land ownership. Cohen et al.
(2002) used multi-date Landsat data to characterize the
relationships among disturbance rates and patterns between
mostly federal and private owners to determine the impact of
land management activities and wildfire in western Oregon.
Turner et al. (1996) studied land ownership patterns between
1975 and 1991 related to land cover change in the Southern
Appalachians and the Olympic Peninsula. They found some
differences in land cover transitions through time, between
ownerships (public and private lands) and between the two
regions. A literature review did not reveal any large landscape
scale, spatially explicit studies that have analyzed nearly three
decades of forest disturbances over multiple private owner-
ships.
1.1. Objectives
This research will analyze forest cover and change maps
derived from satellite imagery to understand the relationship of
changing ownership on timber harvest rates (area of forest
disturbance expressed as a percentage) and trends for a large
study area in northwestern Maine. Given the extensive
clearcutting of the 1980s following the spruce budworm
outbreak, coupled with forestry legislation (e.g. 1991 imple-
mentation of the Maine Forest Practices Act) and major
ownership changes that occurred from the late 1980s to early
2000s, some interesting landscape level research questions
arise. The core question is ‘‘Does ownership type and
ownership change have a significant effect on forest harvest
rates over time’’? Specifically, have some forest holdings
experienced disproportionately high or low harvest rates
compared to other holdings? Is there a trend over time? Are
there differences in landowner’s preference to harvest particular
forest types? The research will provide a new analysis and a
landscape scale perspective of forest harvesting activity across
multiple ownerships.
1.2. Study area
The study site is approximately 1.8 million ha and includes
portions of five counties in northern Maine, USA (Fig. 1). The
study area was selected because it contained a mix of ownership
types that were representative of the unorganized townships of
northern Maine. Also the area was contained wholly within one
Landsat scene (Path 12 Row 28 of the Worldwide Reference
System), making data processing and analysis more convenient.
This Acadian forest (a matrix of woods and waterways with
hardwood and softwood trees typical of the Northern
Appalachians and the Boreal Forest) in Maine occupies the

S. Jin, S.A. Sader / Forest Ecology and Management 228 (2006) 177–186 179
Fig. 1. The northern Maine study area (gray area with white township bound-
ary) encompasses approximately 1.8 million ha and portions of five counties.
Black lines are Maine county boundaries.
northern boundary of temperate forest and southern edge of
boreal forest (Loo and Ives, 2003). The upland vegetation is
composed of conifer (>75% softwood), deciduous (>75%
hardwood) and mixed stands (softwood–hardwood = 51–75%
softwood; hardwood–softwood = 51–75% hardwood) with a
variety of age classes from early successional to mature forest
types. Soils are derived mainly from glacial till. The area is
relatively flat to rolling with occasional low mountains,
abundant lakes, ponds, streams and associated wetland
vegetation and essentially no urban development (Hepinstall
et al., 1999).
2. Methods
2.1. Satellite data acquisition and preprocessing
To make all of the data compatible for processing and
analysis, some preliminary steps were followed. Radiome-
trically corrected and geo-referenced 1991 and 2004 Landsat
Thematic Mapper (TM), and 2000 Landsat Enhanced Thematic
Mapper Plus (ETM+) images (in the data archive of the Maine
Image Analysis Laboratory at the University of Maine) were
available to support the forest change mapping. All images
were collected in the summer months (hardwood leaf-on).
Clouds and cloud shadows in the 1991, 2000 and 2004 Landsat
imagery were removed through screen digitizing polygons
around the affected areas. These data were supplemented with
1993 and 1999 Landsat TM and 2001 and 2002 Landsat ETM+
images for areas covered by clouds in the 1991, 2000 and 2004
datasets. The 2001 Landsat imagery was cloud free.
2.2. Preparation of forest change maps
A forest cover and change map derived from 1991 and 2000
Landsat imagery was available to this study. Based on
comparison with 178 randomly sampled photo interpretation
plots, the accuracy of the forest-no change, forest cover loss,
and forest cover gain classes of the map was 90%, 88%, and
92%, respectively (Sader et al., 2005). An unsupervised
classification approach (isodata clustering) was used to identify
forest areas represented by pixels that experienced some level
of disturbance or canopy loss (e.g. light to heavy harvesting
activity for the purposes of this study) from areas were no
disturbance (equated with no change) was detected. Note that
the terms forest disturbance and forest cover loss are used
interchangeably throughout the manuscript. Pixels indicating
forest cover gain represented mostly natural forest regeneration
following harvesting activity that occurred at least a few years
before the 1991 image was recorded. The visible red, near
infrared and middle infrared wavebands of the Landsat sensor
(TM 3, 4, 5) and the normalized difference moisture index for
both dates were used in the classification approach. The
detailed methods used to prepare the 1991–2000 forest change
map were reported by Sader et al. (2005).
Recent investigations into the use of vegetation indices in
Maine forest change detection studies have indicated that the
time-series normalized difference moisture index (NDMI),
derived from Landsat data (Eq. (1)), produce accurate results
for the Maine forest conditions (Wilson and Sader, 2002; Sader
et al., 2003; Jin and Sader, 2005). The forest change classes for
the 2000, 2001 and 2004 Landsat data sets were processed
using a method called RGB_NDMI, described by Sader et al.
(2003). Wilson and Sader (2002) demonstrated that the
RGB_NDMI classification method can detect partial or clearcut
harvests with high overall accuracy (>90%) when Landsat
image acquisitions were less than 3 years apart:
NDMI ¼ ðNIR�MIRÞðNIRþMIRÞ ; (1)
where NIR is the near infrared spectral band 4 (0.76–0.90 mm)
of Landsat and MIR is mid infrared spectral band 5 (1.55–
1.75 mm).
For the 2000, 2001 and 2004 Landsat datasets (with 1999
and 2001 replacement for cloud affected areas), three-date
NDMI images were used as input data to unsupervised
classification (Isodata clustering). Clusters were interpreted
into four classes using visual interpretation of the original TM
color composite images (Cohen et al., 1998; Wilson and Sader,
2002; Sader et al., 2003). The four classes were: forest cover
loss (pixels indicating disturbance or harvest) before 2000,
forest cover loss between 2000 and 2001, forest cover loss
between 2001 and 2004, and forest-no change (pixels with no
disturbance or cover loss detected). These were later grouped
into two classes: forest loss 2000–2004, forest-no change.
S. Jin, S.A. Sader / Forest Ecology and Management 228 (2006) 177–186180
Cohen et al. (1998) demonstrated that that there was no
significant difference in accuracy of detecting clearcuts
between field visits combined with photo interpretation
methods and visual interpretation of Landsat color composites.
Also Sader et al. (2003) reported the method to be accurate and
not significantly different compared to photo interpretation
plots of partial and clearcut harvest areas in Maine.
2.3. Forest ownership type and ownership change class
Maine forest ownership maps from 1994, 2000 and 2004
were acquired from a private company. These maps identified
individual landowners and ownership type at each date (names
of all private landowners will remain confidential). An alpha-
numeric labeling system was used to identify each landowner in
the database. The three dates of ownership identities were
recoded into four general groups: no change in ownership from
1994 to 2004 (NC940004), ownership change between 1994
and 2000 (C1_9400), ownership change between 2000 and
2004 (C1_0004), and ownership change between 1994 and
2000, and between 2000 and 2004 (C2_940004). The 2004
forest ownership map was categorized into nine ownership
types: Industrial (I), NIPF, TIMO, Logger/Short-Term Investor
(LD), Non-Government Organization (NGO), State (S), Indian
(IN), Federal (F) and Others (O). One of the major landowners
is not a TIMO but is a publicly traded REIT. Nevertheless, we
put the REIT into the TIMO group because its major assets in
Maine are timberlands. The ‘‘Others’’ ownership type are a
mixed category of smaller NIPFs and other unknown owners,
altogether representing a much smaller proportion of the study
area. Organizing the ownership data in this way will facilitate
the comparison of harvest activity over time by ownership type
and ownership change class.
2.4. Forest area available for harvest
To normalize the different topographic characteristics and
ownership size effects, the forest cover loss (harvest)
estimates were based on the percentage of the ‘‘accessible’’
forest in each ownership type. The forest harvest rates were
calculated as ‘‘forest cover loss area/accessible forest
area � 100’’ (i.e. forest cover loss percentage in time period).
The proportion of forest considered accessible was based on
the percentage of the forest types present in the 1993 Maine
Gap land cover map (Hepinstall et al., 1999) minus elevations
over 3200 feet, slopes greater than 40%, and land in reserve or
protected status. The State of Maine and forest management
companies generally do not harvest forests under these three
constraints; therefore we excluded these forest areas from
consideration so that the percentage of harvested forest would
be based on the forestland base with harvest potential.
Collectively, the forest excluded from the analysis repre-
sented approximately 8.5% of the total forest area, of which
7.0% was contained within Baxter State Park. The total
accessible forest represented is approximately 1.5 million ha.
The accuracy of forest versus non forest cover types in the
Maine Gap map was 94% (Hepinstall et al., 1999).
2.5. Forest cover loss and gain over three decades
To prepare the datasets for analysis of forest harvest rates in
the different time periods, we needed to combine information
from different maps. The Maine Gap land cover map
(Hepinstall et al., 1999) included two regeneration stand types:
early regeneration and late regeneration. Late regeneration
represented older harvesting, mainly clearcuts (spruce bud-
worm, salvaged stands), in the late 1970s through the early
1980s. Early regeneration represented stands harvested from
approximately the mid 1980s to 1990. The two regeneration
types from the Maine Gap map were combined to represent the
forest stands harvested from late 1970s and throughout the
1980s. Because nearly all of the study area is under working
forest ownerships (Industrial, NIPF, State, Other), we assumed
that natural regeneration was occurring and the land has
remained in forest use. Tree planting is a small component of
the total forest regeneration area in Maine (Laustsen et al.,
2003; McWilliams et al., 2005). The 1991–2000 forest cover
loss from the change detection map (Sader et al., 2005)
represented forests harvested throughout the 1990s. The forest
cover loss area between 2000 and 2004 (from the 2000-01-04
RGB-NDMI change detection mapping) represented forests
harvested in the early 2000s.
To improve the visualization and localization of the harvest
activity over the study area, we calculated a ‘‘disturbance
index’’, which we define operationally as the cumulative
disturbance detected over the three time periods (percentage of
forest pixels in each township with forest canopy loss detected).
The disturbance rotation (time span/disturbance index) for
major selected major landowner types was also calculated as
another metric to compare among landowner types. This metric
was calculated on each ownership type area and not on the
township level.
2.6. Forest type harvested by ownership type and
ownership change class
The forest cover loss areas of 1991–2000 and 2000–2004
were intersected with the Maine Gap map (Hepinstall et al.,
1999) to determine the forest types harvested in each time
period—hardwood (H), hardwood–softwood (HS), softwood–
hardwood (SH) and softwood (S). The regeneration areas in the
Maine Gap map were intersected with a 2004 forest cover map
to estimate the forest type harvested during the 1980s. The
methods used to prepare the 2004 forest cover map have been
reported elsewhere (Metzler and Sader, 2005). The assumption
was made that the regenerated forest composition (although not
age class or structure) is representative of the forest
composition before harvesting. The regeneration stands derived
from the Maine Gap map represent mostly the legacy of the
massive spruce budworm infestation and subsequent salvage
logging practiced by all major landowners. Although the name
of the insect implies otherwise, the spruce trees (Picea sp.) are
not the most preferred host as judged by higher mortality of
balsam fir (Abies balsamea (L.) Mill.) following past epidemics
(Miller, 1963; Royama, 1984). According to Baskerville
S. Jin, S.A. Sader / Forest Ecology and Management 228 (2006) 177–186 181
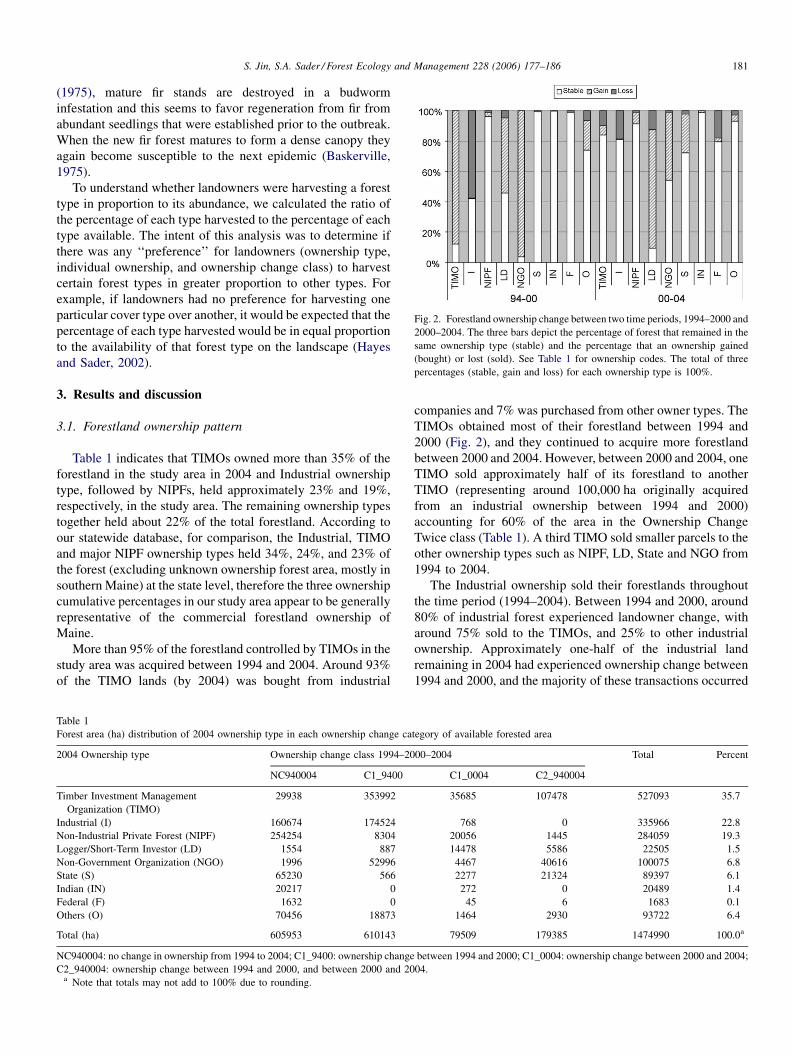
Fig. 2. Forestland ownership change between two time periods, 1994–2000 and
2000–2004. The three bars depict the percentage of forest that remained in the
same ownership type (stable) and the percentage that an ownership gained
(bought) or lost (sold). See Table 1 for ownership codes. The total of three
percentages (stable, gain and loss) for each ownership type is 100%.
(1975), mature fir stands are destroyed in a budworm
infestation and this seems to favor regeneration from fir from
abundant seedlings that were established prior to the outbreak.
When the new fir forest matures to form a dense canopy they
again become susceptible to the next epidemic (Baskerville,
1975).
To understand whether landowners were harvesting a forest
type in proportion to its abundance, we calculated the ratio of
the percentage of each type harvested to the percentage of each
type available. The intent of this analysis was to determine if
there was any ‘‘preference’’ for landowners (ownership type,
individual ownership, and ownership change class) to harvest
certain forest types in greater proportion to other types. For
example, if landowners had no preference for harvesting one
particular cover type over another, it would be expected that the
percentage of each type harvested would be in equal proportion
to the availability of that forest type on the landscape (Hayes
and Sader, 2002).
3. Results and discussion
3.1. Forestland ownership pattern
Table 1 indicates that TIMOs owned more than 35% of the
forestland in the study area in 2004 and Industrial ownership
type, followed by NIPFs, held approximately 23% and 19%,
respectively, in the study area. The remaining ownership types
together held about 22% of the total forestland. According to
our statewide database, for comparison, the Industrial, TIMO
and major NIPF ownership types held 34%, 24%, and 23% of
the forest (excluding unknown ownership forest area, mostly in
southern Maine) at the state level, therefore the three ownership
cumulative percentages in our study area appear to be generally
representative of the commercial forestland ownership of
Maine.
More than 95% of the forestland controlled by TIMOs in the
study area was acquired between 1994 and 2004. Around 93%
of the TIMO lands (by 2004) was bought from industrial
Table 1
Forest area (ha) distribution of 2004 ownership type in each ownership change ca
2004 Ownership type Ownership change class 1994–20
NC940004 C1_9400
Timber Investment Management
Organization (TIMO)
29938 353992
Industrial (I) 160674 174524
Non-Industrial Private Forest (NIPF) 254254 8304
Logger/Short-Term Investor (LD) 1554 887
Non-Government Organization (NGO) 1996 52996
State (S) 65230 566
Indian (IN) 20217 0
Federal (F) 1632 0
Others (O) 70456 18873
Total (ha) 605953 610143
NC940004: no change in ownership from 1994 to 2004; C1_9400: ownership change
C2_940004: ownership change between 1994 and 2000, and between 2000 and 20a Note that totals may not add to 100% due to rounding.
companies and 7% was purchased from other owner types. The
TIMOs obtained most of their forestland between 1994 and
2000 (Fig. 2), and they continued to acquire more forestland
between 2000 and 2004. However, between 2000 and 2004, one
TIMO sold approximately half of its forestland to another
TIMO (representing around 100,000 ha originally acquired
from an industrial ownership between 1994 and 2000)
accounting for 60% of the area in the Ownership Change
Twice class (Table 1). A third TIMO sold smaller parcels to the
other ownership types such as NIPF, LD, State and NGO from
1994 to 2004.
The Industrial ownership sold their forestlands throughout
the time period (1994–2004). Between 1994 and 2000, around
80% of industrial forest experienced landowner change, with
around 75% sold to the TIMOs, and 25% to other industrial
ownership. Approximately one-half of the industrial land
remaining in 2004 had experienced ownership change between
1994 and 2000, and the majority of these transactions occurred
tegory of available forested area
00–2004 Total Percent
C1_0004 C2_940004
35685 107478 527093 35.7
768 0 335966 22.8
20056 1445 284059 19.3
14478 5586 22505 1.5
4467 40616 100075 6.8
2277 21324 89397 6.1
272 0 20489 1.4
45 6 1683 0.1
1464 2930 93722 6.4
79509 179385 1474990 100.0a
between 1994 and 2000; C1_0004: ownership change between 2000 and 2004;
04.

S. Jin, S.A. Sader / Forest Ecology and Management 228 (2006) 177–186182
Fig. 3. The 2004 forest ownership map is displayed on the left; disturbance index map is on the right side. The disturbance index represents the cumulative sum of
percent forest disturbed (harvested) of available forest land throughout the 1980s, 1990s, and early 2000s for each township in the study area.
among the Industrial ownership themselves (Table 1, Fig. 2). In
contrast, nearly 90% of NIPF land remained in single
ownership (stable over the time periods). The 10% of NIPF
area change was attributed to one purchase by a TIMO between
2000 and 2004. The NGOs acquired several parcels of forest
from Industrial, NIPFs, TIMOs, and LDs through 1994–2004.
The LDs and State acquired more forestland during the 1994–
2000 time frame.
3.2. Forest harvest rates by ownership type
The 2004 forest ownership map and the disturbance index
map (cumulative% of 1980s, 1990s and 2000s harvest area by
township) are depicted in Fig. 3. Note that 2004 is the base year
for ownership identification and comparison for reporting
convenience, however some landowners (e.g. TIMOs, LD,
NGO) did not own a large percentage of the land at earlier dates
Fig. 4. Left image is an example of the combined forest change map for three time pe
is forest harvested from the late 1970s through 1980s, dark green is forest-no change
color composite.
(1970s and 1980s). Much of the harvesting may have occurred
prior to the purchase dates of the 2004 owners and therefore the
disturbance measured is largely a legacy of the earlier owners.
There are 47% of Industrial townships and 37% TIMO
townships based on 2004 ownership type, which represented
the higher disturbance categories (>50% of available forest
harvested). Compared to the Industrial and TIMO owned lands
in 2004, the stable NIPF ownership had many more townships
represented by the low to medium disturbance categories (30–
50%), and only 8% of the townships had high cumulative
disturbance (>50%). More than half of the State, Federal and
Indian owned townships were lightly disturbed (0–30%) up
through 2004.
A full resolution example of the combined forest change
map (Fig. 4, left map) for three time periods is provided with the
2004 Landsat color composite images (Fig. 4, right map) for
visual reference. For example, the harvested areas during 1980s
riods. Red is forest disturbed in 1990s, yellow is forest disturbed in 2000s, green
since the late 1970s. The right image is the 2004 Landsat TM band 4, 5, 3 (RGB)
S. Jin, S.A. Sader / Forest Ecology and Management 228 (2006) 177–186 183
Table 2
Forest harvest percentage by time period and by 2004 ownership type
Type No
change
Late
1970–1980s
1990s 2000sa Area (ha)
TIMO 51.0 22.4 16.4 10.2 527093
I 51.1 27.5 15.1 6.3 335966
NIPF 64.5 18.0 10.9 6.7 284059
LD 69.1 3.7 18.5 8.7 22505
NGO 61.4 20.0 13.8 4.7 100075
S 79.1 9.9 7.6 3.4 89397
F 83.7 6.4 7.3 2.6 1683
IN 75.1 18.3 4.7 1.9 20489
O 60.7 20.9 13.3 5.1 93722
Total accessible
forestb
57.3 21.3 14.0 7.3 1474990
a Note that the 2000–2004 time interval represents less than one-half of the
interval of the 1980s and 1990s data. See Table 1 for identification of ownership
types.b Total accessible forest does not add to 100 due to rounding.
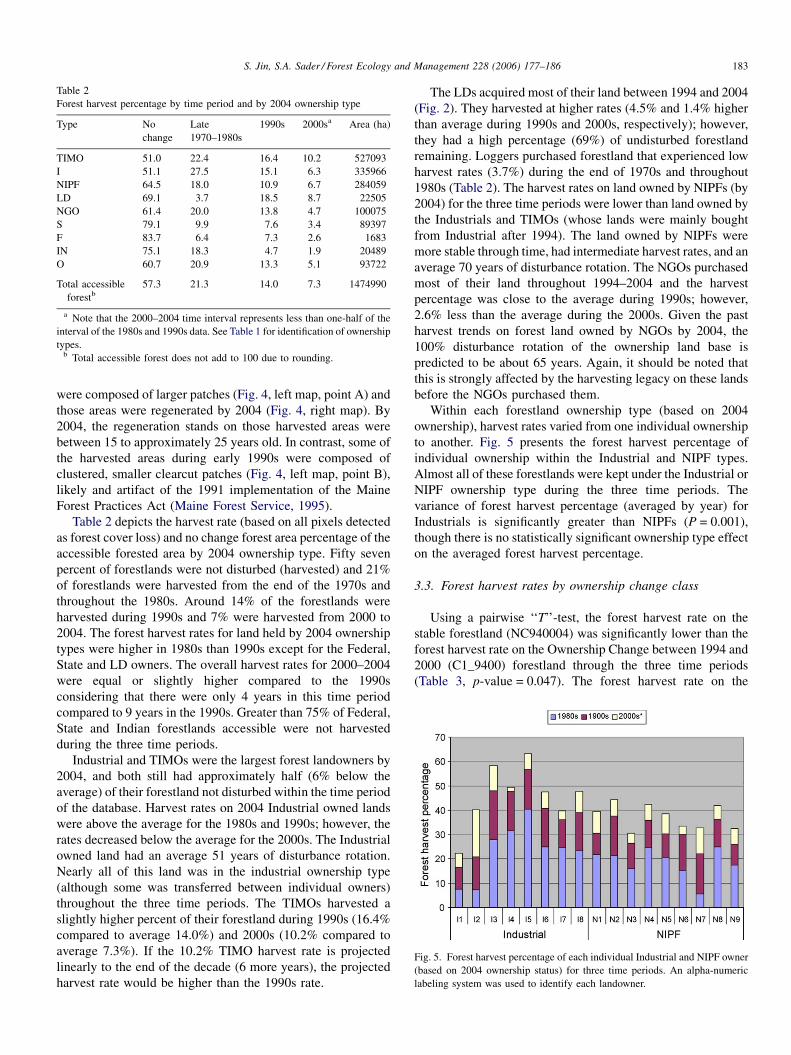
Fig. 5. Forest harvest percentage of each individual Industrial and NIPF owner
(based on 2004 ownership status) for three time periods. An alpha-numeric
labeling system was used to identify each landowner.
were composed of larger patches (Fig. 4, left map, point A) and
those areas were regenerated by 2004 (Fig. 4, right map). By
2004, the regeneration stands on those harvested areas were
between 15 to approximately 25 years old. In contrast, some of
the harvested areas during early 1990s were composed of
clustered, smaller clearcut patches (Fig. 4, left map, point B),
likely and artifact of the 1991 implementation of the Maine
Forest Practices Act (Maine Forest Service, 1995).
Table 2 depicts the harvest rate (based on all pixels detected
as forest cover loss) and no change forest area percentage of the
accessible forested area by 2004 ownership type. Fifty seven
percent of forestlands were not disturbed (harvested) and 21%
of forestlands were harvested from the end of the 1970s and
throughout the 1980s. Around 14% of the forestlands were
harvested during 1990s and 7% were harvested from 2000 to
2004. The forest harvest rates for land held by 2004 ownership
types were higher in 1980s than 1990s except for the Federal,
State and LD owners. The overall harvest rates for 2000–2004
were equal or slightly higher compared to the 1990s
considering that there were only 4 years in this time period
compared to 9 years in the 1990s. Greater than 75% of Federal,
State and Indian forestlands accessible were not harvested
during the three time periods.
Industrial and TIMOs were the largest forest landowners by
2004, and both still had approximately half (6% below the
average) of their forestland not disturbed within the time period
of the database. Harvest rates on 2004 Industrial owned lands
were above the average for the 1980s and 1990s; however, the
rates decreased below the average for the 2000s. The Industrial
owned land had an average 51 years of disturbance rotation.
Nearly all of this land was in the industrial ownership type
(although some was transferred between individual owners)
throughout the three time periods. The TIMOs harvested a
slightly higher percent of their forestland during 1990s (16.4%
compared to average 14.0%) and 2000s (10.2% compared to
average 7.3%). If the 10.2% TIMO harvest rate is projected
linearly to the end of the decade (6 more years), the projected
harvest rate would be higher than the 1990s rate.
The LDs acquired most of their land between 1994 and 2004
(Fig. 2). They harvested at higher rates (4.5% and 1.4% higher
than average during 1990s and 2000s, respectively); however,
they had a high percentage (69%) of undisturbed forestland
remaining. Loggers purchased forestland that experienced low
harvest rates (3.7%) during the end of 1970s and throughout
1980s (Table 2). The harvest rates on land owned by NIPFs (by
2004) for the three time periods were lower than land owned by
the Industrials and TIMOs (whose lands were mainly bought
from Industrial after 1994). The land owned by NIPFs were
more stable through time, had intermediate harvest rates, and an
average 70 years of disturbance rotation. The NGOs purchased
most of their land throughout 1994–2004 and the harvest
percentage was close to the average during 1990s; however,
2.6% less than the average during the 2000s. Given the past
harvest trends on forest land owned by NGOs by 2004, the
100% disturbance rotation of the ownership land base is
predicted to be about 65 years. Again, it should be noted that
this is strongly affected by the harvesting legacy on these lands
before the NGOs purchased them.
Within each forestland ownership type (based on 2004
ownership), harvest rates varied from one individual ownership
to another. Fig. 5 presents the forest harvest percentage of
individual ownership within the Industrial and NIPF types.
Almost all of these forestlands were kept under the Industrial or
NIPF ownership type during the three time periods. The
variance of forest harvest percentage (averaged by year) for
Industrials is significantly greater than NIPFs (P = 0.001),
though there is no statistically significant ownership type effect
on the averaged forest harvest percentage.
3.3. Forest harvest rates by ownership change class
Using a pairwise ‘‘T’’-test, the forest harvest rate on the
stable forestland (NC940004) was significantly lower than the
forest harvest rate on the Ownership Change between 1994 and
2000 (C1_9400) forestland through the three time periods
(Table 3, p-value = 0.047). The forest harvest rate on the

S. Jin, S.A. Sader / Forest Ecology and Management 228 (2006) 177–186184
Table 3
Forest harvest percentage by time period and by ownership change class
Ownership
change class
No
change
Late
1970–1980s
1990s 2000s Area (ha)
NC940004 63.43 18.63 11.58 6.35 615520.0
C1_9400 49.83 25.86 15.88 8.43 604280.4
C1_0004 59.00 17.60 15.90 7.50 78674.7
C2_940004 60.81 16.89 15.14 7.16 176515.3
NC940004: no change in ownership from 1994 to 2004; C1_9400: ownership
change between 1994 and 2000; C1_0004: ownership change between 2000 and
2004; C2_940004: ownership change between 1994 and 2000, and between
2000 and 2004.
Table 4
Percent forest type available by ownership change class
Forest type Ownership change class 1994–2000–2004
NC940004 C1_9400 C1_0004 C2_940004
S 25.6 25.5 16.2 19.8
SH 24.7 24.7 27.4 26.0
HS 23.8 25.6 22.7 21.2
H 25.9 24.3 33.7 33.0
Total (%) 100.0 100.0 100.0 100.0
NC940004, no change in ownership from 1994 to 2004; C1_9400, ownership
change between 1994 and 2000; C1_0004, ownership change between 2000 and
2004; C2_940004, ownership change between 1994 and 2000, and between
2000 and 2004.
Fig. 6. The ratio of harvested forest type to available forest through time for
four ownership change classes. 100 indicates equal percentage harvested in
proportion to available.
C1_0004 and C2_940004 forestland was slightly lower than
NC940004 during the late 1970s and 1980s, however higher
during the 1990s and 2000s. These results suggest a trend that
the forestland that experienced ownership change by 2004 also
experienced higher harvest rates.
3.4. Forest type available and harvested by ownership type
Table 4 is the percentage of forest type available by
ownership change class. In the early 1990s there was nearly an
equal proportion of four forest types (S, SH, HS, H) available in
the two ownership change classes (NC940004 and C1_9400).
There was a higher proportion of hardwood than softwood in
C1_0004 and C2_940004 classes (Table 4). Table 5 indicates
the percentage of forest type available at the beginning of the
1990s based on the 2004 ownership status. By 2004, there was
roughly an equal proportion of four forest types (H, HS, SH, S)
available in the TIMO, Industrial, Non-industrial, State and
Table 5
Percent forest type available at the beginning of 1990s for 2004 ownership types
Forest type TIMO I NIPF LD
S 20.5 28.8 25.5 19.7
SH 26.5 22.6 24.2 26.1
HS 25.8 23.4 23.8 20.2
H 27.2 25.2 26.6 34.1
Total (%)a 100.0 100.0 100.0 100.0
a Totals may not add to 100% due to rounding.
Others ownership types. Loggers purchased forestland with a
higher proportion of hardwood (34%) than softwood (20%)
compared to the proportions of these forest types available on
the other ownerships (Table 5). This may be because those
forestlands with higher proportion of hardwood experienced
much lower harvest rates during 1980s (Table 2), and the
hardwood stands that had matured were marketable by the
2000s. The NGOs appeared to purchase forestlands with a
higher proportion of softwood (Table 5). It is unclear whether
this indicates that the NGOs valued softwood dominant stands
for conservation or if this stand composition was just a function
of the land available and negotiated for purchase at the time.
Indian and Federal owners had the two highest percentages of
hardwood composition.
Fig. 6 suggests the forest type preferred for harvest under the
ownership change classes during the three time periods. During
the end of 1970s and 1980s for all forestland area in the study
area (whether ownership was kept stable or not), softwood
(120–139%) and softwood–hardwood (110–123%) stands were
harvested in much higher proportion while less hardwood–
softwood (50–66%) and much less hardwood (28–58%) were
harvested than was proportionally available on the landscape.
Most of the 1980s harvesting occurred in softwood and
softwood–hardwood stands, especially those containing balsam
fir (A. balsamea (L.) Mill.), as these were the preferred host of
the spruce budworm, leading to the extensive salvage logging
(Maine Forest Service, 1995; McWilliams et al., 2005).
The general trend of forest type harvested over time
(Fig. 6) indicates a shift from softwood to hardwood dominant
stands. During 1990s, softwood and hardwood–softwood were
NGO S IN F O
34.4 24.4 12.0 17.0 20.2
22.7 29.7 20.8 24.9 24.7
17.4 23.3 28.4 20.8 26.4
25.5 22.6 38.8 37.3 28.6
100.0 100.0 100.0 100.0 100.0

S. Jin, S.A. Sader / Forest Ecology and Management 228 (2006) 177–186 185
Table 6
The ratio of harvested forest type to available forest for 2004 ownership type
Time Forest type TIMO I NIPF LD NGO S IN F O
1980s S 127.8 127.2 116.0 89.5 118.2 101.2 133.8 92.0 119.2
SH 127.0 130.3 126.2 157.1 123.3 109.5 149.9 132.2 132.2
HS 52.6 43.4 56.6 70.7 42.5 81.6 47.0 92.6 54.6
H 43.1 31.3 50.0 53.5 33.7 76.6 10.1 50.0 35.6
1991–2000 S 95.9 115.4 86.7 94.7 118.1 89.5 91.4 52.3 98.8
SH 140.5 162.3 167.8 152.2 161.0 171.4 198.5 200.1 147.4
HS 91.3 72.6 88.5 104.3 57.8 69.6 105.5 132.2 88.8
H 71.9 52.0 61.2 60.6 50.2 48.8 45.8 37.1 70.3
2000–2004 S 89.8 106.7 87.2 78.6 145.1 72.5 87.4 85.5 88.0
SH 105.6 113.1 110.5 107.9 116.8 120.3 79.8 179.5 86.1
HS 99.6 104.0 103.4 83.0 59.3 89.3 183.5 87.6 106.1
H 102.5 76.9 99.7 116.4 52.1 114.0 53.6 60.5 114.9
Note: 100 means equal percentage harvested in proportion to available, more than 100 means higher percentage harvested in proportion to available.
harvested in roughly equal proportion to the percentage of
available forest types and softwood–hardwood stands became
the preferred forest type harvested (109–163%). Hardwood
harvesting (39–67%) increased though still in lower proportion
to that available. In the recent 4 years (2000s), all of the forest
types were harvested in almost equal proportion. Rice (2003)
reported that markets for hardwood products in Maine were
generally unfavorable for many years, but this began to change
in the 1990s. The 2003 Maine Forest Inventory (McWilliams
et al., 2005) stated ‘‘recent increases in demand for hardwoods,
both pulp and sawlogs, have created opportunities for managing
and developing deciduous forests.’’
The same general trend of forest type harvested over time
was also shown in the data of the forest type preferred (by 2004
forestland ownership type) for harvest during the three time
periods (Table 6). From 2000 to 2004, Industrials and NGOs
were the only owners who harvested more softwood in
proportion to the amount available. Industrial ownership may
have harvested softwood in higher proportion because they
needed softwood to supply their own mills. NGOs had the
highest percentage of softwood available (34%, Table 5). One
NGO purchased forestland from an Industrial ownership
between 2000 and 2004 but the Industrial ownership held
the logging rights and harvested mostly softwood and
softwood–hardwood stands (Dr. Jeremy Wilson, University
of Maine, personal communication, 4/05). This helps to explain
an anomaly of the NGO class showing a high proportion of
softwood harvested (to available) between 2000 and 2004 that
otherwise might not be expected from this type of owner
(Table 6). The LDs harvested hardwood in higher proportion
from 2000 to 2004 (and they bought lands with a much higher
percentage of hardwood). The TIMOs preference of forest type
harvested was similar to the NIPF.
4. Conclusions
The results indicated that forest ownership type and
ownership change did influence forest harvest intensity and
trend over time in northern Maine. One cautionary note is that
these results should not be extrapolated beyond the study area
where they may not be representative of other commercial
forests of Maine or other states where the individual forest
owners and forest type conditions (among other variables) are
different. The forest change detection methods and merging of
older land cover maps with updated forest change maps should
be widely applicable to other regions and landscapes.
Both TIMOs and LDs harvested forest at slightly higher
rates than other owners in the 1990s and 2000s. The NGO
ownership had harvest rates that were slightly lower than the
average mostly on lands that they purchased between 1994 and
2004. The NIPF owners held more stable ownership and had
more equal and intermediate harvest rates through time. Most
TIMOs, NGO and LDs have held the land for only a short time
(mostly less than 10 years). Sales of some lands formally owned
by TIMOs to LDs (between 2000 and 2004) suggest that
TIMOs may be willing to turn over some of their timber
holdings in shorter time compared to other owners, like NIPFs.
There are many possible explanations for differences
detected in harvest rates and trends among landowner types.
A socio-economic survey of the forest landowners would be
necessary to explain the underlying drivers and elucidate the
individual and group ownership harvest trends reported here,
however this is beyond the scope of this study. Readers are
referred to other authors (e.g. NFLC, 1994; Irland and Lloyd,
1999; Irland, 2000; Yale Forest Forum Review, 2002; Rice,
2003) for discussions on forest industry trends, wood markets,
forest policy issues and socio-economic factors that may
influence landowner forest management strategies and land
sales in Maine and the northeastern U.S.A. Significant trends in
forest management and harvest rates may emerge after more
time evolves under the new ownership mix in northern Maine.
Thus an update of the harvesting data at the end of the 2000s
decade is recommended to assess these new spatial patterns and
longer term trends.
Time-series medium spatial resolution Landsat imagery
offers a large landscape perspective to monitor forest disturbance
over multiple ownerships which is generally not feasible or cost-
effective using ground based methods or extensive high
resolution aerial imagery. Satellite remote sensing analysis
incorporating socio-economic and other ground-based data
S. Jin, S.A. Sader / Forest Ecology and Management 228 (2006) 177–186186
(e.g. forest inventory) may be a promising approach for
predicting future forest change or timber supply availability
under different ownership change scenarios on a statewide or
regional basis.
Acknowledgments
This research was supported by the Maine Agricultural and
Forest Experiment Station (MAFES)-Grant ME-09608.
MAFES External Publication 2860.
References
Baskerville, G.L., 1975. Spruce budworm: super silviculturist. Forest. Chron.
51, 138–140.
Cohen, W.B., Fiorella, M., Gray, J., Helmer, E., Anderson, K., 1998. An
efficient and accurate method for mapping forest clearcuts in the Pacific
Northwest using Landsat imagery. Photogramm. Eng. Rem. Sens. 64 (4),
293–300.
Cohen, W.B., Spies, T.A., Alig, R.J., Oetter, D.R., Maiersperger, T.K., Fiorella,
M., 2002. Characterizing 23 years (1972–1995) of stand replacement
disturbance in western Oregon forests with Landsat imagery. Ecosystems
5, 122–137.
Coppin, P.R., Bauer, M.E., 1996. Digital change detection in forest ecosystems
with remote sensing imagery. Rem. Sens. Rev. 13, 207–234.
Franklin, S.E., Moskal, L.M., Lavigne, M.B., Pugh, K., 2000. Interpretation and
classification of partially harvested forest stands in the Fundy model forest
using multitemporal Landsat TM digital data. Can. J. Rem. Sens. 26 (4),
318–333.
Grigal, D.F., Bates, P.C., 1997. Assessing impacts of forest harvesting—The
Minnesota experience. Biomass Bioenerg. 13 (4–5), 213–222.
Griffith, D.M., Alerich, C.L., 1996. Forest statistics for Maine—1995. USDA
Forest Service, NE Forest Exp. Sta., Res. Bull. NE-135, Radnor, PA, 134 pp.
Hagan, J.M., Boone, R.B., 1997. Harvest rate, harvest configuration, and forest
fragmentation—a simulation of the 1989 Maine Forest Practices Act.
Manomet Center for Conservation Sciencies, Report No. MCDCF-
97001. 17 pp.
Hayes, D., Sader, S.A., 2002. Analyzing a forest conversion history database to
exlore the spatial and temporal characteristics of land cover change in
Guatemala’s Maya Biosphere Reserve. Landscape Ecol. 17, 299–314.
Hepinstall, J.A., Sader, S.A., Krohn, W.B., Boone, R.B., Barlett, R.I., 1999.
Development and testing of a vegetation and land cover map of Maine.
Technical Bulletin 173, Maine Agricultural and Forest Experiment Station,
104 pp.
Irland, L., 2000. Maine forests: a century of change, 1900–2000 and elements of
policy change for a new century. In: Maine Policy Review, Winter, 2000,
University of Maine, Orono, ME, pp. 66–77.
Irland, Lloyd, C., 1999. Forest Landownership. In The Northeast’s Changing
Forest. The Harvard University Press, Petersham, MA, 427pp.
Jin, S., Sader, S.A., 2005. Comparison of time-series tasseled cap wetness and
the normalized difference moisture index in detecting forest disturbances.
Rem. Sens. Environ. 94 (3), 364–372.
Kushwaha, S.P.S., 1990. Forest-type mapping and change detection from
satellite imagery. ISPRS J. Photogramm. Rem. Sens. 45, 175–181.
Larsen, J.B., 1995. Ecological stability of forests and sustainable silviculture.
Forest Ecol. Manage. 73 (1–3), 85–96.
Laustsen, K.M., Griffith, D.M., Steinman, J.R., 2003. Fourth Annual Inventory
Report on Maine’s Forests, URL: http://www.state.me.us/doc/mfs/pubs/pdf/
anninv/2002invrpt.pdf, Maine Forest Service, Augusta, Maine (last date
accessed: January 28, 2004).
Loo, J., Ives, N., 2003. The Acadian forest: historical condition and human
impacts. Forest. Chron. 79 (3), 462–474.
Maine Forest Service, 1995. An Evaluation of the Effects of the Forest Practices
Act. Maine Forest Service, Augusta, ME, 29 pp.
Maine Forest Service, 1999. State of the Forest and Recommendations for
Forest Sustainability Standards. http://www.state.me.us/doc/mfs/sofjun12.
PDF.
Maine Tree Foundation, 2005. http://www.mainetreefoundation.org/forestfacts/
WhoOwnsMaine’sForest.htm.
McWilliams, W.H., Butler, B.J., Caldwell, L.E., Griffith, D.M., Hoppus, M.L.,
Laustsen, K.M., Lister, A.J., Lister, T.W., Metzler, J.W., Morin, R.S., Sader,
S.A., Stewart, L.B., Steinman, J.R., Westfall, J.A., Williams, D.A., Whit-
man, A., Woodall, C.W., 2005. The forests of Maine: 2003. Resource Bull.
NE-164. U.S. Department of Agriculture, Forest Service, Northeastern
Research Station, Newtown Square, PA. 188 p.
Metzler, J., Sader, S.A., 2005. Agreement assessment between regression-
derived forest cover maps and forest industry type maps. Photogram.
Eng. Rem. Sens. 71 (11), 1303–1309.
Miller, C.A., 1963. The spruce budworm. In: Morris, R.F. (Ed.), The Dynamics
of Epidemic Spruce Budworm Populations. Memoirs of the Entomological
Society of Canada, pp. 12–19.
Northern Forest Lands Council (NFLC), 1994. Finding Common Ground:
Conserving the Northern Forest. Northern Forest Lands Council, Concord,
NH, 27 pp.
North East State Foresters Association (NEFA), 2004. The northern forest of
Maine, New Hampshire, Vermont and New York: a look at the land,
economies and communities 1994–2004. Draft. 145 pp.
Phillips, S., 1993. Forest products manufacturing: factors and trends affecting
the working forest. The Northern Forest Strategies for Sustainability, vol. 1.
The Wilderness Society, Washington, DC, 40 pp.
Rice, R., 2003. Issues in Maine’s Natural Resources Industries—A Brief
Review of the Pulp and Paper Industry. College of Nautral Sciences,
Forestry, and Agriculture White Papers, University of Maine, 2 pp.
Royama, T., 1984. Population dynamics of the spruce budworm Christoneura
fumiferana. Ecol. Monogr. 54 (4), 429–462.
Sader, S.A., Ross, K., Reed, F., 2002. The Pingree forest partnership: monitor-
ing easements at the landscape level. J. Forest. 100 (3), 25–30.
Sader, S.A., Bertrand, M., Wilson, E.H., 2003. Satellite change detection of
forest harvest patterns on an industrial forest landscape. Forest Sci. 49 (3),
341–353.
Sader, S.A., Hoppus, M., Metzler, J., Jin, S., 2005. Perspectives of Maine forest
cover change from Landsat imagery and FIA inventory. J. Forest. 103 (6),
299–303.
Turner, M.G., Wear, D.N., Flamm, R.O., 1996. Land ownership and land-cover
change in the southern Appalachian highlands and the Olympic Peninsula.
Ecol. Appl. 6 (4), 1150–1172.
Wilson, E.H., Sader, S.A., 2002. Detection of forest harvest type using multiple
dates of Landsat TM imagery. Rem. Sens. Environ. 80, 385–396.
Yale Forest Forum Review, 2002. Institutional Timberland Investment: A
Summary of a Forum Exploring Changing Ownership Patterns and the
Implications for Conservation of Environmental Values. Global Institute of
Sustainable Forestry, New Haven, Connecticut, 30 pp.
Yin, R.S., Caulfield, J.P., Aronow, M.E., Harris Jr., T.G., 1998. Industrial
timberland: current situation, holding rationale, and future development.
Forest Prod. J. 48 (10), 43–48.