
Sustained action of multi-particulate system of telithromycin
Upload
khangminh22Category
view
3download
0
Int. J. Electrochem. Sci., 12 (2017) 5539 – 5552, doi: 10.20964/2017.06.25
International Journal of
ELECTROCHEMICAL SCIENCE
www.electrochemsci.org
Effect of Sustained Load on the Passive Film of Carbon Steel
Embedded in Concrete
Sen Pang
1,*, Bo Diao
1,2, Yinghua Ye
1
1 School of Transportation Science and Engineering, Beihang University, Beijing 100191, China.;
[email protected](S.Pang);[email protected](B.Diao);[email protected](Y.H.Ye); 2
State Laboratory of Subtropical Building Science, South China University of Technology,
Guangzhou 510640, China. *E-mail: [email protected]
Received: 6 March 2017 / Accepted: 11 April 2017 / Published: 12 May 2017
Reinforced concrete structures experience different kinds of load, which may influence the passive
behaviour of steel. For the purpose of simulating in-service condition, the steel sample for
electrochemical measurement was embedded in concrete in this study. The effects of sustained load
level and duration on the passive behaviour of carbon steel were studied via electrochemical
impedance spectroscopy. The protective effect of passive film decreased as the load level increased. A
re-passivation kinetics was detected during sustained loading. The degree of re-passivation decreased
when the load level increased. A peak of re-passivation was observed after the load was sustained for
24h. Electrochemical measurement applied on steel embedded in concrete offers the possibility of non-
destructive testing in reinforced concrete structures.
Keywords: Steel reinforced concrete; EIS; Passive films; Re-passivation; Effects of strain;
1. INTRODUCTION
The steel bar in concrete is protected by a passive film formed under the alkaline condition of
concrete (pH 12–13). However, the passive film may be damaged by an aggressive medium, such as
chloride, atmospheric carbonation and load. Passivation and de-passivation of steel play a great role in
corrosion process. The breakdown of passive film will accelerate the corrosion process of steel bar in
concrete. Many studies on de-passivation and re-passivation of steel were conducted. Saremi et al. [1]
found a severe decrease in resistance of interfacial reaction, which meant the breakdown of passive
film when the [Cl-]/[OH
-] ratio was above 0.6 in simulated concrete pore solution. Zhao et al. [2] found
that steel embedded in mortar after 3.5% NaCl drying-wetting cycles had three corrosion stages, a
Int. J. Electrochem. Sci., Vol. 12, 2017
5540
competition process between breakdown and re-passivation of passivation film, a pitting development
and an active corrosion process. Lin and Xu [3] investigated the corrosion behavior of fine-grain high-
strength reinforcement in simulated concrete pore solutions with various [NO2-
]/[Cl-] ratios. Results
showed that the corrosion resistance improved in the presence of nitrite. Reffass et al. [4, 5]
investigated the effect of nitrite ions and phosphate ions on corrosion process of carbon steel in
NaHCO3+NaCl solution and found that nitrite ions were efficient inhibitors of the corrosion of steel
reinforcement in concrete and the re-passivation was completely associated with oxidizing action of
nitrite ions. In contrast with nitrite ions, the addition of phosphate ions did not lead to the re-
passivation of steel inside well-grown pits. Tang et al. [6] found that sodium molybdate, sodium
tungstate and sodium nitrite revealed effective inhibition effects by promoting passivation of the steel.
Dong et al. [7] found nitrite and TEPA can accelerate the rehabilitation process of metastable pits,
resulting in an increase of pitting corrosion resistance of carbon steel. In contact with a high alkaline
environment, carbon steel can attain a very stable passive state [8, 9] and may be re-passivated under
certain circumstance [10].
The reinforced concrete structure in working condition suffers different kinds of load, such as
cycle load, fatigue load and sustained load, and may affect the passive behaviour of steel bars
embedded in concrete. Feng et al. [10, 11, 12] studied the effect of stress on passivation of steel bar in
pore solution. The results showed that the passive ability of the steel in pore solution decreased as the
applied load increased. Zhu et al. [13] studied the effects of tensile stress on the oscillatory
electrodissolution of X70 carbon steel in sulfuric acid solution and found that the tensile stress
degrades the stability and increases the defects of passive film. Jiang et al. [14] discovered that the
chloride threshold value first increased and then decreased with increasing fatigue cycle times under a
certain stress level and number of cracks on passive film. Zhang and Poursaee [15, 16] studied the
passivation behaviour of carbon steel and semi-conductive behaviour of passive film on carbon steel in
simulated concrete pore solution under stress. The results showed that the passive film formed under
tensile condition is more protective compare to that under compressive loading conditions in chloride-
free pore solution. Liu et al. [17] studied electrochemical impedance spectroscopy characteristic of
Ti6Al-4V alloy under the different load and results showed that the load stress reduced the oxide film
resistance, which indicated that the integrality of the oxide film was destroyed. In the study of Li et al.
[18], the intergranular stress corrosion cracking of sensitized 304 stainless steel in Na2S2O3 solution
was detected by electrochemical noise and acoustic emission techniques. Results showed that, under
the elastic deformation, the passive film on sensitized 304 stainless steel especially at the sensitized
grain boundaries would be firstly broken down and then re-passivated again.
Most studies on passive behaviour of steel were performed in saturated Ca(OH)2 solution or
simulated concrete pore solution. However, for reinforced concrete structures, steel bars were
embedded in concrete, and tensile cracks were induced by service load. Thus, the working conditions
of steel bars to become passivated are different from the conditions of saturated Ca(OH)2 solution or
simulated concrete pore solution. Ghods et al. [19] studied the effect of cations on passive film grown
in saturated Ca(OH)2 solution. The results showed that Na+, K
+ and Ca
2+, which were commonly
observed in most ordinary Portland cement, could affect the passive film formed on steel. In particular,
ion in pore solution had a significant negative effect on the protective properties of passive film.
Int. J. Electrochem. Sci., Vol. 12, 2017
5541
Zhu et al. [20] studied the effect of chloride salt type on the chloride binding capacity of concrete and
found that the chloride binding capacity varied with the chloride cation type as Ca2+
>Mg2+
>Na+.
Duarte et al. [21] studied the electrochemical behaviour of stainless steels by electrochemical
impedance spectroscopy when embedded in concrete specimens and found that the use of stainless
steel rebars provided a strong increase of the corrosion resistance when concrete specimens in contact
with chlorides. Yang et al. [22] studied the general corrosion processes of mild steel caused by the
introduction of chloride ions and sulfate ions in simulated marine environment and results showed that
in simulated marine environment sulfate ions only had slight influence for the passive film compared
to chloride ions which could rapidly destroy the passive film on the steel surface.
The disadvantage of simulating the working environment in pore solution was that the
passivation evolution on the surface of steel bar covered by concrete cannot be replicated in pore
solution [23]. In the site condition, many factors influence the situation of the passive film, including
the following: (1) type of cement [24]; (2) concrete additive [25-27]; (3) water/cement ratio [28]; (4)
surface finishing and metallurgical composition of steel bars [29]; and (5) level of loading damage. In
this study, for the purpose of simulating the real working condition of reinforced concrete structures,
the steel bar was embedded in concrete and not in simulated pore solution to investigate the effect of
sustained load level and load duration on the passive behaviour of steel bar. A self-designed device
was used in the experiment for applying and sustaining loads.
2. EXPERIMENTAL METHODS
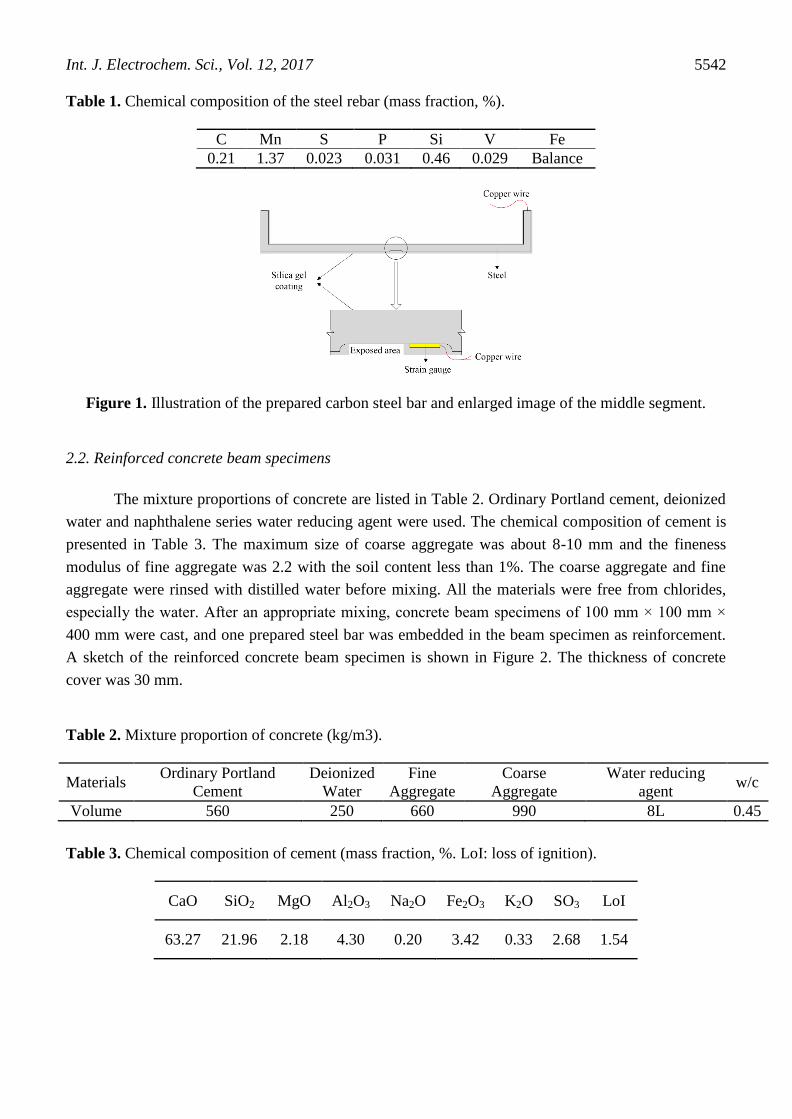
2.1 Preparation of carbon steel bars
The steel for the test was a hot rolled ribbed bar with 10 mm in diameter, and all bars were
from the same batch. The Young’s modulus of the steel bar was 2.03×10⁵ MPa, and its yield strength
was 350 MPa. The chemical composition (wt. %) of the steel bars is shown in Table 1. The steel bar
was cut into segments with length of 450 mm and was bended at right angle at both ends for good
bond between concrete and bar. The middle segment of the steel bar was grinded on an emery wheel
machine to grind off ribs and formed a platform. The platform was abraded with silicon carbide
abrasive paper to No. 800, degreased by rinsing with acetone, and dried in air. A strain gauge of 1×2
mm was stick on the platform of steel bar to test the tensile strain. A copper wire was soldered to the
end of the steel bar for electrochemical testing. The surface of the steel bar platform had an exposed
area of about 1 cm2, and the remaining areas of the bar were sealed by silica gel, as shown in Figure 1.
The prepared steel bars subsequently embedded in concrete were used as working electrode in
electrochemical measurements. All chemical reagents applied in this study were of analytical reagent
grade.
Int. J. Electrochem. Sci., Vol. 12, 2017
5542
Table 1. Chemical composition of the steel rebar (mass fraction, %).
C Mn S P Si V Fe
0.21 1.37 0.023 0.031 0.46 0.029 Balance
Figure 1. Illustration of the prepared carbon steel bar and enlarged image of the middle segment.
2.2. Reinforced concrete beam specimens
The mixture proportions of concrete are listed in Table 2. Ordinary Portland cement, deionized
water and naphthalene series water reducing agent were used. The chemical composition of cement is
presented in Table 3. The maximum size of coarse aggregate was about 8-10 mm and the fineness
modulus of fine aggregate was 2.2 with the soil content less than 1%. The coarse aggregate and fine
aggregate were rinsed with distilled water before mixing. All the materials were free from chlorides,
especially the water. After an appropriate mixing, concrete beam specimens of 100 mm × 100 mm ×
400 mm were cast, and one prepared steel bar was embedded in the beam specimen as reinforcement.
A sketch of the reinforced concrete beam specimen is shown in Figure 2. The thickness of concrete
cover was 30 mm.
Table 2. Mixture proportion of concrete (kg/m3).
Materials Ordinary Portland
Cement
Deionized
Water
Fine
Aggregate
Coarse
Aggregate
Water reducing
agent w/c
Volume 560 250 660 990 8L 0.45
Table 3. Chemical composition of cement (mass fraction, %. LoI: loss of ignition).
CaO SiO2 MgO Al2O3 Na2O Fe2O3 K2O SO3 LoI
63.27 21.96 2.18 4.30 0.20 3.42 0.33 2.68 1.54
Int. J. Electrochem. Sci., Vol. 12, 2017
5543
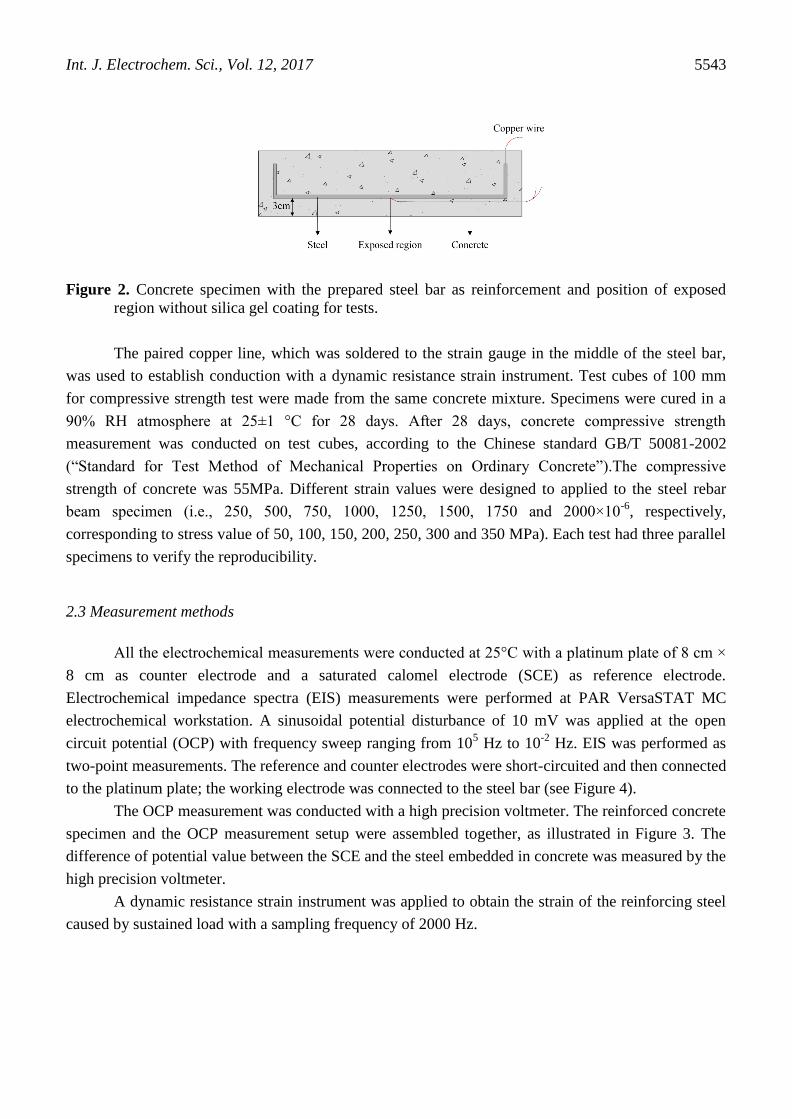
Figure 2. Concrete specimen with the prepared steel bar as reinforcement and position of exposed
region without silica gel coating for tests.
The paired copper line, which was soldered to the strain gauge in the middle of the steel bar,
was used to establish conduction with a dynamic resistance strain instrument. Test cubes of 100 mm
for compressive strength test were made from the same concrete mixture. Specimens were cured in a
90% RH atmosphere at 25±1 °C for 28 days. After 28 days, concrete compressive strength
measurement was conducted on test cubes, according to the Chinese standard GB/T 50081-2002
(“Standard for Test Method of Mechanical Properties on Ordinary Concrete”).The compressive
strength of concrete was 55MPa. Different strain values were designed to applied to the steel rebar
beam specimen (i.e., 250, 500, 750, 1000, 1250, 1500, 1750 and 2000×10-6
, respectively,
corresponding to stress value of 50, 100, 150, 200, 250, 300 and 350 MPa). Each test had three parallel
specimens to verify the reproducibility.
2.3 Measurement methods
All the electrochemical measurements were conducted at 25°C with a platinum plate of 8 cm ×
8 cm as counter electrode and a saturated calomel electrode (SCE) as reference electrode.
Electrochemical impedance spectra (EIS) measurements were performed at PAR VersaSTAT MC
electrochemical workstation. A sinusoidal potential disturbance of 10 mV was applied at the open
circuit potential (OCP) with frequency sweep ranging from 105 Hz to 10
-2 Hz. EIS was performed as
two-point measurements. The reference and counter electrodes were short-circuited and then connected
to the platinum plate; the working electrode was connected to the steel bar (see Figure 4).
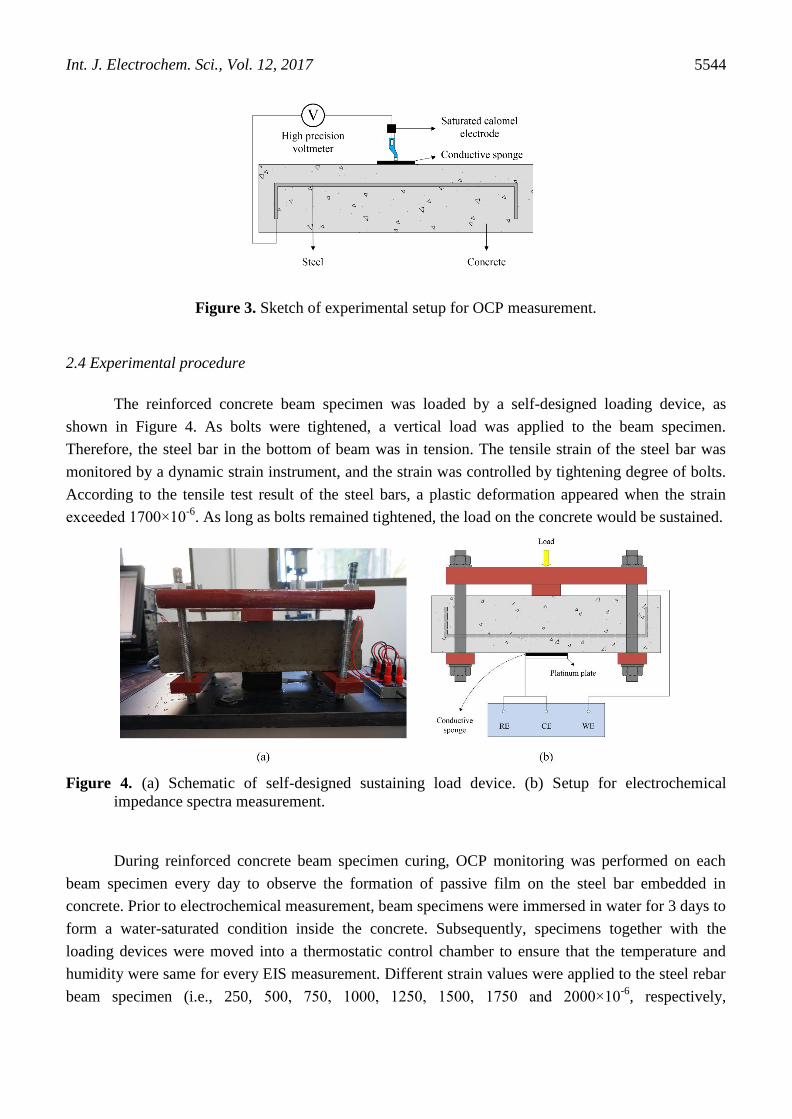
The OCP measurement was conducted with a high precision voltmeter. The reinforced concrete
specimen and the OCP measurement setup were assembled together, as illustrated in Figure 3. The
difference of potential value between the SCE and the steel embedded in concrete was measured by the
high precision voltmeter.
A dynamic resistance strain instrument was applied to obtain the strain of the reinforcing steel
caused by sustained load with a sampling frequency of 2000 Hz.
Int. J. Electrochem. Sci., Vol. 12, 2017
5544
Figure 3. Sketch of experimental setup for OCP measurement.
2.4 Experimental procedure
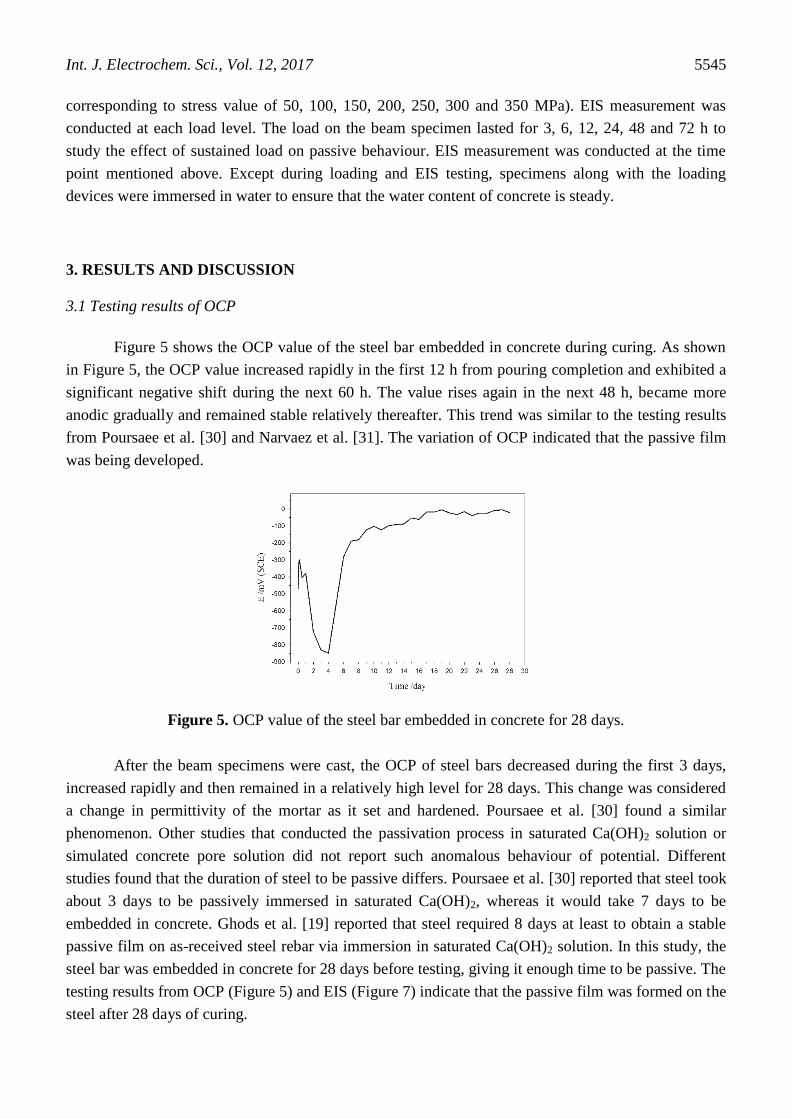
The reinforced concrete beam specimen was loaded by a self-designed loading device, as
shown in Figure 4. As bolts were tightened, a vertical load was applied to the beam specimen.
Therefore, the steel bar in the bottom of beam was in tension. The tensile strain of the steel bar was
monitored by a dynamic strain instrument, and the strain was controlled by tightening degree of bolts.
According to the tensile test result of the steel bars, a plastic deformation appeared when the strain
exceeded 1700×10-6
. As long as bolts remained tightened, the load on the concrete would be sustained.
Figure 4. (a) Schematic of self-designed sustaining load device. (b) Setup for electrochemical
impedance spectra measurement.
During reinforced concrete beam specimen curing, OCP monitoring was performed on each
beam specimen every day to observe the formation of passive film on the steel bar embedded in
concrete. Prior to electrochemical measurement, beam specimens were immersed in water for 3 days to
form a water-saturated condition inside the concrete. Subsequently, specimens together with the
loading devices were moved into a thermostatic control chamber to ensure that the temperature and
humidity were same for every EIS measurement. Different strain values were applied to the steel rebar
beam specimen (i.e., 250, 500, 750, 1000, 1250, 1500, 1750 and 2000×10-6
, respectively,
Int. J. Electrochem. Sci., Vol. 12, 2017
5545
corresponding to stress value of 50, 100, 150, 200, 250, 300 and 350 MPa). EIS measurement was
conducted at each load level. The load on the beam specimen lasted for 3, 6, 12, 24, 48 and 72 h to
study the effect of sustained load on passive behaviour. EIS measurement was conducted at the time
point mentioned above. Except during loading and EIS testing, specimens along with the loading
devices were immersed in water to ensure that the water content of concrete is steady.
3. RESULTS AND DISCUSSION
3.1 Testing results of OCP
Figure 5 shows the OCP value of the steel bar embedded in concrete during curing. As shown
in Figure 5, the OCP value increased rapidly in the first 12 h from pouring completion and exhibited a
significant negative shift during the next 60 h. The value rises again in the next 48 h, became more
anodic gradually and remained stable relatively thereafter. This trend was similar to the testing results
from Poursaee et al. [30] and Narvaez et al. [31]. The variation of OCP indicated that the passive film
was being developed.
Figure 5. OCP value of the steel bar embedded in concrete for 28 days.
After the beam specimens were cast, the OCP of steel bars decreased during the first 3 days,
increased rapidly and then remained in a relatively high level for 28 days. This change was considered
a change in permittivity of the mortar as it set and hardened. Poursaee et al. [30] found a similar
phenomenon. Other studies that conducted the passivation process in saturated Ca(OH)2 solution or
simulated concrete pore solution did not report such anomalous behaviour of potential. Different
studies found that the duration of steel to be passive differs. Poursaee et al. [30] reported that steel took
about 3 days to be passively immersed in saturated Ca(OH)2, whereas it would take 7 days to be
embedded in concrete. Ghods et al. [19] reported that steel required 8 days at least to obtain a stable
passive film on as-received steel rebar via immersion in saturated Ca(OH)2 solution. In this study, the
steel bar was embedded in concrete for 28 days before testing, giving it enough time to be passive. The
testing results from OCP (Figure 5) and EIS (Figure 7) indicate that the passive film was formed on the
steel after 28 days of curing.
Int. J. Electrochem. Sci., Vol. 12, 2017
5546
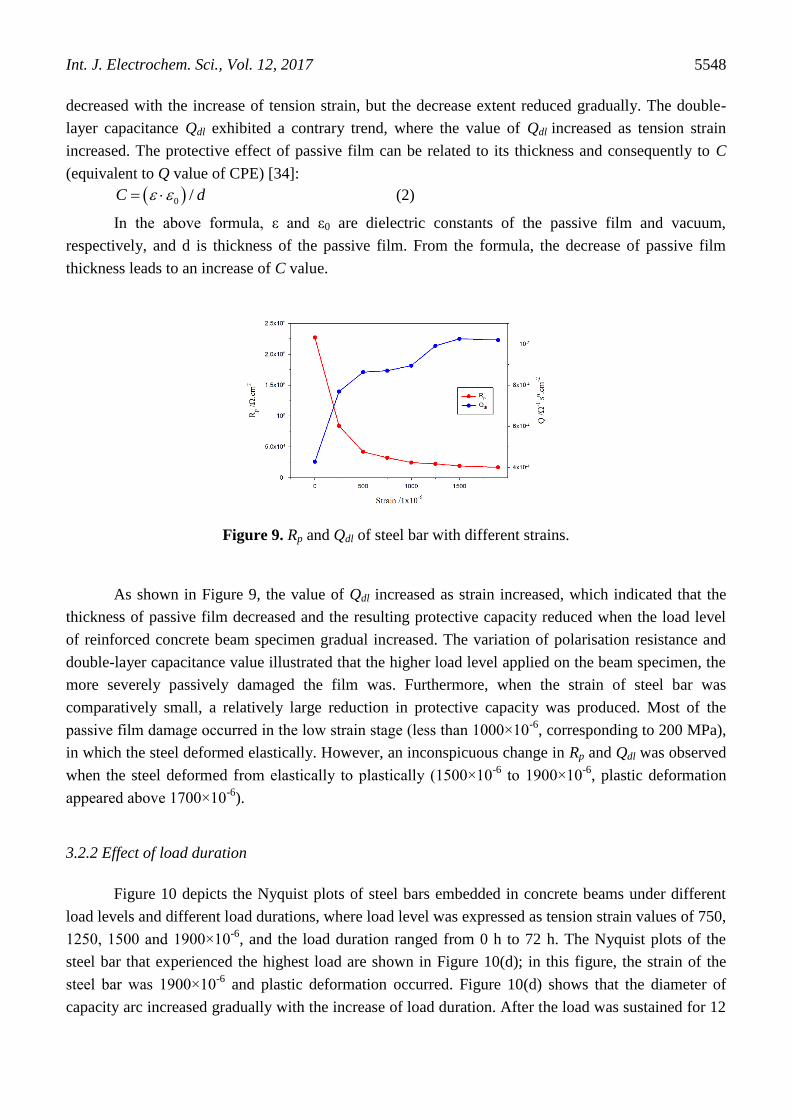
A difference in the OCP value between the end time of curing and the start time of loading can
be observed in Figure 5 and Figure 8. This difference could be explained by the change in resistance of
concrete due to the variation of water-saturated degree. The water content had a great effect on
concrete resistance, and a higher water content of concrete would result in a lower resistance. This
finding could be proved by the study [32] that found that the concrete resistance decreased obviously
as water content increased. In this study, concrete specimens were immersed in water for 3 days to
form a water-saturated condition inside the concrete. Therefore, a decrease of concrete resistance
produced a voltage drop, which was equivalent to a decrease in internal resistance of source in circuit.
The voltage drop resulted in the difference of the OCP value between the end time of curing and the
start time of loading.
3.2 Electrochemical impedance spectroscopy (EIS)
All the impedance spectra presented resistance behaviour in high frequency and capacity
behaviour in low frequency at the initial time. As a result of three-point bending, the concrete beam
cracked in the tension zone. Thus, water uptake in the cracked regions would lead to the change of
electrical properties of cracked concrete and affected the electrochemical measurement which resulted
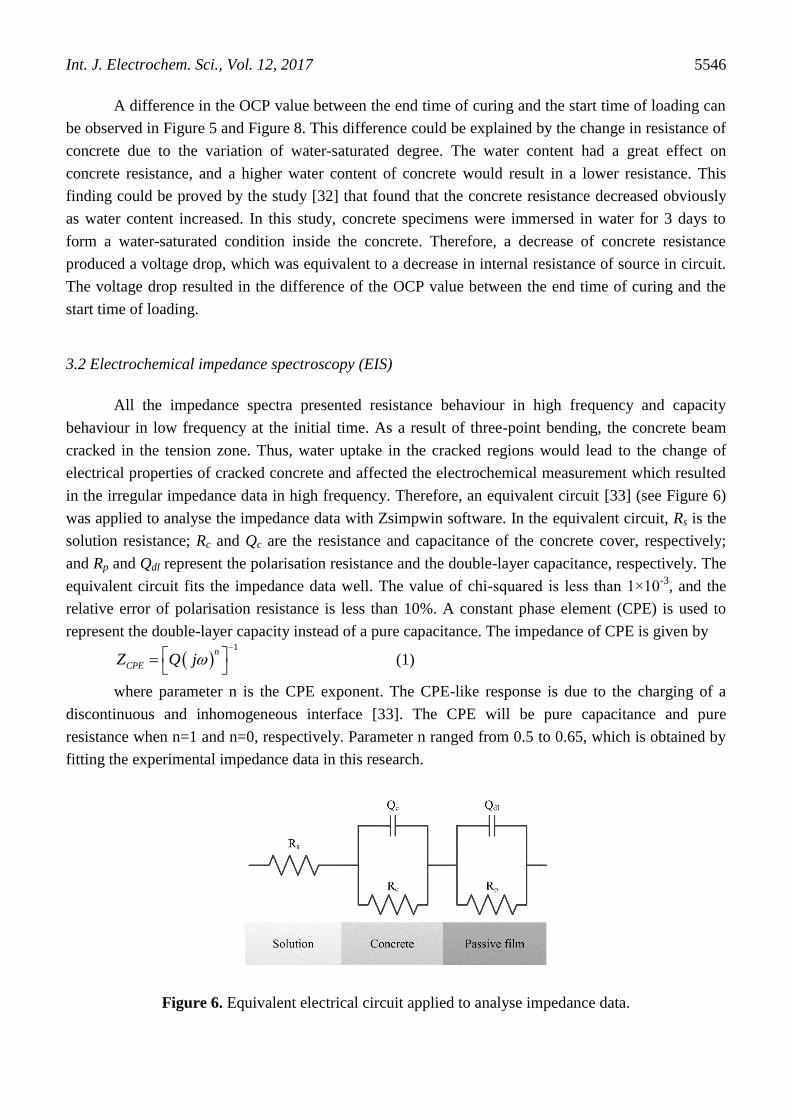
in the irregular impedance data in high frequency. Therefore, an equivalent circuit [33] (see Figure 6)
was applied to analyse the impedance data with Zsimpwin software. In the equivalent circuit, Rs is the
solution resistance; Rc and Qc are the resistance and capacitance of the concrete cover, respectively;
and Rp and Qdl represent the polarisation resistance and the double-layer capacitance, respectively. The
equivalent circuit fits the impedance data well. The value of chi-squared is less than 1×10⁻³
, and the
relative error of polarisation resistance is less than 10%. A constant phase element (CPE) is used to
represent the double-layer capacity instead of a pure capacitance. The impedance of CPE is given by
1
n
CPEZ Q j
(1)
where parameter n is the CPE exponent. The CPE-like response is due to the charging of a
discontinuous and inhomogeneous interface [33]. The CPE will be pure capacitance and pure
resistance when n=1 and n=0, respectively. Parameter n ranged from 0.5 to 0.65, which is obtained by
fitting the experimental impedance data in this research.
Figure 6. Equivalent electrical circuit applied to analyse impedance data.
Int. J. Electrochem. Sci., Vol. 12, 2017
5547
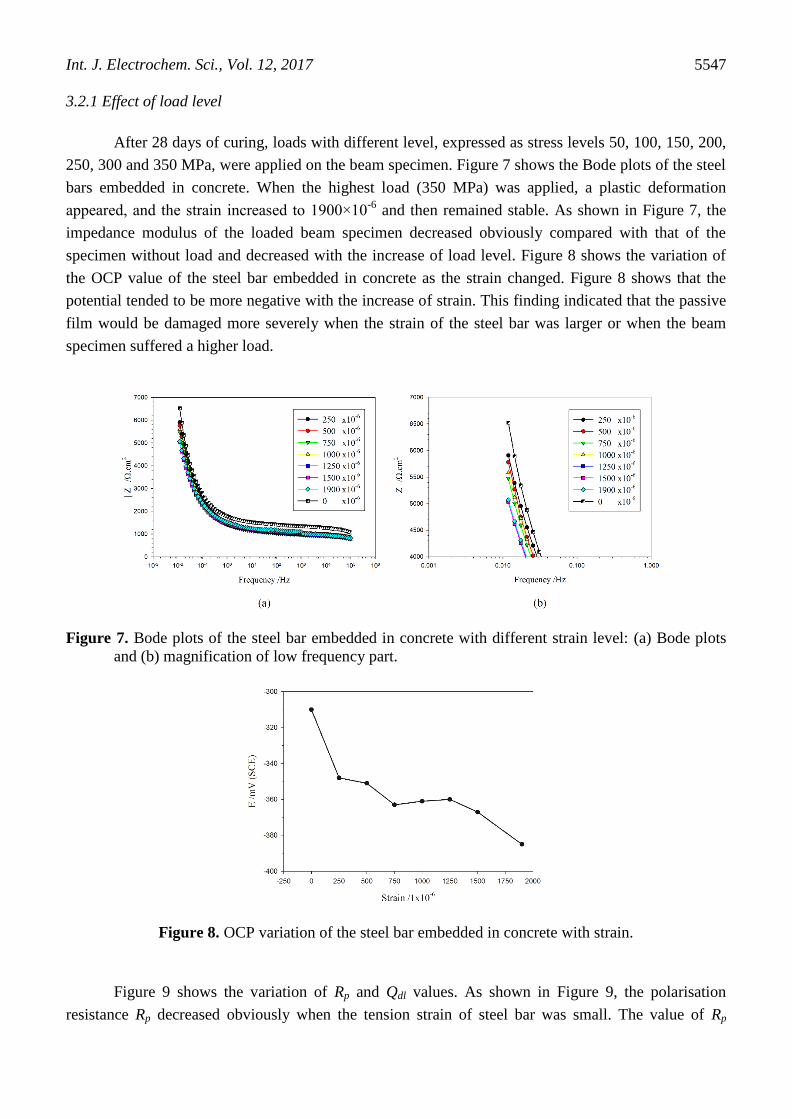
3.2.1 Effect of load level
After 28 days of curing, loads with different level, expressed as stress levels 50, 100, 150, 200,
250, 300 and 350 MPa, were applied on the beam specimen. Figure 7 shows the Bode plots of the steel
bars embedded in concrete. When the highest load (350 MPa) was applied, a plastic deformation
appeared, and the strain increased to 1900×10-6
and then remained stable. As shown in Figure 7, the
impedance modulus of the loaded beam specimen decreased obviously compared with that of the
specimen without load and decreased with the increase of load level. Figure 8 shows the variation of
the OCP value of the steel bar embedded in concrete as the strain changed. Figure 8 shows that the
potential tended to be more negative with the increase of strain. This finding indicated that the passive
film would be damaged more severely when the strain of the steel bar was larger or when the beam
specimen suffered a higher load.
Figure 7. Bode plots of the steel bar embedded in concrete with different strain level: (a) Bode plots
and (b) magnification of low frequency part.
Figure 8. OCP variation of the steel bar embedded in concrete with strain.
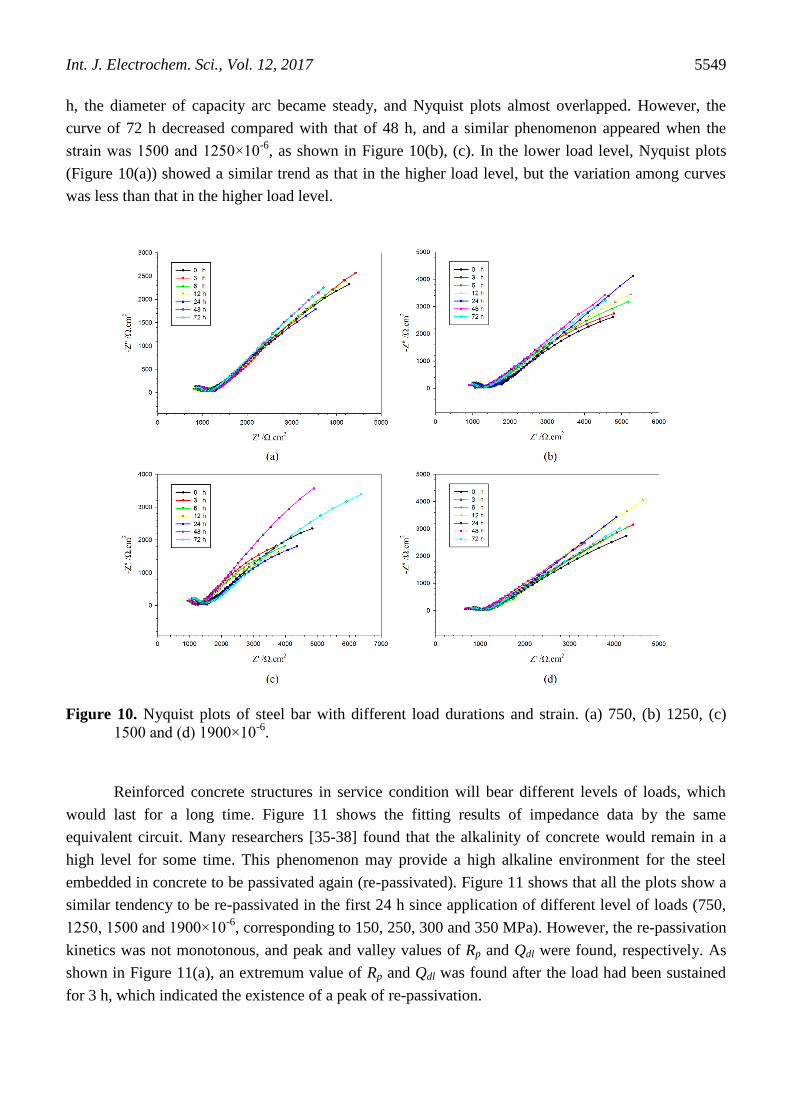
Figure 9 shows the variation of Rp and Qdl values. As shown in Figure 9, the polarisation
resistance Rp decreased obviously when the tension strain of steel bar was small. The value of Rp
Int. J. Electrochem. Sci., Vol. 12, 2017
5548
decreased with the increase of tension strain, but the decrease extent reduced gradually. The double-
layer capacitance Qdl exhibited a contrary trend, where the value of Qdl increased as tension strain
increased. The protective effect of passive film can be related to its thickness and consequently to C
(equivalent to Q value of CPE) [34]:
0 /C d (2)
In the above formula, ε and ε0 are dielectric constants of the passive film and vacuum,
respectively, and d is thickness of the passive film. From the formula, the decrease of passive film
thickness leads to an increase of C value.
Figure 9. Rp and Qdl of steel bar with different strains.
As shown in Figure 9, the value of Qdl increased as strain increased, which indicated that the
thickness of passive film decreased and the resulting protective capacity reduced when the load level
of reinforced concrete beam specimen gradual increased. The variation of polarisation resistance and
double-layer capacitance value illustrated that the higher load level applied on the beam specimen, the
more severely passively damaged the film was. Furthermore, when the strain of steel bar was
comparatively small, a relatively large reduction in protective capacity was produced. Most of the
passive film damage occurred in the low strain stage (less than 1000×10-6
, corresponding to 200 MPa),
in which the steel deformed elastically. However, an inconspicuous change in Rp and Qdl was observed
when the steel deformed from elastically to plastically (1500×10-6
to 1900×10-6
, plastic deformation
appeared above 1700×10-6
).
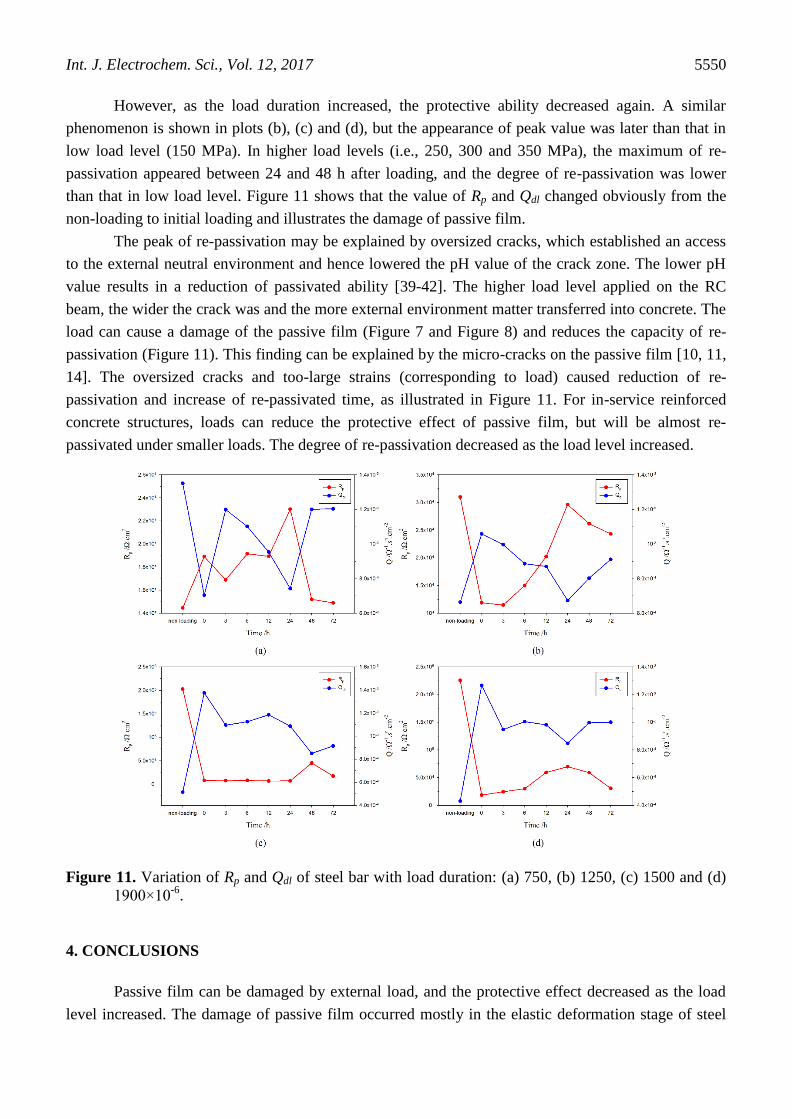
3.2.2 Effect of load duration
Figure 10 depicts the Nyquist plots of steel bars embedded in concrete beams under different
load levels and different load durations, where load level was expressed as tension strain values of 750,
1250, 1500 and 1900×10-6
, and the load duration ranged from 0 h to 72 h. The Nyquist plots of the
steel bar that experienced the highest load are shown in Figure 10(d); in this figure, the strain of the
steel bar was 1900×10-6
and plastic deformation occurred. Figure 10(d) shows that the diameter of
capacity arc increased gradually with the increase of load duration. After the load was sustained for 12
Int. J. Electrochem. Sci., Vol. 12, 2017
5549
h, the diameter of capacity arc became steady, and Nyquist plots almost overlapped. However, the
curve of 72 h decreased compared with that of 48 h, and a similar phenomenon appeared when the
strain was 1500 and 1250×10-6
, as shown in Figure 10(b), (c). In the lower load level, Nyquist plots
(Figure 10(a)) showed a similar trend as that in the higher load level, but the variation among curves
was less than that in the higher load level.
Figure 10. Nyquist plots of steel bar with different load durations and strain. (a) 750, (b) 1250, (c)
1500 and (d) 1900×10-6
.
Reinforced concrete structures in service condition will bear different levels of loads, which
would last for a long time. Figure 11 shows the fitting results of impedance data by the same
equivalent circuit. Many researchers [35-38] found that the alkalinity of concrete would remain in a
high level for some time. This phenomenon may provide a high alkaline environment for the steel
embedded in concrete to be passivated again (re-passivated). Figure 11 shows that all the plots show a
similar tendency to be re-passivated in the first 24 h since application of different level of loads (750,
1250, 1500 and 1900×10-6
, corresponding to 150, 250, 300 and 350 MPa). However, the re-passivation
kinetics was not monotonous, and peak and valley values of Rp and Qdl were found, respectively. As
shown in Figure 11(a), an extremum value of Rp and Qdl was found after the load had been sustained
for 3 h, which indicated the existence of a peak of re-passivation.
Int. J. Electrochem. Sci., Vol. 12, 2017
5550
However, as the load duration increased, the protective ability decreased again. A similar
phenomenon is shown in plots (b), (c) and (d), but the appearance of peak value was later than that in
low load level (150 MPa). In higher load levels (i.e., 250, 300 and 350 MPa), the maximum of re-
passivation appeared between 24 and 48 h after loading, and the degree of re-passivation was lower
than that in low load level. Figure 11 shows that the value of Rp and Qdl changed obviously from the
non-loading to initial loading and illustrates the damage of passive film.
The peak of re-passivation may be explained by oversized cracks, which established an access
to the external neutral environment and hence lowered the pH value of the crack zone. The lower pH
value results in a reduction of passivated ability [39-42]. The higher load level applied on the RC
beam, the wider the crack was and the more external environment matter transferred into concrete. The
load can cause a damage of the passive film (Figure 7 and Figure 8) and reduces the capacity of re-
passivation (Figure 11). This finding can be explained by the micro-cracks on the passive film [10, 11,
14]. The oversized cracks and too-large strains (corresponding to load) caused reduction of re-
passivation and increase of re-passivated time, as illustrated in Figure 11. For in-service reinforced
concrete structures, loads can reduce the protective effect of passive film, but will be almost re-
passivated under smaller loads. The degree of re-passivation decreased as the load level increased.
Figure 11. Variation of Rp and Qdl of steel bar with load duration: (a) 750, (b) 1250, (c) 1500 and (d)
1900×10-6
.
4. CONCLUSIONS
Passive film can be damaged by external load, and the protective effect decreased as the load
level increased. The damage of passive film occurred mostly in the elastic deformation stage of steel
Int. J. Electrochem. Sci., Vol. 12, 2017
5551
bars embedded in concrete beams. A re-passivation kinetics was detected when the load was sustained.
The steel bar embedded in concrete beam can be re-passivated due to the high alkaline environment of
concrete. The effect of re-passivation decreases as the tensile strain of the steel bar increases. The 72 h
value of double-layer capacitance Qdl (relate to the thickness of passive film) can reach 60–80% of the
non-loading value in higher load levels (the tensile strains are 1250 and 1500×10-6
, corresponding to
250 and 300 MPa, respectively). Plastic deformation makes the steel bar more difficult to be re-
passivated. A peak value of Rp and a valley value of Qdl appear when the load has been sustained for
about 24 h. This peak value may be caused by oversized cracks, which establish an access to the
external neutral environment and hence lower the local pH value.
-
ACKNOWLEDGEMENTS
This work was financially supported by National Natural Science Foundation of China (51578031) and
the Open Project of State Key Laboratory of Subtropical Building Science, South China University of
Technology (2016ZA03).
Conflicts of Interest
The authors declare that they have no conflict of interest.
References
1. M. Saremi and E. Mahallati, Cem. Concr. Res., 32 (2002) 1915-1921.
2. B. Zhao, J. H. Li, R. G. Hu, R. G. Du and C. J. Lin, Electrochim. Acta, 52 (2007) 3976-3984.
3. B. L. Lin and Y. Y. Xu, Int. J. Electrochem. Sci., 11 (2016) 3824-3842.
4. M. Reffass, R. Sabot, M. Jeannin, C. Berziou and P. Refait, Electrochim. Acta, 52 (2007) 7599-
7606.
5. M. Reffass, R. Sabot, M. Jeannin, C. Berziou and P. Refait, Electrochim. Acta, 54 (2009) 4389-
4396.
6. Y. M. Tang, G. D. Zhang and Y. Zuo, Constr. Build. Mater., 28 (2012) 327-332.
7. Z. H. Dong, W. Shi, G. A. Zhang and X. P. Guo, Electrochim. Acta, 56 (2011) 5890-5897.
8. M. B. Valcarce and M. Vazquez, Electrochim. Acta, 53 (2008) 5007-5015.
9. D. Z. Tang, Y. X. Du, M. X. Lu, Y. Liang, Z. T. Jiang and L. Dong, Mater. Corros., 66 (2015) 1467-
1479.
10. X. G. Feng, Y. M. Tang and Y. Zuo, Corros. Sci., 53 (2011) 1304-1311.
11. X. G. Feng, Y. Zuo, Y. M. Tang, X. H. Zhao and X. Y. Lu, Electrochim. Acta, 58 (2011) 258-263.
12. X. G. Feng, X. Y. Lu, L. Q. Guo and D. Chen, Int. J. Electrochem. Sci., 10 (2015) 10677-10688.
13. Y. Y. Zhu, L. Li and C. Wang, Corrosion Sci., 94 (2015) 445-451.
14. L. H. Jiang, H. Liu, H. Q. Chu, C. L. Zhu, C. S. Xiong, L. S. You, J. X. Xu, Y. Zhang and Y. J. Qin,
Constr. Build. Mater., 73 (2014) 699-704.
15. Y. Zhang and A. Poursaee, J. Mater. Civ. Eng., 27 (2015) 9.
16. Y. J. Zhang and A. Poursaee, Anti-Corros. Methods Mater., 62 (2015) 363-370.
17. Y. Liu, S. W. Tang, G. Y. Liu, Y. Sun and J. Hu, Int. J. Electrochem. Sci., 11 (2016) 8530-8545.
18. B. Li, J. H. Wang, X. H. Wang and X. Yue, Int. J. Electrochem. Sci., 11 (2016) 1-13.
19. P. Ghods, O. B. Isgor, G. McRae and T. Miller, Cem. Concr. Compos., 31 (2009) 2-11.
20. Q. Zhu, L. H. Jiang, Y. Chen, J. X. Xu and L. L. Mo, Constr. Build. Mater., 37 (2012) 512-517.
21. R. G. Duarte, A. S. Castela, R. Neves, L. Freire and M. F. Montemor, Electrochim. Acta, 124
Int. J. Electrochem. Sci., Vol. 12, 2017
5552
(2014) 218-224.
22. L. J. Yang, Y. Z. Xu, Y. S. Zhu, L. Liu, X. N. Wang and Y. Huang, Int. J. Electrochem. Sci., 11
(2016) 6943-6958.
23. T. D. Marcotte and C. M. Hansson, Mater. Struct., 40 (2007) 325-340.
24. C. Arya and Y. Xu, Cem. Concr. Res., 25 (1995) 893-902.
25. M. Thomas, Cem. Concr. Res., 26 (1996) 513-519.
26. B. Pacewska, M. Bukowska, I. Wilinska and M. Swat, Cem. Concr. Res., 32 (2002) 145-152.
27. D. M. Bastidas, A. Fernandez-Jimenez, A. Palomo and J. A. Gonzalez, Corrosion Sci., 50 (2008)
1058-1065.
28. W. Morris and M. Vazquez, Corros. Rev., 20 (2002) 469-508.
29. L. T. Mammoliti, L. C. Brown, C. M. Hansson and B. B. Hope, Cem. Concr. Res., 26 (1996) 545-
550.
30. A. Poursaee and C. M. Hansson, Cem. Concr. Res., 37 (2007) 1127-1133.
31. L. E. Narvaez, R. I. Rosales-Martinez, L. Narvaez-Hernandez, L. S. Hernandez-Hernandez and J.
M. Miranda-Vidales, Int. J. Electrochem. Sci., 10 (2015) 10003-10016.
32. C. T. Chen, J. J. Chang and W. C. Yeih, Constr. Build. Mater., 71 (2014) 35-43.
33. V. Feliu, J. A. González, C. Andrade and S. Feliu, Corrosion Sci., 40 (1998) 975-993.
34. M. Keddam, M. Krarti and C. Pallotta, Corrosion, 43 (1987) 454-458.
35. V. Rasanen and V. Penttala, Cem. Concr. Res., 34 (2004) 813-820.
36. Q. Pu, L. H. Jiang, J. X. Xu, H. Q. Chu, Y. Xu and Y. Zhang, Constr. Build. Mater., 28 (2012) 519-
524.
37. L. Li, A. A. Sagüés and N. Poor, Cem. Concr. Res., 29 (1999) 315-321.
38. F. Bjork and C. A. Eriksson, Constr. Build. Mater., 16 (2002) 535-542.
39. H. Xu, Y. Liu, W. Chen, R. G. Du and C. J. Lin, Electrochim. Acta, 54 (2009) 4067-4072.
40. B. Huet, V. L'Hostis, F. Miserque and H. Idrissi, Electrochim. Acta, 51 (2005) 172-180.
41. M. Moreno, W. Morris, M. G. Alvarez and G. S. Duffo, Corrosion Sci., 46 (2004) 2681-2699.
42. S. M. Abd El Haleem, E. E. Abd El Aal, S. Abd El Wanees and A. Diab, Corrosion Sci., 52 (2010)
3875-3882.
© 2017 The Authors. Published by ESG (www.electrochemsci.org). This article is an open access
article distributed under the terms and conditions of the Creative Commons Attribution license
(http://creativecommons.org/licenses/by/4.0/).
Copyright © 2022 FDOKUMEN