Effect of Feeding of Moringa oleifera Seed Meal as a New ...
Upload
beaconhousenationaluniversityCategory
view
0download
0
ARTICLE IN PRESS
JOURNAL OFFOOD COMPOSITION
AND ANALYSIS
0889-1575/$ - se
doi:10.1016/j.jfc
�Correspondfax: +92221 77
E-mail addr
ranashahid313@
Journal of Food Composition and Analysis 19 (2006) 544–551
www.elsevier.com/locate/jfca
Original Article
Effect of season and production location on antioxidant activity ofMoringa oleifera leaves grown in Pakistan
Shahid Iqbal�, M.I. Bhanger
Free Radical Research Laboratory, National Center of Excellence in Analytical Chemistry, University of Sindh, Jamshoro-76080, Pakistan
Received 28 September 2004; received in revised form 9 May 2005; accepted 12 May 2005
Abstract
Antioxidant activity (AA) of methanolic extracts from Moringa oleifera leaves, as function of seasons and agroclimatic locations,
was investigated. Total phenolic content (TPC), total flavonoid content (TFC), ascorbic acid (AAcid) content , reducing power, AA
in linoleic acid system and scavenging power of superoxide anion radical were taken as parameters for evaluation of AA. Significant
differences were observed in the AA of the extracts from different locations and seasons. Generally, samples from Mardaan
exhibited highest AA followed by Balakot, Chakwal, Jamshoro, and Nawabshah. Overall antioxidant efficacy was greater in
December or March depending upon location, and least in June. Antioxidant potential of M. oleifera leaves from Pakistan was quite
comparable or higher than literature values for M. oleifera from other countries and some other potent antioxidants. This work
shows that season and agroclimatic locations have profound effect on the AA of M. oleifera leaves.
r 2005 Elsevier Inc. All rights reserved.
Keywords: Moringa leaves; Antioxidant activity; Agroclimatic locations; Seasons; Total phenolics; Reducing power
1. Introduction
Epidemiological studies have shown that foods rich inantioxidants provide protection against degenerativediseases including cancer, coronary heart diseases, andAlzheimer’s disease (Pezzuto and Park, 2002; Razaliet al., 1997; Ames et al., 1993). Therefore, it isconsidered important to increase intake of antioxidantsfrom dietary sources (Soong and Barlow, 2004).Previously, synthetic antioxidants like BHA and BHThave been in use as food additives but recent reportshave expressed safety concerns about their usage (Sunet al., 2005) and natural antioxidant have become thefocus of intense interest (Wilson, 1999). The commercialdevelopment of plants as sources of antioxidants to
e front matter r 2005 Elsevier Inc. All rights reserved.
a.2005.05.001
ing author. Tel.: +92333 2656248/92 300 3079516;
1560.
esses: [email protected],
hotmail.com (S. Iqbal).
enhance health and food preservation is the focus ofcurrent interest (Rice-Evans et al., 1997). Plants are richsources for natural antioxidants, the best known aretocopherols, flavonoids, vitamin C, and different phe-nolic compounds (Laandrault et al., 2001). Many herbs,fruits (Ramarathnam et al., 1995), vegetables (Ismailet al., 2004), spices, and legumes have been exploited assources of antioxidants.
Moringa oleifera, Lam. (Moringaceae) is grownworld-wide in the tropics and sub-tropics of Asia andAfrica (Booth and Wickens, 1988) and is one of the 14species of genus Moringa, which are native to India,Africa, Arabia, Southeast Asia, the Pacific and Car-ibbean islands, and South America (Sengupta andGupta, 1970). The species are drought resistant andtolerate a wide range of soil and rainfall conditions.Various varieties of M. oleifera have been developed tomeet the tastes of local populations (Rajan, 1986).Two species of Moringa, i.e., M. concanensis andM. oleifera are present in Pakistan, but no compiled

ARTICLE IN PRESSS. Iqbal, M.I. Bhanger / Journal of Food Composition and Analysis 19 (2006) 544–551 545
information about these varieties is present. M. con-
canensis is found rarely, but M. oleifera is cultivatedwidely throughout the temperate regions of the country(Qaiser, 1973).
Different parts of this plant, i.e., leaves, flowers, rootsand fruits, have traditionally been used for dietarypurposes as vegetables (Qaiser, 1973; Siddhuraju andBecker, 2003). Fresh leaves have been used by Indianinhabitants for the preparation of cow and buffalo gheefrom butterfat. Its leaves are a valuable source ofvitamins A and C, they promote digestion, and they areused in catarrhal afflictions and for treating wounds (Palet al., 1995). The leaves mixed with chicken soup areused by Philippine women to enhance breast milkproduction (Chopra et al., 1956). Leaves of M. oleifera
have been reported to contain flavonoid pigments suchas kaempferol, rhamnetin, isoquercitrin, and kaempfer-itrin (Nair and Subramanian, 1962). Recently, from ourlaboratory, Anwar and Bhanger (2003) exploited M.
oleifera as a non-conventional source of oil withsignificantly high oxidative stability, revealing thepresence of natural antioxidants. Lalas and Tsaknis(2002), from Greece reported the oxidative stability ofseed oil and isolated components liable for antioxidantactivity (AA) from Malawi variety. A report onantioxidant properties of M. oleifera leaves fromdifferent countries, suggesting wide variation, has beenexploited by Siddhuraju and Becker (2003). Recently,Anwar et al. (2005) have reported significant variationsin oil content of Moringa seeds as function of agrocli-matic locations.
However, no study has been conducted so far dealingwith the AA and composition of M. oleifera leavesindigenous to Pakistan. No data describe the effectof agroclimatic location and season on the antioxidantpotential of M. oleifera leaves. The ultimate objectiveof the present study was to investigate AA andcomposition of M. oleifera leaves, and the effectsof agroclimatic conditions and seasons within Pakistanon AA.
2. Materials and methods
2.1. Materials
Fresh leaves of M. oleifera were collected in themonths of December, March, June, and September fromfive different areas of Pakistan: Balakot, Chakwal,Jamshoro, Mardaan, and Nawabshah for 2 yearsw.e.f. December 2001 to September 2003. Leaves werecollected at the beginning, mid-point and at the endof each month mentioned to ensure the reliability ofdata. All reagents (analytical and HPLC) used werefrom E. Merck, Fluka or Sigma Aldrich unless statedotherwise.
2.2. Extraction of total phenolics
Extraction of Moringa leaves was carried out follow-ing the method reported by Zuo et al. (2002). Air-driedleaf samples (5.0 g) were ground so as to pass 1mm sievesize and extracted with 25mL of 80% methanol for 3 hin an electrical shaker at room temperature. Thecontents of the flasks were further extracted twice with20mL of 80% methanol containing 0.15% HCl underthe same set of conditions. The extracts were combinedand filtered through 0.45mm of Nylon membrane filter.The extracts were evaporated to dryness under reducedpressure at 45 1C by a rotary evaporator and stored in afreezer at �18 1C until used for further analyses.
2.3. Measurement of total phenolic content (TPC)
TPC in the methanolic extracts of M. oleifera leaveswas determined by Folin–Ciocalteu reagent assay (Folinand Ciocalteu, 1927; Singleton and Rossi, 1965). Thereaction mixture contained 200 mL of extracts, 750 mL offreshly prepared diluted (1:10) Folin–Ciocalteu reagentand 2mL of 7.5% sodium carbonate. The final mixturewas diluted to 7mL with deionized water. Mixtures werekept in the dark at ambient conditions for 2 h tocomplete the reaction. Then the absorbance at 765 nmwas measured on a Perkin-Elmer Lambda-2 Spectro-photometer, with a 1 cm cell. All the experiments wereconducted thrice using gallic acid as a calibrationstandard, and results were recorded as gallic acidequivalents (g/100 g of extract).
2.4. Determination of total flavonoid content (TFC)
The TFC was measured following a reported colori-metric assay (Zhishen et al., 1999; Kim et al., 2002) withslight modifications. Briefly, the methanolic extract ofeach sample (1mL) was appropriately diluted and addedto a 10mL volumetric flask containing 4mL of H2O.Initially, 0.3mL of 5% NaNO2 was added to eachvolumetric flask; at 5min, 0.3mL of 10% AlCl3 wasadded; at 6min, 2mL of 1M NaOH was added. Eachreaction flask was then immediately diluted with 2.4mLof H2O and mixed. Absorbance of the mixtures wasdetermined at 510nm. TFC of the samples was deter-mined as epicatechin equivalents (mg/g). Three readingswere taken for each sample and results were averaged.
2.5. Quantitative determination of ascorbic acid
Ascorbic acid determination was carried out followinga reported indophenol titration method (Anwar et al.,1990). Samples were homogenized in metaphosphoricacid solution and extracted. The vitamin C was titratedagainst 2,6-dichlorophenol–indophenol solution at pH0.6 in the presence of formaldehyde, to a pink end point.

ARTICLE IN PRESSS. Iqbal, M.I. Bhanger / Journal of Food Composition and Analysis 19 (2006) 544–551546
2.6. Determination of reducing power
Reducing power was determined following the meth-od reported by Yen and Duh (1993). Extracts (0, 1.0,2.0, 5.0, 7.5, 10.0, and 15.0mg) were mixed withphosphate buffer (5.0mL, 2.0 M, pH 6.6) and 1%potassium ferricyanide (5mL), and the mixtures wereincubated at 50 1C for 20min. The quantity 5mL of10% trichloroacetic acid were added and the mixturewas centrifuged at 650g for 10min. The upper layer ofthe solution (5mL) was mixed with distilled water(5mL) and 0.1% ferric chloride (1mL), and absorbancewas measured at 700 nm. The experiment was conductedin triplicate and results were averaged.
2.7. Antioxidant activity determination in linoleic acid
system
The AA of methanolic extracts was determinedfollowing a reported method (Osawa and Namiki,1981). Sample extracts were added to a solution mixtureof linoleic acid (0.13mL), 99.8% ethanol (10mL), and0.2M sodium phosphate buffer (pH 7.0, 10mL). Thetotal volume was adjusted to 25mL with distilled water.The solution was incubated at 40 1C, and the degree ofoxidation was measured according to the thiocyanatemethod (Mitsude et al., 1966) with 10mL of ethanol(75%), 0.2mL of an aqueous solution of ammoniumthiocyanate (30%), 0.2mL sample solution, and 0.2mLof ferrous chloride (FeCl2) solution (20mM in 3.5%HCl) being added sequentially. After 3min of stirring,the absorption values of mixtures measured at 500 nmwere taken as peroxide contents. A control wasperformed with linoleic acid but without the extracts.Each sample was run in triplicate and results wereaveraged.
2.8. Scavenging of superoxide anion radical
Superoxide anion radical scavenging activity ofmethanolic extracts of M. oleifera leaves was determinedby the PMS–NADH superoxide generating system(Nikishimi et al., 1972; Lai et al., 2001). Extracts wereadded to a solution mixture that contained 200 mMNBT, 624 mM NADH, and 80 mM PMS in 0.1M
phosphate buffer, pH 7.4. After 2min of incubation atroom temperature, the absorbance was measured at560 nm. Percentage capability to scavenge the super-oxide radical was calculated using the followingequation:
Scavenging effect ð%Þ
¼ 1�Absorbance of sample at 560 nm
Absorbance of control at 560 nm
� �� 100
2.9. Statistical analysis
All the data is reported as mean7S.D. Data wereanalyzed using two-way ANOVA with replicationsfollowing method reported by (Zar, 1996). Data wasconsidered significant at Po0:05. Statgraphics1990–1991 Version 5.0 was used for statistical analysis.
3. Results and discussion
3.1. Total phenolic content
The phenolic compounds may contribute directly toantioxidative action (Awika et al., 2003); therefore it isnecessary to investigate TPC. The TPC was determinedfollowing a modified Follin–Ciocalteu method andresults were expressed as gallic acid equivalents(Table 1).
Significant differences (Po0:05) in TPC were ob-served as function of season and production location.Among locations, highest TPC was observed forsamples from Mardaan followed by Balakot, Chakwal,Jamshoro, and Nawabshah, respectively. Samples fromNawabshah and Jamshoro, with almost identicalagroclimatic conditions and environmental temperature(e.g., up to 51 1C during June) exhibited non-significantdifferences in TPC and were the lowest among thelocations investigated. This might be attributed to thestrong effect of temperature on TPC. It is supported byreport of Wang and Zheng (2001), showing thatenvironmental temperature strongly alters antioxidantproperties in strawberry. Furthermore, the observationof Yu et al. (2003) also supports the findings of thepresent work, stating that solar radiation reflects the UVexposure, which may be associated with free radicalformation and singlet oxygen production. Recently,Anwar et al. (2005) described wide variation in oilcontent of M. oleifera seeds from different agroclimaticlocations due to diversity in natural soil texture andclimatic constraints.
A survey of the literature reveals that TPC in M.
oleifera leaves from Mardaan was higher than thosereported from India, Niger, and Nicaragua (Siddhurajuand Becker, 2003) throughout the year. The samplescollected from Chakwal and Balakot had TPC that washigher than India but lower than Niger and Nicaragua.
Generally, the trend of TPC as a function of theseason was as: December4March4September4Junefor all the locations investigated. However, for samplesfrom Mardaan, TPC in March was higher than inDecember, perhaps due to extreme cold weather inDecember in Mardaan. Results for December andMarch were statistically non-significant among them-selves, while for June and September TPC wasstatistically significant (Po0:05). Temperature ranges

ARTICLE IN PRESS
Table 1
Total phenolic content of methanolic extracts of Moringa oleifera leaves (g/100 g)
Nawabshah Jamshoro Mardaan Chakwal Balakot Average
Dec. 9.1770.45 9.3470.58 13.0970.38 11.8770.19 12.3970.40 a11.1770.4
Mar. 8.9870.30 9.0270.21 13.5670.11 10.7970.70 12.0870.23 a10.8970.31
Jun. 8.3770.33 8.4370.41 11.8270.31 9.6770.24 11.4770.10 b9.9570.28
Sep. 8.7470.27 9.1670.10 12.6870.36 9.8370.37 11.8370.52 c10.4570.32
Average a8.8270.34 a8.9970.33 b12.7970.29 c10.5470.38 d11.9470.31
All data is reported as mean7S.D. (n ¼ 6).
F-statistics for seasons ¼ 26.405 at df ¼ 3, P ¼ 0:000.F-statistics for locations ¼ 230.496 at df ¼ 4, P ¼ 0:000.Values with same letter are statistically non-significant at 0.05 LSD.
Dec. ¼ December, Mar. ¼March, Jun. ¼ June, Sep. ¼ September.
S. Iqbal, M.I. Bhanger / Journal of Food Composition and Analysis 19 (2006) 544–551 547
for all the locations were determined from PakistanMeteorological Department, and an inverse relation ofenvironmental temperature with TPC was observed.Highest TPC was observed in the month of December(coldest temperatures) while the lowest was in June(hottest temperatures). This may be due to the fact thatMoringa leaves grow in the month of June and maturefrom December to March, and phenolic content islowest in newly opened leaves, increasing gradually withthe maturity of leaves. Previous reports suggest thatphenolic content increases with the increase in leaf-ageand is lower in early stages of leaf growth, graduallyincreasing with the maturity of leaves (Julkunen-Tiitto,1989; Wiermann, 1981). Furthermore, the activity of theplants is at its maximum during hot seasons (June inPakistan), leading to a loss of phenolic content.However, this activity reduces with the decrease inseasonal temperature resulting in a retention of pheno-lics (Lavola, 1998). The report by Sanders (1982),describing that an increase in unsaturated fatty acids isgenerally associated with cooler climates leading toproduction of antioxidants for a self-defense systemagainst environmental stress, supports our presentfindings suggesting pronounced effects of environmentaltemperature on AA. Some literature reports (Wang andStretch, 2001) reveal that an increase in TPC occurs withthe increase in storage temperature up to an optimizedlevel, while environmental temperature exhibited con-troversial behavior than storage temperature in thepresent study.
Another observation was made concerning the effectof altitude on TPC. Balakot and Mardaan, at analtitude ranging from 400–2700 ft with respect to otherlocations and with strong stormy wind throughout theyear, exhibited higher TPC than those of otherlocations, which are flat and have no stormy winds orrains. Although no previous findings support thisobservation directly, eastern practitioners generallybelieve that plants from hilly areas are more importantfrom a nutritional and dietary point of view (Anwaret al., 2004).
3.2. Total flavonoid content (TFC)
Flavonoid content was determined by a reportedmethod (Zhishen et al., 1999) and results were expressedas epicatechin equivalents (Table 2). TFC was found inappreciable amounts.
Exactly the same effects of agroclimatic location onTFC were observed as for TPC, perhaps due to thephenolic nature of flavonoids. However, the seasonaleffects on TFC were different from TPC, and nosignificant differences among seasons for TFC couldbe observed. Only the results of September versusMarch and December were statistically different(Po0:05). TFC was comparable to those of Moringa
samples from India, Niger, and Nicaragua (Siddhurajuand Becker, 2003) and in mulberry leaves (Zhishen et al.,1999) for all samples. However, samples from Mardaanexhibited higher TFC than the literature values (Sid-dhuraju and Becker, 2003). These results suggest thatMoringa leaves may be exploited as an important sourcein nutraceutical and functional food industries.
3.3. Ascorbic acid concentration
Ascorbic acid (AAcid), was determined following areported method (Anwar et al., 1990) and results arepresented in Table 3. Slight differences among locationscould be investigated; however, the differences werenon-significant among seasons. AAcid content washighest in the month of March for Mardaan, Chakwal,and Balakot locations (i.e., 0.044–0.046 (g/100 g)), andin December for those from Jamshoro and Nawabshah,i.e., 0.037–0.039 (g/100 g). AAcid remained unchangedduring March, June, and September for Jamshorosamples, whereas for the Nawabshah samples it wasexactly the same during December and September.AAcid content was lowest for all the locations in June.AAcid content in the Mardaan and Balakot samples wascomparable to Moringa samples from India andNicaragua (Siddhuraju and Becker, 2003) and orange-colored carrot, while it is almost three times higher than
ARTICLE IN PRESS
Table 3
Ascorbic acid content (g/100 g) of methanolic extracts of Moringa oleifera leaves (g/100 g)
Nawabshah Jamshoro Mardaan Chakwal Balakot Average
Dec. 0.03770.01 0.03970.01 0.04270.01 0.03970.01 0.04470.01 a0.04070.01
Mar. 0.03670.01 0.03570.01 0.04570.02 0.04470.01 0.04670.01 a0.04170.01
Jun. 0.03270.01 0.03570.01 0.03670.01 0.03670.01 0.04170.01 a0.03670.01
Sep. 0.03770.01 0.03570.01 0.0470.02 0.03570.01 0.04270.00 a0.03870.01
Average a0.03670.01 a0.03670.01 b0.04170.015 b0.03870.01 c0.04370.01
All data is reported as mean7S.D. (n ¼ 6).
F-statistics for seasons ¼ 1.174 at df ¼ 3, P ¼ 0:3292,F-statistics for locations ¼ 1.804 at df ¼ 4, P ¼ 0:1428.Values with same letter are statistically non-significant at 0.05 LSD.
Dec. ¼ December, Mar. ¼March, Jun. ¼ June, Sep. ¼ September.
Table 2
Total flavonoid content of methanolic extracts of Moringa oleifera leaves (g/100 g)
Nawabshah Jamshoro Mardaan Chakwal Balakot Average
Dec. 7.3770.26 7.1270.51 12.7970.30 9.9170.25 11.9570.28 a9.8370.32
Mar. 7.0270.24 8.1470.21 12.6970.21 9.3970.27 12.1570.21 a9.8870.23
Jun. 6.5970.21 6.9370.21 12.1570.43 8.8570.14 11.6770.36 b9.2470.27
Sep. 6.7470.27 7.3470.17 12.4970.17 9.1370.18 11.8270.40 c9.5170.24
Average a6.9370.25 a7.3870.28 b12.5370.28 c9.3270.21 d11.9070.31
All data is reported as mean7S.D. (n ¼ 6).
F-Statistics for seasons ¼ 2.526 at df ¼ 3, P ¼ 0:0680,F-Statistics for locations ¼ 46.167 at df ¼ 4, P ¼ 0:000.Values with same letter are statistically non-significant at 0.05 LSD.
Dec. ¼ December, Mar. ¼March, Jun. ¼ June, Sep. ¼ September
S. Iqbal, M.I. Bhanger / Journal of Food Composition and Analysis 19 (2006) 544–551548
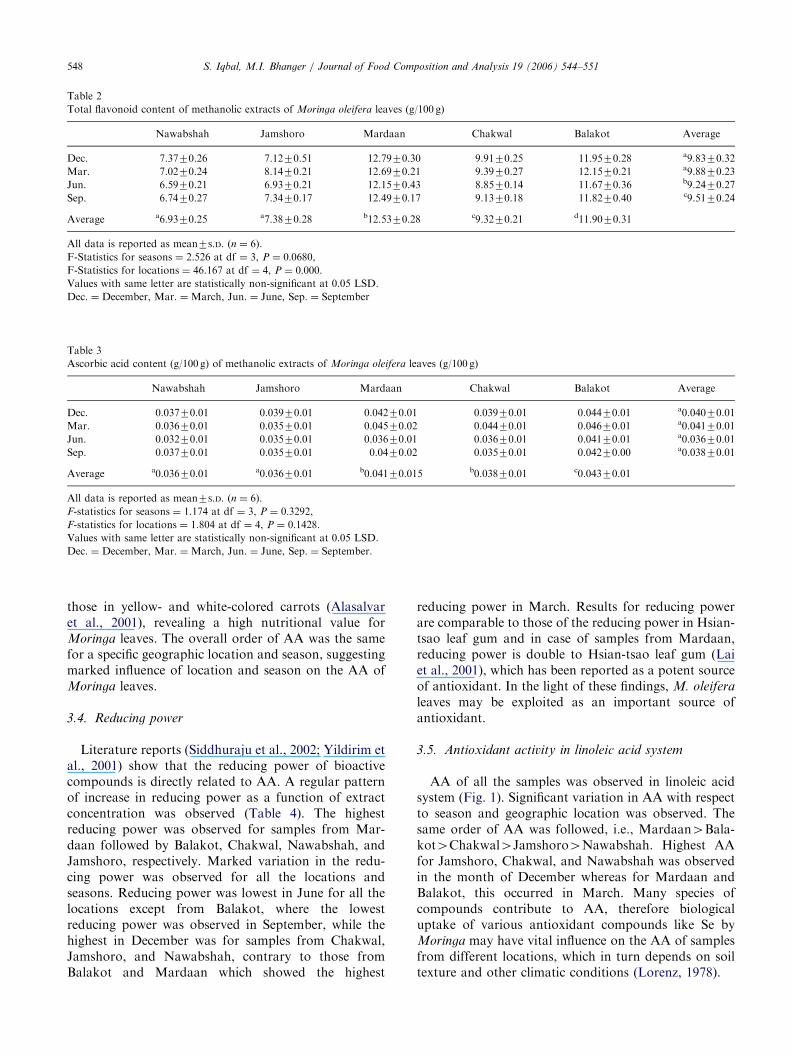
those in yellow- and white-colored carrots (Alasalvaret al., 2001), revealing a high nutritional value forMoringa leaves. The overall order of AA was the samefor a specific geographic location and season, suggestingmarked influence of location and season on the AA ofMoringa leaves.
3.4. Reducing power
Literature reports (Siddhuraju et al., 2002; Yildirim etal., 2001) show that the reducing power of bioactivecompounds is directly related to AA. A regular patternof increase in reducing power as a function of extractconcentration was observed (Table 4). The highestreducing power was observed for samples from Mar-daan followed by Balakot, Chakwal, Nawabshah, andJamshoro, respectively. Marked variation in the redu-cing power was observed for all the locations andseasons. Reducing power was lowest in June for all thelocations except from Balakot, where the lowestreducing power was observed in September, while thehighest in December was for samples from Chakwal,Jamshoro, and Nawabshah, contrary to those fromBalakot and Mardaan which showed the highest
reducing power in March. Results for reducing powerare comparable to those of the reducing power in Hsian-tsao leaf gum and in case of samples from Mardaan,reducing power is double to Hsian-tsao leaf gum (Laiet al., 2001), which has been reported as a potent sourceof antioxidant. In the light of these findings, M. oleifera
leaves may be exploited as an important source ofantioxidant.
3.5. Antioxidant activity in linoleic acid system
AA of all the samples was observed in linoleic acidsystem (Fig. 1). Significant variation in AA with respectto season and geographic location was observed. Thesame order of AA was followed, i.e., Mardaan4Bala-kot4Chakwal4Jamshoro4Nawabshah. Highest AAfor Jamshoro, Chakwal, and Nawabshah was observedin the month of December whereas for Mardaan andBalakot, this occurred in March. Many species ofcompounds contribute to AA, therefore biologicaluptake of various antioxidant compounds like Se byMoringa may have vital influence on the AA of samplesfrom different locations, which in turn depends on soiltexture and other climatic conditions (Lorenz, 1978).
ARTICLE IN PRESS
Table 4
Reducing power of methanolic extracts of Moringa oleifera leaves from different agroclimatic locations in different seasons
Samp month Conc. (mg) Nawabshah Jamshoro Mardaan Chakwal Balakot
Dec. 0 0.01670.001 0.02270.001 0.01370.001 0.01770.002 0.00970.001
1 0.2770.01 0.3370.01 0.4370.01 0.3970.01 0.4370.02
2 0.5070.02 0.5970.01 0.7870.01 0.7270.01 0.7670.01
5 1.3170.02 1.3270.03 1.7770.02 1.4970.03 1.6770.04
7.5 1.7870.03 1.8170.05 2.4770.07 2.0970.01 2.2270.02
10 2.2170.02 2.4270.02 3.0270.02 2.4770.02 2.6270.01
15 2.7470.03 2.7870.01 3.8470.09 3.1770.03 3.3270.03
Mar. 0 0.00970.001 0.02370.001 0.01370.001 0.02870.001 0.01970.001
1 0.2370.01 0.2770.01 0.4670.01 0.3470.01 0.4570.02
2 0.4270.01 0.4870.01 0.8370.02 0.6670.03 0.8270.04
5 1.1370.04 1.1970.01 1.8670.04 1.4070.06 1.7670.05
7.5 1.6670.03 1.6170.02 2.5470.05 1.9270.03 2.3170.02
10 1.9770.02 2.0570.04 3.1970.12 2.4170.01 2.7970.03
15 2.5970.02 2.4970.03 4.0270.02 3.0770.03 3.3970.07
Jun. 0 0.00770.001 0.01470.001 0.01870.001 0.0270.001 0.01570.001
1 0.1970.01 0.2270.01 0.3970.01 0.2970.01 0.3970.01
2 0.3770.01 0.4070.01 0.6770.01 0.5370.02 0.6870.03
5 1.0470.04 0.9170.02 1.5870.03 1.2470.01 1.4770.06
7.5 1.5270.02 1.3270.03 2.2770.08 1.7370.04 2.0770.03
10 1.8070.02 1.6670.01 2.8470.04 2.0470.01 2.5470.02
15 2.4170.06 2.3170.02 3.6970.06 2.4270.03 3.2770.06
Sep. 0 0.01970.001 0.00870.001 0.02170.001 0.02470.002 0.00370.001
1 0.1970.01 0.2670.01 0.4270.01 0.3170.01 0.3970.01
2 0.4170.02 0.4670.01 0.7270.02 0.5770.01 0.7170.02
5 1.0470.03 1.0470.01 1.8170.03 1.3070.02 1.5670.02
7.5 1.5770.01 1.4570.02 2.4570.01 1.8170.03 2.0070.04
10 1.8570.03 1.8970.02 2.9670.07 2.1970.02 2.4270.01
15 2.4970.01 2.4670.03 3.7870.04 2.7670.02 3.2170.06
All data is reported as mean7S.D. (n ¼ 6).
Statistical analysis was subjected to values of 5mg for all locations and seasons.
F-Statistics for seasons ¼ 56.523 at df ¼ 3, P ¼ 0:0000.F-Statistics for locations ¼ 264.785 at df ¼ 4, P ¼ 0:0000.Values with same letter are statistically non-significant at 0.05 LSD.
Dec. ¼ December, Mar. ¼March, Jun. ¼ June, Sep. ¼ September.
80
82
84
86
88
90
92
94
Nawabshah Jamshoro Mardan Chakwal Balakot
Production Locations
Inhi
bitio
n of
per
oxid
atio
n (%
) .Dec. Mar.
Jun. Sep.
Fig. 1. Antioxidant activity of methanolic extracts of Moringa oleifera in linoleic acid system.
S. Iqbal, M.I. Bhanger / Journal of Food Composition and Analysis 19 (2006) 544–551 549
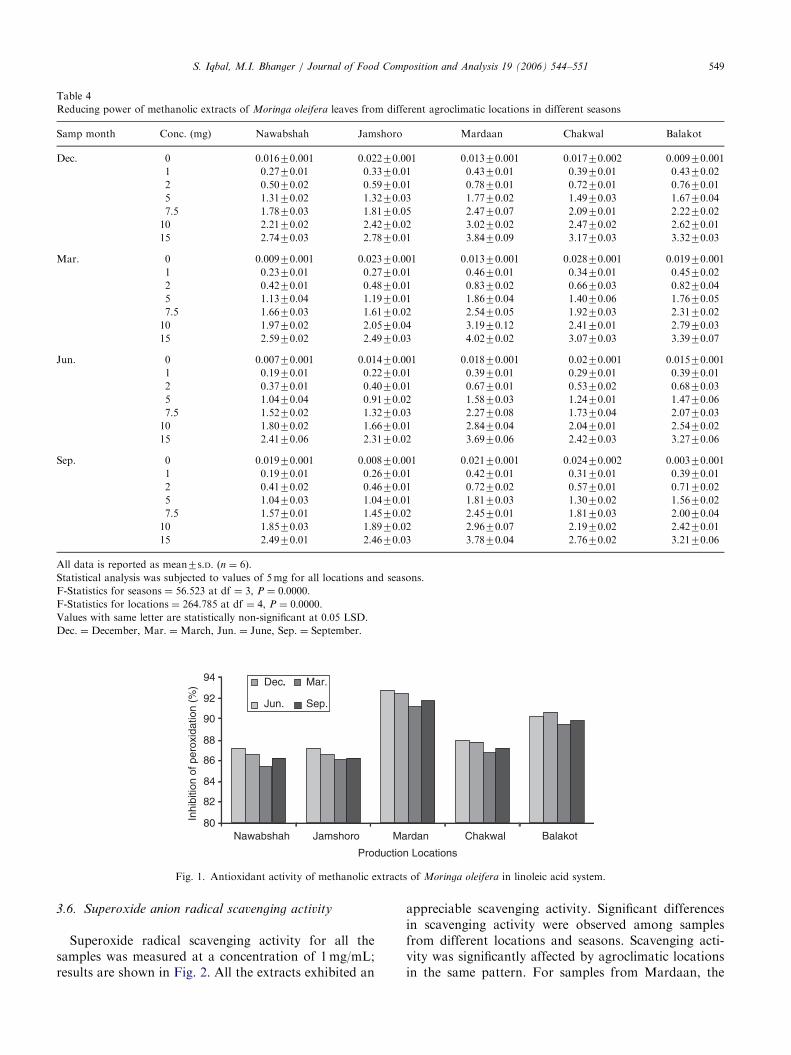
3.6. Superoxide anion radical scavenging activity
Superoxide radical scavenging activity for all thesamples was measured at a concentration of 1mg/mL;results are shown in Fig. 2. All the extracts exhibited an
appreciable scavenging activity. Significant differencesin scavenging activity were observed among samplesfrom different locations and seasons. Scavenging acti-vity was significantly affected by agroclimatic locationsin the same pattern. For samples from Mardaan, the

ARTICLE IN PRESS
78
86848280
889092949698
Nawabshah Jamshoro Mardan Chakwal BalakotProduction Locations
Sca
veng
ing
Cap
acity
(%
)
Dec. Mar.
Jun. Sep.
Fig. 2. Scavenging capacity of methanolic extracts of Moringa oleifera on superoxide anion radicals.
S. Iqbal, M.I. Bhanger / Journal of Food Composition and Analysis 19 (2006) 544–551550
highest scavenging activity was observed in March andthe lowest in June. For all other locations the highestscavenging activity was in December and lowest inMarch for Nawabshah, in June for Chakwal, Mardaan,Jamshoro, and Balakot. For Nawabshah, a controversyrelative to previous results was observed, reducingpower in June was far higher than in Septemberand March. Overall order of scavenging was similar toTPC, TFC, and reducing power for all the locations.Results of scavenging effects for Jamshoro, Nawabshah,and Chakwal were closer to one another, whileBalakot and Mardaan exhibited closer values amongthemselves.
4. Conclusions
From the present work, it could be concluded thatagroclimatic locations and seasons have profoundeffects on the AA of M. oleifera leaves. AA of samplesfrom cold areas was relatively higher than those fromtemperate regions. Similarly, from all the samples, AAwas highest in December (cold month) and lowest inJune (hot month), with few exceptions. These findingssuggest that environmental temperature has a significanteffect on AA evaluation. However, there is still a need toinvestigate effects of soil properties on AA of Moringaleaves.
References
Alasalvar, C., Grigor, J.M., Zhang, D., Quantick, P.C., Shahidi, F.,
2001. Comparison of volatiles, phenolics, sugars, antioxidant
vitamins, and sensory quality of different colored carrot varieties.
Journal of Agricultural and Food Chemistry 49, 1410–1416.
Ames, B.N., Shigenga, M.K., Hagen, T.M., 1993. Oxidants, antiox-
idants and degenerative diseases of aging. Proceedings of the
National Academy of Sciences of the United States of America 90,
7915–7922.
Anwar, F., Bhanger, M.I., 2003. Analytical characterization of
Moringa oleifera seed oil grown in temperate regions of Pakistan.
Journal of Agricultural and Food Chemistry 51, 6558–6563.
Anwar, J., Farooqi, M.I., Nagra, S.A., Khan, A.M., 1990. A new
method for the spectrophotometric determination of ascorbic acid.
Journal of Chemical Society of Pakistan 12, 75–79.
Anwar, F., Manzoor, M., Bajwa, J., 2004. Antioxidant activity of
solvent extracts of strawberry using various antioxidant assay.
Pakistan Journal of Analytical Chemistry 5 (2), 28–37.
Anwar, F., Ashraf, M., Bhanger, M.I., 2005. Interprovenance
variation in the composition of Moringa Oleifera oilseeds from
Pakistan. Journal of the American Oil Chemists Society 82, 45–51.
Awika, J.M., Rooney, L.W., Wu, X., Prior, R.L., Zevallos, L.C., 2003.
Screening methods to measure antioxidant activity of sorghum
(Sorghum bicolor) and sorghum products. Journal of Agricultural
and Food Chemistry 51, 6657–6662.
Booth, F.E.M., Wickens, G.E., 1988. Non-timber uses of selected arid
zone trees and shrubs in Africa. In FAO Conservation Guide.
Food and Agriculture Organization, Rome 176pp.
Chopra, R.N., Nayar, S.L., Chopra, I.C., 1956. Moringa oleifera. In
Glossary of Indian Medicinal Plants. Council of Scientific and
Industrial Research, New Delhi: India, pp. 330.
Folin, O., Ciocalteu, V., 1927. On tyrosine and tryptophane
determination in proteins. Journal of Biological Chemistry 27,
627–650.
Ismail, A., Marjan, Z.M., Foong, C.W., 2004. Total antioxidant
activity and phenolic content in selected vegetables. Food
Chemistry 87, 581–586.
Julkunen-Tiitto, R., 1989. Phenolic constituents of Salix: a chemo-
taxonomic survey of further Finnish species. Phytochemistry 25,
663–667.
Kim, D.O., Lee, K.W., Lee, H.J., Lee, C.Y., 2002. Vitamin C
equivalent antioxidant capacity (VCEAC) of phenolic phytochem-
icals. Journal of Agricultural and Food Chemistry 50, 3713–3717.
Laandrault, N., Pouchert, P., Ravel, P., Gase, F., Cros, G., Teissedro,
P.-L., 2001. Antioxidant activities and phenolic level of French
wines from different varities and vintages. Journal of Agricultural
and Food Chemistry 49, 3341–3343.
Lai, L.S., Chou, S.T., Chao, W.W., 2001. Studies on the antioxidant
activities of Hsian-tsao (Mesona procumbens Hemsl) leaf gum.
Journal of Agricultural and Food Chemistry 49, 963–968.
Lalas, S., Tsaknis, J., 2002. Extraction and identification of natural
antioxidant from the seeds of the Moringa oleifera tree variety of
Malawi. Journal of the American Oil Chemists Society 79 (7),
677–683.
Lavola, A., 1998. Accumulation of flavonoids and related compounds
in birch induced by UV-B irradiance. Tree Physiology 18, 53–58.
Lorenz, K., 1978. Selenium in wheat and commercial wheat flours.
Cereal Chemistry 55, 587–594.
Mitsude, H., Yasumoto, K., Iwami, K., 1966. Antioxidative action of
indole compounds during autoxidation of linoleic acid. Eiyo to
shokuryo 19, 210–214.
ARTICLE IN PRESSS. Iqbal, M.I. Bhanger / Journal of Food Composition and Analysis 19 (2006) 544–551 551
Nair, A.G.R., Subramanian, S.S., 1962. Pigments of the flowers of
Moringa pterygosperma. Current Science 31, 155–156.
Nikishimi, M., Rao, N., Yagi, K., 1972. The occurrence of superoxide
anion in the reaction of reduced phenazine methsulphate and
molecular oxygen. Biochemistry and Biophysics Research Com-
munications 46, 849–854.
Osawa, T., Namiki, M., 1981. A novel type of antioxidant isolated
from leaf wax of eucalyptus leaves. Agricultural and Biological
Chemistry 45, 735–739.
Pal, S., Mukherjee, K., Saha, B.P., 1995. Studies on the antiulcer
activity of Moringa oleifera leaf extract on gastric ulcer models in
rats. Phytotheraphy Research 9, 463–465.
Pezzuto, J.M., Park, E.J., 2002. Autoxidation and antioxidants. In:
Swarbrick, J., Boylan, J.C. (Eds.), Encyclopedia of Pharmaceu-
ticals Technology, vol. 1, second ed. Marcel Dekker Inc., New
York, pp. 97–113.
Qaiser, M., 1973. Moringaceae. In: Nasir, E., Ali, S.I. (Eds.), Flora of
West Pakistan, vol. 38. Department of Botany, University of
Karachi, Karachi, Pakistan, pp. 1–4.
Rajan, B.K.C., 1986. Apiculture and farm forestry in semi-arid tracts
of Karnataka. My Forest 22 (1), 41–49.
Ramarathnam, N., Osawa, T., Ochi, H., Kawakishi, S., 1995. The
contribution of plant food antioxidants to human health. Trends in
Food Science and Technology 6, 75–82.
Razali, I., Norhaya, H., Norasimah, A.S., 1997. Determination of
antioxidants in Palm Oil products by HPLC. Elaeis 9 (1), 25–31.
Rice-Evans, C.A., Miller, N.J., Paganga, G., 1997. Antioxidant
properties of phenolic compounds. Trends in Plant Science 2,
152–159.
Sanders, T.H., 1982. Peanut Triacylglycerols: Effect of Season and
Production Location. Journal of the American Oil Chemists
Society 59 (8), 346–349.
Sengupta, A., Gupta, M.P., 1970. Studies on seed fat composition of
Moringaceae family. Fette, Seifen, Anstrichm 72, 6–10.
Siddhuraju, P., Becker, K., 2003. Antioxidant properties of various
solvent extracts of total phenolic constituents from three different
agroclimatic origins of Drumstick tree (Moringa oleiferea Lam.)
leaves. Journal of Agricultural and Food Chemistry 51, 2144–2155.
Siddhuraju, P., Mohan, P.S., Becker, K., 2002. Studies on the
antioxidant activity of Indian Laburnum (Cassia fistula L.): a
preliminary assessment of crude extracts from stem bark, leaves,
flowers and fruit pulp. Food Chemistry 79, 61–67.
Singleton, Y.L., Rossi, J.A., 1965. Colorimetry of total phenolics with
phosphomolybdic-phosphotungestic acid reagent. American Jour-
nal of Oenology and Viticulture 16, 144–158.
Soong, Y.Y., Barlow, P.J., 2004. Antioxidant activity and phenolic
content of selected fruit seeds. Food Chemistry 88, 411–417.
Sun, T., Ho, Chi-Tang, 2005. Antioxidant activities of buckwheat
extracts. Food Chemistry 90, 743–749.
Wang, S.Y., Stretch, A.W., 2001. Antioxidant capacity in cranberry is
influenced by cultivar and storage temperature. Journal of
Agricultural and Food Chemistry 49, 969–974.
Wang, S.Y., Zheng, W., 2001. Effects of plant growth temperature on
antioxidant capacity in strawberry. Journal of Agricultural and
Food Chemistry 49, 4977–4982.
Wiermann, R., 1981. Secondary plant products and cell and tissue
differentiation. In: Stumpf, P.K., Conn, E.E. (Eds.), The Biochem-
istry of Plants, vol. 7. Academic Press Inc., New York, pp. 85–116.
Wilson, T., 1999. Whole foods, antioxidants and health. In Antiox-
idants, Human Health and Diseases, 141–150.
Yen, G.C., Duh, P.D., 1993. Antioxidative properties of methanolic
extracts from peanut hulls. Journal of the American Oil Chemists
Society 70 (4), 383–386.
Yildirim, A., Oktay, M., Bilaloglu, V., 2001. The antioxidant activity
of the leaves of Cydonia vulgaris. Turkish Journal of Medical
Sciences 31, 23–27.
Yu, L., Perret, J., Harris, M., Wilson, J., Haley, S., 2003. Antioxidant
properties of bran extracts from ‘‘Akron’’ wheat grown at different
locations. Journal of Agricultural and Food Chemistry 51,
1566–1570.
Zhishen, J., Mengcheng, T., Jianming, W., 1999. The determination of
flavonoid contents in mulberry and their scavenging effects on
superoxide radicals. Food Chemistry 64, 555–559.
Zar, J.H., 1996. Multiway factorial analysis of variance. In:
Biostatistical Analysis, third ed. Prentice-Hall, Inc., NJ, USA,
pp. 2306–2865.
Zuo, Y., Chen, H., Deng, Y., 2002. Simultaneous determination of
catechins, caffeine and gallic acids in green, Oolong, black and pu-
erh teas using HPLC with a photodiode array detector. Talanta 57,
307–316.
Copyright © 2022 FDOKUMEN