Effect of Process Parameters on the Quality of Laser-Cut ...
13
metals Article Effect of Process Parameters on the Quality of Laser-Cut Stainless Steel Thin Plates Irene Buj-Corral * , Lluís Costa-Herrero and Alejandro Domínguez-Fernández Citation: Buj-Corral, I.; Costa- Herrero, L.; Domínguez-Fernández, A. Effect of Process Parameters on the Quality of Laser-Cut Stainless Steel Thin Plates. Metals 2021, 11, 1224. https://doi.org/10.3390/met11081224 Academic Editor: Thomas Niendorf Received: 28 June 2021 Accepted: 28 July 2021 Published: 31 July 2021 Publisher’s Note: MDPI stays neutral with regard to jurisdictional claims in published maps and institutional affil- iations. Copyright: © 2021 by the authors. Licensee MDPI, Basel, Switzerland. This article is an open access article distributed under the terms and conditions of the Creative Commons Attribution (CC BY) license (https:// creativecommons.org/licenses/by/ 4.0/). Department of Mechanical Engineering, School of Engineering of Barcelona (ETSEIB), Universitat Politècnica de Catalunya (UPC), Av. Diagonal, 647, 08028 Barcelona, Spain; [email protected] (L.C.-H.); [email protected] (A.D.-F.) * Correspondence: [email protected]; Tel.: +34-934-05-4015 Abstract: At present, laser cutting is currently employed to cut metallic plates, due to their good finish and dimensional quality, as well as because of the flexibility of the process to obtain different shapes. In the present paper, surface roughness, dimensional accuracy, and burr thickness of thin plates of 0.8 mm are studied as functions of different process parameters: pulse frequency, pulse width, and speed. Eight different experiments were performed according to a full 2 3 factorial design, with two replicates each. Square specimens of 10 mm × 10 mm were cut. Arithmetical mean roughness Ra was measured with a contact roughness meter, and the dimensions and burr thickness with a micrometer. Ra values ranged between 1.89 and 3.86 μm, dimensional error values between 0.22 and 0.93%, and burr thickness between 2 and 34 μm. Regression analysis was performed, and linear models were obtained for each response. Results showed that roughness depends mainly on frequency, on the interaction of frequency and pulse width and on pulse width. Dimensional error depends on pulse width, frequency, and the interaction between pulse width and speed. Burr thickness is influenced by frequency, pulse width, and the interaction between frequency and speed. Multi-objective optimization showed that, in order to simultaneously minimize the three responses, it is recommended to use high frequency (80 Hz), high pulse width (0.6 ms), and high speed (140 mm/min). The present study will help to select appropriate laser cutting conditions in thin plates, in order to favor good surface finish and dimensional accuracy, as well as low burr thickness. Keywords: laser cutting; roughness; dimensional error; burr thickness; pulse frequency; pulse width; feed speed 1. Introduction Different kinds of lasers are used in industry, with light ranging from ultraviolet (UV) radiation to infrared (IR) radiation. Within the group of IR radiation, three main categories are known, CO 2 , Nd: YAG, and diode lasers. The first two ones provide high power, up to 15,000 W for the CO 2 lasers and to 2000 W for the Nd: YAG lasers. In recent years, Nd: YAG lasers have gained increasing importance because their low wavelength around 1.06 μm guarantees higher energy absorptance than that of CO 2 lasers [1]. Thus, Nd: YAG lasers are appropriate to cut high reflectivity materials such as Al or Cu or allows including Ni or Mo [2]. In addition, the high peak power of pulsed Nd: YAG lasers allows cutting thicker plates. Laser cutting with Nd: YAG has many advantages such as good dimensional quality and surface finish, its flexibility to obtain different geometries without the need of tooling, the possibility to cut a wide range of metallic (steel, superalloys, copper, aluminum, and copper) and non-metallic materials (ceramics, thermoplastics, rubber, wood, and fabrics), the fact that it is a cost-effective process to obtain good quality cut, a relatively high cutting speed, etc. [3,4]. However, many different parameters will affect the surface quality of the parts, such as the type of material to be cut, the sheet thickness, the voltage, the pulse frequency, the pulse width, the beam diameter, the type of auxiliary gas, the pressure of Metals 2021, 11, 1224. https://doi.org/10.3390/met11081224 https://www.mdpi.com/journal/metals
-
Upload
khangminh22 -
Category
Documents
-
view
0 -
download
0
Transcript of Effect of Process Parameters on the Quality of Laser-Cut ...
metals
Article
Effect of Process Parameters on the Quality of Laser-CutStainless Steel Thin Plates
Irene Buj-Corral * , Lluís Costa-Herrero and Alejandro Domínguez-Fernández
�����������������
Citation: Buj-Corral, I.; Costa-
Herrero, L.; Domínguez-Fernández,
A. Effect of Process Parameters on the
Quality of Laser-Cut Stainless Steel
Thin Plates. Metals 2021, 11, 1224.
https://doi.org/10.3390/met11081224
Academic Editor: Thomas Niendorf
Received: 28 June 2021
Accepted: 28 July 2021
Published: 31 July 2021
Publisher’s Note: MDPI stays neutral
with regard to jurisdictional claims in
published maps and institutional affil-
iations.
Copyright: © 2021 by the authors.
Licensee MDPI, Basel, Switzerland.
This article is an open access article
distributed under the terms and
conditions of the Creative Commons
Attribution (CC BY) license (https://
creativecommons.org/licenses/by/
4.0/).
Department of Mechanical Engineering, School of Engineering of Barcelona (ETSEIB), Universitat Politècnica deCatalunya (UPC), Av. Diagonal, 647, 08028 Barcelona, Spain; [email protected] (L.C.-H.);[email protected] (A.D.-F.)* Correspondence: [email protected]; Tel.: +34-934-05-4015
Abstract: At present, laser cutting is currently employed to cut metallic plates, due to their goodfinish and dimensional quality, as well as because of the flexibility of the process to obtain differentshapes. In the present paper, surface roughness, dimensional accuracy, and burr thickness of thinplates of 0.8 mm are studied as functions of different process parameters: pulse frequency, pulsewidth, and speed. Eight different experiments were performed according to a full 23 factorial design,with two replicates each. Square specimens of 10 mm × 10 mm were cut. Arithmetical meanroughness Ra was measured with a contact roughness meter, and the dimensions and burr thicknesswith a micrometer. Ra values ranged between 1.89 and 3.86 µm, dimensional error values between0.22 and 0.93%, and burr thickness between 2 and 34 µm. Regression analysis was performed, andlinear models were obtained for each response. Results showed that roughness depends mainlyon frequency, on the interaction of frequency and pulse width and on pulse width. Dimensionalerror depends on pulse width, frequency, and the interaction between pulse width and speed.Burr thickness is influenced by frequency, pulse width, and the interaction between frequency andspeed. Multi-objective optimization showed that, in order to simultaneously minimize the threeresponses, it is recommended to use high frequency (80 Hz), high pulse width (0.6 ms), and highspeed (140 mm/min). The present study will help to select appropriate laser cutting conditions in thinplates, in order to favor good surface finish and dimensional accuracy, as well as low burr thickness.
Keywords: laser cutting; roughness; dimensional error; burr thickness; pulse frequency; pulse width;feed speed
1. Introduction
Different kinds of lasers are used in industry, with light ranging from ultraviolet (UV)radiation to infrared (IR) radiation. Within the group of IR radiation, three main categoriesare known, CO2, Nd: YAG, and diode lasers. The first two ones provide high power, upto 15,000 W for the CO2 lasers and to 2000 W for the Nd: YAG lasers. In recent years,Nd: YAG lasers have gained increasing importance because their low wavelength around1.06 µm guarantees higher energy absorptance than that of CO2 lasers [1]. Thus, Nd: YAGlasers are appropriate to cut high reflectivity materials such as Al or Cu or allows includingNi or Mo [2]. In addition, the high peak power of pulsed Nd: YAG lasers allows cuttingthicker plates.
Laser cutting with Nd: YAG has many advantages such as good dimensional qualityand surface finish, its flexibility to obtain different geometries without the need of tooling,the possibility to cut a wide range of metallic (steel, superalloys, copper, aluminum, andcopper) and non-metallic materials (ceramics, thermoplastics, rubber, wood, and fabrics),the fact that it is a cost-effective process to obtain good quality cut, a relatively high cuttingspeed, etc. [3,4]. However, many different parameters will affect the surface quality ofthe parts, such as the type of material to be cut, the sheet thickness, the voltage, the pulsefrequency, the pulse width, the beam diameter, the type of auxiliary gas, the pressure of
Metals 2021, 11, 1224. https://doi.org/10.3390/met11081224 https://www.mdpi.com/journal/metals
Metals 2021, 11, 1224 2 of 13
auxiliary gas, the focal distance, etc. [5]. In addition, the edges of the plates may sufferthermal damage in the so-called heat-affected zone (HAZ). Moreover, burr formation isone of the main drawbacks of the laser cutting process. In order to monitor burr, sensorsare commonly added to the laser cutting machines [6].
Several authors have investigated the optimal parameters to be used in laser cuttingto improve the quality of the parts. As for CO2 lasers, Lamikiz et al. [7] varied the mainparameters of the process, such as power, gas pressure, feed speed, and focal position, inorder to study their influence on the quality and geometry of different Advanced HighStrength Steel (AHSS) plates. They considered two groups of plates, of more and lessthan 1 mm thickness respectively. They recommended increasing the power to 300 W inorder to avoid the risk of rough areas on the surface, which increased with feed speed.Regarding Nd: YAG lasers, Ghany and Newishy [8] evaluated the laser cutting processof austenitic stainless steel of 1.2 mm thickness, with a Nd: YAG laser, both pulsed andcontinuous, and with either nitrogen or oxygen as auxiliary gases. They observed that thecut quality depended mainly on the laser power, the pulse frequency, the feed speed, andthe focal positions of the laser. Optimal values corresponded to a frequency of 200–250 Hz,a power peak of 880–1100 W, a feed speed of 1–2 m/min, a focal position of 0.5–1 mmunder the surface, and a nitrogen pressure of 9–11 bar. Although nitrogen producedbrighter and smoother surfaces, it was more expensive than oxygen. Ramírez et al. [9]presented a study on the influence of the laser processing parameters on the quality andmicrostructure of austenitic AISI 304 stainless steel of 1 mm thickness. They used a Nd:YAG laser with nitrogen as assistance gas. They observed that, for frequency values of 500Hz and power values of 800 W, quality improved with speed. Grevey and Desplats [10]compared the cutting performance in Nd: YAG laser cutting of metallic plates between 0.8and 2 mm thickness, using oxygen as assistance gas They found that the highest optimalspeed corresponded to 5 m/min for continuous laser with the thinnest plate. They alsofound that higher speed is required for continuous-wave lasers than for pulsed-wave ones.Tahmouch et al. [11] performed an experimental study of stainless steel plates up to 20 mmthickness without assistance gas in pulsed mode. Selected variables were frequency, peakpower, and feed speed. This study revealed that less power density is required in orderto cut without assistance gas when compared to conventional cutting. They also foundthat low frequency and high peak power favor the use of high feed speed. Shanjin andYang [12] investigated the effect of varying the pulse energy, the frequency, the feed speed,the gas pressure, and the type of assistance gas on the surface quality, the HAZ, and thecorrosion resistance, in titanium alloy plates of 1 mm thickness. They employed Nd: YAGlaser with pulsed mode. Their observations determined that medium mean pulse energy,high speed, high pressure, and argon as assistance gas lead to a thinner HAZ. He et al. [13]studied, both analytically and experimentally, the optimization of wavelength to machinemetals with the generation of harmonics of a Nd: YAG laser. Optimal wavelength can beestimated by means of calculation of the absorptance efficiency. They found that, for metalssuch as gold, silver, and copper, the maximal absorptance efficiency is found at the third,fourth, and second harmonic respectively.
Surface roughness obtained in laser cutting processes has been specifically studied bydifferent authors. As for CO2 laser equipment, Jarosz et al. [14] studied the effect of cuttingspeed on surface roughness of the cut area on AISI 316 stainless-steel disks of 50 mmdiameter and 10 mm thickness. They observed that, at high-speed values of 16.5 and9.17 mm/s, roughness increased with the distance from the upper edge of the cut surface.However, at the low-speed value of 1.84 mm/s, the lowest Ra values at around 2 µm weremeasured in the middle of the cut surface. Nevertheless, such low speed resulted in adamaged surface with an important HAZ. Patel and Bhavsar [15] studied the effect of speedon the surface roughness of hard die steel EN-31 plates of 10 mm thickness. They foundthat a speed of 1250 mm/min (20.83 mm/s), a power of 3000 W, a frequency of 1400 Hz, aduty cycle of 95%, and a gas pressure of 0.10 bar provided a minimum Ra value of around1.4 µm. Orishich et al. [16] studied the possibility to cut thick plates of low-carbon steel
Metals 2021, 11, 1224 3 of 13
with oxygen-assisted CO2 laser cutting. They found that above 50 mm thickness it is notpossible to obtain good quality laser-cut parts. They also found that the higher the platethickness, the higher roughness is. In addition, the lower thickness, the higher speed isrequired. Salem et al. [17] studied the effect of cutting conditions on the HAZ. They variedpower laser, cutting speed, and gas pressure. They found that the HAZ is significantlyaffected by the gas pressure. Rajaram et al. [18] studied the effects of power and feed rateon kerf width, surface roughness, striation frequency, and dimensions of the HAZ whencutting 4130 steel. They found that feed rate had a more important effect on roughnessthan power. Ahn and Byun [19] investigated the effect of cutting parameters on surfaceroughness of Inconel 718, for thickness values between 1 mm and 2 mm. They observedthat surface roughness decreased with cutting speed in all cases. Riveiro et al. [20] obtainedRa values between 1 µm and 3 µm when using a rectangular nozzle to cut 3-mm thickplates of an Al-4.5%Cu (2024-T3) alloy. Several authors have studied the cutting processof Al6061-T6 alloy. When cutting sheets of 1 mm and 3 mm respectively, Jiang et al. [21]found that the lowest Ra values below 2.5 µm were obtained when a medium speed valueof 3 m/min was selected. Yongbin et al. [22] defined a neural network model. Studiedvariables were cutting speed (between 2 and 4 m/min), laser power (between 1500 and3000 W), metal sheet thickness (between 1.5 and 3 mm), and gas pressure (between 5 and6 bar). Experimental Ra values ranged from 2.36 to 4.58 µm. The lowest roughness valuescorrespond to high laser power, high cutting speed, high pressure, and low sheet thickness.Akbari [23] addressed the effect of cutting speed, laser power, sheet thickness, and nozzlestandoff distance on roughness. Metal sheet thickness was 1 mm or 3 mm. The lowestroughness values correspond to the medium speed of 3 m/min, medium laser power of3000 W, and medium standoff distance of 2 mm. They reported Ra values around 2 µm. Inanother study about laser cutting of Ti-alloys with CO2 equipment, El Aoud et al. observedthat roughness decreased with cutting speed and with laser power. They reported Ravalues from 8 to almost 14 µm.
Regarding Nd-YAG laser equipment, for Al6061-T6 Alloy, Leone et al. [24] reportedRa values around 4 µm. Sharifi and Kumar Pandey and Kumar Dubey [25] studied theeffect of assist gas pressure, pulse width, pulse frequency, and cutting speed on surfaceroughness and kerf thickness in titanium plates. They employed low cutting speed valuesbetween 15 and 25 mm/min, and pulse frequency between 7.5 and 12.5 Hz. They foundroughness values between 10 and 12 µm.
However, the surface roughness of metallic thin walls obtained with Nd-YAG laser hasbeen scarcely studied in the literature. For example, Pfeifer et al. [26] presented a methodto cut nitinol Ni-Ti plates of 1 mm thickness, which show the thermal memory effect, witha Nd: YAG pulsed laser, with high mean power. Relatively good quality was obtained atRz = 10–30 µm, with a high feed speed between 2 and 12 mm/s (120 and 720 mm/min).
Determination of surface roughness of cut edges is not a direct task, especially in thinwalls. For example, some authors have estimated roughness from RGB (red-green-blue)images of the edges [27]. In industry, sometimes roughness is checked by means of visualinspection. If roughness is to be measured in contact roughness meters, specific supportswill be required, in order to avoid bending of the plates.
As for dimensional accuracy, Soltysak et al. [28] compared the performance of 6 mmthick S235JR steel sheets with both fiber and CO2 lasers, with a cutting speed of 0.03667 m/s.They found that fiber laser provided better dimensional accuracy and better roughnessthan the CO2 laser. Girdu et al. [29] analyzed the influence of laser power, cut pressure,and cutting speed on the cutting width of Hardox 400 parts obtained with a CO2 laser. Inorder to obtain a fine cut, they propose to use the combination of laser power of 5000 W,auxiliary gas pressure of 0.50 bar, and constant cutting speed of 1900 mm/min. Ninikaset al. [30] found that, for CO2 laser cutting of PMMA plates, the most influential factorson dimensional accuracy were laser speed and x position from the origin. However, fewpapers address the dimensional accuracy of Nd-YAG laser-cut thin metallic plates. Forexample, Josh and Sharma [30] considered gas pressure, cutting speed, pulse width, and
Metals 2021, 11, 1224 4 of 13
pulse frequency as process parameters with a Taguchi analysis. They found pulse frequencyto be the most influential factor on dimensional accuracy. Pramanik et al. [31] studiedthe effect of process parameters such as cutting wedge angle, power, duty cycle, pulsefrequency, and scanning speed on the quality of 1 mm stainless steel sheets.
In the present paper, the surface roughness of stainless-steel thin plates of 0.8 mmthickness is assessed, as a function of different Nd: YAG laser cutting parameters: pulsefrequency, pulse width, and speed. For this, experimental tests were carried out accordingto a 23 full factorial design, and a mathematical model for roughness was obtained. Inaddition, the dimensional error, and the burr thickness were measured. Linear modelswere obtained and a multi-objective optimization was carried out for the three responses.
2. Materials and Methods2.1. Manufacture of Samples
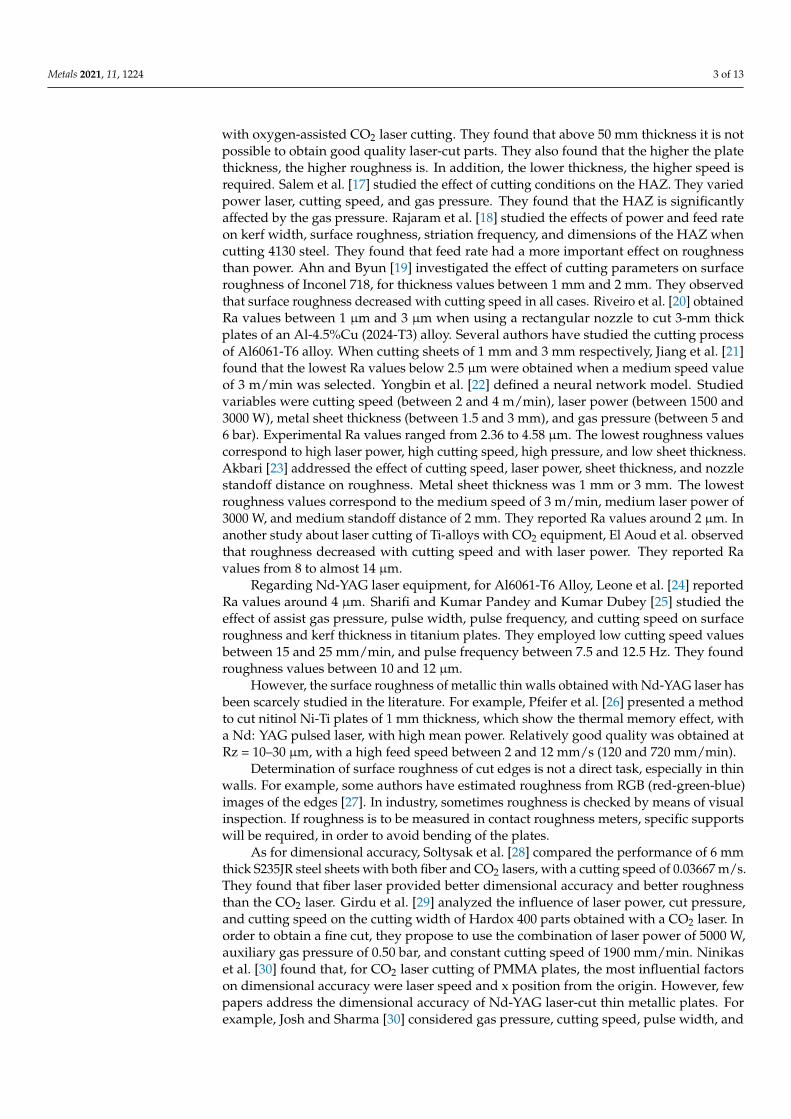
AISI 304 stainless steel was used (equivalent to WNR 1.4301), of thickness 0.8 mm.It is a common and standardized material in the metal sheet industry. It contains Ni andCr, which help to absorb the laser energy, while it dissipates heat slowly. For this reason,it provides good results in laser cutting. Square samples were cut of 10 mm × 10 mm(Figure 1). Ninikas et al. employed similar specimens when addressing laser cutting ofpoly methyl methacrylate sheets [29].
Metals 2021, 11, x FOR PEER REVIEW
4 of 14
Ninikas et al. [30] found that, for CO2 laser cutting of PMMA plates, the most influential
factors on dimensional accuracy were laser speed and x position from the origin. How-
ever, few papers address the dimensional accuracy of Nd-YAG laser-cut thin metallic
plates. For example, Josh and Sharma [30] considered gas pressure, cutting speed, pulse
width, and pulse frequency as process parameters with a Taguchi analysis. They found
pulse frequency to be the most influential factor on dimensional accuracy. Pramanik et al.
[31] studied the effect of process parameters such as cutting wedge angle, power, duty
cycle, pulse frequency, and scanning speed on the quality of 1 mm stainless steel sheets.
In the present paper, the surface roughness of stainless-steel thin plates of 0.8 mm
thickness is assessed, as a function of different Nd: YAG laser cutting parameters: pulse
frequency, pulse width, and speed. For this, experimental tests were carried out according
to a 23 full factorial design, and a mathematical model for roughness was obtained. In
addition, the dimensional error, and the burr thickness were measured. Linear models
were obtained and a multi-objective optimization was carried out for the three responses.
2. Materials and Methods
2.1. Manufacture of Samples
AISI 304 stainless steel was used (equivalent to WNR 1.4301), of thickness 0.8 mm. It
is a common and standardized material in the metal sheet industry. It contains Ni and Cr,
which help to absorb the laser energy, while it dissipates heat slowly. For this reason, it
provides good results in laser cutting. Square samples were cut of 10 mm × 10 mm (Figure
1). Ninikas et al. employed similar specimens when addressing laser cutting of poly me-
thyl methacrylate sheets [29].
Figure 1. Laser-cut AISI 304 stainless steel specimens.
An AlphaLaser AC200 Nd-YAG laser cutting machine (Alpha Laser, Puchheim, Ger-
many) was used. The cutting conditions that are usually not modified at every cutting
operation were left constant. Their values are presented in Table 1
Table 1. Factors that were not varied during the experimentation.
Factor Value
Lamp voltage (V) 250
Beam diameter (mm) 0.2
Focal distance (mm) 120
Type of gas Compressed air
Gas pressure (bar) 11
Nozzle diameter (mm) 0.8
Diameter of focal spot (µm) 200
Focal distance (mm) 160
Maximum lamp power (W) 200
Machine power (kW) 12
Figure 1. Laser-cut AISI 304 stainless steel specimens.
An AlphaLaser AC200 Nd-YAG laser cutting machine (Alpha Laser, Puchheim, Ger-many) was used. The cutting conditions that are usually not modified at every cuttingoperation were left constant. Their values are presented in Table 1.
Table 1. Factors that were not varied during the experimentation.
Factor Value
Lamp voltage (V) 250Beam diameter (mm) 0.2Focal distance (mm) 120
Type of gas Compressed airGas pressure (bar) 11
Nozzle diameter (mm) 0.8Diameter of focal spot (µm) 200
Focal distance (mm) 160Maximum lamp power (W) 200
Machine power (kW) 12
Lamp average power was estimated for each experiment from the information pro-vided by the machine’s manufacturer and is provided in Table 3.
2.2. Roughness Measurement
Since the main objective of the paper is to maximize the final quality of the parts, thesurface roughness of the lateral edges was considered as the response. Roughness was
Metals 2021, 11, 1224 5 of 13
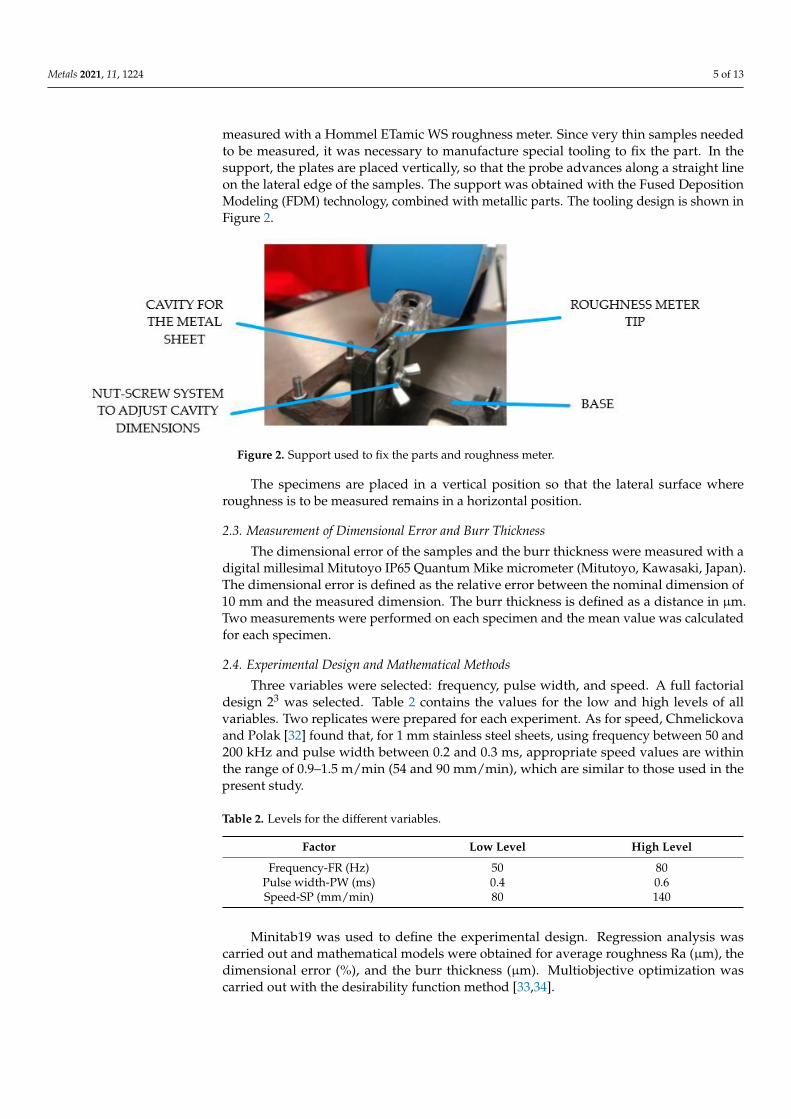
measured with a Hommel ETamic WS roughness meter. Since very thin samples neededto be measured, it was necessary to manufacture special tooling to fix the part. In thesupport, the plates are placed vertically, so that the probe advances along a straight lineon the lateral edge of the samples. The support was obtained with the Fused DepositionModeling (FDM) technology, combined with metallic parts. The tooling design is shown inFigure 2.
Metals 2021, 11, x FOR PEER REVIEW
5 of 14
Lamp average power was estimated for each experiment from the information pro-
vided by the machine’s manufacturer and is provided in Table 3.
2.2. Roughness Measurement
Since the main objective of the paper is to maximize the final quality of the parts, the
surface roughness of the lateral edges was considered as the response. Roughness was
measured with a Hommel ETamic WS roughness meter. Since very thin samples needed
to be measured, it was necessary to manufacture special tooling to fix the part. In the sup-
port, the plates are placed vertically, so that the probe advances along a straight line on
the lateral edge of the samples. The support was obtained with the Fused Deposition Mod-
eling (FDM) technology, combined with metal sheet parts. The tooling design is shown in
Figure 2.
Figure 2. Support used to fix the parts and roughness meter.
The specimens are placed in a vertical position so that the lateral surface where
roughness is to be measured remains in a horizontal position.
2.3. Measurement of Dimensional Error and Burr Thickness
The dimensional error of the samples and the burr thickness were measured with a
digital millesimal Mitutoyo IP65 Quantum Mike micrometer (Mitutoyo, Kawasaki, Ja-
pan). The dimensional error is defined as the relative error between the nominal dimen-
sion of 10 mm and the measured dimension. The burr thickness is defined as a distance in
µm. Two measurements were performed on each specimen and the mean value was cal-
culated for each specimen.
2.4. Experimental Design and Mathematical Methods
Three variables were selected: frequency, pulse width, and speed. A full factorial de-
sign 23 was selected with two replicates. Table 2 contains the values for the low and high
levels of all variables. Two replicates were prepared for each experiment. As for speed,
Chmelickova and Polak [32] found that, for 1 mm stainless steel sheets, using frequency
between 50 and 200 kHz and pulse width between 0.2 and 0.3 ms, appropriate speed val-
ues are within the range of 0.9–1.5 m/min (54 and 90 mm/min), which are similar to those
used in the present study.
Table 2. Levels for the different variables.
Figure 2. Support used to fix the parts and roughness meter.
The specimens are placed in a vertical position so that the lateral surface whereroughness is to be measured remains in a horizontal position.
2.3. Measurement of Dimensional Error and Burr Thickness
The dimensional error of the samples and the burr thickness were measured with adigital millesimal Mitutoyo IP65 Quantum Mike micrometer (Mitutoyo, Kawasaki, Japan).The dimensional error is defined as the relative error between the nominal dimension of10 mm and the measured dimension. The burr thickness is defined as a distance in µm.Two measurements were performed on each specimen and the mean value was calculatedfor each specimen.
2.4. Experimental Design and Mathematical Methods
Three variables were selected: frequency, pulse width, and speed. A full factorialdesign 23 was selected. Table 2 contains the values for the low and high levels of allvariables. Two replicates were prepared for each experiment. As for speed, Chmelickovaand Polak [32] found that, for 1 mm stainless steel sheets, using frequency between 50 and200 kHz and pulse width between 0.2 and 0.3 ms, appropriate speed values are withinthe range of 0.9–1.5 m/min (54 and 90 mm/min), which are similar to those used in thepresent study.
Table 2. Levels for the different variables.
Factor Low Level High Level
Frequency-FR (Hz) 50 80Pulse width-PW (ms) 0.4 0.6Speed-SP (mm/min) 80 140
Minitab19 was used to define the experimental design. Regression analysis wascarried out and mathematical models were obtained for average roughness Ra (µm), thedimensional error (%), and the burr thickness (µm). Multiobjective optimization wascarried out with the desirability function method [33,34].
Metals 2021, 11, 1224 6 of 13
3. Results3.1. Ra, Dimensional Error, and Burr Thickness
Table 3 shows the conditions of the different experiments and the results of averageroughness Ra. They correspond to the average value of the two replicates.
Table 3. Roughness Ra results (average value of the two replicates). SD means standard deviation.
Exp. FR(Hz)
PW(ms)
SP(mm/min)
AveragePower (W)
Ra(µm)
SD Ra(µm)
Dim.Error (%)
SD Dim.Error (%)
BurrThickness
(µm)
SD BurrThickness
(µm)
1 50 0.4 80 34 1.89 0.17 0.78 0.11 5 0.02 80 0.4 80 78 3.86 0.62 0.63 0.05 9 1.43 50 0.6 80 57 2.32 0.18 0.60 0.02 2 0.44 80 0.6 80 102 2.44 0.45 0.48 0.06 34 4.25 50 0.4 140 34 2.03 0.23 0.93 0.06 6 0.76 80 0.4 140 78 3.76 0.78 0.61 0.17 4 1.47 50 0.6 140 57 2.19 0.09 0.43 0.08 4 0.08 80 0.6 140 102 3.00 0.35 0.22 0.02 9 1.1
The highest Ra value of 3.86 µm corresponds to experiment 2, followed by experiment6, with 3.76 µm. Both samples were manufactured with high pulse frequency and lowpulse width. The lowest roughness values of 1.89 µm and 2.03 µm were achieved forexperiments 1 and 5 respectively, which correspond to low frequency and low pulse width.This suggests that frequency has an important effect on roughness in this case. Roughnessvalues obtained in the present work are similar to those reported by Jarosz et al. for AISI-316 stainless steel [14] and by Rajaram et al. [18] for 4130 steel. On the contrary, for EN-31steel, lower roughness values around 1 µm were obtained [15]. As a general trend, thehighest standard deviation was found in experiments 2, 4, 6, and 8, corresponding to highfrequency, compared to the rest of the experiments performed with low frequency.
The highest dimensional error of 0.93% was obtained in experiment 5, with lowfrequency, low pulse, and high speed. On the contrary, the lowest dimensional error of0.22% corresponds to experiment 8, with high frequency, high pulse, and high speed. As ageneral trend, high frequency leads to lower dimensional error than low frequency, for acertain combination of speed and voltage. As for dimensional accuracy, Soltysiak et al. [27]reported dimensional error values of 0.36% and 0.30% for nominal dimensions of 9 mmand 11 mm respectively, using a fiber laser. Such values are similar to those obtained in thepresent work.
The lowest burr thickness of 2 µm corresponds to experiment 3, manufactured withlow frequency, high pulse width, and low speed, while the highest burr thickness of 34 µmcorresponds to experiment 5, obtained with the combination of low frequency, low pulsewidth, and high speed. Xin and Wang [35] reported lower burr thickness below 8 µm atlow speed up to 200 m/min. However, burr thickness increases with speed up to morethan 20 µm when a high speed of 400 m/min is used. Those burr thicknesses are similar tothe ones obtained in the present paper.
3.2. Regression Model for Ra
The simplified model for Ra, with an R2-adj. value of 78.32%, is shown in Equation (1).
Ra = −6.68 + 0.1610·FR + 13.59·PW − 0.2425·FR·PW (1)
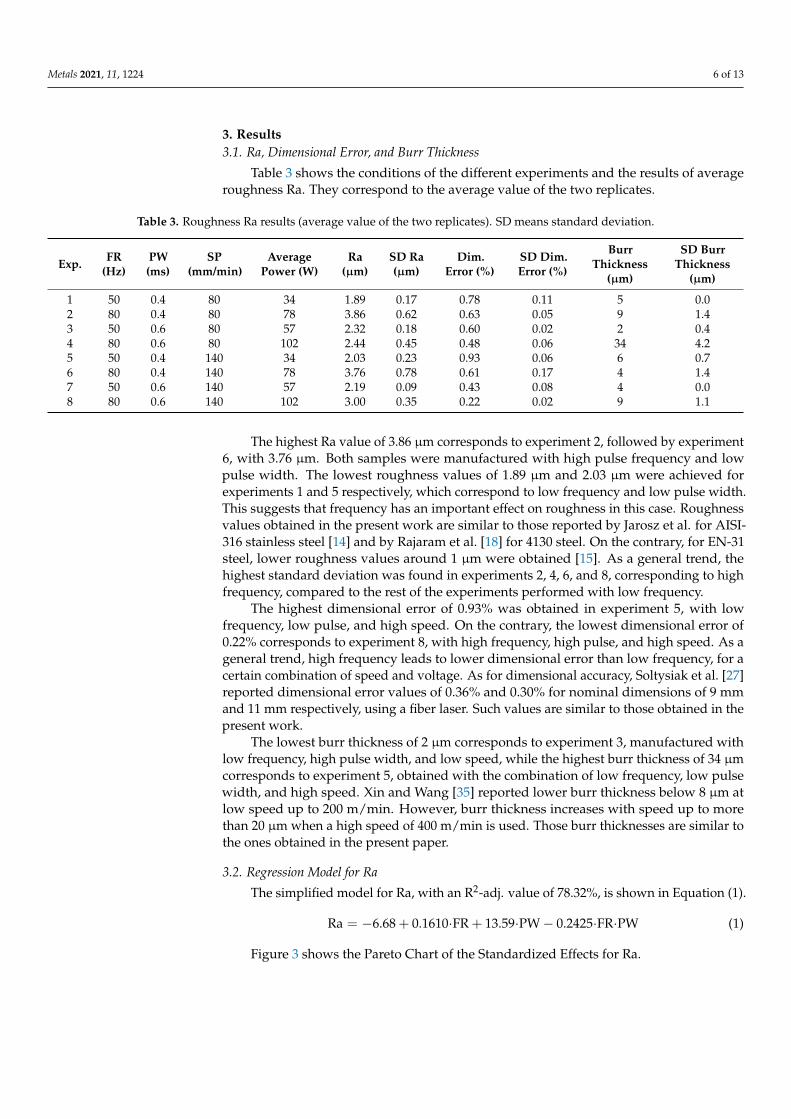
Figure 3 shows the Pareto Chart of the Standardized Effects for Ra.
Metals 2021, 11, 1224 7 of 13
Metals 2021, 11, x FOR PEER REVIEW
7 of 14
more than 20 µm when a high speed of 400 m/min is used. Those burr thicknesses are
similar to the ones obtained in the present paper.
3.2. Regression Model for Ra
The simplified model for Ra, with an R2-adj. value of 78.32%, is shown in Equation
(1).
𝑅𝑎 = −6.68 + 0.1610 · 𝐹𝑅 + 13.59 · 𝑃𝑊 − 0.2425 · 𝐹𝑅 · 𝑃𝑊 (1)
Figure 3 shows the Pareto Chart of the Standardized Effects for Ra.
Figure 3. Pareto Chart of the Standardized Effects for Ra.
The main parameter affecting roughness is pulse frequency, followed by the interac-
tion between frequency and pulse width and by pulse width. Kumar Pandey and Kumar
Dubey [36] observed that surface roughness increased with pulse frequency. Moreover,
pulse frequency and speed were found to be significant factors in another study about
laser cutting of 1 mm thickness of AISI 316 stainless steel [31]. In the present work, within
the range of values that were considered for the different variables, feed speed had low
significance and does not appear in the simplified model for Ra (Equation (1)). This is
probably due to the fact that the selected values for speed are within the range of the
correct Nd-YAG laser cutting operation defined for thin stainless steel sheets [32]. Some
authors have defined that each material, thickness, and beam power has an appropriate
range of cutting speed [37]. Below this range, the high energy input leads to an intense
material removal because of vaporization, with high roughness values. Above this range,
the process becomes unstable because of insufficient melting of the material, with an ir-
regular surface and high surface roughness. In addition, high cutting speed leads to spot
overlap, thus increasing roughness [25]. As for pulse width, when cutting NiTi plates of 1
mm thickness, Pfeifer et al. [25] observed that roughness decreased significantly when
increasing pulse width from 0.15 ms to 0.5 ms. Too low pulse width values imply higher
intensity and this leads to a higher temperature gradient in the material, with high rough-
ness. They also reported a slight increase in roughness for higher values of the pulse
width. They used a frequency of 100 Hz and a speed of 3.3 mm/s. In the present work,
similar pulse width values between 0.40 ms and 0.60 ms are employed, and also a slight
increase in roughness is observed with pulse width.
Figure 4 depicts the Contour Plot of Ra vs frequency and pulse width.
Figure 3. Pareto Chart of the Standardized Effects for Ra.
The main parameter affecting roughness is pulse frequency, followed by the interactionbetween frequency and pulse width and by pulse width. Kumar Pandey and KumarDubey [36] observed that surface roughness increased with pulse frequency. Moreover,pulse frequency and speed were found to be significant factors in another study aboutlaser cutting of 1 mm thickness of AISI 316 stainless steel [31]. In the present work, withinthe range of values that were considered for the different variables, feed speed had lowsignificance and does not appear in the simplified model for Ra (Equation (1)). This isprobably due to the fact that the selected values for speed are within the range of the correctNd-YAG laser cutting operation defined for thin stainless steel sheets [32]. Some authorshave defined that each material, thickness, and beam power has an appropriate range ofcutting speed [37]. Below this range, the high energy input leads to an intense materialremoval because of vaporization, with high roughness values. Above this range, the processbecomes unstable because of insufficient melting of the material, with an irregular surfaceand high surface roughness. In addition, high cutting speed leads to spot overlap, thusincreasing roughness [25]. As for pulse width, when cutting NiTi plates of 1 mm thickness,Pfeifer et al. [25] observed that roughness decreased significantly when increasing pulsewidth from 0.15 ms to 0.5 ms. Too low pulse width values imply higher intensity and thisleads to a higher temperature gradient in the material, with high roughness. They alsoreported a slight increase in roughness for higher values of the pulse width. They used afrequency of 100 Hz and a speed of 3.3 mm/s. In the present work, similar pulse widthvalues between 0.40 ms and 0.60 ms are employed, and also a slight increase in roughnessis observed with pulse width.
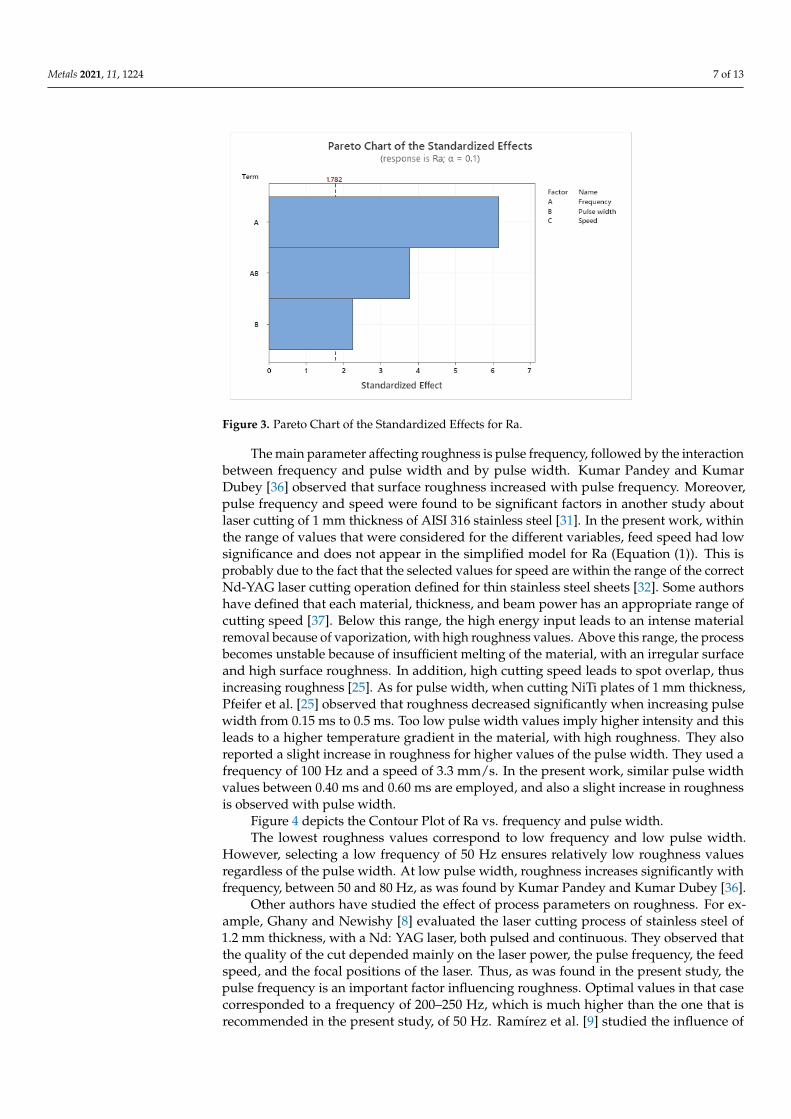
Figure 4 depicts the Contour Plot of Ra vs. frequency and pulse width.The lowest roughness values correspond to low frequency and low pulse width.
However, selecting a low frequency of 50 Hz ensures relatively low roughness valuesregardless of the pulse width. At low pulse width, roughness increases significantly withfrequency, between 50 and 80 Hz, as was found by Kumar Pandey and Kumar Dubey [36].
Other authors have studied the effect of process parameters on roughness. For ex-ample, Ghany and Newishy [8] evaluated the laser cutting process of stainless steel of1.2 mm thickness, with a Nd: YAG laser, both pulsed and continuous. They observed thatthe quality of the cut depended mainly on the laser power, the pulse frequency, the feedspeed, and the focal positions of the laser. Thus, as was found in the present study, thepulse frequency is an important factor influencing roughness. Optimal values in that casecorresponded to a frequency of 200–250 Hz, which is much higher than the one that isrecommended in the present study, of 50 Hz. Ramírez et al. [9] studied the influence of
Metals 2021, 11, 1224 8 of 13
the laser processing parameters on the quality and microstructure of austenitic stainlesssteels with a Nd: YAG laser. They observed that, for frequency values of 500 Hz and powervalues of 800 W, quality improved with speed. In the present study, at lower frequencyvalues, feed speed seems to have a lower effect on roughness than at high-frequency values.This suggestion is in accordance with the work of Tahmouch et al. [11], who performed anexperimental study of stainless steel plates up to 20 mm thickness without assistance gasin pulsed mode. This study revealed that low frequency and high peak power favor theuse of high feed speed without significantly worsening surface finish.
Metals 2021, 11, x FOR PEER REVIEW
8 of 14
Figure 4. Contour plot of Ra vs. frequency and pulse width.
The lowest roughness values correspond to low frequency and low pulse width.
However, selecting a low frequency of 50 Hz ensures relatively low roughness values re-
gardless of the pulse width. At low pulse width, roughness increases significantly with
frequency, between 50 and 80 Hz, as was found by Kumar Pandey and Kumar Dubey [36].
Other authors have studied the effect of process parameters on roughness. For exam-
ple, Ghany and Newishy [8] evaluated the laser cutting process of stainless steel of 1.2
mm thickness, with a Nd: YAG laser, both pulsed and continuous. They observed that the
quality of the cut depended mainly on the laser power, the pulse frequency, the feed
speed, and the focal positions of the laser. Thus, as was found in the present study, the
pulse frequency is an important factor influencing roughness. Optimal values in that case
corresponded to a frequency of 200–250 Hz, which is much higher than the one that is
recommended in the present study, of 50 Hz. Ramírez et al. [9] studied the influence of
the laser processing parameters on the quality and microstructure of austenitic stainless
steels with a Nd: YAG laser. They observed that, for frequency values of 500 Hz and power
values of 800 W, quality improved with speed. In the present study, at lower frequency
values, feed speed seems to have a lower effect on roughness than at high-frequency val-
ues. This suggestion is in accordance with the work of Tahmouch et al. [11], who per-
formed an experimental study of stainless steel plates up to 20 mm thickness without as-
sistance gas in pulsed mode. This study revealed that low frequency and high peak power
favor the use of high feed speed without significantly worsening surface finish.
3.3. Regression Model for Dimensional Error
The simplified model for dimensional error is shown in Equation (2), with an R2-adj.
value of 84.47%, is shown in Equation (2).
𝐷𝑖𝑚. 𝐸𝑟𝑟. = 0.628 − 0.0669 · 𝐹𝑅 + 1.073 · 𝑃𝑊 + 0.01052 · 𝑆𝑃 − 0.02365 · 𝑃𝑊 · 𝑆𝑃 (2)
Figure 5 depicts the Pareto diagram for Dimensional error.
Figure 4. Contour plot of Ra vs. frequency and pulse width.
3.3. Regression Model for Dimensional Error
The simplified model for dimensional error is shown in Equation (2), with an R2-adj.value of 84.47%, is shown in Equation (2).
Dim. Err. = 0.628 − 0.0669·FR + 1.073·PW + 0.01052·SP − 0.02365·PW·SP (2)
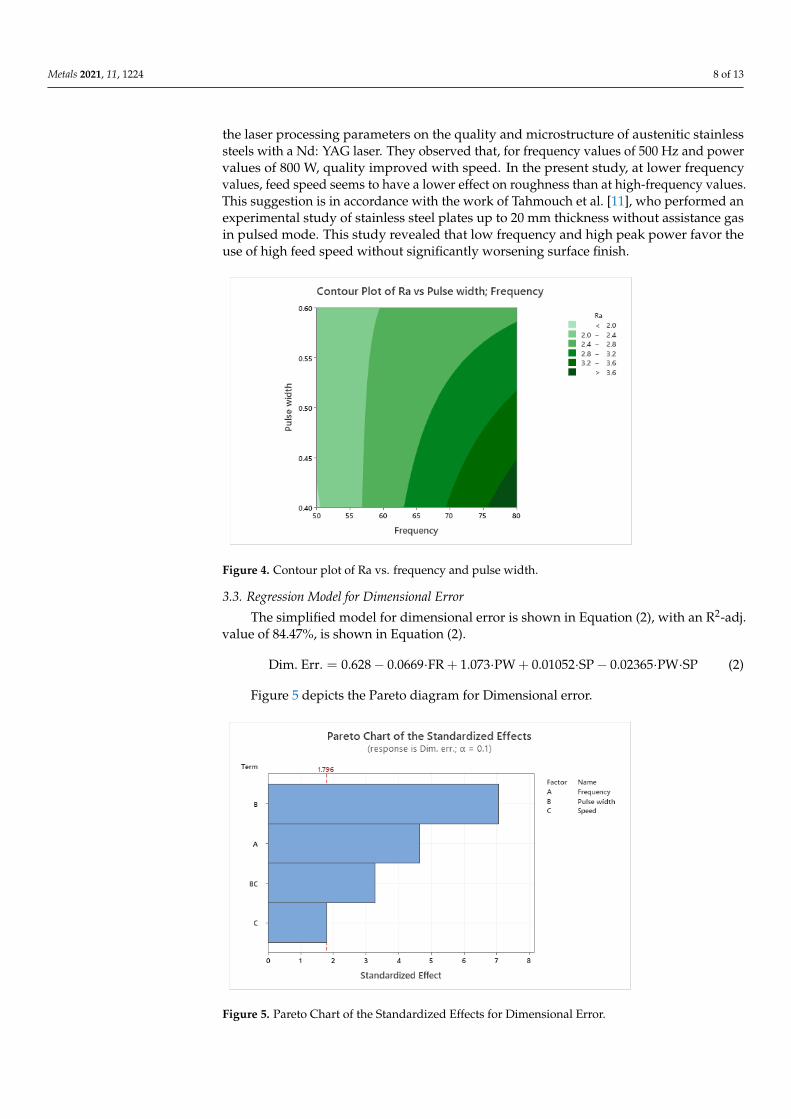
Figure 5 depicts the Pareto diagram for Dimensional error.
Metals 2021, 11, x FOR PEER REVIEW
9 of 14
Figure 5. Pareto Chart of the Standardized Effects for Dimensional Error.
The most influential factor on dimensional error is the pulse width, followed by fre-
quency and by the interaction between pulse width and speed. On the other hand, fre-
quency has been shown to affect the taper when cutting round holes with a Nd: YAG laser
of gamma-titanium aluminide [38]. Pulse frequency was also found to be an influential
factor in the dimensional accuracy of aluminum alloy [30].
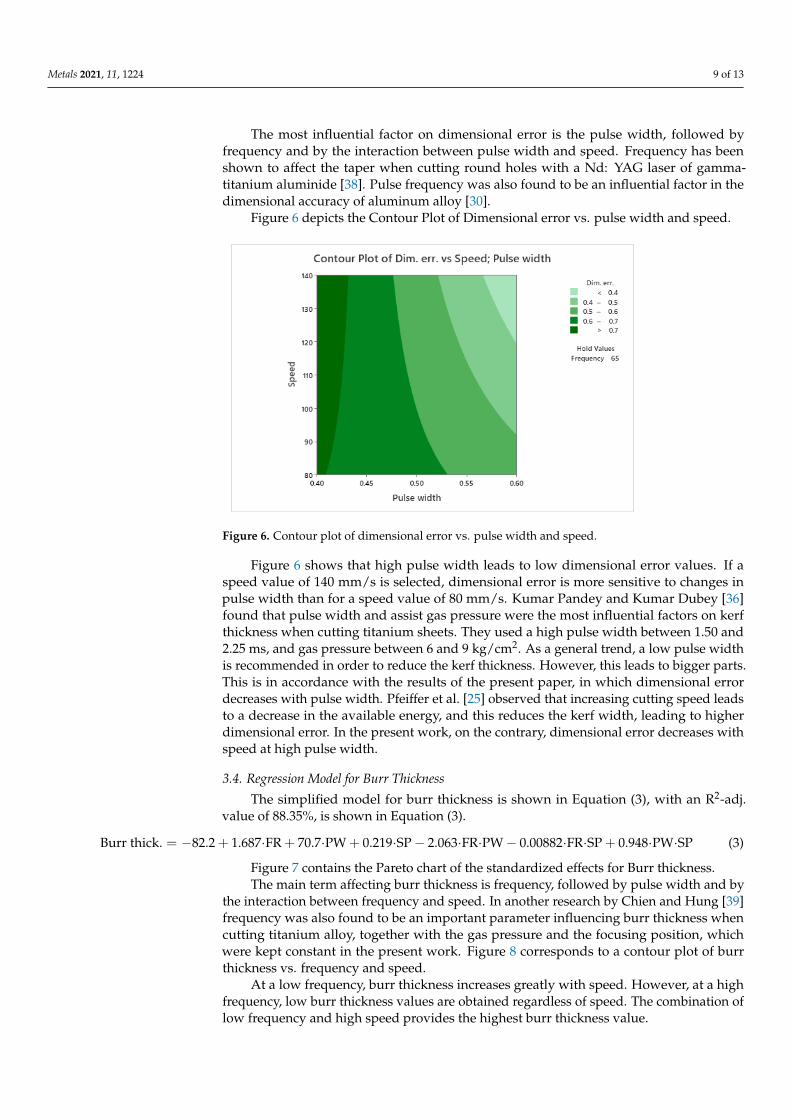
Figure 6 depicts the Contour Plot of Dimensional error vs pulse width and speed.
Figure 6. Contour plot of dimensional error vs. pulse width and speed.
Figure 6 shows that high pulse width leads to low dimensional error values. If a
speed value of 140 mm/s is selected, dimensional error is more sensitive to changes in
pulse width than for a speed value of 80 mm/s. Kumar Pandey and Kumar Dubey [36]
found that pulse width and assist gas pressure were the most influential factors on kerf
thickness when cutting titanium sheets. They used a high pulse width between 1.50 and
2.25 ms, and gas pressure between 6 and 9 kg/cm2. As a general trend, a low pulse width
is recommended in order to reduce the kerf thickness. However, too low pulse width in-
creases the kerf thickness, leading to higher dimensional error. This is in accordance with
the results of the present paper, in which dimensional error decreases with pulse width.
Figure 5. Pareto Chart of the Standardized Effects for Dimensional Error.
Metals 2021, 11, 1224 9 of 13
The most influential factor on dimensional error is the pulse width, followed byfrequency and by the interaction between pulse width and speed. Frequency has beenshown to affect the taper when cutting round holes with a Nd: YAG laser of gamma-titanium aluminide [38]. Pulse frequency was also found to be an influential factor in thedimensional accuracy of aluminum alloy [30].
Figure 6 depicts the Contour Plot of Dimensional error vs. pulse width and speed.
Metals 2021, 11, x FOR PEER REVIEW
9 of 14
Figure 5. Pareto Chart of the Standardized Effects for Dimensional Error.
The most influential factor on dimensional error is the pulse width, followed by fre-
quency and by the interaction between pulse width and speed. On the other hand, fre-
quency has been shown to affect the taper when cutting round holes with a Nd: YAG laser
of gamma-titanium aluminide [38]. Pulse frequency was also found to be an influential
factor in the dimensional accuracy of aluminum alloy [30].
Figure 6 depicts the Contour Plot of Dimensional error vs pulse width and speed.
Figure 6. Contour plot of dimensional error vs. pulse width and speed.
Figure 6 shows that high pulse width leads to low dimensional error values. If a
speed value of 140 mm/s is selected, dimensional error is more sensitive to changes in
pulse width than for a speed value of 80 mm/s. Kumar Pandey and Kumar Dubey [36]
found that pulse width and assist gas pressure were the most influential factors on kerf
thickness when cutting titanium sheets. They used a high pulse width between 1.50 and
2.25 ms, and gas pressure between 6 and 9 kg/cm2. As a general trend, a low pulse width
is recommended in order to reduce the kerf thickness. However, too low pulse width in-
creases the kerf thickness, leading to higher dimensional error. This is in accordance with
the results of the present paper, in which dimensional error decreases with pulse width.
Figure 6. Contour plot of dimensional error vs. pulse width and speed.
Figure 6 shows that high pulse width leads to low dimensional error values. If aspeed value of 140 mm/s is selected, dimensional error is more sensitive to changes inpulse width than for a speed value of 80 mm/s. Kumar Pandey and Kumar Dubey [36]found that pulse width and assist gas pressure were the most influential factors on kerfthickness when cutting titanium sheets. They used a high pulse width between 1.50 and2.25 ms, and gas pressure between 6 and 9 kg/cm2. As a general trend, a low pulse widthis recommended in order to reduce the kerf thickness. However, this leads to bigger parts.This is in accordance with the results of the present paper, in which dimensional errordecreases with pulse width. Pfeiffer et al. [25] observed that increasing cutting speed leadsto a decrease in the available energy, and this reduces the kerf width, leading to higherdimensional error. In the present work, on the contrary, dimensional error decreases withspeed at high pulse width.
3.4. Regression Model for Burr Thickness
The simplified model for burr thickness is shown in Equation (3), with an R2-adj.value of 88.35%, is shown in Equation (3).
Burr thick. = −82.2 + 1.687·FR + 70.7·PW + 0.219·SP − 2.063·FR·PW − 0.00882·FR·SP + 0.948·PW·SP (3)
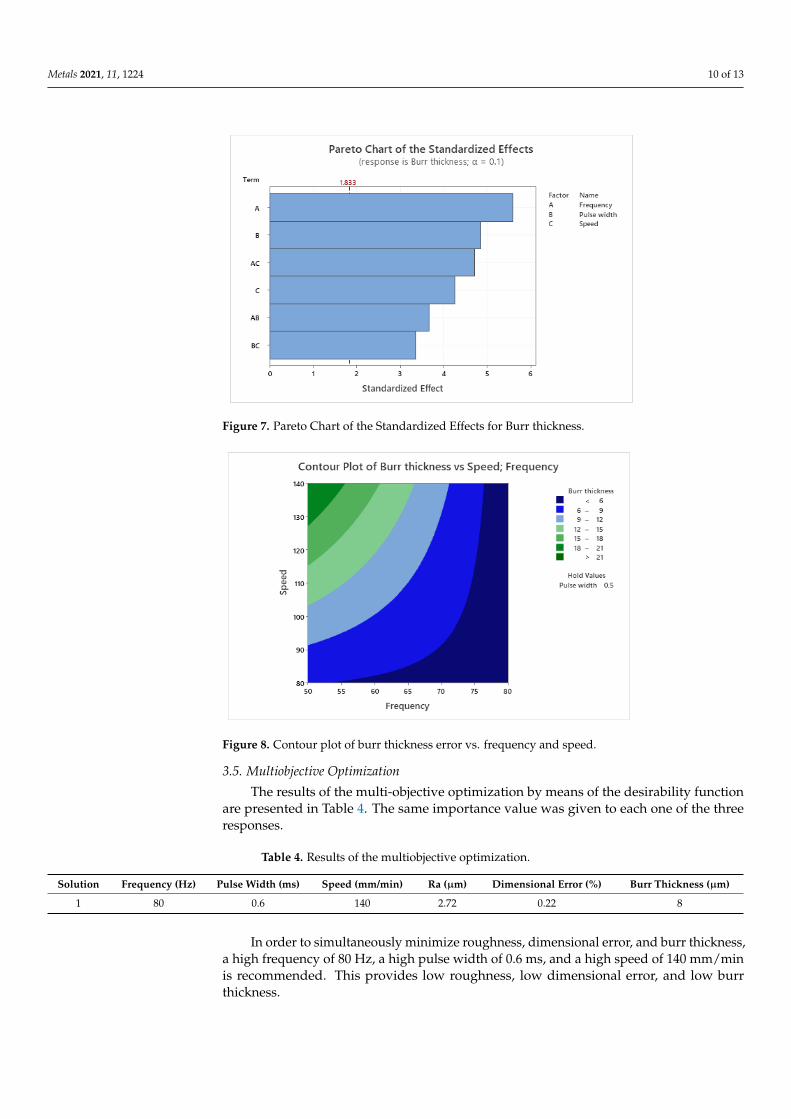
Figure 7 contains the Pareto chart of the standardized effects for Burr thickness.The main term affecting burr thickness is frequency, followed by pulse width and by
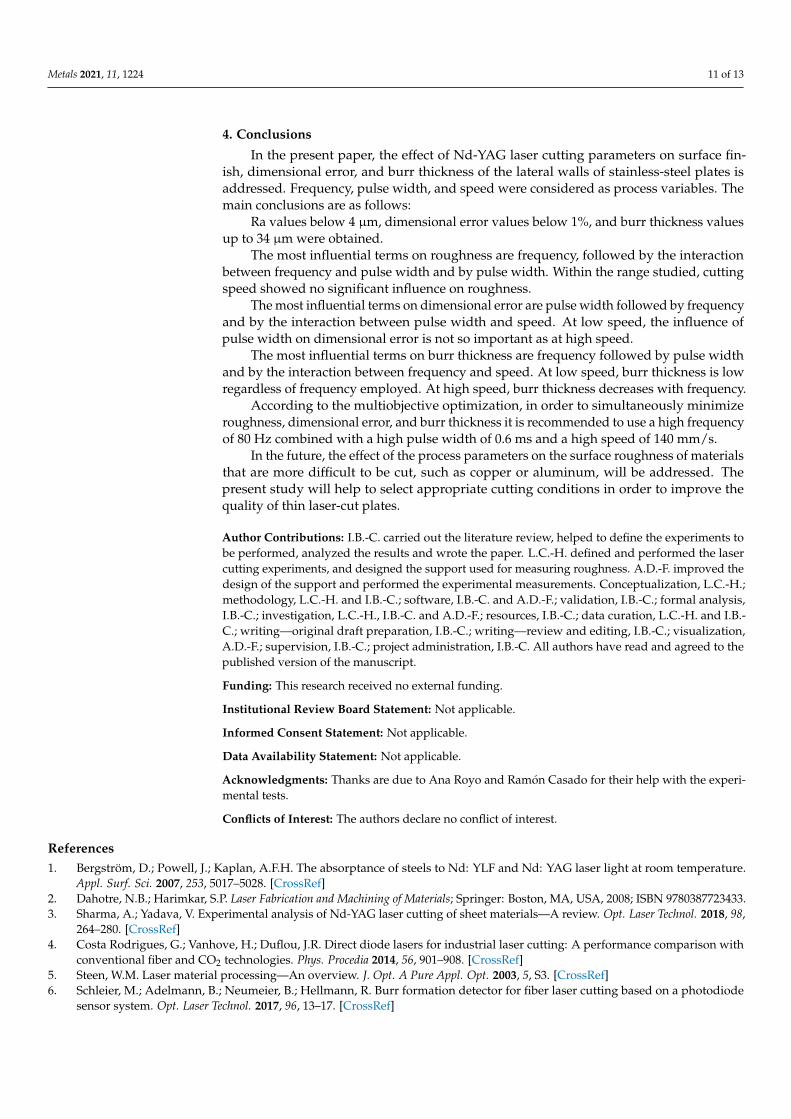
the interaction between frequency and speed. In another research by Chien and Hung [39]frequency was also found to be an important parameter influencing burr thickness whencutting titanium alloy, together with the gas pressure and the focusing position, whichwere kept constant in the present work. Figure 8 corresponds to a contour plot of burrthickness vs. frequency and speed.
At a low frequency, burr thickness increases greatly with speed. However, at a highfrequency, low burr thickness values are obtained regardless of speed. The combination oflow frequency and high speed provides the highest burr thickness value.
Metals 2021, 11, 1224 10 of 13
Metals 2021, 11, x FOR PEER REVIEW
10 of 14
Pfeiffer et al. [25] observed that increasing cutting speed leads to a decrease in the availa-
ble energy, and this reduces the kerf width, leading to lower dimensional error. In the
present work, the same behavior is observed at a high pulse width.
3.4. Regression Model for Burr Thickness
The simplified model for burr thickness is shown in Equation 3, with an R2-adj. value
of 88.35%, is shown in Equation (3).
𝐵𝑢𝑟𝑟 𝑡ℎ𝑖𝑐𝑘. = −82.2 + 1.687 · 𝐹𝑅 + 70.7 · 𝑃𝑊 + 0.219 · 𝑆𝑃 − 2.063 · 𝐹𝑅 · 𝑃𝑊 − 0.00882 · 𝐹𝑅 · 𝑆𝑃 + 0.948 · 𝑃𝑊 · 𝑆𝑃 (3)
Figure 7 contains the Pareto chart of the standardized effects for Burr thickness.
Figure 7. Pareto Chart of the Standardized Effects for Burr thickness.
The main term affecting burr thickness is frequency, followed by pulse width and by
the interaction between frequency and speed. In another research by Chien and Hung [39]
frequency was also found to be an important parameter influencing burr thickness when
cutting titanium alloy, together with the gas pressure and the focusing position, which
were kept constant in the present work. Figure 8 corresponds to a contour plot of burr
thickness vs. frequency and speed.
Figure 8. Contour plot of burr thickness error vs. frequency and speed.
Figure 7. Pareto Chart of the Standardized Effects for Burr thickness.
Metals 2021, 11, x FOR PEER REVIEW
10 of 14
Pfeiffer et al. [25] observed that increasing cutting speed leads to a decrease in the availa-
ble energy, and this reduces the kerf width, leading to lower dimensional error. In the
present work, the same behavior is observed at a high pulse width.
3.4. Regression Model for Burr Thickness
The simplified model for burr thickness is shown in Equation 3, with an R2-adj. value
of 88.35%, is shown in Equation (3).
𝐵𝑢𝑟𝑟 𝑡ℎ𝑖𝑐𝑘. = −82.2 + 1.687 · 𝐹𝑅 + 70.7 · 𝑃𝑊 + 0.219 · 𝑆𝑃 − 2.063 · 𝐹𝑅 · 𝑃𝑊 − 0.00882 · 𝐹𝑅 · 𝑆𝑃 + 0.948 · 𝑃𝑊 · 𝑆𝑃 (3)
Figure 7 contains the Pareto chart of the standardized effects for Burr thickness.
Figure 7. Pareto Chart of the Standardized Effects for Burr thickness.
The main term affecting burr thickness is frequency, followed by pulse width and by
the interaction between frequency and speed. In another research by Chien and Hung [39]
frequency was also found to be an important parameter influencing burr thickness when
cutting titanium alloy, together with the gas pressure and the focusing position, which
were kept constant in the present work. Figure 8 corresponds to a contour plot of burr
thickness vs. frequency and speed.
Figure 8. Contour plot of burr thickness error vs. frequency and speed. Figure 8. Contour plot of burr thickness error vs. frequency and speed.
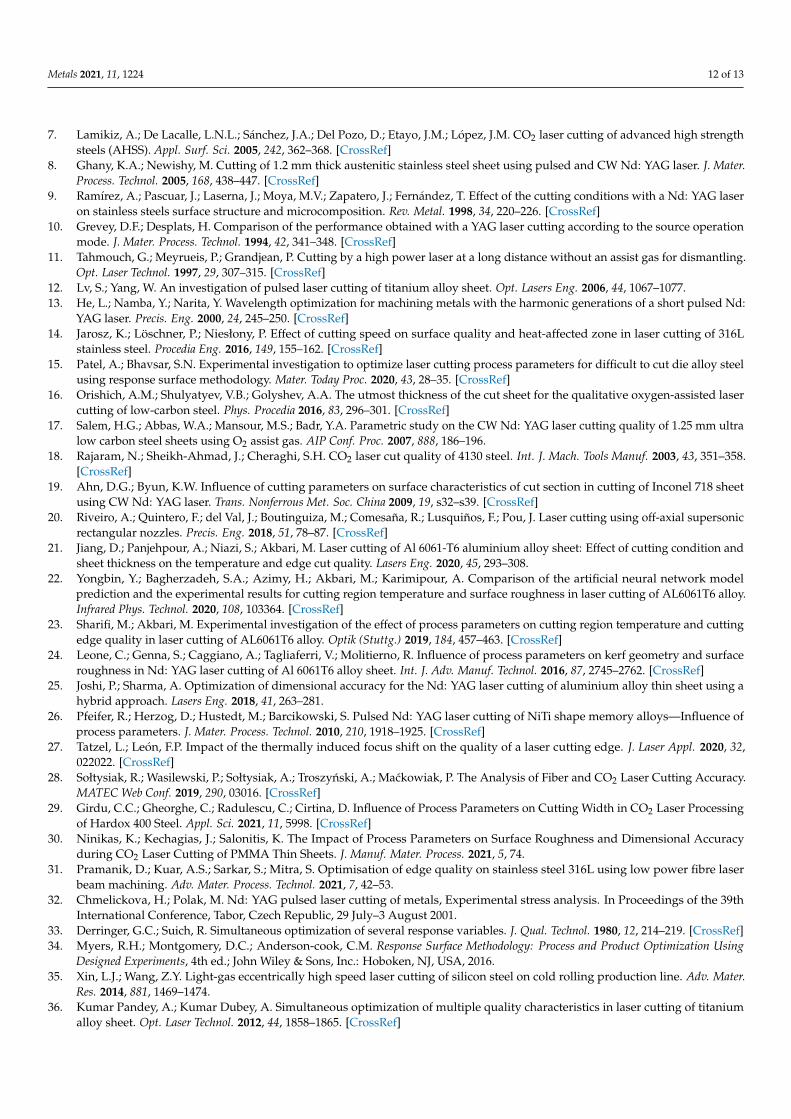
3.5. Multiobjective Optimization
The results of the multi-objective optimization by means of the desirability functionare presented in Table 4. The same importance value was given to each one of the threeresponses.
Table 4. Results of the multiobjective optimization.
Solution Frequency (Hz) Pulse Width (ms) Speed (mm/min) Ra (µm) Dimensional Error (%) Burr Thickness (µm)
1 80 0.6 140 2.72 0.22 8
In order to simultaneously minimize roughness, dimensional error, and burr thickness,a high frequency of 80 Hz, a high pulse width of 0.6 ms, and a high speed of 140 mm/minis recommended. This provides low roughness, low dimensional error, and low burrthickness.
Metals 2021, 11, 1224 11 of 13
4. Conclusions
In the present paper, the effect of Nd-YAG laser cutting parameters on surface fin-ish, dimensional error, and burr thickness of the lateral walls of stainless-steel plates isaddressed. Frequency, pulse width, and speed were considered as process variables. Themain conclusions are as follows:
Ra values below 4 µm, dimensional error values below 1%, and burr thickness valuesup to 34 µm were obtained.
The most influential terms on roughness are frequency, followed by the interactionbetween frequency and pulse width and by pulse width. Within the range studied, cuttingspeed showed no significant influence on roughness.
The most influential terms on dimensional error are pulse width followed by frequencyand by the interaction between pulse width and speed. At low speed, the influence ofpulse width on dimensional error is not so important as at high speed.
The most influential terms on burr thickness are frequency followed by pulse widthand by the interaction between frequency and speed. At low speed, burr thickness is lowregardless of frequency employed. At high speed, burr thickness decreases with frequency.
According to the multiobjective optimization, in order to simultaneously minimizeroughness, dimensional error, and burr thickness it is recommended to use a high frequencyof 80 Hz combined with a high pulse width of 0.6 ms and a high speed of 140 mm/s.
In the future, the effect of the process parameters on the surface roughness of materialsthat are more difficult to be cut, such as copper or aluminum, will be addressed. Thepresent study will help to select appropriate cutting conditions in order to improve thequality of thin laser-cut plates.
Author Contributions: I.B.-C. carried out the literature review, helped to define the experiments tobe performed, analyzed the results and wrote the paper. L.C.-H. defined and performed the lasercutting experiments, and designed the support used for measuring roughness. A.D.-F. improved thedesign of the support and performed the experimental measurements. Conceptualization, L.C.-H.;methodology, L.C.-H. and I.B.-C.; software, I.B.-C. and A.D.-F.; validation, I.B.-C.; formal analysis,I.B.-C.; investigation, L.C.-H., I.B.-C. and A.D.-F.; resources, I.B.-C.; data curation, L.C.-H. and I.B.-C.; writing—original draft preparation, I.B.-C.; writing—review and editing, I.B.-C.; visualization,A.D.-F.; supervision, I.B.-C.; project administration, I.B.-C. All authors have read and agreed to thepublished version of the manuscript.
Funding: This research received no external funding.
Institutional Review Board Statement: Not applicable.
Informed Consent Statement: Not applicable.
Data Availability Statement: Not applicable.
Acknowledgments: Thanks are due to Ana Royo and Ramón Casado for their help with the experi-mental tests.
Conflicts of Interest: The authors declare no conflict of interest.
References1. Bergström, D.; Powell, J.; Kaplan, A.F.H. The absorptance of steels to Nd: YLF and Nd: YAG laser light at room temperature.
Appl. Surf. Sci. 2007, 253, 5017–5028. [CrossRef]2. Dahotre, N.B.; Harimkar, S.P. Laser Fabrication and Machining of Materials; Springer: Boston, MA, USA, 2008; ISBN 9780387723433.3. Sharma, A.; Yadava, V. Experimental analysis of Nd-YAG laser cutting of sheet materials—A review. Opt. Laser Technol. 2018, 98,
264–280. [CrossRef]4. Costa Rodrigues, G.; Vanhove, H.; Duflou, J.R. Direct diode lasers for industrial laser cutting: A performance comparison with
conventional fiber and CO2 technologies. Phys. Procedia 2014, 56, 901–908. [CrossRef]5. Steen, W.M. Laser material processing—An overview. J. Opt. A Pure Appl. Opt. 2003, 5, S3. [CrossRef]6. Schleier, M.; Adelmann, B.; Neumeier, B.; Hellmann, R. Burr formation detector for fiber laser cutting based on a photodiode
sensor system. Opt. Laser Technol. 2017, 96, 13–17. [CrossRef]
Metals 2021, 11, 1224 12 of 13
7. Lamikiz, A.; De Lacalle, L.N.L.; Sánchez, J.A.; Del Pozo, D.; Etayo, J.M.; López, J.M. CO2 laser cutting of advanced high strengthsteels (AHSS). Appl. Surf. Sci. 2005, 242, 362–368. [CrossRef]
8. Ghany, K.A.; Newishy, M. Cutting of 1.2 mm thick austenitic stainless steel sheet using pulsed and CW Nd: YAG laser. J. Mater.Process. Technol. 2005, 168, 438–447. [CrossRef]
9. Ramírez, A.; Pascuar, J.; Laserna, J.; Moya, M.V.; Zapatero, J.; Fernández, T. Effect of the cutting conditions with a Nd: YAG laseron stainless steels surface structure and microcomposition. Rev. Metal. 1998, 34, 220–226. [CrossRef]
10. Grevey, D.F.; Desplats, H. Comparison of the performance obtained with a YAG laser cutting according to the source operationmode. J. Mater. Process. Technol. 1994, 42, 341–348. [CrossRef]
11. Tahmouch, G.; Meyrueis, P.; Grandjean, P. Cutting by a high power laser at a long distance without an assist gas for dismantling.Opt. Laser Technol. 1997, 29, 307–315. [CrossRef]
12. Lv, S.; Yang, W. An investigation of pulsed laser cutting of titanium alloy sheet. Opt. Lasers Eng. 2006, 44, 1067–1077.13. He, L.; Namba, Y.; Narita, Y. Wavelength optimization for machining metals with the harmonic generations of a short pulsed Nd:
YAG laser. Precis. Eng. 2000, 24, 245–250. [CrossRef]14. Jarosz, K.; Löschner, P.; Niesłony, P. Effect of cutting speed on surface quality and heat-affected zone in laser cutting of 316L
stainless steel. Procedia Eng. 2016, 149, 155–162. [CrossRef]15. Patel, A.; Bhavsar, S.N. Experimental investigation to optimize laser cutting process parameters for difficult to cut die alloy steel
using response surface methodology. Mater. Today Proc. 2020, 43, 28–35. [CrossRef]16. Orishich, A.M.; Shulyatyev, V.B.; Golyshev, A.A. The utmost thickness of the cut sheet for the qualitative oxygen-assisted laser
cutting of low-carbon steel. Phys. Procedia 2016, 83, 296–301. [CrossRef]17. Salem, H.G.; Abbas, W.A.; Mansour, M.S.; Badr, Y.A. Parametric study on the CW Nd: YAG laser cutting quality of 1.25 mm ultra
low carbon steel sheets using O2 assist gas. AIP Conf. Proc. 2007, 888, 186–196.18. Rajaram, N.; Sheikh-Ahmad, J.; Cheraghi, S.H. CO2 laser cut quality of 4130 steel. Int. J. Mach. Tools Manuf. 2003, 43, 351–358.
[CrossRef]19. Ahn, D.G.; Byun, K.W. Influence of cutting parameters on surface characteristics of cut section in cutting of Inconel 718 sheet
using CW Nd: YAG laser. Trans. Nonferrous Met. Soc. China 2009, 19, s32–s39. [CrossRef]20. Riveiro, A.; Quintero, F.; del Val, J.; Boutinguiza, M.; Comesaña, R.; Lusquiños, F.; Pou, J. Laser cutting using off-axial supersonic
rectangular nozzles. Precis. Eng. 2018, 51, 78–87. [CrossRef]21. Jiang, D.; Panjehpour, A.; Niazi, S.; Akbari, M. Laser cutting of Al 6061-T6 aluminium alloy sheet: Effect of cutting condition and
sheet thickness on the temperature and edge cut quality. Lasers Eng. 2020, 45, 293–308.22. Yongbin, Y.; Bagherzadeh, S.A.; Azimy, H.; Akbari, M.; Karimipour, A. Comparison of the artificial neural network model
prediction and the experimental results for cutting region temperature and surface roughness in laser cutting of AL6061T6 alloy.Infrared Phys. Technol. 2020, 108, 103364. [CrossRef]
23. Sharifi, M.; Akbari, M. Experimental investigation of the effect of process parameters on cutting region temperature and cuttingedge quality in laser cutting of AL6061T6 alloy. Optik (Stuttg.) 2019, 184, 457–463. [CrossRef]
24. Leone, C.; Genna, S.; Caggiano, A.; Tagliaferri, V.; Molitierno, R. Influence of process parameters on kerf geometry and surfaceroughness in Nd: YAG laser cutting of Al 6061T6 alloy sheet. Int. J. Adv. Manuf. Technol. 2016, 87, 2745–2762. [CrossRef]
25. Joshi, P.; Sharma, A. Optimization of dimensional accuracy for the Nd: YAG laser cutting of aluminium alloy thin sheet using ahybrid approach. Lasers Eng. 2018, 41, 263–281.
26. Pfeifer, R.; Herzog, D.; Hustedt, M.; Barcikowski, S. Pulsed Nd: YAG laser cutting of NiTi shape memory alloys—Influence ofprocess parameters. J. Mater. Process. Technol. 2010, 210, 1918–1925. [CrossRef]
27. Tatzel, L.; León, F.P. Impact of the thermally induced focus shift on the quality of a laser cutting edge. J. Laser Appl. 2020, 32,022022. [CrossRef]
28. Sołtysiak, R.; Wasilewski, P.; Sołtysiak, A.; Troszynski, A.; Mackowiak, P. The Analysis of Fiber and CO2 Laser Cutting Accuracy.MATEC Web Conf. 2019, 290, 03016. [CrossRef]
29. Girdu, C.C.; Gheorghe, C.; Radulescu, C.; Cirtina, D. Influence of Process Parameters on Cutting Width in CO2 Laser Processingof Hardox 400 Steel. Appl. Sci. 2021, 11, 5998. [CrossRef]
30. Ninikas, K.; Kechagias, J.; Salonitis, K. The Impact of Process Parameters on Surface Roughness and Dimensional Accuracyduring CO2 Laser Cutting of PMMA Thin Sheets. J. Manuf. Mater. Process. 2021, 5, 74.
31. Pramanik, D.; Kuar, A.S.; Sarkar, S.; Mitra, S. Optimisation of edge quality on stainless steel 316L using low power fibre laserbeam machining. Adv. Mater. Process. Technol. 2021, 7, 42–53.
32. Chmelickova, H.; Polak, M. Nd: YAG pulsed laser cutting of metals, Experimental stress analysis. In Proceedings of the 39thInternational Conference, Tabor, Czech Republic, 29 July–3 August 2001.
33. Derringer, G.C.; Suich, R. Simultaneous optimization of several response variables. J. Qual. Technol. 1980, 12, 214–219. [CrossRef]34. Myers, R.H.; Montgomery, D.C.; Anderson-cook, C.M. Response Surface Methodology: Process and Product Optimization Using
Designed Experiments, 4th ed.; John Wiley & Sons, Inc.: Hoboken, NJ, USA, 2016.35. Xin, L.J.; Wang, Z.Y. Light-gas eccentrically high speed laser cutting of silicon steel on cold rolling production line. Adv. Mater.
Res. 2014, 881, 1469–1474.36. Kumar Pandey, A.; Kumar Dubey, A. Simultaneous optimization of multiple quality characteristics in laser cutting of titanium
alloy sheet. Opt. Laser Technol. 2012, 44, 1858–1865. [CrossRef]

Metals 2021, 11, 1224 13 of 13
37. Decker, I.; Ruge, J.; Atzert, U. Physical Models and Technological Aspects of Laser Gas Cutting. Ind. Appl. High Power Lasers 1984,0455, 81.
38. Biswas, R.; Kuar, A.S.; Sarkar, S.; Mitra, S. A parametric study of pulsed Nd: YAG laser micro-drilling of gamma-titaniumaluminide. Opt. Laser Technol. 2010, 42, 23–31. [CrossRef]
39. Chien, W.T.; Hung, W.C. Investigation on the Predictive Model for Burr in Laser Cutting Titanium Alloy. Mater. Sci. Forum 2006,526, 133–138. [CrossRef]