Effect of Particle Size on Respiratory Protection Provided by Two Types of N95 Respirators Used in...
24
Western Kentucky University TopSCHOLAR® Nursing Faculty Publications Nursing 9-1-2010 Particle Size on Respiratory Protection Provided by Two Types of N95 Respirators on Agricultural Settings Jacob Cho Kyungmin University of Cincinnati - Main Campus M. Susan Jones Western Kentucky University, [email protected] Gordon Jones Western Kentucky University, [email protected] Roy McKay University of Cincinnati - Main Campus Sergey A. Grinshpun University of Cincinnati - Main Campus See next page for additional authors This Article is brought to you for free and open access by TopSCHOLAR®. It has been accepted for inclusion in Nursing Faculty Publications by an authorized administrator of TopSCHOLAR®. For more information, please contact [email protected]. Recommended Repository Citation Kyungmin, Jacob Cho; Jones, M. Susan; Jones, Gordon; McKay, Roy; Grinshpun, Sergey A.; Swivedi, Alok; Shukla, Rakesh; Singh, Umesh; and Reponen, Tiina. (2010). Particle Size on Respiratory Protection Provided by Two Types of N95 Respirators on Agricultural Settings. Journal of Occupational and Environmental Hygiene, 7 (11), 622-627. Original Publication URL: DOI: 10.1080/15459624.2010.513910 Available at: http://digitalcommons.wku.edu/nurs_fac_pub/45
-
Upload
independent -
Category
Documents
-
view
0 -
download
0
Transcript of Effect of Particle Size on Respiratory Protection Provided by Two Types of N95 Respirators Used in...
Western Kentucky UniversityTopSCHOLAR®
Nursing Faculty Publications Nursing
9-1-2010
Particle Size on Respiratory Protection Provided byTwo Types of N95 Respirators on AgriculturalSettingsJacob Cho KyungminUniversity of Cincinnati - Main Campus
M. Susan JonesWestern Kentucky University, [email protected]
Gordon JonesWestern Kentucky University, [email protected]
Roy McKayUniversity of Cincinnati - Main Campus
Sergey A. GrinshpunUniversity of Cincinnati - Main Campus
See next page for additional authors
This Article is brought to you for free and open access by TopSCHOLAR®. It has been accepted for inclusion in Nursing Faculty Publications by anauthorized administrator of TopSCHOLAR®. For more information, please contact [email protected].
Recommended Repository CitationKyungmin, Jacob Cho; Jones, M. Susan; Jones, Gordon; McKay, Roy; Grinshpun, Sergey A.; Swivedi, Alok; Shukla, Rakesh; Singh,Umesh; and Reponen, Tiina. (2010). Particle Size on Respiratory Protection Provided by Two Types of N95 Respirators onAgricultural Settings. Journal of Occupational and Environmental Hygiene, 7 (11), 622-627.Original Publication URL: DOI: 10.1080/15459624.2010.513910Available at: http://digitalcommons.wku.edu/nurs_fac_pub/45

AuthorsJacob Cho Kyungmin, M. Susan Jones, Gordon Jones, Roy McKay, Sergey A. Grinshpun, Alok Swivedi,Rakesh Shukla, Umesh Singh, and Tiina Reponen
This article is available at TopSCHOLAR®: http://digitalcommons.wku.edu/nurs_fac_pub/45
Effect of Particle Size on Respiratory Protection Provided by Two Types of N95
Respirators on Agricultural Settings
Kyungmin Jacob Cho1, Susan Jones
2, Gordon Jones
3, Roy McKay
1, Sergey A. Grinshpun
1, Alok
Dwivedi1, Rakesh Shukla
1, Umesh Singh
1, Tiina Reponen
1*
1 Department of Environmental Health, University of Cincinnati, Cincinnati, Ohio, USA
2 School of Nursing, Western Kentucky University, Bowling Green, Kentucky, USA
3 Department of Agriculture, Western Kentucky University, Bowling Green, Kentucky, USA
*corresponding author
Keywords: respirator, workplace protection factor, aerosol, agriculture
Word count: 3033

ABSTRACT
The objective of this study was to compare size-selective workplace protection factors
(WPFs) of an N95 elastomeric respirator (ER) and an N95 filtering facepiece respirator (FFR) in
agricultural environments. Twenty-five healthy farm workers ranging in age from 20 to 30 years
voluntarily participated in the study. Altogether eight farms were included representing three
different types: two horse farms, three pig barns, and three grain handling sites. Subjects wore
the ER and FFR while performing their daily activities, such as spreading hay, feeding livestock,
and shoveling. Aerosol concentrations in an optical particle size range of 0.7–10 µm were
determined simultaneously inside and outside of the respirator during the first and last 15
minutes of a 60-minute experiment. For every subject, size-selective WPFs were calculated in
one-minute intervals and averaged over 30 minutes. For the ER, geometric mean WPFs were
172, 321, 1013, 2097 and 2784 for particles of 0.7–1.0, 1.0–2.0, 2.0–3.0, 3.0–5.0, and 5.0–10.0
µm, respectively. Corresponding values for the FFR were 69, 127, 324, 893, and 1994. The 5th
percentiles for the ER and FFR were higher than the Assigned Protection Factor of 10 and varied
from 28 to 250 and from 16 to 225, respectively. The results show that the N95 ER and FFR
tested in the study provided expected level of protection for workers on agricultural farms
against particles ranging from 0.7 to 10 µm. The WPFs for the ER were higher than those for the
FFR in all size ranges, and the WPFs for both respirators increased with increasing particle size.
INTRODUCTION
Agricultural workers are at high risk for exposure to airborne hazards that can cause
adverse respiratory effects. Several studies have shown that farmers growing different types of
grain and soy beans (1-2)
and farmers raising livestock (3)
have respiratory symptoms and diseases.
This may have considerable impact worldwide considering there are approximately 3 million
farm workers in the US alone. (4)
It is difficult to protect farmers from airborne particles by
engineering controls due to the diversity of particle sources and the mobility of farmers. This is
one reason why respirators are used on agricultural farms.
Although Respiratory Protection Standard (29 CFR Part 1910.134) is not applicable to
many agricultural environments,(5)
respirators used by agricultural workers should be certified by
the National Institute for Occupational Safety and Health in accordance with 42 CFR Part 84.(6)
The efficiency of respirators used in the workplace can be expressed as a workplace protection
factor (WPF), defined as a ratio of the concentration of airborne contaminant (e.g., particles)
outside the respirator to that inside the respirator, measured under the conditions of the
workplace using a properly selected, fit-tested, and functioning respirator while it is correctly
worn.(7)
Several WPF studies have investigated the efficiency of elastomeric respirators (ERs) and
filtering facepiece respirators (FFRs) against airborne particles.(8-12)
However, some of the
studies were conducted before the issuance of new certification regulations for respirator filters(6)
that designate filters based on filter efficiency (95, 99, and 100%) and resistance to various liquid
aerosols (N, R, and P). These studies reported that 5th
percentiles of WPFs were in the range
from below 10 to 56 and varied between respirator models. Furthermore, WPFs for ERs were not
significantly different from those for FFRs.(12)
It was also shown that log-transformed WPFs
were negatively correlated with log-transformed inside mass concentrations, whereas there were
no correlations between log-transformed WPFs and log-transformed outside mass
concentrations.(9, 11-12)
In addition, some investigators reported that WPFs are not particle size-
dependent.(8)
Although these studies provided information on the WPF, the tested occupational
environments did not include agricultural settings. Furthermore, most of the previous studies did
not aim at quantitatively characterizing the factors, which may cause variation in WPFs, e.g.,
particle size. In contrast, an earlier investigation by our research group addressed the effect of
particle size on WPFs in agricultural environments and demonstrated that WPFs increase with
increased size for a typical FFR with average fitting characteristics when challenged by particles
of 0.7–10 µm in diameter.(10)
The objectives of the current study were to compare the WPF of an
N95 FFR with that of an N95 ER and to continue collecting size-selective WPF data in
agricultural environments.
METHODS
Test Subjects, Sites, and Respirators
Twenty-five healthy farm workers ranging in age from 20 to 30 years voluntarily
participated in the study. Among 25 subjects, one Hispanic male and six females were included
to reflect the gender and racial make-up of farmers in Ohio and Kentucky (which are very close
to US average). Altogether eight farms were included representing three different types: two
horse/livestock pavilions, three pig barns, and three grain handling sites. The activities on farms
of these types were expected to generate high aerosol concentrations with a wide particle size
range. The selected farms were typical of those in the south central region of the US.
The respirators tested in the study were represented by one model of ER with N95 filters
and one model of N95 FFR. ER was available in three sizes, whereas FFR was available in two
sizes. The respirators used for this study were selected because they were known from our
clinical experience to have high success rates during routine quantitative fit testing (i.e., good
fitting characteristics).
Field Study Design
Subjects wore the ER and FFR while performing their daily activities, such as spreading
hay, feeding livestock, and shoveling. Table I summarizes the activities at each site. Among 25
subjects, two subjects failed the fit test for the FFR (one on Horse Farm 2 and the other in Pig
Barn 3). In addition, the data were missing on one subject (Pig Barn 1) due to an instrument
malfunction that took place when this subject was tested with the FFR.
All subjects signed the consent form approved by the University of Cincinnati
Institutional Review Board and were medically cleared using an on-line questionnaire prior to
the field testing. (13)
All subjects were asked not to smoke for at least one hour prior to the field
test and male subjects were asked to be clean shaven. In the beginning of the field test, the
subjects were trained to wear both respirators according to the manufacturer’s instructions. All
subjects conducted a user seal check and fit testing. The fit testing was conducted using a TSI
PortaCount Plus with an N95 companion (TSI, Inc., St. Paul, MN). In order to minimize
systematic errors in results, the type of the test respirator (ER or FFR) to be worn first was
randomly assigned to the first subject on each day of the field test and the subsequent subjects
were systematically tested so that every other subject had the same order for test respirators.
Some farmers wear respirators during the entire time they are working while others only wear
respirators during the most critical times, for example approximately 15 minutes in grain bins.
However, our preliminary experiments demonstrated that subjects could not tolerate wearing of
respirators more than 1 hour at moderate to strenuous work load. Consequently, each field
experiment lasted for 1 hour for each respirator type per subject.
Particle Measurement
The aerosol particle concentrations inside and outside the respirator were measured with
the personal sampling system that was described in an earlier WPF-study conducted in
agricultural environments.(14)
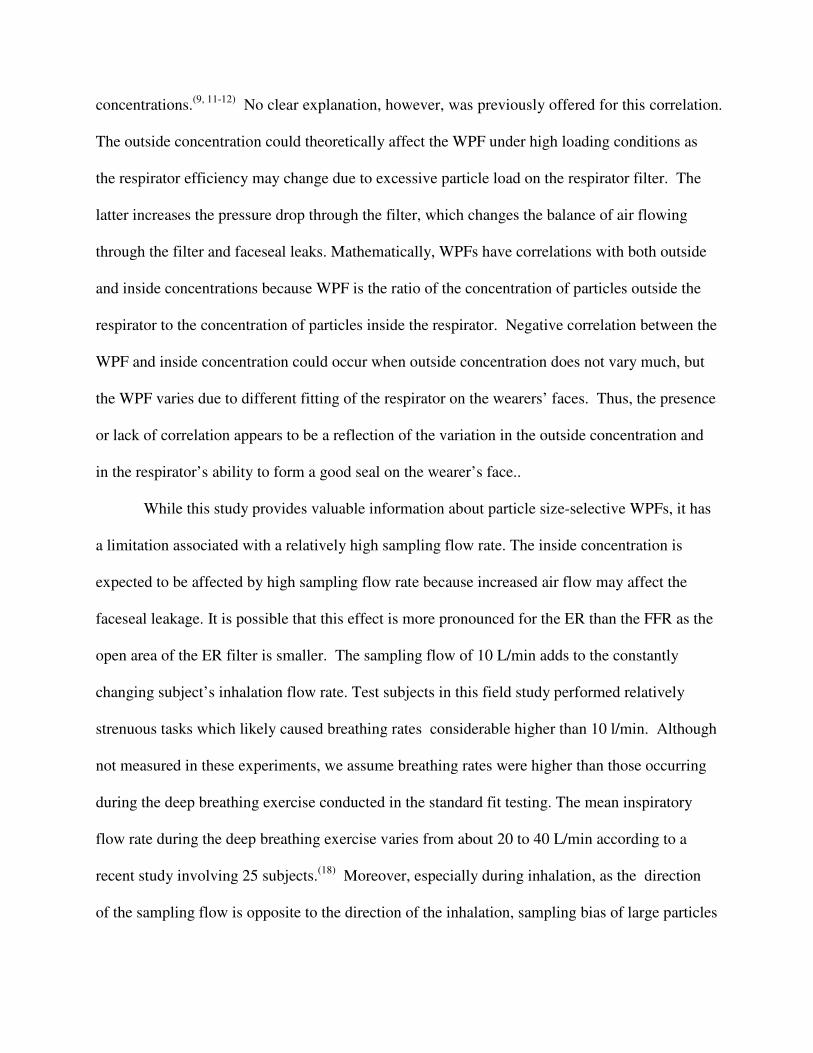
Briefly, as shown in Figure 1, the personal sampling system
consists of two identical sampling lines with each one including a sampling probe, a sampling
chamber, an optical particle counter (HHPC-6, Hach Company, Loveland, CO ), and a pump
(Leland Legacy, SKC Inc., Eighty Four, PA). The optical particle counter measures the particle
number concentration in five size channels: 0.7–1.0, 1.0–2.0, 2.0–3.0, 3.0–5.0, and 5.0–10.0 µm.
The corresponding mean sizes of these channels are 0.85, 1.5, 2.5, 4, and 7.5 µm. Using a
DryCal DC-Lite calibrator (Bios International Corporation, Butler, NJ), the flow rate for the
pump was adjusted to maintain the total sampling flow of 10 L/min. Particle concentrations
were determined simultaneously inside and outside of the respirator during 15 minutes in the
beginning and 15 minutes at the end of the 60-minute experiment. The sampling time was shorter
than the time of the respirator wear to avoid the build-up of moisture condensation inside
sampling tubing. For every subject, size-selective WPFs were calculated in one-minute intervals
and then averaged over the 30-minute sampling time. WPF was also calculated for all particles
across the tested size range after combining the particle concentrations determined in each of the
five channels.
Statistical Analysis
Geometric means (GM) and geometric standard deviations (GSD) were used to describe
the outside concentrations and WPFs. Log-transformation was done for each of the continuous
variables to induce normality. To compare the average WPF for the first 15 minutes with that for
the second 15 minutes, t-test was used (SigmaPlot 11; Systat software Inc., San Jose, CA).
Pearson correlation coefficients were calculated to investigate how the WPF was associated with
the concentrations measured inside and outside the respirator (SigmaPlot 11; Systat software Inc.,
San Jose, CA). To identify the factors associated with the outside concentration and WPF,
univariate generalized estimating equations (GEE) were used (SAS 9.2; SAS Institute Inc., Cary,
NC). (15)
Initially, the effect of farm type and particle size was evaluated for each of the two
outcomes. For WPF, the effect of respirator type, outside concentration, and gender were also
evaluated. Variables that were significant at 5% level under the univariate analysis were
considered for the multivariate GEE. Possible interaction effects were also assessed before
finalizing the regression model. Variables that were significant at 5% level were included in the
final multivariate model. Bar and line graphs for outside concentrations and WPFs (GM and
GSD) were used to depict important results.
RESULTS AND DISCUSSION
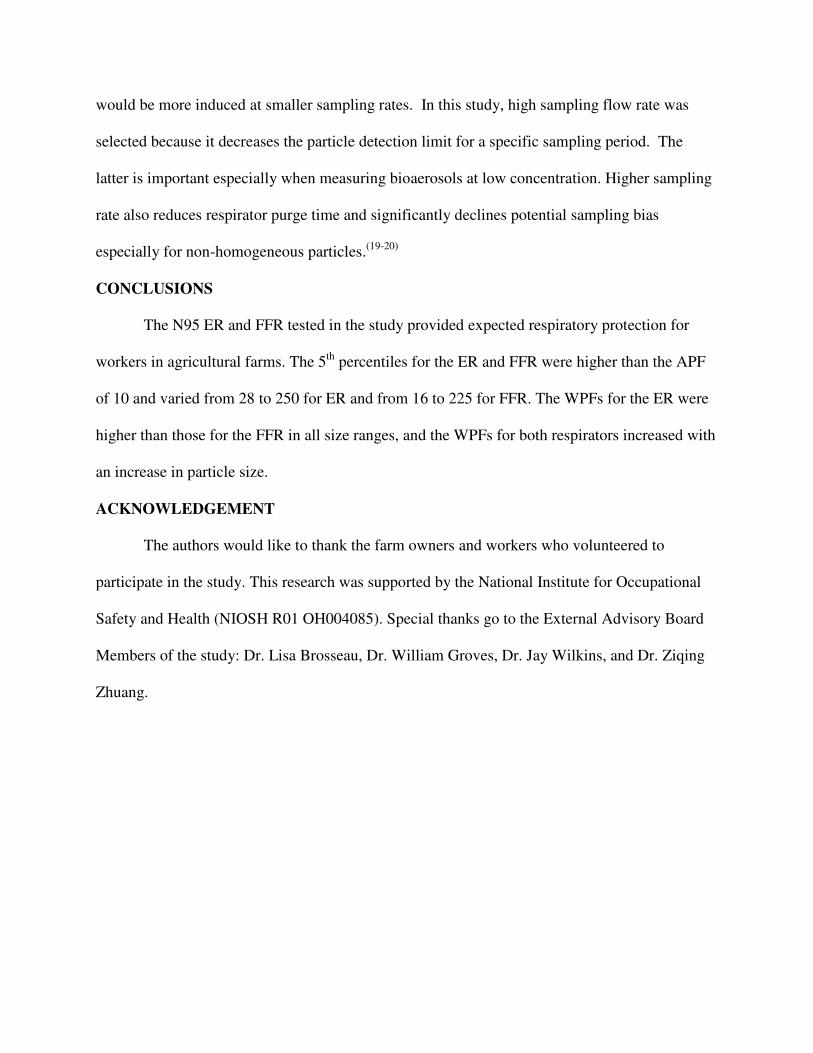
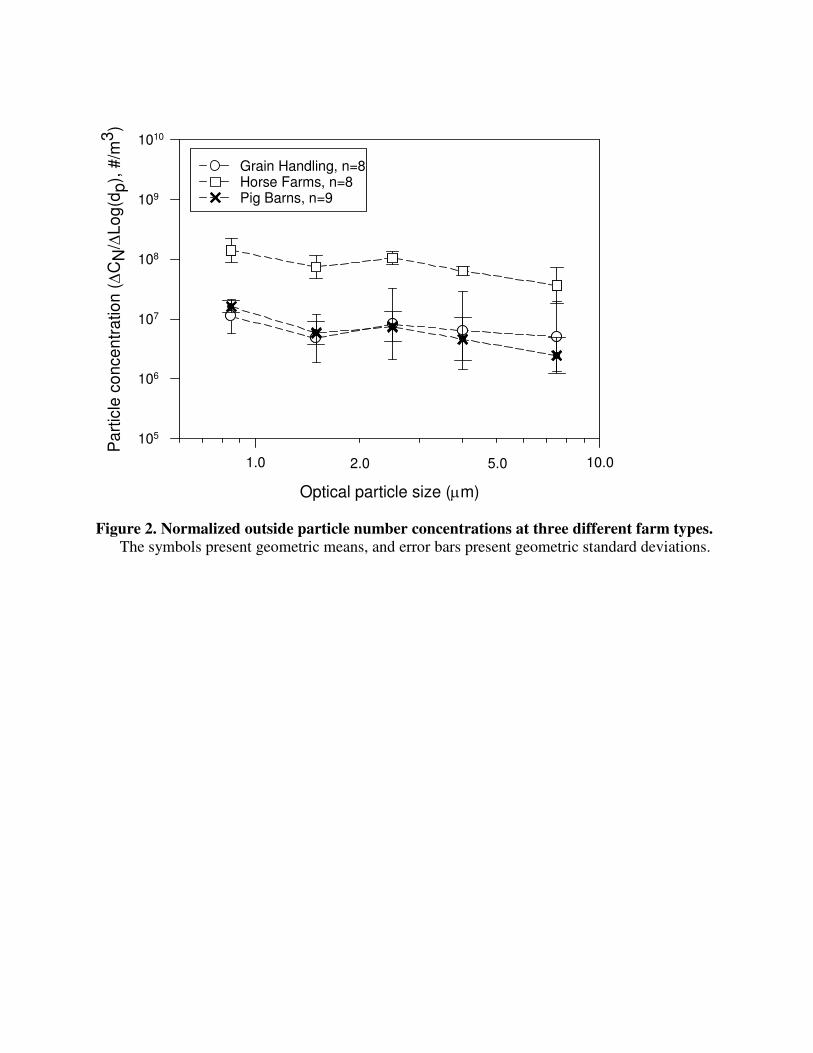
Normalized size-selective number concentrations of particles measured outside of the
respirator at three different types of farms are presented in Figure 2. The multivariate analysis
assessed the effect of farm type and particle size on the outside concentrations. Interaction was
found between the farm type and particle size and therefore, the model was adjusted for the
interaction. On average, horse farms had an 11-fold higher geometric mean outside
concentration than grain handling sites (p≤0.0001). There was, however, no significant

difference in the concentrations between the grain handling and the pig barns (p=0.101). All the
particle size distributions measured in this study appear to be similar to those measured during
grain harvesting and unloading by Lee et al.(17)
. In contrast to the current study, Lee et al. (17)
found that the contribution of large particles (>2 µm) generated in these workplaces was greater
than that measured in animal confinements. The difference may be attributed to the differences
in human and animal activities taking place in these two studies. O’Shaughnessy et al.,(16)
who
measured workers’ dust exposures in swine confinements using personal photometers, showed
that work tasks performed near moving animals resulted in the highest exposure.
The total number concentrations of particles (non-normalized) over the entire size range
of 0.7–10.0 µm varied from 1.2 × 10⁶ to 3.3 × 10
7 particles/m
3 at grain handling sites and in pig
barns and from 1 × 10⁷ to 1.7 × 10
8 particles/m
3 on horse farms. Lee et al.
(17) reported that
corresponding concentrations ranged from 4.4 × 10⁶ to 5.8 × 10
7 particles/m
3 at grain harvesting
and from 1.7 × 10⁶ to 2.9 × 10
7 particles/m
3 in animal confinements. Thus, the outside
concentrations obtained in our study at grain handling sites and in pig barns were similar to those
reported by Lee et al.,(17)
; however, we measured higher concentrations on horse farms.
Before WPF was averaged over the 30-minute sampling time, average of WPFs for the
first15 minutes was compared with those for the second15 minutes to obtain insight towards
continuing performance of the respirators. Result assessed by t-test showed that there was no
statistically significant difference between WPFs for the two periods (ER: p=0.76, FFR: p=0.77).
Therefore, an average over the 30-minute sampling time was used in the further data analyses.
Two subjects did not pass the fit test with FFR, and their fit factors were 50 and 80. The
effect of not passing the fit test was assessed through analyzing two data sets: including and
excluding the WPF values produced by the two subjects who did not pass the fit test with the
FFR from a total of 24 subjects for whom valid FFR data were generated (it is noted that one
subject was excluded from the 25-worker cohort because of the malfunction of the optical
particle counter while testing with FFR). A multivariate analysis indicated that WPFs and 5th
percentiles of WPFs for 24 subjects (including those who passed and failed the fit test) were not
statistically significantly different from the 22 subjects who passed the fit test. This is a
reasonable result because the failed fit factors were close to 100, which is the passing criteria for
the fit test. Therefore, further analyses of the FFR performance included all data obtained for 24
subjects.
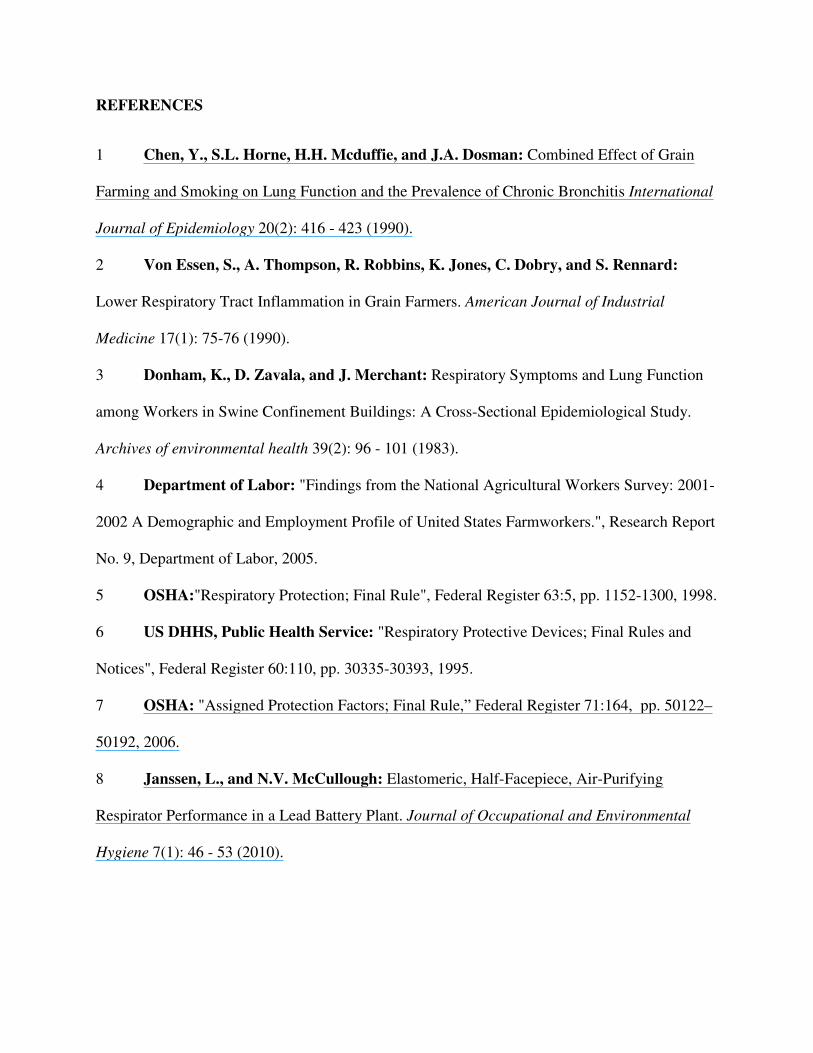
Figure 3 presents the WPFs provided by the two types of respirators as a function of
particle size. For the ER, geometric means (GMs) were 172, 321, 1013, 2097, and 2784 for
particles of 0.7–1.0, 1.0–2.0, 2.0–3.0, 3.0–5.0, and 5.0–10.0 µm, respectively. Corresponding
values for the FFR were 69, 127, 324, 893, and 1994. The size-selective WPFs for both
respirators were higher than those reported for another model of FFR by Lee et al.(10)
(21, 28, 51,
115, and 270, respectively). While the difference in WPFs observed in our study and those of
Lee et al. are not known with certainty, we believe differences in fitting characteristics between
the two FFRs are a plausible explanation. Differences in filter efficiency may be another factor,
although likely of smaller magnitude. The WPFs for both respirators in the current study
increased as the particle size increased, which is consistent with the results reported by Lee et
al.(10)
However, it is discrepant to the hypothesis by Janssen and McCullough(8)
who measured
the WPF of an ER with P100 filters and suggested that WPFs are not particle size-dependent.
The investigators found relatively large particles on the in-facepiece samples and hypothesized
that WPFs should not depend on the particle size because both large and small particles enter the
respirators during temporary leakage. As indicated in Table II, the 5th
percentile of the ER
calculated over all particle sizes was 63.8 in our study and corresponding value for the study
conducted by Janssen and McCullough was 51.5. This demonstrates that these two types of
respirators have similar performance when assessed non-size selectively. However, the most
distinguishable difference between the quoted and the present study is the basis for determining
the WPF. While Janssen and McCullough(8)
calculated WPFs based on mass over all size ranges,
WPFs in this study were based on the simultaneous measurements of the number of particles
with specific size ranges inside and outside the respirator.
Another observation from Figure 3 is that the WPFs were higher for the ER than the FFR
in all size ranges. Thus, for the respirator models tested in this study, the ER provided a higher
level of performance than the FFR. This finding was not surprising since the ER selected for this
study was based upon our fit testing and other experiences with local companies. The selected
ER comes in three sizes (versus two for the FFR), consistently achieves high fit factors, and is
reported by users to maintain acceptable fit during use. Myers et al.(12)
reported that no
difference in the performance of ER or FFR was observed at different workplaces. However, the
filter materials used in their study may not be directly comparable with N95 filters used in our
study as their study was conducted before the issuance of new certification regulations.(6)
Performance characteristics and the selection of respirators (within the same category) may also
be a consideration whenever a small number of models are compared. WPF performance ranges
are expected and the actual performance of any two models is not known until they are evaluated.
Consequently two models could be selected from the two tails of WPF while another study could
select models near the mean.
Table II shows the comparison of the 5th
percentiles of the WPFs for the ER and FFR.
For both respirator types, all particle size selective WPFs were higher than the assigned
protection factor (APF) of 10 for half facepiece respirators.(7)
The 5th
percentiles for the ER were
higher than those for the FFR against particles in all five size ranges. Similar trend was seen
when WPFs were calculated from the total number concentrations of particles. For the FFR, the
5th
percentiles for 24 subjects were not significantly different from those for 22 subjects
excluding 2 subjects who failed the fit test. The 5th
percentiles of the WPFs for the ER and FFR
indicate a similar trend: the WPFs increased as particle sizes increased.
In the univariate analysis, the WPF was found to be significantly associated with
respirator type, farm type, particle size, and outside concentration, whereas no association was
found with the gender of the respirator wearer. The WPFs measured on horse farms were higher
than those measured on the two other farm types. A high co-linearity between outside
concentration and farm type was observed. This indicates that the difference in the WPF between
farm types was mainly due to the difference in the outside concentration. The possible
interaction effects between particle size and respirator type, farm type and particle size, and
respirator type and farm type were also explored. The results on the multivariate analysis
assessing factors that affect the WPF are summarized in Table III. In the final multivariate
model, only respirator type and particle size remained significant. The WPFs were 2.2 times
higher for the ER than for the FFR (p≤0.0001). Furthermore, the size-selective WPFs increased
significantly with the increase in particle size.
The association between WPFs and total outside/inside concentrations was further
investigated by a correlation analysis. The correlation coefficient was -0.41 (p ≤ 0.001) for the
inside concentration and 0.31 (p=0.03) for the outside concentration (data not shown). This is
consistent with several WPF studies demonstrating that log-transformed WPFs were significantly,
negatively correlated with log-transformed inside concentrations rather than outside
concentrations.(9, 11-12)
No clear explanation, however, was previously offered for this correlation.
The outside concentration could theoretically affect the WPF under high loading conditions as
the respirator efficiency may change due to excessive particle load on the respirator filter. The
latter increases the pressure drop through the filter, which changes the balance of air flowing
through the filter and faceseal leaks. Mathematically, WPFs have correlations with both outside
and inside concentrations because WPF is the ratio of the concentration of particles outside the
respirator to the concentration of particles inside the respirator. Negative correlation between the
WPF and inside concentration could occur when outside concentration does not vary much, but
the WPF varies due to different fitting of the respirator on the wearers’ faces. Thus, the presence
or lack of correlation appears to be a reflection of the variation in the outside concentration and
in the respirator’s ability to form a good seal on the wearer’s face..
While this study provides valuable information about particle size-selective WPFs, it has
a limitation associated with a relatively high sampling flow rate. The inside concentration is
expected to be affected by high sampling flow rate because increased air flow may affect the
faceseal leakage. It is possible that this effect is more pronounced for the ER than the FFR as the
open area of the ER filter is smaller. The sampling flow of 10 L/min adds to the constantly
changing subject’s inhalation flow rate. Test subjects in this field study performed relatively
strenuous tasks which likely caused breathing rates considerable higher than 10 l/min. Although
not measured in these experiments, we assume breathing rates were higher than those occurring
during the deep breathing exercise conducted in the standard fit testing. The mean inspiratory
flow rate during the deep breathing exercise varies from about 20 to 40 L/min according to a
recent study involving 25 subjects.(18)
Moreover, especially during inhalation, as the direction
of the sampling flow is opposite to the direction of the inhalation, sampling bias of large particles
would be more induced at smaller sampling rates. In this study, high sampling flow rate was
selected because it decreases the particle detection limit for a specific sampling period. The
latter is important especially when measuring bioaerosols at low concentration. Higher sampling
rate also reduces respirator purge time and significantly declines potential sampling bias
especially for non-homogeneous particles.(19-20)
CONCLUSIONS
The N95 ER and FFR tested in the study provided expected respiratory protection for
workers in agricultural farms. The 5th
percentiles for the ER and FFR were higher than the APF
of 10 and varied from 28 to 250 for ER and from 16 to 225 for FFR. The WPFs for the ER were
higher than those for the FFR in all size ranges, and the WPFs for both respirators increased with
an increase in particle size.
ACKNOWLEDGEMENT
The authors would like to thank the farm owners and workers who volunteered to
participate in the study. This research was supported by the National Institute for Occupational
Safety and Health (NIOSH R01 OH004085). Special thanks go to the External Advisory Board
Members of the study: Dr. Lisa Brosseau, Dr. William Groves, Dr. Jay Wilkins, and Dr. Ziqing
Zhuang.
REFERENCES
1 Chen, Y., S.L. Horne, H.H. Mcduffie, and J.A. Dosman: Combined Effect of Grain
Farming and Smoking on Lung Function and the Prevalence of Chronic Bronchitis International
Journal of Epidemiology 20(2): 416 - 423 (1990).
2 Von Essen, S., A. Thompson, R. Robbins, K. Jones, C. Dobry, and S. Rennard:
Lower Respiratory Tract Inflammation in Grain Farmers. American Journal of Industrial
Medicine 17(1): 75-76 (1990).
3 Donham, K., D. Zavala, and J. Merchant: Respiratory Symptoms and Lung Function
among Workers in Swine Confinement Buildings: A Cross-Sectional Epidemiological Study.
Archives of environmental health 39(2): 96 - 101 (1983).
4 Department of Labor: "Findings from the National Agricultural Workers Survey: 2001-
2002 A Demographic and Employment Profile of United States Farmworkers.", Research Report
No. 9, Department of Labor, 2005.
5 OSHA:"Respiratory Protection; Final Rule", Federal Register 63:5, pp. 1152-1300, 1998.
6 US DHHS, Public Health Service: "Respiratory Protective Devices; Final Rules and
Notices", Federal Register 60:110, pp. 30335-30393, 1995.
7 OSHA: "Assigned Protection Factors; Final Rule,” Federal Register 71:164, pp. 50122–
50192, 2006.
8 Janssen, L., and N.V. McCullough: Elastomeric, Half-Facepiece, Air-Purifying
Respirator Performance in a Lead Battery Plant. Journal of Occupational and Environmental
Hygiene 7(1): 46 - 53 (2010).

9 Janssen, L.L., T.J. Nelson, and K.T. Cuta: Workplace Protection Factors for an N95
Filtering Facepiece Respirator. Journal of Occupational and Environmental Hygiene 4(9): 698-
707 (2007).
10 Lee, S.-A., A. Adhikari, S.A. Grinshpun, R. McKay, R. Shukla, H.L. Zeigler et al.:
Respiratory Protection Provided by N95 Filtering Facepiece Respirators Against Airborne Dust
and Microorganisms in Agricultural Farms. Journal of Occupational and Environmental
Hygiene 2(11): 577 - 585 (2005).
11 Myers, W.R., and Z. Zhuang: Field Performance Measurements of Half-Facepiece
Respirators: Steel Mill Operations. American Industrial Hygiene Association Journal 59(11):
789 - 795 (1998).
12 Myers, W.R., Z. Zhuang, and T. Nelson: Field Performance Measurements of Half-
Facepiece Respirators;Foundry Operations. American Industrial Hygiene Association Journal
57(2): 166 - 174 (1996).
13 OSHA: Respiratory Protection. In Code of Federal Regulations Title 29, Part 1910.134,
Appendix A, 1998.
14 Lee, S.-A., S.A. Grinshpun, A. Adhikari, W. Li, R.O.Y. McKay, A. Maynard et al.:
Laboratory and Field Evaluation of a New Personal Sampling System for Assessing the
Protection Provided by the N95 Filtering Facepiece Respirators against Particles. Annals of
Occupational Hygiene 49(3): 245-257 (2005).
15 Hardin, J., and J. Hilbe: Generalized Estimating Equations. London: Chapman and
Hall/CRC, 2003.

16 O'Shaughnessy, P.T., K.J. Donham, T.M. Peters, C. Taylor, R. Altmaier, and K.M.
Kelly: A Task-Specific Assessment of Swine Worker Exposure to Airborne Dust. Journal of
Occupational and Environmental Hygiene 7(1): 7 - 13 (2010).
17 Lee, S.-A., A. Adhikari, S.A. Grinshpun, R. McKay, R. Shukla, and T. Reponen:
Personal Exposure to Airborne Dust and Microorganisms in Agricultural Environments. Journal
of Occupational and Environmental Hygiene 3(3): 118 - 130 (2006).
18 Grinshpun, S.A., H. Haruta, R.M. Eninger, T. Reponen, R.T. McKay, and S.-A. Lee:
Performance of an N95 Filtering Facepiece Particulate Respirator and a Surgical Mask During
Human Breathing: Two Pathways for Particle Penetration. Journal of Occupational and
Environmental Hygiene 6(10): 593 - 603 (2009).
19 Myers, W.R., J. Allender, W. Iskander, and C. Stanley: Causes of In-Facepiece
Sampling Bias-I. Half-Facepiece Respirators. Annals of Occupational Hygiene 32(3): 345-359
(1988).
20 Myers, W.R., J. Allender, R. Plummer, and T. Stobbe: Parameters that Bias the
Measurement of Airborne Concentration within a Reapirator. American Industrial Hygiene
Association Journal 47(2): 106-114 (1986).
Figure 1. Schematic presentation of the personal sampling setup.
Optical particle size (µm)
1.0 10.0
Pa
rtic
le c
on
ce
ntr
atio
n (∆
CN
/∆L
og
(dp
), #
/m3
)
105
106
107
108
109
1010
2.0 5.0
Grain Handling, n=8Horse Farms, n=8Pig Barns, n=9
Figure 2. Normalized outside particle number concentrations at three different farm types.
The symbols present geometric means, and error bars present geometric standard deviations.
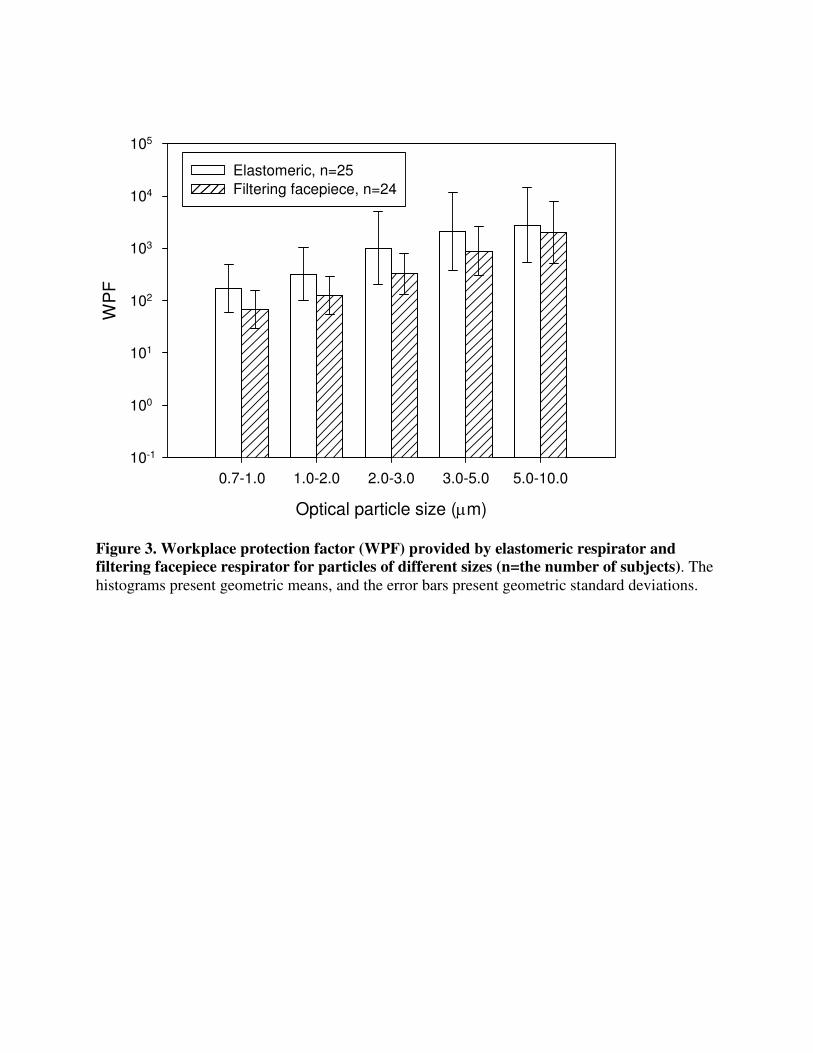
Optical particle size (µm)
0.7-1.0 1.0-2.0 2.0-3.0 3.0-5.0 5.0-10.0
WP
F
10-1
100
101
102
103
104
105
Elastomeric, n=25
Filtering facepiece, n=24
Figure 3. Workplace protection factor (WPF) provided by elastomeric respirator and
filtering facepiece respirator for particles of different sizes (n=the number of subjects). The
histograms present geometric means, and the error bars present geometric standard deviations.
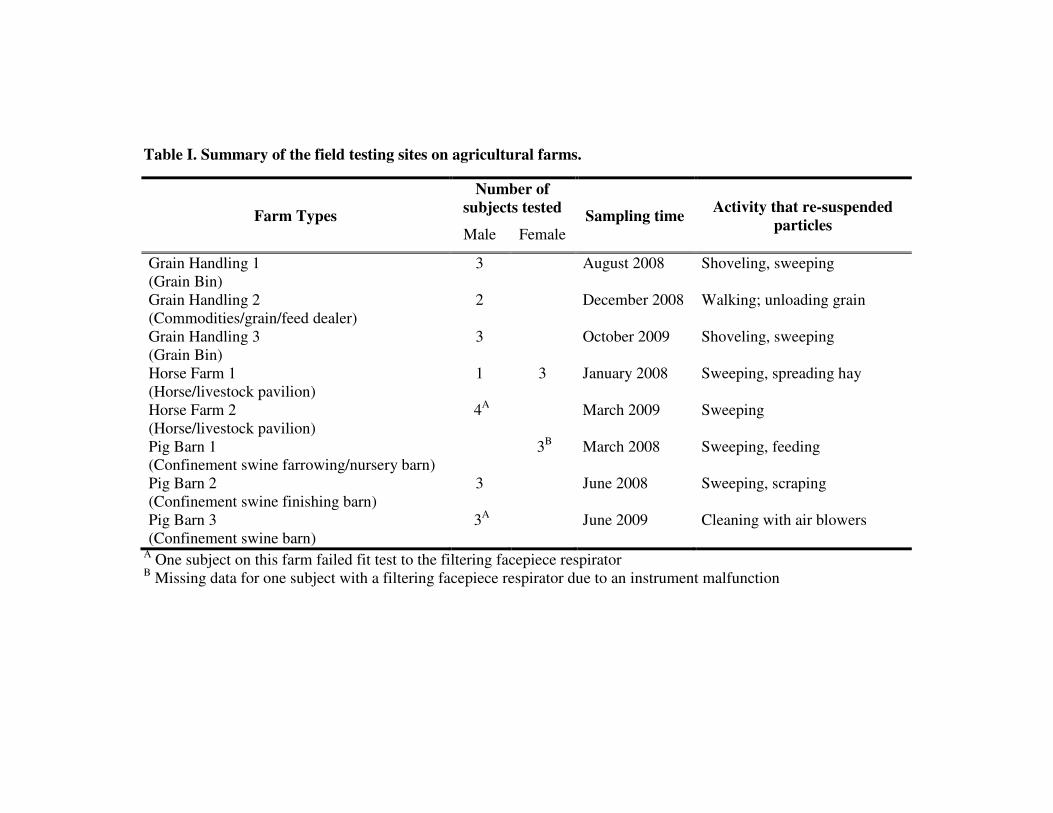
Table I. Summary of the field testing sites on agricultural farms.
Farm Types
Number of
subjects tested Sampling time
Activity that re-suspended
particles Male Female
Grain Handling 1
(Grain Bin)
3 August 2008 Shoveling, sweeping
Grain Handling 2
(Commodities/grain/feed dealer)
2 December 2008 Walking; unloading grain
Grain Handling 3
(Grain Bin)
3 October 2009 Shoveling, sweeping
Horse Farm 1
(Horse/livestock pavilion)
1 3 January 2008 Sweeping, spreading hay
Horse Farm 2
(Horse/livestock pavilion)
4A March 2009 Sweeping
Pig Barn 1
(Confinement swine farrowing/nursery barn)
3B March 2008 Sweeping, feeding
Pig Barn 2
(Confinement swine finishing barn)
3 June 2008 Sweeping, scraping
Pig Barn 3
(Confinement swine barn)
3A June 2009 Cleaning with air blowers
A One subject on this farm failed fit test to the filtering facepiece respirator
B Missing data for one subject with a filtering facepiece respirator due to an instrument malfunction
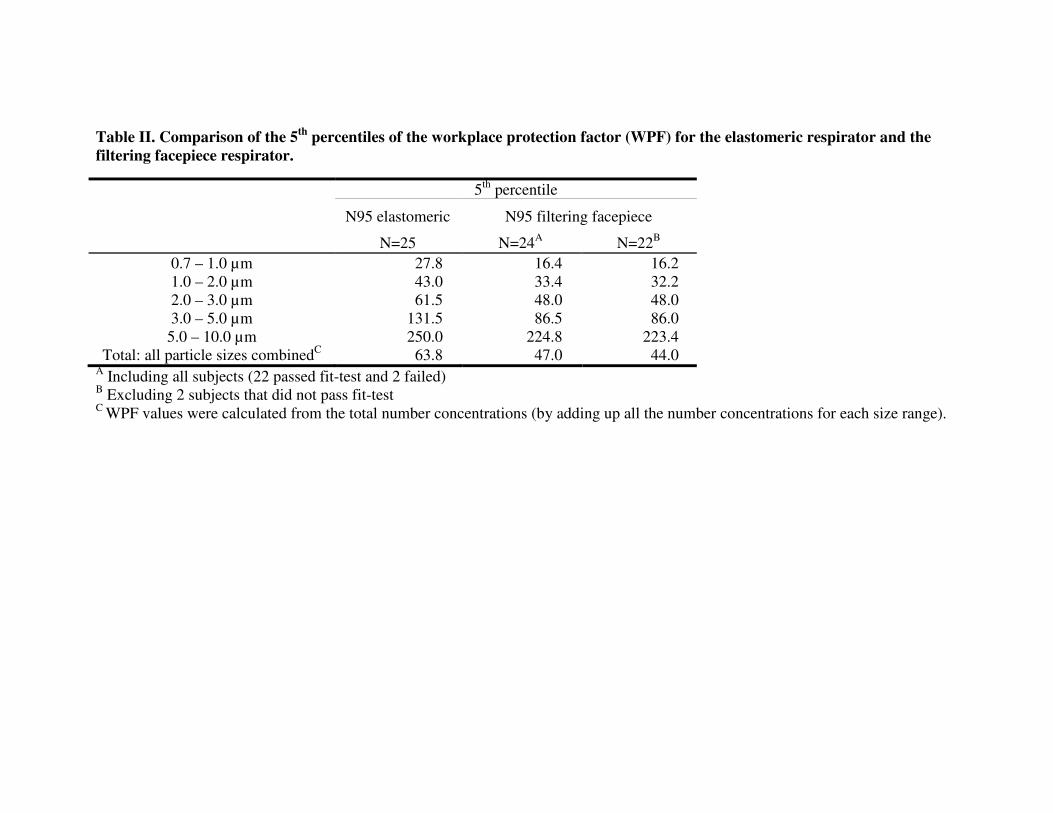
Table II. Comparison of the 5th
percentiles of the workplace protection factor (WPF) for the elastomeric respirator and the
filtering facepiece respirator.
5th
percentile
N95 elastomeric N95 filtering facepiece
N=25 N=24A N=22
B
0.7 – 1.0 µm 27.8 16.4 16.2
1.0 – 2.0 µm 43.0 33.4 32.2
2.0 – 3.0 µm 61.5 48.0 48.0
3.0 – 5.0 µm 131.5 86.5 86.0
5.0 – 10.0 µm 250.0 224.8 223.4
Total: all particle sizes combinedC
63.8 47.0 44.0 A Including all subjects (22 passed fit-test and 2 failed)
B Excluding 2 subjects that did not pass fit-test
C WPF values were calculated from the total number concentrations (by adding up all the number concentrations for each size range).
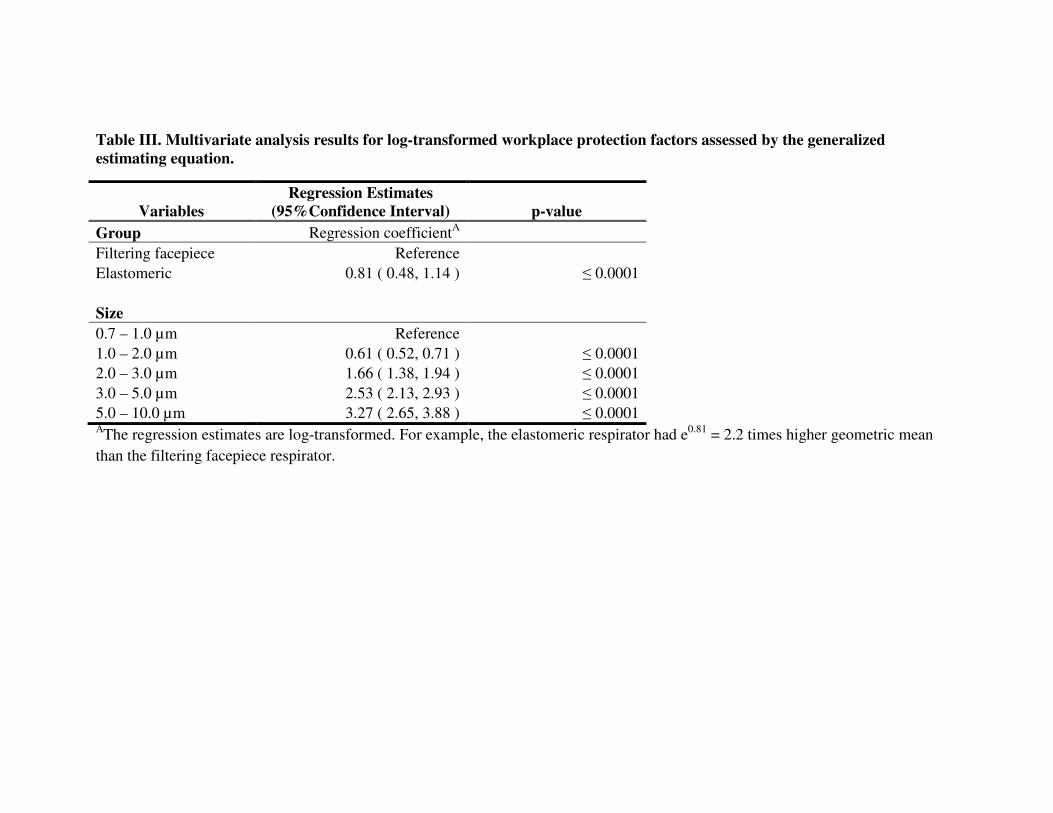
Table III. Multivariate analysis results for log-transformed workplace protection factors assessed by the generalized
estimating equation.
Variables
Regression Estimates
(95%Confidence Interval) p-value
Group Regression coefficientA
Filtering facepiece Reference
Elastomeric 0.81 ( 0.48, 1.14 ) ≤ 0.0001
Size
0.7 – 1.0 µm Reference
1.0 – 2.0 µm 0.61 ( 0.52, 0.71 ) ≤ 0.0001
2.0 – 3.0 µm 1.66 ( 1.38, 1.94 ) ≤ 0.0001
3.0 – 5.0 µm 2.53 ( 2.13, 2.93 ) ≤ 0.0001
5.0 – 10.0 µm 3.27 ( 2.65, 3.88 ) ≤ 0.0001 AThe regression estimates are log-transformed. For example, the elastomeric respirator had e
0.81 = 2.2 times higher geometric mean
than the filtering facepiece respirator.