
New serine-derived gemini surfactants as gene delivery systems
Effect of Ionic Surfactants and Alcohols on the Morphology ofCuSO4·5H2O Crystals: Combined Use of Factors and Significance ofThreshold Surfactant ConcentrationNitish Singh, Ribani Yeri, and Jayanta Chakraborty*
Indian Institute of Technology, Kharagpur PIN-721302, India
*S Supporting Information
ABSTRACT: Batch cooling and antisolvent crystallization of copper sulfate pentahydrate using surfactant additives isinvestigated to understand the effect of various factors on its morphology. It has been found that nonionic surfactants have amarginal effect on this ionic compound, whereas ionic surfactants are able to modify the morphology substantially. Alcoholicantisolvents are also found to be effective habit modifiers that produce elongated crystals. It has been shown that the effects ofsurfactants and antisolvents can be combined by using a surfactant−antisolvent pair. The effect of surfactant is observed after acertain threshold concentration. A detailed study of the critical micellar concentration (CMC) of sodium dodecyl sulfate incopper sulfate pentahydrate solution confirmed that this threshold concentration is close to the CMC of the surfactant in coppersulfate pentahydrate solution. Evidence suggests that a concentration higher than CMC is required to maintain a surfactantreservoir in the system, leading to a change in the crystal morphology. This insight may help to predict the minimum requiredsurfactant concentration for habit modification for an unknown system.
1. INTRODUCTION
The morphology or shape of crystals is an important propertyof crystalline solids. Fundamental properties like opticaltransparency,1 bioavailability of drugs2 and industrially relevantproperties like bulk density3 and mechanical strength dependon the shape of the crystal. Manipulation of crystal size isusually achieved by manipulating the rate of nucleation andgrowth, whereas the growth morphology of a crystal can bemanipulated by altering the relative growth rates of the crystalfaces.4
The easiest way to manipulate the shape of a crystal is bychanging the growth supersaturation.5 This method does notintroduce any impurity, and the habit of the crystal can bechanged by simply choosing the proper cooling profile.6,7
However, if the growth rates of different faces do not showdifferent features at different supersaturations,8 this route is noteffective. Varying the solvent and using certain additives arepossible alternatives in such cases.7,9,10
A vast literature exists on the effects of additives on crystalmorphology. A recent book11 and reviews12−15can be referredto for details. In general, surfactants are excellent additives thataffect both the shape and the size of crystals. A large number ofstudies9,16−22have been carried out to elucidate these effects.The effects are often very complex. For example, in thepresence of sodium dodecyl sulfate (SDS), CaCO3 forms verysmall (0.5 μm) prismatic crystals,16 whereas if polyvinylpyrro-lidone (PVP) is present along with SDS, it forms flat sheets oreven flower-like structures. Even the polymorph that isprecipitated may change depending on the surfactant present.At very low concentration of SDS, vaterite is the dominantpolymorph of CaCO3, whereas calcite is formed at higherconcentration of SDS.18 Ionic surfactants are more frequentlyused than nonionic surfactants for altering crystal morphology
because of the strong ionic interaction between crystal sites andsurfactant head groups.The concentration of surfactant used in crystallization
experiments is a critical parameter.17,19 The effect of surfactantusually increases with increasing concentration. As surfactantsform various self-assembled structures in solution, it is not clearwhether the concentration effect is related to the appearance ofsuch structures. The critical micellar concentration (CMC) ofsurfactants is reported in pure aqueous solution, and the CMCin a salt solution is usually not known. The effect of SDSmicelle on crystallization of CaCO3 was studied by Bang et al.
17
who showed that accelerated morphological transformationoccurs in the presence of SDS micelles. Bujan et al.9 alsoreported the formation of different phases of calcium hydrogenphosphate above and below the CMC of the surfactant used.Konig et al.22 observed different crystallization kinetics aboveand below the CMC of SDS.In this work, we investigate the effect of surfactants on ionic
copper sulfate pentahydrate crystals (CuSO4·5H2O, will beabbreviated as CS henceforth). Despite its industrialimportance, very few studies6,7,23 have been conducted onthe morphological development of CS crystals. Hence, athorough investigation regarding the effect of all three types ofsurfactants and alcoholic antisolvents is first carried out. It isthen shown that the effects of surfactants and antisolvents canbe combined to achieve a combined effect. Next, it is shownthat for SDS, the effect of surfactant is prominent only after acertain concentration. Measurement of CMC of SDS in CSsolution confirms that this concentration is very close to the
Received: April 7, 2013Revised: September 10, 2013Accepted: September 25, 2013Published: September 26, 2013
Article
pubs.acs.org/IECR
© 2013 American Chemical Society 15041 dx.doi.org/10.1021/ie4024403 | Ind. Eng. Chem. Res. 2013, 52, 15041−15048
CMC. This observation sets a lower limit on the concentrationof SDS needed for habit modification. Such a limit, if it exists ingeneral, can be used to predict the minimum surfactantconcentration needed for effective habit modification.
2. EXPERIMENTAL SECTION2.1. Materials. Copper sulfate pentahydrate (CuSO4·
5H2O), sodium dodecylsulfate (SDS), tween 80, polyethyleneglycol 6000 (PEG 6000), toluene, and glacial acetic acid werepurchased from Merck chemicals, India. Polyvinylpyrolidone(PVP) and cetyltrimethyl ammonium bromide (CTAB) werepurchased from S. D. Fine Chemicals, India. Span 80(sorbitanemonooleate), dioctyl sodium sulphosuccinate(AOT), sodium dodecyl benzene sulfonic acid (SDBS),acridine orange, and methyl orange (MO) were purchasedfrom Loba Chemie, India. Sudan III dye was purchased fromSisco research laboratory. All chemicals were used as received.Double distilled water was used for all experiments.2.2. Crystallization. Saturated solution of CS was prepared
at 30 °C and filtered with 11 μm Whatman filter paper. Thesolution was then heated to 35 °C for about 10 min to dissolveany particle that might be present and finally cooled to 30 °C.Ten milliliters of this solution was taken in a 30 mL glass vialand immediately immersed in an ice bath for coolingcrystallization. For testing of an additive, the additive wasdissolved in a saturated CS solution at higher concentration andthen diluted with fresh saturated CS solution to the desiredconcentration. Additives were used at low concentrations, andhence a significant change in solubility is not expected. Toconfirm this, the solubility of CS in SDS solution was testedquantitatively. It is found that over the range of SDSconcentration used, the change in solubility of CS is below2%, and hence such effects were not considered. The solution/slurry was stirred continuously during the crystallizationexperiment using a Teflon-coated magnetic stirrer at a speedof 150 rpm to ensure good mixing. The temperature wasmaintained at 0 °C (±1 °C) throughout. The slurry was filteredwith an 11 μm Whatman filter paper after 3 h.2.3. Measurements and Characterization. Spectroscopic
measurements were obtained using a Perkin-Elmer spectropho-tometer (model: Lambda 35). SEM images were obtained usinga JEOL JSM5800 scanning electron microscope unlessotherwise mentioned. Surface tension of solutions wasmeasured using a Du Nouy tensiometer (Test Master, Testingand Instruments, India). Precipitation of surfactant was testedby dynamic light scattering (DLS) using a Malvern zetasizer(nano series). FTIR spectra were obtained using a Perkin-Elmer (Spectrum Rx) spectrometer.2.4. Measurement of CMC of SDS in CuSO4 Solution.
CMC of SDS in a salt solution was measured using three well-known techniques: dye micellization, surface tension, and dyesolubilization. Methyl orange was used in dye micellizationexperiments. Details of these methods are available in theliterature.24−27 For dye micellization experiments,25 theconcentration of SDS was varied over a wide range, and theUV−visible spectra of samples were obtained. The peakwavelengths were plotted against concentrations of SDS.Such plots show a sharp change after a certain concentrationof SDS. This concentration is interpreted as CMC.Sudan III was used for dye solubilization26 experiments.
Excess amount of dye was added to the surfactant + CSsolutions, and the mixture was sonicated for 30 min. Themixture was allowed to settle for 2 h before filtration. For
experiments at lower temperature, the sonication wasconducted by wrapping the vial with disposable rubber glovescontaining ice. In some experiments, where CS/SDS mayprecipitate, the sonication period was reduced. The 2 h settlingperiod was also omitted for such cases by using centrifugation.The duration of these steps were decided on the basis of theinduction time. After filtration, absorbance of the dye wasmeasured to quantify the amount solubilized in the micelles.
2.5. Quantitative Measurement of SDS Using AcridineOrange. Acridine orange test28 was used for determining theamount of SDS present in a solution. SDS forms a yellowcolored complex with acridine orange, which can be extractedusing toluene and quantified using UV−visible spectroscopy.Briefly, 100 μL of solution containing SDS was mixed with 100μL of 1% acridine orange solution and then shaken for aminute. The complex was then extracted using 3 mL of tolueneby shaking for 3 min. The toluene solution was analyzed usingUV−vis spectroscopy against a calibration curve to determinethe concentration of SDS.To quantify the amount of SDS present on crystal surface,
acridine orange, glacial acetic acid, and toluene were added to ameasured amount of dried CS powder and then stirred. Thetoluene turns yellow, indicating the formation of SDS−acridineorange complex. The mixture was filtered, and the filtrate wasanalyzed quantitatively for SDS.
2.6. Preparation of Microemulsion. Oil-in-water micro-emulsion was prepared by adding 40 μL of toluene to 15 mL ofCS solution (with 0.5 mM SDS). The solution was stirredcontinuously at a speed of 200 rpm for 30 min. After beingstirred, a transparent microemulsion formed.
2.7. Measurement of Size of Hydrated SDS Crystals.SDS was dissolved at a desired concentration in 0.9 M CSsolution and kept in an ice bath. This solution was taken outperiodically and visually observed under a strong light for anyscattering. The observation period was very short so that nosignificant change in temperature occurred during observation.To supplement the visual observation, DLS (dynamic lightscattering) measurements of samples were also taken. For DLSmeasurements, the solution was transferred to the measure-ment cell after the desired period. The cell was also equilibratedat the same temperature. The cell was then placed in theZetasizer, which has accurate temperature control. Thecorrelation curve was then obtained, and the particle size wasmeasured using the built-in software.
3. RESULTS AND DISCUSSIONAll of the crystallization experiments discussed in this workwere carried out with identical concentration of copper sulfatein water, that is, the saturated solution at 30 °C. They were alsosubjected to identical supersaturation by cooling to the sametemperature (0 °C) irrespective of the introduced additive. Thecrystals were allowed to grow until the supersaturation wasexhausted. The crystals then were filtered and dried at 30 °C.Several trial runs had been conducted with and without
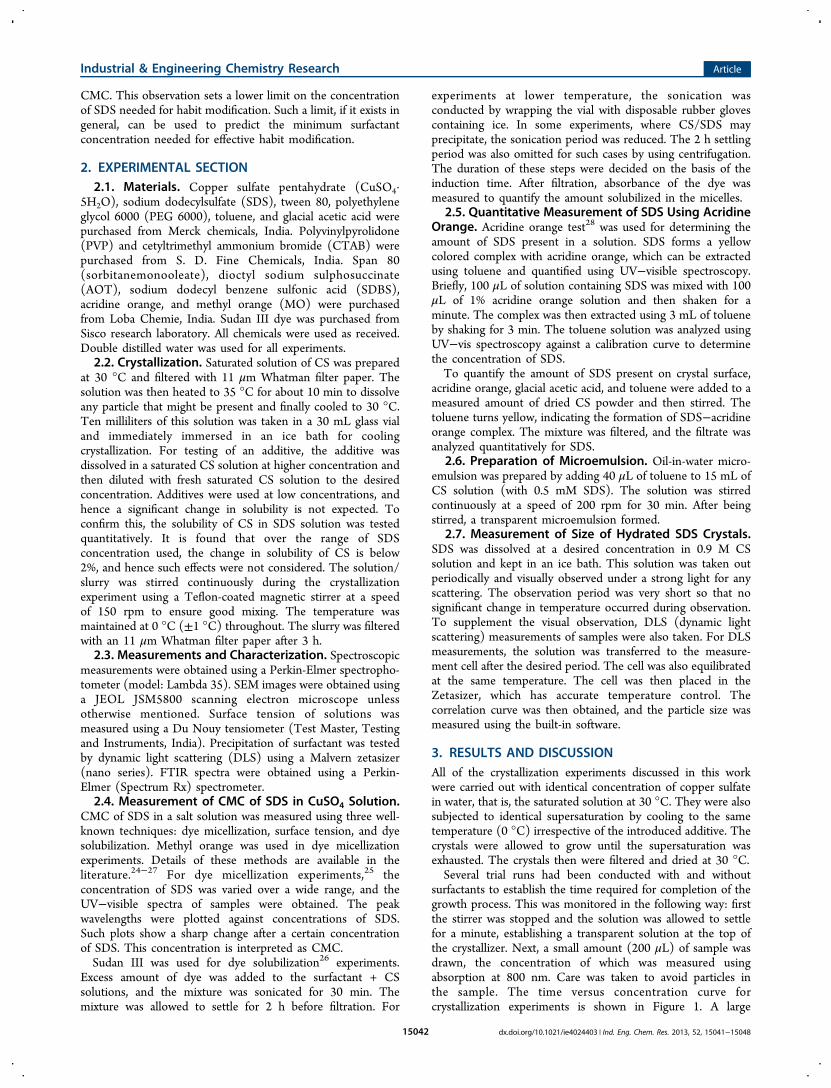
surfactants to establish the time required for completion of thegrowth process. This was monitored in the following way: firstthe stirrer was stopped and the solution was allowed to settlefor a minute, establishing a transparent solution at the top ofthe crystallizer. Next, a small amount (200 μL) of sample wasdrawn, the concentration of which was measured usingabsorption at 800 nm. Care was taken to avoid particles inthe sample. The time versus concentration curve forcrystallization experiments is shown in Figure 1. A large
Industrial & Engineering Chemistry Research Article
dx.doi.org/10.1021/ie4024403 | Ind. Eng. Chem. Res. 2013, 52, 15041−1504815042
number of crystals are formed within the first 5−10 min, andthe majority of the supersaturation is exhausted in 2 h, but theconcentration of CS in the growth solution reaches thereported saturation concentration29 in 3 h. Therefore, the slurrywas filtered after 3 h in all experiments of cooling crystallizationin this work.3.1. Effect of Various Surfactants on Morphology of
CS. Although the effect of surfactant on crystal morphology iswell discussed in the literature, the specific system is notexplored systematically. Hence, we briefly discuss the effect ofvarious surfactants on the morphology of CS. All three classesof surfactants, cationic, anionic, and nonionic, have been
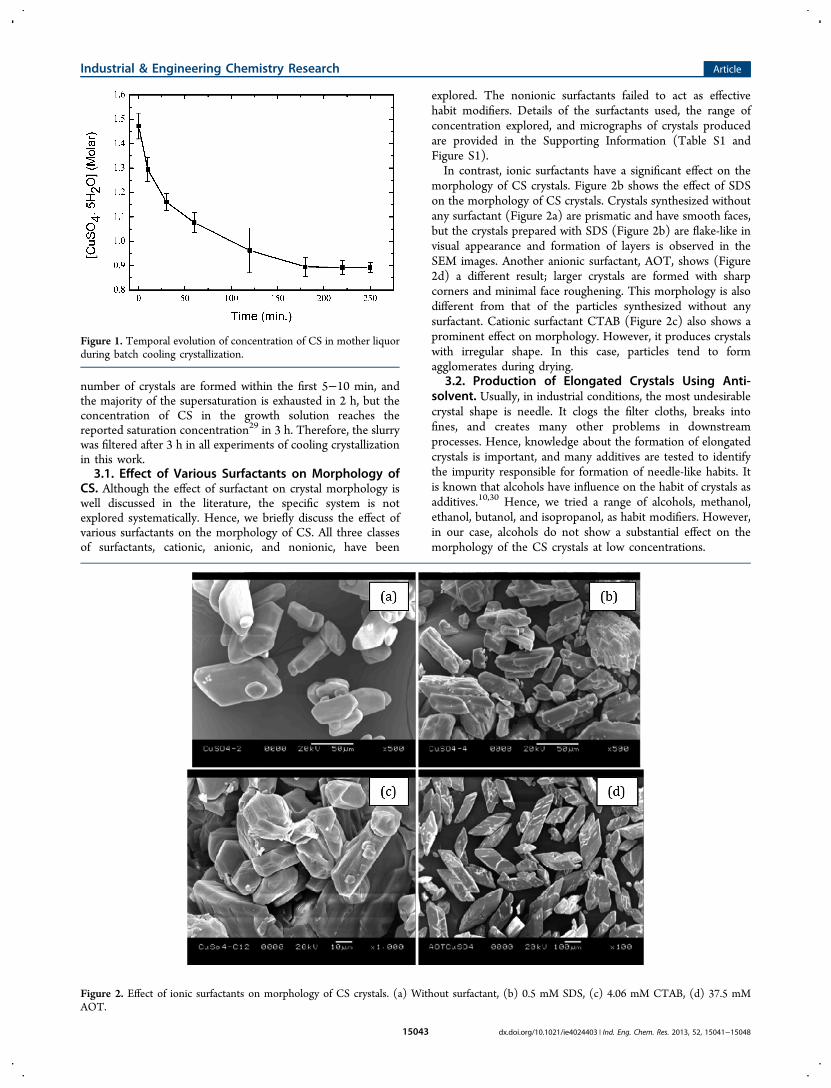
explored. The nonionic surfactants failed to act as effectivehabit modifiers. Details of the surfactants used, the range ofconcentration explored, and micrographs of crystals producedare provided in the Supporting Information (Table S1 andFigure S1).In contrast, ionic surfactants have a significant effect on the
morphology of CS crystals. Figure 2b shows the effect of SDSon the morphology of CS crystals. Crystals synthesized withoutany surfactant (Figure 2a) are prismatic and have smooth faces,but the crystals prepared with SDS (Figure 2b) are flake-like invisual appearance and formation of layers is observed in theSEM images. Another anionic surfactant, AOT, shows (Figure2d) a different result; larger crystals are formed with sharpcorners and minimal face roughening. This morphology is alsodifferent from that of the particles synthesized without anysurfactant. Cationic surfactant CTAB (Figure 2c) also shows aprominent effect on morphology. However, it produces crystalswith irregular shape. In this case, particles tend to formagglomerates during drying.
3.2. Production of Elongated Crystals Using Anti-solvent. Usually, in industrial conditions, the most undesirablecrystal shape is needle. It clogs the filter cloths, breaks intofines, and creates many other problems in downstreamprocesses. Hence, knowledge about the formation of elongatedcrystals is important, and many additives are tested to identifythe impurity responsible for formation of needle-like habits. Itis known that alcohols have influence on the habit of crystals asadditives.10,30 Hence, we tried a range of alcohols, methanol,ethanol, butanol, and isopropanol, as habit modifiers. However,in our case, alcohols do not show a substantial effect on themorphology of the CS crystals at low concentrations.
Figure 1. Temporal evolution of concentration of CS in mother liquorduring batch cooling crystallization.
Figure 2. Effect of ionic surfactants on morphology of CS crystals. (a) Without surfactant, (b) 0.5 mM SDS, (c) 4.06 mM CTAB, (d) 37.5 mMAOT.
Industrial & Engineering Chemistry Research Article
dx.doi.org/10.1021/ie4024403 | Ind. Eng. Chem. Res. 2013, 52, 15041−1504815043
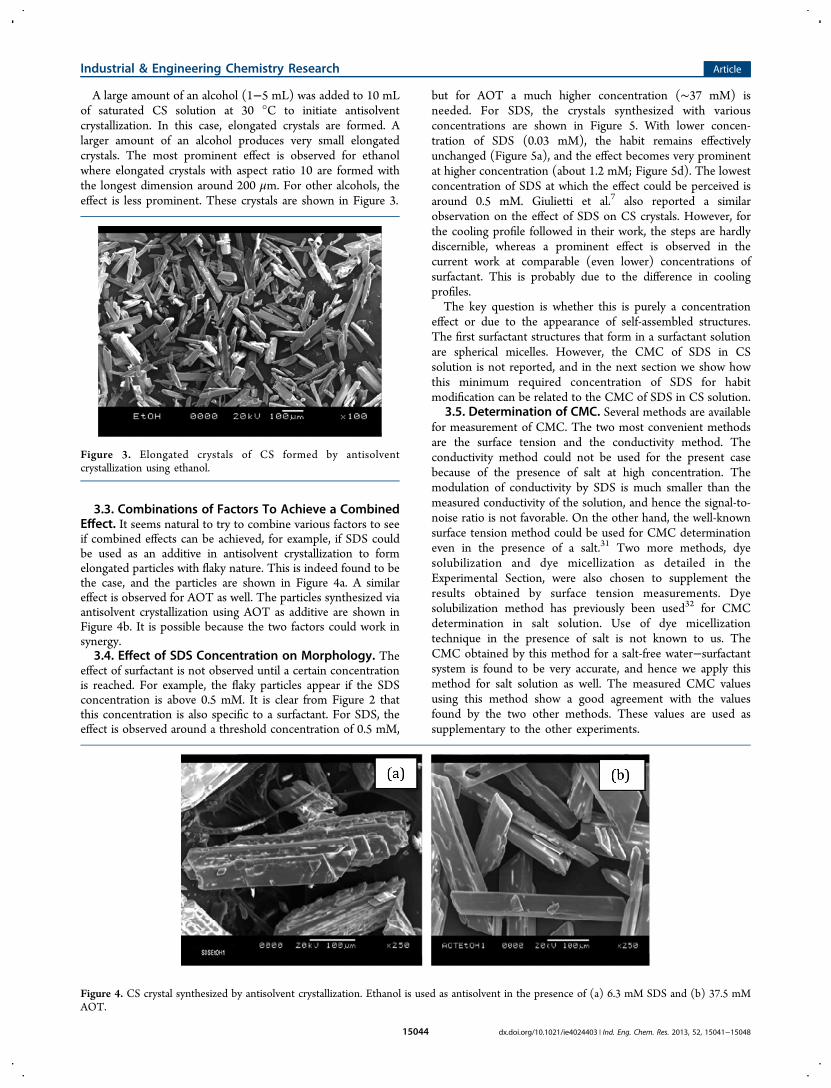
A large amount of an alcohol (1−5 mL) was added to 10 mLof saturated CS solution at 30 °C to initiate antisolventcrystallization. In this case, elongated crystals are formed. Alarger amount of an alcohol produces very small elongatedcrystals. The most prominent effect is observed for ethanolwhere elongated crystals with aspect ratio 10 are formed withthe longest dimension around 200 μm. For other alcohols, theeffect is less prominent. These crystals are shown in Figure 3.
3.3. Combinations of Factors To Achieve a CombinedEffect. It seems natural to try to combine various factors to seeif combined effects can be achieved, for example, if SDS couldbe used as an additive in antisolvent crystallization to formelongated particles with flaky nature. This is indeed found to bethe case, and the particles are shown in Figure 4a. A similareffect is observed for AOT as well. The particles synthesized viaantisolvent crystallization using AOT as additive are shown inFigure 4b. It is possible because the two factors could work insynergy.3.4. Effect of SDS Concentration on Morphology. The
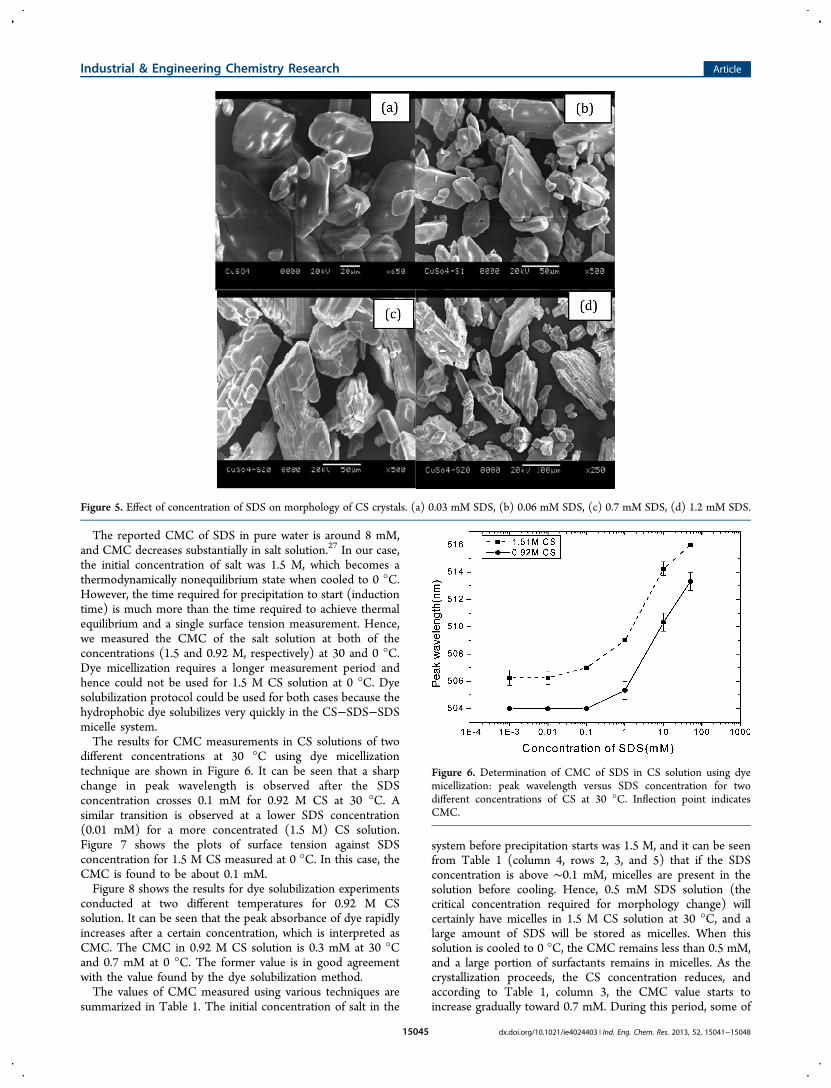
effect of surfactant is not observed until a certain concentrationis reached. For example, the flaky particles appear if the SDSconcentration is above 0.5 mM. It is clear from Figure 2 thatthis concentration is also specific to a surfactant. For SDS, theeffect is observed around a threshold concentration of 0.5 mM,
but for AOT a much higher concentration (∼37 mM) isneeded. For SDS, the crystals synthesized with variousconcentrations are shown in Figure 5. With lower concen-tration of SDS (0.03 mM), the habit remains effectivelyunchanged (Figure 5a), and the effect becomes very prominentat higher concentration (about 1.2 mM; Figure 5d). The lowestconcentration of SDS at which the effect could be perceived isaround 0.5 mM. Giulietti et al.7 also reported a similarobservation on the effect of SDS on CS crystals. However, forthe cooling profile followed in their work, the steps are hardlydiscernible, whereas a prominent effect is observed in thecurrent work at comparable (even lower) concentrations ofsurfactant. This is probably due to the difference in coolingprofiles.The key question is whether this is purely a concentration
effect or due to the appearance of self-assembled structures.The first surfactant structures that form in a surfactant solutionare spherical micelles. However, the CMC of SDS in CSsolution is not reported, and in the next section we show howthis minimum required concentration of SDS for habitmodification can be related to the CMC of SDS in CS solution.
3.5. Determination of CMC. Several methods are availablefor measurement of CMC. The two most convenient methodsare the surface tension and the conductivity method. Theconductivity method could not be used for the present casebecause of the presence of salt at high concentration. Themodulation of conductivity by SDS is much smaller than themeasured conductivity of the solution, and hence the signal-to-noise ratio is not favorable. On the other hand, the well-knownsurface tension method could be used for CMC determinationeven in the presence of a salt.31 Two more methods, dyesolubilization and dye micellization as detailed in theExperimental Section, were also chosen to supplement theresults obtained by surface tension measurements. Dyesolubilization method has previously been used32 for CMCdetermination in salt solution. Use of dye micellizationtechnique in the presence of salt is not known to us. TheCMC obtained by this method for a salt-free water−surfactantsystem is found to be very accurate, and hence we apply thismethod for salt solution as well. The measured CMC valuesusing this method show a good agreement with the valuesfound by the two other methods. These values are used assupplementary to the other experiments.
Figure 3. Elongated crystals of CS formed by antisolventcrystallization using ethanol.
Figure 4. CS crystal synthesized by antisolvent crystallization. Ethanol is used as antisolvent in the presence of (a) 6.3 mM SDS and (b) 37.5 mMAOT.
Industrial & Engineering Chemistry Research Article
dx.doi.org/10.1021/ie4024403 | Ind. Eng. Chem. Res. 2013, 52, 15041−1504815044
The reported CMC of SDS in pure water is around 8 mM,and CMC decreases substantially in salt solution.27 In our case,the initial concentration of salt was 1.5 M, which becomes athermodynamically nonequilibrium state when cooled to 0 °C.However, the time required for precipitation to start (inductiontime) is much more than the time required to achieve thermalequilibrium and a single surface tension measurement. Hence,we measured the CMC of the salt solution at both of theconcentrations (1.5 and 0.92 M, respectively) at 30 and 0 °C.Dye micellization requires a longer measurement period andhence could not be used for 1.5 M CS solution at 0 °C. Dyesolubilization protocol could be used for both cases because thehydrophobic dye solubilizes very quickly in the CS−SDS−SDSmicelle system.The results for CMC measurements in CS solutions of two
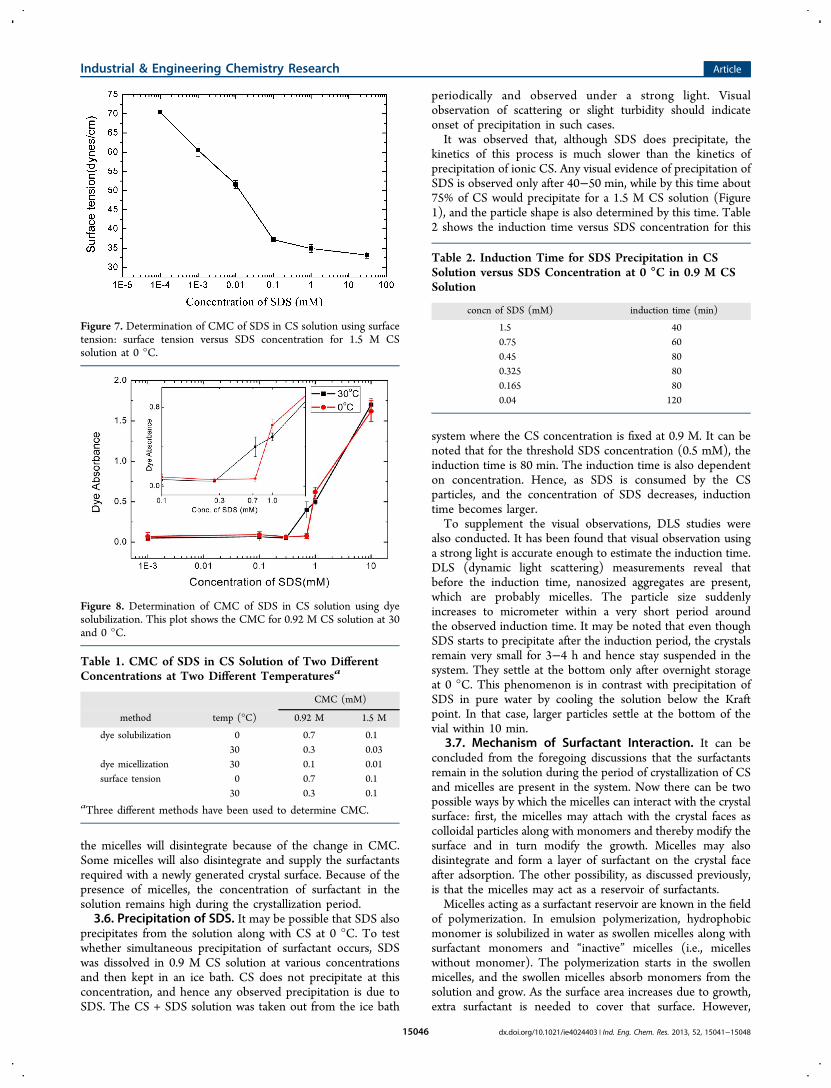
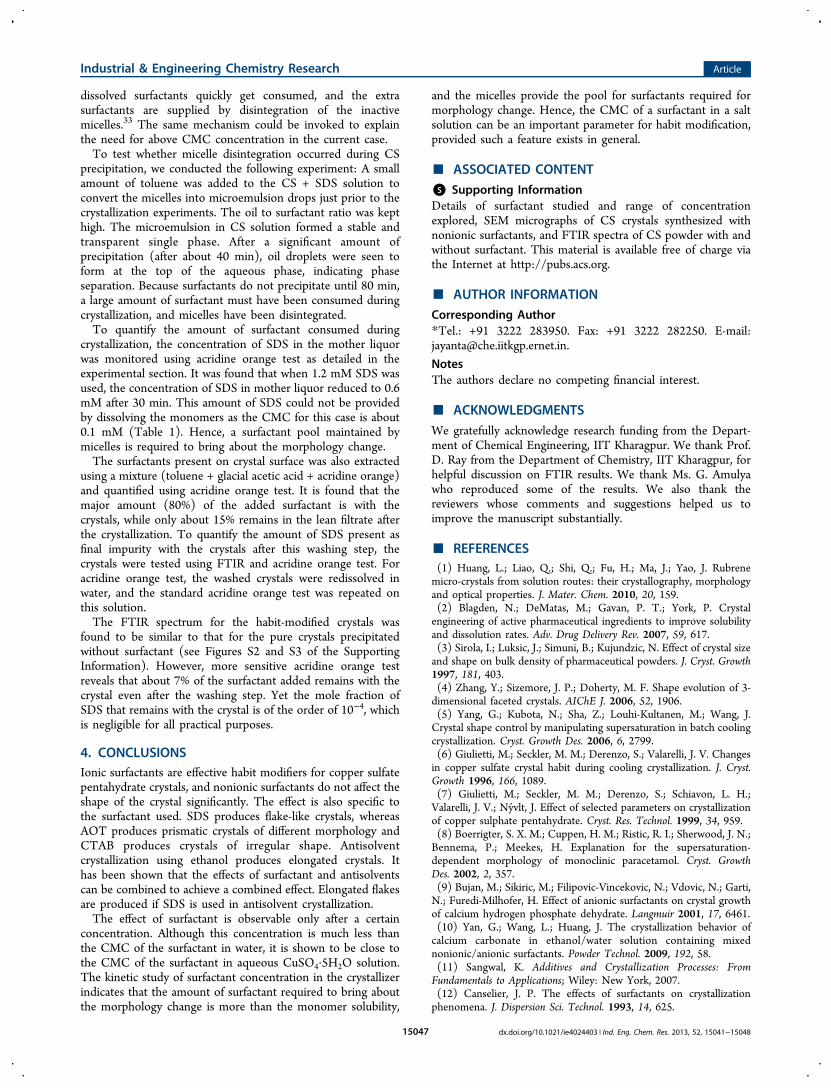
different concentrations at 30 °C using dye micellizationtechnique are shown in Figure 6. It can be seen that a sharpchange in peak wavelength is observed after the SDSconcentration crosses 0.1 mM for 0.92 M CS at 30 °C. Asimilar transition is observed at a lower SDS concentration(0.01 mM) for a more concentrated (1.5 M) CS solution.Figure 7 shows the plots of surface tension against SDSconcentration for 1.5 M CS measured at 0 °C. In this case, theCMC is found to be about 0.1 mM.Figure 8 shows the results for dye solubilization experiments
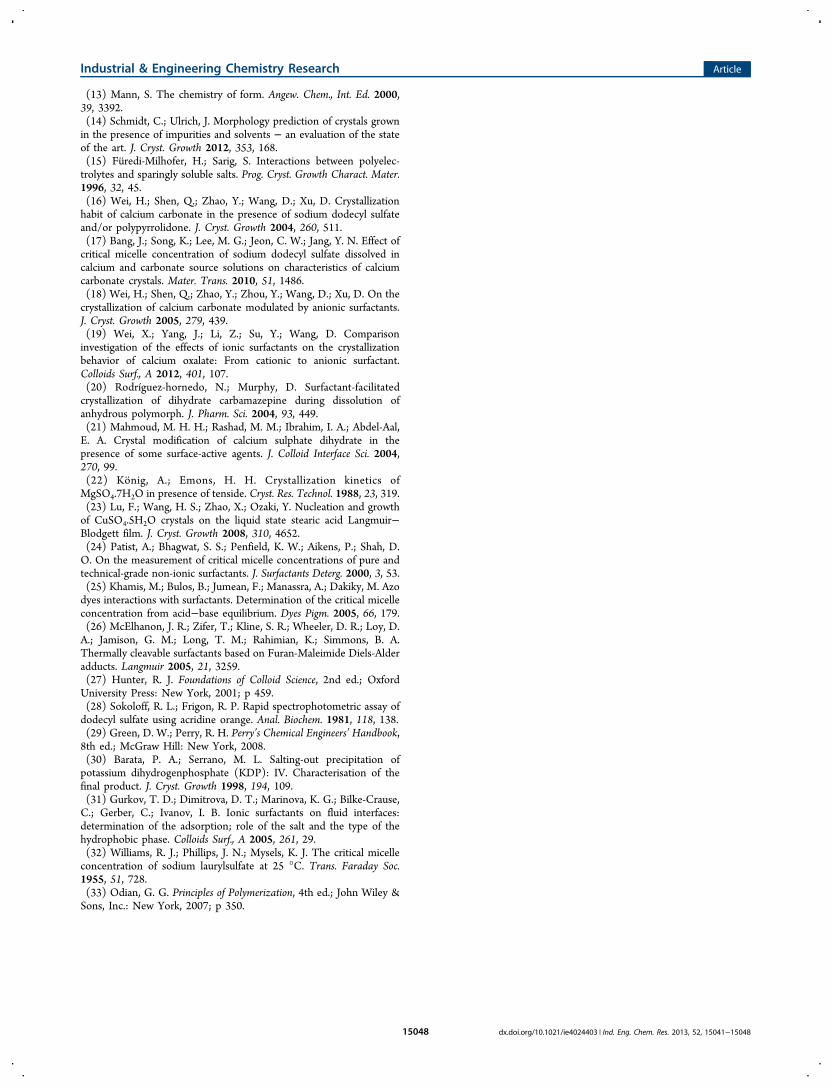
conducted at two different temperatures for 0.92 M CSsolution. It can be seen that the peak absorbance of dye rapidlyincreases after a certain concentration, which is interpreted asCMC. The CMC in 0.92 M CS solution is 0.3 mM at 30 °Cand 0.7 mM at 0 °C. The former value is in good agreementwith the value found by the dye solubilization method.The values of CMC measured using various techniques are
summarized in Table 1. The initial concentration of salt in the
system before precipitation starts was 1.5 M, and it can be seenfrom Table 1 (column 4, rows 2, 3, and 5) that if the SDSconcentration is above ∼0.1 mM, micelles are present in thesolution before cooling. Hence, 0.5 mM SDS solution (thecritical concentration required for morphology change) willcertainly have micelles in 1.5 M CS solution at 30 °C, and alarge amount of SDS will be stored as micelles. When thissolution is cooled to 0 °C, the CMC remains less than 0.5 mM,and a large portion of surfactants remains in micelles. As thecrystallization proceeds, the CS concentration reduces, andaccording to Table 1, column 3, the CMC value starts toincrease gradually toward 0.7 mM. During this period, some of
Figure 5. Effect of concentration of SDS on morphology of CS crystals. (a) 0.03 mM SDS, (b) 0.06 mM SDS, (c) 0.7 mM SDS, (d) 1.2 mM SDS.
Figure 6. Determination of CMC of SDS in CS solution using dyemicellization: peak wavelength versus SDS concentration for twodifferent concentrations of CS at 30 °C. Inflection point indicatesCMC.
Industrial & Engineering Chemistry Research Article
dx.doi.org/10.1021/ie4024403 | Ind. Eng. Chem. Res. 2013, 52, 15041−1504815045
the micelles will disintegrate because of the change in CMC.Some micelles will also disintegrate and supply the surfactantsrequired with a newly generated crystal surface. Because of thepresence of micelles, the concentration of surfactant in thesolution remains high during the crystallization period.3.6. Precipitation of SDS. It may be possible that SDS also
precipitates from the solution along with CS at 0 °C. To testwhether simultaneous precipitation of surfactant occurs, SDSwas dissolved in 0.9 M CS solution at various concentrationsand then kept in an ice bath. CS does not precipitate at thisconcentration, and hence any observed precipitation is due toSDS. The CS + SDS solution was taken out from the ice bath
periodically and observed under a strong light. Visualobservation of scattering or slight turbidity should indicateonset of precipitation in such cases.It was observed that, although SDS does precipitate, the
kinetics of this process is much slower than the kinetics ofprecipitation of ionic CS. Any visual evidence of precipitation ofSDS is observed only after 40−50 min, while by this time about75% of CS would precipitate for a 1.5 M CS solution (Figure1), and the particle shape is also determined by this time. Table2 shows the induction time versus SDS concentration for this
system where the CS concentration is fixed at 0.9 M. It can benoted that for the threshold SDS concentration (0.5 mM), theinduction time is 80 min. The induction time is also dependenton concentration. Hence, as SDS is consumed by the CSparticles, and the concentration of SDS decreases, inductiontime becomes larger.To supplement the visual observations, DLS studies were
also conducted. It has been found that visual observation usinga strong light is accurate enough to estimate the induction time.DLS (dynamic light scattering) measurements reveal thatbefore the induction time, nanosized aggregates are present,which are probably micelles. The particle size suddenlyincreases to micrometer within a very short period aroundthe observed induction time. It may be noted that even thoughSDS starts to precipitate after the induction period, the crystalsremain very small for 3−4 h and hence stay suspended in thesystem. They settle at the bottom only after overnight storageat 0 °C. This phenomenon is in contrast with precipitation ofSDS in pure water by cooling the solution below the Kraftpoint. In that case, larger particles settle at the bottom of thevial within 10 min.
3.7. Mechanism of Surfactant Interaction. It can beconcluded from the foregoing discussions that the surfactantsremain in the solution during the period of crystallization of CSand micelles are present in the system. Now there can be twopossible ways by which the micelles can interact with the crystalsurface: first, the micelles may attach with the crystal faces ascolloidal particles along with monomers and thereby modify thesurface and in turn modify the growth. Micelles may alsodisintegrate and form a layer of surfactant on the crystal faceafter adsorption. The other possibility, as discussed previously,is that the micelles may act as a reservoir of surfactants.Micelles acting as a surfactant reservoir are known in the field
of polymerization. In emulsion polymerization, hydrophobicmonomer is solubilized in water as swollen micelles along withsurfactant monomers and “inactive” micelles (i.e., micelleswithout monomer). The polymerization starts in the swollenmicelles, and the swollen micelles absorb monomers from thesolution and grow. As the surface area increases due to growth,extra surfactant is needed to cover that surface. However,
Figure 7. Determination of CMC of SDS in CS solution using surfacetension: surface tension versus SDS concentration for 1.5 M CSsolution at 0 °C.
Figure 8. Determination of CMC of SDS in CS solution using dyesolubilization. This plot shows the CMC for 0.92 M CS solution at 30and 0 °C.
Table 1. CMC of SDS in CS Solution of Two DifferentConcentrations at Two Different Temperaturesa
CMC (mM)
method temp (°C) 0.92 M 1.5 M
dye solubilization 0 0.7 0.130 0.3 0.03
dye micellization 30 0.1 0.01surface tension 0 0.7 0.1
30 0.3 0.1aThree different methods have been used to determine CMC.
Table 2. Induction Time for SDS Precipitation in CSSolution versus SDS Concentration at 0 °C in 0.9 M CSSolution
concn of SDS (mM) induction time (min)
1.5 400.75 600.45 800.325 800.165 800.04 120
Industrial & Engineering Chemistry Research Article
dx.doi.org/10.1021/ie4024403 | Ind. Eng. Chem. Res. 2013, 52, 15041−1504815046
dissolved surfactants quickly get consumed, and the extrasurfactants are supplied by disintegration of the inactivemicelles.33 The same mechanism could be invoked to explainthe need for above CMC concentration in the current case.To test whether micelle disintegration occurred during CS
precipitation, we conducted the following experiment: A smallamount of toluene was added to the CS + SDS solution toconvert the micelles into microemulsion drops just prior to thecrystallization experiments. The oil to surfactant ratio was kepthigh. The microemulsion in CS solution formed a stable andtransparent single phase. After a significant amount ofprecipitation (after about 40 min), oil droplets were seen toform at the top of the aqueous phase, indicating phaseseparation. Because surfactants do not precipitate until 80 min,a large amount of surfactant must have been consumed duringcrystallization, and micelles have been disintegrated.To quantify the amount of surfactant consumed during
crystallization, the concentration of SDS in the mother liquorwas monitored using acridine orange test as detailed in theexperimental section. It was found that when 1.2 mM SDS wasused, the concentration of SDS in mother liquor reduced to 0.6mM after 30 min. This amount of SDS could not be providedby dissolving the monomers as the CMC for this case is about0.1 mM (Table 1). Hence, a surfactant pool maintained bymicelles is required to bring about the morphology change.The surfactants present on crystal surface was also extracted
using a mixture (toluene + glacial acetic acid + acridine orange)and quantified using acridine orange test. It is found that themajor amount (80%) of the added surfactant is with thecrystals, while only about 15% remains in the lean filtrate afterthe crystallization. To quantify the amount of SDS present asfinal impurity with the crystals after this washing step, thecrystals were tested using FTIR and acridine orange test. Foracridine orange test, the washed crystals were redissolved inwater, and the standard acridine orange test was repeated onthis solution.The FTIR spectrum for the habit-modified crystals was
found to be similar to that for the pure crystals precipitatedwithout surfactant (see Figures S2 and S3 of the SupportingInformation). However, more sensitive acridine orange testreveals that about 7% of the surfactant added remains with thecrystal even after the washing step. Yet the mole fraction ofSDS that remains with the crystal is of the order of 10−4, whichis negligible for all practical purposes.
4. CONCLUSIONSIonic surfactants are effective habit modifiers for copper sulfatepentahydrate crystals, and nonionic surfactants do not affect theshape of the crystal significantly. The effect is also specific tothe surfactant used. SDS produces flake-like crystals, whereasAOT produces prismatic crystals of different morphology andCTAB produces crystals of irregular shape. Antisolventcrystallization using ethanol produces elongated crystals. Ithas been shown that the effects of surfactant and antisolventscan be combined to achieve a combined effect. Elongated flakesare produced if SDS is used in antisolvent crystallization.The effect of surfactant is observable only after a certain
concentration. Although this concentration is much less thanthe CMC of the surfactant in water, it is shown to be close tothe CMC of the surfactant in aqueous CuSO4·5H2O solution.The kinetic study of surfactant concentration in the crystallizerindicates that the amount of surfactant required to bring aboutthe morphology change is more than the monomer solubility,
and the micelles provide the pool for surfactants required formorphology change. Hence, the CMC of a surfactant in a saltsolution can be an important parameter for habit modification,provided such a feature exists in general.
■ ASSOCIATED CONTENT
*S Supporting InformationDetails of surfactant studied and range of concentrationexplored, SEM micrographs of CS crystals synthesized withnonionic surfactants, and FTIR spectra of CS powder with andwithout surfactant. This material is available free of charge viathe Internet at http://pubs.acs.org.
■ AUTHOR INFORMATION
Corresponding Author*Tel.: +91 3222 283950. Fax: +91 3222 282250. E-mail:[email protected].
NotesThe authors declare no competing financial interest.
■ ACKNOWLEDGMENTS
We gratefully acknowledge research funding from the Depart-ment of Chemical Engineering, IIT Kharagpur. We thank Prof.D. Ray from the Department of Chemistry, IIT Kharagpur, forhelpful discussion on FTIR results. We thank Ms. G. Amulyawho reproduced some of the results. We also thank thereviewers whose comments and suggestions helped us toimprove the manuscript substantially.
■ REFERENCES(1) Huang, L.; Liao, Q.; Shi, Q.; Fu, H.; Ma, J.; Yao, J. Rubrenemicro-crystals from solution routes: their crystallography, morphologyand optical properties. J. Mater. Chem. 2010, 20, 159.(2) Blagden, N.; DeMatas, M.; Gavan, P. T.; York, P. Crystalengineering of active pharmaceutical ingredients to improve solubilityand dissolution rates. Adv. Drug Delivery Rev. 2007, 59, 617.(3) Sirola, I.; Luksic, J.; Simuni, B.; Kujundzic, N. Effect of crystal sizeand shape on bulk density of pharmaceutical powders. J. Cryst. Growth1997, 181, 403.(4) Zhang, Y.; Sizemore, J. P.; Doherty, M. F. Shape evolution of 3-dimensional faceted crystals. AIChE J. 2006, 52, 1906.(5) Yang, G.; Kubota, N.; Sha, Z.; Louhi-Kultanen, M.; Wang, J.Crystal shape control by manipulating supersaturation in batch coolingcrystallization. Cryst. Growth Des. 2006, 6, 2799.(6) Giulietti, M.; Seckler, M. M.; Derenzo, S.; Valarelli, J. V. Changesin copper sulfate crystal habit during cooling crystallization. J. Cryst.Growth 1996, 166, 1089.(7) Giulietti, M.; Seckler, M. M.; Derenzo, S.; Schiavon, L. H.;Valarelli, J. V.; Nyvlt, J. Effect of selected parameters on crystallizationof copper sulphate pentahydrate. Cryst. Res. Technol. 1999, 34, 959.(8) Boerrigter, S. X. M.; Cuppen, H. M.; Ristic, R. I.; Sherwood, J. N.;Bennema, P.; Meekes, H. Explanation for the supersaturation-dependent morphology of monoclinic paracetamol. Cryst. GrowthDes. 2002, 2, 357.(9) Bujan, M.; Sikiric, M.; Filipovic-Vincekovic, N.; Vdovic, N.; Garti,N.; Furedi-Milhofer, H. Effect of anionic surfactants on crystal growthof calcium hydrogen phosphate dehydrate. Langmuir 2001, 17, 6461.(10) Yan, G.; Wang, L.; Huang, J. The crystallization behavior ofcalcium carbonate in ethanol/water solution containing mixednonionic/anionic surfactants. Powder Technol. 2009, 192, 58.(11) Sangwal, K. Additives and Crystallization Processes: FromFundamentals to Applications; Wiley: New York, 2007.(12) Canselier, J. P. The effects of surfactants on crystallizationphenomena. J. Dispersion Sci. Technol. 1993, 14, 625.
Industrial & Engineering Chemistry Research Article
dx.doi.org/10.1021/ie4024403 | Ind. Eng. Chem. Res. 2013, 52, 15041−1504815047
(13) Mann, S. The chemistry of form. Angew. Chem., Int. Ed. 2000,39, 3392.(14) Schmidt, C.; Ulrich, J. Morphology prediction of crystals grownin the presence of impurities and solvents − an evaluation of the stateof the art. J. Cryst. Growth 2012, 353, 168.(15) Furedi-Milhofer, H.; Sarig, S. Interactions between polyelec-trolytes and sparingly soluble salts. Prog. Cryst. Growth Charact. Mater.1996, 32, 45.(16) Wei, H.; Shen, Q.; Zhao, Y.; Wang, D.; Xu, D. Crystallizationhabit of calcium carbonate in the presence of sodium dodecyl sulfateand/or polypyrrolidone. J. Cryst. Growth 2004, 260, 511.(17) Bang, J.; Song, K.; Lee, M. G.; Jeon, C. W.; Jang, Y. N. Effect ofcritical micelle concentration of sodium dodecyl sulfate dissolved incalcium and carbonate source solutions on characteristics of calciumcarbonate crystals. Mater. Trans. 2010, 51, 1486.(18) Wei, H.; Shen, Q.; Zhao, Y.; Zhou, Y.; Wang, D.; Xu, D. On thecrystallization of calcium carbonate modulated by anionic surfactants.J. Cryst. Growth 2005, 279, 439.(19) Wei, X.; Yang, J.; Li, Z.; Su, Y.; Wang, D. Comparisoninvestigation of the effects of ionic surfactants on the crystallizationbehavior of calcium oxalate: From cationic to anionic surfactant.Colloids Surf., A 2012, 401, 107.(20) Rodríguez-hornedo, N.; Murphy, D. Surfactant-facilitatedcrystallization of dihydrate carbamazepine during dissolution ofanhydrous polymorph. J. Pharm. Sci. 2004, 93, 449.(21) Mahmoud, M. H. H.; Rashad, M. M.; Ibrahim, I. A.; Abdel-Aal,E. A. Crystal modification of calcium sulphate dihydrate in thepresence of some surface-active agents. J. Colloid Interface Sci. 2004,270, 99.(22) Konig, A.; Emons, H. H. Crystallization kinetics ofMgSO4.7H2O in presence of tenside. Cryst. Res. Technol. 1988, 23, 319.(23) Lu, F.; Wang, H. S.; Zhao, X.; Ozaki, Y. Nucleation and growthof CuSO4.5H2O crystals on the liquid state stearic acid Langmuir−Blodgett film. J. Cryst. Growth 2008, 310, 4652.(24) Patist, A.; Bhagwat, S. S.; Penfield, K. W.; Aikens, P.; Shah, D.O. On the measurement of critical micelle concentrations of pure andtechnical-grade non-ionic surfactants. J. Surfactants Deterg. 2000, 3, 53.(25) Khamis, M.; Bulos, B.; Jumean, F.; Manassra, A.; Dakiky, M. Azodyes interactions with surfactants. Determination of the critical micelleconcentration from acid−base equilibrium. Dyes Pigm. 2005, 66, 179.(26) McElhanon, J. R.; Zifer, T.; Kline, S. R.; Wheeler, D. R.; Loy, D.A.; Jamison, G. M.; Long, T. M.; Rahimian, K.; Simmons, B. A.Thermally cleavable surfactants based on Furan-Maleimide Diels-Alderadducts. Langmuir 2005, 21, 3259.(27) Hunter, R. J. Foundations of Colloid Science, 2nd ed.; OxfordUniversity Press: New York, 2001; p 459.(28) Sokoloff, R. L.; Frigon, R. P. Rapid spectrophotometric assay ofdodecyl sulfate using acridine orange. Anal. Biochem. 1981, 118, 138.(29) Green, D. W.; Perry, R. H. Perry’s Chemical Engineers’ Handbook,8th ed.; McGraw Hill: New York, 2008.(30) Barata, P. A.; Serrano, M. L. Salting-out precipitation ofpotassium dihydrogenphosphate (KDP): IV. Characterisation of thefinal product. J. Cryst. Growth 1998, 194, 109.(31) Gurkov, T. D.; Dimitrova, D. T.; Marinova, K. G.; Bilke-Crause,C.; Gerber, C.; Ivanov, I. B. Ionic surfactants on fluid interfaces:determination of the adsorption; role of the salt and the type of thehydrophobic phase. Colloids Surf., A 2005, 261, 29.(32) Williams, R. J.; Phillips, J. N.; Mysels, K. J. The critical micelleconcentration of sodium laurylsulfate at 25 °C. Trans. Faraday Soc.1955, 51, 728.(33) Odian, G. G. Principles of Polymerization, 4th ed.; John Wiley &Sons, Inc.: New York, 2007; p 350.
Industrial & Engineering Chemistry Research Article
dx.doi.org/10.1021/ie4024403 | Ind. Eng. Chem. Res. 2013, 52, 15041−1504815048
Copyright © 2022 FDOKUMEN


![Synthesis of [(4-Chloro-5H-1,2,3-dithiazol-5-ylidene)amino]azines](https://static.fdokumen.com/doc/165x107/6344ded56cfb3d4064096a20/synthesis-of-4-chloro-5h-123-dithiazol-5-ylideneaminoazines.jpg)