effect of information technology on tax administration and ...
82
EFFECT OF INFORMATION TECHNOLOGY ON TAX ADMINISTRATION AND PERFORMANCE BY KENYA REVENUE AUTHORITY (KRA): A STUDY OF SAMEER PARK BRANCH BY CHARITY N. KINYUA UNITED STATES INTERNATIONAL UNIVERSITY - AFRICA SUMMER 2019
-
Upload
khangminh22 -
Category
Documents
-
view
1 -
download
0
Transcript of effect of information technology on tax administration and ...

EFFECT OF INFORMATION TECHNOLOGY ON TAX
ADMINISTRATION AND PERFORMANCE BY KENYA REVENUE
AUTHORITY (KRA): A STUDY OF SAMEER PARK BRANCH
BY
CHARITY N. KINYUA
UNITED STATES INTERNATIONAL UNIVERSITY - AFRICA
SUMMER 2019

EFFECT OF INFORMATION TECHNOLOGY ON TAX
ADMINISTRATION AND PERFORMANCE BY KENYA REVENUE
AUTHORITY (KRA): A STUDY OF SAMEER PARK BRANCH
BY
CHARITY N. KINYUA
A Research Project Report Submitted to the Chandaria School of Business in Partial
Fulfillment of the Requirement for the Degree of Masters in Business
Administration (MBA)
UNITED STATES INTERNATIONAL UNIVERSITY - AFRICA
SUMMER 2019

ii
STUDENT’S DECLARATION
I, the undersigned, declare that this is my original work and has not been submitted to any
other college, institution or university other than the United States International
University - Africa in Nairobi for academic credit.
Signed: ________________________ Date: _________________________
Charity N. Kinyua (ID No: 657273)
This research project report has been presented for examination with my approval as the
appointed supervisor.
Signed: ________________________ Date: _________________________
Prof. Zachary Mosoti
Signed: ________________________ Date: _________________________
Dean, Chandaria School of Business

iii
COPYRIGHT
Copyright © Charity N. Kinyua, 2019
All Rights Reserved
No part of this research project report may be reproduced or distributed in any form or
any means electronically, mechanically or photocopy, or stored in a database or retrieval
systems, without prior permission of the author and the institution.

iv
ABSTRACT
The objective of this study was to investigate the effect of information technology on tax
administration and performance by Kenya Revenue Authority (KRA). The study was
guided by specific objectives driven to identify the effect of employees’ IT knowledge on
tax administration performance, the effect of business processes technology on tax
administration performance, and effect of taxpayers’ IT knowledge on tax administration
performance in relation to the performance of KRA and its sustainability.
The study adopted an explanatory research design. The population of the study targeted
300 members of staff working at the Sameer Park Branch along Mombasa road who were
300. The sample frame for the study was a list of the population which was obtained from
the staff members at Sameer Park Branch provided by the directors at Sameer Park. The
study used a probability sampling design known as the systematic random sampling
design. The sample size was derived using the formula suggested by Yamane (1967),
which provided the study with a sample size of 171 respondents. The study collected
primary data using questionnaires which comprised of closed-ended questions.
Cronbach’s Alpha test was used to examine the reliability of the questionnaires. The data
collected was analysed using Statistical Package for Social Science (SPSS). Descriptive
statistics of frequencies, means and standard deviations were used during analysis to
provide figures and tables. Inferential statistics including Correlation and regression
analysis were also employed in the study.
The study showed that information technology has increased productivity in the
organization, as well as help staff from different departments in the organization to
communicate without necessarily having to meet in person, enabled the employees to
meet deadlines for daily operations as well as prioritize their work in terms of need. IT
has allowed employees to access to information via a touch of a button and the automated
systems have reduced the work of printing personal and business information. KRA is
keen on ensuring all staff members are educated and trained appropriately in order for
them to operate effectively and meet their deadlines.
The study indicated that automated systems in the organization required less if any human
labour and they were cheap as compared to human labour. Social media in the
organization involves turning communication into interactions through various platforms

v
and KRA values the integration of social media into its business process. KRA employees
prefer to make their own time to work and their working behaviour has changed due to
the increasing use of IT, because, the adoption of computers in the organization has
transformed the organization.
The study revealed that technology is necessary for the tax administration activities in the
organization, it has reduced the period of time between when the tax is generated and the
moment it is paid. Technology in tax administration aims at enhancing efficiency in tax
collection and it has reduced the errors in procedures of gathering of data automatically as
well as reducing the overall cost of tax administration. Automating revenue collection has
helped taxpayers to have a better audit trail of their tax, and technology has brought about
a significant improvement in the revenue collection time for tax payers.
The study concludes that technology had distracted employees, especially social media
and entertainment sites, as well as leading to a decrease in creativity and innovation in the
workplace. However, it had also facilitated the streamlining of KRA’s administrative
process, as well as enabling the organization to reduce the need for middle managers, by
helping employees bypass traditional organizational hierarchy and menu-driven mail
repositories.
The study recommends the management of KRA at Sameer Business Park to encourage
its employees to make use of technology and become more creative and innovative in the
firm. The managers could encourage and task employees to come-up with better methods
of using technology to process and handle their tax administration which would improve
the firm’s overall tax administration performance.

vi
ACKNOWLEDGEMENT
I would like to thank my supervisor Prof. Zachary Mosoti for leading me through this
research project report journey and certifying that I have completed it in the desired
manner. Thank you for words of encouragement and support throughout my research
period for I would not have made it.
I would also wish to extend my thanks to my family and friends for their support and
encouragement throughout my study.

vii
DEDICATION
I dedicate this project to God Almighty my creator, my strong pillar, my source of
wisdom, knowledge and inspiration and understanding. He has been the source of my
strength throughout my pursuit for education and on His wings have I soared. I also
dedicate this work to my family who have encouraged me all the way and whose
encouragement has made sure that I give it all it takes to finish that which I have started.
To my child, Ryan who has been affected in every way possible by this quest. Thankyou.
My love for you all can never be quantified. God bless you.

viii
TABLE OF CONTENTS
STUDENT’S DECLARATION ........................................................................................ ii
COPYRIGHT ....................................................................................................................iii
ABSTRACT ....................................................................................................................... iv
ACKNOWLEDGEMENT ................................................................................................ vi
DEDICATION.................................................................................................................. vii
TABLE OF CONTENTS ...............................................................................................viii
LIST OF TABLES ............................................................................................................. x
LIST OF FIGURES .......................................................................................................... xi
LIST OF ABBREVIATIONS AND ACRONYMS ....................................................... xii
CHAPTER ONE ................................................................................................................ 1
1.0 INTRODUCTION........................................................................................................ 1
1.1 Background of the Study ............................................................................................... 1
1.2 Statement of the Problem ............................................................................................... 5
1.3 General Objective .......................................................................................................... 6
1.4 Specific Objectives ........................................................................................................ 7
1.5 Significance of the Study ............................................................................................... 7
1.6 Scope of Study ............................................................................................................... 8
1.7 Definition of Terms........................................................................................................ 8
1.8 Chapter Summary .......................................................................................................... 8
CHAPTER TWO ............................................................................................................. 10
2.0 LITERATURE REVIEW ......................................................................................... 10
2.1 Introduction .................................................................................................................. 10
2.2 Employees’ Information and Technology Knowledge and Tax Administration ......... 10
2.3 Business Process Technology and Tax Administration ............................................... 14
2.4 Taxpayers’ Information and Technology Knowledge and Tax Administration .......... 19
2.5 Chapter Summary ........................................................................................................ 24
CHAPTER THREE ......................................................................................................... 25
3.0 RESEARCH METHODOLOGY ............................................................................. 25
3.1 Introduction .................................................................................................................. 25
3.2 Research Design........................................................................................................... 25

ix
3.3 Population and Sampling Design ................................................................................. 25
3.4 Data Collection Methods ............................................................................................. 27
3.5 Research Procedures .................................................................................................... 28
3.6 Data Analysis Methods ................................................................................................ 29
3.7 Chapter Summary ........................................................................................................ 29
CHAPTER FOUR ............................................................................................................ 30
4.0 RESULTS AND FINDINGS ..................................................................................... 30
4.1 Introduction .................................................................................................................. 30
4.2 Demographic Information ............................................................................................ 30
4.3 Employees’ Information and Technology Knowledge and Tax Administration ......... 33
4.4 Business Process Technology and Tax Administration ............................................... 37
4.5 Taxpayers’ Information and Technology Knowledge and Tax Administration .......... 41
4.6 Chapter Summary ........................................................................................................ 46
CHAPTER FIVE ............................................................................................................. 47
5.0 DISCUSSIONS, CONCLUSIONS AND RECOMMENDATIONS ...................... 47
5.1 Introduction .................................................................................................................. 47
5.2 Summary of Findings ................................................................................................... 47
5.3 Discussions .................................................................................................................. 48
5.4 Conclusions .................................................................................................................. 55
5.5 Recommendations ........................................................................................................ 56
REFERENCES ................................................................................................................. 58
APPENDICES .................................................................................................................. 63
APPENDIX I: RESEARCH PARTICIPATION LETTER ............................................... 63
APPENDIX II: QUESTIONNAIRE .................................................................................. 64
APPENDIX III: NACOSTI PERMIT ………………………………………………...…68

x
LIST OF TABLES
Table 3.1: Population Distribution .................................................................................... 26
Table 3.2: Sample Size Distribution ................................................................................. 27
Table 4.1: Reliability Test ................................................................................................. 30
Table 4.2: Assessment of Employees’ IT Knowledge and Tax Administration ............... 34
Table 4.3: Correlations for Employees’ IT Knowledge and Tax Administration ............ 35
Table 4.4: Employees’ IT Knowledge and Tax Administration Model Summary ........... 36
Table 4.5: Employees’ IT Knowledge and Tax Administration Coefficients .................. 36
Table 4.6: Assessment of Business Process Technology and Tax Administration .......... 38
Table 4.7: Correlations for Business Process Technology and Tax Administration ........ 39
Table 4.8: Business Process Technology and Tax Administration Model Summary ....... 40
Table 4.9: Business Process Technology and Tax Administration Coefficients .............. 40
Table 4.10: Assessment of Taxpayers’ IT Knowledge and Tax Administration .............. 42
Table 4.11: Correlations for Taxpayers’ IT Knowledge and Tax Administration............ 43
Table 4.12: Taxpayers’ IT Knowledge and Tax Administration Model Summary .......... 43
Table 4.13: Taxpayers’ IT Knowledge and Tax Administration Coefficients ................. 44
Table 4.14: Correlations for Information Technology Items and Tax Administration ..... 44
Table 4.15: Information Technology Items and Tax Administration Model Summary ... 45
Table 4.16: Information Technology Items and Tax Administration Coefficients ........... 45
xi
LIST OF FIGURES
Figure 4.1: Response Rate ................................................................................................ 30
Figure 4.2: Gender ............................................................................................................ 31
Figure 4.3: Age Bracket .................................................................................................... 31
Figure 4.4: Education Level.............................................................................................. 32
Figure 4.5: Years with KRA ............................................................................................. 32
Figure 4.6: Designation..................................................................................................... 32

xii
LIST OF ABBREVIATIONS AND ACRONYMS
CBK:
DSS:
EGMS:
EIS:
FY:
G2B:
G2C:
G2E:
G2G:
GDP:
ICT:
IRS:
IS:
IT:
KRA:
MIS:
OSBP:
PAYE:
RECTS:
SA:
TPS:
UK:
USA:
VAT:
Central Bank of Kenya
Decision Support Systems
Excisable Goods Management System
Executive Information Systems
Financial Year
Government-to-Businesses
Government-to-Citizens
Government-to-Employees
Government-to-Government
Gross Domestic Product
Information Communication and Technology
Internal Revenue Services
Information Systems
Information Technology
Kenya Revenue Authority
Management Information Systems
One Stop Border Post
Pay as You Earn
Regional Electronic Cargo Tracking System
South Africa
Transactional Processing Systems
United Kingdom
United States of America
Value-Added Tax

1
CHAPTER ONE
1.0 INTRODUCTION
1.1 Background of the Study
Over the last decade, public administration around the world has been following the goal
of increasing its efficiency and flexibility by using information technology (IT). This has
been inspired by the success of IT in other environments, especially in the private sector.
Various authors have demonstrated that IT enables improved quality and performance of
services (easier, faster, better) (Gupta, 2008), improved quality and increased operational
efficiency, reduced costs, and increased productivity (Gil-García & Pardo, 2015). Wang
and Liao (2016) stress that throughout the various efforts of understanding the use of IT
in business; the focus must be multidimensional and interdependent.
While the term “information technology in government” goes back at least to the 1970s,
the term e-government emerged in the late 1990s with the internet boom (Grönlund &
Horan, 2014). It does not rely only on the internet, but also includes other technologies
and aspects. Throughout the e-government domain a classification of areas of interactions
with citizens through government-to-citizens (G2C), government-to-businesses (G2B),
internal employee’s government-to-employees (G2E), and other institutional government
organizations government-to-government (G2G) emerged and remain (Wang & Liao,
2016). In the case of G2C, integrated information systems are needed in order to gather,
transfer, process, and store internal data, which is the foundation for the further
elaboration of electronic government services offered to external users, namely citizens,
the private sector, and other governmental organizations (Baležentis & Paražinskaitė,
2012).
According to Au and Cheng (2012), ensuring that end users are able and willing to use
advanced information systems (IS) is critical for the organization to gain operational
efficiency and user satisfaction. Many researchers have recognized user satisfaction as a
critical determinant of the success of IS. In their work DeLone and McLean (2013)
proposed that higher levels of individual satisfaction with IS usage leads to higher levels
of intention to use, which subsequently affects the use of the system. Hsieh et al. (2012)
proved that employees’ overall user satisfaction with their mandated use of IS has a
positive impact on employee service quality. Thus, IS performance, the organizational
2
environment, and the people who use the IS are crucial. Iivari (2015) also showed that IS
performance has a positive relationship with the satisfaction of the IS user.
Today, taxation-related services are among the most developed e-government services all
over the world. At the same time, e-taxation services are among those most used by
clients in many countries, sometimes even because clients are forced to use them. For
instance, the e-Europe measurement reports indicate that year after year the services
included in the income-generating cluster (income and corporate tax, social contributions
for employees, value-added tax (VAT), customs declarations) were and remain the most
developed (Baležentis & Paražinskaitė, 2012). When one explains e-taxation, they usually
refer to on-line filing and assessment of tax returns, enabling electronic payment of taxes,
sharing information on tax assessment between different government departments, and
web-based portals for educating taxpayers on taxation issues (Wang & Liao, 2016). Use
of e-taxation systems by the tax administration according to Jiménez, Sionnaigh and
Kamenov (2013) has been shown to have several advantages such as: provision of
support, automation, workflow management, and authorization management to tax
administration functions; it provides information, education, and support to taxpayers and
facilitates compliance and administration; a compliance performance system deploys risk-
based procedures to detect and deter noncompliance; and a management information
system facilitates the collection and dissemination of performance information to staff
and management.
The electronic and automated tax filing and administration were fast used in the United
States of America (USA), where her Internal Revenue Services (IRS) started offering tax
return e-filing for only tax refunds. This has seen tremendous growth to the level that
almost all the taxpayers are required to file and pay their taxes electronically. This has
been enabled by the various features and enhancements being added to the system over
the years (Muita, 2011). The electronic filing today has been adopted by many other
developed countries such as Canada, France, Germany, United Kingdom (UK), Australia,
Italy, Finland, Netherlands, Turkey, Singapore, Norway, India, China, Turkey, Malaysia
(Ramayah, Ramoo & Amlus, 2012).

3
In Slovenia, the Slovenian government introduced a special e-taxation portal soon after
the introduction of the main e-government portal. Slovenia’s e-taxation portal was
established at the end of 2003. Initially, taxpayers could find and print tax forms from the
e-taxation portal. Subsequently, form completion was possible, such that taxpayers could
complete forms and submit them to the tax administration (Iivari, 2015). As of 2015, all
communication with business taxpayers is carried out through the e-taxation system.
Several small surveys among tax administrators were carried out in Slovenia before its
establishment and they concluded from all of them that civil servants find e-taxation to
entail an improvement in their working conditions, since information is available more
quickly, less importing of different data is necessary, a finding of logical incorrectness is
available promptly, archiving documents is easier and requires less space, processing of
the calculation of tax obligations is much shorter (Muita, 2011).
Currently, the world has become a global village and the interconnection between Africa
and the rest of the world is the use of IT in, almost, every sector of its economy. For
instance, a country like Malaysia implemented the new tax system in 2005. Through the
internet, a multi-stage tax is imposed on goods and services at every delivery point to the
end customer (Booth, 2012). The objective of tax autonomy in South Africa (SA) was
mainly to increase effectiveness and efficiency and tax equality in the country (Muita,
2011). Other developing countries like Nigeria, Rwanda, Tanzania, and Uganda have also
embraced the automated electronic filing of tax documents and tax returns (Muita, 2011).
In Nigeria, Oseni (2015) deduced that tax evaders will no longer have loopholes to hide
with the usage of the modern automated tax technology and systems because all the
taxpayers have to make use of the tax system to declare all their transactions. The
objective of tax autonomy in Uganda, Zambia, Ghana, and Tanzania was to increase tax
collection. Research by Chatama (2013), Tanzania adopted technology in tax
administration in 2001. The technological tax systems adopted by Tanzania minimized
delays in filing of tax returns and reduced operational costs.
Policies on tax administration play a vital role in resulting in high tax compliance by
taxpayers. Good policies ensure good governance. High tax collections are attributed to
better technology advances and proper policies (Wang & Liao, 2016). A research by
Kiema (2017), concluded that high tax collections are evident in countries practicing

4
appropriate tax policies. Ejiaku (2014) suggested that government policies affect tax
administration, more so in developing countries.
In Kenya, taxation has been the single largest contributor to government budgetary
resources. Between 2006 and 2017, the tax revenue instituted 93% of total government
revenue. Given its major role in the government, taxation has been used to attain to meet
several objectives (KRA, 2015). First, taxation is used to raise adequate revenue to fund
the governments’ public spending without recourse to excessive borrowing. Secondly, it
has been used to collect revenue using methods that are equitable which reduce its
disincentive impacts on economic activities (Broadway, 2012). The organization in
charge with tax collection in Kenya is the Kenya Revenue Authority (KRA).
KRA was established by an Act of Parliament Cap.469 in 1995 as an Independent
organization for tax administration and autonomous from the Ministry of Finance and
Treasury. It was mandated to collect revenue on behalf of the government of Kenya to
finance service delivery to the Kenyan population of over 45million, which is estimated
to increase by one million per year (Macharia, 2016). The Ministry of Finance and
Treasury is responsible for setting tax policies and tax reforms while on the other hand
KRA is mandated to ensure that these policies relating to revenue mobilization are
undertaken. The Authority is mandated to collect these types of taxes: VAT, Pay as You
Earn (PAYE), Excise duty tax, Income Tax Corporation Taxes, Customs Duty, Import
Duty, Income Tax Individual Business Taxes among others (KRA, 2012).
The specific functions of KRA are: to govern and enforce written laws or specified
provisions of written laws which pertain to collection, assessment and accounting for
whole revenue in accordance with these laws, enhance the effectiveness and efficiency of
administration of tax, eliminate tax evasion by streamlining and simplifying procedures to
improve the compliance rates through improving taxpayer education and service delivery,
promote professionalism and ensure protection of the local industries and enable
economic growth of the country through the administration of the various tax laws
relating to trade (KRA, 2012).

5
The key mandate of KRA is revenue collection, and of the key performance indicators is
the Gross Domestic Product (GDP) ratio. In financial year (FY) 2016/2017 the tax
authority managed to collect sh. 1.365 Trillion, whereas in the FY 2015/2016 KRA had
collected sh. 1.210 trillion. This shows a growth of 13.8%. The current Tax-to-GDP ratio
is at 19.3% marking the 2nd highest in non-oil economies in Africa. This achievement is
attributed to the technological reforms that KRA has embarked on in the recent past.
These include iTax, icms, Cargo Scanner Management Solution, Regional Electronic
Cargo Tracking System (RECTS), Excisable Goods Management System (EGMS), i-
support, i-care, One Stop Border Post (OSBP), among others (KRA, 2015). These
reforms have enhanced revenue collection through reduced compliance costs, increased
tax base and efficient revenue administration. This is by providing an online platform for
the customers to account and pay their taxes. These reviews are done under the arm of
information communication and technology (ICT) which oversees the process and their
objective is to offer integrated self-service and online services to customers in an
effective and efficient way (KRA, 2015).
1.2 Statement of the Problem
Information technology forms part of individuals’ lives in the modern world. Dependency
on technology by people is increasing on a daily basis. The reason is that new innovations
in technological devices and applications are encouraged all over the world. Countries
around the world have adopted technology in matters tax (Masese, 2011). Technology
contributes to easier, faster, and more accurate tax system. Tax administration has
improved in efficiency and effectiveness as a result of information technology. Many
countries are investing heavily in the tax administration systems. Governments depend on
tax revenues to develop a country, hence the demand to improve tax administration
systems (Wang & Liao, 2016).
Research by Muita (2011) found that the electronic and automated tax filing and
administration were fast used in the USA, where her IRS started offering tax return e-
filing for only tax refunds. This has seen tremendous growth to the level that almost all
the taxpayers are required to file and pay their taxes electronically. This has been enabled
by the various features and enhancements being added to the system over the years. The
electronic filing today has been adopted by many other developed countries such as

6
Canada, France, Germany, UK, Australia, Italy, Finland, Netherlands, Turkey, Singapore,
Norway, India, China, Turkey, Malaysia (Ramayah, Ramoo & Amlus, 2012).
In Nigeria, Oseni (2015) deduced that tax evaders will no longer have loopholes to hide
with the usage of the modern automated tax technology and systems because all the
taxpayers have to make use of the tax system to declare all their transactions. Hadler
(2000) observed the objectives for tax autonomy vary between governments. The
objective of tax autonomy in SA was mainly to increase effectiveness and efficiency and
tax equality in the country. The objective of tax autonomy in Uganda, Zambia, Ghana,
and Tanzania was to increase tax collection, and the research by Chatama (2013) in
Tanzania showed that the country adopted technology in tax administration in 2001. The
technological tax systems adopted by Tanzania minimized delays in filing of tax returns
and reduced operational costs.
KRA has invested heavily in technology improvements and innovations as a strategic tool
to ensure tax compliance since 2003 (KRA, 2015). Technological automation of revenue
collection has further added a fresh touch to the once choking KRA, with tax evasion
minimized and improved business efficiency recorded. Automation has reduced the cost
of revenue collection and interaction between the taxpayer and staff, a fertile area for
corruption (Masese, 2011). The system has enhanced a seamless flow of information
between KRA, Central Bank of Kenya (CBK) and other government departments in the
areas of taxpayer registration, customer service, cargo clearance, both on air and sea,
returns processing, payments on specific tax heads and tax clearance certificates and a
copy of records. With this emergence of technology, the length of time used in filing tax
returns has condensed from 2 weeks to 30 minutes, while that of clearing cargo reduced
from between 6 to 15 days to between 2 and 6 days (Masese, 2011). However, with all
these improvements, one still finds that the voluntary compliance levels have not
increased as previously anticipated. This, therefore, calls for the question whether
technology has been efficient in enhancing tax compliance in Kenya. It is because of the
above concern that this study was therefore necessary.
1.3 General Objective
The objective of this study was to investigate the effect of information technology on the
performance of Kenya Revenue Authority’s tax administration.
7
1.4 Specific Objectives
The study was guided by the following specific objectives:
1.4.1 To identify the effect of employees’ IT knowledge on tax administration
performance.
1.4.2 To identify the effect of business process technology on tax administration
performance.
1.4.3 To identify the effect of taxpayers’ IT knowledge on tax administration
performance.
1.5 Significance of the Study
1.5.1 KRA Management and Board
The findings of the study avails recommendations to the KRA Board on the options for
improvement of its technological improvements and innovations in future so as to ensure
that the Authority is able to achieve its set revenue collection targets over the respective
financial years.
1.5.2 Taxpayers/ Customers
The findings of this study offer in details the effect of technological improvements and
automation on the performance of Kenya Revenue Authority to the taxpayers and also a
breakdown of the tax reforms already undertaken for both educational purposes and
improving awareness and service delivery to the customers.
1.5.3 Policy Makers
The findings of the study provide recommendations to the policymakers and the Treasury
on the options for improvement of its technological improvements and innovations in
future so as to ensure that the Authority is able to achieve its set revenue collection targets
over the respective financial years.
1.5.4 Future Researchers
This study forms a basis for further research in the areas of leveraging technology to
enhance increased performance by Kenya Revenue Authority. Research could be carried
out on the effects of increased automation and innovation by Kenya Revenue Authority
on product awareness.

8
1.6 Scope of Study
The study focused on KRA, in particular, the Small Taxpayers Office based in Sameer
Park Branch Mombasa road. The explanatory research design was adopted with a focus
on quantitative characteristics and status of revenue collection strategies at KRA with
regard to enhancements of revenue collection. The target population in this category was
about 300 members of staff. The data was collected between January and April 2019. In
this study, data was collected using a questionnaire which was administered through drop
and pick format.
1.7 Definition of Terms
1.7.1 Small Taxpayers
These are the taxpayers whose annual turnover ranges from one Kenyan shilling to 200
million Kenya shillings. Most of these operate under the informal sector (KRA, 2012).
1.7.2 Technological Change
This is defined as an increase in the efficiency of a process or product that results in
output growth with the input remaining constant, through three main ways which include
invention, innovation and diffusion (Crabtree, 2012).
1.7.3 Automation
This refers to the use of technological devices, programs, applications, and systems that
render human labor obsolete (Ng’ang’a, 2013).
1.7.4 E-Filing
Electronic filing/ e-filing refers to the transmission of tax data directly to the tax
administration system using technology and internet. This may be done in the comfort of
every taxpayer in their homes, offices, and malls or done by a tax agent or auditor
provided there is internet connectivity (Allink & Kommer, 2010).
1.8 Chapter Summary
Chapter one covers the introduction and background information on the research topic. It
provides information on the statement of the problem and the general objective of the
study as well as the specific objectives that guided the study. The chapter provides the
significance and scope of the study as well as the definition of key terms used in the

9
study. The second chapter provides the study’s literature review by exploring deeper into
the study research topic, while chapter three provides literature on the particular research
methodologies that were adopted in the study. Chapter four presents the study’s results
and findings and chapter five provides the study’s discussions, conclusions and
recommendations.

10
CHAPTER TWO
2.0 LITERATURE REVIEW
2.1 Introduction
This section focuses on the literature about the effect of information technology on tax
administration. This study aims at addressing three research objectives: identifying the
effect of employees’ IT knowledge on tax administration performance, the effect of
business processes technology on tax administration performance, and effect of
taxpayers’ IT knowledge on tax administration performance.
2.2 Employees’ Information and Technology Knowledge and Tax Administration
Information technology has taken over the world of business. Many institutions and
organizations have adapted to the new era of IT which involves the transmission and
storage of information in electronic formats (Rezaei et al., 2014). Businesses,
organizations, and institutions have adopted information technology. Thus, employees are
the first to be affected by the introduction of information technology. The reason is that
the employees are responsible for operating the technological systems (Berisha-Shaqiri,
2015). Information technology affects employees in both negative and positive ways.
Some employees appreciate the introduction of technology in the workplace while others
are rigid to the change (Cyr, Gehling & Gibson, 2014).
2.2.1 Increased Productivity
One of the impacts of information technology on the authority is increased productivity.
The employees use technological devices and systems in carrying out daily operations
which have led to high levels of productivity (Rezaei et al., 2014). Increased productivity
by staff is as a result of less time used in operations and accessibility to information. By a
touch of a button information, reports, and records are available with the help of
technology (Grönlund & Horan, 2014). Currently, most employees rely more on
information from the internet as compared to print media. Information is power, thus,
organizations practice storing information in servers and websites. Information
technology saves time since all information required is easily accessible and
communication is also made easier (Kaino, 2008). Staff from different departments in an
organization can communicate without necessarily having to meet in the same room.
Communication is possible between staff members in different department, regions, and
even countries via telephone, teleconferencing, email, fax, and social media. The

11
increased productivity results in high performance by the employees and in turn the
organization (Grönlund & Horan, 2014).
The manufacturing process is made faster by the use of technology. The automated
machines used to manufacture products work at an increasingly high speed without
stopping, thus, increasing the productivity in an organization that has adopted information
technology (Kaino, 2008). Information technology has increased the levels of creativity
by many employees. Through research, employees learn new ways of operations and
saving time. Multi-tasking is possible as a result of information technology. By using
simple applications such as Skype an employee can teleconference with another
employee while simultaneously sending emails, and memos to other staff members.
Increased productivity is evident from all the marketing and advertising on electronic
media (Jiménez, Sionnaigh & Kamenov, 2013). Most organizations market their products
and services via social media and electronic media. Creativity from employees uploading
marketing items is attributed to extensive research on the internet and use of various
applications such as Photoshop. Rezaei et al. (2014) states that employee’s productivity
increases with the extensive use of information technology thus improving the
performance of an organization.
2.2.2 Work Efficiency
Information technology has a vital role in work efficiency (Hadler, 2014). It is via
information technology that employees are able to meet deadlines for daily operations.
Work is done faster due to less paperwork and the accessibility of information. Due to
automated systems, most of the work that would have consumed a lot of time and
procedures can be done in seconds (Masese, 2011). Staff members are able to prioritize
work in terms of need, which ensures all operations are carried out within the required
deadlines. Information technology provides adequate information via the internet
(Peansupap & Walker, 2015). Through websites and social platforms, employees are able
to obtain information required for daily operations. Research is made easier for
employees via information technology (Hadler, 2014).

12
Work efficiency is attained as a result of fast communication processes (Mutuku &
Nyaribo, 2015). Information technology has made communication easy and cheap. By
having internet an individual is able to communicate with other people from different
countries and even continents. Communication via phone calls, emails, memos, fax, video
conferencing, text, and social media is practiced in most organizations. Good
communication between employees and departments has improves the work efficiency in
organizations (Otaghsara & Mohseni, 2012). Employees work performance has improved
also as a result of continued use of information technology to obtain information and in
communication. Communication is important in ensuring the success or failure of any
organization. According to Mutuku and Nyaribo (2015), great internal and external
communications an institution stands to make profits and grow into a big corporation.
2.2.3 Reduced Workload
Previously, information was obtained and stored in print media. Print media meant a lot
of paperwork which had to be stored for future reference. However, the new era of
information technology focusses for less paperwork, since all information is saved on
servers. Information technology allows for access to information via a touch of a button
(Rezaei et al., 2014). The reduced workload of staff is convenient, thus saving time in the
organization. Information is easily accessed, stored and retrieved by employees who use
information technology. The automated systems have reduced the work of printing
personal and business information, which is later stored in paper form. Currently, only the
required and relevant information is stored in print media. In case of any additional
information, the servers are simply updated from the office (Hsieh et al., 2012).
Information technology has simplified all the work carried out by most employees in an
organization. From communication to the actual performance of an activity, automation
has made working easier. Research is obtained straight from the internet. As Haddud,
Dugger and Gill (2016) concluded, most employees rely on the internet for information
and research. Better performance by employees is experienced as a result of the reduced
workload. The reason is that the employees are not overworked, hence able to undertake
all daily operations in due time (Hsieh et al., 2012).
13
2.2.4 Employee Education and Training
Technological devices demand skilled labor. Thus, organizations using information
technology are keen on ensuring all staff members are educated and trained appropriately.
Through education and training, employees are able to earn skills that help with daily
operations and projects (Otaghsara & Mohseni, 2012). The training equips the staff
members with the relevant knowledge and skills in operating the automated systems
efficiently. Education and training are relevant to each institution, especially when
introducing new systems. The reason is that trained staff members are able to operate
effectively and meet all deadlines (Gil-García & Pardo, 2015). Performance of employees
and organizations improve with continued emphasis on training and education. The
improving performance of organizations using information technology is partly attributed
to the education and training offered to employees (Hsieh et al., 2012).
Through training and education, employees are able to offer better and improved services
to all customers (Otaghsara & Mohseni, 2012). The knowledge on how to operate
technological applications and devices, staff members are able to concentrate in catering
to customer’s needs rather than worrying about how a system is operated. The training
offered also involves some knowledge on how to handle customers via phone and
computer. Eloquence, etiquette, and result oriented skills are equipped to all employees
throughout the training process (Gil-García & Pardo, 2015). Eloquence is of importance
since with the adoption of information technology most queries are addressed via phone
calls and emails. The training offered ensures that all staff members are in a position to
handle all customers thus providing better services at all times (Kimani, 2015). Reduced
cases of customer complaints are evidence of improved services offered by employees.
Training and education of staff members improve the performance of employees resulting
in high performance by an organization (Iivari, 2015).
2.2.5 Concentration and Innovation Levels
Information technology contributes greatly to the success of any organization. However,
information technology also destructs most employees. Information technology includes
social media and entertainment sites. Employees love to relate to other people more so via
the internet. As such, some employees easily lose concentration from work and start
chatting in the office via social media platforms (Turban, Bolloju & Liang, 2011). Some
of the social media platforms frequented by employees include Facebook, WhatsApp,

14
Twitter, and Instagram. Research shows that 77% of employees with Facebook accounts
spend one-hour daily chatting while at work (Haddud, Dugger & Gill, 2016). The easy
accessibility of such social media platforms in the workplace results in low productivity
by employees. The low productivity then results in low performance by organizations
(Hsieh et al., 2012).
Creativity and innovation form the backbone of some organizations. However, the level
of innovation of employees in the workplace is reducing with the increased use of
technology (Rubin, 2012). Since almost every innovation in available online, most
employees lack the drive to work in creating anything originals. The rate of counterfeit
product and services is increasing in Kenya with every passing day. Young people in the
workforce are highly dependent on internet searches for solutions that creativity has
become a thing of the past (Kiema, 2017). Prior to technology, the rate of creativity by
young people was high. With the accessibility of information, research, and reports
people have become reluctant to be creative (Rubin, 2012). Creativity in the past was
practiced through reading. In the 21st century reading of printed books is a rare
phenomenon. Most young people prefer playing video games, watching, and listening to
music. Some writers like Abelson et al. (2015), have warned against such activities since
they inhibit innovation (Rubin, 2012). However other writers have reported that surgeons
who play video games make less surgical errors in comparison to those who do not play
video games.
2.3 Business Process Technology and Tax Administration
Business processes and procedures have changed as a result of information technology
adoption. Organizations and institutions are using technology in daily operations and as
motivators for employees especially the millennial staff (Peansupap & Walker, 2015).
The businesses procedures that were used in the past are almost obsolete due to the
increased use of technology. The procedures are now easy to practice, save time and
money, and are not barred by geographical area. The effects of information technology on
business processes include saving time and reduced costs of production (Webley, 2014).
IT, in its nascent business world form, was generally considered a support tool. But as
time passed and technological sophistication grew, IT’s usage and impact increased
dramatically (Gupta, 2008). This pattern of progress may be due to advancement of
15
technology. But a technological diffusion or infusion may be attributable to the fact that
IT's introduction into an organization creates further technological needs and encourages
product and policy innovation to meet such needs (Peansupap & Walker, 2015).
2.3.1 Automation
Automation is the use of control processes and systems that render human labor obsolete
(Ng’ang’a, 2013). Automated systems require less if any human labor. Organizations all
over the world are turning to automated systems in place of human labor. Automated
systems include all machines that simplify work and requires little labor such as
lawnmowers, manufacturing machines, and smart cars (Kimani, 2015). Most large
corporations have adopted the use of automated systems including Coca-Cola, Apple,
Google, and Microsoft (Ng’ang’a, 2013). Automated systems are computerized and are in
electric form. Automated systems are cheap as compared to human labor thus favored by
many organizations. The initial purchase of the automated systems is expensive, however
afterward the machine works with little maintenance costs. Automated systems are also
fast in comparison to human labor, thus saving time (Kimani, 2015).
Automated machines work at a faster rate in comparison to human labor (Ng’ang’a,
2013). Humans are prone to get tired, but an automated machine does not tire thus can
work more hours. With more hours and high speed of work, automated systems increase
productivity. Organizations that use automation make large profits as a result of the
continuous productivity (Kimani, 2015). However, for an automated system to be
successful, an organization must select the best suitable automated system. An
organization stands to lose if it selects an automated system that is not compatible with
the production of products and services (Ng’ang’a, 2013).
The automated systems are different from year’s prior technology. Before technology was
invented and adopted by organizations and companies, human labor was valued by
managers (Nübler, 2016). Information technology has changed organizations from
accessing human labor to favoring machines and computers. Automation has led to the
loss of jobs, hence the increasing rates of unemployment (Jenkins, 2014). The machineis
invented daily and different codes discover, thus reducing the opportunities for human
labor. Research by Ng’ang’a (2013) when Coca-Cola was shifting to automated systems
100,000 employees lost their jobs. Kenya, however, has been slow in adopting

16
automation systems. This is despite the many advantages of automated systems. By 2002
only 33% of the textile industry had adopted automation (Ng’ang’a, 2013). However,
organizations that turned to automated systems have lowered labor costs and expenditure.
2.3.2 Social Media Use
Social media is part of information technology. Social media involves turning
communication into interactions through various platforms. Social media platforms
include; Facebook, WhatsApp, Twitter, Instagram, and LinkedIn. Social media has
invaded the workplace thus the business process practiced. The research concluded that
each of the fortune 500 companies had at least one social media platform in 2010
(Haddud, Dugger & Gill, 2016). The rise of social media use in the workplace is growing
rapidly more so with the millennials occupying the workplace. Some organizations value
the integration of social media into the business while some are rigid to the changing
times (Berisha-Shaqiri, 2015). Research by Kane et al. (2014), showed that 18% of
managers acknowledged the importance of social media in business while 63% predicted
the importance of social media in the future. With the increasing rise of information
technology, many organizations are acknowledging the use and importance of social
media.
Different research argues the correlation between social media use and work. Research by
Haddud, Dugger and Gill (2016), states that, 28% of employees spend their time
responding to emails while 20% spend time surfing the net for appropriate labor. Hence
social media plays a vital role in work especially due to the embrace of information
technology. Social media is reported to increase employees’ productivity. Most marketing
and advertising are carried out via social media platforms. However, some researches like
Turban, Bolloju and Liang (2011), argue that social media in the workplace lowers
productivity. Employees spend most of the time chatting rather than working thus
lowering organizations productivity.
2.3.3 Work Behavior Change
The work behaviors have changed with the increased use of technology. Many employees
prefer making their own time to work. Prior to technology the working hours were
stipulated and had to be followed to the letter (Haddud, Dugger & Gill, 2016). However,
with the changing times, most employees favor jobs that allow them to set their own time.

17
According to Berisha-Shaqiri (2015), working hours and places of working have changed
as a result of information technology. Most people are able to work from home and others
while on the move. Millennials prefer working from home rather than in an office. The
growth of information technology is evident more so in the United States of America,
where a quarter of the working population works from home while the other quarter is
mobile working from anywhere in the country (Berisha-Shaqiri, 2015). Working from
home or during the late hours at night is possible as a result of internet availability that
allows for communication and research. The changing working behavior is effective since
employees work with passion resulting in increased productivity.
The working behavior of employee and employers is changing with increasing use of
information technology. Due to the high rates of automation, many employees are losing
their jobs since they are being replaced by the machines (Ng’ang’a, 2013). The
fragmentation in the workplace is changing thus demanding new jobs. Some researchers
argue that with the continued innovation of technological devices more jobs will be
created while others argue that more jobs are lost (Nubler, 2016). As technology takes
charge of all aspects of life in the modern world, many employees are losing jobs on a
daily basis, reducing the income earned by a country through PAYE taxation. However,
with the new wave of innovation and creativity on matters technology, new startups are
developing, thus creating better jobs (Turban, Bolloju & Liang, 2011). The work
environment is no longer static as a result of changes in services and products offered
through information technology.
With every new innovation and invention, new jobs are created. Such is the hope of some
researchers that history will repeat itself (Nubler, 2016). Research shows that throughout
history, new inventions resulted in loss and creation of jobs. Many employees are holding
on to such optimism, that information technology will not mean the end of jobs and
sources of incomes for most people. However, some pessimistic researchers warn that the
continuing high rise of technology will mean the doom of life. Researches argue that
technology is moving at a fast rate that the human brain can comprehend (Rubin, 2012).
The technological advances are way beyond the imagination of humans.

18
2.3.4 Computer Adoption
The adoption of the computer in an organization not only enabled changes in the job
routine itself but may also lead to organization transformation. IT’s spread beyond
clerical support is characterized by IT applications such as Transactional Processing
Systems (TPS), Management Information Systems (MIS), Decision Support Systems
(DSS), and Executive Information Systems (EIS) (Ramayah, Ramoo & Amlus, 2012).
While the traditional TPS, MIS, and DSS are primarily enablers and facilitators of
business processes, they have evolved to providing organizational support that augments
basic office features such as word-processing programs with a diverse collection of
information communication systems (Evans, 2013). For example, these systems may
include e-mail, videotext, and some horizontal and vertical integration technologies. The
resulting system enables the circulation and dissemination of information to the
appropriate parties and facilitates the information flow to be at a rapid rate (Winter &
Taylor, 2015).
IT enables the bypassing of the traditional organizational hierarchy and menu-driven mail
repositories reduce information overload. Intelligence can now be included in information
systems such as data warehousing systems (Jenkins, 2014). Companies are thus
empowered to compete more efficiently and to respond internally to developments in the
external business environment more rapidly (Cyr et al., 2014). Furthermore, organizations
can apply EIS-related applications. Top executives are now enabled to make more
informed decisions, as information and knowledge are now available at a much faster
pace. On the other hand, this initiated a change in what top executives have to do and how
they do their job (Ramayah, Ramoo & Amlus, 2012). It becomes necessary to have EIS
applications developed to meet this need because, due to the availability of information,
any uninformed decision may put an organization into a competitive disadvantage or may
even be detrimental (Winter & Taylor, 2015). Furthermore, as a result, the way top
executives are making decisions is changed to require more information and analysis of
information (Cyr et al., 2014).
2.3.5 Streamlined Administrative Process
IT facilitates the streamlining of the administrative process and enables the
decentralization of the scope and scale of the business (Rubin, 2012). An unparalleled
method for processing, analyzing and communicating the information from both inside
19
and outside the organization enables the detection and understanding of the pattern and
pace of change. Furthermore, facilitation on the improvement of telecommunication has
enabled a reduction of the need for middle managers as conduits for information (Winter
& Taylor, 2015).
Organizations may become distributed as opposed to centralization. Furthermore, IT is
often recognized as a powerful agent for social and economic change. As the pace of
technological development quickens, human knowledge and understanding are likewise
exploding (Ramayah, Ramoo & Amlus, 2012). The dissemination of information and the
dissection of new discoveries take place in today's environment in a matter of seconds.
Just as IT has made communication a faster and more approachable process, it has
heightened our dependence on such forms of communication (Cyr et al., 2014).
Davenport and Short (1990) pointed out that there is a need to establish, in this context, a
more flexible, team-oriented, and communication-based working environment to take
advantage of the current climate and to maximize benefit to the whole organization.
Furthermore, organizations may become learning organizations.
2.4 Taxpayers’ Information and Technology Knowledge and Tax Administration
Technology needs to make it easier for taxpayers to comply with their tax obligations if it
increases the accessibility level as well as the amount of information available, widening
the range of payment modalities, reducing the need for taxpayers to visit the office and
shortening waiting times for those taxpayers who need help (Abelson et al., 2015).
Advanced internet options, payment via electronic banking services as well as virtual
telephone have been developed to achieve these aims. The tax administration agency
needs to see the taxpayer as a customer, not as someone who owes money to the
Administration (Holniker, 2015).
Finally it can be argued that the effective cost of tax administration, collection costs are
likely to be positively related to tax compliance. Such a relationship, however, depends
largely on the way compliance maximization is achieved (Wang & Liao, 2016). For
instance if the only target set for the tax authority is to maximize tax compliance, it will
go a long way in allocating its budget such that the last amount spent on enforcement
activities offers the same tax revenue as compared to the last amount spent on improving
taxpayer services (Abelson et al., 2015). Hence, it goes without saying that the
20
unconditional maximization of tax compliance is unlikely to reduce collection costs, as
well as the additional goal of minimizing compliance costs needs to be imposed explicitly
(Wang & Liao, 2016).
2.4.1 Tax Administration Activity
Technology is necessary for the tax administration activity as large sets of data needs to
be processed. However technology needs not be considered given that the objective, quite
the opposite needs to be regarded as a means to gain efficiency (Reinganum & Wilde,
2012). State-of-the-art technology though expensive to purchase and maintain in some
cases the results are not so brilliant from the economic point of view. In order to achieve
the excellence in the tax administration activity, organisations needs to focus on the
customer/taxpayer (Kane et al., 2014). As a consequence, the most essential concepts are
“reducing the period of time between when the tax is generated and the moment it is
paid”, “decreasing the number of the human errors by automating ordinary procedures”,
“therefore making possible to pay the tax any time and almost anywhere”, and “therefore
allowing any employee to help every customer at the office” (Reinganum and Wilde,
2012).
Bearing these objectives in mind, it is very easy to infer that indeed technology in tax
administration simply means integrated software with a one-stop-shop implementation;
comprehensive work flow systems in that every document or form is included in the
information system; easy-to-use internet websites that have online information and
payment options; customer service network which is connected by fast lines; mobility to
allow service in remote areas as well as real-time process monitoring (Andarias, 2012).
Most if not all revenue bodies have taken a unique approach to the selection, development
and deployment of information technology software applications to support the operation
and delivery of their business (Haddud, Dugger & Gill, 2016). Very little has yet been
done between revenue bodies - and between revenue bodies and the software industry - to
develop a shared and sharable model which revenue bodies and the software industry can
use to explore and develop best practice, and – most importantly – assets, providing
common solutions to common business needs (Andarias, 2012).
21
2.4.2 Technology Usage
Technology is an important tool if properly used; otherwise it can as well become a
problem that needs solving, rather than the solution. The technology used in tax
administration entails the use of computer, internet and software applications. Technology
is only regarded as efficient when handled by well-trained personnel and if embedded in
the workflow of the organization (Jiménez, Sionnaigh & Kamenov, 2013).
Good technology needs only to be applied in tax administration if it satisfies some basic
principles which also include; reducing life of tax, improving efficiency and reducing
errors in procedures, increasing multi-tasking levels of tax officers and facilitating
taxpayers in complying with tax regulations (Erard, 2012). In the reduction of the “life-
time of the tax”, proper technology needs to ensure that the time period between the date
a property or service become liable for tax and the payment of this tax or rate is reduced
to the minimum (Andarias, 2012). All technological advances in automation processing,
mass data processing and elimination of administrative challenges fall in this category
(Jiménez, Sionnaigh & Kamenov, 2013).
Technology in tax administration needs to also aim at enhanced efficiency and also the
reduction of errors in procedures, gathering of data automatically, as well as avoidance of
duplication, storage of images of documents, integration of aerial photography and digital
plans with identification data of property (Winter & Taylor, 2015). Additionally good
technology needs to increase the multitask-level of personnel, as well as the integration of
all procedures in a single information system and also the design of appropriate software
enables any employee to provide all service at a “single counter” (Gil-García & Pardo,
2015).
Technology needs to facilitate the task of taxpayers when complying with their tax
obligations, as it aids in increasing accessibility to information, widening range of means
of payment, reducing need for tax-payers to visit tax office, and by reduction in the time
taken by taxpayers waiting for assistance (Jiménez, Sionnaigh & Kamenov, 2013). All
these activities described are simply aimed at enhancing compliance.

22
2.4.3 Tax Costs
Technology use is key for the tax administration activity given that large set of data must
be processed. But the technology needs not be considered the objective, quite opposite it
needs to be regarded as a means to gain efficiency and also cost reduction in overall tax
administration (Evans, 2013). Effective tax administration is therefore desired by the tax
authority and the taxpayers. For the taxpayers, it comes with numerous advantages such
as less paperwork, rationalization as well as simplification of ancillary tax obligations,
elimination of tax audits on companies, expedition of procedures controlled by tax
administration and enhanced competitive edge with decrease in tax evasion (Winter &
Taylor, 2015).
Jenkins (2014) also emphasizes that indeed the tax system can never work better than its
tax administration, but even the best tax administration would certainly fail to turn a bad
tax system into a well-operating one. He also warns that the existence of many ambitious
tax reforms did not succeed because of the inefficient tax administration. In the absence
of permanent reorganization of the tax administration and almost daily improvements in
the methods of its management, it is not possible to expect that tax reforms will be
successfully realized (Quintana, 2016). This therefore means that tax reforms has a close
correlation between successful tax policy and efficient tax administration. In other words,
there is no good tax policy without efficient tax administration (Jenkins, 2014).
2.4.4 Tax Compliance
In terms of tax compliance, exercising this responsibility requires taxpayers to have a
systematic approach for managing tax compliance risks, aims to ensure that these risks
are properly identified, assessed, prioritised and also treated (Webley, 2014). One of the
ways through which to achieve cost effectiveness in tax administration is by use of
technology (Bird & Casangera, 2012). The use of technology not only in tax
administration but also in e-government as well as e-services already have a certain
amount of history, having developed from just simpler past levels to the more
sophisticated levels offered today (Webley, 2014).
According to Reinganum and Wilde (2012), improved technology in tax administration
alone is not entirely positive, however its benefits include features such as 24/7 access to
taxation services, services from the comfort of one’s home, lower services’ costs, reduced

23
burden on tax officers, as well as automated procedures. However, the most important
negatives include high costs, additional communication channels to be managed,
additional knowledge requirements, and the need for policies and plans (Jiménez,
Sionnaigh & Kamenov, 2013). According to Erard (2012) planning the anticipated costs
ine-tax administration, is often limited to the purchase costs for equipment, with many
parties neglecting to consider the costs of maintaining and upgrading IT, educational
costs for users both tax officers and taxpayers alike, and costs for additional human
resources, for management, and maintenance of IT (or outsourcing costs).
2.4.5 Tax Automation
Automation system helps to improve revenue collection. This is because they are based
on the electronic payment system via applications such as toll revenue collection,
automatic fare collection, bus revenue system and parking system (Gil-García & Pardo,
2015). Additionally by automating revenue collection, service providers are in better
audit trail since all transactions captured can be detailed by time, whom and where (Sani,
2016). This prevents revenue loss through abuses as all moves are recorded electronically.
Automation also provides huge transactions that need to be handled efficiently.
According to Sani (2016), automating revenue collection is key especially within the
revenue collection agencies, which therefore requires fast and efficient output, as there
will always be a trade-off between control and operational needs.
Holniker (2015) argues that the use of the system has brought about a significant
improvement in the revenue collection time for tax payers. Revenue mobilization is
considered as one of the key factors key for economic development of nations and links
into national agenda on social wellbeing, poverty reduction and economic development of
countries and their citizens. Revenue collection, according to Gil-García and Pardo
(2015) is considered as a mandatory element when it comes to the movement of goods
across borders and the procedures applied to these goods significantly influence the role
of national industry in international trade and their contribution to national economy.
The efficiency and effectiveness of revenue collection procedures has an important
influence on the economic competitiveness of nations and in the growth of international
trade and the development of the global marketplace (Holniker, 2015). As government
organizations that control revenue generation, are so much in a unique position to provide

24
increased security to the global supply chain and to contribute to socio-economic
development through revenue collection and trade facilitation (Erard, 2012).
2.5 Chapter Summary
The literature review chapter focused on identifying the effect of information technology
on employee’s performance, identifying the effect of employees’ IT knowledge on tax
administration performance, the effect of business processes technology on tax
administration performance, and effect of taxpayers’ IT knowledge on tax administration
performance in relation to the performance of KRA and its sustainability. This has been
achieved through focusing on other studies relevant to the effects of information
technology on employees, business processes, and taxpayers. The next chapter is research
methodology.

25
CHAPTER THREE
3.0 RESEARCH METHODOLOGY
3.1 Introduction
This chapter covers a comprehensive discussion on the research methodology that was
used to carry out the study. The research design, target population, and data collection
and analysis methods are discussed in the chapter.
3.2 Research Design
Research design refers to the direction taken in collecting information relevant to a
research study (Creswell & Clark, 2014). A research design focuses on answering the
research questions. It aims at directing the method of data collection and analysis to solve
the research problem. The study adopted an explanatory research design. An explanatory
research design has two phases in which the qualitative data explains the quantitative data
(West, 2012). Explanatory research design provides for a deeper understanding and
analysis of a particular topic. An explanatory research design is suitable for social studies
related topic.
The reason is that through explanatory design better explanations are provided for the
quantitative data available. Also, explanatory design works well with topics that have
been researched before to explain the findings of the research and identify the study gaps
available on the topic. This study required the explanation of previous quantitative data
collected on topics relevant to technology and tax administration by the Kenya Revenue
Authority, thus, an explanatory research design appropriate for the study.
3.3 Population and Sampling Design
3.3.1 Population
Sekaran and Bougie (2013) refers to the population as a group of things or people that a
researcher has interest and wants to investigate. The main aim of the population in a study
is to ensure correct conclusions are derived without biases. A study population mainly
comprise of the stakeholders to be affected by the research topic. The population of the
study targeted 300 members of staff working at the Sameer Park along Mombasa road.
The 300 employees included all the head of departments, uniformed and non-uniformed
staff at Sameer Park distributed as indicated in Table 3.1. The population of the study was

26
appropriate since all the 300 members of staff at Sameer Park had KRA pins, thus,
taxpayers and some work in the KRA small taxpayers’ officers.
Table 3.1: Population Distribution
Cadre Number Percentage
Senior Managers
Middle Level Managers
Head of Departments
Uniformed Staff
Non-uniformed Staff
7
12
23
121
137
2.3
4
7.7
40.3
45.7
Total 300 100
Population distribution 2018
3.3.2 Sampling Design
3.3.2.1 Sampling Frame
A sampling frame comprises of elements from which a sample is created and has to be
related to the population (Mukabi, 2014). A sampling frame forms the basis for sample
creation in probability sampling designs. A sampling frame is vital since it ensures only
the target population is covered by the study. Thus, the study was relevant and inclusive
of all target population. The list of the population was obtained from the staff members at
Sameer Park. The list was provided by the managers at Sameer Park.
3.3.2.2 Sampling Technique
A sample is a small number of people of things selected from a population under
investigation (Alvi, 2016). A good sample should represent the characteristics of the
larger population. Sampling, therefore describes the process in which a sample is
extracted. Sampling designs vary from probability to nonprobability sampling designs.
Probability sampling is based on the fact that every population has a known probability of
being part of a sample (Alvi, 2016). The study used a probability sampling design known
as the systematic random sampling design, where if the population target if finite,
systematic random sampling becomes convenient.
Systematic random sampling is best suited for homogeneous populations. Unlike simple
random sampling where each population has an equal chance of being selected into a
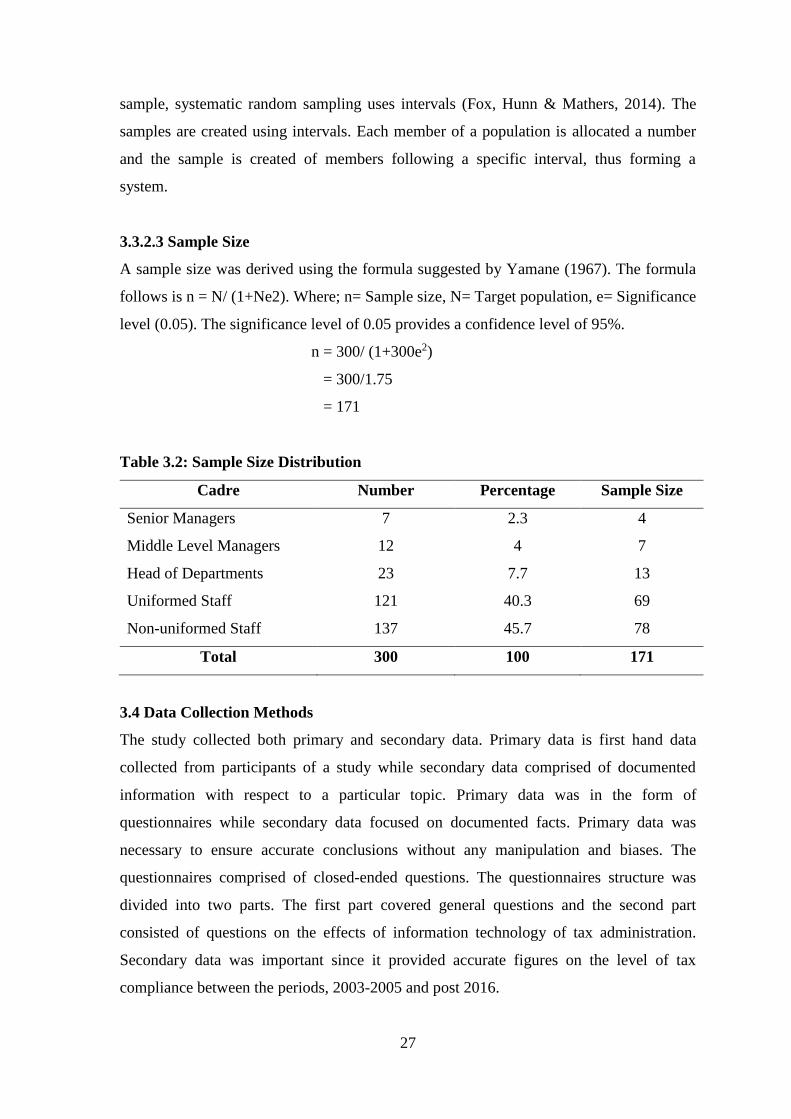
27
sample, systematic random sampling uses intervals (Fox, Hunn & Mathers, 2014). The
samples are created using intervals. Each member of a population is allocated a number
and the sample is created of members following a specific interval, thus forming a
system.
3.3.2.3 Sample Size
A sample size was derived using the formula suggested by Yamane (1967). The formula
follows is n = N/ (1+Ne2). Where; n= Sample size, N= Target population, e= Significance
level (0.05). The significance level of 0.05 provides a confidence level of 95%.
n = 300/ (1+300e2)
= 300/1.75
= 171
Table 3.2: Sample Size Distribution
Cadre Number Percentage Sample Size
Senior Managers
Middle Level Managers
Head of Departments
Uniformed Staff
Non-uniformed Staff
7
12
23
121
137
2.3
4
7.7
40.3
45.7
4
7
13
69
78
Total 300 100 171
3.4 Data Collection Methods
The study collected both primary and secondary data. Primary data is first hand data
collected from participants of a study while secondary data comprised of documented
information with respect to a particular topic. Primary data was in the form of
questionnaires while secondary data focused on documented facts. Primary data was
necessary to ensure accurate conclusions without any manipulation and biases. The
questionnaires comprised of closed-ended questions. The questionnaires structure was
divided into two parts. The first part covered general questions and the second part
consisted of questions on the effects of information technology of tax administration.
Secondary data was important since it provided accurate figures on the level of tax
compliance between the periods, 2003-2005 and post 2016.

28
The questionnaires were self-administered. The questionnaires were dropped at Sameer
Park and picked later to give the respondents enough time to answer the questions
submitted. The distribution of the questionnaires assumed that the employees and
taxpayers represented the Kenya Revenue Authority and the country respectively.
Quantitative data was collected in order to answer the rate of tax compliance between two
periods, pre-technology period of 2003-2005 and post technology period from 2016- to
date.
3.5 Research Procedures
To quantify reliability, a pilot test was conducted and the Cronbach’s Alpha test was used
to examine the reliability of the questionnaires. The reliability of the questionnaire was
>0.7, which Creswell and Clark (2014) state that, for questionnaires with items 7 and
above, the compulsory coefficient is 0.7. Validity is the extent to which empirical
measure mirrors the concept under investigation. Validity can be perceived in three ways,
Face validity, concurrent validity, and construct validity. Face validity focusses on the
link between the research questions and the objectives. Concurrent validity assesses the
difference between instruments when administered concurrently. Construct validity looks
at the contribution of each instrument administered (Sekaran & Bougie, 2013). The type
of validity to be used in the study was under the guidance of lecturers and supervisors to
ensure the best validity test is adopted during the study.
The questionnaires were collected and arranged in order from 1-171. Then using
systematic sampling design, samples were extracted. The data collected was analyzed
later using descriptive analysis. The Statistical Package for Social Science (SPSS) was
applied to analyze the data which was presented in tabular forms. Prior to data collection,
the questionnaires were prepared and printed in preparation for data collection. Prior
visits to Sameer Business Park were made to seek permission to conduct the study and to
collect and create the list of all the staff members. In addition to the collection of primary
data through questionnaires.
3.6 Data Analysis Methods
Data analysis involves the activities undertaken to summarize the data collected to answer
the research questions (Sekaran & Bougie, 2013). The aim of data analysis is to ensure
29
the research questions are answered, thus the purpose of the study. The data collected was
analyzed using descriptive analysis. The analysis made use of quantitative analysis. The
quantitative analysis sought to answer the relationship between different studies on the
topic, impacts of technology on tax administration.
Descriptive statistics of frequencies, means and standard deviations were used during
analysis to provide figures and tables. Inferential statistics including Correlation and
regression analysis were also employed in the study. Correlations analysis was used to
examine how information technology was significant in influencing employee’s
performance, business processes as well as taxpayers. Simple regression was also
employed to determine the nature of the relationship between information technology and
employee’s performance, business processes and taxpayers. The simple regression
analysis model as indicated: Y = a + B1X1 + B2X2 + B3X3 + e
Where: a = the constant (point at which line crosses Y axis)
Y = Dependent Variable
B (1,2,1) = Intersection between Y and X
X1 = Employee Performance
X2 = Business Processes
X3 = Taxpayers
e = error (or residual) value
3.7 Chapter Summary
This chapter is essential since it forms the basis for the next chapter that is results and
findings. The chapter covers all the steps that were undertaken to ensure correct data was
collected and it also explains the method that was used to analyze the data. The chapter
has explained in detail the procedures for data collection methods as well as the research
procedures that were employed and finally it presents the data analysis methods and
presentations. The next chapter present the study’s results and findings.

30
CHAPTER FOUR
4.0 RESULTS AND FINDINGS
4.1 Introduction
This section focuses on the results and findings of the effect of information technology on
tax administration. This chapter presents the results from the analyzed data for the effect
of employees’ IT knowledge, business process technology and taxpayers’ IT knowledge
on tax administration.
4.2 Demographic Information
4.2.1 Response Rate
The researcher managed to distribute the questionnaires to all the targeted respondents
who were 171. After the data cleaning exercise, 115 questionnaires were found to be
complete and were coded and used for analysis. This meant that the study had a response
rate of 67.3% that was above the required threshold.
Figure 4.1: Response Rate
4.2.2 Reliability Test
Table 4.1 presents the reliability test results and it shows that the Alpha coefficients for
employees’ IT knowledge and tax administration, business process technology and tax
administration, taxpayers’ IT knowledge and tax administration, and tax administration
performance were >0.7 meaning that all questionnaire items were reliable.
Table 4.1: Reliability Test
Questionnaire Section Items Coefficient
Employees’ IT Knowledge and Tax Administration
Effect of Information Technology on Business Processes
Effect of Information Technology on Taxpayers
Information Technology Performance
10
10
10
8
.849
.853
.796
.739

31
4.2.3 Gender of Respondents
Figure 4.2 shows that 55.7% of the respondents were male and 44.3% were female. This
means that majority of the population at Sameer Business Park are male, however, there
was a fair representation of the female population in the study.
Figure 4.2: Gender of Respondents
4.2.4 Age Bracket of Respondents
Figure 4.3 presents the age bracket of the respondents and it shows that 31.3% were aged
between 26-35 years, 22.6% were between the age of 45-55 years, 21.7% were aged
between 36-45 years, 17.4% were aged between 56 years and above and 7% were
between the age of 18-25 years. This shows that the whole demographic in terms of age
was captured in the study.
Figure 4.3: Age Bracket of Respondents
4.2.5 Education Level of Respondents
Figure 4.4 shows the education level of the respondents and it indicates that 47% had
their Master’s degree, 34.8% had undergraduate degrees and 18.2% had certificates/
college diplomas. This shows that the respondents were well educated and could easily
understand the study research questions.

32
Figure 4.4: Education Level of Respondents
4.2.6 Years with KRA
Figure 4.5 shows the number of years the respondents had worked with KRA, and it
shows 49.6% had worked with KRA for 11-15 years, 27.8% for 16-20 years, 14.8% for 5
years and below, and 7.8% for 6-10 years. This shows that the respondents were good
candidates for the study because of the number of years they had worked with KRA.
Figure 4.5: Years with KRA
4.2.7 Designation of Respondents
Figure 4.6 presents the designation of the respondents and it shows that 44.4% were
senior managers, 30.4% were middle managers, 19.1% were subordinates and 6.1% were
directors. This means off staff cadre was included in the study.
Figure 4.6: Designation of Respondents

33
4.3 Employees’ Information and Technology Knowledge and Tax Administration
4.3.1 Assessment of Employees’ IT Knowledge and Tax Administration
Table 4.2 shows that information technology has increased productivity as agreed to by
93% of the respondents while 7% were neutral with a mean of 4.43 and a standard
deviation of 0.623. Information technology helps staff from different departments in the
organization to communicate without necessarily having to meet in person as agreed to by
89.6% of the respondents while 10.4% were neutral with a mean of 4.35 and a standard
deviation of 0.663. Information technology helps employees to meet deadlines for daily
operations as agreed to by 89.6% of the respondents while 10.4% were neutral with a
mean of 4.32 and a standard deviation of 0.656. Information technology has helped staff
to prioritize work in terms of need as agreed to by 93.9% of the respondents while 6.1%
were neutral with a mean of 4.42 and a standard deviation of 0.607.
Information technology allows for access to information via a touch of a button as agreed
to by 85.2% of the respondents while 14.8% were neutral with a mean of 4.23 and a
standard deviation of 0.689. Automated systems have reduced the work of printing
personal and business information as agreed to by 80.9% of the respondents while 19.1%
were neutral with a mean of 4.17 and a standard deviation of 0.725. KRA is keen on
ensuring all staff members are educated and trained appropriately as agreed to by 81.7%
of the respondents while 18.3% were neutral with a mean of 4.14 and a standard deviation
of 0.699.
Trained employees are able to operate effectively and meet their deadlines as agreed to by
87% of the respondents while 13% were neutral with a mean of 4.33 and a standard
deviation of 0.697. Information technology distracts employees especially social media
and entertainment sites as agreed to by 83.5% of the respondents while 16.5% were
neutral with a mean of 4.26 and a standard deviation of 0.727. Creativity and innovation
in the workplace have reduced with the increased use of technology as agreed to by
90.4% of the respondents while 9.6% were neutral with a mean of 4.37 and a standard
deviation of 0.655.

34
Table 4.2: Assessment of Employees’ IT Knowledge and Tax Administration
SD D N A SA
Mean
Std
Dev % % % % %
Information technology has increased
productivity
0 0 7 42.6 50.4 4.43 .623
Information technology helps staff from
different departments in the organization to
communicate without necessarily having to
meet in person
0 0 10.4 44.3 45.2 4.35 .663
Information technology helps employees to
meet deadlines for daily operations
0 0 10.4 47 42.6 4.32 .656
Information technology has helped staff to
prioritize work in terms of need
0 0 6.1 46.1 47.8 4.42 .607
Information technology allows for access to
information via a touch of a button
0 0 14.8 47.8 37.4 4.23 .689
Automated systems have reduced the work
of printing personal and business
information
0 0 19.1 45.2 35.7 4.17 .725
KRA is keen on ensuring all staff members
are educated and trained appropriately
0 0 18.3 49.6 32.2 4.14 .699
Trained employees are able to operate
effectively and meet their deadlines
0 0 13 40.9 46.1 4.33 .697
Information technology distracts employees
especially social media and entertainment
sites
0 0 16.5 40.9 42.6 4.26 .727
Creativity and innovation in the workplace
have reduced with the increased use of
technology
0 0 9.6 43.5 47 4.37 .655
4.3.2 Correlations for Employees’ IT Knowledge and Tax Administration
Table 4.3 shows that increased productivity was significant to tax administration
(r=0.474, p<0.01). Work efficiency was significant to tax administration (r=0.361,
p<0.01). Reduced workload was significant to tax administration (r=0.611, p<0.01).

35
Employee education and training was significant to tax administration (r=0.653, p<0.01).
Concentration and innovation levels were significant to tax administration (r=0.588,
p<0.01).
Table 4.3: Correlations for Employees’ IT Knowledge and Tax Administration
Tax
Admin
Increased
Productivity
Work
Efficiency
Reduced
Workload
Employee
Education
& Training
Concentration
& Innovation
Levels
Tax
Administration
1
Increased
Productivity
.474**
.000
1
Work
Efficiency
.361**
.000
.333**
.000
1
Reduced
Workload
.611**
.000
.510**
.000
.570**
.000
1
Employee
Education &
Training
.653**
.000
.369**
.000
.210*
.025
.310**
.001
1
Concentration
& Innovation
Levels
.588**
.000
.266**
.004
.345**
.000
.313**
.001
.236*
.011
1
** Correlation is significant at the 0.01 level (2-tailed)
* Correlation is significant at the 0.05 level (2-tailed)
4.3.3 Regressions for Employees’ IT Knowledge and Tax Administration
Table 4.4 presents the model summary for employees’ IT knowledge significant factors
(increased productivity, work efficiency, reduced workload, employee education &
training, and concentration & innovation levels) and their influence on tax administration.
The table shows that employees’ IT knowledge factors (increased productivity, work
efficiency, reduced workload, employee education & training, and concentration &
innovation levels) affect tax administration by 72.7% which is very significant.
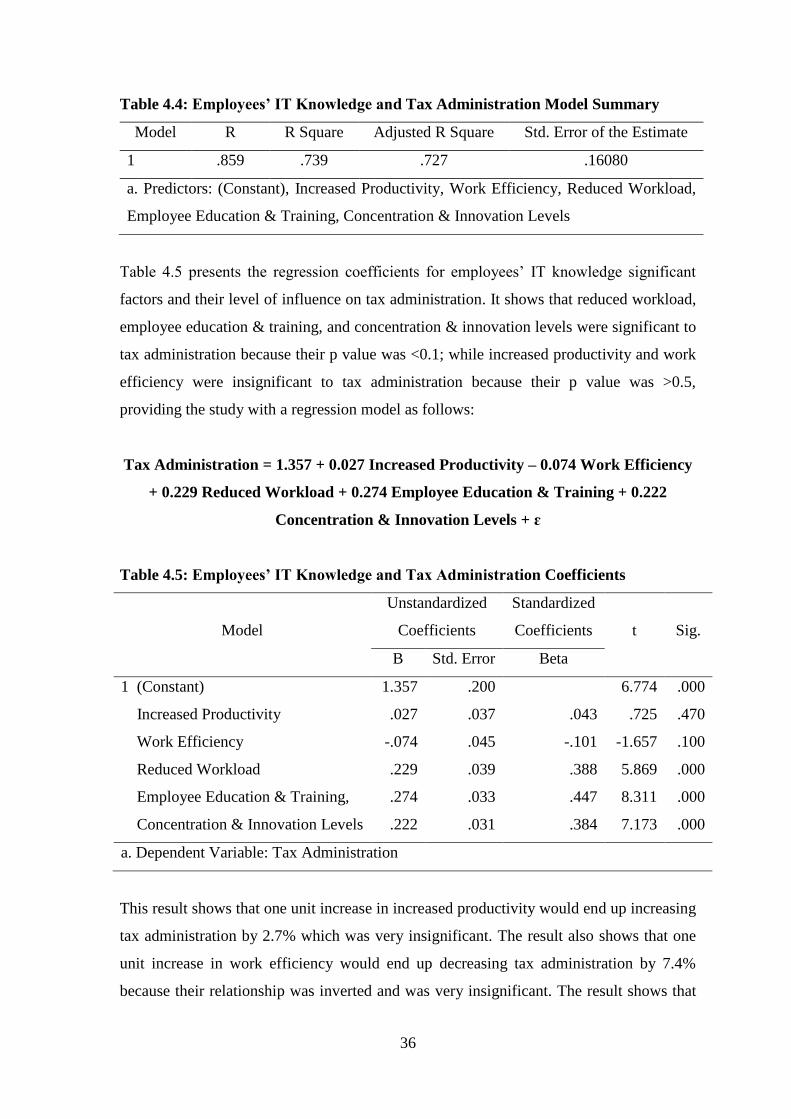
36
Table 4.4: Employees’ IT Knowledge and Tax Administration Model Summary
Model R R Square Adjusted R Square Std. Error of the Estimate
1 .859 .739 .727 .16080
a. Predictors: (Constant), Increased Productivity, Work Efficiency, Reduced Workload,
Employee Education & Training, Concentration & Innovation Levels
Table 4.5 presents the regression coefficients for employees’ IT knowledge significant
factors and their level of influence on tax administration. It shows that reduced workload,
employee education & training, and concentration & innovation levels were significant to
tax administration because their p value was <0.1; while increased productivity and work
efficiency were insignificant to tax administration because their p value was >0.5,
providing the study with a regression model as follows:
Tax Administration = 1.357 + 0.027 Increased Productivity – 0.074 Work Efficiency
+ 0.229 Reduced Workload + 0.274 Employee Education & Training + 0.222
Concentration & Innovation Levels + ɛ
Table 4.5: Employees’ IT Knowledge and Tax Administration Coefficients
Model
Unstandardized
Coefficients
Standardized
Coefficients
t
Sig.
B Std. Error Beta
1 (Constant)
Increased Productivity
Work Efficiency
Reduced Workload
Employee Education & Training,
Concentration & Innovation Levels
1.357
.027
-.074
.229
.274
.222
.200
.037
.045
.039
.033
.031
.043
-.101
.388
.447
.384
6.774
.725
-1.657
5.869
8.311
7.173
.000
.470
.100
.000
.000
.000
a. Dependent Variable: Tax Administration
This result shows that one unit increase in increased productivity would end up increasing
tax administration by 2.7% which was very insignificant. The result also shows that one
unit increase in work efficiency would end up decreasing tax administration by 7.4%
because their relationship was inverted and was very insignificant. The result shows that

37
one unit increase in reduced workload would end up increasing tax administration by
22.9% which was insignificant. The result shows that one unit increase in employee
education and training would end up increasing tax administration by 27.4% which was
insignificant. The result shows that one unit increase in concentration and innovation
levels would end up increasing tax administration by 22.2% which was insignificant.
4.4 Business Process Technology and Tax Administration
4.4.1 Assessment of Business Process Technology and Tax Administration
Table 4.6 shows that automated systems in the organization requires less if any human
labor as agreed to by 78.3% of the respondents while 21.7% were neutral with a mean of
4.03 and a standard deviation of 0.681. Automated systems in the organization are cheap
as compared to human labor as agreed to by 87% of the respondents while 13% were
neutral with a mean of 4.29 and a standard deviation of 0.685. Social media in the
organization involves turning communication into interactions through various platforms
as agreed to by 88.7% of the respondents while 11.3% were neutral with a mean of 4.28
and a standard deviation of 0.656. KRA value the integration of social media into its
business process as agreed to by 67.8% of the respondents while 32.2% were neutral with
a mean of 3.91 and a standard deviation of 0.744.
KRA employees prefer to make their own time to work as agreed to by 91.3% of the
respondents while 8.7% were neutral with a mean of 4.25 and a standard deviation of
0.605. The working behavior of employees and employers have changed due to the
increasing use of information technology as agreed to by 82.6% of the respondents while
17.4% were neutral with a mean of 4.15 and a standard deviation of 0.691. The adoption
of the computers in the organization has transformed the organization as agreed to by
90.4% of the respondents while 9.6% were neutral with a mean of 4.25 and a standard
deviation of 0.619.
Information technology has helped employees bypass traditional organizational hierarchy
and menu-driven mail repositories as agreed to by 87.8% of the respondents while 12.2%
were neutral with a mean of 4.30 and a standard deviation of 0.678. Information
technology has facilitated the streamlining of KRA’s administrative process as agreed to
by 86.1% of the respondents while 13.9% were neutral with a mean of 4.29 and a
standard deviation of 0.698. Information technology has enabled the organization to

38
reduce the need for middle managers as agreed to by 98.3% of the respondents while
1.7% were neutral with a mean of 4.60 and a standard deviation of 0.526.
Table 4.6: Assessment of Business Process Technology and Tax Administration
SD D N A SA
Mean
Std
Dev % % % % %
Automated systems in the organization
requires less if any human labor
0 0 21.7 53.9 24.3 4.03 .681
Automated systems in the organization are
cheap as compared to human labor
0 0 13 45.2 41.7 4.29 .685
Social media in the organization involves
turning communication into interactions
through various platforms
0 0 11.3 49.6 39.1 4.28 .656
KRA value the integration of social media
into its business process
0 0 32.2 44.3 23.5 3.91 .744
KRA employees prefer to make their own
time to work
0 0 8.7 57.4 33.9 4.25 .605
The working behavior of employees and
employers have changed due to the
increasing use of information technology
0 0 17.4 50.4 32.2 4.15 .691
The adoption of the computers in the
organization has transformed the
organization
0 0 9.6 55.7 34.8 4.25 .619
Information technology has helped
employees bypass traditional organizational
hierarchy and menu-driven mail repositories
0 0 12.2 45.2 42.6 4.30 .678
Information technology has facilitated the
streamlining of KRA’s administrative
process
0 0 13.9 43.5 42.6 4.29 .698
Information technology has enabled the
organization to reduce the need for middle
managers
0 0 1.7 36.5 61.7 4.60 .526
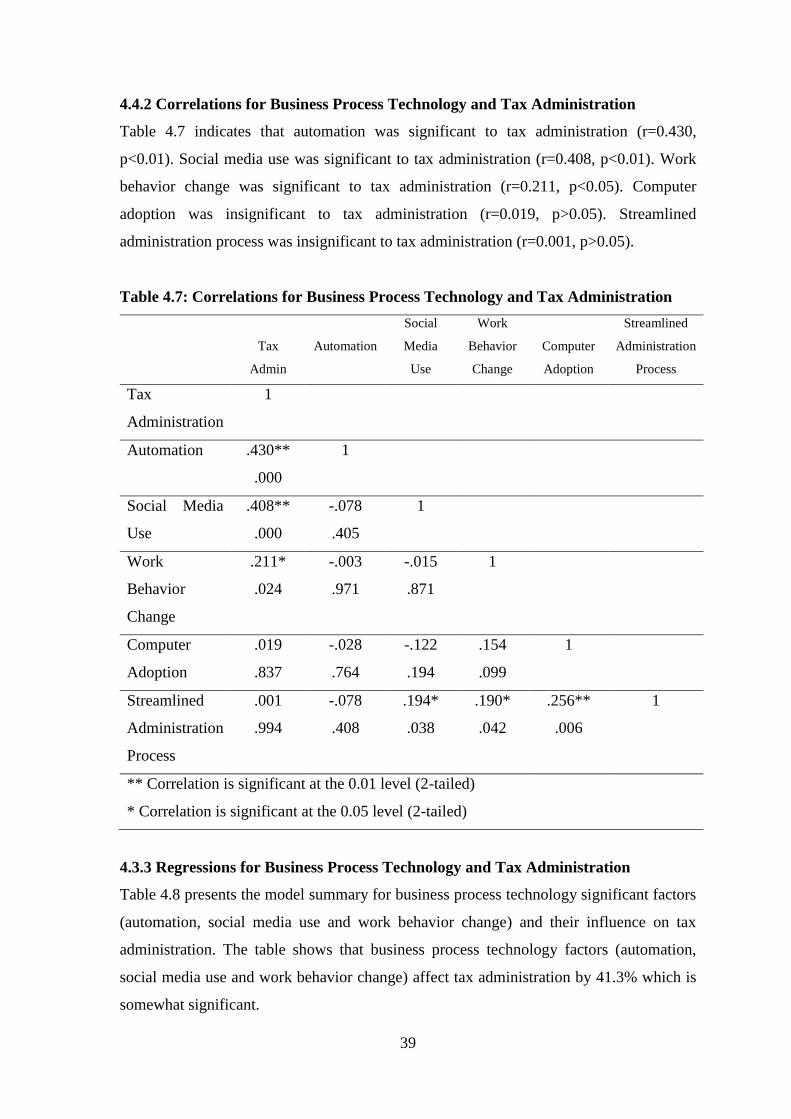
39
4.4.2 Correlations for Business Process Technology and Tax Administration
Table 4.7 indicates that automation was significant to tax administration (r=0.430,
p<0.01). Social media use was significant to tax administration (r=0.408, p<0.01). Work
behavior change was significant to tax administration (r=0.211, p<0.05). Computer
adoption was insignificant to tax administration (r=0.019, p>0.05). Streamlined
administration process was insignificant to tax administration (r=0.001, p>0.05).
Table 4.7: Correlations for Business Process Technology and Tax Administration
Tax
Admin
Automation
Social
Media
Use
Work
Behavior
Change
Computer
Adoption
Streamlined
Administration
Process
Tax
Administration
1
Automation .430**
.000
1
Social Media
Use
.408**
.000
-.078
.405
1
Work
Behavior
Change
.211*
.024
-.003
.971
-.015
.871
1
Computer
Adoption
.019
.837
-.028
.764
-.122
.194
.154
.099
1
Streamlined
Administration
Process
.001
.994
-.078
.408
.194*
.038
.190*
.042
.256**
.006
1
** Correlation is significant at the 0.01 level (2-tailed)
* Correlation is significant at the 0.05 level (2-tailed)
4.3.3 Regressions for Business Process Technology and Tax Administration
Table 4.8 presents the model summary for business process technology significant factors
(automation, social media use and work behavior change) and their influence on tax
administration. The table shows that business process technology factors (automation,
social media use and work behavior change) affect tax administration by 41.3% which is
somewhat significant.

40
Table 4.8: Business Process Technology and Tax Administration Model Summary
Model R R Square Adjusted R Square Std. Error of the Estimate
1 .655 .429 .413 .23554
a. Predictors: (Constant), Automation, Social Media Use, Work Behavior Change
Table 4.9 presents the regression coefficients for business process technology significant
factors and their level of influence on tax administration. It shows that three of the
business process technology factors (automation, social media use and work behavior
change) were significant to tax administration because their p value was <0.1, providing
the study with a regression model as follows:
Tax Administration = 1.448 + 0.274 Automation + 0.260 Social Media Use + 0.139
Work Behavior Change + ɛ
Table 4.9: Business Process Technology and Tax Administration Coefficients
Model
Unstandardized
Coefficients
Standardized
Coefficients
t
Sig.
B Std. Error Beta
1 (Constant)
Automation
Social Media Use
Work Behavior Change
1.448
.274
.260
.139
.321
.042
.042
.045
.465
.448
.219
4.508
6.467
6.218
3.054
.000
.000
.000
.003
a. Dependent Variable: Tax Administration
This result indicate that one unit increase in automation would end up increasing tax
administration by 27.4% which was somewhat insignificant. The result also indicates that
that one unit increase in social media use would end up increasing tax administration by
26% which was somewhat insignificant. The result also indicates that that one unit
increase in work behavior change would end up increasing tax administration by 13.9%
which was insignificant.

41
4.5 Taxpayers’ Information and Technology Knowledge and Tax Administration
4.5.1 Assessment of Taxpayers’ IT Knowledge and Tax Administration
Table 4.10 shows that technology is necessary for the tax administration activity in the
organization as agreed to by 84.3% of the respondents while 15.7% were neutral with a
mean of 4.23 and a standard deviation of 0.705. Technology has reduced the period of
time between when the tax is generated and the moment it is paid as agreed to by 94.8%
of the respondents while 5.2% were neutral with a mean of 4.32 and a standard deviation
of 0.570. Technology in tax administration aims at enhancing efficiency in tax collection
as agreed to by 86.1% of the respondents while 13.9% were neutral with a mean of 4.28
and a standard deviation of 0.695. Technology in tax administration has reduced the
errors in procedures of gathering of data automatically as agreed to by 77.4% of the
respondents while 22.6% were neutral with a mean of 4.12 and a standard deviation of
0.751.
Technology use has reduced the overall cost of tax administration as agreed to by 91.3%
of the respondents while 8.7% were neutral with a mean of 4.36 and a standard deviation
of 0.638. The tax system cannot work better than its tax administration as agreed to by
88.7% of the respondents while 11.3% were neutral with a mean of 4.28 and a standard
deviation of 0.656. Technology helps taxpayers to have a systematic approach for
managing tax compliance risks as agreed to by 90.4% of the respondents while 9.6% were
neutral with a mean of 4.21 and a standard deviation of 0.600.
Technology has provided taxpayers with a 24/7 access to taxation services as agreed to by
91.3% of the respondents while 8.7% were neutral with a mean of 4.34 and a standard
deviation of 0.634. Automating revenue collection has helped taxpayers to have a better
audit trail of their tax as agreed to by 88.7% of the respondents while 11.3% were neutral
with a mean of 4.34 and a standard deviation of 0.674. Technology has brought about a
significant improvement in the revenue collection time for tax payers as agreed to by
98.3% of the respondents while 1.7% were neutral with a mean of 4.60 and a standard
deviation of 0.526.

42
Table 4.10: Assessment of Taxpayers’ IT Knowledge and Tax Administration
SD D N A SA
Mean
Std
Dev % % % % %
Technology is necessary for the tax
administration activity in the organization
0 0 15.7 45.2 39.1 4.23 .705
Technology has reduced the period of time
between when the tax is generated and the
moment it is paid
0 0 5.2 57.4 37.4 4.32 .570
Technology in tax administration aims at
enhancing efficiency in tax collection
0 0 13.9 44.3 41.8 4.28 .695
Technology in tax administration has
reduced the errors in procedures of
gathering of data automatically
0 0 22.6 42.6 34.8 4.12 .751
Technology use has reduced the overall cost
of tax administration
0 0 8.7 47 44.3 4.36 .638
The tax system cannot work better than its
tax administration
0 0 11.3 49.6 39.1 4.28 .656
Technology helps taxpayers to have a
systematic approach for managing tax
compliance risks
0 0 9.6 60 30.4 4.21 .600
Technology has provided taxpayers with a
24/7 access to taxation services
0 0 8.7 48.7 42.6 4.34 .634
Automating revenue collection has helped
taxpayers to have a better audit trail of their
tax
0 0 11.3 43.5 45.2 4.34 .674
Technology has brought about a significant
improvement in the revenue collection time
for tax payers
0 0 1.7 36.5 61.7 4.60 .526
4.5.2 Correlations for Taxpayers’ IT Knowledge and Tax Administration
Table 4.11 indicates that tax administration activity was insignificant to tax
administration (r=0.148, p>0.05). Technology usage was significant to tax administration
(r=0.258, p<0.01). Tax costs were significant to tax administration (r=0.271, p<0.01). Tax
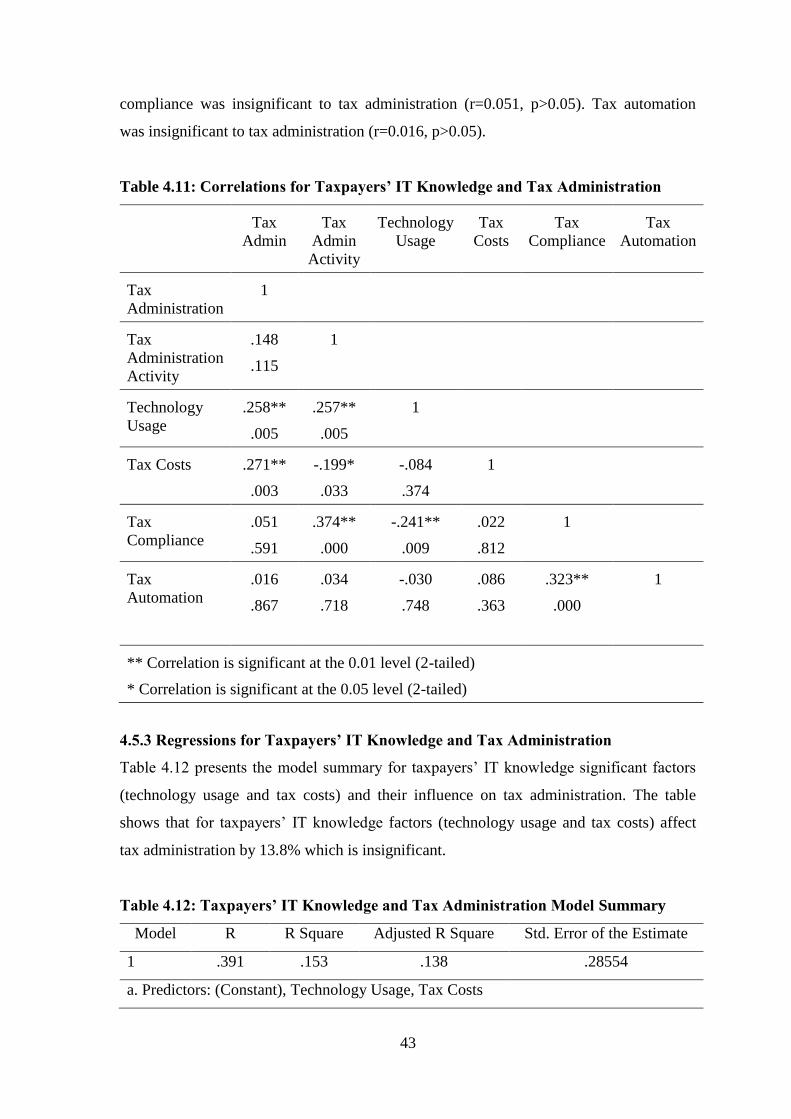
43
compliance was insignificant to tax administration (r=0.051, p>0.05). Tax automation
was insignificant to tax administration (r=0.016, p>0.05).
Table 4.11: Correlations for Taxpayers’ IT Knowledge and Tax Administration
Tax
Admin
Tax
Admin
Activity
Technology
Usage
Tax
Costs
Tax
Compliance
Tax
Automation
Tax
Administration
1
Tax
Administration
Activity
.148
.115
1
Technology
Usage
.258**
.005
.257**
.005
1
Tax Costs .271**
.003
-.199*
.033
-.084
.374
1
Tax
Compliance
.051
.591
.374**
.000
-.241**
.009
.022
.812
1
Tax
Automation
.016
.867
.034
.718
-.030
.748
.086
.363
.323**
.000
1
** Correlation is significant at the 0.01 level (2-tailed)
* Correlation is significant at the 0.05 level (2-tailed)
4.5.3 Regressions for Taxpayers’ IT Knowledge and Tax Administration
Table 4.12 presents the model summary for taxpayers’ IT knowledge significant factors
(technology usage and tax costs) and their influence on tax administration. The table
shows that for taxpayers’ IT knowledge factors (technology usage and tax costs) affect
tax administration by 13.8% which is insignificant.
Table 4.12: Taxpayers’ IT Knowledge and Tax Administration Model Summary
Model R R Square Adjusted R Square Std. Error of the Estimate
1 .391 .153 .138 .28554
a. Predictors: (Constant), Technology Usage, Tax Costs

44
Table 4.13 presents the regression coefficients for taxpayers’ IT knowledge significant
factors and their level of influence on tax administration. It shows that two of the
taxpayers’ IT knowledge factors (technology usage and tax costs) were significant to tax
administration because their p value was <0.1, providing the study with a regression
model as follows: Tax Administration = 2.690 + 0.171 Technology Usage + 0.191 Tax
Costs + ɛ
Table 4.13: Taxpayers’ IT Knowledge and Tax Administration Coefficients
Model
Unstandardized
Coefficients
Standardized
Coefficients
t
Sig.
B Std. Error Beta
1 (Constant)
Technology Usage
Tax Costs
2.690
.171
.191
.345
.053
.057
.282
.295
7.807
3.235
3.378
.000
.002
.001
a. Dependent Variable: Tax Administration
This result indicates that that one unit increase in technology usage would end up
increasing tax administration by 17.1% which was insignificant. The result also indicates
that that one unit increase in tax costs would end up increasing tax administration by
19.1% which was insignificant.
4.5.4 Correlations for Information Technology Items and Tax Administration
Table 4.14 indicates that employees’ IT knowledge was significant to tax administration
(r=0.516, p<0.01). Business process technology was significant to tax administration
(r=0.617, p<0.01). Taxpayers’ IT knowledge was significant to tax administration
(r=0.262, p<0.01).
Table 4.14: Correlations for Information Technology Items and Tax Administration
Tax
Administration
Employees’ IT
Knowledge
Business Process
Technology
Taxpayers’ IT
Knowledge
Tax
Administration
1
Employees’ IT
Knowledge
.516**
.000
1
Business
Process
Technology
.617**
.000
.254**
.006
1
Taxpayers’ IT
Knowledge
.262**
.005
.308**
.001
-.015
.877
1
** Correlation is significant at the 0.01 level (2-tailed)
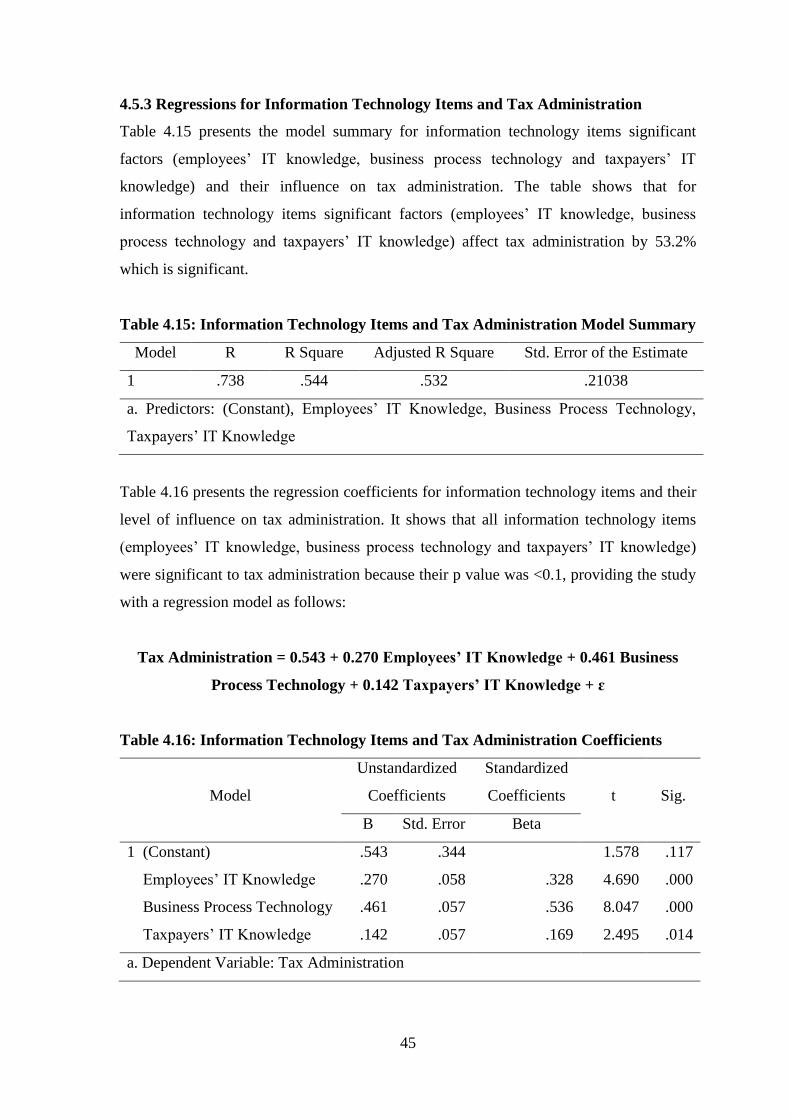
45
4.5.3 Regressions for Information Technology Items and Tax Administration
Table 4.15 presents the model summary for information technology items significant
factors (employees’ IT knowledge, business process technology and taxpayers’ IT
knowledge) and their influence on tax administration. The table shows that for
information technology items significant factors (employees’ IT knowledge, business
process technology and taxpayers’ IT knowledge) affect tax administration by 53.2%
which is significant.
Table 4.15: Information Technology Items and Tax Administration Model Summary
Model R R Square Adjusted R Square Std. Error of the Estimate
1 .738 .544 .532 .21038
a. Predictors: (Constant), Employees’ IT Knowledge, Business Process Technology,
Taxpayers’ IT Knowledge
Table 4.16 presents the regression coefficients for information technology items and their
level of influence on tax administration. It shows that all information technology items
(employees’ IT knowledge, business process technology and taxpayers’ IT knowledge)
were significant to tax administration because their p value was <0.1, providing the study
with a regression model as follows:
Tax Administration = 0.543 + 0.270 Employees’ IT Knowledge + 0.461 Business
Process Technology + 0.142 Taxpayers’ IT Knowledge + ɛ
Table 4.16: Information Technology Items and Tax Administration Coefficients
Model
Unstandardized
Coefficients
Standardized
Coefficients
t
Sig.
B Std. Error Beta
1 (Constant)
Employees’ IT Knowledge
Business Process Technology
Taxpayers’ IT Knowledge
.543
.270
.461
.142
.344
.058
.057
.057
.328
.536
.169
1.578
4.690
8.047
2.495
.117
.000
.000
.014
a. Dependent Variable: Tax Administration

46
This result indicates that that one unit increase in employees’ IT knowledge would end up
increasing tax administration by 27% which was somehow significant. The result also
indicates that that one unit increase in business process technology would end up
increasing tax administration by 46.1% which was significant. The result also indicates
that that one unit increase in taxpayers’ IT knowledge would end up increasing tax
administration by 14.2% which was somehow insignificant.
4.6 Chapter Summary
This section has focused on the results and findings of the effect of information
technology on tax administration. This chapter presents the results from the analyzed data
for the effect of employees’ IT knowledge, business process technology and taxpayers’ IT
knowledge on tax administration. The next chapter is the study’s discussions, conclusions
and recommendations.

47
CHAPTER FIVE
5.0 DISCUSSIONS, CONCLUSIONS AND RECOMMENDATIONS
5.1 Introduction
This section focuses on the discussions, conclusions and recommendations for the effect
of information technology on tax administration. These are discussions and
recommendations for the effect of employees’ IT knowledge on tax administration
performance, the effect of business processes technology on tax administration
performance, and effect of taxpayers’ IT knowledge on tax administration performance.
5.2 Summary
The objective of this study was to investigate the effect of information technology on tax
administration and performance by KRA. The study was guided by specific objectives
driven to identify the effect of employees’ IT knowledge on tax administration
performance, the effect of business processes technology on tax administration
performance, and effect of taxpayers’ IT knowledge on tax administration performance in
relation to the performance of KRA and its sustainability.
The study adopted an explanatory research design. The population of the study targeted
300 members of staff working at the Sameer Park along Mombasa road who were 300.
The sample frame for the study was a list of the population which was obtained from the
staff members at Sameer Park provided by the directors at Sameer Park. The study used a
probability sampling design known as the systematic random sampling design. The
sample size was derived using the formula suggested by Yamane (1967), which provided
the study with a sample size of 171 respondents. The study collected primary data using
questionnaires which comprised of closed-ended questions. Cronbach’s Alpha test was
used to examine the reliability of the questionnaires. The data collected was analysed
using SPSS. Descriptive statistics of frequencies, means and standard deviations were
used during analysis to provide figures and tables. Inferential statistics including
Correlation and regression analysis were also employed in the study.
The study showed that information technology has increased productivity in the
organization, as well as help staff from different departments in the organization to
communicate without necessarily having to meet in person, enabled the employees to
meet deadlines for daily operations as well as prioritize their work in terms of need. IT

48
has allowed employees to access to information via a touch of a button and the automated
systems have reduced the work of printing personal and business information. The study
revealed that KRA is keen on ensuring all staff members are educated and trained
appropriately in order for them to operate effectively and meet their deadlines. It had also
distracted employees especially social media and entertainment sites, and the use of IT
had also led to a decrease in creativity and innovation in the workplace.
The study indicated that automated systems in the organization required less if any human
labour and they were cheap as compared to human labour. Social media in the
organization involves turning communication into interactions through various platforms
and KRA values the integration of social media into its business process. KRA employees
prefer to make their own time to work and their working behaviour has changed due to
the increasing use of IT, because, the adoption of computers in the organization has
transformed the organization. The study showed that IT has helped employees bypass
traditional organizational hierarchy and menu-driven mail repositories and has facilitated
the streamlining of KRA’s administrative process, as well as enabled the organization to
reduce the need for middle managers.
The study revealed that technology is necessary for the tax administration activities in the
organization, it has reduced the period of time between when the tax is generated and the
moment it is paid. Technology in tax administration aims at enhancing efficiency in tax
collection and it has reduced the errors in procedures of gathering of data automatically as
well as reducing the overall cost of tax administration. The tax system cannot work better
than its tax administration, and thus, technology helps taxpayers to have a systematic
approach for managing tax compliance risks, while providing taxpayers with a 24/7
access to taxation services. Automating revenue collection has helped taxpayers to have a
better audit trail of their tax, and technology has brought about a significant improvement
in the revenue collection time for tax payers.
5.3 Discussions
5.3.1 Employees’ Information and Technology Knowledge and Tax Administration
The results showed that information technology has increased productivity. These
outcomes have been reinforced by Rezaei et al. (2014) who state that, one of the impacts
of information technology on tax authority is increased productivity, whereby,

49
employees’ use technological devices and systems in carrying out daily operations leads
to high levels of productivity as a result of less time used in operations and accessibility
to information.
The results showed that information technology helps staff from different departments in
the organization to communicate without necessarily having to meet in person. These
outcomes have been reinforced by Grönlund and Horan (2014) who state that, staff from
different departments in an organization can communicate without necessarily having to
meet in the same room, thereby increasing productivity results in high performance by the
employees and in turn the organization.
The results showed that information technology helps employees to meet deadlines for
daily operations. According to Hadler (2014), information technology has a vital role in
work efficiency, because, it is via information technology that employees are able to meet
deadlines for daily operations and work is done faster due to less paperwork and the
accessibility of information.
The results showed that information technology has helped staff to prioritize work in
terms of need. The results are confirmed by Peansupap and Walker (2015) who detected
that, through IT, staff members are able to prioritize work in terms of need, which ensures
all operations are carried out within the required deadlines, since IT provides adequate
information via the internet.
The results showed that information technology allows for access to information via a
touch of a button. These outcomes have been reinforced by Rezaei et al. (2014) who state
that, the new era of information technology focusses for less paperwork, since all
information is saved on servers, and IT allows for access to information via a touch of a
button, and this reduces the workload of staff making it convenient, thus saving time in
the organization.
The results showed that automated systems have reduced the work of printing personal
and business information. This, according to Hsieh et al. (2012), the automated systems
have reduced the work of printing personal and business information, which is later stored

50
in paper form, since, all required and relevant information is stored in print media, and in
case of any additional information, the servers are simply updated from the office.
The results showed that KRA is keen on ensuring all staff members are educated and
trained appropriately. The results are confirmed by Otaghsara and Mohseni (2012) who
state that, technological devices demand skilled labor, and therefore, organizations using
IT are keen on ensuring all staff members are educated and trained appropriately in order
to earn skills that help with daily operations and projects.
The results showed that trained employees are able to operate effectively and meet their
deadlines. The results are confirmed by Gil-García and Pardo (2015) who note that,
training equips the staff members with the relevant knowledge and skills in operating the
automated systems efficiently, thus, education and training is relevant to each institution,
especially when introducing new systems, because it enables staff members are able to
operate effectively and meet all deadlines.
The results showed that information technology distracts employees especially social
media and entertainment sites. This is acknowledged by Turban, Bolloju and Liang
(2011) who note that, IT also destructs most employees because it includes social media
and entertainment sites, and since employees love to relate to other people more so via the
internet, some employees easily lose concentration from work and start chatting in the
office via social media platforms.
The results showed that creativity and innovation in the workplace have reduced with the
increased use of technology. This is acknowledged by Rubin (2012) who states that, the
level of innovation of employees in the workplace is reducing with the increased use of
technology because almost every innovation in available online, most employees lack the
drive to work in creating anything originals. Kiema (2017) also notes that, young people
in the workforce are highly dependent on internet searches for solutions that creativity has
become a thing of the past.
5.3.2 Business Process Technology and Tax Administration
The results showed that automated systems in the organization requires less if any human
labor. The results are confirmed by Kimani (2015) whose study indicated that, automated

51
systems include all machines that simplify work and requires little labor such as
lawnmowers, manufacturing machines, and smart cars. Ng’ang’a (2013) also notes that,
most large corporations have adopted the use of automated systems including Coca-Cola,
Apple, Google, and Microsoft.
The results showed that automated systems in the organization are cheap as compared to
human labor. The results are confirmed by Kimani (2015) whose study indicated that,
automated systems are cheap as compared to human labor thus favored by many
organizations, however, the initial purchase of the automated systems is expensive,
however afterward the machine works with little maintenance costs and they are also fast
in comparison to human labor, thus saving time.
The results showed that social media in the organization involves turning communication
into interactions through various platforms. The results are confirmed by Haddud, Dugger
and Gill (2016) that, social media involves turning communication into interactions
through various platforms and has invaded the workplace. He further states that, social
media platforms include; Facebook, WhatsApp, Twitter, Instagram, and LinkedIn. Social
media has invaded the workplace thus the business process practiced.
The results showed that KRA value the integration of social media into its business
process. The results are confirmed by Berisha-Shaqiri (2015) that, some organizations
value the integration of social media into the business while some are rigid to the
changing times. Research by Kane et al. (2014), showed that 18% of managers
acknowledged the importance of social media in business while 63% predicted the
importance of social media in the future.
The results showed that KRA employees prefer to make their own time to work. The
results are confirmed by Haddud, Dugger and Gill (2016) who detected that, the work
behaviors have changed with the increased use of technology and many employees prefer
making their own time to work, while prior to technology, the working hours were
stipulated and had to be followed to the letter. However, with the changing times, most
employees favor jobs that allow them to set their own time.

52
The results showed that the working behavior of employees and employers have changed
due to the increasing use of information technology. The results are confirmed by
Haddud, Dugger and Gill (2016) who noted that, the working behavior of employee and
employers is changing with increasing use of information technology. Ng’ang’a (2013)
also notes that, due to the high rates of automation, many employees are losing their jobs
since they are being replaced by the machines.
The results showed that the adoption of the computers in the organization has transformed
the organization. These results are reinforced by Ramayah, Ramoo and Amlus (2012)
who opine that, the adoption of the computer in an organization not only enabled changes
in the job routine itself but may also lead to organization transformation, whereby IT in
organizations has spread beyond clerical support to IT applications such as TPS, MIS,
DSS, and EIS.
The results showed that information technology has helped employees bypass traditional
organizational hierarchy and menu-driven mail repositories. Comparable observation was
made by Jenkins (2014) that, IT enables the bypassing of the traditional organizational
hierarchy and menu-driven mail repositories reduce information overload, and
intelligence can now be included in information systems such as data warehousing
systems.
The results showed that information technology has facilitated the streamlining of KRA’s
administrative process. This is acknowledged by Rubin (2012) who states that, IT
facilitates the streamlining of the administrative process and enables the decentralization
of the scope and scale of the business with an unparalleled method for processing,
analyzing and communicating the information from both inside and outside the
organization enables the detection and understanding of the pattern and pace of change.
The results showed that information technology has enabled the organization to reduce
the need for middle managers. These outcomes have been reinforced by Winter and
Taylor (2015) who state that, facilitation on the improvement of telecommunication has
enabled a reduction of the need for middle managers as conduits for information.
Ramayah, Ramoo and Amlus (2012) also note that, as the pace of technological
development quickens, human knowledge and understanding are likewise exploding.
53
5.3.3 Taxpayers’ Information and Technology Knowledge and Tax Administration
The results showed that technology is necessary for the tax administration activity in the
organization. These outcomes have been reinforced by Reinganum and Wilde (2012) who
state that, technology is necessary for the tax administration activity as large sets of data
needs to be processed, however, technology needs not be considered given that the
objective, quite the opposite needs to be regarded as a means to gain efficiency.
The results showed that technology has reduced the period of time between when the tax
is generated and the moment it is paid. These outcomes have been reinforced by
Reinganum and Wilde (2012) who state that, the most essential concepts are “reducing
the period of time between when the tax is generated and the moment it is paid”,
“decreasing the number of the human errors by automating ordinary procedures”
therefore making possible to pay the tax any time and almost anywhere”, and “therefore
allowing any employee to help every customer at the office.
The results showed that technology in tax administration aims at enhancing efficiency in
tax collection. The results are confirmed by Erard (2012) who postulated that, good
technology needs only to be applied in tax administration if it satisfies some basic
principles which also include; reducing life of tax, improving efficiency and reducing
errors in procedures, increasing multi-tasking levels of tax officers and facilitating
taxpayers in complying with tax regulations.
The results showed that technology in tax administration has reduced the errors in
procedures of gathering of data automatically. These outcomes have been reinforced by
Winter and Taylor (2015) who state that, technology in tax administration needs to also
aim at enhanced efficiency and also the reduction of errors in procedures, gathering of
data automatically, as well as avoidance of duplication and storage of documents.
The results showed that technology use has reduced the overall cost of tax administration.
The results are confirmed by Evans (2013) who postulated that, technology use is key for
the tax administration, but, it needs not be considered the objective, quite opposite it
needs to be regarded as a means to gain efficiency and also cost reduction in overall tax
administration.
54
The results showed that the tax system cannot work better than its tax administration.
Comparable observation was made by Jenkins (2014) who emphasizes that, indeed the
tax system can never work better than its tax administration, but even the best tax
administration would certainly fail to turn a bad tax system into a well-operating one, and
warns that the existence ofmany ambitious tax reforms did not succeed because of the
inefficient tax administration.
The results showed that technology helps taxpayers to have a systematic approach for
managing tax compliance risks. This is acknowledged by Webley (2014) who states that,
in terms of tax compliance, exercising this responsibility requires taxpayers to have a
systematic approach for managing tax compliance risks, aims to ensure that these risks
are properly identified, assessed, prioritised and also treated, and that one way to achieve
this is through technology.
The results showed that technology has provided taxpayers with a 24/7 access to taxation
services. The results are confirmed by Reinganum and Wilde (2012) who state that,
improved technology in tax administration alone is not entirely positive, however its
benefits include features such as 24/7 access to taxation services, services from the
comfort of one’s home, lower services’ costs, reduced burden on tax officers, as well as
automated procedures.
The results showed that automating revenue collection has helped taxpayers to have a
better audit trail of their tax. Comparable observations were made by Sani (2016) that,
automating revenue collection, service providers are in better audit trail since all
transactions captured can be detailed by time, whom and where, and this is key especially
within the revenue collection agencies, which therefore requires fast and efficient output,
as there will always be a trade-off between control and operational needs.
The results showed that technology has brought about a significant improvement in the
revenue collection time for tax payers. Comparable observations were made by Holniker
(2015) who argues that, the use of the system has brought about a significant
improvement in the revenue collection time for tax payers, and that, revenue mobilization
is considered as one of the key factors key for economic development of nations and links

55
into national agenda on social wellbeing, poverty reduction and economic development of
countries and their citizens.
5.4 Conclusions
5.4.1 Employees’ Information and Technology Knowledge and Tax Administration
The study concludes that information technology has increased productivity in the
organization, as well as help staff from different departments in the organization to
communicate without necessarily having to meet in person, enabled the employees to
meet deadlines for daily operations as well as prioritize their work in terms of need. IT
has allowed employees to access to information via a touch of a button and the automated
systems have reduced the work of printing personal and business information. The study
concludes that KRA is keen on ensuring all staff members are educated and trained
appropriately in order for them to operate effectively and meet their deadlines. It had also
distracted employees especially social media and entertainment sites, and the use of IT
had also led to a decrease in creativity and innovation in the workplace.
5.4.2 Business Process Technology and Tax Administration
The study concludes that automated systems in the organization required less if any
human labor and they were cheap as compared to human labor. Social media in the
organization involves turning communication into interactions through various platforms
and KRA values the integration of social media into its business process. KRA employees
prefer to make their own time to work and their working behavior has changed due to the
increasing use of IT, because, the adoption of computers in the organization has
transformed the organization. The study concludes that IT has helped employees bypass
traditional organizational hierarchy and menu-driven mail repositories and has facilitated
the streamlining of KRA’s administrative process, as well as enabled the organization to
reduce the need for middle managers.
5.4.3 Taxpayers’ Information and Technology Knowledge and Tax Administration
The study concludes that technology is necessary for the tax administration activities in
the organization, it has reduced the period of time between when the tax is generated and
the moment it is paid. Technology in tax administration aims at enhancing efficiency in
tax collection and it has reduced the errors in procedures of gathering of data
automatically as well as reducing the overall cost of tax administration. The tax system
56
cannot work better than its tax administration, and thus, technology helps taxpayers to
have a systematic approach for managing tax compliance risks, while providing taxpayers
with a 24/7 access to taxation services. Automating revenue collection has helped
taxpayers to have a better audit trail of their tax, and technology has brought about a
significant improvement in the revenue collection time for tax payers.
5.5 Recommendations
5.5.1 Recommendations for Improvement
5.5.1.1 Employees’ Information and Technology Knowledge and Tax Administration
The study recommends the management of KRA at Sameer Business Park to ensure that
the use of technology does not distracts employees. This could be achieved by ensure that
the firm’s network both local area network and WiFi do no access social media sites as
well as entertainment sites. This would minimize the level of employee distractions by
visiting these sites.
5.5.1.2 Business Process Technology and Tax Administration
The study recommends the management of KRA at Sameer Business Park to encourage
its employees to make use of technology and become more creative and innovative in the
firm. The managers could encourage and task employees to come-up with better methods
of using technology to process and handle their tax administration which would improve
the firm’s overall tax administration performance.
5.5.1.3 Taxpayers’ Information and Technology Knowledge and Tax Administration
The study recommends that KRA should ensure that its taxpayers have a systematic
approach for managing their tax compliance risks. The firm should use its county
government offices to ensure that taxpayers are trained on how to properly identify, and
track their payments using the e-system, as well as how to effectively and efficiently
manage their tax returns.

57
5.5.2 Recommendations for Further Research
The study focused on KRA, in particular, the Small Taxpayers Office based in Sameer
Park Mombasa road. Therefore, there is need for a similar study to be conducted at
KRA’s headquarters at Times Tower. This would facilitate the application of a
comparison study that would provide an overall comprehensive and detailed finding on
how technology has influenced tax administration in the country.

58
REFERENCES
Abelson, J., Forest, P. G., Eyles, J., Casebeer, A., Martin, E. & Mackean, G. (2015).
Examining the role of context in the implementation of a deliberative public
participation experiment: Results from a Canadian comparative study. Social
Science & Medicine, 64(10), 2115‐2128.
Allink, M. & Kommer, V. (2010). Handbook for tax administrations. Organizational
structure and management of Tax Administrations. Inter-American Center of Tax
Administrations.
Alvi, M. (2016). A manual for selecting sampling techniques in research. Retrieved from
https://mpra.ub.uni-muenchen.de.pdf (Accessed 10/10/2018).
Andarias, R. (2012). The Use of Technology in Local Tax Administration. A paper
presented to the European and Mediterranean Conference on Information Systems,
July 2006, Costa Blanca, and Alicante, Spain.
Au, N. & Cheng, T. C. E. (2012). The Formation of Employee Satisfaction with Airline
Information Systems. Journal of Travel Tourism and Marketing, 29, 335-351.
Baležentis, A. & Paražinskaitė, G. (2012). The Benchmarking of the Government to
Employee (G2e) Technology Development: Theoretical Aspects of the Model
Construction. Social Technologies, 2(1), 53-66.
Berisha-Shaqiri, A. (2015). Impact of information technology and internet in
businesses. Academic Journal of Business, Administration, Law and Social
Sciences, 1(1), 73-79.
Bird, M. & Casangera, J. (2012). Improving tax administration in developing countries.
World Development, Elsevier, 17(8), 1145-1157.
Booth, P. (2012). Compliance: A 21st Century Approach. National Tax Journal, 49(3),
413-420.
Brief, A. I. (2012). Qualitative and Quantitative Research Techniques for Humanitarian
Needs Assessment. Physical Review, 47, 777-780.
Broadway, R. W. (2012). From optimal tax theory to tax policy: retrospective and
prospective views. Cambridge, TN: MIT Press.
Chatama, Y. J. (2013). The impact of ICT on Taxation: the case of Large Taxpayer
Department of Tanzania Revenue Authority. Developing Country Studies, 3(2), 91-
100.
Crabtree, P. (2012). A framework for understanding technology and technological
change. The Innovation Journal: The Public Sector Innovation Journal, 11(1), 1-16.

59
Creswell, J. W. & Clark, V. P. (2014). Designing and conducting mixed methods
research. Thousand Oaks, CA: Sage Publications Inc.
Cyr, D., Gehling, L. & Gibson, M. (2014). IT power and the post-emptive strike.
Information Systems Management, 14(3), 7-15.
Davenport, T. & Short, J. (1990). The new industrial engineering: information technology
and business process redesign. Sloan Management Review, 31(4), 11-27.
DeLone, W. H. & McLean, E. R. (2013). Information systems success: The quest for the
dependent variable. Information System Research, 3(1), 60-95.
Ejiaku, S. A. (2014). Technology adoption: Issues and Challenges in information
technology adoption in emerging economies. Journal of International Technology
and Information Management, 23(2), 59-68.
Erard, B. (2012). The role of moral sentiments and audit perceptions in tax compliance.
Public Finance/Finances, 49(1), 70-89.
Evans, C. (2013). Tax aggression among tax professionals. E-Journal of Tax Research,
1(1), 64-92.
Fox, N., Hunn, A. & Mathers, N. (2014). Sampling and sample size calculation. New
York, NY: The NIHR RDS for the East Midlands/Yorkshire & the Humber.
Gil-García, J. R. & Pardo, T. A. (2015). E-government success factors: Mapping practical
tools to theoretical foundations. Government Information Quarterly, 22(2), 187-
216.
Grönlund, Å. & Horan, T. A. (2014). Introducing e-government: history, definitions, and
issues. Communications of the Association for Information Systems, 15(1), 713-729.
Gupta, A. S. (2008). Determinants of Tax Revenue Efforts in Developing Countries. IMF
Working Paper WP/07/184, Washington, DC: International Monetary Fund.
Haddud, A., Dugger, J. C. & Gill, P. (2016). Exploring the Impact of Internal Social
Media Usage on Employee Engagement. Journal Social Media for
Organizations, 3(1), 1-17.
Hadler, S. (2014). Improving Tax Administration in Sub-Saharan Africa: the Potential of
Revenue Agencies and Electronic Service Delivery. United Nations, 3(2), 1-29.
Holniker, D. (2015). Computerization of Commercial Tax System. A Review of Some
Efficiency and Macroeconomic Aspects. In V. Tanzi. Policies, Institutions and the
Dark Side of Economics. Cheltenham, UK: Edward Elgar.
Hsieh, J. P. A., Rai, A., Petter, S. & Zhang, T. (2012). Impact of user satisfaction with
mandated CRM use on employee service quality. MIS Quarterly, 36, 1065-1080.
60
Iivari, J. (2015). An Empirical Test of the DeLone-McLean Model of Information System
Success. ACM SIGMIS Database, 36, 8-27.
Jenkins, G. P. (2014). Economic Reform and Institutional Innovation. Bulletin
International Bureau of Fiscal Documentation, 4(12), 588-596.
Jiménez, G., Sionnaigh, N. M. & Kamenov, A. (2013). Information Technology for Tax
Administration. Retrieved from http://pdf.usaid.gov/pdf_docs/pnaea485.pdf
(Accessed 12/10/2018).
Kaino, L. M. (2008). Information and Communication Technology (ICT) developments,
utilization and challenges in ICMI history. In Symposium on the Occasion of the
100th Anniversary of ICMI. Rome (pp. 5-8).
Kane, C., Alavi, M., Labianca, G. & Borgatti, P. (2014). What’s different about social
media networks? MIS Quarterly, 38(1), 275-304.
Kiema, J. (2017). Effects of ICT Support Services on Revenue Collection by Kenya
Revenue Authority. Unpublished Doctoral Dissertation, University of Nairobi.
Kimani, K. A. (2015). Impact of Information Technology on Organizational
Performance: Case of Population Services Kenya. Unpublished Doctoral
Dissertation, University of Nairobi.
KRA. (2012). A Historical Perspective to Revenue Performance in Kenya. Nairobi, KE:
The Institute of Certified Public Accountants of Kenya, CPA Centre.
KRA. (2015). Kenya Revenue Authority Annual Report and Financial Statements as at
June 2015. Nairobi, KE: The Institute of Certified Public Accountants of Kenya,
CPA Centre.
Macharia, M. (2016). Technology adoption to increase Kenya revenue inflows: Caj News
Africa. Retrieved from http://cajnewsafrica.com/2016/11/04/technology-adoption
(Accessed 12/10/2018).
Masese, W. (2011). KRA Automation to Boost Tax Collection. Retrieved from:
http://www.nation.co.ke/business/Automation-has-boostedKRA-/index.html.
(Accessed 12/10/2018).
Muita, E. W. (2011). Factors that Influence Adoption and Use of E-Filing System of
Kenya Revenue Authority among the Large Taxpayers. Unpublished MBA Project
submitted to the JKUAT Nairobi Central Business District Campus.
Mukabi, D. N. (2014). Factors Influencing Turnover Tax Compliance in the Kenya
Revenue Authority Domestic Taxes Department in Nairobi County. Unpublished
MBA Project. University of Nairobi, Kenya.

61
Mutuku, M. N. & Nyaribo, W. M. (2015). Effect of Information Technology on
Employee Productivity in Selected Banks in Kenya. Review of Contemporary
Business. Research, 4(1), 49-57.
Ng’ang’a, O. G. (2013). Influence of Automation on the International Operations of
Iqplus (k) Limited. Doctoral dissertation, School of Business, University of Nairobi.
Nübler, I. (2016). New technologies: A jobless future or the golden age of job
creation. Research Department, ILO Working paper, (13).
Oseni, M. (2015). Sustenance of Tax Administration by Information and
Communications Technology in Nigeria. Archives of Business Research, 4(1), 47-
54.
Otaghsara, M. K. & Mohseni, A. (2012). The role of ICT in-service training of employees
of government Organization: A Case Study of the Institute of Water and Power
Unit, Mazandaran. Procedia-Social and Behavioral Sciences, 47, 1985-1990.
Peansupap, M. C. & Walker, O. A. (2015). Information technology and staff
development: Issues and problems related to new skills and competence
acquisition. Journal of Technology and Teacher Education, 9(2), 153-170.
Quintana, F. (2016). The Organization of Tax Administration in the CIAT Members
Countries. CIAT.
Ramayah, T., Ramoo, V. & Amlus, I. (2012). Profiling online and manual tax filers:
Results from an exploratory study in Penang Malaysia. Labuan e-Journal of
Muamalat and Society, 2(2), 1-8.
Reinganum, J. F. & Wilde, L. L. (2012). Equilibrium Enforcement and Compliance in the
Presence of Tax Practitioners. Journal of Law, Economics and Organization, 7(1),
163-81.
Rezaei, M., Zare, M., Akbarzadeh, H. & Zare, F. (2014). The Effects of Information
Technology (IT) on Employee Productivity in Shahr Bank: Case study of Shiraz,
Iran. Applied mathematics in Engineering, Management, and Technology, Special
Issue in Management and Technology, 1208-1214.
Rubin, H. (2012). Technology Economics: Rubin’s Law and Why Your IT Spending is
About to Hit the Wall. Retrieved from http://www.rubinworldwide.com/.pdf
(Accessed 15/10/2018).
Sani, A. (2016). Contentious issues in tax administration and policy in Nigeria: A
governor's perspective. First National Retreat on Taxation. Lagos, NI: Joint Tax
Board.

62
Sekaran, U. & Bougie, R. (2013). Research Methods for Business: A Skill-Building
Approach. (6th Ed.). New York, NY: Wiley.
Turban, E., Bolloju, N. & Liang, T. P. (2011). Enterprise social networking:
Opportunities, adoption, and risk mitigation. Journal of Organizational Computing
and Electronic Commerce, 21(3), 202-220.
Wang, Y. S. & Liao, Y. W. (2016). Assessing e-Government systems success: A
validation of the DeLone and McLean model of information systems success.
Government Information Quarterly, 25(4), 717-733.
Webley, P. (2014). Tax compliance by businesses. New perspectives on economic crime.
Cheltenham, UK: Edward Elgar.
West, C. P. (2012). A mixed methods sequential explanatory study of the impact of
chronic pain on family resilience. Doctoral dissertation, James Cook University.
Winter, S. & Taylor, S. (2015). The role of IT in the transformation of work: a
comparison of post-industrial, industrial, and proto-industrial organization.
Information System Research, 7(1), 5-21.
Yamane, T. (1967). Statistics: An Introductory Analysis. (2nd Ed.). New York, NY:
Harper and Row.

63
APPENDICES
APPENDIX I: RESEARCH PARTICIPATION LETTER
Dear Respondent,
I am a Master’s student at United States International University, pursing an MBA
degree. I am kindly requesting your participation in a research study that I am conducting
titled, “Impact of Information Technology on Tax Administration and Performance at
Kenya Revenue Authority (KRA)”. The intention is to assess the impact of IT on KRA’s
business performance.
The study involves completing basic demographic information and four surveys on the
effects of information technology on employee performance, effect of information
technology on business processes, effect of information technology on taxpayers and
information technology performance.
Please note that your participation is completely voluntary and you may withdraw from
the study at any time. The study is completely anonymous; therefore, it does not require
you to provide your name or any other identifying information. Your participation in the
research will be of great importance to this study.
Thank you for your time and participation.
Sincerely,
Charity N. Kinyua.

64
APPENDIX II: QUESTIONNAIRE
Instructions: Please respond to the following questions and where applicable, mark the
relevant box with a tick (√).
Confidentiality: The responses you provide will be strictly confidential. No reference
will be made to any individual(s) in the report of the study.
Part A: General Information
1. What is your gender?
a) Male [ ]
b) Female [ ]
1. In which of the following age brackets do you belong?
a) 18Years – 25 years [ ]
b) 26Years – 35 Years [ ]
c) 36Years – 45 Years [ ]
d) 45 Years – 55 Years [ ]
e) 56 Years and above [ ]
2. Indicate your highest level of qualification (tick where appropriate)
a) Secondary education [ ]
b) Certificate/diploma [ ]
c) Undergraduate [ ]
d) Masters [ ]
e) Doctorate [ ]
3. How many years have you worked with Kenya Revenue Authority? (Tick ( )
where appropriate).
a) Less than 5 Years [ ]
b) 6-10 Years [ ]
c) 11-15 Years [ ]
d) 16-20 Years [ ]
e) 21 Years and above [ ]
4. Please state your designation
a) Director [ ]
b) Senior management [ ]
c) Middle management [ ]
d) Subordinate [ ]

65
Part B: Effects of Information Technology on Employee Performance
5. Do you agree with the following statements in relation to effect of IT on employee
performance? Please indicate by ticking your level of agreement on the factors: 1 -
Strongly Disagree, 2 - Disagree, 3 – Neutral, 4 – Agree and 5 - Strongly Agree.
1 2 3 4 5
Information technology has increased productivity
Information technology helps staff from different
departments in the organization to communicate without
necessarily having to meet in person
Information technology helps employees to meet deadlines
for daily operations
Information technology has helped staff to prioritize work
in terms of need
Information technology allows for access to information via
a touch of a button
Automated systems have reduced the work of printing
personal and business information
KRA is keen on ensuring all staff members are educated
and trained appropriately
Trained employees are able to operate effectively and meet
their deadlines
Information technology distracts employees especially
social media and entertainment sites
Creativity and innovation in the workplace have reduced
with the increased use of technology

66
Part C: Effect of Information Technology on Business Processes
6. Do you agree with the following statements in relation to effect of IT on business
processes? Please indicate by ticking your level of agreement on the factors: 1 -
Strongly Disagree, 2 - Disagree, 3 – Neutral, 4 – Agree and 5 - Strongly Agree.
1 2 3 4 5
Automated systems in the organization requires less if any
human labor
Automated systems in the organization are cheap as
compared to human labor
Social media in the organization involves turning
communication into interactions through various platforms
KRA value the integration of social media into its business
process
KRA employees prefer to make their own time to work
The working behavior of employees and employers have
changed due to the increasing use of information technology
The adoption of the computers in the organization has
transformed the organization
Information technology has helped employees bypass
traditional organizational hierarchy and menu-driven mail
repositories
Information technology has facilitated the streamlining of
KRA’s administrative process
Information technology has enabled the organization to
reduce the need for middle managers
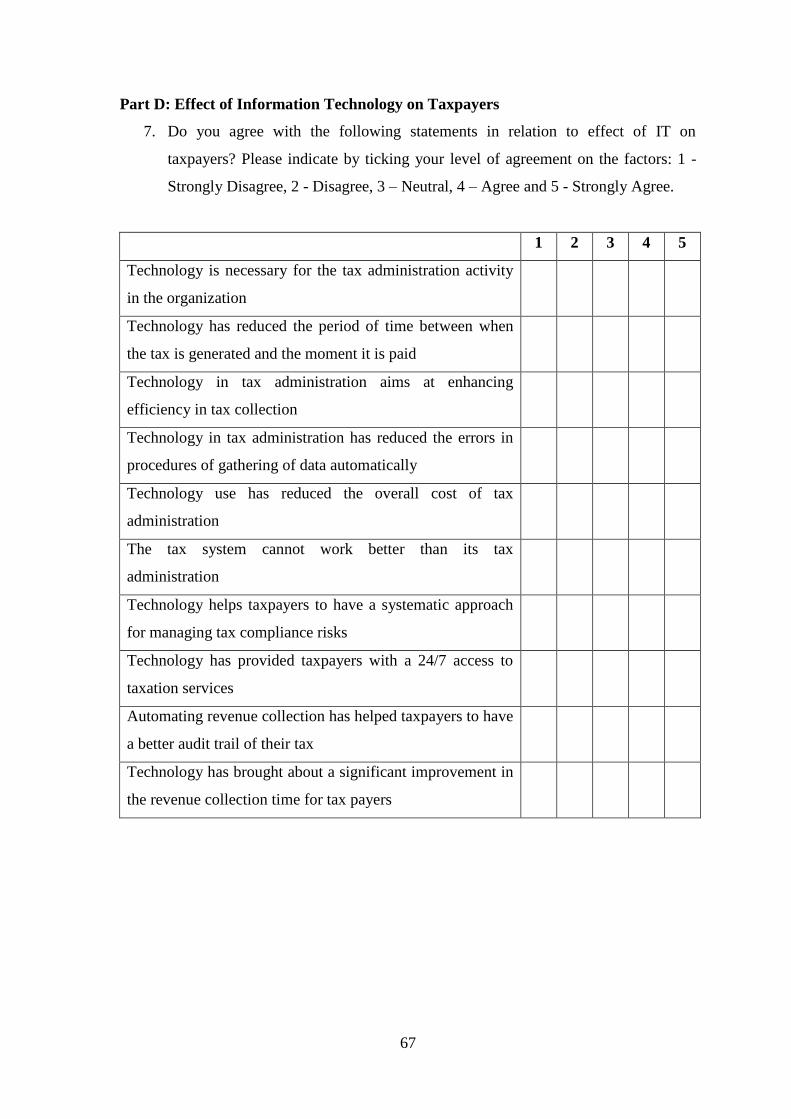
67
Part D: Effect of Information Technology on Taxpayers
7. Do you agree with the following statements in relation to effect of IT on
taxpayers? Please indicate by ticking your level of agreement on the factors: 1 -
Strongly Disagree, 2 - Disagree, 3 – Neutral, 4 – Agree and 5 - Strongly Agree.
1 2 3 4 5
Technology is necessary for the tax administration activity
in the organization
Technology has reduced the period of time between when
the tax is generated and the moment it is paid
Technology in tax administration aims at enhancing
efficiency in tax collection
Technology in tax administration has reduced the errors in
procedures of gathering of data automatically
Technology use has reduced the overall cost of tax
administration
The tax system cannot work better than its tax
administration
Technology helps taxpayers to have a systematic approach
for managing tax compliance risks
Technology has provided taxpayers with a 24/7 access to
taxation services
Automating revenue collection has helped taxpayers to have
a better audit trail of their tax
Technology has brought about a significant improvement in
the revenue collection time for tax payers

68

69
THE END