Effect of Color Overlays on Reading Efficiency - CORE
73
University of Massachuses Amherst ScholarWorks@UMass Amherst Open Access Dissertations 9-2011 Effect of Color Overlays on Reading Efficiency Rhonda Morrison University of Massachuses Amherst, [email protected] Follow this and additional works at: hps://scholarworks.umass.edu/open_access_dissertations Part of the School Psychology Commons is Open Access Dissertation is brought to you for free and open access by ScholarWorks@UMass Amherst. It has been accepted for inclusion in Open Access Dissertations by an authorized administrator of ScholarWorks@UMass Amherst. For more information, please contact [email protected]. Recommended Citation Morrison, Rhonda, "Effect of Color Overlays on Reading Efficiency" (2011). Open Access Dissertations. 431. hps://scholarworks.umass.edu/open_access_dissertations/431
-
Upload
khangminh22 -
Category
Documents
-
view
1 -
download
0
Transcript of Effect of Color Overlays on Reading Efficiency - CORE

University of Massachusetts AmherstScholarWorks@UMass Amherst
Open Access Dissertations
9-2011
Effect of Color Overlays on Reading EfficiencyRhonda MorrisonUniversity of Massachusetts Amherst, [email protected]
Follow this and additional works at: https://scholarworks.umass.edu/open_access_dissertations
Part of the School Psychology Commons
This Open Access Dissertation is brought to you for free and open access by ScholarWorks@UMass Amherst. It has been accepted for inclusion inOpen Access Dissertations by an authorized administrator of ScholarWorks@UMass Amherst. For more information, please [email protected].
Recommended CitationMorrison, Rhonda, "Effect of Color Overlays on Reading Efficiency" (2011). Open Access Dissertations. 431.https://scholarworks.umass.edu/open_access_dissertations/431

THE EFFECT OF COLOR OVERLAYS ON READING EFFICIENCY
A Dissertation Presented
by
RHONDA F. MORRISON
Submitted to the Graduate School of the
University of Massachusetts Amherst in partial fulfillment
of the requirements for the degree of
DOCTOR OF PHILOSOPHY
September 2011
School Psychology Program

© Copyright by Rhonda F. Morrison 2011
All Rights Reserved

THE EFFECT OF COLOR OVERLAYS ON READING EFFICIENCY
A Dissertation Presented
by
RHONDA F. MORRISON
Approved as to style and content by:
_______________________________________
William J. Matthews, Chair
_______________________________________
John M. Hintze, Member
_______________________________________
Adrian B. Staub, Member
____________________________________
Christine B. McCormick, Dean
School of Education

DEDICATION
To my family and friends who encouraged and believed in me.
I never would have made it without you.

v
ACKNOWLEDGMENTS
I would like to extend my gratitude to all those who have helped me throughout this process. A
special thank you to my advisor, William Matthews, for his many years of guidance, support, and
patience. I would also like to thank the members of my committee, John Hintze, Adrian Staub, and Keith
Rayner for their helpful comments and suggestions. I want to thank Helen Irlen for providing access to
training and materials for use in this research. I wish to express my appreciation to all the individuals
who volunteered their participation in this project. Thank you to my research assistants, Sarah Peller and
Suzy Klein. Finally, a special thank you to Dr. Carlos Turriago for his support, friendship, and
encouragement to continue when the going got tough.

vi
ABSTRACT
THE EFFECT OF COLOR OVERLAYS ON READING EFFICIENCY
SEPTEMBER 2011
RHONDA F. MORRISON, B.A., COLLEGE OF OUR LADY OF THE ELMS
M.A., UNIVERSITY OF MASSACHUSETTS AMHERST
Ph.D., UNIVERSITY OF MASSACHUSETTS AMHERST
Directed by: Professor William J. Matthews
Reading is a skill that unlocks the doors of learning and success. It is commonly
accepted that reading is a foundational skill that plays a major role in a child‘s academic success.
The history of teaching reading includes many theories about the development of reading, the
source of reading difficulties, and interventions for remediation. A large body of research has
demonstrated that reading difficulties stem from a phonological basis and interventions that
target this area are generally beneficial in helping improving reading skills (National Reading
Panel, 2000; Shaywitz, 2003; Stanovich, 1986). However, there are some who even with
extensive intervention continue to struggle to read. Helen Irlen (2005) proposed that these
people may experience visual-perceptual distortions when reading high-contrast text (black on
white background). Irlen claims that symptoms of this disorder, termed Scotopic Sensitivity or
Irlen Syndrome, can be alleviated by the use of color overlays or filters (tinted glasses).
Research into the existence of this syndrome and the effectiveness of the overlays and filters to
remediate reading problems has been inconsistent and criticized for lacking scientific rigor and
heavy reliance on subject report of improvement. The present study seeks to evaluate
differences that may exist in eye movements and reading fluency when subjects diagnosed with

vii
IS read text with and without color overlays. Participants were screened with the Irlen Reading
Perceptual Scale (IRPS) to determine whether or not they suffered from the syndrome. From this
screening, participants chose an overlay reported to alleviate distortions or discomfort they
experienced when reading. They were then asked to read 18 passages under three conditions—
with a clear overlay, with their chosen overlay, and with a random overlay—while their eye
movements were recorded. Results indicated that participants showed no improvement in eye
movement or reading fluency when they read passages with an optimum (chosen) overlay verses
a clear overlay or a random overlay.

viii
TABLE OF CONTENTS
Page
ACKNOWLEDGMENTS ................................................................................................. v
ABSTRACT ...................................................................................................................... vi
LIST OF TABLES ............................................................................................................. x
CHAPTER
1. STATEMENT OF THE PROBLEM ............................................................................ 1
The Importance of Learning to Reading ...................................................................... 1
Reading Instruction ...................................................................................................... 2
Irlen Syndrome............................................................................................................. 5
Causes and Treatments of IS.................................................................................. 7
Previous Research on IS/Scoptopic Sensitivity Syndrome .................................... 8
Critiques of IS Research ...................................................................................... 19
Eye Movement in Reading......................................................................................... 21
Fluency in Reading .................................................................................................... 23
Current Investigation ................................................................................................. 24
2. METHODS ................................................................................................................. 27
Participants ................................................................................................................. 27
Materials .................................................................................................................... 27
Irlen Reading Perceptual Scale (IRPS) ................................................................ 27
Reading Fluency .................................................................................................. 30
Reading Passages ................................................................................................. 30
Eye Tracking ........................................................................................................ 31
Independent Variables ............................................................................................... 31
Dependent Variables .................................................................................................. 31
Analysis...................................................................................................................... 32
Data Collectors........................................................................................................... 32
Procedures .................................................................................................................. 32
3. RESULTS ................................................................................................................... 34
Questionnaire ............................................................................................................. 34
Irlen Screening ........................................................................................................... 35
Eye Tracking measures .............................................................................................. 36
Fixations ............................................................................................................... 36
Fixation Duration ................................................................................................. 37
Saccades ............................................................................................................... 38
Saccade Length .................................................................................................... 39
Regressions .......................................................................................................... 40

ix
Regression Length ............................................................................................... 41
Reading Time ....................................................................................................... 42
4. DISCUSSION ............................................................................................................. 43
Results Summary ....................................................................................................... 43
Discussion .................................................................................................................. 44
Limitations ................................................................................................................. 48
Computer versus Paper ........................................................................................ 48
Vision Examination ............................................................................................. 48
Summary and Conclusion .......................................................................................... 49
APPENDICES
A. INFORMATION FOR PARTICIPANTS.................................................................. 50
B. QUESTIONNAIRE ................................................................................................... 51
C. DEBRIEFING FORM ............................................................................................... 52
D. CONSENT FORM – UNDERGRADUATE PARTICIPANTS ................................ 53
E. CONSENT FORM – COMMUNITY PARTICIPANTS .......................................... 56
F. TABLES OF QUESTIONNAIRE RESULTS ........................................................... 58
REFERENCES ................................................................................................................ 60

x
LIST OF TABLES
Table Page
1. Mean Scores and Standard Deviations for Number of Fixations ...................37
2. Mean Scores and Standard Deviations for Fixation Duration ........................38
3. Mean Scores and Standard Deviations for Number of Saccades ...................39
4. Mean Scores and Standard Deviations for Saccade Length (letter spaces)....40
5. Mean Scores and Standard Deviations for Number of Regressions ..............41
6. Means and Standard Deviations for Regression Length (letter spaces) .........42
7. Means and Standard Deviations for Reading Time (Milliseconds) ...............42
F.1. Number of Hours Spent Reading Per Week ...................................................58
F.2. Lighting Preference ........................................................................................58
F.3. Corrected Vision .............................................................................................58
F.4. Irlen Diagnosis Categories .............................................................................58
F.5. Number of Overlays Chosen ..........................................................................59
F.6. Overlay Color Preference ...............................................................................59
F.7. Glare vs. Non-Glare .......................................................................................59

1
CHAPTER 1
STATEMENT OF THE PROBLEM
The Importance of Learning to Read
Reading is a skill that unlocks the doors of learning and success. In our society, those
who are considered ‗literate‘ are generally successful and perceived as more intelligent than
those who are less literate. Individuals who learn to read well are more likely to be adequately
employed, and socially and financially stable. Fluent readers tend to possess general knowledge
and skill that allows them to thrive in an information-based society. Conversely, people who are
less literate may fail to develop such knowledge and skill and are at a disadvantage both
economically and socially. These adults are at risk for low employment and underemployment,
receiving welfare benefits, and involvement in criminal activity resulting in imprisonment
(Adams, 1994; Hall & Moats, 1999). Thus, because the price of illiteracy is so high, learning to
read is a critical element in one‘s success.
Hall and Moats (1999) stated, ―Reading is the most important skill for success in school
and society (Hall & Moats, 1999 p. 6). So important is the ability to read that we deem it a
necessary foundational skill and teach it to our children in the primary years with the expectation
that by the third grade they will have become skillful enough to read connected text at a
minimum level of effectiveness for meaning. This expectation is based on the fact that it is at the
third grade that the focus of reading instruction changes from learning to manipulate letters and
sounds for decoding and encoding words, to reading for comprehension as a means of obtaining
knowledge (Adams, 1994; Moats, 2001). Children who experience positive early interactions
with reading tend to develop into good readers who enjoy engaging in the task of reading.
Because these children are able to read with relative ease and comfort, they will read more and

2
continue to build their reading skill and knowledge base (Irlen, 2005; Stanovich, 1986; Morgan,
Morgan, Fuchs, Compton, Cordray, & Fuchs, 2008). As they progress through the higher
grades, when material becomes more challenging, their efficiency of reading allows them to keep
pace and adequately profit from instruction. As a result, these children tend to grow up to
become literate adults (Stanovich, 1986).
However, for many people, reading does not develop quite as easily. Instead, reading is
an arduous task, and one that requires a significant amount of energy and effort to obtain
meaning. Comprehension comes at the cost of significant time spent manipulating text and can
result in an understanding that may or may not represent the author‘s intent. Additionally, such
negative experience with the task of reading may have the effect of significantly reducing the
amount of reading in which one engages, which in turn may hinder comprehension due to poor
development of the background knowledge that is normally obtained from exposure to large
amounts of print resources (Moats, 2001; National Reading Panel, 2000; Morgan & Fuchs, 2007;
Stanovich, 1986).
Reading Instruction
Because reading is so important, researchers have endeavored to find the best way to
teach children to read and to help those who struggle to learn to read. Educators have long
debated the best methods for reading instruction, and this debate has led to pendulum swings in
reading curriculums and teaching approaches. Prior to the 1980‘s reading was taught with a
focus on learning the code and the use of basal readers as a means of developing comprehension.
Children were taught the alphabet and sounds of the letters with a belief that learning the code
would lead to comprehension. In the 1980‘s the rise of whole language led to reading instruction

3
that emphasized a constructivists approach. Focus was turned from direct teaching of the code to
exposure to literature rich texts presented in unedited form, with the belief that students would
learn to read through experiencing literature in its purest form. This view emphasized
comprehension as a means of reading rather than the result of reading. Instead of decoding
words to determine meaning, students were encouraged to utilize picture and context cues
towards understanding. Reading skills were not directly taught to students because it was
believed that skills would emerge from meaningful communication activities and spontaneously
taught mini-lessons (Pearson, 2004).
A report of the National Reading Panel (2000) examined reading research and identified
key components in reading instruction. It found that in order for children to become proficient
readers, they must develop alphabetic understanding and phonemic awareness and these skills
must be taught explicitly and systematically in the early years of education. Further,
interventions to help struggling readers should focus on phonological processing deficits.
Early research compared poor readers to good readers in an attempt to understand the
cognitive processes involved in reading. Many differences were observed and inferences made
about the cause of reading difficulties in poor readers (Stanovich, 1986; Jenkins, Fuchs, Van den
Broek, Espin, & Deno, 2003; Vullentino, 2007). One area in which disparities were found in
reading behavior between good and poor readers was eye movement (Rayner, 1998).
Observations during reading provided basic information about eye movement behavior.
Technology made it possible to capture and measure these movements and provided a basis for
describing these differences. Research in this area reported that poor readers make more
regressive eye movements, have a higher number of fixations, and longer fixations durations per
line of text than more skilled readers (Rayner, 1998). These observed differences were

4
erroneously interpreted by some to mean reading difficulties were the result of visual processing
deficits which when corrected would improve reading (Stanovich, 1996). In fact, the converse is
true, with eye movements being a reflection of reading ability. Unfortunately, this interpretation
resulted in the widespread use of such interventions as eye movement training programs which
attempted to improve reading by correcting visual efficiency. Such programs have not been
demonstrated to be an effective method for improving reading (Rayner, 1998; Stanovich, 1986).
A large body of research has demonstrated that most reading difficulties stem from a
phonological basis and interventions that address this area are generally beneficial in helping
children develop and improve reading skills (National Reading Panel, 2000; Shaywitz, 2003;
Stanovich, 1986). However, there are some who, even with considerable intervention, still
struggle to learn to read. Others learn to read adequately but inefficiently, and reading for them
remains laborious and unenjoyable (Irlen, 2005). Even with what we know about what
constitutes good reading instruction and intervention, one researcher has proposed that there is
still another area of reading processing that should be addressed when considering why someone
may have difficulties with the task of reading. Helen Irlen (2005) believes that helping children
develop into who readers able to comfortably engage in the task of reading requires further
consideration of the visual system in the process of reading.
Why do some people still struggle with the task of reading after much intervention and
effort? Irlen (2005) posited that people who continue to struggle to learn to read efficiently may
in fact suffer from Scoptopic Sensitivity Syndrome or Irlen‘s Syndrome (IS). According to Irlen
(2005), this syndrome is characterized by visual perception distortions that occur most often with
high-contrast text (black text on white paper) and result in symptoms that make reading
uncomfortable. Such symptoms include seeing movement of text (i.e. shaking or wiggling),

5
white spaces becoming more pronounced than black text, text fading in and out, etc. Readers
may find that they have difficulty tracking text and may often misread words, skip lines, and
develop somatic symptoms such as headaches, nausea, or eyestrain (Irlen, 2005). According to
Irlen (2005), as many as 46% of people diagnosed with learning disabilities suffer from IS and it
is a key factor interfering with reading improvement. In the general population, 12-14% may
struggle with IS, affecting the amount of time one spends reading (Irlen, 2001). Irlen (2005) is
careful to say that IS is not the cause of reading difficulties. Rather she considers it a piece of
the puzzle that may play a role in why some fail to adequately respond to reading interventions.
According to Irlen (2005), when visual distortions can be controlled, individuals will become
more available to engage in the task of reading and interventions that address language-based
deficits may be more effective. She states that a person with IS, ―cannot become a fluent,
confident reader, no matter what the intervention until the [IS] is treated‖ (p.61).
Irlen Syndrome
In her book entitled, Reading by the Colors: Overcoming Dyslexia and Other Reading
Difficulties (Irlen, 2005), Helen Irlen describes how she discovered the syndrome in 1981 during
her work at a federally-funded research program at California State University in Long Beach.
The research was performed at an adult learning disability center and its purpose was to study the
factors in learning disabilities that had not responded to remediation and maturation, and had
gone undetected within the context of established school evaluation systems. Irlen‘s previous
experience as a school psychologist had led her to believe that the present systems for evaluating
reading difficulties were not accounting for all of the factors that may affect a child‘s learning.
She believed that there was something else standing in the way of real progress for many people

6
with learning disabilities and hoped that the research would reveal unexplored factors that could
be targeted for intervention giving hope to those who continue to struggle to learn to read.
Subjects in her study were adults who had been diagnosed as children with learning
disabilities. These subjects had experienced special education evaluation and placement,
interventions designed to remediate reading skills, and private tutoring yet they continued to
struggle with the task of reading. Irlen found that for all of these individuals, there was one
important question that had never been asked during previous assessments. They had never been
asked what happens when they read. Irlen wanted to fully understand what these individuals
were experiencing when they engaged in the task of reading. In order to answer this question,
Irlen spent hours interviewing each of the 1,500 subjects. A subset of subjects emerged with
patterns in their responses. These subjects reported that overall reading was difficult and
frustrating and many reported reading more slowly than their peers. There was a high incidence
of such symptoms as frequent loss of place on the page, misreading words, skipping lines, and
the need to reread text repeatedly. These experiences often led to frustration, feeling fidgety,
falling asleep during reading, and difficulties comprehending text. To further understand this
phenomena, Irlen asked a population of proficient readers what they saw on a page text. Their
responses were simply, ―Letters and words.‖ None reported the symptoms experienced by the
population with learning disabilities. This led her to conclude that there were differences in what
people see on a page of text that lead to varying reading experiences. These experiences may
indirectly affect the development of reading skills (Irlen, 2005).

7
Causes and Treatment of IS
In the Irlen study (Irlen, 2005), 35 subjects identified with IS were sent to a group of
professionals from various disciplines over a nine-month period for remediation. These
professionals included ophthalmologists, optometrists, developmental specialists, neurologists,
reading specialists, and psychologists. Irlen (2005) stated that at the end of the nine months,
―Although some treatments were helpful, none made any significant difference in reducing or
eliminating the reported distortions‖ (p. 21). These results guided her belief that the visual
perceptual distortions these subjects suffered were part of a unique syndrome that required
treatment not available within established methods of remediation.
Irlen (2005) describes the discovery of the benefits of color to improve visual perception
as happening quite by accident when a student brought in a red overlay she had used in vision
training several years earlier. Another student within the group discovered that when she used
the overlay, the distortions she had experienced were eliminated. This discovery led Irlen to
experiment with other colors and text. Using color plastic gels used in theater lights, she found
that the effect of the color overlays was idiosyncratic with some colors helping and other colors
worsening the problem for different individuals. Of the 37 subjects who identified and used an
optimum color overlay, 31 reported being able to read longer and faster, as well as being able to
keep up with their peers. Conversely, good readers reported no effects on how long or how well
they read with the overlays. Students who reported improvement with the overlays indicated that
they had difficulties using the overlays for such tasks as reading material from an overhead, or
when writing. In order to improve the practicality of the use of color to control or eliminate
visual perceptual distortions, Irlen developed color filters (tinted glasses). Overlay colors do not
correspond to colors used in the filters, and the process for determining filter colors is lengthy

8
and expensive. Where diagnosis and overlay determination can be done by a certified Irlen
screener, filters must be obtained through a specially trained diagnostician (Irlen, 2005).
While it is not fully understood what causes the perceptual distortions and why the use of
color overlays reduce or eliminate the distortions, Irlen (2005) states that this disorder is possibly
due to a structural deficit in the brain which causes signals in the brain to be inappropriately
processed. She believes that those who suffer with IS have a sensitivity to full-spectrum light
that alters how visual stimuli is processed in the brain (Irlen, 2005). Irlen proposes that the color
overlays and filters selectively block certain wavelengths and results in reduced perceptual
distortions (Irlen, 2005). Another theory of visual processing deficits in reading was described
by Singleton and Henderson (2006). According to this theory, termed the Magnocellular Deficit
theory, it is believed that a dysfunction occurs in the neural pathway that sub serves vision. The
two systems of cells that aid in the process of reading, the magno system and the parvo system,
work together to aid perception of text. The parvo system codes information about color and
detail, while the magno system is responsible for inhibiting the parvo system when the eyes are
in motion so that images are perceived as stationary even though the eyes are moving across text.
In visual perceptual disorders, it is believed that there is a defect in the magno system which may
cause problems in the smooth and efficient processing of text (Singleton & Henderson, 2006).
Irlen describes her research in her book, but does not give detail about methodology or
report any data analysis.
Previous Research on IS/Scoptopic Sensitivity Syndrome
Although there have been several studies conducted on the use of color overlays (Blaskey
et al., 1990; Evans, Cook, Richard & Drasdo, 1994; Tyrell, Holland, Dennis & Wilkins, 1995;

9
Fletcher & Martinez, 1994; Robinson & Conway, 1990; Wilkins, Lewis Smith, Rowland &
Tweedie, 2001), reviewers have criticized the research as being largely subjective and lacking
scientific rigor (Hoyt, 1990; Scheiman et al.,1990; Solan, 1990). Researchers fail to agree on the
existence of this syndrome and the effectiveness of color overlays as a treatment.
Researchers in the field of ophthalmology dispute IS as a distinct syndrome and claim
that the perceptual difficulties experienced by those diagnosed with IS are actually part of a
vision problem that should be addressed through optometric interventions. When listing the
symptoms of scoptopic sensitivity syndrome, Scheiman et al. (1990) stated, ―This list, of course,
is identical to one that any optometrist would consider to be signs and symptoms associated with
refractive, accommodative, binocular or ocular motility disorders.‖ (p. 601). Blaskey et al.
(2001) examined the effectiveness of the use of Irlen filters (tinted glasses) to relieve symptoms
over traditional optometric intervention. 40 subjects aged 9-51 were recruited to participate in a
study about the effectiveness of the Irlen filters. As the study took place two months after an
airing of a 20-minute segment about Irlen Syndrome on the television program 60 Minutes, some
of the participants were viewers who called for more information in response to the program. Of
the 40 volunteers, 38 met the criteria for both vision problems and Irlen Syndrome. Subjects
were randomly placed into three groups and received either the Irlen intervention (filters), vision
therapy, or no intervention (control group). Subjects were given complete vision examinations
and screened with the Irlen screening battery. Subjects in the Irlen treatment group had
significant vision problems and underwent examination for Irlen filters. All subjects tested
positive for filters (found filters which they reported improved their symptoms). They were also
given a second pair of filters with ordinary tint which served as a placebo. The real and placebo
filters were randomly selected and given to subjects by an individual who was blind to all aspects

10
of the study. Subjects received the filters approximately 1 month after initial testing and were
asked to try them for two weeks. They then received the other pair of filters to wear for two
weeks. Subjects were then asked to select the pair of filters that were most comfortable and to
wear those for two more weeks. Subjects in the vision therapy treatment group were given
glasses or modification to glasses as indicated by their vision examination. Each subject
underwent a vision therapy program which included vision exercises or procedures performed
once or twice week in 45-minute sessions. They were also given vision therapy procedures to
work on at home.
All subjects were given a battery of reading tests [the Woodcock Reading Mastery Test
(forms G & H, and word recognition subtest), Gray Oral Reading Test (forms c & d), Standford
Reading Test (level red, green brown or blue, forms G & H and the Irlen Clinic Test of Random
Letters], intelligence tests [Wechsler Intelligence Scale for Children-Revised (WISC-R) or
Wechsler Adult Intelligence Scale-Revised (WAIS-R)], and completed an optometric
questionnaire. Results showed significant differences between the pre and post scores for the
subjective measures (scotopic sensitivity score and symptom questionnaire) in both the Irlen and
the vision therapy groups. The Irlen subjects reported fewer symptoms and more comfort when
reading through their preferred filters. However, there were no significant differences seen on
any of the reading measures for this group. Additionally, the vision therapy group obtained a
significant difference in their reading fluency measure (Gray Oral Reading) indicating that their
rate of reading also improved with treatment. No significant scores were obtained on any of the
other reading measures for this group. Blaskey et al. (2001) concluded from these findings that
the immediate effect of use of Irlen filters is reduction in visual complaints. However, results did
not show significant improvement in reading ability with the use of filters. Further, the fact that

11
subjects in the vision therapy group also improved in comfort on the Irlen measures suggests that
scotopic sensitivity is not a distinct entity and that vision problems may be an underlying factor
in people who feel they may benefit from Irlen filters.
Evans, Richards, and Drasdo (1994), proposed that pattern glare (described as a pattern
such as stripes that are typically problematic for people who suffer from epilepsy and migraine
headaches) may account for the visual symptoms experienced by those with IS. They reported
that about 3% of people who suffer from epilepsy are sensitive to certain patterns and that many
people who do not suffer from epilepsy find patterns such as stripes uncomfortable. Such
patterns can induce illusions of color, shape, and motion similar to those experienced by people
with IS. Further, tinted lenses have often been used to treat these symptoms in people with
epilepsy, migraines, and visual discomfort. Evans et al. (1994) stated that positive results from
previous studies on the effectiveness of color lenses to treat IS may have been due to expectancy
and the placebo effect. In those studies, there was significant publicity associated with the Irlen
therapy and subjects knew that they were expected to perform better with the color lenses. They
also argued that the tints themselves were reinforcing, ―brightly colored tints, like highlighter
pens, can appear to have the effect of enhancing the contrast of print; hence, colored filters may
act as a self-reinforcing placebo‖ (p. 620). They hypothesized that because symptoms are
produced by the spatial properties of text on the page, manipulation of those properties would
change the amount of pattern glare one experiences. If pattern glare accounted for the symptoms
behind IS, the benefit that one experiences with the color overlays would vary with subtle
changes in the text and the naïve subject would be unaware of this hypothesis.
In this study, subjects were given a photocopy of a pattern to induce pattern glare and a
questionnaire of about their history of epilepsy or migraines. They were then asked to look at the

12
pattern for 10 seconds and check off from a list of nine illusions all those which they
experienced. Subjects then chose color overlays that reduced or alleviated the illusions. From
this group 5 subjects were chosen who reported the most pattern glare (experimental group) and
compared to 6 subjects who showed the least pattern glare (control group). All subjects were
given a simulated reading visual search task (SRVST) in which the spatial patterns of the text
were closely spaced (more likely to elicit pattern glare) and widely spaced (less likely to elicit
pattern glare). Results showed that those in the experimental group generally read more slowly
than did the control group across all conditions, although this difference was not significant.
Results showed that subjects read faster with their chosen overlay when reading the closely
spaced text, than they did with their overlay on the widely spaced text. However, this difference
was not significant. Subjects in the control group read comparably on each of the tasks with and
without an overlay.
Studies have reported positive results on reading comfort and reading skill measures with
the use of color. Tyrrell, R., Holland, K., Dennis, D. and Wilkins, A. J. (1995) investigated the
effects of color overlays on reading skills and general reading behavior in school children. In
their study, 60 children between the ages of 8 and 16 were selected from three high schools and
one middle school to participate. Based on a score of greater than 97 on the Cognitive Abilities
Test (National Foundation of Education Research, 1974) and performance on the The Standard
Reading Tests (Daniels & Diack, 1977) placed in groups based on the difference between their
chronological age and reading age (above average readers n=10, average readers n=18, and
below average readers n=12). Additionally, there was another group (n=6) of students identified
as well below average readers and a control group of students of similar age with average
reading ability (n=8). Subjects were screened with the IRPS resulting in the choice (or non

13
choice) of an overlay(s). Based on results of the IRPS, perceptual difficulties were scored and
categorized as low, medium, and high. Subjects were also given visual search task and oral
reading tasks. The visual search task consisted of a passage of text where letters within the
passage were replaced at random by other similar looking letters (according to ascending or
descending strokes). Subjects were instructed to look for the letter ‗x‘ as quickly as possible and
call out the letter that followed it. Results indicated higher percentages of subjects in the
average, below average, and well below average reading categories had perceptual difficulty
scores in the high category and were likely to choose a color overlay versus a clear overlay when
reading. Subjects who chose a color overlay had significantly better oral reading rates when
they read with the overlay versus with a clear overlay. Conversely, they found that after 15
minutes of reading, these same subjects had increased number of symptoms and decreased
reading rate when they read through the clear overlay. There were no significant differences in
reading rates for each task of subjects that chose a clear overlay or that were given random
overlays when they read with clear or color overlays. They concluded that for some individuals
the use of color overlays can be an effective intervention in the classroom.
Robinson & Conway (2001) reported positive results in their study of the effects of use of
color overlays over time (12 month period) on reading skills and perception of reading ability.
They hypothesized that correction of distortions experienced in those with IS would result in
improvements in reading rate, accuracy, and comprehension, and improved perception of ability
towards school tasks. Subjects in this study were students between 9 and 16 years of age who
were screened with the IRPS and placed into two groups, those identified with Irlen Syndrome
(n=44) and those without (n=47). Reading age was determined with the Neale Analysis of
Reading Ability (Neale, 1958). Subjects in the IS group had an average discrepancy between

14
their chronological age and reading age of 3 years 3 months, and those without IS had an average
discrepancy between chronological age and reading age of 2 years 9 months. Subjects were also
asked to complete the Student‘s Perception of Ability Scale (SPAS), a 70 item scale relating to
specific areas of school performance. They were tested with alternate forms of the Neal Analysis
of Reading Ability at three-month intervals over four occasions for (3 months, 6 months, 9
months and 12 months), and completed the SPAS at the last two testing sessions. Subjects were
given color overlays based on their chosen preference within two weeks of assessment. The
authors claimed these overlays served to give subjects intermediate benefit prior to the 2-hour
diagnostic sessions for the filters (tinted lenses). Subjects were then supplied with the filters after
three months. They reported gains in rate, accuracy, and comprehension over each test occasion
with the greatest gains seen between the 9 and 12 month period. It should be noted that there
was no control group included in this study because the researchers believed it to be unethical to
deny treatment to students for one year. Therefore, it is difficult to say whether these gains
would have been seen in subjects who did not receive the Irlen intervention. The authors
addressed this issue by adding 12 months to the initial scores. They stated, ―Because a control
group was not employed in this study, 12 months were added to each initial Neale Analysis of
Reading Ability for calculations of significance‖ (p. 592). Improved SPAS scores were reported
indicating that students felt more positive about their ability in school after the 12 months.
Finally, they divided the data into two groups based on subject reading ages for initial accuracy
and comprehension of 8 years and below and above 8 years in. The researchers hypothesized
that subjects with reading ages above 8 years should have mastered basic word-recognition skills
and should therefore would show the most gains in reading achievement with improved clarity of

15
print. Results showed a significantly better performance in accuracy in the higher reading age
group as compared to the group with the lower reading age.
Wilkins, A. J., Lewis, E., Smith, F., Rowland, E., and Tweedie, W. (2001) also reported
positive results with the use of the color overlays. In this article, the researchers reported on
three studies conducted with school-aged children. The purpose of the first study was to
investigate the reliability of the choice of color overlay and the effect of use of the overlay on
reading speed. Subjects in this study were 89 students between 9 and 11 years of age who
underwent three sessions of testing. The first session took place in a group format and involved
subjects answering questions about their vision (whether they wore glasses and for what tasks),
and then reading aloud a passage containing 20 lines of randomly ordered common words for the
purpose of tiring their eyes. Subjects were asked to continue looking at the page while
answering questions about what they saw. The second and third sessions involved individual
testing where subjects were read aloud a passage for one minute from the Rate of Reading Test
and then answered the same questions presented in the group session. They then participated in
one of two techniques to determine color overlay choice. One technique used the Intuitive
Overlays Instruction Book (IOO Marketing, London) that involved presentation of overlays
across half a page of the stimulus. Subjects were asked to identify which side was clearer or
more comfortable. The process continued with each of the overlays until an optimum overlay
was identified. The second technique involved use of an A4 sized booklet of two side by side
stacks of overlays with an identical page of text on white paper between each. Each page was
fully covered and subjects were asked which overlay (or plain white page) was more comfortable
to read. Again, all colors were presented and compared until an optimum overlay was
indentified. Finally, subjects read the Rate of Reading Test passage aloud for one minute two

16
more times, with and without their chosen overlay and their words read correct per minute was
recorded. One to two days later, subjects attended the third session that involved the same
procedure using the alternate technique for choosing an overlay. Results of this study showed
that all subjects who chose an overlay in the first sessions (78) also chose an overlay in the
second session. 47% of these subjects chose the same color overlay, 21% chose an overlay of
similar color, and 22% chose a completely different color overlay. Students who chose the same
or similar overlays showed a greater increase in reading fluency with the use of the overlay than
those who choose different colors. The increase in reading at testing time 1 was strongly
correlated to the increase in reading at testing time 2 (r=0.86; p<.001). They also reported that
subjects with many symptoms reported in the group testing sessions, continued to report these
symptoms throughout the individual testing sessions. These subjects were more likely to choose
an overlay and demonstrated improved reading speed with its use. These results led them to
conclude that group screening techniques would be sufficient to identify individuals for whom
color overlays could be beneficial.
The purpose of the second study was to examine the relationship between visual
difficulties with reading, and scholastic attainment in reading, including phonological and non-
phonological reading strategies. 378 middle school children ages 8 to 12 participated in
individual testing with one of three examiners in the same manner as described in study one. In
addition to identification of an optimum overlay, examiners assigned a random overlay by
choosing an overlay positioned behind the overlay subject described is being the least
comfortable to read through. Students were given either a color overlay (chosen or random) or a
grey overlay to use for 5 months.

17
Results showed that 83% of children in this study chose a color overlay. These students
read significantly faster with their chosen overlay than with the random or no overlay (mean
words per minute: no overlay 112.7, chosen overlay 116.8, and random overlay 115.25). They
also read faster with the random overlay as compared to no overlay. Twenty-seven children
chose a grey overlay and demonstrated no significant difference in reading rate with or without
the overlay. After 5 months, there was a trend in the amount of usage of the overlays. Subjects
given their chosen overlay were more likely to continue to use it than those given a random
overlay, or a grey overlay. Again, they concluded that children who report symptoms and
choose an overlay showed the most benefit from its use and this benefit was stable over time.
These children did not differ in their use of a phonological reading strategy from those who did
not choose an overlay.
In the last study, authors attempted to replicate findings in the previous studies with a
larger sampling in order to better estimate the number of children who would benefit from
overlay usage. Twenty schools volunteered to participate following a lecture given to teachers in
the district. Twelve of these schools completed the study. Students ranged in age from 6 years
10 months to 8 years 6 months. The Teacher‘s Assessment Pack of the Intuitive Overlays was
supplied to teachers who assessed students in the autumn of the year. Teachers were asked to
give their opinion about the student‘s reading skill and whether or not the student had difficulty
concentrating. Students were shown a stimulus page and asked questions about what they saw.
Overlays were then identified using the above described method. Subjects who choose an
overlay were then administered the Rate of Reading Test (four forms) with, without, without,
and then with the chosen overlay. These subjects were also given the overlay free of charge to
18
use when they wished. Teachers were told not to pressure students to use the overlays. Teachers
were contacted nine months later to report which students were still using the overlays.
Results of this study showed that 60% of the 426 children chose a color overlay. These
children read faster with their chosen overlay than with no overlay (test 1 with=73.64(20.5), test
2 without=71.63(22.48), test 3 without=71.83(22.3), test 4 with=75.23(21.1)). Eight months
later, 52% of these children were still using the overlay. These children did not differ from
other children who did not continue to use the overlay in the particular symptoms reported
during screening. However, they did differ in their reported symptoms from children who did
not choose an overlay. These children were also more likely to be reported by their teachers as
having difficulty concentrating. Based on these results, they concluded that the children who
report the most symptoms and who find overlays reduce or alleviate these symptoms tend to reap
the most benefits from use of the overlays and these benefits appear to be stable over time.
O‘Connor, Sofo, Kendall and Olsen (1990) investigated the effects of colored filters on
reading rate, accuracy, and comprehension in a sample of school children aged 8-12. Children
were screened with the IDPS (Irlen Differential Perceptual Schedule) (Irlen, 1983) and
determined to be scoptopic or non-scoptopic. There is no available reliability or validity data
available for this instrument. The Scoptopic group (n=67) was further divided and randomly
placed into four groups: optimum overlay (n=17), clear overlay (n=17), random overlay (n=17),
clear overlay with no pretest (n=16). The non-scoptopic group was randomly placed into two
groups: clear overlay (n=12) and random overlay (n=13). Groups were pre and post tested a
week apart using the Neale Analysis of Reading Ability (Neale, 1958) and Formal Reading
Inventory (Wiederholt, 1986). One group from the scoptopic sample was only post tested to
control for possible testing effects. Each student was given an overlay to use for one week for all

19
reading tasks including math and told, ―We think this might make reading a little easier for you.‖
Results indicate significant improvement in reading rate, accuracy, and comprehension for
children with scoptopic sensitivity given the optimum overlay. All other groups had mixed
results with some children showing no change, and others showing small improvements or
regressions in reading performance. They concluded that results from this study indicate that
color overlays provide improvements to those with scoptopic sensitivity syndrome and that these
changes cannot be attributed to motivational changes. According to these researchers, if
improvement with color overlays is due to motivation (children expect they will do better with
the overlays) positive changes should have also occurred in children in the scoptopic group given
the wrong color, as well as in children in the non scoptopic group given color overlays.
Critiques of IS Research
Solan (1990), and Hoyt (1990) criticized several studies on Irlen Syndrome. First, in
regards to the prevalence of scotopic sensitivity syndrome, Solan (1990) criticized O‘Connner et
al.‘s (1990) report of more symptoms in poor readers than in good readers as evidence of higher
incidence of IS. Instead, Solan claims that because these subjects did not undergo vision
examination, that these numbers could be due to optometric problems rather than Irlen Syndrome
as purported in Blaskey et al (1990). Hoyt (1990) states that because scoptopic sensitivity
syndrome is not medically recognized, it is ―an absolute necessity for any patient enrolled in an
Irlen lens trial study to have a complete optometric or ophthalmologic examination at the time of
enrollment into the study.‖ Both Solan (1990) and Hoyt (1990) also criticized O‘Conner et al.
(1990) for possibly biasing their sample by using teachers who had attended an information
session about scoptopic sensitivity prior to nominating students for the study. Further, Solan

20
(1990) criticizes the use the Neal Analysis of Reading Ability because it reports age scores that
are difficult to interpret. He concluded that the present research was insufficient to identify IS as
a separate syndrome nor color overlays or filters as permanent treatment of symptoms. Hoyt
(1990) questioned the results that showed large numbers of subjects identified with scoptopic
sensitivity regressed with the use of a clear overlay and stated, ―We must conclude that testing
parameters are so pernicious that validation may be nearly impossible.‖ Additionally,
improvements reported in subjects given the clear overlay give credence to the argument of
placebo effects. Finally, Hoyt (1990) criticizes O‘Conner et al (1990) for their method of using 6
groups which yield small sample sizes in each group.
Hoyt (1990) and Solan (1990) also critique a study by Robinson & Conway (1990). This
study suffered from many of the same flaws identified in the O‘Conner et al. study. According
to both Hoyt (1990) and Solan (1990) these researchers failed to ensure adequate optometric
screening of subjects and lacked a control group. Hoyt (1990) additionally points out that even
though researchers in both studies utilized the same reading measure, they obtained different
results.
Even though research has not provided a strong basis for its use, the Irlen method
(diagnosis of IS and use of color overlays and filters) has grown in popularity. Over 4,000
school districts use the Irlen Method. Clinics are located in 22 states in the U.S. and in several
countries all over the world. Additionally, many organizations recognize the Irlen Method and
fund diagnosis and treatment of Irlen Syndrome. Bills have been passed or are pending in
Arizona, California and Massachusetts allowing use of the Irlen Method, and the Irlen Syndrome
is recognized as a learning disability in the state of Alabama (Irlen, 2001).

21
One major criticism of the Irlen method is that effects are determined largely through
self-report methods. Although Helen Irlen contends that IS is a problem of perception rather
than a vision problem, measurements of eye movement during reading may provide another level
of measurement of one‘s visual perceptual experiences. Research on eye movements during
reading has provided a basis for understanding and measuring reading efficiency (Rayner, 1998)
and is likely to yield important information in the area of visual perception as well.
Eye Movement in Reading
Over the past century, eye movement studies have shed light on what happens with the
eyes during reading. It was previously believed that a good reader‘s eyes move smoothly across
the page. However, research has found that movements are not smooth, but rather are broken.
During reading, the eyes jump from point to point. These movements, termed saccades and
fixations, occur so rapidly (milliseconds) that they are imperceptible. However, through the use
of instrumentation, these movements can be captured and measured. Development of research in
the area of eye movements has created a base for comparison of differences between and within
subjects in the area of reading. Basic eye movements are described as saccades, fixations, and
regressions. Saccades are high velocity movements of the eyes during which time no
information is being processed. The purpose of saccades is to move the eye to the next point in
which text can be brought into view and processed. Fixations occur between saccades during
which time the eyes are still and are processing information in the fields of view. Regressions
are backward saccades and can be short (a few letter spaces to correct for saccades that are too
long) or long (greater than 10 letter spaces along the same line or to other lines that occur when
the reader needs to reread text for comprehension) (Rayner, 1998). Data collected through eye

22
movement studies have provided mean values of saccades and fixation measurements in silent
and oral reading, visual research, scene perception, and typing (Rayner, 1998). A study by
Fletcher and Martinez (1994) examined changes in eye movements with the use of color overlays
(Fletcher & Martinez, 1994). In their study, subjects were screened with the IDPS to determine
scoptopic sensitivity, as well as given the Vocabulary subtest of the Wechsler Adult Intelligence
Scale-Revised (WAIS-R) (Wechsler, 1981) or the Wechsler Intelligence Scale for Children-
Revised (WISC-R) (Wechsler, 1974) to estimate intelligence, and the Wide Range Achievement
Test-Revised (WRAT-R). (Jastak & Wilkinson, 1984). Subjects of average intelligence, who
met criteria for scoptopic sensitivity syndrome and who had at least fourth-grade decoding skills
were included in the study (n=22). Subjects chose overlays that they identified as best reducing
their symptoms. They were then asked to read a passage for five minutes to induce symptoms.
Subjects were stabilized on the eye tracking equipment and shown a set of 10 randomly ordered
paragraphs under the first condition (either with or without the overlay) and then shown another
set of 10 in the opposite condition. Subjects read only the middle sentence in each passage.
Each paragraph was followed by a multiple choice question. Data was analyzed with an
ANOVA statistic. They stated that overall, results generally support the hypothesis that use of
the color overlays improves parsing. Specifically, fixation counts and duration were
significantly improved with subjects demonstrating fewer number of fixations (F=4.241,
p=0.040) and shorter fixation durations (F=5.075, p=0.025) with the use of the overlay. These
results indicate subjects had more automatic parsing when they read with an overlay verses when
they read without it. There was also a significant reduction the number of regressions (F=5.024,
p=0.026) and length of regressions (F=6.726, p=0.010) indicating that subjects had fewer
misunderstandings that required correction of eye movements when they read with an overlay.

23
There were no significant differences in the number of saccades (F=1.578, p=0.210) and
saccade lengths (F=2.228, p=0.136). There was also no significant difference in comprehension
with use of the overlay (F=0.144, p=0.706). Descriptive statistics were not reported. It is
possible that differences in comprehension were not observed because the amount of information
that subjects read (one sentence per paragraph) was insufficient to ascertain the effects of IS on
comprehension.
Fluency in Reading
One of the hallmarks of a good reader is the ability to read fluently. Fluent readers read
with speed, accuracy, and proper expression. Their reading sounds natural and allows for
understanding text. The ability to read fluently facilitates comprehension because text can be
read automatically, allowing for resources to be used in the task of comprehension. Shaywitz
(2003) describes fluency as the bridge to comprehension. For this study, fluency will be
measured using oral reading fluency (ORF) which is a curriculum-based measure of speed and
accuracy and has been shown to be sensitive to change, and predictive of overall reading ability
(Shinn, 1989). These measures are quick (one minute) and easy to administer and have been
demonstrated to be reliable and valid (Shinn, 1989).
One major criticism of the Irlen method is that improvement is determined predominately
by subject report. Use of eye movement technology may prove to be very useful in providing an
additional measure of the immediate effects of color overlays. Previous research using eye
measurements reported improved parsing with the use of color overlays (Fletcher & Martinez,
1994). In that study, subjects showed a reduced number of fixations and regressions and
decreased fixation durations with the use of optimum overlays.

24
Current Investigation
The purpose of this study is to further examine the immediate effects of the use of color
overlays on reading efficiency as measured by an eye movement data recording system and oral
reading fluency. The question to be answered is whether the use of color overlays improves
reading efficiency.
People who suffer from IS report experiencing perceptual distortions and movements of
the text. It is hypothesized that these experiences will be reflected in their eye movements.
Those diagnosed with IS should exhibit longer fixation durations, more regressions, and shorter
saccade lengths than those not diagnosed with IS. The null hypothesis is that there is no
difference in eye movements between those diagnosed with IS and those not diagnosed with IS.
This hypothesis could not be tested because of the 26 participants in the study, 24 met criteria for
IS. Therefore, there were not enough participants who did not meet criteria for IS to provide a
comparison group. This will be discussed later.
It is also hypothesized that subjects who no longer have to struggle to keep text stable
will show improvement in their eye movements. Therefore, there should be differences observed
in eye movements with the use of an optimal overlay, a random overlay, and a clear overlay.
The null hypothesis is there is no difference in eye movements between conditions—optimum
overlay, random overlay, clear overlay. The alternative hypothesis is that there is improved
efficiency in eye movements in the optimum overlay condition as compared to the random and
clear overlay conditions. The following hypotheses were tested for each eye movement measure:
Ho1: There are no differences in the number of eye fixations when participants read with
an optimal overlay, a random overlay, or with a clear overlay.

25
Ha1: Participants will show a fewer number of eye fixations when they read with an
optimal overlay, versus a random overlay, or with a clear overlay.
Ho2: There are no differences in the duration of eye fixations when participants read
with an optimal overlay, a random overlay, or with a clear overlay.
Ha2: Participants will show a shorter eye fixation duration when they read with an
optimal overlay, versus a random overlay, or with a clear overlay.
Ho3: There are no differences in the number of saccades when participants read with an
optimal overlay, a random overlay, or with a clear overlay.
Ha3: Participants will show a fewer number of saccades when they read with an optimal
overlay, versus a random overlay, or with a clear overlay.
Ho4: There are no differences in the length of saccades when participants read with an
optimal overlay, a random overlay, or with a clear overlay.
Ha4: Participants will have shorter saccades lengths when they read with an optimal
overlay, versus a random overlay, or with a clear overlay.
Ho5: There are no differences in the number of regressions when participants read with
an optimal overlay, a random overlay, or with a clear overlay.
Ha5: Participants will show a fewer number of regressions when they read with an
optimal overlay, versus a random overlay, or with a Clear overlay.
Ho6: There are no differences in the length of regressions when participants read with an
optimal overlay, a random overlay, or with a clear overlay.
Ha6: Participants will show shorter regression lengths when they read with an optimum
overlay, versus a random overlay, or with a clear overlay.

26
Improvement in visual perception should also affect reading fluency. It was originally
hypothesized that participants would read faster and have fewer errors as measured by oral
reading fluency. Because oral reading fluency data was not collected for several of the
participants, this hypothesis was not tested as stated. Instead, during the study, reading time was
measured through the eye tracking apparatus. Participants were asked to read 18 passages and
data was collected on the amount of time they spent reading each one of them. This data was
used in the study as a measure of reading fluency. The following hypothesis was tested:
H07: There are no differences in the reading time when participants read with an optimal
overlay, a random overlay, or with a clear overlay.
Ha7: Participants will show a shorter reading time when they read with an optimum
overlay, versus a random overlay, or with a clear overlay.

27
CHAPTER 2
METHODS
A repeated measures design was used to assess differences in eye movements when
participants read with a clear overlay, their optimum overlay, and random overlay.
Participants
An a priori power analysis was conducted. For alpha = .05, effect size = .25 and power =
.8 requires n = 28. Participants in this study were 24 people (2 males and 22 females) recruited
from a pool of undergraduate psychology students (18) at a large university in the northeastern
United States as well as in from the surrounding community (6). They ranged in age from 17 to
57 with a mean age of 22 (1.7). Students earned academic credit as outlined in the departmental
policy for research participation. Community participants received $22 for participation in the
study (see Appendix A).
Subjects were provided with information regarding the study, any risks that they may
incur, confidentiality procedures, and their rights of participation. After insuring subjects
understood their rights, they were asked to sign a consent form (Appendix A). This study was
reviewed and approved by the School of Education and the Psychology Department Institutional
Review Boards.
Materials
Irlen Reading Perceptual Scale (IRPS)
Subjects were screened for scotopic sensitivity syndrome (Irlen Syndrome) with the Irlen
Reading Perceptual Scale (Irlen, 2003). The Irlen Institute states that this instrument requires

28
specialized training to administer and use of the materials are restricted to certified Irlen
screeners (Irlen, 2003). With the permission of Helen Irlen, this researcher was trained at a
certified Irlen Screeners two-day training for the purpose of this study and administered all
screening.
The IRPS consists of three components. The first is a questionnaire used to gather
information from subjects regarding symptoms they may experience and compensatory strategies
they employ to ease these symptoms. Subjects are asked to recall their experiences for those
times when reading becomes uncomfortable and when they feel as though they want to stop
reading. Reading difficulties include skipping lines and losing one‘s place in text during reading
while somatic symptoms range from red watery eyes to headaches and nausea. Compensatory
strategies that may be used to manage these problems include using one‘s finger as a marker
when they read, taking frequent breaks, rubbing eyes, blinking often and reading in dim lighting
conditions (Irlen, 2003). For each question, participants indicate the degree to which they
experience the problem by responding often, sometimes, never, or don‘t know. For example,
respondents were asked, ―Do you unintentionally read words from lines above or below?‖ and
―Do you get a headache.‖ Irlen (2003) states that because proficient readers rarely engage in
reading compensatory behaviors, scores yielded from answers on this questionnaire identifies
people suffering from IS and to what degree from slight to moderate.
The second component of the screening involves the use of perceptual tasks designed to
elicit symptoms of IS quickly or more intensely. Screening was administered under layout and
lighting conditions as prescribed in the training manual. There are seven tasks. However, Irlen
(2003) states that there is no particular task that will elicit symptoms in everyone with IS.
Therefore, the number and particular tasks administered will depend upon how quickly

29
symptoms appear. Irlen (2003) states that the tasks are designed to elicit each individual‘s
unique set of misperceptions and gives subjects a language with which to talk about them. The
tasks involve the use of high-contrast black figures on which backgrounds which subjects are
asked to look at and answer questions about what they see happening and perform such tasks as
counting symbols or lines in the figure. The tasks are not designed for subjects to give a right or
wrong answer; rather, subjects are asked to report what happens during the task. In addition, the
examiner observes and records subject‘s body language for signs of discomfort or adjustment
such as head movements, excessive blinking, narrowing or widening of the eyes, and any
comments the subject makes regarding their experience. According to Irlen (2003), people
without IS have a preferences for reading black text on white paper even under florescent
lighting conditions; however, for those who suffer form IS, these normal reading conditions
stress the visual system and cause perceptual distortions (Irlen, 2003). Thus, these tasks serve
the purpose of validating the diagnosis of IS.
The third component of the screening involves use of the color overlays. The overlays
consist of transparent color plastic sheets with colors ranging from yellow to blue-gray. A total
of 10 overlays are presented to subjects to determine color preference. Subjects are shown a
page of text written in Dutch and asked to read letters in a line of text. The use of Dutch
eliminates prediction of text that occurs during reading and allows subjects to focus on and
report their visual perceptual experience. The examiner then places an overlay over half the page
and asks the subject if symptoms appear better or worse with or without the overlay. Each
overly is presented in like manner, and repeated with two or more overlays at a time until the
optimum overlay or combination is identified. After the subject chooses their preferred
overlay(s), the preference for glossy verse mat finish is determined. Perceptual tasks that elicited

30
symptoms for the subject can then be repeated with the chosen overlay to see if the subject‘s
experience is improved. The overlays are purported to reduce or eliminate the perceptual
distortions and are the last step in screening to validate the presence of IS. According to Irlen
(2003), those without IS see no difference with the use of color overlays and will prefer no color
to color. There is no published peer-reviewed reliability and validity data for this instrument.
Reading Fluency
Irlen (2003) states, ―Changes in reading flow, fluency, or accuracy can be observed
during the screening since symptoms disappear with the correct colour‖ (p. 35). Changes in
fluency will be measured with both silent and oral reading. Changes in silent reading fluency
will be measured using eye measurement technology (discussed below). To examine changes in
oral reading fluency, subjects were administered Curriculum-Based Measurement Oral Reading
Fluency measures. Oral reading fluency is a curriculum-based measure that has been
demonstrated to be a good indicator of reading efficiency (Shinn, 1989). Validity studies of
CBM one-minute reading measures reported correlation coefficients ranging from .73 to .91 with
criterion tests of reading (Marston, 1989). Scorers administered these measures using
standardized directions which asked participants to read aloud passages of text for one minute
(Shinn,1989).
Reading Passages
Passages of text were used for both eye measurement reading tasks and the oral reading
fluency measure. Passages were obtained from various aptitude preparation manuals and were
controlled for difficulty using the OKAPI! On-line system for creating curriculum-based

31
assessment problems using the Dale-Chall readiblity formula (Wright, 2007). Passages with
difficultly ratings of 11th
– 12th
grade were used. Methods for probe creation and administration
were followed as prescribed by Shinn (1989).
Eye Tracking
Eye movement data was collected using the Eyelink II video-based eye tracking system.
This system consists of a padded headband mounted with three miniature cameras that track
pupil and corneal reflections and record eye movement data into a PC computer for analysis.
The system is reported to be accurate with a less than .05º average gaze position error rate (SR
Research, 2007). Subjects were presented with passages of text on a computer screen and asked
to read aloud for one minute. Data was collected for eye movement measures (fixations,
saccades, regressions) as well as the amount of time it took to read the passage.
Independent Variables
The independent variables for this study are the color overlays. Three conditions were
used—a clear overlay, optimum overlay(s), and random overlay(s)—which are determine
individually through the IRPS screening process described above.
Dependent Variables
Dependent variables include eye-tracking measures--fixations, saccades, and
regressions—reading time, and oral reading fluency measures.

32
Analysis
This research will examine the differences in eye movement and oral reading
performance between conditions—clear overlay, optimum overlay, and random overlay. Data
was data will be analyzed using a MANOVA statistic.
Data Collectors
Two graduate students enrolled in a school psychology program were used as data
collectors and scorers/raters. They were trained in the use of the eye measurement apparatus by
researchers in the eye laboratory, and practiced until they were proficient in the use of the
apparatus. These students were naïve to the optimum and random conditions. They had been
previously trained in the administration of oral reading fluency passages.
Procedure
Participants in the study were undergraduate students recruited through the human
subjects pool of the psychology department as well as several subjects who were recruited from
the surrounding community. Data collection took place over two sessions. In the first session,
volunteers were asked to participate in a study about the effect of color in reading. and were
provided with information regarding the study, risks involved, and rights of participation and
will be asked to sign a consent form (Appendix A). Volunteers who agree to participate in the
study completed a questionnaire regarding demographic information, reading histories and
experiences, and knowledge of Irlen Syndrome/Scotopic Sensitivity Syndrome and or use of
color overlays or filters in reading (Appendix A), and were then screened for scoptopic
sensitivity syndrome/Irlen Syndrome with the Irlen Reading Perceptual Scale (IRPS). In the

33
original design of this study, subjects were to be placed into one of two groups based on the
results of this screening—Irlen+ or Irlen-. However, during screening it became apparent that
that most subjects met criteria for IS. Therefore, a comparison group could not be created.
In the second session, subjects reported to the eye tracking lab and were given a paper back copy
of The Complete Short Stories of Mark Twain to read for five minutes to induce symptoms of
scoptopic sensitivity (Fletcher & Martinez, 1994). They were then asked to read aloud from
three passages for one minute each while they were audio recorded. Each passage was read
under one of the three conditions—with a clear overlay, with an optimum overlay, and with a
random overlay. The experimenter followed along, marking errors and recording the one-minute
mark in the text. The experimenter then read a brief description of the eye measurement
procedures and fitted subject with the headband apparatus following procedures for safety and
hygiene. Subjects sat in front of a computer monitor while the experimenter went through the
initial calibration procedure which last approximately one to two minutes. After calibration,
subjects were presented with a passage of text consisting of black type on a white background,
double-spaced in times new roman size 10 font. Subjects were asked to read the passage silently
and then answer multiple choice questions. A total of 18 passages were read under the three
conditions--clear overlay, optimum overlay, and random overlay (6 pages in each condition).
The order of presentation was randomized to control for possible order effects. At the end of the
session, subjects were debriefed information through a short questionnaire to assess subject‘s
experience in the study and perceived usefulness of the overlays (Appendix A).

34
CHAPTER 3
RESULTS
This chapter will present the descriptive statistics (means and standard deviations) for
dependent measures (eyetracking indices), and an analysis of each measure under three
conditions: clear overlay, optimum overlay and random overlay conditions.
Each subject completed a short questionnaire and was screened with the Irlen Reading
Perceptual Scale (IRPS). The purpose of this scale is to understand one‘s reading history and
experience, elicit symptoms of IS through various perceptual tasks, and to select color overlays
that alleviate the distortions. This information is then used to initially diagnose IS. The
following were results of the questionnaire and IRPS.
Questionnaire
According to Irlen, people who suffer from Irlen Syndrome will typically read less for
pleasure as reading is uncomfortable. They may also prefer to read in low lighting conditions.
Participants in this study were asked how many hours they spend engaged in reading activities
per week as well as under what kind of lighting conditions they prefer to read. They reported a
wide range of hours spent each week reading for pleasure (0-22). Some reported not reading for
pleasure at all, while others reported reading as many as 22 hours per week for pleasure. On
average, participants read 4.13 (4.93) hours per week for pleasure. Participants reported
spending more time reading for work or school. On average they read 9.58 (8.05) hours per
week with a range of 0-30 hours (see in Appendix F). Most participants reported preferring
bright lighting conditions (14). Five (5) reported preferring medium lighting conditions and four
(4) reported preferring dim lighting conditions. One (1) participant indicated no preference of

35
lighting conditions (see Table 2 in Appendix B). When asked whether they have a history of
reading problems, one (1) participant reported having diagnosis of a specific reading disability.
None of the participants had neither heard of IS prior to the study nor had ever been prescribed
overlays for reading or undergone vision training. The average number of months since their last
eye exam was 20.17 (26.76). Eleven participants reported having normal uncorrected vision, 10
wore contact lenses, two (2) reported occasionally wearing reading glasses, and one (1) reported
wearing glasses for distance (see Table 3 in Appendix B).
Irlen Screening
Twenty-six participants were screened with the Irlen Reading Perception Scale (IRPS)
and placed into one of four IRPS diagnostic categories based on the number of symptoms they
experience during visual tasks and the amount of improvement they report with the color
overlay. Ten participants were identified as Excellent Candidates, seven (7) were identified as
Good Candidates, seven (7) as Possible Candidates and two (2) were Non-candidates. For
purposes of this study, data from the two non-candidates were not included in the analysis (see
table 4 in appendix B). Participants chose a color overlay or combination of overlay(s) that they
believed alleviated distortions or improved reading comfort. Most participants (12) chose one
overlay. However, 10 participants chose a combination of two overlays, and two (2) participants
chose three overlays. Darker colors were most often preferred (see Table 5 in Appendix B). The
most commonly chosen color overlay was blue-gray (11) followed by turquoise (7) and then
purple (6) (see Table 6 in Appendix B).

36
Eye Tracking Measures
Participants were asked to read text on a computer screen under three conditions—clear overlay,
optimum overlay and random overlay—while their eye movements were tracked. Data was then
averaged for each subject under each condition. A multivariate analysis of variance (MANOVA)
was used to analyze each dependent variable for differences between conditions. This statistic
was chosen because the data yielded many dependent variables. The Dunn-Bonferroni
procedure was used to control the Type I error for each of the family of dependent variables
(Fixations, Saccades, and Regressions). The Fisher LSD procedure was used to control the
familywise error rate for each of the multiple comparisons within the univariate analyses. Effect
sizes were calculated with a pooled standard deviation using Cohen‘s d (Cohen, 1998).
Fixations
Fixations are the points in the text where the eyes rest and process information. Studies
have suggested that poor readers make more fixations than do normal readers (Rayner, 1998).
The hypotheses being tested are:
Ho1: There are no differences in the number of eye fixations when participants read with
an optimal overlay, a random overlay, or with a clear overlay.
Ha1: Participants will show a fewer number of eye fixations when they read with an
optimal overlay, versus a random overlay, or with a clear overlay.
The omnibus F indicated that there were differences in the number of fixations when
participants read with a clear, an optimum, or a random overlay(s) and these differences were
statistically significant (F=5.34, p=.013) (see Table 1). Post hoc contrasts indicate a significant
difference between the clear and optimum conditions (t=-2.87, p=.009) with a medium effect
size (ES) of .6. There was also a significant difference between the optimum and random

37
conditions (t=2.73, p=.012) with a small ES of .4. Differences between the clear and random
condition were not significant (t=-1.02, p=.318). Given these results, the null hypothesis is
rejected, indicating that participant‘s had more fixations with their chosen (optimum) overlay,
than with a random or clear overlay(s). These results are contrary to what would be predicted
by Irlen.
Table 1: Mean Scores and Standard Deviations for Number of Fixations
Clear Overlay Optimum Overlay Random Overlay
Mean (SD) 85.82 (17.81) 96.78 (18.16) 89.55 (16.86)
Fixation Duration
Poor readers make longer fixations than do good readers. (Rayner, 1998). It should
follow that people with IS should show shorter fixation durations when reading under the
corrected condition (optimum overlay) than in the uncorrected conditions (clear or random). The
hypotheses being tested are:
Ho2: There are no differences in the duration of eye fixations when participants read
with an optimal overlay, a random overlay, or with a clear overlay.
Ha2: Participants will show a shorter eye fixation duration when they read with an
optimal overlay, versus a random overlay, or with a clear overlay.
The omnibus F indicated that there were significant differences in fixation duration
between the conditions. On average, participants fixated longer when reading with their chosen
(optimum) overlay then they did with a random overlay or with a clear overlay (see table 2).
Analysis of this data indicate that these differences were statistically significant (F=7.58,
p=.003). Post hoc contrasts indicated a significant difference between the clear overlay and the
optimum overlay conditions (t=-3.36, p=.001) with a medium ES of .6; as well as between the

38
clear overlay and random overlay conditions (t=-3.74, p=.001,) medium ES of .6. There was no
significant difference between the optimum overlay and random overlay conditions. Thus, the
null hypothesis in this case would be rejected. As was the case with the number of fixations,
these results to do not support improvement with the use of the color overlays.
Table 2: Mean Scores and Standard Deviations for Fixation Duration
Clear Overlay Optimum Overlay Random Overlay
Mean (SD) 236.46 (21.77) 252.73 (29.20) 247.81 (23.36)
Saccades
Saccades are the rapid movement of the eyes across the text. The purpose of saccades is
to move the eyes to the optimal viewing position where new text can be processed most
efficiently (quickly). When the eyes land in an area other than the optimal position, refixations
may occur where the eyes must then adjust to another position to process the word, and this can
result in longer processing times (Rayner, 1998). Poor readers tend to have shorter saccades. It
is reasonable to predict that these readers would also have a higher number of saccades. The
hypotheses being tested are:
Ho3: There are no differences in the number of saccades when participants read with an
optimal overlay, a random overlay, or with a clear overlay.
Ha3: Participants will show a fewer number of saccades when they read with an optimal
overlay, versus a random overlay, or with a clear overlay.
The omnibus F indicated there were significant differences in the number of saccades
participants made under each condition. On average, participants had more saccades when they
read with their optimum overlay(s) versus reading with a clear overlay or a random overlay (see

39
Table 3). Analysis of these differences indicate that they are statistically significant (F=5.22,
p=.014). Post hoc analysis showed significant differences between the clear condition and the
optimum condition (t=-2.74, p=.011) medium ES of .6, as well as between the optimum
condition and the random condition (t=2.81, p=.010) small ES of .4. Differences between the
clear and the random conditions were not significant (t=-.949, p=.352). Given these results, the
null hypothesis would be rejected. Contrary to what would be predicted by Irlen, these
participants did not show improvement in saccadic eye movements with the use of the color
overlays.
Table 3: Mean Scores and Standard Deviations for Number of Saccades
Clear Optimum Random
Mean (SD) 67.97 (16.54) 77.64 (16.85) 71.12 (15.93)
Saccade Length
Saccades occur when the eyes move rapidly across text to land at a position where
information can be processed most efficiently. As text becomes more difficult to read, saccade
length decreases (Rayner, 1998). It is reasonable to predict that participants will have longer
saccade lengths when they read with their optimum overlay versus a clear or a random overlay.
The hypotheses being tested are:
Ho4: There are no differences in the length of saccades when participants read with an
optimal overlay, a random overlay, or with a clear overlay.
Ha4: Participants will have shorter saccades lengths when they read with an optimal
overlay, versus a random overlay, or with a clear overlay.
Participants had shorter saccades when they read with their optimum overlay(s) verses a
clear overlay or a random overlay(s) (see Table 4). However, these differences were not shown

40
to be statistically significant (F = .406, p = .671). Thus, in this case we failed to reject the null
hypothesis. Again, participants in this study did not show improvement with the use of their
chosen color overlay as was predicted by Irlen.
Table 4: Mean Scores and Standard Deviations for Saccade Length (letter spaces)
Clear Optimum Random
Mean (SD) 12.26 (1.82) 12.01 (1.88) 12.20 (1.53)
Regressions
Regressions are saccades where the eyes move backward in the text. Poor readers tend to
make more regressions than do good readers (Rayner, 1998). It should be predicted that
participants will have fewer regressions with the optimal overlay than without a clear overlay or
a random overlay. The hypotheses being tested are:
Ho5: There are no differences in the number of regressions when participants read with
an optimal overlay, a random overlay, or with a clear overlay.
Ha5: Participants will show a fewer number of regressions when they read with an
optimal overlay, versus a random overlay, or with a clear overlay.
The Omnibus F indicated significant differences in the number of regressions under each
condition (F = 5.05, p = .016). Participants had the fewest number of regressions when they read
with a random overlay, as compared to when they read with a clear overlay or their optimum
overlay(s) (see Table 5). Post hoc tests show that the differences between the clear condition and
the optimum condition were not statistically significant (t=-1.52, p=.142). Differences between
the Clear condition and the random condition were also not significant (t=1.15, p=2.63).
However, there was a statistically significant difference between the optimum and random
conditions (t=2.87, p=.009) small ES (d=.3). Here, the null hypothesis is rejected. Participants

41
did not show predicted improvement with the use of the optimum overlay. However, they did
show a small improvement with the use of the random overlay over the clear or chosen overlay.
This result would be contrary to that which IS would predict.
Table 5: Mean Scores and Standard Deviations for Number of Regressions
Clear Optimum Random
Mean (SD) 22.35 (10.94) 23.66 (10.03) 20.86 (9.06)
Regression Length
Readers may regress a few letter spaces to correct for overshooting the targeted text, or
they may regress further back in the text when they fail to comprehend what was read. Good
readers show more accuracy in moving to the point in text that caused the difficulty, whereas
poor readers tend to back track more through the text (Rayner, 1998). It should be predicted that
participants will have shorter regression lengths when they read with their chosen overlay versus
a clear or random overlay. The hypotheses to be tested are:
Ho6: There are no differences in the length of regressions when participants read with an
optimal overlay, a random overlay, or with a clear overlay.
Ha6: Participants will show shorter regression lengths when they read with an optimum
overlay, versus a random overlay, or with a clear overlay.
The omnibus F indicated differences in regression lengths between conditions were not
statistically significant (F=.817, p=.455). Participants regressed farther in text when reading
with their optimum overlay(s) than with a clear overlay or a random overlay(s) (see Table 6). As
such, the null hypothesis is not rejected and is contrary to what IS would predict.

42
Table 6: Means and Standard Deviations for Regression Length (letter spaces)
Clear Optimum Random
Mean (SD) 7.51 (4.08) 7.64 (2.77) 6.99 (2.50)
Reading Time
Data from eye tracking measures yielded a reading time reporting the amount of time that
participants took to read passages under each condition. It would be expected that participants
should take less time to read passages when reading with their optimum overlay. The hypotheses
to be tested are:
H07: There are no differences in the reading time when participants read with an optimal
overlay, a random overlay, or with a clear overlay.
Ha7: Participants will show a shorter reading time when they read with an optimum
overlay, versus a random overlay, or with a clear overlay.
The omnibus F indicated that there were no significant differences between conditions (F=1.51,
p=.241). Participants read fastest under the random overlay condition and slowest in the
optimum overlay condition (see Table 7). These participants did not see improvement in how
fast they read when they used their optimum overlay.
Table 7: Means and Standard Deviations for Reading Time (Milliseconds)
Clear Overlay Optimum Overlay Random Overlay
Mean(SD) 56094.78 (20417.86) 60815.40 (15552.48) 55968.32 (18767.97)

43
CHAPTER 4
DISCUSSION
First, this chapter will summarize the results of the current study. Second, the limitations
of this study will be discussed. Finally, future research questions and implications for use of
color overlays will be discussed.
Results Summary
The current study examined immediate effects of use of color overlays by looking at
differences in eye movements during reading under three conditions, with a clear overlay, a
random overlay(s), or an optimum overlay(s). One major criticism of the Irlen method is that
improvement has been determined largely through subjective measures such as self-report. The
present study used eye tracking technology as a more objective measure of differences when
subjects used color overlays.
Results showed variations in participants‘ reading efficiency as measured by eye
tracking measures (i.e. fixation, fixation duration, saccades, saccade length, and regressions).
Participants had more fixation and shorter fixation times when they read with a clear overlay as
compared to reading with their optimum overlay(s) or a random overlay(s) (Tables 8 and 9). In
addition, they had significantly more saccades when they read with an optimum overlay versus
with a random or clear overlay (Table 10) indicating that participants were able to process text
more efficiently with a clear overlay. There were no significant differences in the length of
saccades in each condition (Table 11).
Participants in this study showed the fewest number of regressions when they read with a
random overlay versus with their optimum or a clear overlay (Table 12). The difference was

44
statistically significant between the optimum and the random conditions for this measure;
however, the effect size was small (d=.3). In addition, regressions of a few character spaces, to
up to a full line of text indicate a correction for understanding. There was no significance in the
length of regressions in text between conditions (Table 13).
As mentioned earlier, because oral reading fluency data was not collected for several
participants, fluency was determined by reading time data collected from the eye tracking
apparatus. Results showed no significant difference in the amount of time participants took to
read passages under each condition described above (Table 14). This finding indicates that there
was no increase in reading fluency with the use of the color overlays. This finding appears to
correlate with findings from Blaskey et al. (1990) who found no differences in rate of reading
with use of color overlays.
Discussion
Several studies have that reported positive effects of the overlays on reading (Blaskey et
al., 1990; Evans, Cook, Richard & Drasdo, 1994; Tyrell, Holland, Dennis & Wilkins, 1995;
Fletcher & Martinez, 1994; Robinson & Conway, 1990; Wilkins, Lewis Smith, Rowland &
Tweedie, 2001). Fletcher and Martinez (1994) examined changes in eye movements with the use
of color overlays and reported improvements in parsing with the use of chosen color overlays.
The present study does not support those findings. In this study, significant differences were
found when participants read with and without color overlays, indicating improved reading
efficiency was variably found between the clear and the random conditions. That is, participants
tended to show improvements in eye movements when they read with a clear or random overlay
versus an optimum overlay. One explanation for this finding might be that the subjects in this

45
study despite meeting the criteria for IS, did not report a reading problem or a reading disability.
However, previous studies indicated that participants with a history of reading difficulties benefit
most for the use of the color overlays. Irlen (2005) stated that IS is a major factor that
contributes to those who struggle to learn to read. She reported that as many as 46% of people
diagnosed with learning disabilities have IS. Tyrell et al. (1995) found improvement with the
use of color overlays for participants who met criteria for IS and had average, below average,
and well-below average reading ability. In the present study, only one person reported reading
problems and had a diagnosis of a reading disability. (However, even for this person, there was
varied performance on the eye tracking measures with improvement seen in some measures with
the optimum overlay, and not in others). Participants reading skills were not assessed in the
present study. Participants were college undergraduates and community members who might
have a reading ability that falls within the average range and have developed effective strategies
that seem to overcome the perceptual distractions and discomfort. It is interesting to note that
most of the participants fell within the excellent, good, and possible candidate diagnostic
categories on the IRPS, indicating that they all experience some kind of discomfort or distortions
during reading and that they felt the overlays moderately or significantly improved their
experience. It may be that these distortions were not severe enough in these participants to affect
reading efficiency or there is something about the IRPS as an instrument that is not valid and
reliable to discriminate who meets or does not meet the IRPS criteria.
Based on the above findings, there are major criticisms that can be made about the Irlen
method. The first concerns the diagnosis of IS using the Irlen Reading Perceptual Scale (IRPS).
There are no reliability and validity data published for this instrument, and so it is difficult to
know if the scale is measuring what it purports to measure or how reliable results are. Further,

46
the process of diagnosis poses a problem of expectancy when evaluating the effectiveness of the
color overlays. According to Irlen (2003), the IRPS is not intended to be administered as a
standardized test instrument, but rather as a diagnostic tool and means of ―educating the client‖
about their condition. Many of the studies cited in this research state that their methods were
designed to reduce or eliminate results due to subject expectancy. However, the IRPS
intentionally informs the subject about the premise of the study; and therefore creates the
opportunity for results based on expectancy. For example, the initial questioning about
symptoms experienced and compensatory strategies used during reading primes subjects about
the problem of IS. Such questions as, ―Does it take effort to stay on the words you are reading?
Do you unintentionally skip words?‖ alert the subject to the proposed problem of IS. Subjects
become more aware of the premise of IS during administration of the tasks. When given high
contrast black and white figure and asked to count lines, spaces, or characters, subjects are then
asked a series of specific questions about what they may see. The problem here is that the
questions are so specific as to be suggestive. For example, when staring at a figure of a cube
composed of lines and spaces, the examiner asks such questions as, ―Do the lines rise up or stay
flat? Do you see flashes of light?‖ Much like staring at optical illusions, subjects may try to
―figure out‖ what they are supposed to see, and may report symptoms because they were
suggested by the examiner. In the present study, all subjects reported seeing at least some of the
suggested distortions. It would be interesting to see if questions were modified to be more
general, what subjects would report seeing. The last component of the IRPS, is the selection of
the color overlays. This process suggests to subjects that they should experience improvement
with the use of the overlays. For example, when the overlays are presented over text and/or
figures, the examiner asks the subject which color ―is more comfortable‖ and ―best stops the

47
distortions‖. The examiner is instructed to place and remove overlays in such as way as to not
let any of the white background show. When an optimum color is chosen, the overlay is placed
over the page and the examiner asks if the page is too bright or uncomfortable. The overlay is
then removed and the same question is asked. The overlay is then placed over half the page and
specific questions about comfort, sharpness of text, brightness of the background, and spacing
between letters and lines of text are asked. Again, this questioning seems so specific as to
further convince the subject of the existence of a problem and introduces the idea that the color
overlay will alleviate it.
Finally, the threshold for diagnosis appears quite low. According to the manual three
areas of the test are used to determine the presence of IS. The first area refers to the scores
obtained on the initial questions about reading difficulties and discomfort. There are 17
questions that describe reading difficulty and 17 questions that describe discomfort. Subjects
respond, ―never, sometimes, often, or don‘t know‖ for each item and points are given for
answers of sometimes or often. Scores of 4 or more are considered moderate and score greater
than 7 are considered severe. The second area considered in diagnosis is the appearance of
symptoms on a white page, which is a page of text in Dutch. Subjects need only to report one
symptom on this page to meet criteria in this area. The last consideration is the amount of
improvement that subjects report on the white page with the use of the identified color overlay.
The minimum requirement for subjects to be considered a possible candidate for IS is a moderate
to high score on either the reading difficulty or reading discomfort questions, one symptom on
the white page, and slight improvement with the use of the overlay. This low threshold for
diagnosis would seem to identify high numbers of subjects who would be described as possibly
suffering from IS. In the present study, 24 of 26 participants met at least these minimum criteria.

48
Limitations
The first limitation of this study was the number of participants who met criteria for IS.
Because most participants met criteria for IS, it was not possible to create two groups
(experimental and control) to evaluate differences in eye movements between those who have IS
and those who do not. This difficulty illustrates the limitations of the IRPS as a valid instrument
for the study in selection of subjects for this study. Only one participant in the study reported
having a reading disability. Recruitment of subjects with a history of reading disabilities may
have yielded different results as previous studies have shown these populations may benefit most
from use the color overlays.
Computer versus Paper
A second limitation of this study was the use of a computer screen to measure eye
tracking. Diagnosis of IS and selection of overlay(s) was conducted with text on paper, while
eye tracking measures were conducted on a computer screen. Placement of the overlays was
somewhat cumbersome. Although participants read under similar lighting conditions, there may
have been some difference in effects of the overlays between light reflected on the paper and the
light illuminated from computer screen. During debriefing, some participants indicated that
reading text on the computer screen was more difficult than reading from paper. Further,
because we were not able to collect oral reading fluency data from all subjects, we were not able
to evaluate any differences that may have been seen when subjects read from paper versus the
computer screen.
Vision Examination
The final limitation of this study involves vision screening. For practical reasons,
participants in this study did not undergo the specific vision examination suggested by Blaskey et
49
al. (1990). Most participants had received a regular eye-examination with the past 2 years.
However, it is possible that symptoms reported were due to a vision disorder rather than IS.
Summary & Conclusions
The current study investigated the effect of color overlays on reading efficiency as
measured by eye tracking. According to Irlen (2005), Irlen Syndrome is a visual perceptual
condition that makes reading uncomfortable and affects reading efficiency and fluency. Color
overlays or specially tinted glasses (filters) are claimed to alleviate symptoms of this condition.
Several studies have been conducted on the effect of color overlays on reading and found
positive results in reading fluency with the use of overlays (Tyrrell et al., 1995; Robinson &
Conway, 2001; Wilkins et al., 2001; O‘Connor, et al., 1990; Fletcher & Martinez, 1994).
Blaskey et al. (2001) reported no improvement in reading fluency with the use of color overlays.
The current study supports results from Blaskey et al. (2001).
Findings of the present study raise a number of questions about the use of the IRPS as a
tool to diagnose Irlen Syndrome. Irlen (2005) stated that 12-14% of people in the general
population may struggle with IS. In the current study, all but 2 participants met criteria for the
syndrome. This finding suggests the IRPS instrument is not valid and reliable in assessing
individuals who present with visual perception difficulties that affect reading. Given the
growing popularity of the Irlen method and its use in schools as a reading intervention, there is a
need for future research to determine the validity and reliability of the IRPS instrument in
assessing visual perceptual difficulties that affect reading.

50
APPENDIX A
INFORMATION FOR PARTICIPANTS
The Effect of Color Overlays on Reading Efficiency
Rhonda Morrison
Doctoral Candidate, School Psychology
University of Massachusetts
413-546-3170, [email protected]
Thank you for participating in this study. The premise of this research is to study the effect of
using color overlays on reading efficiency. It is based upon the Irlen Method which proposes
that some people who struggle with reading do so because they experience visual-perceptual
distortions of text which make reading uncomfortable. Using the Irlen Reading Perceptual Scale
(IRPS), subjects who report and are shown to have these difficulties are diagnosed with
Scoptopic Sensitivity Syndrome or Irlen Syndrome (IS). According to the Irlen Method, using
color overlays helps to alleviate these distortions making reading more comfortable. Previous
research has reported improvements in subjects who use the overlays. However, improvement
has been largely subjective and based upon self-reports. The current research seeks to measure
differences in reading efficiency using eye movement technology. This technology provides
measures of reading efficiency by examining eye movement behavior during reading. It is
hypothesized that subjects will show more efficient eye movements during reading with the use
of an optimal color overlay verses clear or random overlay.
If you would like to receive a summary of the findings of this research when it is completed,
please contact Rhonda Morrison at [email protected]. For information about the Irlen
Method, please see www.Irlen.com.
If you would like further information, please contact the faculty advisor for this research, Dr.
Adrian Staub in the Psychology Department, Tobin 430, 545-5925, [email protected]. If
you have any concerns about your rights as a participant in this study you may contact the Chair
of the Psychology Department, Dr. Melinda Novak, at [email protected], or call 413-
545-2387; you may also contact the Human Research Protection Office via email
([email protected]); telephone (413-545-3428); or mail (Office of Research
Affairs, 108 Research Administration Building, University of Massachusetts, 70 Butterfield
Terrace, Amherst, MA 01003-9242).
Thank you again for your participation.
Rhonda Morrison
Researcher

51
APPENDIX B
QUESTIONNAIRE
The Effect of Color Overlays on Reading Efficiency – Questionnaire
(These questions were presented orally to participants)
Name: ___________________________________________ Date: _____________
Age: _________ Sex: _________
1. Do you have a history of reading problems?
2. Have you ever been diagnosed with a reading
disability?
3. How much would you say that you read for pleasure
each week? (# of hours)
4. How much would you say you read for work/school
each week? (# of hours)
5. Under what kind of lighting conditions do you like to
read?
6. Do you wear glasses or contact lenses?
7. When was the date of your last eye exam?
8. Have you ever heard of Irlen Syndrome or Scotopic
Sensitivity Syndrome?
9. Have you ever been screened for Irlen Syndrome?
10. Have you ever had vision training?
11. Have you ever been prescribed color overlays for
reading?
12. If yes, have you ever used color overlays for reading?
Other comments:

52
APPENDIX C
DEBRIEFING FORM
The Effect of Color Overlays on Reading Efficiency
Rhonda Morrison
Doctoral Candidate, School Psychology
University of Massachusetts
413-546-3170, [email protected]
Thank you for participating in this study. The premise of this research is to study the effect of
using color overlays on reading efficiency. It is based upon the Irlen Method which proposes
that some people who struggle with reading do so because they experience visual-perceptual
distortions of text which make reading uncomfortable. Using the Irlen Reading Perceptual Scale
(IRPS), subjects who report and are shown to have these difficulties are diagnosed with
Scoptopic Sensitivity Syndrome or Irlen Syndrome (IS). According to the Irlen Method, using
color overlays helps to alleviate these distortions making reading more comfortable. Previous
research has reported improvements in subjects who use the overlays. However, improvement
has been largely subjective and based upon self-reports. The current research seeks to measure
differences in reading efficiency using eye movement technology. This technology provides
measures of reading efficiency by examining eye movement behavior during reading. It is
hypothesized that subjects will show more efficient eye movements during reading with the use
of an optimal color overlay verses clear or random overlay.
If you would like to receive a summary of the findings of this research when it is completed,
please contact Rhonda Morrison at [email protected]. For information about the Irlen
Method, please see www.Irlen.com.
If you would like further information, please contact the faculty advisor for this research, Dr.
Adrian Staub in the Psychology Department, Tobin 430, 545-5925, [email protected]. If
you have any concerns about your rights as a participant in this study you may contact the Chair
of the Psychology Department, Dr. Melinda Novak, at [email protected], or call 413-
545-2387; you may also contact the Human Research Protection Office via email
([email protected]); telephone (413-545-3428); or mail (Office of Research
Affairs, 108 Research Administration Building, University of Massachusetts, 70 Butterfield
Terrace, Amherst, MA 01003-9242).
Thank you again for your participation.
Rhonda Morrison
Researcher

53
APPENDIX D
CONSENT FORM – UNDERGRADUATES
Consent Form for Participation in a Research Study University of Massachusetts Amherst
Principal Investigator: Rhonda Morrison
Study Title: The Effect of Color Overlays on Reading Efficiency
WHAT IS THIS FORM?
This form is called a Consent Form. It will give you information about the study so you can make an informed
decision about participation in this research study.
WHO IS ELIGIBLE TO PARTICIPATE?
Undergraduate students of the University of Massachusetts psychology department who have normal, uncorrected
vision or wear soft contact lenses are eligible to participate in this study.
WHAT IS THE PURPOSE OF THIS STUDY?
The purpose of this research project is to study the effect of the use of color overlays on reading efficiency as measured
through oral reading rate and eye movements.
WHERE WILL THE STUDY TAKE PLACE AND HOW LONG WILL IT LAST?
The study will be conducted in the eye tracking laboratory and adjacent classrooms in Tobin Hall. The study will be
conducted over two sessions which may or may not occur on the same day. The first session will last approximately
45 minutes, and the second session will last approximately 1 hour.
WHAT WILL I BE ASKED TO DO?
This experiment will take place over two sessions. At the first session, you will be screened for visual perception in
reading. Based on the results of this screening, you may be asked to complete further reading tasks in the Eye
Movement laboratory in Tobin Hall.
Session One - Screening: You will be given a questionnaire about your demographic information and reading
history. You will then be given a reading and visual perceptual screening. The screening involves answering
questions about your reading experiences, performing perceptual tasks with printed figures, and reading text through
transparent color sheets. This session will last approximately 45 minutes.
Session Two – Reading and Eye Movement: The second session will take place in the eye movement laboratory
in Tobin Hall. Upon arrival to the lab, you will be given text to read for approximately five minutes. You will then
be audio taped as you read aloud passages with and without the transparent color sheets. No identifying information
will be recorded.
You will then be asked to read passages on a computer screen while your eye movements are monitored. There are
no anticipated risks with participating in this experiment. The eye-tracker that you will be using will require some
adjustments in order to align your eye so that the computer can track it. The entire session should last approximately
an hour.

54
WHAT ARE MY BENEFITS OF BEING IN THIS STUDY?
You will receive three subject pool credits for your participation in this study.
WHAT ARE my RISKS OF being in THIS STUDY?
We believe there are no known risks associated with this research study; however, a possible inconvenience may be
the time it takes to complete the study.
HOW WILL MY PERSONAL INFORMATION BE PROTECTED?
The following procedures will be used to protect the confidentiality of your study records and, if applicable, of audio or
videotapes. The researchers will keep all study records (including any codes to your data) in a secure location. Research
records will be labeled with a code. A master key that links names and codes will be maintained in a separate and secure
location. The master key and audiotapes will be destroyed six (6) years after the close of the grant or three (3) years if
unfunded. All electronic files (e.g., database, spreadsheet, etc.) containing identifiable information will be password
protected. Any computer hosting such files will also have password protection to prevent access by unauthorized users.
Only the members of the research staff will have access to the passwords. At the conclusion of this study, the
researchers may publish their findings. Information will be presented in summary format and you will not be identified
in any publications or presentations.
WHAT IF I HAVE QUESTIONS?
Take as long as you like before you make a decision. We will be happy to answer any question you have about this
study. If you have further questions about this project or if you have a research-related problem, you may contact the
principal investigator, Rhonda Morrison at 413-546-3170.
If you have any questions concerning your rights as a research subject, you may contact the University of
Massachusetts Amherst Human Research Protection Office (HRPO) at (413) 545-3428 or
CAN I STOP BEING IN THE STUDY?
You do not have to be in this study if you do not want to. If you agree to be in the study, but later change your mind, you
may drop out at any time. There are no penalties or consequences of any kind if you decide that you do not want to
participate.
WHAT IF I AM INJURED?
The University of Massachusetts does not have a program for compensating subjects for injury or complications
related to human subjects research, but the study personnel will assist you in getting treatment.
SUBJECT STATEMENT OF VOLUNTARY CONSENT
I have read this form and decided that I will participate in the project described above. The general purposes and
particulars of the study as well as possible hazards and inconveniences have been explained to my satisfaction. I
understand that I can withdraw at any time.
________________________ ____________________ __________
Participant Signature: Print Name: Date:
By signing below I indicate that the participant has read and, to the best of my knowledge, understands the details
contained in this document and has been given a copy.

55
_________________________ ____________________ __________
Signature of Person Print Name: Date:
Obtaining Consent
Page 2 of 2
Version 1
Initials RFM

56
APPENDIX E
CONSENT FORM – COMMUNITY PARTICIPANTS
Informed Consent Form
This experiment will take place over two sessions. At the first session, you will be
screened for visual perception in reading. Based on the results of this screening, you may be
asked to complete further reading tasks in the Eye Movement laboratory in Tobin Hall.
Session One - Screening: You will be given a questionnaire about your demographic
information and reading history. You will then be given a reading and visual perceptual
screening. The screening involves answering questions about your reading experiences,
performing perceptual tasks with printed figures, and reading text through transparent color
sheets. This screening session take approximately one hour. Information obtained from this
session will be kept confidential. You will receive $11 for participating in this part of the study.
Session Two – Reading and Eye Movement: The second session will take place in the eye
movement laboratory in Tobin Hall. Upon arrival to the lab, you will be given text to read for
approximately five minutes. You will then be audio taped as you read aloud passages with and
without the transparent color sheets. No identifying information will be recorded.
You will also be asked to read passages on a computer screen while your eye movements
are monitored. There are no anticipated risks with participating in this experiment. In order to
undergo the eye movement procedure, it is necessary that you have normal, uncorrected vision or
wear soft contacts. Please tell the researcher if you are wearing contacts. The eye-tracker that
you will be using will require some adjustments in order to align your eye so that the computer
can track it. The entire session should last approximately an hour. You will receive $11 for
participating in this part of the study.
If at any time you wish to discontinue your participation, you may do so without penalty.
Your data will remain strictly confidential. If you would like a copy of the informed consent
form, the experimenter will provide you with a copy. In addition, if you are interested in
obtaining more information about this research, please contact Rhonda Morrison 413-546-3170.
If there are any complaints/comments regarding the experiment, you can contact Keith Rayner at
545-2175. Alternatively you can contact the Human subjects review board at 545-3428 or
[email protected]. At the end of the experiment, we may ask you if you are
interested in doing more psychology experiments in the eye-tracking lab in the future, for either
money or credit. If you do indicate that you are interested, we may call you again to schedule
you for another experiment.
If you would like to participate in this experiment, please read the following statement. If
you agree with its content, then sign below. Thank you.

57
―I have read the preliminary description of this experiment and agree to participate. I
understand that there are no anticipated risks, and I am free to discontinue my participation at
any time without penalty.‖
Name: _______________________________________________ Date: __________________
Signature: ____________________________________________________________________

58
APPENDIX F
Tables of Questionnaire Results
Table F.1 Number of Hours Spent Reading Per Week
Hours read per week M SD
Read for pleasure 4.13 4.93
Read for work/school 9.58 8.05
Table F.2 Lighting Preference
Lighting Conditions No. of People
Bright 15
Medium 5
Dim 5
No Preference 1
Table F.3 Corrected Vision
Vision Correction
No. of People
Reporting
Contacts 10
Glasses (for distance) 1
No 11
Reading glasses 2
IRPS Results
Table F.4 Irlen Diagnosis Categories
Category No. of People
Excellent 10
Good 7
Possible 7
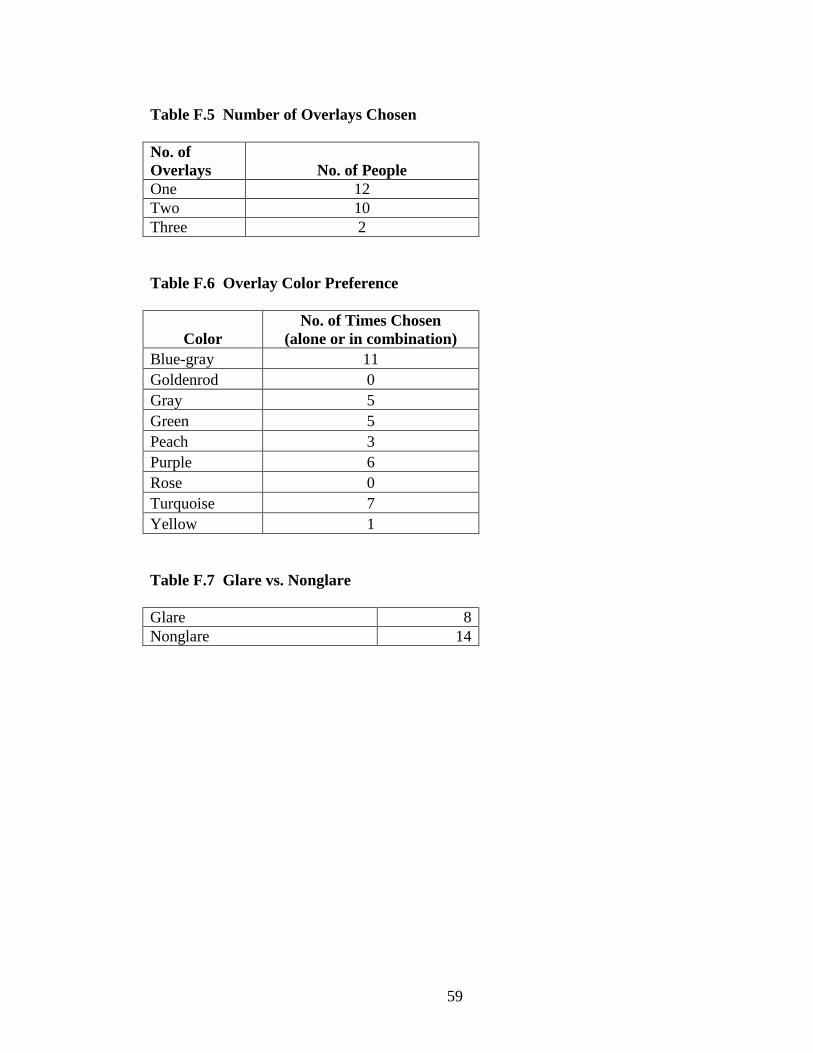
59
Table F.5 Number of Overlays Chosen
No. of
Overlays No. of People
One 12
Two 10
Three 2
Table F.6 Overlay Color Preference
Color
No. of Times Chosen
(alone or in combination)
Blue-gray 11
Goldenrod 0
Gray 5
Green 5
Peach 3
Purple 6
Rose 0
Turquoise 7
Yellow 1
Table F.7 Glare vs. Nonglare
Glare 8
Nonglare 14

60
REFERENCES
Adams, M. J. (1994). Beginning to read: Thinking and learning about print. Cambridge, MA:
The MIT Press.
Blaskey, P.,Scheiman, M., Parisi, M., Ciner, E., Gallaway, M., & Seiznick, R. (1990). The
Effectiveness of Irlen Filters for Improving Reading Performance: A Pilot Study. Journal of
learning disabilities, v23(n10), p604.
Cohen, J. (1988). Statistical Power analysis for the behavior sciences. Laurence Erlbaum.
Cone, J. D. (1999). Observational assessment: Measure development and research issues. In P.
C. Kendall, J. N. Butcher & G. N. Holmbeck (Eds.), Handbook of research methods in
clinical psychology (2nd ed.). (pp. 183-223) John Wiley & Sons, Inc.
Daniels, J. C. & Diack, H. (1977). The Standard Reading Tests. St. Albans: Hart-Davis
Educational.
Evans, B. J., Cook, A., Richards, I. L., & Drasdo, N. (1994). Effect of pattern glare and colored
overlays on a stimulated-reading task in dyslexics and normal readers. Optometry and vision
science: official publication of the American Academy of Optometry, 71(10), 619-628.
Evangs, B. & Jospeh, F. (2000). The effect of coloured filters on the rate of reading in an adult
student population. Ophthalmic & Physiological Optics. 22, 535-545.
Fletcher, J., & Martinez, G. (1994). An eye-movement analysis of the effects of scotopic
sensitivity correction on parsing and comprehension. Journal of learning disabilities, 27(1),
67-70.
Guthrie, J., Schafer, W. & Huang, C. (2001). Benefits of Opportunity to Read and Balanced
Instruction the NAEP. The Journal of Educational Research., 94(3), 145-162.
Hall, S., & Moats, L. (1999). Straight talk about reading: how parents can make a difference
during the early years. Lincolnwood, IL: Contemporary Books.
Hoyt, C. S. (1990). Irlen Lenses and Reading Difficulties. Journal of learning disabilities, 23(1),
624.
Jenkins, J., Fuchs, L., van den Broek, P., Espin, C., & Deno, S. (2003). Sources of Individual
Differences in Reading Comprehension and Reading Fluency. Journal of Educational
Psychology. 95(4), 719-729.
Irlen, H. (2001). Irlen Institute for Perceptual and Learning Difficulties Certified Irlen
Screener's Information Handbook, Irlen Institute.
Irlen, H. (2003). Irlen Reading Perceptual Scale Instructional Manual (Tenth ed.). Long Beach,
CA: Perceptual Development Corporation.

61
Irlen, H. (2005). Reading by the Colors: Overcoming Dyslexia and Other Reading Disabilities
Through the Irlen Method (REV ed.). New York, NY: The Berkley Group.
Jastak, S., & Wilkinson, G. S. (1984). Wide range achievement test-Revised. Wilmington, DE:
Jastak Associates.
Marston, D. (1989). A curriculum-based measurement approach to assessing academic
performance: What it is and why do it. In M. Shinn (Ed.), Curriculum-Based Measurement
(pp. 18). New York: Guilford Press.
Moats, L. C. (2001). When Older Students Can't Read. Educational Leadership, 58, 36.
Morgan, P. L., & Fuchs, D. (2007). Is there a bidirectional relationship between children‘s
reading skills and reading motivation? Exceptional Children. 73 (2), 165-183.
Morgan, P., Fuchs, D., Compton, D., Corday, D., & Fuchs, L. (2008). Does early reading failure
decrease children‘s reading motivation? Journal of Learning Disabilities, 41(5), 387-404.
National Reading Panel. (2000). National Reading Panel: Teaching Children to Read: An
Evidence-Based Assessment of the Scientific Research Literature on Reading and It's
Implications for Reading Instruction. Washington, DC: National Institute of Child Health
and Human Development.
Neale, M. D. (1958). Neale Analysis of Reading Ability. London: Macmillan.
O‘Connor, P., Sofo, F., Kendall, L. & Olsen, G. (1990). Reading disabilities and the effects of
colored filters. Journal of Learning Disabilities. 23(10), 597-620.
Pearson, P. (2004). The reading wars. Educational Policy. 18 (1), 216-252.
Rayner, K. (1998). Eye movements in reading and information processing: 20 years of research.
Psychological bulletin, 124(3), 372-422.
Robinson, G. L., & Conway, R. N. (1990). The effects of Irlen colored lenses on students'
specific reading skills and their perception of ability: A 12-month validity study. Journal of
learning disabilities, 23(10), 589-596.
Scheiman, M., Blaskey, P., Ciner, E. B., Gallaway, M., Parisi, M., Pollack, K., et al. (1990).
Vision characteristics of individuals identified as Irlen Filter candidates. Journal of the
American Optometric Association, 61(8), 600-605.
Shaywitz, S. (2003). Overcoming Dyslexia: A New and Complete Science-Based Program for
Reading Problems at Any Level. New York: Alfred A. Knopf.
Shinn, M. (1989). In Shinn M. (Ed.), Curriculum-based measurement: assessing special
children. New York, NY: Guilford Press.
Solan, H. A. (1990). An Appraisal of the Irlen Technique of Correcting Reading Disorders Using
Tinted Overlays and Tinted Lenses. Journal of learning disabilities, 23(1), 621.

62
SR Research. Eye Link II Product Information. Retrieved March 3, 2007, from
http://www.eyelinkinfo.com/mount_main.php
Stanovich, K. E. (1986). Matthew effects in reading: Some consequences of individual
differences in the acquisition of literacy. Reading Research Quarterly, 21(4), 360-406.
Tyrrell, R., Holland, K., Douglas, D., Wilkins, A. (1995). Coloured overlays, visual discomfort,
visual search and classroom reading. Journal of Research in Reading, 18(1), 10-23.
Vellutino, F, Tunmer, W., Jaccard, J., Chen, R. (2007). Components of reading ability:
Multivariate evidence for convergent skills model of reading development. Scientific
Studies of Reading, 11(1), 3-32.
Wechsler, D. (1974). Wechsler intelligence scale for children-Revised. San Antonio, TX:
Psychological Corp.
Wechsler, D. (1981). Wechsler adult intelligence scale-Revised. San Antonio, TX:
Psychological Corp.
Wiederholt, J.L. (1986). Formal reading inventory. Austin, TX: PRO-ED.
Wilkins, A. J., Lewis, E., Smith, F., Rowland, E., & Tweedie, W. (2001). Coloured overlays and
their benefit for reading. Journal of Research in Reading, 24(1), 41-64.
Wright, J. OKAPI! The Internet Application for Creating Curriculum-Based Assessment Reading
Probes. Retrieved March 2, 2007, from
http://www.interventioncentral.org/htmdocs/tools/okapi/okapi.php