Study on phase stability and ionic conductivity in Hf IV-substituted bismuth vanadate
Upload
teknologimalaysiaCategory
view
0download
0
Effect of bismuth and strontium interaction on the microstructuredevelopment, mechanical properties and fractography of a secondaryAl–Si–Cu–Fe–Zn alloy
Saeed Farahany n, Mohd Hasbullah Idris, Ali OurdjiniDepartment of Materials, Manufacturing and Industrial Engineering, Faculty of Mechanical Engineering, Universiti Teknologi Malaysia (UTM),81310 Johor Bahru, Malaysia
a r t i c l e i n f o
Article history:Received 17 July 2014Received in revised form19 October 2014Accepted 20 October 2014Available online 28 October 2014
Keywords:Aluminium alloyInteractionEBSDMechanical characterisationFracture behaviour
a b s t r a c t
The effect of various additions of bismuth and strontium on the microstructure characteristics, impactand tensile properties, as well as fracture behaviour of a secondary Al–Si–Cu–Fe–Zn under as-castcondition are systematically investigated in this study. The as-cast samples were examined using opticalmicroscopy (OM), scanning electron microscopy (SEM), and transmission electron microscopy (TEM).Microstructural analyses showed the occurrence of interaction between Bi and Sr, which, significantly,led to the change of eutectic Si morphology from fibrous to flake morphology, with an increase of meanlength, area, and shape factor, an alteration of crystallographic orientation, and an increase in twindensity. The mechanical properties were investigated by hardness, impact, and tensile tests with variousconcentrations of Bi and Sr. It was found that the highest mechanical properties obtained for Sr/Bi werefor a ratio of more than 0.44, while deterioration occurred at a ratio of less than 0.32. The hardness,impact toughness, ultimate tensile strength (UTS), elongation to fracture (El), and quality index (Q) ofalloys decreased by 7%, 62%, 19%, 57% and 48% respectively when the Sr/Bi ratio diminished from 0.44 to0.32. The fracture behaviour of impact samples with an Sr/Bi ratio of more than 0.44 showed clearductile fracture, while the specimens with an Sr/Bi ratio of less than 0.32 presented brittle fracture thatcorresponds to impact toughness values. Furthermore, the fracture surfaces of tensile samples revealedthat the dimple ductile fracture transformed to cleavage brittle mode with drop of the Sr/Bi ratio to lessthan 0.32 due to an increase in the length, area, and shape factor of eutectic Si. Additionally, theinteraction mechanism between Bi and Sr are also discussed in this study.
& 2014 Elsevier B.V. All rights reserved.
1. Introduction
With the objective of providing a lightweight material withreasonably high mechanical properties, that is both cost- andenergy-saving, as well as less detrimental to the environment, thealuminium industries have been moving towards using secondaryAl in the form of returns and scrap as a replacement of virginingots [1]. Secondary alloys are made from recycled material, so asto economise the great amount of energy required to smeltAl from its ore – since melting Al for a second time requires only5% of the initial energy output [2]. Despite the increasing use ofsecondary materials, especially in the production of Al-basedcomponents, their usage nevertheless poses some technical
drawbacks generally associated with additives, which may causechemical contamination and neutralise the effect of melt treat-ment, such as grain refinement and modification. It is for thisreason that the interaction among these additions and impuritieshas attracted researchers. Grain refinement and eutectic Si mod-ification are commonly employed in the production of Al castingsto enhance their mechanical properties. Strontium is the mostwidely used and a very effective element for modifying themorphology of eutectic Si [3]. Of late, the interaction between Srand different types of Al–Ti–B grain refiners [3–7], and theinfluence of the combined additions of calcium and phosphoruson the nucleation of the Al–Si eutectic of a high purity Al–7% Sialloy have been studied [8].
Additionally, the usage of bismuth in Al industries is alsoexpected to increase, in view of its use as an alloying element inspecial applications, such as obtaining increased machinability,promoting chip breaking, and helping tool lubrication [9] in 2xxx,6xxx and 8xxx series. Bi is also added to Al–Mg alloys to prevent
Contents lists available at ScienceDirect
journal homepage: www.elsevier.com/locate/msea
Materials Science & Engineering A
http://dx.doi.org/10.1016/j.msea.2014.10.0530921-5093/& 2014 Elsevier B.V. All rights reserved.
n Corresponding author. Tel.: þ60 127686357; fax: þ60 7 5566159.E-mail addresses: [email protected],
[email protected] (S. Farahany).
Materials Science & Engineering A 621 (2015) 28–38

embrittlement by sodium [10], and disrupts the formation of oxidedefects in Al alloys [11]. It has been shown that the influence of Biis not subject to the fading phenomenon, and is also independentof holding time [12]. This means that the impact of Bi should beconsidered comprehensively during melt treatment of secondaryalloys to obtain the preferred microstructure and mechanicalproperties. It has also been noted that the presence of Bi inhypo-eutectic Al–Si casting alloys has a refinement effect onSi morphology [12–16]. Based on thermal analysis data, it hasbeen reported that the modification efficiency was eliminated inSr-modified A356.2 and 319 alloys with increasing Bi content[14,17]. With the increased usage of secondary alloys in Alindustries, and in view of the fact that information in this area israre, this aspect is an important technological step that requiresmore detailed study. There is a lack of adequate informationavailable on the influence of Bi and Sr on microstructure featuressuch as Al–Si eutectic structure, eutectic phase orientation, twin-ning of Si, and the corresponding mechanical properties of Al–Sisecondary alloys. The microstructure was observed using anoptical scanning electron microscope (SEM), including electronback-scattered diffraction (EBSD), and a transmission electronmicroscope (TEM). To test whether the mechanical properties oftreated alloys deteriorated due to interaction, hardness, impactand tensile tests were performed.
2. Experimental procedure
Returned and recycled Al–Si materials were cut into smallerpieces and then melted using an induction furnace to fabricateingots. The fabricated secondary alloy ingot (see chemical compo-sition in Table 1) was re-melted at a temperature of 75075 1C. Themolten metal was degassed using hexachloroethance tablets. After
degassing, the desired amount of pure Bi (99.99 wt%) in the formof metallic shots, and Sr in the form of the Al-10Sr master alloy,were introduced into the molten alloy. After around five minutesto allow for dissolution and homogenisation, the melt was stirred,skimmed, and then carefully poured at the temperature of73075 1C into preheated mild steel moulds (500 1C/30 min) tofabricate both tensile and impact test specimens. The castingswere machined and milled to get the exact specimen dimensionsfor cylindrical tensile and Charpy impact test according to ASTMB577 and ASTM E23 respectively (Fig. 1). A sample for chemicalanalysis was made in a preheated ceramic mould at the same timeas each casting. The chemical analyses of all samples investigatedwere obtained from samplings for chemical analysis using a glowdischarge spectrometer (LECO GDS-850A). The alloy compositionsrepresent average values taken over three measurements made oneach chemical analysis sample. Tensile testing was carried out onthe prepared test bars using an Instron Universal MechanicalTesting machine (5982) at a displacement rate of 1.0 mm/min atambient temperature. The impact test was conducted based onCharpy type using Zwick impact testing machine (D-7900) using a15J hammer to measure the total absorbed energy. The hardnessmeasurements were measured by Vicker's hardness machine(Matsuzawa DVK-2) at an applied load of 5 N.
Samples for metallography were selected from ceramic mouldcastings and then prepared through standard grinding procedures.The ground specimens were then subjected to a final polishingwith colloidal silica suspension (5 mm). Samples were etched with2% HF acid. Some samples were also deep-etched for four hours ina solution of 20% HCl acid and 80% ethanol in order to reveal thethree-dimensional morphology of the silicon phase. Microstruc-tures were analysed using an optical microscope (Nikon-MIDRO-PHOT-FXL), field emission scanning electron microscopy (Supra-35VP, Carl Zeiss, Germany) coupled with electron back-scattered
Table 1Chemical composition of the secondary alloy.
Element Si Fe Cu Mn Cr Ni Zn Ti B Pb Mg Al
Wt% 11.8 0.823 1.82 0.254 0.037 0.025 1.02 0.019 0.007 0.009 0.220 Balance
Fig. 1. (a) Tensile and (b) charpy samples (all dimensions in mm).
S. Farahany et al. / Materials Science & Engineering A 621 (2015) 28–38 29
diffraction (EBSD) and energy dispersive spectroscopy (EDS) facil-ities, and transmission electron microscopy (JEM-2100). For EBSDsample preparation, samples were ion milled with Arþ on a Gatanion milling system. The operation parameters were as follows:acceleration voltage 5 kV, beam irradiation angle 21, duration 1 h,followed by a final milling step: acceleration voltage 4 kV, beamirradiation angle 11, duration 0.5 h. The orientation mapping wasacquired in 701 tilted position at a step size of 0.4 mm on a FEIHelios 600i equipped with a NordlysNano EBSD system by onlineindexing for Al with the Aztec 2.0 software. TEM examination discswith thicknesses of 2 mm each were sectioned by wire cut, hand-ground and polished down to 0.2 mm, and suitable areas forexamination were selected and punched (3 mm diameter). Thethinning of the discs was first performed by dimpling using adimpling grinding machine (Gatan-656), and then ion beamthinning was conducted using a precise ion polishing system(Gatan-691). The Nikon optical microscope and FESEM were usedto examine the fracture surface and also fracture profile of tensileand impact tests were sectioned off perpendicular to the fracturesurface. In order to evaluate the influence of Bi and Sr concentra-tion, three parameters (length, area, and shape factor) weremeasured for the quantitative metallographic analysis by usingan i-Solution image analyser. The mean length, area, and shapefactor were calculated as follows:
Mean length¼ 1m
∑m
j ¼ 1
1n
∑n
i ¼ 1Li
!i
ð1Þ
Mean area¼ 1m
∑m
j ¼ 1
1n
∑n
i ¼ 1Ai
!i
ð2Þ
Mean shape factor¼ 1m
∑m
j ¼ 1
1n
∑n
i ¼ 1
P2i
4πAi
!i
ð3Þ
where Li and Ai and Pi are the length, area, and perimeter of singleSi respectively, n is the number of Si particles measured in a singlefield (67075.5 mm2), and m is the number of the evaluated fields.
3. Results
3.1. Analyses of microstructures
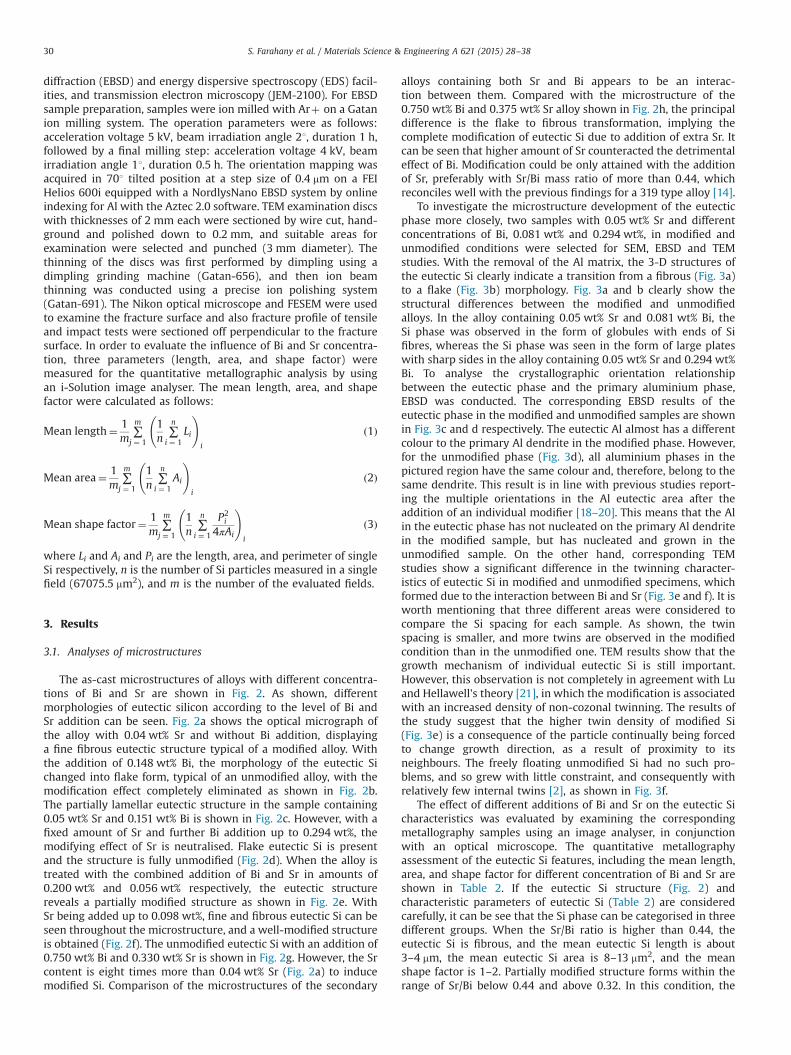
The as-cast microstructures of alloys with different concentra-tions of Bi and Sr are shown in Fig. 2. As shown, differentmorphologies of eutectic silicon according to the level of Bi andSr addition can be seen. Fig. 2a shows the optical micrograph ofthe alloy with 0.04 wt% Sr and without Bi addition, displayinga fine fibrous eutectic structure typical of a modified alloy. Withthe addition of 0.148 wt% Bi, the morphology of the eutectic Sichanged into flake form, typical of an unmodified alloy, with themodification effect completely eliminated as shown in Fig. 2b.The partially lamellar eutectic structure in the sample containing0.05 wt% Sr and 0.151 wt% Bi is shown in Fig. 2c. However, with afixed amount of Sr and further Bi addition up to 0.294 wt%, themodifying effect of Sr is neutralised. Flake eutectic Si is presentand the structure is fully unmodified (Fig. 2d). When the alloy istreated with the combined addition of Bi and Sr in amounts of0.200 wt% and 0.056 wt% respectively, the eutectic structurereveals a partially modified structure as shown in Fig. 2e. WithSr being added up to 0.098 wt%, fine and fibrous eutectic Si can beseen throughout the microstructure, and a well-modified structureis obtained (Fig. 2f). The unmodified eutectic Si with an addition of0.750 wt% Bi and 0.330 wt% Sr is shown in Fig. 2g. However, the Srcontent is eight times more than 0.04 wt% Sr (Fig. 2a) to inducemodified Si. Comparison of the microstructures of the secondary
alloys containing both Sr and Bi appears to be an interac-tion between them. Compared with the microstructure of the0.750 wt% Bi and 0.375 wt% Sr alloy shown in Fig. 2h, the principaldifference is the flake to fibrous transformation, implying thecomplete modification of eutectic Si due to addition of extra Sr. Itcan be seen that higher amount of Sr counteracted the detrimentaleffect of Bi. Modification could be only attained with the additionof Sr, preferably with Sr/Bi mass ratio of more than 0.44, whichreconciles well with the previous findings for a 319 type alloy [14].
To investigate the microstructure development of the eutecticphase more closely, two samples with 0.05 wt% Sr and differentconcentrations of Bi, 0.081 wt% and 0.294 wt%, in modified andunmodified conditions were selected for SEM, EBSD and TEMstudies. With the removal of the Al matrix, the 3-D structures ofthe eutectic Si clearly indicate a transition from a fibrous (Fig. 3a)to a flake (Fig. 3b) morphology. Fig. 3a and b clearly show thestructural differences between the modified and unmodifiedalloys. In the alloy containing 0.05 wt% Sr and 0.081 wt% Bi, theSi phase was observed in the form of globules with ends of Sifibres, whereas the Si phase was seen in the form of large plateswith sharp sides in the alloy containing 0.05 wt% Sr and 0.294 wt%Bi. To analyse the crystallographic orientation relationshipbetween the eutectic phase and the primary aluminium phase,EBSD was conducted. The corresponding EBSD results of theeutectic phase in the modified and unmodified samples are shownin Fig. 3c and d respectively. The eutectic Al almost has a differentcolour to the primary Al dendrite in the modified phase. However,for the unmodified phase (Fig. 3d), all aluminium phases in thepictured region have the same colour and, therefore, belong to thesame dendrite. This result is in line with previous studies report-ing the multiple orientations in the Al eutectic area after theaddition of an individual modifier [18–20]. This means that the Alin the eutectic phase has not nucleated on the primary Al dendritein the modified sample, but has nucleated and grown in theunmodified sample. On the other hand, corresponding TEMstudies show a significant difference in the twinning character-istics of eutectic Si in modified and unmodified specimens, whichformed due to the interaction between Bi and Sr (Fig. 3e and f). It isworth mentioning that three different areas were considered tocompare the Si spacing for each sample. As shown, the twinspacing is smaller, and more twins are observed in the modifiedcondition than in the unmodified one. TEM results show that thegrowth mechanism of individual eutectic Si is still important.However, this observation is not completely in agreement with Luand Hellawell's theory [21], in which the modification is associatedwith an increased density of non-cozonal twinning. The results ofthe study suggest that the higher twin density of modified Si(Fig. 3e) is a consequence of the particle continually being forcedto change growth direction, as a result of proximity to itsneighbours. The freely floating unmodified Si had no such pro-blems, and so grew with little constraint, and consequently withrelatively few internal twins [2], as shown in Fig. 3f.
The effect of different additions of Bi and Sr on the eutectic Sicharacteristics was evaluated by examining the correspondingmetallography samples using an image analyser, in conjunctionwith an optical microscope. The quantitative metallographyassessment of the eutectic Si features, including the mean length,area, and shape factor for different concentration of Bi and Sr areshown in Table 2. If the eutectic Si structure (Fig. 2) andcharacteristic parameters of eutectic Si (Table 2) are consideredcarefully, it can be see that the Si phase can be categorised in threedifferent groups. When the Sr/Bi ratio is higher than 0.44, theeutectic Si is fibrous, and the mean eutectic Si length is about3–4 mm, the mean eutectic Si area is 8–13 mm2, and the meanshape factor is 1–2. Partially modified structure forms within therange of Sr/Bi below 0.44 and above 0.32. In this condition, the
S. Farahany et al. / Materials Science & Engineering A 621 (2015) 28–3830
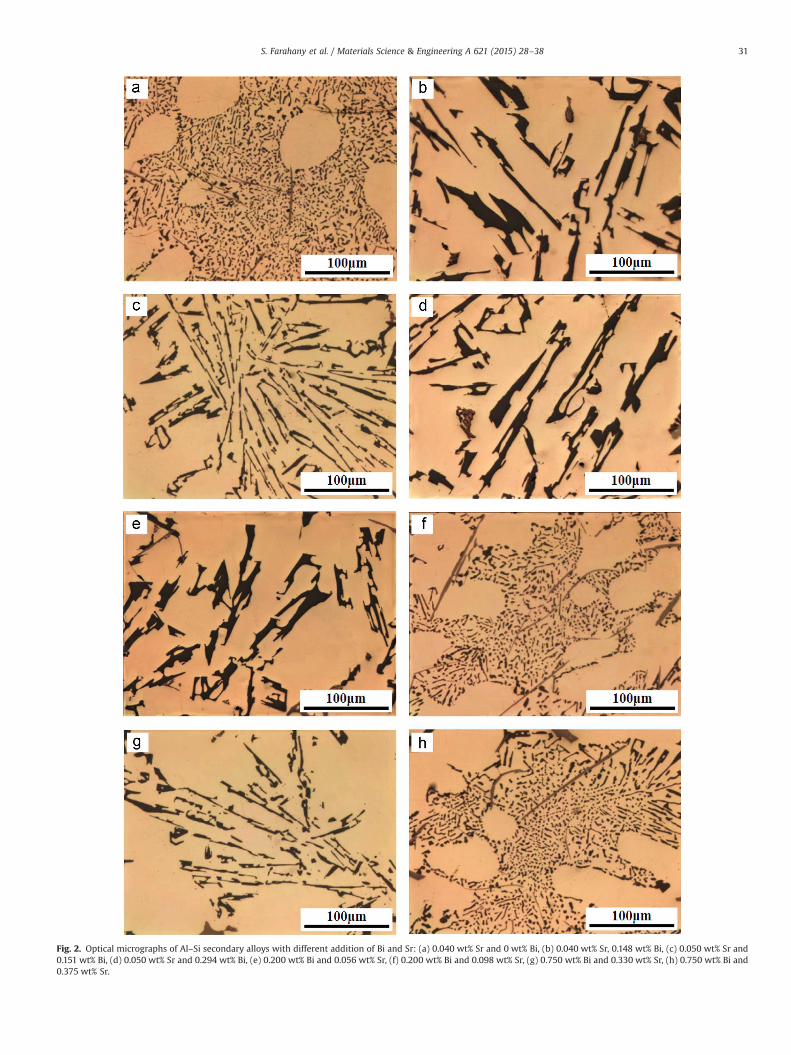
Fig. 2. Optical micrographs of Al–Si secondary alloys with different addition of Bi and Sr: (a) 0.040 wt% Sr and 0 wt% Bi, (b) 0.040 wt% Sr, 0.148 wt% Bi, (c) 0.050 wt% Sr and0.151 wt% Bi, (d) 0.050 wt% Sr and 0.294 wt% Bi, (e) 0.200 wt% Bi and 0.056 wt% Sr, (f) 0.200 wt% Bi and 0.098 wt% Sr, (g) 0.750 wt% Bi and 0.330 wt% Sr, (h) 0.750 wt% Bi and0.375 wt% Sr.
S. Farahany et al. / Materials Science & Engineering A 621 (2015) 28–38 31

mean eutectic Si length is about 16–23 mm, the mean eutectic Siarea is 61–127 mm2, and the mean shape factor is 7–8. However,when the Sr/Bi is lower than 0.32, the eutectic Si exhibits a flake-like structure. In this condition, the mean eutectic Si length andthe area are about 72–97 mm and 490–612 mm2 respectively, with amean shape factor of about 17–23. The results obtained clearlyindicate the occurrence of an interaction between Bi and Sr duringmelt treatment of secondary alloy.
3.2. Analyses of mechanical properties
Table 2 presents the mechanical properties including hardness,impact toughness, yield strength, tensile strength and elongationto fracture of cast alloys with different additions of Bi and Sr.
Different results were obtained when the various additions of Biand Sr were added to the secondary Al–Si alloy. An analysis of thehardness property showed that the hardness value for the alloywith an Sr/Bi ratio of less than 0.32 ranges from 76.2 to 77.8 HV.Moreover, at Sr/Bi ratios between 0.32 and 0.44, the hardness wasin the range of 79.2–80.2 HV. With an Sr/Bi ratio of more than0.44, the hardness increased to the highest value of 81.2–82.5 HV.Samples which have finer Si structure and uniformly distributedeutectic Si presented higher hardness values compared to others.This may be due to the increase of the eutectic Si fraction solid as ahard phase leading to a superior hardness value. Moreover, finer Siprovides more obstacles to grain boundary sliding.
Impact toughness is another important property, since dataregarding this property can provide a means for assessing alloy
Fig. 3. (a, b) SEM images, (c, d) EBSD maps and (e, f) TEM images of Al–Si-Cu–Fe–Zn alloy with different concentration of Bi and Sr: (left) 0.081 wt% Bi and 0.050 wt% Sr,(right) 0.294 wt% Bi and 0.050 wt% Sr.
S. Farahany et al. / Materials Science & Engineering A 621 (2015) 28–3832
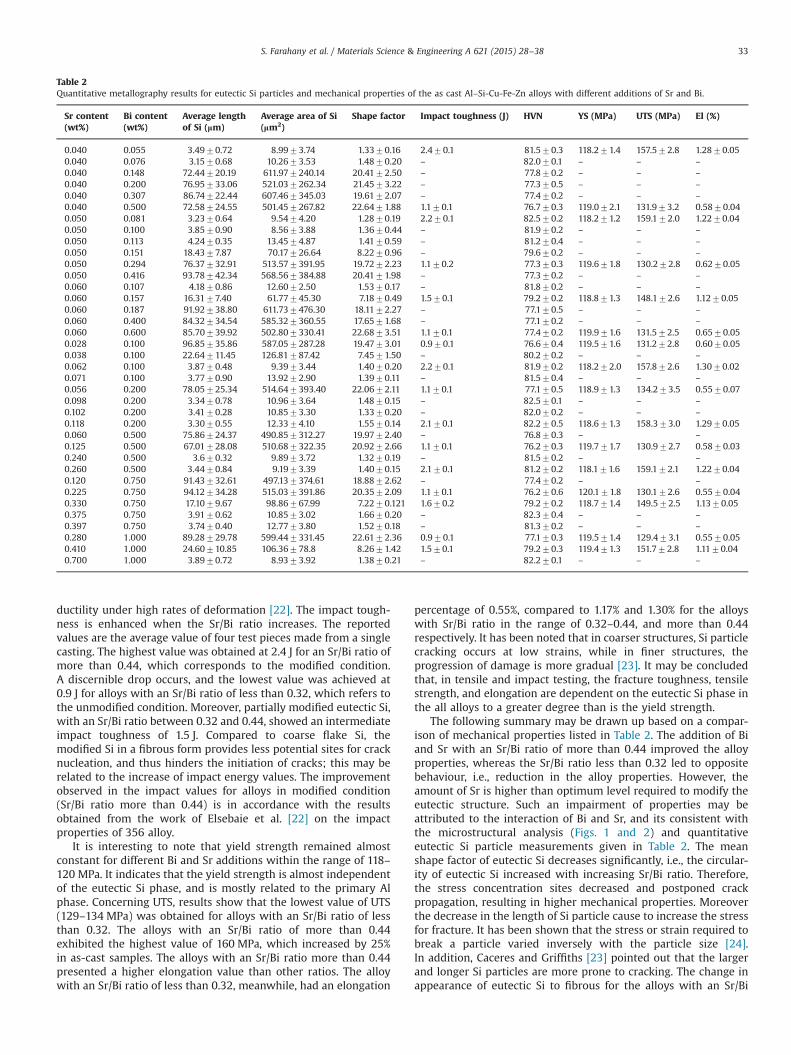
ductility under high rates of deformation [22]. The impact tough-ness is enhanced when the Sr/Bi ratio increases. The reportedvalues are the average value of four test pieces made from a singlecasting. The highest value was obtained at 2.4 J for an Sr/Bi ratio ofmore than 0.44, which corresponds to the modified condition.A discernible drop occurs, and the lowest value was achieved at0.9 J for alloys with an Sr/Bi ratio of less than 0.32, which refers tothe unmodified condition. Moreover, partially modified eutectic Si,with an Sr/Bi ratio between 0.32 and 0.44, showed an intermediateimpact toughness of 1.5 J. Compared to coarse flake Si, themodified Si in a fibrous form provides less potential sites for cracknucleation, and thus hinders the initiation of cracks; this may berelated to the increase of impact energy values. The improvementobserved in the impact values for alloys in modified condition(Sr/Bi ratio more than 0.44) is in accordance with the resultsobtained from the work of Elsebaie et al. [22] on the impactproperties of 356 alloy.
It is interesting to note that yield strength remained almostconstant for different Bi and Sr additions within the range of 118–120 MPa. It indicates that the yield strength is almost independentof the eutectic Si phase, and is mostly related to the primary Alphase. Concerning UTS, results show that the lowest value of UTS(129–134 MPa) was obtained for alloys with an Sr/Bi ratio of lessthan 0.32. The alloys with an Sr/Bi ratio of more than 0.44exhibited the highest value of 160 MPa, which increased by 25%in as-cast samples. The alloys with an Sr/Bi ratio more than 0.44presented a higher elongation value than other ratios. The alloywith an Sr/Bi ratio of less than 0.32, meanwhile, had an elongation
percentage of 0.55%, compared to 1.17% and 1.30% for the alloyswith Sr/Bi ratio in the range of 0.32–0.44, and more than 0.44respectively. It has been noted that in coarser structures, Si particlecracking occurs at low strains, while in finer structures, theprogression of damage is more gradual [23]. It may be concludedthat, in tensile and impact testing, the fracture toughness, tensilestrength, and elongation are dependent on the eutectic Si phase inthe all alloys to a greater degree than is the yield strength.
The following summary may be drawn up based on a compar-ison of mechanical properties listed in Table 2. The addition of Biand Sr with an Sr/Bi ratio of more than 0.44 improved the alloyproperties, whereas the Sr/Bi ratio less than 0.32 led to oppositebehaviour, i.e., reduction in the alloy properties. However, theamount of Sr is higher than optimum level required to modify theeutectic structure. Such an impairment of properties may beattributed to the interaction of Bi and Sr, and its consistent withthe microstructural analysis (Figs. 1 and 2) and quantitativeeutectic Si particle measurements given in Table 2. The meanshape factor of eutectic Si decreases significantly, i.e., the circular-ity of eutectic Si increased with increasing Sr/Bi ratio. Therefore,the stress concentration sites decreased and postponed crackpropagation, resulting in higher mechanical properties. Moreoverthe decrease in the length of Si particle cause to increase the stressfor fracture. It has been shown that the stress or strain required tobreak a particle varied inversely with the particle size [24].In addition, Caceres and Griffiths [23] pointed out that the largerand longer Si particles are more prone to cracking. The change inappearance of eutectic Si to fibrous for the alloys with an Sr/Bi
Table 2Quantitative metallography results for eutectic Si particles and mechanical properties of the as cast Al–Si-Cu-Fe-Zn alloys with different additions of Sr and Bi.
Sr content(wt%)
Bi content(wt%)
Average lengthof Si (lm)
Average area of Si(lm2)
Shape factor Impact toughness (J) HVN YS (MPa) UTS (MPa) El (%)
0.040 0.055 3.4970.72 8.9973.74 1.3370.16 2.470.1 81.570.3 118.271.4 157.572.8 1.2870.050.040 0.076 3.1570.68 10.2673.53 1.4870.20 – 82.070.1 – – –
0.040 0.148 72.44720.19 611.977240.14 20.4172.50 – 77.870.2 – – –
0.040 0.200 76.95733.06 521.037262.34 21.4573.22 – 77.370.5 – – –
0.040 0.307 86.74722.44 607.467345.03 19.6172.07 – 77.470.2 – – –
0.040 0.500 72.58724.55 501.457267.82 22.6471.88 1.170.1 76.770.3 119.072.1 131.973.2 0.5870.040.050 0.081 3.2370.64 9.5474.20 1.2870.19 2.270.1 82.570.2 118.271.2 159.172.0 1.2270.040.050 0.100 3.8570.90 8.5673.88 1.3670.44 – 81.970.2 – – –
0.050 0.113 4.2470.35 13.4574.87 1.4170.59 – 81.270.4 – – –
0.050 0.151 18.4377.87 70.17726.64 8.2270.96 – 79.670.2 – – –
0.050 0.294 76.37732.91 513.577391.95 19.7272.23 1.170.2 77.370.3 119.671.8 130.272.8 0.6270.050.050 0.416 93.78742.34 568.567384.88 20.4171.98 – 77.370.2 – – –
0.060 0.107 4.1870.86 12.6072.50 1.5370.17 – 81.870.2 – – –
0.060 0.157 16.3177.40 61.77745.30 7.1870.49 1.570.1 79.270.2 118.871.3 148.172.6 1.1270.050.060 0.187 91.92738.80 611.737476.30 18.1172.27 – 77.170.5 – – –
0.060 0.400 84.32734.54 585.327360.55 17.6571.68 – 77.170.2 – – –
0.060 0.600 85.70739.92 502.807330.41 22.6873.51 1.170.1 77.470.2 119.971.6 131.572.5 0.6570.050.028 0.100 96.85735.86 587.057287.28 19.4773.01 0.970.1 76.670.4 119.571.6 131.272.8 0.6070.050.038 0.100 22.64711.45 126.81787.42 7.4571.50 – 80.270.2 – – –
0.062 0.100 3.8770.48 9.3973.44 1.4070.20 2.270.1 81.970.2 118.272.0 157.872.6 1.3070.020.071 0.100 3.7770.90 13.9272.90 1.3970.11 – 81.570.4 – – –
0.056 0.200 78.05725.34 514.647393.40 22.0672.11 1.170.1 77.170.5 118.971.3 134.273.5 0.5570.070.098 0.200 3.3470.78 10.9673.64 1.4870.15 – 82.570.1 – – –
0.102 0.200 3.4170.28 10.8573.30 1.3370.20 – 82.070.2 – – –
0.118 0.200 3.3070.55 12.3374.10 1.5570.14 2.170.1 82.270.5 118.671.3 158.373.0 1.2970.050.060 0.500 75.86724.37 490.857312.27 19.9772.40 – 76.870.3 – –
0.125 0.500 67.01728.08 510.687322.35 20.9272.66 1.170.1 76.270.3 119.771.7 130.972.7 0.5870.030.240 0.500 3.670.32 9.8973.72 1.3270.19 – 81.570.2 – –
0.260 0.500 3.4470.84 9.1973.39 1.4070.15 2.170.1 81.270.2 118.171.6 159.172.1 1.2270.040.120 0.750 91.43732.61 497.137374.61 18.8872.62 – 77.470.2 – –
0.225 0.750 94.12734.28 515.037391.86 20.3572.09 1.170.1 76.270.6 120.171.8 130.172.6 0.5570.040.330 0.750 17.1079.67 98.86767.99 7.2270.121 1.670.2 79.270.2 118.771.4 149.572.5 1.1370.050.375 0.750 3.9170.62 10.8573.02 1.6670.20 – 82.370.4 – – –
0.397 0.750 3.7470.40 12.7773.80 1.5270.18 – 81.370.2 – – –
0.280 1.000 89.28729.78 599.447331.45 22.6172.36 0.970.1 77.170.3 119.571.4 129.473.1 0.5570.050.410 1.000 24.60710.85 106.36778.8 8.2671.42 1.570.1 79.270.3 119.471.3 151.772.8 1.1170.040.700 1.000 3.8970.72 8.9373.92 1.3870.21 – 82.270.1 – – –
S. Farahany et al. / Materials Science & Engineering A 621 (2015) 28–38 33
ratio of more than 0.44 makes the fracture toughness, tensilestrength, and elongation superior than that of alloys with flake Siand an Sr/Bi ratio less than 0.32.
It is interesting to compare the changes in impact toughnessand tensile elongation with different Bi and Sr additions. It hasbeen reported that impact toughness is more sensitive to smallvariations in the microstructure than elongation percentage [25].It can be seen that the impact toughness increased by 136%, whilethe tensile elongation improved by about 110% when the Sr/Biratio was increased from 0.32 to 0.44. The linear relationship isevident between impact toughness and elongation as shown inFig. 4. It observed that with an increase in elongation, the absorbedenergy of impact testing increases for all cast alloys.
To evaluate the effect of Bi and Sr additions on the performanceof the secondary alloys, a quality index (Q) was employed. Thequality index is described by Drouzy et al. [25], and modified byClosset et al. [26], as semi-logarithmic plot of UTS versus elonga-tion to fracture, Q¼UTSþ150log (El). The variation of Q as afunction of Sr/Bi ratio is shown in Fig. 5. Since the quality indexcombines both strength and ductility, it is much more descriptiveof the true tensile properties of a casting, rather than tensilestrength, or elongation alone. It is seen from Fig. 5 that there isrelationship between Q value and Sr/Bi ratio. Three distinctareas can be identified as corresponding to various Sr/Bi ratios.In the region of Sr/Bi ratio less than 0.32, the Q value is around90.5–103.4 MPa. For the area of Sr/Bi ratio more than 0.32 and lessthan 0.44, the Q value increased significantly to 155.5–158.5 MPa.Moreover, the Q value increased to highest value of 172–174.9 MPafor the area of Sr/Bi ratio more than 0.44. It is worth noting thatthe major difference between the alloys was in the morphology ofSi phase particles. Hence, it can be concluded that interaction of Biand Sr was effective in changing the morphology and orientationof eutectic Si (Figs. 2 and 3), which in turn significantly improvedthe quality index of the castings.
3.3. Fractography
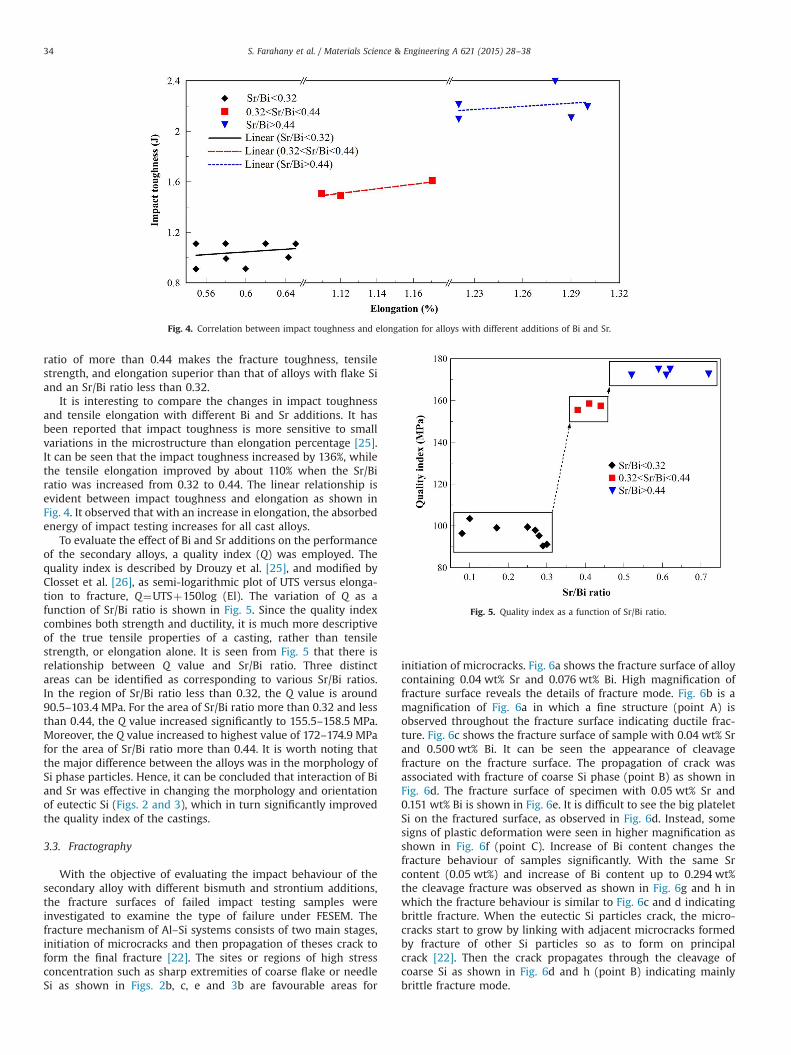
With the objective of evaluating the impact behaviour of thesecondary alloy with different bismuth and strontium additions,the fracture surfaces of failed impact testing samples wereinvestigated to examine the type of failure under FESEM. Thefracture mechanism of Al–Si systems consists of two main stages,initiation of microcracks and then propagation of theses crack toform the final fracture [22]. The sites or regions of high stressconcentration such as sharp extremities of coarse flake or needleSi as shown in Figs. 2b, c, e and 3b are favourable areas for
initiation of microcracks. Fig. 6a shows the fracture surface of alloycontaining 0.04 wt% Sr and 0.076 wt% Bi. High magnification offracture surface reveals the details of fracture mode. Fig. 6b is amagnification of Fig. 6a in which a fine structure (point A) isobserved throughout the fracture surface indicating ductile frac-ture. Fig. 6c shows the fracture surface of sample with 0.04 wt% Srand 0.500 wt% Bi. It can be seen the appearance of cleavagefracture on the fracture surface. The propagation of crack wasassociated with fracture of coarse Si phase (point B) as shown inFig. 6d. The fracture surface of specimen with 0.05 wt% Sr and0.151 wt% Bi is shown in Fig. 6e. It is difficult to see the big plateletSi on the fractured surface, as observed in Fig. 6d. Instead, somesigns of plastic deformation were seen in higher magnification asshown in Fig. 6f (point C). Increase of Bi content changes thefracture behaviour of samples significantly. With the same Srcontent (0.05 wt%) and increase of Bi content up to 0.294 wt%the cleavage fracture was observed as shown in Fig. 6g and h inwhich the fracture behaviour is similar to Fig. 6c and d indicatingbrittle fracture. When the eutectic Si particles crack, the micro-cracks start to grow by linking with adjacent microcracks formedby fracture of other Si particles so as to form on principalcrack [22]. Then the crack propagates through the cleavage ofcoarse Si as shown in Fig. 6d and h (point B) indicating mainlybrittle fracture mode.
Fig. 4. Correlation between impact toughness and elongation for alloys with different additions of Bi and Sr.
Fig. 5. Quality index as a function of Sr/Bi ratio.
S. Farahany et al. / Materials Science & Engineering A 621 (2015) 28–3834
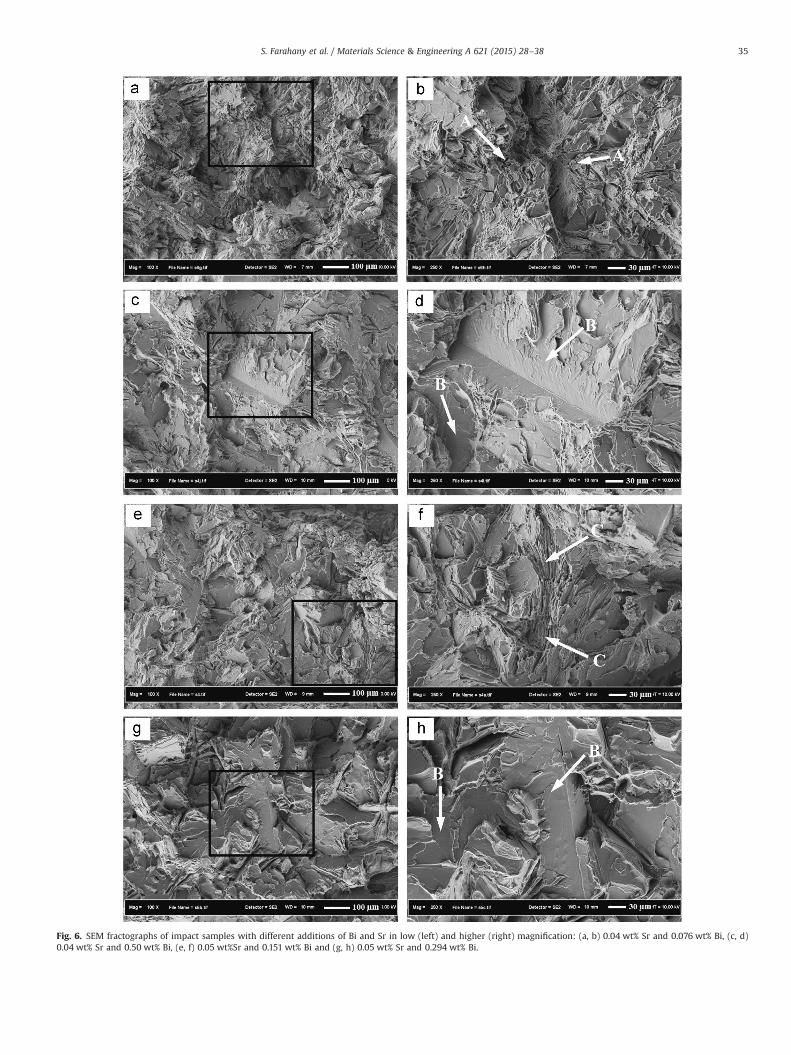
Fig. 6. SEM fractographs of impact samples with different additions of Bi and Sr in low (left) and higher (right) magnification: (a, b) 0.04 wt% Sr and 0.076 wt% Bi, (c, d)0.04 wt% Sr and 0.50 wt% Bi, (e, f) 0.05 wt%Sr and 0.151 wt% Bi and (g, h) 0.05 wt% Sr and 0.294 wt% Bi.
S. Farahany et al. / Materials Science & Engineering A 621 (2015) 28–38 35

Fig. 7. SEM fractographs and fracture profile of Al–Si–Cu–Fe–Zn alloy tensile samples with different additions of Bi and Sr: (a, b) 0.04 wt% Sr and 0.076 wt% Bi (c, d) 0.04 wt%Sr and 0.5 wt% Bi (e, f) 0.410 wt% Sr and 1 wt% Bi and (g) 0.7 wt% Sr and 1 wt% Bi.
S. Farahany et al. / Materials Science & Engineering A 621 (2015) 28–3836
With respect to the microstructure of corresponding alloy, thistype of change in fracture behaviour maybe attributed mainly tothe eutectic Si particle. It has been noted that Si particle size andshape are parameters affecting the ductility of Al–Si alloys [22,27].Turning now to Table 2, it shows that the eutectic Si area decreasessignificantly for alloy with Sr/Bi ratio more than 0.44 in compareto alloy with Sr/Bi ratio less than 0.32. Indeed, the area of highstress located at the edges of Si particles diminishes while the Simorphology changes to fibrous. On the other hand, as noted byMerlin et al. [28] and Elsebaie et al. [22] an increase of areafraction of plastic aluminium matrix after flake to fibrous trans-formation results in an improvement of resistance to crackpropagation and superior impact toughness.
The SEM micrographs of fracture surfaces and the correspond-ing optical micrographs of the longitudinal sections below thefracture surfaces of tensile test specimens of alloys tested withdifferent amounts of Bi and Si, as shown in Fig. 7. The micrographsshow clearly different fracture surfaces depending on the Bi and Sradditions. The fractographs shown in Fig. 7a and b characterise thenature of fracture in the alloy with 0.04 wt% Sr and 0.076 wt% Bi.It can be seen that the dimples are much more apparent on thefracture surfaces distributed uniformly, as shown by the arrows inFig. 6a. The ductile fracture is determined by the size of dimples,and its size is governed by the number and distribution ofmicrovoids that are nucleated [29]. Moreover, the optical micro-graph of the side view represents a transgranular fracture. Theseobservations indicate that the fracture exhibits ductile behaviour,which is attributed to the high elongation of the castings.In contrast, fracture surface of alloy with higher amount ofBi (0.5 wt%) as shown in Fig. 7c present that the dimples mostlydisappear, and the fracture surface is covered mainly by cleavage.Moreover, a broken eutectic Si on the fracture surface suggeststhat cracks will be initiated and propagated through coarse plate-like Si (Fig. 7d) with intergranular fracture. These observationsclearly show the mechanism of rupture with initiation of crack in
the hard Si phase and propagation of crack till complete failure.Nano-hardness test measurement showed that the hardness andmodulus of elasticity of eutectic Si are 6 and 1.6 times more thanaluminium matrix, respectively [30]. Then the eutectic Si is easierto rupture due to brittleness than the aluminium matrix. Thefracture surfaces of alloy containing 0.410 wt% Sr and 1 wt% Bi arerepresented in Fig. 7e and f. It can be seen that the fracturemechanism is different of that observed in Fig. 7a and c. Thefracture of eutectic Si is shortened, and the sign of plasticdeformation was observed to occur at the aluminium matrix.As can be seen from Fig. 7f, the fracture surface is characterisedas mixed mode fracture where the areas of typical ductile fractureand also cleavage fracture were observed. With increasing Srcontent up to 0.7 wt% Sr, the fracture mechanism changes frommixed (Fig. 7e and f) to ductile mode. The surface exhibits thepresence of dimples, indicating a failure of ductile fracture andplastic deformation, as shown in Fig. 7g. The examination by theoptical microscopy of the longitudinal section near the fracturesurfaces reveals transgranular fracture mode (Fig. 7h) which issimilar to Fig. 7b. The fibrous eutectic Si with smaller size, area andshape factor sustains more deformation before fracture occurs,which is in accordance to higher elongation and ultimate tensilestrength values. It can be concluded that respect to the Bi and Sradditions present in the secondary alloy, the fracture behaviour ischanged, as indicated by the values of elongation percentage tofracture.
3.4. Proposed mechanism of interaction
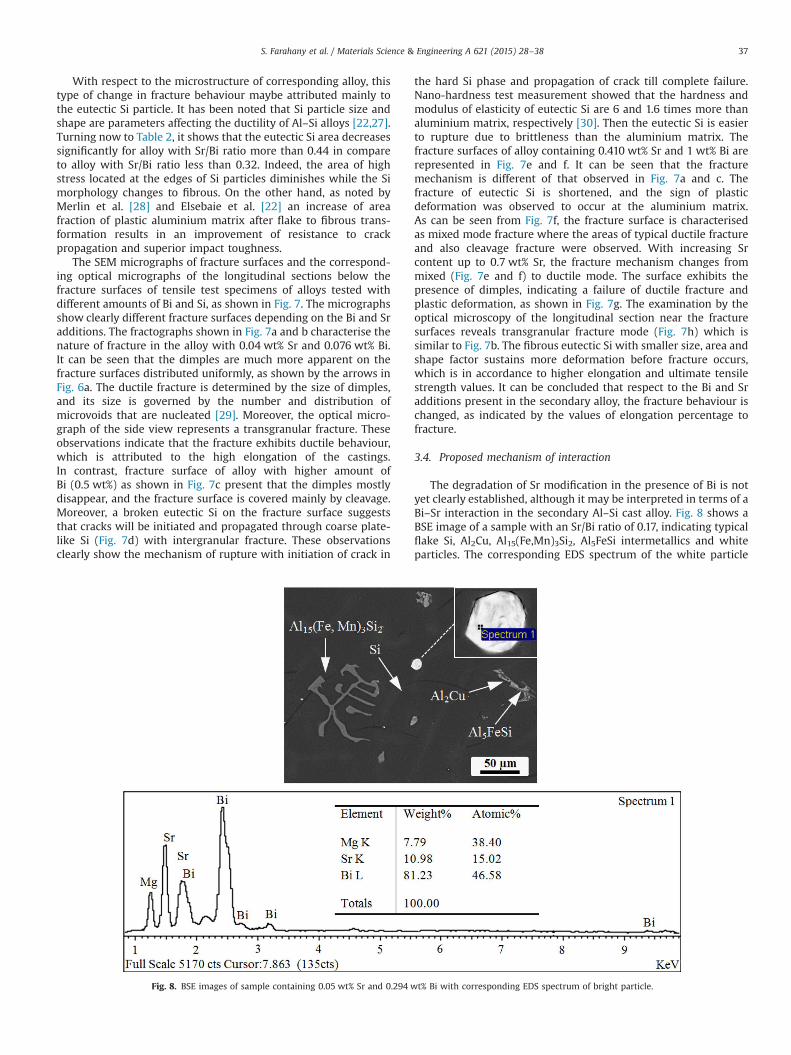
The degradation of Sr modification in the presence of Bi is notyet clearly established, although it may be interpreted in terms of aBi–Sr interaction in the secondary Al–Si cast alloy. Fig. 8 shows aBSE image of a sample with an Sr/Bi ratio of 0.17, indicating typicalflake Si, Al2Cu, Al15(Fe,Mn)3Si2, Al5FeSi intermetallics and whiteparticles. The corresponding EDS spectrum of the white particle
Fig. 8. BSE images of sample containing 0.05 wt% Sr and 0.294 wt% Bi with corresponding EDS spectrum of bright particle.
S. Farahany et al. / Materials Science & Engineering A 621 (2015) 28–38 37
suggests that the bright particle contains predominantly Bi, Mg,and Sr with at% ratio of 46.6:38.4:15 respectively. In Bi–Mg–Srternary system, there is only one compound present with amolecular formula of Mg2Bi2Sr. Due to the solutes of thoseelements and enriching locally in the melt, it is possible to forma ternary intermetallic. Moreover, the composition of this whitecompound is closed to the stoichiometric value of Mg2Bi2Sr. Theformation of Mg2Bi2Sr compound before the eutectic reaction isexpected to be the main factor for deactivation of Sr duringmodification of Si. This compound might form before eutecticnucleation, leading to a reduction in the amount of free Sravailable for modification of eutectic Si.
4. Conclusion
The effect of different quantities of Bi and Sr on the micro-structure and mechanical properties of an Al–Si–Cu–Fe–Zn sec-ondary alloy was studied. The following conclusions were drawn:
(1) Interaction of Bi and Sr led to change the characteristic ofeutectic Si structure. When the Sr/Bi ratio was less than 0.32,the eutectic structure transformed from fine fibrous to coarseflake like. Moreover, the mean length, mean area, and meanshape factor of eutectic Si increased from 3.2 mm, 9 mm2 and1.3 to 96 mm, 611 mm2 and 22 respectively.
(2) The orientation of the eutectic Al phase changed, the twindensity of Si increased and twin spacing decreased whereasthe Sr/Bi ratio decreased from 0.44 to 0.32.
(3) Due to the interaction and de-modification of eutectic Si, thehardness, impact toughness, ultimate tensile strength, elonga-tion and quality index are significantly decreased by 7%, 62%,19%, 57% and 48% respectively.
(4) Impact and tensile fractures show that fracture mode makestransition from ductile failure type to brittle type due to Bi andSr interaction, which are in accordance to decrease of absorbedenergy for fracture and elongation percentage values.
Acknowledgement
The authors acknowledge financial support provided by UniversitiTeknologi Malaysia (UTM) under the vote QJ130000.2524.08H36.
References
[1] K. Das Subdoh, J.A.S. G., J. Gilbert Kaufman, Daryoush Emadi, M. Mahfoud, JOM62 (2) (2010) 23–26.
[2] J. Campbell, Complete Casting Handbook, Elsevier, Oxford, UK, 2011.[3] L. Lu, A.K. Dahle, Mater. Sci. Eng. A 435–436 (2006) 288–296.[4] J.G. Li, B.Q. Zhang, L. Wang, W.Y. Yang, H.T. Ma, Mater. Sci. Eng. A 328 (2002)
169–176.[5] H. Liao, Y. Sun, G.X. Sun, J. Mater. Sci. 37 (2002) 3489–3495.[6] H. Liao, G.X. Sun, Scr. Mater. 48 (2003) 1035–1039.[7] A.M. Samuel, H.W. Doty, S. Valtierra, F.H. Samuel, Mater. Des. 56 (0) (2014)
264–273.[8] T.H. Ludwig, E. Schonhovd Dæhlen, P.L. Schaffer, L. Arnberg, J. Alloys Compd.
586 (0) (2014) 180–190.[9] Anawati, H. Nordmark, S. Diplas, J.C. Walmsley, K. Nisancioglu, J. Electrochem.
Soc. 159 (3) (2012) C137–C145.[10] D.E.J. Talbot, C.E. Ransley, Metall. Trans. A 8 (1997) 1149–1154.[11] A. Papworth, P. Fox, Mater. Lett. 35 (3–4) (1998) 202–206.[12] S. Farahany, A. Ourdjini, T. Bakar, M. Idris, Met. Mater. Int. 20 (5) (2014)
929–938.[13] J.I. Cho, C.R. Loper, AFS Trans. 108 (2000) 359–367.[14] C.J. Machovec, G.E. Byczynski, J.W. Zindel, L.A. Godlewski, AFS Trans. 108 (76)
(2000) 439–444.[15] S. Farahany, A. Ourdjini, T. Bakar, M. Idris, Metall. Mater. Trans. A 45 (3) (2014)
1085–1088.[16] S. Farahany, A. Ourdjini, M.H. Idrsi, S.G. Shabestari, Thermochim. Acta 559
(2013) 59–68.[17] S. El-Hadad, A.M. Samuel, F.H. Samuel, H.W. Doty, S. Valtierra, AFS Trans. 112
(2004) 141–153.[18] A.K. Dahle, K. Nogita, J.W. Zindel, S.D. McDonald, L.M. Hogan, Metall. Mater.
Trans. A 32 (2001) 949–960.[19] K. Nogita, A.k. Dahle, Mater. Trans. 42 (2) (2001) 207–214.[20] U. Patakham, J. Kajornchaiyakul, C. Limmaneevichitr, J. Alloys Compd. 575 (0)
(2013) 273–284.[21] S.Z. Lu, A. Hellawell, Metall. Trans. A 18 (1987) 1721–1733.[22] O. Elsebaie, A.M. Samuel, F.H. Samuel, J. Mater. Sci. 46 (9) (2011) 3027–3045.[23] C.H. Caceres, J.R. Griffiths, Acta Mater. 44 (1) (1996) 25–33.[24] A. Saigal, J. Berry, AFS Trans. (1985) 699–70493 (1985) 699–704.[25] M. Drouzy, S. Jacob, M. Richard, AFS Int. Cast Met. 5 (1980) 43–50.[26] B. Closset, J. Gruzleski, AFS Trans. 90 (1982) 453–464.[27] E. Samuel, B. Golbahar, A.M. Samuel, H.W. Doty, S. Valtierra, F.H. Samuel,
Mater. Des. 56 (0) (2014) 468–479.[28] M. Merlin, G. Timelli, F. Bonollo, G.L. Garagnani, J. Mater. Process. Technol. 209
(2) (2009) 1060–1073.[29] A.M.A. Mohamed, F.H. Samuel, S.A. kahtani, Mater. Sci. Eng.: A 577 (0) (2013)
64–72.[30] Y.-C. Tzeng, C.-T. Wu, H.-Y. Bor, J.-L. Horng, M.-L. Tsai, S.-L. Lee, Mater. Sci. Eng.:
A 593 (0) (2014) 103–110.
S. Farahany et al. / Materials Science & Engineering A 621 (2015) 28–3838
Copyright © 2022 FDOKUMEN