effect of audit market concentration and auditors' attributes on ...
232
EFFECT OF AUDIT MARKET CONCENTRATION AND AUDITORS’ ATTRIBUTES ON AUDIT QUALITY IN NIGERIA AGGREH, MESHACK 2012407005F PhDACCOUNTANCY JUNE, 2017
-
Upload
khangminh22 -
Category
Documents
-
view
0 -
download
0
Transcript of effect of audit market concentration and auditors' attributes on ...

EFFECT OF AUDIT MARKET CONCENTRATION AND AUDITORS’
ATTRIBUTES ON AUDIT QUALITY IN NIGERIA
AGGREH, MESHACK
2012407005F
PhDACCOUNTANCY
JUNE, 2017

| ii
EFFECT OF AUDIT MARKET CONCENTRATION AND AUDITORS’
ATTRIBUTES ON AUDIT QUALITY IN NIGERIA
AGGREH, MESHACK
2012407005F
BEING A PhD DISSERTATION SUBMITTED TO THE SCHOOL OF
POSTGRADUATE STUDIES, IN PARTIAL FULFILMENT OF THE
REQUIREMENTS FOR THE AWARD OF DOCTOR OF PHILOSOPHY
(PhD) DEGREE IN ACCOUNTANCY,
DEPARTMENT OF ACCOUNTANCY
FACULTY OF MANAGEMENT SCIENCES
NNAMDI AZIKIWE UNIVERSITY, AWKA, NIGERIA
JUNE, 2017

| iii
DECLARATION
I hereby declare that this dissertation has been written by me and it is a report of my
research. To the best of my knowledge, this work has not been presented in any previous
application for degree or published journal. All quotations are indicated and sources of
information specifically acknowledged by means of references.
Aggreh Meshack
2012407005F

| iv
APPROVAL PAGE
This dissertation (Effect of Audit Market Concentration and Auditors’ Attributes on Audit
Quality in Nigeria) has been approved in partial fulfilment for the award of Doctor of
Philosophy (Ph.D.) Degree in Accountancy.
____________________________ ______________________
Professor Emma I. Okoye Date
Supervisor
____________________________ ______________________
Professor S. M. Ifurueze Date
Supervisor
____________________________ ______________________
Dr. Patrick Egbunike Date
Head, Department of Accountancy,
____________________________ ______________________
Professor Wilson Ani Date
External Examiner
____________________________ ______________________
Professor Nkamnebe A. D. Date
Dean, Faculty of Management Sciences
____________________________ ______________________
Professor H. I. Odimegwu Date
Dean, School of Post Graduate Studies, NAU,Awka

| v
DEDICATION
To my Mummy – Mrs Comfort Aggreh

| vi
ACKNOWLEDGEMENTS
I sincerely ascribe all praise and adoration to the Almighty, Most Merciful, Omniscience,
Most Gracious and All-Powerful God, in whom dwells the fullness of all wisdom, for
giving me grace, mercy, wisdom and resources to complete this programme, making the
dream a rhapsody of reality. I, from the lowest part of my heart wish to say, ―Dalu nu”.
I earnestly appreciate my awesome supervisors - Prof E. I. Okoye and Prof S. M. Ifurueze,
great scholars in every way, noble Professors par excellence, totally thorough, with eagle
eyes, always proffering constructive criticism, heavily and heavenly supportive to the
core, fathers indeed, readily available at all times… to mention but a few. If not for men
with high quality, integrity, veracity, transparency, simplicity academic and professional
competence with due care, the quality of this work would have been eroded, impaired and
underestimated without recourse – Sirs, I am immensely grateful and wish to say,
“Megwo”.
I genuinely acknowledge Prof. B. C. Osisioma, Our Doyen, Dr. Patrick Egbunike, The
Head, Department of Accountancy, Prof. A. D. Nkamnebe, Dean, Faculty of Management
Sciences, Prof. B. E. Osaze, Ven. Prof. I. O. Osanwonyi, Prof. J. T. Akinmayowa, Prof. A.
E. Okoye, Prof. O. T. Ekannem, Prof. P. O. Eriki, Prof. F. Izedonmi, Prof. Asaolu, Prof.
Akpa, Prof. (Ms) P. A. Donwa, Prof. (Mrs) P. A. Isenmila, Prof. (Mrs) C. M. Ekwueme,
Prof. P. J. Ilaboya, Prof. E. L. Dabor, Prof. Ofili, Prof. Tsegba, Prof. Nwankwo Canis and
other professors that have given me professorial prophesies concerning the completion of
this program, I wish to say “Imela ofuma 𝑜 fuma”.
I also validly recognize the lecturers in Accountancy Department, especially Dr U.C
Nzewi, Dr. P. V. C. Okoye, Dr Ijeoma, Dr. Odum, Dr. Eziagbe, Dr. Udeh, Dr. Ogor
Okafor, Dr. Toochukwu G. Okafor and all others for their advice and supports all through
the way, not forgetting the non-academic staff – Mrs. Patience, Mrs Ngozi, Aunty Rose,
Mrs Amaka, that have tirelessly encouraged me with the administrative keen assistance. I
truly love to say, “e seun lopo lopo”

| vii
My Parents, Mrs Comfort, and (Late) Mr. Gabriel Aggreh, my Siblings, FS. Shadrach,
Mrs Esther, Messer Abednego, Miss Ruth … you have all supported me financially,
morally, academically, spiritually, emotionally, and in other qualitative means which
cannot be measured in words or figure or validated empirically. I am most grateful. I‘d
love to say “Wa wese kakaboo”
Without mincing words, this acknowledgement will be incomplete, irrespective of
whatever, without mentioning some key resource back-bone, ever present in time of need,
no matter the degree or period involve: The Adenirans, The Dabors, The Colemans, The
Arebuns, The Okemes, The Anerus, The Abioyes, The Okoyes, and every other persons
and families too numerous to mention. I love you all.

| viii
ABSTRACT
The objective of this study is to ascertain the effect of audit market concentration and
auditor‘s attributes on audit quality in the Nigerian manufacturing sector.
Specificallyit aimed at finding out the impacton relative audit market concentration
(RAMC), absolute audit market concentration (AAMC), auditors‘ independence
(AUIND), auditors‘ tenure (AUTEN) and audit risk (AUDRISK) on audit quality
(AQ) in the Nigerian manufacturing sector. The study employed anex post
factoresearch design because the data for the study was extracted from archived of
past events. The study was restricted to Nigerian manufacturing firms.Simple random
sampling technique was employed to select 52 firms quotedon the Nigerian Stock
Exchange as at 31st December, 2015. The study covered a period of 15 years from
2001 – 2015, forming an observation of 780 firm-year observation in the Nigerian
audit market. Data on relative audit market concentration, absolute audit market
concentration, auditor‘s independence, audit tenure and audit firm size were obtained
from secondary sources (annual reports and accounts) and subjected to the regression
analysis using the pooled OLS and Panel EGLS. Theresult shows that there is a
negative relationship between audit quality and relative audit market concentration,
absolute audit market concentration, auditor tenure, audit firm size and rendering of
non-audit services while auditor independence and audit fee have a positive
relationship with audit quality.The study recommended that professional bodies,
management and auditors should introduce alternative appointment processes for
auditors.Again, regulators and standards setters should come up with early warning
systems of significant threats to the operations of a ‗Big 4‘ firm; while investors
should find a way of ensuring that the largest institutional investors act together to
influence large companies to consider ‗Mid-Tier‘ audit firms, as they usually get the
changes they are looking for in the interest of all and sundry.

| ix
TABLE OF CONTENT
Title
Declaration iii
Certification iv
Dedication v
Acknowledgements vi
Abstract viii
Table of Content ix
List of Tables xii
List of Figures xiii
CHAPTER ONE: INTRODUCTION
1.1 Background to the Study 1
1.2 Statement of The Problem 4
1.3 Research Questions 7
1.4 Objectives of the Study 8
1.5 Research Hypotheses 8
1.6 Significance of Study 9
1.7 Scope and Limitationsof the Study 9
1.8 Operational Definition of Terms 10
CHAPTER TWO: REVIEW OF RELATED LITERATURE
2.1 Introduction 11
2.2 Conceptual Framework 11
2.2.2 The Audit Market 11
2.2.3 Market Structures Measured by Auditor Concentration 13
2.2.3.1 Oligopoly 13
2.2.3.2 Perfect Competition 14
2.2.3.3 Monopoly 15
2.2.4 Audit Quality 15
2.2.5 Attributes of Audit Quality 18
2.2.6 Measures of Audit Quality 19
2.2.6.1 Propensity to Issue a Going Concern Opinion 19

| x
2.2.6.2 Auditor Size 19
2.2.6.3 Audit Fees 20
2.2.7 Factors Influencing Audit Quality 21
2.3 Theoretical Review 22
2.3.1 Theory of Rational Expectations 22
2.3.2 The Agency Theory 23
2.3.3 The Industrial Organization Theory 26
2.4 The Theoretical Framework 28
2.5 Empirical Review 29
2.5.1 Determinants of Auditor Choice 29
2.5.2 Audit Firm Size and Audit Quality 32
2.5.3 Audit Market Concentration and Audit Quality 35
2.5.3.1 Auditee Size 37
2.5.4.2 Auditee Risk 38
2.5.5 Audit Quality and Audit Fees 38
2.6 Gaps in Literature 39
2.7 Summary of Reviewed Literature 41
CHAPTER THREE: RESEARCH METHODOLOGY
3.1 Introduction 45
3.2 Research Design 45
3.3 Population of the Study 45
3.4 Sample Size and Sampling Technique 46
3.5 Source of Data 46
3.6 Method of Data Analysis 46
3.7 Model Specification 47
3.8 Measurement of Variables 49
CHAPTER FOUR: PRESENTATION AND ANALYSIS OF DATA
4.1 Introduction 51
4.2.1 Data Presentation 51
4.2.2 Descriptive Statistics 51
4.3 Pearson Correlation 56
4.4 Diagnostic Test 59
4.4.1 Variance Inflation Factor 59

| xi
4. 4.2 Heteroskedasticity 60
4.5 Regression Results 60
4.6 Test of Hypotheses 77
4.7 Discussion of Results 82
CHAPTER FIVE: SUMMARY OF FINDINGS, CONCLUSION AND
RECOMMENDATIONS
5.1 Introduction 86
5.2 Summary of Findings 86
5.3 Conclusion 87
5.4 Recommendations 87
5.4.1 Policy Recommendations 87
5.4.2 Contribution to Knowledge 90
5.4.3 Recommendations for further studies 91
REFERENCES 93
APENDIX A: List of Sampled Manufacturing Firms 106
APENDIX B: Calculation of Discretionary Accruals 107
APPENDIX C: Data for Analysis 111
APPENDIX D: Analyses Results

| xii
LIST OF TABLES
Table 2.1: Summary of Reviewed Literature 42
Table 3.1: Summary of Variables 56
Table 4.1 Descriptive Statistics 58
Table 4.2 Pearson Correlation Result 62
Table 4.3 Variance Inflation Factor (VIF) result 65
Table4.4 Heteroskedacity 66
Table 4.5 Audit Quality and Auditor Attributes 67
Table 4.6 Audit Market Concentration and Audit Quality 69
Table 4.7 Audit Market Concentration and Audit Quality –Sector-by-Sector 72
Table 4.8 Audit Quality and Auditor Attributes 74
Table 4.9 Audit Market Concentration and Audit Quality 81
Table 4.10 Audit Market Concentration and Audit Quality 83
Table 4.11 Audit Market Concentration and Audit Quality 86
Table 4.12 Audit Market Concentration and Audit Quality 88
Table 4.13 Audit Market Concentration and Audit Quality –Sector-by-Sector 91

| xiii
LIST OF FIGURES
Fig. 2.1: Elements of Audit Quality 19
Fig. 2.2: Environmental influences, Audit ServiceProviders and Audit Quality 23

CHAPTER ONE
INTRODUCTION
1.1 Background to the Study
The word ―audit‖ was derived from the Latin word ―audire‖ which means ―to hear‖.
In the early days, an auditor used to listen to the accounts read over by an Accountant
in order to check them. Gray and Manson (2002) documents that an audit is an
examination or a search for facts to enable an judgment to be made on the truth and
fairness of financial reports prepared by management with the intention of increasing
its credibility and therefore its usefulness‖.Hayes, Dassen, Schilder and Wallage(2005)
elucidates that the major purposefor performing an audit is to show credibility to
financial statements hence, the crucial role of auditin the operation of capital markets
cannot be over emphasized. The engagement of the services of an external auditor for
quality assurance is inevitable because it is a statutory requirement for all quoted
companies to file audited report (OECD Policy Roundtables Report, 2009).
Jensen and Meckling (1976) opine that in line with agency theory, audit exercise is a
sort of scrutinizing toolthat guarantees stakeholders that agents are carrying on
business activities in the interest of owners. Therefore, the decision to choose auditors
is to resolve the agency problem that may arise as a result of separation of ownership
and control. Companies are expected to have a high quality of financial reporting.
Management is saddled with the responsibility of preparing financial statements and
ensuring that the statements meet reporting requirements like the General Accepted
Accounting Principles (GAAP) or the International Financial Reporting Standards
(IFRS) (Arens, Elder & Beasley, 2010). Stakeholders and other users should be able to
rely on the financial statements for making informed investment decisions. Auditors
are also saddled with the responsibility of plummeting information hazardthat may
arise from published financial reports which is the principalrationale behind the
engagement of the services of an auditor (Suyono, Yi & Riswan, 2013).
It is interesting to know that audit quality is anunfamiliar concept in accounting
research yet till date, there is no consensus on the definition of the subject matter by
accounting researchers. A conventionalmeaning of audit quality is that of the market–

| 2
gauged combinedlikelihood that a given auditor will both: (i) spotout issues of
violation of GAAP in the auditee accounting system and (ii) report that breach, that is
that the auditor has both the technical competence to detect any material errors during
the audit process, and the independence to ensure that material errors and omissions
are corrected or disclosed in the auditor‘s report (DeAngelo, 1981). Kilgore (2007)
defines auditquality as the likelihood that an auditor will mutuallyspotout a violation of
GAAP in client‘s domain and thereafter,give account of the violation at the end of the
audit exercise. The detection of a misstatement reflects qualitywith regardsto the
auditor‘s sagacity and aptitude, while the disclosure on a misstatement is a upon the
auditor‘s inducement to divulge.
The Cadbury Report (1992) confirmed that the yearly audit is one of the cornerstones
of corporate governance. Esteemedaudit quality makes financial report dependable for
the viability of the capital. Some scholars (Kilgore, 2007 Skinner & Srinivasen, 2009)
are of the view that audit quality as an essential ingredient is needed for the efficient
functioning of the capital markets.Zureigat (2011) further stresses that audit quality has
taken the front burner in accounting research because of the role it plays in enhancing
reliability of financial statements.In the absence of audit quality the worth of financial
information presentedby managers to users of financial report is likely to decline.
High quality financial reporting is important toboth investors and the firm because
itguides the investors‘investment decisions and helps to evaluate managers‘ true
performance. Other stakeholders, like- employees, government and researchers rely on
informationgenerated from financial statements to guidethem in decision
making.Abysmal financial report will mislead the aforementionedcategories of interest
groups(Scott, 2009). Flanagan, Muse and O‘Shaughnessy (2008) asserts that auditis a
device that enhances quality assurance and gives credibility to financialreports. It
boosts the confidence of the potential investors on the financial reports.The author
further stresses that when an auditor issuesan unqualified opinion instead of a qualified
audit opinion on a financial report, such a report will eventually mislead the users of
such financial report.

| 3
Velte and Stinglbaecer (2012) opine thatthe concept ―concentration‖ describes the
agglomeration of economic power, that is present in several industrial sectors, having
varied causes. Extant literature examines the use of market share as a proxy for market
concentration (Dubaere, 2008; Miguel, 2010). Market concentration is a function of
the number of firms in a market and their respective market shares (Wikipedia, 2015).
Schaen and Maijoor (1997) assert that concentration is the joint market allocation of
foremostcompanies whichconnotes a level of oligopoly. Feldman (2006) further argues
that mergers of some prominent auditfirms in the 1ast two decades have raised the
concentration of prominent audit firms. Pong (1999) reports that in extremely tight
markets, theprobability of conspiring with (high) fee fixing engagements is very
highand auditee choice is limitedwhileconflict of interest hasbecomethe order of the
day. Dubaere (2008) documents that smaller audit firms and governments
apprehensiveof fact that excessive concentration of the large audit firms will result
toindiscriminate increasein audit prices, unabated decreasein auditor independence and
lowered audit quality. Dubaere(2008) reports that the outstanding method to determine
the market allocation is taking the sum of audit fees paid by the auditee.Eshleman
(2013)further emphasizes that audit fees received by an audit firm is a function of the
audit supplier. Extremely concentrated markets can result to homogeneouspricing
and/or abysmal servicedelivery. The author furtherstresses that less competitive market
result to extremely high audit fee and a corresponding lowaudit quality.
Auditor remuneration can affect audit quality basically in two ways: abnormal auditor
remunerationmay make auditor to exert more efforts on the audit exercise hence leads
to quality audit. Alternatively, excess auditor remuneration, especially those that are
related to non-audit services creates an economic bonding of theauditor to his clients.
This kind of financialdependencecanbring about anassociationthat willmakethe auditor
give the client free hands to window dress its reportsin order to retain the client. On the
other hand some scholars (DeAngelo, 1981; Simunic, 1984)are of the view that the
moral hazard and reputation loss from audit failure outweighs the benefit derived from
economic bonding.
The Government Accountability Office (2003) observes that mergers and acquisitions
have been used as a means for audit firms to expand their business by achieving

| 4
greater economies of scale and also industry expertise. According to Newton, Wang &
Wilkins (2013), there are at least two concerns with this consolidation of auditors:
first, fewer competitors may lead to higher prices; and second, less competition may
lead to a lower quality product. In the case of auditing, the higher concentration could
lead to complacency, as auditors realize that clients have very few audit firms to
choose from. According to these authors, this can lead to a less skeptical approach to
auditing.
Current high-profile of dominance of the Big4 in the audit market has become a
subject of concern in developed countries like United States, United Kingdom and
European Union (General Accounting Office, 2003; Government Accountability
Office, 2008; Oxera, 2006; Oxera, 2007).United States Treasury (2008) reports that the
domination of the audit market by the Big4 is detrimentalto the growth of the market
because it restrictsclient‘ choices of auditor, especially for blue chip firms. Theagency
further expressed its fears that if the present trend is not curtailed, it will culminate into
excessive audit pricing and low audit quality because of the absence of competition.
Despite the above reports, very little is known about the consequences of market
concentration on the quality of audit services (Francis, Michas & Seavey, 2010) in
Nigeria.
Pound and Francis (1981) assert that the domination of big audit firmshas made some
authors to conclude that audit services market exhibits characteristics of an oligopoly.
One of the features of an oligopoly as stated by economists is the likelihood to
conspire. Sammelson and Nordhous (2001) see conspiracyassynchronization between
different firms to unanimously agreeto hike prices, dividing markets or otherwise
reducing competition. One of the ways to collude is by merging or forming a cartel.
Regulators are concerned about audit market concentration because the market
dominance of ―Big4‖ auditors may pose a threat to audit quality (Government
Accountability Office in US, 2008).

| 5
1.2 Statement ofthe Problem
The results of previousstudies (Pearson & Trompeter, 1994; Willekens & Achmadi,
2003; McMeeking, Peasnell & Pope, 2007; Numan & Willekens, 2012; Ding & Jia,
2012) are inconclusive on the impact of market concentration on audit quality. There
are diverging perceptionsof the potential consequences of increased competition in
audit marketsby two different schools of thought. The legalistic look at market
concentration from the traditional view of legislators and courts. They assert that
competition in the market will increase quality and decrease prices.On the contrary the
economists suggest that when suppliers compete for market share, competition will
lead to poor product quality.
As at 2011, twenty thousand audit firms offer audit services to unquoted and
quotedfirms in Nigeria (World Bank, 2011). In spite of the existence of large number
of audit service providers, the audit market is controlled by few large audit firms,
knownas the ‗Big4‘ (World Bank, 2011). These accounting firms audit about 90
percent of quoted firms in Nigeria. They dominate the practice in Nigeria while the 15
national firms with international affiliation audit the remaining percent. The difference
in market share betweenthe Big4 and non-big4 has become wider, eventually
plummeting the likelihood for the non-Big4 firms to become momentous service
suppliers of audit services in the market (World Bank, 2004).
Extant literature shows that the mode of market allotment that prevalent in the audit
market has been on the increase world over. Oxera (2006) opines that the degree of
market concentration in the audit industry increased after the Pricewaterhouse/Coopers
& Lybrand merger in 1998 and after the demise of Arthur Andersen in 2002, in the
United Kingdom. The author furtherstresses that theBig4 audit firms– Deloitte
&Touché, Ernst & Young, KPMG and PricewaterhouseCoopers – audit all but one of
the Financial Times-Stock Exchange (FTSE) 100 companies, and represent 99% of
audit fees in the FTSE 350. The resultsshow that more than 700 UK-listed companies,
covering the period 1995-2004 that experienced an increase in audit fees in recent
years is as a result of domination of the market by the Big4. Feldman (2006) concludes
that the crash of Arthur Andersen has led to the domination of the Big4in the US audit

| 6
market and also caused hike of audit fees. Atotal of 94% of the audit share in the EU
is dominated by the Big4 (Le Vourc‘h & Morand, 2011).
Toward the end of last decade,the eight largest audit firmscrashed and thisled to
mergers that whittled down the number of large multinational auditing firms to five. In
2002 Arthur Andersen also crashed followingthe Enron saga. This invariably ledto the
reduction of the number of multinational audit firm to four. In Nigeria, the ‗Big4‖
audit firms are Akintola Williams Deloitte, Ernest and Young (E&Y),
PricewaterhouseCoopers (PwC) and KPMG professionals. Rising audit market
concentration has been a serious issue in the mind of regulators and market
participants. Francis, Michas and Seavey (2013) opine thatdespite that fact the Big4
are the major providers ofaudit services the hike in prices cannot be justified.
Velury (2005) opines that the audit failure that erupted across the globe has put
auditing in the accounting spotlight in recent times. Dopuch (1988) argues that if a
firm goes underimmediately after it was audited, the auditors should be held liable.He
stresses whenever a firm fails, there should be an enquiry to ascertain if the failure was
as a result of auditor‘s negligence.Similarly, Okaro and Okafor (2013) reports that the
Nigerian Security and Exchange Commission indicted the Akintola Williams Deloitte
for its role in the Cadbury Nigeria Plc scandal. It is consequentlyimperative to
evaluate the effect of the volume of audit work in relationship withthe size ofthe audit
firms onthe audit quality of quoted manufacturing companies in Nigeria.
The emergence of the Big4 in the audit market in the last decade
hassubsequentlyculminated into a heavier concentration. The collapse of Arthur
Andersen in 2002 led to the decrease in the number of choices for large public clients
looking for an auditor to just four. Stressing the importance of effective competition,
the increasingly taut oligopoly in the audit service industry raises concerns about non-
competitive pricing behaviour. Bain, (1956) suggests that highly concentrated
industriesexert a negative effect on quality in the long run. It further asserts that such
industries can still be very price competitive. Scholars have not reachedany consensus
on the effect of market concentration on audit quality. The mixed results in literature
on theeffect of concentration on audit quality, suggests that additional evidence is

| 7
required to ascertain if audit market concentration will negatively affects audit quality
in an emerging economy like Nigeria.
Audit attributes are said to determine audit quality.Following the market framework,
early studies (Simunic, 1980; Palmrose, 1986; Butterworth & Houghton, 1995) used
the market framework to identify the determinants of audit pricing and hence, the audit
quality. However, most of the researches on audit market and audit quality were
donein developed countries like, United States of America, United Kingdom, Belgium,
New Zealand, Australia and the likes. It will be disingenuous to presumeovertto the
resultsand draw conclusion for audit markets of emerging economic. Hence, this study
will incorporates some certain audit peculiarities that exist in the supply side of the
audit market for emerging economies (like Nigeria), such as the audit independence,
auditors‘ tenure, audit fees, audit risk and audit firm size.
1.3 Objectives of the Study
On the basis of the above research problem, the main objective of this study is to
empirically ascertain the effect of audit market concentration and auditors‘ attributes
on audit quality in the Nigerian manufacturing sector.The specific objectives are:
i.) To determinewhetherrelative audit market concentration has significant
relationship withaudit quality in the Nigerian manufacturing sector.
ii.) To ascertain whetherabsolute audit market concentration has significant
relationship withaudit quality in the Nigerian manufacturing sector.
iii.) To assess whether auditors‘ independence has significant relationship with
audit quality in Nigeria.
iv.) To empirically ascertain whether auditors‘ tenure has significant relationship
with audit quality in Nigeria.
v.) To determine whether audit firm sizehas significant relationship with audit
quality in the Nigerian manufacturing sector.
1.4 Research Questions
This study seeks to provide answers to the following research questions:
i.) What is the relationship between relative audit market concentration and
audit quality in the Nigerian manufacturing sector?

| 8
ii.) What is the relationship between absolute audit market concentration on
audit quality in the Nigerian manufacturing sector?
iii.) What is the relationship between auditors‘ independence and audit quality?
iv.) What is the relationship between auditors‘ tenure and audit quality?
v.) What is the relationship between audit firm size and audit quality?
1.5 Statement of the Research Hypotheses
The following research hypotheses, which are stated in their nullform will be tested:
Hypothesis One
Ho1: There is no significant relationship between Relative audit market
concentration and audit quality in the Nigerian manufacturing sector.
Hypothesis Two
Ho2: There is no significant relationship between absolute audit market
concentration and audit quality in the Nigerian manufacturing sector.
Hypothesis Three
Ho3: There is no significant relationship between auditors’ independence and
audit quality
Hypothesis Four
Ho4: Auditors’ tenure does not have significant relationship with audit quality.
Hypothesis Five
Ho5: Auditors’ firm size does not have significant relationship with audit quality.
1.6 Significance of Study
There are a number of reasons why this present study is important. First, most of the
studies undertaken on effect of market concentration on audit quality are done in
advanced countries. Second, the usage of a panel data of Nigerian quoted
manufacturing companies unlike most studies which used cross-sectional data within a
period of 15 years (2001-2015), will assist in contributing to the understanding of the
structure of audit market. Third, the shareholders and the varying stakeholders,

| 9
including senior management, managers, policy makers and regulatory authorities in
Nigeria, like Financial Reporting Council of Nigeria (FRCN) who are constantly
looking for ways to promote audit quality in the country will find the study useful.
Four, researchers who are carrying out studies in the area of market concentration and
audit quality will also find the work useful.
Lastly, this study is important because there is paucity of work about the consequences
of market concentration on the quality of audit services, in essence, it is necessary to
investigate whether audit concentration has a beneficial or detrimental effect on audit
quality in developing countries like Nigeria. Therefore, this study will extend and
contribute to the body of knowledge by using Nigerian quoted manufacturing
companies to investigate the likely effect of market concentration alongside auditors‘
attributes on audit quality.
1.7 Scope and Limitationsof the Study
This study focused on manufacturing companies listed on the Nigerian Stock
Exchange as at 31st December 2015. The study covers a period of 15 years (2001-
2015), with year 2001 as the lagged year and 2002 as the base year. The year 2002 was
chosen as the base year because it was the year the number of five large international
auditing firms was reduced to four, after the demise of Arthur Andersen in 2002,
following the involvement in Enron scandal. The period witnessed different reported
scandals involving Accountants, Auditors and regulatory bodies in Nigeria. It also
witnessed a sharp drop in the value of stock in the Nigerian capital market. Moreover,
the choice of this period is based on the expected availability of data.
The year 2001 was included for the computation of the lagged year for 2002. We will
assume also that the accounting construct of reliability is perfectly captured by our
model of measurement error, although, other elements of reliability may be missing in
our model.
1.8 Operational Definition of Terms
Audit Market: This is a market for the provision of auditing services to companies
operating within specific industrial segments. For the purpose of this study, quoted
manufacturing companies in Nigeria is the audit market.

| 10
Audit Quality: A quality audit is audit conducted in accordance with applicable
auditing standards to provide reasonable assurance about whether the audited financial
statements are presented in accordance with applicable accounting principles and are
free of material misstatements. It is an audit that captures the technical competence of
and independence of the auditor as represented in his audit report.
Low balling: A process whereby an audit firms agree with the client upon a non cost-
covering audit fee in the first audit period hoping this would lead to future
rationalization effects.
Market Concentration: This is the extent or degree to which a relative small number
of audit firms (The Big4 Audit Firms) account for a relative large percentage of the
audit market.
The Big Four (Big4): For the purpose of this study, the audit markets are segmented
into two categories, the Big4 and non-Big4. The term ―Big4‖ dates from 2002 and
refers to the remaining four large international accounting firms after the collapse of
Arthur Andersen. The Big4 auditing firms represent the dominant group of large
providers of auditing services, that is, they dominate the industry in terms of revenues,
global reach, infrastructural investments and professional staff. In Nigeria, the Big4
accounting firms are Akintola Williams Deloitte; Ernst & Young; Pricewaterhouse
Coopers and KPMG Professional Services.
Non-Big Four: All other firms which have a national or local reputation are termed
non-Big4 audit firms. If a firm is not one of the ‗Big4‘ audit firms, then it is referred to
as a ‗non-Big4‘.

| 11
CHAPTER TWO
REVIEW OF RELATED LITERATURE
2.1 Introduction
This section presents a review of the conceptual, theoretical and the empirical
literature on the relationship between market concentration and auditors‘ attributes on
audit quality. The section is sub-divided into four. The first section discussed the
conceptual review, the second theoretical literature reviews, while the third section
focused on the empirical literature in developed countries, developing countries and in
Nigeria, and the fourth section provided the theoretical framework for the study.
2.2 Conceptual Review
The purpose of this subsection is to define and provide the basic understanding of
concepts relevant to the study.
.
2.2.2 The Audit Market
Audit competitionhas a number ofcharacteristics that differentiate it from other
services in the audit markets even though the conventional audit
marketreasonablystandardizes the quality that the auditeerequested. The products are
varied and more complex. Products, broadly comprising three parts: the technical
audit, value-added services on top of the audit itself and insurance against catastrophes
and reputational risk (Oxera, 2006).
The audit market is analyzed to givedeeper knowledge on the supply of audit services.
The supply side of audit has transformedextremely during the previous decade.
Therevolutionized audit service delivery was as a result ofcountlesscircumstances
arising from diverselocales. The profile scandals involving some blue-chip companies
(like Enron and Worldcom) called for more thorough audits (Asthana, Balse & Kim,
2009). Around 1980, Benston (1985) describes the accounting industry as largely
unimpeded by legal barriers. Another characteristic of the supply side of the audit
market is the economies of scale. Benston (1985) identifies two types of economies of
scale. One emanates from the size and geographic distribution of the corporate clients
that demand audits by public accountants and the second emanates from the technical

| 12
know-howneeded for specialized services (Maris, 2010). A solitarybig audit firm has a
comparative advantage over a group of firms by recommending standardized audit
procedures. The second economies of scale is the development and support of the
expertise required for specialized services, such as taxes, SEC reporting, regulatory
agency reporting, internal control systems and management services (Benston, 1985).
The supply side of audit is employed to give detailson changes in the audit market. The
supply side of audit comprises auditors, audit firms and events influencing the auditors
and the audit firms (Maris, 2010).
The Nigerian legal regulation mandateallfirms to have their final reports audited by an
independent auditor, while the firm management is saddled with the
responsibilityofthe preparation and presentation of the financial statements in line with
international best practices and in conformity with Nigerian laws and acts like,
provisions of the Companies and Allied Matters Act (CAMA), CAP C20, Laws of the
Federation of Nigeria 2004 and the Financial Reporting Council of Nigeria Act No 6,
2011 for such internal control as the directors determine necessary to enable the
preparation of financial statements that have nosignificant misstatements, as a result of
fraud or error.It is the sole responsibility of external auditorstoperform its audit
exercise in line withthe Generally Accepted Auditing Standards (GAAS) to validate
fairness and true presentation of the financial statements prepared by management. The
auditor, as a monitoring agent, strengthens the capital markets because investors and
other stakeholders‘ have sufficient confidence on the audited financial statements
especially those financial statements audited by reputable audit firms that stakeholders
perceive that they have brand names.
In additionto audit service, audit firms also engage in non-audit services like, tax and
advisory services for their clients. The independence rules enacted by the
USgovernment under Sarbanes-Oxley Act of 2002 restrain audit firm from serving in
the capacity of external auditor and at the same time rendering non-audit service for
the same client. The most apparent influence of the mergers thattook place among the
Big5 is the strict independence rules which apparently limits the auditors‘ choices of
large auditees with international coverage. The GAO report states that 88% of public
companies would not consider using a mid-tier (non-Big Four) firm for audit and

| 13
attestation services. For most of the large auditees, the utmost number of audit firms to
select from has decreased from eight in 1988 to four in 2002. In fact, for some
firmswith complex operations there are fewer alternatives to select from. Industry
specialization by the firms may further reduce the number of available alternatives
when companies voluntarily switch auditor or because of compulsory firm rotation.
This might be knotty for a large firm to find a firm with the requisite industry-specific
expertise and staff capacity.
2.2.3 Market Structures Measured by Auditor Concentration
Three main market structures were reviewed in this study.
2.2.3.1 Oligopoly
An oligopoly is a market with a few sellers. One of the features of an oligopoly as
stated by many economists is the capability to conspire. As defined by Sammelson and
Nordhous (2001), conspiracy is an agreement among different firms to corporate by
hiking prices, separating markets or otherwise preventing competition. One of the
ways to conspire is by consolidating or forming a cartel. Oligopoly theory proposes
that firms with higher concentration may have monopolistic power to raise price
because of absence of price competition (Weiss, 1989). A ‗stiff‘ oligopoly is described
as a market structure where the top four players control at least 60% of the market and
where other entities face momentousobstacles from entering the market. For the U.S.
market for example, the Big Four audit firms audit more than 78% of the public
companies, representing 99% of public annual sales (GAO, 2003). As prices fall and
revenues with them, the weakest members tend to go out of business or are acquired by
the stronger firms as postulated by Hermanson, Dykes & Turner (1987) competitive
model. According to the Cohen Commission, there is virtually no product
differentiation in the auditing profession. Thus, audit firms have to attempt to
distinguish their audit services on the basis of price (Simunic, 1980).
There are at least two severeimplications when audit firms reduce their prices for the
audit services. The first implication is that, as total revenues reduce as a result of the
price-cutting larger audit firms tend to attract clients of smaller audit firms to make lost
revenues. The smaller firms will lose many of their clients in this way and

| 14
consequently have to go out of the business or merge with one of the larger firms. The
second consequence is that the audit firms will focus more on provision of non-audit
serviceto their clients (Hermanson et al., 1987).
On the other hand, there are also articles that conclude that firms attract new customers
with product differentiation (Langendijk, 1994). All audit firms provide the same
services to their clients. The biggest difference is the quality of this service they
provide. In line with this assertion it is suggestedthat quality of audit services is related
to the size of the firms. Suffices to say that quality audit is synonymous with size
(Palmrose, 1986). For this reason, most stakeholders and management of large firm
prefer to engagethe services of the Big Four audit firm, with good reputationsfor their
audit exercise. For example, in perception of most 350 FTSE companies, the Big Four
are better placed to offer two key components of the audit product: value-added
services on top of the audit itself, to insure against calamity and reputation hazard
(Oxera, 2006). Meanwhile the rationalization of customers over competing suppliers
may result to a more efficient utilization of resources (Sullivan, 2002), the mergers
enabled the constituent merging firms to coalesce their staffexpertise and their
complementary locationswill allow the merged firms to compete more effectively for
large audit clients.
2.2.3.2 Perfect Competition
This is a market arrangement characterized by an absolutenonexistence of rivalry
among the individual firms. Thus, perfect competition in economic theory has a
meaning diametrically opposite to the everyday use of this term (Koutsoyiannis, 2003).
In practice, businessmen use the word competition as synonymous to rivalry. In
theory, perfect competition implies no rivalry among firms. A state of perfect
competition exists when the market price of any commodity is established by forces
beyond the control of the individual economic agents in the market, and it is as such a
given and unalterable constant (Ojo, 2002).
2.2.3.3 Monopoly
Monopoly is a market arrangement in which there is a single seller, there are no close
alternatives for the commodity it produces and there are obstacles to entry

| 15
(Koutsoyiannis, 2003).The extremes of monopolist represent 100% concentration in a
market, while various, undifferentiated suppliers portray a stumpydegree of
concentration. Economic theory states that customers have restricted preference and
this empowers the monopolist to place marginal revenues above marginal costs;
nonetheless, the many preferences obtainable in markets with low concentration push
marginal prices to marginal costs. In addition, concentration normally increases the
suppliers‘ incentive to differentiate via quality supplied to gain customers, and gives
customers bargaining power for lower prices and higher quality from suppliers.
However, thisdoes not actuallymeans that quality is synonymous with increase in
concentration (Dedman & Lennox, 2009).
2.2.4 Audit Quality
There is no agreed definition of audit quality that can be used as a parameter for
measuring actual performance (The Financial Reporting Council, 2006). An audit does
not involves those responsible of preparing financial information butengages a firms of
accountants (the auditor) to report in a way that as stipulated by the law.
An audit is therefore designedfor qualityassurance, it is meant to ascertain the accuracy
of the financial statements. Extent literaturedefines audit quality as degreeat which the
audit exercise stick to germane auditing principles and regulations (Cook, 1987).
However, a broadbody of literature also propose that audit quality is
normallyinterconnectedwith the proficiency and autonomy of the auditor in being able
to discover (competence) and then report (independence) any significanterrorin the
financial prepared by management (DeAngelo, 1981a). It is imperative to note that the
literature divides this definition into two discrete components - perceived audit quality
and actual audit quality. Actual audit quality refers to the ability of the auditor to both
discern and report any significantinherent error in the financial statements while
perceived audit quality refers to the standpoint and personal opinion of various
stakeholders towards the auditors‘ ability to discover and report such error (Dang,
2004). DeAngelo (1981) defines perceived audit quality as "the market-assessed
combinedlikelihood that a given auditor will both (a) discover a violationof GAAS in
the client's accounting system and (b) report the breach‖. The probability of
discovering a breach depends on the audit abilityof the audit firm and the audit

| 16
procedure. The likelihood of reporting the misstatement depends on the independence
of the audit firm.
Francis (2004) sees audit quality as ‗meeting or not meeting minimum legal and
professional requirements‘. Audit quality ranges from low audit quality at the one side
to very high audit quality at the other side. Abysmal audit quality means that there is
audit failure: the audited financial statements might misguide users of financials. This
can take in two situations: when the audit firm did not enforce the Generally Accepted
Accounting Principles and when the audit firm did not issue a qualified audit report
when needed. Quality audit is obtainedwhen the auditormeets all the audit objectives
and performs its works in line withthe rules and standards. Arens, Elder and Beasley,
(2010) opine that the purposeof audit can be transaction-related, balance-related or
presentation and disclosure-related these can further categorized into completeness,
accuracy, occurrence and classification. Regulations and standards are set by a
country‘s legal system in line with international best practices and international policy
setters like, International Standards on Auditing (ISA) and International Federation of
Accountants (IFAC).
DeAngelo‘s concept of audit quality does not in any way put into cognizance
institutional influence like, legal environment or government intervention, which can
adjust the responsibility of the auditor. The importance of auditing services
iswiderthanspecializedproficiency and independence. Francis (2004) criticized the
aforementioned definitions, given that many of the aspects that they attempt to define
are intrinsically unobservable. Users of financial statements will not be abletoknowif
the audit report has materialmisstatements or not. ICAEW (2010) further argues that
users will not be able to know if the accounts is an exactexpression of the firm‘s true
and fair state of affairs.Dang (2004) Also argues that theparties arenot giventhe
opportunity to see the audit evidence throughout the audit process and thus are not in
position to decide when audit is quality or not except when audit failure occurs. In the
absence of a direct measure of actual audit quality, a variety of different proxies have
been derived in an attempt to quantify the degree of actual audit quality. The U.K.‘s
Financial Reporting Council (FRC, 2006, p20) provided a key definition in the
expression:

| 17
“Understanding a quality audit involves obtaining sufficient and
appropriate audit evidence to support the conclusions on which the audit
report is based and making objective and appropriate audit judgments...
A quality audit (also) involves appropriate and complete reporting by the
auditors which enables the Audit Committee and the Board to properly
discharge their responsibilities.”
The Financial Reporting Council (FRC) (2008) states thataudit quality is dynamic; the
indicators and drivers of audit quality change over time. Therefore, the definition of
DeAngelo (1981) and Francis (2004) might not be all-embracing anymore. Though,
the Financial Reporting Council does not give a precise definition, yet, it gives five
main drivers of audit quality: (1) the audit firm‘s traditions; (2) the individual qualities
and expertise of staff and audit partners; (3) the audit process‘ efficiency; (4) the worth
and dependability of audit reporting; and (5) factors that affect audit quality beyond
the audit firm‘s control.Audit quality is anincessant construct that maps closely into
financial reporting quality. DeFond and Zhang (2013) defines higher audit quality as
greater guarantee that the financial statements truly represent germane information
about the firm‘s vitalfinancialconditionand firm‘sinherentfeatures and financial
reporting culture.It is vital to note that the standpoint from which audit quality is
defined depend to a large extent on whose eyes one looks through. Users, auditors,
regulators and society—all stakeholders in the financial reporting process—may have
very dissimilar views as on the components that make up quality audit.That will go
along way to affect the parameter formeasuring audit quality.
The user of financial reports may believe that high audit quality means the absence of
material misstatements. The auditor that performed the audit exercise may describe
quality audit as one that adequately complete all aspect of firm‘s audit methodology.
The audit firm canalso assess a quality audit as one which canprevail over any ligation
filed against in law court. Regulators can view a high quality audit as one that
conforms to professional standards. Finally, society canviewa quality audit as one that
will not cause economic problems for a firm or the capital market. To this end,

| 18
Knechel, Krishnan, Pevzner, Shefechik and Velury (2012) conclude that the
differencein audit quality views suggest different metrics.
2.2.5 Attributes of Audit Quality
Arrunada (2000) examines two vitalfeatures of audit quality: professional judgment
and the impact of independence on the third party and other clients. Professional
judgment is anessentialfeature of auditing quality because it,to a large extent, boosts
the informational worth of audit report for the third party. However, a situation where
auditor independence is impaired, auditors canchoose not to exertmore audit efforts
that can lead to discovery of financial misstatement which will only be exposed when
there is an audit failure.For that reason, some have drawn the conclusion that the
concept of audit quality, competence and independence, are interrelated.
Some required level of auditor independence differ with the situation at hand
althoughthe third parties and other classes of auditees‘ desire that their independence
remain constant at all times, if not, they are likelyto fire the auditor because they will
perceive the credibility of the audited financial reports is impaired. Whether auditors
give up their autonomy or not to a particular auditee is an experimentalmatter that
involves weighing thegain and reputational costs of a failed audit.Auditor
independence is however intangible and difficult to observe. Management can measure
audit independence on period basis by examining the audit plans, audit scope and
checking the performance of audit firm personnel (Simunic & Stein, 1987). The third
party users of financial statements(such as shareholders and creditors)do not have
enough opportunity to measure independence (Colbert & Murray, 1999). Indeed, only
the audit firm has enoughinformation about its ability and independence hence this
createsinformation asymmetry.The lacuna between perceived and actual independence
makes it possible for a firm to take advantageof perceived high independence that is
actually lower. There is a need for the formulation of a formidable measure for actual
audit quality. Extantliterature examinesdiverseproxies for measuring audit quality,
such as size, brand name, industry specialization, to mention but a few.

| 19
The IAASB provides a following graph to illustrate interactions of the elements of audit
quality.
Figure 2.1 : Elements of Audit Quality
Source: Federation of European Accountants (2016)
The IAASB‘s Framework promotes the key elements of audit quality which are
distinguished as follows:
a) Inputs covering such factors as values, ethics, and attitudes which are influenced
by the culture of a firm; also it covers knowledge, skills, and experience of
auditors as well as allocated time to complete the audit. These apply at both the
engagement and firm levels as well as at national level;
b) Process covering audit processes and quality control procedures and their effect
on audit quality;
c) Outputs including reports and information that are formally prepared for the
purposes of audit;

| 20
d) Key interactions within the Financial Reporting Supply Chain covering formal
and informal communication between stakeholders and the context which may
influence those interactions; and
e) Contextual Factors including a number of environmental factors that might affect
audit quality.
2.2.6 Measures of Audit Quality
In spite of the intricacy in measuring audit quality, several proxies for actual audit
quality have been developed which includes the probability of giving a going concern
opinion, auditor size, audit fees and earnings management correlated measures
(DeAngelo, 1981; Palmrose, 1986; DeFond & Subramanyam, 1998; Knechel and
Vanstraelen, 2007).
2.2.6.1 Propensity to Issue a Going Concern Opinion
One of the most common proxies for measuring audit quality is the propensity to issue
a going concern opinion (Geiger & Raghhunadan, 2002; Carey & Simnett, 2006;
Knechel & Vanstraelen, 2007). Knechel and Vanstraelen (2007), examines the
influence of auditor tenure on audit quality usinga sample of 618 audit reports of
private Belgian companies, between 1992 – 1996. Theirresult showsthat auditor tenure
has no influence on the auditor‘s choice to issue a going concern opinion.
In the same way, Jackson, Moldrich and Roebuck (2008), used the propensity to issue
a going concern opinion to measure audit quality when they examined the voluntary
switching patterns of publicly listed Australian firms between 1995-2003.The result
shows that auditor tenure has a positive impact on audit quality, the authors emphasize
the intrinsic weaknesses linked with this measure, considering that the chances of
issuing a going concern opinion is dependent on thefirm that is in needof such a
report.
2.2.6.2 Audit Firm Size
DeAngelo (1981)opines that audit firm size is positively associated with audit quality.
Auditors‘ size has turned out to be a broadly used measure of audit quality (Clarkson

| 21
& Simunic, 1994; Krishnan, 2003). DeAngelo (1981) argues that bigger audit firms
have larger client base and thus generate more revenue fromaudit, higher reputation to
keep, so, they have more inducementforprovision of high quality servicedelivery. This
assertion is corroborated by a large body of empirical studies, which alsorecognized
the presence of a positive association between auditor size and audit quality (Clarkson
& Simunic, 1994; Krishnan, 2003).
2.2.6.3 Audit Fees
Some other scholars (Palmrose, 1986; Copley, 1991; Hoitash-Markelevich &
Barragato, 2007) used different measure for measuring audit quality- audit fees.
Palmrose (1986) identifies a significant relationship between audit fees and auditor
size when looking at a Big Eight vs. non-Big Eight basis. Considering the
prevalentacceptability of auditor size as a measure for audit quality as discussed, audit
fees can also be seenas a suitable proxy for audit quality. Similarly, Copley (1991),
arguesthat having adopted audit fees as a measure for audit quality, that it had greater
power than a Big Eight vs. non-Big Eight dichotomy in elucidating changes in levels
of local government disclosure.
Audit fee is defined as the entiretyof audit cost. Dubaere (2008) posits that the best
way to find the market share is taking the amount of audit fees paid by the audit client.
The higher the audit revenuecollected by an audit firm, the larger the audit supplier.
The proxy for measuring market allocation is audit fees. Eshleman (2013) contends
that the best proxy for the size of the audit market is the sum of all audit fees charged
to Clients. Dubaere (2008) also contend that audit fee is the best proxy because it
makes concentration sensitive to population size. Audit fees can be described as the
total sumcollectedby the external auditor fromthe auditees for audit services rendered.
In Nigeria, this information is readily accessible, because all quotedfirms are
statutorily mandated to disclose the total auditor remuneration in the final financial
reports. Yuniariti (2011) opines that auditor remuneration is a vital variable that
influences the quality of audit. The author further explains that a higher auditor
remunerationimplies quality audit.

| 22
2.2.7 Factors Influencing Audit Quality
Audit quality can be influenced bya lot of factorsincluding, audit fees, non-audit fees,
audit tenure, audit firm alumni, and audit committees. Francis (2004) positsthatpositive
abnormal audit fee implies quality audit because high charges connotesthe engagement
proficiency and skilful human capital and exertion more audit effort. Frankel, Johnson
and Nelson (2002)positthat earnings soothingprevail infirmsthat pay comparatively
more non-audit fees to their audit firms. This is because providers of audit services and
non-audit services can create economic bonding between audit firm and auditee.
Thiswill invariably increase the probability of the audit firm yielding to the pressure
mounted on it by management, thereby compromising audit quality and giving the
client free hand to perpetrateearnings management (Simunic, 1984). On the contrary,
theauditor tends to acquaint himself with auditees‘ accounting system whenhe
performs non-audit services, which may have a positive effect on audit quality.
Audit tenure is also capable ofdiminishing audit qualitywhen auditors‘ tenure is
elongated –auditee has the same external auditor year in year and year out without
changing him. This can weakenauditors‘ independence, and makesthe auditor,a puppet
inthe hands of the auditee (Francis, 2004). Conversely, acquaintancewith auditee by
reason of long term relationship is sometimes advantageous than indiscriminate auditor
switching, because it takes time for the new auditor to be familiar with the accounting
system. Another vital determinant of audit quality is audit firm alumni. This implies
the presence of alumni of the audit firm who occupy management position at the audit
client. This may impair audit firm‘s objectivity and scepticism. Furthermore, the
alumni can easily mislead the auditor because they are familiar with the audit firm‘s
methodology (Francis, 2004). Finally,the presence of a formidable andindependent
audit committee and board of directors has a positive impact on audit quality because
it a crucial devicethat protect the credibility of the company‘s financial statements.
A business entity cannot exist in isolation from its environment. It inter-relates with its
environment, and its survival and strategic success depend on how well it responds to
the threats and opportunities that the environment provides (Woolf, 2014). From the
above, a number of environmental factors also influence the audit market with
corresponding impact on the audit quality as shown in the figure below.

| 23
Fig 2.2:Environmental influences,Audit Service Providersand Audit Quality
Source: Researcher (2016) adapted from Wolf (2014).
2.3 Theoretical Review
This sub – section presents the main theories generally used to explain and analyze the
effect of audit market concentration and auditors‘ attributes on audit quality as found
in literature. They include: theory of rational expectations, the agency theory and the
industrial organization theory.
2.3.1 Theory of Rational Expectations
Theodore Limperg of the University of Amsterdam in 1926 propounded a theory,
known as the Theory of Inspired Confidence, which ultimately transformed intotheory
of rational expectations. The theory asserts that the worth of the auditors‘ report is a
function of theauditor technical know-how, auditorindependence andhis professional
competence. Generally speaking, this theory is a non-static theory which presupposes
that as the business community evolves, soalso the demand itput on the auditors‘

| 24
function (Millichamp & Taylor, 2012). Limperg supposed that the work performed by
the auditor ought to be guided by the realisticexpectation of the users of auditreports
and the expectation should not be dashed by the auditor. In the other hand, auditors
should not give auditee unrealistic hope that cannot be attained.
Limperg‘s theory states that the usefulness of the auditor‘s opinion is based on the
general understanding the society has about the usefulness of audit.
Lawfulconcernsnotwithstanding, firm spend on audit because it is important that it
gives credibility to financial report, hence,investors and lenders can rely on such
information for decision making. If the audit report changed in anorder that
itsinformation is understood by certain sets in the society while it is vague to some
other set of users , society‘s confidence in the audit process declines as the social
usefulness of the audit decreases. Limperg stresses the social usefulness of auditors is
in meeting societal expectations for reliable financial information. The auditor must
meet the expectations of the rationally well knowledgeable layman but should not
create unrealistic expectations that cannot be justified by the work carried out. The
auditor thus has a broaderduty to society than amere a watchdog for the shareholders
(Millichamp & Taylor, 2012).
Limperg‘s Theory dwellsmajorly on demand and the supply of audit services.
According to Hayes, Dansses, Schilder and Wattage(2005) the demand for audit
services is the expressoutcome of the contribution of external stakeholders in the firm.
These stakeholders requireanswerability from the management, on return for their
investmentin the firm. With regard to the level of quality assurance that auditors
should offer, Limperg implement a normative approach: the auditor‘s workought to be
performed in such a way that the expectations of a pragmaticstakeholdersshould not
be dashed (Agostini & Favero, 2012). So, given the possibilities of audit technology,
the auditor should do everything to meet reasonable public expectations. Limperg
presented his theory of ‗inspired confidence‘ as a framework for developing auditing
norms rather than as a coherent collection of norms themselves. Hayes et al. (2005)
argue that since information provided by management might be biased, because of a
possible divergence between the interests of management and outside stakeholders, an
audit of this information is required. This theory is of immense importance to this

| 25
study in that it gives a theoretical underpinning for the perceived form of audit quality
– demand/market-gauged combined likelihood.
2.3.2 The Agency Theory
The Agency Theory is based on the relationship between the principal (owners) and
the agent (managers). The separation of ownership from management in modern
corporations provides the context for the function of the agency theory. Modern
organisations have extensivelystrewn ownership, in form of shareholders, who are not
usually involved in the management of their companies. In these situations an agent is
appointed to oversee the daily operations of the company. This separation of
ownership from control generates conflicts of interests between agents and principals,
which result in costs associated with resolving these conflicts (Jensen & Meckling,
1976; and Eisenhardt, 1989).
The most significantrationale behind agency theory is that the managers are usually
stimulated by their own gains and work to take advantage of their own personal
interests rather than having shareholders‘ interests and value maximisation at the back
of their minds. For instance, managers can be fascinated to buy cars and other
excessive items, since the cost is borne by the owners. Thus, the key dilemma
indicated by agency theory is ensuring that managers pursue the interests of
shareholders and not only their own interests. Eisenhardt (1989) elucidates that agency
problems start when ―The goals of the principal and agent conflict, and it is difficult
and costly for the principal to verify what the agent is actually doing‖. Controversy
occurs because principals are unable to monitor the performance of agents (Jensen &
Meckling 1976). Agency theory simply recognises that the proclivity of agents, in
this case, the directors or managers of the business, is to act rather more in their own
interests than those of their employers and the shareholders. The Institute of Chartered
Accountants in England and Wales, in November 2006 (as cited in Millichamp &
Taylor, 2008:1) put it this way:
In principle, the agency model assumes that no agents are
trustworthy and if they can make themselves richer at the
expense of their principals they will. The poor principal, so

| 26
the argument goes, has no alternative but to compensate
the agent well for their endeavours so that they will not be
tempted to go into business for themselves using the
principal’s assets to do so.
Watts and Zimmerman (1978) opine that audit developednot as a result of
governmental requirements, but rather for purpose of reducing the agency costs and
conflicts of interest among parties to the firm. According to Agency Theory, the agent
(management) carries out certain responsibilities for the principal (shareholders) by
reason of the terms of the financialindenture. The major means of monitoring
managers of a firm is by an audit of the financial statements by an independent
scrutinizer (audit firm). In order for this scrutinizingdevice to be effective, several
factor of the audit must be in place. First, the supervision must be doneby an
independent auditor, meaning that the auditors must not have any stake in the
company. Second, the principles for performing the audit must offer reasonable
convictionthat misstatements or fraud will be detected. Finally, the agent‘s accounting
practices and financial disclosures must be relevant and reliable (Culpan & Trussel,
2005).
Jensen & Meckling (1976) point out that auditing derive significance from its role in
reducing information asymmetries by giving external confirmation of the
dependability of a firm‘s financial statements. The efficacy of an external monitoring
determines the quality of audit. It is therefore, the nature of a high quality audit which
makes audit services valuable (Kilgore, 2007). Agency Theory can also be employed
to elucidate the supply side of the audit market. The contribution of an audit to their
parties is essentially determined by the likelihood that the auditor will detect errors in
the financial statements and the auditor‘s willingness to report these errors (e.g. by
qualifying the auditor‘s reports), even against the wish of the auditee (auditor
independence). Costsof reputation loss have been established in numerousresearch
works, which reveals that loss of reputation makes the audit to lose public confidence
and reduces patronage (Hayes, et al., 2005).

| 27
Based on this framework, auditing dilutes the adverse effects of the separation of
ownership and control (Jensen & Meckling, 1976). However, some of the main
features of the audit environment, such as competition and regulations, interfere in the
role of separation of ownership and control. Competition from the marketplace
restricts the auditor remuneration paid to audit firm by its clients. The marketalso
provides the audit firm with supplementary sources of demand that increase its threats
of resignation. Furthermore, some set of laws create the prerequisite for the purchase
of a minimum quantity of auditing, as suggested by Generally Accepted Auditing
Standards that prescribe minimum audit procedures (Antle & Demski 1991).
Therefore, competition and regulation may interrelate in determining the connection
between an audit firm and its role in diluting the unfavourableinfluence of the
separation of ownership and control – agency cost.
In addition, principals hire external auditors who, as agents under contract, are
expected to be independent of the agents who manage their company. The role of the
external auditor is to reduce agency costs by cutting information asymmetry in
financial reporting (Piot, 2001). Agency Theory recognises external auditing as the
most important monitoring mechanism because it controls conflicts of interest and
diminishes agency costs. Watts and Zimmerman (1983), confirm that high quality
external auditing will undermine the opportunistic behaviour cost (agency cost)
introduced by management. These monitors act on behalf of the shareholders. As a
result, high audit quality involving a specialised independent auditor can decrease
opportunities for managers to pursue self-interest at the expense of owners and, thus,
principals obtain more favourable returns. Therefore, the agency relationship provides
a vehicle to analyze the market concentration and audit quality of quoted
manufacturing companies in Nigeria in tandem with the auditors attributes.
2.3.3 The Industrial Organization Theory
The competitive circumstancesof the audit market and the inclinationin the direction
offirmdomination can be treated by severalmethodsemployed in industrial economies
(Hechmeister, 2001 as cited in Velte & Stiglbauer, 2012). Conventional industrial
economists assert that market configuration is an underlying determinant of market
demeanour. Market demeanour, in turn, decides economic recital, in particular,
ifsurplus profits are madeasresult of oligopolistic conspiracy or the application of

| 28
monopolisticsupremacy. It is assumed in this structure-conduct-performance paradigm,
in Bain (1956) to be a conventionalmodel, whichelucidates the reasonforintensifying
the degree of audit market concentration. In consonance with the degree of market
structure, industrial organization scrutinizes the amount of competitors who function in
the related market and the allocation of market shares. The configuration of a market
is the bedrockon which industrial organization theory is built. The theory point out the
impact of competitive verve on the industry, as well as, how the profit is decided by
them.
The Structure-Conduct-Performance paradigm (SCP) of the industrial organization
theory (Manson, 1939 as cited in Dubaere, 2008), asserts that the market
arrangementaffects the market behaviour and it is therefore the most essentialfactor
that determines economic recital. Market demeanourrelates to the behaviour of a firms
in setting prices and expressing thedegree of control they have over the market. In
market arrangement with high concentration, leading firms will increase their control
over the market and enable conspiracy. The perceived ascendancy of the large audit
firms has madesmaller firms to criticise large firms on the ground that give buyers of
audit the impression that quality is synonymous with size. Some schools of though
argue that marketsupremacy will lead to abuse of power as recommended by
Traditional Industrial Organizational Theory. Competitiveness and
influentialarrangement in audit market has supposedlychallenged TIOTand has led to
the emergence of new industrial organizational theory.
In currenttimes, industrial economists have shiftedtheir focusfrom mere looking at
causality result of concentration on audit quality but also the effect of auditor attribute
on audit quality. It is also contended by some scholar that at equilibrium, both
concentration and recital are mutuallydetermined by fundamental cost and demand
considerations.In view of this, theunfavourableimpact of intensify concentration is less
unambiguous (Farrell &Shapiro, 1990). Therecent industrial organisation economics
has brought tacticalquestions to the fore, stressing the significance of barriers to
market entry andtacticalconnections (Office of Fair Trading, 1999). According to
Shepherd (1997), the contemporary industrial organization literature categorizes
markets into six broad types. Three types of the market are synonymous with high
market influence and normally less effective competition: monopoly (one firm has
| 29
100%); prevailing firm (one firm has 40% to 99%); and tight oligopoly (four firms
have over 60%). The other three market types displayeffective competition: loose
oligopoly (four firms have less than 40%), monopolistic competition (many
competitors each with a slight degree of market power) and Wholesome competition
(many competitors, none of whom has market power).
The Industrial Organization Theory shows that concentration influences competition
and audit fees. This relationship makes many authors to agree that audit feecan be the
best measure for market share. Audit fees as been on front burner of accounting
research morein Europe in recent times than any other continent, especially in post-
Enron era (Choi & Zeghal, 1999). In US, Feldman (2006) reports thatthe demise
Andersen‘s intensified the already concentrated audit market and increased auditor
remuneration by 100%. The author further stresses that alteration in market
concentration isestablish to reasonably cause change in audit pricingimplying that the
composition-recital hypothesis is suitablefor the post-Andersen.He finally concluded
that another factor that led to hick audit prices in the US is SOX Act. (complying with
the SOX required higher costs and assumed higher audit risks).
Bandyopadhyay and Kao (2004) document that the smaller auditors have a bigger
relative fee increase, but their absolute fee is still lower than the Big-Four.Oxera
(2006) further contend that among the Big Four audit firms, there are price
discrepancies in the industries. Pong (1999) in line with previous studies asserts thatas
size, complexity and risk of the auditeeincreases, auditor remuneration goes up.
Bandyopadhyay and Kao (2004) also find a positive relation between concentration
and audit fees of non-Big four local offices after admitting ‗effect of economies of
scale‘. They did not find a relation with Big4 audit fees.
2.4 The Theoretical Framework The theoretical framework for this study is centred on the new Industrial Organization
Theory. It provides the main theoretical underpinning of the thesis and determines to a
great extent the approach to be used in this study. It influences the formulation of the
study hypotheses, informs the research methodology and statistical techniques used in
this study. New industrial economists are convinced that there is no single one-
direction relationship between concentration and performance, but a feedback between

| 30
those two parameters. The existing link between market structure and performance is
thought to be indirect because they are determined by the underlying cost and demand
parameters (Peel, 1997; Buijink, Maijoor & Meuwissen, 1998; Beattie, Goodacre, &
Fearnley, 2003;) - On the demand side, Beattie and Fearnley (1994) explained high
concentration by the voluntary realignments of clients who choose top auditors
because of their good reputation or because of the dissatisfaction about their old
auditor. The cost parameter and economies of scale motivate audit firms to be merged,
which increased concentration. This new industrial view implies that high
concentration does not necessarily lead to low competition (and to higher prices).
The effect of concentration on the market for audit services has been the subject of
intense research since Simunic‘s seminal 1980 paper. The evolution of the market in
the decades subsequent to this work has resulted in heavier concentration. In particular,
the collapse of Arthur Andersen in 2002 left just four of the largest auditors auditing
nearly all large public companies. Given the emphasis placed on the merits of effective
competition, the increasingly tight oligopoly in the audit service industry raises
concerns about non-competitive pricing behavior. While Traditional Industrial
Organization Theory (Bain, 1956), suggests that adverse effects would surface in
highly concentrated industries, more recent theories hypothesize that such industries
can still be very price competitive. In addition, empirical studies in the audit industry
have not reached consensus on whether or not the handful of dominant auditors are
able to exert market power.
2.5 Empirical Review
2.5.1 Determinants of Auditor Choice
The reason why a firmselects an auditor can be multifaceted and isprobable to be
differentfrom one firm to another and the various benefits accrued to acquisition of an
audit. Most works done in the pastconclude that some of the keyfactors that determine
auditors‘ choice are the size of auditor and its reputation. In Finland, Knecheel, Niemi
and Sudgren (2008) investigatethe factors that determine auditor choice in a small
company market. In a sample of 2015 mostly small and mid –size Finnish firms, the
authors employ three logistical regression models to ascertain thediverse auditor
selection decisions. The result of their study shows that amongst the smallest firms the

| 31
choice to engagethe services of chartered accountant auditor tells the level of
complexity in the firmproxied by size and degree of manpower. Their results
alsoshowsthat the choice between a first tier and second tier firm is connected to the
level of debt financing and concern about revealing proprietary information to
competitors and finally in the upper end of the market. The decision to hire a large
international firm relates to equity financing and competition in the industry.
Jiang (2010) studies how debt, as an opposingvariable to equity and corporate
governance of banks affect the choice of auditor by Japanese listed companies.
Employinginformation from Japanese listed companies in the Tokyo Stock Exchange
over the period of seven years (2002 – 2008), the author used discretional accruals as a
measure of audit quality. The results of his findings indicate the companies who
choose the same auditors as their main banks have higher audit quality than companies
who choose different auditors from their main banks.
In Belgium, Reheul, Caneghem and Verbruggen (2011) examine auditor preference in
Belgiannon-profit organizations from a behavioural viewpoint. The research
population comprises Belgian non-profit organization that had their financial
statements monitored by an external auditor during the period 2006 – 2008. The data
to conduct this study was collected from three sources; a national survey addressed to
1000 Belgian non-profit organizations, the non-profit organizations‘ financial
statements and archival research. Their resultshows that there is a segment of auditors
specialized in the non – profit sector and that this segment is well known to the non-
profit organization and the second finding is that non-profit granting high value to an
auditor‘s client orientation eventually choose an auditor with a higher level of sector
specialization.
Houge and Zjil (2011) examine the connection between country level government
quality and firms‘ preferencefor auditors. Using a cross sectional sample of 142, 193
firm year observations from 46 countries over the period of (1998 – 2007), the authors
regress the Big Four indicator variable on government and a number of control
variables. The researcher find that firms domiciled in strong government countries are
more likely to hire a Big Four auditor. They also find that the positive effect of home

| 32
country government quality value on the likelihood of choosing a ‗Big Four‘ auditor is
augmented by the IFRS adoption decision in these countries.
Zijl, Dunstan and Karim (2012) examine whether firms‘ auditor choice reflects the
strength of board ethics. Based on a sample of 132,853 firm year observations from
forty-six countries around the globe during the period between 1999-2007 and
controlling for a number of firm-and country-level factors, the authors find that firms
in countries where ―high board ethical values‖ prevail are more likely to hire a Big 4
auditor. They also find that the positive effect of home country board ethical values on
the likelihood of hiring a high-quality auditor is reinforced by the extent of the firm‘s
board size. These results establish an indirect link between board ethics and financial
reporting quality through the firms‘ choice of auditor.
In Jordan, At – Bawals (2012), identifies the factors which affect the choice of the
external auditor in Jordanian Banks from the perspective of the external auditors in
Jordan. The researcher used survey design. The findings of the study are: there are
causes related to the banks of Jordan to lead to change the external auditor and there
are reasons related to the audit office to change the external auditor.
Extant literature on auditing confirm that companies choose external auditors based on
auditors‘ characteristics such as audit fees, audit opinion, size of audit firm, locality
reputation and industry specialization. The client companies also select external
auditor based on their own situation such as agency costs and client company‘s own
demands. The economy, political and legal institutions are regional factors and they
also impact on the selection (Wang, 2013).
In US, Li (2013), examines the impact of auditor choice on debt pricing for listed
companies by using the samples of listed companies in U.S. In his study, Big Four
audit firms are constructed to be ―high – quality‖ auditors and consequently they
provide a higher perceived and actual audit quality. After controlling for other
determinants of debt pricing, the results do not significantly support hypothesis that
―the interest rate on debt capital for listed companies is negatively related to the choice
of high – quality, audit firm (Big 4 Firms).

| 33
In China, Wang (2013) examines the evidence on the choice of external audit firms by
Chinese listed companies. Nearly half of the listed companies are state – owned in
China. Moreover, China experienced the third merger wave of audit firms during 2005
– 2008. The author collected data on auditor choice, audit opinion and audit fees of
China‘s listed companies from 2008 to 2012. The study reveals that central state
owned enterprises and local state owned enterprises have the tendency to hire small
local auditors (Small auditors within the same region).
In Turkey, Karaibrahim (2013), investigates the association between corporate
governance and auditor choice by using a sample of 805 firm – year observations from
Istanbul Stock Exchange between the years 2005 – 2009. The study uses data from non
– financial firms listed in the Istanbul Stock Exchange. Firms in the financial sector
were excluded from the sample. The study uses an empirical model based on
multinomial logit and panel regression analysis of ‗Big – four‘ and audit firm industry
specialization. His findings show that firms‘ auditor choice in terms of ‗Big Four‘ and
audit industry specialization is affected by the firm level corporate governance
mechanisms of firms particularly board of directors‘ composition and ownership
structure.
2.5.2 Audit Firm Size and Audit Quality
Previous studies generally concur that the audit quality of large audit firms (offices)
with international brand names is better than that of small audit firms. There is now a
great deal of evidence that large audits firms provide higher quality audits and offer
greater credibility to clients‘ financial statements than small audit firms. The stock
market reacts more favourably when a company switches to a large auditor rather than
to a small auditor (Eichenseher, Hagigi & Shields, 1989; Nichols & Smith, 1983);
large audit firms give more accurate signals of financial distress in their audit opinions
(Lennox, 1999).
Two explanations for the positive correlation between auditor size and audit quality
have been provided by theoretical research - these relate to auditors‘ reputations and
the depth of auditors‘ pocket. It should be noted that even when the empirical evidence

| 34
shows very convincing evidence on the positive association between auditor size and
audit quality, literature is still unable to come to a conclusion whether the linkage is
causal from the auditor size to audit quality. An alternative explanation is endogeneity.
―Good‖ companies may more likely choose good (Big-four) auditors, in which case
selection bias may explain outcome not audit(or) quality. Only few studies have
examined endogeneity but in general, the results of these studies support the view that
there is a positive relationship between auditor size and audit quality (Hogan, 1997).
In US, DeAngelo (1981), points out that large audit firms provide more independent
audits in an attempt to protect their brand name reputation as they have ―more to lose‖
if their reputation is tarnished. She further argues that audit quality of larger audit
firms is also higher in general. DeAngelo‘s research focused on the idea that large
auditors issue more accurate reports because they have ―more to lose‖ from damage to
their reputations. An alternative to this reputation theory is the ―Deep Pockets Theory.‖
This theory asserts that auditors with more wealth at risk from litigation have more
incentive to issue accurate reports. DeAngelo (1981), has argued that large auditors
have more incentive to issue accurate reports because they have more valuable
reputations. When it becomes known that an auditor has negligently issued an
inaccurate report, the auditor could suffer a loss of rent through fewer clients or lower
fees. If large auditors have higher client-specific rents than small auditors, the loss of
rent is greater for a criticised large auditor than a criticised small auditor. Therefore,
large auditors should have more incentive to issue accurate reports. An alternative
hypothesis is that auditors with more wealth at risk from litigation have more incentive
to issue accurate reports (Dye, 1993). Since large auditors have deeper pockets, they
should have more incentive to be accurate. In the absence of a deep pockets effect, the
reputation hypothesis implies that large auditors are more accurate because they have
more incentive to avoid reputation damaging criticism. Therefore, one should find that
large auditors receive less criticism (and litigation) than small auditors and that
criticised auditors suffer reductions in demand compared to similar uncriticised
auditors. In contrast, the findings suggest that large auditors are more prone to
litigation and that criticised auditors do not suffer reductions in demand. This casts
significant doubt on the empirical validity of the reputation hypothesis.

| 35
In contrast, the deep pockets hypothesis is consistent with litigation being positively
correlated with auditor size. Intuitively, large auditors' deep pockets give them more
incentive to issue accurate reports and increase the likelihood of litigation, conditional
on an audit failure occurring. Moreover, the deep pockets hypothesis explains why
there is little evidence for reputation effects. The reputation hypothesis presumes that
there is some reliable signal of auditor accuracy, such as litigation. In the deep pockets
model, litigation is a poor signal of accuracy for two reasons.
First, auditors are only sued for issuing reports that are insufficiently conservative
(type I errors); they are never sued for being too conservative (type II
errors).Therefore, litigation does not signal auditors' type II error rates. Secondly, large
auditors are more accurate than small auditors but are also more likely to be sued when
a type I error occurs because they are more prone to deep pockets court actions.
Therefore, litigation is a poor signal of auditors' type I error rates (Lennox, 1999).
In Nigeria, Okolie, Izedonmi and Enofe (2013), examine the relationship between
audit quality and earnings management represented by companies discretionary
accruals manipulations. The authors extracted data from annual reports of 57 quoted
companies in Nigeria between 2006 and 2011. Audit Firm size audit fees, auditor
tenure and client importance served as audit quality proxies. The amount of
discretionary accruals (DAC) was used to measure earnings management. The results
of their findings showed that audit quality was significant and negatively related to
the amount of DAC of quoted companies in Nigeria. Okolie (2014), investigates total
levels of cash –based earnings management relative to the association between cash-
based earnings management earnings and audit firm size of companies in Nigeria.
First, the study measures the normal level of real activities by focusing on three
manipulation schemes namely; manipulation of sales, overproduction and reduction in
discretionary expenses. The normal levels of each types of real activities manipulation
were measured as the residual from relevant estimation models. Based on sample of
342 companies-year observations from the Nigerian Stock Exchange (NSE) market
and applying audit firm size as a measure comprehensive multivariate analysis were
conducted on archival data covering six years. The result shows that audit firm size

| 36
exerts significant negative relationship with cash-based earnings management of
quoted companies in Nigeria.
Ilaboya and Ohiokha (2014), examine the impact of audit firm characteristics on audit
quality in Nigeria. The authors proxy the dependent variable (audit quality) using the
usual dichotomous variable of 1 if the Big Four audit firm and 0 if otherwise. Data for
the study were sourced from the financial statements of 18 food and beverage
companies listed on the Nigerian Stock Exchange market within the period of six
years (2007 – 2012). The multivariate regression technique with emphasis Logit and
Probit method to estimate the model for the study. The study reveals that firm size
has the unlikelihood to increase audit quality; audit tenure and audit firm size has the
likelihood to reduce audit quality while auditor‘s independence increases audit
quality.
In US, Yu (2007) examines the effect of Big Four office size on audit quality. The
author conjuncture is tested for a sample of 6,568 firm – year observations for the
period 2003 to 2005 that are audited by 285 unique offices of the Big Four accounting
firms in the United States. The results are consistent with larger offices providing
higher auditing quality.
In Indonesia, Yuniarti (2011) examines the determinant factors of audit quality by
proposing the hypothesis that the audit firm size and audit fees have an effect on the
audit quality. She utilized a CPA firms in Bandung, West Java, Indonesia as her unit of
analysis. The author used descriptive verification research. She examines the
hypothesis through simultaneous test and individual test using the t-test and f-test. Her
empirical test results showed that the CPA firm size does not significantly affect the
audit quality in public accounting firms in Bandung.
Sawan and Alsaqqa (2013), examine the relation between size of audit firm and audit
quality in Libya. A questionnaire was used to collect data and semi – structured
interviews were conducted to confirm and support the questionnaire findings. The
result of their findings shows that Big Four firms are superior to their non-Big Four

| 37
counterparts in all of the reputation issues presented to them and that the size of the
audit firm is positively associated with audit quality.
2.5.3 Audit Market Concentration and Audit Quality
The evident on the relation between audit market concentration and audit quality is
mixed. Audit markets are measured by a Herfindahl index based on market shares of
all auditors, both the Big Four group and non-Big Four group. They examine the
association between city-level Herfindahl indices and two measures of earnings
quality: the absolute value of discretionary accruals and accrual estimation error
(Dechow & Dichev, 2002). Kallapur, Sankaraguruswamy & Zang (2010) examine the
relation between audit concentration and audit quality within city-specific US. Their
findings show that there is a positive relationship between audit market concentration
and audit quality.
In US, Boone et al. (2012), examine auditor‘s tolerance for earnings management in
different audit markets during 2003-2009. The authors used the Herfindahl index to
measure concentration and finds that clients of auditors located in more concentrated
audit markets are more likely to use income-increasing discretionary accruals to
achieve earnings benchmarks. This implies that higher audits market concentration
leads to lower quality; and hence, lower quality.
In an international study, Francis et al. (2013), find that, in countries where the
markets share is concentrated by just one or two of the Big-4 audit firms, Big-4 clients
have less conservative earnings, are less likely to report losses and generally record
higher accruals. Similar to the evidence in Boone et al. (2012), the evidence in Francis
et al. (2013) suggest that audit market concentration leads to lower audit quality.
In US, Newton et al. (2013), examine the relationship between auditor competition and
the likelihood of financial restatements that occur as a result of failures in the
application of Generally Accepted Accounting Principles (GAAP). The authors used
logistic regression to determine whether Metropolitan Statistically Areas (MSAs)-level
auditor competition affect the probability of client restatements. Their results show that

| 38
MSA-level audit market competition is positively associated with the presence of
restatements that arise from misapplication of GAAP.
In Nigeria, Adeyemi, Okpala and Dabor (2012), investigate the factors affecting audit
quality. The auditors used both primary and secondary data. The test of their study
revealed that among others, multiple directorships is the most significant effect on the
audit quality in Nigeria. Enofe, Mgbame, Aderin and Ehi-Oshio (2013) analyze the
determinants of audit quality in the Nigerian business environment. The researchers
empirically examine the relationship between audit quality engagement and the firm
related characteristics such as audit tenure, audit firm size, board independence and
ownership structure. A regression model was used to analyze the existence of
significant relationship between audit quality and the firm audit related characteristics.
Audit firm size, board independence and ownership structure were found to be
positively related to audit quality, however, only board independence exhibited a
significant relationship with audit quality, while audit tenure exhibited a negative
relationship with audit quality which was not significant.
2.5.3.1 Auditee Size
The most consistent result in all previous research has been that auditee size is by far
the most significant explanatory variable in determining audit fees (Chan, Ezzamel, &
Gwilliam, 1993). Prior research (Waresul & Moizer, 1996; Joshi & Al-Bastaki, 2000;
Simon, 1995; Taylor & Baker, 1981; Firth, 1985; Johnson, Walker & Westergaard,
1995; Low, Tan & Koh, 1990; Anderson & Zeghal, 1994; Langendijk, 1997; Sandra &
Patrick, 1996; Simon, Ramanan & Dugar, 1996; Simon, Teo & Trompeter, 1992),
provide consistent evidence that auditors of large sized companies have to spend a lot
of time in reviewing their auditees operations and performing detailed audit
procedures. Al-Harshani (2008: 687) hypothesised that ―the external audit firm is
expected to perform more audit work as the client size increases to ensure the
performance of an adequate amount of compliance and substantive testing. This
increase in audit effort is naturally expected to be associated with the increase in the
amount of audit fees‖

| 39
Auditee size is clearly an important determinant of audit fees since larger auditees will
require more audit effort (Simon, 1995). Joshi and Al-Bastaki (2000); Simon (1995);
Taylor and Baker (1981); Firth (1985); Johnson et al. (1995); Low et al. (1990);
Anderson and Zeghal (1994); Langendijk (1997); Sandra and Patrick (1996); Simon et
al. (1996); Simon et al. (1992), all provide evidence that size is best represented by
total assets. However, Gerrard, Houghton & Woodcliff (1994) outlined the fact that the
relationship between audit fees and client size is unlikely to be linear. In fact, the audit
fee literature is replete with evidence suggesting that external audit fees are likely to be
a decreasing function of size (Simunic, 1984; Francis and Stokes, 1986; Palmrose,
1986; Simon and Francis, 1988; Maher, Tiessen, Colson & Broman 1992). The main
reasons cited are three-fold:
the likelihood of economies of scale in the auditor‘s costs of doing work (Ho
and Ng, 1996);
the existence of more sophisticated internal control procedures in larger
companies which help to reduce audit work (Ahmed and Goyal, 2005); and
the use of audit sampling, as the sample size needed to achieve a required level
of control and precision increases at a decreasing rate (Low et al., 1990).
2.5.4.2 Auditee Risk
Chan et al. (1993) found that auditee risk was a significant factor in determining the
extent of necessary audit work and in consequence in determining the amount of audit
fee to be charged. This finding has been substantiated by Joshi and Al-Bastaki (2000);
Simon, (1995); Johnson et al. (1995); Anderson and Zeghal (1994); Langendijk
(1997); and Simon et al. (1996). Sandra and Patrick (1996), state that to measure
auditee risk is difficult, as no single proxy for auditee risk is considered appropriate.
The proportion of inventories and receivables to total assets has been used to measure
auditee risk (Simon, 1995; Firth, 1985; Johnson et al., 1995; Low et al., 1990;
Anderson and Zeghal, 1994; Langendijk, 1997; Simon et al., 1996; Simon et al.,
1992). Spathis (2003), argues that the ratio of inventories and receivables to total
assets captures risk or hard to audit assets that involve audit time and effort beyond
that of other assets. Sandra and Patrick (1996), used gearing and liquidity ratios to

| 40
measure auditee‘s risk. Waresul and Moizer (1996), also used the variable leverage,
which was defined as the ratio of total long-term debt to total assets as a measure of
risk. Joshi and Al-Bastaki, (2000) and Carson et al. (2004), also used the ratio of long-
term debt to total assets to measure auditee risk.
2.5.5 Audit Quality and Audit Fees
Companies can experience high start-up costs when hiring a new auditor. By working
on the same clients for a period of years, auditors can earn client-specific quasi-rents
that can serve as collateral against opportunistic behavior. Larger auditors have ―more
to lose‖ from supplying a lower-than promised level of audit quality and thus have a
higher perceived audit quality. DeAngelo (1981), argues that the difference in agency
costs indicate a differing ―level‖ of audit quality. A complex audit may be required for
a larger client or a client with more complicated accounting procedures, and thus
demand a certain type of auditor to deliver the services required.
There are several challenges to the correlation of audit fees and audit quality. First, the
total fees will clearly be larger for a larger firm because bigger clients will purchase
more services than smaller clients. Auditors may also be contracted to provide special
reports and/or opinions in addition to general external audits of financial statements.
Audit fees can vary with these additional reports (Palmrose, 1986). Audit fees can also
be affected by location and the coordination and complexity of an engagement. For
instance, if the client has multiple locations that require on-site visits, the audit fees
will be higher. In many cases, an auditor will rely on the client‘s inputs or utilize client
personnel for some audit tasks. The audit fees are reduced by any of these client
inputs. The client‘s industry can also affect audit fees by measuring differences in risk.
Audit fees are also generally higher among companies with public ownership.
Companies with public ownership are at a greater exposure to risk and require more
audit evidence. If there are any report modifications, the auditor is required to
accumulate a greater amount of evidence to achieve the same quality, which results in
more billable hours and higher audit fees (Arens & Loebbecke, 1997). All of these
variables can attribute to the difference in fees between a small and large firm; thus it
is difficult to determine if audit firms with higher fees provide higher audit quality.

| 41
2.6 Gaps in Literature
The gaps in the literature reviewed that motivated this study are hereunder highlighted.
Many past empirical studies investigate the implications of audit quality since the
seminal work of DeAngelo in 1981. Firstly, the majority of these investigations are
based on developed economies, while very little is empirically known about the
implications, relationships and impact of audit market concentration on audit quality in
emerging or transition economies like Nigeria. Secondly, the methodology for all these
aforementioned studies tend to be similar, with very few exceptional cases, in the type
of data set that is basically cross-sectional, hence, small sample sizes which hampers
valid holistic generalizations. The problem of heterogeneity is one of the several
problems that are associated with the cross sectional unit design that cannot be
addressed. Moreover, most of these researches continually include the financial sector,
despite the overwhelming importance of manufacturing sector to the economy. In
addition to the above, it is also observed that while the literature uses a large number
of proxies to measure audit quality, there is no consensus on which measures are best
and little guidance on how to evaluate them.
In addition to the above, there is no consensus in literature as regards the relation
between audit market concentration and audit quality. On the other hand, there is
evidence that concentration is associated with few restatements and increased earnings
quality (Kallapur, et al., 2010; Newton, et al., 2013; Dunn, et al., 2013) also, there is
an evidence that concentration is associated with higher tolerance for earnings
management (Boone, et al., 2012), removing a ban on competition among municipal
audits improved audit quality. In short, given the limited number of studies and the
mixed finding, this study believes additional evidence is needed to address whether
market concentration adversely affects audit quality by using quoted manufacturing
companies in Nigeria.
Some further critical points of the studies are that not in any case an appropriate
sample size and length of the evaluation period was selected. Exceptions are the
studies of Schaen/Maijoor(1997), in the Belgian audit market, Beattie/Fearnley (1994)
and Peel (1997) in the UK audit market, relating to the sample size and the studies of

| 42
Briston/Kedslie (1985), in the UK audit market and Maijoor et al. (1880-1990), in the
Dutch audit market, relating to the evaluation period. To this end, this study seeks to
cover a sample of sixty (60) firms for a period of 15 years (2002-2015) forming an
observation of 900 firm year observation in the Nigerian audit market, a relatively
appropriate sample size and length of evaluation period.
Finally, while there is no publicly known review in Nigerian literature, Yardley et al.
(1992) have analyzed the results of research on the US American audit market until the
end of 1980's. In contrast, Walker/Johnson (1996) presented selected concentration
studies on Australia, UK, New Zealand and Denmark. Insofar, an increasing need for
research accrues in light of the EC regulation draft of 2011, which relates the
increasing supplier concentration at the European audit market to a decrease in audit
quality. Herewith, an increase in audit market concentration with indispensable impact
on competitiveness of audit firms, the audit price levels alongside the independence of
auditor is said to be associated. Resulting from the mergers of audit firms and the
internationalization of accounting and auditing, the audit market concentration is
recognized as a global phenomenon (Gilling and Stanton, 1978). This study seeks to
validate empirically, using Nigerian (Country-specific) data the effect of audit market
concentration on audit quality.
2.7 Summary of Reviewed Literature
The table below shows the summary of some reviewed literature
Table 2.1: Summary of Reviewed Literature
S/N AUTHORS COUNTRY
OF STUDY SUMMARY OF REVIEW
GAPS
IDENTIFIED
1 Boone et al.
(2012),
US
clients of auditors located in more concentrated audit
markets are more likely to use income-increasing
discretionary accruals to achieve earnings
benchmarks. This implies that higher audits market
concentration leads to lower quality
They used only one
of the absolute
measures of market
concentration
2
Quick et al.,
1998), Gilling
and Stanton,
(1978)
relates the increasing supplier concentration at the
European audit market to a decrease in audit quality.
Herewith, an increase in supplier concentration with
essential impact on competitiveness of audit firms,
the amount of audit fees as well as auditor
independence is said to be associated. Resulting
from the mergers of audit firms and the
internationalization of accounting and auditing the
supplier concentration is recognized as a global
phenomenon
The measurement
of concentration
based on client
numbers is
insufficient and
only allowed as an
auxiliary variable.
Even though,
numerous
concentration

| 43
3
(Grothe,
2005),
Velte, and
Stiglbauer
(2012)
An enhanced research density is allocated to UK
with regard to EU-member states. A transnational
comparison of past studies is only possible within
the scope of diverging assessment periods and
objects as well as sample sizes, deviating legal
systems and national accounting and auditing
standards
measurements have
been conducted
recently from an
European point of
view, state of the
art reviews tend to
be found rarely,
which summarize
transnationally the
respective results of
empirical audit
research concerning
supplier
concentration.
4
Gul, Kim and
Qiu
China We also find that stock price synchronicity is higher
when the largest shareholder is government-related
than otherwise. We also find that the presence of
shares issued to foreign investors and the
appointment of high-quality auditors lead to a
decrease in synchronicity. Finally, we provide
evidence that our measure of stock price
synchronicity is associated with the amount of
earnings information reflected in stock returns.
5
Ross D. F.
(2005)
Uk This finding suggests that there was justification for
the exercise of the prosecutorial discretion of the
United States Department of Justice in seeking an
indictment of Arthur Andersen.
6 Schruff
(1973)
Germany
78.9% of the audit firms cover just 10% of the audit
market and the remaining 90% are served by 21.1%
of the audit firms. The high concentration of
providers is confirmed by the G-coefficient of 0.86.
They use the
relative market
concentration
measures – Lorenz
curve and G-
coefficients for the
exposition of the
concentration
development
7 Albach
(1976)
The increasing concentration is confirmed by the
Lorenz curve and the G-coefficient [rise from 0.625
(1951) to 0.67 (1971)].
8 Grothe (2005) proved an increasing concentration development on
the German audit market for 1996, 1998 and 2000 During the study
period no trend
towards
homogenization of
the market shares
within the
oligopoly group
during the study
period is evident.
9
Moeller/Hoell
bacher
(2009).
conduct concentration measurements through the use
of direct and indirect variables (audit fee, total
balance sheet, sales revenue and number of
mandates). Very high concentration measurement on
the German audit market can be derived for the last
reporting interval 2007 (CR4 = 0.97). Besides a
slight increase for the concentration ratio over time
can be determined.
10 Quick/Sattler
(2011)
examined the time period 2005-2007 and confirmed
the results of Moeller/Hoellbacher (2009).
11 Moizer/Turle
y (1989)
UK
Similar to the German audit market high rates for
supplier concentration are derived in UK. In contrast to the
German studies, the
use of the Lorenz
curve and G-
coefficients for the
exposition of the
concentration
development is
12 Beattie/Fearnl
ey (1994)
The market share for the Big Six is 72% in 1991.
The increasing concentration process over time
[from CR4 = 0.43 (1987) to 0.59 (1991)] can be
explained with mergers of larger audit firms and
auditor changes, whereby the large audit firms must
pass comparatively less mandates to smaller audit

| 44
firms. omitted. Rather, CR
and HHI are
focused.
13 Drew (2015)
They identified five factor groups that influences
auditor selection in typically comprehensive
proposal processes. These were: Relationships at the
start of the proposal process, Service design,
Capabilities and competences of the bidding firms,
Behavioural influences during the proposal process
and Final decision making. It also identifies
interrelationships between these factor groups.
14 Pong (1999)
only a slight increase in the concentration (from CR4
= 0.57 to 0.6) for 1991-95, since no mergers occur
between firms in this period. The UK audit market is
characterized as an oligopoly. If the UK audit
market is
characterized by an
oligopoly, what can
we say about the
Nigerian audit
market? 15
Abidin/Beatti
e/Goodacre
(2010)
determine for 1998-2003 an increasing concentration
over time based on audit fees [CR4 = 0.88 (1998)
and 0.96 (2003)], whereby the concentration ratio
remains approximately constant on the basis of audit
engagements. The omission of Arthur Andersen also
leads to a greater balancing of the market share
among the major audit firms.
16
Bernard A.(
2008)
It also reports on anticompetitive practices of major
accounting firms in the past and the need for
regulatory authorities to maintain constant vigilance
to avoid any recurrence. Finally, responding to the
question posed in the title, the paper concludes that
considering the industry's market dominance, the
relaxation of punitive actions by regulatory
authorities and the availability of some forms of
liability limitation, the audit industry may not be the
ideal candidate for weakest oligopoly in the world.
17
Gaynor,
Kelton,
Mercer and
Yohn
(2016)
Florida A primary goal of both financial reporting research
and audit research is to understand the determinants
of quality, and researchers in both areas have
identified a wide set of variables that enhance or
impair quality. In this paper, we define financial
reporting quality and audit quality and use a
person/task/environment framework to summarize
prior findings on the determinants of each. We use
this framework to discuss the links between the
financial reporting and audit academic literatures and
highlight the recursive relation between financial
reporting quality and audit quality. Our discussion
provides insights and suggestions on how financial
reporting and audit researchers can learn from each
other to improve our collective understanding of
financial reporting and audit quality. Using this
framework, we also identify opportunities for future
research.
18 Schaen/Maijo
or (1997)
Belgium
positive correlation between the concentration ratios
for the entire sample and the industry-specific
concentration ratios for 1987.
Regarding the
selection of
variables for the
measurement of the
market share a high
heterogeneity can
be observed,
although, in general
19 Willekens/Ak
hmadi (2003)
a positive correlation between the market share of
the audit firm and the audit fee is demonstrated,
whence the authors derive an increased price
competition.

| 45
the studies resort to
only one variable.
20 Maijoor et al.
(1995),
The
Netherlands
a significant increase in concentration can be
determined which is explained by growing
regulatory standards and mergers. However, until the
1960s, very low and constant concentration ratios
can be assessed for the Dutch audit market.
In a country
comparison with
Germany (CR4 =
0.16), the
concentration ratios
are significantly
higher (CR4 =
0.52). 21
Buijink/
Maijoor/
Meuwissen
(1998),
identify a substantial increase of provider
concentration between 1970-1973 and 1988-1991.
Analogous to other international comparative
studies, the mergers between audit firms is stated as
a reason for the results.
22 Christiansen/
Loft (1992) Scandinavia
significant increase in the concentration ratios [CR4
= 0.543 (1989) and 0.705 (1990)] on the Danish
audit market
23
Loft/Sjoefors
(1993) Scandinavia an essential increase in the concentration ratios for
1983 and 1990 (Denmark) resp. 1985 and 1990
(Sweden) can be stated as well, whereby a
dominance of two (Denmark) resp. three (Sweden)
audit firms exist.
The audit market is
classified as a
duopoly.
24
Cassell,
Giroux,
Myers, and
Omer (2012)
United
States
The results suggest that Big N auditors consider
client corporate governance mechanisms when
making client portfolio decisions. Specifically,
downward auditor-client realignments are more
likely for clients that score lower on our corporate
governance index.
25
Kalelkar and
Khan (2016)
United
States
Using a panel of U.S. firms between 2004 and 2013,
we find that firms that have a financial expert CEO
pay lower audit fees. Our results are robust to
various specifications, including firm-fixed effect
model and specifications that control for other CEO-
and Chief Financial Officer (CFO)-specific and audit
committee characteristics. Our findings thus add to
the literature on the advantages and disadvantages of
a functional background of top managers and how
this background can create value for a firm through
savings in audit fees
26
Hines, Masli,
Mauldin, and
Peters (2015)
United
States
we find that on average, the presence of RCs is
associated with higher audit fees. Our results are
robust to multiple specifications, including self-
selection and propensity score matched samples. For
a reduced sample of 458 firms that employ an RC we
also examine RC characteristics. We find RC
independence and audit committee overlaps are
associated with lower audit fees and RC size, relative
to board size, is associated with higher audit fees.
27 Eshleman
(2013)
North
Carolina
The evidence suggests that audit quality is higher in
markets where both audit market concentration and
audit market size are high.
28
Sanjay and
Srinivasan
(2010)
Indian Our results are robust to alternative concentration
and audit quality measures, and several sensitivity
tests attempting to rule out omitted variables
correlated with client firms‘ MSA location or
attributes of clients and auditors. Our results are also
robust to controls for endogeneity between audit
market concentration and audit quality. Our evidence
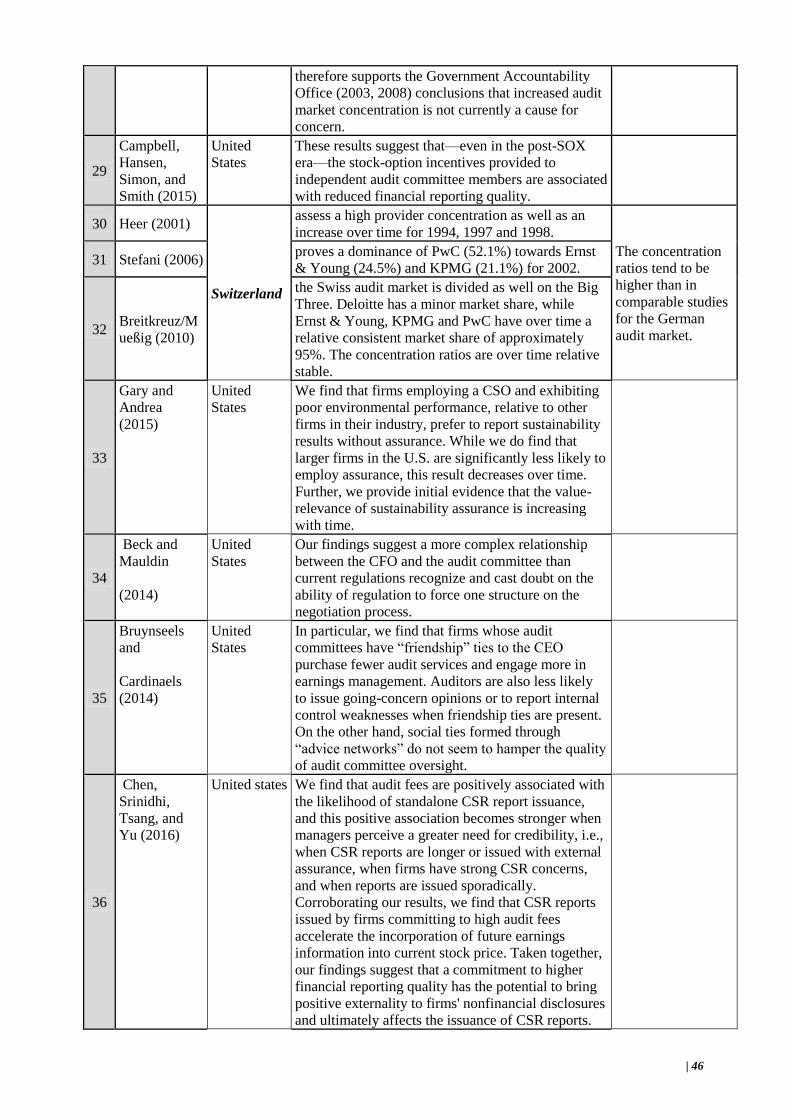
| 46
therefore supports the Government Accountability
Office (2003, 2008) conclusions that increased audit
market concentration is not currently a cause for
concern.
29
Campbell,
Hansen,
Simon, and
Smith (2015)
United
States
These results suggest that—even in the post-SOX
era—the stock-option incentives provided to
independent audit committee members are associated
with reduced financial reporting quality.
30 Heer (2001)
Switzerland
assess a high provider concentration as well as an
increase over time for 1994, 1997 and 1998.
The concentration
ratios tend to be
higher than in
comparable studies
for the German
audit market.
31 Stefani (2006) proves a dominance of PwC (52.1%) towards Ernst
& Young (24.5%) and KPMG (21.1%) for 2002.
32 Breitkreuz/M
ueßig (2010)
the Swiss audit market is divided as well on the Big
Three. Deloitte has a minor market share, while
Ernst & Young, KPMG and PwC have over time a
relative consistent market share of approximately
95%. The concentration ratios are over time relative
stable.
33
Gary and
Andrea
(2015)
United
States
We find that firms employing a CSO and exhibiting
poor environmental performance, relative to other
firms in their industry, prefer to report sustainability
results without assurance. While we do find that
larger firms in the U.S. are significantly less likely to
employ assurance, this result decreases over time.
Further, we provide initial evidence that the value-
relevance of sustainability assurance is increasing
with time.
34
Beck and
Mauldin
(2014)
United
States
Our findings suggest a more complex relationship
between the CFO and the audit committee than
current regulations recognize and cast doubt on the
ability of regulation to force one structure on the
negotiation process.
35
Bruynseels
and
Cardinaels
(2014)
United
States
In particular, we find that firms whose audit
committees have ―friendship‖ ties to the CEO
purchase fewer audit services and engage more in
earnings management. Auditors are also less likely
to issue going-concern opinions or to report internal
control weaknesses when friendship ties are present.
On the other hand, social ties formed through
―advice networks‖ do not seem to hamper the quality
of audit committee oversight.
36
Chen,
Srinidhi,
Tsang, and
Yu (2016)
United states We find that audit fees are positively associated with
the likelihood of standalone CSR report issuance,
and this positive association becomes stronger when
managers perceive a greater need for credibility, i.e.,
when CSR reports are longer or issued with external
assurance, when firms have strong CSR concerns,
and when reports are issued sporadically.
Corroborating our results, we find that CSR reports
issued by firms committing to high audit fees
accelerate the incorporation of future earnings
information into current stock price. Taken together,
our findings suggest that a commitment to higher
financial reporting quality has the potential to bring
positive externality to firms' nonfinancial disclosures
and ultimately affects the issuance of CSR reports.

| 47
37
Fonda,Wongb
and Lic
(1999)
China Our findings suggest that government regulation
alone is insufficient to create financial markets that
foster auditor independence
38
Gula, Kimb
andQiuc
(2010)
China We show that synchronicity is a concave function of
ownership by the largest shareholder with its
maximum at an approximate 50% level. Further, we
find that synchronicity is higher when the largest
shareholder is government related. We also find that
foreign ownership and auditor quality are inversely
associated with synchronicity. Finally, we show that
the amount of earnings information reflected in stock
returns is lower for firms with high synchronicity.
39 Sanja and
Mateja (2015) Croatia
The characteristics of the audit market in Croatia are
investigated, with a focus on market concentration
measured by standard measures such as the
Concentration rate, the Herfindahl-Hirschman Index
and the Gini coefficient. According to market shares
based on total clients‘ assets and revenues, the audit
market for listed companies is moderately to highly
concentrated, with a decrease in the five-year period
(2013 compared to 2008).
In contrast to the
German and UK
studies, they used
of the G-
coefficients, CR
and HHI with
moderately high
concentration.
40 Guo (2014) China
regional market concentration for domestic-listed
firms is positively related to audit fees and
negatively related to audit quality; in less
concentrated regional markets, abnormal audit fees
have a positive association with audit quality;
however, this association is weaker in highly
concentrated regional markets. As market
concentration increases, monopoly auditors can
extract abnormally high profits without additional
effort; thus, abnormal audit fees in concentrated
markets are more likely to capture the auditor-client
economic bonding that may impair audit quality.
41
Allen, Jere
and Taylora
(1995)
Australia The development of both brand name reputation and
industry specialization by Big 8 auditors is argued to
be costly and therefore to increase audit fees. For a
sample of 1484 Australian publicly listed companies
we estimate audit fee premia for Big 8 auditors. On
average, industry specialist Big 8 auditors earn a
34% premium over no specialist Big 8 auditors, and
the Big 8 brand name premium over non-Big 8
auditors averages around 30%. These results support
that industry expertise is a dimension of the demand
for higher quality Big 8 audits and a basis for within
Big 8 product differentiation.
42
Sirois and
Simunic
( 2011)
UK Based on this model, we predict how certain market
characteristics, namely market size and investor
protection regime, affect the structure of the auditing
industry and differences between Big 4 and non-Big
4 audit quality and fees. In the model, audit
technology plays a central role in determining the
level of audit quality and fees as Big 4 auditors
compete on both quality and price through fixed
investments in technology, the level of which is
increasing in both market size and the level of
investor protection. The model offers a coherent
explanation for the documented ‗Big 4/non-Big 4

| 48
dichotomy‘ and dual structure of the industry.
43
Jere , Michas
and Seavey (
2011)
Columbia Thus concentration within the Big 4 group appears to
be detrimental to audit quality in a country and of
legitimate concern to regulators and policymakers.
However, Big 4 dominance per se does not appear to
harm audit quality and is in fact associated with
higher earnings quality, after controlling for other
country characteristics that potentially affect
earnings quality.
44
Joanna L. Ho
and Fei Kang
(2013)
Our results also show that family firms, on average,
incur lower audit fees than non-family firms, which
is driven by family firms' lower demand for external
auditing services and auditors' perceived lower audit
risk for family firms. Our additional analysis
indicates that the tendency of family firms to hire
non-top-tier auditors and to pay lower audit fees is
stronger when family owners actively monitor their
45
Eshleman,
Lawson
(2016)
United
States
We find that audit market concentration is associated
with significantly higher audit fees, consistent with
the concerns of regulators and managers. We also
find that increases in audit market concentration are
associated with fewer initial engagement fee
discounts (i.e., reduced lowballing), particularly for
non-Big 4 clients. We reconcile our findings with
those of prior research and find that our divergent
findings are attributable to controls for MSA fixed
effects. In supplemental analyses, we find that audit
market concentration is associated with higher audit
quality. We also find that concentration is associated
with higher audit quality for first-year engagements,
but only if the auditor does not lowball on the
engagement. Our results are relevant to the ongoing
debate regarding the consequences of increased
concentration within the U.S. audit market (GAO
2003, 2008).
Audit Market
Structure and Audit
Pricing
46
Leuphana and
Stiglbauer
(2012)
UK Results show that EC reforms cannot clearly be
related to increase audit quality but increasing
transaction costs.
Audit Market
Concentration and
Its Influence on
Audit Quality
47
Boone,
Khurana and
Raman (2012)
United
States
Our findings hold after accounting for the effects of
concentration on audit fees, the potential
endogeneity of concentration, and other variables
identified in the prior literature to affect audit
quality. A separate analysis of the earnings
distributions for all companies covered by IBES
during 2003-09 also suggests that higher
concentration increases clients‘ propensity to just
beat (rather than just miss) the analysts‘ earnings
forecast. Collectively, our findings are consistent
with the misgivings expressed by policy makers, i.e.,
that oligopolistic dominance of the audit market by
the Big 4 fosters complacency among auditors
resulting in a more lenient and less skeptical
approach to audits and lowers service quality.
Audit Market
Concentration and
Auditor Tolerance
for Earnings
Management

| 49
48
Azibi and
Velte(2015)
Tunisia The link between joint audits and audit quality is still
controversial. Then, the main results of empirical
research on joint audit are focused. A clear positive
link between joint audits and audit quality cannot be
found, but there is strong evidence for higher audit
costs which could lead to an increased price
competition. Insofar, a lower audit market
concentration by joint audits is not generally
connected with higher audit quality, because there
are many corporate governance interactions. To test
this hypothesis, we use a sample of 306 Germany
and French companies between 2008 and 2012.
Empirical results demonstrate unclear effect of the
joint audit on audit quality in these two countries.
Are Joint Audits a
Proper Instrument
for Increased Audit
Quality?
49
Aron T.
(2008)
UK In the absence of scale economies I show that the
presence of moral hazard results in a convergence
towards market concentration regardless of the
intensity of competition. On the other hand, the
dynamics leading to market concentration reduces
moral hazard even when prices do not increase with
concentration (e.g. Bertrand competition). Therefore,
the main policy implication is that market
concentration can be effective against moral hazard
and as such, welfare increasing. The model is
suitable to explain the puzzling market
transformation of industries such as banking, health
care and audit.
The Great Industry
Gamble: Market
Structure Dynamics
with Moral Hazard
50
Joha and
Günther
(2014)
Germany We observe a fee premium for BIG-4 auditors in
both market segments when applying an aggregated
BIG-4 variable as well as looking at these audit firms
separately. This suggests product differentiation as
the root for higher prices and competitive audit
pricing refuting regulators' concerns of monopolistic
pricing behavior due to a high market concentration.
This is supported by a Fee Cutting effect.
Furthermore, our results demonstrate that similar to
listed firms audit pricing for private firms is
influenced by client's size, complexity and risk
factors.
The Big-4 Premium
in the German
Audit Market for
Listed and Private
Firms
51
Dirk and Zein
(2014)
Germany The result could be of special interest for standard
setters, e.g. the European Commission, which is
currently revising EU audit regulation. Further, the
analysis may serve as an instrument to analyze
economic consequences of future changes of
regulation.
Audit Market
Segmentation –The
Impact of Mid-Tier
Firms on
Competition
52
Marianne O.
(2009)
United
States
In arriving at the conclusion that the benefits
associated with the external investor model outweigh
the possible risks it generates, the paper not only
considers theories on managerial behaviour and
ownership structure, but also gives attention to the
safeguards for audit independence as listed under the
2002 Statutory Auditors‘ Independence in the EU: A
Set of Fundamental Principles, and the 2006
Statutory Audit Directive. It will also consider why,
in view of the limitations and restrictions placed on
audit firms, with particular reference to the Sarbanes
Oxley Act of 2002, actions aimed at encouraging
Regulating the
International Audit
Market and the
Removal of
Barriers to Entry:
The Provision of
Non Audit Services
by Audit Firms and
the 2006 Statutory
Audit Directive

| 50
new market players at EU level, whilst ensuring that
auditors‘ independence and audit quality are not
compromised, would also require a consideration of
an international dimension of issues involved in
lowering barriers to entry.
53
Bleibtreu and
Stefani (2015)
Germany Our results indicate that prohibiting general non-
audit services that actually do not impair
independence can indeed further in-crease
concentration. Moreover, a ban on these services can
even decrease the quality of the audited financial
statements because the average probability that
managers will misreport in-creases. Our model
predicts the opposite effects resulting from a
prohibition on audit-related non-audit services. We
find that the effects of prohibiting the supply of non-
audit services depend crucially on the time at which
the non-audit fees are negotiated.
The
Interdependence
between the
Structure of the
Audit Market and
the Quality of
Audited Financial
Statements: The
Case of Non-Audit
Services
54
Ettredge,
Sherwood and
Sun (2016)
United
States
We find that higher levels of OCR are associated
with smaller audit fee levels paid by NAFs in the
shock year of 2004, and smaller fee increases from
2003 to 2004. HERF does not perform as a (reverse)
proxy for competition in either year. We then
investigate the associations of OCR and HERF with
fee levels in three more recent years, 2010-2012. We
again find that OCR outperforms HERF. In
additional analyses we investigate the associations of
OCR and HERF with three measures of AQ in the
2010-2012 period: absolute discretionary accruals,
misstatements of audited data, and auditors‘
propensity to issue first-time going concern modified
opinions to potentially distressed clients. We find
some evidence that competition, measured as OCR
but not as HERF, is associated with improved AQ
(i.e. reduced likelihood of misstatements and higher
likelihood of going concern opinions). In summary,
OCR appears to be an effective proxy for
competition in the audit fees context. It also is
significantly associated with AQ metrics although to
a lesser extent. We find no evidence that HERF
serves as a (reverse) proxy for competition.
Metro Audit
Market
Competition, Audit
Fees and Audit
Quality
55 Romero et al.
(1995) Spain
The first and only country-specific study determine a
clear increase in the concentration for 250 companies
in the period 1991-93. Since the implementation of
the audit requirements, the dominance of the Big Six
can be assessed. Their market share grows between
the years 1991-93 from 83% to 95%.
Is there any
country-specific
study in Nigeria?
Source: Researcher’s Computation (2016)

| 51
CHAPTER THREE
RESEARCH METHODOLOGY
3.1 Introduction
This section focuses on the method adopted in the process of carrying out this study. In
Section 3.1, research design is discussed. Section 3.2 discusses population, sample size and
sample technique, Section 3.3 describes sources of data, Section 3.4 describes the model
specification, while Section 3.5 discusses measurement of variables of the study.
3.2 Research Design
The research design adopted for this study is the ex post facto design being a suitable
technique for time order assessment of variables, which in this case measures the effect of
independent variables (audit market concentration and auditor attributes) on a given
dependent variable (audit quality) of 52 quoted manufacturing firms over a period of 15 years
(from 2001 – 2015), 2001 been the lagged year and 2002, the base year. Moreover, the
suitability of this choice was based on the fact that the design allows researchers to establish
the time sequence of the variables on the basis of logical considerations. This is appropriate
for a developing economy like Nigeria, and also, it is adequate enough to validly capture any
behavioral change contrary to a cross-sectional design method usually associated with most
studies in this area both in developed and developing economies. The year 2002 was chosen
as the base year because it was the year the number of five large international auditing firms
was reduced to four, after the demise of Arthur Andersen in 2002, following the involvement
in Enron scandal. The period witnessed different reported scandals involving accountants,
auditors and regulatory bodies in Nigeria. It also witnessed a sharp drop in the value of stock
in the Nigerian capital market. Furthermore, the expected availability of data contributed to
the choice of this period.

| 52
3.3 Population of the Study
The population of the study comprises all sixty (60) manufacturing companies (which include
agriculture, consumer goods, health care and industrial goods) quoted on Nigerian Stock
Exchange as at 31st December, 2015 (2011 – 2015). However, resulting from the practical
difficulties of accessing the population, a subset regarded as a sample was utilized.
3.4 Sampling and Sampling Technique
We employed the simple random sampling techniqueto give all members of the population
equal opportunity to be selected and thereafter appliedthe Yamen formula to calculatethe
sample.The technique is well suited for determining the sample as it provides an equal
probability of selection and as such minimizes selection bias. Year 2001 was used as the
lagged year foor the computation of the lagged period while purposive sampling technique
was used to select the 52 firms, excluding firms with incomplete data for the study. The
sample size is 52 when the aforementioned formular is applied.
The Taro Yamen formula employed is as shown below:
n = 𝑵
𝟏 + 𝑵 𝒆 𝟐 3.1
where,
n = Sample Size = ?
N = Population Size = 60
e = error margin = 5 % or 0.05
Therefore, the sample size,
n = 𝟔𝟎
𝟏 + 𝟔𝟎 𝟎.𝟎𝟓 𝟐
n = 𝟔𝟎
𝟏 + 𝟔𝟎 𝟎.𝟎𝟎𝟐𝟓
n = 𝟔𝟎
𝟏 + 𝟔𝟎 𝟎.𝟎𝟎𝟐𝟓
n = 𝟔𝟎
𝟏 + 𝟎.𝟏𝟓𝟎𝟎
n = 𝟔𝟎
𝟏.𝟏𝟓𝟎𝟎
n = 𝟓𝟐. 𝟏𝟕𝟒 ≈ 52 firms

| 53
3.5 Sources of Data
The data for this study was sourced from secondary sources. The data covered audit-related –
dataextracted from the annual reports and accounts of the selected fifty-two (52)
manufacturing companies in Nigeria covering a period of 15 years (2001 – 2015) amounting
to 780 firm-year observation.
3.6 Method of Data Analysis
The study utilized the panelled ordinary least squares regression analysis as the data analysis
method having presented the descriptive statistics, pearson correlation analysis and the
variance inflation factor (VIF) analysis with other diagnostic tests.
3.7 Model Specification
The models employed in this study were adapted from the studies of Le Vourc’h and
Morand (2011), and Sanja, and Mateja (2015) with some modifications and country-
specific variables to align with our objectives.
Model One
This model relates audit quality with audit market concentration
AQ = f (AAMC, RAMC, AUFEE,, RISK) … … … … 3.1
where:
AQ = Audit Quality
AAMC = Absolute Audit Market Concentration
RAMC = Relative Audit Market Concentration
AUFEE = Auditors’ Remuneration
RISK = Auditee Firms Risk
This equation can be expressed in econometric form as follows:
AQit = α0 +β1 CR4it + β2 HHIit + t + β3AUFEEit +
+ β4RISKit + it … … … … 3.2
where:
AQit = Audit Quality for year it
CR4it = Concentration Ratio for Big 4 in the year it
HHIit = Hirschman-Herfindahl Index for the year it
AUFEEit = Audit remuneration for the year it
RISKit = Auditee Firms Risk for year it
i = Entity of each quoted manufacturing company at time (t)
t = Time (per year) (i.e. 2001 – 2015)
it = Stochastic term for the year it
α0 = Regression Constant
β0, ..., β4> 0 Apriori expectation

| 54
This model will be used to validate empirically the research objectives 1 and 2
Model Two
The model tends to show the relationship between audit quality and auditor attributes
AQ = f (AUDINP, AUDTEN, AUDFZ, SIZE, FISY) … … … 3.3
where:
AQ = Audit Quality
AUDINP = Audit Independence
AUDTEN = Audit Tenure
AUDFZ = Audit firm Size
SIZE = Auditee Firm Size
FISY = Auditee Fiscal Year End Date
This function is transformed to equation as follows:
AQit = β0 + α1 AUDINPit + α2 AUDTENit + α3 AUDFZit +
α4SIZEit + α5 FISYit + it … … … … (iib)
where:
AQit = Audit Quality
AUDINPit = Audit Independence
AUDTENit = Audit Tenure
AUDFZit = Audit firm Size
SIZEit = Auditee Firm Size
FISYit = Auditee Fiscal Year End Date
i = Entity of each quoted manufacturing company at time (t)
t = Time (per year) (i.e. 2001 – 2015)
it = Stochastic term for the year it
β0 = Regression Constant
α0, ..., α5> 0 Apriori expectation

| 55
3.8 Measurement of Variables
3.8.1 Dependent Variable
The dependent variable for this study is audit quality. The discretionary accruals (DA) shall be
used as a proxy to measure audit quality because it captures the quality of accounting
information in a more general sense, whereas other measures such as audit opinion or
accounting fraud are only related to a few extreme situations (Myers et al., 2003).
Discretionary accruals as a measure of audit quality are the ‗most commonly used‘ measure
for audit quality (Beattie, 2012). The measure of audit quality to be used is the modified Jones
model (Dechow, Sloan and Sweeney, 1995), which is one of the models used to determine
quality of audit. Accounting fundamentals are used to separate accruals into non-discretionary
(normal) and discretionary (abnormal) components. The absolute value of the abnormal
component determines the quality of audit. The larger the absolute value of discretionary
accrual, the lower the quality of audit (Dechow et al., 1995). (See Appendix B)
3.8.2 Independent Variables
The explanatory variables for this study include audit market concentration
(concentrationratio(CR) and Hirschman-Herfindahl Index {See Appendix}) as well as the
auditors‘ attributes (auditors‘ independence (AUDINP), audit tenure (AUTEN) and audit
firms‘ size (AUDFZ)).
3.8.3 Control Variables
The control variables for this study include audit fee (ADFEE), auditees‘ firm size (SIZE),
profitability of the reporting entity (), the risk (RISK) and the auditee fiscal year-end and
date (Y_END).
For clarity, a summary of these variables, their measurements and their expected sign based
on apriori expectations are as tabulated in Table 3.1 below:

| 56
Table 3.1: Summary of Variables
Variable Variable
Label Measurement Source
Expected sign
Dependent
Audit Quality AQ Discretionary Accruals Le Vourc’h, and Morand (2011),
Independent
Absolute Audit Market Concentration
AAMC Hirschman-Herfindahl Index (HHI)
Sanja, and Mateja (2015), Quick and Sattler, 2011; Velte and Stiglbauer, 2012
-
Relative Audit Market Concentration
RAMC Concentration ratio (CR4)
Quick and Sattler, 2011; Sanja, and Mateja (2015); Velte and Stiglbauer, 2012
-
Auditors’ Independence
AUDINP 1 if audit fee is above industrial average and zero if other wise
DeAngelo (1981); Ferguson, Pinnuck, and Skinner, (2013),
+
Auditors’ Tenure AUTEN Number of years for the current audit engagement
Thinggaard and Kiertzner (2008),
-
Audit Firm Size AUDFZ Big 4 or Non Big 4 Firth (1993), Caneghem (2009).
+
Control
Audit price ADFEE Total auditor’ remuneration
Simunic (1980), Soltani and Rekik (2011)
-
Auditees’ Firm size SIZE Natural log of total assets
Gonthier- Besacier and Schatt, (2007)
+
Profitability Return on equity Kajola (2010)
Risk RISK Total Liabilities / Total Assets
Velte and Stiglbauer, 2012; DeAngelo (1981);
-
Auditee Fiscal Year-end Date
Y_END Dummy value of “1”if Fiscal Year-end Date is December otherwise “0”
Soltani and Rekik (2011) -
Source: Researcher’s Compilation (2016)

| 57
CHAPTER FOUR
PRESENTATION AND ANALYSIS OF DATA
4.1 Introduction
This chapter presents and analyzes the data gathered in the pursuit of the objectives of this
study and as a basis for accepting or rejecting the hypotheses.Firstly, data for the study will be
described, that is, mean, median mode and standard deviation for each of the variables used
for the study. The description also includes the Jarque-Bera test for the possibility of outlier or
bias selection. Secondly, the regression results for the two models will be analysed,interpreted
and presented. For robustness, we used both discretionary accruals as proxy for audit quality
and post-test to ensure model specification were performed. Finally, the results were
discussed in relation with other studies.
4.2.1 Data Presentation
Data for discretionary accruals (DAC), Audit firm size (AUDFZ), audit tenure (AUTEN),
firm size (FSIZE), auditor‘s independence (AUDIND), risk, (RISK), Hirschman Herfindahl
Index (HHI), concentration ratio (CR4), audit fee (ADFEE), firm size (SIZE) and non-audit
services were obtained from the secondary sources and computed as presented in appendix B

| 58
4.2.2 Descriptive Statistics
Table 4.1 Descriptive Statistics
DAC AUDFZ AUTEN FSIZE FISY AUDIND
Mean 7.350720 0.662806 6.225225 15.55988 0.680824 3.686176
Median 7.332971 1.000000 5.000000 15.29000 1.000000 3.720159
Maximum 11.49805 1.000000 15.00000 23.56000 1.000000 5.281033
Minimum 4.009278 0.000000 1.000000 11.14000 0.000000 2.204120
Std. Dev. 1.138461 0.604595 4.077153 2.104338 0.466458 0.541230
Skewness 0.386167 6.095772 0.535509 0.682706 -0.775805 -0.038723
Kurtosis 3.620168 1.108381 2.205708 3.789285 1.601874 2.579848
Jarque-Bera 31.76334 381303.0 57.56200 80.52706 141.2279 5.909274
Probability 0.000000 0.000000 0.000000 0.000000 0.000000 0.005298
RISK HHI CR4 NAS ADFEE
Mean 0.723876 1601.918 0.640530 0.502584 10233.60
Median 0.570000 1603.000 0.630000 1.000000 5250.000
Maximum 16.57000 2224.000 0.690000 1.000000 191000.0
Minimum -4.150000 1002.000 0.580000 0.000000 160.0000
Std. Dev. 1.317917 323.8828 0.031242 0.500317 17391.65
Skewness 8.223116 0.058536 -0.261338 -0.010336 5.964934
Kurtosis 84.73349 2.441269 2.006918 1.000107 49.95865
Jarque-Bera 224164.6 10.50982 40.61568 129.0000 75704.84
Probability 0.000000 0.005222 0.000000 0.000000 0.000000
Observations 780 780 780 780 780
Source: Researcher’s computation (2016), using E-views 7.0
Table 4.1 presents the results for the descriptive statistics for the variables. As observed,
discretionary accruals (DAC) has a mean value of 7.35 while it has maximum and minimum
values of 11.4 and 4.0 respectively. The standard deviation reported relatively small values
1.13 shows that DAC is clustered around the mean. Since the mean is relatively greater than
(to the right of) the median DAC is slightly skewed to the right. The kurtosis is a
measurement of the ends of a distribution and is used to dictate the size of the tails of a data
distribution. The coefficient value of kurtosis of 3.6 > 3 implies a fat tails and it is a
leptokurtic distributions . The Jacque-Bera value of 31.7 and the associated p-value of 0.00
indicate that the data is normal(p>0) and that outliers or selection bias that the generalization
from the study are unlikely. Audit firm has (AUDFZ) a mean value of 0.66 while it has
maximum and minimum values of 1 and 0 respectively. The standard deviation reported

| 59
relatively small values 0.66 implies that there is clustering around the mean. Since the mean
(0.66<1) is less than the median it indicates AUDFZ is skewed to the left. The coefficient
value of kurtosis of 0.38 < 3 implies a platykurtic distribution with toped s tail . The Jacque-
Bera value of 381303 and the associated p-value of 0.00 indicate that the data is normal (p>0)
and that outliers or selection bias that the generalization from the study are unlikely
Auditor tenure(AUTEN) has a mean value of 6.5 while it has maximum and minimum values
of 15 and 1. It implies that auditors tenure spend a maximum of 15years. The standard
deviation reported relatively small values 4.0 shows that AUTEN is clustered around the
mean. Since the mean is relatively greater than (6.2>5.0) the median it indicates that it
slightly skewed to the right. The variable is positively skewed and the positive value of the
kurtosis signifies that the regression variable is peaked than the Gausian distribution. Kurtosis
value less than 3 implies platykurtic distribution .The Jarque –Bera value of 57.5 and p-
values (0.00) implies that is that the variable is l normally distributed .
Firm size (FSIZE) has a mean value of 15.5 while it has maximum and minimum values of
23 and 11 respectively. The standard deviation reported relatively small values 2.2 shows that
FSIZE is clustered around the mean. Since the mean is relatively greater than (15.5>15.2) the
median it implies that it is slightly skewed to the right. The kurtosis is a measurement of the
ends of a distribution and is used to dictate the size of the tails of a data distribution. The
coefficient value of kurtosis of 3.7 > 3 implies a fat tails and FSIZE it is a leptokurtic
distributions . The Jacque-Bera value of 80.0 and the associated p-value of 0.00 indicate that
the data is normal(p>0) and that outliers or selection bias that the generalization from the
study are unlikely
Balance date (FISY) has a mean value of 0.68 while it has maximum and minimum values of
1 and 0 respectively. The standard deviation reported relatively small values -0.77 shows that

| 60
FISY is clustered around the mean. The mean .68 is less than the median value of 1
relatively implies that it is slightly skewed to the left. The kurtosis is a measurement of the
ends of a distribution and is used to dictate the size of the tails of a data distribution. The
coefficient value of kurtosis of 1.6< 3 implies a flat slope and FISY it is a platykurtic
distributions . The Jacque-Bera value of 141.0 and the associated p-value of 0.00 indicate that
the data is normal (p>0) and that outliers or selection bias that the generalization from the
study are unlikely.
Auditor independence (AUDIND) has a mean value of 3.7 while it has maximum and
minimum values of 5.3 and 2.2. The standard deviation reported relatively small values 0.54
shows that there is cluster around the mean. The mean value of 3.7 relatively less than
(6.2>5.0) the median it indicates that it slightly skewed to the left . The variable is
positively skewed and the positive value of the kurtosis signifies that the regression variable is
peaked than the Gausian distribution. Kurtosis value less than 3 implies platykurtic
distribution .The Jarque –Bera value of 57.5 and p- values (0.00) implies that is that the
variable is l normally distributed .
Risk(RISK) has a mean value of 0.72 while it has maximum and minimum values of 16.6 and
-0.57 respectively. The standard deviation reported relatively small values 1.32 shows that
RISK is clustered around the mean. Mean value of 0.72 is relatively greater than the median
of 0.57 this simply implies that there a is slightly skewed to the right. The kurtosis is a
measurement of the ends of a distribution and is used to dictate the size of the tails of a data
distribution. The coefficient value of kurtosis of 84 > 3 implies a fat tails slope indicating
that is a leptokurtic distribution . The Jacque-Bera value of 224164.6 and the associated p-
value of 0.00 indicate that the data is normal(p>0) and that outliers or selection bias that the
generalization from the study are unlikely.

| 61
Absolute (HHI) as a mean value of 1601.9 while it has maximum and minimum values of
2224 and 1002. The standard deviation reported relatively small values 322.5 shows that
there is clustering around the mean. Since the mean is relatively greater than (1601.9< 1603)
the median it indicates that it is slightly skewed to the left. The variable is positively
skewed and the positive value of the kurtosis signifies that the regression variable is peaked
than the Gausian distribution. Kurtosis value greater than 3 implies a leptokurtic
distribution.The jarque –Bera value of 10.51 and p- values (0.00) implies that the variable is
normally distributed .
CR4 as a mean value of 0.64 while it has maximum and minimum values of 0.69 and
0.63.This implies that 63% of audit firms are big4 . The standard deviation reported relatively
small value 0.31 showsthat thereis clustering around the mean. Since the mean is relatively
greater than (0.64 > 0.63) the median it indicates that slope is slightly skewed to the right.
The variable is positively skewed and the positive value of the kurtosis signifies that the
regression variable is peaked than the Gausian distribution. Kurtosis value less than 3
implies a platykurtic distribution .The jarque –Bera value of 40.61 and p- values (0.00)
implies that is that the variable is normally distributed
NAS has a mean value of 0.50 while it has maximum and minimum values of 1 and 0. The
standard deviation reported relatively small value 0.5 shows that there is clustering around
the mean. Since the mean is relativelyless than (0.5 > 1) the median it indicates that slope is
slightly skewed to the left. The variable is negatively skewed and the positive value of the
kurtosis signifies that the regression variable is peaked than the Gausian distribution. Kurtosis
value less than 3 implies a platykurtic distribution .The jarque –Bera value of 129 and p-
values (0.00) implies that is that the variable is normally distributed.
Auditor fee(AUFEE) has mean value of 10233 while it has maximum and minimum values
of 10233 and 5250. The standard deviation reported relatively largevalue of17391 shows

| 62
that there is a great dispersion from the mean. Since the mean is relatively greater than the
median it indicates that slope is slightly skewed to the left . The variable is positively
skewed and the positive value of the kurtosis signifies that the regression variable is peaked
than the Gausian distribution. Kurtosis value greater than 3 implies a leptokurtic
distribution .The jarque –Bera value of 75704 and p- values (0.00) implies that is that the
variable is normally distributed
4.3 Pearson Correlation
Table 4.2 Pearson Correlation Result (model 1 and 2)
DAC AUDFZ AUTEN SIZE FISY AUIND
DAC 1.000000
AUDFZ 0.069740 1.000000
AUTEN -0.018529 -0.011989 1.000000
SIZE 0.794636 0.096861 -0.019862 1.000000
FISY 0.112824 -0.034838 -0.031208 0.070068 1.000000
AUIND 0.395321 0.214851 0.038399 0.497964 0.044710 1.000000
DAC RISK HHI CR4 NAS ADFEE
DAC 1.000000
RISK -0.135111 1.000000
HHI -0.032308 -0.044252 1.000000
CR4 -0.152886 -0.025698 0.309806 1.000000
NAS -0.006516 0.111110 0.003397 0.009430 1.000000
ADFEE 0.395066 -0.023219 -0.093596 -0.244331 -0.049332 1.000000
Source: Researcher’s computation (2016), using E-views 7.0
Table 4.2 presents the PEARSON correlation coefficient results at 5% level of significance
for the variables in model one and two. It is observed that audit firm size(AUDFZ) appears to
positively correlated with audit quality (DAC) as depicted by the correlation
coefficient(0.06).It implies that bigger audit firm is synonymous with quality audit . Audit
tenure (AUTEN) exhibits a negative association with audit quality(DAC)as depicted by
correlation coefficient(-0.018).It implies that elongated tenure will lead to improve audit
quality. Firm size also exhibit a positive association with DAC. Balance sheet is observed to

| 63
have positive association with DAC. Auditor independence exhibits a positive association
with audit quality (DAC).It implies that auditor independence will lead to quality audit.
Audit firm size (AUDFZ) exhibits negative association with auditor tenure (AUTEN) as
depicted by correlation coefficient (0. 011). It is observed that audit firm size(AUDFZ)
appears to be positively correlated with firm size (SIZE) as depicted by the correlation
coefficient(0.09).It implies that bigger audit firms are hired by firm bigger firm. On the other
hand balance sheet date (FISY) exhibits a negative association with audit firm size
(AUDFZ)as depicted by correlation coefficient(-0.034). Auditor independence also exhibit a
positive association with audit size as depicted by correlation coefficient (0.21) .It implies that
level of audit is a function the size of the audit firm.
Auditor tenure (AUTEN) exhibits a negative association with firm size (SIZE)as depicted by
correlation coefficient(-0.019). Balance sheet date also exhibits a negative association with
auditor tenure as depicted by (-0.03). Auditor independence is observed to have positive
association with auditor tenure as depicted correlation coefficient(0.04).
Firm size (SIZE) exhibits positive association with balance sheet date (FISY) as depicted by
correlation coefficient (0. 07). It is observed that auditor independence (AUIND) appears to
be positively correlated with firm size (SIZE) as depicted by the correlation coefficient(0.50).
It is observed that risk (RISK) is negatively correlated with audit quality (DAC) as depicted
by the correlation coefficient(0.06).It implies that the presence of high risk will result to low
audit quality. Absolute audit market concentration (HHI) exhibits a negative association with

| 64
audit quality(DAC)as depicted by correlation coefficient(-0.03). It implies that concentrated
market will lead compromised audit quality. Relative audit market concentration also exhibit a
negative association with DAC. It implies that audit quality is impaired when the market is
concentrated with bigger audit firms. Relative audit market concentration also exhibit a
negative association with DAC. It implies that audit quality is impaired when the market is
concentrated with bigger audit firms. Non-audit services (NAS) also exhibit a negative
association with DAC. It implies that audit quality is impaired when the same auditor renders
both audit and non-audit services.
Absolute audit market concentration (HHI) exhibits negative association with risk (RISK) as
depicted by correlation coefficient (-0. 04). It is also observed that relative audit market
concentration (CR4) appears to be negatively correlated with risk (RISK) as depicted by the
correlation coefficient(0.03).It implies that bigger audit firms are hired by firm bigger firm .
On the other non-audit service (NAS) exhibits a positive association with risk (RISK)as
depicted by correlation coefficient(0.11). Auditor fee also exhibit a negative association with
risk as depicted by correlation coefficient (-0.2). Absolute audit market concentration (HHI)
exhibits positive association relative audit market concentration (CR4) as depicted by
correlation coefficient (0. 31). Non-audit service (NAS) exhibits a positive association with
absolute audit market concentration (HHI) as depicted by correlation coefficient(0.03).
Auditor fee also exhibits a negative association with auditor fee as depicted by (-0.09).
Relative audit market concentration(CR4) is observed to have positive association with non-
audit services(NAS) as depicted correlation coefficient (0.009). Relative audit market
concentration (CR4) exhibits positive association with audit fee (AUFEE) as depicted by

| 65
correlation coefficient (-0. 02). It is observed that rendering non-audit services (NAS) appears
to be negatively correlated with audit fee (AUFEE) as depicted by the correlation
coefficient(-0.04).
The correlation coefficient results show that none of the variables is very strongly correlated
and this indicates that the problem of multicollinearity is unlikely and hence the variables are
suitable for conducting regression analysis.
4.4 Diagnostic Test
4.4.1 Variance Inflation Factor
Table 4.3 Variance Inflation Factor (VIF) result
uncentred centred
RISK 1.31 1.0
HHI 2.8 1.1
CR4 4.9 1.2
AUDIND 2.1 1.5
AUTEN 4.1 1.2
AUDFZ 2.3 1.1
ADFEE 1.4 1.1
FISY 3.4 1.0
FSIZE 7.4 1.3
Source: Researcher’s computation (2016), using E-views 7.0
To further strengthen the result of the absence multicollinearity, we carried out a residual
diagnostic test of variance inflation factor. From the in table 4.3, it is observe that the
variance inflation factor (VIF) which measures the level of collinearity between the variables

| 66
show how much of the variance of a variable most likely the coefficient estimate of a
regressors has been inflated due to collinearity with the other variables or likely regressors.
They can be calculated by simply diving variance of a coefficient estimated by the variance of
that coefficient had other regressors not been included in the equation. The VIFs are inversely
related to the tolerance with larger values indicating involvement in more severe
relationships.Basically, VIFs above 10 are seen as a cause of concern(Landau &Everit,2003) .
RISK reported a VIF of 1.0; HHI (1.1);CR4 (1.2);AUDIND (1.5);AUTEN(1.2);
AUDFZ(1.1);ADFEE(1.1);FISY(1.0) and FSIZE (1.3). Inclusion, the VIFs of the variables
are all less than 10 indicating the unlikelihood of multicollinearity amongst the variables and
hence the variables satisfy a very important condition the multivariate regression analysis
4. 4.2 Heteroskedasticity
Table4.4 Heteroskedacity
F-statistic 0.497737 ProbF(4,773) 0.7374
Obs*R-Square 1.999 Prob.Chi-Square(4) 0.7360
Scaled explained SS 3.411 Prob.Chi-Square(4) 0.4915
Coefficient Uncentered Centered
Variable Variance VIF VIF
C 0.631654 458.6755 NA
RISK 0.000800 1.306295 1.003183
HHI 1.46E-08 2.831466 1.109014
CR4 1.648432 4.925470 1.168562
ADFEE 4.88E-12 1.433851 1.065921
Source: Researcher’s computation (2016), using E-views 7.0
The Breusch –Pagan –Godfrey test of heteroskedasticity was adopted .The result of the
reported probability values of 0.73 and 0.492 which far exceeds the 0.05 bench mark, this
implies the null hypothesis of hetroskedasticity residual is uniform across all observations.

| 67
4.5 Regression Results
Table 4.5 Audit Quality and Auditor Attributes (2001 – 2004)
Variables 2001 2002 2003 2004
Coff p-value Coef p-value Coef p- value Coef p-value
C 4.196820 0.3116 2.661511 0.0033 -0.274399 0.8007 0.872239 0.4082
AUDFZ -0.114880 0.8801 -0.540990 0.0105 0.165411 0.5221 -0.092700 0.7403
AUTEN 0.003049 0.8887 -0.240868 0.0434 -0.044581 0.5081 -0.184335 0.1887
FSIZE -2.550441 0.0001 0.350915 0.0000 0.487736 0.0000 0.447488 0.0000
FISY 0.508003 0.4682 -0.122669 0.4706 0.059769 0.8323 0.019150 0.9328
AUIND 4.94E-05 0.6339 4.85E-05 0.1098 0.032793 0.9081 5.26E-05 0.0274
𝑅2 0.205272 0.69 0.57 0.67
𝑅2Adjusted 0.116969 0.66 0.52 0.63
F-statistic
(p value)
2.3
0.05
4.8
0.001
20.7
0.0
18.8
0.0
DW-sta 2.2 2.0 2.3 1.9
Source: Researcher’s computation (2016), using E-views 7.0
From the Ordinary least squares multivariate regression result presented in table 4.5 it is
observed that the estimates are presented on year by basis order to provide insight on the
sensitivity checks for the outcomes. Beginning with 2001 the relationship between audit
firm size(AUDFZ) and audit quality (AQ) depicted by discretionary accruals is negative
and insignificant (-0.11, p=0.88) at 5% significance level. In 2002, it also shows a
negative and significant (-0.54, p=0.02). In 2003, the variable appeared to be negatively
related with audit quality but demonstrated insignificance relationship (0.17, p=0.52).In
2004 audit firm exhibits a negative but statistically insignificant relationship with audit
quality( -0.09,p=74).
Audit tenure(AUTEN) has a positive but insignificant relationship with audit quality
(p=0.88) at 5% significance level in 2001. In 2002, auditor tenure also appeared to be
negatively and significant related with audit quality (-0.22, p=0.04). In 2003, the variable
appears to be negatively related with audit quality but demonstrated insignificant
relationship (-0.05, p=0.51). In 2004 auditor tenure exhibits a negative but statistically
insignificant relationship with audit quality(-0.18,p=0.19). The effect of firm size on audit
quality depicted by discretionary accruals appears to be negatively related with audit

| 68
quality in 2001(-2.5.p=0.01). Firm size positively related with audit quality in 2002, 2003
and 2004 with coefficients (0.35,0.45 and 0.18) and p-value( p=0.0,0.0 and0.0)
respectively. Balance sheet date (FISY) has a positive but insignificant relationship with
audit quality ( 0.51, p=0.47) at 5% significance level. In 2002, FISY appeared to be
negatively and insignificantly related with audit quality (-0.12, p=0.47). In 2003, the
variable appears to be positively related with audit quality but demonstrated insignificant
relationship (0.06, p=0.83). In 2004 FISY exhibits a positive but insignificant relationship
with audit quality(0.02,p=0.93).
Auditor independence (AUIND) appears to be positively related with audit quality but
demonstrated insignificance relationship (4.94, p=0.63) in 2001. Auditors‘independence
exhibited a positive but insignificant relationship with audit quality(4.9,p=0.11) in 2002.
In 2003, auditor independence is noticed to be positively signed and still insignificantly
related with audit quality (0.03, p=0.91). The outcome for 2004 indicates that auditor
independence demonstrated positive and significant relationship with audit
quality(5.26,p=0.027).
In evaluating the yearly performance of the model which relates auditor attribute and audit
quality it is observed that for 2001, the R2 stood at 0.21 indicating that the model explains
about 21% of systematic variations in audit quality in 2001. The F-stat for the model is
significant at 5% (p=0.05) it implies that the hypotheses of a linear relationship cannot be
rejected at 5%. The D.W stat of 2.2 suggest that stochastic dependence is unlikely between
successive units of the error term. For 2002, the R2 stood at 0.69 indicating that the model
explains about 69 % of systematic variations in audit quality. The F-stat (p=0.00)for the
models significant at 5% , it implies that the hypotheses of a linear relationship cannot be
rejected at 5% .The d.w stat of 2.0 suggest that stochastic dependence is unlikely between

| 69
successive units of the error term. For 2003, the R2 stood at 0.57 indicating that the model
explains about 57% of systematic variations in audit quality of quoted companies. The F-stat
for the model with interactions is significant at 5% (p=0.00) indicting that the hypothesis of a
linear relationship cannot be rejected at 5%. The D.W stat of 2.09 suggest that stochastic
dependence is unlikely between successive units of the error term. For 2004, the R2 stood at
0.63 indicating that the model explains about 63% of systematic variations in audit quality of
quoted companies. The F-stat for the model with interactions is significant at 5% (p=0.00)
indicting that the hypothesis of a linear relationship cannot be rejected at 5%. The D.W stat of
1.9 suggests that stochastic dependence is unlikely between successive units of the error term.
Table 4.6 Audit Quality and Auditor Attributes (2005 – 2008)
Source: Researcher’s computation (2016), using E-views 7.0
Table 4.6 shows in 2005, audit firm size is noticed to be negatively signed and still
insignificant (-0.19, p=0.56). The outcome for 2006 indicates that audit firm size
demonstrated negatively related with audit quality (-0.11,p=0.53) .It was further observed
that the variables exhibits negative relationship with audit quality in 2007 and 2008. It
however appears to be insignificant in both years (-0.19, p=0.95,-0.56,p=0.09).
2005 2006 2007 2008
Variables Coff p-value Coef p-value Coef p- value Coef p-value
C 0.413950 0.7037 1.281145 0.1753 -0.045556 0.9562 1.095389 0.1707
AUDFZ -0.19216 0.5611 -0.109219 0.5339 -0.018500 0.9584 -0.56028 0.0888
AUTEN -0.01009 0.8431 0.030712 0.5700 0.000470 0.9929 -0.09255 0.0149
FSIZE 0.44656 0.0000 0.369771 0.0000 0.477819 0.0000 0.472913 0.0000
FISY 0.11248 0.6824 0.243115 0.2303 -0.028895 0.8723 -0.01227 0.9395
AUIND 1.74E-0 0.5574 1.86E-05 0.3252 2.84E-06 0.8408 7.12E-06 0.5473
𝑅2 0.570629 0.637891 07662 0.79
𝑅2Adjusted 0.523958 0.598531 0.7584 0.69
F-statistic
(p value)
12.2
0.0
16.2
0.0
29.2
DW-sta 2.2 1.9 1.9 1.7

| 70
In 2005, auditor tenure is noticed to be negatively signed and still insignificant (-0.019,
p=0.84). The outcome for 2006 indicates that auditor tenure demonstrated positive but
insignificant relationship with audit quality(0.03,p=0.57). It was further observed that the
variables exhibits positive relationship with audit quality in 2007 however the relationship
appeared to be insignificant(0.005, p=0.99). Auditor tenure exhibited negative but
significant relationship with audit quality in 2008 (-0.09,p=0.015) .
In 2005, FSIZE is noticed to be positively signed and significant (0.44, p=0.00). The
outcome for 2006 indicates that FSIZE demonstrated positive and significant relationship
with audit quality(0.36,p=0.00). It was further observed that the variables exhibits positive
relationship with audit quality in 2007 the relationship alsoappeared to be
significant(0.47, p=0.00).) .In 2008, it was also observed that FSIZE appeared to be
positively related with audit quality but the relationship is also significant (0.49, p=0.0)
In 2005, FISY is noticed to be positively signed and still insignificant (0.11p=0.68). The
outcome for 2006 indicates that FISY demonstrated positive but insignificant relationship
with audit quality(0.24,p=0.23). It was further observed that the variables exhibits
negative relationship with audit quality in 2007 however the relationship appeared to be
insignificant(-0.02, p=0.57).In 2008, it was also observed that FISY appeared to be
negatively related with audit quality but the relationship is still insignificant (-0.012,
p=0.94).It was further observed that the variables exhibits positive relationship with audit
quality in 2005 however the relationship appeared to be insignificant (1.74, p=0.56).
Auditor independence exhibited positive but insignificant relationship with audit quality in
2006 (1.84, p=0.32) .In 2007, it was also observed that auditor independence appeared to
be positively but insignificantly related with audit quality (2.8, p=0.84).In addition, in
2008, auditor independence appears to be positively but insignificantly related with audit
quality (7.123,p=0.55).

| 71
In evaluating the model,.in 2005, the R2 stood at 0.57 indicating that the model explains
about 57% of systematic variations in audit quality by quoted companies. F-stat for the
model is significant at 5%.(p=0.0) The D.W stat of 2.2 suggest that stochastic
dependence is unlikely between successive units of the error term. For 2006, the R2 at 0.63
indicating that the model explains about 63% of systematic variations in audit quality of
quoted companies. The F-stat for the model is significant at 5% (p=0.00) it indicates that
the hypothesis of a linear relationship cannot be rejected at 5%. The D.W stat of 1.9
suggests that stochastic dependence is unlikely between successive units of the error term.
For 2007, the R2at 0.76 indicating that the model explains about 76% of systematic
variations in audit quality of quoted. The F-stat for the model is significant at 5% (p=0.0)
as the hypothesis of a linear relationship cannot be rejected at 5%. The d.w stat of 1.9
suggest that stochastic dependence is unlikely between successive units of the error term.
For evaluation of yearly performance of the model it is observed that for 2008, the R2
without stood at 0.79 indicating that the model explains about 79% of systematic
variations in audit quality of quoted companies 2008. The F-stat for the model with is
significant at 5% (p=0.00) this suggest that the models readily explains the relationship
between auditor and audit quality as the hypotheses of a linear relationship cannot be
rejected at 5%. The D.W stat of 1.7 suggest that stochastic dependence is unlikely
between successive units of the error term.

| 72
Table 4.7 Audit Quality and Auditor Attributes (2009 – 2012)
2009 2010 2011 2012
Variables Coff p-value Coef p-value Coef p- value Coef p-value
C -0.56182 0.5816 1.675706 0.0601 1.248358 0.1564 0.83464 0.4082
AUDFZ 0.129715 0.7543 0.092532 0.8032 0.149446 0.5430 -0.33347 0.7403
AUTEN -0.00746 0.8427 0.036325 0.1914 0.025489 0.3530 -1.33409 0.0188
FSIZE 0.492866 0.0000 0.365760 0.0000 0.392730 0.0000 6.568216 0.0000
FISY 0.207056 0.3259 -0.360164 0.1027 -0.341953 0.1414 0.084733 0.9328
AUIND 4.46E-06 0.00767 -4.75E-06 0.0437 -3.31E-06 0.556 2.642141 0.0274
𝑅2 0.70444 0.704449 0.63030 0.67132
𝑅2Adjusted 0.67161 0.671610 0.589245 0.63560
F-statistic
(p value)
21.0
0.0
14.1
0.0
15.3
0.0
18.7
0.0
DW-sta 2.2 2.0 1.4 1.9
Source: Researcher’s computation (2016), using E-views 7.0
Table 4.7 shows that in 2009, a reversal is observed as audit firm size appeared to be
positive but still insignificant (0.13, P=0.75).In addition, in 2010 audit firm size appear to
be positively related with audit quality. The relationship is however not significant at 5%
level of significance. Audit firm size appears to be negatively but insignificantly related
with audit quality (-028,p=0.23).In 2011firm has positive but insignificant relationship
with audit quality.Furthermore, audit firm appears to have negative but not significant
relationship with audit quality(0.14,p=0.54) .In 2012, audit firm size has negative but
insignificant relationship with audit quality(-0.33,p=0.74).
In 2009, it was also observed that auditor tenure appeared to be negatively related with
audit quality but the relationship is still insignificant (-0.007, p=0.84).In addition, in 2010
and 2011 auditor tenure appears to be positively but insignificantly related with audit
quality (0.03,p=019;0.0.03,p=0.35). The relationship is however not significant at 5%
level of significance. In 2012, auditor tenure appears to be negatively but insignificantly
related with audit quality (-0.10,p=0.73).

| 73
In, addition, in 2009 FISY appears to be positively but insignificantly related with audit
quality (0.21,p=0.32). The relationship is however not significant at 5% level of
significance. In 2010, FISY appears to be negatively but insignificantly related with audit
quality (-0.36,p=0.11). In 2011 FISY appears to be negatively related with audit quality (-
0.34, p=0.14) and relationship is insignificant at 5% level of significance. In 2012, FISY
appeared to be negatively but insignificantly related with audit quality(-0.89, p=0.93).
In 2009, 2010,2011 and 2012 firm size also appeared to be positive and significantly
related with audit quality with coefficient values of (0.4,0.36,0.39 and 6.5) and p- values
(0.00,0.00,00 and 0.0) respectively. In 2009 and 2011 auditor independence appeared to
be positive and significantly related with audit quality (4.6, p=0,0466,0.56,p=0.03). In
2010 and 2011 audit independence appeared to be negatively but not significantly related
with audit quality (-4.7,p=0.043).
In explaining the model for 2009, the R2 stood at 0.70 indicating that the model explains
about 70 % of systematic variations in audit quality of quoted companies in 2009. F-stat
for the models is significant (p=0.0) at 5% .The D.W stat of 2.2 suggest that stochastic
dependence is unlikely between successive units of the error term. For 2010, the R2 stood
at 0.70 indicating that the model explains about 70% of systematic variations in of audit
quality of quoted companies in 2010. The F-stat for the model is significant at 5% (p=0.0)
this suggest that the hypotheses of a linear relationship cannot be rejected at 5%. The
D.W stat of 2.0 suggest that stochastic dependence is unlikely between successive units of
the error term. For 2011, the R2 stood at 0.63 indicating that the model explains about
63% of systematic variations in quality of quoted companies in 2011. F-stat for the
models significant at 5%. The D.W stat of 1.4 suggest that stochastic dependence is
unlikely between successive units of the error term. For 2012, the R2 without interaction

| 74
stood at 0.59 indicating that the model explains about 59% of systematic variations in
audit quality of quoted companies in 2012.The F-stat for the model at 5% (p=0.04)
suggest the hypotheses of a linear relationship cannot be rejected at 5%. The D.W stat of
1.6 suggest that stochastic dependence is unlikely between successive units of the error
term.
Table 4.8 Audit Quality and Auditor Attributes (2013 – 2015)
2013 2014 2015
Variables Coff p-value Coef p-value Coef p- value
C 0.400758 0.6093 1.046420 0.1902 0.590140 0.3975
AUDFZ 0.211667 0.3532 -0.042637 0.0405 0.191634 0.3330
AUTEN -0.01283 0.0425 0.000588 0.9778 -0.008710 0.0402
FSIZE 0.463855 0.0000 0.430961 0.0000 0.450816 0.0000
FISY -0.34490 0.0948 -0.324114 0.1309 -0.293740 0.1334
AUIND -4.59E-06 0.3331 -5.53E-07 0.8980 -3.13E-06 0.3910
𝑅2 0.725010 0.708069 0.763988
𝑅2Adjusted 0.694456 0.675632 0.738334
F-statistic
(p value)
23.7
0.0
21.8
0.0
29.7
0.0
DW-sta 2.1 2.1 1.9
Source: Researcher’s computation (2016), using E-views 7.0
Table 4.8 shows that in 2013 audit firm size appeared to be positively related with audit
quality. The relationship is however not significant at 5% level of significance. Audit firm
size appears to negatively but statistically insignificant related with audit quality
(0.21,p=0.35). On the contrary in 2014, firm size appears to be negatively related with
audit quality, the relationship is significant(-0.43,p= 0.04). In 2015, audit firm size has a
negative relationship with audit. This relationship is significant at 5% level of
significantquality(-0.43,p=0.041).
In 2013 and 2015 auditor tenure appears to be negatively related with audit quality (-0.01,
p=0.041;0.19,p=0.33;-0.009,p=0.04) and relationship is significant at 5% level of
significant. On contrary in 2014, auditor tenure appeared to be positively but
insignificantly related with audit quality(0.00059, p=0.98).

| 75
Firm size finally appears to be positively related with audit in 2013,2014 and
2015(0.46p=,0.00;p=0.43and 0.45,p=0.00)
In 2013, it was also observed that FISY appeared to be negatively related with audit
quality but the relationship is still insignificant (-0.34, p=0.09). Furthermore, in 2014
FISY also appeared to be positively but insignificantly related with audit quality
(0.321,p=0.13). The relationship is however not significant at 5% level of significance. In
2010, FISY appears to be negatively. Finally FISY exhibited a negative but insignificant
relationship with audit quality (-0.29,0.13) in 2015.
In 2013, auditor independence appears to be ngatively but insignificantly related with
audit quality (-4.59, p=0.33). In 2014 and 2015 auditor independence appeared to be
negatively but insignificantly related with audit quality with coefficient values of (-5.5,
and 3.13) and p-values ( 0.89 and 0.59) respectively at 5% level of significant.
In evaluation of yearly performance of the model for 2013, the R2 stood at 0.72
indicating that the model explains about 72% of systematic variations of audit quality of
quoted companies in 2013. The F-stat for the model is significant at 5% (p=0.0) indicate
that hypotheses of a linear relationship cannot be rejected at 5%. The D.W stat of 2.1
suggest that stochastic dependence is unlikely between successive units of the error term.
For 2014, the R2 stood at 0.70 indicating that the model explains about 72%of systematic
variations of audit quality of quoted companies in 2014. The F-stat for the model is
significant at 5% (p=0.0) indicate that hypotheses of a linear relationship cannot be
rejected at 5%. The D.W stat of 2.1 suggest that stochastic dependence is unlikely
between successive units of the error term. For 2015, the R2 stood at 0.76 indicating that
the model explains about 76% of systematic variations of audit quality of quoted

| 76
companies in 2015. The F-stat for the model is significant at 5% (p=0.0) indicate that
hypotheses of a linear relationship cannot be rejected at 5%. The D.W stat of 1.9 suggests
that stochastic dependence is unlikely between successive units of the error term.
From the Ordinary least squares multivariate regression result presented in table 4.5 it is
observed that the estimates are presented on year by basis order to provide insight on the
sensitivity checks for the outcomes. Beginning with 2001 the relationship between risk
(RISK) and audit quality (AQ) depicted by discretionary accruals is negative and insignificant
(-011, p=0.40) at 5% significance level. In 2002, it also appeared to be negative but
insignificantly related with audit quality (-0.12, p=0.27). In 2003, the variable appears to be
negative but demonstrated insignificant relationship with audit quality(-0.30, p=0.27).In
2004 risk exhibits a negative but statistically insignificant relationship with audit quality( -
0.69,p=0.27. In 2005, risk is noticed to be negatively signed and still insignificant (-0.58,
p=0.05). The outcome for 2006 indicates that risk demonstrated negative but insignificant
relationship with audit quality (0.058,p=0.73) .It was further observed that the variables
exhibits negative but insignificant relationship with audit quality in 2007and 2008. It
however the relationship appears to be insignificant in both years (-0.17, p=0.95,-
0.29,p=0.209).
In 2009, risk appeared to be negative and significant (-0.34, P=0.080).In addition, in 2010 risk
appeared to be negatively and also significantly related with audit quality(-0.02,p= 0.0008).
Risk appears to be positive but statistically insignificant related with audit quality
(0.15,p=0.06) in 2011. On the contrary risk appeared to have negative but insignificant
relationship with audit quality in both 2012(-0.065,p=0.22). In 2013, risk has a negative and
significant relationship with audit quality(-0.065,p=0.45). This relationship is insignificant at
5% level of significant. Risk appeared to be negatively and significantly related with audit

| 77
quality (-0.24,p=0.01) in 2014. In 2015, risk appeared to have negative but insignificant
relationship with audit quality(-0.07,p=0.42) .
Non-audit services (NAS) has a positive but insignificant relationship with audit quality (
0.51, p=0.04) at 5% significance level in 2001 . In 2002, NAS appeared to be negatively and
insignificantly related with audit quality (-0.20, p=0.44). In 2003, the variable appears to be
negatively related with audit quality but demonstrated insignificance relationship (-0.20,
p=0.83). In 2004 NAS exhibited a negative but insignificant relationship with audit quality(-
0.15,p=0.44). In 2005, NAS is noticed to be negative signed and still insignificant (-
0.23,p=0.50). The outcome for 2006 indicates that NAS demonstrated negative but
insignificant relationship with audit quality(-0.13,p=0.64). It was further observed that the
variables exhibits negative relationship with audit quality in 2007. However, the relationship
appeared to be insignificant (0.005, p=0.99). FISY exhibited negative but insignificant
relationship with audit quality in 2007 (-0.13,p=0.67) .In 2008, it was also observed that NAS
appeared to be negatively related with audit quality but the relationship is still insignificant (-
0.13, p=0.67).In addition, in 2009 NAS appeared to be positively but insignificantly related
with audit quality (.0.66, p=0.03). The relationship is however not significant at 5% level of
significance. In 2010, NAS appears to be negatively but insignificantly related with audit
quality (0.39, p=0.17). In 2011 NAS appeared to be negatively related with audit quality
(0.35, p=0.2) and relationship is insignificant at 5% level of significant. In 2012, NAS
appeared to be negatively but insignificantly related with audit quality (0.50, p=0.21)..In
2013, it was also observed that NAS appeared to be positively related with audit quality but
the relationship is still insignificant (0.49, p=0.12). Furthermore, in 2014 NAS also appeared
to be positive and significantly related with audit quality (0.62, p=0.02). In 2015, NAS
appeared to be positive but not significantly related with audit quality (0.46,p=0.13).

| 78
Audit fee (AUFEE) appears to be positively related with audit quality but demonstrated
insignificance relationship (4.94, p=0.06) in 2001. Audit fee exhibited a positive and
significant relationship with audit quality (8.8,p=0.0003) in 2002. In 2003, audit fee is noticed
to be positively signed and still significant.(0.00013, p=0.0003). The outcome for 2004
indicates that audit fee demonstrated positive and significant relationship with audit quality
(0.00016,p=0.0.0003).
It was further observed that the variables exhibits positive and significant relationship with
audit quality in 2005 (0.00013, p=0.0004). Audit fee exhibited positive and significant
relationship with audit quality in 2006 (7.96, p=0.002) .In 2007, it was also observed that
audit fee appeared to be positive and significantly related with audit quality (.8.58,
p=0.0002).In addition, in 2008, audit fee appears to be positive and significantly related with
audit quality (7.32,p=0.0003). In 2009, audit fee appears to be positive and significantly
related with audit quality (2.86, p=0.002). In 2010 and 2011 audit fee appeared to be positive
and significantly related with audit quality with coefficient values of 2.2.7, and 0.1.98) and p-
values (0.0056 0.44 and 0.058) respectively at 5% level of significant. In 2012, audit fee
appeared to be positively and significantly related with audit quality(1.93, p=0.0031).In 2013
audit fee appeared to be positive and significantly related with audit quality (1.93, p=0.003).
Furthermore, in 2014, NAS also appeared to be positive and significantly related with audit
quality (1.66, p=0.02). In 2015, NAS appeared to be positive and t significantly related with
audit quality (1.64.p=0.0007).
In evaluating the yearly performance of the model which relates audit market concentration
and audit quality it is observed that for 2001, the R2 stood at 0.11 indicating that the model
explains about 11% of systematic variations in audit quality in 2001. The F-stat for the model
is significant at 5% (p=0.05) it implies that the hypotheses of a linear relationship cannot be
rejected at 5%. The D.W stat of 1.5 suggest that stochastic dependence is unlikely between

| 79
successive units of the error term. For 2002, the R2 stood at 0.09 indicating that the model
explains about 9 % of systematic variations in audit quality. The F-stat (p=0.01)for the
models significant at 5% , it implies that the hypotheses of a linear relationship cannot be
rejected at 5% .The d.w stat of 2.4 suggest that stochastic dependence is unlikely between
successive units of the error term. For 2003, the R2 stood at 0.01indicating that the model
explains about 1% of systematic variations in audit quality of quoted companies. The F-stat
for the model is significant at 5% (p=0.00) indicting that the hypothesis of a linear
relationship cannot be rejected at 5%. The D.W stat of 1.9 suggest that stochastic dependence
is unlikely between successive units of the error term. For 2004, the R2 stood at 0.21
indicating that the model explains about 21% of systematic variations in audit quality by
quoted companies. F-stat for the model is significant at 5%.(p=0.0) The D.W stat of 2.3
suggest that stochastic dependence is unlikely between successive units of the error term. For
2005, the R2 at 0.29 indicating that the model explains about 29% of systematic variations in
audit quality of quoted companies. The F-stat for the model is significant at 5% (p=0.00) it
indicates that the hypothesis of a linear relationship cannot be rejected at 5%. The D.W stat of
2.7 suggests that stochastic dependence is unlikely between successive units of the error term.
For 2006, the R2at 0.26 indicating that the model explains about 26% of systematic variations
in audit quality of quoted. The F-stat for the model is significant at 5% (p=0.0) as the
hypothesis of a linear relationship cannot be rejected at 5%. The d.w stat of 2.2 suggest that
stochastic dependence is unlikely between successive units of the error term.
For evaluation of yearly performance of the model it is observed that for 2007, the R2
without stood at 0.26 indicating that the model explains about 26% of systematic variations in
audit quality of quoted companies 2007. The F-stat for the model with is significant at 5%
(p=0.00) this suggest that the models readily explains the relationship between auditor and
audit quality as the hypotheses of a linear relationship cannot be rejected at 5%. The D.W stat
of 2.2 suggest that stochastic dependence is unlikely between successive units of the error

| 80
term. For 2008, the R2
stood at 0.30 indicating that the model explains about 70 % of
systematic variations in audit quality of quoted companies in 2008. F-stat for the models is
significant (p=0.0) at 5% .The D.W stat of 2.2 suggest that stochastic dependence is unlikely
between successive units of the error term. For 2009, the R2 stood at 0.34 indicating that the
model explains about 70% of systematic variations in of audit quality of quoted companies in
2008. The F-stat for the model is significant at 5% (p=0.0) this suggest that the hypotheses of
a linear relationship cannot be rejected at 5%. The D.W stat of 1.7 suggest that stochastic
dependence is unlikely between successive units of the error term. For 2010, the R2 stood at
0.63 indicating that the model explains about 63% of systematic variations in quality of
quoted companies in 2010. F-stat for the models significant at 5%. The D.W stat of 1.4
suggest that stochastic dependence is unlikely between successive units of the error term. For
2011, the R2 wood at 0.26 indicating that the model explains about 26% of systematic
variations in audit it quality of quoted companies in 2011.The F-stat for the model at 5%
(p=0.04) suggest the hypotheses of a linear relationship cannot be rejected at 5%. The D.W
stat of 1.6 suggest that stochastic dependence is unlikely between successive units of the error
term. For 2012, the R2 stood at 0.49 indicating that the model explains about 49% of
systematic variations of audit quality of quoted companies in 2012. The F-stat for the model
is significant at 5% (p=0.0) indicate that hypotheses of a linear relationship cannot be rejected
at 5%. The D.W stat of 2.1 suggest that stochastic dependence is unlikely between successive
units of the error term. For 2013, the R2 stood at 0.25 indicating that the model explains about
25%of systematic variations of audit quality of quoted companies in 2013. The F-stat for the
model is significant at 5% (p=0.0) indicate that hypotheses of a linear relationship cannot be
rejected at 5%. The D.W stat of 2.1 suggest that stochastic dependence is unlikely between
successive units of the error term. For 2014, the R2 stood at 0.46 indicating that the model
explains about 76% of systematic variations of audit quality of quoted companies in 2015.
The F-stat for the model is significant at 5% (p=0.0) indicate that hypotheses of a linear

| 81
relationship cannot be rejected at 5%. The D.W stat of 1.9 suggests that stochastic dependence
is unlikely between successive units of the error term.
Table 4.9 AuditMarket Concentration and Audit Quality (2001 – 2004)
2001 2002 2003 2004
Variables Coff p-value Coef p-value Coef p- value Coef p-value
C 4.196820 0.4706 5.600867 0.0121 6.563514 0.0121 3.976712 0.0121
RISK -0.114880 0.4019 -0.123320 0.2714 -0.301988 0.2714 -0.698172 0.2714
HHI 0.003049 0.4284 -0.000106 0.7157 -0.000329 0.7157 -0.001499 0.0257
CR4 -2.550441 0.5000 2.029353 0.5280 1.474633 0.5280 0.004128 0.5280
NAS 0.508003 0.0403 -0.021909 0.4429 -0.203798 0.4429 -0.154937 0.4429
AUFEE 4.94E-05 0.0574 8.79E-05 0.0003 0.000136 0.0003 0.000155 0.0003
𝑅2 0.205272 0.086678 0.0121 0.0121
𝑅2Adjusted 0.116969 -0.014802 0.2714 0.2714
F-statistic
(p value)
2.3
0.0
0.8
0.5
3.029177
0.4429
0.01
2.3
DW-sta 1.5 2.4 0.0003 0.4429
Source: Researcher’s computation (2016), using E-views 7.0
From the Ordinary least squares multivariate regression result presented in table 4.9 it is
observed that the estimates are presented on year by basis order to provide insight on the
sensitivity checks for the outcomes. Beginning with 2001 the relationship between risk
(RISK) and audit quality (AQ) depicted by discretionary accruals is negative and
insignificant (-011, p=0.40) at 5% significance level. In 2002, it also appeared to be
negative but insignificantly related with audit quality (-0.12, p=0.27). In 2003, the variable
appears to be negative but demonstrated insignificant relationship with audit quality(-0.30,
p=0.27).In 2004 risk exhibits a negative but statistically insignificant relationship with
audit quality(-0.69,p=0.27)
Absolute audit market concentration (HHI) has a positive but insignificant relationship
with audit quality (0.003,p=0.43) at 5% significance level in 2001. In 2002, absolute audit
market concentration appeared to be negatively but insignificantly related with audit
quality (-0.0001, p=0.07). In 2003, the variable appears to negatively related with audit
quality but demonstrated insignificance relationship (-0.0003, p=0.71). In 2004 absolute

| 82
audit market concentration exhibited a negative and significant relationship with audit
quality(-0.001,p=0.02).
The effect of relative audit market concentration (CR4) on audit quality depicted by
discretionary accruals appears to be negatively related with audit quality. negatively
related with audit quality in 2001 , with coefficients (-2.6) and p-value( p=0.5). The
relationship is not significant at level. In 2002, relative market audit concentration
appeared to be positive and not significantly related with audit quality with (2.02,
p=,0.53).In 2003, the variable appears to be positive but demonstrated insignificant
relationship with audit quality(1.48, p=0.53). In 2004 relative audit market concentration
exhibited a positive but insignificant relationship with audit quality(0.004,p=0.53)
Non-audit services (NAS) has a positive but insignificant relationship with audit quality
(0.51, p=0.04) at 5% significance level in 2001. In 2002, NAS appeared to be negatively
and insignificantly related with audit quality (-0.20, p=0.44). In 2003, the variable appears
to be negatively related with audit quality but demonstrated insignificance relationship (-
0.20, p=0.83). In 2004 NAS exhibited a negative but insignificant relationship with audit
quality(-0.15,p=0.44). Audit fee (AUFEE) appears to be positively related with audit
quality but demonstrated insignificance relationship (4.94, p=0.06) in 2001. Audit fee
exhibited a positive and significant relationship with audit quality (8.8,p=0.0003) in 2002.
In 2003, audit fee is noticed to be positively signed and still significant.(0.00013,
p=0.0003). The outcome for 2004 indicates that audit fee demonstrated positive and
significant relationship with audit quality (0.00016,p=0.0.0003).
In evaluating the yearly performance of the model which relates audit market
concentration and audit quality it is observed that for 2001, the R2 stood at 0.11

| 83
indicating that the model explains about 11% of systematic variations in audit quality in
2001. The F-stat for the model is significant at 5% (p=0.05) it implies that the hypotheses
of a linear relationship cannot be rejected at 5%. The D.W stat of 1.5 suggest that
stochastic dependence is unlikely between successive units of the error term. For 2002, the
R2 stood at 0.09 indicating that the model explains about 9 % of systematic variations in
audit quality. The F-stat (p=0.01)for the models significant at 5% , it implies that the
hypotheses of a linear relationship cannot be rejected at 5% .The d.w stat of 2.4 suggest
that stochastic dependence is unlikely between successive units of the error term. For
2003, the R2 stood at 0.01indicating that the model explains about 1% of systematic
variations in audit quality of quoted companies. The F-stat for the model is significant at
5% (p=0.00) indicting that the hypothesis of a linear relationship cannot be rejected at 5%.
The D.W stat of 1.9 suggest that stochastic dependence is unlikely between successive
units of the error term. For 2004, the R2 stood at 0.21 indicating that the model explains
about 21% of systematic variations in audit quality by quoted companies. F-stat for the
model is significant at 5%.(p=0.0) The D.W stat of 2.3 suggest that stochastic
dependence is unlikely between successive units of the error term.
Table 4.10 AuditMarket Concentration and Audit Quality (2005 – 2008)
Source: Researcher’s computation (2016), using E-views 7.0
2005 2006 2007 2008
Variables Coff p-value Coef p-value Coef p- value Coef p-value
C 14.45872 0.0242 10.46396 0.0301 9.445991 0.0913 8.791321 0.0631
RISK -0.58775 0.0597 0.058097 0.7343 -0.171426 0.5681 -0.293321 0.1981
HHI -0.00299 0.0754 -0.00091 0.6512 -0.001199 0.6684 -0.000727 0.7953
CR4 -2.11687 0.8088 -3.17590 0.5046 -0.799103 0.8476 -1.078766 0.6284
NAS -0.23359 0.5014 -0.13470 0.6456 -0.132220 0.6723 -0.128620 0.6725
AUFEE 0.000128 0.0004 7.96E-05 0.0023 8.58E-05 0.0002 7.32E-05 0.0003
𝑅2 0.293266 0.260966 0.280021 0.302195
𝑅2Adjusted 0.214739 0.178852 0.200023 0.224661
F-statistic
(p value)
3.7
0.0
3.2
0.0
3.5
0.0
3.9
0.0
DW-sta 2.7 2.2 2.4 2.4
| 84
In 2005, risk is noticed to be negatively signed and still insignificant (-0.58, p=0.05). The
outcome for 2006 indicates that risk demonstrated negative butinsignificant relationship
with audit quality (0.058,p=0.73) .It was further observed that the variables exhibits
negative but insignificant relationship with audit quality in 2007and 2008.
In 2005, risk is noticed to be negatively signed and still insignificant (-0.58, p=0.05). The
outcome for 2006 indicates that risk demonstrated negative but insignificant relationship
with audit quality (0.058,p=0.73). It was further observed that the variables exhibits
negative but insignificant relationship with audit quality in 2007and 2008. It however the
relationship appears to be insignificant in both years (-0.17, p=0.95,-0.29,p=0.19).
In 2005, audit market concentration was noticed to be negatively signed and still
insignificant (-0.003, p=0.08). The outcome for 2006 indicates that absolute audit market
concentration demonstrated positive but insignificant relationship with audit quality (-
0.0009,p=0.65). It was further observed that the variables exhibits negative relationship
with audit quality in 2007 however the relationship appeared to be insignificant(-0.001,
p=0.67). Audit market concentration exhibited negative but significant relationship with
audit quality in 2008 (-0.0007,p=0.80).
In 2005, relative audit market concentration is noticed to be negatively signed and still
insignificant (-2.11, p=0.81). The outcome for 2006 indicates that relative audit market
concentration demonstrated negative but insignificant relationship with audit quality (-
3.18,p=0.50) .It was further observed that the variables exhibits negative but insignificant
relationship with audit quality in 2007and 2008. It however the relationship appears not
to be significant in both years (-0.80, p=0.85,-1.08,p=0.63).

| 85
In 2005, NAS is noticed to be negative signed and still insignificant (-0.23,p=0.50). The
outcome for 2006 indicates that NAS demonstrated negative but insignificant relationship
with audit quality(-0.13,p=0.64).. However, the relationship appeared to be insignificant
(0.005, p=0.99). NAS exhibited negative but insignificant relationship with audit quality
in 2007 (-0.13,p=0.67) .In 2008, it was also observed that NAS appeared to be negatively
related with audit quality but the relationship is still insignificant (-0.13, p=0.67)
It was further observed that the AUF exhibits positive and significant relationship with
audit quality in 2005 (0.00013, p=0.0004). Audit fee exhibited positive and significant
relationship with audit quality in 2006 (7.96, p=0.002) .In 2007, it was also observed that
audit fee appeared to be positive and significantly related with audit quality (.8.58,
p=0.0002).In addition, in 2008, audit fee appears to be positive and significantly related
with audit quality (7.32,p=0.0003).
In evaluating model for 2005, the R2 at 0.29 indicating that the model explains about 29%
of systematic variations in audit quality of quoted companies. The F-stat for the model is
significant at 5% (p=0.00) it indicates that the hypothesis of a linear relationship cannot be
rejected at 5%. The D.W stat of 2.7 suggests that stochastic dependence is unlikely
between successive units of the error term. For 2006, the R2at 0.26 indicating that the
model explains about 26% of systematic variations in audit quality of quoted. The F-stat
for the model is significant at 5% (p=0.0) as the hypothesis of a linear relationship cannot
be rejected at 5%. The d.w stat of 2.2 suggest that stochastic dependence is unlikely
between successive units of the error term.
For evaluation of yearly performance of the model it is observed that for 2007, the R2
without stood at 0.26 indicating that the model explains about 26% of systematic

| 86
variations in audit quality of quoted companies 2007. The F-stat for the model with is
significant at 5% (p=0.00) this suggest that the models readily explains the relationship
between auditor and audit quality as the hypotheses of a linear relationship cannot be
rejected at 5%. The D.W stat of 2.2 suggest that stochastic dependence is unlikely
between successive units of the error term. For 2008, the R2 stood at 0.30 indicating that
the model explains about 70 % of systematic variations in audit quality of quoted
companies in 2008. F-stat for the models is significant (p=0.0) at 5% .The D.W stat of
2.2 suggest that stochastic dependence is unlikely between successive units of the error
term. For 2009, the R2 stood at 0.34 indicating that the model explains about 70% of
systematic variations in of audit quality of quoted companies in 2008.
Table 4.11 AuditMarket Concentration and Audit Quality (2009 – 2012)
2009 2010 2011 2012
Variables Coff p-value Coef p-value Coef p- value Coef p-value
C -17.724 0.0473 11.11429 0.0451 -16.2552 0.0830 15.83819 0.5771
RISK -0.34750 0.0084 -0.226395 0.0008 0.152208 0.0608 -0.06498 0.2296
HHI 0.006894 0.1955 -0.002228 0.4815 0.019898 0.0117 -0.00561 0.0290
CR4 0.647776 0.7884 -1.281894 0.00766 -0.399725 0.00896 -0.008131 0.00514
NAS 0.682714 0.0270 0.378922 0.1737 0.353884 0.1955 0.494430 0.02161
AUFEE 2.85E-05 0.0024 2.27E-05 0.0038 1.98E-05 0.0056 1.93E-05 0.0031
𝑅2 0.341028 0.373259 0.26841 0.251857
𝑅2Adjusted 0.267809 0.303622 0.18713 0.168730
F-statistic
(p value)
4.6
0.0
5.3
0.0
3.3
0.01
3.0
0.0
DW-sta 1.7 2.1 2.5 1.6
Source: Researcher’s computation (2016), using E-views 7.0
In 2009 of table 4.11. risk appeared to be negative and significant (-0.34, P=0.080).In
addition, in 2010 risk appeared to be negatively and also significantly related with audit
quality(-0.02,p= 0.0008). Risk appears to be positive but statistically insignificant related
with audit quality (0.15,p=0.06) in 2011. On the contrary risk appeared to have negative
but insignificant relationship with audit quality in both 2012(-0.065,p=0.22).
In 2009, it was also observed that absolute audit market concentration appeared to be
negatively related with audit quality but the relationship is still insignificant (-0.006,
p=0.19).In 2010 and 2012 audit market concentration appears to be negatively

| 87
andinsignificantly related with audit quality (-0.0002,p=0.048;-0.0.006,p=0.02). The
relationship is however is not significant at 5% level of significance. In 2011, audit market
concentration appeared to be positive and significantly related with audit quality(0.01,
p=0.011)
In 2009, relative audit market concentration appeared to be positive but not significantly
related with audit quality (0.64, p=0.780).In addition, in 2010 relative market appeared
to be negatively but significantly related with audit quality (-102,p= 0.007). Relative
audit market appears to be negativelyand significantly related with audit quality (-0.39,
p=0.008) in 2011. The relative audit market concentration also appearedto be negatively
related with audit quality(0.008,p=0.005) in 2012. In 2013, relative audit market
concentration has positive but insignificant relationship with audit quality(0.065,p=0.45).
This relationship is insignificant at 5% level of significant
In addition, in 2009 NAS appeared to be positively but insignificantly related with audit
quality (.0.66, p=0.03). The relationship is however not significant at 5% level of
significance. In 2010, NAS appears to be negatively but insignificantly related with audit
quality (0.39, p=0.17). In 2011 NAS appeared to be negatively related with audit quality
(0.35, p=0.2) and relationship is insignificant at 5% level of significant. In 2012, NAS
appeared to be negatively but insignificantly related with audit quality (0.50, p=0.21).
In 2009, audit fee appears to be positive and significantly related with audit quality (2.86,
p=0.002). In 2010 and 2011 audit fee appeared to be positive and significantly related
with audit quality with coefficient values of 2.2.7, and 0.1.98) and p-values (0.0056 0.44
and 0.058) respectively at 5% level of significant. In 2012, audit fee appeared to be
positively and significantly related with audit quality(1.93, p=0.0031)

| 88
In evaluating model the F-stat for the model is significant at 5% (p=0.0) this suggest that
the hypotheses of a linear relationship cannot be rejected at 5%. The D.W stat of 1.7
suggest that stochastic dependence is unlikely between successive units of the error term.
For 2010, the R2 stood at 0.63 indicating that the model explains about 63% of systematic
variations in quality of quoted companies in 2010. F-stat for the models significant at
5%. The D.W stat of 1.4 suggest that stochastic dependence is unlikely between
successive units of the error term. For 2011, the R2 wood at 0.26 indicating that the model
explains about 26% of systematic variations in audit it quality of quoted companies in
2011.The F-stat for the model at 5% (p=0.04) suggest the hypotheses of a linear
relationship cannot be rejected at 5%. The D.W stat of 1.6 suggest that stochastic
dependence is unlikely between successive units of the error term. For 2012, the R2 stood
at 0.49 indicating that the model explains about 49% of systematic variations of audit
quality of quoted companies in 2012. The F-stat for the model is significant at 5%
(p=0.0) indicate that hypotheses of a linear relationship cannot be rejected at 5%. The
D.W stat of 2.1 suggest that stochastic dependence is unlikely between successive units of
the error term
Table 4.12 AuditMarket Concentration and Audit Quality
Source: Researcher’s computation (2016), using E-views 7.0
Table 4.12 shows in 2013, risk has a negative and significant relationship with audit
quality(-0.065,p=0.45). This relationship is insignificant at 5% level of significant. Risk
2013 2014 2015
Variables Coff p-value Coef p-value Coef p- value
C 15.83819 0.3283 -34.35922 0.0673 8.475196 0.0000
RISK -0.064986 0.4499 -0.235721 0.0103 -0.074607 0.4238
HHI -0.005610 0.5258 0.022075 0.0271 -0.000636 0.4805
CR4 0.008131 0.9991 4.383209 0.6537 -1.111441 0.5533
NAS 0.494430 0.1215 0.628616 0.0270 0.469427 0.1290
AUFEE 1.93E-05 0.0030 1.66E-05 0.0013 1.8405 0.0007
𝑅2 0.240507 0.4027 0.258761
𝑅2Adjusted 0.156118 0.3363 0.178191
F-statistic
(p value)
2.8
0.01
6.9
0.00
3.3
0.01
DW-sta 1.8 1.9 2.1

| 89
appeared to be negatively and significantly related with audit quality (-0.24,p=0.01) in
2014. In 2015, risk appears to be negatively related with audit quality in 2015 (-
0.07,p=0.42)
Absolute audit market concentration appears to be negatively related with audit quality (-
0.006, p=0.53) this relationship is not significant at 5% level of significant in 2013. On the
contrary in 2014, audit market concentration appeared to be positively and significantly
related with audit quality (0.022, p=0.027). In 2015 absolute audit market concentration
appears to be negatively related with audit quality (-0.0006, p=0.48) relationship is not
significant at 5% level of significant have negative but insignificant relationship with
audit quality(-0.07,p=0.42).
In 2013, relative audit market concentration has positive but insignificant relationship
with audit quality(0.065,p=0.45). This relationship is insignificant at 5% level of
significant. In 2013 audit market concentration appears to be negatively related with audit
quality (-0.006, p=0.53) relationship is not significant at 5% level of significant. On
contrary in 2014, relative audit market concentration appeared to be positively but not
significantly related with audit quality (0.022, p=0.03). In 2015 absolute audit market
concentration appears to be negatively related with audit quality (-0.0006, p=0.48)
relationship is not significant at 5% level of significant
In 2013, relative audit market concentration has positive but insignificant relationship
with audit quality(0.065,p=0.45). This relationship is insignificant at 5% level of
significant.

| 90
Relative audit market concentration also appeared to be positive but not significantly
related with audit quality (4.38,p=0.6) in 2014. In 2015, relative market concentration
appeared to be negative but not significantly related with audit quality(-1.11,p=0.55) .
In 2013, it was also observed that NAS appeared to be positively related with audit
quality but the relationship is still insignificant (0.49, p=0.12). Furthermore, in 2014 NAS
also appeared to be positive and significantly related with audit quality (0.62, p=0.02). In
2015, NAS appeared to be positive but not significantly related with audit quality
(0.46,p=0.13).
In 2013 audit fee appeared to be positive and significantly related with audit quality
(1.93, p=0.003). Furthermore, in 2014, NAS also appeared to be positive and significantly
related with audit quality (1.66, p=0.02). In 2015, NAS appeared to be positive and t
significantly related with audit quality (1.64.p=0.0007).
In evulating the model. For 2013, the R2 stood at 0.25 indicating that the model explains
about 25%of systematic variations of audit quality of quoted companies in 2013. The F-
stat for the model is significant at 5% (p=0.0) indicate that hypotheses of a linear
relationship cannot be rejected at 5%. The D.W stat of 2.1 suggest that stochastic
dependence is unlikely between successive units of the error term. For 2014, the R2 stood
at 0.46 indicating that the model explains about 76% of systematic variations of audit
quality of quoted companies in 2015. The F-stat for the model is significant at 5%
(p=0.0) indicate that hypotheses of a linear relationship cannot be rejected at 5%. The
D.W stat of 1.9 suggests that stochastic dependence is unlikely between successive units
of the error term
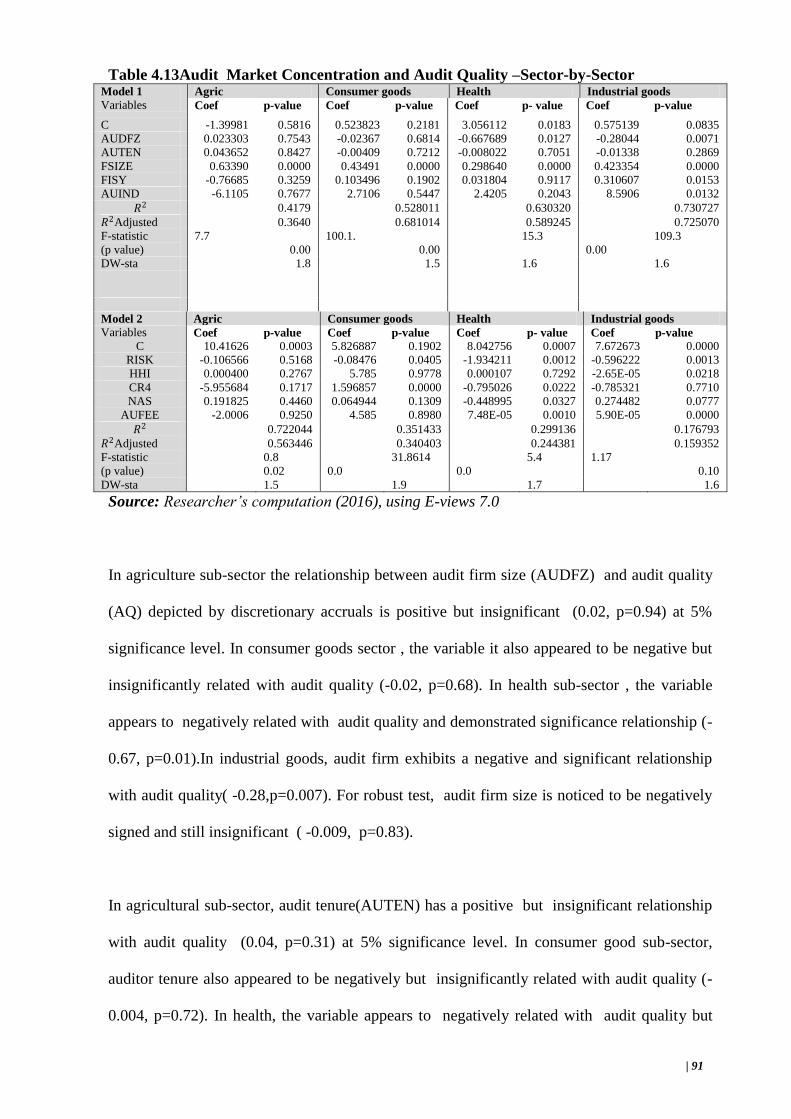
| 91
Table 4.13Audit Market Concentration and Audit Quality –Sector-by-Sector Model 1 Agric Consumer goods Health Industrial goods
Variables Coef p-value Coef p-value Coef p- value Coef p-value
C -1.39981 0.5816 0.523823 0.2181 3.056112 0.0183 0.575139 0.0835
AUDFZ 0.023303 0.7543 -0.02367 0.6814 -0.667689 0.0127 -0.28044 0.0071
AUTEN 0.043652 0.8427 -0.00409 0.7212 -0.008022 0.7051 -0.01338 0.2869
FSIZE 0.63390 0.0000 0.43491 0.0000 0.298640 0.0000 0.423354 0.0000
FISY -0.76685 0.3259 0.103496 0.1902 0.031804 0.9117 0.310607 0.0153
AUIND -6.1105 0.7677 2.7106 0.5447 2.4205 0.2043 8.5906 0.0132
𝑅2 0.4179 0.528011 0.630320 0.730727
𝑅2Adjusted 0.3640 0.681014 0.589245 0.725070
F-statistic
(p value)
7.7
0.00
100.1.
0.00
15.3
0.00
109.3
DW-sta 1.8 1.5 1.6 1.6
Model 2 Agric Consumer goods Health Industrial goods
Variables Coef p-value Coef p-value Coef p- value Coef p-value
C 10.41626 0.0003 5.826887 0.1902 8.042756 0.0007 7.672673 0.0000
RISK -0.106566 0.5168 -0.08476 0.0405 -1.934211 0.0012 -0.596222 0.0013
HHI 0.000400 0.2767 5.785 0.9778 0.000107 0.7292 -2.65E-05 0.0218
CR4 -5.955684 0.1717 1.596857 0.0000 -0.795026 0.0222 -0.785321 0.7710
NAS 0.191825 0.4460 0.064944 0.1309 -0.448995 0.0327 0.274482 0.0777
AUFEE -2.0006 0.9250 4.585 0.8980 7.48E-05 0.0010 5.90E-05 0.0000
𝑅2 0.722044 0.351433 0.299136 0.176793
𝑅2Adjusted 0.563446 0.340403 0.244381 0.159352
F-statistic
(p value)
0.8
0.02
0.0
31.8614
0.0
5.4 1.17
0.10
DW-sta 1.5 1.9 1.7 1.6
Source: Researcher’s computation (2016), using E-views 7.0
In agriculture sub-sector the relationship between audit firm size (AUDFZ) and audit quality
(AQ) depicted by discretionary accruals is positive but insignificant (0.02, p=0.94) at 5%
significance level. In consumer goods sector , the variable it also appeared to be negative but
insignificantly related with audit quality (-0.02, p=0.68). In health sub-sector , the variable
appears to negatively related with audit quality and demonstrated significance relationship (-
0.67, p=0.01).In industrial goods, audit firm exhibits a negative and significant relationship
with audit quality( -0.28,p=0.007). For robust test, audit firm size is noticed to be negatively
signed and still insignificant ( -0.009, p=0.83).
In agricultural sub-sector, audit tenure(AUTEN) has a positive but insignificant relationship
with audit quality (0.04, p=0.31) at 5% significance level. In consumer good sub-sector,
auditor tenure also appeared to be negatively but insignificantly related with audit quality (-
0.004, p=0.72). In health, the variable appears to negatively related with audit quality but
| 92
demonstrated insignificance relationship (-0.0, p=0.71). In industrial goods sub-sector,
auditor tenure exhibits a negative but insignificant relationship with audit quality( -
0.013,p=0.29). For robust test, auditor tenure is noticed to be negatively signed and significant
(-0.0008, p=0.03).
The effect of firm size on audit quality depicted by discretionary accruals appears to be
positively and significantly related with audit quality(0.63,p=0.0) in agriculture sub-sector.
Firm size is positively related with audit quality in consumer goods sub-sector with coefficient
(0.435) and p-value (p=0.00) . The relationship is significant at level. In the health sub-sector
firm size also appeared to be positive and significantly related with audit quality with
coefficient values of ( 0.3) and p-.values (p=0.00) . Firm size further appears to be positively
and significantly related with audit quality (0.42,p=,0.00) .Finally for robust test, Firm size
appeared to positively and significantly related with audit quality(0.43,p=0.0)
Balance sheet date (FISY) has a negative but insignificant relationship with audit quality
(0.51, p=0.47) at 5% significance level in agriculture sub-sector(-0.77, p=0.0). In consumer
good sub-sector, FISY appeared to be positively but insignificantly related with audit quality
(0.10, p=0.19). In health sub-sector, the variable appears to be positive but demonstrated
insignificance relationship with audit quality (0.03, p=0.91). In industrial goods sub-sector,
FISY exhibits a positive and significant relationship with audit quality (0.31, p=0.02). In
2005, FISY is noticed to be positively signed and still insignificant (0.11p=0.68). The
outcome for robust test indicated that FISY demonstrated positive and significant relationship
with audit quality(0.14,p=0.0).
Auditor independence (AUIND) appears to be positive related with audit quality but
demonstrated insignificance relationship (4.94, p=0.63) in 2001. Auditor independence
exhibited a negative and significant relationship with audit quality(-6.11,p=0.001) in

| 93
consumer sub-sector, auditor independence is noticed to be positively signed but
insignificant.(2.7, p=0.54). The outcome for health, indicates that auditor independence
demonstrated positive but insignificant relationship with audit quality(2.4,p=0.20).
It was further observed that the variables exhibits positive and significant relationship with
audit quality in industrial goods sub-sector (8.59, p=0.013). Auditor independence exhibited
positive and significant relationship with audit quality for robust test (6.44, p=0.037).
In evaluating the yearly performance of the model which relates auditor attribute and audit
quality.It is observed that for agriculture sub-sector, the R2 stood at 0.42 indicating that the
model explains about 42% of systematic variations in audit quality in agriculture sub-sector.
The F-stat for the model is significant at 5% (p=0.05) it implies that the hypotheses of a linear
relationship cannot be rejected at 5%. The D.W stat of 1.9 suggests that stochastic dependence
is unlikely between successive units of the error term. For consumer goods, the R2 stood at
0.69 indicating that the model explains about 69 % of systematic variations in audit quality.
The F-stat (p=0.00)for the models significant at 5% , it implies that the hypotheses of a
linear relationship cannot be rejected at 5% .The d.w stat of 1.6 suggest that stochastic
dependence is unlikely between successive units of the error term. For health sub-sector, the
R2 stood at 0.47 indicating that the model explains about 47% of systematic variations in audit
quality of quoted companies. The F-stat for the model is significant at 5% (p=0.00) indicting
that the hypotheses of a linear relationship cannot be rejected at 5%. The D.W stat of 1.6
suggest that stochastic dependence is unlikely between successive units of the error term. For
industrial goods the R2 stood at 0.73 indicating that the model explains about 73% of
systematic variations in audit quality by quoted companies. F-stat for the model is significant
at 5%.(p=0.0) The D.W stat of 1.6 suggest that stochastic dependence is unlikely between
successive units of the error term. Finally, the R2 stood at 0.63 indicating that the model
explains about 63% of systematic variations in audit quality of quoted companies. The F-stat

| 94
for the model is significant at 5% (p=0.00) it indicates that the hypothesis of a linear
relationship cannot be rejected at 5%. The D.W stat of 2.1 suggests that stochastic dependence
is unlikely between successive units of the error term.
To further valid the result the model was re-estimated by running regression for the various
sub-sectors a robust panel data multivariate regression test .
In agriculture sub-sector the relationship between audit Risk and HHI show negative but
insignificant with audit quality (AQ) depicted by discretionary accruals insignificant
relationship audit quality (-0.11, p=0.52:-5.9,0.52) at 5% significance level in agric and
consumer goods respectively . In health goods sector, the variable it also appeared to be
negative and significantly related with audit quality (-0.06, p=0.31). In industrial goods sub-
sector, the variable appears to negatively related with audit quality and demonstrated
significance relationship (-0.59., p=0.013). For robust test, absolute audit market
concentration is positively related with audit quality, but relationship is insignificant (7.71,
p=0.52).
In agricultural sub-sector, relative audit market concentration has a positive but insignificant
relationship with audit quality (0.0, p=0.17) at 5% significance level. In consumer good sub-
sector, relative market concentration also appeared to be positive but insignificantly related
with audit quality (1.57004, p=0.397). In health goods sub-sector, the variable appears to be
negatively related with audit quality but demonstrated insignificance relationship (-0.79,
p=0.0.03). In industrial goods sub-sector, relative audit market concentration exhibits a
negative and significant relationship with audit quality ( -0.78,p=0.77). For robust test,
relative market concentration is noticed to be negatively signed and significant (-2.8,
p=0.018).

| 95
The effect of NAS on audit quality depicted by discretionary accruals appears to be positively
but insignificantly related with audit quality (0.19,p=0.45) in agriculture sub-sector. NAS is
positively related with audit quality in consumer goods sub-sector with coefficient (0.64) and
p-value (p=0.54). The relationship is not significant at 5% level significant. In the health sub-
sector NAS appeared to be negative and significantly related with audit quality with
coefficient values of ( -0.45) and p-.values (p=0.03) . NAS further appears to be positive but
not significantly related with audit quality (0.27,p=,0.078). Finally for robust test, NAS
appeared to positively and significantly related with audit quality(0.,p=0.00)
Audit fee has a negative but insignificant relationship with audit quality ( -2.0, p=0.45) at 5%
significance level in agriculture sub-sector. In consumer good sub-sector, audit fee appeared
to be positively and significantly related with audit quality (4.5, p=0.0). In health sub-sector,
the variable appears to be positive and has significant relationship with audit quality (7.48,
p=0.001). In industrial goods sub-sector, audit fee exhibits a positive and significant
relationship with audit quality (5.91, p=0.00). The outcome for robust test indicated that audit
fee demonstrated positive and significant relationship with audit quality(2.4.,p=0.0).
In evaluating the sector- by- sector performance of the model which relates market
concentration and audit quality it is observed that for agriculture sub-sector, the R2 stood at
0.72 indicating that the model explains about 72% of systematic variations in audit quality in
agriculture sub-sector. The F-stat for the model is significant at 5% (p=0.02) it implies that the
hypotheses of a linear relationship cannot be rejected at 5%. The D.W stat of 1.5 suggests that
stochastic dependence is unlikely between successive units of the error term. For consumer
goods, the R2 stood at 0.34 indicating that the model explains about 34 % of systematic
variations in audit quality. The F-stat (p=0.00)for the models significant at 5% , it implies
that the hypotheses of a linear relationship cannot be rejected at 5% .The d.w stat of 1.7
suggest that stochastic dependence is unlikely between successive units of the error term. For

| 96
health sub-sector, the R2 stood at 0.29 indicating that the model explains about 29% of
systematic variations in audit quality of quoted companies. The F-stat for the model is
significant at 5% (p=0.00) indicting that the hypotheses of a linear relationship cannot be
rejected at 5%. The D.W stat of 1.9 suggest that stochastic dependence is unlikely between
successive units of the error term. For industrial goods the R2 stood at 0.73 indicating that
the model explains about 73% of systematic variations in audit quality by quoted companies.
F-stat for the model is significant at 5%.(p=0.0) The D.W stat of 1.6 suggest that stochastic
dependence is unlikely between successive units of the error term. Finally, the R2 stood at
0.11 indicating that the model explains about 11% of systematic variations in audit quality of
quoted companies. The F-stat for the model is significant at 5% (p=0.00) it indicates that the
hypothesis of a linear relationship cannot be rejected at 5%. The D.W stat of 2.1 suggests that
stochastic dependence is unlikely between successive units of the error term.
In evaluating the performance of the robust model which relates audit market concentration
and audit quality it is observed the R2 stood at 0.49 indicating that the model explains about
50% of systematic variations in audit quality. The F-stat for the model is significant at 5%
(p=0.05) it implies that the hypotheses of a linear relationship cannot be rejected at 5%. The
D.W stat of 2.1 suggest that stochastic dependence is unlikely between successive units of the
error term.
4.6 Test of Hypotheses
Hypothesis One
Hoi: There is no significant relationship between Relative audit market concentration
and audit quality in the Nigerian manufacturing sector.
The result in table 4.11 shows that in 2010 relative market appeared to be negatively related
with audit quality (-1.28,p= 0.007).The relative audit market concentration appeared to

| 97
benegatively and significantly related with audit quality(-0.008,p=0.005) in 2012 .CR4
appear to negatively relatewith audit market concentration in 2011(0.39,p=0.009). Based on
the negative results of 2010,2011and 2012 the hypothesis that there is no significant
relationship between Relative audit market concentration and audit quality in the Nigerian
manufacturing sector is rejected.
Hypothesis Two
Ho2: There is no significant relationship between absolute audit market concentration
and audit quality in the Nigerian manufacturing sector.
From the Ordinary least squares Absolute audit market concentration (HHI) has anegative
relationship with audit quality (-0.004,p=0.025) at 5% significance level in 2004. In 2010, the
variable appears to be negatively relatedwith auditquality relationship (-0.0022,
p=0.048).The result further shows HHI has positive relationship with audit quality
(0.19,p=0.117) in 2011. In addition, the result shows that HHI has negative relationship with
in 2012 and 2014 respectively (-0.056,p=0.029; -0.22p=0.027).Based on the resultsof 2004,
2010and 2014 the hypothesis that there is nopositive relationship with significant relationship
between absolute audit market concentration and audit quality in the Nigerian manufacturing
sector is rejected.
Hypothesis Three
Ho3:There is no significant relationship between auditors’ independence and audit quality
The result shows that auditor independence is positively related with audit quality (5.6,
p=0,027) in 2004. It also shows that audit independence is positively related with audit
quality(4.47,p=0.007) in 2009.The result finally shows that auditor independence is
negative related with audit quality. Based on the results gotten from 2004,2009and 2012

| 98
the hypothesis there is no significant relationship between auditors‘ independence and audit
quality is rejected
Hypothesis Four
Ho4: Auditors’ tenure does not have significant relationship with audit quality.
In 2002, auditor tenure also appeared to be negatively and significant related with audit
quality (-0.22, p=0.04). In 2008, the variable appears to negatively related with audit quality
(-0.09, p=0.014). In 2012, auditor tenure appears to be negatively related with audit quality
(--1.33, p=0.018).Furthermore, the results show that auditor tenure has negative relationship
with audit quality. Based on the results of negative result of 2002, 2008, 2012 and 2015the
auditors‘ tenure does not have significant relationship with audit quality is rejected.
Hypothesis Five
Ho5: Auditor’s firm size does not have significant relationship with audit quality.
In 2014, audit firm size has a negative relationship with audit quality(-0.43,p=0.041). This
relationship is significant at 5% level of significant.Based on this the hypothesis that auditor‘s
firm size does not have significant relationship with audit quality. The hypothesis is therefore
rejected.
4.7 Discussion of Results
This study uses a year by year analysis for 52 firms for fifteen years, 2001 and 2015.This
study also section the sample into four subsectors(agric, consumer goods, health and industrial
goods) The results are presented for each of the fifteen years using discretionary accruals
proxies for . To establish whether audit concentration and attributes have impact on audit
quality. We restrict our conclusion to results where the variables are significant. For some
variables, the significant results have both negative and positive signs. To resolve this, we

| 99
take the sign that is more frequent within the period.This conforms with Boone et al. (2012)
and Numan et al (2012) but contradicts Jere et al. (2013) and Kallapur et al (2010).
Auditor firm size
From both the correlation and regression results, the audit firm appeared to negatively impact
audit quality post Enron era and post audit reform era. Predominantly sectorially audit firm
size appears to be negatively influence audit quality. Both year –by-year and sectorial analysis
give an overwhelmingly negative relationship with audit quality. For all results where audit
firm size is significant, it was negatively related to audit quality. The conclusion of this study
is that audit firm size is negatively related to audit quality. The result corroborates the
negative gotten by Okile,Izedonmi and Enofe (2013) and Sawan and Alsaqfi (2013) and in
variance with positive gotten by Ilaboya and Ohiokha (2014).This also in variance with
reputation .It possible that bigger firms pay less attention to diligence because of high
patronage while smaller firms will put in their best in order to build good reputation.
Auditor tenure
Prior studies have provided mixed results on the relationship between auditor tenure and audit
quality.However in this study tenure exhibited negative relationship audit quality. This is
result however in variance with learning curve theory.The possible reason for this is the
elongated auditee-auditor relationship. The long audit-client relationship contract resulted to
over familiarity which led to gradual loss of audit firm ‗honest disinterest‘ and thereby
aligning themselves with client‘s interest. This result aligns with Enofe el at (2013) that find a
negative relationship between auditor tenure and audit quality.
Absolute market concentration
This study finds that absolute audit firm concentration has a negative relationship with audit
quality. This is variance with GAO‘s (2003, 2008) which proposes that high intensity of big4
concentration does not in any way lower audit it quality.

| 100
Auditor independence
DeAngelo (1981) relates the probability of detection to auditor competence and probability of
revelation is associated with independence. The result of this study shows that auditor
independence has a positive relationship with audit quality. This implies that audit-client
economic bonding impaired audit quality. The higher theeconomic bonding, the lower the
audit independence and hence the lower the audit quality.
Relative market concentration
The results for this study show thatafter controlling for various auditor attributes indicates
thatwhen audit market has higher ratio of big audit firms is a greater likelihood of the client
engaging in opportunistic behaviour .These result shows that higher concentration of bigger
audit firms will lower audit quality .It implies that high auditor concentration lead to amplify
the auditor‘s tolerance for earnings management. This is result corroborates Boone et al
(2010) and Francis et al (2013) that discover that relative audit concentration lowers audit
quality.
Also, higher concentration may facilitate tacit collusion among the Big 4 auditors who
dominate the market .Thus auditor concentration in local audit markets could facilitate parallel
behavior among the Big 4
Control variable
Control variables were inserted into model for much robust result . The results show that
balance sheet date is negatively to audit quality. It indicates that firms prepare their report in
busy period are prone to financial misstatements. The result shows firm size has possible
relationship with audit quality. The result further shows that risk is negatively related to audit
quality. Rendering of non-audit services was discovered to have positive relationship with
audit. This is aligns with learning curve theory what states that familiarity with a given task
leads to competency . Finally, the result shows that audit fee positively related to audit
quality . This possible explanation for this is that more audit effort leads to quality audit and
effort is a function of time and expertise. Imploring this factors will lead to high audit fee.

| 101
CHAPTER FIVE
SUMMARY OF FINDINGS, CONCLUSION AND RECOMMENDATIONS
5.1 Introduction
In this chapter, the findings of this study are summarised. This chapter also concludes the
study and makes policy recommendations and recommendations for further studies. The
summary of findings is based on the presentation and analysis of data in chapter four. The
policy recommendations are based on the findings and the recommendations for further
study discuss gaps in knowledge for future consideration.
5.2 Summary of Findings
The hypotheses of this study relate audit quality toauditor attributes and audit market
concentration. In all variables were related to audit quality. The study finds as follows:
i. relative audit market concentration has negative and significant relationship with
audit quality;
ii. absolute audit market concentration has a negative and significant relationship
with audit quality in the Nigerian manufacturing sector
iii. auditor independence has positive and significant relationship with audit quality;
iv. auditor tenure has negative and significant relationship with audit quality;
v. there is a negative and significant relationship between audit firm size and audit
quality;
vi. audit fee has a positive and significant relationship with audit quality;
vii. rendering of non-audit services has negative relationship with audit quality;

| 102
5.3 Conclusion
This study lies at the heart of the issue of reliability of financial statements. Reliability is
the accountant‘s terminology for integrity of financial statements. Reliability is the
cornerstone of credibility, which in turns determines investor confidence. The focus of this
study is audit market concentration; auditor attributes and audit quality in the Nigerian
manufacturing sectors. The study is motivated by the paucity of research on subject matter
in manufacturing sub-sector in Nigeria. This study therefore uses the discretionary accrual
to proxy audit quality. The study deliberately cover the post-Enron era and post-audit
reforms era decipher the activities of audit after the demise of Enron.
This study contributes to audit quality literature by being the first to best of our knowledge
in the Nigerian context to use both relative and absolute audit market concentration in a
single model. Besides, the models used in this study are unique to this study. The models
were built based on a study of extant literature, GOA and audit reforms. These variables
all show a significant and negative relationship with earnings management.
The study provides empirical evidence to support a positive relationship between auditor
independence and audit quality. On the other hand, absolute audit market concentration,
relative market concentration andaudit firm size negatively impact audit quality and align
with negative gotten in extant literature.
5.4 Recommendations
5.4.1 Policy Recommendations
Professional bodies, Management and auditors
i. Alternative appointment processes for auditors, e.g. involving shareholder panels,
or appointment by regulator.
ii. limit the auditor from undertaking any non-audit work for their audit clients.
iii. Require fees for ‗audit related work‘ and ‗extended audit work‘ to be reported by
audit firms separately from fees for audit work.
iv. Limit the proportion of audit fees a firm can receive from a single client

| 103
Regulators and standards setters
i. Narrow the scope of the annual audit, so that companies can get other advice from
‗mid-tier‘ firms
ii. Consistency/alignment of the regulatory framework globally.
iii. An early warning system of significant threats to the operations of a ‗Big 4‘ firm
should be introduced
Reducing ‘Big 4’ dominance
i. Place limits on the market share of firms measured by the number of appointments
held over a five year period.
ii. Audit committees to disclose when and how periodic formal evaluations of the
internal and external auditors were undertaken and the key conclusions arising
therefrom.
Investors
i. Find a way of ensuring that the largest institutional investors act together to
influence large companies to consider ‗Mid-Tier‘ audit firms, as they usually get
the changes they are looking for.
ii. The FRC should convene a group of large institutional investors to come up with
audit market intervention initiatives.
Accounts manipulation is a menace that has lead the fall of corporate giants, both within
and without Nigeria. Accounts manipulation could fall within or without the law. It is
easier to tackle the illegal manipulation of accounts. However, where due to weaknesses
in regulations, accounts are manipulated, there is a greater challenge. Weaknesses in
accounting regulations are most times not obvious until they have been exploited by
management. Audit market concentration is a virus that mutates as the law changes. The
professionals bodies, and regulatory authorities in Nigeria, like the Institute of Chartered
Accountants of Nigeria (ICAN) and Financial Reporting Council of Nigeria (FRCN) who
are constantly looking for ways to promote and improve audit quality in the private and

| 104
public sectors, SME, large corporations, and the country at large should employ the above
mentioned since an understanding the factors that predisposes an audit failure will help
policy formulation to constrain the practice.
Furthermore, the recommendations for ensuring quality audit:
i. Audit market concentration
A change from a big four to a big four may not be a change indeed as these are basically
multinationals with almost the same audit practice hence, regulatory bodies should
regulate the audit activities by ensuring that a does switch from one big4 audit firm to
another big4.
ii. Audit tenure
Change in auditors should be done against the unending tenure that is in place. Firstly,
the study indicates that a long tenure in place does not a guarantee quality audit. This
study recommends that auditor should be changeeveryfive year to avoid over familiarity
with client which can reduce the quality of audit. A change from a big four to a big four
may not be a change indeed as these are basically multinationals with almost the same
audit practice. Furthermore, professional bodies
iii. Audit firm size
Thirdly, the audit firm size should be regulated. Government should strength
indigenous/small audit firm and also ensure switching from one big audit firm to another
is discouraged in to bring sanity into the Nigerian audit market.
iv. Auditor independence
Finally, strong economic bonding of auditor to client should be discouraged because with
destroys auditor independence. When a client pays high audit fee he indirect buys audit
opinion. This can be discouraged by formulating an audit fee model and enforce
compliance.

| 105
5.4.2 Contribution to Knowledge
This study contributes to knowledge in the following ways:
1. This study developed a modified regression model for audit quality assessment
which can be adopted by professionals, management, researchers, government
agencies, standard setters, corporate firms, external auditors, and policy
formulators in assessing the quality of audit quantitatively. The model is
represented as:
AQit = - β1AUDINPit +β2 AUDTENit +β3 AUDFZit + β4FSIZEit + β5FISYit + it
=0 827 + 5.26it - 0.184it – 0.09it - 0 .4493 - 0.019 it t + it
2. This study, to the best of the our knowledge, is the first of its kind in Nigeria
employing Nigerianbased data of 52 manufacturing firms for 15 years which
contributes to a robust result.
3. The study adds to the body of existing knowledge and guide for researchers and
professionals to further research on the subject matters in areas that were not
considered in this study.
5.4.3 Recommendations for Further Studies
This study focused on specific discretionary accruals as a proxy for audit quality. The first
suggestion for further study is to repeat the study in other sectors like financial
institutions. Thus discretionary accruals, as used in the models can be replaced with
abnormal loan loss provision.
Future research could be directed towards expanding audit concentration analysis on
unlisted companies. It would also be interesting to compare audit concentration levels
among various sectors and company sizes. Moreover, the existing research could be
upgraded. The direct approach would imply conducting a survey, using primary data

| 106
among internal and external users of statutory audit. On the other hand, it could also be
tested indirectly, by exploring other statistical techniques and tools
A further recommendation is to look at the earnings management practice pre-
recapitalisation. This study has examined the post-recapitalisation. By comparing earnings
management post- and pre-recapitalisation, it would help us to determine the effects of
changes in regulatory capital on earnings management practice and the quality of audit.
This study deals with the manufacturing sector. An examination of these models for
financial sector and other non-financial sectors of the economy is recommended for
further studies. However, in that case, the models will have to change accordingly
Finally, the proxies for the independent variables may be changed. Audit committee
competence and activity was not considered in this study. This variable and others may be
added within a longer time frame to evaluate the trend in the analysis.

| 107
REFERENCES
Abdel-Khalik, A. (2002). Reforming Corporate Governance Post Enron: Shareholders‘ Board of
Trustees and The Auditor. Journal of Accounting and Public Policy. 21(2), 97-103.
Abidin, S. (2006). Audit Market Concentration and Auditor Choice in the UK. A Thesis submitted for
the degree of Doctor of Philosophy in Accounting. University of Stirling.
Adeyemi, S. B., Okpala, O. & Debor, E. L. (2012) The Factors Affecting Audit Quality in Nigeria.
International Journal of Business and Social Science. 198 – 209.
Agostini M. &Favero, G. (2012).Accounting Fraud, Business Failure and Creative Auditing: a micro-
analysis of the strange case of Sunbeam Corp. Working paper series. Department of
Management.Ca‘ Foscari University of Venice, Italy
Ahmed, J. & Karim, A. (2005). Compliance to International Accounting Standards inBangladesh: A
Survey of Annual Reports. The Blangladesh Accountants July – September: 23 – 41.
Ahmed, K. & Goyal, M.K. (2005) ―A Comparative Study of Pricing of Audit Services in Emerging
Economies,‖ International Journal of Auditing, Vol. 9: 103-116.
Ajaegbu, O. (2014). The Case of Joint Audit. Retrieved from http:/www.icanig.org/ican/.../ICAN
accessed: September 13th, 2015.
Allen, Jere and Taylora (1995) Auditor brand name reputations and industry specializations, Retrieved
(5/10/16) from: https://papers.ssrn.com
Al-Harshani, M. (2008) ―The Pricing of Audit Services: Evidence from Kuwait,‖ Managerial
Auditing Journal, Vol. 23 ( 7): 685-696.
Ali shah, S. Z., Ali Butt, S., & Hassan, A. (2009). Corporate governance and earnings management: an
empirical evidence from Pakistan companies. European Journal of Scientific Research, 26(4),
624-638.
Almutairi, A. R. (2008). Does Auditor Industry Specialization Matter? Evidence from the Bond
Market. TheIcfai University Journal of Audit Practice, 5(3), 44-72.
Anderson, T. & Zeghal, D. (1994). The pricing of audit services: Further evidence.Accounting and
Business Research, Summer, 195-207.
`
Antle, R. & Demski, J. (1991).Contracting Frictions, Regulation, and the Structure of CPA Firms.
Journal of Accounting Research.29(1), 1 – 24.
Arens, A. A. & Loebbecke, J. K. (1994), Auditing: an Integrated Approach (6th ed.), London: Prentice
Hall.
Arens, A. A., & J. K. Loebbecke. (1997). Auditing, an Integrated Approach. Upper SaddleRiver, NJ:
Prentice Hall.
Arens, A. A., Elder, R. J., & Beasley, M. S. (2010). Auditing and assurance services: An sintegrated
approach. Upper Saddle River, N.J: Prentice Hall.
Aron T. (2008) The Great Industry Gamble: Market Structure Dynamics with Moral Hazard, Retrieved
(5/10/16) from: https://papers.ssrn.com
Arrunada, B. (2000). Audit Quality: Attributes, Private Safeguards and the Role of Regulation.
European Accounting Review, 9 (2), 205-224.

| 108
Aslan, O. (2012). Mandatory Audit Firm Rotation: A Cure or a Placebo? A Master Thesis Submitted
to Faculty of Law, International Business Law. Tilburg University.
Asthana, S., Balse M. S. & Kim, S. (2009). The Effect of Enron Anderson and Sarbanes Oxley on the
US Market of Audit Services. Accounting Research Journal.
Azibi and Velte (2015) Are Joint Audits a Proper Instrument for Increased Audit Quality? Retrieved
(5/10/16) from: https://papers.ssrn.com
Bain, J.S. (1956). ―Barriers to New Competition‖. Harvard University Press.
Balsam, S., Krishnan, J. & Yang, J. S. (2003). ―Auditor Industry Specialization and Earnings Quality‖,
Auditing: A Journal of Practice and Theory. 22(1) 71-97.
Bandyopadhyay, S.P. & Kao, J.L. (2004). Market Structure and Audit Fees: A Local Analysis,
Contemporary Accounting Research. 21(3), 529-56.
Beattie, V. (2012) Competition Commission Statutory Audit Market Investigation Initial Review of
Relevant Academic Literature.
Beattie, V., & S. Fearnley (1994) ―The Changing Structure of the Market for Audit Servicesin the UK:
a Descriptive Study‖. British Accounting Review. 26(1), 301-322.
Beattie, V., Goodacre, A. & Fearnley, S. (2003). And Then There Were Four: A study of UK Audit
Market Concentration – Causes, Consequences and The Scope for Market Adjustment.
Journal of Financial Regulation and Compliance, 11(3), 250-265.
Beck and Mauldin (2014) Who's Really in Charge? Audit Committee versus CFO Power and Audit
Fees, Retrieved (5/10/16) from: https://papers.ssrn.com
Becker, C. C., Defond, M. L., Jiambaluo, J. & Subramanyam, K. R. (1998). The Effect of Audit
Quality on Earnings Management. Contemporary Accounting Research, 15 (1), 1 – 24.
Bernard A.( 2008)The Audit Industry: World's Weakest Oligopoly? Retrieved (5/11/16) Retrieved
(5/10/16) from: https://papers.ssrn.com
Bleibtreu and Stefani (2015) The Interdependence between the Structure of the Audit Market and the
Quality of Audited Financial Statements: The Case of Non-Audit Services, Retrieved
(5/10/16) from: https://papers.ssrn.com
Benston, G. T. (1985). The Market for Public Accounting Services: Demand, Supply and Regulation.
Journal of Accounting and Public Policy, 4(1), 33 – 79.
Blokdijk, H.F., Drieenhuizen, F., Simunic, D. & Stein, M. (2006). An Analysis of Cross-Sectional
Differences in Big and Non-Big Public Accounting Firms‘ Audit Programs. Auditing: A
Journal of Practice and Theory, 25(1), 27 – 48.
Boo, E. & Sharma, D. (2008). Effect of regulatory oversight on the association between internal
governance characteristics audit fees. Accounting and Finance 48:51–71.
Boone, J. P, Khurana I. K., & Raman, K. K. (2012). Audit Market Concentration and Auditor
Tolerance for Earnings Management. The University of Texas at San Antonio, College of
Business. Working Pager Series. March 29.
Bruynseels and Cardinaels (2014) The Audit Committee: Management Watchdog or Personal Friend
of the CEO?

| 109
Bugshan, T. (2005). Corporate governance, earnings management, and the information content of
accounting earnings: theoretical model and empirical tests. Unpublished doctoral dissertation,
Queensland, Australia
Bukit, R. B., & Iskandar, T. M. (2009). Surplus free cash flow, earnings management and audit
committee. International Journal of Economics and Management, 3(1), 204-223.
Buijink W.F.J., S. J. Maijoor, & R.H.G. Meuwissen, (1998), Competition in Auditing: Evidence from
Entry, Exit and Market Share Mobility in Germany versus The Netherlands, Contemporary
Accounting Research, 15(3), 385-404.
Butterworth, S. & Houghton, K.A. (1995). ‗Auditor Switching: The Pricing of Audit Services‘. Journal
of Business Finance and Accounting. 22(3), 323-344.
Cameron, M. (2005). Audit Fees and the Larger Auditor Premium in the Italian Market. International
Journal of Auditing, 9: 129-146.
Campbell, Hansen, Simon, and Smith (2015) Audit Committee Stock Options and Financial Reporting
Quality after the Sarbanes-Oxley Act of 2002
Cassell, Giroux, Myers, and Omer (2012) The Effect of Corporate Governance on Auditor-Client
Realignments
Carey P., & R. Simnett. (2006). Audit partner tenure and audit quality. The Accounting Review, 81 (3),
653-676.
Carson, E., Farger, N., Simon, D. &Taylor, M. (2004). Audit Fees and MarketSegmentation – Further
Evidence how Client Size Matters within the Context of Audit Fee Models. International
Journal of Auditin, 8(1),79-91.
Casey, J. & Kehoe, J. (2013). The Impact of Voluntary Auditor Rotation on Audit Quality: An
Empirical Study of the FTSE 350 Companies. A Working Paper Presented at School of
Business, Waterford Institute of Technology, Ireland.
Chan, P., Ezzamel, M. and Gwilliam, D. (1993). Determinants of audit fees for quoted
UK companies. Journal of Business Finance and Accounting, 20(6),765-786.
Chaney, P., Jeter, D., & Shivakumar, L. (2004). Self-Selection of Auditors and Audit Pricing in
Private Firms. Accounting Review, 79(1), 51-72.
Chen,Srinidhi, Tsang, and Yu (2016)Audited Financial Reporting and Voluntary Disclosure of
Corporate Social Responsibility (CSR) Reports
Choi M., & Zeghal D. (1999). The Effect of Accounting Firm Mergers on International Markets for
Accounting Services, Journal of International Accounting, Auditing and Taxation, 8(1), 1-22.
Chtourou, S. M., Bedard, J., &Courteau, L. (2001). Corporate governance and earnings management.
http://www.ssrn.com/abstract=275053, accessed 25 October, 2015.
Clarkson, P. M. & Simunic, D. A. (1994) ‗The Association between Audit Quality, Ownership, and
Firm-Specific Risk in U. S. vs. Canadian IPO Markets‘, Journal of Accounting and
Economics, 17 (1-2), 207-228.
Clatworthy, M. A., & Peel, M. J. (2006). The effect of corporate status on external audit fees:
Evidence from the UK. Journal of Business Finance and Accounting, 1(2), 169-201.
Colbert, G & Murray, D. (1999). An Assessment of Recent Changes in the Uniform Accountancy Act.
Accounting Horizons, 13 (March), 63.

| 110
Cook, J. M. (1987) ‗Two years of progress in financial accounting and reporting‘, Journal of
Accountancy, 163(6), 96-108.
Cooper, D. C. & Emory, C. W. (1995). Business Research Methods. New York: Irwin.
Copley, P. A. (1991) ‗The Association Between Municipal Disclosure Practices and Audit Quality‘,
Journal of Accounting and Public Policy, 10(4), 245-266.
Culpan, R. & Trussel, J. (2005). Applying the Agency and Stakeholder Theories to The Enron
Debacle: An Ethical Perspective. Business and Society Review. 110 (1), 59-76.
Craswell, A. & S. Taylor. (1991). The Market Structure of Auditing in Australia: The Roleof Industry
Specialization. Research in Accounting Regulation.
Craswell, A. T., Francis, J. & Taylor, S. (1995). Auditor Brand Name Reputations and Industry
Specialization. Journal of Accounting and Economics, 20 (December), 297-322
Dang, L. (2004) Assessing Actual Audit Quality, Ph.D. Thesis, Faculty of Drexel University.
Danos P., & Eichenseher, J.W. (1981). ―The Analysis of Industry-Specific Auditor Concentration -
towards an Explanatory Model. The Accounting Review, 56(3), 479-492.
DeAngelo, L. (1981a). Auditor Independence, ―Low Balling‖ and Disclosure Regulation.Journal of
Accounting and Economics, 3(1), 113-127.
DeAngelo, (1981b). Auditor Size and Audit Quality. Journal of Accounting and Economics, 3(1),
183-199.
Dechow, P., R. Sloan, & A. Sweeney (1995). Detecting Earnings Management. The Accounting
Review, 70 (2), 193–225.
Dechow, P. M. & Dichev, I. D. (2002). The quality of accruals and earnings: the role of accrual
estimation errors. The Accounting Review, 77 (supplement), 35-59.
Dedman, E., & C. Lennox. (2009). Perceived Competition, Profitability and The Withholding of
Information About Sales and The Cost of Sales. Journal of Accounting and Economics, 48(2),
210–230.
DeFond, M. L. (1992). The Association between Changes in Client Firm Agency Costs and Auditor
Switching. Auditing: A Journal of Practice and Theory, 11 (1), 16-31.
DeFond, M. L. & Subramanyam, K. R. (1998) ‗Auditor changes and discretionary accruals‘, Journal
of Accounting and Economics, 25(1), 35-67.
Defond M. & Zhang J. (2013). A review of archival auditing research. Journal of Accounting and
Economics. 58(2-3), 275-326.
Dimitropoulos, P. E., &Asteriou, D. (2010). The Effect of Board Composition on the Informativeness
and Quality of Annual Earnings: Empirical Evidence from Greece. Research in International
Business and Finance, 24(1), 190-205.
Ding, Y., & Jia, Y. (2012). Auditor Mergers, Audit Quality and Audit Fees: Evidence from the
PricewaterhouseCoopers Merger in the UK. Journal of Accounting and Public Policy, 31, 69-
85.
Dirk, S. and Zein, N. (2014) Audit Market Segmentation –The Impact of Mid-Tier Firms on
Competition Retrieved (5/10/16) from: https://papers.ssrn.com

| 111
Dopuch, N. (1988). Implication of the Tort Rules of the Accountant‘s Liability for the Accounting
Model. Journal of Accounting, Auditing and Finance, 3 (3), 245-249.
Dubaere, C. (2008) Concentration on the Audit Market M.Sc Thesis Submitted to Faculty of
Economics and Business Administration, Ghent University.
Dunn, K. A. & Mayhew, B. W. (2004). ―Audit Firm Industry Specialization and Client Disclosure
Quality‖, Review of Accounting Studies, (9), 35-58.
Dunn, K., Kohlbeck, M.J. & Mayhew, B.W., (2013).The Impact of Market Structure on Audit Price
and Quality. Working Paper, University of Wisconsin, Madison.
Dye, R. A. 1993."Auditing Standards, Legal Liability, and Auditor Wealth." Journal of Political
Economy, 101(5), 887-914.
Edwards, S., Allen, A.J., Shaik, S. (2006). Market Structure Conduct Performance (SCP) Hypothesis
Revisited using Stochastic Frontier Efficiency Analysis. Selected Paper prepared for
presentation at the American Agricultural Economics Association Annual Meeting, Long
Beach, California, U.S.A.
Eichenseher, J., M. Hagigi, & D. Shields. (1989). Market Reaction to Auditor Changes by OTC
Companies. Auditing: A Journal of Practice &Theory, 9(1): 29–40.
Eisenhardt, K.M. (1989). Agency Theory: An Assessment and Review. Academy of Management
Review, 14(1), 57–74.
Enofe, A. O., Mgbanme, C. O., Adeyemi, A. & Ehi – Oshio, O. U. (2013). Determinants of audit
quality in the Nigeria business environment. Research Journal of Finance and Accounting,
4(4), 36 – 43.
Eshleman, J. D. & P. Guo. (2013). Do Big-4 Auditors Provide Higher Audit Quality After Controlling
for the Endogenous Choice of Auditor? A Working Paper, Louisiana State University.
Eshleman, J. D. (2013). The Effect of Audit Market Concentration on Audit Pricing and Audit Quality:
The Role of The Size of the Market. A Dissertation submitted to the Graduate Faculty of the
Louisiance, State University and Agriculture and Mechanical College for the Degree of Doctor
of Philosophy in The Department of Accounting.
Eshleman, Lawson (2016) Audit Market Structure and Audit Pricing Retrieved (5/10/16) from:
https://papers.ssrn.com
Ettredge, Sherwood and Sun (2016) Metro Audit Market Competition, Audit Fees and Audit Quality,
Retrieved (5/10/16) from: https://papers.ssrn.com
Farag, M. (2007).The Effect of Accounting Regulation on Second-Tier Audit Firms and Their Clients:
Audit Pricing and Quality, Cost of Capital, And Backdating of Stock Options. A dissertation
submitted to the Kent State University Graduate School of Management.
Farrell, J. & Shapiro, C., (1990). ―Horizontal mergers: an equilibrium analysis.‖ American
Economic Review, 80(1), 107-126.
Fathi, J., (2013). Corporate governance system and quality of financial information. Mediterranean
Journal of Social Sciences 4(2): 129–142. doi:10.5901/mjss.2013.v4n2p129
Federal Trade Commission. (2003). Identity Theft Survey Report. Available at:
http://www.ftc.gov/os/2003/09/synovatereport.pdf (accessed on 18 April 2012).

| 112
Federation of European Accountants (2016) Overview of Audit Quality Indicators Initiatives,
INFORMATION PAPER, July, Update to December 2015 edition,
Feldman, E. R. (2006). A Basic Quantification of the Competitive Implications of the Demise of
Arthur Anderson. Review of Industrial Organization, 29 (3), 193-212.
Ferguson, P.R. (1988). Industrial Economics: Issues and Perspectives. London: Macmillan Press LTD.
Financial Reporting Council (FRC) ( 2006). Promoting Audit Quality, Discussion Paper. London:
Financial Reporting Council.
Financial Reporting Council (FRC) (2006).Discussion Paper. Promoting Audit Quality.November.
Financial Reporting Council (2008). The audit quality framework. Financial Reporting Council.
Firth, M. (1985). An Analysis of Audit Fees and their Determinants in New Zealand.Auditing: Journal
of Practice and Theory.
Firth, M. (1997) ―The Provision of Non-audit Services and the Pricing of Audit Fees,‖ Journal of
Business Finance and Accounting,, 24(): 511-525.
Firth, M., Fung, P. M., &Rui, O. M. (2007). Ownership, two-tier board structure, and the
informativeness of earnings –evidence from china. Journal of Accounting and Public Policy,
27(1), 463-496.
Flanagan, D.J., Muse, L.A., & O‘Shaughnessy, K.C. (2008). An overview of accounting restatement
activity in the United States. International Journal of Commerce and Management, 4(), 363-
81.
Francis, J. & Stokes, D. (1986). Product Differentiation and Scale Economies: Further Evidence from
the Australian Market. Journal of Accounting Research, 24(2), 383 – 393.
Francis, J. R. & Wilson, E.R. (1988). Auditor Changes: A Joint Test of Theories Relating to Agency
Costs and Auditor Differentiation. The Accounting Review, 63(4), 663 -682.
Francis, J. R., Michas P. N. & Seavey S. E. (2010). Big Four Audit Market Concentration and Client
Earnings Quality around the World. Conference paper presented at European Auditing
Research Network Conference at National Taiwan University, Taiwan.
Francis, J.R. (2004). What do we know about audit quality? The British Accounting Review, 36(3), 45-
68.
Francis, J. R., P. Michas, & S. Seavey. (2013). Does Audit Market Concentration Harm the Quality
of Audited Earnings? Evidence from Audit Markets in 42 Countries. Contemporary
Accounting Research, 30(1), 325-355.
Francis, J. R., Michas, P.N. & Yu, M.D., (2013). Office Size of Big 4 Auditors and Client
Restatements. Contemporary Accounting Research, Forthcoming.
Frankel, R., Johnson, M. & Nelson, K. (2002). The Relation between Auditors‘ fees for nonaudit
services and earnings management. The Accounting Review, 77(1), 71- 105.
Fonda,Wongb and Lic (1999) The impact of improved auditor independence on audit market
concentration in China Retrieved (5/10/16) from: https://papers.ssrn.com
Garcia-Meca, E., & Sanchez-Ballesta, J. P. (2009). Corporate governance and earnings management: a
meta- analysis. Corporate governance: An International Review, 17(5), 594-610.

| 113
Gary and Andrea (2015) The Association between Sustainability Governance Characteristics and the
Assurance of Corporate Sustainability Reports, Retrieved (5/10/16) from:
https://papers.ssrn.com
Gaynor, Kelton, Mercer and Yohn (2016)Understanding the Relation between Financial Reporting
Quality and Audit Quality, Retrieved (5/10/16) from: https://papers.ssrn.com
Geiger, M.A. & Raghunandan, K. (2002). Auditor Tenure and Audit Reporting Failures.
Auditing, 21(1), 67-78.
General Accounting Office (2003). Public accounting firms: Mandated study on consolidation and
competition. Available online at http://www.gao.gov/new. items/d03864. pdf, (Accessed July,
2014).
General Accounting Office (2008). Audits of Public Companies: Continued Concentration in Audit
Market for Large Public Companies Does Not Call for Immediate Action. GAO-08-163.
Washington, D.C.
Gerrard, I., Houghton, K.A. & Woodcliff, D. (1994) ―Audit Fees: The Effects of Auditee, Auditor and
Industry Differences,‖ Managerial Auditing Journal, Vol. 9(7): 3-11.
Gigler, F., & Penno, M., (1995). ―Imperfect competition in audit markets and its effect on the demand
for audit-related services‖. Accounting Review, 70(2), 317-336.
Government Accountability Office. (2008). Audits of Public Companies: ContinuedConcentration in
Audit Market for large Public Companies does not call for immediate action‖. Available
online at http://www.gao.gov/new.items/d08163.pdf, (accessed April, 2014).
Gray, I. & Manson S. (2002). The Audit Process Principles, Practice & Cases. (2nd ed.) London.
Thomson Learning.
Gul, Kim and QiuOwnership Concentration, Foreign Shareholding, Audit Quality and Firm-Specific
Return Variation: Evidence from China Retrieved (5/10/16) from: https://papers.ssrn.com
Gula, Kimb and QiucM (2010) Ownership concentration, foreign shareholding, audit quality, and
stock price synchronicity: Evidence from China, Retrieved (5/10/16) from:
https://papers.ssrn.com
Hackenbrack, K., and W. R. Knechel. (1997). Resource allocation decisions in audit
engagements.Contemporary Accounting Research 14 (3): 481-500.
Hall, T. J. (2013). The Strength of Industry Specialization: Highlighted by the IFRS Adoption in the
EU. Being a PhD Thesis Submitted to the University of Arizona.
Hayes, R., Dansses, R., Schilder, A. & Wattage P. (2005). Principles of Auditing. An Introduction to
International Standards on Auditing (2nd
ed.): England. Pearson Education Limited.
Hennes, K. M., Leone A. J., & Miller B. P. (2011). Accounting restatements and auditor
accountability. Working paper, University of Oklahoma, University of Miami, and Indiana
University. January 5. Available at SSRN: http://ssrn.com/ abstract=1735675.
Hermanson, R., Dykes, L., & D. Turner. (1987). Enforced Competition in the AccountingProfession –
Does it Make Sense? Accounting Horizons (December),13-19
Hesp, F. (2007). Concentration in the Dutch Audit Market: The Use of Auditor Association
Membership Lists and Annual Reports in Research. Being a Thesis Submitted to the Faculty
of Economics and Business, University of Amsterdam.

| 114
Hines, Masli, Mauldin, and Peters (2015) Board Risk Committees and Audit Pricing, Retrieved
(5/10/16) from: https://papers.ssrn.com
Ho, S.W.M. & Ng, P.P.H. (1996) ―The Determinants of Audit Fees in Hong Kong: An Empirical
Study,‖ Asian Review of Accounting, Vol. 4(2): 32-50.
Hogan, C.E. (1997). Industry Specialization by Auditors, Vanderbilt University.
Hoitash, R., Markelevich, A. & Barragato, C.A. (2007). ―Auditor Fees and Audit Quality‖. Managerial
Auditing Journal, 22 (8), 761-786.
Hribar, P. & Collins, D. W. (2002). Errors in Estimating Accruals: Implications for Empirical
Research. Journal of Accounting Research, 40(1), 105 – 134.
ICAEW (2010). Audit quality: challenges for international consistency [Online]. Available
http://www.icaew.com/~/media/Files/Technical/Audit-and-assurance/audit-quality/audit-
quality-forum/meeting-notes-2010/audit-quality-challenges-for-international-consistency-5-
jul-10.pdf (Accessed 25 May 2015).
Ilaboya, O. J. & Ohiokha, F. I. (2014). Audit Firm characteristics and audit quality in
Nigeria.International Journal of Business and Economics Research, 3 (5), 187 – 195.
Jackson, A. B., Moldrich, M. & Roebuck, P. (2008). Mandatory audit firm rotation and audit Quality.
Managerial Auditing Journal, 23(5), 420–437.
Jensen, M.C. & Meckling W. H. (1976). Theory of the Firm: Managerial Behavior, Agency Costs and
Ownership Structure. Journal of Financial Economics, 3 (4): 305-360
Jensen, M. (1993). Presidential address: The modern industrial revolution, exit and the failure of
internal control systems. Journal of Finance, 48: 831–880.
Jere, Michas and Seavey ( 2011) Does Audit Market Concentration Harm the Quality of Audited
Earnings? Evidence from Audit Markets in 42 Countries Retrieved (5/10/16) from:
https://papers.ssrn.com
Jiang, J. (2010). The Influence of Banks on Auditor Choice and Auditor Reporting in Japan. Master of
Philosophy in Business. Thesis submitted to Lingnan University.
Joanna L. Ho and Fei Kang (2013) Auditor Choice and Audit Fees in Family Firms: Evidence from the
S&P 1500, Retrieved (5/10/16) from: https://papers.ssrn.com
Joha, P. and Günther, J. (2014) The Big-4 Premium in the German Audit Market for Listed and Private
Firms, Retrieved (5/10/16) from: https://papers.ssrn.com
Johnson, E.N., Walker, K.B. and Westergaard, E. (1995). Supplier Concentration andPricing of Audit
Services in New Zealand. Auditing: A Journal of Practice and Theory, 14(Fall): 74-84.
Joshi, P. L., and Al-Bastaki, H. (2000). Determinants of Audit Fees: Evidence from theCompanies
Listed in Bahrain. International Journal of Auditing, 4(2):129-138.
Kallapur, S., Sankaraguruswamy, S., Zang, Y., (2010). Audit Market Concentration and Audit Quality.
Working Paper, Indian School of Business, obtained at: http://ssrn.com/abstract-1546356.pdf
accessed on 26/12/2014.
Kalelkar and Khan (2016), CEO Financial Background and Audit Pricing, Retrieved (5/10/16) from:
https://papers.ssrn.com

| 115
Karaibrahim, Y. Z. (2013). Is Corporate Governance A Determinant of Audit Choice? Evidence from
Turkey. EGE Academic Review, Nisan: 273 – 284.
Kersner, J. (2008). Mending fences. CFO.com.
http://cfo.com/article.cfm/10768242/1/c_10792674?f=search.
Kiel, G. C. & Nicholoson, G. J. (2003). Board composition and corporate performance: How the
Australian experience informs contrasting theories of corporate governance. Corporate
Governance: An International Review, 11:189–205.
Kilgore, A. (2007). Corporate Governance, Professional Regulation and Audit Quality. Malaysian
Accounting Review, 6(1), 65-83.
Kittsteiner, T. & Selvaggi, M. (2008). Concentration, Auditor Switching and Fees in the UK Audit
Market, ELSE Research Report. Prepared For BDO Stoy Hayward LLP.
Knechel, W. R. (2002), ‗The role of the independent accountant in effective risk management‘,
Tijdschrift voor Economie en Management, XI (I), 65–86.
Knechel, W. R., Naiker, V, & Pacheco, G. (2007). Does Audit Industry Specialization Matter?
Evidence from Market Reaction to Auditor Switches. In: Auditing: A Journal of Practice and
Theory, 26(1), 19-45.
Knechel, W. R., Niemi, L. & Sundgren, S. (2008). Determinants of Auditor Choice: Evidence from a
Small Client Market. International Journal of Auditing, 12(1), 65 – 88.
Knechel, W. R., Krishnan, G. V, Pevzner, M., Shefchik, L., & Velury, U. (2012). audit quality
indicators: Insights from the academic literature. Retrieved October 25 2015 from
http://ssrn.com/abstract.
Kohlbeck, M. B., Mayhew, B., Marphy, P. & Wilkings, M. (2008). Competition for Andersen‘s
Clients. Contemporary Accounting Research. Vol. 25 (Winter): 1099 – 1136.
Koutsoyiannis, A. (2003). Modern Microeconomics. Second edition. London: Macmillan Press.
Kranton, R.E. (2003). Competition and the Incentive to Produce High Quality. Economica, 70, 385-
404.
Krishnamurthy, S., Zhou, J. & Zhou, N. (2006). Auditor Reputation, Auditor Independence, and the
Stock Market Impact of Andersen‘s Indictment on its Client Firms. Contemporary Accounting
Research, 23(2), 465-490.
Krishnan, G. V. (2003). Does Big 6 Auditor Industry Expertise Constrain Earnings Management?
Accounting Horizons,17(1), 1-16.
Krousse, C. (1990). Theory of Industrial Economics, Basil Blackwell, Oxford.
Langendijk, H.P.A.J. (1994). De MarktVoor De WettelijkWerplichte Accountants Controle in
Nederland: EnkeleKwantitatieve En KwalitatieveAspecten. Delwel.
Langendijk, H. (1997). The Market for Audit Services in the Netherlands. European Accounting
Review, 6(2), 253-264.
Lee, C. (2007). SCP, NEIO and Beyond. Nottingham University Business School. University of
Nottingham Malaysia Campus. Working Paper Series Vol. 2007-05.
Lei, K. (2008). Earnings management and corporate governance in UK: the role of board of directors
and audit committee. Unpublished doctoral dissertation. University of Singapore, Singapore

| 116
Lennox, C. S. (1999). "Audit Quality and Auditor Size: An Evaluation of Reputation and Deep
Pockets Hypotheses‖. Journal of Business Finance Accounting, 26(7&8),779-805.
Lesage and Kettunen(2011) Is Joint Audit Bad or Good? Efficiency Perspective Evidence from Three
European Countries, Retrieved (5/10/16) from: https://papers.ssrn.com
Leuphana and Stiglbauer (2012) Audit Market Concentration and Its Influence on Audit Quality,
Retrieved (5/10/16) from: https://papers.ssrn.com
Le Vourc‘h, J. & Morand, P. (2011). Study on the Effects of the Implementation of the acquisition on
Statutory Audits of Annual and Consolidated Accounts Including the Consequences on the
Audit Market, Final Report, retrieved from http://ec.euro
pa.eu/internal_market/auditing/docs/other/full_study_en.pdf (17.10.2015).
Li, C., Xie, Y. & Zhou, J. (2010). National Level, City Level Auditor Industry Specialization and Cost
of Debt. Accounting Horizons, 24(3), 395-417.
Li, S. (2013). The Influence of Auditor Choice on Cost of Capital from Listed Companies. A Master
Thesis Submitted to Oulu Business School.
Low, K. (2004). The Effects of Industry Specialization on Audit Risk Assessments and Audit-Planning
Decisions. The Accounting Review, 79(1), 201-219.
Low, L., Tan, P. & Koh, H. (1990). The Determination of Audit Fees: in the SingaporeContext.
Journal of Business Finance and Accounting, 17(1), 285-295.
Maher, M., Tiessen, P., Colson, R. and Broman, A. (1992) ―Competition and Audit Fees,‖ The
Accounting Review, Vol. 67(1) January: 199-211.
Marianne O. (2009) Regulating the International Audit Market and the Removal of Barriers to Entry:
The Provision of Non Audit Services by Audit Firms and the 2006 Statutory Audit Directive,
Retrieved (5/10/16) from: https://papers.ssrn.com
Maris, T. J. (2010). The Audit Market and the Relation between Audit Fees and Non Audit Fees.
Being a Thesis Submitted to VrijeUniversiteit Amsterdam.
McMeeking, K.P., Peasnell, K.V., & Pope, P.F. (2007). The Effect of Large Audit Firm Mergers on
Audit Pricing in the UK. Accounting and Business Research, 37(4), 301-319.
Miguel, M. (2010). Does Auditor Industry Specialization Improve Audit Quality? Evidence from
Comparable Clients available at: http://raw.rutgers.edu/does/seminars/ Spring11/Minutti-
meza.pdf accessed on 12/12/2015.
Millichamp, A.H. & Taylor, J.R. (2012). Auditing: (9th ed.). London: Cengage Learning.
Mnif, A. (2009). Corporate governance and management earnings forecast quality: evidence from
IPOs. Post-Print halshs-00459171, HAL.
Moizer, P., & Turley, S. (1989). ―Changes in the UK Market for Audit Services‖: 1972 –1982. Journal
of Business Finance & Accounting, 16(1), 41 – 53.http://dx.doi.org/10.1111/j.1468-
5957.1989.tb00003.x
Morgan, J., & Stocken, P. (1998). ―The Effects of Business Risk on Audit Pricing‖. Review
ofAccounting Studies, 3(1), 365-385.

| 117
Myers J., Myers, L. A. & Omer, T. C. (2003) ‗Exploring the term of auditor-client relationship and the
quality of earnings: a case for mandatory auditor rotation?‘,The Accounting Review, 78(3),
779-799.
Newton, N. J., Wang, D. & Wilkins, M.S. (2013). ―Does a Lack of Choice Lead to Lower Audit
Quality?‖- Evidence from Auditor Competition and Client Restatements. Auditing: A Journal
of Practice & Theory 32(3), 31-67.
Nichols, D. & Smith, D. (1983).Auditor Credibility and Auditor Changes. Journal of Accounting
Research, (Autumn), 534-544.
Ning, Y., Davidson, W., & Wang, J. (2010). Does optimal corporate board size exist: an empirical
analysis? Journal of Applied Finance, 20(1), 57-69.
Numan, W., & Willekens, M. (2012). An Empirical Test of Spatial Competition in the Audit Market.
Journal of Accounting and Economics, 53, 450-465.
OECD Policy Roundtables on Competition and Regulation in Auditing and Related Professions,
(2009). OECD Policy Roundtables Report, available at:
www.oecd.org/regreform/sectors/44762253.pdf. accessed on 25/11/2015.
Office of Fair Trading (1999) .Quantitative Techniques in Competition Analysis., Research Paper 17,
October, London, para. 2.36.
Ojo, O. (2002) ‗A‘ Level Economics Textbook for West Africa. Ibadan: Onibonje.
Okaro, S. C. & Okafor, G. O. (2013). Drivers of Audit Failure in Nigeria – Evidence from Cadbury.
Research Journal of Finance and Accounting 4(6): 14 – 17.
Okolie, A. O. Izedonmi, F. O. & Enofe A. O. (2013) Audit Quality and Accrual –Based Earnings
Management of Quoted Companies in Nigeria IOSR Journal of Economics and Finance, 2(2),
7 – 16.
Okolie, A. O. (2014). Audit Firm Size and Cash-Based Earning Management of QuotedCompanies in
Nigeria, European Journal of Accounting Auditing and Finance Research. 2(5), 48 – 75.
Okolie, A.O. (2014). Audit Quality and Earnings Response Coefficients of QuotedCompanies in
Nigeria. Journal of Applied Finance & Banking. 4(2), 139-161.
Oxera. (2006). Competition and choice in the U.K. audit market: Prepared for the Department of Trade
and Industry and Financial Reporting Council. Oxera Consulting (Oxford, UK). Available
online at http://www.frc.org.uk/images/uploaded/documents/ (accessed June, 2013).
Oxera. (2007). Ownership rules of audit firms and their consequences for audit market concentration.
Oxera Consulting (Oxford, UK). Available online at http://ec.europa.eu/
internal_market/auditing/docs/market/oxera_report_en. pdf (accessed July, 2013).
Palmrose, J. (1984). The Demand for Quality-Differentiated Audit Services in an Agency-Cost
Setting: An Empirical Investigation. In: the Sixth Symposium on Auditing Research.
Champaign: University of Illinois Press, 229-251.
Palmrose, Z. (1986). Audit Fees and Auditor Size: Further Evidence. Journal of Accounting Research.
24, Issue (1), Spring, 97-110.
Pearson, T., & Trompeter, G. (1994). Competition in the market for audit services: The effect of
supplier concentration on audit fees. Contemporary Accounting Research, 11(1), 115-135.

| 118
Peel M., (1997), UK Auditor Concentration: A Descriptive Note, Accounting and Business Research,
27(4), 311-22.
Pepall, L., Richards, D. & Norman, G. (2008). Industrial Organization: Contemporary Theory and
Empirical Applications Malden, MA: Blackwell Publishing.
Porter, M.E. (2008). Competitive Strategy (11thed.). New York: Campus.
Pong, C. K. M. (1999). Auditor Concentration: A Replication and Extension for the UK Audit Market
1991 – 1995. Journal of Business Finance & Accounting, 26(3-4), 451 – 475.
Pound, G.D. & J.R. Francis, (1981), The Accounting Services Market: Theory an Evidence, Journal of
Business Finance and Accounting,8(3), 353-371
Piot, C. (2001). Agency costs and audit quality: evidence from France. European Accounting Review,
10(3), 461-499.
Piot, C. & Janin, R. (2007). External Auditors, Audit Committees and Earnings Management in
France. European Accounting Review, 16(2), 429-454.
Rama, D. V. & Read, W. J. (2006). Resignations by the Big 4 and the Market for Audit Services.
Accounting Horizons, 20(2), 97-109.
Rashidah, A. R., &Fairuzanana, H. M. (2006). Board, audit committee, culture and
earningsmanagement: Malaysian Evidence. Managerial Auditing Journal, 21(7), 783-804.
Romanus, R. N., Maher, J. J. & Fleming, D. M. (2008). Auditor Industry Specialization, Auditor
Changes and Accounting Restatements. Accounting Horizons, 22(4), 389-413.
Roodposhti, R. F., &Chashmi, N. S. (2010). The effect of board composition and ownership
concentration on earnings management: evidence from Iran. World Academy of Science,
Engineering and Technology.
Ross, D. F. (2005) Differentiating Between Arthur Andersen and the Surviving Big Four on the Basis
of Auditor Quality: An Empirical Investigation of the Decision to Criminally Prosecute Arthur
Andersen Retrieved (5/10/16) from: https://papers.ssrn.com
Saleh, N. M., Iskandar, T. M., & Rama, M. M. (2005). Earnings management and board
characteristics: evidence from Malaysia. JournalPengurusan, 24(1), 77-103.
Sammelson, P. A. & Nordhams, W. D. (2001). Economics 17th (ed). Virgina: McGraw-Hill Higher
Education.
Sandra, W., & Patrick, P. (1996). The determinants of audit fees in Hong Kong: An empirical study.
Asian Review of Accounting, 4(2), 32-50.
Sanjay and Srinivasan (2010)Audit Market Concentration and Audit Quality, Retrieved (5/10/16)
from: https://papers.ssrn.com
Schaen, M. & Maijoor, S. (1997). The Structure of the Belgian Audit Market: The Effects of Clients‘
Concentration and Capital Market Activity. Internal Journal of Auditing, 1(2), 151 – 162.
Scott, W.R. (2009). Financial Accounting Theory. 5th (ed). London: Prentice Hall.
Shepherd, W.G. (1997). The Economics of Industrial Organization, 4th ed. New Jersey: Prentice-Hall
International, 15-16.
Sikka, P. (2013). The race is on, but the field is limited in the auditing business. The Conversation.

| 119
Simon, D. T., & Francis, J. R. (1988). The effects of auditor change on audit fees: Tests of price
cutting and price recovery. Accounting Review, 63(2), 255-269.
Simon, D., Teo, S. &Trompeter, G. (1992). A Comparative Study of the Market forAudit Services in
Hong Kong, Malaysia and Singapore. International Journal ofAccounting Education and
Research, (27), 234-240.
Simon, D. (1995). The Market for Audit Services in South Africa. International Journal of
Accounting, 30(1), 56 – 365.
Simon, D., Ramanan, R. & Dugar, A. (1996). The Market for Audit Services in India: an Empirical
Examination. International Journal of Accounting Education and Research, (Spring), 27-35.
Simunic, D.A. (1980). The Pricing of Audit Services: Theory and Evidence. Journal of Accounting
Research, 18(1), 161-190.
Simunic, D. A. (1984). ―Auditing, consulting, and auditor independence‖, Journal of Accounting
Research, 22( 2), 679-702.
Simunic, D. & Stein, M. (1987). Product Differentiation in Auditing: Auditor Choice in the Market for
Unseasoned new issues. Vancouver:TheCanadian Certified General Accountants’ Research
Foundation. Research Monograph, 13.
Sirois and Simunic (2011) Auditor Size and Audit Quality Revisited: The Importance of Audit
Technology, Retrieved (5/10/16) from: https://papers.ssrn.com
Solomon, I., Shields, M.D., & Whittington, O.R., (1999). What Do Industry-specialized Auditors
Know? Journal of Accounting Research, 37(1), 191-208.
Soyemi, K. A. & Olowookere, J. K. (2013). Determinants of External Audit Fees: Evidence from the
Banking Sector in Nigeria. Research Journal of Finance and Accounting: 4 (5).
Spathis, T. (2003). Audit Qualification, Firm Litigation, and Financial Information: anEmpirical
Analysis in Greece. International Journal of Auditing, 7(1), 71-85.
Stiglitz, J. E. (1987). Competition and the Number of Firms in a Market: Are Duopolies More
Competitive than Atomistic Markets? Journal of Political Economy, 95(5), 1041.
Sullivan, M. W. (2002). The Effect of The Big Eight Accounting Firm Mergers on The Market or
Audit Services. Journal of Law and Economics, 45(2), 375–99.
Suyono, E., Yi, F. & Riswan, M. (2013). Determinant Factors Affecting the Auditor Switching: An
Indonesian Case. Global Review of Accounting and Finance. 4(2), 103-116.
Switzerland Global Enterprise (2014) Nigeria Food, Beverage and Tobacco Industry Booming.
www.s-ge.com/sites/default/files/private_files/1408_nigeria_food.pdfAug 18, 2014. Accessed
on 7th January, 2016.
Taylor, M. E., & Baker, R. L. (1981). An analysis of the external audit fee. Accounting and Business
Research, 12, 55-60.
The Cadbury Report (1992). The Report of the committee of Financial Aspects of Corporate. Accessed
from www.ecgi.org/codes/documents/cadbury.pdf. (on 23/12/2014).The Guardian Monday,
19th August, 2013.
The Nigerian Stock Exchange (2013). Factbook.

| 120
United States Treasury. (2008). Advisory committee on the auditing profession: Final report,October
6, 2008. Available online at http://www.treas.gov/offices/domestic-finance/acap/docs/final-
report.pdf (accessed May, 2013).
Urhoghide, R.O. & Emeni, F.K. (2014). The Effect of Client Characteristics on Audit Fee: Evidence
from Nigeria. Global Journal of Accounting. 4(1), 48-58.
Vander-Bauwhede, H., Willekens, M. & Gaeremynck, A. (2003). Audit firm size, public ownership,
and firms' discretionary accruals management. The International Journal of Accounting, 38(1),
1-22.
Vander-Bauwhede, H. & Willekens, M. (2004). Evidence on (the lack of) audit-quality differentiation
in the private client segment of the Belgian audit market. European Accounting Review, 13(3),
501-522.
Velte, P. & Stiglbauer, M. (2012). Audit Market Concentration in Europe and Its Influence on Audit
Quality. International Business Research. 5(11), 146 – 161.
Velury, U. (2005). The Association between an Auditor Industry Specialization and Earnings
Management. Research in Accounting Regulation, 16(1), 107 – 184.
Verbruggen, S., Christiaens, J., Reheul, A & Caneghem, T. (2011). Audit Prizing in a Reformed Non –
Profit Market. HUB Research Papers/2011/29 Economics &Management .
Wang, Y. (2013). Evidence on the Choice of Chinese Companies External Audit Firms. M.Sc Thesis
Submitted to School of Economics and Management. Tilbury University.
Waresul, K. & Moizer, P. (1996). Determinants of Audit Fess in Bangladesh. The International
Journal of Accounting, 31(4), 497-509.
Watts, R. L. & Zimmerman, J. L. (1978). Toward a Positive Theory of the Determination of
Accounting Standards. The Accounting Review. (January), 112-134.
Watts, R. L. & Zimmerman, J. L. (1983). Agency Problems, Auditing and the Theory of the Firm:
Some Evidence. Journal of Law and Economics, 26(3), 613 – 33.
Weil, R. L. (2009). Quality of Earnings and Earnings Management: a Primer for Audit Committee
Membershttp://www.aicpa.org/ForThePublic/AuditCommitteeEffectiveness/AuditCommittee
Brief/DownloadableDocuments/Audit_Committee_Quality_of_Earnings.pdf, accessed 25th
October, 2015.
Weiss Leonard W. (1989). Concentration and Price. Cambridge, MA USA: The MIT Press.
Willekens, M., & Achmadi, C. (2003). Pricing and Supplier Concentration in the Private Client
Segment of the Audit Market: Market Power or Competition? The International Journal of
Accounting, 38(4), 431-455.
Wikipedia (2015). Online Dictionary available at www.wikipedia.org
World Bank (2004). Report on the Observance of Standards And Codes (ROSC) Nigeria Accounting
and Auditing. Retrieved from http:/www.documents.worldbank.org/ Nigeria-report-
observance-standards-codes-rosc accessed: October 8, 2015.
World Bank (2011) Report on the Observance of Standards and Codes (ROSC) Nigeria Accounting
and Auditing. Retrieved from http:/www.documents.worldbank.org/ Nigeria- report-
observance-standards-codes-rosc accessed: October 8, 2015.

| 121
Yermack, D., (1997). Good Timing: CEO stock option awards and company news announcements.
Journal of Finance 52: 449– 476.
Yu, M. D. (2007). The Effect of Big 4 Office Size on Audit Quality. ProQuest.
Yuniarti, R. (2011). Audit Firm Size, Audit Fee and Audit Quality. Journal of Global Management,
2(1), 84-97.
Zahn, M. V., & Tower, G. (2004). Audit committee features and earnings management: further
evidence. International Journal of Business Governance and Ethics, 1(2/3), 233-258.
Zureigat, Q. M. (2011). The Effect of Ownership Structure on Audit Quality: Evidence from Jordan.
International Journal of Business and Social Science. 2(10), 38-46.

| 122
APPENDIX A: LIST OF SAMPLED MANUFACTURING FIRMS AGRICULTURE
1 Ftn Cocoa Processors Plc
2 Okomu Oil Palm Plc. 3 Presco Plc
4 Livestock Feeds Plc.
Total 4
CONSUMER GOODS
1 Dn Tyre & Rubber Plc
2 Guinness Nig Plc
3 International Breweries Plc. 4 Nigerian Brew. Plc
5 7-Up Bottling Comp. Plc. 6 Dangote Sugar Refinery Plc
7 Flour Mills Nig. Plc.
8 P S Mandrides & Co Plc. 9 Nascon Allied Industries Plc
10 N Nig. Flour Mills Plc.
11 Tiger Branded Consumer Goods Plc
12 Union Dicon Salt Plc
13 U T C Nig. Plc.
14 Cadbury Nigeria Plc. 15 Nestle Nigeria Plc.
16 Nigerian Enamelware Plc.
17 Vitafoam Nig Plc 18 Vono Products Plc.
19 P Z Cussons Nigeria Plc.
20 Unilever Nigeria Plc
Total 20
HEALTHCARE
1 Ekocorp Plc.
2 Morison Industries Plc. 3 Evans Medical Plc.
4 Fidson Healthcare Plc
5 Glaxo Smithkline Consumer Nig. Plc.
6 May & Baker Nigeria Plc.
7 Neimeth International Pharmaceuticals Plc 8 Nigeria-German Chemicals Plc.
9 Pharma-Deko Plc
Total 9
INDUSTRIAL GOODS
1 African Paints (Nigeria) Plc.
2 Ashaka Cem Plc
3 Berger Paints Plc 4 Cap Plc
5 Cement Co. Of North.Nig. Plc
6 Dn Meyer Plc 7 First Aluminium Nigeria Plc
8 Ipwa Plc
9 Paints And Coatings Manufactures Plc 10 Portland Paints & Products Nigeria Plc
11 Premier Paints Plc.
12 Lafarge Africa Plc. 13 Cutix Plc
14 Avon Crowncaps & Containers
15 Beta Glass Co Plc 16 Greif Nigeria Plc
17 Nigerian Ropes Plc
Total 17
OTHERS
1 Poly Products Nigeria Plc
2 Dangote Cement Total 2
GRAND – TOTAL 52
Source: The Nigerian Stock Exchange Daily Official List - Equities for 31-12-2015 &
Researchers’ Compilation (2016)

| 123
APPENDIX B: CALCULATION OF DISCRETIONARY ACCRUALS
Step 1: Calculation of Total Accruals (TAC)
The first step in the process of calculating discretionary accruals for an individual company
involves deriving total accruals. Total accruals can be obtained by using either a cash flow or
balance sheet approach. However, Hribar and Collins (2002) conclude that the balance sheet
approach is potentially fraught with measurement error. Therefore, consistent with their
recommendations, we adopt the more robust cash flow statement approach in calculating total
accruals by deducting operating cash flows from net income as shown in below:
TACit = PATit – CFOit
where:
TACit = Total accruals of firm i in year t;
PAT = Profit after Tax of firm i in year t
CFOit = Cash flows from operations of firm i in year t;
Total accruals shall be computed for all firms for all years in order to facilitate the next step of
the process. The figures calculated will serve as the dependent variable in the regression
computed in step 2(a) in order to derive the industry specific parameter values for each firm.
Step 2: Calculation of Non-Discretionary Accruals (NDAC) - Modified Jones Model
2(a) Cross-sectional Analysis –
Calculate industry specific parameter values for each company in sample.
Firstly, in order to compute the non-discretionary component of total accruals, industry
specific parameter values will be calculated for each firm. These parameters will be estimated
from the OLS regression using the cross-sectional modified Jones model below:
TACit = β1𝟏
𝑨𝒊𝒕−𝟏 + β2
𝑹𝑬𝑽𝒊𝒕−𝑹𝑬𝑪𝒊𝒕
𝑨𝒊𝒕−𝟏 + β3
𝑮𝑷𝑷𝑬𝒊𝒕
𝑨𝒊𝒕−𝟏 +
where:
TACit = Total accruals of firm i in year t;
REVit = Change in revenue of firm i from year t-1 to year t;
RECit = Change in receivables of firm i from year t-1 to year t;
GPPEit = Gross property, plant and equipment of firm i at the end of year t;

| 124
Ait-1 = Book value of total lagged assets of firm i at the end of year t-1;
β1, β2&β3 = Industry specific parameter values;
= The error term which represents the firm-specific discretionary portion
of total accruals
2(b) Application of Parameter Values –
To individual company to calculate non-discretionary accruals (NDAC)
Next, by applying the above specific classification parameters calculated for a cross-section of
firms an estimate of the non-discretionary component of total accruals shall be derived from
the regression equation:
NDAit = β1 + β2 + β3 + i
where:
NDAit = Non-discretionary accruals of firm i in year t;
REVit = Change in revenue of firm i from year t-1 to year t;
RECit = Change in receivables of firm i from year t-1 to year t;
GPPEit = Gross property, plant and equipment of firm i at the end of year t;
Ait-1 = Book value of total lagged assets of firm i at the end of year t-1;
β1, β2, & β3 = Industry specific parameter values as calculated in step 2(a).
Step 3: Calculation of Discretionary Accruals
Once the non-discretionary component has been derived for both years, this will be deducted
from total accruals to arrive at discretionary accruals for each firm. The mean value of
discretionary accruals serves as a proxy for the quality of earnings and consequently audit
quality. Thus, the larger the mean value of discretionary accruals, the lower the earnings
quality and consequently the lower the degree of audit quality provided (Dechow et al.,1995).

| 111
APPENDIX C: DATA FOR ANALYSIS
DATA FOR VARIABLES OF ANALYSIS (ONE)
SECTOR/FIRMS Year Current Assets Receivable (Debtors)
Fixed Assets Property, Plant & Equipment
Sales (Revenue) Current Liability Total Liability Net Assets
AGRICULTURE 2015 784,472.00 435,674.00 3,069,123.00 3,069,123.00 2,938.00 3,034,445.00 (2,858,714.00) 702,645.00
FTN COCOA PROCESSORS PLC
2014 831,900.00 407,792.00 3,181,431.00 3,181,431.00 247,418.00 2,559,621.00 (3,222,819.00) 1,198,604.00
2013 879,328.00 379,910.00 3,293,739.00 3,293,739.00 491,898.00 2,084,797.00 (2,858,714.00) 1,694,563.00
2012 592,011.00 342,246.00 3,453,012.00 3,453,012.00 278,170.00 1,301,938.00 (2,408,763.00) 1,980,639.00
2011 1,304,202.00 298,792.00 3,205,446.00 3,205,446.00 836,936.00 749,262.00 (2,569,545.00) 1,941,295.00
2010 1,456,900.00 341,886.00 2,865,693.00 2,865,693.00 1,196,729.00 589,585.00 (2,063,918.00) 2,260,165.00
2009 1,533,783.00 862,281.00 1,946,798.00 1,946,798.00 1,361,490.00 230,121.00 (1,092,205.00) 2,389,265.00
2008 984,498.00 415,733.00 2,046,325.00 2,046,325.00 171,014.00 126,406.00 (739,248.00) 2,481,337.00
2007 740,792.00 151,399.00 1,637,345.00 1,637,345.00 267,080,912.00 137,520,348.00 (302,879.00) 2,383,202.00
2006 143,305.00 117,630.00 849,552.00 849,552.00 582,466.00 904,307.00 (908,785.00) 353,207.00
2005 109,928.00 149,096.00 81,584.00 81,584.00 765,484.00 500,784.00 (501,114.00) 311,235.00
2004 101,106.00 178,792.00 87,588.00 87,588.00 948,502.00 97,261.00 (477,856.00) 151,181.00
2003 922,842.70 208,489.00 93,592.00 93,592.00 1,131,520.00 106,262.00 (3,745.00) 284,212.00
2002 834,619.80 238,186.00 599,596.00 99,596.00 1,314,538.00 87,785.00 (477,856.00) 417,243.00
2001 740,792.00 267,882.00 105,600.00 105,600.00 1,497,556.00 113,308.00 (3,745.00) 550,274.00
OKOMU OIL PALM PLC.
2015 1,927,690.50 318,717.00 7,044,368.00 11,854,778.00 7,525,425.00 5,106,384.00 11,187,158.00 30,123,836.00
2014 2,505,813.00 105,304.00 30,375,665.00 10,255,455.00 8,655,718.00 4,589,434.00 9,648,093.00 23,233,385.00
2013 3,850,611.00 133,971.00 26,200,036.00 6,507,126.00 8,860,425.00 2,582,732.00 7,433,489.00 22,617,158.00
2012 5,719,860.00 154,277.00 25,334,813.00 4,325,947.00 10,146,164.00 2,007,416.00 5,523,922.00 25,530,751.00
2011 5,006,856.00 982,013.00 7,044,368.00 3,308,480.00 11,121,011.00 1,548,832.00 4,355,359.00 8,836,256.00
2010 2,252,713.00 709,692.00 6,415,413.00 2,761,046.00 6,087,836.00 979,304.00 2,801,720.00 5,866,406.00
2009 1,694,390.00 368,454.00 6,253,692.00 6,253,692.00 4,741,217.00 1,092,685.00 3,626,842.00 4,353,494.00
2008 1,877,283.00 525,541.00 5,878,168.00 5,878,168.00 4,734,193.00 1,431,059.00 3,216,352.00 4,282,988.00
2007 1,299,268.00 235,655.00 5,703,653.00 5,703,653.00 2,807,711.00 1,737,366.00 3,562,116.00 3,188,175.00
2006 1,319,907.00 437,273.00 5,057,144.00 5,057,144.00 2,740,784.00 1,341,495.00 3,084,978.00 4,728,321.00
2005 969,334.00 291,584.00 4,618,087.00 4,618,087.00 2,465,657.00 1,194,906.00 1,917,018.00 4,404,186.00
2004 1,026,553.00 427,477.00 4,502,019.00 4,502,019.00 2,311,226.00 1,340,799.00 2,273,213.00 4,231,151.00
2003 1,024,011.00 449,266.00 4,060,257.00 4,060,257.00 2,136,179.00 1,495,711.00 2,192,893.00 3,648,466.00
2002 3,270,369.00 209,541.00 3,270,369.00 3,270,369.00 1,218,090.00 1,183,955.00 1,183,955.00 2,800,076.00
2001 2,366,891.00 130,106.00 2,366,891.00 2,366,891.00 1,143,170.00 664,142.00 664,142.00 2,810,812.00
PRESCO PLC
2015 3,863,998.50 2,430,777.50 42,221,127.00 13,086,181.50 29,112,189.50 2,574,962.00 6,231,037.00 26,304,605.00
2014 3,195,791.00 1,768,774.00 31,749,382.00 10,868,351.00 19,137,704.00 4,296,685.00 14,986,024.00 19,959,147.00
2013 4,169,281.00 1,914,507.00 28,494,018.00 10,686,754.00 18,485,143.00 4,399,225.00 15,281,229.00 17,382,069.00
2012 2,463,156.00 350,805.00 25,543,349.00 18,534,791.00 11,251,521.00 2,789,404.00 10,918,407.00 17,088,098.00
2011 2,832,866.00 590,500.00 7,550,528.00 6,251,093.00 8,536,172.00 2,574,962.00 6,231,037.00 4,691,153.00
2010 1,466,723.00 172,384.00 5,914,343.00 5,914,343.00 5,386,056.00 534,135.00 3,863,049.00 3,518,196.00
2009 2,835,519.00 327,717.00 4,753,772.00 4,740,974.00 4,004,524.00 1,980,025.00 4,966,124.00 2,623,167.00
2008 1,452,936.00 275,393.00 4,223,150.00 4,204,526.00 3,964,454.00 1,874,748.00 3,122,557.00 2,694,107.00
2007 1,454,262.50 144,001.50 3,904,957.00 3,243,464.00 2,266,945.00 1,577,279.50 6,231,037.00 1,956,962.00
2006 1,177,163.10 65,002.70 3,445,144.67 2,388,555.50 2,104,745.00 1,511,804.30 3,863,049.00 2,155,680.00
2005 950,795.00 347,533.00 3,345,252.00 3,328,405.00 2,347,611.00 577,807.00 1,902,438.00 2,315,582.00
2004 765,998.00 266,296.00 3,332,674.00 3,321,375.00 2,346,068.00 686,346.00 1,863,954.00 2,274,900.00
2003 706,917.00 74,068.00 3,226,349.00 3,226,349.00 2,128,304.00 665,411.00 2,014,708.00 1,918,558.00
2002 376,454.00 94,001.00 3,159,884.00 3,916,701.00 1,369,364.00 1,039,640.00 3,122,557.00 1,793,365.00
2001 409,790.00 138,798.00 2,808,654.00 3,406,975.00 1,236,626.00 1,123,389.00 6,231,037.00 1,165,055.00

| 112
SECTOR/FIRMS Year Current Assets Receivable (Debtors)
Fixed Assets Property, Plant & Equipment
Sales (Revenue) Current Liability Total Liability Net Assets
LIVESTOCK FEEDS PLC.
2015 3,722,112.00 290,664.00 839,094.00 832,575.00 8,963,293.00 2,423,715.00 2,423,715.00 1,948,799.00
2014 4,970,726.00 146,355.00 782,061.00 765,098.00 7,914,488.00 3,684,086.00 3,684,086.00 1,983,900.00
2013 2,930,981.00 725,604.00 739,623.00 721,660.00 6,113,864.00 1,899,728.00 1,899,728.00 1,729,730.00
2012 1,511,875.00 172,359.00 560,446.00 546,943.00 5,433,057.00 1,380,684.00 1,439,512.00 632,808.00
2011 1,131,426.00 250,188.00 427,819.00 418,727.00 3,623,939.00 1,001,944.00 1,001,944.00 519,846.00
2010 710,046.00 154,073.00 366,612.00 354,018.00 2,000,767.00 619,617.00 619,617.00 422,164.00
2009 570,035.00 93,605.00 302,339.00 290,803.00 2,178,432.00 440,333.00 440,333.00 393,860.00
2008 676,816.00 93,564.00 320,603.00 304,722.00 2,368,590.00 588,438.00 633,507.00 363,912.00
2007 456,171.00 69,135.00 264,997.00 260,230.00 931,976.00 366,681.00 402,997.00 318,171.00
2006 104,242.00 14,453.00 217,495.00 217,495.00 560,018.00 606,183.00 665,143.00 (343,406.00)
2005 91,736.00 5,511.00 232,747.00 232,747.00 587,068.00 1,324,868.00 1,393,378.00 (1,068,895.00)
2004 136,116.40 28,746.00 186,185.87 189,592.07 409,415.00 103,789.00 261,049.00 (828,728.00)
2003 170,672.00 57,451.00 158,201.21 164,712.90 403,985.00 114,652.00 81,765.00 (745,645.00)
2002 305,234.00 86,157.00 130,216.55 139,833.72 384,461.00 125,515.00 633,507.00 403,783.00
2001 439,794.00 114,862.00 102,231.90 114,954.55 292,919.50 136,378.00 402,997.00 842,314.33
CONSUMER GOODS 2015 3,086,211.00 265,775.00 17,367,261.00 12,254,096.00 14,622,914.80 7,074,713.00 7,074,713.00 (5,443,931.00)
DN TYRE & RUBBER PLC
2014 2,322,409.20 160,188.00 13,827,430.00 11,047,078.00 13,407,485.00 6,972,431.00 6,972,431.00 (4,912,105.00)
2013 1,558,607.00 54,602.00 10,287,602.00 8,640,058.00 9,192,055.00 6,870,149.00 6,870,149.00 (4,380,279.00)
2012 794,805.00 50,984.60 6,747,774.00 5,233,032.00 7,976,625.00 6,856,954.00 7,653,308.00 10,204,475.00
2011 1,003,993.00 156,571.20 3,207,945.00 1,826,020.00 6,238,804.00 8,276,488.00 10,315,838.00 6,900,327.00
2010 719,646.00 258,940.00 2,226,860.00 1,581,176.00 5,645,712.00 6,767,867.00 6,767,867.00 (3,848,453.00)
2009 780,670.00 165,231.00 2,580,125.00 1,934,441.00 2,766,176.00 6,665,585.00 6,665,585.00 (3,316,627.00)
2008 2,855,024.00 432,003.00 4,123,442.00 2,287,706.00 4,886,640.00 6,563,303.00 6,563,303.00 (2,784,801.00)
2007 4,035,361.00 1,281,985.00 13,822,422.00 13,176,738.00 6,041,984.00 6,856,954.00 7,653,308.00 10,204,475.00
2006 2,911,310.00 228,496.00 14,304,855.00 12,995,123.00 5,084,957.00 8,276,488.00 10,315,838.00 6,900,327.00
2005 2,465,082.00 103,849.00 11,045,077.00 10,996,684.00 5,037,493.00 4,845,237.00 5,745,810.00 3,935,349.00
2004 2,319,202.00 214,824.00 4,822,951.00 4,771,829.00 5,038,312.00 3,626,924.00 6,554,205.00 587,948.00
2003 2,988,858.00 307,362.00 2,937,761.00 2,848,225.00 4,153,177.00 3,168,513.00 5,022,644.00 903,975.00
2002 2,701,639.00 262,121.00 1,455,897.00 1,236,221.00 4,669,661.00 1,935,214.00 2,956,658.00 1,200,878.00
2001 2,062,831.00 116,336.00 1,283,847.00 1,026,767.00 4,324,803.00 1,529,484.00 2,056,945.00 1,817,194.00
GUINNESS NIG PLC
2015 33,511,512.00 15,503,824.00 88,696,961.00 87,754,074.00 118,495,882.00 27,804,912.00 73,905,256.00 48,341,376.00
2014 40,840,041.00 19,281,236.00 91,291,543.00 90,683,405.00 109,202,120.00 43,018,077.00 87,266,556.00 45,061,717.00
2013 32,238,619.00 15,138,749.00 88,691,623.00 88,112,852.00 122,463,538.00 23,746,413.00 75,021,510.00 46,039,111.00
2012 37,622,976.00 10,852,303.00 64,389,124.00 63,709,332.00 126,288,184.00 38,996,801.00 62,181,668.00 40,352,504.00
2011 44,369,719.00 18,133,997.00 47,129,837.00 46,098,557.00 123,663,125.00 36,535,848.00 51,891,540.00 40,283,492.00
2010 42,489,725.00 13,256,299.00 39,626,621.00 38,244,541.00 109,366,975.00 36,588,640.00 51,944,332.00 34,199,199.00
2009 35,764,651.00 9,104,844.00 37,704,793.00 35,897,959.00 89,148,207.00 31,141,958.00 42,344,036.00 31,524,710.00
2008 34,612,598.00 6,528,920.00 38,044,776.00 36,733,310.00 69,172,852.00 23,853,133.00 36,328,640.00 36,862,557.00
2007 41,416,320.00 6,662,196.00 30,393,107.00 30,124,847.00 62,265,413.00 26,568,316.00 40,170,585.00 31,638,842.00
2006 30,136,445.00 3,231,294.00 29,713,744.00 29,531,969.00 53,651,781.00 15,950,244.00 34,182,645.00 25,667,544.00
2005 20,407,820.00 1,451,095.00 29,558,796.00 29,179,564.00 47,030,812.00 15,061,854.00 23,239,174.00 18,227,442.00
2004 24,160,132.00 3,542,907.00 24,840,864.00 24,822,548.00 47,508,486.00 18,884,045.00 32,092,752.00 16,908,244.00
2003 23,364,257.00 1,696,029.00 16,030,568.00 16,012,316.00 38,103,096.00 18,313,075.00 24,205,397.00 15,189,428.00
2002 17,941,946.00 1,346,005.00 12,741,362.00 12,729,046.00 25,454,410.00 13,689,411.00 16,525,498.00 14,157,810.00
2001 17,392,102.00 892,290.00 7,945,542.00 7,945,542.00 19,876,775.00 10,636,350.00 12,692,820.00 12,663,140.00

| 113
SECTOR/FIRMS Year Current Assets Receivable (Debtors)
Fixed Assets Property, Plant & Equipment
Sales (Revenue) Current Liability Total Liability Net Assets
INTERNATIONAL BREWERIES PLC.
2015 7,329,665.00 3,675,605.00 22,841,925.00 22,679,843.00 20,649,295.00 9,975,208.00 18,003,331.00 12,168,259.00
2014 5,575,071.00 2,945,043.00 18,795,469.00 18,677,771.00 18,493,907.00 6,604,447.00 13,100,617.00 11,269,923.00
2013 6,624,318.00 3,142,040.00 16,412,444.00 15,496,354.00 17,388,632.00 7,854,517.00 13,656,589.00 9,380,173.00
2012 3,053,452.00 1,098,644.00 11,234,860.00 9,662,962.00 9,908,167.00 10,153,591.00 12,704,989.00 1,583,323.00
2011 4,666,058.00 1,098,644.00 8,173,771.00 8,139,751.00 9,908,167.00 10,167,650.00 11,537,172.00 1,302,657.00
2010 3,156,335.00 1,058,460.00 6,755,341.00 6,754,341.00 4,794,946.00 2,471,742.00 9,995,897.00 (84,221.00)
2009 2,005,058.00 134,957.00 3,085,804.00 3,084,804.00 1,616,503.00 1,150,597.00 5,090,862.00 (283,355.00)
2008 614,817.00 199,666.67 1,001,186.00 952,776.00 931,921.00 (4,420,390.00) (3,050,868.00) (283,355.00)
2007 715,683.00 681,510.17 230,257.00 202,516.00 561,669.00 (8,928,916.50) (1,404,761.50) 2,191.00
2006 2,046,183.00 1,163,353.67 243,943.00 243,943.00 313,048.00 (13,437,443.00) (9,497,178.00) (1,308,062.00)
2005 142,837.00 20,713.00 257,682.00 256,682.00 401,399.00 825,229.00 1,229,006.00 (828,487.00)
2004 154,429.00 9,947.00 300,583.00 299,583.00 594,704.00 759,842.00 759,842.00 (304,830.00)
2003 131,461.00 17,667.00 287,769.00 286,769.00 452,001.00 481,672.00 481,672.00 (62,442.00)
2002 274,355.00 17,913.00 167,349.00 166,349.00 453,732.00 361,560.00 361,560.00 80,144.00
2001 168,132.00 34,069.00 159,308.00 158,308.00 399,185.00 435,409.00 435,409.00 (107,969.00)
NIGERIAN BREW. PLC
2015 53,091,649.00 13,260,300.00 328,308,188.00 214,315,929.67 276,251,664.00 128,281,761.00 177,068,263.33 381,399,837.00
2014 56,930,683.00 16,357,156.00 292,746,101.00 193,569,624.00 266,372,475.00 114,554,626.00 177,793,954.00 349,676,784.00
2013 45,285,469.00 14,212,062.00 207,474,164.00 153,366,133.00 268,613,518.00 100,295,715.00 140,400,448.00 252,759,633.00
2012 56,866,627.00 19,929,893.00 196,767,002.00 142,348,420.00 252,674,213.00 86,834,468.00 160,185,737.00 253,633,629.00
2011 52,143,019.00 10,200,583.00 163,304,104.00 96,618,541.00 207,303,379.00 85,652,875.00 137,142,382.00 215,447,123.00
2010 40,284,272.00 6,445,450.00 74,105,160.00 73,800,157.00 185,862,785.00 44,879,962.00 64,217,270.00 50,172,162.00
2009 37,629,344.00 3,589,438.00 69,358,539.00 69,003,023.00 164,206,848.00 42,318,498.00 60,417,789.00 46,570,094.00
2008 40,625,416.00 3,849,950.00 63,787,224.00 63,557,667.00 145,461,762.00 54,775,451.00 72,183,459.00 32,229,181.00
2007 39,931,255.00 7,585,753.00 50,617,027.00 50,194,644.00 111,748,297.00 29,413,531.00 47,365,240.00 43,183,042.00
2006 24,756,329.00 4,772,215.00 50,900,733.00 49,677,917.00 86,322,075.00 23,875,475.00 39,407,669.00 36,249,393.00
2005 18,576,447.00 1,782,268.00 53,822,322.00 52,428,880.00 880,130,968.00 25,967,953.00 37,674,528.00 34,724,241.00
2004 28,095,950.00 5,196,550.00 54,448,027.00 54,448,027.00 73,594,134.00 44,606,971.00 54,290,033.00 28,253,944.00
2003 35,055,567.00 2,767,099.00 50,041,941.00 50,041,941.00 62,974,995.00 51,807,834.00 58,910,762.00 26,186,746.00
2002 32,807,013.00 5,641,152.00 37,022,763.00 37,022,763.00 39,407,663.00 39,689,329.00 43,403,793.00 26,425,983.00
2001 34,277,542.00 1,173,748.00 15,287,003.00 15,287,003.00 29,738,414.00 21,209,450.00 24,367,420.00 25,197,125.00
7-UP BOTTLING COMP. PLC.
2015 22,984,268.00 4,421,832.00 44,702,571.00 44,440,675.00 82,450,505.00 32,423,653.00 43,753,206.00 67,686,839.00
2014 17,625,144.00 2,839,697.00 38,238,065.00 37,893,504.00 77,888,548.00 29,867,824.00 38,534,514.00 55,863,209.00
2013 15,496,426.00 3,253,760.00 35,873,744.00 35,451,669.00 64,088,879.00 27,862,495.00 38,792,190.00 51,370,170.00
2012 17,469,595.00 4,527,707.00 26,860,810.00 26,626,605.00 59,864,385.00 25,587,998.00 34,117,114.00 10,213,291.00
2011 17,892,516.00 4,217,815.00 22,339,475.00 22,332,636.00 51,098,232.00 16,914,742.00 31,654,779.00 8,577,212.00
2010 12,899,761.00 4,135,577.00 20,528,699.00 20,528,699.00 41,069,113.00 12,735,725.00 18,701,725.00 8,973,770.00
2009 13,287,036.00 4,083,530.00 18,592,815.00 18,592,815.00 34,864,287.00 11,617,672.00 18,974,456.00 7,984,017.00
2008 9,741,455.00 3,193,034.00 14,240,755.00 14,240,755.00 30,572,218.00 6,725,435.00 12,623,850.00 7,223,047.00
2007 10,407,041.00 2,935,993.00 11,240,326.00 11,240,326.00 27,309,123.00 7,823,831.00 12,309,577.00 6,280,352.00
2006 8,265,182.33 2,256,648.67 7,338,809.67 8,098,747.00 22,071,731.00 4,928,471.67 7,971,082.00 5,576,272.00
2005 6,825,184.83 1,682,880.17 3,662,565.17 7,282,981.00 17,346,662.00 3,031,551.17 4,638,642.50 4,409,059.00
2004 5,385,187.33 1,109,111.67 1,113,678.00 5,025,595.00 14,937,371.00 1,134,630.67 1,306,203.00 3,967,235.00
2003 3,945,189.83 535,343.17 3,689,923.83 3,729,289.00 10,984,228.00 162,289.83 2,026,236.50 3,041,818.33
2002 2,505,192.33 38,425.33 7,366,168.33 2,192,713.00 7,417,048.00 2,659,210.33 5,358,676.00 2,237,299.83
2001 1,065,194.83 612,193.83 11,042,412.83 656,137.00 3,849,868.00 2,556,130.83 8,691,115.50 1,432,781.33
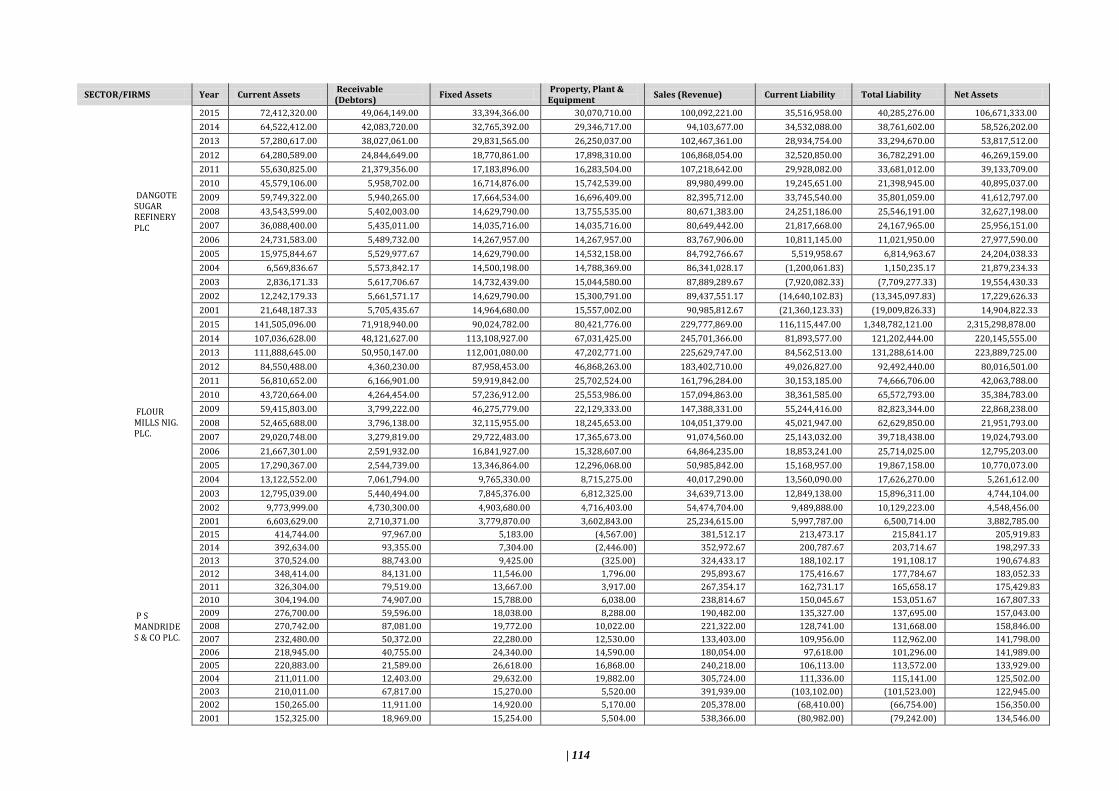
| 114
SECTOR/FIRMS Year Current Assets Receivable (Debtors)
Fixed Assets Property, Plant & Equipment
Sales (Revenue) Current Liability Total Liability Net Assets
DANGOTE SUGAR REFINERY PLC
2015 72,412,320.00 49,064,149.00 33,394,366.00 30,070,710.00 100,092,221.00 35,516,958.00 40,285,276.00 106,671,333.00
2014 64,522,412.00 42,083,720.00 32,765,392.00 29,346,717.00 94,103,677.00 34,532,088.00 38,761,602.00 58,526,202.00
2013 57,280,617.00 38,027,061.00 29,831,565.00 26,250,037.00 102,467,361.00 28,934,754.00 33,294,670.00 53,817,512.00
2012 64,280,589.00 24,844,649.00 18,770,861.00 17,898,310.00 106,868,054.00 32,520,850.00 36,782,291.00 46,269,159.00
2011 55,630,825.00 21,379,356.00 17,183,896.00 16,283,504.00 107,218,642.00 29,928,082.00 33,681,012.00 39,133,709.00
2010 45,579,106.00 5,958,702.00 16,714,876.00 15,742,539.00 89,980,499.00 19,245,651.00 21,398,945.00 40,895,037.00
2009 59,749,322.00 5,940,265.00 17,664,534.00 16,696,409.00 82,395,712.00 33,745,540.00 35,801,059.00 41,612,797.00
2008 43,543,599.00 5,402,003.00 14,629,790.00 13,755,535.00 80,671,383.00 24,251,186.00 25,546,191.00 32,627,198.00
2007 36,088,400.00 5,435,011.00 14,035,716.00 14,035,716.00 80,649,442.00 21,817,668.00 24,167,965.00 25,956,151.00
2006 24,731,583.00 5,489,732.00 14,267,957.00 14,267,957.00 83,767,906.00 10,811,145.00 11,021,950.00 27,977,590.00
2005 15,975,844.67 5,529,977.67 14,629,790.00 14,532,158.00 84,792,766.67 5,519,958.67 6,814,963.67 24,204,038.33
2004 6,569,836.67 5,573,842.17 14,500,198.00 14,788,369.00 86,341,028.17 (1,200,061.83) 1,150,235.17 21,879,234.33
2003 2,836,171.33 5,617,706.67 14,732,439.00 15,044,580.00 87,889,289.67 (7,920,082.33) (7,709,277.33) 19,554,430.33
2002 12,242,179.33 5,661,571.17 14,629,790.00 15,300,791.00 89,437,551.17 (14,640,102.83) (13,345,097.83) 17,229,626.33
2001 21,648,187.33 5,705,435.67 14,964,680.00 15,557,002.00 90,985,812.67 (21,360,123.33) (19,009,826.33) 14,904,822.33
FLOUR MILLS NIG. PLC.
2015 141,505,096.00 71,918,940.00 90,024,782.00 80,421,776.00 229,777,869.00 116,115,447.00 1,348,782,121.00 2,315,298,878.00
2014 107,036,628.00 48,121,627.00 113,108,927.00 67,031,425.00 245,701,366.00 81,893,577.00 121,202,444.00 220,145,555.00
2013 111,888,645.00 50,950,147.00 112,001,080.00 47,202,771.00 225,629,747.00 84,562,513.00 131,288,614.00 223,889,725.00
2012 84,550,488.00 4,360,230.00 87,958,453.00 46,868,263.00 183,402,710.00 49,026,827.00 92,492,440.00 80,016,501.00
2011 56,810,652.00 6,166,901.00 59,919,842.00 25,702,524.00 161,796,284.00 30,153,185.00 74,666,706.00 42,063,788.00
2010 43,720,664.00 4,264,454.00 57,236,912.00 25,553,986.00 157,094,863.00 38,361,585.00 65,572,793.00 35,384,783.00
2009 59,415,803.00 3,799,222.00 46,275,779.00 22,129,333.00 147,388,331.00 55,244,416.00 82,823,344.00 22,868,238.00
2008 52,465,688.00 3,796,138.00 32,115,955.00 18,245,653.00 104,051,379.00 45,021,947.00 62,629,850.00 21,951,793.00
2007 29,020,748.00 3,279,819.00 29,722,483.00 17,365,673.00 91,074,560.00 25,143,032.00 39,718,438.00 19,024,793.00
2006 21,667,301.00 2,591,932.00 16,841,927.00 15,328,607.00 64,864,235.00 18,853,241.00 25,714,025.00 12,795,203.00
2005 17,290,367.00 2,544,739.00 13,346,864.00 12,296,068.00 50,985,842.00 15,168,957.00 19,867,158.00 10,770,073.00
2004 13,122,552.00 7,061,794.00 9,765,330.00 8,715,275.00 40,017,290.00 13,560,090.00 17,626,270.00 5,261,612.00
2003 12,795,039.00 5,440,494.00 7,845,376.00 6,812,325.00 34,639,713.00 12,849,138.00 15,896,311.00 4,744,104.00
2002 9,773,999.00 4,730,300.00 4,903,680.00 4,716,403.00 54,474,704.00 9,489,888.00 10,129,223.00 4,548,456.00
2001 6,603,629.00 2,710,371.00 3,779,870.00 3,602,843.00 25,234,615.00 5,997,787.00 6,500,714.00 3,882,785.00
P S MANDRIDES & CO PLC.
2015 414,744.00 97,967.00 5,183.00 (4,567.00) 381,512.17 213,473.17 215,841.17 205,919.83
2014 392,634.00 93,355.00 7,304.00 (2,446.00) 352,972.67 200,787.67 203,714.67 198,297.33
2013 370,524.00 88,743.00 9,425.00 (325.00) 324,433.17 188,102.17 191,108.17 190,674.83
2012 348,414.00 84,131.00 11,546.00 1,796.00 295,893.67 175,416.67 177,784.67 183,052.33
2011 326,304.00 79,519.00 13,667.00 3,917.00 267,354.17 162,731.17 165,658.17 175,429.83
2010 304,194.00 74,907.00 15,788.00 6,038.00 238,814.67 150,045.67 153,051.67 167,807.33
2009 276,700.00 59,596.00 18,038.00 8,288.00 190,482.00 135,327.00 137,695.00 157,043.00
2008 270,742.00 87,081.00 19,772.00 10,022.00 221,322.00 128,741.00 131,668.00 158,846.00
2007 232,480.00 50,372.00 22,280.00 12,530.00 133,403.00 109,956.00 112,962.00 141,798.00
2006 218,945.00 40,755.00 24,340.00 14,590.00 180,054.00 97,618.00 101,296.00 141,989.00
2005 220,883.00 21,589.00 26,618.00 16,868.00 240,218.00 106,113.00 113,572.00 133,929.00
2004 211,011.00 12,403.00 29,632.00 19,882.00 305,724.00 111,336.00 115,141.00 125,502.00
2003 210,011.00 67,817.00 15,270.00 5,520.00 391,939.00 (103,102.00) (101,523.00) 122,945.00
2002 150,265.00 11,911.00 14,920.00 5,170.00 205,378.00 (68,410.00) (66,754.00) 156,350.00
2001 152,325.00 18,969.00 15,254.00 5,504.00 538,366.00 (80,982.00) (79,242.00) 134,546.00

| 115
SECTOR/FIRMS Year Current Assets Receivable (Debtors)
Fixed Assets Property, Plant & Equipment
Sales (Revenue) Current Liability Total Liability Net Assets
NASCON ALLIED INDUSTRIES PLC
2015 9,385,415.00 4,852,546.00 6,909,411.00 6,795,039.00 16,178,197.00 7,951,500.00 9,206,593.00 162,948,226.00
2014 5,622,868.00 3,216,800.00 6,933,017.00 6,683,479.00 11,250,544.00 5,346,115.00 6,248,579.00 12,555,885.00
2013 5,682,111.00 1,119,395.00 5,749,056.00 5,749,056.00 10,837,261.00 3,806,716.00 4,538,541.00 11,431,167.00
2012 7,023,083.00 613,608.00 3,666,461.00 3,666,461.00 14,414,185.00 3,377,126.00 4,111,965.00 10,689,544.00
2011 6,739,203.00 325,717.00 3,307,506.00 3,307,506.00 9,681,720.00 3,551,370.00 4,259,217.00 5,784,492.00
2010 5,312,469.00 673,335.00 2,555,371.00 2,555,371.00 8,894,015.00 2,382,264.00 2,912,706.00 4,955,134.00
2009 5,247,107.00 1,285,669.00 2,907,900.00 2,907,900.00 8,767,353.00 2,800,807.00 3,523,475.00 4,631,532.00
2008 5,710,297.00 1,220,531.00 1,937,810.00 1,937,810.00 7,888,276.00 3,281,360.00 3,799,144.00 3,848,961.00
2007 4,671,782.00 473,426.00 1,416,520.00 1,416,520.00 2,652,575.00 2,302,930.00 2,615,918.00 3,472,384.00
2006 3,228,816.00 236,839.00 1,157,059.00 159,699.00 2,213,437.00 2,243,658.00 2,246,437.00 2,233,521.00
2005 2,055,484.00 1,340,093.33 723,045.33 723,045.33 1,423,409.67 1,571,614.00 2,089,398.00 1,569,515.33
2004 2,814,743.50 1,831,939.33 332,669.83 332,669.83 4,260,829.17 1,052,763.00 1,365,751.00 761,795.33
2003 2,425,997.00 1,323,785.33 1,157,705.67 159,699.00 7,098,248.67 533,912.00 536,691.00 (45,924.67)
2002 1,666,737.50 1,815,631.33 2,448,081.17 2,448,081.17 9,935,668.17 415,061.00 932,845.00 (853,644.67)
2001 2,907,478.00 1,307,477.33 1,838,456.67 1,838,456.67 12,773,087.67 503,790.00 816,778.00 (1,661,364.67)
N NIG. FLOUR MILLS PLC.
2015 4,200,045.00 2,830,178.00 734,721.00 728,107.00 10,529,075.00 3,110,795.00 3,454,703.00 4,934,766.00
2014 2,576,926.00 465,609.00 689,689.00 678,886.00 11,392,017.00 1,187,714.00 1,492,703.00 3,266,615.00
2013 2,765,711.00 550,030.00 857,706.00 837,389.00 11,701,741.00 1,634,103.00 2,017,700.00 3,623,417.00
2012 2,599,672.00 1,876,950.00 758,356.00 689,199.00 12,674,555.00 1,650,012.00 2,178,526.00 1,361,502.00
2011 3,282,737.00 1,854,717.00 851,335.00 789,128.00 11,448,740.00 2,034,890.00 2,581,300.00 1,552,772.00
2010 3,399,732.67 2,731,919.33 816,094.67 723,644.33 11,688,677.67 2,173,788.67 2,017,700.00 108,585.33
2009 3,658,245.67 3,384,262.83 812,909.17 699,513.83 11,562,177.17 2,374,182.17 2,902,696.17 (926,737.17)
2008 1,998,672.00 629,168.00 359,675.00 260,079.00 5,500,508.00 1,353,099.00 1,405,877.00 666,015.00
2007 1,609,338.00 465,446.00 366,364.00 292,973.00 4,784,224.00 1,017,812.00 1,314,781.00 608,429.00
2006 1,600,086.00 670,627.00 318,881.00 286,506.00 4,886,440.00 860,774.00 1,125,239.00 793,728.00
2005 1,679,685.00 648,634.00 247,549.00 216,134.00 5,414,843.00 887,411.00 1,134,596.00 775,783.00
2004 1,434,343.00 578,468.00 166,524.00 135,109.00 3,786,915.00 474,122.00 697,632.00 703,235.00
2003 1,150,992.00 561,308.00 101,283.00 101,283.00 4,243,386.00 399,893.00 654,127.00 598,148.00
2002 989,401.00 494,593.00 104,356.00 104,356.00 4,210,517.00 371,884.00 607,717.00 486,040.00
2001 651,712.00 80,961.00 102,736.00 102,736.00 2,288,617.00 251,971.00 358,648.00 395,800.00
TIGER BRANDED CONSUMER GOODS PLC
2015 22,421,035.00 10,335,953.00 16,704,080.00 12,030,563.00 40,483,702.00 54,749,758.00 53,208,180.00 39,125,115.00
2014 27,615,605.00 13,082,546.00 18,728,824.00 13,691,988.00 36,094,021.00 43,861,797.00 46,348,700.00 46,344,429.00
2013 32,810,175.00 15,829,139.00 20,753,568.00 15,353,413.00 31,704,340.00 32,973,836.00 39,489,220.00 53,563,743.00
2012 31,889,255.00 3,732,123.00 27,302,587.00 18,747,467.00 29,859,976.00 22,275,610.00 36,477,369.00 59,191,842.00
2011 41,652,612.00 5,608,778.00 28,726,626.00 20,633,574.00 38,679,844.00 39,180,069.00 44,026,646.00 70,379,238.00
2010 32,529,277.00 9,560,201.00 27,434,080.00 19,880,243.00 42,695,383.00 29,699,699.00 33,474,033.00 26,489,145.00
2009 28,200,475.00 7,838,096.00 26,753,509.00 18,961,805.00 41,839,919.00 27,739,780.00 28,204,403.00 26,749,581.00
2008 34,133,066.00 6,118,790.00 23,798,071.00 15,732,534.00 30,109,610.00 34,397,016.00 34,773,378.00 23,157,859.00
2007 31,318,723.00 4,583,207.00 21,126,012.00 13,375,453.00 31,303,845.00 30,224,414.00 30,537,243.00 21,907,492.00
2006 34,335,669.33 2,925,142.00 18,228,616.00 10,436,912.00 23,881,717.33 33,271,704.00 33,736,327.00 19,096,221.67
2005 35,894,793.33 1,297,697.50 15,709,273.00 7,643,736.00 18,613,680.33 34,514,021.00 34,890,383.00 16,675,177.17
2004 37,453,917.33 329,747.00 12,601,119.00 4,850,560.00 13,345,643.33 35,756,338.00 36,069,167.00 14,254,132.67
2003 39,013,041.33 1,957,191.50 9,849,088.00 2,057,384.00 8,077,606.33 36,998,655.00 37,463,278.00 11,833,088.17
2002 40,572,165.33 3,584,636.00 8,801,329.00 735,792.00 2,809,569.33 38,240,972.00 38,617,334.00 9,412,043.67
2001 42,131,289.33 5,212,080.50 11,279,527.00 3,528,968.00 2,458,467.67 39,483,289.00 39,796,118.00 6,990,999.17

| 116
SECTOR/FIRMS Year Current Assets Receivable (Debtors)
Fixed Assets Property, Plant & Equipment
Sales (Revenue) Current Liability Total Liability Net Assets
UNION DICON SALT PLC
2015 45,006.00 23,253.67 62,666.50 62,666.50 737,573.70 959,650.00 1,177,665.00 (851,977.50)
2014 36,339.00 18,655.67 62,587.00 61,935.00 222,159.00 955,303.00 1,142,453.00 (856,377.00)
2013 24,333.00 12,930.00 62,094.00 62,094.00 306,746.00 941,832.00 1,168,547.00 (855,405.00)
2012 25,683.00 11,715.00 63,255.00 63,255.00 191,332.00 964,857.00 1,182,872.00 (875,919.00)
2011 6,999.00 3,734.00 61,935.00 61,935.00 675,918.00 933,138.00 1,142,453.00 (864,204.00)
2010 5,850.00 2,890.00 63,795.00 63,795.00 160,504.00 899,204.00 1,100,947.00 (829,559.00)
2009 3,657.00 3,222.00 121,007.00 67,025.00 164,509.00 873,138.00 1,067,309.00 (748,474.00)
2008 131,621.00 3,836.00 131,621.00 77,640.00 112,967.00 819,103.00 1,005,829.00 657,607.00
2007 173,203.00 1,357.00 173,203.00 119,222.00 614,263.00 797,956.00 970,113.00 469,022.00
2006 250,617.00 162,571.00 237,407.00 183,426.00 111,734.00 784,592.00 940,739.00 (296,568.00)
2005 226,966.00 90,156.00 318,239.00 264,258.00 263,468.00 702,902.00 855,740.00 (157,697.00)
2004 266,456.00 249,273.00 282,467.00 341,486.00 928,262.00 770,579.00 817,724.00 (108,656.00)
2003 1,430,135.00 150,281.00 767,898.00 681,917.00 1,333,047.00 1,939,275.00 1,978,866.00 219,167.00
2002 954,140.00 598,680.00 1,266,400.00 1,142,685.00 1,762,107.00 1,149,981.00 1,189,572.00 1,030,968.00
2001 752,407.00 253,543.00 1,359,232.00 1,216,911.00 2,739,490.00 839,226.00 839,226.00 1,272,413.00
U T C NIG. PLC.
2015 103,819.50 122,618.50 2,054,030.00 2,892,743.50 3,279,558.00 (393,270.50) (153,131.50) 3,329,076.00
2014 206,064.00 121,080.00 2,326,178.00 2,736,620.00 3,170,409.00 (131,375.00) 487,856.00 3,033,351.00
2013 308,308.50 119,541.50 2,074,640.00 2,580,496.50 3,061,260.00 130,520.50 418,962.50 2,737,626.00
2012 410,553.00 118,003.00 2,054,030.00 2,424,373.00 2,952,111.00 392,416.00 632,555.00 2,441,901.00
2011 526,704.00 119,904.00 2,326,178.00 2,309,678.00 2,798,120.00 594,682.00 1,213,913.00 2,258,200.00
2010 587,229.00 108,047.00 2,074,640.00 2,029,269.00 2,823,497.00 1,035,466.00 1,323,908.00 1,626,403.00
2009 731,193.00 116,827.00 2,054,030.00 1,997,431.00 2,579,822.00 1,118,473.00 1,358,612.00 1,666,750.00
2008 583,225.00 158,000.00 2,098,709.00 2,033,665.00 2,153,930.00 1,128,412.00 1,227,005.00 1,553,522.00
2007 562,001.00 191,010.00 1,958,298.00 1,908,225.00 1,465,050.00 992,028.00 1,261,706.00 1,528,271.00
2006 444,080.00 94,022.00 929,511.00 879,438.00 951,552.00 573,264.00 686,520.00 800,327.00
2005 323,525.00 235,765.00 495,240.00 445,167.00 612,569.00 517,979.00 616,838.00 300,786.00
2004 508,246.00 433,725.00 1,374,975.00 1,318,152.00 1,979,559.00 1,619,221.00 1,763,945.00 264,000.00
2003 920,276.00 411,035.00 1,599,668.00 1,580,897.00 1,496,770.00 1,950,801.00 2,290,621.00 569,143.00
2002 1,180,766.67 535,445.00 495,240.00 2,250,468.67 2,247,167.00 2,795,489.00 2,894,348.00 646,333.33
2001 448,084.00 192,391.00 1,982,439.00 1,975,663.00 1,050,942.00 1,792,920.00 2,422,481.00 637,603.00
CADBURY NIGERIA PLC.
2015 8,889,339.33 5,148,808.00 16,849,932.00 17,487,864.00 16,291,011.33 10,384,975.00 15,876,489.67 25,739,271.33
2014 12,744,984.00 5,166,194.00 15,672,021.00 15,365,655.00 27,825,194.00 11,651,634.00 16,131,708.00 28,417,005.00
2013 26,231,468.00 6,266,806.00 16,941,156.00 16,929,458.00 35,760.00 14,386,781.00 19,177,693.00 43,172,624.00
2012 25,271,693.00 5,742,579.00 14,539,722.00 12,964,243.00 31,231,751.00 14,919,196.00 18,037,528.00 39,811,415.00
2011 18,589,512.00 3,552,064.00 14,107,869.00 11,338,578.00 31,018,546.00 12,182,826.00 15,268,826.00 32,697,381.00
2010 13,976,821.00 3,018,275.00 14,740,995.00 10,647,839.00 26,998,611.00 12,097,087.00 15,099,087.00 28,717,816.00
2009 10,306,999.00 1,573,356.00 15,124,401.00 10,191,657.00 23,240,611.00 8,792,676.00 12,275,704.00 25,431,400.00
2008 7,775,647.00 2,456,994.00 15,354,489.00 11,613,492.00 21,729,161.00 22,202,130.00 25,864,656.00 23,130,129.00
2007 7,366,306.00 1,446,624.00 16,591,315.00 12,986,441.00 18,017,952.00 20,466,428.00 23,444,052.00 23,957,621.00
2006 5,542,291.00 1,698,926.00 17,156,982.33 14,391,980.67 15,773,249.00 28,827,496.67 31,696,485.33 22,699,271.00
2005 4,071,944.50 1,635,560.00 17,890,439.33 15,789,372.67 13,161,919.50 34,664,372.67 37,280,659.33 21,962,381.50
2004 2,601,598.00 1,572,194.00 18,623,896.33 17,186,764.67 10,550,590.00 40,501,248.67 42,864,833.33 21,225,492.00
2003 1,131,251.50 1,508,828.00 19,357,353.33 18,584,156.67 7,939,260.50 46,338,124.67 48,449,007.33 20,488,602.50
2002 9,664,121.00 1,253,707.00 3,479,332.00 2,391,065.00 14,752,982.00 5,184,680.00 5,689,924.00 7,453,529.00
2001 8,632,988.00 1,187,628.00 2,420,112.00 1,331,845.00 12,319,653.00 4,381,160.00 7,211,585.00 3,841,515.00

| 117
SECTOR/FIRMS Year Current Assets Receivable (Debtors)
Fixed Assets Property, Plant & Equipment
Sales (Revenue) Current Liability Total Liability Net Assets
NESTLE NIGERIA PLC.
2015 46,200,279.33 26,764,605.67 71,976,158.00 70,539,434.33 157,661,738.67 25,707,016.00 79,515,687.67 118,176,437.33
2014 37,389,330.00 22,330,813.00 68,672,737.00 67,514,854.00 143,328,982.00 25,484,372.00 70,122,424.00 106,062,067.00
2013 41,755,808.00 17,884,775.00 66,451,672.00 65,878,425.00 133,084,076.00 34,379,584.00 67,612,679.00 108,207,480.00
2012 26,356,145.00 13,457,105.00 62,607,073.00 62,159,769.00 116,707,394.00 29,598,012.00 54,777,656.00 88,963,218.00
2011 21,954,807.00 8,585,072.00 54,990,986.00 54,859,249.00 97,961,260.00 24,816,440.00 53,452,906.00 76,945,793.00
2010 20,105,323.00 8,410,169.00 40,241,739.00 40,004,612.00 80,108,738.00 20,034,868.00 45,481,709.00 60,347,062.00
2009 18,845,756.00 3,402,510.00 25,404,616.00 25,404,616.00 68,317,303.00 24,559,526.00 33,706,437.00 44,250,372.00
2008 15,342,204.00 4,304,928.00 13,817,348.00 13,817,348.00 51,742,302.00 35,264,611.00 38,190,792.00 29,159,552.00
2007 21,252,320.00 2,299,073.00 10,435,952.00 10,435,952.00 44,027,525.00 11,093,617.00 20,128,312.00 29,159,552.00
2006 11,572,200.00 2,232,066.67 7,336,015.00 7,336,015.00 36,981,928.00 7,325,189.00 12,547,723.00 18,908,215.00
2005 10,351,760.00 849,208.00 6,523,324.00 6,183,324.00 34,335,891.00 11,461,243.00 15,122,272.00 16,875,084.00
2004 9,079,343.00 1,144,080.00 4,320,527.00 3,980,527.00 28,461,078.00 8,464,422.00 11,665,811.00 13,399,870.00
2003 9,445,468.00 707,440.00 2,464,548.00 2,124,548.00 24,631,949.00 8,005,041.00 10,312,388.00 11,910,016.00
2002 7,263,488.00 1,048,868.00 1,565,635.00 1,225,635.00 19,578,894.00 5,629,279.00 7,337,267.00 8,829,843.00
2001 6,764,401.00 523,365.00 1,447,319.00 1,107,319.00 14,146,932.00 4,306,954.00 5,275,280.00 1,489,121.00
NIGERIAN ENAMELWARE PLC.
2015 3,966,517.00 1,301,021.00 1,056,029.00 1,056,029.00 2,608,286.00 3,405,863.00 3,716,941.00 5,022,544.00
2014 1,981,556.00 809,095.00 1,102,465.00 1,102,465.00 2,569,751.00 1,520,725.00 1,842,440.00 30,842,021.00
2013 1,056,467.00 263,254.00 1,146,921.00 1,146,921.00 2,516,038.00 683,910.00 1,019,450.00 2,203,388.00
2012 971,775.00 127,159.00 86,323.00 86,323.00 2,490,376.00 676,476.00 699,485.00 295,299.00
2011 925,071.00 25,349.00 94,257.00 94,257.00 2,365,078.00 706,374.00 722,045.00 218,697.00
2010 1,386,389.00 32,729.00 40,080.00 40,080.00 2,356,933.00 1,184,790.00 1,191,970.00 234,499.00
2009 981,726.00 254.00 41,780.00 41,780.00 2,412,920.00 842,803.00 849,458.00 174,051.00
2008 1,281,659.00 243,830.00 8,225.00 8,225.00 1,510,019.00 1,047,565.00 1,144,754.00 145,130.00
2007 1,452,327.00 87,025.00 8,707.00 8,707.00 1,568,955.00 1,236,267.00 1,318,407.00 142,627.00
2006 828,494.00 465,034.00 10,315.00 10,315.00 1,573,400.00 669,021.00 720,721.00 118,088.00
2005 820,457.00 339,249.00 19,197.00 19,197.00 1,776,702.00 682,072.00 727,909.00 111,745.00
2004 917,408.00 457,862.00 33,816.00 33,816.00 1,639,663.00 793,270.00 848,389.00 102,835.00
2003 694,570.00 213,022.00 49,715.00 49,715.00 1,778,588.00 630,377.00 645,900.00 98,385.00
2002 495,699.00 105,695.00 60,938.00 60,938.00 1,673,462.00 448,019.00 462,525.00 94,112.00
2001 456,215.00 32,164.00 66,705.00 66,705.00 1,662,691.00 422,762.00 436,134.00 86,786.00
VITAFOAM NIG PLC
2015 8,420,390.00 5,182,168.00 3,659,266.00 2,666,278.00 15,487,801.00 6,768,890.00 7,944,122.00 12,079,656.00
2014 7,720,151.00 3,428,412.00 3,311,980.00 2,672,818.00 15,519,856.00 6,664,528.00 7,285,127.00 11,032,131.00
2013 6,212,526.00 2,601,369.00 3,182,707.00 2,616,600.00 15,592,358.00 896,817.00 6,108,912.00 8,498,416.00
2012 6,968,430.00 2,191,704.00 3,147,792.00 2,535,991.00 14,126,527.00 781,677.00 6,988,755.00 9,334,545.00
2011 6,246,044.00 247,852.00 3,200,062.00 2,376,079.00 13,979,353.00 5,686,106.00 6,519,101.00 2,927,005.00
2010 4,239,256.00 745,838.00 1,887,869.00 1,686,509.00 10,538,440.00 3,113,858.00 3,627,444.00 2,499,681.00
2009 3,724,841.00 334,472.00 1,725,374.00 1,643,608.00 9,739,916.00 2,731,365.00 3,272,443.00 2,177,772.00
2008 3,230,097.00 350,262.00 1,397,874.00 1,345,847.00 8,172,005.00 2,101,498.00 2,732,835.00 1,895,134.00
2007 2,762,482.00 275,151.00 660,073.00 629,973.00 6,149,520.00 1,719,760.00 2,020,967.00 1,401,588.00
2006 1,817,759.00 289,704.00 596,855.00 529,855.00 4,060,955.00 1,222,850.00 1,452,340.00 962,274.00
2005 1,437,108.00 256,606.00 501,710.00 501,610.00 3,525,480.00 822,355.00 1,153,382.00 785,436.00
2004 1,503,076.00 257,794.00 559,556.00 559,456.00 3,650,990.00 946,208.00 1,290,563.00 772,069.00
2003 1,977,205.00 270,246.00 587,063.00 586,963.00 3,887,025.00 1,520,008.00 1,867,873.00 696,395.00
2002 1,299,235.00 233,858.00 598,389.00 565,577.00 3,391,283.00 1,024,679.00 1,311,719.00 585,905.00
2001 1,071,477.00 98,685.00 487,660.00 454,848.00 3,364,194.00 842,254.00 1,057,197.00 501,940.00

| 118
SECTOR/FIRMS Year Current Assets Receivable (Debtors)
Fixed Assets Property, Plant & Equipment
Sales (Revenue) Current Liability Total Liability Net Assets
VONO PRODUCTS PLC.
2015 432,987.00 57,626.00 1,418,046.00 1,415,121.00 937,918.00 961,080.00 1,028,957.00 1,851,033.00
2014 381,120.00 88,472.00 1,474,984.00 1,472,340.00 889,666.00 848,036.00 1,028,869.00 1,856,104.00
2013 329,253.00 119,318.00 1,531,922.00 1,529,559.00 841,414.00 734,992.00 1,028,781.00 1,861,175.00
2012 308,404.00 67,506.00 1,578,989.00 1,577,481.00 525,875.00 710,863.00 1,062,158.00 1,887,393.00
2011 280,328.00 60,040.00 1,689,779.00 1,688,196.00 670,694.00 842,009.00 1,426,283.00 1,970,107.00
2010 426,844.00 90,111.00 1,724,223.00 1,724,223.00 437,384.00 1,092,677.00 1,542,784.00 608,319.00
2009 229,419.00 110,757.00 1,801,698.00 1,801,698.00 447,867.00 839,090.00 1,025,824.00 1,005,293.00
2008 196,689.00 61,355.00 742,818.00 742,818.00 629,858.00 503,648.00 796,069.00 143,438.00
2007 332,146.00 152,978.00 781,062.00 781,062.00 1,404,134.00 819,639.00 849,604.00 263,604.00
2006 553,174.00 140,181.00 223,604.00 223,604.00 1,001,487.00 476,218.00 508,569.00 268,209.00
2005 293,172.00 21,127.00 204,863.00 204,863.00 264,621.00 202,679.00 229,960.00 268,075.00
2004 272,543.00 114,218.00 126,437.00 126,437.00 408,952.00 183,304.00 206,793.00 192,187.00
2003 255,993.00 66,719.00 170,554.00 170,554.00 440,053.00 197,493.00 214,561.00 211,986.00
2002 225,571.00 70,330.00 186,413.00 186,413.00 380,003.00 191,396.00 205,325.00 206,659.00
2001 220,375.00 114,152.00 170,873.00 170,873.00 312,896.00 185,413.00 192,408.00 198,840.00
P Z CUSSONS NIGERIA PLC.
2015 28,340,582.00 13,085,927.00 19,766,079.00 19,239,673.00 73,126,070.00 17,763,887.00 21,521,732.00 30,342,774.00
2014 32,654,512.00 13,658,252.00 19,039,654.00 18,513,248.00 72,905,679.00 20,712,273.00 24,086,853.00 30,981,893.00
2013 31,110,422.00 15,122,085.00 19,133,432.00 18,703,383.00 71,343,088.00 15,072,479.00 50,243,854.00 35,171,375.00
2012 29,919,320.00 12,021,551.00 1,922,789.00 19,135,657.00 72,154,601.00 14,474,915.00 49,149,109.00 34,674,194.00
2011 35,157,741.00 8,865,618.00 19,662,063.00 19,135,657.00 65,877,984.00 17,933,131.00 21,538,417.00 33,281,387.00
2010 29,498,577.00 8,091,245.00 22,970,779.00 22,454,373.00 62,667,910.00 16,425,550.00 19,790,473.00 32,678,883.00
2009 26,447,253.00 6,489,272.00 19,684,035.00 19,167,629.00 80,974,071.00 13,287,765.00 16,057,981.00 30,073,307.00
2008 25,570,571.00 5,808,462.00 17,133,294.00 16,616,888.00 65,945,174.00 11,213,083.00 13,667,150.00 29,036,715.00
2007 24,646,112.00 5,811,728.00 15,389,679.00 14,873,273.00 54,216,824.00 14,675,375.00 16,642,210.00 28,098,218.00
2006 24,047,750.00 4,015,555.00 14,501,462.00 13,995,056.00 42,225,417.00 16,487,599.00 19,674,972.00 27,801,688.00
2005 19,073,823.00 1,505,879.00 12,142,039.00 11,635,633.00 34,134,609.00 10,515,204.00 13,257,628.00 19,914,819.00
2004 15,052,577.00 1,074,079.00 11,934,057.00 11,427,651.00 27,995,035.00 9,315,353.00 11,925,110.00 18,623,640.00
2003 15,639,313.00 852,063.00 8,446,912.00 7,940,506.00 24,024,950.00 6,922,194.00 8,890,164.00 15,162,047.00
2002 13,741,601.00 373,526.00 7,214,930.00 6,708,524.00 20,619,531.00 4,801,323.00 6,582,875.00 14,303,535.00
2001 13,053,190.00 388,406.00 5,238,948.00 5,231,687.00 16,089,203.00 4,900,384.00 4,965,384.00 12,002,636.00
UNILEVER NIGERIA PLC
2015 21,007,814.00 6,173,113.00 29,164,670.00 27,368,919.00 59,221,748.00 34,697,653.00 42,169,231.00 50,172,484.00
2014 18,571,159.00 8,544,431.00 27,165,096.00 24,803,779.00 55,754,309.00 31,370,833.00 38,257,447.00 45,736,255.00
2013 18,401,327.00 8,143,362.00 25,352,787.00 23,224,938.00 60,004,119.00 28,072,640.00 34,406,192.00 43,754,114.00
2012 14,778,273.00 5,637,668.00 21,719,351.00 19,265,833.00 55,547,798.00 22,332,576.00 26,454,101.00 36,497,624.00
2011 16,126,510.00 5,425,893.00 15,622,312.00 14,263,978.00 54,724,749.00 18,892,176.00 22,615,278.00 32,249,928.00
2010 14,195,763.00 5,231,304.00 11,738.00 11,738.00 46,807,860.00 14,395,173.00 17,600,114.00 8,335,227.00
2009 13,706,482.00 6,798,481.00 9,975,242.00 9,975,242.00 44,481,277.00 12,404,654.00 15,478,990.00 8,202,734.00
2008 14,436,466.00 7,097,891.00 9,056,190.00 9,056,190.00 37,377,492.00 13,742,718.00 16,811,103.00 6,681,553.00
2007 11,711,961.00 5,066,930.00 8,640,971.00 8,640,971.00 33,990,848.00 12,741,389.00 15,322,088.00 5,030,844.00
2006 10,850,004.00 3,860,709.00 7,772,471.00 7,772,471.00 25,554,415.00 12,110,780.00 14,669,127.00 3,953,348.00
2005 16,818,583.00 9,369,197.00 7,645,186.00 7,645,186.00 33,390,940.00 15,788,090.00 18,893,158.00 5,570,611.00
2004 9,454,494.00 2,617,038.00 6,179,653.00 6,179,653.00 28,576,997.00 9,590,532.00 11,679,993.00 3,954,154.00
2003 10,571,724.00 2,035,830.00 4,822,861.00 4,822,861.00 23,693,923.00 9,775,992.00 11,489,035.00 3,905,550.00
2002 6,243,911.00 1,413,654.00 4,498,208.00 4,498,208.00 19,003,356.00 5,351,758.00 6,574,455.00 892,153.00
2001 5,489,363.00 945,636.00 3,598,035.00 3,598,035.00 15,203,511.00 3,993,489.00 4,978,333.00 1,495,874.00

| 119
SECTOR/FIRMS Year Current Assets Receivable (Debtors)
Fixed Assets Property, Plant & Equipment
Sales (Revenue) Current Liability Total Liability Net Assets
HEALTHCARE 2015 40,190.70 70,160.30 24,524,063.00 3,128,221.00 872,154,434.00 103,663.00 57,612,052.00 1,951,295,851.50
EKOCORP PLC.
2014 12,272.00 25,033.90 75,929,762.00 2,883,920.00 827,991,940.50 959,733.00 965,084.00 1,827,309,233.00
2013 42,485.00 20,092.50 24,035,462.00 2,639,620.00 783,829,447.00 882,828.00 882,828.00 1,703,322,614.50
2012 72,697.00 65,218.90 9,645,319.00 2,395,319.00 739,666,953.50 805,922.00 805,922.00 1,579,335,996.00
2011 102,910.00 10,345.30 42,906,035.00 21,510,193.00 695,504,460.00 729,017.00 786,529.00 1,455,349,377.50
2010 133,122.00 555,471.70 74,952,560.00 1,906,718.00 651,341,966.50 652,111.00 705,631.00 1,331,362,759.00
2009 163,335.00 400,598.10 23,058,259.00 1,662,417.00 607,179,473.00 575,206.00 575,206.00 1,207,376,140.50
2008 193,548.00 245,724.50 8,668,117.00 1,418,117.00 563,016,979.50 498,300.00 498,300.00 1,083,389,522.00
2007 256,496.00 533,111.00 22,452,148.00 1,056,306.00 532,747,223.00 356,952.00 932,035.00 919,737,517.00
2006 186,848.00 169,209.00 74,214,637.00 1,168,795.00 457,690,877.00 428,170.00 470,152.00 946,999,042.00
2005 320,228.00 310,907.00 21,955,028.00 559,186.00 422,853,519.00 293,549.00 293,549.00 607,260,312.00
2004 312,745.00 305,783.00 7,695,174.00 445,174.00 397,151,364.00 145,474.00 145,474.00 619,695,032.00
2003 257,414.00 251,462.00 7,707,299.00 457,299.00 376,092,881.00 130,732.00 146,544.00 591,231,223.00
2002 339,631.00 332,579.00 7,576,666.00 326,666.00 356,058,097.00 102,254.00 149,387.00 524,159,806.00
2001 302,563.00 298,809.00 7,587,143.00 337,143.00 336,858,746.00 104,254.00 174,108.00 472,525,272.00
MORISON INDUSTRIES PLC.
2015 65,453.67 117,811.00 317,954.00 298,695.67 132,439.00 174,701.33 206,316.33 208,706.33
2014 99,428.00 25,145.00 349,619.00 337,263.00 217,848.00 118,486.00 118,486.00 330,561.00
2013 189,573.00 84,349.00 336,642.00 328,291.00 339,303.00 89,198.00 113,323.00 437,017.00
2012 195,462.00 117,811.00 390,628.00 390,628.00 406,689.00 19,519.00 51,134.00 566,571.00
2011 177,354.00 74,484.00 400,196.00 400,196.00 205,801.00 118,356.00 144,571.00 459,194.00
2010 189,132.00 109,438.00 363,295.00 368,581.00 270,227.00 125,381.00 154,364.00 403,349.00
2009 198,638.00 394,466.00 383,034.00 394,466.00 270,330.00 126,144.00 156,628.00 436,476.00
2008 177,277.00 91,374.00 393,899.00 412,139.00 369,232.00 94,522.00 124,474.00 464,942.00
2007 163,475.00 70,934.00 64,442.00 67,858.00 221,765.00 82,186.00 105,888.00 125,445.00
2006 157,365.00 67,420.00 66,542.00 66,542.00 211,336.00 75,944.00 103,952.00 119,955.00
2005 153,213.00 46,502.00 41,877.00 41,877.00 195,010.00 50,436.00 74,151.00 120,939.00
2004 145,216.00 47,702.00 37,804.00 37,804.00 179,330.00 53,800.00 72,843.00 110,177.00
2003 123,410.00 33,307.00 33,476.00 33,476.00 153,008.00 27,704.00 37,245.00 109,641.00
2002 109,760.00 2,742.00 35,092.00 35,092.00 128,123.00 24,897.00 37,885.00 106,967.00
2001 105,272.00 19,650.00 41,137.00 41,137.00 129,182.00 28,402.00 40,305.00 106,104.00
EVANS MEDICAL PLC.
2015 3,646,449.00 1,802,874.00 4,753,451.00 4,258,723.00 5,741,729.00 3,734,259.00 5,947,161.00 3,413,683.00
2014 3,390,229.00 1,749,631.00 4,644,569.00 4,239,190.00 5,449,315.00 3,456,754.00 5,429,420.00 3,085,850.00
2013 3,134,009.00 1,696,388.00 4,535,687.00 4,219,657.00 5,156,901.00 3,179,249.00 5,392,151.00 2,758,017.00
2012 2,877,789.00 1,643,145.00 4,426,805.00 4,200,124.00 4,864,487.00 2,901,744.00 4,874,410.00 2,430,184.00
2011 2,621,569.00 1,589,902.00 4,317,923.00 4,180,591.00 4,572,073.00 2,624,239.00 4,837,141.00 2,102,351.00
2010 2,400,637.00 1,256,169.00 1,692,561.00 1,555,862.00 3,942,683.00 2,401,959.00 4,150,242.00 (57,044.00)
2009 2,283,452.00 906,718.00 1,638,470.00 1,623,469.00 3,523,703.00 3,746,540.00 3,774,953.00 (65,807.00)
2008 2,961,694.00 1,502,375.00 1,735,509.00 1,690,469.00 4,465,237.00 3,514,758.00 3,873,419.00 823,784.00
2007 2,749,144.00 1,447,351.00 1,598,611.00 1,556,154.00 3,151,753.00 2,823,171.00 3,023,873.00 1,323,882.00
2006 2,415,119.00 1,210,442.00 1,404,258.00 1,393,455.00 2,908,469.00 2,023,317.00 2,178,476.00 1,640,901.00
2005 1,995,705.00 951,819.00 1,350,236.00 1,304,235.00 2,529,500.00 1,613,342.00 1,735,962.00 1,563,978.00
2004 2,032,555.00 995,873.00 1,358,815.00 1,117,037.00 1,009,091.00 1,704,606.00 1,755,681.00 1,635,688.00
2003 1,224,768.00 320,504.00 1,060,986.00 1,060,985.00 1,537,467.00 817,024.00 843,112.00 1,442,643.00
2002 510,568.00 168,016.00 1,093,613.00 1,093,612.00 1,183,302.00 528,600.00 536,296.00 1,067,886.00
2001 397,695.00 111,313.00 1,122,316.00 1,122,315.00 919,215.00 527,564.00 535,260.00 984,751.00

| 120
SECTOR/FIRMS Year Current Assets Receivable (Debtors)
Fixed Assets Property, Plant & Equipment
Sales (Revenue) Current Liability Total Liability Net Assets
FIDSON HEALTHCARE PLC
2015 4,615,450.00 3,707,292.33 13,308,280.67 13,615,929.33 11,257,972.67 7,535,054.00 11,973,867.67 5,949,862.33
2014 4,654,412.00 3,187,471.00 11,118,082.00 10,790,758.00 9,719,185.00 5,909,026.00 10,007,213.00 5,765,281.00
2013 4,769,698.00 2,344,387.00 7,473,390.00 7,043,474.00 9,235,056.00 4,114,146.00 6,997,753.00 5,245,335.00
2012 4,770,498.00 1,986,197.00 6,010,438.00 4,679,359.00 7,168,939.00 2,572,544.00 5,552,501.00 5,228,436.00
2011 3,836,962.00 1,957,500.00 5,578,102.00 3,447,601.00 7,127,853.00 1,797,651.00 4,224,687.00 5,190,377.00
2010 2,864,344.00 1,850,131.00 5,037,986.00 2,207,534.00 5,100,523.00 2,551,513.00 2,671,416.00 5,319,386.00
2009 3,744,047.00 1,687,122.00 3,437,641.00 1,903,839.00 5,019,778.00 1,914,364.00 2,086,667.00 5,095,021.00
2008 4,346,309.00 2,737,290.00 2,617,006.00 870,478.00 4,503,645.00 370,451.00 618,270.00 4,965,948.00
2007 5,133,531.67 2,184,894.00 947,725.00 586,483.00 3,307,421.00 1,749,548.00 1,997,367.00 1,426,726.00
2006 5,874,514.17 2,628,473.50 757,739.00 501,154.00 220,167.00 1,797,651.00 4,224,687.00 1,068,571.00
2005 6,615,496.67 2,833,919.20 518,291.00 441,992.00 1,624,471.00 2,551,513.00 2,671,416.00 698,141.00
2004 7,356,479.17 3,039,364.90 422,434.00 362,934.00 1,080,231.00 1,914,364.00 2,086,667.00 528,842.00
2003 8,097,461.67 3,244,810.60 947,725.00 290,688.50 238,756.00 1,749,548.00 1,997,367.00 164,549.50
2002 8,838,444.17 3,450,256.30 474,292.60 217,707.60 288,970.60 1,797,651.00 4,224,687.00 (141,858.70)
2001 9,579,426.67 3,655,702.00 221,025.70 144,726.70 816,697.20 2,551,513.00 2,671,416.00 (448,266.90)
GLAXO SMITHKLINE CONSUMER NIG. PLC.
2015 17,370,362.00 6,236,265.00 13,874,402.00 13,751,502.00 30,634,708.00 16,114,288.00 18,127,398.00 31,121,864.00
2014 14,369,484.00 4,977,242.00 13,482.00 13,419,554.00 30,521,127.00 13,199,001.00 15,022,810.00 27,789,038.00
2013 13,900,136.00 4,088,284.00 12,122,017.00 12,121,857.00 29,183,675.00 11,753,615.00 13,840,146.00 26,022,153.00
2012 12,736,048.00 3,692,678.00 8,835,220.00 8,835,060.00 25,127,000.00 9,449,552.00 11,068,641.00 21,571,268.00
2011 10,447,981.00 2,488,055.00 7,262,398.00 7,262,398.00 21,148,210.00 7,388,344.00 8,798,782.00 17,710,379.00
2010 7,857,202.00 1,838,385.00 6,880,870.00 6,880,710.00 16,863,533.00 5,143,337.00 6,407,503.00 14,737,912.00
2009 7,289,936.00 1,616,061.00 4,788,586.00 4,788,426.00 14,952,445.00 4,625,976.00 5,495,121.00 12,078,361.00
2008 5,649,286.00 1,108,840.00 3,836,806.00 3,961,995.00 12,545,129.00 3,321,911.00 4,159,822.00 9,611,281.00
2007 5,203,386.00 2,104,274.00 3,515,935.00 3,515,775.00 9,915,400.00 3,331,697.00 4,117,210.00 8,719,161.00
2006 5,754,979.00 1,999,102.00 3,114,388.00 3,114,228.00 10,389,553.00 3,986,227.00 4,676,132.00 8,869,207.00
2005 5,601,493.00 2,837,848.00 2,695,056.00 2,694,896.00 8,589,814.00 4,233,569.00 4,802,924.00 8,296,389.00
2004 3,899,467.00 848,760.00 2,122,676.00 2,122,516.00 7,149,033.00 2,975,635.00 3,504,261.00 6,021,983.00
2003 3,732,602.00 1,071,229.00 1,087,118.00 1,086,958.00 5,672,213.00 2,470,001.00 2,978,061.00 4,819,560.00
2002 4,346,977.00 1,104,728.00 918,115.00 917,955.00 4,098,758.00 3,279,805.00 3,868,584.00 5,264,932.00
2001 2,179,356.00 603,597.00 593,688.00 593,528.00 2,504,498.00 1,171,371.00 1,698,219.00 1,074,825.00
MAY & BAKER NIGERIA PLC.
2015 3,672,778.00 1,787,606.00 4,603,048.00 4,287,425.00 7,415,203.00 3,503,260.00 5,117,743.00 3,158,083.00
2014 3,542,877.00 2,069,007.00 4,586,273.00 4,270,652.00 6,899,496.00 3,123,864.00 4,976,599.00 3,152,551.00
2013 3,374,525.00 1,562,398.00 4,782,075.00 4,466,454.00 6,253,986.00 3,207,522.00 5,097,214.00 3,059,386.00
2012 3,103,110.00 1,523,599.00 4,968,740.00 4,653,119.00 5,484,925.00 2,768,543.00 4,934,348.00 3,137,502.00
2011 2,005,617.00 837,428.00 5,036,440.00 4,723,581.00 4,749,617.00 2,817,287.00 3,905,611.00 4,224,770.00
2010 2,658,508.00 974,711.00 4,158,408.00 3,845,787.00 4,639,202.00 2,693,127.00 3,933,532.00 4,123,789.00
2009 2,647,472.00 631,692.00 3,506,376.00 3,175,002.00 4,604,458.00 2,637,900.00 3,448,141.00 2,705,707.00
2008 3,429,738.00 1,063,816.00 2,300,371.00 1,650,709.00 5,439,910.00 2,236,366.00 2,976,483.00 2,753,626.00
2007 3,298,830.00 463,793.00 1,778,032.00 1,084,112.00 3,859,749.00 1,481,292.00 2,721,697.00 2,615,664.00
2006 2,300,418.00 373,669.00 1,664,154.00 940,643.00 2,253,389.00 986,923.00 1,279,507.00 2,617,346.00
2005 1,302,006.00 283,545.00 644,129.00 573,021.00 1,996,974.00 492,554.00 1,046,197.00 816,905.00
2004 933,016.00 335,129.00 409,452.00 302,617.00 1,900,865.00 498,727.00 627,322.00 715,146.00
2003 914,255.00 341,778.00 361,083.00 318,919.00 1,780,448.00 513,451.00 635,941.00 639,397.00
2002 784,837.00 313,857.00 306,217.00 306,217.00 1,274,867.00 378,483.00 476,529.00 614,525.00
2001 825,137.00 325,197.00 298,997.00 298,997.00 1,055,219.00 459,882.00 550,684.00 573,450.00

| 121
SECTOR/FIRMS Year Current Assets Receivable (Debtors)
Fixed Assets Property, Plant & Equipment
Sales (Revenue) Current Liability Total Liability Net Assets
NEIMETH INTERNATIONAL PHARMACEUTICALS PLC
2015 1,728,848.00 830,025.00 471,396.00 471,396.00 1,460,728.00 831,812.00 1,042,919.00 1,157,325.00
2014 2,215,997.00 1,217,035.00 566,491.00 541,976.00 1,628,395.00 1,116,455.00 1,289,479.00 1,493,009.00
2013 2,384,890.00 1,420,440.00 506,189.00 426,045.00 2,016,522.00 919,505.00 1,110,870.00 1,733,789.00
2012 2,665,951.00 1,346,245.00 549,485.00 469,247.00 2,330,203.00 1,043,617.00 1,345,945.00 158,293.00
2011 2,523,433.00 1,288,252.00 537,742.00 473,331.00 1,898,501.00 1,763,187.00 1,796,576.00 1,015,504.00
2010 2,578,299.00 985,372.00 388,007.00 300,648.00 1,871,667.00 1,234,964.00 1,537,292.00 1,160,416.00
2009 2,640,091.00 812,391.00 402,012.00 189,899.00 1,867,365.00 1,238,352.00 1,792,483.00 1,209,255.00
2008 2,938,259.00 1,007,650.00 297,854.00 183,698.00 1,946,513.00 861,456.00 1,612,655.00 1,615,199.00
2007 2,316,102.00 700,062.00 207,176.00 95,260.00 1,503,858.00 1,728,381.00 2,040,221.00 1,623,717.00
2006 2,486,143.00 1,236,644.00 74,774.00 48,874.00 1,203,530.00 1,836,526.00 2,171,827.00 1,576,000.00
2005 1,555,100.00 507,597.00 72,221.00 58,571.00 1,241,949.00 617,098.00 1,086,402.00 540,919.00
2004 1,461,385.00 44,907.00 54,800.00 54,800.00 1,002,024.00 564,732.00 1,097,191.00 418,994.00
2003 1,193,736.00 486,442.00 59,352.00 59,352.00 950,804.00 898,833.00 944,627.00 308,461.00
2002 1,168,096.00 502,786.00 76,010.00 76,010.00 897,811.00 936,796.00 983,015.00 261,091.00
2001 1,047,699.00 562,406.00 96,389.00 96,389.00 1,003,036.00 877,236.00 909,725.00 233,331.00
NIGERIA-GERMAN CHEMICALS PLC.
2015 2,815,185.33 293,467.00 10,700,087.67 9,356,973.67 2,892,729.00 6,058,630.67 8,628,943.67 3,376,648.00
2014 2,444,271.00 279,675.00 9,220,555.00 8,060,155.00 2,800,516.00 5,085,005.00 8,601,521.00 3,063,305.00
2013 2,829,076.00 318,661.00 7,833,325.00 7,462,039.00 2,940,451.00 3,474,580.00 8,233,123.00 2,429,278.00
2012 2,080,302.00 278,480.00 6,307,641.00 5,815,869.00 2,732,164.00 2,819,354.00 5,389,667.00 2,276,277.00
2011 1,959,273.00 399,178.00 5,784,276.00 5,233,989.00 2,937,599.00 2,227,163.00 5,112,754.00 2,595,799.00
2010 1,504,562.00 132,536.00 5,040,345.00 4,261,614.00 2,801,145.00 3,275,570.00 4,190,435.00 2,407,224.00
2009 1,527,365.00 448,383.00 5,070,294.00 4,261,614.00 2,801,145.00 3,275,570.00 4,190,435.00 2,407,224.00
2008 2,203,270.00 1,073,057.00 2,127,196.00 1,128,952.00 2,683,985.00 2,402,709.00 3,093,574.00 1,236,891.00
2007 1,763,805.00 1,060,112.00 1,389,635.00 651,872.00 2,492,459.00 1,240,559.00 1,880,025.00 1,273,415.00
2006 1,371,676.00 599,050.00 1,373,226.00 691,401.00 2,040,006.00 1,155,042.00 1,561,781.00 1,183,121.00
2005 1,085,727.00 436,487.00 1,149,057.00 729,770.00 2,060,023.00 961,099.00 1,145,684.00 1,138,683.00
2004 952,387.00 314,943.00 1,079,709.00 716,312.00 1,900,800.00 829,824.00 984,416.00 1,047,680.00
2003 993,275.00 312,724.00 889,235.00 560,247.00 1,603,313.00 698,549.00 883,134.00 1,011,483.00
2002 1,042,562.00 311,625.00 754,176.00 571,342.00 1,439,659.00 699,969.00 1,696,056.00 996,087.00
2001 1,057,002.00 255,332.00 706,533.00 518,092.00 977,168.00 717,191.00 1,705,262.00 988,071.00
PHARMA-DEKO PLC
2015 1,252,363.00 9,657.00 1,317,719.00 1,294,310.00 1,481,964.00 712,545.00 784,885.00 2,570,082.00
2014 838,643.00 103,081.00 2,000,586.00 2,000,586.00 1,566,190.00 1,791,935.00 1,908,024.00 2,839,229.00
2013 477,873.00 99,321.00 2,498,136.00 2,020,263.00 1,060,308.00 1,568,346.00 1,667,939.00 2,498,136.00
2012 654,699.00 89,071.00 2,782,811.00 2,128,112.00 1,037,463.00 1,603,929.00 1,839,379.00 2,782,811.00
2011 1,240,293.00 54,031.00 1,068,343.00 552,422.00 1,261,876.00 2,177,412.00 3,117,592.00 1,068,343.00
2010 1,055,820.00 96,027.00 1,110,501.00 571,778.00 494,457.00 2,070,468.00 3,047,495.00 1,110,501.00
2009 335,295.00 52,943.00 910,110.00 584,509.00 501,930.00 163,684.00 418,654.00 (646,407.00)
2008 376,863.00 322,216.00 999,419.00 622,556.00 1,105,570.00 1,636,842.00 1,905,267.00 (184,910.00)
2007 417,705.00 179,086.00 1,079,895.00 652,283.00 790,399.00 1,205,058.00 1,564,037.00 (66,437.00)
2006 340,195.00 109,958.00 1,097,441.00 616,516.00 648,868.00 927,109.00 1,351,678.00 85,958.00
2005 734,380.00 126,675.00 513,662.00 498,663.00 564,944.00 732,888.00 829,251.00 423,288.00
2004 443,040.00 252,989.00 373,427.00 368,499.00 712,481.00 474,817.00 571,483.00 244,985.00
2003 321,968.00 148,189.00 220,363.00 213,783.00 610,263.00 263,383.00 345,974.00 196,357.00
2002 179,705.00 96,865.00 166,570.00 161,978.00 408,908.00 218,086.00 277,398.00 68,877.00
2001 114,243.00 51,600.00 167,120.00 167,120.00 229,334.00 201,011.00 249,703.00 31,660.00

| 122
SECTOR/FIRMS Year Current Assets Receivable (Debtors)
Fixed Assets Property, Plant & Equipment
Sales (Revenue) Current Liability Total Liability Net Assets
INDUSTRIAL GOODS 2015 9,346.20 10,140.70 296,981.90 296,981.90 78,435.60 311,094.40 311,094.40 (4,766.30)
AFRICAN PAINTS (NIGERIA) PLC.
2014 9,742.80 9,027.30 307,177.60 307,177.60 73,467.40 310,870.10 310,870.10 6,050.30
2013 10,139.40 7,913.90 317,373.30 317,373.30 68,499.20 310,645.80 310,645.80 16,866.90
2012 10,536.00 6,800.50 327,569.00 327,569.00 63,531.00 310,421.50 310,421.50 27,683.50
2011 10,732.00 6,774.00 336,807.00 336,807.00 58,719.00 329,350.00 329,350.00 18,189.00
2010 8,739.00 2,425.00 348,383.00 348,383.00 52,203.00 288,685.00 288,685.00 68,437.00
2009 17,508.00 4,497.00 360,184.00 360,184.00 50,941.00 294,866.00 294,866.00 82,826.00
2008 9,131.00 2,372.00 366,859.00 366,859.00 42,579.00 326,542.00 326,542.00 49,448.00
2007 16,466.00 11,300.00 276,245.00 276,245.00 59,905.00 280,906.00 284,605.00 8,106.00
2006 29,978.00 11,707.00 289,747.00 289,747.00 78,115.00 281,494.00 281,494.00 24,532.00
2005 25,702.00 7,300.00 305,115.00 305,115.00 70,387.00 272,937.00 272,937.00 44,180.00
2004 56,973.00 28,788.00 319,541.00 319,541.00 79,412.00 241,826.00 241,826.00 107,290.00
2003 103,051.00 69,962.00 175,384.00 175,384.00 213,571.00 231,515.00 231,515.00 18,922.00
2002 106,211,909.00 53,781,864.00 261,125,978.00 261,125,978.00 228,215,209.00 325,426,349.00 325,426,349.00 41,911,538.00
2001 112,495,872.00 38,024,758.00 275,315,592.00 275,315,592.00 226,849,538.00 361,670,150.00 361,670,150.00 26,141,314.00
ASHAKA CEM PLC
2015 19,988,994.00 8,557,708.00 50,387,131.00 50,320,782.00 17,414,893.00 7,396,978.00 17,360,887.00 70,376,125.00
2014 21,693,256.00 5,176,449.00 49,833,615.00 49,747,587.00 21,133,974.00 8,128,613.00 20,265,239.00 71,526,871.00
2013 18,695.00 819,896.00 48,727,848.00 48,649,149.00 21,694,657.00 773,336.00 20,261,496.00 67,423,536.00
2012 18,971,251.00 501,554.00 48,353,981.00 48,271,636.00 21,825,927.00 9,612,129.00 17,810,987.00 67,325,232.00
2011 15,929,863.00 32,013.00 18,432,903.00 18,386,341.00 20,780,234.00 10,770,706.00 15,315,611.00 19,047,155.00
2010 9,346,439.00 35,236.00 18,778,686.00 18,701,082.00 19,153,655.00 7,706,713.00 11,978,843.00 16,146,282.00
2009 6,552,415.00 87,618.00 19,066,089.00 5,217,572.00 17,193,974.00 9,648,275.00 12,476,916.00 13,141,588.00
2008 8,398,790.00 139,355.00 16,597,159.00 5,686,074.00 21,378,197.00 10,075,675.00 12,200,791.00 12,795,158.00
2007 7,151,565.67 191,522.00 15,965,784.33 (3,146,765.33) 21,466,484.00 11,512,516.33 15,784,646.33 10,676,552.00
2006 6,677,741.17 243,581.50 14,875,020.83 (9,654,269.33) 22,578,755.00 12,696,997.33 15,525,638.33 9,000,990.00
2005 6,203,916.67 295,641.00 13,784,257.33 (16,161,773.33) 23,691,026.00 13,881,478.33 16,006,594.33 7,325,428.00
2004 10,728,786.00 767,012.00 2,499,175.00 2,499,175.00 12,567,156.00 5,671,274.00 6,009,244.00 7,281,717.00
2003 9,862,598.00 618,795.00 1,875,533.00 1,875,533.00 10,198,926.00 5,100,879.00 5,414,023.00 6,324,108.00
2002 7,224,940.00 1,199,241.00 1,536,612.00 1,534,639.00 8,741,820.00 2,769,050.00 3,060,614.00 5,700,938.00
2001 6,841,066.00 603,426.00 1,514,235.00 1,512,229.00 8,649,057.00 3,355,457.00 3,650,152.00 4,705,149.00
BERGER PAINTS PLC
2015 2,168,268.00 216,826.80 1,046,326.00 1,046,326.00 3,022,264.00 1,143,703.00 1,308,540.00 3,895,870.00
2014 2,075,700.00 207,570.00 878,958.00 878,958.00 3,082,930.00 816,531.00 1,180,315.00 3,640,145.00
2013 2,040,378.00 204,037.80 1,406,054.00 1,406,054.00 2,710,986.00 798,623.00 989,570.00 3,627,598.00
2012 1,586,397.00 158,639.70 1,164,418.00 1,164,418.00 2,513,664.00 922,893.00 1,112,631.00 2,929,838.00
2011 1,430,014.00 106,220.00 1,074,250.00 1,074,250.00 2,574,359.00 737,820.00 977,805.00 2,675,035.00
2010 1,538,744.00 204,129.00 1,052,108.00 1,052,108.00 2,756,608.00 552,747.00 (11,756.00) 1,678,532.00
2009 1,201,008.00 203,437.00 1,059,297.00 1,059,297.00 2,379,847.00 1,547,562.00 1,857,074.40 1,344,753.00
2008 929,662.00 169,108.00 1,093,009.00 1,093,009.00 2,534,721.00 1,407,058.00 1,688,469.60 1,216,686.00
2007 614,056.00 157,203.67 1,209,025.00 1,209,025.00 2,275,356.00 1,264,638.00 1,517,565.60 1,080,086.00
2006 717,195.00 290,700.00 1,251,048.00 1,251,048.00 2,300,615.00 1,145,444.00 1,374,532.80 967,467.00
2005 767,051.00 307,416.00 1,278,937.00 1,278,937.00 1,914,236.00 1,055,529.00 1,266,634.80 885,789.00
2004 1,172,070.00 590,126.00 274,705.00 279,571.00 1,760,874.00 605,310.00 726,372.00 498,349.00
2003 1,468,642.00 874,425.00 276,983.00 235,573.00 1,500,188.00 565,562.00 678,674.40 462,017.00
2002 1,765,214.00 1,158,724.00 272,539.00 250,502.00 1,142,995.00 521,968.00 626,361.60 440,430.00
2001 2,061,786.00 1,443,023.00 155,082.00 213,166.00 1,903,755.00 464,938.00 557,925.60 426,220.00

| 123
SECTOR/FIRMS Year Current Assets Receivable (Debtors)
Fixed Assets Property, Plant & Equipment
Sales (Revenue) Current Liability Total Liability Net Assets
CAP PLC
2015 2,913,886.00 131,089.00 492,388.80 410,324.00 7,205,676.00 1,833,838.00 1,889,167.00 1,520,133.00
2014 2,576,123.00 330,188.00 479,695.20 399,746.00 6,987,604.00 1,825,999.00 1,900,309.00 1,180,572.00
2013 2,554,585.00 519,148.00 496,989.60 414,158.00 6,195,824.00 1,684,573.00 1,766,864.00 1,268,148.00
2012 2,423,767.00 181,307.00 493,984.80 411,654.00 5,231,330.00 1,682,098.00 1,757,230.00 1,118,572.00
2011 2,659,718.00 309,701.00 207,350.00 356,580.00 4,312,774.00 1,280,390.00 1,468,474.00 1,598,672.00
2010 2,033,084.00 295,236.00 247,875.00 365,744.00 3,644,934.00 801,885.48 1,166,378.88 1,089,322.00
2009 1,916,463.00 311,012.00 245,154.00 245,154.00 3,027,604.00 666,072.88 968,833.28 754,441.00
2008 1,984,455.00 305,003.00 236,974.00 236,974.00 2,679,857.00 589,568.54 857,554.24 686,461.00
2007 1,804,953.00 360,115.00 144,764.00 144,764.00 2,099,929.00 461,984.38 671,977.28 1,000,819.00
2006 1,325,760.00 266,006.00 172,347.00 172,347.00 1,986,246.00 436,974.12 635,598.72 857,065.00
2005 1,146,684.00 270,258.00 161,168.00 161,168.00 1,525,426.00 335,593.72 488,136.32 796,317.00
2004 1,023,168.00 193,215.00 177,747.00 177,747.00 1,466,762.00 322,687.64 469,363.84 594,747.00
2003 862,612.00 170,368.67 146,498.00 146,498.00 1,203,038.00 264,668.36 384,972.16 548,792.00
2002 711,316.00 133,973.17 127,766.00 127,766.00 1,093,199.00 240,503.78 349,823.68 481,009.00
2001 560,020.00 97,577.67 71,291.00 71,291.00 1,051,489.00 231,327.58 336,476.48 407,405.00
CEMENT CO. OF NORTH.NIG. PLC
2015 7,024,345,407.00 508,237,021.00 10,118,987,353.00 10,118,987,353.00 13,037,847,294.00 (4,214,077,183.00) 7,002,114,913.00 10,144,768,246.00
2014 7,405,955,548.00 1,427,754,759.00 8,368,950,068.00 8,368,950,068.00 15,119,050,874.00 (3,496,155,259.00) 6,334,353,741.00 9,445,658,415.00
2013 7,958,806,666.00 6,040,618,322.00 6,816,998,216.00 6,816,998,216.00 15,311,033,677.00 (4,101,943,600.00) 6,773,856,772.00 8,284,619,000.00
2012 7,738,594,389.00 10,653,481,885.00 6,501,058,894.00 6,501,058,894.00 15,125,577,305.00 (5,091,528,630.00) 4,840,184,737.60 6,623,437,987.00
2011 6,738,651,040.00 15,266,345,448.00 5,690,691,335.00 5,690,691,335.00 13,915,099,146.00 (4,055,925,074.00) 4,452,831,726.72 6,006,086,699.00
2010 5,285,982,238.00 642,563,189.00 5,420,598,399.00 5,420,598,399.00 11,181,438,919.00 (4,783,829,908.00) 3,578,060,454.08 4,703,754,297.00
2009 4,786,864.00 1,001,983,731.00 4,950,494,290.00 4,950,494,290.00 11,868,786.00 (4,397,470.00) 3,798,011.52 4,217,877.00
2008 4,137,089.00 716,707,468.00 4,654,692,365.00 4,654,692,365.00 9,878,093.00 (3,630,905.00) 3,160,989.76 3,976,416.00
2007 4,662,997.00 775,371,854.00 4,016,742,426.00 4,016,742,426.00 8,042,946.00 (5,574,628.00) 2,573,742.72 3,148,332.00
2006 3,923,434.00 743,057,550.00 2,753,158,990.00 2,753,158,990.00 6,374,331.00 (6,155,661.00) 2,039,785.92 1,544,254.00
2005 3,606,030.00 987,445,036.00 2,140,175,389.00 2,140,175,389.00 5,916,167.00 (4,328,569.00) 1,893,173.44 1,606,945.00
2004 2,943,188.00 940,526.00 2,160,467,801.00 2,160,467,801.00 5,530,497.00 (3,508,387.00) 1,769,759.04 1,665,561.00
2003 1,563,992.00 319,665.00 2,074,289,057.00 2,074,289,057.00 3,305,812.00 (2,648,768.00) 1,057,859.84 995,645.00
2002 1,627,646.00 325,529.20 1,062,659.00 1,062,659.00 1,913,906.00 (2,067,220.00) 612,449.92 1,170,114.00
2001 662,111.00 132,422.20 917,617.00 917,617.00 574,241.00 (1,329,414.00) 183,757.12 495,262.00
DN MEYER PLC
2015 383,368.00 76,673.60 1,840,741.30 1,917,753.00 1,187,236.00 594,689.00 1,068,332.00 638,100.00
2014 452,972.00 90,594.40 1,859,788.40 1,965,640.00 1,340,104.00 690,701.00 1,163,041.00 564,870.00
2013 578,218.00 115,643.60 1,878,835.50 1,738,405.00 1,500,112.00 750,754.00 1,975,135.00 622,382.00
2012 596,682.00 119,336.40 1,964,236.00 1,793,748.00 1,472,734.00 795,795.00 1,924,685.00 652,988.00
2011 695,748.00 139,149.60 1,830,951.00 1,855,818.00 1,362,715.00 859,098.00 2,049,602.00 679,096.00
2010 807,103.00 51,494.00 1,908,874.00 1,920,529.00 1,184,594.00 (879,522.00) (339,968.00) 587,384.00
2009 652,022.00 146,617.00 2,001,752.00 2,001,752.00 1,894,487.00 (838,026.00) (339,968.00) 823,758.00
2008 1,143,893.00 350,026.00 2,075,759.00 2,075,759.00 2,266,913.00 (448,278.00) (193,409.00) 1,434,072.00
2007 1,155,260.00 564,810.00 765,378.00 612,302.40 2,094,034.00 703,621.00 (100,178.00) 603,443.00
2006 836,299.00 466,580.00 260,923.00 208,738.40 2,008,794.00 361,595.00 (150,000.00) 163,357.00
2005 720,525.00 232,614.00 251,238.00 200,990.40 1,368,935.00 (79,546.00) (69,088.00) 171,692.00
2004 810,725.00 458,973.00 274,705.00 219,764.00 1,760,874.00 108,994.00 (70,551.00) 383,699.00
2003 593,357.50 378,448.67 276,983.00 221,586.40 1,500,188.00 (282,589.50) (61,914.00) 289,575.00
2002 478,419.60 374,645.17 272,539.00 218,031.20 1,142,995.00 (505,091.70) (59,011.00) 288,364.00
2001 363,481.70 370,841.67 155,082.00 124,065.60 903,755.00 (727,593.90) (6,227.00) 312,602.00

| 124
SECTOR/FIRMS Year Current Assets Receivable (Debtors)
Fixed Assets Property, Plant & Equipment
Sales (Revenue) Current Liability Total Liability Net Assets
FIRST ALUMINIUM NIGERIA PLC
2015 2,408,198.80 632,917.80 5,320,360.00 4,724,665.40 8,437,494.90 2,670,258.67 3,250,235.67 3,894,248.80
2014 2,765,656.00 726,873.50 5,536,561.00 4,989,454.00 8,465,748.50 3,471,162.00 3,964,384.00 4,432,292.50
2013 2,925,028.00 915,936.00 5,557,684.00 5,028,674.00 8,390,463.00 2,919,664.00 3,861,404.00 4,621,308.00
2012 3,691,560.00 724,955.00 6,219,206.00 5,806,716.00 8,639,181.00 3,229,642.00 3,909,371.00 5,929,395.00
2011 4,010,304.00 1,103,080.00 6,269,912.00 5,885,156.00 8,627,276.00 3,448,761.00 4,028,738.00 6,251,478.00
2010 4,010,304.00 1,103,080.00 6,261,452.00 5,885,156.00 8,488,610.00 3,471,162.00 3,964,384.00 6,307,426.00
2009 3,979,096.00 1,289,702.00 6,182,016.00 5,857,058.00 7,740,481.00 3,483,751.00 3,793,278.00 6,367,834.00
2008 6,113,256.00 1,371,207.00 2,345,256.00 2,033,726.00 7,375,573.00 5,831,136.00 6,128,179.00 233,033.00
2007 4,861,202.00 1,647,615.00 2,275,025.00 2,137,533.00 7,863,244.00 4,529,901.00 6,255,274.00 880,953.00
2006 4,336,191.00 1,578,752.00 2,264,765.00 2,207,021.00 7,602,722.00 4,587,512.00 5,231,216.00 1,343,785.00
2005 2,557,582.00 1,226,667.00 1,725,613.00 1,671,874.00 7,045,438.00 2,470,675.00 2,787,671.00 1,448,800.00
2004 2,151,532.00 963,987.00 1,650,389.00 1,604,706.00 5,268,688.00 2,112,193.00 2,491,160.00 1,310,761.00
2003 1,958,363.00 921,975.00 1,412,648.00 1,372,152.00 4,059,859.00 2,014,599.00 2,116,229.00 1,254,781.00
2002 1,780,104.00 854,189.00 1,463,575.00 1,454,653.00 3,391,939.00 2,495,773.00 3,432,405.00 532,274.00
2001 1,584,100.00 778,673.00 1,482,965.00 1,474,043.00 3,228,165.00 1,834,457.00 2,299,773.00 767,292.00
IPWA PLC
2015 252,346.67 158,766.83 218,529.00 218,529.00 201,856.50 227,851.50 248,010.50 3,055,513.50
2014 287,030.67 184,987.33 3,446,283.00 3,445,945.00 237,514.00 232,240.00 297,783.00 2,583,706.00
2013 321,714.67 211,207.83 2,357,201.00 2,356,863.00 273,171.50 236,628.50 255,101.50 2,111,898.50
2012 356,398.67 237,428.33 218,529.00 218,529.00 308,829.00 241,017.00 261,176.00 1,640,091.00
2011 402,274.00 269,303.00 1,268,119.00 1,267,781.00 328,562.00 254,560.00 320,103.00 1,350,290.00
2010 403,384.00 278,561.00 179,037.00 178,699.00 411,993.00 231,485.00 249,958.00 332,463.00
2009 471,642.00 321,744.00 218,529.00 218,529.00 399,877.00 263,337.00 283,496.00 406,675.00
2008 401,115.00 273,684.00 244,635.00 244,635.00 562,798.00 234,908.00 244,920.00 400,830.00
2007 413,019.00 264,039.00 243,168.00 243,168.00 485,671.00 265,053.00 275,065.00 381,122.00
2006 260,804.00 152,446.00 250,729.00 250,729.00 303,920.00 430,427.00 440,439.00 71,094.00
2005 223,795.00 126,164.00 387,479.00 387,479.00 253,974.00 479,979.00 489,991.00 121,281.00
2004 158,818.00 94,847.00 413,545.00 413,545.00 291,903.00 406,938.00 406,938.00 165,425.00
2003 153,381.00 79,269.00 446,491.00 446,491.00 227,896.00 438,763.00 438,763.00 161,109.00
2002 136,634.00 55,860.00 478,085.00 478,085.00 152,683.00 501,838.00 501,838.00 112,881.00
2001 151,597.00 63,152.00 539,448.00 539,448.00 146,148.00 450,603.00 450,603.00 238,442.00
PAINTS AND COATINGS MANUFACTURES PLC
2015 2,033,259.00 795,180.00 282,558.00 281,587.00 3,090,076.00 499,353.00 528,803.00 1,787,014.00
2014 3,068,936.00 1,683,779.00 265,183.00 263,242.00 3,264,090.00 1,655,760.00 1,672,677.00 1,661,442.00
2013 2,041,763.00 210,639.00 530,682.00 295,458.00 3,090,745.00 802,951.00 815,710.00 1,521,511.00
2012 1,670,161.00 184,445.00 537,541.00 324,932.00 2,908,193.00 651,253.00 666,282.00 132,811.00
2011 1,362,298.00 400,115.00 357,566.00 357,565.00 1,788,705.00 518,606.00 541,487.00 1,178,377.00
2010 1,423,691.00 218,609.00 155,005.00 155,005.00 1,257,908.00 627,475.00 627,475.00 951,221.00
2009 899,396.00 151,010.00 160,693.00 160,693.00 555,517.00 183,703.00 183,703.00 876,387.00
2008 531,157.00 159,347.10 4,882.00 4,882.00 600,267.00 273,320.00 273,320.00 262,719.00
2007 440,787.00 132,236.10 5,300.00 5,300.00 625,594.00 358,437.00 358,437.00 87,650.00
2006 353,078.00 105,923.40 13,048.00 13,048.00 536,757.00 256,321.00 256,321.00 109,805.00
2005 123,773.50 151,010.00 64,648.50 64,648.50 571,795.50 343,688.00 343,688.00 (284,563.50)
2004 149,158.90 44,747.67 108,900.20 108,900.20 568,700.20 373,985.10 373,985.10 (532,045.00)
2003 222,091.30 66,627.39 153,151.90 153,151.90 565,604.90 404,282.20 404,282.20 (779,526.50)
2002 395,023.70 118,507.11 197,403.60 197,403.60 562,509.60 434,579.30 434,579.30 (1,027,008.00)
2001 567,956.10 151,010.00 241,655.30 241,655.30 559,414.30 464,876.40 464,876.40 (1,274,489.50)

| 125
PORTLAND PAINTS & PRODUCTS NIGERIA PLC
2015 1,307,605.00 467,700.00 591,676.00 456,202.00 2,168,480.00 1,054,748.00 1,207,665.00 691,617.00
2014 1,541,327.00 504,841.00 736,231.00 547,040.00 2,798,165.00 971,609.00 1,352,956.00 924,603.00
2013 1,395,448.00 584,800.00 785,852.00 55,701.00 2,771,147.00 829,846.00 1,297,262.00 884,038.00
2012 1,451,983.00 482,202.00 934,039.00 650,086.00 2,865,581.00 1,330,981.00 1,609,456.00 776,566.00
2011 1,450,374.00 520,289.00 697,135.00 642,359.00 2,584,183.00 786,443.00 1,139,215.00 1,078,732.00
2010 1,263,519.00 499,179.00 290,212.00 273,356.00 2,380,328.00 541,937.00 600,922.00 952,809.00
2009 1,344,777.00 517,224.00 302,918.00 282,068.00 2,269,253.00 733,391.00 778,510.00 869,185.00
2008 1,160,384.00 359,495.00 303,054.00 278,794.00 1,963,721.00 669,530.00 745,353.00 718,085.00
2007 998,565.00 351,843.00 238,858.00 209,696.00 1,711,416.00 667,254.00 702,127.00 535,297.00
2006 821,696.67 328,678.67 217,550.00 172,019.00 1,441,011.00 733,391.00 778,510.00 360,963.00
2005 648,590.67 259,436.27 185,520.00 154,072.00 1,175,523.00 669,530.00 745,353.00 358,818.00
2004 475,484.67 190,193.87 153,490.00 117,229.00 1,020,136.00 667,254.00 702,127.00 439,916.00
2003 302,378.67 120,951.47 121,460.00 92,983.33 791,348.33 733,391.00 778,510.00 465,518.67
2002 129,272.67 51,709.07 89,430.00 65,588.33 580,910.83 669,530.00 745,353.00 504,995.17
2001 112,543.00 45,017.20 57,400.00 38,193.33 370,473.33 667,254.00 702,127.00 544,471.67
PREMIER PAINTS PLC.
2015 119,059.00 78,063.67 346,358.00 346,358.00 434,675.00 268,401.00 325,406.00 876,877.00
2014 104,476.50 67,634.17 307,640.00 307,640.00 386,056.50 238,057.00 310,206.00 700,138.50
2013 89,894.00 57,204.67 268,922.00 268,922.00 337,438.00 132,242.00 246,876.00 523,400.00
2012 71,652.00 43,099.00 214,120.00 214,120.00 279,977.00 207,713.00 295,006.00 285,772.00
2011 68,048.00 43,698.00 223,654.00 223,654.00 257,886.00 177,369.00 279,806.00 291,702.00
2010 42,487.00 22,240.00 136,684.00 136,684.00 182,740.00 132,242.00 246,876.00 (67,705.00)
2009 25,707.00 14,834.00 142,275.00 142,275.00 166,062.00 108,959.00 182,704.00 14,722.00
2008 70,398,056.00 26,923,492.00 155,728,718.00 155,728,718.00 234,925,046.00 59,703,785.00 103,589,417.00 122,537,358.00
2007 51,449,083.00 22,290,979.00 112,201,726.00 112,201,726.00 186,017,710.00 77,815,163.00 78,395,839.00 85,254,971.00
2006 48,722,562.00 15,367,823.00 110,082,740.00 110,082,740.00 203,082,286.00 58,782,141.00 80,936,636.00 (77,868,666.00)
2005 50,678,310.00 29,148,218.00 97,506,068.00 97,506,068.00 189,053,462.00 47,964,843.00 53,545,519.00 94,638,859.00
2004 40,862,006.00 25,897,853.00 104,095,571.00 104,095,571.00 185,508,313.00 52,895,061.00 58,475,737.00 86,481,841.00
2003 77,530,826.00 51,914,446.00 22,685,861.00 22,685,861.00 199,232,318.00 78,694,318.00 82,994,318.00 17,222,369.00
2002 83,209,563.33 58,419,733.67 2,257,707.00 2,257,707.00 201,443,553.67 90,580,882.33 96,161,558.33 (11,302,133.67)
2001 89,221,253.00 54,319,178.00 23,868,782.00 23,868,782.00 247,914,986.00 77,954,077.00 80,254,077.00 32,835,958.00
LAFARGE AFRICA PLC.
2015 32,978,501.00 10,759,231.00 348,294,452.00 118,251,256.00 114,558,245.00 49,980,301.00 78,671,084.00 313,292,652.00
2014 25,299,262.00 7,714,284.00 329,555,510.00 120,154,329.00 105,848,657.00 36,526,476.00 66,963,220.00 307,101,082.00
2013 36,688,153.00 4,837,158.00 123,178,764.00 123,128,764.00 97,174,505.00 39,334,496.00 67,225,252.00 120,532,421.00
2012 24,290,353.00 2,584,203.00 127,365,266.00 127,275,266.00 87,091,634.00 31,642,958.00 83,381,334.00 120,012,660.00
2011 24,945,651.00 2,063,542.00 127,469,132.00 127,379,132.00 62,211,143.00 32,487,776.00 96,511,419.00 20,249,429.00
2010 17,668,945.00 2,125,408.00 100,811,968.00 100,751,762.00 43,841,325.00 58,070,071.00 70,189,152.00 60,410,842.00
2009 17,422,052.00 1,028,118.00 69,741,015.00 69,680,809.00 45,589,798.00 10,674,274.00 43,452,509.00 76,488,793.00
2008 18,587,114.00 1,786,840.00 43,181,302.00 43,121,096.00 43,273,809.00 18,099,375.00 21,312,296.00 43,669,041.00
2007 17,179,658.00 1,782,697.00 33,416,274.00 33,356,068.00 38,664,795.00 15,748,127.00 17,789,921.00 34,847,805.00
2006 16,328,186.00 731,868.00 32,421,341.00 32,361,135.00 39,517,587.00 16,396,206.00 17,793,829.00 32,357,115.00
2005 11,656,295.00 2,838,489.00 30,957,110.00 30,917,110.00 26,626,109.00 15,836,817.00 28,015,784.00 26,661,012.00
2004 7,820,880.00 2,414,300.00 31,481,254.00 31,441,254.00 22,095,823.00 15,985,175.00 36,648,847.00 23,366,520.00
2003 7,691,021.00 854,332.00 31,414,848.00 31,374,848.00 13,729,548.00 20,963,055.00 33,695,360.00 18,797,776.00
2002 8,092,347.00 759,942.00 25,718,414.00 25,678,414.00 13,263,159.00 13,152,479.00 25,111,270.00 21,192,856.00
2001 8,711,708.00 832,898.00 16,753,395.00 16,088,243.00 13,410,247.00 8,250,995.00 15,293,771.00 17,655,984.00
CUTIX PLC 2015 1,072,162.00 343,091.84 896,651.00 892,451.00 2,358,412.00 922,893.00 1,225,102.00 743,711.00

| 126
2014 970,022.00 310,407.04 774,648.00 769,917.00 2,234,959.00 696,155.00 1,044,968.00 699,703.00
2013 716,661.00 229,331.52 357,204.00 348,989.00 1,929,477.00 399,744.00 476,312.00 597,554.00
2012 606,763.00 194,164.16 334,846.00 325,493.00 1,572,976.00 357,909.00 432,458.00 509,152.00
2011 574,189.00 183,740.48 361,248.00 260,098.56 1,435,500.00 360,104.00 360,104.00 493,546.00
2010 683,049.00 218,575.68 377,069.00 271,489.68 1,389,280.00 210,498.96 501,188.00 474,704.00
2009 429,888.00 137,564.16 383,955.00 276,447.60 1,323,451.00 136,524.78 325,059.00 400,048.00
2008 446,161,667.00 142,771,733.44 312,946.00 225,321.12 1,307,337.00 12,438,420.12 29,615,286.00 385,147.00
2007 465,673,069.00 149,015,382.08 172,200.00 123,984.00 1,064,021.00 12,600,337.26 30,000,803.00 270,666.00
2006 342,625,471.00 109,640,150.72 75,948.00 54,682.56 714,167.00 98,922,416.46 235,529,563.00 180,678.00
2005 319,224,246.00 102,151,758.72 81,258.00 58,505.76 574,181.00 102,136,472.34 243,182,077.00 152,779.00
2004 234,188,474.00 74,940,311.68 86,077.00 61,975.44 434,208.00 72,993,158.70 173,793,235.00 122,364.00
2003 190,456,022.70 60,945,927.26 50,212.00 36,152.64 37,034.00 65,421,424.74 155,765,297.00 100,154.00
2002 133,416,501.80 42,693,280.58 56,211.00 40,471.92 387,204.00 52,456,795.86 124,897,133.00 86,108.00
2001 76,376,980.90 24,440,633.89 50,750.00 36,540.00 284,296.00 39,492,166.98 94,028,969.00 72,616.00
AVON CROWNCAPS & CONTAINERS
2015 6,776,564.00 2,168,500.48 1,159,419.80 828,157.00 9,210,364.00 5,891,951.00 6,063,935.00 7,604,721.00
2014 3,970,087.00 1,270,427.84 1,033,190.20 737,993.00 9,319,210.00 2,948,744.00 3,138,429.00 4,708,080.00
2013 4,495,929.00 1,438,697.28 897,702.40 641,216.00 8,628,262.00 4,475,155.00 5,817,701.50 6,184,128.00
2012 6,329,007.00 2,025,282.24 942,055.80 672,897.00 9,022,138.00 5,333,476.00 6,933,518.80 7,048,201.00
2011 4,353,775.00 1,393,208.00 1,112,322.40 794,516.00 9,561,966.00 3,407,424.00 4,429,651.20 1,460,466.00
2010 6,927,907.00 1,212,863.00 920,655.00 920,655.00 9,348,511.00 5,079,643.00 6,603,535.90 1,339,167.00
2009 5,902,747.00 1,498,533.00 790,867.00 790,867.00 7,829,338.00 3,923,861.00 5,101,019.30 1,385,049.00
2008 4,183,542.00 1,980,534.00 915,105.00 915,105.00 5,821,069.00 2,512,800.00 3,266,640.00 1,315,759.00
2007 2,742,834.00 1,192,905.00 1,001,775.00 1,001,775.00 6,155,214.00 1,775,531.00 2,308,190.30 1,192,583.00
2006 2,682,673.00 405,276.00 847,437.00 847,437.00 5,145,045.00 1,920,183.00 2,496,237.90 1,347,310.00
2005 3,651,481.00 520,875.00 1,003,805.00 702,663.50 5,153,412.00 3,084,541.00 4,009,903.30 1,246,093.00
2004 2,347,305.00 414,667.00 890,775.00 623,542.50 4,507,887.00 1,883,268.00 2,448,248.40 1,194,420.00
2003 2,499,299.00 1,124,684.55 862,863.00 604,004.10 3,567,216.00 4,313,304.00 5,607,295.20 1,174,957.00
2002 2,001,230.00 900,553.50 619,429.00 433,600.30 3,034,608.00 5,911,416.10 7,684,840.93 1,172,180.00
2001 1,452,276.00 653,524.20 528,917.00 370,241.90 2,375,186.00 7,509,528.20 9,762,386.66 1,150,761.00
BETA GLASS CO PLC
2015 17,178,579.00 10,538,255.00 9,511,714.00 9,493,420.00 19,169,635.00 9,423,313.00 10,537,488.00 18,152,805.00
2014 17,325,659.00 8,833,000.00 9,602,728.00 9,579,958.00 16,632,879.00 7,673, 957 10,975,406.00 15,952,981.00
2013 17,472,739.00 7,127,745.00 9,693,742.00 9,666,496.00 14,096,123.00 9,423,313.00 13,413,324.00 13,753,157.00
2012 12,564,592.00 5,422,490.00 9,891,975.00 9,864,569.00 12,932,549.00 4,760, 565 10,000,764.00 12,455,803.00
2011 8,907,682.00 3,717,235.00 9,113,908.00 9,100,926.00 12,726,227.00 3,650,513.00 6,694,378.00 11,327,212.00
2010 7,777,777.00 2,011,980.00 8,688,689.00 6,082,082.30 11,168,096.00 3,516,478.00 5,932,966.00 10,073,211.00
2009 5,276,371.00 1,408,789.00 7,953,933.00 5,567,753.10 10,561,248.00 2,097,066.00 2,608,888.00 8,524,350.00
2008 5,132,053.00 1,870,226.00 8,772,101.00 6,140,470.70 9,075,941.00 4,422,727.00 2,191,861.00 7,289,566.00
2007 3,538,206.00 1,207,408.00 8,835,764.00 6,185,034.80 7,032,235.00 4,316,154.00 1,892,763.00 6,165,053.00
2006 3,264,852.00 1,182,832.00 6,166,314.00 4,316,419.80 5,135,840.00 2,390,718.00 1,673,469.00 5,366,979.00
2005 2,963,374.00 514,569.00 5,728,236.00 4,009,765.20 4,822,986.00 2,219,054.00 756,401.00 5,031,343.00
2004 3,038,255.00 916,132.00 5,631,788.00 3,942,251.60 6,053,265.00 2,261,056.00 304,515.67 4,926,248.00
2003 2,498,914.00 739,871.00 5,399,174.00 3,779,421.80 5,260,632.00 1,863,640.00 263,665.33 4,763,651.00
2002 1,959,573.00 563,610.00 4,185,362.00 2,929,753.40 4,902,451.00 1,759,169.33 831,846.33 4,046,146.00
2001 1,420,232.00 387,349.00 3,765,233.00 2,635,663.10 5,123,986.00 1,581,462.33 1,400,027.33 3,559,221.00
GREIF NIGERIA
2015 567,282.00 184,954.00 148,432.00 148,432.00 805,370.00 358,913.00 466,586.90 715,714.00
2014 501,293.00 128,704.00 162,480.00 162,480.00 787,582.00 291,215.00 378,579.50 663,773.00

| 127
PLC 2013 516,550.00 105,353.00 165,740.00 165,740.00 795,200.00 324,210.00 421,473.00 682,415.00
2012 476,809.00 215,120.00 171,805.00 171,805.00 748,664.00 296,951.00 386,036.30 631,567.00
2011 450,067.00 225,804.00 176,513.00 176,513.00 879,498.00 324,616.00 422,000.80 622,478.00
2010 372,715.00 133,889.00 257,423.00 257,423.00 784,678.00 327,484.00 425,729.20 341,381.00
2009 424,984.00 210,361.00 253,832.00 253,832.00 823,239.00 334,778.40 435,211.92 297,748.00
2008 376,290.00 206,477.00 253,832.00 253,832.00 643,710.00 216,225.00 281,092.50 315,006.00
2007 378,276.00 165,042.00 309,377.00 309,377.00 532,622.00 (40,728.00) (52,946.40) 317,401.00
2006 503,534.00 232,417.00 317,214.00 317,214.00 592,093.00 (475,386.00) (618,001.80) 333,001.00
2005 440,564.00 231,036.00 318,155.00 318,155.00 586,872.00 (508,674.00) (661,276.20) 230,932.00
2004 280,042.00 166,902.00 318,262.00 318,262.00 458,573.00 (389,477.00) (506,320.10) 198,549.00
2003 305,087.00 202,821.00 318,094.00 318,094.00 398,241.00 (272,487.00) (354,233.10) 345,555.00
2002 206,420.67 172,038.00 311,639.00 311,639.00 436,311.00 (154,025.67) (200,233.37) 405,729.00
2001 138,682.17 157,930.50 268,540.00 268,540.00 400,057.00 (35,932.17) (46,711.82) 441,841.00
NIGERIAN ROPES PLC
2015 626,399.40 203,475.40 39,134.40 39,134.40 337,905.40 713,028.60 487,739.00 204,078.80
2014 611,096.30 182,860.20 53,176.50 53,176.50 354,508.70 642,537.80 519,863.00 134,835.80
2013 633,659.00 172,679.00 78,623.00 78,623.00 340,158.00 706,178.00 892,638.00 155,549.00
2012 486,438.00 96,575.00 78,065.00 78,065.00 384,165.00 361,729.00 551,544.00 67,660.00
2011 642,262.00 173,346.00 77,063.00 77,063.00 492,112.00 395,656.00 565,707.00 153,618.00
2010 526,427.00 89,165.00 109,794.00 109,794.00 379,802.00 314,351.00 487,739.00 148,482.00
2009 537,149.00 73,308.00 132,969.00 132,969.00 425,356.00 377,413.00 519,863.00 150,255.00
2008 622,137.00 82,819.00 147,332.00 147,332.00 442,660.00 331,500.00 453,741.00 295,728.00
2007 524,641.00 83,917.00 151,151.00 151,151.00 450,707.00 305,943.00 371,143.00 286,269.00
2006 478,393.00 92,204.00 148,356.00 148,356.00 417,564.00 293,040.00 363,234.00 263,515.00
2005 472,139.00 307,126.00 157,447.00 157,447.00 430,239.50 257,305.00 519,863.00 331,522.00
2004 344,606.00 146,958.00 164,991.00 164,991.00 352,689.00 200,405.00 260,319.00 249,278.00
2003 321,834.00 148,170.00 154,432.00 154,432.00 412,561.00 212,535.00 247,541.00 228,725.00
2002 213,766.00 47,901.00 69,614.00 69,614.00 252,064.00 191,007.00 246,913.00 36,467.00
2001 136,539.00 42,087.00 47,985.00 47,985.00 259,753.00 119,547.00 163,547.00 28,220.00
OTHERS 2015 513,393.00 274,672.00 1,390,480.33 1,188,689.33 2,547,751.67 365,372.67 1,116,460.67 509,455.00
POLY PRODUCTS NIGERIA PLC
2014 569,971.00 278,394.50 1,178,243.33 1,088,512.33 2,421,781.17 430,063.67 1,174,229.67 474,038.50
2013 626,549.00 282,117.00 1,021,605.33 988,335.33 2,295,810.67 494,754.67 931,574.67 438,622.00
2012 731,329.00 323,312.00 1,072,182.00 870,391.00 2,213,828.00 651,071.00 1,402,159.00 401,352.00
2011 643,301.00 214,617.00 913,247.00 823,516.00 1,955,894.00 440,886.00 1,185,052.00 371,496.00
2010 844,485.00 330,757.00 703,307.00 670,037.00 1,961,887.00 780,453.00 1,217,273.00 330,519.00
2009 547,803.00 182,632.00 431,830.00 429,530.00 1,649,124.00 586,031.00 663,493.00 316,140.00
2008 625,470.00 116,866.00 236,649.00 234,349.00 1,362,799.00 525,470.00 586,361.00 275,760.00
2007 542,541.00 139,220.00 286,352.00 281,896.00 1,510,158.00 503,421.00 564,653.00 264,240.00
2006 433,033.50 32,274.50 97,322.00 64,052.00 1,210,614.00 375,929.50 812,749.50 236,860.50
2005 350,217.00 (31,763.20) 172,799.00 (71,908.40) 1,046,462.80 286,763.80 364,225.80 212,938.80
2004 475,148.00 250,178.00 360,636.00 356,180.00 1,147,116.00 539,017.00 589,031.00 246,753.00
2003 336,558.00 181,045.00 329,761.00 325,305.00 951,579.00 393,744.00 399,319.00 239,707.00
2002 293,614.00 132,589.00 307,992.00 303,536.00 787,880.00 359,220.00 369,295.00 212,582.00
2001 286,784.50 238,993.10 386,473.00 502,142.70 740,438.10 412,710.10 490,172.10 225,966.10
DANGOTE CEMENT
2015 112,586,000.00 4,252,000.00 1,011,889,000.00 577,017,000.00 389,215,000.00 235,410,000.00 375,996,000.00 1,124,475,000.00
2014 117,883,370.00 8,462,728.00 845,557,694.00 526,721,478.00 371,534,117.00 119,068,273.00 324,897,950.00 963,441,064.00
2013 136,939,020.00 9,120,840.00 684,760,760.00 452,046,889.00 371,551,567.00 99,144,108.00 250,136,954.00 821,699,780.00

| 128
2012 191,869,348.00 4,990,785.00 447,596,761.00 377,864,231.00 285,635,278.00 124,308,218.00 211,787,515.00 639,466,109.00
2011 113,907,919.00 3,394,812.00 410,075,002.00 348,844,271.00 241,405,977.00 110,356,933.00 229,727,875.00 524,045,921.00
2010 157,626,076.20 4,488,337.30 199,499,164.70 274,937,962.30 217,413,322.30 64,197,649.70 204,783,649.70 357,175,640.90
2009 165,289,057.80 3,969,705.40 39,340,271.80 214,417,691.80 179,261,633.80 39,711,030.80 245,540,707.80 204,692,329.60
2008 2,174,679.00 28,832.00 41,905,638.00 41,950,588.00 16,453,711.00 29,683,946.00 30,373,922.00 13,751,395.00
2007 3,030,077.00 110,467.00 33,458,405.00 33,458,355.00 5,473,439.00 26,612,254.00 27,154,354.00 9,607,128.00
2006 3,887,272.00 1,676,117.00 25,222,854.00 25,222,804.00 6,029,209.00 14,945,901.00 20,755,228.00 8,354,898.00
2005 1,947,949.00 604,006.00 17,834,106.00 17,834,056.00 4,005,101.00 20,131,696.00 21,136,925.00 (1,354,870.00)
2004 4,457,277.00 4,408,049.00 3,057,778.00 3,057,728.00 3,700,911.67 8,610,569.00 11,074,491.00 (3,559,436.00)
2003 396,113.00 240,393.00 3,036,020.00 3,035,970.00 390,996.00 607,109.00 607,109.00 (2,646,976.00)
2002 1,119,235.00 243,181.00 3,202,924.00 3,202,874.00 583,009.00 5,590,361.00 6,242,477.00 (1,920,318.00)
2001 1,430,982.00 344,949.00 3,389,503.00 3,389,453.00 115,172.00 3,352,260.00 4,593,396.00 227,089.00

| 129
DATA FOR VARIABLES OF ANALYSIS (TWO) SECTOR/
FIRMS Year Profit before Tax Tax Profit After Tax Audit Date Year End
Cash flow from
Operating Activities
Audit Fee
(Remuneration) Shareholders' Fund Name of Auditor
AGRICULTU
RE
2015
(949,577.00)
(60,783.00) (868,332.00) 11th may 2016
31st
DECEMBER
(236,947.00)
2,000.00
842,567.00
OLUWOLE O.
OGUNDEJI
FTN COCOA
PROCESSORS
PLC
2014
(577,204.00)
(60,783.00) (577,204.00) 31st july 2015
31ST
DECEMBER
(114,496.00)
1,900.00
1,198,604.00
OLUWOLE O.
OGUNDEJI
2013
(204,831.00)
(60,783.00) (286,076.00) 12th june 2014
31ST
DECEMBER
(225,476.00)
1,700.00
1,694,563.00
OLUWOLE O.
OGUNDEJI
2012
(404,580.00)
(60,783.00) (405,980.00) 20th february 2014
31st
DECEMBER
13,688.00
1,700.00
1,980,639.00
OLUWOLE O.
OGUNDEJI
2011
(243,808.00)
(60,783.00)
(221,032.00) 24th april 2012
31st
DECEMBER
(338,761.00)
1,700.00
1,941,295.00
BAKER TILLY,
NIGERIA
2010
(63,647.00)
(60,783.00) 63,647.00 6th july 2011
31st
DECEMBER
(240,216.00)
1,500.00
2,260,165.00
BAKER TILLY,
NIGERIA
2009
259,710.00
(60,834.00) 259,659.00 7th may 2010
31st
DECEMBER
46,061.00
1,200.00
2,389,265.00
BAKER TILLY,
NIGERIA
2008
282,350.00
(86,323.00) 196,027.00 25th march 2009
31st
DECEMBER
137,554.00
1,070.00
2,481,337.00
BAKER TILLY,
NIGERIA
2007
147,248.00
(4,478.00) 142,770.00 15th february 2008
31st
DECEMBER
589,393.00
500.00
2,383,202.00
OLALEKAN AFOLABI
&CO
2006
21,088.00
(4,478.00)
16,310.00 7th july 2007
31st
DECEMBER
256,750.00
810.00
353,207.00
OLALEKAN AFOLABI
&CO
2005
(4,504.00)
(330.00)
(4,834.00) 8th may 2006
31st
DECEMBER
447,095.00
680.00
311,235.00
OLALEKAN AFOLABI
&CO
2004
(4,695.00)
(287.00) 4,982.00 26th march 2009
31st
DECEMBER
506,693.00
550.00
151,181.00
OLALEKAN AFOLABI
&CO
2003
(2,202.00)
(250.00)
4,715.00 16th february 2005
31st
DECEMBER
566,291.00
420.00
284,212.00
OLALEKAN AFOLABI
&CO
2002
291.00
(213.00) 4,448.00 8th july 2004
31st
DECEMBER
625,889.00
290.00
183,199.00
OLALEKAN AFOLABI
&CO
2001
2,784.00
(176.00)
4,181.00 9th may 2002
31st
DECEMBER
685,487.00
160.00
146,492.00
OLALEKAN AFOLABI
&CO
OKOMU OIL
PALM PLC.
2015
1,145,553.00
734,681.00 2,279,197.00 27th march 2016
31st
DECEMBER
686,557.50
21,501.00
30,123,836.00
HORWATH
DAFINONE
2014
2,127,996.00
574,541.00 1,570,137.00 24th march 2015
31ST
DECEMBER
1,527,816.00
20,001.00
23,233,385.00
HORWATH
DAFINONE
2013
2,693,555.00
601,381.00 425,092.00 13th march 2014
31ST
DECEMBER
1,182,444.00
24,000.00
22,617,158.00
HORWATH
DAFINONE
2012
4,346,666.00
755,903.00 8,954,343.00 13th march 2013
31st
DECEMBER
3,922,513.00
24,000.00
25,530,751.00
HORWATH
DAFINONE
2011
4,658,441.00
734,681.00 3,923,760.00 14th march 2012
31st
DECEMBER
2,864,961.00
21,000.00
8,836,256.00
HORWATH
DAFINONE
2010
1,971,262.00
341,806.00 1,629,456.00 15th march 2011
31st
DECEMBER
544,891.00
20,000.00
5,866,406.00
HORWATH
DAFINONE
2009
661,741.00
112,217.00 549,524.00 1st april 2010
31st
DECEMBER
(21,706.00)
10,000.00
4,353,494.00
SPIROPOULOS,
ADIELE, OKPARA &
CO
2008
1,240,038.00
32,578.00 1,207,460.00 12th march 2009
31st
DECEMBER
(190,156.00)
10,000.00
4,282,988.00
SPIROPOULOS,
ADIELE, OKPARA &
CO
2007
150,794.00
11,000.00 139,794.00 18th febraury 2008
31st
DECEMBER
(556,609.00)
7,000.00
3,188,175.00
SPIROPOULOS,
ADIELE, OKPARA &
CO
2006
405,674.00
9,943.00 395,731.00 20th march 2007
31st
DECEMBER
150,799.00
3,500.00
4,728,321.00
SPIROPOULOS,
ADIELE, OKPARA &
CO

| 130
2005
724,531.00
23,224.00 701,307.00 15th march 2016
31st
DECEMBER
309,156.00
2,500.00
4,404,186.00
SPIROPOULOS,
ADIELE, OKPARA &
CO
2004
670,895.00
6,000.00 664,895.00 9th march 2005
31st
DECEMBER
232,370.00
2,500.00
4,231,151.00
SPIROPOULOS,
ADIELE, OKPARA &
CO
2003
513,571.00
20,344.00 493,227.00 22nd Feb 2004
31st
DECEMBER
122,423.00
1,600.00
3,648,466.00
SPIROPOULOS,
ADIELE, OKPARA &
CO
2002
164,269.00
7,651.00
156,618.00 24th april 2003
31st
DECEMBER
51,811.00
1,400.00
2,800,076.00
SPIROPOULOS,
ADIELE, OKPARA &
CO
2001
231,934.00
822.00
231,112.00 16th april 2002
31st
DECEMBER
130,106.00
1,400.00
2,810,812.00
SPIROPOULOS,
ADIELE, OKPARA &
CO
PRESCO PLC
2015
3,297,140.50
869,438.00 2,427,702.50 22nd march 2016
31st
DECEMBER
489,541.00
14,000.00
26,304,605.00 GRANT THORNTON
2014
3,420,308.00
814,996.00 2,605,312.00 17th april 2015
31ST
DECEMBER
63,087.00
12,000.00
19,959,147.00 GRANT THORNTON
2013
2,333,970.00
996,768.00 1,337,202.00 28th march 2014
31ST
DECEMBER
127,812.00
12,000.00
17,382,069.00 GRANT THORNTON
2012
3,875,622.00
387,553.00 3,488,069.00 20th march 2013
31st
DECEMBER
129,483.00
12,000.00
17,088,098.00
SPIROPOULOS
ADIELE, OKPARA
&CO
2011
2,580,305.00
887,884.00 1,692,421.00 23rd march 2012
31st
DECEMBER
(725,096.00)
8,000.00
4,691,153.00
SPIROPOULOS
ADIELE, OKPARA
&CO
2010
1,333,623.00
238,593.00 1,095,030.00 26th march 2011
31st
DECEMBER
161,524.00
8,000.00
3,518,196.00
SPIROPOULOS
ADIELE, OKPARA
&CO
2009
338,148.00
98,721.00 239,427.00 26th march 2010
31st
DECEMBER
957,049.00
8,000.00
2,623,167.00
SPIROPOULOS
ADIELE, OKPARA
&CO
2008
997,414.00
182,781.00 814,633.00 18th april 2009
31st
DECEMBER
134,523.00
8,000.00
2,694,107.00
SPIROPOULOS
ADIELE, OKPARA
&CO
2007
23,913.00
202,662.00 37,251.00 29th march 2008
31st
DECEMBER
639,164.10
6,400.00
1,956,962.00
SPIROPOULOS
ADIELE, OKPARA
&CO
2006
293,710.00
76,840.00 216,870.00 21st march 2007
31st
DECEMBER
808,386.60
5,600.00
2,155,680.00
SPIROPOULOS
ADIELE, OKPARA
&CO
2005
453,620.00
112,938.00 340,682.00 30th march 2006
31st
DECEMBER
107,299.00
3,000.00
2,315,582.00
AKINTOLA
WILLIAMS DELOITTE
2004
672,242.00
65,900.00 606,342.00 7th april 2005
31st
DECEMBER
(194,479.00)
2,000.00
2,274,900.00
AKINTOLA
WILLIAMS DELOITTE
2003
407,615.00
32,647.00 375,193.00 21st april 2004
31st
DECEMBER
217,179.00
2,000.00
1,918,558.00
AKINTOLA
WILLIAMS DELOITTE
2002
131,378.00
22,218.00 153,596.00 7th may 2003
31st
DECEMBER
284,258.00
1,300.00
1,793,365.00
MOJIBOLA OLUWA &
CO
2001
225,349.00
8,085.00 217,264.00 31st march 2002
31st
DECEMBER
391,797.00
1,050.00
1,165,055.00
AKINTOLA
WILLIAMS DELOITTE
LIVESTOCK
FEEDS PLC.
2015
300,115.00
(112,198.00)
187,917.00 22nd march 2016
31st
DECEMBER
(447,909.00)
17,141.00
1,948,799.00
BDO PROFESSIONAL
SERVICES
2014
402,151.00
(147,981.00) 254,170.00 18th march 2015
31st
DECEMBER
159,110.00
18,193.00
1,983,900.00
BDO PROFESSIONAL
SERVICES
2013
282,798.00
(72,052.00) 210,746.00 27th march 2014
31st
DECEMBER
307,936.00
13,952.00
1,729,730.00
BDO PROFESSIONAL
SERVICES
2012 221,221.00 (77,119.00) 144,102.00 27th march 2013 31st (865,101.00) 4,982.00 632,808.00 BDO PROFESSIONAL

| 131
DECEMBER SERVICES
2011
150,894.00
(53,212.00) 97,682.00 27th march 2012
31st
DECEMBER
(515,106.00)
4,874.00
519,846.00
BDO PROFESSIONAL
SERVICES
2010
52,844.00
(24,540.00) 28,304.00 28th march 2011
31st
DECEMBER
(370,697.00)
2,826.00
422,164.00
BDO PROFESSIONAL
SERVICES
2009
38,751.00
(8,803.00) 29,948.00 18th june 2010
31st
DECEMBER
(158,524.00)
3,633.00
393,860.00
BDO PROFESSIONAL
SERVICES
2008
64,208.00
(18,467.00) 45,741.00 1st june 2009
31st
DECEMBER
(177,195.00)
5,500.00
363,912.00
BDO PROFESSIONAL
SERVICES
2007
48,769.00
19,683.00 57,605.00 3rd october 2007
31st
DECEMBER
162,691.00
1,500.00
318,171.00
DELOITEE TOUCHE
TOHMATSU
2006
728,170.00
(20,254.00) 748,424.00 14th july 2016 31ST MARCH
(25,328.00)
1,500.00
(343,406.00)
DELOITEE TOUCHE
TOHMATSU
2005
(237,134.00)
(1,033.00)
(238,167.00) 28th march 2013 31ST MARCH
(662,577.00)
1,500.00
(1,068,895.00)
DELOITEE TOUCHE
TOHMATSU
2004
(236,421.00)
3,230.87
(237,114.00) 28th march 2012 31st MARCH
(429,058.30)
246.80
(828,728.00)
DELOITEE TOUCHE
TOHMATSU
2003
(189,259.00)
6,697.50
(189,832.00) 29th march 2011 31st MARCH
(514,682.20)
579.80
(745,645.00)
DELOITEE TOUCHE
TOHMATSU
2002
(179,192.00)
10,164.12
(179,703.00) 19th june 2010 31st MARCH
(600,306.10)
1,406.40
403,783.00
DELOITEE TOUCHE
TOHMATSU
2001
(144,395.00)
13,630.75
(155,535.50) 2nd june 2009 32nd MARCH
(685,930.00)
2,233.00
842,314.33
DELOITEE TOUCHE
TOHMATSU
CONSUMER
GOODS 2015
(13,698,754.70)
491,355.40 (13,207,399.30) 28th April, 2011 30th sept
3,593,775.90
7,540.00
(23,906,831.60) ernst & young
DN TYRE &
RUBBER PLC
2014
(12,804,327.60)
450,259.60 (12,354,068.00) 18th april. 2010 30th sept
2,963,625.80
7,340.00
(20,259,516.80) ernst & young
2013
(11,909,900.50)
409,163.80
(11,500,736.70) 14th march 2009 30th sept
2,333,475.70
7,140.00
(16,612,202.00) ernst & young
2012
(11,015,473.40)
368,068.00 (10,647,405.40) 2nd feb 2008 31st dec
1,703,325.60
6,940.00
(12,964,887.20) ernst & young
2011
(10,121,046.30)
326,972.20 (9,794,074.10) 23rd may, 2007 31st dec
1,073,175.50
6,740.00
(9,317,572.40) ernst & young
2010
(428,466.00)
40,339.00
(388,127.00) 29th April, 2011 30th sept
229,367.00
5,000.00
(3,848,453.00) ernst & young
2009
(11,482,409.00)
338,858.00
(11,143,551.00) 19th april. 2010 30th sept
(253,000.00)
9,000.00
(3,316,627.00) ernst & young
2008
(22,536,352.00)
637,377.00 (21,898,975.00) 15th march 2009 30th sept
(735,367.00)
5,200.00
(2,784,801.00) ernst & young
2007
(2,088,126.00)
(4,878.00) (2,093,004.00) 3rd feb 2008 31st dec
(558,981.00)
6,000.00
10,683,867.00 ernst & young
2006
(653,472.00)
6,728.00 (646,744.00) 24th may, 2007 31st dec
(2,768,393.00)
5,500.00
7,387,874.00 ernst & young
2005
(207,953.00)
3,344.00 (204,609.00) 27th march, 2006 31st dec
(2,424,350.00)
5,000.00
3,935,349.00 ernst & young
2004
(407,551.00)
91,524.00
(316,027.00) 31st dec
(2,049,222.00)
4,500.00
587,948.00 ernst & young
2003
(750,135.00)
20,802.00 (770,937.00) 26th march, 2004 31st dec
644,995.00
4,500.00
903,975.00 ernst & young
2002
51,094.00
12,559.00 38,935.00 19th march, 2003 31st dec
596,265.00
4,500.00
1,200,878.00 ernst & young
2001
204,743.00
34,663.00 170,080.00 11th march, 2002 31st dec
556,777.00
33,000.00
1,289,733.00 ernst & young
GUINNESS
NIG PLC
2015
10,795,102.00
3,000,203.00 7,794,899.00 03th september 2015 30TH JUNE
32,538,985.00
35,144.00
48,341,376.00 KPMG Audit
2014
11,681,560.00
2,108,080.00 9,573,480.00 1st september 2014 30TH JUNE
19,157,202.00
33,470.00
45,061,717.00 KPMG Audit
2013
17,008,875.00
5,145,149.00 11,863,726.00 12th september2013 30TH JUNE
24,298,137.00
31,575.00
46,039,111.00 KPMG Audit

| 132
2012
21,074,950.00
6,403,755.00
14,671,195.00 12th september 2012 30TH JUNE
21,224,240.00
29,236.00
40,352,504.00 KPMG Audit
2011
26,176,966.00
8,249,032.00 17,927,934.00 09th september 2011 30TH JUNE
19,530,773.00
26,578.00
40,283,492.00 KPMG Audit
2010
19,988,735.00
6,252,376.00 13,736,359.00 2nd september 2010 30TH JUNE
27,633,777.00
24,162.00
34,199,199.00 KPMG Audit
2009
18,991,762.00
5,450,573.00
13,541,189.00 03th september 2009 30TH JUNE
11,281,730.00
21,965.00
31,524,710.00 KPMG Audit
2008
17,092,950.00
5,232,070.00 11,860,880.00 11th september 2008 30TH JUNE
14,591,643.00
19,100.00
36,862,557.00 KPMG Audit
2007
14,884,450.00
4,193,390.00 10,691,060.00
20th september
2007 30TH JUNE
15,204,725.00
14,375.00
31,638,842.00 KPMG Audit
2006
11,436,771.00
3,996,669.00 7,440,102.00 10th september 2011 30TH JUNE
19,009,171.00
14,375.00
25,667,544.00 KPMG Audit
2005
6,276,167.00
1,417,148.00 4,859,019.00
22nd september
2005 30TH JUNE
11,708,329.00
12,500.00
18,227,442.00 KPMG Audit
2004
11,687,494.00
3,773,991.00 7,913,503.00 23th september 2004 30TH JUNE
7,455,036.00
10,000.00
16,908,244.00 KPMG Audit
2003
9,901,668.00
3,265,333.00 6,636,335.00 18th september 2003 30TH JUNE
6,807,125.00
9,000.00
15,189,428.00 KPMG Audit
2002
5,851,413.00
1,701,877.00 4,149,536.00 12th september 2002 30TH JUNE
8,545,610.00
5,850.00
14,157,810.00 KPMG Audit
2001
5,660,054.00
1,554,175.00 4,105,879.00 4th september 2001 30TH JUNE
2,368,332.00
4,500.00
12,663,140.00 KPMG Audit
INTERNATION
AL
BREWERIES
PLC.
2015
2,815,554.00
869,064.00 1,946,490.00 18th may 2015 31st march
3,151,232.00
21,618.00
12,168,259.00 Baker Tilly
2014
3,925,500.00
1,406,473.00 2,519,027.00 15th july 2014 31st march
6,271,583.00
18,796.00
11,269,923.00 Baker Tilly
2013
3,734,694.00
1,258,771.00 2,475,923.00 06th may 2013 31st march
(4,043,424.00)
12,490.00
9,380,173.00 Baker Tilly
2012
677,887.00
869,064.00
(191,177.00) 23th september 2005 31st march
2,101,802.00
10,964.00
1,583,323.00 Baker Tilly
2011
190,340.00
42,993.00 147,347.00 23th march 2012 31st december
2,101,802.00
10,964.00
1,302,657.00 Baker Tilly
2010
199,133.00
869,064.00
199,133.00 24th march 2011 31st december
3,873,729.00
7,399.00
(84,221.00) Baker Tilly
2009
(285,546.00)
- (285,546.00) 13th march 2010 31st december
1,946,706.00
6,000.00
(283,355.00) Baker Tilly
2008
(76,579.00)
208,967.00 (285,546.00) 23th march 2013 31st december
2,485,649.67
4,000.00
(283,355.00) Baker Tilly
2007
142,465.00
78,960.00 63,505.00 25th march 2011 31st december
2,408,101.67
2,900.00
2,191.00 Baker Tilly
2006
(26,917.00)
91,298.00
(118,215.00) 14th march 2010 31st december
2,330,553.67
2,500.00
(1,308,062.00) Baker Tilly
2005
(523,657.00)
- (523,657.00) 31th march 2006 31st december
(65,031.00)
2,000.00
(828,487.00)
Oyelami Soetan Adeleke
& Co
2004
(242,388.00)
- (242,388.00) 08th december 2005 31st december
(188,354.00)
800.00 #REF!
Oyelami Soetan Adeleke
& Co
2003
(142,586.00)
-
(142,586.00) 23th july 2004 31st december
(92,204.00)
800.00 #REF!
Oyelami Soetan Adeleke
& Co
2002
(100,228.00)
-
(100,228.00) 14th may 2003 31st december
(180,625.00)
800.00
80,144.00
Oyelami Soetan Adeleke
& Co
2001
(59,729.00)
- (59,729.00) 31th march 2007 31st december
22,710.00
800.00
(107,969.00)
Oyelami Soetan Adeleke
& Co
NIGERIAN
BREW. PLC
2015
65,612,956.33
19,920,978.67 45,691,977.67 19th feb 2013 31st dec
75,228,850.67
45,000.00
381,399,837.00 KPMG
2014
61,461,821.00
18,941,568.00 42,520,253.00 11th feb 2015 31st dec
60,860,045.00
43,692.00
349,676,784.00 KPMG
2013 62,240,317.00 19,159,968.00 43,080,349.00 20th feb 2013 31st dec 94,023,548.00 40,043.00 252,759,633.00 KPMG

| 133
2012
55,624,366.00
17,581,652.00 38,042,714.00 20th feb 2013 31st dec
55,888,588.00
45,801.00
253,633,629.00 KPMG
2011
57,143,228.00
18,709,195.00 38,434,033.00 17th feb 2010 31st dec
61,212,209.00
33,264.00
215,447,123.00 KPMG
2010
44,880,248.00
14,548,130.00 30,332,118.00 23rd feb 2011 31st dec
39,149,661.00
33,943.00
50,172,162.00 KPMG
2009
41,399,796.00
13,489,705.00 27,910,091.00 18th feb 2010 31st dec
36,976,535.00
30,306.00
46,570,094.00 KPMG
2008
37,518,114.00
11,818,521.00 25,699,593.00 25th feb 2009 31st dec
39,918,636.00
27,059.00
32,229,181.00 KPMG
2007
27,876,336.00
8,933,480.00 18,942,856.00 27th feb 2008 31st dec
25,289,284.00
24,160.00
43,183,042.00 KPMG
2006
16,436,255.00
5,535,731.00 10,900,524.00 28th feb 2007 31st dec
24,764,657.00
20,133.00
36,249,393.00 KPMG
2005
12,897,746.00
463,189.00 12,434,557.00 26th feb 2009 31st dec
28,483,150.00
17,507.00
34,724,241.00 KPMG
2004
9,148,139.00
4,061,736.00 5,086,403.00 7th april 2005 31st dec
1,137,968.00
14,586.00
28,253,944.00 KPMG
2003
10,992,047.00
3,639,760.00 7,352,287.00 6th april 2004 31st dec
(1,731,625.00)
12,188.00
26,186,746.00 KPMG
2002
11,987,940.00
2,759,986.00 9,227,954.00 27th feb 2009 31st dec
(9,059,533.00)
8,155.00
26,425,983.00 KPMG
2001
7,489,351.00
2,954,307.00 4,535,044.00 8th april 2005 31st dec
4,807,865.00
7,093.00
25,197,125.00 KPMG
7-UP
BOTTLING
COMP. PLC.
2015
8,749,101.00
1,623,313.00 7,125,788.00 28th june, 2015 31st march
17,133,519.00
38,000.00
23,933,633.00 KPMG
2014
7,616,444.00
1,181,843.00 6,434,601.00 31st july, 2014 31st march
19,225,600.00
35,000.00
17,328,695.00 KPMG
2013
3,262,719.00
406,215.00 2,856,504.00 31st july, 2013 31st march
13,880,315.00
33,000.00
12,577,980.00 KPMG
2012
2,928,512.00
859,978.00 2,068,534.00 29th june, 2012 31st march
8,042,118.00
28,000.00
10,213,291.00 KPMG
2011
2,525,082.00
247,538.00 2,277,544.00 5th july, 2011 31st march
6,995,524.00
25,000.00
8,577,212.00 KPMG
2010
2,635,163.00
743,017.00 1,892,146.00 9th july, 2010 31st march
7,300,578.00
8,000.00
8,973,770.00
EGUNJOBI ADEGBITE
& CO.
2009
2,223,436.00
693,762.00 1,529,674.00
11th september,
2009 31st march
4,712,186.00
8,000.00
7,984,017.00
EGUNJOBI ADEGBITE
& CO.
2008
2,480,798.00
871,888.00 1,608,910.00 22nd july, 2008 31st march
4,605,980.00
8,000.00
7,223,047.00
EGUNJOBI ADEGBITE
& CO.
2007
1,960,711.00
741,309.00 1,219,402.00 25th july, 2007 31st march
2,890,751.00
8,000.00
6,280,352.00
EGUNJOBI ADEGBITE
& CO.
2006
1,705,992.00
538,779.00
1,167,213.00 19th july, 2006 31st march
1,543,452.00
7,500.00
5,576,272.00
EGUNJOBI ADEGBITE
& CO.
2005
1,519,526.00
565,230.00 954,296.00 21st july, 2005 31st march
1,209,883.30
7,000.00
4,409,059.00
EGUNJOBI ADEGBITE
& CO.
2004
1,686,561.00
542,566.00 1,143,995.00 20th july, 2004 31st march
1,123,685.40
5,300.00
3,967,235.00
EGUNJOBI ADEGBITE
& CO.
2003
1,617,928.67
552,645.33 1,065,283.33 16th july, 2003 31st march
2,457,254.10
4,000.00
3,041,818.33
EGUNJOBI ADEGBITE
& CO.
2002
1,608,213.17
554,538.83 1,053,674.33 10th july, 2002 31st march
3,790,822.80
3,000.00
2,237,299.83
EGUNJOBI ADEGBITE
& CO.
2001
1,598,497.67
556,432.33 1,042,065.33 21st july, 2001 31st march
5,124,391.50
2,500.00
1,432,781.33
EGUNJOBI ADEGBITE
& CO.
DANGOTE
SUGAR
REFINERY
PLC
2015
18,144,955.00
5,485,100.00 12,659,855.00 16th march, 2016 31st december
10,655,421.00
35,000.00
106,671,333.00
Akintola Williams
Deloitte & Touche
2014
17,472,841.00
5,564,515.00 11,908,326.00 14th april, 2015 31st december
9,047,869.00
32,000.00
58,526,202.00
Akintola Williams
Deloitte & Touche
2013 13,537,612.00 28th april, 2014 31st december Akintola Williams

| 134
20,099,517.00 6,561,905.00 1,076,855.00 32,000.00 53,817,512.00 Deloitte & Touche
2012
16,331,679.00
5,535,263.00 10,796,416.00 11th april, 2013 31st december
25,057,605.00
32,000.00
46,269,159.00
Akintola Williams
Deloitte & Touche
2011
10,921,229.00
3,517,632.00 7,403,597.00 15th april, 2015 31st december
7,403,597.00
28,600.00
39,133,709.00
Akintola Williams
Deloitte & Touche
2010
16,146,930.00
4,864,690.00 11,282,240.00 11th april, 2011 31st december
(5,468,002.00)
26,000.00
40,895,037.00
Akintola Williams
Deloitte & Touche
2009
19,586,932.00
6,401,333.00 13,185,599.00 26th may, 2009 31st december
8,101,200.00
24,150.00
41,612,797.00
Akintola Williams
Deloitte & Touche
2008
30,151,378.00
8,280,331.00 21,871,047.00 26th may, 2009 31st december
13,817,511.00
23,000.00
32,627,198.00
Akintola Williams
Deloitte & Touche
2007
30,660,730.00
9,182,169.00 21,478,561.00 11th march, 2008 31st december
38,994,640.00
21,000.00
25,956,151.00
Akintola Williams
Deloitte & Touche
2006
16,657,066.00
- 16,657,066.00 6th march, 2007 31st december
8,148,220.00
17,000.00
27,977,590.00
Akintola Williams
Deloitte & Touche
2005
12,328,746.00
10,084,007.00 2,244,739.00 27th may, 2009 31st december
14,650,832.67
14,333.33
24,204,038.33
Akintola Williams
Deloitte & Touche
2004
5,581,590.00
10,985,845.00 (5,404,255.00) 12th march, 2008 31st december
11,816,187.17
11,333.33
21,879,234.33
Akintola Williams
Deloitte & Touche
2003
(1,165,566.00)
-
(1,165,566.00) 7th march, 2007 31st december
8,981,541.67
8,333.33
19,554,430.33
Akintola Williams
Deloitte & Touche
2002
(7,912,722.00)
11,887,683.00 (19,800,405.00) 28th may, 2009 31st december
6,146,896.17
5,333.33
17,229,626.33
Akintola Williams
Deloitte & Touche
2001
(14,659,878.00)
12,789,521.00 (27,449,399.00) 13th march, 2008 31st december
3,312,250.67
2,333.33
14,904,822.33
Akintola Williams
Deloitte & Touche
FLOUR MILLS
NIG. PLC.
2015
910,984.00
1,508,560.00 2,419,544.00 16th july, 2015 31st march
(11,230,638.00)
103,300.00
231,529,878.00
Akintola Williams
Deloitte & Touche
2014
12,457,034.00
2,019,512.00 10,437,522.00 31st july, 2014 31st march
9,934,540.00
103,300.00
220,145,555.00
Akintola Williams
Deloitte & Touche
2013
11,626,381.00
2,725,392.00 8,900,989.00 31st july, 2013 31st march
(527,217.00)
88,800.00
223,889,725.00
Akintola Williams
Deloitte & Touche
2012
11,377,133.00
2,480,415.00 8,896,718.00 29th june, 2012 31st march
847,748.00
50,000.00
80,016,501.00
Akintola Williams
Deloitte & Touche
2011
14,264,723.00
4,168,971.00 10,095,752.00 5th july, 2011 31st march
5,338,226.00
40,000.00
42,063,788.00
Akintola Williams
Deloitte & Touche
2010
19,300,962.00
5,930,231.00 13,370,731.00 9th july, 2010 31st march
21,858,180.00
36,300.00
35,384,783.00
Akintola Williams
Deloitte & Touche
2009
3,595,443.00
1,125,931.00 2,469,512.00
11th september,
2009 31st march
5,308,299.00
33,000.00
22,868,238.00
Akintola Williams
Deloitte & Touche
2008
7,057,007.00
2,732,247.00 4,324,760.00 22nd july, 2008 31st march
(3,295,620.00)
28,800.00
21,951,793.00
Akintola Williams
Deloitte & Touche
2007
7,264,623.00
2,168,632.00 5,095,991.00 25th july, 2007 31st march
8,638,051.00
23,500.00
19,024,793.00
Akintola Williams
Deloitte & Touche
2006
4,286,096.00
1,270,886.00 3,015,210.00 19th july, 2006 31st march
2,582,538.00
18,000.00
12,795,203.00
Akintola Williams
Deloitte & Touche
2005
1,740,115.00
435,440.00 1,304,675.00 21st july, 2005 31st march
4,888,165.00
15,000.00
10,770,073.00
Akintola Williams
Deloitte & Touche
2004
1,405,345.00
378,237.00 1,027,108.00 20th july, 2004 31st march
3,179,931.00
12,500.00
5,261,612.00
Akintola Williams
Deloitte & Touche
2003
628,003.00
141,155.00 486,848.00 16th july, 2003 31st march
2,717,201.00
10,000.00
4,744,104.00
Akintola Williams
Deloitte & Touche
2002
1,575,353.00
500,182.00
1,075,171.00 10th july, 2002 31st march
4,371,038.00
13,350.00
4,548,456.00
KPMG & Aintola
Williams Deloitte
&Touche
2001
968,406.00
250,045.00
718,361.00 21st july, 2001 31st march
2,352,182.00
11,275.00
3,882,785.00
KPMG & Aintola
Williams Deloitte
&Touche
P S
MANDRIDES
2015 86,195.50 27,008.00 59,187.50 18th decenber, 2010 30th sept 127,629.00 2,250.00 205,919.83 PKF Pannel Kerr Forster
2014 52,192.00 5th october, 2009 30th sept PKF Pannel Kerr Forster

| 135
& CO PLC. 76,051.00 23,859.00 110,568.00 2,040.00 198,297.33
2013
65,906.50
20,710.00 45,196.50 5th october, 2009 30th sept
93,507.00
1,830.00
190,674.83 PKF Pannel Kerr Forster
2012
55,762.00
17,561.00 38,201.00 19th decenber, 2010 30th sept
76,446.00
1,620.00
183,052.33 PKF Pannel Kerr Forster
2011
45,617.50
14,412.00 31,205.50 5th october, 2009 30th sept
59,385.00
1,410.00
175,429.83 PKF Pannel Kerr Forster
2010
35,473.00
11,263.00 24,210.00 5th october, 2009 30th sept
42,324.00
1,200.00
167,807.33 PKF Pannel Kerr Forster
2009
20,355.00
6,555.00 13,800.00 20th decenber, 2010 30th sept
17,488.00
1,020.00
157,043.00 PKF Pannel Kerr Forster
2008
25,131.00
8,083.00 17,048.00 5th october, 2009 30th sept
23,752.00
720.00
158,846.00 PKF Pannel Kerr Forster
2007
66.00
257.00
(191.00) 5th october, 2009 30th sept
(16,634.00)
600.00
141,798.00 PKF Pannel Kerr Forster
2006
6,358.00
1,702.00 8,060.00 5th october, 2009 30th sept
1,975.00
600.00
141,989.00 PKF Pannel Kerr Forster
2005
15,746.00
7,319.00 8,427.00 22th august, 2007 30th sept
(41,618.00)
332.00
133,929.00
Akintola Williams
Deloitte & Touche
2004
14,386.00
3,829.00 10,557.00 5th october, 2009 30th sept
66,947.00
332.00
125,502.00
Akintola Williams
Deloitte & Touche
2003
28,485.00
942.00 27,543.00 3rd august, 2004 30th sept
10,799.00
220.00
122,945.00
Akintola Williams
Deloitte & Touche
2002
45,825.00
14,021.00 31,804.00 9th july, 2003 30th sept
9,212.00
220.00
95,402.00 KPMG
2001
87,869.00
31,108.00 56,761.00 10th july, 2002 30th sept
57,021.00
200.00
86,973.00 KPMG
NASCON
ALLIED
INDUSTRIES
PLC
2015
3,017,564.00
911,918.00 2,105,646.00 21st march 2016 31st dec
4,007,770.00
14,500.00
162,948,226.00
Akintola Williams
Deloitte
2014
2,856,399.00
989,361.00 1,867,038.00 30th april 2015 31st dec
4,194,319.00
14,500.00
12,555,885.00
Akintola Williams
Deloitte
2013
4,038,405.00
1,338,863.00 2,699,542.00 16th may 2014 31st dec
1,881,899.00
14,500.00
11,431,167.00
Akintola Williams
Deloitte
2012
4,036,336.00
1,270,030.00 2,766,306.00 30th april 2013 31st dec
3,240,019.00
13,000.00
10,689,544.00
Akintola Williams
Deloitte
2011
3,114,170.00
960,093.00 2,154,077.00 13th april 2012 31st dec
3,645,645.00
9,000.00
5,784,492.00
Akintola Williams
Deloitte
2010
2,058,340.00
410,019.00 1,648,321.00 18th may 2011 31st dec
1,208,791.00
9,000.00
4,955,134.00
Akintola Williams
Deloitte
2009
2,712,448.00
870,102.00 1,842,346.00 29th july 2010 31st dec
1,489,230.00
8,400.00
4,631,532.00
Akintola Williams
Deloitte
2008
1,897,617.00
599,324.00 1,298,293.00 7th aug 2009 31st dec
1,654,830.00
8,000.00
3,848,961.00
Akintola Williams
Deloitte
2007
1,752,331.00
492,458.00 1,259,873.00 15th may 2008 31st dec
1,816,553.00
7,000.00
3,472,384.00
Akintola Williams
Deloitte
2006
1,566,254.00
385,592.00 1,180,662.00 29th feb 2008 31st dec
11,727.00
6,300.00
2,221,863.00
Akintola Williams
Deloitte
2005
1,407,371.00
278,726.00 1,128,645.00 8th aug 2009 31st dec
(482,066.33)
5,400.00
1,553,971.33
Akintola Williams
Deloitte
2004
1,241,689.50
171,860.00 1,069,829.50 16th may 2008 31st dec
(1,303,617.83)
4,550.00
740,422.33
Akintola Williams
Deloitte
2003
1,076,008.00
64,994.00
1,011,014.00 30th feb 2008 31st dec
(2,125,169.33)
3,700.00
(73,126.67)
Akintola Williams
Deloitte
2002
910,326.50
(41,872.00) 952,198.50 9th aug 2009 31st dec
(2,946,720.83)
2,850.00
(886,675.67)
Akintola Williams
Deloitte
2001
744,645.00
(148,738.00) 893,383.00 17th may 2008 31st dec
(3,768,272.33)
2,000.00
(1,700,224.67)
Akintola Williams
Deloitte
N NIG. FLOUR
MILLS PLC. 2015
(215,430.00)
15,872.00
(199,558.00) 27th june 2012 31st march
555,099.00
14,500.00
4,934,766.00
Alintola Williams
Deloitte & Touch Amiun

| 136
Ibrahim & Co
2014
341,800.00
108,255.00 233,545.00 0th aug 2008 31st march
(55,295.00)
14,500.00
3,266,615.00
Alintola Williams
Deloitte & Touch Amiun
Ibrahim & Co
2013
330,377.00
105,232.00 225,145.00 11th july 2007 31st march
1,125,731.00
12,500.00
3,623,417.00
Alintola Williams
Deloitte & Touch Amiun
Ibrahim & Co
2012
47,331.00
42,288.00 5,043.00 27th june 2012 31st march
(903,610.00)
12,500.00
1,361,502.00
Alintola Williams
Deloitte & Touch Amiun
Ibrahim & Co
2011
649,463.00
193,865.00 455,598.00 1st aug 2006 31st march
1,307,711.00
10,000.00
1,552,772.00
Alintola Williams
Deloitte & Touch Amiun
Ibrahim & Co
2010
661,476.33
202,428.00 459,048.33 3ed aug 2004 31st march
691,924.00
9,166.67
108,585.33
Alintola Williams
Deloitte & Touch Amiun
Ibrahim & Co
2009
821,019.33
246,744.50 574,274.83 28th june 2012 31st march
782,914.00
7,916.67
(926,737.17)
Alintola Williams
Deloitte & Touch Amiun
Ibrahim & Co
2008
70,542.00
12,956.00 57,586.00 1st aug 2008 31st march
489,173.00
5,000.00
666,015.00
Alintola Williams
Deloitte & Touch Amiun
Ibrahim & Co
2007
(93,529.00)
10,814.00
(104,343.00) 12th july 2007 31st march
287,562.00
2,500.00
608,429.00
Alintola Williams
Deloitte & Touch Amiun
Ibrahim & Co
2006
83,865.00
28,795.00 55,070.00 2nd aug 2006 31st march
(152,776.00)
2,500.00
793,728.00
Alintola Williams
Deloitte & Touch Amiun
Ibrahim & Co
2005
212,383.00
65,586.00 146,797.00 3ed aug 2005 31st march
225,121.00
2,500.00
775,783.00
Alintola Williams
Deloitte & Touch Amiun
Ibrahim & Co
2004
204,070.00
65,571.00 138,499.00 19th july 2004 31st march
204,014.00
2,500.00
703,235.00
Alintola Williams
Deloitte & Touch Amiun
Ibrahim & Co
2003
219,396.00
70,163.00 149,233.00 24th june 2003 31st march
44,597.00
1,500.00
598,148.00
Alintola Williams
Deloitte & Touch Amiun
Ibrahim & Co
2002
220,840.00
71,200.00 149,640.00 22nd july 2002 31st march
40,948.00
1,200.00
486,040.00
Alintola Williams
Deloitte & Touch Amiun
Ibrahim & Co
2001
82,881.00
27,438.00 55,443.00 19th july 2001 31st march
83,495.00
1,200.00
395,800.00
Alintola Williams
Deloitte & Touch Amiun
Ibrahim & Co
TIGER
BRANDED
CONSUMER
GOODS PLC
2015
(21,523,720.00)
(1,317,054.00) (22,840,774.00) 17th may 2016 30th sept
(7,260,090.00)
47,300.00
40,185,925.00
Akintola Williams
Deloitte & Touche
2014
(13,789,416.00)
289,378.00 (14,078,794.00) 30th dec 2015 30th sept
(3,859,337.00)
44,220.00
46,344,429.00
Akintola Williams
Deloitte & Touche
2013
(6,055,112.00)
1,895,810.00 (4,159,302.00) 18th nov 2014 30th sept
(458,584.00)
40,200.00
53,563,743.00
Akintola Williams
Deloitte & Touche
2012
(4,264,583.00)
1,126,464.00
(3,138,119.00) 29th nmay 2013 31st dec
(4,372,373.00)
38,750.00
59,191,842.00
Akintola Williams
Deloitte & Touche
2011
1,373,230.00
583,076.00 790,154.00 16th may 2012 31st dec
5,670,978.00
31,000.00
70,379,238.00
Akintola Williams
Deloitte & Touche
2010
5,481,077.00
1,727,829.00 3,753,248.00 8th aug 2011 31st dec
6,227,095.00
30,000.00
26,489,145.00
Akintola Williams
Deloitte & Touche
2009
5,156,801.00
203,060.00 4,953,741.00 19th aug 2010 31st dec
13,655,822.00
28,800.00
26,749,581.00
Akintola Williams
Deloitte & Touche
2008
1,758,137.00
54,045.00 1,704,092.00 29th oct 2009 31st dec
7,932,504.00
27,500.00
23,157,859.00
Akintola Williams
Deloitte & Touche

| 137
2007
375,651.00
85,316.00 290,335.00 19th nov 2008 31st dec
(12,816,418.00)
22,500.00
21,907,492.00
Akintola Williams
Deloitte & Touche
2006
(2,350,953.67)
(3,603.67) (2,347,350.00) 20th aug 2010 31st dec
(84,424.00)
20,463.33
5,196,647.73
Akintola Williams
Deloitte & Touche
2005
(4,741,528.67)
(62,475.67) (4,679,053.00) 30th oct 2009 31st dec
(884,621.71)
17,807.62
(4,169,793.72)
Akintola Williams
Deloitte & Touche
2004
(7,132,103.67)
(121,347.67) (7,010,756.00) 20th nov 2008 31st dec
(1,684,819.43)
15,151.90
(13,536,235.18)
Akintola Williams
Deloitte & Touche
2003
(9,522,678.67)
(180,219.67) (9,342,459.00) 21st aug 2010 31st dec
(2,485,017.14)
12,496.19
(22,902,676.64)
Akintola Williams
Deloitte & Touche
2002
(11,913,253.67)
(239,091.67)
(11,674,162.00) 31st oct 2009 31st dec
(3,285,214.86)
9,840.48
(32,269,118.10)
Akintola Williams
Deloitte & Touche
2001
(14,303,828.67)
(297,963.67) (14,005,865.00) 21st nov 2008 31ST DEC
(4,085,412.57)
7,184.76
(41,635,559.55)
Akintola Williams
Deloitte & Touche
UNION
DICON SALT
PLC
2015
64,397.17
(290.00)
64,107.17 3rd april, 2012 31ST DEC
1,095.83
2,300.00
(1,096,092.50)
Akintola Williams
Deloitte & Touche
2014
37,381.67
(290.00) 37,091.67 23rd april, 2008 31ST DEC
1,846.33
2,300.00
(1,091,792.00)
Akintola Williams
Deloitte & Touche
2013
12,104.00
(290.00)
11,814.00 16th june, 2010 31ST DEC
(1,711.00)
2,300.00
(1,082,120.00)
BDO Professional
Services
2012
(20,125.00)
(290.00)
(20,415.00) 10th october, 2006 31ST DEC
11,963.00
2,300.00
(1,093,934.00)
BDO Professional
Services
2011
(41,927.00)
(290.00)
(42,217.00) 14th june, 2010 31ST DEC
(210.00)
2,300.00
(1,073,519.00)
BDO Professional
Services
2010
(88,069.00)
(290.00) (88,657.00) 2nd april, 2012 31ST DEC
2,501.00
2,300.00
(1,031,302.00)
BDO Professional
Services
2009
(98,022.00)
(290.00)
(98,312.00) 25th june, 2011 31ST DEC
(10,664.00)
2,300.00
(942,645.00)
BDO Professional
Services
2008
(202,864.00)
290.00
(203,154.00) 15th june, 2010 31ST DEC
(121,623.00)
2,850.00
(844,333.00)
BDO Professional
Services
2007
(188,174.00)
290.00
(188,464.00) 3rd april, 2012 31ST DEC
69,131.00
2,850.00
(641,179.00)
BDO Professional
Services
2006
(141,751.00)
429.00
(142,180.00) 26th june, 2011 31ST DEC
151,682.00
2,300.00
(452,715.00)
BDO Professional
Services
2005
(481,607.00)
619.00 (482,226.00) 16th june, 2010 31ST DEC
194,871.00
2,300.00
(310,535.00)
BDO Professional
Services
2004
(374,968.00)
- (374,968.00) 4th april, 2012 31ST DEC
(161,711.00)
2,300.00
(155,801.00)
BDO Professional
Services
2003
(789,534.00)
22,267.00
(811,801.00) 24th april, 2008 31ST JULY
(330,646.00)
2,300.00
219,167.00
BDO Oyediran Faleye
Oke & Co.
2002
(210,766.00)
39,591.00 (250,357.00) 17th june, 2010 31ST JULY
(61,465.00)
1,800.00
1,030,968.00
BDO Oyediran Faleye
Oke & Co.
2001
214,165.00
32,547.00
181,618.00 11th october, 2006 31ST JULY
192,722.00
2,500.00
1,272,413.00
OSINDERO, ONI &
LASEBIKAN
U T C NIG.
PLC.
2015
(607,060.50)
44,529.67
(651,590.17) 15th june, 2010 31st december
(91,887.83)
11,583.33
1,998,742.00
Akintola Williams
Deloitte & Touche
2014
(491,206.00)
41,907.67
(533,113.67) 3rd april, 2012 31st december
(41,105.33)
10,333.33
1,892,563.00
Akintola Williams
Deloitte & Touche
2013
(375,351.50)
39,285.67 (336,065.83) 26th june, 2011 31st december
9,677.17
9,083.33
1,786,384.00
Akintola Williams
Deloitte & Touche
2012
(259,497.00)
36,663.67
(296,160.67) 16th june, 2010 31st december
60,459.67
7,833.33
1,680,205.00
Akintola Williams
Deloitte & Touche
2011
(154,936.00)
7,250.00
(162,186.00) 4th april, 2012 31st december
42,773.00
7,000.00
1,638,969.00
Akintola Williams
Deloitte & Touche
2010
(5,201.00)
85,003.00 79,802.00 27th june, 2011 31st december
298,963.00
4,500.00
1,337,961.00
Akintola Williams
Deloitte & Touche
2009 76,773.00 2,006.00 74,767.00 17th june, 2010 31st december 144,338.00 4,500.00 1,426,611.00
Akintola Williams
Deloitte & Touche
2008 46,362.00 5th april, 2012 31st december Akintola Williams

| 138
49,388.00 3,026.00 173,464.00 4,500.00 1,351,844.00 Deloitte & Touche
2007
40,168.00
2,603.00 37,565.00 25th april, 2008 31st december
113,718.00
3,000.00
1,258,593.00
Akintola Williams
Deloitte & Touche
2006
54,318.00
1,757.00 52,561.00 18th june, 2010 31st december
(140,366.00)
2,400.00
687,071.00
Akintola Williams
Deloitte & Touche
2005
(286,552.00)
119,816.00
(166,736.00) 12th october, 2006 31st december
(141,443.00)
2,400.00
201,927.00
Akintola Williams
Deloitte & Touche
2004
(29,042.00)
45,073.00
(74,115.00) 6th septmber, 2005 31st december
(88,122.00)
2,400.00
119,276.00
Akintola Williams
Deloitte & Touche
2003
213,374.00
30,670.00 182,704.00 13th october, 2006 31st december
(101,105.00)
2,400.00
229,323.00
Akintola Williams
Deloitte & Touche
2002
465,852.67
(23,959.67) 441,893.00 13th october, 2006 31st december
(69,885.33)
2,400.00
210,904.67
KSMG &Akintokla
wWlliams Deloitte &
Touche
2001
138,707.00
32,344.00 106,363.00 6th june, 2002 31st december
421,660.00
2,400.00
8,042.00
KSMG &Akintokla
wWlliams Deloitte &
Touche
CADBURY
NIGERIA PLC.
2015
393,560.33
(293,386.67) 686,947.00 18th april 2010 31st dec
2,710,148.33
24,069.33
25,739,271.33 KPMG
2014
1,577,412.00
424,117.00 1,153,295.00 26th may 2016 31st dec
3,781,283.00
24,000.00
28,417,005.00 KPMG
2013
7,421,477.00
1,398,258.00 6,023,219.00 27th march 2011 31st dec
6,513,983.00
26,000.00
43,172,624.00 KPMG
2012
6,275,222.00
1,987,443.00 4,287,779.00 19th april 2010 31st dec
6,754,335.00
24,896.00
39,811,415.00 KPMG
2011
5,338,658.00
1,525,832.00 3,812,826.00 28th march 2012 31st dec
6,827,819.00
20,900.00
32,697,381.00 KPMG
2010
2,259,730.00
907,576.00 1,352,154.00 28th march 2011 31st dec
3,915,199.00
19,000.00
28,717,816.00 KPMG
2009
(2,192,161.00)
1,168,462.00 (1,023,699.00) 20th april 2010 31st dec
3,954,315.00
19,800.00
25,431,400.00 KPMG
2008
(3,086,948.00)
134,176.00 (2,952,772.00) 29th march 2011 31st dec
1,760,569.00
18,500.00
23,130,129.00 KPMG
2007
(3,986,976.00)
3,522,745.00
(464,231.00) 29th nov 2008 31st dec
3,090,751.00
17,500.00
23,957,621.00 KPMG
2006
(4,883,510.00)
3,962,744.00 (920,766.00) 21st april 2010 31st dec
2,071,647.67
16,300.00
22,699,271.00 KPMG
2005
(5,780,917.50)
5,139,885.50
(641,032.00) 21st april 2010 31st dec
1,639,865.67
15,150.00
21,962,381.50 KPMG
2004
(6,678,325.00)
6,317,027.00
(361,298.00) 30th march 2011 31st dec
1,208,083.67
14,000.00
21,225,492.00
Akintola Williams
Deloitte & Touche
2003
(7,575,732.50)
7,494,168.50
(81,564.00) 21st april 2010 31st dec
776,301.67
12,850.00
20,488,602.50
Akintola Williams
Deloitte & Touche
2002
3,303,230.00
1,010,788.00 2,292,442.00 14th feb2003 31st dec
1,900,061.00
6,000.00
7,453,529.00
Akintola Williams
Deloitte & Touche
2001
2,352,600.00
757,884.00 1,594,716.00 13th feb 2002 31st dec
3,562,994.00
6,000.00
3,841,515.00
Akintola Williams
Deloitte & Touche
NESTLE
NIGERIA PLC.
2015
24,577,052.67
1,601,623.00 22,975,429.67 17th february 2013 31st december
23,234,022.67
31,148.00
118,176,437.33 kPMG
2014
24,445,978.00
2,210,338.00 22,235,640.00 23rd february 2015 31st december
23,495,038.00
30,783.00
106,062,067.00 kPMG
2013
26,047,590.00
3,789,311.00 22,258,279.00 24th february 2014 31st december
36,209,580.00
35,676.00
108,207,480.00 KPMG
2012
25,050,172.00
3,912,897.00 21,137,275.00 18th february 2013 31st december
30,243,832.00
32,682.00
88,963,218.00 KPMG
2011
18,539,669.00
1,730,905.00 16,808,764.00 20th february 2012 31st december
20,648,003.00
28,219.00
76,945,793.00 KPMG
2010
18,244,454.00
5,642,345.00 12,602,109.00 16th febuary 2011 31st december
15,348,315.00
24,612.00
60,347,062.00 KPMG

| 139
2009
13,783,244.00
3,999,666.00 9,783,578.00 19th february 2010 31st december
11,920,089.00
23,000.00
44,250,372.00 KPMG
2008
11,862,213.00
3,530,614.00 8,331,599.00 20th february 2009 31st december
5,576,221.00
20,500.00
29,159,552.00 KPMG
2007
8,463,788.00
3,021,889.00 5,441,899.00 21st february 2012 31st december
7,796,005.00
18,900.00
21,252,320.00 KPMG
2006
8,197,897.00
2,537,568.00 5,660,329.00 17th febuary 2011 31st december
2,909,958.00
16,250.00
18,908,215.00 KPMG
2005
7,907,848.00
2,604,720.00 5,303,128.00 20th february 2010 31st december
6,296,591.00
12,800.00
16,875,084.00 kPMG
2004
6,100,281.00
2,264,788.00 3,835,493.00 18th febuary 2005 31st december
6,466,448.00
10,700.00
13,399,870.00 kPMG
2003
5,846,923.00
2,042,809.00 3,804,114.00 16th febuary 2004 31st december
4,967,270.00
9,750.00
11,910,016.00 kPMG
2002
4,683,388.00
1,509,308.00 3,174,080.00 19th febuary 2005 31st december
2,985,272.00
7,800.00
8,829,843.00 kPMG
2001
3,699,334.00
1,172,884.00 2,526,450.00 21st febuary 2002 31st december
2,829,028.00
6,000.00
1,489,121.00 kPMG
NIGERIAN
ENAMELWAR
E PLC.
2015
122,141.00
47,784.00 74,357.00 31st july 2015 30th april
(1,652,580.00)
17,000.00
5,022,544.00 OOP & Partners
2014
111,658.00
25,503.00 86,155.00 26th november 30th april
(719,515.00)
16,000.00
3,084,021.00
Akintola Williams
Deloitte & Touche
2013
117,678.00
43,708.00 73,970.00 25th september 2008 30th april
(32,250.00)
15,000.00
2,203,388.00
Akintola Williams
Deloitte & Touche
2012
138,048.00
50,107.00 87,941.00 23th november 2012 30th april
164,284.00
13,000.00
358,613.00
Akintola Williams
Deloitte & Touche
2011
123,707.00
35,579.00 88,128.00 5th october 2011 30th april
472,641.00
12,000.00
297,283.00
Akintola Williams
Deloitte & Touche
2010
110,288.00
35,383.00 74,905.00 24th november 2010 30th april
(332,748.00)
11,000.00
234,499.00
Akintola Williams
Deloitte & Touche
2009
93,407.00
29,926.00 63,481.00 16th december2009 30th april
(85,349.00)
9,000.00
174,051.00
Akintola Williams
Deloitte & Touche
2008
41,324.00
21,541.00 19,783.00 26th september 2008 30th april
636,496.00
6,500.00
145,130.00
Akintola Williams
Deloitte & Touche
2007
38,233.00
13,694.00 24,539.00 5th may 2008 30th september
(129,171.00)
2,700.00
142,627.00
Akintola Williams
Deloitte & Touche
2006
31,411.00
10,668.00 20,743.00 12th april 2007 30th september
218,193.00
2,200.00
118,088.00
Akintola Williams
Deloitte & Touche
2005
35,067.00
11,121.00 23,946.00 26th may 2006 30th september
277,647.00
2,000.00
111,745.00
Akintola Williams
Deloitte & Touche
2004
26,631.00
10,661.00 15,970.00 14th april 2005 30th september
(107,410.00)
2,000.00
102,835.00
Akintola Williams
Deloitte & Touche
2003
26,204.00
11,851.00 14,353.00 6th may 2004 30th september
(103,773.00)
1,411.00
98,385.00
Akintola Williams
Deloitte & Touche
2002
24,858.00
8,892.00 15,966.00 22nd april 2003 30th september
55,325.00
1,500.00
94,112.00
Akintola Williams
Deloitte & Touche
2001
24,479.00
5,443.00 19,036.00 14th july 2002 30th september
(14,875.00)
1,375.00
86,786.00
Akintola Williams
Deloitte & Touche
VITAFOAM
NIG PLC
2015
810,488.00
292,816.00 517,672.00 29th april, 2015 30th september
858,923.00
18,150.00
12,079,656.00
Akintola Williams
Deloitte & Touche
2014
926,311.00
266,421.00 659,890.00 29th april, 2015 30th september
1,653,262.00
16,500.00
11,032,131.00
Akintola Williams
Deloitte & Touche
2013
633,170.00
219,472.00 413,698.00 21st january, 2014 30th september
1,309,683.00
14,850.00
9,395,233.00
Akintola Williams
Deloitte & Touche
2012
873,485.00
311,135.00 562,350.00
29th december,
2011 30th september
941,329.00
13,200.00
10,116,222.00
Akintola Williams
Deloitte & Touche
2011 970,248.00 297,224.00 673,024.00 30th april, 2015 30th september 89,459.00 12,500.00 2,927,005.00 pricewaterhouse coopers
2010
836,785.00
310,125.00 526,660.00 4th january, 2011 30th september
618,707.00
11,000.00
2,499,618.00 pricewaterhouse coopers

| 140
2009
798,477.00
270,139.00 528,338.00 22nd january, 2014 30th september
701,234.00
8,500.00
2,177,772.00 pricewaterhouse coopers
2008
1,013,719.00
315,423.00 698,296.00 4th february, 2008 30th september
771,051.00
8,500.00
1,895,134.00 pricewaterhouse coopers
2007
652,284.00
212,970.00 439,314.00 6th february, 2008 30th september
(5,925.00)
7,000.00
1,401,558.00 pricewaterhouse coopers
2006
302,564.00
27,446.00
275,118.00 1st february, 2007 30th september
412,625.00
6,000.00
926,274.00 pricewaterhouse coopers
2005
173,492.00
61,845.00
111,647.00 9th february, 2006 30th september
(99,452.00)
5,250.00
785,436.00 pricewaterhouse coopers
2004
402,234.00
130,000.00 272,234.00 14th february, 2005 30th september
70,606.00
5,250.00
772,069.00 pricewaterhouse coopers
2003
485,659.00
178,800.00 306,859.00 2nd february, 2007 30th september
648,585.00
4,375.00
696,395.00 pricewaterhouse coopers
2002
413,610.00
155,200.00 258,410.00 23rd january, 2003 30th september
406,514.00
3,500.00
585,905.00 pricewaterhouse coopers
2001
396,781.00
139,500.00 257,281.00 7th february, 2001 30th september
356,796.00
2,800.00
501,940.00 pricewaterhouse coopers
VONO
PRODUCTS
PLC.
2015
3,571.00
9,005.00
(5,434.00) 29th december 2013 30th september
(85,666.00)
7,000.00
1,851,033.00 Ernst & Young
2014
2,547.00
7,706.00
(5,159.00) 30th december 2014 30th september
(35,095.00)
7,000.00
1,856,104.00 Ernst & Young
2013
1,523.00
6,407.00
(4,884.00) 30th december 2013 30th september
15,476.00
7,000.00
1,861,175.00 Ernst & Young
2012
(98,911.00)
4,802.00
(103,713.00) 10th july 2013 30th september
(81,023.00)
7,060.00
1,887,393.00 Ernst & Young
2011
(80,575.00)
3,458.00 (84,033.00) 22nd march2012 31st december
32,132.00
4,300.00
1,970,107.00 Ernst & Young
2010
(393,350.00)
3,624.00 (396,974.00) 27th july 2011 31st december
(116,570.00)
4,300.00
608,319.00 Ernst & Young
2009
(247,983.00)
5,614.00 (253,597.00) 27th october 2010 31st december
61,365.00
4,300.00
1,005,293.00 Ernst & Young
2008
(118,647.00)
1,519.00
(120,166.00) 27th august 2009 31st december
69,270.00
2,000.00
143,438.00
BDO Oyediran Faleye
&Co
2007
(545,070.00)
3,072.00
(548,142.00) 27th march 2009 31st december
(152,932.00)
2,000.00
263,604.00
BDO Oyediran Faleye
&Co
2006
3,522.00
3,388.00
134.00 28th september 2007 31st december
(91,008.00)
1,000.00
268,209.00
BDO Oyediran Faleye
&Co
2005
(105,120.00)
17,125.00 (87,995.00) 28th october 2010 31st december
11,968.00
1,000.00
268,075.00
BDO Oyediran Faleye
&Co
2004
58,345.00
21,018.00 37,327.00 16th may 2005 31st december
37,045.00
1,000.00
192,187.00
BDO Oyediran Faleye
&Co
2003
26,800.00
2,700.00 24,100.00 13th may 2004 31st december
(5,836.00)
1,000.00
211,986.00
BDO Oyediran Faleye
&Co
2002
23,350.00
8,278.00 15,072.00 28th may 2003 31st december
89,315.00
720.00
206,659.00
BDO Oyediran Faleye
&Co
2001
3,847.00
2,100.00
1,747.00 17th may 2005 31st december
(9,186.00)
600.00
198,840.00
BDO Oyediran Faleye
&Co
P Z CUSSONS
NIGERIA PLC.
2015
3,147,400.00
978,533.00 2,168,867.00 21st august, 2015 31ST MAY
3,705,398.00
24,528.00
48,106,661.00 pricewaterhouse coopers
2014
4,975,262.00
984,798.00 3,990,464.00 21st august, 2014 31ST MAY
10,287,781.00
21,979.00
51,694,166.00 pricewaterhouse coopers
2013
3,567,621.00
1,346,174.00 2,221,447.00 14th august, 2013 31ST MAY
5,117,598.00
18,294.00
50,243,854.00 pricewaterhouse coopers
2012
778,912.00
169,380.00 609,532.00 27th july, 2012 31ST MAY
3,285,663.00
14,178.00
40,149,109.00 pricewaterhouse coopers
2011
4,766,551.00
1,432,314.00 3,334,237.00 27th july, 2011 31ST MAY
(93,646.00)
15,420.00
33,281,387.00 pricewaterhouse coopers
2010 4,765,224.00 3rd august, 2010 31ST MAY pricewaterhouse coopers

| 141
6,599,905.00 1,834,681.00 13,567,568.00 15,420.00 32,678,883.00
2009
4,375,703.00
1,371,754.00 3,003,949.00 31st july, 2009 31ST MAY
8,512,525.00
13,180.00
30,073,307.00 pricewaterhouse coopers
2008
3,653,426.00
910,744.00 2,742,682.00 29th july, 2008 31ST MAY
7,845,082.00
13,180.00
29,036,715.00 pricewaterhouse coopers
2007
2,976,585.00
926,692.00 2,049,893.00 31st july, 2007 31ST MAY
(547,688.00)
12,500.00
28,098,218.00
Akintola Williams
Deloitte & Touche
2006
3,851,009.00
1,232,325.00 2,618,684.00 20th july, 2006 31ST MAY
770,401.00
10,600.00
27,801,688.00
Akintola Williams
Deloitte & Touche
2005
3,929,565.00
1,004,818.00 2,924,747.00 18th july, 2005 31ST MAY
385,905.00
9,900.00
19,914,819.00
Akintola Williams
Deloitte & Touche
2004
3,265,643.00
1,216,308.00 2,049,335.00 30th july, 2008 31ST MAY
4,574,929.00
8,250.00
18,623,640.00
Akintola Williams
Deloitte & Touche
2003
2,857,276.00
848,832.00 2,008,444.00 25th august, 2003 31ST MAY
2,338,659.00
6,602.00
15,162,047.00
Akintola Williams
Deloitte & Touche
2002
2,447,761.00
744,822.00 1,702,939.00 19th july, 2005 31ST MAY
340,020.00
5,913.00
14,303,535.00
Akintola Williams
Deloitte & Touche
2001
1,787,083.00
516,926.00 1,270,157.00 5th september, 2001 31ST MAY
426,090.00
7,630.00
12,002,636.00 KPMG
UNILEVER
NIGERIA PLC
2015
1,771,063.00
578,697.00 1,192,366.00 23rd march1016 31st december
15,589,947.00
15,752.00
50,172,484.00 KPMG
2014
2,873,235.00
460,892.00 2,412,343.00
19TH MARCH
2015 31st december
(1,824,795.00)
15,800.00
45,736,255.00 KPMG
2013
6,793,615.00
2,069,186.00 4,724,429.00
27TH MARCH
2014 31st december
11,608,745.00
17,539.00
43,754,114.00 pricewaterhouse coopers
2012
8,185,987.00
2,588,374.00 5,597,613.00 28th march 2013 31st december
7,164,096.00
27,539.00
36,497,624.00 pricewaterhouse coopers
2011
8,018,115.00
2,502,902.00 5,515,213.00 23rd march 2012 31st december
10,622,492.00
17,852.00
32,249,938.00 pricewaterhouse coopers
2010
6,151,885.00
1,971,235.00 4,180,650.00 20th march 2011 31st december
8,800,214.00
16,400.00
8,335,227.00 pricewaterhouse coopers
2009
5,661,952.00
1,567,230.00 4,094,722.00 19th march 2010 31st december
5,169,815.00
16,414.00
8,202,734.00 pricewaterhouse coopers
2008
4,144,849.00
1,548,316.00 2,596,533.00 15th april 2009 31st december
4,803,177.00
17,028.00
6,681,553.00 pricewaterhouse coopers
2007
2,013,148.00
716,615.00 1,296,533.00 12th march 2008 31st december
4,104,352.00
16,802.00
5,030,844.00 pricewaterhouse coopers
2006
(2,120,233.00)
745,870.00 (1,374,363.00) 8th march 2007 31st december
4,829,815.00
21,500.00
3,953,348.00 pricewaterhouse coopers
2005
2,281,416.00
664,959.00 1,616,457.00 12th april 2006 31st december
(2,513,640.00)
14,500.00
5,570,611.00 pricewaterhouse coopers
2004
2,970,047.00
802,798.00 2,167,249.00 10th march 2005 31st december
6,356,476.00
10,192.00
3,954,154.00 pricewaterhouse coopers
2003
2,778,116.00
907,857.00 1,870,259.00 5th february 2004 31st december
820,618.00
9,500.00
3,905,550.00 pricewaterhouse coopers
2002
2,053,089.00
481,171.00
1,571,918.00 17th february 2003 31st december
156,453.00
8,500.00
4,167,664.00 pricewaterhouse coopers
2001
2,707,231.00
543,117.00
2,164,114.00 22nd march 2002 31st december
1,978,414.00
6,265.00
4,109,065.00 pricewaterhouse coopers
HEALTHCARE 2015
147,511,480.40
38,471,312.10 109,040,168.30 22nd July 2008 31st dec
964,160.00
1,540.00
1,756,424,630.40
emmanuel adebola
fayemi & co
EKOCORP
PLC.
2014
140,145,994.70
35,802,503.80 104,343,490.90 16th july 2007 31st dec
856,296.00
1,490.00
1,654,830,562.00
emmanuel adebola
fayemi & co
2013
132,780,509.00
33,133,695.50 99,646,813.50 5th sept 2006 31st dec
748,432.00
1,440.00
1,553,236,493.60
emmanuel adebola
fayemi & co
2012 125,415,023.30 30,464,887.20 94,950,136.10 5th nov 2005 31st dec 640,570.00 1,390.00 1,451,642,425.20
emmanuel adebola
fayemi & co
2011
118,049,537.60
27,796,078.90 90,253,458.70 23rd July 2008 31st dec
706,946.00
1,340.00
1,350,048,356.80
emmanuel adebola
fayemi & co

| 142
2010
110,684,051.90
25,127,270.60 85,556,781.30 17th july 2007 31st dec
843,676.00
1,290.00
1,248,454,288.40
emmanuel adebola
fayemi & co
2009
103,318,566.20
22,458,462.30 80,860,103.90 6th sept 2006 31st dec
980,406.00
1,240.00
1,146,860,220.00
emmanuel adebola
fayemi & co
2008
95,953,080.50
19,789,654.00 76,163,426.50 6th nov 2005 31st dec
117,136.00
1,190.00
1,045,266,151.60
emmanuel adebola
fayemi & co
2007
87,083,833.00
14,925,962.00 72,157,871.00 24th July 2008 31st dec
65,741.00
1,400.00
919,737,517.00
emmanuel adebola
fayemi & co
2006
83,314,106.00
17,703,683.00 65,610,423.00 18th july 2007 31st dec
98,420.00
900.00
946,999,042.00
emmanuel adebola
fayemi & co
2005
74,183,915.00
11,864,589.00 62,319,326.00 7th sept 2006 31st dec
99,281.00
900.00
640,568,961.00
emmanuel adebola
fayemi & co
2004
65,575,611.00
7,976,299.00 57,599,312.00 7th nov 2005 31st dec
75,224.00
800.00
619,695,032.00
emmanuel adebola
fayemi & co
2003
60,763,340.00
5,753,966.00 55,009,374.00 11th novem 2004 31st dec
51,556.00
1,200.00
575,419,180.00 tunde williams & co
2002
58,493,838.00
6,859,304.00 51,634,534.00 21st oct 2003 31st dec
43,971.00
800.00
524,169,806.00 kunle oshinaike & co
2001
52,513,615.00
6,270,976.00 46,242,639.00 22nd oct 2002 31st dec
2,981.00
800.00
472,525,272.00 kunle oshinaike & co
MORISON
INDUSTRIES
PLC.
2015
(126,675.33)
(8,203.00)
(118,472.33) 25th march 2013 31st december
36,922.00
3,000.00
371,879.00
omogoroye okin pepoola
and co.
2014
(88,309.00)
(5,978.00)
(82,331.00) 20th march 2015 31st december
32,444.00
3,000.00
449,047.00
omogoroye okin pepoola
and co.
2013
(14,100.00)
7,965.00 (22,065.00) 20th march 2014 31st december
(36,834.00)
3,000.00
526,215.00
omogoroye okin pepoola
and co.
2012
6,345.00
4,331.00
2,014.00 26th march 2013 31st december
11,530.00
3,000.00
586,090.00
omogoroye okin pepoola
and co.
2011
(28,401.00)
(2,264.00)
(26,137.00) 27th march 2012 31st december
4,122.00
2,000.00
577,550.00
omogoroye okin pepoola
and co.
2010
(33,682.00)
(555.00)
(33,127.00) 25th july 2011 31st december
5,312.00
3,500.00
403,349.00 akintola williams deloitte
2009
(20,452.00)
405.00 (20,857.00) 2nd august 2010 31st december
25,643.00
3,500.00
436,476.00 akintola williams deloitte
2008
20,165.00
5,716.00 14,449.00 4th june 2009 31st december
19,481.00
3,500.00
464,942.00 akintola williams deloitte
2007
536.00
(4,954.00) 5,490.00 28th november 2008 31st december
(1,437.00)
3,000.00
125,445.00 akintola williams deloitte
2006
14,282.00
6,135.00
8,147.00 9th october 2007 31st december
44,546.00
1,400.00
119,955.00 akintola williams deloitte
2005
10,804.00
42.00 10,762.00 1st september 2006 31st december
22,056.00
1,300.00
120,939.00 akintola williams deloitte
2004
19,695.00
10,028.00 9,667.00 1st september 2005 31st december
(9,013.00)
1,100.00
110,177.00 akintola williams deloitte
2003
16,037.00
6,516.00
9,521.00 2nd july 2004 31st december
14,976.00
875.00
109,641.00 akintola williams deloitte
2002
10,991.00
4,651.00 6,340.00 2nd april 2003 31st december
(1,685.00)
650.00
106,967.00 KPMG audit
2001
6,173.00
(5,418.00)
11,591.00 8th may 2002 31st december
5,467.00
650.00
106,104.00 KPMG audit
EVANS
MEDICAL
PLC.
2015
56,059.00
561,385.00 617,444.00 11th april 2012 31st dec
1,275,832.00
17,500.00
3,413,683.00 pricewaterhousecoopers
2014
103,318.00
403,146.00 506,464.00 5th june 2013 31st dec
1,045,369.00
17,500.00
3,085,850.00 pricewaterhousecoopers
2013
150,577.00
244,907.00 395,484.00 12th april 2012 31st dec
814,906.00
17,500.00
2,758,017.00 pricewaterhousecoopers
2012
197,836.00
86,668.00 284,504.00 6th june 2013 31st dec
584,443.00
17,500.00
2,430,184.00 pricewaterhousecoopers
2011 173,524.00 13th april 2012 31st dec pricewaterhousecoopers

| 143
245,095.00 (71,571.00) 353,980.00 17,500.00 2,102,351.00
2010
(54,379.00)
63,142.00 8,763.00 1st april 2011 31st dec
523,018.00
16,500.00
(57,044.00) pricewaterhousecoopers
2009
(958,983.00)
69,392.00
(889,591.00) 11th Nov 2010 31st dec
770,106.00
16,500.00
(65,807.00) pricewaterhousecoopers
2008
(387,824.00)
(122,274.00)
(510,098.00) 14th may 2009 31st dec
277,420.00
8,000.00
823,784.00 pricewaterhousecoopers
2007
(373,436.00)
56,417.00
(317,019.00) 11th July 2008 31st dec
(23,641.00)
8,000.00
1,323,882.00 pricewaterhousecoopers
2006
186,613.00
(54,409.00) 132,204.00 10th oct 2007 31st dec
(174,150.00)
8,000.00
1,640,901.00 pricewaterhousecoopers
2005
94,721.00
15,547.00 79,174.00 10th april 2006 31st dec
(183,260.00)
8,000.00
1,563,978.00 pricewaterhousecoopers
2004
92,241.00
45,589.00 46,652.00 30th sept 2005 31st dec
(289,027.00)
8,500.00
1,635,688.00 pricewaterhousecoopers
2003
125,953.00
48,312.00 77,641.00 2nd june 2004 31st dec
(210,560.00)
3,500.00
1,442,643.00 pricewaterhousecoopers
2002
105,798.00
7,845.00 97,953.00 16th april 2003 31st dec
153,756.00
3,500.00
1,067,886.00 pricewaterhousecoopers
2001
44,595.00
(15,527.00) 60,122.00 27th February 2002 31st dec
187,714.00
2,500.00
984,751.00 pricewaterhousecoopers
FIDSON
HEALTHCARE
PLC
2015
884,226.33
128,059.00 756,167.33 29th april 2013 31st dec
4,070,129.00
12,500.00
10,388,676.00 ernst & young
2014
870,812.00
238,987.00 631,825.00 25th march 2015 31st dec
3,002,259.00
10,500.00
9,863,468.00 ernst & young
2013
249,591.00
94,611.00 154,980.00 30th april 2014 31st dec
1,963,511.00
10,500.00
8,128,942.00 ernst & young
2012
540,080.00
333,191.00 206,889.00 30th april 2013 31st dec
881,080.00
7,500.00
8,208,393.00 ernst & young
2011
214,264.00
158,674.00 55,590.00 18th april 2012 31st dec
200,144.00
7,500.00
7,617,413.00 ernst & young
2010
642,183.00
176,290.00 465,893.00 20th jan 2011 30th june
1,165,800.00
6,500.00
5,668,278.00 ernst & young
2009
623,036.00
193,963.00 429,073.00 7th dec 2010 30th june
1,194,995.00
5,750.00
5,095,021.00 ernst & young
2008
526,379.00
337,079.00 189,300.00 20th nov 2009 30th june
(879,219.00)
4,250.00
4,965,948.00 ernst & young
2007
505,304.00
- 505,304.00 31st april 2014 30th june
267,069.00
3,000.00
1,426,726.00 ernst & young
2006
370,430.00
- 370,430.00 31st april 2013 30th june
(755,440.50)
3,300.00
1,068,571.00 ernst & young
2005
246,268.00
950.00 245,318.00 19th april 2012 30th june
(1,232,481.20)
3,000.00
698,141.00 ernst & young
2004
182,984.00
(36,074.00) 219,058.00 21st jan 2011 30th june
(1,709,521.90)
2,500.00
528,842.00 ernst & young
2003
53,466.00
(35,599.00) 89,065.00 8th dec 2010 30th june
(2,186,562.60)
1,750.00
(1,143,193.50) ernst & young
2002
(55,646.20)
(46,326.20)
(9,320.00) 21st nov 2009 30th june
(2,663,603.30)
1,500.00
(2,103,473.20) ernst & young
2001
(164,758.40)
(57,053.40)
(107,705.00) 32nd april 2014 30th june
(3,140,644.00)
1,250.00
(3,063,752.90) ernst & young
GLAXO
SMITHKLINE
CONSUMER
NIG. PLC.
2015
1,152,485.00
192,467.00 956,315.00 15th march 2016 31st decem
5,138,681.00
24,000.00
12,994,466.00
Akintola Williams
Deloitte
2014
2,739,022.00
903,374.00 1,830,533.00 30th march 2015 31st decem
1,378,889.00
27,721.00
12,766,228.00 Pricewaterhouse Coopers
2013 4,312,070.00 1,395,659.00 2,915,897.00 21st march 2014 31st decem 4,996,026.00 25,019.00 12,182,007.00 Pricewaterhouse Coopers
2012
4,070,838.00
1,315,825.00 2,754,862.00 22nd april 31st decem
4,049,325.00
21,295.00
10,502,627.00 Pricewaterhouse Coopers
2011 2,671,444.00 24th feb 2012 31st decem Pricewaterhouse Coopers

| 144
3,810,123.00 1,136,892.00 4,212,628.00 18,000.00 8,911,598.00
2010
3,371,582.00
909,491.00 2,461,395.00 29th march 2011 31st decem
3,086,812.00
16,695.00
7,385,195.00 Pricewaterhouse Coopers
2009
2,471,096.00
767,767.00 1,701,829.00 24th march 2010 31st decem
2,540,219.00
14,100.00
5,772,938.00 Pricewaterhouse Coopers
2008
1,852,250.00
573,923.00 1,277,441.00 20th march 2009 31st decem
1,993,626.00
13,005.00
4,160,681.00 Pricewaterhouse Coopers
2007
1,174,290.00
329,572.00 836,876.00 21st april 2008 31st decem
1,333,999.00
12,000.00
4,029,992.00 Pricewaterhouse Coopers
2006
1,565,005.00
440,144.00 1,082,293.00 27th april 2007 31st decem
1,613,615.00
10,800.00
3,742,505.00 Pricewaterhouse Coopers
2005
1,441,864.00
433,422.00 975,741.00 25th april 2006 31st decem
380,457.00
9,000.00
3,158,093.00 Pricewaterhouse Coopers
2004
1,342,609.00
369,998.00 955,261.00 26th april 2005 31st decem
1,320,173.00
7,200.00
2,276,190.00 Pricewaterhouse Coopers
2003
1,069,675.00
378,438.00 684,327.00 23rd march 2004 31st decem
415,543.00
6,000.00
1,674,026.00 Pricewaterhouse Coopers
2002
791,951.00
286,155.00 497,053.00 26th march 2003 31st decem
414,928.00
5,500.00
1,314,837.00 Pricewaterhouse Coopers
2001
128,908.00
30,441.00 98,467.00 5th april 2002 31st decem
905,985.00
3,500.00
1,074,825.00 Pricewaterhouse Coopers
MAY &
BAKER
NIGERIA PLC.
2015
127,325.00
72,793.00 54,532.00 24th march 2016 31st Dec
1,652,612.00
9,000.00
3,158,083.00
PKF Professional
Services
2014
127,931.00
34,766.00 93,165.00 24th march 2015 31st Dec
748,151.00
9,000.00
3,152,551.00
PKF Professional
Services
2013
13,037.00
91,153.00
(78,116.00) 24th march 2014 31st Dec
1,188,479.00
8,000.00
3,059,386.00
PKF Professional
Services
2012
50,176.00
(32,106.00) 82,282.00 8th may 2013 31st Dec
(314,040.00)
12,000.00
3,137,502.00
Akintola Williams
Deloitte
2011
334,268.00
81,206.00 253,062.00 28th march 2012 31st Dec
990,145.00
7,500.00
3,136,446.00
Akintola Williams
Deloitte
2010
307,790.00
114,813.00 192,977.00 22nd march 2011 31st Dec
579,802.00
5,280.00
2,883,384.00
Akintola Williams
Deloitte
2009
344,162.00
112,081.00 232,081.00 25th may 2010 31st Dec
802,735.00
5,280.00
2,705,707.00
Akintola Williams
Deloitte
2008
422,632.00
290,350.00 417,962.00 11th may 2009 31st Dec
240,578.00
4,800.00
2,753,626.00
Akintola Williams
Deloitte
2007
398,078.00
189,760.00 208,318.00 16th march 2008 31st Dec
201,812.00
4,200.00
2,615,664.00
Akintola Williams
Deloitte
2006
266,191.00
54,721.00
211,470.00 7th june 2007 31st Dec
812,072.00
3,250.00
2,617,346.00
Akintola Williams
Deloitte
2005
154,621.00
52,862.00
101,759.00 14th march 2006 31st Dec
(99,201.00)
2,800.00
816,905.00
Akintola Williams
Deloitte
2004
126,158.00
35,019.00
91,139.00 24th may 2005 31st Dec
270,250.00
2,100.00
715,146.00
Akintola Williams
Deloitte
2003
134,489.00
55,322.00 79,167.00 3rd may 2004 31st Dec
102,897.00
2,500.00
639,397.00
Akintola Williams
Deloitte
2002
77,383.00
36,308.00 41,075.00 20th march 2003 31st Dec
145,577.00
2,300.00
614,525.00 KPMG
2001
169,593.00
54,599.00
114,994.00 19thmarch 2002 31st Dec
(33,815.00)
2,000.00
573,450.00 KPMG
NEIMETH
INTERNATION
AL
PHARMACEU
TICALS PLC
2015
(315,772.00)
19,912.00 (335,684.00) 18th decem 2015 30th Sept
243,948.00
7,700.00
1,157,325.00
PKF Professional
Services
2014
(198,173.00)
30,362.00 (228,535.00)
16th december
2014 30th Sept
89,515.00
7,000.00
1,493,009.00
PKF Professional
Services
2013
182,135.00
51,556.00 130,578.00
14th december
2013 30th Sept
96,845.00
7,000.00
1,733,789.00
PKF Professional
Services
2012
(78,140.00)
(18,204.00) (59,936.00) 12th decem 2012 30th Sept
104,175.00
6,500.00
158,293.00
PKF Professional
Services

| 145
2011
123,436.00
10,359.00
113,077.00 2nd augst 2011 31st March
166,395.00
6,000.00
1,015,504.00
Akintola Williams
Deloitte
2010
(40,501.00)
8,338.00 (48,839.00) 21st sept 2010 31st March
293,220.00
5,500.00 #REF!
Akintola Williams
Deloitte
2009
(406,380.00)
46,815.00 (455,206.00) 10th septe 2009 31st March
170,015.00
4,200.00
1,072,787.00
Akintola Williams
Deloitte
2008
165,130.00
66,863.00 98,267.00 28th july 2008 31st March
(339,076.00)
3,200.00
1,634,075.00
Akintola Williams
Deloitte
2007
172,306.00
55,891.00
116,415.00 4th july 2007 31st March
(96,950.00)
2,250.00
1,623,717.00
Akintola Williams
Deloitte
2006
124,592.00
42,364.00 82,228.00 5th october 2006 31st March
(716,164.00)
1,500.00
1,576,000.00
Akintola Williams
Deloitte
2005
153,602.00
55,175.00 98,427.00 14th june 2005 31st March
43,397.00
1,200.00
540,919.00
Akintola Williams
Deloitte
2004
89,155.00
29,980.00 59,175.00 27th july 2004 31st March
173,993.00
1,000.00
418,994.00
Akintola Williams
Deloitte
2003
72,386.00
20,302.00 52,084.00 20th july 2003 31st March
49,314.00
850.00
308,461.00
Akintola Williams
Deloitte
2002
35,215.00
(446.00) 35,661.00 15th july 2002 31st March
278,775.00
850.00
261,091.00 KPMG
2001
30,043.00
8,986.00 21,057.00 13th august 2001 31st March
336,568.00
850.00
233,331.00 KPMG
NIGERIA-
GERMAN
CHEMICALS
PLC.
2015
(186,032.33)
(1,250,956.33) 1,064,924.00 3rd sept 2012 31st march
650,608.00
8,500.00
3,358,354.00
PKF Professional
services
2014
(133,795.00)
(718,158.00) 584,363.00 5th nov 2014 31st march
791,929.00
6,000.00
3,063,305.00
PKF Professional
services
2013
(177,239.00)
(356,413.00)
179,174.00 18th august 2013 31st march
211,610.00
6,000.00
2,429,278.00
PKF Professional
services
2012
(77,161.00)
261,912.00 (339,073.00) 4th sept 2012 31st march
713,751.00
6,000.00
2,303,718.00
PKF Professional
services
2011
(307,011.00)
(152,358.00)
(154,653.00) 21st sept 2011 31st march
250,544.00
7,000.00
2,618,714.00
PKF Professional
services
2010
(480,799.00)
16,427.00 (497,226.00) 21st sept 2010 31st March
1,771,965.00
6,500.00
2,472,461.00
Akintola Williams
Deloitte
2009
(548,011.00)
16,427.00 (564,438.00) 12th oct 2009 31st dec
1,771,966.00
6,500.00
2,407,224.00
Akintola Williams
Deloitte
2008
56,280.00
23,600.00 32,680.00 11th june 2008 31st dec
237,558.00
6,500.00
1,236,891.00
Akintola Williams
Deloitte
2007
218,294.00
58,796.00 159,498.00 11th june 2008 31st dec
236,115.00
4,500.00
1,273,415.00
Akintola Williams
Deloitte
2006
147,841.00
49,578.00 98,263.00 15th june 2007 31st dec
50,705.00
3,000.00
1,183,121.00
Akintola Williams
Deloitte
2005
159,748.00
68,745.00 91,003.00 17th august 2006 31st dec
329,140.00
2,400.00
1,138,683.00
Akintola Williams
Deloitte
2004
136,575.00
54,242.00 82,333.00 18th june 2005 31st dec
448,883.00
2,000.00
1,047,680.00
Akintola Williams
Deloitte
2003
124,751.00
63,219.00 15,396.00 13th may 2004 31st dec
368,626.00
1,850.00
956,677.00
Akintola Williams
Deloitte
2002
95,090.00
56,317.00
8,016.00 25th april 2003 31st dec
380,621.00
1,700.00
996,087.00
Akintola Williams
Deloitte
2001
39,336.00
34,872.00 4,464.00 31st july 2002 31st dec
79,716.00
1,250.00
988,071.00
Akintola Williams
Deloitte
PHARMA-
DEKO PLC
2015
701,674.00
(42,410.00) 659,264.00 30th March 2016 31st December
782,327.00
3,500.00
2,570,082.00 Joshua Ansa, FCA
2014 150,171.00 (49,164.00) 101,007.00 30th March 2015 31st December 518,302.00 3,500.00 2,839,229.00 Joshua Ansa
2013
(127,993.00)
6,811.00
(121,182.00) 25th March 2014 31st December
134,554.00
3,500.00
2,498,136.00 Joshua Ansa
2012
686,776.00
54,169.00 (740,945.00) 28th February 2013 31st December
658,184.00
3,000.00
2,782,811.00 Siao

| 146
2011
48,071.00
5,913.00 42,158.00 27th March 2012 31st December
164,899.00
3,000.00
(1,068,343.00) Siao
2010
462,919.00
1,175.00 (464,094.00) 29th March 2011 31st December
17,055.00
3,000.00
(1,110,501.00) Siao
2009
(460,455.00)
1,042.00
(461,497.00) 3rd nov 2010 31st December
175,358.00
5,000.00
(646,407.00)
Akintola Williams
Deloitte
2008
194,826.00
3,146.00
(197,972.00) 6th nov 2009 31st December
78,377.00
5,000.00
(184,910.00)
Akintola Williams
Deloitte
2007
239,801.00
2,483.00 (242,284.00) 23rd october 2008 31st December
207,677.00
2,246.00
(66,437.00)
Akintola Williams
Deloitte
2006
357,559.00
(20,229.00) (337,330.00) 23rd october 2007 31st December
412,648.00
1,872.00
85,958.00
Akintola Williams
Deloitte
2005
12,088.00
3,872.00
8,216.00 24th august 2006 31st December
(259,983.00)
1,600.00
423,288.00
Akintola Williams
Deloitte
2004
36,969.00
6,351.00 30,618.00 24th may 2005 31st December
57,480.00
1,200.00
244,985.00
Akintola Williams
Deloitte
2003
69,939.00
6,341.00 63,598.00 31st march 2004 31st December
47,622.00
1,000.00
196,357.00
Akintola Williams
Deloitte
2002
50,455.00
8,151.00 42,304.00 16th july 2003 31st December
59,950.00
835.00
68,877.00
Akintola Williams
Deloitte
2001
(5,732.00)
1,007.00 4,806.00 17th may 2002 31st December
33,449.00
792.00
31,660.00
Akintola Williams
Deloitte
INDUSTRIAL
GOODS 2015
11,934.40
503.40
11,431.00 4th april 2012 31st dec
42,000.00
3,850.00
32,500.00
BDO Oyediran Faleye
Oke &Co
AFRICAN
PAINTS
(NIGERIA)
PLC.
2014
3,923.60
483.10 3,440.50 30th march 2011 31st dec
38,556.00
3,250.00
29,225.00
BDO Oyediran Faleye
Oke &Co
2013
(4,087.20)
462.80
(4,550.00) 5th april 2010 31st dec
36,251.00
3,000.00
27,683.50
BDO Oyediran Faleye
Oke &Co
2012
(12,098.00)
442.50
(12,540.50) 25th may 2009 31st dec
33,252.00
2,500.00
32,110.00
BDO Oyediran Faleye
Oke &Co
2011
(49,850.00)
398.00 (50,248.00) 5th april 2012 31st dec
2,595.00
1,500.00
18,189.00
BDO Oyediran Faleye
Oke &Co
2010
13,999.00
390.00 13,609.00 31st march 2001 31st dec
24,619.00
1,000.00
68,437.00
BDO Oyediran Faleye
Oke &Co
2009
(31,144.00)
478.00
(31,622.00) 27th april 2008 31st dec
(15,585.00)
1,000.00
82,826.00
BDO Oyediran Faleye
Oke &Co
2008
(61,505.00)
301.00
(61,806.00) 26th may 2009 31st dec
31,949.00
900.00
49,448.00
BDO Oyediran Faleye
Oke &Co
2007
(16,189.00)
237.00
(16,426.00) 5th nov 2008 31st dec
30,017.00
800.00
8,106.00
BDO Oyediran Faleye
Oke &Co
2006
(22,040.00)
260.00 (22,300.00) 28th april 2008 31st dec
9,299.00
600.00
24,532.00
BDO Oyediran Faleye
Oke &Co
2005
(66,689.00)
250.00 (66,939.00) 28th april 2008 31st dec
16,760.00
650.00
44,180.00
BDO Oyediran Faleye
Oke &Co
2004
(63,725.00)
43,565.00 107,290.00 28th april 2008 31st dec
(1,676.00)
600.00
107,290.00
BDO Oyediran Faleye
Oke &Co
2003
9,363.00
(27,676.00) 18,922.00 28th april 2008 31st dec
41,463.00
650.00
18,922.00
BDO Oyediran Faleye
Oke &Co
2002
17,170,224.00
1,400,000.00 15,770,224.00 19th sept 2003 31st dec
59,472.00
680.00
17,170,224.00
BDO Oyediran Faleye
Oke &Co
2001
(79,868,889.00)
670,422.00
(80,539,311.00) 19th sept 2003 31st dec
(42,650,705.00)
600.00
(79,868,889.00)
BDO Oyediran Faleye
Oke &Co
ASHAKA
CEM PLC
2015
3,209,246.00
444,719.00 2,764,527.00 14th march 2016 31st dec
(1,949,228.00)
20,000.00
70,376,125.00
Akintola Williams
Deloitte
2014
5,250,933.00
684,266.00 4,566,667.00 10th march 2015 31st dec
2,190,474.00
23,000.00
71,526,871.00
Akintola Williams
Deloitte
2013
2,844,864.00
20,553.00 2,824,311.00 28th march 2011 31st dec
2,042,923.00
21,000.00
67,423,536.00
Akintola Williams
Deloitte
2012 3,124,848.00 25th april 2013 31st dec Akintola Williams

| 147
5,473,736.00 2,348,888.00 3,315,218.00 26,000.00 67,325,232.00 Deloitte
2011
4,763,702.00
1,190,993.00 3,572,709.00 30th march 2012 31st dec
8,457,086.00
20,000.00
19,047,155.00
Akintola Williams
Deloitte & Touche &
PKF Pannell Kerr Forster
2010
4,389,168.00
1,384,474.00 3,004,694.00 29th march 2011 31st dec
2,671,401.00
20,000.00
16,146,282.00
Akintola Williams
Deloitte & Touche &
PKF Pannell Kerr Forster
2009
2,365,777.00
1,422,159.00 943,618.00 24th march 2010 31st dec
2,748,918.00
20,000.00
13,141,588.00
Akintola Williams
Deloitte & Touche &
PKF Pannell Kerr Forster
2008
3,430,941.00
1,360,896.00 2,070,045.00 30th april 2009 31st dec
5,904,812.00
16,000.00
12,795,158.00
Akintola Williams
Deloitte & Touche &
PKF Pannell Kerr Forster
2007
2,437,068.33
1,365,598.33 1,071,470.00 30th march 2011 31st dec
7,008,454.67
14,400.00
10,676,552.00
Akintola Williams
Deloitte & Touche &
PKF Pannell Kerr Forster
2006
1,957,954.83
1,353,809.33 604,145.50 25th march 2010 31st dec
8,625,160.17
12,400.00
9,000,990.00
Akintola Williams
Deloitte & Touche &
PKF Pannell Kerr Forster
2005
1,478,841.33
1,342,020.33
136,821.00 31st april 2009 31st dec
10,241,865.67
10,400.00
7,325,428.00
Akintola Williams
Deloitte & Touche &
PKF Pannell Kerr Forster
2004
4,892,887.00
1,512,220.00 3,380,667.00 3rd march 2005 31st dec
1,949,773.00
6,000.00
7,281,717.00
Akintola Williams
Deloitte & Touche &
PKF Pannell Kerr Forster
2003
3,135,497.00
1,012,327.00 2,123,170.00 28th march 2016 31st dec
3,339,303.00
6,000.00
6,324,108.00
Akintola Williams
Deloitte & Touche &
PKF Pannell Kerr Forster
2002
2,093,071.00
570,782.00 1,522,289.00 27th feb 2003 31st dec
(577,324.00)
5,000.00
5,700,938.00
Akintola Williams
Deloitte & Touche &
PKF Pannell Kerr Forster
2001
2,792,578.00
941,608.00 1,850,970.00 7th march 2002 31st dec
1,087,843.00
2,100.00
4,705,149.00
PKF- pannell Kerr
Forster
BERGER
PAINTS PLC
2015
565,212.00
14,552.00 330,316.00 29th march 2016 31/12/2015
586,288.00
16,000.00
2,587,330.00
KPMG
PROFESSIONAL
SERVICES KPMG
TOWER BISHOP
ABOYADE COLE
STREET
2014
249,258.00
33,026.00 148,808.00 30th march 2015 31/12/2014
(395,168.00)
16,000.00
2,459,830.00
KPMG
PROFESSIONAL
SERVICES KPMG
TOWER BISHOP
ABOYADE COLE
STREET
2013
342,767.00
66,605.00 257,580.00 28th maech 2014 31/12/2013
305,444.00
15,500.00
2,476,257.00
KPMG
PROFESSIONAL
SERVICES KPMG
TOWER BISHOP
ABOYADE COLE
STREET
2012
284,465.00
12,834.00 192,009.00 28th march 2013 31/12/2012
255,537.00
15,000.00
1,755,445.00
KPMG
PROFESSIONAL
SERVICES KPMG
TOWER BISHOP
ABOYADE COLE
STREET
2011
369,325.00
(3,769.00) 227,816.00 27th march 2012 31/12/2011
287,248.00
12,650.00
1,727,153.00
KPMG
PROFESSIONAL
SERVICES KPMG
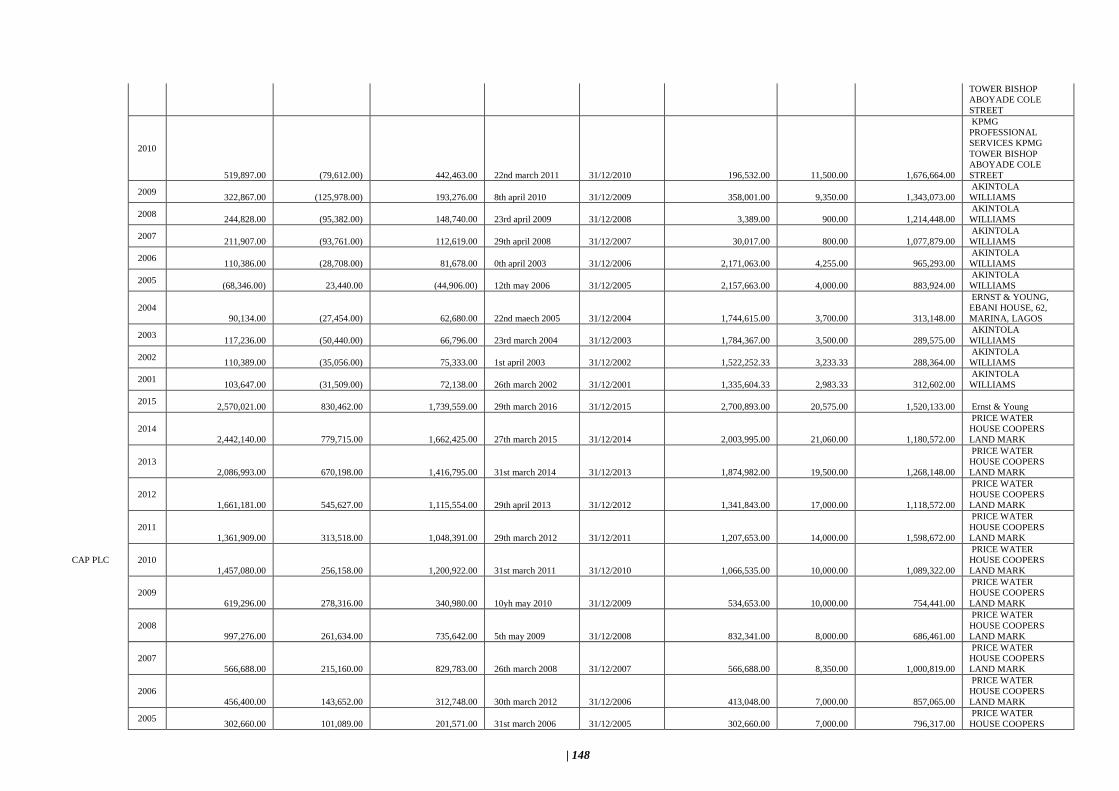
| 148
TOWER BISHOP
ABOYADE COLE
STREET
2010
519,897.00
(79,612.00) 442,463.00 22nd march 2011 31/12/2010
196,532.00
11,500.00
1,676,664.00
KPMG
PROFESSIONAL
SERVICES KPMG
TOWER BISHOP
ABOYADE COLE
STREET
2009
322,867.00
(125,978.00) 193,276.00 8th april 2010 31/12/2009
358,001.00
9,350.00
1,343,073.00
AKINTOLA
WILLIAMS
2008
244,828.00
(95,382.00) 148,740.00 23rd april 2009 31/12/2008
3,389.00
900.00
1,214,448.00
AKINTOLA
WILLIAMS
2007
211,907.00
(93,761.00)
112,619.00 29th april 2008 31/12/2007
30,017.00
800.00
1,077,879.00
AKINTOLA
WILLIAMS
2006
110,386.00
(28,708.00) 81,678.00 0th april 2003 31/12/2006
2,171,063.00
4,255.00
965,293.00
AKINTOLA
WILLIAMS
2005
(68,346.00)
23,440.00 (44,906.00) 12th may 2006 31/12/2005
2,157,663.00
4,000.00
883,924.00
AKINTOLA
WILLIAMS
2004
90,134.00
(27,454.00) 62,680.00 22nd maech 2005 31/12/2004
1,744,615.00
3,700.00
313,148.00
ERNST & YOUNG,
EBANI HOUSE, 62,
MARINA, LAGOS
2003
117,236.00
(50,440.00) 66,796.00 23rd march 2004 31/12/2003
1,784,367.00
3,500.00
289,575.00
AKINTOLA
WILLIAMS
2002
110,389.00
(35,056.00) 75,333.00 1st april 2003 31/12/2002
1,522,252.33
3,233.33
288,364.00
AKINTOLA
WILLIAMS
2001
103,647.00
(31,509.00) 72,138.00 26th march 2002 31/12/2001
1,335,604.33
2,983.33
312,602.00
AKINTOLA
WILLIAMS
CAP PLC
2015
2,570,021.00
830,462.00 1,739,559.00 29th march 2016 31/12/2015
2,700,893.00
20,575.00
1,520,133.00 Ernst & Young
2014
2,442,140.00
779,715.00 1,662,425.00 27th march 2015 31/12/2014
2,003,995.00
21,060.00
1,180,572.00
PRICE WATER
HOUSE COOPERS
LAND MARK
2013
2,086,993.00
670,198.00 1,416,795.00 31st march 2014 31/12/2013
1,874,982.00
19,500.00
1,268,148.00
PRICE WATER
HOUSE COOPERS
LAND MARK
2012
1,661,181.00
545,627.00
1,115,554.00 29th april 2013 31/12/2012
1,341,843.00
17,000.00
1,118,572.00
PRICE WATER
HOUSE COOPERS
LAND MARK
2011
1,361,909.00
313,518.00 1,048,391.00 29th march 2012 31/12/2011
1,207,653.00
14,000.00
1,598,672.00
PRICE WATER
HOUSE COOPERS
LAND MARK
2010
1,457,080.00
256,158.00 1,200,922.00 31st march 2011 31/12/2010
1,066,535.00
10,000.00
1,089,322.00
PRICE WATER
HOUSE COOPERS
LAND MARK
2009
619,296.00
278,316.00 340,980.00 10yh may 2010 31/12/2009
534,653.00
10,000.00
754,441.00
PRICE WATER
HOUSE COOPERS
LAND MARK
2008
997,276.00
261,634.00 735,642.00 5th may 2009 31/12/2008
832,341.00
8,000.00
686,461.00
PRICE WATER
HOUSE COOPERS
LAND MARK
2007
566,688.00
215,160.00 829,783.00 26th march 2008 31/12/2007
566,688.00
8,350.00
1,000,819.00
PRICE WATER
HOUSE COOPERS
LAND MARK
2006
456,400.00
143,652.00 312,748.00 30th march 2012 31/12/2006
413,048.00
7,000.00
857,065.00
PRICE WATER
HOUSE COOPERS
LAND MARK
2005
302,660.00
101,089.00
201,571.00 31st march 2006 31/12/2005
302,660.00
7,000.00
796,317.00
PRICE WATER
HOUSE COOPERS

| 149
LAND MARK
2004
250,842.00
(89,387.00)
161,455.00 24th march 2005 31/12/2004
250,842.00
6,000.00
594,747.00
PRICE WATER
HOUSE COOPERS
LAND MARK
2003
208,634.00
(56,852.00)
151,782.00 31st march 2004 31/12/2003
159,977.33
5,666.67
548,792.00
PRICE WATER
HOUSE COOPERS
LAND MARK
2002
178,973.00
(38,167.00) 140,806.00 14th april 2003 31/12/2002
78,874.33
5,166.67
481,009.00
PRICE WATER
HOUSE COOPERS
LAND MARK
2001
411,608.00
(11,151.00) 400,457.00 5th april 2002 31/12/2001
(2,228.67)
4,666.67
407,405.00
PRICE WATER
HOUSE COOPERS
LAND MARK
CEMENT CO.
OF
NORTH.NIG.
PLC
2015
1,549,596,856.00
(348,488,807.00) 1,201,108,049.00 21st maech 2016 31/12/2015
1,549,596,856.00
9,000.00
10,144,768,246.00
GBENGA BADEJO &
CO (CHARTERED
ACCOUNTANTS)
2014
2,476,771,561.00
(558,409,707.00) 1,918,361,854.00 26th march 2015 31/12/2014
2,476,771,561.00
9,000.00
9,445,658,415.00
GBENGA BADEJO &
CO (CHARTERED
ACCOUNTANTS)
2013
2,105,835,392.00
(546,804,845.00) 1,559,030,547.00 28th march 2014 31/12/2013
2,105,835,392.00
7,500.00
8,284,619,000.00
GBENGA BADEJO &
CO (CHARTERED
ACCOUNTANTS)
2012
1,086,466,140.00
(682,883,824.33) 1,086,466,140.00 22nd maech 2013 31/12/2012
1,734,899,223.00
6,000.00
6,623,437,987.00
GBENGA BADEJO &
CO (CHARTERED
ACCOUNTANTS)
2011
2,292,325,261.00
(782,041,843.33) 1,302,332,402.00 29th march 2012 31/12/2011
1,363,963,054.00
4,500.00
6,006,086,699.00
GBENGA BADEJO &
CO (CHARTERED
ACCOUNTANTS)
2010
1,752,034,103.00
461,197,822.00 1,269,034,103.00 24th march 2011 31/12/2010
12,155,348,379.00
3,000.00
4,703,754,297.00 MU'ALLAHYIDI & CO
2009
2,317,300.00
209,942,554.00 1,812,300.00 29th march 2014 31/12/2009
12,216,081,165.00
3,000.00
4,217,877.00 MU'ALLAHYIDI & CO
2008
1,680,524.00
39,255,842.00 1,530,524.00 20th feb 2009 31/12/2008
10,793,831,413.00
1,200.00
3,976,416.00 MU'ALLAHYIDI & CO
2007
172,848.00
39,515,555.00 138,664.00 4th march 2008 31/12/2007
8,752,532,185.00
1,200.00
3,148,332.00 MU'ALLAHYIDI & CO
2006
(10,443.00)
28,652,232.00 (34,955.00) 29th march 2007 31/12/2006
7,141,201,676.00
1,200.00
1,544,254.00 MU'ALLAHYIDI & CO
2005
379,886.00
30,839,360.00 224,282.00 30th jan 2006 31/12/2005
6,282,077,277.00
500.00
1,606,945.00 MU'ALLAHYIDI & CO
2004
845,081.00
2,848,922.00 827,081.00 15th march 2005 31/12/2004
5,621,600,211.00
500.00
1,406,438.00 MU'ALLAHYIDI & CO
2003
(93,351.00)
2,199,812.00
(108,351.00) 27th march 2004 31/12/2003
3,129,176,211.00
500.00
675,716.00 MU'ALLAHYIDI & CO
2002
(668,380.00)
1,550,702.00 (668,380.00) 17th march 2003 31/12/2002
1,858,050,167.00
500.00
(579,886.00) MU'ALLAHYIDI & CO
2001
(1,064,275.00)
901,592.00 (1,074,496.00) 28th feb 2002 31/12/2001
281,599,634.00
500.00
195,262.00 MU'ALLAHYIDI & CO
DN MEYER
PLC
2015
80,544.00
(7,314.00) 73,230.00 22nd march 2016 31/12/2015
73,230.00
4,000.00
638,100.00
BDO PROFESSIONAL
SERVICES ,ADOL
HOUSE
2014
(33,894.00)
787.00
(33,107.00) 15th march 2015 31/12/2014
(40,757.00)
10,000.00
564,870.00
BDO PROFESSIONAL
SERVICES ,ADOL
HOUSE
2013
(22,029.00)
(4,121.00)
(26,149.00) 3rd april 2014 31/12/2013
246,381.00
8,000.00
622,382.00
AKINTOLA
WILLIAMS DELOITTE
2012
(25,844.00)
1,887.00 (23,957.00) 15th aug 2013 30/12/2012
(43,957.00)
9,000.00
652,988.00
AKINTOLA
WILLIAMS DELOITTE
2011 25th march 2012 31/12/2011 AKINTOLA

| 150
(80,304.00) 26,213.00 (54,091.00) 318,753.00 5,000.00 679,096.00 WILLIAMS DELOITTE
2010
(231,935.00)
(4,439.00) (236,374.00) 21st march 2011 31/12/2010
788,700.00
4,500.00
740,347.00
AKINTOLA
WILLIAMS DELOITTE
2009
(473,237.00)
(153,832.00) (627,069.00) 8th july 2010 31/12/2009
2,160,506.00
4,200.00
823,758.00
AKINTOLA
WILLIAMS DELOITTE
2008
(297,580.00)
1,163.00
(296,417.00) 16th aug 2013 31, DECEMBER
2,417,725.00
4,200.00
1,434,072.00
AKINTOLA
WILLIAMS DELOITTE
2007
83,326.00
(19,548.00) 63,778.00 14th july 2008 31, DECEMBER
361,544.00
2,700.00
603,443.00 ERNST & YOUNG
2006
47,315.00
13,438.00 60,753.00 9th july 2010 31, DECEMBER
119,555.00
2,500.00
163,357.00 ERNST & YOUNG
2005
(207,154.00)
(1,639.00) (208,793.00) 20th june 2006 31, DECEMBER
137,437.00
2,000.00
102,604.00 ERNST & YOUNG
2004
90,134.00
(27,454.00) 62,680.00 22nd march 2005 31, DECEMBER
(70,805.00)
2,000.00
313,148.00 ERNST & YOUNG
2003
117,236.00
(50,440.00) 66,796.00 16th march 2004 31, DECEMBER
(182,858.50)
1,650.00
289,575.00 ERNST & YOUNG
2002
110,389.00
(35,056.00) 75,333.00 10th march 2003 31, DECEMBER
(310,775.00)
1,390.00
288,364.00 ERNST & YOUNG
2001
103,647.00
(31,509.00) 72,138.00 12th march 2002 31, DECEMBER
(438,691.50)
1,130.00
312,602.00 ERNST & YOUNG
FIRST
ALUMINIUM
NIGERIA PLC
2015
311,946.00
343,313.20
(31,367.20) 14th march 2012 31st dec
759,763.50
13,000.00
2,005,134.00
BDO Professional
Service
2014
(78,662.00)
293,706.00 215,044.00 4th july 2011 31st dec
720,547.00
12,000.00
3,313,221.00
BDO Professional
Service
2013
29,761.00
69,409.00 99,170.00 20th march 2014 31st dec
872,972.00
11,000.00
4,621,308.00
BDO Professional
Service
2012
(1,064,990.00)
488,847.00
(576,143.00) 25th march 2013 31st dec
258,831.00
10,000.00
5,929,395.00
BDO Professional
Service
2011
311,946.00
80,243.00 231,703.00 15th march 2012 31st dec
794,539.00
9,000.00
6,251,478.00
BDO Professional
Service
2010
(78,662.00)
40,253.00 (38,409.00) 5th july 2011 31st dec
573,759.00
9,000.00
6,307,426.00 pricewaterhouse coopers
2009
24,949.00
6,349.00 31,298.00 24th june 2010 31st dec
1,439,706.00
10,000.00
6,367,834.00 pricewaterhouse coopers
2008
(331,029.00)
174,038.00
(156,991.00) 28th aug 2009 31st dec
642,616.00
9,000.00
233,033.00 pricewaterhouse coopers
2007
(542,861.00)
80,028.00 (462,833.00) 11th april 2008 31st dec
(301,357.00)
8,000.00
880,953.00 pricewaterhouse coopers
2006
(41,221.00)
1,682.00 (42,903.00) 17th may 2007 31st dec
(207,611.00)
4,400.00
1,343,785.00 pricewaterhouse coopers
2005
156,702.00
18,664.00 138,038.00 24th may 2005 31st dec
435,636.00
4,000.00
1,448,800.00 pricewaterhouse coopers
2004
142,932.00
24,841.00
118,091.00 18th july 2005 31st dec
(428,014.00)
4,000.00
1,310,761.00 pricewaterhouse coopers
2003
178,687.00
23,296.00
155,391.00 29th april 2004 31st dec
(99,303.00)
4,000.00
1,254,781.00 pricewaterhouse coopers
2002
(298,236.00)
63,218.00
(235,018.00) 3rd june 2003 31st dec
435,133.00
4,000.00
532,274.00 pricewaterhouse coopers
2001
(177,927.00)
24,813.00
(153,114.00) 31st may 2002 31st dec
337,384.00
3,375.00
767,292.00 pricewaterhouse coopers
IPWA PLC
2015
(493,437.33)
36,099.17 (529,536.50) 22nd aug 2010 31st dec
(32,217.90)
2,200.00
2,148,356.90 Balougn Badejo &Co
2014
(409,655.33)
32,592.67 (442,248.00) 12th sept 3012 31st dec
(27,183.10)
2,050.00
1,870,940.10 Balougn Badejo &Co
2013
(325,873.33)
29,086.17
(296,787.17) 28th aug 2011 31st dec
(22,148.30)
1,900.00
1,593,523.30 Balougn Badejo &Co
2012
(242,091.33)
25,579.67
(267,671.00) 23rd aug 2010 31st dec
(17,113.50)
1,750.00
1,316,106.50 Balougn Badejo &Co

| 151
2011
(156,697.00)
22,318.00
(179,015.00) 13th sept 3012 31st dec
(28,355.00)
1,500.00
1,350,290.00 Balougn Badejo &Co
2010
(77,752.00)
18,077.00 (59,675.00) 29th aug 2011 31st dec
10,678.00
1,500.00
332,463.00 Balougn Badejo &Co
2009
10,867.00
15,305.00
(4,438.00) 24th aug 2010 31st dec
11,376.00
1,500.00
406,675.00 Balougn Badejo &Co
2008
29,363.00
7,853.00
21,510.00 30th july 2009 31st dec
(11,805.00)
1,000.00
400,830.00 Balougn Badejo &Co
2007
73,611.00
5,093.00 68,518.00 30th july 2008 31st dec
(28,129.00)
800.00
381,122.00 Balougn Badejo &Co
2006
49,230.00
957.00 48,273.00 3rd aug 2007 31st dec
(46,986.00)
650.00
71,094.00 Balougn Badejo &Co
2005
33,227.00
10,917.00 22,310.00 8th march 2007 31st dec
(6,623.00)
650.00
121,281.00 Balougn Badejo &Co
2004
34,448.00
400.00 34,048.00 15th dec 2005 31st dec
28,955.00
900.00
165,425.00 Balougn Badejo &Co
2003
76,418.00
985.00 75,433.00 20th july 2004 31st dec
52,164.00
500.00
161,109.00 Balougn Badejo &Co
2002
(113,868.00)
1,714.00
(115,582.00) 26th feb 2004 31st dec
25,669.00
650.00
112,881.00 Balougn Badejo &Co
2001
134,499.00 134,499.00 5th nov 2002 31st dec
30,630.00
650.00
238,442.00 Balougn Badejo &Co
PAINTS AND
COATINGS
MANUFACTU
RES PLC
2015
135,354.00
9,780.00 125,574.00 18th March 2016 31st dec
282,210.00
3,500.00
1,787,014.00
OOC Chartered
Accountant
2014
215,831.00
12,468.00 203,363.00 27th april 2015 31st dec
104,618.00
3,100.00
1,661,442.00
OOC Chartered
Accountant
2013
292,460.00
4,610.00 287,850.00 25th march 2014 31st dec
42,740.00
3,000.00
1,521,511.00
OOC Chartered
Accountant
2012
275,025.00
7,876.00 252,621.00 28th march 2013 31st dec
(6,483.00)
2,500.00
132,811.00
OOC Chartered
Accountant
2011
122,970.00
- 122,970.00 14th march 2012 31st dec
(339,664.00)
1,900.00
1,178,377.00
OOC Chartered
Accountant
2010
108,607.00
1,938.00 106,669.00 6th nov 2002 30th septem
(389,770.50)
1,340.00
951,221.00
OOC Chartered
Accountant
2009
29,184.00
11,380.00 17,804.00 19th March 2016 30th septem
(525,255.40)
1,100.00
876,387.00
OOC Chartered
Accountant
2008
109,274.00
32,782.00 76,492.00 28th april 2015 30th septem
(660,740.30)
1,000.00
262,719.00
OOC Chartered
Accountant
2007
68,873.00
23,650.00 45,223.00 26th march 2014 30th septem
(796,225.20)
780.00
87,650.00
OOC Chartered
Accountant
2006
51,767.00
18,000.00 33,767.00 29th march 2013 30th septem
(931,710.10)
750.00
109,805.00
OOC Chartered
Accountant
2005
71,611.50
24,135.00 47,476.50 15th march 2012 30th septem
(1,067,195.00)
700.00
(284,563.50)
OOC Chartered
Accountant
2004
74,346.30
25,207.80 49,138.50 7th nov 2002 30th septem
(1,202,679.90)
650.00
(532,045.00)
OOC Chartered
Accountant
2003
77,081.10
26,280.60 50,800.50 20th March 2016 30th septem
(1,338,164.80)
600.00
(779,526.50)
OOC Chartered
Accountant
2002
79,815.90
27,353.40 52,462.50 29th april 2015 30th septem
(1,473,649.70)
500.00
(1,027,008.00)
OOC Chartered
Accountant
2001
82,550.70
28,426.20 54,124.50 27th march 2014 30th septem
(1,609,134.60)
500.00
(1,274,489.50)
OOC Chartered
Accountant
PORTLAND
PAINTS &
PRODUCTS
NIGERIA PLC
2015 (258,369.00) (25,384.00) (232,985.00) 31st march 2016 31st dec 249,371.00 10,735.00 691,617.00 pricewaterhouse coopers
2014
194,297.00
45,654.00 148,643.00 30th march 2015 31st dec
175,896.00
10,000.00
924,603.00 pricewaterhouse coopers
2013
123,591.00
16,118.00 107,473.00 31st march 2014 31st dec
34,158.00
8,000.00
884,038.00 pricewaterhouse coopers
2012
(199,166.00)
29,199.00 228,365.00 30th april 2013 31st dec
295,582.00
6,500.00
776,566.00 pricewaterhouse coopers

| 152
2011
253,188.00
79,336.00 173,852.00 28th march 2012 31st dec
303,476.00
5,000.00
1,078,732.00 Ernst & Young
2010
246,842.00
115,218.00
131,624.00 30th march 2011 31st dec
193,971.00
4,000.00
952,809.00 Ernst & Young
2009
272,558.00
66,569.00 205,989.00 3rd june 2010 31st dec
79,791.00
3,500.00
869,185.00 Ernst & Young
2008
285,141.00
97,378.00 187,763.00 32nd march 2014 31st dec
171,672.00
2,195.00
718,085.00 Ernst & Young
2007
240,439.00
27,686.00 212,753.00 31st april 2013 31st dec
109,287.00
1,500.00
535,297.00 Ernst & Young
2006
132,544.00
22,400.00
122,144.00 29th march 2012 31st dec
149,746.00
1,250.00
360,963.00 Ernst & Young
2005
86,433.00
(5,335.00) 81,098.00 31st march 2011 31st dec
164,494.00
1,250.00
358,818.00 Ernst & Young
2004
107,264.30
24,753.30
82,511.00 4th june 2010 31st dec
179,242.00
1,100.00
436,353.00 Ernst & Young
2003
72,303.40
16,685.40 55,618.00 33rd march 2014 31st dec
193,990.00
950.00
460,768.00 Ernst & Young
2002
46,541.95
10,740.45 35,801.50 32nd april 2013 31st dec
208,738.00
550.00
498,463.00 Ernst & Young
2001
20,780.50
4,795.50 15,985.00 30th march 2012 31st dec
223,486.00
500.00
536,158.00 Ernst & Young
PREMIER
PAINTS PLC.
2015
42,380.33
10,478.00 31,902.33 30th march 2014 31st dec
100,163.00
6,583.33
876,877.00 Ernst & Young
2014
22,162.33
9,641.50 31,803.83 23rd may 2013 31st dec
70,000.00
5,958.33
700,138.50 Ernst & Young
2013
1,944.33
8,805.00 10,749.33 5th june 2012 31st dec
39,837.00
5,333.33
523,400.00 Ernst & Young
2012
(16,002.00)
5,128.00
(21,130.00) 31st march 2014 31st dec
10,585.00
4,500.00
285,772.00 Ernst & Young
2011
(43,035.00)
12,813.00 (30,222.00) 24th may 2013 31st dec
(22,311.00)
4,500.00
291,702.00 Ernst & Young
2010
(56,438.00)
3,455.00 (52,983.00) 6th june 2012 31st dec
(49,741.00)
3,250.00
(67,705.00) Ernst & Young
2009
(57,116.00)
29,966.00 (87,082.00) 10th aug 2011 31st dec
5,540.00
3,250.00
14,722.00 Ernst & Young
2008
9,584,300.00
901,913.00 8,682,387.00 1st april 2009 31st dec
8,528,172.00
5,000.00
122,537,358.00 D.O Adegbuyi &Co
2007
7,006,017.00
891,337.00 6,114,680.00 1st sept 2008 31st dec
4,511,482.00
4,500.00
85,254,971.00 D.O Adegbuyi &Co
2006
9,459,151.00
1,014,379.00 8,444,772.00 23rd nov 2007 31st dec
22,108,426.00
4,500.00
(77,868,666.00) D.O Adegbuyi &Co
2005
4,914,540.00
562,104.00 4,352,436.00 27th oct 2006 31st dec
25,296,280.67
3,125.00
94,638,859.00 D.O Adegbuyi &Co
2004
(5,603,048.00)
705,860.00 (6,308,908.00) 27th oct 2005 31st dec
32,086,407.67
2,500.00
86,481,841.00 D.O Adegbuyi &Co
2003
(7,320,746.00)
467,474.00 (7,788,220.00) 2nd sept 2008 31st dec
38,876,534.67
7,500.00
17,222,369.00 D.O Adegbuyi &Co
2002
(14,905,037.33)
483,849.33 (15,388,886.67) 24th nov 2007 31st dec
45,666,661.67
6,500.00
52,037,103.00
BDO Oyediran Faleye
&Co
2001
11,075,827.00
3,500,000.00 7,575,827.00 15th june 2002 31st dec
19,250,455.00
6,000.00
32,835,958.00
BDO Oyediran Faleye
&Co
LAFARGE
AFRICA PLC.
2015
30,906,793.00
17,242,087.00 13,664,706.00 20th march 2016 31st dec
33,919,597.00
41,000.00
302,601,869.00
Akintola Williams
Deloitte
2014
32,352,996.00
16,497,962.00 15,855,034.00 31st march 2015 31st dec
37,737,758.00
43,000.00
276,664,338.00
Akintola Williams
Deloitte
2013
27,443,083.00
17,537,803.00 9,905,280.00 18th march 2014 31st dec
35,370,708.00
30,800.00
92,641,665.00
Akintola Williams
Deloitte
2012 3,601,920.00 28th march 2013 31st dec Akintola Williams

| 153
21,164,004.00 17,562,084.00 24,415,859.00 30,800.00 68,274,284.00 Deloitte
2011
10,364,606.00
8,113,406.00 2,251,200.00 20th march 2012 31st dec
29,896,325.00
28,266.00
56,109,454.00
Akintola Williams
Deloitte
2010
8,464,365.00
3,583,002.00 4,881,363.00 29th March 2011 31st dec
12,593,125.00
28,266.00
48,291,761.00
Akintola Williams
Deloitte
2009
9,237,328.00
4,181,930.00 5,055,398.00 3rd march 2 31st dec
9,459,432.00
28,266.00
43,710,558.00
Akintola Williams
Deloitte
2008
13,033,219.00
1,781,189.00 11,252,030.00 18th feb 2008 31st dec
13,775,297.00
24,200.00
40,456,120.00
Akintola Williams
Deloitte
2007
12,536,431.00
1,857,779.00 10,678,652.00 20th feb 2008 31st dec
7,052,516.00
22,000.00
32,806,011.00
Akintola Williams
Deloitte
2006
12,119,592.00
1,173,388.00 10,946,204.00 20thfeb 2007 31st dec
15,061,157.00
16,500.00
25,546,742.00
Akintola Williams
Deloitte
2005
3,194,635.00
431,471.00 2,763,164.00 7th march 2006 31st dec
6,230,092.00
14,000.00
14,337,885.00
Akintola Williams
Deloitte
2004
(1,711,977.00)
1,689,152.00
(3,401,129.00) 1st march 2005 31st dec
2,243,622.00
18,000.00
2,636,679.00
Akintola Williams
Deloitte/ pkf
2003
(3,070,884.00)
104,072.00 (3,174,956.00) 3rd june 2004 31st dec
4,944,870.00
16,000.00
6,037,808.00
Akintola Williams
Deloitte/ pkf
2002
21,512.00
1,405,059.00 (1,383,547.00) 27th may 2003 31st dec
2,509,291.00
15,200.00
9,212,764.00
Akintola Williams
Deloitte/ pkf
2001
1,079,903.00
91,326.00 988,577.00 17th may 2002 31st dec
(791,076.00)
13,200.00
10,603,214.00
Akintola Williams
Deloitte/ pkf
CUTIX PLC
2015
149,209.00 (52, 898) 202,107.00 17th july 2015 30/04/2015
2,379,461.00
2,000.00
743,711.00
Alatta Nzewi Oyeka &
Co (Chartered
Accountants)
2014
207,116.00 ( 57, 721 ) 264,837.00 18th july 2014 30/04/2014
2,228,039.00
2,000.00
699,703.00
Alatta Nzewi Oyeka &
Co (Chartered
Accountants)
2013
151,423.00 ( 77, 864 ) 229,287.00 24th july 2013 30/04/2013
1,912,544.00
1,800.00
597,554.00
Alatta Nzewi Oyeka &
Co (Chartered
Accountants)
2012
79,014.00 ( 39, 621 )
118,635.00 30th july 2012 30/04/2012
1,533,787.00
1,800.00
509,152.00
Alatta Nzewi Oyeka &
Co (Chartered
Accountants)
2011
84,326.00 ( 41, 028 ) 125,354.00 18th july 2015 30/04/2011
1,474,841.00
1,800.00
493,546.00
Alatta Nzewi Oyeka &
Co (Chartered
Accountants)
2010
138,061.00 ( 74, 053 )
212,114.00 22nd july 2010 30/04/2010
1,369,737.00
1,250.00
474,704.00
NNAMDI OYEKA &
CO
2009
78,312.00 ( 55, 822 )
134,134.00 31st july 2012 30/04/2009
1,340,957.00
1,000.00
400,015.00
NNAMDI OYEKA &
CO
2008
114,481.00 ( 81, 070 )
195,551.00 25th july 2008 30/04/2008
1,309,993,930.00
1,000.00
385,147.00
NNAMDI OYEKA &
CO
2007
121,691.00 ( 65, 869 ) 187,560.00 27th july 2007 30/04/2007
1,071,280,743.00
750.00
270,666.00
NNAMDI OYEKA &
CO
2006
54,321.00 ( 26, 554 ) 80,875.00 21st july 2006 30/04/2006
716,486,119.00
660.00
180,678.00
NNAMDI OYEKA &
CO
2005
43,624.00 ( 11, 670 ) 55,294.00 22th july 2005 30/04/2005
70,897,644.00
550.00
152,779.00
NNAMDI OYEKA &
CO
2004
45,850.00
(10,340.00) 35,420.00 23th july 2004 30/04/2004
57,318,422.00
550.00
122,364.00
NNAMDI OYEKA &
CO
2003
43,569.00
(16,313.00) 27,256.00 24th july 2003 30/04/2003
3,776,302.00
450.00
100,154.00
NNAMDI OYEKA &
CO
2002
43,442.00
(16,741.00) 26,701.00 24th july 2002 30/04/2002
70,718,150.50
379.00
86,108.00
NNAMDI OYEKA &
CO
2001
24,011.00
(5,644.00) 18,367.00 25th july 2003 30/04/2001
36,767,999.00
308.00
72,616.00
NNAMDI OYEKA &
CO
AVON 2015 (25, 611) (3, 290) 14th june 2015 31/03/2015 PKF PROFESSIONAL

| 154
CROWNCAPS
&
CONTAINERS
(28,901.00) 9,159,431.00 5,796.00 7,604,721.00 SERVICES
2014
226,030.00 (152, 179) 73,860.00 18th july 2014 31/03/2014
9,317,700.00
5,040.00
4,708,080.00
PKF PROFESSIONAL
SERVICES
2013
133,306.00 (131, 529)
1,777.00 3th july 2013 31/03/2013
8,595,327.00
4,500.00
6,184,128.00
PKF PROFESSIONAL
SERVICES
2012
84,730.00 (16, 912) 67,818.00 15th june 2015 31/03/2012
8,539,103.00
3,750.00
7,048,201.00
PKF PROFESSIONAL
SERVICES
2011
105,101.00 (40, 103) 64,998.00 26th july 2011 31/03/2011
8,482,879.00
3,000.00
1,460,466.00
PKF PROFESSIONAL
SERVICES
2010
104,309.00 (68, 114) 36,195.00 4th aug 2010 31/03/2010
309,108.00
2,800.00
1,339,167.00
PKF PROFESSIONAL
SERVICES
2009 382,260 (145,712)
151,367.00 6th july 2009 31/03/2009
431,587.00
2,800.00
1,385,049.00
PKF PROFESSIONAL
SERVICES
2008 329,401 (78,291)
180,174.00 12th aug 2008 31/03/2008
(405,911.00)
2,250.00
1,315,759.00
PKF PANNELL KERR
FORSTER
2007 275,558 (102,917) 120,356.00 28th sept 2007 31/03/2007
464,633.00
1,750.00
1,192,583.00
PKF PROFESSIONAL
SERVICES
2006 225,444 (67,229)
158,215.00 13th oct 2006 31/03/2006
566,381.00
1,500.00
1,347,310.00
PKF PROFESSIONAL
SERVICES
2005 202,059 (99, 088)
102,971.00 20th sept 2005 31/03/2005
1,180,659.67
1,500.00
1,246,093.00
PKF PROFESSIONAL
SERVICES
2004
141,120.00
76,059.00 65,061.00 29th sept 2004 31/03/2004
1,666,805.67
1,200.00
1,194,420.00
PKF PANNELL KERR
FORSTER
2003
103,081.00
60,405.00 42,676.00 20th oct 2003 31/03/2003
2,152,951.67
1,100.00
1,174,957.00
PKF PROFESSIONAL
SERVICES
2002
91,418.00
35,800.00 55,618.00 5th sept 2002 31/03/2002
2,639,097.67
950.00
1,172,180.00
PKF PROFESSIONAL
SERVICES
2001
63,570.00
22,427.00
41,143.00 5th sept 2001 31/03/2001
3,125,243.67
800.00
1,150,761.00
PKF PROFESSIONAL
SERVICES
BETA GLASS
CO PLC
2015
4,629,127.00 (578, 619) 3,306,872.00 26th april 2016 31/12/2015
6,490,006.00
21,870.00
18,152,805.00
PRICEWATERHOUSEC
OOPERS
2014
3,340,660.00 (950, 437) 2,390,223.00 30th march 2015 31/12/2014
5,040,621.00
20,527.00
15,952,981.00
PRICEWATERHOUSEC
OOPERS
2013
2,052,193.00 (578, 619) 1,473,574.00 6th sept 2002 31/12/2013
3,591,236.00
19,184.00
13,753,157.00
PRICEWATERHOUSEC
OOPERS
2012
1,857,089.00 (528, 509) 1,328,580.00 25th march 2013 31/12/2012
1,283,118.00
19,184.00
12,455,803.00
PRICEWATERHOUSEC
OOPERS
2011
2,300,357.00 (525, 697) 1,774,660.00 29th march 2012 31/12/2011
2,092,485.00
14,400.00
11,327,212.00
PRICEWATERHOUSEC
OOPERS
2010
1,832,403.00 (359, 959) 1,472,444.00 5th may 2011 31/12/2010
2,033,093.00
14,400.00
10,073,211.00
PRICEWATERHOUSEC
OOPERS
2009
1,813,400.00
1,384,776.00 1,813,400.00 28th may 2010 31/12/2009
2,162,657.00
8,400.00
8,524,350.00
PRICEWATERHOUSEC
OOPERS
2008
1,453,360.00
1,192,690.00 1,453,360.00 4th june 2009 31/12/2008
1,721,065.00
8,400.00
7,289,566.00
PRICEWATERHOUSEC
OOPERS
2007
1,056,841.00
866,252.00 1,056,841.00 9th march 2008 31/12/2007
1,215,836.00
7,540.00
6,165,053.00
PRICEWATERHOUSEC
OOPERS
2006
493,974.00
381,088.00 493,974.00 22nd march 2007 31/12/2006
701,081.00
7,480.00
5,366,979.00
AKINTOLA
WILLIAMS
2005 147,928.00 9th march 2006 31/12/2005 AKINTOLA

| 155
147,928.00 218,654.00 394,459.00 6,800.00 5,031,343.00 WILLIAMS
2004
224,113.00
(61,516.00) 162,597.00 7th april 2005 31/12/2004
542,679.00
6,000.00
4,926,248.00
AKINTOLA
WILLIAMS
2003
779,369.00
(237,624.00) 541,745.00 10th march 2004 31/12/2003
844,208.00
5,290.00
4,763,651.00
AKINTOLA
WILLIAMS
2002
1,010,922.00
(296,737.00)
714,185.00 13th march 2003 31/12/2002
1,043,531.00
4,520.00
4,046,146.00
AKINTOLA
WILLIAMS
2001
1,247,148.00
(384,506.00) 862,642.00 10th march 2006 31/12/2001
1,268,405.50
3,765.00
3,559,221.00
AKINTOLA
WILLIAMS
GREIF
NIGERIA PLC
2015
40,149.00
(15,525.00) 24,624.00 5th march 2016 31/10/2015
766,025.00
5,250.00
715,714.00 ERNST & YOUNG
2014
58,029.00
19,669.00 43,443.00 10th feb 2015 31/10/2014
767,375.00
5,250.00
663,773.00 ERNST & YOUNG
2013
52,469.00
18,291.00 30,626.00 16th april 2014 31/10/2013
793,110.00
3,087.00
682,415.00 ERNST & YOUNG
2012
56,068.00 (19, 682) 38,947.00 26th feb 2013 31/10/2012
795,342.00
3,087.00
631,567.00 ERNST & YOUNG
2011
71,580.00 (33, 198 ) 38,382.00 15th march 2012 31/10/2011
863,360.00
3,087.00
622,478.00 ERNST & YOUNG
2010
73,094.00 (29, 461) 43,633.00 20th april 2011 31/10/2010
891,797.00
3,087.00
341,381.00 ERNST & YOUNG
2009
813.00 ( 18, 071 )
(17,258.00) 31st may 2010 31/10/2009
861,614.00
2,750.00
297,748.00 ERNST & YOUNG
2008
58,413.00
9,782.00 68,195.00 13th may 2009 31/10/2008
612,840.00
2,500.00
315,006.00 ERNST & YOUNG
2007 (13, 684) (1, 916)
(15,600.00) 3rd april 2008 31/10/2007
600,287.00
2,500.00
317,401.00 ERNST & YOUNG
2006
1,896.00
28,320.00 30,216.00 11th june 2007 31/10/2006
607,057.00
1,800.00
333,001.00 ERNST & YOUNG
2005 (31, 207)
26,780.00
(4,427.00) 27th april 2006 31/10/2005
542,287.00
1,800.00
230,932.00 ERNST & YOUNG
2004
(101,948.00)
(22,331.00)
(124,279.00) 23th march 2005 31/10/2004
(101,948.00)
1,800.00
198,549.00 ERNST & YOUNG
2003
(97,312.00)
(7,395.00)
(104,707.00) 16th march 2004 31/10/2003
(97,312.00)
1,017.00
345,555.00 ERNST & YOUNG
2002
(33,674.00)
(2,438.00)
(36,112.00) 19th feb 2003 31/10/2002
(92,676.00)
1,000.00
405,729.00 ERNST & YOUNG
2001
13,104.00
(6,371.00) 6,733.00 27th nov 2001 31/10/2001
(88,040.00)
1,000.00
441,841.00 ERNST & YOUNG
NIGERIAN
ROPES PLC
2015
(224,291.20)
11,503.00 (237,844.40) 26th may, 2011 31st december,
(178,496.40)
4,380.00
155,829.50 pkf professional services
2014
(192,129.10)
637.00 (203,552.70) 7th september, 2010 31st december,
(143,531.90)
3,795.00
154,148.00 pkf professional services
2013
(198,899.00)
(24,309.00) (223,208.00) 29th march, 2014 31st december,
(163,166.00)
3,000.00
246,055.00 pkf professional services
2012
(168,667.00)
13,547.00
(155,120.00) 27th mar5ch, 2013 31st december,
(23,689.00)
3,000.00
246,055.00 pkf professional services
2011
5,136.00
-
5,136.00 26th may, 2011 31st december,
19,920.00
2,000.00
153,618.00 pkf professional services
2010
13,276.00
11,503.00
(1,773.00) 26th may, 2011 31st december,
(52,138.00)
1,250.00
148,482.00 pkf professional services
2009 (129,060.00) 637.00 (128,423.00) 8th september, 2010 31st december, 25,881.00 950.00 150,255.00 pkf professional services
2008
41,420.00
(11,699.00) 29,721.00 2nd july, 2009 31st december,
138,807.00
750.00
295,728.00 pkf professional services
2007
37,074.00
(14,320.00) 22,754.00 19th may, 2008 31st december,
81,469.00
600.00
286,269.00 pkf professional services
2006
24,791.00
(10,554.00) 14,237.00 19th may, 2008 31st december,
11,904.00
400.00
263,515.00 pkf professional services
2005 89,825.50 4th may, 2006 31st december, pkf professional services

| 156
107,858.00 (18,032.50) 6,555.00 400.00 263,515.00
2004
21,826.00
(7,471.00) 14,355.00
12th september,
2005 31st december,
45,922.00
400.00
249,278.00 pkf professional services
2003
29,692.00
(3,492.00) 36,200.00
6th septewmber,
2004 31st december,
55,552.00
378.00
228,725.00
PKF PANNELL KERR
FORSTER
2002
13,928.00
(4,124.00) 9,804.00 26th august, 2003 31st december,
(36,401.00)
400.00
36,467.00 pkf professional services
2001
18,237.00
(2,298.00) 15,939.00 31st october, 2002 31st december,
65,474.00
400.00
28,220.00
Akintola Williams
Deloitte & Ahmed Zakari
&Co
Others 2015
17,079.33
5,721.33
11,358.00 21st nov 2012 31st march
375,324.67
7,250.00
509,455.00
Akintola Williams
Deloitte & Ahmed Zakari
&Co
POLY
PRODUCTS
NIGERIA PLC
2014
24,744.83
6,725.33
18,019.50 15th april 2012 31st march
296,071.17
6,875.00
474,038.50
Akintola Williams
Deloitte & Ahmed Zakari
&Co
2013
32,410.33
7,729.33 24,681.00 7th feb 2011 31st march
216,817.67
6,500.00
438,622.00
Akintola Williams
Deloitte & Ahmed Zakari
&Co
2012
41,132.00
11,276.00 29,856.00 22nd nov 2012 31st march
162,629.00
6,250.00
401,352.00
Akintola Williams
Deloitte & Ahmed Zakari
&Co
2011
45,629.00
4,652.00 40,977.00 16th april 2012 31st march
8,181.00
5,500.00
371,496.00
Akintola Williams
Deloitte & Ahmed Zakari
&Co
2010
56,463.00
13,284.00 43,179.00 8th feb 2011 31st march
4,122.00
5,500.00
330,519.00
Akintola Williams
Deloitte & Ahmed Zakari
&Co
2009
59,378.00
18,998.00 40,380.00 1st june 2010 31st march
194,151.00
4,800.00
316,140.00
Akintola Williams
Deloitte & Ahmed Zakari
&Co
2008
19,229.00
7,708.00
11,521.00 9th nov 2009 31st march
95,624.00
4,800.00
275,760.00
Akintola Williams
Deloitte & Ahmed Zakari
&Co
2007
26,596.00
7,781.00
18,815.00 17th July 2007 31st march
359,804.00
3,900.00
264,240.00
Akintola Williams
Deloitte & Ahmed Zakari
&Co
2006
7,979.00
4,993.00 2,986.00 9th may 2006 31st march
405,555.00
2,850.00
236,860.50
Akintola Williams
Deloitte & Ahmed Zakari
&Co
2005
(4,996.00)
2,213.10
(7,209.10) 2nd june 2005 31st march
502,406.90
2,470.00
212,938.80
Akintola Williams
Deloitte & Ahmed Zakari
&Co
2004
43,783.00
24,737.00 19,046.00 9th nov 2004 31st march
166,981.00
2,235.00
246,753.00
Akintola Williams
Deloitte & Ahmed Zakari
&Co
2003
34,129.00
6,950.00 27,179.00 6th 0ct 2003 31st march
143,733.00
2,000.00
239,707.00
Akintola Williams
Deloitte & Ahmed Zakari
&Co
2002
20,645.00
949.00 21,594.00 14th Augst 2002 31st march
113,453.00
1,650.00
212,582.00
Akintola Williams
Deloitte & Ahmed Zakari
&Co
2001
40,207.50
3,317.45 36,890.05 3rd june 2005 31st march
(65,883.95)
1,415.00
225,966.10
Akintola Williams
Deloitte & Ahmed Zakari
&Co
DANGOTE
CEMENT
2015
220,567,000.00
7,396,000.00 213,171,000.00 29th feb 2016 31st dec
249,235,000.00
191,000.00
1,124,475,000.00
Akintola Williams
Deloitte & Ahmed Zakari
&Co
2014 185,814,123.00 19th march 2015 31st dec Akintola Williams

| 157
213,039,663.00 27,225,540.00 195,608,439.00 176,000.00 963,441,064.00 Deloitte & Ahmed Zakari
&Co
2013
200,010,823.00
10,251,931.00 210,262,754.00 25th march 2014 31st dec
275,953,727.00
160,000.00
821,699,780.00
Akintola Williams
Deloitte & Ahmed Zakari
&Co
2012
138,088,716.00
14,836,382.00 152,925,098.00 19th april 2013 31st dec
130,949,179.00
160,000.00
639,466,109.00
Akintola Williams
Deloitte & Ahmed Zakari
&Co
2011
113,779,556.00
7,635,957.00
121,415,513.00 29th march 2012 31st dec
104,291,491.00
132,000.00
524,045,921.00
Akintola Williams
Deloitte & Ahmed Zakari
&Co
2010
90,539,401.10
9,896,388.80 80,643,012.30 30th feb 2016 31st dec
84,843,683.80
123,600.00
357,175,640.90
Akintola Williams
Deloitte & Ahmed Zakari
&Co
2009
61,686,817.60
8,705,464.40 52,981,353.20 20th march 2015 31st dec
49,389,056.00
110,200.00
204,692,329.60
Akintola Williams
Deloitte & Ahmed Zakari
&Co
2008
4,733,990.00
589,723.00 4,144,267.00 4th june 2009 31st dec
20,002,851.00
12,000.00
13,751,395.00
BDO Oyediran Faleye
&Co
2007
1,870,302.00
618,072.00 1,252,230.00 14th march 2008 31st dec
4,566,891.00
8,000.00
9,607,128.00
BDO Oyediran Faleye
&Co
2006
3,860,646.00
755,581.00 3,105,065.00 8th march 2007 31st dec
1,497,892.00
4,200.00
8,354,898.00
BDO Oyediran Faleye
&Co
2005
2,310,743.00
66,803.00 2,243,940.00 4th july 2006 31st dec
8,344,201.00
3,000.00
(1,354,870.00)
BDO Oyediran Faleye
&Co
2004
(911,841.00)
619.00
(912,460.00) 24th june 2005 31st dec
(3,638,597.00)
2,300.00
(3,559,436.00)
BDO Oyediran Faleye
&Co
2003
(1,624,038.00)
1,107.00
(1,625,145.00) 21st june 2004 31st dec
947,481.00
2,300.00
(2,646,976.00)
BDO Oyediran Faleye
&Co
2002
(2,100,384.00)
47,023.00 (2,147,407.00) 21st june 2003 31st dec
(126,406.00)
2,300.00
(1,920,318.00)
BDO Oyediran Faleye
&Co
2001
(1,067,331.00)
3,115.00 (1,070,446.00) 21st june 2003 31st dec
(529,764.00)
2,300.00
227,089.00
BDO Oyediran Faleye
&Co

| 158
APPENDIX D: ANALYSES RESULTS
2001
Dependent Variable: DAC
Method: Least Squares
Date: 09/04/16 Time: 17:01
Sample (adjusted): 1 51
Included observations: 51 after adjustments Variable Coefficient Std. Error t-Statistic Prob. C 4.196820 5.767345 0.727687 0.4706
RISK -0.114880 0.135745 -0.846295 0.4019
HHI 0.003049 0.003815 0.799162 0.4284
CR4 -2.550441 3.750801 -0.679972 0.5000
NAS 0.508003 0.240594 2.111455 0.0403
AUFEE 4.94E-05 2.53E-05 1.950074 0.0574 R-squared 0.205272 Mean dependent var 7.005499
Adjusted R-squared 0.116969 S.D. dependent var 0.863984
S.E. of regression 0.811883 Akaike info criterion 2.531211
Sum squared resid 29.66195 Schwarz criterion 2.758484
Log likelihood -58.54587 Hannan-Quinn criter. 2.618059
F-statistic 2.324635 Durbin-Watson stat 1.565351
Prob(F-statistic) 0.058269
Dependent Variable:DAC
Method: Least Squares
Date: 09/04/16 Time: 16:57
Sample (adjusted): 1 51
Included observations: 51 after adjustments Variable Coefficient Std. Error t-Statistic Prob. C 5.600867 2.100022 2.667051 0.0106
RISK -0.123320 0.249070 -0.495120 0.6229
HHI -0.000106 0.001052 -0.100753 0.9202
CR4 2.029353 2.784843 0.728714 0.4700
NAS -0.021909 0.325502 -0.067307 0.9466
AUFEE 8.79E-05 4.82E-05 1.823912 0.0748 R-squared 0.086678 Mean dependent var 6.979948
Adjusted R-squared -0.014802 S.D. dependent var 1.103205
S.E. of regression 1.111339 Akaike info criterion 3.159140
Sum squared resid 55.57838 Schwarz criterion 3.386413
Log likelihood -74.55807 Hannan-Quinn criter. 3.245988
F-statistic 0.854141 Durbin-Watson stat 2.383871
Prob(F-statistic) 0.519134

| 159
2015
Dependent Variable: DAC
Method: Least Squares
Date: 09/04/16 Time: 12:07
Sample: 1 52
Included observations: 52 Variable Coefficient Std. Error t-Statistic Prob. C 0.590140 0.690946 0.854104 0.3975
AUDFZ 0.191634 0.195865 0.978399 0.3330
AUTEN -0.008710 0.018544 -2.469684 0.0402
FSIZE 0.450816 0.044536 10.12245 0.0000
FISY -0.293740 0.192245 -1.527945 0.1334
AUIND -3.13E-06 3.61E-06 -0.865966 0.3910 R-squared 0.763988 Mean dependent var 7.624266
Adjusted R-squared 0.738334 S.D. dependent var 1.166731
S.E. of regression 0.596821 Akaike info criterion 1.913768
Sum squared resid 16.38499 Schwarz criterion 2.138912
Log likelihood -43.75797 Hannan-Quinn criter. 2.000083
F-statistic 29.78101 Durbin-Watson stat 1.988043
Prob(F-statistic) 0.000000
2014
Dependent Variable: DAC
Method: Least Squares
Date: 09/04/16 Time: 12:25
Sample (adjusted): 1 51
Included observations: 51 after adjustments Variable Coefficient Std. Error t-Statistic Prob. C 1.046420 0.786668 1.330191 0.1902
AUDFZ -0.042637 0.218920 -2.194761 0.0405
AUTEN 0.000588 0.021015 0.027988 0.9778
FSIZE 0.430961 0.049587 8.690987 0.0000
FISY -0.324114 0.210654 -1.538605 0.1309
AUIND -5.53E-07 4.29E-06 -0.128935 0.8980 R-squared 0.708069 Mean dependent var 7.775988
Adjusted R-squared 0.675632 S.D. dependent var 1.161291
S.E. of regression 0.661393 Akaike info criterion 2.121195
Sum squared resid 19.68485 Schwarz criterion 2.348469
Log likelihood -48.09047 Hannan-Quinn criter. 2.208043
F-statistic 21.82921 Durbin-Watson stat 2.139193
Prob(F-statistic) 0.000000

| 160
2013
Dependent Variable: DAC
Method: Least Squares
Date: 09/04/16 Time: 12:28
Sample (adjusted): 1 51
Included observations: 51 after adjustments Variable Coefficient Std. Error t-Statistic Prob. C 0.400758 0.778586 0.514726 0.6093
AUDFZ 0.211667 0.225642 0.938065 0.3532
AUTEN -0.012838 0.022758 -2.564127 0.0425
FSIZE 0.463855 0.050641 9.159629 0.0000
FISY -0.344900 0.202110 -1.706496 0.0948
AUIND -4.59E-06 4.70E-06 -0.978342 0.3331 R-squared 0.725010 Mean dependent var 7.564626
Adjusted R-squared 0.694456 S.D. dependent var 1.177492
S.E. of regression 0.650871 Akaike info criterion 2.089119
Sum squared resid 19.06346 Schwarz criterion 2.316393
Log likelihood -47.27254 Hannan-Quinn criter. 2.175967
F-statistic 23.72852 Durbin-Watson stat 2.082084
Prob(F-statistic) 0.000000
2012
Dependent Variable: DAC
Method: Least Squares
Date: 09/04/16 Time: 14:36
Sample: 1 52
Included observations: 52 Variable Coefficient Std. Error t-Statistic Prob. C 0.872239 1.045047 0.834642 0.4082
AUDFZ -0.092700 0.277979 -0.333479 0.7403
AUTEN -0.184335 0.138172 -1.334097 0.0188
FSIZE 0.447488 0.068129 6.568216 0.0000
FISY 0.019150 0.226004 0.084733 0.9328
AUIND 5.26E-05 3.20E-05 2.642141 0.0274 R-squared 0.671329 Mean dependent var 7.138003
Adjusted R-squared 0.635604 S.D. dependent var 1.256792
S.E. of regression 0.758666 Akaike info criterion 2.393655
Sum squared resid 26.47638 Schwarz criterion 2.618799
Log likelihood -56.23504 Hannan-Quinn criter. 2.479970
F-statistic 18.79153 Durbin-Watson stat 1.944547
Prob(F-statistic) 0.000000

| 161
2011
Dependent Variable: DAC
Method: Least Squares
Date: 09/04/16 Time: 12:31
Sample (adjusted): 1 51
Included observations: 51 after adjustments Variable Coefficient Std. Error t-Statistic Prob. C 1.248358 0.866082 1.441385 0.1564
AUDFZ 0.149446 0.243825 0.612925 0.5430
AUTEN 0.025489 0.027160 0.938463 0.3530
FSIZE 0.392730 0.056304 6.975107 0.0000
FISY -0.341953 0.228465 -1.496741 0.1414
AUIND -3.31E-06 5.58E-06 -0.593103 0.5561 R-squared 0.630320 Mean dependent var 7.538600
Adjusted R-squared 0.589245 S.D. dependent var 1.142625
S.E. of regression 0.732310 Akaike info criterion 2.324907
Sum squared resid 24.13254 Schwarz criterion 2.552180
Log likelihood -53.28512 Hannan-Quinn criter. 2.411755
F-statistic 15.34540 Durbin-Watson stat 1.350044
Prob(F-statistic) 0.000000

| 162
2010
Dependent Variable: 2010
Method: Least Squares
Date: 09/04/16 Time: 12:34
Sample (adjusted): 1 51
Included observations: 51 after adjustments Variable Coefficient Std. Error t-Statistic Prob. C 1.675706 0.868708 1.928964 0.0601
AUDFZ 0.092532 0.369160 0.250655 0.8032
AUTEN 0.036325 0.027383 1.326513 0.1914
FSIZE 0.365760 0.051936 7.042499 0.0000
FISY -0.360164 0.216202 -1.665869 0.1027
AUIND -4.75E-06 6.06E-06 -0.783056 0.0437 R-squared 0.610787 Mean dependent var 7.532886
Adjusted R-squared 0.567542 S.D. dependent var 1.033228
S.E. of regression 0.679467 Akaike info criterion 2.175115
Sum squared resid 20.77539 Schwarz criterion 2.402388
Log likelihood -49.46542 Hannan-Quinn criter. 2.261962
F-statistic 14.12361 Durbin-Watson stat 1.992537
Prob(F-statistic) 0.000000
2009
Dependent Variable: DAC
Method: Least Squares
Date: 09/04/16 Time: 15:09
Sample (adjusted): 1 51
Included observations: 51 after adjustments Variable Coefficient Std. Error t-Statistic Prob. C -0.561827 1.012058 -0.555133 0.5816
AUDFZ 0.129715 0.411933 0.314893 0.7543
AUTEN -0.007469 0.037434 -0.199531 0.8427
FSIZE 0.492866 0.064503 7.640992 0.0000
FISY 0.207056 0.208473 0.993201 0.3259
AUIND 4.46E-06 1.50E-05 0.297117 0.00767 R-squared 0.704449 Mean dependent var 7.337122
Adjusted R-squared 0.671610 S.D. dependent var 1.193782
S.E. of regression 0.684101 Akaike info criterion 2.188709
Sum squared resid 21.05974 Schwarz criterion 2.415983
Log likelihood -49.81208 Hannan-Quinn criter. 2.275557
F-statistic 21.45158 Durbin-Watson stat 2.192788
Prob(F-statistic) 0.000000

| 163
2008
Dependent Variable: DAC
Method: Least Squares
Date: 09/04/16 Time: 15:06
Sample: 1 52
Included observations: 52 Variable Coefficient Std. Error t-Statistic Prob. C 1.095389 0.787112 1.391656 0.1707
AUDFZ -0.560285 0.322253 -1.738646 0.0888
AUTEN -0.092554 0.036568 -2.530987 0.0149
FSIZE 0.472913 0.044639 10.59409 0.0000
FISY -0.012279 0.160856 -0.076334 0.9395
AUIND 7.12E-06 1.17E-05 0.606367 0.5473 R-squared 0.790222 Mean dependent var 7.409936
Adjusted R-squared 0.767421 S.D. dependent var 1.104494
S.E. of regression 0.532659 Akaike info criterion 1.686295
Sum squared resid 13.05137 Schwarz criterion 1.911439
Log likelihood -37.84368 Hannan-Quinn criter. 1.772610
F-statistic 34.65597 Durbin-Watson stat 1.718456
Prob(F-statistic) 0.000000
2007
Dependent Variable: DAC
Method: Least Squares
Date: 09/04/16 Time: 15:01
Sample (adjusted): 1 52
Included observations: 52 after adjustments Variable Coefficient Std. Error t-Statistic Prob. C -0.045556 0.825355 -0.055195 0.9562
AUDFZ -0.018500 0.353088 -0.052394 0.9584
AUTEN 0.000470 0.052238 0.008996 0.9929
FSIZE 0.477819 0.047941 9.966898 0.0000
FISY -0.028895 0.178825 -0.161581 0.8723
AUIND 2.84E-06 1.41E-05 0.202032 0.8408 R-squared 0.760533 Mean dependent var 7.387759
Adjusted R-squared 0.734504 S.D. dependent var 1.126994
S.E. of regression 0.580698 Akaike info criterion 1.858995
Sum squared resid 15.51166 Schwarz criterion 2.084138
Log likelihood -42.33386 Hannan-Quinn criter. 1.945309
F-statistic 29.21873 Durbin-Watson stat 1.766191
Prob(F-statistic) 0.000000

| 164
2006
Dependent Variable: DAC
Method: Least Squares
Date: 09/04/16 Time: 14:05
Sample: 1 52
Included observations: 52 Variable Coefficient Std. Error t-Statistic Prob. C 1.281145 0.930680 1.376569 0.1753
AUDFZ -0.109219 0.174252 -0.626790 0.5339
AUTEN 0.030712 0.053671 0.572227 0.5700
FSIZE 0.369771 0.057001 6.487055 0.0000
FISY 0.243115 0.199994 1.215616 0.2303
AUIND 1.86E-05 1.87E-05 0.994518 0.3252 R-squared 0.637891 Mean dependent var 7.344834
Adjusted R-squared 0.598531 S.D. dependent var 1.059291
S.E. of regression 0.671183 Akaike info criterion 2.148618
Sum squared resid 20.72240 Schwarz criterion 2.373761
Log likelihood -49.86407 Hannan-Quinn criter. 2.234933
F-statistic 16.20670 Durbin-Watson stat 1.949242
Prob(F-statistic) 0.000000
2005
Dependent Variable: DAC
Method: Least Squares
Date: 09/04/16 Time: 14:13
Sample: 1 52
Included observations: 52 Variable Coefficient Std. Error t-Statistic Prob. C 0.413950 1.081789 0.382653 0.7037
AUDFZ -0.192161 0.328240 -0.585428 0.5611
AUTEN -0.010094 0.050722 -0.199008 0.8431
FSIZE 0.446561 0.073158 6.104043 0.0000
FISY 0.112488 0.273186 0.411762 0.6824
AUIND 1.74E-05 2.94E-05 0.591083 0.5574 R-squared 0.570629 Mean dependent var 7.151582
Adjusted R-squared 0.523958 S.D. dependent var 1.302891
S.E. of regression 0.898940 Akaike info criterion 2.732966
Sum squared resid 37.17229 Schwarz criterion 2.958110
Log likelihood -65.05712 Hannan-Quinn criter. 2.819281
F-statistic 12.22667 Durbin-Watson stat 2.239266
Prob(F-statistic) 0.000000

| 165
2004
Dependent Variable: DAC
Method: Least Squares
Date: 09/04/16 Time: 14:36
Sample: 1 52
Included observations: 52 Variable Coefficient Std. Error t-Statistic Prob. C 0.872239 1.045047 0.834642 0.4082
AUDFZ -0.092700 0.277979 -0.333479 0.7403
AUTEN -0.184335 0.138172 -1.334097 0.1887
FSIZE 0.447488 0.068129 6.568216 0.0000
FISY 0.019150 0.226004 0.084733 0.9328
AUIND 5.26E-05 3.20E-05 1.642141 0.1074 R-squared 0.671329 Mean dependent var 7.138003
Adjusted R-squared 0.635604 S.D. dependent var 1.256792
S.E. of regression 0.758666 Akaike info criterion 2.393655
Sum squared resid 26.47638 Schwarz criterion 2.618799
Log likelihood -56.23504 Hannan-Quinn criter. 2.479970
F-statistic 18.79153 Durbin-Watson stat 1.944547
Prob(F-statistic) 0.000000
2003
Method: Least Squares
Date: 09/04/16 Time: 14:26
Sample: 1 52
Included observations: 52 Variable Coefficient Std. Error t-Statistic Prob. C -0.274399 1.080438 -0.253970 0.8007
AUDFZ 0.165411 0.256411 0.645099 0.5221
AUTEN -0.044581 0.066832 -0.667067 0.5081
FSIZE 0.487736 0.077919 6.259564 0.0000
FISY 0.059769 0.280729 0.212907 0.8323
AUIND 0.032793 0.282667 0.116013 0.9081 R-squared 0.571645 Mean dependent var 7.151582
Adjusted R-squared 0.525085 S.D. dependent var 1.302891
S.E. of regression 0.897875 Akaike info criterion 2.730596
Sum squared resid 37.08428 Schwarz criterion 2.955739
Log likelihood -64.99549 Hannan-Quinn criter. 2.816910
F-statistic 12.27752 Durbin-Watson stat 2.352197
Prob(F-statistic) 0.000000

| 166
2002 Dependent Variable: DAC
Method: Least Squares
Date: 09/04/16 Time: 14:40
Sample: 1 52
Included observations: 52 Variable Coefficient Std. Error t-Statistic Prob. C 2.661511 0.857612 3.103398 0.0033
AUDFZ -0.540990 0.202753 -2.668219 0.0105
AUTEN -0.240868 0.115969 -2.076998 0.0434
FSIZE 0.350915 0.055320 6.343338 0.0000
FISY -0.122669 0.168597 -0.727587 0.4706
AUIND 4.85E-05 2.97E-05 1.630441 0.1098 R-squared 0.692211 Mean dependent var 7.045146
Adjusted R-squared 0.658755 S.D. dependent var 0.995554
S.E. of regression 0.581565 Akaike info criterion 1.861977
Sum squared resid 15.55800 Schwarz criterion 2.087121
Log likelihood -42.41141 Hannan-Quinn criter. 1.948292
F-statistic 20.69056 Durbin-Watson stat 2.032183
Prob(F-statistic) 0.000000
2001 Dependent Variable: DAC
Method: Least Squares
Date: 09/04/16 Time: 14:49
Sample: 1 52
Included observations: 52 Variable Coefficient Std. Error t-Statistic Prob. C 1.586182 1.550493 1.023018 0.3116
AUDFZ 0.044819 0.295507 0.151669 0.8801
AUTEN -0.064040 0.455225 -0.140678 0.8887
FSIZE 0.379566 0.089255 4.252613 0.0001
FISY -0.207092 0.283136 -0.731421 0.4682
AUIND -2.36E-05 4.92E-05 -0.479418 0.6339 R-squared 0.344135 Mean dependent var 6.955635
Adjusted R-squared 0.272845 S.D. dependent var 1.106316
S.E. of regression 0.943393 Akaike info criterion 2.829500
Sum squared resid 40.93960 Schwarz criterion 3.054644
Log likelihood -67.56701 Hannan-Quinn criter. 2.915815
F-statistic 4.827271 Durbin-Watson stat 2.240928
Prob(F-statistic) 0.001247
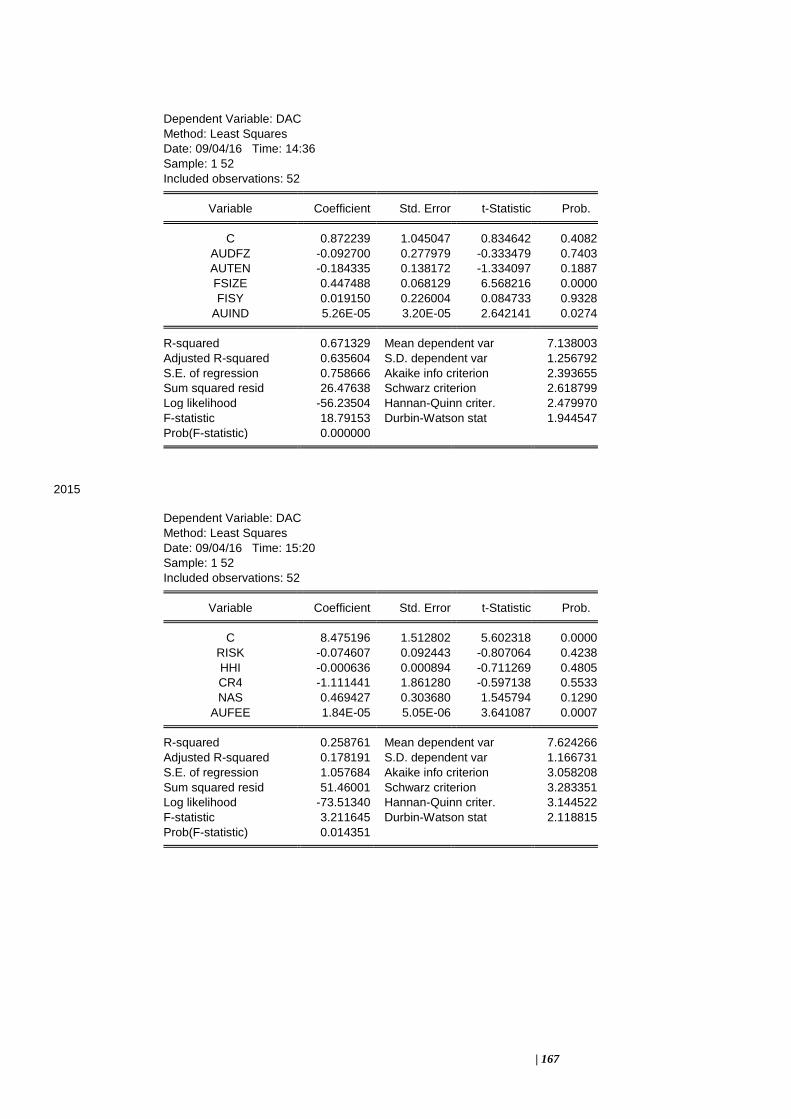
| 167
Dependent Variable: DAC
Method: Least Squares
Date: 09/04/16 Time: 14:36
Sample: 1 52
Included observations: 52 Variable Coefficient Std. Error t-Statistic Prob. C 0.872239 1.045047 0.834642 0.4082
AUDFZ -0.092700 0.277979 -0.333479 0.7403
AUTEN -0.184335 0.138172 -1.334097 0.1887
FSIZE 0.447488 0.068129 6.568216 0.0000
FISY 0.019150 0.226004 0.084733 0.9328
AUIND 5.26E-05 3.20E-05 2.642141 0.0274 R-squared 0.671329 Mean dependent var 7.138003
Adjusted R-squared 0.635604 S.D. dependent var 1.256792
S.E. of regression 0.758666 Akaike info criterion 2.393655
Sum squared resid 26.47638 Schwarz criterion 2.618799
Log likelihood -56.23504 Hannan-Quinn criter. 2.479970
F-statistic 18.79153 Durbin-Watson stat 1.944547
Prob(F-statistic) 0.000000
2015
Dependent Variable: DAC
Method: Least Squares
Date: 09/04/16 Time: 15:20
Sample: 1 52
Included observations: 52 Variable Coefficient Std. Error t-Statistic Prob. C 8.475196 1.512802 5.602318 0.0000
RISK -0.074607 0.092443 -0.807064 0.4238
HHI -0.000636 0.000894 -0.711269 0.4805
CR4 -1.111441 1.861280 -0.597138 0.5533
NAS 0.469427 0.303680 1.545794 0.1290
AUFEE 1.84E-05 5.05E-06 3.641087 0.0007 R-squared 0.258761 Mean dependent var 7.624266
Adjusted R-squared 0.178191 S.D. dependent var 1.166731
S.E. of regression 1.057684 Akaike info criterion 3.058208
Sum squared resid 51.46001 Schwarz criterion 3.283351
Log likelihood -73.51340 Hannan-Quinn criter. 3.144522
F-statistic 3.211645 Durbin-Watson stat 2.118815
Prob(F-statistic) 0.014351

| 168
2014
Dependent Variable: DAC
Method: Least Squares
Date: 09/04/16 Time: 15:25
Sample (adjusted): 1 51
Included observations: 51 after adjustments Variable Coefficient Std. Error t-Statistic Prob. C -34.35922 18.32776 -1.874709 0.0673
RISK -0.235721 0.087988 -2.679001 0.0103
HHI 0.022075 0.009660 2.285332 0.0271
CR4 4.383209 9.704947 0.451647 0.6537
NAS 0.628616 0.275037 2.285571 0.0270
AUFEE 1.66E-05 4.84E-06 3.432143 0.0013 R-squared 0.402749 Mean dependent var 7.775988
Adjusted R-squared 0.336388 S.D. dependent var 1.161291
S.E. of regression 0.946016 Akaike info criterion 2.837015
Sum squared resid 40.27254 Schwarz criterion 3.064289
Log likelihood -66.34389 Hannan-Quinn criter. 2.923863
F-statistic 6.069037 Durbin-Watson stat 1.895146
Prob(F-statistic) 0.000225
2013
Dependent Variable: DAC
Method: Least Squares
Date: 09/04/16 Time: 15:31
Sample (adjusted): 1 51
Included observations: 51 after adjustments Variable Coefficient Std. Error t-Statistic Prob. C 15.83819 16.02695 0.988222 0.3283
RISK -0.064986 0.085254 -0.762259 0.04499
HHI -0.005610 0.008774 -0.639398 0.5258
CR4 0.008131 7.120495 0.001142 0.9991
NAS 0.494430 0.313251 1.578381 0.1215
AUFEE 1.93E-05 6.15E-06 3.136153 0.0030 R-squared 0.240507 Mean dependent var 7.564626
Adjusted R-squared 0.156118 S.D. dependent var 1.177492
S.E. of regression 1.081679 Akaike info criterion 3.105038
Sum squared resid 52.65137 Schwarz criterion 3.332311
Log likelihood -73.17846 Hannan-Quinn criter. 3.191886
F-statistic 2.850004 Durbin-Watson stat 1.849505
Prob(F-statistic) 0.025554

| 169
2012
Dependent Variable: DAC
Method: Least Squares
Date: 09/04/16 Time: 15:37
Sample (adjusted): 1 51
Included observations: 51 after adjustments Variable Coefficient Std. Error t-Statistic Prob. C -9.591488 17.07737 -0.561649 0.5771
RISK -0.101378 0.083243 -1.217861 0.2296
HHI 0.012641 0.010365 1.219536 0.0229
CR4 -5.743306 8.742583 -0.656935 0.5146
NAS 0.377046 0.300530 1.254604 0.2161
AUFEE 1.96E-05 6.26E-06 3.126492 0.0031 R-squared 0.251857 Mean dependent var 7.538600
Adjusted R-squared 0.168730 S.D. dependent var 1.142625
S.E. of regression 1.041777 Akaike info criterion 3.029864
Sum squared resid 48.83846 Schwarz criterion 3.257137
Log likelihood -71.26153 Hannan-Quinn criter. 3.116712
F-statistic 3.029784 Durbin-Watson stat 1.559154
Prob(F-statistic) 0.019300
2011
Dependent Variable: DAC
Method: Least Squares
Date: 09/04/16 Time: 15:41
Sample (adjusted): 1 51
Included observations: 51 after adjustments Variable Coefficient Std. Error t-Statistic Prob. C -16.25522 9.168703 -1.772903 0.0830
RISK 0.152208 0.079152 1.922980 0.0608
HHI 0.019898 0.007574 2.627222 0.0117
CR4 -0.399725 2.246699 -0.177916 0.8596
NAS 0.353884 0.269304 1.314069 0.1955
AUFEE 1.98E-05 6.80E-06 2.910784 0.0056 R-squared 0.268418 Mean dependent var 7.532886
Adjusted R-squared 0.187131 S.D. dependent var 1.033228
S.E. of regression 0.931550 Akaike info criterion 2.806198
Sum squared resid 39.05038 Schwarz criterion 3.033472
Log likelihood -65.55805 Hannan-Quinn criter. 2.893046
F-statistic 3.302109 Durbin-Watson stat 2.496849
Prob(F-statistic) 0.012647

| 170
2010
Dependent Variable: DAC
Method: Least Squares
Date: 09/04/16 Time: 15:48
Sample (adjusted): 1 51
Included observations: 51 after adjustments Variable Coefficient Std. Error t-Statistic Prob. C 11.11429 5.391423 2.061477 0.0451
RISK -0.226395 0.063279 -3.577720 0.0008
HHI -0.002228 0.003139 -0.709865 0.4815
CR4 -1.281894 4.281641 -0.299393 0.7660
NAS 0.378922 0.274098 1.382430 0.1737
AUFEE 2.27E-05 7.45E-06 3.048334 0.0038 R-squared 0.373259 Mean dependent var 7.389500
Adjusted R-squared 0.303622 S.D. dependent var 1.144462
S.E. of regression 0.955046 Akaike info criterion 2.856016
Sum squared resid 41.04505 Schwarz criterion 3.083289
Log likelihood -66.82840 Hannan-Quinn criter. 2.942864
F-statistic 5.360009 Durbin-Watson stat 2.116311
Prob(F-statistic) 0.000600
2009
Dependent Variable: DAC
Method: Least Squares
Date: 09/04/16 Time: 15:59
Sample (adjusted): 1 51
Included observations: 51 after adjustments Variable Coefficient Std. Error t-Statistic Prob. C 17.72418 8.690701 2.039442 0.0473
RISK -0.347501 0.126054 -2.756762 0.0084
HHI -0.006894 0.005246 -1.314076 0.1955
CR4 0.647776 2.398987 0.270021 0.7884
NAS 0.682714 0.298574 2.286584 0.0270
AUFEE 2.85E-05 8.87E-06 3.210925 0.0024 R-squared 0.341028 Mean dependent var 7.358600
Adjusted R-squared 0.267809 S.D. dependent var 1.202629
S.E. of regression 1.029068 Akaike info criterion 3.005314
Sum squared resid 47.65411 Schwarz criterion 3.232588
Log likelihood -70.63552 Hannan-Quinn criter. 3.092162
F-statistic 4.657641 Durbin-Watson stat 1.738140
Prob(F-statistic) 0.001644

| 171
2008
Dependent Variable: DAC
Method: Least Squares
Date: 09/04/16 Time: 16:05
Sample (adjusted): 1 51
Included observations: 51 after adjustments Variable Coefficient Std. Error t-Statistic Prob. C 8.791321 4.614175 1.905285 0.0631
RISK -0.293321 0.224527 -1.306397 0.1981
HHI -0.000727 0.002786 -0.260960 0.7953
CR4 -1.078766 2.213736 -0.487306 0.6284
NAS -0.128620 0.302319 -0.425445 0.6725
AUFEE 7.32E-05 1.84E-05 3.971860 0.0003 R-squared 0.302195 Mean dependent var 7.378034
Adjusted R-squared 0.224661 S.D. dependent var 1.091017
S.E. of regression 0.960677 Akaike info criterion 2.867773
Sum squared resid 41.53049 Schwarz criterion 3.095047
Log likelihood -67.12822 Hannan-Quinn criter. 2.954621
F-statistic 3.897590 Durbin-Watson stat 2.436493
Prob(F-statistic) 0.005087
2007
Dependent Variable: DAC
Method: Least Squares
Date: 09/04/16 Time: 16:12
Sample (adjusted): 1 51
Included observations: 51 after adjustments Variable Coefficient Std. Error t-Statistic Prob. C 9.445991 5.474852 1.725342 0.0913
RISK -0.171426 0.298096 -0.575071 0.5681
HHI -0.001199 0.002781 -0.431169 0.6684
CR4 -0.799103 4.135339 -0.193238 0.8476
NAS -0.132220 0.310505 -0.425824 0.6723
AUFEE 8.58E-05 2.12E-05 4.042610 0.0002 R-squared 0.280021 Mean dependent var 7.366192
Adjusted R-squared 0.200023 S.D. dependent var 1.127319
S.E. of regression 1.008290 Akaike info criterion 2.964520
Sum squared resid 45.74920 Schwarz criterion 3.191793
Log likelihood -69.59526 Hannan-Quinn criter. 3.051368
F-statistic 3.500357 Durbin-Watson stat 2.378104
Prob(F-statistic) 0.009318

| 172
2006
Dependent Variable: DAC
Method: Least Squares
Date: 09/04/16 Time: 16:39
Sample (adjusted): 1 51
Included observations: 51 after adjustments Variable Coefficient Std. Error t-Statistic Prob.
C 10.46396 4.670774 2.240305 0.0301
RISK 0.058097 0.170101 0.341545 0.7343
HHI -0.000910 0.002000 -0.455150 0.6512
CR4 -3.175906 4.721329 -0.672672 0.5046
NAS -0.134709 0.290926 -0.463035 0.6456
AUFEE 7.96E-05 2.46E-05 3.236049 0.0023 R-squared 0.260966 Mean dependent var 7.374683
Adjusted R-squared 0.178852 S.D. dependent var 1.047513
S.E. of regression 0.949227 Akaike info criterion 2.843794
Sum squared resid 40.54647 Schwarz criterion 3.071068
Log likelihood -66.51675 Hannan-Quinn criter. 2.930642
F-statistic 3.178068 Durbin-Watson stat 2.264265
Prob(F-statistic) 0.015326
2005
Dependent Variable: DAC
Method: Least Squares
Date: 09/04/16 Time: 16:43
Sample (adjusted): 1 51
Included observations: 51 after adjustments Variable Coefficient Std. Error t-Statistic Prob. C 14.45872 6.198854 2.332482 0.0242
RISK -0.587750 0.304276 -1.931633 0.0597
HHI -0.002996 0.001647 -1.819789 0.0754
CR4 -2.116879 8.695154 -0.243455 0.8088
NAS -0.233595 0.344701 -0.677673 0.5014
AUFEE 0.000128 3.37E-05 3.804981 0.0004 R-squared 0.293266 Mean dependent var 7.161570
Adjusted R-squared 0.214739 S.D. dependent var 1.313843
S.E. of regression 1.164261 Akaike info criterion 3.252181
Sum squared resid 60.99768 Schwarz criterion 3.479455
Log likelihood -76.93063 Hannan-Quinn criter. 3.339029
F-statistic 3.734627 Durbin-Watson stat 2.667983
Prob(F-statistic) 0.006514
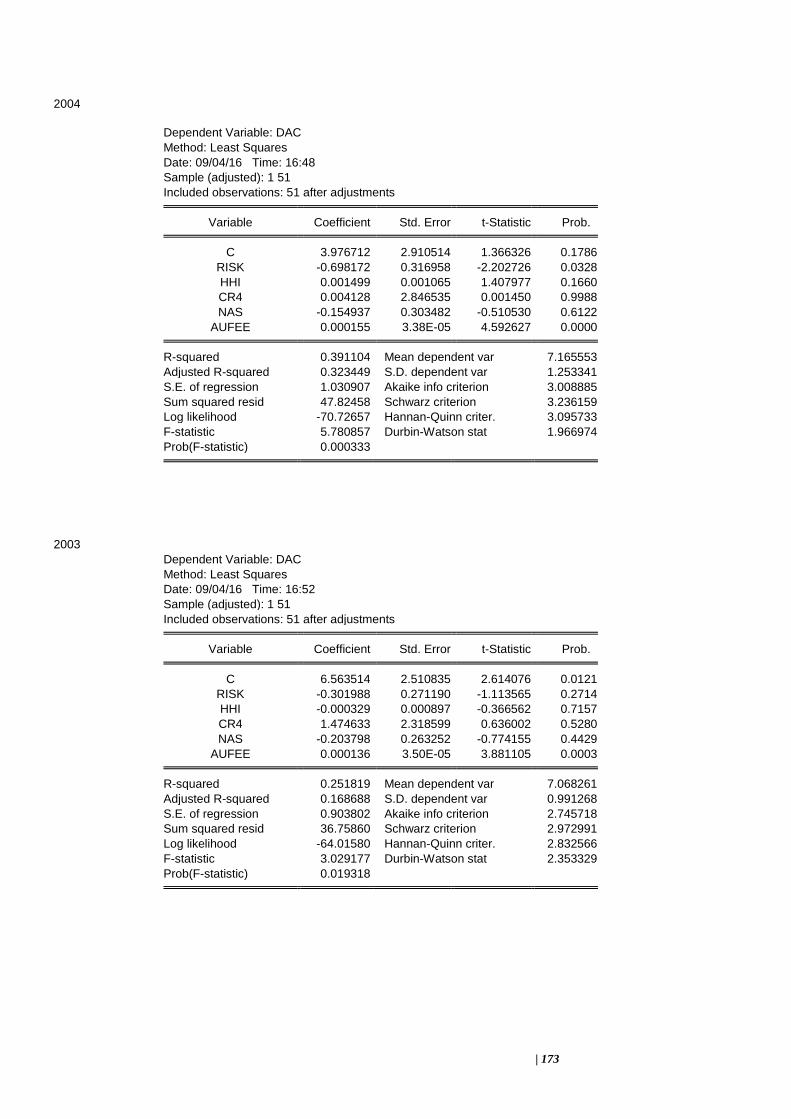
| 173
2004
Dependent Variable: DAC
Method: Least Squares
Date: 09/04/16 Time: 16:48
Sample (adjusted): 1 51
Included observations: 51 after adjustments Variable Coefficient Std. Error t-Statistic Prob. C 3.976712 2.910514 1.366326 0.1786
RISK -0.698172 0.316958 -2.202726 0.0328
HHI 0.001499 0.001065 1.407977 0.1660
CR4 0.004128 2.846535 0.001450 0.9988
NAS -0.154937 0.303482 -0.510530 0.6122
AUFEE 0.000155 3.38E-05 4.592627 0.0000 R-squared 0.391104 Mean dependent var 7.165553
Adjusted R-squared 0.323449 S.D. dependent var 1.253341
S.E. of regression 1.030907 Akaike info criterion 3.008885
Sum squared resid 47.82458 Schwarz criterion 3.236159
Log likelihood -70.72657 Hannan-Quinn criter. 3.095733
F-statistic 5.780857 Durbin-Watson stat 1.966974
Prob(F-statistic) 0.000333
2003
Dependent Variable: DAC
Method: Least Squares
Date: 09/04/16 Time: 16:52
Sample (adjusted): 1 51
Included observations: 51 after adjustments Variable Coefficient Std. Error t-Statistic Prob. C 6.563514 2.510835 2.614076 0.0121
RISK -0.301988 0.271190 -1.113565 0.2714
HHI -0.000329 0.000897 -0.366562 0.7157
CR4 1.474633 2.318599 0.636002 0.5280
NAS -0.203798 0.263252 -0.774155 0.4429
AUFEE 0.000136 3.50E-05 3.881105 0.0003 R-squared 0.251819 Mean dependent var 7.068261
Adjusted R-squared 0.168688 S.D. dependent var 0.991268
S.E. of regression 0.903802 Akaike info criterion 2.745718
Sum squared resid 36.75860 Schwarz criterion 2.972991
Log likelihood -64.01580 Hannan-Quinn criter. 2.832566
F-statistic 3.029177 Durbin-Watson stat 2.353329
Prob(F-statistic) 0.019318

| 174
2002
2001
Dependent Variable: DAC
Method: Least Squares
Date: 09/04/16 Time: 17:01
Sample (adjusted): 1 51
Included observations: 51 after adjustments Variable Coefficient Std. Error t-Statistic Prob. C 4.196820 5.767345 0.727687 0.4706
RISK -0.114880 0.135745 -0.846295 0.4019
HHI 0.003049 0.003815 0.799162 0.4284
CR4 -2.550441 3.750801 -0.679972 0.5000
NAS 0.508003 0.240594 2.111455 0.0403
AUFEE 4.94E-05 2.53E-05 1.950074 0.0574 R-squared 0.205272 Mean dependent var 7.005499
Adjusted R-squared 0.116969 S.D. dependent var 0.863984
S.E. of regression 0.811883 Akaike info criterion 2.531211
Sum squared resid 29.66195 Schwarz criterion 2.758484
Log likelihood -58.54587 Hannan-Quinn criter. 2.618059
F-statistic 2.324635 Durbin-Watson stat 1.565351
Prob(F-statistic) 0.058269
Dependent Variable:DAC
Method: Least Squares
Date: 09/04/16 Time: 16:57
Sample (adjusted): 1 51
Included observations: 51 after adjustments Variable Coefficient Std. Error t-Statistic Prob. C 5.600867 2.100022 2.667051 0.0106
RISK -0.123320 0.249070 -0.495120 0.6229
HHI -0.000106 0.001052 -0.100753 0.9202
CR4 2.029353 2.784843 0.728714 0.4700
NAS -0.021909 0.325502 -0.067307 0.9466
AUFEE 8.79E-05 4.82E-05 1.823912 0.0748 R-squared 0.086678 Mean dependent var 6.979948
Adjusted R-squared -0.014802 S.D. dependent var 1.103205
S.E. of regression 1.111339 Akaike info criterion 3.159140
Sum squared resid 55.57838 Schwarz criterion 3.386413
Log likelihood -74.55807 Hannan-Quinn criter. 3.245988
F-statistic 0.854141 Durbin-Watson stat 2.383871
Prob(F-statistic) 0.519134

| 175
Dependent Variable: DAC
Method: Panel Least Squares
Date: 09/04/16 Time: 17:19
Sample: 2001 2015
Periods included: 15
Cross-sections included: 52
Total panel (unbalanced) observations: 777 Variable Coefficient Std. Error t-Statistic Prob. C 0.604573 0.216567 2.791624 0.0054
AUDFZ -0.009208 0.042021 -0.219122 0.8266
AUTEN -0.000780 0.015685 -0.049739 0.9603
FSIZE 0.428007 0.013613 31.44183 0.0000
FISY 0.139584 0.053336 2.617044 0.0090
AUIND -6.44E-09 1.68E-06 -0.003830 0.9969 R-squared 0.634754 Mean dependent var 7.350720
Adjusted R-squared 0.632385 S.D. dependent var 1.138461
S.E. of regression 0.690263 Akaike info criterion 2.104205
Sum squared resid 367.3533 Schwarz criterion 2.140154
Log likelihood -811.4835 Hannan-Quinn criter. 2.118034
F-statistic 267.9807 Durbin-Watson stat 1.484147
Prob(F-statistic) 0.000000
Heteroskedasticity Test: Breusch-Pagan-Godfrey F-statistic 0.497737 Prob. F(4,773) 0.7374
Obs*R-squared 1.998678 Prob. Chi-Square(4) 0.7360
Scaled explained SS 3.411063 Prob. Chi-Square(4) 0.4915
Test Equation:
Dependent Variable: RESID^2
Method: Least Squares
Date: 09/06/16 Time: 15:49
Sample: 1 780
Included observations: 780 Variable Coefficient Std. Error t-Statistic Prob. C 0.480127 1.522812 0.315290 0.7526
RISK -0.016574 0.054198 -0.305800 0.7598
HHI 0.000180 0.000231 0.779061 0.4362
CR4 0.404306 2.460040 0.164349 0.8695
ADFEE 4.75E-06 4.23E-06 1.121946 0.2622 R-squared 0.002569 Mean dependent var 1.064519
Adjusted R-squared -0.002592 S.D. dependent var 1.980711
S.E. of regression 1.983277 Akaike info criterion 4.213784
Sum squared resid 3040.509 Schwarz criterion 4.243712
Log likelihood -1634.162 Hannan-Quinn criter. 4.225296
F-statistic 0.497737 Durbin-Watson stat 1.660408
Prob(F-statistic) 0.737422

| 176
Heteroskedasticity Test: Breusch-Pagan-Godfrey F-statistic 2.661012 Prob. F(5,771) 0.5214
Obs*R-squared 13.18114 Prob. Chi-Square(5) 0.6017
Scaled explained SS 24.38375 Prob. Chi-Square(5) 0.0002
Test Equation:
Dependent Variable: RESID^2
Method: Least Squares
Date: 09/04/16 Time: 17:23
Sample: 1 780
Included observations: 780 Variable Coefficient Std. Error t-Statistic Prob. C 1.056856 0.286196 3.692769 0.0002
AUDFZ -0.101646 0.055531 -1.830433 0.0676
AUTEN -0.020682 0.020727 -0.997813 0.3187
FSIZE -0.031607 0.017989 -1.756971 0.0793
FISY 0.081032 0.070485 1.149639 0.2506
AUIND -1.48E-06 2.22E-06 -0.666801 0.5051 R-squared 0.106964 Mean dependent var 0.472784
Adjusted R-squared 0.010589 S.D. dependent var 0.917060
S.E. of regression 0.912192 Akaike info criterion 2.661760
Sum squared resid 641.5447 Schwarz criterion 2.697709
Log likelihood -1028.094 Hannan-Quinn criter. 2.675589
F-statistic 2.661012 Durbin-Watson stat 1.751423
Prob(F-statistic) 0.021426
| 177
Variance Inflation Factors
Date: 09/04/16 Time: 23:08
Sample: 1 780
Included observations: 780 Coefficient Uncentered Centered
Variable Variance VIF VIF C 0.631654 458.6755 NA
RISK 0.000800 1.306295 1.003183
HHI 1.46E-08 28.31466 1.109014
CR4 1.648432 492.5470 1.168562
ADFEE 4.88E-12 1.433851 1.065921
Variance Inflation Factors
Date: 09/06/16 Time: 15:42
Sample: 1 780
Included observations: 780 Coefficient Uncentered Centered
Variable Variance VIF VIF C 0.043689 71.55059 NA
AUDFZ 0.001761 2.319606 1.052749
AUTEN 4.50E-05 4.077401 1.222868
FSIZE 0.000185 74.86399 1.342982
FISY 0.002875 3.205818 1.023221
AUIND 3.12E-12 2.067884 1.537144

| 178
2015
Dependent Variable: DAC
Method: Least Squares
Date: 09/04/16 Time: 12:07
Sample: 1 52
Included observations: 52 Variable Coefficient Std. Error t-Statistic Prob. C 0.590140 0.690946 0.854104 0.3975
AUDFZ 0.191634 0.195865 0.978399 0.3330
AUTEN -0.008710 0.018544 -2.469684 0.0402
FSIZE 0.450816 0.044536 10.12245 0.0000
FISY -0.293740 0.192245 -1.527945 0.1334
AUIND -3.13E-06 3.61E-06 -0.865966 0.3910 R-squared 0.763988 Mean dependent var 7.624266
Adjusted R-squared 0.738334 S.D. dependent var 1.166731
S.E. of regression 0.596821 Akaike info criterion 1.913768
Sum squared resid 16.38499 Schwarz criterion 2.138912
Log likelihood -43.75797 Hannan-Quinn criter. 2.000083
F-statistic 29.78101 Durbin-Watson stat 1.988043
Prob(F-statistic) 0.000000
2014
Dependent Variable: DAC
Method: Least Squares
Date: 09/04/16 Time: 12:25
Sample (adjusted): 1 51
Included observations: 51 after adjustments Variable Coefficient Std. Error t-Statistic Prob. C 1.046420 0.786668 1.330191 0.1902
AUDFZ -0.042637 0.218920 -2.194761 0.0405
AUTEN 0.000588 0.021015 0.027988 0.9778
FSIZE 0.430961 0.049587 8.690987 0.0000
FISY -0.324114 0.210654 -1.538605 0.1309
AUIND -5.53E-07 4.29E-06 -0.128935 0.8980 R-squared 0.708069 Mean dependent var 7.775988
Adjusted R-squared 0.675632 S.D. dependent var 1.161291
S.E. of regression 0.661393 Akaike info criterion 2.121195
Sum squared resid 19.68485 Schwarz criterion 2.348469
Log likelihood -48.09047 Hannan-Quinn criter. 2.208043
F-statistic 21.82921 Durbin-Watson stat 2.139193
Prob(F-statistic) 0.000000

| 179
2013
Dependent Variable: DAC
Method: Least Squares
Date: 09/04/16 Time: 12:28
Sample (adjusted): 1 51
Included observations: 51 after adjustments Variable Coefficient Std. Error t-Statistic Prob. C 0.400758 0.778586 0.514726 0.6093
AUDFZ 0.211667 0.225642 0.938065 0.3532
AUTEN -0.012838 0.022758 -2.564127 0.0425
FSIZE 0.463855 0.050641 9.159629 0.0000
FISY -0.344900 0.202110 -1.706496 0.0948
AUIND -4.59E-06 4.70E-06 -0.978342 0.3331 R-squared 0.725010 Mean dependent var 7.564626
Adjusted R-squared 0.694456 S.D. dependent var 1.177492
S.E. of regression 0.650871 Akaike info criterion 2.089119
Sum squared resid 19.06346 Schwarz criterion 2.316393
Log likelihood -47.27254 Hannan-Quinn criter. 2.175967
F-statistic 23.72852 Durbin-Watson stat 2.082084
Prob(F-statistic) 0.000000
2011
Dependent Variable: DAC
Method: Least Squares
Date: 09/04/16 Time: 12:31
Sample (adjusted): 1 51
Included observations: 51 after adjustments Variable Coefficient Std. Error t-Statistic Prob. C 1.248358 0.866082 1.441385 0.1564
AUDFZ 0.149446 0.243825 0.612925 0.5430
AUTEN 0.025489 0.027160 0.938463 0.3530
FSIZE 0.392730 0.056304 6.975107 0.0000
FISY -0.341953 0.228465 -1.496741 0.1414
AUIND -3.31E-06 5.58E-06 -0.593103 0.5561 R-squared 0.630320 Mean dependent var 7.538600
Adjusted R-squared 0.589245 S.D. dependent var 1.142625
S.E. of regression 0.732310 Akaike info criterion 2.324907
Sum squared resid 24.13254 Schwarz criterion 2.552180
Log likelihood -53.28512 Hannan-Quinn criter. 2.411755
F-statistic 15.34540 Durbin-Watson stat 1.350044
Prob(F-statistic) 0.000000

| 180
Dependent Variable: 2010
Method: Least Squares
Date: 09/04/16 Time: 12:34
Sample (adjusted): 1 51
Included observations: 51 after adjustments Variable Coefficient Std. Error t-Statistic Prob. C 1.675706 0.868708 1.928964 0.0601
AUDFZ 0.092532 0.369160 0.250655 0.8032
AUTEN 0.036325 0.027383 1.326513 0.1914
FSIZE 0.365760 0.051936 7.042499 0.0000
FISY -0.360164 0.216202 -1.665869 0.1027
AUIND -4.75E-06 6.06E-06 -0.783056 0.4377 R-squared 0.610787 Mean dependent var 7.532886
Adjusted R-squared 0.567542 S.D. dependent var 1.033228
S.E. of regression 0.679467 Akaike info criterion 2.175115
Sum squared resid 20.77539 Schwarz criterion 2.402388
Log likelihood -49.46542 Hannan-Quinn criter. 2.261962
F-statistic 14.12361 Durbin-Watson stat 1.992537
Prob(F-statistic) 0.000000
2009
Dependent Variable: DAC
Method: Least Squares
Date: 09/04/16 Time: 15:09
Sample (adjusted): 1 51
Included observations: 51 after adjustments Variable Coefficient Std. Error t-Statistic Prob. C -0.561827 1.012058 -0.555133 0.5816
AUDFZ 0.129715 0.411933 0.314893 0.7543
AUTEN -0.007469 0.037434 -0.199531 0.8427
FSIZE 0.492866 0.064503 7.640992 0.0000
FISY 0.207056 0.208473 0.993201 0.3259
AUIND 4.46E-06 1.50E-05 0.297117 0.7677 R-squared 0.704449 Mean dependent var 7.337122
Adjusted R-squared 0.671610 S.D. dependent var 1.193782
S.E. of regression 0.684101 Akaike info criterion 2.188709
Sum squared resid 21.05974 Schwarz criterion 2.415983
Log likelihood -49.81208 Hannan-Quinn criter. 2.275557
F-statistic 21.45158 Durbin-Watson stat 2.192788
Prob(F-statistic) 0.000000

| 181
2008
Dependent Variable: DAC
Method: Least Squares
Date: 09/04/16 Time: 15:06
Sample: 1 52
Included observations: 52 Variable Coefficient Std. Error t-Statistic Prob. C 1.095389 0.787112 1.391656 0.1707
AUDFZ -0.560285 0.322253 -1.738646 0.0888
AUTEN -0.092554 0.036568 -2.530987 0.0149
FSIZE 0.472913 0.044639 10.59409 0.0000
FISY -0.012279 0.160856 -0.076334 0.9395
AUIND 7.12E-06 1.17E-05 0.606367 0.5473 R-squared 0.790222 Mean dependent var 7.409936
Adjusted R-squared 0.767421 S.D. dependent var 1.104494
S.E. of regression 0.532659 Akaike info criterion 1.686295
Sum squared resid 13.05137 Schwarz criterion 1.911439
Log likelihood -37.84368 Hannan-Quinn criter. 1.772610
F-statistic 34.65597 Durbin-Watson stat 1.718456
Prob(F-statistic) 0.000000
2007
Dependent Variable: DAC
Method: Least Squares
Date: 09/04/16 Time: 15:01
Sample (adjusted): 1 52
Included observations: 52 after adjustments Variable Coefficient Std. Error t-Statistic Prob. C -0.045556 0.825355 -0.055195 0.9562
AUDFZ -0.018500 0.353088 -0.052394 0.9584
AUTEN 0.000470 0.052238 0.008996 0.9929
FSIZE 0.477819 0.047941 9.966898 0.0000
FISY -0.028895 0.178825 -0.161581 0.8723
AUIND 2.84E-06 1.41E-05 0.202032 0.8408 R-squared 0.760533 Mean dependent var 7.387759
Adjusted R-squared 0.734504 S.D. dependent var 1.126994
S.E. of regression 0.580698 Akaike info criterion 1.858995
Sum squared resid 15.51166 Schwarz criterion 2.084138
Log likelihood -42.33386 Hannan-Quinn criter. 1.945309
F-statistic 29.21873 Durbin-Watson stat 1.766191
Prob(F-statistic) 0.000000

| 182
2006
Dependent Variable: DAC
Method: Least Squares
Date: 09/04/16 Time: 14:05
Sample: 1 52
Included observations: 52 Variable Coefficient Std. Error t-Statistic Prob. C 1.281145 0.930680 1.376569 0.1753
AUDFZ -0.109219 0.174252 -0.626790 0.5339
AUTEN 0.030712 0.053671 0.572227 0.5700
FSIZE 0.369771 0.057001 6.487055 0.0000
FISY 0.243115 0.199994 1.215616 0.2303
AUIND 1.86E-05 1.87E-05 0.994518 0.3252 R-squared 0.637891 Mean dependent var 7.344834
Adjusted R-squared 0.598531 S.D. dependent var 1.059291
S.E. of regression 0.671183 Akaike info criterion 2.148618
Sum squared resid 20.72240 Schwarz criterion 2.373761
Log likelihood -49.86407 Hannan-Quinn criter. 2.234933
F-statistic 16.20670 Durbin-Watson stat 1.949242
Prob(F-statistic) 0.000000
2005 Dependent Variable: DAC
Method: Least Squares
Date: 09/04/16 Time: 14:13
Sample: 1 52
Included observations: 52 Variable Coefficient Std. Error t-Statistic Prob. C 0.413950 1.081789 0.382653 0.7037
AUDFZ -0.192161 0.328240 -0.585428 0.5611
AUTEN -0.010094 0.050722 -0.199008 0.8431
FSIZE 0.446561 0.073158 6.104043 0.0000
FISY 0.112488 0.273186 0.411762 0.6824
AUIND 1.74E-05 2.94E-05 0.591083 0.5574 R-squared 0.570629 Mean dependent var 7.151582
Adjusted R-squared 0.523958 S.D. dependent var 1.302891
S.E. of regression 0.898940 Akaike info criterion 2.732966
Sum squared resid 37.17229 Schwarz criterion 2.958110
Log likelihood -65.05712 Hannan-Quinn criter. 2.819281
F-statistic 12.22667 Durbin-Watson stat 2.239266
Prob(F-statistic) 0.000000

| 183
2004
Dependent Variable: DAC
Method: Least Squares
Date: 09/04/16 Time: 14:36
Sample: 1 52
Included observations: 52 Variable Coefficient Std. Error t-Statistic Prob. C 0.872239 1.045047 0.834642 0.4082
AUDFZ -0.092700 0.277979 -0.333479 0.7403
AUTEN -0.184335 0.138172 -1.334097 0.1887
FSIZE 0.447488 0.068129 6.568216 0.0000
FISY 0.019150 0.226004 0.084733 0.9328
AUIND 5.26E-05 3.20E-05 1.642141 0.1074 R-squared 0.671329 Mean dependent var 7.138003
Adjusted R-squared 0.635604 S.D. dependent var 1.256792
S.E. of regression 0.758666 Akaike info criterion 2.393655
Sum squared resid 26.47638 Schwarz criterion 2.618799
Log likelihood -56.23504 Hannan-Quinn criter. 2.479970
F-statistic 18.79153 Durbin-Watson stat 1.944547
Prob(F-statistic) 0.000000
2003
Method: Least Squares
Date: 09/04/16 Time: 14:26
Sample: 1 52
Included observations: 52 Variable Coefficient Std. Error t-Statistic Prob. C -0.274399 1.080438 -0.253970 0.8007
AUDFZ 0.165411 0.256411 0.645099 0.5221
AUTEN -0.044581 0.066832 -0.667067 0.5081
FSIZE 0.487736 0.077919 6.259564 0.0000
FISY 0.059769 0.280729 0.212907 0.8323
AUIND 0.032793 0.282667 0.116013 0.9081 R-squared 0.571645 Mean dependent var 7.151582
Adjusted R-squared 0.525085 S.D. dependent var 1.302891
S.E. of regression 0.897875 Akaike info criterion 2.730596
Sum squared resid 37.08428 Schwarz criterion 2.955739
Log likelihood -64.99549 Hannan-Quinn criter. 2.816910
F-statistic 12.27752 Durbin-Watson stat 2.352197
Prob(F-statistic) 0.000000

| 184
2002 Dependent Variable: DAC
Method: Least Squares
Date: 09/04/16 Time: 14:40
Sample: 1 52
Included observations: 52 Variable Coefficient Std. Error t-Statistic Prob. C 2.661511 0.857612 3.103398 0.0033
AUDFZ -0.540990 0.202753 -2.668219 0.0105
AUTEN -0.240868 0.115969 -2.076998 0.0434
FSIZE 0.350915 0.055320 6.343338 0.0000
FISY -0.122669 0.168597 -0.727587 0.4706
AUIND 4.85E-05 2.97E-05 1.630441 0.1098 R-squared 0.692211 Mean dependent var 7.045146
Adjusted R-squared 0.658755 S.D. dependent var 0.995554
S.E. of regression 0.581565 Akaike info criterion 1.861977
Sum squared resid 15.55800 Schwarz criterion 2.087121
Log likelihood -42.41141 Hannan-Quinn criter. 1.948292
F-statistic 20.69056 Durbin-Watson stat 2.032183
Prob(F-statistic) 0.000000
2001 Dependent Variable: DAC
Method: Least Squares
Date: 09/04/16 Time: 14:49
Sample: 1 52
Included observations: 52 Variable Coefficient Std. Error t-Statistic Prob. C 1.586182 1.550493 1.023018 0.3116
AUDFZ 0.044819 0.295507 0.151669 0.8801
AUTEN -0.064040 0.455225 -0.140678 0.8887
FSIZE 0.379566 0.089255 4.252613 0.0001
FISY -0.207092 0.283136 -0.731421 0.4682
AUIND -2.36E-05 4.92E-05 -0.479418 0.6339 R-squared 0.344135 Mean dependent var 6.955635
Adjusted R-squared 0.272845 S.D. dependent var 1.106316
S.E. of regression 0.943393 Akaike info criterion 2.829500
Sum squared resid 40.93960 Schwarz criterion 3.054644
Log likelihood -67.56701 Hannan-Quinn criter. 2.915815
F-statistic 4.827271 Durbin-Watson stat 2.240928
Prob(F-statistic) 0.001247

| 185
Dependent Variable: DAC
Method: Least Squares
Date: 09/04/16 Time: 14:36
Sample: 1 52
Included observations: 52 Variable Coefficient Std. Error t-Statistic Prob. C 0.872239 1.045047 0.834642 0.4082
AUDFZ -0.092700 0.277979 -0.333479 0.7403
AUTEN -0.184335 0.138172 -1.334097 0.1887
FSIZE 0.447488 0.068129 6.568216 0.0000
FISY 0.019150 0.226004 0.084733 0.9328
AUIND 5.26E-05 3.20E-05 2.642141 0.0274 R-squared 0.671329 Mean dependent var 7.138003
Adjusted R-squared 0.635604 S.D. dependent var 1.256792
S.E. of regression 0.758666 Akaike info criterion 2.393655
Sum squared resid 26.47638 Schwarz criterion 2.618799
Log likelihood -56.23504 Hannan-Quinn criter. 2.479970
F-statistic 18.79153 Durbin-Watson stat 1.944547
Prob(F-statistic) 0.000000
2015
Dependent Variable: DAC
Method: Least Squares
Date: 09/04/16 Time: 15:20
Sample: 1 52
Included observations: 52 Variable Coefficient Std. Error t-Statistic Prob. C 8.475196 1.512802 5.602318 0.0000
RISK -0.074607 0.092443 -0.807064 0.4238
HHI -0.000636 0.000894 -0.711269 0.4805
CR4 -1.111441 1.861280 -0.597138 0.5533
NAS 0.469427 0.303680 1.545794 0.1290
AUFEE 1.84E-05 5.05E-06 3.641087 0.0007 R-squared 0.258761 Mean dependent var 7.624266
Adjusted R-squared 0.178191 S.D. dependent var 1.166731
S.E. of regression 1.057684 Akaike info criterion 3.058208
Sum squared resid 51.46001 Schwarz criterion 3.283351
Log likelihood -73.51340 Hannan-Quinn criter. 3.144522
F-statistic 3.211645 Durbin-Watson stat 2.118815
Prob(F-statistic) 0.014351

| 186
2014
Dependent Variable: DAC
Method: Least Squares
Date: 09/04/16 Time: 15:25
Sample (adjusted): 1 51
Included observations: 51 after adjustments Variable Coefficient Std. Error t-Statistic Prob. C -34.35922 18.32776 -1.874709 0.0673
RISK -0.235721 0.087988 -2.679001 0.0103
HHI 0.022075 0.009660 2.285332 0.0271
CR4 4.383209 9.704947 0.451647 0.6537
NAS 0.628616 0.275037 2.285571 0.0270
AUFEE 1.66E-05 4.84E-06 3.432143 0.0013 R-squared 0.402749 Mean dependent var 7.775988
Adjusted R-squared 0.336388 S.D. dependent var 1.161291
S.E. of regression 0.946016 Akaike info criterion 2.837015
Sum squared resid 40.27254 Schwarz criterion 3.064289
Log likelihood -66.34389 Hannan-Quinn criter. 2.923863
F-statistic 6.069037 Durbin-Watson stat 1.895146
Prob(F-statistic) 0.000225
2013
Dependent Variable: DAC
Method: Least Squares
Date: 09/04/16 Time: 15:31
Sample (adjusted): 1 51
Included observations: 51 after adjustments Variable Coefficient Std. Error t-Statistic Prob. C 15.83819 16.02695 0.988222 0.3283
RISK -0.064986 0.085254 -0.762259 0.4499
HHI -0.005610 0.008774 -0.639398 0.5258
CR4 0.008131 7.120495 0.001142 0.9991
NAS 0.494430 0.313251 1.578381 0.1215
AUFEE 1.93E-05 6.15E-06 3.136153 0.0030 R-squared 0.240507 Mean dependent var 7.564626
Adjusted R-squared 0.156118 S.D. dependent var 1.177492
S.E. of regression 1.081679 Akaike info criterion 3.105038
Sum squared resid 52.65137 Schwarz criterion 3.332311
Log likelihood -73.17846 Hannan-Quinn criter. 3.191886
F-statistic 2.850004 Durbin-Watson stat 1.849505
Prob(F-statistic) 0.025554

| 187
2012
Dependent Variable: DAC
Method: Least Squares
Date: 09/04/16 Time: 15:37
Sample (adjusted): 1 51
Included observations: 51 after adjustments Variable Coefficient Std. Error t-Statistic Prob. C -9.591488 17.07737 -0.561649 0.5771
RISK -0.101378 0.083243 -1.217861 0.2296
HHI 0.012641 0.010365 1.219536 0.2290
CR4 -5.743306 8.742583 -0.656935 0.5146
NAS 0.377046 0.300530 1.254604 0.2161
AUFEE 1.96E-05 6.26E-06 3.126492 0.0031 R-squared 0.251857 Mean dependent var 7.538600
Adjusted R-squared 0.168730 S.D. dependent var 1.142625
S.E. of regression 1.041777 Akaike info criterion 3.029864
Sum squared resid 48.83846 Schwarz criterion 3.257137
Log likelihood -71.26153 Hannan-Quinn criter. 3.116712
F-statistic 3.029784 Durbin-Watson stat 1.559154
Prob(F-statistic) 0.019300
2011
Dependent Variable: DAC
Method: Least Squares
Date: 09/04/16 Time: 15:41
Sample (adjusted): 1 51
Included observations: 51 after adjustments Variable Coefficient Std. Error t-Statistic Prob. C -16.25522 9.168703 -1.772903 0.0830
RISK 0.152208 0.079152 1.922980 0.0608
HHI 0.019898 0.007574 2.627222 0.0117
CR4 -0.399725 2.246699 -0.177916 0.8596
NAS 0.353884 0.269304 1.314069 0.1955
AUFEE 1.98E-05 6.80E-06 2.910784 0.0056 R-squared 0.268418 Mean dependent var 7.532886
Adjusted R-squared 0.187131 S.D. dependent var 1.033228
S.E. of regression 0.931550 Akaike info criterion 2.806198
Sum squared resid 39.05038 Schwarz criterion 3.033472
Log likelihood -65.55805 Hannan-Quinn criter. 2.893046
F-statistic 3.302109 Durbin-Watson stat 2.496849
Prob(F-statistic) 0.012647

| 188
2010
Dependent Variable: DAC
Method: Least Squares
Date: 09/04/16 Time: 15:48
Sample (adjusted): 1 51
Included observations: 51 after adjustments Variable Coefficient Std. Error t-Statistic Prob. C 11.11429 5.391423 2.061477 0.0451
RISK -0.226395 0.063279 -3.577720 0.0008
HHI -0.002228 0.003139 -0.709865 0.4815
CR4 -1.281894 4.281641 -0.299393 0.7660
NAS 0.378922 0.274098 1.382430 0.1737
AUFEE 2.27E-05 7.45E-06 3.048334 0.0038 R-squared 0.373259 Mean dependent var 7.389500
Adjusted R-squared 0.303622 S.D. dependent var 1.144462
S.E. of regression 0.955046 Akaike info criterion 2.856016
Sum squared resid 41.04505 Schwarz criterion 3.083289
Log likelihood -66.82840 Hannan-Quinn criter. 2.942864
F-statistic 5.360009 Durbin-Watson stat 2.116311
Prob(F-statistic) 0.000600
2009
Dependent Variable: DAC
Method: Least Squares
Date: 09/04/16 Time: 15:59
Sample (adjusted): 1 51
Included observations: 51 after adjustments Variable Coefficient Std. Error t-Statistic Prob. C 17.72418 8.690701 2.039442 0.0473
RISK -0.347501 0.126054 -2.756762 0.0084
HHI -0.006894 0.005246 -1.314076 0.1955
CR4 0.647776 2.398987 0.270021 0.7884
NAS 0.682714 0.298574 2.286584 0.0270
AUFEE 2.85E-05 8.87E-06 3.210925 0.0024 R-squared 0.341028 Mean dependent var 7.358600
Adjusted R-squared 0.267809 S.D. dependent var 1.202629
S.E. of regression 1.029068 Akaike info criterion 3.005314
Sum squared resid 47.65411 Schwarz criterion 3.232588
Log likelihood -70.63552 Hannan-Quinn criter. 3.092162
F-statistic 4.657641 Durbin-Watson stat 1.738140
Prob(F-statistic) 0.001644
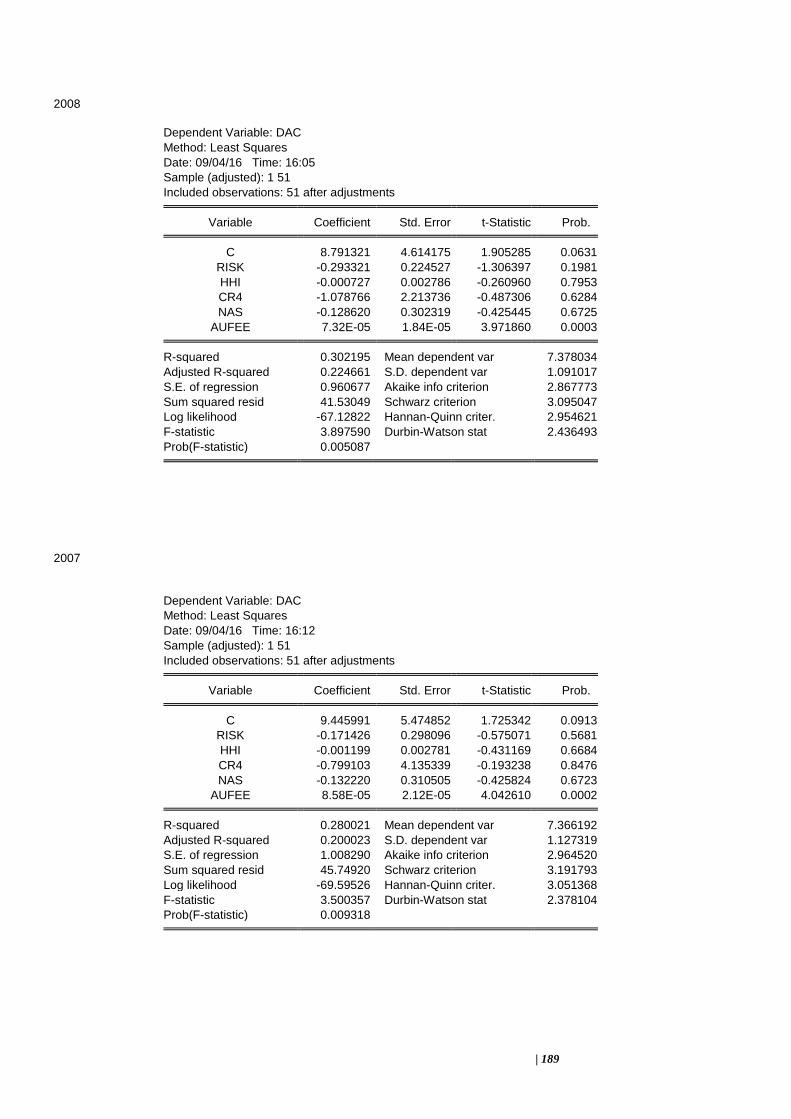
| 189
2008
Dependent Variable: DAC
Method: Least Squares
Date: 09/04/16 Time: 16:05
Sample (adjusted): 1 51
Included observations: 51 after adjustments Variable Coefficient Std. Error t-Statistic Prob. C 8.791321 4.614175 1.905285 0.0631
RISK -0.293321 0.224527 -1.306397 0.1981
HHI -0.000727 0.002786 -0.260960 0.7953
CR4 -1.078766 2.213736 -0.487306 0.6284
NAS -0.128620 0.302319 -0.425445 0.6725
AUFEE 7.32E-05 1.84E-05 3.971860 0.0003 R-squared 0.302195 Mean dependent var 7.378034
Adjusted R-squared 0.224661 S.D. dependent var 1.091017
S.E. of regression 0.960677 Akaike info criterion 2.867773
Sum squared resid 41.53049 Schwarz criterion 3.095047
Log likelihood -67.12822 Hannan-Quinn criter. 2.954621
F-statistic 3.897590 Durbin-Watson stat 2.436493
Prob(F-statistic) 0.005087
2007
Dependent Variable: DAC
Method: Least Squares
Date: 09/04/16 Time: 16:12
Sample (adjusted): 1 51
Included observations: 51 after adjustments Variable Coefficient Std. Error t-Statistic Prob. C 9.445991 5.474852 1.725342 0.0913
RISK -0.171426 0.298096 -0.575071 0.5681
HHI -0.001199 0.002781 -0.431169 0.6684
CR4 -0.799103 4.135339 -0.193238 0.8476
NAS -0.132220 0.310505 -0.425824 0.6723
AUFEE 8.58E-05 2.12E-05 4.042610 0.0002 R-squared 0.280021 Mean dependent var 7.366192
Adjusted R-squared 0.200023 S.D. dependent var 1.127319
S.E. of regression 1.008290 Akaike info criterion 2.964520
Sum squared resid 45.74920 Schwarz criterion 3.191793
Log likelihood -69.59526 Hannan-Quinn criter. 3.051368
F-statistic 3.500357 Durbin-Watson stat 2.378104
Prob(F-statistic) 0.009318

| 190
2006
Dependent Variable: DAC
Method: Least Squares
Date: 09/04/16 Time: 16:39
Sample (adjusted): 1 51
Included observations: 51 after adjustments Variable Coefficient Std. Error t-Statistic Prob. C 10.46396 4.670774 2.240305 0.0301
RISK 0.058097 0.170101 0.341545 0.7343
HHI -0.000910 0.002000 -0.455150 0.6512
CR4 -3.175906 4.721329 -0.672672 0.5046
NAS -0.134709 0.290926 -0.463035 0.6456
AUFEE 7.96E-05 2.46E-05 3.236049 0.0023 R-squared 0.260966 Mean dependent var 7.374683
Adjusted R-squared 0.178852 S.D. dependent var 1.047513
S.E. of regression 0.949227 Akaike info criterion 2.843794
Sum squared resid 40.54647 Schwarz criterion 3.071068
Log likelihood -66.51675 Hannan-Quinn criter. 2.930642
F-statistic 3.178068 Durbin-Watson stat 2.264265
Prob(F-statistic) 0.015326
2005
Dependent Variable: DAC
Method: Least Squares
Date: 09/04/16 Time: 16:43
Sample (adjusted): 1 51
Included observations: 51 after adjustments Variable Coefficient Std. Error t-Statistic Prob. C 14.45872 6.198854 2.332482 0.0242
RISK -0.587750 0.304276 -1.931633 0.0597
HHI -0.002996 0.001647 -1.819789 0.0754
CR4 -2.116879 8.695154 -0.243455 0.8088
NAS -0.233595 0.344701 -0.677673 0.5014
AUFEE 0.000128 3.37E-05 3.804981 0.0004 R-squared 0.293266 Mean dependent var 7.161570
Adjusted R-squared 0.214739 S.D. dependent var 1.313843
S.E. of regression 1.164261 Akaike info criterion 3.252181
Sum squared resid 60.99768 Schwarz criterion 3.479455
Log likelihood -76.93063 Hannan-Quinn criter. 3.339029
F-statistic 3.734627 Durbin-Watson stat 2.667983
Prob(F-statistic) 0.006514

| 191
2004
Dependent Variable: DAC
Method: Least Squares
Date: 09/04/16 Time: 16:48
Sample (adjusted): 1 51
Included observations: 51 after adjustments Variable Coefficient Std. Error t-Statistic Prob. C 3.976712 2.910514 1.366326 0.1786
RISK -0.698172 0.316958 -2.202726 0.0328
HHI 0.001499 0.001065 1.407977 0.1660
CR4 0.004128 2.846535 0.001450 0.9988
NAS -0.154937 0.303482 -0.510530 0.6122
AUFEE 0.000155 3.38E-05 4.592627 0.0000 R-squared 0.391104 Mean dependent var 7.165553
Adjusted R-squared 0.323449 S.D. dependent var 1.253341
S.E. of regression 1.030907 Akaike info criterion 3.008885
Sum squared resid 47.82458 Schwarz criterion 3.236159
Log likelihood -70.72657 Hannan-Quinn criter. 3.095733
F-statistic 5.780857 Durbin-Watson stat 1.966974
Prob(F-statistic) 0.000333
2003
Dependent Variable: DAC
Method: Least Squares
Date: 09/04/16 Time: 16:52
Sample (adjusted): 1 51
Included observations: 51 after adjustments Variable Coefficient Std. Error t-Statistic Prob. C 6.563514 2.510835 2.614076 0.0121
RISK -0.301988 0.271190 -1.113565 0.2714
HHI -0.000329 0.000897 -0.366562 0.7157
CR4 1.474633 2.318599 0.636002 0.5280
NAS -0.203798 0.263252 -0.774155 0.4429
AUFEE 0.000136 3.50E-05 3.881105 0.0003 R-squared 0.251819 Mean dependent var 7.068261
Adjusted R-squared 0.168688 S.D. dependent var 0.991268
S.E. of regression 0.903802 Akaike info criterion 2.745718
Sum squared resid 36.75860 Schwarz criterion 2.972991
Log likelihood -64.01580 Hannan-Quinn criter. 2.832566
F-statistic 3.029177 Durbin-Watson stat 2.353329
Prob(F-statistic) 0.019318

| 192
2002
2001
Dependent Variable: DAC
Method: Least Squares
Date: 09/04/16 Time: 17:01
Sample (adjusted): 1 51
Included observations: 51 after adjustments Variable Coefficient Std. Error t-Statistic Prob. C 4.196820 5.767345 0.727687 0.4706
RISK -0.114880 0.135745 -0.846295 0.4019
HHI 0.003049 0.003815 0.799162 0.4284
CR4 -2.550441 3.750801 -0.679972 0.5000
NAS 0.508003 0.240594 2.111455 0.0403
AUFEE 4.94E-05 2.53E-05 1.950074 0.0574 R-squared 0.205272 Mean dependent var 7.005499
Adjusted R-squared 0.116969 S.D. dependent var 0.863984
S.E. of regression 0.811883 Akaike info criterion 2.531211
Sum squared resid 29.66195 Schwarz criterion 2.758484
Log likelihood -58.54587 Hannan-Quinn criter. 2.618059
F-statistic 2.324635 Durbin-Watson stat 1.565351
Prob(F-statistic) 0.058269
Dependent Variable: DAC
Dependent Variable:DAC
Method: Least Squares
Date: 09/04/16 Time: 16:57
Sample (adjusted): 1 51
Included observations: 51 after adjustments Variable Coefficient Std. Error t-Statistic Prob. C 5.600867 2.100022 2.667051 0.0106
RISK -0.123320 0.249070 -0.495120 0.6229
HHI -0.000106 0.001052 -0.100753 0.9202
CR4 2.029353 2.784843 0.728714 0.4700
NAS -0.021909 0.325502 -0.067307 0.9466
AUFEE 8.79E-05 4.82E-05 1.823912 0.0748 R-squared 0.086678 Mean dependent var 6.979948
Adjusted R-squared -0.014802 S.D. dependent var 1.103205
S.E. of regression 1.111339 Akaike info criterion 3.159140
Sum squared resid 55.57838 Schwarz criterion 3.386413
Log likelihood -74.55807 Hannan-Quinn criter. 3.245988
F-statistic 0.854141 Durbin-Watson stat 2.383871
Prob(F-statistic) 0.519134

| 193
Method: Panel Least Squares
Date: 09/04/16 Time: 17:19
Sample: 2001 2015
Periods included: 15
Cross-sections included: 52
Total panel (unbalanced) observations: 777 Variable Coefficient Std. Error t-Statistic Prob. C 0.604573 0.216567 2.791624 0.0054
AUDFZ -0.009208 0.042021 -0.219122 0.8266
AUTEN -0.000780 0.015685 -0.049739 0.9603
FSIZE 0.428007 0.013613 31.44183 0.0000
FISY 0.139584 0.053336 2.617044 0.0090
AUIND -6.44E-09 1.68E-06 -0.003830 0.9969 R-squared 0.634754 Mean dependent var 7.350720
Adjusted R-squared 0.632385 S.D. dependent var 1.138461
S.E. of regression 0.690263 Akaike info criterion 2.104205
Sum squared resid 367.3533 Schwarz criterion 2.140154
Log likelihood -811.4835 Hannan-Quinn criter. 2.118034
F-statistic 267.9807 Durbin-Watson stat 1.484147
Prob(F-statistic) 0.000000
Heteroskedasticity Test: Breusch-Pagan-Godfrey
F-statistic 2.661012 Prob. F(5,771) 0.0214
Obs*R-squared 13.18114 Prob. Chi-Square(5) 0.0217
Scaled explained SS 24.38375 Prob. Chi-Square(5) 0.0002
Test Equation:
Dependent Variable: RESID^2
Method: Least Squares
Date: 09/04/16 Time: 17:23
Sample: 1 780
Included observations: 777 Variable Coefficient Std. Error t-Statistic Prob. C 1.056856 0.286196 3.692769 0.0002
AUDFZ -0.101646 0.055531 -1.830433 0.0676
AUTEN -0.020682 0.020727 -0.997813 0.3187
FSIZE -0.031607 0.017989 -1.756971 0.0793
FISY 0.081032 0.070485 1.149639 0.2506
AUIND -1.48E-06 2.22E-06 -0.666801 0.5051 R-squared 0.016964 Mean dependent var 0.472784
Adjusted R-squared 0.010589 S.D. dependent var 0.917060
S.E. of regression 0.912192 Akaike info criterion 2.661760
Sum squared resid 641.5447 Schwarz criterion 2.697709
Log likelihood -1028.094 Hannan-Quinn criter. 2.675589
F-statistic 2.661012 Durbin-Watson stat 1.751423
Prob(F-statistic) 0.021426

| 194
Ramsey RESET Test
Equation: UNTITLED
Specification: DAC C AUDFZ AUTEN FSIZE FISY AUIND
Omitted Variables: Squares of fitted values Value df Probability
t-statistic 2.099827 770 0.0361
F-statistic 4.409274 (1, 770) 0.0361
Likelihood ratio 4.436667 1 0.0352 F-test summary:
Sum of Sq. df Mean
Squares
Test SSR 2.091609 1 2.091609
Restricted SSR 367.3533 771 0.476463
Unrestricted SSR 365.2616 770 0.474366
Unrestricted SSR 365.2616 770 0.474366 LR test summary:
Value df
Restricted LogL -811.4835 771
Unrestricted LogL -809.2652 770
Unrestricted Test Equation:
Dependent Variable: DAC
Method: Least Squares
Date: 09/04/16 Time: 17:24
Sample: 1 780
Included observations: 777 Variable Coefficient Std. Error t-Statistic Prob. C 2.634294 0.990473 2.659633 0.0080
AUDFZ 0.014140 0.043377 0.325984 0.7445
AUTEN -0.001949 0.015660 -0.124430 0.9010
FSIZE 0.152952 0.131692 1.161439 0.2458
FISY 0.049867 0.068248 0.730672 0.4652
AUIND -1.79E-07 1.68E-06 -0.106385 0.9153
FITTED^2 0.041950 0.019978 2.099827 0.0361 R-squared 0.636833 Mean dependent var 7.350720
Adjusted R-squared 0.634003 S.D. dependent var 1.138461
S.E. of regression 0.688742 Akaike info criterion 2.101069
Sum squared resid 365.2616 Schwarz criterion 2.143010
Log likelihood -809.2652 Hannan-Quinn criter. 2.117203
F-statistic 225.0396 Durbin-Watson stat 1.515219
Prob(F-statistic) 0.000000

| 195
Breusch-Godfrey Serial Correlation LM Test: F-statistic 28.17932 Prob. F(2,769) 0.0000
Obs*R-squared 53.05652 Prob. Chi-Square(2) 0.0000
Test Equation:
Dependent Variable: RESID
Method: Least Squares
Date: 09/04/16 Time: 17:25
Sample: 1 780
Included observations: 777
Presample and interior missing value lagged residuals set to zero. Variable Coefficient Std. Error t-Statistic Prob. C 0.171721 0.210786 0.814668 0.4155
AUDFZ 0.001830 0.040614 0.045061 0.9641
AUTEN 0.007480 0.015194 0.492286 0.6227
FSIZE -0.012561 0.013280 -0.945860 0.3445
FISY -0.006435 0.051565 -0.124800 0.9007
AUIND 2.66E-07 1.62E-06 0.163457 0.8702
RESID(-1) 0.239141 0.036237 6.599289 0.0000
RESID(-2) 0.067198 0.036150 1.858863 0.0634 R-squared 0.068284 Mean dependent var 2.45E-15
Adjusted R-squared 0.059803 S.D. dependent var 0.688036
S.E. of regression 0.667146 Akaike info criterion 2.038626
Sum squared resid 342.2690 Schwarz criterion 2.086558
Log likelihood -784.0061 Hannan-Quinn criter. 2.057064
F-statistic 8.051233 Durbin-Watson stat 2.010357
Prob(F-statistic) 0.000000

| 196
DAC AUDFZ AUTEN FSIZE FISY AUIND
Mean 7.350720 0.662806 6.225225 15.55988 0.680824 3.686176
Median 7.332971 1.000000 5.000000 15.29000 1.000000 3.720159
Maximum 11.49805 11.00000 15.00000 23.56000 1.000000 5.281033
Minimum 4.009278 0.000000 1.000000 11.14000 0.000000 2.204120
Std. Dev. 1.138461 0.604595 4.077153 2.104338 0.466458 0.541230
Skewness 0.386167 6.095772 0.535509 0.682706 -0.775805 -0.038723
Kurtosis 3.620168 110.8381 2.205708 3.789285 1.601874 2.579848
Jarque-Bera 31.76334 381303.0 57.56200 80.52706 141.2279 5.909274
Probability 0.000000 0.000000 0.000000 0.000000 0.000000 0.002098
Sum 5711.510 515.0000 4837.000 12090.03 529.0000 2864.159
Sum Sq. Dev. 1005.768 283.6551 12899.59 3436.312 168.8443 227.3134
Observations 780 780 780 780 780 780
agric
Dependent Variable: DAC
Method: Least Squares
Date: 09/04/16 Time: 17:57
Sample: 1 60
Included observations: 60 Variable Coefficient Std. Error t-Statistic Prob. C -1.399818 1.448660 -0.966285 0.3382
AUDFZ 0.023303 0.328142 0.071015 0.9436
AUTEN 0.043652 0.042322 1.031437 0.3069
FSIZE 0.633904 0.106408 5.957296 0.0000
FISY -0.766850 0.458492 -1.672549 0.1002
AUIND -6.11E-05 1.86E-05 -3.284114 0.0018 R-squared 0.417977 Mean dependent var 7.237214
Adjusted R-squared 0.364086 S.D. dependent var 0.851684
S.E. of regression 0.679169 Akaike info criterion 2.158745
Sum squared resid 24.90860 Schwarz criterion 2.368180
Log likelihood -58.76236 Hannan-Quinn criter. 2.240667
F-statistic 7.755962 Durbin-Watson stat 1.785040
Prob(F-statistic) 0.000015

| 197
CONSUMER GOODS
Dependent Variable: DAC
Method: Least Squares
Date: 09/04/16 Time: 21:32
Sample (adjusted): 1 299
Included observations: 298 after adjustments Variable Coefficient Std. Error t-Statistic Prob. C 0.523823 0.424361 1.234380 0.2181
AUDFZ -0.023679 0.057626 -0.410904 0.6814
AUTEN -0.004092 0.011456 -0.357157 0.7212
FSIZE 0.434915 0.029024 14.98477 0.0000
FISY 0.103496 0.078819 1.313083 0.1902
AUIND 2.71E-06 4.47E-06 0.606385 0.5447 R-squared 0.632655 Mean dependent var 7.517676
Adjusted R-squared 0.626365 S.D. dependent var 1.100675
S.E. of regression 0.672795 Akaike info criterion 2.065177
Sum squared resid 132.1747 Schwarz criterion 2.139615
Log likelihood -301.7113 Hannan-Quinn criter. 2.094974
F-statistic 100.5787 Durbin-Watson stat 1.570989
Prob(F-statistic) 0.000000
HEALTH
Dependent Variable: DAC
Method: Least Squares
Date: 09/04/16 Time: 21:38
Sample: 1 75
Included observations: 74 Variable Coefficient Std. Error t-Statistic Prob. C 3.056112 1.264385 2.417074 0.0183
AUDFZ -0.667689 0.260832 -2.559838 0.0127
AUTEN -0.008022 0.021104 -0.380102 0.7051
FSIZE 0.298640 0.067969 4.393784 0.0000
FISY 0.031804 0.285583 0.111367 0.9117
AUIND 2.42E-05 1.89E-05 1.281803 0.2043 R-squared 0.486942 Mean dependent var 7.299284
Adjusted R-squared 0.449217 S.D. dependent var 0.908083
S.E. of regression 0.673932 Akaike info criterion 2.126229
Sum squared resid 30.88450 Schwarz criterion 2.313045
Log likelihood -72.67046 Hannan-Quinn criter. 2.200752
F-statistic 12.90771 Durbin-Watson stat 1.649990
Prob(F-statistic) 0.000000

| 198

| 199
Dependent Variable: DAC
Method: Least Squares
Date: 09/04/16 Time: 21:41
Sample: 1 244
Included observations: 244 Variable Coefficient Std. Error t-Statistic Prob. C 0.575139 0.330924 1.737980 0.0835
AUDFZ -0.280449 0.103255 -2.716092 0.0071
AUTEN 0.013380 0.012535 1.067403 0.2869
FSIZE 0.423354 0.021081 20.08202 0.0000
FISY 0.310607 0.127157 2.442704 0.0153
AUIND 8.59E-06 8.15E-06 2.053451 0.0132 R-squared 0.730727 Mean dependent var 7.284941
Adjusted R-squared 0.725070 S.D. dependent var 1.292688
S.E. of regression 0.677805 Akaike info criterion 2.084369
Sum squared resid 109.3419 Schwarz criterion 2.170365
Log likelihood -248.2930 Hannan-Quinn criter. 2.119003
F-statistic 129.1723 Durbin-Watson stat 1.644341
Prob(F-statistic) 0.000000
Breusch-Godfrey Serial Correlation LM Test: F-statistic 331.3572 Prob. F(2,771) 0.0000
Obs*R-squared 359.6196 Prob. Chi-Square(2) 0.0000
Test Equation:
Dependent Variable: RESID
Method: Least Squares
Date: 08/29/16 Time: 14:24
Sample: 1 780
Included observations: 778
Presample and interior missing value lagged residuals set to zero. Variable Coefficient Std. Error t-Statistic Prob. C 0.364524 0.584046 0.624136 0.5327
RISK -0.007799 0.020777 -0.375375 0.7075
HHI -5.92E-05 8.87E-05 -0.667655 0.5046
CR4 -0.386498 0.943243 -0.409754 0.6821
ADFEE -1.55E-06 1.62E-06 -0.955953 0.3394
RESID(-1) 0.543231 0.035418 15.33788 0.0000
RESID(-2) 0.186322 0.035424 5.259844 0.0000 R-squared 0.462236 Mean dependent var 1.00E-15
Adjusted R-squared 0.458051 S.D. dependent var 1.032419
S.E. of regression 0.760038 Akaike info criterion 2.298059
Sum squared resid 445.3738 Schwarz criterion 2.339958
Log likelihood -886.9451 Hannan-Quinn criter. 2.314176
F-statistic 110.4524 Durbin-Watson stat 2.032867
Prob(F-statistic) 0.000000

| 200
Dependent Variable: DAC
Method: Panel Least Squares
Date: 09/02/16 Time: 21:05
Sample: 2001 2015
Periods included: 15
Cross-sections included: 52
Total panel (unbalanced) observations: 779 Variable Coefficient Std. Error t-Statistic Prob. C 0.524775 0.222060 2.363217 0.0184
AUDFZ -0.009167 0.043538 -0.210549 0.8333
AUTEN 0.000942 0.015666 0.060104 0.9521
FSIZE 0.431182 0.013571 31.77264 0.0000
FISY 0.132197 0.055880 2.365738 0.0182
RISK 0.033638 0.019365 1.737055 0.0828
AUIND 0.014738 0.062869 0.234425 0.8147 R-squared 0.636222 Mean dependent var 7.350720
Adjusted R-squared 0.633387 S.D. dependent var 1.138461
S.E. of regression 0.689322 Akaike info criterion 2.102751
Sum squared resid 365.8765 Schwarz criterion 2.144692
Log likelihood -809.9187 Hannan-Quinn criter. 2.118885
F-statistic 224.4457 Durbin-Watson stat 1.492691
Prob(F-statistic) 0.000000

| 201
DAC AUDFZ AUTEN FSIZE FISY AUIND
Mean 7.350720 0.662806 6.225225 15.55988 0.680824 10198.39
Median 7.332971 1.000000 5.000000 15.29000 1.000000 5250.000
Maximum 11.49805 11.00000 15.00000 23.56000 1.000000 191000.0
Minimum 4.009278 0.000000 1.000000 11.14000 0.000000 160.0000
Std. Dev. 1.138461 0.604595 4.077153 2.104338 0.466458 17367.13
Skewness 0.386167 6.095772 0.535509 0.682706 -0.775805 5.972595
Kurtosis 3.620168 110.8381 2.205708 3.789285 1.601874 50.09559
Jarque-Bera 31.76334 381303.0 57.56200 80.52706 141.2279 76427.07
Probability 0.000000 0.000000 0.000000 0.000000 0.000000 0.000000
Sum 5711.510 515.0000 4837.000 12090.03 529.0000 7924153.
Sum Sq. Dev. 1005.768 283.6551 12899.59 3436.312 168.8443 2.34E+11
Observations 780 780 780 780 780 780
DAC RISK HHI CR4 NAS ADFEE
Mean 7.352714 0.723876 1601.918 0.640530 0.502584 10233.60
Median 7.333287 0.570000 1603.000 0.630000 1.000000 5250.000
Maximum 11.49805 16.57000 2224.000 0.690000 1.000000 191000.0
Minimum 4.009278 -4.150000 1002.000 0.580000 0.000000 160.0000
Std. Dev. 1.139344 1.317917 323.8828 0.031242 0.500317 17391.65
Skewness 0.384361 8.223116 0.058536 -0.261338 -0.010336 5.964934
Kurtosis 3.616600 84.73349 2.441269 2.006918 1.000107 49.95865
Jarque-Bera 31.31887 224164.6 10.50982 40.61568 129.0000 75704.84
Probability 0.000000 0.000000 0.005222 0.000000 0.000000 0.000000
Sum 5691.001 560.2800 1239884. 495.7700 389.0000 7920803.
Sum Sq. Dev. 1003.436 1342.628 81087776 0.754483 193.4948 2.34E+11
Observations 774 774 774 774 774 774
DAC RISK HHI CR4 NAS ADFEE
DAC 1.000000 -0.135111 -0.032308 -0.152886 -0.006516 0.395066
RISK -0.135111 1.000000 -0.044252 -0.025698 0.111110 -0.023219
HHI -0.032308 -0.044252 1.000000 0.309806 0.003397 -0.093596
CR4 -0.152886 -0.025698 0.309806 1.000000 0.009430 -0.244331
NAS -0.006516 0.111110 0.003397 0.009430 1.000000 -0.049332
ADFEE 0.395066 -0.023219 -0.093596 -0.244331 -0.049332 1.000000

| 202
Variance Inflation Factors
Date: 09/04/16 Time: 23:08
Sample: 1 780
Included observations: 778 Coefficient Uncentered Centered
Variable Variance VIF VIF C 0.631654 458.6755 NA
RISK 0.000800 1.306295 1.003183
HHI 1.46E-08 28.31466 1.109014
CR4 1.648432 492.5470 1.168562
ADFEE 4.88E-12 1.433851 1.065921
Dependent Variable: DAC
Method: Panel Least Squares
Date: 09/05/16 Time: 11:48
Sample: 2001 2015
Periods included: 15
Cross-sections included: 52
Total panel (balanced) observations: 780 Variable Coefficient Std. Error t-Statistic Prob. C 8.762923 0.746439 11.73964 0.0000
RISK -0.119694 0.028211 -4.242848 0.0000
HHI 7.71E-05 0.000119 0.647617 0.5174
CR4 -2.845013 1.202152 -2.366600 0.0182
NAS 0.246019 0.074102 3.320020 0.0009
AUFEE 2.42E-05 2.19E-06 11.07122 0.0000 R-squared 0.189653 Mean dependent var 7.348121
Adjusted R-squared 0.184418 S.D. dependent var 1.137964
S.E. of regression 1.027690 Akaike info criterion 2.900167
Sum squared resid 817.4580 Schwarz criterion 2.936008
Log likelihood -1125.065 Hannan-Quinn criter. 2.913952
F-statistic 36.22925 Durbin-Watson stat 2.128898
Prob(F-statistic) 0.000000

| 203
Breusch-Godfrey Serial Correlation LM Test: F-statistic 53.71602 Prob. F(2,237) 0.0000
Obs*R-squared 76.10621 Prob. Chi-Square(2) 0.0000
Test Equation:
Dependent Variable: RESID
Method: Least Squares
Date: 09/04/16 Time: 22:55
Sample: 1 244
Included observations: 244
Presample missing value lagged residuals set to zero. Variable Coefficient Std. Error t-Statistic Prob. C 0.768738 1.033379 0.743907 0.4577
RISK -0.017168 0.020888 -0.821922 0.4119
HHI -0.000147 0.000151 -0.974948 0.3306
CR4 -0.750532 1.646416 -0.455858 0.6489
ADFEE -2.76E-06 3.29E-06 -0.838083 0.4028
RESID(-1) 0.431002 0.063611 6.775628 0.0000
RESID(-2) 0.202435 0.063760 3.174926 0.0017 R-squared 0.311911 Mean dependent var -9.23E-17
Adjusted R-squared 0.294491 S.D. dependent var 0.855080
S.E. of regression 0.718221 Akaike info criterion 2.204189
Sum squared resid 122.2543 Schwarz criterion 2.304518
Log likelihood -261.9111 Hannan-Quinn criter. 2.244596
F-statistic 17.90534 Durbin-Watson stat 2.025469
Prob(F-statistic) 0.000000
Dependent Variable: DAC
Method: Least Squares
Date: 09/05/16 Time: 13:20
Sample: 1 60
Included observations: 60 Variable Coefficient Std. Error t-Statistic Prob. C 10.41626 2.726988 3.819694 0.0003
RISK -0.106566 0.163305 -0.652558 0.5168
HHI 0.000400 0.000364 1.098826 0.2767
CR4 -5.955684 4.299687 -1.385144 0.1717
NAS 0.191825 0.249876 0.767679 0.4460
ADFEE -2.00E-06 2.11E-05 -0.094630 0.9250 R-squared 0.072440 Mean dependent var 7.237214
Adjusted R-squared -0.013446 S.D. dependent var 0.851684
S.E. of regression 0.857391 Akaike info criterion 2.624793
Sum squared resid 39.69641 Schwarz criterion 2.834228
Log likelihood -72.74380 Hannan-Quinn criter. 2.706715
F-statistic 0.843446 Durbin-Watson stat 1.059556
Prob(F-statistic) 0.524990

| 204
CONSUMER GOODS
Dependent Variable: DAC
Method: Least Squares
Date: 09/05/16 Time: 13:33
Sample: 1 300
Included observations: 300 Variable Coefficient Std. Error t-Statistic Prob. C 5.826887 1.189795 4.897386 0.0000
RISK -0.084760 0.026222 -3.232354 0.0014
HHI 5.78E-05 0.000168 0.343651 0.7314
CR4 1.596857 1.881496 0.848717 0.3967
NAS 0.064944 0.105767 0.614032 0.5397
ADFEE 4.58E-05 4.05E-06 11.29626 0.0000 R-squared 0.351433 Mean dependent var 7.517795
Adjusted R-squared 0.340403 S.D. dependent var 1.098238
S.E. of regression 0.891940 Akaike info criterion 2.628962
Sum squared resid 233.8938 Schwarz criterion 2.703038
Log likelihood -388.3443 Hannan-Quinn criter. 2.658607
F-statistic 31.86147 Durbin-Watson stat 0.943394
Prob(F-statistic) 0.000000
HEALTH
Dependent Variable: DAC
Method: Least Squares
Date: 09/05/16 Time: 14:01
Sample: 1 72
Included observations: 72 Variable Coefficient Std. Error t-Statistic Prob. C 8.042756 2.253248 3.569405 0.0007
RISK -1.934211 0.570355 -3.391240 0.0012
HHI 0.000107 0.000309 0.347670 0.7292
CR4 -0.795026 3.565148 -2.222999 0.0222
NAS -0.448995 0.205719 -2.182569 0.0327
ADFEE 7.48E-05 2.16E-05 3.460601 0.0010 R-squared 0.299136 Mean dependent var 7.282381
Adjusted R-squared 0.244381 S.D. dependent var 0.916695
S.E. of regression 0.796850 Akaike info criterion 2.465515
Sum squared resid 40.63802 Schwarz criterion 2.658243
Log likelihood -80.29301 Hannan-Quinn criter. 2.542069
F-statistic 5.463184 Durbin-Watson stat 1.179343
Prob(F-statistic) 0.000301

| 205
INDUSTRIAL GOODS
Dependent Variable: DAC
Method: Least Squares
Date: 09/05/16 Time: 14:10
Sample: 1 342
Included observations: 342 Variable Coefficient Std. Error t-Statistic Prob. C 7.672673 1.666303 4.604608 0.0000
RISK -0.596222 0.182551 -3.266052 0.0013
HHI -2.65E-05 0.000250 -2.105864 0.0218
CR4 -0.785321 2.695220 -0.291375 0.7710
NAS 0.274482 0.154926 1.771693 0.0777
ADFEE 5.90E-05 1.13E-05 5.237516 0.0000 R-squared 0.176793 Mean dependent var 7.287439
Adjusted R-squared 0.159352 S.D. dependent var 1.297674
S.E. of regression 1.189796 Akaike info criterion 3.209922
Sum squared resid 334.0852 Schwarz criterion 3.296425
Log likelihood -382.4006 Hannan-Quinn criter. 3.244769
F-statistic 10.13673 Durbin-Watson stat 1.552727
Prob(F-statistic) 0.000000