Effect of Artificial Aging on Mechanical and Tribological ... - MDPI
22
Materials 2021, 14, 4678. https://doi.org/10.3390/ma14164678 www.mdpi.com/journal/materials Article Effect of Artificial Aging on Mechanical and Tribological Properties of CAD/CAM Composite Materials Used in Dentistry Marcel Firlej 1 , Daniel Pieniak 2 , Agata M. Niewczas 3 , Agata Walczak 4 , Ivo Domagała 1 , Anna Borucka 5 , Krzysztof Przystupa 6, *, Joanna Igielska-Kalwat 1 , Wojciech Jarosz 4 and Barbara Biedziak 1 1 Department of Craniofacial Anomalies, Poznan University of Medical Sciences, Bukowska 70, 60-812 Poznan, Poland; [email protected] (M.F.); [email protected] (I.D.); [email protected] (J.I.-K.); [email protected] (B.B.) 2 Department of Mechanics and Machine Building, University of Economics and Innovations in Lublin, Projektowa 4, 20-209 Lublin, Poland; [email protected] 3 Departament of Conservative Dentistry with Endodontics, Medical University of Lublin, W. Chodźki 6, 20-093 Lublin, Poland; [email protected] 4 Departament of Fire Technology the Main School of Fire Service, Faculty of Safety Engineering and Civil Protection, Slowackiego 52/54, 01-629 Warsaw, Poland; [email protected] (A.W.); [email protected] (W.J.) 5 Faculty of Security, Logistics and Management, Military University of Technology, Gen. S. Kaliskiego 2, 00-908 Warsaw, Poland; [email protected] 6 Department of Automation, Lublin University of Technology, Nadbystrzycka 36, 20-618 Lublin, Poland * Correspondence: [email protected] Abstract: With easy-to-process 3D printing materials and fast production, the quality of dental services can be improved. In the conventional procedure, the dentist makes temporary crowns directly in the patient’s mouth, e.g., from the most commonly used bis-acrylic composites. Temporary crowns made directly in the office without the use of CAD/CAM are often of inferior quality, which directly results in impaired hygiene, poorer masticatory mechanics, greater deposition of plaque, calculus and sediment, and may adversely affect periodontal and gum health. The mechanical strength, resistance to aging and abrasion of 3D printing materials are higher than those of the soft materials used in conventional methods. This translates into durability. The patient leaves the surgery with a restoration of higher utility quality compared to the conventional method. The objective of the paper was to determine the influence of aging in artificial saliva of AM (additive manufacturing) orthodontic composites on their functional properties. For the purpose of the study, fillings well-known worldwide were selected. These were traditional UV-curable resins (M I, M II, M III, M V) and a hybrid material based on a UV-curable resin (M VI). Samples were stored in artificial saliva at 37 ± 1 °C in a thermal chamber for 6 months. Indentation hardness, frictional tests and sliding wear measurements were conducted. A comparison between various materials was made. Descriptive statistics, degradation coefficients, H 2 E, Archard wear and specific wear rate were calculated. The Weibull statistical test for indentation hardness was performed and Hertzian contact stresses for the frictional association were calculated for unaged (M I, M II, M III, M V, M VI) and aged (M I AS, M II AS, M III AS, M V AS, M VI AS) samples. M I exhibited the lowest average hardness among the unaged materials, while M III AS had the lowest average hardness among the aged materials. Comparably low hardness was demonstrated by the M I AS material. The coefficient of friction values for the aged samples were found to be higher. The lowest wear value was demonstrated by the M I material. The wear resistance of most of the tested materials deteriorated after aging. The M VI AS material had the highest increase in wear. According to the results provided, not only the chemical composition and structure, but also aging have a great impact on the indentation hardness and wear resistance of the tested orthodontic materials. Citation: Firlej, M.; Pieniak, D.; Niewczas, A.M.; Walczak, A.; Domagała, I.; Borucka, A.; Przystupa, K.; Igielska-Kalwat, J.; Jarosz, W.; Biedziak, B. Effect of Artificial Aging on Mechanical and Tribological Properties of CAD/CAM Composite Materials Used in Dentistry. Materials 2021, 14, 4678. https://doi.org/10.3390/ ma14164678 Academic Editor: Leszek Klimek Received: 14 July 2021 Accepted: 17 August 2021 Published: 19 August 2021 Publisher’s Note: MDPI stays neutral with regard to jurisdictional claims in published maps and institutional affiliations. Copyright: © 2021 by the authors. Licensee MDPI, Basel, Switzerland. This article is an open access article distributed under the terms and conditions of the Creative Commons Attribution (CC BY) license (http://creativecommons.org/licenses /by/4.0/).
-
Upload
khangminh22 -
Category
Documents
-
view
1 -
download
0
Transcript of Effect of Artificial Aging on Mechanical and Tribological ... - MDPI

Materials 2021, 14, 4678. https://doi.org/10.3390/ma14164678 www.mdpi.com/journal/materials
Article
Effect of Artificial Aging on Mechanical and Tribological Properties of CAD/CAM Composite Materials Used in Dentistry Marcel Firlej 1, Daniel Pieniak 2, Agata M. Niewczas 3, Agata Walczak 4, Ivo Domagała 1, Anna Borucka 5, Krzysztof Przystupa 6,*, Joanna Igielska-Kalwat 1, Wojciech Jarosz 4 and Barbara Biedziak 1
1 Department of Craniofacial Anomalies, Poznan University of Medical Sciences, Bukowska 70, 60-812 Poznan, Poland; [email protected] (M.F.); [email protected] (I.D.); [email protected] (J.I.-K.); [email protected] (B.B.)
2 Department of Mechanics and Machine Building, University of Economics and Innovations in Lublin, Projektowa 4, 20-209 Lublin, Poland; [email protected]
3 Departament of Conservative Dentistry with Endodontics, Medical University of Lublin, W. Chodźki 6, 20-093 Lublin, Poland; [email protected]
4 Departament of Fire Technology the Main School of Fire Service, Faculty of Safety Engineering and Civil Protection, Slowackiego 52/54, 01-629 Warsaw, Poland; [email protected] (A.W.); [email protected] (W.J.)
5 Faculty of Security, Logistics and Management, Military University of Technology, Gen. S. Kaliskiego 2, 00-908 Warsaw, Poland; [email protected]
6 Department of Automation, Lublin University of Technology, Nadbystrzycka 36, 20-618 Lublin, Poland * Correspondence: [email protected]
Abstract: With easy-to-process 3D printing materials and fast production, the quality of dental services can be improved. In the conventional procedure, the dentist makes temporary crowns directly in the patient’s mouth, e.g., from the most commonly used bis-acrylic composites. Temporary crowns made directly in the office without the use of CAD/CAM are often of inferior quality, which directly results in impaired hygiene, poorer masticatory mechanics, greater deposition of plaque, calculus and sediment, and may adversely affect periodontal and gum health. The mechanical strength, resistance to aging and abrasion of 3D printing materials are higher than those of the soft materials used in conventional methods. This translates into durability. The patient leaves the surgery with a restoration of higher utility quality compared to the conventional method. The objective of the paper was to determine the influence of aging in artificial saliva of AM (additive manufacturing) orthodontic composites on their functional properties. For the purpose of the study, fillings well-known worldwide were selected. These were traditional UV-curable resins (M I, M II, M III, M V) and a hybrid material based on a UV-curable resin (M VI). Samples were stored in artificial saliva at 37 ± 1 °C in a thermal chamber for 6 months. Indentation hardness, frictional tests and sliding wear measurements were conducted. A comparison between various materials was made. Descriptive statistics, degradation coefficients, H2E, Archard wear and specific wear rate were calculated. The Weibull statistical test for indentation hardness was performed and Hertzian contact stresses for the frictional association were calculated for unaged (M I, M II, M III, M V, M VI) and aged (M I AS, M II AS, M III AS, M V AS, M VI AS) samples. M I exhibited the lowest average hardness among the unaged materials, while M III AS had the lowest average hardness among the aged materials. Comparably low hardness was demonstrated by the M I AS material. The coefficient of friction values for the aged samples were found to be higher. The lowest wear value was demonstrated by the M I material. The wear resistance of most of the tested materials deteriorated after aging. The M VI AS material had the highest increase in wear. According to the results provided, not only the chemical composition and structure, but also aging have a great impact on the indentation hardness and wear resistance of the tested orthodontic materials.
Citation: Firlej, M.; Pieniak, D.;
Niewczas, A.M.; Walczak, A.;
Domagała, I.; Borucka, A.;
Przystupa, K.; Igielska-Kalwat, J.;
Jarosz, W.; Biedziak, B. Effect of
Artificial Aging on Mechanical and
Tribological Properties of
CAD/CAM Composite Materials
Used in Dentistry. Materials 2021, 14,
4678. https://doi.org/10.3390/
ma14164678
Academic Editor: Leszek Klimek
Received: 14 July 2021
Accepted: 17 August 2021
Published: 19 August 2021
Publisher’s Note: MDPI stays
neutral with regard to jurisdictional
claims in published maps and
institutional affiliations.
Copyright: © 2021 by the authors.
Licensee MDPI, Basel, Switzerland.
This article is an open access article
distributed under the terms and
conditions of the Creative Commons
Attribution (CC BY) license
(http://creativecommons.org/licenses
/by/4.0/).

Materials 2021, 14, 4678 2 of 22
Keywords: dental materials; composites; CAD/CAM; 3D printing; artificial saliva; sliding wear; indentation hardness; coefficient of friction
1. Introduction Dental treatment is often multi-step in nature and requires long-term temporary
restorations intended for use over a period of several weeks to several months. For example, temporary restorations are indicated for partially edentulous patients undergoing implant treatment when the teeth adjacent to the edentulous area are restored with crowns [1]. In such cases, temporary restorations prevent loading of newly placed implants or tissue grafts during the healing phase, which is the case with removable partial dentures. Temporary restorations are indicated to protect the dental pulp and periodontal tissues, prevent lateral tooth movement, help maintain a stable tooth position, and ensure adequate chewing efficiency and smile aesthetics [2]. Sample photos covering the treatment process using this method are presented in Figure 1. Treatment planning in the CAD/CAM environment enables the removal of the teeth, insertion of the implant in place of the tooth and the closure of the extraction socket with an individual healing screw, ensuring the desired emergence profile and the shape of the gingiva suitable for a given tooth (Figure 1a–c). Temporary crowns made by 3D printing are also used in minor prosthetic rehabilitation of the patient’s masticatory organ. The patient can adapt to the planned shape and cavity of the teeth with easy-to-manufacture 3D-printed crowns, which is important in the case of rehabilitation of the entire masticatory organ and occlusal reconstruction (Figure 1d–f). In addition, this solution allows the patient to function and bite normally immediately after the procedure while the dental implants heal, which usually takes 4–9 months. The patient does not have to wear uncomfortable removable dentures of vastly inferior function and comfort compared to permanent restorations attached to the implants (Figure 1f). Temporary restorations have also become an effective diagnostic tool for evaluating the effectiveness of shape matching, as well as for checking and testing occlusion and periodontal response, and for checking the progress of healing after implantation. Specific applications of temporary restorations in dentistry include: 1. Cases of major prosthetic and orthodontic-prosthetic rehabilitation. Here, a thorough
diagnosis preceded by taking diagnostic impressions and determining the therapeutic position is necessary. The therapeutic position determines the mutual positioning of the teeth to stabilize the mandibular alignment in all planes. This requires long-term use of temporary crowns or onlays (with or without tooth preparation) to reprogram the masticatory muscles and adapt the temporomandibular joint to its new normal position. These can be cemented permanently or used as removable restorations such as bite splints worn around the clock or for a required number of hours. This type of restoration is also used in the treatment of MLD (mandibular lateral displacement/deviation), in the repositioning of the TMJ disc, in the treatment of asymmetrical or symmetrical compressions and distractions of the temporomandibular joint.
2. Cases of immediate loading of implants. By making temporary crowns for the entire dental arch before the removal of old teeth, it is possible to prepare temporary crowns using the CAD/CAM method even before implantation on the basis of photographs and the patient’s smile design. Temporary crowns can be immediately screwed on and are used in this form for at least 5–9 months. After a period of healing, they are replaced with the final restoration using the immediate implant bridge.
3. Cases of patients who undergo gingivectomy (gum resection). In these cases, temporary crowns or veneers should be used for a period of 2–4 months until the shape of the gums stabilizes, before the final dental restoration is performed.

Materials 2021, 14, 4678 3 of 22
4. Cases of patients who receive dental implants followed by individualized gum emergence and shaping profile using individual shapes generated in software and screwed to the implant for 1–9 months. Temporary restorations are often used in the oral cavity for a period of several
months, which requires high durability of the restoration [3]. As demands from patients and dentists increase, new surgical materials and techniques are developed.
In recent years, CAD-CAM additive technology including 3D printing has been increasingly used for the fabrication of temporary crowns. Digital light processing (DLP) composite materials have been widely used in this area [4–6]. The DLP 3D printing technique involves curing polymer composites with the light of a projector or an LCD screen. Due to the good quality of the reproduction of the nominal dimensions of the CAD model by the printout, and the low roughness of the printed model, the DLP technology is now increasingly used in dentistry to make extremely accurate and efficient reconstructive elements. Such models and devices are particularly applicable in orthodontics and prosthetics [7–11]. Special polymer composites are used as structural materials for temporary crowns and orthodontic splints in particular [12,13].
Temporary restorations in the oral setting are exposed to aging factors. One of the most important factors is the humid environment, in particular due to the influence of saliva and food, as well as a relatively constant temperature. Some believe that in the structure of polymer matrix composites, water acts as a plasticizer and leads to stress relaxation and reduction of material stiffness [14]. However, the mechanism of hydrolytic degradation has not been sufficiently investigated. It is likely that chemical compounds in aqueous solution cause decomposition of the polymer network by breaking down ester bonds [15]. Degradation of the polymer network depends on the presence of specific chemical groups in the molecular structure, such as ester, amide, and urea groups [16]. The intensity of material degradation also depends on the surface condition of the restorations as well as the type and proportion of additional substances (filler particles, type of initiators) [16,17].
(a) (b)
(c) (d)

Materials 2021, 14, 4678 4 of 22
(e) (f)
Figure 1. The process of manufacturing and applying an individual patient’s emergence profile: (a) 3D printout of an individual gingival emergence profile for an implant with supports, (b) cemented gingival emergence profile for an im-plant abutment, (c) individual healing screw cemented on a prosthetic abutment, screwed to the implant in the bone (d) 3D prints of temporary crowns after removal of the structural supports that have been polished and varnished (e) 3D printed full arch temporary crowns placed on the plaster model of the patient’s jaw, (f) the effects after cementing the temporary crowns in the patient.
There are documented cases of clinical failure due to the effect of humid environment on complex CAD/CAM polymeric materials [18]. Due to the complexity of the problem of hydrolytic aging, and even more so the impact of artificial saliva of complex chemical composition, it is not possible to analytically predict the degradation of functional prop-erties of complex CAD/CAM materials. The clinical success of a material depends largely on its behavior under mechanical load and tribological processes when exposed to oral cavity conditions. Clinical studies are not yet available and in vitro studies may provide new information for clinical applications [19]. However, the results of clinical trials show no differences in the degradation of composite materials of different structures [20]. Com-paring test results obtained in different units is also difficult. Moreover, superficial obser-vations often lead to premature interpretations, mainly due to the dynamic behavior of durability curves [21]. In contrast, laboratory studies can focus on individual degradation mechanisms. Therefore, mechanical and tribological properties can be determined exper-imentally according to standardized laboratory methods for material compositions and fabrication methods independently. It was assumed that degradation at the biotribologi-cal junction does not depend only on contact stresses, but also on hydrolytic aging and chemical corrosion. For example, salivary enzymes or acids may increase wear of restor-ative materials through corrosive processes [22]. Tribological wear may be associated with non-tribological wear [23,24] and other surface layer effects, whose influence on the prop-erties of the surface layer of dental polymer composites is not obvious [24], e.g., in the paper by [25], an increase in nanoindentation hardness of composites was observed after exposure in a humid environment with physiological temperature. Therefore, unlike many other papers, tribological tests before and after artificial aging were assumed but in conditions taking into account the lubrication mechanism of saliva [26] and physiological temperature. Practical confrontation of the obtained results with those obtained by other researchers is difficult, therefore wear rates of practical importance, hardness to modulus of elasticity [27] and Archard wear [28] and specific wear rate [29] can be used. In the light of the above analysis of the problem, the aim of the paper was formulated. It was assumed that the purpose of this study is to evaluate the long-term effect of artificial saliva and temperature simulating physiological oral cavity conditions on the surface of DLP 3D printing materials used in the fabrication of temporary dental restorations. The null hy-pothesis is that they have no effect on the microindentation properties and the sliding friction and wear of resin-based DLP 3D printed CAD/CAM materials aged in artificial saliva for up to 6 months.

Materials 2021, 14, 4678 5 of 22
2. Materials and Test Method 2.1. Materials
Five materials dedicated for additive 3D printing applications in the dental industry were used in this study. These were traditional UV-curable resins (M I, M II, M III, M V) and a hybrid material based on a UV-curable resin (M VI). The chemical composition char-acteristics of the polymers used according to the manufacturers data are shown in Table 1.
Table 1. Characteristic and composition of additively manufactured polymers used for tests [30–35].
Material Brand Producer
Name of Ma-terial in the
Article Printer Chemical Composition Concentration
[% w/w]
Gr-17.1 tem-porary It Pro3dure M I ASIGA
UV MAX
7,7,9(or 7,9,9)-trimethyl-4,13-dioxo-3,14-dioxa-5,12-diazahexadecane-1,16-diyl bismethacrylate 20–50
3,6,9-trioxaundecamethylene Dimethacrylate 10–25 Phenyl bis(2,4,6-trimethylbenzoyl)-phosphine
oxide <50
Silicon dioxide <2
GR-10 guide Pro3dure M II ASIGA UV MAX
Phenyl bis(2,4,6-trimethylbenzoyl)-phosphine oxide ≤2
Esterification products: of 4,4′-isopropylidenedi-phenol, ethoxylated and 2-methylprop-2-enoic
acid ≥95
GR-17 tempo-rary Pro3dure M III ASIGA
UV MAX
7,7,9(or 7,9,9)-trimethyl-4,13-dioxo-3,14-dioxa-5,12-diazahexadecane-1,16-diyl bismethacrylate 20–50
3,6,9-trioxaundecamethylene Dimethacrylate 10–25 Phenyl bis(2,4,6-trimethylbenzoyl)-phosphine
oxide <50
Silicon dioxide <2
NextDent SG Orange NextDent M V
Phrozen Shuffle Lite 3D
Ethoxylated bisphenol A dimethacrylate ≥75 7,7,9(or 7,9,9)-trimethyl-4,13-dioxo-3,14-dioxa-
5,12-diazahexadecane-1,16-diyl bismethacrylate 30–50
Phenyl bis (2,4,6-trimethylbenzoyl)-phosphine oxide <10
NextDent C&B MFH NextDent M VI
Phrozen Shuffle Lite 3D
7,7,9(or 7,9,9)-trimethyl-4,13-dioxo-3,14-dioxa-5,12-diazahexadecane-1,16-diyl bismethacrylate 50–75
2-hydroxyethyl methacrylate <25 Silicon dioxide 1–5
diphenyl(2,4,6-trimethylbenzoyl)phosphine ox-ide 1–5
Ethoxylated bisphenol A dimethacrylate <10 ethylene dimethacrylate <10
Titanium dioxide <0.1 Mequinol; 4-methoxyphenol; hydroquinone
monomethyl ether <0.1
2.2. Sample Preparation and Aging The samples were made in the shape of cylindrical discs 30 mm in diameter and 6
mm thick and cubes 6 mm thick, 25 mm wide and 25 mm long. Samples of similar sizes were used in [36]. Tables 2 and 3 show the printing parameters of the samples for each material. All samples were sprayed with Isopropyl alcohol (IPA) for 1 min. to remove excess resin before final rinsing in Anycubic Wash & Cure. All printed samples were rinsed in 99.9% isopropyl alcohol to remove any residual uncured resin, followed by ex-posure in an Anycubic All-in-one Wash & Cure machine (Shenzhen, China) (Tables 4 and 5) [37]. The samples were then ground (P600, P1200 and P2400 grit) and polished with honing disks and diamond slurry (1 μm) on a Saphir 550 grinding and polishing machine

Materials 2021, 14, 4678 6 of 22
(ATM Gmbh, Mammelzen, Germany). In the next step, the samples were rinsed (washed) in water. The control group consisted of samples not conditioned in artificial saliva. A total of 10 disc-shaped and 10 cubical samples were made from each material. Once made, the samples, from each material separately, were stored in a tank with saline at room temperature for 7–10 days. Then half of the samples—five discs and five cuboids—were subjected to indentation and sliding wear tests. The other half of the samples were conditioned. This part of samples were immersed in artificial saliva (pH = 5.3) and aged (stored) for 6 months in conditions simulating those of the oral environment in a Q-Cell laboratory thermal chamber (Pol-Lab, Wilkowice, Poland) at 37 °C. The composition of the artificial saliva was prepared based on the PN-EN ISO 10271:2012 standard [38]: NaCl—0.4 g, KCl—0.4 g, NaHO4 x H2O—1.35 g, NaH2P—0.78 g and Na2S x 9H2O—0.005 g in 1 dm3 of solution. The conditioned samples were then subjected to indentation and sliding wear tests.
Table 2. 3D printing parameters: ASIGA MAX UV PRINTER (385 nm wavelength 3D printer with DLP technology).
No. Factory Software Pa-rameters
Heater Tem-perature [°C]
Light Inten-sity
Burn-In Lay-ers
Burn-In Ex-posure
1 Gr-17.1 LT (pro3dure) 40 6 1 0.5 2 GR-17 (pro3dure) 30 6 1 0.5 3 GR-10 guide (pro3dure) 30 6 1 0.5
Table 3. 3D printing parameters: PHROZEN SHUFFLE LITE PRINTER.
No. Material Color Layer Thick-ness [mm]
Lowering Speed Delay [ms]
1 NextDent SG Orange Orange 0.1 100 1000 2 NextDent C&B MFH N1 0.05 100 1000
Lower layers
No. Material Number of layers Exposure time [ms]
Height [mm]
Lifting speed
1 NextDent SG Orange 6 30,000 10 80 2 NextDent C&B MFH 8 40,000 6 80
Normal layers
No. Material Exposure time [ms] Height [mm) Lifting speed
1 NextDent SG Orange 13,500 9 100 2 NextDent C&B MFH 15,000 4 100
Table 4. Post-fabrication parameters: ASIGA MAX UV PRINTER (385 nm wavelength 3D printer with DLP technology) with post-curing chamber from ASIGA MAX UV PRINTER set.
No. Factory Software Parameters Rinsing in Isopropyl Alcohol (min) Post-Curing (min)
1 Gr-17.1 LT (pro3dure) 4.5 10 2 GR-17 (pro3dure) 4.5 10 3 GR-10 guide (pro3dure) 4.5 10
Table 5. Post-fabrication parameters: PHROZEN SHUFFLE LITE PRINTER with post-curing Anycubic Wash & Cure.
No. Material Color Rinsing in
Isopropylalcohol (min)
Post-Curing (min)
1 NextDent SG Orange Orange 4.5 20 2 NextDent C&B MFH N1 4.5 20
2.3. Indentation Hardness Measurements

Materials 2021, 14, 4678 7 of 22
A Micro Combi Tester universal microhardness tester (MCT, Anton Paar GmbH, Ost-fildern, Germany) was used to measure the mechanical and elastic surface parameters of the tested samples. The number of samples in each test group was 5 (n = 5). Indentation hardness HIT was determined as the ratio of the highest normal force loading the indenter Pmax to the contact area of the indenter under maximum load A, according to formula (1) [39]: 𝐻 = 𝑃𝐴 (1)
Stiffness S was determined from relationship (2) [39]: 𝑆 = 𝑑𝑃𝑑ℎ = 𝛽 ∙ 2√𝜋 ∙ 𝐸∗√𝐴 (2)
In Equation (2) the relationship was determined from the indenter force-displace-ment diagram (Figure 2). Parameter β is equal to 1 for a symmetric indenter and for a Vickers indenter the corrected value of the β parameter is β = 1.0055 [39].
The value A is a function of the depth hc and is determined from relationship (3), according to [40]: 𝐴 = 𝐹 ℎ = 24.54ℎ + 𝐶 ℎ + 𝐶 ℎ / + 𝐶 ℎ / + 𝐶 ℎ / + ⋯+ 𝐶 ℎ / (3)
In Equation (3), the calculations are based on the constant Cn, which expresses the indenter geometry. The method of determining the constant Cn is described in [41]. In stiffness calculations, there is a surface layer modulus denoted by the letter E. This quan-tity is defined by Equation (4): 1𝐸∗ = 1 − 𝜈𝐸 + 1 − 𝜈𝐸 (4)
In Equation (4), E* stands for the reduced modulus of elasticity and ν stands for the Poisson number. The value of E* takes into account the elastic deformations in both the tested sample and the indenter. This issue is further described in [39]. In contrast, Ei and νi, respectively, apply only to the indenter. The relationship (4) is a general relationship that applies to any symmetric indenter, not limited to a particular geometry such as a cone or pyramid. The Equation (4) was originally introduced for the case of elastic contact; however, it has also proven to be appropriate for the case of elastic-plastic contact [39].
Based on the stiffness S calculated from the Equation (2) and the penetration path of the indenter corresponding to the elastic deformations of the test surface—hc, the inden-tation modulus of elasticity EIT was calculated according to Equation (5): 𝐸 = √𝜋𝑆2𝛽√𝐴 ∙ ℎ𝑐 (5)
Figure 2. Ball-on-disc setup for wear testing.

Materials 2021, 14, 4678 8 of 22
2.4. Sliding Wear Sliding friction tests were performed using a universal microtribometer (CSM Instru-
ments SA., Peseux, Switzerland), in a ball-on-disc setup (Figure 2). The samples were tested in artificial saliva at a constant temperature of 37 °C. Cylindrical discs made of 3D printed materials were used as samples, while the counter-samples were beads with a diameter of Ø 6 mm. The beads were made of aluminum oxide (Al2O3). The material and diameter of the counter-sample were selected based on our own experience, according to the principles reported in [30]. During the test, the bead was stationary while the disc rotated at a frequency of 1.5 Hz. A constant load of 5 N was applied. The number of sam-ples in each test group was 5 (n = 5). The course of the coefficient of friction μ as a function of the number of load cycles was recorded. After the friction tests, cross-sectional profilo-graphs of the wear tracks were analyzed. Profile measurements were carried out with the use of Dektak 150 surface profilometer (Veeco, Plainview, NY, USA). All tested samples were measured on the plane transverse to the sliding direction. Distance between profiles was about 35 degrees, 10 measurements were made around the perimeter of the wear scar.
2.5. Statistical Analysis The statistical analysis aimed to evaluate the individual measurement results in the
analyzed groups of materials and the relationships between them. Basic descriptive sta-tistics were determined for general evaluation first. The results were grouped according to the material tested and the “before and after aging” category of the sample. For the results of the indentation test the mean value (Mean), standard deviation (Std. Dev.), min-imum (Min.) and maximum (Max.) values, sample size (N), and median (Median) are cal-culated and reported. One of the main factors affecting surface strength is the reproduci-bility of material hardness [42]. The statistical scatter of the hardness HIT measurement results was evaluated using Weibull analysis. The purpose of the analysis was to deter-mine the scale and shape parameters of the Weibull distribution. The scale parameter de-fines a characteristic hardness value, which corresponds to 63.2% of the cases in the con-sidered population. The shape parameter (Weibull modulus) can be considered as an in-dicator of the uniqueness of surface hardness. The Weibull analysis procedure has been described in, inter alia, [43,44]. For the results of the sliding wear test, the box plot shows the mean value, confidence interval and standard deviator. In order to identify signifi-cantly different groups for non-normal distributions, the Wilcoxon Rank-Sum Test was used, which is a non-parametric alternative to the multiple Student’s t-test. The Wilcoxon Rank-Sum Test is used when a variable is measured several times. The test examines the difference between pairs of measurements of the tested characteristic for each of the tested objects. This difference is used to verify the null hypothesis of equality of medians. Statis-tica 13 software (StatSoft, Tulsa, OK, USA) was used for statistical calculations.
3. Results 3.1. Indentation Hardness, Stiffness and Elasticity
Descriptive statistics of the results of the indentation hardness measurements are shown in Table 6a,b.

Materials 2021, 14, 4678 9 of 22
Table 6. (a) Descriptive statistics of indentation hardness, stiffness and indentation modulus of the surface of the tested materi-als—materials without aging; (b) Descriptive statistics of indentation hardness, stiffness and indentation modulus of the surface of the tested materials—materials after aging.
(a) Descriptive Statistics of Indentation Hardness, Stiffness and Indentation Modulus of the Surface of the Tested Materi-als—Materials without Aging
Mechanical Size
Statistical Parame-ter
Materials without Aging M I M II M III M V M VI
N (no. of. specim.) = 5 n (no. of. obs.) 25 25 25 25 25
HIT (O&P) [MPa]
Mean 78.414 84.475 81.767 254.001 116.568 Std Dev 1.437 1.445 1.795 21.086 5.63
Min. 76.06 80.087 77.102 211.728 107.606 Max. 81.377 86.927 85.799 289.394 129.209
Median 78.207 84.652 82.169 249.701 116.89 Shape (Weibull) 61.572 67.557 52.147 13.893 23.579 Scale (Weibull) 79.104 85.153 82.614 263.37 119.18
S (O&P) [mN/μm]
Mean 383.728 315.936 372.101 420.71 1170.405 Std Dev 4.023 2.557 1.971 3.103 126.55
Min. 374.736 311.198 368.443 414.862 682.258 Max. 390.423 320.156 377.42 426.686 1394.335
Median 384.018 315.211 371.749 420.5 1183.031
EIT (O&P) [GPa]
Mean 1.918 1.639 1.899 3.788 7.16 Std Dev 0.033 0.023 0.027 0.172 0.757
Min. 1.87 1.585 1.825 3.433 4.21 Max. 1.989 1.672 1.953 4.088 8.57
Median 1.911 1.638 1.9 3.742 7.229
E* (O&P) [GPa]
Mean 2.108 1.801 2.086 4.163 7.868 Std Dev 0.036 0.025 0.03 0.189 0.832
Min. 2.055 1.742 2.006 3.772 4.627 Max. 2.185 1.838 2.146 4.492 9.417
Median 2.1 1.8 2.088 4.113 7.944 (b) Descriptive statistics of indentation hardness, stiffness and indentation modulus of the surface of the tested materials—
materials after aging Mechanical
size Statistical parame-
ter Materials after aging
M I AS M II AS M III AS M V AS M VI AS N (no. of.
specim.) = 5 n (no. of. obs.) 25 25 25 25 25
HIT (O&P) [MPa]
Mean 51.565 67.722 50.664 219.804 189.726 Std Dev 2.864 3.767 2.024 5.56 6.904
Min. 46.261 60.433 46.551 207.193 178.742 Max. 55.124 72.87 54.427 228.273 203.9
Median 52.154 68.128 50.89 219.878 188.594 Shape (Weibull) 20.454 20.66 29.162 46.17 31.090 Scale (Weibull) 52.889 69.442 51.588 222.37 192.99
S (O&P) [mN/μm]
Mean 249.884 256.947 254.125 401.786 481.595 Std Dev 2.7 5.212 2.931 5.267 5.916
Min. 245.445 244.751 248.441 393.725 472.935 Max. 254.98 263.548 260.178 410.869 489.864
Median 249.783 257.835 253.171 401.018 483.139
EIT (O&P) [GPa]
Mean 1.011 1.193 1.02 3.366 3.75 Std Dev 0.038 0.056 0.031 0.07 0.11
Min. 0.941 1.073 0.956 3.208 3.602 Max. 1.067 1.268 1.07 3.48 3.956
Median 1.025 1.199 1.014 3.365 3.753
E* (O&P) [GPa]
Mean 1.112 1.311 1.121 3.698 4.121 Std Dev 0.042 0.062 0.034 0.077 0.121
Min. 1.034 1.179 1.05 3.526 3.958 Max. 1.173 1.394 1.175 3.824 4.348
Median 1.126 1.318 1.114 3.698 4.124
Materials 2021, 14, 4678 10 of 22
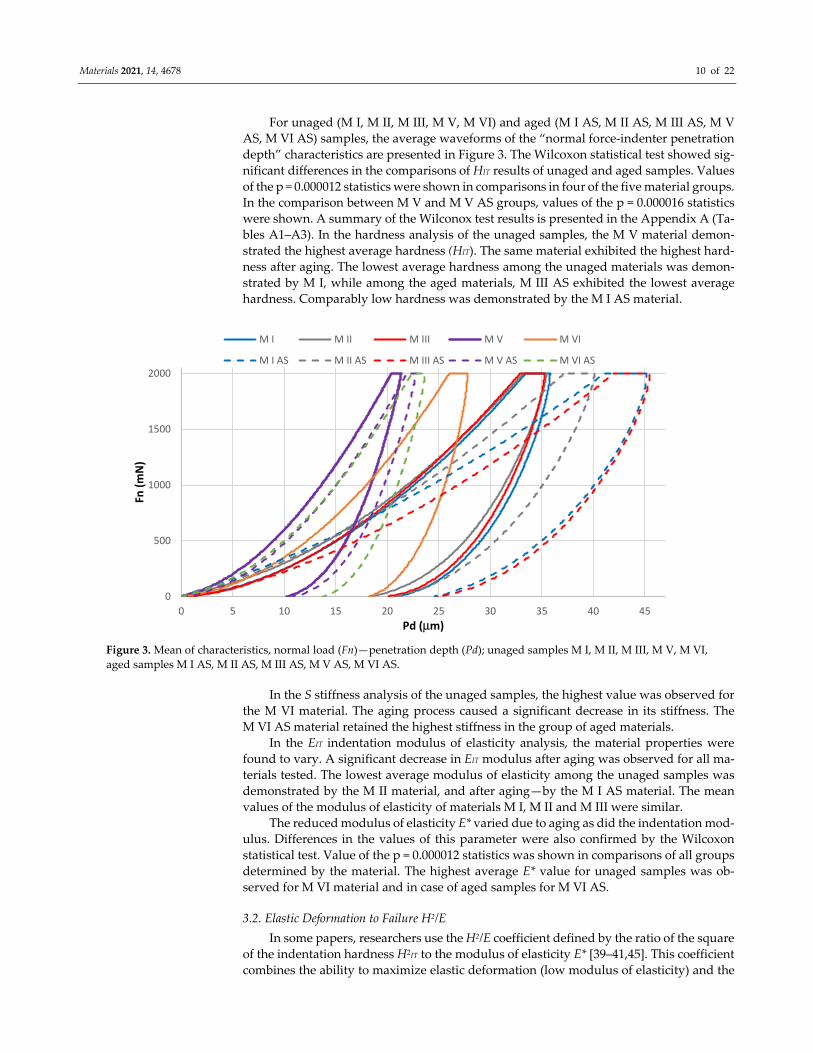
For unaged (M I, M II, M III, M V, M VI) and aged (M I AS, M II AS, M III AS, M V AS, M VI AS) samples, the average waveforms of the “normal force-indenter penetration depth” characteristics are presented in Figure 3. The Wilcoxon statistical test showed sig-nificant differences in the comparisons of HIT results of unaged and aged samples. Values of the p = 0.000012 statistics were shown in comparisons in four of the five material groups. In the comparison between M V and M V AS groups, values of the p = 0.000016 statistics were shown. A summary of the Wilconox test results is presented in the Appendix A (Ta-bles A1–A3). In the hardness analysis of the unaged samples, the M V material demon-strated the highest average hardness (HIT). The same material exhibited the highest hard-ness after aging. The lowest average hardness among the unaged materials was demon-strated by M I, while among the aged materials, M III AS exhibited the lowest average hardness. Comparably low hardness was demonstrated by the M I AS material.
Figure 3. Mean of characteristics, normal load (Fn)—penetration depth (Pd); unaged samples M I, M II, M III, M V, M VI, aged samples M I AS, M II AS, M III AS, M V AS, M VI AS.
In the S stiffness analysis of the unaged samples, the highest value was observed for the M VI material. The aging process caused a significant decrease in its stiffness. The M VI AS material retained the highest stiffness in the group of aged materials.
In the EIT indentation modulus of elasticity analysis, the material properties were found to vary. A significant decrease in EIT modulus after aging was observed for all ma-terials tested. The lowest average modulus of elasticity among the unaged samples was demonstrated by the M II material, and after aging—by the M I AS material. The mean values of the modulus of elasticity of materials M I, M II and M III were similar.
The reduced modulus of elasticity E* varied due to aging as did the indentation mod-ulus. Differences in the values of this parameter were also confirmed by the Wilcoxon statistical test. Value of the p = 0.000012 statistics was shown in comparisons of all groups determined by the material. The highest average E* value for unaged samples was ob-served for M VI material and in case of aged samples for M VI AS.
3.2. Elastic Deformation to Failure H2/E In some papers, researchers use the H2/E coefficient defined by the ratio of the square
of the indentation hardness H2IT to the modulus of elasticity E* [39–41,45]. This coefficient combines the ability to maximize elastic deformation (low modulus of elasticity) and the
0
500
1000
1500
2000
0 5 10 15 20 25 30 35 40 45
Fn (m
N)
Pd (μm)
M I M II M III M V M VI
M I AS M II AS M III AS M V AS M VI AS

Materials 2021, 14, 4678 11 of 22
ability to minimize permanent deformation (high hardness). The H2/E coefficient ex-presses “elastic deformation to failure”. The literature reveals that the higher the H2/E value, the higher the wear resistance of the material [46,47]. The results of the H2/E coeffi-cient calculation are shown in Figure 4. Among the tested materials, the highest value of the H2/E coefficient was demonstrated by the M V material, both before and after aging. Most of the aged samples had a lower H2/E coefficient value than the corresponding unaged samples. Only for the M VI material did the coefficient increase after aging. It should be noted that the M VI material had the lowest “to failure” ratio in the unaged group of samples. However, the modulus of elasticity E* did not change significantly, while the hardness of HIT increased by about 50%.
Figure 4. Summary of average coefficient H2/E values (solid bar edges—unaged samples, dashed bar edges—samples after aging).
3.3. Indentation Hardness Repeatability—Weibull Analysis The results of the shape and scale parameter calculations are presented in Table 6a,b. The highest values of the shape parameter, indicating the lowest statistical scatter of
hardness were obtained for M I, M II, M III materials without aging, and the lowest values were obtained for samples for M V and M VI materials without aging. In contrast, for the aged samples, this relationship was reversed. The M I AS, M II AS and M III AS materials had the lowest shape parameters, while the M V AS material had the highest shape pa-rameter value. The largest value of the scale parameter was obtained for the M V material without aging. The scale parameters of M I, M II and M III materials without aging were comparable, but significantly lower than the M V material. After aging, the scale parame-ter values decreased significantly, except for material M VI, for which an increase was recorded.
3.4. Analysis of Elasticity Changes In general, the degree of degradation in terms of material stiffness can be determined
using the formula presented in [48] having the following form: 𝑑𝐸(𝑛)𝑑𝑛 = −𝐴𝑐𝑛 (6)
where: A, c—constants depending on material, E(n)—residual stiffness, n—number of load cycles (time). Another way of calculating the degree of degradation based on the change in tangent
modulus of elasticity, according to [49], may also be of practical significance
2.923.96 3.21
15.50
1.73 2.393.50
2.29
13.06
8.73
02468
1012141618
M I M II M III M V M VI M I M II M III M V M VI
H2 /E

Materials 2021, 14, 4678 12 of 22
𝐷 = 1 − 𝐸 ∗ 𝐸∗ (7)
where: D—degree of degradation, E*after aging —mean value of the tangent modulus of elasticity after aging, E*—initial mean value of the tangent modulus of elasticity. Based on Equation (7), the material degradation rate was calculated based on the
change in elasticity. The results of the calculations are shown in Figure 5. The degradation of the modulus of elasticity was found to be selectively differentiated and material de-pendent. The group of M I, M III, M VI materials stands out here and is internally compa-rable. The M V composite has the lowest degree of degradation. It is also the hardest of all the materials tested and is characterized by the values of the H2/E coefficient.
Figure 5. Graph of the degree of change of aging-dependent modulus of elasticity in artificial saliva
3.5. Results of Sliding Wear Tests In friction tests in artificial saliva, the variation patterns of the sliding coefficient of
friction were recorded. Figure 6 summarizes friction representative plots depending on material and effect of aging in artificial saliva. The coefficient of friction values for the samples after aging were found to be higher. Only for the M II material were the differ-ences in coefficient of friction values found to be relatively small.
M I M II
0.47
0.27
0.46
0.11
0.48
0
0.1
0.2
0.3
0.4
0.5
0.6
M I M II M III M V M VI
D

Materials 2021, 14, 4678 13 of 22
M III M V
M VI
Figure 6. Dependence of the coefficient of friction on the number of friction cycles recorded in the ball-on-disc test.
After friction testing, wear tracks were checked using a contact profilometer. The cross-sectional area of the wear track was used as a measure of wear. Figure 7 shows se-lected profilographs for materials exhibiting diverse wear behavior. Figure 8 presents a box plot of the results of the statistical calculations of wear of the tested materials.
Without aging After aging in artificial saliva (AS) M II
M V
M VI

Materials 2021, 14, 4678 14 of 22
Figure 7. Profilographs of wear track cross-sections of the tested materials in abrasion test.
Figure 8. Box plot of the cross-sectional area of the wear track (AS—samples aged in artificial saliva).
The highest average wear value expressed by the cross section of the wear track (Fig-ure 8) was demonstrated by the M II material, for both aged and unaged samples. The lowest wear value was demonstrated by the M I material. The wear resistance of most of the tested materials deteriorated after aging. The M VI material exhibited the highest in-crease in wear after aging. This is also confirmed by the Wilcoxon test results for this ma-terial (p = 0.005062). For the M I material wear remained unchanged (p = 0.059337). Also in the case of the M V material, no differences were found in the statistical Wilcoxon test. It should be noted that a high level of wear of the M II material compared to the M I and M III materials was found, despite the similar properties determined in sample indenta-tion. It can be assumed that this is due to the different chemical structure of the M I and M III materials compared to the M II material.
3.6. Analysis of the Effect of Material Hardness on Tribological Properties In dentistry, many kinematic junctions require polymer composites with low Ar-
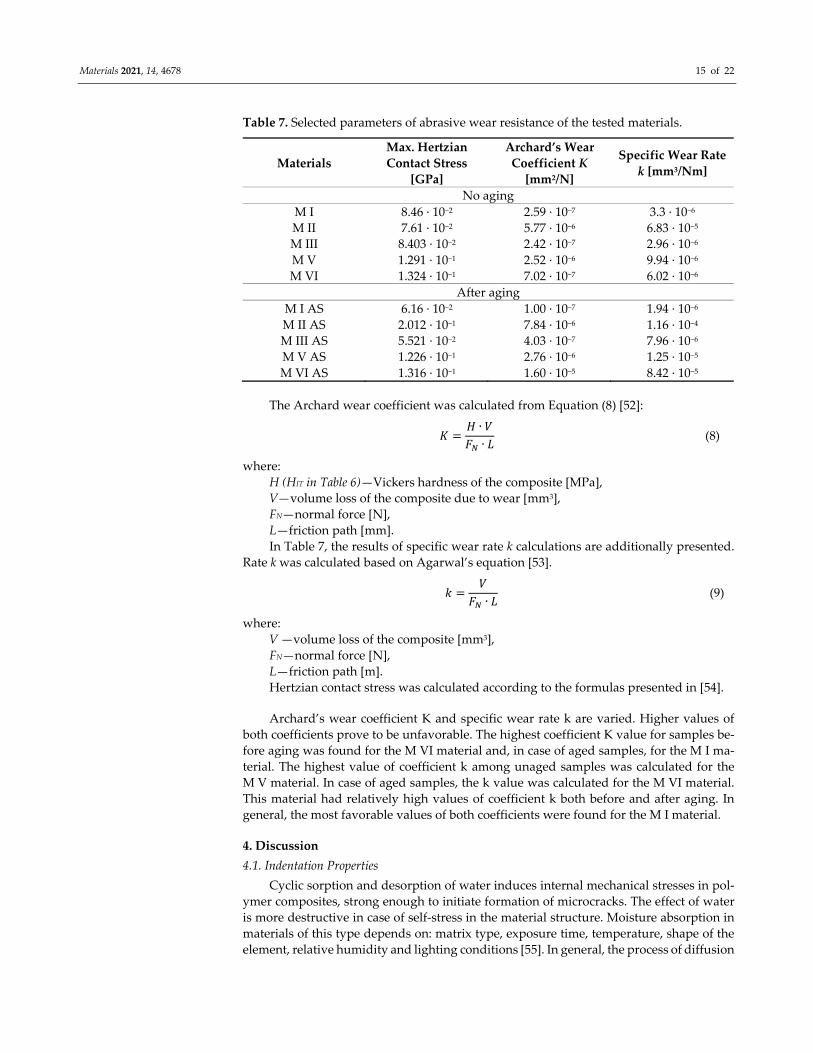
chard’s wear coefficient K. The Archard coefficient is the product of the wear rate and the material hardness [50]. According to Borrero-Lopez et al. [51] the range of Archard wear coefficient can serve as a basis for quantitative prediction of the life of wear-limiting dental materials. The results of calculating the values of these coefficients and the Hertzian con-tact stress are presented in Table 7.
Materials 2021, 14, 4678 15 of 22
Table 7. Selected parameters of abrasive wear resistance of the tested materials.
Materials Max. Hertzian Contact Stress
[GPa]
Archard’s Wear Coefficient K
[mm2/N]
Specific Wear Rate k [mm3/Nm]
No aging M I 8.46 · 10−2 2.59 · 10−7 3.3 · 10−6 M II 7.61 · 10−2 5.77 · 10−6 6.83 · 10−5 M III 8.403 · 10−2 2.42 · 10−7 2.96 · 10−6 M V 1.291 · 10−1 2.52 · 10−6 9.94 · 10−6 M VI 1.324 · 10−1 7.02 · 10−7 6.02 · 10−6
After aging M I AS 6.16 · 10−2 1.00 · 10−7 1.94 · 10−6 M II AS 2.012 · 10−1 7.84 · 10−6 1.16 · 10−4 M III AS 5.521 · 10−2 4.03 · 10−7 7.96 · 10−6 M V AS 1.226 · 10−1 2.76 · 10−6 1.25 · 10−5 M VI AS 1.316 · 10−1 1.60 · 10−5 8.42 · 10−5
The Archard wear coefficient was calculated from Equation (8) [52]: 𝐾 = 𝐻 ∙ 𝑉𝐹 ∙ 𝐿 (8)
where: H (HIT in Table 6)—Vickers hardness of the composite [MPa], V—volume loss of the composite due to wear [mm3], FN—normal force [N], L—friction path [mm]. In Table 7, the results of specific wear rate k calculations are additionally presented.
Rate k was calculated based on Agarwal’s equation [53]. 𝑘 = 𝑉𝐹 ∙ 𝐿 (9)
where: V —volume loss of the composite [mm3], FN—normal force [N], L—friction path [m]. Hertzian contact stress was calculated according to the formulas presented in [54].
Archard’s wear coefficient K and specific wear rate k are varied. Higher values of both coefficients prove to be unfavorable. The highest coefficient K value for samples be-fore aging was found for the M VI material and, in case of aged samples, for the M I ma-terial. The highest value of coefficient k among unaged samples was calculated for the M V material. In case of aged samples, the k value was calculated for the M VI material. This material had relatively high values of coefficient k both before and after aging. In general, the most favorable values of both coefficients were found for the M I material.
4. Discussion 4.1. Indentation Properties
Cyclic sorption and desorption of water induces internal mechanical stresses in pol-ymer composites, strong enough to initiate formation of microcracks. The effect of water is more destructive in case of self-stress in the material structure. Moisture absorption in materials of this type depends on: matrix type, exposure time, temperature, shape of the element, relative humidity and lighting conditions [55]. In general, the process of diffusion

Materials 2021, 14, 4678 16 of 22
of water molecules into multicomponent materials can be described by Fick’s law, accord-ing to which the diffusion rate is dependent on time and temperature [56]. The mechanism of hydrolytic degradation is not yet fully understood. It is likely that chemical compounds in an aqueous solution cause decomposition of the polymer network by breaking down ester bonds [15]. It is also believed that moisture absorption depends on the amount and type of filler particles and the type of monomers used to form the matrix [57]. The intensity of material degradation also depends on surface condition, structural defects as well as the type and proportion of additional substances (e.g., filler particles, initiators) [16]. The thesis [58] demonstrated the effect of moisture absorption on the decrease in flexural strength of materials used to make bite splints. In theses [59,60], the influence of moisture on changes of hardness of conventional dental restoration composites was shown. In the thesis by Rayyan et al. a higher water absorption was observed in traditional composites than in CAD/CAM composites [61].
In the present thesis, the problem of the effects of moisture on the composite structure in additive CAD/CAM technology was evaluated similarly to the theses [62,63]. The hard-ness of the materials tested in this study was shown to be relatively low compared to standard reconstruction composites. The mechanical properties of the tested materials were found to change differently during aging. Three materials—M I, M II and M III had similar hardness before aging. On the other hand, after aging, the hardness of M II, a ma-terial with structure different from M I and M II, decreased to a lesser extent. The degra-dation rate of this material was also lower. It should be noted that M II is a material with-out inorganic fillers. Most remarkable is the increase in hardness of the M VI material after aging, which was accompanied by a significant decrease in modulus of elasticity. This is probably due to the way these parameters are determined according to Oliver&Pharr [39]. In this case, the elasticity test results translate into a relatively high value of degradation coefficient D. The increase in coefficient H2/E of the M VI material after aging, caused mainly by a significant increase in indentation hardness, may be related to its structure. It is the material with the most complex composition among the tested materials, classified as a micro-hybrid material with microfiller [35]. This phenomenon can be explained based on the artificial aging time adopted in the study. Drummond et al. [64] found that when water is absorbed into the resin matrix, the composite becomes more flexible. This can cause a sharp increase in some of its mechanical properties. However, over time, leaching of the components as well as swelling and degradation of the crosslinked matrix and hy-drolysis in the interphase area eventually leads to a decrease in mechanical properties [65]. Such a case was analyzed in [59]. The aging rate of polymer composites depends mainly on their physical and chemical properties. Amorphous polymers are more suscep-tible to hydrolytic degradation than crystalline materials, linear polymers to a greater ex-tent than branched polymers with higher molecular weight. Degradation rate depends on the presence of specific chemical groups in the molecule, such as ester, amide, and urea groups [16]. The intensity of degradation also depends on the surface condition of the material, defects found in it as well as the type and proportion of additional substances (e.g., filler particles, initiators) [16].
4.2. Friction and Abrasive Wear One cause of abrasive wear of the dentition is attrition [24]. Attrition occurs as a result
of contact and interaction between opposing teeth [66]. The level of attrition progression is mainly influenced by occlusive forces, as well as frictional contact geometry and oral cavity environment conditions [67]. Restrained or loose abrasive particles may be present in the frictional contact zone [68]. If both contact surfaces are hard and brittle at the same time, then deformation of surface micro-roughness occurs, followed by micro-cracking when the critical stress value is exceeded. When, in a frictional contact, the surface of one body has a significantly higher hardness than the antagonistic surface, rapid wear occurs by micro-attrition [69]. As reported in [70], attrition wear of the enamel surface can be up to 40 μm per year. This type of wear occurring in the process of mastication alone is quite

Materials 2021, 14, 4678 17 of 22
low. On the other hand, it is often the result of a disease—bruxism [71]. The paper [72] describes a case in which bruxism caused the clenching of 22 maxillary teeth with a force of 50–200 N per night (7 h of sleep). Maximum occlusive forces in patients with bruxism range from 450 to 650 N [73]. The average forces can be 120 N [74] or 380 N [75]. The researchers found that deformation and wear of prosthetic crown surfaces are also ob-served at the occlusive contact points of the teeth. New materials used in 3D printing tech-nology must exhibit similar wear resistance to conventionally used materials [76]. Lower wear resistance can lead to reduced stability of occlusive contacts due to premature for-mation of defects on abraded surfaces or even to shortened life of the entire temporary crown [77]. Tooth restorations should be abrasion resistant and prevent abrasion of op-posing contact surfaces. According to [36], there is little research into abrasion resistance of occlusion devices.
In this study, the tribological parameters investigated were the coefficient of friction and wear resistance before and after aging the samples in artificial saliva. Wear coeffi-cients were determined. Most of the materials tested (except M VI) exhibited deterioration of the tribological properties of the surfaces after aging in artificial saliva at oral cavity temperature. In the group of materials tested, the tribological properties of the surface layer changed to varying degrees during aging. Similar to theses [77,78], it was confirmed that the wear resistance of a material is related to its hardness. However, it was noted that the hardest and most rigid materials, M V and M VI, were not found to be the most re-sistant to wear when aged in artificial saliva.
The results of tests presented in this paper reveal the influence of artificial aging on the variation of the coefficient of friction. The highest variation in the coefficient of friction before and after aging was observed for the M VI material. The lowest variation was ob-served for the M II material (Figure 6). The interrelationships in biotribological nodes may be variable during friction [79], which is confirmed by the results obtained. In the study of dental composites, it was occasionally observed that the coefficient of friction increases along with wear due to the intensification of mechanical component of friction [80]. But such a relationship occurs in the absence of associated effects [81]. Also, a change in sur-face roughness can cause a change in the coefficient of friction, but the lubricating effect of artificial saliva is also of importance. The salivary pellicle has an effect on the coefficient of friction [82]. However, in case of the M VI material, a significantly higher wear after aging was demonstrated, which may indicate the importance of the described factors. Moreover, the M VI material as a microfilling material contains larger filler particles. It was reported in [83] that such a proportion of these particles in the composite structure causes an increase in the coefficient of friction. But it seems that the increase in the coeffi-cient of friction after aging was related to the exposure of the filler particles.
It is possible that there was degradation of the polymer phase on the surface of the M VI material. In the literature, the mechanisms of degradation of polymer composites containing powder fillers by water particles: diffusion into the polymer network and hy-drolysis reaction. In the first mechanism, water particles diffuse into the polymer network and fill the empty spaces between the polymer chains and micro-gaps. This phenomenon leads to plasticization and swelling of the polymer matrix. Cleavage of the polymer chains occurs, followed by leaching of the monomer. In the second mechanism, the hydrolysis reaction breaks down the bonds between the polymer phase and the filler, which can lead to filler separation [84]. On the other hand, an adequate range of the coefficient of friction is necessary to retain the patient’s physiological functions. As reported in [85], excessive values of the coefficient of friction may lead to premature wear, while overly low values may lead to reduced efficiency in crushing food.
The M I and M III materials demonstrated the highest resistance to wear before and after aging in artificial saliva for 6 months. But it should be noted that resin-based mate-rials with additives can become brittle after an extended period of time [63], which does not occur in preclinical accelerated aging tests [36]. The paper [36] advocates the require-ment of long-term clinical in vivo testing to confirm the results in terms of wear resistance

Materials 2021, 14, 4678 18 of 22
[36]. However, according to the authors, the potential for clinical trials in this area is al-most exclusively qualitative and not quantitative. The limitations of clinical trials relate to the study of wear mechanisms. Therefore, clinical trials should be supported by long-term in vitro studies under simulated laboratory conditions, taking into account loads and oral environmental factors.
The limitation of this study is its scope covering one of the many degradation mech-anisms of DLP 3D printing dental materials, namely artificial aging. This compromises the methodical reproducibility of the study and has to be considered a limitation as the tests were conducted using artificial saliva made according to a technical standard. In ad-dition, the effect of artificial aging was studied only with regard to surface properties. Aging times were limited. The researchers intend to continue the study after a longer ex-posure time in artificial saliva. In addition, it was noted that hydrolytic aging under non-stationary temperature conditions can be accelerated. The authors plan further research in this area.
5. Conclusions The research described in this article investigates the effects of long-term storage in
artificial saliva on the indentation hardness and abrasive wear of composite materials used for temporary CAD/CAM prosthetic and orthodontic restorations. Five commercial light-cured polymer composites used in dental practice for reconstructive work by 3D printing were tested.
Indentation hardness changes were determined. The degradation coefficient of the modulus of elasticity and the change in the coefficient of friction and abrasive wear re-sistance were determined. Storage in artificial saliva at oral cavity temperature was found to have a significantly negative effect on most indentation tested maintenance properties of the tested materials, except the composite with microfiller—M VI. In the case of sliding wear resistance, the M I material proved to be an exception. However, for this material the surface modulus of elasticity behaved differently, which resulted in the most unfavor-able (highest) value of degradation coefficient. Unfortunately, the M VI material is char-acterized by the highest specific wear rate after aging. In case of resistance to sliding wear the M I material proved to be an exception. Archard’s coefficient and specific wear rate were found to be lower after aging, which should be considered as a very advantageous feature of the material. The effect was considered to have a nature of hydrolytic aging associated with changes in the structure of the materials.
Due to the results obtained, the null hypotheses can be largely rejected.
Author Contributions: Conceptualization, M.F., D.P. and A.M.N.; methodology, K.P., J.I.-K. and B.B.; software, A.W., W.J. and I.D.; data curation, A.B. and D.P.; validation, D.P. and K.P.; formal analysis, M.F., A.M.N. and A.W.; writing—original draft preparation, M.F., A.M.N. and A.W.; in-vestigation, I.D. and B.B.; writing—review and editing, K.P. and J.I.-K.; visualization, B.B. and W.J.; supervision, I.D. and A.B.; resources, J.I.-K. and W.J.; project administration, A.B.; funding acquisi-tion, A.M.N. All authors have read and agreed to the published version of the manuscript.
Funding: This work was financed within the project Medical University of Lublin—contract DS296. This work was financed within the project Lublin University of Technology—Regional Excellence Initiative, funded by the Polish Ministry of Science and Higher Education (contract no. 030/RID/2018/19).
Institutional Review Board Statement: Not applicable.
Informed Consent Statement: Not applicable.
Data Availability Statement: Data sharing is not applicable to this article.
Conflicts of Interest: The authors declare no conflict of interest.
Materials 2021, 14, 4678 19 of 22
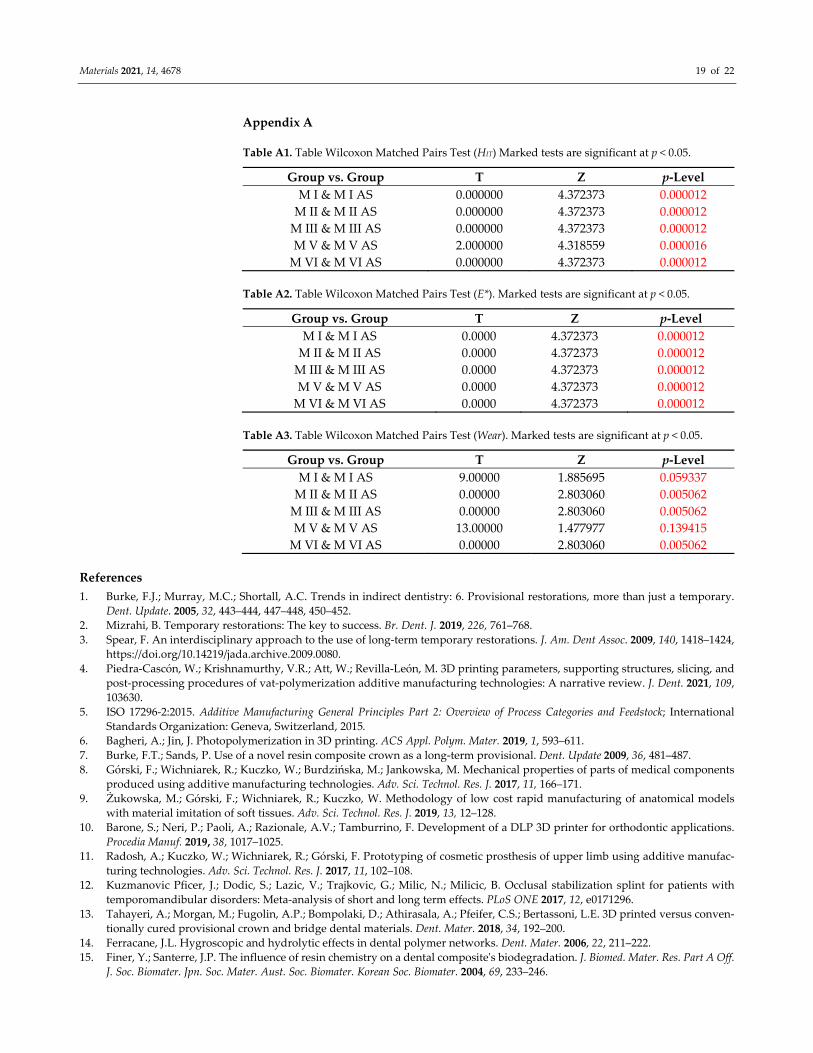
Appendix A
Table A1. Table Wilcoxon Matched Pairs Test (HIT) Marked tests are significant at p < 0.05.
Group vs. Group T Z p-Level M I & M I AS 0.000000 4.372373 0.000012
M II & M II AS 0.000000 4.372373 0.000012 M III & M III AS 0.000000 4.372373 0.000012 M V & M V AS 2.000000 4.318559 0.000016
M VI & M VI AS 0.000000 4.372373 0.000012
Table A2. Table Wilcoxon Matched Pairs Test (E*). Marked tests are significant at p < 0.05.
Group vs. Group T Z p-Level M I & M I AS 0.0000 4.372373 0.000012
M II & M II AS 0.0000 4.372373 0.000012 M III & M III AS 0.0000 4.372373 0.000012 M V & M V AS 0.0000 4.372373 0.000012
M VI & M VI AS 0.0000 4.372373 0.000012
Table A3. Table Wilcoxon Matched Pairs Test (Wear). Marked tests are significant at p < 0.05.
Group vs. Group T Z p-Level M I & M I AS 9.00000 1.885695 0.059337
M II & M II AS 0.00000 2.803060 0.005062 M III & M III AS 0.00000 2.803060 0.005062 M V & M V AS 13.00000 1.477977 0.139415
M VI & M VI AS 0.00000 2.803060 0.005062
References 1. Burke, F.J.; Murray, M.C.; Shortall, A.C. Trends in indirect dentistry: 6. Provisional restorations, more than just a temporary.
Dent. Update. 2005, 32, 443–444, 447–448, 450–452. 2. Mizrahi, B. Temporary restorations: The key to success. Br. Dent. J. 2019, 226, 761–768. 3. Spear, F. An interdisciplinary approach to the use of long-term temporary restorations. J. Am. Dent Assoc. 2009, 140, 1418–1424,
https://doi.org/10.14219/jada.archive.2009.0080. 4. Piedra-Cascón, W.; Krishnamurthy, V.R.; Att, W.; Revilla-León, M. 3D printing parameters, supporting structures, slicing, and
post-processing procedures of vat-polymerization additive manufacturing technologies: A narrative review. J. Dent. 2021, 109, 103630.
5. ISO 17296-2:2015. Additive Manufacturing General Principles Part 2: Overview of Process Categories and Feedstock; International Standards Organization: Geneva, Switzerland, 2015.
6. Bagheri, A.; Jin, J. Photopolymerization in 3D printing. ACS Appl. Polym. Mater. 2019, 1, 593–611. 7. Burke, F.T.; Sands, P. Use of a novel resin composite crown as a long-term provisional. Dent. Update 2009, 36, 481–487. 8. Górski, F.; Wichniarek, R.; Kuczko, W.; Burdzińska, M.; Jankowska, M. Mechanical properties of parts of medical components
produced using additive manufacturing technologies. Adv. Sci. Technol. Res. J. 2017, 11, 166–171. 9. Żukowska, M.; Górski, F.; Wichniarek, R.; Kuczko, W. Methodology of low cost rapid manufacturing of anatomical models
with material imitation of soft tissues. Adv. Sci. Technol. Res. J. 2019, 13, 12–128. 10. Barone, S.; Neri, P.; Paoli, A.; Razionale, A.V.; Tamburrino, F. Development of a DLP 3D printer for orthodontic applications.
Procedia Manuf. 2019, 38, 1017–1025. 11. Radosh, A.; Kuczko, W.; Wichniarek, R.; Górski, F. Prototyping of cosmetic prosthesis of upper limb using additive manufac-
turing technologies. Adv. Sci. Technol. Res. J. 2017, 11, 102–108. 12. Kuzmanovic Pficer, J.; Dodic, S.; Lazic, V.; Trajkovic, G.; Milic, N.; Milicic, B. Occlusal stabilization splint for patients with
temporomandibular disorders: Meta-analysis of short and long term effects. PLoS ONE 2017, 12, e0171296. 13. Tahayeri, A.; Morgan, M.; Fugolin, A.P.; Bompolaki, D.; Athirasala, A.; Pfeifer, C.S.; Bertassoni, L.E. 3D printed versus conven-
tionally cured provisional crown and bridge dental materials. Dent. Mater. 2018, 34, 192–200. 14. Ferracane, J.L. Hygroscopic and hydrolytic effects in dental polymer networks. Dent. Mater. 2006, 22, 211–222. 15. Finer, Y.; Santerre, J.P. The influence of resin chemistry on a dental composite's biodegradation. J. Biomed. Mater. Res. Part A Off.
J. Soc. Biomater. Jpn. Soc. Mater. Aust. Soc. Biomater. Korean Soc. Biomater. 2004, 69, 233–246.

Materials 2021, 14, 4678 20 of 22
16. Ammar-Khodja, I.; Picard, C.; Fois, M.; Marais, C.; Netchitaïlo, P. Preliminary results on thermo-oxidative ageing of multi-hole carbon/epoxy composites. Compos. Sci. Technol. 2009, 69, 1427–1431.
17. Sobków, D.; Barton, J.; Czaja, K.; Sudoł, M.; Mazoń, B. Badania odporności materiałów na działanie czynników środowiska naturalnego. Chemik 2014, 68, 347–354.
18. Romil, S.; Kumar, A.S.; Kumar, A.S.; Saurabh, G.; Praveen, G.; Siddhi, T. An evaluation of flexural strength of different provi-sional restorative materials-an in-vitro study. Ind. J. Dent. Sci. 2012, 4, 17–19.
19. Stawarczyk, B.; Liebermann, A.; Eichberger, M.; Güth, J.-F. Evaluation of mechanical and optical behavior of current esthetic dental restorative CAD/CAM composites. J. Mech. Behav. Biomed. Mater. 2015, 55, 1–11.
20. Heintze, S.D.; Rousson, V. Clinical effectiveness of direct class II restorations a meta-analysis. J. Adhes. Dent. 2012, 14, 407–431. 21. Bayne, S.C. Correlation of clinical performance with ‘in vitro tests’ of restorative dental materials that use polymer-based ma-
trices. Dent. Mater. 2012, 28, 52–71. 22. Scribante, A.; Vallittu, P.; Lassila, L.V.J.; Viola, A.; Tessera, P.; Gandini, P.; Sfondrini, M.F. Effect of Long-Term Brushing on
Deflection, Maximum Load, and Wear of Stainless Steel Wires and Conventional and Spot Bonded Fiber-Reinforced Compo-sites. Int. J. Mol. Sci. 2019, 20, 6043.
23. Lewis, R.; Dwyer-Joyce, R.S. Wear of human teeth: A tribological perspective. Proc. Inst. Mech. Eng. J. J. Eng. Tribol. 2005, 219, 1–18.
24. Zhou, Z.R.; Yu, H.Y.; Zheng, J.; Qian, L.M.; Yan, Y. Friction and Wear Behavior of Human Teeth. In Dental Biotribology; Springer: New York, NY, USA, 2013, https://doi.org/10.1007/978-1-4614-4550-0.
25. Ayatollahi, M.R.; Yahy, M.Y.; Karimzadeh, A.; Nikkhooyifar, M.; Ayo, A. Effects of temperature change and beverage on me-chanical and tribological properties of dental restorative composites. Mater. Sci. Eng. 2015, 54, 69–75.
26. Berg, I.C.H.; Rutland, M.W.; Arnebrant, T. Lubricating properties of the initial salivary pellicle—an AFM study. Biofouling 2003, 19, 365–369.
27. Leyland, A.; Matthews, A. On the significance of the H/E ratio in wear control: A nanocomposite coating approach to optimised tribological behaviour. Wear 2000, 246, 1–11.
28. Yang, L.J. Wear coefficient equation for aluminium-based matrix composites against steel disc. Wear 2003, 255, 579–592. 29. Agarwal, G.; Patnaik, A.; Sharma, R.K. Parametric Optimization and Three-Body Abrasive Wear Behavior of Sic Filled Chopped
Glass Fiber Reinforced Epoxy Composites. Int. J. Compos. Mater. 2013, 3, 32–38. 30. Wesemann, C.; Spies, B.C.; Sterzenbach, G.; Beuer, F.; Kohal, R.; Wemken, G.; Pieralli, S. Polymers for conventional, sub-tractive,
and additive manufacturing of occlusal devices differ in hardness and flexural properties but not in wear re-sistance. Dent. Mater. 2021, 37, 432–442.
31. Available online: https://www.pro3dure.com/media/pdf/73/9d/56/GR-17-1-temporary-lt_Gebrauchsanweisung-D-EN-ES-FR-IT.pdf (accessed on 20 June 2021).
32. ISO 10271:2020. Dentistry—Corrosion Test Methods for Metallic Materials; International Standards Organization: Geneva, Switzer-land, 2020.
33. Oliver, W.C.; Pharr, G.M. Measurement of hardness and elastic modulus by instrumented indentation: Advances in under-standing and refinements to methodology. J. Mater. Res. 2004, 19, 3–20.
34. Hardiman, M.; Vaughan, T.J.; McCarthy, C.T. The effects of pile-up, viscoelasticity and hydrostatic stress on polymer matrix nanoindentation. Polym. Test. 2016, 52, 157–166.
35. Sneddon, I.N. The relation between load and penetration in the axisymmetric Boussinesq problem for a punch of arbitrary profile. Int. J. Eng. Sci. 1965, 3, 47–57.
36. Ilie, N.; Bucuta, S.; Draenert, M. Bulk-fill resin-based composites: An in vitro assessment of their mechanical performance. Oper. Dent. 2013, 38, 618–625.
37. Safety Data Sheet according to Regulation (EC) No. 1907/2006 (REACH). Available online: https://www.pro3dure.com/me-dia/pdf/ed/df/f5/printodent-GR-17-1-temporary-lt_05_19-GB.pdf (accessed on 12 July 2021).
38. Safety Data Sheet according to Regulation (EC) No. 1907/2006 (REACH). Available online: https://www.pro3dure.com/me-dia/pdf/19/a4/5d/printodent-GR-10-guide_51_20-GB.pdf (accessed on 12 July 2021).
39. Safety Data Sheet according to Regulation (EC) No. 1907/2006 (REACH). Available online: https://www.pro3dure.com/me-dia/pdf/7c/f9/d5/printodent-GR-17-temporary_05_19-GB.pdf (accessed on 12 July 2021).
40. NextDent SG (Surgical Guide). Available online: https://nextdent.com/products/sg-surgical-guide/ (accessed on 12 July 2021). 41. NextDent C&B MFH (Micro Filled Hybrid). Available online: https://nextdent.com/products/cb-mfh-micro-filled-hybrid (ac-
cessed on 12 July 2021). 42. Walczak, A.; Pieniak, D.; Niewczas, A.; Niewczas, A.M.; Kordos, P. Study of ceramic-polymer composites reliability based on
the bending strength test. J. KONBiN 2015, 35, 169. 43. Danzer, R. On the relationship between ceramic strength and the requirements for mechanical design. J. Eur. Ceram. Soc. 2014,
34, 3435–3460. 44. Niewczas, A.M.; Pieniak, D.; Ogrodnik, P. Reliability analysis of strength of dental composites subjected to different photopol-
ymerization procedures. Eksploat. Niezawodn. Maint. Reliab. 2012, 14, 249–255. 45. Walczak, A.; Pieniak, D.; Niewczas, A.M.; Gil, L. Laboratory studies of the influence of thermal cycling on anti-wear properties
of composites used in biotribological friction pairs. Tribologia. 2018. 4, 143-149.

Materials 2021, 14, 4678 21 of 22
46. Łepicka, M.; Grądzka-Dahlke, M.; Pieniak, D.; Pasierbiewicz, K.; Niewczas, A. Effect of mechanical properties of substrate and coating on wear performance of TiN-or DLC-coated 316LVM stainless steel. Wear 2017, 382, 62–70.
47. Łępicka, M.; Grądzka-Dahlke, M.; Pieniak, D.; Pasierbiewicz, K.; Kryńska, K.; Niewczas, A. Tribological performance of tita-nium nitride coatings: A comparative study on TiN-coated stainless steel and titanium alloy. Wear 2019, 422, 68–80.
48. Hwang, W.; Han, K.S. Fatigue of composites—fatigue modulus concept and life prediction. J. Compos. Mater. 1986, 20, 154–165. 49. Kamimura, K. Modélisation théorique de la croissance d'endommagement appliquée à la théorie des plaques stratifiées. J. Méca-
nique Théorique Et Appliquée 1985, 4, 537–553. 50. Ashby, M.F.; Shercliff, H.; Cebon, D. Materials: Engineering, Science, Processing and Design; Butterworth-Heinemann: Oxford, UK,
2018. 51. Borrero-Lopez, O.; Guiberteau, F.; Zhang, Y.; Lawn, B.R. Wear of ceramic-based dental materials. J. Mech. Behav. Biomed. Mater.
2019, 92, 144–151. 52. Hutchings, I.; Shipway, P. Tribology: Friction and Wear of Engineering Materials; Butterworth-Heinemann: Oxford, UK, 2017. 53. Goh, G.D.; Agarwala, S.; Goh, G.L.; Dikshit, V.; Sing, S.L.; Yeong, W.Y. Additive manufacturing in unmanned aerial vehicles
(UAVs): Challenges and potential. Aerosp. Sci. Technol. 2017, 63, 140–151. 54. Parker, G. Encyclopedia of Materials: Science and Technology; Elsevier: Amsterdam, The Netherlands, 2001. 55. Ochelski, S. Metody Doświadczalne Mechaniki Kompozytów Konstrukcyjnych (Experimental Methods of Mechanics of Structural
Composites); WNT: Warszawa, Poland, 2004. 56. Imielińska, K.; Wojtyra, R. Wpływ absorpcji wody na właściwości laminatów winyloestrowych wzmocnionych włóknem
aramidowym i szklanym. Kompoz. (Compost.) 2003, 3, 192–197. 57. Janda, R.; Roulet, J.F.; Latta, M.; Rüttermann, S. Water sorption and solubility of contemporary resin-based filling materials. J.
Biomed. Mater. Res. Part B Appl. Biomater. Off. J. Soc. Biomater. Jpn. Soc. Biomater. Aust. Soc. Biomater. Korean Soc. Biomater. 2007, 82, 545–551.
58. Väyrynen, V.O.; Tanner, J.; Vallittu, P.K. The anisotropicity of the flexural properties of an occlusal device material processed by stereolithography. J. Prosthet. Dent. 2016, 116, 811–817.
59. Pieniak, D.; Niewczas, A.; Walczak, A.; Łępicka, M.; Grądzka-Dahlke, M.; Maciejewski, R.; Kordos, P. The effect of thermal stresses on the functional properties of various dental composites. Tribol. Int. 2020, 152, 106509.
60. Pieniak, D.; Walczak, A.; Walczak, M.; Przystupa, K.; Niewczas, A.M. Hardness and wear resistance of dental biomedical na-nomaterials in a humid environment with non-stationary temperatures. Materials 2020, 13, 1255.
61. Rayyan, M.M.; Aboushelib, M.; Sayed, N.M.; Ibrahim, A.; Jimbo, R. Comparison of interim restorations fabricated by CAD/CAM with those fabricated manually. J. Prosthet. Dent. 2015, 114, 414–419.
62. Berli, C.; Thieringer, F.M.; Sharma, N.; Müller, J.A.; Dedem, P.; Fischer, J.; Rohr, N. Comparing the mechanical properties of pressed, milled, and 3D-printed resins for occlusal devices. J. Prosthet. Dent. 2020, 124, 780–786.
63. Reymus, M.; Stawarczyk, B. In vitro study on the influence of postpolymerization and aging on the Martens parameters of 3D-printed occlusal devices. J. Prosthet. Dent. 2012, 125, 817–823.
64. Drummond, J.L.; Lin, L.; Al-Turki, L.A.; Hurley, R.K. Fatigue behaviour of dental composite materials. J. Dent. 2009, 37, 321–330.
65. Takeshige, F.; Kawakami, Y.; Hayashi, M.; Ebisu, S. Fatigue behavior of resin composites in aqueous environments. Dent. Mater. 2007, 23, 893–899.
66. Mayworm, C.D.; Camargo, S.S., Jr.; Bastian, F.L. Influence of artificial saliva on abrasive wear and microhardness of dental composites filled with nanoparticles. J. Dent. 2008, 36, 703–710.
67. Mehl, C.; Scheibner, S.; Ludwig, K.; Kern, M. Wear of composite resin veneering materials and enamel in a chewing simulator. Dent. Mater. 2007, 23, 1382–1389.
68. Ozimina, D.; Ryniewicz, A. Eksploatacja Systemów Tribologicznych. T. 1, Znaczenie Tribologii w Eksploatacji Obiektów Technicznych (red. Ozimina, D.); Wydawnictwo Politechniki Świętokrzyskiej w Kielcach: Kielce, Poland, 2013.
69. Yilmaz, E.Ç.; Sadeler, R. A Literature Review on Chewing Simulation and Wear Mechanisms of Dental Biomaterials. J. Bio. Tribo Corros. 2021, 7, 1–10. https://doi.org/10.1007/s40735-021-00529-0.
70. Rodríguez, H.A.; Kriven, W.M.; Casanova, H. Development of mechanical properties in dental resin composite: Effect of filler size and filler aggregation state. Mater. Sci. Eng. C 2019, 101, 274–282.
71. Lambrechts, P.; Goovaerts, K.; Bharadwaj, D.; De Munck, J.; Bergmans, L.; Peumans, M.; Van Meerbeek, B. Degradation of tooth structure and restorative materials: A review. Wear 2006, 261, 980–986.
72. Claude, A.; Robin, O.; Gehin, C.; Massot, B. Design and evaluation of a novel technology for ambulatory monitoring of bruxism events. Sens. Actuators A Phys. 2019, 295, 532–540.
73. Rosar, J.V.; de Souza Barbosa, T.; Dias, I.O.V.; Kobayashi, F.Y.; Costa, Y.M.; Gavião, M.B.D.; Castelo, P.M. Effect of interocclusal appliance on bite force, sleep quality, salivary cortisol levels and signs and symptoms of temporomandibular dysfunction in adults with sleep bruxism. Arch. Oral Biol. 2017, 82, 62–70.
74. Jain, V.; Mathur, V.P.; Abhishek, K.; Kothari, M. Effect of occlusal splint therapy on maximum bite force in individuals with moderate to severe attrition of teeth. J. Prosthodont. Res. 2012, 56, 287–292.
75. Alkan, A.; Bulut, E.; Arici, S.; Sato, S. Evaluation of treatments in patients with nocturnal bruxism on bite force and occlusal contact area: A preliminary report. Eur. J. Dent. 2008, 2, 276–282.
76. Xu, X.; He, L.; Zhu, B.; Li, J.; Li, J. Advances in polymeric materials for dental applications. Polym. Chem. 2017, 8, 807–823.

Materials 2021, 14, 4678 22 of 22
77. Casey, J.; Dunn, W.J.; Wright, E. In vitro wear of various orthotic device materials. J. Prosthet. Dent. 2003, 90, 498–502. 78. Prpic, V.; Slacanin, I.; Schauperl, Z.; Catic, A.; Dulcic, N.; Cimic, S. A study of the flexural strength and surface hardness of
different materials and technologies for occlusal device fabrication. J. Prosthet. Dent. 2019, 121, 955–959. 79. Suwannaroop, P.; Chaijareenont, P.; Koottathape, N.; Takahashi, H.; Arksornnukit, M. In vitro wear resistance, hardness and
elastic modulus of artificial denture teeth. Dent. Mater. J. 2011, 30, 461–468. 80. Rodrigues, D.; Buciumeanu, M.; Martinelli, A.E.; Nascimento, R.M.; Henriques, B.; Silva, D.S.; Souza, J.C.M. Mechanical strength
and wear of dental glass-ionomer and resin composites affected by porosity and chemical composition. J. Bio. Tribo. Corros. 2015, 1, 1–9.
81. Souza, J.; Bentes, A.; Reis, K.; Gavinha, S.; Buciumeanu, M.; Henriques, B.; Silva, F.S.; Gomes, J.R. Abrasive and sliding wear of resin composites for dental restorations. Tribol. Int. 2016, 102, 154–160.
82. Hannig, M. The proetctive nature of the salivary pellicle. Int. Dent. J. 2002, 52, 417–423. 83. Turssi, C.P.; Ferracane, J.L.; Vogel, K. Filler features and their effects on wear and degree of conversion of particulate dental
resin composites, Biomaterials 2005, 26, 4932–4937. 84. Curtis, A.R.; Palin, W.M.; Fleming, G.J.P.; Shortall, A.C.C.; Marquis, P.M. The mechanical properties of nanofilled resin-based
composites: The impact of dry and wet cyclic preloading on bi-axial flexure strength. Dent. Mater. 2009, 25, 188–197. 85. Szafran, M.; Cwalińska, A.; Jałbrzykowski, M. Effect of new branched urethane-methacrylic resins on mechanical and wear
properties of ceramic-polymer composites used in dentistry. Kompoz. (Compos.) 2008, 8, 11–14.