Optical properties of annealed silicon rich oxide (SRO) films
Engineering Fracture Mechanics 72 (2005) 2106–2127
www.elsevier.com/locate/engfracmech
Effect of a hard artificial asperity on the crack closurebehavior in an annealed SAE 1015 steel
M. Okayasu a, Z. Wang a,*, D.L. Chen b
a Department of Materials Science and Engineering, University of Toronto, 184 College Street, Toronto, Ont., Canada M5S 3E4b Department of Mechanical and Industrial Engineering, Ryerson University, 350 Victoria Street, Toronto, Ont., Canada M5B 2K3
Received 3 March 2004; received in revised form 16 November 2004; accepted 16 December 2004
Available online 24 May 2005
Abstract
The load–crack opening displacement (COD) curves and deformation characteristics in the vicinity of a hard arti-
ficial asperity in an annealed SAE 1015 steel were studied. The artificial asperity was found to have a significant effect on
the trend of the load–COD curves. The lower portion of the load–COD curves in the unloading phase exhibited a con-
vex shape without the asperity, but a concave shape with the asperity. The concave shape, signifying the acceleration in
the COD decrease, was further verified by varying the size of the asperity, conducting special compression tests and
elastic–plastic load–COD tests. The plastic deformation in the vicinity of both asperity and crack tip was studied via
microhardness tests, etching techniques, and finite element analysis. Based on the experimental observations, a modified
crack closure process model was proposed, where three stages of the unloading curve was defined: (i) the asperity does
not contact the upper crack face, (ii) a process where both the asperity and the specimen material deform elastically, and
the elastic-wedge model is applicable, and (iii) the plastic deformation of the specimen material adjacent to the asperity
occurs, thus resulting in the concavely shaped load–COD curves. An equation was proposed to estimate the COD val-
ues, in which the plastic deformation both at the crack tip and at the asperity was considered. The residual COD cal-
culated from the proposed equation was found to be consistent with the experimental results.
� 2005 Elsevier Ltd. All rights reserved.
Keywords: SAE 1015 steel; Crack closure; Plastic deformation; Crack opening displacement (COD); Artificial asperity
1. Introduction
Since the crack closure behavior was first observed by Christensen in 1963 [1] and defined by Elber in
1970 [2], fatigue crack growth tests have been performed to identify the effect of crack closure on the
0013-7944/$ - see front matter � 2005 Elsevier Ltd. All rights reserved.
doi:10.1016/j.engfracmech.2004.12.006
* Corresponding author. Fax: +1 416 978 4155.
E-mail address: [email protected] (Z. Wang).

M. Okayasu et al. / Engineering Fracture Mechanics 72 (2005) 2106–2127 2107
da/dN–DK relationship. In particular, numerous studies have demonstrated that the extrinsic resistance of
fatigue crack growth was attributed to the roughness-, oxide- and/or plasticity-induced crack closure
behavior.
The plasticity-induced crack closure arises from the situations, where the stretched material in the crack
wake leads to a premature contact of crack faces [3–19]. This closure mechanism has been observed usingan etch-pit etching technique [3], a digital photo-elastic technique [4], and finite element analysis (FEA) [5–
15]. Specifically, the FE analysis has been extensively utilized by many researchers to examine this closure
mechanism under different conditions. Very recently, based on their previous FE analysis data, several
researchers have further calculated the crack growth behavior more accurately [14,15]. Although a number
of investigators have studied the mechanism of plasticity-induced crack closure, the fundamentals of this
closure mechanism have been challenged by Vasudevan et al. [16–18]. They reported that there is no sig-
nificant contribution to crack closure by the plasticity behind the crack tip, as the permanent deformation
takes place just in front of the crack tip. However, their claims were countered by the work of Pippan andRiemelmoser [19], who developed mathematical and dislocation models for the fracture surface contact
mechanism.
Roughness-induced crack closure mechanism has also been studied experimentally and numerically [20–
29]. Rough crack surfaces are considered to be produced by the following process: the low restraint on cyc-
lic slip will primarily promote crack extension along a single slip system at the microscopic scale, resulting
in serrated or zig-zag fracture paths [20], in which the maximum plastic zone size at the crack tip is typically
less than the grain size [21]. On the basis of this process, a geometrical crack closure model (zig-zag model)
was presented by Suresh and Ritchie [20]. Parry et al. [22] studied roughness-induced crack closure behaviorusing FE analysis, in which the calculated crack closure level under a plane strain condition was found
similar to those results obtained via the zig-zag model. However, this closure model has been recently ques-
tioned by Wang et al. [23] and Wasen and Karlsson [24] due to its over simplification. In Ref. [23], the mod-
el of fracture surface mismatch has been extended using dislocation theory; the effective stress intensity
range for the crack growth predicted with their dislocation model was found to be superior to the zig-
zag model. However, such a dislocation model has also been countered. Parry et al. [22] stated that ‘‘the
predictive power of their dislocation model [23] is limited due to the inclusion of unknown proportionality
constants, which must be fitted to experimental results’’.To understand the crack growth behavior associated with crack closure more clearly, several researchers
[30–36] made attempts to use artificial wedge/asperity in their fatigue tests. Vecchio et al. [30] measured the
crack growth rate influenced by a needle tip positioned adjacent to the crack tip in a 2024 aluminum
alloy. They concluded that ‘‘the crack growth rate changed marginally despite the dramatic increase
in apparent closure levels’’. In the same manner, Hertzberg et al. [31] evaluated the effect of the artifi-
cial asperities—shims of different sizes—on the level of crack growth rate and the effective stress intensity
range, where the conventional effective stress intensity ranges measured with CMOD gauges underesti-
mated the observed crack growth rate. In addition, artificial asperities made of epoxy with 0.2 lm and0.5 lm alumina particles were used to evaluate the effect of infiltration induced crack closure on crack
growth retardation by Sheu et al. [32], who concluded that ‘‘although the crack growth increment is affected
by the size of reinforcing particles, no distinct trend was detected in the crack growth rate at the maximum
retardation’’.
The experimentally obtained crack growth behavior affected by the artificial wedge has been further
assessed by theoretical crack closure model. There are several theoretical models [37–43] for characterizing
the crack closure involving the artificial asperity. Suresh and Ritchie [37] and Maiti and Paramguru [38]
proposed rigid crack closure models, in which the wedge is assumed to be completely stiff as shown inFig. 1(a). In this case, Stage II, i.e. after the surface contact occurred, is represented by a vertical line.
In Chen et al.�s elastic-wedge model [39], an elastically deformable asperity is placed into crack surfaces;
the applied stress–COD behavior in Stage II exhibits a gradual and linear variation, as shown in

σmax
Stage II
δ
σop
δmaxo
Stage I
δmin
σ(a) (b)
Stage II
δ
σop
σmax
δmaxo
Stage I
δmin
σ
δop
σclosed
σmin
σmin, act
Stage II
δ
σmax
δmaxo
Stage I
δmin
σ
δop
(c)
Nonlinear portionσ1
σ2, or σop
Fig. 1. Schematic illustrations of typical crack closure models: (a) rigid-wedge model [37,38]; (b) elastic-wedge model [39] and (c) crack
closure model associated with crack surface interferences [40].
2108 M. Okayasu et al. / Engineering Fracture Mechanics 72 (2005) 2106–2127
Fig. 1(b). Very recently, Tada and Paris [40] proposed a crack closure model, where a nonlinear unloading
portion between Stage I and II is introduced due to the effect of crack closure or surface interference be-
tween the asperity and the crack face, shown in Fig. 1(c). In this model, Stage II can be defined by simple
elastic analysis models. Song et al. [33] calculated the crack growth rates using both the rigid-wedge model
[37] and the elastic-wedge model [39], and made a comparison with their experimental results obtained froma 4130 steel specimen with electroless nickel artificial asperities. They concluded that ‘‘the elastic-wedge
model predicted more accurately a post-plating crack growth rate than the rigid-wedge model’’. In the same
way, Rehman and Thomason [34] analyzed the crack growth rate using the rigid-wedge model presented by
Maiti and Paramguru [38], in which four different artificial asperities (electroless nickel, electroplated nick-
el, ethylcyanoacrylate adhesive and low-melting point solder) were used. However, the model predicted well
only for the softer asperity materials, such as adhesive and solder.
Although the artificial wedges into the crack surfaces have been simply designed and employed in their
studies to understand the stress intensity level and the crack growth rate, the fundamental aspects of such aclosure mechanism have not been considered nor even substantiated. The fundamental aspects, involving (i)
deformation characteristics in the wedge and specimen, and (ii) the related COD value, are especially
important for understanding clearly the load–COD relations and the associated crack growth behavior.
In addition, even though these theoretical closure models are considered valid for particular reasons, there
is apparently a lack of experimental data for their validation.
The aim of this paper is, therefore, to identify the crack closing mechanism involving an artificial asperity,
and to understand the underlying load–COD relations. Moreover, an attempt is made to link the theoretical

M. Okayasu et al. / Engineering Fracture Mechanics 72 (2005) 2106–2127 2109
and numerical modeling of closure to the experimental measurement of the load–COD curve. The experi-
mental work is carried out using a harder artificial wedge inserted into softer crack surfaces, since such a
material condition is considered to be similar to the crack closing behavior occurring naturally [44–54],
e.g., harder and round shaped asperities (such as reinforcing Si particles [44–47], primary Si [48,49] parti-
cles and inclusions, Al2O and SiO2 particles [50–52]) coming into contact with relatively softer crack sur-faces. It should be pointed out that, although the size of wedges selected in the present experiment is
much larger compared to the aforementioned particles, the selection of such larger and harder artificial
wedges should be appropriate and constructive in facilitating a more accurate examination of the crack clos-
ing behavior. As a matter of fact, the results obtained have revealed, indeed, a rather indicative crack closure
behavior.
2. Materials and experimental procedure
2.1. Material and specimens
The material selected in this investigation is a commercial hot rolled low carbon steel, SAE 1015, sup-
plied in the form of 12.7 mm thick flat bars. The chemical composition of the alloy is (wt%): 0.14 C, 0.64
Mn, <0.01 P, <0.01 S and balanced with Fe. The alloy was annealed at 650 �C for 2 h to remove potential
residual stresses. The mechanical properties of the alloy tested at room temperature are: ry = 259 MPa,
rUTS = 417 MPa, elongation = 34%, and average Vickers hardness = 173 HV.Three point bending specimens with two different thicknesses, B = 8.0 mm or 12.0 mm, were used in this
study. The specimen surfaces were ground with 600 emery paper to facilitate the observation of the pre-
crack. A pre-crack of approximately 3 mm in the specimen was produced through fatigue using an elec-
tro-servo-hydraulic system with 100 kN capacity under load control at room temperature. The pre-cracking
test was conducted with a sinusoidal waveform at a frequency of 10 Hz and load ratio of R = 0.1. The crack
length during the cyclic loading was continuously monitored using a traveling light microscope with a res-
olution of 0.01 mm. After the crack had been produced, a semi-circular hole on the crack was machined
through electro-discharge machining (EDM) to facilitate the insert of a high carbon steel wire (piano wire)between the crack surfaces as shown in Fig. 2. In this study, different sizes of piano wires, B0.75 mm and
B0.90 mm, were used, with mechanical properties of ry = 1470 MPa, rUTS = 1950 MPa, elongation
<0.02%, and average Vickers hardness = 550 HV [55].
2.2. Load–COD tests
The crack closing behavior, both with and without the hard asperity, was evaluated via the load–COD
curves, which were monitored by a data acquisition system in conjunction with a computer through a stan-dard load cell and extensometer. At a maximum value of approximately 85% or 110% of the load corre-
sponding to the bending yield load of the three point specimen, the piano wire was tightly inserted into
the semi-circular hole. It should be pointed out that the bending yield load is defined as the load level,
at which a 0.01 mm proof-COD value is measured. The load–COD tests were then executed at a displace-
ment rate of 0.5 mm/min.
2.3. Deformation zone examination
To reveal the deformation zone in the specimen after the load–COD tests, the work-hardened area was
examined by means of the microhardness, a newly developed etching technique [56] and FE analysis. In the

(b)Inserted piano wire
Three point bending specimen
W =12mm
l = 80mm
B = 8mm or 12mmS = 53mm
(a)
Semi-circular hole a1=2.5mm
Pre-crack
ai = 5mm
0.1mm
Equivalent height
Fig. 2. Dimensions of three point bending specimen and a semi-circular hole used to facilitate inserting piano wires.
2110 M. Okayasu et al. / Engineering Fracture Mechanics 72 (2005) 2106–2127
microhardness tests, two regions surrounding the piano wire and the crack tip, respectively, as shown in
Fig. 3, were studied using a Vickers microhardness tester. A load of 98 N was used on the ferrite grains,
including grain boundaries. The etching procedure based upon Fry etching method [57] has been briefly
described as follows. First, an annealed specimen was strained, and the surface for observation was ground
with emery papers down to 2000 grade. Then the sample was heated at 550 �C for 2 h, and the surface was
polished to a mirror level. Finally, the polished surface was etched with a solution of 50 ml hydrochloric
acid, 30 ml ethyl alcohol, 50 ml water and 10 g CuCl2 under ultrasonic vibration. After about 10 min etch-
ing, the etched surface was lightly polished again by a cloth. In this etching technique, the plastic zone wasrevealed by different degrees of etching between the plastically deformed and nondeformed regions; the
plastic zone was found to be only slightly etched, whereas the other region was deeply etched due to
their different morphologies in the microstructure. Moreover, due to the surface offset after etching, the
Piano wire
Crack tipB
A
Fig. 3. Schematic illustration of the locations for the microhardness measurement: A, adjacent to the piano wire and B, around the
crack tip.

M. Okayasu et al. / Engineering Fracture Mechanics 72 (2005) 2106–2127 2111
deformation zone became observable at a low magnification. Details of the mechanisms behind such
etching technique can be found in Ref. [56].
2.4. Finite element analysis
Finite element analysis was employed to analyze both the load–COD relation and the deformation pat-
tern in the areas surrounding the piano wire and the crack tip. In this analysis, two-dimensional finite ele-
ment simulation with eight-noded quad elements was used. The FE model was designed based on the
specimen geometry shown in Fig. 2, and the mesh size adjacent to the asperity and the crack tip was
0.02 and 0.05 mm, respectively. In this calculation, the case of bilinear kinematics hardening was selected,
where the initial slope of the stress–strain curve is taken as Young�s modulus of the material, and after
yielding the curve continues along the second slope defined by the tangent modulus. The following material
properties were selected: Young�s modulus of E = 210 GPa, a tangent modulus was defined to be equal 10%of the Young�s modulus and, hence, a value of 21 GPa was obtained [58], yield stress ry = 259 MPa, and
Poisson�s ratio m = 0.3. A friction coefficient of 0.1 between the asperity and the specimen was assumed
in this model.
2.5. Deformation displacement examination
The displacement value during the deformation process due to the contact behavior between the annealed
SAE 1015 and the piano wire was specifically investigated. The following special experiment was designed,where the rectangular annealed steel samples were slowly compressed against a piano wire with the electro-
servo-hydraulic system shown in Fig. 4. The contact condition between the piano wire and the rectangular
specimen material was similar to that in the load–COD tests as shown in Fig. 2(b), where the piano wire
was inserted into the semi-circular hole. In addition, to confirm the experimentally obtained load–displace-
ment relation, FE analysis was also performed. Fig. 5 shows the FE model based on the experimental
set-up in Fig. 4, where the mesh size in the region surrounding the B0.90 mm piano wire was selected to be
0.01 mm. The analysis was carried out under plane strain condition to evaluate the displacement change.
The required material properties were the same as those described in Section 2.4.
Piano wire
Load
SAE 1015 steel
8mm
Clip gauge
High hardness steel (HRC55)
High hardness steel (HRC55)
8mm 10mm
B=12mm
SAE 1015 steel
Fig. 4. An experimental set-up used to determine the displacement around the piano wire.

Fig. 5. A FE model used to determine the deformation displacement value (DL).
2112 M. Okayasu et al. / Engineering Fracture Mechanics 72 (2005) 2106–2127
3. Results and discussion
3.1. Effect of piano wire on the crack opening behavior
Fig. 6 shows the load–COD curves obtained by the application of a load up to approximately 85% yield
load of the specimen. The three plots in Fig. 6 are for the following conditions: (a) without any artificial
asperity, (b) with B0.75 mm piano wire, and (c) with B0.90 mm piano wire. The loading and unloading
curves exhibited apparent hysteresis-like loops, when the asperities were inserted. However, even without
the artificial asperity, a weak hysteresis behavior could also be detected. This may be attributed to the
localized yielding occurred at the crack tip. The maximum difference in the COD between the loading
and unloading phases, indicated by Ddmax, of the samples displays an obvious trend in proportion to the
size of the asperity, i.e., the larger the asperity size, the greater value of the Ddmax.It is of particular interest to note from Fig. 6 that there exists an inflection point on all the unloading
load–COD curves although the trend between Fig. 6(a)–(c) is totally different. The lower portion of the
unloading curve exhibits a convex shape in Fig. 6(a) without any artificial asperity, but a concave shape
in Fig. 6(b) and (c) with an artificial asperity. It should be pointed out that the convex shaped load–
COD curve has been reported in almost all the related publications, as a consequence of the normal crack
closure effect (e.g., near-tip fracture surface roughness-induced closure, oxide-induced closure, etc.). The
theoretical basis for the existence of such a convex shaped load–COD curve has been recently proposed
[43], whereas the concave shaped load–COD curves and the residual COD with the plastic deformationof the specimen material (dRP) will be discussed in the later sections of this report.
To verify the above observations, the load–COD curves were also determined under loading up to 110%
of the bending yield load. The obtained results are shown in Fig. 7: (a) without any artificial asperity; (b)
withB0.75 mm piano wire and (c) with B0.90 mm piano wire. Unlike the results shown in Fig. 6, the upper
portion of load–COD curves obtained in the loading phase (Fig. 7) are clearly curved due to the yielding of
the specimen. This also results in wider hysteresis-like loops shown in Fig. 7. Again, the lower portion of the
unloading curves is very different between the samples with and without artificial asperities, an observation
similar to that seen in Fig. 6.The unloading portion of the load–COD curves was further examined via FE analysis.The load–COD
results calculated with 85% and 110% yield load are shown in Figs. 6(b) and (c) and 7(b) and (c), respectively.

El
0
500
1000
1500
2000
2500
3000
3500
0 0.1 0.2 0.3 0.4 0.5
COD, mm
Loa
d, N
Real zero COD
max
Unloading
Loading
Linear portion
Measurement zero
0
500
1000
1500
2000
2500
3000
3500
0 0.1 0.2 0.3 0.4 0.5
COD, mm
Loa
d, N
max
PR
Linear portion
Unloading
Loading
R
Experiment× FEA
Elastic wedge model [39]
0
500
1000
1500
2000
2500
3000
3500
0 0.1 0.2 0.3 0.4 0.5
COD, mm
Loa
d, N
max
Linear portion
Unloading
Loading
PR
R
Experiment× FEA
astic wedge model [39]
(b)(a)
(c)
Fig. 6. Load–COD curves for an annealed SAE 1015 steel loaded at a maximum value of about 85% of the load corresponding to the
yield load: (a) without any asperity; (b) with a B0.75 mm piano wire and (c) with a B0.90 mm piano wire. (Specimen size:
12.0(W) · 12.0(B) · 80 mm(l).)
M. Okayasu et al. / Engineering Fracture Mechanics 72 (2005) 2106–2127 2113
Similar to the experimental results, the obtained FEA load–COD data exhibited a concave change with
decreasing the load. While the FEA data in the case of 85% yield load are somewhat shifted to the right-hand
side, the FEA data for 110% yield load are in excellent agreement with the experimental results.
The upper unloading portion shown in Fig. 6(b) and (c) may be understood using the elastic-wedgemodel [39], which was developed with an elastic wedge located adjacent to the crack tip in an elastically
deformed material. In the elastic-wedge model the residual crack opening displacement, dR, after the
applied load is removed, can be expressed [39]
dR ¼ kh11þ k
ffiffiffiffiffiaia1
r; ð1Þ
with
k ¼ 8E1W 1
ph1E0 ; ð1aÞ
E0 ¼ E for plane stress; ð1bÞ

0
500
1000
1500
2000
2500
3000
3500
0 0.1 0.2 0.3 0.4 0.5 0.6 0.7 0.8 0.9
COD, mm
Loa
d, N
Unloading
Loading
Linear portion
Real zero COD Measurement zero
0
500
1000
1500
2000
2500
3000
3500
0 0.1 0.2 0.3 0.4 0.5 0.6 0.7 0.8 0.9
COD, mm
Loa
d, N
Unloading
Loading
Linear portion
δPR
δR
Experiment× FEA Elastic wedge model [39]
0
500
1000
1500
2000
2500
3000
3500
0 0.1δ
δ
0.2 0.3 0.4 0.5 0.6 0.7 0.8 0.9
COD, mm
Loa
d, N
Unloading
Loading
Linear portion
PR
R
Experiment FEA
Elastic wedge model [39]×
(a) (b)
(c)
Fig. 7. Load–COD curves for an annealed SAE 1015 steel loaded at a maximum value of about 110% of the load corresponding to the
yield load: (a) without any asperity; (b) with a B0.75 mm piano wire and (c) with a B0.90 mm piano wire. (Specimen:
12.0(W) · 8.0(B) · 80 mm(l).)
2114 M. Okayasu et al. / Engineering Fracture Mechanics 72 (2005) 2106–2127
E0 ¼ E1� m2
for plane strain; ð1cÞ
where h1 is the height of the asperity, W1 is the width of the asperity, al is the distance from the center of
the asperity to the crack tip, ai is the distance of the measuring location from the crack tip, m is Poisson�sratio, E1 and E are Young�s modulus of the asperity and the specimen, respectively. Since the piano wire
was tightly inserted at the maximum load shown in Fig. 6(b) and (c), it would contact the fracture surface
immediately during the subsequent unloading process. This corresponds directly to Stage II in the elastic-
wedge model [39]. It should be noted that, the elastic-wedge model was originally adapted for the asperity
height smaller than or equal to the COD value at the location of the asperity under the maximum load,
although our wedge height was higher than the COD value as shown in Fig. 2(b). Based upon the elastic-wedge model, the equivalent height of our asperity was obtained from the wedge height, or the distance,
prior to the EDM machining between the two points on the top and bottom fracture surface, as shown in
Fig. 2(b). The height for the B0.75 mm and B0.90 mm piano wires was determined to be 0.275 mm and
0.35 mm, respectively. Since the piano wire has a circular shape it is difficult to determine accurately the

Fig. 8. Micrographs of the annealed SAE 1015 steel adjacent to the piano wire after the load–COD test, showing: (i) contact between
the piano wire and specimen and (ii) plastic deformation in the specimen around the piano wire.
M. Okayasu et al. / Engineering Fracture Mechanics 72 (2005) 2106–2127 2115
value of W1. However, as a first approximation, W1 might be taken from the contact width between the
asperity and crack surface, since W1 is always equal to the contact width in the case of rectangular shapedwedge used [39]. Fig. 8 shows a micrograph of the specimen in the vicinity of the B0.90 mm piano wire
after the load–COD test, where the specimen was loaded to 110% of the yield load. The micrograph in
Fig. 8 indicates clearly that the wire is in contact with the permanently deformed specimen surface, where
the contact width is about 0.18 mm. Based on this observation, W1 could be considered to be approxi-
mately one fifth of the asperity height. If a plane strain condition of the three-point bending specimens
is considered, E1 = E = 210 GPa for both the high strength steel piano wire and the annealed SAE
1015 steel, and m is taken as 0.3, k becomes a constant, i.e., k = 1.6 · (1 � m2)/p = 0.464 according to
Eq. (1a). As shown in Fig. 2, a1 = 2.5 mm and ai = 5.0 mm, the residual crack opening displacement(dR) calculated in terms of Eq. (1) is dR = 0.123 mm and dR = 0.157 mm for the B0.75 mm and
B0.90 mm piano wires, respectively. The dR value could also be obtained from the load–COD curves
shown in Fig. 6(b) and (c). It corresponds to the value from the real zero COD, obtained on the basis
of linear elastic fracture mechanics [39], to the intersection of a straight line passing through the linear
portion of the upper unloading curve with the abscissa. The experimentally determined dR value was
about 0.122 mm and 0.161 mm for the B0.75 mm and B0.90 mm piano wires, respectively, as shown
in Fig. 6(b) and (c). These values are in good agreement with the above theoretical prediction according
to Eq. (1).In addition, the upper unloading portion shown in Figs. 6(b) and (c) and 7(b) and (c) may also be
understood using another theoretical model proposed by Tada and Paris [40]. In this model a nonlinear
portion between Stage I and II is indicated with a convex shape connecting two load points, r1 and r2, asshown in Fig. 1(c). The model is about a center crack partly or wholly filled with a wedge. The range of
this portion between r1 and r2 is dependent on the ratio of the asperity width W1 to the crack length a,
e.g., this range diminishes with decreasing W1/a ratio. From Figs. 6(b) and (c) and 7(b) and (c), it is seen
that no Stage I was present due to the fact that the piano wire was tightly inserted into the crack surfaces
as described above, the potential nonlinear portions based on Ref. [40] were also not observed in theupper unloading portions. This may be due to the fact that the ratio of the asperity width to the crack
length was very small, i.e., W1/a = 0.03 and 0.036 for the B0.75 mm and B0.90 mm piano wires, respec-
tively. It should be noted that, since three point bending specimens were used in this study, the crack
length was taken as ai, i.e., from the bottom edge of the specimen to the crack tip, as indicated in
Fig. 2(a).

2116 M. Okayasu et al. / Engineering Fracture Mechanics 72 (2005) 2106–2127
3.2. Deformation zone
As seen in Fig. 8, the specimen surface was permanently deformed by the contact action, in which the
surface was clearly dented along the outline of piano wire. Fig. 9 illustrates, at larger magnifications, the
microstructure of the same sample as shown in Fig. 8, where two typical features, i.e. delamination andplastic flow, can be seen. Apparently, more severe plastic deformation occurred in the specimen materials,
while no clear deformation was observed in the piano wire. Such a deformation feature could be eas-
ily understood based upon the following reasons: (i) the yield strength and hardness of the piano wire
are approximately three times higher than those of the specimen material, and (ii) a larger strain occurs
in the local area of the specimen around the asperity due to the contact on the round surface of the piano
wire.
To further clarify the deformation characteristics in the same sample, the work-hardened areas were
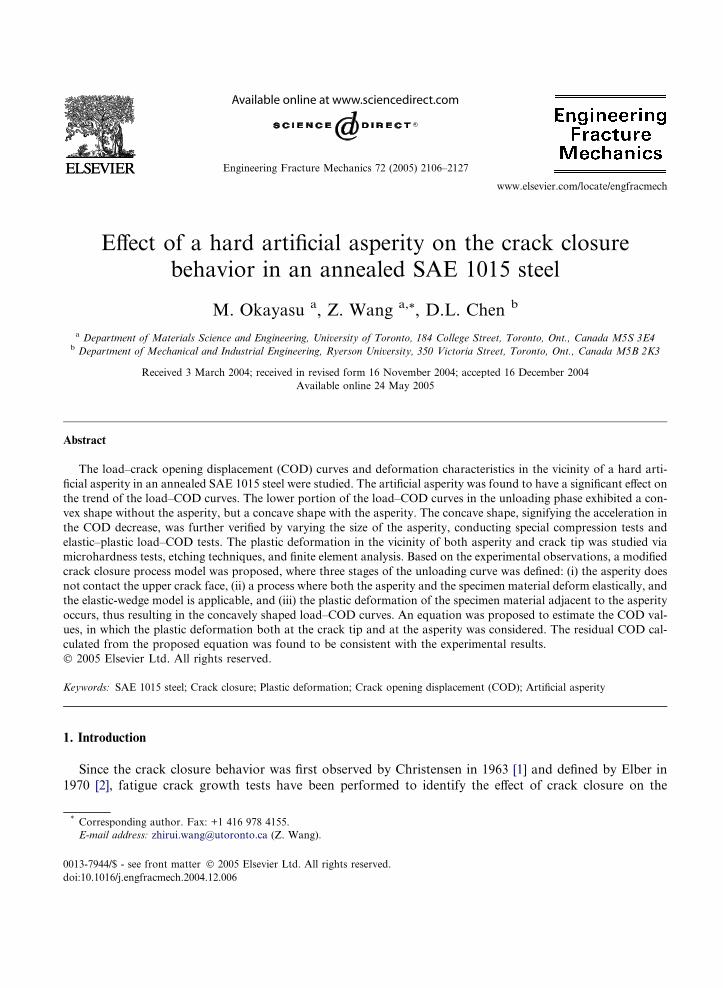
examined via the microhardness test and the etching technique. Fig. 10 presents the microhardness mappingindicated by contour lines around the piano wire and the crack tip before and after the load–COD test. To
identify the hardened zones more easily, the contour lines are defined by the ratio of the hardness in the
deformed region to that in the nondeformed material. As can be seen from Fig. 10, before testing
the work-hardened zones, e.g., characterized by the ratio above 1.2, are observed to be restricted only in
the small regions surrounding the fatigue crack and very close to the crack tip. The hardened zones were
obviously expanded after testing, and they are indicated in these figures by aforementioned ratio.
To further reveal the hardened zones, the special etching procedure described earlier was applied. Fig. 11
shows a typical macrograph after etching, where the etching makes the hardened regions darkened. Thus,the plastic zone profiles are clearly seen in the region around the piano wire and the crack tip, respectively.
Fig. 9. Micrographs of the annealed SAE 1015 steel adjacent to a piano wire after the load–COD test, showing: (a) delamination and
(b) plastic flow.
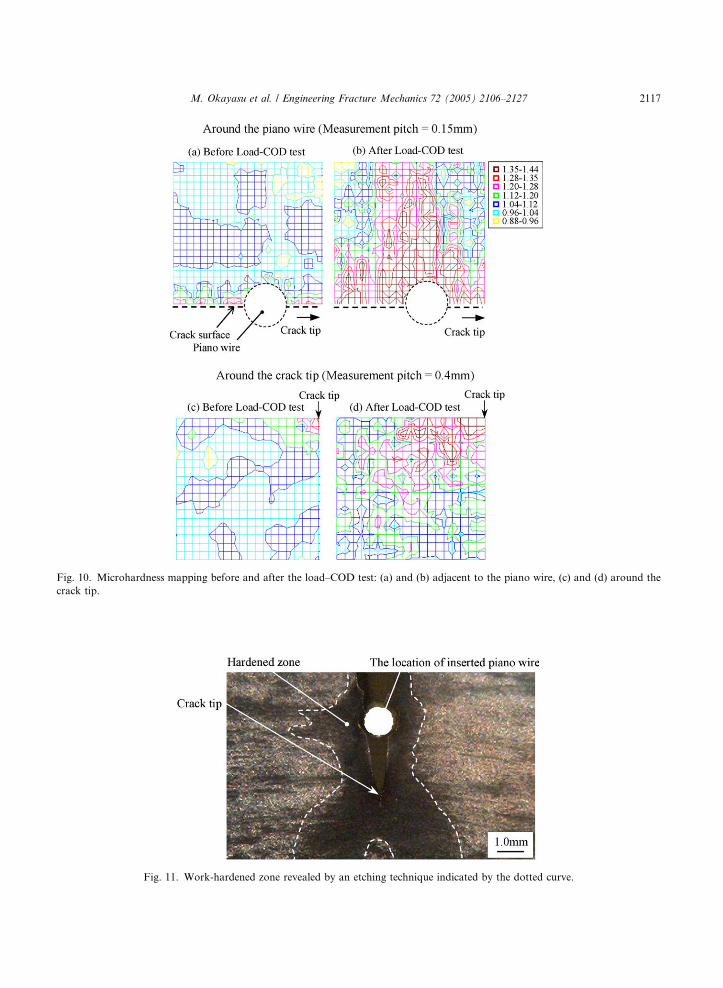
Fig. 10. Microhardness mapping before and after the load–COD test: (a) and (b) adjacent to the piano wire, (c) and (d) around the
crack tip.
Fig. 11. Work-hardened zone revealed by an etching technique indicated by the dotted curve.
M. Okayasu et al. / Engineering Fracture Mechanics 72 (2005) 2106–2127 2117
2118 M. Okayasu et al. / Engineering Fracture Mechanics 72 (2005) 2106–2127
In comparison to the hardened zones obtained via the microhardness test, the darkened areas around the
crack tip and the piano wire revealed by the etching technique are more clearly visible.
3.3. Finite element analysis
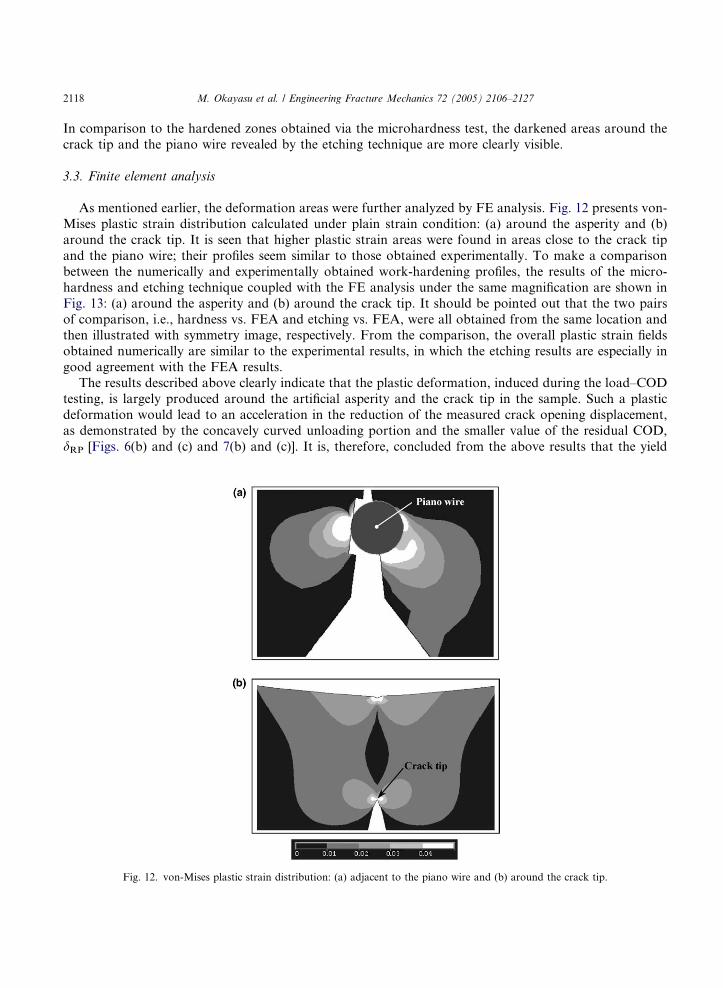
As mentioned earlier, the deformation areas were further analyzed by FE analysis. Fig. 12 presents von-
Mises plastic strain distribution calculated under plain strain condition: (a) around the asperity and (b)
around the crack tip. It is seen that higher plastic strain areas were found in areas close to the crack tip
and the piano wire; their profiles seem similar to those obtained experimentally. To make a comparison
between the numerically and experimentally obtained work-hardening profiles, the results of the micro-
hardness and etching technique coupled with the FE analysis under the same magnification are shown in
Fig. 13: (a) around the asperity and (b) around the crack tip. It should be pointed out that the two pairs
of comparison, i.e., hardness vs. FEA and etching vs. FEA, were all obtained from the same location andthen illustrated with symmetry image, respectively. From the comparison, the overall plastic strain fields
obtained numerically are similar to the experimental results, in which the etching results are especially in
good agreement with the FEA results.
The results described above clearly indicate that the plastic deformation, induced during the load–COD
testing, is largely produced around the artificial asperity and the crack tip in the sample. Such a plastic
deformation would lead to an acceleration in the reduction of the measured crack opening displacement,
as demonstrated by the concavely curved unloading portion and the smaller value of the residual COD,
dRP [Figs. 6(b) and (c) and 7(b) and (c)]. It is, therefore, concluded from the above results that the yield
Fig. 12. von-Mises plastic strain distribution: (a) adjacent to the piano wire and (b) around the crack tip.

Fig. 13. Deformation zones revealed by the microhardness test, etching technique, and FE analysis: (a) adjacent to the piano wire and
(b) around the crack tip.
M. Okayasu et al. / Engineering Fracture Mechanics 72 (2005) 2106–2127 2119
strength and hardness of, and their differences between the asperity and the specimen materials as well as
the resultant stress/strain level around the asperity all play important roles in the load–COD characteristics.
The plastic deformation in the vicinity of a harder asperity could result in a significant reduction in the mea-
sured COD value.
4. Fatigue crack closure process with a hard asperity and COD estimation
There are several models [37–43] so far for characterizing the crack closure involving the artificial
wedges. As shown in Fig. 1, either a rigid- or an elastic-wedge is artificially placed in the vicinity of a crack
tip to stimulate the obstruction of crack closure; their stress–displacement relations in Stage II exhibit linear
or linear plus nonlinear variations. However, as seen from the above experimental/numerical results shown
in Figs. 6(b) and (c) and 7(b) and (c), when the stress level around the asperity and the strength ratio of the
asperity over the specimen material are high, the crack closure behavior is strongly affected. Such an influ-
ence on the load–COD relations has not been considered in the earlier models. By combining the presentresults with the crack closure model [39], a modified applied stress–COD process is presented in Fig. 14.
If the applied stress is high, the plastic deformation at the crack tip would occur. This causes a convex
curvature of the applied stress–COD relationship in the loading phase towards the right-hand side, as
shown in Fig. 14. In the unloading phase, the first stage corresponds to the situation where the asperity does
not contact the upper crack face. At rop, the asperity just touches the upper crack face. In Stage II, both the

Stage II
Stage Iσop
δmaxo
σmin
σmax
δ (COD)
δminStage III
σ
σpl
δII/III δop
σII/III
σclosed
σmin, act
Stage I
P1
Stage II
COD Stage III
P1
Fig. 14. Schematic illustrations of the proposed crack closure process including the plastic deformation in the specimen material at the
asperity.
2120 M. Okayasu et al. / Engineering Fracture Mechanics 72 (2005) 2106–2127
asperity and the specimen material (near the asperity) deform elastically. Therefore, the equation derived in
the elastic-wedge model [39] is applicable, which is also verified by the present experimental results, as
shown in Figs. 6(b) and (c) and 7(b) and (c). At rII/III, the onset of the plastic deformation occurs. From
this point on, plastic deformation of the specimen material in the vicinity of the asperity occur, i.e., Stage
III, since the annealed steel is considerably softer than the piano wire. This is also verified by the observa-
tions of the deformation behavior, examined both experimentally and numerically, as demonstrated in Figs.
8–13.It should be pointed out that even if the strength of the asperity is similar to that of the base material,
localized plastic deformation is still inevitable, as there exists a strong stress concentration near the contact
area between the asperity and the specimen.
4.1. Determination of COD
It can be seen from Fig. 14 that the COD value at zero load should be associated with the plastic defor-
mation behavior in the specimen around the asperity and at the crack tip. To estimate the COD values withconsideration of the plastic deformation, a schematic drawing is shown in Fig. 15. In the figure, COD1 (or
Dc) is the crack opening displacement contributed by the crack tip blunting, which could be approximated
using Irwin�s formula [59,60], whereas COD2 is the crack opening displacement associated with the artificial
wedge with considerations of both elastic and plastic deformation in the vicinity of the wedge. Hence, the
crack opening displacement may be expressed as,
COD ¼ COD1 þ COD2; ð2Þ
COD1 ¼ Dc; ð2aÞ
COD2 ¼ aiLA � Dc � DA
a1
� �; ð2bÞ
where LA is the height of the asperity from the lower crack surface, ai is the distance of the measuring loca-
tion from the crack tip, a1 is the distance of the asperity from the crack tip, and Dc and DA are the displace-
ment at the crack tip and at the asperity, caused by the plastic deformation, which are required to be
determined.

COD
ai
a1
DCLADA
Plastic zone(around crack tip)
2 ry
W
BRound asperity
Crack face
COD1
(DC)
COD2
Plastic zone(around asperity)
Fig. 15. Schematic illustrations of a model proposed to estimate the crack opening displacement caused by the plastic deformation
both at the crack tip and at the asperity.
M. Okayasu et al. / Engineering Fracture Mechanics 72 (2005) 2106–2127 2121
4.2. Determination of the displacement or blunting value at the crack tip
To assess an approximate value of the displacement caused by the plastic deformation at the crack tip,
Dc, Irwin�s plastic zone correction modified by Dugdale is used here. Then the displacement at the crack tip
can be described as follows [59–61]:
Dc ¼4rE0
ffiffiffiffiffiffiffiffiffiffi2airy
p; ð3Þ
where r is externally applied stress, E 0 is given in Eqs. (1b) and (1c), ai is the distance of the measuring loca-
tion from the crack tip, and ry is half of the plastic zone size at the crack tip.
It should be pointed out that the externally applied stress in this equation is considered for a center
cracked tension specimen. As a first approximation, let us assume that Eq. (3) is also applicable for thethree point bending specimen with the following applied stress:
r ¼ 3PS
2BðW � aiÞ2; ð4Þ
where P is the externally applied load, S is a supporting span, B and W are the specimen thickness and
width, respectively. Substituting Eq. (4) into Eq. (3) leads to an expression for the displacement at the crack
tip, caused by the plastic deformation, in the three point bending specimen as follows:
Dc ¼6PS
BE0ðW � aiÞ2ffiffiffiffiffiffiffiffiffiffi2airy
pð5Þ
with
ry ¼1
2pKry
� �2
for plane stress; ð5aÞ
ry ¼1
6pKry
� �2
for plane strain; ð5bÞ

2122 M. Okayasu et al. / Engineering Fracture Mechanics 72 (2005) 2106–2127
K ¼ 3YPS
2BW 2
ffiffiffiffiffiffiffipai
p; ð5cÞ
Y ¼ 1.09� 1.735nþ 8.20n2 � 14.18n3 þ 14.57n4; ð5dÞ
n ¼ ai=W ; ð5eÞ
where K is the stress intensity factor for the three point bending specimen, ry is the yield strength of thespecimen, and Y is the geometric correction factor [62].
4.3. Determination of the displacement at the asperity
To obtain the displacement value, DA, the experiment involving the annealed SAE 1015 rectangular sam-
ples compressed slowly against a piano wire was conducted, Fig. 4. The load–displacement curves, obtained
with B0.75 mm and B0.90 mm piano wires, respectively, are shown in Fig. 16. The two curves display
essentially a similar tendency. However, the displacement obtained with theB0.75 mm piano wire is slightly
larger than that obtained with B0.90 mm piano wire in the region with more than 2000 N due to the higher
stress concentration. It is of particular interest to note that the tendency of the curves is similar to the lowerportion of the unloading load–COD curves as shown in Figs. 6(b) and (c) and 7(b) and (c). Thus, the defor-
mation displacement at the asperity, DA, in the load–COD tests may be estimated using the load–displace-
ment behavior shown in Fig. 16. Based on the experimental data, an empirical polynomial equation for the
load vs. displacement behavior in the two cases may be expressed as follows:
DA ¼ 2� 10�11P 3 � 6� 10�8P 2 þ 1� 10�4P � 4.1� 10�3 for £0.75 mm piano wire; ð6Þ
orDA ¼ 9� 10�12P 3 � 3� 10�8P 2 þ 9� 10�5P þ 3.2� 10�3 for £0.90 mm piano wire; ð7Þ
where P is the externally applied load [N].To verify the above load–displacement behavior, FE analysis was also performed. The obtained load vs.
displacement curve is shown in Fig. 17, which in general is consistent with the experimentally obtainedload–displacement results.
By combining the above Eqs. (2)–(7) one may express the crack opening displacement as
COD ¼ Dc þaia1
ðLA � Dc � DAÞ; ð8Þ
-3500
-3000
-2500
-2000
-1500
-1000
-500
0
-0.3 -0.25 -0.2 -0.15 -0.1 -0.05 0
Loa
d, N
Displacement, mm (∆L)
∅0.90mm
∅0.75mm
Fig. 16. Load–displacement curves for the annealed SAE 1015 steel against a B0.75 mm and B0.90 mm piano wires.

0
500
1000
1500
2000
2500
3000
0 0.1 0.2 0.3 0.4 0.5 0.6 0.7COD, mm
Loa
d, N
Eq. (8)
Experimental data
Unloading portion in Fig. 6(b)
0
500
1000
1500
2000
2500
3000
3500
0 0.1 0.2 0.3 0.4 0.5 0.6 0.7 0.8COD, mm
Loa
d, N
Eq. (8)
Experimental data
Unloading portion in Fig. 6(c)
(b)
(a)
Fig. 18. Comparison between the theoretical estimates from Eq. (8) and the unloading portion of the load–COD curves in an annealed
SAE 1015 steel loaded up to 85% of the yield load: (a) with a B0.75 mm piano wire and (b) with a B0.90 mm piano wire.
-3500
-3000
-2500
-2000
-1500
-1000
-500
0
-0.35 -0.3 -0.25 -0.2 -0.15 -0.1 -0.05 0Displacement, mm (∆L)
Loa
d, N
Fig. 17. A load–displacement curve analyzed by means of FE analysis (B0.90 mm piano wire).
M. Okayasu et al. / Engineering Fracture Mechanics 72 (2005) 2106–2127 2123

2124 M. Okayasu et al. / Engineering Fracture Mechanics 72 (2005) 2106–2127
where Dc is given by Eq. (5) and DA by Eq. (6) or (7) for B0.75 mm and B0.90 mm piano wires,
respectively.
To check the validity of the model described above, the COD values with B0.75 mm and B0.90 mm pia-
no wires were calculated using Eq. (8). The required parameters for the three point bending specimen were
taken from Fig. 2. The specimen thickness of 8 mm was chosen. The externally applied load of P = 2700 Nwas taken from the load–COD curves shown in Fig. 7(b) and (c). If a plane strain condition is assumed for
the three point bending specimen, the ry value is approximately 0.342 mm according to Eq. (5b). Since the
equivalent height of LA would be 0.275 mm and 0.35 mm for the B0.75 mm and B0.90 mm piano wires,
respectively, the corresponding CODs at zero load are 0.089 mm and 0.275 mm. These two values are about
54% and 96% of the experimentally determined residual crack opening displacements, dPR = 0.163 mm and
dPR = 0.285 mm after the plastic deformation or the concavely curved portion is taken into consideration,
as shown in Fig. 7(b) and (c). The proposed equation may be, therefore, used to predict the approximate
crack opening displacement value in Stage III, where the plastic deformation occurs.To further confirm the validity of the proposed equation for Stage III, the theoretical curve calculated by
Eq. (8) was compared to the experimentally obtained lower portion shown in Figs. 6(b) and (c) and 7(b)
and (c). The required geometrical parameters were the same as those described in Fig. 2. It should be noted
that, in the case of loading up to 85% of the yield load, Dc value might be neglected due to the tests carried
0
500
1000
1500
2000
2500
3000
0 0.1 0.2 0.3 0.4 0.5 0.6 0.7
COD, mm
Loa
d, N
Eq. (8)
Experimental data
Unloading portion in Fig. 7(b)
(a)
(b)
0
500
1000
1500
2000
2500
3000
0 0.2 0.4 0.6 0.8 1
COD, mm
Loa
d, N
Eq. (8)
Experimental data
Unloading portionin Fig. 7(c)
Fig. 19. Comparison between the theoretical estimates from Eq. (8) and the unloading portion of the load–COD curves in an annealed
SAE 1015 steel loaded up to 110% of the yield load: (a) with a B0.75 mm piano wire and (b) with a B0.90 mm piano wire.

M. Okayasu et al. / Engineering Fracture Mechanics 72 (2005) 2106–2127 2125
out in the elastic region. Fig. 18 shows the theoretical and experimental load–COD curves, loaded up to
85% of the yield load, (a) with a B0.75 mm piano wire and (b) with a B0.90 mm piano wire. The trend
of the theoretical estimate is similar to that in the lower portion of the load–COD curve, although the val-
ues of the theoretical estimate are positioned at the right-hand side of the experimentally obtained curve.
However, in the case of loading up to 110% of the bending yield load, as shown in Fig. 19, the theoreticalestimate based on Eq. (8) is in good agreement with the lower portion of the experimentally-determined
load–COD curve for both B0.75 mm and B0.90 mm piano wires.
5. Conclusions
The effect of a harder artificial asperity on the crack closure behavior in annealed steel samples has been
studied experimentally and numerically. The following conclusions can be drawn.
1. In the elastic load–COD tests, an inflection point can always be observed on the unloading portion of all
load–COD curves, regardless of whether or not there is an artificial asperity. However, the trend of the
inflection is different in cases with and without any asperity. In the case where the asperity is not inserted,
the lower portion of the unloading curves exhibits a convex shape, whereas a concave shape is found for
samples with an artificial asperity.
2. The concave nature of the unloading curve indicates acceleration in the COD reduction. The change of
the curve shape from convexity to concavity induced by the addition of a hard asperity has been verifiedby different experimental observations such as (a) the effect of asperity size, (b) the load–displacement
behavior via pressing a piano wire against an annealed steel sample, and (c) the elastic–plastic load–
COD tests.
3. The width of the loading–unloading hysteresis-like loops and the residual COD values in the elastic–
plastic tests are both larger than those in the elastic tests. This indicates that a large plastic deformation
or blunting occurs at the crack tip. However, in all the load–COD tests, the plastic deformation in the
vicinity of the piano wire similarly occurred, which has been confirmed via the microhardness tests, etch-
ing techniques, and finite element analysis.4. A modified model on the crack closure process in the case of hard asperities in soft material samples has
been proposed. During unloading three stages of crack closure can be defined: in the first stage, the
asperity does not get in touch with the upper crack face; in the second stage, both the asperity and
the specimen material deform elastically, and thus the elastic-wedge model is applicable; in the third
stage, plastic deformation of the specimen material close to the asperity occurs, leading to the observed
concave shape on the load–COD curves.
5. A semi-empirical equation has been proposed to estimate the COD value, in which the plastic deforma-
tion at both the crack tip and the asperity is taken into consideration. The residual COD value calculatedfrom the proposed equation is found to be in fair agreement with the experimental result.
Acknowledgements
The authors would like to express the appreciation to Prof. M.N.James for helpful comments and sug-
gestions. This work was performed under the financial support of the Natural Sciences and EngineeringResearch Council of Canada (NSERC), Materials and Manufacturing Ontario (MMO). The work was
technically supported by ANSYS JAPAN LTD, ISOYA LTD, JIT Automation Inc. and ROI Engineering
Inc. M.Okayasu acknowledges financial support from the University of Toronto, the Ontario Graduate

2126 M. Okayasu et al. / Engineering Fracture Mechanics 72 (2005) 2106–2127
Scholarship Award (OGS) and the Award of Association of Japanese Canadian Businesses and Profession-
als. D.L.Chen would also like to thank the financial support received from the Premier�s Research Excel-
lence Award (PREA), and Canada Foundation for Innovation (CFI).
References
[1] Christensen RH. Fatigue crack growth affected by metal fragments wedged between opening–closing crack surfaces. Appl Mater
Res 1963(October):207–10.
[2] Elber W. Fatigue crack closure under cyclic tension. Engng Fract Mech 1970;2:37–45.
[3] Birol Y. Plastic deformation around fatigue cracks. Metallography 1988;21:77–90.
[4] James MN, Pacey MN, Wei LW, Patterson EA. Characterization of plasticity-induced closure-crack flank contact force versus
plastic enclave. Engng Fract Mech 2003;70:2473–87.
[5] Solanki K, Daniewicz SR, Newman Jr JC. Finite element modeling of plasticity-induced crack closure with emphasis on geometry
and mesh refinement effects. Engng Fract Mech 2003;70:1475–89.
[6] McClung RC, Thacker BH, Roy S. Finite element visualization of fatigue crack closure in plane-stress and plane-strain. Int J
Fract 1991;50:27–49.
[7] Orura K, Ohji K, Honda K. Influence of mechanical factors on the fatigue crack closure. In: Advances in research on the strength
and fracture of materials (Fracture 1977), Proceeding, 4th International Conference on Fracture Mechanics, Waterloo, Canada;
vol. 2B; 1977. p. 1035–47.
[8] Wei LW, James MN. Numerical modeling of plasticity-induced crack closure for interfacial cracks in bi-material specimens.
Engng Fract Mech 2004;71:309–27.
[9] James MN, Knott JK. An assessment of crack closure and the extent of the short crack regime in QIN (HY 80) steel. Fatigue
Fract Engng Mater Struct 1985;8:171–91.
[10] McClung RC, Sehitoglu H. On the finite element analysis of fatigue crack closure. Part I; basic modeling issues. Engng Fract
Mech 1989;33:237–52.
[11] Newman Jr JC. An evaluation of the plasticity-induced crack-closure concept and measurement methods. NASA 1998;TM-1998-
208430:1–26.
[12] Newman Jr JC. A crack-closure model for predicting fatigue crack growth under aircraft spectrum loading. In: Methods and
models for predicting fatigue crack growth under random loading, ASTM STP; vol. 748. 1981. p. 53–84.
[13] Newman Jr JC. FASTRAN II—a fatigue crack growth structural analysis program. NASA 1992;TM 104159.
[14] Newman Jr JC, Brot A, Matias C. Crack-growth calculations in 7075-T7351 aluminum alloy under various load spectra using an
improved crack-closure model. Engng Fract Mech 2004;71:2347–63.
[15] Wei LW, James MN. A study of fatigue crack closure in polycarbonate CT specimens. Engng Fract Mech 2000;66:223–42.
[16] Vasudevan AK, Sadananda K, Louat N. Reconsideration of fatigue crack closure. Scr Metall Mater 1992;27:1673–8.
[17] Louat N, Sadananda K, Duesbury M, Vasudevan AK. A theoretical evaluation of crack closure. Metall Trans A
1993;24:2225–32.
[18] Vasudevan AK, Sadananda K, Louat N. A review of crack closure, fatigue crack threshold and related phenomena. Mater Sci
Engng 1994;A188:1–22.
[19] Pippan R, Riemelmoser FO. Visualization of the plasticity-induced crack closure under plane strain conditions. Engng Fract
Mech 1998;60:315–22.
[20] Suresh S, Ritchie RO. A geometric model for fatigue crack closure induced by fracture surface roughness. Metall Trans A
1982;13A:1627–31.
[21] Ritchie RO, Suresh S. Some considerations on fatigue crack closure at near-threshold stress intensities due to fracture surface
morphology. Metall Trans A 1982;13A:937–40.
[22] Parry MR, Syngellakis S, Sinclair I. Numerical modeling of combined roughness and plasticity induced crack closure effects in
fatigue. Mater Sci Engng 2000;A291:224–34.
[23] Wang SH, Muller C, Exner HE. A model for roughness-induced fatigue crack closure. Metall Mater Trans A 1998;29A:1933–9.
[24] Wasen J, Karlsson B. The relation between fracture surface geometry and crack closure in fatigue. In: Kitagawa H, Tanaka T,
editors. Fatigue 90. Birmingham: Materials and Component Engineering Publications Ltd; 1990. p. 1289–94.
[25] Ritchie RO, Suresh S, Moss CM. Near-threshold fatigue crack growth in 214Cr–1Mo pressure vessel steel in air and hydrogen. J
Engng Mater Technol 1980;102:293–9.
[26] Suresh S, Zamiski GF, Ritchie RO. Oxide-induced crack closure: an explanation for near-threshold corrosion fatigue crack
growth behavior. Metall Trans A 1981;12A:S1435–43.
[27] Kim JH, Lee SB. Behavior of plasticity-induced crack closure and roughness-induced crack closure in aluminum alloy. Int J
Fatigue 2001;23:247–51.

M. Okayasu et al. / Engineering Fracture Mechanics 72 (2005) 2106–2127 2127
[28] Minakawa K, McEvily AJ. On crack closure in the near-threshold region. Scr Metall 1981;15:633–6.
[29] Minakawa K, Matsuo Y, McEvily AJ. The influence of a duplex microstructure in steels on fatigue crack growth in the near-
threshold region. Metall Trans A 1982;13A:439–43.
[30] Vecchio RS, Crompton JS, Hertzberg RW. Anomalous aspects of crack closure. Int J Fract 1986;31:R29–33.
[31] Hertzberg RW, Newton CH, Jaccard R. Crack closure: correlation and confusion. Mechanics of Fatigue Crack Closure. In:
Newman Jr JC, Elber W, editors. ASTM STP 982. Philadelphia: American Society for Testing and Materials; 1988. p. 139–48.
[32] Sheu BC, Song PS, Shin CS. The effect of infiltration induced crack closure on crack growth retardation. Scr Metall Mater
1994;31:1301–6.
[33] Song PS, Sheu BC, Chou HH. Deposition of plating metals to improve crack growth life. Int J Fatigue 2001;23:259–70.
[34] UR-Rehman A, Thomason PF. The effect of artificial fatigue-crack closure on fatigue-crack growth. Fatigue Fract Engng Mater
Struct 1993;16:1081–90.
[35] Shin CS, Hsu SH. Fatigue life extension by an artificially induced retardation mechanism. Engng Fract Mech 1992;43:677–84.
[36] Sharp PK, Clayton JQ, Clark G. Retardation and repair of fatigue cracks by adhesive infiltration. Fatigue Fract Engng Mater
Struct 1997;20:605–14.
[37] Suresh S, Ritchie RO. Some considerations on the modelling of oxide-induced fatigue crack closure using solutions for a rigid
wedge inside a linear elastic crack. Scr Metall 1983;17:575–80.
[38] Maiti M, Paramguru R. Stress distribution due to a crack opened by a semi-infinite wedge. Int J Fract 1982;18:39–44.
[39] Chen DL, Weiss B, Stickler R. A model for crack closure. Engng Fract Mech 1996;53:493–509.
[40] Tada H, Paris PC. Theoretical analysis of load–displacement relations associated with crack surface interface. Int J Fatigue
2003;25:915–22.
[41] Paris PC, Toda H, Donald JK. Service load fatigue damage—a historical perspective. Int J Fatigue 1999;21:S35–46.
[42] Chen DL, Wang Z. Modeling of fatigue crack closure effect incorporated with the asperity plasticity. In: Bodner SR, Rittel D,
Sherman D, editors. The 9th International Conference on the Mechanical Behavior of Materials (ICM-9), Geneva, Switzerland;
2003.
[43] Chen DL, Wang Z. Derivation of applied stress–crack opening displacement relationships for the evaluation of effective stress
intensity factor range. Int J Fract 2004;125:371–86.
[44] Koh SK, Oh SJ, Li C, Ellyin F. Low-cycle fatigue life of SiC–particulate-reinforced Al–Si cast alloy composites with tensile mean
strain effects. Int J Fatigue 1999;21:1019–32.
[45] Healy JC, Beevers CJ. A study of fatigue crack growth in a particulate-reinforced Al–Si alloy at 23 and 220 �C. Mater Sci Engng
1991;A142:183–92.
[46] Qian L, Wang ZG, Toda H, Kobayashi T. High temperature low cycle fatigue and thermo-mechanical fatigue of a 6061Al
reinforced with SiCw. Mater Sci Engng 2000;A291:235–45.
[47] Kumai S, Hu J, Higo Y, Nunomura S. Effects of dendrite cell size and particle distribution on the near-threshold fatigue crack
growth behavior of cast Al–SiCp composites. Acta Mater 1996;44:2249–57.
[48] Okayasu M, Nishi N, Kanazawa K. Effects of silicon contents on tensile properties of Al–Si–Cu alloy die castings. J Jpn Foundry
Engng Soc 1998;70:266–72.
[49] Okayasu M, Nishi N, Ohmura H, Kanazawa K. Effect of silicon contents on mechanical properties of Al–Si–Cu alloy die castings.
In: Proceedings of the 130th Conference of Japan Foundry Engineering Society, Chiba, Japan; 1997. p. 92.
[50] Fernandes M, Pires JC, Cheung N, Garia A. Influence of refining time on nonmetallic inclusions in a low-carbon, silicon-killed
stee1. Mater Charact 2003;51:301–8.
[51] Khalifa TA. Effect of inclusions on the fatigue limit of a heat-treated carbon steel. Mater Sci Engng A 1988;102:175–80.
[52] Preston S. Bending fatigue strength of nitrocarburized steel SS2244. Mater Sci Engng 1993;A160:7–15.
[53] Fegredo DM, Pritchard C. A metallographic examination of rollers subjected to wear under rolling–sliding conditions. Wear
1978;49:67–78.
[54] Sarrafi-nour GR, Coyle TW. Temperature dependence of crack wake bridging stresses in a SiC-whisker-reinforced alumina. Acta
Mater 2001;49:3553–63.
[55] Kim H, Fukunaga O, YoshikawaM. Performance of prestressed wire-wounded cylindrical die and fatigue test of piano wire. J Jpn
Soc Technol Plast 1990;31:893–8.
[56] Okayasu M, Wang Z, Chen DL. An etching technique for revelation of plastic deformation zone in a low carbon steel. Mater Sci
T 2005;21, in press.
[57] Fry A. Kraftwirkungsfiguren in flußeisen, dargestellt durch ein neues aetzverfahren. Stahle und Eisen 1921;41:1093–7.
[58] Holister GS, Thomas C, King I. Yield behaviour of a split fibre in a two-dimensional elasto-plastic matrix: an experimental
analysis. Fibre Sci Technol 1969;1:227–41.
[59] Dugdale DS. Yielding of steel sheets containing slits. J Mech Phys Solids 1960;8:100–8.
[60] Meguid SA. Engineering fracture mechanics. 1st ed. Amsterdam: Elsevier Applied Science; 1989. p. 170–83.
[61] Janssen M, Zuidema J, Wanhill RJH. Fracture mechanics. 2nd ed. Delft University Press; 2002. p. 64–5.
[62] Brown Jr WF, Srawley J. ASTM STP 1966;410:1–65.
Copyright © 2022 FDOKUMEN