Educational Risk and Resilience in African-American Youth: Context, Self, Action, and Outcomes in...
15
Educational Risk and Resilience in African-American Youth: Context, Self, Action, and Outcomes in School James Patrick Connell PubliclPrivate Ventures Margaret Beale Spencer Emory University J. Lawrence Aber Barnard College CONNELL, JAMES PATRICK; SPENCER, MARGARET BEALE; and ABER, J. LAWRENCE. Educational Risk and Resilience in African-American Youth: Context, Self, Action, and Outcomes in School. CHILD DEVELOPMENT, 1994, 65, 493-506. This study examined the empirical validity of a model of human motivation as it applies to school success and failure in 3 independent samples of 10- to 16-year-old African-American youth. Specifically, we assessed how indicators oi context, self, and action relate to measures of risk and resilient outcomes in school in 3 different samples, using 3 different measurement strategies. Correlational and path analyses on the 3 data sets supported the empirical validity of the model. African-American youth's experience of their parents' school involvement predicted a composite of self-system processes, which in turn pre- dicted the subjects' reports of their engagement in school. Engagement then predicted school performance and adjustment. The data supported a reciprocal path from action to context, sug- gesting that youth who show more disaffected patterns of behavior and emotion in school experi- ence less support from their families than those reporting more engaged patterns of action. Implications for program and policy decisions are discussed. There is ample documentation of the ferences are necessary to understand why educational problems of poor, African- some youth fail, some survive, and some American, inner-city children and youth. even thrive in high-risk environments. The Most of this research focuses on differences present study conducts such an analysis of between these children and white middle- within-group variation and then goes one class children. Much less attention has been step further by attempting to test and repli- paid to variation among individuals within cate a theoretical model of individual varia- this group. Yet, analyses of within-group dif- tion in African-American young adolescents' The authors wish to thank data analysts Peter Usinger, Steve Gole, Stephanie Jones, and Ghristina Mitchell for their great skills and efforts. Also, special thanks to Bonnie L. Halpem- Felsher for her work on assembling and editing the final manuscript. Text preparation was skillfully completed by Audrey Walmsley. The authors also wish to thank Drs. Seidman, Allen, and Mitchell for their generous permission to utilize the data from the Adolescent Pathways Project (APP) for the purposes of this paper. The authors wish to thank their colleagues from the working group on Neighborboods, Gommunity, and Family Influences on Individual Devel- opment, and particularly Martha Gephart as the senior staff officer for the Social Science Research Gouncil. This research is a part of a larger collaborative effort funded by the Russell Sage Foundation, the William T. Grant Foundation, and the Smith Richardson Foundation under the direction of the Social Science Research Gouncil's Committee on the Urban Underclass. Data on the NYC/B/DC sample are drawn from the Adolescent Pathways Project, a longitudinal study of the development of urban yoiitb. The first author's theoretical and empirical work on these issues is supported by a Faculty Scholar Award from the W.T. Grant Foundation. The APP was supported by grants primarily from the National Institute of Mental Health (MH43084) and the Carnegie Corporation and secondarily from the Foundation for Ghild Development, the Smith Richardson Foundation, and the William T. Grant Foundation to Edward Seidman, Lawrence Aber, LaRue Allen, and Ghristina Mitchell. Reprint requests should be sent to: James Patrick Gonnell, Public/Private Ventures, Philadelphia, PA 19106. [Child Development, 1994, 65, 493-506. © 1994 by the Society for Research in Child Development, Inc. All rights reserved. 0009-3920/94/6502-0016$01.00]
Transcript of Educational Risk and Resilience in African-American Youth: Context, Self, Action, and Outcomes in...
Educational Risk and Resilience inAfrican-American Youth: Context, Self,Action, and Outcomes in School
James Patrick ConnellPubliclPrivate Ventures
Margaret Beale SpencerEmory University
J. Lawrence AberBarnard College
CONNELL, JAMES PATRICK; SPENCER, MARGARET BEALE; and ABER, J. LAWRENCE. Educational Riskand Resilience in African-American Youth: Context, Self, Action, and Outcomes in School.CHILD DEVELOPMENT, 1994, 65, 493-506. This study examined the empirical validity of a modelof human motivation as it applies to school success and failure in 3 independent samples of 10-to 16-year-old African-American youth. Specifically, we assessed how indicators oi context, self,and action relate to measures of risk and resilient outcomes in school in 3 different samples,using 3 different measurement strategies. Correlational and path analyses on the 3 data setssupported the empirical validity of the model. African-American youth's experience of theirparents' school involvement predicted a composite of self-system processes, which in turn pre-dicted the subjects' reports of their engagement in school. Engagement then predicted schoolperformance and adjustment. The data supported a reciprocal path from action to context, sug-gesting that youth who show more disaffected patterns of behavior and emotion in school experi-ence less support from their families than those reporting more engaged patterns of action.Implications for program and policy decisions are discussed.
There is ample documentation of the ferences are necessary to understand whyeducational problems of poor, African- some youth fail, some survive, and someAmerican, inner-city children and youth. even thrive in high-risk environments. TheMost of this research focuses on differences present study conducts such an analysis ofbetween these children and white middle- within-group variation and then goes oneclass children. Much less attention has been step further by attempting to test and repli-paid to variation among individuals within cate a theoretical model of individual varia-this group. Yet, analyses of within-group dif- tion in African-American young adolescents'
The authors wish to thank data analysts Peter Usinger, Steve Gole, Stephanie Jones, andGhristina Mitchell for their great skills and efforts. Also, special thanks to Bonnie L. Halpem-Felsher for her work on assembling and editing the final manuscript. Text preparation wasskillfully completed by Audrey Walmsley. The authors also wish to thank Drs. Seidman, Allen,and Mitchell for their generous permission to utilize the data from the Adolescent PathwaysProject (APP) for the purposes of this paper. The authors wish to thank their colleagues fromthe working group on Neighborboods, Gommunity, and Family Influences on Individual Devel-opment, and particularly Martha Gephart as the senior staff officer for the Social Science ResearchGouncil. This research is a part of a larger collaborative effort funded by the Russell SageFoundation, the William T. Grant Foundation, and the Smith Richardson Foundation under thedirection of the Social Science Research Gouncil's Committee on the Urban Underclass. Dataon the NYC/B/DC sample are drawn from the Adolescent Pathways Project, a longitudinal studyof the development of urban yoiitb. The first author's theoretical and empirical work on theseissues is supported by a Faculty Scholar Award from the W.T. Grant Foundation. The APP wassupported by grants primarily from the National Institute of Mental Health (MH43084) and theCarnegie Corporation and secondarily from the Foundation for Ghild Development, the SmithRichardson Foundation, and the William T. Grant Foundation to Edward Seidman, LawrenceAber, LaRue Allen, and Ghristina Mitchell. Reprint requests should be sent to: James PatrickGonnell, Public/Private Ventures, Philadelphia, PA 19106.
[Child Development, 1994, 65, 493-506. © 1994 by the Society for Research in Child Development, Inc.All rights reserved. 0009-3920/94/6502-0016$01.00]

494 Child Development
positive and negative outcomes in the aca-demic domain.
More specifically, this study tests a gen-eral model of interpersonal, intrapsychic,and behavioral influences on educationaloutcomes (see Fig. 1). This general model istested in three different samples of African-American youth (Aber, Seidman, Allen,Mitchell, & Garfinkel, 1992; Connell et al.,1994; Spencer, 1992). All three of these sam-ples are predominantly poor—one is fromupstate New York, one is from Atlanta, andone is from New York City, Baltimore, andWashington, D.C. (NYC/B/DC).
The general model guiding this empiri-cal work is compatible with at least threedistinct theoretical perspectives on humandevelopment: motivational and self-systems(M-SS) theories (Connell, 1990; Connell &Wellborn, 1991); identity and cultural-ecological (IC-E) theories (Ogbu, 1985;Spencer & Markstrom-Adams, 1990); anddevelopmental risk (DR) research (Allen,Aber, & Leadbeater, 1990; Allen, Lead-beater, & Aber, 1992). The model assertsthat interpersonal contexts shape individu-als' beliefs about themselves within particu-lar cultural endeavors, such as school, and
that these beliefs result in patterns of actionreflecting engagement or disaffection withinthese endeavors. The model goes on to spec-ify that these patterns of action contributedirectly (a) to culturally defined outcomes,such as successful and unsuccessful schoolperformance, and (b) to the individual's ex-perience of the social context—as this con-text reacts to the individual's patterns of ac-tion. The general model is shown in Figure1. While this model is most similar to moti-vational and self-system perspectives, andhas been empirically tested by Connell andhis colleagues (Connell et al., 1994; Connell& Wellborn, 1991; Skinner, Wellborn, &Connell, 1990), it also shares certain featureswith the identity and cultural-ecological anddevelopmental risk perspectives that guidethe other two projects represented in thisstudy (e.g., Bronfenbrenner, 1979; Ford &Lerner, 1992; Lerner, 1986; Magnusson,1988).
First, all three theoretical perspectives(M-SS, IC-E, and DR) emphasize "meaningmaking" in the etiology of risk and resil-ience in youth. In the general model, thesemeaning-making processes are labeled selfIn this study, these processes include ap-
tCONTEXT
PerceivedParental
Involvement
SELF
PerceivedCompetence/
Efficacy
PerceivedRelatednessto Self and
Others
1ACTION
Emotionaland
BehavioralEngagement
OUTCOMES
NEGATIVE:
Low AttendanceLow Test ScoresLow GradesSuspensionRetention
POSITIVE:High AttendanceHigh Test ScoresHigh Grades
FIG. 1.—Hypothesized model used in fitting New York, Atlanta, and NYG/B/DC data sets
Connell, Spencer, and Aber 495
praisals of efficacy in school, general self-esteem, and the perceived quality of rela-tionships with others.
Second, all three perspectives view self-system processes not as traits but as dynamicadaptations to everyday life and to culture-specific developmental imperatives (Con-nell, 1990; Obgu, 1985). The general modelincludes subjects' reports of their everydayinterpersonal contexts and examines the in-fluence of these experiences on meaningmaking within samples of African-Americanyouth in high-risk environments.
Third, all three perspectives share thegeneral model's hypothesis of a transactionbetween the individual's actions and the so-cial context (Bell, 1970; Bronfenbrenner,1979; Sameroff & Chandler, 1975). The ac-tions of youth are hypothesized to influencethe degree of support they experience frominteractions with their families.
Finally, the general model and the threetheoretical perspectives converge on the im-portance of understanding positive out-comes (academic success and adjustment) aswell as negative outcomes (school failure)within groups of youth in high-risk environ-ments.
Not surprisingly, the general modeldoes not reflect the full richness and speci-ficity of each of the three theoretical per-spectives—it is, in a certain sense, the leastcommon denominator. But, as Figure 1makes clear, the model does make specificpredictions about the relations among theconstructs of (interpersonal) context, self, ac-tion, and (culturally defined) outcomes—predictions that, if confirmed, will buttressthe empirical support for all three perspec-tives.
The general model also enabled us touse different operationalizations of con-structs specific to each perspective and inte-grate them into a single model that could betested in multiple samples. The subcon-structs are shown in Figure 1, and are la-beled using terminology from Connell andhis colleagues' work (Connell, 1990; Con-nell & Wellborn, 1991). From left to right,perceived parental involvement (vs. neglectand/or rejection) refers to students' experi-ence of their families dedicating psychologi-cal resources to them. Perceived competencerefers to the youths' reports that they havethe capacity to do well in school. Perceivedrelatedness to others refiects the subjects'
reports that they feel connected to theirclassmates and peers. Perceived relatednessto self is defined as a general sense of worthand well-being. Action is conceptualizedalong a bipolar dimension of engagementversus disaffection and includes emotionaland behavioral features (Wellborn, 1991).Negative outcomes are events predictive oflong-term school failure (failing corecourses, low achievement test scores, low at-tendance, suspensions, and history of re-peated grades). Finally, positive outcomesare events that predict higher levels of edu-cational attainment (good grades, highachievement test scores, and high levels ofschool attendance). As detailed in theMethod section, the authors reviewed theresearch protocols from the three projects toidentify measures that adequately operation-alize each construct. The goal of the studywas to test the same general model usingdifferent measures with different samples ofAfrican-American youth.
This approach to analyzing cross-projectdata on youth in high-risk environments hasbeen forged through several years of collab-oration by scholars who are studying theeffects of neighborhood poverty on familyprocesses and individual development(Gephart, 1989). This approach is currentlybeing used to examine models similar to thattested in this study in local and national sam-ples that include younger children and olderadolescents than those used in these sam-ples, and that have focused on different de-velopmental outcomes and have sampleddifferent ethnic and gender groupings (Dun-can & Brooks-Cunn, 1994). Another strandof this collaborative research effort is a studyof how variables such as ethnicity, gender,family economic risk, family structure, andneighborhood risk shape the developmentaltrajectories of poor children and adolescents.In the present study, we include these vari-ables primarily as control variables in orderto look at how interindividual variation inthe psychological experience of African-American children affects their positive andnegative educational outcomes, over andabove differences attributable to these char-acteristics.
Independent replications that use dif-ferent operationalizations of general modelsand test these models in different samplesof youth drawn from different locales shouldhelp establish more robust theories of thedevelopment of minority children and youthin high-risk environments. Such models and

496 Child Development
data are much more likely to influence pro-gram and policy decisions than are idiosyn-cratic theoretical models that are not explic-itly aligned with other compatible modelsand that are validated only on single, homo-geneous samples (Aber, Allen, Carlson, &Cicchetti, 1990).
MethodSample
Three independent samples were exam-ined in this study. All subjects are African-American early adolescents and are partici-pating in larger longitudinal studies.
The Atlanta sample was drawn from alarger sample of 552 subjects (386 boys, 166girls) participating in a study of the develop-ment of identity, competency, and resiliencyin African-American youth. In the largerstudy, students were randomly selectedfrom the school rolls at four public middleschools (grades 6—8). Parental consent wasobtained for 76% of those students selectedfor the larger study. For the present study,only data collected in the 1989-90 schoolyear were included. This Atlanta sample in-cluded 215 students (145 boys, 70 girls) fromgrades 6-8. These were students who hada complete set of demographic information,educational outcomes, and questioniiaire re-sponses. The mean age of this Atlanta sam-ple was 13.1 years (SD = 1.1), with a rangeof 10.9-16.7 years.
The New York sample was drawn froma larger, multiethnic sample (N = 787) ofjunior high school students (grades 7-9) whowere participating in a longitudinal study ofurban students' self-system and motivationalprocesses. Half of the subjects in this largersample were identified as eligible for partic-ipation in five programs for at-risk youth be-ing conducted in an urban district in upstateNew York. The other half of the larger sam-ple was randomly selected to match thisgroup by school, grade level, ethnicity, andgender. Parental permission was achievedby informational consent. For the presentstudy, only data collected during the 1987-88 school year were analyzed. This criterionresulted in 399 subjects from grades 7—9(206 boys, 193 girls) who had complete setsof demographic information, educationaloutcomes, and questionnaire responses. Themean age of this New York sample was 13.9years (SD = 1.3), with a range of 12-17years.
The NYC/B/DC sample was drawn fromsubjects participating in the AdolescentPathways Project. The larger project consistsof 1,333 adolescents (561 boys, 772 girls;27% black, 23% white, 38% latino, and 12%other/unspecified) who were part of an ac-celerated longitudinal study looking at thedevelopment of adaptation and maladapta-tion of youth living in high-risk communitiesin New York City, Baltimore, and Washing-ton, D.C. (For further details on the largersample and procedures of the AdolescentPathways Project, see Seidman, 1991.) Subjects in the larger sample were drawn fromelementary and junior high/middle schools(fifth or sixth grade) or high schools (eighthor ninth grade) that were predominantly Af-rican-American, latino, or white and had aminimum of 60%-80% of the student bodyeligible for reduced-price and/or free lunch.Data were collected during the spring of1988 or the spring of 1989. Written parentalconsent was obtained for subject participa-tion. One hundred fourteen subjects com-prise this NYC/B/DC sample. These sub-jects were those African-American subjectswho had complete data on the variablesshown in Figure 1. The mean age of thisNYC/B/DC sample (grades 5-6 and 8-9)was 12.7 years (SD = 1.51), with a range of10.3 to 16.7 years.
Measurement StrategiesThe measures used in the present study
fall under three headings: demographic vari-ables, educational outcomes, and question-naire responses. Every effort was made toinclude in the analyses measures that werecomparable across the three data sets.
Demographic variables.—Gender wasincluded in the study, with males coded 0and females 1 in the subsequent correla-tional and regression analyses. Neighbor-hood risk was measured using 1980 censustract data that had previously been attachedto the larger data sets in the three longitudi-nal studies. Duncan and Aber (1994) con-ducted a principal components analysis of35 census tract variables on the Panel Studyof Income Dynamics (PSID) data set as wellas the NYC/B/DC data used in this study.The principal components analysis revealedsix neighborhood composition factors: (a)poverty/female headship/race, (b) socioeco-nomic status (SES), (c) ethnic diversity, (d)crowding/age structure, (e) residential sta-bility, and (/) joblessness. Based on the vari-ance accounted for by these factors, and
Connell, Spencer, and Aber 497
their interpretability as indices of risk usingWilson and his colleagues' work on definingunderclass neighborhoods (Wilson, 1987),three of the six indices were aggregated toform one neighborhood composition vari-able for this study: (a) high concentration offamily and individual poverty, female head-ship, and African-Americans; (b) low con-centration of high-SES residents; and (c)high levels of joblessness. A common metricfor each factor was created to represent stan-dard deviation units away from the averageof a nationally representative sample ofneighborhoods developed by Duncan andhis colleagues on the Panel Study of IncomeDynamics data set.
Family economic risk was assessed inthe New York and Atlanta samples using in-formation obtained from school recordsabout the eligibility for the free or reduced-price lunch program. In the NYC/B/DCsample, student reports of family labor mar-ket participation were used to create a familypoverty index. Family structure was ob-tained from the student questionnaires. A di-chotomous variable was created, with sub-jects who reported living with their motherwithout a male caregiver coded as single fe-male-headed family and other family con-figurations coded as other.
Educational outcomes.—Negative out-comes were assessed using the 5-FIag Iden-tification System developed by Crichlowand Vito (1989) for assessing presence anddegree of risk for school departure. In thissystem, a Hag was assigned when yearly at-tendance was below 82%; national percen-tile scores on standardized achievementtests were below 38% for math and below37% for reading, or when one of these scoreswas below 15%; 2 or more core courses (En-glish, math, social studies, science) werefailed in the past academic year; 2 or moreinstructional days were lost due to suspen-sion; or the student was 1 or more yearsolder than the student average at the samegrade level. The negative outcomes indexused in the present study ranges from 0 to 5flags and was calculated based on the 1987-88 academic year for the New York sample,the 1988-89 academic year for the Atlantasample, and either the 1987-88 or 1988-89academic year for the NYC/B/DC sample,depending on when the student question-naire was administered. In the New Yorkand Atlanta samples, student records wereused to create this negative outcomes vari-
able. In the NYC/B/DC sample, student rec-ords were used to obtain te.st scores and re-tention, and student reports were used toassess attendance, grade point average(CPA), and suspensions.
Positive outcomes were assessed usinga 3-star system developed for this study bythe authors. A star was assigned when theratio of days attended to total school dayswas greater than or equal to .98, the nationalpercentile scores on standardized tests ofboth math and reading achievement weregreater than or equal to 70%, or the gradepoint average for core courses was greaterthan or equal to a B. The positive educa-tional outcomes index ranged from 0 to 3 andwas calculated for the same time periods asthe negative outcomes index.
Questionnaire responses.—In all the re-search sites, surveys were administered togroups of between 25 and 33 subjects inschool classrooms. The three sets of ques-tionnaires were different in format. Theygenerally consisted of statements that wererated either on Likert-type scales by the sub-jects or on forced-choice formats that variedby the content of the items. The completeprotocols were reviewed by the investiga-tors individually and as a group to identifysets of items that would be theoretically con-sistent with the general constructs in themodel shown in Figure 1. The search forcompatible items resulted in a composite ofitems from each data set that tapped one as-pect of the students' perceived home con-text: parental involvement. Three compo-nent processes of the self-system weremeasured across the three data sets: per-ceived competence (including items on per-ceived ability, perceived capacity to pro-duce effort, and perceived control overacademic outcomes); perceived relatednessto self (including items tapping general self-worth and positive feelings toward self); andperceived relatedness to other students (in-cluding items tapping peer acceptance inschool and closeness to peers in school andin general). Finally, one component of ac-tion was assessed across the data sets: en-gagement versus disaffection. This wasmeasured by items tapping emotionalengagement in school (e.g., bored, happy)and behavioral engagement (e.g., paying at-tention, doing schoolwork, putting out effort,and turning in work on time). Initial sets ofitems were modified based on internal con-sistency analyses of the composites.^
^ A summary of the measures employed in this study may be obtained from the first author.
498 Child Development
In the Atlanta sample, items tappingthese constructs were extracted from the fol-lowing instruments: the Hare Self-Esteem/School Subscale (Hare, 1977), the Intellec-tual Achievement Responsibility Scale(Crandall, Katkovsky, & Crandall, 1965), theLife Satisfaction Scale (Conte & Salamon,1982), and the Simmons Self-Esteem Scale.
For the New York sample, the itemsused to assess the constructs in the generalmodel were obtained from the Rochester As-sessment Package for Schools—Student Re-port (RAPS-S)—a 204-item questionnairethat taps all of the constructs shown in Fig-ure 1 as well as other constructs included inthe full M-SS model (Wellborn & Connell,1987). This version and subsequent versionsof the RAPS-S have been administered toover 7,000 urban students, and psychometricproperties of the instrument have beenfound to be adequate to excellent withinthese samples.
In the NYC/B/DC sample, measuresused to assess the common constructs in-cluded items taken from the following mea-sures—some of which were modified for thelarger project: Social Support Rating Scale(Cauce, Felner, & Primavera, 1982), Self-Efficacy Expectations (from Children's Self-Efficacy for Peer Interaction Scale; Wheeler& Ladd, 1982), Loneliness Scale (Asher, Hy-mel, & Renshaw, 1984), Self-Esteem (fromSelf-Perception Profile for Children/Adoles-cents; Harter, 1988), Youth Self-Report(Achenbach & Edelbrock, 1987), Daily Has-sles Questionnaire (Rowlison & Felner,1988), and measures adapted from the HighSchool and Beyond Study (Bachman, O'Mal-ley, & Johnston, 1978).
In order to eliminate effects of differentranges in the response format of the variousscales used in the three samples, the vari-ables were standardized at the item level to
a mean of 0 and a standard deviation of 1.Composites to be used in the correlationaland path analyses were formed by averagingthe items within subconstructs (e.g., paren-tal involvement) and then averaging thesescores within the general constructs in themodel (i.e., context, self, and action).
Results
The results will be presented in threesections. The first section presents compara-tive data on the demographic characteristicsand the positive and negative educationaloutcomes for the three samples. The secondsection presents the correlations among allthe variables included in the study. Thethird section reports results of the ordinaryleast-squares path analyses used to test themodel (Fig. 1) for the three independentsamples.
Descriptive Data on DemographicVariables and Educational Outcomes
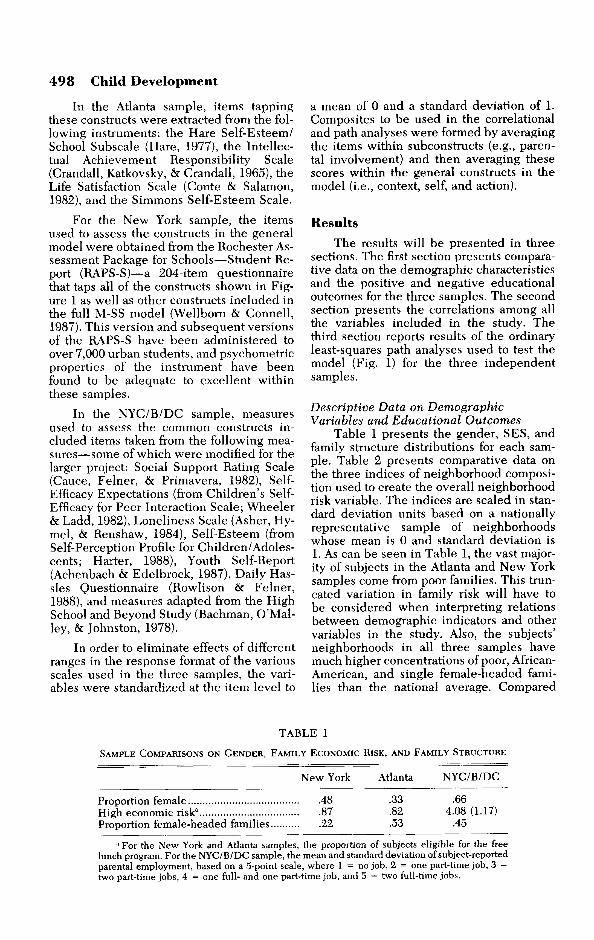
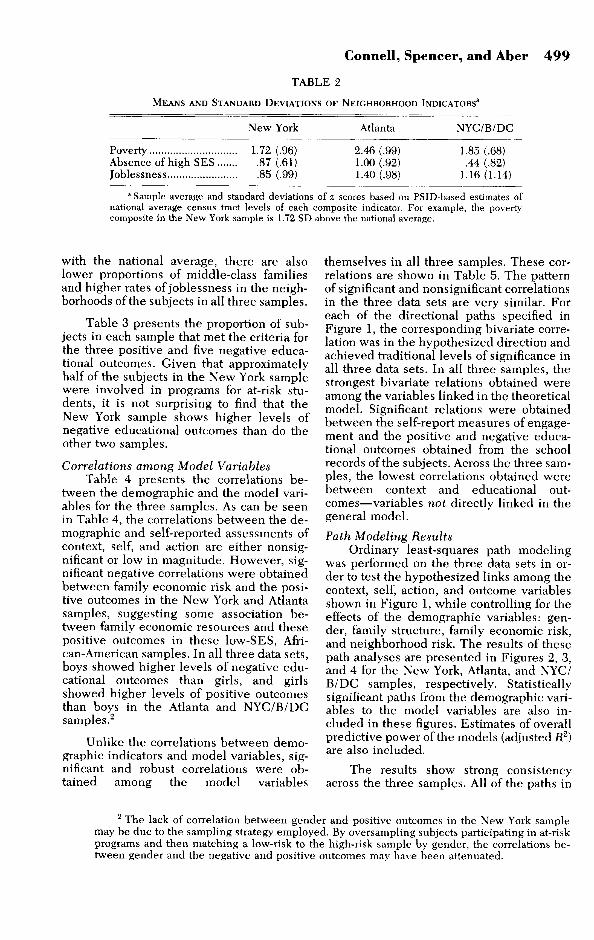
Table 1 presents the gender, SES, andfamily structure distributions for each sam-ple. Table 2 presents comparative data onthe three indices of neighborhood composi-tion used to create the overall neighborhoodrisk variable. The indices are scaled in stan-dard deviation units based on a nationallyrepresentative sample of neighborhoodswhose mean is 0 and standard deviation is1. As can be seen in Table 1, the vast major-ity of subjects in the Atlanta and New Yorksamples come from poor families. This trun-cated variation in family risk will have tobe considered when interpreting relationsbetween demographic indicators and othervariables in the study. Also, the subjects'neighborhoods in all three samples havemuch higher concentrations of poor, African-American, and single female-headed fami-lies than the national average. Compared
TABLE 1
SAMPLE COMPARISONS ON GENDER, FAMILY ECONOMIC RISK, AND FAMILY STRUCTURE
New York Atlanta NYC/B/DC
Proportion female 48 .33 .66High economic risk^ 87 .82 4.08 (1.17)Proportion female-headed families 22 .53 .45
" For the New York and Atlanta samples, the proportion of subjects eligible for the freelunch program. For the NYC/B/DC sample, the mean and standard deviation of subject-reportedparental employment, based on a 5-point scale, where 1 = no job, 2 = one part-time job, 3 =two part-time jobs, 4 = one full- and one part-time job, and 5 = two full-time jobs.
Connell, Spencer, and Aber 499
TABLE 2
MEANS AND STANDARD DEVIATIONS OF NEIGHBORHOOD INDICATORS"
New York Atlanta NYC/B/DC
Poverty 1.72 (.96)Absence of high SES 87 (.61)Joblessness 85 (.99)
2.46 (.99)1.00 (.92)1.40 (.98)
1.85 (.68).44 (.82)
1.16 (1.14)
' Sample average and standard deviations of z scores based on PSID-based estimates ofnational average census tract levels of each composite indicator. For example, the povertycomposite in the New York sample is 1.72 SD above the national average.
with the national average, there are alsolower proportions of middle-class familiesand higher rates of joblessness in the neigh-borhoods of the subjects in all three samples.
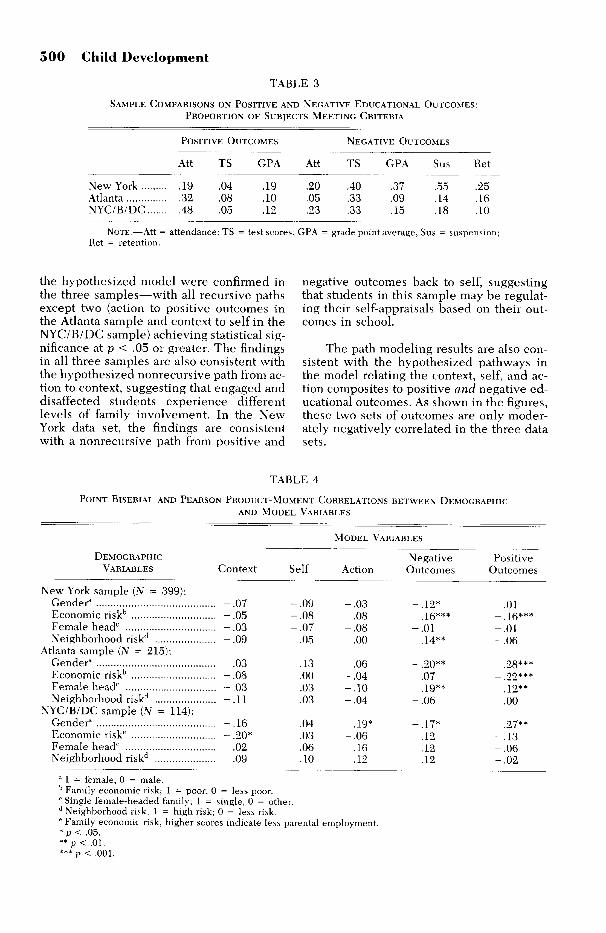
Table 3 presents the proportion of sub-jects in each sample that met the criteria forthe three positive and five negative educa-tional outcomes. Given that approximatelyhalf of the subjects in the New York samplewere involved in programs for at-risk stu-dents, it is not surprising to find that theNew York sample shows higher levels ofnegative educational outcomes than do theother two samples.
Correlations among Model VariablesTable 4 presents the correlations be-
tween the demographic and the model vari-ables for the three samples. As can be seenin Table 4, the correlations between the de-mographic and self-reported assessments ofcontext, self, and action are either nonsig-nificant or low in magnitude. However, sig-nificant negative correlations were obtainedbetween family economic risk and the posi-tive outcomes in the New York and Atlantasamples, suggesting some association be-tween family economic resources and thesepositive outcomes in these low-SES, Afri-can-American samples. In all three data sets,boys showed higher levels of negative edu-cational outcomes than girls, and girlsshowed higher levels of positive outcomesthan boys in the Atlanta and NYC/B/DCsamples.^
Unlike the correlations between demo-graphic indicators and model variables, sig-nificant and robust correlations were ob-tained among the model variables
themselves in all three samples. These cor-relations are shown in Table 5. The patternof significant and nonsignificant correlationsin the three data sets are very similar. Foreach of the directional paths specified inFigure 1, the corresponding bivariate corre-lation was in the hypothesized direction andachieved traditional levels of significance inall three data sets. In all three samples, thestrongest bivariate relations obtained wereamong the variables linked in the theoreticalmodel. Significant relations were obtainedbetween the self-report measures of engage-ment and the positive and negative educa-tional outcomes obtained from the schoolrecords of the subjects. Across the three sam-ples, the lowest correlations obtained werebetween context and educational out-comes—variables not directly linked in thegeneral model.
Path Modeling ResultsOrdinary least-squares path modeling
was performed on the three data sets in or-der to test the hypothesized links among thecontext, self, action, and outcome variablesshown in Figure 1, while controlling for theeffects of the demographic variables: gen-der, family structure, family economic risk,and neighborhood risk. The results of thesepath analyses are presented in Figures 2, 3,and 4 for the New York, Atlanta, and NYC/B/DC samples, respectively. Statisticallysignificant paths from the demographic vari-ables to the model variables are also in-cluded in these figures. Estimates of overallpredictive power of the models (adjusted R^)are also included.
The results show strong consistencyacross the three samples. All of the paths in
^ The lack of correlation between gender and positive outcomes in the New York samplemay be due to the sampling strategy employed. By oversampling subjects participating in at-riskprograms and then matching a low-risk to the high-risk sample by gender, the correlations be-tween gender and the negative and positive outcomes may have been attenuated.
500 Child Development
TABLE 3
SAMPLE COMPARISONS ON POSITIVE AND NEGATIVE EDUCATIONAL OUTCOMES:PROPORTION OF SUBJECTS MEETING CRITERIA
POSITIVE OUTCOMES NEGATIVE OUTCOMES
Att TS GPA Att TS
New York 19 .04Atlanta 32 .08NYC/B/DC 48 .05
.19 .20 .40
.10 .05 .33
.12 .23 .33
CPA
.37
.09
.15
Sus
.55
.14
.18
Ret
.25
.16
.10
NOTE.—Att = attendance; TS = test scores; GPA = grade point average; Sus = suspension;Ret = retention.
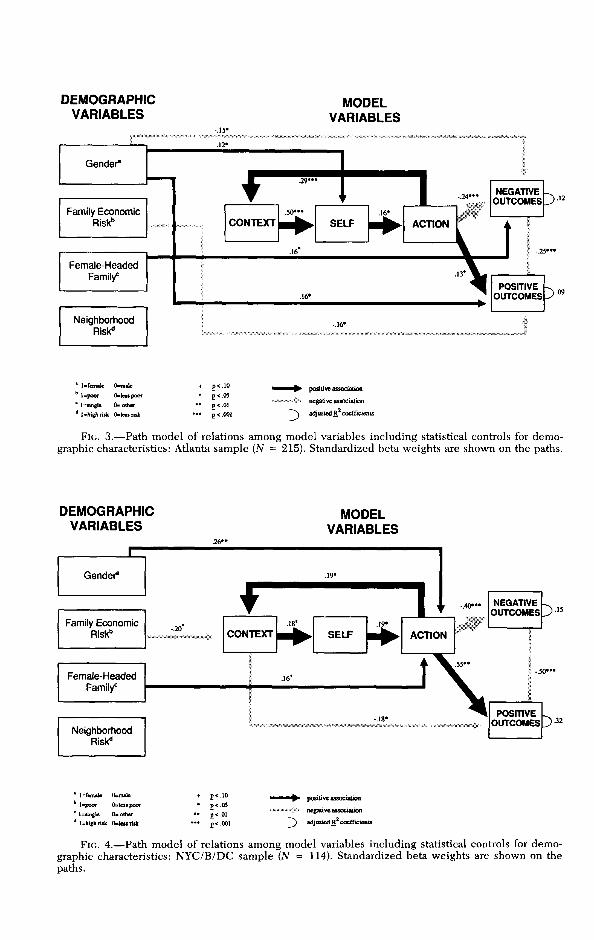
the hypothesized model were confirmed inthe three samples—with all recursive pathsexcept two (action to positive outcomes inthe Atlanta sample and context to self in theNYC/B/DC sample) achieving statistical sig-nificance at p < .05 or greater. The findingsin all three samples are also consistent withthe hypothesized nonrecursive path from ac-tion to context, suggesting that engaged anddisaffected students experience differentlevels of family involvement. In the NewYork data set, the findings are consistentwith a nonrecursive path from positive and
negative outcomes back to self, suggestingthat students in this sample may be regulat-ing their self-appraisals based on their out-comes in school.
The path modeling results are also con-sistent with the hypothesized pathways inthe model relating the context, self, and ac-tion composites to positive and negative ed-ucational outcomes. As shown in the figures,these two sets of outcomes are only moder-ately negatively correlated in the three datasets.
TABLE 4POINT BISERIAL AND PEARSON PRODUCT-MOMENT CORRELATIONS BETWEEN DEMOGRAPHIC
AND MODEL VARIABLES
MODEL VARIABLES
DEMOGRAPHIC NegativeVARIABLES Context Self Action Outcomes
New York sample {N = 399):Cender^ - .07 -.09 - .03 -.12*Economic risk'' - .05 -.08 .08 .16***Female head'̂ ^ - .03 - .07 -.08 - .01Neighborhood risk'' - .09 -.05 .00 .14**
Atlanta sample (N = 215):Cender^ 03 .13 .06 -.20**Economic risk'' - .08 .00 -.04 .07Female head"" - .03 .03 -.10 .19**Neighborhood risk"* - .11 .03 -.04 - 0 6
NYC/B/DC sample (N = 114);Cender" - .16 .04 .19* -.17*Economic risk*" -.20* .03 -.06 .12Female head" 02 .06 -.16 .12Neighborhood risk"̂ -.09 .10 .12 - .12
" 1 = female, 0 = male.'' Family economic risk; 1 = poor, 0 = less poor.' Single female-headed family; 1 = single, 0 = other."̂ Neighborhood risk; 1 = high risk; 0 = less risk." Family economic risk; higher scores indicate less parental employment.* p < .05.**p< .01.*** p < .001.
PositiveOutcomes
-.01-.16***-.01-.06
_ 22***-.12**
.00
.27**- .13-.06-.02
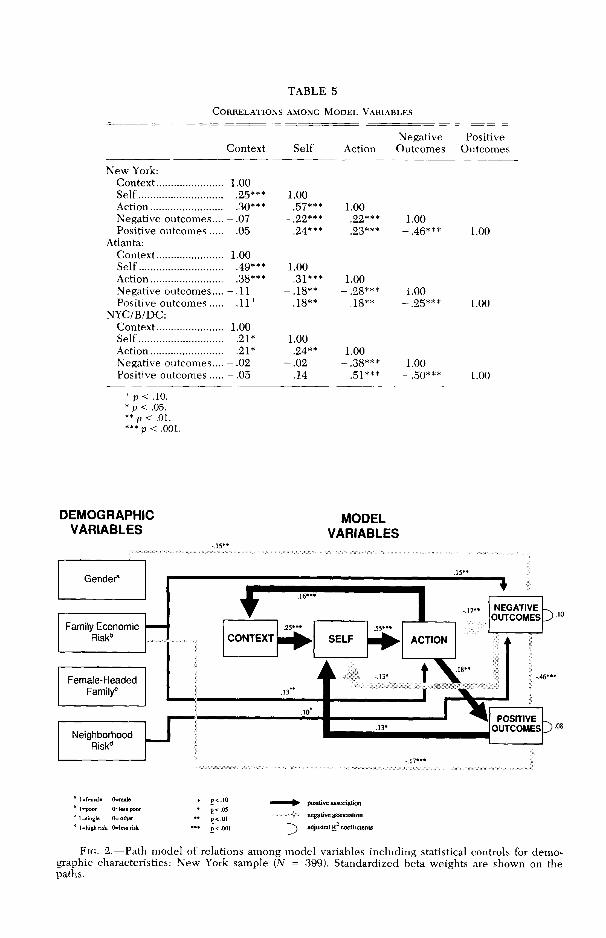
TABLE 5
CORRELATIONS AMONG MODEL VARIABLES
Negative PositiveContext Self Action Outcomes Outcomes
New York:Context 1.00Self 25*** 1.00Action 30*** .57*** 1.00Negative outcomes....-.07 -£2*** £2*** 1.00Positive outcomes 05 24*** ,23*** -.46*** 1.00
Atlanta:Context 1.00Self 49*** 1.00Action 38*** .31*** 1.00Negative outcomes....-.11 -.18** -.28*** 1.00Positive outcomes 11+ .18** .18** -.25*** 1.00
NYC/B/DC:Context 1.00Self 21* 1.00Action 21* .24** 1.00Negative outcomes....-.02 - .02 -.38*** 1.00Positive outcomes - .05 .14 .51*** -.50*** 1.00
* p < .10.* p < .05.**p< .01.***p < .001.
DEMOGRAPHICVARIABLES
MODELVARIABLES
Gender*
Family EconomicRisk"
Female-HeadedFamily*
CONTEXT
NeighborhoodRisk"
SELF ACTION
tv
NEGATIVE ^OUTCOMES J '°
POSITIVE f-̂OUTCOMES J "
' l=poor O=less poor' Usingle O=olher
p<.10p<.05p<.01p<.001
positive association
negative association
^ coefficients
FIG. 2.—Path model of relations among model variables including statistical controls for demo-graphic characteristics: New York sample {N = 399). Standardized beta weights are shown on thepaths.
DEMOGRAPHICVARIABLES
MODELVARIABLES
UfcnuUe
l=poor
l.highriik
O-male
O=kupoor
0-otherOclcirisk
+ p<.10
• p<.05" p<.01
""• p < .001
^ ^ ^ ^ ^ positive associauoa
negative association
) adjusted R^coefricients
FIG. 3.—Path model of relations among model variables including statistical controls for demo-graphic characteristics: Atlanta sample (N = 215). Standardized beta weights are shown on the paths.
DEMOGRAPHICVARIABLES
MODELVARIABLES
O=]eupoor(bother
' t̂ ^Kithrilk 0>leurilk
p<.10p<.OS
p<.01
positive Bssociation
negative assocUoioii
adjusted R^ cocflicicn
FIG. 4.—Path model of relations among model variables including statistical controls for demo-graphic characteristics: NYC/B/DC sample (N = 114). Standardized beta weights are shown on thepaths.
Connell, Spencer, and Aber 503
The relations between the demographicvariables and the model variables are gener-ally consistent with the correlational find-ings: Significant paths emerged from genderto negative outcomes in the Atlanta and NewYork data sets, indicating more risk behaviorin boys than girls, and from family risk topositive outcomes, indicating more positiveschool outcomes for children from the lesspoor families.
In addition to these shared findings, theresults from the New York sample revealedthree idiosyncratic paths from the demo-graphic variables to the model variables:One from neighborhood risk to negative out-comes, indicating that children from poorerneighborhoods are more likely to show neg-ative outcomes than children from less poorneighborhoods in this sample; one from fam-ily risk to negative outcomes in the directionof higher family risk producing more risk be-havior; and one counterintuitive path fromfamily risk to action, suggesting that subjectsfrom less poor families report less engage-ment in school.
The path analyses of the Atlanta samplerevealed significant paths from gender toself and from gender to positive educationaloutcomes, indicating that girls are reportinghigher levels of self-system processes andare showing more positive outcomes thanboys in this sample. A significant path fromfemale headship to negative outcomes wasalso obtained in the Atlanta sample, indicat-ing higher levels of risk behavior in childrenfrom families with a female head.
Path analyses of the NYC/B/DC samplerevealed three other paths. There werepaths from gender and family structure toaction, suggesting greater academic engage-ment from girls and from youth in familieswith no male caregiver. There was also apath from family risk to context, indicatingless parental involvement in more economi-cally disadvantaged families.
In summary, the results of the path anal-yses lend strong support to the processmodel guiding the study—in terms of boththe cross-sample consistency and the abilityof the model to predict both positive andnegative educational outcomes. The linksbetween demographic characteristics andmodel variables show greater variationamong the samples and between the twotypes of outcomes.
DiscussionThis study examined the validity of a
broad model relating interpersonal contexts,self-system processes, patterns of action, andculturally defined outcomes as it applies toschool success and failure in poor, urban, Af-rican-American youth. The results support-ing the general process model in this studyreplicate similar findings in samples ofwhite and middle-class youth (Connell &Wellborn, 1991; Skinner et al., 1990). Theunique contributions of the current study are(a) the extension of these earlier findings,using nearly identical methods, to an eco-nomically disadvantaged African-Americanurban sample (New York sample), {b) thesupport for the model from two additionaldata sets using measures designed to tapconstructs from different but complementarytheoretical models (Atlanta and NYC/B/DCsamples), and (c) the evidence for commonprocesses affecting positive and negative ed-ucational outcomes in all three samples. Itis also important to note that each link inthis hypothetical causal process receivedempirical support from all three data sets.These results suggest that African-Americanyouth's experiences of their family's supportfor them, of their own sense of control overtheir success and failure in school, and oftheir feelings of self-worth and emotional se-curity with others are regulating their ac-tions in school over and above the influenceof their family's and their neighborhood'seconomic conditions and their gender.
The variability in the strength of rela-tions among the model constructs and in therelations between the demographic vari-ables and the model constructs encouragesus to explore more detailed models that "un-pack" these broad constructs into more spe-cific variables and processes. In addition, in-tensive studies of local samples like thosereported here should be complemented withstudies of nationally representative samplesusing measures specifically designed to testthese more elaborated theoretical models.
We recognize that this study has limitsas a test of the predictive power of the theo-retical model shown in Figure 1 and as aconfirmation of the causal processes it speci-fies. The predictive power was reduced inall three data sets by having to intersect thedata sets to create theoretically and empiri-cally similar constructs. Many of the originalvariables included in the full M-SS model(Connell, 1990), the I-CE model (Spencer,

504 Child Development
1992), and the DR model (Seidman, 1991)could not be included in the present analy-ses. This "stripping down" of the data setsresulted in a loss of predictive power, boththrough decreased psychometric precisionand through the exclusion of nonshared the-oretical constructs. However, strong similar-ities were still found among the results fromthe three data sets, and positive and negativeeducational outcomes were reliably pre-dicted in all three samples. The predictivecapacities of the general model would havebeen enhanced by including nonsharedmeasures. For example, the Atlanta modelincluded identity processes (Spencer, 1992),the New York model included measures ofrelatedness to teachers (Connell et al., 1994),and the NYC/B/DC model included mea-sures of peers' antisocial values (Aber et al.,1992)—each of which have been shown inthese previous studies to predict educationaloutcomes among urban adolescents (Aberet al., 1992; Connell et al., 1994; Spencer,1992). For example, when Connell et al. in-corporated additional measures included inthe M-SS model to predict the same educa-tional risk index used in this study they ob-tained approximately twice the predictivepower reported here.
Causal inferences are weakened by thecross-sectional design and simplified form ofthe model. With these same data, several al-ternative models could have been tested.Further work with longitudinal assessmentsof these same constructs and with other setsof developmental outcomes (e.g., psycholog-ical symptoms, antisocial behavior) is underway by our collaborative research group.
The ultimate goal of the research en-deavor that spawned this study was to bringtogether in more synergistic ways differentperspectives from within and across disci-plines on how the life trajectories of poorchildren and adolescents are shaped by theireveryday experiences. This study is one steptoward this goal within the field of develop-mental psychology. In addition, the researchprogram seeks to take insights gained fromthis work and inform youth program and pol-icy efforts attempting to transform and ele-vate the life trajectories of these youth.
Toward these more applied ends, asKurt Lewin said, there is nothing as practicalas a good theory. The present study providescross-sample, cross-measure support forsuch a theory—a theory that points to impor-tant interpersonal, psychological, and be-
havioral "points of entry" for interventionsdesigned to increase the educational successof low-income African-American youth.
The results of this study confirm familyinvolvement as an important target for theseinterventions. For older youth, and for dis-advantaged older youth in particular, familyis often viewed as outside the bailiwick ofeducational intervention. This study's re-sults also support efforts to develop inter-vention strategies for increasing poor Afri-can-American youth's belief in their ownabilities and capacities to affect their aca-demic outcomes and for improving their re-lationships with peers in the school context.Further, the results point to youth engage-ment as the most proximal point of entry forreform efforts designed to enhance the edu-cational chances of poor African-Americanyouth. In other research by Connell and hiscolleagues (Connell et al., 1994; Skinner etal., 1990), ratings of engagement by teachersand parents, when combined with studentratings, show even stronger direct links tothe indices of risk and resilience in poor Af-rican-American youth than were obtained inthis study.
Perhaps the most intriguing and dis-turbing implication of this study for our un-derstanding of risk and resilience is thatdisaffected behavior in low-income African-American youth can lessen parental involve-ment, which in turn contributes to negativeappraisals of self that exacerbate disaffectedpatterns of action and contribute to negativeeducational outcomes. In order to avertthese destructive transactional processes,adults, including but not restricted to par-ents, will have to reinterpret disaffected be-havior on the part of youth and find waysto increase (not decrease) their involvementwith these youth. Finally, the robustness ofthe general model tested in this study, andsimilar findings in other populations ofyouth, should support universal policy ini-tiatives directed at enhancing all youth's in-terpersonal contexts, self-system processes,and engagement in educational settings.
ReferencesAber, J. L., Allen, J. P., Carlson, V., tSc Cicchetti,
D. (1990). The effect of maltreatment on de-velopment during early childhood: Recentstudies and their theoretical, clinical, and pol-icy implications. In D. Cicchetti & V. Carlson(Eds.), Child maltreatment: Theory and re-
Connell, Spencer, and Aber 505
search on causes and consequences (pp. 579-619). New York: Cambridge University Press.
Aber, J. L., Seidman, E., Allen, L., Mitchell, T.,& Carfinkel, R. (1992). Poverty, life events,and the psychosocial adaptation of urbanyouth: Testing mediational models. Manu-script submitted for publication.
Achenbach, T. M., & Edelbrock, C. S. (1987).Manual for the youth self-report and profile.Burlington: Department of Psychiatry, Uni-versity of Vermont.
Allen, J. P., Aber, J. L., & Leadbeater, B. J. (1990).Adolescent behavior problems: The influenceof attachment and autonomy. PsychiatricClinics of New America, 13(3), 455-467.
Allen, J. P., Leadbeater, B. J., & Aber, J. L. (1992).The development of problem behavior syn-dromes in at-risk adolescents. Manuscriptsubmitted for publication.
Asher, S. R., Hymel, S., & Renshaw, P. D. (1984).Loneliness in children. Child Development,55, 1456-1464.
Bachman, J. C , O'Malley, P. M., & Johnston, J.(1978). Youth in transition (Vol. 6). AnnArbor, MI: Survey Research Center, Institutefor Social Research.
Bell, S. (1970). The development of the concept ofobject as related to infant-mother attachment.Child Development, 41, 219-310.
Bronfenbrenner, U. (1979). The ecology of humandevelopment. Cambridge, MA: Harvard Uni-versity Press.
Cauce, A. M., Felner, R. D., & Primavera, J. T.(1982). Social support in high-risk adoles-cents: Structural components and adaptiveimpact. American journal of Community Psy-chology, 10, 417-427.
Connell, J. P. (1990). Context, self, and action: Amotivational analysis of self-system processesacross the life span. In D. Cicchetti & M.Beeghly (Eds.), The self in transition: In-fancy to childhood (pp. 61-97). Chicago: Uni-versity of Chicago Press.
Connell, J. P., Clifford, E., Crichlow, W., Hal-pern-Felsher, B. L., Usinger, P., & Duncan,C. (1994). Motivatiotxal analysis of urban Af-rican-American adolescent.s' educational riskand resilience. Manuscript in preparation.
Connell, J. P., & Wellborn, J. (1991). Competence,autonomy, and relatedness: A motivationalanalysis of self-system processes. In M. Cun-nar & A. Sroufe (Eds.), Minnesota sympo.siumon child development (Vol. 22, pp. 43-77).Hillsdale, NJ: Erlbaum.
Conte, V. A., & Salamon, M. J. (1982). An objectiveapproach to the measurement and use of lifesatisfaction. Measurement and Evaluation inGuidance, 15, 194-200.
Crandall, V. C , Katkovskv, W., & Crandall, V. J.
(1965). Children's beliefs in their own controlof reinforcements in intellectual-academicachievement situations. Child Development,36, 91-109.
Crichlow, W., & Vito, R. C. (1989). Evaluation ofintervention projects for at-risk students:Comparative results of the Rochester Assess-ment Package for Schools administered atjive at-risk project schools. Unpublishedmanuscript. University of Rochester, Roches-ter, NY.
Duncan, C , & Aber, J. L. (1994). Neighborhoodconditions and structure. Manuscript in prep-aration.
Duncan, C , & Brooks-Cunn, J. (1994). Lessonslearned and future directions for research oncommunities and neighborhoods. Manuscriptin preparation.
Ford, D. H., & Lerner, R. M. (1992). Develop-mental systems theory: An integrated ap-proach. Newbury Park, CA: Russell Sage.
Gephart, M. A. (1989). Neighborhoods and com-munities in concentrated poverty. Items, 43,84-92.
Hare, B. R. (1977). Racial and socioeconomic vari-ations in preadolescence area specific andgeneral self-esteem. International Journal ofIntercultural Relations, 1, 31-51.
Harter, S. (1988). Self-Perception Profile for Ado-lescents. Unpublished manual. University ofDenver, Denver, CO.
Lerner, R. M. (1986). Concepts and theories ofhuman development. New York: McCraw-Hill.
Magnusson, D. (1988). Individual developmentfrom an interactional perspective. Hillsdale,NJ: Erlbaum.
Ogbu, T. U. (1985). A cultural ecology of compe-tence among inner-city blacks. In M. B. Spen-cer, C. K. Brookins, & W. R. Allen (Eds.), Be-ginnings: The social and affectivedevelopment of black children. Hillsdale, NJ:Erlbaum.
Rowlison, R., & Felner, R. D. (1988). Major lifeevents, hassles, and adaptation in adoles-cence: Confounding in the conceptualizationand measurement of life stress and adjust-ment revisited. Journo/ of Personality and So-cial Psychology, 55, 432-444.
Sameroff, A. J., &c Chandler, M. J. (1975). Repro-ductive risk and the continuum of caretakingcausality. In F. D. Horowitz, M. Hethering-ton, S. Scarr-Salapatek, & C. Siegel (Eds.), Re-view of child development research (Vol. 4).Chicago: University of Chicago Press.
Seidman, E. (1991). Growing up the hard way:Pathways of urban adolescents. Americanjournal of Community Psychology, 18,173-203.
506 Child Development
Skinner, E. A., Wellborn, J., & Connell, J. P.(1990). What it takes to do well in school andwhether I've got it: The role of perceived con-trol in children's engagement and schoolachievement. Journal of Educational Psy-chology, 82, 22-32.
Spencer, M. B. (;i992, April). Neighborhood, self-esteem and achievem.ent orientation. Paperpresented at the Society for Research on Ado-lescence, Washington, DC.
Spencer, M. B., & Markstrom-Adams, C. (1990).Identity processes among racial and ethnicminority children in America. Child Develop-ment, 61, 290-310.
Wellborn, J. (1991). A theory and assessment ofaction. Unpublished doctoral dissertation.University of Rochester, Rochester, NY.
Wellborn, J., & Connell, J. P. (1987). RAPS-S:Rochester Assessm^ent Package for SchoolsStudent Report. Unpublished manuscript.University of Rochester, Rochester, NY.
Wheeler, V. A., & Ladd, G. W. (1982). Assessmentof children's self-efficacy for social interactionwith peers. Developmental Psychology, 18,795-805.
Wilson, W. J. (1987). The truly disadvantaged:The inner city, the underclass, and publicpolicy. Chicago: University of Chicago Press.