Editor in Chief / Baş Editör Asst. Prof. Dr. Yilmaz Kaya ...
198
-
Upload
khangminh22 -
Category
Documents
-
view
1 -
download
0
Transcript of Editor in Chief / Baş Editör Asst. Prof. Dr. Yilmaz Kaya ...
Editor in Chief / Baş Editör
Asst. Prof. Dr. Yilmaz Kaya
Ondokuz Mayis University, Turkey
Section Editors / Bölüm Editörleri*
* sıralama akademik unvan içinde alfabetik sıralamaya göredir. * The ranking is arranged alphabetically within the academic title.
Prof. Dr. Ali ASLAN, PhD, Van Yuzuncuyıl University
Prof. Dr. Ercan BURSAL, PhD, Muş Alparslan University
Prof. Dr. Hasan AKAN, PhD, Harran University
Prof. Dr. Nermin GOZUKİRMIZİ, PhD Istinye University
Prof. Dr. Tengku Haziyamin TENGKU ABDUL HAMİD, PhD, International Islamic University Malaysia
Assoc. Prof. Dr. Ayhan HORUZ, PhD Ondokuz Mayıs University
Assoc. Prof. Dr. Hasan Murat AKSOY, PhD, Ondokuz Mayıs University
Editorial Board / Editör Kurulu
Prof. Dr. İsmail KOCAÇALIŞKAN, PhD, Yildiz Technical University
Prof. Dr. Kasim BAJROVİC, University of Sarajevo
Prof. Dr. Muhammet KURULAY, PhD, Yildiz Technical University
Assoc. Prof. Dr. Gulbubu KURMANBEKOVA, Kyrgyz-Turkish Manas University
Assoc. Prof. Dr. İsmail ERPER, PhD, Ondokuz Mayıs University
Assoc. Prof. Dr. Muhammad Arshad JAVED, PhD, Universiti Teknologi Malaysia
Assoc. Prof. Dr. Roswanira AB. WAHAB, PhD, Universiti Teknologi Malaysia
Assoc. Prof. Dr. Sevgi MARAKLI, PhD, Amasya University
Asst. Prof. Dr. Abdussamat GÜZEL, PhD, Inonu University
Asst. Prof. Dr. Ali Yuksek, PhD, Ondokuz Mayıs University
Asst. Prof. Dr. Cihan İNAN, PhD, Karadeniz Technical University
Asst. Prof. Dr. Ertan ERMİŞ, PhD, Istanbul Sabahattin Zaim University
Asst. Prof. Dr. Feyza TUFAN, PhD, Halic University
Asst. Prof. Dr. Harun ÖZER, PhD, Ondokuz Mayıs University
Asst. Prof. Dr. Kasım TAKIM, PhD, Harran University
Asst. Prof. Dr. Mohamed EDBEİB, PhD, Baniwalid University, Libya
Asst. Prof. Dr. Muhammed YÜCEER, PhD, Canakkale Onsekiz Mart University,
Dr. Aliyu ADAMU, PhD, Kaduna State University
Dr. Abdulwali ABLAT, University of Malaya
Dr. Lect. Abdulgani DEVLET, PhD, Bilecik Seyh Edebali University
Dr. Nedim UZUN, PhD, Taksim Education and Research Hospital, Turkey
Dr. Res. Asst. Kiran NAWAZ, PhD, University of Arizona
Advisory Board / Danışma Kurulu
Prof. Dr. Ahmet OKUMUŞ, PhD, Aydın Adnan Menderes University
Prof. Dr. Didem ÖZÇİMEN, PhD, Yildiz Technical University
Prof. Dr. Fahrul Zaman HUYOP, PhD, Universiti Teknologi Malaysia
Prof. Dr. İbrahim İlker ÖZYİĞİT, PhD, Marmara University
Assoc. Prof. Dr. Funda ARSLANOĞLU, PhD, Ondokuz Mayıs University
Assoc. Prof. Dr. Kadyrbay CHEKİROV, Kyrgyz - Turkısh Manas Unıversıty, Kyrgyzstan
Assoc. Prof. Dr. Sibel YILMAZ, PhD, Yeni Yuzyil University
Assoc. Prof. Dr. Zarina Bt ZAİNUDDİN, PhD, International Islamic University Malaysia
Volume / Cilt:4 2021 Issue / Sayı:1
Language Editors/ Dil Editörleri
Assoc. Dr. Sevgi Maraklı, Amasya Unıversıty, Turkey
Res. Assist. Bermet Kıdıralıyeva, Kyrgyz - Turkısh Manas Unıversıty, Kyrgyzstan
Specialist Nurjamal Omurzakova, Kyrgyz - Turkısh Manas Unıversıty, Kyrgyzstan
Managing Editor / Yönetici Editör
Yunus Emre ARVAS, PhD Cand., Yildiz Technical University
Yönetim Ofisi/ Management Office
Yildiz Technical University, Faculty of Chemical and Metallurgical Engineering.
ESENLER/ISTANBUL
Yasal Sorumluluk
Yazıların yasal ve hukuki sorumluluğu yazarlara aittir.
Tüm hakları saklıdır. Derginin hiçbir bölümü, yazılı ön izin olmaksızın ve dergi adına referans
gösterilmeden herhangi bir formatta çoğaltılamaz veya kullanılamaz.
Legal Responsibility
The legal responsibility of the articles belongs to the authors. All rights reserved. No part of this
journal may be reproduced or used in any form without the prior writen permission and a
reference to name of the journal.
Editörden;
Değerli okurlar ve yazarlar,
“International Journal of Life Sciences and Biotechnology” olarak dergimizin dokuzuncu sayısını yayın
hayatına sunmaktan mutluluk ve onur duyuyoruz. “International Journal of Life Sciences and
Biotechnology” dergisi araştırma- geliştirme ve uygulama ilkeleri baz alınarak yayınlanan uluslararası
hakemli açık erişimli akademik bir elektronik dergidir.
“International Journal of Life Sciences and Biotechnology” dergisi Yaşam Bilimleri, Biyoloji,
Biyoteknoloji, Biyomühendislik, Ziraat Bilimleri, Gıda Biyoteknolojisi ve Genetik alanlarındaki ilgili
araştırmacılara, kurum ve kuruluşlara teorik ve pratik uygulamalarda katkı sağlamayı, tarafsızlık ve
bilim etiği ilkelerine bağlı kalarak çözüm temelli, yenilikçi ve katma değeri olan çalışmalara odaklanan,
günceli ve geleceği tartışan çalışmaların yayınlanmasını hedeflemektedir.
Bu düşüncelerle 2021 yılı birinci sayısını yayınladığımız “International Journal of Life Sciences and
Biotechnology” dergisini, makaleleri ile onurlandıran akademisyenlere, Fikir / Görüş / Öneri / Katkı ve
Eleştirileri ile değerlendirme süreçlerine katkılarından dolayı hakem ve yayın kurullarında yer alan
kıymetli bilim insanlarına yürekten teşekkür ediyoruz. Bir sonraki sayıda görüşmek ümidiyle…
15.04. 2021
Editör
Dr. Öğrt. Üyesi Yilmaz KAYA
From The Editor;
Dear Readers and Authors,
As “International Journal of Life Sciences and Biotechnology”, we are pleased and honored to present
the ninth issue of the journal. "International Journal of Life Sciences and Biotechnology" is an
international double peer-reviewed open access academic journal published on the basis of research-
development and code of practice.
The aims of this journal are to contribute in theoretical and practical applications in relevant
researchers of Life Sciences, Biology, Biotechnology, Bioengineering, Agricultural Sciences, Food
Biotechnology and Genetics institutions and organizations in Turkey, and to publish solution based
papers depending on the principle of impartiality and scientific ethics principles, focusing on innovative
and added value work, discussing the current and future.
With these thoughts, We are especially thankful to academicians honoring with the articles, valuable
scientists involved in editorial boards and reviewers for their contributions to the evaluation processes
with through their opinions/ideas/contributions/criticisms in the first issue of 2021 "International
Journal of Life Sciences and Biotechnology". Hope to see you in the next issue…
15. 04. 2021
Editor in Chief
Assist. Prof. Dr. Yilmaz KAYA
Sayının Hakemleri / Reviewers of the Issue*
* sıralama akademik unvan içinde alfabetik sıralamaya göredir. * The ranking is arranged alphabetically within the academic title.
Prof. Dr. Burhan KARA, PhD, Isparta University of Applied Sciences
Prof. Dr. Cigdem KUCUK, PhD, Harran University, Turkey
Prof. Dr. Kasim BAJROVİC, PhD, University of Sarajevo
Prof. Dr. Mehmet DEMİRKAYA, PhD, Eskisehir Osmangazi University
Prof. Dr. Satı UZUN, PhD, Erciyes University
Assoc. Dr. Esin SAKALLI ÇETİN, PhD, Muğla University, Turkey
Assoc. Prof. Dr. Funda ARSLANOĞLU, PhD, Ondokuz Mayıs University
Assoc. Prof. Dr. Ismaila Yada SUDI, PhD, Adamawa State University, Nigeria
Assoc. Prof. Dr. İsmail ERPER, PhD, Ondokuz Mayıs University
Assoc. Prof. Dr. İsmail SEZER, PhD, Ondokuz Mayıs University, Turkey
Assist. Prof. Dr. Hüseyin UYSAL, PhD, Aydin Adnan Menderes University
Assist. Prof. Dr. Mehtap USTA, PhD, Trabzon University, Turkey
Assist. Prof. Dr. Parham TASLİMİ, PhD, Bartin University
Assist. Prof. Dr. Samet KOCABAY, PhD, Inonu University, Turkey
Assist. Prof. Dr. Wafaa Hassan MUSLEM, PhD,Mustansiriyah University
Assist. Prof. Dr. Yilmaz KAYA, PhD, Ondokuz Mayis University, Turkey
Dr. Aida BAHARUDDİN, PhD, Uitm Jengka Pahang, Malaysia
Dr. Aliyu ADAMU, PhD, Kaduna State University
Dr. Asli Hocaoglu-OZYİGİT, PhD, Marmara University
Dr. Mohd Firdaus ABDUL-WAHAB, PhD, Universiti Teknologi Malaysia, Malaysia
Dr. Res. Assist. Mehmet TÜTÜNCÜ, PhD, Ondokuz Mayıs University, Turkey
Dr. Res. Assist. Muhammed M. ABED, PhD, University of Anbar, Iraq
Dr. Res. Assist. Serap ÇETİNKAYA, PhD, Sivas Cumhuriyet University, Sivas Turkey
Dr. Res. Assist. Zafer SEÇGİN, PhD, Ondokuz Mayis University, Turkey
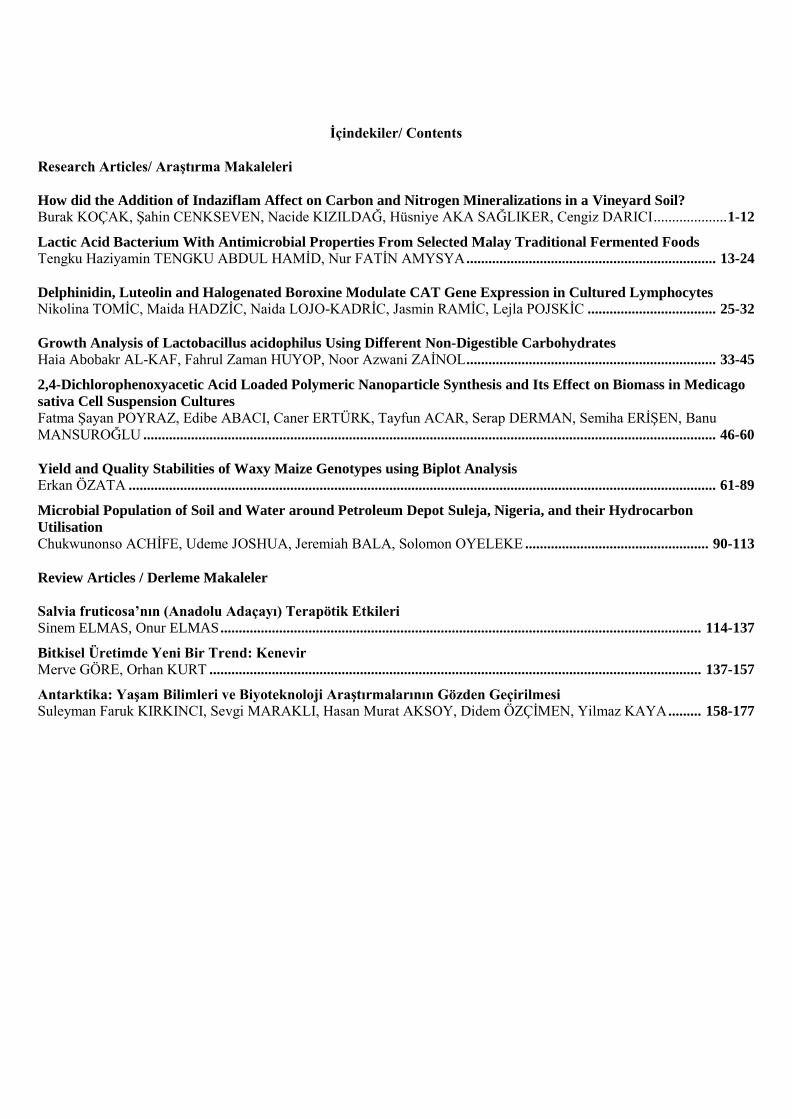
İçindekiler/ Contents
Research Articles/ Araştırma Makaleleri
How did the Addition of Indaziflam Affect on Carbon and Nitrogen Mineralizations in a Vineyard Soil?
Burak KOÇAK, Şahin CENKSEVEN, Nacide KIZILDAĞ, Hüsniye AKA SAĞLIKER, Cengiz DARICI .................... 1-12
Lactic Acid Bacterium With Antimicrobial Properties From Selected Malay Traditional Fermented Foods
Tengku Haziyamin TENGKU ABDUL HAMİD, Nur FATİN AMYSYA .................................................................... 13-24
Delphinidin, Luteolin and Halogenated Boroxine Modulate CAT Gene Expression in Cultured Lymphocytes
Nikolina TOMİC, Maida HADZİC, Naida LOJO-KADRİC, Jasmin RAMİC, Lejla POJSKİC ................................... 25-32
Growth Analysis of Lactobacillus acidophilus Using Different Non-Digestible Carbohydrates
Haia Abobakr AL-KAF, Fahrul Zaman HUYOP, Noor Azwani ZAİNOL .................................................................... 33-45
2,4-Dichlorophenoxyacetic Acid Loaded Polymeric Nanoparticle Synthesis and Its Effect on Biomass in Medicago
sativa Cell Suspension Cultures
Fatma Şayan POYRAZ, Edibe ABACI, Caner ERTÜRK, Tayfun ACAR, Serap DERMAN, Semiha ERİŞEN, Banu
MANSUROĞLU ............................................................................................................................................................ 46-60
Yield and Quality Stabilities of Waxy Maize Genotypes using Biplot Analysis
Erkan ÖZATA ................................................................................................................................................................ 61-89
Microbial Population of Soil and Water around Petroleum Depot Suleja, Nigeria, and their Hydrocarbon
Utilisation
Chukwunonso ACHİFE, Udeme JOSHUA, Jeremiah BALA, Solomon OYELEKE .................................................. 90-113
Review Articles / Derleme Makaleler
Salvia fruticosa’nın (Anadolu Adaçayı) Terapötik Etkileri
Sinem ELMAS, Onur ELMAS ................................................................................................................................... 114-137
Bitkisel Üretimde Yeni Bir Trend: Kenevir
Merve GÖRE, Orhan KURT ...................................................................................................................................... 137-157
Antarktika: Yaşam Bilimleri ve Biyoteknoloji Araştırmalarının Gözden Geçirilmesi
Suleyman Faruk KIRKINCI, Sevgi MARAKLI, Hasan Murat AKSOY, Didem ÖZÇİMEN, Yilmaz KAYA ......... 158-177
Research article
Kocak., B., et al., How did the Addition of Indaziflam Affect on Carbon and Nitrogen Mineralizations in
a Vineyard Soil? International Journal of Life Sciences and Biotechnology, 2021.
DOI: 10.38001/ijlsb.751731
How did the Addition of Indaziflam Affect on Carbon and
Nitrogen Mineralizations in a Vineyard Soil?
Burak Koçak1* , Şahin Cenkseven2 , Nacide Kızıldağ3 , Hüsniye Aka
Sağlıker4 , Cengiz Darıcı1
ABSTRACT
Indaziflam is a herbicide used for weed control in vineyards, apple, peach and orange
orchards that inhibit cellulose biosynthesis in plants. The objective of this study was
to evaluate the effects of recommended field dose of herbicide Indaziflam (10 ml/ da,
RD) and its 2 (RD x2), 4 (RD x4), 8 (RD x8) and 16 (RD x16) folds of RD on carbon
and nitrogen mineralizations in a vineyard soil. Herbicide+soil mixtures were
humidified at 80% of soil field capacity and then incubated for 42 days at 28ºC .
Effects of RD and RD x2 doses on soil carbon mineralization were similar to control
and no significant difference was found between them. Higher doses of indaziflam
(RD x4, RD x8 and RD x16) stimulated mineralization of soil carbon and there were
found significant differences between control and these doses (P<0.05). All
application doses of herbicide showed variability in ammonium (NH4-N) and nitrate
(NO3-N) contents while there were generally found no significant differences
between control and RD. In general, contents of soil NH4-N and NO3-N were
increased in all applications as time passed and there were significant differences
between days that were measured of these contents (P<0.05). Results of soil nitrogen
mineralization rate were as following: 1) It was significantly decreased by only RD
x2 on 11th day (P<0.05) 2) Higher doses of Indaziflam (RD x4, RD x8 and RD x16)
significantly stimulated it on 26th day (P<0.05) 3) All doses of this herbicide
significantly decreased it on 42nd day (P<0.05). In conclusion, the recommended
field dose of Indaziflam had no negative effect on microorganisms that play an active
role in soil carbon and nitrogen mineralization.
Introduction
The global area under vines and total production of grapevine were reported as
7.400.000 ha and 77.800.000 tonnes in world in 2018 [1]. Turkey takes place as fifth in
world countries in the production area of vineyard (4.170.410 da) and total grape
1 Cukurova University, Faculty of Arts and Sciences, Department of Biology, Adana / Turkey
2 Cukurova University, Faculty of Agriculture, Department of Soil Science and Plant Nutrition, Adana /
Turkey 3 Cukurova University, Central Research Laboratory, Adana / Turkey 4 Osmaniye Korkut Ata University, Faculty of Science and Arts, Department of Biology, Adana / Turkey
*Corresponding Author: Burak Koçak, e-mail: [email protected]
KEY WORDS
Indaziflam,
mineralization,
carbon,
nitrogen,
herbicide
ARTICLE HISTORY
Received
11 June 2020
Accepted
15 September 2020
(3.933.000 tonnes) [1, 2]. It was noted that grape export is an important income source
for the economy of a country [3].
Weed control and elimination in and between grapevine rows by chemicals were more
widespread applied as the intensification of viticulture was increased [4]. Vines were
competed by weeds for water and nutrients in soils and many pathogens causing
diseases in weeds by hosting can cause loss in productivity in grapes at 10.1 % [3].
Prevention of trunk damage by mechanical weeding machines and decrease of working
time spent in the vineyard were provided by herbicides [5]. Herbicides have become the
most important control method for weed while these chemicals were more considered
than other methods due to their easy application and being effective and reliable in weed
control [6]. Amount of herbicides that was applied in agricultural fields was reported as
12.644 tonnes and this was 24.6% of total pesticides that were applied in Turkey in
2019 [7]. While the impacts of fungicides and insecticides on soil organisms that were
applied in vineyards, it was reported that there is a little knowledge about the effects of
herbicides on these organisms [8]. In addition to that, various non-target effects of
herbicide on soil microorganisms were found in laboratory and pot studies [9, 10].
Indaziflam is a pre-emergent herbicide that inhibits cellulose biosynthesis and used for
perennial grasses and broadleaf weeds [11]. This herbicide has been mainly applied in
perennial plants (orange, grape, apple and drupe trees), settlements and areas that were
not used for plant production, public domains and forests [12]. Indaziflam can remain as
a residue for a long time even in low doses as well as it is resistant to decompose for
much longer (150 days) [13]. Researches in four soil samples in Europe and two soil
samples in the United States of America (U.S.A) showed that this duration could be in
between 22 and 176 days [12].
It was reported that indaziflam showed weak acid ability over soil pH 5.4 [11, 13]. In
addition, it was highlighted that indaziflam was non-volatile and could be fade away
through decomposition and leaching [11]. It was found that mobility of indaziflam in
soil was low and mid-level and sorption of this herbicide in six Brazil oxisol and in
three U.S.A. mollisol soils showed positive correlation with organic carbon content
[11]. It was indicated that the phytotoxic effects of indaziflam increased in soils
containing low organic carbon [14]. Furthermore, it was pointed out that damage of
indaziflam to hybrid bermuda grass grown in sandy soil was higher than in silt loam soil
[15]. Finally, it was suggested that the effects of increasing doses of Indaziflam on soil
microbial activity should be determined [12].
It was hypothesized that higher doses of Indaziflam would decrease soil microbial
activity. The objective of this study was to evaluate the effects of recommended field
dose (RD) and its 2 (RD x2), 4 (RD x4), 8 (RD x8) and 16 (RD x16) folds of indaziflam
on carbon and nitrogen mineralizations in a vineyard soil.
Material and Methods
Material and study area
Soils used in this study were sampled at 0-10 cm depth from Cukurova University
Faculty of Agriculture Vineyard (Adana, Turkey) in May 2018. Indaziflam containing
herbicide (C16H20FN5, molecular weight: 301.369 g/mol, 500 g/ 1000 ml active
ingredient) was bought commercially and its recommended field dose was 10 ml/da.
Some soil physical and chemical properties
Soils were mixed homogenized and considered as a composite and representative
sample and then sieved a 2 mm mesh sieve, plant debris was removed. Soil texture was
determined by Bouyoucos hydrometer, field capacity (%, FC) by 1/3 atmospheric
pressure with a vacuum pump, pH by a 1:2.5 soil-water suspension with pH-meter
(inoLab pH/Cond 720, WTW GmbH, Weilheim, Germany) and CaCO3 content (%) by
a Scheibler calcimeter [16]. Organic carbon and total nitrogen (TN) contents of soils
(%) were determined by the modified Walkley and Black method and Kjeldahl method,
respectively [16]. The determination of soil organic carbon is based on the Walkley &
Black chromic acid wet oxidation method. Oxidizable organic carbon in the soil is
oxidised by potassium dichromate (K2Cr2O7) solution in concentrated sulfuric acid. The
determination of total nitrogen in soil is based on digestion of the dried and
homogenised soil in a suitable Kjeldahl tube with sulfuric acid. To rise the temperature,
potassium sulfate is added and copper sulfate is used as a catalyst. After adding sodium
hydroxide to the digestion solution the produced ammonium from all nitrogen species is
evaporated by distillation as ammonia. This is condensed in a conical flask with boric
acid solution. The amount is titrated against Tashiro’s indicator with sulfuric acid [16].
Three replicates were used for each analysis.
Soil carbon and nitrogen mineralizations
Based on the calculation of soil volume weight (1.28 g/cm3) and introduction of
herbicide to the soil at 1 mm depth, recommended field dose of herbicide containing
Indaziflam (RD, 10 ml/da) and 2 (RD x2), 4 (RD x4), 8 (RD x8) and 16 (RD x16) folds
of RD were mixed with soil. Soils untreated with Indaziflam were used as control.
Soil mixtures (100 g soil+herbicide) were placed in 750 ml incubation vessels and the
final moisture content of soils was adjusted to 80% of their own field capacity before
incubation at 28 °C over 42 days for carbon mineralization. CO2 produced from the
microbial activity was absorbed periodically in 10 ml saturated 1 M NaOH solution in
beakers, which were placed on the top of the soil in incubation vessels. Microbial
respiration was measured by titration with 1 M HCl in these closed vessels in the
following days of incubation: 1, 3, 7, 14, 28 and 42 [17]. Three replicates were used for
each treatment and control. Cumulative carbon mineralization (mg CO2-C/100 g soil)
was calculated by summing up all measured days CO2 until the end of incubation period
while their rates at 42nd day were calculated by dividing cumulative mineralized carbon
by its soil organic carbon [18].
Soil samples (100 g) mixed with herbicide were humidified at 80% of soil field
capacity, placed in 750 ml incubation vessels and incubated for 42 days at 28°C for
nitrogen mineralization. Three replicates were used for each treatment and control.
These vessels covered with gauze for aeration were weighed three times every week to
determine any weight loss. Distilled water was added when necessary to maintain soil
moisture for 42 days. Ammonium and nitrate contents (NH4-N + NO3-N) were
measured in soils to calculate nitrogen mineralization rate at 11th, 26th and 42nd days of
incubation. All soil samples were mixed separately with 200 ml 1 N CaCl2 solution and
shaken for 1 h strained samples were distilled to measure mineral nitrogen by the
Parnas-Wagner method [19, 20]. Nitrogen mineralization rate was calculated by
dividing the total amount of mineral nitrogen by total nitrogen of soil [21].
Statistical analysis
Statistical analyses were performed by the software SPSS v.20. The data were
submitted to ANOVA to assess the differences among treatments and incubation days.
The separation of means was made according to the Tukey honestly significant
difference (HSD). Differences between the data were declared as significant at P < 0.05.
Results
Soil analysis
Some physical and chemical properties of soil sampled from the vineyard were
summarized in Table 1 below. The soil was loamy and slightly alkaline while field
capacity and CaCO3 contents of soil were 24.48% and 43.38%, respectively. Soil
organic carbon and nitrogen contents were 1.97% and 0.15% respectively while C/N
was determined 12.86.
Table 1 Some physical and chemical properties of soil samples
Clay (%) 25.10 ± 0.06
Silt (%) 30.83 ± 0.09
Sand (%) 44.07 ± 0.03
Texture Loam
FC (%) 24.48 ± 0.16
pH 7.98 ± 0.03
CaCO3 (%) 43.38 ± 0.24
C (%) 1.97 ± 0.02
N (%) 0.153 ± 0.001
C/N 12.86 ± 0.11 Results are presented as means ± standard error of triplicate analysis (FC: field capacity)
Soil CO2 evolution
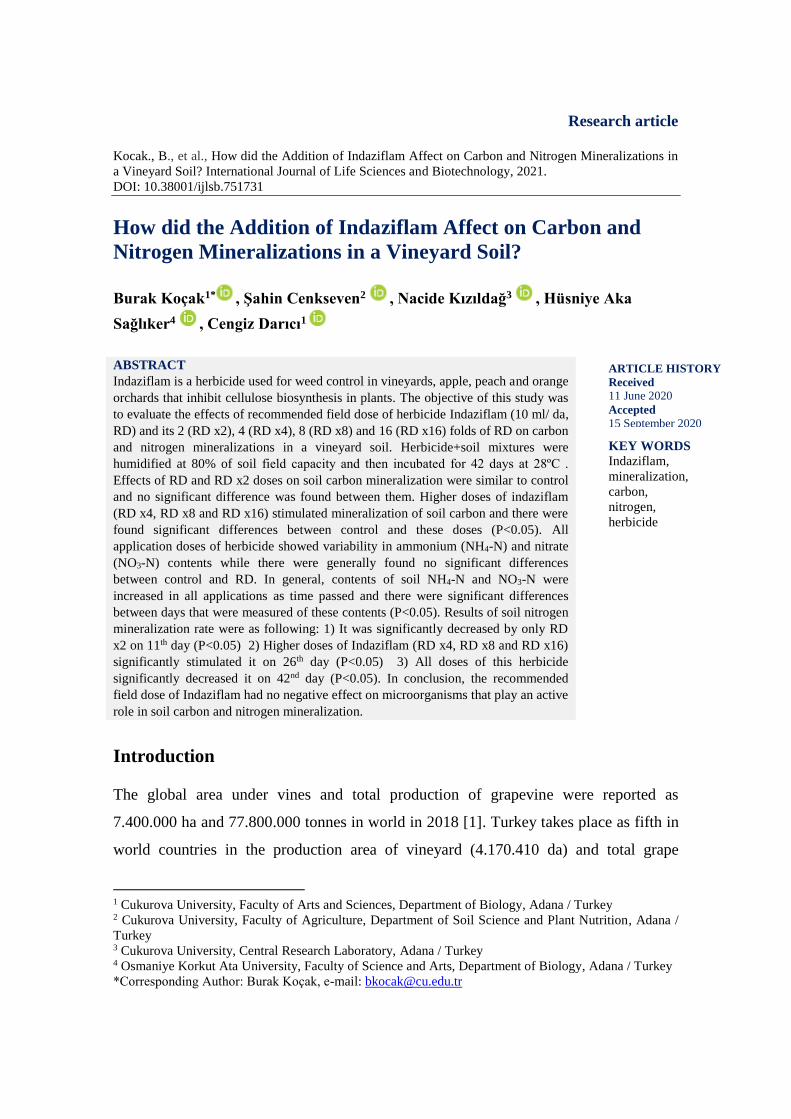
Cumulative carbon mineralization of soils (mg C(CO2)/100 g soil) for 42 days were as
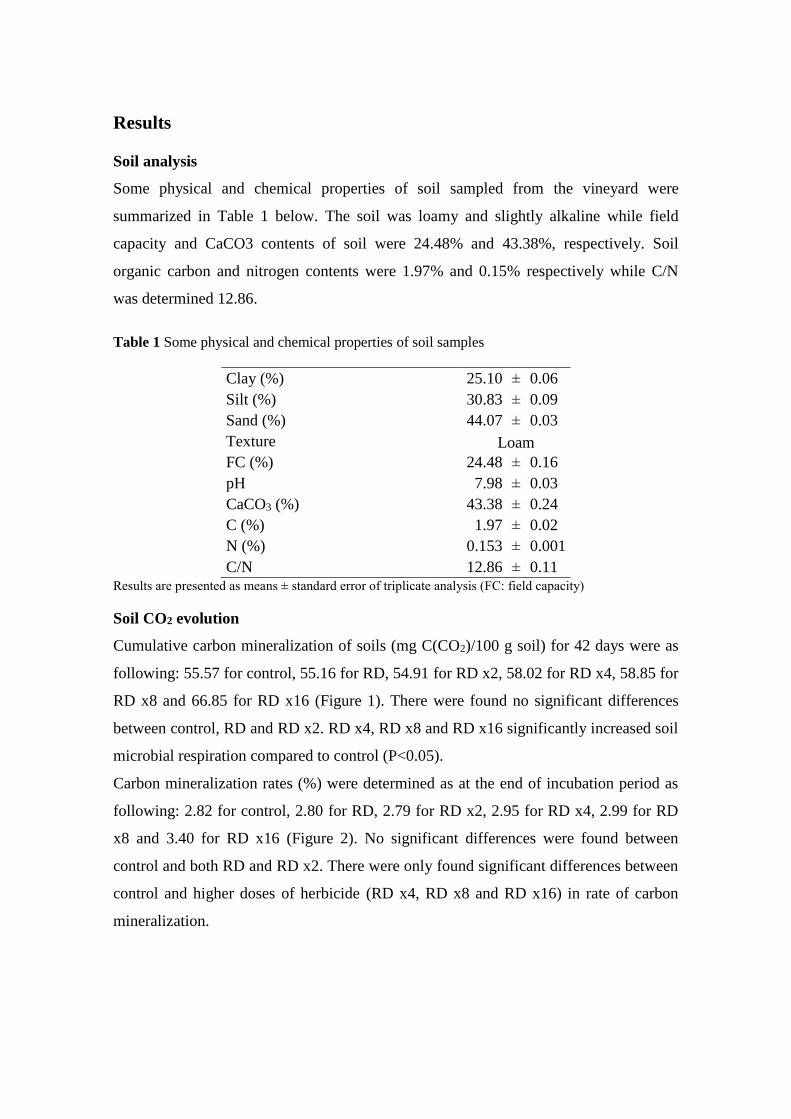
following: 55.57 for control, 55.16 for RD, 54.91 for RD x2, 58.02 for RD x4, 58.85 for
RD x8 and 66.85 for RD x16 (Figure 1). There were found no significant differences
between control, RD and RD x2. RD x4, RD x8 and RD x16 significantly increased soil
microbial respiration compared to control (P<0.05).
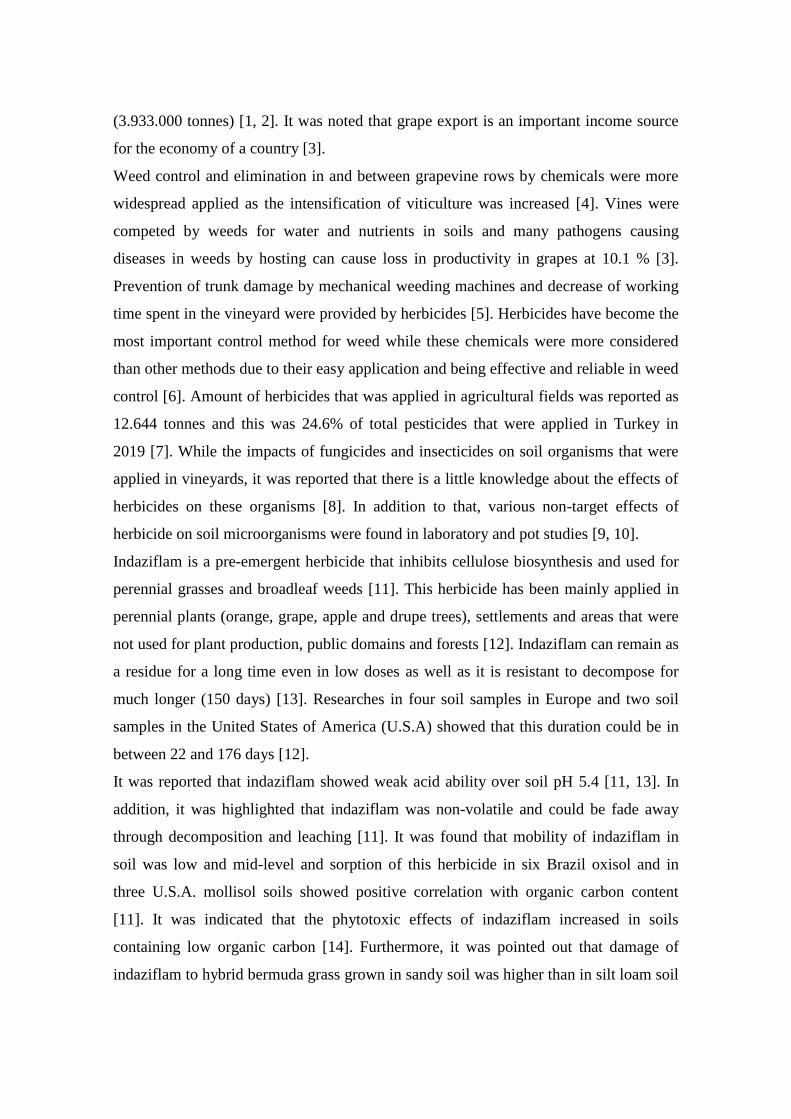
Carbon mineralization rates (%) were determined as at the end of incubation period as
following: 2.82 for control, 2.80 for RD, 2.79 for RD x2, 2.95 for RD x4, 2.99 for RD
x8 and 3.40 for RD x16 (Figure 2). No significant differences were found between
control and both RD and RD x2. There were only found significant differences between
control and higher doses of herbicide (RD x4, RD x8 and RD x16) in rate of carbon
mineralization.
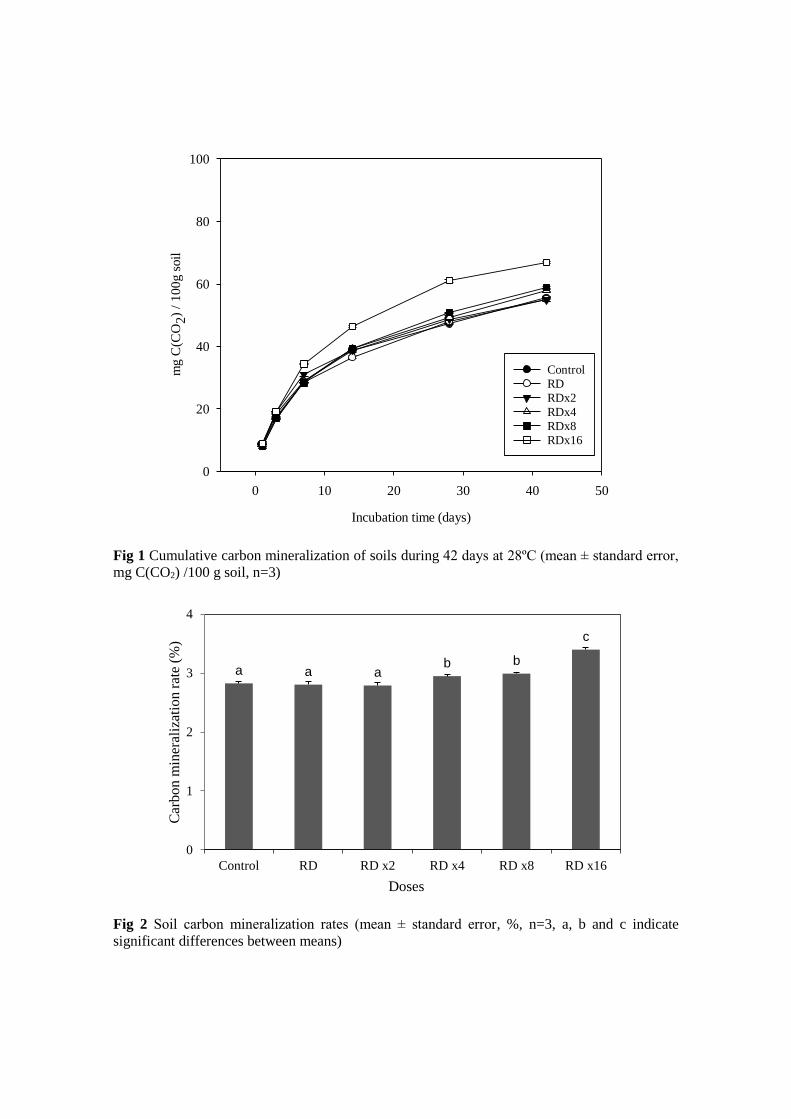
Fig 1 Cumulative carbon mineralization of soils during 42 days at 28ºC (mean ± standard error,
mg C(CO2) /100 g soil, n=3)
Fig 2 Soil carbon mineralization rates (mean ± standard error, %, n=3, a, b and c indicate
significant differences between means)
Incubation time (days)
0 10 20 30 40 50
mg C
(CO
2)
/ 1
00
g s
oil
0
20
40
60
80
100
Control
RD
RDx2
RDx4
RDx8
RDx16
a a ab b
c
0
1
2
3
4
Control RD RD x2 RD x4 RD x8 RD x16
Car
bo
nm
iner
aliz
atio
n r
ate
(%)
Doses
Soil NH4-N and NO3-N contents and nitrogen mineralization rates
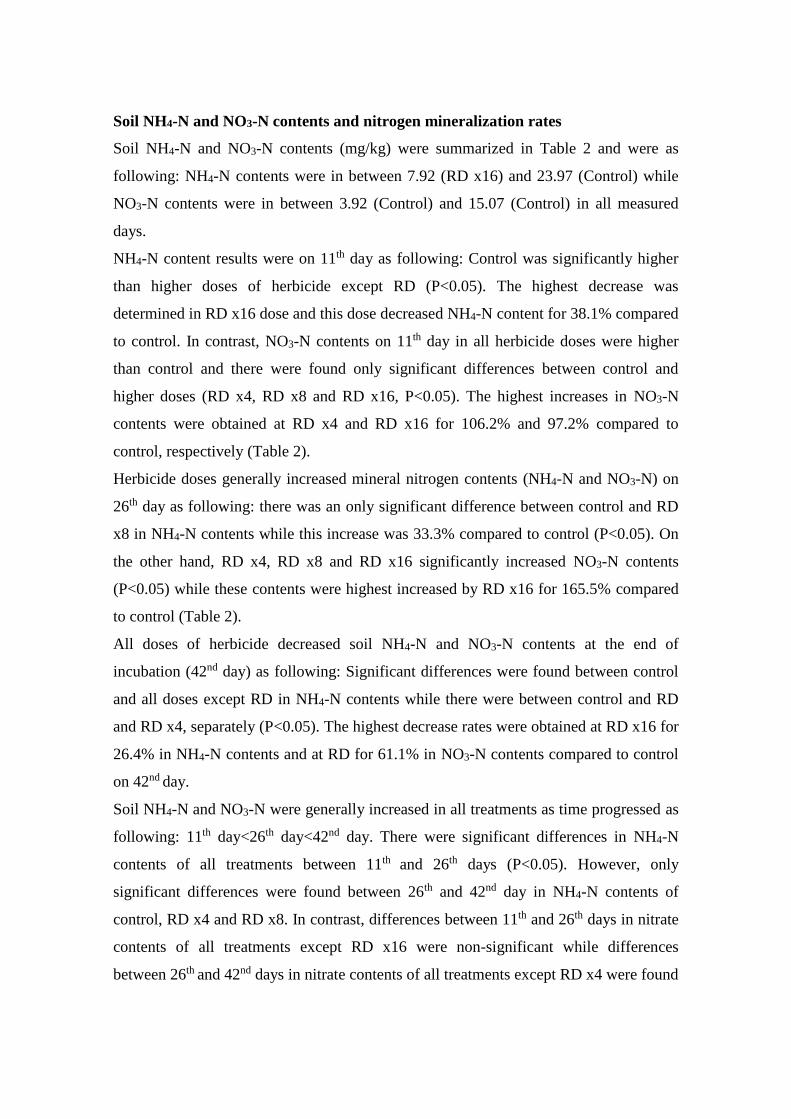
Soil NH4-N and NO3-N contents (mg/kg) were summarized in Table 2 and were as
following: NH4-N contents were in between 7.92 (RD x16) and 23.97 (Control) while
NO3-N contents were in between 3.92 (Control) and 15.07 (Control) in all measured
days.
NH4-N content results were on 11th day as following: Control was significantly higher
than higher doses of herbicide except RD (P<0.05). The highest decrease was
determined in RD x16 dose and this dose decreased NH4-N content for 38.1% compared
to control. In contrast, NO3-N contents on 11th day in all herbicide doses were higher
than control and there were found only significant differences between control and
higher doses (RD x4, RD x8 and RD x16, P<0.05). The highest increases in NO3-N
contents were obtained at RD x4 and RD x16 for 106.2% and 97.2% compared to
control, respectively (Table 2).
Herbicide doses generally increased mineral nitrogen contents (NH4-N and NO3-N) on
26th day as following: there was an only significant difference between control and RD
x8 in NH4-N contents while this increase was 33.3% compared to control (P<0.05). On
the other hand, RD x4, RD x8 and RD x16 significantly increased NO3-N contents
(P<0.05) while these contents were highest increased by RD x16 for 165.5% compared
to control (Table 2).
All doses of herbicide decreased soil NH4-N and NO3-N contents at the end of
incubation (42nd day) as following: Significant differences were found between control
and all doses except RD in NH4-N contents while there were between control and RD
and RD x4, separately (P<0.05). The highest decrease rates were obtained at RD x16 for
26.4% in NH4-N contents and at RD for 61.1% in NO3-N contents compared to control
on 42nd day.
Soil NH4-N and NO3-N were generally increased in all treatments as time progressed as
following: 11th day<26th day<42nd day. There were significant differences in NH4-N
contents of all treatments between 11th and 26th days (P<0.05). However, only
significant differences were found between 26th and 42nd day in NH4-N contents of
control, RD x4 and RD x8. In contrast, differences between 11th and 26th days in nitrate
contents of all treatments except RD x16 were non-significant while differences
between 26th and 42nd days in nitrate contents of all treatments except RD x4 were found
significant (P<0.05). There were significant differences between 11th and 42nd days in
ammonium contents of all treatments and nitrate contents of all treatments except RD
x4 (P<0.05).
Table 2 Soil NH4-N and NO3-N contents (mg/kg) on 11th, 26th and 42nd days
NH4-N (mg/kg) NO3-N (mg/kg)
11. Day 26. Day 42. Day 11. Day 26. Day 42. Day
Control 12.79 abz 17.72 by 23.97 ax 3.92 cy 4.05 dy 15.07 ax
(0.71)
(1.07)
(0.18)
(0.03)
(0.37)
(0.33)
RD 14.97 ay 18.15 bxy 23.96 ax 4.20 cy 5.03 dy 9.21 bx
(0.97)
(0.07)
(1.48)
(0.01)
(0.33)
(0.30)
RD x2 8.53 cy 16.99 bx 19.51 bcx 4.54 cy 6.01 cdy 13.71 ax
(0.40)
(0.23)
(1.19)
(0.12)
(0.80)
(0.83)
RD x4 9.75 bcz 18.01 by 19.44 bcx 8.09 ax 8.60 bcx 9.22 bx
(0.25)
(0.07)
(0.22)
(0.22)
(0.35)
(0.02)
RD x8 9.54 cz 23.62 ay 19.07 bcx 6.09 by 7.99 aby 14.16 ax
(0.04)
(0.33)
(0.05)
(0.09)
(0.47)
(0.49)
RD x16 7.92 cy 18.75 bx 17.65 cx 7.74 az 10.74 ay 13.12 ax
(0.44)
(0.23)
(0.07)
(0.42) (0.26) (0.43)
Results are presented as means ± standard error of triplicate analysis. Significant differences between
measurement days were indicated in the same column as x, y and z and in the same line as a, b, c and d
between treatments (P<0.05)
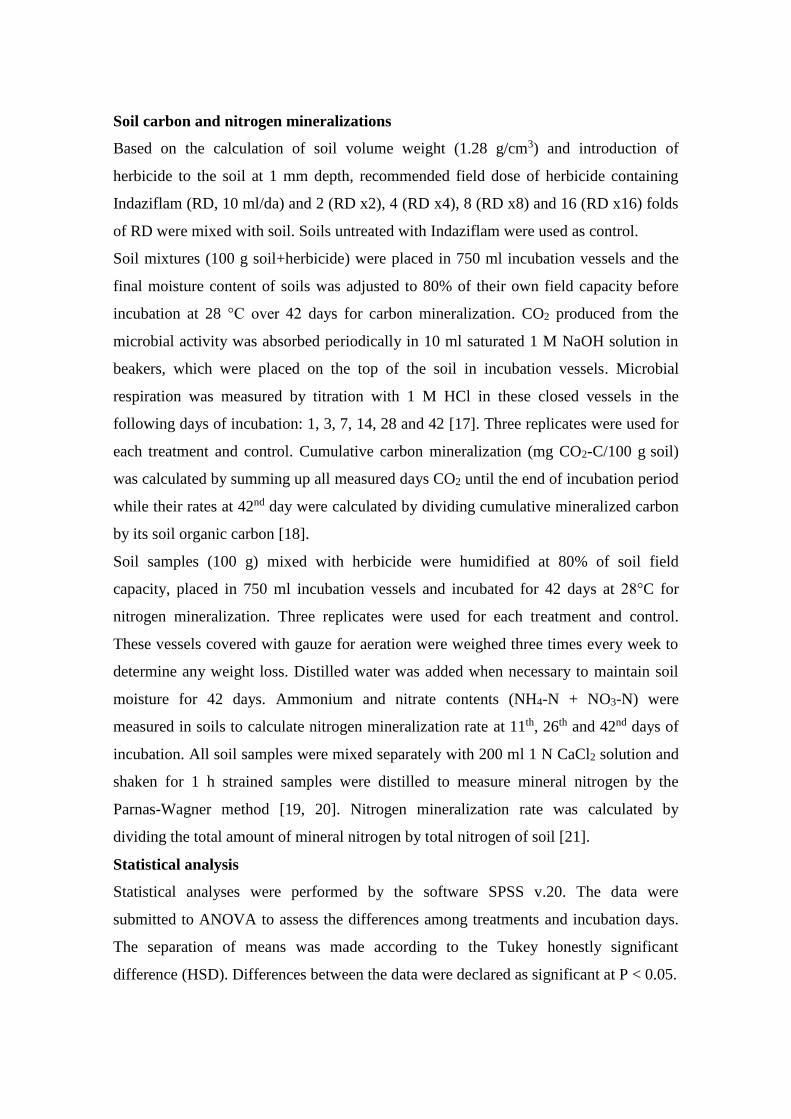
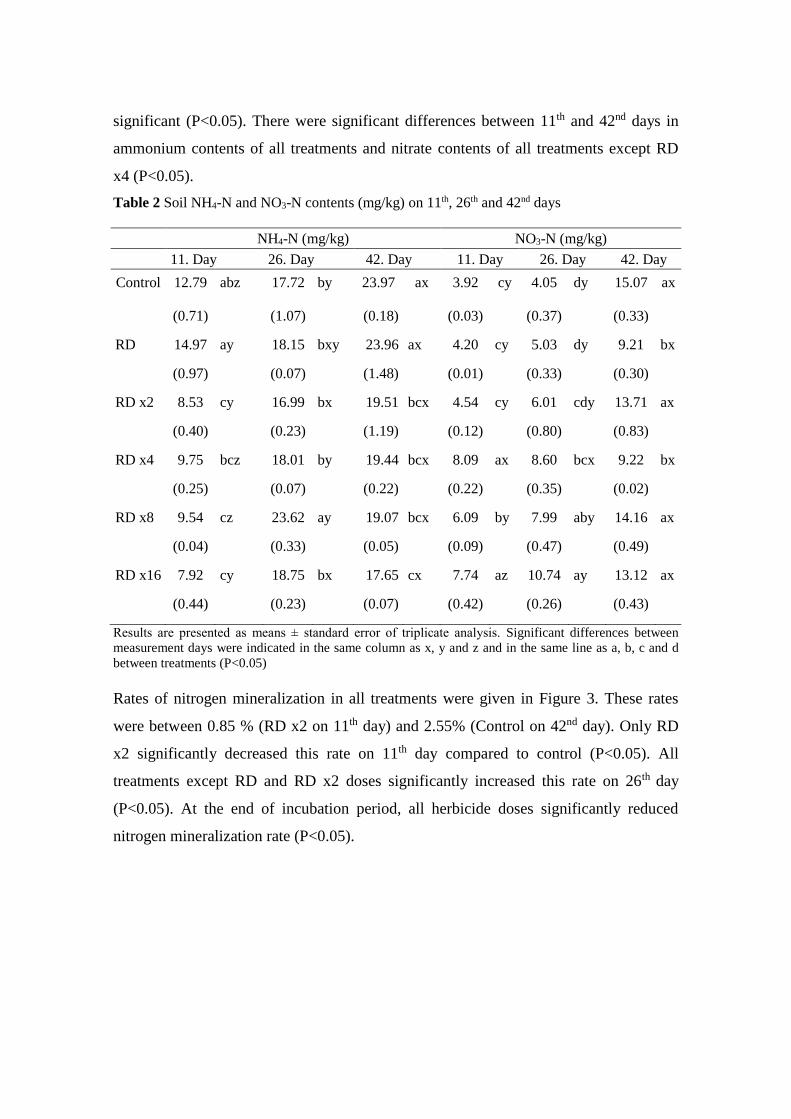
Rates of nitrogen mineralization in all treatments were given in Figure 3. These rates
were between 0.85 % (RD x2 on 11th day) and 2.55% (Control on 42nd day). Only RD
x2 significantly decreased this rate on 11th day compared to control (P<0.05). All
treatments except RD and RD x2 doses significantly increased this rate on 26th day
(P<0.05). At the end of incubation period, all herbicide doses significantly reduced
nitrogen mineralization rate (P<0.05).
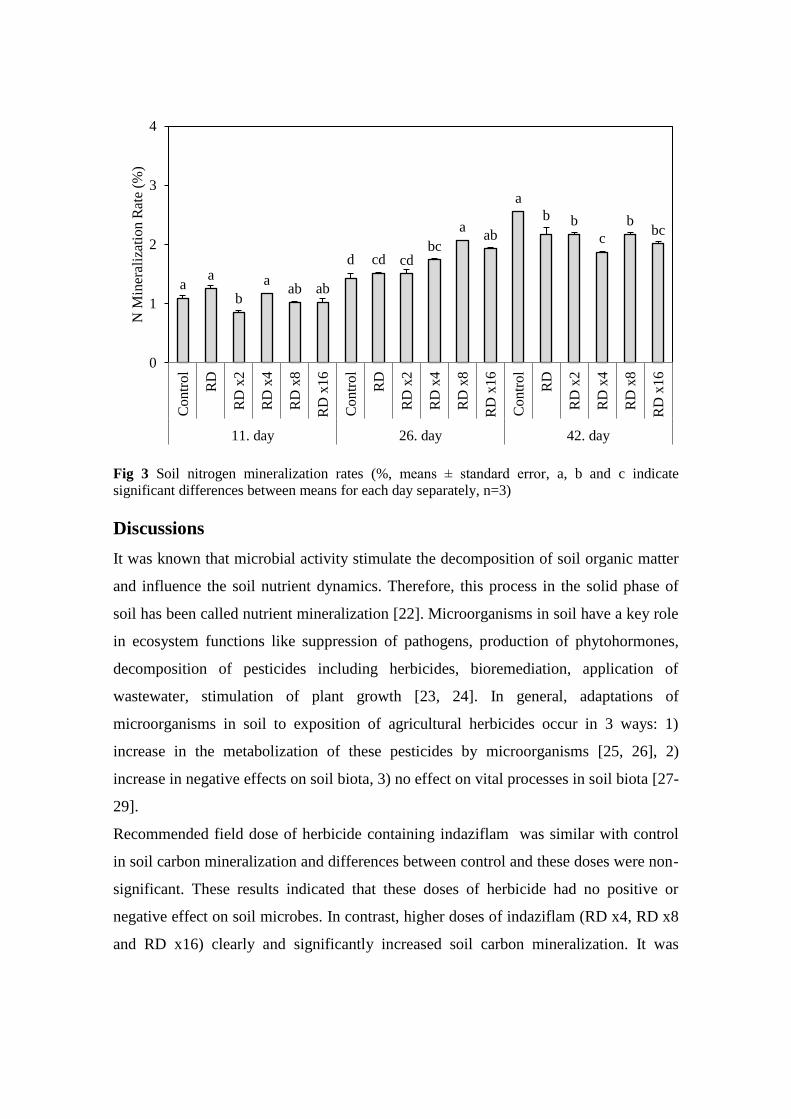
Fig 3 Soil nitrogen mineralization rates (%, means ± standard error, a, b and c indicate
significant differences between means for each day separately, n=3)
Discussions
It was known that microbial activity stimulate the decomposition of soil organic matter
and influence the soil nutrient dynamics. Therefore, this process in the solid phase of
soil has been called nutrient mineralization [22]. Microorganisms in soil have a key role
in ecosystem functions like suppression of pathogens, production of phytohormones,
decomposition of pesticides including herbicides, bioremediation, application of
wastewater, stimulation of plant growth [23, 24]. In general, adaptations of
microorganisms in soil to exposition of agricultural herbicides occur in 3 ways: 1)
increase in the metabolization of these pesticides by microorganisms [25, 26], 2)
increase in negative effects on soil biota, 3) no effect on vital processes in soil biota [27-
29].
Recommended field dose of herbicide containing indaziflam was similar with control
in soil carbon mineralization and differences between control and these doses were non-
significant. These results indicated that these doses of herbicide had no positive or
negative effect on soil microbes. In contrast, higher doses of indaziflam (RD x4, RD x8
and RD x16) clearly and significantly increased soil carbon mineralization. It was
aa
b
aab ab
d cd cdbc
aab
a
b b
c
bbc
0
1
2
3
4
Co
ntr
ol
RD
RD
x2
RD
x4
RD
x8
RD
x1
6
Co
ntr
ol
RD
RD
x2
RD
x4
RD
x8
RD
x1
6
Co
ntr
ol
RD
RD
x2
RD
x4
RD
x8
RD
x1
6
11. day 26. day 42. day
N M
iner
aliz
atio
n R
ate
(%)
possible to conclude that soil microorganisms could use these herbicide doses for
energy source and their activity.
Soil microorganisms can decompose natural and synthetic organic compounds while
their decomposition products may increase or decrease microbial activity [30, 31]. As a
result, when any environmental change like the application of herbicides for weed
control occurred, this can affect soil carbon cycling by altering metabolic activity and
community structure [22]. It was reported that soil microorganisms that were not
affected by different soil moistures could use imazamox (a herbicide) as both carbon
and nitrogen source and recommended field dose and its 2 fold dose of this herbicide
were found similar with control in soil carbon mineralization [32]. In another study, it
was noted that recommended field dose, its 2 and 4 folds of another herbicide named
glyphosate-amine salt had no negative or positive effect on soil carbon mineralization
compared to its non-herbicide exposed soil [33].
Diversity of microorganisms is in a wide range in soil ecosystem and therefore they
were classified as photolithotrophic, photoorganotrophic, chemolithotrophic and
chemoorganotrophic based on nutritional status. Phototrophic microorganisms
(photolithotrophic and photoorganotrophic) were found rare in soil but chemotrophic
microorganisms can be found in a wide range and numbers. All fungi species are
chemoorganotrophic and can use organic molecules for carbon and energy source while
bacterial and actinomycetes are originated from different groups. Nitrification
(conversion of NH4 to NO3) and biological nitrogen fixation were maintained by
chemolithotrophic organisms and these organisms can use CO2 as a carbon source and
obtain energy from the oxidation of inorganic compounds [34].
Most microorganisms play an active role in nitrification are chemolithotrophic and they
can show the metabolic decomposition of herbicides [35]. It was indicated that when
glyphosate and glufosinate (herbicides) applied in two different soils (haplustox and
quartsmanet), NO3-N contents were decreased in quartpsament soil but had no change
in haplustox soil [36]. The reason of this decrease was explained by the higher amounts
of clay and organic matter in quartpsament soil than haplustox soil [36]. Same authors
reported that the avaliability of NH4-N to NO3-N microorganisms were lower in
haplustox soil than quatzpsament and this decrease was caused by higher ion absorption
in soil colloidal fraction [36]. In addition, it was found that glyphosate had a great
interest in iron and aluminium oxides that are common in oxisol soils [37]. Therefore, it
was reported that this strong connection between glyphosate and these compounds
decreased the bioavailability of glyphosate for microorganisms [35]. A decrease in
nitrification may indicate a damaging factor for soil microbiota while an increase in
conversion of ammonium to nitrate may cause nitrate contamination in soil and
underground waters. It is important to indicate that these events can decrease the
amount and availability of this nutrient [35].
Effects of recommended field dose of indaziflam (RD) on soil ammonium and nitrate
contents with nitrogen mineralization rates were generally similar with control for 42
days of laboratory incubation in this study. It was possible to conclude that RD dose had
no negative or positive effect on soil microorganisms that play an active role in
ammonification and nitrification. In contrast, higher doses of indaziflam generally
decreased ammonium contents but increased nitrate contents in this study. Mineral
nitrogen contents were generally increased in all treatments as time progressed (11th
day<26th day<42nd day). In general, indaziflam had no negative or positive effects on
the soil nitrogen mineralization rate on 11th day. In contrast, higher doses of indaziflam
(RD x4, RD x8 and RD x16) on 26th day significantly increased but all treatments on
42nd day decreased nitrogen mineralization rate (P<0.05).
It was reported that applications of recommended field dose and its 2 and 4 folds of
imazamox (a herbicide) showed similarities with control in ammonium contents while
increasing doses of imazamox decreased soil nitrate production [32]. Authors in the
same research indicated that nitrate producing bacteria in soils were sensitive to addition
of imazamox into soil [32].
Temporal results in nitrogen mineralization can be differed based on soil type. It was
noted that mixation of a soil sampled from Adana (Turkey) with potassium bichromate
at soil Cr levels increased in NH4-N and NO3-N contents after 42 days of incubation as
following: 11th day< 26th day < 42nd day [38]. It was suggested that chromium affected
bacteria that take role in nitrogen mineralization [38]. In contrast, it was indicated that
NH4-N contents and nitrogen mineralization of gypsum, marl and serpentine soils were
higher on 11th day than 26th and 42nd days becuase of the availability of
biodecomposable organic matter [39].
Conclusions
Recommended field dose of herbicide containing indaziflam had generally no negative
effect on soil carbon and nitrogen mineralizations in this study. Higher doses of this
herbicide (RD x4, RD x8 and RD x16) stimulated carbon mineralization after 42 days of
incubation. In general, all herbicide doses had generally no negative or positive effect
on soil nitrogen mineralization rate on 11th day but it was positive on 26th day. In
contrast, all doses of herbicide had negative effect on soil ammonium and nitrate
producing microorganims on 42nd day.
Funding
Funding was received from Cukurova University Scientific Research Projects Department (Project
number: FBA-2018-10572) and all authors thank this department for their contribution for this study.
References
1. OIV Statistical report on world vitiviniculture. International Organisation of Vine and Wine.
2019. Available from: http://www.oiv.int/public/medias/6782/oiv-2019-statistical-report-on-
world-vitiviniculture.pdf
2. TUIK. Meyveler, içecek ve baharat bitkilerin üretim miktarları (Seçilmiş ürünlerde), 2001-2019.
2019.
3. Kaçan, K. and Ö. Boz, Ege bölgesi geleneksel ve organik bağ alanlarında yabancı ot tür
yoğunluk ve rastlama sıklıklarının belirlenmesi ve karşılaştırılması. Ege Üniversitesi Ziraat
Fakültesi Dergisi, 2015. 52(2): p. 169-179.
4. Keller, M., The science of grapevines. 2015, 2 edn. Elsevier, Oxford
5. Mandl, K., et al., Effects of glyphosate-, glufosinate- and flazasulfuron-based herbicides on soil
microorganisms in a vineyard. Bulletin of Environmental Contamination and Toxicology, 2018.
101: p. 562–569.
6. Kraehmer, H., et al., Herbicides as Weed Control Agents: State of the Art: I. Weed Control
Research and Safener Technology: The Path to Modern Agriculture. Plant Physiology, 2014.
166(3): p. 1119-1131.
7. TUIK. Tarımsal ilaç kullanımı, 2006-2019. 2019.
8. Zaller, J.G., et al., Herbicides in vineyards reduce grapevine root mycorrhization and alter soil
microorganisms and the nutrient composition in grapevine roots, leaves, xylem sap and grape
juice. Environmental Science and Pollution Research, 2018. 25: p. 23215–23226.
9. van Hoesel, W., et al., Single and combined effects of pesticide seed dressings and herbicides on
earthworms, soil microorganisms, and litter decomposition. Frontiers in Plant Science, 2017.
8:215.
10. Zaller J.G., et al., Glyphosate herbicide affects belowground interactions between earthworms
and symbiotic mycorrhizal fungi in a model ecosystem. Scientific Reports, 2014. 4:5634.
11. Alonso, D.G., et al., Sorption-Desorption of Indaziflam in Selected Agricultural Soils. Journal of
Agricultural and Food Chemistry, 2011. 59(24): p. 13096-13101.
12. Gonzalez-Delgado, A.M., et al., Effect of application rate and irrigation on the movement and
dissipation of indaziflam. Journal of Environmental Sciences, 2017. 51: p. 111-119.
13. EPA U. S., Pesticide fact sheet, indaziflam. 2010.
14. Jones, P.A., et al., Effect of Reed-Sedge Peat Moss on Hybrid Bermudagrass Injury with
Indaziflam and Prodiamine in Sand-Based Root Zones. Weed Technology, 2013. 27(3): p. 547-
551.
15. Jones, P.A., et al., Soil Type and Rooting Depth Affect Hybrid Bermudagrass Injury with
Preemergence Herbicides. Crop Science, 2013. 53(2): p. 660-665.
16. Kacar, B., Toprak Analizleri. Vol. 484. 2012, Ankara: Nobel Akademik Yayıncılık.
17. Alef, K., Soil Respiration, in Methods in Applied Soil Microbiology and Biochemistry, K. Alef
and P. Nannipieri, Editors. 1995, Academic Press Inc.: New York. p. 214-215.
18. Koçak, B., Atrazine ve Glyphosate'ın Toprak Karbon Mineralizasyonuna Olan Etkileri.
International Journal of Life Sciences and Biotechnology, 2020. 3: p. 108-116.
19. Lemee, G., Investigations sur la Mineralisation de L’azote et son Evolution Annuelle Dans des
Humus Forestiers in Situ. Oecıologia Plantarum, 1967. 2: p. 285-324.
20. Sağlam, M.T., Toprakta Mevcut Bazı Azot Formlarının Tayini Ve Azot Elverişlilik İndeksleri
Vol. 18. 1979, Erzurum: Atatürk Üniversitesi Ziraat Fakültesi Yayınları.
21. Aka, H. and C. Darici, Carbon and nitrogen mineralization in carob soils with Kermes oak and
Aleppo pine leaf litter. European Journal of Soil Biology, 2005. 41(1-2): p. 31-38.
22. Mendes, K.F., et al., Glucose mineralization in soils of contrasting textures under application of
S-metolachlor, terbuthylazine, and mesotrione, alone and in a mixture. Bragantia, 2018. 77(1): p.
152-159.
23. Bottomley, P.J., Microbial Ecology, in Principles and Applications of Soil Microbiology, D.M.
Sylvia, et al., Editors. 2005: New Jersey. p. 463-488.
24. Saleem, M. and L.A. Moe, Multitrophic microbial interactions for eco- and agro-
biotechnological processes: theory and practice. Trends in Biotechnology, 2014. 32(10): p. 529-
537.
25. Reis, M.R., et al., Atividade microbiana em solo cultivado com cana-de-açúcar após aplicação de
herbicidas. Planta Daninha, 2008. 26: p. 323-331.
26. Hussain, S., et al., Bioremediation and Phytoremediation of Pesticides: Recent Advances.
Critical Reviews in Environmental Science and Technology, 2009. 39(10): p. 843-907.
27. Pereira, J.L., et al., Effects of glyphosate and endosulfan on soil microorganisms in soybean
crop. Planta Daninha, 2008. 26: p. 825-830.
28. Mahia, J., et al., Microbial biomass and C mineralization in agricultural soils as affected by
atrazine addition. Biology and Fertility of Soils, 2008. 45(1): p. 99-105.
29. Blume, E. and J.M. Reichert, Banana leaf and glucose mineralization and soil organic matter in
microhabitats of banana plantations under long-term pesticide use. Environmental Toxicology
and Chemistry, 2015. 34(6): p. 1232-1238.
30. Schmidt, M.W.I., et al., Persistence of soil organic matter as an ecosystem property. Nature,
2011. 478(7367): p. 49-56.
31. Hussain, S., et al., Impact of Pesticides on Soil Microbial Diversity, Enzymes, and Biochemical
Reactions. Advances in Agronomy, Vol 102, 2009. 102: p. 159-200.
32. Aka Sagliker, H., et al., Effects of Imazamox on Soil Carbon and Nitrogen Mineralization under
Two Different Humidity Conditions. Ekoloji, 2014. 23(91): p. 22-28.
33. Sagliker, H.A., Carbon Mineralisation in Orange Grove Soils Treated with Different Doses of
Glyphosate-Amine Salt. Journal of Environmental Protection and Ecology, 2018. 19(3): p. 1102-
1110.
34. Moreira, F.M.S. and J.O. Siqueira, Microbiologia e bioquímica do solo, ed. UFLA. 2006:
Universidade Federal de Lavras (UFLA). 729.
35. Damin, V. and P. Trivelin, Herbicides Effect on Nitrogen Cycling in Agroecosystems, in
Herbicide and Environment, A. Kortekamp, Editor. 2011, InTech: Rijeka, Croatia.
36. Damin, V., P.C.O. Trivelin, and T.G. Barbosa, Mineralização do nitrogênio da stubble de
milheto dessecado com herbicides. Revista Brasileira de Ciência do Solo, 2009. 33: p. 925-934.

37. Prata, F., et al., Influência da matéria orgânica na sorção e dessorção do glifosato em solos com
diferentes atributos mineralógicos. Revista Brasileira de Ciência do Sol, 2000. 24(4): p. 947-951.
38. Kızıldağ, N., Doğu Akdeniz Bölgesindeki Krom Maden Alanı Topraklarında Azot
Mineralizasyonu. Toprak Su Dergisi, 2017. 6(1): p. 52-57.
39. Sagliker, H.A., et al., Is parent material an important factor in soil carbon and nitrogen
mineralization ? European Journal of Soil Biology, 2018. 89: p. 45-50.
Research article
Hamid, T.H.T.A. and N.F.A.M. Fuzi, Lactic Acid Bacterium with Antimicrobial Properties from Selected
Malay Traditional Fermented Foods International Journal of Life Sciences and Biotechnology, 2021. DOI:
10.38001/ijlsb.781522
Lactic Acid Bacterium with Antimicrobial Properties from
Selected Malay Traditional Fermented Foods
Tengku Haziyamin Tengku Abdul Hamid1* , Nur Fatin Amysya M. Fuzi1
ABSTRACT
Traditional or local fermented foods have been the favourite sources for Lactic acid
bacteria (LAB) used for starter cultures. Traditional food such as fermented cassava
‘tapai ubi’, fermented glutinous rice ‘tapai pulut’ and fermented shrimp paste ‘belacan’
have been local heritage consumed as Malay delicacies. In this work, 33 LAB samples
were isolated from tapai ubi, tapai pulut and belacan and out of these only 5 LAB
isolates (PG, PH, BG, UG and UL) showed inhibitory properties against selected
indicator organisms (Bacillus subtilis, Escherichia coli, Salmonella typhimurium, and
Staphylococcus aureus). Morphologically, isolate PG, PH, BG are cocci, UL is rod and
UG is coccobacillus. Biochemically, isolates (PG, PH, BG UL and UG) are found to be
Gram positive, non motile, lactose fermenter and catalase negative. The 16s Ribosomal
RNA gene sequencing was carried out and each was identified with an accession number
(PB: MT645488, PH: MT645489; BG: MT645490 UG: MT645491 and UL
MT645492). Isolates PG and PH from tapai pulut belonged to Pediococcus pentosaceus
(at 99% and 98%, respectively). Meanwhile, isolate from Belacan BG belonged to
Enterococcus faecium (99%), and those from fermented shrimp, UG and UL belonged
to Weissella confusa (99%), and Lactobacillus fermentum (98%), respectively. Majority
of the isolates demonstrated broad spectrum inhibition against both Gram positive and
negative indicator strains. Compared to the rest of isolates, PH exhibited the highest
antibacterial activity against Bacillus subtilis. These results suggested that isolate PH
are the most potent isolates which is producing antimicrobial agent with potential as
food preservatives.
Introduction
Recent consumer awareness and perception have renewed interest in the consumption of
healthy food; food with no additives or preservatives; or so called ‘natural’ or ‘traditional’
foods. The consumption of fermented food can offer many benefits that it was suggested
to be included in food consumption guides [1]. Fermented foods exist in many cultures
and lactic acid bacteria (LAB), or yeast are the common starter cultures used in food
fermentation aimed at enhancing the texture and flavour of the desired products [2].
1 Department of Biotechnology, Kulliyyah of Science, International Islamic University Malaysia,
Kuantan Campus, Jalan Istana, Bandar Indera Mahkota, 25200, Kuantan, Pahang, Malaysia
*Corresponding Autor: Tengku Haziyamin Tengku Abdul Hamid1 e-mail: [email protected]
ARTICLE HISTORY
Received
17 August 2020
Accepted
15 September 2020
KEYWORDS
Lactic acid bacteria,
malay traditional food,
bacterial antagonism
Fermentation of carbohydrates produces product such as lactic acid which reduces the pH
thereby creating condition unfavourable for the growth of harmful or food spoilage
organism.
As a result of urbanisation and commercial demand, the production of traditional food
need to up-scaled to ensure its benefit or relevance. However, the large scale production
of traditional food is still a challenge. According to Anal et al [3], fermented food which
is usually prepared in a small scale set up is subjected to safety risk, especially due to
microbial contamination following bad agricultural practises. Therefore, the use of
selected microflora or a more define starter cultures is highly recommended in
minimizing this risk. For years, works have been carried out to isolate useful LAB in an
attempt to screen for the best strain to be used as starter culture. Lactobacillus,
Lactococcus, Streptococcus, Pediococus and Leuconostac are among the commonest
group of LAB which have been used as starter cultures [4]. Despite LAB can be found
widely in other non-food sources such as gastrointestinal tract of human or animals,
fermented food was still considered the favourite target of many works on isolation for
LAB. LAB produces ribosomally synthesized antimicrobial peptides known as
bacteriocins which were considered as potential alternative to chemical food
preservatives and antimicrobial drugs [5]. The diversity of LAB, and their target spectrum
of their antimicrobial activities have made them interesting target for bacteriocin
isolation.
There have been several studies on the isolation LAB from several types of Malay
traditional foods. These include tapai (fermented tapioca), tempoyak (fermented durian
flesh), chilli puree and fresh goat's milk [6]; fermented fish; Chili bo (chili puree) [7];
bambangan [8]; pekasam (fermented fish), jeruk maman (fermented vegetable), tapai
(fermented glutinous rice) and tempoyak (fermented durian)[9]; and a local vinegar [10].
In one of our previous study, Staphylococcus piscifermentans was isolated from Cincaluk
(Malaccan fermented shrimp) [11]. These studies indicated that different or diverse
groups of LAB are continually being isolated even from similar food sources. Moreover,
the same type of food may not be similarly prepared or following a standard ingredients.
In this study, Malay traditional fermented food such “tapai pulut”, “tapai ubi” and
“belacan” were selected as the sources for lactic acid bacterium (LAB). This LAB strains
were tested for their probiotic properties and their ability to produce antimicrobial
activities against selected pathogenic strains. The properties of this isolates could make
them suitable candidate to be used as starter culture in food fermentation.
Materials and Methods
Media and reagents preparation
Isolation and culturing of lactic acid bacteria (LAB) was carried out using De Man
Rogosa and Sharpe (MRS) media. Pathogenic strains used as indicator bacterium
Bacillus subtilis, Escherichia coli, Salmonella typhimurium and Staphylococcus aureus
were grown in nutrient agar (NA). Nutrient agar (NA) media was also used for the
antimicrobial activities. Pathogenic strains Bacillus subtilis, Escherichia coli,
Staphylococcus aureus and Salmonella typhimurium were obtained from the Kuliyyah of
Sciences collection at International Islamic University Malaysia, Kuantan Campus.
Sample sources
Three types of Malay traditional food, tapai pulut (fermented glutinous rice), tapai ubi
(fermented cassava) and belacan (fermented shrimp paste) were purchased from local
fresh market in Kuantan. About 10 g of each food sample was added with 90 ml of
peptone water. Samples were homogenised and serially diluted up to 1 x 10⁻³ with 0.1%
peptone water. The diluted samples were vortexed and spread on (MRS) agar plates. The
plates were incubated anaerobically in gas pack for 3 days (72 hours), at 37°C. New
formed colonies were sub-cultured on new MRS agar and incubated anaerobically for 24
hours at 37°C, and the procedure was repeated until single colony was obtained for each
isolate. The new LAB isolates were maintained in MRS broth with 40 % glycerol and
stored at -80 °C
Identification of lactic acid bacteria (LAB)
Preliminary identification and characterization of selected isolates were based on lactose
utilization test, Gram staining and catalase test. Carbohydrate fermentation was tested
using bromocresol lactose agar which contained bromocresol purple (purple indicator)
(0.025 g), peptone (5.0 g), beef extract (3.0 g), lactose (10.0 g), and nutrient agar (15.0 g)
per 1 liter water. The gram staining were carried out on the isolates using standard
protocols and examined under light microscope (Nikon) at 100X magnification
(immersion oil).
Screening of antimicrobial activities of LAB
In this work, preliminary screening for inhibitory activities from LAB were detected
using disk diffusion methods according to Kirby method [12] and Bacillus subtilis,
Eschericia coli, Staphylococcus aureus and Salmonella typhimurium were used as
indicator bacterium. The strains were grown in Mueller-Hinton broth until turbidity
reached at 0.5 McFarland standard and spread evenly using sterile cotton swab on NA
agar plates to make bacterial lawn. The test LAB isolates were incubated anaerobically
in MRS broth medium at for 48 hours at 37°C. Filter paper disks (Whatman, 9.0 mm
diameter) were loaded with 20 µl of fresh cultures and allowed to dry. The filter discs
were then laid on NA plates pre-streaked with indicator strains with gentle press. Then,
all of the plates were incubated at 37°C for 24 hours. Tetracycline was used as positive
control while MRS broth was used as negative control. The antimicrobial activities of
the selected strains were determined by inhibitory zones around the wells and diameter
of zone inhibition was measured (in mm).
Cell free extraction (CFE) and agar well diffusion assay
Following disk diffusion method, inhibitory activities from cell free extract (CFE) were
detected using agar well diffusion assay [13]. Each LAB was propagated in MRS broth
and incubated at 37°C for 48 hours. The broths were centrifuged (12 000x g) for 5
minutes at 4°C. Collected supernatant was filtered (Millipore, 0.22 µm pore size) to form
LABs’ CFE. About 35 ml of molten NA was poured into 50 ml falcon tube and mixed
with 30 µl of indicator strains. This mixture was then poured on sterile plate and left to
solidify, in which holes were later punched on solidified agar using sterile glass dropper.
Each well was filled with 70 µl of prepared CFE and incubated at 37°C for 24 hours.
MRS broth was used as a negative control. Following incubation, the zone on inhibitions
around the well were observed and measured (in mm).
Genotypic characterisation
To all five LAB strains, the genomic DNA were extracted (GF-1, Vivantis) according to
manufacturer’s protocols. The gene for 16S rRNA were amplified using a pair of
universal primer (forward: 5’ – AGA GTT TGA TCC TGG CTC AG – 3’ and reverse 5’
– CCG TCA ATT CCT TTG AGT TT- 3’) [14]. PCR reaction mixture contained 25 µl
of master mix, 3 µl of DNA template, 5 µl of each primer and made up to 50 µl reaction
volume with distilled H20. The PCR runs were as follows: Initial denaturation at 94°C (2
minutes), denaturation at 94°C (1 minute), annealing at 55°C (1 minute), and extension
at 72°C (1 minute). The amplification was repeated in 25 cycles followed by a final
extension at 72°C (7 minutes). In this work, the DNA concentrations were checked using
Nanodrop Spectrophotometer (NanoDropTM 2000, USA). The gel was visualised using
1% agarose gel electrophoresis and viewed using UV transiluminator (AlphaImager). The
PCR products were electrophoresed and purified (Clean-Up kit,Vivantis) and sent to a
sequencing agency (Apical scientific Sdn. Bhd.). The generated sequences were analysed
using BLASTn which available at NCBI website (http://blast.ncbi.nlm.nih.gov). Selected
sequences were aligned using ClustalX2, and MEGA 6 software were used to build up a
phylogenetic tree. The 16S rRNA gene sequences of representative LAB strains were
analysed using Neighbour-joining methods with bootstrap values based on 500
replications.
Results and Discussion
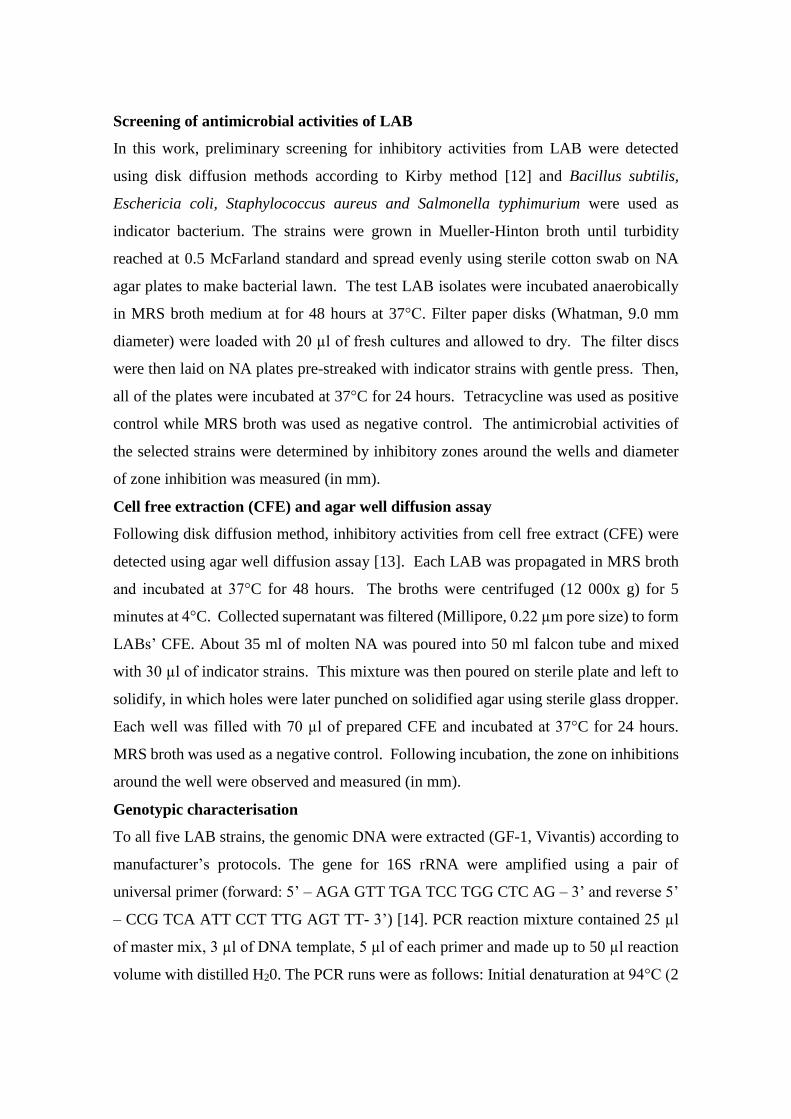
Morphological and biochemical characterisations
From 33 colonies, only five isolates (PG, PH, BG, UG and UL) were able to show lactose
utilisation on MRS agar plate and these isolates were further subjected to biochemical,
morphological and genotypic characterizations. As shown in Fig 1, the results of Gram
staining, all isolates are gram positives in which three of the isolates (PG, PH and BG)
are cocci. Meanwhile isolate UL appears rod-shaped and UG is coccobacillus (see to
Table 1). The lactose fermentation was indicated by the changes in the colour of
bromocresol dye from purple to yellow. Fermentation of lactose produces lactic acid as
the main metabolite which in turn reduces the pH of media, a common feature exhibited
by LAB [15]. LAB ferment sugar for carbon and energy sources while producing a variety
of compounds such as organic acids, aromatic compounds and other substances beneficial
to health. As shown in Table 1, all of these isolates were found to be catalase negative.
Since LAB are adapted to anaerobic environment, they are lacking in hydrogen peroxide
scavenging enzyme such as catalase [16]. Therefore, in catalase test there would be no
bubble due to evolution of oxygen gas. Overall results from biochemical tests were
consistent with other characterizations featured for LAB which are Gram positive,
catalase negative, coccus, non-spore former, non-motile and anaerobic organisms.
Table 1 Morphological and biochemical tests on LAB
Characteristics Lactic acid bacteria (LAB)
PG PH BG UG UL
Lactose test + + + + +
Gram staining + + - + -
Cell morphology coccus coccus coccus coccobacillus bacillus
Catalase test - - - - -
Fig 1 Morphologies of LAB isolates from Malay traditional food after Gram staining method, and
viewed under light microscopic (Nikon, 100X magnification with oil immersion)
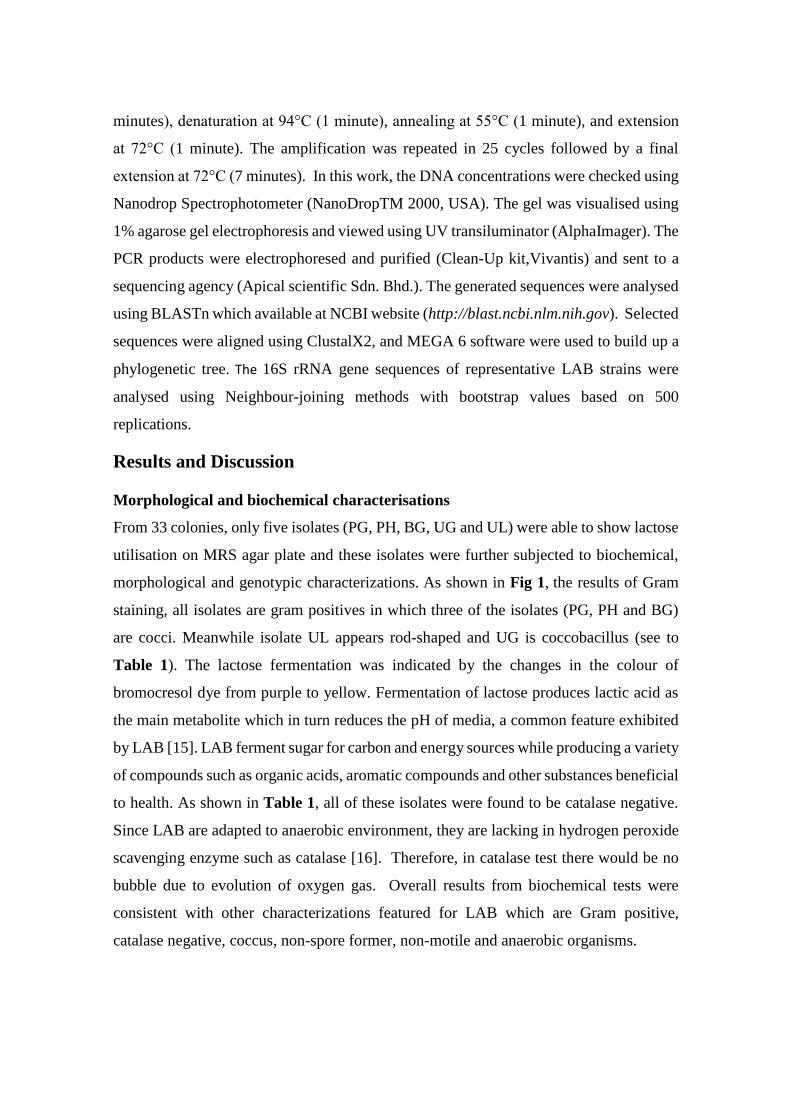
Antimicrobial activities of LAB
Based on disc diffusion assay, five isolates showed antimicrobial activities against Gram
positive and Gram negative indicator bacterium (see Table 2 and Fig 2). Both isolate PG
and PH were able to show inhibitions against all indicator strains tested. Isolate PH
showed strong inhibitions against almost all strains except a moderate inhibition against
S. thyphimurium. Isolate BG was only active against gram negative strains (E .coli and S.
thyphimurium). Meanwhile, Isolate UG and UL were lacking of inhibitory properties
except against gram negative E. coli.
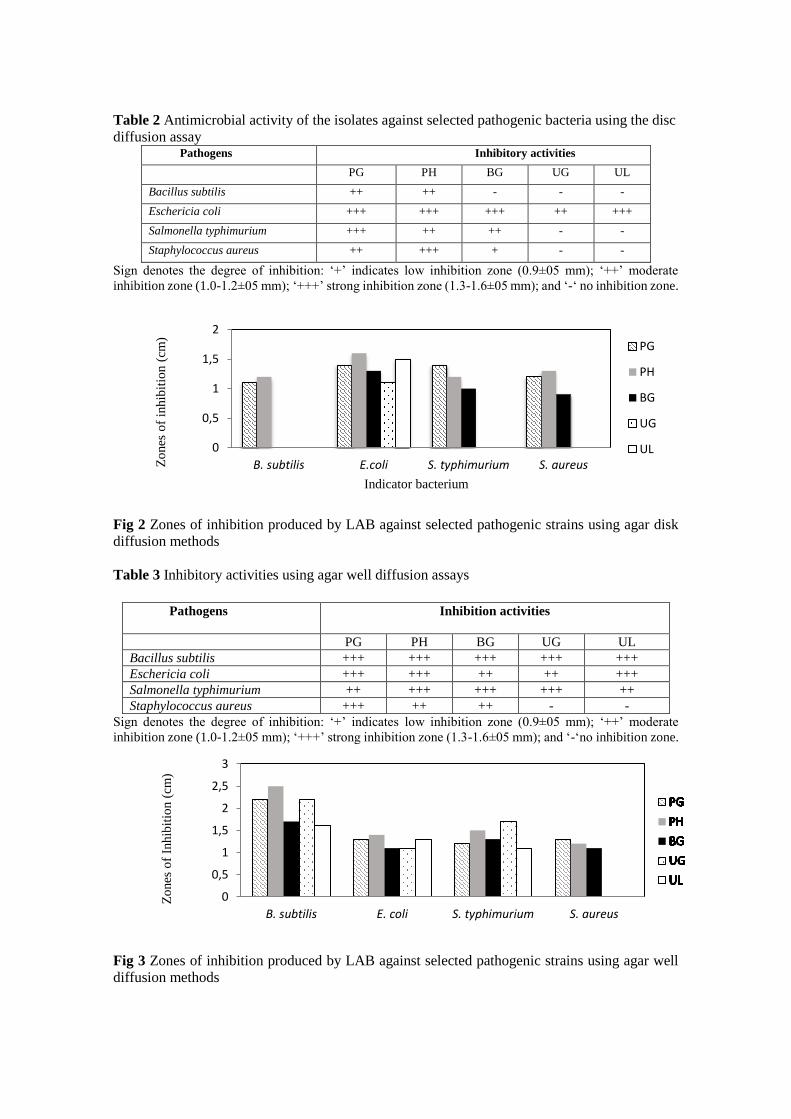
Table 2 Antimicrobial activity of the isolates against selected pathogenic bacteria using the disc
diffusion assay Pathogens Inhibitory activities
PG PH BG UG UL
Bacillus subtilis ++ ++ - - -
Eschericia coli +++ +++ +++ ++ +++
Salmonella typhimurium +++ ++ ++ - -
Staphylococcus aureus ++ +++ + - -
Sign denotes the degree of inhibition: ‘+’ indicates low inhibition zone (0.9±05 mm); ‘++’ moderate
inhibition zone (1.0-1.2±05 mm); ‘+++’ strong inhibition zone (1.3-1.6±05 mm); and ‘-‘ no inhibition zone.
Fig 2 Zones of inhibition produced by LAB against selected pathogenic strains using agar disk
diffusion methods
Table 3 Inhibitory activities using agar well diffusion assays
Pathogens
Inhibition activities
PG PH BG UG UL
Bacillus subtilis +++ +++ +++ +++ +++
Eschericia coli +++ +++ ++ ++ +++
Salmonella typhimurium ++ +++ +++ +++ ++
Staphylococcus aureus +++ ++ ++ - -
Sign denotes the degree of inhibition: ‘+’ indicates low inhibition zone (0.9±05 mm); ‘++’ moderate
inhibition zone (1.0-1.2±05 mm); ‘+++’ strong inhibition zone (1.3-1.6±05 mm); and ‘-‘no inhibition zone.
Fig 3 Zones of inhibition produced by LAB against selected pathogenic strains using agar well
diffusion methods
0
0,5
1
1,5
2
B. subtilis E.coli S. typhimurium S. aureusZo
nes
of
inhib
itio
n (
cm)
Indicator bacterium
PG
PH
BG
UG
UL
0
0,5
1
1,5
2
2,5
3
B. subtilis E. coli S. typhimurium S. aureus
Zo
nes
of
Inhib
itio
n (
cm)
Both agar disk diffusion and well diffusion methods were commonly used in studying
antimicrobial activities. Due to its simplicity and cheap, disk diffusion method is
commonly employed in antimicrobial screening work [17]. The trend of inhibition
observed using disk diffusion method was however not necessarily replicated when tested
in agar well diffusion method. In agar well diffusion assay (Table 3 and Fig 3), all
pathogenic strains showed inhibitions except for Staphylococcus aureus which showed
resistance against isolates UG and UL. However, some of the zero inhibitions observed
in disk diffusion method were able to shown inhibition in agar well method. Agar well
diffusion methods were shown to be more sensitive than disk methods [18]. Disk
diffusion method sometime produces smaller inhibition zones compared to agar well
methods [19], and even the type of agar media used may affect its sensitivity [20]. The
discordant we observed here were due to the phyco-chemical environment of these two
methods and differences in the nature of inhibitory compounds produced by
microorganism. For instance, inhibition due to low pH may be ineffective or not
favourable when using disk diffusion method, a condition which is more effective for
small organic or bacteriocin. Nevertheless, ability to show antagonisms is one of the
desirable properties of LAB. Based on inhibitory strength and number of antagonised
strains, the degree of antagonistic property among the isolates was in the order of PH >
PG > BG > UG > UL. In term of spectrum of inhibition, Isolates PG, PH and BG are
notable based on their ability to inhibit both Gram positive (Bacillus subtilis,
Staphylococcus aureus) and Gram negative (Escherichia coli and Salmonella
typhimurium) bacterium. Some of these inhibitions were due to the ability of LAB strains
to produce bacteriocin or antimicrobial peptides.
Genotypic characterisations
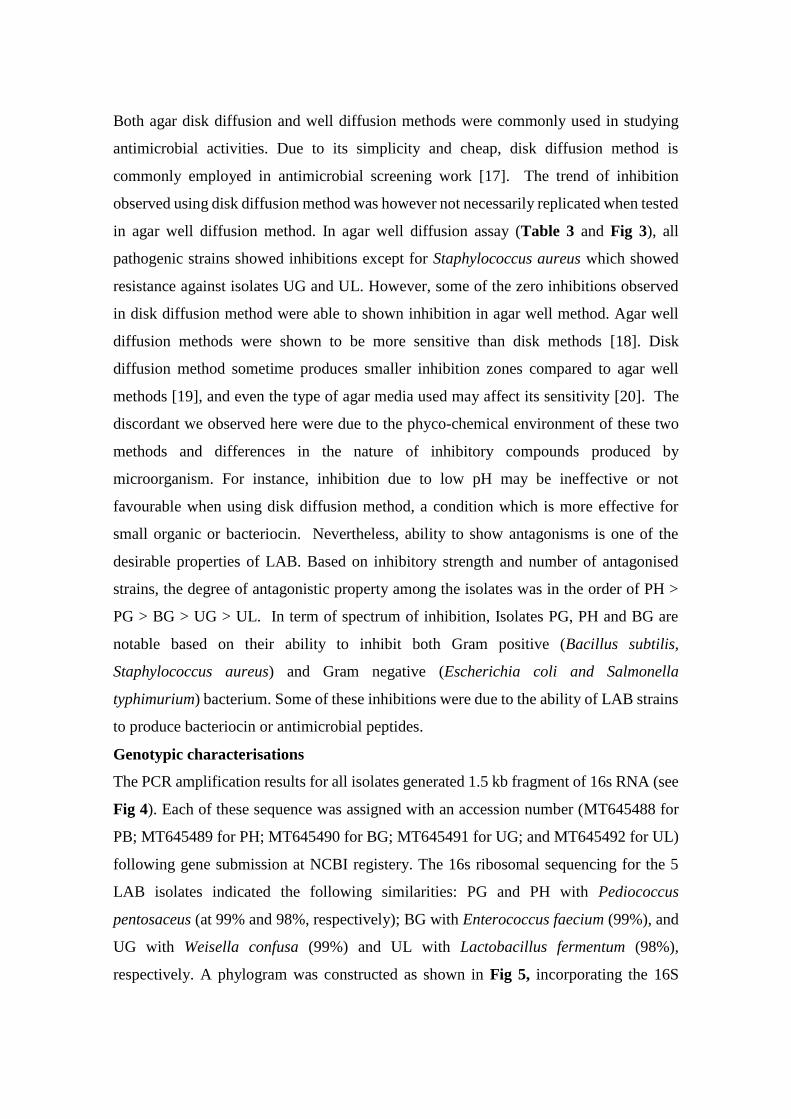
The PCR amplification results for all isolates generated 1.5 kb fragment of 16s RNA (see
Fig 4). Each of these sequence was assigned with an accession number (MT645488 for
PB; MT645489 for PH; MT645490 for BG; MT645491 for UG; and MT645492 for UL)
following gene submission at NCBI registery. The 16s ribosomal sequencing for the 5
LAB isolates indicated the following similarities: PG and PH with Pediococcus
pentosaceus (at 99% and 98%, respectively); BG with Enterococcus faecium (99%), and
UG with Weisella confusa (99%) and UL with Lactobacillus fermentum (98%),
respectively. A phylogram was constructed as shown in Fig 5, incorporating the 16S
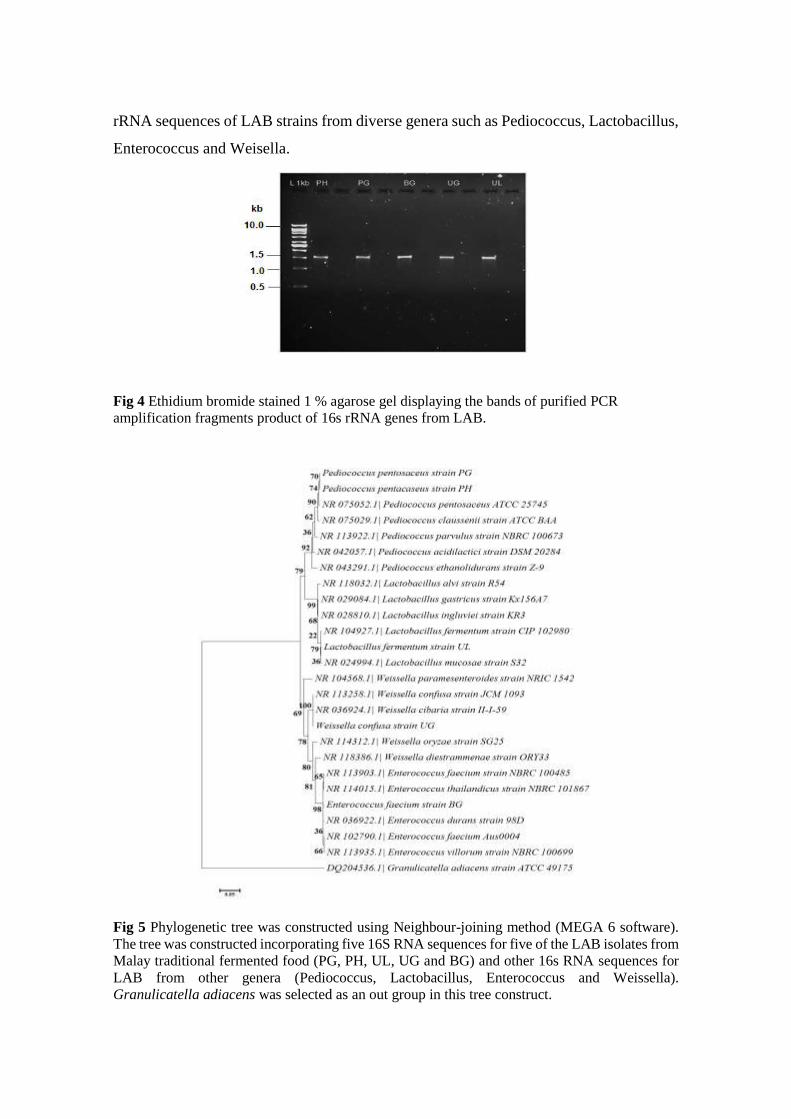
rRNA sequences of LAB strains from diverse genera such as Pediococcus, Lactobacillus,
Enterococcus and Weisella.
Fig 4 Ethidium bromide stained 1 % agarose gel displaying the bands of purified PCR
amplification fragments product of 16s rRNA genes from LAB.
Fig 5 Phylogenetic tree was constructed using Neighbour-joining method (MEGA 6 software).
The tree was constructed incorporating five 16S RNA sequences for five of the LAB isolates from
Malay traditional fermented food (PG, PH, UL, UG and BG) and other 16s RNA sequences for
LAB from other genera (Pediococcus, Lactobacillus, Enterococcus and Weissella).
Granulicatella adiacens was selected as an out group in this tree construct.
All of the 5 isolates belonged common LAB isolated from various fermented foods
throughout the world. For instance, Pediococcus pentosaceus were isolated from Kimchi
(Korean fermented vegetable) [21], Korean sea food [22] and several Indonesian [23]
and Tanzanian [24] fermented food. The isolation of Lactobacillus fermentum were
common from fermented food product in many countries such as China [25, 26]; Turkey
[27]; Tanzania [24] and Iran [28]. Diversity of LAB is notable as some of the strains could
belong to opportunistic pathogen of which these were still being debated for being
considered as probiotic. These include Weissella confusa [29] and nosocomial pathogen
Enterococcus faecium [30]. Weisella confusa can be isolated from Indian fermented food
[31]; Tanzanian [24] and Kimchi (Korea) [32]. Meanwhile, Enterococcus faecium are
ubiquitous organism which can be isolated from cheese [33]; and other food sources [34].
Conclusion
In this study, five lactic acid bacteria strains designated as isolates PG, PH, BG, UG and
UL have been successfully isolated from three types of traditional Malay food i.e., “tapai
pulut”, “tapai ubi” and “belacan”. The phenotypic identifications indicated that these
isolates showed typical properties of LAB with the abilities to antagonize selected
pathogens. Antimicrobial activities studies showed varying degree of inhibition against
pathogenic strains and most of these isolates showed broad spectrum inhibition. Based on
16S rRNA sequencing analysis, with more than 98% similarity; isolate PG was identified
as Pediococcus pentasaceus, isolate UG as Enterococcus faecium, isolate UL as
Weissella confusa and isolate BG as Lactobacillus fermentum. These isolates can be
potential starter culture for traditional food preparation. Inhibitory studies may indicate
that these isolates can be a potential sources for antibacterial agent such as bacteriocins
which has potential to be used as natural bio-preservatives and in preventing the growth
of spoilage pathogens in various food products.
Acknowledgements
The author wishes to thank to International Islamic University for facilities in completing this work.
Conflict of Inerest
The authors declare no conflict of interest.
Abbreviations
LAB: lactic acid bacteria, CFE: cell free extract, rRNA: ribosomal ribonucleic acid
References
1. Chilton, S.N., J.P. Burton, and G. Reid, Inclusion of fermented foods in food guides around the
world. Nutrients, 2015. 7(1): p. 390-404.
2. Tamang, J.P., et al., Fermented foods in a global age: East meets West. Comprehensive Reviews
in Food Science and Food Safety, 2020. 19(1): p. 184-217.
3. Anal, A.K., et al., Food safety risks in traditional fermented food from South-East Asia. Food
Control, 2020. 109: p. 106922.
4. Altieri, C., Ciuffreda, E., Di Maggio, B. and Sinigaglia, M., Lactic acid bacteria as starter cultures,
in Starter Cultures in Food Production. p. 1-15.
5. Perez, R.H., T. Zendo, and K. Sonomoto, Novel bacteriocins from lactic acid bacteria (LAB):
various structures and applications. Microbial Cell Factories, 2014. 13(1): p. S3.
6. Mohd Adnan, A.F. and I.K. Tan, Isolation of lactic acid bacteria from Malaysian foods and
assessment of the isolates for industrial potential. Bioresour Technol, 2007. 98(7): p. 1380-5.
7. Leisner, J.J., et al., Identification of Lactic Acid Bacteria from Chili Bo, a Malaysian Food
Ingredient. Applied and Environmental Microbiology, 1999. 65(2): p. 599-605.
8. Ng, S.Y., et al., Evaluation of probiotic potential of lactic acid bacteria isolated from traditional
Malaysian fermented Bambangan (Mangifera pajang). CyTA - Journal of Food, 2015. 13(4): p.
563-572.
9. Siti Nasiroh, I.a.N.S., Azmi and Makky, Essam A. (2018) I), 7-9 August 2018 ,. Antibiotic
susceptibility of Lactic Acid Bacteria (LAB) Isolated from Malaysian Fermented Foods. in
International Food Science and Agrotechnology Conference (IFoSAC 2018). 2018.
10. Agnes Lee Chiu Nee, et al., Lactic acid bacteria isolated from locally produced vinegars and their
antibacterial activity against foodborne bacteria. Universiti Malaysia Terengganu Journal of
Undergraduate Research 2019. 1(2): p. 1-7.
11. Hajar, S. and T.H.T.A. Hamid, Isolation of lactic acid bacteria strain Staphylococcus
piscifermentans from Malaysian traditional fermented shrimp cincaluk. International Food
Research Journal 2013. 20(1): p. 125-129.
12. Hudzicki, J. Kirby-Bauer Disk Diffusion Susceptibility Test Protocol. 2009. 1-23.
13. Schillinger, U. and W.H. Holzapfel, Antibacterial activity of carnobacteria. Food Microbiology,
1990. 7(4): p. 305-310.
14. Edwards, U., Rogall, T., Blocker, H., Emde, M. and Bottger, E.C., Isolation and direct complete
nucleotide determination of entire genes. Nucleic Acid Research 1989. 17: p. 7843-7853.
15. Bintsis, T., Lactic acid bacteria as starter cultures: An update in their metabolism and genetics.
AIMS microbiology, 2018. 4(4): p. 665-684.
16. Hertzberger, R., et al., H2O2 Production in Species of the Lactobacillus acidophilus Group: a
Central Role for a Novel NADH-Dependent Flavin Reductase. Applied and Environmental
Microbiology, 2014. 80(7): p. 2229-2239.
17. Uwizeyimana, J.D., et al., Determination of Colistin Resistance by Simple Disk Diffusion Test
Using Modified Mueller-Hinton Agar. alm, 2020. 40(4): p. 306-311.
18. Valgas, C., et al., Screening methods to determine antibacterial activity of natural products.
Brazilian Journal of Microbiology, 2007. 38: p. 369-380.
19. Yesim, E., S. Nur, and M. Mustafa, Antimicrobial Activity of Essential Oil Against Rhizobium
(Agrobacterium) vitis Using Agar Well and Disc Diffusion Method. Bacteriology Journal, 2018.
8: p. 1-11.
20. Nassar, M.S.M., W.A. Hazzah, and W.M.K. Bakr, Evaluation of antibiotic susceptibility test
results: how guilty a laboratory could be? Journal of the Egyptian Public Health Association, 2019.
94(1): p. 4.
21. Jang, S., et al., The Culture of Pediococcus pentosaceus T1 Inhibits Listeria Proliferation in
Salmon Fillets and Controls Maturation of Kimchi. Food Technol Biotechnol, 2015. 53(1): p. 29-
37.
22. Lee, K.W., et al., Probiotic properties of Pediococcus strains isolated from jeotgals, salted and
fermented Korean sea-food. Anaerobe, 2014. 28: p. 199-206.
23. Endang, S.R., Lactic Acid Bacteria in Fermented Foods of Indonesian Origin. Agritech, 2003.
23(2): p. 75-84
24. Mugula, J.K., et al., Microbiological and fermentation characteristics of togwa, a Tanzanian
fermented food. International Journal of Food Microbiology, 2003. 80(3): p. 187-199.
25. Nawaz, M., et al., Characterization and Transfer of Antibiotic Resistance in Lactic Acid Bacteria
from Fermented Food Products. Current Microbiology, 2011. 62(3): p. 1081-1089.
26. Bao, Y., et al., Screening of potential probiotic properties of Lactobacillus fermentum isolated
from traditional dairy products. Food Control, 2010. 21(5): p. 695-701.
27. Sengun, I.Y., et al., Identification of lactic acid bacteria isolated from Tarhana, a traditional
Turkish fermented food. International Journal of Food Microbiology, 2009. 135(2): p. 105-111.
28. Vasiee, A.R., et al., Isolation, identification and characterization of probiotic Lactobacilli spp.
from Tarkhineh. International Food Research Journal, 2014. 21(6): p. 2487-2492.
29. Fairfax, M.R., P.R. Lephart, and H. Salimnia, Weissella confusa: problems with identification of
an opportunistic pathogen that has been found in fermented foods and proposed as a probiotic.
Frontiers in Microbiology, 2014. 5(254).
30. Gao, W., B.P. Howden, and T.P. Stinear, Evolution of virulence in Enterococcus faecium, a
hospital-adapted opportunistic pathogen. Current Opinion in Microbiology, 2018. 41: p. 76-82.
31. Sharma, S., et al., Probiotic characterization and antioxidant properties of Weissella confusa
KR780676, isolated from an Indian fermented food. LWT, 2018. 97: p. 53-60.
32. Su-Bin Ahn, H.-E.P., Sang-Myeong Lee, So-Young Kim, Mi-Yae Shon, Wan-Kyu Lee. ,
Characteristics and immuno-modulatory effects of Weissella cibaria JW15 isolated from Kimchi,
Korea traditional fermented food, for probiotic use. Journal of Biomedical Research, 2013. 14(4):
p. 206-211.
33. Amaral, D.M.F., et al., Enterococcus faecium and Enterococcus durans isolated from cheese:
Survival in the presence of medications under simulated gastrointestinal conditions and adhesion
properties. Journal of Dairy Science, 2017. 100(2): p. 933-949.
34. Ben Braïek, O. and S. Smaoui, Enterococci: Between Emerging Pathogens and Potential
Probiotics. BioMed Research International, 2019: p. 5938210.
Research article
Tomic, N., et al., Delphinidin, Luteolin and Halogenated Boroxine Modulate CAT Gene Expression in
Cultured Lymphocytes. International Journal of Life Sciences and Biotechnology, 2021.
DOI: 10.38001/ijlsb.789990
Delphinidin, Luteolin and Halogenated Boroxine Modulate CAT
Gene Expression in Cultured Lymphocytes
Nikolina Tomic 1 , Maida Hadzic 1 , Naida Lojo-Kadric1* , Jasmin Ramic1 ,
Lejla Pojskic1
ABSTRACT
Luteolin and delphinidin are the flavonoids with known protective roles. They inhibit
genotoxic effects induced by halogenated boroxine (HB) in vitro. Statistically significant
decrease in the number of micronuclei and nuclear buds and decrease in proportion of
abnormal cells were observed before, but mechanism of their anti-genotoxic activity is still
not clear. In our experiment we aimed to quantify HB effects on the relative expression of
CAT (catalase) gene and explore antioxidative effects of luteolin and delphinidin via
restoration of CAT gene activity. Cell cultures from peripheral blood lymphocytes of five
healthy donors were established and treated with single and combined treatments of HB with
luteolin or delphinidin. Total RNA was isolated from harvested cells and reverse-transcribed.
SYBR based Real-Time PCR amplification method was used. Relative gene expression
measurements were done using normalization of ratio of target (CAT) and housekeeping
(GAPDH) genes. Intergroup variance analysis was done with REST® software. Luteolin itself
lead to downregulation of relative CAT gene expression as well as HB. But simultaneous
treatment of HB and bioflavonoids lead to upregulation. Delphinidin as indenpendent
treatment and as simultaneous treatment caused upregulation of relative CAT gene expression.
Obtained results may suggest protective role of delphinidin and luteolin to oxidative-stress
damage caused by HB, and also that new approaches to the treatment applications of HB
should include bioflavonoids and monitoring corresponding antioxidant system. Our findings
indicate that there is a quantifiable effect of luteolin and delphinidine on antioxidant genes
which could be used in exact monitoring of oxidative stress related events.
Introduction
Oxidative stress presents the imbalance in cellular oxidation-reduction (redox) reactions in
favor of the oxidation, leading to oxidative damage [1]. Oxidative-stress damage may
influence the structure and function of numerous biomolecules (nucleic acids, proteins,
carbohydrates, polyunsaturated lipids), which results in changes in the structure and
1 University of Sarajevo, Institute for Genetic Engineering and Biotechnology, Zmaja od Bosne 8 (Kampus),
Sarajevo, Bosnia and Herzegovina
*Corresponding Author: Naida Lojo-Kadric, E-mail: [email protected]
ARTICLE HISTORY
Received
3 September 2020
Accepted
18 October 2020
KEYWORDS
bioflavonoids,
dipotassium-
trioxohydroxytetra
fluorotriborate,
catalase,
antioxidants
function of cells, tissues and organs [2]. The resulting damage may disturb ion homeostasis,
signal transduction in cells, gene transcription, and thus lead to other disorders. Oxidative
stress has a significant role in the etiopathogenesis of cardiovascular and infectious
disorders, cancer, fibrosis and the aging process [3].
Antioxidant enzymes fulfill the major role in antioxidant defense [1]. Catalase has a key
antioxidant enzymatic role in the bodies defense against oxidative stress. It catalyses
degradation of the reactive oxygen species (ROS) hydrogen peroxide to water and oxygen
and thereby protects cells against ROS toxic effects [4]. Catalase is encoded by the CAT
gene. It is reported that various polymorphisms in this gene cause decrease in catalase
activity and confer to various diseases [4]. The levels of catalase are strongly affected by
CAT gene expression modulation [4].
Bioflavonoids present natural, polyphenolic compounds with numerous protective
antioxidant, antimutagenic and anticarcinogenic properties in human cells. These properties
of selected bioflavonoids (delphinidin and luteolin) have been addressed in several studies
before. Luteolin showed antiproliferative and anticarcinogenic activity against various
cancers [5-7]. It has also increased level of other antioxidative enzymes i.e. glutathione-S-
transferase, glutathione reductase or superoxide dismutase [8]. Delphinidin prevented
muscle atrophy and upregulated miR-23a expression, inhibited tumor transformation of
mouse skin JB6 P+ cells and also showed cytotoxic effects in human osteosarcoma cells
and protective effects against ROS-induced injuries in epithelial cells of human retina [9-
12].
Halogenated boroxine (HB; dipotassium-trioxohydroxytetrafluorotriborate) is a compound
with suggested activity in treatment of benign and malignant skin changes [13]. It has been
shown to have suppressive role in division of various cell types both in vitro and in vivo,
and at higher concentrations exhibit proven genotoxic effects [14-15]. It’s suggested that it
might act as a pro-oxidant at higher concentrations [16]. It’s observed that it can also inhibit
activity of catalase [17].
In treatment of HB in combination with bioflavonoids (delphinidin and luteolin), its
genotoxic effects were significantly decreased. In the presence of the HB, luteolin showed
more potent to decrease the number of micronuclei and nuclear buds. In similar setting
delphinidin suppressed the occurrence of aberrant cells [18]. It was also observed that the
expression of hTERT gene was upregulated in samples treated in combine with HB and
selected bioflavonoids (luteolin and delphinidin) [19]. Still the mechanism of their anti-
genotoxic activity is not clear. Since HB is recognized as inhibitor of catalase activity as a
major antioxidant enzyme, we designed experiment to assess antioxidative effects of
luteolin and delphinidin on level of relative expression of CAT (catalase) gene.
Materials and Methods
Sample collection, cell cultures and treatments
Five healthy female volunteers donated blood samples. They were informed about the study
details and they signed informed consent forms. Total volume of 400 μL heparinized (BD
Vacutainer Systems, Plymouth, UK) peripheral blood was mixed with 5 mL of the PB-
MAX karyotyping medium (GIBCO Invitrogen) and cultured for 72 h at 37 °C. Each
culture was treated with luteolin, delphinidin and halogenated boroxine—K2(B3O3F4OH)
(HB) individually, and with two substances simultaneously. So, six different treatments
were conducted for each blood sample.
Treatments preparation
HB, a white powder soluble in water, dimethyl sulfoxide (DMSO) and ethanol, was
synthesized according to modified protocol which was described by Ryss and Slutskaya
[20]. In our experiment HB was dissolved in the PB-MAX karyotyping medium (GIBCO-
Invitrogen, Carlsbad, CA, USA) at a definitive concentration of 0.1 mg/mL (397.4 μM), for
which has been shown to exhibit genotoxic potential. Bioflavonoids delphinidin, -
delphinidin chloride (96.70%; HPLC) and luteolin (98.34%; HPLC) (Phyto-Lab GmbH &
Co. KG, Germany) were also dissolved in DMSO (Panreac Quimica, Barcelona, Spain).
Their final concentration added in cultures was 50 μM.
RNA isolation and reverse transcription
After the cultivation, Quick-RNATM Mini Prep Plus kit (Zymo Research) was used for
isolation of total RNA from harvested cell cultures. Isolated RNA was quantified on Qubit
2.0. Fluorometer (Invitrogen, Life Technologies), using a high-sensitivity RNA assay kit
and then reverse transcription of total RNA (10 ng) was done using Proto Script First-
Strand cDNA Synthesis kit (New England BioLabs).
Relative gene expression analysis
SYBR based Real-Time PCR amplification method was used to analyze relative gene
expression level in treated cultures. Realtime PCR was conducted in the 7300 Real-time
PCR System (Applied Biosystems) and power SYBR Green Master Mix (Applied
Biosystems,USA) was used according to the manufacturer’s instructions. The following
cycling conditions were set: 50 °C for 2 min, 95 °C for 10 min, and then 40 cycles of 95 °C
for 15 s and 60 °C for 1 min following standard program for dissociation curve. For the
amplification of CAT target and GAPDH housekeeping gene highly purified primers
obtained from BioTeZ Berlin-Buch GmbH (Germany) were used (Table 1.).
Relative Expression Software Tool (REST®) was used for the analysis of results -
normalization of ratio of target (CAT) and housekeeping (GADPH) gene and statistical
analysis (Pair Wise Fixed Reallocation Randomisation Test©) were done. Based on
calculated relative expression ratio REST© gives us regulation factor. For up-regulation, the
regulation factor is equal to the value of expression ratio and for down-regulation, the
regulation factor is presented as a reciprocal value [21].
Table 1 Primers used for amplification of target and housekeeping gene in Real Time PCR
Gene Forward Reverse
GAPDH TGAAGGTCGGAGTCAACGGA CATCGCCCCACTTGATTTTGG
CAT GAACTGTCCCTACCGTGCTC GAATCTCCGCACTTCTCCAG
Result and Discussion
In luteolin-treated cultures CAT gene expression was down regulated when compared
against control and HB-treated cultures, although not statistically significant. In all other
cultures, when they were compared against culture treated with luteolin individually, CAT
gene expression was statistically significant up regulated. It was observed that CAT
expression was significantly upregulated in delphinidin-treated cultures and cultures treated
simultaneously with HB and bioflavonoid (HB+delphinidin and HB+luteolin) when
compared to cultures treated with HB only. In combined treatments of HB and antioxidants,
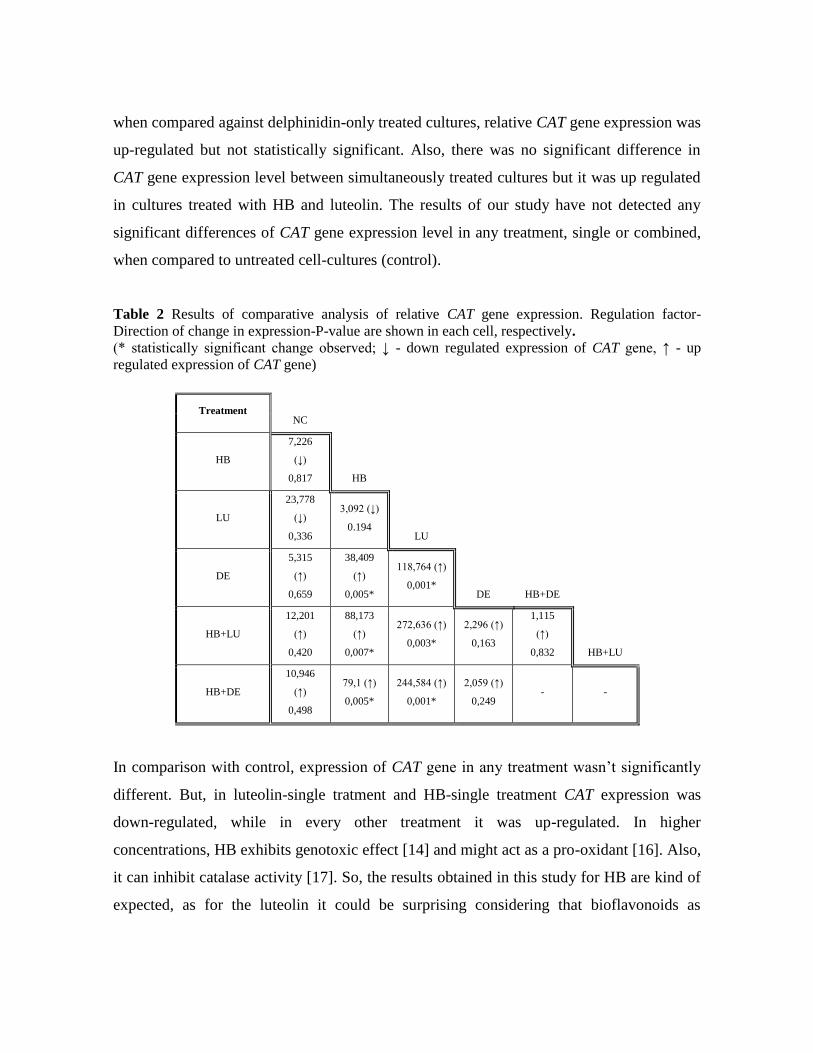
when compared against delphinidin-only treated cultures, relative CAT gene expression was
up-regulated but not statistically significant. Also, there was no significant difference in
CAT gene expression level between simultaneously treated cultures but it was up regulated
in cultures treated with HB and luteolin. The results of our study have not detected any
significant differences of CAT gene expression level in any treatment, single or combined,
when compared to untreated cell-cultures (control).
Table 2 Results of comparative analysis of relative CAT gene expression. Regulation factor-
Direction of change in expression-P-value are shown in each cell, respectively.
(* statistically significant change observed; ↓ - down regulated expression of CAT gene, ↑ - up
regulated expression of CAT gene)
Treatment
NC
HB
7,226
(↓)
0,817 HB
LU
23,778
(↓)
0,336
3,092 (↓)
0.194 LU
DE
5,315
(↑)
0,659
38,409
(↑)
0,005*
118,764 (↑)
0,001* DE HB+DE
HB+LU
12,201
(↑)
0,420
88,173
(↑)
0,007*
272,636 (↑)
0,003*
2,296 (↑)
0,163
1,115
(↑)
0,832 HB+LU
HB+DE
10,946
(↑)
0,498
79,1 (↑)
0,005*
244,584 (↑)
0,001*
2,059 (↑)
0,249 - -
In comparison with control, expression of CAT gene in any treatment wasn’t significantly
different. But, in luteolin-single tratment and HB-single treatment CAT expression was
down-regulated, while in every other treatment it was up-regulated. In higher
concentrations, HB exhibits genotoxic effect [14] and might act as a pro-oxidant [16]. Also,
it can inhibit catalase activity [17]. So, the results obtained in this study for HB are kind of
expected, as for the luteolin it could be surprising considering that bioflavonoids as
antioxidants are directly engaged in the suppression of damage of genetic structures [22]
and that antigenotoxic activity of selected bioflavonoids in vitro has been confirmed [18].
However, luteolin also showed genotoxic effects and inhibited proliferation of human
lymphocyte culture [23]. Furthermore, in the previous study of Hadzic et al. [19] in
combined treatment of HB and luteolin, when compared to treatment with luteolin only,
hTERT gene was significantly upregulated. This is in a way in correlation with our results
as when we compared individual luteolin treatment and simultaneous HB and luteolin
treatment, in cultures treated with simultaneous treatment CAT gene expression was
significantly up regulated and by highest observed factor in the study.
In almost every culture treated with delphinidin, simultaneously or individually, CAT gene
expression was up regulated, except when compared against culture treated with HB and
luteolin simultaneously. It is familiar from previous studies that delphinidin reduces the
proportion of micronuclei in vivo [24], has cytostatic [25] and concentration-dependent
cytotoxic effects [11]. Concerning its genotoxic effects, in some studies it showed neither
aneugenic nor clastogenic activity [23], while in others it showed significant inhibitory
potential to the frequencies of total defect cells in the presence of genotoxins, but also
induced them in individual treatments with delphinidin [26]. In this study, delphinidin did
not cause down regulation of expression of CAT, as was the case with luteolin.
Nevertheless, the upregulation in cultures treated with simultaneous treatment of HB and
delphinidin compared to those treated with delphinidin respectively as well as higher
regulation factors associated with simultaneous treatment than those associated with
individual treatment, may indicate that this antioxidant also shows stronger antioxidant
activity in the presence of prooxidants.
Non-concordant results from our study concerning luteolin effects could be explained by
the fact that in numerous studies it has been shown that some well-known antioxidants such
as vitamin C, flavonoid myricetin, hormone melatonin and various carotenoids can exhibit
bimodal effects, both antioxidant and prooxidant, depending on the conditions [27-30].
Hence, though delphinidin and luteolin in combined treatment with HB have showed
positive effect on CAT gene expression, there is a need for additional studies to better
understand the precise role of these flavonoids and to elucidate whether they could be
double-edge sword in certain conditions.
Conclusion
Obtained results may indicate protective role of delphinidin and luteolin in combined
treatment with HB, and also that potential treatment use of HB should include
bioflavonoids and monitoring corresponding antioxidant system. Still, for more precise
determination of luteolin and delphinidin antioxidative effects in combined treatments,
more treatments and effector genes should be explored.
Acknowledgments
This research was partly supported by the Ministry of Education and Science of the Federation of Bosnia and
Herzegovina [grant number 05-39-5613-1-2/11].
References
1. Sies, H., Oxidative stress: a concept in redox biology and medicine. Redox biology, 2015. 4: p. 180–
183.
2. Pisoschi, AM. and A. Pop, The role of antioxidants in the chemistry of oxidative stress: A review.
European Journal of Medicinal Chemistry, 2015. 97: p. 55–74.
3. Ghezzi, P., et al., The oxidative stress theory of disease: levels of evidence and epistemological
aspects. British Journal of Pharmacology, 2017. 174: p. 1784–1796.
4. Kodydková, J., et al., Human Catalase, Its Polymorphisms, Regulation and Changes of Its Activity in
Different Diseases. Folia Biologica, 2014. 60: p. 153-167.
5. Gao, G., et al., Luteolin exhibits anti-breast cancer property through up-regulating miR-203.
Artificial Cells, Nanomedicine, and Biotechnology, 2019. 47 (1): p. 3265-3271.
6. Imran, M., et al., Luteolin, a flavonoid, as an anticancer agent: A review. Biomedicine &
Pharmacotherapy, 2019. 112: 108612.
7. Seelinger, G., et al., Anti-carcinogenic Effects of the Flavonoid Luteolin. Molecules, 2008. 13: p.
2628-2651.
8. Lin, Y., et al., Luteolin, a flavonoid with potentials for cancer prevention and therapy. Current
Cancer Drug Targets, 2008. 8 (7): p. 634–646.
9. Murata, M., et al., Delphinidin Prevents Muscle Atrophy and Upregulates miR-23a Expression.
Journal of Agricultural and Food Chemistry, 2017. 65 (1): p. 45-50.
10. Kuo, H.D., et alAnthocyanin Delphinidin Prevents Neoplastic Transformation of Mouse Skin JB6 P+
Cells: Epigenetic Re-activation of Nrf2-ARE Pathway. The AAPS Journal, 2019. 21 (5): p. 83.
11. Lee, D.Y., et al., Cytotoxic effects of delphinidin in human osteosarcoma cells. Acta Orthopaedica et
Traumatologica Turcica, 2018. 52 (1): p. 58–64.
12. Ni, T., W. Yang, and Y. Xing, Protective effects of delphinidin against H2O2 induced oxidative
injuries in human retinal pigment epithelial cells. Bioscience Reports, 2019. BSR20190689.
13. Galic, B., Removal of skin changes. European patent EP1996514, 2013.
14. Haverić, S., et al., Effects of dipotassium trioxohydroxytetrafluorotriborate (K2[B3O3F4OH]) on
genetic material and inhibition of cell division in human cell cultures. Drug and Chemical
Toxicology, 2011. 34 (3): p. 250-254.
15. Haveric, S., et al., Genotoxicity evaluation of dipotassium-trioxohydroxytetrafluorotriborate,
K2(B3O3F4OH), in human lymphocyte cultures and mice reticulocytes. Brazilian Archives of Biology
and Technology, 2016. 59: e16160195.
16. Marasović, M., et al., Quantum Chemical and Biochemical Study on Antioxidant Properties of
Halogenated Boroxine K2[B3O3F4OH]. Croatica chemica acta, 2017. 90 (2): p. 155–161.
17. Islamovic, S., B. Galic, and M. Milos, A study of the inhibition of catalase by dipotassium-
trioxohydroxytetrafluorotriborat K2[B3O3F4OH]. Journal of Enzyme Inhibition and Medicinal
Chemistry, 2014. 29 (5): p. 744–748.
18. Hadzic, M., et al., Inhibitory effects of delphinidin and luteolin on genotoxicity induced by
K2(B3O3F4OH) in human lymphocytes in vitro. Biologia, 2015. 70: p. 553–8.
19. Hadzic, M., et al., Bioflavonoids protect cells against halogenated boroxine-induced genotoxic
damage by upregulation of hTERT expression. Zeitschrift fur Naturforschung. C, Journal of
biosciences, .2018. 74 (5-6): p. 125-129.
20. Ryss, I.G., and M.M. Slutskaya, Report on the Platinum Sector. Akademia Nauka SSSR, 1951. 26:
p. 216.
21. Pfaffl, M.W., G.W. Horgan, and L. Dempfle, Relative expression software tool (REST) for group-
wise comparison and statistical analysis of relative expression results in real-time PCR. Nucleic
Acids Research, 2002. 30 (9): e36.
22. Luca, V.S., A. Miron, and A.C. Aprotosoaie, The antigenotoxic potential of dietary flavonoids.
Phytochemistry Reviews, 2016. 15 (4): p. 591-625.
23. Ezić, J., et al., Analysis of delphinidin and luteolin genotoxicity in human lymphocyte culture.
Journal of Health Sciences, 2015. 5 (2): p. 41-45.
24. Azevedo, L., et al., Differential response related to genotoxicity between eggplant (Solanum
melanogena) skin aqueous extract and its main purified anthocyanin (delphinidin) in vivo. Food and
Chemical Toxicology, 2007. 45: p. 5852-5858.
25. Lazzé, M.C., et al., Anthocyanins induce cell cycle perturbations and apoptosis in different human
cell lines. Carcinogenesis, 2004. 25: p. 81427-81433.
26. Hadžić, M., Analysis of potential of bioflavonoids (luteolin and delphinidin) in inhibition of
genotoxic and cytotoxic effects of halogenated boroxine in vitro. MSc Thesis, University of
Sarajevo, 2013.
27. Chakraborthy, A., et al., Antioxidant and pro-oxidant activity of Vitamin C in oral environment.
Indian Journal of Dental Research, 2014. 25 (4): p. 499.
28. Chobot, V., and F. Hadacek, Exploration of pro-oxidant and antioxidant activities of the flavonoid
myricetin. Redox report Communications in free radical research, 2011. 16 (6): p. 242–247.
29. Wang, J., et al., Antioxidant and Pro-Oxidant Activities of Melatonin in the Presence of Copper and
Polyphenols In Vitro and In Vivo. Cells, 2019. 8 (8): p. 903.
30. Ribeiro, D., et al., Antioxidant and pro-oxidant activities of carotenoids and their oxidation products.
Food and Chemical Toxicology, 2018. 120: p. 681-699.
Research article
Al-kaf. H.A., F. Huyop, and N.A. Zainol, Growth Analysis of Lactobacillus Acidophilus Using Different
Non-Digestible Carbohydrates. International Journal of Life Sciences and Biotechnology, 2021. 4(1)
DOI: 10.38001/ijlsb.796319
Growth Analysis of Lactobacillus Acidophilus Using Different
Non-Digestible Carbohydrates
Haia Abobakr Al-kaf 1* Fahrul Huyop1 Noor Azwani Zainol1
ABSTRACT
Probiotics are live microorganisms and offer health benefits to the digestive system
and used in the production of many fermented foods. Non-digestible carbohydrates are
dietary fibers which cannot be digested and absorbed by the small intestine. Strains of
Lactobacillus, are among the most common and popular group of probiotics and added
to many dairy products and dietary supplements. Besides, Lactobacillus acidophilus
can exhibit many useful benefits such as showing thermostability, maintaining the
growth activity at a wide pH range, and offering strong inhibition actions against
spoilage of food and pathogenic bacteria. Aims of this study are to analyse the ability
of non-digestible carbohydrates to act as a carbon source in enhancing the growth
activity of L. acidophilus in vitro and to determine which type of non-digestible
carbohydrate sources contributed a high biomass production. L. acidophilus was
grown on de Man, Rogosa and Sharpe (MRS) medium. The optical density and pH of
the cell biomass produced were measured and cell dry weight was determined. The
highest biomass production recorded was for barley 10.02 g. L-1 followed by yam 8.79
g. L-1, 7.17 g. L-1 for garlic, 6.81 g. L-1 for banana and 4.86 g. L-1 for sweet potato,
while positive control (glucose) recorded 4.20 g. L-1 of cell biomass. The results also
showed a decreasing in the pH values which indicated the formation of lactic acids in
the medium after 24 h of incubation at 37°C on rotary shaker set at 200 rpm. The
overall results, confirmed that L. acidophilus helps in the hydrolysis of non-digestible
carbohydrates and subsequent conversion of the sugars to cell biomass and decrease
the pH compared to the negative control (without carbon source). This shows that in
future, production of a synbiotic products using these non-digestible carbohydrates
and probiotics strains is promising to offer many benefits to human’s health.
Introduction
Probiotics are live microorganisms that play an important role in the digestive system by
keeping the gut healthy and balancing the beneficial microflora in the gut [1]. The use of
probiotics in the last two decades has been increased significantly due to their ability in
conferring many health benefits to human’s digestive system such as protecting the host
from different harmful microorganisms, and making the immune system stronger. In
1 Department of Biosciences, Faculty of Science, Universiti Teknologi Malaysia,81310 Johor Bahru,
Malaysia
* Correspondence: [email protected]/ [email protected]
ARTICLE HISTORY
Received
17 September 2020
Accepted
25 October 2020
KEYWORDS
Probiotics,
Lactobacillus acidophilus,
non-digestible
carbohydrates,
Rogosa and Sharpe (MRS),
cell biomass
addition, probiotics are known for their ability in improving feed digestibility and
decreasing the metabolic disorders [2]. Non-digestible carbohydrates are dietary fibres
(prebiotics) and cannot be digested and absorbed by the small intestine. Prebiotic is
defined as non-digestible food which helps in improving and balancing the growth of the
beneficial microflora in the digestive system. Plants are considered the common source of
these non-digestible carbohydrates and contain a mixture of polysaccharides which are
the integral components in the cell wall of the plants [3]. Gut microbiota offer many
positive effects to the function, metabolism and integrity of the intestine. Gut microbiota
can also fight many pathogens by the induction of immunomodulatory molecules which
have antagonistic properties and can be gained from the production of lactic acid bacteria
for instance Bifidobacterium and Lactobacillus genera [3]. Choosing substrate
specificities for probiotics is important for the optimization of the density of probiotics in
the intestine. The increase of probiotics population is influenced by the composition of
the monosaccharide of the non-digestible carbohydrates, the glycosidic linkage between
the monosaccharide residues, and the degree of polymerization [4]. Many researchers
proved the ability of prebiotics (non-digestible carbohydrates) in inhibiting the
attachment of pathogens to epithelial cells and it is depending on the secretion of the
peptides which are responsible in enhancing the absorption of minerals, stimulating the
appetite, and preventing from diseases [3]. The term “synbiotic” was introduced by
Gibson and Roberfroid (1995) which referred to a combination of both probiotics and
prebiotics [5]. Consuming synbiotic can stimulate and activate the metabolism of a
physiological intestinal microbiota [6]. Thus, using synbiotic can help in overcoming
problems related to the survival of probiotics in the gastrointestinal tract. The
combination of both probiotics and prebiotics as a single product can lead to great
influence compared of using probiotic or prebiotic alone [7]. Thus, current studies are
focusing on studying and selecting carbohydrates components which can be utilized by
probiotic strains in high levels to produce synbiotic products to enhance the growth of
beneficial bacteria in the gastrointestinal tract. Recently, many people prefer a good
quality in purchasing food products and they search for specific features such as longer
shelf-life products that had been produced using natural fermentation process. The
process of natural food fermentation is carried out by using fermenting microbial
communities such as lactic acid bacteria (LAB) as an energy source to enhance the
quality of the product [8]. LAB are among the most common and significant groups of
probiotic used in food processing industries, particularly in dairy products. These
microorganisms can boost the digestion of lactose and stimulate the immune system, and
prevent from diarrhea [9]. Functional food ingredients offer many beneficial effects for
humans and these benefits are gained from the bioactive components present in the
products. These ingredients in functional food are probiotics, prebiotics, soluble fibers,
and others. Nowadays, the demand for fermented probiotic foods is increasing
significantly and > 500 of the probiotic products have been introduced in the world, since
probiotic products offer many benefits to humans, therefore the most common way to
consume probiotics is mostly through the intake of food products and some fermented
products may not last longer than a month and the cells may die or not be active for a
period of time [10]. Thus, it is important to maintain probiotics strains live longer and
also indicates the importance of dietary fibers to be used as substrates for sustaining the
growth and increasing the shelf-life of probiotic strains along with the processing and
storage conditions [11]. Therefore, the aims of this study were, to prepare raw non-
digestible carbohydrates and seeding with L. acidophilus in the prepared MRS media.
The growth of the bacteria was analysed by measuring cell dry weight of L. acidophilus
over specific time frame with pH.
Material and Methods
Preparation of non-digestible carbohydrates samples
Selected sources of non-digestible carbohydrates samples have been used in this study
namely, sweet potato, yam, garlic, barley and banana. Garlic and barley are commercially
available. For the preparation of sweet potato, yam and banana samples, 500 g of each
was obtained as a raw material from a local market. The samples were washed, peeled
and sliced thinly. Then, both sweet potato and yam samples were placed on a
dehydrator’s tray and dried at 68C for 24 h. For banana sample the drying process was
carried out at 45C for 72 h. After the drying process, all the samples were ground into a
fine powder. On the other hand, 100 g of fine powder of barley and garlic samples were
obtained from commercially available product in the supermarket.
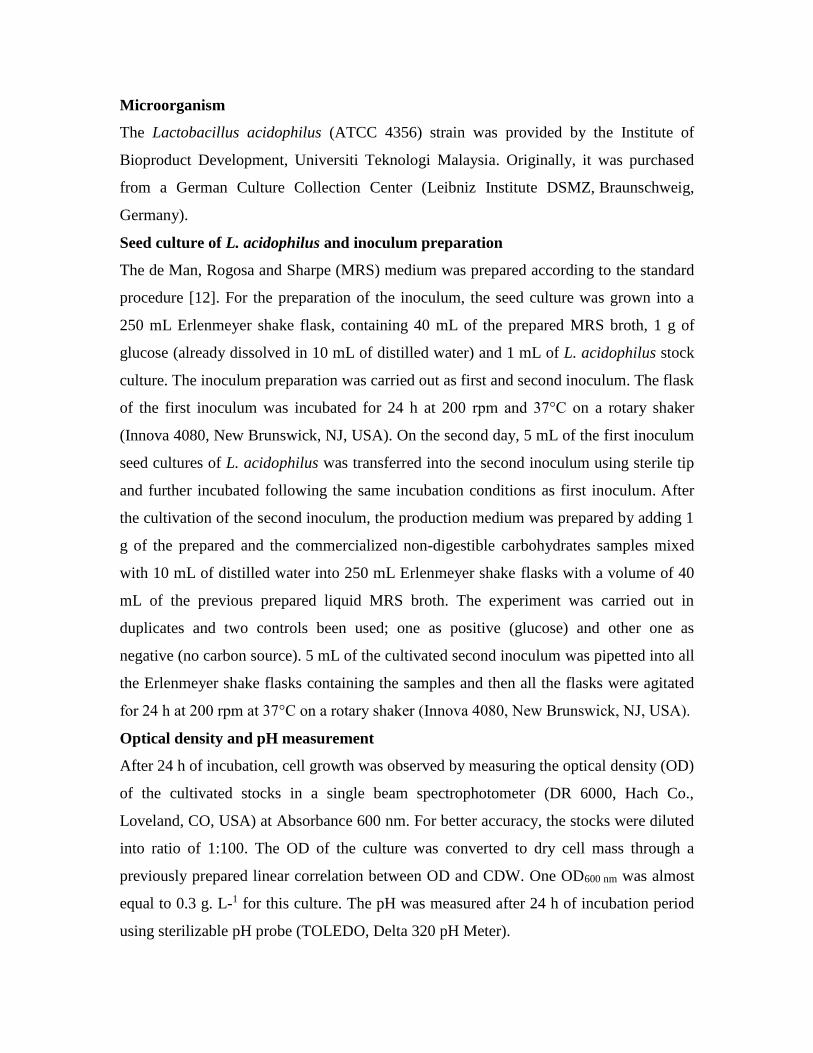
Microorganism
The Lactobacillus acidophilus (ATCC 4356) strain was provided by the Institute of
Bioproduct Development, Universiti Teknologi Malaysia. Originally, it was purchased
from a German Culture Collection Center (Leibniz Institute DSMZ, Braunschweig,
Germany).
Seed culture of L. acidophilus and inoculum preparation
The de Man, Rogosa and Sharpe (MRS) medium was prepared according to the standard
procedure [12]. For the preparation of the inoculum, the seed culture was grown into a
250 mL Erlenmeyer shake flask, containing 40 mL of the prepared MRS broth, 1 g of
glucose (already dissolved in 10 mL of distilled water) and 1 mL of L. acidophilus stock
culture. The inoculum preparation was carried out as first and second inoculum. The flask
of the first inoculum was incubated for 24 h at 200 rpm and 37°C on a rotary shaker
(Innova 4080, New Brunswick, NJ, USA). On the second day, 5 mL of the first inoculum
seed cultures of L. acidophilus was transferred into the second inoculum using sterile tip
and further incubated following the same incubation conditions as first inoculum. After
the cultivation of the second inoculum, the production medium was prepared by adding 1
g of the prepared and the commercialized non-digestible carbohydrates samples mixed
with 10 mL of distilled water into 250 mL Erlenmeyer shake flasks with a volume of 40
mL of the previous prepared liquid MRS broth. The experiment was carried out in
duplicates and two controls been used; one as positive (glucose) and other one as
negative (no carbon source). 5 mL of the cultivated second inoculum was pipetted into all
the Erlenmeyer shake flasks containing the samples and then all the flasks were agitated
for 24 h at 200 rpm at 37°C on a rotary shaker (Innova 4080, New Brunswick, NJ, USA).
Optical density and pH measurement
After 24 h of incubation, cell growth was observed by measuring the optical density (OD)
of the cultivated stocks in a single beam spectrophotometer (DR 6000, Hach Co.,
Loveland, CO, USA) at Absorbance 600 nm. For better accuracy, the stocks were diluted
into ratio of 1:100. The OD of the culture was converted to dry cell mass through a
previously prepared linear correlation between OD and CDW. One OD600 nm was almost
equal to 0.3 g. L-1 for this culture. The pH was measured after 24 h of incubation period
using sterilizable pH probe (TOLEDO, Delta 320 pH Meter).
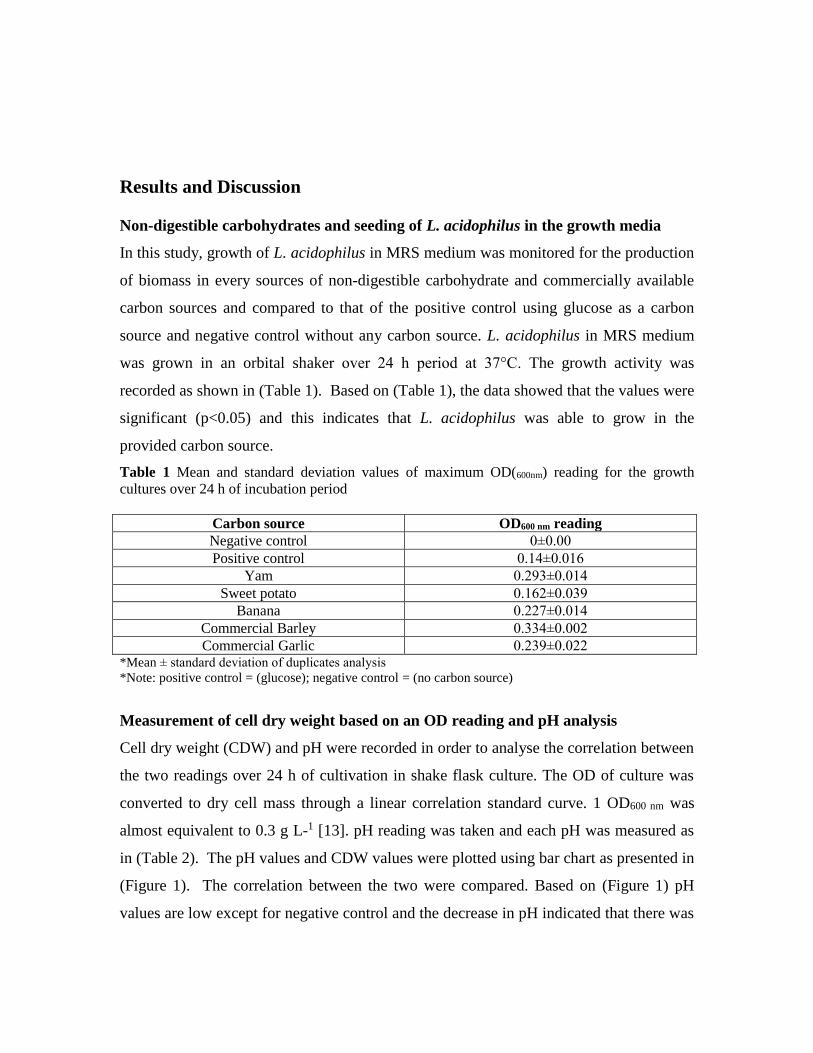
Results and Discussion
Non-digestible carbohydrates and seeding of L. acidophilus in the growth media
In this study, growth of L. acidophilus in MRS medium was monitored for the production
of biomass in every sources of non-digestible carbohydrate and commercially available
carbon sources and compared to that of the positive control using glucose as a carbon
source and negative control without any carbon source. L. acidophilus in MRS medium
was grown in an orbital shaker over 24 h period at 37°C. The growth activity was
recorded as shown in (Table 1). Based on (Table 1), the data showed that the values were
significant (p<0.05) and this indicates that L. acidophilus was able to grow in the
provided carbon source.
Table 1 Mean and standard deviation values of maximum OD(600nm) reading for the growth
cultures over 24 h of incubation period
Carbon source OD600 nm reading
Negative control 0±0.00
Positive control 0.14±0.016
Yam 0.293±0.014
Sweet potato 0.162±0.039
Banana 0.227±0.014
Commercial Barley 0.334±0.002
Commercial Garlic 0.239±0.022 *Mean ± standard deviation of duplicates analysis
*Note: positive control = (glucose); negative control = (no carbon source)
Measurement of cell dry weight based on an OD reading and pH analysis
Cell dry weight (CDW) and pH were recorded in order to analyse the correlation between
the two readings over 24 h of cultivation in shake flask culture. The OD of culture was
converted to dry cell mass through a linear correlation standard curve. 1 OD600 nm was
almost equivalent to 0.3 g L-1 [13]. pH reading was taken and each pH was measured as
in (Table 2). The pH values and CDW values were plotted using bar chart as presented in
(Figure 1). The correlation between the two were compared. Based on (Figure 1) pH
values are low except for negative control and the decrease in pH indicated that there was
a cell biomass accumulation and the provided carbon sources were fermented by L.
acidophilus effectively.
Table 2 Mean and standard deviation values of pH for the growth cultures over 24 h of
incubation
Carbon source pH
Negative control 8.5±0.098
Positive control 5.17±0.028
Yam 4.81±0.056
Commercial Garlic 4.86±0.021
Banana 4.97±0.014
Commercial Barley 4.22±0.021
Sweet potato 4.96±0.014 *Mean ± standard deviation of duplicates analysis
*Note: Positive control = (glucose); Negative control = (no carbon source)
Fig 1 pH and cell dry weight (CDW) of the cultivated samples over 24 h of incubation period
From (Figure 1), we can conclude that using commercial barley allowed the highest
production of the cell biomass recorded as 10.02 g L-1 and this is due to the structure of
barley since it is consisting of heterogeneous complex molecules and this leads in
improving the growth and the activity of Lactobacillus strains [14]. Moreover, [15],
stated the lactic acid bacteria can grow well in the presence of any cereal source
especially barley, and this makes it a good substrate. In addition, the increase of the cell
biomass could be due to the decrease in the content of starch during fermentation of
barley with Lactobacilli as it was previously reported [16]. The approximate amount of
starch content in barley is about 70%, this indicated that L. acidophilus had fermented the
starch efficiently during the 24 h of cultivation. Moreover, the biochemical characteristics
of β-1,3-1,4-glucanase; which is an endoglucanase enzyme and mainly found in
Lactobacillus species played a role as well in increasing the production of cell biomass
by hydrolyzing barley β-glucan compound completely [17]. According to one study [14] ,
β-glucans were reported to be fermented completely by the intestinal microbiota and were
able to enhance the growth rate and the production of lactic acid bacteria. Yam, produced
cell biomass of 8.79 g L1. The high cell biomass produced can be due to α-amylase by L.
acidophilus with yam. The production of α-amylase results in the breaking down of
starch into fermentable carbohydrates and yield lactic acid as a final product [18].
Furthermore, yam generally is consist of 60-80% starch content and 20-30% of amylose;
which makes it a good source for L. acidophilus to utilize it and used it as a carbon
source [19]. The high content of starch leads to the accumulation of lactic acid, which
had formed due to the use of α-amylase which degraded it effectively. According to the
analysis done by [20] it was reported that yam when it was applied in vivo to mice it had
inhibited the growth of pathogenic bacteria of Clostridium perfringens. The growth of
Lactobacillus has been observed and it was reported that addition of yam as prebiotic
source had increased and enhanced Lactobacillus in the gut of mice. Commercial garlic
recorded 7.17 g L1 of cell biomass. The increase of the produced cell biomass is could be
due to the fructan compound present in garlic which is an important storage carbohydrate
and it was recorded that the fructan amount in garlic is more than 75% [21].
Fructooligosaccharides, shown in (Figure 2) can be found in an amount of 10-16% in
garlic and it has a degree of polymerization from 3-50 which makes garlic a good source
of prebiotic and promotes the survival of L. acidophilus [22]. Thus, to influence and
enhance the growth of probiotics strains it is mainly depending on the length of degree
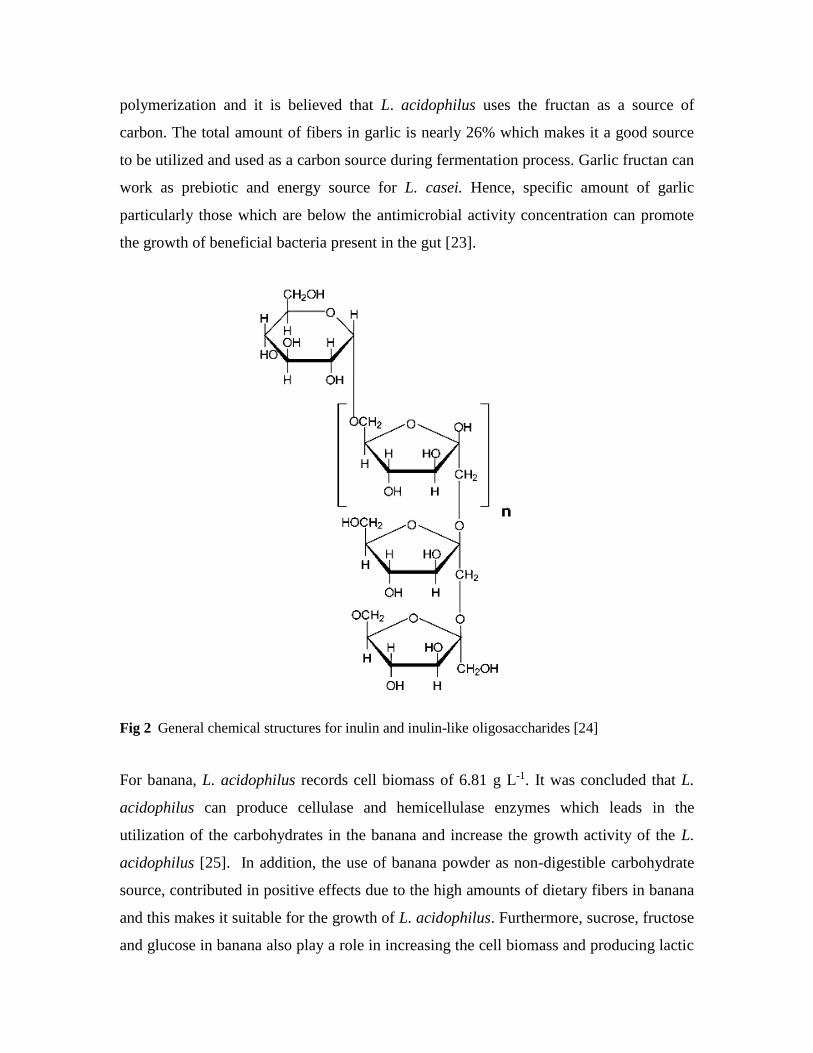
polymerization and it is believed that L. acidophilus uses the fructan as a source of
carbon. The total amount of fibers in garlic is nearly 26% which makes it a good source
to be utilized and used as a carbon source during fermentation process. Garlic fructan can
work as prebiotic and energy source for L. casei. Hence, specific amount of garlic
particularly those which are below the antimicrobial activity concentration can promote
the growth of beneficial bacteria present in the gut [23].
Fig 2 General chemical structures for inulin and inulin-like oligosaccharides [24]
For banana, L. acidophilus records cell biomass of 6.81 g L-1. It was concluded that L.
acidophilus can produce cellulase and hemicellulase enzymes which leads in the
utilization of the carbohydrates in the banana and increase the growth activity of the L.
acidophilus [25]. In addition, the use of banana powder as non-digestible carbohydrate
source, contributed in positive effects due to the high amounts of dietary fibers in banana
and this makes it suitable for the growth of L. acidophilus. Furthermore, sucrose, fructose
and glucose in banana also play a role in increasing the cell biomass and producing lactic
acid and pyruvic acids, the pathway used to produce these compounds is Embden-
Meyerhoff-Parnas, which used NADH as the co-factor and the enzyme lactate
dehydrogenase. The biomass produced for sweet potato sample was 4.86 g L-1 which is
somewhat low value compared to barley, yam and garlic. The utilization of sweet potato
as a carbon source by L. acidophilus is due to the capability of the strain in producing
exogenous enzymes such as amylase, protease, and lipase in order to degrade the
carbohydrates in the sweet potato such as sucrose, maltose, and glucose [26]. The
degradation of these carbohydrates resulted in the production of lactic acid and promote
the survival of L. acidophilus because of the nitrogen and carbon sources offered during
the fermentation of the carbohydrates. Moreover, based on the data, it was indicated that
the fermentation process was effective by the enzymes produced by L. acidophilus which
utilized the fibers or starch in sweet potato as an energy source. On the other hand, for the
positive control containing glucose, the biomass of cells produced was as low as 4.20 g L-
1 and pH 5.17. This was due to L. acidophilus fermented glucose and the value of cell
biomass decreased slightly due to the simple building blocks of glucose compound and
the number of the molecules 1-2 in glucose [27]. The overall results indicated that non-
digestible carbohydrates samples were utilized significantly and no growth of L.
acidophilus in medium without sugar (negative control) was recorded. CDW and pH
were correlated to each other. Low in pH value during growth was due to L. acidophilus
since it is a lactic acid bacteria and used the provided carbohydrate and transformed it
into the simplest form of glucose and then converted it back as lactic acid during the
fermentation. The decrease of pH values indicates the formation of titratable acidity in
the cultivated culture. Based on the results, the differences in the values of CDW for the
samples is mainly depending on the chemical composition and structure for each carbon
source used. According to Healthline American website
(https://www.healthline.com/about) barley is consisting of 73.5 g of carbohydrates;
mainly polysaccharides and 17.3 g of fibers. The different types of polysaccharides in
barley such as cellulose and β-glucans are playing a critical role in enhancing the
fermentation process and increasing the biomass production in L. acidophilus effectively
and this is linked to β and α -glycosidic bonds [28]. Moreover, the amount of
carbohydrates and fibers in yam are 37 g and 5 g respectively. Garlic contains 33 g of
carbohydrates and 3.1 g of fibers. While, banana contains 24 g of carbohydrates and 3.1 g
of fibers. Lastly, for sweet potato it contains 20 g of carbohydrates and 3 g of fibers. All
these different ranges of carbohydrates and fibers content in each sample indicated their
ability to be utilized by L. acidophilus and increase the biomass production after 24 h of
incubation and indicated the differences of the cell dry weight values and pH values.
Based on the results, we can conclude that barley is considering one of the important
source that can be used in future to produce fermented products and act as a natural
supplier or substrate for enhancing the growth of probiotics or can be used in the
production of synbiotics products because it helps in sustaining the growth and shelf-life
of probiotics strains and the beneficial bacteria in the gut if it is consumed regularly.
In the future, it is recommended to study the chemical composition, structures and
characteristics of non-digestible carbohydrates (barley, yam, garlic, banana and sweet
potato) to understand how L. acidophilus can utilize these non-digestible carbohydrates
effectively. This study focuses on using selected non-digestible carbohydrates in food
industries to act as a carbon source for probiotic strains to increase shelf-life and enhance
the growth activity. In addition, it will potentially help in producing symbiotic products
which consist of both probiotics and prebiotics and this will help in providing many
health benefits to the consumers and used as a treatment for any disorder in human
health.
Conclusion
Thus, combining non-digestible carbohydrates and L. acidophilus can gain great benefits
for human’s health because probiotics can survive the acidic gastric environment in the
gut, whereby non-digestible carbohydrates (barley) can enhance the growth activity and
produce high cell biomass. In future, production of synbiotic products using non-
digestible carbohydrates and L. acidophilus can help in sustaining the product’s quality
and increase the shelf-life.
Abbreviations
LAB: lactic acid bacteria; CDW: cell dry weight; OD: optical density; MRS: de Man, Rogosa and Sharpe;
dp: degree of polymerization; NADH: Nicotinamide adenine dinucleotide (NAD) + hydrogen (H); rpm:
Rotary per minute; nm: Nanometers; h: Hours.
Acknowledgements
We sincerely thankful for the lab staff of Biosciences Department, University Teknologi Malaysia and
Institute of Bioproduct Development (IBD), Johor Bahru.
Funding
We are grateful to the Fundamental Research Grant Scheme (FRGS) R.J130000.7854.5F189 (Ministry of
Higher Education Malaysia) and RUG-UTM-HR-Q.J130000.2414.08G59 for partial financial assistance.
References
1. Sharifi, M., et al., Kefir: a powerful probiotics with anticancer properties. Medical Oncology, 2017.
34 (11): p. 1-7.
2. Zielińska, D., D. Kolożyn-Krajewska, and M. Laranjo, Food-origin lactic acid bacteria may
exhibit probiotic properties: review. BioMed Research International, 2018. p. 1-15.
3. Davani-Davari, D., et al., Prebiotics: Definition, types, sources, mechanisms, and clinical
applications. Foods, 2019. 8 (3): p. 92.
4. Zartl, B., et al., Fermentation of non-digestible raffinose family oligosaccharides and
galactomannans by probiotics. Food & Function, 2018. 9 (3): p. 1638-1646.
5. Gibson, G. and M.B. Roberfroid, Dietary modulation of the human colonic microbiota:
introducing the concept of prebiotics. Journal of Nutrition, 1995. 125 (6): p. 1401–12.
6. Śliżewska, K. and A. Chlebicz-Wójcik, The in vitro analysis of prebiotics to be used as a
component of a synbiotic preparation. Nutrients, 2020. 12 (5): p. 1272.
7. Markowiak, P. and K. Ślizewska, Effects of probiotics, prebiotics, and synbiotics on human
health. Nutrients, 2017. 9 (9): p. 1021.
8. Srivastava, R.K, Enhanced shelf life with improved food quality from fermentation processes.
Journal of Food Technology and Preservation, 2018. 2 (3): p. 1–7.
9. Colombo, M., et al., Beneficial properties of lactic acid bacteria naturally occurring in dairy
production systems. BMC Microbiology, 2018. 18 (1): p. 1-12.
10. Dinkçi, N., V. Akdeniz, and A.S, Akalin, Survival of probiotics in functional foods during shelf
life. Food Quality and Shelf Life, 2019. p. 201-233.
11. Capozzi, V., et al., Stressors and Food Environment: Toward strategies to improve robustness and
stress tolerance in probiotics. Probiotics, Prebiotics, and Synbiotics: Bioactive Foods in Health
Promotion, 2016. p. 245-256.
12. Atlas, R.M., 2006, The Handbook of Microbiological Media for the Examination of Food. Boca
Raton, Fla, USA. p. 246.
13. Kepli, A. N., et al., Medium optimization using response surface methodology for high cell mass
production of Lactobacillus acidophilus. Journal of Scientific and Industrial Research, 2019. 78
(9): p. 608–14.
14. Arena, M., et al., Barley β-glucans-containing food enhances probiotic performances of beneficial
bacteria. International Journal of Molecular Sciences, 2014. 15 (2): p. 3025-3039.
15. Suman, D., Barley: A cereal with potential for development of functional fermented foods. Intl. J.
Ferment. Food, 2019. 8 (1): p. 1–13
16. Liptáková, D., Z. Matejčeková, and L. Valík, Lactic acid bacteria and fermentation of cereals and
pseudocereals. Fermentation Processes, 2017.
17. Lee, J.M., et al Improvement of thermostability and halostability of β-1,3-1,4-glucanase by
substituting hydrophobic residue for Lys48. International Journal of Biological Macromolecules,
2017. 94. p. 594-602.
18. Batista, N.N., et al., Fermentation of yam (Dioscorea spp. L.) by indigenous phytase-producing
lactic acid bacteria strains. Brazilian Journal of Microbiology, 2019. 50 (2): p. 507-514.
19. Li, T., et al., The beneficial effects of purple yam (: Dioscorea alata L.) resistant starch on
hyperlipidemia in high-fat-fed hamsters. Food & Function, 2019. 10 (5): p. 2642-2650.
20. Hsu, C.C., et al., Effect of yam (Dioscorea olata compared to Dioscorea japonica) on
gastrointestinal function and antioxidant activity in mice. Journal of Food Science, 2006. 71 (7): p.
S513-S516.
21. Zhang, N., et al., Study on prebiotic effectiveness of neutral garlic fructan in vitro. Food Science
and Human Wellness, 2013. 2 (3-4): p. 119-123.
22. Martinez-Gutierrez, F., et al., Potential use of Agave salmiana as a prebiotic that stimulates the
growth of probiotic bacteria. LWT, 2017. 84. p. 151-159.
23. Shalini, R., et al., Growth of selected probiotic bacterial strains with fructans from Nendran
banana and garlic. LWT - Food Science and Technology, 2017. 83: p. 68-78.
24. Pramono, Y.B., et al., Utilization of lesser yam (Dioscorea esculenta L.) flour as prebiotic in
yogurt to total lactic acid bacteria (LAB), sugar reduction, and organoleptic properties. Digital
Press Life Sciences, 2020. 2: p. 00011.
25. Powthong, P., et al., study of prebiotic properties of selected banana species in Thailand. Journal
of Food Science and Technology, 2020. 57 (7): p. 2490-2500.
26. Putra, A.N, Sweet potato varieties sukuh potential as a prebiotics in tilapia Feed (Oreochromis
niloticus). International Conference of Aquaculture Indonesia, 2014. (1989): p. 254–58.
27. Ikuta, D., et al., Conformationally supple glucose monomers enable synthesis of the smallest
cyclodextrins. Science, 2019. 8 (5): p. 674-677.
28. Bello, B., et al., Evaluation of the effect of soluble polysaccharides of palm kernel cake as a
potential prebiotic on the growth of probiotics. 3 Biotech, 2018. 8 (8): p. 1-14.
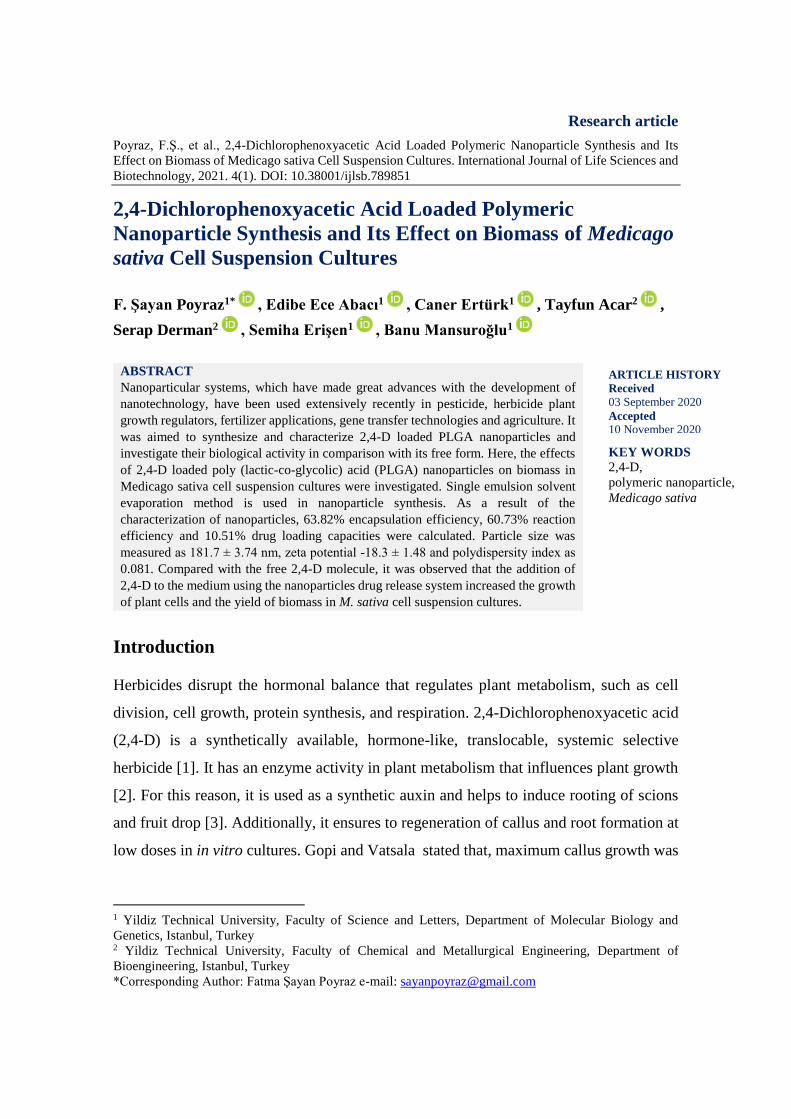
Research article
Poyraz, F.Ş., et al., 2,4-Dichlorophenoxyacetic Acid Loaded Polymeric Nanoparticle Synthesis and Its
Effect on Biomass of Medicago sativa Cell Suspension Cultures. International Journal of Life Sciences and
Biotechnology, 2021. 4(1). DOI: 10.38001/ijlsb.789851
2,4-Dichlorophenoxyacetic Acid Loaded Polymeric
Nanoparticle Synthesis and Its Effect on Biomass of Medicago
sativa Cell Suspension Cultures
F. Şayan Poyraz1* , Edibe Ece Abacı1 , Caner Ertürk1 , Tayfun Acar2 ,
Serap Derman2 , Semiha Erişen1 , Banu Mansuroğlu1
ABSTRACT
Nanoparticular systems, which have made great advances with the development of
nanotechnology, have been used extensively recently in pesticide, herbicide plant
growth regulators, fertilizer applications, gene transfer technologies and agriculture. It
was aimed to synthesize and characterize 2,4-D loaded PLGA nanoparticles and
investigate their biological activity in comparison with its free form. Here, the effects
of 2,4-D loaded poly (lactic-co-glycolic) acid (PLGA) nanoparticles on biomass in
Medicago sativa cell suspension cultures were investigated. Single emulsion solvent
evaporation method is used in nanoparticle synthesis. As a result of the
characterization of nanoparticles, 63.82% encapsulation efficiency, 60.73% reaction
efficiency and 10.51% drug loading capacities were calculated. Particle size was
measured as 181.7 ± 3.74 nm, zeta potential -18.3 ± 1.48 and polydispersity index as
0.081. Compared with the free 2,4-D molecule, it was observed that the addition of
2,4-D to the medium using the nanoparticles drug release system increased the growth
of plant cells and the yield of biomass in M. sativa cell suspension cultures.
Introduction
Herbicides disrupt the hormonal balance that regulates plant metabolism, such as cell
division, cell growth, protein synthesis, and respiration. 2,4-Dichlorophenoxyacetic acid
(2,4-D) is a synthetically available, hormone-like, translocable, systemic selective
herbicide [1]. It has an enzyme activity in plant metabolism that influences plant growth
[2]. For this reason, it is used as a synthetic auxin and helps to induce rooting of scions
and fruit drop [3]. Additionally, it ensures to regeneration of callus and root formation at
low doses in in vitro cultures. Gopi and Vatsala stated that, maximum callus growth was
1 Yildiz Technical University, Faculty of Science and Letters, Department of Molecular Biology and
Genetics, Istanbul, Turkey 2 Yildiz Technical University, Faculty of Chemical and Metallurgical Engineering, Department of
Bioengineering, Istanbul, Turkey
*Corresponding Author: Fatma Şayan Poyraz e-mail: [email protected]
KEY WORDS
2,4-D,
polymeric nanoparticle,
Medicago sativa
ARTICLE HISTORY
Received
03 September 2020
Accepted
10 November 2020
obtained from 2,4-D, compared to 1-Naphthaleneacetic acid (NAA), Indole-3-acetic acid
(IAA) and Indole-3-butyric acid (IBA) in Gymnema sylvestre [4]. In a study conducted
on effects of kinetin and 2,4-D over callus formation in various mediums, kinetin was not
effective alone while 2,4-D induced callus regeneration were reported [5]. Malik et al.
stated that high 2,4-D levels inhibit callus proliferation, but low concentrations of 2,4-D
involve morphogenesis [6]. Besides these positive effects of 2,4-D, it has toxic effects at
higher concentrations was reported by another research for rooting of vine rootstock
cuttings [7]. Additionally, 2,4-D concentration affect germination and initial development
of Regnellidium diphyllum Lindman (Monilophyta, Marsileaceae). The development
ratio of megaspores were high at lowest concentration of 2,4-D, it was negatively affected
as the concentration increased [8]. Overall, previous studies show that the concentration
of 2,4-D has important roles in plant growth and development.
Cell suspension cultures are one of the methods used for the production of medically and
economically valuable secondary metabolites [9]. The production of secondary
metabolite from whole plants is limited owing to cultivation and environmental
limitations. The cells in the suspension medium have many advantages since they are
physiologically more homogeneous and controllable. Plant cell cultures may also use as
model systems for the study of metabolite pathways because the initiation of cell growth
in suspension culture leads to rapid increase of biomass and a condensed biosynthetic
cycle. Whereas, secondary metabolite synthesis may occur in specific cell and organ types
and at a certain time period in whole plants. Because of these advantages, cell suspension
cultures are frequently used in plant tissue culture studies [10].
In recent years, there has been a significant increase in studies on nanoparticular systems
in areas such as medicine, food and agriculture. In these systems, the continuous release
of active chemicals from nanomaterials can increase the effectiveness of them by offering
better results with lower doses and number of applications [11]. Although different
nanoparticular systems (metalic, polymeric, protein etc.) have various features, especially
polymeric nanoparticles with high stability in biological fluids are preferred. This is
because of polymeric nanoparticles which are obtained from biodegradable materials and
it makes them possible to release the active ingredient in the target tissue by
biodegradation. The Poly- (D,L-lactic-co-glycolic acid) (PLGA) is the most commonly
used polymer in the production of polymeric nanoparticles. It has been determined that
the systems created by loading the active substances into the PLGA nanoparticle have
increased the pharmacokinetic properties, therapeutic indices and biocompatibilities of
the active substances compared to the free form [12-15].
European Medicine Agency (EMA) and Food and Drug Administration (FDA) approved
that PLGA nanoparticles can be used for the preparation of DNA, RNA, peptide and
protein carrier systems in many different structures. Additionally, having long-term
clinical experience, being biocompatible and biodegradable are among the advantages of
PLGA [13, 16]. For these reasons, PLGA is accepted and used as the gold standard of
biodegradable polymers [17].
Although there are many studies about nanoparticular systems of PLGA [11, 18, 19], a
controlled delivery system where 2,4-D is used as an active ingredient have not been
found in the literature.
Thus, in this study whose originality was demonstrated, the characterization and In vitro
release of the 2,4-D loaded nanoparticular system which prepared by a single emulsion
solvent evaporation method using PLGA copolymer was investigated. Then, the
optimized nanoparticles were added to the nutrient medium in Medicago sativa L.
suspension cultures and their effect on time-dependent biomass yield was investigated.
Materials and Methods
Materials
PLGA (lactide:glycolide = 50:50; inherent viscosity 0.45–0.60 dL/g, Mw ∼ 38-54 kDa,),
polyvinyl alcohol, 2,4-dichlorophenoxyacetic acid, ethanol, dichloromethane (DCM),
NaCl, NaOH, HCl, Na2HPO4.2H2O, NaH2PO4, Murashige and Skoog (MS) medium were
purchased from Sigma Aldrich (St. Louis, USA). All the chemicals and solvents used in
nanoparticle preparation were of analytical grade and used without further purification.
Methods
Preparation of nanoparticles
2,4-D loaded PLGA nanoparticles were prepared with a single emulsion solvent
evaporation method according to the literature [20]. Firstly, 2,4-D and PLGA were
dissolved in ethanol and DCM, respectively. After that, solutions were mixed for the
preparation of the homogeneous mixture. Mixture was added to 3% (w/v) polyvinyl
alcohol (PVA) solution drop by drop. Sonication was done to emulsify the aqueous phase
and the organic phase. The emulsified solution was added to 0.1% (w/v) PVA solution so
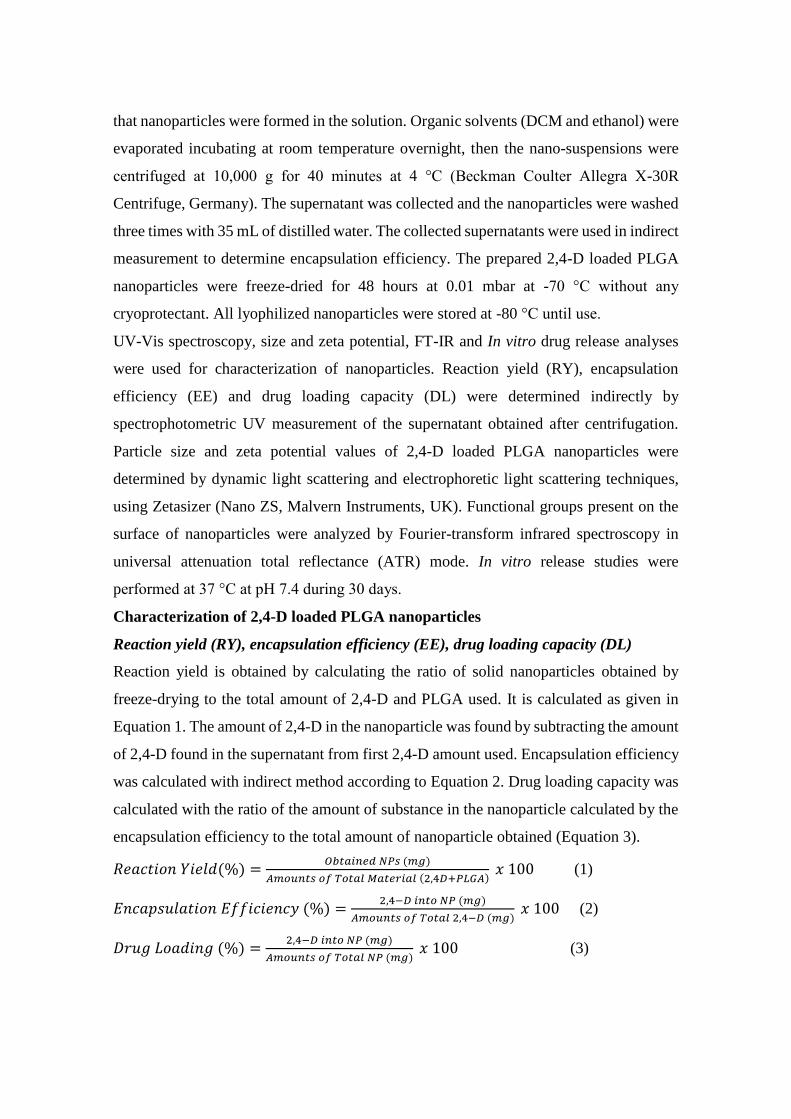
that nanoparticles were formed in the solution. Organic solvents (DCM and ethanol) were
evaporated incubating at room temperature overnight, then the nano-suspensions were
centrifuged at 10,000 g for 40 minutes at 4 °C (Beckman Coulter Allegra X-30R
Centrifuge, Germany). The supernatant was collected and the nanoparticles were washed
three times with 35 mL of distilled water. The collected supernatants were used in indirect
measurement to determine encapsulation efficiency. The prepared 2,4-D loaded PLGA
nanoparticles were freeze-dried for 48 hours at 0.01 mbar at -70 °C without any
cryoprotectant. All lyophilized nanoparticles were stored at -80 °C until use.
UV-Vis spectroscopy, size and zeta potential, FT-IR and In vitro drug release analyses
were used for characterization of nanoparticles. Reaction yield (RY), encapsulation
efficiency (EE) and drug loading capacity (DL) were determined indirectly by
spectrophotometric UV measurement of the supernatant obtained after centrifugation.
Particle size and zeta potential values of 2,4-D loaded PLGA nanoparticles were
determined by dynamic light scattering and electrophoretic light scattering techniques,
using Zetasizer (Nano ZS, Malvern Instruments, UK). Functional groups present on the
surface of nanoparticles were analyzed by Fourier-transform infrared spectroscopy in
universal attenuation total reflectance (ATR) mode. In vitro release studies were
performed at 37 °C at pH 7.4 during 30 days.
Characterization of 2,4-D loaded PLGA nanoparticles
Reaction yield (RY), encapsulation efficiency (EE), drug loading capacity (DL)
Reaction yield is obtained by calculating the ratio of solid nanoparticles obtained by
freeze-drying to the total amount of 2,4-D and PLGA used. It is calculated as given in
Equation 1. The amount of 2,4-D in the nanoparticle was found by subtracting the amount
of 2,4-D found in the supernatant from first 2,4-D amount used. Encapsulation efficiency
was calculated with indirect method according to Equation 2. Drug loading capacity was
calculated with the ratio of the amount of substance in the nanoparticle calculated by the
encapsulation efficiency to the total amount of nanoparticle obtained (Equation 3).
𝑅𝑒𝑎𝑐𝑡𝑖𝑜𝑛 𝑌𝑖𝑒𝑙𝑑(%) =𝑂𝑏𝑡𝑎𝑖𝑛𝑒𝑑 𝑁𝑃𝑠 (𝑚𝑔)
𝐴𝑚𝑜𝑢𝑛𝑡𝑠 𝑜𝑓 𝑇𝑜𝑡𝑎𝑙 𝑀𝑎𝑡𝑒𝑟𝑖𝑎𝑙 (2,4𝐷+𝑃𝐿𝐺𝐴) 𝑥 100 (1)
𝐸𝑛𝑐𝑎𝑝𝑠𝑢𝑙𝑎𝑡𝑖𝑜𝑛 𝐸𝑓𝑓𝑖𝑐𝑖𝑒𝑛𝑐𝑦 (%) =2,4−𝐷 𝑖𝑛𝑡𝑜 𝑁𝑃 (𝑚𝑔)
𝐴𝑚𝑜𝑢𝑛𝑡𝑠 𝑜𝑓 𝑇𝑜𝑡𝑎𝑙 2,4−𝐷 (𝑚𝑔) 𝑥 100 (2)
𝐷𝑟𝑢𝑔 𝐿𝑜𝑎𝑑𝑖𝑛𝑔 (%) =2,4−𝐷 𝑖𝑛𝑡𝑜 𝑁𝑃 (𝑚𝑔)
𝐴𝑚𝑜𝑢𝑛𝑡𝑠 𝑜𝑓 𝑇𝑜𝑡𝑎𝑙 𝑁𝑃 (𝑚𝑔) 𝑥 100 (3)
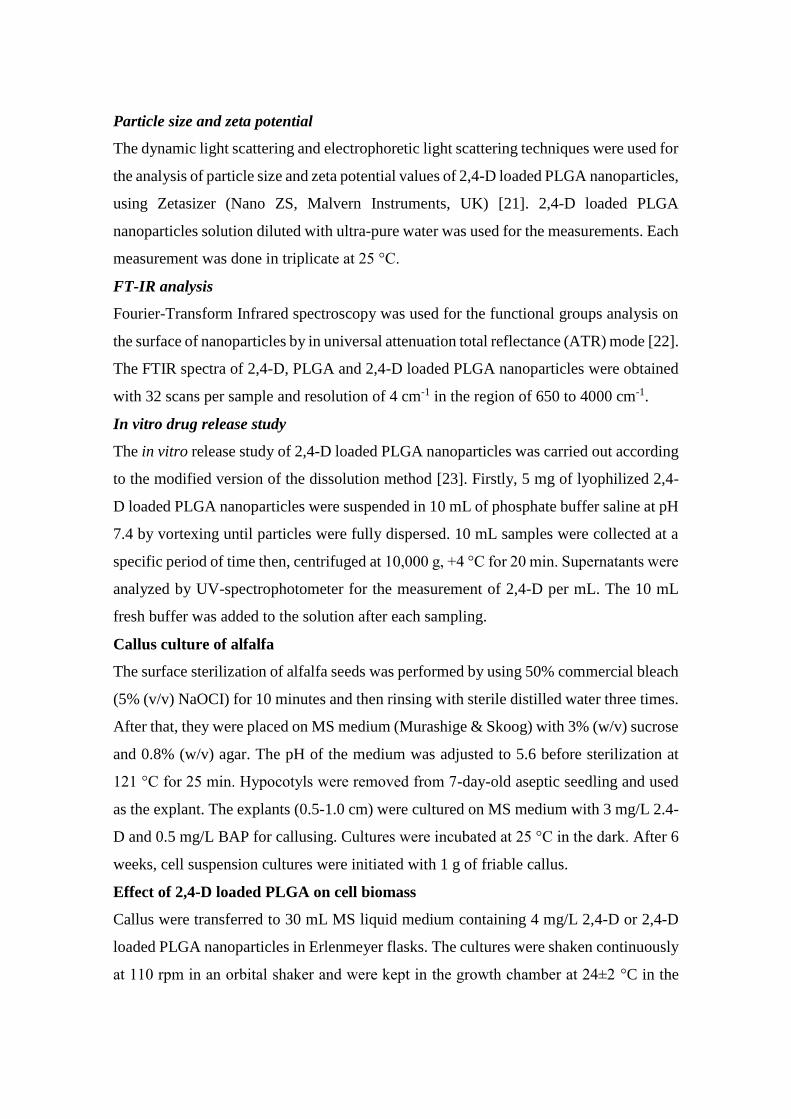
Particle size and zeta potential
The dynamic light scattering and electrophoretic light scattering techniques were used for
the analysis of particle size and zeta potential values of 2,4-D loaded PLGA nanoparticles,
using Zetasizer (Nano ZS, Malvern Instruments, UK) [21]. 2,4-D loaded PLGA
nanoparticles solution diluted with ultra-pure water was used for the measurements. Each
measurement was done in triplicate at 25 °C.
FT-IR analysis
Fourier-Transform Infrared spectroscopy was used for the functional groups analysis on
the surface of nanoparticles by in universal attenuation total reflectance (ATR) mode [22].
The FTIR spectra of 2,4-D, PLGA and 2,4-D loaded PLGA nanoparticles were obtained
with 32 scans per sample and resolution of 4 cm-1 in the region of 650 to 4000 cm-1.
In vitro drug release study
The in vitro release study of 2,4-D loaded PLGA nanoparticles was carried out according
to the modified version of the dissolution method [23]. Firstly, 5 mg of lyophilized 2,4-
D loaded PLGA nanoparticles were suspended in 10 mL of phosphate buffer saline at pH
7.4 by vortexing until particles were fully dispersed. 10 mL samples were collected at a
specific period of time then, centrifuged at 10,000 g, +4 °C for 20 min. Supernatants were
analyzed by UV-spectrophotometer for the measurement of 2,4-D per mL. The 10 mL
fresh buffer was added to the solution after each sampling.
Callus culture of alfalfa
The surface sterilization of alfalfa seeds was performed by using 50% commercial bleach
(5% (v/v) NaOCI) for 10 minutes and then rinsing with sterile distilled water three times.
After that, they were placed on MS medium (Murashige & Skoog) with 3% (w/v) sucrose
and 0.8% (w/v) agar. The pH of the medium was adjusted to 5.6 before sterilization at
121 °C for 25 min. Hypocotyls were removed from 7-day-old aseptic seedling and used
as the explant. The explants (0.5-1.0 cm) were cultured on MS medium with 3 mg/L 2.4-
D and 0.5 mg/L BAP for callusing. Cultures were incubated at 25 °C in the dark. After 6
weeks, cell suspension cultures were initiated with 1 g of friable callus.
Effect of 2,4-D loaded PLGA on cell biomass
Callus were transferred to 30 mL MS liquid medium containing 4 mg/L 2,4-D or 2,4-D
loaded PLGA nanoparticles in Erlenmeyer flasks. The cultures were shaken continuously
at 110 rpm in an orbital shaker and were kept in the growth chamber at 24±2 °C in the
dark. Twelve replicates were used for each treatment. The cell biomass was determined
during 28 days by measuring every 7 days. Three replicates were used to each
measurement. The cell biomass yield was measured in term of fresh weight and was
determined using the formula in Equation 4.
𝑇ℎ𝑒 𝑐𝑒𝑙𝑙 𝑏𝑖𝑜𝑚𝑎𝑠𝑠 𝑦𝑖𝑒𝑙𝑑 =𝐹𝑖𝑛𝑎𝑙 𝑤𝑒𝑖𝑔ℎ𝑡−𝐼𝑛𝑖𝑡𝑖𝑎𝑙 𝑤𝑒𝑖𝑔ℎ𝑡
𝐼𝑛𝑖𝑡𝑖𝑎𝑙 𝑤𝑒𝑖𝑔ℎ𝑡 𝑥 100 (4)
Statistical Analyses
The data were presented as means ± standard deviation (SD) of at least three separate
experiments performed in triplicate. Statistical analysis was performed using GraphPad
Prism software version 6 (GraphPad Software, La Jolla, CA).
Results
Nanoparticle analysis
Characterization studies of synthesized and optimized nanoparticles were carried out by
size analysis, zeta potential measurement, FT-IR and in vitro release studies. Particle size
distribution and zeta potential measurement of the 2,4-D loaded PLGA nanoparticles
were performed with the Zeta Sizer (Malvern ZEN 3600 Nano iS10). The average particle
size of the nanoparticles were measured as 181.7±3.74 nm, the mean zeta potential value
was -18.3±1.48 mV and the multiple distribution indices determining the size distribution
were measured as 0.081. EE was found as a 63.82%, RY 60.73% and DL 10.51 %. Table
1 shows the results regarding the optimized 2,4-D loaded nanoparticles.
Table 1 Physicochemical characterization results of 2,4-D loaded PLGA nanoparticles
2,4
-D L
oad
ed
PL
GA
Na
nop
art
icle
s
RY (%)
EE (%)
DL (%)
Size (nm)
Zeta (mV)
PDI
60.73
63.82
10.51
181.7±3.74
-18.3±1.48
0.081
FT-IR spectra of free 2,4-D molecule, PLGA and 2,4-D loaded PLGA nanoparticles were
plotted to determine polymer interactions with 2,4-D in the nanoparticle formation
process. As a result of the examination of the FT-IR spectra , FT-IR spectra of the
nanoparticles were similar to the PLGA spectrum and there is no extra band (belonging
to any adsorption or a newly formed bond) observed. The result indicate that the 2,4-D
molecule is effectively loaded to nanoparticles (Figure 1).
Figure 1 FT-IR Spectra of 2,4-D, PLGA and 2,4-D loaded PLGA nanoparticles (DNP)
The release experiment of the nanoparticles, which were suspended in PBS buffer (pH
7.4) and allowed to shake horizontally at 200 rpm at 37 °C, were performed for a period
of 30 days. The samples were centrifuged at 10,000 g for 20 minutes at certain times and
the 2,4-D amount released calculated by reading the UV values of the upper phases at 284
nm in the UV spectrophotometer. As a result of the release experiments it is observed that
the 2,4-D contained in the nanoparticles was released slowly and in a controlled manner
and released a total of 37.10% after 30 days.
0 5 10 15 20 25 30 35
0
10
20
30
40
50
Cum
ula
tive R
ele
ase (
%)
Day
Figure 2 In vitro drug release of 2,4-D loaded PLGA nanoparticles
Preparation of nanoparticular systems was carried out by single emulsion (o/w) solvent
evaporation method [24]. Reaction yield (RY), entrapment efficiency (EE), drug loading
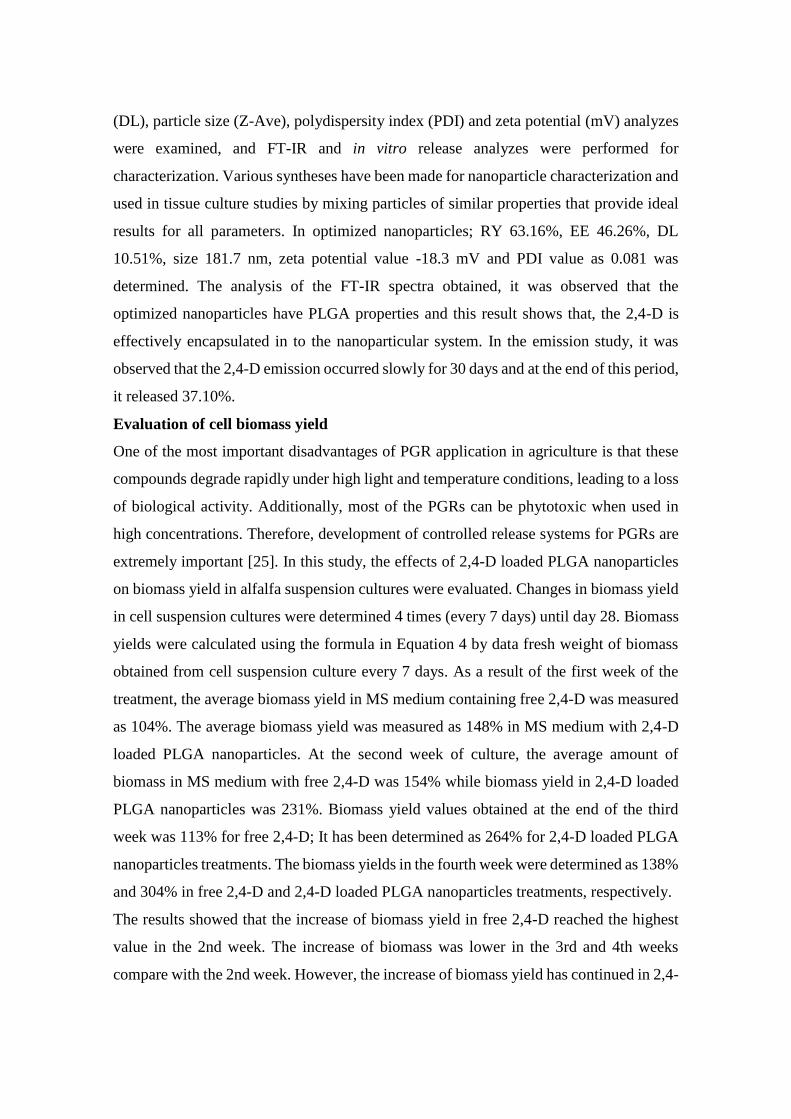
(DL), particle size (Z-Ave), polydispersity index (PDI) and zeta potential (mV) analyzes
were examined, and FT-IR and in vitro release analyzes were performed for
characterization. Various syntheses have been made for nanoparticle characterization and
used in tissue culture studies by mixing particles of similar properties that provide ideal
results for all parameters. In optimized nanoparticles; RY 63.16%, EE 46.26%, DL
10.51%, size 181.7 nm, zeta potential value -18.3 mV and PDI value as 0.081 was
determined. The analysis of the FT-IR spectra obtained, it was observed that the
optimized nanoparticles have PLGA properties and this result shows that, the 2,4-D is
effectively encapsulated in to the nanoparticular system. In the emission study, it was
observed that the 2,4-D emission occurred slowly for 30 days and at the end of this period,
it released 37.10%.
Evaluation of cell biomass yield
One of the most important disadvantages of PGR application in agriculture is that these
compounds degrade rapidly under high light and temperature conditions, leading to a loss
of biological activity. Additionally, most of the PGRs can be phytotoxic when used in
high concentrations. Therefore, development of controlled release systems for PGRs are
extremely important [25]. In this study, the effects of 2,4-D loaded PLGA nanoparticles
on biomass yield in alfalfa suspension cultures were evaluated. Changes in biomass yield
in cell suspension cultures were determined 4 times (every 7 days) until day 28. Biomass
yields were calculated using the formula in Equation 4 by data fresh weight of biomass
obtained from cell suspension culture every 7 days. As a result of the first week of the
treatment, the average biomass yield in MS medium containing free 2,4-D was measured
as 104%. The average biomass yield was measured as 148% in MS medium with 2,4-D
loaded PLGA nanoparticles. At the second week of culture, the average amount of
biomass in MS medium with free 2,4-D was 154% while biomass yield in 2,4-D loaded
PLGA nanoparticles was 231%. Biomass yield values obtained at the end of the third
week was 113% for free 2,4-D; It has been determined as 264% for 2,4-D loaded PLGA
nanoparticles treatments. The biomass yields in the fourth week were determined as 138%
and 304% in free 2,4-D and 2,4-D loaded PLGA nanoparticles treatments, respectively.
The results showed that the increase of biomass yield in free 2,4-D reached the highest
value in the 2nd week. The increase of biomass was lower in the 3rd and 4th weeks
compare with the 2nd week. However, the increase of biomass yield has continued in 2,4-
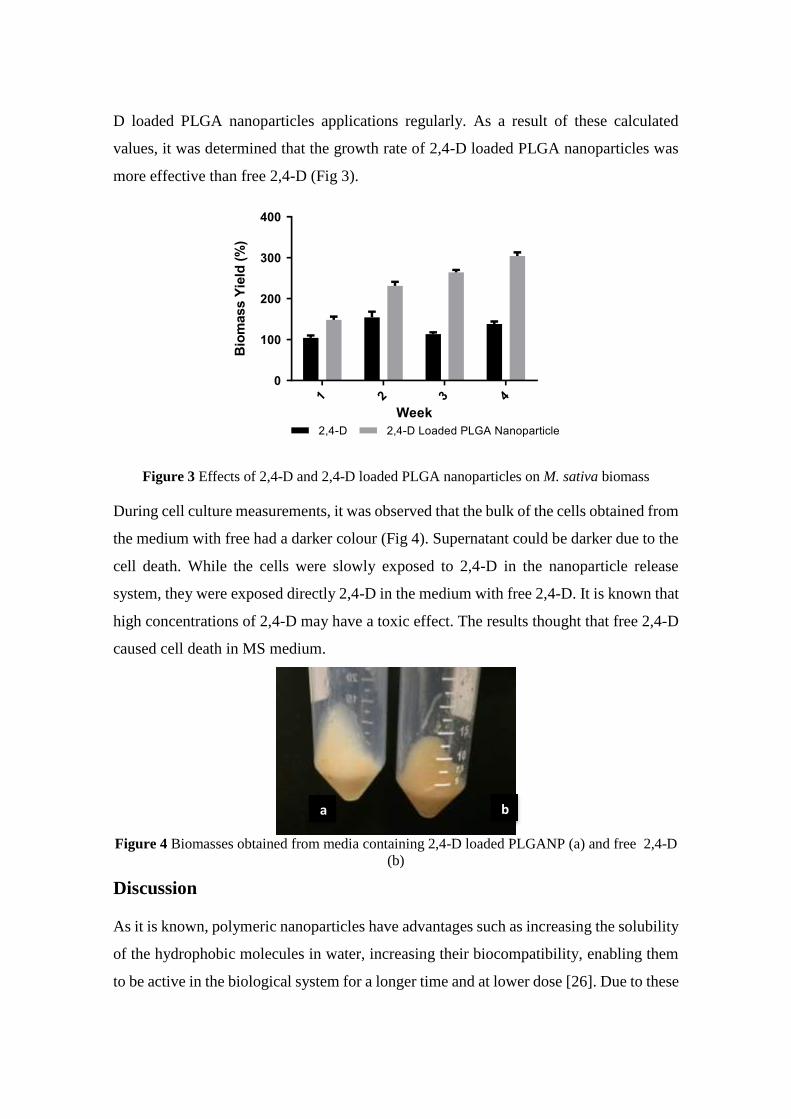
D loaded PLGA nanoparticles applications regularly. As a result of these calculated
values, it was determined that the growth rate of 2,4-D loaded PLGA nanoparticles was
more effective than free 2,4-D (Fig 3).
Week
Bio
mass Y
ield
(%
)
1 2 3 4
0
100
200
300
400
2,4-D 2,4-D Loaded PLGA Nanoparticle
Figure 3 Effects of 2,4-D and 2,4-D loaded PLGA nanoparticles on M. sativa biomass
During cell culture measurements, it was observed that the bulk of the cells obtained from
the medium with free had a darker colour (Fig 4). Supernatant could be darker due to the
cell death. While the cells were slowly exposed to 2,4-D in the nanoparticle release
system, they were exposed directly 2,4-D in the medium with free 2,4-D. It is known that
high concentrations of 2,4-D may have a toxic effect. The results thought that free 2,4-D
caused cell death in MS medium.
Figure 4 Biomasses obtained from media containing 2,4-D loaded PLGANP (a) and free 2,4-D
(b)
Discussion
As it is known, polymeric nanoparticles have advantages such as increasing the solubility
of the hydrophobic molecules in water, increasing their biocompatibility, enabling them
to be active in the biological system for a longer time and at lower dose [26]. Due to these
a b
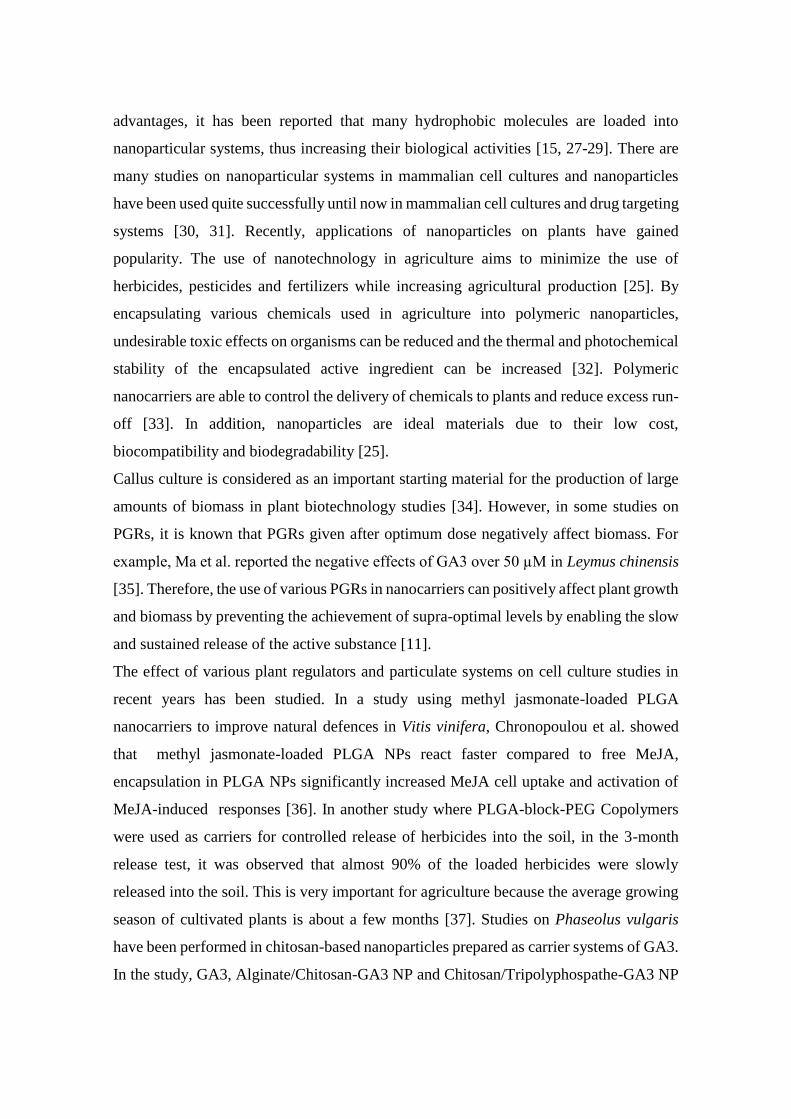
advantages, it has been reported that many hydrophobic molecules are loaded into
nanoparticular systems, thus increasing their biological activities [15, 27-29]. There are
many studies on nanoparticular systems in mammalian cell cultures and nanoparticles
have been used quite successfully until now in mammalian cell cultures and drug targeting
systems [30, 31]. Recently, applications of nanoparticles on plants have gained
popularity. The use of nanotechnology in agriculture aims to minimize the use of
herbicides, pesticides and fertilizers while increasing agricultural production [25]. By
encapsulating various chemicals used in agriculture into polymeric nanoparticles,
undesirable toxic effects on organisms can be reduced and the thermal and photochemical
stability of the encapsulated active ingredient can be increased [32]. Polymeric
nanocarriers are able to control the delivery of chemicals to plants and reduce excess run-
off [33]. In addition, nanoparticles are ideal materials due to their low cost,
biocompatibility and biodegradability [25].
Callus culture is considered as an important starting material for the production of large
amounts of biomass in plant biotechnology studies [34]. However, in some studies on
PGRs, it is known that PGRs given after optimum dose negatively affect biomass. For
example, Ma et al. reported the negative effects of GA3 over 50 µM in Leymus chinensis
[35]. Therefore, the use of various PGRs in nanocarriers can positively affect plant growth
and biomass by preventing the achievement of supra-optimal levels by enabling the slow
and sustained release of the active substance [11].
The effect of various plant regulators and particulate systems on cell culture studies in
recent years has been studied. In a study using methyl jasmonate-loaded PLGA
nanocarriers to improve natural defences in Vitis vinifera, Chronopoulou et al. showed
that methyl jasmonate-loaded PLGA NPs react faster compared to free MeJA,
encapsulation in PLGA NPs significantly increased MeJA cell uptake and activation of
MeJA-induced responses [36]. In another study where PLGA-block-PEG Copolymers
were used as carriers for controlled release of herbicides into the soil, in the 3-month
release test, it was observed that almost 90% of the loaded herbicides were slowly
released into the soil. This is very important for agriculture because the average growing
season of cultivated plants is about a few months [37]. Studies on Phaseolus vulgaris
have been performed in chitosan-based nanoparticles prepared as carrier systems of GA3.
In the study, GA3, Alginate/Chitosan-GA3 NP and Chitosan/Tripolyphospathe-GA3 NP
were compared and ALG/CS-GA3 showed stronger effects in terms of leaf development
and carotenoid levels [38]. Pereira et al. synthesized GA3 nanoparticles with γ-PGA and
Chitosan as a plant hormone carrier. The nanoparticular system was more effective than
free hormone in Phaseolus vulgaris seeds and accelerates germination within 24 hours
after treatment and increases leaf area and root development (including the formation of
lateral roots) [39].
There are a lot of studies on the loading of molecules with low solubility and stability in
the physiological environment in to the nanoparticular systems [26, 40-43]. These
systems can improve the distribution of the molecule more effectively and more
efficiently in nanoparticles that can be controlled and can release for a long time. A few
promising studies have evaluated the use of PLGA nanoparticle in plants. Atrazine
(ATZ), was encapsulated into PLGA to prevent damage to the environment. When the
release profiles of ATZ loaded PLGA-NPs were examined, it was observed that they
showed a much slower release compared to the pure herbicide [19]. In another study with
ATZ, potato plants were used as biological models and herbicidal activity of designed
PLGA nanoherbicides were evaluated. As a result of in vitro findings, it was determined
that as the ATZ concentration increased in PLGA nanoparticles, potato plants
experienced a significant decrease in root length, fresh weight, dry weight and leaf
number. It was observed that the root length was affected the most among these
parameters. Thus, it has been proposed that PLGA nanoherbicides can be used as an
alternative method to prevent weed growth [44]. Tong et al. stated that nanoparticles
obtained in the formulation in which metolachlor was encapsulated into mPEG-PLGA
increased the solubility of hydrophobic metolachlor in water and did not contain any
active substance on its surface. Nanoparticular systems have been proven to have a higher
biological effect on Oryza sativa and Digitaria sanguinalis compared to free
metholachlor. In addition, in the cytotoxicity test, it was observed that the NP toxicity
decreased on the preosteoblast cell line [18]. These studies showed that polymeric
nanoparticles caused less environmental damage when used as a pesticide carrier and
contributed to plant growth by eliminating various damages of herbicides.
Considering unique properties of nanoparticles and the lack of nanoparticular systems
with 2,4-D in the literature; 2,4-D, which is a water-insoluble and toxic molecule, was
added to nanoparticular systems, thus making it soluble in tissue culture studies. At
present study, free 2,4-D and 2,4-D loaded PLGA nanoparticles were applied to M. sativa
cell cultures and their effects on biomass yield were compared. The addition of 2,4 D
loaded PLGA nanoparticles to the medium was much more effective compared to the free
2,4-D added medium, thanks to the controlled release of 2,4-D in the particulate system.
Conclusion
In this study, it is aimed to reduce the adverse effects of 2,4-D molecule, which is known
to show a high concentration level of toxic effects, by nanoparticular systems. We also
intended to increase its effectiveness by remaining intact for a longer time thanks to the
controlled release mechanism of the substance. It is known that nanoparticle release
systems increase the effect of active subtances on cells. However, a study on the
application of 2,4-D using nanoparticular release systems in plant cell cultures has not
been reached. In this study, the effect of applying 2,4-D with nanoparticle release systems
to plant cell cultures was demonstrated for the first time. After reaching the optimized
formulation of the 2,4-D loaded PLGA nanoparticles system, the effect of 2,4-D loaded
PLGA NPs on plant cell growth was investigated. At the end of the study, it was observed
that the addition of 2,4-D to the medium using the nanoparticles drug release system was
increased the amount of cell biomass. It has been observed that the particulate system was
much more effective than the free substance at the study.
It is thought that the optimized system, which was loaded into the particular system and
whose water solubility increased and positive results were obtained in plant cell culture
studies, may be a reference for drug delivery systems. These systems can be used as an
alternative method for the addition of compounds with a high concentration of toxic
effects to the medium. In nanoparticle systems, the amount of oscillation can be adjusted
and time-dependent manipulation of cells can be performed without the need for
subculture.
Abbreviations
2,4-D; 2,4-Dichlorophenoxyacetic Acid, PLGA; Poly (lactic-co-glycolic) acid, EE; Encapsulation
efficiency, RY; Reaction yield, DL; Drug loading, FT-IR; Fourier-transform infrared spectroscopy, MS
medium; Murashige and Skoog medium, DNP; 2,4-D loaded PLGA nanoparticles.
Funding
There is no fundings for this project.
References
1. Sezer, K., Şeker Pancarı Küspesinden Elde Edilen Aktİf Karbonun Atiksulardaki 2,4-D Ve
Metribuzin Pestisitlerinin Adsorpsiyonda Kullanilabilirliğinin Araştırılması, in Kimya
Mühendisliği Ana Bilim Dalı. 2010, Hacettepe Üniversitesi.
2. Turan, G.T., 2,4-Diklorofenoksiasetik Asitin (2,4-D) Kılıçkuyruk (Xiphophorus Hellerii)
Balıklarının Bazi Dokularında Asetiklorinesteraz (AChE) Aktivitesi Üzerine Etkileri, in Biyoloji
Ana Bilim Dalı. 2012, Marmara Üniversitesi.
3. Yalçınkaya, M., Bir Herbisit Olan 2,4-D (Diklorofenoksiasetik Asit)’nin Poecilia reticulata
P.,1859’da Medulla Spinalis Üzerine Etkileri, in Biyoloji Ana Bilim Dalı. 2006, Ege Üniversitesi.
4. Gopi, C. and T. Vatsala, In vitro studies on effects of plant growth regulators on callus and
suspension culture biomass yield from Gymnema sylvestre R. Br. African Journal of
Biotechnology, 2006. 5(12).
5. Dalila, Z.D., H. Jaafar, and A.A. Manaf, Effects of 2, 4-D and kinetin on callus induction of
Barringtonia racemosa leaf and endosperm explants in different types of basal media. Asian
Journal of Plant Sciences, 2013. 12(1): p. 21-27.
6. Malik, S.I., et al., Effect of 2, 4-dichlorophenoxyacetic acid on callus induction from mature wheat
(Triticum aestivum L.) seeds. International Journal of Agriculture & Biology [Internet], 2003: p.
156-159.
7. Tofanelli, M.B.D., P.L. Freitas, and G.E. Pereira, 2, 4-dichlorophenoxyacetic acid as an alternative
auxin for rooting of vine rootstock cuttings. Revista Brasileira de Fruticultura, 2014. 36(3): p. 664-
672.
8. Cassanego, M., A. Droste, and P. Windisch, Effects of 2, 4-D on the germination of megaspores
and initial development of Regnellidium diphyllum Lindman (Monilophyta, Marsileaceae).
Brazilian Journal of Biology, 2010. 70(2): p. 361-366.
9. Surmuş Asan, H., Hypericum Retusum Aucher’in Kallus Ve Hücre Süspansiyon Kültürlerinde
Hiperisin Türevlerinin Üretilmesi. 2013, Dicle Üniversitesi: Fen Bilimleri Enstitüsü.
10. Phillips, G.C., J.F. Hubstenberger, and E.E. Hansen, Plant regeneration by organogenesis from
callus and cell suspension cultures, in Plant Cell, Tissue and Organ Culture. 1995, Springer. p. 67-
79.
11. Santo Pereira, A.d.E., H.C. Oliveira, and L.F. Fraceto, Polymeric nanoparticles as an alternative
for application of gibberellic acid in sustainable agriculture: a field study. Scientific reports, 2019.
9(1): p. 1-10.
12. Alimohammadi, Y.H. and S.W. Joo, PLGA-based nanoparticles as cancer drug delivery systems.
Asian Pac J Cancer Prev, 2014. 15: p. 517-535.
13. Danhier F, A.E., Silva JM, Coco R, Le Breton A, Preat V., Plga-Based Nanoparticles: An
Overview Of Biomedical Applications. Journal of Controlled Release, 2012. 161: p. 505-522.
14. Panyam, J. and V. Labhasetwar, Biodegradable nanoparticles for drug and gene delivery to cells
and tissue. Advanced drug delivery reviews, 2003. 55(3): p. 329-347.
15. Duranoğlu, D., et al., Synthesis of hesperetin-loaded PLGA nanoparticles by two different
experimental design methods and biological evaluation of optimized nanoparticles.
Nanotechnology, 2018. 29(39): p. 395603.
16. Makadia HK, S.S., Poly Lactic-Co-Glycolic Acid (Plga) As Biodegradable Controlled Drug
Delivery Carrier. Polymers, 2011. 3: p. 1377-1397.
17. Kutlu, C., Beyİn Tümörlerİnİn Tedavİsİ İçİn Çİft Etkİlİ Doku İskelesİ-Nanopartİkül
Sİstemlerİnİn Gelİştİrİlmesİ in Biyomühendislik. 2011, Hacettepe Üniversitesi.
18. Tong, Y., et al., Polymeric nanoparticles as a metolachlor carrier: water-based formulation for
hydrophobic pesticides and absorption by plants. Journal of agricultural and food chemistry, 2017.
65(34): p. 7371-7378.
19. Chen, X.-t. and T. Wang, Preparation and characterization of atrazine-loaded biodegradable PLGA
nanospheres. Journal of Integrative Agriculture, 2019. 18(5): p. 1035-1041.
20. Kızılbey, K., Optimization of Rutin-Loaded PLGA Nanoparticles Synthesized by Single-
Emulsion Solvent Evaporation Method. ACS Omega, 2019. 4(1): p. 555-562.
21. Kamaly, N., et al., Degradable controlled-release polymers and polymeric nanoparticles:
mechanisms of controlling drug release. Chemical reviews, 2016. 116(4): p. 2602-2663.
22. Van de Voort, F., Fourier transform infrared spectroscopy applied to food analysis. Food Research
International, 1992. 25(5): p. 397-403.
23. Heng, D., et al., What is a suitable dissolution method for drug nanoparticles? Pharmaceutical
research, 2008. 25(7): p. 1696-1701.
24. G Nava-Arzaluz, M., et al., Single emulsion-solvent evaporation technique and modifications for
the preparation of pharmaceutical polymeric nanoparticles. Recent patents on drug delivery &
formulation, 2012. 6(3): p. 209-223.
25. Pascoli, M., et al., State of the art of polymeric nanoparticles as carrier systems with agricultural
applications: a minireview. Energy, Ecology and Environment, 2018. 3(3): p. 137-148.
26. Makadia, H.K. and S.J. Siegel, Poly lactic-co-glycolic acid (PLGA) as biodegradable controlled
drug delivery carrier. Polymers, 2011. 3(3): p. 1377-1397.
27. Men, K., et al., Nanoparticle-delivered quercetin for cancer therapy. Anti-Cancer Agents in
Medicinal Chemistry (Formerly Current Medicinal Chemistry-Anti-Cancer Agents), 2014. 14(6):
p. 826-832.
28. Arasoglu, T., et al., Synthesis, characterization and antibacterial activity of juglone encapsulated
PLGA nanoparticles. Journal of applied microbiology, 2017. 123(6): p. 1407-1419.
29. Bishayee, K., A.R. Khuda-Bukhsh, and S.-O. Huh, PLGA-loaded gold-nanoparticles precipitated
with quercetin downregulate HDAC-Akt activities controlling proliferation and activate p53-ROS
crosstalk to induce apoptosis in hepatocarcinoma cells. Molecules and cells, 2015. 38(6): p. 518.
30. Stella, B., et al., Design of folic acid-conjugated nanoparticles for drug targeting. J Pharm Sci,
2000. 89(11): p. 1452-64.
31. Bilemsoy, E., Development Of Nonsurfactant Cyclodextrin Nanoparticles Loaded With
Anticancer Drug Paclitaxel. Journal of Pharmaceutical Sciences, 2007. 97(4): p. 1519–1529.
32. Cicek, S. and H. Nadaroglu, The use of nanotechnology in the agriculture. Advances in Nano
research, 2015. 3(4): p. 207.
33. Chhipa, H., Nanofertilizers and nanopesticides for agriculture. Environmental chemistry letters,
2017. 15(1): p. 15-22.
34. Khalil, S.A., N. Ahmad, and R. Zamir, Gamma radiation induced variation in growth
characteristics and production of bioactive compounds during callogenesis in Stevia rebaudiana
(Bert.). New Negatives in Plant Science, 2015. 1: p. 1-5.
35. Ma, H.-Y., et al., A Multi-year Beneficial Effect of Seed Priming with Gibberellic Acid-3 (GA 3)
on Plant Growth and Production in a Perennial Grass, Leymus chinensis. Scientific reports, 2018.
8(1): p. 1-9.
36. Chronopoulou, L., et al., Microfluidic synthesis of methyl jasmonate-loaded PLGA nanocarriers
as a new strategy to improve natural defenses in Vitis vinifera. Scientific Reports, 2019. 9(1): p.
1-9.
37. Lewicka, K., et al., Biodegradable Blends of Grafted Dextrin with PLGA-block-PEG Copolymer
as a Carrier for Controlled Release of Herbicides into Soil. Materials, 2020. 13(4): p. 832.
38. Santo Pereira, A.E., et al., Chitosan nanoparticles as carrier systems for the plant growth hormone
gibberellic acid. Colloids and Surfaces B: Biointerfaces, 2017. 150: p. 141-152.
39. Pereira, A., et al., γ-Polyglutamic acid/chitosan nanoparticles for the plant growth regulator
gibberellic acid: Characterization and evaluation of biological activity. Carbohydrate polymers,
2017. 157: p. 1862-1873.
40. Kumar, M., Nano and microparticles as controlled drug delivery devices. J. Pharm. Pharm. Sci,
2000. 3(2): p. 234-258.
41. Pal, S.L., et al., Nanoparticle: An overview of preparation and characterization. Journal of Applied
Pharmaceutical Science, 2011. 1(6): p. 228-234.
42. Danhier, F., et al., PLGA-based nanoparticles: an overview of biomedical applications. Journal of
controlled release, 2012. 161(2): p. 505-522.
43. Mora-Huertas, C., H. Fessi, and A. Elaissari, Polymer-based nanocapsules for drug delivery.
International journal of pharmaceutics, 2010. 385(1-2): p. 113-142.
44. Schnoor, B., et al., Engineering atrazine loaded poly (lactic-co-glycolic acid) nanoparticles to
ameliorate environmental challenges. Journal of agricultural and food chemistry, 2018. 66(30): p.
7889-7898.
61
Research article
Ozata, E., Yield and Quality Stabilities of Waxy Corn Genotypes using Biplot Analysis. International
Journal of Life Sciences and Biotechnology, 2021. 4(1): p. 61-89. DOI: 10.38001/ijlsb.811966
Yield and Quality Stabilities of Waxy Corn Genotypes using
Biplot Analysis
Erkan ÖZATA 1*
ABSTRACT This study was conducted to determine the stability of the potential genotypes of waxy
Corn (10 candidates, 2 standard varieties) in terms of yield, yield components and quality
characteristics in various environments over a period of two years under Samsun
conditions. Biplot analysis of GGE and AMMI was used to determine the stability of
genotypes. Mean grain yields of genotypes ranged from 8560.6 to 17290.6 kg ha-1, number
of days to flowering from 71.3 to 77.5 days, plant height from 251.7 to 295.0 cm, the
height of first ear from 85.3 to 98.3 cm, grain ear ratio from 81.3 to 85.5%, grain moisture
content from 20.5 to 25.0%, single ear weight from 145 to 286.3 g, the number of ears per
plant from 0.9 to 1.0 ear plant-1, 1000 grain weight from 317.7 to 402.2 g, hectoliter from
76.9 to 79.3%, crude protein ratio from 9.4 to 10.4%, crude oil content from 3.3 to 5.0%,
total starch ratio from 57.5 to 60.0%, carbohydrate ratio from 69.6 to 71.6%, and energy
value from 383.8 to 393.7 kcal. The result of the analysis of variance showed that yield,
yield components and chemical composition of corn varieties significantly (p>0.01)
different between genotypes (G), environments (E) and genotype x environment (GE)
interactions. A significant difference in yield, yield components, and quality
characteristics of waxy Corn genotypes was shown by the biplot (AMMI and GGE)
multivariate analysis. Compared with other genotypes evaluated, the yield and stability of
the ADAX11 and ADAX18 genotypes were higher. In addition, in the scientific and
precise assessment of the high yield, stability, and adaptations of the waxy Corn hybrids,
the AMMI model and GGE biplot analysis provide great ease for Corn breeders.
Introduction
Waxy Corn (Zea mays L. ceritina) is one of the seven subspecies included in the Corn
plant; according to USDA records, this type of Corn was discovered in China in 1908 and
was first described by Collins in 1909[1]. Fresh waxy Corn is consumed in most Asian
countries (China, Korea, Taiwan, Vietnam, Laos, Myanmar and Thailand) and the
growing area continues to expand rapidly [2].
Starch, a complex carbohydrate produced by plants for long-term storage of excess
glucose, is found in tiny granular structures in the roots, tubers and seeds of plants. Starch
is produced in almost all plants and can be obtained by means of many plants for
1 Blacksea Agrıculture Research Instıtute, Department of Field Crops, Samsun / Turkey
*Corresponding Author: Erkan ÖZATA, e-mail: [email protected]
ARTICLE HISTORY
Received
17 October 2020
Accepted
20 December 2020
KEYWORDS
Waxy Corn,
GGEBiplot,
AMMIBiplot,
Stability,
Waxy quality
62
commercial purposes, one of which is obtained by means of corn kernels (dent corn). The
starch content in wet corn milling is around 66% of the dry weight. Starch can be
measured as a percentage of raw Corn production, which makes starch a profitable
material. The yield of starch can be obtained from the wet milling of dent corn, a variety
widely grown for starch production. However, starch obtained from waxy Corn by wet
milling method has a starch yield of about 90% of dry weight [3].
Some of the starches known as "waxy starches" derive from the endosperm tissue, which
is waxy and contains a small amount of amylose in the granular composition (< 15%).
Due to its crystalline nature, the energy requirements of waxy starches for gelatinization
are very high [4]. In comparison to waxy starch, the amylose content in other types of
starch is more than 30%. In addition, researchers have reported that this starch contains
other polysaccharide molecules and is slightly deformed from other starches [5].
The starch content present in waxy Corn has a high molecular weight so that it is digested
faster than starches of other types. The starch of waxy Corn can be extracted through a
wet milling process. Heat treatment causes a loss of starch viscosity in common Corn, but
since waxy Corn does not produce amylase, starch maintains its stickiness. Waxy Corn
starch can therefore be modified and used in the food industry, in particular in the
production of corn snacks with sauce [6]. Apart from food production, waxy Corn starch
can be used in the textile industry, the production of glue, corrugated carton, the paper
industry as well as animal nutrition due to its high feed quality [7,8].
The main objective of plant breeding is to develop new superior and high quality varieties.
Therefore, plant breeders must look for the most appropriate breeding materials and
methods to clearly present the results of scientific studies. A graphic technique is a tool
commonly used to demonstrate findings obtained in Corn breeding experiments. The
visual presentation of the results of the breeding study is essential to better convey the
message to readers. Various graphic methods have been introduced and used by
researchers as alternatives to traditional methods. The biplot is one of the most preferred
techniques for visualizing the results of a breeding experiment.
The additive main effects and multiplicative interaction (AMMI) and genotype main
effect (G) and genotype by environment (GE) interaction (GGE) biplot model are
excellent tools for visual assessment to demonstrate the combining abilities of parents
and crosses. The multivariate models have been frequently used by plant breeders to
63
estimate the adaptability and stability of Corn hybrids in breeding experiments
[9,10,11,12,13,14,15].
The genotype of waxy Corn has been intensively cultivated in the production of roasted
corn snacks and amylopectin starch in Turkey. However, the waxy Corn varieties used in
agricultural production all come from abroad and are not officially registered in Turkey.
Consequently, the breeding of new varieties of waxy Corn is required to meet domestic
demand for waxy Corn. Research on waxy Corn is relatively new in Turkey and few
studies have investigated the stability of yields and the genotypic quality characteristics
of waxy Corn. This research was conducted to identify genotypes with high stability in
yield, yield components and quality characteristics of potential waxy Corn genotypes in
different environments in Samsun during the 2018 and 2019 Corn growing seasons.
Materials and Methods
The materials used in the experimental study consisted of 10 high-yield waxy Corn
hybrids provided by the Corn Research Institute (MAEM) and 2 control varieties. The
information on experimental plant material is given in (Table 1). Since no genotype of
waxy Corn was recorded in Turkey, 2 genotype hybrid Corn varieties which were very
common in Turkey were used as control treatments to compare yields of MAEM hybrid
waxy Corn.
The soil in the experimental field had clay loamy texture, mildly alkaline, non-salty,
mildly calcareous, and low organic matter content. The available phosphorus content for
plants is low, while the potassium content is high (Table 2).
The experimental field was located in Samsun province which is characterized by a rainy
and temperate climate. The relative humidity and temperature values during growing
seasons (2018-2019) were relatively close to each other, whereas differed from the long
term averages. Average temperature values in 2018 and 2019 were 1.0 and 1.5 °C higher
than the long term averages. Total and monthly precipitation values of the study area were
significantly different from the long term precipitation data (Figure 1)
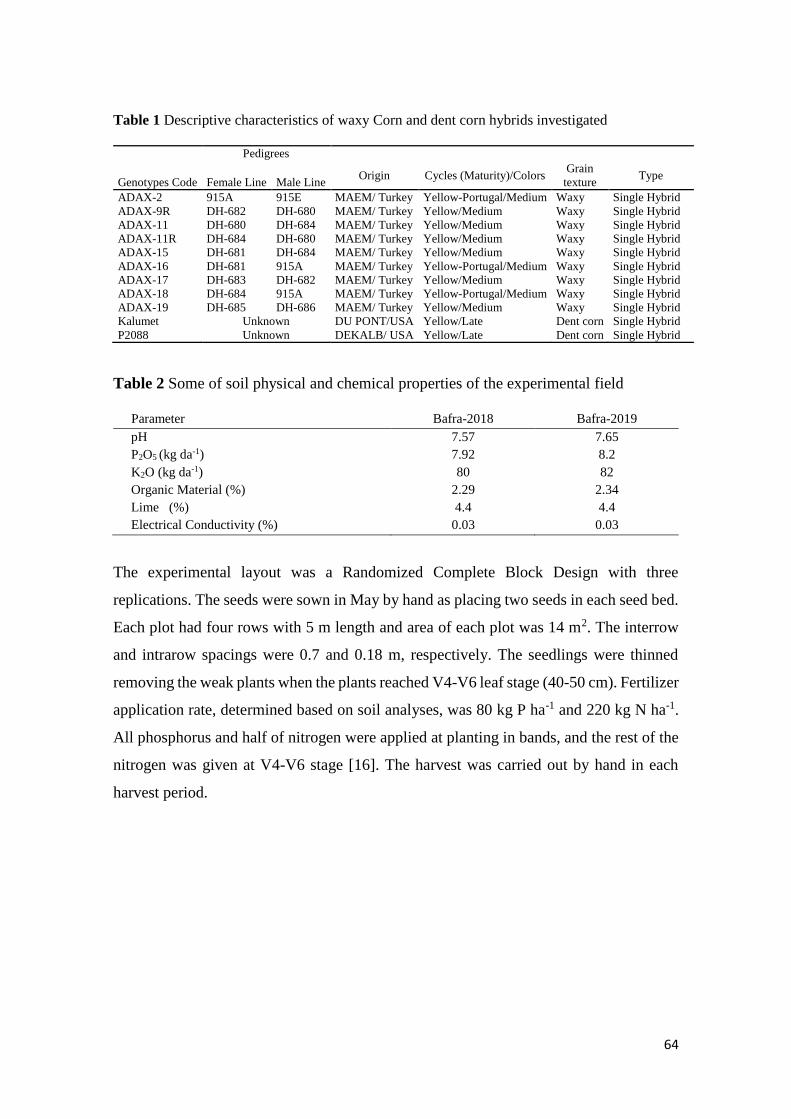
64
Table 1 Descriptive characteristics of waxy Corn and dent corn hybrids investigated
Genotypes Code
Pedigrees
Female Line Male Line Origin Cycles (Maturity)/Colors
Grain
texture Type
ADAX-2 915A 915E MAEM/ Turkey Yellow-Portugal/Medium Waxy Single Hybrid
ADAX-9R DH-682 DH-680 MAEM/ Turkey Yellow/Medium Waxy Single Hybrid
ADAX-11 DH-680 DH-684 MAEM/ Turkey Yellow/Medium Waxy Single Hybrid
ADAX-11R DH-684 DH-680 MAEM/ Turkey Yellow/Medium Waxy Single Hybrid
ADAX-15 DH-681 DH-684 MAEM/ Turkey Yellow/Medium Waxy Single Hybrid
ADAX-16 DH-681 915A MAEM/ Turkey Yellow-Portugal/Medium Waxy Single Hybrid
ADAX-17 DH-683 DH-682 MAEM/ Turkey Yellow/Medium Waxy Single Hybrid
ADAX-18 DH-684 915A MAEM/ Turkey Yellow-Portugal/Medium Waxy Single Hybrid
ADAX-19 DH-685 DH-686 MAEM/ Turkey Yellow/Medium Waxy Single Hybrid
Kalumet Unknown DU PONT/USA Yellow/Late Dent corn Single Hybrid
P2088 Unknown DEKALB/ USA Yellow/Late Dent corn Single Hybrid
Table 2 Some of soil physical and chemical properties of the experimental field
Parameter Bafra-2018 Bafra-2019
pH 7.57 7.65
P2O5 (kg da-1) 7.92 8.2
K2O (kg da-1) 80 82
Organic Material (%) 2.29 2.34
Lime (%) 4.4 4.4
Electrical Conductivity (%) 0.03 0.03
The experimental layout was a Randomized Complete Block Design with three
replications. The seeds were sown in May by hand as placing two seeds in each seed bed.
Each plot had four rows with 5 m length and area of each plot was 14 m2. The interrow
and intrarow spacings were 0.7 and 0.18 m, respectively. The seedlings were thinned
removing the weak plants when the plants reached V4-V6 leaf stage (40-50 cm). Fertilizer
application rate, determined based on soil analyses, was 80 kg P ha-1 and 220 kg N ha-1.
All phosphorus and half of nitrogen were applied at planting in bands, and the rest of the
nitrogen was given at V4-V6 stage [16]. The harvest was carried out by hand in each
harvest period.
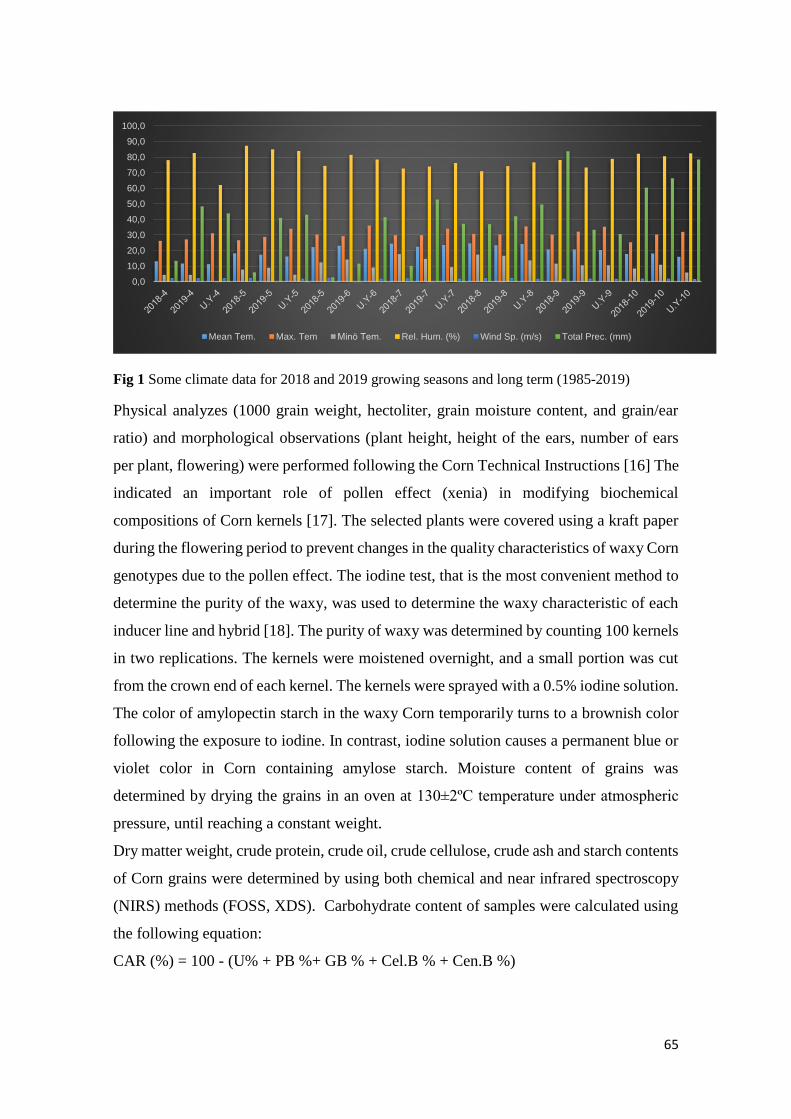
65
Fig 1 Some climate data for 2018 and 2019 growing seasons and long term (1985-2019)
Physical analyzes (1000 grain weight, hectoliter, grain moisture content, and grain/ear
ratio) and morphological observations (plant height, height of the ears, number of ears
per plant, flowering) were performed following the Corn Technical Instructions [16] The
indicated an important role of pollen effect (xenia) in modifying biochemical
compositions of Corn kernels [17]. The selected plants were covered using a kraft paper
during the flowering period to prevent changes in the quality characteristics of waxy Corn
genotypes due to the pollen effect. The iodine test, that is the most convenient method to
determine the purity of the waxy, was used to determine the waxy characteristic of each
inducer line and hybrid [18]. The purity of waxy was determined by counting 100 kernels
in two replications. The kernels were moistened overnight, and a small portion was cut
from the crown end of each kernel. The kernels were sprayed with a 0.5% iodine solution.
The color of amylopectin starch in the waxy Corn temporarily turns to a brownish color
following the exposure to iodine. In contrast, iodine solution causes a permanent blue or
violet color in Corn containing amylose starch. Moisture content of grains was
determined by drying the grains in an oven at 130±2ºC temperature under atmospheric
pressure, until reaching a constant weight.
Dry matter weight, crude protein, crude oil, crude cellulose, crude ash and starch contents
of Corn grains were determined by using both chemical and near infrared spectroscopy
(NIRS) methods (FOSS, XDS). Carbohydrate content of samples were calculated using
the following equation:
CAR (%) = 100 - (U% + PB %+ GB % + Cel.B % + Cen.B %)
0,0
10,0
20,0
30,0
40,0
50,0
60,0
70,0
80,0
90,0
100,0
Mean Tem. Max. Tem Minö Tem. Rel. Hum. (%) Wind Sp. (m/s) Total Prec. (mm)
66
In the equation, CAR (%) is the percent carbohydrates; U (%) is the moisture content of
grains; PB (%) is the crude protein content; GB (%) is the crude oil content; Cel.B (%) is
the crude fiber content and Cen.B (%) is the crude ash content [19].
The energy value was calculated using the Atwater general factor system Conversion
factors were taken as 4.0 kcal g-1 for protein and carbohydrates, and 9.0 kcal g-1 for oil
[20].
Energy = (Protein x 4) + (Oil x 9) + [(Carbohydrate- Dietary fiber) x4]
Statistical analysis
Statistical evaluations of the data were carried out using GenStat (12th Edition) software.
Homogeneity and normality tests were applied prior to the combined variance analysis
for the mean values obtained in different environments. The data was log-transformed in
case of nonnormal distribution, before the analyses to linearize the relationships between
the variables [21]. Multiple location test (MLT) data were analyzed without scaling
('Scala 0' option) to create environment centered (centering 2) GE biplots as described by
Yan and Tinker 2006. For GE genotype assessment, GE genotype-oriented singular value
segmentation (SVP = 1) was used along with the 'Mean versus stability' option of the GE
biplot software, whereas environment-oriented singular value segmentation (SVP = 2)
(Relation among testers) was used for the evaluation of the locations. The 'The-Which-
won-where' option was used to identify the ideal genotype in a given environment and
define the mega environments [22]. The significance in the dataset was assessed by
analysis of variance (ANOVA) and the least significant difference (LSD) was used to
differentiate the means in case ANOVA denoted significant differences.
Result
Yield, yield components and chemical composition performances of waxy hybrid
corn genotypes
Grain yield is the most important selection criterion in Corn breeding. Variance analysis
indicated that genotype (G), year (Y) and GY interaction had statistically significant
impact (p≤ 0.01) on grain yield (Table 3). Grain yields ranged from 6481 (ADAX-2) to
17986 (Kalumet) kg ha-1 in the first year, and from 7518 (Adax17) to17623 (Kalumet) kg
ha-1 in the second year. Flowering time is one of the selection criteria used to determine
the maturation groups of genotypes (Table 3). Variance analysis showed that G, Y and
GY interaction had a statistically significant effect (p≤0.01) on the number days to
67
flowering. Flowering time of genotypes ranged from 68.0 (ADAX17R) to 77.0 (Kalumet)
days in 2018, and from 71.3 (ADAX17R) to 77.5 (Kalumet) days in 2019 (Table 3). Plant
height is another important selection criteria in corn breeding. Variance analysis indicated
significant (p≤0.01) differences in plant heights between G, Y and GY interaction. The
plant height of the genotypes varied between 228.3 (ADAX17) and 286.7 (ADAX16) cm
in the first year, and 251.7 (ADAX17R) and 295.0 (ADAX17) cm in the second year, and
the mean plant length of genotypes was 264.2 cm (Table 3). Ear height is another
morphological evaluation criterion in Corn breeding. Corn breeders co-evaluate two
factors as the criteria in the ear height. The first one is that the ear height should be at the
same height for all plants in a plot, and the second one is that the plant height and ear
height ratio should be between 1/2 and 1/3. Higher or lower ear/plant ratio may cause
plants to lie down and the harvesting becomes difficult. Variance analysis showed that
the effect of Genotype, Year, and GY interaction (p≤0.01) on the ear heights was
statistically significant (Table 3). The mean ear height varied between 68.3 (ADAX-11R)
and 108.3 (ADAX-17) cm in the first year and between 81.7 (ADAX-2) and 110.0
(ADAX-18) cm in the second year. The mean first ear height in the experiment was
determined as 90.9 cm. (Table 3). Grain/ear ratio value is another important characteristic
determined in corn harvest, and is calculated together with the grain moisture content
right after the harvest. The effects of Genotype and GY interaction on grain/ear ratio was
statistically significant (p≤0.01), while the effect of year was insignificant. The grain/ear
ratio in the experiment varied between 80.7 and 84.8% in the first year and between 79.9
and 86.8% in the second year, and the mean grain/ear ratio was determined as 82.3%
(Table 4). Grain moisture content is of great importance in corn breeding and is one of
the important selection criteria. Moisture content of grains is desired to be low in the
Black Sea region, where the relative humidity is high. Therefore, corn breeders focus on
genotypes with low grain moisture content or genotypes losing the grain moisture fast.
The variance analysis showed that the effects of Genotype and GY interaction on grain
moisture content was statistically significant at p<0.01 level, while the effect of year was
important at p<0.05 level. The grain moisture content varied between 19.7 and 25.8% in
the first year and between 21.2 and 25.8% in the second year (Table 4).
68
Ear weight is used as a selection criterion in Corn breeding. The ear weight ranged from
130.6 to 306.0 g in the first year, and from 105.5 to 266.7 g in the second year, and the
mean ear weight for combined genotype was between 156.6 and 286.3 g (Table 4). The
number of ears per plant varied depending on the subspecies of the Corn. The sugar corn
and popcorn subspecies have the potential to form two or more ears in a plant, while dent
corn and hard corn subspecies tend to form single ear per plant. The number of ears per
plant in the experiment was between 0.89 and 1.01 ear plant-1 in the first year, and
between 0.84 and 1.01 ear plant-1 in the second year, and mean number of ear per plant
for the experiment was 0.97 (Table 4). On thousand grain weight is the common selection
criterion used in all field crops by the plant breeders. The result of variance analysis
showed that the differences in 1000 grain weight significantly (p<0.01) differed between
Genotype, Year and GY interaction. The 1000 grain weight varied between 310.3 and
411.7 g in the first year of the experiment and ranged from 315.1 to 392.8 g in the second
year. The mean 1000 grain weights of both years varied between 312.7 and 402.2 g, and
the mean value for the experiment was calculated as 344.5 g (Table 5). Hectoliter weight
refers to the weight of 100 L corn in kilogram, and is one of the most commonly used
physical quality parameter which has a positive effect on corn quality. The shape, size
and homogeneity of corn grains are the most important factors that determine the
hectoliter weight of genotypes. Positive relationship has been reported between hectoliter
weight and grain yield. The mean hectoliter weight of genotypes ranged from 77.2 to 79.6
kg h-1, and the mean hectoliter weight in the experiment was determined to be 78.1 kg h-
1 (Table 5). Carbohydrate content is one of the widely used grain chemical content
properties in assessing the quality criteria in recent years. Low-energy and nutritious
products have become highly preferred in the daily diet. The mean carbohydrate content
of genotypes varied between 69.6 and 71.6%, with an average of 70.5% (Table 5). The
energy value, considered a criteria to determine the consumption rates of the products in
the daily diet, has become an important selection criterion for popcorn, sugar corn and
waxy corn which are used in direct consumption. In general, the products with low calorie
and high fiber content are recommended to include in the daily diet. The energy values
of genotypes ranged from 383.8 to 393.7 kcal 100 g-1 (Table 5). The crude protein ratio
is a selection criterion used to assess the quality of the product in all field crops. The mean
crude protein ratio of genotypes varied between 8.7 and 10.5% in the first year and
69
between 9 and 10.4% in the second year (Table 6). Crude oil ratio varied depending on
the subspecies of the waxy Corn. The mean crude oil ratios of genotypes varied between
3.21 and 4.73% in the first year, and between 3.31 and 3.98% in the second year, with a
mean value of 3.60% (Table 6). Starch ratios of genotypes varied between 56.6 and 60.3%
in the first year, and 57.7 and 60.0% in the second year, and the average starch ratio in
the experiment was 58.8% (Table 6).
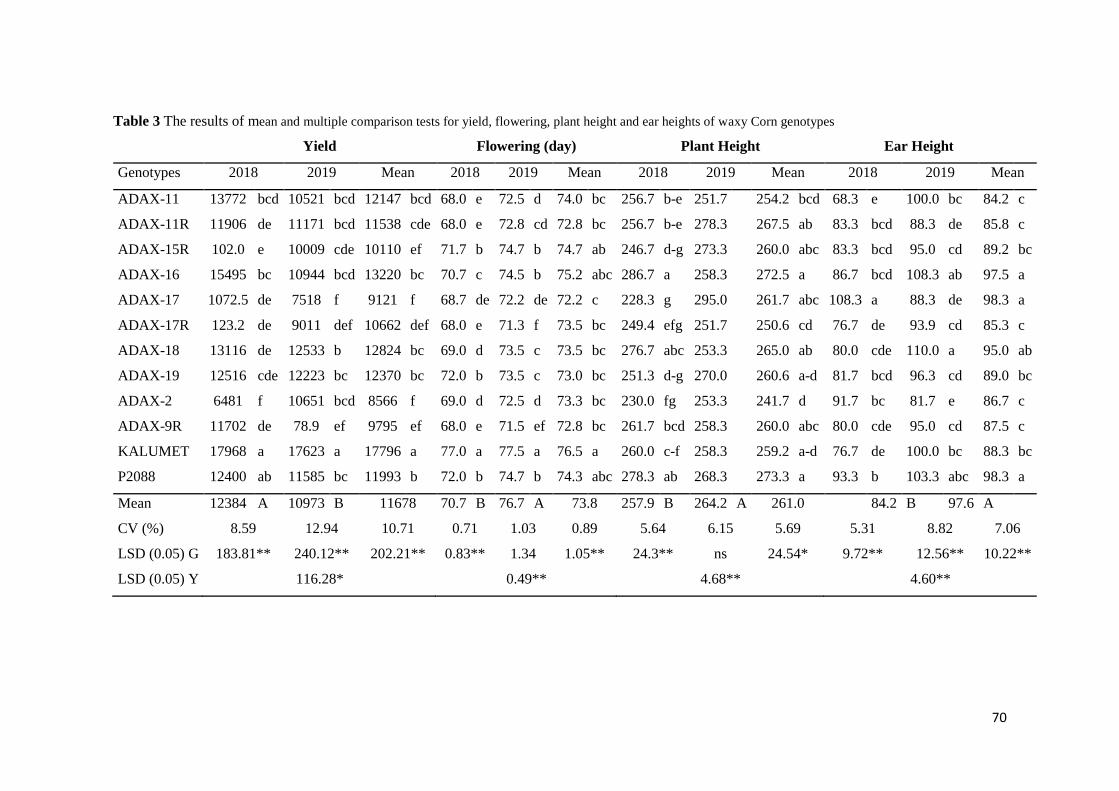
70
Table 3 The results of mean and multiple comparison tests for yield, flowering, plant height and ear heights of waxy Corn genotypes
Yield Flowering (day) Plant Height Ear Height
Genotypes 2018 2019 Mean 2018 2019 Mean 2018 2019 Mean 2018 2019 Mean
ADAX-11 13772 bcd 10521 bcd 12147 bcd 68.0 e 72.5 d 74.0 bc 256.7 b-e 251.7 254.2 bcd 68.3 e 100.0 bc 84.2 c
ADAX-11R 11906 de 11171 bcd 11538 cde 68.0 e 72.8 cd 72.8 bc 256.7 b-e 278.3 267.5 ab 83.3 bcd 88.3 de 85.8 c
ADAX-15R 102.0 e 10009 cde 10110 ef 71.7 b 74.7 b 74.7 ab 246.7 d-g 273.3 260.0 abc 83.3 bcd 95.0 cd 89.2 bc
ADAX-16 15495 bc 10944 bcd 13220 bc 70.7 c 74.5 b 75.2 abc 286.7 a 258.3 272.5 a 86.7 bcd 108.3 ab 97.5 a
ADAX-17 1072.5 de 7518 f 9121 f 68.7 de 72.2 de 72.2 c 228.3 g 295.0 261.7 abc 108.3 a 88.3 de 98.3 a
ADAX-17R 123.2 de 9011 def 10662 def 68.0 e 71.3 f 73.5 bc 249.4 efg 251.7 250.6 cd 76.7 de 93.9 cd 85.3 c
ADAX-18 13116 de 12533 b 12824 bc 69.0 d 73.5 c 73.5 bc 276.7 abc 253.3 265.0 ab 80.0 cde 110.0 a 95.0 ab
ADAX-19 12516 cde 12223 bc 12370 bc 72.0 b 73.5 c 73.0 bc 251.3 d-g 270.0 260.6 a-d 81.7 bcd 96.3 cd 89.0 bc
ADAX-2 6481 f 10651 bcd 8566 f 69.0 d 72.5 d 73.3 bc 230.0 fg 253.3 241.7 d 91.7 bc 81.7 e 86.7 c
ADAX-9R 11702 de 78.9 ef 9795 ef 68.0 e 71.5 ef 72.8 bc 261.7 bcd 258.3 260.0 abc 80.0 cde 95.0 cd 87.5 c
KALUMET 17968 a 17623 a 17796 a 77.0 a 77.5 a 76.5 a 260.0 c-f 258.3 259.2 a-d 76.7 de 100.0 bc 88.3 bc
P2088 12400 ab 11585 bc 11993 b 72.0 b 74.7 b 74.3 abc 278.3 ab 268.3 273.3 a 93.3 b 103.3 abc 98.3 a
Mean 12384 A 10973 B 11678 70.7 B 76.7 A 73.8 257.9 B 264.2 A 261.0 84.2 B 97.6 A
CV (%) 8.59 12.94 10.71 0.71 1.03 0.89 5.64 6.15 5.69 5.31 8.82 7.06
LSD (0.05) G 183.81** 240.12** 202.21** 0.83** 1.34 1.05** 24.3** ns 24.54* 9.72** 12.56** 10.22**
LSD (0.05) Y 116.28* 0.49** 4.68** 4.60**
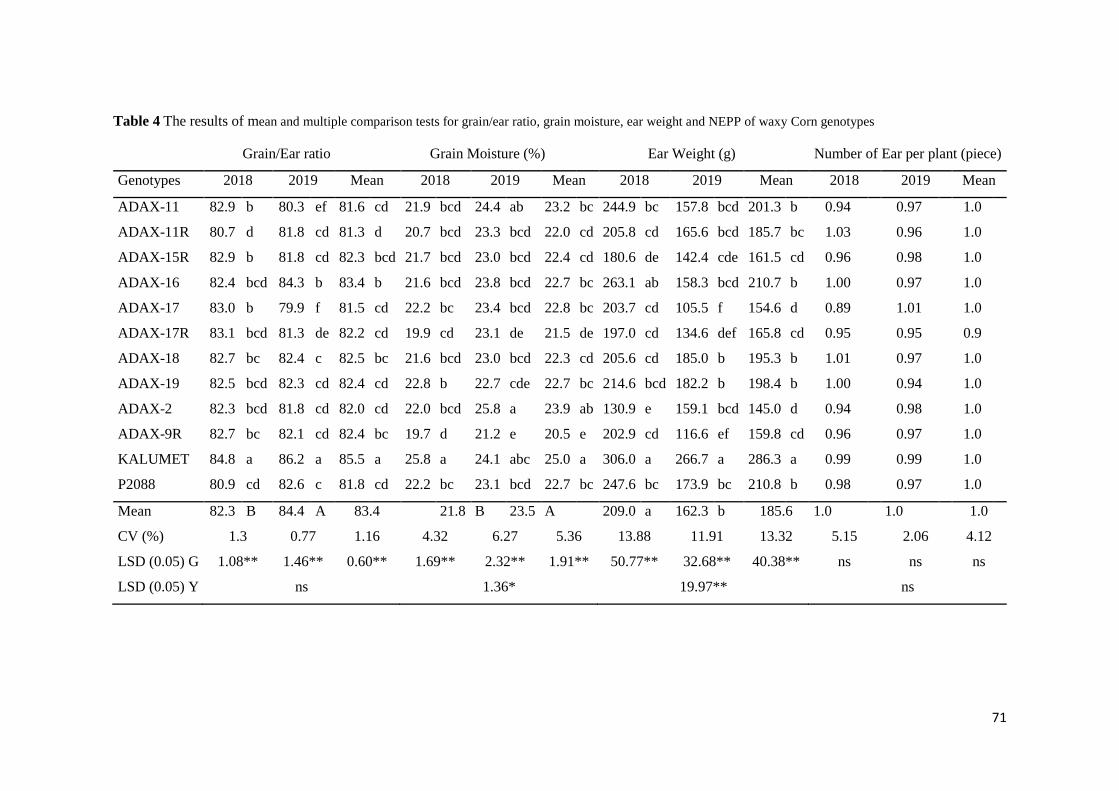
71
Table 4 The results of mean and multiple comparison tests for grain/ear ratio, grain moisture, ear weight and NEPP of waxy Corn genotypes
Grain/Ear ratio Grain Moisture (%)
Ear Weight (g)
Number of Ear per plant (piece)
Genotypes 2018 2019 Mean 2018 2019 Mean 2018 2019 Mean 2018 2019 Mean
ADAX-11 82.9 b 80.3 ef 81.6 cd 21.9 bcd 24.4 ab 23.2 bc 244.9 bc 157.8 bcd 201.3 b 0.94
0.97
1.0
ADAX-11R 80.7 d 81.8 cd 81.3 d 20.7 bcd 23.3 bcd 22.0 cd 205.8 cd 165.6 bcd 185.7 bc 1.03
0.96
1.0
ADAX-15R 82.9 b 81.8 cd 82.3 bcd 21.7 bcd 23.0 bcd 22.4 cd 180.6 de 142.4 cde 161.5 cd 0.96
0.98
1.0
ADAX-16 82.4 bcd 84.3 b 83.4 b 21.6 bcd 23.8 bcd 22.7 bc 263.1 ab 158.3 bcd 210.7 b 1.00
0.97
1.0
ADAX-17 83.0 b 79.9 f 81.5 cd 22.2 bc 23.4 bcd 22.8 bc 203.7 cd 105.5 f 154.6 d 0.89
1.01
1.0
ADAX-17R 83.1 bcd 81.3 de 82.2 cd 19.9 cd 23.1 de 21.5 de 197.0 cd 134.6 def 165.8 cd 0.95
0.95
0.9
ADAX-18 82.7 bc 82.4 c 82.5 bc 21.6 bcd 23.0 bcd 22.3 cd 205.6 cd 185.0 b 195.3 b 1.01
0.97
1.0
ADAX-19 82.5 bcd 82.3 cd 82.4 cd 22.8 b 22.7 cde 22.7 bc 214.6 bcd 182.2 b 198.4 b 1.00
0.94
1.0
ADAX-2 82.3 bcd 81.8 cd 82.0 cd 22.0 bcd 25.8 a 23.9 ab 130.9 e 159.1 bcd 145.0 d 0.94
0.98
1.0
ADAX-9R 82.7 bc 82.1 cd 82.4 bc 19.7 d 21.2 e 20.5 e 202.9 cd 116.6 ef 159.8 cd 0.96
0.97
1.0
KALUMET 84.8 a 86.2 a 85.5 a 25.8 a 24.1 abc 25.0 a 306.0 a 266.7 a 286.3 a 0.99
0.99
1.0
P2088 80.9 cd 82.6 c 81.8 cd 22.2 bc 23.1 bcd 22.7 bc 247.6 bc 173.9 bc 210.8 b 0.98 0.97 1.0
Mean 82.3 B 84.4 A 83.4 21.8 B 23.5 A 209.0 a 162.3 b 185.6 1.0
1.0
1.0
CV (%) 1.3 0.77 1.16 4.32 6.27 5.36 13.88 11.91 13.32 5.15 2.06 4.12
LSD (0.05) G 1.08** 1.46** 0.60** 1.69** 2.32** 1.91** 50.77** 32.68** 40.38** ns ns ns
LSD (0.05) Y ns 1.36* 19.97** ns
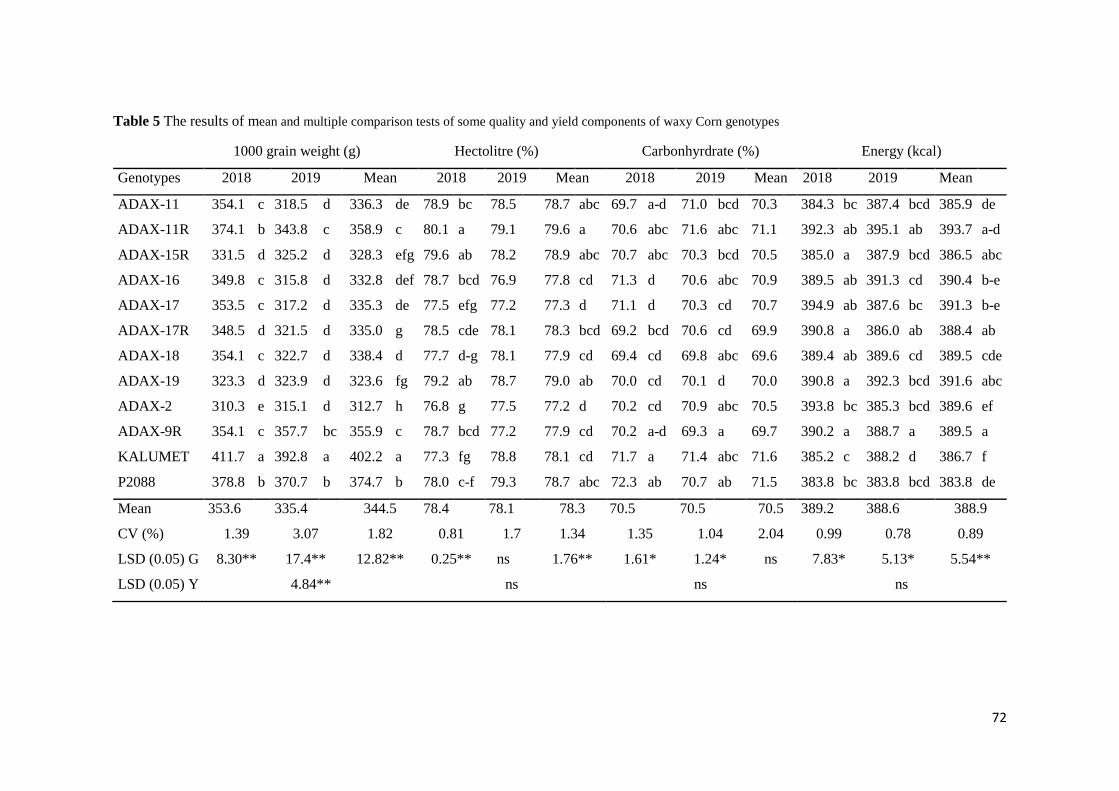
72
Table 5 The results of mean and multiple comparison tests of some quality and yield components of waxy Corn genotypes
1000 grain weight (g) Hectolitre (%) Carbonhyrdrate (%) Energy (kcal)
Genotypes 2018 2019 Mean 2018 2019 Mean 2018 2019 Mean 2018 2019 Mean
ADAX-11 354.1 c 318.5 d 336.3 de 78.9 bc 78.5 78.7 abc 69.7 a-d 71.0 bcd 70.3 384.3 bc 387.4 bcd 385.9 de
ADAX-11R 374.1 b 343.8 c 358.9 c 80.1 a 79.1 79.6 a 70.6 abc 71.6 abc 71.1 392.3 ab 395.1 ab 393.7 a-d
ADAX-15R 331.5 d 325.2 d 328.3 efg 79.6 ab 78.2 78.9 abc 70.7 abc 70.3 bcd 70.5 385.0 a 387.9 bcd 386.5 abc
ADAX-16 349.8 c 315.8 d 332.8 def 78.7 bcd 76.9 77.8 cd 71.3 d 70.6 abc 70.9 389.5 ab 391.3 cd 390.4 b-e
ADAX-17 353.5 c 317.2 d 335.3 de 77.5 efg 77.2 77.3 d 71.1 d 70.3 cd 70.7 394.9 ab 387.6 bc 391.3 b-e
ADAX-17R 348.5 d 321.5 d 335.0 g 78.5 cde 78.1 78.3 bcd 69.2 bcd 70.6 cd 69.9 390.8 a 386.0 ab 388.4 ab
ADAX-18 354.1 c 322.7 d 338.4 d 77.7 d-g 78.1 77.9 cd 69.4 cd 69.8 abc 69.6 389.4 ab 389.6 cd 389.5 cde
ADAX-19 323.3 d 323.9 d 323.6 fg 79.2 ab 78.7 79.0 ab 70.0 cd 70.1 d 70.0 390.8 a 392.3 bcd 391.6 abc
ADAX-2 310.3 e 315.1 d 312.7 h 76.8 g 77.5 77.2 d 70.2 cd 70.9 abc 70.5 393.8 bc 385.3 bcd 389.6 ef
ADAX-9R 354.1 c 357.7 bc 355.9 c 78.7 bcd 77.2 77.9 cd 70.2 a-d 69.3 a 69.7 390.2 a 388.7 a 389.5 a
KALUMET 411.7 a 392.8 a 402.2 a 77.3 fg 78.8 78.1 cd 71.7 a 71.4 abc 71.6 385.2 c 388.2 d 386.7 f
P2088 378.8 b 370.7 b 374.7 b 78.0 c-f 79.3 78.7 abc 72.3 ab 70.7 ab 71.5 383.8 bc 383.8 bcd 383.8 de
Mean 353.6
335.4
344.5 78.4 78.1
78.3 70.5
70.5
70.5 389.2
388.6
388.9
CV (%) 1.39 3.07 1.82 0.81 1.7 1.34 1.35 1.04 2.04 0.99 0.78 0.89
LSD (0.05) G 8.30** 17.4** 12.82** 0.25** ns 1.76** 1.61* 1.24* ns 7.83* 5.13* 5.54**
LSD (0.05) Y 4.84** ns ns ns
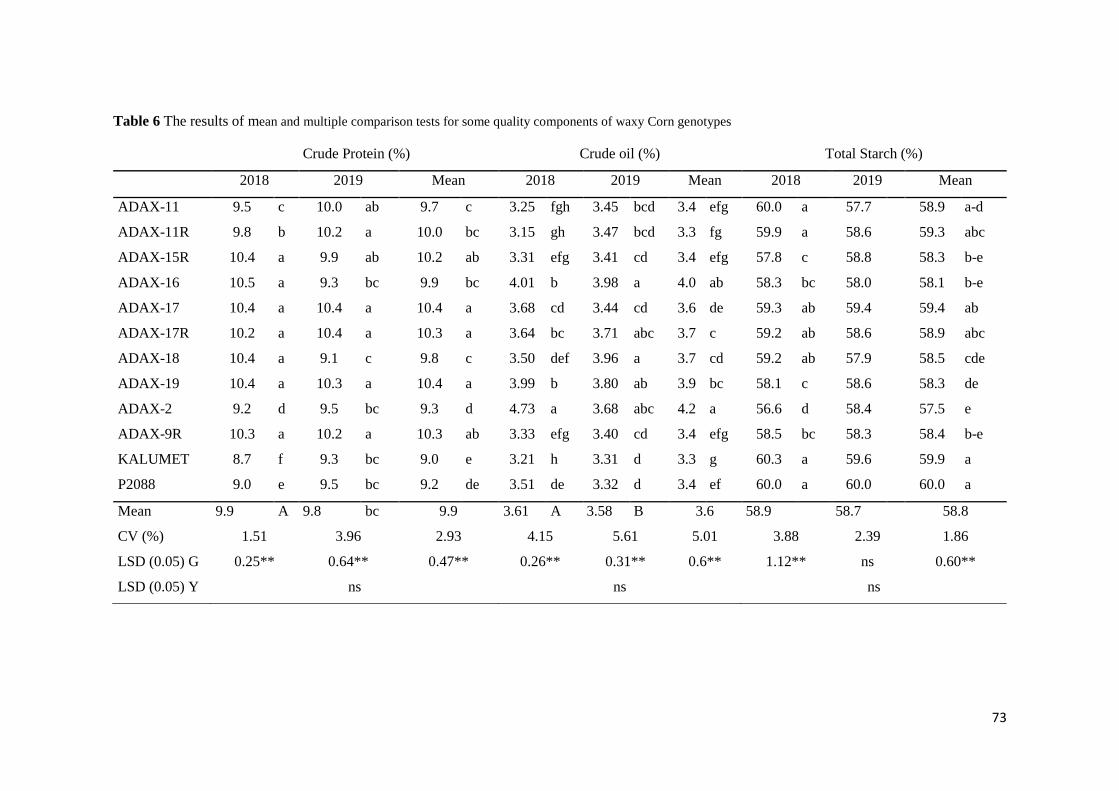
73
Table 6 The results of mean and multiple comparison tests for some quality components of waxy Corn genotypes
Crude Protein (%) Crude oil (%) Total Starch (%)
2018 2019 Mean 2018 2019 Mean 2018 2019 Mean
ADAX-11 9.5 c 10.0 ab 9.7 c 3.25 fgh 3.45 bcd 3.4 efg 60.0 a 57.7 58.9 a-d
ADAX-11R 9.8 b 10.2 a 10.0 bc 3.15 gh 3.47 bcd 3.3 fg 59.9 a 58.6 59.3 abc
ADAX-15R 10.4 a 9.9 ab 10.2 ab 3.31 efg 3.41 cd 3.4 efg 57.8 c 58.8 58.3 b-e
ADAX-16 10.5 a 9.3 bc 9.9 bc 4.01 b 3.98 a 4.0 ab 58.3 bc 58.0 58.1 b-e
ADAX-17 10.4 a 10.4 a 10.4 a 3.68 cd 3.44 cd 3.6 de 59.3 ab 59.4 59.4 ab
ADAX-17R 10.2 a 10.4 a 10.3 a 3.64 bc 3.71 abc 3.7 c 59.2 ab 58.6 58.9 abc
ADAX-18 10.4 a 9.1 c 9.8 c 3.50 def 3.96 a 3.7 cd 59.2 ab 57.9 58.5 cde
ADAX-19 10.4 a 10.3 a 10.4 a 3.99 b 3.80 ab 3.9 bc 58.1 c 58.6 58.3 de
ADAX-2 9.2 d 9.5 bc 9.3 d 4.73 a 3.68 abc 4.2 a 56.6 d 58.4 57.5 e
ADAX-9R 10.3 a 10.2 a 10.3 ab 3.33 efg 3.40 cd 3.4 efg 58.5 bc 58.3 58.4 b-e
KALUMET 8.7 f 9.3 bc 9.0 e 3.21 h 3.31 d 3.3 g 60.3 a 59.6 59.9 a
P2088 9.0 e 9.5 bc 9.2 de 3.51 de 3.32 d 3.4 ef 60.0 a 60.0 60.0 a
Mean 9.9 A 9.8 bc 9.9 3.61 A 3.58 B 3.6 58.9
58.7
58.8
CV (%) 1.51 3.96 2.93 4.15 5.61 5.01 3.88 2.39 1.86
LSD (0.05) G 0.25** 0.64** 0.47** 0.26** 0.31** 0.6** 1.12** ns 0.60**
LSD (0.05) Y ns ns ns
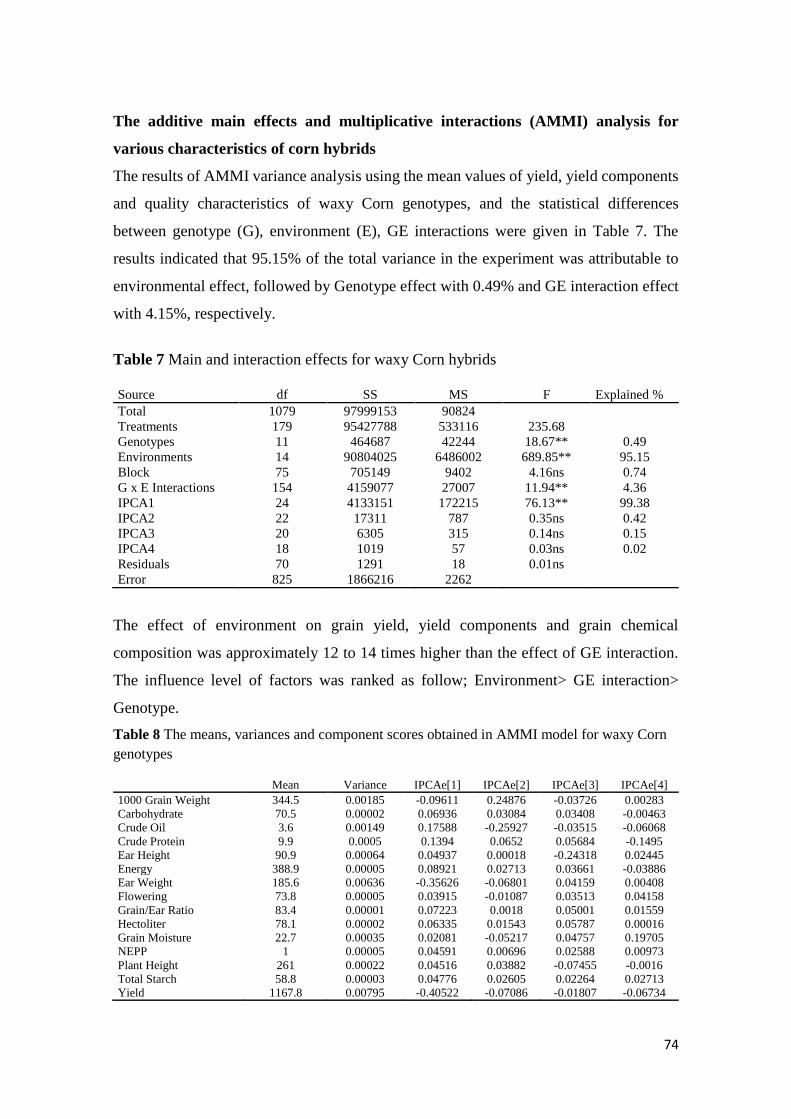
74
The additive main effects and multiplicative interactions (AMMI) analysis for
various characteristics of corn hybrids
The results of AMMI variance analysis using the mean values of yield, yield components
and quality characteristics of waxy Corn genotypes, and the statistical differences
between genotype (G), environment (E), GE interactions were given in Table 7. The
results indicated that 95.15% of the total variance in the experiment was attributable to
environmental effect, followed by Genotype effect with 0.49% and GE interaction effect
with 4.15%, respectively.
Table 7 Main and interaction effects for waxy Corn hybrids
Source df SS MS F Explained %
Total 1079 97999153 90824
Treatments 179 95427788 533116 235.68
Genotypes 11 464687 42244 18.67** 0.49
Environments 14 90804025 6486002 689.85** 95.15
Block 75 705149 9402 4.16ns 0.74
G x E Interactions 154 4159077 27007 11.94** 4.36
IPCA1 24 4133151 172215 76.13** 99.38
IPCA2 22 17311 787 0.35ns 0.42
IPCA3 20 6305 315 0.14ns 0.15
IPCA4 18 1019 57 0.03ns 0.02
Residuals 70 1291 18 0.01ns
Error 825 1866216 2262
The effect of environment on grain yield, yield components and grain chemical
composition was approximately 12 to 14 times higher than the effect of GE interaction.
The influence level of factors was ranked as follow; Environment> GE interaction>
Genotype.
Table 8 The means, variances and component scores obtained in AMMI model for waxy Corn
genotypes
Mean Variance IPCAe[1] IPCAe[2] IPCAe[3] IPCAe[4]
1000 Grain Weight 344.5 0.00185 -0.09611 0.24876 -0.03726 0.00283
Carbohydrate 70.5 0.00002 0.06936 0.03084 0.03408 -0.00463
Crude Oil 3.6 0.00149 0.17588 -0.25927 -0.03515 -0.06068
Crude Protein 9.9 0.0005 0.1394 0.0652 0.05684 -0.1495
Ear Height 90.9 0.00064 0.04937 0.00018 -0.24318 0.02445
Energy 388.9 0.00005 0.08921 0.02713 0.03661 -0.03886
Ear Weight 185.6 0.00636 -0.35626 -0.06801 0.04159 0.00408
Flowering 73.8 0.00005 0.03915 -0.01087 0.03513 0.04158
Grain/Ear Ratio 83.4 0.00001 0.07223 0.0018 0.05001 0.01559
Hectoliter 78.1 0.00002 0.06335 0.01543 0.05787 0.00016
Grain Moisture 22.7 0.00035 0.02081 -0.05217 0.04757 0.19705
NEPP 1 0.00005 0.04591 0.00696 0.02588 0.00973
Plant Height 261 0.00022 0.04516 0.03882 -0.07455 -0.0016
Total Starch 58.8 0.00003 0.04776 0.02605 0.02264 0.02713
Yield 1167.8 0.00795 -0.40522 -0.07086 -0.01807 -0.06734
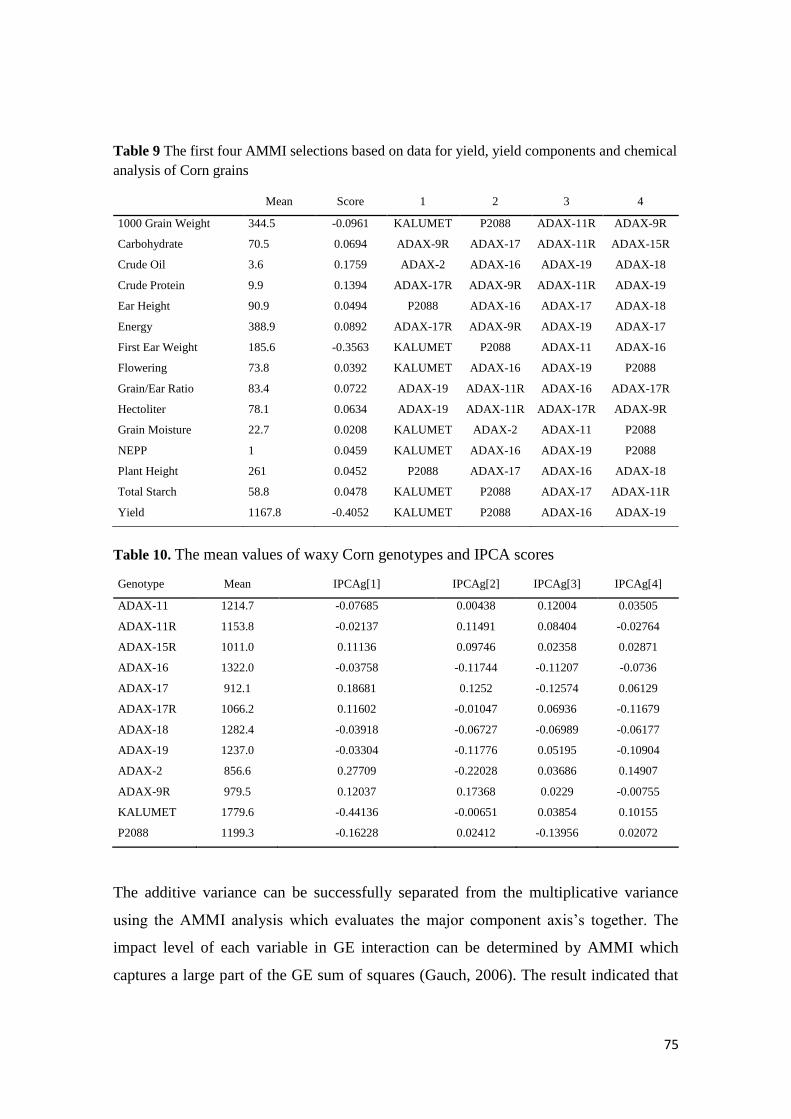
75
Table 9 The first four AMMI selections based on data for yield, yield components and chemical
analysis of Corn grains
Mean Score 1 2 3 4
1000 Grain Weight 344.5 -0.0961 KALUMET P2088 ADAX-11R ADAX-9R
Carbohydrate 70.5 0.0694 ADAX-9R ADAX-17 ADAX-11R ADAX-15R
Crude Oil 3.6 0.1759 ADAX-2 ADAX-16 ADAX-19 ADAX-18
Crude Protein 9.9 0.1394 ADAX-17R ADAX-9R ADAX-11R ADAX-19
Ear Height 90.9 0.0494 P2088 ADAX-16 ADAX-17 ADAX-18
Energy 388.9 0.0892 ADAX-17R ADAX-9R ADAX-19 ADAX-17
First Ear Weight 185.6 -0.3563 KALUMET P2088 ADAX-11 ADAX-16
Flowering 73.8 0.0392 KALUMET ADAX-16 ADAX-19 P2088
Grain/Ear Ratio 83.4 0.0722 ADAX-19 ADAX-11R ADAX-16 ADAX-17R
Hectoliter 78.1 0.0634 ADAX-19 ADAX-11R ADAX-17R ADAX-9R
Grain Moisture 22.7 0.0208 KALUMET ADAX-2 ADAX-11 P2088
NEPP 1 0.0459 KALUMET ADAX-16 ADAX-19 P2088
Plant Height 261 0.0452 P2088 ADAX-17 ADAX-16 ADAX-18
Total Starch 58.8 0.0478 KALUMET P2088 ADAX-17 ADAX-11R
Yield 1167.8 -0.4052 KALUMET P2088 ADAX-16 ADAX-19
Table 10. The mean values of waxy Corn genotypes and IPCA scores
Genotype Mean IPCAg[1] IPCAg[2] IPCAg[3] IPCAg[4]
ADAX-11 1214.7 -0.07685 0.00438 0.12004 0.03505
ADAX-11R 1153.8 -0.02137 0.11491 0.08404 -0.02764
ADAX-15R 1011.0 0.11136 0.09746 0.02358 0.02871
ADAX-16 1322.0 -0.03758 -0.11744 -0.11207 -0.0736
ADAX-17 912.1 0.18681 0.1252 -0.12574 0.06129
ADAX-17R 1066.2 0.11602 -0.01047 0.06936 -0.11679
ADAX-18 1282.4 -0.03918 -0.06727 -0.06989 -0.06177
ADAX-19 1237.0 -0.03304 -0.11776 0.05195 -0.10904
ADAX-2 856.6 0.27709 -0.22028 0.03686 0.14907
ADAX-9R 979.5 0.12037 0.17368 0.0229 -0.00755
KALUMET 1779.6 -0.44136 -0.00651 0.03854 0.10155
P2088 1199.3 -0.16228 0.02412 -0.13956 0.02072
The additive variance can be successfully separated from the multiplicative variance
using the AMMI analysis which evaluates the major component axis’s together. The
impact level of each variable in GE interaction can be determined by AMMI which
captures a large part of the GE sum of squares (Gauch, 2006). The result indicated that
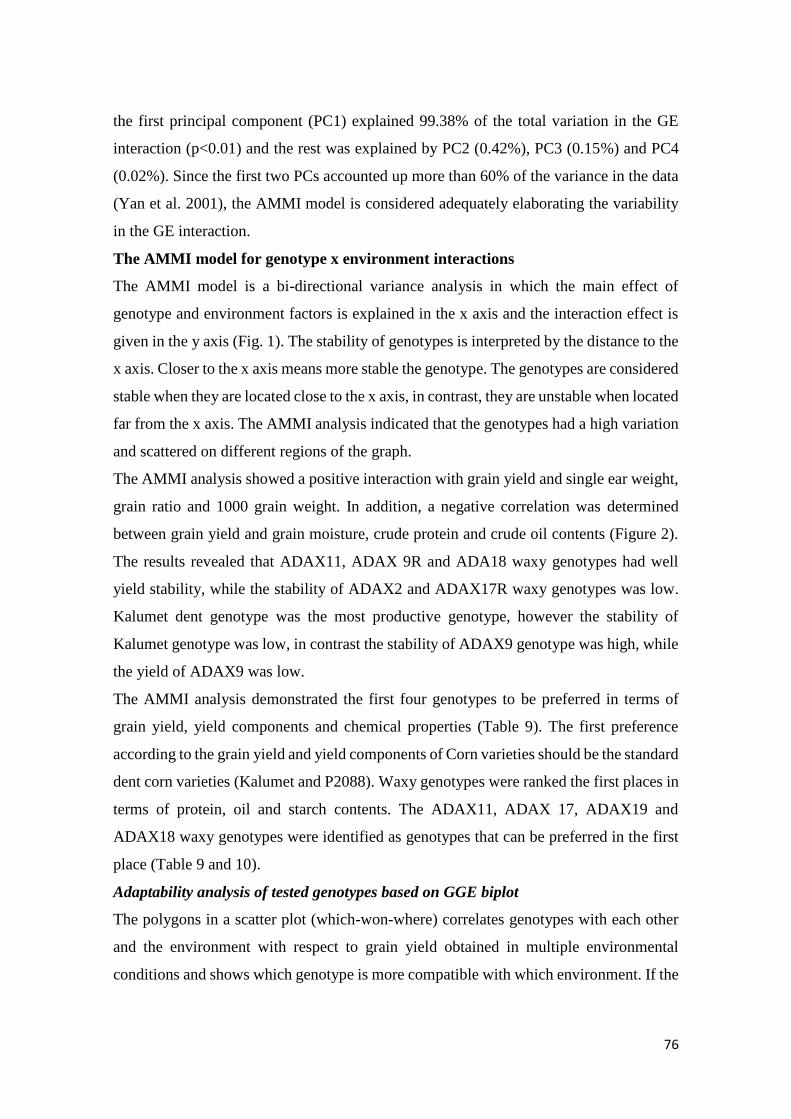
76
the first principal component (PC1) explained 99.38% of the total variation in the GE
interaction (p<0.01) and the rest was explained by PC2 (0.42%), PC3 (0.15%) and PC4
(0.02%). Since the first two PCs accounted up more than 60% of the variance in the data
(Yan et al. 2001), the AMMI model is considered adequately elaborating the variability
in the GE interaction.
The AMMI model for genotype x environment interactions
The AMMI model is a bi-directional variance analysis in which the main effect of
genotype and environment factors is explained in the x axis and the interaction effect is
given in the y axis (Fig. 1). The stability of genotypes is interpreted by the distance to the
x axis. Closer to the x axis means more stable the genotype. The genotypes are considered
stable when they are located close to the x axis, in contrast, they are unstable when located
far from the x axis. The AMMI analysis indicated that the genotypes had a high variation
and scattered on different regions of the graph.
The AMMI analysis showed a positive interaction with grain yield and single ear weight,
grain ratio and 1000 grain weight. In addition, a negative correlation was determined
between grain yield and grain moisture, crude protein and crude oil contents (Figure 2).
The results revealed that ADAX11, ADAX 9R and ADA18 waxy genotypes had well
yield stability, while the stability of ADAX2 and ADAX17R waxy genotypes was low.
Kalumet dent genotype was the most productive genotype, however the stability of
Kalumet genotype was low, in contrast the stability of ADAX9 genotype was high, while
the yield of ADAX9 was low.
The AMMI analysis demonstrated the first four genotypes to be preferred in terms of
grain yield, yield components and chemical properties (Table 9). The first preference
according to the grain yield and yield components of Corn varieties should be the standard
dent corn varieties (Kalumet and P2088). Waxy genotypes were ranked the first places in
terms of protein, oil and starch contents. The ADAX11, ADAX 17, ADAX19 and
ADAX18 waxy genotypes were identified as genotypes that can be preferred in the first
place (Table 9 and 10).
Adaptability analysis of tested genotypes based on GGE biplot
The polygons in a scatter plot (which-won-where) correlates genotypes with each other
and the environment with respect to grain yield obtained in multiple environmental
conditions and shows which genotype is more compatible with which environment. If the
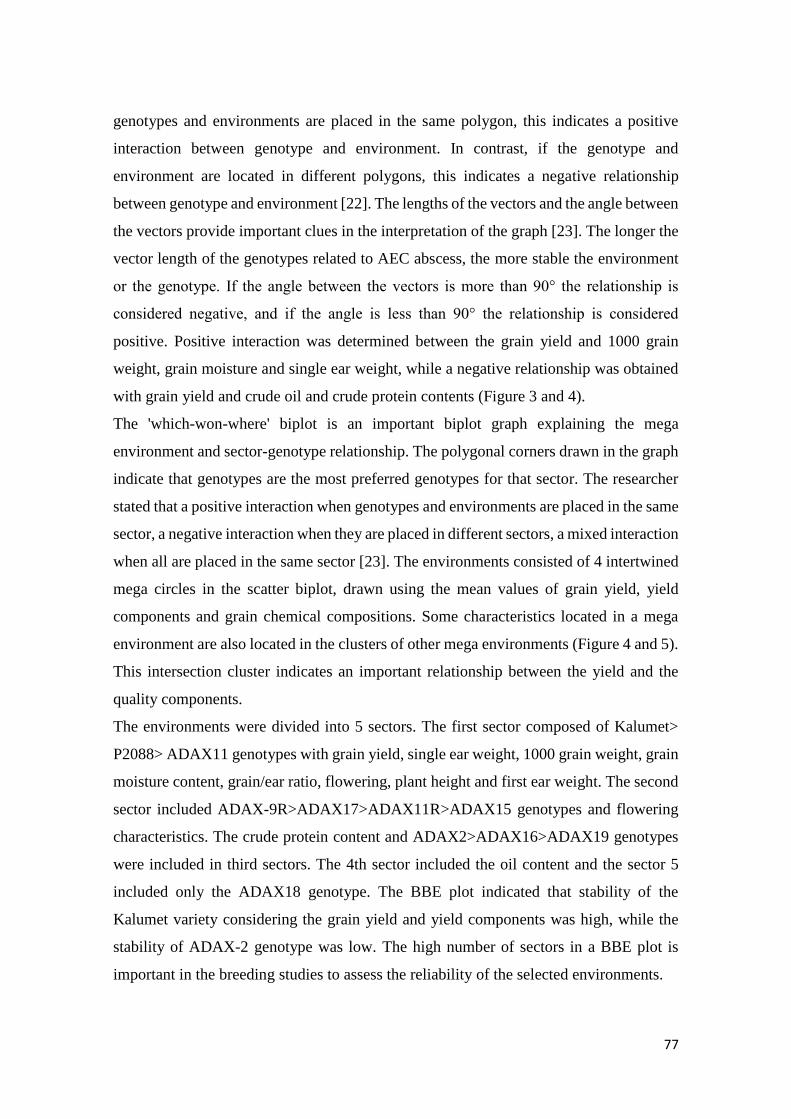
77
genotypes and environments are placed in the same polygon, this indicates a positive
interaction between genotype and environment. In contrast, if the genotype and
environment are located in different polygons, this indicates a negative relationship
between genotype and environment [22]. The lengths of the vectors and the angle between
the vectors provide important clues in the interpretation of the graph [23]. The longer the
vector length of the genotypes related to AEC abscess, the more stable the environment
or the genotype. If the angle between the vectors is more than 90° the relationship is
considered negative, and if the angle is less than 90° the relationship is considered
positive. Positive interaction was determined between the grain yield and 1000 grain
weight, grain moisture and single ear weight, while a negative relationship was obtained
with grain yield and crude oil and crude protein contents (Figure 3 and 4).
The 'which-won-where' biplot is an important biplot graph explaining the mega
environment and sector-genotype relationship. The polygonal corners drawn in the graph
indicate that genotypes are the most preferred genotypes for that sector. The researcher
stated that a positive interaction when genotypes and environments are placed in the same
sector, a negative interaction when they are placed in different sectors, a mixed interaction
when all are placed in the same sector [23]. The environments consisted of 4 intertwined
mega circles in the scatter biplot, drawn using the mean values of grain yield, yield
components and grain chemical compositions. Some characteristics located in a mega
environment are also located in the clusters of other mega environments (Figure 4 and 5).
This intersection cluster indicates an important relationship between the yield and the
quality components.
The environments were divided into 5 sectors. The first sector composed of Kalumet>
P2088> ADAX11 genotypes with grain yield, single ear weight, 1000 grain weight, grain
moisture content, grain/ear ratio, flowering, plant height and first ear weight. The second
sector included ADAX-9R>ADAX17>ADAX11R>ADAX15 genotypes and flowering
characteristics. The crude protein content and ADAX2>ADAX16>ADAX19 genotypes
were included in third sectors. The 4th sector included the oil content and the sector 5
included only the ADAX18 genotype. The BBE plot indicated that stability of the
Kalumet variety considering the grain yield and yield components was high, while the
stability of ADAX-2 genotype was low. The high number of sectors in a BBE plot is
important in the breeding studies to assess the reliability of the selected environments.
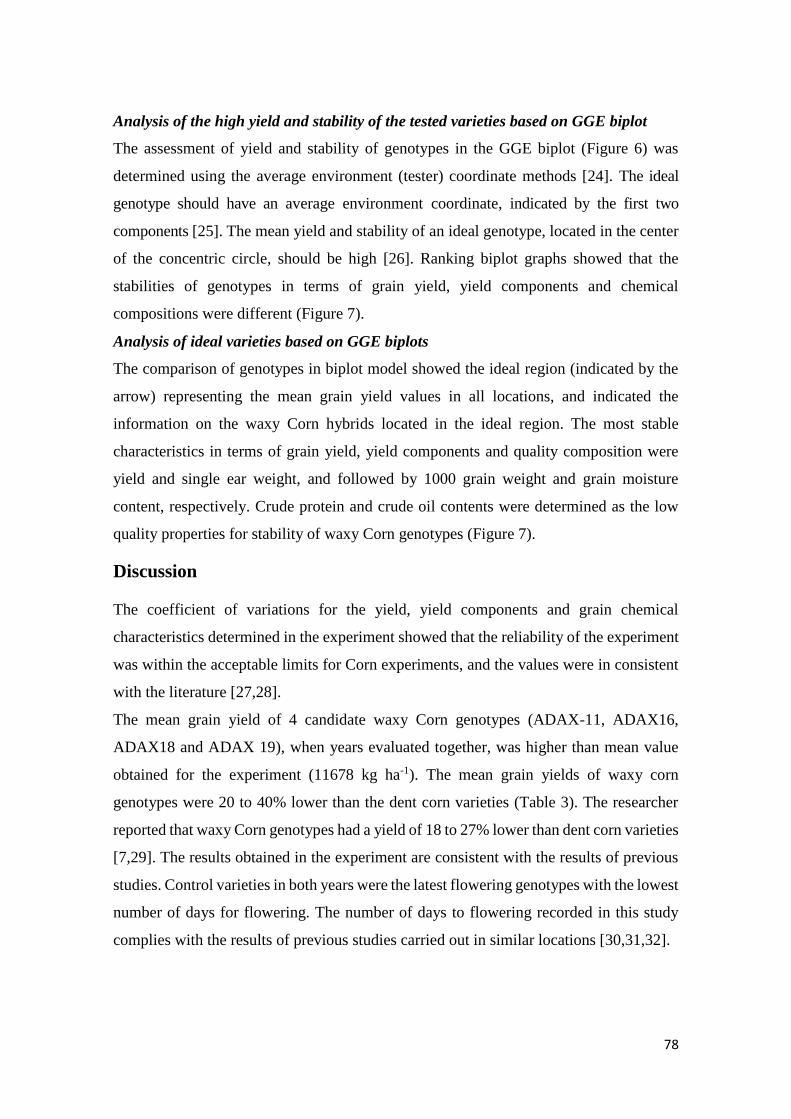
78
Analysis of the high yield and stability of the tested varieties based on GGE biplot
The assessment of yield and stability of genotypes in the GGE biplot (Figure 6) was
determined using the average environment (tester) coordinate methods [24]. The ideal
genotype should have an average environment coordinate, indicated by the first two
components [25]. The mean yield and stability of an ideal genotype, located in the center
of the concentric circle, should be high [26]. Ranking biplot graphs showed that the
stabilities of genotypes in terms of grain yield, yield components and chemical
compositions were different (Figure 7).
Analysis of ideal varieties based on GGE biplots
The comparison of genotypes in biplot model showed the ideal region (indicated by the
arrow) representing the mean grain yield values in all locations, and indicated the
information on the waxy Corn hybrids located in the ideal region. The most stable
characteristics in terms of grain yield, yield components and quality composition were
yield and single ear weight, and followed by 1000 grain weight and grain moisture
content, respectively. Crude protein and crude oil contents were determined as the low
quality properties for stability of waxy Corn genotypes (Figure 7).
Discussion
The coefficient of variations for the yield, yield components and grain chemical
characteristics determined in the experiment showed that the reliability of the experiment
was within the acceptable limits for Corn experiments, and the values were in consistent
with the literature [27,28].
The mean grain yield of 4 candidate waxy Corn genotypes (ADAX-11, ADAX16,
ADAX18 and ADAX 19), when years evaluated together, was higher than mean value
obtained for the experiment (11678 kg ha-1). The mean grain yields of waxy corn
genotypes were 20 to 40% lower than the dent corn varieties (Table 3). The researcher
reported that waxy Corn genotypes had a yield of 18 to 27% lower than dent corn varieties
[7,29]. The results obtained in the experiment are consistent with the results of previous
studies. Control varieties in both years were the latest flowering genotypes with the lowest
number of days for flowering. The number of days to flowering recorded in this study
complies with the results of previous studies carried out in similar locations [30,31,32].
79
Fig 2 Graphic of AMMI analyses of Waxy Corn cultivars Fig 3 The scatter plot of Waxy Corn (The connect
environment scores with origin)
Fig 4 The which-won-where plot of Scatter
80
Fig 5 Mega environment scatter plot of waxy Corn genotypes Fig 6 Ranking biplot of waxy Corn genotypes Fig 7 Comparison biplots for waxy Corn genotypes
81
The researchers reported that the number of days to flowering between 58.5 and 77.5 days.
In addition, the variation in flowering period over the years shows that although the flowering
period is a genetic feature, it is also affected by the environmental factors (mean temperature
during sowing-flowering period and precipitation regime).
The mean plant heights of 4 waxy Corn genotypes (ADAX11R, ADAX15R, ADAX17 and
ADAX 19) were higher than the mean plant height recorded in the experiment (Table 7). In
addition, the plant heights of waxy Corn genotypes were similar to the plant heights of dent
corn (control) varieties. The results obtained in the experiment are similar to the plants
heights (255-335.8 cm) reported in the studies conducted under Samsun conditions
[30,31,32]. Plant height is a genetic characteristics, though significantly affected by the
environmental factors. The lower average temperature and higher precipitation during the
vegetation period of the second year caused higher plant heights of the genotypes compared
to the first year of the experiment.
The mean ear heights of 3 waxy Corn genotypes (ADAX-16, ADAX-17 and ADAX-18)
were higher than the mean value recorded in the experiment. The ear height of waxy corn
genotypes was 10 to 20% lower than that of the dent corn varieties. The many researcher
reported that the ear height of corn varieties varied between 98.3 and 145 cm, which are
partially lower than the ear heights obtained in the experiment [31,32, 33]. The results in the
experiment indicated that the ear height is not only affected by the genetic characteristics but
also by the environmental factors. The differences in ear height may be related to low ear
formation in waxy corn genotypes, and higher sensitivity of waxy corn genotypes to plant
density compared to the dent corn.
Grain/ear ratios of 3 waxy Corn genotypes (ADAX-16, ADAX19 and ADAX-2R) were
higher than the mean grain/ear ratio of the experiment. Corn breeders desire to have a
grain/ear ratio higher than 85%. Waxy genotypes had relatively lower grain/ear ratios than
the control varieties. The results obtained in the experiment are in harmony with the grain/ear
ratios (78.0-85.8%) reported by [34,31]. The results of the study revealed the strong influence
of genetic structure on grain/ear ratio of waxy Corn genotypes. The mean grain moisture
content of the genotypes was 22.7% and mean grain moisture content of 5 waxy Corn
genotypes (ADAX11R, ADAX15R, ADAX17R, ADAX-18 and ADAX9R) was lower than
82
the mean moisture content of the experiment. The waxy genotypes in both years had lower
grain moisture content than the standard varieties (Table 8). The results obtained in the
experiment are compatible with the grain moisture contents (19.30-30.9%) recorded in a
similar location by [34,31]. In addition, the grain moisture content of waxy Corn genotypes
in a five year study varied between 20.7 and 24.0%, which were relatively lower compared
to grain moisture contents of dent corn [7].
One thousand grain weight is a genetic trait but also affected by the environmental factors.
Positive correlation was obtained between 1000 grain weight and grain yield. Many
researcher reported that 1000 grain weights of dent corn varied between 302.7 and -489.0 g.
[35,36]. In addition, Hao and Wu (2008) reported that 1000 grain weights of waxy Corn pure
lines ranged from 142 to 192 g, while Edy and Baktiar (2017) reported that waxy Corn
hybrids ranged from 312 to 332 g. The values obtained in the experiment are higher than
those reported [37]. 100 grain weight can be attributed to the genetic structure of hybrid
genotypes used in the experiment. The shape, size and homogeneity of corn grains are the
most important factors to determine the hectoliter weight of genotypes. The mean hectoliter
weights of genotypes was determined as 78.1 kg h-1. Sayaslan et al. (2016) and Saygı and
Toklu (2017) reported that hectoliter weights ranged between 65.1 and 80.1 kg h-1. The
results showed that the hectoliter weights of waxy Corn genotypes were similar to hectoliter
weights of dent corn varieties, and the genetic structure has a significant effect on hectoliter
weight of corn varieties. The products with low energy and nutritious have recently become
more preferred. The mean carbohydrate content of the genotypes was 70.5% (Table 5). The
results revealed that the genetic (genotype potential) effect has predominant influence on
carbohydrate content. The carbohydrate content of dent corn varieties varied between 67.9
and 81.2%, and waxy Corn genotypes ranged between 71.5 and 74.5% [37,19,39]. The
carbohydrate content obtained in this study are similar to the results reported in previous
studies.
Energy content varied depending on Corn genotypes. Ma et al. (2019) reported that the mean
energy values of dent corn and waxy corn varieties were 378.5 and 380.5 kcal 100 g-1,
respectively, which were slightly higher than the energy values calculated in this study. The
difference is probably related to the higher oil and protein contents of waxy Corn genotypes
83
used in the experiment compared to those used by [38]. The energy values, similar to the
grain chemical composition, are under the influence of the genetic structure.
Single ear weight was significantly different among Corn genotypes. The researcher reported
that single corn weight of dent corn varied between 177 and 224 g, while the other reported
that single ear weights of waxy corn genotypes ranged between 98 and 282 g [40,41,42]. The
results are similar to the finding reported in the previous studies. The number of ears per
plant recorded for waxy and dent Corn genotypes were similar. The number of ears per plant
for grain corn was reported between 1.12 and 1.28, for waxy Corn genotypes from 1 to 3
[40,43,44]. The number of ears per plant obtained in this experiment were lower than those
reported by Souvandouane et al. (2010), while in harmony with the values given in the
previous studies. This difference can be attributed to the difference in genetic structure (waxy
x super sweet hybrid) of the waxy genotypes used in the experiment and the differences in
fertilizer applications and the sowing density (60x25 cm).
Crude protein ratio is one of the most important quality traits and varies depending on the
corn subspecies. The protein ratios in various experiments reported varying between 8 and
13% [19,45]. In addition, the protein ratio of waxy corn varies reported varying between
7.89 and 9.4% [46,41,7,38]. The protein ratios reported in previous studies are compatible
with the dent corn, while higher than the waxy corn genotypes. The oil content of waxy and
dent Corn genotypes were different. The oil ratio of dent corn varieties was reported varying
between 3.4 and 5.0% [17,19,31].
The crude oil ratio of waxy Corn genotypes reported in the previous studies ranges from 4.4
to 5.1% [7,47,41,38]. The crude oil ratios obtained in the experiment were relatively lower
compared to those reported in the literature. The difference is related to the low crude oil
ratios of the parents of the genotypes used in the experiment, and the crude oil ratios of waxy
Corn genotypes were higher than the crude oil ratios of the control varieties. In addition, the
results showed that the genetic structure of genotypes significantly affects the crude oil
content. Similar to the crude protein and oil contents, the grain starch content slightly differed
between the genotypes. The results indicated that starch content of waxy genotypes is
significantly affected by the genetic structure.
84
The starch ratios of waxy corn genotypes have been reported between 69.01 and 73.2%
[7,47,38]. The differences between starch ratios reported in the literature and those obtained
in this study can be attributed the difference in the genotypes used.
The significance of GY interaction is related to the differences in climate and soil conditions
between the years. The significance of GE interaction (p<0.01) in both years can be explained
by changes in the stabilities of genotypes under different environments. The variation of yield
potentials for corn genotypes depending on the environment have been reported also by
[48,49,27].
The AMMI biplot is a comprehensive and effective method to classify the genotypes based
on their levels in combination with target environments, and graphically ranks the genotypes
with their strengths and weaknesses in different environments [20]. GGE biplot method
provides convenience in explaining the ideal genotype and environment relationship for
breeders [50,51] Both biplot methods (AMMI and GGE) explain the grain yield, yield
components and chemical composition interactions, and provide reliable information to the
breeders about the candidate genotypes or halfway materials in the gene pool. The AMMI
biplot analysis indicated that the highest effect on experimental variance was resulted from
the environment (95.15%) followed by genotype (0.49%) and GE interaction (4.15%),
respectively. The coassessment of grain yield, yield components and chemical composition
showed that the effect of the environment was quite higher than genotype and GE interaction.
Similar results on AMMI studies have been reported by [50,51]. The study to determine the
yield stability of some corn hybrids, and explained that genotype effect on the experimental
variance was 9.17%, the effect of year and environment was 77.13% and GE interaction was
13% [52]. The other reported that the environment effect on the agronomic properties of
some corn varieties was 46.67%, the effect of the genotype was 22.26%, and the GE
interaction was 31.06% [53]. The results obtained in this study differed from other studies.
The difference can be attributed to the type of genotypes (waxy Corn) used in the experiment
and narrow genetic diversity of the genotypes. The first four genotypes determined by the
AMMI analysis in terms of yield, yield components and chemical compositions were given
in Table 5. The dent corn variety (Kalumet) can be preferred in terms of 1000 grain weight,
single ear weight, flowering, grain moisture content and number of ears per plant, while, the
85
variation was high in the waxy genotypes (Table 5). One thousand grain weight and single
ear weight came to the fore as the most stable traits of the corn varieties (Figure 1). The
ADAX11 and ADAX18 waxy genotypes are considered the most fertile and stabile
genotypes. In addition, both waxy genotypes can be recommended as good candidates for
similar ecologies.
The GGE biplot analysis is used extensively in different test environments to determine the
stability of genotypes in terms of yield, yield components and quality characteristics. The
representative stability graph of grain yield, yield components, and chemical composition
plotted on the mean of the squares showed that Kalumet> P2088> ADAX16>ADAX19 were
the first four genotypes which have average yields above the overall average in ideal
environments and higher stability. The mean yields of ADAX-2>ADAX-9R>ADAX17
genotypes were lower than the mean yield of the experiment; thus, the stability of genotypes
was considered low. Similar results have been reported many researcher [54,55,49,27]. The
GGE biplot defines the relationships between all environments based on the general model
of MET data, whereas the simple correlation coefficients describe the relationships between
the two environments [20,21]. The GGE biplot is considered an efficient method to determine
the best genotypes, which are representative across environments [50,51]. The most stable
cultivars were Kalumet and P2088, while ADAX-11 and ADAX18 genotypes were
determined as the most stable waxy Corn genotypes. Many researchers indicated that the
comparison biplot model helps determine the ideal genotype based on the mean yield and
quality values [27,49,56]. Placement of the varieties in different sectors indicated that these
genotypes were genetically different in terms of yield. The ADAX-9R, ADAX17,
ADAX11R and ADAX15 cultivar candidates were genetically similar to each other. Similar
results have been obtained in the biplot studies conducted by [50,51]. Highly stable and
efficient waxy genotypes (ADAX11 and ADAX18) identified by the GGE biplot analysis
have the potential to be used in countries where the ecological conditions are similar.
Conclusion
Waxy Corn is an important Corn subspecies used in many areas of the starch industry and
the consumption of fresh ear has recently increased due to the rich nutrient content. This
86
study was carried out in 2018 and 2019 to determine the grain yield, yield components and
chemical contents (protein, oil, starch, multiple element contents) of waxy Corn genotypes
and to determine the stable genotypes in terms of all traits using the Biplot (GGE and AMMI
model) analysis. The mean grain yield of the genotypes ranged from 8560.6 to 17290.6 kg -
1ha, the number of days to flowering from 71.3 to 77.5 days, plant height from 251.7 to 295.0
cm, the first ear height from 85.3 to 98.3 cm, crude protein ratio from 9.4 to 10.4%, crude oil
ratio from 3.3% to 5.0% , total starch content from 57.5% to 60.0, 1000 grain weight from
317.7 to 402.2 g, hectoliter from 76.9% to 79.3, carbohydrate content from 69.6 to 71.6%,
energy content from 383.8 to 393.7 kcal, grain/ear ratio from 81.3 to 85.5%, grain moisture
content from 20.5 to 25.0, single ear weight from 145 to 286.3 g, and the number of ears per
plant from 0.9 to 1.0 ear. Significant positive correlations were determined between the grain
yield, 1000 grain weight and single ear weight of the genotypes. The results revealed that the
chemical composition of wax Corn genotypes are within the acceptable limits and their
energy values are low. The grain yields of Corn genotypes were 10 to 30% lower than the
yields of dent corn varieties. Nevertheless, the enrichment of waxy corn gene pool with new
half-way materials will increase the yield. In addition, investigating the fresh ear
characteristics, macro and micro nutrient contents, vitamin values and amino acid contents
is of great importance. The biplot (AMMI and GGE) analyzes evaluating the grain yield,
yield components and chemical composition of waxy Corn together, revealed that ADAX11
and ADAX18 genotypes have the high stability.
Acknowledgments I would like to thank the General Directorate of Agricultural Research and Policies (TAGEM) for the funding
of this project and to the staff of the Corn Research Institute Directorate (MAEM) for the convenience in
providing the materials used in the study.
References
1. Collins, G. N., A New Type of Indian Corn from China. Bureau of Plant Industry (Bulletin) 1909,161:
1-30.
2. Harakotr, B., et al., Anthocyanins and antioxidant activity in coloured waxy corn at different
maturation stages. Journal of Functional Foods. 2014, 9: 109-118.
3. Fergason, V., Specialty Corn, High Amylose and Waxy Corns, Second Edition Ed: Halluer A.R. 2001,
pp: 71-92.
87
4. Hung P, V., T, Maeda, and N. Morita, Study on physicochemical characteristics of waxy and high-
amylose wheat starches in comparison with normal wheat starch. Starch/Staerke 2007, 59(3-4), p. 125-
131. http://dx.doi.org/10.1002/star.200600577.
5. Alcázar-Alay S, C. and M. A, A, Meireles, Physicochemical properties, modifications and applications
of starches from different botanical sources. Food Sci. Technol, Campinas 2015, 35(2): 215-236.
6. Cengiz, R., et al., Development of Waxy corn (Zea mays ceratina) varieties, 11th Field Crops
Congress Proceedings Book-1 2015, 259-261.
7. Fergason, V., Specialty Corn, High Amylose and Waxy Corns, Second Edition Ed: Halluer A.R. 2001,
pp: 71-92.
8. Zheng H, et al., Genetic diversity and molecular evolution of Chinese waxy corn germplasm. Plosone
2013, 8(6): e66606. Doi: 10.1371/journal.pone.0066606.
9. Mostafavi, K., et al., Heterotic grouping of Iranian corn inbred lines based on yield-specific combining
ability in diallel crosses and GGE biplot. J. Res. Agric. Sci., 2012, 8: 113-125.
10. Badu-apraku, B., K., et al., Performance of extra-early corn cultivars based on GGE biplot and AMMI
analysis. J. Agric. Sci., 2011, 150:1–11.
11. Badu-apraku, B., et al., Combining ability, heterotic patterns and genetic diversity of extra-early
yellow inbreds under contrasting environments. Euphytica, 2013,192: 413-433.
12. Ruswandi, D, J., et al., Determination of combining ability and heterosis of grain yield components for
Corn mutants based on line x tester analysis. Asian J. Crop Sci., 2015, 7: 19-33.
13. Stojaković, M, B., et al., Dodig grouping pattern of Corn test locations and its impact on hybrid zoning.
Euphytica, 2015; 204, 2: 419-431.
14. Oyekunle, M., et al., Stability analysis of corn cultivars adapted to tropical environments using AMMI
analysis. Cereal Res. Comm., 2017, 45, 2: 336–345.
15. Boţovıć, D., et al., Assessment stability of corn lines yield by GGE-Biplot analysis Genetıka, 2018,
Vol. 50, No3, 755 -770, 2018. doi.org/10.2298/gensr1803755b
16. Anonymous,. Technical instruction for testing agricultural data. 2018 P.1-17, Ankara.
17. Lambert, H., High oil corn hybrids. Second Edition Halluer 2001, A.R. pp: 148-150.
18. Anonymous, Testing methodology and interpretation of results, 2013. Chapter 5, U.S. Grains Council,
and U.S. America.
19. Sayaslan, A., et al., Wet-milling qualities of Dent corn (Zea mays indentata L.) hybrids grown as main
crop in Adana and Sakarya. Journal of Agricultural Faculty of Gaziosmanpasa University (2016) 33
(3), 167-180. E-ISSN: 2147-8848. Doi: 10.13002/jafag1144
20. FAO., Food energy – methods of analysis and conversion factors. FAO food and nutrition paper.
2003ISSN 0254-4725 p.23
21. Yan, W. and N, A, Tinker, Biplot analysis of multi-environment trial data: principles and applications.
Canadian journal of plant science, 2006, 86, 623-645. https://doi.org/10.4141/P05-169
22. Yan, W., et al., Cultivar evaluation and mega-environment investigation based on the GGE biplot.
Crop Science2000,40:597-605.
23. Yan, W., et al., GGE biplot vs. AMMI analysis of genotype-by-environment data. Crop science, 2007,
47, 643-653. https://doi.org/10.2135/cropsci2006.06.0374
24 Yan, W., and J. Bi Holland, A heritability-adjusted GGE biplot for test environment evaluation.
Euphytica, 2010, 171, 355-369. https://doi.org/10.1007/s10681-009-0030-5
25. Yan, W., GGE biplot: a Windows application for graphical analysis of multi-environment trial data
and other types of two-way data. Agron. J., 2001, 93: 1111–1118.
88
26. Yan, W., and N. A, Tinker, An integrated biplot analysis system for displaying, interpreting,
and Exploring genotype X environment interaction. Crop Science 2005,45:1004-
1016.https://doi.org/10.2135/cropsci2004.0076
27. Oliviera, T, R, A., et al., Hybrid Corn selection through GGE biplot analysis. Bragantia vol.78 no.2
Campinas Apr./June 2019 Epub Mar 14, 2019. https://doi.org/10.1590/1678-4499.20170438.
28. Fritsche-Neto, R., et al., Updating the ranking of the coefficients of variation from Corn experiments.
Acta Scientarium, 2012, 34, 99-101. https://doi.org/10.4025/actasciagron.v34i1.13115
29. Solaimalai, A., P. Anantharaju, and S. Irulandi., Corn Crop: Improvement, Production, Protection and
Post-Harvest Technology. Fırst Edition. 2020
30. Özata E., A, Öz, and H. Kapar, Determination of yield and quality characteristics of silage hybrid corn
variety candidates. Agricultural Sciences Research Journal 2012, 5 (1): 37-41,
31. Özata, E., and H. Kapar, Determination of the quality and performance of some dent corn hybrid (Zea
mays indentata Sturt) under Samsun conditions. Agricultural Sciences Research Journal 2014, 7 (2):
01-07, 2014 ISSN: 1308-3945, E-ISSN: 1308-027X,
32. Özata, E., et al., Determination of the Performances of Candidate Dent Corn Hybrids under the Main
Product Conditions. Iğdır Univ. Journal of Science Institute, 2013, 3(1): 91-98
33. Özata, E., S. İkincikarakaya, Ünver, and A. Özturk, The Determination of silage yield and quality traits
of candidate corn hybrids. Ekin Journal of Crop Breeding and Genetics. 2018, 4(1):31-40, 2018.
34. Öz, A., et al., A study on the development of corn varieties suitable for Samsun and Konya conditions.
National Cereal Symposium, June 2-5 2008.
35. Acıbuca, A., Researches on Silage and Grain Yield and Yield Characteristics of Some Corn Varieties
Grown as the Second Crop in Mardin Ecological Conditions. 2015, Ege University Institute of Science
and Technology, Master Thesis (Unpublished), Izmir.
36. Sabancı, S., Determination of the yield, quality and antioxidant activities of some corn (Zea Mays L.)
cultivars grown in the Aegean region. 2016, Ege University Institute of Science and Technology,
Master Thesis (Unpublished), Izmir.
37. Creech, R., G., Genetic control of carbohydrate Synthesis in corn endosperm. Genetics 1965, 52: 1175-
1186 December 1965.
38. Ma, Dongli Li, et al., Determination of the energy contents and nutrient digestibility of corn, waxy
corn and steam-flaked corn fed to growing pigs. Asian-Australasian Journal Animal Science Vol. 32,
No. 10:1573-1579 October 2019 https://doi.org/10.5713/ajas.18.0713 pISSN 1011-2367 eISSN 1976-
5517.
39. Saygı, M., and F.Toklu, Evaluation of some grain Corn (Zea mays indentata sturt.) cultivars grown
under the first crop conditions in Çukurova Region in terms of grain yield, some vegetative
characteristics and inter-character relations. KSU Journal of Natural Sciences, 2017, 20 (Special Issue),
308-312, Kahramanmaraş.
40. Souvandouane, S., et al. Effects of Planting Dates and Mulch Types on the Growth, Yield and
Chemical Properties of Waxy Corn Crosses Sonjajang×KNU-7 and Asan×KNU-7 Korean J. Crop
SCI.), 55(2), 2010.
41. Thakur, S., N. Singh, and A. Kaur, Characteristics of normal and waxy corn: physicochemical, protein
secondary structure, dough rheology and chapatti making properties. J Food Sci Technol (September
2017) 54(10):3285–3296 DOI 10.1007/s13197-017-2775-5
42. Storck, L., et al.,Sample size for single, double and triple hybrid corn ear traits. Scientia Agricola 2007,
64: 30-35
43. Akan, S., Determination of suitable Corn varieties for the ecological conditions of Muş province. 2017
Bingöl University, Institute of Science and Technology, Master's Thesis (Unpublished).
89
44. Sinay, H., et al., Proline content and yield components of local corn cultivars from Kisar Island,
Maluku, Indonesia. International Journal of Plant Biology 2015; 6:6071.
45. Khan, A.K., et al., Estimation of protein, carbohydrate, starch and oil contents of indigenous corn (Zea
mays L.). Germplasm European Academic Research Vol. II, Issue 4/ July 2014.
46. Edy, S, N., and I. Baktiar, Increased potential of protein pontent of Waxy corn. International Journal
of Environment, Agriculture and Biotechnology (IJEAB) Vol-2, Issue-4, July-Aug- 2017.
http://dx.doi.org/10.22161/ijeab/2.4.55 ISSN: 2456-1878
47. Klimek-Kopyra A, et al., Some aspects of cultıvatıon and utılızatıon of waxy maıze (Zea mays L. Ssp.
Ceratina). ACTA Agrobotanica Vol. 65 (3): 3-12 2012.
48. Faria, S. V, et al.,Adaptability and stability in commercial Corn hybrids in the southeast of the State
of Minas Gerais, Brazil. Revista Ciência Agronômica, 2017, 48, 347-357. https://
doi.org/10.5935/1806-6690.20170040.
49. Oliveira, T, R, A., et al., Correlation among adaptability and stability assessment models in Corn
cultivars. Australian Journal of Crop Science, 2017, 11, 516-521.
http://dx.doi.org/10.21475/ajcs.17.11.05.p304
50. Kendal, E. and Y. Dogan, Stability of a cveidate and cultivars (Hordeum vulgare L) by GGE Biplot
analysis of Multi-environment Yield Trials in Spring Barley. Agriculture and Forestry. 2015; 61(4),
307-318.
51. Oral, E,, E. Kendal, and Y. Doğan, Evaluation of yield stability in some bread wheat varieties using
biplot and AMMI analysis. Methods Journal of Agriculture, ADÜ, 2018;15(1):55-64 — doi:
10.25308/aduziraat.373685.
52. Mitrović B, et al., Evaluation of experimental Corn hybrids tested in multi-location trials using AMMI
and GGE biplot analyses. Turkish Journal of Field Crops 2012:17(1): 35-40.
53. Yue, H, W., et al., Effects of genotype-by-environment interaction on the main agronomic traits of
Corn hybrids. Applied Ecology and Environmental Research, 2020
54. Gauch, H, G., and R. W, Zobel, Predictive and postdictive success of statistical analysis of yield trials.
Theoretical and Applied Genetics 1997, 76.1 1988: 1-10.
55. Gauch, H, G., Statistical Analysis of Yield Trials by AMMI and GCE. Crop Science 2006, 46: 1488-
1500.
56. Oliveira, R.L., et al., Ferreira Evaluation of Corn hybrids and environmental Evaluation of Corn
hybrids and environmental stratification by the methods AMMI and GGE biplot stratification by the
methods AMMI and GGE biplot. Crop Breeding App. Biotech., 2010, 10: 247-253.
90
Research article
Achife, C. E., et al., Microbial Population of Soil and Water around Petroleum Depot Suleja, Nigeria, and
their Hydrocarbon Utilization. International Journal of Life Sciences and Biotechnology, 2021. 4(1): p. 90-
113. DOI: 10.38001/ijlsb.791853
Microbial Population of Soil and Water around Petroleum
Depot Suleja, Nigeria, and their Hydrocarbon Utilization
Achife, C. E.1* , Ijah, U.J.J2 , Bala J. D.1 ,Oyeleke, S. B. 3
ABSTRACT Contamination by petroleum products is a common occurrence in various depots in Nigeria.
Suleja depot in recent times has recorded several petroleum spillages and fire incidence
attributed to petroleum products storage and distribution. This study was aimed at determining
the microbiological quality of soil and water sources in communities around petroleum
products depot in Suleja, Nigeria. Soil and water samples were collected from petroleum
depot and the five communities around the petroleum products depot and a control site.
Microorganisms in the soil and water samples were enumerated by spread inoculation on
general purpose media and selective media. Bacterial and fungal isolates were tested for their
potential to utilize petroleum products in a Bushnell Haas Broth containing 0.05 mL of
petroleum products (diesel, kerosene, engine oil, crude oil) as a source of carbon and energy.
The utilization rate was determined by spectrophotometry. The capacities of selected bacterial
and fungal isolates to mineralize crude oil were further tested in minimal salt medium. The
bacteria isolated were Staphylococcus aureus, Streptococcus faecalis, Proteus mirabilis,
Pseudomonas aeruginosa, Bacillus subtilis and Escherichia coli. The microbial isolates were
not evenly distributed in the six experimental and control plots. Soil samples had higher
aerobic heterotrophic bacterial counts than the water samples. Crude oil was most utilized by
the microbial isolates. Bacterial isolates from genera Pseudomonas and Bacillus had the
highest capacity in utilizing the petroleum products. Among the fungal species, Aspergillus
niger and Penicillium notatum exhibited greater capacity to utilize the petroleum products.
Present study revealed isolates capable of utilizing the various petroleum products which can
be useful in oil spill bioremediation in the tropical environments.
Introduction
Crude oil pollution is currently considered to be a great threat to the health of living things
in the environment including humans. Nigeria records an average of 300 oil spills in the oil
producing States annually, making the Niger Delta regions the most polluted part of
Nigeria, affecting the air, soil and water bodies [1]. Apart from the Niger Delta regions,
other places that serve as depots for petroleum products such as diesel, premium motor
1 Department of Microbiology, School of Life Sciences, Federal University of Technology Minna, Nigeria 2 Department of Biological Sciences, Federal University of TechnoIogy, Minna, Nigeria 3 Department of Crop Production. Federal University of Technology,Minna, Nigeria
* Corresponding Author: Achife, Chukwunonso Emperor. E-mail: [email protected]
ARTICLE HISTORY
Received
10 September 2020
Accepted
20 October 2020
KEYWORDS
Bacteria,
fungi,
soil,
water,
hydrocarbons
91
spirit, and kerosene among others have in one way or the other encountered oil spills during
transportation or storage either accidentally or due to human error contributing to soil and
water pollution [2,1].
Crude oil also known as petroleum is composed of saturated alkanes and cycloalkanes,
unsaturated alkynes and alkenes, as well as polycyclic aromatic hydrocarbons (PAHs) [3].
PAHs are difficult to degrade from the environment and their presence in the environment
has been proven to have debilitating effects on living things [3]. Nwakanma et al. [ 2]
reported that Nigerian crude oil could be hepatotoxic and hemotoxic which can cause
cancer and infertility. Furthermore, crude oil has been reported to contain heavy metals and
their accumulation in plant or animal tissues can cause mutation or even death depending
on the dose and period of exposure [1, 4]. Oil spills have adverse effects on the
environment, productivity of farmlands, water bodies and birds of the sky as well as
microbial community and their distribution in the environment compared to a pristine
environment [5].
Nigeria has 22 Nigerian National Petroleum Corporation/Pipeline and Products marketing
Company (NNPC/PPMC) depots, saddled with the responsibility of transportation, storage
and marketing of petroleum products such as; Premium Motor Spirit (PMS), Automotive
Gas Oil (AGO) and Dual Purpose kerosene (DPK) in the domestic and efficient evacuation
of refined petroleum products from the local refineries. The operation of the Nigerian
Pipelines and Storage Company Ltd (NPSC) started in 1979 [6]. There are total of twelve
storage tanks in Suleja depot in Niger State. Among these storage thanks, 4 tanks are for
PMS, 4 storage tanks for AGO, and 4 storage tanks for DPK. Each storage tank of PMS,
AGO, and DPK has a storage capacity of 12.6million, 7.6million and 7.6million liters
respectively. These storage tanks are prone to leakages and washing which may lead to
contamination of the soil and water in the surrounding communities.
Microorganisms are ubiquitous, and when faced with extreme conditions, some still find a
way of surviving in the environment through various means of adaption such as alteration
in membrane permeability, change of metabolic pathways, spore formation, mutation
among others [5, 7]. Once faced with extreme conditions as is the case of crude oil
pollutants, some microorganisms survive and eventually thrive in the environment utilizing
92
the hydrocarbons in the petroleum products as a source of carbon and energy. Others may
assume a dormant form whereas those microorganisms that cannot withstand this extreme
exposure die leaving the promising ones, which have been sought for in carrying out
bioremediation process2.
From the exploration, distribution and storage of crude oil and its products, several
incidences of oil spillage have occurred, which caused huge adverse effects on health safety
and the environment [8,9]. Several attempts have been tried to clean up oil spillage from
the environment, but bioremediation is preferred [10]. Bioremediation is a process that
involves the use of living microorganisms or their enzymes in detoxifying and degrading
environmental pollutants, thus, restoring a polluted environment. The microbial population
and activities in the affected environment such as microbial counts, respiration, biomass
diversity, and enzyme activities can be used to evaluate the extent of bioremediation [1,
11]. Microbial biodegradation of petroleum contaminants is cheap and environmentally
friendly and can be enhanced for better cleanup operations. Petroleum utilizing
microorganisms are more in number in oil polluted environment than pristine environment.
However, microorganisms that are indigenous to a petroleum contaminated site have been
reported to best remediate the environment from oil spills and other pollutants than the non-
indigenous microorganisms to that site [2, 10].
The bacterial genera that have been isolated from varying crude oil contaminated sites
include Nocardia, Pseudomonas, Gordonia, Micrococcus, Rhodococcus, Arthrobacter,
Mycobacterium, Flavobacterium, Corynebacterium, Klebsiella, Alcaligenes and Bacillus
while the fungal genera include Penicillium, Aspergillus, Trichoderma, and Fusarium [12-
15]. The aim of this study was to assess microbial population and their hydrocarbon
utilizing potentials from soil and water sources around petroleum products depot in Suleja,
Nigeria.
Materials and Methods
Experimental areas
[The sampling areas were five surrounding communities and depot premises (Table 1)]
designated Plots 1-6. These communities include Dikko, Maje, Tunga Shanu, Dagweru,
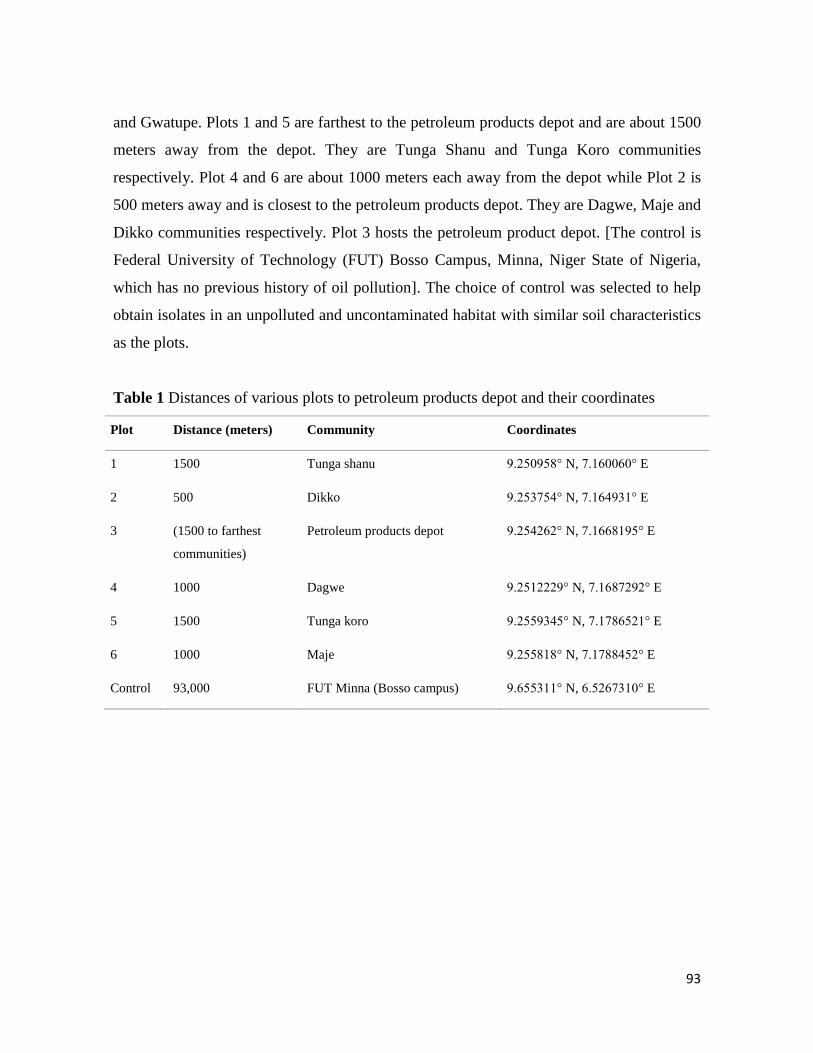
93
and Gwatupe. Plots 1 and 5 are farthest to the petroleum products depot and are about 1500
meters away from the depot. They are Tunga Shanu and Tunga Koro communities
respectively. Plot 4 and 6 are about 1000 meters each away from the depot while Plot 2 is
500 meters away and is closest to the petroleum products depot. They are Dagwe, Maje and
Dikko communities respectively. Plot 3 hosts the petroleum product depot. [The control is
Federal University of Technology (FUT) Bosso Campus, Minna, Niger State of Nigeria,
which has no previous history of oil pollution]. The choice of control was selected to help
obtain isolates in an unpolluted and uncontaminated habitat with similar soil characteristics
as the plots.
Table 1 Distances of various plots to petroleum products depot and their coordinates
Plot Distance (meters) Community Coordinates
1 1500 Tunga shanu 9.250958° N, 7.160060° E
2 500 Dikko 9.253754° N, 7.164931° E
3 (1500 to farthest
communities)
Petroleum products depot 9.254262° N, 7.1668195° E
4 1000 Dagwe 9.2512229° N, 7.1687292° E
5 1500 Tunga koro 9.2559345° N, 7.1786521° E
6 1000 Maje 9.255818° N, 7.1788452° E
Control 93,000 FUT Minna (Bosso campus) 9.655311° N, 6.5267310° E
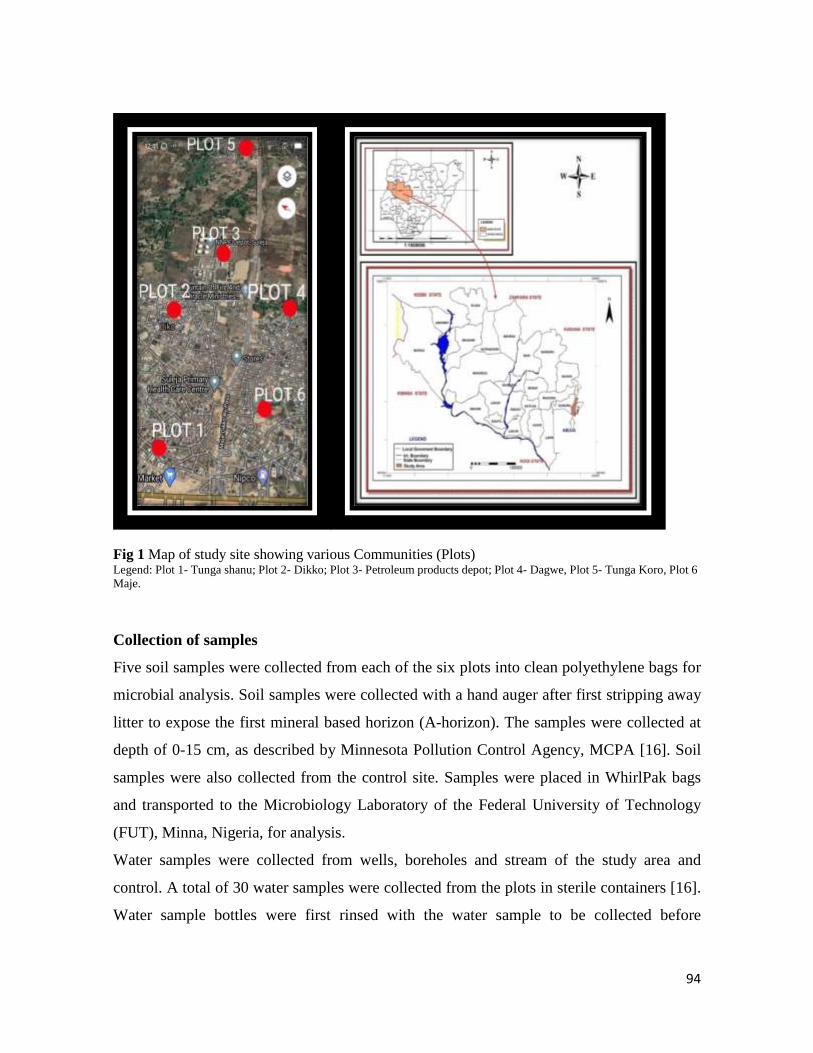
94
Fig 1 Map of study site showing various Communities (Plots) Legend: Plot 1- Tunga shanu; Plot 2- Dikko; Plot 3- Petroleum products depot; Plot 4- Dagwe, Plot 5- Tunga Koro, Plot 6
Maje.
Collection of samples
Five soil samples were collected from each of the six plots into clean polyethylene bags for
microbial analysis. Soil samples were collected with a hand auger after first stripping away
litter to expose the first mineral based horizon (A-horizon). The samples were collected at
depth of 0-15 cm, as described by Minnesota Pollution Control Agency, MCPA [16]. Soil
samples were also collected from the control site. Samples were placed in WhirlPak bags
and transported to the Microbiology Laboratory of the Federal University of Technology
(FUT), Minna, Nigeria, for analysis.
Water samples were collected from wells, boreholes and stream of the study area and
control. A total of 30 water samples were collected from the plots in sterile containers [16].
Water sample bottles were first rinsed with the water sample to be collected before
95
collection. Water samples were collected during rainy and dry seasons in icebox and
transported to Microbiology Laboratory, FUT, Minna for analysis.
Collection of hydrocarbons
Bonny light crude oil and petroleum products (Diesel, Kerosene, and Engine oil) were
collected from Kaduna Refinery and Petrochemical Company (KRPC), Kaduna, Nigeria, in
clean bottles. The bottles were first rinsed with the product to be sampled before collection.
The products were transported to the laboratory for biodegradation studies.
Enumeration and isolation of microorganisms in soil and water samples
Microorganisms in the soil and water samples were enumerated by spread inoculation. Ten
grams (10 g) of soil samples were suspended in 90 mL of sterile distilled water and were
serially diluted. One milliliter of the serially diluted soil was dispensed on the surface of
Nutrient agar (NA) and Sabouraud dextrose agar (SDA) in petri dishes for the enumeration
of total aerobic heterotrophic bacteria (TAHB) and fungi respectively. The NA plates were
incubated for 24-48h at 30ºC while the SDA plates were incubated for 3-5d at room
temperature (28 ±2ºC) [17]. Aliquot of the serially diluted water samples were also
inoculated on MacConckey agar (MCA), Eosine methylene blue (EMB) agar,
Pseudomonas base agar (PBA), thiosulfate-citrate-bile salt (TCBS) agar,
Salmonella/Shigella agar (SSA) and spread evenly for the isolation of total coliform
bacteria (TCB), Pseudomonas, Vibrio, Salmonella and Shigella respectively. Developed
colonies on the surfaces of the nutrient medium were enumerated and recorded as colony
forming units per gram of soil (cfu/g) and colony forming units per millilitre (cfu/mL) of
water. The inoculated plates were incubated for 24 - 48h at 37°C after which colonies were
counted. The isolates were sub-cultured repeatedly on fresh media to obtain pure cultures,
and were maintained on agar slants for further characterization and identification.
Enumeration of total hydrocarbon utilizing bacteria and fungi
Total hydrocarbon utilizing bacteria (THUB) were enumerated using the method described
by Hamamura et al. [18]. The method basically involves the dilution and plating out of 0.1
mL of sample suspensions on Bushnell Haas agar (Sigma-Aldrich, USA). Supply of
hydrocarbon was carried out through the vapor phase to hydrocarbon utilizers by placing
sterile Whatman filter papers (No.1) saturated with 3mL of hydrocarbons (crude oil, diesel,
96
kerosene, engine oil) on the lids of the inverted plates. The plates were incubated for 14 -
21d at 30°C. Colonies were counted and discreet colonies of different THUB were sub
cultured on freshly prepared nutrient agar plates and incubated for 24-48h at 37°C while
THUF were sub-cultured on freshly prepared SDA plates and incubated for 3- 5days at
28°C to obtain pure isolates.
Characterization and identification of microbial isolates
Bacterial isolates were characterized and identified on the basis of Gram’s reaction and
biochemical tests as described by Cheesbrough [19]. Some of the biochemical tests carried
were: indole, sugar fermentation, catalase, coagulase, citrate utilisation, motility, spore
formation, nitrate reduction, starch hydrolysis, urease and oxidase tests. The identities of
the bacterial isolates were confirmed using Bergey’s Manual of Determinative Bacteriology
[20].
The fungal isolates were identified macroscopically and microscopically according to;
aerial and substrate hyphae, type and shape of hyphae, spore formation, presence of
specialized structures (foot cell, sporangiophores, conidiophores) and pigmentation. A
small portion from each fungal isolate was placed in a drop of lactophenol cotton blue on a
clean glass slide and then covered before viewing with 10X and 40X objective lenses of
light microscope to confirm hyphae type. Fungal isolates were identified using Atlas of
Clinical Fungi [21] and schemes of Domsch and Gams [22].
Screening for the bacterial utilization of petroleum products by bacterial isolates
Bacterial and fungal isolates were tested for their potential to utilize petroleum products
under aerobic conditions by inoculating a calibrated loopful of 18-24h old culture of each
isolate into 5 mL of Bushnell Haas Broth containing 0.05 mL of petroleum products
(diesel, kerosene, engine oil, crude oil) which had been sterilized by autoclaving for 15 min
at 121°C. Hydrocarbon utilization potential of the isolates was screened by determining the
turbidity, total viable counts and emulsification of oil in the medium after 14 days’
incubation at 30°C [23]. The optical density of the isolates was determined at a wavelength
of 600 nm using PG T70 UV/VIS spectrophotometer.
97
Utilization efficiencies of petroleum products by selected bacterial and fungal isolates
The capacities of selected bacterial and fungal isolates to utilize crude oil were further
tested in minimal salt medium (MSM). One hundred millilitres of MSM (10g NaCl, 0.29g
KCl, 0.42g MgSO4, 0.83g KH2PO4, 0.42g NaNO3, 1.25g NaHPO4, 100ml distilled water,
pH 7.2) was introduced into 250 ml conical flasks and 1.0% (v/v) of crude oil was
introduced and sterilized using the method described by Okpokwasili and Okorie [24]. A
24 hours old broth culture of each selected organism was seeded into each flask and
incubated in a rotatory shaker incubator (New Brunswick Scientific Incubator Shaker) at
150 rev/min and 30°C. The efficiency of utilization of other hydrocarbons was monitored
at three days interval for 21d by monitoring bacterial and fungal growth measured by viable
counts in the MSM. The optical density was also determined at a wavelength of 600 nm
using PG T70 UV/VIS spectrophotometer.
Statistical analysis
Data obtained were subjected to statistical package for social science (SPSS 23) using one-
way analysis of variance (ANOVA) and Duncan multiple range tests for the determination
of the significant difference between values and comparison of various means respectively.
P values less than 0.05 was considered significant while P values greater than 0.05 was
considered as non-significant.
Result
Total aerobic heterotrophic bacteria (TAHB) in soil and water samples
The mean counts of total aerobic heterotrophic bacterial (AHB) in soil samples are
presented in Table 2. The total mean counts of AHB observed in control were higher than
the values obtained in the Plots. In the rainy season, observed mean counts of AHB were
lower than the mean counts obtained in the control. The highest mean count (49 x 106
cfu/g) for the dry season was obtained in Plot 4 while the lowest count (12.0x10⁶ cfu/g) was
obtained in Plot 3. There were significant differences (P<0.05) among the counts in the
Plots.
The results for water samples also revealed that AHB counts for both rainy and dry seasons
were higher in the control samples when compared with the results from the Plots. The
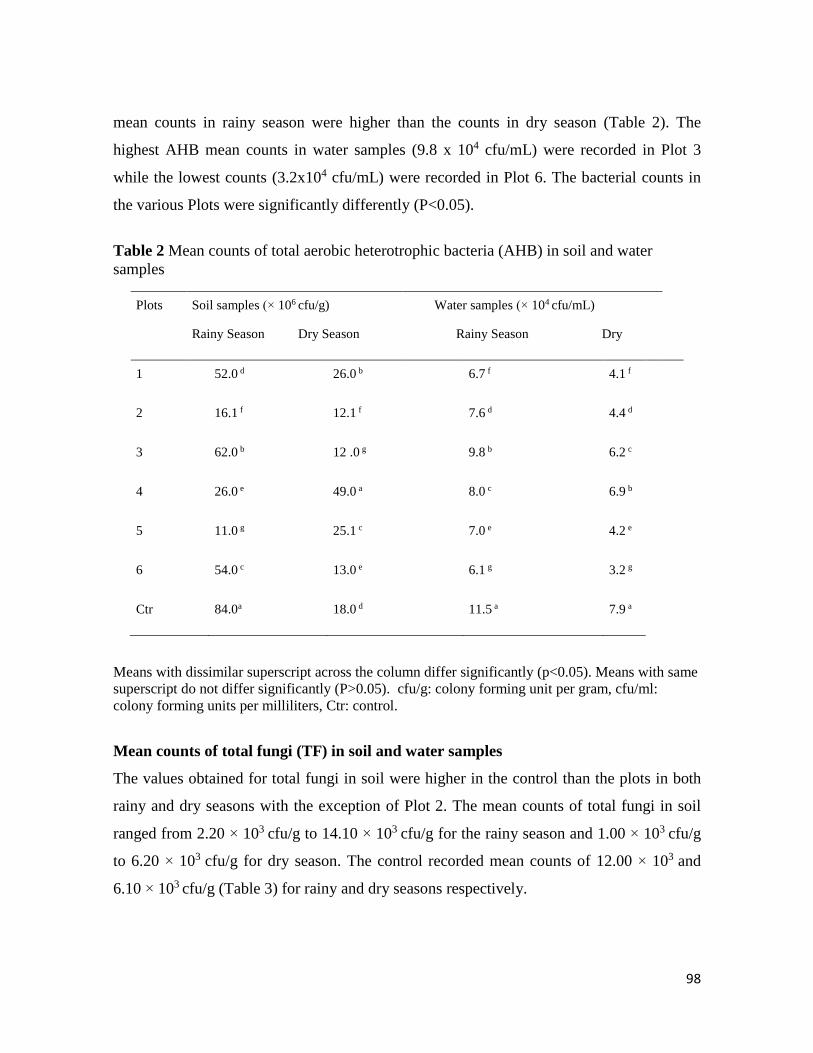
98
mean counts in rainy season were higher than the counts in dry season (Table 2). The
highest AHB mean counts in water samples (9.8 x 10⁴ cfu/mL) were recorded in Plot 3
while the lowest counts (3.2x10⁴ cfu/mL) were recorded in Plot 6. The bacterial counts in
the various Plots were significantly differently (P<0.05).
Table 2 Mean counts of total aerobic heterotrophic bacteria (AHB) in soil and water
samples
Plots Soil samples (× 106 cfu/g)
Rainy Season Dry Season
Water samples (× 104 cfu/mL)
Rainy Season Dry
1 52.0 d 26.0 b 6.7 f 4.1 f
2 16.1 f 12.1 f 7.6 d 4.4 d
3 62.0 b 12 .0 g 9.8 b 6.2 c
4 26.0 e 49.0 a 8.0 c 6.9 b
5 11.0 g 25.1 c 7.0 e 4.2 e
6 54.0 c 13.0 e 6.1 g 3.2 g
Ctr 84.0a 18.0 d 11.5 a 7.9 a
Means with dissimilar superscript across the column differ significantly (p<0.05). Means with same
superscript do not differ significantly (P>0.05). cfu/g: colony forming unit per gram, cfu/ml:
colony forming units per milliliters, Ctr: control.
Mean counts of total fungi (TF) in soil and water samples
The values obtained for total fungi in soil were higher in the control than the plots in both
rainy and dry seasons with the exception of Plot 2. The mean counts of total fungi in soil
ranged from 2.20 × 10³ cfu/g to 14.10 × 10³ cfu/g for the rainy season and 1.00 × 10³ cfu/g
to 6.20 × 10³ cfu/g for dry season. The control recorded mean counts of 12.00 × 10³ and
6.10 × 10³ cfu/g (Table 3) for rainy and dry seasons respectively.
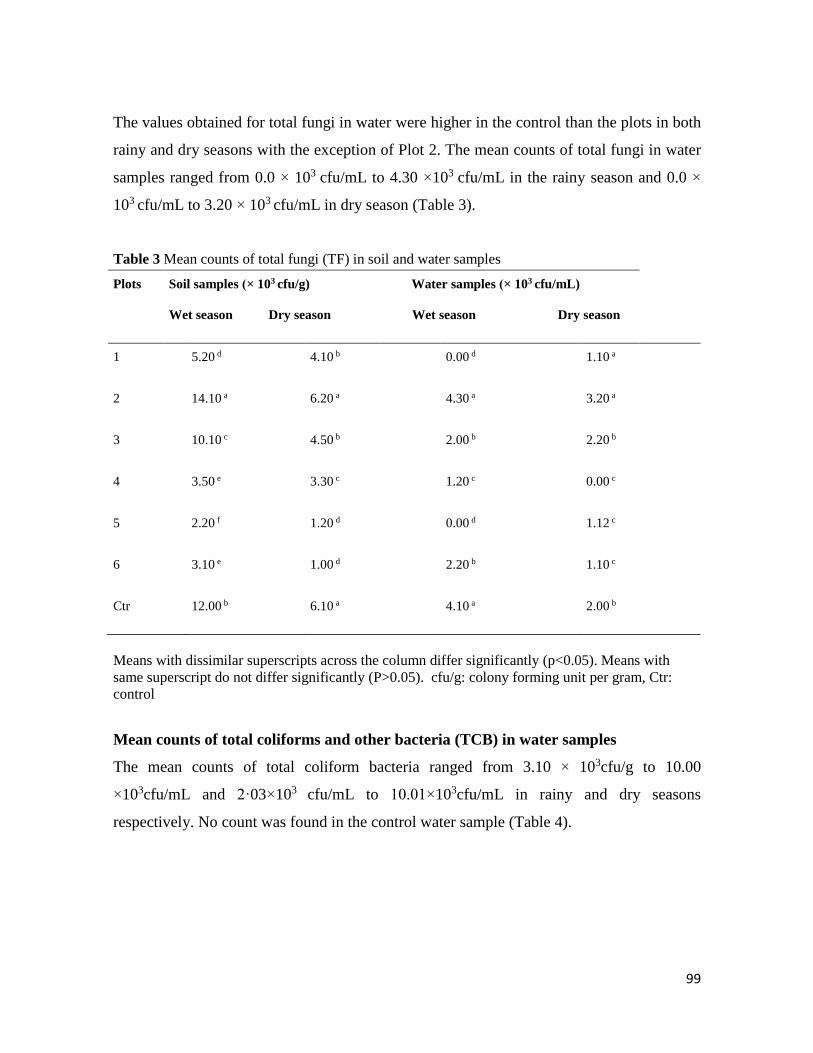
99
The values obtained for total fungi in water were higher in the control than the plots in both
rainy and dry seasons with the exception of Plot 2. The mean counts of total fungi in water
samples ranged from 0.0 × 10³ cfu/mL to 4.30 ×10³ cfu/mL in the rainy season and 0.0 ×
103 cfu/mL to 3.20 × 10³ cfu/mL in dry season (Table 3).
Table 3 Mean counts of total fungi (TF) in soil and water samples
Plots Soil samples (× 103 cfu/g)
Wet season Dry season
Water samples (× 103 cfu/mL)
Wet season Dry season
1 5.20 d 4.10 b 0.00 d 1.10 a
2 14.10 a 6.20 a 4.30 a 3.20 a
3 10.10 c 4.50 b 2.00 b 2.20 b
4 3.50 e 3.30 c 1.20 c 0.00 c
5 2.20 f 1.20 d 0.00 d 1.12 c
6 3.10 e 1.00 d 2.20 b 1.10 c
Ctr 12.00 b 6.10 a 4.10 a 2.00 b
Means with dissimilar superscripts across the column differ significantly (p<0.05). Means with
same superscript do not differ significantly (P>0.05). cfu/g: colony forming unit per gram, Ctr:
control
Mean counts of total coliforms and other bacteria (TCB) in water samples
The mean counts of total coliform bacteria ranged from 3.10 × 10³cfu/g to 10.00
×103cfu/mL and 2·03×103 cfu/mL to 10.01×10³cfu/mL in rainy and dry seasons
respectively. No count was found in the control water sample (Table 4).
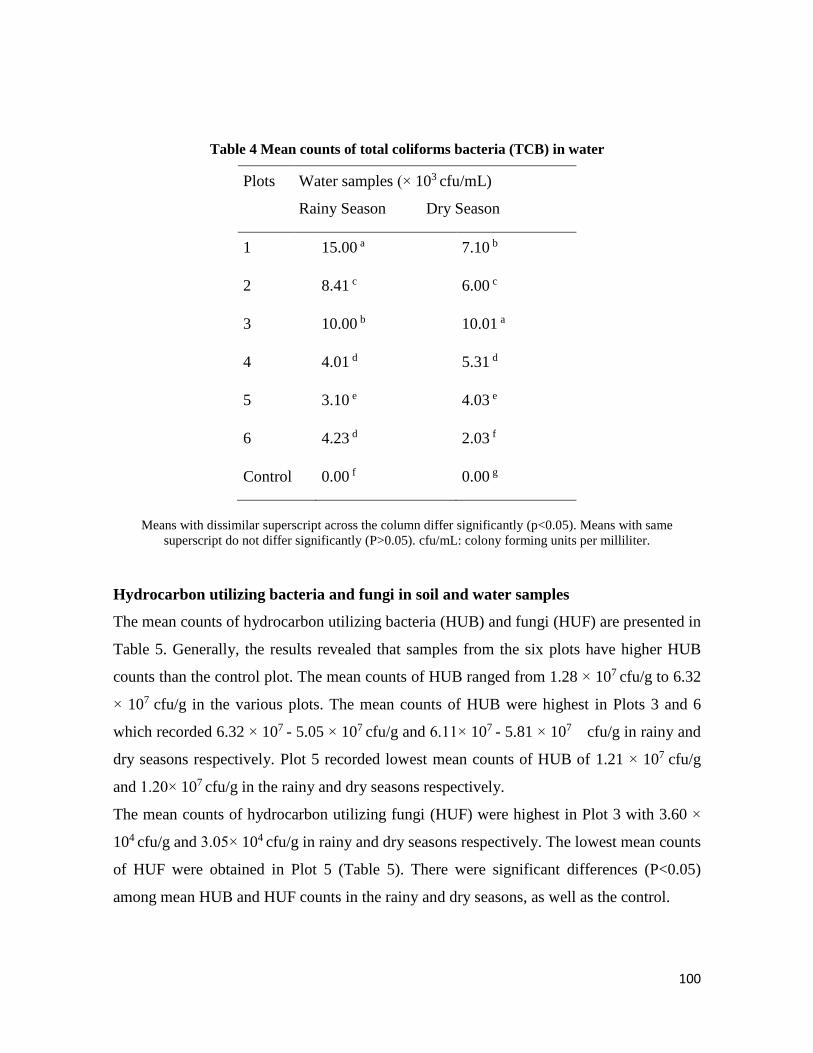
100
Table 4 Mean counts of total coliforms bacteria (TCB) in water
Plots Water samples (× 103 cfu/mL)
Rainy Season Dry Season
1 15.00 a 7.10 b
2 8.41 c 6.00 c
3 10.00 b 10.01 a
4 4.01 d 5.31 d
5 3.10 e 4.03 e
6 4.23 d 2.03 f
Control 0.00 f 0.00 g
Means with dissimilar superscript across the column differ significantly (p<0.05). Means with same
superscript do not differ significantly (P>0.05). cfu/mL: colony forming units per milliliter.
Hydrocarbon utilizing bacteria and fungi in soil and water samples
The mean counts of hydrocarbon utilizing bacteria (HUB) and fungi (HUF) are presented in
Table 5. Generally, the results revealed that samples from the six plots have higher HUB
counts than the control plot. The mean counts of HUB ranged from 1.28 × 10⁷ cfu/g to 6.32
× 107 cfu/g in the various plots. The mean counts of HUB were highest in Plots 3 and 6
which recorded 6.32 × 10⁷ - 5.05 × 10⁷ cfu/g and 6.11× 10⁷ - 5.81 × 10⁷ cfu/g in rainy and
dry seasons respectively. Plot 5 recorded lowest mean counts of HUB of 1.21 × 10⁷ cfu/g
and 1.20× 10⁷ cfu/g in the rainy and dry seasons respectively.
The mean counts of hydrocarbon utilizing fungi (HUF) were highest in Plot 3 with 3.60 ×
104 cfu/g and 3.05× 10⁴ cfu/g in rainy and dry seasons respectively. The lowest mean counts
of HUF were obtained in Plot 5 (Table 5). There were significant differences (P<0.05)
among mean HUB and HUF counts in the rainy and dry seasons, as well as the control.
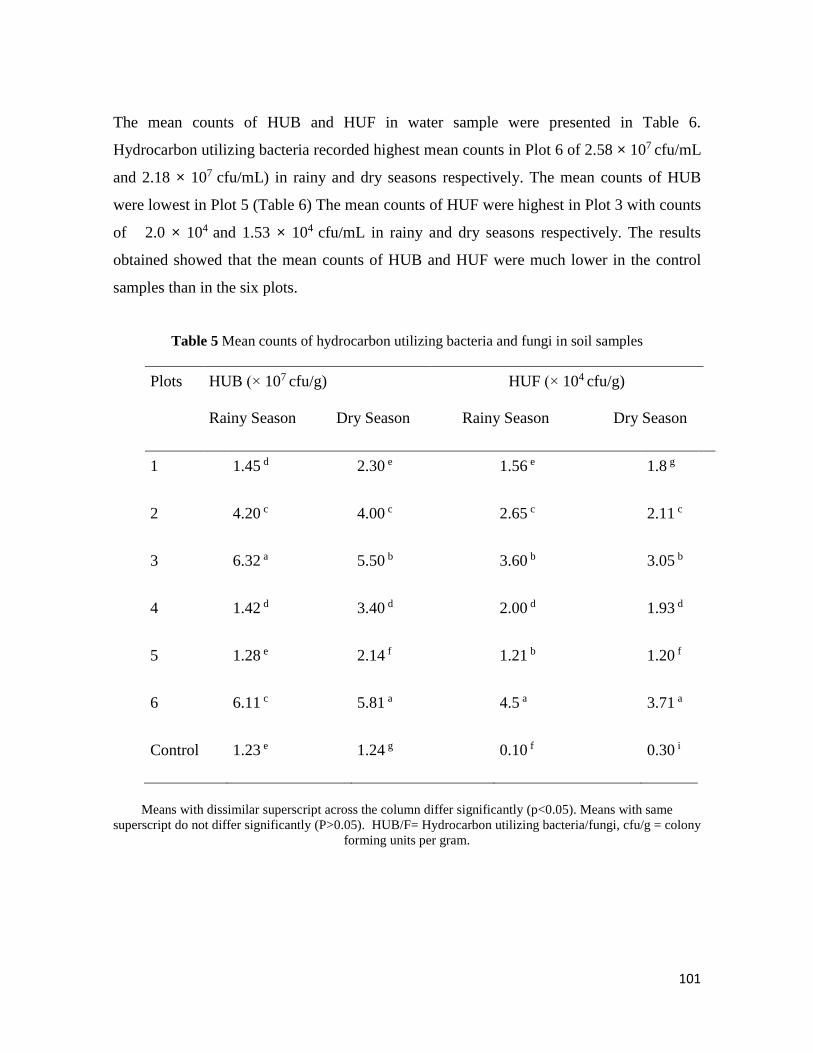
101
The mean counts of HUB and HUF in water sample were presented in Table 6.
Hydrocarbon utilizing bacteria recorded highest mean counts in Plot 6 of 2.58 × 10⁷ cfu/mL
and 2.18 × 10⁷ cfu/mL) in rainy and dry seasons respectively. The mean counts of HUB
were lowest in Plot 5 (Table 6) The mean counts of HUF were highest in Plot 3 with counts
of 2.0 × 10⁴ and 1.53 × 10⁴ cfu/mL in rainy and dry seasons respectively. The results
obtained showed that the mean counts of HUB and HUF were much lower in the control
samples than in the six plots.
Table 5 Mean counts of hydrocarbon utilizing bacteria and fungi in soil samples
Plots HUB (× 107 cfu/g)
Rainy Season Dry Season
HUF (× 104 cfu/g)
Rainy Season Dry Season
1 1.45 d 2.30 e 1.56 e 1.8 g
2 4.20 c 4.00 c 2.65 c 2.11 c
3 6.32 a 5.50 b 3.60 b 3.05 b
4 1.42 d 3.40 d 2.00 d 1.93 d
5 1.28 e 2.14 f 1.21 b 1.20 f
6 6.11 c 5.81 a 4.5 a 3.71 a
Control 1.23 e 1.24 g 0.10 f 0.30 i
Means with dissimilar superscript across the column differ significantly (p<0.05). Means with same
superscript do not differ significantly (P>0.05). HUB/F= Hydrocarbon utilizing bacteria/fungi, cfu/g = colony
forming units per gram.
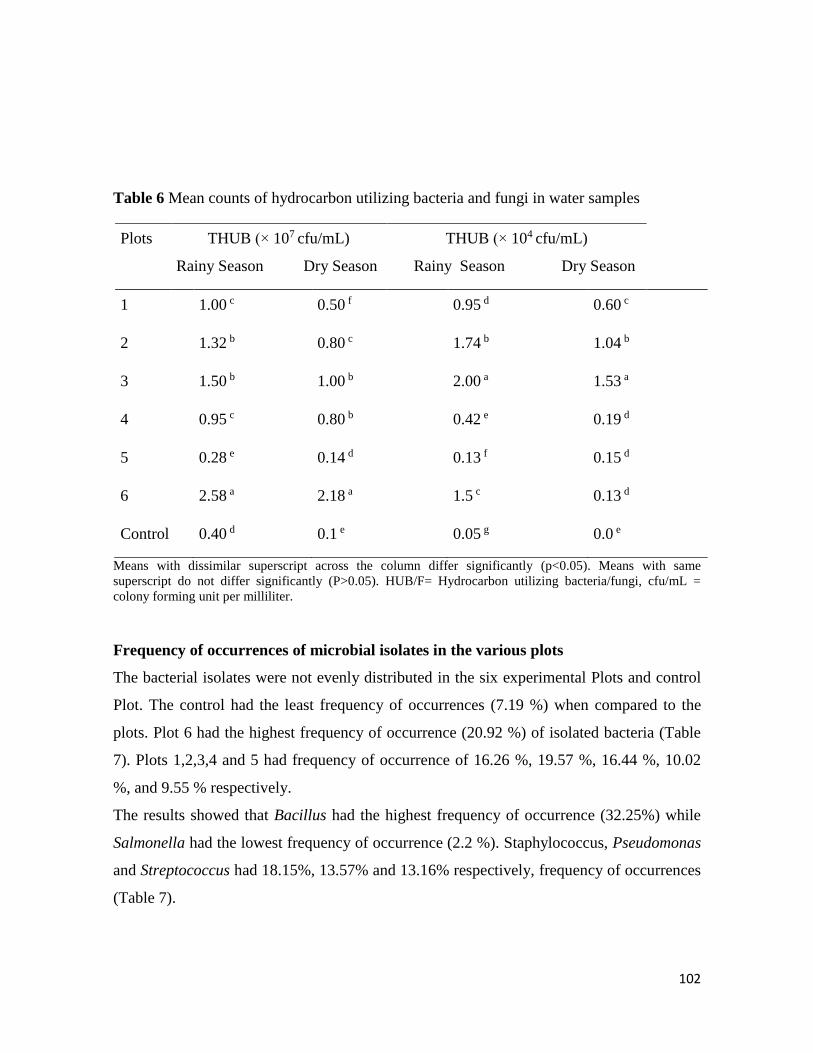
102
Table 6 Mean counts of hydrocarbon utilizing bacteria and fungi in water samples
Plots THUB (× 107 cfu/mL)
Rainy Season Dry Season
THUB (× 104 cfu/mL)
Rainy Season Dry Season
1 1.00 c 0.50 f 0.95 d 0.60 c
2 1.32 b 0.80 c 1.74 b 1.04 b
3 1.50 b 1.00 b 2.00 a 1.53 a
4 0.95 c 0.80 b 0.42 e 0.19 d
5 0.28 e 0.14 d 0.13 f 0.15 d
6 2.58 a 2.18 a 1.5 c 0.13 d
Control 0.40 d 0.1 e 0.05 g 0.0 e
Means with dissimilar superscript across the column differ significantly (p<0.05). Means with same
superscript do not differ significantly (P>0.05). HUB/F= Hydrocarbon utilizing bacteria/fungi, cfu/mL =
colony forming unit per milliliter.
Frequency of occurrences of microbial isolates in the various plots
The bacterial isolates were not evenly distributed in the six experimental Plots and control
Plot. The control had the least frequency of occurrences (7.19 %) when compared to the
plots. Plot 6 had the highest frequency of occurrence (20.92 %) of isolated bacteria (Table
7). Plots 1,2,3,4 and 5 had frequency of occurrence of 16.26 %, 19.57 %, 16.44 %, 10.02
%, and 9.55 % respectively.
The results showed that Bacillus had the highest frequency of occurrence (32.25%) while
Salmonella had the lowest frequency of occurrence (2.2 %). Staphylococcus, Pseudomonas
and Streptococcus had 18.15%, 13.57% and 13.16% respectively, frequency of occurrences
(Table 7).
103
There were higher frequencies of occurrence of bacterial isolates in rainy seasons than in in
dry season. The genera Micrococcus, Enterobacter, Salmonella and Escherichia were only
observed in one season in some Plots. The results also showed that only the genus Bacillus
was observed in both rainy and dry seasons in all the Plots (Table 7).
The frequency of occurrence of fungal isolates was presented in Table 8. The results
revealed that fungal isolates were observed in all the plots but were not evenly spread. The
control plots had the least frequency of occurrence of 5.27% with two fungal genera;
Penicillium and Aspergillus. Plot 6 had the highest frequency of occurrence (28.57%) and
had four fungal genera (Table 8). Plots 1 and 2 recorded equal number of frequencies of
occurrence (15.80%).
The result showed that Aspergillus was the dominant fungal isolate with a total frequency
of occurrence of 48.88%, while the Rhizopus had the lowest frequency of occurrence Table
8. There were more occurrences of fungal isolates in the rainy season than in the dry
season.
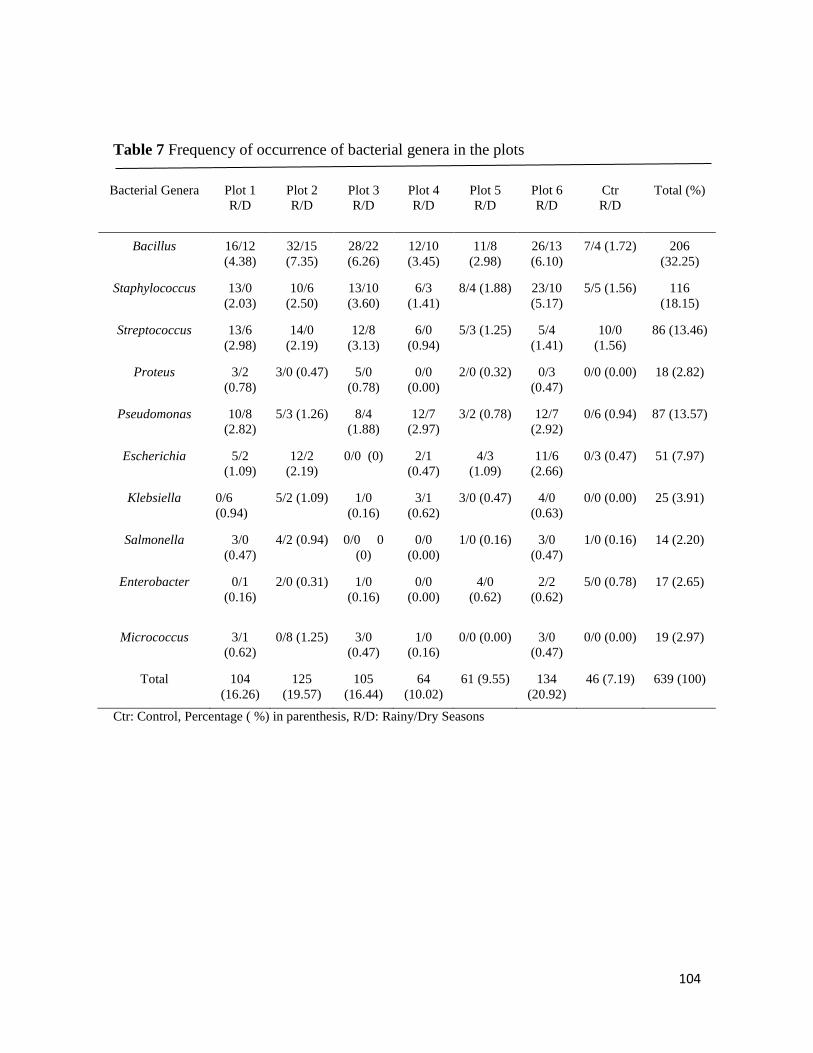
104
Table 7 Frequency of occurrence of bacterial genera in the plots
Bacterial Genera Plot 1
R/D
Plot 2
R/D
Plot 3
R/D
Plot 4
R/D
Plot 5
R/D
Plot 6
R/D
Ctr
R/D
Total (%)
Bacillus 16/12
(4.38)
32/15
(7.35)
28/22
(6.26)
12/10
(3.45)
11/8
(2.98)
26/13
(6.10)
7/4 (1.72) 206
(32.25)
Staphylococcus 13/0
(2.03)
10/6
(2.50)
13/10
(3.60)
6/3
(1.41)
8/4 (1.88) 23/10
(5.17)
5/5 (1.56) 116
(18.15)
Streptococcus 13/6
(2.98)
14/0
(2.19)
12/8
(3.13)
6/0
(0.94)
5/3 (1.25) 5/4
(1.41)
10/0
(1.56)
86 (13.46)
Proteus 3/2
(0.78)
3/0 (0.47) 5/0
(0.78)
0/0
(0.00)
2/0 (0.32) 0/3
(0.47)
0/0 (0.00) 18 (2.82)
Pseudomonas 10/8
(2.82)
5/3 (1.26) 8/4
(1.88)
12/7
(2.97)
3/2 (0.78) 12/7
(2.92)
0/6 (0.94) 87 (13.57)
Escherichia 5/2
(1.09)
12/2
(2.19)
0/0 (0) 2/1
(0.47)
4/3
(1.09)
11/6
(2.66)
0/3 (0.47) 51 (7.97)
Klebsiella 0/6
(0.94)
5/2 (1.09) 1/0
(0.16)
3/1
(0.62)
3/0 (0.47) 4/0
(0.63)
0/0 (0.00) 25 (3.91)
Salmonella 3/0
(0.47)
4/2 (0.94) 0/0 0
(0)
0/0
(0.00)
1/0 (0.16) 3/0
(0.47)
1/0 (0.16) 14 (2.20)
Enterobacter 0/1
(0.16)
2/0 (0.31) 1/0
(0.16)
0/0
(0.00)
4/0
(0.62)
2/2
(0.62)
5/0 (0.78) 17 (2.65)
Micrococcus 3/1
(0.62)
0/8 (1.25) 3/0
(0.47)
1/0
(0.16)
0/0 (0.00) 3/0
(0.47)
0/0 (0.00) 19 (2.97)
Total 104
(16.26)
125
(19.57)
105
(16.44)
64
(10.02)
61 (9.55) 134
(20.92)
46 (7.19) 639 (100)
Ctr: Control, Percentage ( %) in parenthesis, R/D: Rainy/Dry Seasons
105
Table 8 Frequency of occurrences of fungal isolates in the various plots
Fungal
genera
Plot 1
R/D
Plot 2
R/D
Plot 3
R/D
Plot 4
R/D
Plot 5
R/D
Plot 6
R/D
Ctr Total
(%)
Aspergillus 6/3 (6.77) 6/2 (6.02) 8/3 (8.27) 3/2 (3.76) 6/5
(8.27)
11/6
(12.78)
2/2
(3.01)
65(48.88)
Penicillium 5/3 (6.02) 5/2 (5.26) 2/1 (2.25) 4/2 (4.51) 2/1 (2.26) 8/4 (9.02) 2/1
(2.26)
42(31.58)
Mucor 3/1 (3.01) 0/2 (1.50) 2/0 (1.50) 2/0 (1.50) 0/0 (0.0) 4/1 (3.76) 0/0
(0.00)
15(11.27)
Rhizopus 0/0 (0) 3/1 (3.01) 0/1 (0.75) 2/0 (1.50) 0/0 (0.0) 3/1 (3.01) 0/0
(0.00)
11(8.27)
Total
(%)
21 (15.80) 21 (15.80) 17 (12.77) 15 (11.27) 14 (10.53) 38 (28.57) 7 (5.27) 133 (100)
Ctr: Control, (% ): Percentage in parenthesis, R/D: Rainy/Dry Seasons
Utilization of petroleum products by microbial isolates
The ability of selected bacterial isolates from the various plots with potential to degrade
hydrocarbons was tested on some petroleum products (Crude oil, kerosene, Diesel and
engine oil), which served as sole source of carbon and energy in modified minimal salt
nutrient broth. The bacterial isolates were; Staphylococcus aureus, Bacillus subtilis,
Bacillus thuringensis, Streptococcus faecalis, Pseudomonas aeruginosa, Proteus mirabilis,
Staphylococcus epidemidis, Bacillus licheniformis and Pseudomonas putida. The bacterial
isolates utilized the petroleum products to varying capacities after 21d of incubation (Table
9). Bacterial isolates from the genera Pseudomonas and Bacillus had higher absorbance of
0.663±0.55 and 0.601±0.14 respectively on crude oil than other isolates. The lowest
absorbance on crude oil (0.081±0.41) was from Proteus mirabilis (Table 9). Pseudomonas
aeruginosa recorded highest absorbance in kerosene (0.43± 0.002) while B. thuringiensis
recorded highest absorbance in diesel (0.311±0.46) and engine oil (0.284±0.24) (Table 9),
meaning that these organisms had efficient abilities in utilizing the hydrocarbons. The
isolated fungi utilized the petroleum products to varying capacities within 21d of
incubation. The organisms had highest percentage utilization in crude oil (0.211-0.713) and
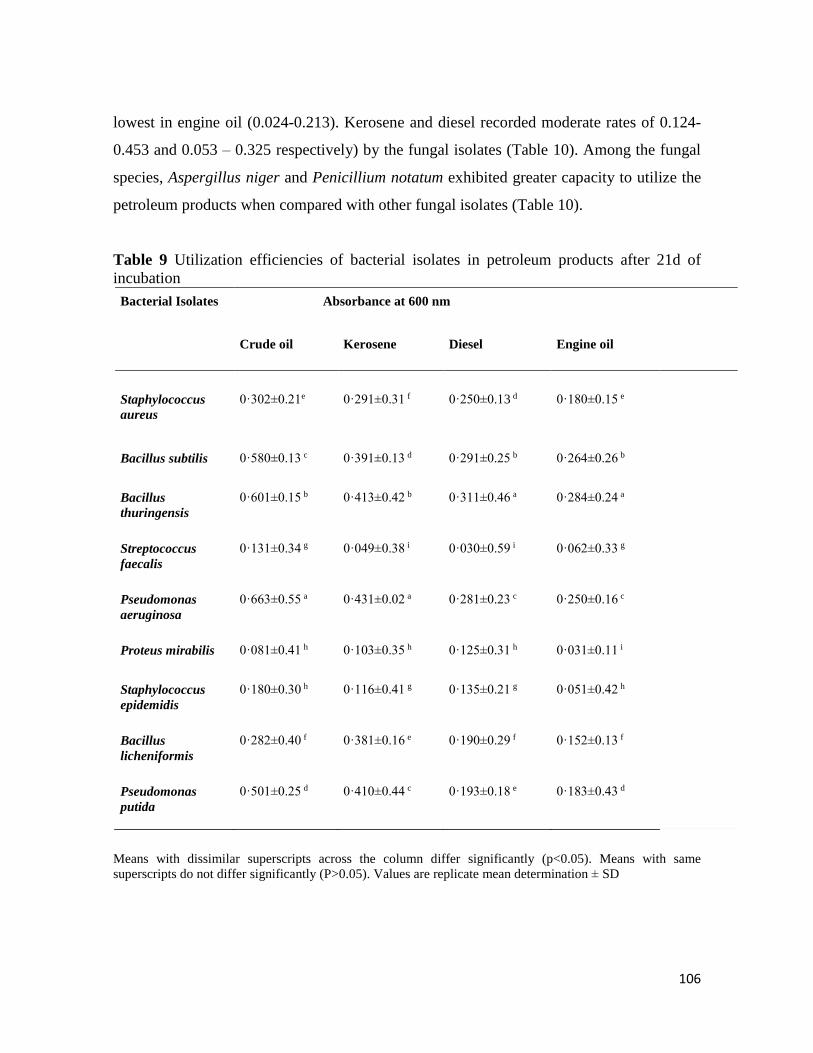
106
lowest in engine oil (0.024-0.213). Kerosene and diesel recorded moderate rates of 0.124-
0.453 and 0.053 – 0.325 respectively) by the fungal isolates (Table 10). Among the fungal
species, Aspergillus niger and Penicillium notatum exhibited greater capacity to utilize the
petroleum products when compared with other fungal isolates (Table 10).
Table 9 Utilization efficiencies of bacterial isolates in petroleum products after 21d of
incubation
Bacterial Isolates Absorbance at 600 nm
Crude oil Kerosene Diesel Engine oil
Staphylococcus
aureus
0·302±0.21e
0·291±0.31 f
0·250±0.13 d
0·180±0.15 e
Bacillus subtilis 0·580±0.13 c 0·391±0.13 d 0·291±0.25 b 0·264±0.26 b
Bacillus
thuringensis
0·601±0.15 b 0·413±0.42 b 0·311±0.46 a 0·284±0.24 a
Streptococcus
faecalis
0·131±0.34 g 0·049±0.38 i 0·030±0.59 i 0·062±0.33 g
Pseudomonas
aeruginosa
0·663±0.55 a 0·431±0.02 a 0·281±0.23 c 0·250±0.16 c
Proteus mirabilis 0·081±0.41 h 0·103±0.35 h 0·125±0.31 h 0·031±0.11 i
Staphylococcus
epidemidis
0·180±0.30 h 0·116±0.41 g 0·135±0.21 g 0·051±0.42 h
Bacillus
licheniformis
0·282±0.40 f 0·381±0.16 e 0·190±0.29 f 0·152±0.13 f
Pseudomonas
putida
0·501±0.25 d 0·410±0.44 c 0·193±0.18 e 0·183±0.43 d
Means with dissimilar superscripts across the column differ significantly (p<0.05). Means with same
superscripts do not differ significantly (P>0.05). Values are replicate mean determination ± SD
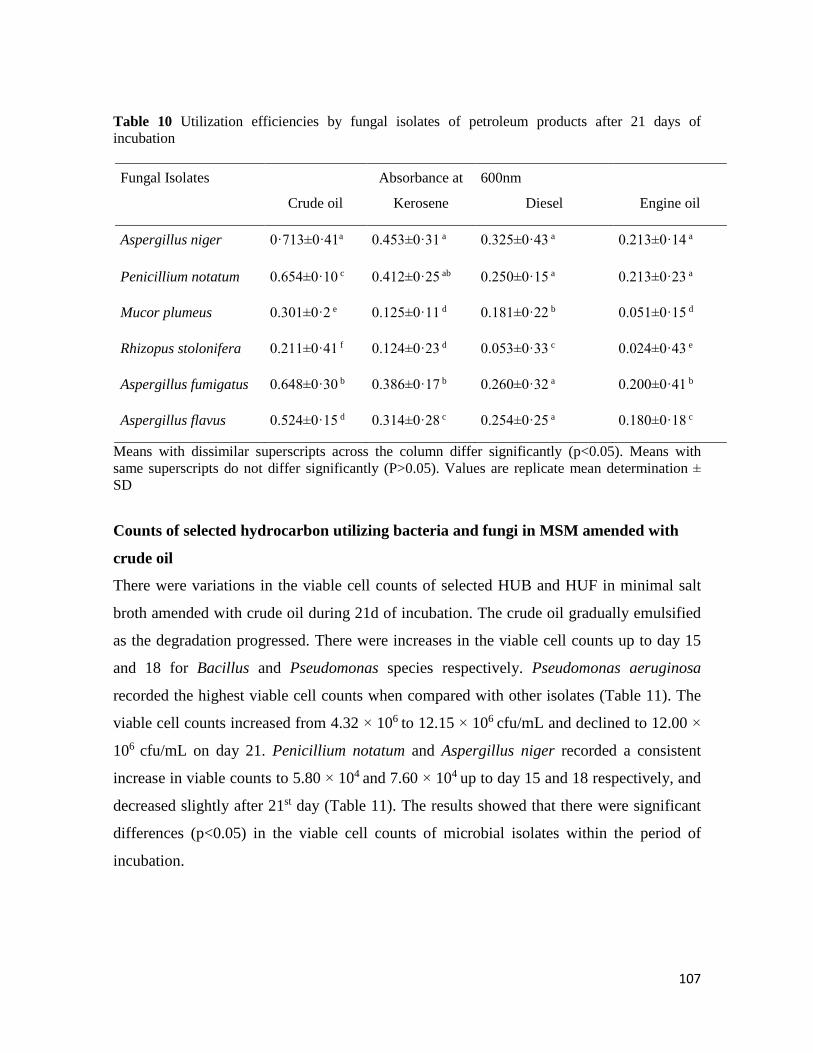
107
Table 10 Utilization efficiencies by fungal isolates of petroleum products after 21 days of
incubation
Fungal Isolates
Crude oil
Absorbance at
Kerosene
600nm
Diesel
Engine oil
Aspergillus niger 0·713±0·41a 0.453±0·31 a 0.325±0·43 a 0.213±0·14 a
Penicillium notatum 0.654±0·10 c 0.412±0·25 ab 0.250±0·15 a 0.213±0·23 a
Mucor plumeus 0.301±0·2 e 0.125±0·11 d 0.181±0·22 b 0.051±0·15 d
Rhizopus stolonifera 0.211±0·41 f 0.124±0·23 d 0.053±0·33 c 0.024±0·43 e
Aspergillus fumigatus 0.648±0·30 b 0.386±0·17 b 0.260±0·32 a 0.200±0·41 b
Aspergillus flavus 0.524±0·15 d 0.314±0·28 c 0.254±0·25 a 0.180±0·18 c
Means with dissimilar superscripts across the column differ significantly (p<0.05). Means with
same superscripts do not differ significantly (P>0.05). Values are replicate mean determination ±
SD
Counts of selected hydrocarbon utilizing bacteria and fungi in MSM amended with
crude oil
There were variations in the viable cell counts of selected HUB and HUF in minimal salt
broth amended with crude oil during 21d of incubation. The crude oil gradually emulsified
as the degradation progressed. There were increases in the viable cell counts up to day 15
and 18 for Bacillus and Pseudomonas species respectively. Pseudomonas aeruginosa
recorded the highest viable cell counts when compared with other isolates (Table 11). The
viable cell counts increased from 4.32 × 10⁶ to 12.15 × 10⁶ cfu/mL and declined to 12.00 ×
106 cfu/mL on day 21. Penicillium notatum and Aspergillus niger recorded a consistent
increase in viable counts to 5.80 × 10⁴ and 7.60 × 10⁴ up to day 15 and 18 respectively, and
decreased slightly after 21st day (Table 11). The results showed that there were significant
differences (p<0.05) in the viable cell counts of microbial isolates within the period of
incubation.
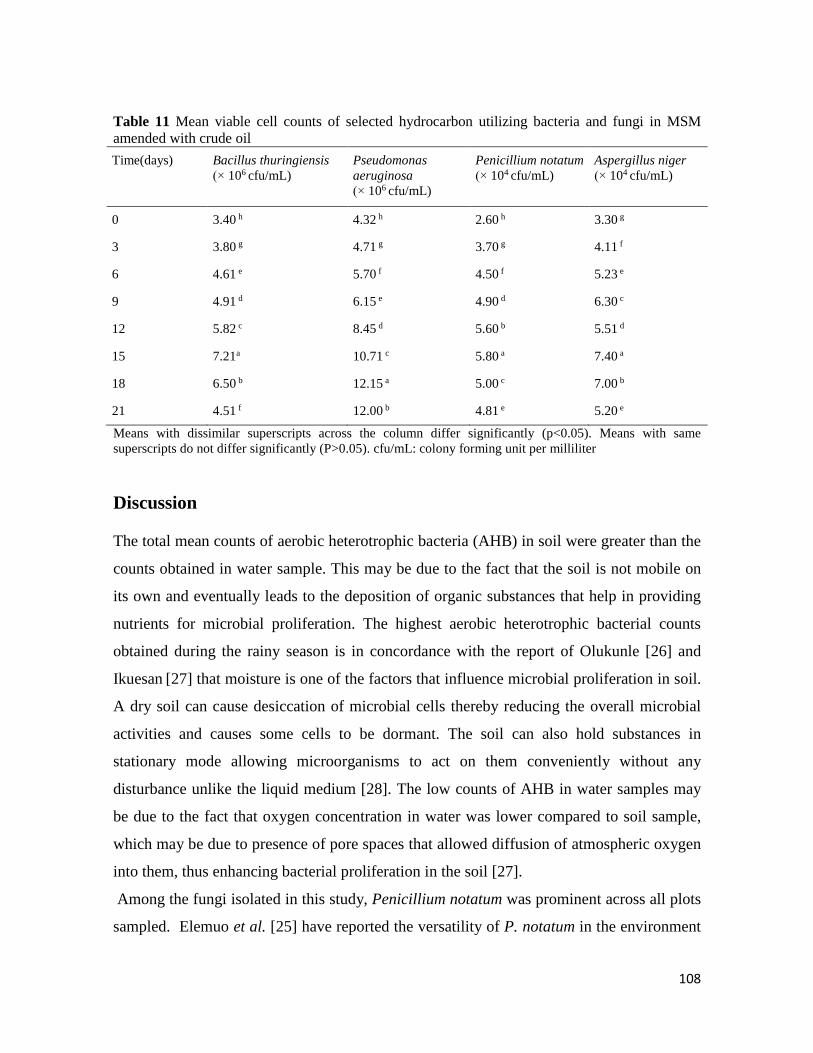
108
Table 11 Mean viable cell counts of selected hydrocarbon utilizing bacteria and fungi in MSM
amended with crude oil
Time(days) Bacillus thuringiensis
(× 106 cfu/mL)
Pseudomonas
aeruginosa
(× 106 cfu/mL)
Penicillium notatum
(× 104 cfu/mL)
Aspergillus niger
(× 104 cfu/mL)
0 3.40 h 4.32 h 2.60 h 3.30 g
3 3.80 g 4.71 g 3.70 g 4.11 f
6 4.61 e 5.70 f 4.50 f 5.23 e
9 4.91 d 6.15 e 4.90 d 6.30 c
12 5.82 c 8.45 d 5.60 b 5.51 d
15 7.21a 10.71 c 5.80 a 7.40 a
18 6.50 b 12.15 a 5.00 c 7.00 b
21 4.51 f 12.00 b 4.81 e 5.20 e
Means with dissimilar superscripts across the column differ significantly (p<0.05). Means with same
superscripts do not differ significantly (P>0.05). cfu/mL: colony forming unit per milliliter
Discussion
The total mean counts of aerobic heterotrophic bacteria (AHB) in soil were greater than the
counts obtained in water sample. This may be due to the fact that the soil is not mobile on
its own and eventually leads to the deposition of organic substances that help in providing
nutrients for microbial proliferation. The highest aerobic heterotrophic bacterial counts
obtained during the rainy season is in concordance with the report of Olukunle [26] and
Ikuesan [27] that moisture is one of the factors that influence microbial proliferation in soil.
A dry soil can cause desiccation of microbial cells thereby reducing the overall microbial
activities and causes some cells to be dormant. The soil can also hold substances in
stationary mode allowing microorganisms to act on them conveniently without any
disturbance unlike the liquid medium [28]. The low counts of AHB in water samples may
be due to the fact that oxygen concentration in water was lower compared to soil sample,
which may be due to presence of pore spaces that allowed diffusion of atmospheric oxygen
into them, thus enhancing bacterial proliferation in the soil [27].
Among the fungi isolated in this study, Penicillium notatum was prominent across all plots
sampled. Elemuo et al. [25] have reported the versatility of P. notatum in the environment
109
with ability to produce various enzymes, which helped the microorganisms degrade crude
oil in contaminated environment.
The mean total fungi (TF) counts in the soil and water sample in this study was highest in
Plot 2, which is closer to the petroleum products depot both in wet and dry seasons. This
may be due to the ability of fungi to tolerate adverse environmental conditions, especially
with the formation of resistant spores.
The low mean total coliform bacterial (TCB) counts generally observed in this study may
be due to the inability of coliform bacteria to produce spores, which have been noted in the
past to help microorganisms survive in environment that are not favorable for their
existence and metabolisms. Moreover, there is paucity of information concerning the low
proliferation of coliform bacteria on environment polluted by crude oil.
The total mean counts of hydrocarbon utilizing bacteria (HUB) and fungi (HUF) were
lowest in the control soil both in wet and dry seasons. This indicated that the microbial
population found in communities surrounding petroleum products depot had the ability to
utilize hydrocarbon due to periodic exposure to petroleum products. Though, there was no
established pattern of growth observed in the microbial community in this study, their
counts were quite higher, than in the control. The total mean counts of HUB and HUF were
generally low in the water sample in rainy and dry seasons compared to the soil sample.
This is because, nutrient and oxygen availability in water is quite low compared to that of
the soil sample. Different microbial genera use different pathways in the degradation of
petroleum products, some of which take little time to complete a degradation process
whereas others take longer time. Also, the types of enzymes utilized by microorganisms as
well as the constituent of the petroleum products plays a great role in influencing
biodegradation processes [29].
Microbial population and diversity are usually high in a pristine environment unlike an
environment experiencing influx of contaminants from crude oil spills. The reduction and
changes in the microbial communities occur as a result of the inability of the indigenous
microorganisms to withstand such extreme conditions and those that are able to withstand
and even strive often have machineries and pathways they utilize to achieve that [30, 29,
110
31]. The indigenous bacterial diversity obtained in this study was similar to the one
obtained by Nkiru et al. [1]
This study reported some microorganisms that were peculiar to crude oil polluted
environment, in which the genera Bacillus had the highest number of species, which
include B. subtilis, B. thurengiensis and B. licheniformis. These bacteria in addition to
Pseudomonas aeruginosa were all isolated from all the plots sampled. The dominant
presence of Bacillus and Pseudomonas in this study supports the fact established by
Osarumwense et al. [32] that these bacterial genera efficiently degrade hydrocarbons in the
environment through the production of surfactants and enzymes such as lipase. Agu et al.
[33] have reported that spore forming ability of Bacillus helped the organisms in resisting
toxic effects exerted by the petroleum compounds.
All the microorganisms (bacteria and fungi) tested for biodegradation of petroleum
products in this study were able to utilize hydrocarbons although at different rates. This
observation was also made by Ikuesan (2017) where the test isolates utilized hydrocarbons
at varying rates. Microbial genera such as Bacillus and Pseudomonas. Penicillium and
Aspergillus had high degradation capabilities in this study. Ikuesan (2017) has suggested
that these differences in degradation rates were associated with the natural ability of the
different microorganisms. It may also be due to the presence of enzymes and
biosurfactants, and petroleum products constituents [31, 34, 35].
The bacterial genus; Bacillus and Pseudomonas had high frequency of occurance and
utilising efficiencies when compared with other bacterial genus. This may be connected
with their high ability to breakdown complex organic and recalcitrant compounds due to
the production of specialized enzymes [17].
The mean viable cell count (VCC) of bacteria and fungi in MSM amended with crude oil
generally showed a progressive growth of microbial cells untill day 15 across all bacterial
and fungal isolates. However, the microbial cells of Bacillus thuringiensis, Penicillium
notatum and Aspergillus niger began to decrease after day 15, while the cells of
Pseudomonas aeruginosa increased till day 18 before it declined. The general progressive
increase of microbial cells observed at the initial and later stages as well as gradual decline
of microbial cells depicts a typical microbial growth curve. The reduction in the number of
111
cells occurred as a result of cell aging as well as the exhaustion of nutrients in the mineral
salt medium used. As microbial cells grow, they metabolize and release their products into
the environment in which they live. Since the medium used in this study is typical of a
batch culture, there was no renewal of nutrients and toxic metabolites, which eventually
deterred the growth of the microorganisms, thus, a decline in the number of cells was
observed in this study and is in concordance with the report of Nwakanma et al. [2].
Conclusion
The microorganisms isolated from soil and water close to petroleum products depot in this
study were capable of utilizing crude oil, kerosene, diesel and engine oil in varying amount.
Pseudomonas aeruginosa had the highest ability to utilize kerosene while B. thuringiensis
was most efficient in utilizing diesel and engine oil. Aspergillus niger recorded a consistent
increase in viable counts and also exhibited the highest capacity to utilize the petroleum
products compared with other fungal isolates. The findings in this study therefore revealed
that bacterial genera Pseudomonas and Bacillus as well fungal genera Aspergillus and
Penicillium were effective in the bioremediation of petroleum products contaminated sites.
It also showed that water sources from the plots were contaminated with coliform bacterial
and poses great challenge to public health.
References
1. Nkiru, U.C., et al., Biodegradation of Crude Oil-Polluted Soil by Bacterial Isolates from Nigeria.
Frontiers in Environmental Microbiology, 2019. 5(1): p. 14-28.
2. Nwakanma, C., E.C. Obih, and O. Onyia, Molecular Identification of Bacteria Involved in
Degradation of Crude Oil. Nigerian Journal of Biotechnology, 2016. 31: p. 1 – 8.
3. Ding, A., et al., Characterizing Microbial Activity and Diversity of Hydrocarbon-Contaminated
Sites. IntechOpen, 2013. p. 137-160. Doi: http://dx.doi.org/10.5772/50480.
4 Naowasarn, S. and S. Leungprasert, Abundance and diversity of hydrocarbon utilising bacteria in the
oil-contaminated soils throughout a remedial scheme using compost amendment. Songklanakarin
Journal of Science and Technology, 2019. 41(1): p. 12-20.
5. Patel, V., et al., Response and resilience of soil microbial communities inhabiting in edible oil
stress/contamination from industrial estates. BMC Microbiology, 2016. 16, p- 50, doi:
10.1186/s12866-016-0669-8.
6. Nigerian National Petroleum Corporation (NNPC), Nigerian Pipelines and Storage Company
Limited (NPSC), 2020. Retrieved from https://nnpcgroup.com/Downstream/pages/npsc.aspx
16/08/20.
112
7. Adeniji, A.O., O.O. Okoh, and A.I. Okoh, Analytical Methods for the Determination of the
Distribution of Total Petroleum Hydrocarbons in the Water and Sediment of Aquatic Systems: A
Review. Hindawi Journal of Chemistry, 2017. 2090-9063 Article ID 5178937. Doi:
https://doi.org/10.1155/2017/5178937.
8. Iquatt, C.B., O.A. Oyewole, and O.P. Abioye, Bioremediation of petroleum polluted soil (a review).
International Journal of Natural and Applied Science, 2005. 1(1): p. 21-25.
9. Osinowo, I., et al., Bioremediation of Diesel Contaminated Soil Using Bacterial Cocktail and
Organic Nutrients. Journal of Microbiology Biotechnology and Food Sciences, 2020. 10(2): p. 1- 14.
10. Oyewole, O.A., et al., Isolation of bacteria from diesel contaminated soil for diesel remediation.
Journal Bio-Sci, 2020. 28, p. 33-41.
11. Ubong, I.U. and J.D. Edwin, Assessment of petroleum products contamination of soil quality at
selected truck parks in Calabar municipality, Nigeria. International Journal of Development and
Sustainability, 2018. 7(4): p. 1336-1354.
12. Chikere, C. B., G.C. Okpokwasili, and B.O. Chikere, Bacterial diversity in a tropical crude oil-
polluted soil undergoing bioremediation. African Journal of Biotechnology, 2009. 8(11): 2535-2540.
13. Ekhaise, F.O. and J. Nkwelle, Microbiological and Physicochemical Analyses of Oil Contaminated
Soil from Major Motor Mechanic Workshops in Benin City Metropolis, Edo State, Nigeria. Journal
of Applied Science and Environmental Management, 2011. 15(4): 597 - 600.
14. Kuang, S., et al., Soil Microbial Community Structure and Diversity around the Aging Oil Sludge in
Yellow River Delta as Determined by High-Throughput Sequencing. Archaea, 2018, ID 7861805.
Doi: https://doi.org/10.1155/2018/7861805.
15. Feng, X., et al., Distribution of Bacterial Communities in Petroleum‑Contaminated Soils from the
Dagang Oilfeld, China. Transactions of Tianjin University, 2020. 26, p. 22–32. Doi:
https://doi.org/10.1007/s12209-019-00226-7.
16. Minnesota Pollution Control Agency, MPCA, Soil sample collection and analysis procedure, 2008.
Guidance Document 4-04, Petroleum Remediation Program. 520 Lafayette Road, N., St. Paul,
Minnesota. p. 1-10.
17. Cappuccino, J. and N. Sherman, Microbiology: A Laboratory Manual 8th Edition 1981. United
States: Suny Rockland, 5-80.
18. Hamamura, N., et al., Microbial population dynamics associated with crude oil biodegradation in
diverse soils. Applied Environmental Microbiology, 2006. 72, p. 6316 – 6324.
19. Cheesbrough, M., District Laboratory Practice in Tropical Countries Part 2, 2nd Edition, 2003.
Cambridge University Presss, New York, USA, p 1-90.
20. Holt, J. G., et al., Bergey’s Manual of Determinative Bacteriology. 9th Ed. 1994. Baltimore, USA,
Williams and Wilkins Company, p. 71-561.
21. deHoog, G. S., J. Guarro, and M.J. Figueras, Atlas of Clinical Fungi 2nd Edition, Central Bureau voor
Schimmel: 1995. Kluwer Accademic Publisher. p 23-1109.
22. Domsch, K. H. and W. Gams, Fungi in Agricultural Soils, 1970. Longman Group Limited, London.
23. Kostka, J. E., et al, Hydrocarbon-degrading bacteria and the bacterial community response in Gulf of
Mexico beach sands impacted by the deep horizon oil spill. Applied Environmental Microbiology,
2011. 77, 7962-7974.
24. Okpokwasili, G. C. and B.B. Okorie, Biodeterioration potentials of microorganisms isolated from car
engine lubricating oil. Tribology International, 1988. 21, p. 215-220.
25. Elemuo, N. G., et al., Production and Characterization of Lipase Enzyme Expressed by Crude Oil
Contaminated Soil Isolates. Universal Journal of Microbiology Research, 2019. 7(1): p. 1-6.
26. Olukunle, F.O., Microbial Population and Physicochemical Properties of Oil-Polluted Sites in
Selected Areas of Niger Delta, Nigeria. FUTA Journal of Research in Sciences, 2013. 2, p. 249-258.
113
27. Ikuesan, F.A., Evaluation of Crude Oil Biodegradation Potentials of Some Indigenous Soil
Microorganisms. Journal of Scientific Research & Reports, 2017. 13(5): p. 1-9.
28. Teknikio, J.B., et al., Isolation and Identification of Bacteria in Petroleum Hydrocarbons Polluted
Soils in North-West Bayelsa State. Covenant Journal of Physical & Life Sciences, 2018. 1(2): p. 1-
13.
29. Das, N. and P. Chandran, Microbial degradation of petroleum hydrocarbon contaminants: an
overview. Biotechnology Research International, 2011. 2011:941810. DOI: 10.4061/2011/941810.
30. Rampelotto, P.H., Resistance of Microorganisms to Extreme Environmental Conditions and Its
Contribution to Astrobiology. Sustainability 2010. 2, p. 1602-1623; doi:10.3390/su2061602.
31. Jain, P.K. et al., Bioremediation of Petroleum oil Contaminated Soil and Water. Research Journal of
Environmental Toxicology, 2011. 5: p. 1-26.
32. Osarumwense, J. O., F.A. Igiebor, and D.E. Idahosa, Isolation, Characterization and Identification of
Bacterial isolates from Auto-mechanic Workshop contaminated with Hydrocarbon. The Pacific
Journal of Science and Technology, 2019. 20(1): p. 349-355.
33. Agu, K. C., et al., Isolation and Characterization of Microorganisms from Oil Polluted Soil in
Kwata, Awka South, Nigeria. American Journal of Current Microbiology, 2015. 3(1): p. 46-59.
34. Oyeleke S.B., et al., Production and Characterization of Biosurfactants by Candida boleticola H09
and Rhodotorula bogoriensis H15 for crude oil recovery and cleaning of oil contaminated fabrics.
International Journal of Life Sciences and Technology, 2017. 10 (15): 109-123.
35. Karlapudi, A.P., et al., Role of biosurfactants in bioremediation of oil pollution-a review. Petroleum,
2018. 4(3): p. 241-249.
114
Derleme makale / Review article
Elmas, S. and O. Elmas, Salvia fruticosa’nın (Anadolu Adaçayı) Terapötik Etkileri. International Journal
of Life Sciences and Biotechnology, 2021. 4(1): p. 114-137. DOI: 10.38001/ijlsb.764602
Salvia fruticosa’nın (Anadolu Adaçayı) Terapötik Etkileri
Sinem Elmas1* , Onur Elmas2
ÖZET Anadolu adaçayı (Salvia fruticosa), Lamiaceae familyasına ait bir bitki olup,
Anadolu’da geleneksel halk hekimliğinde yaygın olarak kullanılmaktadır. Bitkinin
yaprakları çay şeklinde tüketilir ve yapraklarından uçucu yağ elde edilir. Salvia
fruticosa bitkisi farmasötik ajan olarak (antioksidan, antikanser, antimikrobiyal,
antifungal, antihiperglisemik, antihipertansif vb.) kullanımı dışında aromaterapi,
parfümeri ve kozmetik sektöründe; yiyeceklerde baharat, aroma verici ve koruyucu
olarak pek çok alanda kullanıma sahiptir. Ancak bitkinin irrasyonel kullanımı ciddi
yan etkilere ve komplikasyonlara yol açmaktadır. Bu derleme, Salvia fruticosa’nın
botanik özelliklerini, uçucu yağ bileşenlerini, bu bileşenlerin potansiyel terapötik
etkilerini ve neden olabileceği olası toksik etkileri değerlendirmeyi amaçlamaktadır.
Therapeutic Use of Salvia fruticosa (Anatolian Sage)
ABSTRACT
Anatolian sage (Salvia fruticosa) is a plant species belongs to Lamiaceae family and is
widely used in traditional folk medicine in Anatolia. The leaves of the this plant species
are consumed as tea and essential oil is obtained from the leaves. Besides utilizing as
a pharmaceutical agent (antioxidant, anticancer, antimicrobial, antifungal,
antihyperglycemic, antihypertensive etc.). Salvia fruticosa uses in the aromatherapy,
perfumery and cosmetics industry, as a spice, flavoring and preservative in foods.
However, irrational use of the this plant may causes serious side effects and
complications. This review aims to evaluate the botanical properties, essential oil
components, their potential therapeutic effects and possible toxic effects of Salvia
fruticosa.
Giriş
Antik çağlardan itibaren amprik uygulamalarla halk hekimliğinde kullanılan tıbbi ve
aromatik bitkiler modern tıbbın temeli olarak kabul edilir [1]. Son yıllarda modern tıpta
kullanılan sentetik kökenli ilaçların olası yan etkileri, antimikrobiyal olarak kullanılan bu
ilaçlara karşı bazı mikroorganizmaların dirençli olması [2] ve gıda korumada kullanılan
sentetik bileşiklerin yarattığı endişeler doğal bitkisel kaynaklara ilgiyi arttırmıştır [3].
Biyoteknolojinin gelişmesiyle birlikte yapılan çalışmalar, bitkilerdeki sekonder
1 Muğla Sıtkı Koçman University, Faculty of Science, Department of Biology, Muğla / Turkey 2 Muğla Sıtkı Koçman University, Faculty of Medicine, Department of Physiology, Muğla / Turkey
*Corresponding Author: Sinem Elmas, e-mail: [email protected]
KEY WORDS
Anatolian sage,
Salvia fruticosa,
therapeutic effects,
toxic effects
ANAHTAR
KELİMELER
Anadolu adaçayı,
Salvia fruticosa,
terapötik etkiler,
toksik etkiler
ARTICLE HISTORY
Received
6 July 2020
Accepted
3 September 2020
MAKALE GEÇMİŞİ
Geliş
6 Temmuz 2020
Kabul
3 Eylül 2020
115
metabolitlerin çok çeşitli biyoaktif farmasötik bileşenler içerdiği ve çeşitli hastalıkların
tedavisinde terapötik ajan olma potansiyelleri hakkında pek çok kanıt sunmaktadır [4].
Salvia (adaçayı) türleri eski zamanlardan itibaren geleneksel halk hekimliğinde, çay,
merhem, tentür veya ekstrakt olarak hazırlanarak ağrı kesici, balgam söktürücü, gaz
söktürücü, sakinleştirici, ter kesici, haricen yara iyileştirici olarak; soğuk algınlığı,
bronşit, tüberküloz, menstrüel bozukluklar ve midevi rahatsızlıkların tedavisinde
kullanılan şifalı bitkilerdir [5]. Bu nedenle Salvia cinsinin aktif bileşenlerini ve bunların
biyolojik etkinliklerini belirlemek üzere çok sayıda araştırma projesi gerçekleştirilmiştir.
Salvia türleri esas olarak fenolik asitler, flavonoidler, terpenler ve terpenoidler
içermektedir. Araştırmalarda, Salvia türlerinden izole edilen sekonder metabolitlerin
antimikrobiyal, antifungal, antiseptik, analjezik, antioksidan, antispazmodik,
antidepresan, antimutajenik antikolinesteraz, halusinojenik, antidiyabetik, antikanser,
antihipertansif, antienflamatuar, tüberkülostatik, vazodilatör, hipoglisemik ve insektisit
aktiviteler gibi çeşitli biyolojik etkilere sahip olduğu gösterilmiştir [4, 6].
Salvia cinsinin Anadolu’da iyi bilinen, hem tıbbi açıdan hem de ekonomik açıdan önemli
bir türü Salvia fruticosa’dır. Ülkemizde Anadolu adaçayı, elma çalbası, boz şalba, elma
çalısı, almiya çalbası veya adaçayı olarak bilinen bu türün Kew kontrol listesine göre 19
eşanlamlısı vardır. Literatürde en çok Salvia triloba, Salvia libanotica, Salvia cyrpia ve
Salvia lobryana olarak karşımıza çıkmaktadır [5, 7]. Salvia fruticosa’nın baş ağrısı,
romatizma, epilepsi, hepatit, uykusuzluk, ishal, apse, öksürük, gastrit, gut, obezite, ses
kısıklığı, herpes, solunum hastalıkları, akciğer hastalıkları, dalak hastalıkları, sinir
hastalıkları, ağız hastalıkları, cilt hastalıkları, kas-iskelet hastalıkları, kardiyovasküler
hastalıkların tedavisinde; kolesterol düşürücü, diüretik, karminatif, antispazmodik, iştah
açıcı ve yara iyileştirici olarak kullanıldığı belirtilmiştir [6].
Salvia fruticosa bitkisi, tıbbi amaçlarla kullanımının dışında aromaterapi, parfümeri ve
kozmetikte, doğal böcek kovucu olarak, balık, et, çorba, güveçlerde baharat olarak; turşu,
peynir, içeceklerde aroma verici olarak ve işlenmiş gıdalarda antioksidan olarak
kullanılmaktadır [8].
Geleneksel halk hekimliğinde yaygın olarak kullanılan Salvia fruticosa’nın
ekstraktlarının aktif bileşenlerinin tanımlanması ve terapötik potansiyellerinin
belirlenmesi bitkinin etno-farmasötik kullanımına destek vermektedir. Yapılan çalışmalar
Salvia fruticosa’nın antioksidan [9] [10], antikanser [11], antimikrobiyal [12],
116
antianjiyogenik [13], antifungal [14], antikolinesteraz [10] hipoglisemik [15],
antiproliferatif [16] gibi bir dizi terapötik özellik gösterdiğini ortaya koymuştur.
Bu derleme, Salvia fruticosa’nın botanik özelliklerini, uçucu yağ bileşenlerini, bu
bileşenlerin potansiyel terapötik etkilerini, yanlış ve aşırı kullanımda neden olabileceği
toksik etkileri açıklamayı amaçlamaktadır.
Salvia fruticosa Hakkında Genel Bilgiler
Salvia fruticosa çift çenekliler sınıfının (Magnoliopsida), ballıbabagiller (Lamiaceae)
familyasından, Salvia cinsine ait çalı görünümlü çok yıllık bir türdür. Dünyada İtalya,
Sicilya, Balkanlar, Sirenayka ve Suriye’nin batısında, ülkemizde ise Batı Ege, Kuzeybatı
ve Batı Akdeniz bölgelerinde doğal yayılış göstermektedir [17]. Salvia fruticosa bitkisi
0-1350 m rakımlar arasında yetişebilen, maki veya frigana ekosistemlerinde ve adalarda
yayılış gösteren, 160 cm yüksekliğe erişebilen, Mart-Mayıs aylarında çiçeklenen bir
bitkidir. Yapraklar, genç gelişme devresinde beyazımsı griden, gümüş rengine kadar
değişen renkte ve tüylüdür. Esas yaprakların yanında bir veya iki tarafı az veya çok
gelişmiş yan yaprakçık bulunmaktadır [18, 19]. Bitkinin yapraklarından açık sarı renkte
veya renksiz ‘elma yağı’ denilen yağ elde edilir. Elma yağı olarak adlandırılmasının
nedeni bitkinin bazı dallarının ucunda elmaya benzeyen ve yaklaşık 2-3 mm uzunlukta, 2
mm genişlikte ve kalınlıkta olan mazıların (gal) bulunmasıdır [18, 20].
Uzun yıllardır floradan toplanarak kullanılan bu türün hem iç pazarda hem de dış pazarda
önemli bir yeri bulunmaktadır. Türkiye İstatistik Kurumu’nun verilerine göre, 2018
yılında ülkemizden 7.696 milyon dolar karşılığı 1.843 ton kuru adaçayı yaprağı ihraç
edilirken, 2019 yılında 9.488 milyon dolar karşılığı 2.261 ton kuru adaçayı yaprağı ihraç
edilmiştir [21].
Salvia fruticosa’nın Uçucu Yağ Oranı ve Kimyasal Bileşenleri
Bitkilerden elde edilen uçucu yağ bileşikleri, monoterpenler, seskiterpenler ve bunların
oksijenli türevleri olan alkoller, aldehitler, esterler, eterler, ketonlar, fenoller ve oksitlerin
kompleks bir karışımıdır [12]. Salvia fruticosa'daki uçucu yağların başlıca kimyasal
bileşimi mono-seskiterpen hidrokarbonlar (α-pinen, β-pinen, kamfen, mirsen, karyofilin)
ve oksijenli monoterpenlerdir (1,8 sineol, kafur, borneol, α-terpinil asetat) [22]. Bitki
uçucu yağının fenolik asitler, flavonoidler, kafeik asit ve özellikle rosmarinik asit
açısından çok zengin olduğu bildirilmiştir [23].
117
Salvia fruticosa bitkisinin uçucu yağı genellikle hidrodistilasyon yöntemi ile
yapraklarından elde edilir. Bitkinin yaprakları ortalama %1-3 oranında uçucu yağ taşır,
Bornova lokasyonunda yetiştirilen Salvia fruticosa populasyonlarında bu oranın %5,5-
6’ya kadar çıktığını belirtilmiştir [24]. Bitkide uçucu yağ veriminin, özellikle bitki
gelişiminin farklı aşamalarının etkisi altında olduğunu gösterilmiştir. Farklı coğrafyalarda
incelenen Salvia fruticosa’da en yüksek yağ verimini, bazı araştırmacılar çiçeklenmeden
önce veya çiçeklenme başlangıcında olduğunu öne sürmüş [22, 25, 26, 27], bazıları ise
en yüksek verimin çiçeklenme sonrası [28, 29] dönemde olduğunu belirlemişlerdir.
Ayrıca öğle saatleri içeriklerindeki aktif maddelerin zirveye ulaştığı zaman olduğu
bildirilmiştir [30].
Tıbbi ve aromatik bitkilerde, bitki materyalinin terapötik etkinliği fitokimyasal içeriğine
ve bileşimine bağlıdır [27]. Farklı bölgelerde değişik araştırmacılar tarafından yapılan
çalışmalarda Salvia fruticosa’nın uçucu yağ verimi ve bileşiminde geniş varyasyon
olduğu göze çarpmaktadır. Bu varyasyonun nedeni fitokimyasal profili, toprak, sıcaklık,
yağış, ışıklanma süresi ve şiddeti, rakım, bakı, kuraklık, tuzluluk, toprak besin maddeleri,
toprak yapısı gibi pek çok farklı ekolojik, coğrafik ve iklimsel faktörlere [19, 29, 31] bağlı
olabileceği gibi, genetik varyasyona [32, 33], bitkinin ontogenetik evresine [33], hasat
zamanına ve farklı ekstraksiyon yöntemlerine [29] bağlı olarak değişebilmektedir.
Bunların dışında azotlu gübre uygulamasının ve organik gübre uygulamasının bitkide
uçucu yağ miktarını ve içeriğini arttırdığı bildirilmiştir [18, 34, 35].
Terapötik Etkileri
Antimikrobiyal etkileri
Günümüzde bazı patojenlerin antibiyotiklere karşı direnç geliştirmesi enfeksiyonlarla
mücadelede zorluklar yaşanmasına neden olmaktadır. Mevcut antibiyotiklerin olası yan
etkileri de göz önüne alındığında yeni antimikrobiyal ajanların araştırılmasını zorunlu
hale getirmektedir. Araştırmalar, Lamiaceae familyasına ait tıbbi ve aromatik bitkilerin
çoğunun uçucu yağlarının antimikrobiyal ajan olma potansiyellerine sahip olduklarını
göstermektedir [36]. Bunun yanı sıra, bitkilerdeki aktif bileşenlerin gıda güvenliğini
yüksek oranlarda korumayı başardığını belirlenmiş [37], özellikle Salvia fruticosa uçucu
yağının gıdaların bozulmasında rol oynayan bakterilere karşı iyi bir antimikrobiyal
aktivite gösterdiği, bu nedenle gıda güvenliğini ve raf ömrünü artırmaya katkıda bulunan
geleneksel gıda koruyucularına alternatif olabileceğini gösterilmiştir [12].
118
Yapılan bir araştırmada Salvia fruticosa’dan izole edilen 1,8 sineol ve thujon
bileşenlerinin Escherichia coli, Pseudomonas aeruginosa, Salmonella typhimurium,
Staphylococcus aureus, Rhizobium leguminosarum ve Bacillus subtilis suşlarına karşı
antimikrobiyal aktivite sergilediği, ancak diğer bir bileşen kafurun ise test edilen
bakterilere karşı neredeyse hiç aktif olmadığı tespit edilmiştir [38]. Başka bir çalışmada
Salvia fruticosa uçucu yağının, Bacillus cereus, Bacillus megatherium, Bacillus subtilis,
Aeromonas hydrophila, Aeromonas sobria ve Klebsiella oxytoca'ya karşı düşük
konsantrasyonlarda bakteriyostatik, yüksek konsantrasyonlarda bakterisidal aktivite
gösterdiği bildirilmiştir. Ayrıca uçucu yağının çok düşük konsantrasyonun bile
Staphylococcus aureus ve Aeromonas hydrophila’nın büyümesini etkili bir şekilde inhibe
ettiği belirtilmiştir [12]. Ülkemizde Salvia fruticosa’nın da bulunduğu 5 tıbbi bitkinin,
Staphylococcus aureus, Staphylococcus epidermidis, Enterococcus faecalis, Bacillus
cereus, Escherichia coli, Salmonella typhimurium, Enterobacter aerogenes ve Klebsiella
pneumoniae'ye karşı antibakteriyel aktivesinin araştırıldığı çalışmada, S. typhimurium ve
E. aerogenes karşı en yüksek antibakteriyal aktiviteyi Salvia fruticosa’nın sergilediği
bildirilmiştir [39]. Bir başka çalışmada, Salvia fruticosa uçucu yağının gram pozitif
(Staphylococcus aureus, Bacillus cereus, Micrococcus flavus, Sarcina lutea, Listeria
monocytogenes) ve gram negatif bakterilere (Escherichia coli, Salmonella typhimurium,
Salmonella enteritidis, Pseudomonas tolaasii, Pseudomonas aeruginosa, Proteus
mirabilis) karşı önemli derecede bakteriyostatik ve bakterisidal etki gösterdiği tespit
edilmiştir [40]. Salvia fruticosa uçucu yağı ile 1,8 sineol, β-pinen ve kafur bileşenleri,
gram-negatif (Escherichia coli, Pseudomonas aeruginosa, Salmonella typhimurium,
Listeria monocytogenes, Proteus mirabilis) ve gram-pozitif bakteriler (Bacillus cereus,
Micrococcus flavus ve Staphylococcus aureus) üzerinde analiz edilmiş ve uçucu yağın
test edilen tüm türlere antibakteriyel aktivite sergilediği, test edilen bileşenler arasındaki
en iyi aktivitenin, ana bileşen olan 1,8 sineol (0.04-0.07 mg/ml'de bakteriyostatik aktivite
ve 0.04-0.09 mg/ml'de bakterisidal aktivite) tarafından gösterildiği bildirilmiştir [41].
Uçucu yağlarda bulunan ana ve diğer bileşenlerin çeşitliliğinin sinerjistik etkileri,
biyolojik aktivitelerini belirlemektedir [12]. Uçucu yağların farklı kombinasyonlarının,
antimikrobiyal aktivite üzerindeki etkisini araştıran bir çalışmada, Salvia fruticosa,
Elettaria cardamomum ve Lavandula angustifolia uçucu yağ kombinasyonlarından
hazırlanan ağız gargaralarının insan patojenik bakterileri Staphylococcus aureus,
119
Escherichia coli, Bacillus cereus ve Salmonella typhii'ye karşı antimikrobiyal aktivitesi
değerlendirilmiştir. Salvia fruticosa uçucu yağının tek başına Staphylococcus aureus ve
Bacillus cereus'a karşı antimikrobiyal aktivite gösterdiğini ve bu üç bitkinin uçucu
yağlarından hazırlanan kombinasyonun ise incelenen patojenlere karşı yüksek
antimikrobiyal aktivite gösterdiği tespit edilmiştir [42].
Antifungal etkileri
Bitkilerin ürettiği sekonder metabolitler, mikrobiyal patojenlerden korunmayı sağlayan
savunma mekanizmalarının bir parçasıdır. Bitki patojenik mantarları, taze ve işlenmiş
ürünleri hem niceliksel hem de niteliksel olarak olumsuz etkiler. Hasat sonrası sentetik
fungisit kullanımı, gıdalarda kimyasal kalıntı bırakması ve fungusit dirençli patojenlerin
gelişmesi nedeniyle birçok ülkede giderek kısıtlanmaktadır [43, 44]. Gıdaların
depolanmasında mantar oluşumunu kontrol etmede bazı bitkilerin uçucu yağlarının,
fungusidal veya fungistatik olarak kullanım potansiyellerini olduğunu kanıtlanmıştır [45,
46]. Bitki sekonder metabolitlerine dayanan bu doğal fungisitler, sentetik fungusitlerin
yerine, özellikle organik tarımda değerli alternatif bitki koruma ürünlerini temsil edebilir
[47].
Lübnan’da doğal yetişen Salvia fruticosa bitkisinin Verticillium dahliae, Botrytis cinerea,
Fusarium oxysporum ve Alternaria solani gibi bitkilerde ciddi hastalıklara neden olan
mantarlar üzerindeki antifungal etkinliğinin araştırıldığı çalışmada bitkinin petrol eteri
ekstraktlarının, bu bitki patojenik mantarlarına orta ila düşük seviyede antifungal etkisi
olduğu gösterilmiştir [48]. Başka bir çalışmada, Salvia fruticosa bitkisinden izole edilen
1,8 sineol ve kafur bileşenlerinin her ikisinin de Fusarium oxysporum f. sp. dianthi ve
Fusarium proliferatum’a karşı düşük seviyede antifungal etki gösterdiği, Rhizoctonia
solani, Sclerotinia sclerotiorum ve Fusarium solani sp. cucurbitae’ye karşı ise yüksek
antifungal aktiviteler sergilediği bildirilmiştir [33]. Antifungal etkisine dair diğer bir
çalışmada, Yunanistan’da doğal yetişen Salvia fruticosa’nın uçucu yağının Penicillium
expansum, Aspergillus terreus ve Verticillium dahliae üzerinde doza bağlı olarak
antifungal aktivite sergilediği, yüksek dozajda Verticillium dahliae'nin büyümesini güçlü
bir şekilde inhibe ettiği rapor edilmiştir [47]. Yürütülen başka bir çalışmada Salvia
fruticosa'nın etil asetat ekstraktının ve ana bileşenlerinden karnosik asit, karnosol ve
hispidulinin, Botrytis cinerea ve Penicillium digitatum'a karşı antifungal aktivite
sergilediği tespit edilmiştir [14]. Farklı araştırma sonuçları bitkinin farklı ekstraktlarının
120
ve uçucu yağının antifungal etkisini göstermektedir ancak Salvia fruticosa uçucu yağının
toprak kaynaklı patojenler Fusarium oxysporum ve Macrophomina phaseolina ile yaprak
patojenleri Botrytis cinerea ve Exserohilum turcicum fitopatojenik mantarların miselyum
büyümesini inhibe etmediğini belirten bir çalışma literatür verilerinden sapma
göstermiştir [49].
Bununla birlikte, literatürde, uçucu yağların insan mantar patojenlerine karşı antifungal
aktivitesi hakkında sınırlı bilgi bulunmaktadır. Salvia fruticosa’nın insanlarda cilt
enfeksiyonlarına neden olan üç patojenik mantar suşu Malassezia furfur, Trichophyton
rubrum ve Trichosporon beigelii'ye karşı orta ila düşük seviyede antifungal aktivite
sergilediği bildirilmiştir [50]. Diğer bir çalışmada, Salvia fruticosa’nın sulu
ekstraksiyonun insanlarda dermatofitik enfeksiyonlara neden olan Trichophyton
mentagrophytes, Trichophyton violaceum ve Microsporum canis üzerinde değişen
oranlarda antifungal aktivite gösterdiği, en yüksek aktiviteyi ise Trichophyton violaceum
üzerinde gösterdiği tespit edilmiştir [51].
Çalışmalarda, Salvia fruticosa uçucu yağının değişen kantitatif kompozisyonu ve test
edilen mantar türlerinden dolayı çalışma sonuçları farklılık gösterse de bazı mantar
türlerini kontrol etme yeteneği gıda, tarım ve sağlıkta potansiyel kullanımlarını
göstermektedir. Bu nedenle doğal antifungal ajan olarak kullanılacak kaynağın tespit
edilmesi, olası sonuçları ve toksik olmayan dozajını araştırmak için daha fazla çalışmaya
gereksinim vardır.
Antioksidan etkileri
Sağlıklı aerobik organizmalarda, reaktif oksijen türlerinin (ROS) üretimi antioksidan
savunma sistemleri ile dengelenir [52]. Antioksidanlar, vücut dokularındaki serbest
radikallerin neden olduğu oksidatif hasara karşı koyabilen ve hücresel oksidatif stresin
yükünü azaltmaya yardımcı maddelerdir. Antioksidan içeren besinlerin diyetle alınması
vücut direncini arttırması, oksidatif stres seviyesini azaltması, kanser, diyabet gibi birçok
dejeneratif hastalığın önlenmesi ve kronik hastalığın ilerlemesini geciktirebilmesi
açısından önemlidir [53, 54]. Biyolojik sistemlerde serbest oksijen radikallerin
oluşturduğu zararlı etkilerle baş edebilecekleri için bitkilerin ekstraktları ve spesifik
bileşikleri koruyucu rol oynamaktadır [55].
Doğal antioksidanlar yüksek bitkilerde ve bitkinin yaprak, meyve, çiçek ve tohum gibi
tüm kısımlarında görülür [52]. Salvia cinsine ait türlerin yaprak, çiçek ve odunsu
121
kısımlarında bulunan flavonoid ve fenolik asitlerin antioksidan aktiviteden sorumlu
olduğu bilinmektedir. Fenolik bileşikler ve flavanoidler bu antioksidan etkilerini,
hidroksil radikali, süperoksit anyon radikali, lipid peroksil radikalleri gibi serbest
radikalleri temizleyerek, metal iyonlarıyla şelat oluşturarak, diğer antioksidanlarla
etkileşime girerek ve lipid peroksidasyonunu engelleyerek gösterirler [56, 57].
Anadolu’da halk hekimliğinde yaygın olarak kullanılan Salvia fruticosa polifenolik
bileşikler açısından çok zengindir. Rosmarinik asit, karnosik asit, kafeik asit, vanilik asit,
gallik asit, karnosol, luteolin, metil karnosat, apigenin gibi fenolik bileşiklerin ve
flavanoidlerin Salvia fruticosa bitkisinde antioksidan etkiden sorumlu olduğu
belirtilmiştir [9].
Farklı adaçayı türlerinin (Salvia officinalis ve Salvia fruticosa) ve farklı kekik (Origanum
onites ve Origanum indercedens) türlerinin antioksidan aktivitelerinin karşılaştırıldığı bir
çalışmada, adaçayı türlerinin kekik türlerinden daha yüksek antioksidan aktiviteye sahip
olduğu, ayrıca Salvia fruticosa’nın içeriğindeki karnosik asit ve metil karnosat miktarı
daha fazla olduğu için Salvia officinalis’ten daha yüksek antioksidan aktiviteye sahip
olduğu belirtilmiştir [58]. Çeşitli Salvia türlerinin (Salvia fruticosa, Salvia chrysophylla,
Salvia cilicica, Salvia tomentosa, Salvia halophila, Salvia crypthantha, Salvia sclarea ve
Salvia palaestina) antioksidan özelliklerinin araştırıldığı bir başka çalışmada Salvia
fruticosa'nın diğer türlere kıyasla orta derecede antioksidan aktiviteye sahip olduğu
belirlenmiştir [59].
Çalışmalarda Salvia fruticosa ekstraktlarının antioksidan aktiviteleri ile toplam
fenolik/flavonoid içeriği ve belirli fenolik bileşenler arasında yüksek pozitif
korelasyonlar olduğu sonucuna varılmıştır. Bu nedenle araştırmacılar, Salvia
fruticosa'nın uçucu yağındaki fenolik bileşiklerin, anti-oksidatif aktiviteden sorumlu
olduğunu bildirmişlerdir [14, 19, 58].
Salvia fruticosa’nın vejetatif döngüsü sırasında (çiçeklenme öncesi, çiçeklenme dönemi
ve meyve dönemi) toplam fenoliklerin, flavonoidlerin ve antioksidan aktivitenin
mevsimsel değişiminin incelendiği bir çalışmada flavonoid konsantrasyonu en yüksek
çiçeklenme aşamasında (Mayıs), en düşük meyve aşamasında (Ağustos) tespit edilmiş
olup; antioksidan aktivitenin en yüksek olduğu meyve safhası (Ağustos) yüksek fenolik
asit içeriği ile karakterize edilmiştir. Antioksidan aktivite ile toplam fenolik
konsantrasyonu arasında pozitif korelasyon belirlenmiştir. Araştırmacılar, sıcaklık, nem,
122
yağış vb. çevresel faktörlerin kombinasyonu bitkilerde bulunan fenoliklerin birikmesini
hızlandırabilir veya yavaşlatabilir sonucuna varmışlardır [19]. İzmir’den toplanan Salvia
fruticosa'nın yapraklarında ve çiçek ekstraktlarındaki toplam fenolik içeriklerin incelenen
Polygonum cognatum Meissn, Salvia officinalis, Thymus vulgaris, Rosmarinus officinalis
ve Origanum vulgaris türlerininkinden daha yüksek olduğu; yaprak ekstraktındaki
hidroksil radikali süpürme kapasitelerinin (%) ise Origanum vulgaris, Rosmarinus
officinalis, Salvia officinalis ve Thymus vulgaris ekstraktlarından daha yüksek olduğu
belirlenmiştir. Ayrıca, Salvia fruticosa'nın yaprak ekstraktlarının toplam antioksidan
kapasitesinin çiçek ekstraktlarından anlamlı derecede yüksek olduğu tespit edilmiştir
[52]. Benzer bir çalışmada Yunanistan ve Girit’in farklı yerlerinden alınan Salvia
fruticosa’nın yaprakların etanolik ekstraktlarının, çiçeklerinden daha yüksek antioksidan
aktivite gösterdiği bildirilmiştir [60]. Salvia fruticosa kökünün ve toprak üstü kısımlarının
antioksidan aktivitelerinin değerlendirildiği bir çalışmada, bitkinin kök ekstraktlarının en
fazla toplam fenolik konsantrasyona sahip olduğu ve en yüksek antioksidan aktiviteyi
sergilediği dolayısıyla da zengin bir antioksidan kaynağı olduğu bildirilmiştir [3]. Diğer
bir çalışmada 28’i endemik olan 55 Türk Salvia taksonunun antioksidan aktivitelerini
araştırılmış ve incelenen tüm türler arasında en yüksek antioksidan aktiviteyi (%89.23)
Salvia fruticosa’nın diklorometan ekstraktlarının gösterdiği bildirilmiştir [10].
Antalya’da doğal yetişen ve kültürü yapılmış Salvia fruticosa'da fenolik içerik,
kompozisyon ve antioksidan aktivitesi gibi ana kalite parametrelerinin iki yıl boyunca
araştırıldığı bir çalışmada, kültürü yapılan örneklerde fenolik içeriğin daha yüksek
olduğu, doğal yetişen örneklerde toplam flavonoidlerin ve toplam uçucu yağ oranının
daha yüksek sahip olduğu belirtilmiştir. Numunelerin antioksidan aktivitesinin ikinci
hasat yılı için daha yüksek olduğu, altı aylık saklama süresi boyunca doğal yetişen ve
kültürü yapılan Salvia fruticosa’nın antioksidan aktiviteleri arasında anlamlı bir fark
bulunmadığı saptanmıştır [9]. Libya'da doğal olarak yetişen ancak timol ve karvakrol gibi
fenolik bileşiklerden yoksun Salvia fruticosa'dan izole edilen uçucu yağda düşük ise
antioksidan aktivite belirlenmiştir [61]. Lipitlerin oksidasyonu, gıda ürünlerinin hem
organoleptik özellikler hem de toksikolojik yönler açısından raf ömrünü sınırlayan ana
faktörlerden biridir [58]. Bu gıdaların bozulmasını geciktirmek için sentetik katkı
maddeleri yerine bitkilerden izole edilen antioksidan bileşikler kullanılabilir. Çalışmalar
göstermiştir ki Salvia fruticosa antioksidanları, belirli gıda ve nutrasötik ürünlerin raf
123
ömrünü uzatmak ve korunmasını sağlamak için halihazırda kullanılan sentetik
antioksidanlarına alternatif olarak kullanılabilir [58, 62].
Antikanser etkileri
Kanser, DNA hasarı sonucu doku veya organlarda hücrelerin kontrolsüz bir şekilde
büyümesi ve çoğalmasıdır [63]. Dünya Sağlık Örgütü (DSÖ) ve Uluslararası Kanser
Araştırmaları Ajansı, dünyada sadece 2018 yılında 18,1 milyon kişiye kanser teşhisi
konulduğunu ve 9,6 milyon kişinin kanserden yaşamını yitirdiği belirtmiştir. Ayrıca
raporda 2040 yılına kadar dünya genelinde kanser vakalarının %60 artış göstereceği
öngürülmüştür [64]. Dünyada olduğu gibi ülkemizde de kanser vakaları her yıl katlanarak
artmaya devam etmektedir. Türkiye’de kadınlarda en sık görülen kanser türleri, başta
meme, tiroid, kolorektal, rahim ağzı ve akciğer kanserleri; erkeklerde en sık görülen
kanser türleri sırasıyla akciğer, prostat, kolorektal, mesane ve mide kanserleri olduğu
bildirilmiştir [65]. 100’den fazla çeşidi olan kanser, tedavi edilmezse ciddi sağlık
sorunlarına, hatta ölüme neden olabilir.
Kanser tedavisinde kullanılan kemoterapötik ilaçlar, hücre siklus kontrol noktalarını
hedefleyerek, hücre çoğalmasını durdurarak ve apoptoz indüksiyonu ile etki gösterir.
Ancak klasik kemoterapi ilaçlarının kanserli olmayan dokularda sitotoksisiteye neden
olmaları, ciddi yan etkileri ve belirli dozlar üzerinde ölümcül toksisitelere neden
olabilmeleri gibi dezavantajları vardır. Tüm bu nedenler yüksek spesifikliğe sahip kanser
hücrelerinin tedavisinde sentetik muadillerine göre yan etkileri daha az, etkili, doğal ve
uygun fiyatlı yeni antikanser ajanları arayışını gerektirmektedir [66, 67].
Bitki kaynaklı bileşiklerin, serbest radikal süpürme, detoksifikasyon enzimlerini
değiştirme ve transkripsiyon faktörünün tümör promotörleri tarafından indüklenmesini
inhibe etme gibi çeşitli mekanizmalarla tümör oluşumunun çeşitli aşamalarını inhibe
edebildiğine dair pek çok çalışma, kanser önleme ve tedavisinde doğal ürünlerin önemini
belirtmektedir [68, 69]. Birçok Salvia türü ekstraktı, bir dizi farklı kanser hücresi tipinde
in vitro ve in vivo koşullarda sitotoksik, anti-anjiyojenik ve apoptotik etkiler ile antikanser
performansı sergilemiştir [1, 16, 70]. Özellikle Salvia fruticosa’nın farklı ekstraktlarının,
çoğu insan ve memeli hücre hatlarında yapılmış çalışmalarında kemopreventif etkiler
gösterdiği bildirilmiştir.
Deneysel bir çalışmada, DMBA / TPA cilt kanseri modeli Balbc farelerinin derisine
topikal olarak uygulanan Salvia fruticosa uçucu yağının, tümör görünümünü 4 hafta
124
geciktirdiği ve tümör oluşumunu yaklaşık %78 oranında engellediği bildirilmiştir [71].
Potansiyel antineoplastik özelliklere sahip bitki ekstraktlarını belirlemek için hücre
hatlarına karşı sergiledikleri sitotoksik aktiviteler önemli ön veriler sağlamaktadır, bu
nedenle birçok çalışmada sitotoksik aktiviteler belirlenmiştir [72]. Yunanistan’ın farklı
yerlerinden toplanan Salvia cinsine ait bazı türlerin ekstraktlarının in vitro koşullarda dört
tür insan kanser hücre hattına (HCA, HepG2, MCF-7 ve HPC) karşı sitotoksik
aktivitelerini test edilmiş, Salvia fruticosa örneklerinin test edilen insan kanseri hücre
hatlarının en az bir veya daha fazlasına sitotoksik olduğunu belirlenmiştir [73]. Başka bir
çalışmada, Filistin’den alınan Salvia fruticosa’nın da dahil olduğu 24 türün potansiyel
anti-tümör ve anti-inflamatuar aktiviteleri, farelerin fibrosarkom hücreleri (L929sA) ile
insan meme kanseri hücreleri MCF7 ve MDA-MB231 üzerinde test edilmiş, Salvia
fruticosa diklorometan ve metanol ekstraktlarının incelenen tüm hücre hatlarına farklı
derecelerde sitotoksik aktivite sergilediği bildirilmiştir [72].
Fitokimyasalların etkili bir antikanser terapötik seçenek olarak kabul edilebilmesi için
sinyal yolaklarını ve hücre döngüsü kontrol noktalarını hedeflenmesi gerekir. Salvia
fruticosa’da biyoaktif bileşikler polifenoller bakımından oldukça zengindir ve rosmarinik
asitin antiproliferatif özellikleri iyi bilinmektedir [74, 75]. Salvia fruticosa ve Salvia
officinalis sulu ekstraktları ile bunların ana fenolik bileşiği rosmarinik asitin,
MAPK/ERK ve PI3K/Akt sinyal yolaklarında farklı mutasyonlara sahip insan kolon
karsinom türevi hücre hatları (HCT15 ve CO115) üzerinde antiproliferatif ve pro-
apoptotik etkilerinin değerlendirildiği bir çalışmada, Salvia ekstraktlarının ve rosmarinik
asidin iki hücre dizisinde de konsantrasyona bağlı bir şekilde apoptozu indüklendiği,
ancak sadece HCT15 hücre hattında her iki bitki ekstraktının proliferasyonu engellediği
bildirilmiştir [16].
Benzer bir çalışmada, Salvia fruticosa, Salvia officinalis ve Salvia lavandulifolia'nın sulu
ekstraktları, rosmarinik asit ile luteolin-7-glukozitin, oksidatif ajanlara maruz bırakılmış
Caco-2 ve HeLa hücrelerinde DNA onarımı üzerindeki etkileri araştırılmıştır. Çalışma
sonunda incelenen Salvia ekstraktlarının ve rosmarinik asit ile luteolin-7-glukozitin,
hücreleri oksidatif DNA hasarlarına karşı koruduğu ve DNA onarımını uyardığı
belirlenmiştir. Salvia fruticosa’nın kemoprotektif etkisini, DNA hasarını önlemesi,
gelişmiş DNA onarımı, hücre çoğalması önlenmesi ve apoptoz indüksiyonu gibi çoklu
mekanizmalarla gerçekleştirdiği öne sürülmüştür [76]. Benzer bir başka çalışmada ise
125
Salvia fruticosa sulu ekstraktının, insan embriyonik böbrek hücre hatlarını (HEK 293),
hem intrinsik hem de H2O2 ile indüklenen DNA oksidasyonuna karşı koruduğu
gösterilmiştir [54].
Tıbbi bitkilerin kemoprotektif özellikleri, hücre hattına bağlı olarak değişiklik
göstermektedir. Laurus nobilis, Origanum syriacum, Origanum vulgare ve Salvia
fruticosa’nın uçucu fraksiyonları, sulu ve etanol ekstraktlarının MCF7 meme kanseri
hücre hattında kullanarak insan meme adenokarsinomu hücrelerine karşı antiproliferatif
aktivitesinin incelendiği çalışmada antiproliferatif aktiviteyi sadece Salvia fruticosa’nın
etanol ekstraktı göstermiştir [77]. Ürdün'de yürütülen bir çalışmada Salvia fruticosa
etanol ekstraktının, normal insan periodontal fibroblastlarına karşı minimum toksisite ile
östrojen reseptörü pozitif meme kanseri hücre hatlarına (MCF-7, T47D, ZR-75-1 ve BT
474) karşı seçici antiproliferatif aktivite sergilediği belirlenmiştir [78]. Aynı araştırmacı
benzer başka bir çalışmasında, Salvia fruticosa ve Salvia dominica türlerinin etanol
ekstraktlarının, MCF7 ve T47D meme kanseri hücre hatlarına karşı in vitro hücre
proliferasyonu ve hücre döngüsü regülasyonu üzerindeki etkileri değerlendirmişler, her
iki Salvia türünün etanolik ekstraktların MCF7 ve T47D hücre hatları üzerinde
antiproliferatif aktivitelerinin hem apoptoz hem de nekroza bağlı olduğu sonucuna
varmışlardır [67].
Farklı bir çalışmada, Salvia fruticosa ekstraktının metabolik aktivatör (S9mix)
yokluğunda insan periferal lenfositlerinde, mitotik indeksi düşürerek sitotoksik etki
yaptığı ancak proliferasyon indeksi ve nükleer bölünme indeksini düşürmediği, metabolik
aktivatör varlığında ise sitotoksik olmadığı ancak yüksek dozlarda ise siklofosfamidinin
sitotoksik etkiyi artırdığını saptamışlardır [79]. Salvia fruticosa metanolik ekstraktının
prostat kanseri hücreleri üzerinde etkisini araştıran bir çalışmada, ekstraktın normal
hücrelere sitotoksik etki göstermediği ancak kanser hücrelerinde konsantrasyona bağlı bir
şekilde sitotoksisite gösterdiği ve apoptozu indüklediği belirtilmiştir [11]. Salvia fruticosa
bitkisinin alt türü Salvia fruticosa Mill subsp. thomasii (Lacaita) Brullo, Guglielmo,
Pavone & Terrasi’nin antitümör ve proapoptotik etkilerinin araştırıldığı çalışmada ise
bitkinin metanol ekstraktının insan meme kanseri hücre hatlarında (MCF-7 ve MDA-MB-
231) ve kolorektal hücre hatlarında (RKO ve Caco-2) apoptotik mekanizma ile kanser
büyümesini inhibe ettiği gözlenmiş ayrıca tümöral olmayan 3T3-L1 hücreleri üzerinde
düşük sitotoksik etkilere sahip bir apoptotik mekanizma ile ölüme yol açtığı belirlenmiştir
126
[1]. Salvia fruticosa ve Salvia lanigera’nın farklı türde ekstraktlarının insan kolon kanseri
hücre hattı HCT-116 üzerindeki sitotoksik aktivitesini belirledikleri araştırmada ise
sadece Salvia fruticosa'nın etanol ekstraktının aktivite gösterdiği bildirilmiştir [40].
Salvia fruticosa metanol ekstraktlarının, melanom hücre hattı WM 136.1A proliferasyonu
üzerinde doza bağlı olarak anlamlı bir sitotoksik etki gösterdiği bildirilmiştir [80].
Antikanser etkisi ile ilgili yapılan diğer bir çalışmada, Salvia fruticosa’nın sulu
ekstraktının kolorektal adenokarsinom hücre dizilerinde (Caco-2 ve HT-29) zamana ve
doza bağlı anti-proliferatif aktivite sergilediği tespit edilmiştir. Bitki ekstraktının önemli
bir Glutatyon S-transferaz (GST) inhibitörü olarak kabul edilebileceği ve kanser
kemoterapisinde yardımcı madde olarak potansiyel bir kullanıma sahip olduğu sonucuna
varılmıştır [23]. Salvia fruticosa ve Salvia pomifera'nın metanolik ekstraktlarının insan
melanoma hücreleri üzerinde etkisinin değerlendirildiği çalışmada, Salvia fruticosa
ekstresinin daha verimli bir şekilde, kanser hücrelerinin proliferasyonunu azalttığı
bildirilmiştir. Çalışmada fenolik bileşenlerden karnosik asidin mikrotübül dinamiklerini
etkilediği ve G2/M fazındaki hücre döngüsünü durdurduğu tespit edilmiştir. Bu nedenle
karnosik asidin Salvia fruticosa ekstraktlarının sitostatik etkisinden sorumlu bileşik
olabileceğini öne sürmüşlerdir [81]. Libya’da yetişen Salvia fruticosa'nın metanol
ekstraktının üç meme kanseri hücre hattında (MCF-7, T47D ve MDA-MD-468) anti-
proliferatif aktivitesinin değerlendirildiği bir çalışmada bitkinin, incelenen tüm meme
kanseri hücre hatlarına karşı yüksek anti-proliferatif aktivite sergilediği bildirilmiştir [82].
Anti-Anjiyogenik etkisi
Anjiyogenez, var olan damarlardan yeni kan damarların oluşmasıdır [83]. Anjiyogenez,
büyüme, gelişme, yara iyileşmesi gibi süreçlerde olması beklenen olağan bir durumdur
ancak tümörlerin metastazında kritik bir role sahiptir. Çünkü, tümör boyutundaki
herhangi bir artış, kan akışındaki artışla senkronize olmalıdır bu nedenle kanserin
ilerlemesi anjiyogeneze bağlıdır. Ayrıca tümör hücreleri büyümek ve metastaz
yapabilmek için yeni kan damarlarının taşıyacağı besin maddelerine ve oksijene ihtiyaç
duyarlar. Bu nedenle kanser tedavisinde anjiyogenezin inhibisyonu önemli bir strateji
olarak kabul edilmektedir [13].
Literatürde Salvia cinsine ait türlerinin anti-anjiyojenik aktivitesi hakkında bilgiler
sınırlıdır, ancak farklı araştırmacılar tarafından çalışmalarda Salvia miltiorrhiza [84],
127
Salvia plebeia R. Brown [85], Salvia officinalis [86] ve Salvia chinensis’in [87] anti-
anjiyojenik aktivitelerini bildirmişlerdir.
Bu türlerle yapılan umut verici sonuçlarından sonra Ürdün'de yetişen Salvia fruticosa,
Salvia dominica, Salvia syriaca ve Salvia hormium türlerinin antianjiyojenik aktiviteleri
sıçan aortik halka deneyi ile değerlendirilmiştir. İncelenen türler içinde Salvia
fruticosa’nın hem doğrudan ve hem de dolaylı olarak antianjiyojenik aktivite gösterdiği
ve bitkinin kemoterapötik ve/veya kemopreferans potansiyeline sahip güçlü bir aday
olabileceği sonucuna varılmıştır [13]. Benzer başka bir çalışmada Salvia fruticosa
metanolik ekstraktının, prostat kanseri hücrelerinde anjiyojenik sitokin salgılanmasında
önemli değişiklikler oluşturarak anjiyogenezi inhibe ettiği bildirilmiştir [11].
Anti-kolinesteraz etkisi
Salvia türlerinin farklı ekstrakları ile -çoğunlukla yaşlı nüfusu etkileyen ilerleyici
nörodejeneratif bir rahatsızlık olan- Alzheimer hastalığının tedavisi üzerine kapsamlı
birtakım çalışmalar yapılmış ve hastalığın tedavisinde kolinerjik aktivite gösterdikleri
belirlenmiştir [88, 89, 90]. Salvia fruticosa'daki bazı terpenoidlerin özellikle 1,8 sineol,
kafur, α-pinen bileşenlerinin, hastalığın tedavisinde terapötik bir hedef olan
asetilkolinesteraz (AChE) ile bütirilkolinesteraz (BChE) enzimlerinin aktivitesini
baskıladığı gösterilmiştir.
Salvia fruticosa uçucu yağında düşük molekül ağırlıklı bileşenlerin ve yağdaki doğal
kombinasyonların insanlarda BChE'nin inhibisyonuna katkısının in vitro olarak
araştırıldığı bir çalışmada, Salvia fruticosa uçucu yağları zamana bağlı olarak BChE
inhibisyonu göstermiş olup, bu etkinin uçucu yağ bileşenleri arasında sinerjik
etkileşimden kaynaklanabileceği sonucuna varılmıştır, ayrıca düşük molekül ağırlıklı
bileşiklerin AChE'yi kolayca inhibe ettiği tespit edilmiştir [89]. Diğer bir çalışmada
araştırmacılar Salvia fruticosa, Teucrium polium ve Melissa officinalis etanol
ekstraktlarının in vivo antiamnezik aktiviteleri ile in vitro antikolinesteraz aktivitelerini
değerlendirmişler, antiamnezik deneyde en etkili olan bitkinin Salvia fruticosa olduğunu,
antikolinesteraz analizinde ise asetilkolinesteraza karşı en yüksek inhibisyonu Teucrium
polium bitkisinin ardından Salvia fruticosa’nın gösterdiğini belirtmişlerdir [91].
Antikolinesteraz etkinin araştırıldığı kapsamlı bir çalışmada, 55 Türk Salvia taksonunun
AChE inhibe edici potansiyelleri değerlendirilmiş ve en aktif ekstraktın 100 μg/ml'de
%51.08 inhibisyona sahip Salvia fruticosa’nın diklorometan ekstraktları olduğu, ardından
128
Salvia pomifera (%36.39) ve Salvia fruticosa (%34.27) etil asetat ekstraktlarının olduğu
tespit edilmiştir [10]. Araştırmacılar diğer bir çalışmalarında, doğal olarak yetişen ve
kültürü yapılmış Salvia fruticosa bitkisinin farklı ekstraktlarının, asetilkolinesteraz ve
butirilkolinesteraz önleyici aktivitesini araştırmışlardır. Doğal yetişen bitkinin tüm
ekstraktları, ekili türün ekstraktlarından daha düşük inhibitör etki gösterdiği belirtilmiştir.
En yüksek anti-AChE aktiviteyi, kültürü yapılmış Salvia fruticosa türü sergilemiş olup,
BChE üzerinde ise orta derecede bir inhibitör etki sergilediği bildirilmiştir [92]. Diğer bir
çalışmada Salvia fruticosa gallerinin hekzan ekstraktında bulunan oleik asit, palmitoleik
asit ve stearik asit sayesinde anti-BChE aktivite sergilediği; bitkinin toprak üstü
kısımlarından elde edilen uçucu yağdaki ana bileşen 1,8 sineol sayesinde de yüksek
AChE inhibe edici aktivite sergilediği bildirilmiştir [93]. Deneysel olarak Alzheimer
hastalığı indüklenen bir sıçan modelinde, Salvia fruticosa ve Piper nigrum bitki
ekstraktları ile tedavinin oksidatif stresi önemli ölçüde azalttığı ve bu hastalığın
nörodejenerasyon karakteristiğini iyileştirdiği saptanmıştır. Alzheimer hastalığından
korunmada iki bitki ekstraktının gücü kıyaslandığında ise, 750 mg.kg b.wt. dozunda
Salvia fruticosa ile tedavinin, hem biyokimyasal hem de histopatolojik bulgularla Piper
nigrum’ndan daha güçlü olduğu belirtilmiştir [94].
Alzheimer hastalığı progresif nörodejeneratif bir hastalıktır. Uçucu yağ bileşenleri,
lipofilik yapıları ve küçük moleküler boyutları nedeniyle kan-beyin bariyerini geçebilir
[89]. Yapılan çalışmalar, Salvia fruticosa uçucu yağ ekstraktının, Alzheimer hastalığına
bağlı AChE ve BChE enzimlerini bloke ederek, beyindeki bir nörotransmitter olan
asetilkolinin parçalanmasını engellediğini göstermektedir [71]. Ancak Alzheimer
hastalığında nörodejeneratif süreci yavaşlatabilecek, AChE ve BChE inhibitörleri ile
kombinasyon halinde daha etkili bir şekilde çalışabilecek farklı ajanların belirlenmesi için
yeni çalışmalara ihtiyaç vardır [88, 89].
Anti-hiperglisemik etki
Farklı deneysel çalışmalar Salvia fruticosa’nın glikoz homeostazının terapötik
düzenlenmesinde önemini belirtmiştir. Deneysel bir çalışmada, Salvia fruticosa
ekstraktının alloksan-hiperglisemik tavşanlarda glikozun intestinal emilimini azaltarak,
plazma insülin seviyelerini değiştirmeden kandaki glikoz seviyelerini azalttığını böylece
hipoglisemiye neden olduğu bildirilmiştir [95]. Benzer bir çalışmada, Salvia fruticosa
sulu ekstratlarının sıçanlarda açlık kan şekeri seviyelerini önemli ölçüde iyileştirdiğini
129
ancak plazma insülin düzeyi ve karaciğerdeki glikojen düzeyi üzerinde ise etkisinin
olmadığını ve sadece diyabetik hayvanlarda enterosit fırça kenar membranında sodyum
bağımlı glikoz transport proteni 1’i azalttığı belirlenmiştir [15]. Diğer bir çalışmada ise
Salvia fruticosa metanol ekstraktının, sıçanlarda lipid sindirimi ve emiliminde rol
oynayan önemli gastrointestinal enzimleri inhibe edebildiği, bu nedenle adaçayının
obezite ile ilişkili hipertrigliseridemiyi kontrol etmek için potansiyel bir
fitoterapötik/profilaktik strateji olabileceği sonucuna varılmıştır. Ayrıca adaçayının,
vücut kilo alımını bastırmak için potansiyel olarak kullanılabileceğini gösteren çift
hipotrigliseridemik ve antilipolitik özelliklere sahip olduğu belirtilmiştir [96]. Bu
çalışmalara ek olarak, Salvia fruticosa yapraklarının metanol ekstresinin,
streptozotosin/nikotinamid ile oluşturulan diyabetik sıçan modelinde hiperglisemi
düzeylerini düşürdüğü, glikoz toleransını arttırdığı ve diyabetik sıçanlarda
hiperinsülinemiyi önlediği bildirilmiştir [97].
Antifertilite etkisi
Literatürde Salvia fruticosa bitkisinin üremeye ve cinsel davranışlara etkisini
değerlendiren çalışma sayısı oldukça sınırlıdır.
Deneysel bir çalışmada, Salvia fruticosa bitkisinin sulu ve etanolik ekstraktlarının
antiimplantasyon, antifertilite ve üreme toksisite potansiyellerini erkek ve dişi sıçanlarda
araştırılmıştır. Salvia fruticosa’nın sulu (800 mg/kg) veya etanolik ekstraktlarının (400
mg/kg) birbirini takip eden 30 gün boyunca yetişkin dişi fareler tarafından yutulmasının
hamilelik oluşumu üzerinde hiçbir etkisinin olmadığı, ancak implantasyonların ve
yaşayabilir fetusların sayısını azalttığı ve gebe sıçanlarda nefes alma sıklığını artırdığı
saptanmıştır. Yetişkin erkek sıçanlar tarafından yine art arda 30 gün boyunca Salvia
fruticosa'nın sulu ekstraktının (800 mg/kg) veya etanolik ekstraktın (400 mg/kg)
yutulması ise bu erkekler tarafından döllenen dişi sıçanların sayısı üzerinde herhangi bir
etkiye sahip olmadığı ancak, implantasyonların ve canlı fetüslerin sayısını azalttığı
belirlenmiştir. Sonuç olarak, Salvia fruticosa'nın yutulmasının erkek ve dişi sıçanlarda
doğurganlık üzerinde toksik etkiler oluşturduğu sonucuna varılmıştır. Ayrıca çalışmada,
erkek ve dişi sıçan yavrularının Salvia fruticosa’nın 400 mg/kg etanolik ekstraktının
yutulması prenatal maruziyetinin testiküler iniş ve vajinal açılma zamanlaması ile ölçülen
cinsel olgunlaşma (ergenlik) parametreleri üzerinde hiçbir etkisi olmadığı bildirilmiştir
[98]. Başka bir çalışmada ise Salvia fruticosa bitkisi toz halde, 30 gün boyunca günlük
130
800 mg kg-1 vücut ağırlığı dozunda cinsel olarak aktif erkek sıçanlara (Sprague-dawley
sıçanları) oral olarak uygulanmış ve çiftleşme etkinlikleri üzerine etkileri
değerlendirilmiştir. Salvia fruticosa verilen erkek sıçanlarda testosteron serum
seviyesindeki önemli azalmaya bağlı olarak cinsel isteksizlik ve performans kaybı
gözlenmiş bunun da bitkinin yapısında bulunan bileşen veya bileşenlerden
kaynaklanabileceği belirtilmiştir [99].
Diğer etkiler
Salvia fruticosa ekstraktı ile kediler üzerinde yapılan bir çalışmada, ekstraktın kedilerdeki
kan basıncını düşürdüğü, asetilkolin, histamin, serotonin ve BaCl2 tarafından indüklenen
düz kas kasılmalarını inhibe ederek hipotansif ve spazmolitik etkiler oluşturduğu
bildirilmiş, ayrıca bitkinin içerdiği bileşiklerin heksobarbital uykuyu uzattığı tespit
edilmiştir [100].
Salvia fruticosa etanolik ekstraktının, sıçanlardan izole edilmiş torasik aort halkaları
üzerine etkilerinin araştırıldığı bir çalışmada, ekstraktın doza bağlı bir şekilde nitrik oksit
üretimini ve gevşemiş endotelyum sağlam halkaları arttırdığı; endotel bağımlı
vazorelaksasyonu indüklediği tespit edilmiştir. Bitkinin kardiyovasküler
komplikasyonların yükünü azaltmak için antihipertansif bir ajan olarak işlev görebileceği
bildirilmiştir [101].
Toksik etkileri
Salvia fruticosa bitkisinin terapötik etkinliği ile ilgili çok sayıda araştırma projesi
olmasına rağmen, toksisitesi ile ilgili deneysel çalışmalar nadirdir. Adaçayı bitkisinin şifa
verici özelliklerinin yanı sıra, yanlış veya aşırı kullanımı, uçucu yağının toksisitesinden
dolayı çeşitli komplikasyonlara neden olabilmektedir [102,103]. Deneysel bir çalışmada
tıbbi adaçayı (Salvia officinalis) uçucu yağının, sıçanlarda zehirlenmenin subklinik
olduğu doz sınırının 0.3 g/kg olduğu tespit edilmiş, 3,2 g/kg yağın üzerinde kasılmaların
ortaya çıktığı ve ölümcül olduğu belirtilmiştir [102]. Aynı araştırmacının bir başka
deneysel çalışmasında Salvia officinalis’in bu defa insanlarda zehirlenmeye neden
olduğunu ve bu toksisitelerin, Salvia fruticosa’da da bulunan ve konvülsan özellikleri iyi
bilinen, thujon ve kafur bileşenlerinden kaynaklandığı belirtilmiştir [103]. Ayrıca adaçayı
yağının diğer toksik etkileri arasında epileptik reaksiyonlar, denge kaybı ve taşikardi
bildirilmiştir [71, 104].
131
Toksik etkileri ile ilgili diğer bir çalışmada, Salvia fruticosa’nın yağ kompozisyonundaki
mevsimsel değişiklikleri toksisite ile ilişkilendirmek amacıyla yılın farklı zamanlarında
toplanan bitkilerden elde edilen adaçayı yağının in vivo akut toksisitesi araştırılmıştır. Bu
bitkinin yapraklarından elde edilen yağ ekstraktının bileşimi Ağustos (yaz), Ekim
(sonbahar), Ocak (kış) ve Nisan (bahar) aylarında belirlemişler ve yağın bileşiminde
önemli mevsimsel değişiklikler bulunduğunu rapor etmişlerdir. Her fraksiyonun
toksisitesi, farelere intraperitoneal enjeksiyonun ardından araştırılmış buna göre kış
mevsiminde (Ocak) toplanan bitkilerden ekstrakte edilen uçucu yağ, daha yüksek kafur,
kamfen, α ve β-thujon içerdiğini dolayısıyla kış ekstraktının en toksik olduğu (LD50: 839
mg/kg vücut ağırlığı) ve farelerde güçlü konvülsan özellikler sergilediğini bildirmişlerdir.
Bahar ekstraktının ise en az toksik (LD50: 1200 mg/kg vücut ağırlığı) olduğunu ve daha
düşük seviyelerde kafur, kamfen, α ve β-thujon içerdiği bildirilmiştir. Araştırmacılar
çalışmanın sonunda yağların bileşenleri ve toksisiteleri arasında güçlü bir korelasyon
olduğu sonucuna varmışlardır. Ayrıca dört yağ ekstraktının her birinin enjeksiyonundan
sonra farelerde doza bağlı farmakotoksik semptomlar kaydedilmiştir. Ölümden önce
hayvanlarda, hareket koordinasyonunda bozukluk, kas kasılmaları ve konvülsiyonlar gibi
epileptojenik semptomlar izlenmiş ve bunu motor aktivitede azalma takip etmiştir.
Postmortem muayenede yüksek vaskülarize cilt ve periton tabakaları, kalpte koyu kan
pıhtıları ve bağırsak iltihabı saptanmıştır [105]. Sulu ekstraktının toksik etkisi ile ilgili
olarak, Yunanistan’ın ve Girit’in farklı yerlerinden alınan Salvia fruticosa'nın kolesterol
metabolizmasında ve kalp hastalıklarında önemli rol oynayan Cr, Cu, Zn ve Mn başta
olmak üzere toplam 18 element (V, Co, Se, Sr, Sn, Sb, Ba, Bi, Pb, Cd, As, Ni, Fe, Mg)
içerdiği ancak otoyola daha yakın olan populasyonlarda Salvia fruticosa çiçeklerinin ve
yapraklarının, infüzyonda dahi mevcut olan düşük konsantrasyonlarda bazı toksik ağır
metaller (Pb ve Cd) içerdiği bildirilmiştir [60].
Salvia fruticosa toksisitesine ilişkin olarak, gaz giderici olarak topikal kullanımı önerilen
bu bitki yağının çocuklarda oral ve yüksek dozda kullanımına bağlı gelişen ani solunum
sıkıntısı ve kimyasal pnömonili bir olgu ile aynı şekilde yanlış kullanımına bağlı infantil
kolik bebeklerde zehirlenme vakaları bildirilmiştir. Bitki yağının oral kullanımı sonucu
ciddi sistemik yan etkiler gelişebildiği için topikal kullanımında da dikkatli olunması
gerektiği bildirilmiştir [106, 107].
132
Sonuç ve Öneriler
Son yıllarda biyoteknolojinin gelişmesi ile beraber yapılan çalışmalar, tıbbi ve aromatik
bitkilerin içerdiği sekonder metabolitlerin öneminin anlaşılmasında etkili olmuştur.
Kullanımı insanlık tarihi kadar eski olan tıbbi ve aromatik bitkiler, içerdikleri biyoaktif
maddeler sayesinde günümüzde hastalıkların önlenmesi, tedavisi ve yeni ilaçları
keşfetmek için kullanılmaya devam etmektedir. Ancak bu bitkilerin biyoaktiviteleri, içsel
ve dışsal parametrelerden etkilenen spesifik bileşenlerin varlığına ve oranına bağlı
olduğundan, bitki materyalinin standardizasyonu gereklidir. Modern biyoteknolojik
yöntemler istenilen nitelikte bitkinin standardize edilmesini mümkün kılmaktadır.
Verimli bitkilerin genotip kombinasyonu ile kültüre alma işlemi, sürekli yüksek kalitede
ve istenilen özelliklere uygun tıbbi ve aromatik bitki materyalinin elde edilmesine katkıda
bulunabilir. Anadolu’nun geleneksel halk hekimliğinde kullanımı yaygın olan bitkilerden
biri de Salvia fruticosa’dır. Farmakognozik prosedürlere göre bir bitkinin ilaç olarak
kullanılması için, içeriğindeki etken maddeleri, bu etken maddelerin oranını, etki
mekanizmalarını, olası yan etkilerini, başka ilaçlarla etkileşimlerini bilmek gerekir.
Salvia fruticosa sekonder metabolitlerinin çok çeşitli ve yararlı biyoaktiviteleri farklı
çalışmalarla gösterilmiştir bu nedenle bitki nutrasötik bir kokteyl olarak
değerlendirilebilir. Ayrıca bitkiden elde edilecek bazı biyoaktif fitokimyasallar, birçok
hastalığın tedavisine yardımcı olabilecek potansiyel hammadde kaynağı olarak
düşünülebilir. Ancak bitkinin potansiyel toksik etkileri göz ardı edilmemeli, kontrollü ve
doğru kullanımı sağlanmalıdır. Salvia fruticosa bileşenlerinin biyoaktiviteleri ile
farmakolojik özelliklerinin doğrulanması ve irrasyonel kullanımda oluşabilecek ciddi yan
etkiler ve komplikasyonların belirlenmesi için daha fazla çalışmaya ihtiyaç vardır.
Kaynaklar
1. Tundis, R., et al., Assessment of antioxidant, antitumor and pro-apoptotic effects of Salvia
fruticosa Mill. subsp. thomasii (Lacaita) Brullo, Guglielmo, Pavone & Terrasi (Lamiaceae). Food
and Chemical Toxicology, 2017. 106: p. 155-164.
2. Essawi, T. and M. Srour, Screening of some Palestinian medicinal plants for antibacterial activity.
Journal of ethnopharmacology, 2000. 70(3): p. 343-349.
3. Boukhary, R., et al., Anti-inflammatory and antioxidant activities of Salvia fruticosa: An HPLC
determination of phenolic contents. Evidence-Based Complementary and Alternative Medicine,
2016. 2016.
4. Lu, Y. and L.Y. Foo, Polyphenolics of Salvia—a review. Phytochemistry, 2002. 59(2): p. 117-
140.
5. Topçu, G., Bioactive triterpenoids from Salvia species. Journal of natural products, 2006. 69(3):
133
p. 482-487.
6. Gürdal, B. and Ş. Kültür, An ethnobotanical study of medicinal plants in Marmaris (Muğla,
Turkey). Journal of Ethnopharmacology, 2013. 146(1): p. 113-126.
7. WCSP, World checklist of selected plant families. Facilitated by the Royal Botanic Gardens, Kew,
2014.
8. Gali-Muhtasib, H., Anticancer and medicinal properties of essential oil and extracts of East
Mediterranean sage (Salvia triloba). Advances in Phytomedicine, 2006. 2: p. 169-180.
9. Dincer, C., et al., A comparative study on phenolic composition, antioxidant activity and essential
oil content of wild and cultivated sage (Salvia fruticosa Miller) as influenced by storage. Industrial
Crops and Products, 2012. 39: p. 170-176.
10. Şenol, F.S., et al., Survey of 55 Turkish Salvia taxa for their acetylcholinesterase inhibitory and
antioxidant activities. Food Chemistry, 2010. 120(1): p. 34-43.
11. Atmaca, H. and E. Bozkurt, Apoptotic and anti-angiogenic effects of Salvia triloba extract in
prostate cancer cell lines. Tumor Biology, 2016. 37(3): p. 3639-3646.
12. Delamare, A.P.L., et al., Antibacterial activity of the essential oils of Salvia officinalis L. and
Salvia triloba L. cultivated in South Brazil. Food chemistry, 2007. 100(2): p. 603-608.
13. Zihlif, M., et al., The antiangiogenic activities of ethanolic crude extracts of four Salvia species.
BMC Complementary and Alternative Medicine, 2013. 13(1): p. 358.
14. Exarchou, V., et al., HPLC-SPE-NMR characterization of major metabolites in Salvia fruticosa
Mill. Extract with antifungal potential: Relevance of carnosic acid, carnosol, and hispidulin.
Journal of agricultural and food chemistry, 2015. 63(2): p. 457-463.
15. Azevedo, M.F., et al., Rosmarinic acid, major phenolic constituent of Greek sage herbal tea,
modulates rat intestinal SGLT1 levels with effects on blood glucose. Molecular nutrition & food
research, 2011. 55(S1): p. S15-S25.
16. Xavier, C.P., et al., Salvia fruticosa, Salvia officinalis, and rosmarinic acid induce apoptosis and
inhibit proliferation of human colorectal cell lines: the role in MAPK/ERK pathway. Nutrition and
cancer, 2009. 61(4): p. 564-571.
17. TUBIVES, Turkish Plants Data Service. 2004. Available from: http://www.tubives.com/ [Erişim
Tarihi: 29.04.2020].
18. Bayram, E. and Ç. Sönmez, Adaçayı Yetiştiriciliği. EÜ Tar. Uyg. ve Araş. Merkezi Yayım Bülteni,
2006(48).
19. Papageorgiou, V., et al., Variation of the chemical profile and antioxidant behavior of Rosmarinus
officinalis L. and Salvia fruticosa Miller grown in Greece. Journal of agricultural and food
chemistry, 2008. 56(16): p. 7254-7264.
20. Ceylan A., Ege University Agriculture Faculty Press, Izmir, Turkey, p. 225 (1997).
21. TUIK, Dış Ticaret İstatistikleri.2020. Available from:
https://biruni.tuik.gov.tr/disticaretapp/disticaret.zul?param1=25¶m2=0&sitcrev=0&isicrev=
0&sayac=5802/ [Erişim Tarihi: 17.08.2020].
22. Putievsky, E., U. Ravid, and N. Dudai, The essential oil and yield components from various plant
parts of Salvia fruticosa. Journal of natural products, 1986. 49(6): p. 1015-1017.
23. Altay, A., et al., Anatolian sage Salvia fruticosa inhibits cytosolic glutathione-s-transferase activity
and colon cancer cell proliferation. Journal of Food Measurement and Characterization, 2019.
13(2): p. 1390-1399.
24. Bayram, E., A. Ceylan, and H. Geren, Anadolu adaçayı (Salvia fruticosa Mill.) ıslahında
geliştirilen klonların agronomik ve kalite özellikleri üzerinde araştırma. Türkiye, 1999. 3: p. 212-
217.
25. Zgheib, R., et al., Investigation of essential oil chemical polymorphism of Salvia fruticosa
naturally growing in Lebanon. Journal of Essential Oil Bearing Plants, 2019. 22(2): p. 408-430.
26. Karioti, A., et al., Effect of nitrogen concentration of the nutrient solution on the volatile
constituents of leaves of Salvia fruticosa Mill. in solution culture. Journal of agricultural and food
134
chemistry, 2003. 51(22): p. 6505-6508.
27. Sarrou, E., S. Martens, and P. Chatzopoulou, Metabolite profiling and antioxidative activity of
Sage (Salvia fruticosa Mill.) under the influence of genotype and harvesting period. Industrial
Crops and Products, 2016. 94: p. 240-250.
28. Bellomaria, B., et al., Contribution to the study of the essential oils from three species of Salvia
growing wild in the eastern Mediterranean region. Journal of Essential Oil Research, 1992. 4(6):
p. 60.
29. El-Wahab, A., et al., Effect of different planting locations in Egypt on Salvia fruticosa mill. Plants.
Egyptian Journal of Desert Research, 2015. 65(2): p. 291-307.
30. Altindal, D., Determination of genetic diversity of natural sage populations in Muğla region of
Turkey. International Journal of Environmental Science and Technology, 2019. 16(9): p. 5219-
5226.
31. Karousou, R., D. Vokou, and S. Kokkini, Variation of Salvia fruticosa essential oils on the island
of Crete (Greece). Botanica acta, 1998. 111(3): p. 250-254.
32. Skoula, M., J.E. Abbes, and C.B. Johnson, Genetic variation of volatiles and rosmarinic acid in
populations of Salvia fruticosa mill growing in Crete. Biochemical systematics and ecology, 2000.
28(6): p. 551-561.
33. Pitarokili, D., et al., Volatile metabolites from Salvia fruticosa as antifungal agents in soilborne
pathogens. Journal of agricultural and food chemistry, 2003. 51(11): p. 3294-3301.
34. Kaplan, M., et al. The effects of different organic manure applications on the dry weight and the
essential oil quantity of sage (Salvia fruticosa Mill.). in I International Medicinal and Aromatic
Plants Conference on Culinary Herbs 826. 2007.
35. Kocabas, I., et al., Effects of different organic manure applications on the essential oil components
of Turkish sage (Salvia fruticosa Mill.). Asian Journal of chemistry, 2010. 22(2): p. 1599.
36. Uritu, C.M., et al., Medicinal plants of the family Lamiaceae in pain therapy: A review. Pain
Research and Management, 2018. 2018.
37. Alzoreky, N. and K. Nakahara, Antibacterial activity of extracts from some edible plants
commonly consumed in Asia. International journal of food microbiology, 2003. 80(3): p. 223-230.
38. Sivropoulou, A., et al., Antimicrobial, cytotoxic, and antiviral activities of Salvia fructicosa
essential oil. Journal of Agricultural and food Chemistry, 1997. 45(8): p. 3197-3201.
39. Aşkun, T., et al., Characterization of essential oils of some Salvia species and their
antimycobacterial activities. Turkish Journal of Biology, 2010. 34(1): p. 89-95.
40. Duletić-Laušević, S., et al., Composition and biological activities of Libyan Salvia fruticosa Mill.
and S. lanigera Poir. extracts. South African Journal of Botany, 2018. 117: p. 101-109.
41. Giweli, A., et al., Antimicrobial and antioxidant activities of essential oils of Satureja thymbra
growing wild in Libya. Molecules, 2012. 17(5): p. 4836-4850.
42. Karadağ, A.E., et al., Antibacterial evaluation of Elettaria cardamomum (L.) Maton, Lavandula
angustifolia Mill. and Salvia fruticosa Mill. essential oil combinations in mouthwash preparations.
Natural Volatiles&Essential Oils, 2020. 7(1): p. 9-17.
43. Soković, M. and L.J. Van Griensven, Antimicrobial activity of essential oils and their components
against the three major pathogens of the cultivated button mushroom, Agaricus bisporus. European
Journal of plant pathology, 2006. 116(3): p. 211-224.
44. Ağırman, B., M.N. Akalın, and H. Erten, Meyve ve sebzelerde hasat sonrası fungal hastalıkların
antagonistik mayalar ile biyokontrolü. Gıda, 2019. 44(1): p. 31-49.
45. Dwivedi, S.K. and N. Dubey, Potential use of the essential oil of Trachyspermum ammi against
seed-borne fungi of Guar (Cyamopsis tetragonoloba L.(Taub.) Mycopathologia, 1993. 121(2): p.
101-104.
46. Mishra, A. and N. Dubey, Evaluation of some essential oils for their toxicity against fungi causing
deterioration of stored food commodities. Applied and environmental microbiology, 1994. 60(4):
p. 1101-1105.
135
47. Kadoglidou, K., et al., Inhibitory and stimulatory effects of essential oils and individual
monoterpenoids on growth and sporulation of four soil-borne fungal isolates of Aspergillus
terreus, Fusarium oxysporum, Penicillium expansum, and Verticillium dahliae. European journal
of plant pathology, 2011. 130(3): p. 297-309.
48. Abou-Jawdah, Y., H. Sobh, and A. Salameh, Antimycotic activities of selected plant flora,
growing wild in Lebanon, against phytopathogenic fungi. Journal of agricultural and food
chemistry, 2002. 50(11): p. 3208-3213.
49. Shimoni, M., et al., Antifungal activity of volatile fractions of essential oils from four aromatic
wild plants in Israel. Journal of chemical ecology, 1993. 19(6): p. 1129-1133.
50. Adam, K., et al., Antifungal activities of Origanum vulgare subsp. hirtum, Mentha spicata,
Lavandula angustifolia, and Salvia fruticosa essential oils against human pathogenic fungi. Journal
of Agricultural and Food Chemistry, 1998. 46(5): p. 1739-1745.
51. Ali‐Shtayeh, M. and S.I. Abu Ghdeib, Antifungal activity of plant extracts against dermatophytes.
mycoses, 1999. 42(11‐12): p. 665-672.
52. Urek, R.O., et al., Comparison of antioxidant capacities of the leaves and flowers of Salvia
fruticosa grown in Turkey. Asian Journal of Chemistry, 2008. 20(3): p. 2091.
53. Valko, M., et al., Free radicals, metals and antioxidants in oxidative stress-induced cancer.
Chemico-biological interactions, 2006. 160(1): p. 1-40.
54. Hani, S.B. and M. Bayachou, Salvia fruticosa reduces intrinsic cellular and H2O2-induced DNA
oxidation in HEK 293 cells; assessment using flow cytometry. Asian Pacific Journal of Tropical
Biomedicine, 2014. 4(5): p. 399-403.
55. Garg, D., et al., In-vitro antioxidant activity and phytochemical analysis in extracts of Hibiscus
rosa-sinensis stem and leaves. Free Radicals and Antioxidants, 2012. 2(3): p. 41-46.
56. Rice-Evans, C., N. Miller, and G. Paganga, Antioxidant properties of phenolic compounds. Trends
in plant science, 1997. 2(4): p. 152-159.
57. Özyürek, M., Reaktif Oksijen Türleri Süpürücü Antioksidan Aktivitenin Ölçümünde Modifiye
CUPRAC Yöntemlerinin Geliştirilmesi. İstanbul Üniversitesi, Doktora tezi, İstanbul, 2008.
58. Pizzale, L., et al., Antioxidant activity of sage (Salvia officinalis and S fruticosa) and oregano
(Origanum onites and O indercedens) extracts related to their phenolic compound content. Journal
of the Science of Food and Agriculture, 2002. 82(14): p. 1645-1651.
59. Bozan, B., et al., Antioxidant and free radical scavenging activities of eight Salvia species.
Chemistry of Natural Compounds, 2002. 38(2): p. 198-200.
60. Pasias, I.N., et al., Elemental content and total antioxidant activity of Salvia fruticosa. Food
analytical methods, 2010. 3(3): p. 195-204.
61. Giweli, A.A., et al., The chemical composition, antimicrobial and antioxidant activities of the
essential oil of Salvia fruticosa growing wild in Libya. Archives of Biological Sciences, 2013.
65(1): p. 321-329.
62. Durling, N.E., et al., Extraction of phenolics and essential oil from dried sage (Salvia officinalis)
using ethanol–water mixtures. Food chemistry, 2007. 101(4): p. 1417-1424.
63. Hoeijmakers, J.H., DNA damage, aging, and cancer. New England Journal of Medicine, 2009.
361(15): p. 1475-1485.
64. Wild, C., E. Weiderpass, and B. Stewart, World cancer report: cancer research for cancer
prevention. Lyon: International Agency for Research on Cancer, 2020.
65. Yıllığı, S.İ., TC Sağlık Bakanlığı. Sağlık Araştırmaları Genel Müdürlüğü. Ankara, 2017.
66. Gali-Muhtasib, H. and N. Bakkar, Modulating cell cycle: current applications and prospects for
future drug development. Current cancer drug targets, 2002. 2(4): p. 309-336.
67. Abu-Dahab, R., et al., Mechanistic studies of antiproliferative effects of Salvia triloba and Salvia
dominica (Lamiaceae) on breast cancer cell lines (MCF7 and T47D). Zeitschrift für
Naturforschung C, 2014. 69(11-12): p. 443-451.
68. Shih, H., G.V. Pickwell, and L.C. Quattrochi, Differential effects of flavonoid compounds on
136
tumor promoter-induced activation of the human CYP1A2 enhancer. Archives of Biochemistry
and Biophysics, 2000. 373(1): p. 287-294.
69. Altay, A. and F. Bozoğlu, Salvia fruticosa modulates mRNA expressions and activity levels of
xenobiotic metabolizing CYP1A2, CYP2E1, NQO1, GPx, and GST enzymes in human colorectal
adenocarcinoma HT-29 cells. Nutrition and cancer, 2017. 69(6): p. 892-903.
70. Akaberi, M., S. Mehri, and M. Iranshahi, Multiple pro-apoptotic targets of abietane diterpenoids
from Salvia species. Fitoterapia, 2015. 100: p. 118-132.
71. Gali-Muhtasib, H. and N. Affara, Chemopreventive effects of sage oil on skin papillomas in mice.
Phytomedicine, 2000. 7(2): p. 129-136.
72. Kaileh, M., et al., Screening of indigenous Palestinian medicinal plants for potential anti-
inflammatory and cytotoxic activity. Journal of ethnopharmacology, 2007. 113(3): p. 510-516.
73. Badisa, R., et al., Cytotoxic Activities of Salvia of the Labiatae Family. Pharmaceutical biology,
2005. 42(8): p. 640-645.
74. Agarwal, R., Cell signaling and regulators of cell cycle as molecular targets for prostate cancer
prevention by dietary agents. Biochemical pharmacology, 2000. 60(8): p. 1051-1059.
75. Kan, S.F., et al., Anti‐proliferative effects of evodiamine on human prostate cancer cell lines
DU145 and PC3. Journal of cellular biochemistry, 2007. 101(1): p. 44-56.
76. Ramos, A.A., et al., Polyphenolic compounds from Salvia species protect cellular DNA from
oxidation and stimulate DNA repair in cultured human cells. Journal of agricultural and food
chemistry, 2010. 58(12): p. 7465-7471.
77. Al-Kalaldeh, J.Z., R. Abu-Dahab, and F.U. Afifi, Volatile oil composition and antiproliferative
activity of Laurus nobilis, Origanum syriacum, Origanum vulgare, and Salvia triloba against
human breast adenocarcinoma cells. Nutrition Research, 2010. 30(4): p. 271-278.
78. Abu-Dahab, R., et al., Comparison of the antiproliferative activity of crude ethanol extracts of nine
salvia species grown in Jordan against breast cancer cell line models. Pharmacognosy magazine,
2012. 8(32): p. 319.
79. Sevindik, N. and E. Rencuzogullari, The genotoxic and antigenotoxic effects of Salvia fruticosa
leaf extract in human blood lymphocytes. Drug and chemical toxicology, 2014. 37(3): p. 295-302.
80. Fraihat, A., et al., Inhibitory effects of methanol extracts of selected plants on the proliferation of
two human melanoma cell lines. Tropical Journal of Pharmaceutical Research, 2018. 17(6): p.
1081-1086.
81. Koutsoulas, A., et al., Characterization of phenolic compounds and antiproliferative effects of
Salvia pomifera and Salvia fruticosa extracts. Molecules, 2019. 24(16): p. 2921.
82. Eltawaty, S.I., et al., Anticancer effects of methanol extract of Libyan Salvia fruticosa Mill. on
MCF7, T47D and (MDA-MB-468) breast cells lines. European Journal of Pharmaceutical and
Medical Research, 7(2): p. 165-169.
83. Folkman, S. and R.S. Lazarus, Stress, appraisal, and coping. 1984: New York: Springer Publishing
Company.
84. Hur, J.M., et al., Cryptotanshinone but not tanshinone IIA inhibits angiogenesis in vitro.
Experimental & molecular medicine, 2005. 37(2): p. 133-137.
85. Jung, H.-J., et al., Anti-inflammatory, anti-angiogenic and anti-nociceptive activities of an ethanol
extract of Salvia plebeia R. Brown. Journal of ethnopharmacology, 2009. 126(2): p. 355-360.
86. Keshavarz, M., et al., In vitro and ex vivo antiangiogenic activity of Salvia officinalis.
Phytotherapy Research, 2010. 24(10): p. 1526-1531.
87. Liu, F., et al., Effect of Salvia chinensis extraction on angiogenesis of tumor. Zhongguo Zhong
yao za zhi= Zhongguo zhongyao zazhi= China journal of Chinese materia medica, 2012. 37(9): p.
1285-1288.
88. Perry, N.S., et al., In‐vitro inhibition of human erythrocyte acetylcholinesterase by Salvia
lavandulaefolia essential oil and constituent terpenes. Journal of pharmacy and pharmacology,
2000. 52(7): p. 895-902.
137
89. Savelev, S.U., E.J. Okello, and E.K. Perry, Butyryl‐and acetyl‐cholinesterase inhibitory activities
in essential oils of Salvia species and their constituents. Phytotherapy Research: An International
Journal Devoted to Pharmacological and Toxicological Evaluation of Natural Product Derivatives,
2004. 18(4): p. 315-324.
90. Orhan, I.E., et al., Assessment of anticholinesterase and antioxidant properties of selected sage
(Salvia) species with their total phenol and flavonoid contents. Industrial Crops and Products,
2013. 41: p. 21-30.
91. Orhan, I. and M. Aslan, Appraisal of scopolamine-induced antiamnesic effect in mice and in vitro
antiacetylcholinesterase and antioxidant activities of some traditionally used Lamiaceae plants.
Journal of Ethnopharmacology, 2009. 122(2): p. 327-332.
92. Şenol, F.S., et al., Evaluation of cholinesterase inhibitory and antioxidant activities of wild and
cultivated samples of sage (Salvia fruticosa) by activity-guided fractionation. Journal of medicinal
food, 2011. 14(11): p. 1476-1483.
93. Topçu, G., et al., Terpenoids, essential oil composition, fatty acid profile, and biological activities
of Anatolian Salvia fruticosa Mill. Turkish Journal of Chemistry, 2013. 37(4): p. 619-632.
94. Mahdy, K., et al., Effect of some medicinal plant extracts on the oxidative stress status in
Alzheimer’s disease induced in rats. Eur Rev Med Pharmacol Sci, 2012. 16(3): p. 31-42.
95. Perfumi, M., N. Arnold, and R. Tacconi, Hypoglycemic activity of Salvia fruticosa Mill. from
Cyprus. Journal of ethnopharmacology, 1991. 34(2-3): p. 135-140.
96. Arabiyat, S., et al., Antilipolytic and hypotriglyceridemic effects of dietary Salvia triloba Lf
(Lamiaceae) in experimental rats. Tropical Journal of Pharmaceutical Research, 2016. 15(4): p.
723-728.
97. Cam, M.E., et al., Antidiabetic effects of Salvia triloba and Thymus praecox subsp. skorpilii var.
skorpilii in a rat model of streptozotocin/nicotinamide-induced diabetes. Marmara Pharmaceutical
Journal, 2017. 21(4): p. 818-827.
98. Elbetieha, A., et al., Reproductive toxicity potentials of Salvia fruticosa (Labiatae) in rats. Journal
of ethnopharmacology, 1998. 61(1): p. 67-74.
99. Daradka, H.M., The effect of Salvia fruticosa ingestion on male rat sexual behavior. Res J Biol
Sci, 2009. 4(12): p. 1288-91.
100. Todorov, S., et al., Experimental pharmacological study of three species from genus Salvia. Acta
physiologica et pharmacologica Bulgarica, 1984. 10(2): p. 13-20.
101. Anwar, M.A., et al., Salvia fruticosa induces vasorelaxation in rat isolated thoracic aorta: role of
the PI3K/Akt/eNOS/NO/cGMP signaling pathway. Scientific reports, 2017. 7(1): p. 1-14.
102. Millet, Y., et al., Toxicity of some essential plant oils. Clinical and experimental study. Clinical
toxicology, 1981. 18(12): p. 1485-1498.
103. Millet, Y., et al., Experimental study of the toxic convulsant properties of commercial preparations
of essences of sage and hyssop (author's transl). Revue d'electroencephalographie et de
neurophysiologie clinique, 1979. 9(1): p. 12-18.
104. Elisabetsky, E., J. Marschner, and D.O. Souza, Effects of linalool on glutamatergic system in the
rat cerebral cortex. Neurochemical research, 1995. 20(4): p. 461-465.
105. Farhat, G., N. Affara, and H. Gali-Muhtasib, Seasonal changes in the composition of the essential
oil extract of East Mediterranean sage (Salvia libanotica) and its toxicity in mice. Toxicon, 2001.
39(10): p. 1601-1605.
106. Harmancı, K., et al., Elma yağının yanlış kullanımına bağlı gelişen kimyasal pnömonili bir olgu.
Asthma Allergy Immunol, 2011. 9: p. 101-104.
107. Gündüz, S., et al., Acı elma yağının yanlış kullanımına bağlı dört zehirlenme vakası. Dicle Tıp
Dergisi, 2016. 43(2): p. 364-366.
138
Derleme makale/ Research article
Göre, M. and O. Kurt, Bitkisel Üretimde Yeni Bir Trend: Kenevir. International Journal of Life Sciences
and Biotechnology, 2021. 4(1): p. 138-157. DOI: 10.38001/ijlsb.789970
Bitkisel Üretimde Yeni Bir Trend: Kenevir
Merve Göre1* , Orhan Kurt1
ÖZET Kenevir, Cannabaceae familyasında yer alan, tek yıllık, otsu ve çok yönlü kullanım
potansiyeli olan bir endüstri bitkidir. Tarihin en eski bitkilerinden biri olan kenevir,
ilaç, gıda, kâğıt, biyoyakıt, tekstil, kozmetik, inşaat ve otomotiv sektörüne kadar
oldukça geniş yelpazede kullanım alanına sahiptir. Ekolojik ve topografı istekleri
bakımından kanaatkâr bir bitki olan kenevirin adaptasyon kabiliyeti geniştir. Kenevir
tohumu yaklaşık %35 yağ ve %25 protein içermesinin yanında Omega-3 kaynağı
olarak da zengindir. Endüstriyel kenevir, kaliteli lif kaynağı özelliği sayesinde yakın
zamanda geniş ekim alanlarında yer bularak endüstriye önemli ölçüde katkı sağlayacak
potansiyele ulaşmıştır. Narkotik özelliklerinden dolayı birçok ülkede olduğu gibi
ülkemizde de yasaklanan geleneksel kenevirin aksine son yıllarda geliştirilen
endüstriyel amaçlı kenevir çeşitleri sayesinde kenevir tarımı birçok ülkede her geçen
gün genişlemekte ve ülkelerin ekonomilerine önemli katkı sağlama potansiyeli arz
etmektedir.
A New Trend in Crop Production: Hemp
ABSTRACT
Hemp is an industrial plant which has an annual, herbaceous and multi-use potential in
the Cannabaceae family. Cannabis, one of the oldest plants in history, is an alternative
plant with a wide range of uses ranging from pharmaceutical, food, paper, biofuel,
textile, cosmetics, construction and automotive sectors. Cannabis is a satisfactory plant
in terms of ecological and topographic requirements and has high adaptability. Hemp
seed contains about 35% oil and 25% protein, also it is a rich source of Omega-3.
Industrial hemp has recently reached the potential to contribute significantly to the
industry by finding a place in large cultivation areas thanks to its quality fiber source.
Unlike traditional cannabis, which is banned in our country as well as in many countries
due to its narcotic properties, hemp cultivation is expanding in many countries day by
day thanks to the industrial hemp varieties developed in recent years. Also, hemp has the
potential to contribute significantly to the economies of countries.
Giriş
Kenevir (Cannabis), Cannabaceae familyasına ait tek yıllık, çok yönlü kullanım
potansiyeli olan bir endüstri bitkisidir. Kenevir Türkiye’de kendir veya çedene olarak da
adlandırılmaktadır. Lif, iplik, kumaş gibi dokuma, ilaç, kâğıt, biyoyakıt, kozmetik ve
1 Ondokuz Mayıs Üniversitesi, Ziraat Fakültesi, Tarla Bitkileri Bölümü, Samsun
* Sorumlu yazar: [email protected]
KEY WORDS
Hemp,
Cannabis sativa,
crop production,
hemp cultivation
MAKALE GEÇMİŞİ
Geliş
3 Eylül 2020
Kabul
14 Eylül 2020
ARTICLE HISTORY
Received
3 September 2020
Accepted
14 September 2020
ANAHTAR KELİMELER
Kenevir,
Cannabis sativa,
bitkisel üretim,
kenevir tarımı
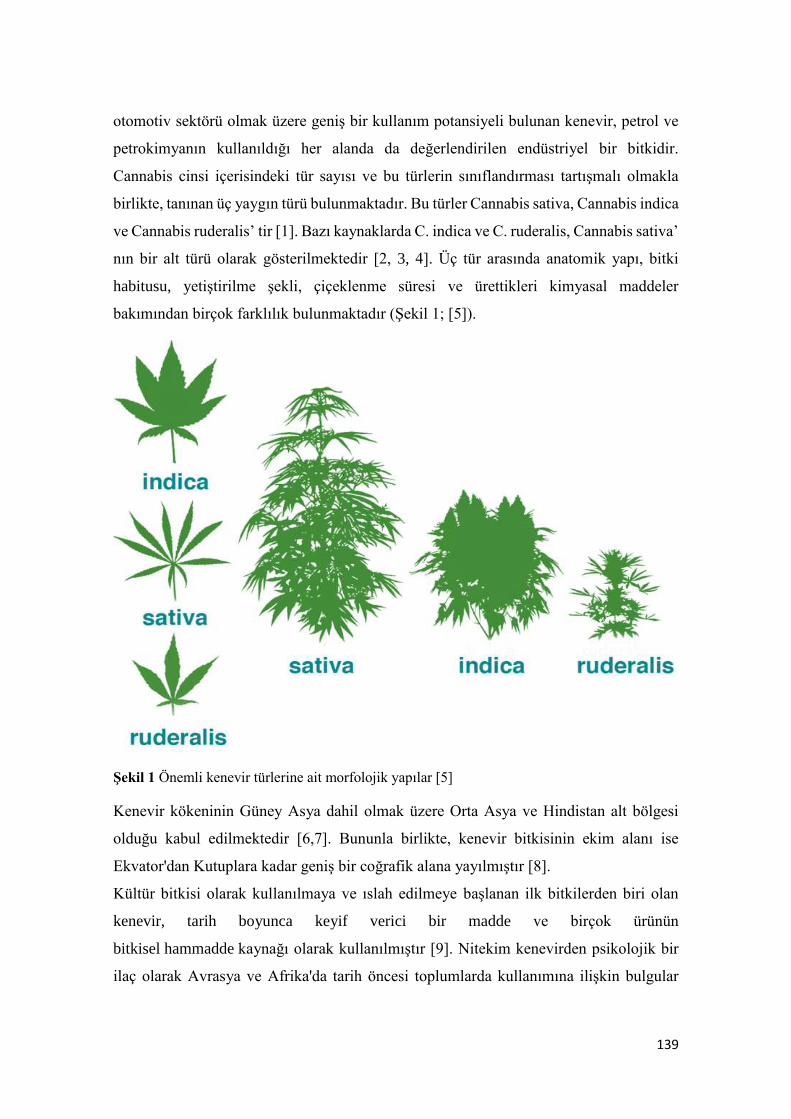
139
otomotiv sektörü olmak üzere geniş bir kullanım potansiyeli bulunan kenevir, petrol ve
petrokimyanın kullanıldığı her alanda da değerlendirilen endüstriyel bir bitkidir.
Cannabis cinsi içerisindeki tür sayısı ve bu türlerin sınıflandırması tartışmalı olmakla
birlikte, tanınan üç yaygın türü bulunmaktadır. Bu türler Cannabis sativa, Cannabis indica
ve Cannabis ruderalis’ tir [1]. Bazı kaynaklarda C. indica ve C. ruderalis, Cannabis sativa’
nın bir alt türü olarak gösterilmektedir [2, 3, 4]. Üç tür arasında anatomik yapı, bitki
habitusu, yetiştirilme şekli, çiçeklenme süresi ve ürettikleri kimyasal maddeler
bakımından birçok farklılık bulunmaktadır (Şekil 1; [5]).
Şekil 1 Önemli kenevir türlerine ait morfolojik yapılar [5]
Kenevir kökeninin Güney Asya dahil olmak üzere Orta Asya ve Hindistan alt bölgesi
olduğu kabul edilmektedir [6,7]. Bununla birlikte, kenevir bitkisinin ekim alanı ise
Ekvator'dan Kutuplara kadar geniş bir coğrafik alana yayılmıştır [8].
Kültür bitkisi olarak kullanılmaya ve ıslah edilmeye başlanan ilk bitkilerden biri olan
kenevir, tarih boyunca keyif verici bir madde ve birçok ürünün
bitkisel hammadde kaynağı olarak kullanılmıştır [9]. Nitekim kenevirden psikolojik bir
ilaç olarak Avrasya ve Afrika'da tarih öncesi toplumlarda kullanımına ilişkin bulgular
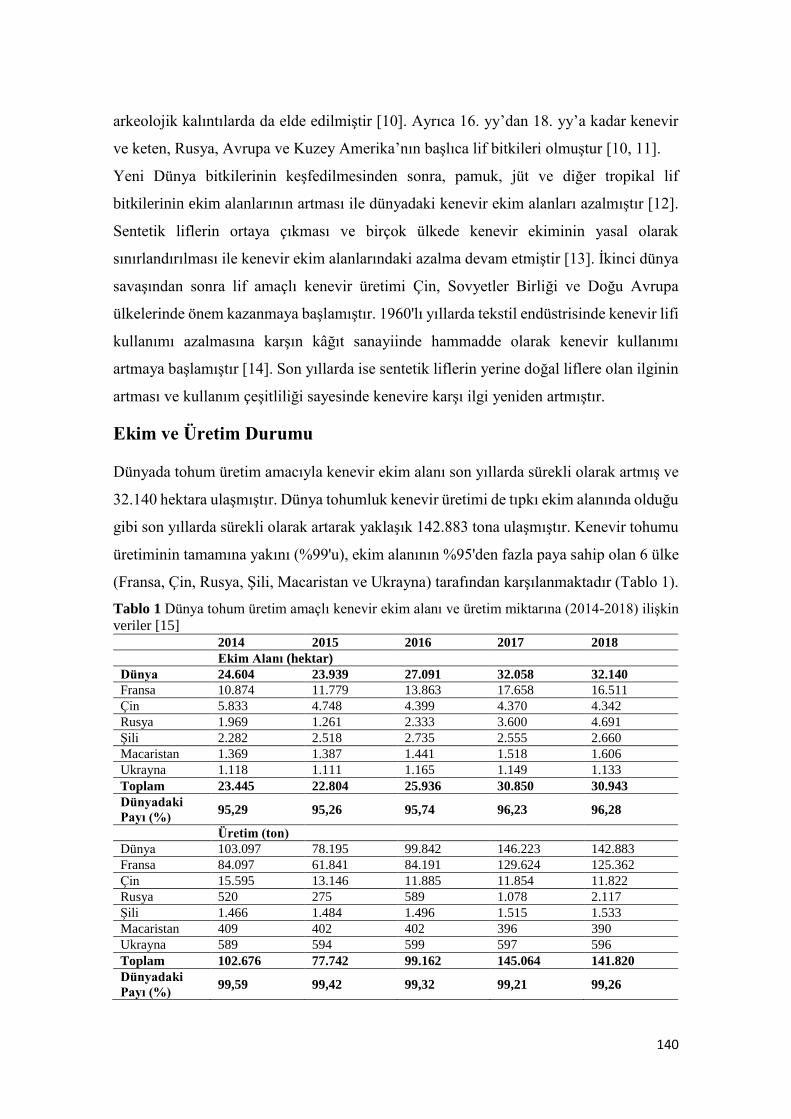
140
arkeolojik kalıntılarda da elde edilmiştir [10]. Ayrıca 16. yy’dan 18. yy’a kadar kenevir
ve keten, Rusya, Avrupa ve Kuzey Amerika’nın başlıca lif bitkileri olmuştur [10, 11].
Yeni Dünya bitkilerinin keşfedilmesinden sonra, pamuk, jüt ve diğer tropikal lif
bitkilerinin ekim alanlarının artması ile dünyadaki kenevir ekim alanları azalmıştır [12].
Sentetik liflerin ortaya çıkması ve birçok ülkede kenevir ekiminin yasal olarak
sınırlandırılması ile kenevir ekim alanlarındaki azalma devam etmiştir [13]. İkinci dünya
savaşından sonra lif amaçlı kenevir üretimi Çin, Sovyetler Birliği ve Doğu Avrupa
ülkelerinde önem kazanmaya başlamıştır. 1960'lı yıllarda tekstil endüstrisinde kenevir lifi
kullanımı azalmasına karşın kâğıt sanayiinde hammadde olarak kenevir kullanımı
artmaya başlamıştır [14]. Son yıllarda ise sentetik liflerin yerine doğal liflere olan ilginin
artması ve kullanım çeşitliliği sayesinde kenevire karşı ilgi yeniden artmıştır.
Ekim ve Üretim Durumu
Dünyada tohum üretim amacıyla kenevir ekim alanı son yıllarda sürekli olarak artmış ve
32.140 hektara ulaşmıştır. Dünya tohumluk kenevir üretimi de tıpkı ekim alanında olduğu
gibi son yıllarda sürekli olarak artarak yaklaşık 142.883 tona ulaşmıştır. Kenevir tohumu
üretiminin tamamına yakını (%99'u), ekim alanının %95'den fazla paya sahip olan 6 ülke
(Fransa, Çin, Rusya, Şili, Macaristan ve Ukrayna) tarafından karşılanmaktadır (Tablo 1).
Tablo 1 Dünya tohum üretim amaçlı kenevir ekim alanı ve üretim miktarına (2014-2018) ilişkin
veriler [15] 2014 2015 2016 2017 2018
Ekim Alanı (hektar)
Dünya 24.604 23.939 27.091 32.058 32.140
Fransa 10.874 11.779 13.863 17.658 16.511
Çin 5.833 4.748 4.399 4.370 4.342
Rusya 1.969 1.261 2.333 3.600 4.691
Şili 2.282 2.518 2.735 2.555 2.660
Macaristan 1.369 1.387 1.441 1.518 1.606
Ukrayna 1.118 1.111 1.165 1.149 1.133
Toplam 23.445 22.804 25.936 30.850 30.943
Dünyadaki
Payı (%) 95,29 95,26 95,74 96,23 96,28
Üretim (ton)
Dünya 103.097 78.195 99.842 146.223 142.883
Fransa 84.097 61.841 84.191 129.624 125.362
Çin 15.595 13.146 11.885 11.854 11.822
Rusya 520 275 589 1.078 2.117
Şili 1.466 1.484 1.496 1.515 1.533
Macaristan 409 402 402 396 390
Ukrayna 589 594 599 597 596
Toplam 102.676 77.742 99.162 145.064 141.820
Dünyadaki
Payı (%) 99,59 99,42 99,32 99,21 99,26
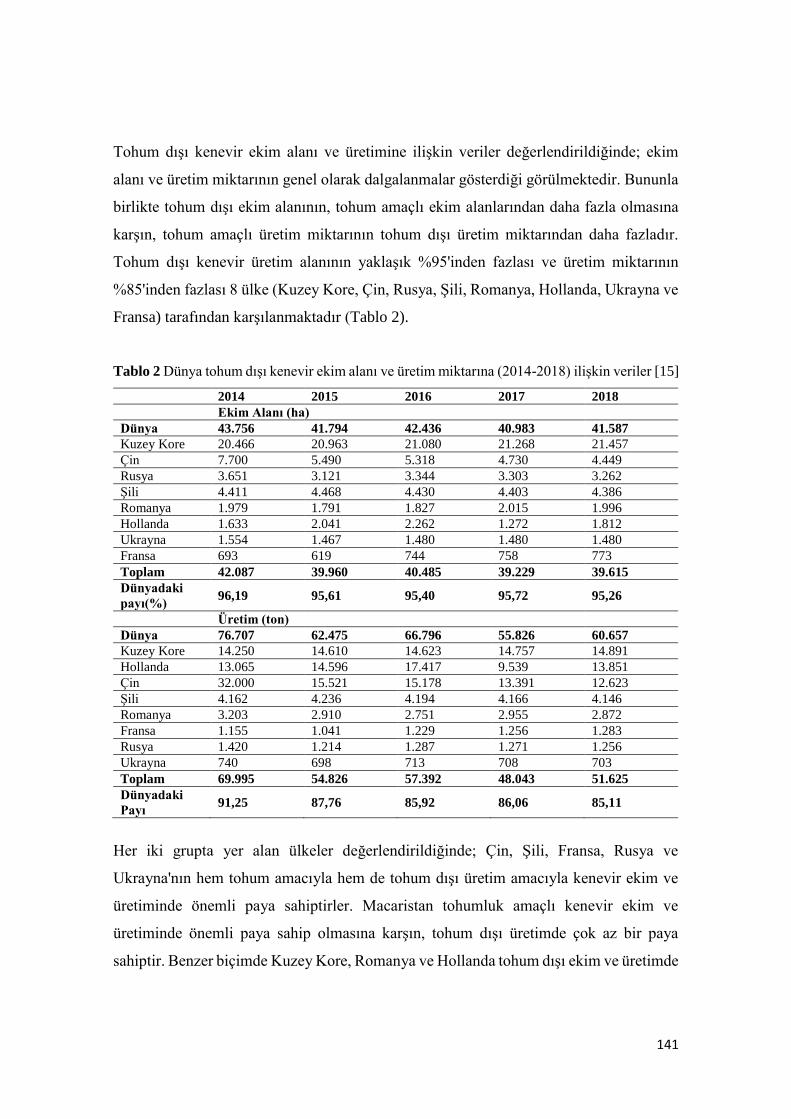
141
Tohum dışı kenevir ekim alanı ve üretimine ilişkin veriler değerlendirildiğinde; ekim
alanı ve üretim miktarının genel olarak dalgalanmalar gösterdiği görülmektedir. Bununla
birlikte tohum dışı ekim alanının, tohum amaçlı ekim alanlarından daha fazla olmasına
karşın, tohum amaçlı üretim miktarının tohum dışı üretim miktarından daha fazladır.
Tohum dışı kenevir üretim alanının yaklaşık %95'inden fazlası ve üretim miktarının
%85'inden fazlası 8 ülke (Kuzey Kore, Çin, Rusya, Şili, Romanya, Hollanda, Ukrayna ve
Fransa) tarafından karşılanmaktadır (Tablo 2).
Tablo 2 Dünya tohum dışı kenevir ekim alanı ve üretim miktarına (2014-2018) ilişkin veriler [15]
2014 2015 2016 2017 2018
Ekim Alanı (ha)
Dünya 43.756 41.794 42.436 40.983 41.587
Kuzey Kore 20.466 20.963 21.080 21.268 21.457
Çin 7.700 5.490 5.318 4.730 4.449
Rusya 3.651 3.121 3.344 3.303 3.262
Şili 4.411 4.468 4.430 4.403 4.386
Romanya 1.979 1.791 1.827 2.015 1.996
Hollanda 1.633 2.041 2.262 1.272 1.812
Ukrayna 1.554 1.467 1.480 1.480 1.480
Fransa 693 619 744 758 773
Toplam 42.087 39.960 40.485 39.229 39.615
Dünyadaki
payı(%) 96,19 95,61 95,40 95,72 95,26
Üretim (ton)
Dünya 76.707 62.475 66.796 55.826 60.657
Kuzey Kore 14.250 14.610 14.623 14.757 14.891
Hollanda 13.065 14.596 17.417 9.539 13.851
Çin 32.000 15.521 15.178 13.391 12.623
Şili 4.162 4.236 4.194 4.166 4.146
Romanya 3.203 2.910 2.751 2.955 2.872
Fransa 1.155 1.041 1.229 1.256 1.283
Rusya 1.420 1.214 1.287 1.271 1.256
Ukrayna 740 698 713 708 703
Toplam 69.995 54.826 57.392 48.043 51.625
Dünyadaki
Payı 91,25 87,76 85,92 86,06 85,11
Her iki grupta yer alan ülkeler değerlendirildiğinde; Çin, Şili, Fransa, Rusya ve
Ukrayna'nın hem tohum amacıyla hem de tohum dışı üretim amacıyla kenevir ekim ve
üretiminde önemli paya sahiptirler. Macaristan tohumluk amaçlı kenevir ekim ve
üretiminde önemli paya sahip olmasına karşın, tohum dışı üretimde çok az bir paya
sahiptir. Benzer biçimde Kuzey Kore, Romanya ve Hollanda tohum dışı ekim ve üretimde
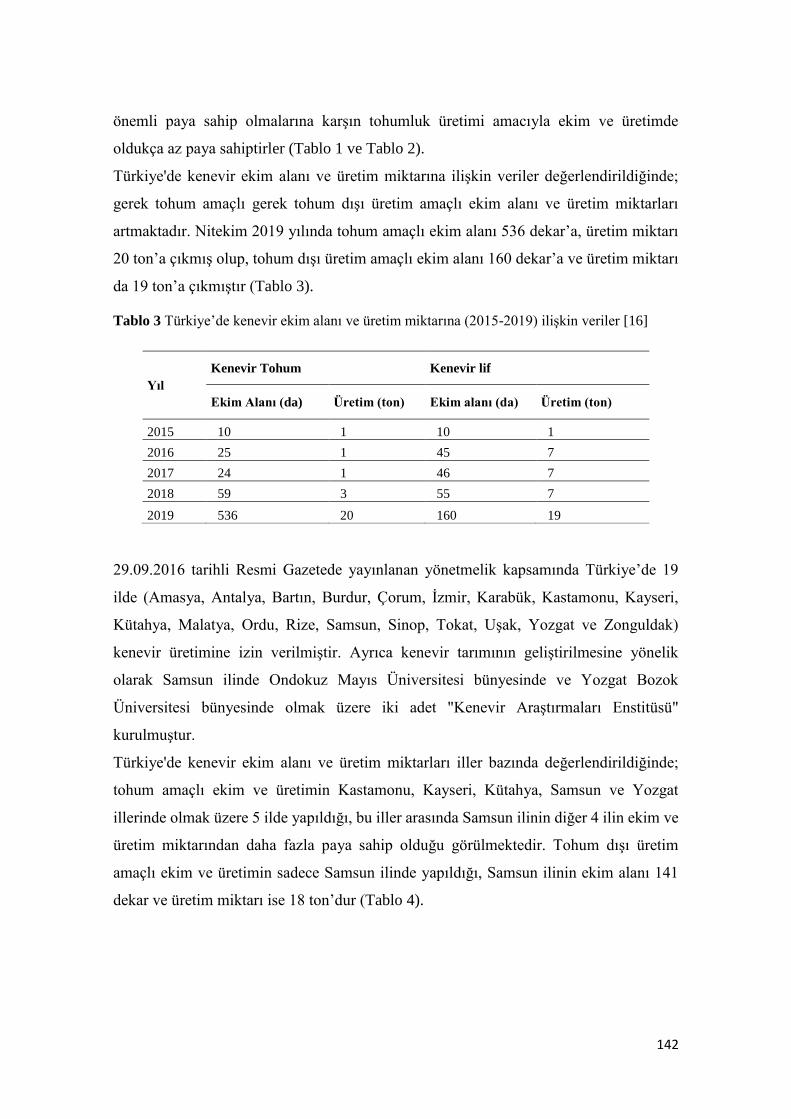
142
önemli paya sahip olmalarına karşın tohumluk üretimi amacıyla ekim ve üretimde
oldukça az paya sahiptirler (Tablo 1 ve Tablo 2).
Türkiye'de kenevir ekim alanı ve üretim miktarına ilişkin veriler değerlendirildiğinde;
gerek tohum amaçlı gerek tohum dışı üretim amaçlı ekim alanı ve üretim miktarları
artmaktadır. Nitekim 2019 yılında tohum amaçlı ekim alanı 536 dekar’a, üretim miktarı
20 ton’a çıkmış olup, tohum dışı üretim amaçlı ekim alanı 160 dekar’a ve üretim miktarı
da 19 ton’a çıkmıştır (Tablo 3).
Tablo 3 Türkiye’de kenevir ekim alanı ve üretim miktarına (2015-2019) ilişkin veriler [16]
Yıl
Kenevir Tohum Kenevir lif
Ekim Alanı (da) Üretim (ton) Ekim alanı (da) Üretim (ton)
2015 10 1 10 1
2016 25 1 45 7
2017 24 1 46 7
2018 59 3 55 7
2019 536 20 160 19
29.09.2016 tarihli Resmi Gazetede yayınlanan yönetmelik kapsamında Türkiye’de 19
ilde (Amasya, Antalya, Bartın, Burdur, Çorum, İzmir, Karabük, Kastamonu, Kayseri,
Kütahya, Malatya, Ordu, Rize, Samsun, Sinop, Tokat, Uşak, Yozgat ve Zonguldak)
kenevir üretimine izin verilmiştir. Ayrıca kenevir tarımının geliştirilmesine yönelik
olarak Samsun ilinde Ondokuz Mayıs Üniversitesi bünyesinde ve Yozgat Bozok
Üniversitesi bünyesinde olmak üzere iki adet "Kenevir Araştırmaları Enstitüsü"
kurulmuştur.
Türkiye'de kenevir ekim alanı ve üretim miktarları iller bazında değerlendirildiğinde;
tohum amaçlı ekim ve üretimin Kastamonu, Kayseri, Kütahya, Samsun ve Yozgat
illerinde olmak üzere 5 ilde yapıldığı, bu iller arasında Samsun ilinin diğer 4 ilin ekim ve
üretim miktarından daha fazla paya sahip olduğu görülmektedir. Tohum dışı üretim
amaçlı ekim ve üretimin sadece Samsun ilinde yapıldığı, Samsun ilinin ekim alanı 141
dekar ve üretim miktarı ise 18 ton’dur (Tablo 4).
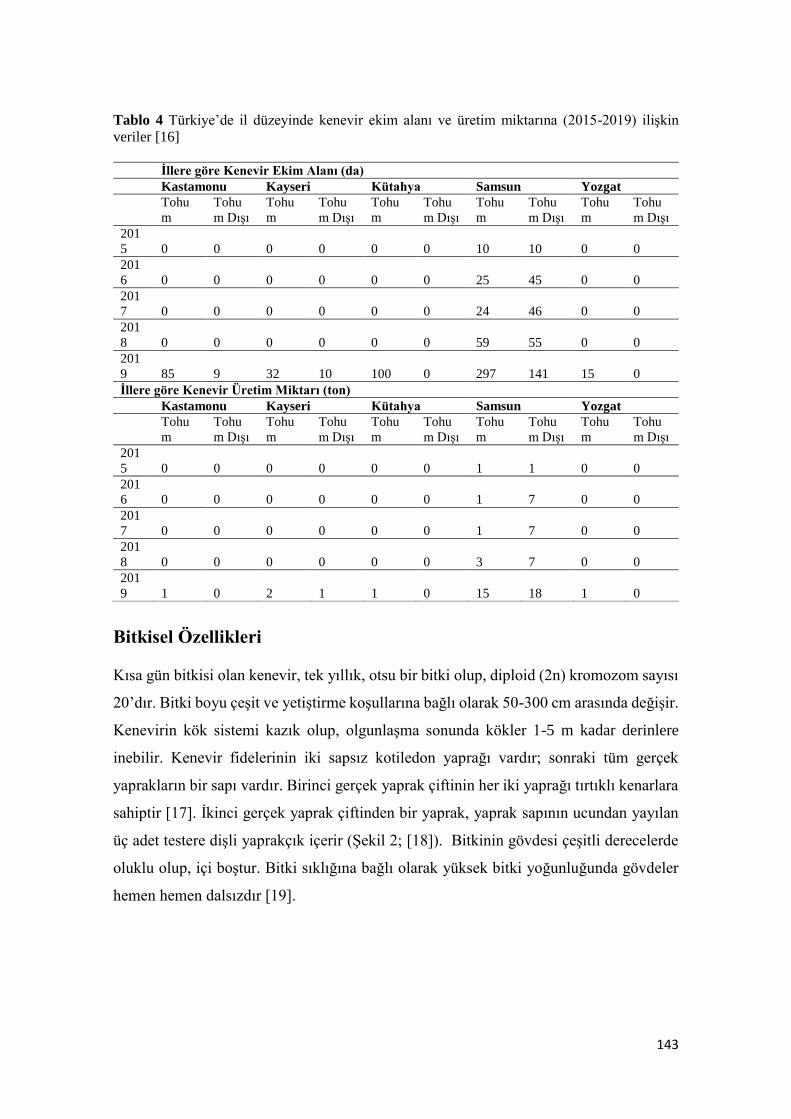
143
Tablo 4 Türkiye’de il düzeyinde kenevir ekim alanı ve üretim miktarına (2015-2019) ilişkin
veriler [16]
İllere göre Kenevir Ekim Alanı (da)
Kastamonu Kayseri Kütahya Samsun Yozgat
Tohu
m
Tohu
m Dışı
Tohu
m
Tohu
m Dışı
Tohu
m
Tohu
m Dışı
Tohu
m
Tohu
m Dışı
Tohu
m
Tohu
m Dışı
201
5 0 0 0 0 0 0 10 10 0 0
201
6 0 0 0 0 0 0 25 45 0 0
201
7 0 0 0 0 0 0 24 46 0 0
201
8 0 0 0 0 0 0 59 55 0 0
201
9 85 9 32 10 100 0 297 141 15 0
İllere göre Kenevir Üretim Miktarı (ton)
Kastamonu Kayseri Kütahya Samsun Yozgat
Tohu
m
Tohu
m Dışı
Tohu
m
Tohu
m Dışı
Tohu
m
Tohu
m Dışı
Tohu
m
Tohu
m Dışı
Tohu
m
Tohu
m Dışı
201
5 0 0 0 0 0 0 1 1 0 0
201
6 0 0 0 0 0 0 1 7 0 0
201
7 0 0 0 0 0 0 1 7 0 0
201
8 0 0 0 0 0 0 3 7 0 0
201
9 1 0 2 1 1 0 15 18 1 0
Bitkisel Özellikleri
Kısa gün bitkisi olan kenevir, tek yıllık, otsu bir bitki olup, diploid (2n) kromozom sayısı
20’dır. Bitki boyu çeşit ve yetiştirme koşullarına bağlı olarak 50-300 cm arasında değişir.
Kenevirin kök sistemi kazık olup, olgunlaşma sonunda kökler 1-5 m kadar derinlere
inebilir. Kenevir fidelerinin iki sapsız kotiledon yaprağı vardır; sonraki tüm gerçek
yaprakların bir sapı vardır. Birinci gerçek yaprak çiftinin her iki yaprağı tırtıklı kenarlara
sahiptir [17]. İkinci gerçek yaprak çiftinden bir yaprak, yaprak sapının ucundan yayılan
üç adet testere dişli yaprakçık içerir (Şekil 2; [18]). Bitkinin gövdesi çeşitli derecelerde
oluklu olup, içi boştur. Bitki sıklığına bağlı olarak yüksek bitki yoğunluğunda gövdeler
hemen hemen dalsızdır [19].
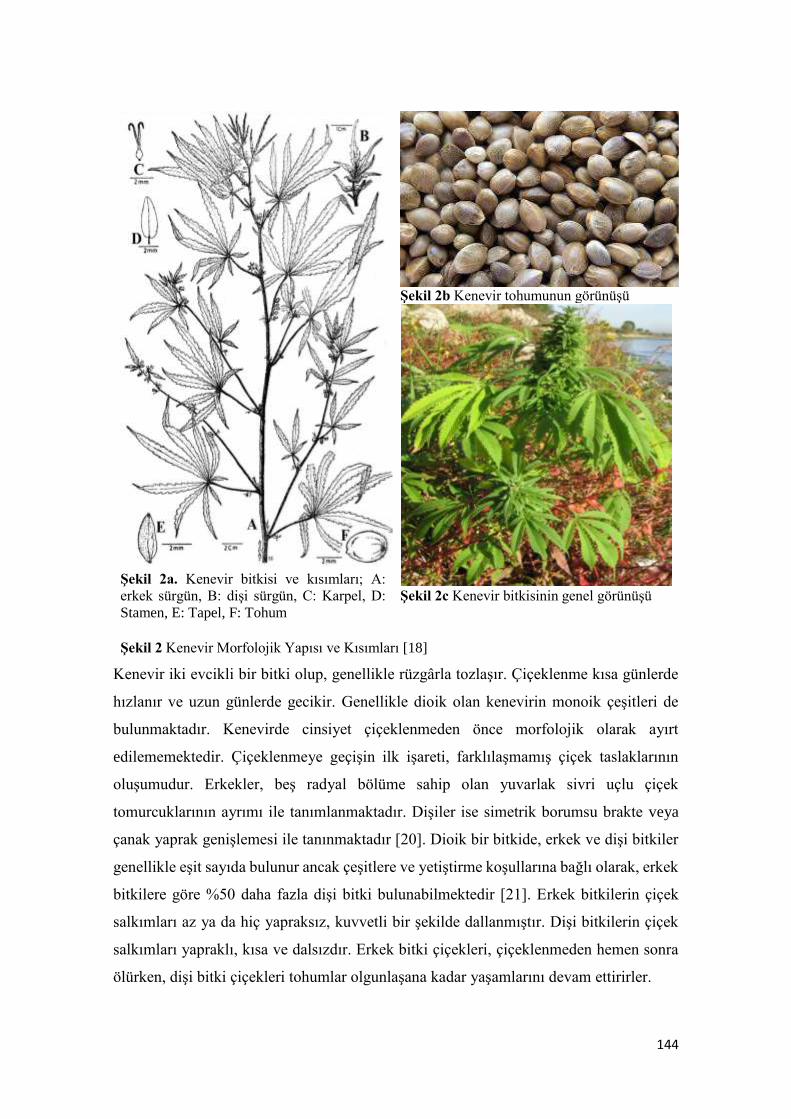
144
Şekil 2a. Kenevir bitkisi ve kısımları; A:
erkek sürgün, B: dişi sürgün, C: Karpel, D:
Stamen, E: Tapel, F: Tohum
Şekil 2b Kenevir tohumunun görünüşü
Şekil 2c Kenevir bitkisinin genel görünüşü
Şekil 2 Kenevir Morfolojik Yapısı ve Kısımları [18]
Kenevir iki evcikli bir bitki olup, genellikle rüzgârla tozlaşır. Çiçeklenme kısa günlerde
hızlanır ve uzun günlerde gecikir. Genellikle dioik olan kenevirin monoik çeşitleri de
bulunmaktadır. Kenevirde cinsiyet çiçeklenmeden önce morfolojik olarak ayırt
edilememektedir. Çiçeklenmeye geçişin ilk işareti, farklılaşmamış çiçek taslaklarının
oluşumudur. Erkekler, beş radyal bölüme sahip olan yuvarlak sivri uçlu çiçek
tomurcuklarının ayrımı ile tanımlanmaktadır. Dişiler ise simetrik borumsu brakte veya
çanak yaprak genişlemesi ile tanınmaktadır [20]. Dioik bir bitkide, erkek ve dişi bitkiler
genellikle eşit sayıda bulunur ancak çeşitlere ve yetiştirme koşullarına bağlı olarak, erkek
bitkilere göre %50 daha fazla dişi bitki bulunabilmektedir [21]. Erkek bitkilerin çiçek
salkımları az ya da hiç yapraksız, kuvvetli bir şekilde dallanmıştır. Dişi bitkilerin çiçek
salkımları yapraklı, kısa ve dalsızdır. Erkek bitki çiçekleri, çiçeklenmeden hemen sonra
ölürken, dişi bitki çiçekleri tohumlar olgunlaşana kadar yaşamlarını devam ettirirler.
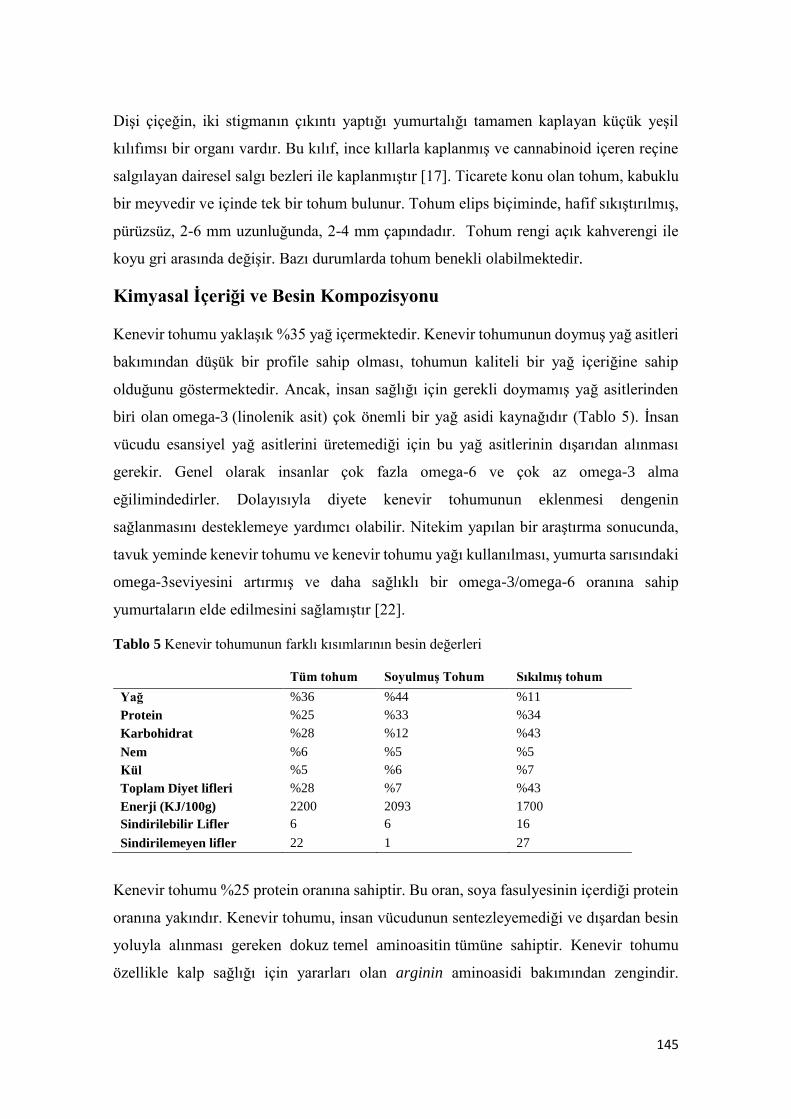
145
Dişi çiçeğin, iki stigmanın çıkıntı yaptığı yumurtalığı tamamen kaplayan küçük yeşil
kılıfımsı bir organı vardır. Bu kılıf, ince kıllarla kaplanmış ve cannabinoid içeren reçine
salgılayan dairesel salgı bezleri ile kaplanmıştır [17]. Ticarete konu olan tohum, kabuklu
bir meyvedir ve içinde tek bir tohum bulunur. Tohum elips biçiminde, hafif sıkıştırılmış,
pürüzsüz, 2-6 mm uzunluğunda, 2-4 mm çapındadır. Tohum rengi açık kahverengi ile
koyu gri arasında değişir. Bazı durumlarda tohum benekli olabilmektedir.
Kimyasal İçeriği ve Besin Kompozisyonu
Kenevir tohumu yaklaşık %35 yağ içermektedir. Kenevir tohumunun doymuş yağ asitleri
bakımından düşük bir profile sahip olması, tohumun kaliteli bir yağ içeriğine sahip
olduğunu göstermektedir. Ancak, insan sağlığı için gerekli doymamış yağ asitlerinden
biri olan omega-3 (linolenik asit) çok önemli bir yağ asidi kaynağıdır (Tablo 5). İnsan
vücudu esansiyel yağ asitlerini üretemediği için bu yağ asitlerinin dışarıdan alınması
gerekir. Genel olarak insanlar çok fazla omega-6 ve çok az omega-3 alma
eğilimindedirler. Dolayısıyla diyete kenevir tohumunun eklenmesi dengenin
sağlanmasını desteklemeye yardımcı olabilir. Nitekim yapılan bir araştırma sonucunda,
tavuk yeminde kenevir tohumu ve kenevir tohumu yağı kullanılması, yumurta sarısındaki
omega-3seviyesini artırmış ve daha sağlıklı bir omega-3/omega-6 oranına sahip
yumurtaların elde edilmesini sağlamıştır [22].
Tablo 5 Kenevir tohumunun farklı kısımlarının besin değerleri
Tüm tohum Soyulmuş Tohum Sıkılmış tohum
Yağ %36 %44 %11
Protein %25 %33 %34
Karbohidrat %28 %12 %43
Nem %6 %5 %5
Kül %5 %6 %7
Toplam Diyet lifleri %28 %7 %43
Enerji (KJ/100g) 2200 2093 1700
Sindirilebilir Lifler 6 6 16
Sindirilemeyen lifler 22 1 27
Kenevir tohumu %25 protein oranına sahiptir. Bu oran, soya fasulyesinin içerdiği protein
oranına yakındır. Kenevir tohumu, insan vücudunun sentezleyemediği ve dışardan besin
yoluyla alınması gereken dokuz temel aminoasitin tümüne sahiptir. Kenevir tohumu
özellikle kalp sağlığı için yararları olan arginin aminoasidi bakımından zengindir.
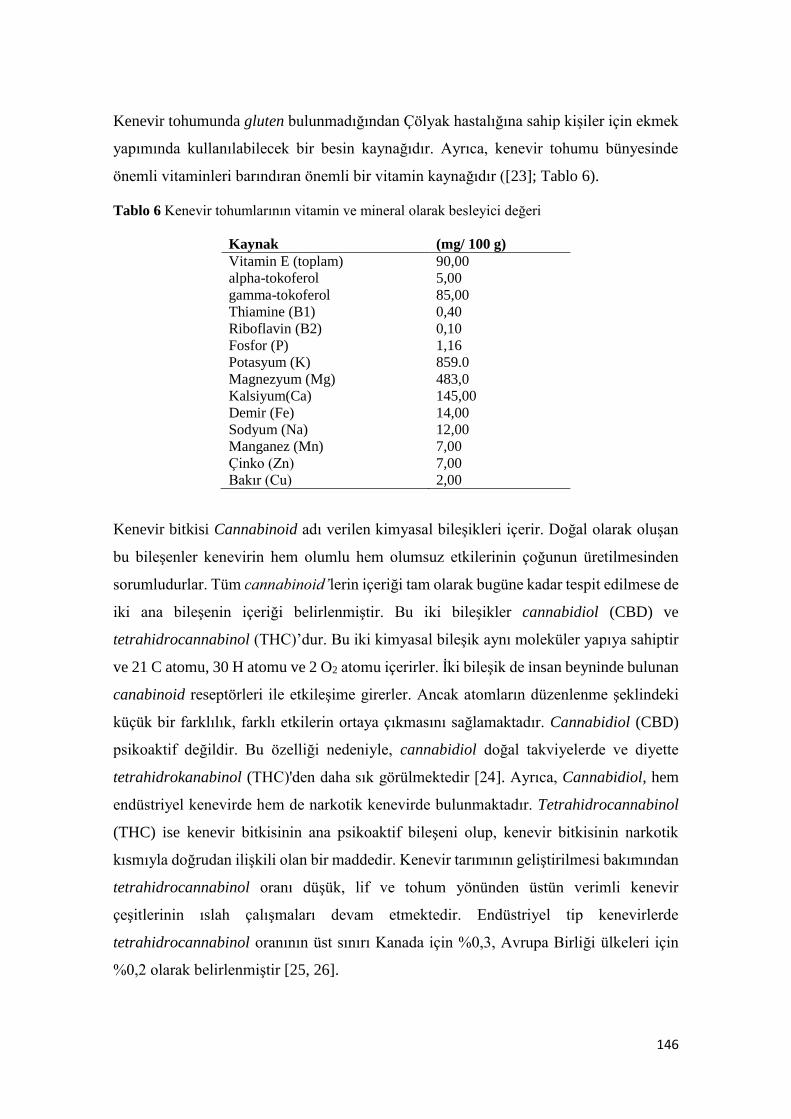
146
Kenevir tohumunda gluten bulunmadığından Çölyak hastalığına sahip kişiler için ekmek
yapımında kullanılabilecek bir besin kaynağıdır. Ayrıca, kenevir tohumu bünyesinde
önemli vitaminleri barındıran önemli bir vitamin kaynağıdır ([23]; Tablo 6).
Tablo 6 Kenevir tohumlarının vitamin ve mineral olarak besleyici değeri
Kaynak (mg/ 100 g)
Vitamin E (toplam) 90,00
alpha-tokoferol 5,00
gamma-tokoferol 85,00
Thiamine (B1) 0,40
Riboflavin (B2) 0,10
Fosfor (P) 1,16
Potasyum (K) 859.0
Magnezyum (Mg) 483,0
Kalsiyum(Ca) 145,00
Demir (Fe) 14,00
Sodyum (Na) 12,00
Manganez (Mn) 7,00
Çinko (Zn) 7,00
Bakır (Cu) 2,00
Kenevir bitkisi Cannabinoid adı verilen kimyasal bileşikleri içerir. Doğal olarak oluşan
bu bileşenler kenevirin hem olumlu hem olumsuz etkilerinin çoğunun üretilmesinden
sorumludurlar. Tüm cannabinoid’lerin içeriği tam olarak bugüne kadar tespit edilmese de
iki ana bileşenin içeriği belirlenmiştir. Bu iki bileşikler cannabidiol (CBD) ve
tetrahidrocannabinol (THC)’dur. Bu iki kimyasal bileşik aynı moleküler yapıya sahiptir
ve 21 C atomu, 30 H atomu ve 2 O2 atomu içerirler. İki bileşik de insan beyninde bulunan
canabinoid reseptörleri ile etkileşime girerler. Ancak atomların düzenlenme şeklindeki
küçük bir farklılık, farklı etkilerin ortaya çıkmasını sağlamaktadır. Cannabidiol (CBD)
psikoaktif değildir. Bu özelliği nedeniyle, cannabidiol doğal takviyelerde ve diyette
tetrahidrokanabinol (THC)'den daha sık görülmektedir [24]. Ayrıca, Cannabidiol, hem
endüstriyel kenevirde hem de narkotik kenevirde bulunmaktadır. Tetrahidrocannabinol
(THC) ise kenevir bitkisinin ana psikoaktif bileşeni olup, kenevir bitkisinin narkotik
kısmıyla doğrudan ilişkili olan bir maddedir. Kenevir tarımının geliştirilmesi bakımından
tetrahidrocannabinol oranı düşük, lif ve tohum yönünden üstün verimli kenevir
çeşitlerinin ıslah çalışmaları devam etmektedir. Endüstriyel tip kenevirlerde
tetrahidrocannabinol oranının üst sınırı Kanada için %0,3, Avrupa Birliği ülkeleri için
%0,2 olarak belirlenmiştir [25, 26].
147
Kenevir Tarımı
Birçok ülkede olduğu gibi Türkiye’de de kenevir tohumu üretimi uzun süre geri planda
kalmıştır. Bunda yapraklarının esrar yapımında kullanılması sebebiyle çiftçinin bu bitkiye
önyargı ile yaklaşılmasının etkisi fazla olmuştur. Ayrıca kanun, yönetmelik ve mevzuatlar
da üretimin sınırlı kalmasında rol oynamışlardır. Nitekim Kenevir ekimi yapacak
çiftçilerin il veya ilçe müdürlüklerinden yasal izin almak durumu ve üretim sürecinde
sürekli olarak kontrol yapılması zorunluluğu bulunmaktadır. İzinsiz yetiştirilen kenevir
bitkisi hangi amaca yönelik olursa olsun kanun hükümlerine göre imha edilmekte ve
yetiştirici hakkında cezai işlemler uygulanmakta ve yasal kovuşturma yapılmaktadır.
İzinli kenevir ekilen alanlar ise il ve ilçe müdürlükleri teknik elemanları tarafından
ekimden hasat zamanına kadar düzenli olarak kontrol edilmektedirler [27]. Tarım Orman
Bakanlığı tarafından yapılan değerlendirmeler sonucunda Türkiye’de 2019 yılı itibariyle
endüstriyel amaçlı kenevir ekiminin 19 ilde serbest bırakılmasına karar verilmiştir. Bu
karar sonrası Türkiye’de lif amaçlı kenevir üretiminin artması beklenmektedir [28].
Kenevir bitkisinin adaptasyon kabiliyeti oldukça geniştir. Bu avantajından dolayı kenevir
her türlü ekolojik koşullarda yetiştirilebilir. Vejetasyon süresi; lif elde etmek için yaklaşık
120 gün, tohumluk elde etmek için ise yaklaşık 150 gün civarındadır [29].
Toprak
Kenevir her yerde yetiştirilebilmesine karşın yetiştiriciliği için toprağın derin ve tavında
sürülerek iyi bir toprak hazırlığı yapılması gerekir. Dolayısıyla gevşek, iyi
havalandırılmış killi, organik madde açısından zengin, besim maddesi içeriği iyi olan pH
değeri 6,0-7,5 aralığında, gevşek yapıda alüvyal topraklarda kenevir iyi yetişir Asitli,
kumlu, tınlı, ağır killi topraklar ve drenaj özelliği bulunmayan topraklar kenevir tarımı
için uygun değildir [29].
Drenajı iyi yapılmış ve eşit kil yoğunluğuna sahip topraklar kullanılabilir fakat drenajı
yetersiz veya yanlış yoğunluktaki topraklara yapılan ekimlerde yaygın olarak fide
çökelmesi durumuna maruz kalınmakta ve başarısız olunmaktadır. Bunu yanında kumlu
topraklar da yeterli sulama ve gübreleme ile verimli bir üretim için hazırlanabilmektedir.
Fakat bunun getirdiği ekstra maliyetler üretimi ekonomik olmaktan çıkartabilmektedir
[30].
Lif tipi kenevir, yüksek nispi nem, uygun sıcaklık ve en az 700 mm yağış alan bölgelerde
sulamaksızın yetiştirilebilir. İlkbahar geç donlarına karşı toleransı az olan kenevir, -5
148
°C’den düşük sıcaklıklara maruz kaldığında zarar görür [27]. Fide döneminde su ihtiyacı
yeterince karşılanırsa iyi bir gelişme gösterir. Toprakta fazla nemin bulunması
durumunda, toprak asitliğinin artmasıyla birlikte bitkinin topraktaki besin maddelerini
alması güçleşir ve yapraklarda kloroz görülmeye başlar. Bu nedenle kenevir tarımında
düzenli yağış rejimi arzu edilir [31].
Ekim derinliği
Tohum yataklarının hazırlanması, kenevir üretiminin önemli çaba harcanması gereken
kısımlarındandır. Sonbaharda pullukla sürme işlemi tavsiye edilmekte ve sonrasında
ilkbahara doğru tohum yataklarının hazırlığına başlanmalıdır. Sıkı ve 19 - 31 mm
derinliğinde yataklar kullanıldığında en iyi sonuçların alındığı görülmüştür. Daha derin
ekimlere karşı da tolerans vardır fakat bu durumda fide çökelmesi ile daha sık
karşılaşılmaktadır [32].
Ekim zamanı
Kenevir bir kısa gün bitkisidir, yani günlerin 12 saatten az olduğu zamanlarda
çiçeklenmektedir. Dolayısıyla bu bilgi göz önünde bulundurularak yapılan erken ekimler
sonucu hem vejetatif büyüme daha yoğun olacak hem de tohum üretimi için daha dirençli,
lif üretimi içinse daha uzun ve dayanıklı yapıda bitkiler elde edilecektir. Yüksek verim
için erken ekim yapılması önerilir. Tohumların donma derecesinin biraz üzerindeki
sıcaklıklara kadar çimlenebilmesine rağmen 12-15oC derece sıcaklığındaki toprak
koşulları en uygun olarak kabul edilmektedir. Toprak nemliliği çimlenme için çok önemli
bir değişkendir ve özellikle ilk 6 hafta boyunca yeterli yağış gereklidir. Yıllık 62-76 cm
yağış, ortalama olarak ideal kabul edilmektedir. Lif için üretim yapılacaksa ilkbaharın
son don zamanı geçtikten sonra, toprak sıcaklığının 8-10 °C olduğunda ekim yapılması
uygundur. Kuzey yarımküredeki ülkeler göz önünde bulunduğunda 21 Haziran tarihini
takip eden 4-5 hafta içinde vejetatif büyüme yavaşlamaya başlar ve çiçeklenme süreci
tetiklenir. Türkiye’de bölgelere göre ekim zamanı değişmekle birlikte genellikle Mart-
Nisan döneminde ekim yapılır [33].
Ekim
Serpme ekim yöntemi hala bazı bölgelerde uygulansa da genellikle mibzerle sıraya ekim
yöntemi uygulanmaktadır. Sıra aralığı belirlenirken bölgenin topoğrafık koşulları ve
yetiştirilecek olan çeşidin özelliği dikkate alınması gerekir. Sıra aralığı; tohumluk üretimi
için genellikle 30-40 cm ve lif için 20-25 cm arasında değişir. Sıra aralığının sık olması
149
lif verimini ve lif kalitesini, seyrek olması ise tohum verimini ve tohum kalitesini artırır.
Tıbbi Tohum olarak yetiştirilen kenevir cannabinoid üretimini maksimumda tutabilmek
için genellikle 70-100 cm aralığında sıklıklarla ekilmektedir [29, 32].
Tohum miktarı
Dekara atılacak tohum miktarı, tohumluğun çimlenme ve çıkış kabiliyetini dikkate
alınarak belirlenir. Lif üretiminde teknik sap uzunluğunun ince ve uzun olması istendiği
için sık ekimi sağlamak için dekara 6-9 kg tohumun atılması önerilir. Yüksek kaliteli sak
lifi üretiminin kor lif üretimine göre daha yüksek tutulabilmesi için ekimin yoğun
yapılması gerekir. Sak lifi yoğunluğu vejetasyonun yoğunluğu ile birlikte artmaktadır
fakat optimal yoğunluk bölgeden bölgeye farklılıklar göstermektedir. Neticede
hedeflenen yoğunluk ise ortalama olarak m2 başına 60-100 bitkidir.
Tohumluk üretiminde fazla dallanma sağlayabilmek için dekara 4-5 kg tohum atılması
yeterli olur [30]. 1kg’a yaklaşık 54.000 tohum düşmektedir. Neticede ulaşılmak istenen
ise m2 de yaklaşık 40-70 adet bitkidir [30].
Bakım
Kenevir özellikle vejetatif aksamını oluşturma döneminde çapalama ve sulama gibi
bakım işlerine ihtiyaç duyar. Yağışı yeterli olmayan kurak bölgelerde iyi bir verim için
gelişme periyodu boyunca 2-4 kez sulama yapılması önerilir. Tohumluk yetiştiriciliğinde
uygulanan fazla su, generatif dönemi ve olgunlaşmayı geciktirdiğinden tavsiye edilmez
[30].
Gübreleme
Sıklıkla karşılaşılan bir düşünce kenevir bitkisinin azot ve potas bazlı besin maddelere
ihtiyacı olmadığıdır. Kenevir üretiminde dekar başına 8-14 kg azot ve 5-8 kg arası fosfor
ile 3,5-8,0 kg arası potas önerilir. Kenevir, özellikle tohum üretimi hedeflendiğinde iyi
bir azot gübrelemesine ihtiyaç duymaktadır. Fosfor seviyeleri toprakta orta - yüksek arası
tutulmalıdır (ortalama >40ppm). Kükürt 5000 ppm’in bir miktar üzerinde ve kalsiyumun
6000 ppm’ i geçmeyecek şekilde tutulduğunda doğru bir üretim koşulu sağlamaktadır. İyi
havalandırılmış killi toprağın yanı sıra organik madde miktarının %3,5’dan yüksek
olduğu koşullarda üretimdeki performansın arttığı gözlenmiştir. Kıyaslamak gerekirse
kenevir, buğday ve mısıra uygulanan gübreleme ile benzer bir uygulamaya ihtiyaç
duymaktadır. Koşullara bağlı olarak dekara 2-4 ton çiftlik gübresi uygulanması da
önerilmektedir [34].
150
Münavebe
Kenevir bitkisi uzun yıllar aynı arazide ekilebilir. Ancak haşere üremesi, özellikle kök
solucanları, delici kurtlar, çürütücülerin varlığı bu durumu riske etmektedir. Kendisinden
sonra rotasyona girecek olan kültür bitkisi için temiz bir tarla bırakması münavebe
açısından kenevir bitkisini tercih önceliği olan bitkiler arasına sokar. İyi bir ön bitki olan
kenevir, baklagillerle ve buğdaygiller ile ekim nöbetine girebilir. Nitekim kenevir,
buğday ve fasulye ile münavebeye girmektedir. Ancak kanola, soya fasulyesi ve ayçiçeği,
kenevir bitkisinde beyaz küf ve bazı pestisit risklerini arttırdıkları gerekçesiyle üretiminde
dönüşümlü olarak kullanılmaması gereken bitkiler olarak gösterilmiştir [35].
Hastalık ve zararlılar
Endüstriyel kenevir üretiminde en sık rastlanan mantar bazlı hastalıklar; gri küf (Botrytis
cinerea) ve beyaz küf (Sclerotinia sclerotiorum)’ tür. Ayrıca Pythium enfeksiyonları, kök
çürümesi, pirinç yanığı, yaprak bakterileri ve bazı viral enfeksiyonlar karşılaşılmış
hastalıklardandır [29].
Birçok bitki türüne göre böceklere çok daha dayanıklı olmasına karşın mevsimsel olarak
problemlerle karşılaşılmaktadır. Mısır biti, kök kurtları, çekirgeler sıklıkla karşılaşılan
böcek türleridir. Özel olarak kenevir için kayıt altına alınmış pestisitler bulunmamaktadır.
Genel olarak 4 yıllık rotasyonlar yapılarak böcek kontrolü sağlanmaya çalışılır [32].
Hasat ve harman
Kenevir bitkisi dioik (iki evcikli) bir yapıya sahiptir. Dolayısıyla bitkiler erkek veya dişi
olurlar (Şekil 3a ve Şekil 3b). Erkek ve dişi bitkilerin büyüme hızı ve gelişimi farklılık
gösterir [26]. Erkek bitkiler erken çiçeklenmeye ve erken olgunlaşmaya daha meyilli
olurlar. Erkek bitkilerin olgunlaşması, dişi bitkilerin olgunlaşmasından yaklaşık 4 hafta
erkendir. Olgunlaşmada dişi bitkiler ile erkek bitkiler aralarındaki farkı en aza indirmede
populasyondaki bitkilerin çoğunluğunun dişi olması ve tozlama için az sayıda erkek
bitkinin olması yeterli olur [33].
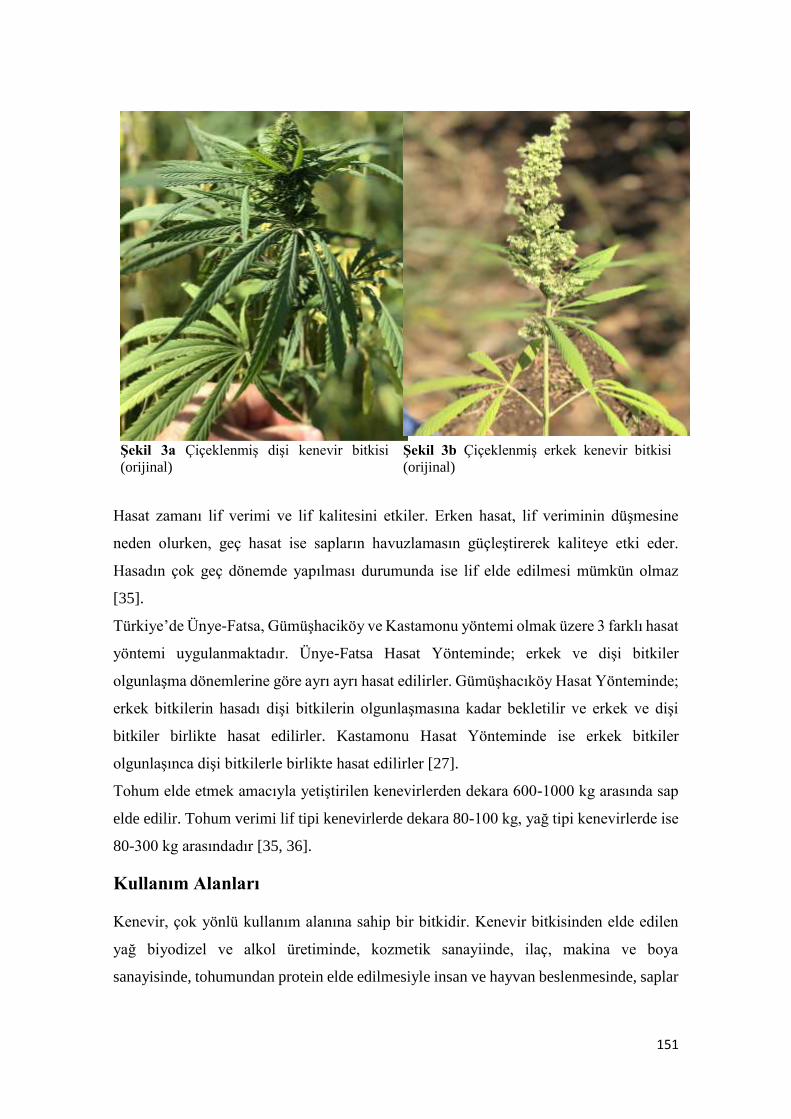
151
Şekil 3a Çiçeklenmiş dişi kenevir bitkisi
(orijinal)
Şekil 3b Çiçeklenmiş erkek kenevir bitkisi
(orijinal)
Hasat zamanı lif verimi ve lif kalitesini etkiler. Erken hasat, lif veriminin düşmesine
neden olurken, geç hasat ise sapların havuzlamasın güçleştirerek kaliteye etki eder.
Hasadın çok geç dönemde yapılması durumunda ise lif elde edilmesi mümkün olmaz
[35].
Türkiye’de Ünye-Fatsa, Gümüşhaciköy ve Kastamonu yöntemi olmak üzere 3 farklı hasat
yöntemi uygulanmaktadır. Ünye-Fatsa Hasat Yönteminde; erkek ve dişi bitkiler
olgunlaşma dönemlerine göre ayrı ayrı hasat edilirler. Gümüşhacıköy Hasat Yönteminde;
erkek bitkilerin hasadı dişi bitkilerin olgunlaşmasına kadar bekletilir ve erkek ve dişi
bitkiler birlikte hasat edilirler. Kastamonu Hasat Yönteminde ise erkek bitkiler
olgunlaşınca dişi bitkilerle birlikte hasat edilirler [27].
Tohum elde etmek amacıyla yetiştirilen kenevirlerden dekara 600-1000 kg arasında sap
elde edilir. Tohum verimi lif tipi kenevirlerde dekara 80-100 kg, yağ tipi kenevirlerde ise
80-300 kg arasındadır [35, 36].
Kullanım Alanları
Kenevir, çok yönlü kullanım alanına sahip bir bitkidir. Kenevir bitkisinden elde edilen
yağ biyodizel ve alkol üretiminde, kozmetik sanayiinde, ilaç, makina ve boya
sanayisinde, tohumundan protein elde edilmesiyle insan ve hayvan beslenmesinde, saplar
152
tekstil sanayisi, kâğıt sanayisi, otomotiv sanayisi ve inşaat malzemesi yapımında
değerlendirilmektedir.
Kenevir lifi yüksek mukavemet, yüksek nem çekme özelliği, nefes alabilirlik kabiliyeti,
anti bakteriyel özelliği, UV koruma, anti-alerjik özelliği ve iyi elektrostatik özellikler
göstermesi ile katma değeri yüksek ürünlerin üretiminde tercih edilmektedir [37, 38, 39].
Bu üstün özellikleri ile iç ve dış giyim ürünleri, ev tekstil ürünleri ve aksesuar ürünleri
%100 kenevir lifinden veya kenevir lifi ile farklı oranlarda çeşitli liflerin karışımları ile
üretilmektedir.
Kenevir lifi ve sapları, çevre dostu malzeme sınıfında yer alırlar. Bu çevre dostu özelliği
ile kenevir yalıtım malzemeleri, jeo-tekstil ürünleri veya kâğıt gibi endüstriyel
kullanımlar için tamamen yenilenebilir bir kaynaktır [37]. Kenevir lifi, yüksek oranlarda
kullanıldığında düşük yoğunluklu kompozit üretimine imkân sağladığı, yüksek sağlamlık
ve sertlik performansı verdiği bilinmektedir. Ayrıca esnek özelliği sayesinde işleme
sırasında kırılmaya karşı da dirençlidir [40, 41, 42]. Daha uzun kullanım süresine olanak
sağlayan biyolojik bozunabilirlik ve düşük ısı iletim katsayısına sahip olması sayesinde
diğer bitkisel liflere oranla kenevir lifi ısı yalıtım malzemesi olarak yüksek performans
gösterir [43]. Nitekim kenevir lifi bu üstün özelliğinden dolayı inşaat sektöründe
izolasyon malzemesi olarak tercih edilmektedir.
Kuzey Amerika, diğer ülkelere kıyasla otomotiv sektöründe kenevir lifi kullanımı
bakımından lider durumdadır. Amerika’daki otomotiv şirketlerinde üretilen araçlarda
kenevir gibi doğal liflerle güçlendirilmiş termoplastik ve termoset kompozitlerini
kullanmaktadırlar [44, 45]. Brezilya’da bulunan Mercedes Benz otomotiv şirketi 1992
yılından itibaren doğal lifleri, ürünlerinde kullanmaya başlamıştır [45, 46]. Bu doğal
lifler; araç gövde altı panelleri, koltuk arkalığı, tavan döşemesi, kaput altındaki radyatör
deposunun altı, kapı pervazı paneli, arka panel rafları, bagaj pervaz kaplaması, çamurluk
parçaları, bagaj bölmesi, hoparlör, motor ve vites kutusu kapağı, yedek lastik
bölümlerinin kapağı, motor kapağı pervazı, kapı paneli, zemin üst levhası, halı döşemesi,
koltuk altlıkları, alet kutusu bölmesi gibi otomobil içi kısımlarda kullanılmaktadır [47,
48, 49].
Kâğıt-karton üretiminde selüloz hammaddesi olarak kenevir gibi tek yıllık bitkiler
değerlendirilmektedir. Kenevir selülozlarının elyaf boyları, genellikle diğer ağaçlardan
elde edilen selülozların elyaf boylarından kısa olduğu için kâğıda daha düzgün görünüm
153
vermektedirler. Türkiye’de üretilen kenevirin büyük bir kısmı sigara kâğıdı üretiminde
hammadde olarak kullanılmaktadır. Kenevir selülozlarının elyafları yüksek mukavemet,
opasite, beyazlık ve sigara kâğıdına daha iyi bir tat vermesi bakımından diğer ağaçlara
göre daha avantajlıdır [50].
Kenevir tohumu ve yağı yüksek besin değerine sahip olmasından dolayı Avrupa’nın
birçok ülkesinde insan tüketimi için kenevir bazlı işlenmiş gıda piyasası bulunmaktadır:
İçeceklerden fermente edilmiş özel ürünlere, tatlı, peynir, ekmek, salata ve çikolata gibi
birçok gıda ürününün hazırlanmasında kenevirin besinsel özelliklerinden
yararlanılmaktadır [51]. Kenevir tohumu ayrıca sabun üretmek amacıyla da
işlenmektedir.
Besin değerine ek olarak kenevir, binlerce yıldır tıbbi amaçla kullanılmıştır. Nitekim
Antik çağlardan beri, birçok anti-enflamatuar, anti-atopik, anti-radikal ve cilt iyileştirici
olarak kenevir kullanılmaktadır. Günümüzde, kenevirin tıbbi kullanımını yasallaştıran
yasalar Dünya çapında giderek artan sayıda çıkarılmaktadır. Kenevir tohumunun
kolesterolün dengelenmesi ve yüksek tansiyon dâhil olmak üzere olumlu sağlık yararları
vardır [52]. Kenevirin yağı, nörodermatoz ve sedef hastalığının tıbbi tedavisinde
potansiyel olarak önemli bir kaynaktır [53, 54, 55]. ABD Gıda ve İlaç İdaresi (FDA),
2018’de ciddi epilepsi formuyla ilişkili nöbetlerin tedavisi için cannabidiol içeren oral
solüsyonu (Epidiolex) onaylamıştır. FDA, kanser hastalarında kemoterapiye bağlı olarak
ortaya çıkan bulantı ve kusmayı tedavi etmek için sentetik cannabinoid’ler olan
dronabinol ve nabilon’u onaylamıştır. Dronabinol aynı zamanda AIDS hastalarının
iştahsızlık ve kilo kaybı tedavilerinde kullanılmak üzere onaylanmıştır [56]. Ayrıca, ıslahı
edilen kenevir çeşitlerinden elde edilen özütlerden, son yıllarda kenevir özlü şaraplar
üretilmeye başlanmıştır [57].
Organik olarak yetiştirilen kenevir tohumu yağına dayalı olarak üretilen cilt bakım
ürünleri potansiyel bir Pazar olarak önem arz etmektedir [58]. Omega-3, omega-6 ve
tokoferoller (E Vitamini) bakımından zengin olan bu yağ, nemlendirici faydaları ve cildin
geçirgenlik bariyerini güçlendirme kapasitesi ile bilinmektedir. Kenevir tohumu yağı,
cilde hızla nüfuz eden oldukça kuru bir yağdır.
Kümes hayvanlarının beslenmesinde karışım olarak kenevir tohumu kullanımının
yumurta ağırlığını artırdığı ve yumurtalarda Omega-3 ve Omega-6 yağ asitlerinin
içeriklerini artırdığı belirlenmiştir [59].
154
Kenevir samanı yalıtım özelliği ve su emme yeteneğinden dolayı hayvan çiftliklerinde
altlık olarak kullanılmaktadır. Ayrıca bahçelerde kaplama malzemesi olarak kullanılan
kenevir samanı sayesinde, yabancı otların büyümesi engellenmekte ve toprak nemi
korunmaktadır [60].
Kenevir biyodizel yapımı için enerji değerleri üzerinden en uygun, en doğa dostu, en hızlı
üretimi olan, en bol kaynaktır. Ek olarak, kenevirin bir yakıt kaynağı olarak bir diğer
avantajı, biyoetanol veya biyobutanol gibi düşük karbonlu yakıtlar oluşturmak için
fermente edilebilecek yüksek bir biyokütle içeriğine sahip olmasıdır [61]. Nitekim
kenevir; damıtma yoluyla kömür, metanol, metan veya benzine işlendiği gibi yakılabilir
veya işlenebilir ve selülozik bazlı etanol elde etmek için kullanılmaktadır [62, 63].
Kenevir türleri bütün bitki ve/veya metabolitleri hammadde olarak değişik amaçlarla
kullanılmaktadır. Bitki bileşenlerinin içeriği ve bileşimi genotip, çevre, yetiştirme tekniği
paketi uygulamalarına bağlı olarak değişkenlik gösterir. Geleneksel üretim yöntemlerinin
yanında özellikle standart ürün elde edilmesinde biyoteknolojik yöntemler üzerinde
durulmaktadır. Son yıllarda yapılan çalışmalarda özellikle üretim yöntemlerinin ve
tekniklerinin geliştirilmesi amacına yönelik yoğun çaba sarf edilmektedir [64].
Sonuç
Kenevir, adaptasyon kabiliyeti ve yabancı ot rekabeti bakımından üstün performanslı,
bitki besin elementi bakımından kanaatkâr olmasından dolayı çevre dostu bir bitkidir.
Besin kompozisyonu bakımından hem insan hem de hayvan beslenmesi bakımından
yüksek bir potansiyele sahiptir. İlaç, gıda, kâğıt, biyoyakıt, tekstil, kozmetik, inşaat ve
otomotiv sektörüne kadar oldukça geniş kullanım alanına sahip olan kenevir, petrol ve
petrokimyanın kullanıldığı her alanda da kullanılabilecek alternatif bir bitkidir. Narkotik
özelliğinden dolayı 19. asrın ortalarında birçok ülkede üretimi yasaklanan kenevir, son
yıllarda özellikle endüstriyel kenevir olarak üretilmek için yeniden önem kazanmaya
başlamıştır. Türkiye'de 2019 yılında endüstriyel kenevir üretim amacıyla 19 ilde kenevir
tarımına izin verilmiştir. Bu illerde kenevir üretiminin artırılmasına yönelik olarak yasal
ve teknik altyapının tamamlanması yönünde önemli çalışmalar yapılmaktadır.
Birçok kaynakta geleceğin bitkileri arasında gösterilen kenevir bilhassa endüstriyel
kenevir olarak tarımsal üretimde mutlaka hak ettiği yeri alacak ve geniş kullanım alanı
sayesinde ulusların ekonomilerine katkı sağlayacak önemli bir kaynak haline gelecektir.
155
Kaynaklar
1. Kew Science: The International Plant Names Index and World Checklist of Selected Plant Families
2019, Cannabis sativa L". Plants of the World Online, Royal Botanic Gardens, Kew, 2019.
Available from: http://www.plantsoftheworldonline.org/taxon/ [Accesed 27 September 2019].
2. Whittle, B.A., G.W. Guy and P. Robson, Prospects for cannabis-based prescripton Medicines.
Journal of Cannabis Therapeutics, 2001. 1: 3-4.
3. Colbert, M.,"Indica, Sativa, Ruderalis – Did We Get It All Wrong?", 2015 Available from: www.
http://theleafonline.com [Accessed: 29 September 2019].
4. USDA,United States Department of Agriculture, Classification Report, 2019. Available from:
https://plants.usda.gov/java/nameSearch. [Accessed27 September 2019].
5. Anonymous, 2020, https://craftsense.co/cannabis/cannabis-levelup/cannabis-ruderalis-having-
moment (Erişim 14.09.2020).
6. ElSohly, M. Marijuana and the Cannabinoids, 2007. Humana Press,ISBN 978-1-58829-456-2.
7. Lambert, D.M. Cannabinoids in Nature and Medicine, 2009. Wiley-VCH Publisher, ISBN 978-
3906390567.
8. Vavilov, N.I. Centers of origin of cultivated plants,in Origin and geography of cultivated plants,
V.F. Dorofeyev, Editor, 1926,Cambridge, Cambridge University Press, pp.22-135. ISBN 0-521-
40427-4.
9. Schultes, R.E. Random thoughts and queries on the botany of Cannabis. In: The botany and
chemistry of Cannabis, C.R.B.Joyce and S.H. Curry, Editors, 1970, J & A Churchill, London,
pp.11-38. ISBN: 0700014799.
10. Abel, E. The First 12,000 Years Marijuana, 1980. Plenum Press. New York. ISBN 978-1-4899-
2189-5.
11. Pounds, N.J.G. An historical geography of Europe, 1979. Cambridge University Press. ISBN:
9780511572265.
12. Conrad, C. Hemp, lifeline to the future, 1993. Creative Xpressions Publishing, Los Angeles,
California. ISBN-10: 0963975404
13. Herer, J. Hemp & the marijuana conspiracy: The emperor wears no clothes, 1992. Van Nuys:
Hemp Publications, California.
14. Mathieu, J.P. Chanvre, Techniques Agricoles, 1980. 5: 1-10.
15. FAO, Food and Agriculture Organization of Hemp Cultivation and Production Statistical Data,
FAOSTAT, 2019. http://www.fao.org/faostat/ [Erişim tarihi: 21 Mart 2020].
16. TÜİK, Bitkisel Üretim İstatistikleri, Türkiye İstatistik Kurumu, 2020.
https://biruni.tuik.gov.tr/medas/, [Erişim Tarihi: 21 Mayıs 2020].
17. Stearn, WT. The Cannabis Plant: Botanical Characteristics, in The botany and chemistry of
Cannabis. C.R.B. Joyce and S.H. Curry, Editors, 1970.J & A Churchill, London, pp.1-10. ISBN:
0700014799.
18. Wikipedia, 2020. https://tr.wikipedia.org/wiki/Kenevir. [Erişim tarihi: 14 Ağustos 8.2020]
19. Heslop-Harrison, J. and Y. Heslop-Harrison, Studies on flowering-plant growth and organogenesis
III. Leaf shape changes associated with flowering and sex differentiation in Cannabis sativa.
Proceedings of the Royal Irish Academy,1958. 59: 257-283.
20. Clarke, R.C. Marijuana Botany, 1980. Berkeley: Ronin publishing, California.
21. Hoffmann, W., Hanf, Cannabis sativa, 1957. Handbuch der Pflanzenzüchtung, 5: 204-263.
22. Neijat, M, et al., Hempseed products fed to hens effectively ıncreased n‑3 polyunsaturated fatty
acids in total lipids, triacylglycerol and phospholipid of egg yolk. Lipids, 2016. 51:601–614.
23. Karakaş, Ş. Sanayi kenevir yağının elde edilmesi ve besleyici özellikleri, 2018. Available
from:https://arastirma.tarimorman.gov.tr/ktae/Belgeler/End%C3%BCstriyel%20Kenevir%20Ger
%C3%A7e%C4%9Fi%20Paneli%20Sunular%C4%B1/ekg_7.pdf. [Accessed: 10 Ekim 2019].
156
24. Atakan, Z. Cannabis, a complex plant: different compounds and different effects on individuals,
The Advanced Psychopharmacol,2012. 2(6): 241–254.
25. Holoborodko, P., et al., Results of efforts by french and ukranian breeders to reduce cannabinoid
levels in industrial hemp (Cannabis sativa L.), 2014. Available from:
www.interchanvre.com/docs/article-Laiko.pdf. [Accessed 13 October 2019].
26. Sawler, J., et al., The genetic structure of marijuana and hemp, Plos One,2015. 10:8.
27. Aksoy, D., S. Aytaç ve R. Paslı, Endüstriyel kenevir gerçeği, in 2.Uluslararası 19 Mayıs Yenilikçi
Bilimsel Yaklaşımlar Kongresi, M. Abdullayev, Editor, 2019.Samsun, Türkiye, 27-29 Aralık
2019, İktisadi Kalkınma ve Sosyal Araştırmalar Enstitüsü, pp.850-858.
28. ORAN, Orta Anadolu Kalkınma Ajansı, Kenevir Yetiştiriciliği, 2019. Available from:
http://www.oran.org.tr/images/dosyalar/20190318134910_0.pdf.[Accessed 08 Kasım 2019].
29. İncekara, F. Endüstri Bitkileri ve Islahı: Keyif Bitkileri ve Islahı, 1964.Ege Üniversitesi Ziraat
Fakültesi, İzmir.
30. García-Tejero, I.F., et al., Impact of plant density and irrigation on yield of hemp (Cannabis sativa
L.) in a Mediterranean semi-arid environment, Journal of Agriculture Science Technology,2014.
16: 887-895.
31. Monteith, J.L. Climate and efficiency of crop production in Britain, 1997. Philosophical
Transactions of the Royal Society of London, 281: 277-294.
32. Megep, Tarım Teknolojileri: Lif Bitkileri Yetiştiriciliği Modülü,2012. Ankara. Available
from:http://www.megep.meb.gov.tr/mte_program_modul/moduller_pdf/Lif%20Bitkileri%20Yeti
%C5%9Ftiricili%C4%9Fi.pdf. [Accessed 12 November 2019].
33. Cosentino, S.L., et al., Sowing Time and prediction of flowering of different hemp (Cannabis
sativa L.) genotypes in Southern Europe, Industrial Crops and Products,2012. 37: 20-33.
34. Van der Werf H.M.G. and W. Van den Berg, Nitrogen fertilization and sex expression affect size
variability of fibre hemp (Cannabis sativa L.). Oecologia, 1995. 103: 462–470.
35. Amaducci, S., et al., Influence of agronomic factors on yield and quality of hemp (Cannabis sativa
L.) fibre and ımplication for an ınnovative production system. Field Crop Research, 2008. 107:
161-169.
36. Schumacher, A.G.D., S. Pequito and J. Pazour, Industrial hemp fiber: A sustainable and
economical alternative to cotton. Journal of Cleaner Production, 2020. 268. DOI:
https://doi.org/10.1016/j.jclepro.2020.122180.
37. Ebskamp, M.J.M., Engineering flax and hemp for an alternative to cotton. Trends in
Biotechnology,2002. 20 (6): 229-230.
38. Gedik, G., O.O Avinç ve A. Yavaş, Kenevir lifinin özellikleri ve tekstil endüstrisinde kullanımıyla
sağladığı avantajlar. Tekstil Teknolojisi ve Elektronik Dergisi,2010. 4 (3): 39-48.
39. Şahinbaşkan, YB. Kenevir Dokuma Kumaşa Enzimatik Ön İşlemlerin Etkisi. International Journal
of Advanced Engineer Pure Science, 2019. 3: 208-213.
40. Vantreese, V.L. Hemp support: evolution in EU regulation. Journal of International Hemp
Association, 2002. 7 (12): 1-23.
41. Santos, P.A., et al., Natural fibers plastic composites in automotive applications, 2008. SPE
Automotive Composites Conference & Exhibition, Troy, MI, USA.
42. Spoljaric, S., A. Genovese and R.A. Shanks, Polypropylene-microcrystalline cellulose composites
with enhanced compatibility and properties. Composite Part A:Applied Science and
Manufacturing, 2009. 40: 791-799.
43. Kymäläinen, H.R. and A.M. Sjöberg, Flax and hemp fibres as raw materials for thermal
insulations. Building and Environment, 2008. 43: 1261–1269.
44. Faruk, O. Cars from jute and other bio-fibers. Macromoleculer Materials and Engineer, 2009.291:
449–457.
45. Çavdar, D.A. ve S. Boran, Doğal Liflerin Otomotiv Sanayinde Kullanımı. Kastamonu Üniversitesi
Orman Fakültesi Dergisi, 2016. 16 (1): 253-263.
157
46. Heitzmann, L.F, et al., Aplicaçã de materiais de fontes renová veis na indú stria automobilí.
Daimler Chrysler of Brazil, 2001. SIMEA -Simpó sio De Engenharia Automotiva, Sã Paulo.
47. Ashori, A., Wood–plastic composites as promising green-composites for automotive industries.
Bioresource Technology, 2008. 99: 4661- 4667.
48. Hill, K., B. Swiecki, and J. Cregger, The bio-based materials automotive value chain, 2012. 20585:
Center for Automotive Research, Washington, DC.
49. Biron, M., The plastics industry: economic overview,in Termosets and composites, M. Biron,
Editor, 2014. William Andrew Press, Oxford.pp. 25–104. ISBN:1856174115.
50. Sekizinci Beş Yıllık Kalkınma Planı, Basım Sanayii Özel İhtisas Komisyonu Raporu, 2000.
Available from: http://www.sbb.gov.tr/wp-content/uploads/2018/11/08_BasimSanayii.pdf.
[Accessed: 21 Kasım 2019].
51. Vogl, C.R., et al., Hemp (Cannabis sativa L.) as a resource for green cosmetics.Journal of Industrial
Hemp,2004. 9 (1): 51-68 DOI: 10.1300/J237v09n01_06.
52. Jones, K. Nutritional and medicinal guide to hemp seed, 1995. Rainforest Botanical Laboratory,
Gibsons, BC, Canada.
53. Anstey, A., M. Quigley and J.D. Wilkinson, Topical evening primrose oil as treatment for atropic
eczema, Journal of Dermatological Treatment, , 1990. 1: 199-221.
54. Fiocchi, A., et al., The efficiency and safety of gamma-linolenic acid in the treatment of infantile
atopic dermatitis. Journal of International Medicine Research,1994. 22: 24-32.
55. Pate, D.W., Hemp Seed: A valuable food source, in: Advances in Hemp Research. Food Products
Press New York, P. Ranalli, Editor, 1999. pp. 243-255. ISBN:1560228725.
56. U.S National Institutes of Health, 2019. Available from: https://nccih.nih.gov/health/marijuana.
[Accessed 03 October 2019].
57. Herb, Introducing Alcohol-Free, Cannabis-Infused Wine for the World’s Classiest High, 2019.
Availeble from: https://herb.co/read/[Accessed5 October.2019].
58. Maxwell, B.A., Effects of herbicides on ındustrial hemp (cannabis sativa) phytotoxicity, biomass,
and seed yield, 2016.Msc Thesis, Department of Agriculture, Western Kentucky University,
Kentucky, USA.
59. Gakhar, N., et al., Effect of feeding hemp seed and hemp seed oil on laying hen performance and
egg yolk fatty acid content: Evidence of their safety and efficacy for laying hen diets. Poultry
Science,2012. 91: 701–711.
60. Carus, M. et al., The European Hemp Industry: Cultivation, processing and applications for fibres,
shivs and seeds, European Industrial Hemp Association (EIHA) Report, 2012.
61. Moxley, G., Z. Zhu and Y.P. Zhang, Efficient sugar release by the cellulosesolvent-based
lignocellulose fractionation technology and enzymatic cellulosehydrolysis. Journal. Agriculture
Food Chemistry,2008. 56: 7885–7890.
62. Biewinga E.E. and G. van der Bijl, Sustainability of energy crops in Europe: A Methodology
Developed and Applied, No. 234,1996. Centre for Agriculture and Environment: Utrecht, The
Netherlands.
63. Kuglarz, M., et al., Integrated production of cellulosic bioethanol and succinic acid from industrial
hemp in a biorefinery concept. Bioresource Technology, 2016. 200: 639–647.
64. Çalışkan, K. U. Her Yönüyle Cannabis. Mised, Türk Eczacılar Birliği Yayını- Meslek İçi Sürekli
Eğitim Dergisi. 2019. 43-44: 37-43.
158
Derleme makale / Review article
Kırkıncı, S.F., et al., Antarktika: Yaşam Bilimleri ve Biyoteknoloji Araştırmalarının Gözden Geçirilmesi.
International Journal of Life Sciences and Biotechnology, 2021. 4(1): p. 158- 177.
DOI: 10.38001/ijlsb.853472
Antarktika: Yaşam Bilimleri ve Biyoteknoloji
Araştırmalarının Gözden Geçirilmesi
Süleyman Faruk Kırkıncı1 , Sevgi Marakli2,3 , Hasan Murat Aksoy4 , Didem
Ozcimen5 , Yilmaz Kaya1, 6
ÖZET Yeryüzünde insanlar tarafından en son keşfedilen, en yüksek, en soğuk, en kurak ve
nüfus yoğunluğu en az olan kıta Antarktika’dır. Aynı zamanda yeryüzünün
kullanılabilen tatlı su kaynaklarının yaklaşık % 70’i buz halinde bu kıtada
bulunmaktadır. Bu özellikleriyle geçmişten günümüze insan yaşamı olmadığı halde
canlı yaşama doğal seleksiyon ile devam etmiştir. Antarktika, üzerinde barındırdığı
doğal yaşam habitatlarıyla, bilim insanları için sınırları tüm kıta olan eşsiz bir
laboratuvar gibidir. Antarktika’da az sayıda olmakla birlikte kıtaya özgü olan
hayvan ve bitki türleri ile çeşitli alg, liken ve mikroorganizma türleri bulunmaktadır.
Bilim insanları bu canlı formları üzerinde araştırmalar yaparak, küresel ısınma ve
çevre problemleri gibi güncel sorunlara bir çözüm aramaktadırlar. Kıtadan izole
edilen bazı türler, enzimler ve genler kullanılarak başta biyolojik kontrol olmak
üzere biyoteknoloji, biyoremidasyon gibi farklı alanlarda çalışmalar devam
etmektedir. Bu çalışmada, Antarktikada gerçekleştirilen yaşam bilimleri ve
biyoteknoloji araştırmaları gözden geçirilmiştir.
1 Tarımsal Biyoteknoloji Bölümü, Ziraat Fakültesi, Ondokuz Mayıs Üniversitesi, Samsun, Türkiye
2 Merkezi Araştırma Uygulama Laboratuvarı Uygulama ve Araştırma Merkezi, Amasya
Üniversitesi, Amasya, Türkiye 3 Tıbbi Hizmetler ve Teknikler Bölümü, Sabuncuoğlu Şerefeddin Sağlık Hizmetleri Meslek Yüksek
Okulu, Amasya, Türkiye 4 Bitki Koruma Bölümü, Ziraat Fakültesi, Ondokuz Mayıs Üniversitesi, Samsun, Türkiye 5 Biyomühendislik Bölümü, Kimya-Metalurji Fakültesi, Yıldız Teknik Üniversitesi,
İstanbul, Türkiye 6 Biyoloji Bölümü, Fen Fakültesi, Kırgısiztan Türkiye Manas Üniversitesi, Bişkek, Kırgısiztan
*Corresponding Author: Yılmaz Kaya, e-mail: [email protected]
ANAHTAR
KELİMELER
Antarktika,
antarktika biyoçeşitliliği,
psikrotolerant bakteri,
kutup algleri
MAKALE GEÇMİŞİ
Geliş
4 Ocak 2021
Kabul
24 Şubat 2021
158
Antarctica: A review of Life Sciences and Biotechnology
Researches
ABSTRACT
Antarctica is the last discovered by humans on earth with the highest, the coldest,
the driest and the lowest population density. At the same time, approximately 70 %
of the usable fresh water reserves of the earth are found in this continent as a ice
form. It has continued to live with natural selection with these features even though
there is no human life from the past to the present. Antarctica with this natural
habitat is like a unique laboratory for scientists whose borders are the entire
continent. In Antarctica, there are a small number of animal and plant species
specific to the continent as well as various algae, lichen and microorganism species.
Scientists are searching for a solution about current problems such as global
warming and environmental problems by performing investigations on these living
forms. Studies in different areas such as biotechnology, bioremediation especially
biological control are continue by using some species, enzymes and genes isolated
from the continent. Life sciences and biotechnology researches carried out in
Antarctica have been reviewed in this study.
Giriş
Arktik (Kuzey Kutbu), ismini Arktos’tan yani Kuzey Kutbundaki Büyük Ayı
takımyıldızından almıştır [1,2]. Antarktika kelimesi ise etimolojik olarak Arktik
bölgesinin karşısı anlamına gelmektedir. Kıtalar arasında Antarktika, büyüklük
bakımından beşinci sırada yer almaktadır [3]. Bu kıtanın % 98’lik kısmı buzlarla kaplı
olup toplamda 13.209.000 km2 ölçümü ile yaklaşık olarak Avrupa’dan % 30,
Avustralya’dan ise % 50 daha büyük alana sahiptir [4]. Bölge olarak yeryüzünün en
güneyinde yer almaktadır. Bu kıta; yeryüzünün en kurak, en rüzgarlı ve en soğuk
kıtasıdır. Kıta, Doğu ve Batı Antarktika olmak üzere iki bölgeden oluşmaktadır. Doğu
Antarktika büyük ölçüde yüksek buz kaplı bir platodan oluşurken, Batı Antarktika
büyük ölçüde dağlık adaları ve takımadalarını kapsayan bir buz tabakasından meydana
gelmiştir. Doğu boylamlarında bulunan Doğu Antarktika, batı boylamlarında bulunan
Batı Antarktika’dan daha büyüktür. Doğu ve Batı Antarktika yaklaşık 3.400 km
uzunluğunda Transantarktik Dağlarıyla birbirinden ayrılır [3].
Ortalama kalınlığı yaklaşık 1.800 metre olan buz kütlesi, küresel tatlı su rezervleri
açısından çok önemlidir. Kıtaya hakim olan buz tabakası, dünya buzunun yaklaşık %
90’ını ve dünya tatlı suyunun % 70’ini temsil eden yaklaşık 29 kilometreküp
hacmindedir [5]. Kıtanın bazı bölgeleri ise kullanılabilir suya erişimin zor olduğu soğuk
ve kuru bir çöldür. Kıtada hakim olan karasal ekosistemde, bilinen binlerce organizma
türü bulunmaktadır ve bu organizmaların çoğunu ekstrem koşullara kolaylıkla uyum
KEY WORDS
Antarctic,
Antarctic biodiversity,
psychrotolerant
bacteria,
polar algae
ARTICLE HISTORY
Received
4 January 2021
Accepted
24 February 2021
159
sağlayabilen mikroorganizmalar oluşturur. Kıtanın sahil ve deniz bölgelerindeki yaşam
formları farklılaşarak zenginleşmektedir [3].
Tarihin erken döneminden beri birçok denizci, kâşif, gezgin ve araştırıcı Antarktika ile
ilgili çalışmalar yapmıştır. Antarktika, 1800’lü yıllarda batılı devletler tarafından kıta
olarak keşfedilmesine karşın denizcimiz Piri Reis tarafından 1510’lu yıllarda
Antarktika’ya en yakın nokta olan Tierra del Fuego çoktan haritalandırılmıştı. Bunun
yanı sıra Dünya’nın Antarktika kısmına ve çevresine ait tek haritayı çizen Piri Reis’in
1528 tarihli dünya haritasında ise Atlantik Okyanusu’nun kuzeyinde yer alan
Grönland’ın, Kanada’nın kuzey doğu kıyılarını gösterdiği bilinmektedir [6]. Piri Reis’in
haritasından sonra batılılara ait kıta ile ilgili bilgiler ortaya çıkmıştır. James Cook
denizcilik kariyerine Fransa ve Birleşik Krallık arasında meydan gelen “Yedi Yıl
Savaşları” sırasında başlamıştır. Gösterdiği başarılar sonrasında İngiliz Deniz
kuvvetlerinde görevli olan James Cook ve ekibi 1773’te Antarktika yakınlarındaki
adaları keşfetmelerine karşın Antarktika’yı görememişlerdir [7]. Antarktika’nın 1800’lü
yıllarda yine denizci olan asker kökenli Amudsen, Scott ve Shackelton tarafından
keşfedilmesiyle birlikte sonraki yıllarda batılılar tarafından kıta olarak keşfi yapılmış ve
bununla birlikte 1910’lu yıllardan sonra Antarktika üzerinde toprak kazanım istekleri
başlamıştır [8]. Hiçbir ülkeye ait olmayan bu kıta ''bilim ve barış'' için 53 ülkenin imzası
ile korunmakta ve bu ülkelerden 29’unun kararları ile merkezi Buenos Aires
(Arjantin)’de bulunan bir sekretarya tarafından yönetilmektedir. Kararlar, her yıl
danışman devletlerin alfabetik sırayla ev sahipliğinde ve oy birliğiyle alınmaktadır [9].
Antarktika Yarımadası, Güney Kutbu’nun tabanında bulunan Antarktika anakarasının
en kuzey bölümüdür. Onu örten buz örtüsünün altında bir dizi kayalık adalardan oluşur.
Bu kaya adaları toprak görevi gören bir buz tabakasıyla birbirlerine bağlanmıştır.
Kıtanın tek uzantısı olan Antarktika Yarımadası aynı zamanda Antarktika’nın Güney
Amerika’ya en yakın kısmıdır. Kıtanın en yumuşak iklimine sahip yer olan Antarktika
Yarımadası, biyolojik çeşitlilik bakımından da kıtanın en zengin bölgesidir. Aynı
zamanda bu yarımada; ABD’nin Palmer, İngiltere’nin Rothera, Avustralya’nın Casey,
Güney Afrika’nın Sanea gibi birçok ülkenin araştırma üssüne ev sahipliği yapmaktadır
(Şekil 1) [10].
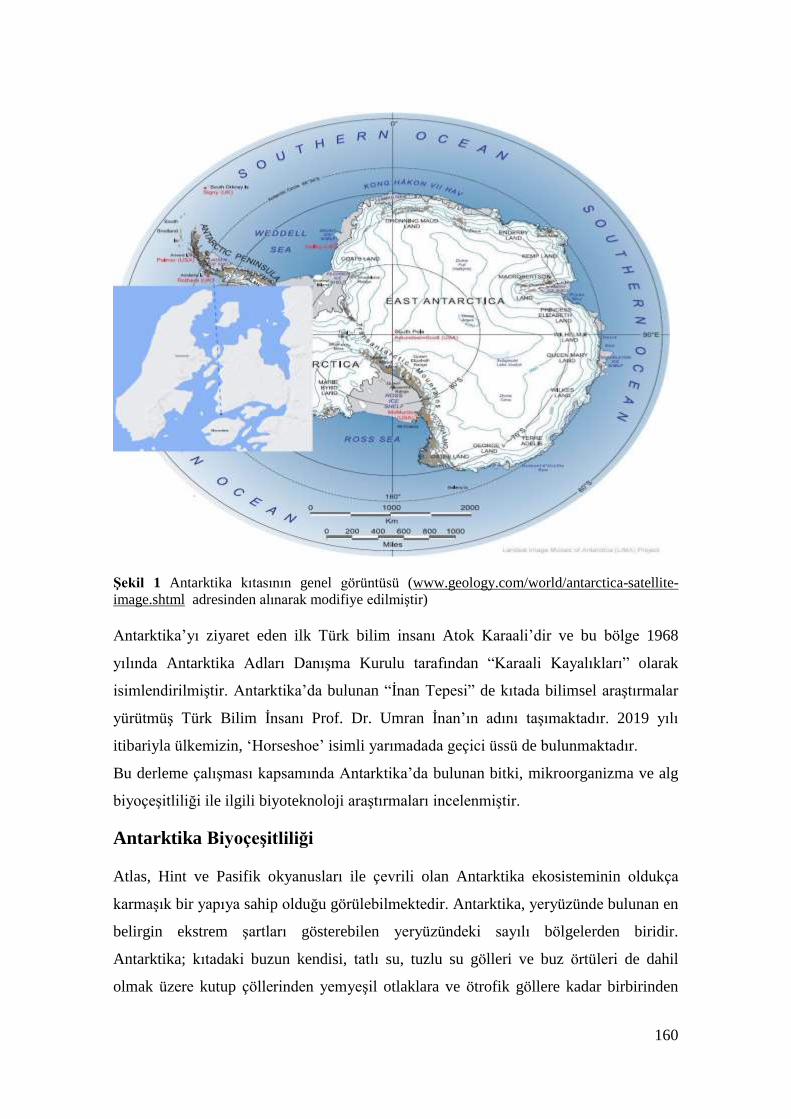
160
Şekil 1 Antarktika kıtasının genel görüntüsü (www.geology.com/world/antarctica-satellite-
image.shtml adresinden alınarak modifiye edilmiştir)
Antarktika’yı ziyaret eden ilk Türk bilim insanı Atok Karaali’dir ve bu bölge 1968
yılında Antarktika Adları Danışma Kurulu tarafından “Karaali Kayalıkları” olarak
isimlendirilmiştir. Antarktika’da bulunan “İnan Tepesi” de kıtada bilimsel araştırmalar
yürütmüş Türk Bilim İnsanı Prof. Dr. Umran İnan’ın adını taşımaktadır. 2019 yılı
itibariyla ülkemizin, ‘Horseshoe’ isimli yarımadada geçici üssü de bulunmaktadır.
Bu derleme çalışması kapsamında Antarktika’da bulunan bitki, mikroorganizma ve alg
biyoçeşitliliği ile ilgili biyoteknoloji araştırmaları incelenmiştir.
Antarktika Biyoçeşitliliği
Atlas, Hint ve Pasifik okyanusları ile çevrili olan Antarktika ekosisteminin oldukça
karmaşık bir yapıya sahip olduğu görülebilmektedir. Antarktika, yeryüzünde bulunan en
belirgin ekstrem şartları gösterebilen yeryüzündeki sayılı bölgelerden biridir.
Antarktika; kıtadaki buzun kendisi, tatlı su, tuzlu su gölleri ve buz örtüleri de dahil
olmak üzere kutup çöllerinden yemyeşil otlaklara ve ötrofik göllere kadar birbirinden
161
farklı ekosistemleri bünyesinde barındırır. Yani ekosisteminde hem ekstrem tuzlu
ortamları hem de hiç tuzlu olmayan ortamları içerebilmektedir [11, 12].
Yapılan son çalışmalar, Antarktika orijinli canlıların kökeninin çok eski olduğunu ve
milyonlarca yıldır izole bir şekilde canlılıklarını koruduklarını göstermiştir. Buradaki
canlıların, 30 milyon yıldan fazladır yaşamlarını sürdürdüğü ama bazılarının da 12-1.8
milyon yıl önce soylarının tükenme noktasına geldiği düşünülmektedir. Günümüzde
fosiller, buz tabakalarının arasında varlığını sürdürebilmiş tundra vejetasyonu ile karasal
ve tatlı su faunalarının tanımlanmasına izin vermektedir. Bugün gördüğümüz karasal
biyota, LGM (Last Glacial Maximum - Son Maksimum Buzul)’den bu yana yerleşik
düzene geçen türlerden oluşmaktadır. 1960’lı yılların başlarında Antarktika’da
gerçekleştirilen araştırmalar sayesinde özellikle Transantarktika Dağları ve Antarktika
Yarımadası’ndaki makro düzeyde biyolojik çeşitliliğin çoğu tanımlanmıştır [13]. Daha
yakın tarihli biyolojik çalışmalar karasal biyotanın çoğunun, bu kıtada izole bir şekilde
süregelen uzun bir geçmişe sahip olduğuna işaret etmektedir. Biyocoğrafik analizler ise
Antarktika’nın LGM ve Gondwana parçalanmasının son evreleri arasında (40 ile 60
milyon yıl önce) Güney Amerika ve Avustralya’dan izole hale geldiğini ve tatlı su
kopepodları ile yaşayan akarların, Antarktika’daki evrimsel sürekliliğe uygun dağılıma
sahip olduklarını belirlemiştir [14]. Çalışmalar kitlesel olarak, Antarktika Yarımadası ve
Doğu Antarktika’da karasal biyotanın halen yaşamını sürdürdüğünü kanıtlamaktadır.
Yapılan çalışmalara göre kanatsız Chironomidler, 49 ile 68 milyon yıldan beri Güney
Georgia, Güney Shetland Adaları ve Antarktika Yarımadası’nda bulunmaktadır. Buzul
barınaklarında, nematod faunası ve toprak ile ilişkili mikroorganizma çeşitliliği yoğun
olarak bulunurken Cladosera, rotiferler ve diatomlar ise en az 130.000 yıldan beri
Antarktik göllerde yaşamaktadır [14]. Ayrıca toplu olarak nototeniyoidler olarak
adlandırılan türler de Antarktika’yı çevreleyen kıtasal buz sahanlıklarındaki balık
faunası biyokütlesinin yaklaşık % 90’ını oluşturur. Bu canlıların, bir antifriz görevi
gören glikoproteine sahip oldukları için Güney Okyanusu’nun donma noktasının
altındaki buzlu sularında hayatta kalabildiği bildirilmiştir [15].
Kıta ekosisteminde yaşayabilen kuşlar ve su canlılarının başında penguenler ve fok
balıkları gelmektedir. Güney Okyanusu’nun çeşitlilik içeren su yaşamı; balina ve diğer
memeli deniz canlılarını kapsamaktadır.
162
Antarktik florası incelendiğinde ise kıtada hüküm süren aşırı soğuklar, birçok liken ve
yalnızca birkaç yosun türü ile birlikte çiçek açan iki bitki türünün yaşamasına izin verir.
Deniz ekosistemleri ise sığ kıyı bölgelerinden açık okyanusun derinliklerine ve buz ile
kaplı bölgelerden buzsuz sıvı ortamlara kadar birbirinden çeşitli habitatlara sahiptir
[13].
Bitki Çeşitliliği
Arktikte 400’e yakın bitki türü sayılabilmektedir. Buna karşın Antarktika sadece çiçekli
iki bitki türüne sahiptir [24]. Bu kıta ayrıca özellikle düşük sıcaklıklara ve kuraklığa
tolerans gösteren alt bitki gruplarına da (yosunlar, ciğer otları, likenler ve funguslar) ev
sahipliği yapmaktadır. Bu ilkel yaşam formlarıyla beraber, bitki ve hayvanlar da
kıtadaki yerlerini almışlardır [16] .
Deschampsia antarctica Desv. (Antarctic hairgrass; Antarktika çayırsaçı)
Poaceae ailesinin bir üyesi olan ve 2n=26 kromozoma sahip olan Deschampsia
antarctica Desv. Antarktika’da bulunan iki çiçekli bitkiden monokotil olanıdır [17].
Deschampsia antarctica en zor çevre koşullarına (aşırı düşük sıcaklık, kuraklık, yüksek
tuzluluk, sel, yüksek UV radyasyonu ve düşük yağış) başarıyla adapte olmuştur. Doku
kültürü, genetik, morfolojik, fizyolojik, biyokimyasal ve moleküler düzeylerde olmak
üzere farklı biyoteknolojik çalışmalarda yaygın olarak kullanılan bir bitkidir
[18,19,20,24,26,33,34,35].
Romero ve ark. (1999), yaptıkları çalışmada Antarktika’da yetişen D. antarctica
örneklerinin in vitro koşullarında yetişenlere kıyasla (2 °C ve 13 °C’de) küçük
epidermal hücre boyutu, yüksek hücre yoğunluğu, karmaşık hücre formu, kalın kütikül
yapısı, yüksek stoma yoğunluğu, fazla yaprak kalınlığı ve küçük lümen damarları gibi
anatomik özelliklerinin farklı olduğunu göstermiştir [21]. Bu bitki, ayrıca ekstrem
soğuk ve kuru koşullara tolerans göstererek donma noktasında fotosentez yapabilir.
Maksimum fotosentetik aktivitenin 13 °C’de gerçekleştiği ve 0 °C’de maksimal
fotosentezin % 30’unun korunduğu bildirilmiştir [22].
Deschampsia antarctica donma toleransı mekanizmasının bir parçası olarak büyüme
döneminde antifriz proteinleri üretmekte ve yapısal olmayan karbonhidratları
biriktirmektedir [21]. RI (Recrystallisation Inhibition - Buz Kristalizasyonunu
Engelleme) aktivitesi; bitkiyi, buz kristallerinin zararlı etkilerine karşı korumakta,
Antarktika çimlerinin hayatta kalmasını ve donma toleransını sürdürmesini
163
sağlamaktadır. Bahsi geçen özellikler bu bitkinin stres toleransı ile ilgili genler
açısından önemli ve değerli bir genetik kaynak olduğunu göstermektedir [23]. Çeşitli
araştırmalar, D. antarctica’nın abiyotik etmenlere (özellikle soğuğa karşı) geliştirdiği
savunma mekanizmalarının bazılarına ışık tutmuştur. Byun ve ark. (2015) yaptıkları
çalışmada, D. antarctica C repeat binding factor 7’yi (DaCBF7), monokot grubu V
CBF homologlarının bir üyesi olarak tanımlamıştır. Bitkilerde donmaya karşı
adaptasyondan sorumlu mekanizmaların araştırılması için D. antarctica bitkisinin,
model bir organizma olarak kullanılabileceği belirtilmiştir [23]. Ayrıca bu bitkinin;
değerli tarımsal mahsullerde üreme stratejilerinin geliştirilmesine izin veren, stres
toleransı ve çevresel adaptasyonla ilişkili olan bir gen kaynağı olarak kullanılabileceği
de öne sürülmektedir [24]. Bu amaçla, John ve ark. (2009), bir antifriz geni olan
DaIRIP4 genini Arabidopsis thaliana bitkisine aktarmış ve bu genin soğuk iklimli
yaşam alanlarında buz kristalizasyonunu engelleyici aktiviteyi meydana getirmek için
yeterli olduğunu rapor etmişlerdir [25]. Ayrıca D. antarctica’nın farmasötik amaçlı
kullanılan ekstraktlarının, UV radyasyonuna karşı koruyucu etkiler gösterdiği de
bilinmektedir [24,26].
Canlılar âleminde bitkiler, çoğu zaman zengin bir mikroorganizma çeşitliliği ile iletişim
ve etkileşim halindedir. Bakteriler, bitkilerin toprak üstü ve toprak altı organlarının
yüzeylerinde olabildiği gibi doku içinde de görülebilir. Bu bakterilerden olan ve
bitkilerin iç dokularında yer alan mikroorganizmalara endofit bakteriler adı verilir
[27,28]. Podolich ve ark. (2019), D. antarctica bitkisini, Antarktika’nın birbirinden
uzak bölgelerinden toplayarak bakteriyel etkileşimleri incelemişlerdir. Endofik
bakterilerden olan Alphaproteobacteria, Betaproteobacteria, Gammaproteobacteria,
Firmicutes, Cytophaga-Flavobacteria ve Actinobacteria bakterilerini tespit etmiş ve
bunlar arasında en fazla bulunanın ise Pseudomonas olduğunu rapor etmişlerdir
[29,30,31,32].
Colobanthus quitensis (Antarktika pearlwort; Antarktika karanfil otu)
Colobanthus quitensis karanfiller ailesinden Antarktika’da doğal olarak yetişen dikotil
bir bitkidir. Ekstrem şartlarda yaşayan model bir bitki olan C. quitensis, 2n=80
kromozoma sahiptir ve genom büyüklüğü 1.95 pg’dir [36,37].
Bu bitki, Antarktika biyomu içinde sadece Antarktika yarımadasında ve Antarktika
sınırları içinde yer alan adalarda bulunmaktadır [40]. Bununla birlikte bu bitkinin
164
dağılım coğrafyası ise Andes bölgesinin bir kısmını ve Falkland adalarını içine alan
Sub-Antarktika’yı kapsamaktadır. Bu bitki, kendi kendine döllenen ve kendine tozlanan
bir bitkidir [41,42,44,45]. Antarktika’nın koşullarına karşın bu bitki hemen hemen her
yıl bolca çiçek açmakta, tozlaşma ve döllenmeden sonra tohum üretmektedir.
Tohumlarda çevre koşullarına bağlı olarak kayıplar yaşanmaktadır [38,39,46, 53,54,55].
Deschampsia antarctica bitkisinde olduğu gibi C. quitensis bitkisinde de farklı
alanlarda çalışmalar yapılmaktadır. Cuba Díaz ve ark. [43], C. quitensis ile ilgili
populasyonlar arasında potansiyel farklılıklar göz önüne alınarak çimlenme ve
çimlenme öncesi çalışmalar yapmış ve asitle muamele etmenin çimlenme üzerindeki
olumlu etkilerini bildirmişlerdir [49,50,51,52]. Elde edilen bulgular ile tüm C. quitensis
populasyonlarına uygulanabilen etkili protokoller oluşturulmuştur. Hughes [47] ise
küresel ısınma ile ilgili araştırmalarında kutup bölgeleri ve benzeri bitki örtüsünü
çalışmıştır. Antarktika kıtasına özgü D. antarctica ve C. quitensis bitkilerini ve küresel
ısınma etkileşimlerini incelemiştir. Yaptığı çalışmanın sonucunda isimleri geçen iki
damarlı bitkide 0 °C’nin, bu bitkilerin fiziksel büyümesini etkilediğini ve
sınırlandırdığını rapor etmiştir. Ayrıca bu bitkilerde, özellikle soğuk direnci yaygın
olarak çalışılmıştır ve ticari olarak uygulamaları değerlendirilmiştir [48,56]. Zuniga ve
ark. (2009) ise C. quitensis bitkisi ile ilgili in vitro şartlarda yaptığı mikroçoğaltım
çalışmasında temel doku kültürü parametrelerini belirlemiştir. Bu çalışma ile iki ay
içinde bitki sayısının yaklaşık dört ile beş kat arttığı rapor edilmiştir. Bu metot,
Antarktik gen kaynaklarının in vitro koşullarda çoğaltılmasını, muhafaza edilmesini ve
gelecek çalışmalar için erişilebilirliğini sağlayabilir [59].
Yukarıda belirtilen farklı araştırmalar olmak üzere birçok çalışmada Antarktika
kaynaklı bitkilerin genetik materyalleri, ekstem koşullara toleransta rol oynayan
adaptasyon mekanizmaları ve bu mekanizmaların ürünü olan metabolik bileşikler
yaygın olarak incelenmektedir. Elde edilen sonuçların tarım ve sanayi sektörünün
gelişmesine katkıda bulunabileceği ve ilgili konularda yeni ufuklar açabileceği
vurgulanmaktadır.
Mikroorganizma Çeşitliliği
Kutup toprakları; doğrudan kuvvetli rüzgarlara, ekstrem düşük sıcaklıklara, kışın düşük
yazın yoğun UV radyasyonuna bununla birlikte düşük seviyeli yağışlara maruz
kalmaktadır [60]. Bu ekstrem çevre koşullarına karşın Antarktik tundra topraklarının
165
diğer biyomlara benzer hatta daha fazla mikrobiyal çeşitlilik barındırdığı bilinmektedir
[61]. Bu durum, ekosistemdeki biyolojik aktivitelerin çoğunun mikroorganizmalar
tarafından kontrol edildiğini göstermektedir [62]. Her ne kadar kutupsal
mikroorganizmalar iklim koşullarından dolayı düşük mikrobiyal aktivite gösterselerde
besin döngüsündeki rolleri yine de önemlidir [63]. Bu mikroorganizmalar besin ağının
temelini oluştururlar ve biyojeokimyasal döngülerde biyoçözünürlük gibi önemli
görevleri vardır [64, 65]. Bununla birlikte ekolojik önemlerine karşın Antarktika
mikrobiyal çeşitliliği ve bu çeşitliliğin coğrafik dağılımı hakkında yeterince bilgi
bulunmamaktadır [66, 67]. Sistematik örnekleme bulunmaması, coğrafik izolasyon ve
özellikle Antarktika’ya ulaşabilirlik gibi problemlerden dolayı mikrobiyal biyoçeşitlilik
hakkında yapılan çalışmalar, teknolojinin gelişmesiyle beraber artmıştır
[68,69,70,71,72] .
Bu biyolojik çeşitliliğe verilecek örneklerden biri bazı göllerin organik karbon
kaynağının çok az olması veya çok fazla olması ya da fosforca zengin olması gibi
özelliklerinden dolayı, metanol, azot ve fosfor parçalayan bakterileri bünyelerinde
barındırmasıdır [73,74]. Farklı olarak Yergeau ve ark. (2007) tarafından elde edilen
bulgular, büyük ölçekli biyocoğrafik bölgelerde azalan mikrobiyal çeşitliliği
göstermektedir [75]. Ancak, Kara Antarktikası dışında kalan bazı habitatlarda hiçbir
azalma durumu yoktur, tam tersine bu habitatlarda bulunan fungus çeşitliliği üzerine
yapılan birçok olumlu çalışma bulunmaktadır [76, 77]. Ayrıca, Antarktika’daki stabil
deniz ortamlarındaki habitatlarda da mikroorganizma çeşitliliğinde hiçbir azalma
durumu söz konusu değildir. Antarktika topraklarındaki bakteri çeşitliliği ile ilgili daha
fazla çalışma yapıldığı için diğer canlılara kıyasla bakterilerin çok daha çeşitli ve sayıca
fazla olduğu bildirilmiştir [78, 79, 80, 81]. Bununla beraber, Antarktika’da
mikroorganizmaların biyocoğrafik çeşitliliği üzerine yapılan çalışmalar hala başlangıç
seviyesindedir.
Gloeocapsa cinsi, kuru vadilerin kayalıklarındaki ekstrem koşullara yüksek adaptasyon
gösteren az sayıdaki kriptoendolitik taksondan biridir. Arthrobacter spp.,
Brevibacterium spp. ve Corynebacterium spp. gibi aktinobakteriler, Antarktika’nın kuru
vadilerinde öne çıkmaktadır [81]. Termofilik bakteriler ise ‘Kuzey Victoria Land’’daki
‘Mt. Rittman’ ve ‘Mt. Melbourne’ yakınlarındaki termal olarak ısıtılmış sıcak
topraklardan izole edilmiştir [82]. Antarktika; Staphylococcus, Bacillus,
166
Corynebacterium, Micrococcus, Streptococcus, Neisseria ve Pseudomonas cinsine ait
bakterileri de bünyesinde barındırmaktadır [83]. Yürütülen araştırmalarda tanımlanmış
bakteri türleri şu şekildedir; Acinetobacter spp., Alicyclobacillus acidocaldarius,
Aquaspirillum spp., Arthrobacter spp., Azospirillum spp., Bacillus spp., Bacillus
fumarioli, Bacillus thermoantarcticus, Bizionia argentinensis, Brevibacterium spp.,
Brevibacterium antarcticum, Brevundimonas spp., Chryseobacterium spp.,
Corynebacterium spp., Flavobacterium spp., Gloeocapsa spp., Hymenobacter
roseosalivarius, Leptolyngbya frigida, Massila spp., Micrococcus spp., Modestobacter
multiseptatus, Neisseria spp., Nocardia spp., Nostoc commune, Paenibacillus spp.,
Planococcus spp., Pseudonocardia antarctica, Pseudomonas spp., Psychrobacter spp.,
Sphingobacterium spp., Staphylococcus spp., Stenotrophomonas spp., Streptococcus
spp., ve Streptomyces spp. [82]. Bu mikroorganizmaların birbirinden farklı işlevleri
bulunmaktadır. Azot döngüsünde önemli rolleri olan Planctomycetes mikroorganizması,
azot üretimine yol açan amonyumun anaerobik oksidasyonuna katılır. Deniz ve tatlı su
ortamlarında genellikle daha fazla bulunurlar. Bununla birlikte kutup toprakları da dahil
olmak üzere karasal ortamlarda değişken miktarlarda tespit edilmiştir [84].
Bunların yanı sıra III. Ulusal Antarktik bilimseferi kapsamında, Galindez adasından
alınan su örneklerinden literatürde ilk defa pestisitleri parçalayan bakteriler
tanımlanmıştır. Bu bakteriler; Psychrobacter sp. strain TaeBurcu001 (Aksesyon
numarası MN061637.1) ve Psychrobacter sp. strain TaeBurcu002 olarak
isimlendirilerek NCBI’a (Aksesyon numarası MN960390.1) yüklenmiş ve literatüre
kazandırılmıştır [85]. Ayrıca bu bakteri türlerinin dışında, III. Ulusal Antartik bilimsefer
kapsamında, ‘Horseshoe’ Adası’ndan alınan buz örneklerinden literatürde ilk defa
Antarktika’dan izole edilmiş Blastomonas sp. strain YTU.POLAR.001 (Aksesyon
numarası MN384971) ve Achromobacter sp. strain YTU.KUTUP.001 (Aksesyon
numarası MN396385) isimli bakteriler de NCBI’a yüklenerek literatüre kazandırılmıştır
[86,87].
Arkea ve fungal toplulukları da kutup mikrobiyal topluluklarının önemli parçalarıdır.
Fungal toplulukların kutuplarda varyasyon göstermesine karşın genellikle Ascomycota
ve Basidiomycota diğer varyetelere kıyasla daha baskın olan karasal ayrıştırıcılardır.
Bununla birlikte bölgede bollukları, çeşitlilikleri ve dağılımları çalışılmaya devam
edilmektedir [88].
167
Kutuplarda sürekli donmuş olan topraklar (permafrost), Dünya’nın kara yüzeyinin
önemli bir alanını kapsamaktadır. Kuzey Kutbu ve Antarktika bölgelerindeki permafrost
çökeltilerinde bulunan bazı mikroorganizmaların, uzun süreler boyunca hayatta
kalabildiği gösterilmiştir [89]. Permafrost özellikli bölgelerden çok sayıda soğuğa
dirençli mikroorganizmanın bulunduğu bilinmektedir [90]. Permafrost alanlar sadece bir
bakteri deposu değildir, aynı zamanda arkeler [91], maya [92], aktinomiset ve
mikromisetler de [93] içerir. Bunlarla beraber farklı yaş ve kökene sahip permafrost
yüzeylerden alınan örneklerde canlı protozoanlar bulunmuştur [94].
Ayrıca bu mikroorganizma türlerinin yanısıra III. Ulusal Antarktik bilim seferi
kapsamında toplanan örneklerde yeni mikroorganizma ırkları da izole edilmiştir. Bu
mikroorganizmalar üzerinde genomik DNA izolasyonundan sonra 18S rRNA analizleri
yapılmıştır. Her bir izolat için elde edilen dizi analiz sonuçları, NCBI veri tabanında
bulunan suşlara ait diziler ile karşılaştırılmıştır. Elde edilen bu ırklara ait diziler, NCBI
veri tabanına kayıtı yapılarak aksesyon numarası alınmıştır. Özellikle kutuplardan
alınan örneklerden literatürde ilk defa Antarktika’dan izole edilmiş Paracercomonas sp.
strain TAE3-YTU.004 (Aksesyon numarası MW485507.1) (95), Flamella arnhemensis
strain TAE3-YTU.007 (Aksesyon numarası MW485950.1) (96), Flamella balnearia
strain TAE3-YTU.005 (Aksesyon numarası MW487484.1) (97), Flamella arnhemensis
strain TAE3-YTU.006 (Aksesyon numarası MW513457.1) (98), Paracercomonas sp.
strain TAE3-YTU.008 (Aksesyon numarası MW521096.1) (99) olarak NCBI’a
yüklenmiş ve literatüre kazandırılmıştır.
Mikrobiyal Çeşitliliğin Potansiyel Kullanım Alanları
Kutupsal çevre koşullarına karşın Güney Kutbu topraklarında yaşayan
mikroorganizmaların hepsi ekstremofilik değildir. Psikrofiller soğuk ortamlarda yaşarlar
ve bu organizmaların çoğu 0 °C’nin altındaki düşük sıcaklıklarda hayatta kalabilirler
ancak daha yüksek sıcaklıklarda da optimum şekilde büyüyebilirler [100].
Pseudomonas’ın B17 ve B18 suşları, optimum büyüme sıcaklığı 25 °C olmasına karşın
0 °C ile 30 °C arasında da büyüyebilmektedir. Ayrıca, 5 °C’de metabolik olarak
aktiftirler ve hem alkanları hem de naftaleni petrol hidrokarbonundan bozabilirler [101].
Soğuğa adapte olan bazı organizmalar gıda endüstrisinde mikrobiyal kontaminasyonu
önlemek, hücre dokularının kriyoprezervasyonunu artırmak ve dondurulmuş gıdaların
dokusunu ve lezzetini korumak için yaygın olarak kullanılan antifriz proteinleri
168
üretebilmektedir [102]. Bu proteinler, fungus gibi mikroorganizmalarda ve az sayıda
bakteri türünde özellikle de Antarktika göllerinden izole edilen Gammaproteobakteriler
de tanımlanmıştır. Ayrıca, bazı mikroorganizmalar düşük sıcaklıklarda mezofilik
enzimlere göre daha aktif ve kararlı olan ve böylece düşük sıcaklıklı endüstriyel
işlemler için kullanılabilecek soğuk aktif veya psikrofilik enzimler de üretebilmektedir
[103] .
Bununla beraber son yıllarda antibiyotiklerin çoğuna dirençli hale gelen suşların artması
nedeniyle mikrobiyal çeşitliliğin tıbbi amaçlar doğrultusunda incelenmesi de potansiyel
anlamda bir öncelik haline gelmiştir. Mikrobiyal çeşitliliğin yoğun olduğu noktalarda,
mikroorganizmalar bir arada yaşadıkları ve özellikle enerji kaynakları konusunda
birbirleriyle rekabet edebilecek yollar geliştirdikleri için bu noktalarda tıbbi
araştırmalara öncelik verilmektedir. Funguslar ve bakteriler; birçok ekstrem ortamda
tanımlandıkları ve bu ortamların zorlu koşullarında hayatta kalmak ve gelişmek
amacıyla özel yöntemler geliştirdiklerinden potansiyel farmasötik uygulamaları olan
antibiyotikler, antitümör ilaçlar veya kolesterol düşürücü ilaçlar gibi yeni biyoaktif
metabolitler için zengin bir kaynak oluşturmaktadır [88, 104,105]. Antarktika
süngerleri ile ilişkili bazı fungus türlerinin de antimikrobiyal ve antitümoral aktivitelere
sahip olduğu gösterilmiştir [106]. Actinomycetes dünya çapında en önemli antibiyotik
kaynaklarından biridir ve Arktik Actinomycetes biyoprospektif için güçlü bir
potansiyele sahiptir [107, 108]. Streptomyces spp. organizmasının Doğu Sibirya
sedimentlerinden izole edilen ART5 suşunun Candida albicans’a karşı inhibe edici
aktivite gösterdiği bildirilmiştir [109].
Bunların yanısıra, biyoremidasyon için de Antarktik mikroorganizmaların
kullanılabilme potansiyelleri vardır. Günümüzdeki sanayileşmiş ve sanayileşmekte olan
devletlerin ekonomilerinde sentetik kimyasallara dayanan sanayilerin katkısı önemlidir.
Bu sanayilerde hammaddelerin işlenmesinde kısa sürede ekonomik olarak kaliteli bir
tüketici ürünü elde etmek için ucuz ve biyolojik olarak çözünmeyen birbirinden farklı
kimyasal maddeler kullanılmaktadır. Bu kimyasallar zaman içinde canlılara ve doğaya
zarar vermektedir. Bunlardan kurtulmak için en yeni ve güvenilir yöntemlerden biri ise
biyoremidasyondur. Biyoremidasyon canlı organizmaları kullanarak kirliliğin
temizlenmesi anlamındadır. Özellikle pestisitler gibi kimyasallar, tarım arazileri başta
olmak üzere ormanları ve doğamızı tehdit etmektedir. Bu kirliliklerden kurtulmak için
169
birçok mikroorganizma tuz gölleri [110], bazik göller [111] ve tarım alanları [112] gibi
birbirinden farklı lokasyonlardan izole edilerek biyoremidasyon için kullanılmıştır.
Kutup çalışmaları ile birlikte kutup bölgelerinden potansiyel türler izole edilip,
pestisitler gibi kirleticilere karşı biyolojik mücadele ile doğa daha temiz hale
getirilebilmektedir [85].
Kutup Algleri
Antarktika’nın sınırlı karasal ekosistemlerinde, tüm fotosentetik organizmalar yaşam
alanlarının ekolojisine önemli bir katkıda bulunmaktadır. Buzsuz zemin, Antarktika
kıtasının sadece % 0.18'ini oluşturmaktadır. Ancak, fotosentetik yaşam bu alanla sınırlı
değildir. Kıyı bölgelerde gerçekleşen alg patlamaları dolayısıyla belirli bölgelerde yeşil
ve kırmızı renkler görülmektedir. Antarktika’daki kar algleri, ilk olarak 1950’lerde ve
1960’larda yapılan keşiflerle tanımlanmıştır ve o zamandan beri Antarktika’da bulunan
çeşitli alg türleri incelenmektedir. Tek bir kar alg patlamasının binlerce metrekareyi
kapsayabileceği düşünüldüğünde kar algleri potansiyel olarak bölgenin en önemli
fotosentetik birincil üreticilerinden biridir. Bununla birlikte karasal ve deniz
ekosistemlerine besin sağlanmasını da etkilemektedir. Son yıllarda küresel ısınmanın
sonucu olarak, Antarktika Yarımadası’ndaki ısınma sanayi öncesi sıcaklıklara göre 1.5
°C’yi aşmıştır. Bu bakımdan özellikle kar alglerinin Antarktika’nın biyosferine nasıl
uyum sağladığını ve küresel ısınmaya karşı olası tepkilerini anlamak, iklim
değişikliğinin Antarktika'nın bitki örtüsü üzerindeki genel etkisini inceleme açısından
çok önemlidir [113, 114].
Algal hücrelerin konsantrasyonu, binlerce hücrelik bir popülasyon mL-1 değerine
ulaştığında, kar veya buzda renk değişikliği meydana gelir. Renk ve yoğunluğu,
pigment kompozisyonuna ve popülasyon yoğunluğuna bağlıdır. Alg patlamaları ortam
koşullarına göre baskın olarak içerdikleri pigment ve metabolitlerine göre kırmızı, yeşil
ve sarı-kahverengi renklerde olabilir. Örneğin klorofil baskın olduğunda yeşil kar
görülürken, fukoksantin gibi birincil karotenoidler baskınsa, altın-kahverengi kar ortaya
çıkabilir [115].
Arktik ve Antarktik’te deniz buzu içinde en bol bulunan mikroalgal taksonlar
diatomlardır (Bacillariophyceae). Sadece Kuzey Kutbu’nda 550’den fazla diatom türü
tanımlanmıştır. Kuzey Kutbu’nda; Fragilaria, Cylindrotheca ve Achnanthes nispeten
yaygın tek hücreli diatom cinsleridir, Antarktika’da ise Amphiprora, Pinnularia,
170
Pleurosigma, Synedra ve Tropidoneis türlerinin varlığı bildirilmiştir. Algler en çok
birinci yıl buzunda, dip buzda, deniz buzunun iç kısmındaki boşluk katmanlarında ve
buz boşluklarında görülmektedir. Deniz buzu içindeki mikroalgal patlama genellikle
oldukça kısa ömürlüdür. Alg biyokütlesi, yetersiz ışık, düşük sıcaklık ve yüksek deniz
buzu tuzluluğu nedeniyle kışın genellikle düşüktür. Alg konsantrasyonları ışık ve
sıcaklık arttıkça ve tuzluluk azaldıkça ilkbaharda hızla artar [116].
III. Ulusal Antarktik bilim seferi kapsamında Antarktika’dan yeni alg suşları da izole
edilmiştir. Özellikle kutuplardan alınan örneklerden literatürde ilk defa Antarktika’dan
izole edilmiş Chlorella variabilis strain YTU.ANTARCTIC.001 (Aksesyon numarası
MN372092) [117], Auxenochlorella pyrenoidosa strain Ozcimen.001 (Aksesyon
numarası MT951391) [118], Chlorella sorokiniana strain Egemen.001 (Aksesyon
numarası MW147167.1) [119] olarak NCBI’a yüklenerek literatüre kazandırılmıştır.
Mikroalgler, suyun bulunduğu her ortamda çoğalabilen, türlerine ve yetiştikleri ortam
koşullarına göre değişik oranlarda yağ, protein ve karbonhidrat içeren bitki benzeri
mikroskobik canlılardır. Bu mikroorganizmalar üstün adaptasyon mekanizmaları
sayesinde Antarktika gibi ekstrem koşullara bile dayanabilmektedir. Antarktik
mikroalgler, içerdikleri yüksek oranda yağ, protein ve karbonhidrat sayesinde gıda,
hayvan yemi ve enerji alanlarında kullanılabilmektedir. Bu içeriklerin yanı sıra bu
mikroalgler, bulundukları ortamın koşullarına adapte olabilmek için hücre içi ve hücre
dışına fukoksantin, astaksantin, beta-karoten, klorofiller, çoklu doymamış yağ asitleri,
steroller ve peptidler gibi birçok değerli metabolit sentezler. Bu intraselüler ve
ekstraselüler metabolitler; antibiyotik, antiviral, antikanser, antifungal, antibakteriyal,
antiinflamatuar ve hipokolestrolemik özellik göstermektedir. Kutup mikroalgleri bu
özellikleri ile ilaç alanındaki biyoteknolojik uygulamaların yanısıra kozmetik, gıda ve
gıda katkı maddesi, gübre, hayvan yemi ve enerji alanlarında da kullanılabilmektedir
[120, 121, 122, 123].
Sonuç
Gezegenimizin geçmişine ait bilgiler bir saklı hazine gibi Antarktika’da bulunmaktadır.
Dünyamızın özellikle kirlilik ve küresel ısınma gibi küresel sorunlarını çözmede bu kıta
insanlığa yardımcı olacaktır. Dünya tatlı su kaynaklarının % 70’ini barındıran
Antarktika, canlı yaşamı ve canlıların geçirdiği süreçleri öğrenme bakımından çok
önemlidir. Özelllikle son yüzyılda Dünyamızın en büyük problemlerinden olan küresel
171
ısınma, çevre kirliliği ve çeşitli sağlık problemlerini çözmede Antarktika kıtasında
araştırılan bitki, alg ve mikroorganizmalar fayda sağlayacaktır. Örnek olarak tarım
arazilerinde kullanılan çeşitli sentetik kimyasal yapılı pestisitlerin topraktan
temizlenmesi ve azaltılmasında Antarktika kaynaklı mikroorganizmalardan
faydalanılabilmektedir. Aynı zamanda kutup algleri başta olmak üzere kıta üzerinde
yaşayan canlılardan çeşitli faydalı ekstraktlar çıkartılarak bunların teröpatik etkileri
sayesinde bazı hastalıkların tedavisinde kullanılabilecekleri düşünülmektedir. Asya ve
Avrupa kıtasının keşisme noktasında bulunan ve sanayileşmekte olan Türkiye, kirlilik
ve küresel ısınma gibi sorunlardan etkilenmektedir. Bu yüzden Antarktika temelli
çalışmalardan elde edilen sonuçlar ile sorunlarımızın çözümüne yönelik projeler
oluşturulmalıdır. Antarktika çalışmaları ülkemiz için stratejik ve ulusal öncelikli
alanlardan olup Türk bilim insanlarının Antarktika ile ilgili araştırmalara
yönlendirilmesi, bu konudaki bilimsel ve teknolojik yetkinliğin artırılmasının
sağlanması ve bu konularda daha fazla bilimsel çalışmaların yapılması için desteklerin
sunulması büyük önem arzetmektedir.
Teşekkür
Tüm yazarlar; Cumhurbaşkanlığı himayesinde, Sanayi ve Teknoloji Bakanlığı uhdesinde ve İTÜ Kutup
Araştırmaları Uyg-Ar Merkezi koordinasyonunca gerçekleştirilen TAE-III seferinde desteklenen
projelerinden dolayı teşekkürlerini sunar. Prof. Dr. Didem Özçimen, yapmış olduğu kutup çalışmalarına
desteklerinden dolayı TÜBA-GEBİP Ödülü kapsamında Türkiye Bilimler Akademisi (TÜBA)’ne
teşekkürlerini sunar.
Kaynaklar
1. WorldAtlas 2018. https://www.worldatlas.com/articles/what-are-the-origins-of-the-names-arctic-
and-antarctica.html
2. Liddell, H. G., Scott, R., Crane, G., Stuart Jones, H. and McKenzie, R., A Greek-English
Lexicon Antarctica. Oxford: Clarendon Press, 2002.
3. Encyclopædia Britannica 2019. https://www.britannica.com/place/Antarctica
4. World Geography 2019. https://www.enchantedlearning.com/geography/continents/Land.shtml
5. Scott K. N., Ice and Mineral Resources. In: Liggett D., Storey B., Cook Y., Meduna V. (eds)
Exploring the Last Continent. Springer Cham., 2015.
6. Burcu Ö, Küresel Salgınlar Kutup Bölgelerinde Öğreneceklerimiz ve Geleceğimiz. Küresel
Salgının Anatomisi: İnsan ve Toplumun Geleceği. 2020, Tuba Bilimler Akademisi. p:1019-
1029, 978-605-2249-46-8.
7. Encyclopedia 2020. https://www.encyclopedia.com/people/history/explorers-travelers-and-
conquerors-biographies/james-cook Erişim tarihi: [08.02.2021]
8. Ingrıd, H., et al., Early knowledge of Antarctica’s vegetation: Expanding past and current
evidence. Revista Chilena de Historia Natural, 2012. 85: p.409-418.
9. Harris, CM. and J. Meadows, Environmental management in Antarctica Instruments and
institutions. Marine Pollution Bulletin, 1992. 25(9-12): p.239–249.
172
10. Stewart, J., Antarctica an Encyclopedia, Second edition. McFarland & Company Inc., North
Carolina, U.S.A., 2011.
11. Barrett, J. E., et al., Variation in biogeochemistry and soil biodiversity across spatial scales in a
polar desert ecosystem. Ecology, 2004. 85: p.3105-3118.
12. Thomas, D. N. et al., The biology of polar regions. Oxford University Press, Oxford, UK, 2008.
13. Convey, P. et al., The spatial structure of Antarctic biodiversity. Ecological monographs, 2014.
84, p. 203-244
14. Convey, P. and Stevens, M. I., Antarctic biodiversity. Science, 2007. 317 (5846): p.1877-1878.
15. Gilbert, J. A. et al., Demonstration of antifreeze protein activity in Antarctic lake bacteria.
Microbiology, 2004. 150(1): p.171-180.
16. British Antarctic Survey 2020. https://www.bas.ac.uk/about/antarctica/wildlife/plants/ Erişim
tarihi: [04.01.2021].
17. Amosova, A. V. et al., Molecular Cytogenetic Analysis of Deschampsia antarctica Desv.
(Poaceae), Maritime Antarctic. PloS one, 2015. 10(9).
18. Ruhland, C. T. et al., The influence of ultraviolet-B radiation on growth, hydroxycinnamic acids
and flavonoids of Deschampsia antarctica during Springtime ozone depletion in Antarctica.
Photochemistry Photobiology, 2005. 81(5): p.1086-1093.
19. Pascual-Díaz, J.P., Serçe, S., Hradecká, I. et al. Genome size constancy in Antarctic populations
of Colobanthus quitensis and Deschampsia antarctica. Polar Biol 43, 1407–1413 (2020).
https://doi.org/10.1007/s00300-020-02699-y
20. Lee, J., et al., Combined analysis of the chloroplast genome and transcriptome of the Antarctic
vascular plant Deschampsia antarctica Desv. PLoS One, 2014. 9(6): e101100.
21. Romero, M., et al., Leaf anatomy of Deschampsia antarctica (Poaceae) from the Maritime
Antarctic and its plastic response to changes in the growth conditions. Revista Chilena de
Historia Natural, 1999. 72(1):p. 411-425.
22. Barcikowski, A., et al., Deschampsia antarctica (Poaceae)–the only native grass from Antarctica.
L. Frey (Ed.), Studies on Grasses in Poland, W. Szafer Institute of Botany, 2001. PAS, Kraków.
pp. 367-377
23. Byun, M., et al., Constitutive expression of DaCBF7, an Antarctic vascular plant Deschampsia
antarctica CBF homolog, resulted in improved cold tolerance in transgenic rice plants. Plant
Science, 2015. 236(1)p: 61-74.
24. Amosova, A., et al., Molecular cytogenetic analysis of Deschampsia antarctica Desv.(Poaceae),
maritime Antarctic. PloS One, 2015. 10(9) p: e0138878.
25. John, U., et al., Ice recrystallization inhibition proteins (IRIPs) and freeze tolerance in the
cryophilic Antarctic hair grass Deschampsia antarctica E. Desv. Plant, Cell & Environment,
2009. 32(4)p: 336-348.
26. Rabert, C., et al., Expression of Deschampsia antarctica Desv. polypeptide with lipase activity in
a Pichia pastoris vector. International Journal of Molecular Sciences, 2014. 15(2) p:2359-2367
27. Kucuk, C., Bitki Probiyotik Bakteriler: Bitkiler Üzerindeki Rolleri ve Uygulamalar. International
Journal of Life Sciences and Biotechnology, 2019. 2(1): p.1-15.
28. Kucuk, C. and A. Almaca, Bitki gelişimini teşvik eden rizobakteriler tarafından üretilen
metabolitler ve bitki gelişimine etkileri. International Journal of Life Sciences and
Biotechnology, 2020. 3(1): p.81- 94.
29. Podolich, O., et al., First record of the endophytic bacteria of Deschampsia antarctica E. Desv.
from two distant localities of the maritime Antarctica. bioRxiv, 2019. p: 1-15
30. Mühling, M., Woolven-Allen, J., Murrell, J.,C, Improved group-specific PCR primers for
denaturing gradient gel electrophoresis analysis of the genetic diversity of complex microbial
communities. The ISME Journal, 2008. 2(1):p. 379-392
31. Park, M, et al., Endophytic bacterial diversity of an Antarctic moss, Sanionia uncinata. Antarctic
Science, 2013. 25(1):p 51-54.
173
32. Podolich, O., et al., Reviving of the endophytic bacterial community as a putative mechanism of
plant resistance. Plant Soil, 2015. 388(1):p. 367-377.
33. Cuba, M. et al., Micropropagation of Deschampsia antarctica a frost-resistant Antarctic plant.
Antarctic Science, 2005. 17(1): p.69-70.
34. Osorio, J. et al., The effects of growth regulators and a scanning electron microscope study of
somatic embryogenesis in Antartic hair grass (Deschampsia antarctica Desv.). Polar Biology,
2014. 37: p.217-225.
35. Marely, C. D. et al., Advances of native and non-native Antarctic species to in
vitro conservation: improvement of disinfection protocols. Scientific Reports, 2020. 10: p.1.
36. Cuba-Díaz, M., et al., Genome size comparison in Colobanthus quitensis populations show
differences in species ploidy. Polar Biology, 2016., 40(7): p. 1475–1480. doi:10.1007/s00300-
016-2058-z
37. Marhold, K., et al., IAPT chromosome data 30/2. Taxon, 2019. 68(5): p.1124-1130.
38. Gielwanowska, I., Bochenek, A. and Szczuka, E., Development of the pollen in the Antarctic
flowering plant Colobanthus quitensis [Kunth] Bartl. Acta Agrobotanica, 2007. 60(3):p 3-8.
39. Cuba-Díaz, M., et al., Optimización de parámetros para la propagación in vitro de Colobanthus
quitensis (Kunth) Bartl. Gayana Botánica, 2014. 71(1): p 58-67.
40. Zúñiga, G. E. et al., Micropropagation of Antarctic Colobanthus quitensis. Antarctic Science,
2009. 21(2): p.149-150
41. Smıth, R. I. L., Terrestrial plant biology of the sub-Antarctic and Antarctic. In: Laws, R. M., ed.
Antarctic biology. Academic Press, 1984. p.61-162.
42. Moore, D. M., Studies in Colobanthus quitensis (Kunth) Bartl.and Deschampsia antarctica Desv.
II. Taxonomy, distribution and relationships. British Antarctic Survey Bulletin, 1970. 23: p.63-
80.
43. Convey, P., Reproduction of Antarctic flowering plants. Antarctic Science, 1996. 8: p.127-134.
44. Vera, M. L., Colonization and demographic structure of Deschampsia antarctica and
Colobanthus quitensis along an altitudinal gradient on Livingston Island, South Shetland Islands,
Antarctica. Polar Research, 2011. 30(1): p.7146.
45. Cannone, N. et al., S. Vascular plants changes in extreme environments: effect of multiple
drivers. Climatic Change, 2016. 134(4): p.651-665.
46. Convey, P. et al., The spatial structure of Antarctic biodiversity. Ecological Monographs, 2014.
80(2): p.203-244.
47. Hughes L., Biological consequences of global warming: Is the signal already, Trends in ecology
& evolution, 2000. 15(2): p.56-61.
48. Bravo, L. A. et al., Cold resistance in antarctic angiosperms. Physiologia Plantarum, 2001. 111:
p.55-65.
49. Oldham , P. D. and Kindness, J., Biodiversity Research and Innovation in Antarctica and the
Southern Ocean. bioRxiv, 2020.
50. Torres-Díaz M., et al., Biological Interactions and Simulated Climate Change Modulates the
Ecophysiological Performance of Colobanthus quitensis in the Antarctic Ecosystem. PLoS ONE,
2016. 11(10): e0164844. https://doi.org/10.1371/journal.pone.0164844.
51. Smith, R. L., Vascular plants as bioindicators of regional warming in antarctica. Oecologia,
1994. 99: p.322-328.
52. Pérez-Torres, E. et al., The role of photochemical quenching and antioxidants in photoprotection
of Deschampsia Antarctica. Functional Plant Biology, 2004. 31(7): p.731-741.
53. Rozema, J. et al. The role of uv-b radiation in aquatic and terrestrial ecosystems an experimental
and functional analysis of the evolution of uv-absorbing compounds. Journal of Photochemistry
and Photobiology B-biology, 2002. 66(2): p.12.
174
54. Salvucci, M. E. and Crafts-Brandner S. J., Relationship between the heat tolerance of
photosynthesis and the thermal stability of rubisco activase in plants from contrasting thermal
environments. Plant Physiology, 2004. 134: 1460-1470.
55. Gidekel, M. et al., Identification and characterization of three novel cold acclimation-responsive
genes from the extremophile hair grass Deschampsia antarctica desv. Extremophiles, 2003. 7:
p.459-469
56. German, S., Peter, J. U. And Martina, P. R., Ice recrystallisation inhibition protein or antifreeze
proteins from deschampsia, lolium and festuca species of grass. WO, 2005
57. Manuel, G., et al., Plant promoter. US 7273931 B2, 2007. https://lens.org/053-289- 529-443-
956
58. Bravo, L. A. and Griffith, M., Characterization of antifreeze activity in antarctic plants. Journal
of Experimental Botany, 2005. 56: p.1189-1196.
59. Manuel, G., et al., Agent for cutaneous photoprotection against uva/uvb rays [Internet]. US
8357407 B2, 2013. Available: https://lens.org/004-963- 1699 859-833-206
60. Cuba-Díaz, M., et al., Advances of native and non-native Antarctic species to in vitro
conservation: improvement of disinfection protocols. Sci Rep, 2020. 10(3845): p1-10.
https://doi.org/10.1038/s41598-020-60533-1.
61. Nemergut, D. R. et al., Structure and function of alpine and arctic soil microbial communities.
Research in microbiology, 2005. 156(7): p.775-784.
62. Sabbe, K., E. et al., Benthic diatom flora of freshwater and saline lakes in the Larsemann Hills
and Rauer Islands, East Antarctica. Antarctic Science, 2003. 15(2): p.227-248.
63. Convey, P. and Stevens, M. I., Antarctic biodiversity. Science, 2007. 317(5846): p.1877-1878.
64. Jakosky, B. M., et al., Subfreezing activity of microorganisms and the potential habitability of
Mars'polar regions. Astrobiology, 2003, 3:2: 343-350.
65. Vincent W.F., Evolutionary origins of Antarctic microbiota: invasion, selection and endemism.
Antarctic Science, 2000. 12: p.374-385.
66. Friedmann E.I. (ed), Antarctic microbiology. John Wiley & Sons, 1993.
67. Gibson, J.A.E. et al., Biogeographic trends in Antarctic lake communities; In Trends in Antarctic
Terrestrial and Limnetic Ecosystems. Bergstrom, D. M., Convey, P. and Huiskes, A.H.L. (eds.)
Springer, (2006a). p.71-99.
68. Simmons, B. L., Long-term experimental warming reduces soil nematode populations in the
McMurdo Dry Valleys, Antarctica. Soil Biology and Biochemistry, 2009. 41(10): 2052-2060
69. Aislabie, J. M., Jordan, S. and Barker, G. M., Relation between soil classification and bacterial
diversity in soils of the Ross Sea region, Antarctica. Geoderma, 2008. 144: p.9-20.
70. Tytgat, B., et al., Bacterial community composition in relation to bedrock type and macrobiota in
soils from the Sør Rondane Mountains, East Antarctica. FEMS Microbiology Ecology, 2016.
92(9).
71. Papale, M. et al., Prokaryotic assemblages within permafrost active layer at Edmonson Point
(Northern Victoria Land, Antarctica). Soil Biology & Biochemistry, 2018. 123: p.165-179.
72. Koo, H. et al., Metagenomic Analysis of Microbial Community Compositions and Cold-
Responsive Stress Genes in Selected Antarctic Lacustrine and Soil Ecosystems. Life, 2018. 8(3):
29.
73. Shivaji, S., Bacterial biodiversity, cold adaptation and biotechnological importance of bacteria
occurring in Antarctica. Proceedings of the Indian National Science Academy, 2017. 83: p.327-
352.
74. Laybourn-Parry, J., W. Quayle, and T., Henshaw, The biology and evolution of Antarctic saline
lakes in relation to salinity and trophy. Polar Biology, 2002. 25(7): p.542-552.
75. Convey, P. et al., The spatial structure of Antarctic biodiversity. Ecological Monographs, 2014.
84: p.203-244.
175
76. Yergeau, E. et al., Size and structure of bacterial, fungal and nematode communities along an
Antarctic environmental gradient. FEMS Microbiology Ecology, 2007. 59: p.436-451.
77. Dennis, P. G. et al., Soil fungal community composition does not alter along latitudinal gradient
through the maritime and sub- Antarctic. Fungal Ecology, 2012. 5: p.403-408.
78. Niederberger, T. D. et al., Microbial community composition in soils of Northern Victoria Land,
Antarctica. Environmental Microbiology, 2008. 10: p.1713-1724.
79. Cary, S. C. et al., On the rocks: microbial ecology of Antarctic cold desert soils. Nature Reviews
Microbiology, 2010. 8: p.129-138.
80. Chong, C. W. et al., Patterns in the distribution of soil bacterial 16S rRNA gene sequences from
different regions of Antarctica. Geoderma, 2012. 181: p.45-55.
81. Vyverman, W. et al., Evidence for widespread endemism among Antarctic micro-organisms.
Polar Science, 2010. 4: 103-113.
82. Cary, S. C. et al., On the rocks: the microbiology of Antarctic Dry Valley soils. Nature Reviews
Microbiology, 2010. 8(2): 129.
83. Adams, B. J. et al., Diversity and distribution of Victoria Land biota. Soil Biology and
Biochemistry, 2006. 38(10): 3003-3018.
84. Pearce, D. A. et al., Microorganisms in the atmosphere over Antarctica. FEMS Microbiology
Ecology, 2009. 69(2): 143-157.
85. Kırkıncı, S. F. (2020). Antarktika kaynakli örneklerden dalapon herbisitini parçalayan
bakterilerin izolasyonu, karakterizasyonu ve tanisi. Ondokuz Mayıs Universitesi Yuksek Lısans
tezi, s 35
86. Ozcimen, D., et al., Isolation of Blastomonas sp. from Horseshoe Island, Skua Lake, Antarctica,
YTU.POLAR.001, MN384971, NCBI GenBank, 28-August-2019
87. Ozcimen,D., et al., Isolation of Achromobacter sp. from Horseshoe Island, Skua Lake,
Antarctica, YTU.KUTUP.001, MN396385, NCBI GenBank, 31-August-2019.
88. Humbert, S. et al., Molecular detection of anammox bacteria in terrestrial ecosystems:
distribution and diversity. The ISME Journal, 2010. 4(3): 450.
89. Shmakova, L., N. Bondarenko, and A., Smirnov, Viable species of Flamella (Amoebozoa:
Variosea) isolated from ancient arctic permafrost sediments. Protist, 2016. 167(1):p. 13–30,
http://dx.doi.org/10.1016/j.protis.2015.11.001.
90. Gilichinsky, D. et al,. Bacteria in permafrost. In Psychrophiles: From Biodiversity to
Biotechnology; Springer: Berlin/Heidelberg, Germany, 2008. p. 83–102, ISBN 9783540743347.
91. Rivkina, E., et al., Biogeochemistry of methane and methanogenic archaea in permafrost. FEMS
Microbiol Ecol, 2007. 61 (1): p 1-15.
92. Faizutdinova, R., et al., Yeasts Isolated from Ancient Permafrost , J.D. Castello, S.O. Rogers
(Eds.), Life in Ancient Ice, 2005, Princeton University Press, Princeton, NJ. P. 118-126.
93. Kochkina, G.A., et al., Survival of micromycetes and actinobacteria under conditions of long-
term natural cryopreservation. Microbiology, 2001. 70(1): p. 356-364.
94. Stoupin D., Cryptic diversity within the choanoflagellate morphospecies complex Codosiga
botrytis - phylogeny and morphology of ancient and modern isolates. Eur J Protistol, 2012. 48
(2): p. 263-273.
95. Ozcimen, D., et al., Isolation of Paracercomonas sp. TAE3-YTU.004 from Galindez Island,
Antarctica, MW485507.1, NCBI GenBank, 22-January-2021.
96. Ozcimen, D., et al., Isolation of Flamella arnhemensis strain TAE3-YTU.007 from Galindez
Island, Antarctica, MW485950.1, NCBI GenBank, 23- January-2021.
97. Ozcimen, D., et al., Isolation of Flamella balnearia strain TAE3-YTU.005 from Horseshoe
Island, Skua Lake, Antarctica, MW487484.1, NCBI GenBank, 24- January-2021.
98. Ozcimen, D., et al., Isolation of Flamella arnhemensis strain TAE3-YTU.006 from Horseshoe
Island, Antarctica, MW513457.1, NCBI GenBank, 30-January -2021.
176
99. Ozcimen, D., et al., M. Isolation of Paracercomonas sp. TAE3-YTU.008 from Horseshoe Island,
Skua Lake, Antarctica, MW521096.1, NCBI GenBank, 31 -January -2021.
100. Malard, L. A. and Pearce, D. A., Microbial diversity and biogeography in Arctic soils.
Environmental Microbiology Reports, 2018. 10(6): 611-625.
101. Morita, R. Y., Psychrophilic bacteria. Bacteriological reviews, 1975. 39(2): 144.
102. Whyte, L. G., Bourbonnière, L., and Greer, C. W., Biodegradation of petroleum hydrocarbons
by psychrotrophic Pseudomonas strains possessing both alkane (alk) and naphthalene (nah)
catabolic pathways. Applied and Environmental Microbiology, 1997. 63(9): p. 3719-3723.
103. Sepideh, P., et al., Psychrophilic enzymes: structural adaptation, pharmaceutical and industrial
applications. Applied Microbiology and Biotechnology, 2021. 105(1): p.899–907.
10.1007/s00253-020-11074-0
104. Gon, O. and Heemstra, P. C., Fishes of The Southern Ocean. JLB Smith Institute of Ichthyology
Grahamstown, 1990. South Africa.
105. Gostinčar, C. et al., Extremotolerance in fungi: evolution on the edge. FEMS Microbiology
Ecology, 2009. 71(1): p.2-11.
106. Medema, M. H. et al., antiSMASH: rapid identification, annotation and analysis of secondary
metabolite biosynthesis gene clusters in bacterial and fungal genome sequences. Nucleic Acids
Research, 2011. 39(2): p.339-346.
107. Henríquez, M. et al., Diversity of cultivable fungi associated with Antarctic marine sponges and
screening for their antimicrobial, antitumoral and antioxidant potential. World Journal of
Microbiology and Biotechnology, 2014. 30(1): p.65-76.
108. Bredholdt, H. et al., Rare actinomycete bacteria from the shallow water sediments of the
Trondheim fjord, Norway: isolation, diversity and biological activity. Environmental
Microbiology, 2007. 9(11): 2756-2764.
109. Liao, L. et al., Bioprospecting potential of halogenases from Arctic marine actinomycetes. BMC
Microbiology, 2016. 16(1): p.34.
110. Akcay K, Kaya Y. (2020). Isolation, characterization and molecular identification of a
halotolerant Bacillus megaterium CTBmeg1 able to grow on halogenated compounds.
Biotechnol Biotechnol Equip. 2019;33(1): 945–953
111. Wahhab, B. H. A., et al., Identification and characterization of a 2, 2-dichloropropionic acid (2,
2-DCP) degrading alkalotorelant bacterium strain BHS1 isolated from Blue Lake, Turkey.
Journal of Tropical Life Science, 2020. 10(3):p 245-252.
112. Edbeib, M., F., et al., Further Analysis of Burkholderia pseudomallei MF2 and Identification of
Putative Dehalogenase Gene by PCR. Indonesian Journal of Chemistry, 2020. 20 (2): p 386 –
394
113. Torstensson, A., et al., Elevated temperature and decreased salinity both affect the biochemical
composition of the Antarctic sea-ice diatom Nitzschia lecointei, but not increased pCO2. Polar
Biol, 2019. 42(1):p 2149–2164. https://doi.org/10.1007/s00300-019-02589-y
114. Gray, A., et al., Remote sensing reveals Antarctic green snow algae as important terrestrial
carbon sink. Nat Commun, 2020. 11(2527):p. 1-9. https://doi.org/10.1038/s41467-020-16018-w
115. Hoham, R., W., and D., Remias, Snow and Glacial Algae: A Review. J Phycol, 2020. 56(1):p
264–282. https://doi.org/10.1111/jpy.12952
116. Arrigo, K., R., Sea Ice Ecosystems. Ann Rev Mar Sci, 2014. 6(1):439–467.
https://doi.org/10.1146/annurev-marine-010213-135103
117. Özçimen D., et al., Isolation, characterization and identification of Chlorella variabilis isolated
from Horseshoe Island, Skua Lake, Antarctica, YTU.ANTARCTIC.001, MN372092, NCBI
GenBank, 2019.
118. Özçimen D., et al.,Isolation, characterization and identification of Auxenochlorella pyrenoidosa
strain Ozcimen.001 isolated from Horseshoe Island, Skua Lake, Antarctica, MT951391, NCBI
GenBank, 2020.
177
119. Özçimen D., et al., Isolation, characterization and identification of Chlorella sorokiniana strain
Egemen.001 isolated from Horseshoe Island, Skua Lake, Antarctica, MW147167.1, NCBI
GenBank, 2020.
120. Del Campo, J., A., García-González, M., and Guerrero, M., G., Outdoor cultivation of
microalgae for carotenoid production: current state and perspectives. Applied microbiology and
biotechnology, 2007. 74(6):p.1163-1174
121. Sathasivam, R., et al., Microalgae metabolites: A rich source for food and medicine. Saudi
Journal of Biological Sciences, 2019. 26(4):p. 709-722.
122. Huilca, G., Licto, L., and Flores, R., Production of lipids from psychrophilic microalgae present
in antarctic glaciers for the synthesis of biofuel. Revista Vínculos, 2020. 4(1):p. 35-51
123. Jha, D., et al., Microalgae‐based Pharmaceuticals and Nutraceuticals: An Emerging Field with
Immense Market Potential. Chem Bio Eng Reviews, 2017. 4(4):p 257-272.

Bir sonraki sayıda görüşmek ümidiyle..
Hope to see you in the next issue..

Author Guidelines
General Principles
1. The article should be submitted by the responsible author responsible as Microsoft Word (Doc, Docx).
2. The responsible author is responsible for monitoring all the processes of the article.
3. The main section headings should be bold and the first letter in capital letters, the first letter of the first word in
the 2nd-degree headings should be large. If a third-degree title is required, the title should be in italics and only
the first letter of the first word should be capitalized. If possible, articles with fourth-degree titles should not be
used in our journal.
4. The main headings and sub-headings should not be numbered.
5. Turkish and English titles of the articles should be short, descriptive, and not more than fourteen words (except
prepositions).
6. In the Pre-Control and Evaluation processes, the authors must submit the proposed corrections within 30 days
at the latest. Otherwise, the article will be rejected.
7. Please click here to see the article written according to tothe rules of our journal.
Note: The general similarity rate should not exceed 20% except the bibliography part of the submitted articles. It
is necessary to inform the journal editor if the rate specified in the necessary cases is exceeded. All articles
submitted to the journal are screened with ithenticate plagiarism program.
8. Except for the Turkish and English titles of the work, all remaining parts should be written on the right side.
9. The text should be written on an A4-size page, in 12-font size Times New Roman, and double-spaced.
10. There should be 3 cm margin on the left, right, and top of the page.
11 Text should be written in a single column, all pages should be given a page number.
There is no page limit in publishing an article in our journal.
Names Section
A double-blind peer reviewer system is applied in our journal. Therefore, the names and addresses of authors
should not be given in the main text when loading the Manuscript to the system. Author names and contact
information should be written on a separate cover page. The cover page is available in the article submission
section of our journal.
Abstract
The article can be written in Turkish and English. English and Turkish abstracts should be written at the beginning
of the Turkish manuscripts.
The abstract should contain brief and clear information about the purpose, method , and results of the article. 10
font size, single line spacing and maximum 300 words should be written. No reference should be made to the
"Abstract".
Keywords: Keywords should be 10 font sizes, minimum 3, and maximum of 5 words. Keywords must be separated
with a comma (,) sign and should be in lowercase.
Introduction
The sections of the main part of the study should be written in 14 font sizes; Bold and the first letter should be
capitalized; Article should have Introduction, Methods, Results, Discussion, and Conclusion sections. The second
level titles should be written in the left, in 12 font sizes, the first letter of the first word should be capitalized, bold,
and numbered. A line in the previous paragraph must be separated by a space.
Figures and Tables
In the Turkish article for Figures and Tables;” Şekil“, ”Tablo“; whereas in The English article “Fig”, “Table”
should be used (Table 1, Fig 1).
Figure and Table words should be written in bold, and at the end of the description of figures and tables should
not have a dot (.)
Figures, graphics, photographs and the like should be written under Figures and written with 11 fonts. Figure and
Table should be given in the main document in the relevant places, should not be uploaded as separate files or
should not be added to the end of the text.
Examples;
Table 1 Possible effects of genetically modified organisms
Table 2 Methods of tissue culture in tomato plants
Fig. 1 Amount of GMO products in the world
Fig. 2 Countries with the highest number of GM cultivation in the world
Citation Inside the Text
In the text, the author should be numbered. Name and year should not be specified.
Example: Potatoes produced on a global scale are used in many basic areas [1, 2, 3]. Fifty percent of primarily
produced potatoes are used for fresh consumption, such as baking, frying, boiling [4, 5, 6, 7].
References
The references section should be written in 10 font sizes and without hanging indentations. In the references
section, italics should not be written except in italic words such as “in vivo, in vitro, ex-situ” and species names.
References should be written according to the “Chicago style”. Besides, there is an endnote style preparing for
"International Journal of Life Sciences and Biotechnology". You can prepare your references using that style. For
Endnote style, you can reach it by clicking on the endnote at the bottom right part of the main page of the journal.
Examples
Example of an article with 1 author;
Marakli, S., A Brief Review of Molecular Markers to Analyze Medicinally Important Plants. International Journal
of Life Sciences and Biotechnology, 2018. 1 (1): p. 29-36.
Example of an article with 2 authors;
Kocacaliskan, I. and I. Tailor, Allelopathic effects of walnut leaf extracts and juglone on seed germination and
seedling growth. The Journal of Horticultural Science and Biotechnology, 2001. 76 (4): p. 436-440.
Example of an article with 3 authors;
Segura-Aguilar, J., I. Hakman, and J. Rydström, The effect of 5OH-1,4-naphthoquinone on Norway spruce seeds
during germination. Plant Physiology, 1992. 100 (4): p. 1955-1961.
Example of articles with 4 or more authors
Arasoglu, T., et al., Synthesis, characterization, and antibacterial activity of juglone encapsulated PLGA
nanoparticles. Journal of applied microbiology, 2017. 123 (6): p. 1407-1419.
Example for the book;
Kocalishkan, I., Allelopathy. 2006, Ankara, Turkey: Our Office Press-In Turkish.

Example for Book Chapter;
Kaya, Y., F.Z. Huyop, and M.F. Edbeib, Genetic Diversity in Plants, in Advances in Biosciences, F.Z. Huyop and
S. Mohammed, Editors. 2019, Penerbit UTM Press. Malaysia: Malaysia. p. 04-24.
Ethical Principles and Publication Policy
Ethical standards for publication exist to ensure high-quality scientific publications, public trust in scientific
findings, and that people receive credit for their ideas. In addition, the authors are encouraged to follow the ethic
guidelines of the Committee on Publication Ethics (COPE) which can be viewed on the COPE website.
International Journal of Life Sciences and Biotechnology (Int J. Life Sci. Biotechnol.) is an electronic peer-
reviewed international journal trying to have the highest standards of publication ethics. For that, we affirm the
following principles of the Publication Ethics and Malpractice Statement.
If malpractice is discovered at any time even after the publication, the articles not in accordance with these
standards will be removed from the publication. Int J. Life Sci. Biotechnol. is checking all papers in a double-blind
peer-review process. We also check for plagiarisms, research fabrication, falsification, and improper use of any
organisms in research. We will also report any cases of suspected plagiarism or duplicate publishing. Int J. Life
Sci. Biotechnol. reserves the right to use plagiarism detecting software to screen submitted papers at all times.
Author’s responsibilities: The author or authors must guarantee that they have written a unique study. Moreover,
they must make sure that the article has not been submitted and evaluated elsewhere at the same time. Literature
of the other researchers, all contributors and sources (including online sites) should be appropriately credited and
referenced. All submitted manuscripts should be edited for language. All references should be cited without been
copied or plagiarized. If needed, any financial sources or another conflict of interest should be disclosed. In order
to correct the paper, any significant error or inaccuracy in the published works should be notified by the related
authors. An author agrees to the license agreement before submitting the article. All articles must be submitted
using the online submission procedure. Submitting a paper simultaneously to more than one publication at a time
is a violation of publications' ethics.
Editorial responsibilities: Editors along with Editor-in-Chief and Editorial Board have publication decisions.
Editors must guarantee a fair double-blind peer-review of the submitted articles for publication. They have to
prevent any potential conflict of interests between the author and editors and reviewers. They have to guarantee
the confidentiality of submitted articles before publishing. Editor-in-Chief will coordinate the work of the editors.
Peer review/responsibility for the reviewers: They have to review the manuscripts based on content without regard
to ethnic origin, gender, sexual orientation, citizenship, religious belief, or political philosophy of the authors.
They have to guarantee the confidentiality of submitted articles before publishing. They have to report any
plagiarisms, research fabrication, falsification, and improper use of any organisms in research to the editors and/or
the Editor-in-Chief. They have to review the papers objectively and state their opinions clearly in the forms and
on the paper. A reviewer having inadequate time or feeling unqualified should notify the editors as soon as possible
and excuse her/himself from the review process.
Plagiarism
All journals published by IJLSB are committed to publishing only original material, i.e., material that has neither
been published elsewhere nor is under review elsewhere. Manuscripts that are found to have been plagiarized from
a manuscript by other authors, whether published or unpublished, will incur plagiarism sanctions.
Manuscripts are checked by Ithenticate Plagiarism System.
Duplicate Submission
Manuscripts that are found to have been published elsewhere, or to be under review elsewhere, will incur
duplicate submission/publication sanctions. If authors have used their own previously published work or work
that is currently under review, as the basis for a submitted manuscript, they are required to cite the previous work
and indicate how their submitted manuscript offers novel contributions beyond those of the previous work.
Citation Manipulation
Submitted manuscripts that are found to include citations whose primary purpose is to increase the number of
citations to a given author’s work or articles published in a particular journal, will incur citation manipulation
sanctions.
Data Fabrication and Falsification
Submitted manuscripts that are found to have either fabricated or falsified experimental results, including the
manipulation of images, will incur data fabrication and falsification sanctions.
Improper Author Contribution or Attribution
All listed authors must have made a significant scientific contribution to the research in the manuscript and
approved all its claims. It is important to list everyone who made a significant scientific contribution, including
students and laboratory technicians.
Redundant Publications
Redundant publications involve the inappropriate division of study outcomes into several articles.
Sanctions
In the event that there are documented violations of any of the above-mentioned policies in any journal, regardless
of whether or not the violations occurred in a journal published by Int J. Life Sci. Biotechnol., the following
sanctions will be applied:
Immediate rejection of the infringing manuscript.
Immediate rejection of every other manuscript submitted to any journal published by Int J. Life Sci. Biotechnol.
by any of the authors of the infringing manuscript.
The prohibition against all of the authors for any new submissions to any journal published by IJLSB, either
individually or in combination with other authors of the infringing manuscript, as well as in combination with any
other authors. This prohibition will be imposed for a minimum of 36 months. Prohibition against all of the authors
from serving on the Editorial Board of any journal published by Int J. Life Sci. Biotechnol.
In cases where the violations of the above policies are found to be particularly egregious, the publisher reserves
the right to impose additional sanctions beyond those described above.
Publication Charge
“International Journal of Life Sciences and Biotechnology” is an Open Access Journal and does not charge any
printing charges from authors, during article delivery, assessment and printing stages.
Aim and Scope
International Journal of Life Sciences and Biotechnology (Int J. Life Sci. Biotechnol.) is an international peer-
reviewed journal that publishes original articles from all biology and molecular biology studies, particularly in the
fields of life sciences and biotechnology. The language of publication is Turkish and English. Also the main
objective of Int J. Life Sci. Biotechnol. is to provide quality publications to scientists, researchers, and engineers
from both academia and industry who want to communicate the latest developments and practices in their field.
Int J. Life Sci. Biotechnol. publishes original papers in various fields of Life Sciences and Biotechnology that
covers, but is not limited to, the following areas:
- Agricultural Biotechnology
- Animal (livestock and fish production, physiology, breeding and genetics, biotechnology, etc),
- Animal Biotechnology
- Biochemical Genetics,
- Biochemistry
- Biodiversity and biodiscovery
- Bioinformatics and system biology
- Biology and Molecular Biology,
- Bioremediation and biodegradation
- Biotechnology
-Bioethics (Life Sciences and Biotechnology)
- Botany,
- Evolution and Population Genetics,
- Food Biotechnology
- Genetic engineering and cloning
- Lichens
- Genetics,
- Biotechnological product and Halal Food
- Industrial Biotechnology
- Medical Biotechnology
- Molecular Genetics
- Plant (Plant production, physiology, breeding and genetics, biotechnology, agronomy, horticulture, plant
protection, etc.),
- Plant Biotechnology
- Soil (soil ecology, physics, and chemistry, etc)
-Polar Science (Life Sciences and Biotechnology)
DECLARATION: This work is part of Gülfidan KUYUMCU’s MA thesis. Articles on 27-29 September 2017
held in Bayburt in Turkey was presented as a Oral Presentation I. International Organic Agriculture and
Biodiversity Symposium
Genetic Analysis Related To Organized Genetic Changes in Potato And Processed Potatoes
Gulfidan Kuyumcu1*, Muhammed Majed Abed2
Author Addresses: 1 Samsun Ondokuz Mayıs University, Faculty of Agriculture, Department of Agricultural
Biotechnology, Samsun / Turkey
2 Samsun Ondokuz Mayıs University, Faculty of Agriculture, Department of Agricultural Biotechnology,
Samsun / Turkey
*Corresponding Autor: Gulfidan Kuyumcu, e-mail: [email protected]
Please write the e-mail addresses and Orcid ID numbers of all authors (required fields)
Author 1 mail and Orcid ID:
Author 2 mail and Orcid ID:
Author 3 mail and Orcid ID:
Copyright Transfer Agreement
INTERNATIONAL JOURNAL OF LIFE SCIENCES SCIENCE AND
BIOTECHNOLOGY (IJLSB)
Title:
Authors:
This form must be signed by all the authors and sent by you to publish your article at
“International Journal of Life Sciences Scıence And Biotechnology (IJLSB)”.
By signing this document, the following conditions are considered acceptable:
1. The fact that all publishing rights belong “International Journal of Life Sciences
Scıence And Biotechnology,
2. Prepared according to the Writing Rules and Publishing Policies of “International
Journal of Life Sciences Scıence And Biotechnology”,
3. Article original and not previously published at home or abroad or is not under
consideration for publication,
4. It belongs to us by the scientific and ethical responsibility is not reached other authors;
All the authors a-re aware of the work and responsibilities of other authors, first author
of the article that I have to accept me as I declare;
Authors Name Surname Date Signature

Ethics Committee Report
Article If an Ethics Committee Report is required to conduct a research on animals and humans and to conduct
this research, it is mandatory that the Ethics Committee Report be scanned and uploaded as a PDF file.
Otherwise, the article is returned to the author at the preliminary examination and other stages.

1.REVIEWER SUGGESTION
DEGREE:
FIRST NAME:
LAST NAME:
MAIL ADDRESS:
INSTITUTION:
DEPARTMENT:
SUBJECTS:
2.REVIEWER SUGGESTION
DEGREE:
FIRST NAME:
LAST NAME:
MAIL ADDRESS:
INSTITUTION:
DEPARTMENT:
SUBJECTS:
3.REVIEWER SUGGESTION
DEGREE:
FIRST NAME:
LAST NAME:
MAİL ADDRESS:
INSTITUTION:
DEPARTMENT:
SUBJECTS: