ED371241.pdf - ERIC - Department of Education
153
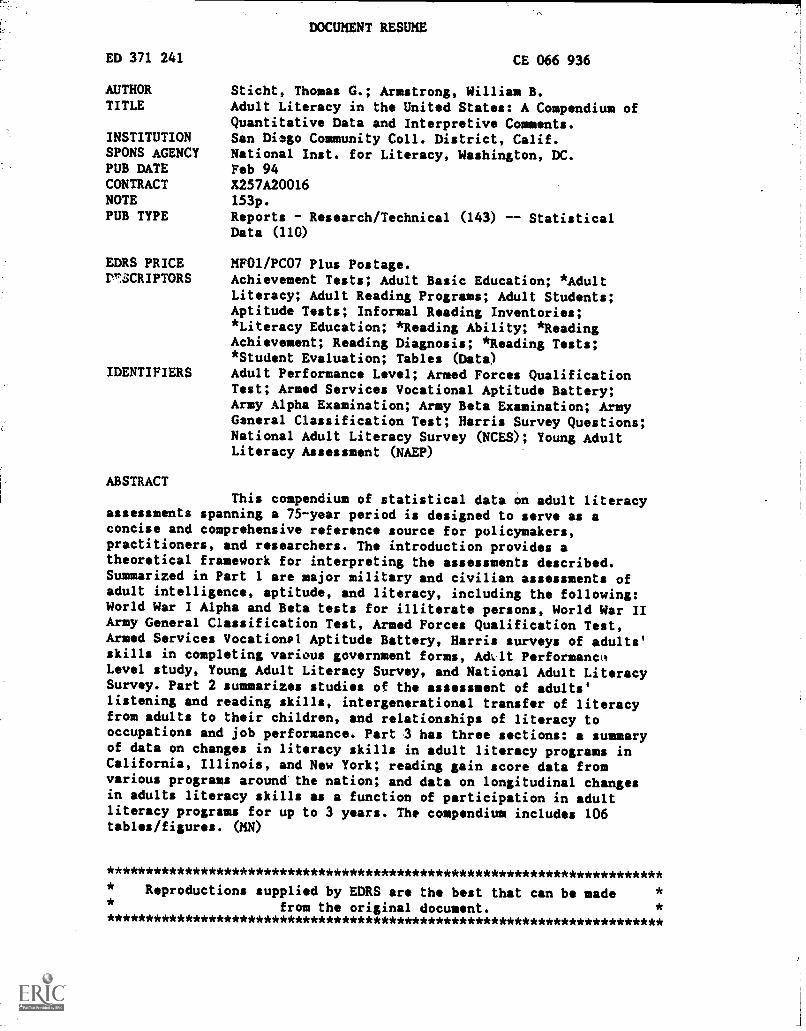
ED 371 241 AUTHOR TITLE INSTITUTION SPONS AGENCY PUB DATE CONTRACT NOTE PUB TYPE EDRS PRICE rrSCRIPTORS IDENTIFIERS DOCUMENT RESUME CE 066 936 Sticht, Thomas G.; Armstrong, William B. Adult Literacy in the United States: A Compendium of Quantitative Data and Interpretive Comments. San Diego Community Coll. District, Calif. National Inst. for Literacy, Washington, DC. Feb 94 X257A20016 153p. Reports - Research/Technical (143) Statistical Data (110) MF01/PC07 Plus Postage. Achievement Tests; Adult Basic Education; *Adult Literacy; Adult Reading Programs; Adult Students; Aptitude Tests; Informal Reading Inventories; *Literacy Education; *Reading Ability; *Reading Achievement; Reading Diagnosis; *Reading Tests; *Student Evaluation; Tables (Data) Adult Performance Level; Armed Forces Qualification Test; Armed Services Vocational Aptitude Battery; Army Alpha Examination; Army Beta Examination; Army General Classification Test; Harris Survey Questions; National Adult Literacy Survey (NCES); Young Adult Literacy Assessment (NAEP) ABSTRACT This compendium of statistical data on adult literacy assessments spanning a 75-year period is designed to serve as a concise and comprehensive reference source for policymakers, practitioners, and researchers. The introduction provides a theoretical framework for interpreting the assessments described. Summarized in Part I are major military and civilian assessments of adult intelligence, aptitude, and literacy, including the following: World War I Alpha and Beta tests for illiterate persons, World War II Army General Classification Test, Armed Forces Qualification Test, Armed Services Vocational Aptitude Battery, Harris surveys of adults' skills in completing various government forms, PALlt Performanct* Level study, Young Adult Literacy Survey, and National Adult Literacy Survey. Part 2 summarizes studies of the assessment of adults' listening and reading skills, intergenerational transfer of literacy from adults to their children, and relationships of literacy to occupations and job performance. Part 3 has three sections: a summary of data on changes in literacy skills in adult literacy programs in California, Illinois, and New York; reading gain score data from various programs around the nation; and data on longitudinal changes in adults literacy skills as a function of participation in adult literacy programs for up to 3 years. The compendium includes 106 tables/figures. (MN) *********************************************************************** Reproductions supplied by EDRS are the best that can be made from the original document. ***********************************************************************
-
Upload
khangminh22 -
Category
Documents
-
view
0 -
download
0
Transcript of ED371241.pdf - ERIC - Department of Education
ED 371 241
AUTHORTITLE
INSTITUTIONSPONS AGENCYPUB DATECONTRACTNOTEPUB TYPE
EDRS PRICErrSCRIPTORS
IDENTIFIERS
DOCUMENT RESUME
CE 066 936
Sticht, Thomas G.; Armstrong, William B.Adult Literacy in the United States: A Compendium ofQuantitative Data and Interpretive Comments.San Diego Community Coll. District, Calif.National Inst. for Literacy, Washington, DC.Feb 94X257A20016153p.
Reports - Research/Technical (143) StatisticalData (110)
MF01/PC07 Plus Postage.Achievement Tests; Adult Basic Education; *AdultLiteracy; Adult Reading Programs; Adult Students;Aptitude Tests; Informal Reading Inventories;*Literacy Education; *Reading Ability; *ReadingAchievement; Reading Diagnosis; *Reading Tests;*Student Evaluation; Tables (Data)Adult Performance Level; Armed Forces QualificationTest; Armed Services Vocational Aptitude Battery;Army Alpha Examination; Army Beta Examination; ArmyGeneral Classification Test; Harris Survey Questions;National Adult Literacy Survey (NCES); Young AdultLiteracy Assessment (NAEP)
ABSTRACT
This compendium of statistical data on adult literacyassessments spanning a 75-year period is designed to serve as aconcise and comprehensive reference source for policymakers,practitioners, and researchers. The introduction provides atheoretical framework for interpreting the assessments described.Summarized in Part I are major military and civilian assessments ofadult intelligence, aptitude, and literacy, including the following:World War I Alpha and Beta tests for illiterate persons, World War IIArmy General Classification Test, Armed Forces Qualification Test,Armed Services Vocational Aptitude Battery, Harris surveys of adults'skills in completing various government forms, PALlt Performanct*Level study, Young Adult Literacy Survey, and National Adult LiteracySurvey. Part 2 summarizes studies of the assessment of adults'listening and reading skills, intergenerational transfer of literacyfrom adults to their children, and relationships of literacy tooccupations and job performance. Part 3 has three sections: a summaryof data on changes in literacy skills in adult literacy programs inCalifornia, Illinois, and New York; reading gain score data fromvarious programs around the nation; and data on longitudinal changesin adults literacy skills as a function of participation in adultliteracy programs for up to 3 years. The compendium includes 106tables/figures. (MN)
***********************************************************************
Reproductions supplied by EDRS are the best that can be madefrom the original document.
***********************************************************************
571,,91, C-74:r.rr-g';
"4,.+0.****Reci.outimitY
VWstatannunas''''''''.14811010/02S1
7i
.....Zrellat
' .,PI 14. ,,,"
V....L., ,..,
."1 ' ,-
1 ';',-; 4.,,,,..,-roteit, -,. s
aragsgPrates.,itismw-....,na
mn,- 4- ,.,-
4 . -1-
.A
.:,
;1,0ig-,IT!teV
, . : ."/ 2
,-
.
Q Thotoas o.,StichtApphed 113ehaviort4 a Coguiti{- iences,.
,
,!- B.:,'Arnigtroag ,i 6StmDifigo..Coiniiiti*Iy.P0114e-Dist*Mt.
. . U.S. DEPARTMENT OF EDUCATIONOffice ot Educationat Research and Improvement
EDUCATIONAL RESOURCES INFORMATION.
. I CENTE (, 1
t 0.. . ",,,0 Minor changes have been made to improve
2reproduct.n quality
.Points of view or opinions slated in this docu-
NrCT entoll AtiLai ARI C
ment do not necessarily represent OfficialOERI position or policy
This document has been reproduced asreceived from the person or orOanizationoriginahrio it
Alt
ADULT LITERACYIN THE
UNITED STATES
A COMPENDIUM OF QUANTITATIVE DATAand
INTERPRETIVE COMMENTS
Thomas G. StichtApplied Behavioral & Cognitive Sciences, Inc.
William B. ArmstrongSan Diego Community College District
February 1994
3
Acknowledgments
Preparation of this report was supported by grant number
X257A20016 from the National Institute for Literacy to the San Diego
Community College District.
We are grateful to Drs. Gregg Jackson, Sandra Robinson, Andrew
Kolstad and Mr Don Woodside for their review and helpful comments on*.
an early draft of this report.
Mr. Doug Cook, of DCWorks Graphic Design has painstakingly
reproduced graphics from across the last 75 years for inClusion in this
report. He has prepared the layout and numerous graphs and tables for the
report. We have been extremely fortunate .to have Doug's creative design,
graphics, and production skills for this project, and we are very grateful tohim for his commitment to this work.
Finally, it should be noted that the ideas and opinions expressed in
this report are solely those of the authors and they do not necessarily reflect
the official positions, opinions or policies of the San Diego Community
College District, the Applied Behavioral & Cognitive Sciences, Inc., the
National Institute for Literacy, the U. S. Department of Education or anyother governmental or non-governmental organizations
4
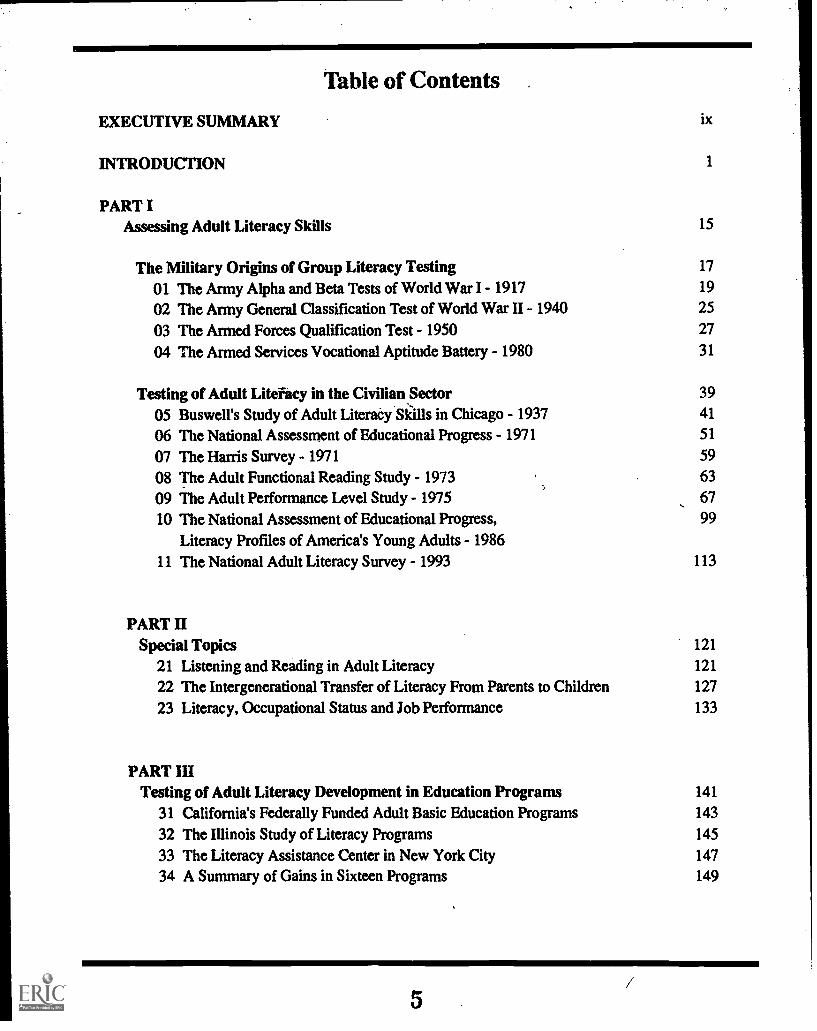
Table of Contents
EXECUTIVE SUMMARY
INTRODUCTION
PART IAssessing Adult Literacy Skills
ix
1
15
The Military Origins of Group Literacy Testing 17
01 The Army Alpha and Beta Tests of World War I - 1917 19
02 The Army General Classification Test of World War II - 1940 25
03 The Armed Forces Qualification Test - 1950 27
04 The Armed Services Vocational Aptitude Battery - 1980 31
Testing of Adult Litefacy in the Civilian Sector 39
05 Buswell's Study of Adult Literacy Slalls in Chicago - 1937 41
06 The National Assessment of Educational Progress - 1971 51
07 The Hanis Survey - 1971 59
08 The Adult Functional Reading Study - 1973 63
09 The Adult Performance Level Study - 1975 67
10 The National Assessment of Educational Progress, 99
Literacy Profiles of America's Young Adults - 198611 The National Adult Literacy Survey - 1993 113
PART 111
Special Topics 121
21 Listening and Reading in Adult Literacy 121
22 The Intergenerational Transfer of Literacy From Parents to Children 127
23 Literacy, Occupational Status and Job Performance 133
PART IIITesting of Adult Literacy Development in Education Programs 141
31 California's Federally Funded Adult Basic Education Programs 143
32 The Illinois Study of Literacy Programs 145
33 The Literacy Assistance Center in New York City 147
34 A Summary of Gains in Sixteen Programs 149
5
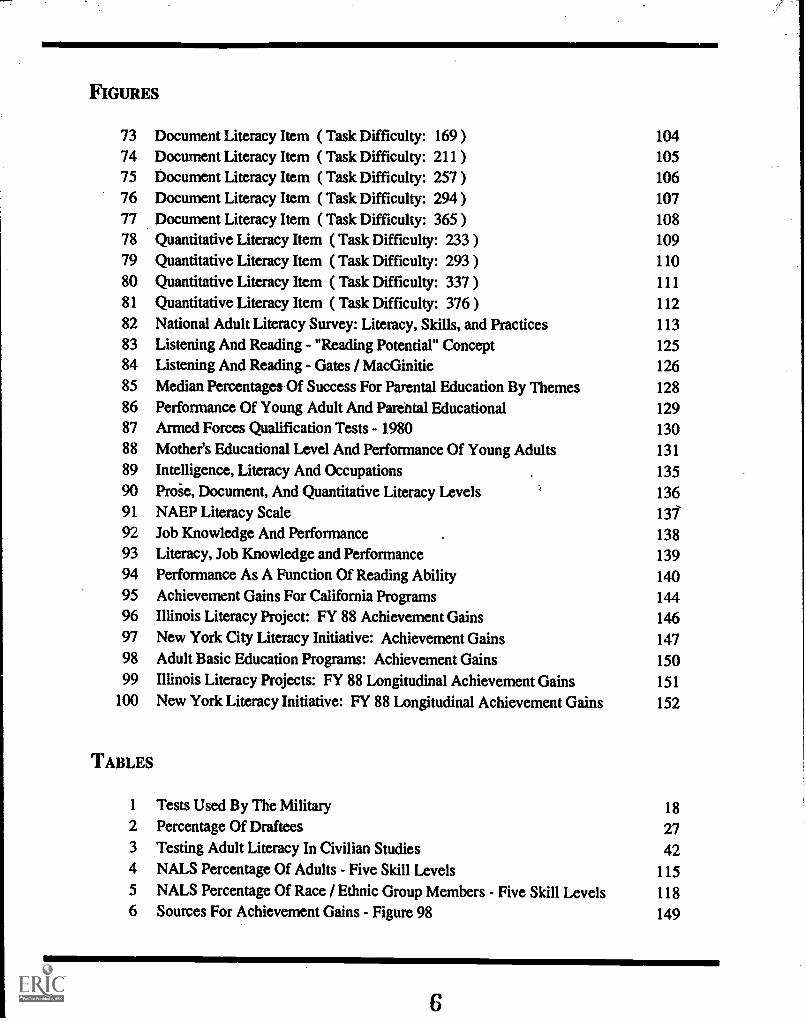
FIGURES
73 Document Literacy Item ( Task Difficulty: 169 ) 10474 Document Literacy Item ( Task Difficulty: 211 ) 10575 Document Literacy Item ( Task Difficulty: 257 ) 10676 Document Literacy Item ( Task Difficulty: 294 ) 107
77 Document Literacy Item ( Task Difficulty: 365 ) 10878 Quantitative Literacy Item ( Task Difficulty: 233 ) 10979 Quantitative Literacy Item ( Task Difficulty: 293 ) 11080 Quantitative Literacy Item ( Task Difficulty: 337 ) 111
81 Quantitative Literacy Item ( Task Difficulty: 376 ) 11282 National Adult Literacy Survey: Literacy, Skills, and Practices 11383 Listening And Reading - "Reading Potential" Concept 12584 Listening And Reading - Gates / MacGinitie 12685 Median Percentages Of Success For Parental Education By Themes 12886 Performance Of Young Adult And Parental Educational 12987 Armed Forces Qualification Tests - 1980 13088 Mother's Educational Level And Performance Of Young Adults 13189 Intelligence, Literacy And Occupations 13590 Proie, Document, And Quantitative Literacy Levels 13691 NAEP Literacy Scale 131-
92 Job Knowledge And Performance 13893 Literacy, Job Knowledge and Performance 13994 Performance As A Function Of Reading Ability 14095 Achievement Gains For California Programs 14496 Illinois Literacy Project: FY 88 Achievement Gains 14697 New York City Literacy Initiative: Achievement Gains 14798 Adult Basic Education Programs: Achievement Gains 15099 Illinois Literacy Projects: FY 88 Longitudinal Achievement Gains 151
100 New York Literacy Initiative: FY 88 Longitudinal Achievement Gains 152
TABLES
1 Tests Used By The Military 182 Percentage Of Draftees 273 Testing Adult Literacy In Civilian Studies 424 NALS Percentage Of Adults - Five Skill Levels 1155 NALS Percentage Of Race / Ethnic Group Members - Five Skill Levels 1186 Sources For Achievement Gains - Figure 98 149
Executive Summary
Questions of how to assess adult literacy skills and the effectiveness of programs that aimto improve these skills are pervasive in adult education. This report addresses the needs ofpolicymakers. program operators, teachers and researchers for information about methodsthat have been and are being used to assess adult literacy skills and programs. It also providesa resource for staff development that provides concrete illustrations of the importance oftheory in determining the types of assessments that are developed and how variousassessments can suggest different approaches to adult literacy development in and out ofprograms.
This report, Adult Literacy In the United States: A Compendium of Quantitative Data andInterpretive Comments, includes extensive quantitative data on the assessment of adultliteracy skills and programs ranging from World War I (1917) up to the present. TheCompendium presents over 100 pages of graphics and literacy test items with interpretivecomments that show the relevance of the data to (1) theoretical and conceptual issues in adultliteracy; (2) workforce and workplace literacy; and (3) family literacy and the intergenerationdtransfer of literacy. Implkations for practice, policy, and research are presented throughoutthe report.
The Compendium contributes to the activities of the National Institute for Literacy (NIFL)that are aimed at assisting the Nation to achieve goal number 5 of the National EducationGoals and Goals 2000. Specifically, it addresses NIFL objectives to t 1) better understandthe assessment of adult literacy skills and the development of promising adult literacyinstructional techniques, (2) establish a national data base with respect to assessment toolsfor adult literacy programs, and (3) disseminate information to adult literacy practitioners,policymakers, and researchers.
Overview of the Compendium
The Compendium provides in three parts a concise and comprehensive reference source foradult literacy policymakers, practitioners and researchers on adult literacy assessmentsspanning a 75 year period. The major divisions of the Compendium include the following.
Introduction to the Compendium. The Introduction provides a theoretical framework forinterpreting the assessments described in the remainder of the report. The frameworkincludes the following concepts from the cognitive sciences.
(1) The concept of a human cognitive system that emphasizes the role of knowledge inliteracy along with the information processes involved in oral and written languageuse and reasoning with graphic tools of thought (flow charts, tables, etc.).
(2) A developmental model of literacy showing how childhood processes developinto adult literacy ability.
7
(3) An information processing view of learning that emphasizes the active, construc-tive nature of cognitive development (including literacy) in social contexts .
Part I: Assessing Adult Literacy Skills. Part I of the Compendium summarizesmajor militaryand civilian assessments of adult "intelligence," "aptitude," and "literacy."Numerous itemsare presented, many with commentary to clarify the item's meaning or to relate the item toother information. Assessments reviewed include the following.
(1) The World War I Army Alpha test for literates and the Army Beta test for illiter-ates.
(2) The World War II Army General Classification Test (AGCT).(3) The Armed Forces Qualification Test (AFQT) from the 1950's up to the present.(4) The Armed Services Vocational Aptitude Battery (ASVAB) including sub-tests
in job-relatedareas such as automotive, shop, electronics, and mechanical infor:mation.
(5) The 1937 studies of adult reading in Chicago by Guy Buswell using "functional,real world" materialrlike those in the current National Adult Literacy Survey.
(6) The 1971 NAEP assessment of adults withe special analysis of some 21 itemsthat were per formed by 9,13, 17 year olds & adults.
(7) The 1971 Harris surveys of adults' skills in completing various governmentforms.
-
(8) The Adult Performance Literacy (APL) study of the early 1970's with data forthe various items in the survey.
(9) The 1986 young adult literacy survey (YALS) that developed the Prose, Docu-ment and Quantitative scales used in the 1993 National Adult Literacy Survey(NALS).
(10) The 1993 National Adult Literacy Survey (NALS).
Part II: Special Topics. This part of the Compendium summarizes studies of the assessmentof listening and reading skills of adults, the intergenerational transfer of literacy from adultsto their children, and relationships of literacy to occupations and to job performance.
Part III: Testing of Adult Literacy Development in Education Programs. Data on changes inliteracy skills in adult literacy programs in California, Illinois, and New York are presented.Reading gain score data are also presented for a variety of adult literacy programs fromaround the nation. Finally, rare data are presented on the longitudinal changes in adults'literacy skills as a function of participation in literacy programs for up to three years.
MAJOR FINDINGS
Major findings are summarized for each part of the Compendium.
Introduction
In developing the theoretical framework from the cognitive sciences, a new interpretation oftests of "verbal intelligence," "verbal aptitude," and "literacy" is provided. In this newconception, all these types of tests are considered as tools for attempting to characterize aperson's cognitive system for some purpose, such as job selection, placement in educationalprograms, or making policy decisions about the need for various services. Using thisreinterpretation of these various types of cognitive assessments to review research studiesand numerous assessment surveys, several major findings have been formulated.
The Nature of Highly Literate Adults. Extensive research is cited that indicates that highlyliterate adults perform well on numerous tests of "intelligence," "aptitude," or "literacy."High correlations among these types of tests mean that people are being rank-ordered in asimilar manner across numerous tests. The tests contain different vocabulary items, paragraphcomprehension, and information processing demands. Therefore, the only way that highlyliterate people can perform well on all such tests is to possess an extensive knowledge basein long term memory and an efficient information processing system in working memory, asoutlined in the human cognitive system model.
The Importance of Vast Bodies of Knowledge. An implication of the foregoing for adultliteracy practice is that, if adults are to achieve high levels of literacy, they must develop anextensive knowledge base (including both content knowledge and strategy knowledge asoutlined in the developmental model of literacy) and very efficient information processingskills for reading and writing. Because the development of large bodies of knowledge andhighly efficient processing skills requires extensive time for practice and wide-rangingreading, adult programs must either retain adults for long periods of time, or stimulate adultsto engage in extensive reading and writing outside of programs, or do both. However, presentadult literacy programs do not focus on developing any particular bodies of knowledge,except to a limited degree in GED preparation.
Where time is limited, literacy programs may develop a fairly extensive body of knowledge,in a restricted domain, in a fairly brief period. Knowledge involved in prose, document, andquantitative literacy as assessed on the National Adult Literacy Survey (NALS), job-relatedliteracy as in workplace literacy programs, or parenting-related literacy as in family literacyprograms may be fairly rapidly acquired. However, there is reason to question whether thisnew knowledge will be retained unless it is actually used either in additional education andtraining programs or in day-to-day activities.
9
The Importance of Practice in Reading. Several assessments of adult literacy skills andpractices (e.g.. reading books, magazines, newspapers) show that y _ars of education. amountof practice, and increased skill go together. Highly literate adults have more education andengage in more reading practices. An important implication for adult literacy programs is that
efforts should be made to get adults to engage in larger amounts of reading in various typesof literacy practices both inside and outside of programs. Extensive free-reading practicemay be as important as direct instruction in producing higher levels of literacy.
Part I: Assessing Adult Literacy Skills
Similarity of Literacy Items Across Time. To a large extent, the tasks found on literacyassessments operationally define what various experts, advisors, teachers of adults, and test-developers think about the nature of literacy. Despite the considerable debates about thesuitability of different types of literacy tasks that are assessed in national surveys, such aswhether to use multiple-choice or constructed response items, "academic" or "real world"items, etc., when the actual items are examined that various advisory boards have approvedover several decades, there appears to be a remarkable similarity among items over the last75 years.
Similarity of Findings Across Time. Beginning with the World War I assessments in 1917,a number of trends have remained salient across time.
(1) Higher educated adults perform better than less educated adults.(2) Younger adults perform better than older adults.(3) Adults in western, eastern, and northern states perform better than those in
southern states.(4) Whites perform better than African-Americans or non-native language speakers.(5) Adults in professional, managerial, and clerical occupations perform better than
adults in laborer, agricultural, and other relatively unskilled occupations.(6) Higher income groups perform better than groups with lower incomes or on
welfare.(7) Higher educated adults engage in a greater amount of reading of books, maga-
zines, and news papers.
An implication of these findings for policymakers and researchers is that any number ofliteracy assessments can be used to rank order the adult population with regard to verbal"intelligence," "aptitude," or "literacy" and the same general trends can be followed. Thissuggests that, if the concern is simply to identify adults who are high, medium or low inliteracy skills, consideration should be given to research for identifying the most cost-effective methods of assessing adult literacy skills. For instance, the very simple vocabularyand paragraph comprehension tests of the Armed Forces Qualification Test (AFQT) produceabout the same distribution of adults in five literacy levels as does the more extensive (andexpensive) National Adult Literacy Survey (NALS).
xii
1 0
An implicatior. for practitioners is that if programs aim to produce highly literate adults, theyshould produce graduates who can score well on any of these "verbal" or "literacy"assessments.
Part II: Special Topics
Listening and Reading
Less Skilled Readers are Less Skilled Listeners. A limited number of studies were reviewedthat used group-administered or individually-administered tests to compare reading tolistening skills. These studies indicate that, as a general trend, adults who score low onreading tests also score low on listening tests. In most cases, they do not perform any betterby listening than by reading, except at the very lowest reading levels (e.g., below the secondgrade level). This line of research is important because the "gap" between a person's readinglevel and his or her "reading potential" identified by an orally-administered "intelligence"test is used to identify adults who are "learning disabled" or "different." The "intelligence"test is very similar to a "listening" test. Hence, studies of listening and reading are importantin the diagnosis of adult learning disabilities.
Knowledge and Listening. An implication of the finding that less literate adults may also beunderdeveloped in listening vocabulary and comprehension is that less literate adults possessa more limited knowledge base than more highly literate adults. Therefore, programs thataim to make large increases in adults' reading skills by a brief program of decoding will findthat this dGes not tend to happen. Even though high levels of reading decoding might bedeveloped (though not in a brief period of time), if the person does not possess a high amountof knowledge expressible in language, then considerable time will be required in extensivewide-ranging reading to acquire the vocabulary and conceptual knowledge that is needed,along with efficient decoding skills to achieve at high levels on literacy assessments.
The Intergenerational Transfer of Literacy
Parents' Education Level is Related to their Adult Children's Literacy Skills. Data arepresented showing that parent's, and especially mother' s education level is related to theliteracy skills of their children at ages 9, 13, 17, and in adulthood. This is true for both militaryand civilian assessments and for whites, blacks, and Hispanics. However, for the minoritygroups studied, the higher educated parents do not transfer higher levels of skills to the sameextent that whites do. For instance, white mothers who are college graduates have adultchildren who score on the average at the 80th percentile on the Armed Forces QualificationTest (AFQT) while African-American mothers who are college graduates have adultchildren who score on the average below the 50th percentile. Research is needed todetermine whether adult basic education or family literacy programs can improve theamount of intergenerational transfer of literacy from parents to children over that whichoccurs naturally in the situations that produced the data summarized in Part II of theCompendium.
11
Literacy, Oc IationaI Status, and Job Performance
Literacy is Related to Occupational Status . Findings from the World War I data on "intel-ligence" to the 1993 data on "literacy" in the National Adult Literacy Survey (NALS) indicatethat cognitive ability is related to the occupational status that adults achieve. Data from theYoung Adult Literacy Survey of 1986 on the literacy Allis of adults and the literacy skillsof members of various occupational groups show that about 63 percent of whites, 39 percentof Hispanics but only 20 percent of blacks have literacy scores on prose, document, andquantitative literacy equal to or greater than the average score of Clerical workers. Blackcollege graduates have average literacy scores below the average for Clerical workers. Animplication of these findings is that if jobs are changing to demand even higher levels ofliteracy, as some have argued, then African-Americans may find it increasingly difficult tocompete for and enter into higher-skilled, higher-paying occupations. There is clearly a needto better understand the implications of the findings from the various adult literacy surveys,the demands of workplaces for literacy skills, and the success of higher education in preparingall graduates to meet these demands.
Literacy is Related to Job Knowledge and Job Task Performance. Studies by the militaryrelating reading ability to paper-and-pencil job knowledge tests and "hands-on" job-sampletests are summarized in Part II of the Compendium. Findings indicate that reading is relatedto higher levels of performance on these measures of job proficiency, though the correlationsare not large. One study indicates that if workers both have higher reading skills and use them,they may increase their productivity on job sample tests by as much as 15 to 20 percent. Noresearch outside the military services was found that explores relationships among literacyskills and various measures of job proficiency. The data reviewed in the Compendium arenow almost a quarter century old.
Part III: Testing of Adult Literacy Development in Education Programs
Judging the effectiveness of educational programs designed to improve the literacy levels ofadults is becoming increasingly important in the current accountability and assessmentclimate. Part III of the Compendium focuses on the assessment of literacy skill developmentin a wide variety of programs across the nation, including California's federally-funded 321programs, community college-based programs in Illinois, programs in New York City anda variety of programs in correctional facilities, the Job Corps, job training centers, familyliteracy programs and others.
Pre- and Post -Test Scores and Gains in Adult Literacy Programs. Viewing across all theprograms, the data indicate that adult literacy programs are uniformly successful in increasingadult literacy skills by 0.5 to 1.5 "years" in anywhere from 1 to over 200 hours of instruction.This observed gain is only minimally influenced by the entering level of adult's skills or thehours of instruction between pre- and post-tests.
xiv
lAngitudinal Data Show Little Gain After the First Post-Test. Only two data bases werefound that presented repeated testing of adults who stayed in literacy programs for a year ormore. In both data sets, an initial year or so of gain was observed, and then repeatedassessments indicated that the rate of gain slowed and became almost level. Students in NewYork City who were in programs for up to three years gained 2.0 years of skill, from the 1.5grade level to the 3.5 grade level. A year and a half of that gain was made between the pre-test and the first post-test given a year later.
It should be noted that all test scores presented were average scores for programs. Averagesconceal the large differences that may occur among the individuals in the programs. Manyof the programs may have included adult students who developed quite a bit of skill.Similarly, however, there may have been many students .vho made little or no gain.
A general finding is that typical program evaluation reports do not provide much informationabout variance in scores; standard deviations a:e typically not reported nor are the distributionsof scores on pre- and post-tests. Importantly, no sradies or reports were found in whichconcern was expressed about the level of gain reported and what might be done to increaseadults' learning as measured by standardized tests during the program. More likely, whenlow test score gains were reported, the standardized tests were criticized as invalid indicatorsof what was actually learned in the program. Generally, no alternative indicators of growthin achievement were reported.
Hopefully, the extensive review of literacy assessments presented in this Compendium, withthe major findings outlined above, will lead to new approaches both to improving the extentof growth that adults achieve both in and out of adult literacy programs, and to new, cost-effective measures that can inform policymakers about general literacy trends among adults.
13
INTRODUCTIONINTRODUCTIONADULT LITERACY IN
THE UNITED STATES
A COMPENDIUM OF QUANTITATIVE DATA
A Compendium of Quantitative Data 1
14
ADULT LITERACY INTHE UNITED STATES
A COMPENDIUM OF QUANTITATIVE DATA
This Compendium presents a large body of quanti-tative data obtained in numerous studies since theU.S. Army introduced the mass testing of adultcognitive skills in World War I. Concepts fromeducational research and the field of cognitive sci-ence are used to interpret these assessments. Thedata and interpretations provide new insights intothe nature of adult literacy and its development.These insights form the basis for suggestions abouthow to produce more effective approaches to adultliteracy assessment and education.
The Compendium and its interpretive commentsshould be of use in staff development programs foradult educators. It can serve as a resource for univer-sity courses in psychological testing and for organi-zations engaged in the development of adult literacyassessments. It can also be used directly by adultliteracy teachers, their students, and interested oth-ers as informal checks of how their own literacyskills compare to the skills of others across the lastseventy-five years. This form of self-checking usingtest items from different time periods can also revealthe extent to which literacy assessments reflect thecultural context of the time.
A Cognitive Science Framework forInterpreting the Assessments of Adult Literacy
In all of the literacy assessments reviewed in theCompendium, a similar process was followed bythose administering the tests. First, instructions weregiven to groups or individuals about the tests theywere to take. Then, some form of test was adminis-
tered that (1) presented some information display,either spoken or in a graphic format, such as writtenlanguage, (2) posed some mental reasoning task tobe performed on the information displayed, (3) re-quired some responses to be made by the examineesthat were (4) used to arrive at a score for each personin the group, that (5) was used to make inferencesabout people's cognitive abilities that could be usedto (6) makes inferences about how well people willperform in some other context beyond the test situ-ation, such as in a training program, on a job, or in acommunity activity.
Figure 1 presents a simple conception of a humancognitive system at work in a test environment likethat just described. The person possesses a long termmemory that contains the person's body of knowl-edge, including among other things, languageknowledge and knowledge about how to do things(procedural knowledge), including grammar andreasoning processes. To a large extent, all of theassessments reviewed herein can be considered asattempts to understand what knowledge the personpossesses and/or what tasks the person can accom-plish by drawing on the knowledge and reasoningprocesses in the cognitive system.
What Figure 1 makes distinct are the differencesbetween the knowledge stored in long term memoryand the language, reasoning and other informationprocessing processes that are used in workingmemory to represent and think about knowledge.
A Compendium of Quantitative Data 3
15
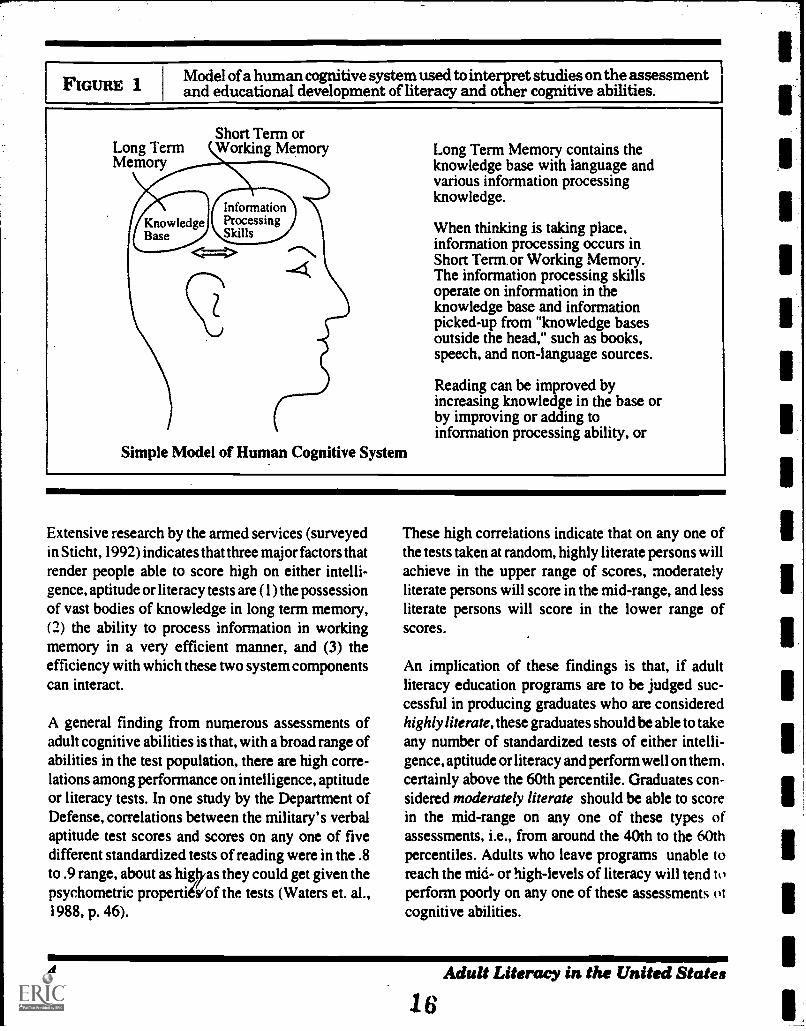
FIGURE 1 Model of a human cognitive system used to interpret studies on the assessmentand educational development of literacy and other cognitive abilities.
Long TermMemory
Short Term orWorking Memory
Simple Model of Human Cognitive System
Long Term Memory contains theknowledge base with language andvarious information processingknowledge.
When thinking is taking place,information processing occurs inShort Term.or Working Memory.The information processing skillsoperate on information in theknowledge base and informationpicked-up from "knowledge basesoutside the head," such as books,speech, and non-language sources.
Reading can be improved byincreasing knowledge in the base orby improving or adding toinformation processing ability, or
Extensive research by the armed services (surveyedin Sticht, 1992) indicates that three major factors thatrender people able to score high on either intelli-gence, aptitude or literacy tests are (1) the possessionof vast bodies of knowledge in long term memory,(2) the ability to process information in workingmemory in a very efficient manner, and (3) theefficiency with which these two system componentscan interact.
A general finding from numerous assessments ofadult cognitive abilities is that, with a broad range ofabilities in the test population, there are high corre-lations among performance on intelligence, aptitudeor literacy tests. In one study by the Department ofDefense, correlations between the military's verbalaptitude test scores and scores on any one of fivedifferent standardized tests of reading were in the .8to .9 range, about as hiOas they could get given thepsychometric propertiis(of the tests (Waters et. al.,1988, p. 46).
These high correlations indicate that on any one ofthe tests taken at random, highly literate persons willachieve in the upper range of scores, moderatelyliterate persons will score in the mid-range, and lessliterate persons will score in the lower range ofscores.
An implication of these findings is that, if adultliteracy education programs are to be judged suc-cessful in producing graduates who are consideredhighly literate, these graduates should be able to takeany number of standardized tests of either intelli-gence, aptitude or literacy and perform well on them.certainly above the 60th percentile. Graduates con-sidered moderately literate should be able to scorein the mid-range on any one of these types ofassessments, i.e., from around the 40th to the 60thpercentiles. Adults who leave programs unable toreach the mid- or high-levels of literacy will tend toperform poorly on any one of these assessments otcognitive abilities.
4
.1 6
Adult Literacy in the United States
A Developmental Perspective
In addition to drawing on the model of the humancognitive system, we interpret findings in the Com-pendium from time to time following a simple devel-opmental model of the major processes, knowledgebases and sequences of development that people gothrough in becoming literate.
The developmental model is based on the under-standing that, living in social groups with sharedcultural experiences, we form normative expecta-tions for what people at different ages can and cannotbe expected to do. In a typical case, one will not usea form of addressing a person's cognitive system thatthe person is not expected to be able to process. Forinstance, one does not typically hand a written noteto a two-year-old that asks for personal informationsuch as a name. But one would ask for the child'sname using oral language. Here the normative as-sumption is that, typically, a two-year-old can talkand comprehend simple oral language but generallycannot read.
Similarly, one does not ask an infant for informationbecause it is assumed that typically infants cannotcomprehend and speak oral language well enough tocommunicate. But facial expressions, gestures,laughing sounds, etc., might be used in a communi-cative m:-.nner to play with the infant and receiveresponses such as laughing, smiling, hand and armmovements, etc.
In short, in our literate society, we have expectationsfor how infants, two-year-olds, six-year-olds, ado-lescents, and adults develop their cognitive systemsover time. We have an implicit developmental modelof literacy that guides our use of communicationmethods in different circumstances.
In several research projects, the implicit develop-mental model of literacy was made explicit andincluded a large number of concepts from cognitivepsychology. This model of "the typical case of achild growing up in our literate society" is presentedschematically in Figure 2 (see Sticht, Beck, Hauke,
Kleiman & James, 1974 for an extended discussionof an earlier version of the developmental model ofliteracy and a review of literature related to hypoth-eses derived from the model; Sticht , 1992 reviewstesting data interpreted in terms of the developmen-tal model).
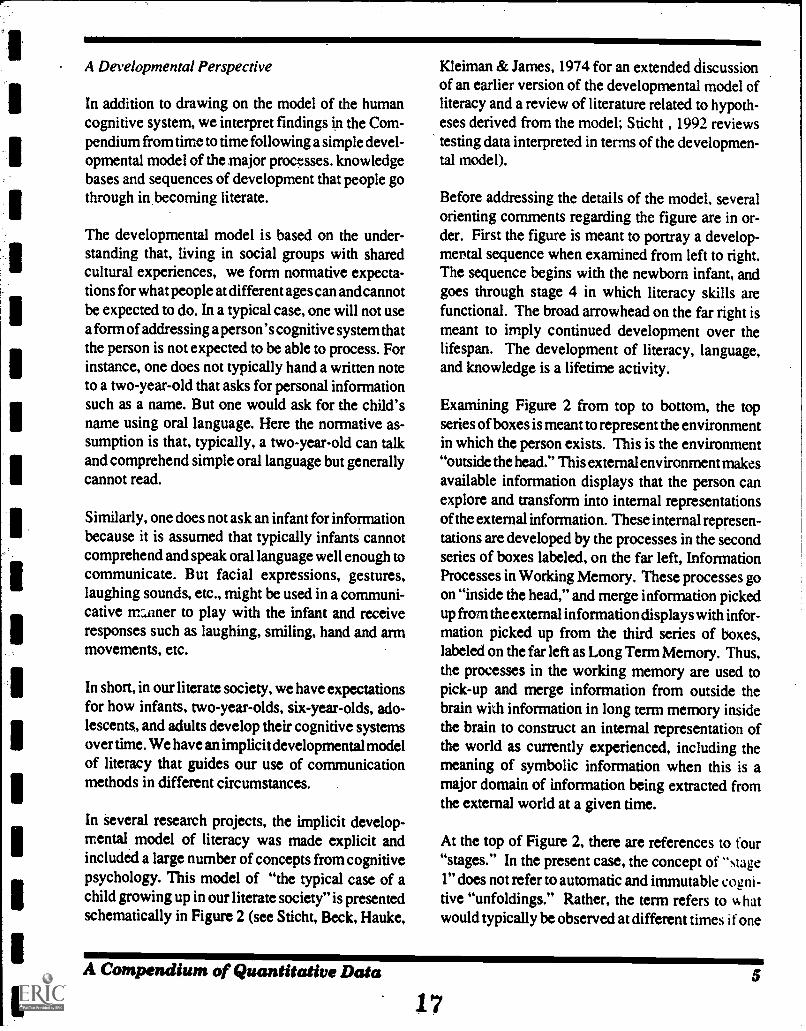
Before addressing the details of the model, severalorienting comments regarding the figure are in or-der. First the figure is meant to portray a develop-mental sequence when examined from left to right.The sequence begins with the newborn infant, andgoes through stage 4 in which literacy skills arefunctional. The broad arrowhead on the far right ismeant to imply continued development over thelifespan. The development of literacy, language,and knowledge is a lifetime activity.
Examining Figure 2 from top to bottom, the topseries of boxes is meant to represent the environmentin which the person exists. This is the environment"outside the head." This external environment makesavailable information displays that the person canexplore and transform into internal representationsof the external information. These internal represen-tations are developed by the processes in the secondseries of boxes labeled, on the far left, InformationProcesses in Working Memory. These processes goon "inside the head," and merge information pickedup from the external information displays with infor-mation picked up from the third series of boxes,labeled on the far left as Long Term Memory. Thus,the processes in the working memory are used topick-up and merge information from outside thebrain with information in long term memory insidethe brain to construct an internal representation ofthe world as currently experienced, including themeaning of symbolic information when this is amajor domain of information being extracted fromthe external world at a given time.
At the top of Figure 2, there are references to four"stages." In the present case, the concept of "stage1" does not refer to automatic and immutable cogni-tive "unfoldings." Rather, the term refers to whatwould typically be observed at different times if one
A Compendium of Quantitative Data
175
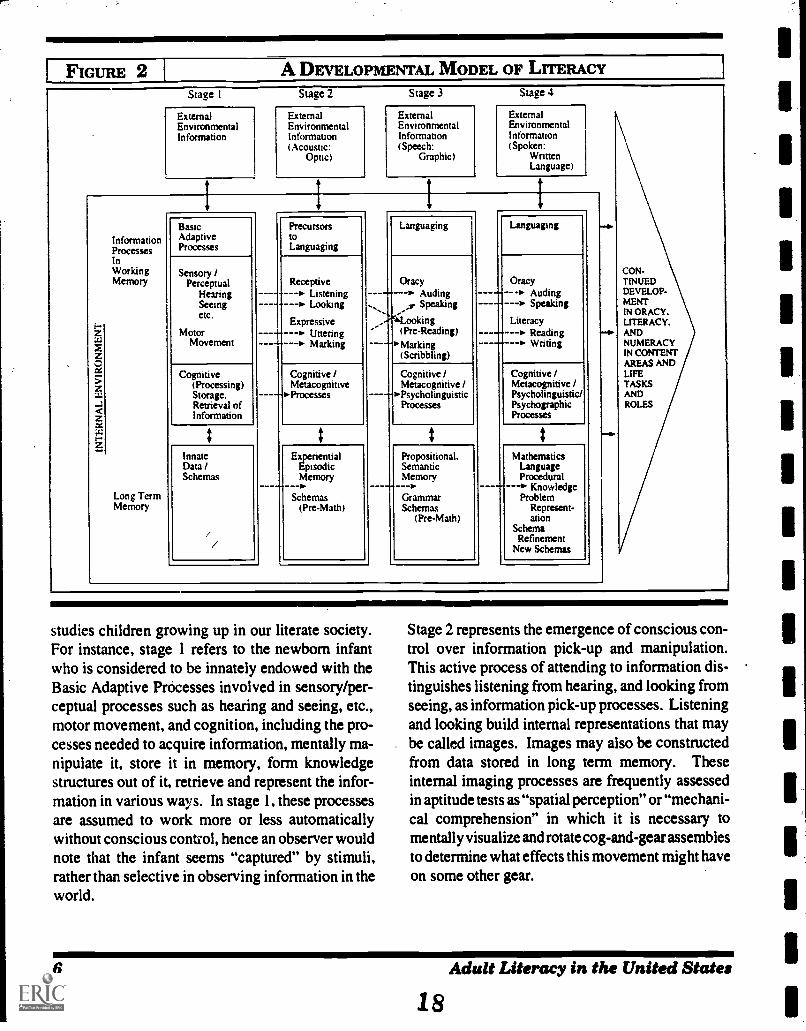
FIGURE 2 I A DEVELOPMENTAL MODEL OF LITERACY
Stage I Stage 2 Stage 3 Stage 4
External External External ExternalEnvironmental Environmental Environmental EnvironmentalInformation Information Information Information
( Acoustic: (Speech: (Spoken:Optic) Graphic) Written
Language)
InformationProcesses
BasicA daptiveProcesses
------->-----,--->
----
PrecursorstoLanguaging
- -e-
Languaging
------->------->
------->------->
Languaging
1z2?.,...w.5z...1"
-czwa.:Iz
InWorkingMemory
Long TermMemory
Sensory /Perceptual
HearingSeeingetc.
MotorMovement
Receptive,. Listening> Looking
ExpressiveUtteringMarking
Oracy--I. Auding
_., Speaking
i:ilooking(Pre-Reading)
>Marking(Scribbling)
OracyAudingSpeaking
LiteracyReadingWriting
Cognitive(Processing)Storage.Retrieval ofInformation
Cognitive /Metacognitive
>Processes ----v*Psycholinguistic
Cognitive /Metacognitive /
Processes
Cognitive /Metacognitive /Psycho linguistic/PsychographicProcesses
t t t
-
tInnateData /Schemas
/./
ExperientialEpisodicMemory
Schemas(Pre-Math)
Propositional.SemanticMemory
GrammarSchema.%
(Pre-Math)
MathematicsLanguageProcedural
---> KnowledgeProblem
Represent-ation
SchemaRefinement
New Schemas
.411.
CON-TINUEDDEVELOP-MENTIN ORACY.LITERACY.ANDNUMERACYIN CONTENTAREAS ANDLIFETASKSANDROLES
studies children growing up in our literate society.For instance, stage 1 refers to the newborn infantwho is considered to be innately endowed with theBasic Adaptive Processes involved in sensory/per-ceptual processes such as hearing and seeing, etc.,motor movement, and cognition, including the pro-cesses needed to acquire information, mentally ma-nipulate it, store it in memory, form knowledgestructures out of it, retrieve and represent the infor-mation in various ways. In stage 1, these processesare assumed to work more or less automaticallywithout conscious control, hence an observer wouldnote that the infant seems "captured" by stimuli,rather than selective in observing information in theworld.
Stage 2 represents the emergence of conscious con-trol over information pick-up and manipulation.This active process of attending to information dis-tinguishes listening from hearing, and looking fromseeing, as information pick-up processes. Listeningand looking build internal representations that maybe called images. Images may also be constructedfrom data stored in long term memory. Theseinternal imaging processes are frequently assessedin aptitude tests as "spatial perception" or "mechani-cal comprehension" in which it is necessary tomentally visualize and rotate cog-and-gear assemblesto determine what effects this movement might haveon some other gear.
6
1 8
Adult Literacy in the United States
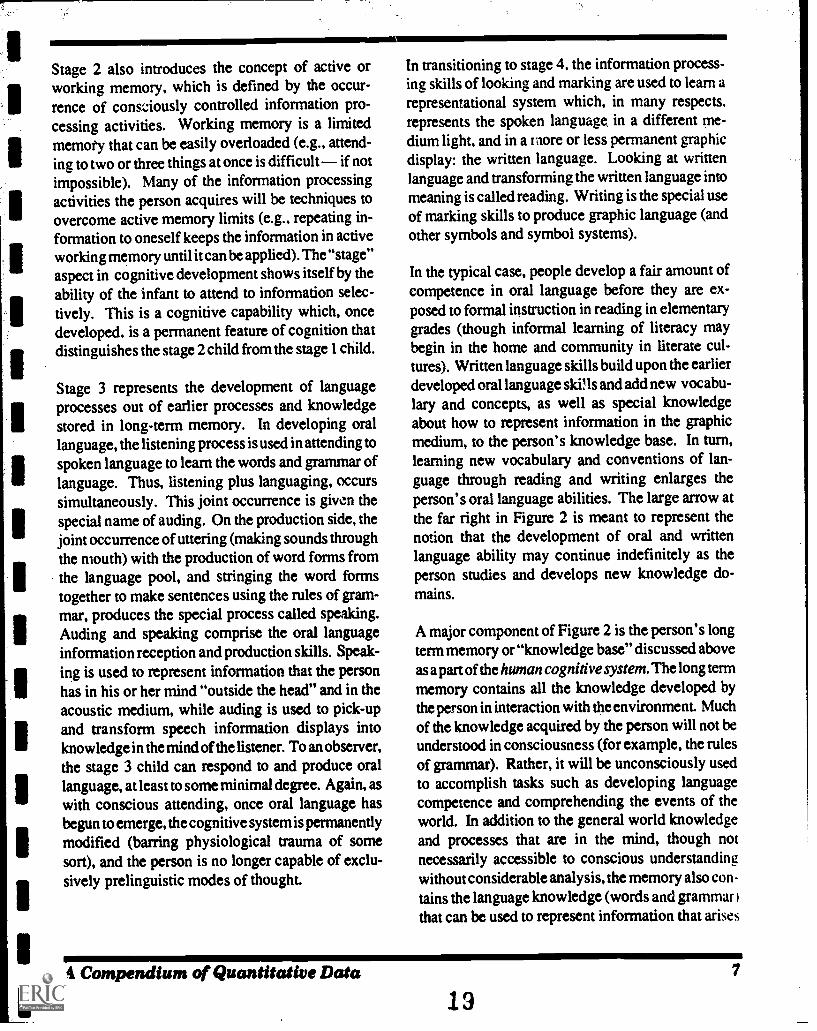
Stage 2 also introduces the concept of active orworking memory, which is defined by the occur-rence of consziously controlled information pro-cessing activities. Working memory is a limitedmemory that can be easily overloaded (e.g., attend-ing to two or three things at once is difficult if notimpossible). Many of the information processingactivities the person acquires will be techniques toovercome active memory limits (e.g., repeating in-formation to oneself keeps the information in activeworking memory until it can be applied). The "stage"aspect in cognitive development shows itselfby theability of the infant to attend to information selec-tively. This is a cognitive capability which, oncedeveloped, is a permanent feature of cognition thatdistinguishes the stage 2 child from the stage 1 child.
Stage 3 represents the development of languageprocesses out of earlier processes and knowledgestored in long-term memory. In developing orallanguage, the listening process is used in attending tospoken language to learn the words and grammar oflanguage. Thus, listening plus languaging, occurssimultaneously. This joint occurrence is given thespecial name of auding. On the production side, thejoint occurrence of uttering (making sounds throughthe mouth) with the production of word forms fromthe language pool, and stringing the word formstogether to make sentences using the rules of gram-mar, produces the special process called speaking.Auding and speaking comprise the oral languageinformation reception and production skills. Speak-ing is used to represent information that the personhas in his or her mind "outside the head" and in theacoustic medium, while auding is used to pick-upand transform speech information displays intoknowledge in the mind of the listener. To an observer,the stage 3 child can respond to and produce orallanguage, at least to some minimal degree. Again, aswith conscious attending, once oral language hasbegun to emerge, the cognitive system is permanentlymodified (barring physiological trauma of somesort), and the person is no longer capable of exclu-sively prelinguistic modes of thought.
In transitioning to stage 4, the information process-ing skills of looking and marking are used to learn arepresentational system which, in many respects,represents the spoken language, in a different me-dium light, and in a more or less permanent graphicdisplay: the written language. Looking at writtenlanguage and transforming the written language intomeaning is called reading. Writing is the special useof marking skills to produce graphic language (andother symbols and symbol systems).
In the typical case, people develop a fair amount ofcompetence in oral language before they are ex-posed to formal instruction in reading in elementarygrades (though informal learning of literacy maybegin in the home and community in literate cul-tures). Written language skills build upon the earlierdeveloped oral language skiHs and add new vocabu-lary and concepts, as well as special knowledgeabout how to represent information in the graphicmedium, to the person's knowledge base. In turn,learning new vocabulary and conventions of lan-guage through reading and writing enlarges theperson's oral language abilities. The large arrow atthe far right in Figure 2 is meant to represent thenotion that the development of oral and writtenlanguage ability may continue indefinitely as theperson studies and develops new knowledge do-mains.
A major component of Figure 2 is the person's longterm memory or "knowledge base" discussed aboveas a part of the human cognitive system. The long termmemory contains all the knowledge developed bythe person in interaction with the environment. Muchof the knowledge acquired by the person will not beunderstood in consciousness (for example, the rulesof grammar). Rather, it will be unconsciously usedto accomplish tasks such as developing languagecompetence and comprehending the events of theworld. In addition to the general world knowledgeand processes that are in the mind, though notnecessarily accessible to conscious understandingwithout considerable analysis, the memory also con-tains the language knowledge (words and grammar )that can be used to represent information that arises
A Compendium of Quantitative Data
137
from experience in the world (e.g., bodies of knowl-edge about machines, parts of the body, houses,neighborhoods sometimes called "schema" or"mental models") and from didactic instruction, asin training programs (Sticht, 1992).
The model indicates that the development of theoracy skills of speaking and auding are built upon theprior development of prelinguistic knowledgethrough information processing activities. It is im-portant that it be understood that this early,prelinguistic cognitive content, or knowledge, willform the foundation for the acquisition of newknowledge over the person's iifetime, including thatknowledge known as "literacy."
Much of this knowledge will remain personal, andwill not be explicitly represented in language forcommunication to others. Nonetheless, such per-sonal, tacit knowledge, which includes perceptuallearnings and general knowledge of "how the worldworks," will be absolutely necessary for learning tocomprehend the spoken, and later the written, lan-guage. This reflects the fact that language is selec-tive in the features and concepts chosen to be repre-sented. We may think of language as producing averbal figure, which can be comprehended only interms of its relationship to a nonlinguistic concep-tual ground of "world knowledge." A simple illus-tration of the role of "world knowledge" in literacytraining is seen in the recommendation to give stu-dents experience with objects and events in theworld through field trips, demonstrations, movies,etc., before they read about them. This approachprovides an experiential base or a "world knowl-edge" which will permit a deeper comprehension ofthe words and concepts the students read, and greater"access" to prior knowledge via perceptual learning.
A final aspect of the model is that it recognizes that,on the one hand, the literacy skills of reading andwriting utilize the same knowledge base that is usedin auding and speaking, plus the special decodingand encoding skills of reading and writing. On theother hand, the very nature of the written languagedisplay characterized by being more or less
permanent, being arrayed in space, and utilizing thefeatures of light (color. contrast) makes possible(i.e., affords) the development of skills and knowl-edge entirely different from those involved in orallanguage.
The model incorporates the role of prelinguisticlooking and marking abilities as contributors to laterutilization of the visual display of written languagein conjunction with graphic marks such as lines,white space, and color to develop graphic tools forthinking and problem solving like matrices, flowcharts, color coded graphs, and so forth. These toolscombine with written language and non-languagegraphic symbols, such as arrowheads and geometlicfigures, to produce analytical products beyond thoseobtainable through the fleeting, temporal, oral lan-guage.
A point to be emphasized is that much of the ac-quisition of literacy is not simply learning to read;that is, it is not just learning a graphic languagesystem that can be substituted for the oral languagesystem. Rather, a large part of learning to be literate,and perhaps the most important part for acquiringhigher levels of literacy, is learning how to performthe many tasks made possible by the unique charac-teristics of printed displays their permanence,spatiality, and use of light, and using that knowledgeto develop large amounts of new knowledge (see thediscussion of the Army's Beta test in Part I to learnhow "literacy," considered here as reasoning whileengaged in visual information processing in work-ing memory, was used by military psychologists toassess "intelligence" without having the person ac-cess much information in long term memory).
The foregoing, and Figure 2 briefly summarize thestructure of the developmental model of literacy andemphasize:
An architecture for a human cognitive system thatcontains a long term memory (knowledge base) anda working memory. The mind draws upon certainprocedural knowledge, including language, that is inthe long term memory and uses that procedural
Adult Literacy in the United States
2 0
knowledge for processing information taken bothfrom the long term memory and from the externalworld. The latter serves as a sort of "externalmemory" that displays information to be picked upby the sensory systems and internal processing skillsand merged with prior knowledge in the processgenerally called "learning."
The development of additional knowledge, includ-ing that knowledge known as literacy, as extensionsto or transformations of earlier knowledge. In par-ticular, the developmental model emphasizes thedevelopment of oral language from earlier,prelinguistic knowledge, and literacy as an amalgamof prelinguistic (stages 1 and 2) and linguistic (stage3) knowledge. Literacy includes the proceduralknowledge (processes) used in guiding informationpick-up and processing by the visual, auditory, andother perceptual systems, and declarative knowl-edge generally representable in oral and graphicsymbol systems (this includes content knowledgesuch as mathematics, geography, etc. when learned).
Learning as Information Processing
In addition to the models of the human cognitivesystem and the development of literacy, the concep-ual framework to be used in interpreting literacyassessments in the Compendium includes a concep-tion of learning as the outcome of constructive,information processing activities.
The information processing approach to learningemphasizes internal mental processes involved inlearning. It views the person as an active, adaptiveorganism busily ordering and arranging an internal-ized representation of life space. According to thisview, learning is the result of an active, constructiveprocess on the part of the learner working withinformation from the internal or external environ-ments. This differs from a strict behavioristic con-ception in which learning is the result of some fixed,automatic process of association among stimuli,responses, and their consequences.
The information processing approach to learning
emphasizes internal strategies for dealing with infor-mation, such as the use of imagery or mnemonic(contextualizing) devices to aid in learning a list ofwords. Thus, the information processing positionwould lead us to seek different internal processingstrategies even though certain stimulus-responsesequences may be the same. For instance, interestwould focus not only on whether or not a problem issolved, but also upon how it was solved. It is thusanalytic, stressing the detailed analysis of tasks inregard to the knowledge and mental operations in-volved "inside the head" between the occurrence ofa stimulus and a subsequent response (i.e., "cogni-tive task analysis").
A most important aspect of the information process-ing approach to learning is the emphasis upon theactive, constructive nature of the person as he or shedraws upon prior knowledge to function in the cur-rent learning context. This suggests that cognitiveassessment and instructional programs should offeran environment for and a stimulus to active informa-tion seeking, mental representation and re-represen-tation to bring a larger share of prior knowledge tobear on the learning task, and external communica-tion to check, confirm and further develop learning.
In summary, the theoretical framework used hereinto interpret research on literacy includes the conceptof a human cognitive system comprised of a longterm memory with its knowledge base and a shortterm working memory that operates through infor-mation processing activities on the information inthe long term memory and the external world ofinformation. Cognition includes both knowledgeand the processes for developing knowledge.
The long term memory develops over the life of theperson as the latter undergoes the transitions frompre-language, to oral language, to written language-based information processing. As the key develop-mental information processing outcome in our liter-ate society, the person comes to acquire th? information processing skills involved in a wide/variety otcognitive acts involving graphic symbol systems forlanguage processing and for performing various
A Compendium of Quantitative DataA. I
9
cognitive tasks involved in problem solving andreasoning.
This developmental progression of the person oc-curs as the result of active, constructive informationprocessing activities that represent and re-representknowledge to forge new learning from old. The newknowledge adds to the knowledge base in the longterm memory and is activated in various contextsthrough constructive processes that are sensitive tothe different contexts. This means, for instance, thateven though one possesses certain knowledge andskills, they may not be accessed if the context inwhich the person is immersed does not activatethem.
In the Compendium, this cognitive science frame-work of a human cognitive system, developmentalmodel of literacy, and an information processingapproach to learning, is used to reinterpret andsummarize the large body of data concerned with theassessment of literacy over the last 75 years.
What Makes People Highly Literate?
If, as indicated earlier, the long term memory mustpossess vast bodies of knowledge and if high levelsof information processing skills in working memoryare needed to be highly literate, then how do thehighly literate acquire this knowledge and skill?
Quantitative data from assessments of adult literacyin 1937, 1973 , and 1986 (see pages 43, 63, and 99 inthis Compendium) suggest what might be called the"triple helix" of literacy development: skill, prac-tice, and education. A salient finding across the lasthalf century is that people with higher levels ofeducation have higher levels of literacy skill andthey engage in higher levels of literacy practices, i.e.,they read books, magazines and newpapers morefrequently than do the less educated and less skilled.
The data on the intergenerational transfer of literacyin Part II shows that better educated parents tend tohave children who achieve better in school. A con-siderable body of evidence indicates that preschool
children from homes that have higher income levelsand where parents have higher education levelsfrequently acquire considerable oral language vo-cabulary and literacy knowledge before they enterschool (see chapters by Mason & Kerr and DianaSlaughter-Defoe in Sticht, Beeler, & McDonald,1992). These children have typically engaged insome forms of literacy practices, such as scribblingwith pencils and crayons as "pre-writing", and per-haps they have even learned to print their names andother words.They may have been read to and devel-oped knowedge of the "sound of printed language."They may have learned the alphabet and even how toread simple stories.
As children who have engaged in pre-school literacypractices and developed pre-school literacy skillenter school, they tend to do better in school, and theschool directs their reading into areas that they mightnot engage in otherwise. As children and otherpeople read more and more widely, they develophigher levels of information processing skills in-volved in recognizing printed words and other fea-tures of the written language, and they learn themeanings of more and more words, i.e., they developmore extensive bodies of knowledge. This in turnhelps them do well in school, so they pursue furthereducation. This guides them to engage in additionalreading practices, and, in turn this helps them de-velop more efficient reading skills and helps themacquire more knowledge.
This scenario suggests that while higher levels ofskill, education and practice typically go together, itis possible to develop high levels of literacy throughthe engagement in high levels of practice, withoutattending formal education for very long. This mayhave been illustrated in the World War I assessmentof "intelligence." The fact that officers with veryfew years of education scored quite high on theAlpha test of "intelligence" for literates, was inter-preted by the military psychologists of the time toindicate that the test measured "innate intelligence."But it seems likely that what made it possible for theunschooled officers to score fairly high on the Alphawas the knowledge and information processing ski I 1
10
22
Adult Literacy in the United States
II
they had acquired, perhaps by doing considerableindependent reading (see pages19 - 24 for a discus-sion of the Alpha and Beta tests and examples of theitems on each of these tests).
The Importance of Practice forLiteracy Development
There is a growing body of evidence to suggest thatchildren's development of literacy skill across theschool years results to a large extent from the readingthey do outside of school (Anderson, Wilson, &Fielding, 1988; Stanovich, 1993). Anderson. et. al.reported a wide range of amount of reading of books,magazines, comics, and mail for fifth grade studentsin a year. Children at the 30th percentile of amountof out-of-school text reading read about 251,000words a year. While children at the 70th percentile ofamount of out-of-school reading read some 1,168.000words a year. Amount of reading was significantlyrelated to reading achievement.
Children in the 3rd through 6th grades with readingskills at the 25th percentile have been found to loseover the summer almost half of the skill they gainduring the school year. While those at the 75thpercentile actually gain skill over the summer (Bar-bara Heynes, as reported in Berlin & Sum, 1988, p.37, Figure 10).
Among adults, higher levels of engagement in read-ing practices has been found to be associated withhigher levels of education, vocabulary, and culturalknowledge, such as knowledge of names of famousauthors, magazines, and other people (West,Stanovich, & Mitchell, 1993).
The combined evidence suggests that practice inreading, and especially the reading of books, is apotent contributor to the development of vast bodiesof knowledge in long term memory and efficiency inword recognition and other aspects of the processingof language and graphic displays of information inworking memory.
The low achievement gains in the pre- and post-test
scores of adult literacy programs found in Part III ofthe Compendium may reflect low levels of practicein reading by students outside of the literacy pro-grams (or, for that matter, inside the program. Wehave very little information on "time on task" inadult literacy classrooms or learning centers). Todate there is very little information about the extentto which adults increase their out-of-class reading asa consequence of participating in adult literacy pro-grams. The data above would seem to suggest that ifsuch programs do not lead to fairly large increases inout-of-class reading, then the adult learners are notlikely to develop the vast bodies of knowledge andefficient information processing skills needed toachieve high levels of literacy.
Losi of Literacy Ability
Some evidence exists to suggest that adult studentswho leave literacy programs may not only fail todevelop additional literacy skills if they do notengage in further literacy practice, but also that theymay actually, and fairly rapidly, lose new foundskills if they are not practiced after the program(Sticht, 1975, p. 118). In military research, U. S.Army literacy students who received job-relatedreading training and then went on to job technicaltraining were retested about eight weeks after leav-ing the literacy program. It was found that at the endof the six week literacy program the students hadgained 2.4 reading grade levels (RGL) of skill in job-related reading. Eight weeks later, after completingjob technical training, that gain dropped to 1.9 RGL,for a retention rate of 80 percent. However, whilegain in general literacy was about 1.0 RGL at the endof the job-related literacy program, eight weeks laterthat gain had dropped to 4 months (or 0.4 RGL), fora retention rate of only 40 percent of what had beengained in general literacy.
The foregoing suggests that although the amount ofreading practice may have dropped when the stu-dents left literacy training and entered job technicaltraining, they nonetheless continued to practicereading job-related materials. This may have helpedthem maintain their gain in job-related literacy.
A Compendium of Quantitative Data 11
et 3
However, since it is likely that they did not engagein as much reading practice as during the literacyprogram, this may have contributed to their loss ofmost of their gain in general literacy.
Overview of the Compendium
Part I: Assessing Adult Literacy Skills.
Part I of the Compendium includes data from thetesting of adults to determine the distribution ofliteracy skills in the population. Data are summa-rized for the period beginning with the Army'sintroduction of mass testing in 1917 during WorldWar I and ending some seventy-five years later in the1992 assessment of adult literacy skills by the U.S.Department of Education. Data gathered in studiesfalling between these two points in time are alsosummarized.
An interesting observation is that, despite consider-able debates about what sorts of tasks adults shouldbe asked to perform to indicate their degree ofliteracy, whenever test specialists, educators andcitizen groups have gotten together to decide how toassess adult literacy, the actual tasks that end up inassessment instruments look remarkably similar overthe seventy-five year period. The major findings ortrends in the data also look remarkably similar.
Part I of the Compendium presents not only summa-ries of the data on adult literacy skills from thisseventy-five year span of America's history. Addi-tionally, it presents numerous actual test items thatwere used in these studies to assess adult literacyskills. This permits readers to study these items todetermine for themselves whether they appear to besuitable tasks that literate adults in the United Statesshould be able to perform. Also, it permits adultliteracy teachers to use these items with their stu-dents as informal indicators of literacy developmentin adult literacy programs. Indeed, both adult teach-ers and adult learners (and others) may find it inter-esting, and informative, to try their skill at doingtasks from across time, such as items from WorldWars I (1917) and II (1940s), or the 1930's and1970's.
Part II: Special Topics
Part II of the Compendium examines three specialtopics in adult literacy assessment. First, relation-ships between listening and reading vocabulary andcomprehension are examined. As suggested by thedevelopmental model of literacy summarized above,children first develop a fair amount of knowledgeand language ability before they formally beginlearning reading and writing. Then, when they enterschool, one of the primary aims of reading instruc-tion is to permit the child to access oral languageencoded information via the printed display.
When applied to adults, it is frequently believed thatmost less literate adults have followed the orallanguage development sequence in the developmen-tal model, and that they have acquired extensive orallanguage vocabularies and large amounts of concep-tual knowledge. It is thought that their literacy prob-lems are due mostly to their failure to learn how to"break the code" of written language. In this case,then, the simple and expeditious remedy for theproblem is to provide a course of instruction inphonics and additional "decoding" skills. Then, oncethe adult has "broken the code" he or she will be ableto bring a vast amount of vocabulary and oral lan-guage comprehension skills to bear on reading andunderstanding the written language.
But the studies of listening and reading indicate that,despite some individual differences, as a trend, lessliterate adults tend to perform as poorly on tests ofspoken language vocabulary and comprehension,when decoding written language is not part of thetask, as they do on reading tests. Thus, brief tutoringon the decoding of written language will generallynot suffice to bring the less literate to the higherlevels of literacy being called for today.
The second and third special topics deal with theintergenerational relationships of parent's educa-tion to the literacy skills of their chi,dren and withrelationships of literacy to occupational status andjob petformance.
12 Adult Literacy in the United States2 4
Together, data from these three special topics indi-cate that the less literate adults are likely to be low inboth oral and written language competence4 and thattheir children tend not to achieve at the higher levelsof literacy, even though they may complete educa-tion at the high school level or beyond. Further, aschildren grow up to become the less literate adults,the more likely they are to be found in the lowerstatus occupations, and in many instances, the leastliterate will not perform job tasks as well as the morehighly literate.
One of the most disconcerting findings from thestudy of literacy and occupational status is thatAfrican-American college graduates performedProse, Document and Quantitative literacy tasksat a level of skill below that of the typical clericalworker in the nation (page 137). Only 20 percent ofAfrican-Americann of any education level exceededthe average literacy levels of clerical workers (page136). This suggests serious occupational accessproblems for African-Americans in the future.
Part III: Testing of Adult Literacy Development inEducation Programs
Part III of the Compendium moves from the assess-ment of the literacy skills of adults to the assessmentof literacy skill development in adult literacy pro-grams. It presents a summary of the gains that adultliteracy students have made in a wide variety of adultliteracy programs across the nation. Numerous scoreson standardized tests given at the beginnings ofliteracy programs are presented (called "pre-test"scores), along with scores made later on in theprogram or at the end of a program (called "post-test" scores). Limited data are pi esented for adultswho were tested three or four times for up to threeyears.
Generally, the data from these program assessmentsindicate that, on average, adults achieve about one-half to one-and-a-half "years" of gain in a widevariety of programs. This gain is not influencedmuch by the entering level of skill of the students orthe number of hours of instruction between pre- andpost-tests.
The data for students who were repeatedly post-,-r4e#ted three or more times in longitudinal studies( inaicate that little improvement occured after the
first post-test. Why this is so is not knowable fromthe data presented. But in part. it may reflect afailure on the part of adult learners to engage insufficient literacy practice, either in or out of pro-grams, to develop the extensive bodies of knowl-edge needed to move up the scale from lower tohigher levels of literacy.
References
Richard C. Anderson, P. T. Wilson, & L. G. Fielding(1988, Summer). Growth in reading and how chil-dren spend their time outside of school. ReadingResearch Quarterly, 23, 285-303.
Gordon Berlin & A. Sum (1988, February). Towarda More Perfect Union. Basic Skills, Poor Families,and Our Economic Future. Occasional Paper 3.New York: The Ford Foundation.
Keith E. Stanovich (1993). Does reading make yousmarter? Literacy and the development of verbalintelligence. In H. Reese (Ed.) Advances in ChildDevelopment and Behavior, Vol . 24. New York:Academic Press.
Thomas G. Sticht (1975, June). A Program of ArmyFunctional Job Reading Training: Development,Implementation , and Delivery Systems. Final Re-port HumRRO-FR-WD(CA)-75-7. Alexandria, VA:Human Resources Research Organization.
Thomas G. Sticht (1992, October). The MilitaryExperience andWorkplace Literacy: A Review andSynthesis for Policy and Practice. Pennsylvania, PA:National Center on Adult Literacy, University ofPennsylvania.
Thomas G. Sticht, M. J. Beeler, & B. A. McDonald(1992). The I ntergenerationalTransfer of CognitiveSkills : Volume II : Theory and Research in CognitiveScience. Norwood, NJ: ABLEX Publishing Corpo-ration.
A Compendium of Quantitative Data41E`
13
Thomas G. Sticht, L. Beck, R. Hauke, G. Kleiman,& J. James (1974). Auding and Reading: A Devel-opmental Model. Alexandria, VA: Human Re-sources Research Organization.
Brian K. Waters, J. D. Barnes, P. Foley, S. D.Steinhaus, & D.C. Brown (1988, October). Esti-mating the Reading Skills of Military Applicants:Development of an ASVAB to RGLConversion Table.HumRRO Final Report 88-22, FR-PRD-88-22. Al-exandria, VA: Human Resources Research Organi-zation.
Richard F. West, K. E. Stanovich, & H. R. Mitchell(1993, January/February). Reading in the real worldand its correlates. Reading Research Quarterly, 28,35-50.
1426 Adult Literacy in the United States
P A R T IP A R T IASSESSING ADULT
LITERACY SKILLS
MILITARY ORIGINS OF GROUP LITERACY TESTINGTESTING OF ADULT LITERACY IN THE CIVILIAN SECTOR
A Compendium of Quantitative Data27
15
MILITARY ORIGINS OF GROUP LITERACY TESTING
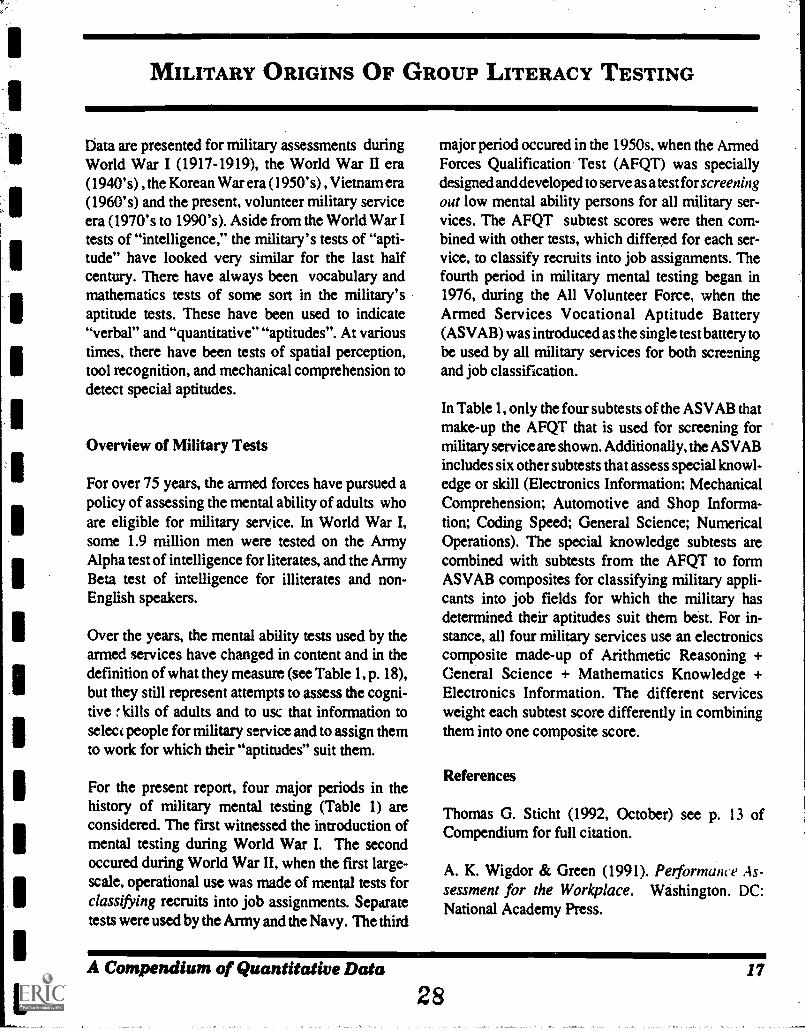
liata are presented for military assessments duringWorld War I (1917-1919), the World War II era(1940's) , the Korean War era (1950's) , Vietnam era(1960's) and the present, volunteer military serviceera (1970's to 1990's). Aside from the World War Itests of "intelligence," the military's tests of "apti-tude" have looked very similar for the last halfcentury. There have always been vocabulary andmathematics tests of some sort in the military'saptitude tests. These have been used to indicate"verbal" and "quantitative" "aptitudes". At varioustimes, there have been tests of spatial perception,tool recognition, and mechanical comprehension todetect special aptitudes.
Overview of Military Tests
For over 75 years, the armed forces have pursued apolicy of assessing the mental ability of adults whoare eligible for military service. In World War I,some 1.9 million men were tested on the ArmyAlpha test of intelligence for literates, and the ArmyBeta test of intelligence for illiterates and non-English speakers.
Over the years, the mental ability tests used by thearmed services have changed in content and in thedefinition of what they measure (see Table 1, p. 18),but they still represent attempts to assess the cogni-tive f. kills of adults and to usc that information toseleci people for military service and to assign themto work for which their "aptitudes" suit them.
For the present report, four major periods in thehistory of military mental testing (Table 1) areconsidered. The first witnessed the introduction ofmental testing during World War I. The secondoccured during World War II, when the first large-scale, operational use was made of mental tests forclassifying recruits into job assignments. Separatetests were used by the Army and the Navy. The third
major period occured in the 1950s, when the ArmedForces Qualification Test (AFQT) was speciallydesigned and developed to serve as a test for screeningout low mental ability persons for all military ser-vices. The AFQT subtest scores were then com-bined with other tests, which differed for each ser-vice, to classify recruits into job assignments. Thefourth period in military mental testing began in1976, during the All Volunteer Force, when theArmed Services Vocational Aptitude Battery(ASVAB) was introduced as the single test battery tobe used by all military services for both screeningand job classification.
In Table 1, only the four subtests of the ASVAB thatmake-up the AFQT that is used for screening formilitary service are shown. Additionally, the ASVABincludes six other subtests that assess special knowl-edge or skill (Electronics Information; MechanicalComprehension; Automotive and Shop Informa-tion; Coding Speed; General Science; NumericalOperations). The special knowledge subtests arecombined with subtests from the AFQT to formASVAB composites for classifying military appli-cants into job fields for which the military hasdetermined their aptitudes suit them best. For in-stance, all four military services use an elecvonicscomposite made-up of Arithmetic Reasoning +General Science + Mathematics Knowledge +Electronics Information. The different servicesweight each subtest score differently in combiningthem into one composite score.
References
Thomas G. Sticht (1992, October) see p. 13 ofCompendium for full citation.
A. K. Wigdor & Green (1991). Petformunce As-sessment for the Workplace. Washington. DC:National Academy Press.
A Compendium of Quantitative Data
28
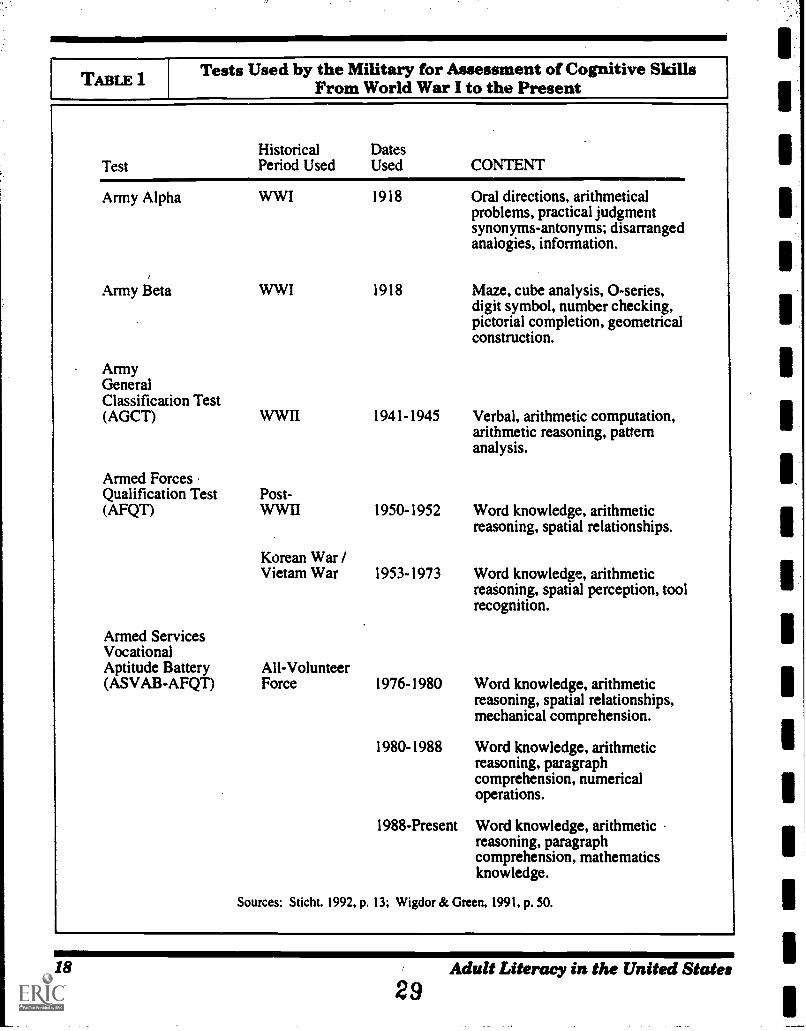
TAME 1Tests Used by the Military for Assessment of Cognitive Skills
From World War I to the Present
TestHistorical DatesPeriod Used Used CONTENT
Army Alpha WWI 1918 Oral directions, arithmeticalproblems, practical judgmentsynonyms-antonyms; disarrangedanalogies, information.
Army Beta WWI 1918 Maze, cube analysis, 0-series,digit symbol, number checking,pictorial completion, geometricalconstruction.
ArmyGeneralClassification Test(AGCT) WWII 1941-1945 Verbal, arithmetic computation,
arithmetic reasoning, patternanalysis.
Armed ForcesQualification Test Post-(AFQT) WWII 1950-1952 Word knowledge, arithmetic
reasoning, spatial relationships.
Korean War /Vietam War 1953-1973 Word knowledge, arithmetic
reasoning, spatial perception, toolrecognition.
Armed ServicesVocationalAptitude Battery All-Volunteer(ASVAB-AFQT) Force 1976-1980 Word knowledge, arithmetic
reasoning, spatial relationships,mechanical comprehension.
1980-1988 Word knowledge, arithmeticreasoning, paragraphcomprehension, numericaloperations.
1988-Present Word knowledge, arithmeticreasoning, paragraphcomprehension, mathematicsknowledge.
Sources: Sticht. 1992, p. 13; Wigdor & Green, 1991, p. 50.
18
29Adult Literacy in the United States
The Alpha and Beta Tests of World War I
The first mental tests designed to be used for mass,group testing were developed by psychologists forthe U.S. Army in 1917-1918. The group tests weremodeled after intelligence tests designed for indi-vidual use in one-on-one assessment. In developingthe mental tests, the psychologists subscribed to theposition that one could be quite intelligent, butilliterate or not proficient in the English language.Based on this reasoning, two major tests were devel-oped, the Army Alpha for literate groups, and theArmy Beta for illiterates, low literates or non-Englishspeaking (Yerkes, 1921). Both tests were based onthe theoretical position that intelligence was aninherited trait, and the assumption was made thatnative intelligence was being assessed. Each testwas made-up of a number of subtests (Figure 4, p.24), the contents of which differed depending onwhether the test was for literates or illiterates, lowliterates or non-English speakers.
Results
Figure 3, p.23 shows the results of assessments withthe Alpha and Beta tests for several special studies.These results show trends that have persisted up tothe present time with national assessments. First, forboth the Alpha and Beta tests, scores generallyincrease as years of education increase. Second,whites exceed blacks at all levels of education.Third, scores for Northern blacks exc.eed those ofSouthern blacks.
As mentioned earlier, the fact that poorly educatedOfficers performed well on the Alpha test was in-terpreted as indicating that the Alpha measurednative intelligence. However, careful examinationof the types of items that made-up each subtestsuggests that literacy practices may have been higheramong the Officers and this may have led to theirimproved performance on the Alpha test.
The Alpha Test
As indicated in Figur:. 4, p. 24, the Alpha test batteryfor literates included a wide range of tests ofknowledge and various cognitive skills. Using thesimple model of the human cognitive system givenin Figure 1, p. 4, the Alpha test can be reinterpretednot as a test of native intelligence but is a samplingof a wide variety of cognitive abilities by addressingthe person's knowledge base by both oral languageand written language.
Test I : Following Oral Directions, involves audingand comprehending simple or complex oral lan-guage directions and looking at and marking in theappropriate places on the answer sheet. To a largeextent, this is a test of the ability to hold informationin working memory and to combine earlier instruc-tions with later ones to determine the correct markingresponses.
The role of special bodies of knowledge in theperformance of information processing activities isclearly illustrated in the remaining tests.
Test 2: Arithmetical Problems, requires both theability to read and comprehend the stated problemand the knowledge of arithmetic to perform thecomputations called for. Again, working memory isstressed by having to hold more than one phrase in itthat is information bearing, then combining thephrases and performing the required computations.Mathematics knowledge is also required for Test 6.
Test 3: Practical Judgment, clearly requires readingand comprehending language. Additionally, how-ever, it requires knowledge of cuturally, normativeexpectations to make the "correct" choice. In termsof the developmental model of literacy, this meansthat the person's mind would have had to develop inan external context or environment in which theinformation needed to make the normativel ",:or-rect" response would be presented in some tom.
A Compendium of Quantitative Data 19
Test 4: Synonyms-Antonyms, requires specific vo-cabulary knowledge. in addition to the knowledge of"same" and "opposite."
Test 5: Disarranged Sentences, requires semanticknowledge about flies as well as grammaticalknowledge to rearrange the sentences. and informa-tion has to be held in working memory while rear-ranging the sentences.
Test 6: Number Series Completion, emphasizesreasoning with number knowledge in workingmemory.
Test 7: Analogies, clearly emphasizes culturallydetermined, semantic knowledge retrieval from thelong term memory knowledge base, and also infor-mation processing in working memory to detectsimilarities among the different knowledge domainsaddressed by the analogies.
Test 8: Information, is heavily loaded with culturalknowledge requirements. It is a probe of the person' sknowledge base to discover the extent to which itincludes both very familiar and less familiar de-clarative knowledge available in the United States'culture.
To determine each person' s intelligence level, scoresfor all eight subtests were combined into one totalscore. The correlation of Alpha total scores withStanford-Binet mental age was .81 (Yerkes, 1921, p.634, table 155).
Based on a person's total Alpha score he wasassigned a letter grade of A (superior intelligence),8, OF, C (average intelligence), C-, D, or D- (inferiorintelligence). The letter grade became the person'smental category, and was taken as a general indicatorof the person's native intelligence. This position washeld even though there was a clear relationship ofAlpha scores to years of schooling, in which much ofthe special knowledge, vocabulary and culturalknowledge would have been developed. Correlationsof subtest scores with education were found in onespecial study to range from .51 for Test 3 (Practical
Judgment) and years of schooling to .68 for Test 4and years of schooling, when low literates and non-English speaking were excluded. With low literatesincluded (but not non:-English speaking), these cor-relations ranged from .60 for Test 7 (Analogies) to.74 for Test 2 (Arithmetic) and years of schooling(Yerkes, 1921, p. 781, Table 326). Generally, thecorrelations of Alpha total test scores with educationranged from .65 if the low literates and non-Englishspeaking were excluded to .75 when the latter wereincluded (Yerkes, 1921, pp. 779-780).
Rather than regarding the Alpha scores as reflectingthe results of literacy practices and years of schooling,the test developers considered that the years ofschooling completed reflected the results of thenative intelligence measured by the Alpha tests(Yerkes, 1921, p.783).
The Beta Test
In determining who should take the Beta test, deci-sions were made frequently in terms of the numberof years of education reported. Generally, those withfewer than four, five, or six years of education weresent to Beta testing. Additionally, men who werenon-English speakers, or very poor in speakingEnglish were sent for Beta testing. In some cases,men who tried the Alpha tests but were subsequentlyjudged to be poor readers were readministered theBeta tests. The procedures were not uniform acrossthe testing locations.
As shown in Figure 4, p. 24, like the Alpha test, theBeta test battery for illiterates, low literates or non-English speakers also used a number of subtests.However, unlike the Alpha test in which instructionswere given in oral and written language, the Betasubtest instructions were executed in pantomime bythe testor and his aides.The examinees marked theirresponses on paper using pencils, but they were notrequired to use written language (though reading ofnumber symbols was required in some subtests). Asfor the Alpha test, the Beta subtest scores werecombined into one score, and that score was used to
20 Adult Literacy in the United States3 1
assign letter grades indicating general intelligence.
Thouzh the attempt was to use the Beta test as anintelligence test comparable to the Alpha "out freed ofinfluences of literacy and the English language,examination of the subtests in (Figure 4) revealsmajor differences between the Alpha and Beta testsboth in terms of the knowledge called for and theinformation processing skills involved in processinggraphically presented information.
As noted in the discussion of the developmentalmodel of literacy (Figure 2, p. 6) there are two mainaspects to literacy. On the one hand, literacy involvesthe use of graphics technology to produce a secondsignaling system for speech. That is, the writtenlanguage is a graphical representation of the spokenlanguage to a large degree.
However, the second major aspect of literacy is theuse of the elements of graphics technology - light,space, and permanence - to produce graphic devicesto be used in information processing for problemsolving, reasoning, and communicating. In thesubtests of the Beta test, it is clear that literacy as theuse of graphics technology for problem solving andreasoning is included in every subtest.
Test I: Maze, requires looking at the graphicallyrepresented maze while reasoning about the path tobe taken.
Test 2: Cube Analysis, requires counting cubes in thegraphic representation and this combines the use ofgraphics information with knowledge of the languageof arithmetic for counting
Test 3: X-0 Series, requires reading graphic displaysin left to right sequences while reasoning in workingmemory.
Test 4: Digit Symbol, requires scanning the uppernumber and graphic symbols, holding them inworking memory while scanning the lower numbersand then producing the appropriate mark to matchthe graphic symbol to the number.
Test 5: Number Checking, is similar to Test 4 inrequiring scanning and matching of graphic sym-bols, this time in numeric forms.
Test 6: Picture Completion, clearly involves thescanning of graphic displays and the knowledge ofthe depicted objects to complete the picture.
Test 7: Geometrical Construction, involves study-ing in working memory the graphics information onthe left and mentally rearranging it to construct thefigure on the right.
From the foregoing analysis, it becomes clear thatboth the Alpha and Beta assessed cognitive skillswith the concomitant use of literacy. That is, theability to utilize graphic marks arrayed in variousdesigns for information procesing is common toboth tests. The primary difference between the twotests is that the Alpha requires extensive readingdefined in the developmental model as looking whilelanguaging, while this is not required to any sig-nificant degree in the Beta test (though reading theletters and numbers of Tests 3, 4 and 5 permits somereading while languaging).
In turn, languaging of sentences requires the retrievalof semantic information from the knowledge basestored in long term memory to be used in workingmemory for comprehending the information beingpicked-up from the graphic display in the text of thetest. In the Beta test, on the other hand, most of theinformation processing could be done in workingmemory without the need to locate and retrievesemantically encoded knowledge from the long termmemory.
Intercorrelations among the Beta subtests rangedfrom a low of .41 for subtests 1 (Maze) and 5(Number Checking) to a high of .75 for subtests 5(Number Checking) and 4 (Digit Symbol). Perhapsthe relatively high correlation of .75 for subtests 4and 5 reflects the. fact that both make extensive useof number reading (Yerkes, 1921, p. 155, Table634).
A Compendium of Quantitative Data . 21
32
The intercorrelations among the Alpha and Betasubtests that were obtained for the sample of menwho first took the Alpha and then were referred forBeta testing ranged from a low of .36 for Beta test 2(Cube 'Analysis) with Alpha test 3 (Practical Judg-ment) to a high of .68 for Beta test 4 (Digit Symbol)with Alpha test 2 (Arithmetical Problems) (Yerkes,1921. p. 634, Table 155). These are quite a bit lowerthan the correlations in the range of .59 to .86 forintercorrelations among the Alpha tests given above.
The correlation of Beta total scores with schoolingranged from .45 for a sample of over 11,000 nativeborn men with education levels ranging from none tocollege, to .67 for a sample of 653 native-borndraftees (Yerkes, 1921, p. 781, tables 327, 328). Fora sample of 5,803 foreign born the correlation ofBeta total score with schooling was .50. In general,then, the correlations of Beta scores with years ofschooling were lower than the correlaticns of Alphascores and education (.75) when the full range ofAlpha test takers (including those subsequently sentfor Beta testing) was included.
When the Alpha and Beta test total scores (excludingnon-English speakers) were correlated with mentalage scores on the Stanford-Binet individually ad-ministered intelligence test, the resulting coefficientswere .81 and .73, respectively. Since the Stanford-Binet is essentially an auding test, in which theadministrator speaks the questions and the giveninformation, it is perhaps to be expected that thecorrelation between the heavily language-ladenAlpha and Stanford-Binet tests would be greaterthan the very low language-based Beta test with theStanford-Binet. For a sample of 653 recruits, thecorrelation of Stanford-Binet with years of school-ing was .65 (Yerkes, 1921, p. 782, Table 330).
Reference
Robert M. Yerkes (1921). Psychological Examiningin the United States Army. Memoirs of the NationalAcademy of Sciences, Vol. XV. Washington, DC: U.S.Government Printing Office.
22 Adult Literacy in the United States3 3
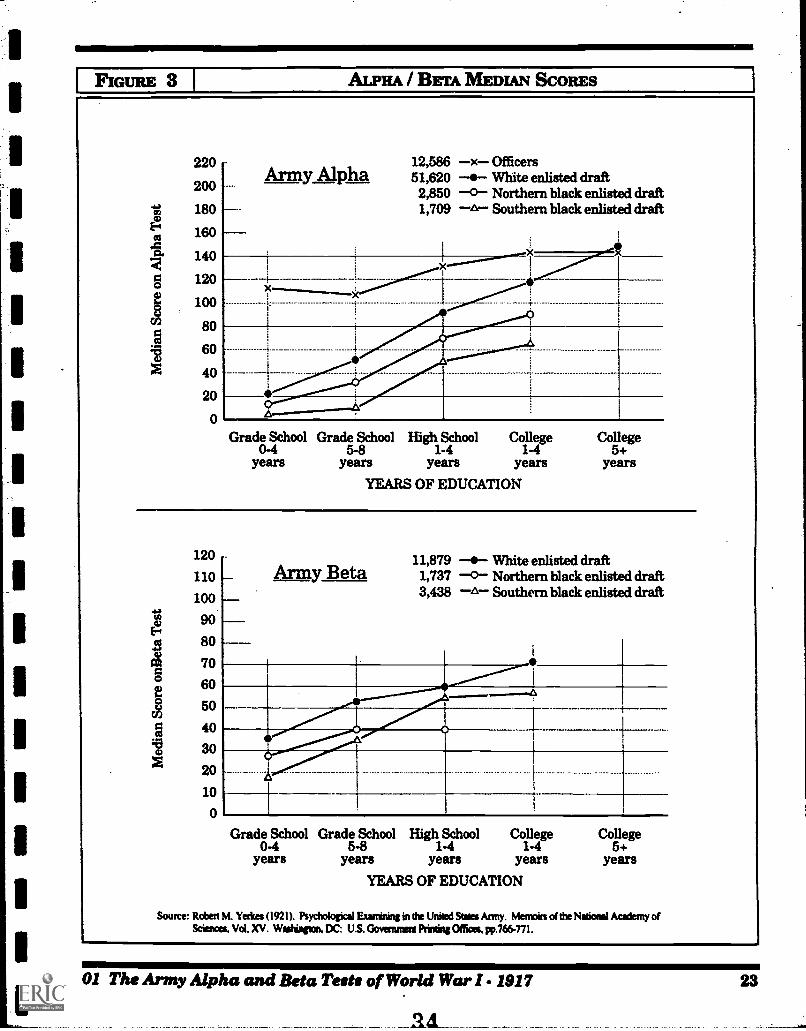
1
1
111111111111111011W
FIGURE 3 I ALPHA / BETA MEDIAN SCORES
220
200
180
160
140
120
100
80
60
40
20
Army Alpha12,586 -x- Officers51,620 4 White enlisted draft2,850 -0- Northern black enlisted draft1,709 -A- Southern black enlisted draft
Grade School Grade School High School College College0-4 5-8 1-4 1-4 5+
years years years years yearsYEARS OF EDUCATION
120
110
100
90
80
70
60
50
40
30
20
10
11,879 -0- White enlisted draftArmy Beta 1,737 -0- Northern black enlisted draft
3,438 -fr- Southern black enlisted draft
_-'.---..'1-----4
A
Grade School Grade School High School College College0-4 5-8 1-4 1-4 5+
years years years years yearsYEARS OF EDUCATION
SOUrCC: Robert M. Yerkes (1921). Psychological Eunining in the United States Anny. Memoirs of the National Academy ofSciences, Vc4. XV. %Animal. DC: U.S. Government Prindng Offices, pp.766.771.
01 The Army Alpha and Beta Tests of World War I - 1917 23
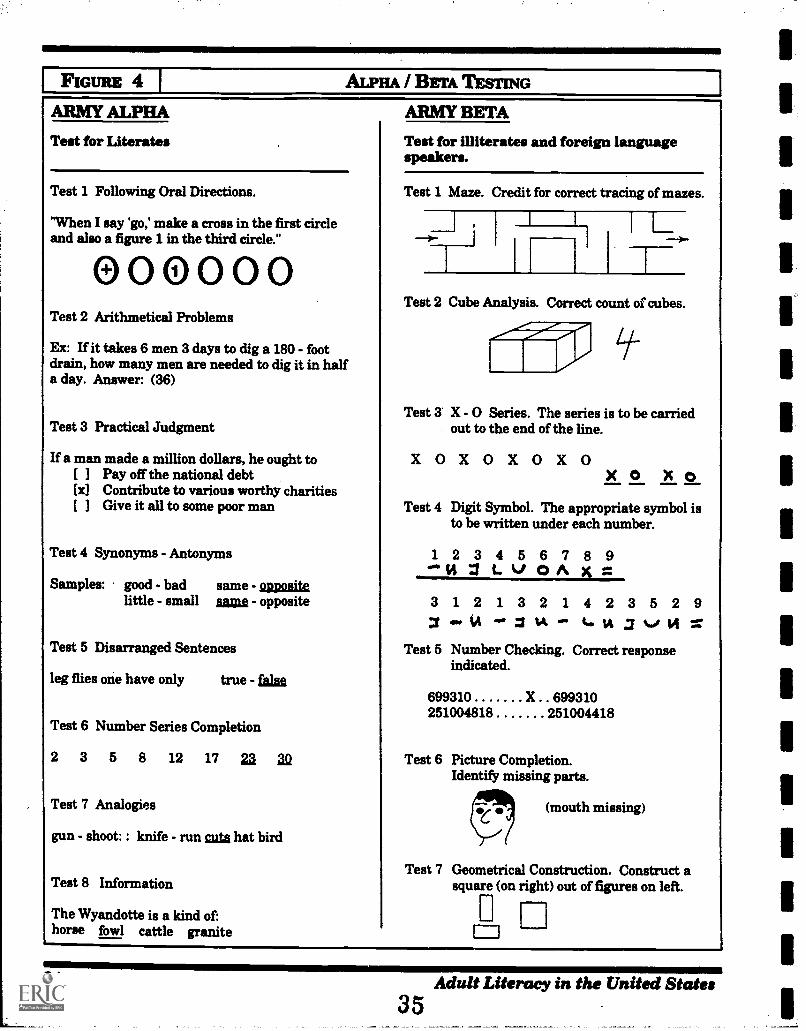
I FIGURE 4 I ALPHA / BETA TESTING
ARMY ALPHA
Test for Literates
Test 1 Following Oral Directions.
"When I say 'go,' make a cross in the first circleand also a figure 1 in the third circle."
0 0 0 0 0Test 2 Arithmetical Problems
Ex: If it takes 6 men 3 days to dig a 180 - footdrain, how many men are needed to dig it in halfa day. Answer: (36)
Test 3 Practical Judgment
If a man made a million dollars, he ought to( ] Pay off the national debt(xl Contribute to various worthy charities( ] Give it all to some poor man
Test 4 Synonyms - Antonyms
Samples: good - bad same - gam&little - small fiaing - opposite
Test 5 Disarranged Sentences
leg flies orie have only true - fan
Test 6 Number Series Completion
2 3 5 8 12 17 Ra aQ
Test 7 Analogies
gun - shoot: : knife - run caga hat bird
Test 8 Information
The Wyandotte is a kind of:horse fowl cattle granite
ARMY BETA
Test for illiterates and foreign languagespeakers.
Test 1 Maze. Credit for correct tracing of mazes.
1
1 L
Test 2 Cube Analysis. Correct count of cubes.
LiL
Test a X - 0 Series. The series is to be carriedout to the end of the line.
X OX0 X0 X0X 0 X 0
Test 4 Digit Symbol. The appropriate symbol isto be written under each number.
1 2 3 4 5 6 7 8 914 3 L 0A X r.
3 1 2 1 3 2 1 4 2 3 5 2 94" tA tA *." 4s IA 3 r.:
Test 5 Number Checking. Correct responseindicated.
699310 X. 699310251004818 251004418
Test 6 Picture Completion.Identify missing parts.
(mouth missing)
Test 7 Geometrical Construction. Construct asquare (on right) out of figures on left.
24 Adult Literacy in the United States35
The Army General Classification TestOf World War II
As the United States moved into World War II, theArmy developed new mental tests to aid in theclassification of recruits into jobs. At the time thatthe Army General Classification Test (AGCT) wasdeveloped, psychologists in the military personnelresearch sections considered that "intelligence testsdo not measure native mental capacity. They mea-sure actual performance on test questions. A test is afairly valid measure of the native capacities whichunderlie the abilities tapped by its questions whenevery one tested has had equal opportunity and equalincentive to develop the abilities measured" (Zeidner& Drucker, 1983, p. 34).
As interpreted by Zeidner & Drucker (1983), bothlong time members of the Army' s personnel researchactivity, "the Army psychologists' World War IIposition was that the test scores represented nothingmore than an index of measured abilities at the timethe test was taken" (p. 35).
The purpose of the AGCT was to serve as a measureof "general learning ability" that could be used toassign new recruits to jobs.
The AGCT Test
As indicated in Figure 5, p. 26, the Army GeneralClassification Test (AGCT) included four subtests:
The Vocabulary Test, required knowledge to selectthe correct response regarding the meanings of wordsin the person's long term memory.
The Arithmetic Test, required knowledge of math-ematics as well as language-based knowledge tocomprehend the words in the word problems.Thesetypes of problems are heavily dependent on efficiencyof information processing in working memory, too.
The Block-Counting Test, emphasized the use ofliteracy as graphics display processing and requiredvisualization to imagine the presence of obscuredblocks.
Because the Army of World War II had to draw upona primarily inexperienced young adult populationand train recruits in a wide variety of technical andadministrative fields, as well as mechanized combatjobs, the AGCT was validated as a classficationinstrument by correlating scores on AGCT withgrades in training courses. This seemed consistentwith the interpretation of the AGCT as a measure of"general learning ability." Indeed, in content, theAGCT (Figure 5, p. 26) resembled measures ofschooling, such as reading vocabulary ("verbal"ability) and arithmetic computation and wordproblem solving . Only a measure of "spatial analy-sis" was included that differed from school-basedachievement tests. Given that the AGCT so muchresembled a measure of past school learning, it is notsurprising that it was found to correlate reasonablywell with achievement in Army schools.
As in World War I, scores on the subtests of theAGCT were combined into a total score, and recruitswere assigned to "grades" based on their total scores.High scoring recruits, "rapid learners" were assignedto Army Grade I, next highest were Grade ils, then"average learners" in Grade 111, "below average" inGrade IV, and "slow learners" were assigned toArmy Grade V. With the Selective Service Act of1948, an entire mental category, Army Grade V,comprised of some 8 percent of the young, white,male population, was excluded from service (Wool,1968, p.66). This was the first time that a statutorymental (literacy?) standard was set for military ser-vice.
References
Joseph Zeidner and Arthur J. Dnicker (1983). Be-havioral Science in the Army: A Corporate Historyof the Army Research Institute. Almindria, VA: U.S. Army Research Institute for the Behavioral andSocial Sciences.
Harold Wool (1968). The Military Specialist: SkilledManpower for the Armed Forces. Baltimore, MD:The Johns Hopkins Press.
02 The Army General Classification Test of World War II - 194036
26
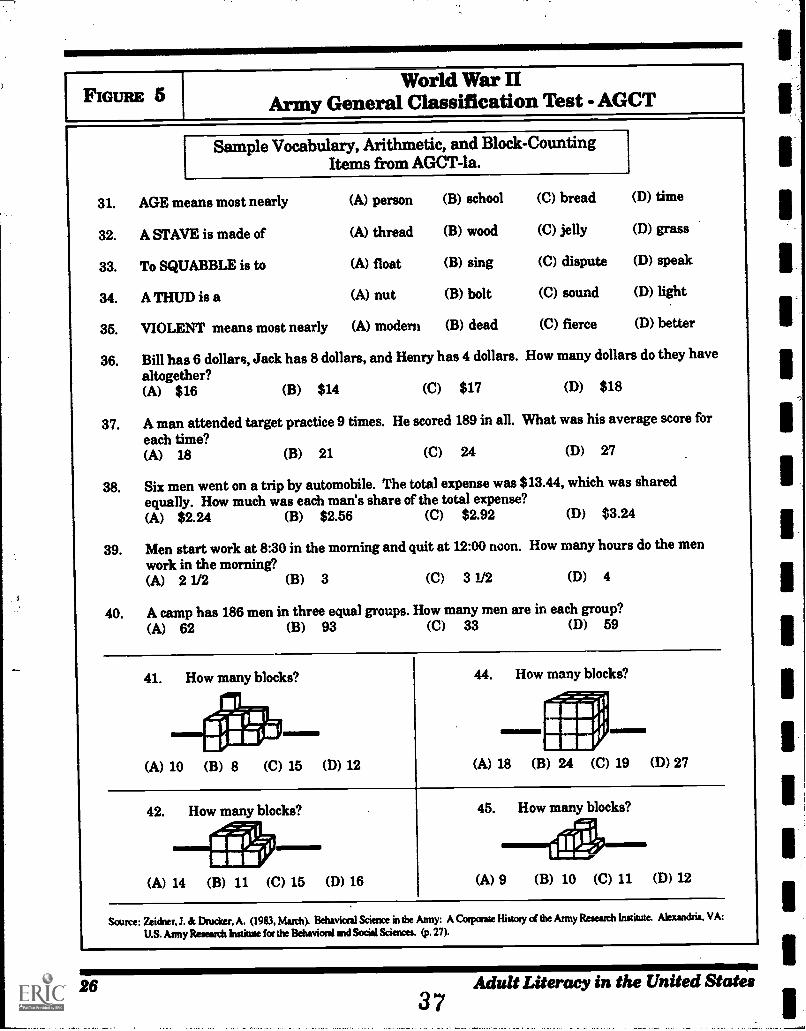
FIGURE 5World War II
Army General Classification Test AGCT
31.
32.
33.
34.
35.
36. Bill has 6 dollars, Jack has 8 dollars, and Henry has 4 dollars. How many dollars do they havealtogether?(A) $16 (B) $14 (C) $17 (D) $18
Sample Vocabulary, Arithmetic, and Block-CountingItems from AGCT4a.
AGE means most nearly (A) person (B) school (C) bread (D) time
A STAVE is made of (A) thread (B) wood (C) jelly (D) grass
To SQUABBLE is to (A) float (B) sing (C) dispute (D) speak
A THUD is a (A) nut (B) bolt (C) sound (D) light
VIOLENT means most nearly (A) modern (B) dead (C) fierce (D) better
37. A man attended target practice 9 times. He scored 189 inall. What was his average score foreach time?(A) 18 (B) 21 (C) 24 (D) 27
38. Six men went on a trip by automobile. The total expense was $13.44, which was sharedequally. How much was each man's share of the total expense?(A) $2.24 (B) $2.56 (C) $2.92 (D) $3.24
39. Men start work at 8:30 in the morning and quit at 12:00 noon. How many hours do the menwork in the morning?(A) 2 1/2 (B) 3 (C) 3 1J2 (D) 4
40. A camp has 186 men in three equal groups. How many men are in each group?
(A) 62 (B) 93 (C) 33 (D) 59
41. How many blocks?
(A) 10 (3) 8 (C) 15 (D) 12
44. How many blocks?
(A) 18 (B) 24 (C) 19 (D) 27
42. How many blocks?
(A) 14 (13) 11 (C) 15 (D) 16
45. How many blocks?
(A) 9 (B) 10 (C) 11 (D) 12
Source: Zeidner, J. & Dmdter, A. (1983, March). Behavioral Science in the Anny: A Corporate History oldie Anny Reseasdi institute. Alexandria, VA:
U.S. Army Research institute for the Behavioral and Social Sciences. (p. 27).
263 7
Adult Literacy in the United States
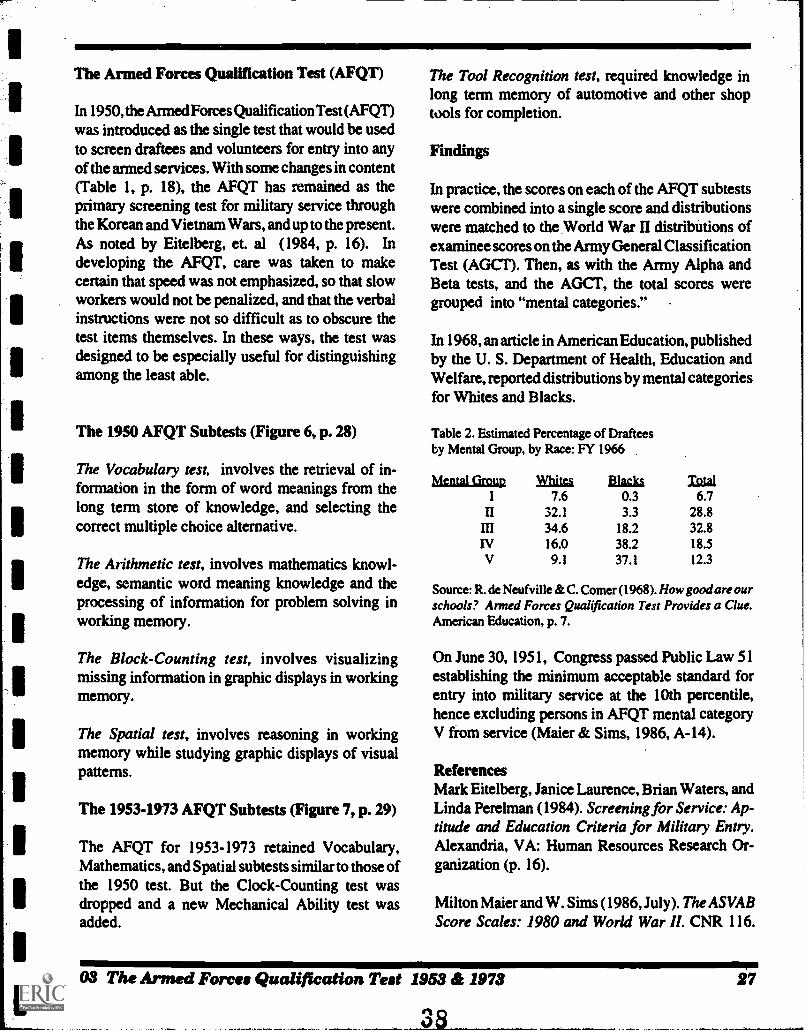
The Armed Forces Qualification Test (AFQT)
In 1950, the Anned Forces Qualification Test (AFQT)was introduced as the single test that would be usedto screen draftees and volunteers for entry into anyof the armed services. With some changes in content(Table 1, p. 18), the AFQT has remained as theprimary screening test for military service throughthe Korean and Vietnam Wars, and up to the present.As noted by Eitelberg, et. al (1984, p. 16). Indeveloping the AFQT, care was taken to makecertain that speed was not emphasized, so that slowworkers would not be penalized, and that the verbalinstructions were not so difficult as to obscure thetest items themselves. In these ways, the test wasdesigned to be especially useful for distinguishingamong the least able.
The 1950 AFQT Subtests (Figure 6, p. 28)
The Vocabulary test, involves the retrieval of in-formation in the form of word meanings from thelong term store of knowledge, and selecting thecorrect multiple choice alternative.
The Arithmetic test, involves mathematics knowl-edge, semantic word meaning knowledge and theprocessing of information for problem solving inworking memory.
The Block-Counting test, involves visualizingmissing information in graphic displays in workingmemory.
The Spatial test, involves reasoning in workingmemory while studying graphic displays of visualpatterns.
The 1953-1973 AFQT Subtests (Figure 7, p. 29)
The AFQT for 1953-1973 retained Vocabulary,Mathematics, and Spatial subtests similar to those ofthe 1950 test. But the Clock-Counting test wasdropped and a new Mechanical Ability test wasadded.
The Tool Recognition test, required knowledge inlong term memory of automotive and other shoptools for completion.
Findings
In practice, the scores on each of the AFQT subtestswere combined into a single score and distributionswere matched to the World War II distributions ofexaminee scores on the Army General ClassificationTest (AGM). Then, as with the Army Alpha andBeta tests, and the AGCT, the total scores weregrouped into "mental categories."
In 1968, an article in American Education, publishedby the U. S. Department of Health, Education andWelfare, reported distributions by mental categoriesfor Whites and Blacks.
Table 2. Estimated Percentage of Drafteesby Mental Group, by Race: FY 1966
Mental Group Whites7.6
Blacks0.3
Tidal6.7
II 32.1 3.3 28.8III 34.6 18.2 32.8IV 16.0 38.2 18.5V 9.1 37.1 12.3
Source: R. de Neufville & C. Corner (1968). How good are ourschools? Armed Forces Qual(fication Test Provides a Clue.American Education, p. 7.
On June 30, 1951, Congress passed Public Law 51establishing the minimum acceptable standard forentry into military service at the 10th percentile,hence excluding persons in AFQT mental categoryV from service (Maier & Sims, 1986, A-14).
ReferencesMark Eitelberg, Janice Laurence, Brian Waters, andLinda Perelman (1984). Screening for Service: Ap-titude and Education Criteria for Military Entry.Alexandria, VA: Human Resources Research Or-ganization (p. 16).
Milton Maier and W. Shns (1986, July). The ASVABScore Scales: 1980 and World War II. CNR 116.
03 The Armed Forces Qualification Test 1953 & 1973
38
27
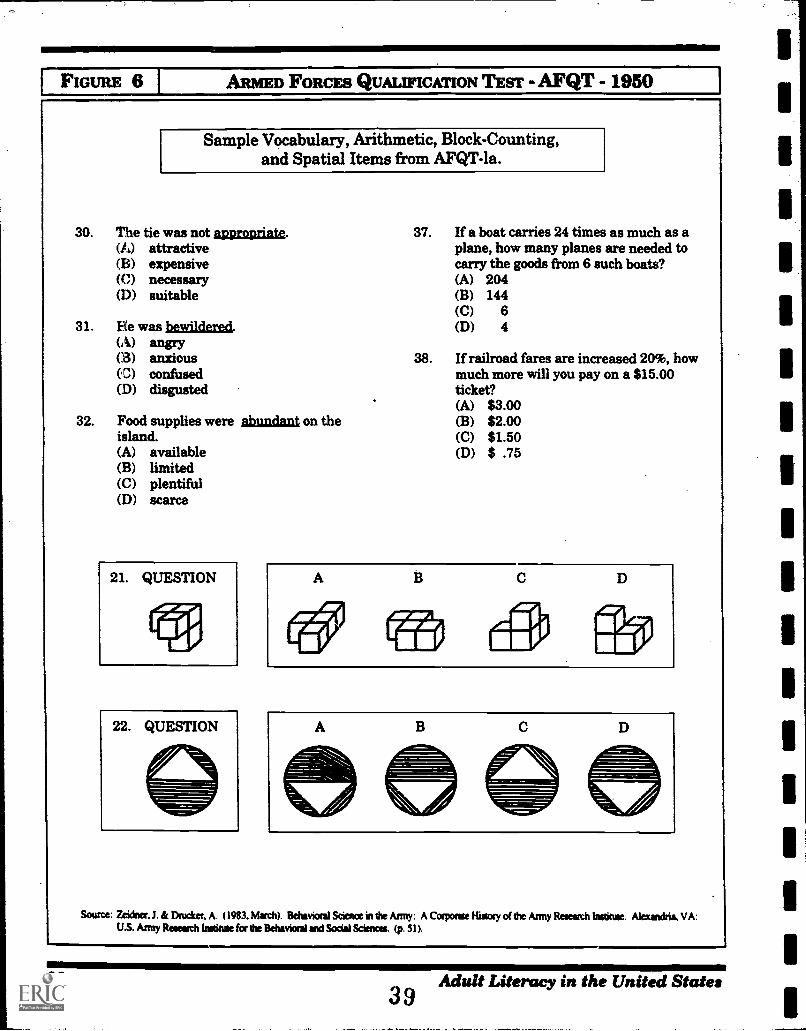
FIGURE 6 I Am= FORCES QUALIFICATION TEST AFQT - 19501
Sample Vocabulary, Arithmetic, Block-Counting,and Spatial Items from AFQT-la.
30. The tie was not apaggriatt.(A) attractive(B) expensive(C) necessary(I)) suitable
31. Be was heyilidezed.(A) angry(B) anxious(C) confused(D) disgusted
32. Food supplies were &adult on theisland.(A) available(B) limited(C) plentiful(D) scarce
22. QUESTION
37. If a boat carries 24 times as much as aplane, how many planes are needed tocarry the goods from 6 such boats?(A) 204(B) 144(C) 6(D) 4
38. If railroad fares are increased 20%, howmuch more will you pay on a $15.00ticket?(A) $3.00(B) $2.00(C) $1.50(D) $ .75
A
Source: Zeidner..1. & Drucker. A. (1983. Much). Behsvioral Science in the Army: A Corporate Histosy of the Army Research Institute. Mesandria. VA:U.S. Army Research Winne for the Behavioral and Social Sciences. (p. 31).
28 Adult Literacy in the United States39
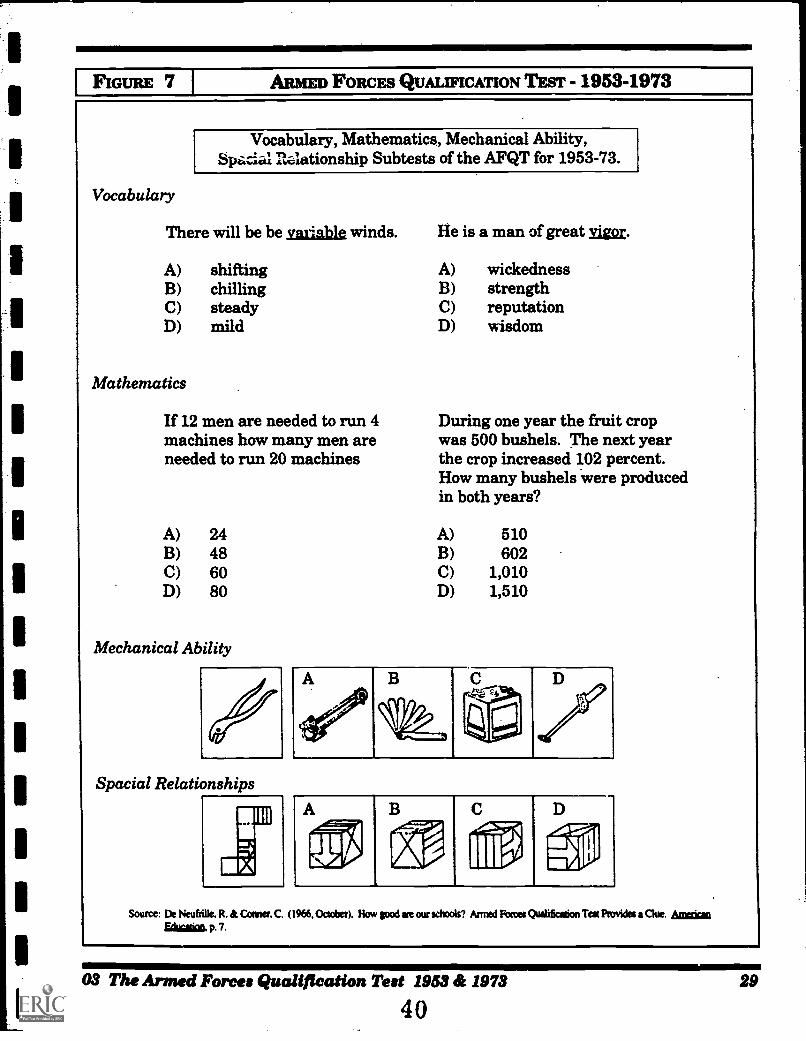
IFIGURE 7 I Amin) FORCES QUALIFICATION TEST - 1953-1973
Vocabulary
Vocabulary, Mathematics, Mechanical Ability,Spacial P.alationship Subtests of the AFQT for 1953-73.
There will be be variable winds. He is a man of great vigor.
A) shifting A) wickedness8) chilling B) strengthC) steady C) reputationD) mild D) wisdom
Mathematics
If 12 men are needed to run 4machines how many men areneeded to run 20 machines
A) 24B) 48C) 60D) 80
Mechanical Ability
Spacial Relationships
During one year the fruit cropwas 500 bushels. The next yearthe crop increased 102 percent.How many bushels were producedin both years?
A) 510B) 602C) 1,010D) 1,510
\VIP,......
Source: De Hearth& R. & Comet C. (1966, Octcber). How good are our ichcois? Armed Forces Qualification Tat Provides a Clue. ismccican
Maim p. 7.
Ammo.03 The Armed Forces Qualification Test 1953 & 1973 29
40
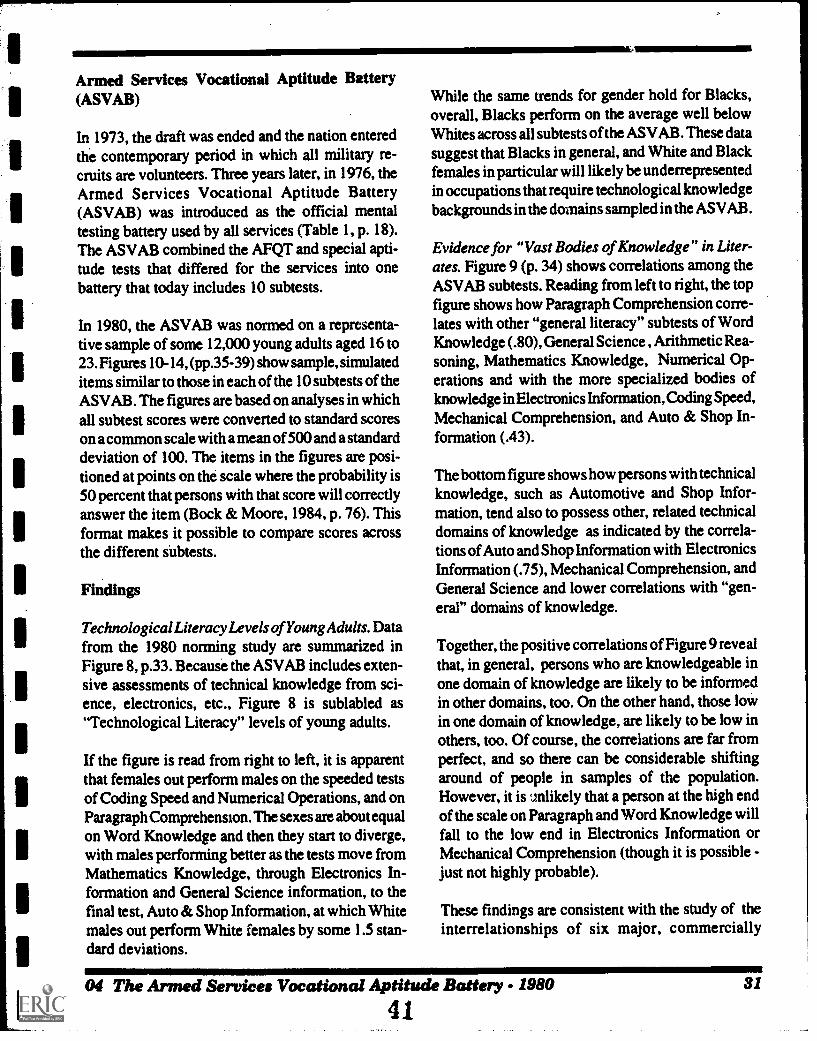
Armed Services Vocational Aptitude Battery(ASVAB)
In 1973, the draft was ended and the nation enteredthe contemporary period in which all military re-cruits are volunteers. Three years later, in 1976, theArmed Services Vocational Aptitude Battery(ASVAB) was introduced as the official mentaltesting battery used by all services (Table 1, p. 18).The ASVAB combined the AFQT and special apti-tude tests that differed for the services into onebattery that today includes 10 subtests.
In 1980, the ASVAB was normed on a representa-tive sample of some 12,000 young adults aged 16 to23. Figures 10-14, (pp.35-39) show sample, simulateditems similar to those in each of the 10 subtests of theASVAB. The figures are based on analyses in whichall subtest scores were converted to standard scoreson a common scale with a mean of 500 and a standarddeviation of 100. The items in the figures are posi-tioned at points on the scale where the probability is50 percent that persons with that score will correctlyanswer the item (Bock & Moore, 1984, P. 76). Thisformat makes it possible to compare scores acrossthe different iubtests.
Findings
Technological Literacy Levels of Young Adults. Datafrom the 1980 norming study are summarized inFigure 8, p.33. Because the ASVAB includes exten-sive assessments of technical knowledge from sci-ence, electronics, etc., Figure 8 is sublabled as"Technological Literacy" levels of young adults.
If the figure is read from right to left, it is apparentthat females out perform males on the speeded testsof Coding Speed and Numerical Operations, and onParagraph Comprehension. The sexes are about equalon Word Knowledge and then they start to diverge,with males performing better as the tests move fromMathematics Knowledge, through Electronics In-formation and General Science information, to thefinal test, Auto & Shop Information, at which Whitemales out perform White females by some 1.5 stan-dard deviations.
While the same trends for gender hold for Blacks,overall, Blacks perform on the average well belowWhites across all subtests of the ASVAB. These datasuggest that Blacks in general, and White and Blackfemales in particular will likely be underrepresentedin occupations that require technological knowledgebackgrounds in the domains sampled in the AS VAB.
Evidence for "Vast Bodies of Knowledge" in Liter-ates. Figure 9 (p. 34) shows correlations among theASVAB subtests. Reading from left to right, the topfigure shows how Paragraph Comprehension corre-lates with other "general literacy" subtests of WordKnowledge (.80), General Science , Arithmetic Rea-soning, Mathematics Knowledge, Numerical Op-erations and with the more specialized bodies ofknowledge in Electronics Information, Coding Speed,Mechanical Comprehension, and Auto & Shop In-formation (.43).
The bottom figure shows how persons with technicalknowledge, such as Automotive and Shop Infor-mation, tend also to possess other, related technicaldomains of knowledge as indicated by the correla-tions of Auto and Shop Information with ElectronicsInformation (.75), Mechanical Comprehension, andGeneral Science and lower correlations with "gen-eral" domains of knowledge.
Together, the positive correlations of Figure 9 revealthat, in general, persons who are knowledgeable inone domain of knowledge are likely to be informedin other domains, too. On the other hand, those lowin one domain of knowledge, are likely to be low inothers, too. Of course, the correlations are far fromperfect, and so there can be considerable shiftingaround of people in samples of the population.However, it is unlikely that a person at the high endof the scale on Paragraph and Word Knowledge willfall to the low end in Electronics Information orMechanical Comprehension (though it is possible -just not highly probable).
These findings are consistent with the study of theinterrelationships of six major, commercially
04 The Armed Services Vocational Aptitude Battery - 1980
4131
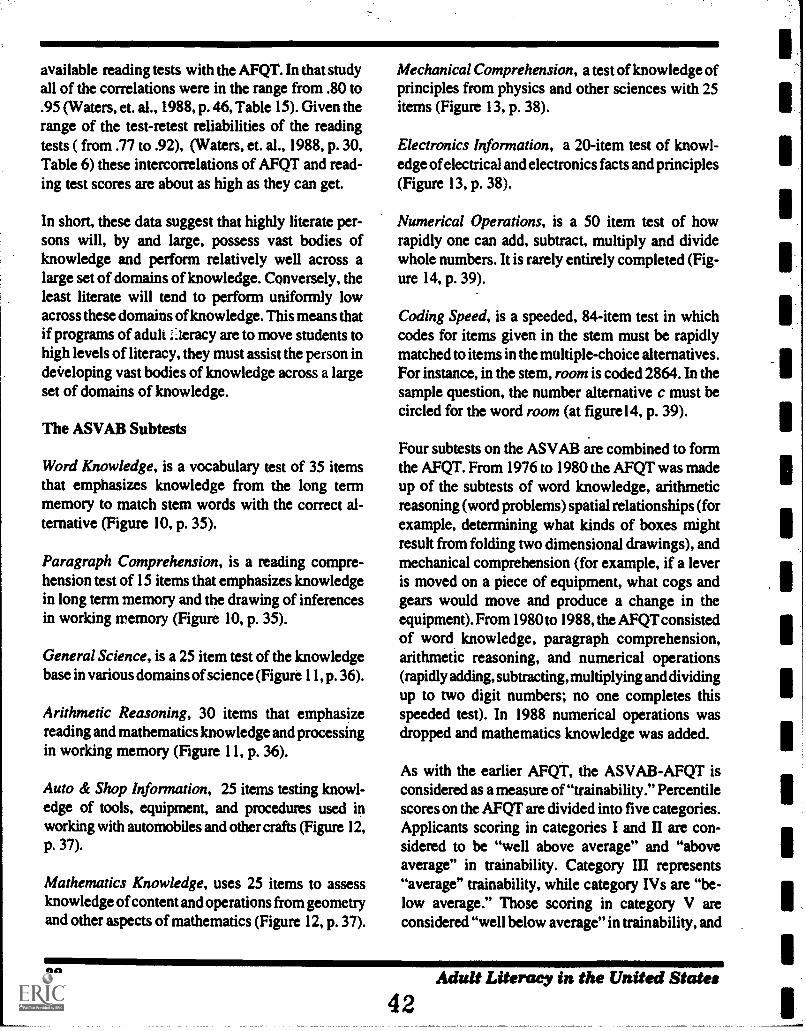
available reading tests with the AFQT. In that studyall of the correlations were in the range from .80 to.95 (Waters, et. al., 1988, p. 46, Table 15). Given therange of the test-retest reliabilities of the readingtests ( from .77 to .92), (Waters, et. al., 1988, p. 30,Table 6) these intercorrelations of AFQT and read-ing test scores are about as high as they can get.
In short, these data suggest that highly literate per-sons will, by and large, possess vast bodies ofknowledge and perform relatively well across alarge set of domains of knowledge. Conversely, theleast literate will tend to perform uniformly lowacross these domains of knowledge. This means thatif programs of adult :iteracy are to move students tohigh levels of literacy, they must assist the person inde/eloping vast bodies of knowledge across a largeset of domains of knowledge.
The ASVAB Subtests
Word Knowledge, is a vocabulary test of 35 itemsthat emphasizes knowledge from the long termmemory to match stem words with the correct al-ternative (Figure 10, p. 35).
Paragraph Comprehension, is a reading compre-hension test of 15 items that emphasizes knowledgein long term memory and the drawing of inferencesin working memory (Figure 10, p. 35).
General Science, is a 25 item test of the knowledgebase in various domains of science (Figure 11, p. 36).
Arithmetic Reasoning, 30 items that emphasizereading and mathematics knowledge and processingin working memory (Figure 11, p. 36).
Auto & Shop Information, 25 items testing knowl-edge of tools, equipment, and procedures used inworking with automobiles and other crafts (Figure 12,p. 37).
Mathematics Knowledge, uses 25 items to assessknowledge of content and operations from geometryand other aspects of mathematics (Figure 12, p. 37).
Mechanical Comprehension, a test of knowledge ofprinciples from physics and other sciences with 25items (Figure 13, p. 38).
Electronics Information, a 20-item test of knowl-edge of electrical and electronics facts and principles(Figure 13, p. 38).
Numerical Operations, is a 50 item test of howrapidly one can add, subtract, multiply and dividewhole numbers. It is rarely entirely completed (Fig-ure 14, p. 39).
Coding Speed, is a speeded, 84-item test in whichcodes for items given in the stem must be rapidlymatched to items in the multiple-choice alternatives.For instance, in the stem, room is coded 2864. In thesample question, the number alternative c must becircled for the word room (at figure14, p. 39).
Four subtests on the ASVAB are combined to formthe AFQT. From 1976 to 1980 the AFQT was madeup of the subtests of word knowledge, arithmeticreasoning (word problems) spatial relationships (forexample, determining what kinds of boxes mightresult from folding two dimensional drawings), andmechanical comprehension (for example, if a leveris moved on a piece of equipment, what cogs andgears would move and produce a change in theequipment). From 1980 to 1988, the AFQT consistedof word knowledge, paragraph comprehension,arithmetic reasoning, and numerical operations(rapidly adding, subtracting, multiplying and dividingup to two digit numbers; no one completes thisspeeded test). In 1988 numerical operations wasdropped and mathematics knowledge was added.
As with the earlier AFQT, the ASVAB-AFQT isconsidered as a measure of "trainability." Percentilescores on the AFQT are divided into five categories.Applicants scoring in categories I and II are con-sidered to be "well above average" and "aboveaverage" in trainability. Category III represents"average" trainability, while category IVs are "be-low average." Those scoring in category V areconsidered "well below average" in trainability, and
32 Adult Literacy in the United States
42
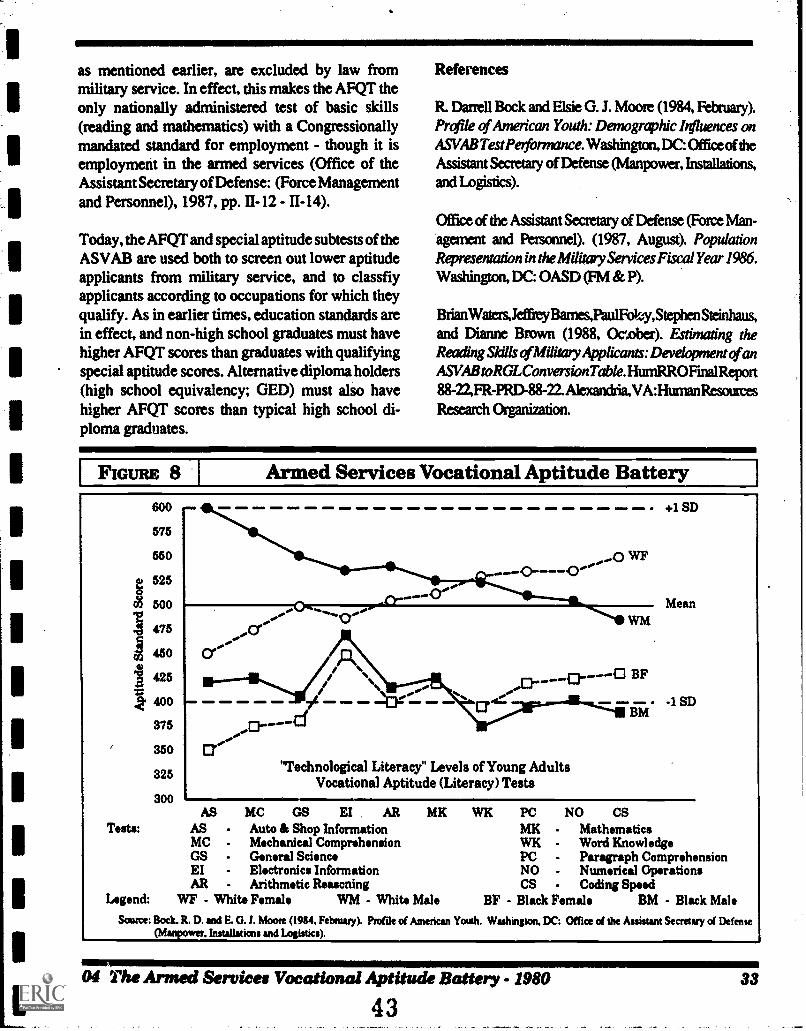
as mentioned earlier, are excluded by law frommilitary service. In effect, this makes the AFQT theonly nationally administered test of basic skills(reading and mathematics) with a Congressionallymandated standard for employment - though it isemployment in the armed services (Office of theAssistant Secretary of Defense: (Force Managementand Personnel), 1987, pp. II-12 - II-14).
Today, the AFQT and special aptitude subtests of theASVAB are used both to screen out lower aptitudeapplicants from military service, and to classfiyapplicants according to occupations for which theyqualify. As in earlier times, education standards arein effect, and non-high school graduates must havehigher AFQT scores than graduates with qualifyingspecial aptitude scores. Alternative diploma holders(high school equivalency; GED) must also havehigher AFQT scores than typical high school di-ploma graduates.
FIGURE 8
References
R. Darrell Bock and Elsie G. J. Moore (1984, February).Profile of Anwrican Youth: Demographic Influences onASVABTest Petformance. Washington, DC: Office of theAssistant Secretary of Defense (Manpower, Installations,and Logistics).
Office of the Assistant Secretary of Defense (Force Man-agement and Personnel). (1987, August). PopulationRepresentation in the Military Services Fiscal Year 1986.Washington, DC: OASD (FM & P).
BrianWaters,JeffityBames,PaulFoky,Stephen Steinhaus,and Dianne Brown (1988, Omber). Estimating theReading Sldlls o f Militar y Applicants: Developnent cf anASVABtoRGLConversionTabk.HumRROFinalReport88-22,FR-PRD-88-22.Alexandria,VA:HumanResourcesResearch Organimion.
Armed Services Vocational Aptitude Battery 7600
575
550
E 525
43 500
1 475
450
425
400
375
350
325
300
WFli MeanWM
+1 SD
"Technological Literacy" Levels of Young AdultsVocational Aptitude (Literacy) Tests
BF
-1 SDBM
AS MC GS EI AR MKTests: AS - Auto & Shop Information
MC - Mechanical ComprehensionGS General ScienceEI - Electronics InformationAR Arithmetic Reaming
Legend: WF - Whit* Female WM Whit. Male
WK PC NO CS
MK - MathematicsWK - Word KnowledgePC - Paragraph ComprehensionNO - Numerical OperationsCS - Coding Speed
BF - Black Female BM - Black Male
Source: Bock. R. D. and E. G.I. Moore (1984. February). Profile of American Youth. Washington, DC: Office alt the Assistant Secretary of Defense(Manpower, Installatices and Logistics).
04 The Armed Servkee Vocational Aptitude Battery - 1980
4 3
33
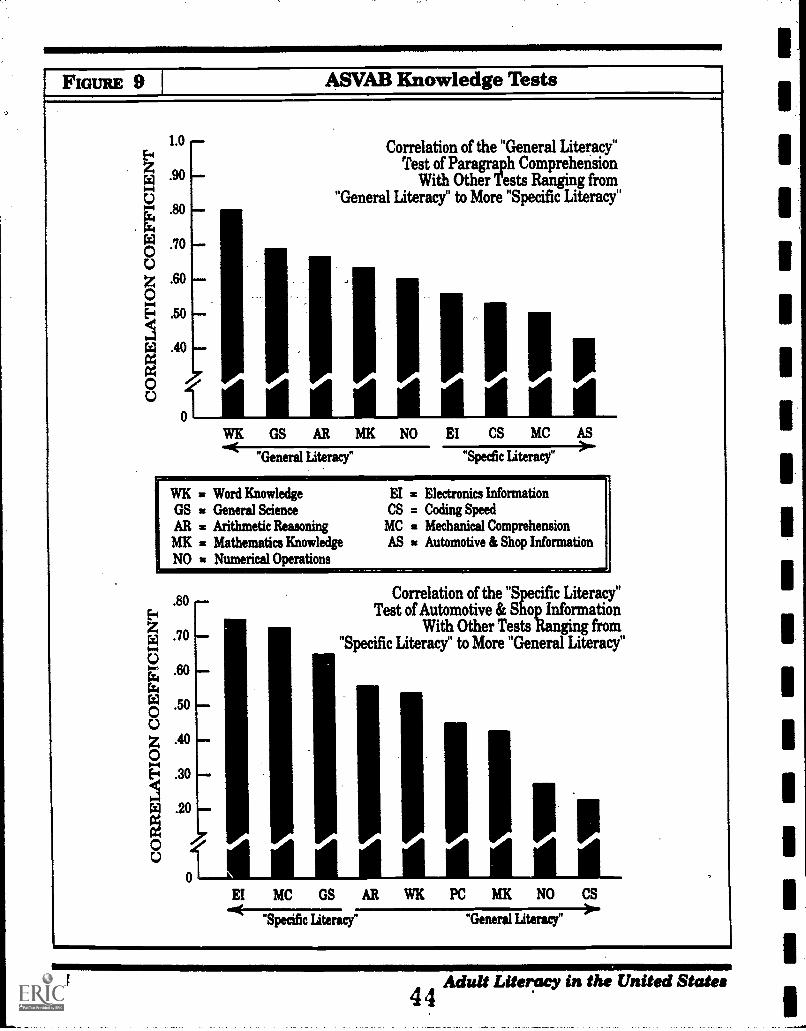
FIGURE 9 ASVAB Knowledge Tests
1.0
Xi
.80
.70
d
.40 11didddd Pidp
Correlation of the "General Literacy"'fest of Paragraph Comprehension
With Other Tests Ranging from"General Literacy" to More "Specific Literacy"
WK GS AR MK NO EI
"General Literacy"
CS MC AS
"Specfic Literacy"
WK Word KnowledgeGS = General ScienceAR = Arithmetic ReasoningMK = Mathematics KnowledgeNO = Numerical Operations
EI = Electronics InformationCS = Coding Speed
MC = Mechanical ComprehensionAS = Automotive & Shop Information
.80
.70
.60
Correlation of the "Specific Literacy"Test of Automotive & Shop Information
With Other Tests Ranging from"Specific Literacy" to More "General Literacy"
01; I P.'.30
.20
0 1
.40
EI MC GS AR WK PC MK NO CS>-
Specific Literacy" "General Literacy"
34 Adult Literacy in the United States44
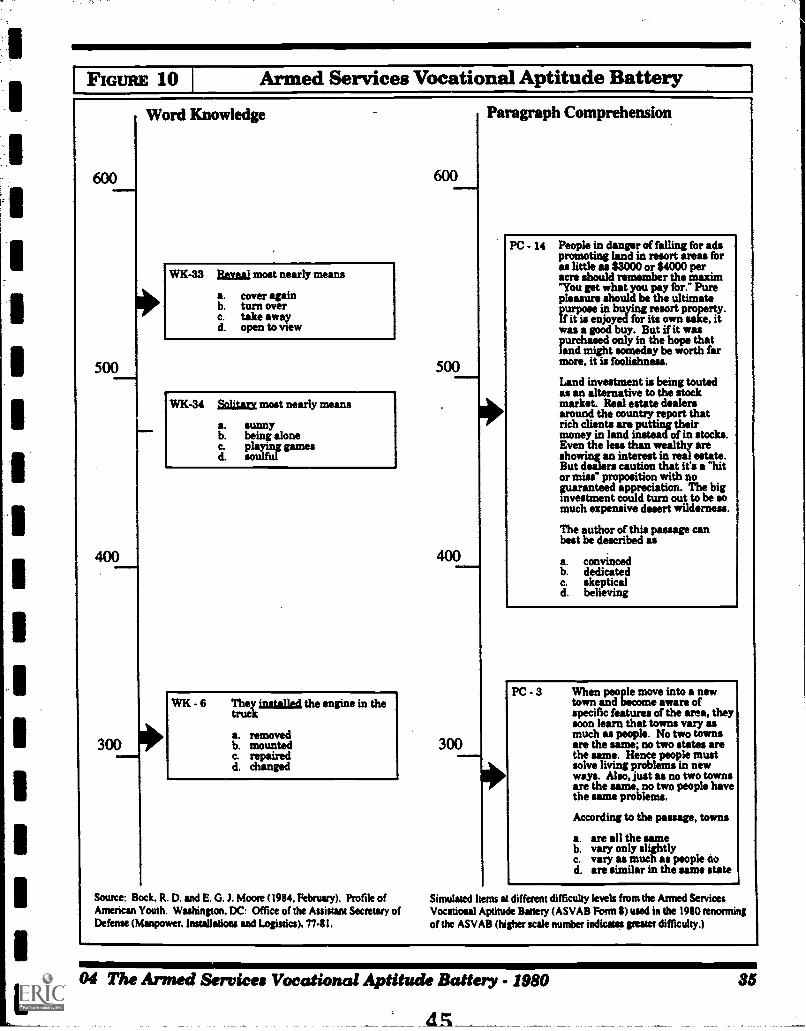
FIGURE 10 Armed Services Vocational Aptitude Battery
600
500
400
300
Word Knowledge
WK-33 Bend most nearly means
a.b.C.d.
cover againturn overtake awayopen to view
WK-34 riftEtary most nearly means
a. sunnyb. being alonec. playiw gamesd. soulful
WK - 6 They installed the engine in thetruck
a. removedb. mountedc. repairedd. changed
Source: Bock, R. D. and E. G. I. Moore (1934. February). Profile ofAmerican Youth. Washington, DC: Office of the Auistant Secretary ofDefense (Manpower. Installations and Logisda). 7741.
500
300
Paragraph Comprehension
PC 14 People in danger of falling for adspromoting land in resort areas foraa little as $3000 or $4000 peracre should remember the maxim"You get what you pay for." Purepleuure should be the ultimatapurpose in buying resort property.If it is enjoyed for its own sake, itwu a good buy. But if it waspurchased only in the hope thatland might someday be worth farmore, it is foolishness.
Land investment is being toutedas an alternative to the stockmarket. Real estate dealersaround the country report thatrich clients are putting theirmoney in land instead- of in stocks.Even the leu than wealthy areshowing an interest in real estate.But dealers caution that it's a "hitor miss" proposition with noguaranteed appreciation. The biginvestment could turn out to be somuch expensive desert wilderness.
The author of this passage canbest be described as
a. convincedb. dedicatedc. skepticald. believing
PC - 3 When people move into a newtown and bemme aware ofspecific features of the area, theysoon learn that towns vary asmuch as people. No two townsare the same; no two states arethe same. Hence people mustsolve living problems in newways. Also, just as no two townsare the same, no two people havethe same problems.
According to the passage, towns
a. are all the sameb. vary only slightlyc. vary as much as people silod. are similar in the same state
Simulated Items at different difficulty levels from the Armed ServicesVocational Aptitude Battery (ASVAB Form 6) used in the 1980 reformingof the ASVAB (higher scale number indicates greater difficulty.)
04 The Armed Services Vocational Aptitude Battery.- 1980 35
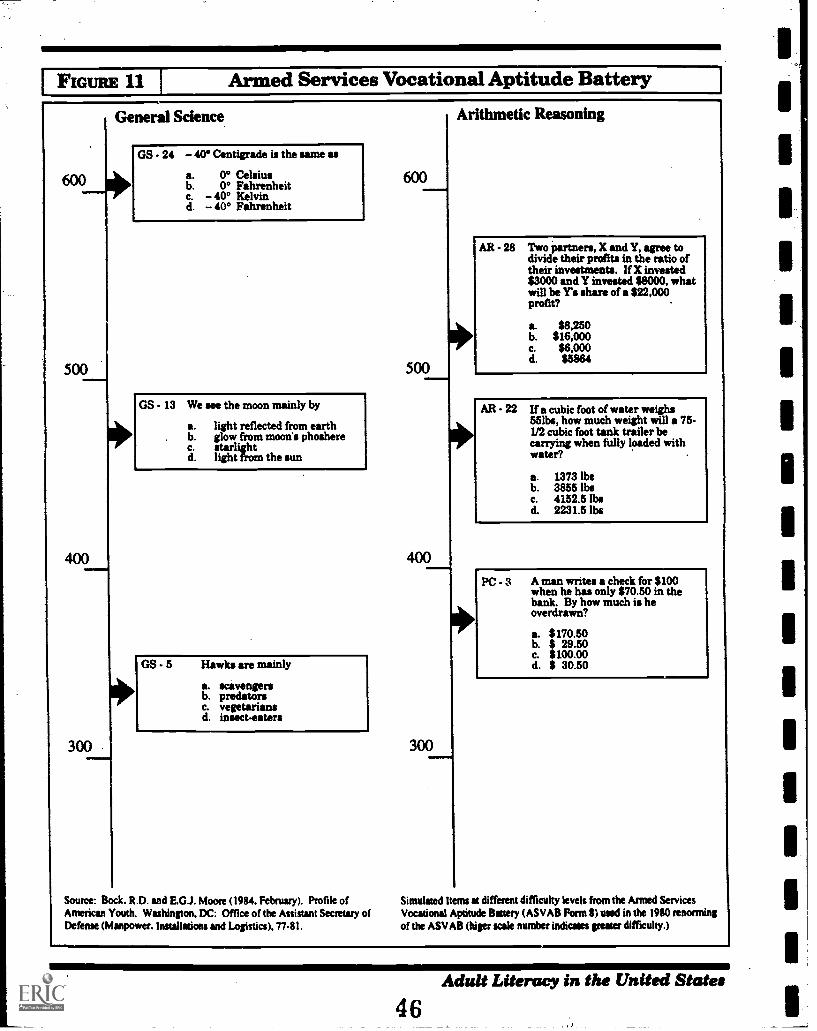
IFIGURE 11 Armed Services Vocational Aptitude Battery
600
500
400
300
General Science
GS - 24 40° Centigrade is the same as
a. 0° Celsiusb. 0° Fahrenheitc. 40° Kelvind. 40° Fahrenheit
GS - 13 We see the moon mainly by
a. light reflected from earthb. glow from moon's phosherec. starli6td. light fivm the sun
GS - 5 Hawks are mainly
a. scavengersb. predatorsc. vegetariansd. insecteaters
Source: Bock. R.D. and E.G.). Moore (1984. February). Profile ofAmerican Youth. Washington. DC: Office of the Assistant Secretary ofDefense (Manpower. Installations and Logistics). 77-81.
4111M11
500
400
300
Arithmetic Reasoning
AR - 28 Two Partners, X and Y, agree todivide their profits in the ratio oftheir investments. If X invested$3000 and Y invested $8000, whatwill be Y's share of a $22,000profit?
a. 88,250b. $16,000c. $6,000d. $5864
AR 22 If a cubic foot of water weighs&Sibs, how much weight will a 75-I/2 cubic foot tank trailer becarrying when My loaded withwater?
a.b.c.d.
1373 lbe3855 lbs4152.5 lbs2231.5 lbs
PC . 3 A man writes a check for $100when he has only $70.50 in thebank. By how much is heoverdrawn?
a. $170.50b. $ 29.50c. $100.00d. $ 30.50
Simulated Items at different difficulty kvels from the Armed ServicesVocational Aptitude Butery (ASVAB Form 8) used in the 1980 renormingof the ASVAB (higer scale number indicates greater difficulty.)
36 Adult Literacy in the United States
46
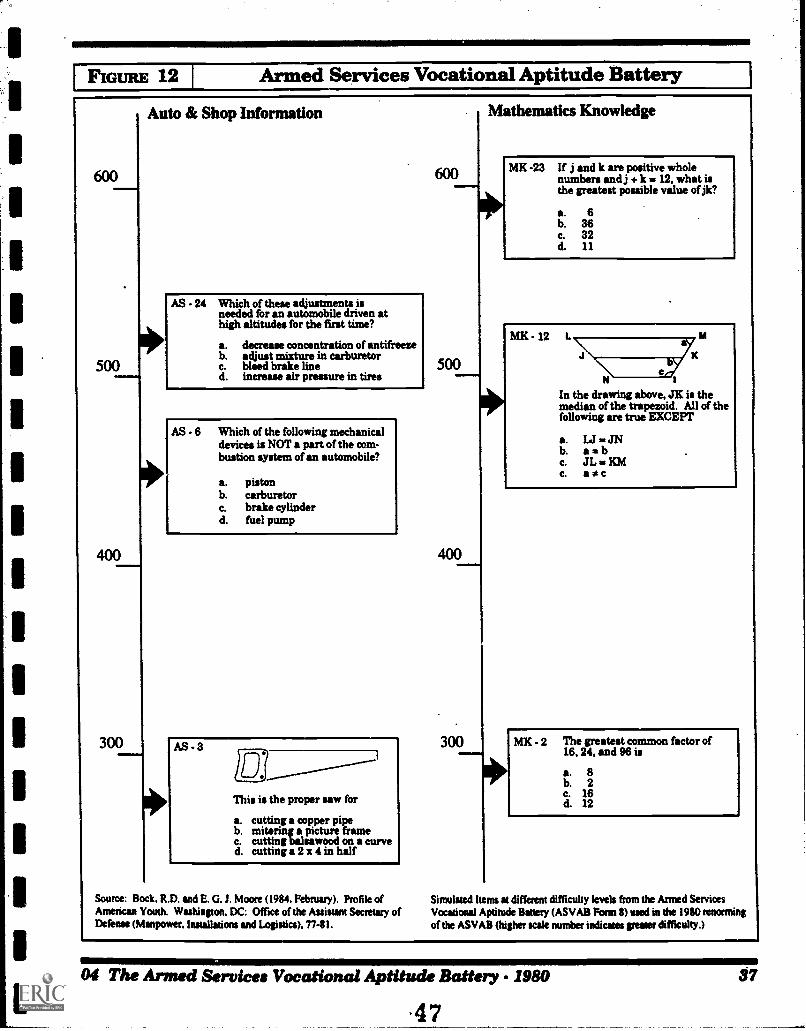
FIGURE 12 Armed Services Vocational Aptitude Battery
Auto & Shop Information
600
AS - 24
500
AS - 6
400
300 AS - 3
Which of these adjustments isneeded for an automobile driven athigh altitudes for the first time?
a. decrease concentration of antifreezeb. adjust mixture in carburetorc. bleed brake lined. increase air pressure in tires
Which of the following mechanicaldevices is NOT a part of the com-bustion system of an automobile?
a.b.C.
d.
pistoncarburetorbrake cylinderfuel pump
This is the proper saw for
a. cutting a copper pipeb. mitering a picture framec. cutting balsawood on a curved. cutting a 2 x 4 in hslf
Source: Bock. R.D. and E. G. I. Moore (1984, Febniary). Profile ofAmerican Youth. Washington, DC: Office of the Assistant Secretary ofDefense (Manpower. Installations and Logistics), 77-81.
Mathematics Knowledge
If j and k are positive wholenumbers andj + k In 12, what isthe greatest possible value ofjk?
a. 6b. 36c. 32d. 11
111.1111111W
In the drawing above, is themedian of the trapezoid. All of thefollowing are true EXCEPT
a. LJ st,INb. a bC. JL at KMC. a*c
MK - 2 The greatest common factor of16. 24, and 96 is
a. 8b. 2c. 16d. 12
Simulated hems at different difficulty levels from the Armed SavicesVocational Aptitude Battery (ASVAB Flinn 8) used in the 1980 renamingof the ASVAB (higher scale number indicates rester difficulty.)
04 The Armed Services Vocational Aptitude Battery - 1980
.47
37
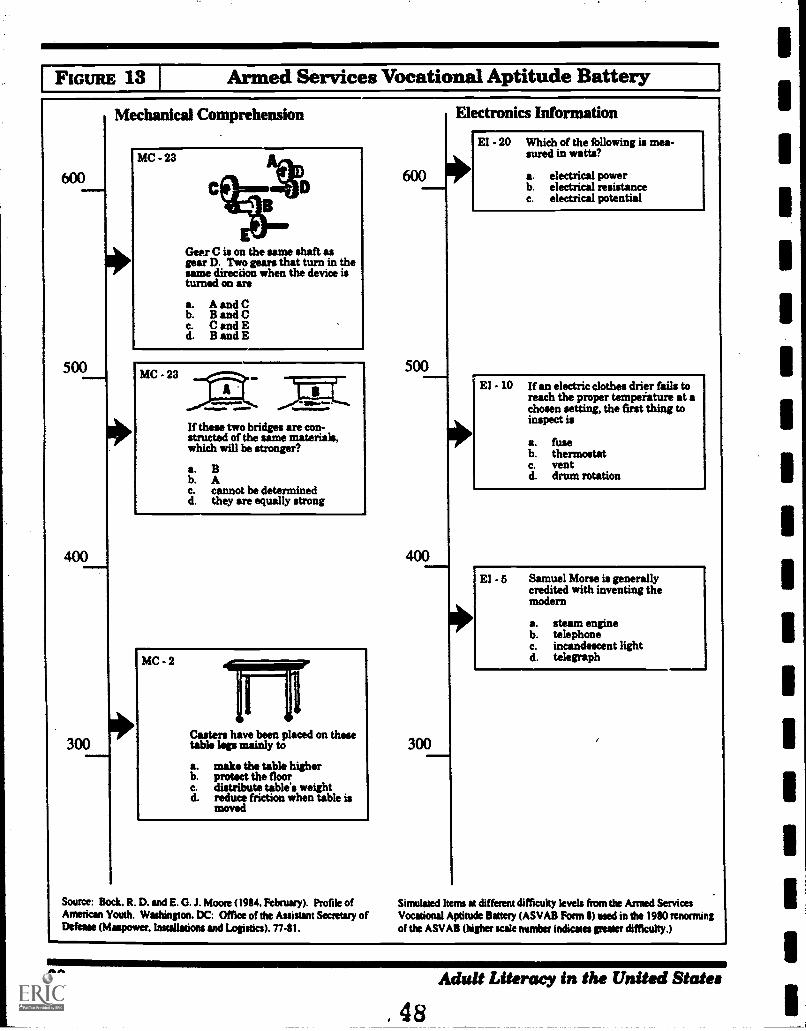
FIGURE 13 Armed Services Vocational Aptitude Battery
500
300
Mechanical Comprehension
MC - 23
Clear C is on the same shaft asgear D. Two gears that turn in thesame direedon when the device isturned on arc
a. A and Cb. B and Cc. C and Ed. B and E
MC - 23
If these two bridges are con-structed of the same materials,which will be stronger?
a. Bb. Ac. cannot be determinedd. they are equally strong
Source: Bock, R. D. and E. G. J. Moore (1984. February). Profile ofAmerican Youth. Washington. DC: Office of the AltifUlat Secretary ofDefease (Manpower. Installed= and Logistics), 7741.
600
500
400
300
Electronics Information
El - 20 Which of the following is mea-sured in watts?
a. electrical powerb. electrical resistancec. electrical potential
EI If an electric clothes drier fails to I
reach the proper tempeiature at achosen setting, the first thing toinspect is
a. fuseb. thermostatc. ventd. drum rotation
El - 5 Samuel Morse is generallycredited with inventing themodern
a.b.c.d.
steam enginetelephoneincandescent lighttelegraph
Simulated kens at different difficulty levels from the Armed ServicesVocational Aptitude Battery (ASVAB Form 8) used in the 1980 renormingof the ASVAB (higher scale number indicates greaser difficulty.)
38
4 s
Adult Literacy in the United States
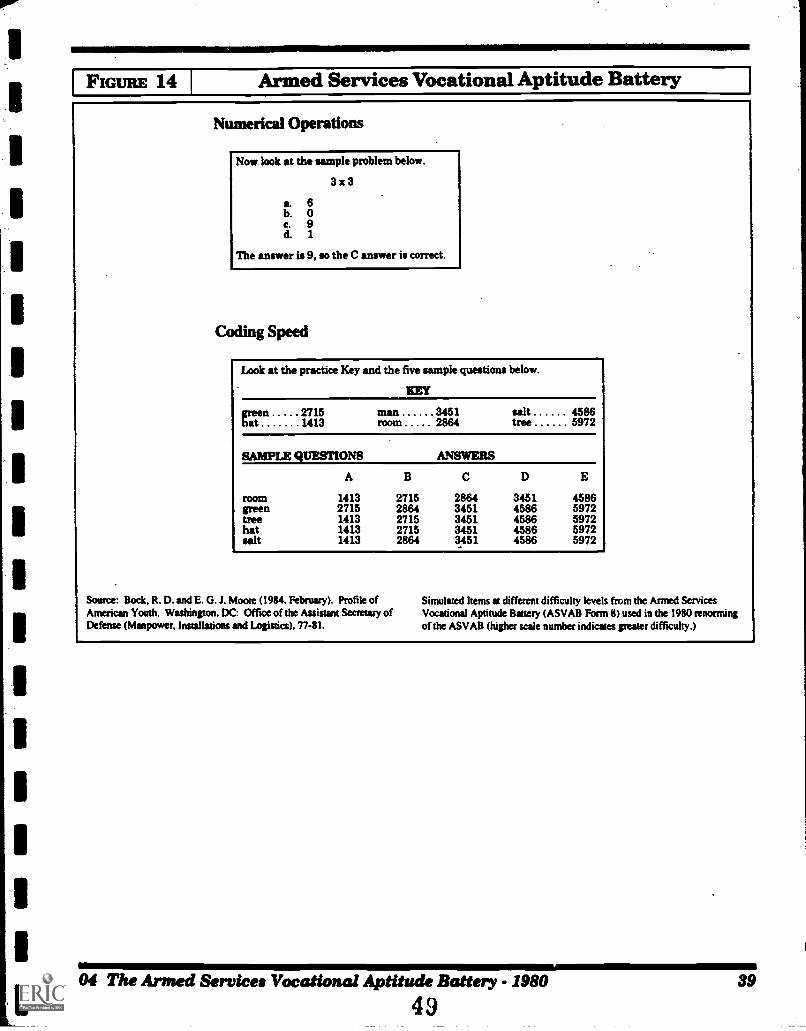
1
Gum 14 Armed Services Vocational Aptitude Battery
Numerical Operations
Now look at the sample problem below.
3 3
a. 6b. 0c. 9d. 1
The answer is 9, so the C answer is correct.
Coding Speed
Look at the practice Key and the five sample questions below.
KEY
green 2715 man 3451 salt 4586MOMhat 1413 2864 tree 5972
SAMPLE QUESTIONS ANSWERS
A B C D E
MOM 1413 2715 2864 3451 4586green 2715 2864 3451 4586 5972tree 1413 2715 3451 4586 5972hat 1413 2715 3451 4586 5972salt 1413 2864 3451. 4586 5972
Source: Bock, R. D. and E. G. I. Moore (1984, February). Profile ofAmerican Youth. Washington, DC: Office of the Assistant Secretary ofDefense (Manpower, Installations and Logistics). 77-81.
Simulated Items at different difficulty levels from the Armed ServicesVocational Aptitude Battery (ASVAB Form 8) used in the 1980 renormingof the ASVAB (higher scale number indicates greater difficulty.)
04 The Armed Services Vocational Aptitude Battery 1980
4939
TESTING OF ADULT LITERACY IN THE CIVILIAN SECTOR
Data are presented for civilian assessments of adultliteracy spanning over a half century (Table 3). Withthe exception of Buswell's study that sampledadults in the Chicago area, the other studies haveused a nationally representative sampling of eitheryoung adults or the full range of adults.
Starting with Buswell's study in 1937, civiliansurveys of literacy skills have gone beyond theassessment of reading and mathematics from an"academic" perspective, like those followed in themilitary tests, to an approach in which the academicskills of reading and mathematics are applied to theperformance of "real life," or "functional" tasks.This includes such tasks as reading movie or TVadvertisements, figuring the price of items in agrocery store advertisement, following instructionsin recipes, locating information in train schedules,filling out various forms and so forth.
The civilian adult surveys of literacy are also morelikely to use open-ended, constructed response itemsrather than relying solely on multiple-choice itemsas do the military tests. However, neither this nor theuse of "real world" tasks has seemed to have affectedmajor trends in the findings with either military orcivilian literacy tests.
Education and Literacy Skill
In both military and civilian literacy assessments,performance is strongly influenced by the amount offormal education the adults have. Higher educatedadults perform better than those with mediumamounts of education and the latter out-perform theleast educated adults.Thus, as a general trend, greateramounts of formal education are associated withgreater amounts of literacy skill, i.e., greater abilityof adults to perform both "academic" and "functional,real world" tasks. (see Figures 15, p. 43; 30, p. 59;33, p. 63; 37, p. 67; 68, p. 99; 82, p. 113).
Education and Literacy Practices
As a general trend, as the amount of education goesup, so, too, does the amount of reading and thevariety of materials read. Better educated adults readbooks, magazines, and newspapers more often thando less well educated adults (see Figures 15, p. 43,33, p. 63, 68, p. 99, 82, p. 113).
Literacy and Ethnicity
On both the military's Armed Services VocationalAptitude Battery (Figure 8, p. 33) and the NationalAssessment of Educational Progress's Literacy:Profiles of America's Young Adults, across all lev-els of education, Whites exceed the performance ofAfrican-Americans, and Hispanics fall in between(see Figure 91, p. 137). These are essentially thesame findings as with the Army's Alpha and Betatests in 1917 (Figure 3, p. 23) when the latter wasused with non-English speaking recruits as well aswith low literates.
05 Buswell's Study ofAdult Literacy Skills in Chicago 193750
41
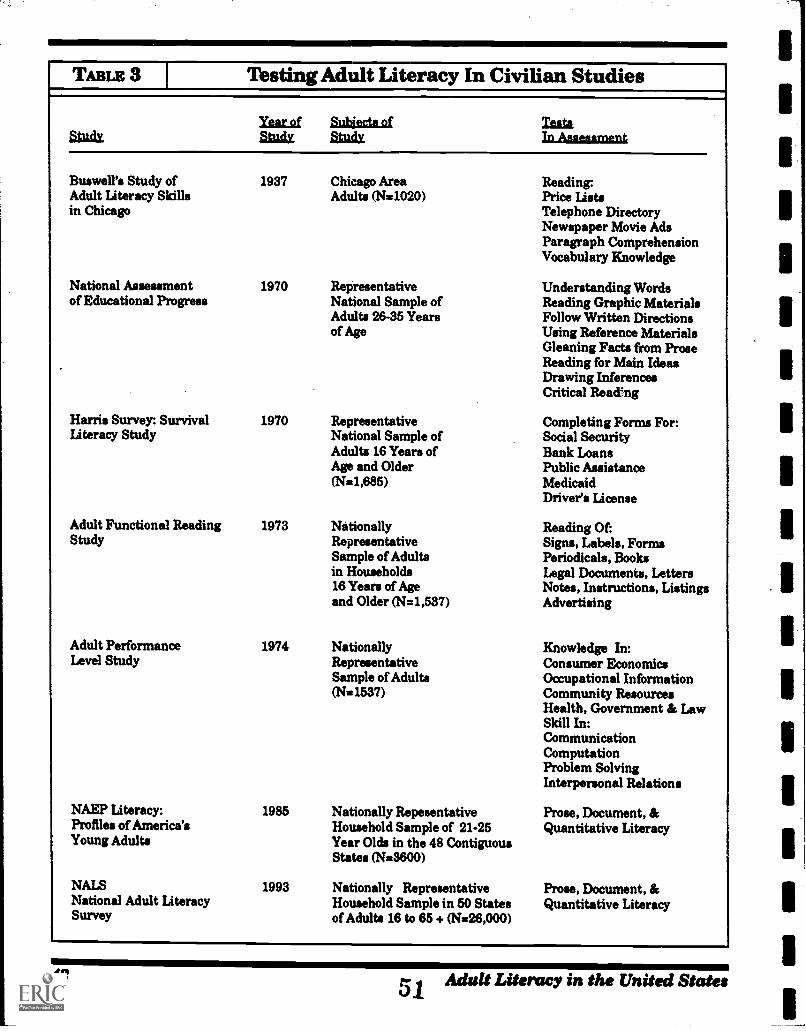
TABLE 3 Testing Adult Literacy In Civilian Studies
Xesr.sf Subjects etElagx Eindx.
lutaL1,81=111=1
Buswell's Study ofAdult Literacy Skillsin Chicago
National Assessmentof Educational Progress
Harris Survey: SurvivalLiteracy Study
1937 Chicago AreaAdults (N=1020)
1970 RepresentativeNational Sample ofAdults 26-35 Yearsof Age
1970 RepresentativeNational Sample ofAdults 16 Years ofAge and Older(N=1,685)
Adult Functional Reading 1973 NationallyStudy Representative
Sample of Adultsin Householde16 Years of Ageand Older (N=1,537)
Adult PerformanceLevel Study
NAEP Literacy:Profiles of America'sYoung Adulta
NALSNational Adult LiteracySurvey
1974 NationallyRepresentativeSample of Adults(N=1537)
1985 Nationally RepesentativeHousehold Sample of 21-25Year Olds in the 48 ContiguousStates (N=3600)
1993 Nationally RepresentativeHousehold Sample in 50 Statesof Adults 16 to 65 + (N=26,000)
Reading:Price ListsTelephone DirectoryNewspaper Movie AdsParagraph ComprehensionVocabulary Knowledge
Understanding WordsReading Graphic MaterialsFollow Written DirectionsUsing Reference MaterialsGleaning Facts from ProseReading for Main IdeasDrawing InferencesCritical Reading
Completing Forms For:Social SecurityBank LoansPublic AssistanceMedicaidDriver's License
Reading Of:Signs, Labels, FormsPeriodicals, BooksLegal Documents, LettersNotes, Instructions, ListingsAdvertising
Knowledge In:Consumer EconomicsOccupational InformationCommunity ResourcesHealth, Government & LawSkill In:CommunicationComputationProblem SolvingInterpersonal Relations
Prose, Document, &Quantitative Literacy
Prose, Document, &Quantitative Literacy
4251 Adult Literacy in the United States
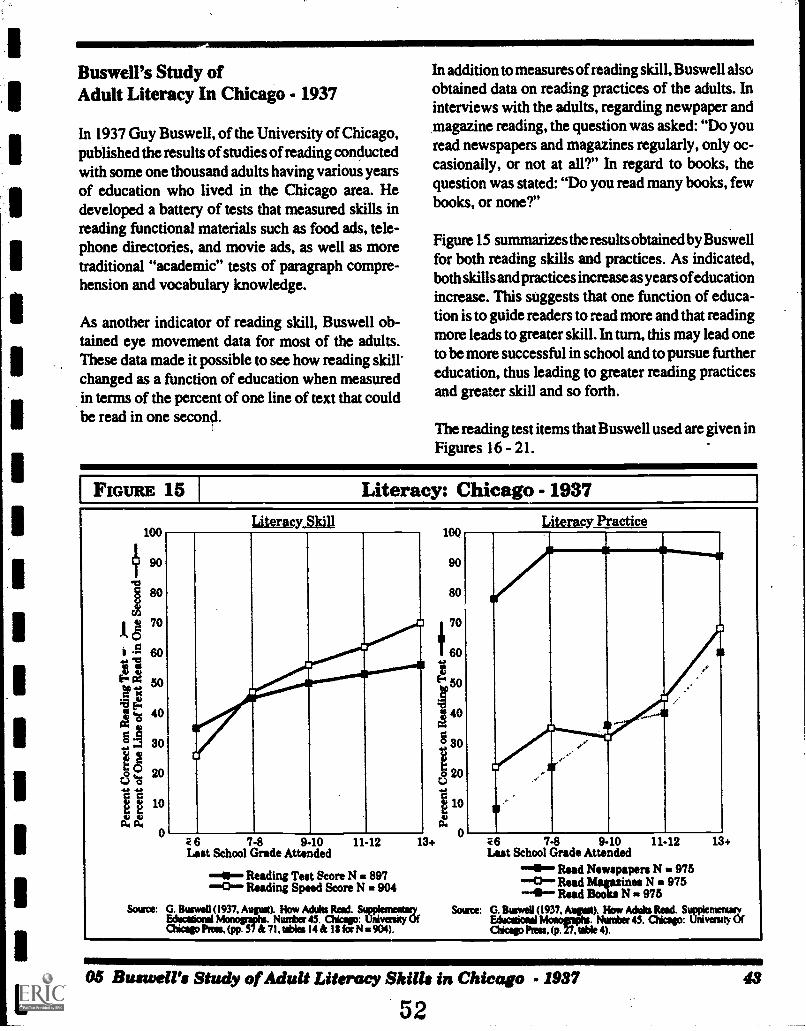
Buswe 11's Study ofAdult Literacy In Chicago - 1937
In 1937 Guy Buswell, of the University of Chicago,published the results of studies of reading conductedwith some one thousand adults having various yearsof education who lived in the Chicago area. Hedeveloped a battery of tests that measured skills inreading functional materials such as food ads, tele-phone directories, and movie ads, as well as moretraditional "academic" tests of paragraph compre-hension and vocabulary knowledge.
As another indicator of reading skill, Buswell ob-tained eye movement data for most of the adults.These data made it possible to see how reading skill'changed as a function of education when measuredin terms of the percent of one line of text that couldbe read in one second.
In addition to measures of reading skill, Buswell alsoobtained data on reading practices of the adults. Ininterviews with the adults, regarding newpaper andmagazine reading, the question was asked: "Do youread newspapers and magazines regularly, only oc-casionally, or not at all?" In regard to books, thequestion was stated: "Do you read many books, fewbooks, or none?"
Figure 15 summarizes the results obtained by Buswellfor both reading skills and practices. As indicated,both skills and practices increase as years of educationincrease. This suggests that one function of educa-tion is to guide readers to read more and that readingmore leads to greater skill. In turn, this may lead oneto be more successful in school and to pursue furthereducation, thus leading to greater reading practicesand greater skill and so forth.
The reading test items that Buswell used are given inFigures 16 - 21.
FIGURE 15 Literacy: Chicago - 1937
100
so
70
40
30
20
10
Literacy Skill100
so
80
Literacy Practice
6 7-8 9-10 11-12Last School Grade Attended
60
E-a 50
A40
Z 30
o 20
10
013+ 6 7-8 9-10 11-12 13+
Lut School Grade Attended141 Read Newspapers N 9750" Read Magazines N 9756 Read Boots N w 975
Source: G. Boswell (1937, Avipst). How Adults Reed. SwpkmenteryEducasiensi Monogrephs. Number45. Chicago: thivensty OfMew Rm. (p. 27.-able 4).
Reading Test Score N 8970 Reading Speed Score N 904
Source: G. 8uswel1 (1937, August). How Adults Rad.Educsiorel Monograpla. Nurnbw45. aticejtevial=Clamp PRIM (pp.-57 & 71, tibia 14 & 111for N -904).
11-12 13+
05 Buswell's Study of Adult Literacy Shills in Chicago - 1937
5243
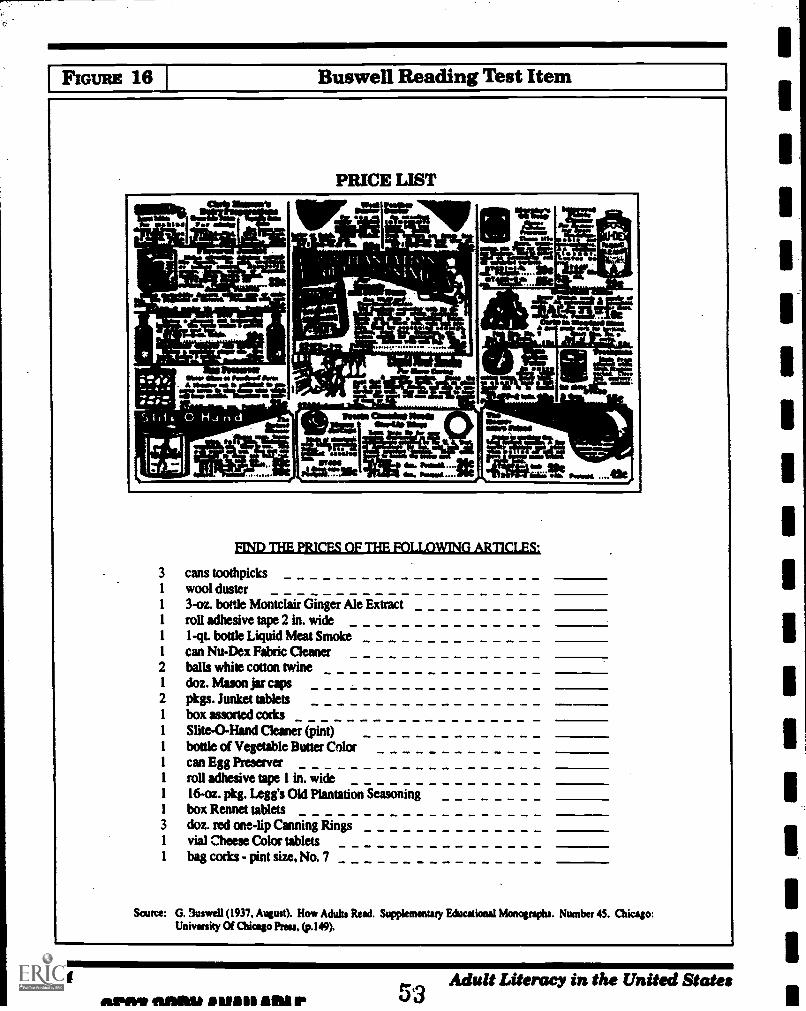
IFIGURE 16 Buswell Reading Test Item
PRICE LIST
pm) THE PRICES OF THE FOLLOWING ARTICLES.,
3 cans toothpicks1 wool duster1 3-oz. bottle Montclair Ginger Ale Extract1 roll adhesive tape 2 in. wide1 1-qt. bottle Liquid Meat Smoke1 can Nu-Dex Fabric Cleaner2 balls white cotton twine1 doz. Muon jar caps2 pkgs. Junket tablets1 box assorted corks1 Slite-O-Hand Cleaner (pint)1 bottle of Vegetable Butter Color1 can Egg Preserver1 roll adhesive tape 1 in. wide1 16-oz. pkg. Legg's Old Plantation Seasoning1 box Rennet tablets3 doz. red one-lip Canning Rings1 vial Cheese Color tablets1 bag corks - pint size, No. 7
Source: G. %swell (1937, August). How Adults Read. Supplementary Educational Monographs. Number 45. aticago:Univsnity Of Chicago Press. (p.149).
44API/Vit MINIM SIMI 11r
Adult Literacy in the United States53
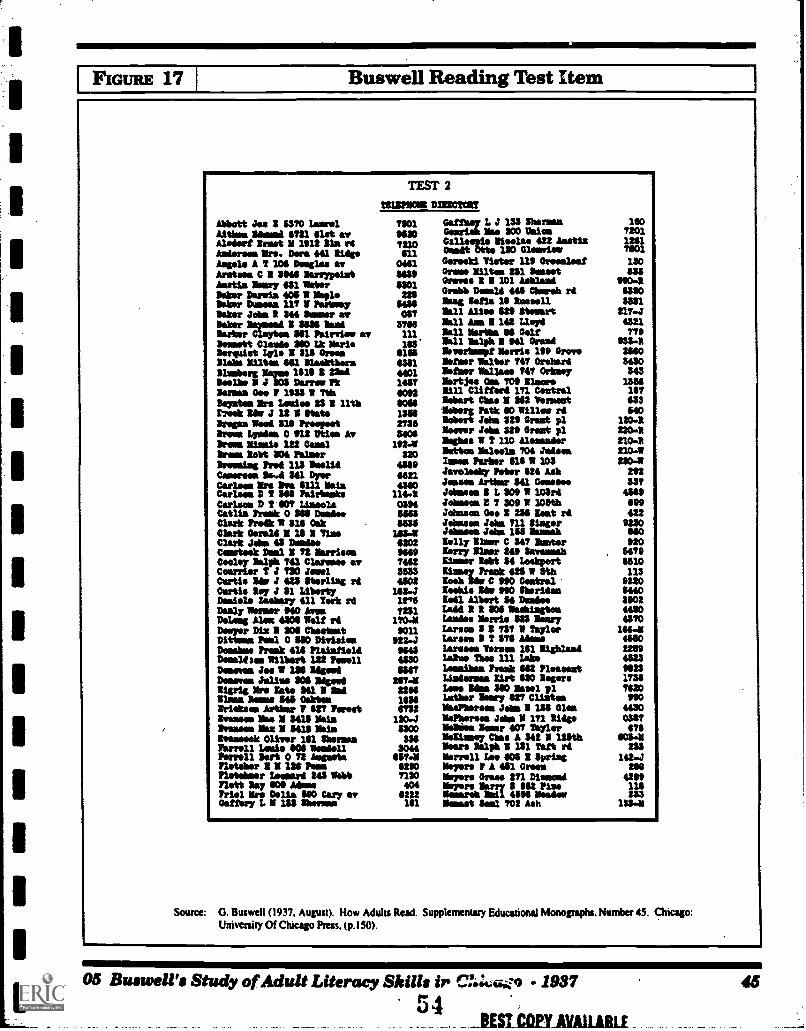
FIGURE 17 Rumen Reading Test Item
TEST 2=MOM DIllieTtlrf
Abbott Jos I $570 Learel 7901 L of 133 nava 190Utiles Ihtersd Ust avMeier! Isnot I 1912 11. rdAsters* Mrs. Dora 441 Ridge
95107210411
Ceurtut Ike 203 DelosGallaspie Please 422 Usti*Omit Otte 110 Glonvies
720112417601
Angela A 7 108 Issas. av 041 Gereskt near no Oressleat 130Assam C 1 51144 lempoistMatta May 651 WaterPoker Dusts 4011 MapleDaher Demean 11? 1 Parkway
141591301
2285464
Gras, lines 251 inmostGraves 1 I 101 AshlandGrid* Denali 446 Chunk rolMug Sofia 31 Russell
8559904
65906551
Dakar Jits 1 244 laser av 0$7 Mall Alias 529 Stoat 217.4Veber lanemd I 3836 Iasi 3/16 Mill Ana I 142 Lloyd 4521loam Clayton 111 Pairriee av 111 Mall Marla 81 Gel! 779Dessatt Claude IMO Ik Mario 153 bill 'all* I 941 Orem& 933-1'Droplet Lyle I 1111 Ones 8156 laerlesst Morris 199 Grove 2540
mites Mil Malabo= 6381 laser Walter 747 Orchard 3430Slastberg lams 1118 I 22ed 1401 Wass Wallas 747 Orksoy 343honks IJ SOS Darrow Pt 1467 lertjes Ow 709 Mare 1554Dorms Gee 1 10301 Tth SOU Rill Clittord 171 Central 157Ileystes Mrs Lodes 23 I 11th SOU lebart Chas 1 162 %met 433[Nook Us J 12 1 StateDrops Weed US ProvostDrew Wades 0 932 Mos AsIran Maile 122 CoalDrees lobt 304 PalmerDrowaing Prod 231 "saidCarrels 114.44 241 DyerCaries' llre Iva 6111 lainCoziest D I 314 Fairbanks
155127353406
1924220
456966214390
1144
Patk 40 Will., rdJain $29 Grant pl
laver Jan no Great piMagas ? 110 AlesesolorMutton lialsoln 704 MassImes Parker 515 lf 103
540120422042104210-142304
292$37
4849
Javelosity Peter 924 AskJana Artless $41 Game&ism L 309 1 10Srd
Carlsos D 401 Wools 0316 &Sam D 1. 309 1 105th 899Canis lank 0 SU Doutioe 5163 &inns Geo 1 234 Sat rd 422Clark Pre& I $11 00t 51115 &base John 711 Singer 9230Clark Gerald Ill I Tia 14114 &Mess &ha 155 lensak 440Mart Jae 43 Dundee 6202 lolly Maar C 147 later 920Carteek Deal I 72 Manias 9441 lorry liar 249 Sinsarmals 5679Cool Palph 741 Clersase av 7462 Meer Rat $4 lakport 5510Courier 7 J 710 Jewel 3533 Omar/ Prank 421 11 Itt 113Certis lea J 42$ Sterling si 4502 look Us C 990 Cestral 9220Curtis ley J $1 Liberty 1112-J Tashi* Us 990 Sheridan $410Daniels &saw 411 Perk it itT5 Zed/ Albert $i Denies $1502Duly laser 940 Awn 7231 laid 11 SOO Waskingtos 4453Moog Alas 4101 Wolf it 1704 lenles Morris US leery 4570layer Dix I 3105 Chesient 9011 lases 3 1 737 11 Taylor
lases 1 T 3711 Masa141141
Online Pea 0 110 Divielos 922J 4150lases* Term 161 IlighlesdDonahoe Freak US Plainfield 9145 /289
Dees14 Hs Wilbert 112 Patel/ 41130 LaRue thee 111 lake 4523Dememen Joe 1 1116 Wood 564? Lavabos bask 542 PleseestDaman Julius 1101 Bigot 2174 Litareas /Art 130 Rigors 173$Stasis ire Nato 141 11 Mel 2214 lame Idea $10 Mal pl 7120Ease Par $U Calm latther leery 427 Ciliates 990*fetus Areal. P 427 Peres! 6752 *senates JOS 1 151 Gles 4430lassos Mao I $415 Maks 1104 Wares' Jdo 1 171 Ridge OUTlames Max 1 5413 this 5300 liellies loner 407 Iwyler 478Weesseek Oliver ill Mama $U MeSimmey Chas 542 1 121th 4034Tarn11 Lads SOS Modell 3064 Mears Ralph 11 131 Taft rd 233Porrell "art 0 72 &gest' 15741 Merrell Les 104 I Spring 1424Pletelsar I I 114 roma $210 Meyers P 441 Gress 2$1Tletdoer launard 245 Webbnot up on Mrs 7110
404Meyers Grum 271 DisnomdMeyers May S 951 Piss
4189111
Mal lire Delia 510 Cary av $222 Marreh Moil UM 15a4re 233Getter, I. 133 lanes 111 lienset Seal 701 Ash 1134
Source: G. Buswell (1937. August). How Adults Read. Supplementary Educational Monographs. Number 43. Chicago:University Of Chicago Press, (p.150).
OS Buswell's Study of Adult Literacy Skills ir Vat; Cii:9 1937
5 4_BESICOPYIVM4R1
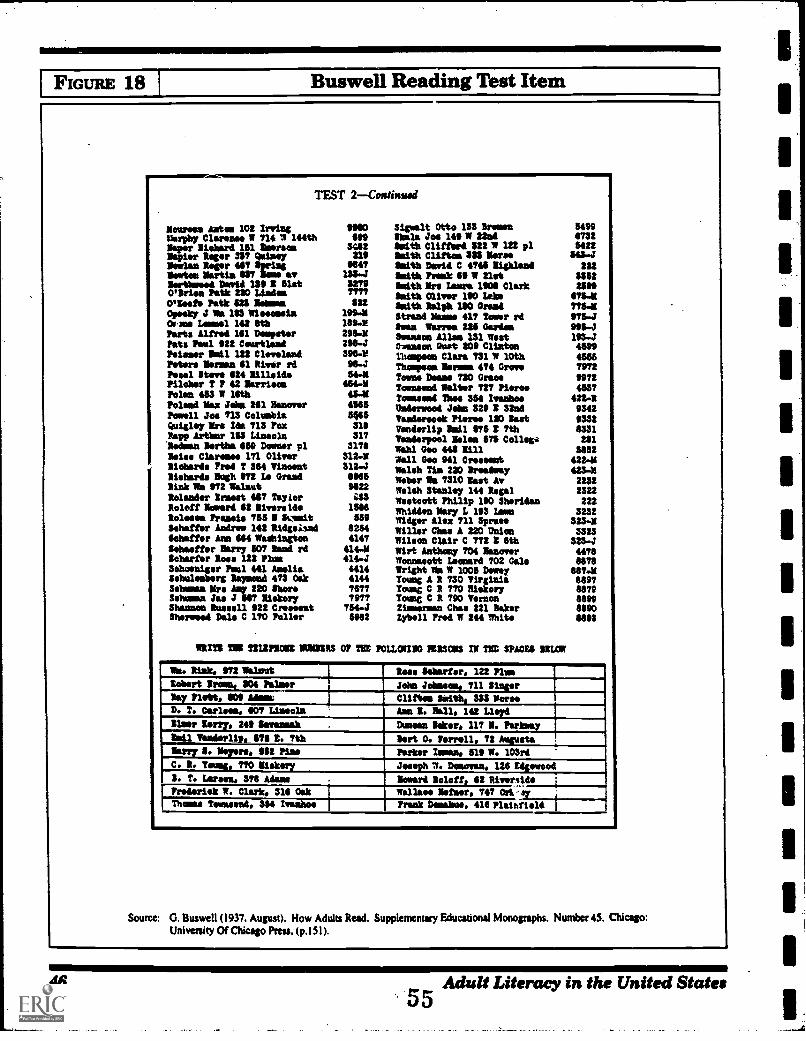
FIGURE 18 Buswell Reading Test Item
TEST 2Continued
Scums Anton 102 IrvingLWOW Clams* 14 714 II 144thSoper Rishard 161 LarsonNapier Roger 34? Way/Neel= Roger 447 SpringNewton Martin 837 lone
4480449
$442214
984?132442797777422
1,44189.12964244-J398-296-154-2
454-245.4I
48455464
518$1?3174
312-2512-J84459822
1544589
82644147
414.24144441441447877797775445982
Sigualt Otto 13$ BremenSkala Jos 1441 21ndSmith Clifferd $22 71 122 plSmith Clifton 411 MorseSmith David C 4744 lighlandSmith Prost III SlotSmithIre Laura 1404 ClarkSmith Oliver 140 USWSmith Ralph 140 GrandStrand Name 411 Tower rdSeen Ayres 225 GardenSwanson Allem 131 Westamass Gush 209 ClintonThompson Clara 731 1 10thTheoposallernem 474 GroveTeens Deane 720 GroomTownsend Walter 117 PierceTommemed This 354 knobs,Omderwood John 329 2 32ndVandereeek Piesee 110 lastVenderlip toil 575 2 ?thVanderpool Melee 675 CollegeWahl Geo 44$ 1111Wall Goo 941 CressestIlleb Tin 220 Brea4mayWeber/1a 7310 last AvWelsh Stamley 144 RegalWestoott Philip 140 Sheridan'hidden Nary L 143 /menWidger Alex 711 Spree.Willer Chas A 220 UnionWilson Clair C 772 2 8thWirt Anthony 704 HanoverBronnemott Leopard 702 GalsWright Wm W 1005 DeweyYoung A 1 730 VirginiaPoore C 1 770 NiekoryYoung C 1 740 VernonZimmerman Chas 221 BakerZybell Fred 1 244 Ibits
5499673254225434
22242522$94
4716.2
775.2475-J948-J195-J459945567972
4912453?
422-1934293328331241
5482422.41
425-122322322222
3232323-13323
323-444788474887488978879889988906895
gmNorthwood David 134 2 SlatO'Brien Patk 220 LimdmaWhet* Patk 824 Airs°reeky J Wa 183 llsoomeinOccise Lemsel 142 StbParts Alfred 141 DempsterPats Paul 422 CourtlandMaser Mmi1 122 ClevelandPeters Merman 41 River rd/heel Steve 414 lillaidoPilober 7 F 42 MorrisonPolon 45$ W 14thPolemd Wax J. 241 HanoverPowell Jos 713 ColumbiaQuigley lirs Ida 713 FoxRapp Arthur 151 Linsoln*Rodman Worths 469 Downer plIsles Owosso 171 OliverRichards Fred T 364 VinoontRichards Neigh 472 1re GramdRink1ba 472 llbstRolander Inset 487 TaylorReleff Seward $2 RiversideRelease hassle 755 2 Siamit'abater Andrew 142 RidgeisndMatter Ann 844 ihishingtenSehaeffer Nervy 037 Rand rdSebarfer Ross 122 PlumSobseniger Paul 441 AeolisSehuleeberg laymond 473 OakSebum' Mrs Amy 220 ShoreSchuman Jae J SS? NiskoryShannon Russell 422 Creel:estShe:weed Dale C 170 Puller
WRITS 112 12121,2011 2023213 OF T112 POLLCWING VERSCOS IN Tyr SPACES MOW
We. Mak. 972 Wa last Ross Seharfer, 122 Plum
Iobert Pram, SO4 Palmer John Jetsam, 711 Singer
Clifton SOM. 322 Norselay nett. 404 Aimma
D. T. Carlson. 601 Linseln Amn I. 2611, 142 Lloyd
Niger Kerry, 244 Ihrrammah Dusan licer, 117 N. Parkway
1 Vanderlip. 474 2. 7th Sort O. Ferrell, 72 Mesita
Nervy S. Weyer,. 412 Pine Parker Inman, 818 14 103rd
C. R. Tomb ?TO Mlekery Joseph W. Darren, 128 Edgewood
B. T. Larsen, 378 Adana,
Seward ROW, 42 RiversideFroderiek W. Clark, 314 Oak wellase after, 747 Oricsy
Frank /Seiko*, 418 Plainfie14 IMamas Townsend,354 Ivanhoe
Source: G. Buswell (1937. August). How Adults Read. Supplementary Educational Monographs. Number 45. Chicago:Univenity Of Chicago Press. (p.151).
46 Adult Literacy in the United States55
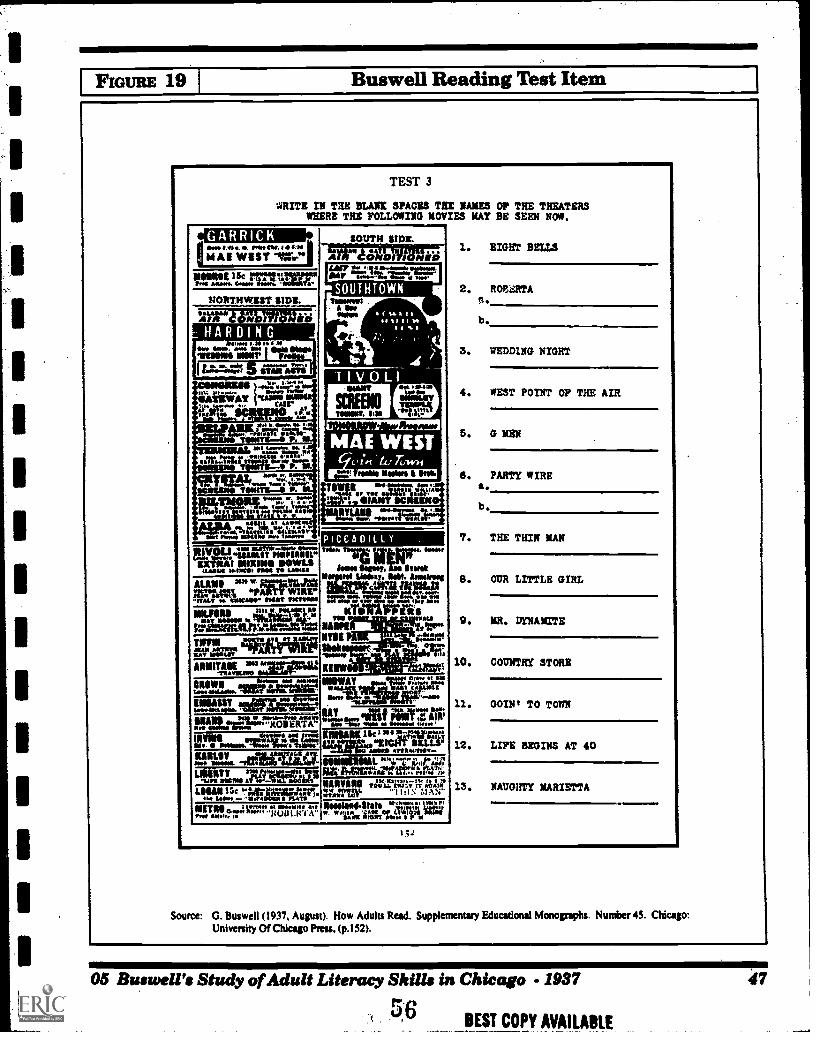
FIGURE 19 %swell Reading Test Item
TEST 3
WRITE rs THE BLAME SPACES THE NAMES OF THE THEATERSWHERE THE FOLLOWING MOVIES MAY BE SEEN NOW.
GARRICK SOUTH SIDE.COdd Idle. a. PrVe.1 MI 1114
MMO WRAY "awril4Aik"'d &IMP.7 laLim so 141.0.400sas ISOloolt.war ....-17......, d Nov
SOUTHTOWNlir:"on I :.:;',. . ...
11 .... .
'...
4 / .
TIVOLIwar OA ..11.1121
WI Soowe evamtv
mut sas IVA'
Melnet I5e I.MmoesuLawr,ft datum Cda Iltstit s.!1'1%'
NORTHWEST SIDE.
ItrA"teSIMAYM4ig;,
.,... 1 NH 4 NOid, Sold dem Ow 1 OW Maw111111111111 lour, 1
I Wail= 5 wrnii-Wifi i.-. 1...2:-Ilalu*"ikiiiiier mum,... ........ .,, car%Ins 4 . t .4
ARK .a......0IL or....t 77/2Arffi
ot-Prnir ."'" inz: . .
c, i ,, tLy TUIV).1111'.
MA. b"1;luirwewasp. tosITs1.:41 P. ay TOW II av jrAIA
biratair": 1..-rgT4311:71Wr-Fr,AY"
....".1/11 411:4:4V" """
43' PICCADILLY
EMU, ' 1111 rerigagal" is i " ' . desist
Mail Nam ownsmums WHIM non To ammo Jesse Owl. beak
11 rot Us1.,:y. SAL AmongALAMO " w. gnottiMnista& *PARTY WIRE" 1141161P1113....._-MILT ft. 01104fr Milt InenSIS Wrami.....4.X.,,741:1
mat5=221111.Palt...11 SITMWFIriliAusiiiivardiVe 7:W...1ffm--- NAM
WM WM IP I '4.1:1611, 9,71:1"1"
awl Arrows 'IV.WIT wow I/Z" vow* - . 7 c: :ARMITO 2$'21EgigwiLt KM
S. 5$ :
AMSAUT sagettrart !"" "wo4stg..0....
;Pa. ="3.1........4617.....111.car="W"--Kos"Erille.invINI ....mut at gjeumq.k' inigkratzisic Roam& ftr S.Mr."Emall IBMSurns momets..-sue 4261ktak2; senuniLurITY Nivrevivssabanz.lirtnimi..1 air 'A*
gal OANYA110 ratir, tmg.:ilr'llaili:1.411015e ktargotwil.........rj,v. "11iIN MAN"
do lall4os -- InerAftlde11-dlATIF ---forme r ..I. soomm...al IlemlawlStats "4:7:ii Jai... *Mir. la N. ' Is001.}4 1 A .. W"Viii Warciegin. as
152
1.. EIGHT BELLS
2. ROEMA
b.
3. WEDDING NIGHT
4. WEST PO/NT OF THE AIR
5. GWEW
6. PARTY WIREa.b.
7. THE THIN MAN
8. OUR L/TTLE GIRL
9. MR. DYNAMITE
10. COUNTRY STORE
11. ODIN' TO TONE
12. LIFE BEGINS AT 40
1 . NAUGHTY MARIETTAOEM!
Source: G. Buswell (1937, August). How Adults Read. Supplementary Educational Monographs. Number 45. Chicago:University Of Chicago Press. (p.152).
05 Buswell's Study of Adult Literacy Shills in Chicago - 1937 47
5:6 BEST COPY AVAILABLE
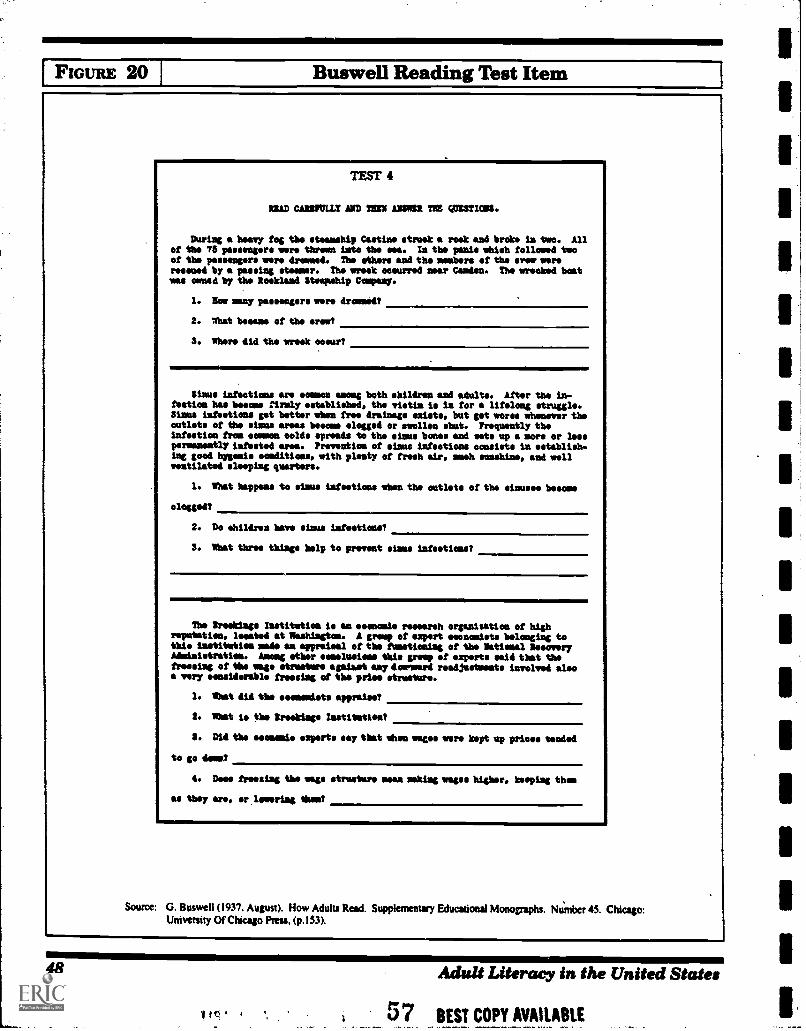
IFIGURE 20 Buswell Reading Test Item
TEST 4
RRAD CAIRPULLY AND INEN WW2' TNE OtitTIC113.
During a heavy fog the steamship Castine struek a rook and broke in two. Allof the 75 passengers Imre threes into tbe sea. In the panic whigh followed twoof the passengers mere drowned. The ethers and the members of the crewmenroomed by a passing steamer. /he wreak assurred near Camden. The urooko4 boatwas vaned by the Rookland Steanship Company.
1. New many passeogers sere drafted?
2. what Wean* of the arse/
3. !here did the week *emir?
Sinus Wootton* are unman among both children and adults. After the in-fection has Weems firmly established, the vietta is la for lifelong struggle.Sinus targetless get better when free drainage exists, but got wore* whenever theoutlets of the sinus areas boom* clogged or swollen shoat. Frequently theingestion from common eolds spreads to the sinus bones and sets up a more or lesspernansatly infested area. Preventioa of sinus infections consists in establish-ing good bygenie conditions, with pleaty of fresh air, nosh sunshine, mavenventilated *looping quarters.
1. Whet hippos* to sinus infections when the outlets of the sinuses bosoms
slogged?
2. Do children love sinus inftetionst
S. What three thing* help to prevent *inns infeetioest
The Spooking* Iiistitation is misogamists mearch organisation of highreputation, legated at Washiagtos. A greep of *sport esonamiste belooging tothis iastitution mad, an appraisal oaths functioning of the Natiemal lieeoveryAdministrittlea. Among ether esmslusions this peep if experts said that the!rootlet et** wage *traduce age/het any dAngwart read3astseats involved aloea very considerable !Tossing of the priee *treaters.
1. What did the esomemints appralest
2. What is the Brookings Instilmtleat
$. Did the soonest* exports say that ekes gages were kept up prices tended
to go deal
4. Dees freesias the uage strusture mean askiagirages higher, keeping thee
as they ere. er.leaeriag thud
Source: G. Buswell (1937. August). How Adults Read. Supplementary Educational Monographs. Nuniber 45. Chicago:University Of Chicago Press. (p.153).
48 Adult Literacy in the United States
BEST COPY AVAILABLE
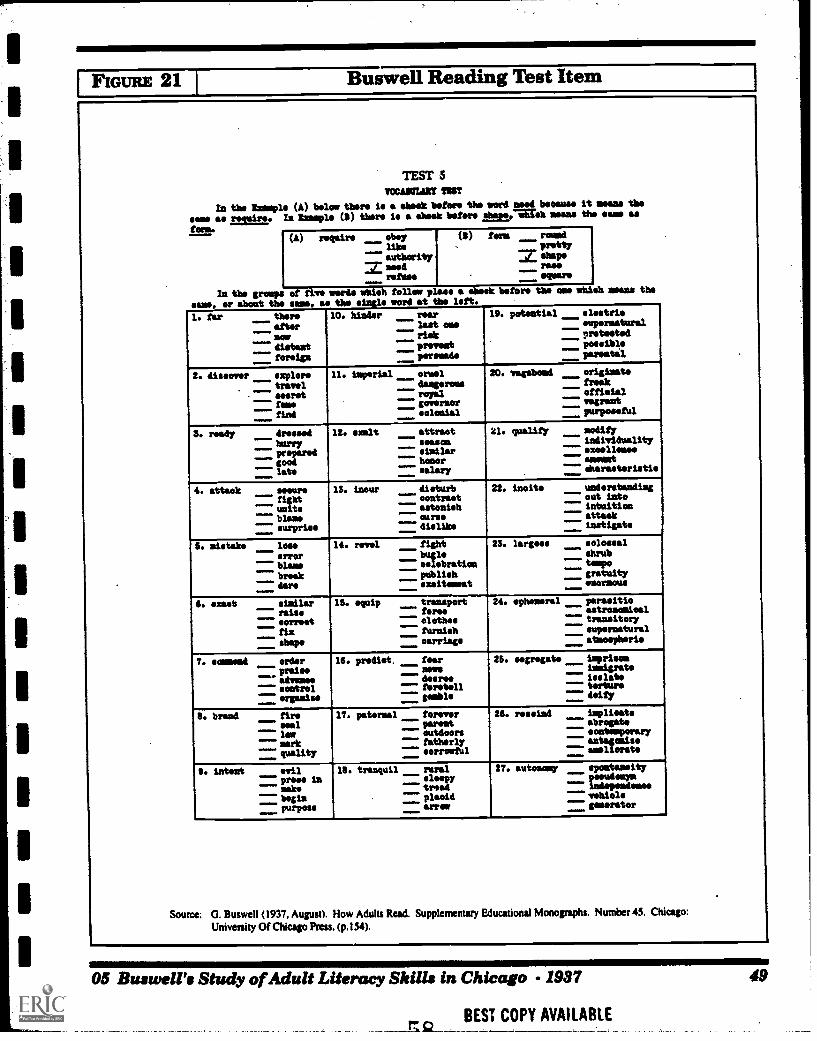
IFIGURE 21 Buswell Reading Test Item
11EST 5
MAMMY TUTIn the aseecle (A) below there is a shook before the word need Weaves it moans the
sole as require. In Ikereple (5) there is a shook beers mane the Sam asfona.
(A) require obey
*authorityseednine*.1
(5) fora roundprettysbaPsIwoegsare
in the groups of five words utih follow plass a Oink before the ame 'shish means the
---I. far there
---- afternowdistantforeign
10. hinder roarlast carriskpreventpersuade
19. potential elstrie..-- supernatural
crotostodpossible
,
pareatil
2. dimmer xploretravel- eseretforefind
11. imperial enrol= dangerous
royal--"" governor
solonial
20. 'moaned originate!reekoffisial
*--* vagrantpurpound
,..3. ready dressed
hurryPre Paredgood_ late
12. exalt attractserumssimilarhonorsalary
21. qualify modifyindividualityenrollee**
. eitarsetoristis......
4. attack secure%Ina 1 re
MUM..... surprise
13. ineur disturb()outputastonishOM*
"-- dislike
22. incite understandingout intointuitionrata.*instigate
S. mistake loserrorblewbreakdare
14. revel IIID fight-.... le
titebraticepublishexeitearat
23. largess eolossalshrub= trap*gratuityenormous
6. xist similarraisesorreotfix
"-- shape
15. quip transportfora*clothesfurnish
...... carriage
24. ephoneral parasiticestrum/dealtransitorysupernaturalatasepheris
7. eommend order.--- praise
abasessontrol
= organise
16. predist. fearBOWS
--- deers.-- foretellgamble
26. eegregato imprisonimigratoisolatetorture
--'' deity
S. brand fire.."-* sea/
lotmarkquality
17. paternal forever--- parent
outdoorsfatherlysorrowful
26. ressiad inplieato--"- abrogate
eantesworaryantagonise
""" analiorate
9. Intent evilpress inmakebeginpurpose
18. tranquil ruralsleepy
-- tread--' placid..... erns
27. autos/ay spontaneitycir.pdriin
ease--"' voided*
generator
Source: G. Buswell (1937, August). How Adults Read. Supplementary Educational Monographs. Number 45. Chicago:University Of Chicago Press, (p.154).
05 Buswell's Study of Adult Literacy Skills in Chicago - 1937 49
ma_BEST COPY AVAILABLE
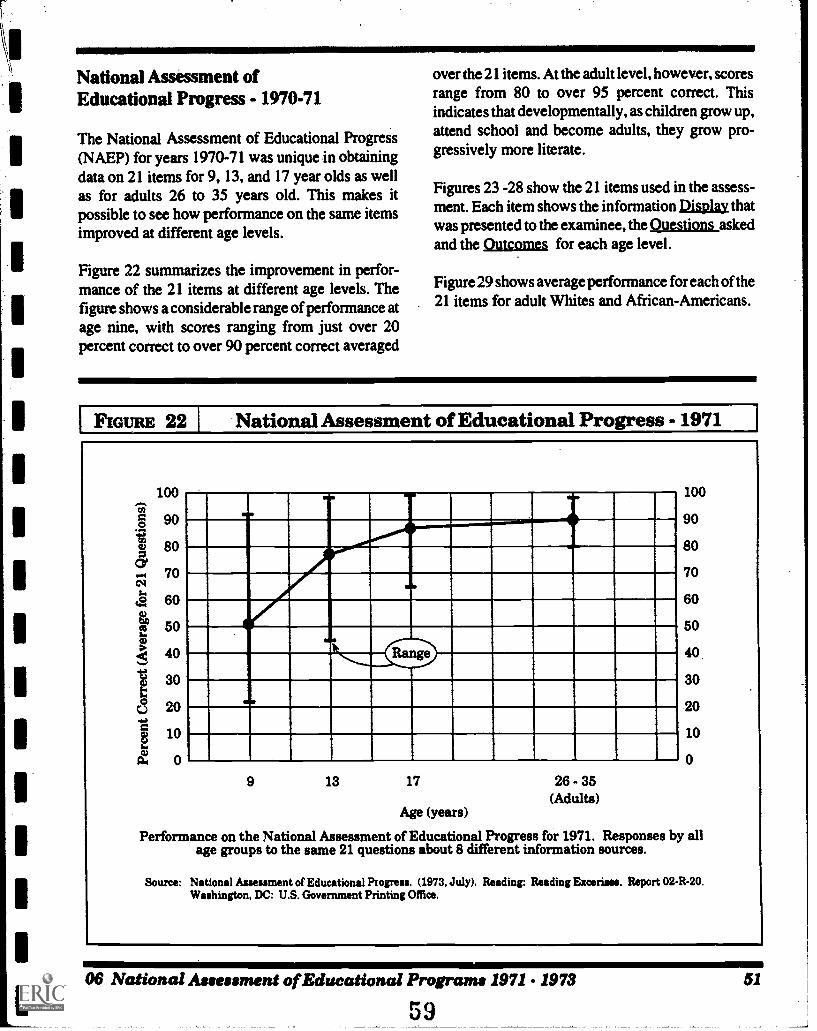
National Assessment ofEducational Progress - 1970-71
The National Assessment of Educational Progress(NAEP) for years 1970-71 was unique in obtainingdata on 21 items for 9, 13, and 17 year olds as wellas for adults 26 to 35 years old. This makes itpossible to see how performance on the same itemsimproved at different age levels.
Figure 22 summarizes the improvement in perfor-mance of the 21 items at different age levels. Thefigure shows a considerable range of performance atage nine, with scores ranging from just over 20percent correct to over 90 percent correct averaged
over the 21 items. At the adult level, however, scoresrange from 80 to over 95 percent correct. Thisindicates that developmentally, as children grow up,attend school and become adults, they grow pro-gressively more literate.
Figures 23 -28 show the 21 items used in the assess-ment. Each item shows the information Display thatwas presented to the examinee, the Oyestions askedand the Outcomes for each age level.
Figure 29 shows average performance for each of the21 items for adult Whites and African-Americans.
FIGURE 22 National Assessment of Educational Progress - 1971
100
90
80
70
60
50
40
30
20
10
0
ale =MI
aft
9 13 17 26 - 35(Adults)
100
90
80
70
60
50
40
30
20
10
0
Age (years)
Performance on the National Assessment of Educational Progress for 1971. Responses by allage groups to the same 21 questions about 8 different information sources.
Source: National Aueument of Educational Progress. (1973, July). Reading: Reading Exceriess. Report 02-R-20.Washington, DC: U.S. Government Printing Office.
06 National Assessment of Educational Programs 1971 - 1973
5951
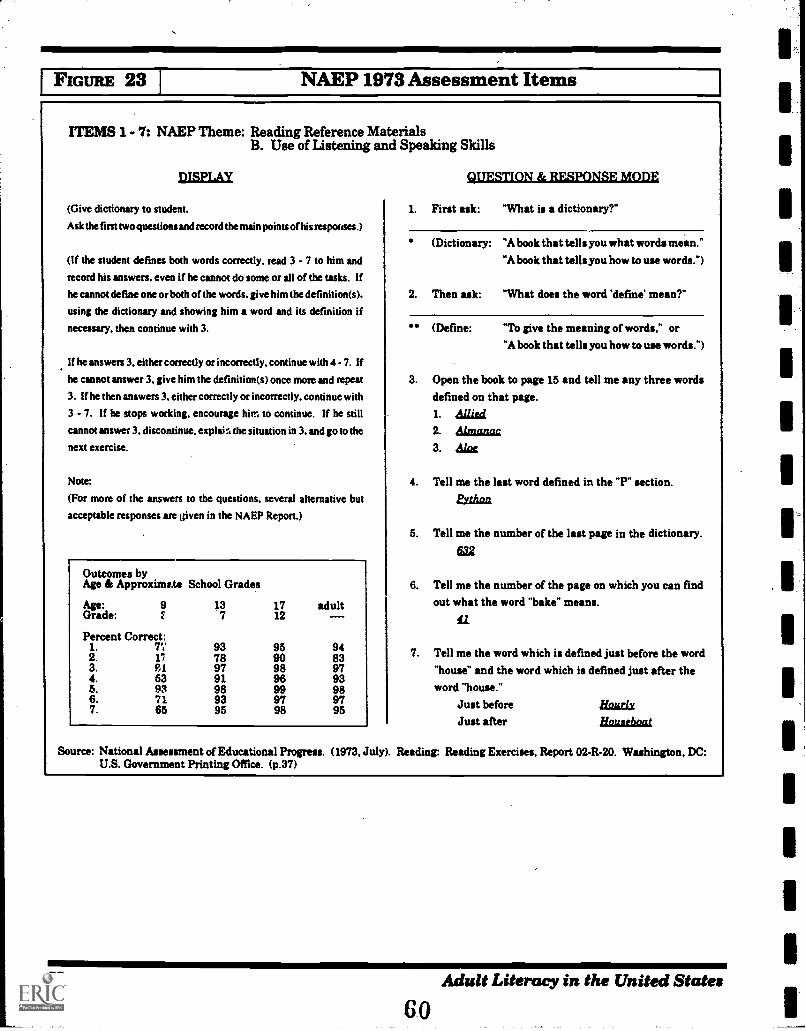
FIGURE 23 NAEP 1973 Assessment Items
ITEMS 1 - 7: NAEP Theme: Reading Reference MaterialsB. Use of Listening and Speaking Skills
J'ASPLAY
(Give dictionary to student.
Ask the first two questions and record the main points of his respofises.)
(If the student defines both words correctly, read 3 - 7 to him and
record his answers, even if he cannot do some or all of the tasks. If
he cannot define one or both of the words, give him the definition(s).
using the dictionary and showing him a word and its definition if
necessary, then continue with 3.
If he answers 3, either correctly or incorrectly, continue with4 - 7. Ifhe cannot answer 3, give him the definition(s) once more and repeat
3. If he then answers 3, either correctly or incorrectly, continue with
3 - 7. If he stops working, encourage him to continue. If he still
cannot answer 3. discontinue, explain the situation in 3. and go to the
next exercise.
Note:
(For more of the answers to the questions, several alternative but
acceptable responses are given in the NAEP Report.)
Outcomes byAge & Approxima.te School Grades
Age: 9 13 17 adultGrade: 2 7 12
Percent Correct:1. 93 95 942. 17 78 90 833. g 1 97 98 974. 53 91 96 935. 93 98 99 986. 71 93 97 977. 65 95 98 95
QUESTIONAIIESEQNSUME
1. First ask: "What is a dictionary?"
(Dictionary: "A book that tells you what words mean."
"A book that tellsyou how to use words.")
2. Then ask: "What does the word 'define' mean?"
** (Define: "To give the meaning of' words," or
"A book that tells you how to use words.")
3. Open the book to page 15 and tell me any three wordsdefined on that page.
1. Alija2. &mama3. al=
4. Tell me the last word defined in the "P" section.
Exam
5. Tell me the number of the last page in the dictionary.
6. Tell me the number of' the page on which you can findout what the word "bake" means.
11.
7. Tell me the word which is defined just before the word
"house" and the word which is defined just after theword "house."
Just before liaatixJust after Hauxthaat
Source: National Assessment of Educational Progress. (1973, July). Reading: Reading Exercises, Report 02-R-20. Washington, DC:U.S. Government Printing Office. (p.37)
52 Adult Literacy in the United States
60
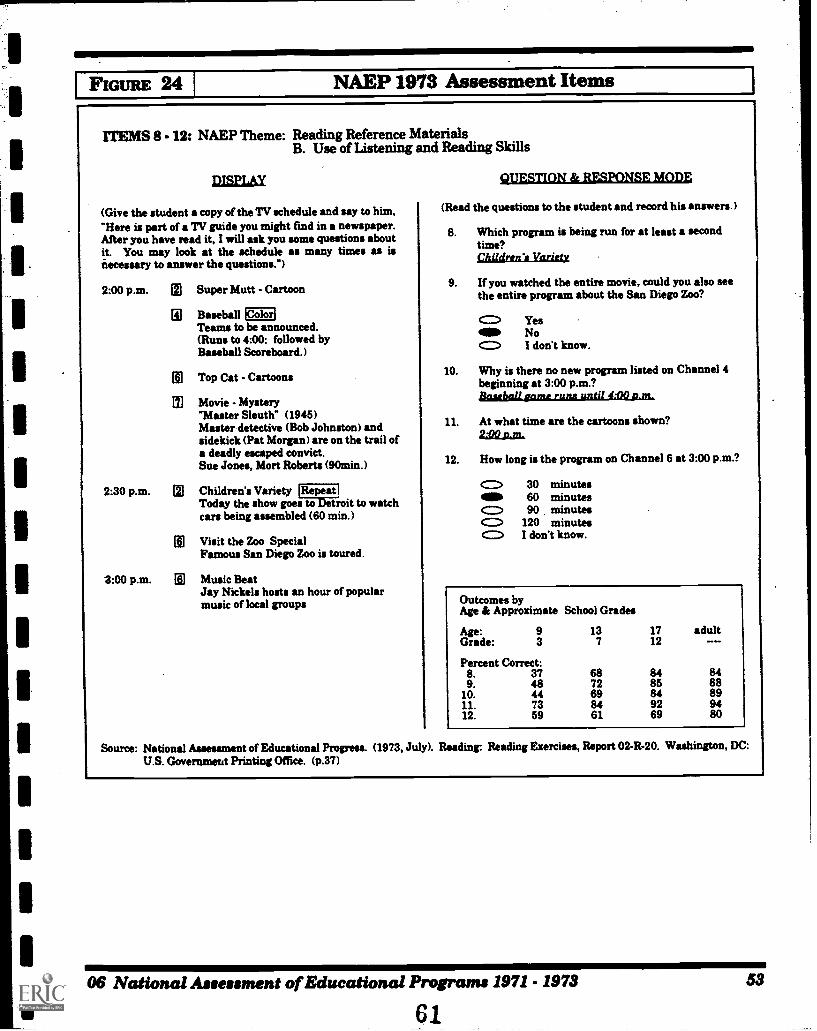
IFi GuRE 24 NAEP 1973 Assessment Items
ITEMS 8 - 12: NAEP Theme: Reading Reference MaterialsB. Use of Listening and Reading Skills
JMSPLAY
(Give the student a copy of the TV schedule and say to him,"Here is part of a TV guide you might fmd in a newspaper.After you have read it, I will ask you some questions aboutit. You may look at the schedule as many times as isnecessary to answer the questions.")
2:00 p.m. m Super Mutt - Cartoon
BaseballTeams to be announced.(Runs to 4:00: followed byBaseball Scoreboard.)
IColor
Top Cat - Cartoons
IN Movie - Mystery"Master Sleuth" (1945)Master detective (Bob Johnston) andsidekick (Pat Morgan) are on the trail ofa deadly escaped convict.Sue Jones, Mort Roberts (90min.)
2:30 p.m. 111 Children's Variety (Repeat IToday the show goes to Detroit to watchcars being assembled (60 min.)
rE Visit the Zoo SpecialFamous San Diego Zoo is toured.
2:00 p.m. Music BeatJay Nickels hosts an hour of popularmusic of local groups
QUESTIONICESPOILIEMODE
(Read the questions to the student and record his answers.)
8. Which program is being run for at least a secondtime?Children's Variety
9. If you watched the entire movie, could you also seethe entire program about the San Diego Zoo?
<=')gibc.'=>
YesNoI don't know.
10. Why is there no new program listed on Channel 4beginning at 3:00 p.m.?flaithalLsamtnum..antiLlilex.m,
11. At what time are the cartoons shown?
12. How long is the program on Channel 6 at 3:00 p.m.?
C:=> 30 minutesOle 60 minutesC:> 90 minutes(=> 120 minutesC:=) I don't know.
Outcomes byAge & Approximate School Grades
Age: 9 13 17 adultGrade: 3 7 12
Percent Correct:8. 37 68 84 849. 48 72 85 88
10. 44 69 84 8911. 73 84 92 9412. 59 61 69 80
Source: National Assessment of Educational Progress. (1973, July). Readinr. Reading Exercises, Report 02-R-20. Washington, DC:U.S. Government Printing Office. (p.37)
06 National Assessment of Educational Programs 1971 - 1973
61
53
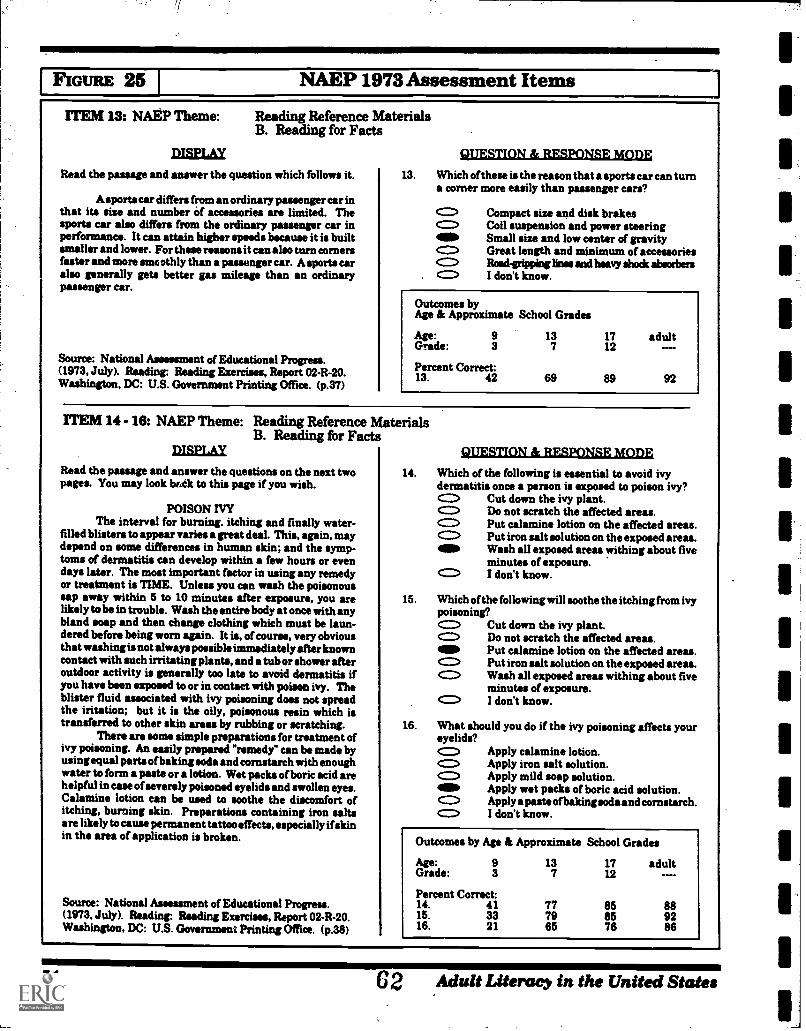
FIGURE 25 NAEP 1973 Assessment Items
ITEM 13: NAEP Theme: Reading Reference MaterialsB. Reading for Facts
PISPLAY
Read the passage and answer the question which follows it.
A sports car differs from an ordinary passenger car inthat its size and number if accessories are limited. Thesports car also differs from the ordinary passenger car inperformance. It can attain higher speeds because it is builtsmaller and lower. For these moons it can also turn cornersfaster and more smoothly than a passenger car. A sports caralso generally gets better gas mileage than an ordinarypassenger car.
Source: National Assessment of Educational Prowess.(1973, July). Reading: Reading Exercises, Report 02-R-20.Washington, DC: U.S. Government Printing Office. (p.37)
QUESTIMILIZSPQNSEXCLUE13. Which of these is the reason that a sports car can turn
a corner more easily than passenger cars?
Compact size and disk brakesCoil suspension and power steeringSmall size and low center of gravityGreat length and minimum of accessoriesRoad-giippiog lints and heavy shock absorbersI don't know.
Outcomes byAge & Approximate School Grades
Age:Gtade:
9 13 17 adult3 7 12
Percent Correct:13. 42 69 89 92
ITEM 14 - 16: NAEP Theme: Reading Reference MaterialsB. Reading for Facts
nISPLAY QUESTION & RESPONSE MODE
Read the passage and answer the questions on the next twopages. You may look bckdk to this page if you wish.
POISON WYThe interval for burning, itching and finally water-
filled blisters to appear varies a great deal. This, again, maydepend on some differences in human skin; and the symp-toms of dermatitis can develop within a few hours or evendays later. The most important factor in using any remedyor treatment is TIME. Unless you can wash the poisonoussap away within 5 to 10 minutes after exposure, you arelikely to be in trouble. Wash the entire body at once with anybland soap and then change clothing which must be laun-dered before being worn again. It is, of course, very obviousthat washing is not always possible immediately after knowncontact with such irritating plants, and a tub or shower afteroutdoor activity is generally too late to avoid dermatitis ifyou have been exposed to or in contact with poison ivy. Theblister fluid associated with ivy poisoning does not spreadthe iritation; but it is the oily, poisonous resin which istransferred to other skin areas by rubbing or scratching.
There are some simple preparations for treatment ofivy poisoning. An easily prepared "remedy" can be made byusing equal parts of baking soda and cornstarch with enoughwater to form a paste or a lotion. Wet packs of boric acid arehelpful in case of severely poisoned eyelids and swollen eyes.Calamine lotion can be used to soothe the discomfort ofitching, burning skin. Preparations containing iron saltsare likely to cause permanent tattoo effects, especially if skinin the area of application is broken.
14. WhichdermatitisC=)
c=>
CZ)
15. Which ofpoisoning?
4110
of the following is essential to avoid ivyonce a person is exposed to poison ivy?
Cut down the ivy plant.Do not scratch the affected areas.Put calamine lotion on the affected areas.Put iron salt solution on the exposed areas.Wash all exposed areas uithing about fiveminutes of exposure.I don't know.
the following will soothe the itching from ivy
Cut down the ivy plant.Do not scratch the affected areas.Put calamine lotion on the affected areas.Put iron salt solution on the exposed areas.Wash all exposed areas withing about fiveminutes of exposure.I don't know.
you do if the ivy poisoning affects your
Apply calamine lotion.Apply iron salt solution.Apply mild soap solution.Apply wet packs of boric acid solution.Apply a pasts ofbaking soda and cornstarch.I don't know.
cZ=1,
16. What shouldeyelids?
(=>
(1110
(=>
Outcomes by Age & Approximate School Grades
Age: 9 13 17 adultGrade: 3 7 12
Percent Correct:Source: National Assessment of Educational Progress. 14. 41 77 85 88(1973. July). Reading: Reading Exercises, Report 02-R-20.Washington, DC: U.S. Government Printing Office. (p.38)
15.16.
3321
7965
6576
92se
54 6 2 Adult Literacy in the United States
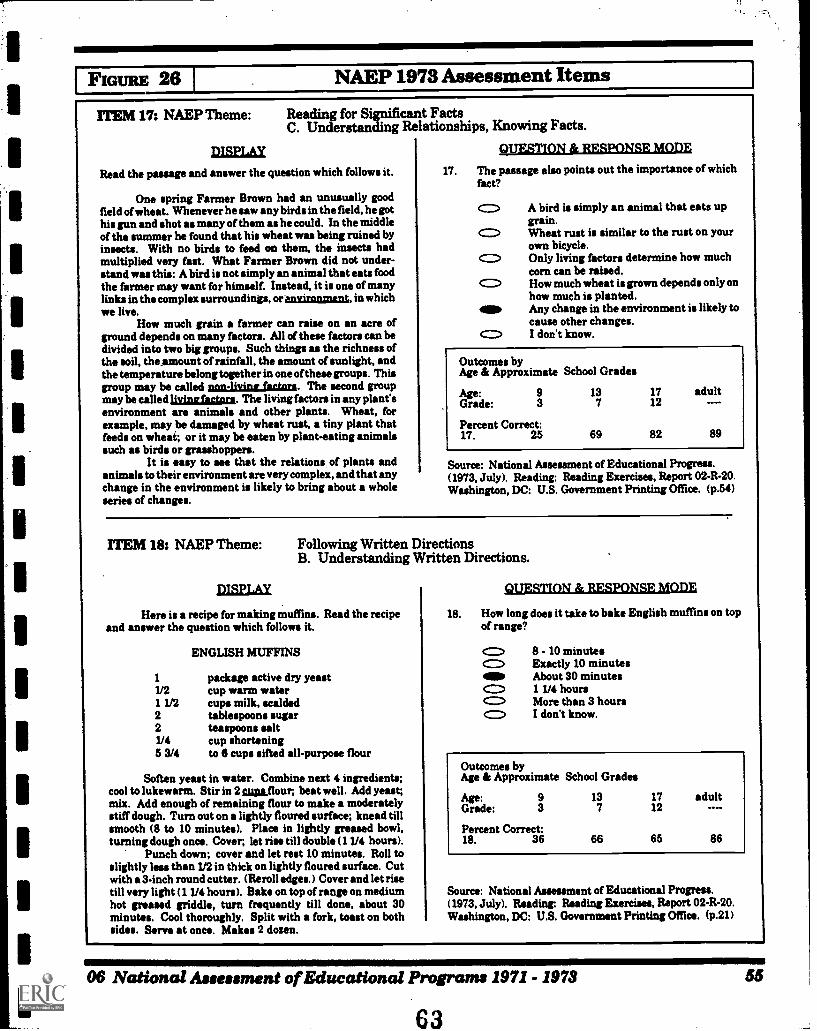
FIGURE 26 I NAEP 1973 Assessment Items
ITEM 17: NAEP Theme: Reading for Significant FactsC. Understanding Relationships, Knowing Facts.
DISPLAY SLIESTIONJUIESEQNSEMDE
Read the passage and answer the question which follows it. 17. The passage also points out the importance of whichfact?
One spring Farmer Brown had an unusually goodfield of wheat. Whenever he saw any birds in the field, he gothis gun and shot as many of them as he could. In the middleof the summer he found that his wheat was being ruined byinsects. With no birds to feed on them, the insects hadmultiplied very fast. What Farmer Brown did not under-stand was this: A bird is not simply an animal that eats foodthe farmer may want for himself. Instead, it is one of manylinks in the complex surroundings, or anyinannigni, in whichwe live.
How much grain a farmer can raise on an acre ofground depends on many factors. All of these factors can bedivided into two big groups. Such things as the richness ofthe soil, thcamount of rainfall, the amount of sunlight, andthe temperature belong together in one of these groups. Thisgroup may be called nanaixinghttan. The second groupmay be called lit admits:a. The living factors in any plant'senvironment are animals and other plants. Wheat, forexample, may be damaged by wheat rust, a tiny plant thatfeeds on wheat; or it may be eaten by plant-eating animalssuch as birds or grasshoppers.
It is easy to see that the relations of plants andanimals to their environment are very complex, and that anychange in the environment is likely to bring about a wholeseries of changes.
A bird is simply an animal that eats upgrain.Wheat rust is similar to the rust on yourown bicycle.Only living factors determine how muchcorn can be raised.How much wheat is grown depends only onhow much is planted.Any change in the environment is likely tocause other changes.I don't know.
Outcomes byAge & Approximate School Grades
Age:Grade:
93
Percent Correct:17. 25
13 17 adult7 12
69 82 89
Source: National Assessment of Educational Progress.(1973, July). Reading: Reading Exercises, Report 02-R-20.Washington, DC: U.S. Government Printing Office. (p.54)
ITEM 18: NAEP Theme: Following Written DirectionsB. Understanding Written Directions.
DISPLAY
Here is a recipe for making muffins. Read the recipeand answer the question which follows it.
ENGLISH MUFFINS
1 package active dry yeast112 cup warm water1 1/2 cups milk, scalded2 tablespoons sugar2 teaspoons salt1/4 cup shortening5 3/4 to 6 cups sifted all-purpose flour
Soften yeast in water. Combine next 4 ingredients;cool to lukewarm. Stir in 2 ung.flour, beat well. Add yeast;mix. Add enough of remaining flour to make a moderatelystiff dough. Turn out on a lightly floured surface; knead tillsmooth (8 to 10 minutes). Place in lightly greased bowl,turning dough once. Cover, let rise till double (1 1/4 hours).
Punch down; cover and let rest 10 minutes. Roll toslightly less than 1/2 in thick on lightly floured surface. Cutwith a 3-inch round cutter. (Reroll edges.) Cover and let risetill very light (1 1/4 hours). Bake on top of range on mediumhot greased griddle, turn frequently till done, about 30minutes. Cool thoroughly. Split with a fork, toast on bothsides. Serve at once. Makes 2 dozen.
QUESTIMils..liESEQNSE.M.DE
18. How long does it take to bake English muffins on topof range?
c::=>c=,
8 - 10 minutesExactly 10 minutesAbout 30 minutes1 1/4 hoursMore than 3 hoursI don't know.
Outcomes byAge & Approximate School Grades
Age: 9Grade: 3
Percent Correct:18. 36
13 17 adult7 12
66 65 86
Source: National Assessment of Educational Progress.(1973, July). Reading: Reading Exercises, Report 02-R-20.Washington, DC: U.S. Government Printing Office. (p.21)
06 National Assessment of Educational Programs 1971 - 1973
63
55
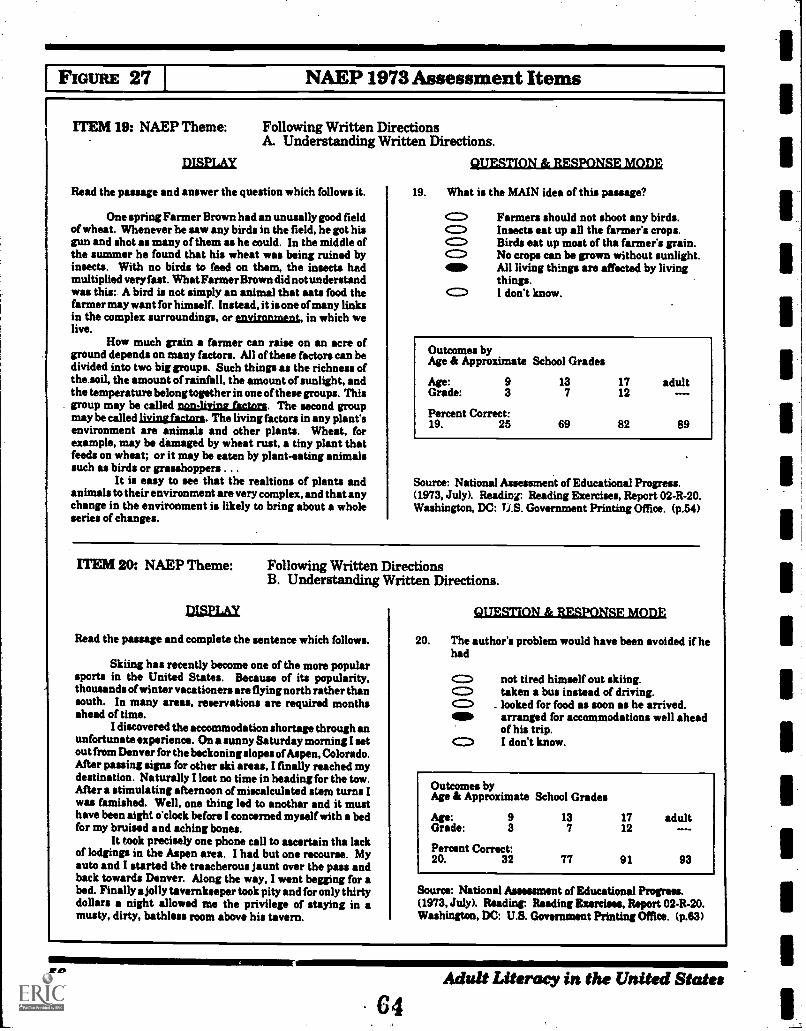
FIGURE 27 NAEP 1973 Assessment Items
ITEM 19: NAEP Theme:
AIRPLAY
Read the passage and answer the question which follows it.
One spring Farmer Brown had an unusally good fieldof wheat. Whenever he saw any birds in the field, he got hisgun and shot as many of them as he could. In the middle ofthe summer he found that his wheat was being ruined byinsects. With no birds to feed on them, the insects hadmultiplied very fast. What Farmer Brown did not understandwas this: A bird is not simply an animal that eats food thefarmer may want for himself. Instead, it is one of many linksin the complex surroundings, or raxannmeni, in which welive.
How much grain a farmer can raise on an acre ofground depends on many factors. All of these factors can bedivided into two big groups. Such things as the richness ofthe soil, the amount of rainfall, the amount of sunlight, andthe temperature belong together in one of these groups. Thisgroup may be called non-living &Oars. The second groupmay be called The living factors in any planesenvironment are animals and other plants. Wheat, forexample, may be damaged by wheat rust, a tiny plant thatfeeds on wheat; or it may be eaten by plant-eating animalssuch as birds or grasshoppers . . .
It is easy to see that the realtions of plants andanimals to their environment are very complex, and that anychange in the environment is likely to bring about a wholeseries of changes.
Following Written DirectionsA. Understanding Written Directions.
eLIESTIDEJEZESPONSE.MODE
19. What is the MAIN idea of this passage?
c:=)<=::$
4110
Farmers should not shoot any birds.Insects eat up all the farmer's crops.Birds eat up most of the farmer's grain.No crops can be grown without sunlight.All living things are affected by livingthings.I don't know.
Outcomes byAge & Approximate School Grades
Age:Grade:
9 13 17 adult3 7 12
Percent Correct:19. 25 69 82 89
Source: National Assessment of Educational Progress.(1973, July). Reading Reading Exercises, Report 02-R-20.Washington, DC: TI.S. Government Printing Office. (p.54)
ITEM 20: NAEP Theme:
DISPL&Y
Following Written DirectionsB. Understanding Written Directions.
Read the passage and complete the sentence which follows.
Skiing has recently become one of the more popularsports in the United States. Because of its popularity,thousands of winter vacationers are flying north rather thansouth. In many areas, reservations are required monthsahead of time.
I discovered the accommodation shortage through anunfortunate experience. On a sunny Saturday morning I setout from Denver for the beckoning slopes of Aspen, Colorado.After passing signs for other ski areas, I finally reached mydestination. Naturally I lost no time in heading for the tow.After a stimulating afternoon of miscalculated stem turns Iwas famished. Well, one thing led to another and it musthave been eight o'clock before I concerned myself with a bedfor my bruised and aching bones.
It took precisely one phone call to ascertain the lackof lodgings in the Aspen area. I had but one recourse. Myauto and I started the treacherous jaunt over the pass andback towards Denver. Along the way, I went begging for abed. Finally ajolly tavernkeeper took pity and for only thirtydollars a night allowed me the privilege of staying in amusty, dirty, bathless room above his tavern.
QUESTION & RESPONSE MODE
20. The author's problem would have been avoided if hehad
C:=>
C=:1411110
CZ>
not tired himself out skiing.taken a bus instead of driving.
_ looked for food as soon as he arrived.arranged for accommodations well aheadof his trip.I don't know.
Outcomes byAge & Approximate School Grades
Age:Grade:
9 13 17 adult3 7 12
Percent Correct:20. 32 77 91 93
Source: National Assessment of Educational Progress.(1973, July). Reading: Reading Exercises, Report 02-R-20.Washington, DC: U.S. Government Printing Office. (p.63)
56 Adult Literacy in the United States
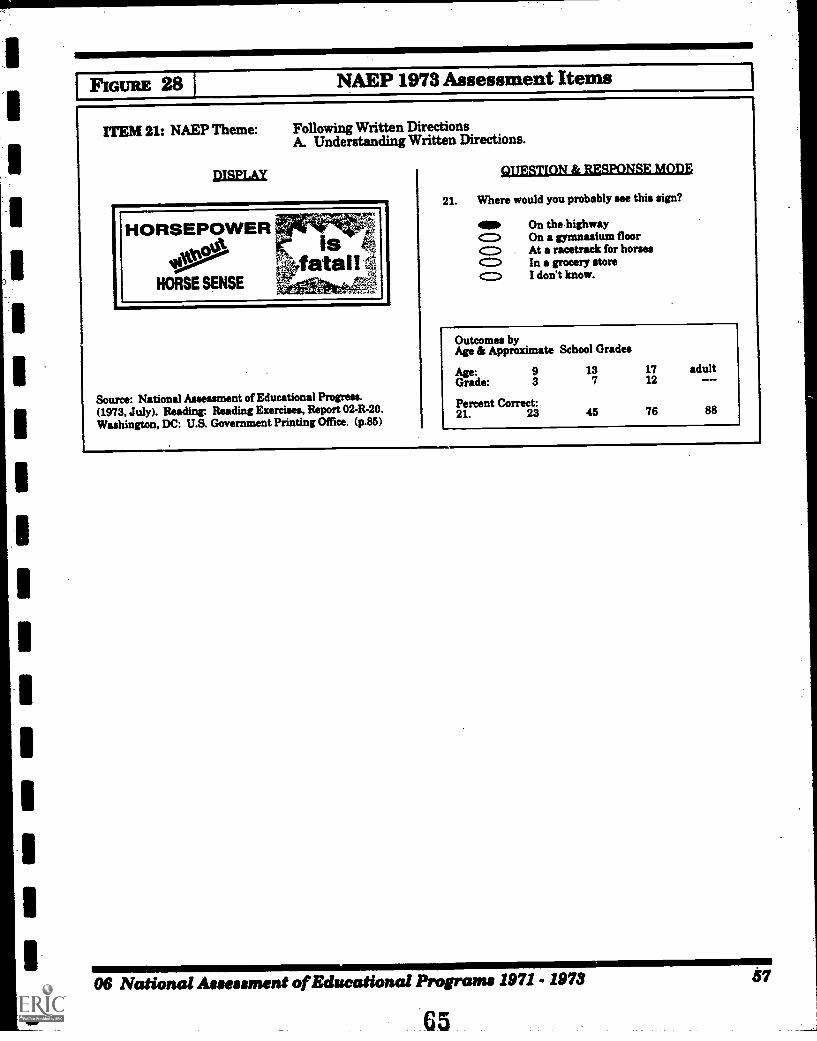
FIGURE 28 NAEP 1973 Assessment Items
ITEM 21: NAEP Theme:
PISPLAY
Following Written DirectionsA. Understanding Written Directions.
HORSEPOWER,11000t fat:int
isHORSE SENSE &gsltiva
Source: National Asseument of Educational Progress.(1973, July). Reading: Reading Exercises, Report 02-R-20.Washington, DC: U.S. Government Printing Office. (p.85)
QUESTIOILABESPONSKIIME
21. Where would you probably see this sign?
4110C=20sr.=>CZ,C:
On the highwayOn a gymnasium floorAt a racetrack for horsesIn a grocery storeI don't know.
Outcomes byAge & Approximate School Grades
Age:Grade:
9 13 173 7 12
Percent Correct:21. 23 45 76
adult
88
06 National Assessment of Educational Programs 197.1 - 1973
65
87
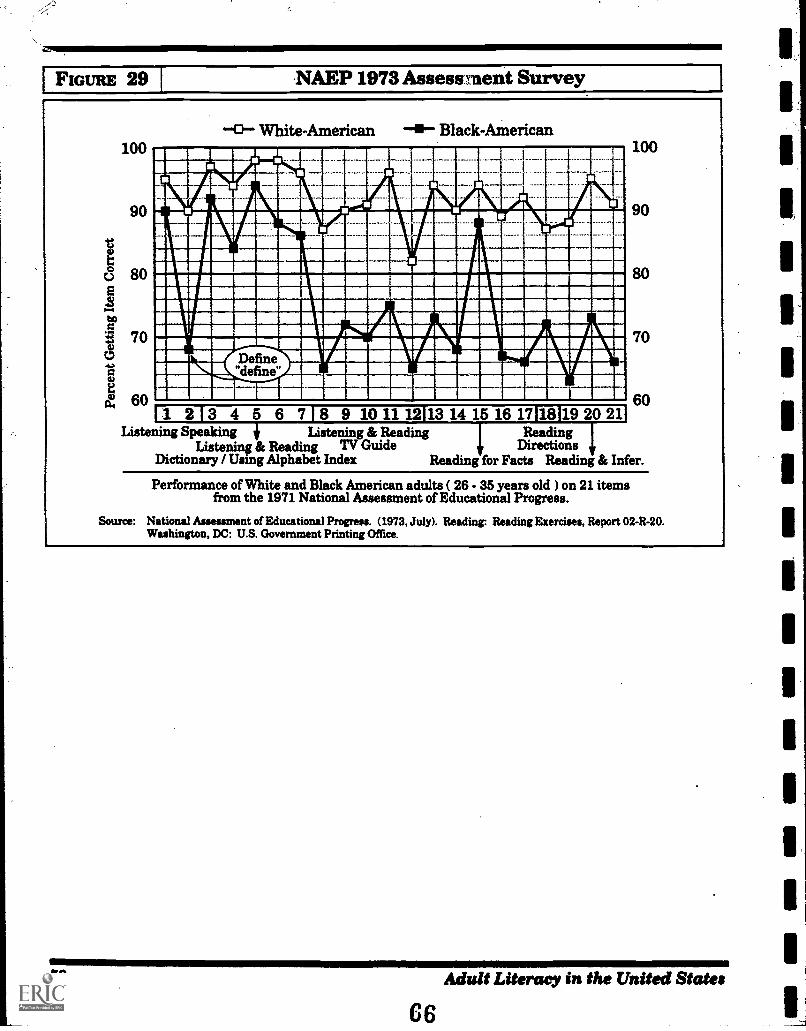
FIGURE 29 AEP 1973 Assessment Survey
100
90
u 80
t
70
(14 60
a White-American al Black-American
letrim A IALIUMMIIIIR19111111111enr....remummi11111111111111111111111111111111B1110111111111111111M11111111111111111111118111111111111111111111111111
111111111111111111111111111M11111.10.1111111111111111111111111111111111111111111111111111111111
1111/111111111111191.411111111111BINIU1111111111111111111111111111111111111111111WA:11121111111111111,4,1111111/1111111
1111111111111111111111111/11BAIIIIIIVAW1111011111111VAIIINISIIIII1111111011111I Define 11111111VPA11111111111111Vaid1111111D,ra011/811110111111111631. IL "define" Afirtmourmiamaismadmaymundi1:1111200011-1111:111=111111ELIIIII11 2 13 4 5 6 718 9 10 11 12113 14 15 16 17118119 20 211
Listening SpeakingListening & Reeding TV Guide
Listening & Reading ReadingDirections
Dictionary / Using Alphabet Index Reading for Facts Reading & Infer.
100
90
80
70
60
Performance of White and Black American adults ( 26 - 35 years old ) on 21 itemsfrom the 1971 National Assessment of Educational Progress.
Source: National Amessment of Educational Progress. (1973, July). Reading: Reading Exercises, Report 02-R-20.Washington, DC: U.S. Government Printing Office.
58 Adult Literacy in the United States
66
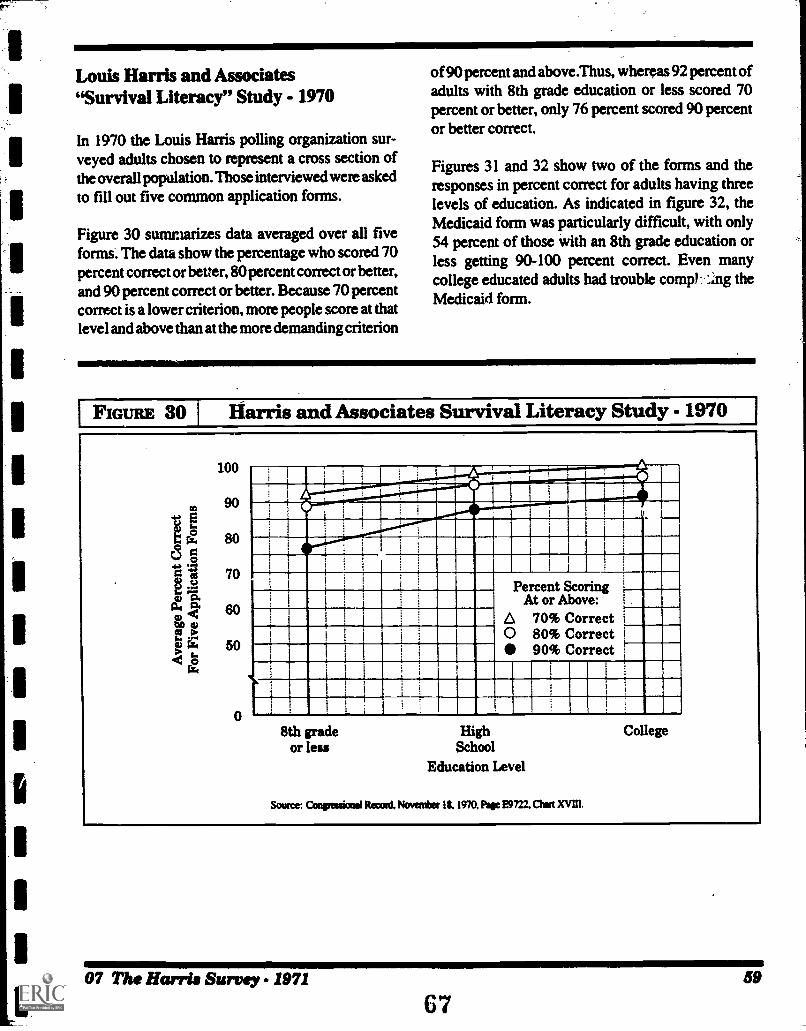
Louis Harris and Associates"Survival Literacy" Study - 1970
In 1970 the Louis Harris polling organization sur-veyed adults chosen to represent a cross section ofthe overall population. Those interviewed were askedto fill out five common application forms.
Figure 30 summarizes data averaged over all fiveforms. The data show the percentage who scored 70percent correct or better, 80 percent correct or better,and 90 percent correct or better. Because 70 percentcorrect is a lower criterion, more people score at thatlevel and above than at the more demanding criterion
of 90 percent and above.Thus, whereas 92 percent ofadults with 8th grade education or less scored 70percent or better, only 76 percent scored 90 percentor better correct.
Figures 31 and 32 show two of the forms and theresponses in percent correct for adults having threelevels of education. As indicated in figure 32, theMedicaid form was particularly difficult, with only54 percent of those with an 8th grade education orless getting 90-100 percent correct. Even manycollege educated adults had trouble corm* :;ng theMedicaid form.
FIGURE O Flarris and Associates Survival Literacy Study - 1970 I
100
90
E 80g
70I -§4)
a) 44boos1.4
r z4 50
rm.
60
aaa 111 nimmr.
IIMEA*111.1115----23761--71111111111111M111111009..1010111 NIPP---1111111111=111ww OMNImire--Mm
IBM IIEll111111.1111MIR I 111.mmis
Percent ScoringAt or Above:
70% Correct0 80% Correct
90% Correct
8th gradeor leu
HighSchool
Education Level
Source: CougressiomI Record. November It 1970. Page E9722. Chan XVIII.
College
07 The Harris Survey.- 1971
6759
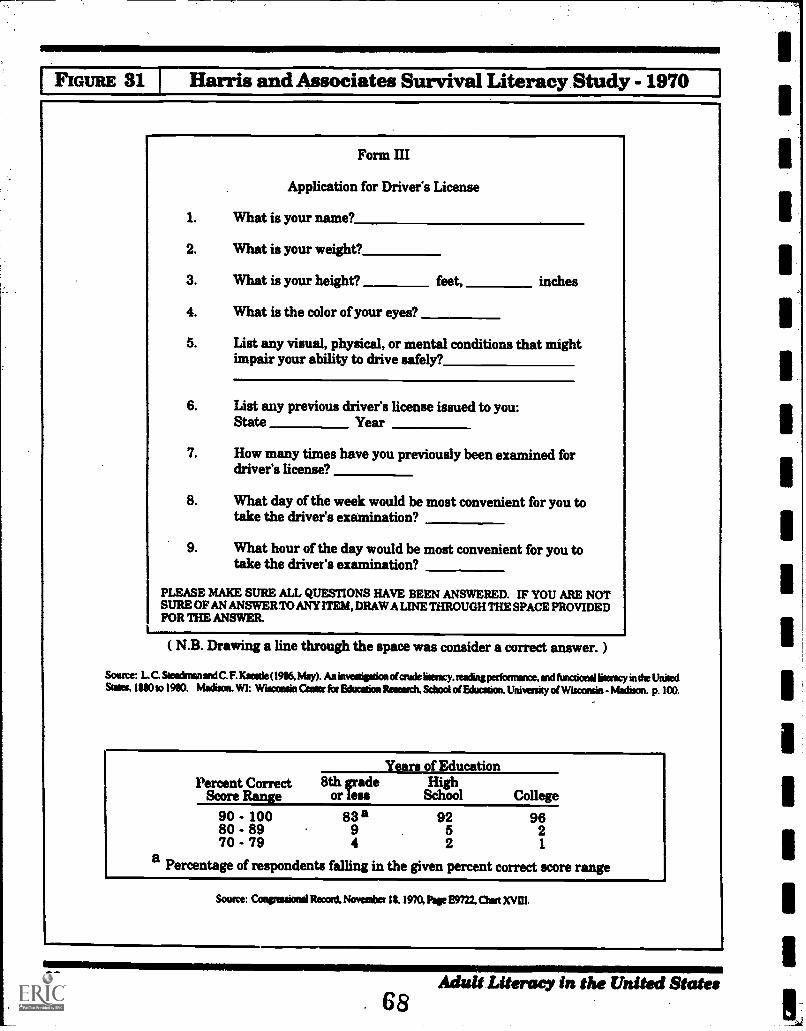
I FIGURE 31J
Harris and Associates Survival Literacy.Study - 1970 I
Form III
Application for Driver's License
1. What is your name?
2. What is your weight?
3. What is your height? feet, inches
4. What is the color of your eyes?
5. List any visual, physical, or mental conditions that mightimpair your ability to drive safely?
6. List any previous driver's license issued to you:State Year
7. How many times have you previously been examined fordriver's license?
8. What day of the week would be most convenient for you totake the driver's examination?
9. What hour of the day would be most convenient for you totake the driver's examination?
PLEASE MAKE SURE ALL QUESTIONS HAVE BEEN ANSWERED. IF YOU ARE NOTSURE OF AN ANSWER TO ANY ITEM, DRAW A LINE THROUGH THE SPACE PROVIDEDFOR THE ANSWER.
( N.B. Drawing a line through the space was consider a correct answer. )
Source: L. C. Ssealitnon srid C.F. Kamde (1916, May). An imemissionotaudeViency, reading perfornince. and functional baxacy in the UnitedStates. 1110 to 1910. Madison. WI: Wisconsin Caner kir Eduestion Retards. School of Education, University of Wuconsis - Madison. p. 100.
Years of EducationPercent Correct 8th grade High
Score Range or ieu School College
90 - 100 83 a 92 9680 - 89 9 5 270 - 79 4 2 1
aPercentage of respondents falling in the given percent correct score range
Source: Congressional Record. November 11, 1970. Page E9722. aisit XVIII.
60 Adult Literacy in the United States
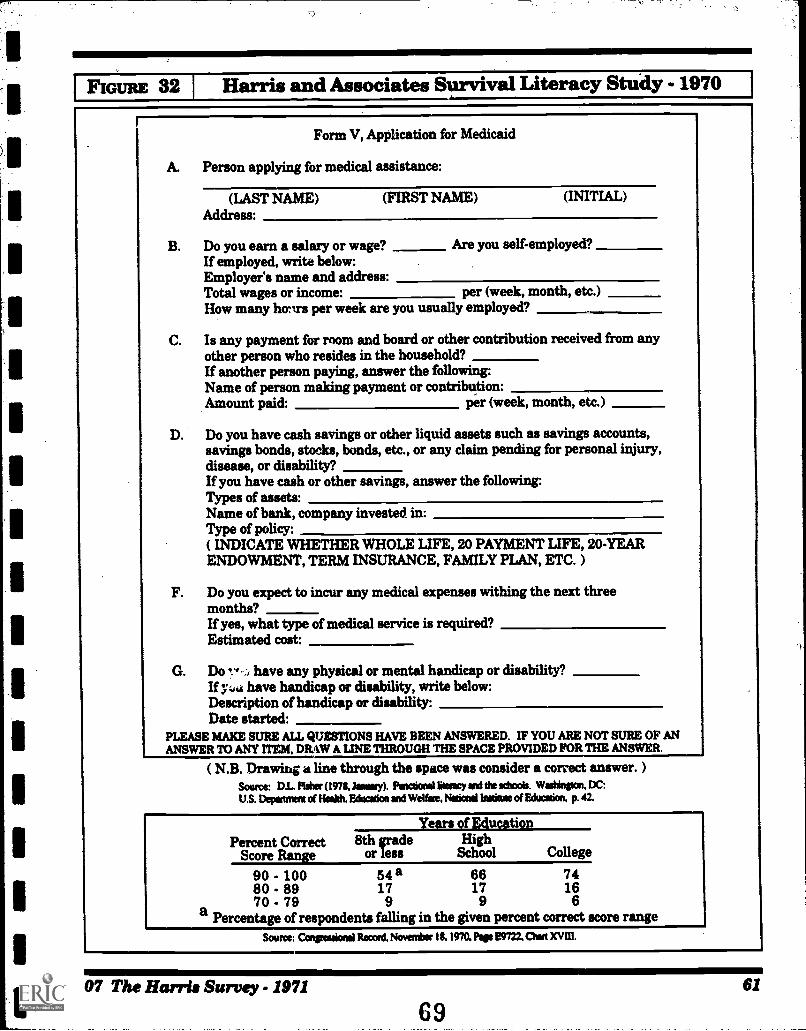
FIGURE 32 Harris and Associates Survival Literacy Study.. 1970
Form V, Application for Medicaid
A. Person applying for medical assistance:
(LAST NAME) (FIRST NAME)Address:
(INITIAL)
B. Do you earn a salary or wage? Are you self-employed?If employed, write below:Employer's name and address:Total wages or income: per (week, month, etc.)How many honrs per week are you usually employed?
C. Is any payment for room and board or other contribution received from anyother person who resides in the household?If another person paying, answer the following:Name of person making payment or contribution:Amount paid: per (week, month, etc.)
D. Do you have cash savings or other liquid assets such as savings accounts,savings bonds, stocks, bonds, etc., or any claim pending for personal injury,disease, or disability?If you have cash or other savings, answer the following:Types of assets:Name of bank, company invested in:Type of policy:( INDICATE WHETHER WHOLE LIFE, 20 PAYKENT LIFE, 20-YEARENDOWMENT, TERM INSURANCE, FAMILY PLAN, ETC. )
F. Do you expect to incur any medical expenses withing the next threemonths?If yes, what type of medical service is required?Estimated cost:
G. Dol.. have any physical or mental handicap or disability?If have handicap or disability, write below:Description of handicap or disability:Date started:
PLEASE MAKE SURE ALL QUESTIONS HAVE BEEN ANSWERED. IF YOU ARE NOT SURE OF ANANSWER TO ANY ITEM, DRAW A LINE THROUGH THE SPACE PROVIDED FOR TIM ANSWER.
( N.B. Drawing a line through the space was consider a correct answer. )Source: DL Maher (1971kommy). Panctional listeacy and the schoob. Wadimpon. DC:U.S. Department of Health. Eduminon and Welfare. Nuked Imam of Education. p. 42.
Years of EducationPercent Correct 8th grade High
Score Range or less School College
90 - 100 54 a 66 7480 - 89 17 17 1670 - 79 9 9 6a Percenthge of respondents falling in the given percent correct score range
Source: Congressional Record. November 11. 1970. Page E9722. Cheat XVIII.
07 The Harris Survey - 1971 61
69
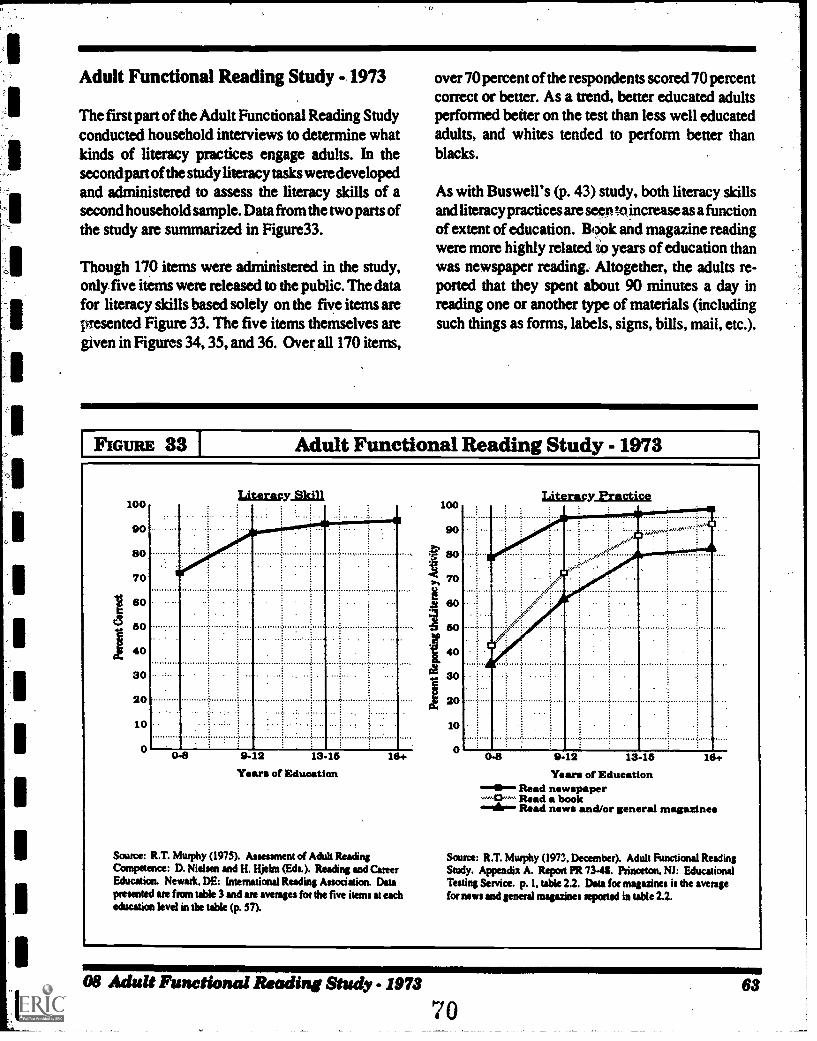
0
Adult Functional Reading Study - 1973
The first part of the Adult Functional Reading Studyconducted household interviews to determine whatkinds of literacy practices engage adults. In thesecondpart of the study literacy tasks were developedand administered to assess the literacy skills of asecond household sample. Data from the two parts ofthe study are summarized in Figure33.
Though 170 items were administered in the study,only five items were released to the public. The datafor literacy skills based solely on the five items arepresented Figure 33. The five items themselves aregiven in Figures 34, 35, and 36. Over all 170 items,
over 70 percent of the respondents scored 70 percentcorrect or better. As a trend, better educated adultsperformed better on the test than less well educatedadults, and whites tended to perform better thanblacks.
As with Buswell's (p. 43) study, both literacy skillsand literacy practices are seen to increase as a functionof extent of education. Book and magazine readingwere more highly related to years of education thanwas newspaper reading. Altogether, the adults re-ported that they spent about 90 minutes a day inreading one or another type of materials (includingsuch things as forms, labels, signs, bills, mail, etc.).
FIGURE 33 I Adult Functional Reading Study.- 1973
4,
1
100
90
80
70
60
50
40
30
20
10
0 0-8 9-12 13-15 16+
Years of Education
Source: R.T. Murphy (1975). Assessment of Adult ReadingCompetence: D. Nielsen and H. Hjekn (Eds.). Reading and CareerEducation. Newark, DE: International Reading Association. Datapresented are from table 3 and ate IMMO for the five items at eacheducation level in the table (p. 57).
100
70
40
10
0
Literacy_Eragligs
0-8 9-12 13-15 16+
Years of EducationRead newspaperRead a book
....16 Read news and/or general magazines
Source: R.T. Murphy (Km. December). Adult Functional ReadingStudy. Appendix A. Report PR 73-411. Princetce, NJ: EducationalTesting Service. p. 1. table 2.2. Data for magazines is the averagefor news and general magazines reported in table 2.2.
08 Adult Functional Reading Study.- 1973
7063
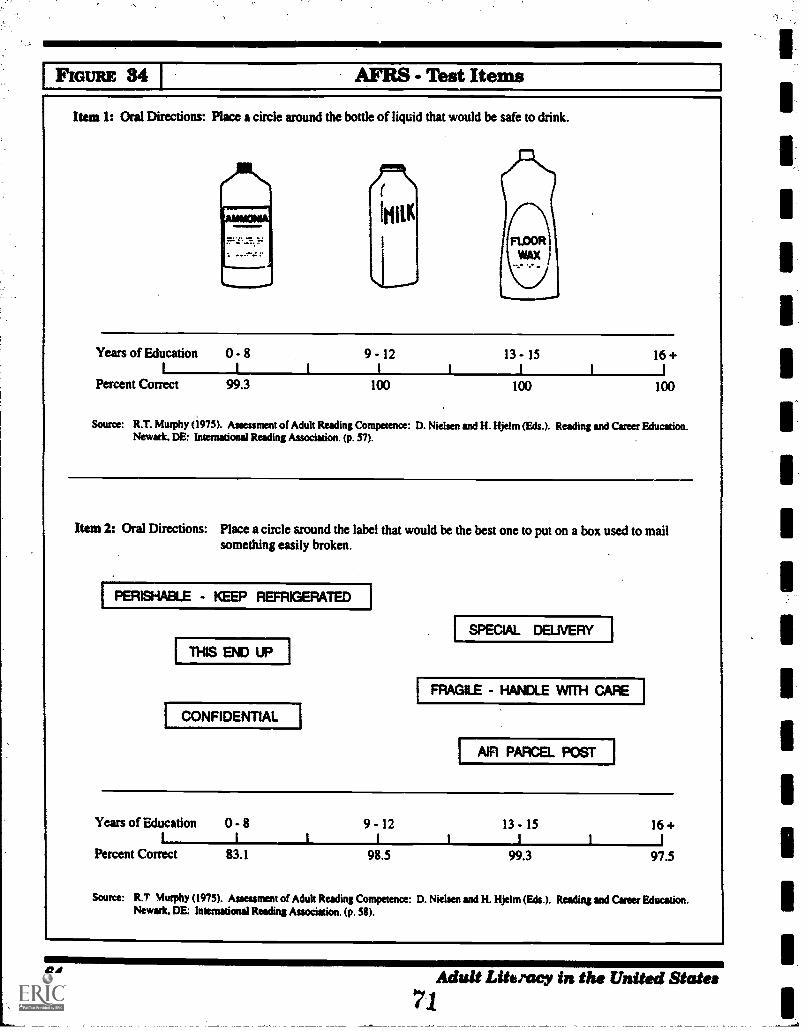
FIGURE 34 AFRS - Test Items
Item 1: Oral Directions: Place a circle around the bottle of liquid that would be safe to drink.
Years of Education 0 - 8
Percent Correct 99.3
9 - 12 13 - 15
100 100
16 +
100
Source: R.T. Murphy (1975). Assessment of Adult Reading Competence: D. Nielsen and H. Hje 1m (Eds.). Reading and Career Education.Newark, DE: htternational Reading Association. (p. 57).
Item 2: Oral Directions: Place a circle around the label that would be the best one to put on a box used to mailsomething easily broken.
PERISHABLE - KEEP REFRIGERATED
THIS END UP
CONFIDENTIAL
SPECIAL DEUVERY
FRAGLE - HANDLE WRH CAFIE
AIR PARCEL POST
Years of Education 0 - 8
Percent Correct 83.11
9 - 121 1
98.5
13 - 151
99.31
16 +
97.5
Source: R.T Murphy (1973). Assessment of Adult Reading Competence: D. Nielsen and H. Hjelm (Eds.). Reading and Career Education.Newark, DE: International Reading Association. (p. 58).
64 Adult Literacy in the United States71
'7,
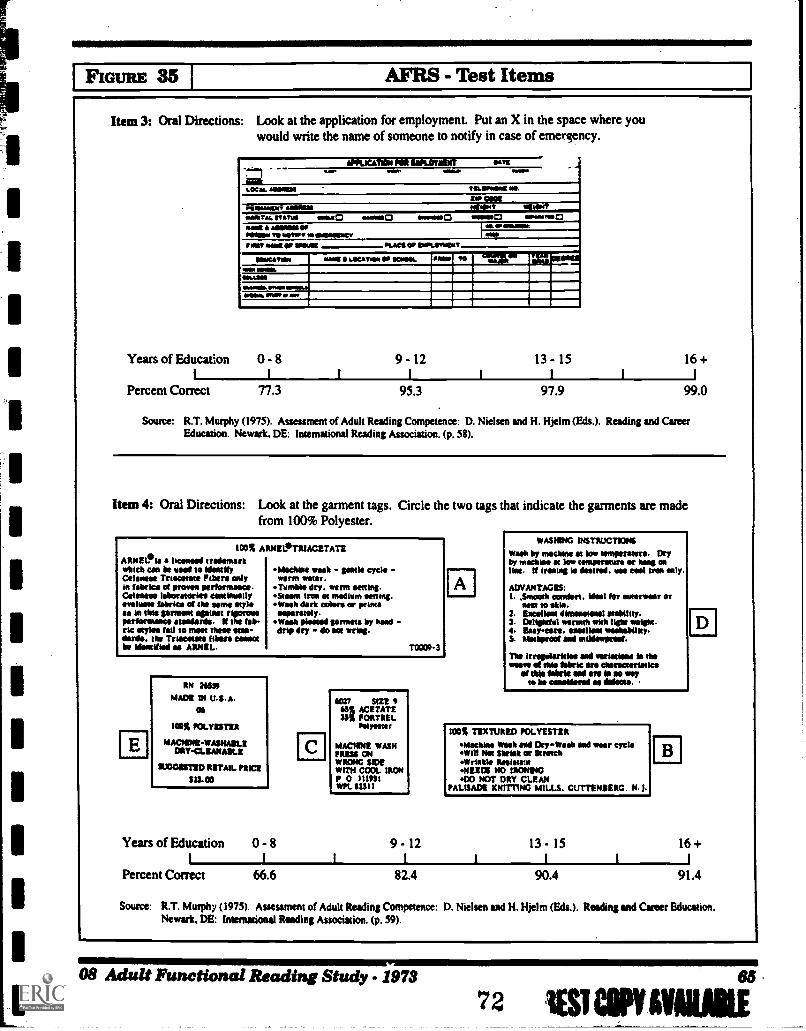
1
IFIGURE 35 AFRS - Test Items
Item 3: Oral Directions: Look at the application for employment. Put an X in the space where youwould write the name of someone to notify in case of emergency.
Years of Education
Percent Correct
APPLICATION PIM INPLOWNINT sam I.. ...mar mow
1.004. saiSaaaa Ire.a.slissa NSVs Not
Plitaamarat allialli WSW nowtisaarss. ;WM wrap mismaCI ~seep olsollICI orsissIsirlmasa a MOINIIII SSMins is WM, so failagesew
i M. 10101111OR
I asoMIT Woe V MIMI SLACIL OS aslitSrlasT = semiOSIMAviase mem Leewen se Nowa. on re =fel
MIN MOILellAilleIWO& MaleNNW& 111%11. NM
0 - 8
77.3
9 - 121
95.3
13 - 15
97.9
16 +
99.0
Source: R.T. Murphy (1975). Assessment of Adult Reading Competence: D. Nielsen and H. Hjelm (Eds.). Reading and CareerEducation. Newark, DE: International Reading Association. (p. 58).
Item 4: Oral Directions: Look at the garment tags. Circle the two tags that indicate the garments are madefrom 100% Polyester.
103% ARNEL.TRIACETATEARNEL Is s linseed trademarkwhich can be unit to Masa*Celanese Trisection Fibers onlyin fabrics at proms performing.Coltman laboratories seminally*ahem* Metes at the same styleas In this garment spigot fillaalonperfeesteoet stsodards. V the tab-rie voles fall to mot Hese seas-dards. the Triseatate fibers comabe bientielml as ANNEL.
Mediae wash - lode cycle -warm water.
Terrible dry, warm setting.Stotim was at molium setting.Wash dark odors or print*
separately.Waeli *SW gamete by Mod -drip dry - do sot wrIn.
RN 24530
MADE DI U.S. A.SI
103% POLYESTER
MACHIIII-WASHMILEDRY-CLEANABLE
ILIGOESTED RETAIL. PRP=
$1340
W NUNI% ACETATE33% PORTREL
Parma
MACHINE WASHPRESS ONWRONG MEWITH COCt. IRONIP 0 1111151WPL 12311
A
WASHING INSTRUCT1CM6
Wash by mashing at low eemperang. Dryby madam st low temperature air Map atHoe. If Innis I. Nairn. use essl iron only.
ADVANTAGES:I. Amooth mann. nal for outerwear or
ant to skis.2. Exiling diessailaist stafillity.3. Dellaktfil warmth nit lipM night.4. Easy-awe. enelisat weeleabUity.5. histesnal Sad atildgenest.
The tresdniaritias sail tarlatan la thenave ad tbis fabric ars ennagristies
aS this SibeM in are lit so wayto be caasMand se Maas.
KO% TEXTURED POLYESTER
Msektint Wash and Dal-Waall Sad SW CyClaNet Shrlik or Stretch
*weak* Mellor.*IEEDS NO IMMO.1340 NOT DRY CLEAN
PALISADE KNITTING MILLS. GUTTENBERG. N. I.
Years of Education 0 - 8 9 - 12 13 - 15 16 +1 1 1
Percent Correct 66.6 82.4 90.4 91.4
Source: R/. Murphy (1975). Assessment of Adult Reading Competence: D. Nielsen and H. Hjelm (Eds.). Reading and Canter Education.Newark, DE: hwentational Reeding Association. (p. 59).
08 Adult Functional Reading Study.- 1973 85
7 2 SI CM MUNE
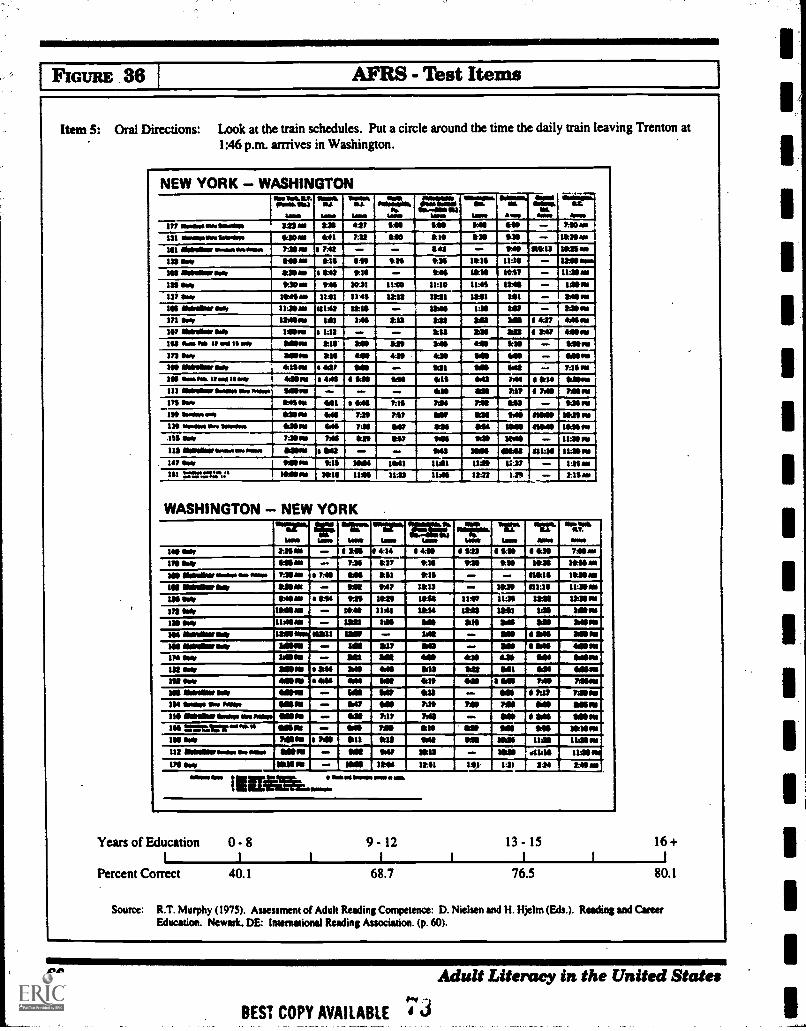
at
elt
00 :4
IMO
op
0 00
11911111111111111/I
i I 1
1/11
f1 i
II
II 1 1
cl
2! 0 -4 0 2C
1
11111111MM;
IIIMIIIIIIIIII1
riggidz
111
12iiiIIIIiiiiiIiiiiIipag
hummiiiimisciPIA
limit
sitIvilmilq
Itus
it;;;m
111;
:if?
i111
11,1
1111
:Iili
ms
.iiiiidinilliiirj
;Iiiiglistimiiiiiiq
1,11111111111111111
1111
1111
1!11
11i
4 111;
;;;;;;
;;III
I;;;;
;;Iiii
ii,
' 1 I
li i
.. 1"
-
plus
ii
i
1
iaaaalatalitt
---
111/11111
'1
it, III
I I
g * ,.< 0 = X 1 *
alifi
sa1 il
liiiiii*i!'.2
......
t.
.t.
4E1 0 2
III;
;..
1;;;
;I;IiI
;;I;;i
riillggigilIggigilil
Iggilh
illIggiggnigglligggal 0
llinginglinglilligil4
;tIIIiEuiIuI1UiJ
Iii
IiiiilliiIIIIIIIINI
tiiiii;liziiiiiiiiiiiiii4
itaataaaaiaaavaalistil
it
olo
amN
o m
e um
ow
so o
w a
mem
serr
iii
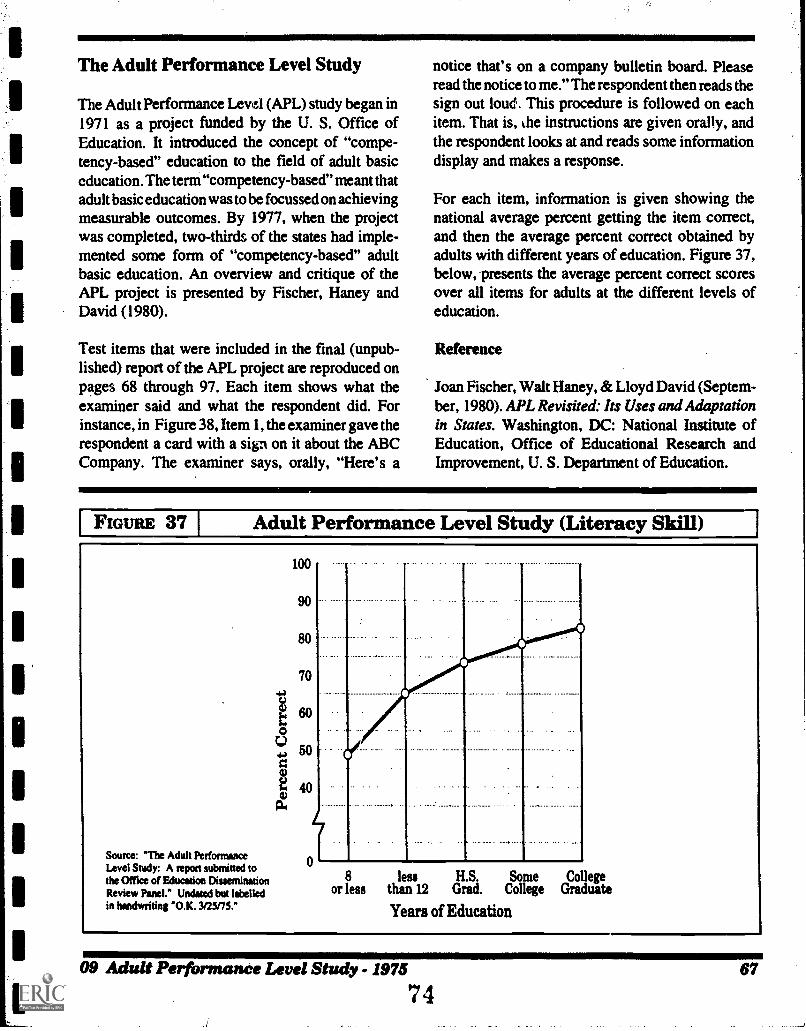
The Adult Performance Level Study
The Adult Performance Level (APL) study began in1971 as a project funded by the U. S. Office ofEducation. It introduced the concept of "compe-tency-based" education to the field of adult basiceducation. The term "competency-based" meant thatadult basic education was to be focussed on achievingmeasurable outcomes. By 1977, when the projectwas completed, two-thirds of the states had imple-mented some form of "competency-based" adultbasic education. An overview and critique of theAPL project is presented by Fischer, Haney andDavid (1980).
Test items that were included in the final (unpub-lished) report of the APL project are reproduced onpages 68 through 97. Each item shows what theexaminer said and what the respondent did. Forinstance, in Figure 38, Item 1, the examiner gave therespondent a card with a sigt on it about the ABCCompany. The examiner says, orally, "Here's a
notice that's on a company bulletin board. Pleaseread the notice to me." The respondent then reads thesign out loud. This procedure is followed on eachitem. That is, the instructions are given orally, andthe respondent looks at and reads some informationdisplay and makes a response.
For each item, information is given showing thenational average percent getting the item correct,and then the average percent correct obtained byadults with different years of education. Figure 37,below, presents the average percent correct scoresover all items for adults at the different levels ofeducation.
Reference
Joan Fischer, Walt Haney, & Lloyd David (Septem-ber, 1980). APL Revisited: Its Uses and Adaptationin States. Washington, DC: National Institute ofEducation, Office of Educational Research andImprovement, U. S. Department of Education.
FIGURE 37 I Adult Performance Level Study (Literacy Skill)
100
90
80
70
60
50
a)
E 40134
Source: "The Adult PerfonnanceLevel Study: A repon submitted tothe Office of Education DiueminarionReview Panel." Undated but labelledin hondwrifing "O.K. 3/25/75."
8 less H.S. Some Collegeor less than 12 Grad. College Graduate
Years of Education
09 Adult Performance Level Study 1975
7467
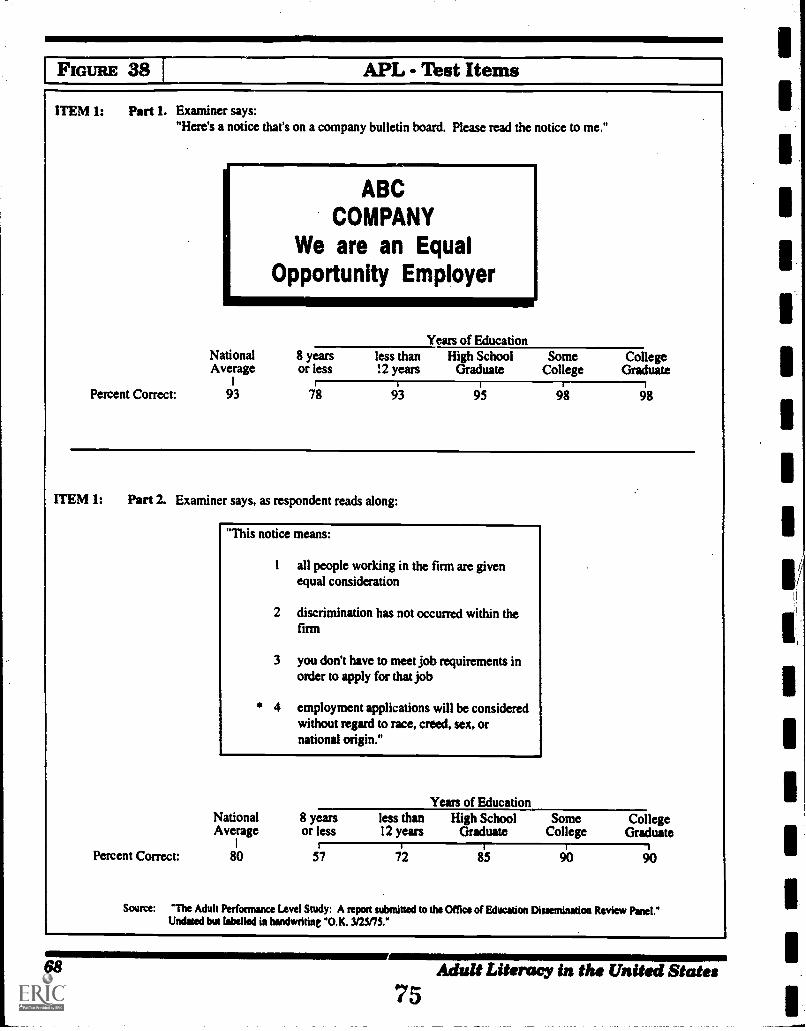
FIGURE 38 APL - Thst Items
ITEM 1: Part 1. Examiner says:"Here's a notice that's on a company bulletin board. Please read the notice to me."
Percent Correct:
ABCCOMPANY
We are an EqualOpportunity Employer
Years of EducationNational 8 years less than High School Some CollegeAverage or less 12 years Graduate College Graduate
I
93 78 93 95 9898ITEM 1: Part 2. Examiner says, as respondent reads along:
Percent Correct:
"This notice means:
I all people working in the firm are givenequal consideration
2 discrimination has not occurred within thefirm
3 you don't have to meet job requirements inonier to apply for that job
* 4 employment applications will be consideredwithout regard to race, creed, sex, ornational origin."
Years of EducationNational 8 years less than High School Some CollegeAverage or less 12 years Graduate College Graduate
80 57 72 85 90 90
Source: "The Adult Performance Level Study: A repon submitted to the Office of Education Dissemination Review Panel."Undated but labelled in handwriting "O.K. 3/25f73."
68 Adult Literacy in the United States7 5
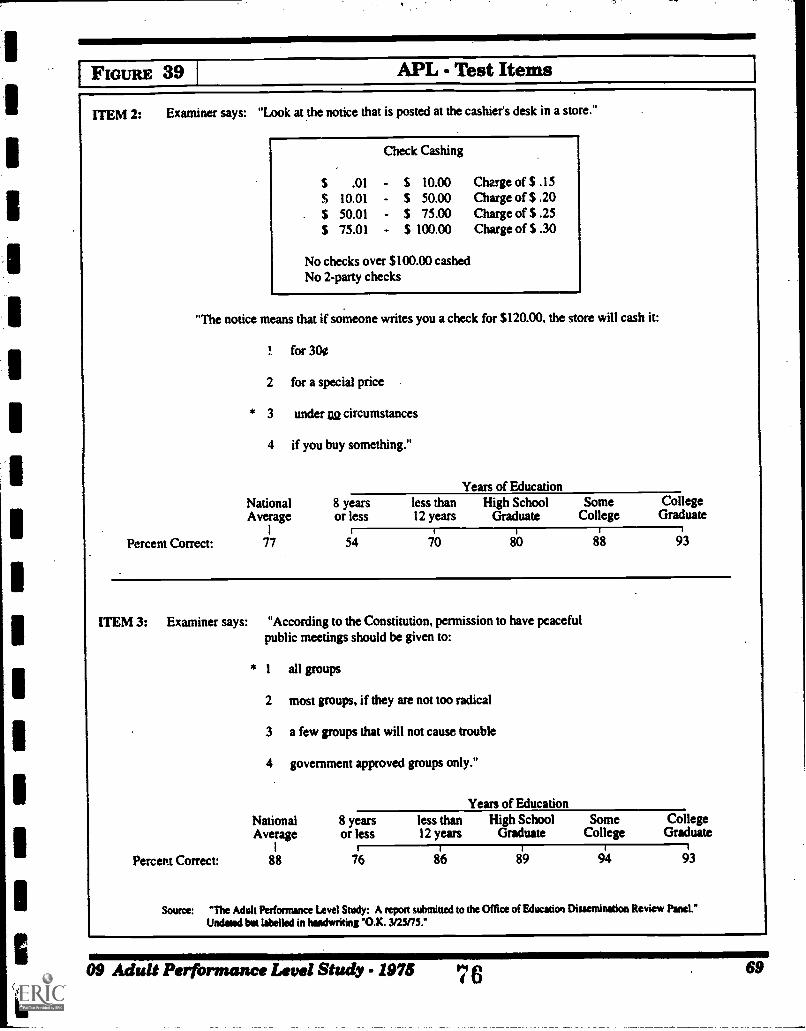
IFIGURE 39 APL - Test Items
ITEM 2: Examiner says: "Look at the notice that is posted at the cashier's desk in a store."
Check Cashing
$ .01 - $ 10.00 Charge of $ .15$ 10.01 - $ 50.00 Charge of S .20$ 50.01 - $ 75.00 Charge of S .25$ 75.01 - $ 100.00 Charge of $ .30
No checks over $100.013 cashedNo 2-party checks
"The notice means that if someone writes you a check for $120.00, the store will cash it:
! for 300
2 for a special price
* 3 under Di2 circumstances
4 if you buy something."
Percent Correct:
Years of EducationNational 8 years less than High School Some CollegeAverage or less 12 years Graduate College Graduate
I i I
77 54 70 8'0 88 93
ITEM 3: Examiner says: "According to the Constitution, permission to have peacefulpublic meetings should be given to:
* 1 all groups
2 most groups, if they are not too radical
3 a few groups that will not cause trouble
4 government approved groups only."
Percent Correct:
Years of EducationNational 8 years less than High School Some CollegeAverage or less 12 years Graduate College Graduate
88 76 86 89 94 93
Source: "The Adult Perfamance Level Study: A report submitted to the Office of Education Diueminadon Review Panel."Undated but labelled in haadwriting "O.K. 3123175."
09 Adult Performance Level Study. - 1976 69
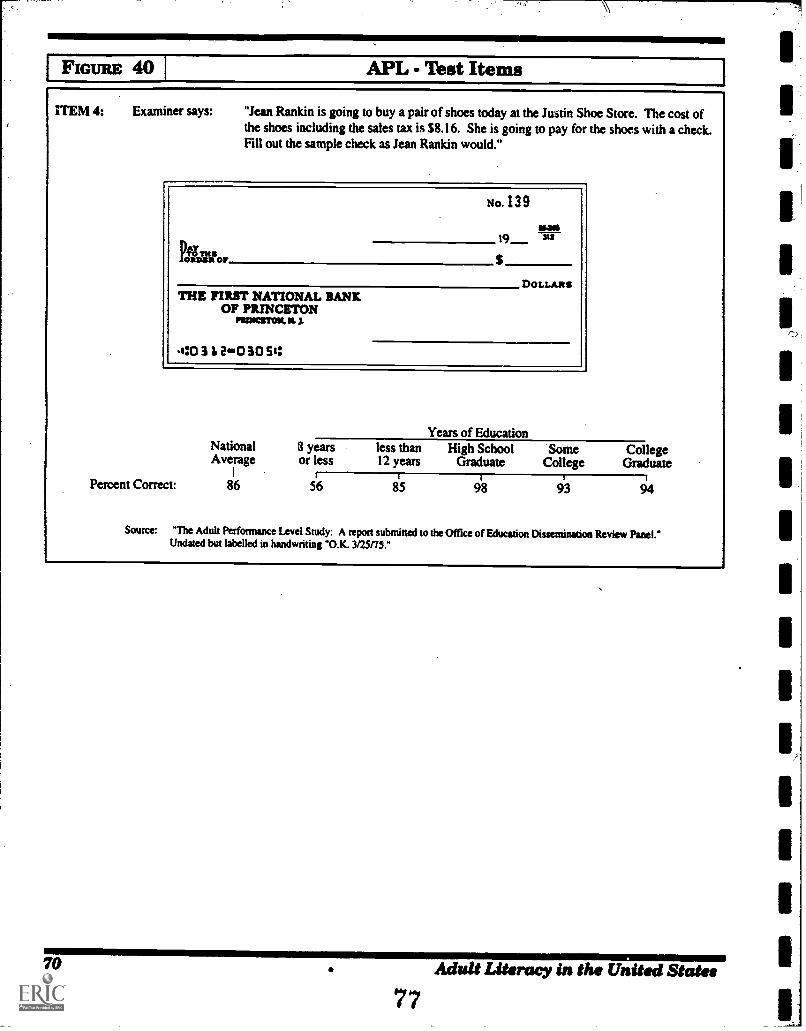
I FIGURE 40 APL - Test Items
rIEM 4: Examiner says: "Jean Rankin is going to buy a pair of shoes today at the Justin Shoe Store. The cost ofthe shoes including the sales tax is $8.16. She is going to pay for the shoes with a check.Fill out the sample check as Jean Rankin would."
NO.139
19
THE FIRBT NATIONAL BANEOF PRINCETON
PIOSCIT011. 35.3.
0 3 i iestO 30 st:
DoLzutas
Percent Correct:
Years of EducationNational II years less than High School Some CollegeAverage or less 12 years Graduate College Graduate
I : I86 56 85 98 93 94
Source: "The Adult Performance Level Study: A tenon submitted to the Office of Education Dissemination ReviewPanel."Undated but labelled in handwfiting "O.K. 3/25n5."
70 Adult Literacy in the United States
77
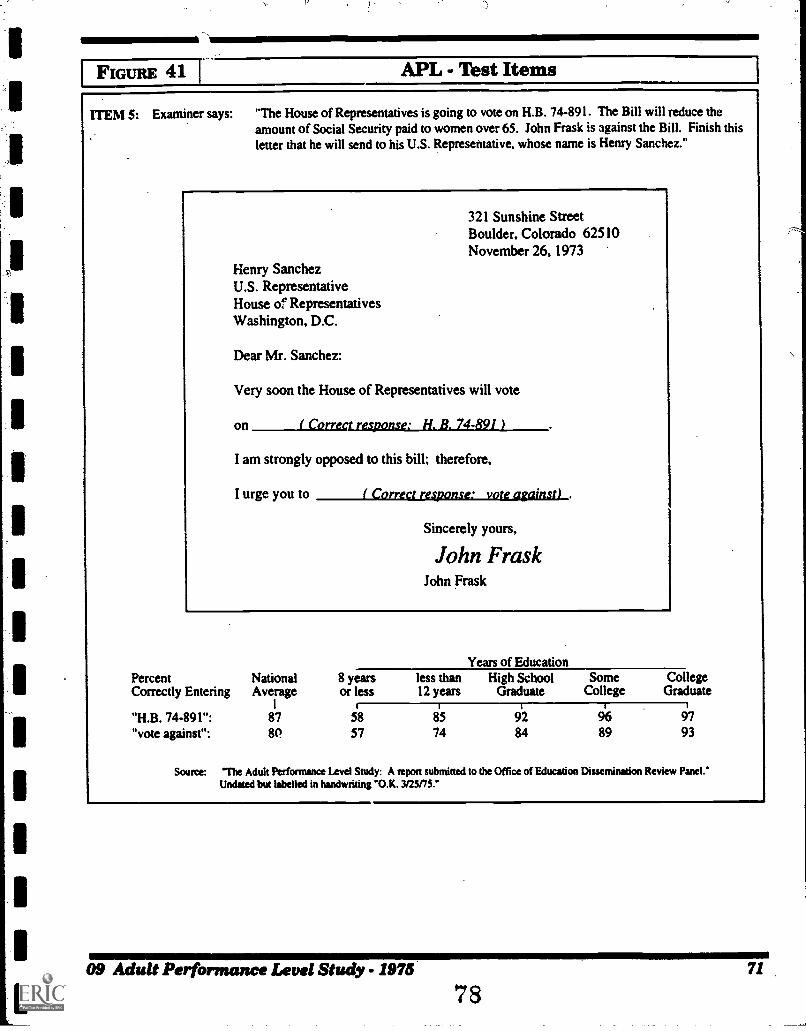
IFIGURE 41 APL - Test Items
ITEM 5: Examiner says: "The House of Representatives is going to vote on H.B. 74-891. The Bill will reduce theamount of Social Security paid to women over 65. John Frask is against the Bill. Finish thisletter that he will send to his U.S. Representative, whose name is Henry Sanchez."
321 Sunshine StreetBoulder, Colorado 62510November 26, 1973
Henry SanchezU.S. RepresentativeHouse of RepresentativesWashington, D.C.
Dear Mr. Sanchez:
Very soon the House of Representatives will vote
on ( Correct response: H. B. 74-891
I am strongly opposed to this bill; therefore,
I urge you to ( Correct response: vote against)
Sincerely yours,
John FraskJohn Frask
Years of EducationPercent National 8 years less than High School Some CollegeCorrectly Entering Average or less 12 years Graduate College Graduate
1
"H.B. 74-891": 87 58 85 92 96 97
"vote against": 57 74 84 89 93
Source: "The Adult Performance Level Study: A moon submitted to the Office of Education Dissemination Review Panel.'Undated but labelled in handwriting "O.K. 3/25175."
09 Adult Performance Level Study. - 1975 71
78
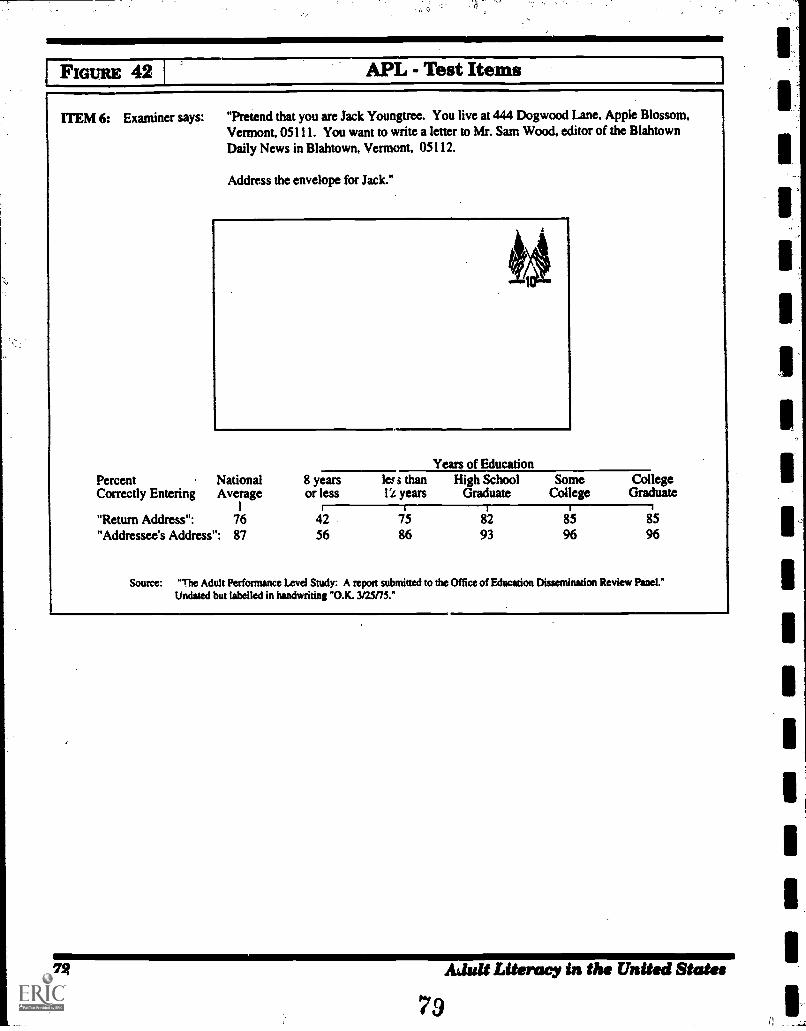
I FIGURE 42 APL - Test Items
ITEM 6: Examiner says: "Pretend that you are Jack Youngtree. You live at 444 Dogwood Lane, Apple Blossom,Vermont, 05111. You want to Write a letter to Mr. Sam Wood, editor of the BlahtownDaily News in Blahtown, Vermont, 05112.
Address the envelope for Jack."
Percent NationalCorrectly Entering Average
"Return Address": 76"Addressee's Address": 87
8 yearsor less
4256
Years of Educationle s than High School SomeI years Graduate College
86 93 96
CollegeGraduate
8596
Source: "The Adult Performance Level Study: A report submitted to the Office of Education Dissemination Review Panel."Undated but labelled in handwriting "O.K. 3/25/75."
72 Adult Literacy in the United States
7 9
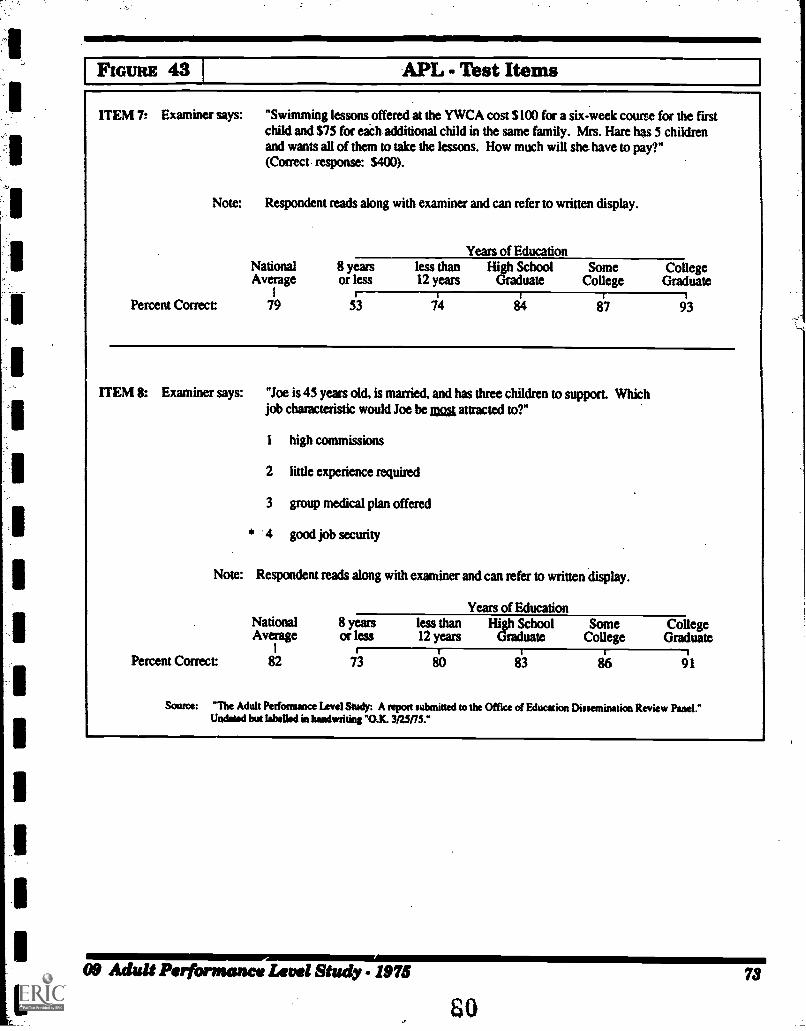
FIGURE 43 APL - Test Items
ITEM 7: Examiner says: "Swimming lessons offered at the YWCA cost $100 for a six-week course for the rustchild and $75 for each additional child in the same family. Mrs. Hare has 5 childrenand wants all of them to take the lessons. How much will she- have to pay?"(Correct. response: VW).
Note: Respondent reads along with examiner and can refer to written display.
Years of EducationNational 8 years less than High School Some CollegeAverage or less 12 years Graduate College Graduate
Percent Correct 79 53 93
ITEM 8: Examiner says: "Joe is 45 years old, is married, and has three children to support. Whichjob characteristic would Joe be ma attracted to?"
1 high commissions
2 little experience required
3 group medical plan offered
* 4 good job security
Note: Respondent reads along with examiner and can refer to written display.
Years of EducationNational 8 years less than High School Some CollegeAverage or less 12 years Graduate College Graduate
I
Percent Correct 82 73 80 83 136 91
Source: "The Adult Performance Level Study: A import submitted to the Office of Education Disseminatice Review Panel."Undated but labelled in handweting "OK. 3125175."
09 Adult Performance Level Study.- 1975 73
80
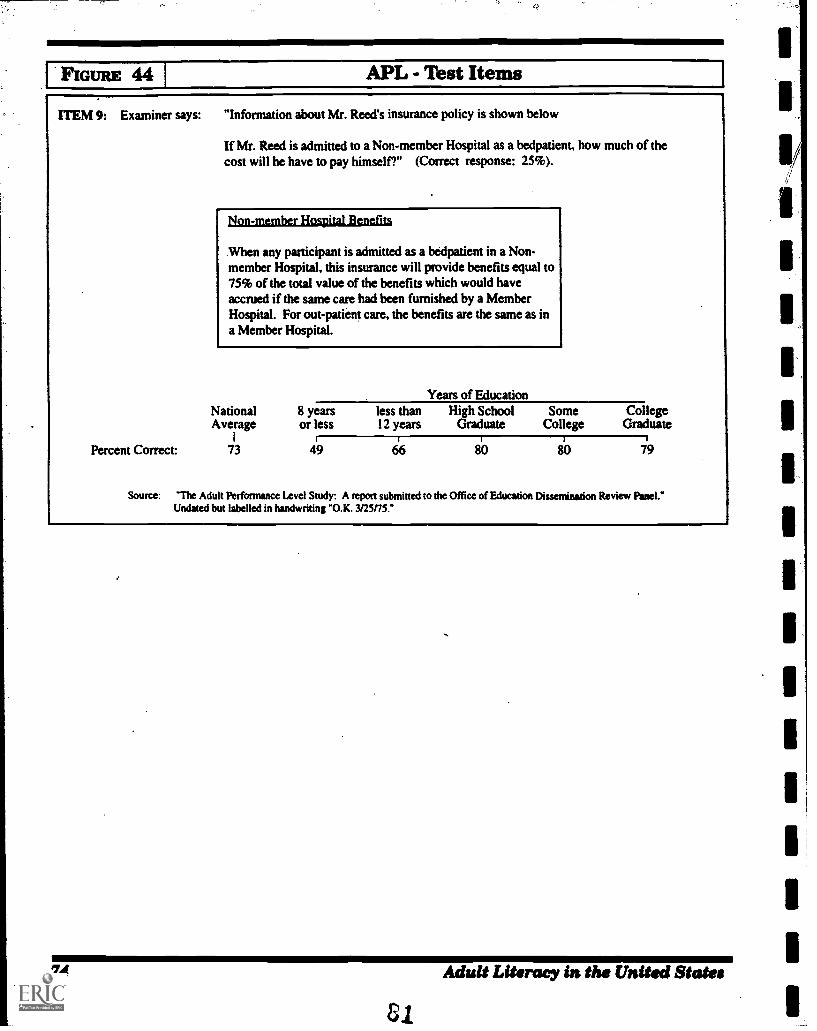
IFIGURE 44 APL - Test Items
ITEM 9: Examiner says: "Information about Mr. Reed's insurance policy is shown below
Percent Correct:
If Mr. Reed is admitted to a Non-member Hospital as a bedpatient, how much of thecost will he have to pay himself?" (Correct response: 25%).
Non-member Hospital BenefitA
When any participant is admitted as a bedpatient in a Non-member Hospital, this insurance will provide benefits equal to75% of the total value of the benefits which would haveaccrued if the same care had been furnished by a MemberHospital. For out-patient care, the benefits are the same as ina Member Hospital.
Years of EducationNational 8 years less than High School Some CollegeAverage or less 12 years Graduate College Graduate
I I
73 49 6 80 806 79
Source: -The Adult Performance Level Study: A repott submitted to the Office of Education Disseminadon Review Panel.'Undated but labelled in handwriting "O.K. 3/25/75."
74 Adult Literacy in the United States
81
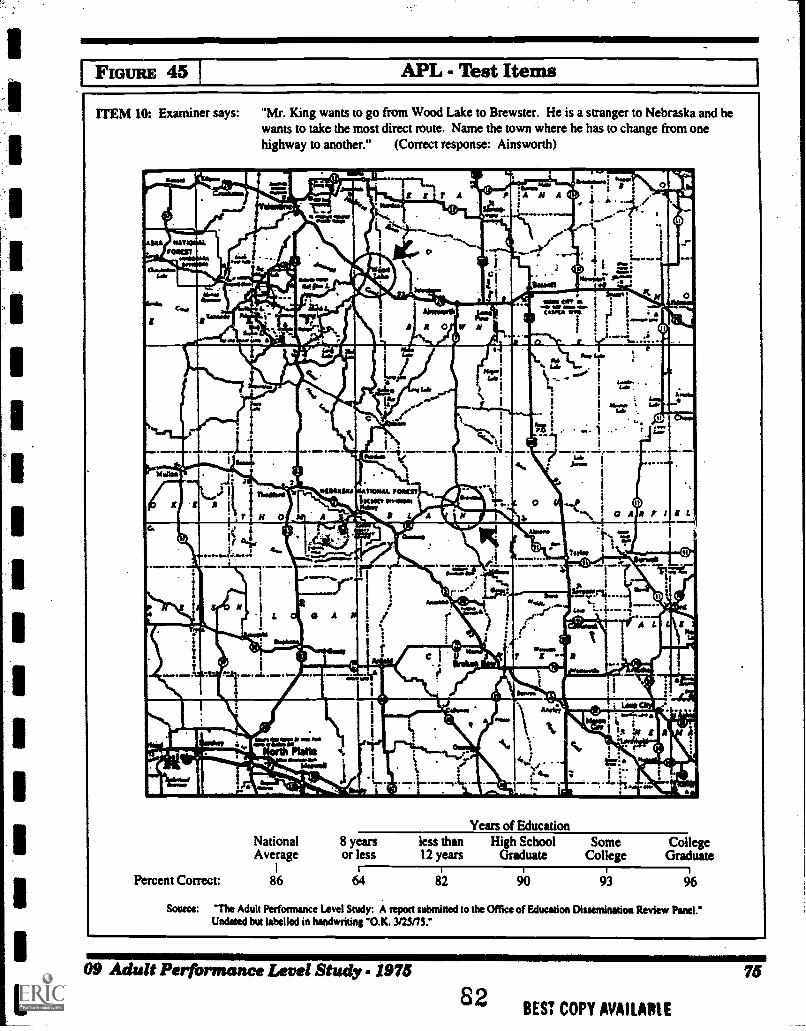
IFIGURE 45 APL - Test Items
ITEM 10: Examiner says: "Mr. King wants to go from Wood Lake to Brewster. He is a stranger to Nebraska and hewants to take the most direct route. Name the town where he has to change from onehighway to another." (Correct response: Ainsworth)
Years of EducationNational 8 years less than High School Some CollegeAverage or less 12 years Graduate College Graduate
I 1 I 1
Percent Correct: 86 64 82 90 93 96
Source: 'The Adult Performance Level Study: A repots submitted to the Office of Education Dissemination Review Panel."Undated but labelled in handwriting "O.K. 3125175."
09 Adult Performance Level Study.- 1975
82BEST COPY AVAILABLE
75
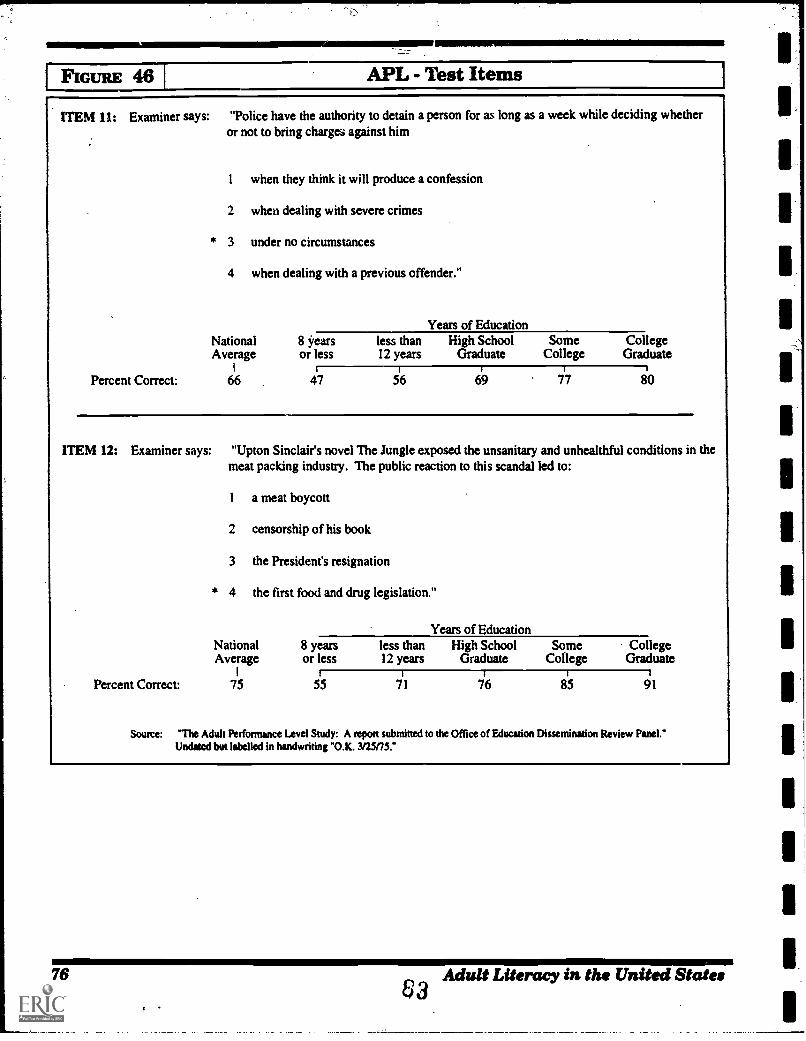
I Fmum 46 APL - Test Items
ITEM 11: Examiner says: "Police have the authority to detain a person for as long as a week while deciding whetheror not to bring charges against him
Percent Correct:
I when they think it will produce a confession
2 when dealing with severe crimes
* 3 under no circumstances
4 when dealing with a previous offender."
Years of EducationNational 8 iears less than High School Some CollegeAverage or less 12 years Graduate College Graduate
I 1
66 47 5'6 69 77 80
ITEM 12: Examiner says: "Upton Sinclair's novel The Jungle exposed the unsanitary and unhealthful conditions in themeat packing industry. The public reaction to this scandal led to:
Percent Correct:
1 a meat boycott
2 censorship of his book
3 the President's resignation
* 4 the first food and drug legislation."
Years of EducationNational 8 years less than High School Some CollegeAverage or less 12 years Graduate Cotlege Graduate
I 1 I
75 55 71 76 85 91
Source: "The Adult Performance Level Study: A report submitted to the Office of Education Dissemination Review Panel."Undated but labelled in handwriting "O.K. 3/25/75."
76 Adult Literacy in the United States
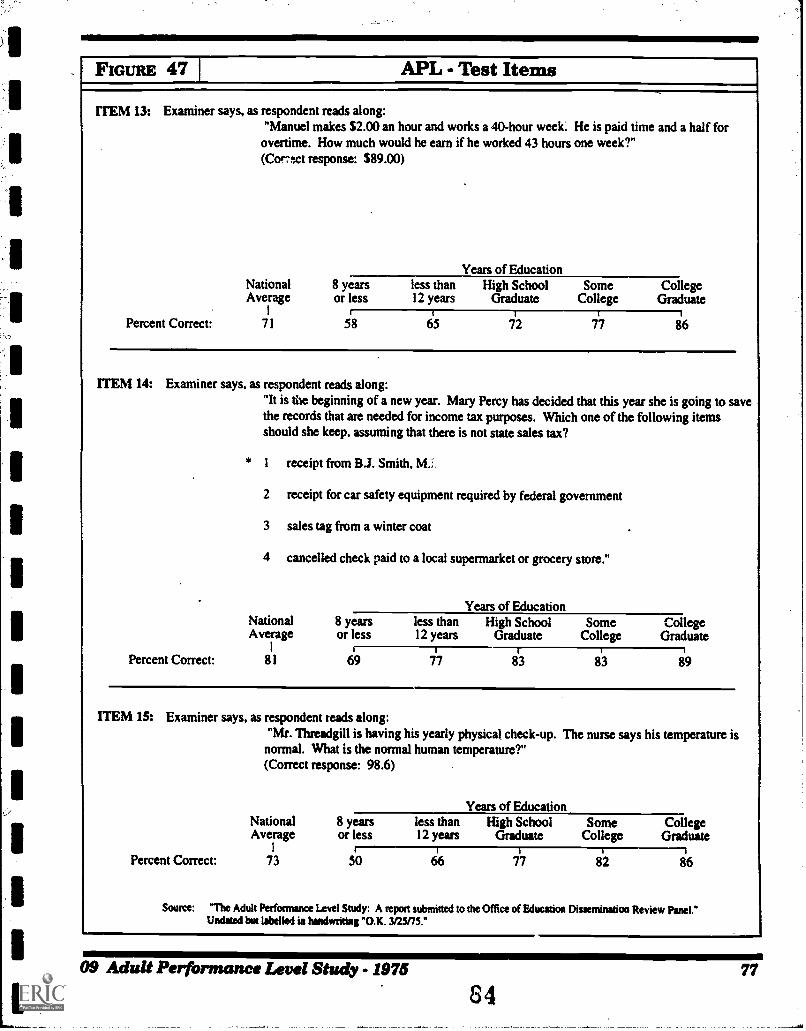
FIGURE 47 APL - Test Items
ITEM 13: Examiner says, as respondent reads along:"Manuel makes $2.00 an hour and works a 40-hour week. He is paid time and a half for
overtime. How much would he earn if he worked 43 hours one week?"(Cortct response: $89.00)
Percent Correct:
Years of EducationNational 8 years less than High School Some CollegeAverage or less 12 years Graduate College Graduate
71 58 65 7'7 86
ITEM 14: Examiner says, as respondent reads along:"It is the beginning of a new year. Mary Percy has decided that this year she is going to savethe records that are needed for income tax purposes. Which one of the following itemsshould she keep, assuming that there is not state sales tax?
* 1 receipt from B.J. Smith, M.I.
2 receipt for car safety equipment required by federal government
3 sales tag from a winter coat
4 cancelled check paid to a local supermarket or grocery store."
Years of EducationNational 8 years less than High School Some CollegeAverage or less 12 years Graduate College Graduate
Percent Correct: 81 69 83 83 89
ITEM 15: Examiner says, as respondent teads along:"Mr. Threadgill is having his yearly physical check-up. The nurse says his temperature isnormal. What is the normal human temperature?"(Correct response: 98.6)
Years of EducationNational 8 years less than High School Some CollegeAverage or less 12 years Graduate College Graduate
I 1
Percent Correct: 73 50 66 86
Source: "The Adult Performance LAvel Study: A report submitted to the Office of Education Dissemination Review Panel."Undated but labelled in handwriting O.K. 3/25/75."
09 Adult Performance Level Study.- 1975
8 4
77
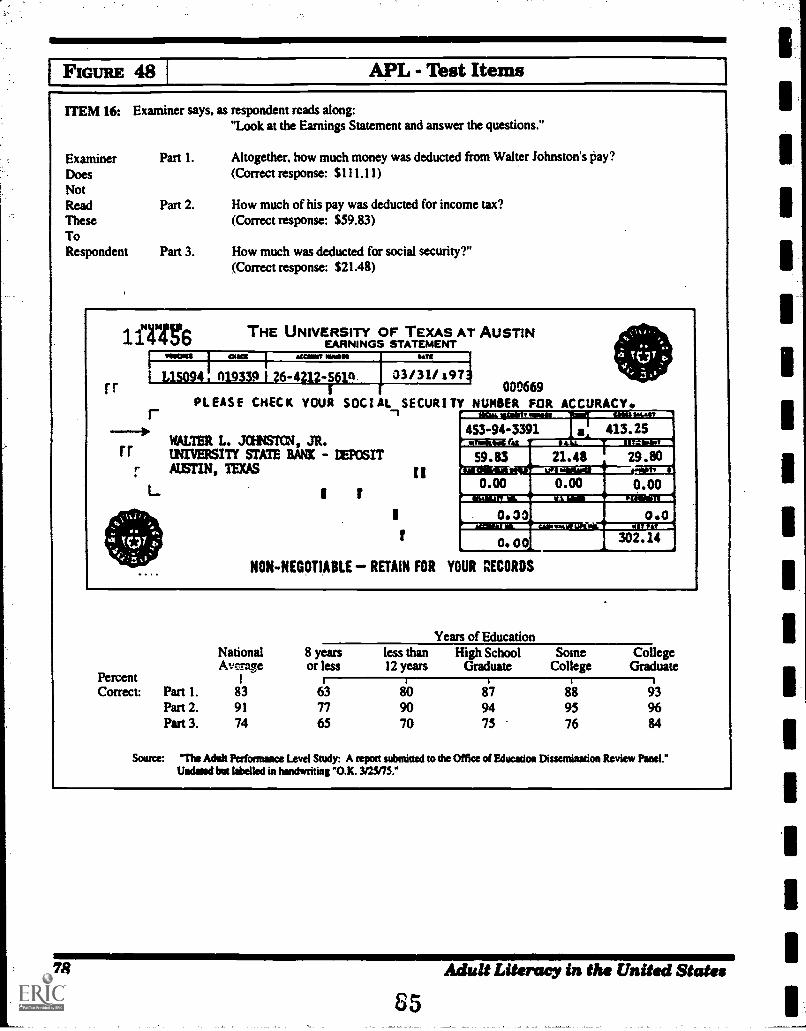
FIGUItE 48 APL - Test Items
ITEM 16: Examiner says, as respondent reads along:"Look at the Earnings Statement and answer the questions."
Examiner Part I. Altogether, how much money was deducted from Walter Johnston's pay?DoesNotRead Part 2. How much of his pay was deducted for income tax?TheseToRespondent Part 3. How much was deducted for social security?"
(Correct response: $21.48)
(Correct response: $111.11)
(Correct response: $59.83)
rr
THE UNIVERSITY OF TEXAS AT AUSTINEARNINGS STATEMENT
Imasts ma I ^COMMIT MEM
I L15094. 019339 I 26-412-i610 33/31/197.0.
000669PLEASE CHECK YOUR SOCIAL SECURI TY NUMBER FOR
WALTER L. jaiNSTON, JR.rr UNIVERSITY STAIE BANK - TEPOSIT
r AUSTIN, TEEM
I1
LI
ACCURACY.
a 413.2511110.=1:7. 1111111=1111/MIN0 /1111111EHEI "I MANI
29.8021.4817 r '. )
000AMU IC" _ aIllE1
0.00 0.00Olt !I +hi MN
0.33AMU I li MI
0.0my, Ti Ir IIMI dlIP", kLW tr. MENU IA/1MM302.140. 00
NON-NEGOTIABLE RETAIN FOR YOUR RECORDS
PercentCorrect:
Years of EducationNational 8 years less than High School Some CollegeAverage or less 12 years Graduate College Graduate
I
Part 1. 83 63 810 817 818 43Part 2. 91 77 90 94 95 96Part 3. 74 65 70 75 76 84
Source: nte Adak Paformance Level Study: A report submitted to the Office of Education Dissemination Review Panel."Undmad but labelled in handwriting "O.K. 3i25/75."
78
85Adult Literacy in the United State.
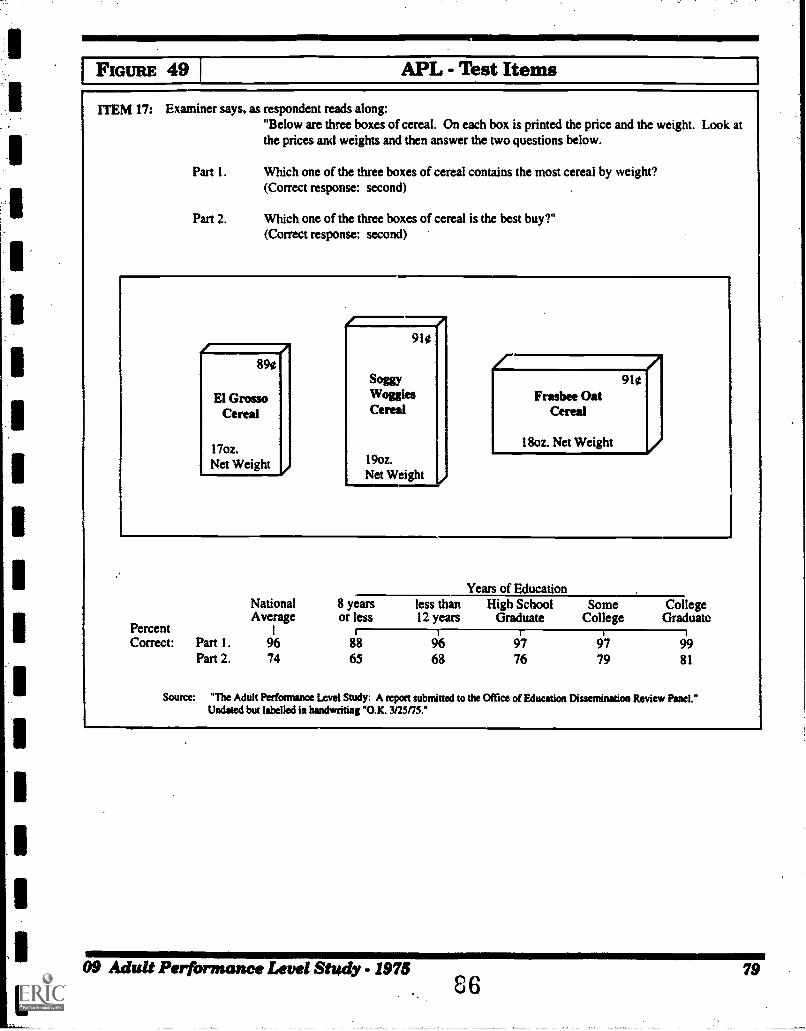
FIGURE 49 APL Thst Items
ITEM 17: Examiner says, as respondent reads along:"Below are three boxes of cereal. On each box is printed the price and the weight. Look atthe prices and weights and then answer the two questions below.
Part I. Which one of the three boxes of cereal contains the most cereal by weight?(Correct response: second)
Part 2. Which one of the three boxes of cereal is the best buy?"(Correct response: second)
89e
El GrossoCereal
17oz.Net Weight
791e
SoggYWogglesCereal
19oz.Net Weight
LFrasbee Oat
Cereal
18oz. Net Weight
910
NationalAverage
Percent I
Correct: Part I. 96Part 2. 74
Years of Education8 years less than High School Some Collegeor less 12 years Graduate College Graduate
i
818 96 917 917 9965 68 76 79 81
Source: "The Adult Performance Level Study: A report submitted to the Office of Education Dissemination Review Panel."Undated but labelled in handwriting "O.K. 3/25175.'
09 Adult Performance Level Study.- 1975 7986
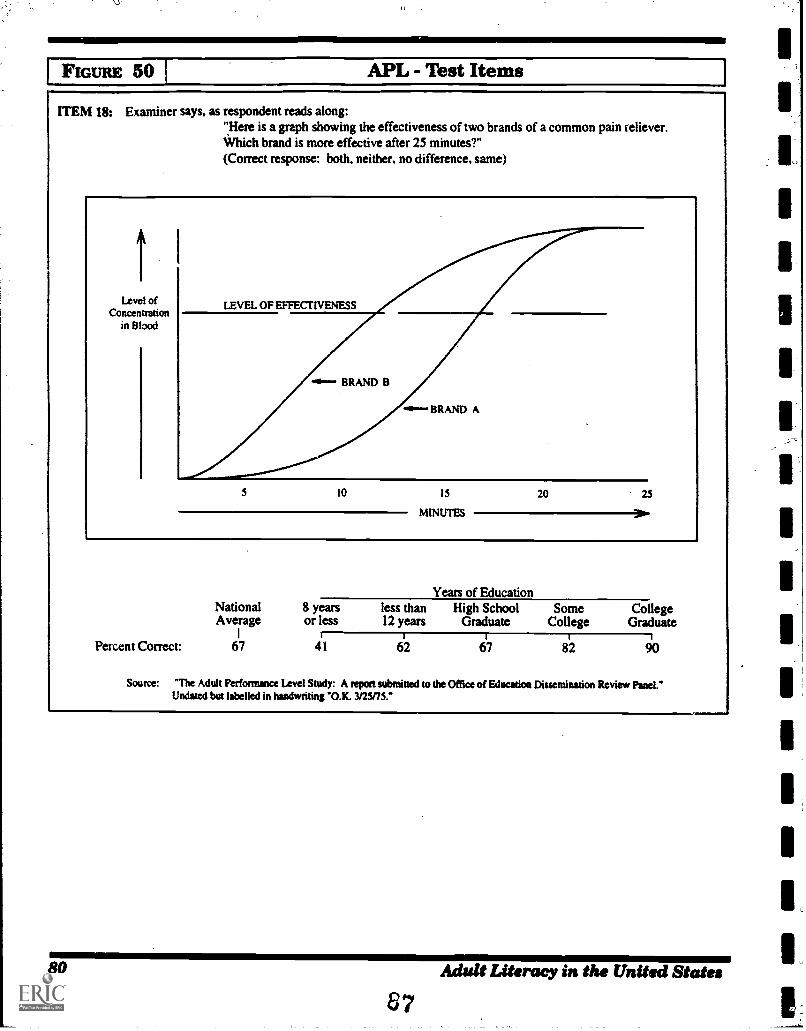
FIGURE 50 APL - Test Items
ITEM 18: Examiner says, as respondent reads along:"Here is a graph showing the effectiveness of two brands of a common pain reliever.Which brand is more effective after 25 minutes?"(Correct response: both, neither, no difference. same)
ftLevel of
Concentrationin Blood
LEVEL OF EFFECTIVENESS
BRAND B
46 BRAND A
10 15 20 25
MINUTES
Percent Correct:
Years of EducationNational 8 years less than High School Some CollegeAverage or less 12 years Graduate College Graduate
67 41 67 82 90
Source: "be Adult Performance Level Study: A report submitted to the Office of Education Dissemination Review PulerUndated but labelled in handwriting O.K.' 3/25/75.*
80 Adult Literacy in the United States
87
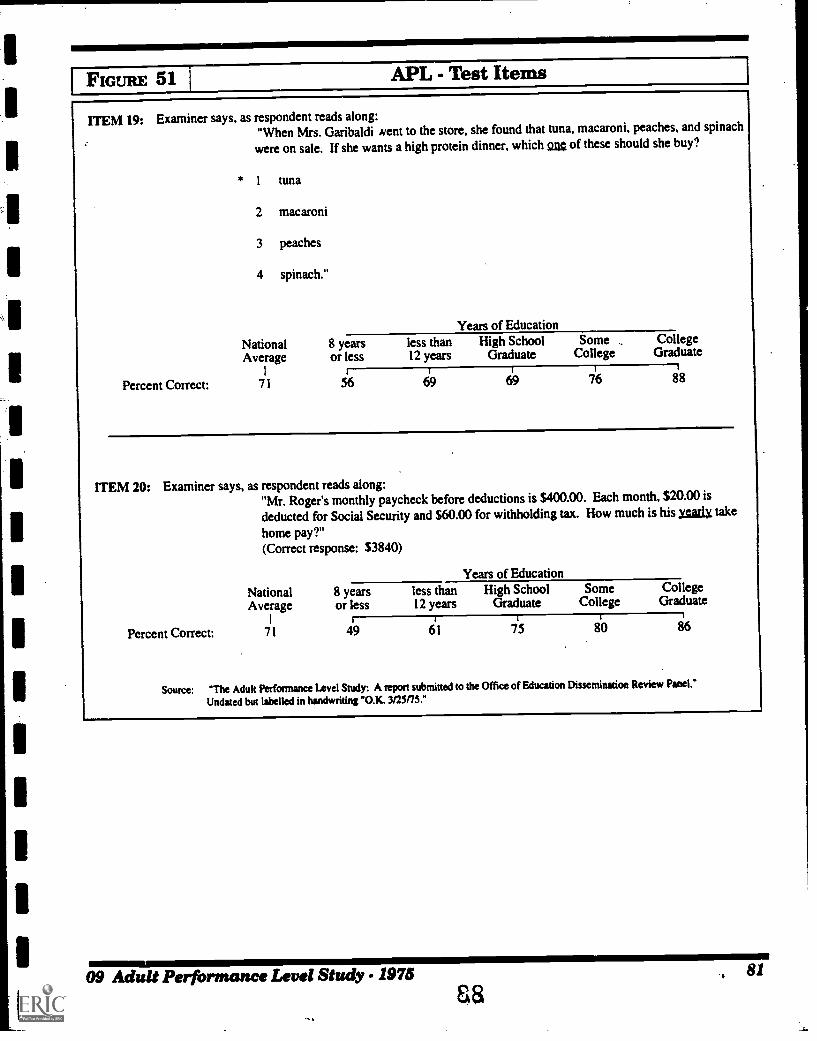
..M11.11111111Ir
IFIGURE 51 A.PL - Test Items
ITEM 19: Examiner says, as respondent reads along:"When Mrs. Garibaldi Nem to the store, she found that tuna, macaroni, peaches, and spinach
were on sale. If she wants a high proteindinner, which Qat of these should she buy?
Percent Cotrect:
* 1 tuna
2 macaroni
3 peaches
4 spinach."
Years of Education
National 8 years less than High School Some .. CollegeAverage or less 12 years Graduate College Graduate
I
71 516 69 69 7'6 88
ITEM 20: Examiner says, as respondent reads along:"Mr. Roger's monthly paycheck before deductions is $400.00. Each month, $20.00 isdeducted for Social Security and $60.00 for withholding tax. How much is his yearly take
home pay?"(Correct response: $3840)
Percent Correct:
Years of Education
National 8 years less than High School Some CollegeAverage or less 12 years Graduate College Graduate
71 ,;19 61 75 80 86
Source: "The Adult Performance Level Study: A report submitted to the Office of Education Dissemination Review Panel."
Undated but labelled in handwriting "O.K. 3/25/75."
09 Adult Performance Level Study. 1975 ., 81
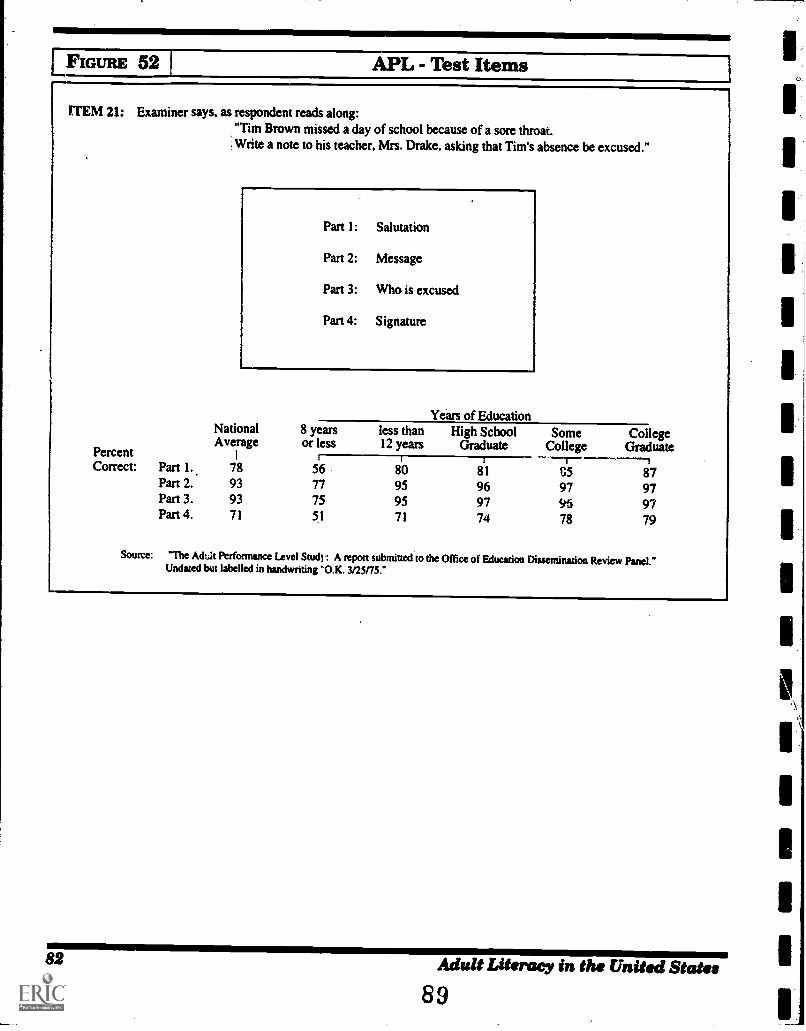
FIGURE 52 APL - Test Items
ITEM 21: Examiner says, as respondent reads along:"Tim Brown missed a day of school because of a sore throat.Write a note to his teacher, Mrs. Drake, asking that Tim's absence be excused."
Part 1: Salutation
Part 2: Message
Part 3: Who is excused
Part 4: Signature
Years of EducationNational 8 years less than High School Some CollegeAverage or less 12 years Graduate College GraduatePercent
I i1 --rCorrect: Part 1.. 78 56 810 81 GS 87
Part 2. 93 77 95 96 97 97Part 3. 93 75 95 97 96 97Part 4. 71 51 71 74 78 79
Source: "The Aduit Performance Level Stud): A report submitted to the Office of Education Dissemination Review Panel."Undated but labelled in handwriting "O.K. 3/25175."
82 Adult Literacy in the United States
89
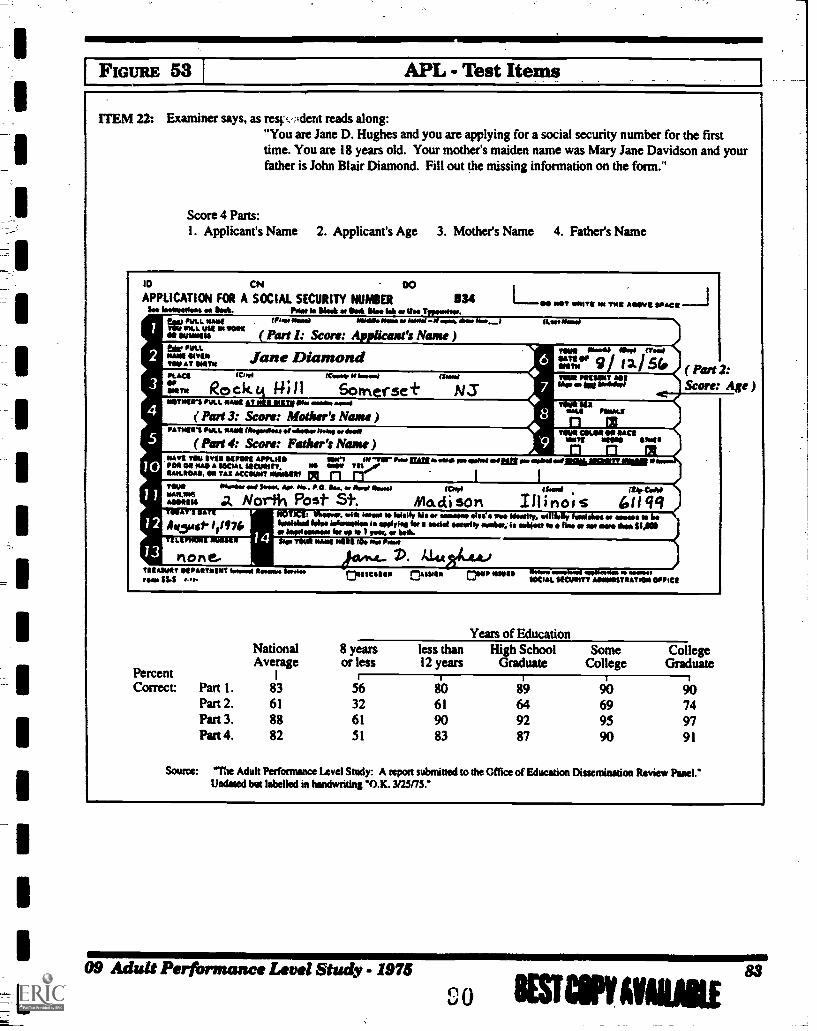
FIGURE 53 I APL Test Items
ITEM 22: Examiner says, as resp.cicient reads along:"You are Jane D. Hughes and you are applying for a social security number for the firsttime. You are 18 years old. Your mother's maiden name was Mary Jane Davidson and yourfather is John Blair Diamond. Fill out Me missing information on the form."
Score 4 Parts:1. Applicant's Name 2. Applicant's Age 3. Mother's Name 4. Father's Name
ID 04APPLICATION FOR A SOCIAL SECURITY NUMBER 134
See bmweifeee se Seek. Po NI* Sleek et Sok Mee lek et Ihe Tweedier.few hou. sere Mao *ewe aUdiNfIe.. es Wog-if ow% PAPdAse...-/Vey um. ust NI WW1MI MOM ( Part 1: Score: Applicant's Name )
1. 00 NOT UOUTII OH Tut AWN! !PAC*
Men NERO
yr PULLNail INTIM Jane DiamondYOU AT SIMI
PtAal tom mum. **woo awe/
Rock,It_p_ Soincrse+IMITIPHYS "ILL MIK
NS( Part 3: Score: Mother's Name )
naiours PULL MAUI fieredleee 0.11466. Skimp es *al
( Part 4: Score: Father's Name )
1111014 11144 ITdolOAMem 11/ 5GTII
71111 5411111117 IIIdo let ikobiliva
( Part 2:Score: Age )
efts POOLS
TOM PIM SAOIMOD 1111161111
NAPS Val ITU GUM! APPLIED III1W1 IN .VIIr Par grm...w. oPOod defiltafilifillUZAMIB *POI 04 MAO A 1110ALIITOUPNTT.SAMOA% SO TAZ ACCOUNT mow nMP Poly
TIM 01%51.. old $moot. Ap. dee. po. *we lam) My. Mont atpc.,/:".55.51 u A North Post St. Ma di so PI Ihinoss butlerTIZBAT-I 0ATI1 . NOME *PAW. oils APOsse Is Oak* We or maloOme ose. owe Need*. Wifely lowlebee se New se be4,15,40 111171, beehbed Mee Weeeetiee ie *Weft fee e seefel mewl* wairwi is MI** le e feet*** sem *ea UM
or meora he le * 1 leer. to beih.Mut AM
JCILAUL. V. 444,34.4410.1 sssss u DUN. DINIP um.
rto nTOIAKIRT sssss T WNW Illoiswetsar $1.1
00010464 4101.4.4140 ONO"SOCIAL $84:10try AsargasTRATKIN OPPCI
PercentCorrect:
National 8 yearsAverage or less
Pan 1. 83 56Part 2. 61 32Part 3. 88 61Pan 4. 82 51
Years of Educationless than High School12 years Graduate
Some CollegeCollege Graduate
810 89 910
61 64 6990 92 9583 87 90
90749791
Source: 'The Adult Performance Level Study: A report submitted to the Office of Education Dissemination Review Panel.'Undated bet labelled in handwriting "O.K. 3/25/15.*
09 Adult Performanat Level Study - 1975
IESTCP011111
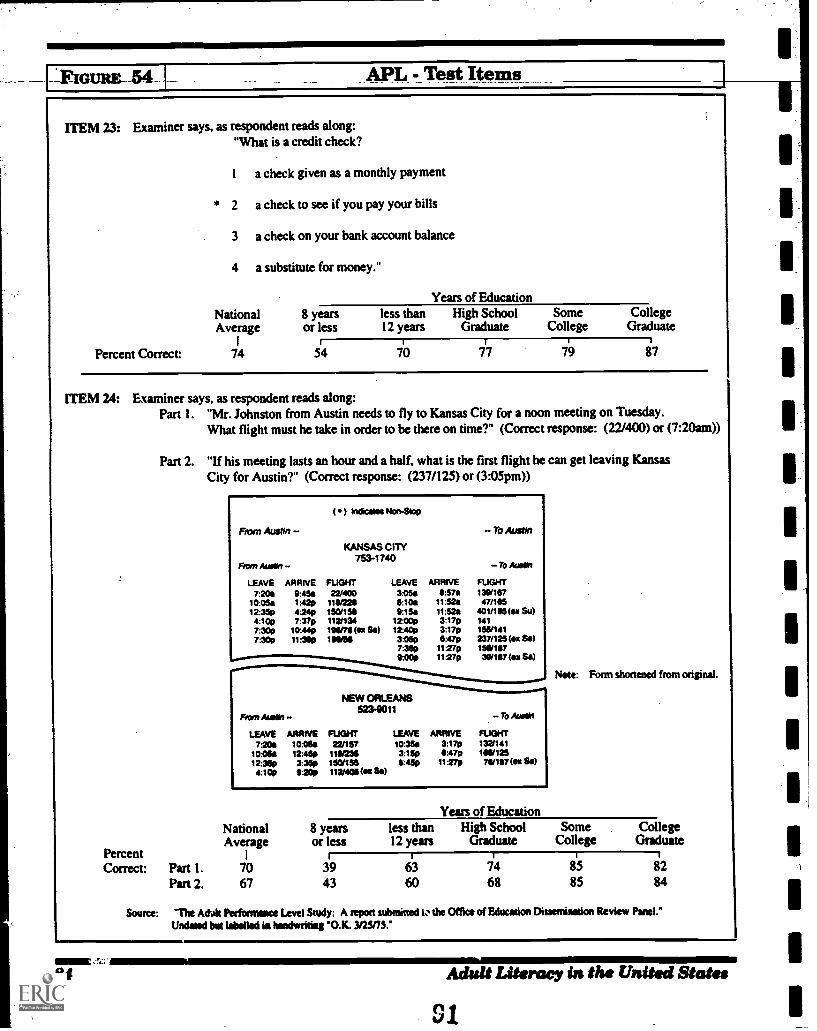
r-FIGURE-- 54_ APL Test Items
ITEM 23: Examiner says, as respondent reads along:"What is a credit check?
Percent Correct:
a check given as a monthly payment
* 2 a check to see if you pay your bills
3 a check on your bank account balance
4 a substitute for money."
Years of EducationNational 8 years less than High School Some CollegeAverage or less 12 years Graduate College Graduate
I 1 I
74 54 76 717 79 87
ITEM 24: Examiner says, as respondent reads along:Part I. "Mr. Johnston from Austin needs to fly to Kansas City for a noon meeting on Tuesday.
What flight must he take in order to be there on time?" (Correct response: (22/400) or (7:20am))
Part 2. "If his meeting lasts an hour and a half, what is the first flight he can get leaving KansasCity for Austin?" (Correct response: (237/125) or (3:05pm))
( ) Indicsiss Non-,5219
From Austin To Austin
KANSAS CITY753-1740
From Autart To Ass01
LEAVE ARRIVE FLIGHT LEAVE ARRIVE FUGHT7:201 9:461 22/400 3054 11:57* 130157
10:051 1:42p 110221 11:104 11324 47114512:33p 4249 450/1511 9154 11:521 401/1439144:10p 7:37p 1121134 12000 3:17p 1417:300 10449 1919711(414 01) 1t40 p 3:17p 1551141
7:30p 11:319 190511 305p $:47p 237/123(14 SO7:35p 11279 1501179:00p 1127p 30117 OM 919
Note: Form shortened from
From Amen
NEW ORLEANS523-9011
To Moen
LEAVE ARRfVE RJGHT LEAVE ARRIVE FLIGHT
7201 10:034 221157 10:350 3:17p 1321141
10:051 12459 1111236 3:11p 1:470 tones12:350 3:35. 150(155 1:45p 11279 711/107 (sx24)4:100 11:200 112/401(41154)
Years of EducationNational 8 years less than High School Some CollegeAverage or less 12 years Graduate College Graduate
Percent I I
Correct: Part 1. 70 39 63 74 85 82Part 2. 67 43 60 68 85 sa
Source: 'The Adak Perfomustee Lzvel Study: A report submitted tz the Office of EducatMe Dissemination Review Panel."Undmad but labelled in handwriting 'O.K. 3/25175."
Adult Literacy in the United States
n
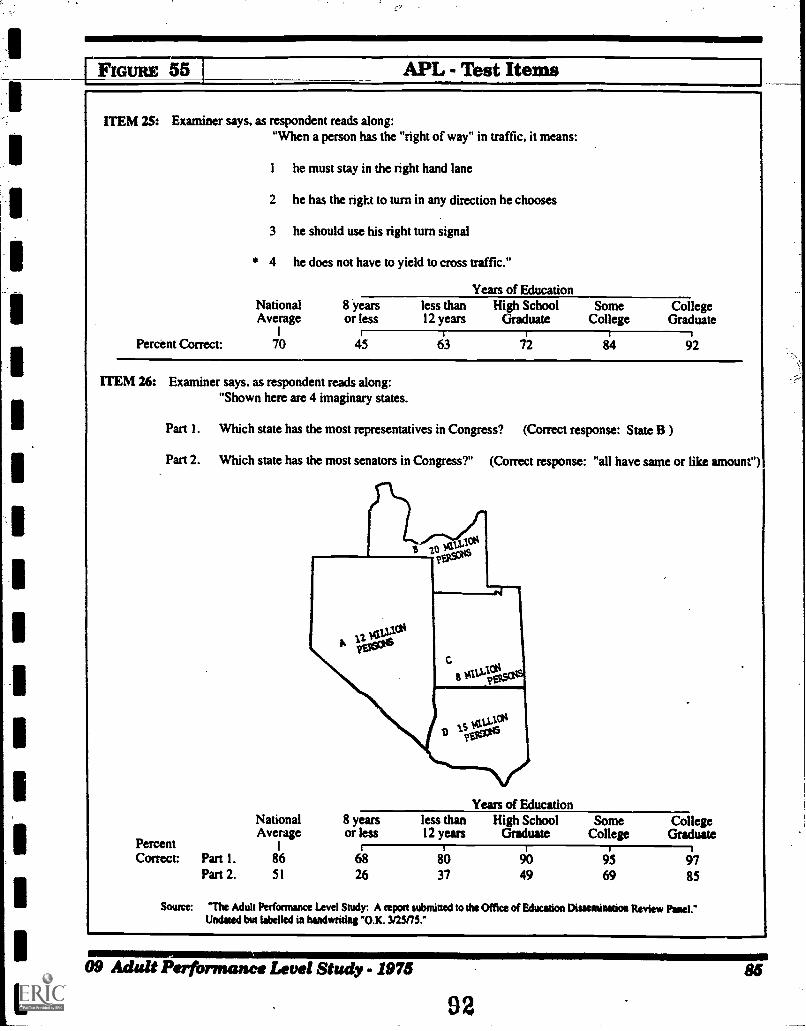
1
ITEM 25: Examiner says, as respondent reads along:"When a person has the "right of way" in traffic, it means:
1 he must stay in the right hand lane
2 he has the right to turn in any direction he chooses
3 he should use his right turn signal
* 4 he does not have to yield to cross traffic."
Years of EducationNational 8 years less than High School Some CollegeAverage or less 12 years Graduate College Graduate
I 1
Percent Correct: 70 45 63 72 84 92
ITEM 26: Examiner says. as respondent reads along:"Shown here are 4 imaginary states.
Part 1. Which state has the most representatives in Congress? (Correct response: State B )
Part 2. Which state has the most senators in Congress?" (Correct response: "all have same or like amount")
Years of EducationNational 8 years less than High School Some CollegeAverage or less 12 years Graduate College Graduate
Percent I
Correct: Part I. 86 68 80 90 95 97Part 2. 51 26 37 49 69 85
Source: "The Adult Performance Level Study: A repon submitted to the Office of Education Dissemination Review Panel."Undated but tatelled in handwriting "O.K. 3125/75."
09 Adult Performance Level Study.- 1975
92
85
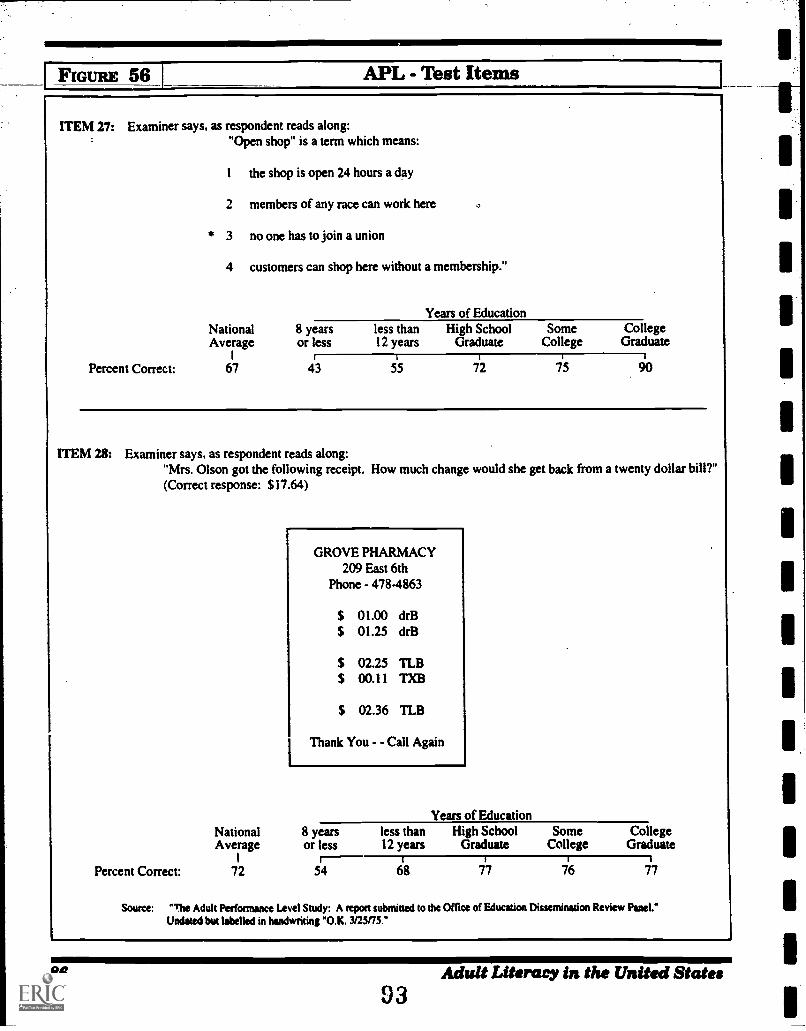
FIGURE 51.1 APL - Test Items
ITEM 27: Examiner says, as respondent reads along:"Open shop" is a term which means:
1 the shop is open 24 hours a day
2 members of any race can work here
* 3 no one has to join a union
4 customers can shop here without a membership."
Percent Correct:
Years of EducationNational 8 years less than High School Some CollegeAverage or less 12 years Graduate College Graduate
I 1 I
67 43 65 72 75 90
ITEM 28: Examiner says, as respondent reads along:"Mrs. Olson got the following receipt. How much change would she get back from a twenty dollar bill?"(Correct response: $17.64)
GROVE PHARMACY209 East 6th
Phone - 478-4863
$ 01.00 drB$ 01.25 drB
$ 02.25 TLB$ 00.11 TXB
$ 02.36 TLB
Thank You - Call Again
Years of EducationNational 8 years less than High School Some CollegeAverage or less 12 years Graduate College Graduate
I
Percent Correct: 72 54 68 77 76 77
Source: "The Adult Performance Level Study: A report submined to the Office of Education Dissemination Review Panel."Undated but labelled in handwriting "O.K. 3/25/75."
86 Adult Literary in the United States93
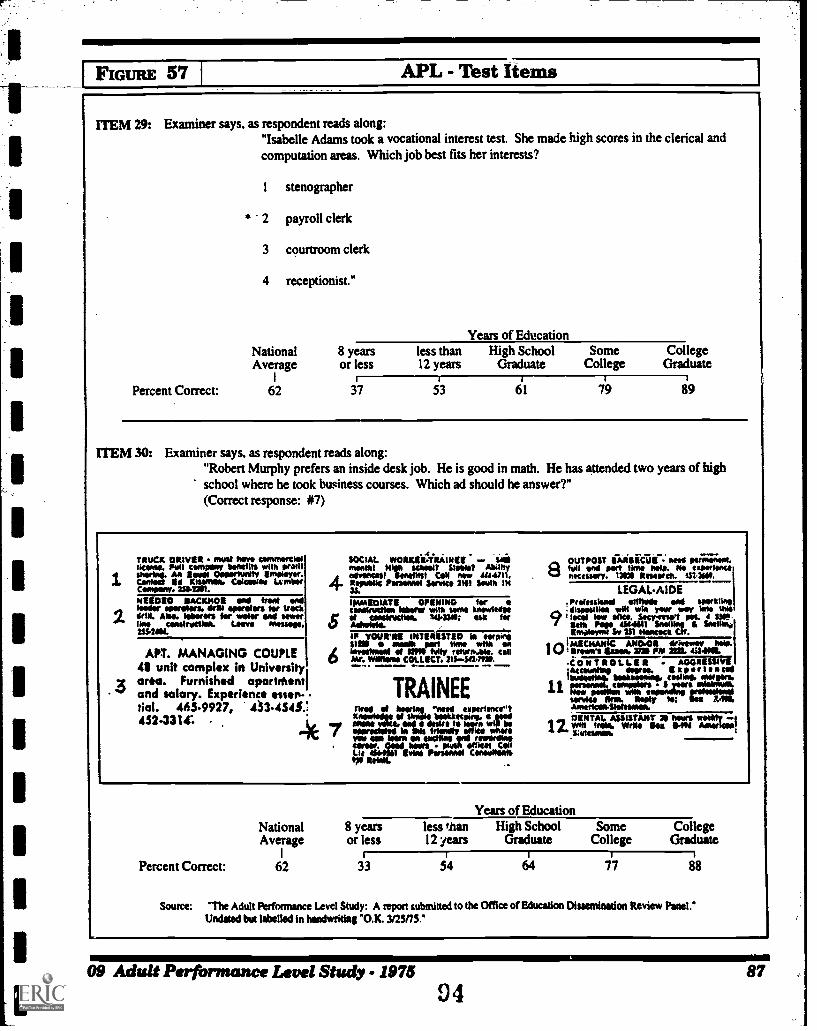
FIGURE 57 APL - Test Items
ITEM 29: Examiner says, as respondent reads along:"Isabelle Adams took a vocational interest test. She made high scores in the clerical andcomputation areas. Which job best fits her interests?
I stenographer
* 2 payroll clerk
3 courtroom clerk
4 receptionist."
NationalAverage
Percent Correct: 62
8 yearsor less
37
Years of Educationless than High School12 years Graduate
SomeCollege
5'3
CollegeGraduate
89
ITEM 30: Examiner says, as respondent reads along:"Robert Murphy prefers an inside desk job. He is good in math. He has attended two years of highschool where he took business courses. Which ad should he answer?"(Correct response: #7)
TMJCK COMER mvst here compere.ficeme. Pali cemPlerr benellts with eretil
4 ~IMP. AO IsviI OthsertimitY Emir Myer.J. Contact Ed Elutes* Calcasieu Lcmear
Corseemr. ZSPESM.NEEDED IACKI4OI end treat earl
2.Metier elserelers. *Sr mentors ter Necketc Alm Wenn; sw Wier OM sewer
cmstractiee. Leave fennel.145441.
3
APT. MANAGING COUPLE40 unit complex in Universityarea. Furnished apartrnentand salary. Experience essert-tial. 465.9927, 43.454S:452.331
6
4e 7
SOCIAL WORICERT INES sitsmotel Nigh ormeit UMW AbilityWeaves! Ometitst CON ?WM e444711,nook Penefinel Sante sit swim INas.IMMEDIATE OPENING forconekvellee haver wile some Mewled,.ii aestrachee. 304319: ask terAdvskftII YOUIVIIIII INTERESTED ie whoreMil meth pert thee with enilleestmaiD et DM telly returrhAft. coilMt. wows coilscr. 31S-50Me..1.111
TRAINEEMee ii hierlee esmeriencetkreperlodoe ii *NM treithlismare e DPWriteprellirreit eat ,s1 *Om le mere am be
Es Meetly office lettereYaw ess Nem eft *millet ford fewer**terelfa&Metvhaverintaast ealgttimfitit
IN; IMMIL
OUTPOST eloisirciiir ;me rejtilristt.8 .1 and pert time hele. No easerlmatnecessary. INN Resnick 451.3iN.
LEGALAIDE!Premien, elltIvele end seeming.414.8141km will wM year erey Ime Wes
9 low elite. Secpreso't P.S. 4 $W-U M Pew awn SnolihteE mOrmer 211 Hancock CM.
"lemtcmA7Z--ANDOlt driveway MO.I Ilsoeft 5415 PM 321. 443411111.
.CONTROLLSR MMMIUMMEdegree. Experleeme
bookteersiesh mkt} women.
11 i*-61A4:12tw:.;JdZr 11111"wake Rms. Moly le: &NDAsserlasiegeleteme.DENTAL ASSISTANT 111 twos weekly I
1 L tills. Wile See 64N Amarlast&Memo&
NationalAverage
Percent Correct: 62
Years of Education8 yearsor less 12 years Graduate
33
less than High School Some CollegeCollege Graduate
64 77 88
Source: "The Adult Performence Level Study: A report submitted to the Office of Education INISCIININDOO Review Panel."Undated but labelled in handwrida 0.K. 3125/75."
09 Adult Performance Level Study. - 197694
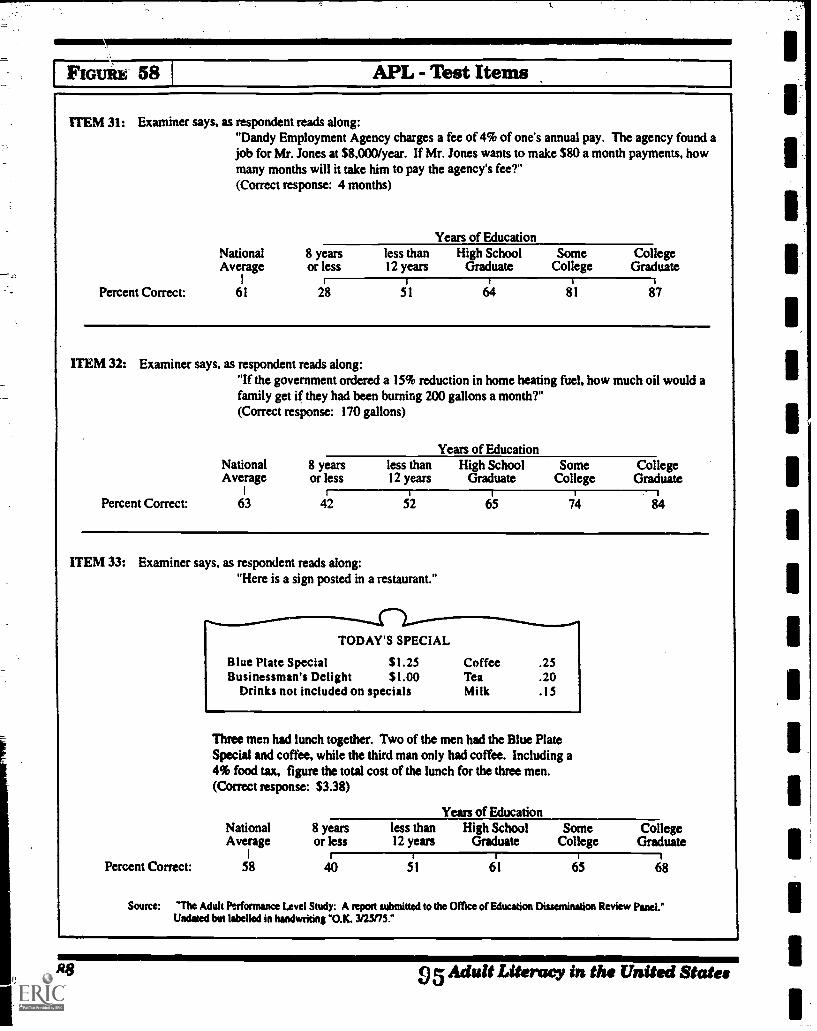
FIGLIH1E 58 I APL - Test Items
ITEM 31: Examiner says, as respondent reads along:"Dandy Employment Agency charges a fee of 4% of one's annual pay. The agency found ajob for Mr. Jones at $8,000/year. If Mr. Jones wants to make $80 a month payments, howmany months will it take him to pay the agency's fee?"(Correct response: 4 months)
Percent Correct:
NationalAverage
I
61
Years of Education8 yearsor less
less than12 years
High SchoolGraduate
SomeCollege
CollegeGraduate
i
28 51 6481 87
ITEM 32: Examiner says, as respondent reads along:"If the government ordered a 15% reduction in home heating fuel, how much oil would afamily get if they had been burning 200 gallons a month?"(Correct response: 170 gallons)
Percent Correct:
Years of EducationNational 8 years less than High School Some CollegeAverage or less 12 years Graduate College Graduate
I 1
63 42 52 45 74 84
ITEM 33: Examiner says, as respondent reads along:"Here is a sign posted in a restaurant."
Percent Correct:
TODAY'S SPECIAL
Blue Plate Special $1.25 Coffee .25Businessman's Delight $1.00 Tea .20
Drinks not included on specials Milk .15
Three men had lunch together. Two of the men had the Blue PlateSpecial and coffee, while the third man only had coffee. Including a4% food tax, figure the total cost of the lunch for the three men.(Correct response: $3.38)
Years of EducationNational 8 years less than High School Some CollegeAverage or less 12 years Graduate College Graduate
I I
58 40 51 61 65 68
Source: "The Adult Performance Level Study: A report submitted to the Office of Education Diuemination Review Panel."Undated but labelled in handwriting "O.K. 3/25/75."
88 5 Adult Literacy in the United States
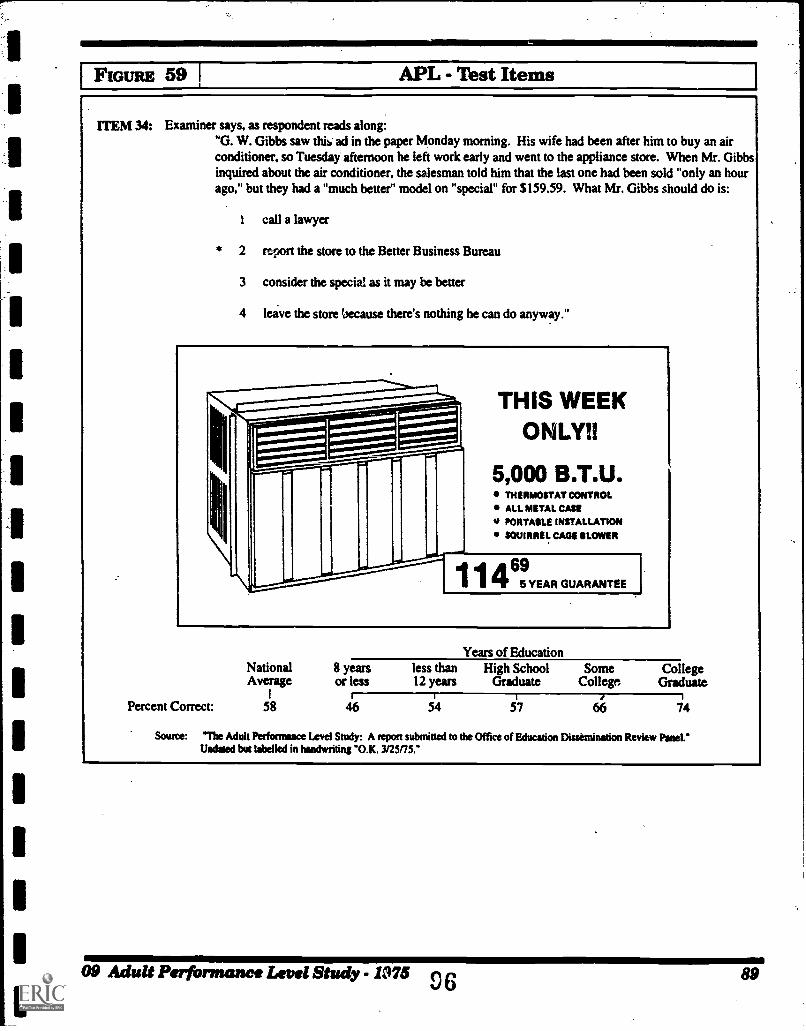
FIGURE 59 AFL - Test Items
ITEM 34: Examiner says, as respondent reads along:"G. W. Gibbs saw th6 ad in the paper Monday morning. His wife had been after him to buy an airconditioner. so Tuesday afternoon he left work early and went to the appliance store. When Mr. Gibbsinquired about the air conditioner, the salesman told him that the last one had been sold "only an hourago," but they had a "much better" model on "special" for $159.59. What Mr. Gibbs should do is:
call a lawyer
2 report the store to the Better Business Bureau
3 consider the special as it may be better
4 leave the store because there's nothing he can do anyway."
THIS WEEKONLY!!
5,000 B.T.U.ThERMOSTAT CONTROL
Alt. METAL CASEPORTASLE INSTALLATION
SQUIRREL CAGE SLOWER
Years of EducationNational 8 years less than High School Some CollegeAverage or less 12 years Graduate College Graduate
I i
Percent Correct: 58 46 54 57 6415 74
Source: Me Adult Performance Level Study: A report submitted to the Office of Education Disstmination Review Panel.'Undated but labelled in handwriting "O.K. 3/25/75."
09 Adult Perfornsance Level Study.- 107549 6 89
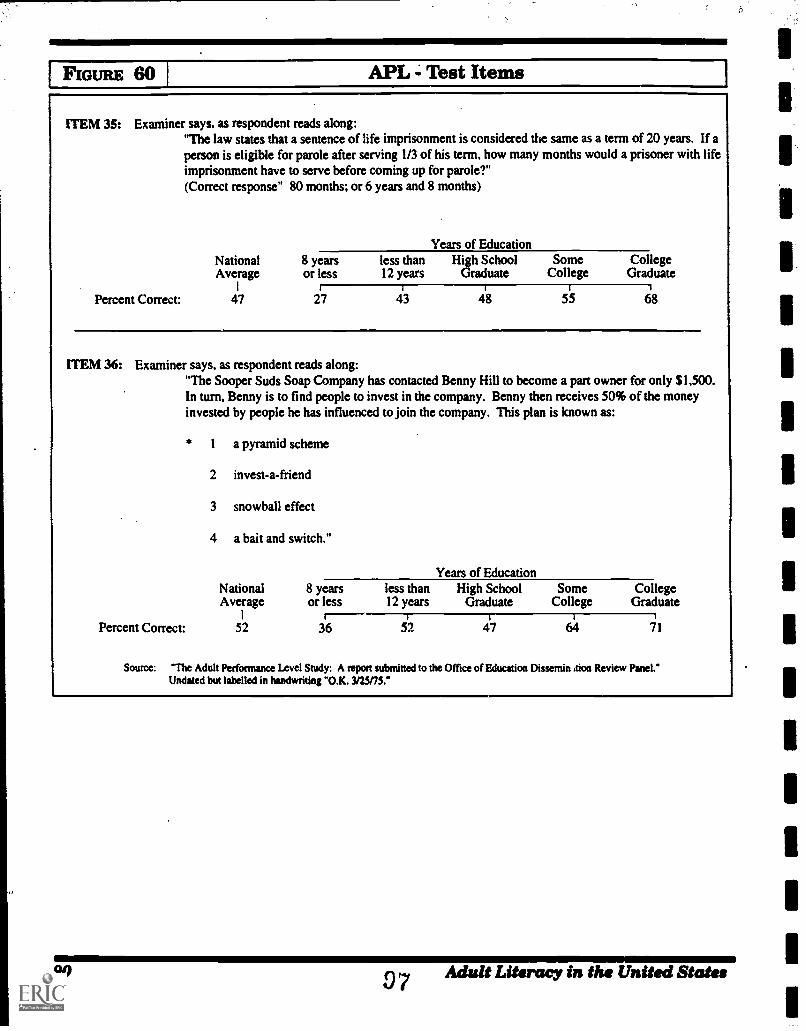
FIGURE 60 APL .; Test Items
ITEM 35: Examiner says, as respondent reads along:"The law states that a sentence of life imprisonment is considered the same as a term of 20 years. If aperson is eligible for parole after serving 1/3 of his term, how many months would a prisoner with lifeimprisonment have to serve before coming up for parole?"(Correct response" 80 months; or 6 years and 8 months)
Percent Correct:
Years of EducationNational 8 years less than High School Some CollegeAverage or less 12 years Graduate College Graduate
I 1 1 I
47 27 43 48 55 68
ITEM 36: Examiner says, as respondent reads along:"The Sooper Suds Soap Company has contacted Benny Hill to become a part owner for only $1,500.In turn, Benny is to find people to invest in the company. Benny then receives 50% of the moneyinvested by people he has influenced to join the company. This plan is known as:
Percent Correct:
1 a pyramid scheme
2 invest-a-friend
3 snowball effect
4 a bait and switch."
Years of EducationNational 8 years less than High School Some CollegeAverage or less 12 years Graduate College Graduate
I
52 36 5'2 47 64 71
Source: "The Adult Performance Level Study: A report submitted to the Office of Education Dissemin &ion Review Panel."Undated but labelled in handwriting "O.K. 3125175."
90 07 Adult Literacy in the United State.
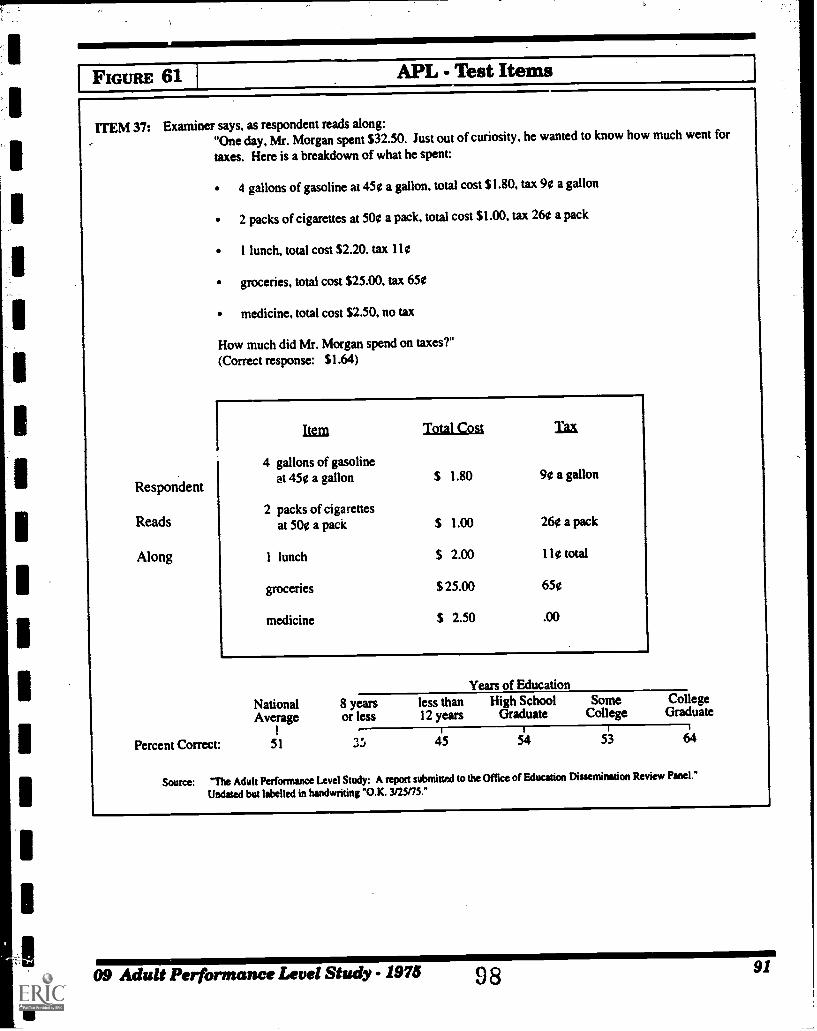
FIGURE 61 APL - Ilest Items
ITEM 37: Examiner says, as respondent reads along:"One day, Mr. Morgan spent $32.50. Just out ofcuriosity, he wanted to know how much went for
taxes. Here is a breakdown of what he spent:
4 gallons of gasoline at 450 a gallon, total cost $1.80, tax 90 a gallon
2 packs of cigarettes at 500 a pack, total cost $1.00. tax 260 a pack
I lunch, total cost $2.20. tax 110
groceries, total cost $25.00, tax 650
medicine, total cost $2.50. no tax
How much did Mr. Morgan spend on taxes?"(Correct response: $1.64)
ECM
4 gallons of gasoline
Total Cost La
Respondentat 450 a gallon $ 1.80 90 a gallon
2 packs of cigarettesReads at 50e a pack $ 1.00 260 a pack
Along 1 lunch $ 2.00 110 total
groceries $ 25.00 650
medicine $ 2.50 .00
Percent Correct:
Years of Education
National 8 years less than High School Some CollegeAverage or less 12 years Graduate College Graduate
I I-:
51 3r) 415 54 53 64
Source: *The Adult Performance Level Study: A report submitted to the Office of Education Dissemination Review Panel."
Undated but labelled in handwriting ''O.K. 3/25/75."
09 Adult Performance Level Study. - 1975 98 91
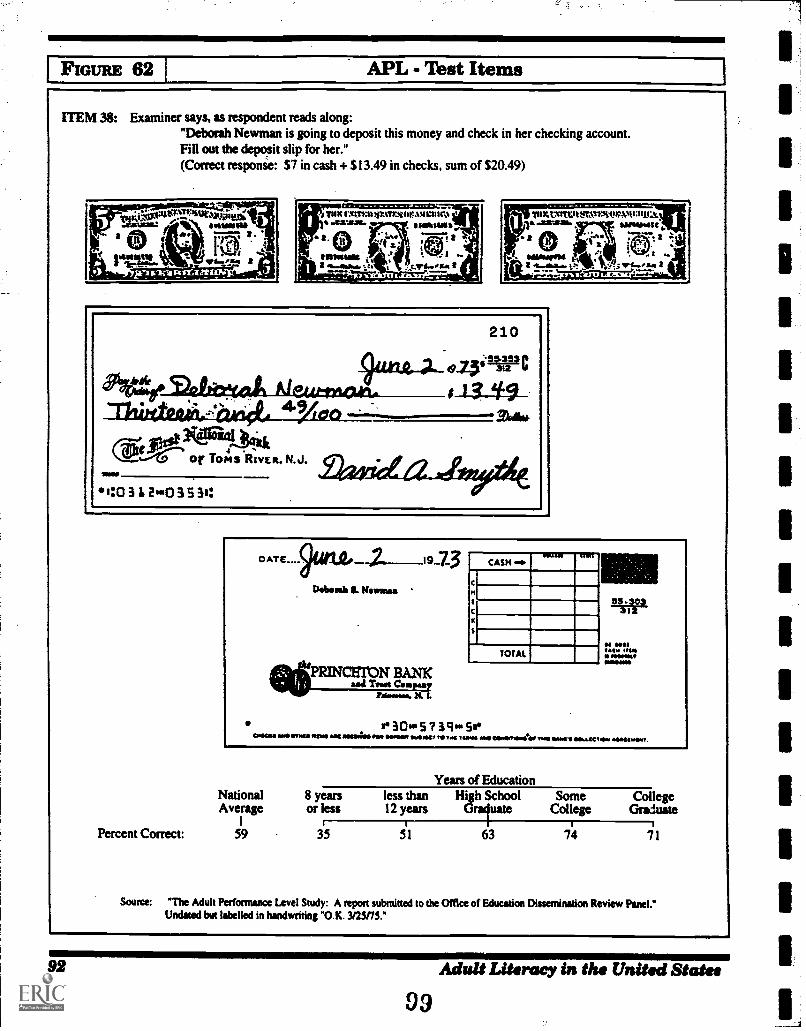
FIGURE 62 APL - Test Items
ITEM 38: Examiner says, as respondent reads along:"Deborah Newman is going to deposit this money and check in her checking account.Fill out the deposit slip for her."(Correct responie: $7 in cash + $13.49 in checks, sum of $20.49)
C1131711131==Cd.TUKINSTEISVATFAtir.U11.1:1C4ataUtar.
1118111001111
VIXXXVOIlttITAMMAN-43:ItILtr Arum.. *mouseI
imagemew "Al,Lk. I, .1,74r-
x i I:70.7t. A
210
,92.50-WPCS4aVate_..52zhteea..kAI&Aasoxt.___$ t 3 11.949
Zak*jrats, kaittditi,
4.1W Of s TOrgs.nIvER, N.J. Eaerietaxii#1.444'40 3 210 3 31:
Percent Correct:
Dobenge & Neiman '
RINCBTON BANKmai Trot Coml..?
Plamtows. M. I.
MelbCASH m0
TOTAL
3016 5 7 3 96. 5*.COMM *NO WWII RIM llI solleale S5 MOW &NW Mule ttiMI Ill COMMINIAM ?..11 ,(0104
NationalAverage
59
8 yearsor less
35
Years of Educationless than12 years
High SchoolGral uate
SomeCollege
CollegeGraduate
5 I1 63 714 71
Source: "The Adult Performance Level Study: A non submitted to the Office of Education Dissemination Review Panel."Undated but labelled in handwriting "O.K. 3125175."
92
09Adult Literacy in the United State.
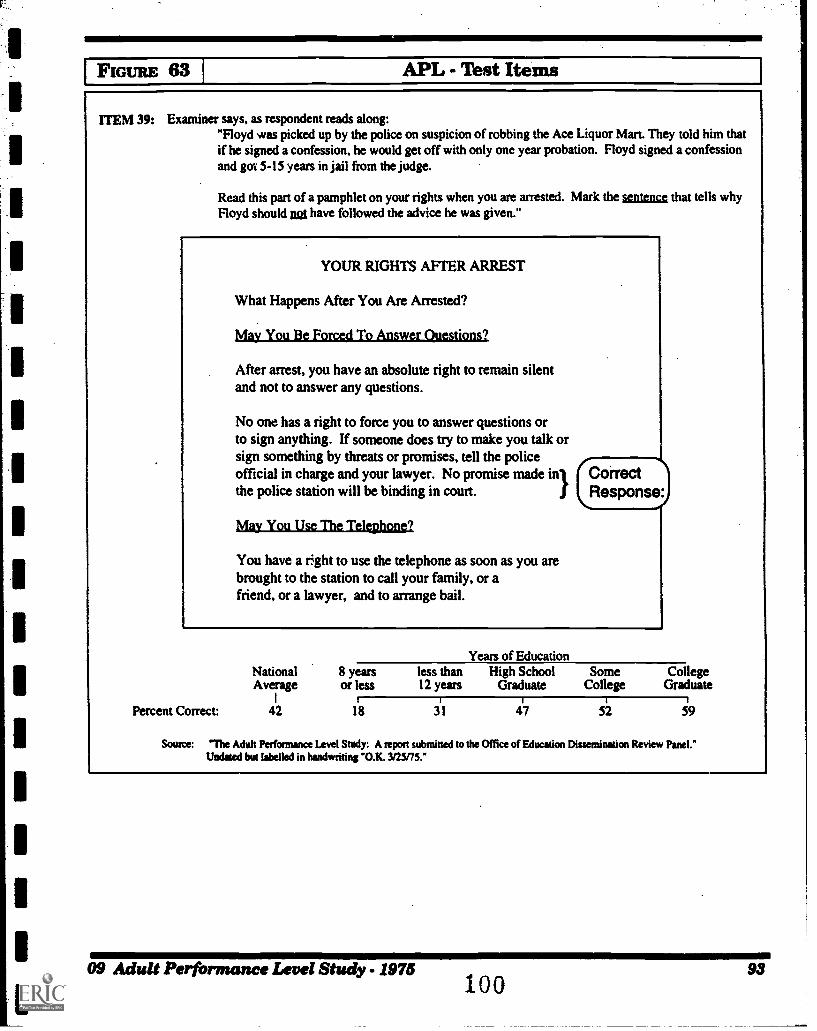
IFIGURE 63 APL - Test Items
ITEM 39: Examiner says, as respondent reads along:"Floyd was picked up by the police on suspicion of robbing the Ace Liquor Mart. They told him thatif he signed a confession, he would get off with only one year probation. Floyd signed a confessionand got 5-15 years in jail from the judge.
Read this part of a pamphlet on your rights when you are arrested. Mark the sentence that tells whyFloyd should nski have followed the advice he was given."
YOUR RIGHTS AFTER ARREST
What Happens After You Are Arrested?
May You Be Forced To Answer Questions?
After arrest, you have an absolute right to remain silentand not to answer any questions.
No one has a right to force you to answer questions orto sign anything. If someone does try to make you talk orsign something by threats or promises, tell the policeofficial in charge and your lawyer. No promise made in}the police station will be binding in court.
May You Use The Telephone?
You have a tight to use the telephone as soon as you arebrought to the station to call your family, or afriend, or a lawyer, and to arrange bail.
(CorrectResponse:
Years of EducationNational 8 years less than High School Some CollegeAverage or less 12 years Graduate College Graduate
Percent Correct: 42 18 3I1 47 52 59
Source: "be Adult Perfamance Level Study: A report submitted to the Office of Education Dissemination Review Panel."Undated but labelled in handwriting "O.K. 3125/75."
09 Adult Performance Level Study. - 197510 0
93
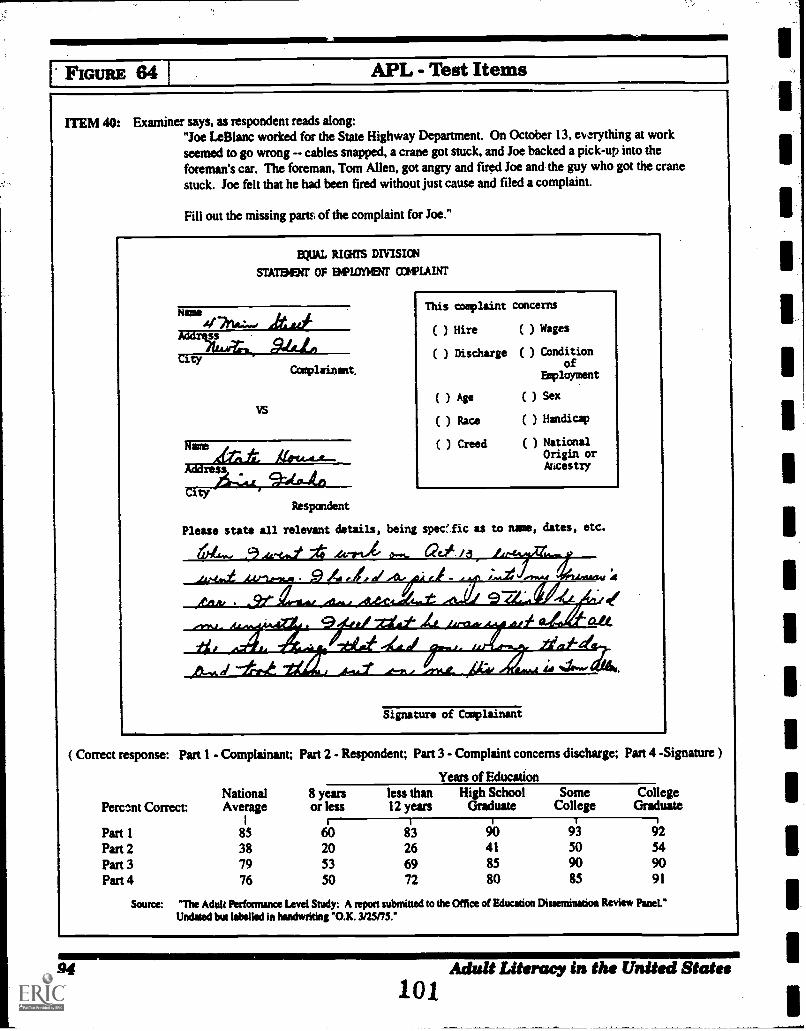
IFIGURE 64 APL - Test Items
ITEM 40: Examiner says, as respondent reads along:"Joe LeBlanc worked for the State Highway Department. On October 13, everything at workseemed to go wrong -- cables snapped, a crane got stuck, and Joe backed a pick-up into theforeman's car. The foreman, Tom Allen, got angry and fired Joe and the guy who got the cranestuck. Joe felt that he had been fired without just cause and filed a complaint.
Fill out the missing parts of the complaint for Joe."
STAMM OF PAPWIleff Omura
Moe
ssA10.1.0
City
vs
Complainant
Name
Ad/tresscr67.42inear-2gg44--..
This cosplaint concerns
( ) Hire ( ) Wages
( ) Discharge ( ) Conditionof
Ertployznent
( ) Age ( ) Sex
( )Race ( ) Handicap
( ) Creed ( ) NationalOrigin orAncestry
Respondent
Please state all relevant details, being specf.fic as to
Qat /name, dates, etc.
.A.
V . _sr
,f/fiff/ANNWIRffelfaffi
sa
jer; /ay
411 P PIPIPIPW
aLL
,
Signature of Complainant
( Correct response: Part 1 - Complainant; Part 2 - Respondent; Part 3 - Complaint concerns discharge; Part 4 -Signature )
Years of EducationNational 8 years less than High School Some College
Perctint Correct: AverageI
or less 12 years Graduate College Graduate
lPart 1 85 fit) 133 9093 '2Part 2 38 20 26 41 50 54Part 3 79 53 69 85 90 90Part 4 76 50 72 80 85 91
Source: "The Adult Performance Level Study: A report submitted to the Office of Education Dissemination Review Panel."Undated but labelled in hendwriting "O.K. 3125175."
94 Adult Literacy in the United States101
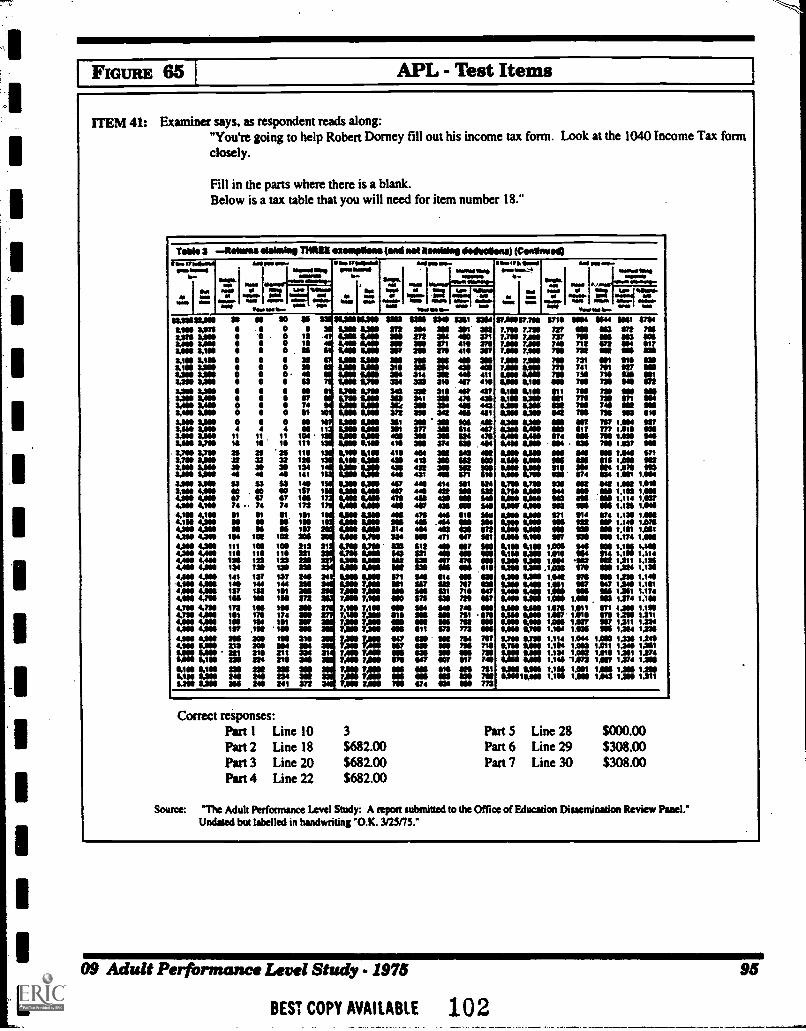
ois
ma
me
am o
wN
oam
am o
w
co
r:rs
.
nano
14 1
4IN
) 0
00
nil f
ill f
ill n
il ili
a fi
ll Ji
ff f
ill n
uM
ali H
O f
ill f
ill M
anila
i a
q10
011
hse
rtst
1111
4
111
1311
IEI h
im y
eas
sus
st
FA
hV
D 0
0is
se v
sits
mai
sit
30 0
0101
301
00
00 3
ft1 W
ei ii
hs !v
s: s
ass
tesa
.11
G1
nulii
inilu
inun
imlir
mbu
ra Im
es s
ane
sats
g
INN
ON
111
1115
1111
11f
f O
N 1
111
11ff
HO
I!
UN
111
1111
1111
1111
1111
1111
111f
f N
H O
Hrl
iU
I 310
1010
0000
11 im
nu
um n
u 00
013
1su
00
nu 0
0 m
a na
l am
san
00
00 0
0 10
111
IN0:
am
an
um m
a sa
il no
00
00 0
0 00
00
Ic 1
11
10 0
0 30
1 00
131
1 S
OH
111
1 00
00
Ifin
mg
gay!
111i
aag
00 0
0 10
100
1110
111
1 st
at a
u 00
111
4
II H
U 1
1111
1ff
HU
MIN
fill
HO
fill
MI
NU
IM
in f
ill f
in li
fi M
inn
NH
HU
HU
Ia
gill
00 0
0 on
00
111.
1 11
31 n
o 2
301
103
nu 3
01 0
0 W
I fai
l Ian
IO
tt
OM
110
0010
1110
am
00
nu m
a am
ma
I Hu'
ii fil
l fai
t ilia
li fil
l lfi
fill n
u no
no
IA!
ins
104
an 0
0 m
a fli
t
1.1
Ill
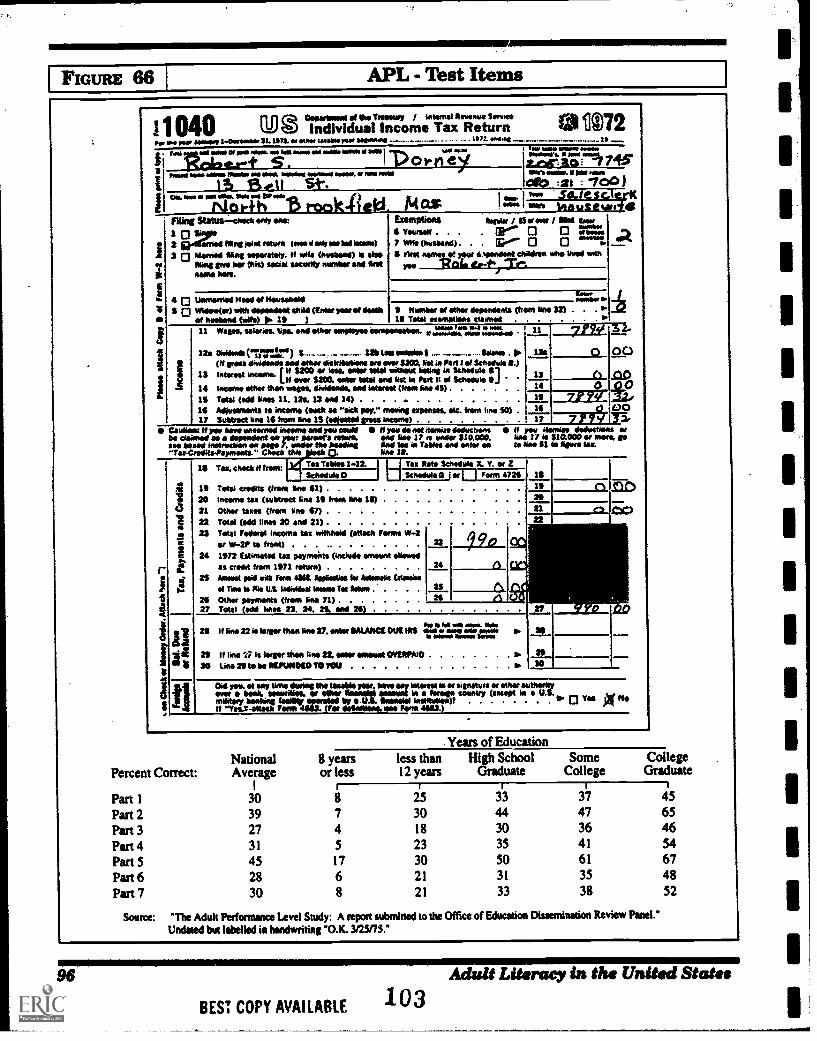
FIGURE 66 APL - Test Items
11040 op Ile Velma I Internal Meanue sows
Individual Income Tax Return 9V2Ie. Me 7110 Maree 141en5.or V. Mi. se Wier I..e5.pe4,115wa 102. weft .. If
fr we WO a .111 mow sse Ms sr al abaft leasole WIN I
ere+ 5.101
7
hood Mae *Nos IfkOmit as abut leskarg alsolmeteamiter. et awe mil
IS St.ov-tiey
Cog. we es ma Wis. Vas as1
flhlnlNisw+ h.
Statuseimmi tinn eft: Exemption0 eilOo'
2 Gallreined nint return One 4 sob en In nom)3 0 Married Sfin. sewateiy. If wif (hutaimul) also
Win give her (his) social security number and fattome here.
JPIN 1110111 IMMO WNW
PizE;roliatis.illers swat, V ME VMS
Ce0 :21 1001ISIS 1_1(
sibs. 5, Ina 1--;i1S--dinfeNenin / Owes* / eem
"'woo tr. 0 0 et bow7 WI% (I.ISM110) Tr' 0 0 liwen 2-1"1It Arst mimes of yew events.* Walden silo lived loth
no VOL 10-4,
4 0 Unmated Heed of Housebell11 0 Wane* with tenant. (EMer yeses/ dean
of hionend wife 19
wownvin.9 *wow euti, .19 Tett esemetleos dawned
11 Wages. seteries. tips. eivd ether emolene seinflevetiet. XI; :drab. "...."1.0 11 7us tit nub (1=4) 12b We minim $ 124 0 0013 laumi intsmej If $200 ims. emit son **hen nen in Schedule $ i
(N gams ilivitemle and nate distrIbalins saw .ast ia ran 1 *I Schodulo a.)
Lit sem Mk eon ton ant NA in Palt of Seholuie 9J14 name other than segos. dividends. sad imam* (hem line 45) 14
16 Total (add lion 11. 12e. 13 eol 14) . 111
16 Ainishasals to Wenn (seek as 'sick My." merMS unites. Wc. Wilm line SO 1617 Subtract line 16 hum line 15 (40eded Wen ilicemn 17 nneial
Canine ff yea haw uneemed intone sod yet mold ff you de net Winn denchens II nu *smile tannin*be dinned es tetendent en yew wean gene% aod line 17 is wale $10.000. lioe 17 is $10.000 a mon insee bend Inetnistion ii me 7. amber the hooding Snd ten it Tenn eat wow en te line 51 Oa Awe tem*Tra-Credits-Payments." Cheek this line IS.
Tax Tables 142. 1 Tin Rate Schedule X. T. orSchedule Et Schedule 13 et I I Form 4726 16
19 Tetsil credits (frem line 01)20 Incase tan (subteen fine 19 front Sn. 11)21 Other Inas (from line 67)22 Total (add lines 20 and 21)23 Total foam' income tax withheld (attach 74mul W-2
er 4-2P to front) a:24 1972 Estimated tat paymeSts (include amen* nand
es credit hem 1971 return) 24
2$ Ansel pad nib Fero 401. 406telin hi SOnfrac 1timfiellel Tow les U.S. ladithal Inns Tat bone 21
26 Other moments (frem line 71) 2627 Total (WI hoes 23. 24. 25. sod 26)
to,00
le Tn. check if from:
alAt
hi
19 r% 110
120
h 1514,0 wow- limbo26 If line 22 ie Inger then line 27. eMer MANCE DUE lin on a. moo an Irmo
Isilwal Isom Savo a.
29 Mine 27 is tamer then fine 22. solar amen* MAPS* a.30 line 29 to be MINNOW TO YOU
04 no. et soy time dories the taxable .year have en Wenn inover MM. ensfitios. ealit elsotin feteigs'eovngiatlitryes(etestellit "titeriZ'PIMP/ MUMS UMW IPPON W/ a U.S. intintios)? U.It "Yes2-8110cli rows sew. (74, nemomm en Fens K631 " LI '66 N.
Years of EducationNational 8 years
Percent Correct: Average or less
30 839 727 431 545 17
28 630 8
Part 1Part 2Part 3Part 4Part 5Part 6Part 7
less than High School Some College12 years Graduate College Graduate
253018233021
21
334430355031
33
37473641613538
Source: "The Adult Perfcemance Level Study: A report submitted to the Office of Education Dissemination Review Panel."Undated but labelled in handwriting "O.K. 3/25175.*
45654654674852
96 Adult Literacy in the United States
BEV COPY AVAILABLE 103
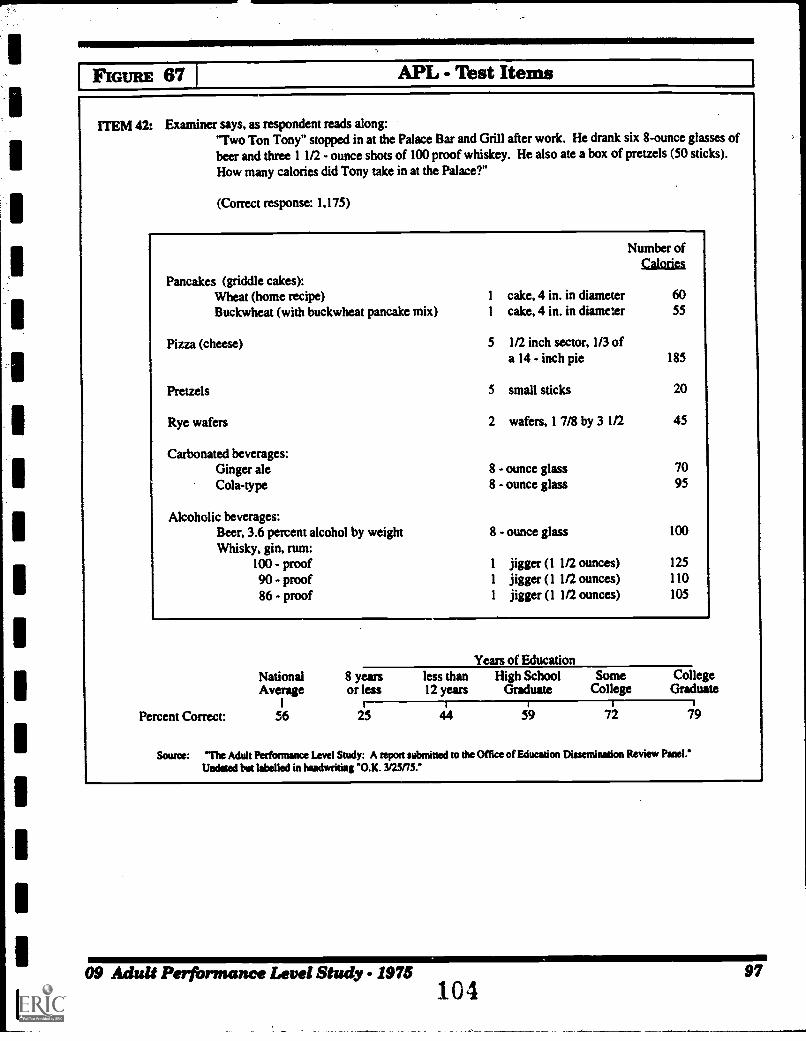
IFIGURE 67 APL Test Items
ITEM 42: Examiner says, as respondent reads along:"Two Ton Tony" stopped in at the Palace Bar and Grill after work. He drank six 8-ounce glasses ofbeer and three 1 1/2 - ounce shots of 100 proof whiskey. He also ate a box of pretzels (50 sticks).How many calories did Tony take in at the Palace?"
(Correct response: 1,175)
Pancakes (griddle cakes):Wheat (home recipe) 1
Buckwheat (with buckwheat pancake mix) 1
Pizza (cheese) 5
Pretzels 5
Rye wafers 2
Carbonated beverages:Ginger aleCola-type
Alcoholic beverages:Beer, 3.6 percent alcohol by weightWhisky, gin, rum:
Number ofCalories
cake, 4 in. in diameter 60cake, 4 in. in diameter 55
1/2 inch sector, 1/3 ofa 14 - inch pie 185
small sticks 20
wafers, 1 7/8 by 3 1/2 45
8 - ounce glass 708 - ounce glass 95
8 - ounce glass 100
100 - proof 1 jigger (1 1/2 ounces)90 - proof 1 jigger (1 1/2 ounces)86 - proof 1 jigger (1 1/2 ounces)
125110105
Years of EducationNational 8 yearsAverage or less
Percent Correct: 56
less than High School Some12 years Graduate College
44
CollegeGraduate
79
Source: The Adult Performance Level Study: A report submitted to the Office of Education Dissemination Review Panel."Undated but labelled in handwriting "O.K. Y25175."
09 Adult Performance Level Study. - 1975104
97
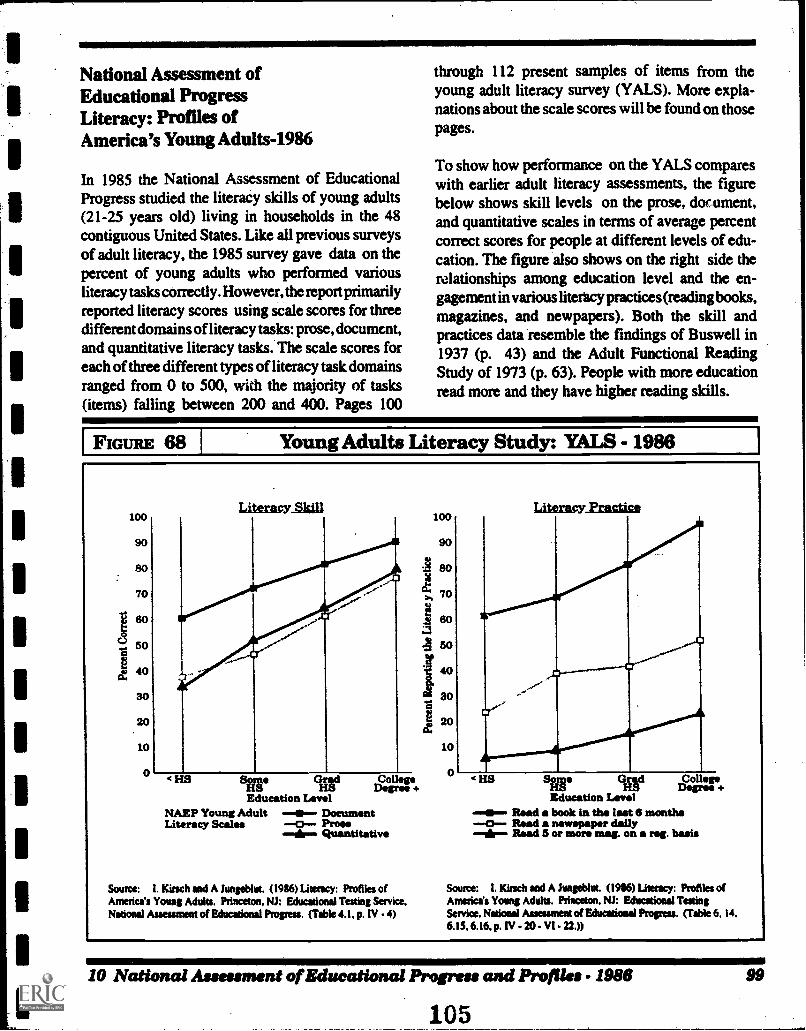
National Assessment ofEducational ProgressLiteracy: Profiles ofAmerica's Young Adults-1986
In 1985 the National Assessment of EducationalProgress studied the literacy skills of young adults(21-25 years old) living in households in the 48contiguous United States. Like all previous surveysof adult literacy, the 1985 survey gave data on thepercent of young adults who performed variousliteracy tasks correctly. However, the report primarilyreported literacy scores using scale scores for threedifferent domains of literacy tasks: prose, document,and quantitative literacy tasks. The scale scores foreach of three different types of literacy task domainsranged from 0 to 500, with the majority of tasks(items) falling between 200 and 400. Pages 100
FIGURE 68
through 112 present samples of items from theyoung adult literacy survey (YALS). More expla-nations about the scale scores will be found on thosepages.
To show how performance on the YALS compareswith earlier adult literacy assessments, the figurebelow shows skill levels on the prose, document,and quantitative scales in terms of average percentcorrect scores for people at different levels of edu-cation. The figure also shows on the right side therelationships among education level and the en-gagement in various literacy practices (reading books,magazines, and newpapers). Both the skill andpractices data resemble the fmdings of Buswell in1937 (p. 43) and the Adult Functional ReadingStudy of 1973 (p. 63). People with more educationread more and they have higher reading skills.
Young Adults Literacy Study: YALS - 1986
100
90
80
70
E 60
... 50
40a.
30
20
10
< HS
Litsracy3kill
Some GradHS HSEducation Level
CollegeDegree +
NAEP Young Adult 11.<- DocumentLiteracy Scales 4:1-. Prose
Iir<N6 Quantitative
Source: I. Kirsch and A Jungeblut. (1986) Literacy: Profiles ofAmerica's Young Adults. Princeton. NJ: Educational Testing Service,Notional Assessment of Educations! Progress. (Table 4.1, p. IV 4)
100
90
80
70
60
50
40
30
20
10
Litgracy2zactica
< HS SomeHS
GadEducation Level
4a, Read a book in the last 6 monthsRead a newspaper daily
ilr Read 6 or more mag. on a reg. basis
CollegeDegree +
Source: I. Kinch and A hingeblut. (1916) Literacy: Profiles ofAmerica's Young Adelts. Princeton. NJ: Eduationsl TestingService, Mimi Assessment of Eduational Progress. (Table 6. 14,61S. 6.16. p. IV 20 VI U.))
10 National Asseunsent of Educational Proem and Profiles 1988
105
99
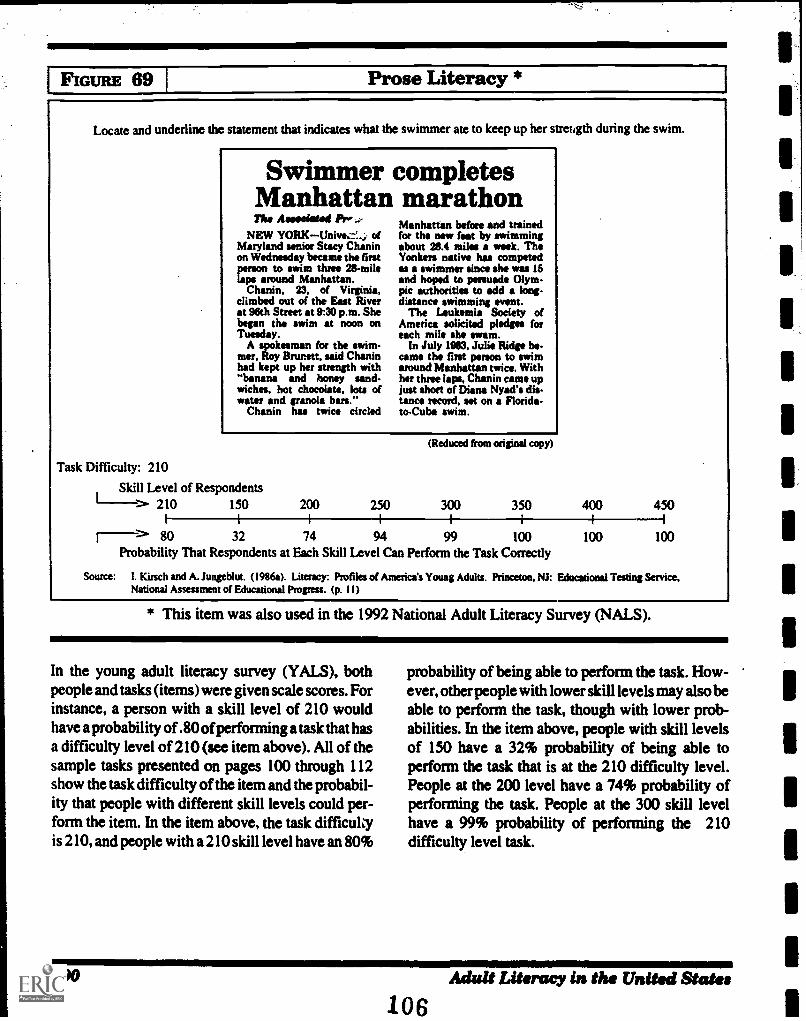
FIGURE 69 Prose Literacy *
Locate and underline the statement that indicates what the swimmer ate to keep up her stretigth during the swim.
Swimmer completesManhattan marathonThe Assimilated Pr
NEW YORKUnive.f..; ofMaryland senior Stacy Chaninon Wednesday became the firstperson to swim three 2/1-milelaps around Manhattan.
Chapin, 23, of Virginia,climbed out of the East Riverat 96th Street at 9:30 p.m. Shebegan the swim at noon onTuesday.
A spokesman for the swim-mer, Roy Bnuntt, said Chaninhad kept up her strength with"bonen* and honey sand-wiches, hot chocolate, lots ofwater and granola ban."
Chanin has twice circled
Manhattan before and trainedfor the new feat by swimmingabout 213.4 miles a week. TheYonkers native has competedas a swimmer since she was 15and hoped to persuade Olym-pic authorities to add a long-distance swimming event.
The Leukemia Society ofAmerica solicited pledges foreach mile she swam.
In July 1903, Julie Ridge be-came the first person to swimaround Manhattan twice. Withher three laps, Chanin came upjust short of Diana Nyad's dis-tance record, set on a Florida-to-Cuba swim.
(Reduced from original copy)
Task Difficulty: 210
Skill Level of Respondents210 150 200 250 300 350 400 450
1-> 80 32 74 94 99 100 100 100Probability That Respondents at Each Skill Level Can Perform the Task Correctly
Source: I. Kinch and A. Jungeblut. 09860. Literacy: Profiles of America's Young Adults. Princeton, NJ: Educational Testing Service.National Assessment of Educational Progress. (p. 11)
* This item was also used in the 1992 National Adult Literacy Survey (NALS).
In the young adult literacy survey (YALS), bothpeople and tasks (items) were given scale scores. Forinstance, a person with a skill level of 210 wouldhave a probability of .80 of performing a task that hasa difficulty level of 210 (see item above). All of thesample tasks presented on pages 100 through 112show the task difficulty of the item and the probabil-ity that people with different skill levels could per-form the item. In the item above, the task difficukyis 210, and people with a 210 skill level have an 80%
probability of being able to perform the task. How-ever, other people with lower skill levels may also beable to perform the task, though with lower prob-abilities. In the item above, people with skill levelsof 150 have a 32% probability of being able toperform the task that is at the 210 difficulty level.People at the 200 level have a 74% probability ofperforming the task. People at the 300 skill levelhave a 99% probability of performing the 210difficulty level task.
100 Adult Literacy in the United States
10 6
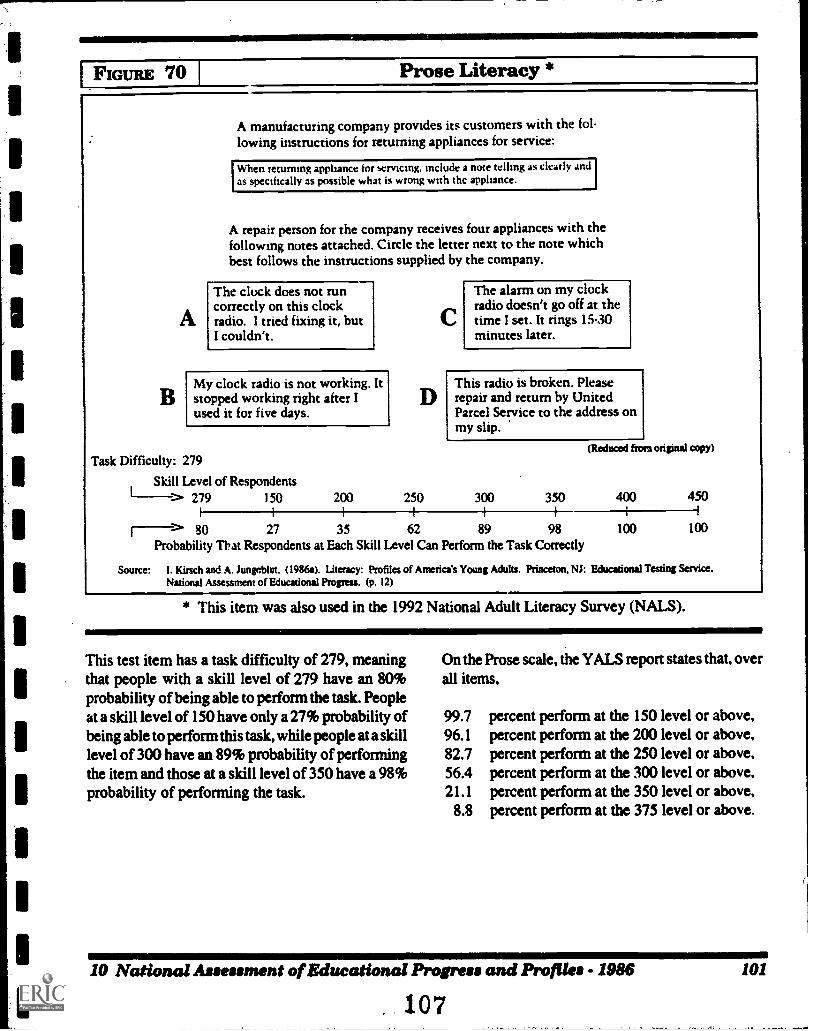
FIGURE 70 Prose Literacy *
A
A manufacturing company provides its customers with the fol-lowing instructions for returning appliances for service:
When returning appliance for servicing. Include a note telling as clearly andas specifically as possible what is wrong with the appliance.
A repair person for the company receives four appliances with thefollowing notes attached. Circle the letter next to the note whichbest follows the instructions supplied by the company.
The clock does not runcorrectly on this clockradio. I tried fixing it, butI couldn't.
My clock radio is not working. Itstopped working right after Iused it for five days.
Task Difficulty: 279
Skill Level of Respondents279 150 200 250
r-->. 80 27 35 62
The alarm on my clockradio doesn't go off at thetime I set. It rings 15-30minutes later.
This radio is broken. Pleaserepair and return by UnitedParcel Service to the address onmy slip.
300 350
(Reduced from original copy)
450
89 98Probability That Respondents at Each Skill Level Can Perform the Task Correctly
Source: I. Kirsch and A. Jungeblut. (1986a). Literacy: Profiles of America's Young Adults. Princeton. NJ: Educational Testing Service.National Assessment of Educational Progreu. (p. 12)
* This item was also used in the 1992 National Adult Literacy Survey (NALS).
100 100
This test item has a task difficulty of 279, meaningthat people with a skill level of 279 have an 80%probability of being able to perform the task. Peopleat a skill level of 150 have only a 27% probability ofbeing able to perform this task, while people at a skilllevel of 300 have an 89% probability of performingthe item and those at a skill level of 350 have a 98%probability of performing the task.
On the Prose scale, the YALS report states that, overall items,
99.7 percent perform at the 150 level or above,96.1 percent perform at the 200 level or above,82.7 percent perform at the 250 level or above,56.4 percent perform at the 300 level or above.21.1 percent perform at the 350 level or above.
8.8 percent perform at the 375 level or above.
10 Nation& Assessment of Educational Progress and Profiles - 1986 101
. 107
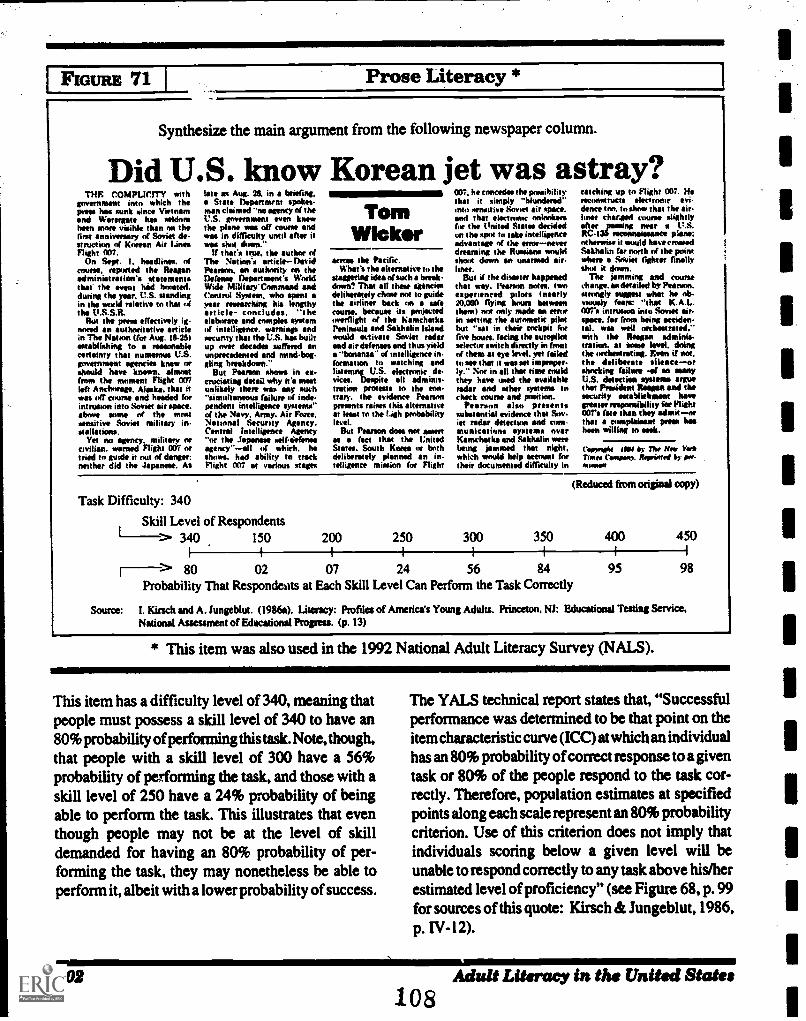
FIGURE 71 I Prose Literacy *
Synthesize the main argument from the following newspaper column.
Did U.S. know Korean jet was astray?THE COMPLICITY with
govenment into which thepress has sunk since Vietnamand Watergate has seldomhem more viaible than on thefirst anniversary of Sooriat de.struction of Korean Air lanesFlight 007.
On Sept. I. headlines, tifcourse, reported the Reaganadministration's statementsthat the event had hoisted.during the year, U.S. standingin the world relative to that ofthe U.S.S.R.
Rut the press effectively ig.noted an authoritative snick,in The Nation (foe Ault. IS-20)establishing to a reasonablecertainty that numerous U.S.government agencies knew atshould have known, almostfrom the moment Flight 0177left Anchorage, Alaska. that itwas off course and headed forintrusion into Soviet air space.above mow of the mostsensitive Soviet military in.stallationa.
Yet no agency, military orcivilian. warned Flight 007 ortried to guide it out of danger:neither did the Japaneee. As
late as Aug. X in a Wolfing,a State Department spokes.man claimed "no agency of theU.S. government even knewthe plane was off course andwas in difficulty until after itwas shot down."
If that's true, the author ofThe Nation's article DavidPurim. an authority tin theDefense Department's WorldWide Military Commaad sadControl System, who spent ayear resestching his lengthyarticle- concludes. "theelaborate and complex sYstemof intelligence, warnings andsecurity that the U.S. has builtup over decades suffered anunprecedented and mind-beg.gling breakdown."
But Amnion shows in es .cniciating detail why it's mostunlikely there was any such"simultaneous failure of inch.pendent intelligence systems-et the Navy, Army, Air Foxe,National Security Agency,Central Intelligence Agency"or the Japanese self-defenseagency"all of which, heshows, had ability to trackFlight 007 at various stages
TomWicker
scents the Pacific.What's the alternstive to the
staggeriag idea of such break-down? That all these agenciesdeliberately chose not to guidethe airliner back on a safecourse, because its projectedoverflight of the KamchatkaPeninsula and Sakhalin Islandwould activate Soviet radioand air defenses and thus yielda "bonanza" of intelligence in.fotmation to watching andlistenmg U.S. electronic de.vices. Devito all adminis-tration protests to the eon-troy. the evidence Pearsonpresents raises this alternativeat least to the tjah probability
But Pearson doss not wenas a fact that the UnitedStates. South Korea ot bothdeliberately planned an in.telligence mission for Flight
007; he concedes the possibility catching up to Flight 007. Hethat it simply "blundered" reconstructs electronic evi .
unto wenottive Sminet air space. denee trim to show that the air-and that electronic ontrnkees liner charged course slightlyfor the United States decided after _palming neer a 1.1.S.
un the spat to take intelligent, RC435 toconnaiesante plane;advantage rif the errornever atherwise it would have croweddreaming the Running would Sakhalin far north of the pointshout down an unarmed air. when a Soviet fmhtet finallyliner, shot it down.
But if the disaster happened The jamming and coursethat way. Pearson notes, two change, so detailed by Pietism.experienced pilots (neatly stinnitly SWIPOW what he ob.20,000 flying hours between timely fears: "that K.A.L.them) not only made an error 007's intrusion into Soviet air.in setting the automatic pilot space, fat from being eniden.hut -sat in their nekpit fie tal, was well orchestrated."five hours, facing the autopilot with the Rowan adminis.selectieswitch directly in front nation, at tome level. doingof them at eye level, yet failed the unhesitating. Even if not,to see that it was set improper, the deliberate silenceorly... Nor in all that time could shocking failure -el' so manythey have used the available U.S. dmectian systems argueradar and other systems to that PresideM Reagan and thecheck court* and position. secutity establiehmant have
Pearson also presents greater responsibility **Flightsubstantial evidence that Sew. 007's fate than they admitorin radar detection and com. that complaisant press hasmunications systems ever hien Willing te seek.Kamchatka and Sakhalin werebeing jammed that night,which would help meow fortheir documented difficulty in mama
Csit,nak Hal by The New Yee*Mat* reniMOW. Reprilla bY
(Reduced from original copy)
Task Difficulty: 340
Skill Level of Respondents150 200 250 300 350 400 450> 340
I I II I I I I
r----> 80 02 07 24 56 84 95 98Probability That Respondeuts at Each Skill Level Can Perform the Task Correctly
source: 1. Kirsch and A. Jungeblut. (19116a). Literacy: Profiles of America's Young Adults, Princeton, NJ: Educational Testing Service,National Assessment of Educational Prows:. (p. 13)
* This item was also used in the 1992 National Adult Literacy Survey (NALS).
This item has a difficulty level of 340, meaning thatpeople must possess a skill level of 340 to have an80% probability of performing this task. Note, though,that people with a skill level of 300 have a 56%probability of performing the task, and those with askill level of 250 have a 24% probability of beingable to perform the task. This illustrates that eventhough people may not be at the level of skilldemanded for having an 80% probability of per-forming the task, they may nonetheless be able toperform it, albeit with a lower probability of success.
The YALS technical report states that, "Successfulperformance was determined to be that point on theitem characteristic curve (ICC) at which an individualhas an 80% probability of correct response to a giventask or 80% of the people respond to the task cor-rectly. Therefore, population estimates at specifiedpoints along each scale represent an 80% probabilitycriterion. Use of this criterion does not imply thatindividuals scoring below a given level will beunable to respond correctly to any task above his/herestimated level of proficiency" (see Figure 68, p. 99for sources of this quote: Kirsch & Jungeblut, 1986,p. IV-12).
102 Adult Literacy in the United States108
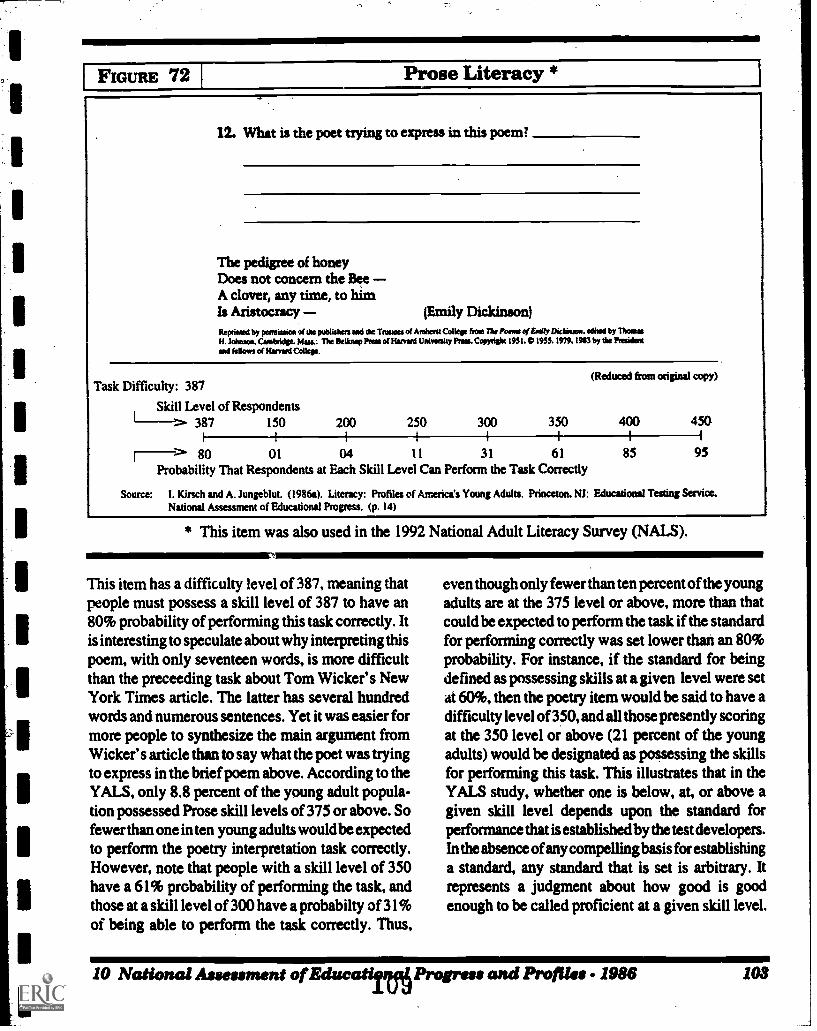
IFIGURE 72 Prose Literacy *
12. What is the poet trying to express in this poem7
The pedigree of honeyDoes not concern the BeeA clover, any time, to himIs Aristocracy (Emily Dickinson)Reprinted by call11111011 of the publishers end the Misers of Arnhem Cave front The Pewee ef Emily Decline*. edited by ThomeH. Johnson. Cembridie. Mew The Belknap Press of Harvard University Pres. Copyripht 1951. 0 1955. 1979. 1910 by die Presidentsod fellows of Harvard College.
Task Difficulty: 387
Skill Level of Respondents
(Reduced from original copy)
150 200 250 300 350 400 450387
r----> 80 01 04 1 1 31 61 85 95Probability That Respondents at Each Skill Level Can Perform the Task Correctly
source: I. Kirsch and A. Jungeblut. (1986a). Literacy: Profiles of America's Young Adults. Princeton. NJ: Educational Testing Service.National Assessment of Educational Progress. (p. 14)
* This item was also used in the 1992 National Adult Literacy Survey (NALS).
This item has a difficulty level of 387, meaning thatpeople must possess a skill level of 387 to have an80% probability of performing this task correctly. Itis interesting to speculate about why interpreting thispoem, with only seventeen words, is more difficultthan the preceeding task about Tom Wicker's NewYork Times article. The latter has several hundredwords and numerous sentences. Yet it was easier formore people to synthesize the main argument fromWicker's article than to say what the poet was tryingto express in the brief poem above. According to theYALS, only 8.8 percent of the young adult popula-tion possessed Prose skill levels of 375 or above. Sofewer than one in ten young adults would be expectedto perform the poetry interpretation task correctly.However, note that people with a skill level of 350have a 61% probability of performing the task, andthose at a skill level of 300 have a probabilty of 31%of being able to perform the task correctly. Thus,
even though only fewer than ten percent of the youngadults are at the 375 level or above, more than thatcould be expected to perform the task if the standardfor performing correctly was set lower than an 80%probability. For instance, if the standard for beingdefmed as possessing skills at a given level were setat 60%, then the poetry item would be said to have adifficulty level of 350, and all those presently scoringat the 350 level or above (21 percent of the youngadults) would be designated as possessing the skillsfor performing this task. This illustrates that in theYALS study, whether one is below, at, or above agiven skill level depends upon the standard forperformance that is establishedby the test developers.In the absence of any compelling basis for establishinga standard, any standard that is set is arbitrary. Itrepresents a judgment about how good is goodenough to be called proficient at a given skill level.
10 National Assessment of EducatiMProgress and Profiles - 1986 103
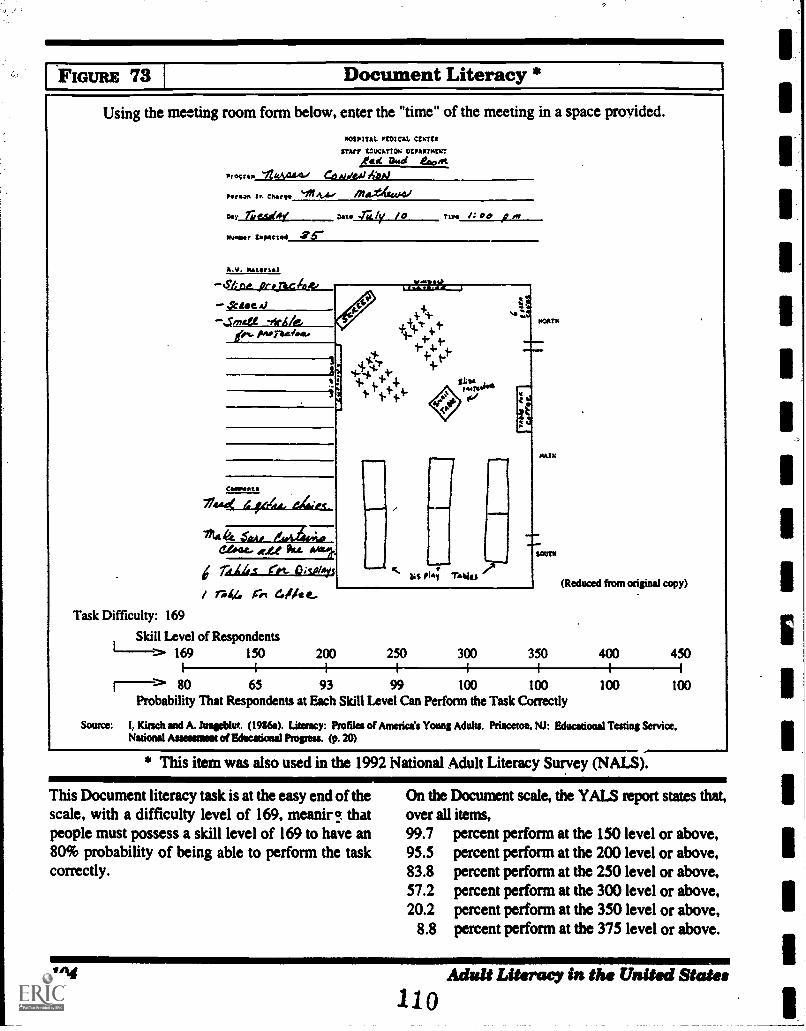
I'FIGURE 73 Document Literacy *
Using the meeting room form below, enter the "time" of the meeting in a space provided.
ProssAA ItioULL41.1
NOSPITM. PLOICAL CD.TLI
surr clICATION ODARTHDr:"eel awl too"
Co 'JAW AbAl
Persan :A Charge
Day
Number tapiettml
!AA. Aticatiod
sat. .)a /y /0 Tara
A.V. ttttt 1
pprecley_
mra&local
'firAkeimTasies.
Camovants
7/4"e 44444. ekt_c_
Saa,eGat 421 Au. 6/041.
I-414s (pt. moils
/ rue. c;., Grife e_.Task Difficulty: 169
Skill Level of Respondents
'Emmy"
11111
biS plA; /loges
4,1
Z2**Arm
4.1.11101
g
it
MAIN
OWEN.
WWI
SCUT,'
(Reduced from original copy)
169 150 200 250 300 350 400 450
65 93 99 100 100 100 10080Probability That Respondents at Each Skill Level Can Perform the Task Correctly
source: I: Kirsch and A. Ittageblut. (19116a). Literacy: Profiles of America's Young Adults. Princeton. NJ: Educational Testing Service.National Amami of Edicational Progiess. (p. 20)
* This item was also used in the 1992 National Adult Literacy Survey (NALS).
This Document literacy task is at the easy end of thescale, with a difficulty level of 169, meanly! thatpeople must possess a skill level of 169 to have an80% probability of being able to perform the taskcorrectly.
On the Document scale, the YALS report states that,over all items,99.7 percent perform at the 150 level or above,95.5 percent perform at the 200 level or above,83.8 percent perform at the 250 level or above,57.2 percent perform at the 300 level or above,20.2 percent perform at the 350 level or above,
8.8 percent perform at the 375 level or above.
104
11 0Adult Literacy in the United States
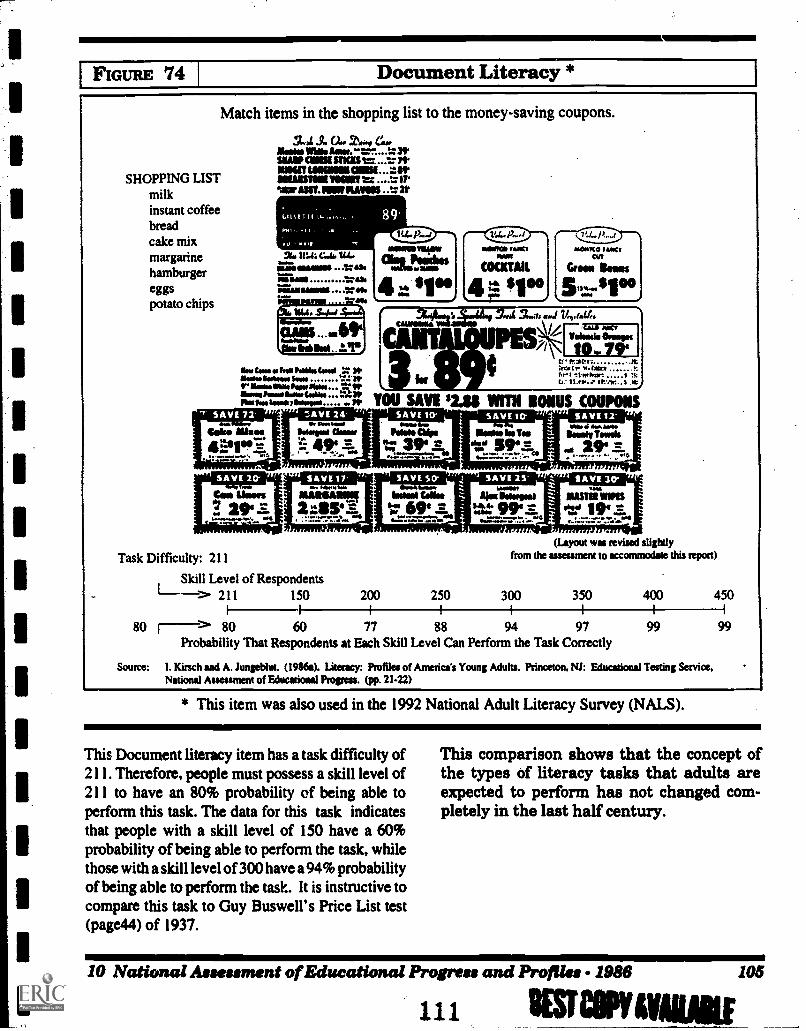
IFIGuRE 74 Document Literacy *
Match items in the shopping list to the money-saving coupons.
SHOPPING LISTmilkinstant coffeebreadcake mixmargarinehamburgereggspotato chips
liselos Me Maw. "'Ir.-. 4.-. 3tlallt UN* UKIIS 7tMOUT LOONS MEN ... =ItMAIMS NNW 11liar AUT. 11111131IMMOS tr. at
Ow Cow to foo halm Could 31.Slaw semrIlloweillietelsalson... "4' VIPMow Moo 11.0.8 Colima ... =3VMaw frone3110mor
2.4 3.os .4
cral: \PES -
t: 17:3169:Wag* W.11*re
.1 INsgimi^: IS:ti '12.11%0. at"
It
YOU SAVE MU WITN BONUS COUPONS
Task Difficulty: 211
Skill Level of Respondents
(Layout was revised slightlyfrom the assessment to accommodate this report)
211 150 200 250 300 350 400 450
80 r----> 80 60 77 88 94 97 99 99Probability That Respondents at Each Skill Level Cart Perform the Task Correctly
Source: I. Kirsch and A. Jungeblut. (19116a). Literacy: Profiles of America's Young Adults. Princeton, NJ: Educational Testing Service,National Assessment of Educational Proveu. (pp. 21-22)
* This item was also used in the 1992 National Adult Literacy Survey (NALS).
This Document literacy item has a task difficulty of211. Therefore, people must possess a skill level of211 to have an 80% probability of being able toperform this task. The data for this task indicatesthat people with a skill level of 150 have a 60%probability of being able to perform the task, whilethose with a skill level of 300 have a 94% probabilityof being able to perform the task. It is instructive tocompare this task to Guy Buswell's Price List test(page44) of 1937.
This comparison shows that the concept ofthe types of literacy tasks that adults areexpected to perform has not changed com-pletely in the last half century.
10 National Assessment of Educational Progress and Profiles - 1986
111 IESTOPYANIAIIIE
105
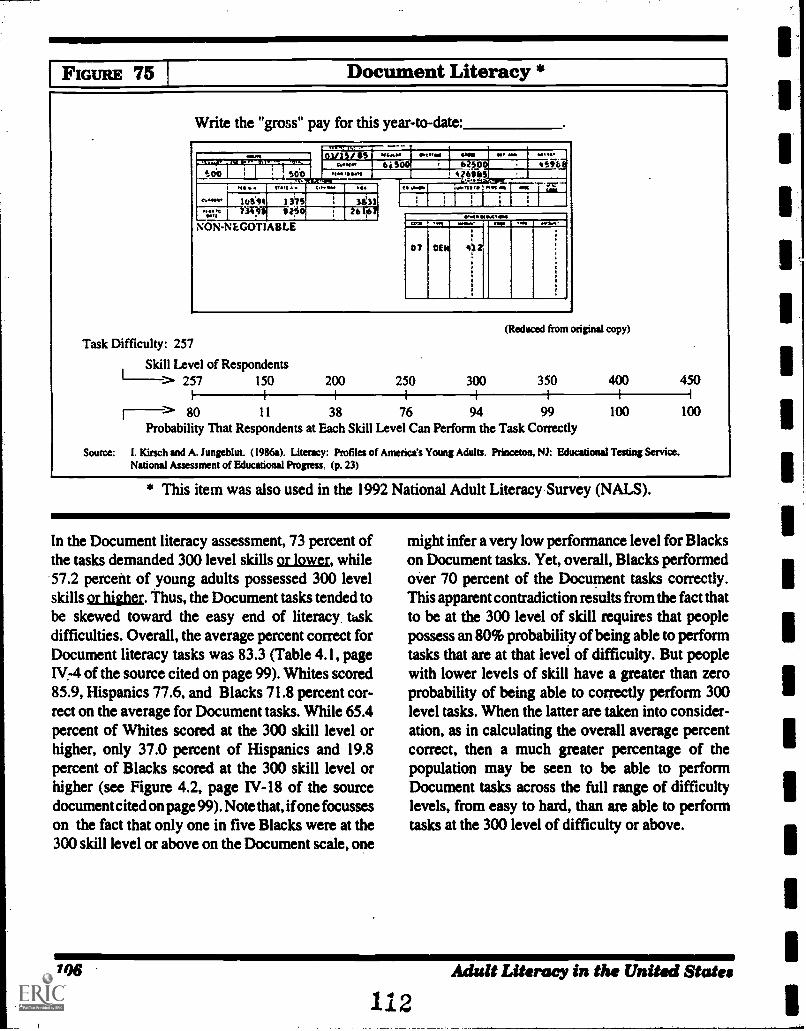
FIGURE 75 Document Literacy *
Write the "gross" pay for this year-to-date:
01/1/ SS
DO 500wow
..4111111114
1 110 1.11101 C. ow .411
ev.m. ios,I I 31S 3161I 3S, SOO 2610
NONNEGOTIABLE
....Km (01.4111 IC SI, AN 1.41.
bi SOO 02500%.12§11/65
C. kemlla .4:;)±47717-1 071 TC.COY
1
6.1.1arkliMKM .... S. COM ...1 WI*.
01 OEN I'l1
Z
Task Difficulty: 257
Skill Level of Respondents
Source:
(Reduced from original copy)
"---> 257 150 200 250 300 350 400 450
11 38 76 94 99 100 10080Probability That Respondents at Each Skill Level Can Perform the Task Correctly
I. Kirsch and A. Jungeblut. (1986a). Literacy: Profiles of America's Young Adults. Princeton, NJ: Educational Testing Service.National Assessment of Educational Progress, (p. 23)
* This item was also used in the 1992 National Adult Literacy Survey (NALS).
In the Document literacy assessment, 73 percent ofthe tasks demanded 300 level skills or lower, while57.2 perceht of young adults possessed 300 levelskills or higher. Thus, the Document tasks tended tobe skewed toward the easy end of literacy tuskdifficulties. Overall, the average percent correct forDocument literacy tasks was 83.3 (Table 4.1, pageIY-4 of the source cited on page 99). Whites scored85.9, Hispanics 77.6, and Blacks 71.8 percent cor-rect on the average for Document tasks. While 65.4percent of Whites scored at the 300 skill level orhigher, only 37.0 percent of Hispanics and 19.8percent of Blacks scored at the 300 skill level orhigher (see Figure 4.2, page IV-18 of the sourcedocument cited on page 99). Note that, if one focusseson the fact that only one in five Blacks were at the300 skill level or above on the Document scale, one
might infer a very low performance level for Blackson Document tasks. Yet, overall, Blacks performedover 70 percent of the Document tasks correctly.This apparent contradiction results from the fact thatto be at the 300 level of skill requires that peoplepossess an 80% probability of being able to performtasks that are at that level of difficulty. But peoplewith lower levels of skill have a greater than zeroprobability of being able to correctly perform 300level tasks. When the latter are taken into consider-ation, as in calculating the overall average percentcorrect, then a much greater percentage of thepopulation may be seen to be able to performDocument tasks across the full range of difficultylevels, from easy to hard, than are able to performtasks at the 300 level of difficulty or above.
106
112Adult Literacy in the United States
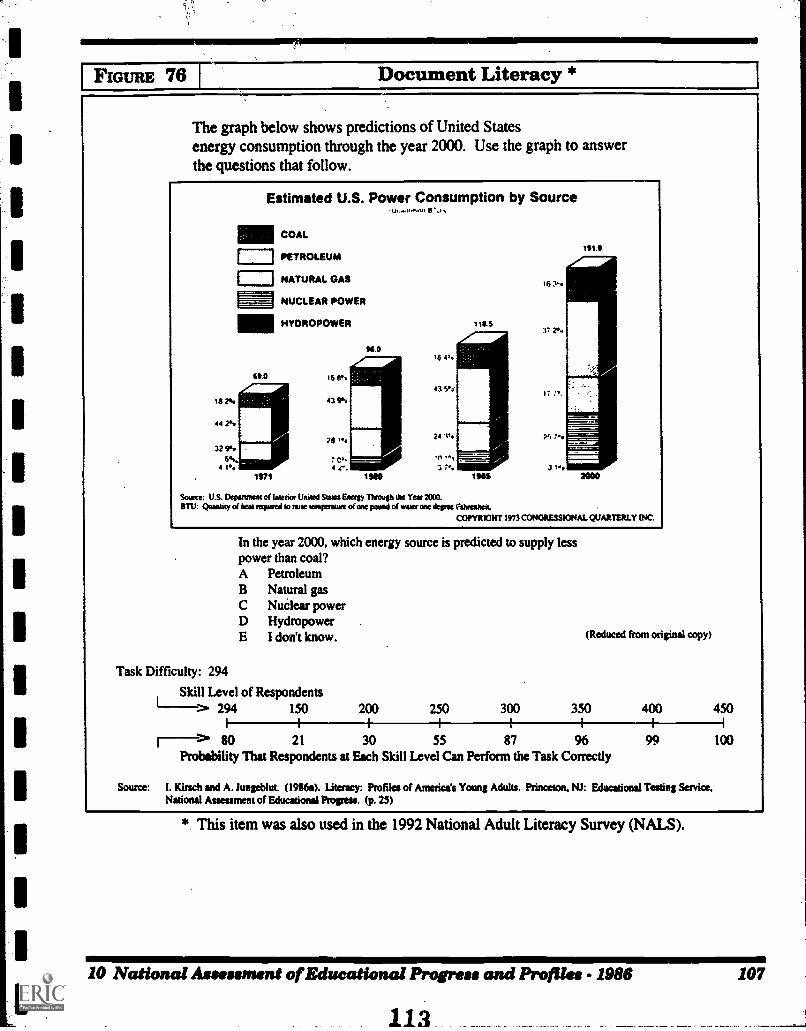
FIGURE 76 Document Literacy *
The graph below shows predictions of United Statesenergy consumption through the year 2000. Use the graph to answerthe questions that follow.
Estimated U.S. Power Consumption by Source
0.0
COAL
PETROLEUM
NATURAL GAS
NUCLEAR POWER
HYDROPOWER
1871
16 V,
43 9S
28 1'.
7 C'4 ez
100
16 4.,
43 12
24 14.
3 74.
116.5
ins
6 31,
37 r.
:*.
/..
3 1.
Int
Source: U.S. Department of Interior United SamsEmmy Through Me Year 2000.BTU: Quality of hem required to me temperature of one pound ol water ore demos Ciltresheit.
COPYRIGHT 1973 CONGRESSIONAL QUARTERLY INC.
In the year 2000, which energy source is predicted to supply lesspower than coal?A PetroleumB Natural gasC Nuelear powerD HydropowerE I don't know.
Task Difficulty: 294
Skill Level of Respondents
(Reduced from original copy)
1---->. 294 150 200 250 300 350 400 450II I I I I I I
21 30 55 87 96 99 10080
Probability That Respondents at Each Skill Level Can Perform the Task Correctly
Source: I. Kirsch and A. Jungeblut. (1956a). Literacy: Profiles of America's Young Adults. Princeton. NJ: Educational Testing Service,National Assessment of Educational Progress. (p. 25)
* This item was also used in the 1992 National Adult Literacy Survey (NALS).
10 National Aneument of Educational Progreu and Profiles - 1986 107
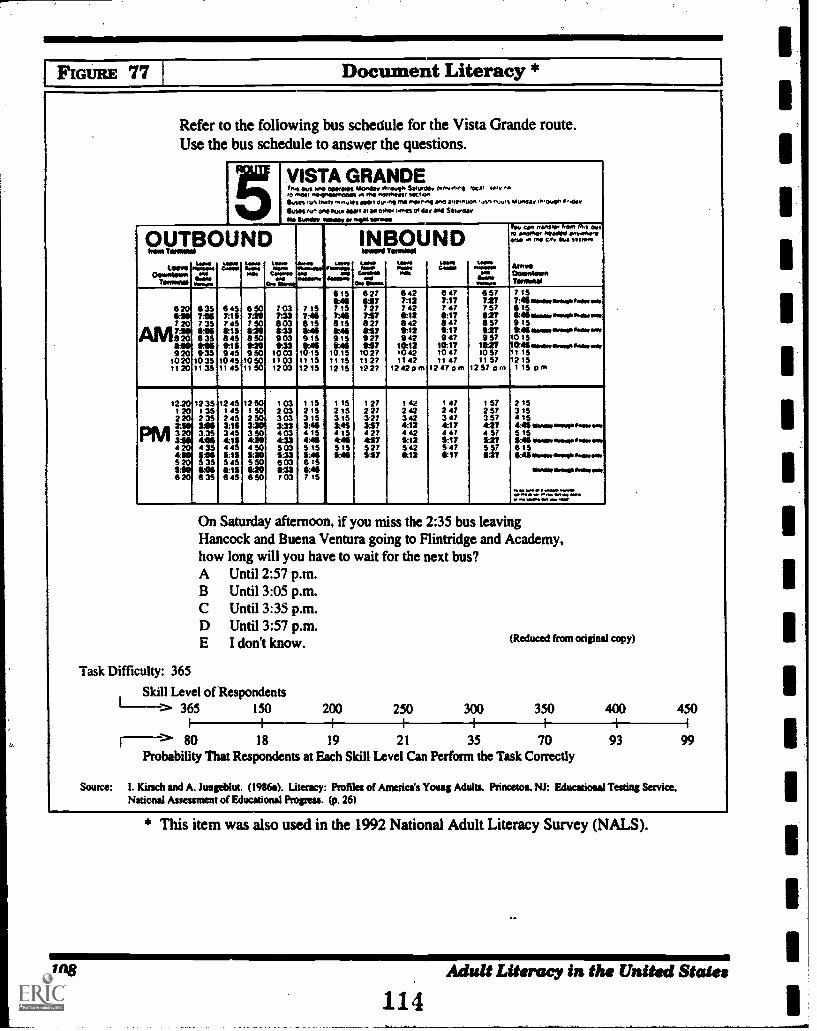
IFIGURE 77 Document Literacy *
Refer to the following bus schedule for the Vista Grande route.Use the bus schedule to answer the questions.
5 VISTA GRANDE1.4 WS SW OMSK WOWS'S WOO'S $11111,011 fs..../.1 Ws, us, ..,,, WW sWWW000OS A S SOWWW Web OsSass tun maw ...ow wen ow "qp me owe., ,W3 SSW'S.. Ss Ms..% WsOCIS .0.0440, 0.441i&Ws tu++ Goa auto nett at aa whet toea at lir lad SahrdarMa S1o44, token el ova wow
OUTBOUND1mm Tammal
1.44Olmottosa
Tersimai
um.Mom*...aWWI..,...
tam*WM
tomWassmei
1..0,Nam
Comm. .....WI
Oss Sisost
4.....ow...apMOWS,
uframapo
....&WSW
INBOUNDlansed
yammot
CSSOODSse
On SW.
Twin.tern4.44OWs
SAWOCraw
VW*%mom
"1WWIsss.....
thoo can moor 1105 I 4 aes,......,,.................WO W. DWI sets Ws mow,
&MOOatifolooraTWIIIMIS
6 20111:11720
AM71p1520111111
92010201120
6357:06735tas835WIG935
10351135
6457:1174511:15845015945
104511 4$
6 507:187506368500209 50
10501150
7037:336036:339038:33
100311031203
7 157:46815046915045
101511 1$12 15
111518467 157:41a is8:419158:41
10.15It 15121$
62?11177 2?757627847927017
102?11 2?122?
6427:127 428:1284211:12942
1012+04211 42
1242pm
6 477:177 471:176 4?9:179 4?
10.17104?11 47
12471:1m
6 577277 StOW8 575279 57
1027105711 57
12 5? pm
7 157:46 wow 0.6.***4815111:411ftesniftrommiwer.91511:46 ormomPirftiomet
10 15104114worromook.a..D,111512 151 15 s? m
12.201202 202:10
pivi3203104204:Ng5 201510620
12 3513$2 353163.354814 351865 35tell6 3S
12 451452 453:153454:1S44511:1115 456:156 45
12 501502 503403 504284506:305 508:206 50
1 032033033:334034:335035:336036:33703
1 152 153 153:464 154:4151511:4116 15CO7 15
1 152 153 153:45a 15CM5155:411
1 272 273 2?3174 27417527587
1 422 423 424:124 425:125428:12
1 472 473 474:174 479:175 47017
1 572 573 57427
575:275 578:27
2 153 15
154:45 woe wourofte.5 155:46 areve....8mr.ow or,6 156:45 sway 0.0.0e4ww*
4.14amosaammor,
%bins. VWe ,11. . M.
V' .11 IOW. 114% Mo *Mt
On Saturday afternoon, if you miss the 2:35 bus leavingHancock and Buena Ventura going to Flintridge and Academy,how long will you have to wait for the next bus?A Until 2:57 p.m.B Until 3:05 p.m.C Until 3:35 p.m.D Until 3:57 p.m.E I don't know.
Task Difficulty: 365
Sldll Level of Respondents
(Reduced from original copy)
"--> 365 150 200 250 300 350 400 450I I I I I I I I
1---> 80 18 19 21 35 70 93 99Probability That Respondents at Each Skill Level Can Perform the Task Correctly
Source: I. Kirsch and A. lungeblut. (1966a). Literacy: Profilet of America's Young Adults. Princeton. NI: Educational Testing Service.National Assessment of Educational Progress. (p. 26)
* This item was also used in the 1992 National Adult Literacy Survey (NALS).
108 Adult Literacy in the United States
114
1
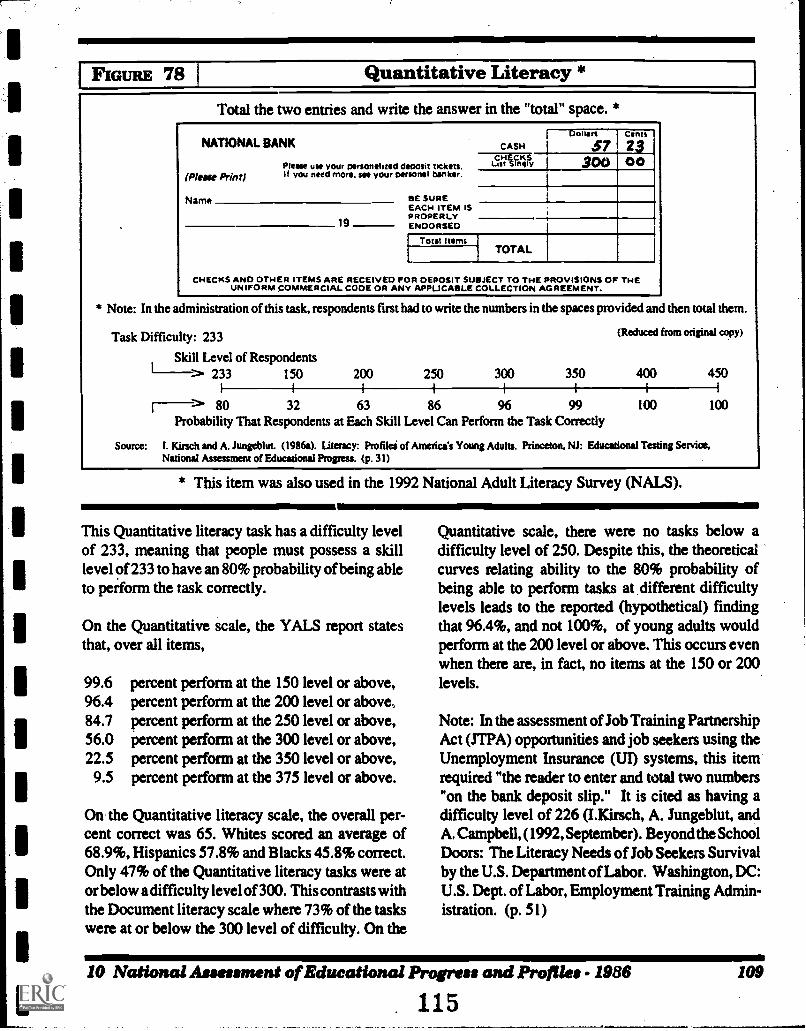
FIGURE 78 Quantitative Literacy *
Total the two entries and write the answer in the "total" space. *
NATIONAL BANK
(PIem Print)please usa your personalized deposit tickets.If you need more. see your personal banker.
Name nEsunEEACH ITEM ISPROPERLY
19 ENDORSED
CASH
t.TiFnVy
Dollars Cents
57 23300 00
Total ItemsTOTAL
CHECKS AND OTHER ITEMS ARE RECEIVED Fon DEPOSIT SUBJECT TO THE PROVISIONS OF THEUNIFORM COMMERCIAL CODE OR ANY APPLICABLE COLLECTION AGREEMENT.
* Note: In the administration of this task, respondents first had to write the numbers in the spaces provided and then total them.
Task Difficulty: 233
Skill Level of Respondents
(Reduced from original copy)
1----> 233 150 200 250 300 350 400 450I I I I I I I
r----> 80 32 63 86 96 99 100 100Probability That Respondents at Each Skill Level Can Perform the Task Correctly
Source: I. Kirsch and A. Jungeblut. (1986a). Literacy: Profilei of America's Young Adults. Princeton. NJ: Educational Testing Service,National Assessment of Educational Progress. (p. 31)
* This item was also used in the 1992 National Adult Literacy Survey (NALS).
This Quantitative literacy task has a difficulty levelof 233, meaning that people must possess a skilllevel of 233 to have an 80% probability of being ableto perform the task correctly.
On the Quantitative scale, the YALS report statesthat, over all items,
99.6 percent perform at the 150 level or above,96.4 percent perform at the 200 level or above84.7 percent perform at the 250 level or above,56.0 percent perform at the 300 level or above,22.5 percent perform at the 350 level or above,
9.5 percent perform at the 375 level or above.
On the Quantitative literacy scale, the overall per-cent correct was 65. Whites scored an average of68.9%, Hispanics 57.8% and Blacks 45.8% correct.Only 47% of the Quantitative literacy tasks were ator below a difficulty level of 300. This contrasts withthe Document literacy scale where 73% of the taskswere at or below the 300 level of difficulty. On the
Quantitative scale, there were no tasks below adifficulty level of 250. Despite this, the theoreticalcurves relating ability to the 80% probability ofbeing able to perform tasks at different difficultylevels leads to the reported (hypothetical) findingthat 96.4%, and not 100%, of young adults wouldperform at the 200 level or above. This occurs evenwhen there are, in fact, no items at the 150 or 200levels.
Note: In the assessment of Job Training PartnershipAct (JTPA) opportunities and job seekers using theUnemployment Insurance (UI) systems, this itemrequired "the reader to enter and total two numbers"on the bank deposit slip." It is cited as having adifficulty level of 226 (I.Kirsch, A. Jungeblut, andA. Campbell, (1992, September). Beyond the SchoolDoors: The Literacy Needs of Job Seekers Survivalby the U.S. Department of Labor. Washington, DC:U.S. Dept. of Labor, Employment Training Admin-istration. (p. 51)
10 National Asseument of Educational Progress and Profiles - 1986
115109
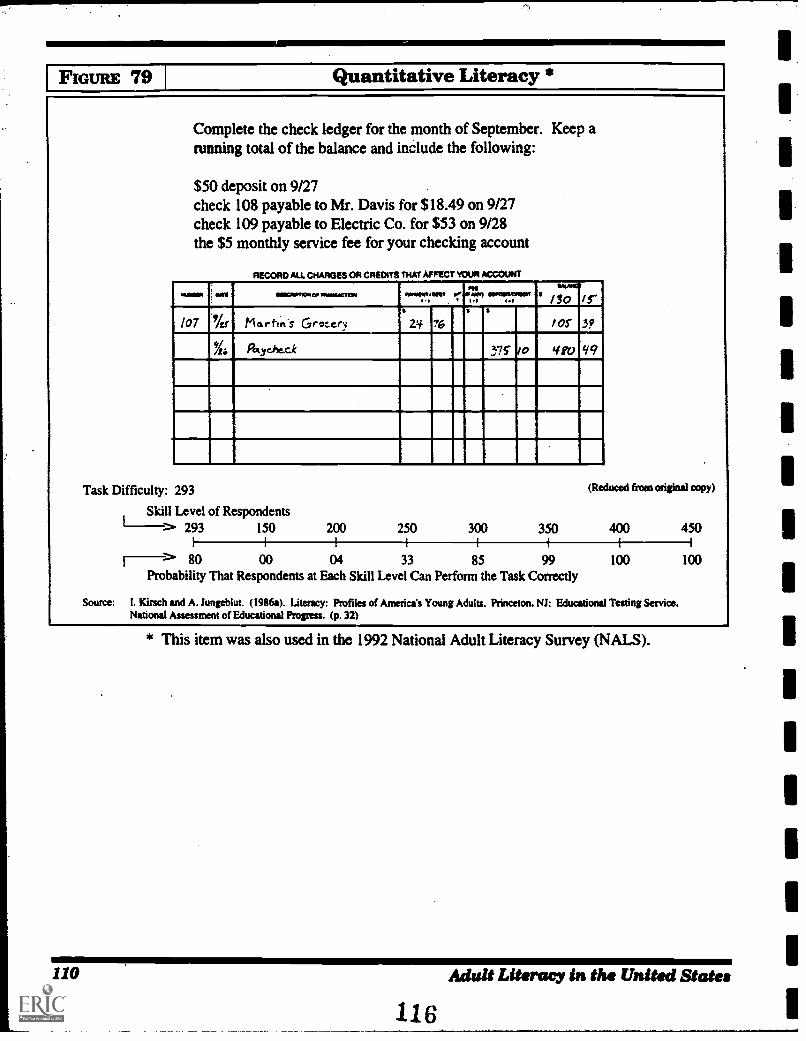
I FIGURE 79 Quantitative Literacy *
Complete the check ledger for the month of September. Keep arunning total of the balance and include the following:
$50 deposit on 9/27check 108 payable to Mr. Davis for $18.49 on 9/27check 109 payable to Electric Co. for $53 on 9/28the $5 monthly service fee for your checking account
RECORD AU. CHARGES OR CREDITS THAT AFFECT YOUR ACCOUNT
Mi ION i SAS ONCANns:o Or WalliSKTels MIMI t MOS so,
NIawn INGSITCMIOn
. 1 4.1
MUM.II /10 ir
107 :3/4s. Martt.i's Grnery 2.4 76 /05" 3?
it Payche.ck 375 10 &fro q9
,
,
-
Task Difficulty: 293
Skill Level of Respondents
(Reduced from original copy)
I---> 293 150 200 250 300 350 400 450I
E---->" 80 00 04 33 85 99 100 100Probability That Respondents at Each Skill Level Can Perform the Task Correctly
Source: I. Kirsch and A. Jungeblut. (1986a). Literacy: Pmfiles of America's Young Adults. Princeton, NJ: Educational Testing Service,National Assessment of Educational Progress. (p. 32)
* This item was also used in the 1992 National Adult Literacy Survey (NALS).
110 Adult Literacy in the United States
116
I.
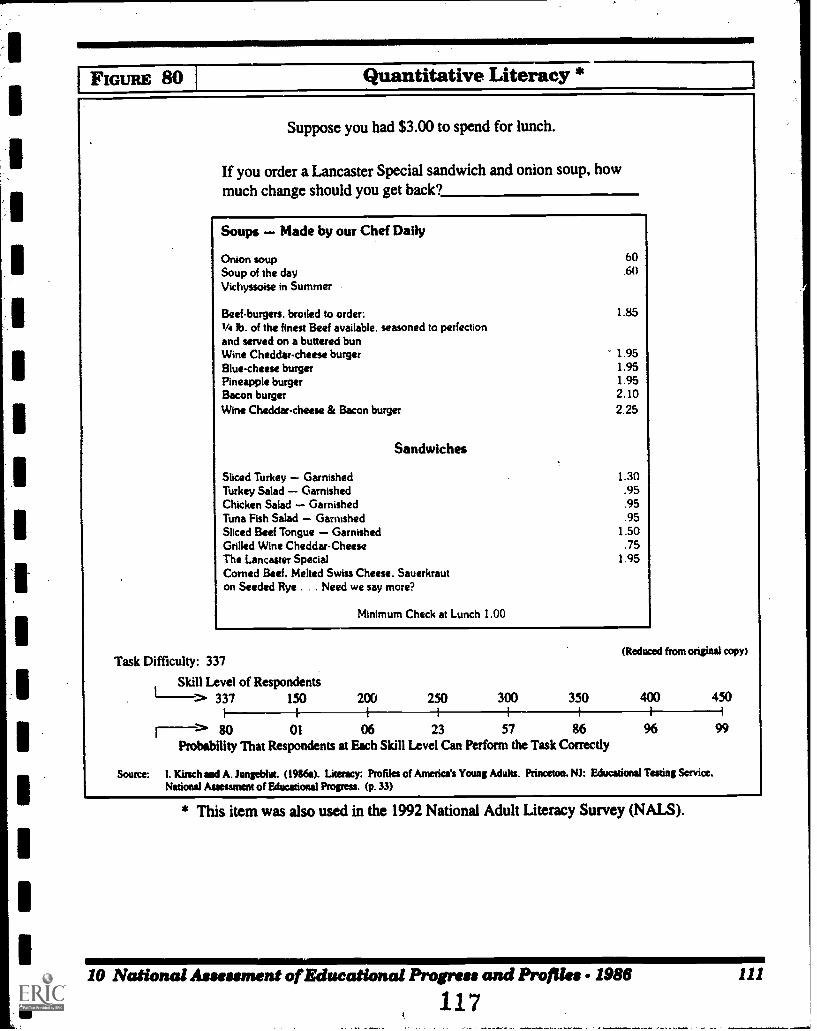
IFIGURE 80 E.- Quantitative Literacy *
Suppose you had $3.00 to spend for lunch.
If you order a Lancaster Special sandwich and onion soup, howmuch change should you get back?
Soups Made by our Chef Daily
Onion soupSoup of the dayVichyssoise in Summer
Beef-burgers, broiled to order:1/4 lb. of the finest Beef available, seasoned to perfectionand served on a buttered bunWine Cheddar-cheese burgerBlue-cheese burgerPineapple burgerBacon burgerWine Cheddar-cheese & Bacon burger
Sandwiches
60.60
1.85
1.951.951.952.102.25
Sliced Turkey Garnished 1.30Turkey Salad Garnished .95Chicken Salad Garnished .95Tuna Fish Salad Garnished .95Sliced Beef Tongue Garnished 1.50Grilled Wine Cheddar-Cheese .75The Lancaster Special 1.95Corned Beef. Melted Swiss Cheese. Sauerkrauton Seeded Rye . . . Need we say more?
Minimum Check at Lunch 1.00
Task Difficulty: 337
Skill Level of Respondents
(Reduced from original copy)
t----> 337 150 200 250 300 350 400 450I
7---- 80 01 06 23 57 86 96 99Probability That Respondents at Each Skill Level Can Perform the Task Correctly
Source: I. Kinch and A. Jungeblut. (19116a). Literacy: Profiles of America's Young Adults. Princeton. NJ: Educational Testing Service.National Assessment of Educational Progress. (p. 33)
* This item was also used in the 1992 National Adult Literacy Survey (NALS).
10 National Assessment of Educational Progress and Profiles - 1986
117111
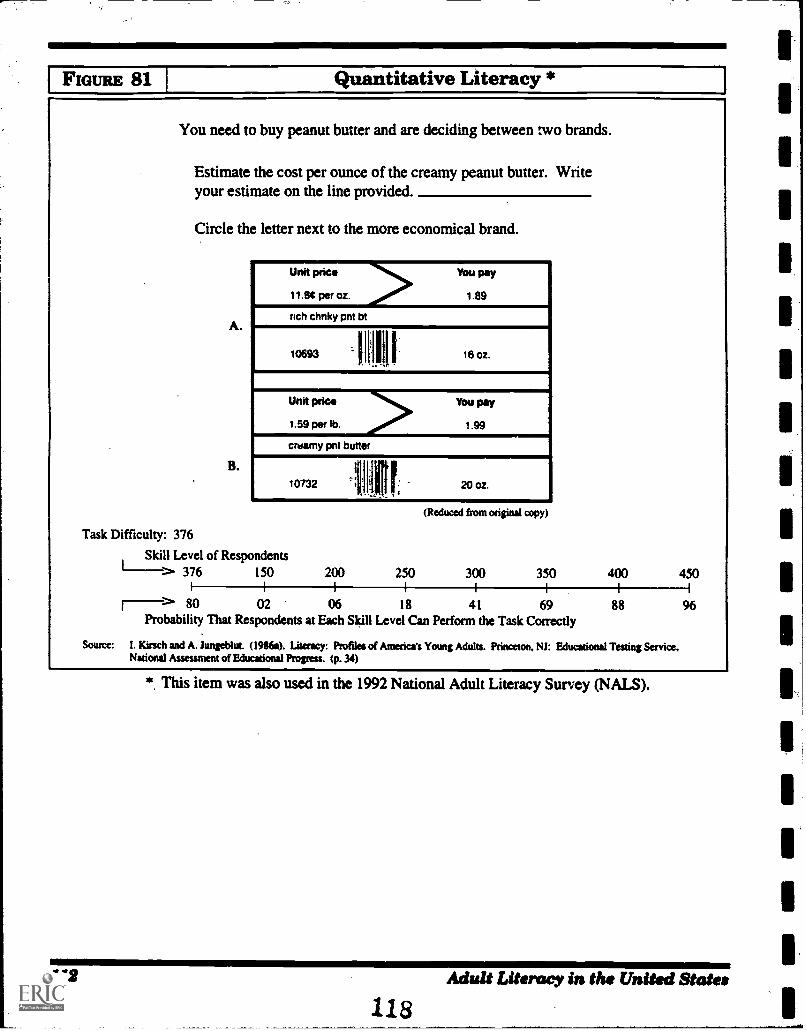
IFiGuitE 81 Quantitative Literacy *
You need to buy peanut butter and are deciding between two brands.
Estimate the cost per ounce of the creamy peanut butter. Writeyour estimate on the line provided.
Circle the letter next to the more economical brand.
A.
B.
Unit price
11.84 per oz.
You pay
1.89
rich chnky pnt bt
10693NI I
lSoz.
Unit price You pay
1.991.59 per lb. >creamy pnt butter
.....1
107324...
20 oz.,
(Reduced from original copy)
Task Difficulty: 376
Skill Level of Respondents376 150 200 250 300 350 400 450
n---> 80 02 06 18 41 69 88 96Probability That Respondents at Each Skill Level Can Perform the Task Correctly
Source: I. Kirsch and A. Jungeblut. (1966a). Literacy: Profiles of America's Young Adults. Princeton. NJ: Educational Testing Service.National Assessment of Educational Propels. (p. 34)
*. This item was also used in the 1992 National Adult Literacy Survey (NALS).
112 Adult Literacy in the United States
118
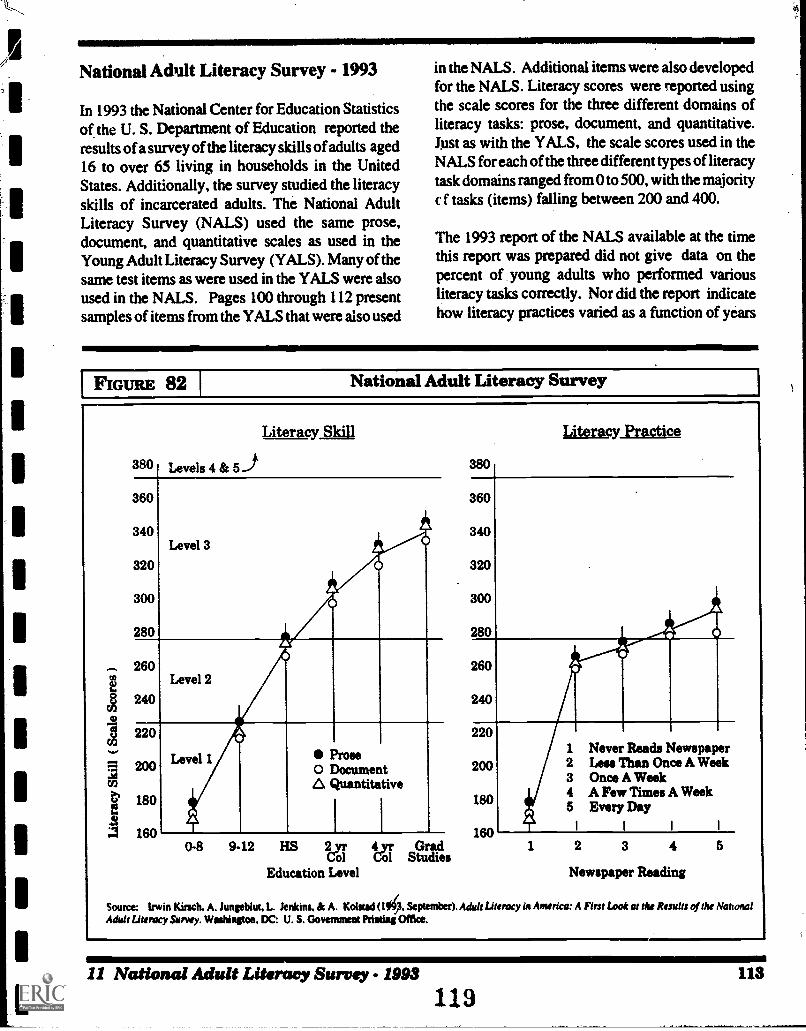
National Adult Literacy Survey - 1993
In 1993 the National Center for Education Statisticsof the U. S. Department of Education reported theresults of a survey of the literacy skills of adults aged16 to over 65 living in households in the UnitedStates. Additionally, the survey studied the literacyskills of incarcerated adults. The National AdultLiteracy Survey (NALS) used the same prose,document, and quantitative scales as used in theYoung Adult Literacy Survey (YALS). Many of thesame test items as were used in the YALS were alsoused in the NALS. Pages 100 through 112 presentsamples of items from the YALS that were also used
in the NALS. Additional items were also developedfor the NALS. Literacy scores were reported usingthe scale scores for the three different domains ofliteracy tasks: prose, document, and quantitative.Just as with the YALS, the scale scores used in theNALS for each of the three different types of literacytask domains ranged from 0 to 500, with the majority
f tasks (items) falling between 200 and 400.
The 1993 report of the NALS available at the timethis report was prepared did not give data on thepercent of young adults who performed variousliteracy tasks correctly. Nor did the report indicatehow literacy practices varied as a function of years
FIGURE 82 National Adult Literacy Survey
Literacy Skill
380 Levels 4 &
360
340
320
300
280
260
240
220
200
180
160
Level 3
Level 2
Level 1 Prose0 Document6, Quantitative
0-8 9-12 HS 2a1 4di s?urgsEducation Level
380
360
340
320
300
280
260
240
220
200
180
160
Literacy Practice
0
1 Never Reads Newspaper2 Less Than Once A Week3 Once A Week4 A Few Times A Week5 Every Day
1 2 3 4
Newspaper Reading
5
Source: Irwin Kirsch. A. Jungeblut, L. Jenkins, & A. KoIstad (14. September). Adult Literacy in Anserica: A First Look at the Results of the NationalAdult Literacy Survey. Washington. DC: U. S. Government Printing Office.
11 National Adult Literacy Survey. - 1993
119
AIM113
of education. Therefore, to show how performanceon the NALS compares with earlier adult literacyassessments, the left side of figure 82 shows skilllevels on the prose, document, and quantitative tasksin terms of scale scores for people at different levelsof education. The figure also shows on the right howscale scores varied for people who engaged in variousamounts of one literacy practice: newspaper reading.Both the skill and practices data resemble the' find-ings of Buswell in 1937 (page 43), the Adult Func-
tional Reading Study of 1973 (page 63) and theYoung Adult Literacy Survey (page 99) in showingthat people with more education have higher readingskills, and that people who read the newspaper morealso have higher reading skills. This confirms theearlier findings that skill, practice and education areinterrelated. Future reports from the NALS areplanned that will discuss additional relationshipsamong education, literacy skills, and literacypractices.
114 Adult Literacy in the United States
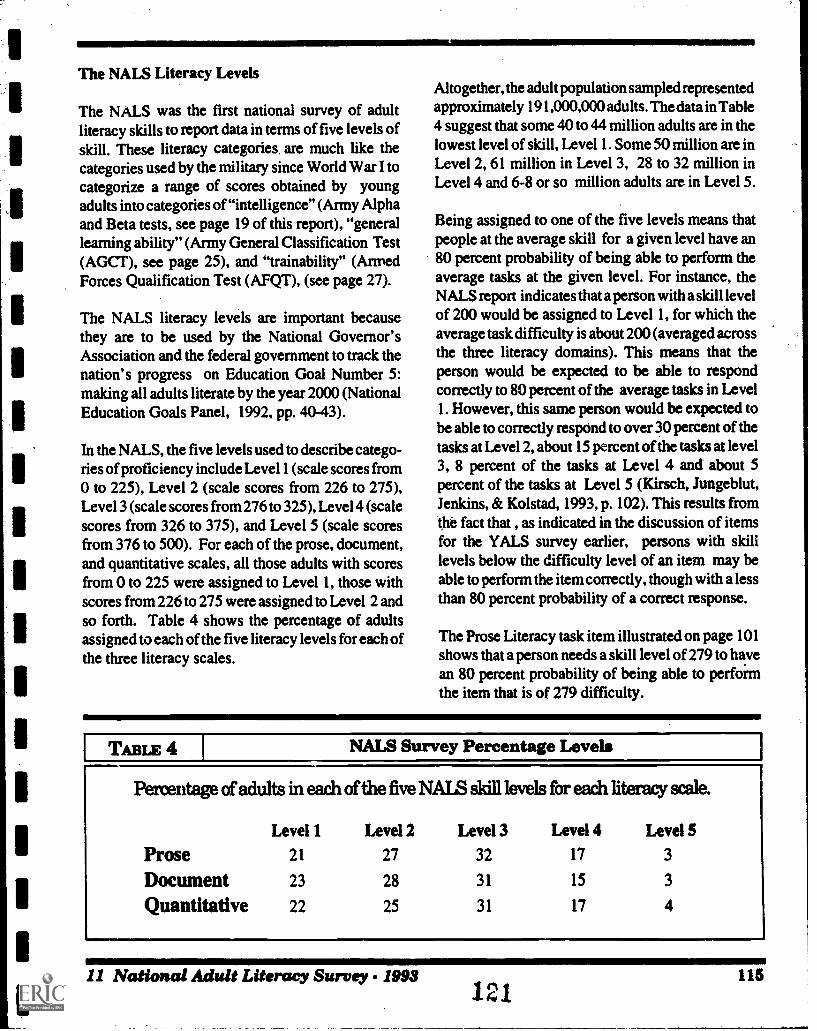
111111116.
The NALS Literacy Levels
The NALS was the first national survey of adultliteracy skills to report data in terms of five levels ofskill. These literacy categories. are much like thecategories used by the military since World War I tocategorize a range of scores obtained by youngadults into categories of "intelligence" (Army Alphaand Beta tests, see page 19 of this report), "generallearning ability" (Army General Classification Test(AGCT), see page 25), and "trainability" (ArmedForces Qualification Test (AFQT), (see page 27).
The NALS literacy levels are important becausethey are to be used by the National Governor'sAssociation and the federal government to track thenation' s progress on Education Goal Number 5:making all adults literate by the year 2000 (NationalEducation Goals Panel, 1992, pp. 40-43).
In the NALS, the five levels used to describe catego-ries of proficiency include Level 1 (scale scores from0 to 225), Level 2 (scale scores from 226 to 275),Level 3 (scale scores from 276 to 325), Level 4 (scalescores from 326 to 375), and Level 5 (scale scoresfrom 376 to 500). For each of the prose, document,and quantitative scales, all those adults with scoresfrom 0 to 225 were assigned to Level 1, those withscores from 226 to 275 were assigned to Level 2 andso forth. Table 4 shows the percentage of adultsassigned to each of the five literacy levels for each ofthe three literacy scales.
Altogether, the adult population sampled representedapproximately 191,000,000 adults. The data in Table4 suggest that some 40 to 44 million adults are in thelowest level of skill, Level 1. Some 50 million are inLevel 2, 61 million in Level 3, 28 to 32 million inLevel 4 and 6-8 or so million adults are in Level 5.
Being assigned to one of the five levels means thatpeople at the average skill for a given level have an80 percent probability of being able to perform theaverage tasks at the given level. For instance, theNALS report indicates that a person with a skill levelof 200 would be assigned to Level 1, for which theaverage task difficulty is about 200 (averaged acrossthe three literacy domains). This means that theperson would be expected to be able to respondcorrectly to 80 percent of the average tasks in Level1. However, this same person would be expected tobe able to correctly respond to over 30 percent of thetasks at Level 2, about 15 percent of the tasks at level3, 8 percent of the tasks at Level 4 and about 5percent of the tasks at Level 5 (Kirsch, Jungeblut,Jenkins, & Kolstad, 1993, p. 102). This results fromthe fact that , as indicated in the discussion of itemsfor the YALS survey earlier, persons with skilllevels below the difficulty level of an item may beable to perform the item correctly, though with a lessthan 80 percent probability of a correct response.
The Prose Literacy task item illustrated on page 101shows that a person needs a skill level of 279 to havean 80 percent probability of being able to performthe item that is of 279 difficulty.
TABLE 4 NALS Survey Percentage Levels
Percentage of adults in each of the five NALS skill levels for each literacy scale.
Level 1 Level 2 Level 3 Level 4 Level 5
Prose 21 27 32 17 3
Document 23 28 31 15 3
Quantitative 22 25 31 17 4
11 Nation& Adult Literacy Survey 1993 115
However, the person with a skill level of 250 has aprobability of .62 of being able to perform the item.Because the person has a skill level of 250, on theNALS this would result in the person being assignedto Level 2. This would mean that the person has a .80probability of being able to perform average Level 2tasks. But note that the person would also be able toperform Level 3 tasks (which is where a task of 279difficulty would fall), but not with as high a prob-ability of success. In the NALS report, it is indicatedthat on either the prose, document or quantitativetasks, a person with a skill level of 250 can beexpected to perform 50 out of 100 tasks that are at theaverage Level a task, 25 to 30 percent of the tasks atLevel 4 and 10 to 20 percent of the tasks at Level 5,depending on the type of literacy scale under discus-sion (Kirsch, et. al. 1993, p. 102).
By assigning people to a given skill level, the im-pression may be formed that the person has no abilityto perform higher level tasks. But this is wrong. Eventhough people may be assigned to a lower skill level,this does not mean that they are totally incapable ofperforming tasks at higher skill levels. In the NALSsurvey, respondents were asked to rate themselvesas to how well they thought they could read and writeEnglish. Of those categorized as Level 1 literates,'some 66 to 75 percent said they could read and write"well" or "very well." The NALS authors refered tothis as the "gap between performance and percep-tion," meaning that the literacy skills of those inLevel 1 are low by NALS methods of setting stan-dards for inclusion at one or another level of skill. Sothe self-perceived skills of the vast majority of thosecategorized as Level 1 literates, who rated them-selves as "well" or "very well" as literates, must beincorrect. They go on to say that "Such a mismatchmay well have a significant impact on efforts toprovide education and training to adults: Those whodo not believe they have a problem will be less likelyto seek out such services or less willing to takeadvantage of services that might be available tothem." (Kirsch, et. al. 1993, p. 20).
But it is possible that many adults labled as Level 1literates perceive themselves as quite literate be-
cause, as indicated above, they are able to performquite a few tasks at higher levels, even a few at Level5. It must be kept in mind that simply because peopleare assigned to a lower level category of literacyskill, this does not mean that they are entirely inca-pable of performing tasks at higher skill levels. Theysimply do not have a .80 probability of performinghigher level tasks. That is, they cannot perform themwith the same high level of probability that is requiredto be categorized at a higher level. This is importantto keep in mind when one discusses the numbers ofadults in the different skill levels. The numbers canbe changed dramatically simply by changing thecriterion for being categorized into the differentlevels. For instance, if instead of requiring thatpeople be able to do 80 percent of the average tasksin a given level, the criterion were changed to beingable to do 70 percent of the tasks, then the numbersof people assigned to the lower levels would de-crease dramatically.
By using the method of "literacy levels" to catego-rize people's literacy skills, one may be led toconclude that people assigned to a given level of skillcannot perform the more demanding types of tasksfound at higher levels of skill. Yet that is incorrectand provides an inaccurate indication of the fullrange of people's literacy skills. Quite possibly,people's perceptions of their literacy ability may bemore accurate than the impressions that might becreated by the use of the five NALS literacy levels.
Some Major Findings from the NALS
The NALS reported data on the literacy scores ofadults across a wide range of age, for persons withspecial health conditions, for ethnic groups, and forincarcerated populations. Some of the key findingsfor each of these groups are summarized below.
literacy and Age
The NALS report indicated that, generally, botheducation and literacy skills increased for adultsfrom ages 16-18 up to ages 40-54, and then skills
11641111111111
Adult Literacy in the United States122
-
dropped rapidly. Adults 55 -64 and those 65 or olderperformed well below the levels of younger adults,even though their average years of education was notmuch different from the 16-18 year olds. Summariz-ing across the three literacy scales, about 44-48percent of those adults categorized in Level 1 wereaged 55 or older, and 32-35 percent were 65 years oldor older. Some 28-32 percent of those in Level 2were 55 years old or older, and 16-18 percent were65 or older.
From the NALS data it is not possible to say whetheradults' literacy skills rise and then decline or whetherthe various age groups have performed at the levelsindicated throughout adulthood. This would requirelongitudinal studies. However, referring to the hu-man cognitive system of page 4 of this report, theNALS tasks do impose heavier burdens on workingmemory as they increase in difficulty. In fact, thismay be one of the major reasons the tasks increase indifficulty. The authors of the NALS report note that,of several variables that might make tasks moredifficult, two of the variables for prose and documenttasks are the number of categories or features ofinformation that the reader has to process or match,and the number of categories or features of informa-tion in the document that can serve to distract thereader or that may seem plausible but are incorrect.In the quantitative tasks, the romber of operationsneeded to perform the task is given as a factor thatmay influence the difficulty of the task (Kirsch, et. al,1993, pp. 74, 85, & 94).
Generally, holding features or categories of infor-mation in short term or working memory and thensearching through other information places greaterdemands upon working memory, and there is consid-erable evidence that working memory performancedeclines with increasing age (Bernstein, Roy, Srull,& Wickens, 1988, p. 401). This may explain, at leastin part, the decrease in literacy skills as age increases.
As indicated in the human cognitive system model,one of the factors that is important for literacy isone's organized bodies of knowledge. The bodies ofknowledge are what makes it possible to compre-
hend printed displays, to reason analogically (i.e.,from one body of knowledge to another), and tomake inferences (i.e., going from the informationgiven in the display to another body of knowledge inone's mental knowledge base to create yet a thirddomain of knowledge needed to correctly performan inference-type task). Generally, these organizedbodies of knowledge continue to develop acrossadulthood and tend to resist deterioration in olderage (Bernstein, et. al, 1988, p. 401). While theNALS includes tasks that include knowledge con-tent from health, consumer economics, and others,it does not systematically assess people's organizedbodies of knowledge in any domain (e.g., health,science, government, etc.). It is not possible to knowwhether poorly performing people's primary prob-lems may be their lack of knowledge (e.g., vocabu-lary, concepts, etc.) or of working memory control,or both. But the rapid decline in performance withages above 55 suggests a strong component ofworking memory control in the NALS tasks.
Health Conditions
A major contribution of the NALS was the samplingof adults with various forms of physical, mental orother health conditions. The survey reported that 12percent of the adult population reported some type ofhealth problem. Significantly, as a type of epide-miological indicator of the self-perceived extent ofadult learning difficulties in the U. S. population,some 3 percent (7.5 million) of adults reported thatthey suffered from learning disabilities. Around 60percent of these adults scored in Level 1, and some22 percent scored in Level 2. Overall, the averagescores for those self-reporting that they had a learningdisabilty were: prose-207; document- 203; andquantitative- 200.
Less than one-half of one-percent reported that theywere mentally retarded. Eighty-six to 89 percent ofthese adults were placed in Level 1, with averagescores of: prose-143; document-147; and quantita-tive- 117.
11 National Adult Literacy Survey. - 1993123
117
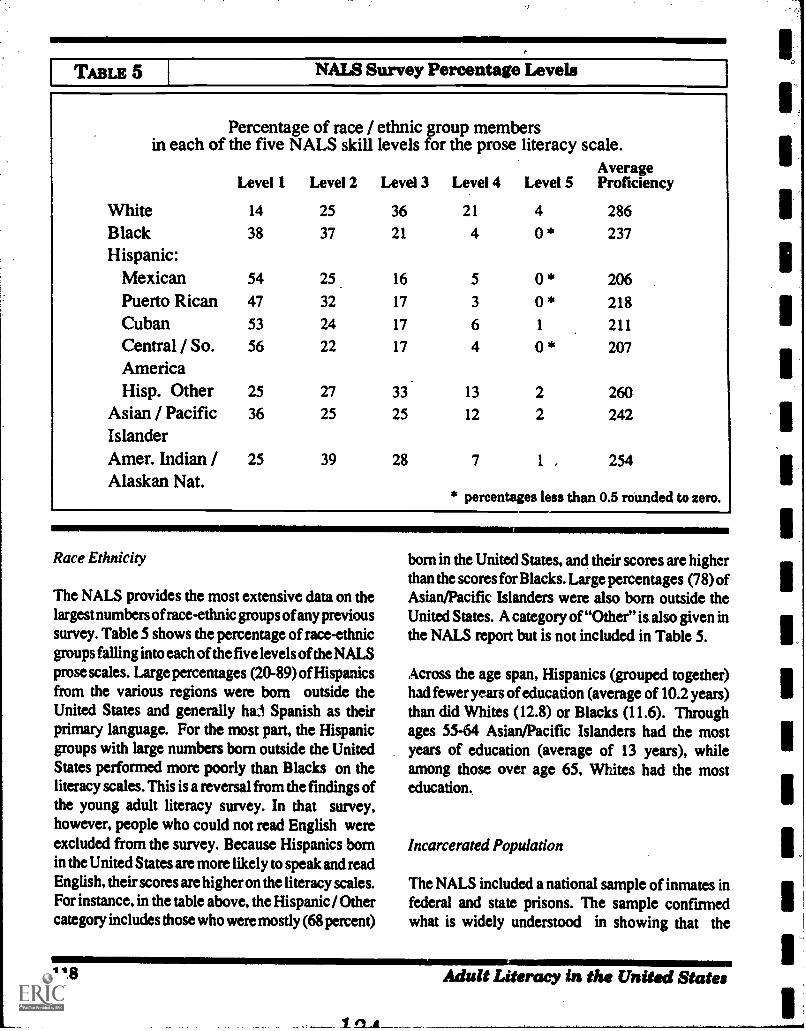
I TABLE 5 NALS Survey Percentage Levels
Percentage of race / ethnic group membersin each of the five NALS skill levels for the prose literacy scale.
AverageLevel 1 Level 2 Level 3 Level 4 Level 5 Proficiency
White 14 25 36 21 4 286
Black 38 37 21 4 0 * 237
Hispanic:Mexican 54 25 16 5 0 * 206
Puerto Rican 47 32 17 3 0 * 218Cuban 53 24 17 6 1 211
Central / So. 56 22 17 4 0 * 207AmericaHisp. Other 25 27 33 13 2 260
Asian / Pacific 36 25 25 12 2 242IslanderAmer. Indian / 25 39 28 7 1 , 254Alaskan Nat.
* percentages less than 0.5 rounded to zero.
Race Ethnicity
The NALS provides the most extensive data on thelargest numbers of race-ethnic groups of any previoussurvey. Table 5 shows the percentage of race-ethnicgroups falling into each of the five levels of the NALSprose scales. Large percentages (20-89) of Hispanicsfrom the various regions were born outside theUnited States and generally he Spanish as theirprimary language. For the most part, the Hispanicgroups with large numbers born outside the UnitedStates performed more poorly than Blacks on theliteracy scales. This is a reversal from the findings ofthe young adult literacy survey. In that survey,however, people who could not read English wereexcluded from the survey. Because Hispanics bornin the United States are more likely to speak and readEnglish, their scores are higher on the literacy scales.For instance, in the table above, the Hispanic / Othercategory includes those who were mostly (68 percent)
born in the United States, and their scores are higherthan the scores for Blacks. Large percentages (78) ofAsian/Pacific Islanders were also born outside theUnited States. A category of "Other" is also given inthe NALS report but is not included in Table 5.
Across the age span, Hispanics (grouped together)had fewer years of education (average of 10.2 years)than did Whites (12.8) or Blacks (11.6). Throughages 55-64 Asian/Pacific Islanders had the mostyears of education (average of 13 years), whileamong those over age 65, Whites had the mosteducation.
Incarcerated Population
The NALS included a national sample of inmates infederal and state prisons. The sample confirmedwhat is widely understood in showing that the
118 Adult Literacy in the United States
prison population tends to be quite different de-mographically than the general adult population. Forexample, the prison population was mostly males(94 percent), 80 percent were below the age of 40,they were less White (35 percent), more Black (44percent) and Hispanic (17 percent), and less welleducated (49 percent with less than a high schooleducation).
The prison population scored lower on literacy thanthe general adult population. The average scalescores for the three literacy scales were: prose-240(272 for the general adult population), document-240 (267 general adult population), and quantita-tive-236 (271 general adult population ). In terms ofthe NALS literacy levels, looking across the threeliteracy scales, some 31 to 40 percent of inmateswere in Le*el 1, 32-38 percent in Level 2, 22-26percent Level 3, 4-6 percent Level 4, and less than0.5 to 1 percent in Level 5.
Poverty, Income, Occupational Status, and theIntergenerational Transfer of Literacy
The NALS confirmed other studies going back overthe decades in showing that the less literate are morelikely to be found in poverty, on welfare, unemployedor employed in poorly paying jobs, and in the lowerstatus jobs that require less education (see page 135of this report) .
The intergenerational effects of parent's educationlevel on the adult's literacy level was also replicatedin the NALS . Adults whose parents had completeda four year college degree were nine times morelikely to have completed a college degree themselvesthan were adults whose parents had 0-8 years ofeducation (46 percent versus 5 percent).Thirty-twopercent of adults whose parents had completed 0-8years of education had themselves completed only0-8 years of education, whereas only 5 percent ofadults whose parents had completed high schoolreported that they themselves had completed only 0-8 years of education. Some caution in interpretingthese data is called for because the NALS includedsome 16 to 18 year olds who were still in school. Seepages 127-131 of this document for more on theintergenerational transfer of literacy.
References
Douglas Bernstein, E. Roy, T. Srull, & C. Wickens(1988). Psychology. Boston: Houghton Mifflin.
Irwin Kirsch, A. Jungeblut, L. Jenkins, & A. Kolstad(1993, September). Adult literacy in America: AFirst Look at the Results of the National AdultLiteracy Survey. Washington, DC: U. S. Govern-ment Printing Office.
National Education Goals Panel (1992). The Na-tional Education Goals Report: Building a Nation ofLearners. Washington, DC: U. S. GovernmentPrinting Office.
11 National Adult Literacy Survey. - 1993
12 5
119
P A R T 2P A R T 2
SPECIAL TOPICS
LISTENING AND READING IN ADULT LITERACY
THE INTERGENERATIONAL TRANSFER OF LITERACY
FROM PARENTS TO CHILDREN
LITERACY, OCCUPATIONAL STATUS AND JOB PERFORMANCE
21 Listening and Reading in Adult Literacy126
121
LISTENING AND READING IN ADULT LITERACY
Atcording to the developmental model of literacyoutlined in the introduction to this Compendium,children typically acquire considerable competencein listening and comprehending speech before theydevelop competence in reading and comprehendingthe written language. Indeed, the whole idea behindthe teaching of "phonics" and other "word attack"techniques is that the learner's main task is to learnhow to "decode" the written language to recover thespoken language which can then be comprehendedas usual.
The idea that listening competence develops firstand then reading competence permits the learner tounderstand in writing that which could earlier beunderstood only in the spoken language leads to theconcept of "reading potential." Figure 83 illustratesthe concept for school children. The general notionis that children enter school at the first grade withtwo types of communication abilities: listening andreading (there are, of course, other cominunicationabilities, but they are not the object of discussionhere). By definition, the average listening ability offirst graders is designated as first grade listeningability. The average reading ability of first graders isdesignated as first grade reading ability. These arethe "nonnative" designations of listening and read-ing skills.
Figure 83 shows the hypothetical case of a child withnormative listening and reading levels at the secondgrade. However, as the figure illustrates, if the childcould read as well as he or she listens, then the"reading potential" score would be at the third gradelevel.
The concept of "reading potential" is important foradult literacy for at least two reasons. First, whetherpeople are designated as "learning disabled" or notis generally based on the idea that on some measure,such as an "intelligence" test, the people are at theirappropriate age level or above, but on a readingmeasure they are two or more years behind. In other
words, they are not reading "up to their potential."Listening tests are one way of assessing people's"reading potential."
The second reason that the concept of "readingpotential" is important in adult literacy education isthat it is frequently thought that adults in need ofliteracy education have lived a reasonably long timeand developed fairly high levels of competence inoral language, including vocabulary and compre-hension ability for listening. Therefore, unlikechildren, whose oral language skills are not welldeveloped yet and who must acquire higher levels ofvocabulary while also learning to read, adults will beable to acquire a fairly high level of literacy in a brieftime, relative to that required by children. This leadsto the expectation that the adult's literacy problemsmay be solved fairly quickly with a relatively briefperiod of training in some form of decoding thewritten word to recover the vast amount of compe-tence already possessed in the oral language.
However, as the data for Figure 84 indicate, whensome 2,000 adults were assessed to compare theirskills in both listening and reading, the anticipatedhigher level of listening ability, particularly at thelower levels of reading as indicated by the Gates-MacGinitie reading test, did not emerge when lis-tening to comprehend paragraphs. While the vo-cabulary tests did show greater skill by listening, itappears that that was due to the fact that in thelistening vocabulary test, the test was administeredboth by listening and by reading. In this case, then,people were paced to complete the entire vocabularytest by the spoken words on the listening test. Thisappears to have provided an indication of greatervocabulary ability than when vocabulary was as-sessed only by reading.
The data of Figure 84 were obtained using groupadministered tests in which the listening and readingmeasures were equated as closely as possible incontent, time to listen or read, and difficulty of the
21 Listening and Reading in Adult Literacy127
123
questions, which were all multiple-choice requiringrecall of factual information.
The chapter by Sticht and James (1984) provides anextensive review of listening and reading studieswith adults. In one study, using the same test as usedto obtain the data in Figure 84, an incarcerated prisonpopulation of men reading at the 4th grade levelshowed about 1.5 grade levels of "potential" asderived in Figure 83.
Using a different group administered test of listeningand reading skills, the Durrell Listening and Read-ing Series tests, Sticht (1978) reported that for 71native speakers of English who were in an adultliteracy program their average reading level was atthe 4.8 grade level, while their reading "potential"(listening transformed to reading as in Figure 83)was 6.0. Interestingly, for 45 adults with English asa second language, their reading score was 4.8 whiletheir reading "potential" score was at the 4.4 gradelevel. In other words, their listening skills werelower than their reading skills, so when the listeningscore was converted to a reading "potential" score,they performed below their actual reading level.
Using the Diagnostic Reading Scales, which areadministered one-on-one as an individual test, Sticht& Beck (1976) assessed the reading "potential" of 42native English speakers and 32 English as a secondlanguage speakers in an adult literacy program. The
native speakers had an average reading level at the6.2 grade level and a "potential" at the grade 6.4level. The non-native English speakers read at anaverage 4.3 grade level and had a "potential" at the4.4 grade level.
Generally speaking, as the data of Figure 84 and thestudies cited above suggest, adults with lower levelsof literacy tend to also have lower levels of orallanguage (listening) comprehension. This appears tobe true for both vocabulary knowledge and thecomprehension of connected discourse. Of course,there can be important exceptions to these generaltrend data. But as a rule, these data on listening andreading suggest that adult literacy educators willhave to provide extensive opportunities for adultlearners to develop considerable bodies of knowl-edge to improve both their oral and written languagecomprehension skills to the higher levels.
Reference
Sources for all of the studies cited above, and manyothers exploring listening and reading skills of adults,may be found in:
Thomas G. Sticht & J. H. James (1984). Listeningand Reading. In P. Pearson, R. Barr; M. Kamil, andP. Mosenthal ( Eds.) Handbook of Reading Re-search. New York: Longmans.
124 Adult Literacy in the United States
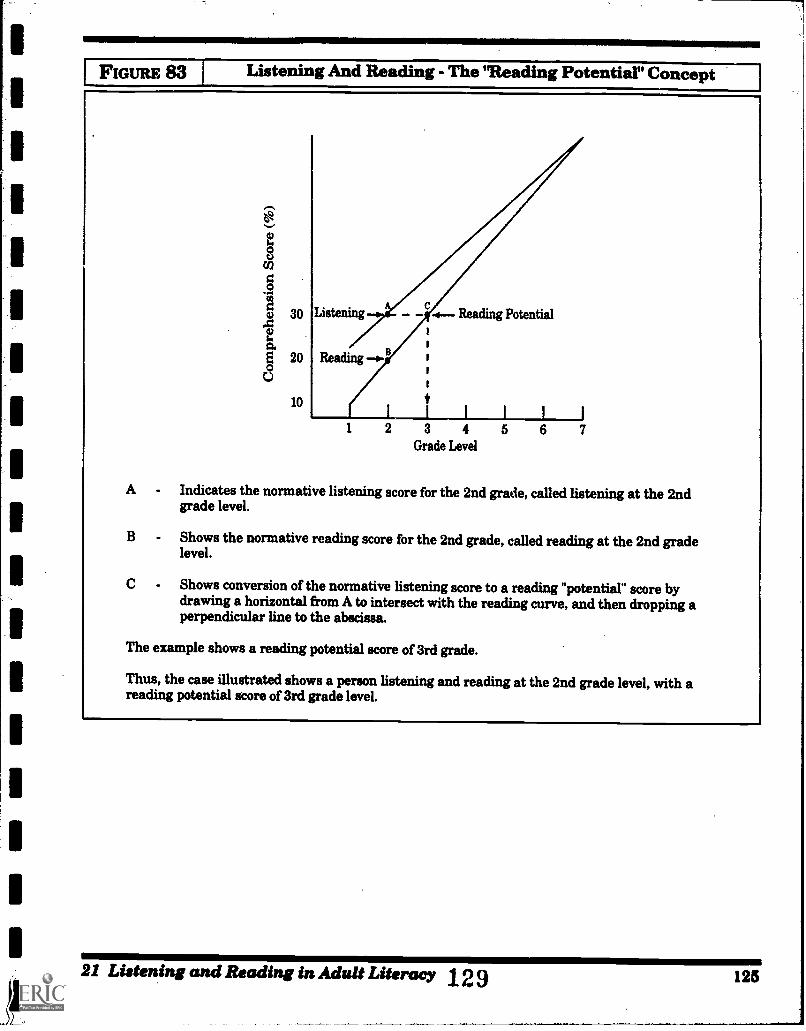
FIGURE 83 Listening And Reading - The "Reading Potential" Concept
30 Listening Reading Potential
20 Reading
10
3 4Grade Level
A Indicates the normative listening score for the 2nd grade, called listening at the 2ndgrade level.
Shows the normative reading score for the 2nd grade, called reading at the 2nd gradelevel.
Shows conversion of the normative listening score to a reading "potential" score bydrawing a horizontal from A to intersect with the reading curve, and then dropping aperpendicular line to the abscissa.
The example shows a reading potential score of 3rd grade.
Thus, the case illustrated shows a person listening and reading at the 2nd grade level, with areading potential score of 3rd grade level.
21 Listening and Reading in Adult Literacy 129 125
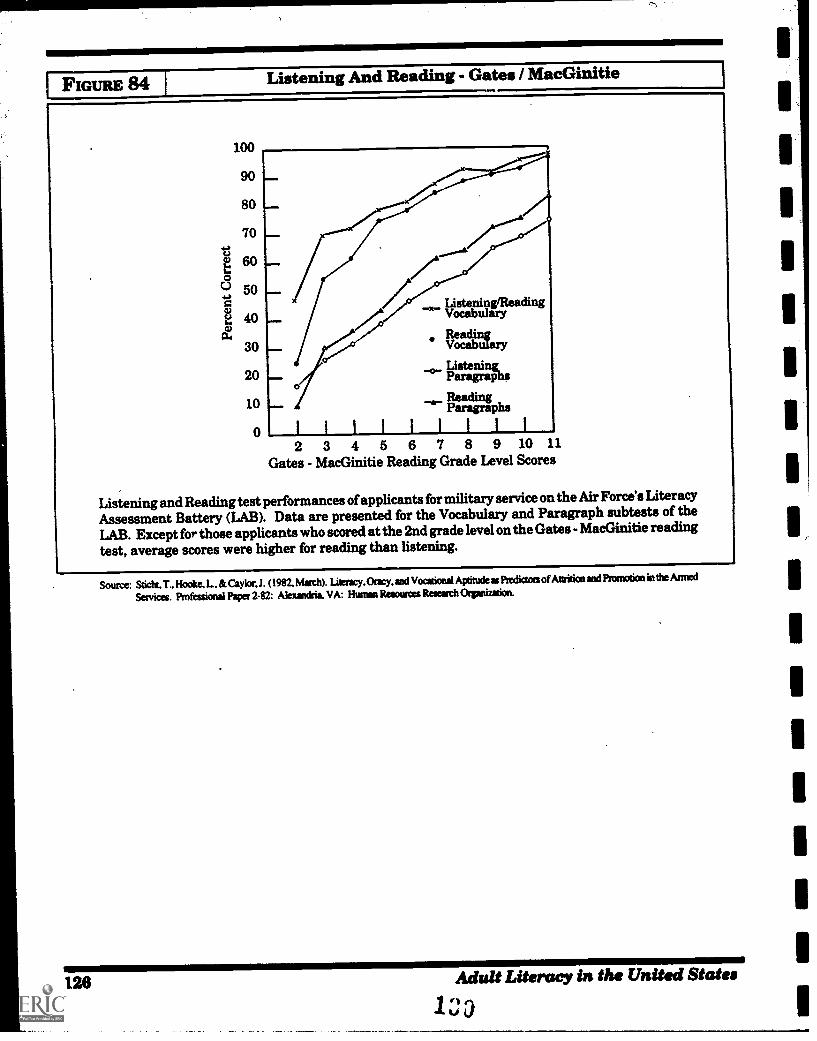
FIGURE 84 Listening And Reading - Gates / MacGinitie
100
90
80
70
60
50
40
30
20
10
2 3 4 5 6 7 8 9 10 11Gates - MacGinitie Reading Grade Level Scores
Listening and Reading test performances of applicants for military service on the Air Force's LiteracyAssessment Battery (LAB). Data are presented for the Vocabulary and Paragraph subtests of theLAB. Except for those applicants who scored at the 2nd grade level on the Gates - MacGinitie readingtest, average scores were higher for reading than listening.
Source: Sncht. T.. Hooke. L. & Caylor. (1982. March). theracy, Oracy. and Vocational Apitude as Pindicton of Anritionand Promotion in the Anned
Services. Professional Paper 2-82: Alexandria. VA: Human Resources Research Orpnizeion.
126 AdultLiteracy in the United States
10
I.
Il
THE INTERGENERATIONALTRANSFER OF LITERACYFROM PARENTS TO CHO DREN
A consistent finding azross all the adult literacysurveys from 1917 to 1992 reviewed in Part 1 is thatthe more education people have, the more reading ofbooks, magazines, and newspapers they do, and themore highly skilled they are.
In this section of the Compendium, we introduceanother salient finding across adult literacy surveysfor the last quarter of a century. People with morehighly educated parents are, themselves, likely tobecome the more highly educated, more extensivelyread, and highly skilled of the next generation.
Regarding the relationship between parent's edu-cation and the next generation's reading skills, Fig-ure 85 shows reading skill data for 9, 13, and 17 yearolds as well as young adults 25-35 years old. Thesedata were obtained by the National Assessment ofEducational Progress (NAEP) in the early 1970s(see sources cited at Figure 85). In the NAEP survey,children and adults were tested on 8 different reading"themes" or skill areas, ranging from word meanings(vocabulary knowledge) to critical reading. As Fig-ure 85 shows, regardless of the type of reading skillassessed, and at all ages, as parent's education in-creased, reading proficiency increased.
In Figure 86, data from the 1985 survey of youngadult literacy skills are presented showing profi-ciency on the NAEP Prose literacy scale (see page
129). The figure shows parent's education levels onthe horizontal (X) axis and the young adult's ownyears of education inside the figure. For instance, forparents with only 0-8 years of education and theiradult children with only 0-8 years of education, theaverage Prose literacy score is 233. As the parent'seducation level increases, there is not much im-provement in the proficiency of young adults withonly 0-8 years of education. However, as the youngadult's own education increases from 0-8 years ofeducation, to some high school (HS), to post highschool and to possession of a college degree, there isan interaction with parent's education level. Thegreater the parent's education and the greater theiradult children's education, the higher the readingproficiency.
Figure 87 shows the relationships of mother's edu-cation to performance on the Armed Forces Quali-fication Test of 1980 for Whites, Hispanics andBlacks. Similar data are presented in Figure 88 forthe 1985 NAEP survey of young adult literacy skills.
The data on the intergenerational transfer of literacyfrom parents to their children has provided a largepart of the evidence to argue for "intergenerationalliteracy" or "family literacy" adult education pro-grams. Today, both the federally-funded Head Startand Even Start programs aim to promote theintergenerational transfer of literacy from parents tochildren through family literacy programs.
22 Intergenerational Transfer of Literacy131
127
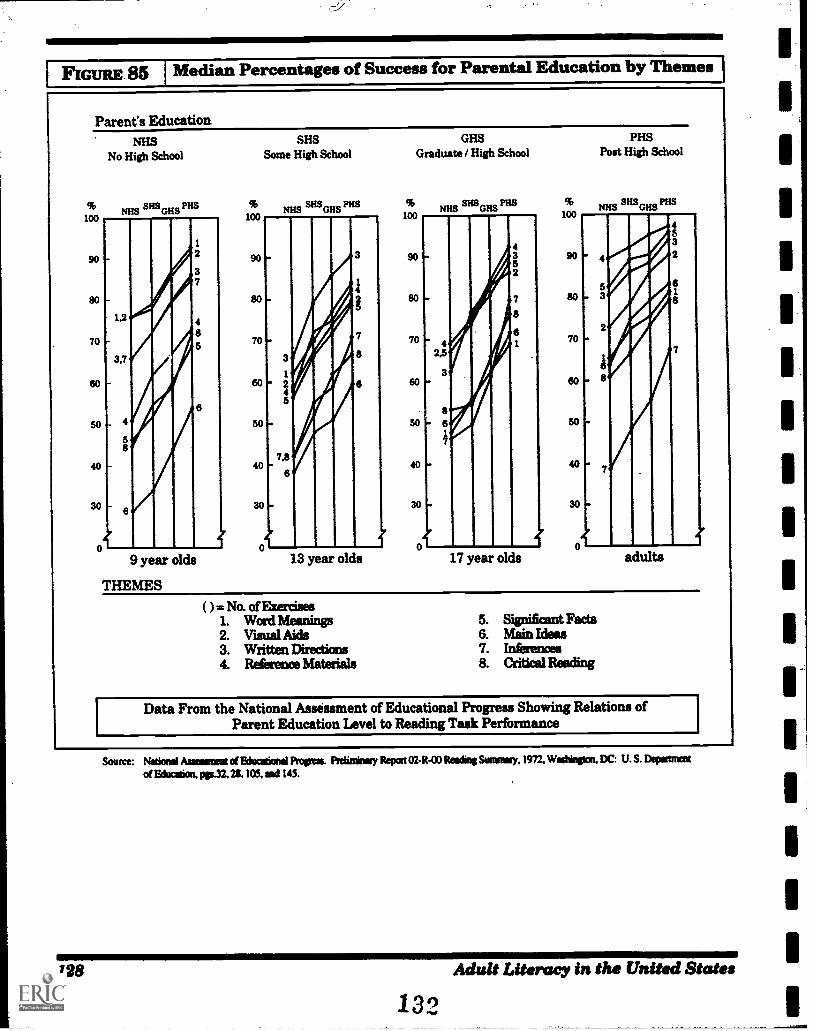
IFiGuRE 85 Median Percentages of Success for Parental Education by Themes I
Parent's Education
100
90
80
70
60
50
40
30
NHSNo High School
SHSGHS PUS
2
3
1,2
8
3,7
5
1
9 year olds
100
90
80
70
60
50
40
30
0
SHS GHS PHS
Some High School Graduate / High School Post High School
SHSGHS PHS
3
I
1/(/ 7
8
1 / /2 / 64
(
/7,8
6
I13 year olds
100
90
80
70
60
50
40
30
0
NHS
2111,(//3
86
4
ril
ill
i
(
,
I 6
17 year olds
100
90
80
70
60
50
40
30
0
NHS SHSGHSPHS
422453
618
1
_
1
adults
THEMES( ) = No. of Exercises
1. Word Meanings 5. Significant Facts2. Visual Aids 6. Main Ideas3. Written Directions 7. Inferences4. Reference Materials 8. Critical Reading
Data From the National Assessment of Educational Progress Showing Relations ofParent Education Level to Reading Task Performance
Source: Notional Ameamest Eduarional Prewar. Preliminary RA*060244:0 ReedMg Smarmy. 1972. Washiipon. DC: U. S. DemurestEdWaift P6132.21. 105. sod 145.
128 Adult Literacy in the United States
13'3
1
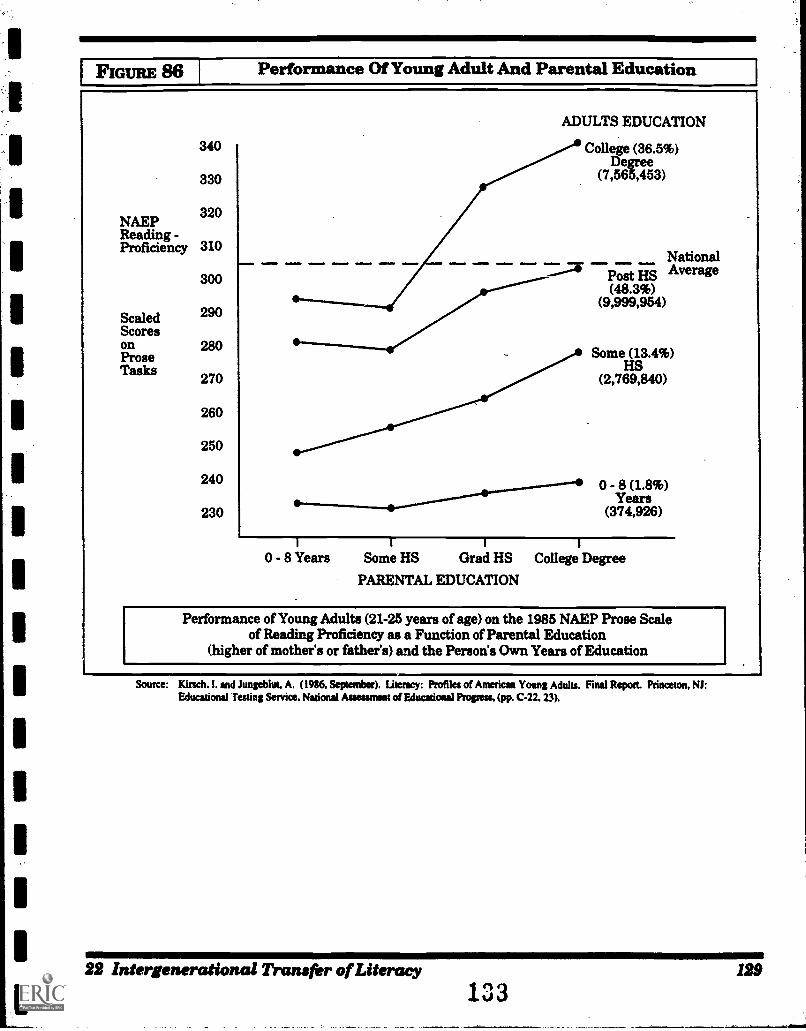
IFIGURE 86 Performance Of Young Adult And Parental Education
340
330
NAEP320
Reading -Proficiency 310
ScaledScoresonProseTasks
300
290
280
270
260
250
240
230
ADULTS EDUCATION
College (36.5%)Degree
(7,565,453)
NationalH AveragePost S --
(48.3%)(9,999,954)
Some (13.4%)HS
(2,769,840)
0 - 8 (1.8%)Years
(374,926)
0 - 8 Years Some HS Grad HS College Degree
PARENTAL EDUCATION
Performance of Young Adults (21-25 years of age) on the 1985 NAEP Prose Scaleof Reading Proficiency as a Function of Parental Education
(higher of mother's or father's) and the Person's Own Years of Education
Source: Kirsch. I. and Jungeblut. A. (1986, Septembet). literacy: Profiles of American Young Adults. Final Report. Princeton. NJ:Educational Testing Service. National Asseument of Educational Progress. (pp. C.22. 23).
22 Intergenerational Transfer of Literacy 129
1 :3 3
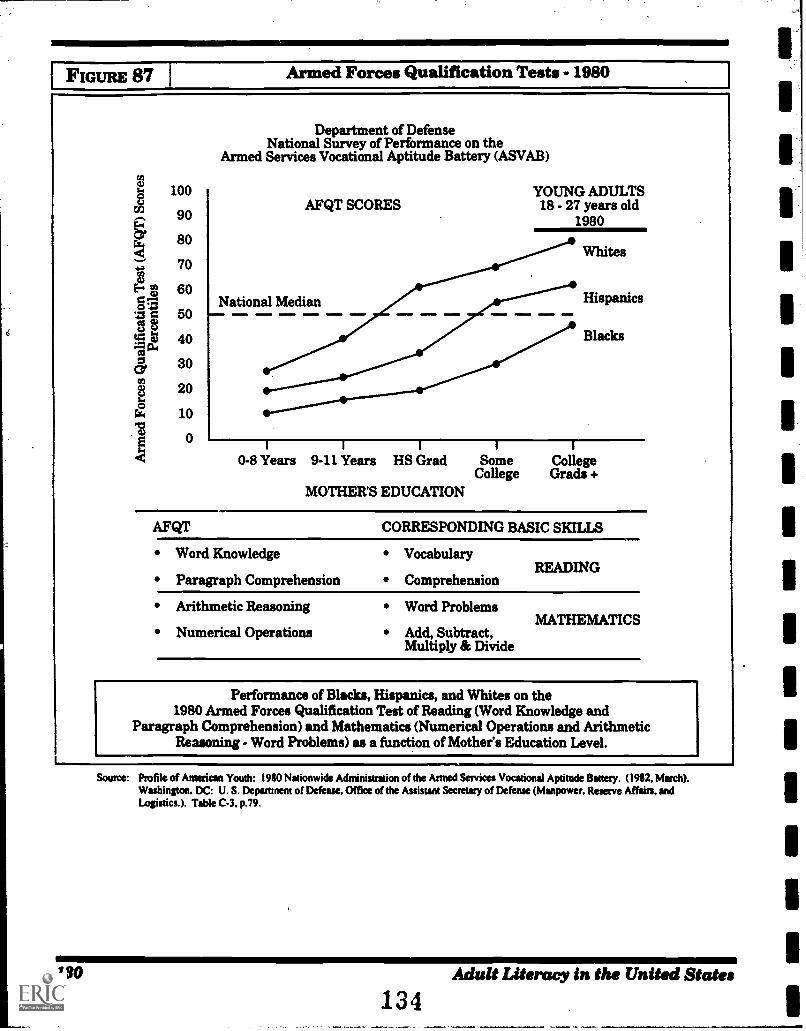
FIGURE 87 Armed Forces Qualification Tests - 1980
100
90
80
70
60
50
40
30
20
10
0
Department of DefenseNational Survey of Performance on the
Armed Services Vocational Aptitude Battery (ASVAB)
AFQT SCORESYOUNG ADULTS18 - 27 years old
1980
VThites
Hispanics
Blacks
0-8 Years 9-11 Years HS Grad SomeCollege
MOTHER'S EDUCATION
CollegeGrads +
AFQT
Word Knowledge
Paragraph Comprehension
CORRESPONDING BASIC SKILLS
Vocabulary
ComprehensionREADING
MINIM
Arithmetic Reasoning
Numerical Operations
Word Problems
Add, Subtract,Multiply & Divide
MATHEMATICS
L Performance of Blacks, Hispanics, and Whites on the1980 Armed Forces Qualification Test of Reading (Word Knowledge and
Paragraph Comprehension) and Mathematics (Numerical Operations and ArithmeticReasoning - Word Problems) as a function of Mother's Education Level.
Source: Profile of American Youth: 1980 Nationwide Administration of the Armed Services Vocational Aptitude Banery. (1982. March).Washington. DC: U. S. Department of Defense. Office of the Assistant Secretary of Defense (Manpower. Reserve Affairs. andLogistics.). Table C-3. p.79.
130 Adult Literacy in the United States
134
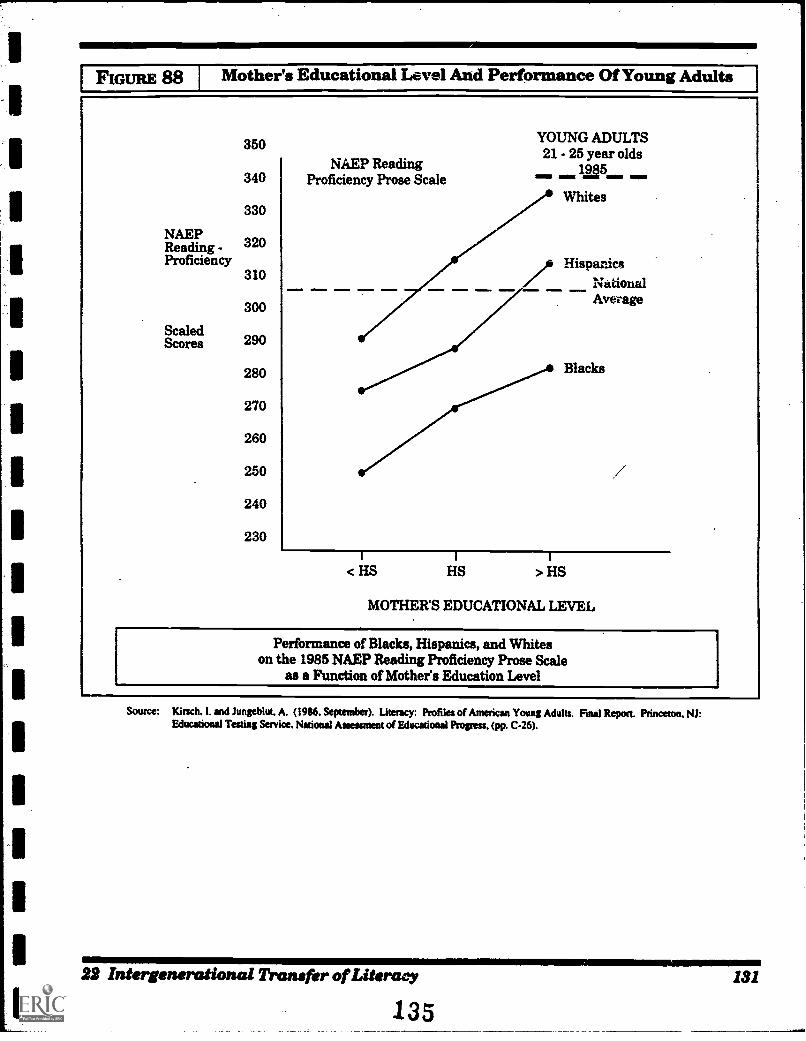
FIGURE 88 Mother's Educational Level And Performance Of Young Adults
330
NAEPReading 320Proficiency
310
ScaledScores
300
290
280
270
260
250
240
230
NAEP ReadingProficiency Prose Scale
YOUNG ADULTS21 - 25 year olds
1985
Whites
HispanicsNadonalAverage
Blacks
< HS HS > HS
MOTHERS EDUCATIONAL LEVEL
Performance of Blacks, Hispanics, and Whiteson the 1985 NAEP Reading Proficiency Prose Scale
as a Function of Mother's Education Level
Source: Kirsch. I. and Jungeblut. A. (1986. September). literacy: PrOfilet of American Young Adults. Final Repon. Princeton, NJ:Educational Testing Service. National Assessment of Educational Progress. (pp. C-26).
22 Intergenerational Transfer of Literacy
135
131
1
LITERACY, OCCUPATIONAL STATUSAND JOB PERFORMANCE
Relationships among "intelligence," "aptitude." and"achievement" test scores, such as literacy tests, andoccupational status have been repeatedly studiedover the last seventy-five ytai s. Tau data presentedin Figure 89 illustrate the trends in such studies. Theupper part of the figure shows data from World WarI in which "intelligence" and occupational statuswas studied. The tests used to measure "intelli-gence" were the Army Alpha and Beta tests discussedin Part 1 of this Compendium.
The bottom part of Figure 89 shows data from the1986 survey of young adult literacy skills ( see pages99 through 112 of this Compendium) relating "lit-eracy" to occupational status. The trends for 1917and 1986 are similar: whether one calls the testsmeasures of "intelligence" or of "literacy," laborerstend to perform more poorly than sales or clericalworkers who, in turn, perform more poorly thantechnical and professional workers.
Figure 90 presents data from the 1986 study of theliteracy skills of young adults in relation to thenumber of jobs that are projected to be available inthe year 2000. It shows that there are large differencesin the percentages of Whites, Hispanics and Blackswho possess literacy skills at or above the level of thetypical clerical worker in the young adult population.
Figure 91 shows relationships of years of educationand ethnicity to proficiency on each of the threeliteracy scales of the 1986 young adult literacysurvey, A disturbing fmding is that the averageproficiency on each of the three literacy scales ofBlack college educated young adults is slightlybelow that of White high school graduates. Moreimportant, however, is the finding that the averageBlack college graduate possesses proficiency inliteracy below the average proficiency of youngadult clerical workers. This is true across all threeliteracy scales. Together, the data of Figures 90 and91 suggest that Blacks, including college graduates,will find it difficult to compete with Whites and
Hispanics for managerial, technical and professionaljobs in the foreseeable future.
Literacy, Job Knowledge and Performance
While there are repeated studies of education, intel-ligence, aptitude, and achievement and occupationalstatus, there are very few sources of informationregarding the relationship of literacy to actual jobknowledge and job performance. Figure 92 presentsdata from military studies showing relationshipsamong reading, job knowledge and job performance.In this work, a commercially available, standardizedreading test was used to measure reading skill levelsexpressed in "reading grade levels." For instance, areading level of 6.5 means that a person has scoredon the reading test like the typical child in the 5thmonth of the 6th grade.
Job Knowledge tests were paper-and-pencil, mul-tiple-choice tests of job knowledge that supervisorsand job incumbents said was essential knowledgefor performing the job. Job Performance tests wereactual job tasks that were performed in a "hands-on"manner. For instance, Cooks cooked scrambled eggsand other things, Supply Specialists filled-out sup-ply orders, automobile Repairman repaired bleedingbrakes and performed other repairs to btoken vehicles,and so forth.
Figure 92 shows that reading is related to both JobKnowledge and Job Performance test performance.For instance, in the Supply Specialists job, on thehands-on, Job Performance test, 66% of workerswith reading skills in the 4-5.5 level performed in thebottom quarter of performers. On the other hand,56% of workers with reading skills at the 11-14.5grade levels were in the top 25% of job performers.These figures show that, even though correlationcoefficients may be low (ranging from .26 for Re-pairman to .40 for Supply Specialists on the hands-on, job sample tests; and from .40 for Supply Spe-cialists to .57 for Armor Crewman), the quarterdistributions reveal considerable relationships ofreading to job proficiency, particulary at the lowestand highest levels of reading.
23 Literacy, Occupational Status and Job Performance
136
133
Figure 93 shows these relationships in a differentmanner. There the percent of job incumbents whoscored 50% or better on the Job Knowledge and JobPerformance tests for Mechanics (Repairmen),Supply Specialists, and Cooks is presented for peoplehaving increasing levels of reading skill. These datasupport those of Figure 92 in showing strong rela-tionships of reading ability to job proficiency (seeespecially the solid, black lines in Figure 93 thataverage over the three jobs).
A final, important finding from these military studiesis summarized in Figure 94. That figure shows howthe performance-of Supply Specialists and Repair-man improved on the hands-on, Job Performancetests as both a function of increasing reading ability(the horizontal axis) and whether or not the personused the available technical manuals while per-forming the job sample test tasks (upper, solid curve).This figure is unique in showing that job performancemay increase as both a function of having a higher
level of reading skill and of actually using that skillwhile performing a job task.
Taken together, the data on literacy, occupationalstatus and job performance indicate that both thetypes of occupations for which people are likely toqualify and the job proficiency they are likely toexhibit in the job they get may be related to theirlevels of literacy. The relationships are not perfect,far from it, yet the trends are there, and they havebeen there for some three-quarters of this century. Inthe absence of major changes in the manner in whichsociety allocates work and workers to jobs, and to theextent that increased educational levels do not leadto greater literacy proficiency for minorities, it islikely that these trends will last far into the nextcentury. This will pose considerable economic du-ress on the underskilled, particularly African-Americans, but Hispanics and poorly educated andless literate Whites, too.
184 Adult Literacy in the United States13 7
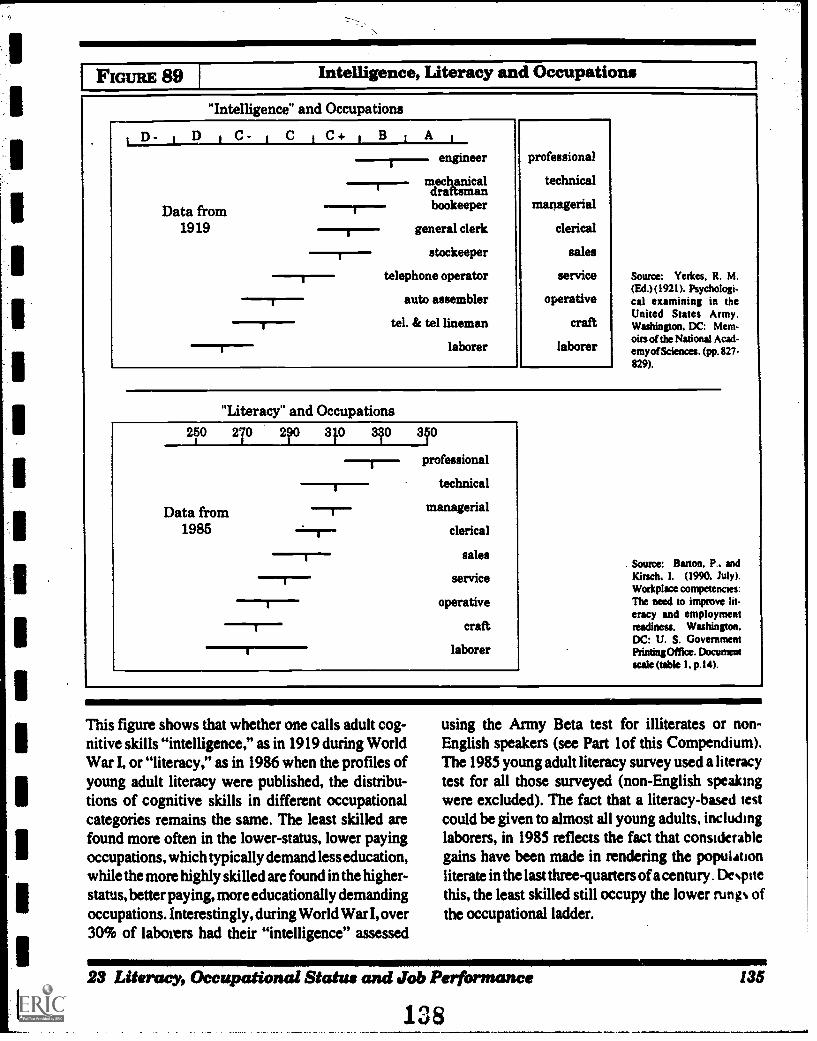
IFIGURE 89 Intelligence, Literacy and Occupations
"Intelligence" and OccupationsOw
D- LI) C. C C+ B 1 A 1
engineer
mechanicaldraftsmanbookeeper
general clerk
stockeeper
telephone operator
auto assembler
tel. & tel lineman
laborer
Data from1919
.1r1=11110
professional
technical
managerial
clerical
sales
service
operative
craft
laborer
Source: Yerkes, R. M.(Ed.)(1921). Psychologi-cal examining in theUnited States Army.Washington. DC: Mem-oirs of the National Acad.emy of Sciences. (pp. 827 -829).
"Literacy'. and Occupations250 270 290 310 330
Data from1985
3501
professional
technical
managerial
clerical
sales
service
operative
craft
laborer
Source: Barton. P.. andKirsch. 1. (1990. July).Workplace competencies:The need to improve lit-eracy and employmentreadiness. Washington.DC: U. S. GovernmentPrintingOffice. Documentscale (table 1. p.14).
This figure shows that whether one calls adult cog-nitive skills "intelligence," as in 1919 during WorldWar I, or "literacy," as in 1986 when the profiles ofyoung adult literacy were published, the distribu-tions of cognitive skills in different occupationalcategories remains the same. The least skilled arefound more often in the lower-status, lower payingoccupations, which typically demand less education,while the more highly skilled are found in the higher-status, better paying, more educationally demandingoccupations. Interestingly, during World War I, over30% of laborers had their "intelligence" assessed
using the Army Beta test for illiterates or non-English speakers (see Part lof this Compendium).The 1985 young adult literacy survey used a literacytest for all those surveyed (non-English speakingwere excluded). The fact that a literacy-based testcould be given to almost all young adults, includinglaborers, in 1985 reflects the fact that considerablegains have been made in rendering the populationliterate in the last three-quarters of a century . Despitethis, the least skilled still occupy the lower rungs ofthe occupational ladder.
23 Literacy, Occupational Status and Job Performance
138
135
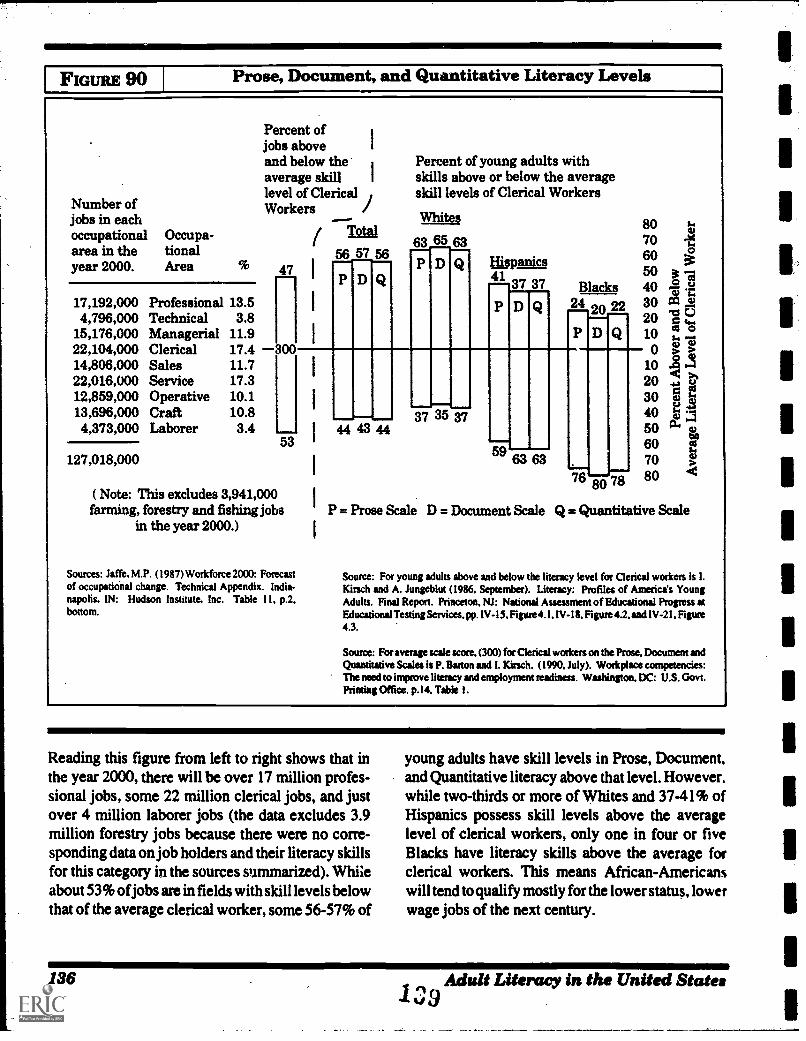
FIGURE 90 IProse, Document, and Quantitative Literacy Levels
Number ofjobs in eachoccupationalarea in theyear 2000.
Occupa-tionalArea
Percent ofjobs aboveand below the Percent of young adults withaverage skill skills above or below the averagelevel of Clerical 1 skill levels of Clerical WorkersWorkers
47 1 P D Q
Total
56 75 56
17,192,000 Professional 13.54,796,000 Technical 3.8
15,176,000 Managerial 11.922,104,000 Clerical 17.4 30014,806,000 Sales 11.722,016,000 Service 17.312,859,000 Operative 10.113,696,000 Craft 10.84,373,000 Laborer 3.4 I IM I
53127,018,000
( Note: This excludes 3,941,000farming, forestry and fishing jobs
in the year 2000.)
Sources: Jaffe. M.P. (1987) Workforce 2000: Forecastof occupariOnal change. Technical Appendix. India-napolis, IN: Hudson Institute. Inc. Table 1 1. p.2.bottom.
44 43 44
Whites
Hispanics41
37 Blacks
8070605040
63 65 63
P D Q 37P D Q 24 on 22 30
20100
102030
37 35 37 40506070
ID 80 7880
P = Prose Scale D = Document Scale Q = Quantitative Scale
Source: For young adults above and below the literacy level for Clerical wodcets is I.Kirsch and A. Jungeblut (1986. September). Literacy: Profiles of Americas YoungAdults. Final Report. Princeton, NJ: National Assessment of Educational Progress atEducational Testing Services, pp. IV-15. Figure 4.1. IV-18. Figure 4.2. and IV-21. Figure4.3.
Source: For average scale score. (300) for Clerical workers on the Prose. Document andQuantitative Scales is P. Barton and I. Kirsch. (1990, July). Workplace competencies:The need to improve literacy and employment readiness. Washington. DC: U.S. Govt.Prirsing Office. p. 14. Table I.
Reading this figure from left to right shows that inthe year 2000, there will be over 17 million profes-sional jobs, some 22 million clerical jobs, and justover 4 million laborer jobs (the data excludes 3.9million forestry jobs because there were no corre-sponding data on job holders and their literacy skillsfor this category in the sources summarized). Whiieabout 53% ofjobs are in fields with skill levels belowthat of the average clerical worker, some 56-57% of
young adults have skill levels in Prose, Document.and Quantitative literacy above that level. However.while two-thirds or more of Whites and 37-41% ofHispanics possess skill levels above the averagelevel of clerical workers, only one in four or fiveBlacks have literacy skills above the average forclerical workers. This means African-Americanswill tend to qualify mostly for the lower status, lowerwage jobs of the next century.
136log Adult Literacy in the United States
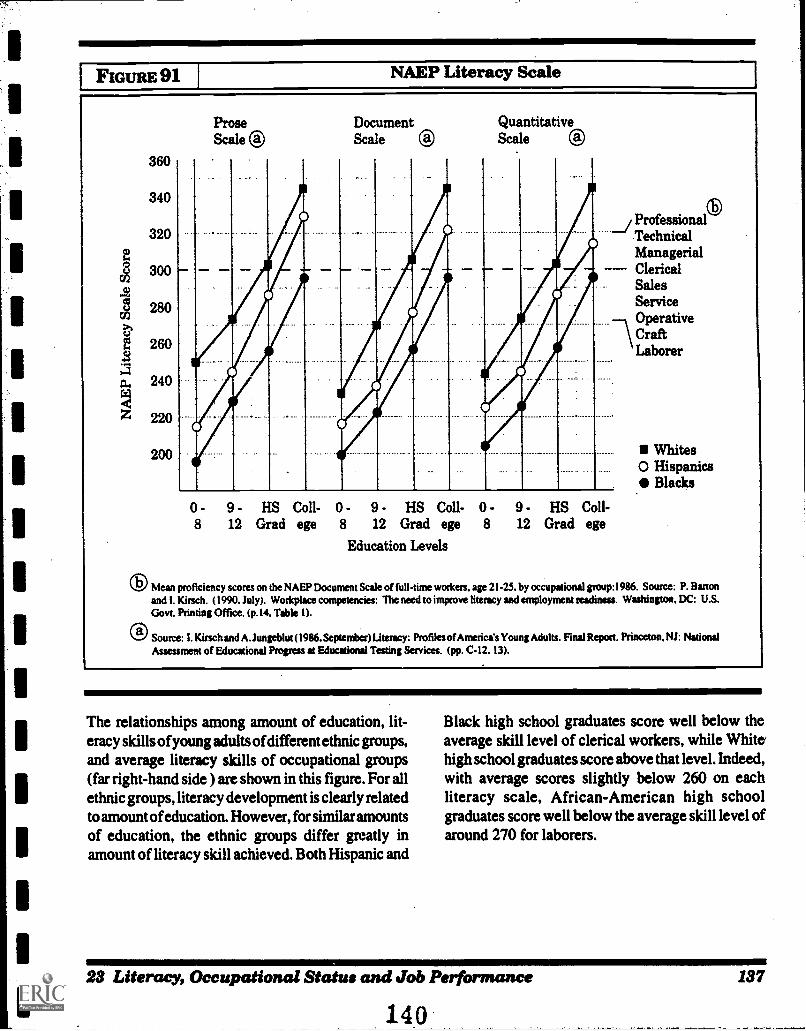
FIGURE 91 NAEP Literacy Scale
360
340
320
300
280
260
240
220
200
ProseScale ®
DocumentScale
QuantitativeScale
ProfessionalTechnicalManagerialClericalSalesServiceOperativeCraftLaborer
0 - 9 - HS Coll- 0 - 9 - HS Coll- 0 - 9 - HS Coll-8 12 Grad ege 8 12 Grad ege 8 12 Grad ege
Education Levels
Whites0 Hispanics
Blacks
0 Mean proficiency scores on the NAEP Document Scale of full-time workers, age 21-25. by occupational group:1986. Source: P. Bartonand I. Kirsch. (1990. July). Workplace competencies: The need to improve literacy and employment readiness. Washington, DC: U.S.Govt. Printing Office. (p.14, Table 1).
0 Source: I. Kirsch and A. Jungeblut (1986. September)Lateracy: Profiles of America's Young Adults. Final Report. Princeton. NJ: NationalAssessment of Educational Progress at Educational Testing Services. (pp. C-12. 13).
The relationships among amount of education, lit-eracy skills of young adults of different ethnic groups,and average literacy skills of occupational groups(far right-hand side ) are shown in this figure. For allethnic groups, literacy development is clearly relatedto amount of education. However, for similar amountsof education, the ethnic groups differ greatly inamount of literacy skill achieved. Both Hispanic and
Black high school graduates score well below theaverage skill level of clerical workers, while White'high school graduates score above that level. Indeed,with average scores slightly below 260 on eachliteracy scale, African-American high schoolgraduates score well below the average skill level ofaround 270 for laborers.
23 Literacy, Occupational Status and Job Performance
140
137
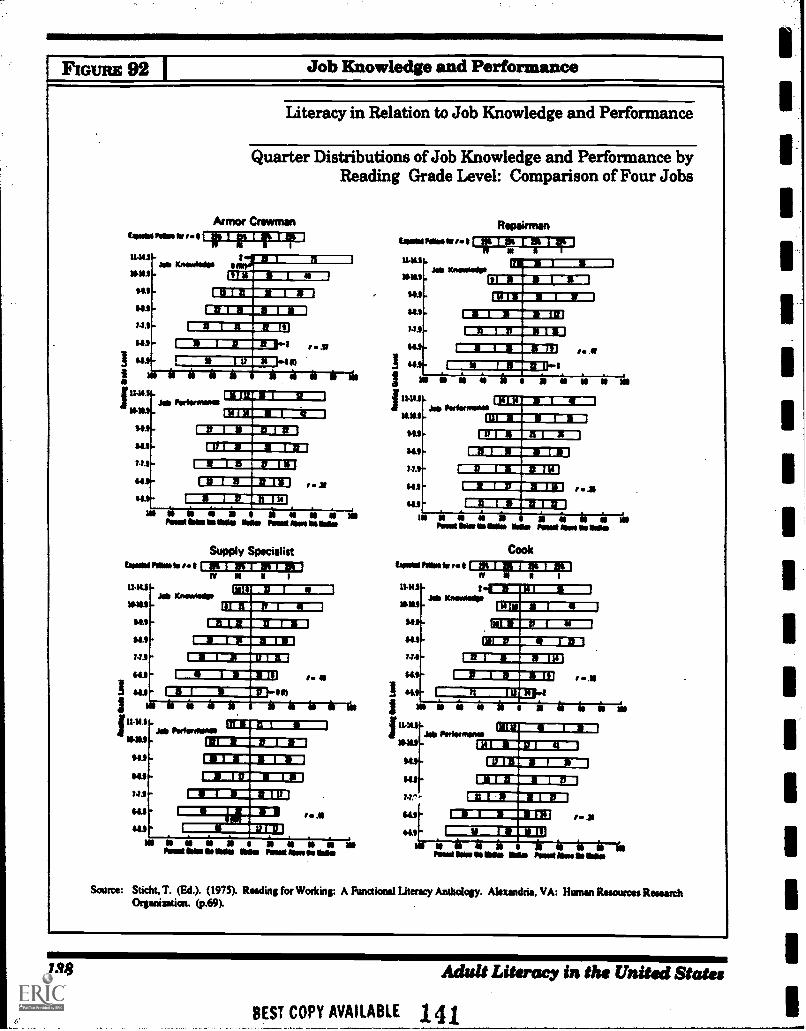
e : I PII:
IF71111-711111_Jill
St
II LIME MO NNE=ELWIN
111W WO NW NI
OWLgraW-11
-
W
num IIIINWIEMINI1111,11111NtliaNICENNI
OW. WigalIWW
Wg11111111Lalla UI I
111 MOM IICU11111 DO
It MINIM
)60 ifilttWaM MEII Me NU 111
g NW
glialga BORANg lWILIWIN EMI
WNW MEW OW 11111,,11
111011W2
IS II:
I! : .1 II:
WAIL.310-1111=mai
ti IWOM1111
FlIE IOW 111111211_110
I'M Mg 21g1WILJNI
RIM WM WI_BM__ CI g
Egg
INW111
IC 11111.3111 4.1
MI'11111W =NW
EMIR 111111123111111
ni EVILJNIMIN-Effill
I'lla 411WILININEF C. la
AISIN 11111W1111'J
1/1111_21I1
=BM LAW -
I 1111111K MOWN VW
illaggILIWWCAI NW
111 11111 I111UM
WU ELME MEMMIMI IWO
1111W91111111 11111-2L1
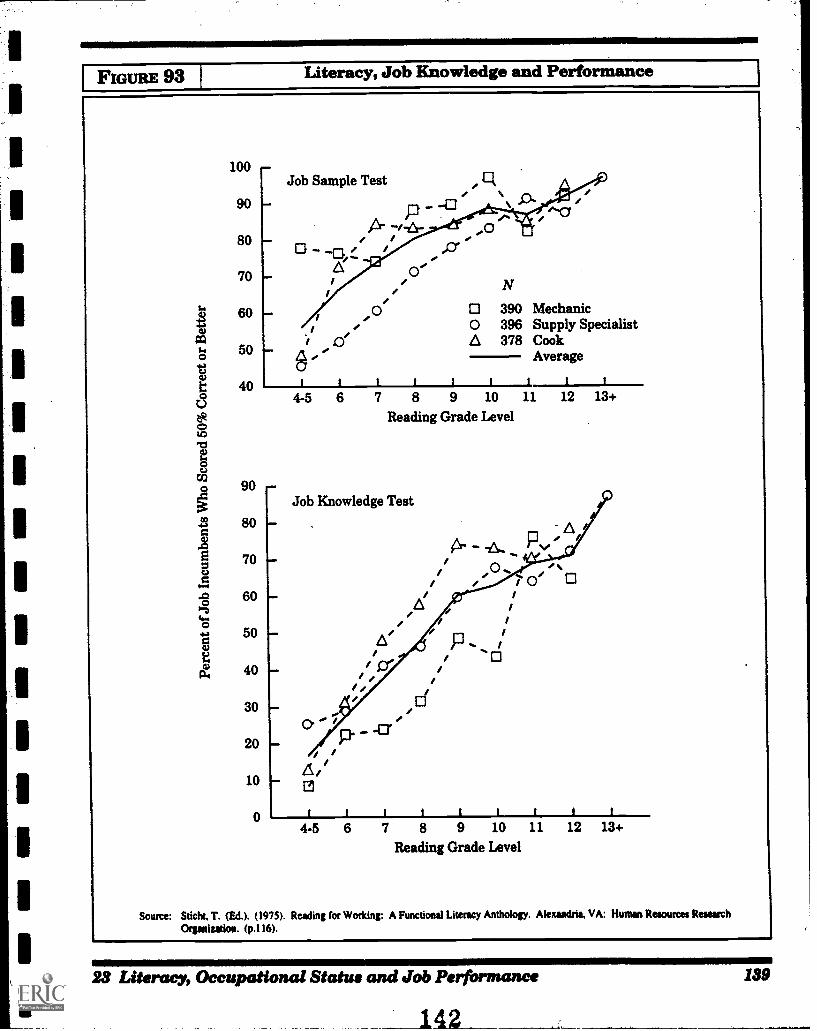
FIGURE 93 Literacy, Job Knowledge and Performance
100
90
80
70
60
50
40
90
80
70
60
50
40
30
20
10
0
111.
Job Sample Test
0',
.,0 0 390 Mechanici . 0 396 Supply Specialist
i e A 378 Cook
8-, Average
t i
Ime
4-5 61 t t 1 1 1 t
7 8 9 10 11 12 13+
Reading Grade Level
Job Knowledge Test
6!
-
o' 0
-13
i=3 I.
II 1 I t 1 1 I I
4-5 6 7 8 9 10 11 12 13+
Reading Grade Level
Source: Stick. T. (Ed.). (1975). Reading for Working: A Functional Literacy Anthology. Alexandria, VA: Human Resources ResearchOrganization. (p.116).
23 Literacy, Occupational Status and Job Performance
142
139
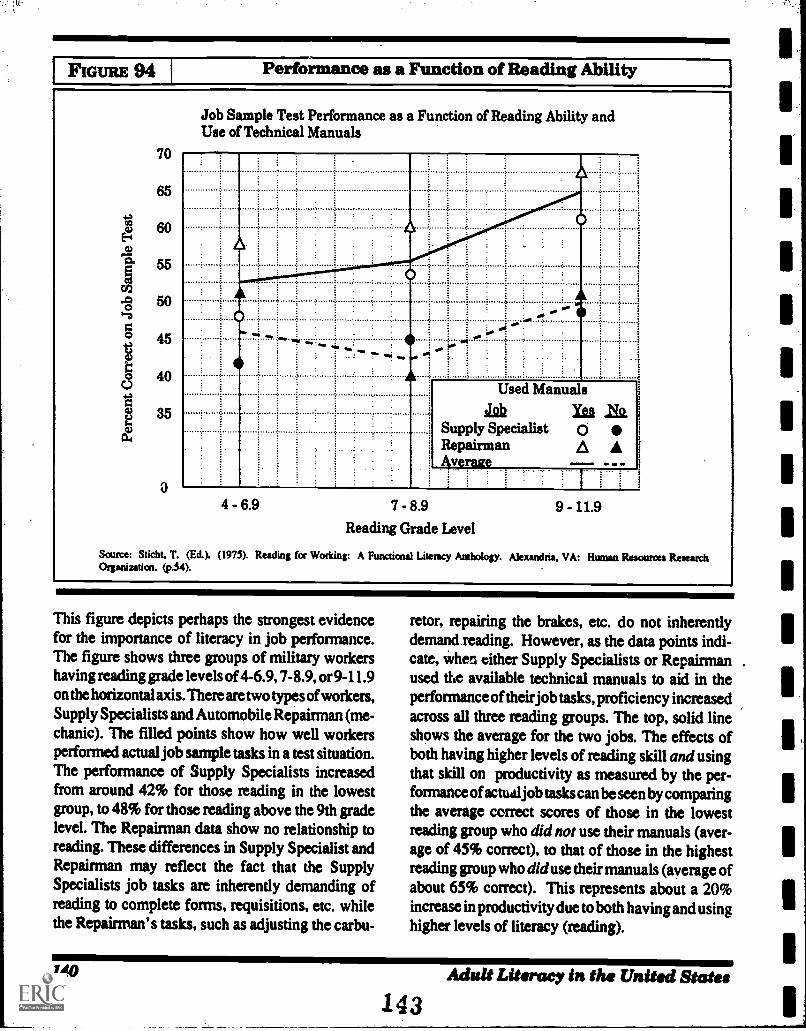
FIGURE 94 Performance as a Function of Reading Ability
70
65
60
55
50
45
40
35
Job Sample Test Performance as a Function of Reading Ability andUse of Technical Manuals
IP
10.I.
Used Manuals
Supply SpecialistRepairmanAverage
4 - 6.9 - 8.9 9 - 11.9
Reading Grade Level
Scarce: Sticht. T. (Ed.). (1975). Reading for Working: A Functicaal Literacy Anthology. Alexandria, VA: Human Resources ResearchOrganization. (p.54).
This fig= depicts perhaps the strongest evidencefor the importance of literacy in job performance.The figure shows three groups of military workershaving reading grade levels of 4-6.9, 7-8.9, or 9-11.9on the horizontal axis. There are two types of workers,Supply Specialists and Automobile Repairman (me-chanic). The filled points show how well workersperformed actual job sample tasks in a test situation.The performance of Supply Specialists increasedfrom around 42% for those reading in the lowestgroup, to 48% for those reading above the 9th gradelevel. The Repairman data show no relationship toreading. These differences in Supply Specialist andRepairman may reflect the fact that the SupplySpecialists job tasks are inherently demanding ofreading to complete forms, requisitions, etc. whilethe Repairman's tasks, such as adjusting the carbu-
retor, repairing the brakes, etc. do not inherentlydemand reading. However, as the data points indi-cate, when tither Supply Specialists or Repairmanused the available technical manuals to aid in theperformance of their job tasks, proficiency increasedacross all three reading groups. The top, solid lineshows the average for the two jobs. The effects ofboth having higher levels of reading skill andusingthat skill on productivity as measured by the per-formance of actudl job tasks can be seen by comparingthe average correct scores of those in the lowestreading group who did not use their manuals (aver-age of 45% correct), to that of those in the highestreading group whodid use their manuals (average ofabout 65% correct). This represents about a 20%increase in productivity due to both having and usinghigher levels of literacy (reading).
140 Adult Literacy in the United States
14 3
I.
I.
PART 3P A R T 3
TESTING OFADULT LITERACY DEVELOPMENT
IN EDUCATION PROGRAMS
CALIFORNIA'S FEDERALLY FUNDED ADULTBASIC EDUCATION PROGRAMS
THE ILLINOIS STUDY OF LITERACY PROGRAMS
THE LITERACY ASSISTANCE CENTER IN NEW YORK CITY
A SUMMARY OF GAINS IN SIXTEEN LOCAL PROGRAMS
LONGITUDINAL STUDIES
131 California's Federally Funded Adult Basic Education Programs 141
144
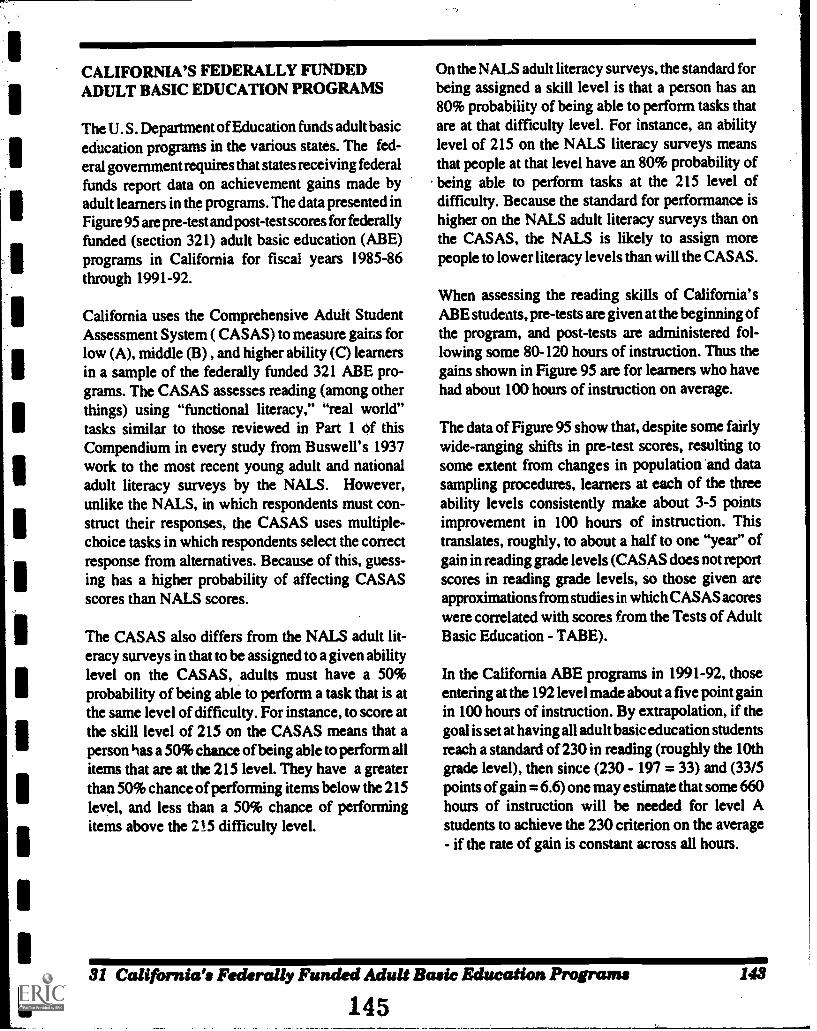
CALIFORNIA'S FEDERALLY FUNDEDADULT BASIC EDUCATION PROGRAMS
The U. S. Department of Education funds adult basiceducation programs in the various states. The fed-eral government requires that states receiving federalfunds report data on achievement gains made byadult learners in the programs. The data presented inFigure 95 are pre-test and post-test scores for federallyfunded (section 321) adult basic education (ABE)programs in California for fiscal years 1985-86through 1991-92.
California uses the Comprehensive Adult StudentAssessment System ( CASAS) to measure gains forlow (A), middle (B) , and higher ability (C) learnersin a sample of the federally funded 321 ABE pro-grams. The CASAS assesses reading (among otherthings) using "functional literacy," "real world"tasks similar to those reviewed in Part 1 Of thisCompendium in every study from Buswell's 1937work to the most recent young adult and nationaladult literacy surveys by the NALS. However,unlike the NALS, in which respondents must con-struct their responses, the CASAS uses multiple-choice tasks in which respondents select the correctresponse from alternatives. Because of this, guess-ing has a higher probability of affecting CASASscores than NALS scores.
The CASAS also differs from the NALS adult lit-eracy surveys in that to be assigned to a given abilitylevel on the CASAS, adults must have a 50%probability of being able to perform a task that is atthe same level of difficulty. For instance, to score atthe skill level of 215 on the CASAS means that aperson has a 50% chance of being able to perform allitems that are at the 215 level. They have a greaterthan 50% chance of performing items below the 215level, and less than a 50% chance of performingitems above the 215 difficulty level.
On the NALS adult literacy surveys, the standard forbeing assigned a skill level is that a person has an80% probability of being able to perform tasks thatare at that difficulty level. For instance, an abilitylevel of 215 on the NALS literacy surveys meansthat people at that level have an 80% probability ofbeing able to perform tasks at the 215 level ofdifficulty. Because the standard for performance ishigher on the NALS adult literacy surveys than onthe CASAS, the NALS is likely to assign morepeople to lower literacy levels than will the CASAS.
When assessing the reading skills of California' sABE students, pre-tests are given at the beginning ofthe program, and post-tests are administered fol-lowing some 80-120 hours of instruction. Thus thegains shown in Figure 95 are for learners who havehad about 100 hours of instruction on average.
The data of Figure 95 show that, despite some fairlywide-ranging shifts in pre-test scores, resulting tosome extent from changes in population and datasampling procedures, learners at each of the threeability levels consistently make about 3-5 pointsimprovement in 100 hours of instruction. Thistranslates, roughly, to about a half to one "year" ofgain in reading grade levels (CASAS does not reportscores in reading grade levels, so those given areapproximations from studies in which CASAS acoreswere correlated with scores from the Tests of AdultBasic Education - TABE).
In the California ABE programs in 1991-92, thoseentering at the 192 level made about a five point gainin 100 hours of instruction. By extrapolation, if thegoal is set at having all adult basic education studentsreagh a standard of 230 in reading (roughly the 10thgrade level), then since (230 - 197 = 33) and (33/5points of gain = 6.6) one may estimate that some 660hours of instruction will be needed for level Astudents to achieve the 230 criterion on the average- if the rate of gain is constant across all hours.
31 California's Federally Funded Adult Basic Education Programs
145143
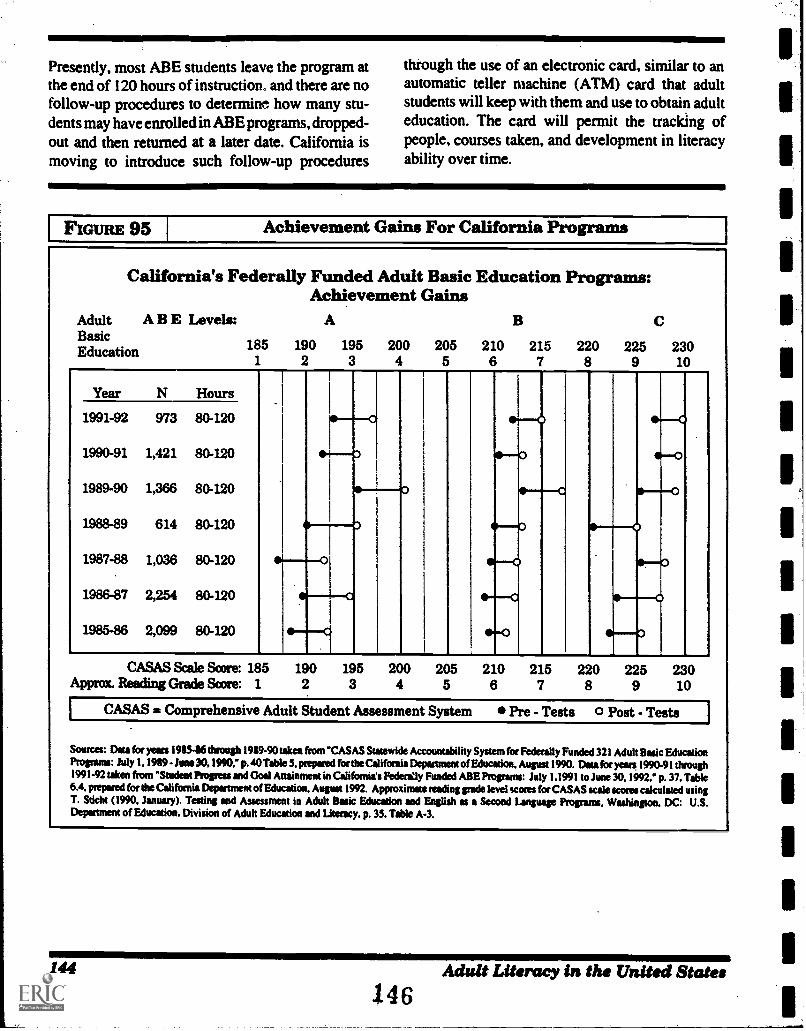
Presently, most ABE students leave the program atthe end of 120 hours of instruction, and there are nofollow-up procedures to determine how many stu-dents may have enrolled in ABE programs, dropped-out and then returned at a later date. California ismoving to introduce such follow-up procedures
through the use of an electronic card, similar to anautomatic teller machine (ATM) card that adultstudents will keep with them and use to obtain adulteducation. The card will permit the tracking ofpeople, courses taken, and development in literacyability over time.
Fi GuRE 95 Achievement Gains For California Programs
California's Federally Funded Adult Basic Education Programs:Achievement Gains
AAdult A B E Levels:BasicEducation 185 190 195 200 205 210 215
1 2 3 4 5 6 7220 225 2308 9 10
Year N Hours
1991-92 973 80-120
1990-91 1,421 80-120 *4o1989-90 1,366 80-120
1988-89 614 80-120 .-7 .
1987-88 1,036 80-120 401---0 eo1986-87 2,254 80-120 a
1985-86 2,099 80-120 ...1 sr-o
CASAS Scale Saxe: 185 190 195 200 205 210 215 220 225 230Approx. Reading Grade Score: 1 2 3 4 5 6 7 8 9 10
CASAS z Comprehensive Adult Student Assessment System pre - Tests OPo.Tests
Sources: Data for years 198546 through 1911940 taken from ''CASAS Statewide Accountability System for Federally Funded 321 Adtdt Basic EducationProlp1MS: July 1. 1989 - Jima 30, 1990." p.40Table S. prepamd for theCalifornia Department of Education. August 1990. Data for years 199041 through1991-92 taken from "Student PrognISS and Goal Attainment in California's Federiely Funded ABE Prostams: July 1.1991 to June 30. 1992," p. 37. Table6.4, prepared for the California Deportment of Education. August 1992. Approximate reading grade level scores for CASAS scale scam cakulated usingT. Sticht (1990. January). Testing and Assessment in Adult Basic Education and English as a Second Language Programs, Washington. DC: U.S.Department of Education. Division of Adult Education and Literacy, p. 35. Table A-3.
144 Adult Literacy in the United States1.46
THE ILLINOIS STUDYOF LITERACY PROGRAMS
A report of reading gains made in 23 literacy programsin Illinois for fiscal year 1988 provided the data forFigure 96. The 23 programs included six LaubachLiteracy Action programs. four Literacy Volunteersof America programs and thirteen "eclectic" pro-grams. These programs were funded by the IllinoisSecretary of State's Literacy Projects office andconducted by a variety of community groups, in-cluding non-profit organizations, community col-leges, libraries, and public schools. The 23 programswere selected to be representative of 89 programsserving 16,400 students in Illinois in fiscal year1988.
The test used to assess reading gain was the SlossonOral Reading Test (SORT), a test that assesses wordidentification without assessing understanding ofmeaning. Scores on the SORT are reported in readinggrade levels. The adult students were assessed at thebeginning of the programs and then again every
three months for a year. The SORT was used repeat-edly, and hence some practice effects may haveinfluenced gain scores. The first test was called thepre-test, and the repeated examinations given everythree months were called post-test 1, post-test 2, andpost-test 3. The data of Figure 96 include the pre-testand post-test 1 data to provide improvement scorescomparable to the California and New York data ofFigures 95 and 97. The hours of instruction betweenthe pre-test and post-test 1 ranged from 1 to 62.5. Thedata obtained with repeated post-testings are givenin Figure 99.
As Figure 96 indicates, there are large variations inthe gains achieved in various programs. programnumber 17 made the largest gain, 1.4 "years", in 25.5hours, while program number 9, with 32 hours ofinstruction made only .6 "years" gain. On the aver-age, about 6.5 "months" of gain were made in some36 hours of instruction between the pre-test and post-test 1. Generally, amount of improvement does notappear to be associated with hours of instruction.
32 The Illinois Study of Literacy Programs
147145
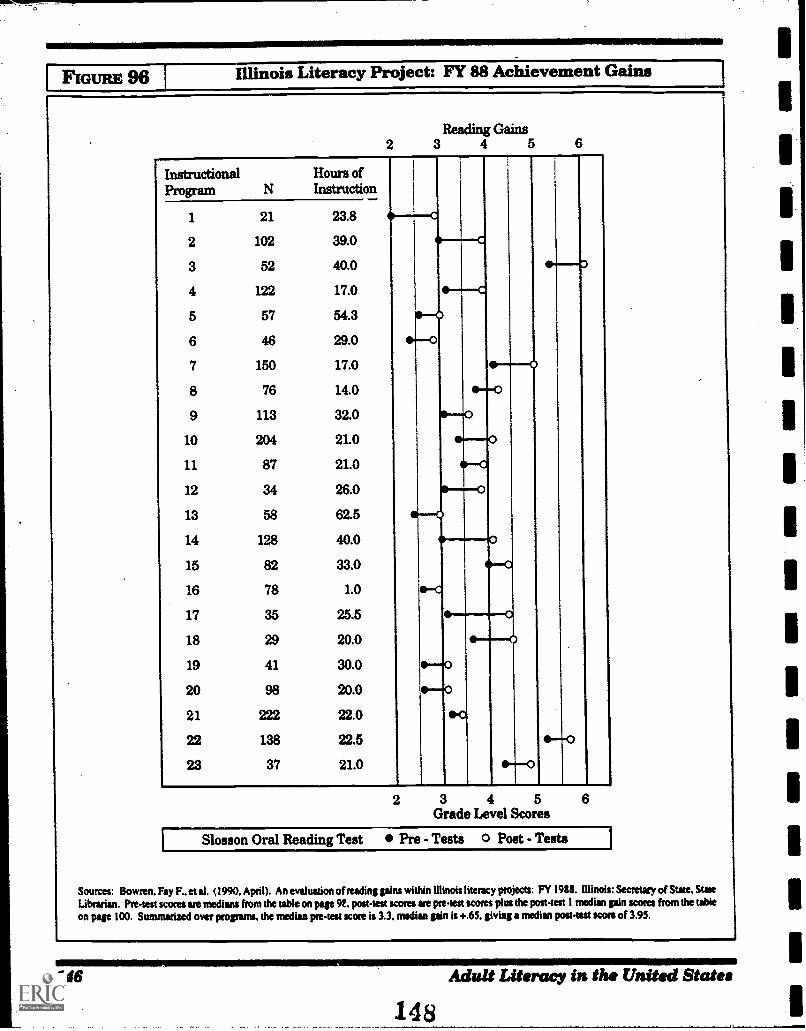
FIGURE 96 Illinois Literacy Project: FY 88 Achievement Gains
Reading Gains2 3 4 5 6
InstructionalProgram N
Hours ofInstruction
I
i
1 21 23.8
2 102 39.0
3 52 40.0
4 122 17.0
5 57 54.3 o6 46 29.0
7 150 17.0
8 76 14.0
9 113 32.0
10 204 21.0
11 87 21.0
12 34 26.0 o13 58 62.5
14 128 40.0
15 82 33.0
16 78 1.0 ec17 35 25.5
18 29 20.0
19 41 30.0 oo--o
20 98 20.0 *-021 222 22.0
22 138 22.5
23 37 21.0
2 3 4 5Grade Level Scores
6
Slosson Oral Reading Test Pre - Tests 0 Post - Tests
Sources: Bowien, Fay F., et al. (1990. April). An evaluation of reading gains within Illinois literacy projects: FY 19116. Illinois: Secretary of State. SimLibrarian. Pre-test scores are medians from the table on page 9f, post-test scores are pre-test scores plus the post-test I median pin scores from the tabieon page 100. Summarized over program. the median pre-test score is 3.3. median gain is +.65. giving a median post-test score of 3.95.
$
146
148Adult Literacy in the United States
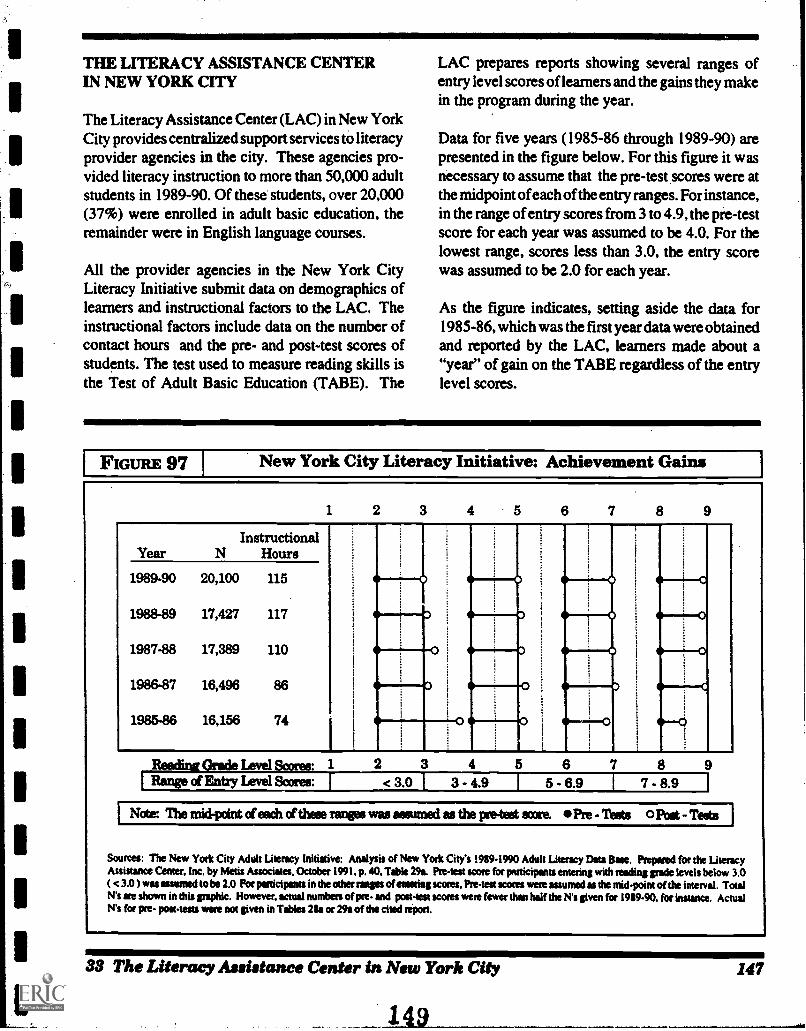
THE LITERACY ASSISTANCE CENTERIN NEW YORK CITY
The Literacy Assistance Center (LAC) in New YorkCity provides centralized support services to literacyprovider agencies in the city. These agencies pro-vided literacy instruction to more than 50,000 adultstudents in 1989-90. Of these students, over 20,000(37%) were enrolled in adult basic education, theremainder were in English language courses.
All the provider agencies in the New York CityLiteracy Initiative submit data on demographics oflearners and instructional factors to the LAC. Theinstructional factors include data on the number ofcontact hours and the pre- and post-test scores ofstudents. The test used to measure reading skills isthe Test of Adult Basic Education (TABE). The
LAC prepares reports showing several ranges ofentry level scores of learners and the gains they makein the program during the year.
Data for five years (1985-86 through 1989-90) arepresented in the figure below. For this figure it wasnecessary to assume that the pre-test scores were atthe midpoint of each of the entry ranges. For instance,in the range of entry scores from 3 to 4.9, the pre-testscore for each year was assumed to be 4.0. For thelowest range, scores less than 3.0, the entry scorewas assumed to be 2.0 for each year.
As the figure indicates, setting aside the data for1985-86, which was the first year data were obtainedand reported by the LAC, learners made about a"year" of gain on the TABE regardless of the entrylevel scores.
FIGURE 97 New York City Literacy Initiative: Achievement Gains
1 2 3 4 5 6 8 9
Year NInstructional
Hours
1989-90 20,100 115
1988-89 17,427 117
1987-88 17,389 110
1986-87 16,496 86
1985-86 16,156 74 0
- Level Scores: 1
Range of Entzy Level Scores:2 3
< 3.04 5
3 - 4.96
5 - 6.98 9
- 8.9
Note: The midixint of each of these ranges was assumed as the pre-test score. Pie - Tests 0 Post - Tests
Sources: The New York City Adult Lissracy Initiadve: Analysis of New York City's 1919-1990 Adult Literacy Data Base. Prepared for the LiteracyAssistance Center. Inc. by Meds Associates, October 1991, p. 40, Table 29a. Pre-test SCOW for paticipants entering with reading grade levels below 3.0
< 3.0 was assumed to be 2.0 For pesticipants in the other ranges of erasing scores, Pre-test NOM were assumed as the mid-point oldie interval. TotalN's are shown in this graphic. However, actual numbers of pre- and poet-test scores were fewer than half the N's given for 1989-90. for instance. ActualN's for pre- post-tests meg not given in Tables 28a or 29a of the cited report.
33 The Literacy Assistance Center in New York City 147
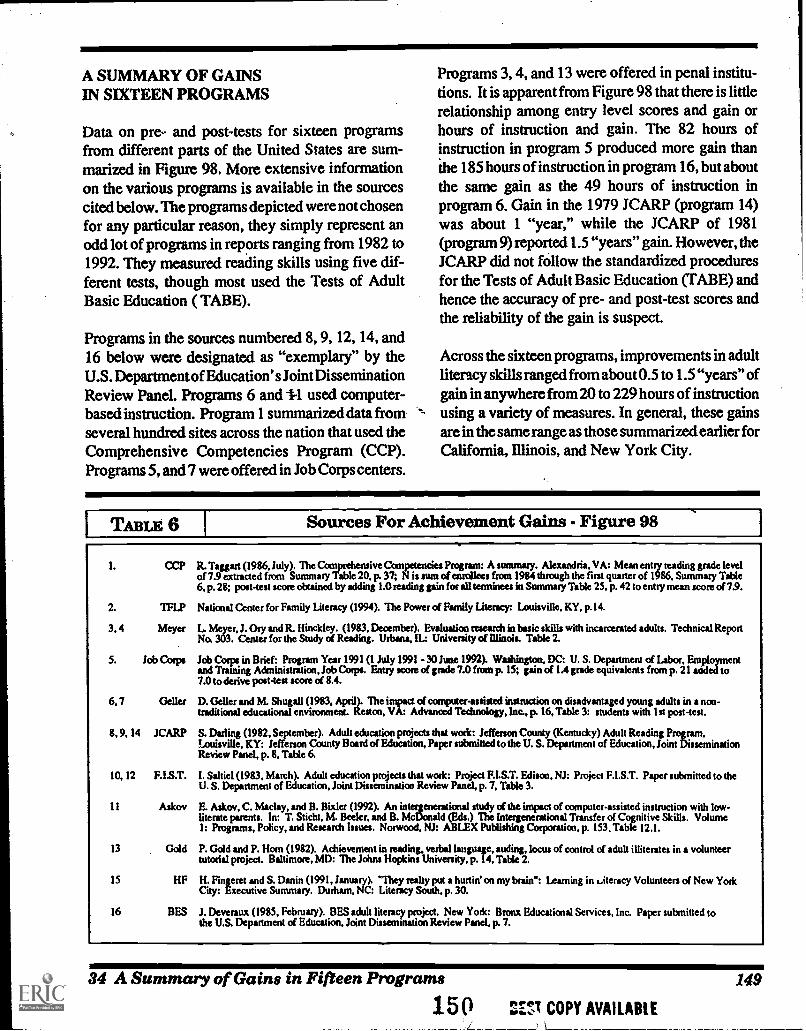
A SUMMARY OF GAINSIN SIMMEN PROGRAMS
Data on pre- and post-tests for sixteen programsfrom different parts of the United States are sum-marized in Figure 98. More extensive informationon the various programs is available in the sourcescited below. The programs depicted were not chosenfor any particular reason, they simply represent anodd lot of programs in reports ranging from 1982 to1992. They measured reading skills using five dif-ferent tests, though most used the Tests of AdultBasic Education ( TABE).
Programs in the sources numbered 8, 9, 12, 14, and16 below were designated as "exemplary" by theU.S. Department of Education' s Joint DisseminationReview Panel. Programs 6 and 1-1 used computer-based instruction. Program 1 summarized data fromseveral hundred sites across the nation that used theComprehensive Competencies Program (CCP).Programs 5, and 7 were offered in Job Corps centers.
Programs 3, 4, and 13 were offered in penal institu-tions. It is apparent from Figure 98 that there is littlerelationship among entry level scores and gain orhours of instruction and gain. The 82 hours ofinstruction in program 5 produced more gain thanthe 185 hours of instruction in program 16, but aboutthe same gain as the 49 hours of instruction inprogram 6. Gain in the 1979 JCARP (program 14)was about 1 "year," while the JCARP of 1981(program 9) reported 1.5 "years" gain. However, theJCARP did not follow the standardized proceduresfor the Tests of Adult Basic Education (TABE) andhence the accuracy of pre- and post-test scores andthe reliability of the gain is suspect.
Across the sixteen programs, improvements in adultliteracy skills ranged from about 0.5 to 1.5 "years" ofgain in anywhere from 20 to 229 hours of instructionusing a variety of measures. In general, these gainsare in the same range as those summarized earlier forCalifornia, Illinois, and New York City.
TABLE 6 Sources For Achievement Gains - Figure 98
1. CCP R. Taggart (1986, July). The Canprehensive Competencies Program: A summary. Alexandria, VA: Mean entry reading grade levelof 7.9 extracted from Summary Table 20, p. 37; ?I is sum of enrollees from 1984 through the first quarter of 1986, Summary Talge6, p. 28; post-test score obtained by adding 1.0 reading gain for all terminees in Summary Table 25, p. 42 to entry mean score of 7.9.
2. TFLP National Center for Family Literacy (1994). The Power of Family Literacy: Louisville, KY, p.14.
3. 4 Meyer L. Meyer, J. Ory and R. Hinckley. (1983, December). Evaluation researds in basic skills with incarcerated adults. Technical ReportNo. 303. Center for the Study of Reading. Urbana, II.: University of Illinois. Table 2.
5. Job Corps Jch Corps in Brief: Program Year 1991 (1 July 1991 - 30 June 1992). Warhington, DC: U. S. Department of Labor, Employmentand Training Administration, Job Corps. &my score of grade 7.0 from p. 15; gain of 1.4 grade equivalents from p. 21 added to7.0 to derive post4est score of 8.4.
6, 7 Geller D. Geller and M. Shugall (1983. April). The impact of computevassisted instruction on disadvantaged young adults in a non-traditional educational environment. Reston, VA: Advanced Technology, Inc., p. 16, Table 3: students with 1st post-test.
8, 9, 14 JCARP S. Darling (1982, Svtember). Adult educatioo projects that work: Jefferson County (Kentucky) Adult Reading Program,Louisville, KY: Jefferson County Board of Education, Paper submitted to the U. S. Department of Education, Joint DisseminationReview Panel, p. 8, Table 6.
10, 12 F.I.S.T. I. Saltiel (1983, March). Adult education projects that work: Project F.I.S.T. Edison, NJ: Project F.I.S.T. Paper submitted to theU. S. Department of Education, Joint Disseminatice Review PaneL p. 7, Table 3.
11 Askov E. Askov, C. Maclay, and B. Bixler (1992). An intergenerational study of the impact of oomputer-assisted instruction with low-literate parents. In: T. Sticht, M. Beeler, and B. McDmald (Eds.) The Intergenerational Transfer of Cognitive Skills. Volume1: Programs, Policy, and Research Issues. Norwood, NJ: ABLEX Publishing Corporation, p. 153. Table 12.1.
13 Gold P. Gold and P. Horn (1982). Achievement in reading, verbal language, audin, locus of control of adult illiterates in a volunteertutorial project. Baltimore. MD: The Johns Hoplcins University, p. 14, Table 2.
15 HF H. Fingerer and S. Danin (1991, January). "They really put a hurtin' on my brain": Learning in jteracy Volunteers of New YorkCity: Executive Summary. Durham, NC: Literacy South, p. 30.
16 BES J. Deveraux (1985, February). BES adult literacy project. New York: Bronx Educational Services, Inc. Paper submitted tothe U.S. Department of Education, Joint Dissemmatice Review Panel,p. 7.
34 A Summary of Gains in Fifteen Programs
150 ZT COPY AVAILABLE
149
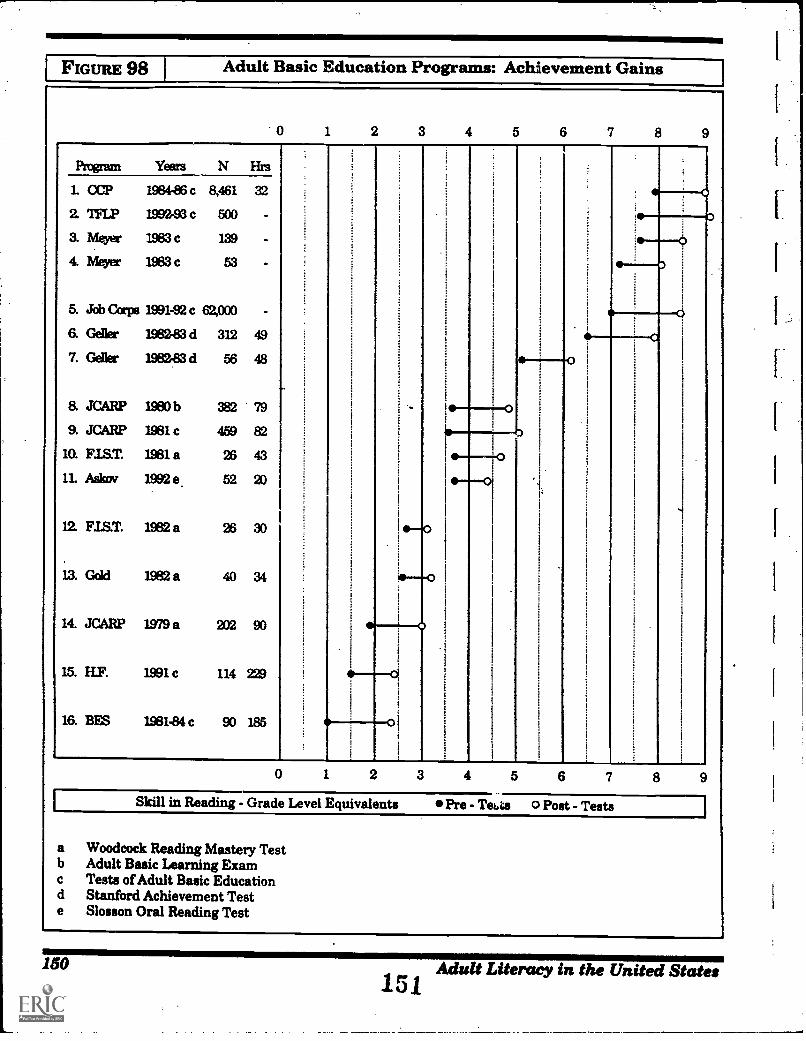
FIGURE 98 Adult Basic Education Programs: Achievement Gains
0 1 2 3 4 5 6 7 8 9
Program Years N Hrs
L OCP 1984-86 c 8,461 32
2 MP 199293 c 500
a Meyer 1983 c 139
4. Meyer 1983 c 53
5. Job Caps 199192 c E2,000 -
6. Geller 1982-83 d 312 49
7. Geller 1982-83 d 56 48
8. JCARP 1980 b 382 79
9. JCARP 1981 c 459 82
10. F.LS.T. 1981 a 26 43
11. Askov 1992 e. 52 20
12. F.LS.T. 1982 a 26 30
13. Gold 1982 a 40 34
14. JCARP 1979 a 202 90
15. H.F. 1991 c 114 229
16. WS 1981.84 c 90 185 0
1
1 2 3 4 5 6 8 9
Skill in Reading - Grade Level Equivalents Pre - Tet..ta 0 Post - Tests
a Woodcock Reading Mastery Testb Adult Basic Learning Examc Tests of Adult Basic Educationd Stanford Achievement Teste Slosson Oral Reading Test
150 Adult Literacy in the United States15 1
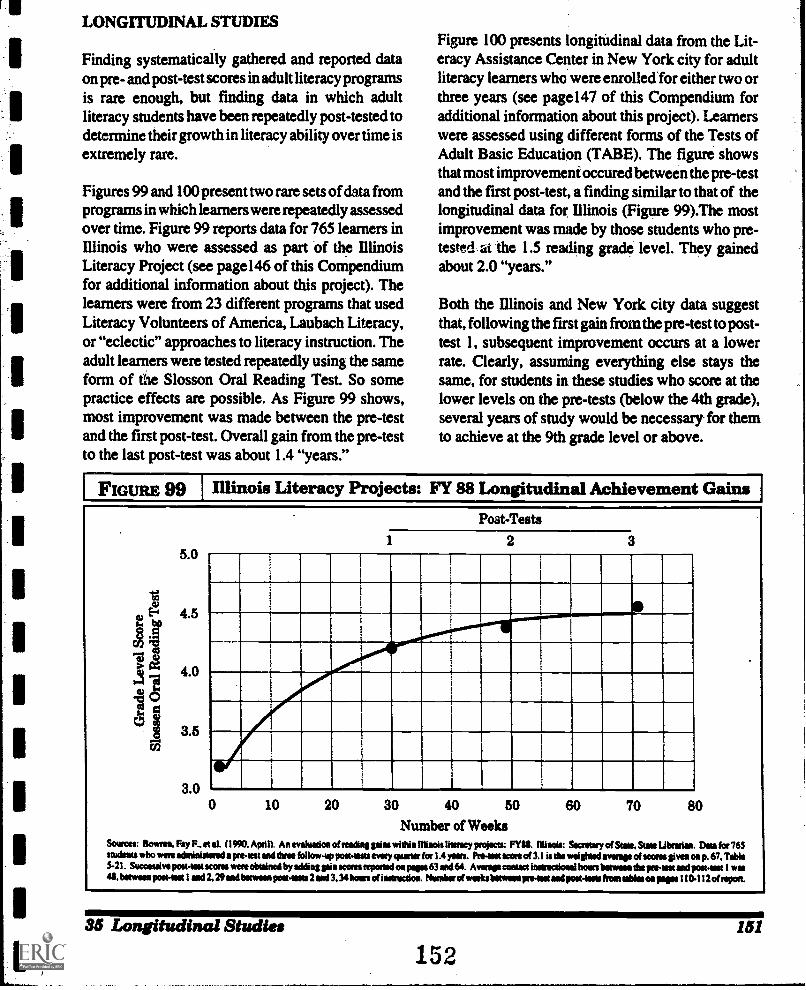
IFIGuRE 99 Illinois Literacy Projects: FY 88 Longitudinal Achievement Gains I
LONGITUDINAL STUDIES
Finding systematically gathered and reported dataon pm- and post-test scores in adult literacy programsis rare enough, but finding data in which adultliteracy students have been repeatedly post-tested todetermine their growth in literacy ability over time isextremely rare.
Figures 99 and 100 present two rare sets of data fromprograms in which learners were repeatedly assessedover time. Figure 99 reports data for 765 learners inIllinois who were assessed as part of the IllinoisLiteracy Project (see page146 of this Compendiumfor additional information about this project). Thelearners were from 23 different programs that usedLiteracy Volunteers of America, Laubach Literacy,or "eclectic" approaches to literacy instruction. Theadult learners were tested repeatedly using the sameform of the Slosson Oral Reading Test. So somepractice effects are possible. As Figure 99 shows,most improvement was made between the pm-testand the first post-test. Overall gain from the pm-testto the last post-test was about 1.4 "years."
Figure 100 presents longitudinal data from the Lit-eracy Assistance Center in New York city for adultliteracy learners who were enrolledfor either two orthree years (see page147 of this Compendium foradditional information about this project). Learnerswere assessed using different forms of the Tests ofAdult Basic Education (TABE). The figure showsthat most improvementoccured between the pm-testand the first post-test, a finding similar to that of thelongitudinal data for Illinois (Figure 99).The mostimprovement was made by those students who pre-tested at the 1.5 reading grade level. They gainedabout 2.0 "years."
Both the Illinois and New York city data suggestthat, following the fust gain from the pm-test to post-test 1, subsequent improvement occurs at a lowerrate. Clearly, assuming everything else stays thesame, for students in these studies who score at thelower levels on the pm-tests (below the 4th grade),several years of study would be necessary for themto achieve at the 9th grade level or above.
5.0
4.0
3.5
3.0
Post-Tests
1 2 3
0 10 20 30 40 50
Number of Weeks60 70 80
Sources: Bowswa, Fay F.. et at (1990, Apsil). An evidanice enabling pis wittia Monis Mem" projacts: FYU. flhlacle: Secretary of Slaw Saw Libearian. Data tot 765maws who wee adwiniswrad a pee-iest and throe follow-op peamasu every quart (ar 1.4 yews. Pre-sest score of 3.1 is de weighted own. of soma even on p. 67. TAW541. Socceuive post-ism scone awe obtained by adding pia sawn reported on paps 63 and 64. Morse mew inannetimi haws beams the remit awl pawns 1 was49. towns pc4Hast 1 wad 2, 29 and Worm yowls* 2 and 3, 34 hours diasanction. Minket of weeks Immo.. pre-Isst met post4NO fica sablesoa poems I 104 12 of report.
35 Longitudinal Studies
152151
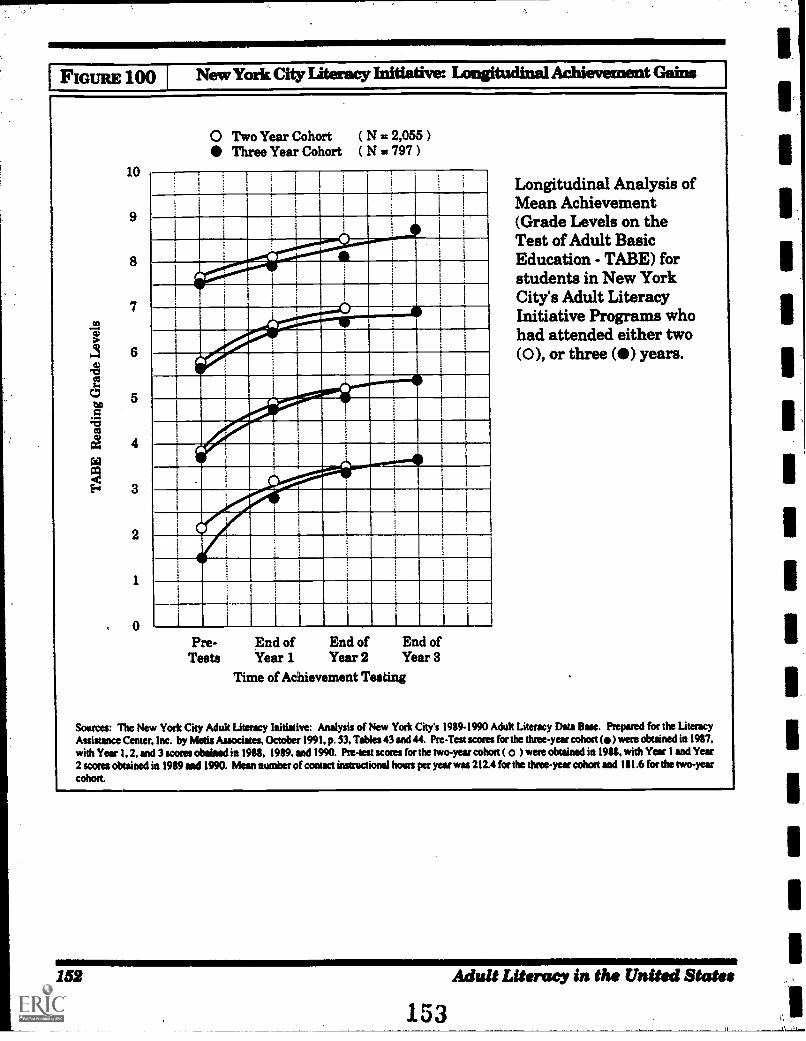
New York City literacy Initiative: Longitudinal Achievement Gains 1IFIGURE 100
10
0 Two Year Cohort ( N = 2,055 )Three Year Cohort ( N = 797 )
Time of Achievement Testing
Longitudinal Analysis ofMean Achievement(Grade Levels on theTest of Adult BasicEducation - TABE) forstudents in New YorkCity's Adult LiteracyInitiative Programs whohad attended either two(0), or three (111) years.
Sources: The New York City Adult Literacy Initiative: Analysis of New York City's 1989-1990 Adult Literacy Data Base. Prepared foe the LiteracyAssistance Center, Inc. by Meths Associates. October 1991, p. 53, Tables 43 and 44. Pre-Test scores for the three-year cohort (*) were obtained in 1957,with Year 1, 2, and 3 scores Maimed in 1988, 1989. and 1990. Pre-lest scores for the two-year cohort ( o ) were obtained in 1981. with Year 1 and Year2 scores obtained in 1989 and 1990. Mean number of contact instructional hours per year was 212.4 for the three-year cohoet and 181.6 teethe twayearcohort.
152 Adult Literacy in the United States
153