USCRIPTORS - ERIC - US Department of Education
269
DOCUMENT RESUME ED 249 244 TM 840 585 AUTHOR Jones, Calvin; And Others TITLE . High School and Beyond First Follow-Up (1982), \\ Technical Report. INSTITUTION SPONS AGENCY PUB DATE NOTE PUB TYPE EDRS PRICE USCRIPTORS IDENTIFIERS National Opinion Research Center, Chicago, 111. National Center for Education Statistics (ED), Washington, DC. Jur 83 275p.; For related documents, see ED 214 990 and TM 840 584, Some of the appendices contain small print. Reports Reiearoh/Technical (143) Tests /Evaluation Instruments (160) MF01/PC11 Plus Postage. Academic Records; :oho:t Analytis; Enrollment; Federal Programs *Followup Studies; Grade 10; Grade 12; *High Schools; Letters (Correspondence); Longitudinal Studies; *National Surveys; Outcomes of Education; Questionnaires; *Research Design; *Research Methodology; Secondary School Curriculum; Student Characteristics; Student Development; Student Educational Objectives *Nigh School and Beybad (NCiS) CZ ABSTRACT This report summarizes and documents the major technical aspects of the High. School and'Beyond First Follow-Up survey. Student data were collected (through questionnaires and tests) from samples of the 1980 High Schpol and Beyond Base Year survey Sophomore and senior cohorts, and school data from administrators.'High school transcripts for a subsample of participating 1980 sophomores were also gathered.' The purposes and major surveys of the National Center for Educatiol Statistics' Longitudinal Studies Program are reviewed. The tests and questionnaires used for the Follow-Up Survey are described. Summary 4 Base Year and detailed First Follow-Up information is provided on: sample design and implementation; data collection; data control and preparation; and data processing. Separate chapters are devoted to the technical aspects of the Transcripts Survey and the Course Offerings and Enrollments Survey. The appendices contain the questionnaires, correspondence from the pre-field and field periods, and critical items for each of the instruments. (BS) *********************************************************************** * Reproducti_ons supplied by EDRS are the best that can 1)0 made * * from the original document. * ***********************************************************************
-
Upload
khangminh22 -
Category
Documents
-
view
1 -
download
0
Transcript of USCRIPTORS - ERIC - US Department of Education

DOCUMENT RESUME
ED 249 244 TM 840 585
AUTHOR Jones, Calvin; And OthersTITLE . High School and Beyond First Follow-Up (1982),
\\ Technical Report.INSTITUTIONSPONS AGENCY
PUB DATENOTE
PUB TYPE
EDRS PRICEUSCRIPTORS
IDENTIFIERS
National Opinion Research Center, Chicago, 111.National Center for Education Statistics (ED),Washington, DC.Jur 83275p.; For related documents, see ED 214 990 and TM840 584, Some of the appendices contain smallprint.Reports Reiearoh/Technical (143)Tests /Evaluation Instruments (160)
MF01/PC11 Plus Postage.Academic Records; :oho:t Analytis; Enrollment;Federal Programs *Followup Studies; Grade 10; Grade12; *High Schools; Letters (Correspondence);Longitudinal Studies; *National Surveys; Outcomes ofEducation; Questionnaires; *Research Design;*Research Methodology; Secondary School Curriculum;Student Characteristics; Student Development; StudentEducational Objectives*Nigh School and Beybad (NCiS)
CZ
ABSTRACTThis report summarizes and documents the major
technical aspects of the High. School and'Beyond First Follow-Upsurvey. Student data were collected (through questionnaires andtests) from samples of the 1980 High Schpol and Beyond Base Yearsurvey Sophomore and senior cohorts, and school data fromadministrators.'High school transcripts for a subsample ofparticipating 1980 sophomores were also gathered.' The purposes andmajor surveys of the National Center for Educatiol Statistics'Longitudinal Studies Program are reviewed. The tests andquestionnaires used for the Follow-Up Survey are described. Summary 4
Base Year and detailed First Follow-Up information is provided on:sample design and implementation; data collection; data control andpreparation; and data processing. Separate chapters are devoted tothe technical aspects of the Transcripts Survey and the CourseOfferings and Enrollments Survey. The appendices contain thequestionnaires, correspondence from the pre-field and field periods,and critical items for each of the instruments. (BS)
************************************************************************ Reproducti_ons supplied by EDRS are the best that can 1)0 made *
* from the original document. *
***********************************************************************
U.S DEPARTMENT OF EDUCATIONNATIONAL INSTIJU fF CrrehlUCA f ION
I Dm A tit SOURCE t, INF ()AMA T IONrso ti
JSoaa ...al halt!. f Ila pwl sa Of elltjapafrfia )11
Pg.mIN a ..mvs. a ,iwumsstMaM in V,i1 dolt,
num!Wra'sfMI ("1 411NIF
High School and BeyondFirst Follow-Up (1982)
. Technical Report
June 1983
Calvin JonesMiriam Clarke
Geraldine MooneyHarold McWilliam:Ioanna Crawfc-IdBruce StephensonRoger rourangeau
National Opinion Research CenterUniversity of Chicago
6030 South EllisChicago, Illinois 60637
Prepared for:
National Center for Education StatisticsOffite of the Assistant Secretary for Educational Research
and ImprovementU.S. Department of Education
. William B. Fetters, Project OfficerRicky Takai, Executive Project Officer,
ti

Acl-,nowledgments4
The authors wish to thank all those peAbons who contributed to the
production of this report. For their considerable effort we would like to
thank Andrew Norton, Lee Lefes, Bobbi Foster, Mark Peebles, Gloria Rauens,
Thelma Bahadur, and Joanne Kalogeras in Data Processing. We would like to
thank SPSS Inc. for the use of the source code for the frequencies procedures
of release 9. Special thanks are also extended to Cassandra Britton, Irene J..
Edwards, Karla Darby-Maze and Art Landeros in Word Processing. Finally, we
would also like to thank those members of the NCES staff who have worked
closely 'with us on this project: William B. Fetters, Project Officer; Ricky
Takai Executie Project Officer; Samuel Peng, former Project Officer; C. Dennis
Carroll, Chief of the Longitudinal Studies Branch; and Jeffrey Owings.

1.
0.1
TABLE OF CONTENTS
OVERVIEW
NCES' Longitudinal Studies Program
.Page
2
1.2 History of High School and Beyond 3
1.2.1 Relation to NLS-72 * 3
1.2.2 Brief Description of Base Year 3
1.3 Overview of First Follow-Up Design 5
1.3.) Sample Design 5
1.3.2 Method of Administration '6
2. DATA COLLECTION INSTRUMENTS 8
2.1 Student Questionnaires 8
2.1.1 1980 Senior Cohort Questionnaire 9
2.1.2 1n0 Sophomore Cohort Questionnaire 9
2.1.3 1980 Sophomore Cohort(Not Currently iji High School) Questionnaire 10
2.1.4 Transfer Supplement2.1.5 Early Graduate Supplement
i1010
2.2 Cognitive Tests 11
2.2.1 Sophomore Test 11
2.2.2 Senior Test 11 %al
2.3 School Questionnaire 12
3. SAMPLE DESIGN AND 'IMPLEMENTATION 13
3.1 Base Ye,:.:r Sample Design 13
3.2 First Follow-Up Sample Design 16
3.3 First Follow-Up Student Selection Procedures 17
3.3..1 1980 Sophomore 'Cohort 18
3.3.1.1 Currently Enrolled Students 18
3.3.1.2 School Leavers 18
3.3.-2 1980 Senior Cohort 19
3.4 Weighting of the Sample 21
3.4.1 General Approach to Weighting 21
3.4.2 Weights Applied to Schodl Level Data 21
3.4.2.1 Nonresponse Adjustments to School Weights for Usewith Course Enrollments 23
3.4.3 weights Applied to Student Level Data 25
3.4.4 Procedures;
25
3.4.4.1 SophomoEe Cohort ')Et
3.4.4.2 Senior Cohort 29
3.4.4.2.1 Base Year Participant Stratum 30
3.4.4.2.2 Base Year Nonparticipant Stratum 31
3.4.4.3 Special Procedures for Parent Weights .. OOOOO c....., 32

TALE OF CONTENTS.(continued),
3.5
3.63.6.1
3.6.2
Results of Weighting
Design Effects and Standard Errors.SchoolLever JDataStudent Level Data
Page
33
, . 34.
34
37
4. DATA COLLECTION 48
4.1 Overview 48
4.2 Data and Materials Collected at the School Level. '49
4.2.1 School Questionnaires t A 49
4.2.2 Teacher Comment Forms 50
4.2.3 Course Offerings and EnrollMena - .
Academic Year 1981-82.,' , , 50
4.2.4 Data Collection Procedures - 'School Level Data 51
4.3 Student Questionnaire Data Collection 53
4.3.1 Base Year Data Collection 4
4.3.2 First Follow-Up Data Collection 56
4.3.2.1 1980 Senior Cohort 6, OOOOOOOOOOO 56
4.3.2.2 1980 Sophomore Cohort 0..59
4.4 On-Campus Data Collection 59
4.5 Off-Campus Data Collection 61
4.6 Management of Student Questionnaire Data Collection% 62
4.7 Training for the Student Questionnaire Dataollection Effort 63
t
5. DATA CONTROL AND PREPARATION 65
45.1 Base Year -Procedures 65
5.2 First Follow-Up Procedures 66
5.2.1 Shipping and Receiving Documents 66
5.2.2 Editing and Coding s. 66
5.3 Data Retrieval and Validation 68
6. DATA PROCESSING 70
6.1 Base Year Data Processing. 70
6.2. First Follow Up Data Processing ,. 71
6.3 Receipt Control Procedures 71
6.4 Data Entry of School Questionnaires 72

6.5
6.6
6.7
6.8
6.9
TABLE OF CONTENTS(continued)
Testing the Optical Scanning Program
Machine Editing
Data File Preparation a
Construction of Composite Variables
TeseComposites and Quartiles r
Page
.73
73
75
76
77
'6.9.1 1980 Sophomore Cohort 77
6.9.2 1980 Senior Cohort 77
6.10 SES Composite and Quartiles 78
6.11 Psychological ,Scales 79
7. THE STUDENT TRANSCRIPTS SURVEY, 41 80
7.1 Overview x.80
7.2 Sample Design an Sample Selection for theHigh School Transcripts Study 82
7.3 Data Collection s ......88
7.3.1 Securing School, Cooperation _ 89
7.3.2
7.4
Student Level Responie Rateswg,
Data Control and Preparation.
92
94
7.4.1 Receiving Documents 94
,7.4.2 ,.Coder Training A 94
7.4.3 aiding.. pN
95
7.4.4 Quality Control 97
7.5 Data Processing 98
7.5.1 Data Conversion , 98
7.5.2 Reconcilation of Data Files Against'lleteiptr Control Files w 98
7.5.3 Machine Editing 98
7.5.4 DataFile Preparation 99
8.
,
THE.COURSE OFFERINGS AND COURSE ENROLLMENTS SURVEY 100
8.1 Introduction 100
8.2 OvermOw of the Sample 100
8.3 .Course Offerings and Course Eprollments Weights 101
8.4 Design Effect 102
6

TABLE OF CONTENTS(continued)
8.5
8.5.1
Course Offerings and Course 'EnrollmentsData Collection
School Response
Page
0102
103
P
8.6 Data Preparation 104
8.6.1 Coding 104
8.6.2 Quality Control 105
8.7 Data Processing 105
8.7.1 Machine Editing ' 105'
8.7.2 Data File Preparatioh....4 105
I
8.8 Organizatioq and Content of the Data Filim 106
O
C
A
,74
%)
APPENDICES
Appendix A: F rst Follow-Up Iristrumentation
First Follow-Up Senior Questionnaire
First Follow-Up In-School Sophomore Questionnaire
First Follow-Up Not-Currently-In-School Sophomore Questionnaire. 0
. First Follow-Up Transfer Student Supplement
First Follow-Up Early Graduate Supplement
First Follow7Up Schdol Questionnaire-
A %N.
Appendix B: Pre-Field Period Correspondence
B.1 Correspondence With Schools and Other Institutions
State Coordinator Ivdtter\
District Superintendent Letter
'Principal Letter (to secure a commitment for the First Follow-Up)
Catholic Dioceses Letter (to secure a°commitment for the FirstFollow - Up)
School Coordinator Letter (4 versions, asking for their assistancein assembling the materials for the .student sample seection)
Roster Update Form
School Coordinator Letter (sent withthe school questionnaire)
AB.2 Correspondence With Students
Locator Letter' '(to sampled students)
Newsletter Vol; 2 No. 1
Appendix C: Field Period Correspondencekj
C.1 1980 Senior Cohort Field Period Correspondence
Cover Letter Accompanying Senior Questionnaire
. Check Request Form
Just A Reminder...(postcard asking respondents to gompleee thequestionnaire if they have not already done so and thanking themfor their participation)

APPENDICES(Continued)
C.2 1980 Sophomore Cohort Field Period Correspondence
Notification to Teachers (giving erm the names. of the studentsselected to participate in the 'First Follow-Up)
Invitation to Students to Participate in the First Follow-Up(giving theM. the day, time and plaie where the survey would be-held) 4
Letters to Pare/its/Permission Forms (sent to parents only when aschool requested-they be sent)
We Missed Youw(giving_etudents day, time and place of the make-upsession) ? .
Check Request Porm-Out of School Sophomores
C.3 Tranicript Survey, ,Correspondence
Principal Letter (requesting .transcripts)
Student Checklist
Reimbursement Voucher ,
Ap2endix D: Critical It
First Follow-Up
First Follow-Up
First Follow-Up
First Follow-Up
First Follow-Up
0 First Follow-UP
e
Sc4pol Questionnaire
Senior Questionnaire
an-,School Sophomore Questionnaire
Not-Currently-In-School Sophomore Questionnaire
Transfer Student Supplement
Early GiaduLte Supplement
4>
s,
tp

-1-
e ft
1. OVERVIrW
'
a
In 1980, the National Opinion Research. Center (NORC) conducted the
Base Year survey of High School and Bey ond (HS&B). In 1982, the First Follow-
Up was conducted, as the first in a series' of planned resurveys of students
and schbols from the Base Year samplt. From February through May of 1982, ,
NORC administered and collected First Follow-Up questionnaires for-e sample of
students who were seniors in 1980, as well as questionnaires and cognitive
tests for a sample'of students who were sophomores in 1980. At this time,
tORC also surveyed school administrators and asked that they provide
information on secondary level course offerings and enrollments for their
institutions. During the fall of 1982, NORC conducted a Transcripts Survey,
which was designed to collect high school transcripts for a subsample of 1980
sophomores who had completed First Follow-Up questionnaires. Simultaneously,
course offerings and course enrollments not previously collected from schools
were requested.
The purpose of this report is to summarize and document the -major
technical aspects of the First Follow-Up Survey, including the survey. fcrms
employed, sample debign and implementation, data collection procedures, data
control and preparation, and data processing. Separate ( chapters (chapters 7
and 8) are devoted to the technical aspects of the TranScripts Survey and the
Course Offerings and Enrollments Survey.
Users of the various HS&B data files should consult the data user's
manuals which provide extensive information regarding the five segments of the
Ftrst Follow-Up Survey: the Senior Cohort, Sophomore Cohc*t, School Question-\
naire, Course Offerings and Enrollments, and High School Transcripts data
fges. In addition, the HS&B First Follow-Up Sample Design Report provides
detailed explanation of the First Follow-Up sample selection, wei'ghting
procedures, sampling variances and the implication of survey nonresponse for
sample ,estimates and the precision of estimates derived from the sample.
To ensure that users are fully aware of the interrelationships among
the many components of the High School and Beyond, this introductory chapter
presents an overview of the entire study.
, 1.1 NCES' Longitudinal Studies Program 'The mandate of the Nationa Center for Education Statistics (NCES)
includes the responsibility db "co 'lent and disseminate statistics and other
data *related to education in the 1:Jnited States" and to "conduct and 'Publish
reports on specific analyses of the 4eaning and significance of uch statis-
tics" (Education Amendments of 1974 - Public Law 93-380, Title V, Section 501,
amending Part A of the General Education Provisions Act).
Consistent with this mandate and in response to the need for policy-
relvant, time-series data on a nationally representative sample of high
school students, NCES instituted the National Longitudinal Studies (NLS)
program, a continuing fong-term project. The general aim of the NLS program
is tootudy longitudinally the educational, vocational, and personal develop-
ment of high school students and the personal, familial, social, institu-_
tional, and cultural faCtors that may affect that development.
The NLS program was planned to utilize time-series data bases in two
ways: (1) each cohort is surveyed at regular intervals over a span of years,
and (2) comparable data is obtainedfrom successive cohorts, permitting
studies of trends relevant to educational, and career development and societal
roles. The NLS program consists of two major studies: The National Longitud-
inal Study of the High School Class of 1972 (NLS-72) and High School and
Beyond (HS&B).
The first, NLS-72, began with the collection or comprehensive Base
Year data from over 22,000 high school seniors in the spring of 1972. Four
Follow-Up surveys were conducted in the fall and/Winter of 1972, 1974, 1976,
and 1979, using a combination of mail. surveys.-Arid personal and telephone
interviews.
This second, HS&B, was designed to inform federal,and state policy in
the decade of the 1980s. HS&B'began in 1980 with the collection of Base Year
data on high school seniors and sophomores. The First Follow-Up study was
conducted in the spring of 1982, and the second is scheduled for the spring of
1984.

1.2 History of High rSchool and Beyond
1.2.1 Relation to NLS-72
High School and Beyond was designed to build on the NLS-72 in three
ways. Fii.st, the Base Year of HS&B included a 1980 cohort of high school
seniors that was directly comparable to the 1972 cohort. Replication of
selected 1972 student questionnaire items and test items makes it possible to
analyze changes that have occurred since 1972 and their relationship to ecent
federal policies. and programs in education. Second, the introduction of a
sophomore cohort provides data on the many critical:, educational and vocational
Choices made between the sophomore and senior years in high \school, permitting
a fuller understanding of the secondary school experience and its impact on
students. .Finally, 11.5&B has expanded the NLS-72 focus by collecting data on a
broader range of lifecycle factors, such as family-formation behavior,
intellectual development, and social participation,
1.2.2 Brief Description of Base Year
The Base Year survey was conducted in the spring of 1980. The study
design included a highly stratified national probability 'sample of Over 1,100
secondary lchools as the first stage units of selection. In the second stage,
36 seniors and 36 sophomores were selected per School (iii schools with fewer
than 36 in either of these groups, all eligible students were included).
Special efrorts were made to 'identify twins and triplets among selected
students, and non-selected twins and triplets were invited to participate in
the study. (Data from non-sampled twins and 'triplets is not included in the
student data, files, but may be obtained in a separate Twin Data File linking
questionnaire dAta for both sampled and non-sampled twins for special
analyses.) Over 30)000 sophomores and 28,00 seniors enrolled in 1,015 public
and private high schools across the country participated in the Base Year
survey. (Detailed information about the samples can be found in the HS&B
Sample Design Report for thd Base Year: Martin R. Frankel, Luane Kohnke,
David Buonanno, and Roger Tourangeau, Sample Design Report, NORC, -1981.).
4 Several special strata were included in the sample with grobabilities
higher than their occurrence in the population to allow for study of certain
types of schools or students. These included:

-4-
- Hispanic strata, with probabilities of selection to insuresufficient numbers of Cuban,'Puerto Rican and Mexican .
students for separate analyses
- a stratum of Catholic schools with high proportions ofblack students
C
C
- a stratum of public alternative schools
- a stratum of private schools with high-achieving students
The Hispanic supplement to the sample was funded jointly by'the Office of
Bilingual Education and Minority Language Affair, (OBEMLA), and the Office for
Civil Rights (OCR' within the Department of Education. An additional supple-
mentary sample was drawn from students attending Departmentof Defense
Dependent Schools (DoDDS) located overseas. DoDDS students are not included
in the data tapes distributed by NCES, however.
Survey instruments in the Base Year included:
-, a school questionnaire
- student identification pages
- a sophomore questionnaire
- a senior questionnaire
- a series of cognitive tests for each cohort
- teacher comment checklist
- parent questionnaires (mailed to a sample of parents from both
cohorts)
The student questionnaires focused on individual and family back-
ground, high school experiences, work experiences, and plans for the future.
Cognitive tests administered to students measured both verbal and quantitative
abilities. In addition, sophomore tests included achievement measures in
science, writing, and civics, while seniors were asked to respond to tests
measuring abstract and nonverbal abilities. Of the 194 test items
administered to the HS&B senior cohort in the Base Year, 86 percent were
i3entical to those given to the NLS-72 Base Year respcndents. School
questionnaires provided information about enrollment, staff, educational
programs, facilities and services, dropout rates, and special programs for
handicapped 4ind disadvantaged students. The teacher comment checklist
provided teacher observations on students participating in the survey. The
parent questionnaire elicited information about how family attitudes and
financial planning affect postsecondary educational goals.
1:i
1.3 Overview of First Follow-Up Design
1.3.1 Sample Design
The First Follow-Up sample consists of approximately 30,000 1980
sophomores and 12,000 1980 seniors. It retains the multistage, stratified,
and clustered design of the Base Year sample. All students selected during
the Base Year (including nonrespondents) had a probability of inclusion in the
First Follow-Up. Unequal probabilities were compensated by weighting. NORC
attempted to survey al' l 1980 sophomores (including Base Year nonrespondents)
who were still enrolled in their original Base Year schools. Certain
categories of 1980 sophomores no longer enrolled in their original schools
were subsampled (as described below) and certain categories were sampled with
certainty. A subsample of 11,500 students was selected from among the senior
cohort Base Year participants. This subsampling was carried out so as to
insure the analytic power to address policy issues in areas such as eixcellence
in education, access to postsecondary education, need for financial aid, and
the impact of education on career choices. A special sample of 495 students
was selected from among 1980 senior Base Year nonrespondents. The First
Follow-Up survey also included all non-sampled co-twins (and triplets) who had
been idehtified and surveyed during the Base Year survey, prvided that the
sampled twin was retained for the follow-up. However, non-eampled twins are
not included in the probability sample and are not weighted. Their data
appear Only on a separate twin data file.
As in the Base Year, the Hi9anic Supplement to the First Follow-Up
was supported by OBEMLA and OCR. Fh addition, the United States Army
Recruiting Command (USARC) supported the retention in the First Follow-Up
sample of 200 additional 1980 seniors who had moderate to high achievement
scores but no plans for postsecondary education.
The First Follow-Up survey included a sample of students from the
Department of Defense Dependents Schools (DoDDS). All DoDDs Base Year
participants currently living overseas and all seaior cohort Base Year
participants living in the United States were included in the DoDDS follow-up
sample. However, sophomore cohort Base Year participants living in the U.S.
were not contacted for the First Follow-Up DoDDS survey. DoDDS students are
not part of the main probability sample and are not weighted.

NORC attempted to obtain a school questionnaire and 1981-J982 course
offerings and enrollment information from all schools selected in the Pase
Year (including Bhse Year nonresponding schools), except from schools that had
-(no 1980 sophomores, had closed, or had merged wi*h other schools in the
sample. In addition, schools that had received pools of students from Base
Year schools also were contacted to provide these materials. However, they
were not included in the probability sample and were not weighted.
High school transcripts were collected for a subsample of 1980
sophomores who had been retained for the First Follow-Up. The sample of
. nearly 18,500 1980,sophomores maximized the size of these selected strata:
twins, dropouts, student from private scho-,1s, selected minority groups, and
students whose parents, were surveyed in the Base Year.
1.3.2 Method of Administration
The survey design for the two cohorts utilized two basic methods of
data collection: group administration of questionnaires and tests to the
sophomore cohort, and mailed questionnaires to the senior cohort.
The sophomore group administrations were conducted in either the
sampled students' high school or an appropriate location off-campus. The
location of the administration depended on the survey member's school enroll-
ment status during the da,ta collection period (February through May 1982).
Group administrations were scheduled off-campus for sample members who were no
longer attending the sampled schools. These individuals (e.g., transfer
students, dropouts, early graduates) were contacted byNORC Survey Representa-
tives and brought together VI small groups of two to six participants. The
same survey administration procedures were followed for both types of group
administration.
Senior cohort members received mailed questionnaires and were not
retested. Nonresponders were followed up by trained telephone interviewers.
Approximately 75 percent of the seniors completed and retu ed questionnaires
by mail, and an additional 20 percent of the senior questio aires were com-
pleted by either in-person or telephone interviews (a metho of administration
variable is included on the file; see section 5.8). Surveyvdesign required
that respondents interviewed over the telephone have a copy of the question-
naire in front of them, to keep their survey experience as comparable as
1. 5

-7-
possible to that of the majority of respondents, who filled out the question-
naires themselves.
School questionnaires were mailed to administrators. Nonrespondents
to the mail request were contacted again by NORC Survey Represen.tatives, who
collected the remaining questionnaires when they visited the schools to
conduct student survey activities. When follow-up efforts were made to
collect course offerings enrollments, and transcripts, an additional 100
school questionnaires were obtained. Twelve of these were completed over the
telephone. The course offerings, enrollments, and student transcripts,
returned by mail, were processed by NORC staff.
2. DATA COLLECTION INSTRUMENTS
Information in the High School and Beyond data base comes primarily
from questionnaires filled out by students, school administrators, teachers,
and parents of students. This data is supplemented by a,lariety of other
materials, including information on courses taught at sampled schools, the
numberd of students enrolled in those courses, and information from students'
high school transcripts. (The protocols and procedures governing the
transmitte5of this information are described in the chapters Se and 6.)
Consult the respeCtive Base Year data user's manuals regarding the surveys of
teachers and parentis of students. Below, the features of the student and.
school questionnaires used for the first two waves of High School and Beyond
are described. Base Year and First Follow-Up senior cohort, sophomore cohort,
and the school questionnaires are reproduced in Appendix A.
2.1 Student Questionnaires
The Base Year senior and sophomore questionnaires were very similar.
Approximately three-fourths of the items in each version were common to
both. Most of the questions in both versions focused on students' behavior
and experiences in the secondary school setting. Also included were questions
about employment outside the school, postsecondary educational and occupa-
tional aspirations, and personal and family background, and a small number of
questions about personal attitudes and beliefs. The First Follow -Up survey
included three major questionnaire versions and two smaller supplementary
questionnaires. The 1980 senior cohort First Follow-Up Questionnaire,
administered to all members of the elder cohort, differed from the sophomore
questionnaire in that it emphasized postsecondary school and work experiences
while the sophomore questionnaire focused more on high school experiences.
The First Follow-Up survey questionnaire for 1980 sophomores, administered to
all sophomores except those who left high school prior to graduation,
replicates nearly all the items used in the Base Year questionnaire. Those^
students who left high school prior to graduation completed the "1980
Sophomore Cohort (Not Currently in High School) Questionnaire." A "Transfer
Supplement" was completed by all 1980 sophomores attending a high school other
than their sampled Base Year high school, and students who graduated early
(before March, 1982) from their Base Year high school were asked to complete
an "Early Graduate Supplement." (See Appendix C for copies of the Student
Questionnaires.)
1 7

2.1.1 1980 Senior Cohort Questionnaire
Most of the First Follow-Up questions can be traced through the Base
Year senior instrument or, to the NLS-72 fourth Follow-Up Questionnaire.
Content areas in the senior questionnaire include education (amount and type
of postsecondary schooling completed, data on schools attended, school
financing,.educational expectations and aspirations, and non-school-based
postsecondary training), woes (labor force participation, detailed job'
histories, aspirations, military service), financial status (dependency,
income), marital status (spouses' occupation, education, dependents), and
demographics (household composition, race, sex, ethnicity, etc.). Approxi-
mately 30 items in the instrument were identified as "critical or key" ques-
tions, for which data was to be retrieved from respondents if necessary.
(Critical questions can be identified in the instruments by the small circle
located under the question number.)
2.1.2 1980 Sophomore Cohort Questio4naire
The purpose of the follow.;.up sophomore questionnaire was to document
secondary school experiences, especially shifts in attitudes and values since
the Base Year, and to document work experiences and plans for postsecondary
education. Almost all of the First Follow-Up questions hadheen asked in the
Base Year--most were from the sophomore document, but many had appeared in the
senior questionnaire only. Content areas included: education (high school
program, courses taken, grades, standardized tests taken, attendance and
disciplinary behavior, paLental involvement, extracurricular and leisure
activities, assessment of quality of school and teachers), postsecondary
education (goals, expectations, plans, and financing), work/labor force
participation (occupational goals, attitudes toward military service),
demographics .(parents' education, father's occupation, family composition,
school age siblings, family income, marital status, race, ethnicity, sex,
birthdate4 physTeal handicaps), and values (attitudes toward life goals,
feelings about self, etc.).
As with the senior questionnaire, approximately 30 items were identi-.
fled as critical items in the sophomore questionnaire.
0
2.1.3 1980 Sophomore Cohort (Not Currently in High School) Questionnaire
This questionnairp was designed for persona who had dropped out of
high school. It focused on the reasons for dropping out and its impact on
students', educational and career development. About a dozen of the items were
developed specially for the situation of leaving school before completion; the
remainder of the questionnaire was made up of items .used either in the regular
1980 sophomore cohort questionnaire or the 1980 senior cohort instrument.
Content areas included: circumstances of leaving school (reasons for leaving,
evaluation ofdecision, plans for obtaining high school diploma or equiva-
lent); participation in training programs and other postsecondary education;
work (labor force participation, detailed job history, aspirations, Armed
Forces service); financial status (dependency, income); marital status
(spouse's education, occupation, dependents); demographics (parents' educa-
tion, father's Occupation, race, sex, ethnicity, date of birth); and other
personal characteristics (physical handicaps, values, feelings about self).
2.1.4 Transfer Supplement
This supplement wash completed by members of the sophomore cohort who
had transferred out of the Base Year sample high school to another high
school. All of the items in the transfer supplement were new items (except a N\
few that were taken from the school questionnaire). Content areas included:
reasons for tranferring aWalor selecting a particular school; identification
of school, location, grade respondent was in when transferred, entrance
requirements, length of interruption in schooling (if any) and reason, type of
school (general, specialized), size of student body, grades. The supplement
was brief, taking about 10 minutes to complete.
2.1.5 Early Graduate Supplement
This supplement was developed for members of the'sophomore cohort
who graduated from high school ahead of schedule. Its intent was to document
reasons for and circumstances of early graduation, the adjustments required
to finish early,.and respondents' activities compared with those of other out-
of-school survey members (i.e., dropouts, 1980 seniors.) Content areas
included: reasons for graduating early, when decision was made (what grade),
persons involved in the decision, course adjudtments required, school

requirements, and postsecondary education and work experience (the questions
for the last area were identical to those in the senior cohort instrument).
"This supplement took about 10 to 15 minutes to complete.
.
2.2 Cognitive Tests
The so t omore cohort was administered the same test in both the Base
Year and the First Follow-Up; the senior cohort was not retested in the First
Follow-Up. The content of these tests is briefly described below.
2.2.1 Sophomore Test
The sophomore test covered the following areas:
1. Vocabulary (21 items, 7 minutes). A brief test using synonymformat.
2. Reading "(20 items, 15 minutes). A test based on short passages(100-200 words) with several related questions concerning a varietyof reading-skills (analysis, interpretation) but focusing onstraightforward comprehension.
3. Mathematics (38 items, 21 minutes). Quantitative comparisons inwhich the student indicates which of two quantities is greater, orasserts their equality or the lack of sufficient data to determinewhich quantity is greater.
4. Science (20 items, 10 minutes). A brief test of science knowledgeand scientific reasoning ability.
5. Writing (17 items, 10 minutes). A test of writing ability andknowledge of basic grammar.
6. Civics Education (10 questions, 5 minutes). A test of students'knowledge of various principles of law, government, and social
,cbehavior.
I
2.2.2 Senior Test
The senior '-est consisted of the following:
1. Vocabulary (27 items, 9 minutes). A brief test using synonymformat.
2. Reading (20 items, 15 minutes). A test based on short passages(100-200 words) with several related questions concerning a varietyof reading skills (analysis, interpretation) but focusing onstraightforward comprehension.
"(I

/3. Mathematics (33 items, 19 tinutes). Quantitative comparisons n
which the student indicates which of two quantities is greater, orasserts their equality or the lack of sufficient data to deterrhinewhich quantity is greater.
4. Picture Number (15 items, '5 minutes). A test of associative memoryconsisting of a series of lrawings of familiar Objects each, pairedwith a number. The student, after studying the picture numberpairs, is asked to recall the number associated with each object.
5. Mosaic Comparisons (89 items, 6 minutes). A test measuringperceptual speed and accuracy through items that require that smalldifferences be detected between pairs of otherwise identical mosaicsor tile-like patterns.
6. Visualization in Three Dimensions (16 items, 9 minutes). Students,were asked to visualize the shape a flat piece of metal (representedby a line drawing) might assutenif foldedvalong a specified Alinepand select this three-d.mensional shape from a group of possibleanswers.
7. Questions About the Test (5 minutes). Students were asked how theyfelt about taking the test, and how important they thought thevarious abilities it measured would be to them later in life.
2.3 '.School Questionnaire
In both the Base Year and First Follow-Up surveys, principals and
headmasters (or their designates) were Asked to complete questionnaires
containing basic questions on such institutional characteristics as type .of
control, ownershipe total enrollment, proportions of students and faulty
belonging to policy- releiant groups, participation in Federal'programs, and
per pupil expenditures.
.
21
ti

III
-13-
43. SAMPLE DESIGN AND IMPLEMENTATION
During the High School and Beyond Aase Year'strvey, a national prop-
ability sample of 1,015 high schools was selected. These schools served
first-stage units (clusters) for the ultimate selection of a sample of high
school students. However, because the sample pf schools Was chosen scientifi-
cally, it can alsotbe used in its own right'to construct estimates for the
population of U.S. nigh schools that had sophomores and seniors (or both)a
enrolled in 1980. Proper use of this sample, however, requires the use of
school - level. weights. Appropriate weights for each school,were calculated.
during the Base Year. These weights adjust for differential probabilities ,of
selection between schools and for differential nonresponse .ates between.A
sampling strata. Sinde every school that participated in the Base Year survey
(with certain exceptions, noted in section 3.2) was included in the sample forr
the First Follow-Up survey; the Base Year school w can be used to
develop estimatesA
for First Follow-Up schools as well. understand the 4
rationale behind the weighting scheme, however, it is necessary to understand
the Base Year sample design and the procedures that were followed in calcu-..
lating the weights.
Sections 3.1 and 3.2 describe the Base Year sample design and First
Follow-Up survepilan. Section 3.3 describes the First Follow-Up student
selection procedures. Sections 3.4 and"-t3.5 explain the weighting procedures
developed in the Base Year, and section 3.6 describes standard errors and
design effects; The sampling scheme for thetiranscript survey. involved sub-
sampling in the 1980 sophomores, retained for the First Follow-Up and is dis-.
cussed in sections 7.1.and 7.2.
3.1 Base Year Sample Design"
In the Base Year, students were selected tHrough a two-stage, strati-\fied probability sample with schools as the first stage units and students
within schools as the second stage units. With the exception of certain
special strata, which were oversampled, schodls were selected with probability
1 For further detaili; on the Base Year sample design see Martin R.Frankel, Luane Kohnke, David Buonanno, and Roger Tourangeau, Sample DesignReport, NORC, 1981.
-14-
nroportiOnal to the estimated enrollment in their 10th and 12th grades.' For
the Base Year, a sample of 1,122 schools was selected from .a sampling frame tif5
24,725 high schools. Within each school, 36,seniors and 36%ophomores were
randomly selected. In those schools wits' fewer than 36 seniors or 36 sdpho-.
mores, all eligibl%students were drawn in the sample. Sampling rates for
each stratum were set 'so as to select in each strati= the number of schools ...
needed to satisf study design criteria regarding minimum sample sizes for
certain "ypes of schools. As a result; some schools had a very high .
probability of inclusion in the sample (in some cases equal to 1.0) while
others had a very low ptobability of inclusion. The total number of schools
selected for the sample was 1,122, from a frame of 24,725 schooDi withigrades4t
10 or 12 or both. 2 Sampt.. .ng strata-and the number of schools selected in
each are shown in Table 3.1 -1,.
Substitution was carried out for schools that refused to: participate
in the survey, but there waso substitution for students who refused, whose
parents efused. or who were absent on Survey Day and make-up days. 3
Subst ution for refusal schools was carried out only within strata. In
certai cases no substitution was possible because a 'school was the sole
member of its stratum. Th reali&tion of thejample by stratum is shown in
Table 3.f-2. Although the sample design specified that students in all but
the special stc,ata would be selected with approximately equal probabilities'
1
2 The sampling frame, defined as the universe of high schools inthe United States, was obtained from the 1978 list of U.S. elementary andsecondary schools of the Curriculum Information Center, a private firm. This
was supplement:A by the NCES lists ofopublic and private elementary and '
secondary ?chools. Any school listed in any of these files that contained a10th grade, A 12th grade, or both was made part of the frame.
3 Apart from substitution for schools that refused, there were anumber of schools in the originally-drawn sample that were "out-of-scope,"failing to fit the criteria for incluulon in the sample. The sample was thenaugmented through selection of an additional school for each out-of-scopeschool, within major strata. Most of the :out -of- scope schools were area voca-tional schools, having no enrollment of their own, although they were listedin the frame as having enrollments.
2:3a

Its
LE 3.1-1
High School and Beyond Base Year School Sample Selections
Special Strata (oversampled)
Alternative publicCuban publicCuban CatholicOther Hispanic public
/ High performance .privateOther non - Catholic private (stratified by
four census regions)Black Catholic
Regular Strata (not oversampled)
Regular Catholic(stratified byfour census regions)
Regular public (stratified by nine census divisions;racial composition; enrollment;central-city, suburban, rural)
Number
5C
20-a10-a
106-a12
38
30-a
48
808
1,122
aThese schools'were defined as those having 30 percent or more ofenrollment frOm the indicated subgroup. / .
the probabilities are'only roughly equal. In addition, the students in
special strata were selected with higher probabilities, in some strata with**
extremely, high probabilities. Moreover, the sample as realized also did not
equal the sample as drawn, creating further deviations from a self-weighting
sample. Consequently, weights were introduced for schools and for students,
which give each school or each student a weight equal to the number of scllools
or students in the universe of schools or students represented by that school
or student. Since each student's overall selection probability (hence weight)
was further influenced by the sample design for the First Follow-Up, the
derivation of student case weights is discussed below. Calculation of school
weights is described in section 3.4.2.
Use of weights should lead to correct estimates (within sampling
error) of the population of 10th and 12th grade students in United States
schools in spring, 1980, and correct estimates of subgroups within it. If
comparison with other data sources strongly indicates that certain population
estimates are too high or too low, further adjustment of weights may be
carried out in future versions of public use files. Preliminary comparisons

-16-
TABLE 3.1-2
High School and Beyond Base Year Sample Realizationipf
Stratum
OINNIPMININ
Stage 1: Sampling.of Schools
Drawn insample
Regular publicAlternative publicCuban publicOther Hispanic public
1Regular CatholicBlack CatholicCuban CatholicHigh performance privateOther non-Catholic private
TOTAL
0 8085020
106
48
3010
12
1,122
Originalschools*
Substitutedschools
Totalrealized
585 '150 73541 4 45
11 .1i
72 30 102
40 5 45
23 7 30
7 2 9
9 2 , 11 -
23 4 27
811. 204 1,015
Stage 2: gamplinli of Students
Total Absent, `both ,
drawn in Survey and Studentsample Make-up days refused
PartialParent materialsrefused missing**
Totalrealized
Number 70,704
100Percent
8,278
12
1,759 223
. 3
2,174
3
58,270
82
*Includes additional selections made when schools were found to beodt-of-scope.
**Unusable because critical survey materials missing.
have shown that the current weights give estimates reasonably close to those
from other data sources.
3.2 First Follow-Up Sample Design
The First Follow-Up sample was based on the High School and Beyond
Base Year sample, retaining the essential features of a multi-stage, strati-
fied, and clustered design. The important features of the First Follow-Up
design are as follows:
All schools selected for the Base Year sample were contacted for
participation in the First Follow-Up school survey except those that had no
1980 sophomores, had closed, or had merged with other schools in the sample.
Of the 1,015 schools that participated in the Base Year survey, a total of 40
I.
-17-
were dropped from the First. Follow -Up sample: 11 because they had no
sophomore- in the Base Year, 5 because they, had merged with other schools
, already in the sample, 17 becanse they were 'j'unior high schools or schools
that.were closed, sending all their 1980 students to a single "target school,"
and 7 because they ,had closed and sent their 1980 students to"a.large Number
of geographically dispersed schools. The 17 "target .schools" that had
received pools of Base Year students were included in survey activities but
not added to the probability sawiPle. Thus, 975 schools from the Base Year
sample and these additional 17 schools not in the probability sample wen.:
contacted for First Follqw-Up student and school questionnaire activities and
for course offerings.tand enrollments.
Students (1980 sophomores) still enrolled in their original Base Year
schools were retained with cert;tinty, since. re- surveying and retesting them
was relatively inexpensive due to the Base Year clustered design.
Sophomore cohort students no longer attending their original Base Year
schools (e.g., dropouts, early graduates, and those who had transferred as
individuals to a new school) were subsampled. Certain groups were retained
with higher probabilities in order to support statistical research on such
policy issues as excellence of education throughout the society, access to
postsecondary education, and transition from school to the labor force.
A sample of 495 senior cohort. Base Year nonparticipants was selected
to provide information about possible bias due to Base Year nonparticipation.
Senior cohort cases that were subsampled were selected with prob-
ability proportional to Base Year weight, in order to reduce the overall
variability of weights in the sample and thereby increase the statistical
efficiency of the First Follow-Up 1980 senior sample.
3.3 First Follow-Up Student Selection Procedures
This section describes the ptocedures used to select the First Follow-
Up cohort samples. Sampling procedures for seniors and for sophomores were
different. Sophomore procedures are described first, followed by senior
procedures.
7

3.3.1 1980 Soohomore Cohort
3.3.1.1 Currently Enrolled Students
All 1980 sophomore cohort students selected for the Base Year sample
were selected with certainty for the First Follow-Up if they were still
enrolled in their Base Year schools at the time of the First Follow-Up Survey
Oa, at the school. Students who transferred as a class to a different school
were considered in-school if their original school had been a junior high
school, had closed, or had merged with another school. Students who had
graduated early or had transferred as individuals to other schools were
treated as school leavers for purposes of sampling.
3.3.1.2 School Leavers
1980 so %more cohort school leavers were selected with certainty or
according to predesignated rates designed to produce approximately the number
of completed cases needed for each of several different sample categories.
School leavers who did not participate in the Base Year were given a selection
probability of 0.1. Table 3.3-1 shows the number of currently enrolled
students and school leavers selected in each major school s4atum.
Table 3.3-1
Sample Allocation for First Follow-Up of 1980 Sophomore Cohort
Original Base Year Student Status
Currently*School Stratum Enrolled Drop-Out Transfer
EarlyGraduate Total
Regular public 18,684 1,932 796 493 21,905
Alternative public 672. 184 58 39 953
Cuban public 220 52 17 30 319
Other Hispanic public 2,375 336 121 86 2,918
Regular Catholic 1,372 19 57 10 1,458
Black Catholic 780 32 128 11 951
Cuban Catholic 252 15 25 8 300
High performance private 336 0 15 4 355
Other non-Catholic private 459 31 73 15 578
TOTAL 25,150 2,601 1,290 696 29,737
* Currently enrolled in Base Year for other related) school.
7 '1ws

-19-
3.3.2 1980 Senior Cohort
All 1980 senior cohort students' selected for the Base Year sample had
a known, non-zero chance of selection fbr the First Follow-Up survey. The
First Follow-Up sampleogonsists of 11,995 selections from the B1se Year
sample. This total includes 11,500 selections from among the 28,240 Base Year
participants and 495 selections from among the 6,741 Base Year nonpartici-
pants. In addition, 204 non-sampled co-twins or triplets (not part of the
probability sample) were included in tie First Follow-Up survey.
Several features of the senior cohort .sampling design enhance. its
usefulness. First, the inclusion of 495 Base Year nonrespondents facilitates
the estimation of nonresponse bias in Base Year data. Second, the selection
of 1,500 additional Hispanic students beyond the number expected in the NCES
core sample allows more complex, detailed analysis of Hispanic student out-
comes. (This supplementary sample is supported by the Office for Bilingual
Education and Miftbfity Affairs and by the Office for Civil Rights.) Third,
since the sampling plan called for retention in the First Follow-Up of less
than one-half of the 1980 seniors who had participated in the Base Year
survey, it was important to devise a subsampling plan that would retain in the
follow -up sample sufficient numbers of students with the kinds of characteris-
t..cs that past research had indicated would be required for certain kinds, of
policy analysis. This meant identifying these students and adjusting the
subsampling rates so as to retain'sufficient numbers of them. Thus, the First
Follow-Up sample, though much smaller, is able to provide estimates for
certain subclaises that are nearly as precise, statistically, as those of the
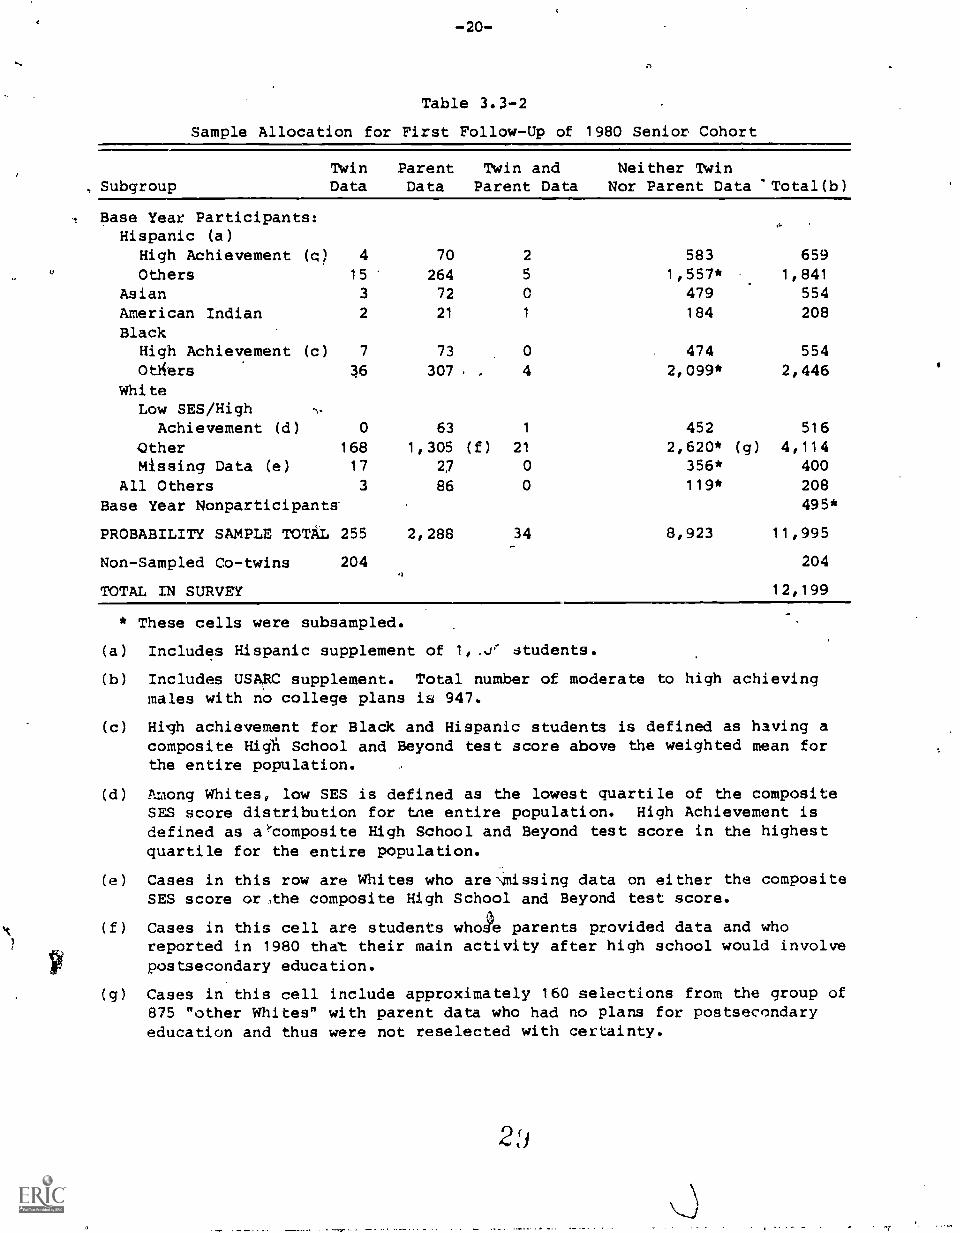
larger Base Year sample. The sample allocation is shown in Table 3.3-2.
The sample of 495 students from the ,6801 of Base Year nonrespondents
was drawn in two stages. First, 404 schools were selected with probabilities
based upon the number of nonrespondents and Base Year sampling weights. From
the 404 selected schools, individual nonrespondents were selected by sequence
number from the original Base Year sample rosters. A single selection was
made in 318 schools; in 86 schools, two or more nonrespondents were selected.
-20-
Table 3.3-2
Sample Allocation for First Follow-Up of 1980 Senior Cohort
Twin, Subgroup Data
ParentData
Twin andParent Data
Neither TwinNor Parent Data 'Total(b)
I Base Year Participants:Hispanic (a)
.
High Achievement (c) 4 70 2 583 659Others 15 264 5 1,557* 1,841
Asian 3 72 0 479 554
American Indian 2 21 1 184 208
BlackHigh Achievement (c) 7 73 0 474 554Odiers 36 307 . 4 2,099* 2,446
WhiteLow SES/High -..
Achievement (d) 0 63 1 452 516
Other 168 1,305 (f) 21 2,620* (g) 4,114Missing Data (e) 17 27 0 356* 400
All Others 3 86 0 119* 208
Base Year Nonparticipants' 495*
PROBABILITY SAMPLE TOTAL 255 2,288 34 8,923 11,995
Non-Sampled Co-twins 204 204
TOTAL IN SURVEY 12,199
* These cells were subsampled.
(a) Includes Hispanic supplement of 1,...rt students.
(b) Includes USARC supplement. Total number of moderate to high achievingmales with no college plans is 947.
(c) High achievement for Black and Hispanic students is defined as having acomposite High School and Beyond test score above the weighted mean forthe entire population.
(d) Among Whites, low SES is defined as the lowest quartile of the compositeSES score distribution for tne entire population. High Achievement isdefined as a'composite High School and Beyond test score in the highestquartile for the entire population.
(e) Cases in this row are Whites who are missing data on either the compositeSES score or the composite High School and Beyond test score.
X (f) Cases in this cell are students whJe parents provided data and whoreported in 1980 that their main activity after high school would involvepostsecondary education.
(g) Cases in this cell include approximately 160 selections from the group of875 "other Whites" with parent data who had no plans for postsecondaryeducation and thus were not reselected with certainty.

3.4 Weighting of. the Sample
3.4.1 General Approach to Weighting
The general purpose of the weighting scheme was to compensate for
unequal probabilites of selection (retention) for the follow-up survey and to
adjust for the fact that not all individuals selected for participation the
survey actually participated. The weights are based on the inverse of the
probabilities of selection through all stages of the sample selection process
and on nonresponse adjustment factors computed within weighting cells. A raw
weight, unadjusted for nonresponse in the First Follow-Up, was also calculated.
3.4.2 Weights Applied to School Level Data
Since every school that participated in the Base Year survey (with
certain exceptions noted in section 3.2) was included in the sample for the
First Follow-Up survey, the Base Year school weights can be used to develop
estimates for First Follow-gip schools as well.," These weights calculated
during the Base Year, incorporate a nonresponse adjustment that compensates
for the fact that of the 1,122 schools selected i the Base Year, only 1,015
allowed students to participate in the survey. Ho ver, the weights do not
adjust for the fact that of the 1,015 "participating" schools, only 996
completed a Base Year school questionnaire. The reason for this is that 996
of 1,015,represents a 98 percent completion rate, and it was felt that an
adjustment for two percent nonresponse would not significantly affect
estimates of school questionnaire items.
In the First Follow-Up survey, 956 of the 975 eligible schools com-
pleted a First Follow-Up school questionnaire. This represents a nonresponse
rate of less than two percent. Again, it was not felt necessary to adjust for
the level of "instrument" nonresponse. This decision was influenced by the
fact that the Base Year an'? First Follow-Up school questionnaires gathered
very similar information and that information is available in either the Base
Year or Fi-rst Follow-Up data files for 1,012 of the 1,015 schools in the
probability sample.
Lists of courses offered in the 1981-82 academic year were supplied bya.
941 (97 percent) of the 975 eligible schools. Collection of enrollment data
proved to be somewhat problematic: adequate data on course enrollments was
received from only 762 (78 percent) of the eligible schools. As explained in
3
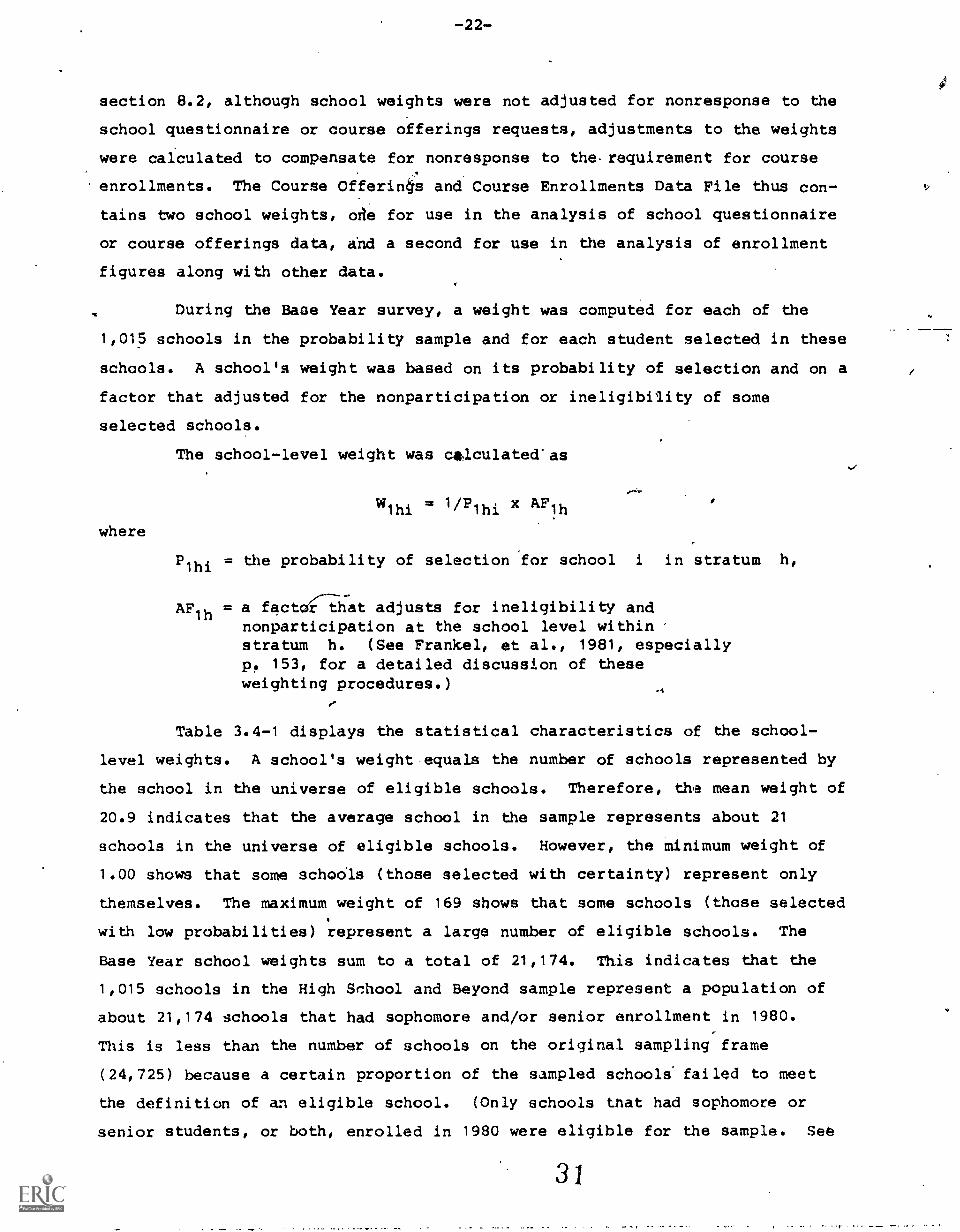
section 8.2, although school weights were not adjusted for nonresponse to the
school questionnaire or course offerings requests, adjustments to the weights
were calculated to compensate for nonresponse to the. requirement for course
enrollments. The Course Offerings and Course Enrollments Data File thus con-
tains two school weights, orie for use in the analysis of school questionnaire
or course offerings data, and a second for use in the analysis of enrollment
figures along with other data.
During the Base Year survey, a weight was computed for each of the
1,015 schools in the probability sample and for each student selected in these
schools. A school's weight was based on its probability of selection and on a
factor that adjusted for the nonparticipation or ineligibility of some
selected schools.
The school-level weight was owlculated'as
where
= x AFthW1hi
P 1hi = the probability of selection for school i in stratum h,
AF1h = a factor that adjusts for ineligibility andnonparticipation at the school level withinstratum h. (See Frankel, et al., 1981, especiallyp. 153, for a detailed discussion of theseweighting procedures.)
Table 3.4-1 displays the statistical characteristics of the school-
level weights. A school's weight equals the number of schools represented by
the school in the universe of eligible schools. Therefore, the mean weight of
20.9 indicates that the average school in the sample represents about 21
schools in the universe of eligible schools. However, the minimum weight of
1.00 shows that some schools (those selected with certainty) represent only
themselves. The maximum weight of 169 shows that some schools (those selected
with low probabilities) represent a large number of eligible schools. The
Base Year school weights sum to a total of 21,174. This indicates that the
1,015 schools in the High School and Beyond sample represent a population of
about 21,174 schools that had sophomore and/or senior enrollment in 1980.
This is less than the number of schools on the original sampling frame
(24,725) because a certain proportion of the sampled schools failed to meet
the definition of an eligible school. (Only schools tnat had sophomore or
senior students, or both, enrolled in 1980 were eligible for the sample. See
31

Frankel, et al., 1981, Chapter 4 for a disct.asion of schools found ineligible
during the Base Year.) In fact, the survey results indicate that only approx-
imately 21,'74 schools out of the 24,725 had sophomore and/or senior students
in 1980.
Table 3.4-1
High School and Beyond Base Year and First Follow-UpStatistical Properties of School Sample Weights
Mean 20.9Standard Deviation 30.4Coefficient of Variation 1.45Minimum 1.00Maximum 169.00
. Skewness 3.04Kurtosis 9.35Number of Cases. 1,015.00
4
3.4.2.1 Nonresponse Adjustments to School Weightsfor Use with Course Enrollments
As indicated in section 3.4.2-above, although school-level response to
requests for questionnaire and course offerings was at a very high level (97
to 98 percent), a substantial proportion of schools were unable to provide
data on total enrollments for the courses offered during the 1981-82 academic
year. As a result, estimates of population parameters basedon enrollment
data from responding schools may be biased. The extent of any bias in the
estimation of statistics such as means or proportions will depend upon the
degree of similarity or difference between responding and nonresponding
schools. Since the nonresponse rate is substantial (22 percent unweighted; 20
percent on a weighted basis), even modest differences in course taking
patterns between responding and nonresponding schools could lead to
significant biases in population estimates.
A simple example may help to alert the user to the level of risk
involved. Assume that in the responding schools, 40 percent of students are
enrolled in some type of mathematics course, but in the nonresponding schools,
only 20 permnt are enrolled in such courses. The estimate based only upon
responding schools will be four percentage points higher than would have been
obtained if all schools had provided data. The amount-of bias may be
calculated as the difference between an estimate based only on responding
units versus an estimate based on all units. Thus, in this efample,
BIAS = .40 - ((.8 x .4) + (.2 x .2)1 = .40 - .36 = .04)
32

Without additional data from the nonresponding units, it is impossible to
assess the actual extent of differences between them and the responding
schools. The existence of school questionnaire data _for all. but a very few of
the schools which were not able. to supply course enrollments provide
researchers with a valuable tool for investigating the likely degree of
difference between responding and nonresponding schools for any particular
analysis.
Even when it is possible to demonstrate that the risk of nonresponse
bias in estimated means and proportions is very low, without adjustments to
the sample weights estimated population totals will be affected by nonresponse
bias. The nonresponse adjustment described here is intended to overcome this
specific type of bias by expanding the sample weights so that the sum of
weights of the responding schools is equal to the estimated .population size.
By computing separate nonresponse adjustments for several strata of responding
schools, it is possible bothto expand the responding, sample to the population
size and to restore the distribution of cases within the responding sample on
variables of interest to equal that for the entire sample of schools.
The adjustments provided in this dataset are based upon a stratifica-
tion of schools by type of control (public versus private),, the percentage of
minority students enrolled (30 percent or more Black or Hispanic students),
and degree of urbanization.. This particular stratification (see Table 3.4-2)
is only one of a large number of plausible methods for partitioning the
sample. It was hosen because all sample cases could be classified on these
dimensions regardless of whether they participated (an essential requirement)
and because preliminary analyses found differential response rates between thea
weighting cells formed, by this classfication scheme. Adjusting the sum of
weights for respondingicases in each such cell thus helps eliminate the
effects of differential nonresponse. Users may choose to compute alternative
adjustments based on strata more closely related to their own specific
research interests. For any adjustment strategy, the adjustment factor for a
specific stratum is calculated as the ratio of the sum of the unadjusted
school weights for all schools in the stratum to the sum of the unadjusted
weights for all schools providing course enrollments within that stratum. The
adjusted weight for each school in the stratum is equal to the product of the
unadjusted weight and the adjustment factor (ratio) for that stratum.
Adjustments will improve sample estimates to the extent that the response
rates differ across strata: the greater the stratum differences, the greater
the benefits from adjustment.
.
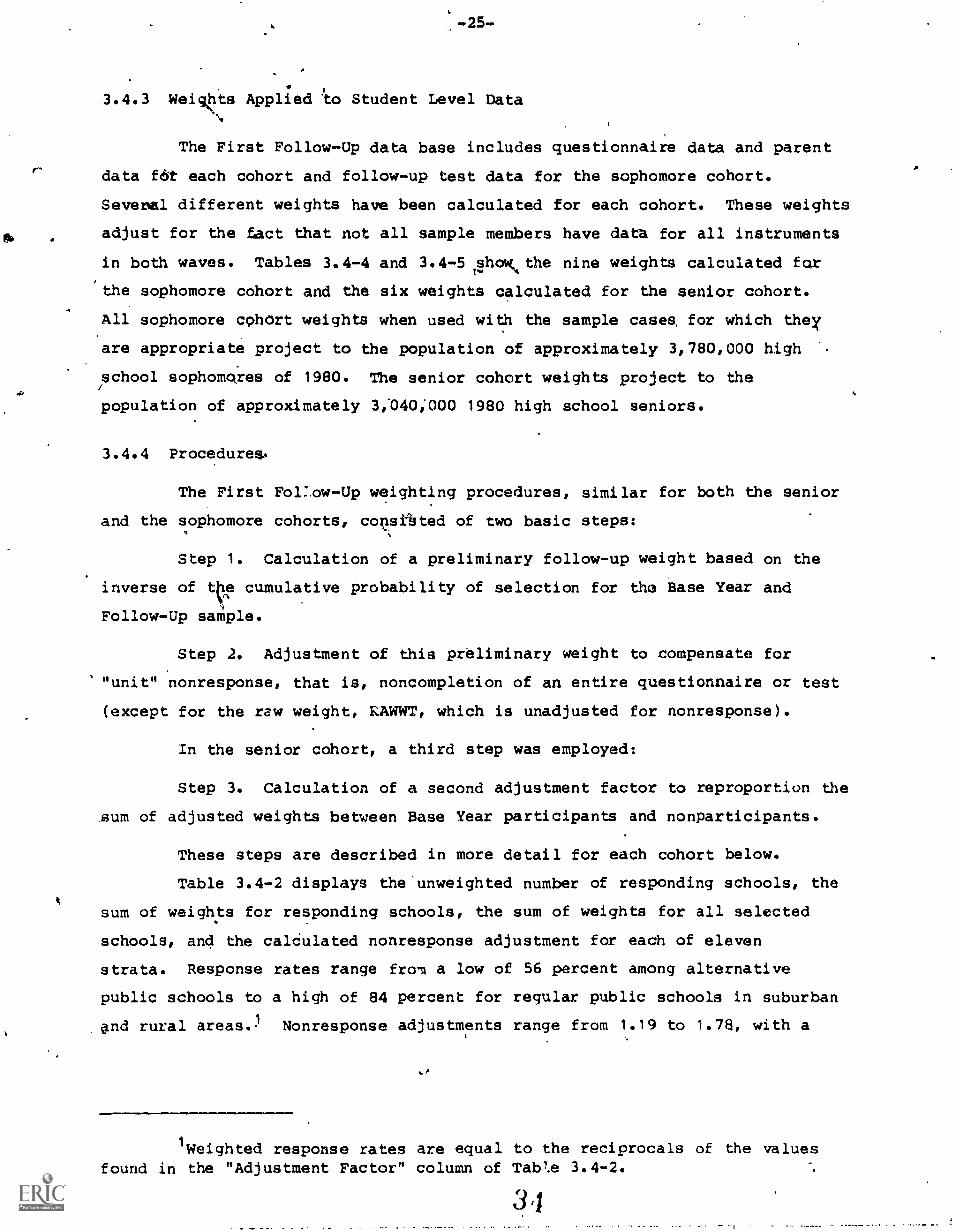
3.4.3 Weights Applied to Student Level Data
The First Follow-Up data base includes questionnaire data and parent
data fest each cohort and follow-up test data for the sophomore cohort.
Several different weights have been calculated for each cohort. These weights
adjust for the fact that not all sample members have data for all instruments
in both waves. Tables 3.4-4 and 3.4-5 4,howthe nine weights calculated for
the sophomore cohort and the six weights calculated for the senior cohort.
All sophomore cphOrt weights when used with the sample cases, for which they
are appropriate project to the population of approximately 3,780,000 high
school sophomores of 1980. The senior cohort weights project to the
population of approximately 3;040;000 1980 high school seniors.
3.4.4 Procedures.
The First Fol:ow-Up weighting procedures, similar for both the senior
and the sophomore cohorts, coklsklated of two basic steps:
Step 1. Calculation of a preliminary follow-up weight based on the
inverse of the cumulative probability of selection for the Base Year and
Follow-Up sample.
Step 2. Adjustment of this preliminary weight to compensate for
"unit" nonresponse, that is, noncompletion of an entire questionnaire or test
(except for the raw weight, RAWWT, which is unadjusted for nonresponse).
In the senior cohort, a third step was employed:
Step 3. Calculation of a second adjustment factor to reproportion the
sum of adjusted weights between Base Year participants and nonparticipants.
These steps are described in more detail for each cohort below.
Table 3.4-2 displays the'unweighted number of responding schools, the
sum of weights for responding schools, the sum of weights for all selected
schools, and the calCulated nonresponse adjustment for each of eleven
strata. Response rates range from a low of 56 percent among alternative
public schools to a high of 84 percent for regular public schools in suburban
and rural areas) Nonresponse adjustments range from 1.19 to 1.78, with a
1Weighted response rates are equal to the reciprocals of the valuesfound in the "Adjustment Factor" column of Tabl.e 3.4-2.
3"

-26-
weighted mean value of 1.25. Table 3.4-3 presents 'summary statistics for the
adjusted weights, paralleling those displayed in Table 3.4-1 for the
unadjusted weights.
Table 3.4-2
Nonresponse Adjustments to School Weightsfor Use with Course Enrollments Data
Adjustment Stratum
UnyeightedN of
Respondents
Sum ofWeights forRespondents
Sum ofWeights forSelections
AdjustmentFactor
Regular Public
Urban., 115 1,069, 1,432 1.34
Suburban 269 4,225 5,049 1;19
Rural 185 7,301 8,704 1.19
Alternative Public 23 96 175 1.78
Cuban Public 7 12 19 1.57
Other Hispanic Public--_,......
81 309 445 1.44
Regular Catholic 33 997 1,392 1.40
Black Catholic 20..
84 117 1.40
Cuban Catholic 4 8 13 1.66
High Performance Private 9 11 14 1.22
Other Private 16 1,741 2,551 .1.47
TOTAL 762 15,851 19,912 1.25
Table 3.4r3
StatistiCal Properties of Adjusted School Weightsfor Use with Course Enrollments Data
Mean . 26.10
Standard Deviation 37.60
Coefficient of Variation 1.44
Minimum fr 1.42
Maximum 231.00
Skewness 3.28
rurtosis 11.85
Nugiber of Cases 762.00
3

TABLE 3.4-4
Sampl? Case Weights
Sophomore Cohort
!tight
BYWT*
BYTESTWT*
FUWT
FUTESTWT
PANELWT
Applies to cases with:
Base Year questionnaire data
Unweighted number of caseshavingthese data
27,118
Base Year test data 24,938
Follow-Up questionnaire data 28,119
26,216Follow-Up test data
Base) Year and Follow-upquestionnaire data 25,875
PNLTSTWT Base Year and Follow-up 22,436test data .
BYPARWT Base Year questionnaire andparent data 31-055
FUPARWT Follow-Up questionnaire andparent data 2,920
RAWWT All First Follow-Up selections 29,737
*These Base Year weights are not the same as those calculated ,during theBase Year survey.
TABLE 3.4-5
SampleCase Weights
Senior Cohort
weight
BYWT*
FUWT
PAN ELWT
Unweighted number of casesApplies to cases with: having these data
Base Year questionnaire data
Follow-Up qtiestionnaire data
Base Year and follow-up-;*
questionnaire data
BYPARWT* Base Year questionnair4 andparent data
FUPARWT Follow-Up questionnaire andparent wata
11,500
11,227
10,815
2,484.
2,3721
RAWWT All First Follow-Up selections 11,995'
*These Base Year weights are not the same as those calculated during thelase Year survey;
tO1
-28-
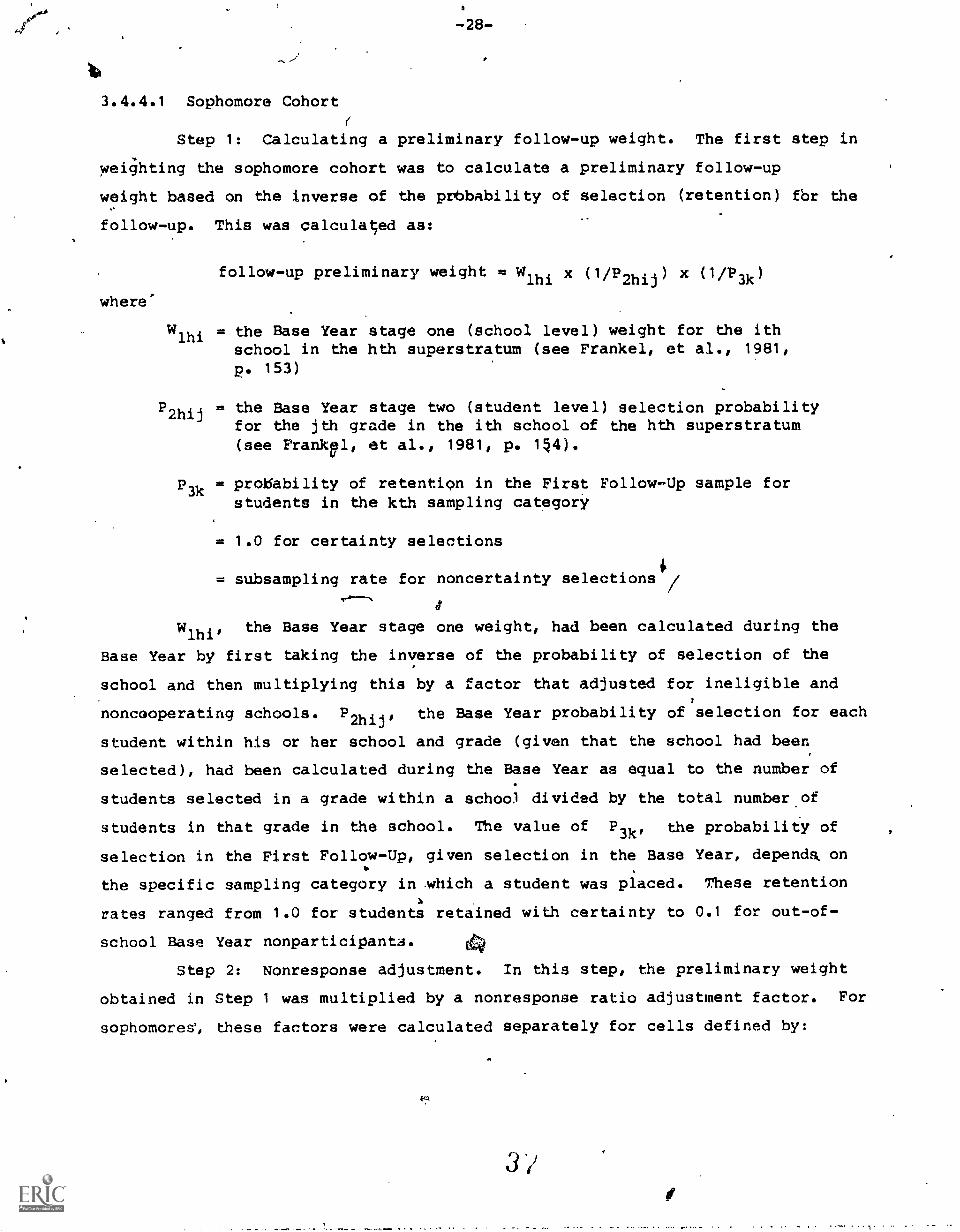
3.4.4.1 Sophomore Cohort
Step 1: Calculating a preliminary follow-up weight. The first step in
weighting the sophomore cohort was to calculate a preliminary follow-up
weight based on the inverse of the prbbability of selection (retention) fbr the
follow-up. This was calculated as:
where'
follow-up preliminary weight = Wlhi x (1 /P2hij) x (11 3k)
Wlhi = the Base Year stage one (school level) weight for the ithschool in the hth superstratum (see Frankel, et al., 1981,p. 153)
P 2hij = the Base Year stage two (student level) selection probabilityfor the jth grade in the ith school of the hth superstratum(see Frankpl, et al., 1981, p. 1§4).
p3k
= probability of retention in the First Follow-Up sample forstudents in the kth sampling category
= 1.0 for certainty selections
= subsampling rate for noncertainty selections /
tl
Wlhi'the Base Year stage one weight, had been calculated during the
Base Year by first taking the inverse of the probability of selection of the
school and then multiplying this by a factor that adjusted for ineligible and
noncooperating schools. P2hij, the Base Year probability of selection for each
student within his or her school and grade (given that the school had been
selected), had been calculated during the Base Year as equal to the number of
students selected in a grade within a school divided by the total number of
students in that grade in the school. The value of P3k, the probability of
selection in the First Follow-Up, given selection in the Base Year, depends. on
the specific sampling category in .which a student was placed. These retention
rates ranged from 1.0 for students retained with certainty to 0.1 for out-of-
school Base Year nonparticipants.
Step 2: Nonresponse adjustment. In this step, the preliminary weight
obtained in Step 1 was multiplied by a nonresponse ratio adjustment factor. For
sophomores', these factors were calculated separately for cells defined by:

(1) Dropout status: (1)
(2)
non-dropoutdropout
(2) School type: (1) Regular public and alternative(3) Hispanic public
.017 (7) Catholic(9) Private non-Catholic
(3) Sex: (1) male(2) female
(4) Race: (1) Hispanic(2) non-Hispanic Black(3) non-Hispanic White and Other
(5) Base Year test quartile:(0) no test data available (0) no test data(1) lowest quartile available(2) second quartile -or- (1) below median(3) third quartile (2) above median(4) highest quartile
Within each cell two sums of preliminary weights were computed. The
first was the sum of preliminary weights for all students in the cell selected
for participation in the First Follow-Up (Selections). The Second was the sum of
preliminary weights for all students in the cell who actually completed the First
Follow-Up questionnaire and /or test (Participants). The ratio of these two sums
(Selections/Participants) provided a factor by which to multiply the preliminary
weight of each participant to compensate for the missing weights of those who
were selected but did no participate. The preliminary weights of First Follow-
Up nonparticipants were ultiplied by a nonresponse adjustment factor of 0 to
produce a final follow-Up weight of 0 for these cases. Thus, the nonresponse
adjustment amounts to distributing the preliminary weights of the nonparticipants
proportionately among the participants in their weighting cell.
3.4.4.2 Senior Cohort
The senior cohort of the First Follow-Up sample consists of two
separately selected and weighted strata: a stratum of 11,500 Base Year
participants, and a stratum of 495 Base Year nonparticipants. These two strata
were separately weighted with inverse probability weights, and adjusted for
nonresponse following procedures similar to those, described above for the
sophomore cohort. An additional step was then carried out for FUWT and RAWWT to
combine these strata so as to properly represent Base Year participants and
7.1 38

30-
nonparticipants in the follow-up sample. .(Since Base Year nonparticipants are
not used with BYWT, PANELWT, BYPARWT, or FUPARWT, reproportioning was not
necessary with these weights.) Thus, the Base Year nonparticipants who were
selected for and participated in the First Follow-Up are allowed to "stand for"
all Base Year nonparticipants in their school type. Similarly, Base Year
participants are represented by the stratum of Base Year participants who
participated in the First Follow-Up. This stratified weighting approach reduces
the possible impact of any bias due to Base Year nonresponse. The weighting of
the Base Year participant stratum is discussed first, followed by the Base Year
nonparticipant stratum.
3.4,4.2.1 Base Year Participant Stratum
Step 1: Calculating a preliminary First Follow-Up weight. As the first
step in weighting this stratum, a preliminary follow-up weight was established
equal to the Base Year final weight times the inverse of the probability of
retention in the First Follow-Up. For students retained with certainty, this
preliminary weight is the same as their Base Year final weight. For all others,
it reflects their effective rate of subsampling for the First Follow-Up.
Step 2: Nonresponse adjustment. In this step, the preliminary First
Follow-Up weight obtained in Step 1 was multiplied by a nonresponse ratio
adjustment factor. These factors were obtained separately for weighting cells
based on the following variables: school type, sex, race/ethnicity, and Base
Year test quartile. The classification variables were constructed as described
for sophomores above. Weighting cells that contained only a few cases were
collapsed with neighboring cells to avoid unacceptably large nonresponse
adjustment factors.
Within each weighting cell a nonresponse adjustment factor was calculated
as the ratio of the sum of preliminary weights for selections and the sum of
preliminary weights for participants. This ratio constitutes the nonresponse
adjustment factor for sample cases in this cell and is applied to the weight of
each sample participant in tie cell. Nonparticipant cases are multiplied by a
nonresponse adjustment factor of 0 to produce a final weight of 0 for these
cases.

3.4.4.2.2 Base Year Nonparticipant Stratum
Step 1': Calculating a preliminary First Follow-Up weight. For senior
Base Year nonparticipants, the probability of retention in the First Follow-Up
sample was made proportional to the Base Year weight of students in the school
where the Base Year nonparticipant had been selected. As a result, for each
of the 495 Base Year nonparticipants selected for the First Follow-Up sample,
the probability of selection in the Base Year times the probability of selec-
tion in the follow-up equaled a constant (.0009536785). Using the inverse of
this selection probability, a preliminary First Follow-Up weight of 1048.5714
was obtained for each senior Base Year nonparticipant selected for the follow-
up sample. This weight was then adjusted for nonresponse as described below.
Step 2: Nonresponse adjustment. In this step, nonresponse adjustment
factors were calculated from the sums of weights of selections and partici-
pants within weighting cells. Cells were based only on four categories of
school type because of the small number of cases in this stratum (n = 495
selections).
Step 3: Reproportioning. Of the 11,995 senior cohort students
selected for the First Follow-Up, 495 were Base Year nonparticipants.. 'Of
these 495, 412 participated in the First Follow-Up survey. Preliminary
weighted analyses comparing the characteristics of these 412 respondents with
the characteristics of the 10,815 Base Year participant follow-up respondents
revealed substantial differences between these two sets of First Follow-Up
participants. Therefore, it was decided to treat Base Year participants and
Base Year nonparticipants as separate strata for purposes of weighting. To do
this the sum of final weights was partitioned proportionately between Base
Year participants and nonparticipants and each stratum was weighted
separately. The partitioning was carried out separately for each of four
school types (see Table 3.4 -6). Within each school type separate targfAs for
sums of final weights were established for Base Year participants and
nonparticipants. These targets were calculated using the sum of final Base
Year weights for each school type and the weighted proportion of students
participating and not participating in each school type in the Base Year
survey. In each of the eight cells, a ratio was formed using the target slip
of weights as the numerator and the First Follow-Up sum of weights (adjusted
for First Follow-Up nonresponse) as the denominator. In each cell these
o

-32-
TABLE 3.4-6
High School and Beyo First Follow-UpPopulation Targets (Sums of Final Weights) for Partitioned Sample (Base
Year Participants/Base Year Nonparticipants) by School Type
Senior Cohort
School typeBase Year Base YearParticipant Nonparticipant
Total
Non-Hispanic Public andAlternative Schools 2,247,160 399,245 2,646,405
Hispanic Public Schools 73,959 14,700 88,659
Catholic Schools 180,245 20,094 200,339
Non-Catholic Private Schools 84,862 19,455 104,317
Total 2,586,226 453,494 3,039,720
"reproportioning ratios" were multiplied times the adjusted follow-up weight
to produce a final reproportioned weight. The sum of these weights then
equalled the "target" sum in each cell. Thus, the Base Y4ar nonparticipants
who were selected for and participated in the First Follow-Up are allowed to
"stand for" all Base Year nonparticipants in their school type. Similarly,
Base Year participants are represented by the stratum of Base Year partici-
pants who participated in the First Follow-Up. This stratiiied weighting
apprcach reduces the possible impact of any bias due to Base Year nonresponse.
3.4.4.3 Special Procedures for Parent Weights
In the case of BYPARWT and FUPARWT the preliminary follow-up weight
was calculated using the Base Year final parent weight instead of the Base
Year final student weight and a student's probability of retention in the
First Follow-Up. The Base Year parent weight takes into account the sub-
sampling of Base Year participants for the parent study and incorporates an
adjustment for differential nonresponse to the parent survey. (See Base Year
Parent Questtdnnaire Codebcok, NORC, 1981, pp. 6-13, for details on the
construction of the parent weight.) Because of the relatively small number of
First Follow-Up cases with parent data (about 2,400 in the senior cohort and
3,000 in the sophomore cohort), adjustments to these weights for student
nonresponse were limited to the calculation of ratios within the 27 super-
strata, which served as the principal sampling strata in the design for the
Base Year Parents Survey (see the Parent Questionnaire Codebook, pp. 3-6) .
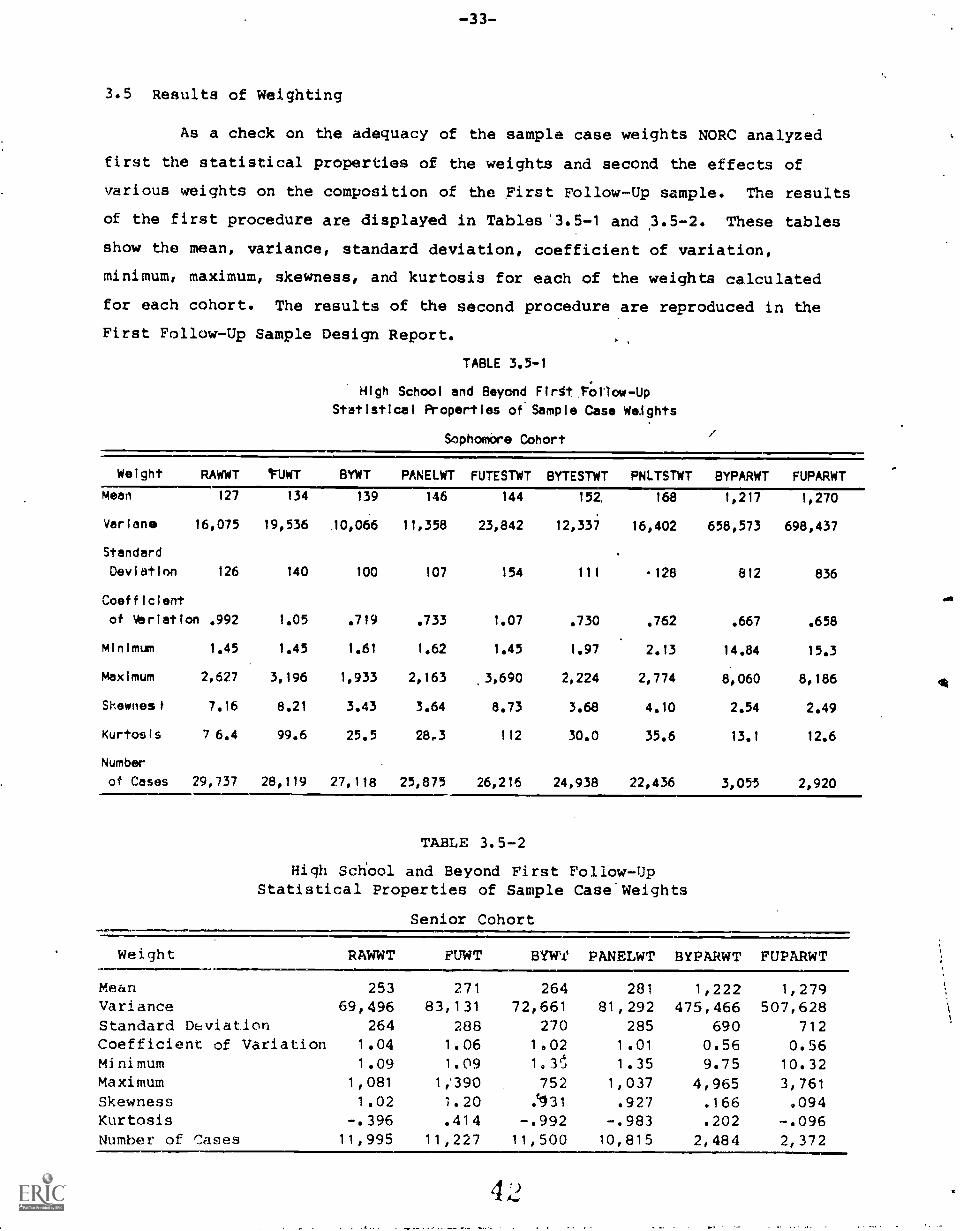
3.5 Results of Weighting
As a check on the adequacy of the sample case weights NORC analyzed
first the statistical properties of the weights and second the effects of
various weights on the composition of the First Follow-Up sample. The results
of the first procedure are displayed in Tables'3,5-1 and 3.5 -2. These tables
show the mean, variance, standard deviation, coefficient of variation,
minimum, maximum, skewness, and kurtosis for each of the weights calculated
for each cohort. The results of the second procedure are reproduced in the
First Follow-Up Sample Design Report.
TABLE 3.5-1
High School and Beyond Firtt.Fonow-Up
Statistical Properties of Sample Case Weights
Sophomore Cohort
Weight RAWWT BYWT PANELWT FUTESTWT BYTESTWT PNLTSTWT BYPARWT FUPARWT
Mean 127 134 139 146 144 152. 168 1,217 1,270
Varian. 16,075 19,536 10,066 11,358 23,842 12,337 16,402 658,573 698,437
Standard
Deviation 126 140 100 107 154 111 128 812 836
Coefficient
of Mariation .992 1.05 .719 .733 1,07 .730 .762 .667 .658
Minimum 1.45 1.45 1,61 1.62 1.45 1.97 2.13 14.84 15.3
Maximum 2,627 3,196 1,933 2,163 .3,690 2,224 2,774 8,060 8,186
Shewnest 7.16 8.21 3.43 3.64 8.73 3.68 4.10 2.54 2.49
Kurtosis 7 6.4 99.6 25.5 28,3 112 30.0 35.6 13.1 12.6
Number
of Cases 29,737 28,119 27,118 25,875 26,216 24,938 22,436 3,055 2,920
TABLE 3.5-2
High School and Beyond First Follow-UpStatistical Properties of Sample Case.Weights
Senior Cohort
Weight RAWWT FUWT BYWT PANELWT BYPARWT FUPARWT
Mean 253 271 264 281 1,222 1,279Variance 69,496 83,131 72,661 81,292 475,466 507,628Standard Deviation 264 288 270 285 690 712Coefficient of Variation 1.04 1.06 1.02 1.01 0.56 0.56Minimum 1.09 1.09 1.3'., 1.35 9.75 10.32Maximum 1,081 1;390 752 1,037 4,965 3,761Skewness 1.02 1.20 .131 .927 .166 .094Kurtosis -.396 .414 -.992 -.983 .202 -.096Number of Cases 11,995 11,227 11,500 10,815 2,484 2,372
4

-34-
3.6 Design Effects and Standard7rors
Since the High School and Beyond sample is a stratified and dispropor-
tionately selected probability sample of schools, simple random sampling (SRS)
formulas will underestimate the sampling variance and standard error of
statistics such as means and proportions. The smpling variance is, in fact,
larger than such calculations would indicate. Thus, tests of statistical
significance based on the SRS standard error or sampling variance are
nonconservative.
The degree of underestimation can be approximated by calculating a
quantity known as the design effect (DEFF). The design effect is a measure of
the efficiency of the sample estimate relative to a simple random sample. It
is defined as the ratio of the actual variance of un estimate' to the variance
of the same estimate from a simple random sample with the same number of
cases.
For the student data files NORC estimated design effects for a repre-=
sentative set of First Follow-Up variables using the method of Balanced
RepliCations (BRR).1 TheS7a-1-esults are presented in section 3.6.2. These
calculations show estimated design effects for the senior cohort for sample
proportions that ranged from 0.8 to 7.2, with an average design effect of 2.6
across 30 proportions.
3.6.1 School Level Data
BRR estimates have not been calculated for theischool questionnaire or
course offerings and enrollments data, but the increase in sampling variance
due to differential weighting can be estimated from the relative variance of
the sample case vreights using the following formula:
where
DEFF =x1 + RV (WT)
RV(WT) = the relative variance of the sample case weights.
(The relative variance of the weights is equal to the variance of the weights
divided by the square of the mean of the weights. It is also identically
equal to the square of the coefficient of variation of the weights.)
1
See Chapter 5 of the First Follow-Up Sample Design Report, NORC,1983, for a discussion of BBR Methods.. , 43

Applying this formula t3 the two weights (WEIGHT AND ENRLWT) on the
course offerings and enrollment data file produces estimates for the design
effects associated with these weights:
DEFF1= 1 + (1.45) 2 = 3.11
DEFF2
= 1 + (1.44) 2 = 3.07
where
DEFF1 = course offerings design effect
DEFF2 = enrollments design effect
Clearly, the design effects (which are only rough estimates) are so similar
that for all practical purposes they may be considered to be identical.
It should be noted that this fdrmula probably overestimates the design
effect because it fails to take into account two factors that contribute to a
reduction in sampling variance. The first of their is a reduction in variance
due to stratification. Stratification of the first-stage selections (schools)
may be expected to reduce the sampling variance. This reduction may amount to
approximately 5 or 10 percent.1 The sampling variance is further reduced
by the fact that the HS&B sample is a significant fraction of the total
population of U.S. high schools. Thus, a finite population correction equal
to (1 - f), where f is the sampling fraction, should be applied to the
estimated sampling variance.2 In this case, f = 1,015/21,174 = .05 and (1
f) = .95. Thus, taking account of these two factors that may act to reduce
the sampling variance, the design effect may, in fact, be closer to 2.66
(3.11 x .95 x .90 = 2.66).
4Calculations conducted by Research Triangle Institute (RTI) on theNLS-72 Base Year data indicated that stratification of the first-stage selec-tions resulted in a variance reduction of approximately 20 percent. Since theHS&B sample design (including the stratifying variables) is very similar tothe NLS-72 design, estimating a 10 percent reduction in variance due tostratification is probably conservative. (See NCES, National LongitudinalStudy of the High School Class of 1972 -- Sample Design Efficiency Study:Effects of Stratification, Clustering, and Unequal weighting on the Variancesof NLS Statistics (Washington, DC: U.S. Government Printing Office, 1977.)
2Actually, the sampling fraction (f) varies from stratum to hstratum. The correction provided here is a whole sample average of theseparate stratum by stratum sampling fractions.

It should be emphasized that the estimated design effect (both before
and after the corrections that have been suggested) iv a rough estimate
only. The concept of design effect is, however, an important one, and users
who are .concerned with the standard error of estimates derived from the school
sample should be aware of the fact that the complex sample design has
significant effects on the precision of estimates computed from the sample
data. A conservative approach to the school sample might assume a design.
effect of 3.0. A less conservative (but reasonable) approach might assume a
design effect of 2.5. The following paragraphs suggest how the design effect
should be used to adjust sample estimates of the sampling variance and
standard error.
The estimated design effect (DEFF) can be used along with the simple
random sample sampling variance (VARSRS) to estimate the actual sampling
variance under the complex sample deign (VARcom).
VAR = DEFF x VARSRSSRS
Similarly, the square root of the estimated design effect (DEFT) can
be used with the SRS standard error (S S) to estimate the standard error
under the complex sample design (SEcom
SE = DEFT x SESRSSRS
For proportions, the SRS sampling variance is just
w
in which
vAR = p(1 - p)/nSRS
p = the estimated proportion (using the weighted data)
n = the unweighted number of valiiobservations
The standard error of the proportion is the square root of VARSRS.
For means, the SRS sampling variance (VARsRs(X)) is the variance of
the observations divided by the number of valid observations. For this data
set the variance of the observations should be computed on a weighted basis
but the number of observations should be the unweighted number of valid cases.
VARSRS
(X) = WGTVAR(X)/n
4()

where
WGTVAR(X) = the weighted variance of the observations
n = the unweighted number of valid observations
In summary, since the estimated design effect is greater an 1.0,
sampling variances and standard errors under the complex sample design are
actually larger than those estimated by SRS formulas. A conservative approach
to the sample estimates would take thit into account. Rough estimates
indicate that the average design effect for the school sample is between 2.5
and 3.0. Using this estimate and the procedures outlined above, the user can
adjust the SRS results to more nearly approximate the truegsampling variance
under the complex sample design. The result, in practical terms, is to
enlarge the confidence intervals that may be computed and to shrink the
critical regions in tests of statistical significance. Using a design effect
of 3.0 will represent a conservative approach to statistical inference based
on this data set. It should be noted that empirical research suggests that
design effects for more complex statistics such as differences of means or
proportions and correlation and regression coefficients' are lower than for
simple estimates Suchas means or proportions.1 Finally, becauie of the
highly disproportionate selection probabilities and consequent dispropor-
tionate weights, unweighted analyses with this data set are not recommended,
If the user has any doubt about the importance of the weights, he or she
should compare the weighted and unweighted percentage frequency distributions
provided in the codebook.
3.6.2 Student Level Data
This section presents three sets of standard errors and design effects
for the senior and sophomore cohorts. Table 3.6-1 provides tan ard errors
for statistics based on data from the First Follow-Up ques onnaire. Table
3.6-2 provides standard errors for the same statistics, th s time based on
1 Leslie Kish and Martin R. Frankel, "Inference from Complex Samples,"Journal of the Royal Statistical Society, B, 1974, 1-37, and Martin R.Frankel, Inference from Survey Samples (Ann. Arbor: Institute for SocialResearch, University of Michigan, 1971).
40

responses to the Base Year questionnaire; the statistics use data from members
of the senior cohort who were selected for the First Follow-Up sample and who
participated during the Base Year. Table 3.6-3 presents estimates of the
change in each of the statistics and the standard error of that change
estimate. The change estimates were calculated using individual change scores
from respondents who participated in both the Base. Year and First Follow-Up.
The standard errors for those estimates, thus, take into account the0
correlation between Base Year and First Follow-Up responses.- .
The estimates in Table 3.6-1, 3.6 -2,, and 3.6-3 are weighted
estimates. The procedures for calculating 'these weights were described in
section 3.4, above. The proportions in Table 3.6-1 use the Follow-Up weight
(FUWT); those in Table .6-2 use the Base Year weight (BYWT); those in
Table 3.6-3 use the Pan 1 weight (PANELWT). The averages developed for the
test scores (sophomore cohort only) use the analogous test weights (FUTESTWT,
BYTESTWT, and PNLTSTWT):
All of the standard errors in the tables were calculated using the
method of Balanced Repeated Replication (BRR). BRR employs a very simple
algorithm: it divides the sample repeatedly into half-samples and compares
the estimates obtained from each of the half-samples with the estimate
obtained from the entire sample. The differences between half- sample /and
entire sample estimates are used to estimate the standard error. BRR is
described in more detail in the First Follow-Up Sample Design Report.
In addition to standard errors, all three tables give design effects
for each estimate (DEFFs) and the square roots of each design effect (DEFTs).
The design effect is a measure of the efficiency of the sample estimate
relative to a simple random sample. It is defined as the ratio of the actial

-39-t
TABLE 3.6-1(a)
High School and Beyond First Follow-Up Estimated Proportion or Average,Standard Error, and Design Effect
Sophomore Cohort
Weight = FUWT, for Proportions= FUTESTWT, for Averages
ItemStatistic Number* Estimate SE DEFF DEFT
ProportionsIn vocational program 2 0.270 0.007 6.922 2.631Worked last week 24 0.532 0.005 2.804 1.675Working at clerical job 29 0.250 0.005 3.080 1.755"People goof off at work" 33A 0.132 0.004 2.958 1.720"Work better than school" 33C 0.513 0.005 2.149 1.466"Work encourages good habits" 3 3D 0.789 0.004 2.114 1.454Father non-professional 53A 0.887 0.005 6.276 2.506Father finished college 55 0.213 0.007 7.040 2.653Mother finished coljege 56 0.136 0.005 5.374 2.318Watch more than hour TV 61 0.791 0.003 1.480 1.217Success in work very import.0 73A 0.860 0.003 1.960 1.400Money not important 73C 0.103 0.003 2.549 1.597Being community leader imp. 73F 0.476 0.006 3.748 1.936Living close to parents imp. 73H 0.707 0.005 3.147 1.774Leisure not important 73L 0.017 0.001 1.552 1.246Positive attitude to self 75. 0.932 0.002 1.564 1.250"Luck more imp. than work" 75B 0.127 0.003 1.986 1.409"Someone prevents success" 75E 0.256. ,0.005 3.122 1.767"Plans don't work out" 75F 0.199 0.004 2.434 1.560"Not much to be proud of" 75L 0.126 0.003 1.992 1.411Correcting inequality not imp. 73J 0.396 0.004 1.738 1.318No serious trouble with law 76A 0.949 0.003 4.845 2.201Expect to finish college 80 0.382 0.007 5.288 2.300Satisfied with less than college 82 0.744 0.006 4.693 2.166Physically unattractive 76 0.103 0.003 2.480 1.575Married 97A 0.035 0.002 2.883 1,698ExpeCting children by 25 97B 0.538 0.005 2.404 1.550Expecting own place by 24 97D 0.921 0.002 1.326 1.151Expecting no children 98 0.089 0.03 2.706 1.645Hard of hearing 103C 0.019 0.001 1.472 1.213
AveragesVocabulary score 10.367 0.085 5.776 2.403Reading score 7.657 0.072 5.217 2.284Math, part 1 score 10.820 0.143 7.407 2.722Math, part 2 score 2.736 0.041 5.031 2.243Science score 9.475 0.073 5.969 2.443Writing score 9.503 0.074 4.993 2.234Civics score 5.441 0.037 4.326 2.080
MEAN (Proportions only) 3.136 1.719MEAN (All statistics) 3.589 1.837MEDIAN 2,958 1.720MINIMUM 1.326 1.151MAXIMUM 7.407 2.722RANGE 6.081 1.570STANDARD DEVIATION 1,804 0.470
*Follow-Up questionnaire number.
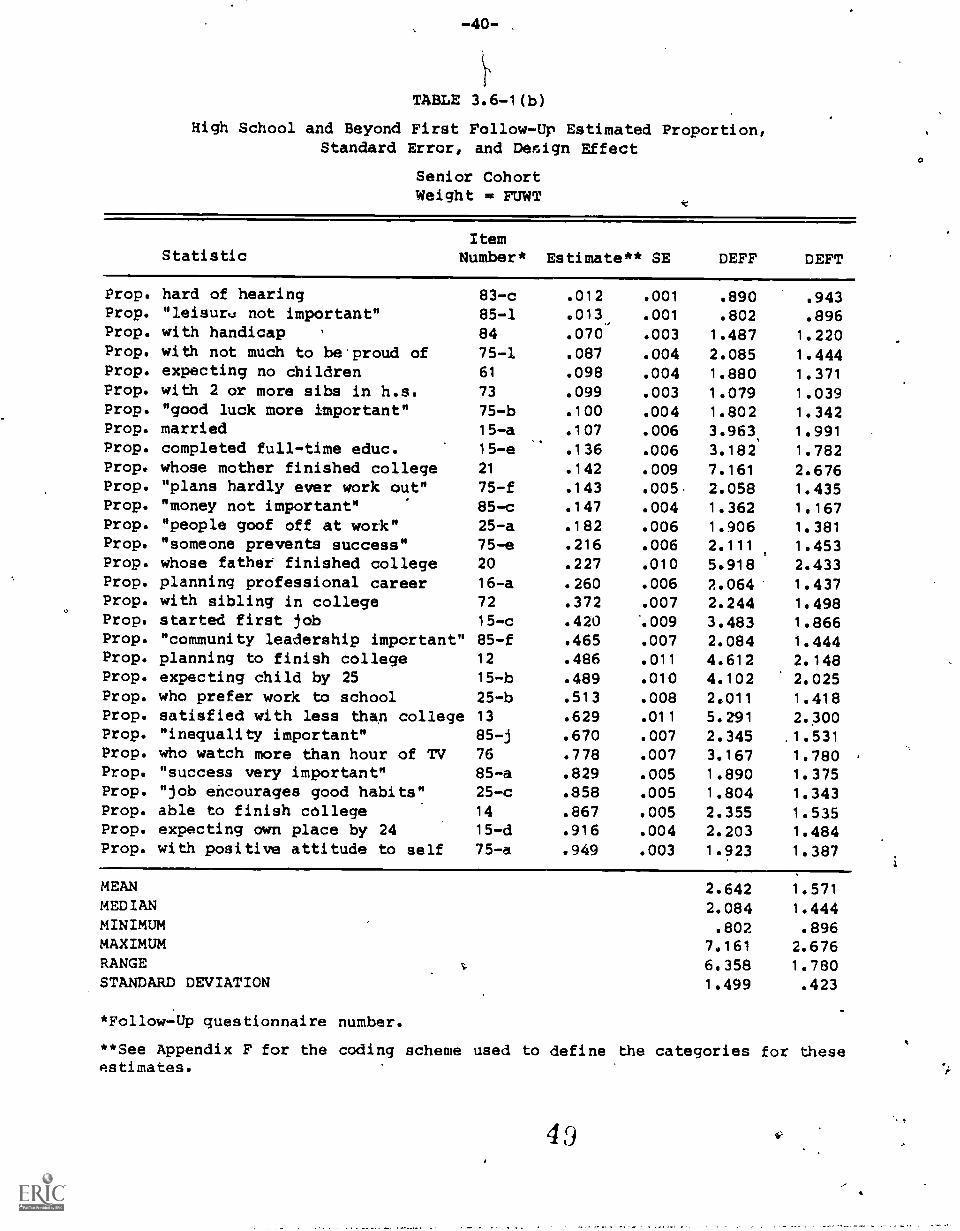
-40- ,
TABLE 3.6-1(b)
High School and Beyond First Follow-Up Estimated Proportion,Standard Error, and Deragn Effect
Senior CohortWeight = FUWT
StatisticItem
Number*
Prop. hard of hearing 83-cProp. "leisuro not important" 85-1Prop. with handicap 84Prop. with not much to be of 75-1Prop. expecting no children 61
Prop. with 2 or more sibs in h.s. 73
Prop. "good luck more important" 75-bProp. married 15-aProp. completed full-time educ. 15-eProp. whose mother finished college 21
Prop. "plans hardly ever work out" 75-fProp. "money not important" 85-cProp. "people goof off at work"Prop. "someone prevents success"Prop. whose father finished collegeProp. planning professional careerProp, with sibling in collegeProp. started first job 15-c
Prop. "community leadership important" 85-fProp. planning to finish college 12
Prop. expecting child by 25 15-bProp. who prefer work to school 25-bProp. satisfied with less than college 13Prop. "inequality important" 85-j
Prop. who watch more than hour of TV 76
Prop. "success very important" 85-aProp. "job encourages good habits" 25-cProp. able to finish college 14
Prop. expecting own place by 24 15-dProp. with positive attitude to self 75-a
25-a75-e20
16-a
72
MEANMEDIANMINIMUMMAXIMUMRANGESTANDARD DEVIATION
Estimate** SE DEFF DEFT
.012 .001 .890 .943
.013,, .001 .802 .896
.070 .003 1.487 1.220
.087 .004 2.085 1.444
.098 .004 1.880 1.371
.099 .003 1.079 1.039
.100 .004 1.802 1.342
.107 .006 3.963, 1.991
.136 .006 3.182 1.782
.142 .009 7.161 2.676
.143 .005 2.058 1.435
.147 .004 1.362 1.167
.182 .006 1.906 1.381
.216 .006 2.111 1.453
.227 .010 5.918 2.433
.260 .006 2.064 1.437
.372 .007 2.244 1.498
.420 ..009 3.483 1.866
.465 .007 2.084 1.444
.486 .011 4.612 2.148
.489 .010 4.102 2.025
.513 .008 2.011 1.418
.629 .011 5.291 2.300
.670 .007 2.345 1.531
.778 .007 3.167 1.780
.829 .005 1.890 1.375
.858 .005 1.804 1.343
.867 .005 2.355 1.535
.916 .004 2.203 1.484
.949 .003 1.923 1.387
2.642 1.571
2.084 1.444.802 .896
7.161 2.6766.358 1.7801.499 .423
*Follow-Up questionnaire number.
**See Appendix F for the coding scheme used to define the categories for theseestimates,
4 9

-41-TABLE 3.6-2(a)
High School and Beyond First Follow-Up Estimated Proportion or Average,Standard Error, and Design Effect
Sophomore CohortWeight = BYWT, for proportions
= BYTESTWT, for averages
Item
Statistics Number* Estimate SE DEFF DEFT
ProportionsIn vocational program 1 0.212 0.006 5.705 2.389Worked last week 24 0.362 0.005 2.901 1.703Working at clerical job 27 0.082. 0.003 2.649 .1.628"People goof of at work" 30A 0.163- 0.003 1.356 1.164"Work i...etter than school" 30C 0.557 0.006 3.050 . 1.746Nork encourage good habits" 30D 0.722 0.003 0.945 0.972Father non-professfbnal 38 0.883 0.004 3.182 1.7g4Father finished college 39 0.225 0.007 5.308 2.304Mother finished college 42 0.139 0.005 4.508 2.123Watch more than hour TV 48 0.909 0.003 2.896 1.702Success in work very import. 61A 0.850 0.003 1.846 1.359Money not important 61C 0.102 0.003 21556 1.599Being communit§ leader imp. 61F 0.539 0.005 2.578 1.606_Living close to paLants imp.. 61H 0.749 0.004 2.200.! 1.'483
Leisure aot important 73t 0.022 0.001 1.189 1.091Positive attitude to self 62A 0.909 0.002 1.131 1.064"Luck mori- imp. than work" 62B 0.155 0.003 1.612 1.270"Someone prevedts success" 62E 0.301 0.004 1.736 1.317"Plans don't work ,out" 62F 0.221 0.004 2.190 1.480"sot much to be proud of" 62L 0.156 0.003 1.623 1.274Correcting. inequality not imp. , 61J 0.363 0.003 1.003 1.001No serious trouble with law 67A 0.944 0.002 1.944 1.394Expect to finish college 69 0.397 0.006 3.916 1.979Satisfied with less than college 71 0.800 0.005 3.943 1.986Physically unattractive* 67C 0.166 0.003 1.606 1.267Married 78A 0.003 0.000 .111 JOIN AND IMMI
Expecting children by 25 78B 0.583 0.004 1.563 1.250Expecting own place by 24 78D . 0.929 0.002 1.469 1.212Expecting no children 80 0;101 0.003 2.458 1.568Hard of hearing 88C 0.024 0.001 1.034 1:017
AveragesVocabulary score 8.479 0.068 4.070 2.017Reading score 6.649 0.060 4.025 2.006Math, part 1 score. 9.801 0.116 5.646 2.376Math, part 2 score 2.494 0.039. 5.148 2.269Science score 8.777 0.069 5.540 2.354Writing score 8.127 0.070 4.523 2.127Civics score 4.479 -0.039' 5.182 2.276
MEAN (Proportions only) 2.417 1.508MEAN (All statistics) 2.695 1.643MEDIAN 2.567 1.602MINIMUM .945 .972MAXIMUM 5.705 2.389RANGE 4.760 1.417STANDARD DEVIATION
r.)
t
-.t
1.523 .448
*Base Year questionnaire number.

-42-
TABLE 3.6 -2(b)
High School and Beyond First Follow -Up, Estimated Proportion,Standard Error, and Design Effect
Senior CohortWeight = BYWT
Statistic\
Prop. hard of hearingProp. "leisure not important"Prop. with handicap.Prop. with not much to be proud ofProp. expecting no childrenProp'. with 2 or more sibs in his.Prop. "good luck more important"Prop. marriedProp. completed full-time educ.Prop. whose mother finished collegeProp. "plans hardly ever work out"Prop. "money not important"Prop. "people goof off at work",Prop. "someone prevents success"Prop. whose father finished collegeProp. planning professional careerProp. with sibling in collegeProp. started first jobProp. "community leadership important"Prop. planning to finish collegeProp. expecting child by 25Prop. who prefei work to schoolProp. satisfied with less than collegeProp. "inequality important",Prop. who watch more than hour of TVProp. "success very important"Prop. "job encourages good habits"Prop. able to finish college
24Prop. expecting awn place byProp. with positive attitude to self
MEANMEDIANMINIMUMMAXIMUMRANGESTANDARD DEVIATION
*Base Year SPSS variable name.
**See Appendix F for the coding scheme used to define the categories for theseestimates.
ItemNumber* Estimate** SE DEFT DEFT
88087C .018 .002 2.404 1.55188057L .021 .002 2.184 1.478B8088 .054 .003 1.932 1.390BE058L .116 .005 2.563 1.601B8082 .098 .005 3.037 1.743EB099 .141 .005 2.222 1.491880588 .121 .004 1.573 1.25488081A .010 .002 4.300 2.074BB081E .013 .001 0.844 0.919BB042 .148 .008 4.915 2.21788058F .188 .006 2.434 1.56088057C -0'16 .005 2.710 1.64688027A .169 .005 1.667 1.29188058E .236 .007 2.763 1.662BB039 .245 .011 5.461 2.337BB062 .269 .005 1.390 1.179EB098 .314 .007 2.443 1.56388081C .170 .005 1.868 1.36788057F .510 .008 2.815 1.678BB065 .457 ,.009 3.646 1.909BB081B .523 .010 4.151 2.038BB027C .515 ..007 1.850 1.360BB067 .713 .009 4.329 2.081
BB057J .610 .008 2.969 1.723BB048 .848 .006 3.150 1.77588057A .880 .004 1.695 1.30288027D .787 .006 2.104 1.450B8069 .803 .005 1.744 1.321BB081D .913 .004 2.123 1.45788058A .908 .006 4.564 2.136
2.728 1.6182.438 1.561
0.844 0.9195.461 2.337...616 1.4181.136 0.336

TABLE 3.6-3(a)
High School and Beyond First Follow -Up Estimated Change ofProportion or Average, Standard Error, and Design Effect
Sophomore CohortWeight am PANELWT, for proportions
= PNLTSTWT, for averages
StatisticChange,Estimate Si DEFF DEFT
ProportionsIn vocational program 0.054 0.004, 1.646 1.283Worked last week 0.177 0.005 1.651 1.285Working at clerical job 0.168 0.005 2.033 1.426"People goof off at work" -0.033 0.004 1.184 1.088"Work better then school" -0.046 0.006 1,487 1.220"Work encourage good habits" 0.077 0.005 1.356 1.165Father non-professional 0.002 0.002 0.952 0.976Father finished college -0.001 0.002 1.242 1.114Mother finished college -0.002 0.002 1.601 1.265Watch more than hour TV -0.116 0.003 1.193 1.092Success in work very import. 0.009 0.004 1.925 1.387Money not important 0.000 0.003 1.577 1.256Being community leader imp. -0.057 0.005 1.751 1.323Living close to parents imp. -0.046 0.005 2.130 1.460Leisure not important -0.006 0.002 2.779 1.667Positive attitude to self 0.027 0.003 1.801 1.342"Luck more imp. than work" -0.030 0.004 2.087 1.445"Someone prevents success" -0.047 0.005 1.810 1.345"Plans don't work out" -0.026 0.004 1.413 1.189"Not much to be proud of" -0.036 0.004 1.8j3 1.354Correctin4 inequality not imp. 0.033 0.005 1.608 1.268No serious trouble with law 0.007 0.00", 1.405 1.185Expect to finish college -0.021 0.004 1.728 '1.315
Satisfied with less than college -0.059 0.004 1.937 1.392Physically unattractive -0.063 0.004 2.081 1.443Married 0.035 0.002 2.198 1.483Expecting children by 25 -0.037 0.005 1.613 1.270Expecting own place by 24 -0.008 0.003, 1.655 1.286Expecting no children -0.020 0.004 3.026 1.740Hard of hearing -0.004 0.002 3.338 1.827
AveragesVocabulary score 2.071 0.040 2.816 1.678Readin9 score -1.17 0.026 1.145 1.070Math, part 1 score 1.352 0.053 2.541 1.594Math, part 2 score
'\
0.317 0.024 1.926 1.388Science score 0.884 0.033 2.044 1.430Writing score 1.603 0.044 2.871 1.695Civics score 1.056 0.035 3:451 1.858
MEAN (Proportions only) 1.801 1.330MEAN (All statistics) 1.945 1.368MEDIAN 1.801 1.342MINIMUM .952 .976MAXIMUM 3.451 1.858RANGE rcr) 2.499 .882STANDARD DEVIATION
ti.611 .213

TABLE 3.6 -3(b)
, High School and Beyond First Follow-Up Estimated Change ofProportiont-Standard.Error, and Design Effect
Senior CohortWeight = PANELWT
Statistic
Prop. hard of hearingProp. "leisure not important"Prop. with handicapProp. with not much to be proud ofProp. expecting no childrenProp. with 2 or more sibs in h.s.Prop. "good luck more important"Prop. marriedProp. completed full-time educ.Prop. whose mother finished collegeProp. "plans hardly ever work out"Prop. "money not important"Prop. "people goof off at work"Prop. "someone prevents success"Prop. whose father finished collegeProp. planning professicial careerProp. with sibling in college e
Prop. started first jobProp. "community leadership important"Prop. planning to finish collegeProp. expecting child by 25Prop. who prefer work to schoolProp. satisfied with less than collegeProp. "inequality important"Prop. who watch more than hour of TVProp. "success very important"Prop. "job encourages good habits"Prop. able to finish collegeProp. expecting own place by 24Prop. with positive attitude to self
MEANMEDIANMINIMUMMAXIMUMRANGESTANDARD DEVIATION
ChangeEstimate* SE DEFF DEFT
-.006 .002 2.060 1.435-.009 .002 1.408 1.187+.015 .005 2.435 1.560-.029 .005 1.520 1.233-.004 .005 1.978 1.407-.043 .005 1.844 1.358-.022 .005 1.588 1.260+.095 .005 2.676 1.636+.116 .005 1.949 1.396-.001 .004 2.988 1.729-.047 .006 1.578 1.256+.030 .008 4.178 2.044+.015 .008 1.693 1.301-.026 .008 2.36 1.522+.002 .004 2.894- 1.701-.010 .006 1.395 1.181+.067 .010 3.323 18823+.247 .008 1.977 1.406-.040 .008 2.155 1.468-.005 .006 1.998 1.414-.032 .007 1.433 1.197-.010 .010 1.653 0.126-.079 .006 1.720 1.312+.062 .010 2.915 1.707-.071 .007 2.207 1.486
-.047 .007 2.613 1.617+.060 .008 1.892 1.376+.066 .006 2.354 1.534+.003 .006 2.590 1.640+.043 .005 2.415 1.554
2.195 1.4682.029 1.4251.395 1.181
4.178 2,0442.783 1.863
0.640 0.207
*See Appendix F for the coding scheme used to define the categories for theseestimates.

variance of an estimate (i.e., the square of the standard error given in the
table) to the variance of the same estimate from a simple random sample with
the same number of cases. For proportions, the simple random sample variance
is just
in which
VAR(SRS) = p(1 - p)/n
p = the estimated proportion
n = the number of cases with non-missing data
Like almost all national samples, the High School and Beyond sample is not a
simple random sample. The High School and Beyond sample departs from the
model of simple random sampling in three major respects: the observations are
clustered at the school level; major groups (such as students who attended
private schools) are deliberately represented disproportionately; and the
sample is stratified by type of school. Each of these departures from simple
random sampling has a predictable effect on efficiency, an effect that is
reflected in the design effect.
Table 3.6-1(a) shows that the mean design effect for the 37 sophomore
statistics is 3.59. This is somewhat higher than the mean (2.88) observed
during the Base Year Survey (see Frankel, et al., p. A-4). The sample of
sophomores .for the First Follow-Up differs from the Base Year sophomore sample
in several key respects. Although the bulk of.the Base Year sophomore sample
was retained for the First Follow-Up with certainty, a few groups were sub-
sampled. The subsampling introduces additional variability into the Follow-Up
weights; the added variability of the weights reduces the efficiency of the
sample, which is reflected in the larger design effects. The largest
contributors to this loss of efficiency were Base Year non-participants who
dropped out of school prior to the First Follow-Up. This group--consisting of
about 500 selected cases--was sampled at a rate of .10; the mean Follow-Up
weight for this group is about 15 times larger than the mean weight for the
rest of the sample.
Table 3.6-1(b) shows that the mean design effect for the 30 senior
proportions is 2.64. This is very close to the mean (2.69) observed during
the Base Year Survey (see Frankel, et al., p. A-24). The sample of seniors
for the First Follow-Up differs from the Base Year senior sample in several
key respects. First of all, the sample is much smaller (11,995 selected cases
versus 34,982), which means that the average cluster size (selections per
school) is much smaller. Reducing the cluster size should increase the
efficiency of the sample. On the other hand, the First Follow Up sample of
seniors represents some grceps even more disproportionately than the Base Year
sample did; this greater disproportionality should decrease the efficiency of
the First Follow-Up sample by introducing additional variability into the
weights. Apparently, the ceffects of the reduced cluster size and the
increased disproportionality offset each other--the Base Year and First
Follow-Up samples exhibit very similar mean design, effects.
Table 3.6-2 displays estimates for the Base Year sample using data
from Base Year participants who were selected for the First Follow-Up
sample. The questionnaire items in Table 3.6-2 are identical to those in
Table 3.6-1 but the estimated proportions and standard errors are based on
responses to these items in the Base Year questionnaire. For the most part,
these items were repeated verbatim in the First Follow-Up questionnaire. In
the Sophomore Follow-Up questionnaire, response options were reordered for one
item. Table 3.6-2(a) shows that the mean design effect is 2.90; this is very
close to the fig'ire (2.88) calculated during the Base Year. The mean design
effect in Table 3.6-2(a) is lower than the mean in Table 3.6-1(a) (2.90 vs.
3.59); the estimates for the Follow-Up sophomore sample are relatively less
efficient than estimates for the Bas. Year sophomorts. This difference
probably reflects the increased variability of the Follow-Up weights. Table
3.5-1 shows that the variance for. BYWT is 10,066, while the variance for FUWT
is 19,530. As noted above, the chief source of this increased variation in
the Follow-Up weights was Base Year non-participants who dropped out of
school; this group was subs.ampled in the First Follow-Up at a rate of .10. In
the Senior Follow-Up questionnaire, three items had an additional response
option. As Table 3.6-2(b) shows, the mean design effect is 2.73; a value that
does not depart sharply from the analogous figure calculated during the Base
Year. Once again, the reduced cluster size for the First Follow-Up sample
seems to have offset the effect of increased oversampli ng on the overall
efficiency of the sample.
Table 3.6-3 shows standard errors and design effects for the change
statistics. The change statistics were computed by taking the weighted mean
of the changes shown by each respondent who participated at both time points.
The standard errors (and design effects) thus reflect the fact that whether
a respondent was, for example, hard of hearing during the Base Year is
correlated with his or her being hard of hearing during the First Follow-Up.

The change estimates are directional: a negative estimate indicates that
fewer respondents fell into the category of interest hard of hearing)
during the follow-up survey; a positive estimate indicates that more respon-
dents fell into the category. The mean design effects in Table 3.6-3 are
lower than those for Tables 3.6-1 and 3.6-2. This probably reflects the fact
that complex estimates (such as change estimates) generally exhibit a smaller
design effect than simple estimates.
The mean design effects given in Tables 3.6-1, 3.6-2, and 3.6-3 can be
used.to calculate approximate standard errors for other estimates not included
in the tables. For example, the standard'error of a proportion can be esti-
mated using the square root of the simple random sample variance times the
mean root design effect (DEFT):
SE = DEFT x (p(1-p)/n)**1/2
Similarly the standard error for a change in proportion can be calculated as
the mean DEFT times the square root of the weighted variance of the change
scores:
in which
SE = DEFT x (WTVAR/n)**1/2
WTVAR = weighted variance of the individual change scores
n = unweighted number of valid observations
DEFT = mean of the root design effects for change estimates
The appropriate weight to use in calculating the variance for change estimates
is the panel weight (PANELWT). For a description of the sampling procedures
used for the Transcripts Survey see section 7.2.

4. DATA COLLECTION
4.1 Overview
To date, High School and Beyond has compiled data from five primary
sources: school administrators, teachers, students, students' administrative
records (transcripts), and parents of selected students. In the Base Year
(1980) survey, 1,015 secondary schools served as the primary sampling units
for the study. The principal or headmaster of each school was asked to
complete a school questionnaire and to provide materials essential for the
sampling of students in the tenth and twelfth grades. Samples of approxi-
mately 36 students in each grade were asked to fill out a Student Identifica-
tion Booklet (which included several items on the use of non-English languages
as well as confidential identifying information) and a student questionnaire,
and to take a timed cognitive (achievement) test. Teachers of selected ,
students were asked to fill out brief Teacher Comment Forms containing
10 items on student traits and behavipr. During the fall following the Base
Year survey, data was colledted from over 7,100 parents of student respondents
(roughly half from each student cohort). This data focuses primarily on
parents' ability to finanne postsecondary education for their sons and
daughters.
The First Follow-Up added a second wave of data from students in the
spring of 1982. All 1980 sophomores (now seniors) who were still enrolled in
their Base Year schools were asked to fill out a questionnaire and to retake
the test that had been administered two years earlier. A stratified subsample
of school leavers within the sophomore cohort (dropouts, transfers, and early
graduates) was resurveyed and retested. School administrators were again
asked to complete a school questionnaire and to provide information on the
secondary level course offerings and enrollments for their institutions. In
the fall of 1982, high school transcripts were requested for a probability
sample of approximately 18,500 members of the 1980 sophomore cohort. As part
of the First Follow-Up, questionnaire data was sought from a stratified sample
of over 12,000 1980 seniors.
In this section the data and materials collected for the High School
and Beyond Base Year and First Follow-Up surveys are described. These
materials and activities are also described in the respective data file user's
manuals and in the Sample Design Report for the First Follow-Up of High School
and Beyond.5 1
4.2 Data and Materials Collected at the School Level
Three broad types of school level information have been compiled for
High School and Beyond: school questionnaires, course offerings and enroll-
ments, and Teacher Comment Forms. School personnel were also asked to provide
such materials as student rosters (see the Base Year Sample Design Report),
class schedules, and so on, which are not part of the public use data base and
are not discussed here.
4.2.1 School Questionnaires
In both the Base Year nd the First Follow-Up, principals and head-
masters (or their designates) were asked to completa questionnaires containing
basic questions on such institutional characteristics as type of control,
ownership, total enrollment, proportions of students and faculty belonging to
policy-relevant groups, participation in Federal programs, per-pupil expendi--
tures and so on. This information is stored primarily in a separate data
file that may be easily merged with student data files or the course offerings
file described below. In addition, approximately 19 of the most basic school
characteristics have been stored on the student data file in order to
facilitate he classification of students according to their school
environment.
School questionnaires were sought from all 1,015 participating schools
during the Base Year survey. In the First Follow-Up, school data was
requested from those schools still in existence as independent institutions
(i.e., that had not closed or merged with other schools), and that still had
members of the 1980 sophomore cohort currently enrolled. Thus, no follow-up
data was collected from schools that closed, merged with other schools, or had
no tenth or twelfth grade during the Base Year survey. In a few instances
when students from a Base Year school were transferred en masse to a different
school, or when two schools within a district merged, school questionnaires
were sought from the schools now attended by the sampled students. In such
cases, data from the new schools is available to be merged with student
records, but is maintained on separate school records in the HS&B school
questionnaire file. No new school data was sought for students who
transferred as individuals. (See Appendix A for a copy of the First Follow-Up
school questionnaire. See Appendix B.1 for a copy of the letter sent with the
school questionnaire.)

-.50-
4.2.2 Teacher Comment Forms
Teacher Comment Forms ware sought from all faculty members who had
taught any HS&B sampled students during the 1979-80 academic year. This data
was collected only during, the Base Year survey. Teacher Comment Forms asked
for perceptions about whither each selected student would probably go to
college, was working up to potential, seemed popular with others, had talked
with.the teacher about school work or plans, seemed to dislike schOol, had
enough self-discipline to hold a job, and had a physical or emotional handicap
that affected school work. Data from these forms has been compiled into
separate files with over 19,000 forms for each of the two student cohorts:
4.2.3 Course Offerings and Enrollments--Academic Year 1981-82
In the First Follow-Up only, school administrators were asked to
provide materials that would allow the construction of a complete listing of
all secondary level courses offered, complete with enrollment figures, for the
1981-82 academic year. This information was not requested in any prescribed
format, but was accepted in a variety of forms. In many instances, schools
were able to provide computer-generated printouts of Master Teaching Sche-
dules. In others, it was necessary t merge information from several sources
such as annotated course listings, catalogs, enrollment records. Procedures
were established to maximize the completeness and accuracy of these materials
(see below). In the data file r.mnstructed from these documents, each school
is represented by a block of records that indicate for each course offered a
6-digit course identification number, the duration and timing of the course .
(i.e., year-long, first semester, third quarter, etc.), the credits earned for
successful completion, and the total number of students enrolled in the course
during the entire 1981-82 academic year. This data set may be merged easily
with either the school questionnaire file, the student data files, or the
student transcript file.

-51-
4.2.4 Data Collection Procedures--School Level Data
. In both the Base Year and First Follow-Up surveys, it was first neces-
sary to secure a commitment from the administrator of each sampled school to
participate generally in the study. In the case of public schools, the
process was begun by contacting the chief state school officer (usually the
state Superintendent of Schools) to explain both the objectives of the study
and the data collection procedures (especially those for protecting individual
and institutional confidentiality), aid to identify the specific districts and
schools selected for the survey./ Once approval was gained at the state level,
contact was made with district superintendents and finally, once district
approval was granted, with school principals. Similarly, wherever selected
private schools were organized into an administrative hierarchy (e.g.,
Catholic school dioceses), approval was obtained at the superior level before
the school principal or headmaster was approached. (See Appendix B.1 for
copies of the letters sent to the school administrators.) Within each .
cooperating school, principals were asked to designate a School Coordinator
who would serve as a liaison between the NORC High School and Beyond staff and
the school administrator and selected students. The School Coordinator (most
often a senior guidance counselor) handled all requests for data and materials
as well as all logistical arrangements for student-level data collection on
the school premises.
In the Base Year, the School Coordinator assisted in assembling the
materials for student sample selection. In the First Follow-Up the coordi-
nator (usually the same individual) reviewed the school sample and assisted in
tdetermining students' current enrollment status, and in locating current
addresses for selected sophomore cohort school leavers and senior cohort Base
Year nonrespondents. (See Appendix B.1 for the Koster Update Form which was
used by the School Coordinator to review the student sample.)
School questionnaires were sent to coordinators in the Fall of 1979
for the Base Year and in the Fall of 1981 for the First Follow-Up. (Student
survey sessions were conducted between February and June of 1980 and 1982. In
most cases, school questionnaires were completed and returned to NORC before
the spring survey sessions. Most of the remainder were collected by NORC
Survey Representatives who visited participating schools to conduct student
survey activities. During the fall of 1981, a telephone shop was established

-52-
as part of the Transcrip*moSurvey, whose primary purpose was to call schools
that had not returned student transcripts. School contacts were. minimized by
covering several iters in one call. In addition to asking for transcripts,
interviewers retrieved missing data from critical items in the .school
questionnaire if necessary and reqwsted course enrollments and course
catalogs when they were missing. About 100 additional school questionnaires
were obtained as a result of this contact.
In the Base Year, coordinators were also asked to distribute some
67,000 Teacher Comment Forms to faculty members who might have taught HS&B
sampled students during the 1979-80 academic year. Completed forms were
returned to NORC in pre-addressed, prepaid envelopes by the teachersti
themselves.
During'the First Follow-Up, coordinators were asked to assemble course
offering and enrollment data to be given tc Survey Representatives at the time
of the student survey sessions. Although nearly 90 percent of the schools
provided course offerings information during the spring of 1982, the majority
were not able to provide enrollment figuies until the fall of that year, when
the schools were recontacted for student transcripts.
Finally, School Coor&nators were notified during the First Follow-Up
data collection period that they would be recontacted the following fall for
their assistance in conducting the Student Transcript Survey. Each coordi-
nator was sent a packet of materials including a list of selected students and
a reimbursement voucher to cover the costs of reproducing up to 36 (or 72 ip
the case of merged schools) high school transcripts for 1980 sophomores. (If
selected students had transferred individually to schools not in the HS&B
sample, transcript requests were sent directly to the principal of the last
school the student attended.) Initial transcript requests were followed
several weeks later by a combination of letters and telephone calls offering
further assistance (remailing of packets, etc.) to each nonresponding
school. Follow-up activities continued through January of 1983.
Table 4.1 displays the completion rates for school questionnaires
(both waves), course offering and enrollment data, and student transcript
collection efforts. (Completion rates cannot be calculated for Teacher
Comment Forms due to the absence of information on the total number of faculty
members who had taught HS&B sampled students during the Base Year).

TABLE 4.1
Response Rates for School Level Data Collection
SchoolQuestionnaires
Base FirstYear Follow-Up
NumberSelected 1,015 992 1
NumberResponding 997 970
ResponseRate 98% 98%
StudentTranscripts
Course Offering Enrollment HS&B Transfer 2
Data Data Schools Schools
992 1
955
96%
992 1
729
73%
992 1
949 3
96%
890
771 4
87%
1Note: Of the 992 schools from which full participation was sought
in the First. Follow-Up, 975 were among the initial 1,015 that participated inthe Base Year, and 17 were included because they received en blod transfers ofall students from Base Year HS&B schools. Of the 975 Base Year schoolseligible for the First Follow-Up, school questionnaires were obtained from 956or 98 percent.
2 Transfer schools are defined as those to which 1,065 HS&B studentshad transferred as individuals.
3 Of the 949 schools that responded, 4 were unable to furnishtranscripts since the sampled students had received a GED only, hot graduated,etc.
4 Of the 771 schools that responded, 115 were unable to 'furnishtranscripts since sampled students had never registered, transferred again,dropped out before earning credits, etc.
4.3 Student Questionnaire Data Collection
ti
Three types of student lavel data have been collected for High School
and Beyond: questionnaires for 1980 seniors, questionnaires for 1980
sophomores, and high schOol transcripts for 1980 sophomores. A thorough
discussion of transcript collection activities is presented in section 7.3.
In the Base Year survey, a single data collection methodology--on-
campus administration of questionnaires and tests to the entire sample of
students rom each selected school - -was employed for both student cohorts. In
the First Follow-Up, three distinct data collection plans were employed.
First, members of the 1980 senior cohort were surveyed primarily by mail.
Nonrespondents to the mail survey (approximately 25 percent of the elder
cohort sample) were
members of the 1980
schools, 'or who had
same district (over
modified version of
interviewee either in person, or by telephone. Second,
sophomore cohort who were still enrolled in Base Year
transferred as part of a class to another school in the
25,000 individuals), were resurveyed and retested using a
the Rase Year on-campus procedure. Third, school leavers
(dropouts, transfers, and early graduates) among the^a/980 sophomore cohort
were first subsampled using a disproportionate design (see Chapter 3 above).
These selected school leavers (approximately 4,600) were then invited to group1/4
sessions held at public facilities near their homes (usually libraries or
other municipal buildings), where they were resurveyed and retested by NORC
Survey Representatives under conditions as similar as possible to the on-
campus sessions. School leavers who could not attend scheduled group
administrations were contacted by NORC Survey Representatives and resurveyed
individually.
4.3.1 Base Year Data Collection
Base xear student data was collected from students in 1,015 high
schools.between.February 1-and May 15 of 1980. Sophomore and senior groups
within each school were'gathered in separate groups on scheduled survey days,
and completed the questionnaires and tests in one session. A NORC Survey
Representative (often assisted by the School Coordinaor) wasapresent with
each group to explain survey procedures and to answer questions. An
Orientation Day was held in each school, usually one to two weeks prior to
Survey Day, in order to inform sampled students about the objectives of the
study and to brief them on the requirements of participation, the voluntary
nature of the study, and the procedures for protecting the confidentiAlity of
their responses. Efforts were made during orientation sessions to identify
all twins and triplets selected into the High School and Beyond sample and to
recruit the participation of the non-selected twins And triplets in the
study. Finally, a check was made during the orientation to see that parental
permission forms had been obtained for all selected students in each school or
district where this step was required.
The first step for students in each survey session was to complete a
Student Identification Pages (SIP) booklet, which requested information about
how the student might be located if selected for future follow-up. To pre-
serve student confidentiality, these documents were handled, shipped, ani
stored separately from all other student instruments. The latter section of

the SIP booklet contained several questions designed to identify students who
had been exposed to non-English languages outside of formal school courses.
Students having such exposure then answered a special series of questions
about their use of and proficiency in the non-English language, as well as
their bilingual education experiences. This data was processed into a
separate file containing responses from over 11,300 students.
Students were then given one hour to complete the questionnaires.
During this time, Survey Representatives scanned the completed SIP booklets
for missing or incomplete responses. At the end of the allotted time ques-
tionhaires were collected. Students were given a ten-minute break, during
which Survey Representatives reviewed the questionnaires for completeness.-
Further attempts were made to obtain any data missing from either the SIP
booklets or the student questionnaires before students left the survey
session.
The cognitive tests were administered following the completion of the
questionnaires. Tests consisted of six timed segments. The Senior Test
Booklet also included a series of items on student perceptions about the six
sub-tests and how the student was feeling while taking the test.
When the testing was completed, students with incomplete SIP booklets
or questithinaires were asked to remain so that missing data could be cap-
tured. For certain questionnaire items considered crucial to the analytical
objectives of the study, students given the option of marking a special
oval in the question field indicsitinthat they did not wish to answer.
Following the survey session, NORC Survey Representatives made
arrangements with School CoordinatOrs to conduct make-up sessions for students'
who were not able to attend the first Survey Day. Survey Representatives then
packaged all completed student questionnaire and test booklets for shipment to
NORC's optical scanning subcontractor for the conversion of student responses
to machine-readable form. Student Identification Pages, parental permission
forms (if any), and administrative documents were returned to NORC's central
offices for processing and storage.
Table 4.2 displaysseparately for each student cohort the numbers and
percentages who completed Base Year questionnaires and tests.

-
Table 4.2
Base Year Data Collection Results by Student Cohort
Number of
Completed
-Questionnaire
Completed
Test
Selections N (%) N (%)
1980 Sophomores 35,723 30,030 (84) 27,569 (77)
1980 Seniors 34,981 28,240 (81) p25,069 (72)
Total 70 704 58,270 (82) 52,638 (74)
4.3.2 First Follow-Up Data Collection
4.3.2.1 1980 Senior Cohort
Questionnaire, data was collected from members of the elder cohort
between February and June of 1982.w During the fall of 1981, packets were sent
by mail to all sample members, containing a HS&B Newsletter that described
selected Base Year survey results and plans for the 1982 follow-up, as well as
a request to return a form confirming or updating name and address information
provided in the Base Year. (See Appendix B.2 for a copy of the Newsletter and
Locator Form.) Those cases where the newsleter was returned by the post
office marked "undeliverable" were turned over to central office telephone
locators, who, using information obtained from the student name and address
file, reverse telephone directories, and other locating tools, attempted to
determine current addresses. The remaining cases for which addresses were not
found were sant to the field for locating. As a result of mail returns and
follow-up efforts by NORC staff, current mailing addresses were compiled for
all but approximately 200 members of the elder cohortjirst Follow.-Up sample
by the end of January 1981. These 200 were nearly all Base Year
nonrespondents.
On February 12, a second packet was mailed to all members of the elder
cohort for whom current addresses had been obtained. This packet contained a
letter explaining the First Follow-Up study objectives and the general
instructions for filling out the survey instrument; a 47-page 1980 senior
cohort First Follow-Up Questionnaire (reproduced in Appendix A), a soft-lead

pencil for marking responses in the form, a respondent fee check in the amountI
of five dollars, and an addressed, prepaid envelope" for returning the com-
pleted questionnaire to NORC. (See Appendix C.1 for a Copy of this letter and
a respondent fee check.) Ten days after the initial mailing, a postcard was
sent to all cohort members expressing thanks, to those who had returned
completed forma and repeating the request to those who had not yet responded.
(See Appendix C.1 for a copy of the reminder postcard.)
Additional follow-up efforts were undertaken five weeks after the
initial mailing. By this time, over 6,100 completed seniur cohort
questiyinaires had been returned. The remaining 6,100 nonrespondents were
assigned to 300 NORC SurVey Representatives at HS&B sample locations whO
initiated follow-up telephone calls to encourage senior cohort-members to
complete their questionnaires and return them by mail. This' early conta'-t
with sample members allowed NORC to diagnose a variety of problems such as
lost materials, questionnaires not received, recent address changes, and so
on, and to take corrective action appropriate to each specific situation. The
first round of telephone prompt calls took approximately two weeks to
complete. Four wediks after the telephone follow -ups were begun, the number of
completed forms received had risen to approximately 7,300 (about 60 percent of
the First Follow-Up elder cohort sample).
Second telephone reminder calls were initiated on April 14, 1982.
4. During these calls, Survey Representatives attempted to assess whether or not
sample members were likely to complete the questionnaire and to return it by
mail. When it was considered unlikely, the Survey Representative attempted to
complete the interview over the telephone. In all such instances, Survey
Representatives attempted to ensure that telephone interview respondents had a
copy of the questionnaire, allowing them to read all survey items and response
categories for themselves. The-Survey Representatives role was thus reduced
to that of assisting the respondent to understand question wording and
instructions, follow any routing directions (skip patterns), record the
answers on his or her own copy of the questionnaire, and return the form to
NORC offices. The second round of telephone reminders was completed by May 8,
1982 and resulted ln the completion of an additional 1,000 questionnaires by
mail and telephone, bringing the total to just under 8,300 responses (68
percent of the sample).

. .-58-By the middle of May, the bulk of the on-campus data collection for
the 1980 sophomore cohort had been completed,freeing Survey Representatives
to follow up elder cohort members who could not be reached by telephone.
Guided by the central office supervisory staff and by NORC's network of.
Regional and Associate Field Managers in 17 regions, HS&B Survey Representa-
tives began extensive tracing efforts in order to reach all remaining non-
respondents and persuade them to return questionnaires by mail or else to
participate in either telephone or in-person interviews. By the end of the
field period questionnaire data had been obtained from 11,227 senior cohort
sample'members (94 percent of the total), and from an additional 192 non-
selected co-twins of sampled students (94 percent of the augmentation twins
retained in the First Follow-Up). Table 4.3 displays the numbers and
percentages of elder cohort sample members in each of six administrative
disposition categories, broken down by major sampling strata for the First
Follow-Up. Data for about 75 percent of the total sample (80 percent of the
completed cases) was 'collected by means of self-administered questionnaires
returned through the mail. About 8 percent of the total (9 percent of
completions) were interviewed over the telephone, and approximately 11 percent
were interviewed in person by Survf Representatives.
' Table 4.3
Data Collection Results for the Elder Cohortby the Major Sampling Strata
Sampling Stratum
Initial
selections
Completed
Cases Refusals Other
Response
1 Rate
Base Year 495 412 16 67 83%Non-respondents
Hispanic - 6.')9 626 11 22 95%
High Achievement
Hispanic -. 1,841 1,705 35 101 93%
Others
Black - 554 521 8 25 94%
High Achievement
Black - Others 2,446 2,265 33 148 93%
Asian 554 516 6 32 93%
American Indian 208 192 7 9 92%
White - Low-SES/ 516 500 5 11 97%
High Achievement
White - Others 4,722 4,490 111 121 95%
Total 11,995 11,227 232 536 94%
1 Included under "other" are cases which were either not available,not located, deceased, or genuine other.

4.3.2.2 1980 Sophomore Cohort
Chapter 3 above describes the dual nature of the 1980 sophomore cohort
First Follow-Up sample. During the fan of 1981, School Coordinators reviewed
printed rosters of HS&B younger cohort members originally selected at their
schools and indicated which of the students were still enrolled at the same
schools and which had transferred to another school, graduated early, or left
school without graduating. School Coordinators were also asked to supply
current name and address' information for all individuals in:the latter three
categories, and then return the rosters to NORC. Students listed on the
rosters had been previously annotated with a sampling flag or marker
reflecting predetermined selection probabilities for several student strata as
described in Chapter 3. Individuals who were both flagged.and identified by
School Coordinators as dropouts, transfers, or early graduates were then
confirmed as selections into the school leaver sample. School leavers who'
were not predesignated by sampling procedures were classified as ineligible;
for the First Follow-Up.
It is important to note that the First Follow-Up sample design
specifications state that the eligibility of students for follow-up is defined
by their enrollment status as of the scheduled Survey Day at their Base Year
schools. It was therefore necessary for School Coordinators to repeat the
review of the original student rosters on Survey Day. Any changes in student
status from the time of the original roster review (e.g., students trans-
ferring or leaving school; dropouts returning to full-time school enrollment)
were immediately implemented by Survey Representatives in accordance with
sample design specifications. By the completion of the data collection
period, 25,150 students had been classified as currently enrolled in Base Year
schools (or designated receiving sch)ols--see below), and 4,587 had been
selected into the school leaver sample (1,290 transfers; 696 early graduates;
2,601 dropouts).
4.4 On-Campus Data Collection
On-campus data collection arrangements were sought for all younger
cohort members who were still enrolled in the schools they attended during the
Base Year, or who had transferred as part of a class to another school in the
same district. ('.'his latter group includes students who attended a junior
6 s

high school during the Base Year, as well as those whose Base Year schools
closed, were destroyed or merged with other schools not in the HS&B sample.)
Survey Days were successfully arranged in 952 school buildings. A total of 40
schools declined to hold survey activities on-campus during regular school
hours. In most of these instances, administrators of noncooperating schools
assisted the survey effort by reviewing student rosters, identifying school
leavers, and updating address information for younger cohort members. Many
officials assisted NORC Survey Representatives in securing alternative sites
for survey sessions and in encouraging sampled students to participate in off-
campus administrations.
Survey Days were conducted between February 15 and June 11, 1982.
Activities generally paralleled those used in the Base Year. Prior to Survey
Day the central office mailed to each cooperating school a package of
materials pertinent to conducting school activities. In the package were
included student invitations to survey day, notification to teachers of
students selected to participate in the First Follow-Up, newsletters with
articles of interest to participants about the Base Year Study and plans for
the future, parent permission forms or notification letters where required,
and pencils for use in completing questionnaires and tests. (Copies of the
documents mentioned above can be found in Appendix C.2. See Appendix B.2 for
the newsletter.) Tests and questionnaires, individually labeled with student
identification, were sent to schools by a mail house. Teams of NORC Survey
Representatives, assisted by School Coordinators, administered student
questionnaires and tests to groups averaging 20 students in size on the first
scheduled Survey Day. Make-up sessions were scheduled for all schools in
which the student-level response rate was less than 95 perce,. About 60 per-
cent of the make-up sessions were conducted by NORC Survey Rev-.?.sentatives and
40 percent were administered by School Coordinators. (See Appendix C.2 for a
copy of a form entitled "We Missed You" which gave students the day, time, and
place of the make-up.) By the end of the data collection period, 96 percent
of the students eligible for on-campus survey administration had been
resurveyed.
Two alternative data collection strategies were implemented for
students enrolled in the 40 schools that had declined to allow on-campus
sessions. Students enroll d in the 2/ noncooperating schools located within
- a ra.. WM.'3

100 miles of at least one NORC Survey Representative were contacted by tele-
phone. screened for current enrollment status, and, if not classified as a
school leaver, invited to participate in a group survey session at a local
public facility. (The screening process also allowed Survey Representatives
to confirm the status of school leavers who had been predesignated for follow-
up and to invite them to survey sessions as well; see below.) Over 95 percent
of the 719 students currently enrolled at these 27 refusing schools were
resurveyed in this manner.
There was a final group of 13 nonparticipating schools located over
100 miles from NORC Survey Representatives; it would have required
unjustifiably large expenditures to administer the survey at these schools
using similar methods. Students in these schools were screened by telephone
for their current enrollment status and recruited to participate as
appropriate. In these instances, however, eligible students were sent packets
containing questionnaires, supplements, and other materials through the
mail. A total of 340 students were found to be currently enrolled in these 13
schools; about 89 percent returned completed questionnaires to NORC offices.
Cognitive test data was not collected from these younger cohort members.
4.5 Off-Campus Data Collection
Off-campus survey sessions were held for 1980 sophomore cohort school
leavers between February 20 and June 25, 1982. Because it was necessary to
reconfirm the enrollment status of each student as of the first scheduled
Survey Day at students' Base Year schools, off-campus group administrations
were always scheduled after Survey Days at the schools where selected
transfers, early graduates and dropouts had formerly been enrolled.
After identifying the out-of-school sample, Reaional and Area Field
managers attempted to contact respondents by telephone. Once located,
managers reintroduced respondents to High School and Beyond and informed them
of upcoming survey activities. This initial telephone contact helped gain
cooperation and reduce in-field locating. The Survey Representative was
responsible for contacting and locating those respondents_ without telephones
or those who for other reasons could not be reached.
Approximately one to two weeks before the in-school survey, the Survey
Representatives began to recontact located respondents and initiate in-field

locating efforts for those not previously found. Once contacted, respondents
were again screened for status and then scheduled for group administrations at
previously determined sites. Respondents were offered alternative group
sessions plus a payment of $25 ($10 for taking the test, $10 to cover travel
expense and $5 incentive) in an effort to avoid scheduling problems and to
enhance cooperation. (See Appentax B.2 for a copy of the Check Request Form
for Out-of-School Sophomores.) Because the off-campus sessions typically
'incolved only two to five school leavers, these administrations were handled
by a single Survey Representative.
Group administrations followed the same format as in-school sessions;
they appropriate questionnaire and supplement) were adminstered first,
followed by a shores break, end ng with the time test. Survey Representatives
scan-edited completed questignnaires during the testing period and attempted
to retrieve missing or incomplete data before the participants left the
sites. Survey materials were then assembled for shipment to the central
office.
Although 85 percent of the participating school leavers were
resurveyed in group administrations, a substantial minority well not able to
attend scheduled sessions. Survey Representatives were able to personally
interview and retest 465 of these individuals whose home addresses were close
to areas where other survey activities were underway. In addition, 92
interviews were conducted over the telephone, and 60 completed questionnaires
were returned by mail by school leavers whose residences were more than 50
miles from the closest Survey Representative. No First Follow-Up test data
was obtained for the latter two groups.
Table 4.4 displays data collection results separately for dropouts,
transfers, and early graduates.
4.6 Management of Student Questionnaire Data Collection
The management and supervision of data collection was multi-levJ1 in
structure and dispersed between both central office and field staff. A Field
Manager was responsible for management of all field activities and reported to
the Project Director. Reporting to the Field Manager were five Central Office
Supervisors (COS) who functioned as liaisons between the central office and
the field. For administrative and management purposes, the country has been

Table 4.4
Data Collection Results for Younger Cohort Scho8l Leaversby Student Type
Number ofSelections
CompletedQuestionnaires
N (Is)
CompletedTests
N (V)
Dropouts 2,601 2,289 (88) 2,034 (78)
Transfers 1,290 1,170 (91) 1,073 (83)
Early Graduates 696 643 (92) 595 (86)
Total 4,587 4,102 (89) 3,702 (81)
divided into 17 geographic regions, each supervised by a Reolonal Field
Manager (RFM) responsible for the data collection activities within her
region. Each RFM reported to an assigned COS. The RFMs were assisted by a
staff of Associate Field Managers (AFM). The RFMs and AFMs supervised a total
of approximately 260 Sukvey Representatives.
4.7 Training for the Student Questionnaire Data Collection Effort
During the pre-field phase three types of individual training sessions
were held; central office supervision training, Regional/Area Field Manager
training, and central office telephone locating training.
A one day training session was held in September 1981 for the five
Central Office Supervisors who were responsible for coordinating field
activities. ,Topics covered in their training included: securing cooperation
at state and district levels, school refusal conversion, supervision of field
personnel, and pre-field locating tasks. During the next three months Central
Office Supervisors received individual in-service training for the supervision
of the mail-out shop, receipt control, and the telephone locating shop. The
effective monitoring of cost and production reports was another area covered
during the on-the-job training period.
In a three day Chicago training held in mid-October, NORC's Regional
and Area Field Managers were instructed in overall management, securing school
level cooperation, scheduling of Survey Days, recruitment of Survey

Representatives and pre-field telephone locating of Sophomore out-of-school
sample members. Central Office Supervisors simulated actual survey activities
by the use of written specifications, role playing, mock telephone calls, and
case studies. Accurate report taking and the monitoring of cost and
production were also stressed.
All Field Managers who directly supervised interviewers attended a
three and a half 4ay training session held in Chicago in early February.
Prior to training, home study materials consisting of admifiistrative and
survey specifications as well as a trainer's guide were sent to all
trainees. The focus of this training session was to prepare Field Managers to
train Survey Representatives in survey procedures. Small group role playing
'was extensively use& in order to simulate Field Manager regional trainings.
In addition to project administrative training, Field Managers received a one
and a half day training in conducting in-school surveys and group administra-
tions. One day was devoted to gaining Senior cohort cooperation and
conducting telephone and in-person interviews. The last half day train g was
used to reinforce locating techniques, explain reporting and case transfera ce
procedures and to answer unresolved questions.
'Tiwo weeks after Field Manager training, seventeen regional trainings,
attended by over 300 Survey Representatives, were held across the country.
Interviewers new to NORC were asked to attend a general training session held
one day before project specific training. General training introduced new
staff to NORC and instructed them in interviewing and the administration of
survey documents. Presentations were also given on standards of accuracy,
confidentiality, sampling, and respondent rights.
Home study packets containing survey specifications for the Sophomore
and Senior Cohorts, the role of the School Representative and the Group
Representative, and administrative procedures were sent to all trainees.
Exercises were included to assist interviewer understanding of study
procedures.
The same topics covered in the Field Manager training were covered in
the Survey Representative training. Telephone and field locating techniques
as well as the interchangable roles of the School and Group Representative
were also presented. Again, role playing and simulations were extensively
used througho. training.
73
- .....

5. DATA CONTROL AND PREPARATION
Data control and preparation refers t6 a series of procedures
governing the preparation of completed questionnaires for optical scanning.
The process involved monitoring the receipt of documents from the field staff
and from individual respondents, editing the completed instruments for missing
information, retrieving missing information for specified questions, and
validating a predetermined percentage of the interviews conducted in person or
by telephone. All of these procedures were completed prior to shipping the
sophomore and senior instruments to Westinghouse Information Services (WIS)
for data conversion by optical scanning. Chapter 5 summarizes the data
control and preparation of First Follow-Up questionnaires. See Chapters 7 and
8 for descriptions of the transcript, course offerings, and course enrollments
activities.
5.1 Base Year Procedures
The procedures for data control and preparation varied significantly
between the Base Year and the First Follow-Up. Since the Base Year student
instruments were less complex than the First Follow-Up student questionnaires
(for example, they required no open-ended coding, etc.), the completed
documents were sent by Survey Representatives directly from the schools to the
scanning subcontractor. The scanning computer was programmed to perform the
Critical Item Edit (described below) and to produce reports that identified
the critical items with missing information for each case. The reports were
sent to NORC, where data retrieval was completed. (The Base Year Teacher
Comment Forms were also sent directly to WIS for optical scanning, but no data
retrieval was conducted.)
The Base Year school questionnaires and parent questionnaires were
converted into machine readable form by the conventional key to disk method at
NORC. In the Base Year, most school questionnaires were completed and
returned to NORC before the scheduled Survey Day at the school; the remainder
were collected by Survey Representatives during their Survey Day visits. This
sequence permitted retrieval of missing school questionnaire data for most
institutions during the course of scheduled survey activities, obviating the
need for additional contact with school officials.
'74
5.2 First Follow-Up Procedures
5.2.1 Shipping and Receiving Documents
All documents shipped to NORC from the field (e.g., the sophomore
questionnaires and tests completed on Survey Day in the schools), and all of
the instruments shipped from NORC to WIS for optical scanning, were accom-
pnied by a detailed transmittal form that listed each case in the shipping
carton. Upon arrival at NORC, the contents of each carton were thoroughly
inspected by the receipt control supervisor. Documents were assigned disposi-
tion codes which characterized the completion status for each case in terms of
both respondent type and the presence or absence of relevant materials. Any
discrepancies were resolved with the appropriate Survey Representatives or
Field Managers within a 24-hour period. Data control disposition codes were
then entered into the in-house processing segment of NORC's Automated Survey
System (NASS), and routed to the appropriate processing station. Additional
updates were made to the NASS record for each case as remaining procedures
(editing and coding, data retrieval, interview validation) were completed. A
final entry into the NASS record was made when the case was processed for
shipment to Westinghouse Information Services for optical scanning. The
transit of large shipments of edited instruments to WIS was safeguarded by the
use of Brinks Incorporated, which provided portal-to-portal secure delivery.
5.2.2 Editing and Coding
A staff of 16 coders/editors handled over 40,000 student question-
naires and nearly 1,000 school questionnaires. Editors and coders were
trained for one week, followed by a 100 percent review of the first 40 cases
edited by each trainee. Those not performing satisfactorily were either
terminated or retrained, depending upon the severity of the problem.
The first data preparation step for each completed document was the
Critical Item Edit. (The large sample and lengthy data collection instruments
of High School and Beyond make 100 percent editing of each questionnaire
infeasible.) A list of approximately forty items in each of the major survey
instruments were designated as "critical" or "key" items (see Appendix D).
Items were so designated if they were deemed to be crucial to the methodo-
logical or analytical objectives of the study. Most of the key items are of
self-evident policy relevance; others were chosen as a means of checking
whether survey respondents had properly followed routing instructions, or

whether they had inadvertently skipped portions of the questionnaires. Cases
were deemed to have failed the Critical Item Edit if the respondent did not
provide a codeable response to any key item. Thus, omissions, illegal
multiple responses and vague, unclear responses were grounds for failure. In
each document, items failing the edit were flagged and the document routed to
the data retrieval station, where respondents were called by telephone to
obtain missing information or otherwise resolve the edit failure.
In addition to the Critical Item Edit, other coding tasks included:
1) Occupational and industrial coding for each job held 1
2) Coding the names of postsecondary schools attended 2
3) Military coding of specialized schooling, specialty andpay grade 3
4) Field-of-study coding for most recent major at eachpostsecondary school attended 4
5) Coding the new open-ended questions in the EarlyGraduate and Transfer Supplements 5
1
The directories used included the U. S. Department of Commerce,Bureau of the Census, Classified Index of Industries and Occupations 1970, andU.S. Department of Commerce, Bureau of the Census, Alphabetical Index ofIndustries d Occupations 1970. The 1970 edition was used so that the codingon High School and Beyond would coincide with that used on NLS 72.
2Schools were coded using FICE six-digit codes. The directories
included the NCES Directory ot Post Secondary Schools with OccupationalPrograms, 1975-76, and the NCES Education Directory, Colleges andUniversities, 1981-82. Codes were created for unique situations not listed inthese directories.
3 Department of Defense, Occupational Conversion Table, Enlisted1974. A copy of this edition was obtained from Research Triangle Institute,so tha High School and Beyond Military coding would be compatible with thatused for NLS 72.
Nl
4The field of study information was converted into six-digit codes
using tfe HEGIS Taxonomy. The directories used included; HEW, NCES, ATaxonomy of Instructional Programs in H3gher Education, 1970 and HEW,Vocational Education and Occupations, '969. These directories were also usedfor field of study coding on NLS 72.
5These codes were created during the coding process.
re7 6
6) Coding licenses, certificates and diplomas 6
7) Entering all numerical responses into optical scanninggrids 7 A
In general, the survey instrument for the 1980 senior cohort contained
many more open-end:ad questions than that used for the younger cohort.
An exception is the instrument completed by 1980 sophomores who left
school without graduating, which included many of the employment-related
items from the senior cohort questionnaire. Thus, senior questionnaires
took an average of 16.4 minutes to edit and code, while questionnaires
from sophomores no longer attending their Base Year high schools
averaged 19.4 minutes, aftd instruments from sophomores still attending
their same Base Year school required an average of 10.9 minutes fort
editing and ceding.
5.3 Data Retrieval and Validation
The proportion of cases requiring retrieval varied widely
between the so1homore and senior cohorts due to differences in the
method of administration. Senior instruments completed in an
unsupervised setting had a 43.6 percent retrieval rate while sophomore
instruments were notably below .that at 16.5 percent. The lower
retrieval rate among sophomores was achieved through the use of on-site
edits performed by Survey Representatives on school Survey Days and at
off-campus group administrations. Questionnaires with missing or
incomplete information on critical items were handed back to the student
for corrections. The students generally complied, time and
circumstances permitting.
Interview validation is the process of recontacting selected
respondents in order to repeat the collection of specified data. Data
6To insure compatibility, the various licenses, certificates and
other diplomas received by respondents were coded according to two-digitscreated for NLS-72.
7The optical scanning equipment could only read information as
darkened ovals. As a consequence, all numerical responses, such as birthdate,dates of employment, etc., had to be entered into numerical optical scanninggrids for processing.
7/

from validation calls (conducted from the central office) is then
compared with data collected by Survey Representatives through personal
or telephone interviews. Discrepancies in the two data sources are
investigated, and if not resolved, the respondent is re-interviewed.
Further validation is then conducted for an interviewer whenever
validation failure occurs, and follow-up action taken as appropriate.
Since the process of validating an interview also requires a
phone call to the respondent, cases requiring both validation and
retrieval were handled in a single call to lessen impositions on the
respondent's time. As noted earlier, approximately 10 percent of the
instruments completed in person or by telephone were validated. No
cases were found to fail validation checks in the First Follow-Up.

6. DATA PROCESSING
Data processing activities during the, First Follow-Up spanned the
entire length of the projec beginning with maintenance of the school name-
and-address file (used for cintacting schools during the prefield period) and
concluding with machine editing and the preparation of public use data'
tapes. Data processing in the Base Year was less extensive since the sampling
procedures, instruments, and the resulting data base were usually less
complex. This section will focus on First Follow-Up questionnaire activities
while providing a brief description of data processing during the Base Year.
Sections 7.5 and 8.8 contain descriptions of data processing activities for
transcripts and for course Offerings and enrollments, respectively.
6.1 Bae Year Data Processing
As discussed in earlier chapters, the Base Year student instruments
were limited to two versions (one per cohort) and the instruments contained
only one logical branch or skip sequence for respondents to follow. Because
of this simplicity, it was efficient for the optical scanning contractor to
perform the critical item edit and convert blank fields to missing value codes
(see below and Chapter 7) at the time of completing the data conversion. The
optical scanning contractor, Westinghouse Information Systems (WIS-then
Westinghouse Learning Corporation) converted the blank response fields to
missing value codes according to instructions from NORC.
WIS created separate data files for the two cohorts. Upon receipt of
each file, NORC first conducted an audit of a sample of cases, comparing the
scanned and machine edited data files with the actual hard-copy question-
naires, as a final check on the accuracy of the data conversion. Then, to
facilitate merging the two files into a single dataset, NORC reformatted the
tape so that identical questions in both versions occupied the same tape
positions in each file. In general, the order of the data followed that of
the senior questionnaire. Items unique to the sophomore instrument were
interspersed among the senior items so that sophomore data remain approxi-
mately in the same order as in the questionnaire. Also, whenever necessary,
the sophomore response category values were recoded to match those for the
elder cohort. NORC also produced SPSS control cards and ran frequency
distributions on the merged file for the purpose of checking for out-of-range

values. Only a few out-of-range codes were found and those were assigned
appropriate missing value codes.
As noted above, Base Xgar questionnaires were designed so that only
one explicit "SKIP TO" instruction appears in the senior questionnaire
(seniors not going on to college do not complete the last section of their
instruments on college education), and none in the sophomore questionnaire.
In the case of two or more related questions, the items following an implicit
screening or'filter question contain response options appropriate for those
"screened out" by the filter question. In the Base Year, no inter-item
consistency checks were carried out between the implicit filter questions and
the related (dependent) items.
A final task was the computation of the composite variables. The Base
Year composite variables were constructed to be compatible with those con-
tained on the public use file for the National Longitudinal Survey of the E..L gh
School class of 1972 (NLS-72). These composite variables are part of the
First Follow-Up public use tape and are discussed later in this chapter.
6.2 First Follow-Up Data Processing
In addition to maintaining an up-to-date school name-and-address file,
data processing staff produced computer-generated rosters for each school,
listing all of the 1980 sophomore cohort participants and any of the 495 Base
Year participants selected at that school (if any). Schools were asked to
update the rosters with respect to a student's current status (e.g., still
enrollad, transfer, dropout, or early graduate) and current address
information if the student was no longer attending that school.
Completed rosters went through a process of editing, data retrieval,
and data entry. The updated information provided a basis for the computer-
generated Survey Representative Assignment Logs and face sheets for locating
sophomore school leavers prior to Survey Day. The updated information also
provided current mailing addresses for the elder cohort.
6.3 Receipt Control Procedures
Using the NORC Automated Survey System (NASS), separate NASS files
were produced for tracking school level events as well as sophomore and senior
u
cohort survey activities. From the school NASS file, weekly summary reports
were generated that tracked refusal rates and patterns, completed survey days
or delays, and the receipt of school level documents (i.e., school question-
naires). NASS also generated customized calendars of scheduled school survey
days for each NORC Survey Representative.
Weekly summary reports were produced on the receipt of sophomore and
senior questionnaires, and data control disposition codes were added to the
NASS files, making it possible to track the internal movement of instruments
through mail receipt, editing, data retrieval, validation, and shipment for
optical scanning at WIS., As noted in Chapter 5, the NASo also generated the
transmittal for shipping the prepared instruments to WIS.
At the end of the data collection period a reconciliation between the
three files provided an accurate count on the number of survey participants
and documents received. The reconciliation used three types of checks: check
digits derived from a fixed mathematical formula that easily identified
misread or miscopied.Atudent ID numbers, a comparison of respondents'
birthdates and sex against Base Year data, and a comparison of field trans-
mittal forms against what the NASS records indicated had been returned from
the field. All discrepancies were reported for review and resolution.
6.4 Data Entry of School Questionnaires
v
Because of the comparatively small number of school questionnaires to
be processed, automated scanning procedures for this questionnaire would not
have been cost-effective. For these reasons, the school questionnaire was
converted to machine-readable form using NORC's DATA-100 key-to-disk data-
entry system. This system incorporates a program that checks data as it is
entered and facilitiates the correction of any keystroke errors.
Data fields of critical importance were verified (independently re-
keyed) on 100 percent of the documents. Ten percent of the documents were
fully verified as a check for systematic errors. A recent test of NORC's
keying error rate has shown it to be approximately one half of one percent,
and those errors were rectified in the course of computer editing.
Si

6.5 Testing the Optical Scanning Program
As discussed in earlier sections, the student questionnaires were
optically scanned using equipment that read darkened ovals or marks on the
page. NORC conducted extensive tests and checks of the machine's ability to
correctly read the darkened ovals. An early test of 131 documents revealed an
adjustment to the mark sense threshold was necessary. A second test of 90
documents was conducted and a thorough audit of the results verified that
satisfactory data conversion was being achieved.
6.6 Machine Editing
The NORC cleaning program (EDIT) was used for machine editing the
school questidnnaires. The program incorporated both simple checks for valid
codes in every data field and logical checks for inter-item relationships.
The final product was an EDIT report that listed every case that failed the
machine edit and the source of the failure. Data preparation personnel,
working from these reports, retrieved the documents in question and resolved
the problems.
This approach to data cleaning insured that data was not distorted or
falsified in the editing process. Genuine inconsistencies were resolved by
calling back respondents or instructing the EDIT program to accept the
inconsistency. The cision in each instance was based on considerations of
data quality, economy, and the prospects of retrieving the correct informa-
tion.
With respect to the student questionnaires, a case-by-case inspection
of inconsistencies and stray codes was impractical due to the sheer number of
cases and the fact that the pages of the questionnaires had been cut apart as
preparation for data entry by optical scanning. Consequently, programs were
written to automatically perform the necessary machine editing. The tasks
performed included: resolution of inconsistencies between filter and depen-
den questions, supplying the appropriate missing-data code for questions left
blank, detecting illegal codes and converting them to missing data codes, and
generating a report on the quality of the (_l'a as measured by the incidence of
correctly and incorrectly answered fields and correctly or incorrectly skipped
fields.
ti <",

Inconsistencies between filter and dependent questions were resolved
in consultation with NCES staff. In most instances, dependent questions that
conflicted with the skip instructions of a filter question contained data
that, although possibly valid, were not responsive to the intent of the
dependent question. Data retrieval verified that filter questions were
typically answered correctly, and the dependent questions which should have
been skipped were often answered simply because they seemed to apply. The
manual editing procedures left such inappropriate responses to be expunged
during the machine edit.
After improperly answered questions were converted to blanks, the
student data were passed to a program which supplied the appropriate missing-
data codes for blank questions. The program converted questions left blank
according to several criteria. If a previous question had been answered in a
way that required that the current question be skipped, a "legitimate skip"
code was supplied. If not, a "missing-data" code -was supplied, except in the
case of critical questions. Critical questions with missing data were flagged
during data preparation, and attempts were made to obtain the information by
telephone. If the respondent specifically refused to answer a question during
the call-hack, a scannable oval was marked. Critical questions marked in this
way were assigned a special code of "refused." Otherwise, critical questions
were treated in the same manner as others. Finally, additional missing-data
codes for multiple-coded questions were supplied by the scanner.
Detection of out-of-range codes was completed during scanning for all
que!itions except those permitting an open-ended response. For the hand-coded,
open-ended questions (such as the 3-digit occupation and industry codes, or
the 6-digit :ollege and field-of-study codes), the data was compared to the
list of valid codes, and invalid codes were converted to the "no answer"
value. The numbers of invalid codes detected were negligible.
For measuring data quality, the machine-edit programs produced bar
Graphs that displayed the frequencies for the different situations rerognized
by the programs: questions properly answered, questions properly skipped (the
"legitimate skip" code), questions skipped in error (the "no answer" code),
and questifms answered in error.
The treatment ,)f inappropriately answ( red items the ? -:0 a rspc)n-
iPot '4,11 ir17-4trld to skip) relied fm the results )f the -ritic-al

editing procedure. With only one or two exceptions, screening or filter ques-
tions were designated as critical items. When respondent.= inconsistent
in answering these items, either by responding to items they were instructed
to skip, or by failing to answer dependent questions related to the filter
item, the case was classified as , :dit failure. Telephone calls were used
to obtain responses to items skipped in error. In addition, the results of
these calls demonstrated unambiguously that inappropriate answers to filter-
dependent items were universally caused by respondents' failure to comply
properly with the routing instructions of the filter questions. Rather than
skipping to the designated target question to resume their responses, these
individuals attempted to answer each filter-dependent question that appeared
to offer a reasonably suitable response category. On the strength of *ehese
findings, all filter-dependent responses entered in error were converted to
the pl:opet missing data values (i.e., the "legitimate skip" code).
6.7 Data File Preparation
The Base Year file combined data from both student cohorts into a
single data set. For the First Follow-up separate files were produced for
each cohort. The sophomore student data file has a relatively complex
layout. The initial section has a randomized ID number, varioe data flags
and composite variables, and several weights needed to use the file; followed
by the Base Year data record (if present), formatted exactly as in the Base
Year public use student file; followed by the First Follow-up sophomore data
(if present). No student has data for all of the documents used for the
younger cohort; only the initial section contains data for all cases in the
file. Documents C-lat were not obtained because of a student's status (e.g.,
basic sophomore tiuestionnaire for dropouts- 'ropout questionnaire, and
transfer supplement for early graduates) are represented in the file by the
"legitimate skip" code for all variables (9, 99, 999, etc.). In the few cases
when early graduates or transfer students failed to fill out the appropriate
supplement, but did complete a basic sophomore questionnaire, the missing
supplements are represented by the "no answer" code for all variables (S, 913,
48, etc.).
The file contains a record for every Base Year sophomore who was in-
f.)r the First Follow -lip: that is, everyone who is still in school, plus
51
.,, .. " -

school leavers who were selected for follow-up. All in-scope students are
included in the file, whether they participated in High School and Beyond or
not.
The senior cohort file layout is considerably simpler than the
sophomore layout. There is only one follow-up documentfor seniors. The
record thus contains a (randomized) ID number, flags, and weights, the Base
Year public-use data record, and the follow-up questionnaire record.
6.8 Construction of Composite Variables
The composite variables and indices created for the First Follow-Up
data files are described below. The mnemonic for each composite or index (in
parentheses) is the SPSS variable name found in the control card files
accompanying the data files (se, Chapter 7).
SEX. Students' sex was availahle in three survey documents: the Base
Year questionnaire, the Base Year student ID Pages, and the Follow-Up
questionnaire. If one or more of these sources contained a valid sex code
(ar' no "' of the sources contained a conflicting sex code) that code was taken
for the e)mposite sex variable (SEX!.
In 857 cases either no valid sex ,;ode or contradictory sex codes were
found. When the information was missing, the value of the composite sex
variable was assigned by inspection of the students' first names. In the
small number of cases with inconsistent codes, a thorough review of the
documentatior for the case was carried out until the conflict was resolved.
RACE. Race and ethnic origin codes were available from both Base Year
and First Follow-Up questionnaires. (See Questions 90 and 91, p. 8-56, for
Base Year race and ethnic origin items and Questions 52 and 53, pp. 8-191 and
8-192, for First Follow-Up race and ethnic origin questions.) Composite race-
ethnicity codes (RACE) were assigned according to a hierarchical sequence as
follows: (1) if a Hispanic ethnic origin (codes 01-04) was indicated either
year, the student was coded as Hispanic; otherwise (2) if an American-Indian
race code, code 3, was present either year, the student was coded as American-
Indian; otherwise (3) if an Asian race code, code 1, was present either year,
the student was coded as Asians.otherwise (4) if a race code of "Black," code
1, was present either year, the student was coded as Black; otherwise (5) if a
race code of "White," code 2, was present either year, the student was coded
White.
All remaining students (685 in both cohorts combined) were assigned to
the residual category, "Other." This category therefore includes students
whose race was coded as "Other" or was missing in both questionnaires and who
did not give a Hispanic ethnic origin either year.
9 Test Composites and Quartiles
6.9.1 1980 Sophomore Cohort
The Base Year test composite (BYTEST) is an average of the reading,
vocabulary, and math (Part 1) standardized scores (YBREADSD, YBVOCBSD,
YBMTH1SD); or of as many of them as are non-missing. If all three are
missing, the composite score is missing. Quartiles cut the population
(weighted by BYTESTWT) into four equal categories. The cutting points are
42.53, 49.07, and 56.28.
The follow-up test composite (FUTEST) is calculated in exactly the
same way, using FYREADSD, FYVOCBSD, and FYMTH1SD, or as many as are non-
miAsing. The quartiles (weighted by FUTESTWT) divided the population into
quarters at 42.50, 49.59, and 56.91.
6.9.2 1980 Senior Cohort
The Base Year test composite (BYTEST) for seniors was slightly more
complicated because there were two vocabulary tests for seniors. Where both
were present, they were combined to a single vocabulary score, weighting by
the number of items in each. EBV0C1SD had 15 items, and EBVOC2SD had 12, so
the combined vocabulary score was (15 x EBVOC1SD 12 x EBVOC2SD) /27. This
procedure had the effect of scoring the two tests as one long test. If only
one vocabulary score as non-missing, it was taken for the combined vocabulary
score. This procedure tends to equalize the weight allocated to the three
tests in the computation of the senior cohort test composite.
With this done, the comonsitc.= test score was computed, as for
sophomores, as an average of the non-missing scores among EBREADSD, EBMTH1SD,
and the combined vocabulary score. The file was weighted by BYWF to determine
the quartile points of 43.28, 49.86, and 56.44.
The elder cohort was not retested in the First Follow-Up.

6.10 SES Composite and Quartiles
BYSES, a socioeconomic status composite, was copied from the Base Year
public-use file for both cohorts. In addition, a new composite SES score for
the First Follow-Up was constructed from the First Follow-Up questionnaire for
the sophomore cohort. However, the senior follow-up questionnaire did not
include enough items to construct an analogous follow-up SES composite for
seniors. Sophomores who did not complete an in-school questionnaire (i.e.,
dropouts, and nonparticipants) are likewise missing follow-up SES.
The Base Year quartile ranks for the socioeconomic composite were not
copied from the Base Year. Rather, for both BYSES and FUSES new quartile
ranks were calculated that did not assume a normally distributed population of
SES scores. All of the following calculations, except the quartiles, were
done (insofar as possible) exactly as in the NLA-72 data files, to maintain
compatibility.
The SES composite has five components (described below). For each
case, the composite score is an average of all the non-mir,sing components. If
one component only, or none, is. non-missing, the SES composite is assigned a
missing value.
The first component is father's occupation, recoded into the Duncan
SEI scale by assigning mean SEI scores to the categories of the High School
and Beyond occupation question. The source variable is FY53A. The recode,
taken from the NLS -72, assigns SEI scores thus:
02 = 56.58 03 = 27.41 04 = 28.00 05 = missing
07 = 67.73 08 = missing 09 = 19.18 10 = 70.21
12 = 49.70 13 = 38.00 14 = 54.42 15 = 70.21
17 = 16.40 18, 19 = missing
06 = 7.33
11 = 70.21
16 = 15.90
The seco,:d tnd third components are father's and mother's education,
recoded as in the NLS-72. The variables are, respectively, FY55 and FY56
the in-schoil questionnaire. These are recoded 02 = 1; 03 = 2;
04, 05, 06, 07 = 3; 08 = 4; 09, 10 = 5; 11 = missing.
The fourth component is family income, recoded to he Linear in
dollars, as in the NLS-72. Thus category midpoints are assigned to the codes
of FY111, in thousands of dollars. (The top category, $50,000 or more, was
given a "milpoint" of $60,000.)

The final component is a scale of eight household-possession items,
FY113h to FY113I. Each of these is standardized; then as many of them as are
non-missing are averaged to provide this last component. 1
Each of the five components is standardized separately, and then the
non-missing components are averaged to form the raw SES score. The quartile
score is formed by dividing the raw score at -.54, -.07, and +.49, so that the
distribution (weighted by BYWT or FUWT, as appropriate) will be evenly
distributed among the four codes.
Note that in the Base Year public-use file, the middle two codes of
the SES "quartile" were combined; and the quartile cutti:ig points were
determined not from the data but (as in the NI'S -72) from the assumption of a
normal distribution. For the follow-up release file, we have therefore
recalculated the Base Year SES quartiles for both sophomores and seniors, to
provide four categories with equal (weighted) frequencies.
6.11 Psychological Scales
For both seniors and sophomores we provide the same five psychological
scales as in the Base Year.. These scales, and their components, are:
Self-concept:
Locus-of-control:
Work orientation:
Family orientation:
FY75A, C, D, HFD77A, C, D, HFE75A, C, D, H
(sophomore in-school)(sophomore dropout)(senior)
FY75B, E, F, G (sophomore in-school)FD77B, .E, F, G (sophomore dropout)FE75B, E, F, G (senior)
FY73A, C, EFD82A, C, EFE85A, C, E
FY73B, H, I
FD82B, H, I
FE85B, H, I
(sophomure in-school)(sophomore dropout)(senior)
(sophomore in-school)(sophomore dropout)(senior)
(Note that component 'I' is given negative weight.)
Community orientation: FY73F, G, JFD82F, G, JFES5F, G, J
(sophomore in-school)(sophomore dropout)(senior)
For all of these composites, each component is standardizc-', separately
(using the appropriate weight), and the non-missing components are averaged.
Students missing all the components of any scale are assigned the missing
value (8) for that scale.

7. THE STUDENT TRANSCRIPTS SURVEY
7.1. Gverview
During the fall of 1982, high school transcripts were sought for a
sample of 18,427 members of the HS&B younger cohort (1980 sophomores). The
existence of transcript data facilitates two important research efforts:
- The validation of certain information provided by students intheir responses to HS&B guestionnares, and
The investigation of course taking patterns and enrollment ratesby student characteristics, and the relationship of suchpatterns to students' activities and success after high school.
The Transcripts Data File augments a large and growing database from
the High School and Beyond Survey. The files may be merged with a growing
system of related databases by means of a common student identification
number.
The sample for the Transcripts Survey was selected from the subset of
1980 sophomores who had been retained for the, First Follow-Up (including non-
sampled co-twins of selected students). First Follow-Up selections were first
grouped into sampling strata based on school ,aid student characteristics
recorded in survey files. The sample design represents an optimization of two
competing objectives: the need for subgroup samples of sufficient size for
complex multivariate policy analyses, and the desire to avoid undue losses in
statistical power due to disproportionate sampling.
The allocation (described in section 7.2 below) is an effective
compromise between these goals. Nearly 18,500 of the 30,000 1980 sophomores
included in the First Follow-Up were retained in the sample for the
Transcripts Survey. Of these, approximately 70 percent (nearly 13,000) were
retained with certainty because of membership in groups of current pOlicy
interest, and the remaining 30 percent were subsampled with a probability of
approximately .35. The sample as drawn thus maximizes the subgroup sizes for
such strata as twins, dropouts, students f.i.om private schools, selected
minority groups, and students whose parents were surveyed in the Base Year.
At the same time, the n ative efficiency of the sample is essentially the
same as that observed for the entire 30,000 case First Follow-Up 36mple.
The request for transcripts was directed not only to the regular HUBsample of approximately 1,000 schoolS, but also to some 900 schools to which
1980 sophomores had transferred since the Base Year survey.
A letter to the Survey Coordinators at the HS &B schools at the time of
the First Follow-Up alerted them to the prospective Transcript Survey planned
for the fall of that year, 1982. (For a copy of this letter see Appendix
A.) In addition, in the First Follow-Up survey questionnaires 1980 Sophomores
were asked to sign a form authorizing the release of their high school
transcripts to the study, and to indicate the name and address of the last
high school attended, if different from the school they attended at the time
of the Base Year survey.
Transcripts, and other school materials necessary for their
interpretation and coding (e.g., school course catalogs and student
handbooks), were collected in the fall (September through December) of 1982.
At that time the principals were sent letters explaining the Transcript
Study. They were also sent instructions for preparing the transcripts, a
checklist of students' names, and a reimbursement form. These items are in
Appendix C.3.
Student Transcript Data Files contain records for each secondary level
course taken. Information for each course includes a 6-digit course
identification number, the school year and term the course was taken, the
credits earned and the final grade. Courses that are part of special
curricula or programs (e.,g., bilingual education, special education, programs
for gifted students) are so identified. In addition, for each student the
record contains infozdlation on the student's rank in class, overall grade
point average, number of days absent for each school year, number of days of
suspensions, the date and reason the student left school, and identifying
codes and scores for standardized tests taken by the student (PSAT, SAT, ACT,
or Advanced Placement Tests), and whether or not a school catalog had been
coded.

7.2 Sample Design and Sample Selection for the High School Transcripts Study
The sample for the High School Transcripts Study consists of 18,427
selections from among the 1980 sophomores who were eligible for the First
Follow-Up Survey. The major features of the sample design include:
the oversampling from population segments of specialconcern to education policy makers as established inthe Base Year Survey (described below).
The inclusion of non-sampled co-twins of HS&B sampledtwins.
The inclusion of a small sample of nonparticipants inthe Base Year Survey to aid the a!;:sessment of theextent of nonresponse bias in Base Year results.
These design features were implemented by stratifying the sample of 1980
sophomores who were retained for the First Follow-Up according to self-
reported student characteristics and school level data. Initially derived
strata were then combined into two major partitions: one containing policy-
relevant subgroups which were to be selected with certainty for the
Transcripts Study, and the other containing all remaining 1980 Sophomores (See
Table 7.2-1). In all, 12,309 cases were retained in the sample with
certainty--12,034 cases in the probability sample plus 275 non-sampled co-
twins. In addition, a systematic sample of 6,118 cases were subsampled from
among 17,703 remaining First Follow-Up selections, with a uniform probability
of approximately .35.
Sampling strata shown in Table 7.2-1 were defined as indicated in the
legend. Sample members were then assigned to strata in the sequence specified
in the table. That is, first, all twins were identified and assigned to the
twins stratum. Then, from all remaining cases, members of the specially
selected subsample of Base Year Survey nonparticipants were identified and
assigned to the second stratum. Third, students from private schools were
identified from among those not previously assigned to the twins or Base Year
nonparticipant strata, and were assigned to the private school stratum. Eight
additional strata were created by repeating the process of assigning to each
subsequent stratum all cases which had not been previously assigned to any
earlier stratum. The first column of Table 7.2-1 presents the marginal
stratum sizes rstsulting from the hierarchical nature of the assignments. A

Table 7.2-1
Sample Allocation for the High SchoolkTranscripts Surveyof High School and Beyond
A. Retained in Transcripts sample with certainty(given retention in the First Follow-Up)
Stratum
N ofMarginalSelections
Total Nin
Stratum
Twins (in sample) 357 357
Base Year nonrespondents(for nonresponse bias assessment)
485 488
Students from private schools 3,576 3,636
Dropouts, early graduates, andtransfers to private schools
2,947 3,424
Cubans and Puerto Ricans 544 990
High Achievement'Hispanics 570 1,195
Asi.ins and Pacific Islanders 356 544
High Achievement Blacks 453 803
High Achievement/Low SES Whites 308 474
American Indians and Alaskan Natives 424 731
Students with Parents Survey data 2,014 3,047
B. Subsampled for Transcripts Survey (p = .35)
Other Hispanics
Other :Blacks
All other students
Totals in probability sample
Non-sampled co-twins
Total Selections
800
930
4,388
18,152
275
18,427
Notes: Sampling Strata are defined as follows. (Only cases retainedin the First Follow -lip were eligible for selection for the Transcriptssurvey.)
1. Twins - All cases identified as twins or triplets in the Base Year surveywhose co-twin also attended the same school and was included in the study.
2. Base Year Nonrespondents - The sample design for the First Follow-up ofHS&B included a procedure for designating a 10 percent subsample of theapprnximately 5,000 Base Year nonrespondents in the 1980 sophomoreco;lort. These cases were to be retained in the f)llow-up samplesregardless of their 1982 enrollment status or any other eligibility(riteria.

-84-
Table 7.2-1(Continued)
3. Students from private schools - Students who attended any type of non-public school at the time of the Base Year survey.
4. Dropouts early graduates and transfers to private schools - Students whohad graduated ahead of schedule or had left high school before graduating,or who had transferred from public to private schools.
5. Cubans and Puerto Ricans - Students who identified themselves as being ofCuban or Puerto Rican origin or descent in either the Base Year or FirstFollow-Up survey.
6. High Achievement Hispanics - Students who identified themselves as beingof Hispanic origin or descent in either the Base Year or First Follow-Upsurvey', and who had composite HS&B test scores above the median for thewhole population (estimated by the weighted median for the sample). FirstFollow-Up HS&B Composite Test Quartiles were used if available; ifmissing, Base Year Composite Test Quartiles were substituted.
7. Asians an3 Pacific Islanders - Students who identified themselves asAsians or Pacific Islanders in either the Base Year or First Follow-Upsurvey.
8. High Achievement Blacks - Students who identified themselves as Black ineither the Base Year or First Follow-Up survey and who had composite HS&Btest scores above the median for the whole population (estimated by theweighted median for the sample). First Follow-Up HS&B Composite TestQuartiles were used if available; if missing, Base Year Composite TestQuartiles were substituted.
9. High Achievement/Low SES Whites - Students who identified themselves aswhite in the Base Year or First Follow-Up survey, who were in the highestquartile of the composite HS&B test score distribution, and who were inthe lowest quartile of the composite SES scale. First Follow-Up HS&BComposite Test Quartiles were used if available; if missing, Base YearComposite Test quartiles were substituted.
10. American Indians d Alaskan Natives - Students who identified themselvesas American Indians or Araskan Natives in either the Base Year or FirstFollow-Up survey.
11. Students with Parent survey data - Students whose parents participated inthe Base fear Parents survey.
12. Other Hispanics - Students who iden'ified themselves as Hispanic in eitherthe Base Year or First Follow-Up survey and who are not members of anystrata numbered 1 through 11.
13. Other Blacks - Students who identified themselves as non-Hispanic BlacksiireTther-TTe Base Year or First Follow-Up survey and who are not membersof any strata numbered 1 through 12.
14. All others - All remaining students who are not members of s.rly strata
numbered 1 through 13.

total of 12,309 cases (including 275 non-sampled co-twins of sampled students)
were assigned to the eleven policy relevant strata, and were retained in the
Transcripts Study with certainty. Because the stratum definitions for the
study are not inherently mutually exclusive, the second column of Table 7.2-1
shows the total number of cases who fit each stratum definition, ignoring the
hierarchical assignment. (Note that column 2 ignores the stratum membership
of non-sampled co-twins.)
The remaining sampling stratum, contains all residual cases not
assigned to policy relevant strata. In order to provide implicit stratifica-
tion (and hence reduce overall sampling error), the list of students was first
sorted by school type and sex. A systematic sample of 6,118 was then selected
from the pool of 17,703 remaining cases. The number of subsampled selections
was conditioned by the requirement for a final data file containing approxi-
mately 16,000 transcripts and an estimated completion rate of approximately 85
to 88 percent. The lower portion of Table 7.2-1 also displays the numbers of
selections belonging to each of three major racial or ethnic categories.
As described in detail in Section 7.3 below, high school transcripts
could not be obtained for every case in the sample. Therefore, weighting
procedures were devised which would take account of both differential
selection probabilities for sample members and differential reaponse rates for
different types of Fchools and students. For each sampled student, an initial
weight was computed as the product of the First Follow-Up weight (prior to
nonresponse adjustment) and the reciprocal of the student's retention prob-
ability in the Transcripts Study. For the certainty selections, the initial
transcripts weights are obviously equal to their initial First Follow-Up
weights. (See the Sample Design Report for the First Follow-Up of High School
and Beyond for a complete description of First Follow-Up weighting proce-
dures.) For the subsampled cases, the initial Transcripts weights are equal
to their First Follow-Up weights multiplied by the reciprocals of their
selection probabilities.
The strategy for adjusting case weights for nouresponse to the
Transcripts Study was conditioned by a series of analyses of response rates by
a variety of school and student characteristics. Since transcript requests
were sent to. school officials for processing, school variables predictably had
the greatest impact on data collection results. One factor in particular--the

school's Base Year primary sample type (stratum)--showed the greatest
variability in response rates to the Transcripts Survey. Moreover,, within
most of the nine school types, significant differences were observed in the
ability of schools to return transcripts for students who had transferred or
who had left school without graduating (dropouts). As a result, nonresponse
adjustment cells were created using nine levels of school sample type and
three levels of student status as shown in Table 7.2-2. Note that one cell
associated with dropouts from high performance non-Catholic private schools
was empty. The weighted response rates presented in Table 7.2-2 (using
initial transcript Study weights 'described above) vary from a high of 96
percent for non-transfer non-dropouts in regular Catholic schools to a low of
42 percent for dropouts from Catholic schools with greater than 30 percent of
enrollments made up of Cuban students.
On average, the nonresponse adjustment factor used in, computing the
final weight for the Transcripts Study was approximately 1.13. In only one of
the cells of Table 7.2-2 is the nonresponse adjustment greater than 2.0
(dropouts from Cuban Catholic-schools). However, this factor is applied to
only 6 caries in the dataset, and thus has negligible effect on the variance of
the final case weights. In a total of 12 cells, the adjustment factor is
greater than 1.30. These relatively large multipliers are applied to a total
of 822 completed cases, or only 4.5 percent of the transcripts sample. The
impact on the design efficiency of the transcripts sample is therefore minimal.
Table 7.2-2
Nonresponse Ndjustment Cells for the HS&B Transcripts Survey(Unweighted Nof respondents / Weighted response rate)
School
Sample Type
Transfer
ThiWc-VaT.N
Student StatusDropout
rm5r.--1777.
Other
N
Regular Public 349 78 1,490 77 8,534 92
Alternative Public 29 71 128 71 369 93
Cuban Public 6 55 33 69 126 68
Other Hispanic Public 57 74 258 65 1,316 87
Regular Catholic 50 90 17 92 1,323 96
Black Catholic 99 74 21 63 671 85
Cuban Catholic 14 56 6 42 205 85
Elite Other Private 14 94 315 95
Other Private 61 81 16 61 434 92
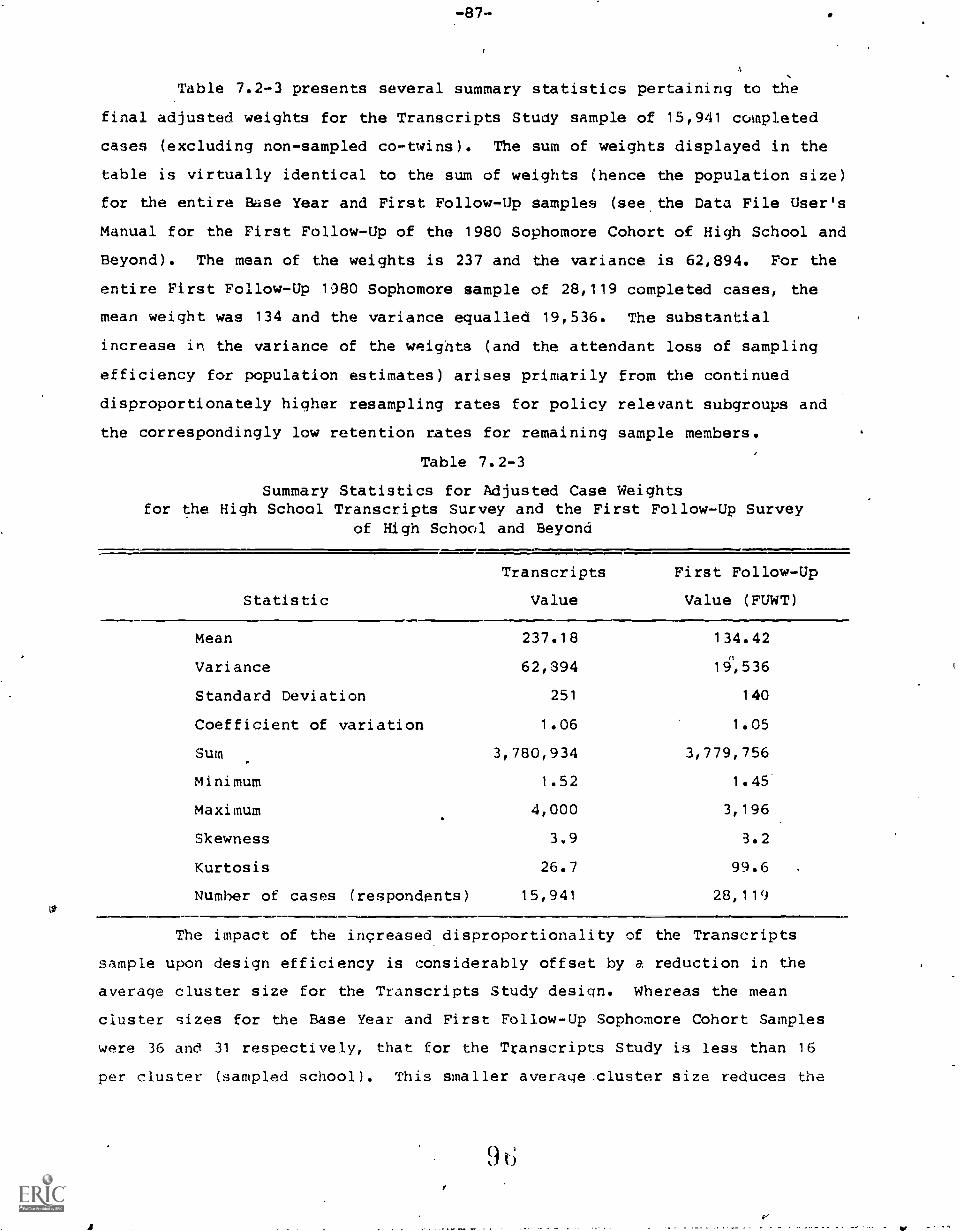
Table 7.2-3 presents several summary statistics pertaining to the
final adjusted weights for the Transcripts Study sample of 15,941 completed
cases (excluding non-sampled co-twins). The sum of weights displayed in the
table is virtually identical to the sum of weights (hence the population size)
for the entire Base Year and First Follow-Up samples (see the Data File User's
Manual for the First Follow-Up of the 1980 Sophomore Cohort of High School and
Beyond). The mean of the weights is 237 and the variance is 62,894. For the
entire First Follow-Up 1380 Sophomore sample of 28,119 completed cases, the
mean weight was 134 and the variance equalled 19,536. The substantial
increase in, the variance of the weights (and the attendant loss of sampling
efficiency for population estimates) arises primarily from the continued
disproportionately higher resampling rates for policy relevant subgroups and
the correspondingly low retention rates for remaining sample members.
Table 7.2-3
Summary Statistics for Adjusted Case Weightsfor the High School Transcripts Survey and the First Follow-Up Survey
of High School and Beyond
Statistic
Transcripts
Value
First Follow-Up
Value (FUWT)
Mean 237.18 134.42
Variance 62,394 14,536
Standard Deviation 251 140
Coefficient of variation 1.06 1.05
Sum 3,780,934 3,779,756
Minimum 1.52 1.45
Maximum 4,000 3,196
Skewness 3.9 3.2
Kurtosis 26.7 99.6
Number of cases (respondents) 15,941 28,119
The impact of the increased disproportionality of the Transcripts
sample upon design efficiency is considerably offset by a reduction in the
average cluster size for the Transcripts Study design. Whereas the mean
cluster sizes for the Base Year and First Follow-Up Sophomore Cohort Samples
were 36 and 31 respectively, that for the Transcripts Study is less than 16
per cluster (sampled school). This smaller average .cluster size reduces the
9
contribution that the clustering of the sample .makes to the overall design
effect. This contribution may be estimated as DEFFCLUST 1 + rho (b-1) in
which rho is equal to the intra-cluster correlation and b is equal.to the
average cluster size. Clearly as b decreases, DEFF decreases also. Although
exact standard errors of estimates fot Transcripts data contained in thiS file
were not calculated for this study, the estimated design effect (DEFF) for the
Transcripts survey dataset provided by generalized procedures appropriate to
the design is approximately 3.70 isee chapter 6 of the Sample Design Report
for the First Follow-Up of High School and Beyond for a fuller description of
these calculations). This isonly slightly greater than that estimated from
First Follow-Up data for the entire sophgmore cohort. Our purpose here is to
alert the data user to the fact that: the use of silaple random sampling (SRS)
assumptions in the computation of sampling errors for population estimatesoof
means and proportions will lead to significant underestimation of the magni-
tude of sampling errors. In the absence of software or computer programs and
facilities for the computation of exact standard errors, the conservative
analyst may wish to employ a generalized design effect to sampling error esti-
mates produced by popular software packaggs such as SPSS or SAS. Our calcula-
tions suggest that SRS standard errors for population estimates of means and
proportions should be multiplied by a f*actor of 1.9 tp1/42.0, representing the
square root of the design effect (DEFT). (See Calvin Jones, Martin R. Frankel,
Roger Tourangeau, Harold McWilliams, and Frank O'Brien, High School and Beyond
First Follow-Up Sampla Design Report, Chicago: National Opinion Research
Center, 1983, Section 7.4, for discussion of how to u,e the estimated design
effects to approximate standard errors for a complex sample design.)
7.3 Data Collection
Planning for the collection of high school transcripts began during
the First Follow-Up Survey in the spring of 1982. At that time letters of
intent were mailed to school officials describing the Transcripts Survey and
discussing implementation procedures. At that time agreement was secured for
each school to assign a coordinator to receive and prc-!ess transcript
requests.
9 I
tii
During the last week of SepteMber 1982, packages of Transcript ihu'rvey
. materials were mailed to 999 HS&B sample schools*and* 900 schools to whiC'h
student respondents selected for the Transcript Survey had transferred. A
total of 18,152 sophomores were subsampled frOm the First Follow-Up Sur;.7ey.
Among them were 891 transfer students, 2,584 dropouts, and 14,677 wiio were
still enrolled at their Base Year schools or.had graduated early. The
Transcripts Survey included 355 sampled twins and 275 non-sampled co-twins and
triplets.
Each package contained a letter to the principal, a transmittal form
with instructions, a, computer -- generated list of students for whom transcripts
were being requested, a label to affix to each transcript to link the correct
transcript to HS&B files, and a signed transcript release form for each
student who had signed one during the First Follow-Up. Reimbursement at $1.50
foi Ach transcript was offered and an invoice'form was enclosed. (See .
Appendix B for copies of the documents mentioned above.)
In addition; the 999 HS&B schools. were asked to provide any materials--
such as course catalogs, student manuals or handbooks, informal course
descriptions and so on--which would aid the process of coding course titles,
earned credits, grades, academic terms, and the relationship of specific
...courses to special curricula or programs (e.g., bilingual programs, special
education, programs for gifted students, etc.). In nearly all cases, schoolst,
which returned student transcripts also returned all appropriate materials
neccssaryfor editing and coding.
7.3.1 Securing School Cooperation
The first response from a sample school was received six days after
the initial mailout. At the end of the first week of the field period-8
percent of the schools had responded; at the end of four weeks, 55 percent.
At that time, the transfer school response rate was 58 per ?ent, that for HS&B -
Throughout this section reference is made to 999 regular HS&Bschools. Of the 999 schools 17 are "target" 'schools which ire not strictlypart of the HS&B probability sample of schools and thus are unweighted in thesample. Seven of the 999 schools were schools that had closed sending BaseYear sample students to a large number of geographically dispersed schools(see section 3.2.)
93

-,trample schools, 52 percent, reflecting the fact that only one or two
transcripts were requested fr m the former and an. average of 16 were requested
from the:latter. Nevertheless, the high rate of earl return from HS&H
schools indicated 'the committment of sample schools to the project.
A telephone follow-up of non-responding HS&B schools had.been sche-
duled to begin in October but the effort was delayed until November 4, 1982,
in light of the demonstrated cooperation from tii-11. schools. That date marked
the end of week 5 of the field period, with a response of 58 percent of the1
HS&B ,schools. Of the remaining 42 percent 333 schools fromwhich 10 or more
tramacripts had been requested were called. (Although over 400 schools were
listed as non-responding when the follow-up began, continued receipts before
calls were made to some schools reduced actual required contacts to 333
schools.) By December. 3, two-thirds of the schools contacted had responded.
The remaining third of the non-respondents (117) were called a second time
beginning on December 6. The 58 (6 percent) that had not responded by the end
of December were called a third time early in 4nuary. No transcripts were
received from 34 schools although each of the school contacts assured the
interviewer that the request would be filled.
The third follow-up effort included a small number of schools with 5
to 9 HS&B students that had riot been called previously. In addition, 179
schools from which only a partial set of transcripts had been received were
included in the third round of calls.
By the end of November, 72 percent of transfer schools had
responded.' Oh December 3 a second request by mail was made to each of the
remaining-28 percent. In the following weeks 117 additional transfer schools
responded.
In all, 772 transfer schools responded. Of these, 115 were unable to
comply with our request for one of several reasons; 7q., the student had not
signed a transcript release form; the student had never registered, or had
registered but dropped out without earning any credits, or had registered but
dropped out without earning any credits, or had registered but subsequently
transferred to another school. One hundred twelve transfer schools did not
reply. Only sixteen survey packages sent to transfer schools were returned as
undeliverable.

-91-
Final school level response to the Transcripts Survey isLshown in
enable 7.3-1. School level response by school sample type is shown in
Table 7.3-2.
Table 7.3-1
Transcrip Survey School Response,(Unweighted)
Arimleprf...SchoolDisposition
HS&BRegu la.r
TransferSchools "ir .Total
Responded
Refused
Closed
Other
No Response.
TOTAL
949
14
2
0
34.
95.0%
1.4%
0.2
-
3.4v
. 771
1
..0-
16
112
-85.7%
0.1%/
-
1:8%
12.4%
1,720
15
2
16
146
90.6%
0.8%.
0.1%
0.8%
7.7%i:.
,999 900 1,899
6i0 Table 7.3-2
High School and Beyond School Response By School Sample Type(Ur.weighted)
Sample TYpe. Total Responded Refused Closed No Response
Regular Public 730 73.1% 704 96.4% 9 1.2% 0 - 17 2.3%
Altetnative Pub.i
39 3.9% 36 92.3% 0 - 1.2.6% 2 5.1%
.
Cuban Hisp. Pub. 11 1,1% 8 72.7% 2 18.2% 0 - 1 9.1%,
Other Hisp..Pub. 102 10.2 95 93.1% 1 1.0% 0 ,- 6 5.9%1,
Regular Cath. 44 4.4% 43 97.7% 0 - 0 - 1 2.3%
Black Catholic .29 2.9% 25 86.2 2 6.9% 1 3.4% 1 3.4%
Cub. Hisp. Cath. 8 0.8% 7' 87.5%, 0 - 0 - 1 12.5%
Elite 0th. Priv. 11 1.1% 11 100.0% 0 - 0 ;- 0 -
Other Private 25 2.5% 20 80.0% 0 - 0 - 5 20.0%
TOTAL 999 100.0% 949 14 2 34
4
oi)
ti

7.3.2, Student Level Response Rateg
The First Follow-Up Soph;more Questionnaire cohtained a form to be
signed by the respondent permitting the project to receive a copy of'his or
her transcript. Although few students literally refused to, sign it, some
overlooked the ferm which was, in fact, the last page in the qu stionnaire.
Other respondents who had completed interviews by telephone Oere unable to
sign the forms. In the final count 584 student transcripts from regular
schools and 13 from transfer schools were refused by the schools for lack of a
signed release form. Two schools refused to provide any transcripts. because
local rules required submission of release forms signed by the student's
parents.
Of the'transcripts requested from HS&B schools, approximately 89
percant were received. From "target'f'Achools (see section 7.31, 88 percent
Were received. In addition to the absence of release forms, the reasons for
the failure'ta return a transcript fell into several categories,
records', student transfer with no transfer school - named, student
and transcript could not be released.
e.g., 'lost
owed money
Transfer schools were more often unable
to provide transcripts for the reasons mentioned in Section 7.3.1 above, and
returned 72 percent of the transcripts sought. The disparity between the
number of transcripts returned by HS&B schools and targset schools and those
returned by transfer schools persuade us to recommend that a back' up strategy
be adopted fr- future transcript collection efforts. For the small' additional
expense we .lieve it would be cost effective to make a request for a
transcript from the original HS&B school for those students for whom the
transfer schools cannot, or will not provide theme 44)
-Complete ,transcript returns by student sam6le type. are shown in Table
7.3-3, and by school type in Table 7.3-4. Transcript returns by HS&B, target,
and transfer schools are shown in Table 7.3-5.
I 0

Table 7.3-3
Transcript Response by Student Sample'Type(UnWeighted)
Sampld Cell,TotalSample
TranscriptsReceived Percent
Twins 355 315 88.7
'Base Yekr Non-Participant 486 386 79.4
Private Schools 1,576 3,194 / 89.3
Drop-out, etc. 2',947 2,336 ,79.1
Cuban - Puerto/Rican 495 428 86.5
High Achievement Hispanic 820 751 91.6
Asian & Pacific Island 341 317 93.0
wee-High Achievement Black 814 707 86.9
4igh Ach. Low SES White 503 439 87.3
American Indian, 1 36,7 .331 90.2
Parent Data 2,008 1,778 88.5
Others 5 440 4,965 91,.3
TOTAL 18,152 15,941 . B7.8
Table 7.3 -4
Transcript Response by School Sample Type/Student Status(Unweighted response rate)
SchoolSample Type (N)
Response
Student Status
Transfer Dropogt Other
%'
RegUlar Public (11,738) 10,3734 88 349 62 1,490 78 8,534 91
Altern. Pub. , (632) 526 83 29 76 128 70 369 90
Cuban Public (245) 165 67 6 46 33 65 126 30
Other Hisp. Pub. (1,901) 1,631 86 57 72 258. 77 1,316 89
Regular Catholic (1,457)- 1;390 95 50 89 17 89 1,323 96
Black Catholic (947) 791 84 99 77 21 70 671 85
Cuban Catholic (300) 225 75 14 56 6 40 205 79
Elite Other Priv. (354) 329 93 14. 93 - 315 93
Other Private (578) 511 88 61 84 16 52 434 92
Total (18,152) 15,941 679
....1.111,969 13,293
I. 0

Table,7.3-5.,
Transcript Response by HS&B, Target and Transfer Schools
°School Sample N Received,
Sigh School and Beyond 16,837 14,948 88.8.
Target 277 tt 244 88.1
Transfer 1,038 749 72.2 6
Total 18,152 15,941
7.4 Data Control And Preparation'
Data control and preparation refers to..a series of procedures'
`governing the preparation, of transcript data for optical scannaq. The
process involves monitbrincvthe receipt of transcriptst
from sample schools;
coding, and transferring the transcript data.to the scannable forms.
7.4.1 Receiving Documents
TranScripts mailed to NORC from schools were 'delivered to ,the receipt,
control supervisor. Each package was thoroughly inspe-Aed. Closely
supervised receipt control clerks reconciled the transcripts repeiied with the
checklist of transcripts requested and entered a disposition code for.each in
4 the space provided on the checklist.% At the same time, an inspection was made
of the course catalog's and other materials to determine their adequacy fort the
A
coding process. Transcripts and related documents were placed in a prepared
school folder, entered .= an inter - office control transmittal, and assigned to
a coding supervisor. Checklists were routed daily to Data Processing there
dispositions were entered into NORC's receipt control system. 'This systim
generated progress reports and Produced the data from which follow-up action
was planned.
7.4.2 Coder Training
. A staff of 24 coders Were trained gor 1-1/2 days. Three elements were
Auphasized in training: .1) skills in making appropriate coding decisions, 2)
accurate transcription of information to optically scannable coding forms, and
3) the legible entry of data on coding forms to ensure rapid and accurate
scann4ng.
103
11
'KY
The princpal focus .of coder training .was the use of the NCESI
-Classification of Secondary.School Courses, (CSSC)1 , along with course catalogs
and student'marials, ba,assign 6 -digit course identification codes to each
course listei on a student's transcript.i Classroom instruction and self -study
materials were supplemented by a series of increasingly difficult tests.
Trainees were not permitted to begin production coding until they had
satisfactorily completed the test series.
*These proceduies were further augmented by additional training in the
proper handling of non-standard courses not covered by the CSSC, as Well as
non-standard credit and grading systems. Finally each coder was supplied with
and trained to use a Transcripts Coding Specifications manual This document
contained rules for coding each .data element and procedures for resolving
unanticipated 'problems. 4
7.4.3 Coding .
4
, .
t . .
As indicated in Sectio 7.1.1 above, the First Follow-Up survey1\ p
included the collection of coinp4ehensive lists of course offerings and,,
enrollments from each sample school. to promote cost effir:iency and decision
consistency in the coding of course titles, the processing of school course.
g,.offerings and student transcripts was integrated as. follows: For HS&B sample
,
schbols, which required tie coding of 1981-82 course offerings and an .average5.1
of 16student'trariscripts, coders first constructed a mlsteri)worksheet listing
each course offered by .he school. The completion of this initial step
greatly increa3ed the ,efficiency and consistency of coding transcripts of
students attending that school, since nearly all courses appearing on the
transcripts would also have been offered in the 1§81-82 acadethic year.
A two-sided, optically scannable, transcript coding 'form, was filled
out for each transcript received. (In a very few cases, an additional form
was required to record all courses on the students transcript.) First,ti
coders affixed a scannable label to the form indicating the .HS&B student
identification numbef. Then, for each transcript, the following data items
were entered (if present on the transcript):
1 Evaluation Technologies Incorporated, Classification of SecondarySchool Courses: 1982. This taxonomy was developed by NCES specifically for
0use in the HS&B Transcripts Survey.
104

a
-96-
whether. ot not a.school catalog had also been added
.:72 number of days absent for each Of four htgh echool years
participation in a specialized educational program (e.g.,special, bilingual, or gifted education
S
rank in Class and total class size t
the date the student Aft high school
- a code for the reason the student left high school (e.g.,graduation, ;dropped out)
the number of days-the student was suspended from school
the grade point 'average reported by the school
PSAT scor9s (Mathematics and Verbal)
SAT scores (MatheMatics and Verbil)
ACT scores (Engli.eh, Mathematics, Natural Science, SocialScience, CoAposite)*
Advanced Placement Tdsts
course data for each courselisted on the transcript:
the grade in-which the course was taken a
the six -di it. CSSC course identification code
4
>.
a code sfgnifying.whether the course was part of a specialprogram such as bilingual education, special education or aprogram fdr gifted students
- the term of the school year that the course was ,taken
quarter,uarter, trimester, or year long course)
- the number of credits earned (standardized to a commonmetic
Aft,
I
the grade assigned
Variance in credit systems was overcome by adopting the system-of standardi-
zation used by the National Longitudinal Survey of Labor Force Behavior. To
standardize credits (SCC):
SCC = CC /SCC)
1O

in which
'CC = Course :credit earned by the student
SCO = Number of credits offered for completion of a.,standard course in a particular school. (A standard
% course is a one-year academic course in a general orcollege preparatory school or a one-year shop ortechnical coarse in a vocational school.)
For example, if a general high school offers one credit for completion
of a standard one-year course and the student earned 0.5 credit for a one-
semester reading course, 0.5 credit is assigned to the course (0.5 = 0.5/1.0).
If another high school offers two credits for successful completion of a stan-
dard course, a one-semester, one-credit course would be assigned 0.5 credits
(0.5 = 1.0/2.0) also.
Some students earned. more than 1.0 credit for particular courses
(e.g., vocational courses, in a primarily college preparatory school). These .
types of credits are exceptions; most course credits ranged from 0.00 to 1.00.
NCES provided a standardized grade scale. All full grades (i.e.,
B, C, p, F) and halt grades (e.g., D -," D+, C-, etc.) were assigned individual
codes. When a minimum passing grade had been established, the coders con-
verted numerical course grades (e. g., 74, 93) by using one of the three grade
scales.
It is important to note that no attempt was made to standardize the
grade point averages to a common thetric becau,e--so many different grade point
average scales were used by schools. Moreover, grade point averages were
contained on less than half the transcripts received. Thus, we strongly urge
the user who desires to employ such,,a measure to compute a new grade point
average score using the grade and credit fields, Ath of which have been
calkbrated to common scales for entry into the transcripts file.r.
7.4.4 Quality Control
.Supervisors performed a 10 percent check of course entries for five
randomly selected transcripts from each HS&B sample school And 10 percent of
the course entries on each transfer school transcript. Retraining was
conducted as needed.
After six weeks of coding the checking activity was revised in view of
the extremely'low rate of error. High frequency courses were eliminated from
.01
4 10t3
t..
the checking procedure. However, intense scrutiny continued to be given to
.courses identified as areas 4t frequent coder disagreemedt, e. g., vocational
programs.
7.5 Data Processing
7.5.1 Data Conversion
Optical character recognition of handwritten numbers was the data
conversion method chosen for this survey. The. data was copied by trained
code4s onto scannable forms designed to meet the needs of the survey.
Scanning speCifications were' given to the "scanning subcontractor in order to
.program their equipment to read the forms. To ensure the reliability of the
equipment, tests were conducted on a sample of the data. The tests were
repeated and the equipment adjusted until the reading error was reduced to
0.6%. Finally, the processing of the coded fob= through .the scanning
,equipment was conducted and supervised by trained NORC staff over a period of
four weeks, During this period, the data was copied to magnetic tapes daily
and returned to NORC.
7.5.2 Reconciliation of Data Files Against Receipt Control Files
After the scanning process was completed, the data was reconciled
against the, receipt- control database. Missing or incomplete cases were
identified and rescanned. The reconciliation priocess was repeated uri if). the
final data file, and the receipt-control database were in agreement.
7.5.3 Machine Editing
The / NORC cleaning program .(EDIT) was used for machine editing the
scaianed documents. The program incorporated both simple checks for valid
codes in every data field and logical checks for inter-item relationships.
For example, no 'class rank' greater'than 'class size' was allowed;
inconsistencies in the duration fields related to each course were flagged,
and so on. The product of each edit~ or cleaning pass was an EDIT report that
listed every case (or course record) that failed the machine edit as well as
the source of the failure. Data preparation personnel, working from thesef
reports, retrieved the documents in question and resolved the problems. The
editing process was repeated until all errors were resolved.t
10 ?

-99-
7.5.4 Bata File Preparation
The Hicin School Transcripts data file was designed to reflect the dual
nature of the data provided by..the transcripts. The first part of the
transcripts coding form was Used to xecord fixed items of information fox all
students ,e.g.,C days absent perlchoor'year, rank in class, and standardized
test scores). Nhe remainder of the form was designed to record fixed infor-
mation on each course contained on the students' transcripts, with the number
of courses per student varying across a wide range. Because the construction
of fixed-length records containing both student- and course-level information
would have resulted in a highly inefficient file structure. transcripts data
have. been split into two record types and economica,lly stored in a variable-
blocked file format. Each of the 15,941 cases do the file has two types of
data records. The..fivt record contains student-level data from the tran-
It-
scripts and from the student questionnaire file. It is designated Record Type
1. The second type,of record contains data from the transcripts about each
course listed on the students' transcripts and is designated Record Type 2.
Type 1 records also., contain data fields which summarize the numbers of
specific types of courses taken by the stIdent..
14/
1U
-100-
8. THE COURSE OFFERINGS AND COURSE ENROLLMENTS SURVEY.
8.1 Introduction
N
During the tall of 1982, course desFriptions (course catalogs, master
schedules) and course enrollments for the 1981-82 school year were collected
for the schools in the. High School and Beyond probability sample.
The HS&B Course Offerings and Course' Enrollment File expands and
complements the HS&B data files in several ways. First, the availability of
course descriRtions contributed to clear, consistent coding of high school
transcripts that were collected from these schools' for a sample of the 1980
sophomore cohort. Furthermore, the existence of the course description and
enrollment data serves the following independent purposes:
- It provides valuable, information about high school programs and theeducational experience of high school students.
- When used with the data from the transcript file, it makes possible theinvestigation of course taking patterns and enrollment rates by studentcharacteristics and the relationship of such patterns to students'activities and success after high school When used with the schoolquestionnaire data included in the course offerings data file, it alsomakes possible the investigation of'course taking and enrollment ratesby school characteristics Nell.
The Course Offerings and Course Enrollment File augments a large and
growing database from the High School and Beyond survey. The files may be
merged by means of a common student identification number. For an overview of
High School and Beyond see Chapter 1 of this report.
8.2 Overview of the Sample
The sample for the Course Offerings and Enrollments Study is identical
to the First Follow-Up sample, which did not involve any subsampling at the
school leve:. In other words, the Base Year probability sample of 1,015
schools was retained intact for the First Follow-Up survey. However, schools
that had no 1980 sophomores, had closed, or had merged with other schools in
the sample were not asked to complete a First Follow-Up school question-
naire. There were 40 such schools (see section 3.2). Thus, 975 of the 1,015
schools in the Base Year probability'gample were to be contacted for the First
Follow-Up survey. Of the 40 schools not recontacted, 17 were junior high
schools or schools that had closed since the Base Year survey, sending all
1 0 9

their 1980 students to a single "tar9et school" that was not a,member of the
HS&B probability sample, These additional 17 target schools were also
contacted to complete a First Follow-Up school questionnaire and to piovide
.data on 1981-1982 course offerings. However, since they are not members of
the probability sample, they are not weighted and course data for these
schools is to be used only as contextual data for the students who transferred
.to these schools.
The Base Year sample of 1,015 schools was a probability sample from an
estimated population of some 21,174 public and private secondary schools with
tenth and/or twelfth grades in 1980. The Follow-Up probability sample of 975
schools represents a change in the universe definition and size of the present
study. Course offe'rings and enrollments data will support inference to the
population of some 20,000 secondary schools which had tenth and/or. twelfth
grades in 1980 and were in continuous existence through the 1982 academic
year.
8.3. Course Offerings and Enrollments Weights
The general purpose of the weighting scheme is to compInsate for
unequal probabilities of selection (retention) for the follow-up survey and to
adjust for the fact that not all individuals selected for participation in the
survey actually participated. The weights are based on the inverse of the
probabilities of selection through all stages of the sample selection process
and on nonresponse adjustments factors.
Every school that participated in the Base Year survey, except those
noted in section 3.2, was included in the sample for the First Follow-Up.
survey. Thus the Base Year school weights, which compensate for unequal
probabilities of selection, can be used to develop estimates for the First
Follow-Up schools as well. Lists of courses offered i,the 1981-1982 academic
year were supplied by 941 (r)7 percent) of the 975 eligible schools. Because
of such a high response rate, it was determined that an adjustment for the 3
percent nonresponse would not significantly affect estimates of course
offerings items.
However, an adjustment for nonresponse to the weights applied to
course enrollments was necessary, since 762 schools or 78 percent returned
adequate enrollment information. Because of this, the-Course Offerings and

Enrollment Data File contains two school weights: one for use in Analysis of
the course offerings data, and a second for use in the analysis of 'enrollment
figures. See sections 3.4 and 3.5 for a discussion pf school weight
computation. and characteristics and for the nonreAponse adjustments to course4
enrollments.
8.4 Design Effect
Since the High.School nd Beyond sample is a stratified and
disproportionately selected probability sample of.schools, simplp random
sampling formulas will underestimate the sampling varian6 and standard error
of statistics such as means and proportions. The degree, of this underestiT
mation can be approximated by calculation of a quantity known as design
effect, which is a measure of the efficiency of the sa-ple estimate relative
to a simple random sample. Design effect is discussed in section'3.6. Users-1,
concerned with the standard error of estimates derived from the school sample
should be aware of the fact that the complex sample design h s significant
effects on' the precision of estimates computed from the samplel data.
8.5 Course Offerings And Course Enrollments Data Collection
During the First Follow -Up Survey most-schools returned course
catalogs, school manuals," or other descriptive materials that would be useful
in constructing a listing of secondary school courses offered. Relatively
few, however, provided course enrollment totals. The reason most often cited
II
for failure to include the ,figures was the fact that final data would not be
known, and therefore avail=ble, before the end oe.the.school ye r (1981-82)., .
A substantial number of schools that did; returt enrollment figures includedC
the information that they were incomplete.
When planning .for the Transcript Survey began in the spring of 1982,
it was decided that the timing of thee:survey (fall of 1982) and the data
collection plan itself offered an opportunity to seek course offerings from
schools that had not provided them duffing the First Follow-Up. Fitarther, by
that time all schools that maintained course enrollment records would have
completed them.
As a result, coding of course offerings and enrollments was moved to
the fall of 1982 also. Additional adVhntage would be obtained by the decision
111

to delay coding since simultaneous coding of school course offerings and
transcript courses reported for the same school would promote cost efficiency
and course coding consistency.
Therefore, in the last week of September 1932, when transcripts were
sought for 18,152 members of the 1980 sophomore cohort probability sample, the
packages mailed to all schools (except those to which students transferred as
individuals from their Base Year schools and from which only transcripts were
requested) included a letter that explaineethe second request for materials--
such as course catalogs, student manuals or handbooks, and informal course
descriptions--which would aid in the process of coding course titles, earned
credits, grades, academic terms, and the relationship of specific courses to
special curricula or programs (e.g., bilingual programs, special education,
and programs for gifted students).
Each school in the Transcript Survey received a computer printout
listing the names of the students for whom transcripts were being requested.
The student, Checklist contained a section in which computer-generated entries
indicated those documents which had been previously received and those which
were being requested. Specificati ns accompanying the form asked that the
reason be entered if the requeste document was not enpIOsed in the return
envelope, e.g., non-existent, not currently available. J
8.5.1 School Response
In early January 1983, a total of 137 of a base of 975 schools had
returned either course offering materials only, enrollments only, or
neither. Calls were made by NORC interviewers to each of these schools. Of
the 137 schools in this group, 126 (94 percent) returned the course offerings
and/or enrollments.
In all, course offerings were received from 941 (97 percent) of the
schools. Eleven schools reported that the information either did not exist or
was not currently available. Course enrollments were returned by 762 (78
percent) of the schools. However, 132 reported that course enrollment
statistics did not exist or were not currently available.
8.6 Data Preparation
Data control and preparation refers to a series of procedures
governing, the preparation of course offerings and enrollment data for optical
scanning. The process involves monitoring the receipt of the relevant
materials from sample schools, coding, and transferring the data to the
scannable forms.
Since the Course Offerings and Enrollments Study coincided with the
Transcript Study, procedures for data control and preparation usually applied
e to both. Fora description of receipt control, coder training, add coding.
procedures see sections 7.4.1, 7.4.2, and 7.4.3., respectively.
4
8.6.1 Coding
For each course offered, the following data items were entered:
- the six-digit CSSC course identification code
- a code signifying whether the course was part of a special education
program such as bilingual education, special education'or a program for
gifted students
- the terms of the school year that the course was offered (semester,
quarter, trimester, or year long courp)
- the number of credits offered (standardized to a common metric)
- the total number of students enrolled during the 1981-82 year
The format in which course enrollments were submitted took many forms
also. Specially trained coders handled the enrollment task.
Variance in credit systems was overcome by adopting tt.,e system of
standardization used by the National Longitudinal Survey of Labor Force
Behavior and differs slightly from the .formula used to standardize transcript
course credits (section 7..4.3). To standardize course credits (SCC):
SCC = CC/SCO
in which
CC = course credits offered. By keeping this redefinition in mind, use
the remainder of the formula and examples in section 5.4.1 as
guidelines to standardizing course offerings credits.
4
113

8.6.2 Quality control
Supervisors performed a 10 percent chqck of entries fo'r each school's )
course offerings. Retraining was conducted as needed.
After six weeks of coding the checking activity was revised in view of
the extremely Plow rate of error. High frequency courses were eliminated from
the checking procedure. However, intense scrutiny continued to be given,to
courses identified as area of frequent coder disagreement, e.g., vocati9nal.
programs.
8.7 Data Processing
Course offerings and transcripts were coded onto two - sided, optically
scannable, coding forms. Therefore, some data processing procedures 'applied
to both. See sections 7.5.1 and 7.5.2 for descriptions of course offerings
data conversion and data file reconcilation.t
8.7.1 Machine Editing
The NORC cleaning program (EDIT) was used for machine editing the
scanned documents. The program incorporated both simple checks for valid
codes in every data field and logical checks for inter-item relationships.
For example, inconsistencies in the duration fields_related to each course#
were reported, as were instances of reported course enrollments larger than
the total school enrollment as recorded in the School Questionnaire Data
File. The final product of each cleaning pass was an EDIT report that listed
every case (or course record) that failed the machine edit as well as the
source for the failure. Data preparation personnel, working from these
reports, retrieves the documents in question and resolved the problems. The
editing process was repeated until all errors were resolved.
8.7.2 Data File Preparation
The Course Offerings and Enrollments Data File contains records of wo
different t'pes for each school. Type 1 records come Ir9m the High School and
Beyond School Questionnaire File, with only minor changes. Type 2 records, on
the other hand, were generated by coding and optically scanning the course
offerings (or catalogs) and enrollments data returned by the school. For each
school, counts of courses in 52 different categories, and a count of the total
fn

:-106-
.3?
number of courses offered by the school, were generated from the type 2
records. These counter variables appear at the end of that school's type 1
record.
Finally, all records were sorted together. The sort order is (1)
school ID;.() record type; and (3) within record type 2, course identifi-
cation code in ascending order.
Ck'8.8 Organization And Content Of The Data File's
The Course Cfferings and Enrollments file includes a record for every
school eligible for the HS&B First Follow-Up School Survey. 0ne thousand and
fifteen of these schools (SCHORIGN = 0 OR 1) are from the High School andA
Beyond "Main`ample"
of secondary schools; seventeen (SCHORIGN = 2) are
"target schocs"which absorbed allor most of the student body of a closed
main sample school. (As indicated earlier, the 17 "target schools" have
unknown selection probabilities -and should not be included in analyses of the
1015 schools in the probability sample. Data for these schools are included
on the file for use only in the contextual analysis,of student data.)
Two different record types are included in the,Course-Offerings and
Course Enrollments file.. For each of the 1,032 schools (main sample plus
target) there'is a single "type 1" record which contains data about the school
as a whole, principally the school questionnaires from the Base Year and First
Follow-Up waves of the High School and Beyond study. In addition, for each
school that participated in the Course Offerings and Course Enrollments Survey
there are multiple "Type 2" records for each school, one for each course
offered. The lengths and contents of the two record types are different.
Therefore, the file structure (or "Record Format") is that structure known
technically as Vatiable Blocked (VB): records of different lengths,
physically grouped together into multiple-record blocks. The file is written
accordfhg to standard IBM conventions for VB records. Each record begin% with
a 4-byte field containing record length, and each block begins with a 4-byte
field containing block length.
Users who are unsure of how to read a file of Variable Blocked records
should consult with technical advtsors at their installations. Details of the
file structure are summarized as follows:
115

-107-
1. The file is sorted by School ID, positions 1-4 in ,each record.
2. The first record for each school is of type 1 (position5 = 1); its.length is 1045 characters. Positions 883-885'contain a count of the type 2 records to follow (COURSCT).
,
3. Later records for the school are of type 2 (position5 =.2); their length is 33 characters. As stated above, therwaber h records for a school will equal the value in
'1; 883-885, of that school's type 1 record.
It
a
/0
I
't4

NI)
V.
I
e.
APPENDICES
117
4.

.4
a
APPENDIX A: FIRST FOLLOW-UP INSTRUMENTATION
Senior Questionnaire
Sophomore Questionnaire
` School. Questionnaire
.' X
118
"1

ti
PY
SR/Q1982 FU.1
tiForm Approved Iv,
0.M.B. No. 1860 -0088App. Exp.; 90/82
1980 SENIOR COHORTFIRST FOLLOW-UP QUESTIONNAIRE
Dear Participant:
you for accepting our invitation to continue your participation in High School and Beyond.ough completion of this questionnaire, valuable information obtained from young people
themselves can be used by policymakers to improve the education system for future students. Theirgoal is to prepare ,students, for productive and meaningful roles in an increasingly complex andchanging society.
ID #;
NAME:
N First,
Sm.
ean
411111111
Last._
Prepared forTHE NATIONAL CENTER FOR EDUCATION STATISTICSby
THE NATIONAL OPINION RESEARCH CENTER
ED(NCES) Form No. 2409-33 11 9
kr,

3
7
$
2
1
3
7
t2
1
7
4
2
MO
GENERAL INSTRUCTIONS
LEASE READ EACH QUESTION CAREULLY.
It is important that,you follow the directions for responding to each kind of question. These are:
(MARK ONE)
What is the colcz of your eyes? (MARK ONE).,
Brown o If the color of your eyes is green, youBlue . 0 would mark the oval to the right ofGreen . . "Green." ,
,Another color ( o
mem=
iMINSEINEI
OM
IMMENWINI
411111
SID
OINIENNEll
NOMEINIM
EININiNEE,
ONINMINNI
!Of
'NEWSOME
allENEWIE
2
1 .111111.
ego
(MARK ALL THAT AP4LY)o.
Last week, did you do any of the following? (MARK ALL THAT APPLY)
ASee a play o If you went to a movie and attended. Go to a movie a sporting event last week, you would
c Attend a sporting event er, mark the two ovals as shown.
.(MARK cktiE OVAL FOR EACH LINE)
Do you plan to do any of the following next week.r(MARK ONE OVAL FOR EACH LII(E)Yes Not sure No If you plan to study at a friend's house,
a. Visit a relative o 0 do not plan to visit a relative, and are not
b. Go to a museum .o 0 sure about going to a museum next week,
. a, c. Study at a friend's house . 0 c you would mark one oval on each line asshown.
(WRITE IN)
What is your favorite sport? (MARK ONE)
FootballBasketballBaseball
Other (WAITE IN) k.461-- Nnei-1-4/
Some questions ask what you were doing during's. specific time period. For example, "What wereyou doing during the rust week of October 1981?" Please watch for these time references andmake sure you are thinking about the correct month and year.
If your favorite sport is ice hockey,you would mark the oval to the rightof "Other" and write "Ice Hockey"on the line as shown.
This questionnaire is not a test. We hope you will answer every question, but you may skip anyquestion you do not wish to answer.
THANK YOU FOR YOUR COOPERATION
120

7
4
2
7
4
41111111
5. How far is this from the city or community where you lived as a senior in highschool? (MARK ONE)
.)Same place I lived in when I was a senior in high school o.Less than 50 miles c50 to 99 miles 0100 to 199 miles o200 to 499 miles . vi. c500 miles or more ....---
6. Did you complete high school? (MARK ONE)
Yes, graduated i).... ,.....
No, still in high school ,...,No, left high school ithout completing cYes, left high school but have since passed a high school eq.:: lency test,
for example, the GED , c
7. When did yOu leave or graduate from the last high school that you attended?o (MARK OVALS FOR MONTH AND YEAR)
Month Y
January 0 'Julyu 0 1979 _February o August c 1980 _March o September 1981 cApril Q October 0 1982. CMay C Novetaber cJune o December c
8. What is the lowest hourly wage you would be willing to accept for a jQb at thepresent time? (MARX ONE)
Below $2.50 .
$2.50 , C$3.00 C$3.50 c$4.00 ., C$4.50 C$5.00 C.$5.56 ,, .--$6.00
--,
$6.50 C$7.00$7.50 per hour or moreWould not accept any job at the present time
9. Now please think back to last October. What were you doing in the first week ofC October 1981? (MARK ALL THAT APPLY)
a.b.C.
d.e.f.
g.h.1.
Working for pay at a full-time or part-time jobTaking academic courses at a two- or four-year collegeTaking vocational or technical courses at any kind of school or college
(for example, vocational, trade, business, or other career training school)Serving in an apprenticeship program or government training programOn active duty in the Armed Forces (or service academy)Homemaker (without other job)With a job but on temporary layoff from work or waiting to report to workLooking for workTaking a break from working
2 I GllaIMP
1 j. Other (DESCRIBE)
3121..

qW
13. At +hat age do you expect to ... (MARK ONE OVAL ''OR EACH LINE)
Don't Have Age in years:2 expect already
, to de done Under 30. or.......3 this this 18 , 18 19 20 21 22 23 24 25 28 27 28 29 more
I1lNIMIIIIMI
a. Get married? o ,..,- 0 .0 o .0 .0 c .0 c 0 0 0 4.-7, .7;s ill& b. Hays your first2 child? o o o, .0 .0 .o -0 o o C o o 0 .o. .c.,- , c1. eMO C. Start your dru
regular (not
....... summer) job? o o o 0 0 0 . .0 , 0 0 C o 0 0 .c.") ...7: Cd. Live in your
amplem
11111111111111*
11111110111
111111111M
NIMMIIIIIIINI
own lame. orapartment? .0 o .0 C, 0 .0 0 .0 .0 -C
1111111111111M
Finish your full-time education? o o o .0 C) .0 .0 0 .0 .0
16. Write in here the name of the job or occupation that you expect or plan to have whenyou are 30 years old. Even if you are not at all sure, write in your best guess.
(WRITE IN)
A. Which of the categories below comes closest to describing that job? (MARK ONE)
CLERICAL such as bank teller, bookkeeper, secretary, typist, mail carrier. ticket agentCRAFTSMAN such as baker, automobile mechanic, machinist, painter, plumber,
telephone installer, carpenterFARMER, FARM MANAGERHOMEMAKER. (without other job)LABORER such as construction worker, car washer, sanitary worker, farm laborerMANAGER, ADMINISTRATOR such as sales manager, office manager,
school administrator, buyer, restaurant manager, government OfficialMILITARY such as career officer, enlisted man or woman in the Armed ForcesOPERATIVE such as meat cutter, assembler, machine operator, welder, taxicab,
bus or truck driverPROFESSIONAL such as accountant., artist, registered nurse, engineer, librarian.
writer, social worker, actor, actress, athlete, politician, but not including school teacher --PROFESSIONAL such as clergyman, dentist, physician, lawyer, scientist, college teacherPROPRIETOR OR OWNER such as owner of a small business, contractor,
restaurant ownerPROTECTIVE SERVICE such as detective, police officer or guard, sheriff, fire fighter ....
SALES such as salesperson, advertising or insurance agent, real estate broker --SCHOOL TEACHER such as elementary or secondary --SERVICE such as barber, beautician, practical nurse, private household worker, janitor,
waiter, waitressTECHNICAL such as draftsman, medical or dental technician, computer programmerNOT WORKING
7 ems 17. What is your sex? (MARK ONE)4 arm
MINMIMIN
4
2
:vialeFemale
1225

22. Between the time you left high school and the end of February 1382 have you heldo a full -'ime or part-time job of any kind? (MARK ONE)
Yes'No ,0 (SKIP TO Q. 29)
23. Which months did you work (full- or part-time) or serve in the military since you lefthigh school? (MARK ALL THAT APPLY)
1.980 1.981 1982
June 0 January o July o January oJuly 0 February 0 August 0 February - 0August o March 0 September oSeptember o April 0 October oOctober o May 0 November 0
' November .. 0 June December cDecember -! c
24. Next we would like informt&on about all of the jobs you have had since you left highschool. We would also like to 'know about any periods of time you were looking forwork between jobs that you held.
IMPORTANT
... Please start with the first job you held after high school, even if it started while you werestill in school. Answer questions 1 through 12 for that job in Column A, (pages 8 and 10).Then go on to the next job you held and' answer the questions about that job in ColumnB, and so on.
... BE SURE TO INCLUDE YOUR CURRENT JOB
If you have been in MIL TARY service, please consider that as one job.
... If you had MORE THAN ONE 'JOB AT A TIME, please put them in separatecolumns.
. If you have had TOO MANY JOBS TO FIT, please make sure to put your current or mostrecent job in Column E even if that means leaving out some jobs.
... If you WOULD LIKE HELP WITH THESE QUESTIONS, please call us collect at area(312) 753-1486.
What is today's date? (MARK OVALS FOR MONTH AND DAY)
Month Day
FebruaryMarchAprilMayJune
.1. 7
1 thru8 thru 1415 thru 21
thru 31

P COLUMN C
4 MID2
SINVIIMNM
MEININIM
MMENININI
11111111
3RD JOB AFTER HIGH SCHOOLCOLUMN D
4TH JOB AFTER HIGH SCHOOLCOLUMN E
3TH JOB AFTER HIGH SCHOOL
.
, "
Office Use Only I Office Use Only r Office Use Only I
aD 0 ID CD OM 01D CD (ID CD
4D CD CD CD 0:3D 4) 0 CD VW
CD 0 CD CEPID IAD CD (1) ICD
al.Q.91) CD CD (I) CD CD CID CID
CDCDCDCDGDCDMCDMCD
aD CD el) CD CD CV cD CDCD CD
ICDOCDCIDCGtx:DaDcD1I
CD CD CD CD CD CD cD cD cD X I
laDocnapaiDe.DmaDcoi
%
\
Office Use Only 1 Office Use Only i Office Use Only
(11:10(2)(1)(i)CD(DCDCD(1)
CCD 0 (2) CD (4) (3)GID CD CD CD I
(DOCI)CDCDCD(DCDCDCD1
CD 0 (2)(1)(3)C0 cD CD (1)CD
apocnamDcpcomaDcocaccpapcpcimpcpwcpj
1ICZCI:41)CDCOCpcDcDcI7CDi
iaocncncowcoomcolvmccDcDocpcincpcpcol
t
.
An employee of a PRIVATECOMPANY 0
A GOVERNMENT employee(federal, state, local) c
Self-employed in your OWNbusiness c
Working WITHOUT PAY infamily business or farm ....o
.
An employee of a PRIVATECOMPANY. .0
A GOVERNMENT employee,i (federal, state, local) .c
Self-employed, in your OWN_
business .cWorking WITHOUT PAY in
family business or farm .o
,,,..
An employee of a PRIVATECOMPANY c
A GOVERNMENT employee(federal, state, local) c
Self-employed in your OWNbusiness c
Working WITHOUT PAY infamily business or farm ..:
Month Year Month Year Month Year
z; Jan. o Aug. 0 1980:.,' Feb. c Sept. 01981
March 0 Oct, 01982"2. A prV 0. Nov.
May 0 Dec.r.-.. June
.=, July
0 Jan. 0 Aug. 019800 Feb. o Sept. 0 19810 March 0 Oct. 019820 April c Nov.0 May c Dec.c June0 July
c Jan. 0 Aug. o 1980o Feb. oSept. 0 1981c March 0 Oct. o 1382o April 0 Nov.c May 0 Dec.°Junec July
Month Year Month Year Merida Yea
:.--,- Jan.. o May o Sept. 01980= Feb. . c June c Oct. 01981..: March c July 0 Nov. 019827.: April c Aug. o Dec.
Still have this job c
o Jan. o May o Sept. 019800 Feb. o Julie o Oct. 019810 March 0 duly Nov. o 1982o April 0 Aug. Dec.
Still have this job c
CJan. 0 May 0 Sept. 0 198c Feb. c June 0 Oct. c 1980 March C July o Nov. ',.c.,^7.98
0 April c? Aug. 0 Dec.
Still have this job c
(MARK ONE)c hourly
3 - c.
(MARK
$
ONE)c hourlyC weekly
(MARK ONE)c hourly.
$ c weeklyweekly:
I
I
1
!
iaDozcpcocowcpcpeoOffice laDsmcDemomcw
UseOnly la Cm a 0 D I D ) t
'mrocoapolD.zowa)
OfficeUse
Only
aDococa(zeixocz)wcpcaoaDaDaDaxpcnqvcva 0 tuD a) D D (2 D CDcDcapapapcnimaxymi
ic11)(Dcf)(1)<INDMCDIDO'Office laDocampapeommeteoney ICDOCDCDGADOCDeLM'
cm cooDcomapargrlocui
GO TO COLUMN C, PAGE 11.
tr
GO TO COLUMN D, PAGE 11.
9 124
GO TO COLUMN E. PAGE 11.

COLUMN C3RD JOB AFTER HIGH SCHOOL7
4 (MARK ONE)o hourly
$ o weekly2
7
OfficeUse
Only
MCODCD(2DCD(DCD(DCE)
CDOCDCDG)CJIDCD(D(1)
GDOCDCDCDC0cDCD(D(1)
(7901011)<MCDI7IDCDCID
111111111
4
2
11111
1111INNM
0)himm°
=MINIM
7
4
2
P 01111/
7
4
2
COLUMN D4TH JOB AFTER HIGH SCHOOL (.
COLUMN E5TH JOB AFTER HIGH SCHOOL'
(MARK ONE)o hourlyo weekly
OfficeUseOnly
OCDCDGDMID(1)(1)(1)
OCID 0:13CDCDCIDCDCD CD
CDGDCD(1)(11)(1) GERD CD CE)
(11) 0 (ID CD <21) CD CD (1) ID CD
S
(MARK ONE)o hourlyc weekly
zOffice
UseOnly
cinocncooaDocraDo)einocpcp(ococoam>a)!aDocooD(ocoaDocpcn(11) 0 ID CD (1) CD(IDCD (Da)
hours per week
1Office Use CID CD aD CD CDID ID CD 0:D CI)
Only anomanapencrapcom
hours per week
i_.Office Use CD 0 CD (D CD CD .1) CM CD
Only cnopopmcDaDapcpmen
hours per week
Office UseOnly
CD 0 CD CD (1) CD CID Cr) (1)
anocnapcD.Toomcv
School employment or*placement service 1.044
Public employment servicePrivate employment agencyNewspaper advertisement oChecked with employer
directlyThrough a relativeThrough a friendCivil Service application.Other (WRITE IN)
0
Lost job (fired, laid off,job ended)
Left job to return toschool
Quit because job, hours,or pay, etc. unsatisfactory
Still have this jobOther (WRITE IN)
School employment orplacement service
Public employment servic!Private employment agency.Newspaper advertisementChecked with employer
directlyThro4gh a relativeThrough a friendCivil Service applicationOther (WRITE IN)
.0
.0
.0
.0
.0
.0
School employment orplacement service
Public employment servicePrivate employment agencyNewspaper advertisementChecked with employer
directlyThrough a relativeThrough a friendCivil Service applicationOther (WRITE IN)
Lost job (fired Aid off,o job ended.
Left job to return to.o school
Quit because job, hours,or pay, etc. unsatisfactory
o Still have this job..Other (WRITE IN)
.0
.0
.0
Lost job (fired, laid off,job ended)
Left' job to return toschool
Quit because job, hours,or pay, etc. unsatisfactory
Still have this jobOther (WRITE IN)
Yes (FOR HOW MANY WEEKS?WRITE LN) weeks o
No o
Still have this job
Office UseOnly
CD 0 CD <D rinIEJE (1) CD
cDocncnotimcoal?teD
Yes (FOR HOW MANY WEEKS?WRITE IN). weeks o
No
Still have this jsb
Office UseOnly
OCD,MCD CD (DC!) (1) X I
(290CD CD (C) CD CD CD CID CD
Yes (FOR HOW MANY WEEKS?WRITE IN) weeks c
No
Still have this job
Office Use .1)0(D(1)(DCD(IDADCDOnly TozczooDocD1)(u
TURN BACK TO PAGE 9 ANDCONTINUE WITH YOUR FOURTHJOB.IF YOU HAD NO OTHER JOB, GOTO Q. 25 ON PAGE 12.
TURN BACK TO PAGE 9 ANDCONTINUE WITH YOUR FIFTHJOB.IF YOU HAD NO OTHER JOB, GOTO Q. 25 ON PAGE 12.
11
12
GO TO Q. 25, PAGE 12.
fr4

111111111
P MI Q29. Continued.7
4
2
1 as
7
4
2
1
4111M111
4111111111
41111=11111111
Oil
7
4wows
2
7
4
2
1 amp
CID
MIN
MID
B. What was the lowest weekly salary or wage rate you would have accepted thatmonth? (WRITE IN)
(MARK ONE)hour oweek 0
L per year
OfficeUse
Only
aD 0 CD CD CO CD CD ID CD
cp an cc wa) cn cip
CD CD CD (DM CD CD CD CD CD
aD CD CD (ID CCM CD ID CD
(2:0 0 CD CI) CD CD CD CD CD CD
C. During the last week you were looking for work, where did you go or what did youdo to find a lob? (MARK ALL THAT APPLY) , *V.
a. School or college employment f.or placement service 0 g
b. Civil Service applications--...... -..-....- o h.C. Public employment service id. Private employment agency ..-------.0 j.e. Community action or welfare groups-wo k.
I. Other (EXPLAIN)
30. At the time you were finishing high school (or right after high school) did you applyfor entrance (fill out a form and send it in) to any schools, colleges or universities?(MARK ONE)
Yes woe 0 (ANSWER A-L).No. 0 (GO TO Q 31)
Newspaper advertisement 0Direct application to employer oRegistration with a unionChecked through relatives 0Checklia through friends 0
A. When you first applied, what were the name and address of the FIRST school orcollege of yourishoice? (WRITE IN)
Name.
Address:(City)
(State)
OfficeUseOnly
OCD a) 0 CD(OCDIDO)
CDC CD CE:00 CD 1) CD CDCD
COCCDMIDCDCDCDCDCD
CDCIDCDCDCD CDCDCDCDCD
C CD 0:1) cliD CD CD CD CD CD
(r) 0 CD a) OD CD OD CD CD CD
B. Were you accepted for admission at this school? (MARK ONE)
Yes, and attendedYes, but this ethool did not have enough roomYes, but did not attend for other reasonsNo, was not accepted
13 126
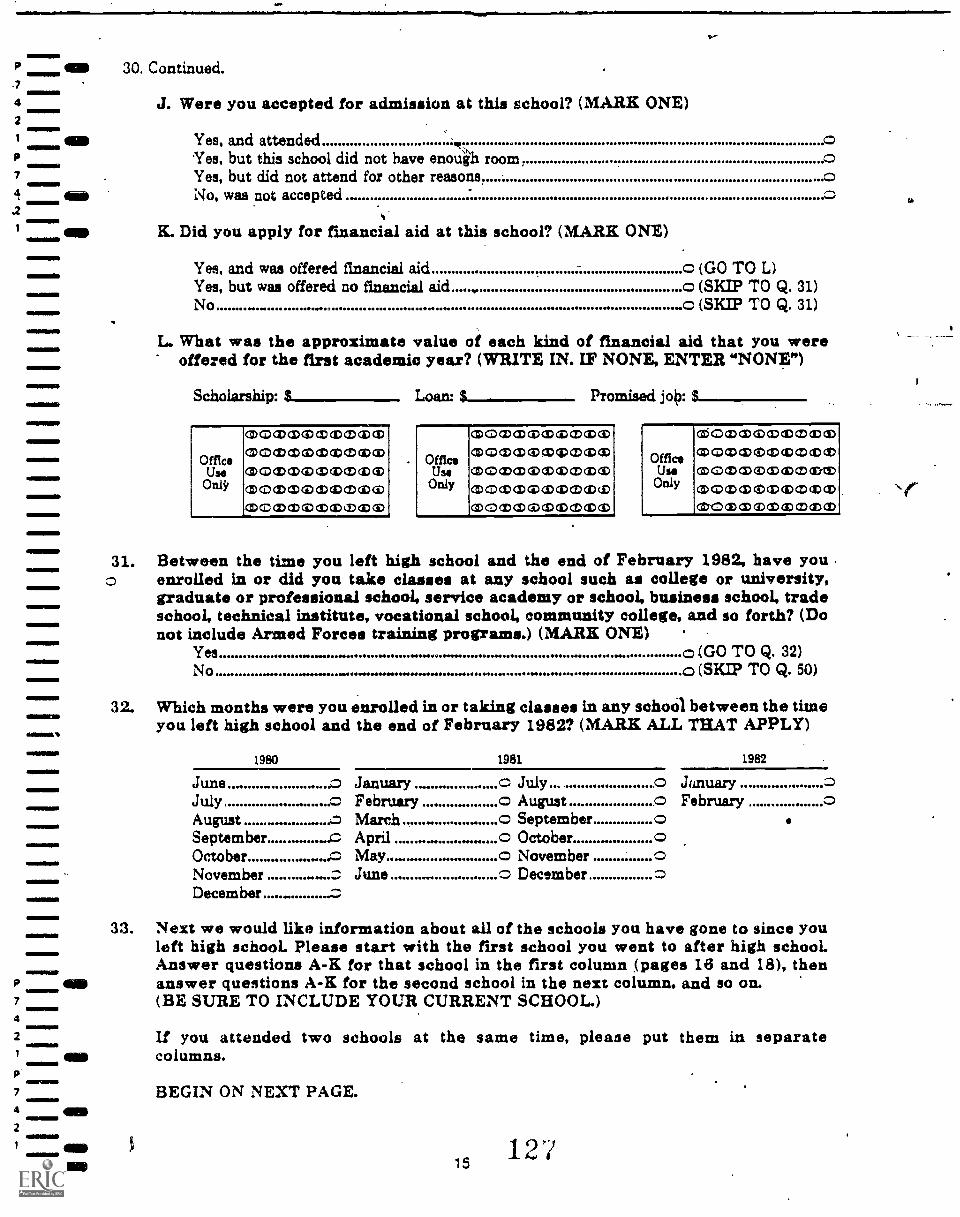
.7
4
2
1
7
.2
O 30. Continued.
ein111111111111111.1
NIB
ERBSIM1
J. Were you accepted for admission at this school? (MARK ONE)
Yes, and attended r oYes, but this school did not have enough room,Yes, but did not attend for other reasons. oNo, was not accepted
K. Did you apply for financial aid at this school? (MARK ONE)
Yes, and was offered financial aid o (GO TO L)Yes, but was offered no financial aid o (SKIP TO Q. 31)No o (SKIP TO Q. 31.)
L. What was the approximate value of each kind of financial aid that you wereoffered for the first academic year? (WRITE IN. IF NONE, ENTER "NONE")
Scholarship: Loan: $ Promised job:
OfficeUse
OnlY
czczapcocococbcocoa)oczcodxboncixbcpcoc:DocncnocimbebtlowCD 0 CD CD cl) (1) CD ciD
CD 0 CD CD 0 cD Oa)
OfficeUse
Only
®ommomcommcnCD CD CDCD (DOD qp CD CD
CD CD CDCD (1-.)(1) cDCD (ID CD
cD CD 043) cD CD aD
CD CD CD CD 0 ct) cD cD cD cD
OfficeUseOnly
G'.) cD ID CD cD cD
CD c:'.) CD a) IAD OD CD cD CD
ciD CD CD CO (ID cD CD (DIM
aD CD CD Ct) c3)(ID cD CD (DOD
GDC) Ct) CZ) CD CD ID CID
31. Between the time you left high school and the end of February 1982, have youenrolled in or did you take classes at any school such as college or university,graduate or professional school, service academy or school, business school, tradeschool, technical institute, vocational school, community college, and so forth? (Donot include Armed Forces training programs.) (MARK ONE)
Yes ** 1100411* 0 (GO TO Q. 32)No .. OM. 1100MISSI o (SKIP TO Q. 50)
32. Which months were you enrolled in or taking classes in any school between the timeyou left high school and the end of February 1982? (MARK ALL THAT APPLY)
1980 1981 1982
June .o January c July.... .0 January 0July o February o August .0 February 0August March ................o September oSeptember...... .......-.0 April .....0 October oOctober . .c May.. o November 0November June o December 0December ......,
33. Next we would like information about all of the schools you have gone to since youleft high school. Please start with the first school you went to after high schooLAnswer questions A-K for that school in the first column (pages 16 and 18), thenanswer questions A-K for the second school in the next column, and so on.(BE SURE TO INCLUDE YOUR CURRENT SCHOOL)
If you attended two schools at the same time, please put them in separatecolumns.
BEGIN ON NEXT PAGE.
15127
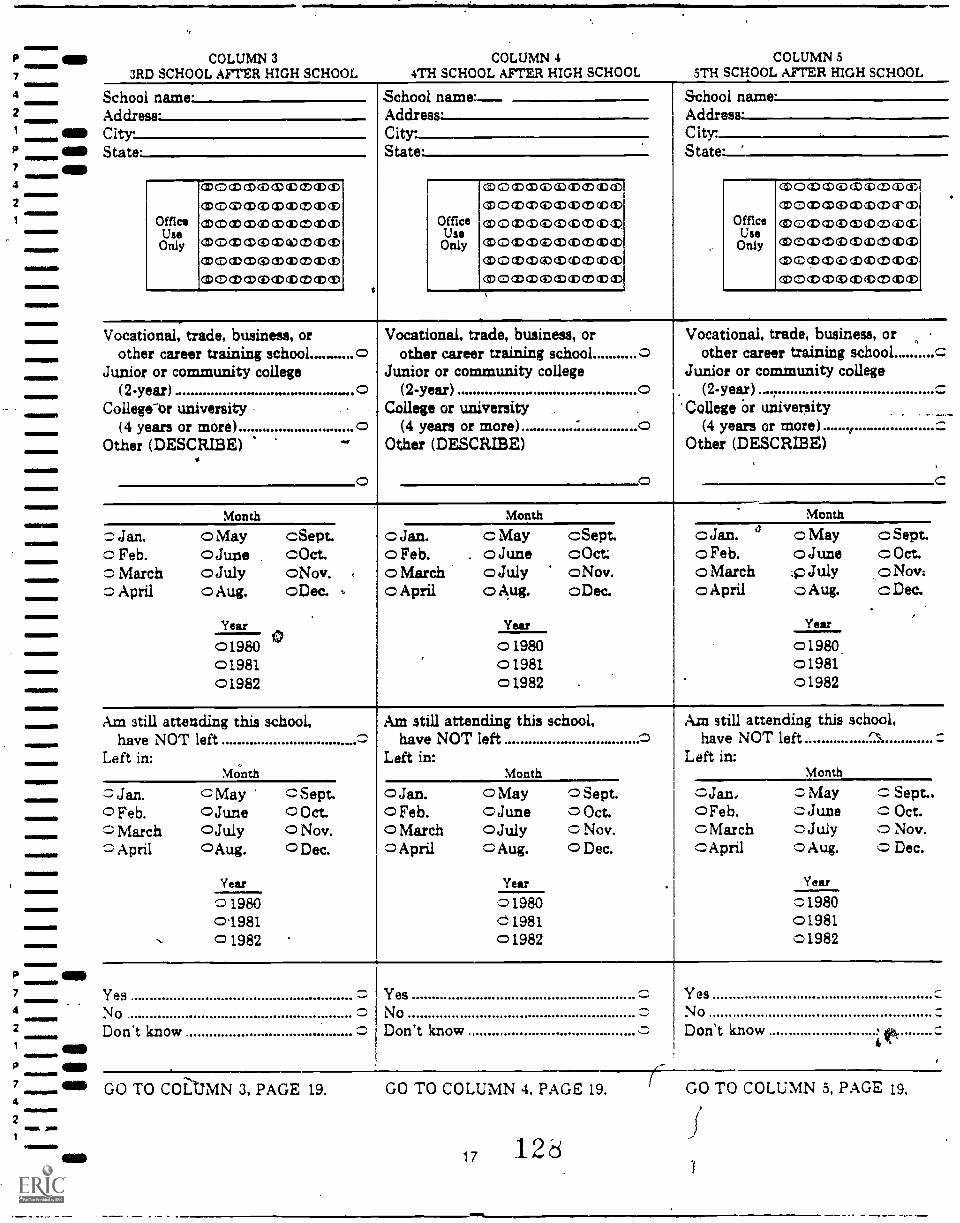
OM)7
4
2
1
7 alp4
2
1
P
7
4
2
7
4
2
1
11111111110
1111111111111.
410111111MMII
=IMMO
MR MEI
COLUMN 33RD SCHOOL AFTER HIGH SCHOOL
School name:Address-City-State.
OfficeUseOnly
OD 0 CD CD CD CD (D OD
OD CD CD 0:1 CD OD OD OD OD CD
t3DCDIDO:IDCID(DC)<IDOD
t3DOODCDCDODWCD(DCD
OD CD CD CD CD (D CD (D CD
OD CD CD CD 11D ONID CD CD CO
COLUMN 44TH SCHOOL AFTER HIGH SCHOOL
School name:Address.City:State:
OfficeUse
Only
CiDOCEXMOZGIDCDGDCD
or:DczrocpmcDcocipC CD 0 (I) (ID (2".> (1:).
CD 11) (S) (iD CD OD CD
aDOCDO:KOCIDCDCDIEE)
®O CD CiD (iD CD ID O>
COLUMN 55TH SCHOOL AFTER HIGH SCHOOL
School name.Address-City:State:
OfficeUse
Only
CD 0 OD CD CD OD IND cl)
CD 0 01)(1) CD CD cD CND
CD 0 OD CDQD ODM CD CD
CD 0 OD C)GD c1DaD MCD
aDecIDO)01)(DCD(DeDMO (DMZ CD (1) CD McD
Vocational, trade, business, orother career training
Junior or community college(2-year)
College or university(4 years or more)
Other (DESCRIBE)
Vocational, trade, business, orother career training school
Junior or community college(2-year)
College or university(4 years or more)
Other (DESCRIBE)
0
Vocational, trade, business, orother career training school
Junior or community college(2-year)
College or university(4 years or more)
Other (DESCRIBE)
t-
%N.
Month
0:- Jan. o Mayc Feb. o Juneo March o July° April o Aug.
Year
019800198101982
cSept.cOct.oNov. <
oDec.
Month
c Jan. c Mayo Feb. . o Juneo March o Julyc April o Aug.
Year
0 19800 198101982
cSept.cOctoNov.oDec.
cJan.oFeb.o Marcho April
Month
c Mayo June:p Julyo Aug.
Year
01980.o198101982
c Sept.cOct.o Nov:c Dec.
Am still attending this school,have NOT left
Left in:Month
c Jan.0 Feb.c March°April
o May0 June0July0 Aug.
Year
019800.198101982
c Sept.0 Oct.0 Nov.0 Dec.
Am still attending this school,have NOT left
Left in:Month
0 Jan. o May0 Feb. OJune0 March 0 July
April o Aug.
Year
01980C198101982
0 Sept.o OctC Nov.0 Dec.
Am still attending this school,have NOT left
Left in:
cJan.,o Feb.c March(=April
Month
c% May:.JuneOJuly0 Aug.
Year
c19800198101982
c Sept..c Oct.C Nov.c) Dec.
YesNoDon't know
411116 GO TO COLUMN 3, PAGE 19.
YesNoDon't know
YesNoDon't know tk
GO TO COLUMN 4, PAGE 19.
17 12d
GO TO COLUMN 5, PAGE 19.

7
4
2
1
7
4
2 imp
111111111111111
7
4
al=11111111.
MIME=
1111111111111111U1'
MONIMININI
SEW 111111
11111111
COLUMN 3'3RD SCHOOL AFTER HIGH SCHOOL
COLUMN 44TH SCHOOL AFTER HIGH SCHOOL
COLUMN 55TH SCHOOL AFTER HIGH SCHOOL
per week
[Office UseOnly
CDOCDCD(ZOcelcD(1)0
aDCD<DCD(DCDciD(DIDM
per week
Office UseOnly
cDococvocvmcbcpxapoaDcpcoamcpcspeD
per week
OffiCi UseOnly
C cD CD 0 (1)(1) cD
CD 0 (2D Ci) CEA) (1) cD
PublicPrivateDon't know o
PublicPrivateDon't know o
PublicPrivateDon't know Sm.
FreshmanSophomore oJunior .
Special Student...... oOther (DESCRIBE)
The school doesn'tclassify students o
FreshmanSophomore. 0Junior...Special. Student 0Other (DESCRIBE)
The school doesn'tclassify students
FreshmanSophomoreJunior.Special StudentOther (DESCRIBE)
.....anaa....4e's....
"MbSe=1,
The school doesn'tclassify students
(Name of specificfield or area)111MIk
OfficeUse
Only
CD 0 CD CD 4:1) CD OD cD GDI)
CD 0 aD CD CD CD QD cD CD
CD CD aD CEI CD CD CD cD
CD 0 aD CD cD
CD CD (111) ci) a) CO JD cD
CDC a) a) cip (I) aa cn .32
(Name of specificfield or area)
OfficeUse
Only
czococtocb(vm(rio)CD CD CD CD CD (V (D cD cD
CD CD cl) CD CD cD (D cD CD
CD OCIDCDMCD cD cDCD
CD CD CID CD cD rD (1)
cs) (D co cr) (ID
(Name of specificfield or area)a 0(10054)w cDrixbeD
OfficeUse
Only
.comaDcom cpcca, webapcbaDcococoLipmccmCD0cDCOMCDcD(DIDcD
CDC cl) mom cD(D WO)clap co co an an cn cn (r)
A vocational program(does not lead toa Bachelor'sdegree)
An academic program(typically leads to a4- or 5-year Bachelor'sdegree)
A vocational program(does not lead toa Bachelor'sdegree)..
Ai academic program(typically leads to a4- or 5-year Bachelor'sdegree)
A vocational program(does not lead toa Bachelor'sdegree)
An academic program(typically lea& to a4- or 5-year Bachelor'sdegree)
Yes, but I later returnedto this school
Yes, but I plan to returnsometime in the future
Yes, and I don't planto return
No2
eis TURN BACK TO PAGE 17 ANDC 0 N TIN UE07 WITH YOUR 4TH
7 alb SCHOOL.4 IF YOU ATTENDED NO OTHER
SCHOOLS, GO TO Q. 34. PAGE 20.2
Yes, but I later returnedto this school
Yes, but I plan to returnsometime in the future
Yes, and I don't planto return
No
Yes, but I later returnedto this school
Yes, but I plan to returnsometime in the future
Yes, and I don't !Sianto return
No
TURN BACK TO PAGE 17 ANDCONTINUE WITH YOUR 5THSCHOOL.IF YOU ATTENDED NO OTHERSCHOOLS, GO TO Q. 34, PAGE 20.
19 129
GO TO Q. 34, PAGE 20.
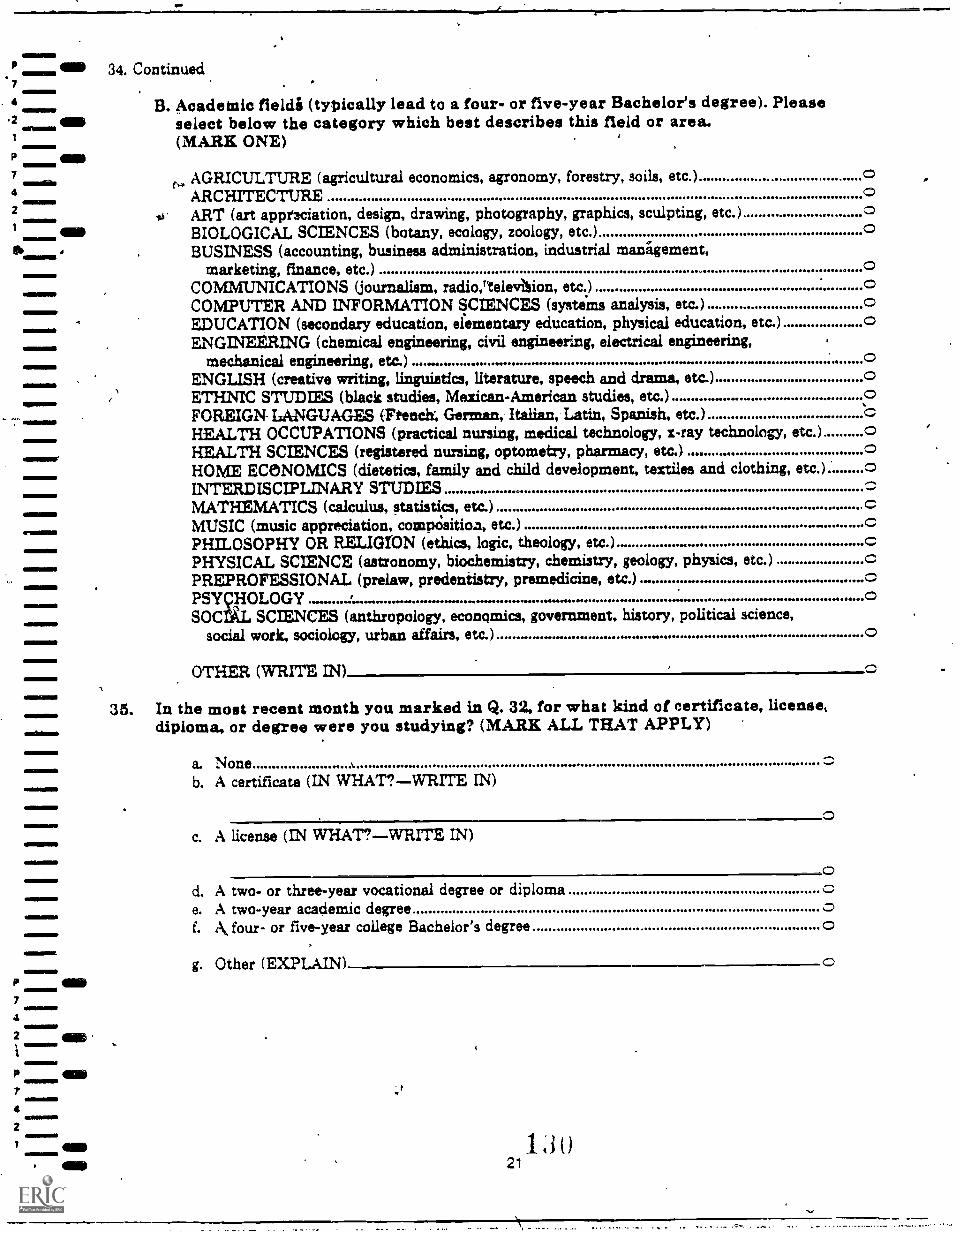
4111/ 34. Continued7
B. Academic fields (tyllically lead to a four- or five-year Bachelor's degree). Please.2 ow select below the category which best describes this field or area.
1 (MARK ONE)
7
4AGRICULTURE (agricultural economics, agronomy, forestry, soils, etc.) 0ARCHITECTURE
2 ART (art appreciation, design, drawing, photography, graphics, sculpting, etc.)1 BIOLOGICAL SCIENCES (botany, ecology, zoology, etc.) 0
BUSINESS (accounting, business administration, industrial management,marketing, finance, etc.) 0
COMMUNICATIONS (journalism, radio,ttelevbion, etc.)COMPUTER AND INFORMATION SCIENCES (systems analysis, etc.)EDUCATION (secondary education, elementary education, physical education, etc.) 0ENGINEERING (chemical engineering, civil engineering, electrical engineering,
mechanical engineering, etc.)ENGLISH (creative writing, linguistics, literature, speech and drama, etc.)ETHNIC STUDIES (black studies, Mexican-American studies, etc.)FOREIGN LANGUAGES (French; German, Italian, Latin, Spanish, etc.)HEALTH OCCUPATIONS (practical nursing, medical technology, x-ray technology, etc.)HEALTH SCIENCES (registered nursing, optometry, pharmacy, etc.)HOME ECONOMICS (dietetics, family and child development, textiles and clothing, etc.) 0INTERDISCIPLINARY STUDIES
1101111 MATHEMATICS (calculus, statistics, etc.)MUSIC (music appreciation, coairxisitioa, etc.)PHILOSOPHY OR RELIGION (ethics, logic, theology, etc.)PHYSICAL SCIENCE (astronomy, biochemistry, chemistry, geology, physics, etc.)PREPROFESSIONAL (prelaw, predentistry, premedicine, etc.) . 0
01111111=111PSYcHOLOGY ........ oSOCrAL SCIENCES (anthropology, economics, government, history, political science,
social work, sociology, urban affairs, etc.) o
P
7
4
2 Ole11111111
OTHER (WRITE IN)
35. In the most recent month you marked in Q. 32, for what kind of certificate, license,diploma, or degree were you studying? (MARK ALL THAT APPLY)
a. Noneb. A certificate (IN WHAT?WRITE IN)
c. A license (IN WHAT?WRITE IN)
od. A two- or three-year vocational degree or diplomae. A two-year academic degreef. A four- or five-year college Bachelor's degree
g. Other (EXPLAIN)
P
7
4is1111111111
2
t Eno 13021

38. Continued.7
a....
A. What were your reasons for changing schools? (If you have changed schools morethan once; please answer for the most recent time.)(MARK ONE OVAL FOR EACH LINE)
4 a. My interest changed, and my former school did
My NOT myreasons reasons
'i not offer the course of study I wanted o oMD b. Wanted to attend a less expensive school , o o
ci Wanted to be at a smaller school c o........d. Wanted to be at a larger school c oe. Wanted to attend school closer to home o cf. Wanted to attend a school farther away from home ....o og. Wanted to attend a schbol that would give me better
career opportunities 0. o
MINNIMMIN111
=MEIN
11111111MI
MNIIMMI
MMIP11111P
MININ111110
111111111111
4111111MI
h. Wanted to attend a more prestigious school o *. 0L Wanted to attend a'school where I could maximize
my intellectual and personal 'development 0 ..oj. More group or social activities of interest o ok. Transferred from a two-year to a four-year school
to continue my education ... .., o o1. Family responsibilities o om. Health problems or physical handicap -4. 0 on. Wanted to transfer to an academically less demanding school o oo. Wanted to transfer to a school that would prepare me
more quickly for an occupation .o 0
pThther (=PLAIN) o
39. Between the time you left high schpol and the end of February 1982, have youwithdrawn from any school before you completed your studies at that school?
* (MARK ONE)
Yes ..o (ANSWER A)No......... (GO TO Q. 40)
A. What were your reasons for withdrawing?(MARK ONE OVAL FOR EACH LINE)
My NOT myreason MIAMI
a. I could not afford to go full time or continue in schoolb. I was working full timec. I was working part timed. I got married, had a baby, or took on other family responsibilities c o je. I was undecided about career plansf. There was too much pressure or strain with my load of
school work.g. The school program was not relevant to the work I wanted to doh. I was failing or not doing as well as I ;anted
i. Other (EXPLAIN)
23
131

1
4
2
3
MID
Cat
The following questions ask about your school finances for the two time periods of (a)Fail 1980 through Summer 1981, and (b) Fall 1981 through Summer 1982. Please makesure you answer each question for both periods. If you are unsure about the actualamounts for a particular item, give your best estimate. Please estimate all of yourschool-related expenses (such as tuition,' fees, books, supplies, transportation toclasses, etc.) through the end of next summer.
2
Considering th3through Summer
time periods of Fail 1980 through Summer 1981,, and Fall 19811 si 43.1982; what is your estimate of how much it cost you
paid? Estimate(or will costthe amounts
a zero, "0",
b. Fall 1981-Summer 1982 cTuition and Fees
you) for tuition and fees to go to school, re ardErofzavizo0111111111117 and record them
where you hadOffice Use Only
below, Do not include costs afterno expendes. (WRITE IN AMOUNTS)
a. Fall 1980-Summer 1981Tuition and Fees$
Summer 1982. Enter
Office Use OnlymocnompcbmageenMO CD CD(10 CD1D CD <D
1) 0 CD CD (11) (D CD (I)
AD 0 CD (ID OD CD CD CD (11) (11:3,
mocncbapabmcDmo)
"aDocpmaxmcDcpcpcpMO WM CD CD CD (3D CD CD
CD CD MCP CD (DM (3D Ma)
cpcDopmapcyciDcDopa)c:r.) o op mow (mow&
MMIN
NIMMIMIN
44. What is your estimate of the total goat for you to go to school, regardless of who paidin each of theie two time periods? This total cost should include tuition and fees,books and supplies, transportation to and from classes, and all other school-relatedexpenses. Enter a zero, "0," where you had no expenses. (WRITE IN AMOUNTS)Office Use Only Office Use Only
3)O CD CD (1)11D (I) CD CD CD a. Fall 1980-Summer 1981 O CD CD CD CD (DIX 1:1D CD CD CD b. Fall 1981-Summer 19823D 0 CD CD CD CID aDCD (1:3(E) Total Cost ®O CD CD CD OD (1) CD CD CD Total Cost
MIM11111110C CD CE) CD CD (I) CD (I) $ 111) G:34.3 CD WO) (3D (111) CD
M..) 0 CD CD CD CD (I) (r) CD (I> 111) CD CD C.01:3D CD CD (3D CD (3)111111MINID
22) 0 CD CE) CD CD (I) CD ID CD ci3CD CD CD COM) (3D cI3C0IIIMPIINIMP
VININI11111
1
7
4
2
WIMINIMPIN
45. Did you receive (or will you receive) any kind of scholarship, fellowship grant, orbenefits (not a loan) to go to school during these time periods?(MARK ALL THAT APPLY)
a. Yes, Fall 1980-Summer 1981 o(ANSWER A AND B)b. Yes, Fall 1981-Summer 1982 °(ANSWER A AND B)c. No o (GO TO Q. 46)
A. What kindls) of scholarship, fellowship, grant, or benefit (not a loan) did you orwill you receive? (MARK ALL THAT APPLY IN EACH COLUMN)
(1)Fall 1980 -
wSummer 1981
a. Basic Educational Opportunity Grant (BEGG) or Pell Grantb. Supplemental. Educational Opportunity Grantc. ROTC Scholarshipd. Social Security Benefits for Children of
Retired, Disabled or Deceased Parentse. Nursing scholarship programf. Veterans Administration Survivors' and
Dependents Educational Assistance Programg. Veterans' Educational Assistance Program NEAP) or new GI Bill --h. State Scholarship Programi. College or University Scholarshipj. SCholarships from Private Organizationsk. Division of Vocational Rehabilitation Educational Benefits1. Financial assistance for which you do not know the sourcem. Other scholarship or grant
5
(2),.
Fall 1981 -Summer 1982
-
0
r (WRITE IN)
ti
25
J. 3 2,
F
ir

4
P OD7 0. Continued.4
2 an D. What is the minimum reduction that would induce you to enlist? (MARK ONE)1, (P din . V3 of loan or $1500 per year maximum 07 INN ... 1/3 of loan or $2000 per year maximum 04 vs of loan or $2500 per year maximum2 V3 'of loan or $3000 per year maximum , o\ 7. Considering the same time periods, did you receive or will you receive financial
assistance (Ligt a loan) from any relatives or friends to go to school?.........(MARK ALL THAT APPLY)
ill111111
Yes, Fall 1980Summer 1981 c (ANSWER A AND B)Yes, Fall 1981- Summer 1982 c (ANSWER A AND B)No o (GO TO Q. 48)
A. From which of the following sources did you (or will you) receive financialassistance (j91 a loan) to go to school/(MARS ALL THAT APPLY IN IACil COLUMN)
(1) (2)Fall 1980- Fell 1981-
Summer 1981 Summer 1982
a. Parents o,b. Husbsild or wifec. Other family or friends
B. Estimate the total dollar value of the amount of financial assistance (not a loan)you received (and will receive) from any relatives or friends to go to schooL Entera zero, "0", where you received no financial assistance.(WRITE IN AMOUNTS)
a. Fall 1980Summer 1981 o Office Use Only b. Fall 1981Summer 1982....0Total Dollar Value zoaocociocomoDopoo Total Dollar Value
apotpc000<DCLMCDCD
Office Use Only4.
IN
C)
ccoaDopcn000pcioaoocpcoaDeociocoaocpcDcocp(zamocpwoooc......RcoopcoopcD000p
f:-.),1) co opeo(E)(1)opeo
20 D C D GO <DM CD CD CD
D 2 C D (1) (2) CID (D
2D 0 CD CD CID (1) (1) C D (1) C D
48. Did you (at any time) try to get a regular bank loan to go to school?(MARK ONE)
Yes, I got a regular bank loan o (GO TO Q. 49)Yes, I inquired but then found better source of finance o (ANSWER A)Yes, I asked for a loan but was refused o (ANSWER A)No, I did not .° (ANSWER A)
A. Please explain in space provided.
27 13.3 ,

CND 50. Continued.
7
4mom=
2
P
7 1111116
4
2 an.
dill
B. Were you being trained for a specific type of work? (MARK ONE)
Yes 0 (GO TO C)No o (GO TO D)
C. What type of work were you being trained for or learning about? If you haveparticipated in more than one program, answer for the one in which you spent themost time. (Examples: plumbing, typing, auto mechanic work, photography, sales,etc.)
(WRITE IN)Office
UseOnly
CD 0 CD CI) 0 CD (1) CI) CD Cf)
(31) CID ClD 0:) CD CD (1) (D CID CID
®O ClD CD CD CD CD c:D (1)
D. How long is or was t program scheduled to last? (MARK ONE)
Less than one month. Six to eleven monthsOne to five months.._ o One year or more
E. When did you first enroll in the program?(MARK OVALS FOR MONTH AND YEAR)
Month
JanuaryFebruary 0March.............---- 0April...-NNNN o
Year
May. ....... .. -o September 0 1980June .. October 0 1981July. ........ November ..... ....0 1982August.----.....0 December..____o
F. Have you completed this program? (MARK ONE)
Yes - MO MM.* 0 (ANSWER G)No, left without completing.. r) (ANSWER G)No, still enrolled..-----. o(GO TO Q. 51)
G. If you are no longer in the program, when did you leave the program?(MARK OVALS FOR MONTH AND YEAR)
Month
January o May o September 0 1980February 0 June. 0 October 0 1981March = July November 0 1982April 0 August 0 December
Year
51. Between the time you left high school and the end of February 1982, have youparticipated in any course or program of academic tutoring, or remedial courses insummer school, college or other educational institution? (MARK ONE)
Yes, I have participatedNo, I have not participated in such a program
134
29

711111111111111
4
2 MID1 NM Yes, active duty o (ANSWER A-J)P GM Yes, National Guard, Reserves or ROTC, but not active duty 0 (GO TO Q. 55)7 No \ o (GO TO Q. 55)4
:0 ONMP1111 .2
54. Since completing high school, have you served in the regular Armed Forces, aReserve or National Guard Unit or the ROTC? (MARIE ONE)
7
4
2
1
7
4emil==
2
1
31
11111118MIMI
UM11111111
11111
4111111110
111111
A. In which branch of th ieArmed Forces did you serve? (MARS ONE)
Army -..o Coast Guard oNavy -ro National Guard or Reserves oAir Force .o ROTC oMarine Corps - .o
B. When did you begin active duty? (MARK OVALS FOR MONTH AND YEAR)
Month Year
January o May o September. 0 1980 0February o June. o October 0 1981 oMarch o July.. .... o November 0 1982 0April o August 0 December o
C. Have you received or are you receiving four or more weeks of specializedschooling while in the Armed Forces? (MARK ONE)
Yes 0 (GO TO D)NO o (SKIP TO E)
D. What is the name of the specialized schooling program in which you spent thelongest period of time? (PLEASE PRINT AND DO NOT ABBREVIATE)
Name of program.
OfficeUseOnly
aciecl,..;:cDocvsvcDsveDCP CD c.1) (I) (I) (D (I) (IDCID 0 ID CD OM (DM CD CD
E. Specify your current primary military specialty code (Army-MOS, Air Force-AFSC, Marines-MOS, Navy-NEC).(PLEASE PRINT AND USE STANDARD ABBREVIATIONS)
Name of specialty and code:
OfficeUse
Only
CD 0 GO (1)(3) CD OD CD (D
CD 0 GO CD (ID CID (1) (I)
cbocomoaDebcPsycb
F. What is the highest pay grade you have held in the Armed Forces?(WRITE IN)
Pay g-rade
OfficeUse
Only
czccoapscrlDipc,,1cDomcD(Dxcipxopl

p
7
4
2
I
7
4
2
I
p
7
4
2
p
7
4
MINNIIIIIMI
11.1111111.1
01111111111111
2 4EN
111111111119
56. What was your husband or wife doing the first week of February 1982?(MARK ALL THAT APPLY)
a. He or she was working for pay at a full-time or part-time jobb. Enrolled in graduate or professional schoolc. Taking academic courses at a two- or four-year colleged. Taking vocational or technical courses at any kind of school or college
(for example, vocational, trade, business, or other career training school)e. On active duty in the Armed Forces (or service academy)f. Homemaker (without other job) og. Temporary layoff from work, looking for work, or waiting to report to work
o
00
o
h. Other (DESCRIBE)
57. Did your husband or wife hold a job ths5first week of ary 1982?(MARK ONE)
Yes 01.0 OM
No0 (ANSWER A-C)0 (SKIP TO Q. 58)
A. Please describe below the job your husband or wife held the first week ofFebruary 1982?
a. For whom did he or she work? (Name of company, business organization, orother employer.)
b.
(WRITE IN)
What kind of business or industry was this? (For example, retail shoe store,restaurant, etc.)
(WRITE IN):
c. What kind of job or occupation did he or she have in this business orindustry? (For example, salesperson, waitress, secretary, etc.)
(WRITE
d. What were his or her most frequent activities or duties on this job? (Forexample, selling shoes, waiting on tables, typing and filing, etc.)
(WRITE IN):
Office Use OnlyC (Dap ID (ID M (1) cID
fD ID CD (3) izn (D (1)
CD OID CD SID (E)CD (I)
33 136
Office Use OnlyCDOODCDOCDT)CD(DcD1
CIIXL) CD cl) CD (D cD cD I
CID0CDCDIDID,CD(Dotx_DI

58. As of the first week of February 19,92, what was the highest level of education thatyour husband or wife had attained? (MARK ONE)
Some high school. or lessFinished high school
Vocational, trade, or businessschool after high school 5
Less than two yearsTwo years or more
Less than two years of collegeTwo or more years of college
(including two-year degree)College program Finished college (four- or five-year degree)
Master's degree or equivalentPh.D., M.D., or other advanced
professional degreeDon't know
0
,
59. Now please think back to October 1, 1981. If you were married tam what was yourhusband or wife doing in October 1981? (MARK ALL THAT APPLY)
a. This does not apply to ma since I was not married at that timeb. He or she was working for pay at a full-time or part-time jobc Enrolled in graduate or professional schoold. Taking academic courses at a two- or four-year collegee. Taking vocational pr technical courses at any kind of school or college
(for example, vocational, trade, business, or other career training school)f. On active duty in the Armed Forces (or service academy)g. Homemaker (without other job)h. On temporary layoff from work. looking for work, or waiting to
report to work
..sr!
i. Other (DESCRIBE)

7
4
2
7
4
2
111111111111111
60. Continued.
B. When did thismarriage end?(MARIE OVALS FORMONTH AND YEARAND COMPLETEPART C AND D)
Month
JanuaryFebruaryMarchApril 0May
JuneJulyAugust.September oOctoberNovemberDecember
Year
1978 or before1979 ...... c198019811982
0
(IF STILL MXRRIED,MARK THIS OVAL) . StillGO TO COLUMN 2, MarriedOR Q. 61.)
Month
JanuaryFebruaryMarchApril ca
MayJuneJulyAugust.SeptemberOctoberNovember...., oDecember
Year.'
1978 or before1979
'19801981 -01982
00
Month
JanuaryFebruaryMarchAprilMayJuneJulyAugust.SeptemberOctoberNovemberDecember
Year
1978 or before 0197919801984198'2
C. How did thismarriage end?(MARK ONE)
Separation..--.0Divorce or
annulmentDeath 11.11
Divorce orannulment
Death
Divorce orannulment.
Death
IF SEPARATED, ANSWER D:
D. When did you stopliving together withyour spouse?
Month
January 0 MayFebruary 0 JuneMarch' 0 JulyApril 0 August.
Year
o September.....0 1978 or0 October 0 before0 November 0 1979
December .019801981.,1982
37
efierriVet
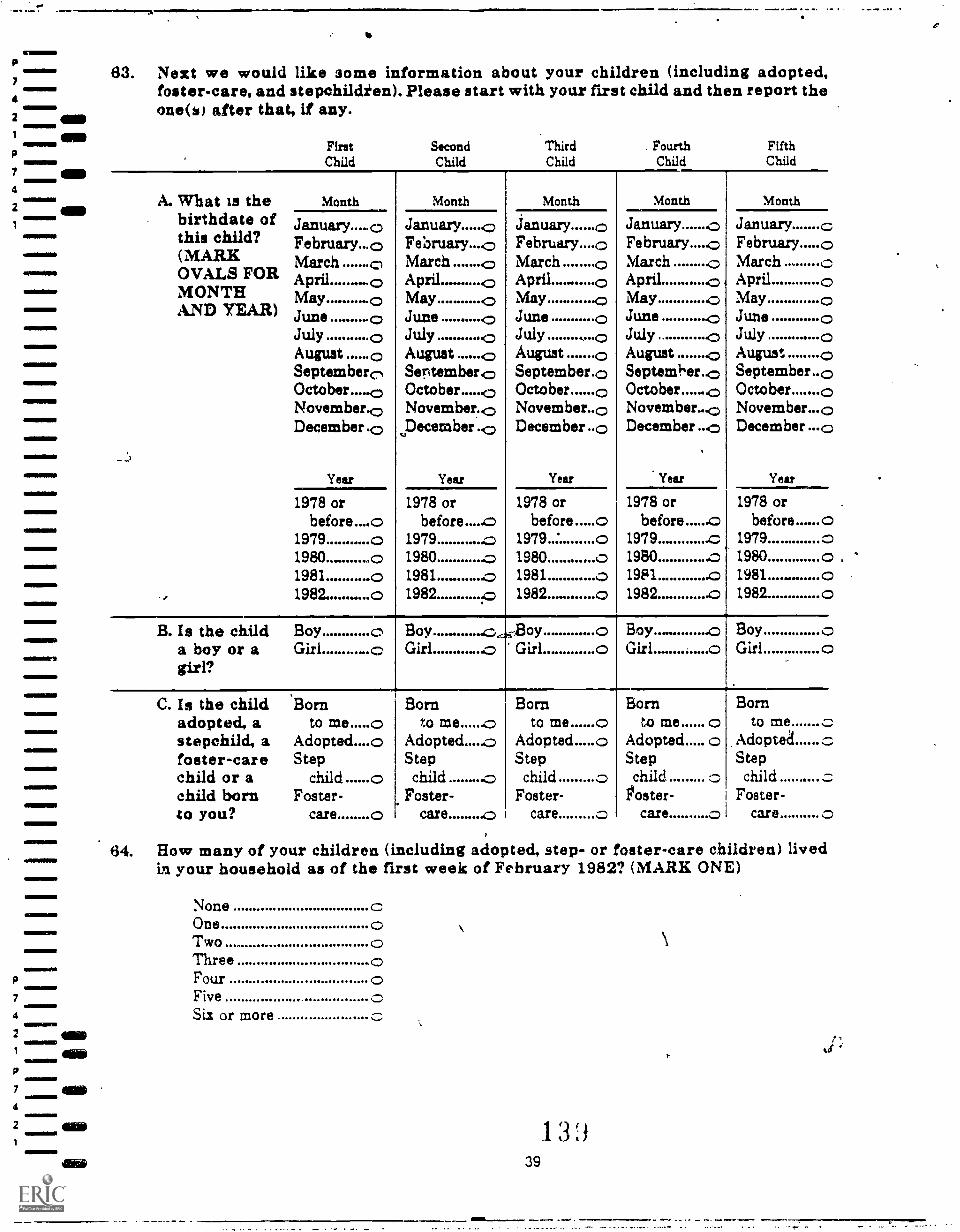
7
4
2
1
7
4
2
1
7
4
2
1
7
4
2
111111110111111
=11111
11111111111111
INNII=17111
IIMOIMEM
IND011111MIIMM
41110sallINIO11111
63. Next we would like some information about your children (including adopted,foster-care, and stepehildien). Please start with your first child and then report theone(s) after that, if any.
FirstChild
SecondChild
ThirdChild
FourthChild
FifthChild
A. What is the Month Month Month Month Month
birthdate of January January c January 0 January .0 January cthis child? February...0 February...0 February....0 February....0 February c(MARX March 0 March .0 March o March 0 March cOVALS FOR April o April...... .0 April - . 0 April. .0 April cMONTH May .o May .0 May 0 May .0 May cAND YEAR) June June 0 June o June .0 June c
July o July .0 July ,...o July .c) July cAugust .o August D August o August .0 August cSeptembers,October.....(0
Sertember°October .0
September.0October o
Septemer..0October .0
September..cOctober c
November.° November.° November-0 November...0 November..<December .0 December -0 December -0 December ...0 December c
_.:,
Year Year Year Year Year
1978 or 1978 or 1978 or 1978 or 1978 orbefore....o before.....o before.....o before .o before...... c
1979 o 1979 .0 1979 0 1979 .c 19791980.. .0 1980 c 1980 o 1980 .0 1980 c1981 o 1981..... .0 1981 0 1981 .0 1981 . c1982...........o 1982 40 1982 . 0 1982 .o 1982 c
B. Is the child Boy c Boy. .. .o -Boy o Boy ..0 Boy ca boy or agirl?
Girl 0 Girl .0 Girl o Girl.. o Girl c
,
C. Is the child Born Born Born Born Bornadopted, a to me o to me .c to me o to me o to me cstepchild, afoster-care
Adopted....0Step
Adopted......oStep
Adopted oStep
Adopted oStep
Adoptea :.-.,
Stepchild or achild born
child-m.0Foster-
child ..oFoster-
child 0Foster-
child ::-..,
roster- I
childFoster-
tin you? care en care i.--J I care ,n care n care ,_--
64. How many of your children (including adopted, step- or foster-care children) livedin your household as of the first week of February 1982? (MARK ONE)
NoneOneTwoThree 0FourFiveSix or more
39
133
P'
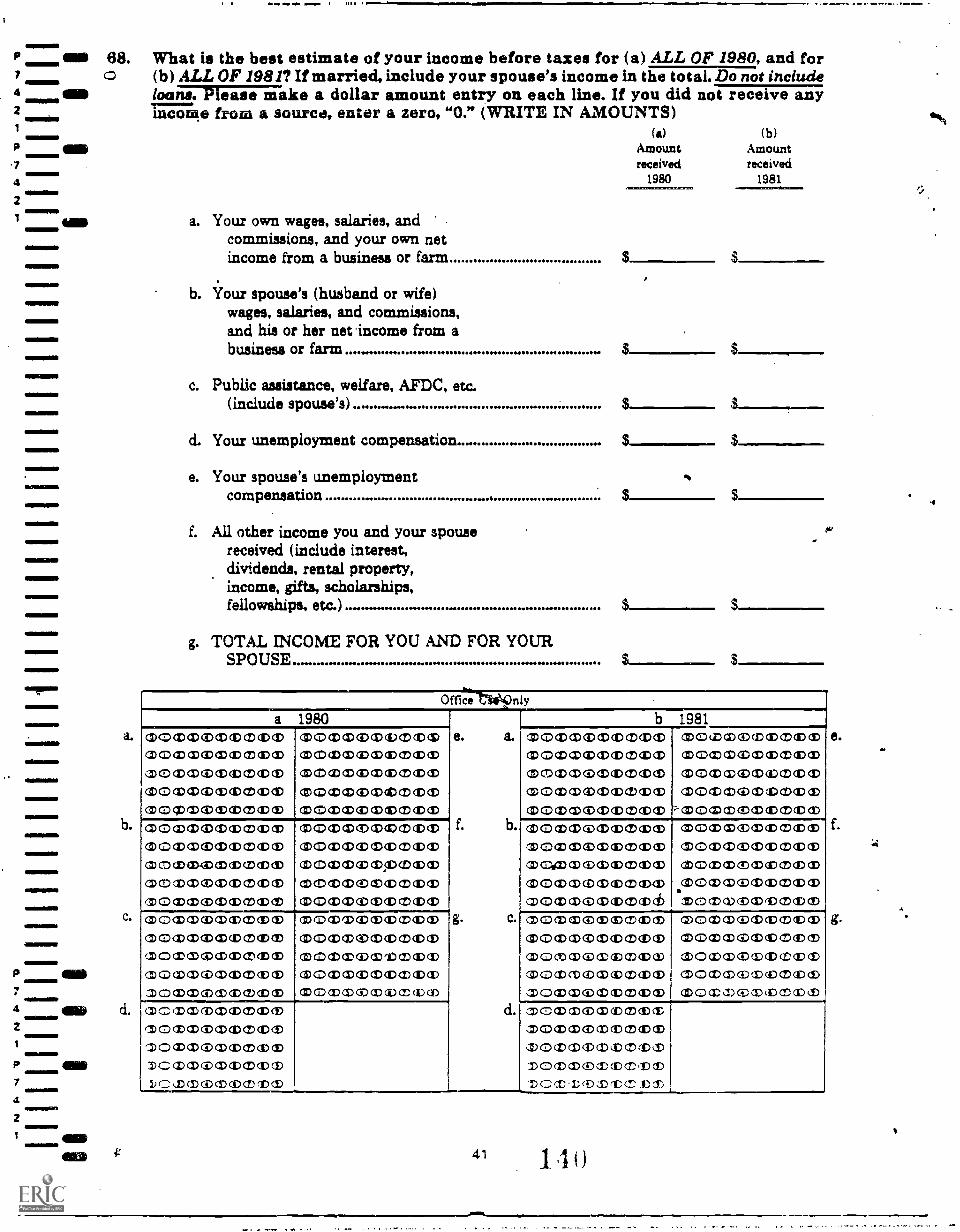
P MO 68. What is the best estimate of your income before taxes for (a) ALL OF 1980, and for7 0 (b) ALL OF 1981? If married, include your spouse's income in the total. Do not include4 in loanTraimake a dollar amount entry on each line. If you did not receive any2 income from a source, enter a zero, "0." (WRITE IN AMOUNTS)I (a) (b)P OM Amount Amount7 received received
4 1980 1981....r.
211111111111111
11111111111111
111111111MINI
INZINIMINO
1121611111113
11=MilIM
418111
111MMENEMI
011141.IIIM
111M1111=1
a.
b.
c.
4IMINO11111M
OO d.2
M11111111.1
a. Your own wages, salaries, andcommissions, and your own netincome from a business or farm
b. Your spouse's (husband or wife)wages, salaries, and commissions,and his or her net income from abusiness or farm
c. Public assistance, welfare, AFDC, etc.(include spouse's)
d. Your unemployment compensation.
e. Your spouse's unemploymentcompensation
f. All other income you and your spousereceived (include interest,dividends, rental property,income, gifts, scholarships,fellowships, etc.) ..-..
g. TOTAL INCOME FOR YOU AND FOR YOURSPOUSE......-----._--
$$
$: $Office
a 1980
e. a.
f. b.
g. c.mommommampm
d.
b 1981
coccommmcommxapocbmcmcbmmmxmommmmmmmxmocbmwmmmmwmoTwommcbmm
mocbmwmcummcbmcgIbmcbmmmmxmccbmcbmmmmxcoxmcbmcbmmxmccommmommx
mommapmmmaDmmomaxipmmcbmpxmommozmmxmaDommmmmmmxmommommmaDm-mommommmwm
mozzozma)mmmomeozmmmmxmommwmommxcmommommmmob
cDommcommmmmcoccbagpcbmmmxmmmetb4mmmmabiocpmapcpmmmmmxmomambmmopmm
mccommmaDmmxmccommommmxmommmmpixDmmmcabmewmmmmmommmmmmmx
momaDommmmebapowebaDmmmmxm.cmcDcbmmmccmmomapmmmaxao.momcDommmmxmocbcDommmxth
mommommmmxmcmcDmmmmmmaDommommmom
mCmmmmmm ®m(mom(Dma)mmmxcDommcciebwmcvmizocbcpcoopmcb(Dm
mommommmxma)ommmcvmmwm
momipmmmmmxmocbmwmmmmxmomwzmiomma)mommcbmmcbmwmocummxwcpmu)
mommaDmmmaDmcDommo(DmmmxOommcbmmQpmma)ommommmmeb
mommommcbcpmmommemcmmebapocbmowscDowxcpcpmmapeomoccmammop
cmcaxiDmmopmmmrmommommmmm1)ommommmmxmcoDzommmapcpDC,DalDCDP(1)
mcmmomcDmaDmmommomximmm,moimapompmx)o)MOaDMCDCIDMCCVD(DM 4---
41 1 1 o
e.
f.
g.
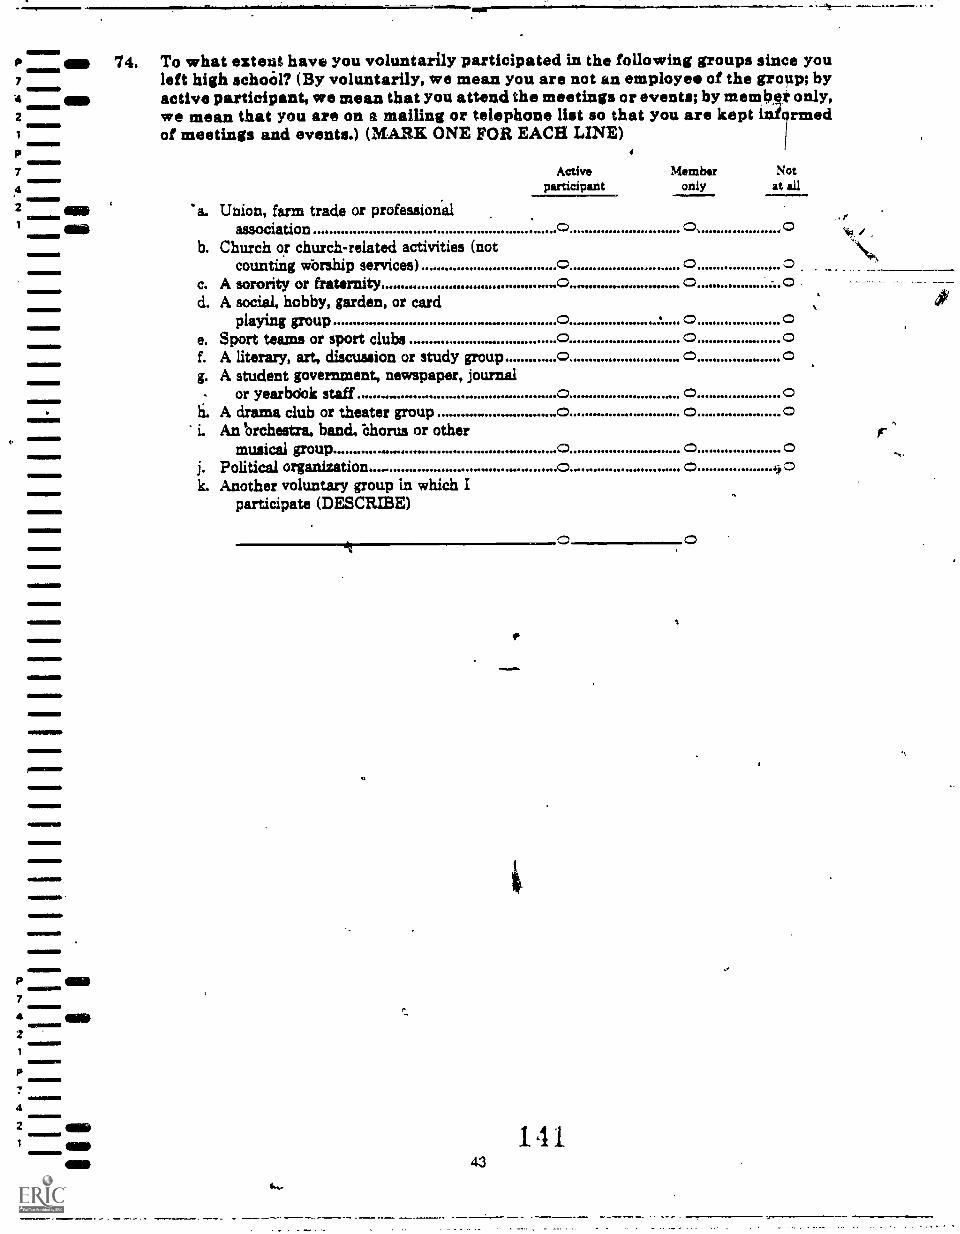
P an 74. To what extent have you voluntarily participated in the following groups since you7 left high school? (By voluntarily, we mean you are not an employee of the group; by4 MID active participant, we mean that you attend the meetings or events; by member only,2 we mean that you are on a mailing or telephone list so that you are kept iniormed
of meetings and events.) (MARK ONE FOR EACH LINE)loommo
7examm.
4
2 gniMID
C.
OISONINNI,
aim.=P
iMMINNIS
7
4 MID2
Activeparticipant
Member Notonly at all
. a. Union, farm trade or professionalassociation o o. ,0
b. Church or church-related activities (notcounting worship services) C C ,.. C
c. A sorority or fraternity 0........... . o od. A social, hobby, garden, or card
playing group o 0 oe. Sport teams or sport clubs ... o o of. A literary, art, discussion or study group o o og. A student government, newspaper, journal
or yearbdok staff .. C. 0 0li. A drama club or theater group o o oi. An 'orchestra, band, 'chorus or other
musical group o o oj. Political organization. o o 4ok. Another voluntary group in which I ,
participate (DESCRIBE)
43
141

QUESTIONS 77 THROUGH 80 ARE STRICTLY VOLUNTARY. WE HOPE YOUWILL ANSWER EVERY QUESTION, BUT YOU MAY SKIP ANY QUESTION YOUDO NOT WISH TO ANSWER.
77. On how many occasions (if any) have you used HASHISH (hash) or MARIJUANA(grass, pot, dope) ...? (MARK ONE OVAL FOR EACH LINE)
2
1
IMMIN1111111
111111111110
MUNN=
111111111111111
411111011.
o.
WINIZSIO
0111M
. 111111=01
0 1-2 3.5 e, 6.9 10-19 20-48 49
times times times times times times or more
a. In your lifetime C d C C C 0 ap 0 0b-.----Duringifie last 12
months o c o c o oc. During the last 30
days 0 . 0 0 C CD 0. 0d. During your last year
of high school. ... ... o c o. o o o o
78. How frequently (if at all) have you smoked cigarettes during the past thirty days?(MARK ONE)
Not at allLess than 5 cigarettes per dayAbout one-half pack per dayAbout onep-eiCk per dayAbout one and one-half packs per dayTwo packs of cigarettes or more per day
79. On how many occasions (if any) have you had alcohol to drink (beer, wine, liquor)during the past thirty days? (MARS ONE)
Did not have alcoholic drink in the last thirty daysOn one or two occasionsOn three to five occasionsOn eix to nine occasionsOn ten to nineteen occasionsOn twenty occasions or more
80. In the last thirty days, how many drinks did you usually have in a row?(MARK ONE)
Did not drinkUsually had only one drinkUsually had two drinks in a rowUsually had three or four drinks in a rowUsually had five or more drinks in a row
81. Are you registered to vote? (MARK ONE)
P OD Yes.. o7 No 04 an2 82. At any time since you have been 18, have you voted in a local, state, or national
MINIMMEI election? (MARK ONE)
7 Yes4 Nib No2 Not yet 181
45
14'

a
all1111111111111.
IND
OOP
OOP
NORC-SR4345
1982
.N0
INFORMATION FOR FUTURE FOLLOW -UPt °
NM!
111111111IM
eaNaNNIND
111111111M1
MINIMMOD
=Mil==MMUS.
PRINT name, address, and the telephone number where you can most usually be reached during the coming year.
YOUR NAME.
DRESS.
CITY:
TELEPHONE
AREA CODE NUMBER
STATE: COUNTY: ZIP
PRINT the name, addzess, and telephone number of your parents.
PARENT'S NAME:
ADDRESS:
CITY:_
TELEPHONE
AREA CODE NUMBER
S TATE: ZIP
PRINT the names and addresses of two other people who will know where to get in touch with you during the coming yew(List no more than one person who now lives with you.)
NAM
ADDRESS.
TELEPHONE
AREA CODE PLUMBER
CITY. STATE:.
NAME.
ADDRESS:
CITY. STATE.
TELEPHONE
r AREA CODE NUMBER
Zr?
PRINT spouse's full name (if you are married).
j SPOUSE'S FULL NAME.
Please give the following information about yourself.
(a) Date of birth (month)(b) Sex: (Mark one)
(c) Driver's License Noid) When did you complete this questionnaire/ J,month)
THANK YOU FOR YOUR COOPERATION
THIS INFORMATION WILL BE KEPT IN STRICT CONFIDENCE AND WILL BE USED ONLYFOR FUTURE FOLLOW-UPS IN THE HIGH SCHOOL AND BEYOND STUDY.
47 143
MaleFemale
(day) (yea:
Stateday) (yea:
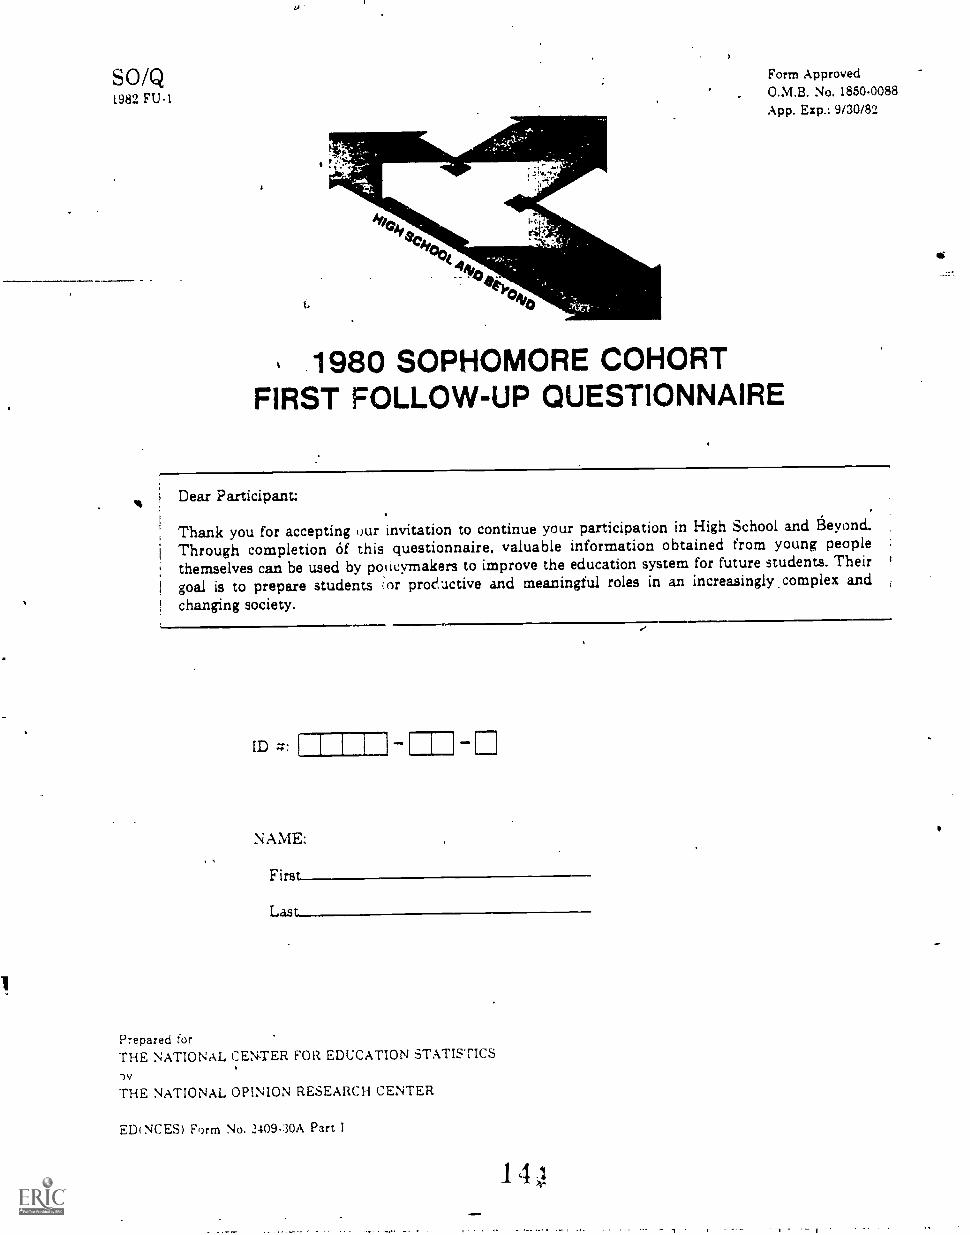
SO/Q1982 FU-1
41C4/00
44e044).0100
Form Approved0.M.B. No, 1850-0088App. Exp.: 9/30/82
1980 SOPHOMORE COHORTFIRST FOLLOW-UP QUESTIONNAIRE
Dear Participant:
Thank you for accepting our invitation to continue your participation in High School and Beyond.
Through completion Of this questionnaire, valuable information obtained from young peoplethemselves can be used by poiicymakers to improve the education system for future students. Theirgoal is to prepare students or pros? active and meaningful roles in an increasingly .complex andchanging society.
ID .7:ONMEINIIMIO
11
NAME:
First
Last
Prepared forTHE NATIONAL CENTER FOR EDUCATION STATISTICS
THE NATIONAL OPINION RESEARCH CENTER
EDNCES) Form No. -2409-30A Part I

!NI
11111111
WIMMIN111
1E1=1=111
0111111111LIION
GENERAL INSTRUCTIONS
PLEASE READ EACH QUESTION CAREFULLY.
It is important that you follow the directions for responding to each kind of question. These are:
IND(MARK ONE)
What is the color of your eyes? (MARK ONE)
BrownBlueGreenAnother color
(MARK ALL THAT APPLY)
If the color of your eyes is green. youwould mark the oval to the right of"Green."
Last week, did you do any of the following? (MARK ALL THAT APPLY)
a. See a playb. Go to a moviec. Attend a sporting event
(MARK ONE OVAL FOR EACH LINE)
If you went to a movie and attendeda sporting event last week, you wouldmark the two ovals as shown.
Do you plan to do any of the following next week? (MARK ONE OVAL FOR EACH LINE)Yee Not sure No If you plan to study at a friend's house.
0 do not plan tp visit a relative, and are not0 sure about going to a museum next week,
0 0 you would mark one oval on each line as. shown.
a. Visit a relativeb. Go to a museumc. Study at a friend's house
(WRITE IN)
What is your favorite sport? (MARK ONE)
FootballBasketballBaseball
Other (WRITE IN)
ma
If your favorite sport is ice hockey,you would mark the oval to the rightof "Other" and write "Ice Hockey"on the line as shown.
This questionnaire is not a test. We hope yflu will answer every question, but you may skip anyo question you do not wish to answer.
THANK YOU FOR YOUR COOPERATION
145

4. Starting with the beginning of the tenth gradf.) and through the end of this school0 year how much coursework will you have taken in each of the followingsubjects?
Count only courses that meet at least three times (or three periods) a week.(MARK ONE OVAL FOR EACH LINE)
a. Mathematicsb. English or
literaturec. Frenchd. Germane. Spanish1. Other foreign
languagesg. History or social
studiesh. Sciencei. Busin ,ss, office,
or sales..j. Trade and
industryk. Technical.
coursesI. Other vocational
courses
SINCE BEGINNING TENTH GRADE:
None year1
year1t:
years2
years2'2
years
0 0 0 0 0 0O.. 0 0 CD 0 00 0 C 0 0 00 0 C 0 0 00 C 0 0 0 00 0 C 0 0 00 0 0 0 0 00 O. 0 0 0 00 O.:, -0 0 0 .6
0 0 C 0 0 00 C 0 0. 0 00 C .0 0 0 0
More3 than 3
years years
0 0Q 00 00 00 00 00. 00 0© 00 00 00 0
5. Which of the following courses have you taken, counting the courses you are takingthis semester? (MARK ONE OVAL FOR EACH LINE)
Yes, No.have taken have not taken
a. First-year algebrab. Second-year algebrac. Geometryd. Trigonometrye. Calculusf. Physicsg. *Chemistryh. Biology
3
146
t.

MID 9. In your junior or senior year have you been in any of the following kinds of courses0 or programs in high school? (MARK ONE OVAL FOR EACH LINE)
No Yes
a. Remedial English (sometimes called basic or essential)b. Remedial Mathematics (sometimes called basic or essential)c. Advanced or honors program in Englishd. Advanced or honors program in Mathematicse. Bilingual or bicultural programf. Family life or sex\educationg. Alcohol or drug abuse educationh. Special 'program for the educationally handicappedi. Special program for the physically handicappedj. Career education (job knowledge, job seeking skills. career awareness)k. Driver education1. Computer programming
OO
OO
OOO0-O
It). Some students spend part of the school day in programs outside of any school insome kind of work or community service setting. Averaged over this school year,about how much, of your school day have you spent in programs held someplace
e
other than at a school? (MARK ONE)
NoneAbout one period a dayMore than one period but less than half a dayAbout half a dayMore than half of the school day
11. In your junior or senior year have you heard of or participated in any of thefollowing high school educational programs?(MARK ONE OVAL FOR EACH LINE)
Have heardof this, Have
Never heard program but participatedof this have not in this
progibm participated program
a. Cooperative Vocational EducationProgram (Co-op Program)
b. High School Vocational Education0 0 0111111:
Work-Study Program 0 0 0c. Talent Search 0 0 0d. Upward Bound ., . 0 0 0e. Continuation High School 0 0 0f. Alternative High School rg. Special School for pregnant
0 0 0girls or tflothers
h. CETA Work Programs (such as the0 0 0
Youth Employment and TrainingEINfk Program or the Conservation
Corps) 0 0 01111111M1
1111111 i. .Junior ROTC r C 0 C
5 14/
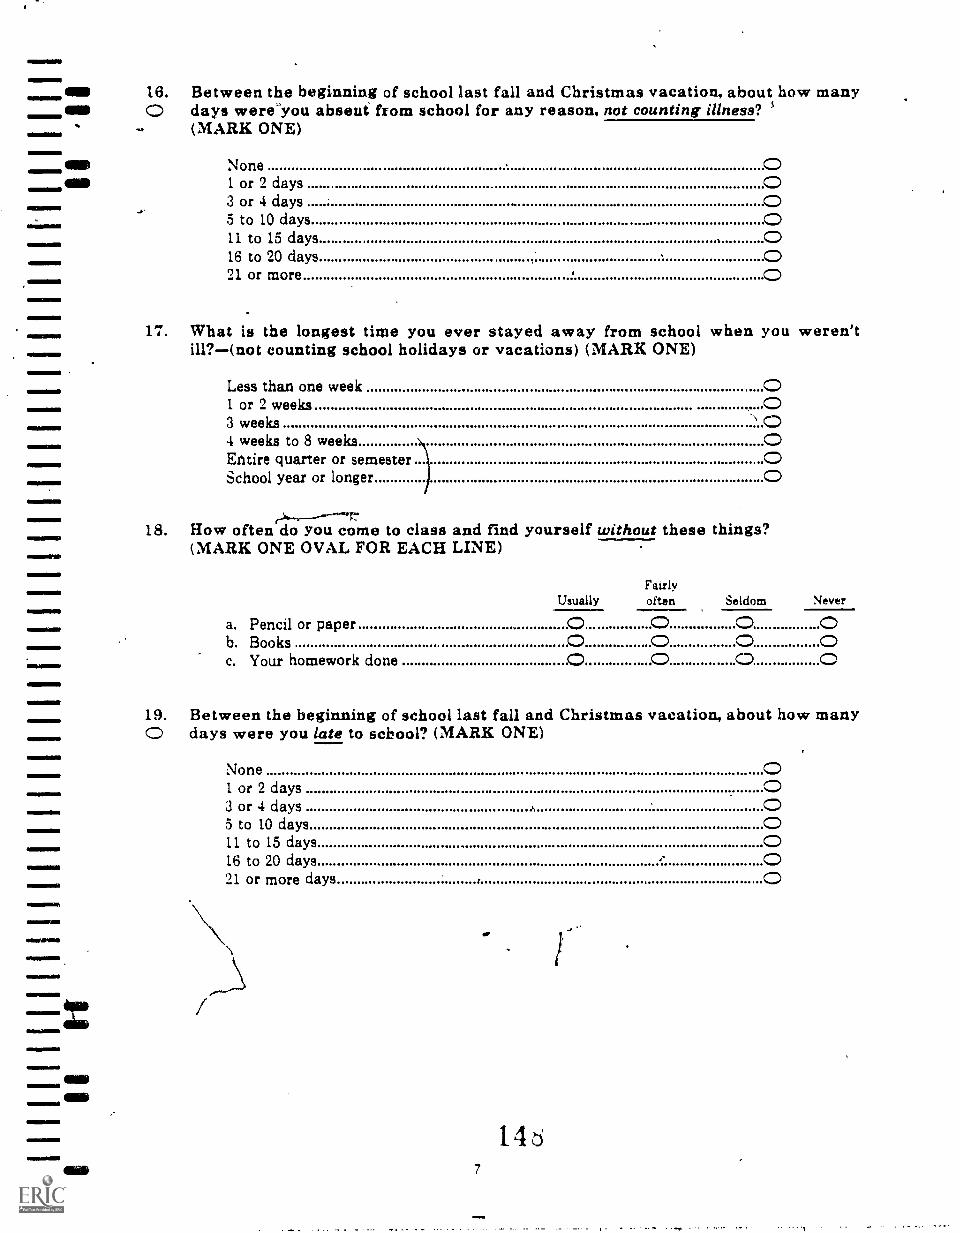
IMMI1111111111
16. Between the beginning of school last fall and Christmas vacation, about how many0 days wereyou absent from school for any reason, not counting illness?(MARK ONE)
None1 or 2 days3 or 4 days5 to 10 days11 to 15 days16 to 20 days21 or more
17. What is the longest time you ever stayed away from school when you weren'till?(not counting school holidays or vacations) (MARK ONE)
Less than one week1 or 2 weeks3 weeks .`
4 weeks to 8 weeksEntire quarter or semesterSchool year or longer
18. How often do you come to class and find yourself without these things?(MARK ONE OVAL FOR EACH LINE)
FairlyUsually often Seldom Never
a. Pencil or paper O. 0 0 0b. Books 0 0 0 0c. Your homework done 0 0 CD 0
19. Between the beginning of school last fall and Christmas vacation, about how many0 days were you late to school? (MARK ONE)
None1 or 2 days3 or 4 days5 to 10 days11 to 15 days16 to 20 days21 or more days
7
14

10111111MI
41.11. 23. Whether or not you already have a job, were you looking for a job last week?(MARK ONE)
1111111111111
11011I
111131111,
ONIIII11111
WRENN=
Yes 0 (ANSWER A)No 0(GO TO Q. 24)
A. What have You been doing in the last week to find a job?(MARK ALL THAT APPLY)
a. Nothing
b. Checked with:1. State employment ag .icy2. Private employment agency3. Military recruiter4. Employer directly5. Friends or relatives
c. Placed or answered adsd. Looked in the newspapere. School employment service
f. Other (WRITE IN)
24. When was the most recent time you worked for pay, not counting work around the0 house? (MARK ONE)
Never worked for pay 0... (SKIP TO Q. 34)Last weekWithin the past month, but not last weekWithin the past 3 monthsSince school started last fallLast summerBefore last summer
25. How many hours do or did you work a week on your current or most recent job?(MARK ONE)
1-4 hours per week5-14 hours per week15-21 hours per week22-29 hours per week30-34 hours per week35-40 hours per week41 or more hours per week

111111111iNI
29. Which of the job categories below comes closest to the kind of work you do or did forpay on your current or most recent job? (If more than one kind of work, choose theone which paid you the most per week.) (MARK ONE)
Lawn wnrk or odd jobsWaiter, waitress, bus boy or cookBabysitting or child care
=MIMI Farm or agricultural workFactory work (unskilled or semi-skilled)Gas station, car wash, or auto repair workSkilled tradeOther manual labor (cleaning-related jobs, stock clerks, etc.)Store clerk, salesperson or cashierOffice or clericalHospital or healthDelivery jobs (newspapers, groceries, etc.)
Other (DESCRIBE)
30. How did you find your curreat (or most recent) job? (MARK ONE)
School employment or placement servicePublic employment servicePrivate employment agencyNewspaper advertisementChecked with employer directlyThrough a relativeThrough a friend
Other (DESCRIBE)
31. Is your current job (or was your most recent job) a CETA-sponsored, a Co-op, or aWork-Study job, or another job with a private company/person, or were youself-employed? (MARK ONE)
CETA-sponsored youth employment jobCooperative Education Program job CD
Work-Study jobPrivate company/person (not CETA, Co-op, or Work-Study) 0Self-employedOther (PLEASE DESCRIBE KIND OF EMPLOYER)OIMMININ
1111111111111011
O
Don't know (PLEASE DESCRIBE KIND OF EMPLOYER)C.M1M11111
("""N111111011111
11111116
AND
111111=111
MEI 1 5 o1 1

35. What is the lowest hourly wage you would be willing to accept for a job after yougraduate from high school? (MARK ONE)
Below $2.50$2.50 tb$3.00$3.50$4.00$4.50$5.00$5.50$6.00$6.50$7.00$7.50 per hour or more
CCCCe"-N,C0CC
36. During last summer (summer of 1981) about how many hours per week did youwork for pay outside your own home? (MARK ONE)
None1..4 hours per week 0544 hours per week15-21 hours per week22-29 hours per week30-34 hours per week35-40 hours per week C41 hours or more per week 0
311. During the school year before this one, about how many hours per week on theaverage did you work for pay outside your own hbme? (MARK ONE)
Nona C1.4 hours per week C5-14 hours per week CC15-21 hours per week ...../
,--,''2.29 hours per week ..,30-:34 hours per week C35-40 hours per week C41 hours or more per week
3
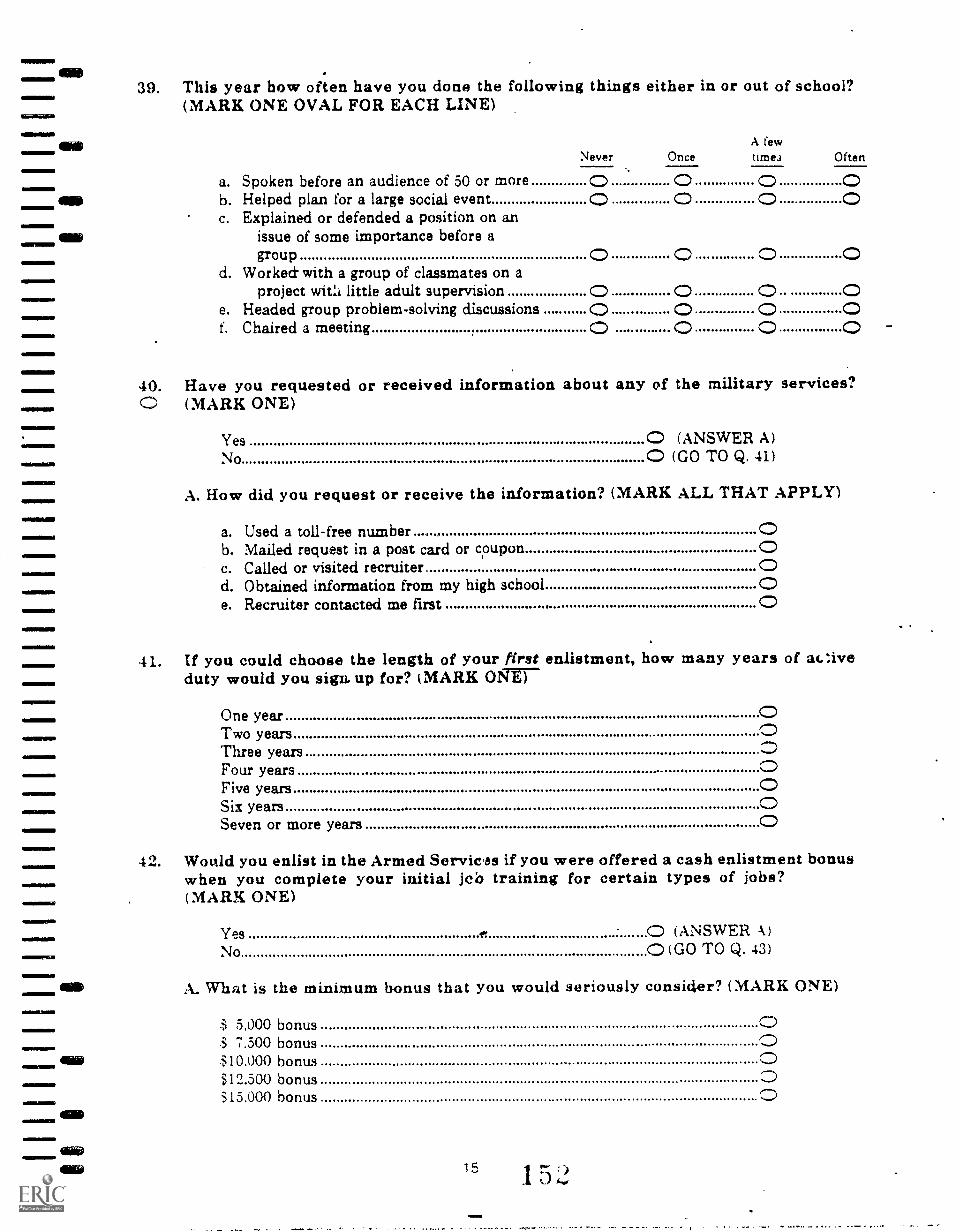
111111
39. This year how often have you done the following things either in or out of school?(MARK ONE OVAL FOR EACH LINE)
A fewNever Once time.) Often
a. Spoken before an audience of 50 or more 0 O 0b. Helped plan for a large social event 0c. Explained or defended a position on an
elm issue of some importance before agroup
d. Worked. with a group of classmates on aproject with little adult supervision O 0 0
e. Headed group problem-solving discussions=MENEM
f. Chaired a meeting O 0 O 0411011111
40. Have you requested or received information about any of the military services?111011111 0 (MARK ONE)
111111111111
M=111
=MEM=
A. How did you request or receive the information? (MARK ALL THAT APPLY)
Yes C (ANSWER A)No C (GO TO Q. 41)
11111=
a. Used a toll-free number 0b. Mailed request in a post card or couponc. Called or visited recruiter 0d. Obtained information from my high school 0
111111 e. Recruiter contacted me first411111111111111
duty would you sign up for? (MARK ONE)=IMMO*
41. If you could choose the length of your first enlistment, how many years of at.;ive
One yearMINIIMEND Two yearsMOWN= Three years
Four yearsFive yearsSix yearsSeven or more years
42. Would you enlist in the Armed Servicts if you were offered a cash enlistment bonuswhen you complete your initial job training for certain types of jobs?(MARK ONE)
YesNo 0(GO TO Q. 43)
O (ANSWER A.)
A. What is the minimum bonus that you would seriously consider? (MARK ONE)
$ 5,000 bonus.3 7.500 bonus 0$10.000 bonus 0312.300 bonus 0315.000 bonus
O 110 15 1 5 2
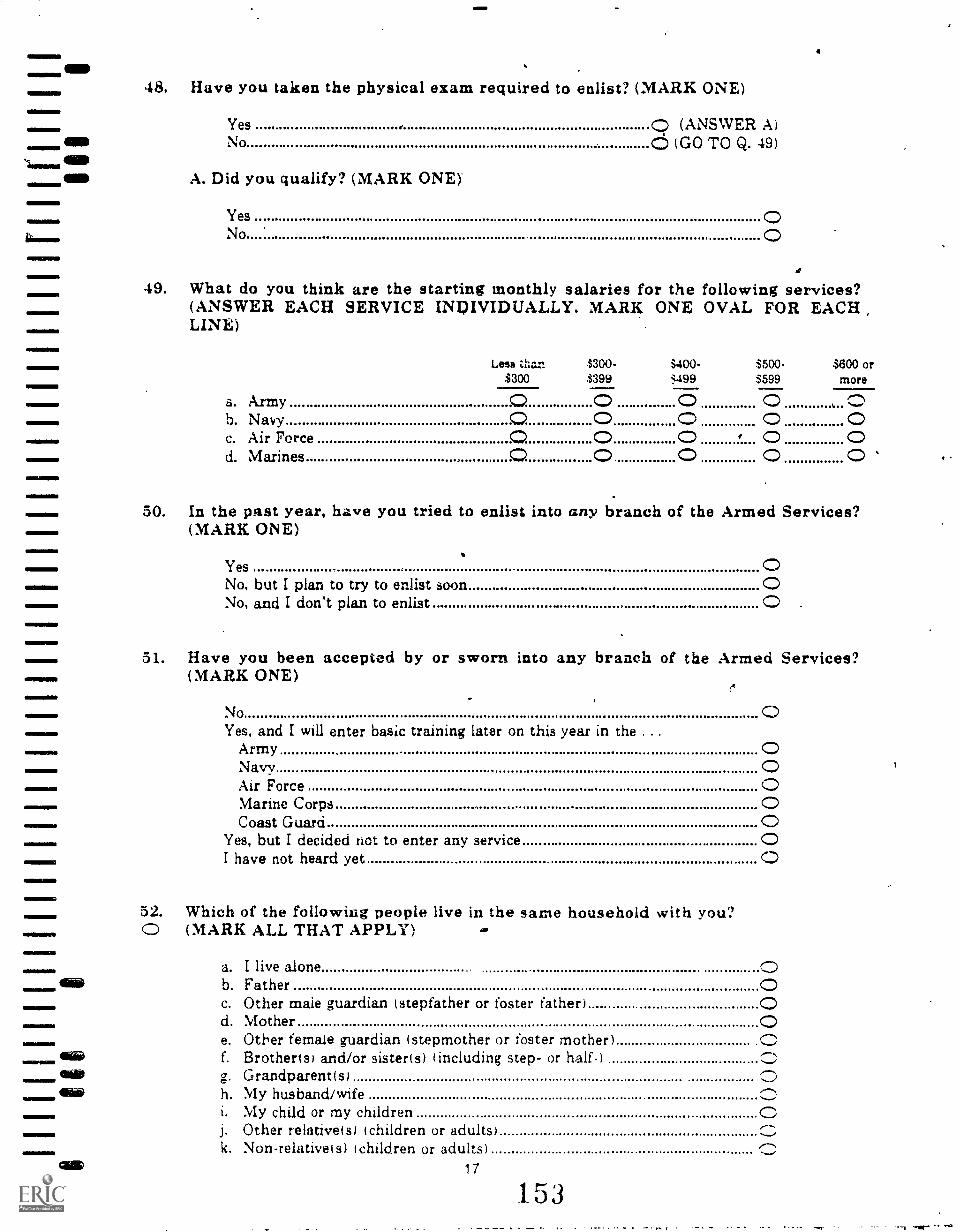
48. Have you taken the physical exam required to enlist? (MARK ONE)
Yes , CD (ANSWER A)No c:-.5 (Go TO Q. 49)
A. Did you qualify? (MARK ONE)
YesNo
49. What do you think are the starting monthly salaries for the following services?(ANSWER EACH SERVICE INDIVIDUALLY. MARK ONE OVAL FOR EACHLINE)
Less than$300
$300-$399
$400-:1499
$500-$599
$600 ormore
a. Army 0 0 0 0 ,..0b. Navy 0 0 0 0 0c. Air Force 0 0 0 . 0 0d. Marines 0 0 0 0 0
50. In the past year, have you tried to enlist into any branch of the Armed Services?(MARK ONE)
YesNo, but I plan to try to enlist soonNo, and I don't plan to enlist 0
51. Have you been accepted by or sworn into any branch of the Armed Services?(MARK ONE)
NoYes, and I will enter basic training later on this year in the .
ArmyNavyAir Force CD
Marine CorpsCoast Guard CD
Yes, but I decided not to enter any service 0I have not heard yet
52. Which of the following people live in the same household with you?C (MARK ALL THAT APPLY)
a. I live alone 0b. Father 0c. Other male guardian (stepfather or foster father)d. Mother 0e. Other female guardian (stepmother or foster mother)f. Brotherts) and/or sisterts) (including step- or half-)g. Grandparent(s)h. My husband/wifei. My child or my childrenj. Other relativets) (children or adults)k. Non-relativets) (children or adults)
153

54. Please describe below the job most recently held by your mother (stepmother or0 female guardian), even if she is not working at present.
(WRITE IN)
A. Which of the categories below comes closest to describing that job? (MARKONE)
CLERICAL such as bank teller, bookkeeper. secretary, typist, mail carrier,ticket agent
CRAFTSMAN such as baker, automobile mechanic, machinist, painter,plumber, telephone installer, carpenter 6
FARMER, FARM MANAGERHOMEMAKER (without other job)LABORER such as construction worker, car washer, sanitary worker,
farm laborer.MANAGER, ADMINISTRATOR such as sales manager, office manager,
school administrator, buyer, restaurant manager, government officialMILITARY such as career officer, enlisted woman in the Armed ForcesOPERATIVE such as meat cutter, assembler, machine operator, welder,
taxicab, bus or truck driverPROFESSIONAL such as accountant, artist, registered nurse. engineer, librarian,
writer, social worker, actress, athlete, politician, but not includingschool teacher
PROFESSIONAL such as clergyman, dentist, physician, lawyer, scientist,college teacher
PROPRIETOR OR OWNER such as owner of a small business, contractor,restaurant owner
PROTECTIVE SERVICE such as detective, police officer or guard, sheriff,/fire fighterALES such as salesperson, advertising or insurance agent, real estate broker
SCHOOL--TEACHER such as elementary or secondarySERVICE such as barber, beautician, practical nurse, private household worker,
janitor, waitressTECHNICAL such as draftsman, medical or dental technician,
computer programmerNever workedDon't know
55. What was the highest level of education your father (stepfather or male guardian)0 completed? (MARK ONE)
Less than high school graduationHigh school graduation only -.0
Vocational, trade, or business Less than two years -0school after high school I Two years or more
Less than two years of college -0Two or more years of college
(including two-year degree) -0College program Finished college (four- or five-year degree)
Master's degree or equivalent -0Ph.D., M.D.. or other advanced
professional degree -0Don't know
19 154

39. Before you started high school were you ever asked to repeat a grade or held backa term in school? (MARK ONE)
Yes (ANSWER A)No O (GO TO Q. 60)0
A. Which grades did you repeat? (MARK ALL THAT APPLY)
a. Firstb. Secondc. Thirdd. Fourth .0e. Fifthf. Sixthg. Seventhh. Eighthi. Ninth
(;)
60. How often do you spend time on the following activities outside of school?(MARK ONE OVAL FOR EACH LINE)
Rarely Less than Once or Every dayor once a twice a or almost
never week week every day
a. Spending time talking withfriends
b. Reading for pleasure 0 0 0 0c. Going out on dates 0 0 0 0d. Just driving or riding around 0 0 0 0
(alone or with friends)e. Thinking or daydreaming alone 0 0 0 0f. Talking with your mother or 0 0 0 0
fatherg. Reading the front page of the 0 NS::) 0 0
newspaper 0 0 0 061. During weekdays about how many hours per day do you watch TV?
(MARK ONE)
Don't watch TV during weekdaysLess than 1. hour1. hour or more, less than 22 hours or more, less than 33 hours or more, less than 44 hours or more, less than 5.. 05 hours or more O
21
153

IMIIM1111111
1111111
11111111M111111
111111011111111
ONIIMININI
1111111
IMMO=
=IMMO!
elMIN
11111.
66. Are the following statements about your experience in high school true or false?(MARK ONE OVAL FOR EACH LINE)
True False
a. I am satisfied with the. way my education is goingb. I have had disciplinary problems in school during
the last yearc. I am interested in schoold. I have been suspended or put on probation in school
for academic reasons O 0e; I have been suspended or put on probation for
disciplinary reasons1. Every once in a while I cut a classg. I don't feel safe at this school
67. Please rate your school on each of the following aspects.(MARK ONE OVAL FOR EACH LINE)
Don'tPoor Fair Good " Excellent know
a. Condition of buildings andclassrooms O. 0 0
b. Library facilities O Pcsatit.
c. Quality of academic instruction 16 Qd. Reputation in the community O 0 0e. Teacher interest in students 0 0f. Effectiveness of discipline O 0 0g. Strictness of discipline O 0 0h. Fairness of discipline O 0 0i. School spirit O 4 0 0
68. How important is each of these characteristics in your definition of a good teacher?(MARK ONE OVAL FOR EACH LINE)
Not Somewhat Veryimportant important important
a. Enjoys his or her work 0b. Is clear in his or her presentationsc. Makes you work hard so
you'll learnd. Treats everyone with respecte. Is witty and humorousf. Doesn't talk over your headg. Is patient and understandingh. Is doing a job just to make moneyi. Returns students' work promptlyj. Takes an interest in students'
lives outside of class
23156
O
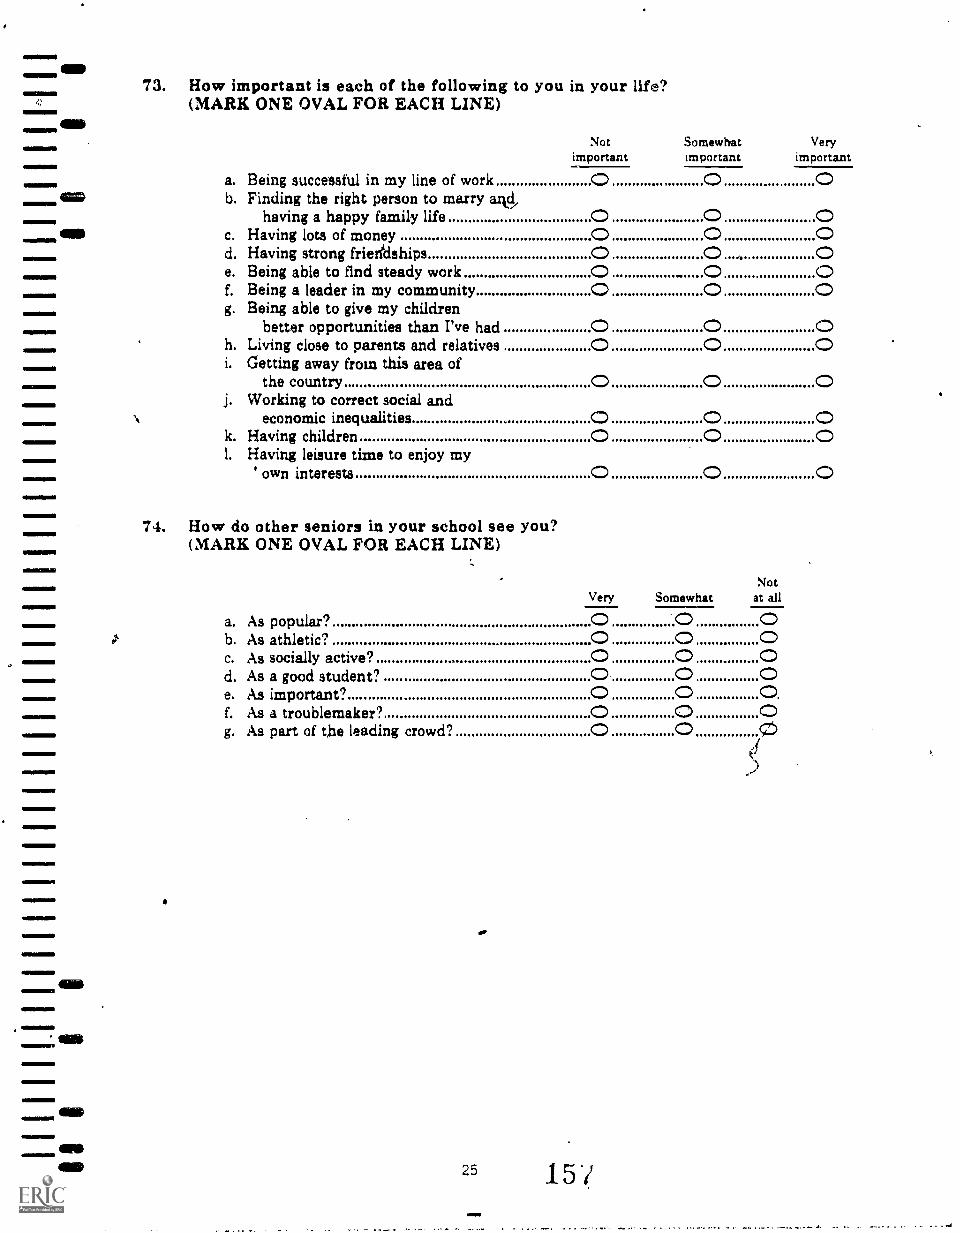
73. How important is each of the following to you(MARK ONE OVAL FOR EACH LINE)
in your life?
Notimportant
Somewhatimportant
a.b.
Being successful in my line of workFinding the right person to marry alisd,
having a happy family life
00
00
c. Having lots of money 0 0d. Having strong friertdships 0 0...,.e. Being able to find steady work 0 01.
g.Being a leader in my communityBeing able to give my children
0 0better opportunities than I've had 0 0
h.i.
Living close to parents and relatives(ietting away from this area of
0 0
j.the country
Working to correct social and0 0
economic inequalities 0 0k. Having children 0 0I. Having leisure time to enjoy my
' own interests 0 0
74. How do other seniors in your school see you?(MARK ONE OVAL FOR EACH LINE)
Very Somewhat
a. As popular? 0 .0b. As athletic? 0 0c. As socially active? 0 0d. As a good student? 0 0e. As important? 0 0f. As a troublemaker? 0. 0g. As part of the leading crowd? 0 0
25
il
15/
Notat all
00000.00
4
Veryimportant
000000000000

77. Write in here the name of the job or occupation that you expect or plan to have whenyou are 30 years old. Even if you are not at all sure, write is your best guess.
(WRITE IN)
A. Which of the categories below comes closest to describing that job?(MARK' ONE)
CLERICAL such as bank teller, bookkeeper, 4cretary, typist, mail carrier.ticket agent 0
CRAFTSMAN such as baker, automobile mechanic, machinist, painter,plumber, telephone installer, carpenter ., 0
FARMER, FARM MANAGER 0HOMEMAKER (without other job) 0LABORER such as construction worker, car washer, sanitary worker,
farm 'laborer : 0MANAGER, ADMINISTRATOR such as sales manager, office manager.
school administrator, buyer, restaurant manager, government official , 0MILITARY such as career officer, enlisted man or woman in the
Armed Forces C..)
OPERATIVE such as meat cutter, assembler, machine operator, welder,taxicab, bus, or truck driver 0
PROFESSIONAL such as accountant, artist, registered nurse, engineer. librarian.writer, sociat worker, actor, actress, athlete, politician, but not includingschool teacher 0
PROFESSIONAL such as clergyman, dentist, physician, lawyer. scientist,college teacher .. 0
PROPRIETOR OR OWNER such as owner of a small business, contractOr,restaurant owner 0
PROTECTIVE SERVICE such as detective, police officer or guard, sheriff,fire fighter 0 r
SALES such as salesperson, advertising or insurance agent. real estate broker 0SCHOOL TEACHER such as elementary or secondary 0SERVICE such as barber, beautician, practical nurse, private household worker,
janitor, waiter, waitress 0TECHNICAL such as draftsman, medical or dental technician,
computer programmer Vs 0NOT WORKING 0
1 5
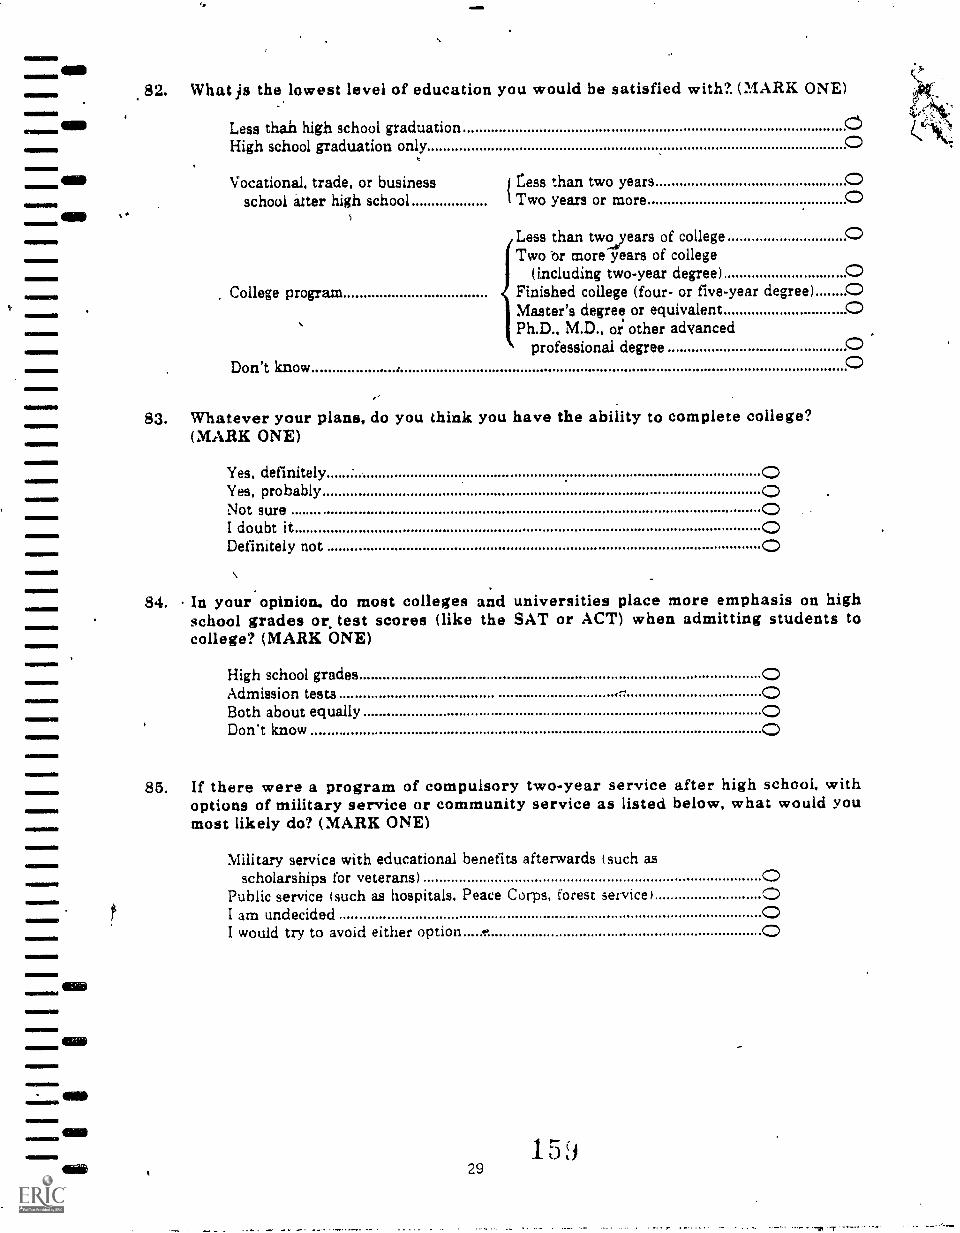
82. What pi the lowest level of education you would be satisfied with?. (MARK ONE)
Less than high school graduationHigh school graduation only
Vocational, trade, or businessschool atter high school
5
Cess than two years1Two years or more
Less than twodyears of collegeTwo 'or more years of college
(including two-year degree) .
College program Finished college (four- or five-year degree) 0Master's degree or equivalentPh.D., M.D., or other advanced
professional degreeDon't know,
83. Whatever your plans, do you think you have the ability to complete college?(MARK ONE)
Yes, definitelyYes, probably 0Not sure 0I doubt itDefinitely not
O
84. In your opinion, do most colleges and universities place more emphasis on highschool grades or test scores (like the SAT or ACT) when admitting students tocollege? (MARK ONE)
High school gradesAdmission testsBoth about equallyDon't know
OOOO
85. If there were a program of compulsory two-year service after high school, withoptions of military service or community service as listed below, what would youmost likely do? (MARK ONE)
Military service with educational benefits afterwards such asscholarships for veterans)
Public service (such as hospitals, Peace Corps, forest service) 0I am undecidedI would try to avoid either option

ONINIENNEI
GIONOInnne
Ininnninin
89. If you plan to work full-time next year and can't find a job after six months, what onething would you probably decide to do? (MARK ONE)
Don't plan to work full-time next yearKeep on looking for a job around hereMove to a different area and look for jobs thereWork part-time but not attend school or collegeEnter an apprenticeship or on-the-job training programGo into regular military service (or service academy)Become a full-time homemakerTake vocational or technical courses at a trade' or business school
full-time or part-time OTake academic courses at a junior or community college
full-time or part-timeTake technical or vocational subjects at a junior or ommunity
college full-time :fr part-timeAttend a four-year college or university full-time or art-timeOther (travel, or take a break)Don't know O .!
90. About how much money do you expect to-earn from work in the year beginning July1982 and ending June 1983? (MARK ONE).
NoneLess than $1,000$1,000 to £2,999. :Ne$3,000 to £4,999$5,000 to $6,999£7,000 to $8,999$9,000 to $10,999$11,000 to £12,999
o $13,000 to $14,999$15,000 or more
91. About how much none o you expect to spend on living expenses (such as room andboard and ,clothing) n year? Include expenses even if they will be paid by ascholarship or loan. (Bu n't include tuition or other schooling expenses.)(MARK ONE)
Almost noneI plan to live at homeNone, for other reasonsLess than $1,000$1,000 to $1,999$2,000 to $2,999$3.000 to $3,999$4,000 to £4,999$5,000 to $6,999$7,000 to $10,000More than $10.000
160031

95. How do you plan to pay for the living expenses and schooling expenses (if any) you0 may have next year? For each source listed below, indicate how much money youexpect to receive in the year beginning July 1982 and ending June 1983. If you are
IND nocgure, make your best guess. (MARK ONE OVAL FOR EACH LINE)
A. My family:None
Under$300
$300 to$599
$600 to$1,199
31.200 to$1,999
$2.000 to Over33.000 $3.000
a. Parents 0 0 0 0 0 0 0b. Husband or wife 0 0 0 0 0 0 0
01111111111111111c. Other relatives 0 0 0..... 0 0 0 0
B. Myself:a. Summer earnings,
1982b. Earnings, Sept. 1982 -
0 0 00 0 0 0 0IMI June 1983 0 0 0 0 0 0 0
c. Savings 0 0 0 0 0 0 0MENIMIMS
C. Other sources:.a. A state scholar-intiMMB
ship or grantb. A federal scholar-
CD 0 0 0 0 0 0,ship or grant
c. Other scholarship0 . 0 0 0 0 0 0
or grant 0 0 0 0' 0 0 0d. A state loan 0 0 0 0 0 0 0e. A federal loan 0 0 0 0 .0 0 0f. Other loang. Social Security or
0 0 0 0 0 0 0Veterans Adminis-
=MOM tration benefits 0 0 0 0 0 0 0
MID
96. Where do you plan to live next year? (MARK ONE)
At homeIn a school dormitory or residence hallIn a place of my own or with a roommateSharing a place with more than one other person CaIn a military barracks
33161

101. What is your race? (MARK ONE)0Ilia 4 Black
WhiteAmerican Indian or Alaskan NativeAsian or Pacific Islander
MID
111111/111 Other (WRITE IN) 0
1111111110
=MINIM
102. What is your origin or descent? (If more than one, please mark below the one you0 consider the most important part of your background.) (MARK ONE)
HISPANIC OR SPANISH:Mexican. Mexican-American, Chicano 0Cuban, CubanoPuerto Rican, Puertorriquefio or BoricuaOther Latin American, Latino, Hispanic, or
Spanish de,, -ent (WRITE IN)NON-HISPANIC
103. Do you have any of the following conditions? (MARK ALL THAT APPLY)O
a. Specific learning disability 0b. Visual handicap (not corrected by glasses) 0c. Hard of hearing 0d. Deafness 0e. Speedh disability .0f. Orthopedic handicap 0g. Other physical disability or handicap
(DESCRIBET 0h. None of these conditions 0
104. Do you feel that you have a physical condition that limits the kind or amount of workyou can do on a job, or affects your chances for more -education? (MARK ONE)
NoYes
11111110
4111110 I 6 02..35

an
109. How many of your brothers and sisters will be in high school next fall? (Pleaseinclude stepbrothers or stepsisters if they live in your parents' home.)(MARK ONE)
I don't have any brothers or sisters 0None 0One 0Two or more 0
110. American families are divided below into three equal groups according to how muchmoney the family makes in a year. Mark the oval for the group which comes closestto the amount of money your family makes in a year. (MARK ONE)
One-third of American families make: $14,999 or lessOne-third of American families make: $15,000 to $29,999One-third of American families make. $30,000 or more
111. This time families are divided into eight groups according to how much money they0 make in a year. Mark the oval for the group which comes closest to the amount of
money your family makes in a year. (MARK ONE)
$7,999 or less$8.000 to $14.999$15.000 to $19,999$20.000. to $24.999$25,000 to $29,999$30,000 to $39,999$40,000 to $49,999$50,000 or more
112. How many rooms are there in your home? Count only the rooms your family lives in.Count the kitzhen (if separate) but not bathrooms. (MARK ONE)
1 'room2 rooms3 rooms4 rooms5 rooms6 rooms
rooms8 rooms9 rooms10 or more
1,

011IMINIM
119. How much do you think each of the following kinds of schooling would cost for ao year? Just answer about expenses for tuition. books. fees, transportation. and so
onnot living expenses. (MARK ONE OVAL FOR EACH LINE)SIP
Schooling expenses would be ...
,P
a. at a public junior or
Under
3500
3500-
$1.000
$1.001-
32.000
$2.001.
3.00033.00135.000
35.001- Don't37.000 know
b.community college
at. a state four-year college or
0 0 0 0 '0 0 0
c.
universityat a private four-
0 0 0 0 0 0 0year college oruniversity 0 0 0 0 C 0 0
12O. If you were to go to a trade or vocational school, what field would you most likelytrain for? (MARK ONE)
Don't plan to go to trade or voca,tional schoolAgriculture, including horticultureAuto mechanics .4
AviationCommercial artsComputer programming or computer operationsConstruction trades:
Carpentry, cabinetmaking, or millworkElectricalMasonry
PlumbingCosmetology, hairdressing, or barberingDraftingElectronicsHome economics, including dietetics and child careMachine shopMedical or dental assistingPractical nursingQuantity food occupationsRefrigerationSales or merchandisingSecretarial, stenographic, typing or other office workWeldingOther (WRITE IN)
O
121. Have you been accepted by any vocational school, trade school, or apprenticeshipprogram? (MARK ONE)
Don't plan to go to trade or vocational school 0Have applied and have been accepted A
Have applied. but have not yet been acceptedProgram does not require advance application 0Plah to apply later 0
39 164
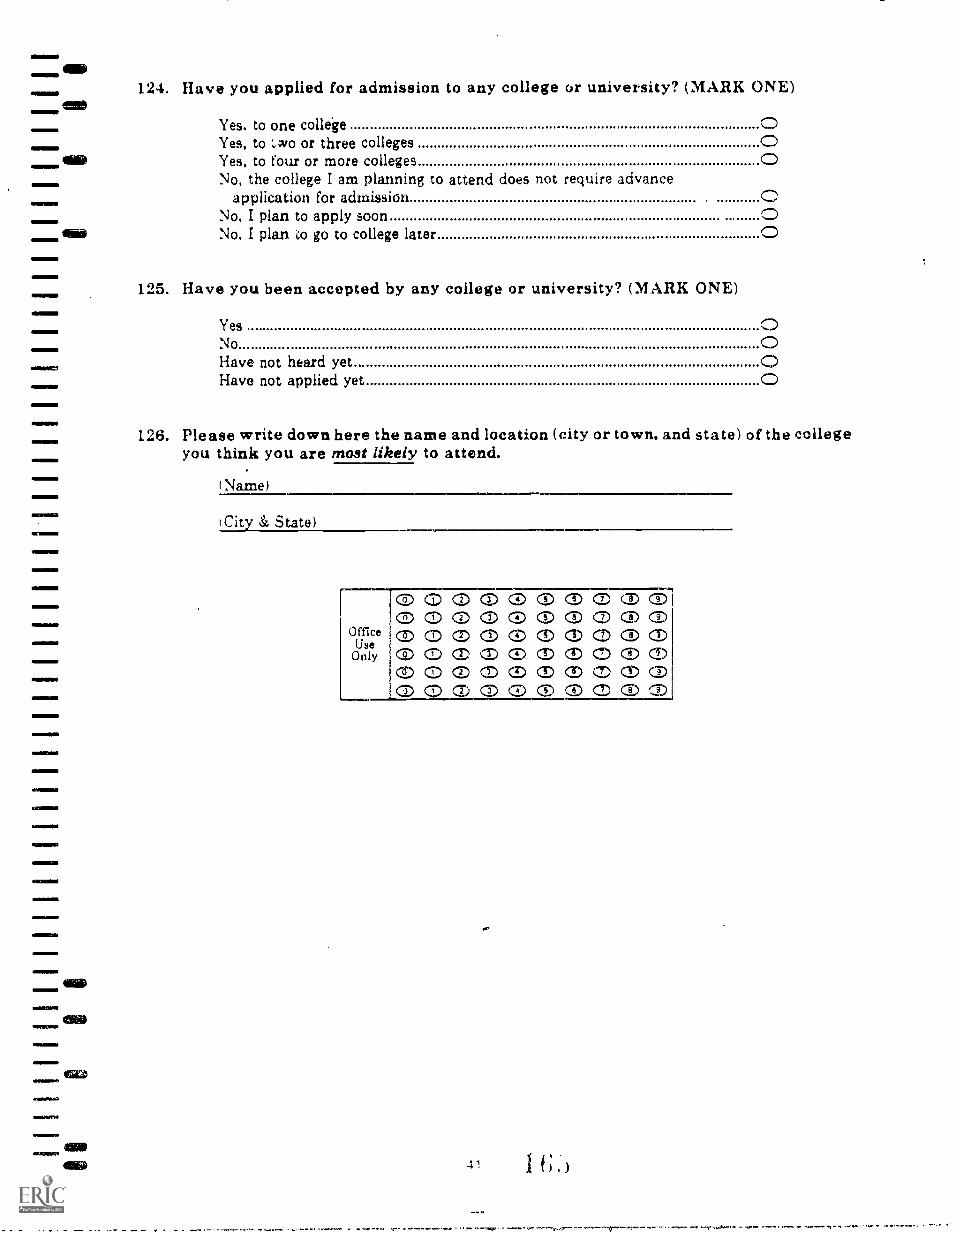
124. Have you applied for admission to any college or university? (MARK ONE)
Yes. to one college 0Yes, to '..wo or three collegesYes, to four or more collegesNo, the college I am planning to attend does not require advance
application for admissionNo, I plan to apply soon 0No, I plan co go to college later 0
125. Have you been accepted by any college or university? (MARK ONE)
YesNoHave not heard yet 0Have not applied yet
126. Please write down here the name and location (city or town, and state) of the collegeyou think you are most likely to attend.
(Name)
(City & State)
OfficeUseOnly
CD CD CD CD CD0GCD 0O 0 0 0 CD 0 0 CDCD 0 CD CD CD CD G CD CD
O CD 0 CD CD CD 0 CDCD CO C:) CD CD CD S) CD CDO G CD G G CD CD CD
41 I (;
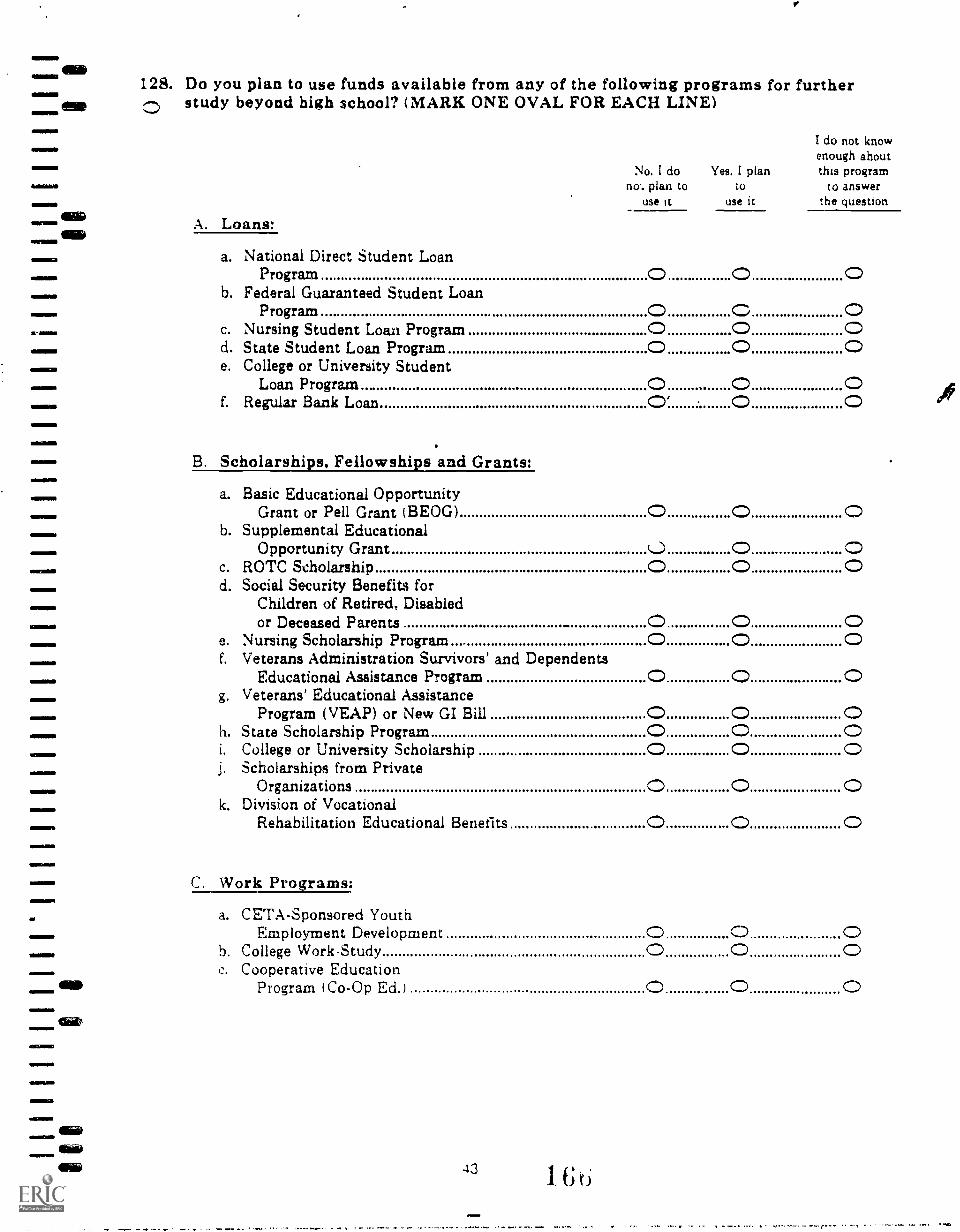
011111111.11111
MINIM
M111ft
41111M1
=dna
C. Work Programs:
128. Do you plan to use funds available from any of the following programs for furtherO study beyond high school? (MARK ONE OVAL FOR EACH LINE)
I do not knowenough about
No I do Yes. I plan this programno-. plan to to to answer
use it use it the question
A. Loans:
a. National Direct Student LoanProgram
b. Federal Guaranteed Student LoanProgram
c. Nursing Student Loan Programd. State Student Loan Programe. College or University Student
Loan Programf. Regular Bank Loan 0' 0
B. Scholarshi s, Fellowshi s and Grants:
a. Basic Educational OpportunityGrant or Pell Grant (BEOG)
b. Supplemental EducationalOpportunity Grant v O 0
c. ROTC Scholarshipd. Social Security Benefits for
Children of Retired, Disabledor Deceased Parents
e. Nursing Scholarship Programf. Veterans Administration Survivors' and Dependents
Educational Assistance Programg. Veterans' Educational Assistance
Program (VEAP) or New GI Billh. State Scholarship Programi. College or University Scholarshipj. Scholarships from Private
Organizations 0 O 0k. Division of Vocational
Rehabilitation Educational Benefits O 0
a. CETA-Sponsored YouthEmployment Development
b. College Work-Studyc. Cooperative Education
Program (Co-Op Ed.)
43 1.6o

a
die
a
NORC.504345
1982ID a:
1
INFORMATION FOR FUTURE FOLLOW-UP
PRINT name, address, and the telephone number where you can most usually be reached during the coming year.
YOUR NAME.
ADDRESS:
TELEPHONE
AREA CODE NUMBER
CITY: STATE. COUNTY: ZIP
PRINT the name, address, and telephone number of your parents.
PARE,,NT'S NAME.
ADDRESS.
TELEPHONE
AREA CODE NUMBER
CITY. STATE. ZIP
PRINT the names and addresses of two ether people who will know where to get in touch with you during the coming year.I List no more than one person who now lives with you.)
NAME.
ADDRESS.
CITY:
TELEPHONE
AREA CODE NUMBER
STATE. ZIP
NAME:_
ADDRESS.
TELEPHONE
AREA CODE NUMBER
CITY: STATE: ZIP
FRINT spouse's full name (if you are married).
SPOUSE'S FULL NAME.
Please give the following information about yourself.
la) Date of birth (month) (day) tyear)bi Sex: Mark one)
MaleFemale 0
ci Driver's License No. State.d When did you complete this questionnaire? 'month) 'day' year,
THANK YOU FOR YOUR COOPERATION
THIS INFORMATION WILL BE KEPT IN STRICT CONFIDENCE AND WILL BE USED ONLYFOR FUTURE FOLLOWCPS IN THE HIGH SCHOOL AND BEYOND STUDY.
45
16/

DO/Q1982 FU1
Form ApprovedO.M.B. No. 1850-0088App. Exp.: 9/30/82
Aletosvock
Clot41000
4404,0
1980 SOPHOMOfiE COHORT(Not Currently in High School)
FIRST FOLLOW-UP QUESTIONNAIRE
Dear Participant:
Thank you for accepting our invitation to continue your participation in High School and Beyond.Through completion of this questionnaire, valuable information obtained from young peoplethemselves can be used by policymakers to improve the education system for future students. Theirgoal is to prepare students for productive and meaningful roles in an increasingly complex andchanging society.
ID [ I
NAME:
First
Last
PrepareaTHE NATIONAL CENTER FOR EDI:CA PION iTATISTICS)vrHE NA-I TONAL OPINION RESEARCH 4: ENTER
i.:DN('ES] F)rm No 2. 309 :QC
\SO

GENERAL INSTRUCTIONS
PLEASE READ EACH QUESTION CAREFULLY.
It is important that you follow the directions for responding to ,each'kind of question. These are:
(MARK ONE)
What is the color of your eyes? (MARK ONE)
BrownBlueGreenAnother color
cc
o
If the color of your eyes is green. youwould mark the oval to the right of"Green."
as4MS
MS111111MI
MID(MARK ALL THAT APPLY)
Last week, did you do any of the following? (MARK ALL THAT APPLY)
a. See a play If you went to a movie and attendedb. Go to a movie a sporting event last week. you wouldc. Attend a sporting event mark the two ovals as shown.
(MARK ONE OVAL FOR EACH LINE)
Do you plan to do any of the following next week? (MARK ONE OVAL FOR EACH LINE)Yes Not sure No If you plan to study at a friend's house.
a. Visit a relative C C do not plan to visit a relative, and are noth. Go to a museum sure about going to a museum next week,
c. Study at a friend's house c you would mark one oval on each line asshown.
(WRITE IN)
What is your favorite sport? (MARK ONE)
Football c If your favorite sport is ice hockey,Basketball -, you would mark the oval to the rightBaseball of "Other" and write "Ice Hockey"
on the line as shown.Other 'WRITE IN) 4.- leskit
This questionnaire is not a test. We hope you will answer every question. but you may skip anyquestion you do not wish to answer.
THANK YOU FOR YOUR COOPERATION
OJ

4. Which of the following best describes the place where you lived in the first week ofr11111111111
MID February 1982? (MARK ONE)
WINMIGIN
IN)1111111
WILMER*
IIIIDIn a rural or farming community oIn a small city or town of fewer than 50.000 pe9ple that is not a suburb of a
larger place 0Iii a medium-sized city (50,000-100,000 people) cIn a suburb pf a medium-sized city c
IND In a large city (100,000. 500,000 people) cMD In a suburb of a large city _
In a very large city (over 500,000 people)In a suburh,of a very large cityA military base or station c
5. How far is this from the city or Community where you lived as a sophomore in highschool? (MARK ONE)
Same place I lived in when I was a sophomore in high schoolLess than 50 miles .1
50 to 99 miles100 to 199 miles200 to 499 miles --500 miles or more
6. When did you leave the last high school that you attended?(MARK OVALS FOR MONTH AND YEAR)
Month Year
January s July ' ,---....., 1979February c August 0March o September c 1981 0April 0 October 0 1982 sMay 0 November 0June 0 December 0
7. What grade were you in then? (MARK ONE)
In tenth gradeAfter completing tenth grade (did not start eleventh grade)In eleventh gradeAfter completing eleventh grade (did not start twelfth grade)In twelfth grade
8. Is the last school you attended, the same school you were attending as a sophomore?(MARK ONE)
c Yesc No (Answer A)
A. What are the name and address of the' last school you attended? (WRITE IN
Name of S.'hool
Street Address
City Sr State3
1 7 o

13. Did any of your brothers or sisters leave school before they finished?(MARK ONE)
Yes ..-
NoDon't have any brothers or sisters
14. Before you started high school were you ever asked to repeat a grade, or held backa term in school? (MARK ONE)
YesNo
15. When you left school did you have a definite job lined up? (MARK ONE)
Yes c (ANSWER A)No c (GO TO Q. 16)
IF YES:A. Was this a job you were already working on before you left school?
(MARK ONE)
YesNo Ptfl
16. Do you plan to go back to school eventual.; to get a diploma or to take a high schoolequivalency test or GED? (MARK ONE)
Yes, plan to go back to schoolYes, plan to take high school equivalency testNoNo, already have GED or equivalent.
Other (WRITE IN)
,
17. On the whole, do you feel that leaving school was a good decision for you?(MARK ONE)
YesNoDon't know
c (ANSWER A)C (ANSWER A)c (GO TO Q. 18)
IF YES OR NO:A, Why do you say that? (PLEASE DESCRIBE IN SPACE PROVIDED)
5
17.1

23. Whether or not you already have a job, were you looking for a job last week?(MARK ONE)
smo
0111111111117
8,111111111111IM
Yes o ... (ANSWER A)No 0 (GO TO Q. 24)
A. What have you been doing in the last week to find a job?(MARK ALL THAT APPLY)
a. Nothing
b. Checked with:1, State employment agency2. Private employment agency3. Military recruiter4. Employer directly5. Friends or relatives o
c. Placed or answered adsd. Looked in the newspapere. School employment service
f. Other (WRITE IN) z
24. When was the most recent time you. worked for pay, not counting work around thehouse? (MARK ONE)
Never worked for pay c (SKIP TO Q. 36)Last weekWithin the past month, but not last weekWithin the past 3 monthsSince school started last fallLast summerBefore last summer
25. Whin did you start your present or most recent job?(MARK OVALS FOR MONTH AND YEAR)
Month Year
January o May = September 197G or before..... 7- 1980...cFebruary c June October 0 1977 ----0 1981...0March July November 1978 .----% 1982...0April August December 0 1979
26. What kind of work do or did you do for pay on your current or most recent job?(PLEASE DESCRIBE IN SPACE PROVIDED)

11111711=1111
IIIIII1111
31. How many hours do or did you work a week on your current or most recent job?(MARK ONE)
NO
11111116
1111121111
32.
1-4 hours per week5-14 hours per week15-21 hours per week22-29 hours per week o30-34 hours per week35-40 hours per week41 hours or more per week
How much do or did you earn per hour on that job (your current or most recent job)?(MARK ONE)
Less than $2.00 per hour$2.00 to $2.49 o$2.50 to $2.89$2.90 to $3.34$3.35 to $3.89$3.90 to $4.49£4.50 to $4.9935.00 to $5.49$5.50 to $5.99$6.00 to $6.49$6.50 to $6.99$7.00 to $7.49$7.5,1 or more
33. How do you usually spend the money that you earn?(MARK ONE OVAL FOR EACH LINE)
AboutA
How much do you usually . .. None little half Most
a. use for living expenses? (--, C c cb. use to buy or do tlitngs. to go out on
dates, buy clothes, etc.? cc. use for car expenses, car loans,
to buy gasoline?d. save to use for school or vocational _
training?e. save for another purpose?
(WHAT IS THAT?WRITE IN. ) . c C
f. give to your family to help supportC
_the household? --- .-'
9'73

This Page is Intentionally Blank

COLUMN C COLUMN D COLUMN E3RD JOB AFTER HIGH SCHOOL 4TH JOB AFTER HIGH SCHOOL 5TH JOB AFTER HIGH SCHOOL
I Office Use Only Office Use Only Office Use Only
it.D0WWW()ti)0(.1.)4) aD ciDaD OLD c0 .1/4MCZZZZ1/4Cj.--E, E
IMO OD (ZS (31) cE) o ci5t9 (ID Cu co cucr) '0 CD ® (ID Ce 1/4."'D
LLCCDCDCOIDIVCD(ED CD0(11)(14CiDaDCD(DCDCD 00 CD CD TAD !Es .0 .1;
tL Office Use Only Office Use Only Office Use Only
;CDC.' (i)a) (VCD cD (DI 1) pc.--.cpcpapcpcouDx1Di L pia,oci)coopx(vcDaxv IcDOQ?mOmmmmml ..DC,ZCDSZCCZkLZic-:)...axmoDcrpmcva:Kvi c ma) cocp (Do ar.) cD! LIC(DCDZOctir-LLZ
An employee of a PRIVATECOMPANY
A GOVERNMENT employeefederal, state, local)
Self-employed in your OWNbusiness
Working WITHOUT PAY infamily business or farm
An employee of a PRIVATECOMPANY 4,
A GOVERNMENT employee(federal, state, local)
Self-employed in your OWNbusiness
Working WITHOUT PAY infamily business or farm
An employee of a PRIVATECOMPANY
A GOVERNMENT employee(federal, state, local) --
Self-employed in your OWNbusiness
Working WITHOUT PAY in, family business or farm
Month
2.Jan.Feb.March
2 AprilMayJune
2July
c Aug.c Sept.c Oct.
Nov.c Dec.
Year
0 1980c 198101982
Month
o Jan.o Feb.c Marcho April
Mayc Junec July
c Aug.c Sept.0 Oct.c Nov.c Dec.
Year
01980o 1981o 1982
Month
o Jan.c Feb.o Marcho Aprilc Mayc Junec July
(Aug.(Sept.c Oct.c Nov.
Dec.
Year
C1980c 1981c 1982
Month Year Month Year
Jan. c May c Sept. 01980' 0 Jan. 0 May c Sept. c 1980Feb. c June c Oct. c 1981 c Feb. C June C Oct. 01981March c July c Nov. c 1982 c March C July C Nov. C 1982April c Aug. c Dec. o April 0 Aug. C Dec.
Still have this job Still have this job
Month
c Jan. 0 Mayc.s., Feb. cJunec March ki:.:.Julyc April c Aug.
Year
o Sept. C198.0 Oct. 7;198c Nov. 0 198c Dec.
Still have this job
OfficeUM/
Only
(MARK ONE)0 hourly
weekly
rzcaxpsapcccvaDoplcromcDcDoccopmcpi(..no CD T1 (DID cr (.1)
(DC IxD (-0 (1),E)
$
OfficeUse
Only
(MARK ONE)c hourly
weekly
CM 0 Cl/CD cD GEKI)
CD c1D CD CEKID (ID CD
CD CD CID cD (1) CD CD (I) C)
(11)0cDcDCO (iD (1)
(0 TO COLUMN C, PAGE 15.
(NIARK ONE)o hourly
weekly
;CDCCDCDOIDCC,ID(DIOffice !mc-_,, cv (oz., ciprD
UseOnly ccroDoccokrapeciCDCCD.1)(DCZIDCEI
GO TO COLUMN D, PAGE 15. GO TO COLUMN E, PAGE 15.
13
.1.7a
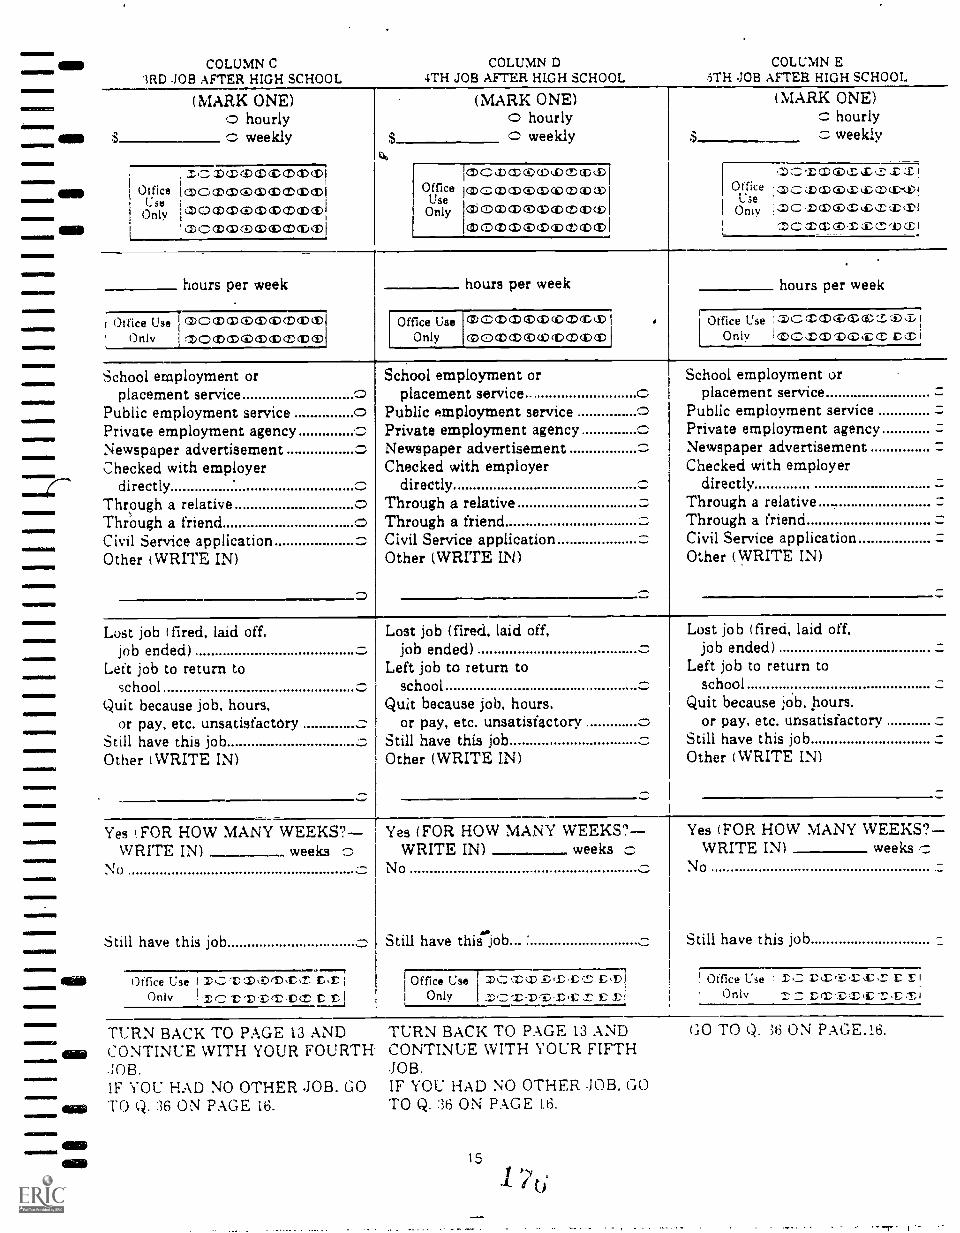
dimemein
6.mm.
111111111
OMNIMMI
INNEN/INS
1111121
COLUMN CRD JOB AFTER HIGH SCHOOL
COLUMN4TH JOB AFTER HIGH SCHOOL
(MARK ONE)o hourlyo weekly
cp CD CD a) ID (DI
Ott I c1
i
e Imc,mmomaDmmmle o co do o p p o!(4i, a
cp c.D axiDCD
S
(MARK ONE)o hourlyC weekly
ICIDC1X20,3),D(ULDOffice ICOCCDCDOCDODZKOW
UseOnly CD 0 GD CD 0 CD CO CD (1)(1)
C C1D Ci) (1)CD (2) (ID (I)
COLUMN E5TH JOB AFTER HIGH SCHOOL
(MARK ONE)C hourlyc weekly
OfficeUse
Oniv
(Dc'rapczcza-.)c az)
:DC XCLCD-ZI:C_^,'Dc.E1
hours per week
Office Use I CDC(DXGDCED(D.WIDOnly 1 TOMCD0cDiDcD(0.1D
hours per week
Office UseOnly
CD0CDCD(DCD(OGDS(.1)
cOCCDMCD(D(DCDCDCD
hours per week
Office Use :C,17)CcLCDZZ:1,Z,:iiiOniv I (Dcz(r)soz.
School employment orplacement service
Public employment service 0Private employment agencyNewspaper advertisementChecked with employer
directlyThrough a relativeThrough a friendCivil Service applicationOther (WRITE IN)
School employment orplacement service
Public employment servicePrivate employment agencyNewspaper advertisementChecked with employer
directlyThrough a relativeThrough a friendCivil Service applicationOther (WRITE IN)
Lost job (fired, laid off,job ended)
Left job to return toschool
Quit because job, hours,or pay. etc. unsatisfactory
Still have this jobOther (WRITE IN)
Lost job (fired, laid off,job ended)
Left job to return toschool
Quit because job, hours.or pay, etc. unsatisfactory
Still have this jobOther (WRITE IN)
School employment orplacement service
Public employment servicePrivate employment agencyNewspaper advertisementChecked with employer
directlyThrough a relativeThrough a friendCivil Service applicationOther (WRITE IN)
Lost job (fired, laid off,job ended)
Left job to return toschool
Quit because job. hours.or pay, etc. unsatisfactory
Still have this jobOther (WRITE IN)
Yes (FOR HOW MANY WEEKS?WRITE IN) weeks o
No
Still have this job
Office Use I TC---C1),ID(DX,E r-r IOnly !,L,,-r-r..r,,r.iper c c
Yes (FOR HOW MANY WEEKS?WRITE IN) weeks c
No
Still have this job...
Office UseL Only
Zi.17.X(D-.17:(DC,21,` J>D!
_DC "E.D.1-./..E 1-;
Yes (FOR HOW MANY WEEKS?WRITE IN) weeks c
No
Still have this job
! Office Use E F. I
Only VcDSZZ-2.7..rti
TURN BACK TO PAGE 13 ANDCONTINUE WITH YOUR FOURTH.JOB.IF YOU HAD NO OTHER JOB. GOTO Q. :36 ON PAGE 16.
TURN BACK TO PAGE 13 ANDCONTINUE WITH YOUR FIFTH.JOB.IF YOU HAD NO OTHER .10B. GOTO Q.:36 ON PAGE 16.
15
1 t;
GO TO Q. 36 ON PAGE.16.
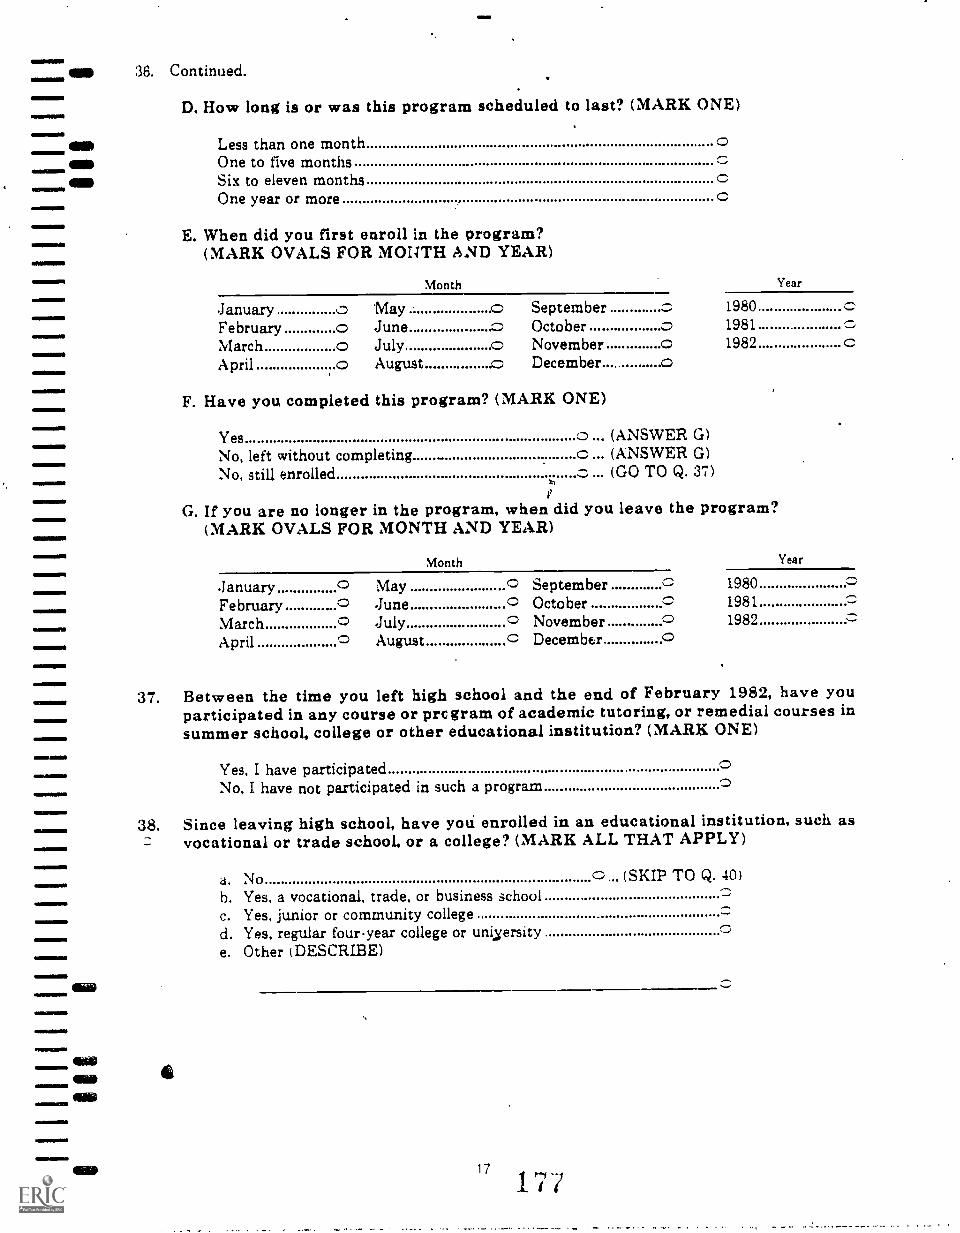
36. Continued.
D. How long is or was this program scheduled to last? (MARK ONE)11111111
Less than one monthOne to five monthsSix to eleven monthsOne year or more
41=1111111411
MINIIIII11111111
111111111
11111111
.INANNINIO
Imws101110
Oil
E. When did you first enroll in the program?(MARK OVALS FOR MONTH AND YEAR)
Month Year
January 0 May c September c 1980
February c June .c October c 1981 ...,
March c July o November c 1982 cApril c August .c December..... o
F. Have you completed this program? (MARK ONE)
Yes 0 (ANSWER G)No, left without completing c (ANSWER G)No, still enrolled (GO TO Q. 37)
G. If you are no longer in the program, when did you leave the program?(MARK OVALS FOR MONTH AND YEAR
Month Year
January 0 May 0 September c 1980 cFebruary ,,.., June 0 October ,- 1981
--March c July 0 November 0 1982 cApril c August C December 0
37. Between the time you left high school and the end of February 1982, have youparticipated in any course or prc gram of academic tutoring, or remedial courses insummer school, college or other educational institution? (MARK ONE)
Yes, I have participatedNo, I have not participated in such a program
38. Since leaving high school, have yoti enrolled in an educational institution, such asvocational or trade school, or a college? (MARK ALL THAT APPLY)
6
a. No 0 (SKIP TO Q. 40)b. Yes, a vocational, trade, or business schoolc. Yes, junior or community colleged. Yes, regular four year college or universitye. Other (DESCRIBE)
7
1 7 '?
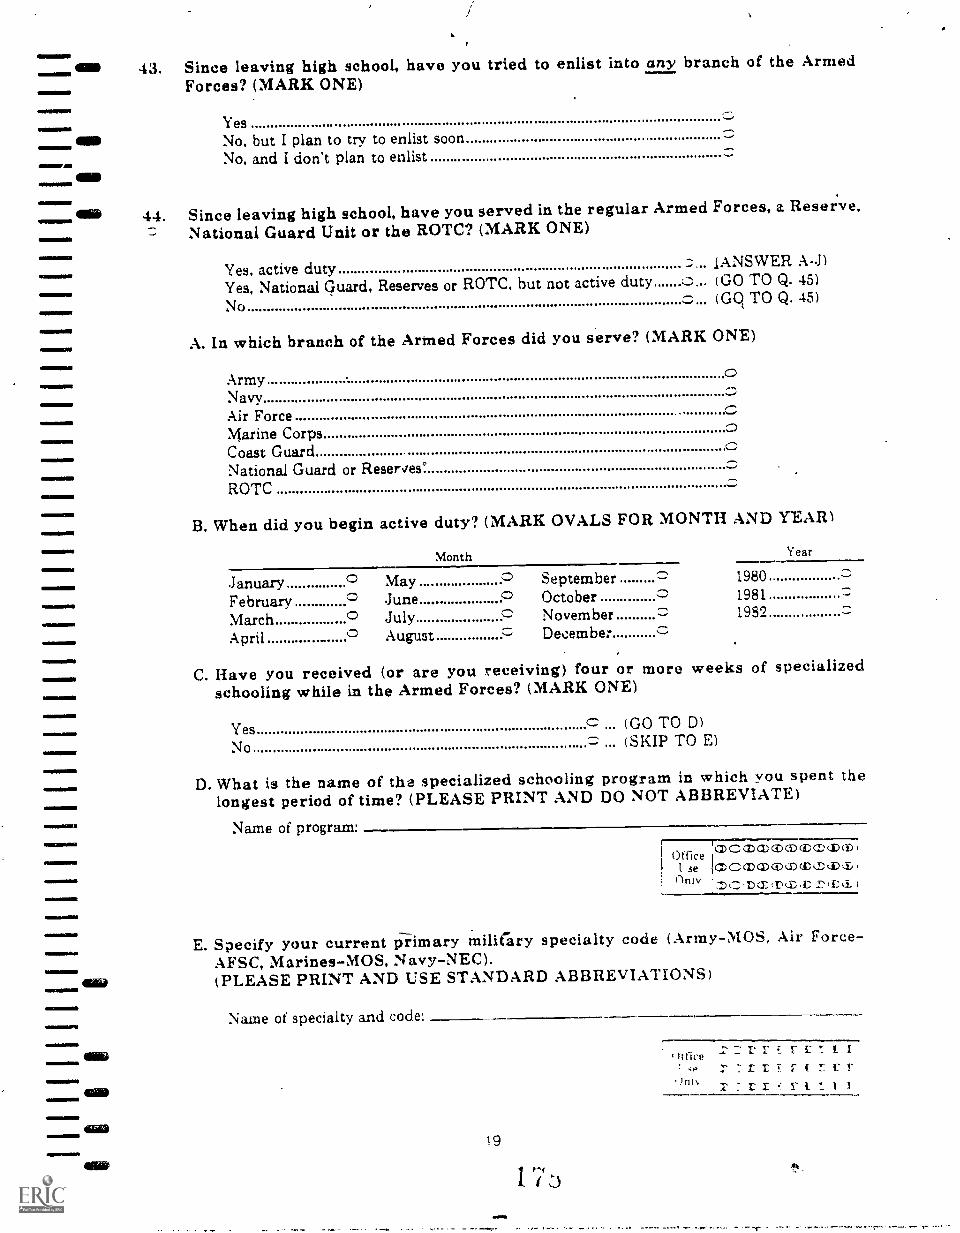
MID
GIB
MEP
43. Since leaving high school, have you tried to enlist into any branch of the ArmedForces? (MARK ONE)
YesNo, but I plan to try to enlist soonNo, and I don't plan to enlist
44. Since leaving high school, have you served in the regular Armed Forces, a Reserve,National Guard Unit or the ROTC? (MARK ONE)
Yes. active duty IANSWER A-)Yes, National Guard, Reserves or ROTC, but not active duty c (GO TO Q. 45)
No C... (Go, TO Q. 45)
A. In which branch of the Armed Forces did you serve? (MARK ONE)
ArmyNavyAir ForceMarine CorpsCoast GuardNational Guard or Reserves°ROTC
B. When did you begin active duty? (MARK OVALS FOR MONTH AND YEAR)
Month Year
January c May c SeptemberFebruary. o June c OctoberMarch o July C November --
April ° August c December
198019811980
C. Have you received (or are you receiving) four or more weeks of specializedschooling while in the Armed Forces? (MARK ONE)
Yes c (GO TO D)
No (SKIP TO E)
D. What is the name of the specialized schooling program in which you spent thelongest period of time? (PLEASE PRINT AND DO NOT ABBREVIATE)
Name of program.ta)C.: .1)(1)Z ci)(t cr (1)
t se laccpapci),D(D,D,D,D,f)niv :Dr'DC)::,P(ZC 4;3. i
E. Specify your current primary military specialty code (Army-NIOS, Air Force-AFSC, Marines-MOS, Navy-NEC).(PLEASE PRINT AND USE STANDARD ABBREVIATIONS)
Name of specialty and code:
19
3
r7Ur
1
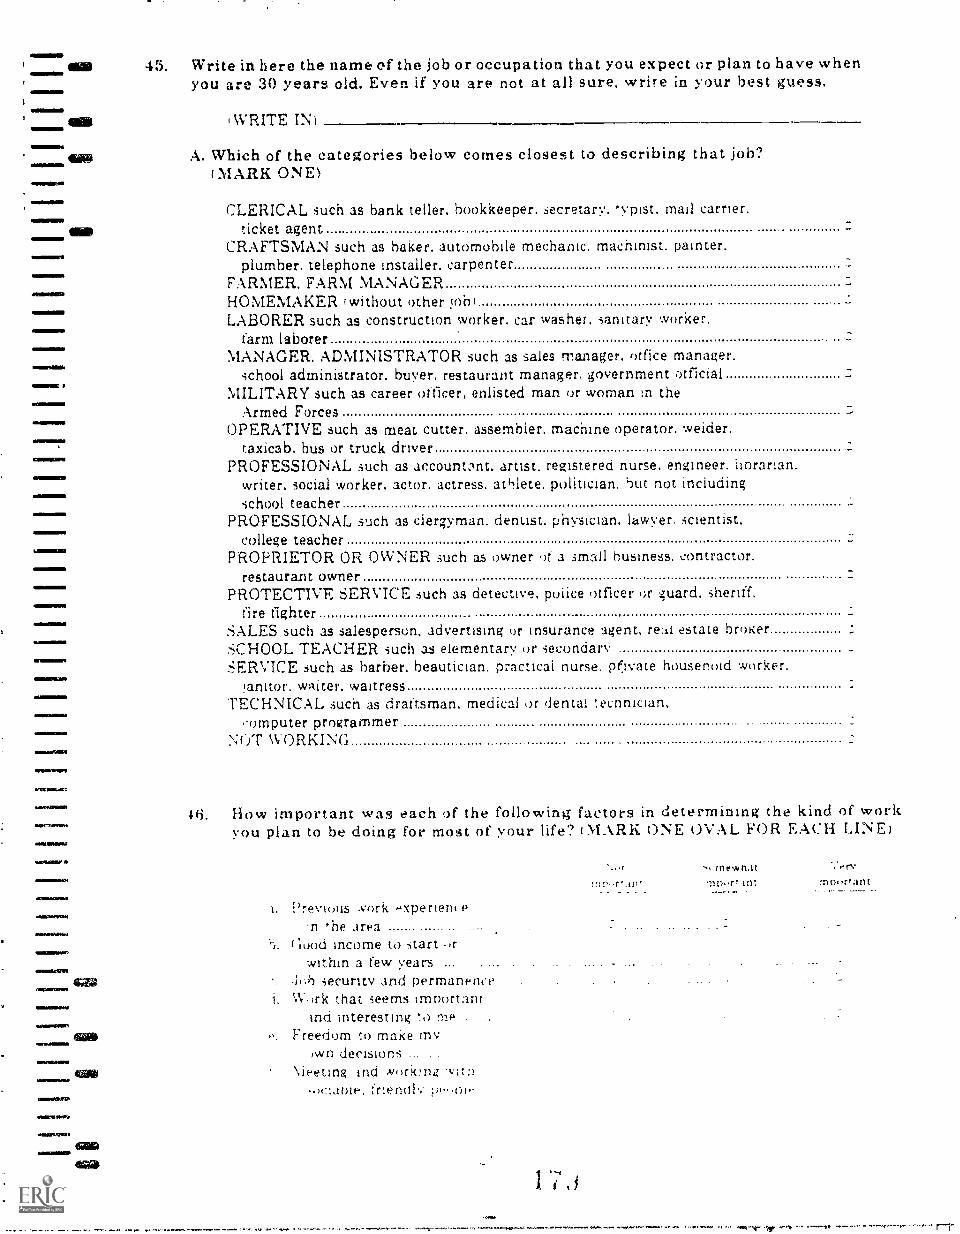
45. Write in here the name of the job or occupation that you expect or plan to have whenyou are 30 years old. Even if you are not at all sure. wriTe in your best guess,
'WRITE IN
A. Which of the categories below comes closest to describing that job?(MARK OYES
CLERICAL such as hank teller, bookkeeper. secretary. 'ypist. mail carrier.ticket agent..
CRAFTSMAN such as baker, automobile mechanic. machinist. painter.plumber. telephone installer, carpenter
FARMER. FARM MANAGERHOMEMAKER (without other oh)LABORER such as construction worker, car washer, sanitary worker.
farm laborerMANAGER, ADMINISTRATOR such as sales manager. office manager.
school administrator. buyer, restaurant manager, government officialMILITARY such as career officer, enlisted man or woman in the
Armed ForcesOPERATIVE such as meat cutter, assembler, machine operator. welder,
taxicab, bus or truck driverPROFESSIONAL such as accountont, artist. registered nurse, engineer. ilorarian.
writer, social worker. actor, actress. atIllete, politician, but not includingschool teacher
PROFESSIONAL such as clergyman. dentist, physician. lawyer. scientist.college teacher
PROPRIETOR OR OWNER such as owner of a small business, contractor.restaurant owner
PROTECTIVE SERVICE such as detective, police officer or guard. sheriff,fire fighter
SALES such as salesperson, advertising or insurance agent, reli estate brokerSCHOOL TEACHER such as elementary or secondarySERVICE such as barber. beautician. practical nurse. pf.iyate household worker.
!armor, waiter, waitressTECHNICAL such as draftsman. medical or dental :eennician.
,omputer programmerNOT WORKING
How important was each of the following factors in determining the kind of workyou plan to be doing for most of your life? (MARK ONE OVAL FOR EACH LINE)
1. Previous .cork .xpertent-n 'he area
flood income to start 4-within a few years
1,n security and permanencei. Wirk that seems important
Ind interesting !,)Freedom '.() make my
iwn decisionsNieeting ind work!ni: -vita
frlenol lie-oie
1 7 1
!!!-` -r..til'- -
rriewh,ltmos -r! ill :no..r *7llt

SIMMONS
49. Please describe below the job most recently held by your motner (stepmother orfemale guardian), even if she is not working at present.
=IMMO
( WRITE IN)
A. Which of the categories below comes closest to describing that job?nem* MI.
(MARK ONE)
MID CLERICAL such as bank teller, bookkeeper. secretary, typist, mail carrier,ticket agent
CRAFTSMAN such as baker. automobile mechanic. machinist. painter.plumber, telephone installer. carpenter
FARMER, FARM MANAGERHOMEMAKER (without other job;LABORER such as construction worker, car washer. sanitary worker.
farm laborerNIANAGER, ADMINISTRATOR such as sales manager. office manager.
school administrator. buyer, restaurant manager, government officialMILITARY such as career officer, enlisted woman in the Armed ForcesOPERATIVE such as meat cutter, assembler. machine operator, welder.
taxicab, bus or truck driverPROFESSIONAL such as accountant, artist, registered nurse, engineer, librarian,
writer, social worker, actress, athlete. politician, but not includingschool teacher
PROFESSIONAL such as clergyman. dentist. physician, lawyer. scientist,college teacher
PROPRIETOR OR OWNER such as owner of a small business, contractor.restaurant owner
PROTECTIVE SERVICE such as detective, police officer or guard. sheriff,tire righter
SALES such as salesperson. advertising or insurance agent, real estate brokerSCHOOL TEACHER such as elementary or secondarySERVICE such as barber. beautician. practical nurse, private household worker.
janitor, waiterTECHNICAL such as draftsman, medical or dental technician.
computer programmerNever workedDon't know
30. What was the highest level of education your father (stepfather or male guardian)completed? (MARK ONE)
Less than high school graduationHigh school graduation only
v:y..at)onal. trade, or businessschool after high school
Less than two years1 Two years or more
Less than two years of.collegaTwo or more years of college
(including two-year degree),liege program Finished college )four or :ive-...ear degree)
Master's degree or equivalentNI.D.. or other advanced
professional .i.egree

4111"IMMO'
11111=1111111
Cie
56. How many of your brothers and sisters will be in college next fall? (Please includestepbrothers and stepsisters if they live in your parents' home.) (MARK ONE)
I don't have any brothers or sistersNoneOneTwo or more
57. How many of your brothers and sisters will be in high school next fall? (Pleaseinclude stepbrothers and stepsisters if they live in your parents' home.)(MARK ONE)
I don't have any brothers or sisters .0NoneOneTwo or more.
38. What was your marital status the first week of February 1982? (MARK ONE)
Never married c... (SKIP TO Q. 63)Divorced ..° (SKIP TO Q. 62)Widowed (SKIP TO Q. 62)Separated (SKIP TO Q. 62)Married.. (GO TO Q. 39)
59. What was your husband or wife doing the first week of February 1982?(MARK ALL THAT APPLY)
He/she was work for pay at a full-time or part-time jobFnrolled in gray/bate or professional schoolTaking academic courses at a two- or four-year collegeTaking vocational or technical courses at any kind of school or college
for example, vocational, trade, business, or other career training school)On active duty in the Armed Forces (or service academy)Homemaker (without ()the!. job)Temporary layoff from work, looking for work, or waiting to report to work
Other (DESCRIBE)

60. Continued.
B. How many hours did he or she usually work at this job in an average week?(WRITE IN)
Hours per weekOfficeLie
Only
C (L CD .1", .E. CT; .SC CC (1) DI
C. In an average week, approximately how much did he or she earn at this job?(Report his or her gross earnings before deductions. If not paid by the week,please estimate.) (WRITE IN)
per week(Earnings before deductions)
Office 'Zic.-,a;crcpcpxcaps.)se
OnlyiDCE'
61. As of the first week of February 1982, what was the highest level of education thatyour husband or wife had attained? (MARK ONE)
Less than high school graduationHigh school graduation only
Vocational, trade. or businessschool after high school
j Less than two years1Two years or more
Less than two years of collegeTwo or more years of college
(including two-year degree)College program Finished college ( four- or five-year degree)
Master's degree or equivalentPh.D., M.D., or other advanced
professional degreeDon't know.

62. 'ontinued. (1)Current or
moat recentmarriage
(2)
Previousmarriage
(3)
Previousmarriage
C. How did this Separationmarriage end? Divorce or Divorce or Divorce or(MARK ONE OVAL) annulment c annulment annulment --
Death .. Death ::- Death
IF SEPARATED, ANSWER D:Month Year
D. When did you January May September C 1979 or before....0stop living together February - June c October . 1979with your spouse? March .:---' July ---; November C 1980(MARK OVALS April August December .----,1981 --FOR MONTHAND YEAR)
63. How many children, altogether, do you eventually expect to have? (MARK ONE)
NoneOneTwoThreeFourFiveSix or more
64. Did you have any children (including adopted, foster-care, and stepchildren) as ofthe first week of February 1982? (MARK ONE)
Yes ;.-.; (ANSWER A)No (SKIP TO Q. 67)
A. How many children (including adopted, foster-care. and stepchildren) did youhave as of the first week of February 1982? (MARK ONE)
OneTwo.ThreeFourFive:ix. or more

66. How many of your children (including adopted, step or foster-care children) lived inyour household as of the first week of February 1982? (MARK ONE)
NoneOneTwoThreeFourFiveSix or more
1
67. Not including yourself, how many persons were dependent upon you for more thanone-half of their financial support in the first week of February 1982?(MARK ONE)
Nrsne COne CTwo ,., 4 . -,
Three .,:f cI
Four 4r-̂,
Five .Six or more
68. In the first week of February 1982, were you dependent upon others such as yourparents, spouse, or any other relatives or friends for more than one-half of yourfinancial support? (MARK ONE)
Yes, primarily upon my parentsYes, primarily upon my spouseYes, primarily upon other relatives or triendSNo
69. As of the first week of February 1982, did you own a house, apartment, co-op,condominium or mobile home? (MARK ONE)
YesNo
31

71. At what age do you expect to ... (MARK ONE OVAL FOR EACH LINE)
Don't Haveexpect alreadyto do done Underthis this 18 18 19
a. Get married'b. Have your first
child?c. Start your first
regular I notsummer) job?
d. Live in yourown home orapartment? -
e. Finish your full-time education?
Age in years:
30 or20 21 22 23 24 25 26 28 29 more
s.r
1 - /1 -1
E.1. 0 0 0 0 C
72. This year how often have you done the following things either in or out of school?(MARK ONE OVAL FOR EACH LINE) A few
Never Once times Often
a. Spoken before an audience of 50 or more - - -z,- -- - ,-b. Helped plan for a large social event - - -
c. Explained or defended a position on anissue of some importance before a group - -
d. Worked with a group on a r -ejectwith little adult supervision _... ..-. (..-,
e. Headed group problem-solving discussions , - - -_ _
f. Chaired a meeting h... - __ _
73. Are the following statements about yourself true or false?(MARK ONE OVAL FOR EACH LINE)
True False
a. I have been in serious trouble with the lawh. I am overweight
Others think of me as physically unattractived. I like to work hard in schoole. I enjoy working for pay1. I will be disappointed if I don't graduate from college
74. How often do you spend time on the following activities?MARK ONE OVAL FOR EACH LINE)
Rarely Less than Once or Every day...
or Once ci twice 3 ,fl. ,uraostnever week week every day
--or-i. .33ending time talking with friendsh. Feeding for Leasurec. Going out on datesd. Just driving or riding around
!alone or with friends)Thinking or daydreaming aloneTalking witn your mother or
fatherReading the front page of
the newspaper
333 I)
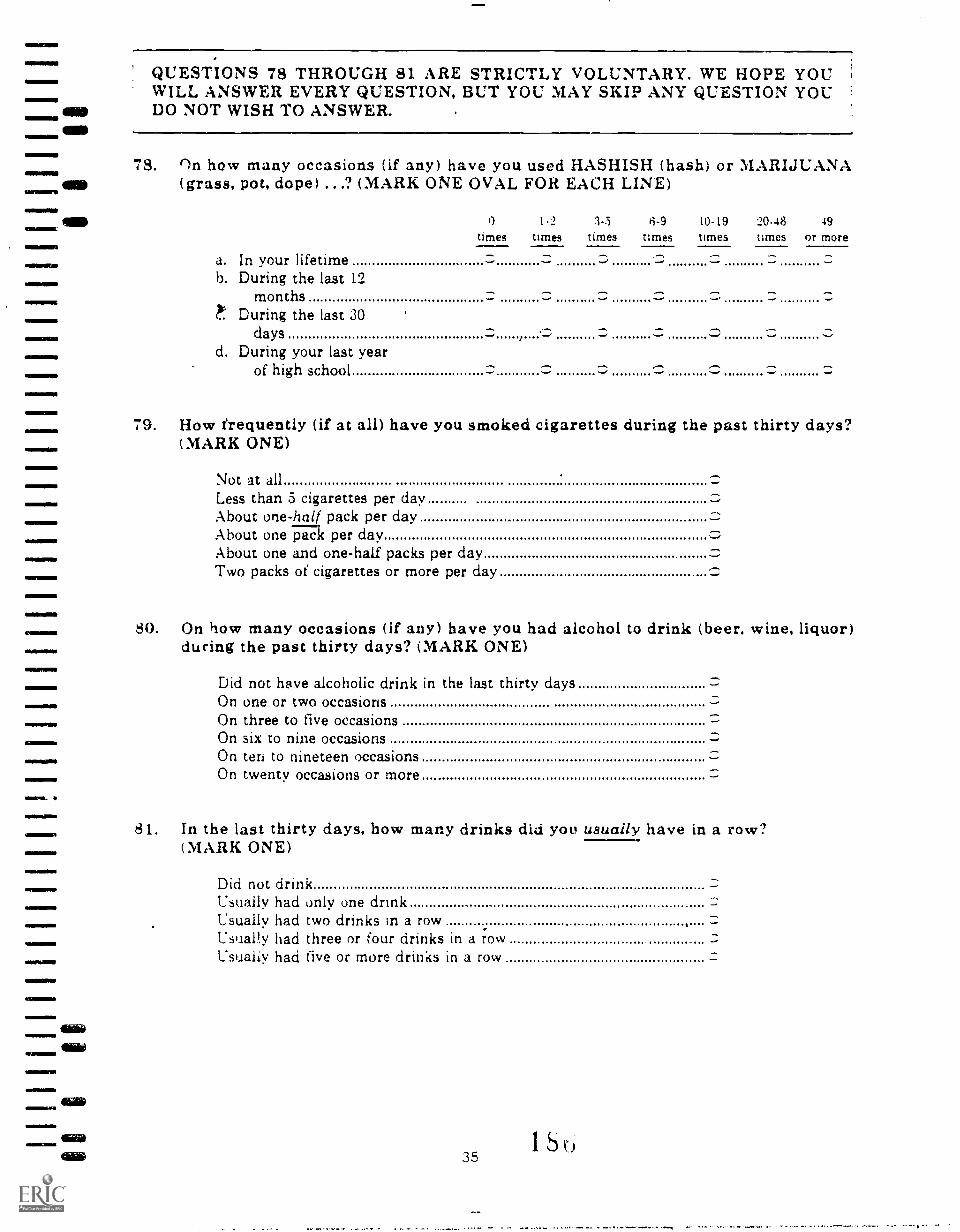
QUESTIONS 78 THROUGH 81 ARE STRICTLY VOLUNTARY. WE HOPE YOUWILL ANSWER EVERY QUESTION, BUT YOU MAY SKIP ANY QUESTION YOU
MID DO NOT WISH TO ANSWER.
MID
MMUM1111111
78. ')n how many occasions (if any) have you used HASHISH (hash) or MARIJUANA(grass, pot, dope) ...? (MARK ONE OVAL FOR EACH LINE)
a.b. During the last 12
monthsDuring the last 30
daysd. During your last year
of high school
0 1.2 1 -5 8-9 10-19 20.48 49
times times times times times times or more
In your lifetime
0.1 '79. How frequently (if at all) have you smoked cigarettes during the past thirty days?
(MARK ONE)
Not at allLess than 3 cigarettes per dayAbout one-half pack per dayAbout one pack per dayAbout one and one-half packs per dayTwo packs of cigarettes or more per day
80. On how many occasions (if any) have you had alcohol to drink (beer, wine, liquor)ducing the past thirty days? (MARK ONE)
Did not have alcoholic drink in the last thirty daysOn one or two occasionsOn three to five occasionsOn six to nine occasionsOn ten to nineteen occasionsOn twenty occasions or more
81. In the last thirty days, how many drinks did you usually have in a row?(MARK ONE)
Did not drinkUsually had only one drinkUsually had two drinks m a rowUsually had three or four drinks in a rowUsually had five or more drinks in a row
351S

MINNIMINO
ONNEWNWO
=NMI=
M11111113
IIIMMIPENOIJOMMIIM
1/Me
UNIMENNill
111101111
M
=.111
MIMIMMO
ONNINININIO
4110
MMINWNNI
lial
!MEM
ANIMON
IMINOW"
111MagiMUNI!MIR
86. What is your birthdate? (WRITE IN) i
MONTH I DAY ; YEAR
OfficeUseOnly
(DC cid
CDC (C (E. (0 GL' (ID CD 0 CD
(CCCtDCCCCC(CCDCDCXZ,E,CD<CMcID(D
Q)CM 4) CD
CDC st 1) LC CV CE
PLEASE FL OUT THE TWO FORMS ON THE PAGE WHICHFOLLOWS. THESE FORMS ARE:
Information for Future Follow-lip: We will be contacting you from timeto time to send newsletters and to talk to you again about two years from now.Please fill out the information form so that we will be able to reach you.
Permission Form: In order to complete our information about students. weneed to obtain additional data from schools. The Permission Form will allowyour school to give us the data.
We appreciate the time and effort you have given to completing thisquestionnaire and want to thank you very much for your help.
3'lOj

NORCDO;45
198'2
ID :
INFORMATION FOR FUTURE FOLLOW-UP
PRINT name, address. and the telephone number where you can most usually be reached during the coming year.
YOUR NAME.
ADDRESS.
. -
TELEPHONE
AREA CODE NUMBER
CITY: STATE: COUNTY. ZIP
PRINT the name, address, and telephone number of your parents.
PARENT'S NAME.
ADDRESS.
TELEPHONE
AREA CODE NUMBER
CITY: STATE: ZIP
PRINT the names and addresses of two other people who will know where to get in touch with you during the coming yea'List no more than one person who now lives with you.)
NAME.
ADDRESS.
CITY.
TELEPHONE
AREA CODE NUMBER
STATE. ZIP
NAME. TELEPHONE
ADDRESS. AREA CODE NUMBER
(l'ITY STATE: ZIP
PRINT spouse's full name (if you are married).
SPOUSE'S FULL NAME.
P!ease give the following intormation about yourself.
Date of birth month) .day)hr Sex: iMark one)
MaieFemale
Drier'i License Nod Whe,1 raid you complete this questionnaire? month)
MONO
ailnIMETHANK Y01: FOR YOUR cn()PERATIONa
THIS INFORMATTON WILL BE KEPT IN STRI('T CONFIDENCE AND WILL iE ONLYFOR FUTURE FOLLOW.LPS IN FUE HIGH Sr 1-100L AND BEYnYD
MUD 39
yea
TR/Q1.00 Fr 1
Form ApprovedO.M.B. No. 1850.0088App. Exp.: 9/30/8:2
TRANSFER STUDENT SUPPLEMENTTO
FIRST FOLLOW-UP QUESTIONNAIRE
Dear Participant:
Thank you for accepting our invitation to continue your oartic:pation :n High School and Beyond.Through completion of this questionnaire. valuable information obtained from young peoplethemselves can be used by policymakers to improve the education system for future students. Theirgoal is to prepare students for productive and meaningful roles in an increasingly complex and,'hanging society.
NAME\
First
Last_
r
a f3 1- .

GENERAL INSTRUCTIONS
PLEASE READ EACH QUESTION CAREFULLY.
It is important that you follow the directions for responding to each kind of question. These are:
OM (MARK ONE)GIP
.1111111
What is the color of your eyes? (MARK ONE)
BrownBlueGreenAnother color
OM (MARK ALL THAT APPLY)
If the color of your eyes is green. youwould mark .the oval to the right of"Green."
Last week, did you do any of the following? (MARK ALL THAT APPLY)
a. See a playb. Go to a moviec. Attend a sporting event
(MARK ONE OVAL FOR EACH LINE)
If you went to a movie and attendeda sporting event last week, you wouldmark the two ovals as shown.
Do you plan to do any of the following next week? (MARK ONE OVAL FOR EACH LINE)Yes Not sure No If you plan to study at a friend's house.CD 0 do not plan to visit a relative. and are notC 0 sure about going to a museum next week,
0 0 you would mark one oval on each line asshown.
a. Visit a relativeb. Go to a museumc. Study at a friend's house
(WRITE IN)
What is your favorite sport? (MARK ONE)
FootballBasketballBaseballOther i WRITE IN).
.0
O If your favorite sport is ice hockey.0 you would mark the oval to the rightO of "Other" and write "Ice Hockey"
on the line as shown.
This questionnaire is not a test. We hope you will answer every question, but you may skip anyquestion you do not wish to answer.
THANK YOU FOR YOUR COOPERATION
38363-001

T3. What is the name of the school you are now enrolled in? (WRITE IN)
NAME.
T4. What is the address of the school? (WRITE IN)
STREET ADDRESS.
CITY. STATE.
T5. When did you begin going to this school? (MARK ONE)
During 10th gradeBeginning or during 11th gradeBeginning or during 12th grade
ZIP.
T6. Did you have to take an entrance exam or meet any special academic requirementsto be able to attend your present school? (MARK ONE)
Yes CD (ANSWER A)NO 0 (GO TO Q. T7)
A. IF YES: Please describe the entrance requirements.(WRITE IN)
T7. Is your high *school a public school or private school? (MARK ONE)0
Public schoolPrivate school: religious
WHICH RELIGION ? -- WRITE IN)Private school: other
191
Office UseOnly

T12.A. What is the lowest grade included at your school? (MARK ONE)
1111i O Pre-KindergartenK
0 1O .)
0 30 40 5
0 78
0 90 100 110 12
B. What is the highest grade (or year) at your school? (MARK ONE)AMOMMOMMII
0 100 110 12
T13. As far as you know, which of these facilities are available at your school?(MARK ALL THAT APPLY)
Indoor lounge for studentsCareer information centerOccupational training centerMedia production facilitiesRemedial reading and/or
remedial mathematics laboratorySubject area resources centerts'
other than central libraryDepartmental officesTeaching resources center for
teachers' useChild care or nursery school facilityStudent cafeteria
Yes No Don t know
IIIMPOMMEIM
IMM=M=11
000 .000000O.
0000000000
00C.-..,......,
C..--,0C,1/4-...-
Cf.---,
MAMIE!
MAMMON
MM11111111111111
o.
111/111MM
NOW, PLEASE GO ON TO THE FIRST FOLLOW-UP QUESTIONNAIRE.
AP
1 'A

EG/Q19'3'2 FU -1
4f-
AP/0N 11111115116h._
.
ggetto.404,0
Form ApprovedO.M.B. No. 1850-0088App. Exp.: 9/30/82
EARLY (RADUATE SUPPLEMENTTO
FIRST FOLLOW-UP QUESTIONNAIRE
Dear Participant:
Thank you for accepting our invitation to continue yo,-r participation in High School and Beyond.completion of this questionnaire, valuable information obtained from 'young people
themselves can be used by polit.Tma.kers to improve the education system for future students. TheirI
'
f,oal is to prepare students for productive and meaningful roles in an increasingly cordplex and'Ianging society.
Le'
ID
NAME:
Last__
Prepareci forTHE NATIONAL ...ENTER FOR EDI:CITION ST.AT'STICS
THE `:.1. ":T.ONAL ()Pr.\ ION RESEARCH CENTER
ED(NCL. '::. 2 W9-10B Pin II
1

0
MINIMS
ale
M11101110111
=11.1111
411110UNI
GENERAL INSTRUCTIONS
PLEASE READ EACH QUESTION *CAREFULLY.
4 -
It is iipportAnt that you follow the directions for respondinieto each kind of question..These are:
Me (MARK ONE)
What is the color of your eyes? (MARK ONE)
Nib Brown If the color of your eyes is green. you-BlueSIM , .... would mark the oval to the right ofGreen ' "Green."Another color 4 ..N
=01111
CIO
(MARK ALL THAT APPLY)
Last week, did you do any of the following?.(MARK ALLTHAT APPLY)
a. See a play If you went to a movie and attendedb. -Go to a movie a sporting event last week, you would
c. Attend"a sporting event . mark the two ovals aS shown.
MARK ONE OVAL FOR EACH LINE)
Do you plan to do any of the following next week? (MARK ONE OVAL FOR EACH LINE)Yes Not sure :%10 If you plan to study at a friend's house.
a. Visit a relativa. %
do not plati to visit a relative, and are not
b. Go to a museum . sure about going to a museum next week,
c. Study at a friend's house . .....you would mark one oval on each line asshown.
4
(WRITE IN)
What is your favorite sport? (MARK ONE)
FootballBasketballBaseball
Other (WRITE IN) .3.00-1-- Age-lay
I
If your favorite sport is ice hockey,you would mark the oval to the ,rightof "Other" and write "Ice Hockey"on the line as shown.
This questionnaire is not a test. We hope you will answer every question, but you may skip any. question you do not wish to answer.
I
THANK YOU FOR YOUR COOPERATION
1.941

INI11.711=11
111.0
4S
.111111
Gl. When did you graduate from high school? (MARK ONE)
1101111111
IIIMIIMINIIII
fINONOINID
IMMNRINO
=MI
.==11110
.1111111J1111111
MAIN1111111
1.1111111111
111
OM
1980 1981 1982
o June c January o July c Januaryo July C February b August c Februaryo August ..i '0 March c Septembero September 0 April c October
October c May c Novemberc November 0 .June c Decemberc December
G2. Why did you decide to graduate early-lild you have some specific plans?c (PLEASE DESCRIBE IN SPACE PROMED)
11)0CDCDCOCCCCDCIDC1)
MCCDC0(11)(5)(1)CDCIfda)
Office UseOnly
(19CCDWW(3)(DC617IDCIDOIIDIDCD(DID I.
e
G3. When did you decide that you wanted to finish high school early? (MARK ONE)
9th vide or before o10th grade11th grade12th grade
G4. Who helped you make the decision to graduate early? (MARK ALL THAT APPLY)
a. Counselorb. Teacher(') cc. Parentsd. Other relotive. Someone else
(WRITE IN)f. No one helped me make the decision' ,
19d

I
Ii1=11'
LL.VORIT
G8. Between the time you left high school and the end of February 1982, have you helda full-time or part-time job of any kind? (MARK ONE)
ti
YesNo EASE GO TO Q. G11)
G9. Please mark an oval for each month during Which you worked (full- or part-time orwere in the military) since yoleft high school.
f.
11111111
1.980
0 June0 July0 August
Septeinber0 October0 November0 December
1.981
C Januaryo February0 Marcho Aprilo May0 June
o Julyo August0 Septembero .Octobero Novembero December
o . anuaryo Febniary
G10. Next we would like information about all of the jobs you have hid since you left highschool. We would also like to know about any periods of time'you were looking forwork between jobs, that you held.
Please startwith the first job you held after high school, even if it started whileyou were still in 'school. Answer questions 1 through 12 for that job in ColumnA. (pages 4 and 6). Then go on to the next.job you held and answer the questionsabout that job in Column B, and so on.
If you HAD!NO JOB after high school, go to Q. G11 on page 9.
BE SURE TO INCLUDE YOUR CURRENT JOB.
If you have been in MILITARY service, please consider that as one job.
If 7ou had MORE THAN ONE JOB Ar'A TIME, please put them in separatecolumns.
If you have had TOO MANY JOBS TO FIT, please make sure to put yourcurrent or most recent job in Cohan= E even if that means leaving out somejobs.
\_1If you WOULD LIKE HELP WITH THESE QUESTIONS, please call uscollect at area 312, 75T-1486.
What is today's date? (MARK OVALS FOR MONTH AND DAY)
Month
FebruaryMarchAprilMayJune.
-3-
Dav 4
1 thru 7 ., 1
8 thru 1415 thr)u 21 --.
" thhi 31
196
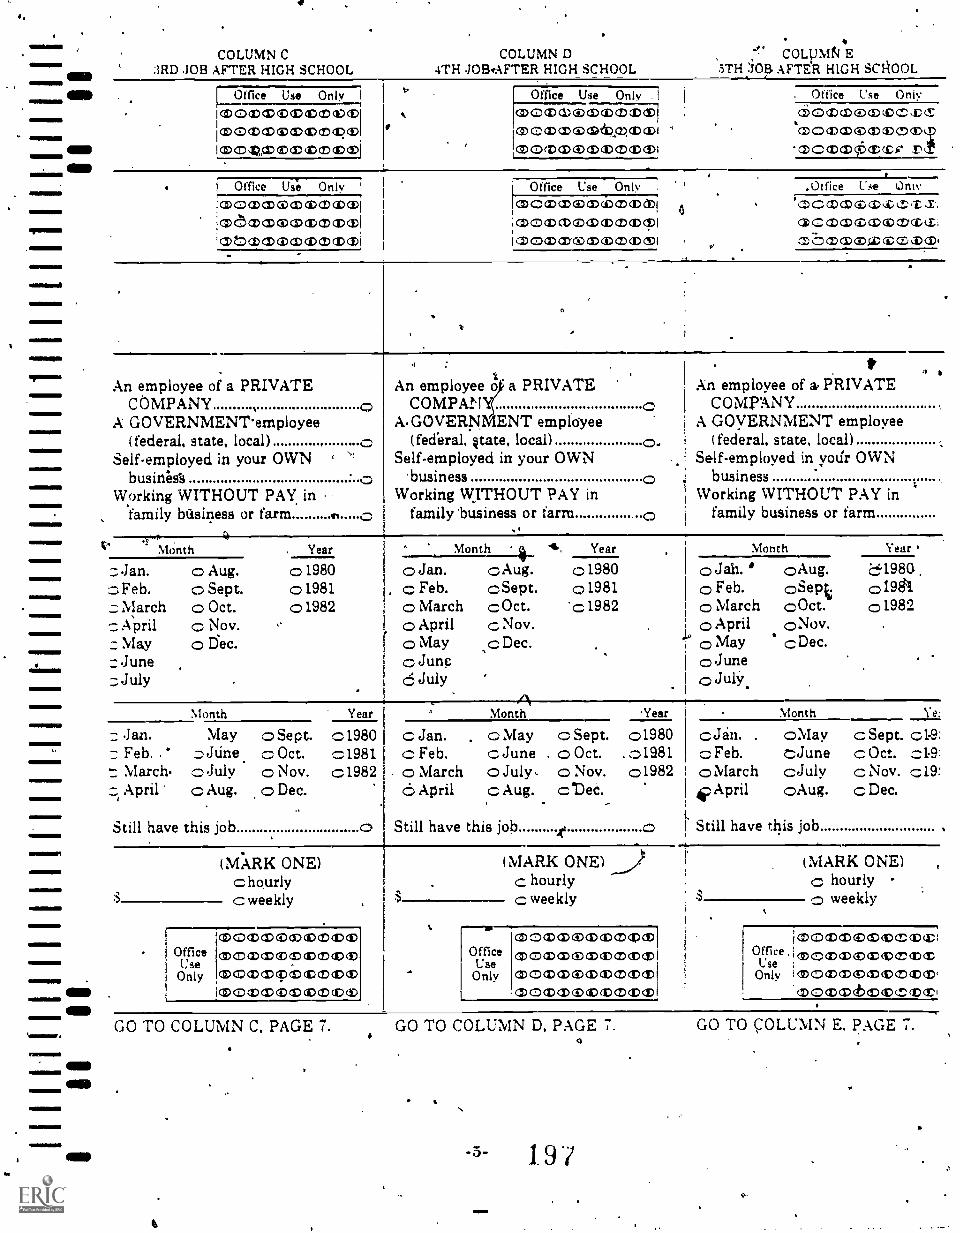
1111111141110
MIINNMI1
COLUMN C3RD JOB AFTER HIGH SCHOOL
Office Use Only
I CID 0 CD CD OD CID 1:D ID (DI
ICIDOCDCIDCIIDCD<DaDcD(Di
I CD CD 4;?,(3)11)(D Xi CC) CDj
COLUMN D4TH OBAFTER HIGH SCHOOL
COLVM1k1 E5TH 3013 AFTER HIGH SCI. OOL
Office Use Only
aDococuciDa.)commeolaDococoodatikalamDIap ci)(3)a-.)cpcb (Don'
. Office Use Only
iziocDopecr.)(oc,vo.-.cpcpcpcDocozocoLp
Tccocz)c6(vccis r1
Office Use Only !
ic:DOCDCDOCDcD(7)(Dcp
46CDCDOc9CDCIOXICDI
'cpbcncr.mcDcvoaxvi
Office Use Only
laDocpcocoaxbapop!cl) 0 CD CD 0 (I) CD CD CD qr.) I
I GDOCDCDCOcticiliMDCDCD1
a
.0tfice Use Oniv
acopoDscoocrkccti(.1.-ccocvs.a)Tzzen.
An employee of a PRIVATECOMPANY
A GOVERNMENTemployee(federal, state, local)
Self-employed in your OWNbusiness
Working WITHOUT PAY infamily business or farm
Month
Feb.MarchAprilMayJune
:July
o Aug.o Sept.o Oct.o Nov.
Dec.o
Year
019800198101982
An employee a PRIVATEo COMPANY'
A. GOVERNMENT employee(federal, &tate, local)
Self-employed in your OWNbusiness
Working WITHOUT PAY infamily' business or farm
C
tAn employee of &PRIVATE
COMPANYA GOVERNMENT employee
(federal, state, local)Self-employed in votir OWN
businessWorking WITHOUT PAY in
family business or farm
111
c Jan., c Feb.
o MarchApril
c Mayc.-, Junp
July
Month_4_cAug.cSept.cOct.
c c Nov.,cDec.
Year
0198001981c 1982
Month
o Jah. °Aug.o Feb. oSepo March cOct.0 April 0Nov.
cDec.Mayo June0 July.
Year
d.'1984,019th01982
Jan.7 Feb.
MarchApril
111111111
Month
May c Sept.Jtine c Oct.
c July 0 Nov.c Aug. o Dec.
Year
01980c1981c 1982
Month 'Year
c Jan.c Feb.c) Marchc*:) April
o May c Sept.June . o Oct.
cp July , o Nov.c Aug. c 'Dec.
Still have this job o Still have this job
(MARK ONE)c hourlyc weekly
CIDOCDCDOCiDcDtDcl>1)
Office ClDommcocncotipcomUse
Only CDOCIIDOCID ID(Dc1)1)
CID CD <ID (ID (ilD cD tD
01980 cJan. .
. c1981 c Feb.01982 cMarch
GApril
Month
oMayJune
cJuly°Aug.
Ye:
cSept. 01-9:c Oct.c Nov. c19:c Dec.
0 I Still have this job
(MARK ONE)c hourlyc weekly
OfficeUse
Only
cmccoaxpoommapcolmccocpcoxicommoDI®0 Ci) cD CD ID CID
mccocoocipmcDaDaDI
(MARK ONE)c hourlyc weekly3
imocpcomcnivaDT:Office. latpiDX(IIDODOcri:M
UseOnly !aDOCIIDOcIDIDIZIDCD'
a) 0 CD CD (1)(10
GO TO COLUMN C, PAGE 7. GO TO COLUMN D, PAGE 7.clt
GO TO COLUMN E. PAGE 7.

1111111111
ammo= N._
11111111
M111111111111,
COLUMN CiftD JOB AFTER HIGH,SCHOOL
COLUMN D4TH JOB AFTER HIGH SCHOOL
COLUMN E5TH JOB AFTER HIGH SCHOOL
(MARK ONE)c hourly
weekly
ci)CcID20CDZCV,ID,r1Office i2omcDc)(1)4)2tr2
Use .OODC.Z)CAN:C4.1only®o (3)con) :ice fi
(MARK ONE)c hourly
weekly
C (D(1.,4),,vciD(ELD.Office rzca)apoixozcz.(1)1-.
UseOnly aDCCID2IKIDZIZID(1)
,MCMZOCD(DODC117)
(MARK ONE)hourl*
z weekly
Office'UseOnly
Is .1-2 sU _E
((DC: r-opi[7.;(...z,LT I
hours per week
Office UseOnly
20XCDOCD22,V(2TOCOODOIJ(CcrIDS
hours per week
Office UseOnly CDC.1)(DOZZ:DeD
hours per week
Office (jagOnly CDC C tI
School employment or it,
placement servicePublic employment servicePriyate employment agencyNewspaper advertisementChecked with employer
directlyThrough a relativeThrough a friendCivil Service applicationOther (WRITE IN)
School employment orplacement service
Public employment servicePrivate employment agency I(Newspaper advertisementChecked with employer
directlyTihrougth a relativeThrough a friendCivil Service applicationOther,,(5111TE IN),.
ISchool employment or
placement servicePublic employment servicePrivate employment agencyNewspaper advertisementChecked with employer
directlyThrough a relativeThrough a friendCivil Service applicationOther ,(WRITE IN)
Lost job (fired, laid off,job ended)
Left job to return toschool
Quit because jdb, hours,or pay, ea. unsatisfactory
Still have this' jobOther (WRITE IN)
4
Lost job (fired, laid off,job ended)
Left job to return toschool
Quit because job, hours,A or pay etc. unsatisfactoryStill havia this job.Other (WRITE IN)
Lost job (fired, laid off,job ended)
Left job to return toschool
Quit because job, hours,or payetc. unsatisfactory
Still have this job. Other (WRITE IN)
Yes FOR HOW MANY.WEEKS?WRITE IN) weeks
No
Still have this jOb
Office UseOnly
.CDC"Cratt,OCerttC ID L.D C. £
Yes (FOR HOW MANY WEEKS?- -WRITE IN) weeks
No
Still have thislob
Office UseOnly
TC22.,.za-7Ar
Sr,
Yes (FOR HOW MANY WEEKS?WRITE IN) veeks
No
Still have this job
Office UseOnly
TURN BACK TO PAGE 5 ANDCONTINUE WITH YOUR FOURTHJOB.
OW IF YOU HAD NO OTHERJOB. GOTO:Q. Gil ON PAGE 9.
TURN BACK TO PAGE 5 ANDCONTINUE WITH YOUR FIFTHJOB.IF YOU HAD .NO OTHERJOB.G0TO Q. Gil ON PAGE 9.
196
GO TO Q. Gil ON PAGE 9.

=44111=11
111111111=011
emeThwee
1111111411=1
411111111=1
1111011111111
11
SCHOOL
G11. Betwee.n the time you left high.school anfl the end of February 1982; have youenrolled in or .did you take classes at any school Such ag college or university,graduate or professional. school, service academy or school. business school. trade*school, technical institute, vocational school, community, college, and so forth? (Donot include Armed Forces training programs.)(MARK ONE)
o Yes (GO TO Q. G12)
No (SKIP TO BOX ON PAGE 14)
G12. Please mark an oval fer each month during which Tou were enrolled in or tookclasses in any school between the time you left high school and the end of February1982.
1980 1981 ) 1982
o June c January C July c,.."' Januaryo July . c February C August :2, Februaryo August s March c September0. September C April 0 Octobero October c May c Novembero November c June C Decemberc December
z
.14
G13. Negt we would like information about all of the schools you have gone to since youleft high school.'Please start with the first school you went to after high scpool.Answer questions A-K for that school in. the first column (pages 10 and 12), thenanswer questions AK for the second school in the next column and so ton.
If you' attended NO SCHOOLIS.afte'r high school. go to box on page 14.
(BE SURE'TO INCLUDE TOUR CU$RENT SC,HOOL.)
If you attended two schools at the same time. please put them in separate columns.
BE GIN ON NEXT PAGE.
t.04
4
9 N.-9- ,19

IMPk.
' COLUMN 3.1RD SCHOOL AFTER HIGH SCHOOL
School name:Addreas.C i ty:
State:4111111111M,
OISINININ
.11111111
1111111111
epoopc,DcocDvx,c,r(Doc') ;DIDZZL-t-D'iCDC ctZli) CD 11; :_f;
CDC.',GDITCM:X:CTI:KD
c cp`ci) cc co or.)
COLUMN 44TH SCHOOL AFTER HIGH SCHOOL
School name.Address.City:State.
OfficeUse
P"Y
Cs
COLUMN 55TH SCHOOL AFTER HIGH SCHOOL
School name:Address.
,City:State:
Vocational, trade, business, or'othei career.training school
unior or community college(2-4ear) .
College or university4 years or more)
Other (DESCRIBE)
Vocational, trade, business, orother career tiainingsahool
Junior or community college(2-year) -
College or university(4 years or more)
Oth9ir (DESCRIBE)
0
O
OfficeUse
Only
ZZ ,L.C.1.7 ZtI9
:7 Lc z D El
Vockional, trade, business, orother career training school
Junior or community college(2-year)
College or university(4 years or more)
Other (DESCRIBE)
Month
an.' c May= Feb. `.-;;June= March cJuly
April c Aug.
Year
c 1980c1981c1982
Sept.c Oct.cNov.cDec.
Am still attending this school.have NOT left
Left in:Month
011171
an. c May :=Sept.z Feb. cJune c Oct.= March c July =Nov.
April cAug. c Dec.
Year
=1980c 1981
41111M.M011
c 1982MMIIMMIN.
MISIMMM
c Jan.=Feb.z.; Marchc April
Month
May =Sept..June c Oct.
c July Nov.,Nug. ,
Year
=1980,c 1981z:1982
'Month
cJan. # =aycFeb. z--June
March c JulyApril: c,Aug.
I.--Xearts
z..198041941
1982;
c Sept.0q.Nov.Dec.
Am still'attending this school,have NOT left
Left in:Month
=Jan. z Mayc Feb. z: Junec March c. July
April Aug.
ti
Year
c 1980=1981c1982
=Sept.7.; Oct.c Nov.
Dec. .
Am still attending this school..hai'le NOT left
Left in:Month
cJan.Fe b.
c 'March=April
May=June=July
Aug.
Year
=198019811982
= SeptOct.
.= Nov.z. Dec.
b
YesNoDon't .know
YesNoDon't know
Yes6No
Don't knowO
Go TO COLUMN :3, PAGE 13. GO TO COLUMN 4. PAGE 13. GO TO COLUMN 5. PAGE 13.

. , 1
.I........---
,.-- q
..----*--NM lb COLUMN 3 ,---- COLUMN 4
:3RD SCHOOL AFTER HIGH.SCIO0I,. 4TH SCHOOL AFTER HIGH SCHOOL. __----
week per week -
111111111111111
41111
ea;-::, all,
1.10111MINI
111111MIL.
1111111101M
4111=111111
ins
1111MIIIMON
-
Per
Office Use taDOCDCD0c2D4DX(Dx1Only (no(vcDcvaDav6oct)
rOffice Use
d;;;) CID C.0 4:).9 <ID ci)
Ci) 0 CD CV 0 CD CD c2) () CD
COLUMN 55TH SCHOOL AFTER HIGH SCHOOL
per week ,
Office UseOnly
cI) G DtDtD4:ci..CV C (I) (1) '.G c:: C £
Public ,
PrivateDon't know
to Privateo Don't know
PublicPrivate.Don't know
Freshman.. -.Sophomore.
Junior ..cSpecial StudentOther (DESCRIBE)r
The school doesn't
Freshman . oSophomoreJunior..Special StudentOther (DESCRIBE)
'De school, doesn'tclassify students o classify students
41
(Name of specific .
field or area)
ffice UseOnly
CD (DX Ci) (i) CD (D CD
(1D (DID cD CO (11) OD ID ID .
FreshmanSophomoreJuniorSpecial StudentOther (DESCRIBE)
The school doesn'to classify students
(Name of specificfield or area)
Office UseOnly
k1;1010(DGD CD cDCDcDCE)
CDCCID (DOM (13,CD(DCE)
6a
ri Name of specificfield or area)
Office UseOnly
COQ Cr CD OD SD OC
C tID 0 (ID CC 'JD I)
A vocational program(does not leada Bachelor'sdegree) 0
An, academic program .(typically leads to a-
. 4- or 5-year Bachelor'sdegree) o
A,vocational program(does not lead toa Bachelor'sdegree)
An academic progrim(typically leads to a4- or 5-ear Bachelor'sdegree)
A vocational program(does not lead toa Bachelor'sdegree)
academic program(typically leads to a4- or 5-year Bachelor'sdegree)
Yes, but I litter returnedto this school,
Yes, but I plan to returnsometime in the future c
Yes, and I don't planto return
No
r-
4 ,,
TURN BACK TO PAGE 11 ANDCONTINUE WITH YOURFOURTH SCHOOL.IF YOU ATTENDED NOOTHER SCHOOLS GO TOBOX ON PAGE 14.
IMO
SID
Yes, but I later returnedto this school
Yes, but I plan to returnsometime in the tuture
?es, and I don't plan .
to returnNo
TURN.BACK TO PAGE 11 ANDCONTINUE WITH YQURFIFTH SCHOOL.IF YOU ATTENDED NOOTHER SCHOOLS. GO TOBOX( ON PAGE 14.
-13-
Yes. but I later returnedto this school
Yes, but I plan to returnsometime in the future
Yes. and I don't planto return
NoI
GO TO BOX ON PAGE 14.a

SQ
1982 FU-1
Pill11411%0".*eif
'it Al 0It%ito
IN-SCHOOL SURVEY OF THE SOPHOMORE COHORT OF 1980
Part II. School Questionnaire'
1
Attach Label Here
1 1-1-1-1 1 1 1 1-1 1
State District Sample School C.D.
,Form ApprovedOMB # 18V-0088App. Exp.: 9/30/82,,
aBEGIN DK '1
8.11 information which would permit identification of the individual
school will be held in strict confidence, will be used only by pers9ns
engaged in ands for the purposes of this survey, and will not be disclosed
or released to others for any purposes except as required by law.
4
Name of R4spondent:
Title:
Data filled out:
Prepared for
THE NATIONAL CENTER FOR EDUCATION STATISTICSby
THE NATIONAL OPINION RESEARCH CENTER
.1ED (:ICES) FORM No. 2409-3CA ?,iiaT II
2
of -1 ±/
a

-1As of October 1, 1981 (or the nearest date for whicn data.are available),what was the total membership in grade 12 is your high school?
t.
2. To the best of your knowledge, about what percentage of the entire 1980-1981 graduating class is now enrolled in a regular twoyear or fouryearcollege?
z
3. To the' best of your knowledge, about what 'percentage of the 1980-1981graduating class went on to postsecondary education or training of somekind OTHER THAN A JUNIOR COLLEGE OR FOURYEAR COLLEGE (for example,beauty school, vocationaltechnical school, air business ,school)? Do notinclude military service.
4. To the best of your knowledge, about what percentage of the 1980-1981'graduating class went into military service? (IF NONE, WRITE "0")
OFFICE ,
USE ONLY
jECK 1
13-17/ ,
4
fi?
18-2d/
24-26/
5. Approximately what percentage of the class of 1982 graduated early (orleft early with a diploma or equivalent)? (IF NONE, WRITE "0")
6. Please estimLte the approximate. percentage of students in the class of1982 and in the -lass of 1983 who entered the 10th grade tylt have since'dropped out. Do not include students who transfer to another scnool.
Class of 1982:
Class of 1983:
203
ti
27-29/
30-32/
33-35/

-2-/
/ .
Does your school Use homogenedus grouping (according to ability orachievement) for 12th grade students in English classes? (CIRCLE ONO
Yes (ANSWER A) 1
No . (GO TO Q. 8) 2f
A, IF YES: How many levels of homogeneous grouping does your school usefor 12th grade students in English classes?
levels
8. About what percentage of the students who enter your school would you sayneed remedial or basic skills instruction in reading, English, or math?
% in reading
% in English
% in math
Are seniors. required to pass a minimum competency (proficiency) test inorder to receive a high school diploma? (CIRCLE ONE)
Yes-
No
1
2
10. In what grades is a minimum competently or proficiency test given to allstudents? (CIRCLE AS MANY NUMBERS AS APPLY)
School does not have such a test
Grade 9
Grade 10
Grade 11
Grade 12
Given in different gradesfor different students
1
3
4
t11. Does the school have a specific re medial program for students who fail
the test? (CIRCLE ONE)
School.does not have such a test 6
',,Yes, specific remedial programs., ..
No, no such _program Is 2
12. In what year was this test first required in this school?
Year: 19 Et I
School does not have such a test 90
Test not required 91
O
204
OFFICEUSE ONLY
DECK.1
36/
37-38/
-.39-41/
42-44/
45-47/
49/ .
50/
51/
52/
53/
34/
55/
56-57/

6
13. A. Please indicate whether or not your school currently .Offert each 'ofthe following to students. (CIRCLE ONE NUMBER ON'EACH LINE)
OfferedNot
.offered
a. Credit by contract .1 1 2
b. Travel for credit . 3 4
c. Off-campus work experience oroccupational training for credit 1. 2
d. College Board Advanced Placement Gourses 3 4
e. Student exchange program 1 2
f. Alternative school program 3 4
g. Special program for pregnantgirls or mothers 1 2
h. Continuation school 3 . 4
i. Program for the gifted or talented 1 2
j. Bilingual program'.... 3 4
k. College-level courses givenat your school 1 2
1. College courses on a college oruniversity campus 3 4
m. Credit by examination 1 2
n. Early graduation 3 4
o. Early exit via examination (fordiploma or equivalent) 2
-p. Remedial basic skills instruction 4,, 3 4
q. Computer literacy courses or programs - 1 e g.,... 2,,,-i-,
-....v.,. ..z.,.
r. Instruccional television program 3 4
B. For each grade listed below, please indicate which of the followingsubjects are offered by your high school. (CIRCLE AS MANY NUMBERS ASAPPLY)
10thGrade
11th
Grade12thGrade
Notofferedin Grades
10-12
English taught.as a second language(either in English or instudents' mother tongue) 1 2 3 4
Students' mother tongue taughtas a first language (otherthan English) 1 2 3 4
vz.
Courses for language minoritystudents in their group'sculture or history 1 2 3 4
OFFICEUSE ONLY
DECK 1
58/
59/
80/
61/
62/
63/
64/
65/
66/
67/
68/
69/
70/
71/.
72/
73/
74/
75/
BEGINDECK 2
13-16/
17-20/
21-24/

,
14. For the time periodof 12th grade studentscommunity service,not physically present
January through March, 1982, about whgt percentagewill be engaged in programs (work experience,
college courses, or other courses) such that theyat your school full time?
.
are
OFFICE-USE ONLY
O
DECK 2
25-27/
28/
Percent of 12th grade students:
15. 'Are some students in your school served by an area vocational schoolwhere they may take vocational courses?
YesNo
1
2
16. Does your school have a work-study program?
Yes (ANSWER A-C) 1 29/
No (GO TO Q. 17) 2
IF YES:
A. Do you have off-campus,programs?
on-campus, or both kinds of work-study
I .
Off-campus only (ANSWER 1 30/
On-campus only (ANSWER C) oohs. 2
Both off-campus andon-campus (ANSWER B Es C) ... 3
B. What kinds of off-campus jobs are students placed in? ( CIRCLE AS
MANY AS APPLY),
Lawn work or odd jobs 01 31-32/
Waiter, waitress, bus boy, or cook 02 33-34/
Babysitting or child care 03 35-36/
Farm or agricultural work 04 37-38/
Factory work (unskilled or semi - skilled) 05 39-40/
Gas station, car wash; or auto repair work 06 41-42/
Skilled trade 07 43-44/
Other manual labor (cleaning-relatedjobs, stock clerks, etc.) 08 45-46/
Store clerk, salesperson, or. cashier 09 47-48/
Office or clerical 10 ,49-50/
Hospital or health 11 51-52/
Delivery jobs (newspapers, groceries, etc..) . 12 53-54/
Other (PLEASE DESCRIBE)13 55-56/
C. What kinds of on-campus jobs are students placed in? (CIRCLE AS MANY
AS.APPLY)
Cafeteria 01 57-58/
Administration 02 59-60/
Maintenance of building or propety 03 61-62/
Audiovisual 04 63-64/
Tutoring, teaching aid, etc. 05 65-66/
Vocationally oriented jobs 06 67-68/
Other (PLEASE DESCRIBE)07 69-70/

17.
R(
a.
. .
.
.
.
.
-5-
..',..
..,.
Please indicate whether or not this high school,the following:federally assisted or financed
NUMBER ON EACH LINE)
i
Upward Bound
,
:
participates in each ofprograms. (CIRCLE ONE
i
v /
Schoolparticipates
School does notparticipate
1 ' 2
r1 2b. Talent Search
c.
.
Elementary and aecondary Education Act:
1. Title I (Education of chil(renof economically disadvantaged) 1 2
2. Title IV-B (Library andlearning resou'ces)
L
1 2
..
3. Title IV-c (Educystionalinnovation and support) i 2
4. Title IV-D (Supplementary-4.
educational centers andservices) P
.------,....
AMMO.
(
1 . 2
5. Title VII (Bilingual education) 1 2
6. Title IX (Ethnic heritage studies) 1 2
d. Indian Education Act 1 2
e. Emergency School Aid let(desegregation assistance) 1 2
f. School Assistance inFederally Affected Areas 1 2
g. Comprehensive Employnt and -
Training Act (CETA) *- y
..
t
.
..
1 ' '2
.
1 2
h.tr
-........--..1---_-.,.
Vocational Education Act- of 1963:
1. Consumer and Homemaking Education
2. Vocational Education Basic Prggrams,
1 .
3e._,Yocational Educition forpersons with special needs ° 1 2
4. Cooperative VocationalEducation Program '
01 2
5. High School Vocational EducationWork-Study Program 1 2
i. Junior ROTC 1 2 .
OFFICEUSE ONLY
BEGINDECK 3
13/
14/
17/
18/
19/
20/
21/
22/
23/
24/
2_5/
26/
27/
28/
2.9/
30/
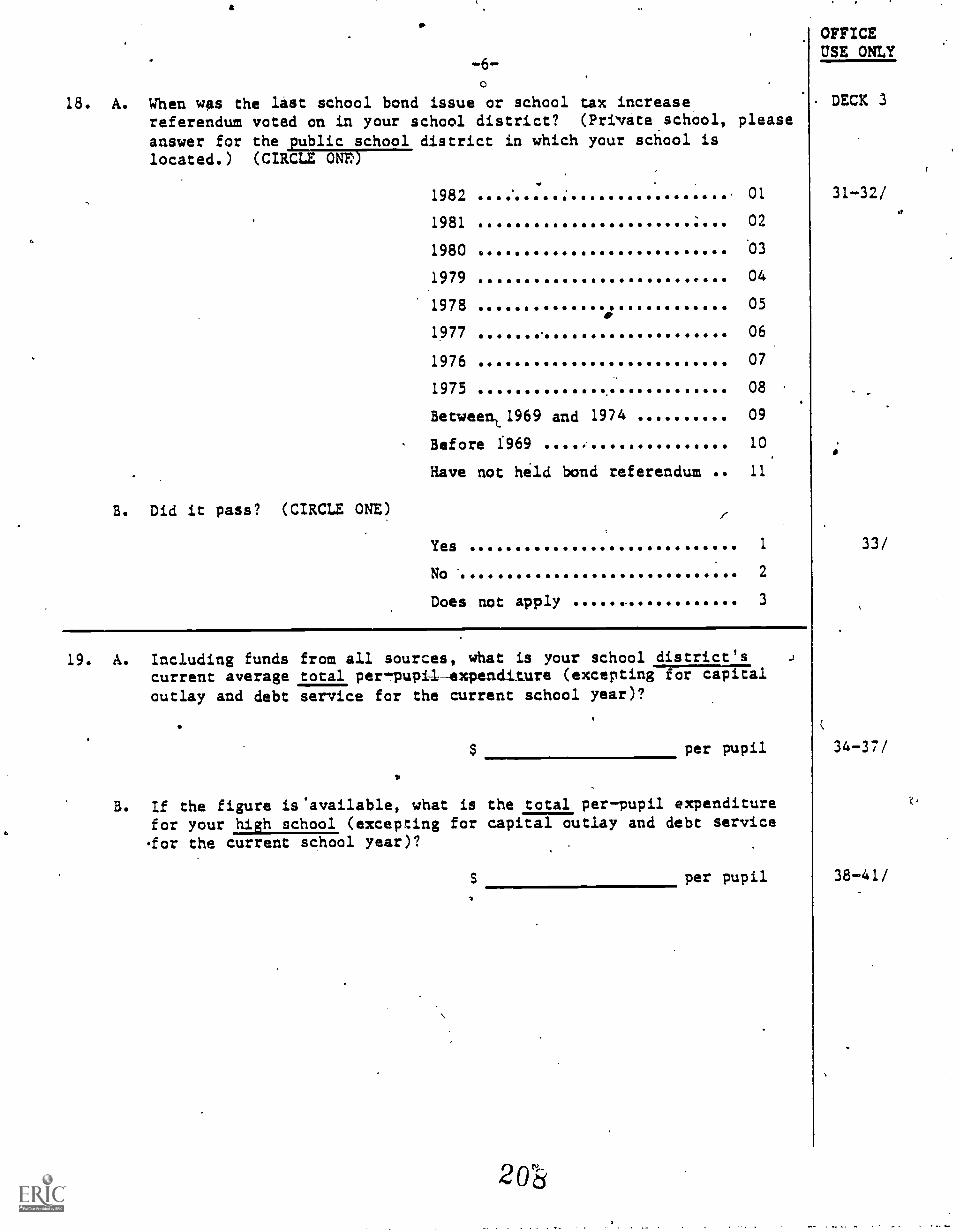
-6-0
18. A. When was the last school bond issue or school tax increasereferendum voted on in your school district? (Privateschool, pleaseanswer for the public school district in which your school islocated.) (CIRCLE ONE)
B. Did it pass? (CIRCLE ONE)
1982 . 01
1981 02
1980 '03
1979 04
1978 05
1977 06
1976 07
1975 08
Betweent1969 and 1974 09
Before 1969 S 10.
Have not held bond referendum 11
Yes
No
Does not apply
1
2
3
19. A. Including funds from all sources, what is your school district'scurrent average total per - pupil expenditure (excepting for capital
outlay and debt service for the current school year)?
per pupil
B. If the figure is'available, what is the total per-pupil expenditurefor your high school (excepting for capital outlay and debt service'for the current school year)?
per pupil
248
OFFICEUSE ONLY
DECK 3
31-32/
33/
34-37/
38-41/
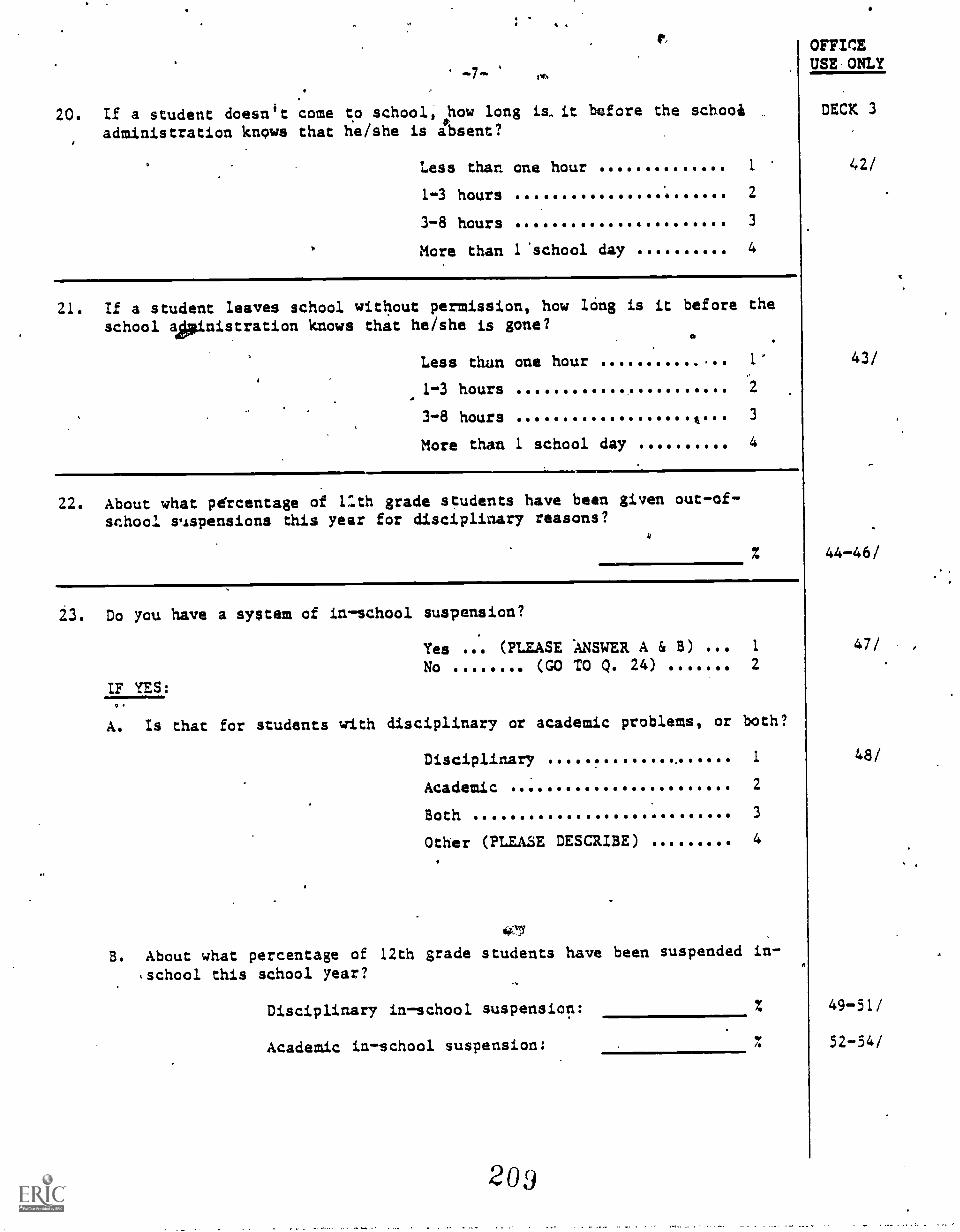
-7-
20. If a student doesn't come to school,ohow long is_ it before the school
administration knows that he/she is absent?
Less than one hour 1
1-3 hours 2
3-8 hours 3
More than 1.school day 4
21. If a student leaves school without permission, how lOng is it before the
school apinistration knows that he/she is gone?a
Less than one hour 1
1-3 hours 2
3-8 hours * t 3
More than 1 school day 4
22. About what percentage of 1:th grade students have been given out-of-school lspensions this year for disciplinary reasons?
z
23. Do you have a system of in-school suspension?
Yes ... (PLEASE ANSWER A & 8) ... I
No (GO TO Q. 24)
IF YES:0
2
A. Is that for students with disciplinary or academic problems, or both?
Disciplinary 1
Academic 2
Both 3
Other (PLEASE DESCRIBE) 4
40Y
B. About what percentage of 12th grade students have been suspended in-
school this school year?
Disciplinary in-school suspension:
Academic in-school suspension:
209
z
/41
OFFICEUSE ONLY
DECK 3
42/
43/
44-46/
47/ ,
48/
49-51/
52-54/

. 24. Are students sometimes put on probation for disciplinary or academic
problems?
IF YES:
INFICEUSE ONLY
DECK 3
Yes ... (PLEASE ANSWER A & B) 1 55/
No (GO TO Q. 25) 2
A. Is that for students with disiplinary or academic problems, or both?
Disciplinary 1
Academic 2'
Both .
Other (PLEASE DESCRIBE) 4
3
B. About what percentage of 12th grade students have been put on
probation this school year?
Disciplinary probation:
O
56/ y
57-59/
Academic probation: 60-62/
25.' Are parents sometimes contacted when a student is having academic or
discipline problems?
Yes ... (PLEASE ANSWER 45 B) 1 63/
No (GO TO Q. 26)
IF YES:
A. Is that for disciplinary or academic problems, or both?
2
Disciplinary 1.
Academic 2
Both 3
Other (PLEASE DESCRIBE) .4
B. AbOut what percentage of 12th grade students hhve had problems about
which you have contacted parents this school year? ,
Disciplinary problems:
Academic problems:
2.10
64/
65-67/
68-70/
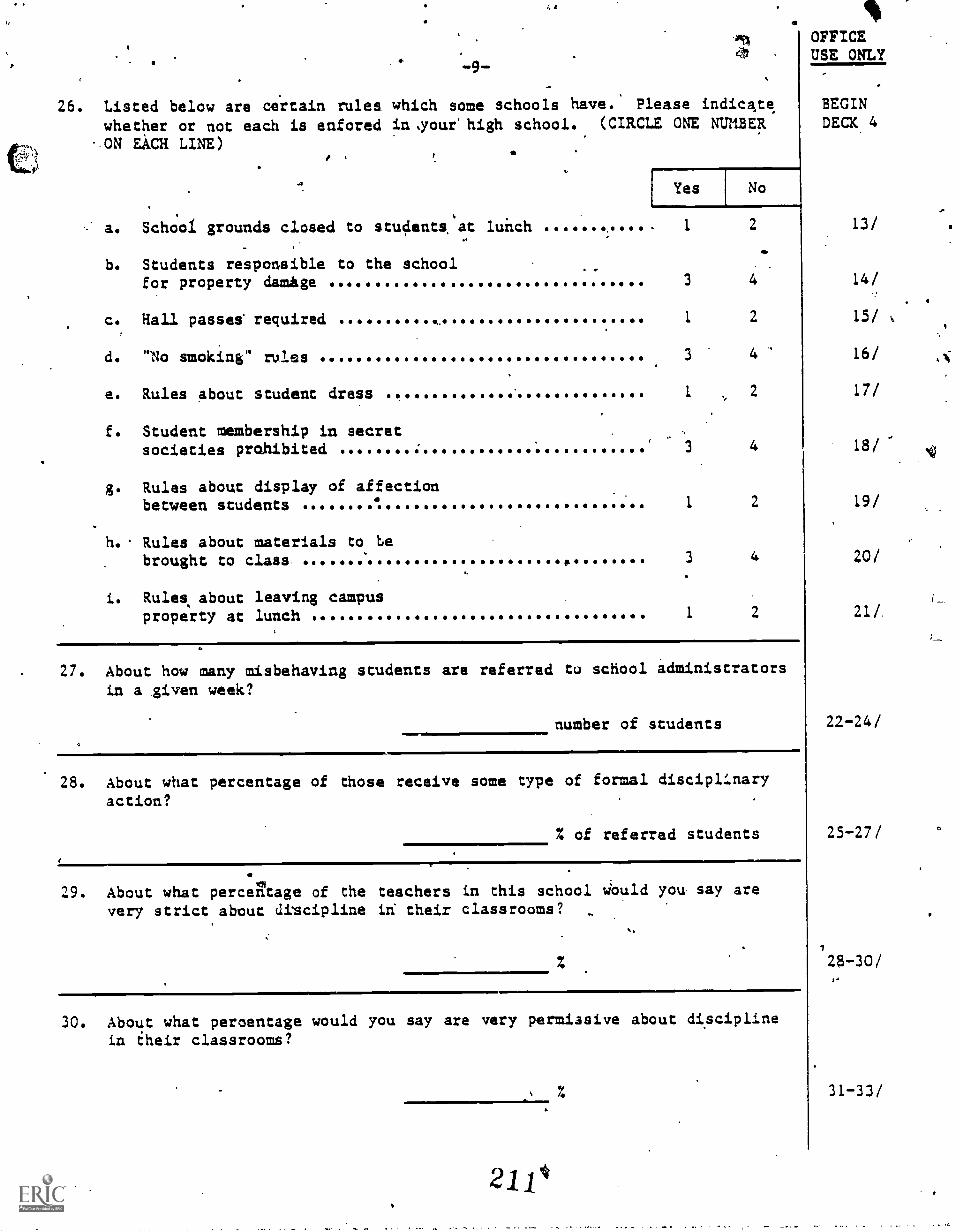
1; 1,
q% OFFICE4, USE ONLY
61
26. Listed below are certain rules which some schools have. Please indicate
whether or not each is enfored in your high school. (CIRCLE ONE NUMBERON EACH LINE)
?
a. School grounds closed to students at luhch
b. Students responsible to the school
Yes No
1 2
for property damAge 3
c. Hall passes' required 1 2
d. "No smoking" rules 3 4
e. Rules about student dress
f. Student membership in secretsocieties prohibited
g. Rules about display of affectionbetween students
h.. Rules about materials to bebrought to class
i. Rules, about leaving campusproperty at lunch .
1 ,
3
1
3
1
2
4
2
2
27. About how many misbehaving students are referred to school administratorsin a given week?
number of studentsIMIME. AVM.
28. About what percentage of those receive some type of formal disciplinaryaction?
% of referred students
29. About what percegtage of the teachers in this school would you- say arevery strict about discipline in their classrooms?
z
30. About what percentage would you say are very permissive about disciplinein their classrooms?
7.
21i
BEGINDECK 4
13/
17/
18/
1 9 /
20/
21/
22-24/
25-27/
28-30/
31-33/
O

4
-10-
31. Who determines, generally, what types of disciplinary action may betaken for certain offenses?
c,
.6
32. Would you.say school administrators have a lot,' some, or very littlediscretion in determining the 'most appropriate disciplinary action?
A lot 1
ibme 2
Very little 3
33. How are school rules made known to students? (IF THEY ARE PRINTED ORPUBLISHED, PLEASE ATTACH A COPY OF THE RULES TO THIS. QUESTIONNAIRE)
a
34. When were the rules most recently revised?
1-7-7-1 777MONTH YEAR
35. Which of the following best describes the practices for enrollment ofpupils to your high school? (CIRCLE ONE)
All pupils in a particular geographic area(or district) attend this school
Pupils in this particular geographic area(or district) are generally enrolled inthis school but transfers are frquently
I
Pupils are enrolled in this school on thean entrance test or another achievement
Pupils are enrolled from particular areasin order td achieve a desired racial orethnic composition in the school
Other (PLEASE SPECIFY)
01
allowed 02
basis ofcriterion 03
04
05
Private school, does not apply 06
2 1 2
OFFICEIISE ONLY
DECK 4'
34-35/.
36-37/
38/
39-40/41 -4Z/
,
43-46/
47-48/

1)
4
36. To what degree each of tese matters a problem in your high school?
(CIRCLE ONE NUMBER ON EACH LINi)
a. Student absenteeism
Serious Moderate Minor
, 1. 3 2 3
b. Students' cutting classes I 1
c. Parents' lack of interestin students' progress 1 2 3
d. 'iParents' lack of interestin school matters 1 2
e. Teacher absenteeism 1 2 3
f. Teachers' lack ofcomm!,tmant or motivation 1
g. Robbery or theft 2 3
h. Vandalism of school property 1 2 3
i. Student use ofdrugs or alcohol 1 2
j. Rape or, attempted rape 1 2 3
At.'" Student possession of weapons 1 2 c3
Verbal abuse of teachers 3.
Not..
at all
4
4
4
4
4
4
4
4
zt4
4
4
/NM
37. Generally speaking, how often would you say that'seridus verbalconfrontation occurs within your school among the groups listed below?
(CIRCLE ONE NUMBER ON EACH LINE) '
a. Among students
b. Among teachers
DailyAt leastonce aweek
At leastonce amonth
RarelyOr
never
'1 2 3 4
1 2 3 4
c. Between teachers and students 1 2 3
d. Between teachers and schooladministrators 1 2 3 4
e. Between teachert and parents 1 2 3 4
f. Between school administratorsand parents 1 2 3 4
g. Between school and central officestaff r governing board 1 3 4
OFFICEUSE ONCY'w
DECK 4
.49/
50/
51/
52/
53/
- 54/
55/
.56/.
57/
58/
59/
60/,
61/
62/
63/
64/ ti
65/ .
66/
67/

ti
-12-
3'18: Is thee a waiting list to get into your school?
4
4
.10
Yes ti
Noc.
1
2D
39. Do students have to take an entrance examination or meat any special'P .
academic requirements to be admitted to your school?
Yes (ANSWER A)
No (liNSWER, B ) .0
1
2 6
A. IF YES : Please describe the entrance requirements.
B. IF NO: Are.there any other reasons f -r which you can reject orrefuse students who wish to attend this school?(PLEASE DESCRIBE)
40. How many cotses (semester length)'in the following subjects are studentsenrolled in a college preparatory program required to have forgraduation?
f4 Math
Science
Foreign language
English/Language .arts
41. About what percentdge of the 12th grade class ransferred into thisschool during the 11th and 12th grades?
of 12th grade transferred into this school
A. Of those who transferred in, about What percentage .came from,.publict
high schools?
A % of transfers came from public schools
2 1 ,1
tr
OFFICEUSE ONLY !
0
BEGINDECK 5
13/
15-1:64
17-1a/
19-20/
21-22/
23-24/
25-26/
27-28/
29-30/.
31-33/
34-36/ A

6 -13-
42. Please indicate your impression of the importance attached to each ofthe followin ossible goals in this high schoo(CIRCLE ONE, NUMBER ON EACH (LINE) ..
ft... I
,
. ,.
.
. 1 .
The high schotil Should:S
. .
.
A
.
.
.
.
.
4
.
er
7
ImP0rtant
.
ImP.0rtant
.
Not
Too
I
P0rtant
N,0.t
'At
A1-1
I
tim.
P0 ,
rt
ant
,
a. help students in their social development bystressing, the ability to'get along with andunderstand all people.,
.
",.....,.
L 1.2 4 '-
4b. prepare students to be good citizens. '1 2 3 4
c. teach basic skills. ..
, 1. 2 3 '4 Q
d. help students make re listickplans for whatthey will be after aduatide.
-)1
,
4
e. develop students' abilities to volve problemsand thiik critically. 1 4
1
f. prepare students to be,iuformed consumers. 1 3 4
. ,
g. prepare students for further sclgels"college, dixmiOr college, or techni arAschool.
.
1 2 3 4
h. help studetits gain .an understanding of theirown strengths and weaknesses. 1 2 3 4
i. provide in- school training for variousvocations. 1 2
----."'......"
4
. .
j. arrange out-of-school experiences invarious vocations. A 1 2 3
.
4
k. give students a broad general educationalbackground. 1 2 3 4
1. prepare students to understand and. deal withcomputers and other information technologies. 1 2 4
WE APPRECIATE THE TIME AND EFFORT YOU RAVE TIAKEN COMPLETINC'THISQUESTIONNAIRE AND WANT TO THANK YOU FOR YOU1 HELP.
OFFICEUSE ONLY
tECK 5
37/
38/
39/
40/
41/
42/
43/
44/
45/
46/
47/
48/

a1-
APPENDIX Eq.- PRE-FIELD PERIOD CORRESPONDENCE

4
C
APPENDIX B.1: CORRESPONDENCE WITH SCHOOLS AND OTHER INSTITrTIONS
State Coordinator Letter4.6
District Superintendent Letter
'Principal Letter (to secure a commitment for the First-Follow-Up)
Catholic Dioceses Letter (to secure a commitment for the FirstFollow-Up) 4
School Coordinator Letter (fOur versions, asking for theirassistance in assembling materials for the student sample selection)
Roster Update Fort
School Coordinator Letter (sent with the school questionnaire)

b. B.1-1 .
.1.4417 %HIGH SCHOOL AND BEYONDa national longitudinal study for the 1980s
. 1 .
NATIONAL OPINION RESEARCH CENTEFI SCGO SOUTH ELLS CHICAGO. IL 60637 311J211 I 484
UNIVERSITY OF CHICAGO
September 10) 1981 .
C
Dear State Coordinator:
I am writing to give, you a progress report on Sigh School and Beyond, the
national longitudinal study of high school students commissioned by the
National Canter for Education Statiseics, for which you graciously served as
State Coordinator during the 1980 base-year survey. Enclosed you will find a
copy of "A Capsule Description of Sigh School Students" which presents an
overview of the data Collected. The public -use tapes are mow available to all
interested parties. Requests for these tapes should be directed toiNCES-
Statistical Information Office, ?residential Building, Room 205, 400 'tazyland
Avenue SW, Washington, D.C. 20202.
We are now planning the first follow-up survey for Sigh School ande,3eyond and
are asking you to serve again as State Coordinator. An important factor in'.
the success of our base-year study was the excellent cooperation given at the
state level. We hope that you will be able to assist us again. .
Your eunction as Stacie Coordinator would be the same as before, namely:
To maintain liaison between the project and the State Department of
Education.
. To assist the project staff with any survey-related problems that
might arise which.can be resolved only through actions of the State
Department of Education.
Our planned activities in the schools have been sr.regmlined to reduce school
staff time as wail as to minimize student time. They will consist of:
l. Updating the list of 1980 sophomores to indicate whether they are
still enrolled at the school.' Obtaining the latest known addresses
for the 1980 sophomores who are not presently enrolled, and for some
selected 1980 seniors.
2. Updating the School Questionnaire to reflect current data, such as
present enrollment, present size of faculty, etc.
-PUGH SCHOOLANO SIVONCI b scansonsarm fitIonsi Caner tar ediscatlat Statistic,. Erawarrlan Ohioan. U S Couranant of Haarth. Educsalari. area Wartano
218
.r.
B.1-2
13
3. Obtaining survey data from those 1980 sophomores who are still
enrolled in the sample school. These students will be asked to
complete a sell-administered questionnaire and achievement test
battery. Project yersonisel will conduct this activity but we will
request that a member of the school staff be present. ta some
instances, school personnel may be asked to assist in Survey Day and
to conduct Make -ap Day activities for students unable to participate
in Survey Day.
You will find enclosed a form and postage-paid envelope addressed to me.
Please indicate an the farm whether you will be able to serve again as State
Coordinator. A copy of this letter is being forwarded to Commissioner Merle
R. Bolton, your Chief State School Officer. We are using this format to
reduce time and paperwork requirements for your Chief and for you.
Of course., if you or your Chief have any questions, please call me collect at
(312) 733-0'7.
We are look:...tr forward to your continued valuable support during the First
Tallow -up phase of the study.
FVC/c1Encl.
Sincerely,
idifdAVIJ& 77' (4
(Mrs.) Fansayde N. CallawayProject Director

B.1-3
HIGH SCHOOL AND BEYONDa national longitudinal study for the 1980s
4
p'9ABLE.I4
NATIONAL OPINION FIESEMI04 COM.. 84:1235C(7111 EL LIE CHICAGO, IL 60837 31217230486
UNIVERSITY Or CHICAGO
.September 24, 1981
pair District Superintendent:
The purpose of this letter is to inform you .of our plans for the first follow,-
up phase of the RI= SCMCGL AND BEYOND survey, and to request your continued
interest and cooperation. In 1980, base-year data were collected from a
sample of over 38,000 students in all 50 states and the District of
Columbia. Enclosed is a list of schools in your district which partic-
ipated. 4.2 was stated in an earlier communication, fol....lir-up surveys at
approximately two -year intervals are planned for our 1980 sophomore
respondents and for a subsample of our 1980 senior respondents.
We are pleased to state that our data collection procedures for the first
follow -up have been streamlined with the result that the awed for school staff.
time is reduced. Student time is also being held. to a miaimum.
Our planned activities are as follows:
First, we will mail to each school a list of their 1980 sophomore
respondents and ask school authorities to indicate for each respondent
whether he or she Li still enrolled there, has transferred out, or for
whatever reason is ao longer enrolled. La some ins taaces we may also ask
the school to provide the lataseaddress in their records for selected
1980 seniors.
Second, we will ask school officials to update the Sabol Questionnaire
data they provided in 1980 on such characteristics as enrollment siza or
faculty size'.
Third, we will collect survey data from all of the original respondents
who are still enrolled. These students will be asked to completei`sself-
administered questionnaire and achievement test battery. approximately 241
to 3 hours of student time will be required. Where feasible, one school
person 1.74..11 be requested to adaist with the survey administration.
We will also ask the school to appoint a school coordinator who will
assume responsibility for aocitying the students and arranging for naka-
ups, etc.
22 0
HIGH 30443121. lifftINO Is ammonia tier Me National Cantorfor Education StalistIci. Olvits0M. U. S. Comment of Hissitri. Education. Ana welfare

B.1-4
Fourth, we will request a copy of the Master .teaching Schedule and a Listof the course offerings.
' If you wish further information about this phase of our study, please callyour area representative, Susann Pelletier, collect at (312) 753-1175.
1'
3y this time you should have received a copy of "A Capsule Description of HighSchool Students" which gives.= overview of the data collected in the base-year survey. Public use data tapes are now available for all interestedparties. Requests for the tapes should be directed to NCES-StatisticalInformation Office, Presidentialluilding, Room 205, 400 Maryland Avenue SW,Washington, D.C. ;0202.
We are most appreciative of your past cooperation and look forward to thisyear's activities.
FNC/spEncl.
ti
bi
Sincerely,C
(Mrs.) Fansayde N. CallowayProject Director
221
r

NORCNational Opinion Research Canter
8.1-5
C
,1J
University of Chicago
6030 South Ellis Chicago, IL 60637 3121753.1300Norman M. Bracbum, Director
Principal(ADDRESS)
(C=T, STATE ZIP)
Dear Principalst
October 5, 1981
43.
In 1.900, a Aziasp.L. of mit sophomore and senior students participated in EIGE
SCSOOL AND ammo, a national longitudinal survey commissioned by the National
Canter for Education Statistics. We are pleased to inform you that over
58,000 youths from all fifty states and the District of Columbia took part in
the base-yeas study. And, as you may recall, we indicated at that time that
follow-up surveys of these sophomores and of a subset of seniors would occur
at approximately two -year intervals and over a period of tan years. We are
asking for your cooperation again as we launch the first follow-up phase of
the study. .
Our planned acpefities in the schools have 'been streamlined to reduce school
staff time, at well as to minimize student time. ?allowing are the tasks to
be accomplished:
School Princival or Designate: Update the Schoul Questionnaire to
reflect current data, such as present enrollment, present size of
faculty, etc.
School Clerk or Other School Seat! Person: update the list of 1980
sophomores and of selected seniors provided by us, or are otherwise no
longer enrolled at the school. Provide the latest known addresses for
the 1980. sophomore students not presently enrolled and for certain of
the 1980 senior students.
Students in 1980 Sophomore Sample: Complete a salt -administered
questionnaire and achievement teat battery (approximately 21/ to 3
hours) . Our staff will conduct the survey at your school. We request
that a member of the school staff be present during the survey
administration. In some instances, school personnel may be asked to
conduct sake-up day activities for the students who are absent on
survey. day.
Provide a cowl of the Master Teaching Schedule as we4.1 as a dehoriotion
of course offerinos.

B.1-6
We will call you within a few days to clear this request with you. At this
time we will also ask that you assign someone to act as your liaison with
us. convenient, we will, be pleased to continue working with the School
Coordinator from the base4ear survey.
By mow you should have received a copy of °A Capsule Description of School
Students" which gives an overview of the data collected in 1980. We hope you
found it interesting.
Your cooperation and support in the past is most appreciated, and we look
forward to visiting.your school again.
PNC/c./
Sincerely yours,
(Mrs.) Pansayde N. CallowayProject Director
223 fr. nsir, .
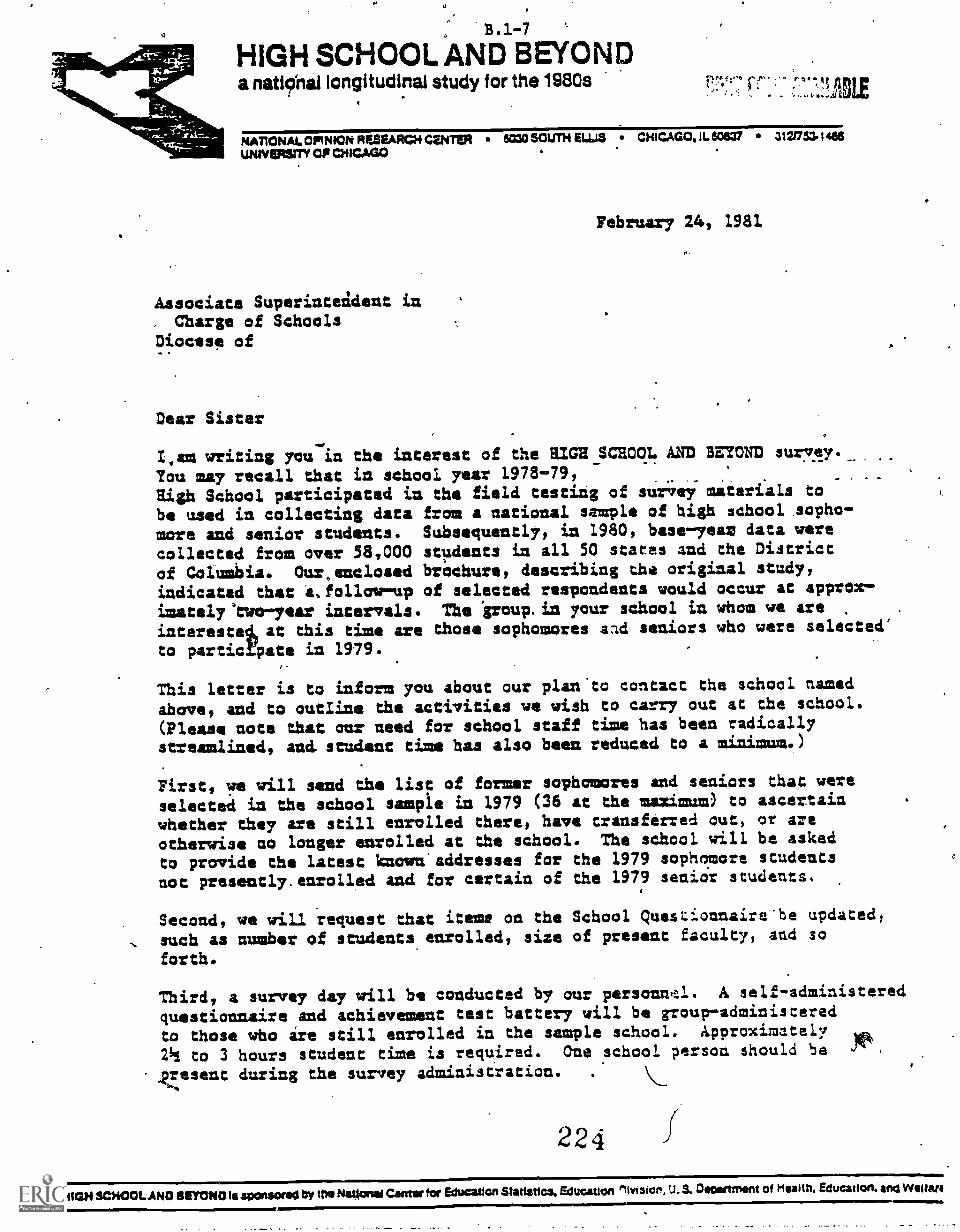
B.1-7 '
HIGH SCHOOL AND BEYONDa national longitudinal study for the 1980s E",tt`''"' TiLt
NATIONAL OPINION RESEARCH CENTER 6:130 SOUTH ELL.15 CHICAGO. L. 60627 312/7611483UNIVERSITY OP CHICAGO
February 24, 1981
A.
Associate SuperinteAdent inCharge of Schools
Diocese of
Dear Sister
lam writing you in the interest of the RIM SCHOOL AND BEYOND survey._
You may recall that in school year 1978-79, _ _
High School participated in the field testing of survey materials to
be used in collecting data from a national sample of high school sopho-
more and senior students. Subsequently, in 1980, base -year data were
collected from over 58,000 students in all 50 states and the District
of Columbia. Omr,enclosed brochure, describing the original study,indicated that cfollow-up of selected respondents would occur at approx-imetely'rwo-year intervals. The 'group.in your school in whom we are
interests at this time are those sophomores aad seniors who were selected'
to participate in 1979.
This letter is to inform you about our plan'to contact the school named
above, and to outline the activities we wish to carry out at the school.
(Please note that our need for school staff time has been radically
streamlined, and student time has also been reduced to a minimum.)
First, we will send the list of former sophomores and seniors that were
selected in the school sample in 1979 (36 at the maximum) to ascertain
whether they are still enrolled there, have transferred out, or are
otherwise no longer enrolled at the school. The school will be asked
to provide the latest known-addresses for the 1979 sophomore students
not presently. enrolled and for certain of the 1979 senior students.
Second, we will request that items on the School Queszionnaire-be updated:
such as number of students enrolled, size of present faculty, and so
forth.
Third, a survey day will be conducted by our personnel. A self-administeredquestionnaire and achievement test battery will be group-administered
to those who are still enrolled in the sample school. Approximately
21/2 to 3 hours student time is required. One school person should be
,gresent during the survey administration.
224
HIGH WM:MAN° egyoyma sponsetypb by um National Came icy &NMI= statistics, Education nivt3icle, U.S. COINIMThlflt ofHealth. Education. inc WORM
8.1 -8%.;14045,
If you wish,further,information about the continuing phase of this study,
please call me collect at Area Code (312) 7,53-1517.
I am pleased to repast that HIOR 4C800L AND BEYOND base-year'data will
be available very shortly from Dr. Jeffrey Owings, DMCS/L5B, National
Center for Education Statistics, U.S. Department of Education, 400 Maryland
Avenue, S.W., Presidential Building, Room 205, Washington, D.C. 20202.
Enclosed is the Newsletter circulated to students who participated in
the base-year survey.
4
We are most appreciative of your cooperation and support.
BITC:tt
Encl.
. Sincerely,
)7.(Mts.) Pansayde N. CallowayloToject Director
223
Mlt

A
HIGH SCHOOL AND BEYONDa natLOnat longitudinal study for the 1980s
B.1-9
c.
NATIONAL OPINION RESEARCH CENTER o 6030 SOUTH ELLISUNIVERSITY OF CHICAGO
Dear School Coordinator:
CHICAGO, IL 80637
O
312/753-14M
November 2, 1981
We wish to extend a warm welcome to those of you who have worked with usbefore, and to those who are new to this study. We are very grateful for yourparticipation in the first follow -up phase of the HIGH SCHOOL AND BEYOND
1) survey. The accompanying brochure explains the purposes behind this importantresearch.
The tasks for which we need your help are tot as numerous as those of SchoolCoordinators .in 1980. We have streamlined the responsibilities of the SchoolCoordinators is an effort to reduce the burden placed on schools participatingin the survey. However, your involvement is an integral part of the successof this' research project. .4
We request your help in obtaining data from the 1980 sophomore cohort of HIGHSCHOOL AND BEYOND. These 1980 students are now presumably seniors attendingyour schcml, or are transfer students attending another school, or are youngadults whh have left school. We need to update our records on all members ofthe 1980 sophomore cohort. Enclosed you will find the 1980 Sophomore UpdateRoster. Please complete this roster for all of the 1910 sophomores listed.For.thOse students who are not attending your school, please complete addi-tional locating information. For those students who are anrolled, you needonly circle "code 1: still enrolled." Please mail the first two copies of thecompleted roster back to us within two weeks and retain the last copy for yourrecords. We have enclosed a postage paid envelope that you can use to returnthe materials we requested to our office.
We plan to administer questionnaires and tests to members of the 1980 sopho-more cohort. The entire session will last 3 to 34 hours. We would appreciateyour confirming or establishing a date, place, and time for Survey Day. Alterplans have been finalized, we will call to obtain this information so that wecan address and mail you the .student invitations. then the invitationsarrive, you are requested to distribute them to the students. We will alsoenclose a form that can be used to notify teachers about the survey. Shortlybefore Survey Day.4i will mail the questionnaires and test booklets to theschool. We asic that your store these materials for us until Survey Day,
V-The survey will be conducted by NORC personnel. However, we would appreciateyour presence in the room an Survey Day. Also, the NORC representative willplan to meet ith you briefly before the survey to discuss procedures.
U
226
KIWI SCHOOL MW SIYONO Is 40o/wad by Ms National Canto' forEducation Slatistics, Education Olvision.U. S. Ooormient 01 Haim. Education. ana Moue..
B.1-10
4'
a
To summarize the, above discussion, it is our expectation that you will serve
as liaison between NORC and your high school in order-to ensure a succesful
survey. Attached is a summary, of the tasks to be ,performed and the person(s)
responsible for them. If you have any 'questions, pleas'e call me collect at
(312) 75341516. Your Area Field Representative will contact you soon to make
arrangements for Survey Day.
DK/viEncl.
r1
Sincerely;
Donald KoteckiSurvey- Coordinator
22,E
I
V
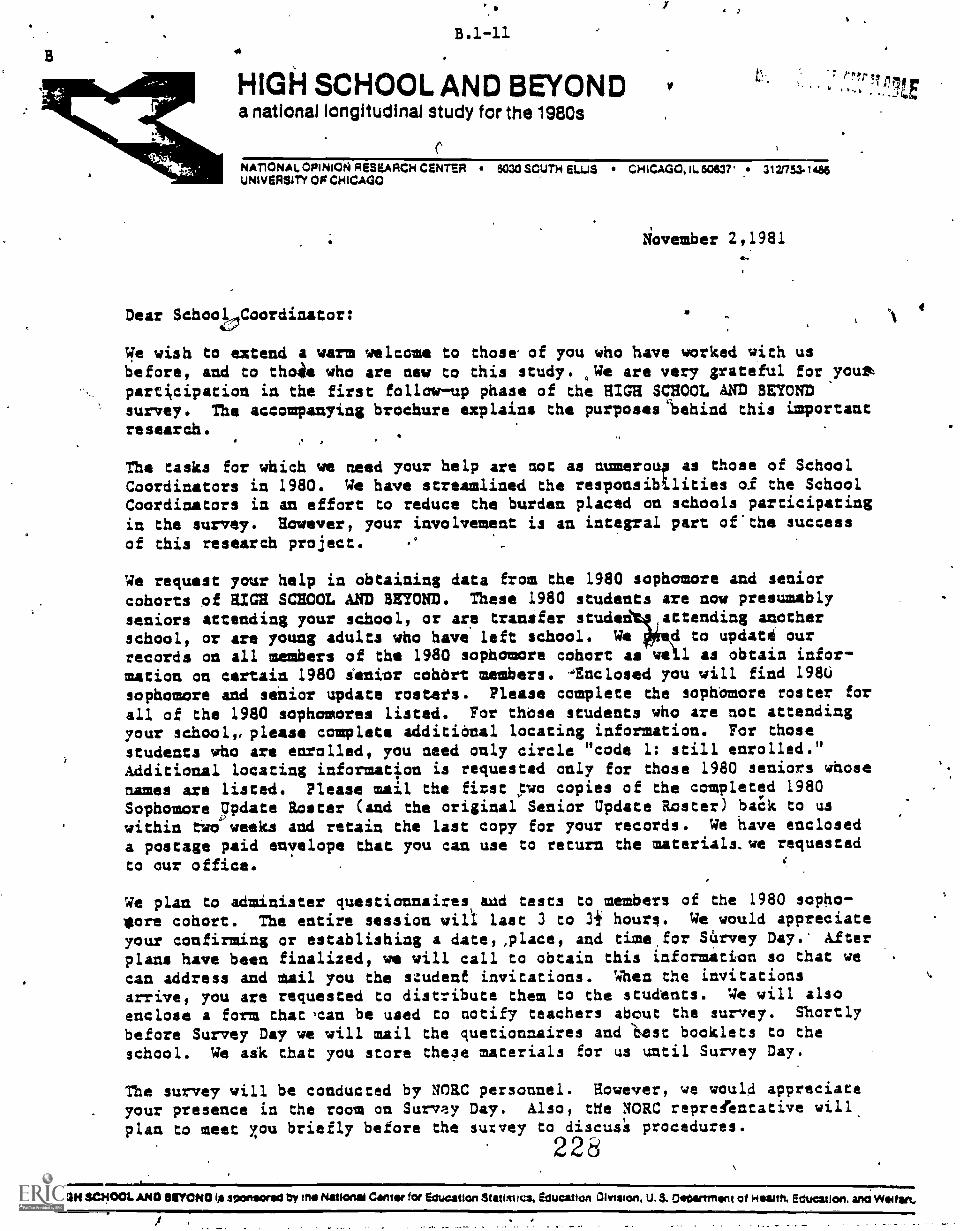
B
B.1-11
HIGH SCHOOL AND BEYONDa national longitudinal study for the 1980s
NATIONAL OPINION RESEARCH CENTER 603o SOUTH ELLIS CHICAGO, 6037' 3121753.11UUNIVERSITY OF CHICAGO
november 2,1981
Dear School Coordinator:
We wish to extend a warm we to those- of you who have worked with usbefore, and to thesis who are new to this study. We are very grateful for youparticipation in the first follow-up phase of the HIM SCHOOL AND BEYONDsurvey. The accompanying brochure explains the purposes` behind this importantresearch.
The tasks for which we need your help are not as numerous as those of SchoolCoordinators in 1980. We have streamlined the responsibilities of the SchoolCoordinators in an effort to reduce the burden placed on schools participatingin the survey. However, your involvement is an integral part °Utile successof this research project.
We request your help in obtaining data from the 1980 sophomore and seniorcohorts of HIGH SCHOOL AND BEYOND. These 1980 students are now presumablyseniors attending your school, or are transfer studen attending anotherschool, or are young adults who have left school. We d to update ourrecords on all members of the 1980 sophomore cohort as we 1 as obtain infor-mation on certain 1980 senior cohdrt members. -Enclosed you will find 1986sophomore and senior update rosters. Please complete the sophomore roster for
all of the 1980 sophomores listed. For these students who are not attendingyour school, please complete additional locating information. For thosestudents who are enrolled, you need only circle "code 1: still enrolled."Additional locating information is requested only for those 1980 seniors whosenames are listed. Please mail the first two copies of the completed 1980Sophomore Update Roster (and the original Senior Update Roster) back to uswithin two weeks and retain the last copy for your records. We have encloseda postage paid envelope that you can use to return the materials,we requested
to our office.
We plan to administer questionnaires,tud tests to members of the 1980 sopho-more cohort. The entire session will last 3 to 34 hours. We would appreciateyour confirming or establishing a date,,place, and time for SArvey Day.* Alterplans have been finalized, we will call to obtain this information so that wecan address and mail you the student invitations. When the invitationsarrive, you are requested to distribute them to the students. We will alsoenclose a form that.can be used to notify teachers about the survey. Shortly
before Survey Day we will mail the quetionnaires and 'test booklets to theschool. We ask that you store these materials for us until Survey Day.
The survey will be conducted by NORC personnel. However, we would appreciateyour presence in the room on Survey Day. Also, the NORC representative willplan to meet you briefly before the sutvey to discus's procedures.
228MNIMIMLIMO
MGM 30100LANO Ityoma 400ftscesea by Nattoetat Cantor tot Education Stan:mos, Education Olviaton, U. S. CiOartrnlent of Heastfi. Education. no Wallin.
kto
To summarize the above discussion, it is our expectation that you will serve
as liaison. between NORC and your high school in order to ensure a succesfuq.
survey. Attachedlis a summary of the tasks to be performed and the personZs)
responsible for them. If you have any questions, please call me collect at
(312) 753-1516. Your Area Field Representative will contact you soon to make
arrangements for Survey Day.
OK/viEncl.
Sincerely,
Donald KoteckiSurvey Coordinator
2 2 9

C
B.1 -13
HIGH SCHOOL AND BEYONDa national longitudinal study for the 1980s
r..- -1 rninq ffl
NATIONAL OPINION RESEARCH CENTER 5030 SOUTH EWS CHICAGO, IL 60637 312/763.1466UNIVERSITY OF CHICAGO
November 2, 1981
Dear School Coordinator:
We wish to eat d a warm welcome to those ,f you who have worked with usbefore, and to ose who are new to this study. We are very grateful for yourparticipation in the first follow -up phase of the HIGH SCHOOL AND BEYONDsurvey. The accompanying brochure explains the purposes behind this importantresearch.
-)
The tasks for which we need your help are not as numerous as those of SchoolCoordinators in 1980. We have streamlined the responsibilities of the SchoolCoordinators in an effort to reduce the burden placed on schools participatingin the survey. However, your involvement is an integral part of the successof this research project.
We request your help in obtaining data from the 1980 sophomore cohort of HIGHSCHOOL AND BEYOND. These 1980 students are now presumably seniors attendingyour school, or are transfer students attending another school, or are youngadults who have left school. We need to update our records on all members ofthe 1980 sophomore cohort. Enclosed you will find the 1980 Sophomore UpdateRoster. Please complete this roster for all of the 1980 sophomores listed.For those students who are not attending your school, please complete addi-tional locating information. For those students who are enrolled, you need"only circle "code 1: still enrolled." Please, mail the first two copies of thecompleted roster back to us within two weeks and retain the last copy for yourrecords. We have enclosed a postage paid envelope that you can use to returnthe materials we requested to our office.
We plan to administer questionnaires and tests to members of the 1980 sopho-more cohort. The entire session will last 3 to 34 hours. We would appreciateyour confirming or establishing a data, place, and time for Survey Day. Alterplans have been finalized, we will call to obtain this information so that wecan address and mail you the student invitations. When the invitationsarrive, you are requested to distribute them to the students. We will alsoenclose a form that can be used to notify teachers about the survey. Shortlybefore Survey Day we will mail the questionnaires and test booklets to theschool. We ask that your store these materials for us until Survey Day.
The survey will be conducted by NORC personnel and you. We want the NORCrepresentative to administer the questionnaire and ,'you to administer thetest. The NOAC representative will plan to meet with you briefly before thesurvey to discuss procedures.
230NIGH 304001, AND ISVONO to samisoned oy die National Canter for Education Statistics. Education Olviston, U. S. O.gmttment of Hawk Education. ano

B.1-14
-
To summarize the ab e discussion, it is our expectation that you will serve
as liaison between NO and your high school in order to ensure a succesful
4survey. ittached is a summary the tasks to be performed and the person(s)
responsihle for them. If you have any questions, please call me collect at
(312) 753-1516. Your Area Field Representative will contact you soon to make
arrangements for Survey Day.
DK/viEncl.
9
Sincerely,
Donald KoteckiSurvey Coordinator
231
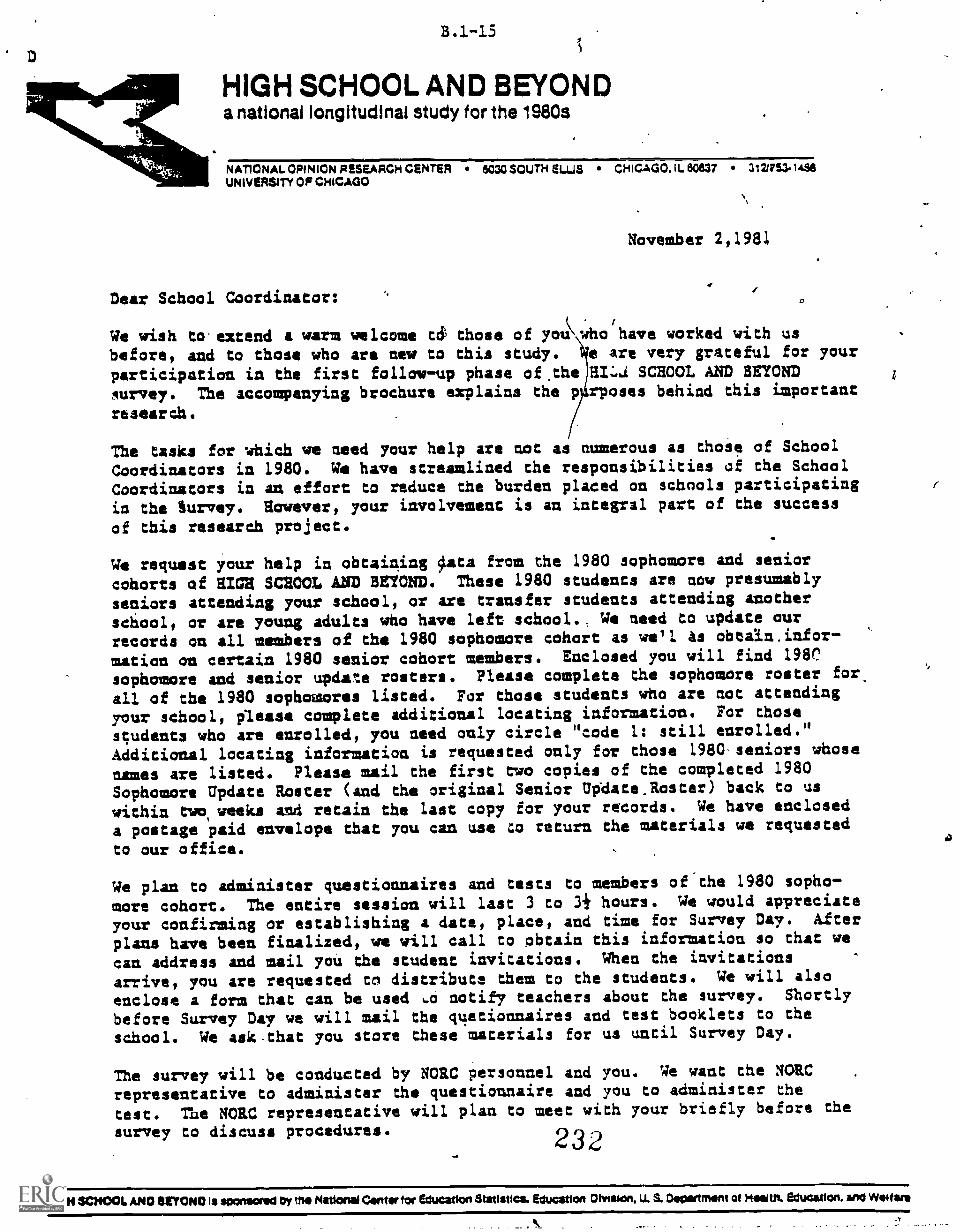
B.1-15
HIGH SCHOOL AND BEYONDa national longitudinal study for the 1980s
NATIONAL OPINION RESEARCH CENTERUNIVERSITY OF CHICAGO
Dear School Coordinator:
SOX SOUTH CHICAGO, IL 6037 31241304SE
November 2,1981
We wish to. extend a warm welcome td those of yothoihave worked with us
before, and to those who are new to this study. e are very grateful for your
participation in the first follow-up phase of .the SCHOOL AND BEYOND
survey. The accompanying brochure explains the p rpoees behind this important
research.
The tasks for which we need your help are not as numerous as those of School
Coordinators in 1980. We have streamlined the responsibilities of the SchoolCoordinators in as effort to reduce the burden placed on schools participating
in the *urvey. However, your involvement is an integral part of the success
of this research project.
We request your help in obtaining 4ata from the 1980 sophomore and senior
cohorts of HIGH SCHOOL AND BEYOND. These 1980 students are now presumably
seniors attending your school, or are transfer students attending another
school, or are young adults who have left school._ We need to update our
records on all members of the 1980 sophomore cohort as we'l As obtain.infor-
mation on certain 1980 senior cohort members. Enclosed you will find 198'
sophomore and senior update rosters. Please complete the sophomore roster for
all of the 1980 sophomores listed. For those students who are not attending
your school, please complete additional locating information. For those
students who are enrolled, you need only circle "code 1: still enrolled."Additional locating information is requested only for those 1980 seniors whose
names are listed. Please mail the first two copies of the completed 1980
Sophomore Update Roster (and the original Senior Update_Roster) back to us
within two, weeks and retain the last copy for your records. We have enclosed
a postage paid envelope that you can use to return the materials we requested
to our office.
We plan to administer questionnaires and tests to members of the 1980 sopho-
more cohort. The entire session will last 3 to 34 hours. We would appreciate
your confirming or establishing a date, place, and time for Survey Day. After
plans have been finalized, we will call to obtain this information so that we
can address and mail you the student invitations. When the invitations
arrive, you are requested to distribute them to the students. We will also
enclose a form that can be used 6o notify teachers about the survey. Shortly
before Survey Day we will mail the quetionnaires and test booklets to the
school. We ask.that you store these materials for us until Survey Day.
The survey will be conducted by NORC personnel and you. We want the NORC
representative to administer the questionnaire and you to administer the
test. The NORC representative will plan to meet with your briefly before the
survey to discuss procedures.234, =3
mit
z
HMI SCHOOL MO egYONO is SOOMICIled Dy ma National Colter for Education Statistics, &women Diviaeon, U. S. Ovoirtm.rtt of Momitti. Education. ano Wo4fare
To summarize the above discussion, it is our expectation that you will serve
as liaison between NORC and your high school in order to ensure a succesful
survey. Attached is a summary of the tasks to be performed and the person(s)responsible for them. If you have any questions, please call me.collect at
(312) 753-1516. Your Area Field Representative will contact you soon to makearrangements for Survey Day.
Sincerely,
Donald KoteckiSurvey Coordinator
DK /vi
Encl.

AREA NIGH. SCHOOL AND E PONDsommorag IOUS, UPDAIE ROSIER
- - AI A UNI.T4 _ _SCHODI, ID I SCHOOL"
PAGE 1 OF 1
'I amyl thatauvaAsuagali.cumbamitatuuto_a_pria_scunoLAINCLUOVIIIIISE_ILL-1111t1L2VIMEILAINECILDA11.111.11111141
IRANSIERSED SIODENt OFFICIALLY ISANSFIRRED /OR immotpwil IN MINIM SCHOOL 100. NOT INCLUDE COLLEGE ENROL. HERE)
DROPPED DUI MOEN! ASSENT IS DAYS UllLONGE0 AND NO) EXPECTED TO MORN.ILI
IV
/
da
I
r
Is
&L.
I
. I MIL MINA It_es..1111U1111_600:1_1111.4.41110UAILSEIIIIILIAIIICII4 4_11111smimeo .. PLEASE Emirs situii.EEsse, DECEASED, INsitlimowAtEnD, Eno
I 1
10 1E1 AIUDEN118-MANE101.
11
I I
'PLEASE
SIAIUE. 4-11ARENIISAANSLAN'PLEASE CISFLf ONLY ONE 1 PHONEf 0.44
.....__:.-4SIILL-111MOLLE0 I I
illIANSFINSED101101110 OU1 >INAHEIMELT 61110UAIK I rwvOl/MIA . 2 XIPHDNIII
to
a_____FLAst_smommLimisEss____JAAANIMACHOOLA[011 .4
1 TRANSFER IIUDENII ONLY)
' 'SPECIFY' I
.
I A$IAIE/S1P11;1111
l! TIM,TTurnstetellemsre.mus*Sevesermare*wer'essesinneit22*222222.22g2222.2222*22222tellies22Ve21111222212V211222222T2----- 22-22 t
MILL ENROLLED 1 I I_ .1---...........-----IIRANSFINRID 1 ....),Fiiiiiti-'
1 IDRUPP10.11U1. 1-2**11NAHil I 1
Islorif-7 soma NINES'EARLY GRADUATE S 1 MAW'
MILL ENROLLED-IMAM/MEDIMMO DUILEANLY ranArauAig
_ _
isoEctfrs#
. IXIILLENHOLLEDIIAANSFERREDlooPPED 0011EARLV_GNAOUSIE .
WHEN
$ ..)IrmomEsiICIIVI1
ISHII/11El
E 2...,airlififir--2:1111111177 iscriariiiiii77_7777777777____i --4 I NAM 1
111114111S swap I etuliit I I ____ I_ ____ .. ___,.. 11. 1_ IV! . . _ ___4 ...)I ICIIVi __-----------
. IA .. - ?) I MP-7RM
.
iiiiifiii---"-.---7---
ISIA11/11Pi
1SCROOL NAHLI
'STAVE/11P'I
I ...)1004111
S )1P111iNii-1 i -11""I 111111:11--ISIAH/11F'ISPECIF's 1 ISIA11/11P1
2222222w. "12.122222 2 - I! t* .1 #..? 2
BEST CEi'il LIM311 235

B.1-18
HIGH SCHOOL AND BEYONDa national longitudinal study for the 1980s
Sponsored by the National Center for Education Statistics, U.S. Department of Education
January 8, 1982
Dear School Coordinator:
We would like to thank you again for your participation in this phase of the
High School and Beyond Survey. Your cooperation is making possible one of the
most thoroughgoing and important data collection efforts ever undertaken with
respect to America's youth population.
We have prepared a new issue of the High School and Beyspd Newsletter for
the survey's student participants. We will be sending you copies for the students
when we mail you the student invitations and other survey related material. You
should receive these materials approximately two weeks before the scheduled
Survey Day for your school.
Our local Survey -Representative will be in touch with you approximately two
weeks before the scheduled Survey Day. S/he will confirm that you have received
the materials at that time.
Enclosed, please find the School Questionnaire, which collects current data on
your school, such as present enrollment, present faculty size, etc. This form is
an essential part of the data collection process. Please give this to the princi-
pal or someone s/he designates, and mail the completed questionnaire back to us in
the enclosed postage paid envelope..0
On Survey Day, your school's Survey Representative will ask you for a copy of
your aster Teaching Schedule and a description of the course offerings. At that
time, s/he can pick up the School Questionnaire if it has not yet been mailed
back to us.4
Latzer in the year, some of the schools in the High School and Beyond Sample
will be contacted by mail to obtain transcripts for the 1980 sophomore cohort.
If your school is sampled for this phase of the project,'we hope you will be able
to continue as our contact person.A
If you have any questions, please feel free to call me collect at. (312) 753-1515.
I thank you again for your participation in this important study.
Sincerely,
X,C4,2-aDonald KoteckiSurvey Coordinator
DK:raw
Conducted cy the National Opinion Researcn Canter University or Chicago 5030 Scutn !Hie Cnicago..L. 50637 312/7511466
236
APPENDIX B.2: CORRESPONDENCE WITH STUDENTS
Locator Letter (to sampled students)
Newsletter Vol. 2 No. 1
23'?

c>
B . 2-1
HIGH SCHOOL AND BEYONDa national longitudinal study for the 1980s
Sponsored by the National Canter for gducation Statistics. U.S.Department of Education
7a11,1981
SUDDENLY ...... TWO YEARS LATER V
Is we promised, we are staying in touch with you by sending you volume 2of the GIGS SCHOOL LED BEYOND Newsletter. The newsletter describes sameof the results of the survey and gives you inforsation about the futureplan for NIGH SCHOOL AND BEYOND.
Since we last contacted you approximately 58,000 students from all 50states and the District of Columbia have participated in the survey.Policymakers are now using these findings to improve the public andprivate educatiOnal syliteasy.
we will be interviewing Several thousand young adults about every twoyears for the next 8 to 10 years. The inforaation we collect will sakeHIGH SCHOOL AND BEYOND one of the aost comprehensive surveys ever condnctelin our nation's history.
You can sake a continuing contribution to the success of BIDE SCHOOL ANDBEYOND. In early February ve will sail you a questionnaire that sill takeabout an hour to complete. We are eager to learn if your planstand.expec-tations have been fulfilled, and whether they have changed during the lasttwo years. We will enclose a check for S5.00 with the questionnaire toshow our appreciation for lour -time and cooperation.
We Aped to confirm your current address so we can deliier our questionnaireand check to you. Please tear off the fora at the bottom of this lettbr,check the appropriate box, sake any corrections and send it to us in theenclosed envelope.
Thank you again for helping us. Have a great year!
Sincerely,
ANTOINETTE DELI
COIMIUCTid br National Outman Rosiarch Owner 6030 South Ellis Chicago, II. 60637 312/7511483University of Chicago
PLEASE DETACH THIS FORM AND RETURN IN THE POSTAGEPAID ENVELOPE
IS THE INFORMATION PRINTED ON THE BOTTOM OF THIS FORM CORRECT? CORRECT ANYTHING THAT IS WRONGYES NO
NAME.
ADDRESS
CITY STATE ZIP CODE
TELEPHONE AfIfiT6) NUMBER
THIS PHONE IS USTED IN THE PHONE BOOK UNDER THIS NAME
THANK YOU FOR YOUR COOPERATION. WE LOOK FORWARD TO WORKING WITH YOU AGAIN.
238
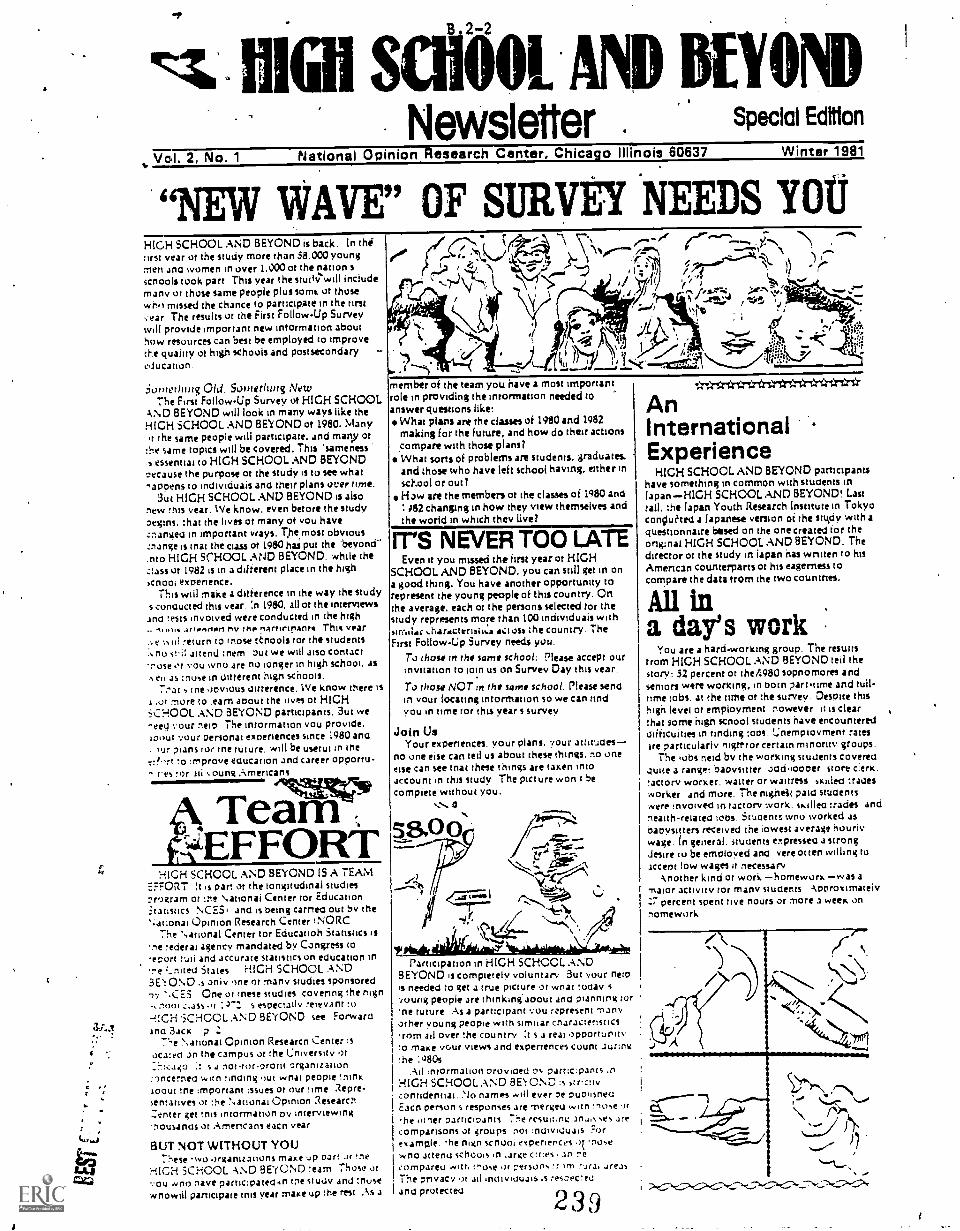
NIGH SC11.0201.AND BEYONDNewsletter Special Edition
Vol. 2, No. 1 National Opinion Research Canter, Chicago Illinois 60637 Winter 1981
"NEW WAVE" OF SURVEY NEEDS YOUHIGH SCHOOL AND BEYOND is back. In chi:first year of the study more than 58.000 youngmen aria women in over 1.000 of the nation sscnools took parr This year the stutly.'svill includemany or those same people plus sorne or thosewho missed the chance to participate in the firstsear The results or the First Follow-Up Surveywill provide important new intormation abouthow resources can best be employed to improvethe quality of high schools and postsecondaryeducation.
.ioinerhing OIL i. Something NewThe First Follow-Up Survey of HIGH SCHOOL
AND BEYOND will look in many ways like theHIGH SCHOOL AND BEYOND of 1980. Manyt the same people will participate, and many of:he same topics will be covered. This 'sameness.s essential to HIGH SCHOOL AND BEYONDTecause the purpose of the study is to see whatnaopens to individuals and their plans over time.
3ut HIGH SCHOOL AND BEYOND is alsonew trus year. We know, even before the studypegins. :hat the lives of many of you haveznangea in important ways. T,he most obvious:nange is tnat the class of 1980 has put the -beyond-.nto HIGH SCHOOL AND BEYOND. while theziass of 1982 is in a different place in the highscnooi experience.
This will make a difference in the way the studys conaucted this year. :n 1980. all of the interviewsand tests involved were conducted in the highm.. isv trio, nsfririn.ints This year
...e %III return to tnose ttnools for the students:m no st,il attend :nem out we will also contactrose or you wno are no longer in high school. asAeli as :note in anterent high schools.
Trot s Inc civious ditterence. We know there is.01 more to iearn about the lives or HIGH
SCHOOL AND BEYOND participants. But we-eeti Your nem The information you provide.wow our Personal experiences since 1980 ana. pions tor tne ruture. will be useful in the:!,rt to :improve eaucation and career opportu-^ tes !Or iii young Americans
,TeamH1GH SCHOOL .ND BEYOND IS A TEAM
EFFORT It is part of the iongitudinal studiesvrtleram or !tie National Center ror Education:tatisiics LACES, and is being cornea out by thes;a1;onal Opinion Research Center INORC
The National Centtr for Educatioh Statistics isne :ederai agency mandated by Congress to-eport ruii and accurate statistics on education ine ;_riltea States HIGH SCHOOL AND3E':OND .$ oniv one or many studies sponsored
'.CE.5 One or inese studies covering the nignnool :..ass .it S especially relevanr
SCHOOL AND BEYOND see ForwardIna Back p
7.-:e National Opinion Researcn Center :soCaied On the campus or he University or
s a notrororotit organizationroncernect wan :mains out wnai people Minkloout tne important issues or our time Repre-sentatives or he National ()Pinion ResearcnZenter get !nis intorrnation Dv interviewingnousanas or .Americans eacn year
BUT NOT WITHOUT YOUThese "No organizations make :Jis oars it the
HiCH SCHOOL AND BEYOND :earn Those or...ou no nave participated.in int study and :nosewnowiil participate MIS year make Up the rest As a
-o Ms.9 IN
)/-I 4I/ .9,t%9: >. "
k 5 1%1 J,
member of the team you nave a most importantrole in providing the intormation needed toanswer questions like:
What plans are the classes of 1980 and 1982making for the future, and how do their actionscompare with those plans?What sorts of problems are students. graduates.and those who have left school having, either insc.ocal or out?Haw are the members of the classes of 1Q80 and: J82 changing in how they view themselves andthe world in which they live?
IT'S NEVER TOO LATEEven it you missed the tint year of HIGH
SCHOOL AND BEYOND. you can still get in ona good thing. You have another opportunity torepresent the young people of this country. Onthe average. each of the persons selected for thestudy represents more than 100 individuals withsirrillor aciosa ;he country TheFirst Follow-Up Survey needs you.
To those in the same school: Please accept ourinvitation to loin us on Survey Day this year.
To those NOT in the same school. Please sendin your locating information so we can rindyou in time ror this year s survey
Join UsYour experiences. your plans. your attitaes
no one else can tell us about these things. no oneelse can see tnat these things are taken intoaccount in this study The picture won t becomplete without you.
.N. 0
AnInternationalExperience
HIGH SCHOOL AND BEYOND participantshave something in common with stuaents inJapanHIGH SCHOOL AND BEYOND! Lasttall, the Japan Youth Research Institute in Tokyocondued a Japanese version of the stu,civ with aquestionnaire bisect on the one created for theoriginal HIGH SCHOOL AND BEYOND. Thedirector of the study in Japan has written to hisAmerican counterparts of his eagerness tocompare the data trom the two countries.
All ina day's work
You are a hard-working group. The resultsfrom HIGH SCHOOL .AND BEYOND tell thestory: 52 percent or the4980 sopnomorei andseniors were working, in botn part-time and lull -r:me :otos. at the time or the survey. Despite thishigh level or employment nowever it is clearthat some ?ugh scnool stuaents have encountereddifficulties in finding tops. L:nemployment ratesire particularly nightfor certain minority groups.
The robs nerd by the working students coveredquite a range: baoysitter acidlooper store c:erk.actOry worker. waiter or waitress slotted tradesworker. and more. The nigneit paid studentswere involved in factory work. smiled trades andneaith-related lobs. Stuaents wno worked asbaoysitters received the iowest average hourlywage. in general. stuaents expresses a strongdesire to be employed ana were ot ten willing toaccent low wages it necessary
Another kind or won. homework was a-naior activity for many stuaents ApproximatelyZ7 percent spent rive nours or more a week onnomework
Participation in HIGH SCHOOL .ANDBEYOND is compietely voluntary But your nelOis needed to get a true picture or wnat tociay svoung people are thinking about ana pianning rot:ne ruture As a participant you represent Manyother young people with sirrniar cnaracieristiCSmom ail over the country :t s a real opportunityo matte Our views and expenences count duringhe :°80s
.Ali ritOrmation orovicied 0. partic.pantsHIGH SCHOOL AND BEYOND :5 ,tr.:!ivcorindentiai. No names will ever pe puoilsnroEat n person s responses are merged wan :some 'ifhe inner aarticioants ".""e resuit,nst .1n.,.%mes arecomparisons of Groups nOt individuals Forexample. the nigh scnoni esperterCel 'nose'wno attend schools in .arge cif:es an recompareu i!so,e or person, :r areasThe privacy of ail incliviouals rewec:eoand protected
239
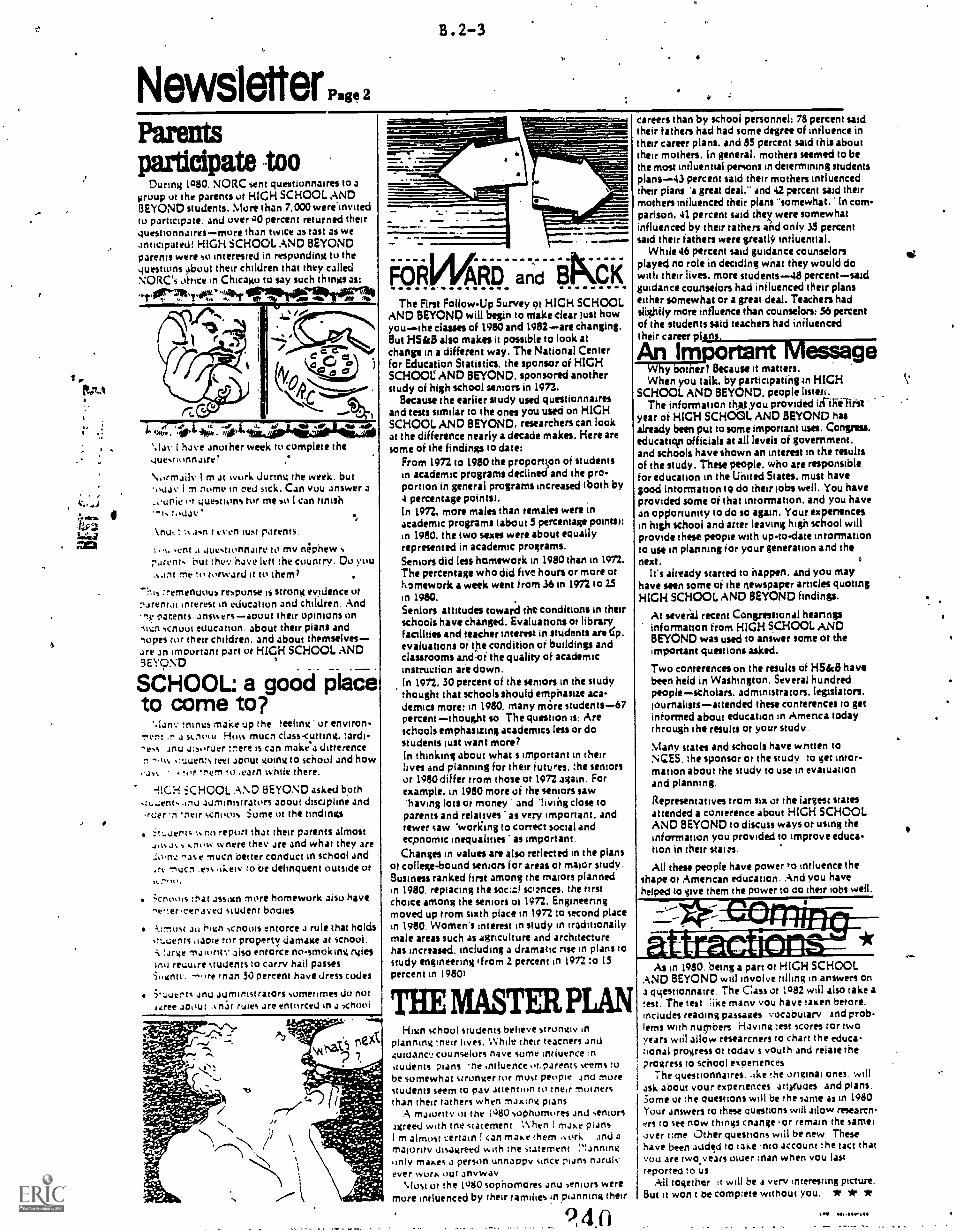
. ,
3.4.1
e
B . 2-3
Newsletter Page 2
Parentsparticipate too
During 1080. NORC sent questionnaires to agroup ot the parents ur HIGH SCHOOL ANDBEYOND students. More than 7.000 wereto participate. and over 00 percent returned theirquestionnairesmore than twice as vast as weanticipated! HIGH SCHOOL AND BEYONDparents were so interested in responding to thequestions about their children that they calledNORC`s oftice in Chicago to say such things as:
HO:7,14V "14kr 11111141111111114:
L1/
0z
las ( have another week to complete theduestionnaire7
Normaile I m at work Junng the week. butokla I m some in bed sick. Can you answer a
questions for me !Li 1 Can rinish
\ : t even lust parents.
'So ant duestionnaire to my nephew sparents Out :he have lett the country. Do you..ant me torward it to them,
:remenuoua response is strong evidence or:,..irentai interest in education and children. And4 parents answersaoout their opinions on-11,:n sunhat education. about their plans and'lopes tor their children. and about themselvesare an imoortant part ut HIGH SCHOOL AND3EYOND -SCHOOL: a good placeto come toy
tnsngs make up the reeling or environ-ment .n a sknoiti How mucn class<utting. :arch--e-s anu d:s,ruer :nere is can make.a difference
.:;;uen:s tent aonut going to school and how,a,% !i'r rnem ,o .earn while there.
4.1CH SCHOOL AND BEYOND asked both.ind administrators aoout discipline and
rder7n !neir scnoois Some ot the tindings
tweets ...no report that their parents almostJiia% wnere they are and what they are
e mucn better conduct in school and,re such .ess .1keiv to be delinquent outside ot
:!lat assign more homework also have"eter.ceraveu student bodies
^use ail i'ign scnooss entorce a rule that holds,iaoie ror property damage at scnool.
:arse mammy also entorce no-smoking Niesinu reduire students to carry hail passesignti-. tnan 50 percent have dress codes
iauents and administrators sometimes do noti.cree aoou: .s Kit ruses are entorced in a ,Cnnt,i
The First Follow-Up Survey or HIGH SCHOOLAND BEYOND will begin to make clear just howyouthe classes of 1980 and 1982are changing,But HSkB also makes it possible to look atchange in a different way. The National Centerfor Education Statistics. the sponsor of HIGHSCHOOL:AND BEYOND. sponsored anotherstudy of high school seniors in 1972.
Because the earlier study used questionnairesand tests similar to the ones you used on HIGHSCHOOL AND BEYOND. researchers can lookat the difference nearly a decade makes. Here aresome of the findings to date:
From 1972 to 1980 the proportion of studentsin academic programs declined and the pro-portion in general programs increased (both by4 percentage points).In 1972. more males than females were inacademic programs (about 5 percentage points':in 1980. the two sexes were about equallyrepresented in academic programs.Seniors did less homework in 1980 than in 1972.The percentage who did five hours or more orHomework a week went from 36 in 1972 to 23in 1980.Seniors attitudes toward the conditions in theirschools have changed. Evaluations or libraryfacilities and teacher interest in students are (p.evaluations or the condition of buildings andclassrooms andoi the quality of academicinstruction are down.In 1972. 30 percent of the seniors in the studythought that schools should emphasize aca-demics more: in 1980. many more students-67percent thought so. The question is: Areschools emphasizing academics lessor dostudents lust want more?In thinking about what s important in theirlives and planning for their futures. :he seniorsor 1980 differ rrom those ot 1972 again. Forexample. in 1980 more of the seniors saw'having lots of money and 'living close toparents and relatives as very important. andrawer saw 'working to correct social andecpnomic inequalities' as important.Changes in values are also reflected in the plans
or college-bound seniors for areas or maior study.Business ranked first among the melon plannedin 1980 replacing the soca! sciences. the rirstchoice among the seniors or 1972. Engineeringmoved up rrom sixth place in 1972 to second placein 1980 Women's interest in study in traditionallymale areas such as agriculture and architecturehas increased. including a dramatic rise in plans tostudy engineering i from 2 percent in 1972 to 13percent in 19801
TIE MASTER PLANHods school students believe strongly in
planning neir lives. while their teacners and.tuidanc: counselors nave some intluence initudents plans ne influence it.parents seems tobe somewhat stronger tor most people and morestudents seem to pay attent ton to t netr mothersthan their bathers when making plans
A maiority of the i080 sophomores and sensorsagreed with tne statement hen I make ownsm almost certain ! can make them and a
maturity disagreed with :tie statement :'!anntrtonly makes a person unnappv since plans naculyever work out anyway
'lost or the 1080 sophomores and sensors weremore influenced by their tamales in pianning their
9,40
careers than by school personnel: 78 percent saidtheir tethers had had some degree of influence intheir career plans. and 85 percent said this abouttheir mothers. In general. mothers seemed to bethe most influential persons in determining studentsplans-43 percent said their mothers influencedtheir plans 'a great deal." and 42 percent said theirmothers influenced their plans 'somewhat." In com-parison. 41 percent said they were somewhatinfluenced by their rather% and only 33 percentsaid their fathers were greatly influential.
While 46 percent said guidance counselorsplayed no role in deciding what they would dowith their lives, more students-48 percentsaidguidance counselors had influenced their planseither somewhat or a great deal. Teachers hadslightly more influence than counselors: 56 percentof the students said teaches had influencedtheir career plans.
An Important MessageWhy bother? Because it matters.When you talk. by participating4n HIGH
SCHOOL AND BEYOND. people lister.The information thx,you provided irriFeliist
year of HIGH SCHOOL AND BEYOND hasalready been put to some important uses. Congress.educatign officials at all levels of government,and schools have shown an interest in the resultsof the study. These people. who are responsiblefor education in the United States, must havegood intormation to do their lobs well. You haveprovided some of that intormation. and you havean opportunity to do so again. Your experiencesin high school and after leaving high school willprovide these people with up-to-date informationto use in planning for your generation and thenext. C
It's already started to happen. and you mayhave seen some of the newspaper articles quotingHIGH SCHOOL AND BEYOND findings.
At several recent Congressional hearingsinformation from HIGH SCHOOL ANDBEYOND was used to answer some of theimportant questions asked.
Two conferences on the results of HS&8 havebeen held in Washington. Several hundredpeoplescholars. administrators. legislators.iournalistsattended these conterences to getinformed about education in Amenca todaythrough the results or your study.
Many states and schools have written toNGES. the sponsor or the study to get :mar-matron about the study to use in evaluationand planning,
Representatives rrom six or the largest statesattended a conterence about HIGH SCHOOLAND BEYOND to discuss ways or using theinformation you provided to improve educa-tion in their stain.
All these people have power to influence theshape or American education. And you havehelped to give them the power to co their iobs well.
As in 1980. being a part of HIGH SCHOOLAND BEYOND will involve tilling in answers ona questionnaire. The Cass of 1082 will also take atest. The test :Ike many You have taken betore.includes reading passages vocabulary ind prob-lems with nucribers Having test scores tor twoyears will allow researcners to chart the educa-tional progress or today s youth and relate theprogress to school expenences
The questionnaires. .1ke the original ones. willask about your experiences attrudes and plans.:tome or the questions will be the same as in 1980Your answers to these questions will allow re-seam/s-eri to see now things cnange .or remain the samelover time Other questions will be new Thesehave been added to take nto account the tact thatYou are two sears older man when you lastreported to us.
All together it will be a very interesting picture.But it won t be compete without you. * *
in 1...64110,411.

APPENDIX C: FIELD PERIOD CORRESPONDENCE
fi
241

APPENDIX C.1.: 1980 SENIOR COHORT FIELD PERIOD CORRESPONDENCE,
Cover Letter Accompanying Senior Questionnaire.
Check Request Form
Just A Reminder...(postcard asking respondents tocomplete the questionnaire if they have not alreadydone so and thanking them for their 'participation)
4
1
t
de
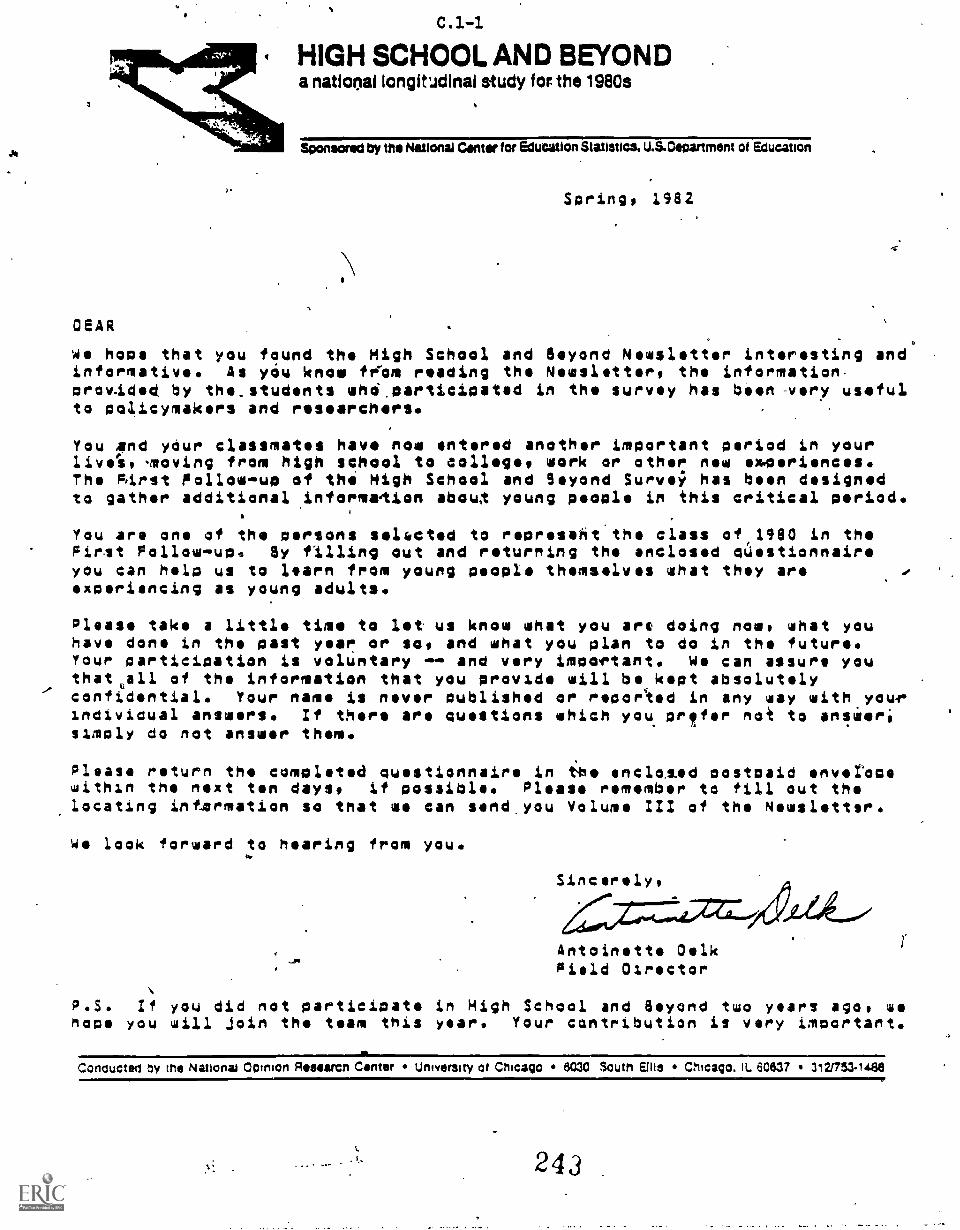
tt
C.1 -1
HIGH SCHOOL AND BEYOND .
a national longiNdinal study for the 1980s
Sponsored by the National Center for Education Statistics. U.S.Oepartment of Education
Spring, 1982
$
GEAR
we hogs that you found the Nigh School and Beyond Newsletter interesting andinformative. As you know front reading the Newsletter, the information.prov.ided by the_ students whd,participated in the survey has been every usefulto policymakers and researchers.
You and your classmates have now entered another important period in yourlivel, moving from high school to college, work or other new experiences.The First Followup of the high School and 9eyond Survey has been designedto gather additional information about young people in this critical period.
You are one of the persons sel4cted to represeht the class of 1980 in theFirst Followup. By filling out and returning the enclosed qUostionmaireyou can help us to learn from young people themselves what they areexperiencing as young adults.
Please take a little time to let us know what you are doing now, what youhave done in the past year or so, and what you plan to do in the future.Your participation is voluntary -- and very important. We can assure youthat all of the information that you provide will be kept absolutelyconfidential. Your name is never published or reported in any way with yourindividual answers. If there are questions which you prefer mak to answer,simply do not answer them.
Please return the completed questionnaire in ttl. enclos.od postpaid envotocewithin the next ten days, if possible. Please remember to fill out thelocating information so that we can send.you Volume /II of the Newsletter.
We look forward to hearing from you.
Sincerely,
Antoinette OelkPield Director
P.S. If you did not participate in High School and Beyond two years ago, weMope you will join the team this year. Your contribution is very important.
Conouctso oy tile National Opinion Researcn Canter University of Chicago 8030 South Ellis Chicago. IL. 60837 312/7511488
.0
C.1-2
JUST A REMINDER...Recently we mailed you a questionnaire accompartiedSy a check for $5.00. The check is our vay of saying
"Thank You".and "we need your help."
If you have already completed and mailed yourquestionnaire or have lost your questionnaire,plaitse ignore this reminder.
If you have not completed your questionnaireyet.,please do so and mail it today. We need :o near
from you so that ve can provide a continuingpicture of,the education and em-.
ploymenc experiences of
4 young Americans.
If you have any questionscall (collect) on Koceckiat (312) 753-1516.
Him smart .WD MOND-FIRST FOLLOW-UP SURVEYNational Opinion
Research Canter6030 S. EllisChicago, IL. 60637
OEM
HIGH SCHOOL AND BEYOND
CHECK REQUEST
Ai agreed over the telephone, we are again sending you materials and a questionnaire
so that you can participate in the HIGH SCHOOL AND BEYOND study. We will send you a
check when we receive your completed questionnaire. Please out the form below and
enclose it with the completed questionnaire.
NAME
ADDRESS
CITY/STATE/ZIP
Thank you very much. for your participation in the HIGH SCHOOL AND BEYOND survey. Ifyou have any questions, please do not hesitate to call (collect) Don Kotecki, Survey
Coordinator, at (312) 753-1516.
Office UseID NUMBER ' NUMBER
\letkmet Opinion RIMOMICII Canter MO South Ellie Chicane, IL E43037 312 7533130h
244,4.
1/82 - 4345 - 90

APPENDIX C.2: 1980 SOPHOMORE COHORT FIELD PERIOD CORRESPONDENCE
Notification to Teachers (giving them the names of thestudents selected to participate in the First Follow -Up)
Invitation to Students to Participate in the First Follow-Up(giving them the day, time and place where the surveywould be held)
Letters to Parents/Permission Forms. (sent to parents onlywhen a school requested they be Sent)
We Missed You...(giving students day, time and place ofthe make-up session)
Check Request Form for Out of School Sophomores

HIGH SCHOOL AND BEYONDC 2-1
NOTIFICATION TO TEACHERS OF STUDENTS SELECTED TO PARTICIPATE
IN THE FIRST FOLLOW-UP OF HIGH SCHOOL. AND BEYOND
To:Room
The following students were selected in 1980 to participate in a national longitudinal survey of high school
students, conducted by the National Opinion Research Center for the National Center for Education Statistics,
U. S. Department of Education. Clearances for their participation have been given by the appropriate authorites
in your school.
Please distribute the enclosed notices to the studenrq to whom they are addressed.
Data for HIGH SCHOOL. AND BEYOND will be collected periodically over the next few years. The survey will examine
the relationship of school, York, and other experiences to subsequent career choices as well as the educational
and labor participation of each of the respondents. This information is important to those who formulate
legislative proposals and educational policy since it gives them direct information about the kinds of students
you and ocher teachers work with every day.
We will greatly appreciate any help you can give in encouraging the students to be present promptly or the
appointed date. It is anticipated that the survey will require about 3 to 34 hours of class time.
Thank you for your cooperation.
'SURVEY
DAY
LACE 11.
NORC Representative
.,
IM11.
School Coordinator
arias.
National Opinion Research Canter 8030 South Ellis Chicago, IL 60637 312 753.1300 1 / 82 - 4345 - 3 30
4.C3 'f ":6Aistil sa I LutdauslIMU- 1 - I - + - -

BACK COM TILE STUDENT iNVIYATiONPACE 4
The first lollow-up survey,of High School andBeyond will help to show how the glasses of1980 and 1982 are changing. The followupsurveil will also add to the information that wasprovided by,high school students surveyed in1972. Findings of these studies indicate:
More than hall -.01 the students surveyed in1980 are working.
Women's interest in traditionally male areasof study such as agliculltiro and'archilecturehas increased since 1912.
Thole were more students 1980 Whothought schools should emphasizeacademics than there. were in-1972..
SelliOIS .did less homework in 1980 than in- 19/2. ,
4A laige inaionly of high schools attended by,`1111lose suiveyed in 1980 required students toGaily hall passes and enforced nosinokingrules
"Having lo1:1 el money" and "living close topatents and ielatives" weie very important tomore 5111t1C1115 surveyed in 1980 than in1972
Slightly' wow than 50 percent of the highsehools alt.:pried by survey participants have(buss coitus
8115111Q:it, 1,44eci among the minorsplanned by t..4,11e9L: bound bunioiti in 1981) 'In1912. wow planned iiiajois in the
I Ito talivry IL lining colulticleil by the NationalOpitiiiiii C:entel. University 01 Chicago.
. 2 4 %7
-:?:,:i';i'..,.,:'....:;- ,...0.zit;;-...:::.iF.' ,-.7,-,...
FRONT COVER OF TUE' STUDENT INVIT4TIONA4GE -1 .
......-t...r.I:ir-1-4.-...,;,.. ., . , ./..; ._,__:_i_r .-gi: .7. "..... ', i'...24:::..:4. ...
.. ,/,. 40, ," .. 11..11:,:f0 ., /I 'E r., .:e.. I t;!\,ttg
ii..,i...*
4
.
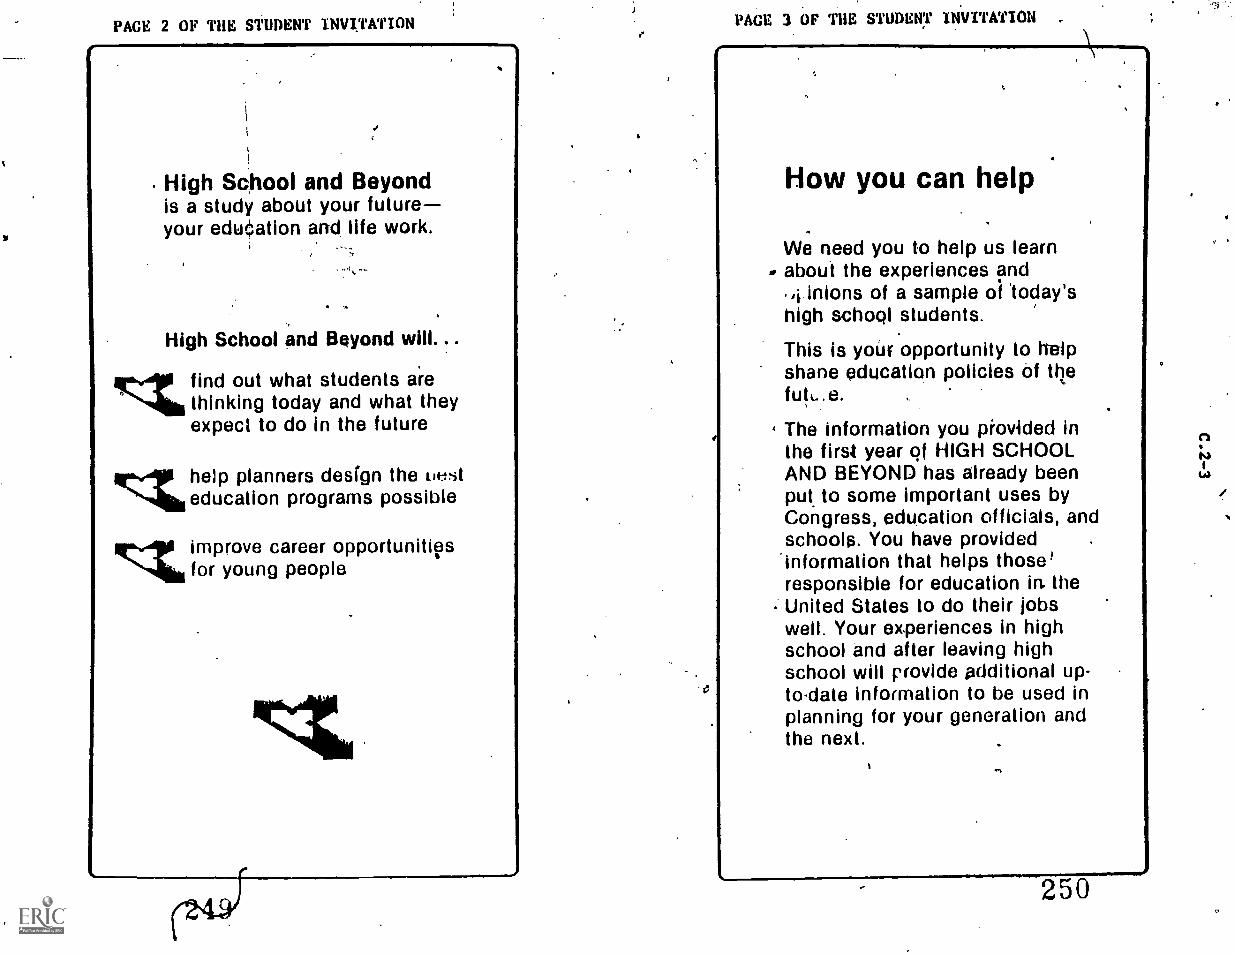
PACE 2 OF THE STUDENT INVITATION PAGE 3 OF THE STUDENT INVITATION
High Sc;hool and Beyondis a study about your futureyour educ'eation and life work.
High School and Beyond
find out what students arethinking today and what theyexpect to do in the future
riribhelp planners design the Lieiteducation programs possible
improve career opportunitiesfor young people
How you can help
We need you to help us learn- about the experiences and
inions of a sample of 'today'shigh school students.
This is yoUr opportunity to helpshane education policies of thefutu.e.
The information you provided inthe first year of HIGH SCHOOLAND BEYOND has already beenput. to some important uses byCongress, education officials, andschools. You have providedinformation that helps those'responsible for education in. theUnited States to do their jobswell. Your experiences in highschool and after leaving highschool will provide additional up-todate information to be used inplanning for your generation andthe next.
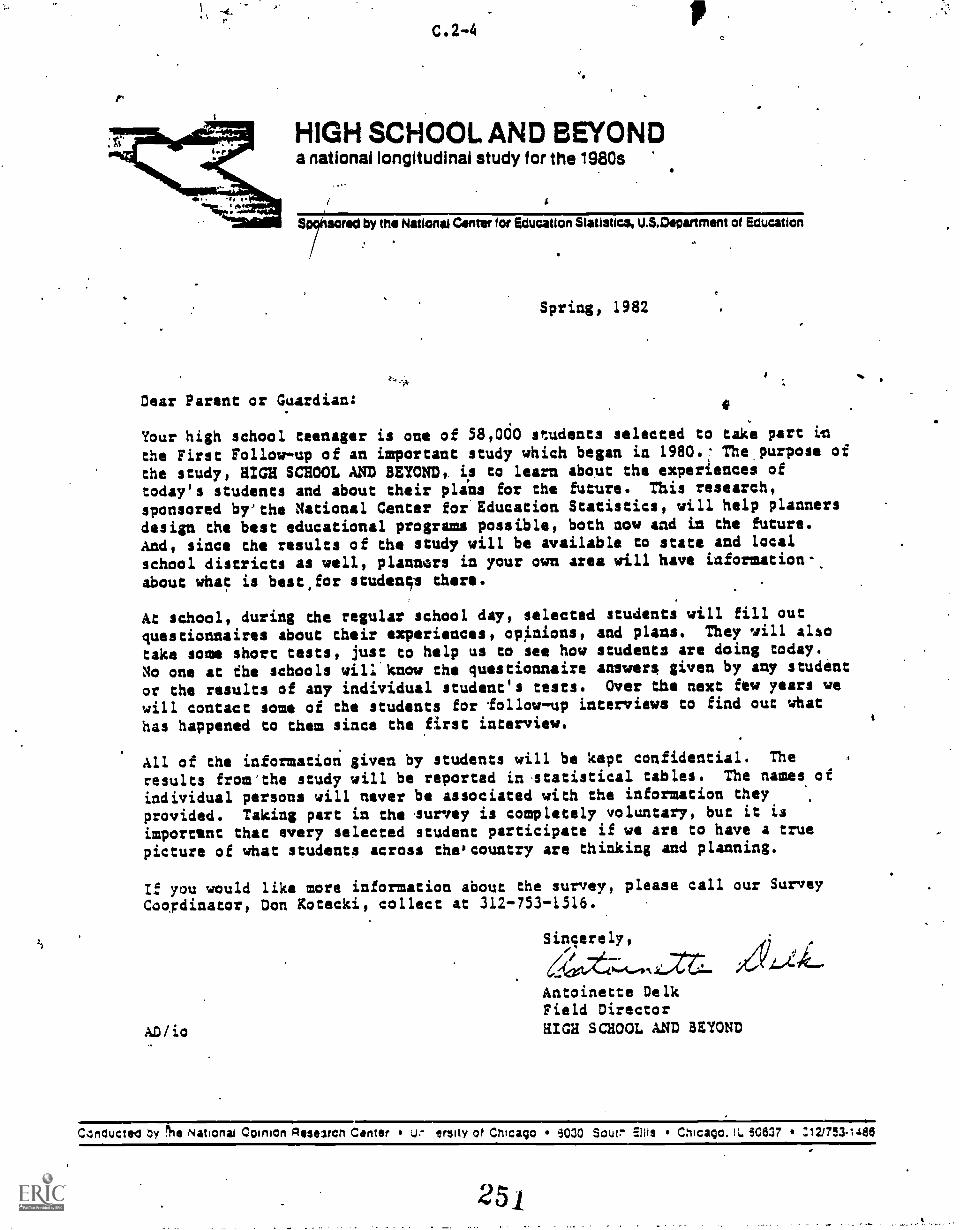
C.2-4Q
HIGH SCHOOL AND BEYONDa national longitudinal study for the 1980s
7nsored by the National Center for Education Statistics, U.S.Ceoartment of Education
Spring, 1982
Dear Parent or Guardian:
Your high school teenager is one of 58,000 students selected to take part ill
the First Follow-up of an important study which began in 1980. The purpose ofthe study, HIGH SCHOOL AND BEYOND, is to learn about the experiences of
today's students and about their plans for the future. This research,
sponsored by'the National Center for Education Statistics, will help planners
design the best educational programs possible, both now and in the future.
And, since the results of the study will be available to state and local
school districts as well, planners in your own area will have information-.
about what is best.for studenqs there.
At school, during the regular school day, selected students will fill out
questionnaires about their experiences, opinions, and plans. They will also
take some short tests, just to help us to see how students are doing today.
No one at dhe schools will know the questionnaire answers given by any student
or the results of any individual student's tests. Over the next few years we
will contact some of the students for ollow-up interviews to find out what
has happened to them since the first interview.
All of the information given by students will be kept confidential. The
results from'the study will be reported in statistical tables. The names of
individual persons will never be associated with the information they
provided. Taking part in the survey is completely voluntary, but it isimportant that every selected student participate if we are to have a true
picture of what students across the'country are thinking and planning.
If you would like more information about the survey, please call our Survey
Coordinator, Don Kotecki, collect at 312-753-1516.
AD / io
Sincerely,
Antoinette DelkField DirectorHIGH SCHOOL AND BEYOND
gm.
ConOuctel oy Nationai Colman Research Canter u.- emity of Chicago W30 Sour Ellis Chicago. IL 50637 :12/753-1486

40%
e.
HIGH SCHOOL AND BEYONDa national longitudinal study for the 1980s
Sponsored by me National Canter tor Education Statistics. U.S.Department of Education
C
Dear Parent or Guardian:ti
Spring, 1982
Your high school teenager is One of 58,000 students selected to take part inthe First Tollowup of an important study which began. in 1980. The purpose ofthe study, SIGH SCHOOL. AND BEYOND, is to learn about the experiences oftoday's students and about their plans for the future. This research,sponsored by the NAtional Center for Education Statistics, will help planneTsdesign the best educational programs possible, both now and in future.And, since the results of the study will be available to stati and localschool districts as well, planners in your own area will have informationabout what is best for students there.
At school, during the regular schooL day, selected students will fill outquestionnaires about their experiences, opinions, and plans. They will alsotake some short tests, just to help us see how students are doing today. No
one at the schools will know the questionnaire answers given by any student orthe results of any individual student's tests. Over the next few years wewill contact some of the students for followup interviews to find out whathas happened to them since the first interview. 4
All of the information given by students will be kept confidential. Theresults from the study willte reported in statistical tables. The names ofindividual persons will never be associated with the information theyprovided. Taking part in the survey is completely voluntary, but it isimportant that every selected student participate"if we are to have a truepicture of what students across the country are thinking and planning.
Please read the enclosed form. If you wish to give permission for your childto participate, you need do nothing; we will assume that you give permission.If, after thinking it over, you decide that you do not want your child toparticipate, please return the enclosed form to the school within three days.But, if you are thinking about not giving your permission, we would like ,to*hear .from you about your reasons. Also, if you feel you need tore informationbefore deciding, please feel free to call. In either case, our SurveyCoordinator, Don Kotecki, will be happy to talk with you; call him collect at312-753-1516.
Sincerely,
Antoinette DelkAD/ic Field DirectorEnclosure HIGH SCHOOL AND 3EYOND
Cons:rmed ty the Nit101141 Opinion Researcn Canter University of Chicago W30 South Ellis Chicago. IL 50637 31Z/753.10W
252

4 C.2-6
National OpiqipeResearch Center.
Univere4dY of Chicago
HIGH SCHOOL AND BEYOND PERMISSION FORM
I understand that the student named in your letter, has been chosen to cakepart in the First Follow-up of a nationwide survey of high school students
called HIGH SCHOOL AND BEYOND.
I understand that
ti
. My child can choose not to be in the survey.° (Most students enjoyanswering the questions, but nothingat all happens to those who don't
Want to.)
. The purpose of the survey is to learn what students think and plan todo after.they leave high school, and some students will be surveyed
again in about,:wo years.
. The names of the students in the survey 4.11 be kapt private and
completely separate from their answers.
. The students' answers will all be added together and published as
tables or charts.
0
I DO NOT grant permission for my daughter/son to take part in HIGH
SCHOOLASD BEYOND.
Parent's or Guardian's same:
Data:
r--7 -
4345/ic
alls amo -
Signature of Parent or Guardian
Please. Print

HIGH SCHOOL AND BEYONDa national longitudinal study fur the 1980s
Unnamed by the National Canter for Education Statistics, U.S.Cumartment of education
Spring, 1982
Dear Parent or Guardian:,
Your high school teenager is one of 58,000 students selected to take part inthe First Follow-41p of an important study which began in 1980. The purpose ofthe study, HIGH SCHOOL AND BEYOND, is to learn about the experiences oftoday's students and about their plans for the future. This research,sponsored by the. National Canter far Education Statistics, '011 help plannersdesign the best educational programs possible, both maw and in the future.And, since the results of the study will be available to state and localschool districts as well, planners in your. own area will have informationabout what is best for students there.
At school, during the regular school day, selected students will fill outquestionnaires about their experiences, opinions, and plans. They will alsotake soma short tests, just to help us see how students are doing today. No
one at the schools will know the questionnaire answers given by any student or
the results of any individual student's testy. Over the next few years wewill contact some of the students for follow -up interviews to find out whathas happened to them linen the first interview.
All of the information given by students will be kept confidential. The
results from the study will be reported in statistical tables.. The names ofindividual persons will never be associated with the information theyprovided. Taking part in the survey is completely voluntary, but it is .
important that every selected student participate if we are to have a truepicture of what students acrtss the country are thinking and planning.
?lease read the 'enclosed form. If you wish lo give permission for your childto participate, simply check the first box, sign, your name, and return theform to the school within three days. /f, after thinking it over, you decidethat you do not want your child to participate, check the second box, signyour name, and return, the form to the school within three days. But, if youare thinking about noc giving your permission, we would like to hear from youabout your reasons. Also, if you feel you need more information beforedeciding, please feel free to call. In either case, our Survey Coordinator,Don Kotecki, will behappy to talk with you; call him collect at312-733-1516.
Sincerely,
ALZk:Antoinette Delk,
AD/pc Field Director
Enclosure 3.1G2 SCHOOL AND BEYOND
V,/ th NitlOrlii COIMICIM RIISONC/1 Canter University of Chicago 3030 SCUM Ellis Chicago. L E0837 312/753.1415
254
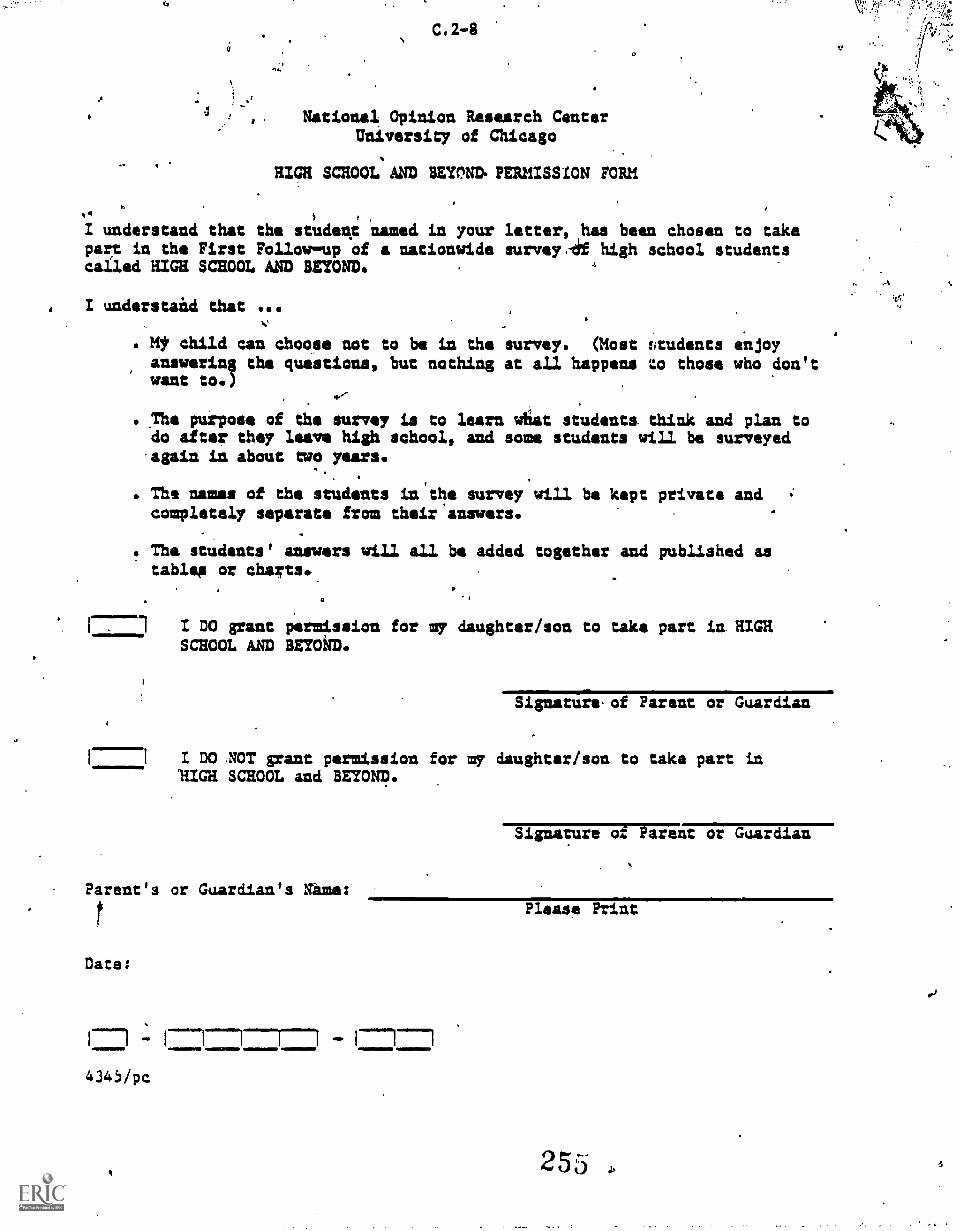
pr
National Opinion Research CenterUniversity of Chicago
RICH SCHOOL AND BEYOND. PERMISSION FORM
I understand that the student named in your letter, has been chosen to takepart in the First Follow-up of a nationwide survey.- f high school studentscalled HIGH SCHOOL AND BEYOND.
I understaid that
. MI child can choose not to be in the survey. (Most fitudents enjoyanswering the questions, but nothing at all happens to those who don'twant to.)
. The purpose of the survey is to learn what students think and plan todo after they leave high school, and some students will be surveyedagain in about two years.
. The names of the students in the survey will be kept private andcompletely separate from their answers.
. The students' answers will all be added together and published astables or charts.
a
I1 I DO grant permission for my daughter/son to take part in HIGHSCHOOL AND BEYOND.
Signature. of Parent or Guardian
I DO SOT grant permission for my daughter/son to take part inHIGH SCHOOL and BEYOND.
Parent's or Guardian's game:
Date:
I---1 - I 7---14345/pc
Signature o: Parent or Guardian
Please Print

HIGH. SCHOOL AND BEYONDa ROOM losolitudiMi study for the 191100
Sas emes MI MO 1610111611 Gem hs, Gramme SAmmere.
u.s. 011111111110Q N leresess
ti
To:
6
N
0
We missed you on Survey Day.
The ;,FIRST FOLLOW-UP OF HIGH SCHOOL AND BEYOND needsyour continued support so that we can learn whattoday's high school students are thinking and doing.
By'eaking part in the survey you will be representingmany ether high school students across the country.Your participation, both in the past and in the future,provides administrators, policy-makers, and educationresearchers with the kind of information they peed to*an better career and education programs for youngpeople.
Another survey session will be held
Time:,
Day:
Date:
Place:
Flease make every effort to come. Your help is importantto us.
?or more information about the surveyr call Don Koceckicollect at (312) 753-1516.
High School and Beyond Survey
25641=a1011011D
Catty'oo
Low.,gaimniC

HIGH SCHOOL AND BEYOND 1980 SOPHOMORE RESPONDENT FEE CHECK REQUEST
111::::1111:111
I
We're Sorry!
We were unable to have a preprinted check for you today. Please fill out.this form, andwe will send your check as soon as possible. Thank you for participating in High Schooland Beyond.
Please print Name
Ni mber and Street
City, State, Zip
Signature
O
SURVEY REPRESENTATIVE USE
Documents completed Ccircle): DO/Q TR /Q EG/Q SO/Q TST
Respondent LIDI I 01 - 1I 1 1 1Amount Date
O
rNSTRDCTONS: Give pink co'? to resiondast. awed whits copy to central unto', and kale yellow copy for files.
OFFICE USE
Clack Number I 1 I L Data Mailed I I I \`Z/82 - 4345 - 91
National Opinion Reourcts Cantor 5030 South Ellis Chicago, IL 50537 312 753.1300
2 5

t
APPENDIX C.3: TRANSCRIPT SURVEY CORRESPONDENCE
Principal Letter (requesting transcripts)
Student Checklist
Reimbursement Vouc4er
11.
258
".
4.

C.3-1
/1I HIGH SCHOOL AND BEYOND). a national longitudinal study for the 1980s'41
Sponsored by the National Canter for Education Statistics, U.S.Department of Education
Fall 1982
Dear Principal:
The National Opinion Research Center at the University of Chicago has been
selected to conduct an eight to ten year study, High School and Beyond, for
the National Center for Education Statistics. High School and Beyond is a
study of young people during the critical period of transition from high
school to post-secondary education, work, and family formation. the study is
designed to provide information of value for the development of future
educational policy at the Federal, State, and locil levels.
Approximately 58,000 students in 1,015 schools 'completed questionnaires and '
cognitive rests.in 1980, the base year. A rubsample of approximately 41,000
young people participated in the first follow-up in 1982. We are currently in
the process of requesting transcripts for approximately 19,000 members of the
class of 1982 nationwide: The Transcripts Sfudy,:is an essential-part of High
School and Beyond because it will Allow-educational patterns to be Analyzed
using accurate administrativeAgl rather than the youths' subjective memory
of their education.
One or more of the students for whom We are requesting transcripts transferred
to your school After the beginning of the study. We would like to have
transcripts for these students as well as your school's course. catalogue and
course enrollments for academic year 1981-82, if available. Attached is a %
list of*the items enclosed in this package, as well as instructions regarding
their preparation and return. The tasks we are asking your school to perform
are strictly clerical -in.naturevwewould Apprecate your aitiEnment of an
appropriate staff member to this project, for which you will be reimbursed
upon requelpt at the rate of $1.50 per transcript.
We would Appreciate the return of the transcripts and other materials by
November 12, 1982. If you are unable to return the materials by that date,
please return them as soon as possible so that we may meet our schedules. We
thank you for your cooperation and assure you that all information collected
in the study remains completely confidential; individual students cannot be
identified since the results are presented only in statistical form. If you
have any questions, please feel free to call me collect at (312) 962-8950,
9:00 a.m. - 5:00 p.m. Central. Time.
Sincerely,
k'emuShirley Rn ght
SR:tr Project Coordinator
Conducted by the National Opinion Research Center University of Chicago 6030 South'Ellis Chicago, IL 60637 312/753.1488
251)
C.372
/BM HIGH SCHOOL AND BEYONDa national longitudinal study for the 19806
Sponsored by the National Center for Education Statistics, U.S.Cepartment of Educatibn
Fall 1982
Dear Principal:
1
4 9
Earlier this year, a number of students from your school participated in HighSchool'and Beyond, a study being conducted for the Natiodal Center forEducation Statistics by the National Opinion Research Center: As.you Jam', animOortant part of High School and Beyond involves the collection of highschool transcripts for some of the students participating/in the study. 'Weare currently in the process of requesting transcripts fokapproximately 4
19,000 members of the class of 1982 nationwide. The Transcripts Stay isessential because it will allow educational patterns to be analyzed usingaccurate administrative data rathei than the youths' subjective memory oftheir education. 4.
During the survey period we obtained a variety of documents from schoolsparticipating in High School and Beyond (School Questionnaires, CourseEnrollments, Course Offerings, and Course Catalogues). In addition torequesting transcripts at this time, we are also requesting any of thesedocuments not yet received from your school.'
Attached is a list of the items enclosed in this package, as well AA in-structions regarding their preparation and return. The tasks we areasking-your school to perform ire strictly clerical in natureLwe would appreciate.your assignment of an appropriate staff member to this project, for which youwill be reimbursed upon request, at the rate of $1.50 per transcript.
We would appreciate the return of the transcripts and other materials byNovember 12, 1982. If you are unable to return the materials by that date,please return them as soon as possible so that we may meet our schedules. Wethank you for your cooperation and assure ycu that all information collectedin the study remains completely confidential; individdal students cannot beidentified since the results are presented only in statistical form. If youhave any queszions, please feel free to call me collect at (312) 962-8950,9:00 a.m. - 5:00 p.m. Central Time.
SK:rg
Sincerely,
Shirley knightProject Coordinator
,
lb
4
Conducted by the National Opinion Research Center University of Chicago 6030 South Ellis Chicago, IL 60637 312/753-1486
C.3-3
HIGH SCHOOL AND BEYONDanational longitudinal study for the 1980s
Sponsored by the National Center for Education Statistics, U.S.Department of ,Education
Fall 1982
Dear Principal:
In the spring of 1982 a number of students frum your school participated inHigh School and Beyond, a study being conducted for t'e National Center forEducation Statistics by the National Opinion Research Center. As eyou know, animportant part of High School and Beyond involves the collectiocCof highschoo/ transcripts for some of the students participating in the study. We
are currently in the process of requesting transcripts for approximately19,000 members of the class of 1982 nationwide. The Transcripts Study is anessential part of High School and Beyond because it will allow educationalpatterns to be analyzed using accurate administrative data rather than theyouths' subjective memory of their education. Though your school has beenunable to participate in some phases of High School and Beyond, you could makean important contribution at this point, one that requires minimal time onyour part.
During the 1982 Survey period we obtained a variety of documents from schoolsparticipating in High School and Beyond (School Questionnaires, CourseEnrollments, Course Offerings, and Course Catalogues). In addition torequesting transcripts at this time, we are also requesting any of thesedocuments not yet received from your school.
Attached is a list of the items enclosed in this package, as well as in-structions regarding their preparation and return. The tasks we are askingyour school to perform are strictly clerical in nature; we would appreciateyour assignment of an appropriate staff member to this project, for which youwill be reimbursed upon request, at the rate of $1.50 per transcript.
We would appreciate the return of the transcripts and other materials byNovember 12, 1982. If you are unable to return the materials by that date,please return them as soon as possible so that we may meet our schedules. We
thank you for your cooperation and assure you that all information collectedin the study remains completely confidential; individuili students cannot beidentified since the results are presented only in stat.,.yAcal form. If you
have any questions, please feel free to call me collect at (312) 962-8950,9:00 a.m. 5:00 p.m. Central Time.
Sincerely,
Shirley KnightProject Coordinator
AttachmentSK:rf
Conducted by the National Opinion Research Center University of Chicago 6030 South Ellis Chicago. IL 60637 312/962.8998

C.3-4
___=1 HIGH SCHOOL AND BEYONDa national longitudinal study for the 1980s:
Sponsored by the National Center for Edutation Statistics, U.S.Department of Education
December 3, 1982
Dear Principal:
A few weeks ago we asked for youi help in collecting transcripts forone or two of your students for the High School and Beyond study,the ten-year project sponsored by the National Center for EducationStatistics. Because we have not received a reply from you during thebusy opening weeks of school, we are making a special request foryour help now.
Approximately 58,000 students participated in 1980, and 41,000 of thesame young people participated in 1982. We are requesting transcriptsfor about 19,000 of them. The student transcript data that is beingcollected currently will provide important factual information forinclusion in the study. Each school and each student provides anirreplaceable contribution to the sample. Confidentiality is rigorously
maintained.
The students whose names appear on the attached checklist told us thatyours was the most recent school they attended. In most cases theysigned forms permitting the release of transcript information, and weincluded them in the earlier mailing.
We would appreciate it if you could provide us with a transcript forthe students whose names appear on the list. You will be reimbursed$1.50 for each transcript upon request by filling out the voucherenclosed and sending it with the,checklist and transcripts. A label
for each student is included and should be attached to the back of thetranscript. If no transcript is available, would you please make anote to that effect on the checklist and return it in the enclosed
envelope?
Thank you for your cooperation. If you have any questions please docall me, collect, at (312)962-8950.
Sincerely,
Shirley KnightProject Coordinator
SK:db
Conducted by the National Opinion Research Center University of Chicago 6030 South Ellis Chicago, IL 60637 3121753.1486
26 "4
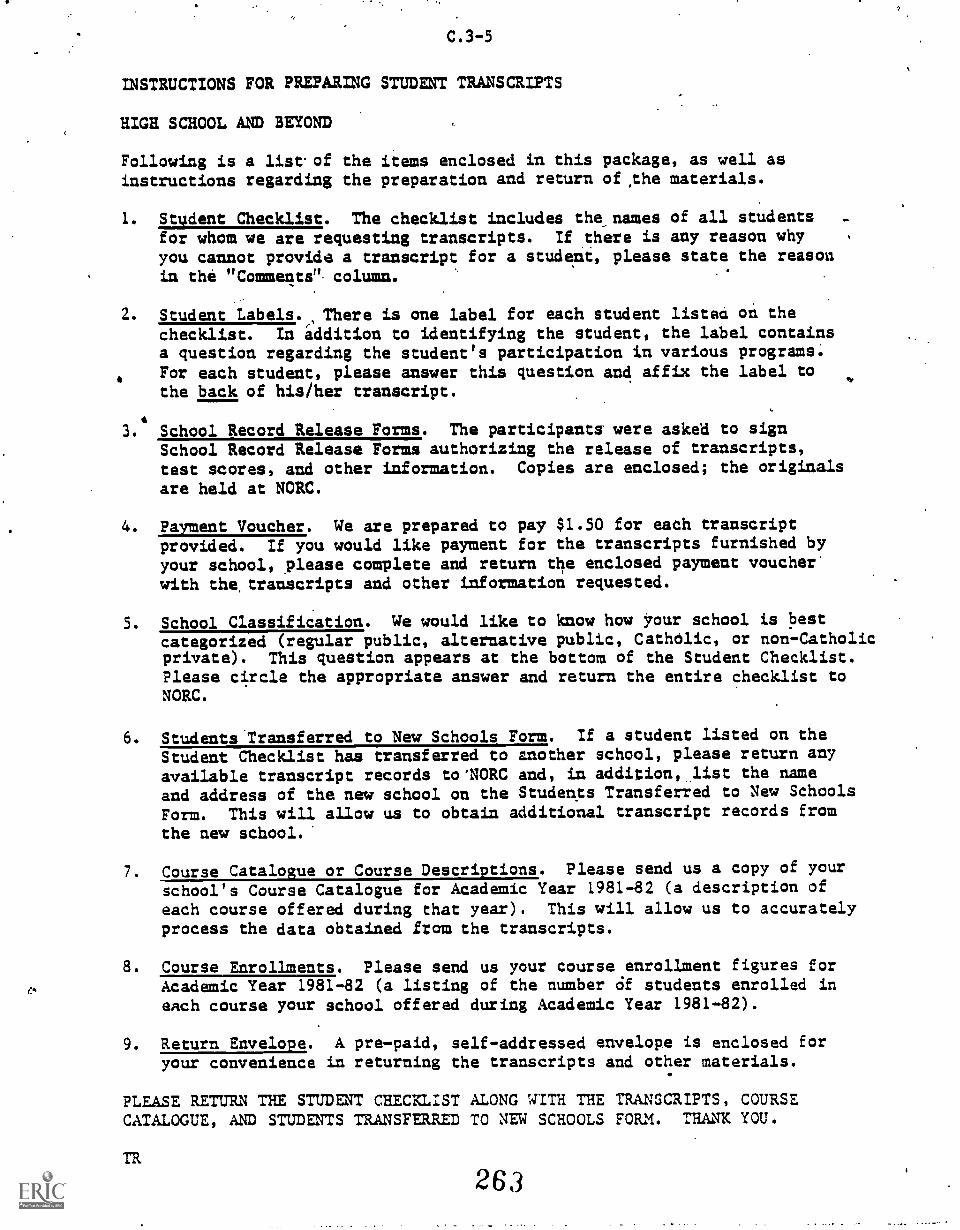
C.3-5
INSTRUCTIONS FOR PREPARING STUDENT TRANSCRIPTS
HIGH SCHOOL AND BEYOND
Following is a listof the items enclosed in this package, as well asinstructions regarding the preparation and return of ,the materials.
1. Student Checklist. The checklist includes the names of all studentsfor whom we are requesting transcripts. If there is any reason whyyou cannot provide a transcript for a student, please state the reasonin the "Comments"- column.
2. Student Labels./ There is one label for each student listen on thechecklist. In addition to identifying the student, the label containsa question regarding the student's participation in various programs:For each student, please answer this question and affix the label tothe back of his/her transcript.
3. School Record Release Forms. The participants were asked to signSchool Record Release Forms authorizing the release of transcripts,test scores, and other information. Copies are enclosed; the originals
are held at NORC.
4. Payment Voucher. We are prepared to pay $1.50 for each transcriptprovided. If you would like payment for the transcripts furnished byyour school, please complete and return the enclosed payment voucher*
with the, transcripts and other information requested.
5. School Classification. We would like to know how your school is bestcategorized (regular public, alternative public, CathOlic, or non-Catholicprivate). This question appears at the bottom of the Student Checklist.Please circle the appropriate answer and return the entire checklist toNORC.
6. Students.Transferred to New Schools Form. If a student listed on theStudent Checklist has transferred to another school, please return anyavailable transcript records to'NORC and, in addition, list the nameand address of the new school on the Students Transferred to New Schools
Form. This will allow us to obtain additional transcript records from
the new school.
7. Course Catalogue or Course Descriptions. Please send us a copy of your
school's Course Catalogue for Academic Year 1981-82 (a description ofeach course offered during that year). This will allow us to accuratelyprocess the data obtained from the transcripts.
8. Course Enrollments. Please send us your course enrollment figures forAcademic Year 1981-82 (a listing of the number Of students enrolled ineach course your school offered during Academic Year 1981-82).
9. Return Envelope. A pre-paid, self-addressed envelope is enclosed foryour convenience in returning the transcripts and other materials.
PLEASE RETURN THE STUDENT CHECKLIST ALONG WITH THE TRANSCRIPTS, COURSECATALOGUE, AND STUDENTS TRANSFERRED TO NEW SCHOOLS FORM. THANK YOU.
TR
263
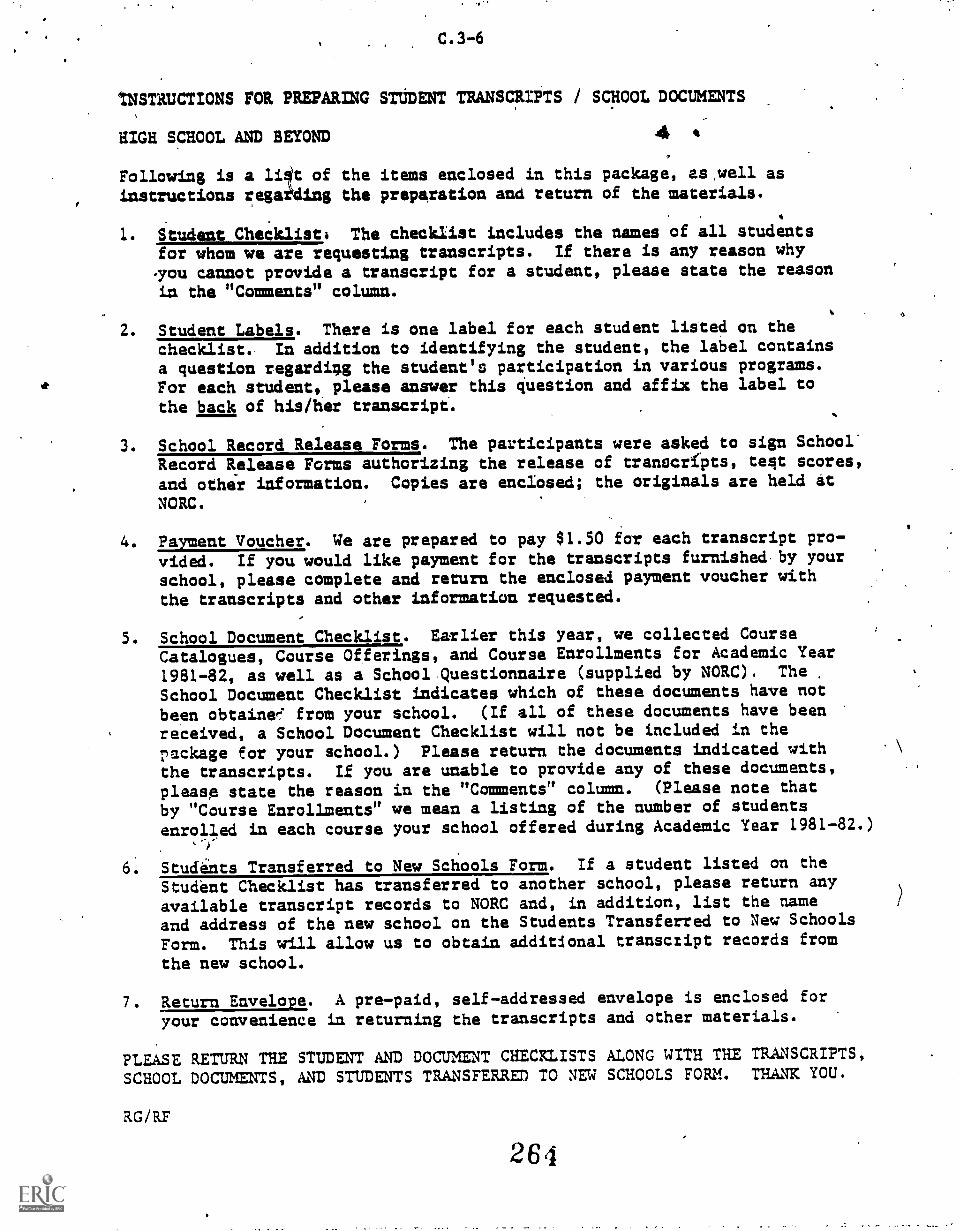
C.3-6
USTRUCTIONS FOR PREPARING STUDENT TRANSCRIPTS / SCHOOL DOCUMENTS
HIGH SCHOOL AND BEYOND
Following is a li4t of the items enclosed in this package, as.well as
instructions regai4ing the preparation and return of the materials.
1. Student Checklists The checklist includes the names of all studentsfor whom we are requesting transcripts. If there is any reason why
you cannot provide a transcript for a student, please state the reason
in the "Comments" column.
2. Student Labels. There is one label for each student listed on the
checklist. In addition to identifying the student, the label containsa question regarding the student's participation in various programs.For each student, please answer this question and affix the label tothe back of his/her transcript.
3. School Record Release Forms. The participants were asked to sign School.Record Release Forms authorizing the release of transcripts, test scores,
and other information. Copies are enclosed; the originals are held at
NORC.
4. Payment Voucher. We are prepared to pay $1.50 for each transcript pro-
vided. If you would like payment for the transcripts furnished by yourschool, please complete and return the enclosed payment voucher with
the transcripts and other information requested.
5. School Document Checklist. Earlier this year, we collected CourseCatalogues, Course Offerings, and Course Enrollments for Academic Year
1981-82, as well as a School Questionnaire (supplied by NORC). The
School Document Checklist indicates which of these documents have not
been obtainer from your school. (If all of these documents have beenreceived, a School Document Checklist will not be included in the
package for your school.) Please return the documents indicated with
the transcripts. If you are unable to provide any of these documents,
please state the reason in the "Comments" column. (Please note thatby "Course Enrollments" we mean a listing of the number of students
enrolled in each course your school offered during Academic Year 1981-82.)
6. Students Transferred to New Schools Form. If a student listed on the
Student Checklist has transferred to another school, please return any
available transcript records to NORC and, in addition, list the name
and address of the new school on the Students Transferred to New Schools
Form. This will allow us to obtain additional transcript records from
the new school.
7. Return Envelope. A pre-paid, self-addressed envelope is enclosed for
your convenience in returning the transcripts and other materials.
PLEASE RETURN THE STUDENT AND DOCUMENT CHECKLISTS ALONG WITH THE TRANSCRIPTS,
SCHOOL DOCUMENTS, AND STUDENTS TRANSFERRED TO NEW SCHOOLS FORM. THANK YOU.
RG/RF
264
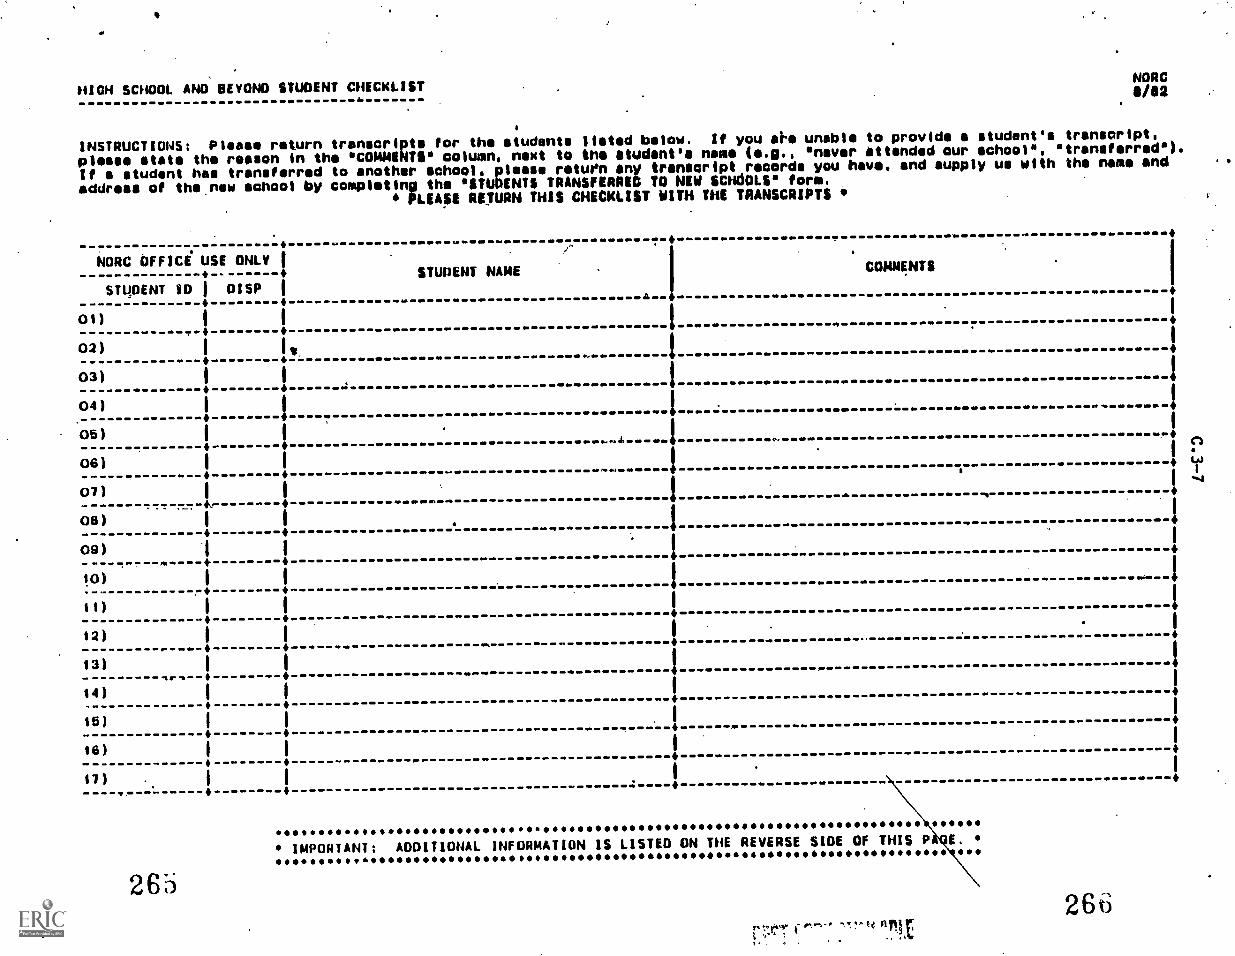
HIGH SCHOOL AND BUONO STUDENT CHECKLISTNORC/42
INSTRUCTIONS; Please return transcripts for the students listed below. If you silo unable to provide a student's transcript,
please state the reason in the 'COMMENTS" column, newt to the student's name (e.g., 'never attended our school ", transferred6).
If a student has transferred to another school, please return any transcript records you have, and supply us with the name and
address of the new school by completing the 'STUDENTS TRANSFERRED TO NEW SCHdOLS" form.PLEASE RETURN THIS CHECKLIST WITH THE TRANSCRIPTS
,
NORC OFFICE USE ONLY i,- i
STUDENT ID I DISP I I
.
COMMENTSSTUDENT NAME
L - -4
01)T
I I02) 1 I. I
03) I I !04) I
1I
06)
05) I ..r, 1 .
II
I
::: i
1 .
Os)4 4 1
09) 1
II
I
$0) I.
1.. .1
11) 1 1I
12) I I . I
.
1
13) II
",.. -4.
14) 1 1
6
I
1 1 I1
4
16) 6 I I
171 1 1 I. .
265
00 ********* 40,0411441001404111,00111 *****1100110000011100000000000010004101110111000004141001140041 00004
IMPORTANT; ADDITIONAL INFORMATION IS LISTED ON THE REVERSE SIDE OF THIS P
*
rt."1- nn;E:, 2613
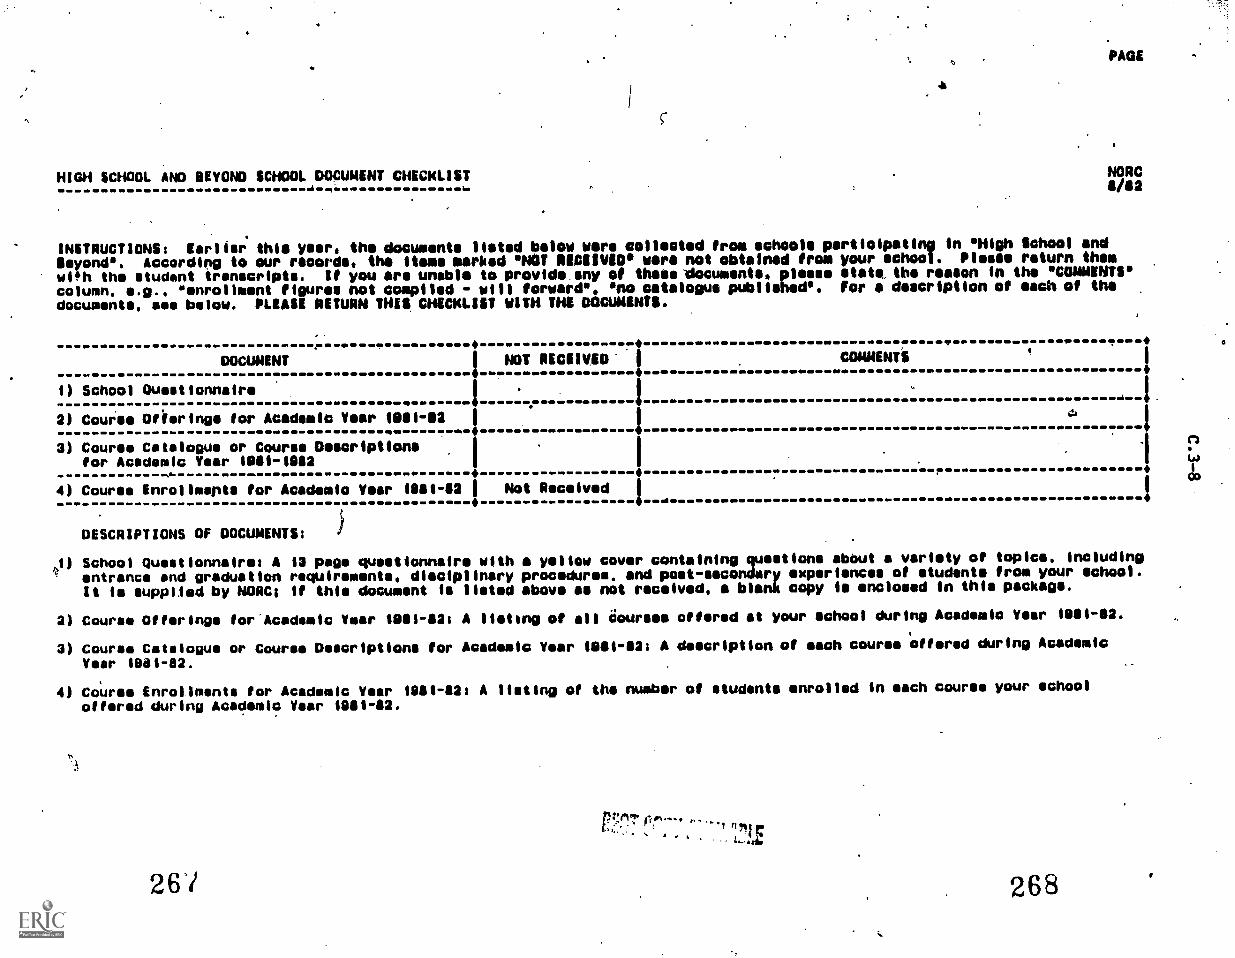
c.
PAGE
HIGH SCHOOL AND BEYOND SCHOOL DOCUMENT CHECKLIST NORCa/s2
INSTRUCTIONS: Earlier this year the documents listed below were collected from schools participating In 'High School and
Beyond'. According to our records, the items marked 'NOT aistme wore not obtained from your school. Please return themwith the student transcripts. If you are unable to provide any of these-documents. please Stets the reason In the 'COMMENTS'column, e.g.. 'enrollment figures not compiled will forward'. 'no catalogue published'. For description of each of thedocuments, see below. PLEASE RETURN THIS CHECKLIST WITH THE amounts.
4.. . - g 0
DOCUMENT NOT RECEIVED' 1 COMMENTS
I) School Questionnaireg I I .i ..4
2) Course Offerings for Academic Year 10111-12 $a.
1
....., I .
3) Course Catalogue or Course Descriptions 11
for Academic Veer 19111-10$2.., I
i 4.44
4.
I
4) Course Enrollments for Academia Year II1111-12 1 Not Received 1 1
OD
4
DESCRIPTIONS OF DOCUMENTS:
1) School Questionnaire: A 13 page questionnaire with yellow cover containing questions about a variety of topics. Including0 entrance end graduation requirements, disciplinary procedures, and past-secondary experiences of students from your school.
It is supplied by NORC; if this document Is listed above as not received, blank copy is enclosed In this package.
3) Course offerings for Academic Year MI-13: A listing of all courses offered at your school during Academic Year 1881-82.
3) Course Catalogue or Course Descriptions for Academic Year 19111-12: A description of each course offered during Academic
Year 1881-82.
4) Course Enrollments for Academic Year 19111-1121 A listing of the number of students enrolled in each course your school
offered during Academic Year 1881-82.
261 268

eti
'HIGH SCHOOL AND BEYOND STUOiNT CHECKLIST NORC4 8/82
INSTRUCTIONS: Please return transcripts for the students listed below. If., ou are unable to provide a student's transcript,please state the reason in the COMMENTS° column, next to the student's name (e.g.. never attended our school ", "transferred').
If student has transferred to another school, please return any transcript records you have, and supply us with the name and
address of the new school by completi the 'STUDENTS TRANSFERRED TO NEW SCHOOLS" form.PngLEASE RETURN THIS CHECKLIST WITH THE TRANSCRIPTS
4
NORC OFFICE USE ONLYSTUDENT NAME COMMENTS
STUDENT ID I DISP 1 I
4 4 4
0 1 )
!I a
SCHOOL CLASSIFICATION
Which of the following categories best describes your school? (CIRCLE ONE)
Regular public school i
Alternative public school 2"
'Catholic s pool 3
Non-Cathsilic private school 4
269270

WNW
HIGH gCWia 4 BEYONDTRANSCRIPTS REIMBURSEMENT FORM
SCHOOL NAME:
MAILING ADD#ESS:
4359
yalm..
Number of ranscripts provided: @ $1.50
Signature of School Official:
Date:
Please return all copies of this form.One copy will be returned with your Payment.
FOR NORC USE ONLYCharge: , 4359 2024 039 116
Project-Activity-Area-Account.
rtg ec e approve or payment y
(Date)
Check #:
Date:
Amount: $
ID#:
White copy to Accounting; Yellow'copy to School; Pink copy to Project
27j

A
APPENDIX D: CRITICAL ITEMS
272

D -1
iy
First Follow-Up School.gUistionnaire
Critical Items Edit.
Q.1: As of October 1, 1981 (or the nearest date for which data areavailable), what was the total membership in grade 12 in your highschool?
Retrieve. if not complete.
Q.2: To the best of your knowledge, about what percentage of the entire1980-1981 graduating class is now enrolled in a regular two-year orfour-year college?
Retrieve only if another retrieval itemexists.
Q.3e To the best of your knowledge, about what percentage of the 1980-1981graduating 'class went on to post-secondary education or training ofsome kind OTHER THAN A UNIOR COLLEGE OR FOUR-YEAR COLLEGE (forexample, beauty school, vocational-technical school, or businessschool)? Do not include military service.
Retrieve only if another retrieval item exists.
Q.5: Approximately what percentage of 'the class of 1982 graduated early (orleft early with a diploma or equivalent)? (IF NONE, WRITE "0").
Retrieve only if another retrieval item exists.
Q.6: Please estimate the approximate percentage of students in the class of1982 and in the class of 19834who entered the 10th grade but have sincedropped out. Do not include students who transferred to anotherschool.
Passes the edit it only class of 1982 is answered.
Q.8: About what percentage of the students.who enter your school would yousay need remedial or basic skills instruction in reading, English, ormath?
Passes the edit if any of the three parts is answered.
Q.9: Are seniors required to pass a minimum competancy (proficiency) test inorder to receive a high school diploma? (CIRCLE ONE)
Retrieve if not complete.
Q.10: In what grades is a minimum competency or proficiency test given to allstudents? (CIRCLE AS MANY NUMBERS AS APPLY)
Retrieve if not completed.
273
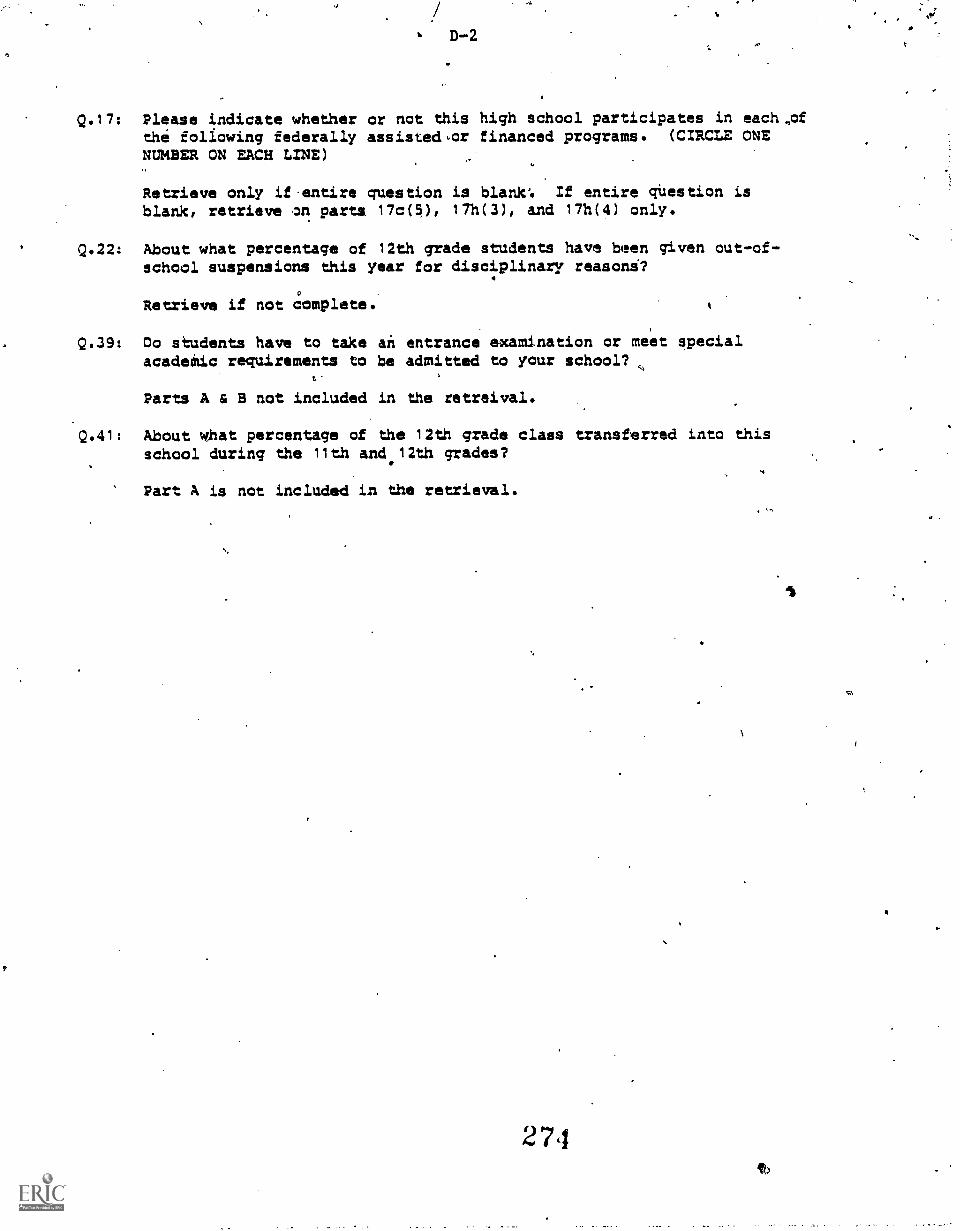
Q.17: Please indicate whether or not this high school participates in each,ofthe following federally assisted.or financed programs. (CIRCLE ONENUMBER ON EACH LINE)
Retrieve only if question is blank: If entire question isblank, retrieve on parts 17c(5), 17h(3), and 17h(4) only.
Q.22: About what percentage of 12th grade students have been given out-of-school suspensions this year for disciplinary reasons?
Retrieve if not complete.
Q.39: Do students have to take an entrance examination or meet specialacadernic requirements to be admitted to your school?
ti
Parts A & B not included in the mstreival.
Q.41: About what percentage of the 12th grade class transferred into thisschool during the 11th and 12th grades?
Part A is not included in the retrieval.
2 7 ,1
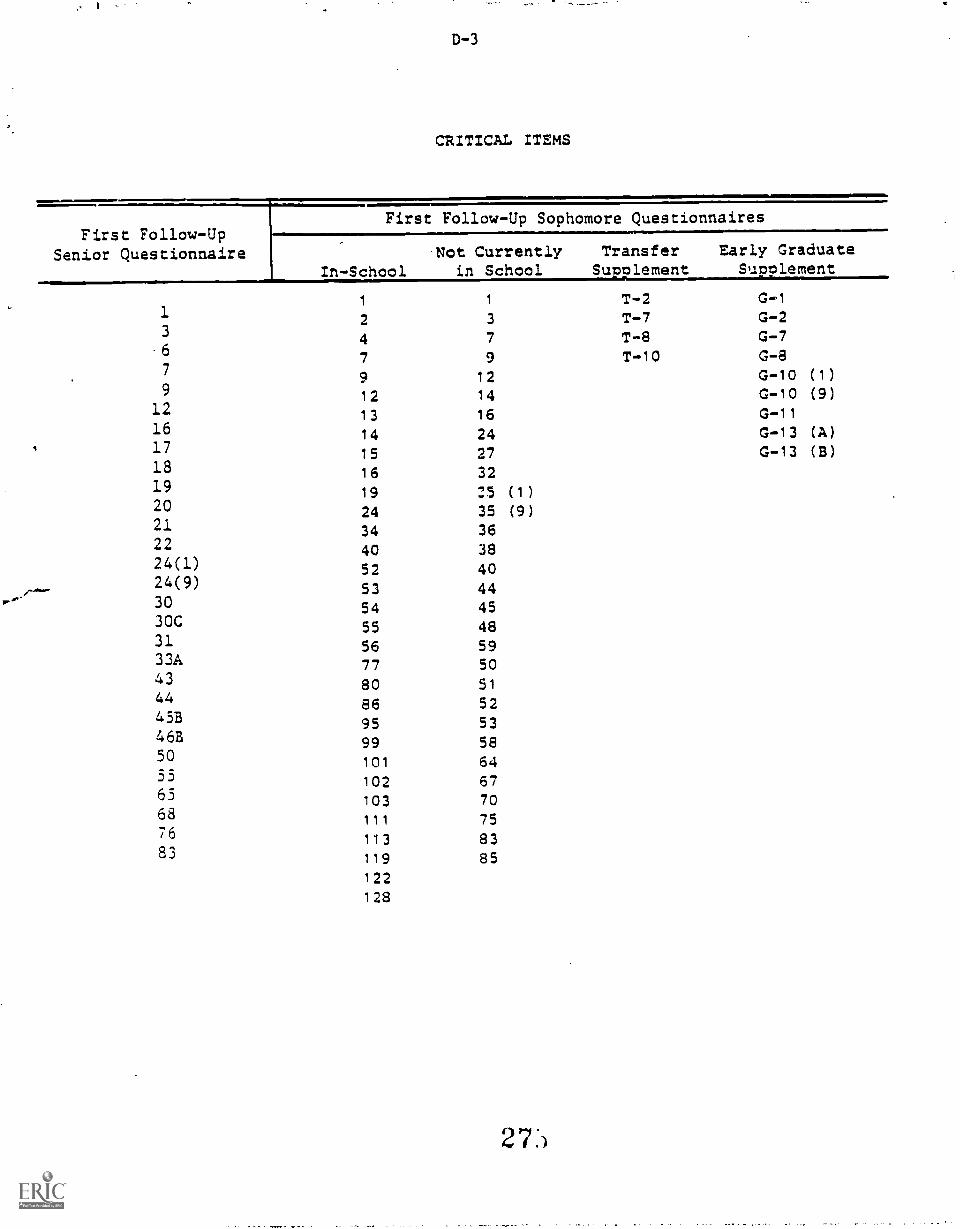
D-3
CRITICAL ITEMS
First Follow-UpFirst Follow-Up Sophomore Questionnaires
Senior Questionnaire Not Currently Transfer Early Graduate
In-School in School Suulement Suoolement
1 T-2 G-11
3
-6
7
2
4
7
9
3
7
9
12
T-7T-8T-10
G-2G-7G-8G-10 (1)
9 12 14 G-10 (9)12 13 16 G-1116 14 24 G-13 (A)17 15 27 G-13 (B)18 16 3219 19 25 (1)20 24 35 (9)21 34 3622 40 3824(1) 52 4024(9) 53 4430 54 4530C 55 4831 56 5933A 77 5043 80 5144 86 5245B 95 5346B 99 5850 101 6455 102 6763 103 7068 111 7576 113 8383 119 85
122
128