ECONOMIC SURVEYOF SINGAPORE 2020 - MTI
98
ECONOMIC SURVEY OF SINGAPORE 2020
-
Upload
khangminh22 -
Category
Documents
-
view
3 -
download
0
Transcript of ECONOMIC SURVEYOF SINGAPORE 2020 - MTI

ECONOMICSURVEY OF
SINGAPORE2020

February 2021Ministry of Trade and IndustryRepublic of Singapore
website: www.mti.gov.sgemail: [email protected]
All rights reserved. No part of this publication may be reproduced, stored in a retrieval system or transmitted in any form or by any means, electronic, mechanised, photocopying, recording or otherwise, without the prior permission of the copyright holder.

58 6.1 Manufacturing
60 6.2 Construction
64 6.3 Wholesale Trade
65 6.4 Retail Trade
66 6.5 Transportation & Storage
68 6.6 Accommodation
70 6.7 Food &
Beverage Services
71 6.8 Information &
Communications
72 6.9 Finance & Insurance
76 6.10 Real Estate and
Professional Services
48
54
Chapter 5Balance of Payments
Chapter 6Sectoral Performance
Main Indicatorsof the Singapore Economy
Chapter 1Economic Performance
Chapter 2Labour Market and Productivity
Chapter 3Costs, Investments and Prices
27 Box Article 3.1 Updated Business Cost
Conditions in Singapore’s Manufacturing and Services Sectors
02
06
14
22
40Chapter 4International Trade
84Feature ArticlePerformance Of The Singapore Economy In 2020
80Chapter 7Economic Outlook
CONTENTS

MAIN INDICATORS OF
THE SINGAPORE ECONOMY
70.1%
BREAKDOWN OF SERVICES PRODUCING INDUSTRIES
16.8%
WholesaleTrade
15.7%
Finance &Insurance
0.4%
Accommodation
Services Producing Industries
4.3%
Ownershipof Dwellings
25.6%
Goods ProducingIndustries
21.5%Manufacturing
2.7%Construction
Information &Communications
5.1%
10.8%
Other ServicesIndustries
STRUCTURE OF THE ECONOMY IN 2020 (% OF NOMINAL VA)
1.0%
Food & BeverageServices
3.0%
RealEstate
5.9%
Professional Services
5.4%
Transportation& Storage
4.5%
Administrative &Support Services
1.4%
RetailTrade
2019 2020-1.3%
Overall Unemployment Rate2019 20202.3% 3.0%
+1.3%
2019 20203,784.3thousand
3,597.7thousand
Employment(as at year end)
Value-Added per Actual Hour Worked(Year-on-Year Growth)
LABOUR MARKET
2019 2020
2019 2020
2019 2020
Unit Labour Cost ofOverall Economy(Year-on-Year Growth)
Unit Business Cost of Manufacturing(Year-on-Year Growth)
Unit Labour Cost of Manufacturing(Year-on-Year Growth)
+2.3% -9.1%
-4.7% -14.4%
+4.9% -22.8%
COST
2019 2020
2019 2020
2019 2020
Consumer Price Index– All Items(Year-on-Year Growth)
Domestic Supply Price Index(Year-on-Year Growth)
Singapore Manufactured Products Price Index(Year-on-Year Growth)
-3.2% -8.7%
+0.6% -0.2%
-3.3% -6.9%
PRICES
$510.7 billion2019
2020$469.1 billion
GDPat Current Market Price
2019+1.3%2020-5.4%(Year-on-Year-Growth)
Real GDP
2019$78,8472020$72,418Per Capita
GNI
OVERALL ECONOMY
02

7.8%Taiwan
14.1%China
10.6%United States
10.7%Malaysia
9.3%EU
TOP 5 TRADING PARTNERS AND SHARE OF TOTAL MERCHANDISE TRADE IN 2020
million
2019
million
2019
million
2020
million
2020
Merchandise Exports
Merchandise Imports
Year-on-Year Growth
Year-on-Year Growth
Year-on-Year Growth
Year-on-Year Growth
$532,514
-4.2%
$489,712
-2.1%
$515,645
-3.2%
$453,467
-7.4%
Top Trading Partners in 2020(Share of Total Merchandise Trade)
14.1%China
10.7%Malaysia
9.3%EU
10.6%United States
MERCHANDISE TRADE
million
2019
million
2019
million
2020
million
2020
Services Exports
Services Imports
Year-on-Year Growth
Year-on-Year Growth
Year-on-Year Growth
Year-on-Year Growth
FinancialServices
Transport Services
OtherBusiness Services
$296,277
+6.2%
$284,015
+5.2%
$258,791
-12.7%
$238,267
-16.1%
Top 5 Services Exports Categories in 2020(Share of Total Services Exports)
4%17% 8%28% 32%Telecomms, Computer and Information
SERVICES TRADE
Charges for the use of IntellectualProperty
03


LABOUR MARKET AN
D PRODUCTIVITYECON
OMIC PERFORM
ANCE
CHAPTER
01
-5
-4
-3
-2
-1
0
-6
-4
-2
0
2
4
ExternalDemand
DomesticDemand
ConsumptionExpenditure
Gross FixedCapital
Formation
MAIN DRIVERS OF GDP GROWTH IN 2020
-15
-10
-5
0
4Q3Q2Q1Q
0.0%
-5.8%
-2.4%
-13.3%
3.5%
1.3%
-5.4%202020192018
-1.5%point
-3.1%point
Manufacturing
1.4%point contribution
Finance& Insurance
0.7%point contribution
Information &Communications
0.1%point contribution
SOURCES OF GROWTH IN 2020INCOME COMPONENTS OF GDP IN 2020
REAL GDP DECLINED BY 5.4% IN 2020 QUARTERLY GDP GROWTH IN 2020(Year-On-Year Growth)
Gross OperatingSurplus
56.2%
Taxes LessSubsidies
on Production
0.2%
Compensationof Employees
43.6%Changes inInventories
-0.2%point
-1.3%point
CHAPTER 1
ECONOMIC PERFORMANCE
Economic Survey of Singapore 2020Chapter 1 | Economic Performance
06

OVERALL PERFORMANCEFourth Quarter 2020The economy contracted by 2.4 per cent year-on-year in the fourth quarter, an improvement from the 5.8 per cent contraction in the preceding quarter (Exhibit 1.1). On a quarter-on-quarter seasonally-adjusted basis, the economy expanded by 3.8 per cent, following the 9.0 per cent growth in the third quarter.1
The services producing industries collectively contracted by 4.7 per cent year-on-year in the fourth quarter, improving from the 8.3 per cent contraction in the previous quarter. Among the services sectors, only the finance & insurance (4.9 per cent), information & communications (2.6 per cent) and wholesale trade (1.8 per cent) sectors posted positive growth.
Meanwhile, the construction sector shrank by 27 per cent year-on-year in the fourth quarter, improving from the 53 per cent contraction in the third quarter. The improved performance of the sector came on the back of the resumption of more construction activities in the fourth quarter as compared to the previous quarter.
Full Year of 2020For the whole of 2020, the Singapore economy contracted by 5.4 per cent, a reversal from the 1.3 per cent growth in 2019 (Exhibit 1.2).
By sectors, the manufacturing sector expanded by 7.3 per cent in 2020, a turnaround from the 1.5 per cent contraction in 2019. The sector’s growth was supported by robust expansions in the biomedical manufacturing, electronics and precision engineering clusters.
Services producing industries shrank by 6.9 per cent in 2020, reversing the 2.0 per cent growth in 2019. Among the services sectors, only the finance & insurance and information & communications sectors expanded in 2020. Specifically, the finance & insurance sector grew by 5.0 per cent, lower than the 7.8 per cent growth recorded in 2019. The information & communications sector expanded by 2.1 per cent, slower than the 12 per cent growth registered in 2019.
Meanwhile, the construction sector contracted by 36 per cent in 2020, a sharp reversal from the 1.6 per cent growth in 2019. Output in the sector was weighed down by declines in both public sector and private sector construction works.
The manufacturing sector grew by 10 per cent year-on-year in the fourth quarter, extending the 11 per cent expansion in the previous quarter. Growth was supported by output expansions in the electronics, biomedical manufacturing, precision engineering and chemicals clusters, which more than offset output declines in the transport engineering and general manufacturing clusters.
In the fourth quarter of 2020, the Singapore economy contracted by 2.4 on a year-on-year basis, an improvement from the 5.8 per cent contraction in the previous quarter. All sectors shrank during the quarter, except for the manufacturing, finance & insurance, information & communications and wholesale trade sectors.
For the whole of 2020, the economy contracted by 5.4 per cent, a reversal from the 1.3 per cent growth in 2019. The sectors that provided support to the economy were the manufacturing, finance & insurance and information & communications sectors, which posted expansions in 2020.
OVERVIEW
Exhibit 1.1: GDP and Sectoral Growth Rates in 4Q 2020
Per Cent
-40 -30 -20 -10 0 10 20Construction
Transportation & Storage
Accommodation
Food & Beverage Services
Administrative & Support
Real Estate
Professional Services
Other Services Industries
Retail Trade
Overall GDP Growth
Wholesale Trade
Information & Comms
Finance & Insurance
Manufacturing
-14.9
-10.8
-7.5
-5.7
1.8
-4.7
2.6
4.9
10.3
-2.4
-19.0
-19.7
-27.4
-27.4
1 The strong GDP growth seen in the third quarter was due to the phased resumption of activities following the Circuit Breaker that was implemented between 7 April to 1 June 2020, as well as the rebound in activity in major economies during the quarter as they emerged from their lockdowns.
Economic Survey of Singapore 2020Chapter 1 | Economic Performance
07

Contribution to GrowthIn the fourth quarter, the manufacturing, finance & insurance, wholesale trade and information & communications sectors, contributed positively to GDP growth (Exhibit 1.3). All the other sectors contracted, with the transportation & storage and construction sectors contributing the most to the decline in GDP during the quarter.
For the whole of 2020, only the manufacturing, finance & insurance and information & communications sectors contributed positively to GDP growth (Exhibit 1.4). The transportation & storage and construction sectors remained the top contributors to the decline in GDP during the year.
Per Cent
-50 -40 -30 -20 -10 0 10 20Construction
Accommodation
Transportation & Storage
Food & Beverage Services
Retail Trade
Administrative & Support
Real Estate
Professional Services
Other Services Industries
Overall GDP Growth
Wholesale Trade
Information & Comms
Finance & Insurance
Manufacturing
-16.0
-15.1
-14.2
-9.7
-2.4
-8.9
2.1
5.0
7.3
-5.4
-25.1
25.4
-28.7
-35.9
Exhibit 1.2: GDP and Sectoral Growth Rates in 2020
Per Cent
-8 -6 -4 -2 0 2Overall GDP Growth
Transportation & Storage
Construction
Other Services Industries
Administrative & Support
Professional Services
Real Estate
Wholesale Trade
Food & Beverage Services
Accommodation
Retail Trade
Information & Comms
Finance & Insurance
Manufacturing
-0.7
-0.6
-0.5
-0.4
-0.2
-0.3
0.1
0.7
1.4
-0.2
-0.9
-1.3
-1.6
-5.4
Exhibit 1.4: Percentage-Point Contribution to Growth in Real GDP in 2020 (By Industries)
Exhibit 1.3: Percentage-Point Contribution to Growth in Real GDP in 4Q 2020 (By Industries)
Per Cent
-4 -3 -2 -1 0 1 2 3Overall GDP Growth
Transportation & Storage
Construction
Administrative & Support
Other Services Industries
Professional Services
Real Estate
Food & Beverage Services
Accommodation
Retail Trade
Information & Comms
Wholesale Trade
Finance & Insurance
Manufacturing
-0.6
-0.4
-0.4
-0.2
0.1
-0.2
0.3
0.7
2.0
-0.1
-0.7
-1.0
-1.7
-2.4
Disaggregation of Services Sectors
With effect from the preliminary GDP estimates for the fourth quarter of 2020, the estimates for the following sectors will be disaggregated into their constituent sectors: (i) Wholesale & Retail Trade into Wholesale Trade and Retail Trade; (ii) Accommodation & Food Services into Accommodation and Food & Beverage Services; and (iii) Business Services into Real Estate, Professional Services and Administrative & Support Services. The Department of Statistics (DOS) will continue to make available the data for the broader sectors for downloading on DOS’ website (www.singstat.gov.sg).
Economic Survey of Singapore 2020Chapter 1 | Economic Performance
08

SOURCES OF GROWTHTotal demand fell by 4.5 per cent year-on-year in the fourth quarter, improving from the 7.1 per cent decline in the preceding quarter (Exhibit 1.5).
For the whole of 2020, total demand contracted by 6.1 per cent, a reversal from the 0.6 per cent growth in 2019. Both external demand (-3.1 percentage-points) and domestic demand (-3.0 percentage-points) weighed on total demand during the year.
Exhibit 1.5: Percentage-Point Contribution to Total Demand Growth
2019 2019 2020II III IV
Total Demand 0.6 -15.3 -7.1 -4.5 -6.1
External Demand 0.1 -8.9 -3.6 -2.5 -3.1
Total Domestic Demand 0.4 -6.3 -3.5 -2.0 -3.0
Consumption Expenditure 0.6 -3.5 -1.2 -1.2 -1.5
Public 0.1 0.7 0.6 0.4 0.5
Private 0.5 -4.2 -1.9 -1.6 -2.0
Gross Fixed Capital Formation 0.1 -2.7 -2.2 -0.4 -1.3
Changes in Inventories -0.3 -0.2 -0.1 -0.3 -0.2
Per Cent
-30
-20
-10
0
10
IVIIIIIIIV20202019
Domestic
External
Total
Exhibit 1.6: Changes in Total Demand in Chained (2015) Dollars
External DemandExternal demand edged down by 3.5 per cent year-on-year in the fourth quarter, extending the 5.0 per cent contraction in the preceding quarter (Exhibit 1.6). The drop in external demand was due to a fall in the real exports of services which outweighed an increase in the real exports of goods.
For the full year, external demand contracted by 4.3 per cent, deteriorating from the 0.1 per cent expansion in 2019. The decline in external demand was largely driven by a contraction in real services exports, which was in turn mainly due to a slump in the exports of travel services and transport services. While real merchandise exports also fell, it contributed less to the decline in external demand, helped by an expansion in the exports of machinery and equipment.
Domestic DemandTotal domestic demand declined by 7.0 per cent year-on-year in the fourth quarter, improving from the 13 per cent contraction in the previous quarter. Domestic demand in the fourth quarter was weighed down by declines in consumption expenditure and gross fixed capital formation.
For 2020 as a whole, total domestic demand contracted by 11 per cent, a reversal from the 1.6 per cent expansion in 2019. The decline was largely attributable to a fall in consumption expenditure and gross fixed capital formation.
Consumption ExpenditureTotal consumption expenditure fell by 6.7 per cent year-on-year in the fourth quarter, extending the 6.7 per cent decline in the previous quarter.
For the full year, total consumption expenditure contracted by 8.1 per cent, a reversal from the 3.3 per cent growth in 2019, driven primarily by a drop in private consumption. Specifically, private consumption plunged by 14 per cent, a reversal from the 3.3 per cent increase in 2019, mainly due to a decline in expenditure on transport, recreation & culture and food serving services. On the other hand, public consumption increased by 13 per cent, accelerating from the 3.4 per cent growth in 2019.
Economic Survey of Singapore 2020Chapter 1 | Economic Performance
09

Gross Fixed Capital FormationGross fixed capital formation (GFCF) declined by 4.7 per cent year-on-year in the fourth quarter, moderating from the 23 per cent contraction in the preceding quarter. The fall in GFCF during the quarter was primarily due to public GFCF, which plummeted by 23 per cent. On the other hand, private GFCF dipped slightly by 0.5 per cent.
For the full year, GFCF shrank by 14 per cent, a reversal from the 1.2 per cent growth in 2019 (Exhibit 1.7). Public GFCF slumped by 24 per cent, in contrast to the 1.5 per cent increase in 2019. The decline in public GFCF was largely due to lower investment spending on public construction & works (Exhibit 1.8). Meanwhile, private GFCF fell by 11 per cent, a reversal from the 1.1 per cent growth in 2019. The drop came on the back of a decline in private construction & works, private transport equipment and private intellectual property products, which outweighed an increase in investment spending on machinery & equipment.
Exhibit 1.7: Annual Changes in Gross Fixed Capital Formation in Chained (2015) Dollars, 2020
Total Public Private
Total -13.7 -24.2 -11.2
Construction & Works -27.5 -29.5 -26.3
Transport Equipment -17.1 13.3 -17.9
Machinery & Equipment 0.5 -15.7 1.7
Intellectual Property Products -2.1 6.2 -2.6
Exhibit 1.8: Percentage-Point Contribution to Growth of Gross Fixed Capital Formation in Chained (2015) Dollars, 2020
Total Public Private
Total -13.7 -4.6 -9.1
Construction & Works -11.1 -4.5 -6.6
Transport Equipment -2.1 0.0 -2.2
Machinery & Equipment 0.1 -0.2 0.3
Intellectual Property Products -0.6 0.1 -0.7
INCOME COMPONENTS OF NOMINAL GDP
Singapore’s nominal GDP amounted to $469 billion in 2020, a decrease of 8.2 per cent over 2019. Gross operating surplus accounted for 56 per cent of nominal GDP, while compensation of employees accounted for 44 per cent (Exhibit 1.9). Taxes on production and imports (less subsidies) made up the remaining share of nominal GDP.
0.2%
Taxes LessSubsidies onProduction & on Imports
43.6%
Compensationof Employees
56.2%
GrossOperating
Surplus
Exhibit 1.9: Income Components of GDP at Current Prices
NATIONAL SAVINGWith factor income outflows exceeding inflows by $57 billion, Gross National Income (GNI) came in at $412 billion in 2020, lower than the $469 billion in nominal GDP.
Gross National Savings (GNS) declined by 5.1 per cent to $189 billion in 2020. This comprised a net outflow of $82 billion that was lent or transferred abroad, and $106 billion in Gross Capital Formation. The national savings rate was 46 per cent of GNI in 2020, higher than the 44 per cent observed in 2019.
Economic Survey of Singapore 2020Chapter 1 | Economic Performance
10

Exhibit 1.10: Singapore’s Earnings from External Economy as a Proportion of Total Income
0
5
10
15
20
25
2018161412100806040200989694
Per Cent
Factor Income From Abroad (FIFA)GDP + FIFA
GNI AND THE EXTERNAL ECONOMYFactor income from abroad reached $137 billion in 2020, down from $149 billion in 2019. The contribution of overseas operations to the total economy was 23 per cent in 2020, similar to the contribution recorded in 2019 (Exhibit 1.10).
Based on the Survey of Singapore’s Investment Abroad, the stock of direct investment abroad increased from $860 billion in 2018 to $913 billion in 2019.
Economic Survey of Singapore 2020Chapter 1 | Economic Performance
11

Image courtesy of Agilent Technologies

LABOUR MARKET AN
D PRODUCTIVITYCHAPTER
02

2.9%2.6%
Real median gross monthlyincome of full-time employed residents rose by
from June 2015 to June 2020+2.6% per annum
ANNUALISEDCHANGE IN REAL GROSS MONTHLY INCOME FROM WORK
VA per Actual Hour Worked
+1.3%-4.9%
EMPLOYMENT AND PRODUCTIVITYGROWTH IN 2020
UNEMPLOYMENTRATES IN 2020
ResidentUnemployment Rate
Overall Unemployment Rate
3.0% 4.1%
0
1
2
3
4
Median20th Percentile
VA PER ACTUAL HOUR WORKED AND VA PER WORKER GROWTH
VA per Worker
VA per Actual Hour Worked
-6
-4
-2
0
2
4
6
202020192018
2.8%4.0%
-1.3%
1.3%
-0.2%
-3.4%
Per Cent Per Annum
Information &Communications
Finance &Insurance
+2,200employed
+2,500employed
MAIN DRIVERS OF EMPLOYMENT GROWTH IN 2020
SECTORS WITH THE HIGHEST VA PER ACTUAL HOUR WORKED GROWTH IN 2020
Manufacturing Wholesale Trade Finance & Insurance
+2.6%+18.3% +3.1%
Employment(as at year end)
CHAPTER 2
LABOUR MARKET AND PRODUCTIVITY
Economic Survey of Singapore 2020Chapter 2 | Labour Market and Productivity
14

OVERVIEW1
EMPLOYMENTTotal employment contracted by 13,400 in the fourth quarter, moderating from the declines seen in the second (-113,500) and third (-34,400) quarters (Exhibit 2.1). A similar trend was observed for total employment excluding FDWs.
By broad sectors, employment declined in the construction (-15,800) and manufacturing (-11,000) sectors, but expanded in the services sector (13,400) in the fourth quarter. Within the services sector, employment gains were the largest in the food & beverage services sector and the other services industries (Exhibit 2.2).
1 Figures for the fourth quarter of 2020 and full year 2020 are based on preliminary estimates.
Exhibit 2.1: Changes in Total Employment
-150
-100
-50
0
50
IVIIIIIIIV
Thousand
2019 2020
Exhibit 2.2: Changes in Employment by Industry in 4Q 2020
Thousand
-25 -20 -15 -10 -5 0 5 10 15 Construction
Manufacturing
Transportation & Storage
Administrative & Support
Wholesale Trade
Real Estate
Accommodation
Professional Services
Finance & Insurance
Information & Comms
Retail Trade
Other Services Industries
Food & Beverage Services
-11.0
-2.2
-1.0
-1.0
-0.8
0.6
2.6
6.4
9.8
-0.2
-0.3
-0.6
-15.8
Against the backdrop of the COVID-19 pandemic, total employment fell by 186,600 in 2020, reversing the increase of 69,700 in 2019. The decline in total employment was due to a fall in foreign employment (-195,900), which outstripped an increase in local employment (9,300). By sectors, total employment declined across all broad sectors (i.e., manufacturing, services and construction). Excluding Foreign Domestic Workers (FDWs), total employment contracted by 172,200.
The number of retrenchments and unemployment rates rose in 2020 as compared to 2019.
Labour productivity, as measured by real value-added per actual hour worked, increased by 1.3 per cent in 2020, a reversal from the 1.3 per cent decline in 2019.
Notwithstanding the decline recorded in 2020, real median gross monthly income of full-time employed residents rose by 2.6 per cent per annum between 2015 and 2020. During this period, real income at the 20th percentile grew by 2.9 per cent per annum.
Economic Survey of Singapore 2020Chapter 2 | Labour Market and Productivity
15

For the whole of 2020, total employment fell by 186,600, with employment declines seen in the services (-96,400), construction (-52,000) and manufacturing (-38,000) sectors.
The decline in total employment was driven by a fall in foreign employment (-195,900), which outstripped a rise in local employment (9,300) (Exhibit 2.3). Local employment increased in the information & communications, financial services and professional services sectors, but fell in the accommodation, wholesale trade and retail trade sectors. Meanwhile, foreign employment fell across all sectors.
For the full year, the annual average unemployment rates rose in 2020 at the overall level (from 2.3 per cent in 2019 to 3.0 per cent), as well as for residents (from 3.1 per cent to 4.1 per cent) and citizens (from 3.3 per cent to 4.2 per cent). However, they remained below the levels observed during SARS2 and the Global Financial Crisis3.
In 2020, 96,500 residents were unemployed on average, of whom 84,100 were Singapore citizens. The respective figures in 2019 were lower, at 72,900 and 63,900.
RETRENCHMENTSThe number of retrenchments was 6,100 in the fourth quarter, lower than the level reached in the preceding quarter (9,120). This reflected the first decline after five consecutive quarters of increases. Over the quarter, retrenchments fell in the services (from 6,710 to 4,900), manufacturing (from 2,070 to 1,100) and construction (from 340 to 100) sectors.
For the full year, total retrenchments (26,570) rose from that observed in 2019 (10,690) on the back of higher retrenchments in the services (from 7,000 to 20,090), manufacturing (from 2,790 to 5,430) and construction (from 860 to 1,020) sectors.
Exhibit 2.3: Changes in Employment by Residential Status
Exhibit 2.4: Unemployment Rates (Seasonally-Adjusted)
Thousand
-200
-150
-100
-50
0
50
100
20202019201820172016
Local ForeignTotal
Per Cent
2019 2020
0
1
2
3
4
5
DecSepJunMarDec
Overall Resident Citizen
As at December 2020, there were 3,597,700 employed persons in Singapore, with 2,366,200 locals and 1,231,500 foreigners. Excluding FDWs, there were 984,100 foreigners.
UNEMPLOYMENTThe seasonally-adjusted overall (3.2 per cent), resident (4.4 per cent) and citizen (4.5 per cent) unemployment rates eased in December 2020, after trending up in the previous quarters (Exhibit 2.4).
In December 2020, there were 104,400 unemployed residents, of whom 90,100 were Singapore citizens. These were lower than the number of unemployed residents (112,500) and citizens (97,700) in September 2020.
2 In 2003, the annual average overall, resident and citizen unemployment rates were 4.0 per cent, 5.2 per cent and 5.4 per cent respectively.3 In 2009, the annual average overall, resident and citizen unemployment rates were 3.0 per cent, 4.3 per cent and 4.5 per cent respectively.
Economic Survey of Singapore 2020Chapter 2 | Labour Market and Productivity
16

Exhibit 2.5: Changes in Value-Added per Actual Hour Worked for the Overall Economy
Exhibit 2.6: Changes in Value-Added per Actual Hour Worked by Industry in 2020
-2
0
2
4
6
20202019201820172016
Per Cent
Per Cent
-30 -20 -10 0 10 20 30Transportation & Storage
Food & Beverage Services
Construction
Administrative & Support
Professional Services
Accommodation
Real Estate
Other Services Industries
Retail Trade
Information & Comms
Overall Productivity
Finance & Insurance
Wholesale Trade
Manufacturing
-14.0
-13.6
-11.6
-9.1
-7.0
-3.9
1.3
3.1
18.3
-22.1
2.6
0.4
-9.6
-17.7
PRODUCTIVITYReal Value-Added per Actual Hour Worked
Overall labour productivity, as measured by real value-added per actual hour worked, increased by 4.0 per cent in the fourth quarter, extending the 2.2 per cent growth in the third quarter. During the quarter, the productivity of the manufacturing, accommodation, wholesale trade, retail trade, finance & insurance and information & communications sectors rose, while that of the transportation & storage, construction, administrative & support services, food & beverage services, professional services, real estate and other services sectors declined.
Collectively, the productivity of outward-oriented sectors increased by 6.1 per cent in the fourth quarter, while that of domestically-oriented sectors declined by 4.9 per cent over the same period.4
For the full year, real value-added per actual hour worked rose by 1.3 per cent, reversing the 1.3 per cent decline in 2019 (Exhibit 2.5). Across the sectors, manufacturing, wholesale trade and finance & insurance experienced the strongest growth in real value-added per actual hour worked (Exhibit 2.6).
Real Value-Added per WorkerReal value-added per worker rose by 2.4 per cent in the fourth quarter, reversing the 2.5 per cent decline in the preceding quarter, as the fall in employment outpaced the contraction in real value-added.
For 2020 as a whole, real value-added per worker decreased by 3.4 per cent, extending the 0.2 per cent decline in 2019. The divergence between the two measures of productivity (real value-added per actual hour worked and real value-added per worker) was due to a fall in average actual hours worked per worker in 2020, against the backdrop of the Circuit Breaker measures implemented in the second quarter of the year and the subsequent gradual re-opening of the economy.
INCOME FROM WORKReflecting the impact of the COVID-19 pandemic, real and nominal median gross monthly income fell in 2020. The nominal median gross monthly income (including employer CPF contributions) of full-time employed residents dipped by 0.6 per cent to $4,534 in 2020, compared to the increase of 2.8 per cent in 2019.
After adjusting for inflation which was negative in 2020, real median income fell by 0.4 per cent in 20205, compared to the increase of 2.2 per cent in 2019.
4 Outward-oriented sectors refer to manufacturing, wholesale trade, transportation & storage, accommodation, information & communications, finance & insurance and professional services. Domestically-oriented sectors refer to construction, retail trade, food & beverage services, real estate, administrative & support services and other services industries.
5 The Consumer Price Index (CPI) for all items fell by 0.2 per cent in 2020.
Economic Survey of Singapore 2020Chapter 2 | Labour Market and Productivity
17

Notwithstanding the decline in 2020, real median income rose over the last five years (i.e., 2015 to 2020) by 14 per cent cumulatively, or 2.6 per cent per annum. During this period, real income at the 20th percentile grew by 15 per cent cumulatively, or 2.9 per cent per annum (Exhibit 2.7).
Exhibit 2.7: Annualised Change in Real Gross Monthly Income from Work of Full-Time Employed Residents, 2015-2020
Per Cent Per Annum
0
1
2
3
Median20th Percentile
2.9
2.6
Economic Survey of Singapore 2020Chapter 2 | Labour Market and Productivity
18

Economic Survey of Singapore 2020Chapter 2 | Labour Market and Productivity
19


COSTS, INVESTM
ENTS AN
D PRICESCHAPTER
03

WITHIN THE MANUFACTURING SECTOR
billion$17.2 $6.8
billion
Overall ULC
INVESTMENTCOMMITMENTSIN 2020
0.4%0.6%
-0.2%
202020192018
CPI-ALL ITEMS INFLATION
The Consumer Price Index (CPI) decreased by0.2% in 2020
Fixed AssetInvestmentCommitments
Total BusinessExpenditureCommitments
Unit LabourCost
-22.8%in 2020
Unit BusinessCost
-14.4%in 2020
-1
0
1-10
-5
0
5
202020192018
-9.1%
OVERALL UNIT LABOUR COST(Year-On-Year Growth)
THE DECLINE IN CPI WAS MAINLY DUE TO DECREASE IN PRICES OF...
Recreation & Culture Transport
-0.1%point contribution
-0.1%point contribution
CLUSTERS THAT ATTRACTED THE HIGHEST FIXED ASSET INVESTMENT COMMITMENTS
Chemicals
CLUSTERS THAT ATTRACTED THE HIGHEST TOTAL BUSINESS EXPENDITURE COMMITMENTS
TransportEngineering
ServicesClusters
Electronics Headquarters &Professional Services
Research &Development
BUT THIS WAS PARTIALLY OFFSET BYINCREASE IN PRICES OF...Food
0.4%point contribution
CHAPTER 3
COSTS, INVESTMENTS AND PRICES
Economic Survey of Singapore 2020Chapter 3 | Costs, Investments and Prices
22

OVERVIEW
Exhibit 3.1: Changes in Unit Labour Cost in 4Q 2020
Per Cent
10.3
-1.0
-2.2
-9.0
-10.9
-15.0
-12.8
-20.0
-24.6
-10.6
-10.7
-7.2
-12.5
-22.3
-40 -30 -20 -10 0 10 20Accommodation
Manufacturing
Retail Trade
Construction
Wholesale Trade
Food & Beverage Services
Information & Comms
Overall Economy
Real Estate
Administrative & Support
Finance & Insurance
Professional Services
Other Services Industries
Transportation & Storage
COSTSOverall ULC for the economy fell by 11 per cent year-on-year in the fourth quarter, extending the 10 per cent decline in the preceding quarter (Exhibit 3.1). The fall in the overall ULC was due to the combined effect of a decrease in total labour cost per worker and an increase in productivity as measured by real value-added per worker.
By broad sectors, the ULC for the manufacturing sector contracted by 22 per cent, moderating from the fall of 27 per cent in the preceding quarter. The ULC decline for the sector occurred on the back of productivity gains alongside a fall in total labour cost per worker.
Similarly, the ULC for services producing industries fell by 6.6 per cent, extending the 4.9 per cent decline in the previous quarter. Most services sectors saw a drop in their ULCs, except for the transportation & storage sector. For the transportation & storage sector, its ULC increased on the back of a fall in labour productivity that more than offset a decline in total labour cost per worker.
The ULC for the construction sector fell by 15 per cent, a reversal from the increase of 20 per cent in the preceding quarter. This came about as total labour cost per worker declined by more than the drop in labour productivity.
For the whole of 2020, overall ULC contracted by 9.1 per cent as a fall in total labour cost per worker outpaced a decline in labour productivity.
Manufacturing unit business cost (UBC) fell by 17 per cent year-on-year in the fourth quarter, similar to the decline recorded in the previous quarter (Exhibit 3.2). This came on the back of declines in the manufacturing ULC (-22 per cent), unit services cost (-14 per cent) and unit non-labour production taxes (-31 per cent). For the whole of 2020, the manufacturing UBC contracted by 14 per cent, extending the 4.7 per cent decline in 2019.
Overall Unit Labour Cost (ULC) fell by 11 per cent on a year-on-year basis in the fourth quarter of 2020, extending the 10 per cent decline in the preceding quarter. For the whole of 2020, the overall ULC decreased by 9.1 per cent, a reversal from the 2.3 per cent increase in 2019.
Total investment commitments attracted by EDB in the manufacturing and services clusters remained healthy in 2020. The manufacturing clusters garnered a larger amount of commitments in terms of both fixed asset investments (FAI), while the services sector attracted a larger amount of total business expenditure (TBE) commitments. The electronics and chemicals clusters within the manufacturing sector were the biggest contributors to FAI commitments, while the transport engineering cluster contributed the most to TBE commitments
The Consumer Price Index-All Items (CPI-All Items) inched down by 0.1 per cent on a year-on-year basis in the fourth quarter, compared to the 0.3 per cent decline in the previous quarter. For 2020 as a whole, CPI-All Items declined by 0.2 per cent, a reversal from the 0.6 per cent increase in 2019.
Producer prices, as measured by the domestic supply price index (DSPI), the Singapore manufactured products price index (SMPPI) as well as the import and export price indices, all fell on a year-on-year basis in the fourth quarter. For the whole of 2020, the DSPI, SMPPI as well as import and export price indices declined by 8.7 per cent, 6.9 per cent, 7.0 per cent and 7.0 per cent respectively.
23Economic Survey of Singapore 2020Chapter 3 | Costs, Investments and Prices

Singapore’s relative unit labour cost (RULC) for manufacturing – a measure of Singapore’s competitiveness against 16 economies1 – fell in 2020 as compared to 2019 (Exhibit 3.3). The decline was mainly on account of the steep fall in Singapore’s manufacturing ULC.
INVESTMENT COMMITMENTSEDB attracted healthy levels of investment commitments in 2020. For the full year, FAI and TBE commitments came in at $17.2 billion and $6.8 billion respectively. In terms of FAI, the largest contribution came from the manufacturing clusters, which garnered $13.1 billion in commitments. Within manufacturing, the electronics cluster attracted the largest amount of FAI commitments, at $6.5 billion, followed by the chemicals cluster, at $4.1 billion. Among the services clusters, the research & development and infocommunications & media clusters contributed the most to total FAI commitments, with $1.3 billion and $1.1 billion respectively (Exhibit 3.4).
Investors from the United States were the largest source of FAI commitments with $9.2 billion (53 per cent). They were followed by local investors who contributed about $3.0 billion of FAI commitments (17 per cent).
For TBE, the services clusters attracted the highest amount of commitments, at $3.6 billion. This was driven by the headquarters & professional services cluster, which garnered $1.2 billion in TBE commitments, followed by the research & development cluster, with $1.1 billion. Among the manufacturing clusters, the transport engineering cluster contributed the highest amount of TBE commitments, at $1.6 billion (Exhibit 3.5).
Exhibit 3.3: Singapore’s Relative Unit Labour Cost in Manufacturing Against Selected 16 Economies1
Exhibit 3.2: Changes in Unit Business Cost for Manufacturing
Per Cent
2019 2020
-20
-15
-10
-5
0
5
IVIIIIIIIV
Index
50
60
70
80
90
100
110
20202019201820172016201520142013
Exhibit 3.4: Fixed Asset Investments by Industry Clusters in 2020
24%Chemicals
38%Electronics
Others14%
24%Services Clusters
1 The 16 economies are Australia, China, France, Germany, Hong Kong, India, Indonesia, Japan, Malaysia, Netherlands, South Korea, Taiwan, Thailand, the United Kingdom, the United States and Vietnam.
Economic Survey of Singapore 2020Chapter 3 | Costs, Investments and Prices
24

Exhibit 3.5: Total Business Expenditure by Industry Clusters in 2020
Transport Engineering24%
Headquarters & ProfessionalServices18%
Others31%
Research &Development16%
Infocommunications& Media11%
For 2020 as a whole, CPI-All Items declined by 0.2 per cent, a reversal from the 0.6 per cent increase in 2019.
Price decreases in the following CPI categories contributed negatively to CPI-All Items inflation in 2020 (Exhibit 3.7). Prices of clothing & footwear dropped by 3.8 per cent because of cheaper ready-made garments and footwear. Recreation & culture prices fell by 1.8 per cent as a result of the lower cost of holiday travel.2 Healthcare costs declined by 1.5 per cent on the back of a fall in the prices of outpatient services and medical products, which outweighed an increase in the cost of hospital services. Prices of miscellaneous goods & services dipped by 1.2 per cent on account of cheaper personal effects. Transport costs edged down by 0.7 per cent due to a drop in the prices of petrol and Electronic Road Pricing (ERP) charges that more than offset higher car prices as well as bus & train fares. Education costs decreased by 0.6 per cent as a result of lower fees at childcare centres and kindergartens due to the enhancement of preschool subsidies since January 2020. Housing & utilities costs fell by 0.3 per cent as lower electricity prices and gas tariffs more than offset a rise in accommodation cost.
Exhibit 3.6: Changes in Overall CPI
Per Cent
-1.0
-0.5
0.0
0.5
1.0
IVIIIIIIIV20202019
YOY Growth
QOQ Growth (SA)
Exhibit 3.7: Changes in CPI by Category in 2020
Per Cent
-6 -4 -2 0 2 4
Clothing & Footwear
Recreation & Culture
Health Care
Misc Goods & Services
Transport
Education
Housing & Utilities
Household Durables
Communication
Food 1.9
0.7
0.3
-0.6
-0.7
-1.2
-1.5
-1.8
-3.8
-0.3
Local investors accounted for most of the TBE commitments, at $2.8 billion (41 per cent), followed by investors from the United States, at $1.5 billion (21 per cent).
When these projects are fully implemented, they are expected to generate $31.2 billion of value-added per annum and create more than 19,000 jobs in the coming years.
CONSUMER PRICE INDEX Singapore’s CPI-All Items dipped by 0.1 per cent on a year-on-year basis in the fourth quarter, compared to the 0.3 per cent decline in the previous quarter (Exhibit 3.6). On a quarter-on-quarter seasonally-adjusted basis, CPI-All Items rose by 0.4 per cent, slightly faster than the 0.3 per cent increase in the previous quarter.
By contrast there were price increases in other CPI categories. Prices of household durables & services rose by 0.3 per cent on account of more expensive domestic and household services. Communication costs climbed by 0.7 per cent due to higher telecommunication services costs. Food costs rose by 1.9 per cent on the back of an increase in the prices of non-cooked food items such as meat and vegetables, as well as food serving services like hawker food and restaurant meals.
2 These services were either fully or partially unavailable in April – December 2020 due to international and safe-distancing measures to contain the COVID-19 pandemic. Price changes were imputed, in line with international guidelines.
25Economic Survey of Singapore 2020Chapter 3 | Costs, Investments and Prices

Exhibit 3.9: Changes in Import and Ewxport Price Indices
Exhibit 3.8: Changes in Domestic Supply Price and Singapore Manufactured Products Price Indices
PRODUCER PRICE INFLATIONProducer prices, as measured by the DSPI, SMPPI, as well as import and export price indices, all fell on a year-on-year basis in the fourth quarter (Exhibits 3.8 and 3.9). The declines seen during the quarter came on the back of a fall in the prices of diesel fuel and motor spirit of ron 90-97.
For the full year, the DSPI and SMPPI declined by 8.7 per cent and 6.9 per cent respectively, while the import and export price indices fell by 7.0 per cent each. Cheaper diesel fuel and motor spirit of ron 90-97 also contributed to the decline in these producer price indices for the year.
Per Cent
2019 2020
-15
-10
-5
0
IVIIIIIIIV
Domestic SupplyPrice Index
Singapore ManufacturedProducts Price Index
Per Cent
2019 2020
-15
-10
-5
0
IVIIIIIIIV
Export Price Index
Import Price Index
Economic Survey of Singapore 2020Chapter 3 | Costs, Investments and Prices
26

BOX ARTICLE 3.1
LATEST BUSINESS COST CONDITIONS IN SINGAPORE’S MANUFACTURING AND SERVICES SECTORS
In 2020, the unit business cost (UBC) in the manufacturing and overall services sectors declined.
UBC for Manufacturing UBC for Services*Refers to first 3 quarters of 2020
UNIT LABOUR COST
-14.4%in 2020
-0.2%in 2020*
OVERVIEW
The decrease in the services UBC in 2020 came on the back of a decline in unit labour cost, which more than offset an increase in other services costs.
KEY DRIVERS
Looking ahead, the overall unit labour cost for the economy is likely to rise in 2021 in tandem with the gradual recovery of the labour market, and there may be some upward pressure on the costs of utilities, fuel and transportation due to higher oil prices. Meanwhile, industrial and commercial rentals are expected to remain largely subdued.
OUTLOOK
The fall in the manufacturing UBC in 2020 was on account of declines in both unit labour cost and unit services cost.
CONTRIBUTION TO MANUFACTURING UBC IN 2020
RENTAL COST
DEFINITION OF UBC
Total Business Cost
Gross Real Value-Added
-6.3%point
Labour Cost
CONTRIBUTION TO SERVICES UBCIN 2020
Labour Cost-1.1%point
+1.0%point Services Cost
UTILITIES COST
-2.4%point
Utilities
-2.1%point
UBC =
Royalties
27Economic Survey of Singapore 2020Chapter 3 | Costs, Investments and Prices
-20
-16
-12
-8
-4
0
1Q20 2Q20 3Q20 4Q20 2020
Unit Labour Cost Utilities Royalties Work Given Out
Others Rental Unit Non-LabourProduction Taxes
Manufacturing UBC
Contribution to yoy change, ppc
1
1 Unit business cost measures the business costs incurred to produce one unit of output. Only operating expenses (without material costs and depreciation) are included in business costs. This follows the definition adopted by the Department of Statistics (DOS) in its computation of the Unit Business Cost for Manufacturing. See DOS’ Information Paper, “Methodological Review on the Unit Business Cost Index for Manufacturing Industry (Base Year 2010=100)”, at https://www.singstat.gov.sg/-/media/files/publications/economy/ip-e38.pdf.
2 Royalties cost refers to payments made to another party (the licensor or franchisor who owns a particular asset) for the right to the ongoing use of that asset.3 Labour-related taxes on production (e.g., foreign worker levy) are classified under labour cost. Taxes on income (e.g., corporate income tax) are excluded. 4 The UBC-Services Index is estimated by MAS to assess cost conditions in the services sector. It is a composite index of proxy cost indicators for each component of
business costs, combined using weights estimated from expenditure data in DOS’ Services Survey Series 2018: The Services Sector, as well as the 2016 Input-Output tables.
5 Latest available UBC-Services Index is up to the third quarter of 2020.6 The percentage-point contributions by ULC and other services costs do not sum to the overall change in the UBC-Services Index due to rounding.
This box article highlights the latest trends in business costs for firms in Singapore’s manufacturing and services sectors, as well as the outlook for key components of business costs in 2021.
(I) UNIT BUSINESS COST IN THE MANUFACTURING AND SERVICES SECTORS
Unit business costs in both the manufacturing and overall services sectors declined in 2020
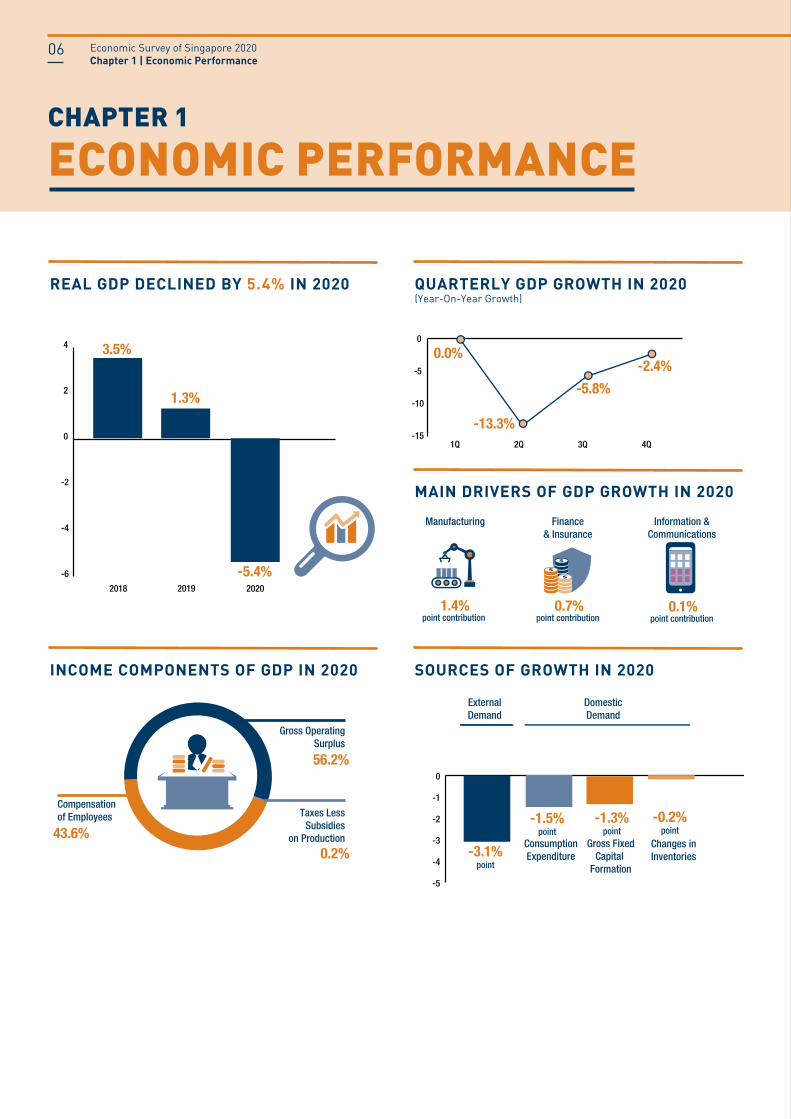
In 2020, the unit business cost index for the manufacturing sector (UBCI) fell by 14.4 per cent (Exhibit 1). The main contributors to the decline were manufacturing unit labour cost (ULC), utilities cost and royalties cost2, with their contributions collectively accounting for 10.8 percentage-points (pp) of the fall in the UBCI. Meanwhile, cost components like rentals and non-labour production taxes3 (e.g., property, road and other indirect taxes) had a relatively small impact on the UBCI, in part because of their low shares of total business costs. (Please refer to Annex A for the business cost structure of firms in the manufacturing and services sectors.)
LATEST BUSINESS COST CONDITIONS IN SINGAPORE’S MANUFACTURING AND SERVICES SECTORS
Exhibit 1: Contribution to UBCI Changes by Key Cost Components
Source: Department of StatisticsNote: “Others” consists of sub-components such as professional fees, advertising, commission and agency fees, sundry expenses, etc.
Similarly, the unit business cost index for the overall services sector (UBC-Services Index)4 dipped by 0.2 per cent in the first three quarters of 2020 compared to the same period a year ago (Exhibit 2).5 The fall in the UBC-Services Index was due to a decline in the services ULC (-1.1pp), which more than offset an increase in other services costs (+1.0pp).6
Economic Survey of Singapore 2020Chapter 3 | Costs, Investments and Prices
28

-4
-2
0
2
4
6
1Q20 2Q20 3Q20 2020 (Year-to-Date)
Unit Labour Cost Other Services Costs UBC-Services Index
Contribution to yoy change, ppc
7 A change in the ULC can be approximately decomposed as the change in total labour cost per worker minus the change in labour productivity (proxied by gross real value-added per worker). The approximation holds better when the changes are small.
8 TLC comprises remuneration, wage subsidies and other labour-related costs, which include the skills development levy, foreign worker levy, and recruitment and net training cost. An example of the wage subsidies provided to companies was the Jobs Support Scheme, which provided wage support of up to 75 per cent of gross monthly wages to help employers retain their local employees during the COVID-19 pandemic.
Exhibit 2: Contribution to Overall Services UBC Changes by Cost Components
Source: Monetary Authority of SingaporeNotes: (1) The UBC-Services Index for 2020 refers to the average of the first three quarters; (2) Detailed cost component breakdowns for the UBC-Services Index are not available; (3) Other services costs include air & sea freight costs, cargo handling costs and warehousing & storage costs.
(II) LATEST TRENDS AND OUTLOOK FOR KEY COST COMPONENTS
Reflecting the fall in the ULCs for the manufacturing and overall services sectors, the ULC for the overall economy declined in 2020, driven by a reduction in total labour cost per worker as wage subsidies were provided to firms to cope with the impact of COVID-19
The ULC for the overall economy declined by 9.1 per cent in 2020,7 on account of a large reduction in total labour cost8 (TLC) per worker (-11.6 per cent) which outpaced a fall in labour productivity (-2.7 per cent) (Exhibit 3). In turn, the fall in TLC per worker was driven by a significant increase in the amount of wage subsidies provided by the government through support measures such as the Jobs Support Scheme, as well as the foreign worker levy (FWL) waiver and rebate granted by the government. Specifically, the increase in wage subsidies per worker and fall in FWL per worker contributed 10.9pp and 2.1pp to the decline in TLC per worker in 2020 respectively. These more than offset the contribution from the rise in remuneration per worker (+1.7pp).
At the sectoral level, most sectors experienced a decline in their respective ULCs in 2020 (Exhibit 4). In the manufacturing sector, the ULC plunged by 22.8 per cent, driven by a fall in TLC per worker as well as strong labour productivity growth. At the same time, the ULC for the overall services sector decreased by 4.9 per cent, as the decline in TLC per worker outpaced a fall in labour productivity. Among the services sectors, most saw a lower ULC, except for the transportation & storage sector, the professional services sector, and the other services industries. As for the construction sector, its ULC increased by 9.0 per cent, as a fall in labour productivity outstripped the decline in TLC per worker.
For 2021, the ULC for the overall economy is likely to increase, as the wage subsidies introduced in 2020 taper. Remuneration per worker is also expected to rise, as the labour market gradually recovers in tandem with the rebound in economic activity.
29Economic Survey of Singapore 2020Chapter 3 | Costs, Investments and Prices

-22.8
-14.7
-13.2
-11.0
-9.4
-7.7
-5.4
-5.1
-4.9
-4.8
0.9
2.2
4.5
9.0
-40 -20 0 20
ManufacturingFood & Beverage Services
Retail TradeWholesale Trade
Information & CommunicationsFinance & Insurance
AccommodationAdministrative & Support Services
Services Producing IndustriesReal Estate
Other Services IndustriesProfessional Services
Transportation & Storage Construction
Per Cent
Exhibit 4: ULC Change by Sectors, 2020
-2.0
-1.5
-1.0
-0.5
0.0
0.5
1.0
1Q20 2Q20 3Q20 4Q20
Per Cent change, yoy
85
86
87
88
89
90
1Q20 2Q20 3Q20 4Q20
Per Cent
Source: JTC CorporationNote: Both the industrial rental index and the industrial occupancy rate cover multiple-user factory space, single-user factory space, business parks and warehouses.
9 About 0.5 million gross square metres are expected to come from completions that were delayed in 2020 due to the impact of COVID-19 on the construction sector.
Exhibit 3: Decomposition of ULC Growth for Overall Economy, 2020
Industrial and commercial rentals fell in 2020
Industrial rentals fell by 1.5 per cent in 2020 on the back of sluggish demand for industrial space amidst the economic uncertainty caused by the COVID-19 pandemic (Exhibit 5). Nonetheless, occupancy rate edged up over the course of the year, on account of the delays in new completions and an increase in the demand for storage space for purposes such as stockpiling and e-commerce (Exhibit 6).
For 2021, while the demand for industrial space could improve in tandem with the global and domestic economic recovery, the upcoming supply of industrial space is likely to exert some downward pressure on industrial rentals. In particular, around 2.7 million gross square metres of industrial space are expected to be completed this year (Annex B, Exhibit B1),9 higher than the average annual supply of industrial space between 2015 and 2020 (approximately 1.6 million gross square metres). Taking into account both demand and supply conditions, industrial rentals are likely to remain broadly stable in 2021.
Source: MTI Staff estimates using data from the Department of Statistics and Ministry of ManpowerNote: The pp contributions of the various types of labour costs do not sum up to the change in TLC per worker due to rounding.
Exhibit 5: Industrial Rental Index, 1Q20-4Q20 Exhibit 6: Industrial Occupancy Rate, 1Q20-4Q20
ULC -9.1%
TLC per worker -11.6%
Remuneration per worker +1.7pp
FWL per worker -2.1pp
Wage subsidies per worker -10.9pp
Other labour costs -0.2pp
Gross real labour productivity -2.7%
Economic Survey of Singapore 2020Chapter 3 | Costs, Investments and Prices
30
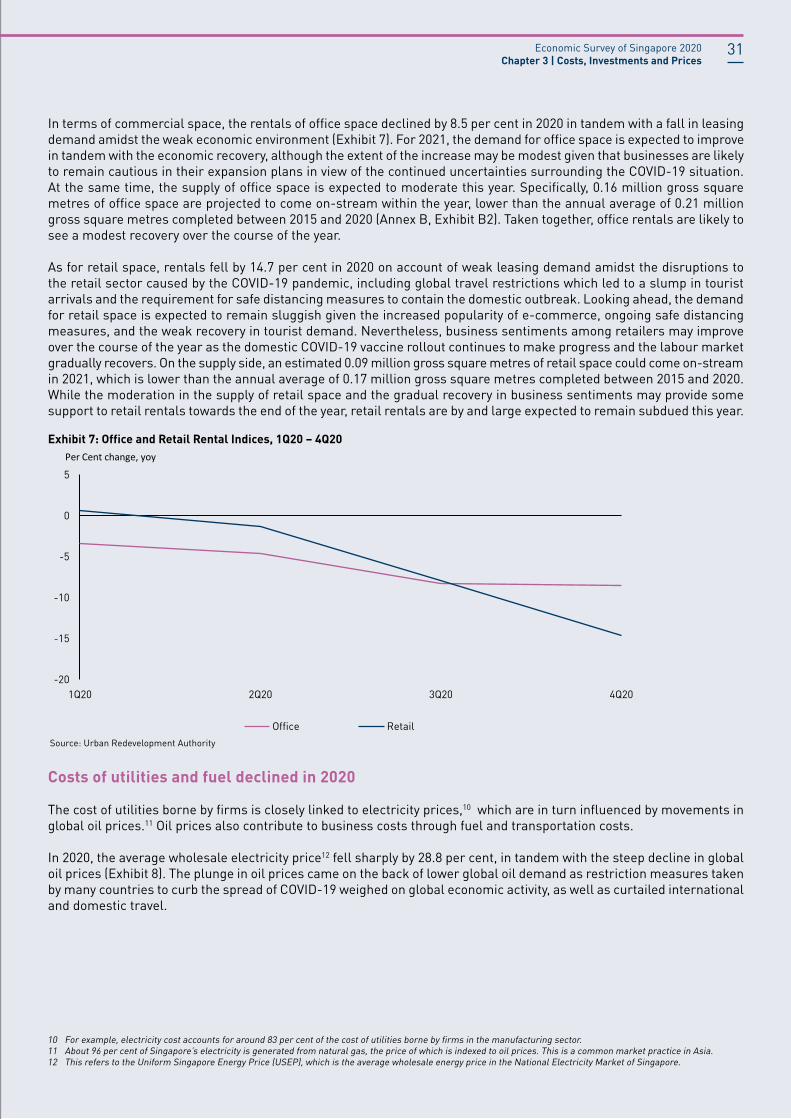
Exhibit 7: Office and Retail Rental Indices, 1Q20 – 4Q20
Source: Urban Redevelopment Authority
-20
-15
-10
-5
0
5
1Q20 2Q20 3Q20 4Q20
Office Retail
Per Cent change, yoy
In terms of commercial space, the rentals of office space declined by 8.5 per cent in 2020 in tandem with a fall in leasing demand amidst the weak economic environment (Exhibit 7). For 2021, the demand for office space is expected to improve in tandem with the economic recovery, although the extent of the increase may be modest given that businesses are likely to remain cautious in their expansion plans in view of the continued uncertainties surrounding the COVID-19 situation. At the same time, the supply of office space is expected to moderate this year. Specifically, 0.16 million gross square metres of office space are projected to come on-stream within the year, lower than the annual average of 0.21 million gross square metres completed between 2015 and 2020 (Annex B, Exhibit B2). Taken together, office rentals are likely to see a modest recovery over the course of the year.
As for retail space, rentals fell by 14.7 per cent in 2020 on account of weak leasing demand amidst the disruptions to the retail sector caused by the COVID-19 pandemic, including global travel restrictions which led to a slump in tourist arrivals and the requirement for safe distancing measures to contain the domestic outbreak. Looking ahead, the demand for retail space is expected to remain sluggish given the increased popularity of e-commerce, ongoing safe distancing measures, and the weak recovery in tourist demand. Nevertheless, business sentiments among retailers may improve over the course of the year as the domestic COVID-19 vaccine rollout continues to make progress and the labour market gradually recovers. On the supply side, an estimated 0.09 million gross square metres of retail space could come on-stream in 2021, which is lower than the annual average of 0.17 million gross square metres completed between 2015 and 2020. While the moderation in the supply of retail space and the gradual recovery in business sentiments may provide some support to retail rentals towards the end of the year, retail rentals are by and large expected to remain subdued this year.
Costs of utilities and fuel declined in 2020
The cost of utilities borne by firms is closely linked to electricity prices,10 which are in turn influenced by movements in global oil prices.11 Oil prices also contribute to business costs through fuel and transportation costs.
In 2020, the average wholesale electricity price12 fell sharply by 28.8 per cent, in tandem with the steep decline in global oil prices (Exhibit 8). The plunge in oil prices came on the back of lower global oil demand as restriction measures taken by many countries to curb the spread of COVID-19 weighed on global economic activity, as well as curtailed international and domestic travel.
10 For example, electricity cost accounts for around 83 per cent of the cost of utilities borne by firms in the manufacturing sector. 11 About 96 per cent of Singapore’s electricity is generated from natural gas, the price of which is indexed to oil prices. This is a common market practice in Asia.12 This refers to the Uniform Singapore Energy Price (USEP), which is the average wholesale energy price in the National Electricity Market of Singapore.
31Economic Survey of Singapore 2020Chapter 3 | Costs, Investments and Prices

13 EIA Short-Term Energy Outlook Report, February 2021.14 Between 2015 and 2019, global oil prices averaged $57/bbl.
Source: International Monetary Fund, CEIC, Energy Market Company
Looking ahead, global oil prices are projected to increase given the expected recovery in oil demand alongside the pickup in global economic activity, even as oil production is likely to remain restrained. Nonetheless, the current high level of global oil inventory is expected to cap upward price pressures in the near term. For 2021 as a whole, the US Energy Information Administration has forecast that global oil prices will average US$53 per barrel (/bbl)13, which is higher than the 2020 average of US$42/bbl but lower than the historical five-year average prior to 2020.14 In turn, the modest recovery in oil prices is likely to exert some upward pressure on the costs of utilities, fuel and transportation in 2021.
Exhibit 8: Global Oil Prices and Uniform Singapore Energy Prices, 1Q20 – 4Q20
ConclusionIn 2020, the unit business cost for the manufacturing sector fell, in large part due to declines in the manufacturing ULC, utilities cost and royalties cost. Meanwhile, the unit business cost for the overall services sector dipped in the first three quarters of 2020 because of a reduction in the services ULC which outweighed an increase in other services costs.
Looking ahead, the overall ULC for the economy is likely to rise in 2021 on account of a tapering of the wage subsidies introduced in 2020 and as remuneration per worker rises in tandem with the gradual recovery of the labour market. At the same time, the costs of utilities, fuel and transportation are likely to see some upward pressure due to higher global oil prices, while industrial and commercial rental costs are expected to remain largely subdued.
Contributed by:
Geraldine LimEconomist Economics DivisionMinistry of Trade and Industry
-60
-50
-40
-30
-20
-10
0
10
1Q20 2Q20 3Q20 4Q20
UK Brent USEP ($/MWh)
Per Cent change, yoy
Economic Survey of Singapore 2020Chapter 3 | Costs, Investments and Prices
32

REFERENCESSingapore Department of Statistics (2014), “Methodological Review on the Unit Business Cost Index for Manufacturing Industry (Base Year 2010=100)” November. https://www.singstat.gov.sg/-/media/files/publications/economy/ip-e38.pdf.
U.S. Energy Information Administration (2021), “Short-Term Energy Outlook (STEO)” February. https://www.eia.gov/outlooks/steo/.
33Economic Survey of Singapore 2020Chapter 3 | Costs, Investments and Prices

ANNEX A: BUSINESS COST STRUCTURE OF MANUFACTURING AND SERVICES SECTORS
Manufacturing Sector
In the manufacturing sector, labour cost, work given out and “others” constitute the largest components of business costs. These three components collectively account for around 86 per cent of the business costs of small- and medium-sized enterprises (SMEs) and around 77 per cent of the business costs of non-SMEs in the sector.
The remaining services cost components, including utilities, fuel, rental of building/premises and charges paid to other firms for inland transportation and ocean/air/other freight, make up a smaller share of business costs, at 22 per cent for non-SMEs and 13 per cent for SMEs. Non-labour production taxes, which include property, road and other indirect taxes, account for around 0.4 per cent and 0.7 per cent of the business costs of SMEs and non-SMEs respectively.
Details of the business cost structure of SMEs and non-SMEs in the various manufacturing clusters are in Exhibit A1.
Services Sector
Like in the manufacturing sector, labour cost constitutes a major cost component for firms in the services sectors, with its share of business costs ranging from around 9 per cent for firms in the transportation & storage sector, to around 39 per cent or more for firms in labour-intensive sectors such as accommodation, food & beverage services and retail trade. Across all services sectors, except for the accommodation and transportation & storage sectors, the labour cost share of business costs is larger for SMEs than for non-SMEs.
On the other hand, utilities cost is a relatively small cost component for firms in the services sectors, accounting for less than 2 per cent of the business costs of firms in most sectors. Key exceptions are firms in the accommodation and food & beverage services sectors, where utilities cost constitutes up to 5 per cent of their business costs. Similarly, rental cost accounts for a small share of the business costs of firms in most services sectors. Key exceptions include the retail trade, accommodation and food & beverage services sectors, where the rental cost share of business costs for SMEs is 28 per cent, 15 per cent and 26 per cent respectively.
Similar to the case for the manufacturing sector, non-labour production taxes account for less than 1 per cent of the business costs of firms in most services sectors. Even for the accommodation and real estate, professional services and administrative & support services sectors, which have the highest shares of non-labour production taxes, they are relatively small, at less than 4 per cent.
Details of the business cost structure of SMEs and non-SMEs in the various services sectors are in Exhibit A2.
Economic Survey of Singapore 2020Chapter 3 | Costs, Investments and Prices
34

Tota
lEl
ectr
onic
sCh
emic
als
Biom
edic
alM
anuf
actu
ring
Prec
isio
n En
gine
erin
gTr
ansp
ort
Engi
neer
ing
Gene
ral
Man
ufac
turi
ngNo
n-SM
EsSM
EsNo
n-SM
EsSM
EsNo
n-SM
EsSM
EsNo
n-SM
EsSM
EsNo
n-SM
EsSM
EsNo
n-SM
EsSM
EsNo
n-SM
EsSM
Es
Labo
ur C
ost
19.5
36.6
12.5
10.1
16.9
25.9
24.1
20.4
32.5
51.2
36.3
46.1
35.6
50.7
Serv
ices
Cos
t80
.162
.787
.389
.482
.173
.075
.679
.166
.948
.163
.353
.363
.848
.5
Wor
k gi
ven
out
21.1
18.2
28.3
37.2
6.8
3.1
1.9
16.2
12.0
15.1
37.0
26.7
4.6
12.9
Roya
lties
10
.72.
77.
84.
04.
74.
337
.46.
323
.41.
22.
51.
23.
21.
4
Utili
ties
3.2
2.9
2.6
0.9
7.3
8.3
1.5
1.3
1.8
2.2
1.8
1.1
6.5
3.0
Fuel
5.5
1.3
0.9
0.1
30.7
5.1
0.5
0.7
0.2
0.4
0.3
0.3
3.8
1.3
Rent
al o
f bui
ldin
g/pr
emis
es0.
42.
40.
30.
70.
21.
40.
51.
00.
72.
50.
52.
01.
95.
2
Char
ges
paid
to o
ther
fir
ms
for i
nlan
d tr
ansp
orta
tion
and
ocea
n/ a
ir/ o
ther
frei
ght2.
24.
31.
10.
75.
114
.41.
85.
83.
52.
41.
51.
36.
63.
1
Othe
rs36
.931
.046
.345
.727
.236
.532
.047
.825
.324
.419
.720
.837
.221
.7
Non-
Labo
ur P
rodu
ctio
n Ta
xes
0.4
0.7
0.2
0.6
1.0
1.1
0.3
0.4
0.6
0.7
0.4
0.6
0.7
0.8
Exhi
bit A
1: B
usin
ess
Cost
Str
uctu
re o
f the
Man
ufac
turi
ng S
ecto
r by
Firm
Siz
e, 2
019
Not
e: S
MEs
refe
r to
ent
erpr
ises
with
ope
ratin
g re
ceip
ts o
f not
mor
e th
an $
100
mill
ion
or e
mpl
oym
ent o
f not
mor
e th
an 2
00 w
orke
rs. N
on-S
MEs
refe
r to
ent
erpr
ises
with
ope
ratin
g re
ceip
ts o
f mor
e th
an $
100
mill
ion
and
empl
oym
ent o
f mor
e th
an 2
00 w
orke
rs.
Sour
ce: E
cono
mic
Dev
elop
men
t Boa
rd
35Economic Survey of Singapore 2020Chapter 3 | Costs, Investments and Prices

w
Sour
ce: D
epar
tmen
t of S
tatis
tics
and
Mon
etar
y Au
thor
ity o
f Sin
gapo
re
Exhi
bit A
2: B
usin
ess
Cost
Str
uctu
re o
f the
Ser
vice
s Se
ctor
s by
Fir
m S
ize,
201
9
Not
es:
1.
SMEs
refe
r to
ent
erpr
ises
with
ope
ratin
g re
ceip
ts o
f not
mor
e th
an $
100
mill
ion
or e
mpl
oym
ent o
f not
mor
e th
an 2
00 w
orke
rs. N
on-S
MEs
refe
r to
ent
erpr
ises
with
ope
ratin
g re
ceip
ts o
f mor
e th
an $
100
mill
ion
and
empl
oym
ent o
f mor
e th
an 2
00 w
orke
rs.
2.
“-“
refe
rs to
nil
or n
eglig
ible
.
Who
lesa
le T
rade
Reta
il Tr
ade
Acco
mm
odat
ion
Food
& B
ever
age
Serv
ices
Tran
spor
tatio
n&
Sto
rage
Info
rmat
ion
&
Com
mun
icat
ions
Fina
nce
&
Insu
ranc
e
Real
Est
ate,
Pr
ofes
sion
al
Serv
ices
and
Ad
min
istr
ativ
e &
Su
ppor
t Ser
vice
s
Non-
SMEs
SMEs
Non-
SMEs
SMEs
Non-
SMEs
SMEs
Non-
SMEs
SMEs
Non-
SMEs
SMEs
Non-
SMEs
SMEs
Non-
SMEs
SMEs
Non-
SMEs
SMEs
Labo
ur C
ost
19.1
19.4
36.5
41.0
51.0
39.1
43.3
49.8
12.1
6.3
16.2
26.3
10.4
13.2
29.3
30.1
Serv
ices
Cos
t80
.479
.862
.358
.345
.458
.056
.149
.887
.593
.483
.273
.489
.586
.568
.667
.2Ut
ilitie
s 0.
70.
22.
51.
44.
45.
54.
04.
60.
50.
10.
90.
90.
10.
10.
41.
0
Frei
ght &
Tran
spor
t 11
.540
.21.
52.
0-
-2.
20.
850
.861
.6-
1.4
--
0.1
2.0
Fina
ncia
l Ser
vice
s 2.
02.
42.
22.
61.
72.
40.
91.
40.
50.
50.
30.
43.
24.
20.
10.
6Co
mm
unic
atio
ns
0.5
0.4
0.4
0.9
0.3
0.6
0.2
0.5
0.2
0.3
1.1
7.4
0.2
0.2
0.3
0.9
Rent
ing
of P
rem
ises
4.2
4.3
34.8
27.9
6.9
15.0
21.2
25.9
0.9
1.8
1.4
2.7
0.6
1.1
1.3
3.9
Prof
essi
onal
Ser
vice
s 4.
13.
61.
82.
22.
81.
70.
71.
41.
00.
516
.79.
42.
33.
89.
65.
7Ot
her S
ervi
ces
57.5
28.9
19.2
21.3
29.4
32.8
27.0
15.3
33.6
28.5
62.8
51.2
83.1
77.2
56.7
53.1
Adve
rtis
ing
&
Ente
rtai
nmen
t4.
83.
14.
76.
34.
33.
43.
12.
00.
40.
93.
015
.51.
50.
60.
65.
7
Adm
in &
M
anag
emen
t Fee
s12
.06.
02.
82.
94.
98.
13.
13.
33.
03.
515
.614
.05.
18.
98.
27.
4
Cont
ract
labo
ur &
wo
rk gi
ven o
ut
10.0
2.8
1.9
1.9
1.1
3.5
4.2
2.1
1.4
1.8
3.2
6.3
0.8
0.3
28.8
11.5
Com
mis
sion
7.
14.
90.
53.
12.
04.
10.
10.
62.
21.
83.
23.
23.
28.
20.
92.
6Ro
yalti
es17
.82.
31.
50.
42.
60.
59.
11.
50.
1-
29.3
3.2
0.5
0.3
0.5
1.2
Mai
nten
ance
&
repa
irs1.
30.
73.
62.
43.
34.
63.
82.
64.
31.
71.
21.
20.
50.
31.
42.
8
Fuel
-1.
10.
10.
1-
-0.
20.
116
.812
.7-
--
--
0.2
Othe
rs4.
58.
04.
14.
311
.28.
73.
43.
05.
46.
17.
37.
871
.458
.616
.221
.8No
n-La
bour
Pro
duct
ion
Taxe
s 0.
50.
71.
20.
73.
62.
90.
60.
30.
40.
20.
60.
30.
10.
22.
12.
7
Economic Survey of Singapore 2020Chapter 3 | Costs, Investments and Prices
36

w
Note: The upcoming supply figures include supply from new development and redevelopment projects. They comprise: - projects with Provisional Permission, Outline Provisional Permission and/or Written Permission; - developments submitted for planning approval and which are under consideration; - projects on awarded Government Land Sales (GLS) and Concept and Price Tender (CPT) sites for which plans have not been submitted for planning approval; and planned projects in the GLS (which refer to sites on the GLS confirmed list and sites on the GLS reserve list that have been triggered) and CPT sites launched for tender.
ANNEX B: SUPPLY OF INDUSTRIAL AND COMMERCIAL SPACE
Exhibit B1: Supply of Industrial Space
Exhibit B2: Supply of Commercial Space
Total 2021 2022 2023 2024 2025 >2025Multiple-User Factory Space ('000 sqm gross)
Total 1,651 885 709 4 52 - -Under Construction 1,439 853 533 0 52 - -
Planned 212 32 176 4 0 - -
Single-User Factory Space ('000 sqm gross)Total 2,014 1,140 493 218 163 - -
Under Construction 1,440 931 262 132 115 - -Planned 574 209 231 86 48 - -
Business Park Space ('000 sqm gross)Total 606 202 0 64 339 - -
Under Construction 415 188 0 0 227 - -
Planned 191 14 0 64 113 - -Warehouse Space ('000 sqm gross)Total 944 450 347 138 10 - -
Under Construction 716 410 306 - - - -Planned 228 39 41 138 10 - -
Total Industrial Space 5,215 2,677 1,549 424 565 - -
Total 2021 2022 2023 2024 2025 >2025Office Space ('000 sqm gross)
Total 770 164 61 222 217 - 106Under Construction 478 164 61 214 39 - -Planned 292 - - 8 178 - 106
Retail Space ('000 sqm gross)Total 426 89 73 62 65 19 118
Under Construction 252 89 72 42 49 - -Planned 174 - 1 20 16 19 118
Total Commercial Space 1,196 253 134 284 282 19 224
Source: JTC Corporation
Source: Urban Redevelopment Authority
37Economic Survey of Singapore 2020Chapter 3 | Costs, Investments and Prices


CHAPTER
04IN
TERNATION
AL TRADE

TOTAL MERCHANDISE TRADEAMOUNTED TO...
TOTAL SERVICES TRADE AMOUNTED TO...
$453 billionMerchandise
Imports
$172 billionNon-Oil
Domestic Exports
$62 billionOil Domestic Exports
$281 billionRe-exports
GROWTH IN MERCHANDISE TRADE
-5.2%Merchandise Trade
-3.2%Merchandise Exports
-7.4%Merchandise Imports
$259 billionServices Exports
$238 billionServices Imports
GROWTH IN SERVICES TRADE
-14.3%Total ServicesTrade
-16.1%Total ServicesImports
-12.7%Total ServicesExports
-20
-10
0
10
20
202020192018
$969billion
in 2020
$497billion
in 2020
-20
-10
0
10
20
202020192018
THE DECLINE IN SERVICES EXPORTS WAS LED BY...
Travel Services
-6.9%
Transport Services
-4.0%
COMPONENTS OF MERCHANDISE EXPORTS
Re-exportsNon-OilDomestic Exports
+0.1%
Oil
-28.1%+4.3%
(Year-On-Year Growth)
point contribution point contribution
CHAPTER 4
INTERNATIONAL TRADE
Economic Survey of Singapore 2020Chapter 4 | International Trade
40
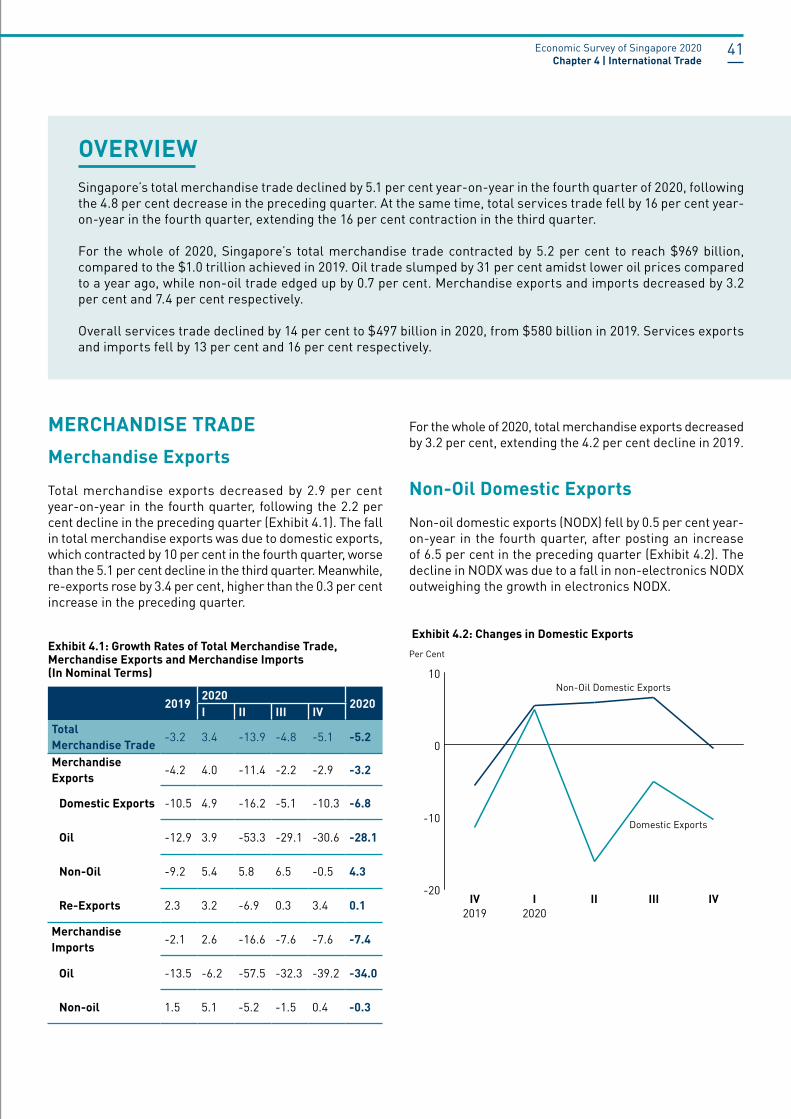
Singapore’s total merchandise trade declined by 5.1 per cent year-on-year in the fourth quarter of 2020, following the 4.8 per cent decrease in the preceding quarter. At the same time, total services trade fell by 16 per cent year-on-year in the fourth quarter, extending the 16 per cent contraction in the third quarter.
For the whole of 2020, Singapore’s total merchandise trade contracted by 5.2 per cent to reach $969 billion, compared to the $1.0 trillion achieved in 2019. Oil trade slumped by 31 per cent amidst lower oil prices compared to a year ago, while non-oil trade edged up by 0.7 per cent. Merchandise exports and imports decreased by 3.2 per cent and 7.4 per cent respectively.
Overall services trade declined by 14 per cent to $497 billion in 2020, from $580 billion in 2019. Services exports and imports fell by 13 per cent and 16 per cent respectively.
OVERVIEW
MERCHANDISE TRADEMerchandise ExportsTotal merchandise exports decreased by 2.9 per cent year-on-year in the fourth quarter, following the 2.2 per cent decline in the preceding quarter (Exhibit 4.1). The fall in total merchandise exports was due to domestic exports, which contracted by 10 per cent in the fourth quarter, worse than the 5.1 per cent decline in the third quarter. Meanwhile, re-exports rose by 3.4 per cent, higher than the 0.3 per cent increase in the preceding quarter.
Exhibit 4.1: Growth Rates of Total Merchandise Trade, Merchandise Exports and Merchandise Imports (In Nominal Terms)
For the whole of 2020, total merchandise exports decreased by 3.2 per cent, extending the 4.2 per cent decline in 2019.
Non-Oil Domestic ExportsNon-oil domestic exports (NODX) fell by 0.5 per cent year-on-year in the fourth quarter, after posting an increase of 6.5 per cent in the preceding quarter (Exhibit 4.2). The decline in NODX was due to a fall in non-electronics NODX outweighing the growth in electronics NODX.
Per Cent
-20
-10
0
10
IVIIIIIIIV20202019
Domestic Exports
Non-Oil Domestic Exports
Exhibit 4.2: Changes in Domestic Exports
2019 2020 2020I II III IVTotal Merchandise Trade -3.2 3.4 -13.9 -4.8 -5.1 -5.2
Merchandise Exports -4.2 4.0 -11.4 -2.2 -2.9 -3.2
Domestic Exports -10.5 4.9 -16.2 -5.1 -10.3 -6.8
Oil -12.9 3.9 -53.3 -29.1 -30.6 -28.1
Non-Oil -9.2 5.4 5.8 6.5 -0.5 4.3
Re-Exports 2.3 3.2 -6.9 0.3 3.4 0.1
Merchandise Imports -2.1 2.6 -16.6 -7.6 -7.6 -7.4
Oil -13.5 -6.2 -57.5 -32.3 -39.2 -34.0
Non-oil 1.5 5.1 -5.2 -1.5 0.4 -0.3
Economic Survey of Singapore 2020Chapter 4 | International Trade
41

Exhibit 4.3: Growth Rates of Non-Oil Domestic Exports to Top Ten Markets in 2020
Per Cent
-30 -20 -10 0 10 20 30 40 50
Indonesia
Hong Kong
China
Malaysia
Thailand
EU
Taiwan
Japan
South Korea
United States 38.3
27.2
26.1
15.5
8.8
6.8
-0.7
-8.0
-15.1
-16.4
Exhibit 4.4: Changes in Re-Exports Per Cent
-10
-5
0
5
IVIIIIIIIV20202019
Re-Exports
Non-Oil Re-Exports
Electronics NODX grew by 2.6 per cent in the fourth quarter, easing from the 9.2 per cent increase in the previous quarter. The rise in electronics NODX was primarily due to higher domestic exports of telecommunications equipment, PCs and disk drives. Non-electronics NODX decreased by 1.4 per cent, a reversal from the 5.7 per cent growth in the previous quarter. The fall in non-electronics NODX was due to a decline in the domestic exports of pharmaceuticals, non-monetary gold and petrochemicals.
For the full year, NODX expanded by 4.3 per cent, after posting a 9.2 per cent decline in 2019. The increase was due to higher shipments of both non-electronics (4.1 per cent) and electronics (4.9 per cent) products.
The top 10 NODX markets accounted for 82 per cent of Singapore’s total NODX in 2020. Singapore’s NODX to the top 10 markets all rose in 2020, except for China, Hong Kong, Indonesia and Malaysia (Exhibit 4.3). The biggest contributors to the increase in NODX were the US (38 per cent), Japan (26 per cent) and South Korea (27 per cent).
NODX to the US expanded mainly because of a pickup in the exports of non-monetary gold, food preparations and disk media products. NODX to Japan rose as a result of an increase in the exports of pharmaceuticals, specialised machinery and glass. Meanwhile, specialised machinery, ICs and pharmaceuticals contributed the most to the growth in NODX to South Korea. On the other hand, NODX to China decreased due to a decline in the exports of non-monetary gold, petrochemicals and ICs.
Oil Domestic ExportsOil domestic exports contracted by 31 per cent year-on-year in the fourth quarter, following the 29 per cent decline in the preceding quarter. The contraction in oil domestic exports was led by lower exports to Malaysia, Indonesia and Australia, partly reflecting lower oil prices in the fourth quarter as compared to a year ago. In volume terms, oil domestic exports declined by 8.4 per cent, a reversal from the 5.1 per cent increase in the third quarter.
For the full year, oil domestic exports fell by 28 per cent, following the 13 per cent contraction in 2019, on account of lower oil prices. The decline in oil domestic exports was driven mainly by lower exports to Malaysia, Indonesia and Australia. In volume terms, oil domestic exports expanded by 3.6 per cent in 2020, a turnaround from the 5.8 per cent decrease in 2019.
Non-Oil Re-ExportsNon-oil re-exports (NORX) grew by 3.4 per cent year-on-year in the fourth quarter, after recording a decline of 0.6 per cent in the preceding quarter (Exhibit 4.4). The growth in NORX was due to an increase in the re-exports of electronics outweighing a decline in non-electronic re-exports. Electronics NORX expanded by 21 per cent, following the 16 per cent growth in the third quarter, on the back of an increase in the re-exports of ICs, diodes & transistors and parts of PCs. Meanwhile, non-electronics NORX decreased by 12 per cent, extending the 13 per cent decline in the preceding quarter. The fall in non-electronics NORX was mainly due to the lower re-exports of non-electric engines & motors, aircraft parts and piston engines.
Economic Survey of Singapore 2020Chapter 4 | International Trade
42

Exhibit 4.5: Growth Rates of Non-Oil Re-Exports to Top Ten Markets in 2020
Exhibit 4.6: Changes in Merchandise Imports
Per Cent
-15 -10 -5 0 5 10 15 20
Malaysia
Japan
Indonesia
United States
Vietnam
South Korea
EU
Taiwan
China
Hong Kong 16.3
9.5
8.3
7.8
7.8
6.3
2.7
-4.9
-8.6
-10.6
Per Cent
-60
-50
-40
-30
-20
-10
0
10
IVIIIIIIIV20202019
Oil Imports
Non-Oil Imports
For the whole of 2020, NORX edged up marginally by 0.1 per cent, moderating from the 3.1 per cent rise in 2019. Growth was attributable to the increase in electronics NORX (13 per cent) which outweighed the decline in non-electronics NORX (-11 per cent).
NORX to all top 10 NORX markets expanded in 2020, except for Malaysia, Japan and Indonesia (Exhibit 4.5). NORX to Hong Kong rose on the back of higher re-exports of ICs, diodes & transistors and non-electric engines & motors. Meanwhile, higher shipments of ICs, personal beauty products and specialised machinery led to an increase in NORX to China. Re-exports to the EU 27 rose due to higher shipments of ICs, telecommunications equipment and parts of PCs. On the other hand, NORX to Malaysia fell because of a drop in the shipments of telecommunications equipment, non-monetary gold and aircraft parts.
Merchandise ImportsNon-oil imports increased by 0.4 per cent year-on-year in the fourth quarter, a reversal from the 1.5 per cent decline in the preceding quarter (Exhibit 4.6). The rise in non-oil imports came on the back of a pickup in the imports of electronics (14 per cent) which outweighed a decline in non-electronics imports (-7.7 per cent). Higher imports of ICs, parts of PCs and parts of ICs contributed to the increase in electronics imports. Meanwhile, non-electronics imports declined due to a drop in the imports of non-electric engines & motors, aircraft parts and petrochemicals.
Oil imports fell by 39 per cent year-on-year in the fourth quarter, following the 32 per cent decline in the preceding quarter. In volume terms, oil imports plunged by 20 per cent, larger than the 3.9 per cent decline in the previous quarter.
For the full year, non-oil imports dipped by 0.3 per cent, deteriorating from the 1.5 per cent growth in 2019. Oil imports slumped by 34 per cent, following the 13 per cent decline in 2019.
Economic Survey of Singapore 2020Chapter 4 | International Trade
43

Exhibit 4.7: Growth Rates of Total Services Trade, Services Exports and Services Imports (In Nominal Terms)
Services ExportsServices exports shrank by 14 per cent year-on-year in the fourth quarter, extending the 14 per cent contraction in the third quarter (Exhibit 4.7). This was primarily driven by the exports of travel services, transport services and maintenance & repair services, which plunged by 85 per cent, 17 per cent and 45 per cent respectively. By contrast, the exports of financial services expanded by 9.4 per cent.
For the full year, services exports declined by 13 per cent, reversing from the 6.2 per cent growth recorded in 2019. Total services exports fell on the back of a contraction in the exports of travel services (-74 per cent), transport services (-14 per cent) and other business services (-3.7 per cent). These decreases were partially offset by an expansion in the exports of financial services (3.7 per cent) and insurance services (3.1 per cent) over the same period.
Services ImportsServices imports fell by 19 per cent year-on-year in the fourth quarter, following the 19 per cent decline recorded in the third quarter. The decrease in services imports was on account of the lower imports of travel services (-90 per cent), transport services (-22 per cent) and other business services (-3.2 per cent). Conversely, the imports of financial services increased by 18 per cent.
For the whole of 2020, services imports contracted by 16 per cent, a reversal from the 5.2 per cent increase in 2019. The decrease in services imports was attributable to the imports of travel services, transport services and other business services contracting by 75 per cent, 18 per cent and 4.2 per cent respectively. These declines were partially offset by an increase in the imports of financial services and telecommunications, computer & information services by 14 per cent and 5.5 per cent respectively.
2019 2020 2020I II III IVTotal Services Trade 5.7 -3.0 -21.4 -16.3 -16.3 -14.3
Services Exports 6.2 -3.3 -19.1 -14.1 -13.8 -12.7
Services Imports 5.2 -2.7 -23.7 -18.7 -18.9 -16.1
Economic Survey of Singapore 2020Chapter 4 | International Trade
44

BALANCE OF PAYM
ENTS
CHAPTER
05

CHAPTER 5
BALANCE OF PAYMENTS
Singapore’s balance of payments surplus came in at$103.3 billion at the end of 2020
$16.9 billion
-$11.4 billion
$103.3 billion
202020192018
-40
-20
0
20
40
60
80
100
CurrentAccount
Capital and Financial Account
$82.5 billion
-$19.9 billion
COMPONENTS OF CAPITAL &FINANCIAL ACCOUNT
-$76.0 billion
Directinvestment
Portfolioinvestment
$71.0 billion
Otherinvestment
-$34.0 billion
Financialderivatives
$19.1 billion
-20
0
20
40
60
80
100
120
BALANCE OF PAYMENTS TREND
COMPONENTS OF CURRENT ACCOUNT
Goodsbalance
$129.2 billion
Servicesbalance
$20.5 billion
Primaryincome balance
-$57.3 billion -$9.9 billion
Secondaryincome balance
Economic Survey of Singapore 2020Chapter 5 | Balance of Payments
48

OVERVIEW
CURRENT ACCOUNTThe current account surplus narrowed to $20 billion in the fourth quarter, from $23 billion in the third quarter (Exhibit 5.1). For 2020 as a whole, the surplus rose by $9.6 billion to $82 billion (18 per cent of GDP). This increase was driven by a larger surplus in the services balance and smaller deficits in both the primary and secondary income balances, which more than offset a decline in the goods surplus.
Exhibit 5.1: Current Account Balance
In terms of the sub-components of the current account, the goods balance saw its surplus decline by $3.9 billion from the third quarter to $31 billion in the fourth quarter, as imports rose by more than exports (Exhibit 5.2). For the 2020 as a whole, the goods balance registered a smaller surplus of $129 billion, compared to the $132 billion in 2019, as the exports of goods fell by more than imports.
$ Billion
2019 2020
16
18
20
22
24
IVIIIIIIIV
The surplus in the services balance came in at $6.9 billion in the fourth quarter, broadly unchanged from the preceding quarter. However, for the whole of 2020, the surplus in the services balance widened to $21 billion, from $12 billion in 2019. This was driven mainly by lower net payments for travel services and a shift from net payments to net receipts for transport services.
For the primary income balance, the deficit narrowed slightly by $0.3 billion from the previous quarter to $16 billion in the fourth quarter. For the year as a whole, the deficit declined to $57 billion, from $61 billion in 2019, as primary income payments fell by more than receipts.
Exhibit 5.2: Components of Current Account Balance
$ Billion
2019 2020-20
-10
0
10
20
30
40
IVIIIIIIIV
Goods Balance
Services Balance
Primary Income Balance
Secondary Income Balance
Singapore’s overall balance of payments rose to $37 billion in the fourth quarter of 2020, from $14 billion in the third quarter. For the year as a whole, the overall balance of payments registered a surplus of $103 billion, reversing the deficit of $11 billion in 2019. This was mainly due to net inflows into the capital and financial account, which was a reversal from the net outflows in 2019. As a result, Singapore’s official foreign reserves rose to $479 billion at the end of 2020.
Economic Survey of Singapore 2020Chapter 5 | Balance of Payments
49

CAPITAL AND FINANCIAL ACCOUNTThe capital and financial account1 registered a net inflow of $16 billion in the fourth quarter, in contrast to the net outflow of $7.4 billion in the preceding quarter (Exhibit 5.3). For 2020 as a whole, net inflows came in at $20 billion (4.2 per cent of GDP), a reversal from the net outflows of $84 billion in 2019. The reversal primarily reflected lower net outflows of portfolio investment and a shift in “other investment” from a net outflow to a net inflow position. These factors outweighed a decline in the net inflows of direct investment and an increase in the net outflows of financial derivatives.
In terms of the sub-components of the capital and financial account, net outflows of portfolio investment rose by $6.4 billion in the fourth quarter to $31 billion (Exhibit 5.4). For the full year, net outflows of portfolio investment amounted to $71 billion, less than half the $145 billion of net outflows recorded in 2019. This was partly due to a shift from a net outflow position in resident deposit-taking corporations in 2019 to a net inflow position in 2020, as resident banks switched to selling overseas securities from net purchases in the previous year.
Exhibit 5.3: Capital and Financial Account Balance
Exhibit 5.4: Components of Financial Account (Net)
1 Net inflows in net balances are indicated by a minus (-) sign. For more details regarding the change in sign convention to the financial account, please refer to DOS’s information paper on “Singapore’s International Accounts: Methodological Updates and Recent Developments”.
$ Billion
2019 2020
-30
-20
-10
0
10
20
IVIIIIIIIV
$ Billion
2019 2020
-40
-20
0
20
40
IVIIIIIIIV
Direct Investment
FinancialDerivatives
OtherInvestment
PortfolioInvestment
Net inflows of “other investment” increased to $33 billion in the fourth quarter, from $6.5 billion in the preceding quarter. For the full year, net inflows were $34 billion, a turnaround from the net outflows of $21 billion in 2019. This was partly attributable to an increase in net inflows to the domestic non-bank private sector, as liabilities to non-residents grew and assets abroad fell.
Direct investment saw net inflows amounting to $19 billion in the fourth quarter, higher than the $16 billion in previous quarter. For 2020 as a whole, net inflows of direct investment fell by $19 billion to $76 billion, as the decline in foreign direct investment into Singapore exceeded the fall in residents’ direct investment abroad.
Net outflows of financial derivatives came in at $5.6 billion in the fourth quarter, largely unchanged from the previous quarter. For the full year of 2020, net outflows of financial derivatives rose to $19 billion, from $13 billion in 2019.
Economic Survey of Singapore 2020Chapter 5 | Balance of Payments
50

Image courtesy of Illumina

CHAPTER
06SECTORAL PERFORM
ANCE

CHAPTER 6
SECTORAL PERFORMANCE
OVERALL ECONOMY MANUFACTURING
Electronics
Chemicals
BiomedicalManufacturing
PrecisionEngineering
GeneralManufacturingIndustries
TransportEngineering
CLUSTERS IN THE MANUFACTURING SECTOR
Real Growth (%)Nominal VA Share (%)
39.2 11.9
14.0 -1.0
17.1 23.7
15.0 10.6
5.9 -25.7
8.7 -11.3
NominalValueAdded Share (%)
TOTAL 100.0 -5.4
Goods Producing Industries 25.6 0.3
Manufacturing 21.5 7.3
Construction 2.7 -35.9
Utilities 1.3 -2.2
RealGrowth(%)
STRUCTURE OF ECONOMY
Other Goods Industries
Services Producing Industries
Wholesale Trade
0.0 -10.0
70.1 -6.9
16.8 -2.4
Retail Trade 1.4 -16.0
Transportation & Storage
Accommodation
Information & Communications
Finance & Insurance
Real Estate
Other Services Industries
Ownership of Dwellings
5.4 -25.4
0.4 -28.7
Food & Beverage Services 1.0 -25.1
5.1 2.1
15.7 5.0
3.0 -14.2
Professional Services 5.9 -9.7
Administrative & Support Services 4.5 -15.1
10.8 -8.9
4.3 1.1
CONSTRUCTION
CERTIFIEDPAYMENTS IN 2020
50.6%Public
49.4%Private
CONTRACTS AWARDED IN 2020
CommercialCivilEngineeringWork
ResidentialInstitutional& Others
Industrial
$1.6$3.9$4.3$5.7 $5.6billion billion billion billion billion
Economic Survey of Singapore 2020Chapter 6 | Sectoral Performance
54

WHOLESALE TRADEDomesticWholesale TradeIndex growth
-12.3%
ForeignWholesale TradeIndex growth
-1.4%
NominalValueAdded Share (%)
RealGrowth(%)
TRANSPORTATION & STORAGE
Air passengers handled growth -82.8%
Total sea cargo handled growth -5.7%
TRANSPORTATION & STORAGE
Land Transport* 18.5 -25.9
Water Transport* 50.9 -7.3
Air Transport* 6.4 -72.5
Storage & Other Support Services 20.3 -11.4
Post & Courier 3.9 7.3
*Including supporting services
INFORMATION & COMMUNICATIONS
Real Growth (%)Nominal VA Share (%)
21.2
64.8 6.4
14.0 0.9
-8.3Telecommunications
IT & InformationServices
Others
RETAIL TRADERetail SalesIndex growth(Motor Vehicles)
-24.3%
Retail SalesIndex growth(Non-motor Vehicles)
-14.3%
ACCOMMODATION
Catering
-54.8%Restaurants
-34.1%
Fast Food
-8.8%Others
-18.3%
Room revenuegrowth
Gross lettingsgrowth
-71.3% -57.8%
PERFORMANCE OF HOTELS, (JANUARY-NOVERMBER 2020)
FOOD & BEVERAGE SERVICESPERFORMANCE OF F&B (SALES GROWTH)
Economic Survey of Singapore 2020Chapter 6 | Sectoral Performance
55

PROFESSIONAL SERVICES
NominalValueAdded Share (%)
RealGrowth(%)
PROFESSIONAL SERVICES
8.8 -4.9
Accounting 6.9 -2.2
Head Offices & BusinessRepresentative Offices 33.6 -5.0
Business &Management Consultancy 9.4 -9.0
Architectural & Engineering, Technical Testing & Analysis 24.5 -16.3
Other Professional,Scientific & Technical Services 16.8 -14.0
Legal
NominalValueAdded Share (%)
RealGrowth(%)
ADMINISTRATIVE &SUPPORT SERVICES
Rental & Leasing
Other Administrative& Support Services
60.5 -14.1
39.5 -16.6
ADMINISTRATIVE & SUPPORT SERVICES
NominalValueAdded Share (%)
RealGrowth(%)
OTHER SERVICES INDUSTRIES
Public Administration & Defence 26.0 0.8
Education, Health & Social Work 54.6 -3.2
Arts, Entertainment & Recreation 5.9 -54.0
Others 13.5 -9.8
OTHER SERVICES INDUSTRIES
PRIVATE RESIDENTIAL REAL ESTATE
REAL ESTATE
2.2%
Price Index Growth
9.2%
Units Transacted Growth
COMMERCIAL AND INDUSTRIAL REAL ESTATE (RENTAL INDEX GROWTH)
-8.5%
Commercial Office Space
-14.7%
Commercial Retail Space
-1.5%
Industrial Space Rental
NominalValueAdded Share (%)
RealGrowth(%)
FINANCE & INSURANCE
FINANCE & INSURANCE
Activities Auxiliary to Financial Services
Fund Management
Insurance
Others
Banking 42.7 4.8
19.5 6.2
10.4 3.7
18.0 10.2
9.5 -3.5
GROWTH OF BANK LOANS & ADVANCESTO NON-BANK CUSTOMERS IN 2020
-1.2%
Consumer Loans
-2.4%
Loans to Businesses
-2.0%
TotalLoans
CHAPTER 6
SECTORAL PERFORMANCE
Economic Survey of Singapore 2020Chapter 6 | Sectoral Performance
56


OVERVIEW
OVERALL MANUFACTURING PERFORMANCE
In the fourth quarter, manufacturing output grew by 10 per cent on account of output expansions in the electronics, biomedical manufacturing, precision engineering and chemicals clusters. On the other hand, output declined in the transport engineering and general manufacturing clusters (Exhibit 6.1).
For the whole of 2020, the manufacturing sector expanded by 7.3 per cent, a rebound from the 1.5 per cent decline in 2019. The strong performance of the sector was driven by output growth in the electronics, biomedical manufacturing and precision engineering clusters (Exhibit 6.2).
Exhibit 6.1: Manufacturing Growth Rates
Exhibit 6.2: Percentage-Point Contribution to Manufacturing Sector’s Growth in 2020
Per Cent
-2.1
-0.1
4.2
7.3
-0.9
1.5
3.0
-5 0 5 10
Transport Engineering
General Manufacturing
Chemicals
Precision Engineering
Biomedical Manufacturing
Electronics
Total Manufacturing
Industries
4.7
Per Cent
2019 2020
-10
-5
0
5
10
15
IVIIIIIIIV
-4.0
10.311.0
-0.4
8.3
The manufacturing sector expanded by 10 per cent year-on-year in the fourth quarter of 2020, extending the 11 per cent growth in the preceding quarter. Growth in the sector was supported by output expansions in the electronics, biomedical manufacturing, precision engineering and chemicals clusters.
For the whole of 2020, the manufacturing sector grew by 7.3 per cent, reversing the 1.5 per cent decline in the previous year, on the back of output growth in the electronics, biomedical manufacturing and precision engineering clusters.
6.1
MANUFACTURING
PERFORMANCE OF CLUSTERS The electronics cluster grew by 23 per cent in the fourth quarter, bolstered by output expansions in the semiconductors (26 per cent), computer peripherals & data storage (11 per cent) and other electronic modules & components (1.8 per cent) segments. In particular, the semiconductors segment was supported by strong demand for semiconductor chips from 5G markets. On the other hand, the infocomms & consumer electronics segment contracted by 6.0 per cent. For 2020 as a whole, the electronics cluster expanded by 12 per cent on account of robust global semiconductor demand (Exhibit 6.3).
Economic Survey of Singapore 2020Chapter 6 | Sectoral Performance
58

Exhibit 6.3: Manufacturing Clusters’ Growth
Per Cent20202019
-30 -20 -10 0 10 20 30
Transport Engineering
General Manufacturing
Chemicals
Total Manufacturing
Precision Engineering
Electronics
Biomedical Manufacturing
Industries
Output in the biomedical manufacturing cluster rose by 13 per cent in the fourth quarter, supported by growth in both the pharmaceuticals and medical technology segments. The pharmaceuticals segment expanded by 11 per cent due to a higher level of production of active pharmaceutical ingredients (APIs) and biological products. Similarly, output in the medical technology segment increased by 16 per cent on the back of higher export demand for medical devices. For the full year, output in the biomedical manufacturing cluster rose by 24 per cent, supported by expansions in both segments.
The precision engineering cluster expanded by 9.7 per cent in the fourth quarter, supported by output expansions in both the machinery & systems (M&S) and precision modules & components (PMC) segments. In particular, the M&S segment grew by 13 per cent on account of a higher level of production of semiconductor equipment. Meanwhile, the PMC segment rose by 1.8 per cent on the back of output increases for optical instruments and metal precision components. For the whole of 2020, the precision engineering cluster grew by 11 per cent.
Growth in the chemicals cluster came in at 7.3 per cent in the fourth quarter, supported by output expansions in all segments except for the petroleum segment. The petrochemicals segment expanded by 15 per cent from a low base, due to plant maintenance shutdowns in the same period a year ago. Likewise, output in the specialty chemicals segment increased by 12 per cent on the back of a rise in the output of industrial gases and mineral oil additives. At the same time, the other chemicals segment grew by 0.5 per cent, supported by a higher level of production of fragrances. Conversely, the petroleum segment contracted by 31 per cent as demand for transportation fuel was weak amidst the international and domestic travel restrictions caused by the COVID-19 pandemic in economies around the world. For 2020 as a whole, the chemicals cluster contracted by 1.0 per cent.
Output in the general manufacturing cluster fell by 6.9 per cent in the fourth quarter, with all segments recording declines. Specifically, the miscellaneous industries segment contracted by 6.9 per cent due to the weak demand for construction-related products, while the food, beverages & tobacco segment recorded a 5.8 per cent contraction on the back of a fall in the production of beverage products and milk powder. Meanwhile, output in the printing segment fell by 12 per cent. For the whole of 2020, the general manufacturing cluster contracted by 11 per cent.
Output in the transport engineering cluster declined by 30 per cent in the fourth quarter, weighed down by the aerospace and marine & offshore engineering (M&OE) segments. In particular, output in the aerospace segment plunged by 39 per cent due to a fall in repair and maintenance work from commercial airlines amidst global travel restrictions and weak air travel demand. Likewise, output in the M&OE segment slumped by 33 per cent as work in shipyards was weighed down by the requirement to implement safe management measures as well as weak order books. By contrast, the land transport segment expanded by 15 per cent on account of an increase in the output of parts and accessories for motor vehicles. For the whole of 2020, the transport engineering cluster shrank by 26 per cent.
Economic Survey of Singapore 2020Chapter 6 | Sectoral Performance
59

OVERVIEW
6.2
CONSTRUCTION
Exhibit 6.5: Contracts Awarded, 2020 ($ Billion)
Exhibit 6.4: Contracts Awarded
CONSTRUCTION DEMANDConstruction demand (contracts awarded) plunged by 29 per cent year-on-year to $5.7 billion in the fourth quarter, on the back of declines in both public and private sector construction demand (Exhibit 6.4).
Public SectorIn the fourth quarter, public sector construction demand contracted by 28 per cent to $3.9 billion. This was primarily due to declines in contracts awarded for public institutional & others building (-64 per cent) and public civil engineering (-52 per cent) works. However, these declines were partially offset by expansions in contracts awarded for public residential building (23 per cent) and industrial building (2080 per cent) works.
Total Public Private
Total 21.0 12.8 8.2
Residential 5.6 2.9 2.7
Commercial 1.6 0.4 1.3
Industrial 4.3 2.1 2.2
Institutional & Others 3.9 2.6 1.3
Civil Engineering Works 5.7 4.9 0.8
0
2
4
6
8
10
IVIIIIIIIV
$ Billion
2019 2020
Total
Private
Public
The construction sector shrank by 27 per cent year-on-year in the fourth quarter of 2020, moderating from the 53 per cent contraction recorded in the previous quarter.
For the whole of 2020, the sector contracted by 36 per cent, a sharp reversal from the 1.6 per cent growth in 2019.
For the full year, total construction demand fell by 37 per cent to $21 billion (Exhibit 6.5), on account of the COVID-19 pandemic which disrupted project implementation schedules.
Economic Survey of Singapore 2020Chapter 6 | Sectoral Performance
60

Exhibit 6.6: Certified Payments
0
2
4
6
8
IVIIIIIIIV
$ Billion
2019 2020
Total
Private
Public
For the full year, public sector construction demand fell by 33 per cent to $12.8 billion. The contraction was due to a reduction in contracts awarded for most types of works, particularly institutional & others building (-48 per cent) and civil engineering (-37 per cent) works. Some of the major projects awarded during the year included LTA’s first contract for the Rapid Transit System (RTS) Link and Integrated Train Testing Centre, NEA’s Integrated Waste Management Facility (IWMF) (Package 1) and PUB’s various contracts for the Deep Tunnel Sewerage System (DTSS) (Phase 2).
Private SectorPrivate sector construction demand decreased by 30 per cent in the fourth quarter to $1.9 billion, weighed down by lower demand for private residential building (-54 per cent) and private institutional & others building (-87 per cent) works. On the other hand, expansions in contracts awarded for private commercial building (28 per cent) and industrial building (137 per cent) works helped to provide some support to private sector construction demand.
For the full year, private sector construction demand fell by 43 per cent to $8.2 billion, due to contractions in demand for all types of works, particularly residential (-46 per cent) and industrial building (-55 per cent) works. Major projects awarded in 2020 included Mandai Park’s rejuvenation project, residential developments for Government Land Sales (GLS) and past en-bloc sale sites, as well as Hyundai Mobility Global Innovation Centre.
CONSTRUCTION ACTIVITIESConstruction output (or certified payments) decreased by 24 per cent year-on-year to $5.7 billion in the fourth quarter, due to contractions in both public and private sector construction output (Exhibit 6.6).
For the full year, construction output dropped by 30 per cent to $19.7 billion, a sharp reversal from the 6.4 per cent increase in 2019. Output was adversely affected by the suspension of construction activities during the Circuit Breaker period, as well as the slow pace of recovery of construction activities due to the need to implement safe management measures at construction worksites.
Public SectorPublic sector construction output contracted by 29 per cent year-on-year to $2.7 billion in the fourth quarter. Construction output for all types of works declined on a year-on-year basis, with public institutional & others building (-35 per cent) and public civil engineering (-25 per cent) works seeing the largest declines.
For the full year, public sector construction output shrank by 31 per cent to $10 billion, led by declines in residential building (-35 per cent) and civil engineering (-33 per cent) works. Major projects supporting public sector construction activities included LTA’s East Coast Integrated Depot and Circle MRT Line 6, JTC’s business park development at the Punggol Digital District and Logistics Hub at Benoi Road, MOH’s Woodlands Health Campus, as well as PUB’s DTSS (Phase 2).
Economic Survey of Singapore 2020Chapter 6 | Sectoral Performance
61

Exhibit 6.8: Changes in Tender Price Index
Exhibit 6.7: Changes in Market Prices of Construction Materials
1 Rebar consumption is estimated from net imports plus local production (without factoring in stock levels).2 The market prices are based on contracts with non-fixed price, fixed price and market retail price. 3 The market prices refer to 16mm to 32mm High Tensile rebar and are based on fixed price supply contracts with a contract period 12 months or below.
Per Cent
2019 2020
-10
-5
0
5
10
15
IVIIIIIIIV
Ready-MixedConcrete
Steel Bars
Per Cent
-10
-5
0
5
20202019201820172016
Private SectorIn the fourth quarter, private sector construction output shrank by 19 per cent year-on-year to $3.0 billion, as all types of construction works declined, particularly private residential building (-15 per cent) and private industrial building (-20 per cent) works.
For the full year, private sector construction output fell by 29 per cent to $9.7 billion. All types of construction output contracted, especially residential building (-28 per cent) and industrial building (-25 per cent) works. Major on-going projects which contributed to private sector construction activities included the chemical and refining facilities at Jurong Island, data centres, a semiconductor fabrication plant, Mandai Park attractions and island-wide cable installation projects.
CONSTRUCTION MATERIALSIn tandem with the reduction in total construction output, total consumption of ready-mixed concrete shrank by 42 per cent to 7.2 million m3 in 2020. Similarly, the total consumption of steel rebars decreased by 39 per cent to 0.83 million tonnes in 2020.
The average market price of Grade 40 pump ready-mixed concrete dropped by 1.8 per cent year-on-year to about $94 per m3 in the fourth quarter (Exhibit 6.7). On the other hand, the average market price of steel rebar rose by 4.8 per cent year-on-year to around $754 per tonne in the fourth quarter, due to the rising costs of raw materials and tight supplies from import countries like China.
CONSTRUCTION COSTSBased on BCA’s Building Works Tender Price Index (TPI), tender prices in the construction sector rose by 2.9 per cent in 2020, mainly on account of significant increases in manpower-related costs, which were in turn attributable to the tight supply of foreign workers as a result of travel restrictions (Exhibit 6.8). Looking ahead, elevated manpower-related costs as well as rising global material costs are likely to continue to exert upward pressures on construction costs and tender prices in 2021.
Economic Survey of Singapore 2020Chapter 6 | Sectoral Performance
62

Exhibit 6.9: Projected Construction Demand in 2021
$ Billion
Public Sector 15.0-18.0
Building Construction Sub-total 6.0-7.9
Residential 3.4-4.2
Commercial 0.1-0.1
Industrial 0.5-0.8
Institutional & Others 2.0-2.8
Civil Engineering Works Sub-total 9.1-10.1
Private Sector 8.0-10.0
Building Construction Sub-total 7.4-9.2
Residential 2.9-3.4
Commercial 1.5-1.9
Industrial 2.2-2.9
Institutional & Others 0.7-1.1
Civil Engineering Works Sub-total 0.6-0.8
TOTAL CONSTRUCTION DEMAND 23.0-28.0
CONSTRUCTION OUTLOOK IN 2021According to BCA, total construction demand is projected to be between $23 billion and $28 billion in 2021 (Exhibit 6.9). Demand from the public sector is expected to improve to between $15 billion and $18 billion, with an anticipated expansion in demand for public housing and major infrastructure works. Meanwhile, total private sector construction demand is projected to be between $8 billion and $10 billion in 2021. Demand is expected to be supported by the redevelopment of the remaining en-bloc sales sites, major retrofitting of commercial developments and construction of high-specification industrial buildings.
Total construction output in 2021 is projected to increase to between $24 billion and $27 billion, supported by an anticipated improvement in construction demand in 2021 as well as the backlogs of remaining workloads adversely affected by the COVID-19 pandemic in 2020.
Economic Survey of Singapore 2020Chapter 6 | Sectoral Performance
63

OVERVIEWThe wholesale trade sector expanded by 1.8 per cent year-on-year in the fourth quarter, a reversal from the 5.0 per cent contraction in the previous quarter, largely on the back of improved foreign wholesale sales of telecommunications & computers and electronic components.
For the whole of 2020, the sector shrank by 2.4 per cent, worse than the 0.8 per cent contraction in 2019.
6.3
WHOLESALE TRADE4
Exhibit 6.10: Changes in Wholesale Trade Index in Chained Volume Terms WHOLESALE SALES
In the fourth quarter, the wholesale trade sector was weighed down by declines in both domestic and foreign wholesale sales volumes.
The domestic wholesale sales volume fell by 16 per cent year-on-year in the fourth quarter, extending the 25 per cent contraction in the preceding quarter (Exhibit 6.10). The decline was led by weaker sales volumes in segments such as petroleum & petroleum-related products (-24 per cent), ship chandlers & bunkering (-14 per cent) and household equipment & furniture (-29 per cent), which outweighed the increase in the sales volumes of chemicals & chemicals-related products (23 per cent) and general wholesale trade (21 per cent). For the whole of 2020, the domestic wholesale trade index fell by 12 per cent, weakening from the 3.4 per cent decline in 2019.
Meanwhile, foreign wholesale sales volume fell by 1.0 per cent year-on-year in the fourth quarter, improving from the 2.4 per cent decline in the preceding quarter. The contraction was largely due to lower sales volumes of petroleum & petroleum-related products (-9.0 per cent) and other wholesale trade5 (-14 per cent). These declines more than offset robust expansions in the sales volumes of electronic components (41 per cent) and telecommunications & computers (38 per cent). For the full year, the foreign wholesale trade index contracted by 1.4 per cent, extending the 1.7 per cent decline in the previous year.
Per Cent
2019 2020
-30
-20
-10
0
10
IVIIIIIIIV
Foreign Wholesale Trade Index
Domestic Wholesale Trade Index
4 With effect from the preliminary GDP estimates for the fourth quarter of 2020, the estimates for the Wholesale & Retail Trade sector will be disaggregated into their constituent Wholesale Trade and Retail Trade sectors. The Department of Statistics (DOS) will continue to make available the data for the broader sectors for downloading on DOS’ website (www.singstat.gov.sg).
5 The “other wholesale trade” segment consists of a diverse range of products that includes agricultural raw materials and live animals, tropical produce, personal effects and medicinal and pharmaceutical products, among others.
Economic Survey of Singapore 2020Chapter 6 | Sectoral Performance
64

OVERVIEWThe retail trade sector contracted by 4.7 per cent year-on-year in the fourth quarter, improving from the 8.6 per cent decline in the previous quarter. For the whole of 2020, the sector shrank by 16 per cent, deteriorating from the 2.4 per cent contraction in 2019.
6.4
RETAIL TRADE6
RETAIL SALESRetail sales volume fell by 4.6 per cent year-on-year in the fourth quarter, moderating from the 8.6 per cent decline in the third quarter (Exhibit 6.11). Retail sales were supported by motor vehicle sales volume, which increased by 4.8 per cent. By contrast, non-motor vehicle sales volume contracted by 5.9 per cent, with declines seen across several categories of goods. In particular, the sales volume of goods such as food & alcohol (-39 per cent), cosmetics, toiletries & medical goods (-30 per cent) and department stores (-26 per cent) registered the highest declines. On the other hand, the sales volumes of supermarkets & hypermarkets (24 per cent), furniture & household equipment (20 per cent) and recreational goods (13 per cent) rose. These were purchases likely to have been made by consumers because they were spending more time at home given that work-from-home arrangements remained largely in place.
Exhibit 6.11: Changes in Retail Sales Index in Chained Volume Terms Exhibit 6.12: Changes in Retail Sales Index at Constant Prices
for Major Segments in 2020Per Cent
2019 2020
-50
-40
-30
-20
-10
0
IVIIIIIIIV
Total(excluding Motor Vehicle)
Total
-60 -40 -20 0 20 40 Department Stores
Watches & Jewellery
Food & Alcohol
Wearing Apparel & Footwear
Cosmetics, Toiletries Others
Optical Goods & Books
Motor Vehicles
Petrol Service Stations
Recreational Goods
Furniture & Household Equipment
Mini-marts & Convenience Stores
Computer & Telecomms Equipment
Supermarkets & Hypermarkets
Per Cent
& Medical Goods
30.1
3.4
3.0
-1.7
-10.0
-14.5
-24.3
-24.7
-25.3
-27.3
-34.4
-38.1
-39.2
-39.9
For the full year, retail sales volume shrank by 16 per cent, extending the 3.4 per cent decline in 2019. The contraction was due to declines in both motor vehicle sales volume (-24 per cent) and non-motor vehicle sales volume (-14 per cent).
The decline in motor vehicle sales volume in 2020 came in tandem with a fall in COE supply. Meanwhile, the decrease in non-motor vehicle sales volume was underpinned by contractions in most categories of goods as a result of sluggish demand arising from the COVID-19 pandemic and public health measures (e.g., border restrictions, Circuit Breaker measures) undertaken to limit COVID-19 transmissions. For instance, department stores (-40 per cent), watches & jewellery (-39 per cent) and food & alcohol (-38 per cent) saw the largest declines in sales volumes (Exhibit 6.12). The exceptions were supermarkets & hypermarkets (30 per cent), computers & telecommunications equipment (3.4 per cent) and mini-marts & convenient stores (3.0 per cent), which saw increases in sales volumes.
6 With effect from the preliminary GDP estimates for the fourth quarter of 2020, the estimates for the Wholesale & Retail Trade sector will be disaggregated into their constituent Wholesale Trade and Retail Trade sectors. The Department of Statistics (DOS) will continue to make available the data for the broader sectors for downloading on DOS’ website (www.singstat.gov.sg).
Economic Survey of Singapore 2020Chapter 6 | Sectoral Performance
65
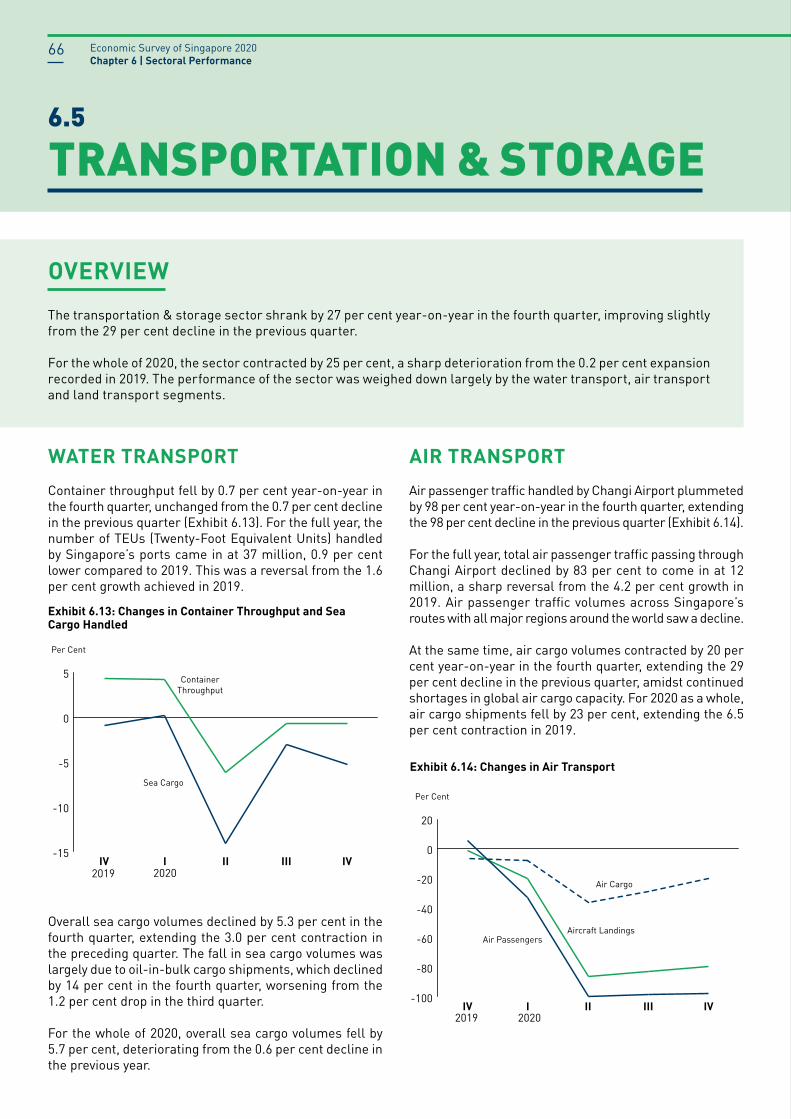
Exhibit 6.14: Changes in Air Transport
Exhibit 6.13: Changes in Container Throughput and Sea Cargo Handled
WATER TRANSPORT Container throughput fell by 0.7 per cent year-on-year in the fourth quarter, unchanged from the 0.7 per cent decline in the previous quarter (Exhibit 6.13). For the full year, the number of TEUs (Twenty-Foot Equivalent Units) handled by Singapore’s ports came in at 37 million, 0.9 per cent lower compared to 2019. This was a reversal from the 1.6 per cent growth achieved in 2019.
Overall sea cargo volumes declined by 5.3 per cent in the fourth quarter, extending the 3.0 per cent contraction in the preceding quarter. The fall in sea cargo volumes was largely due to oil-in-bulk cargo shipments, which declined by 14 per cent in the fourth quarter, worsening from the 1.2 per cent drop in the third quarter.
For the whole of 2020, overall sea cargo volumes fell by 5.7 per cent, deteriorating from the 0.6 per cent decline in the previous year.
AIR TRANSPORT Air passenger traffic handled by Changi Airport plummeted by 98 per cent year-on-year in the fourth quarter, extending the 98 per cent decline in the previous quarter (Exhibit 6.14).
For the full year, total air passenger traffic passing through Changi Airport declined by 83 per cent to come in at 12 million, a sharp reversal from the 4.2 per cent growth in 2019. Air passenger traffic volumes across Singapore’s routes with all major regions around the world saw a decline.
At the same time, air cargo volumes contracted by 20 per cent year-on-year in the fourth quarter, extending the 29 per cent decline in the previous quarter, amidst continued shortages in global air cargo capacity. For 2020 as a whole, air cargo shipments fell by 23 per cent, extending the 6.5 per cent contraction in 2019.
Per Cent
-15
-10
-5
0
5
IVIIIIIIIV
Sea Cargo
ContainerThroughput
2019 2020
Per Cent
-100
-80
-60
-40
-20
0
20
IVIIIIIIIV2019 2020
Air Passengers
Air Cargo
Aircraft Landings
6.5
TRANSPORTATION & STORAGE
OVERVIEWThe transportation & storage sector shrank by 27 per cent year-on-year in the fourth quarter, improving slightly from the 29 per cent decline in the previous quarter.
For the whole of 2020, the sector contracted by 25 per cent, a sharp deterioration from the 0.2 per cent expansion recorded in 2019. The performance of the sector was weighed down largely by the water transport, air transport and land transport segments.
Economic Survey of Singapore 2020Chapter 6 | Sectoral Performance
66

Meanwhile, following the 83 per cent decline in the third quarter, aircraft landings contracted by 79 per cent on-year to reach 9,982 in the fourth quarter. This brought the total number of aircraft landings in 2020 to 62,721, which was 67 per cent lower as compared to 2019.
Economic Survey of Singapore 2020Chapter 6 | Sectoral Performance
67
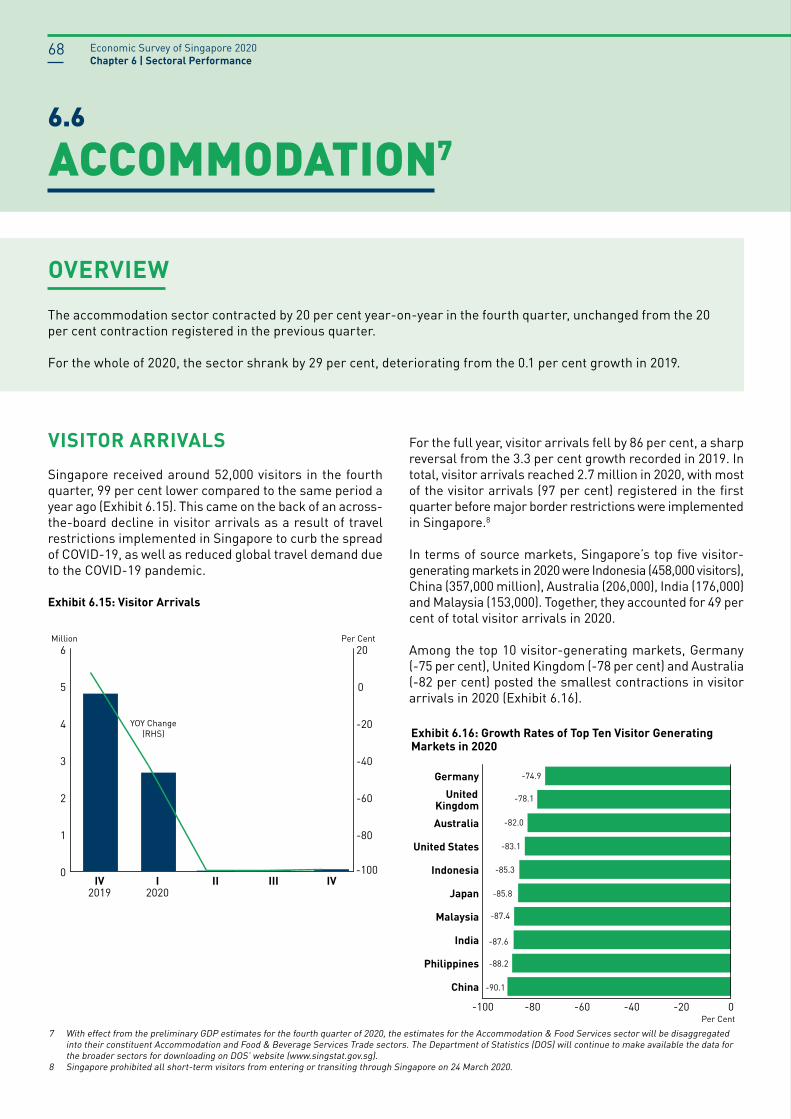
OVERVIEWThe accommodation sector contracted by 20 per cent year-on-year in the fourth quarter, unchanged from the 20 per cent contraction registered in the previous quarter.
For the whole of 2020, the sector shrank by 29 per cent, deteriorating from the 0.1 per cent growth in 2019.
6.6
ACCOMMODATION7
VISITOR ARRIVALSSingapore received around 52,000 visitors in the fourth quarter, 99 per cent lower compared to the same period a year ago (Exhibit 6.15). This came on the back of an across-the-board decline in visitor arrivals as a result of travel restrictions implemented in Singapore to curb the spread of COVID-19, as well as reduced global travel demand due to the COVID-19 pandemic.
For the full year, visitor arrivals fell by 86 per cent, a sharp reversal from the 3.3 per cent growth recorded in 2019. In total, visitor arrivals reached 2.7 million in 2020, with most of the visitor arrivals (97 per cent) registered in the first quarter before major border restrictions were implemented in Singapore.8
In terms of source markets, Singapore’s top five visitor-generating markets in 2020 were Indonesia (458,000 visitors), China (357,000 million), Australia (206,000), India (176,000) and Malaysia (153,000). Together, they accounted for 49 per cent of total visitor arrivals in 2020.
Among the top 10 visitor-generating markets, Germany (-75 per cent), United Kingdom (-78 per cent) and Australia (-82 per cent) posted the smallest contractions in visitor arrivals in 2020 (Exhibit 6.16).
Exhibit 6.15: Visitor Arrivals
2019 2020
0
1
2
3
4
5
6
IVIIIIIIIV
Million
-80
-60
-40
-20
0
20Per Cent
-100
YOY Change(RHS) Exhibit 6.16: Growth Rates of Top Ten Visitor Generating
Markets in 2020
Per Cent-100 -80 -60 -40 -20 0
China
Philippines
India
Malaysia
Japan
Indonesia
United States
Australia
United
Germany
Kingdom
-74.9
-78.1
-82.0
-83.1
-85.3
-85.8
-87.4
-87.6
-88.2
-90.1
7 With effect from the preliminary GDP estimates for the fourth quarter of 2020, the estimates for the Accommodation & Food Services sector will be disaggregated into their constituent Accommodation and Food & Beverage Services Trade sectors. The Department of Statistics (DOS) will continue to make available the data for the broader sectors for downloading on DOS’ website (www.singstat.gov.sg).
8 Singapore prohibited all short-term visitors from entering or transiting through Singapore on 24 March 2020.
Economic Survey of Singapore 2020Chapter 6 | Sectoral Performance
68

Exhibit 6.17: Gross Lettings
ACCOMMODATIONIn tandem with the slump in visitor arrivals, gross lettings of gazetted hotel rooms plummeted by 70 per cent year-on-year in the fourth quarter9, slightly better than the 71 per cent decline registered in the previous quarter (Exhibit 6.17). Similarly, room revenue plunged by 82 per cent year-on-year, improving from the 87 per cent decline in the preceding quarter. The decline in room revenue came on the back of a drop in both the average occupancy rate of gazetted hotels and the average daily room rate. Specifically, the average occupancy rate fell by 32 percentage-points to 56 per cent, while the average daily room rate decreased by 34 per cent to $141 in the fourth quarter.
For the January to November 2020 period10, the performance of the accommodation sector was weak, weighed down by fallout from the COVID-19 pandemic and the associated measures taken to reduce COVID-19 transmissions (e.g., border restrictions). The overall room revenue of gazetted hotels fell by 71 per cent to reach $1.1 billion over this period, driven by a 58 per cent decrease in gross lettings and a 31 per cent decline in the average daily room rate.
2019 2020
0
1
2
3
4
5
IVIIIIIIIV
Million
9 -80
-60
-40
-20
0
20Per Cent
YOY Change(RHS)
9 The statistics for the fourth quarter are estimated based on data for October and November, as data for December 2020 will only be ready at a later date.10 Current figures for the hotel industry are up to November 2020. The hotels’ full-year performance figures for 2020 will be ready at a later date.
Economic Survey of Singapore 2020Chapter 6 | Sectoral Performance
69

OVERVIEW
The food & beverage services sector shrank by 19 per cent year-on-year in the fourth quarter, improving from the 24 per cent contraction in the previous quarter.
For the whole of 2020, the sector contracted by 25 per cent, a sharp reversal from the 0.3 per cent growth in 2019.
6.7
FOOD & BEVERAGE SERVICES11
Exhibit 6.18: Changes in Food and Beverage Services Index in Chained Volume Terms
2019 2020
-50
-40
-30
-20
-10
0
10
IVIIIIIIIV
Per Cent
11 With effect from the preliminary GDP estimates for the fourth quarter of 2020, the estimates for the Accommodation & Food Services sector will be disaggregated into their constituent Accommodation and Food & Beverage Services Trade sectors. The Department of Statistics (DOS) will continue to make available the data for the broader sectors for downloading on DOS’ website (www.singstat.gov.sg).
FOOD & BEVERAGE SALESOverall food & beverage sales volume fell by 20 per cent year-on-year in the fourth quarter, easing from the 26 per cent decline in the preceding quarter (Exhibit 6.18). The decrease came on the back of an across-the-board decline in sales volumes at food caterers (-75 per cent), restaurants (-23 per cent), cafes, food courts & other eating places (-11 per cent) and fast food outlets (-2.5 per cent).
For the whole of 2020, the food & beverage services index declined by 26 per cent. This was a significant pullback compared to the 1.5 per cent growth recorded in 2019. In particular, the food & beverage sales volume was adversely affected by weak demand caused by the COVID-19 pandemic and the attendant public health measures implemented to contain the pandemic (e.g., border restrictions, Circuit Breaker, safe distancing measures and capacity constraints). These, in turn, led to declines in the sales volumes of food caterers (-55 per cent), restaurants (-34 per cent), cafes, food courts & other eating places (-18 per cent), as well as fast food outlets (-8.8 per cent).
Economic Survey of Singapore 2020Chapter 6 | Sectoral Performance
70

6.8
INFORMATION & COMMUNICATIONS
OVERVIEW
Exhibit 6.19: Information & Communications Growth
The information & communications sector expanded by 2.6 per cent year-on-year in the fourth quarter, extending the 1.4 per cent growth in the previous quarter. The positive outturn was supported by the IT & information services and “others” segments12. Meanwhile, the telecommunications segment contracted.
For the whole of 2020, the sector posted growth of 2.1 per cent, slowing from the 12 per cent expansion registered in 2019.
IT & INFORMATION SERVICESIn 2020, the growth of the information & communications sector was led by the IT & information services segment. Specifically, the segment expanded by 6.4 per cent, driven by resilient enterprise demand for services such as web hosting and web portal.
TELECOMMUNICATIONSThe telecommunications segment shrank by 8.3 per cent in 2020, weighed down mainly by weaker demand for mobile roaming and prepaid services as a result of subdued travel activity. For instance, the total number of outgoing retail international telephone call minutes (including transit minutes) over the January-June 2020 period fell by 48 per cent compared to the same period a year ago.
As at November 202013, the number of mobile subscriptions shrank by 8.0 per cent as compared to the same period in 2019 (Exhibit 6.19). This was led by prepaid subscriptions, with the total number of prepaid 3G and 4G subscriptions falling by 24 per cent to reach 2.2 million in November 2020. On the other hand, the number of postpaid 4G subscriptions rose by 4.9 per cent to around 5.9 million.
In 2020, the number of broadband subscriptions decreased by 8.1 per cent. This came on the back of a 9.4 per cent decline in wireless broadband subscriptions, led by fewer mobile data and Wireless@SG subscriptions14, likely as a result of the travel restrictions and more people working from home. Nonetheless, there was a 1.5 per cent increase in optical fibre subscriptions.
-10
-5
0
5
10
20202019201820172016
Per Cent
Broadband Subscriptions
MobileSubscriptions
12 The “others” segment consists of (i) publishing activities (including computer games and software publishing), (ii) motion picture, video and other programme production, sound recording, and music publishing activities, and (iii) radio and television broadcasting activities.
13 Full-year data are not available at the time of publication.14 The number of Wireless@SG subscriptions in a month includes only the active users for the month.
Economic Survey of Singapore 2020Chapter 6 | Sectoral Performance
71

OVERVIEW
6.9
FINANCE & INSURANCE
Exhibit 6.20: Total Assets and Liabilities of Commercial Banks
Exhibit 6.21: Growth of Bank Loans and Advances to Non-Bank Customers by Industry in 2020COMMERCIAL BANKS
In 2020, total assets and liabilities of commercial banks increased by 11 per cent to $1.5 trillion (Exhibit 6.20). Domestic interbank lending rose by $112 billion (33 per cent), while domestic credit extended to non-bank customers fell by $14 billion (-2.0 per cent).
On the assets side, business lending contracted by 2.4 per cent in 2020, reversing the 5.9 per cent expansion in the preceding year. The decline was due to a sharp fall in lending to the general commerce sector and non-bank financial institutions, which was partially offset by resilient demand for loans in the building & construction sector. Meanwhile, consumer lending fell by 1.2 per cent, broadly similar to last year, due to the decline in credit cards and other loans (Exhibit 6.21).
On the liabilities front, total deposits of non-bank customers grew rapidly by 12 per cent in 2020, higher than the 8.9 per cent increase in the previous year. As at end-2020, total non-bank deposits amounted to $764 billion, compared to $684 billion in the year before, driven by strong growth in demand and savings deposits.
600
800
1,000
1,200
1,400
1,600
20202019201820172016
$ Billion
-10
-5
0
5
10
15
Per Cent
YOY Change(RHS)
Per Cent
-20 -15 -10 -5 0 5 10Credit Cards
General commerceOthers (Business)
Financial InstitutionsCar
Others (Consumer)Share Financing
TotalManufacturing
Transport & CommunicationsProf & Pte Individuals (Business)
Housing & BridgingAgriculture, Mining and Quarrying
Building & Construction Business Services 5.7
5.3
0.0
0.6
-3.1
-5.8
-7.8
-8.2
-10.6
0.3
0.0
0.0
-4.1
-2.0
-13.5
The finance & insurance sector grew by 4.9 per cent year-on-year in the fourth quarter of 2020, an improvement from the 4.2 per cent expansion in the previous quarter.
For the whole of 2020, the sector expanded by 5.0 per cent, moderating from the 7.8 per cent growth in the preceding year.
Economic Survey of Singapore 2020Chapter 6 | Sectoral Performance
72

Exhibit 6.23: Growth of Loans and Advances of Finance Companies in 2020
Exhibit 6.22: Total Assets and Liabilities of Finance Companies
Exhibit 6.24: Total Assets and Liabilities of Merchant Banks
0
5
10
15
20
20202019201820172016
$ Billion
-30
-20
-10
0
10
Per Cent
YOY Change(RHS)
Per Cent
-20 -15 -10 -5 0
Housing Loans
Hire Purchase Finance
Total
Others -1.2
-13.4
-4.3
-13.9
20
40
60
80
100
120
20202019201820172016
$ Billion
-15
-10
-5
0
5
10
Per Cent
YOY Change(RHS)
FINANCE COMPANIESTotal assets/liabilities of finance companies contracted by 6.0 per cent in 2020 to $18 billion, in contrast to the 7.6 per cent expansion in 2019 (Exhibit 6.22).
Non-bank lending fell by 4.3 per cent in 2020, a reversal from the 11 per cent expansion recorded the year before, with contractions in both the hire purchase finance and housing loan segments (Exhibit 6.23). Meanwhile, the deposits of non-bank customers fell by 8.1 per cent in 2020, a reversal of the 8.2 per cent growth in 2019.
MERCHANT BANKSTotal assets/liabilities of merchant banks rose by 3.9 per cent to $105 billion in 2020, moderating from the 8.1 per cent growth in the previous year (Exhibit 6.24). The pickup stemmed from the offshore segment, which registered strong growth in interbank lending.
Meanwhile, the domestic operations of merchant banks expanded by 0.3 per cent, a turnaround from the 7.0 per cent contraction posted in 2019.
ASIAN DOLLAR MARKETTotal assets/liabilities of the Asian Dollar Market recorded an expansion of 9.7 per cent in 2020, accelerating from the 3.5 per cent growth in the previous year (Exhibit 6.25).
On the assets side, interbank loans grew by 11 per cent, reversing the 3.8 per cent contraction in 2019. Meanwhile, growth in non-bank loan volumes was only 1.7 per cent in 2020, compared to 6.2 per cent the year before. While credit demand from East Asia continued to support loans growth last year, it had moderated from that seen in 2019.
On the liabilities front, non-bank deposits rose by 10 per cent, driven by an increase in foreign currency deposits by non-residents. Meanwhile, interbank deposits expanded by 3.0 per cent, reversing the 5.6 per cent contraction registered in the previous year.
Economic Survey of Singapore 2020Chapter 6 | Sectoral Performance
73
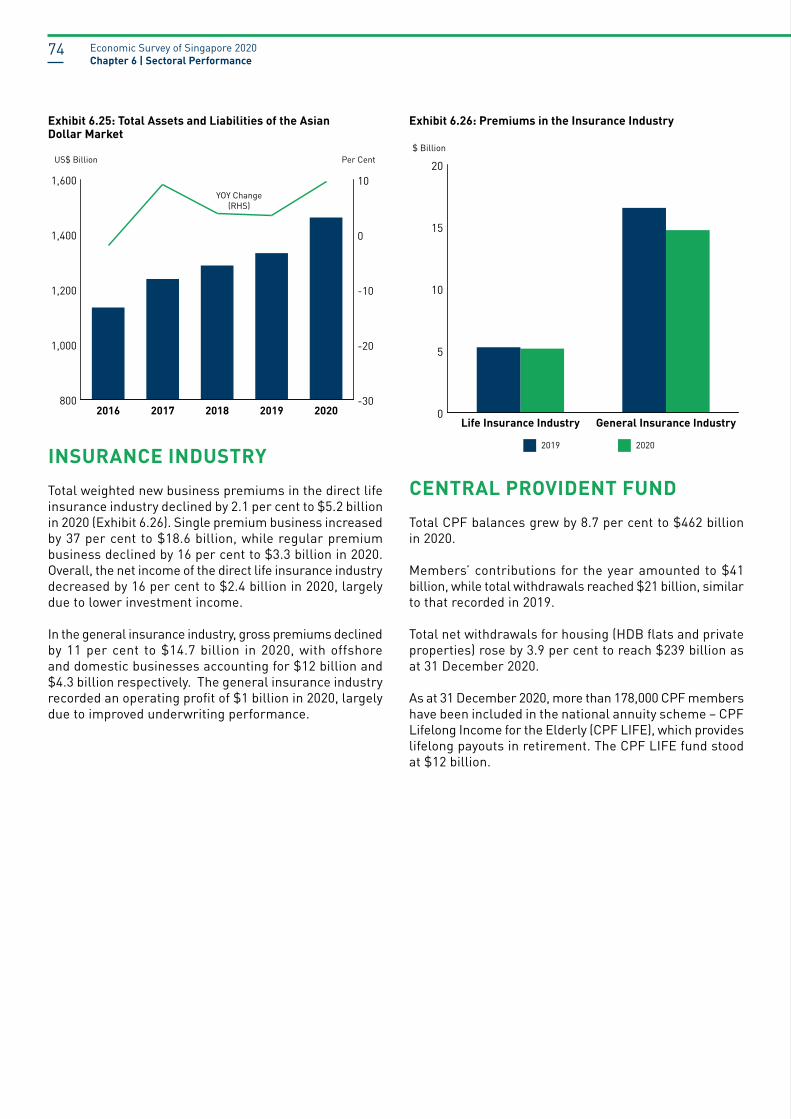
Exhibit 6.25: Total Assets and Liabilities of the Asian Dollar Market
Exhibit 6.26: Premiums in the Insurance Industry
800
1,000
1,200
1,400
1,600
20202019201820172016
US$ Billion
-30
-20
-10
0
10
Per Cent
YOY Change(RHS)
$ Billion
0
5
10
15
20
General Insurance IndustryLife Insurance Industry
2019 2020
INSURANCE INDUSTRYTotal weighted new business premiums in the direct life insurance industry declined by 2.1 per cent to $5.2 billion in 2020 (Exhibit 6.26). Single premium business increased by 37 per cent to $18.6 billion, while regular premium business declined by 16 per cent to $3.3 billion in 2020. Overall, the net income of the direct life insurance industry decreased by 16 per cent to $2.4 billion in 2020, largely due to lower investment income.
In the general insurance industry, gross premiums declined by 11 per cent to $14.7 billion in 2020, with offshore and domestic businesses accounting for $12 billion and $4.3 billion respectively. The general insurance industry recorded an operating profit of $1 billion in 2020, largely due to improved underwriting performance.
CENTRAL PROVIDENT FUNDTotal CPF balances grew by 8.7 per cent to $462 billion in 2020.
Members’ contributions for the year amounted to $41 billion, while total withdrawals reached $21 billion, similar to that recorded in 2019. Total net withdrawals for housing (HDB flats and private properties) rose by 3.9 per cent to reach $239 billion as at 31 December 2020.
As at 31 December 2020, more than 178,000 CPF members have been included in the national annuity scheme – CPF Lifelong Income for the Elderly (CPF LIFE), which provides lifelong payouts in retirement. The CPF LIFE fund stood at $12 billion.
Economic Survey of Singapore 2020Chapter 6 | Sectoral Performance
74

Exhibit 6.27: Straits Times Index
2,200
2,400
2,600
2,800
3,000
3,200
3,400
3,600
3,800
202020192018
Index
Index
STOCK MARKETThe benchmark Straits Times Index (STI) plunged in the first quarter of 2020, reaching its nadir on 23 March, 31 per cent below where it began in 2020 (Exhibit 6.27). The market rout was precipitated by the rising tide of national lockdowns in response to the COVID-19 outbreak, as well as the concomitant decline in oil prices after a price war erupted among the world’s biggest producers.
However, the stock market sell-off in March was quickly followed by a market rally fueled by aggressive stimulus packages rolled out by central banks and governments. For the full year of 2020, the STI declined by 12 per cent, recovering more than half of the loss recorded in the first quarter.
Volatility in capital markets remained elevated throughout the year. The recurring waves of COVID-19 infections which triggered the re-opening and re-closing of economies, and further government stimulus, drove market turnover volumes higher on a year-ago basis.
SECURITIES MARKETIn 2020, the total turnover value of the securities market increased by 35 per cent to $358 billion, and total turnover volume increased by 49 per cent to 442 billion shares, compared with 2019. This translated to a 34 per cent increase in the average daily traded value to $1.4 billion, while the average daily traded volume increased by 48 per cent to 1.7 billion shares.
At the end of 2020, the total number of listed companies in Singapore was 696, with a combined market capitalisation of $862 billion, which was 8.1 per cent lower than 2019’s level. In 2020, there were 479 companies listed on SGX’s Mainboard while the other 217 companies were listed on SGX’s Catalist.
DERIVATIVES MARKETIn 2020, SGX’s derivatives market activity increased by 3 per cent to 247 million contracts. Compared to 2019, total futures trading volume increased by 5 per cent to 235 million, while options on futures trading volume decreased by 22 per cent to 12 million contracts. The most actively-traded contracts were the FTSE, China A50 Index Futures, the Nikkei 225 Stock Index and the CNX Nifty Futures, which formed 59 per cent of the total volume traded on SGX’s derivatives trading platform.
FOREIGN EXCHANGE MARKETIn 2020, the Euro, Japanese Yen and British Pound strengthened against the US Dollar, by 8.9 per cent, 5.2 per cent and 3.1 per cent respectively. The US Dollar initially strengthened to a three-year high in the first quarter of 2020, driven by safe haven demand amidst the COVID-19 outbreak. Subsequently, the US Dollar weakened as the provision of an unprecedented level of monetary and fiscal support by governments and central banks globally provided a boost to risk sentiment and expectations of a global recovery. The Fed had room to cut rates more than the other G4 central banks, and the relatively larger magnitude of Fed rate cuts also drove the weakness in the US Dollar. Towards the end of the year, positive news on COVID-19 vaccines led to further improvements in risk sentiment alongside another bout of US Dollar weakness. The Pound was also supported towards year-end by the successful negotiation of an agreement for the UK’s exit from the EU.
Economic Survey of Singapore 2020Chapter 6 | Sectoral Performance
75

6.10
REAL ESTATE AND PROFESSIONAL SERVICES15
OVERVIEW
Exhibit 6.28: Total Sales of Private Residential Units and Private Residential Property Price IndexREAL ESTATE
The private residential property market remained resilient in the fourth quarter. On a quarter-on-quarter basis, private residential property prices rose by 2.1 per cent during the quarter, improving from the 0.8 per cent increase in the preceding quarter. For the whole of 2020, prices rose by 2.2 per cent, extending the increase of 2.7 per cent seen in 2019. In tandem with the rise in prices, private residential property sales volume also increased in the fourth quarter. Specifically, total private residential property sales surged by 42 per cent year-on-year during the quarter, faster than the 22 per cent growth registered in the previous quarter. For the full year, total sales grew by 9.2 per cent to 20,909 units, from the 19,150 units sold in 2019 (Exhibit 8.28).
2019 2020
0
2
4
6
8
IVIIIIIIIV
Thousand
140
145
150
155
1602009 Q1 = 100
Total Sales Property Price Index (RHS)
The real estate sector shrank by 11 per cent year-on-year in the fourth quarter, extending the 18 per cent contraction in the previous quarter. For the whole of 2020, the sector contracted by 14 per cent, worse than the 1.6 per cent decline recorded in 2019.
The professional services sector contracted by 7.5 per cent year-on-year in the fourth quarter, easing from the 11 per cent decline in the previous quarter. For 2020 as a whole, the sector shrank by 9.7 per cent, a sharp reversal from the 5.4 per cent growth in 2019.
15 With effect from the preliminary GDP estimates for the fourth quarter of 2020, the estimates for the Business Services sector will be disaggregated into their constituent Real Estate, Professional Services and Administrative & Support Services sectors. The Department of Statistics (DOS) will continue to make available the data for the broader sectors for downloading on DOS’ website (www.singstat.gov.sg).
Economic Survey of Singapore 2020Chapter 6 | Sectoral Performance
76

Exhibit 6.29: Changes in Rentals of Private Sector Office and Retail Spaces
-15
-10
-5
0
5
10
20202019201820172016
Per Cent
Office
Retail
50
60
70
80
90
100
20202019201820172016
Per Cent
-8
-6
-4
-2
0
2Per Cent
Multiple-User Factory Space Occupancy Warehouse Space Occupancy
Rental Growth (RHS)
Exhibit 6.30: Occupancy Rate and Rental Growth of Industrial Space
The office space market also weakened in 2020, with rentals falling by 8.5 per cent, larger than the 3.1 per cent decline recorded in the previous year. The decline in office rentals was due to lower rentals in the Central Area (-9.0 per cent) and Fringe Area (-8.5 per cent). Meanwhile, prices in the office space market plummeted by 11 per cent in 2020, significantly worse than the 0.6 per cent decline in 2019.
In the commercial space segment, the retail space market worsened significantly in 2020. Specifically, private retail space rentals fell by 15 per cent, a sharp reversal from the 2.9 per cent increase in the previous year (Exhibit 8.29). The weak rental performance was due to lower rentals in the Central Area (-13 per cent) and Fringe Area (-15 per cent). Similarly, the prices of private retail space declined by 4.5 per cent in 2020, in contrast to the 1.3 per cent increase recorded in 2019, with prices in the Central Area and Fringe Area shrinking by 10 per cent and 3.9 per cent respectively.
In the industrial space market, overall rentals for the whole of 2020 declined by 1.5 per cent, reversing the 0.1 per cent growth seen in the previous year. Rentals of all types of industrial property space (i.e., single-use factories, multiple-user factories, warehouses and business parks) shrank in 2020 (Exhibit 8.30). Meanwhile, the overall prices of industrial properties fell by 2.7 per cent in 2020, extending the 0.3 per cent decline in 2019.
PROFESSIONAL SERVICESIn 2020, the professional services sector contracted, with all segments of the sector registering declines. The contraction in the sector was largely driven by the architectural & engineering, technical testing & analysis segment, as well as the other professional, scientific & technical services segment, which shrank by 16 per cent and 14 per cent respectively.
Economic Survey of Singapore 2020Chapter 6 | Sectoral Performance
77


ECONOM
IC OUTLOOKCHAPTER
07

CHAPTER 7
ECONOMIC OUTLOOK
LEADING INDICATORSThe composite leading index (CLI) points to a continued recovery in the Singapore economy in the near term. Specifically, the CLI rose by 3.6 per cent on a quarter-on-quarter basis in the fourth quarter of 2020, extending the 6.2 per cent increase in the third quarter (Exhibit 7.1).
Of the nine components in the CLI, eight of them increased on a quarter-on-quarter basis, namely wholesale trade, US Purchasing Managers’ Index, stock of finished goods, money supply, non-oil sea cargo handled, domestic liquidity, stock price and new companies formed. By contrast, non-oil retained imports declined compared to a quarter ago.
OUTLOOK FOR 2021Since the last Economic Survey of Singapore in November 2020, there has been further progress in COVID-19 vaccine development and deployment, with several approved vaccines being rolled out in many economies around the world. Although the speed of vaccine deployment varies, advanced economies like the US and Eurozone are likely to reach population immunity by the second half of this year, which should in turn spur their economic recoveries. On the other hand, the growth prospects for regional economies such as Malaysia and Indonesia have weakened due to the recent resurgence in infections, which has necessitated the re-imposition of lockdowns and restrictions. On balance, as the positive developments in key economies broadly offset the negative ones, Singapore’s external demand outlook remains largely similar compared to three months ago.
In particular, the US economy is projected to rebound this year on the back of a recovery in personal consumption expenditure, which is in turn expected to be bolstered by the injection of additional fiscal stimulus amidst an improvement in the health situation and the progressive rollout of vaccines. In the Eurozone, the recent surge in COVID-19 cases and resulting public health measures to contain the outbreak are likely to pose a drag on domestic demand and hence its economic recovery. Nonetheless, the pace of recovery is expected to pick up over the course of the year as the deployment of vaccines becomes more widespread. In Asia, China’s economy is projected to continue to strengthen this year, driven by healthy growth in investment, consumption and exports. Meanwhile, the key ASEAN economies are expected to post a recovery this year, supported by a pickup in external demand, even though domestic demand is likely to be dampened by the recent wave of COVID-19 cases and associated measures taken to contain the virus.
Exhibit 7.1: Composite Leading Index Levels and Growth Rate
98
100
102
104
106
108
110
112
IVIIIIIIIVIIIIIIIVIIIIIIIVIIIIII
2015=100 Per Cent
-25
-20
-15
-10
-5
0
5
10
IVIIIIIIIVIIIIIIIVIIIIIIIVIIIIII2020201920182017
QOQ Change(RHS)
Economic Survey of Singapore 2020Chapter 7 | Economic Outlook
80

At the same time, uncertainties and risks in the global economy remain. First, there continues to be significant uncertainty surrounding the course of the COVID-19 pandemic and the trajectory of the global economic recovery. How these pan out in the year ahead depends on factors such as the adequacy of vaccine supplies and speed of vaccine deployment, the possible emergence and spread of new strains of the virus, as well as the strength of policy support to drive economic recovery. Second, the protracted nature of the economic recovery in many countries could lead to financial system stresses, which could in turn trigger a tightening of financial conditions and adversely affect the global economic recovery. Excessive private sector indebtedness arising from loose monetary conditions also remains a concern. Third, continued geopolitical uncertainty involving the major economies could weigh on global trade and the global economic recovery.
Domestically, Singapore’s COVID-19 situation remains under control and our vaccination programme is also underway. However, the pace of border re-opening has slowed amidst the global surge in COVID-19 cases and the emergence of more contagious strains of the virus.
Against this external and domestic backdrop, the Singapore economy is expected to see a gradual recovery over the course of the year, although the outlook remains uneven across sectors. First, outward-oriented sectors, including trade-related services sectors (e.g., wholesale trade and water transport), are projected to benefit from the pickup in external demand. The manufacturing sector, in particular, is likely to expand at a faster pace than previously projected due to robust semiconductor demand from the 5G and automotive markets. Meanwhile, the information & communications and finance & insurance sectors are expected to continue to post steady growth, supported by sustained enterprise demand for IT and digital solutions, and credit and payment processing services respectively.
Second, the tourism- and aviation-related sectors (e.g., accommodation and air transport) are projected to see a weaker recovery than previously expected due to the slower-than-anticipated lifting of global travel restrictions, as well as sluggish travel demand. Economic activity in these sectors is likely to remain below pre-COVID levels even by the end of 2021.
Third, consumer-facing sectors (e.g., retail trade and food & beverage services) are expected to benefit from an improvement in consumer sentiments amidst a gradual turnaround in labour market conditions. However, the slower recovery in visitor arrivals and capacity constraints arising from safe distancing measures are likely to weigh on their performance. On balance, economic activity in these sectors is not likely to return to pre-COVID levels by end-2021.
Fourth, while the construction and marine & offshore engineering sectors are projected to recover from the low base last year, activity levels at construction worksites and shipyards will continue to be dampened by the requirement for safe management measures. The recovery in output in these two sectors is also expected to be slow due to the plunge in contracts awarded for construction works in 2020 and the weakness in the global oil & gas market respectively.
Taking into account the developments in the global and domestic economic environment, the GDP growth forecast for 2021 is maintained at “4.0 to 6.0 per cent”.
Economic Survey of Singapore 2020Chapter 7 | Economic Outlook
81


FEATURE ARTICLE

FEATURE ARTICLE
PERFORMANCE OF THE SINGAPORE ECONOMY IN 2020
OUTLOOKOverall, Singapore’s GDP is projected to gradually recover and expand by 4.0 to 6.0 per cent this year, with GDP not likely to return to pre-COVID levels until the second half of the year at the earliest. The pace of recovery is also expected to be uneven across sectors. For instance, while outward-oriented sectors are likely to benefit from the pickup in global economic activity, activity levels in tourism- and aviation-related sectors are projected to remain below pre-pandemic levels even by the end of 2021.
SINGAPORE’S ECONOMIC RECOVERY IN 2H20Across sectors, the economic impact of COVID-19 was felt through different transmission channels. Consequently, their economic performance, including their recovery post-CB, was variegated.
Accommodation Air Transport Aerospace Retail Trade Land TransportFood & Beverage Services
CONSUMER-FACINGTOURISM- AND AVIATION-RELATED
Manufacturing Wholesale Trade Information &Communications
ProfessionalServices
Finance &Insurance
Water Transport
OUTWARD-ORIENTED
Construction Real Estate
RENTAL AND SALE OF PROPERTY, TANGIBLE GOODS AND INTANGIBLE ASSETS
HIGH DEPENDENCE ON FOREIGN WORKERS
Marine & Offshore Engineering
Rental and Leasing
The COVID-19 pandemic caused massive global economic disruptions in 2020. Singapore was not spared as the economy recorded its worst full-year recession since independence. During the year, the economy had to grapple with both demand- and supply-side shocks, such as a fall in external demand for goods and services produced in Singapore caused by the economic slowdown in major economies and global travel restrictions, supply chain disruptions, as well as the implementation of the Circuit Breaker (CB) measures domestically from April to June 2020.
INTRODUCTIONREAL GDP GROWTH RATE (%)
-6
-4
-2
0
2
4
2018 2019 2020
Economic Survey of Singapore 2020Feature Article
84

The views expressed in this paper are solely those of the authors and do not necessarily reflect those of the Ministry of Trade and Industry or the Government of Singapore.1
1 We would like to thank Ms Yong Yik Wei, Dr Andy Feng, Mr Kenneth Yeow and Mr Tan Di Song for their useful suggestions and comments. All errors belong to the authors.
2 See Saw, Lin & Wong (2020).3 Pre-pandemic levels refer to the fourth quarter of 2019 for quarterly data and January 2020 for monthly data.
INTRODUCTIONThe COVID-19 pandemic caused massive global economic disruptions in 2020. To-date, the virus has infected more than 100 million people worldwide and resulted in more than two million deaths. Many countries were forced to implement strict public health measures, including lockdowns and border closures, to contain the spread of the virus. This led to significant disruptions in global economic activity. Reflecting the unprecedented extent of the disruptions, the International Monetary Fund had revised its 2020 global growth forecasts downwards over the course of the year, with its forecasts in October 2020 being much lower than that announced a year ago before the start of the pandemic [Exhibit 1]. The Singapore economy was not spared the damage caused by the pandemic, contracting by 5.4 per cent in 2020, its worst full-year recession since independence. Our economic performance turned out to be much worse than the 2020 GDP growth forecast of 0.5 to 2.5 per cent announced by MTI in November 2019, before the pandemic struck. The sharp downturn came about as the economy had to grapple with both demand- and supply-side shocks arising from the pandemic, including a fall in external demand for goods and services produced in Singapore caused by the economic slowdown in major economies and global travel restrictions, supply chain disruptions, as well as the implementation of the Circuit Breaker (CB) measures domestically from 7 April to 1 June 2020. The effects of these shocks were the most pronounced in the first half of 2020 (1H20), and there were signs of recovery in the Singapore economy in the second half of 2020 (2H20) as the economy gradually re-opened and major economies emerged from their initial lockdowns. Building on an earlier article which assessed the immediate impact of COVID-19 on the Singapore economy,2 this article analyses the recovery of the economy in 2H20 relative to pre-pandemic levels3 using high-frequency indicators as well as traditional sectoral indicators.
EXECUTIVE SUMMARY The COVID-19 pandemic caused massive global economic disruptions in 2020. Singapore was not spared
as the economy recorded its worst full-year recession since independence. During the year, the economy had to grapple with both demand- and supply-side shocks, such as a fall in external demand for goods and services produced in Singapore caused by the economic slowdown in major economies and global travel restrictions, supply chain disruptions, as well as the implementation of the Circuit Breaker (CB) measures domestically from April to June 2020.
• Across sectors, the economic impact of COVID-19 was felt through different transmission channels. Consequently, their economic performance, including their recovery post-CB, was variegated. For example, while the proxy indicators for external demand had either surpassed or were close to pre-pandemic levels by the fourth quarter of 2020, air passengers and tourist arrivals remained significantly lower than pre-pandemic levels as at end-2020.
• Furthermore, significant risks in the global economy remain. While Singapore’s vaccination programme is well underway, there is uncertainty over how the COVID-19 pandemic will evolve around the world given the emergence of new strains of the virus and difficulties in vaccine rollouts globally.
• Overall, Singapore’s GDP is projected to gradually recover and expand by 4.0 to 6.0 per cent this year, with GDP not likely to return to pre-COVID levels until the second half of the year at the earliest. The pace of recovery is also expected to be uneven across sectors. For instance, while outward-oriented sectors are likely to benefit from the pickup in global economic activity, activity levels in tourism- and aviation-related sectors are projected to remain below pre-pandemic levels even by the end of 2021
Economic Survey of Singapore 2020Feature Article
85

SINGAPORE’S ECONOMIC RECOVERY IN SECOND HALF OF 2020 The Singapore economy contracted sharply in 1H20, largely due to the CB measures as well as the global fallout from the pandemic. In particular, even though the CB measures – which included the suspension of non-essential services and the closure of most workplace premises – were necessary to contain the increasing local transmissions of COVID-19 then, they had a severe impact on the Singapore economy. In the second quarter of 2020 (2Q20), Singapore registered the largest quarterly GDP contraction, both on a year-on-year and quarter-on-quarter basis, on record [Exhibit 2].
After the CB period, the Singapore economy saw two consecutive quarters of positive quarter-on-quarter growth due to the phased resumption of activities domestically, and the rebound in activity in major economies as they emerged from their initial lockdowns. By the fourth quarter of 2020 (4Q20), the economy had recovered to about 98 per cent of pre-pandemic levels – which is taken to be the seasonally-adjusted GDP level in the fourth quarter of 2019 (4Q19) – compared to the low of 86 per cent in 2Q20.
Exhibit 1: World GDP Growth Forecasts
Dependent Variable 2020 Forecast inOct 2019
2020 Forecast inOct 2020
Percentage point difference
World GDP 3.4 -4.4 -7.8
United States 2.1 -4.3 -6.4Eurozone 1.4 -8.3 -9.7Japan 0.5 -5.3 -5.8Mainland China 5.8 1.9 -3.9Hong Kong SAR 1.5 -7.5 -9.0Taiwan 1.9 0.0 -1.9Republic of Korea 2.2 -1.9 -4.1Malaysia 4.4 -6.0 -10.4Indonesia 5.1 -1.5 -6.6Thailand 3.0 -7.1 -10.1Philippines 6.2 -8.3 -14.5Vietnam 6.5 1.6 -4.9
Source: IMF World Economic Outlook (October 2019, October 2020)
Source: DOS
75
80
85
90
95
100
105
4Q19 1Q20 2Q20 3Q20 4Q20
4Q19 =100
Exhibit 2: Singapore’s Seasonally-adjusted Quarterly GDP
Economic Survey of Singapore 2020Feature Article
86

Group Examples of Sectors Nature of Activity Main Transmission Channels of Economic Impact from COVID-19
1Accommodation, Air Transport, Aerospace
Sectors closely related to tourism and aviation, and dependent on tourist arrivals and air travel
Weak tourist arrivals and air travel due to global travel restrictions
2Retail Trade, Food & Beverage (F&B) Services, Land Transport
Consumer-facing sectors with output mostly driven by domestic demand
Fall in domestic consumption on account of weak consumer sentiments and labour market conditions; capacity constraints from safe distancing measures
3
Manufacturing, Wholesale Trade, Water Transport, Information & Communications, Finance & Insurance, Professional Services
Outward-oriented sectors with output mostly driven by external demand
Fall in external demand and supply chain disruptions
4Construction and Marine & Offshore Engineering
Sectors with a high dependence on foreign workers, especially work-permit holders (WPH) and S-Pass holders
Disruptions in manpower supply; requirement to implement safe management measures which weigh on productivity and activity levels
5 Real Estate, Rental & Leasing
Rental and sale of residential, commercial and industrial property, as well as rental and leasing of tangible goods and intangible assets
Adverse effects on individual and business sentiments from the slowdown in domestic economic activity
Performance of Group 1 SectorsSince February 2020, increasingly tight global travel restrictions and domestic border controls to contain the spread of COVID-19 led to a sharp fall in air travel demand and tourist arrivals to Singapore. While there were attempts to kickstart the recovery in air travel and tourist arrivals to Singapore through the introduction of reciprocal green lanes and travel bubbles in 2H20, the impact has been limited due to the cautious demand for travel globally. The global surge in COVID-19 cases and emergence of more contagious variants of the virus also led to a suspension of some of these arrangements, and a slowdown in the pace of border re-opening in recent months.
As a result, the activity of Group 1 sectors continued to languish even at the end of 2020, with air passenger volume and international visitor arrivals coming in at less than 5 per cent of pre-pandemic (i.e., January 2020) levels throughout the period of April to December 2020 [Exhibit 4]. Consequently, the performance of the accommodation sector was also tepid, with the monthly gross lettings of gazetted hotels only at about 30 per cent of pre-pandemic levels in November 2020, although the re-opening of hotels for staycation bookings since July 2020 provided some support to the sector [Exhibit 5].
Likewise, the sharp reduction in air travel and subsequent grounding of aircraft led to a plunge in the volume of aircraft maintenance and repair work, with output in the aerospace segment remaining depressed compared to year-ago levels since April 2020 [Exhibit 6].
Exhibit 3: Grouping of Sectors, based on Nature of Activity and Transmission Channels
The impact of COVID-19 on the Singapore economy was felt through five main transmission channels: (i) a fall in tourist arrivals and air travel; (ii) a fall in domestic consumption; (iii) a fall in external demand and supply chain disruptions; (iv) manpower disruptions and the requirement to implement safe management measures; and (v) negative spillovers from the slowdown in domestic economic activity. Each of these channels affected the various sectors of the economy to varying degrees [Exhibit 3]. Consequently, the performance of the different sectors of the economy in 2020 was variegated.
Economic Survey of Singapore 2020Feature Article
87

Exhibit 4: Air Passenger Volume and International Visitor Arrivals
Source: Civil Aviation Authority of Singapore, Singapore Tourism Board
Exhibit 5: Gross Lettings of Gazetted Hotels
-60%
-40%
-20%
0%
20%
40%
Jan-20 Mar-20 May-20 Jul-20 Sep-20 Nov-20
Year on Year Growth
0
10
20
30
40
50
60
70
80
90
100
Jan-20 Mar-20 May-20 Jul-20 Sep-20 Nov-20
Jan 20 = 100
Source: Singapore Tourism BoardNote: The data does not take into account the occupancy of rooms arising from government contracts for stay-home notice and quarantine facilities.
Exhibit 6: Index of Industrial Production in the Aerospace Segment
Source: Economic Development Board
0
1
2
3
4
5
20
40
60
80
100
Jan-20 Feb-20 Mar-20 Apr-20 May-20 Jun-20 Jul-20 Aug-20 Sep-20 Oct-20 Nov-20 Dec-20
International Visitor Arrivals Air Passengers Handled at Changi Airport
Jan 20 = 100
Economic Survey of Singapore 2020Feature Article
88

Performance of Group 2 SectorsThe COVID-19 outbreak also had a severe effect on consumer-facing sectors in 1H20, as the CB measures restricted business operations (e.g., physical workplace closures affected most retailers, while F&B outlets were not allowed to offer dining-in services). The economic downturn and resulting weakening of labour market conditions also weighed on sentiments, and in turn, domestic consumption.
In tandem with the phased re-opening of the Singapore economy, activity in the Group 2 sectors picked up in 2H20. For instance, retail and F&B sales volumes saw a rebound with the resumption of physical retail and dining-in activities in June 2020 [Exhibit 7]. However, notwithstanding the improvement, they remained below pre-pandemic (i.e., 4Q19) levels even by 4Q20 on account of sluggish tourist demand brought about by the plunge in visitor arrivals, as well as lacklustre consumer sentiments in view of weak labour market conditions. In addition, the F&B services sector was adversely affected by safe distancing measures which constrained dining-in capacity.
Exhibit 7: Retail and F&B Sales Volume
Source: Department of Statistics
0
20
40
60
80
100
120
4Q19 1Q20 2Q20 3Q20 4Q20
4Q19 = 100
Retail Sales Volume Retail (Excluding Motor Vehicles) Sales Volume F&B Sales Volume
Performance of Group 3 SectorsIn 1H20, COVID-19 affected the external demand for Singapore goods and services as well as disrupted supply chains, as major economies around the world implemented lockdowns and restrictions to contain the spread of the virus. Economic uncertainty caused by the pandemic also negatively affected global consumer and business sentiments. Reflecting these factors, Singapore’s merchandise trade declined significantly from March 2020 to May 2020, with imports and exports in May 2020 reaching a low of 76 per cent and 82 per cent of pre-pandemic (i.e., January 2020) levels respectively [Exhibit 8]. However, merchandise trade rebounded relatively quickly when major economies emerged from their initial lockdowns towards the middle of 2020. By the end of 2020, exports recovered to surpass pre-pandemic levels while imports recovered to 98 per cent of these levels.
Economic Survey of Singapore 2020Feature Article
89

In tandem with the pickup in external demand, the Group 3 sectors generally saw a recovery in activity in 2H20, although the pace of recovery varied across sectors. Activity in trade-related services sectors such as wholesale trade and water transport, while improving over the course of 2H20, remained weaker than pre-pandemic levels amidst continued economic uncertainty. For instance, total foreign wholesale trade volume had not recovered to 4Q19 levels even by 4Q20, while total sea cargo handled and total container throughput also remained below 4Q19 levels in the same quarter [Exhibit 9].
Exhibit 8: Singapore’s Monthly Merchandise Imports and Exports
Source: Department of Statistics
By contrast, the performance of sectors such as manufacturing, information & communications and finance & insurance sectors has been relatively robust. In particular, the overall manufacturing sector saw a strong recovery in 2H20, with the manufacturing purchasing managers’ index (PMI) rebounding from the trough registered in April 2020 during the CB [Exhibit 10].4 This was mainly on account of the robust performance of the electronics and precision engineering clusters as production in these clusters climbed above year-ago levels in 2H20 due to buoyant global demand for semiconductors from the 5G markets, data centres and cloud services, as well as semiconductor equipment respectively [Exhibit 11]. Meanwhile, the information & communications and finance & insurance sectors also continued to post steady growth in both 3Q20 and 4Q20, led by resilient enterprise demand for IT solutions, as well as healthy expansions in the banking and insurance segments respectively.
Exhibit 9: Foreign Wholesale Trade Volume, Total Sea Cargo Handled and Total Container Throughput
Source: Department of Statistics,
70
75
80
85
90
95
100
105
Jan 20 Mar 20 May 20 Jul 20 Sep 20 Nov 20
Jan 20 = 100
Exports Imports
4 The rebound in overall manufacturing output was similarly seen in the Index of Industrial Production, which recorded positive year-on-year growth in all months of 2H20 except for July and October 2020.
80
85
90
95
100
105
4Q19 1Q20 2Q20 3Q20 4Q20
4Q19 = 100
Foreign Wholesale Trade Volume Total Sea Cargo Handled Total Container Throughput
Economic Survey of Singapore 2020Feature Article
90
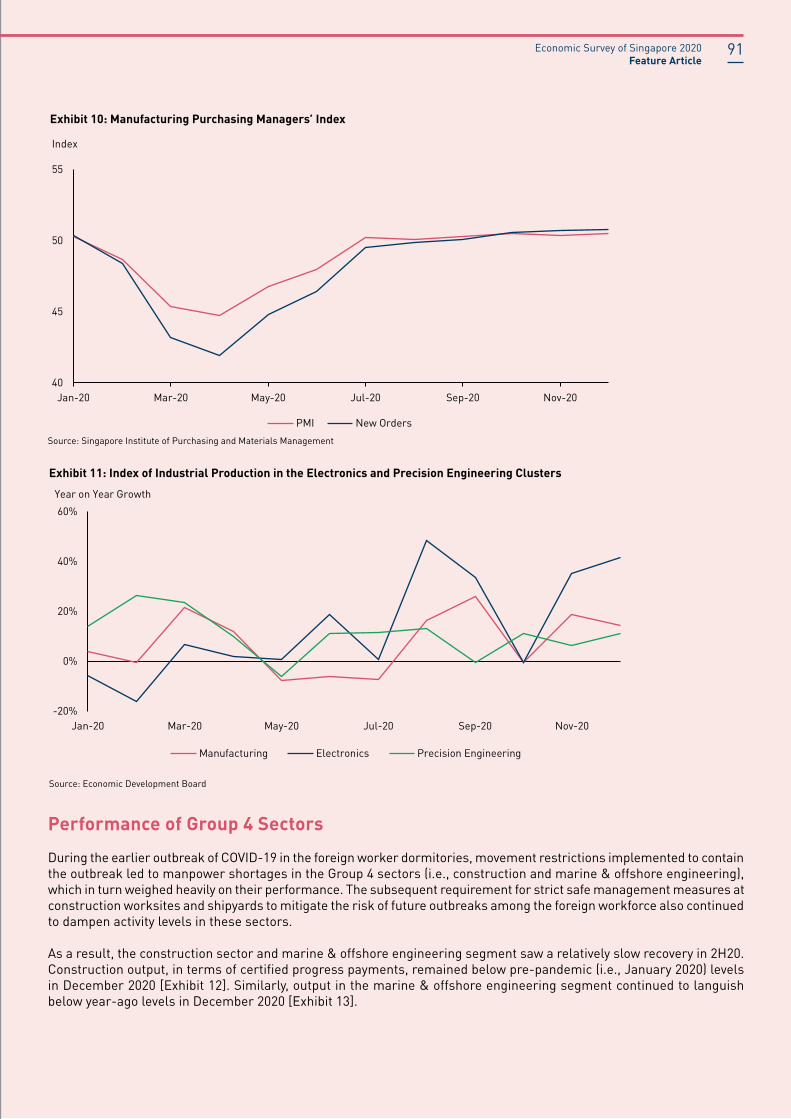
Performance of Group 4 SectorsDuring the earlier outbreak of COVID-19 in the foreign worker dormitories, movement restrictions implemented to contain the outbreak led to manpower shortages in the Group 4 sectors (i.e., construction and marine & offshore engineering), which in turn weighed heavily on their performance. The subsequent requirement for strict safe management measures at construction worksites and shipyards to mitigate the risk of future outbreaks among the foreign workforce also continued to dampen activity levels in these sectors.
As a result, the construction sector and marine & offshore engineering segment saw a relatively slow recovery in 2H20. Construction output, in terms of certified progress payments, remained below pre-pandemic (i.e., January 2020) levels in December 2020 [Exhibit 12]. Similarly, output in the marine & offshore engineering segment continued to languish below year-ago levels in December 2020 [Exhibit 13].
Exhibit 10: Manufacturing Purchasing Managers’ Index
Source: Singapore Institute of Purchasing and Materials Management
40
45
50
55
Jan-20 Mar-20 May-20 Jul-20 Sep-20 Nov-20
PMI New Orders
Index
Exhibit 11: Index of Industrial Production in the Electronics and Precision Engineering Clusters
Source: Economic Development Board
-20%
0%
20%
40%
60%
Jan-20 Mar-20 May-20 Jul-20 Sep-20 Nov-20
Year on Year Growth
Manufacturing Electronics Precision Engineering
Economic Survey of Singapore 2020Feature Article
91
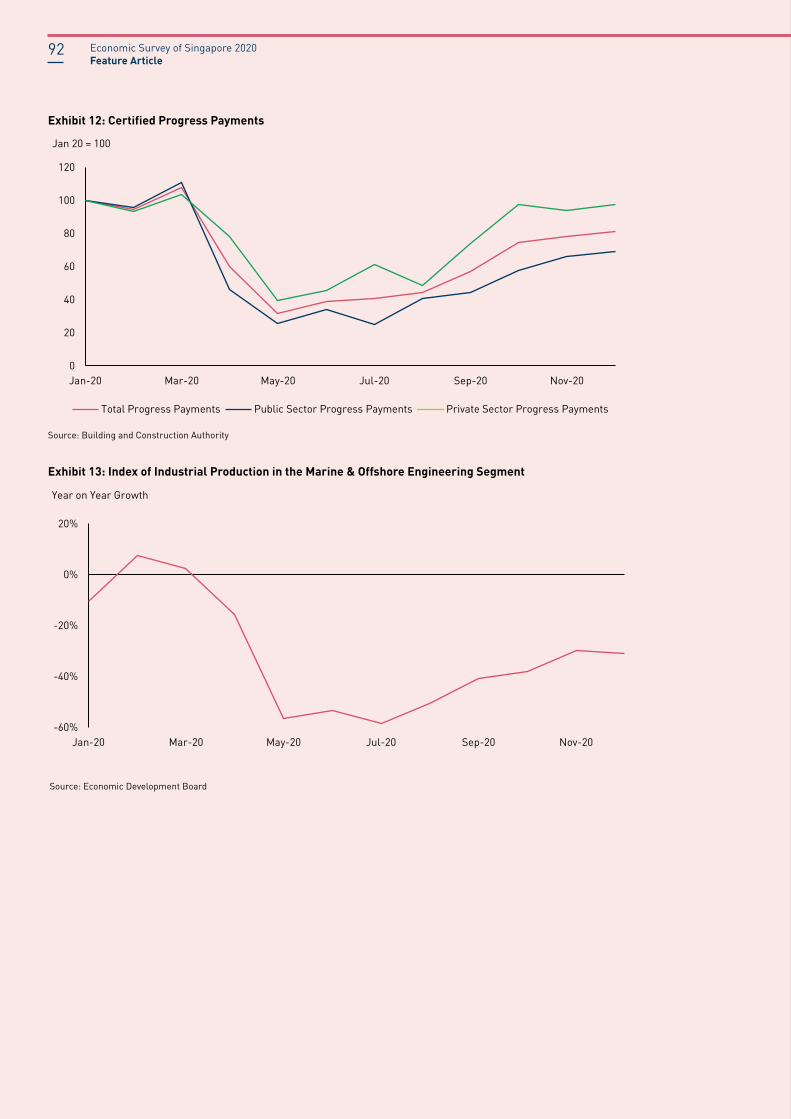
Exhibit 12: Certified Progress Payments
Source: Building and Construction Authority
0
20
40
60
80
100
120
Jan-20 Mar-20 May-20 Jul-20 Sep-20 Nov-20
Jan 20 = 100
Total Progress Payments Public Sector Progress Payments Private Sector Progress Payments
Exhibit 13: Index of Industrial Production in the Marine & Offshore Engineering Segment
Source: Economic Development Board
-60%
-40%
-20%
0%
20%
Jan-20 Mar-20 May-20 Jul-20 Sep-20 Nov-20
Year on Year Growth
Economic Survey of Singapore 2020Feature Article
92

Performance of Group 5 SectorsFinally, the economic downturn in Singapore due to COVID-19 also resulted in negative spillovers to domestically-oriented sectors such as real estate. For example, the poor performance of the retail trade sector in 2020 had a knock-on effect on the commercial retail property segment of the real estate sector, with retail rentals in 4Q20 remaining around 15 per cent lower compared to the same period a year ago due to weak leasing demand. Similarly, commercial office rentals remained depressed as at end-2020 on account of the economic downturn and cautious business sentiments [Exhibit 14]. By contrast, the private residential property segment was resilient, with the prices of landed and non-landed private residential property in 4Q20 already exceeding 4Q19 levels, supported by stable demand from buyers amidst a low interest rate environment [Exhibit 15].
Exhibit 14: Rental Indices of Commercial (Retail and Office) Property
Source: Urban Redevelopment Authority
80
85
90
95
100
105
4Q19 1Q20 2Q20 3Q20 4Q20
4Q19 = 100
Commercial Office Commercial Retail
Exhibit 15: Price Indices of Private Residential Property
Source: Urban Redevelopment Authority
95
100
105
4Q19 1Q20 2Q20 3Q20 4Q20
4Q19 = 100
All Private Residential Landed Private Residential Non-Landed Private Residential
Economic Survey of Singapore 2020Feature Article
93

CONCLUDING REMARKS AND OUTLOOKThe COVID-19 pandemic caused massive global economic disruptions in 2020. Singapore was not spared as the economy recorded its worst full-year recession since independence. Across sectors, the economic impact of COVID-19 was felt through different transmission channels. Consequently, their economic performance in 2020 was variegated.
Furthermore, significant risks in the global economy remain. While Singapore’s vaccination programme is well underway, there is uncertainty over how the COVID-19 pandemic will evolve around the world given the emergence of new strains of the virus and difficulties in vaccine rollouts globally.
Overall, barring the materialisation of downside risks, Singapore’s GDP is projected to recover gradually and expand by 4.0 to 6.0 per cent this year, with GDP not likely to return to pre-COVID levels until 2H21 at the earliest. Moreover, the pace of recovery is expected to remain uneven across sectors. In particular, the tourism- and aviation-related sectors are unlikely to return to pre-pandemic levels even by the end of 2021 due to the slow lifting of global travel restrictions and weak global demand for air travel amidst the emergence of more contagious variants of the virus.
Similarly, the slower recovery in visitor arrivals and capacity constraints due to safe distancing measures are likely to continue to weigh on the performance of the consumer-facing sectors, thus hindering their return to pre-pandemic levels throughout 2021. The recovery of the construction sector and marine & offshore engineering segments will likewise be slow because of the continued need for safe management measures at worksites and shipyards, as well as sluggish demand arising from the plunge in construction contracts awarded in 2020 and weakness in the global oil & gas market respectively. By contrast, the outward-oriented sectors – which had either already surpassed or recovered close to pre-pandemic levels by 4Q20 – are expected to continue to benefit from the pickup in global economic activity this year.
Contributed by:
Mr Muhammad Bin Rahmat, Economist Mr Ong Chong An, EconomistMr Thong Wei En, EconomistEconomics DivisionMinistry of Trade and Industry
Economic Survey of Singapore 2020Feature Article
94
REFERENCESChristopher Saw, Jonathan Lin, & Wong Yu Jie. 2020. “Feature Article: Impact of COVID-19 Pandemic on the Singapore Economy”, Economic Survey of Singapore First Quarter 2020.
Lam Yan Tung. 2016. “Box 1.1: Economic Sentiments in Singapore”, Economic Survey of Singapore Second Quarter 2016.
Chia Keat Loong and Jessica Foo. 2018. “Box 1.1: Recent Trends in Singapore News Economic Sentiments”, Economic Survey of Singapore First Quarter 2018.
Economic Survey of Singapore 2020Feature Article
95

MINISTRY OF TRADE AND INDUSTRY100 High Street, #09-01 The TreasurySingapore 179434
ISSN 2382-6541