Economic Survey 2018-19 - India Environment Portal
468
Economic Survey 2018-19 Government of India Ministry of Finance Department of Economic Affairs Economic Division North Block New Delhi-110001 E-mail: [email protected] July, 2019 Volume 2
-
Upload
khangminh22 -
Category
Documents
-
view
3 -
download
0
Transcript of Economic Survey 2018-19 - India Environment Portal
EconomicSurvey 2018-19
Government of IndiaMinistry of Finance
Department of Economic AffairsEconomic Division
North BlockNew Delhi-110001
E-mail: [email protected], 2019
Volume 2

CONTENTS
Chapter Page Name of the ChapterNo. No.
1 State of the Economy in 2018-19: A Macro View
1 Overview: Global Economic Scenario
4 Overview: Indian Economy
11 Drivers of Growth
17 Supply Side of the Economy
21 Outlook of the Economy
2 Fiscal Developments
35 Central Government Finances
51 State Finances
53 General Government Finances
54 Outlook
3 Monetary Management and Financial Intermediation
64 Monetary Developments during 2018-19
68 Liquidity Conditions and its Management
70 Developments in the G-Sec Market
70 Banking Sector
71 Credit Growth
72 Non-Banking Financial Sector
73 Developments in Capital Market
76 Insurance Sector
77 Insolvency and Bankruptcy Code 2016: Resolving Corporate Stress in a ChangedParadigm
4 Prices and Inflation
88 Introduction
89 Current Trends in Inflation
92 Drivers of Inflation
95 Rural - Urban Inflation
99 State-Wise Inflation
101 Trends in Global Commodity Prices
102 Efforts to Contain Inflation
103 Conclusion
5 Sustainable Development and Climate Change
104 Introduction
105 Achieving the SDGs
108 Ganga-The Lifeline of India
112 Resource Efficiency
118 Air Pollution
119 Climate Change
124 Developments in the Sustainable Finance Arena
125 International Solar Alliance (ISA)
126 Way Forward
6 External Sector
129 Global Economic Environment
131 India's Balance of Payments Developments
145 Nominal and Real Exchange Rate and Terms of Trade
152 Composition of Trade
154 Trade Policy
155 Trade Facilitation
156 Trade Related Logistics
157 Anti-Dumping and Safeguard Measures
157 Outlook
7 Agriculture and Food Management
172 Introduction
173 Overview of Agriculture and Allied Sectors
174 Gross Capital Formation in Agriculture and Allied Sectors
175 Pattern of Agricultural Landholdings in India
177 Bringing Resource Efficiency in Smallholder Agriculture
183 Role of Extension Services
185 Agricultural Credit
186 Allied Sectors: Animal Husbandry, Dairying and Fisheries
189 Food Security and Food Management in India
8 Industry and Infrastructure
197 Indian Industry: An Overview
198 Index of Industrial Production (IIP)
201 Central Public Sector Enterprises (CPSES)
202 Corporate Sector Performance
202 Gross Capital Formation in Industrial Sector
203 Credit Flow to the Industrial Sector
203 Key Initiatives Taken To Boost Industrial Sector In India
206 Sector Wise Issues and Performance
209 Infrastructure
210 Road Sector
212 Railways
215 Civil Aviation
217 Shipping
218 Telecom Sector
220 Petroleum & Natural Gas
222 Power Sector
223 Housing
224 Smart Cities Mission
226 Infrastructure Financing: Public Private Partnerships (PPPs)
226 Way Forward
9 Services Sector
228 Services Sector Performance in India: An Overview
228 India's Gross Value Added in The Services Sector
231 Trade in Services Sector
235 FDI Into Services Sector
235 Services Sector Gross Value Added Versus Employment
237 Major Services: Sector-Wise Performance and Some Recent Policies
238 Tourism
240 ITBPM Services
242 Media and Entertainment Services
248 Space Services
10 Social Infrastructure, Employment and Human Development
251 Introduction
252 Human Development Index
255 Gender Issues
257 Trends in Social Sector Expenditure
260 Education for All
263 Skill Development
265 Employment Scenario
266 Health for All
273 Rural Development
277 The Way Forward

(vii)
Acknowledgements
The Economic Survey is a result of teamwork and collaboration. Contributions to the Survey from the EconomicDivision include: Sanjeev Sanyal, Sushmita Dasgupta, Arun Kumar Jha, Arun Kumar, Rajiv Mishra, RajasreeRay, A Srija, Surbhi Jain, A. Prathibha, S. Arputhaswamy, Nikhila Menon, Ashwini Lal, Abhishek Acharya,Rajani Ranjan, Sindhumannickal Thankappan, Prerna Joshi, Dharmendra Kumar, Aakanksha Arora, M. Rahul,Rabi Ranjan, Tulsipriya Rajkumari, Shamim Ara, J.D. Vaishampayan, Arya B.K., Abhishek Anand, SonalRamesh, Sanjana Kadyan, Amit Sheoran, Shreya Bajaj, Subhash Chand, Riyaz Ahmad Khan, Md. Aftab Alam,Pradyut Kumar Pyne, Narendra Jena, Sribatsa Kumar Parida, Mritunjay Kumar, Rajesh Sharma and Amit KumarKesarwani, Arpitha Bykere, Naveen Bali, Mahima, Ankur Gupta, Lipi Budhraja, Sonum Gayatri Malhotra andLavisha Arora.
The Survey has benefitted from the valuable comments and insights of the Hon'ble Finance Minister SmtNirmala Sitharaman and the Hon'ble Minister of State for Finance Shri Anurag Singh Thakur.
The Survey benefitted from the comments and inputs from officials spread across various Ministries/Departments and organisations, specifically Shri Pranab Kumar Mukhopadhyay, DG, DGCI&S, Kolkata; ShriAjay Srivastava, Economic Adviser, Department of Commerce; Ms. Shruti Shukla, Joint Director, DGCI&S,Kolkata; Dr. M. D. Patra, Executive Director, Reserve Bank of India (RBI); Shri Rajan Goyal, Adviser, ReserveBank of India (RBI); Prof. K. S. James and Prof. Chander Shekhar, International Institute for PopulationSciences; Prof. Suresh Sharma and Vandana Sharma, Institute of Economic Growth; Mr. Surya Prakash B. S.,Fellow and Programme Director; Shri Rajiv Jain, Director, RBI; Shri Dhirendra Gajbhiye, Assistant Adviser,Reserve Bank of India (RBI); Siddharth Mandrekar Rao, Research Associate, Daksh; Ms. Soumasree Tewari,Research Officer, RBI; Shri Sukhbir Singh, CAAA, Department of Economic Affairs, Ministry of Finance; ShriAbhay Bakre, Director General, Bureau of Energy Efficiency; Dr. Ashok Kumar , Director, Bureau of EnergyEfficiency; Dr. Surya P Sethi and Shri Sameer Kumar- Joint Secretary, Ministry of Drinking Water andSanitation.
Apart from the above, various ministries, departments and organisations of the Government of India madecontributions in their respective sectors. Several ministries directly interacted with the CEA via presentationsto provide their inputs. The Economic Survey is gratified for their valuable time, engagement and contributions.Able administrative support was given by K. Rajaraman, Rajkumar Tiwari, Jasbir Singh, Suresh Kumar, AnupamShukla, Sadhna Sharma, Arun Gulati, Sushil Sharma, Manish Panwar, Muna Sah, Suresh Kumar, Jodh Singh,Ombir Singh, R R Meena, Subash Chand, Raj Kumar, Ram Niwas, Kesar Singh, Bal Kishan, Satish Kumar,Gajender Singh and other staff and members of the Economic Division and the Office of CEA. The coverpage for the Survey was designed by India Brand Equity Foundation. Viba Press Pvt. Ltd. undertook the printingof the English and Hindi version of the Survey.
Finally, the Economic Survey owes deep gratitude to the families of all those involved in its preparation forbeing ever so patient, understanding and encouraging and for extending their unflinching emotional and physicalsupport throughout the preparation. The families, indeed, are the silent pillars of strength for the dedicatedcontributors to the Economic Survey.
Krishnamurthy V. Subramanian(Chief Economic Adviser)
Ministry of FinanceGovernment of India

AAI Airports Authority of India
AFD Agence Française de Dévelopment
AH Area Operated by Operational Land Holdings
AI Artificial Intelligence
AIR All India Radio
AITIGA ASEAN India Trade in Goods Agreement
AM Alternative Mechanism
AMC Asset Management Company
AMFFRI Agricultural Marketing and Farmer FriendlyReforms Index
AMRUT Atal Mission for Rejuvenation and UrbanTransformation
ANC Ante-Natal Care
APL Above Poverty Line
APMC Agricultural Produce Market Committee
APWRIMS Andhra Pradesh Water Resources Information &Management Systems
AQI Air Quality Index
AR Augmented Reality
ASEAN Association of South-East Asian Nations
ASER Annual Status of Education Report
ASI Annual Survey of Industries
ASK Available Seat Kilometers
AYUSH Ayurveda, Yoga and Naturopathy, Unani, Siddhaand Homoeopathy
B2B Business to business
B2C Business to Consumer
BARC Broadcasting Audience Research Council
BBBP Beti Bachao Beti Padhao
BCD Basic Customs Duty
BE Budget Estimates
BHEL Bharat Heavy Industries Limited
BOD Biological Oxygen Demand
BoP Balance of Payments
BOT Build-Operate-Transfer
BPL Below Poverty Line
BRE Bureau of Resource Efficiency
BSE Bombay Stock Exchange
BTIA Bilateral Trade and Investment Agreement
BU Billion Units
BUR Biennial Update Report
C&D Construction & Demolition
CAD Current Account Deficit
CAG Comptroller Auditor General of India
CAGR Compound Annual Growth Rate
CBDR-RC Common but Differentiated Responsibilities andRespective Capabilities
CBM Coal Bed Methane
CCAP Climate Change Action Programme
CCEA Cabinet Committee on Economic Affairs
CE Circular Economy
CECA Comprehensive Economic Cooperation Agreement
ABBREVIATIONS
CECPA Comprehensive Economic Cooperation andPartnership Agreement
CEPA Comprehensive Economic Partnership Agreement
CEPI Custodian of Enemy Property
CER Corporate Environmental Responsibility
CFPI Consumer Food Price Index
CGA Controller General of Accounts
CGST Central Goods and Services Tax
CHCs Custom Hiring Centres
CIB Centre for Insolvency and Bankruptcy
CIC Currency in Circulation
CII Confederation of Indian Industries
CIL Coal India Limited
CIP Central Issue Price
CIRP Corporate Insolvency Resolution Process
CLAF City Level Advisory Forums
CMIE Centre for Monitoring Indian Economy
CoC Committee of Creditors
CPCB Central Pollution Control Board
CPI Consumer Price Index
CPI (AL) Consumer Price Index (Agricultural Labourers)
CPI (IW) Consumer Price Index (Industrial Workers)
CPI (RL) Consumer Price Index (Rural Labourers)
CPI-C Consumer Price Index (Combined)
CPSE Central Public Sector Enterprise
CRAR Capital to Risk-weighted Asset Ratio
CRF Central Road Fund
CRIF Central Road and Infrastructure Fund
CSL Cochin Shipyard Limited
CSO Central Statistics Office
CSR Corporate Social Responsibility
CSS Centrally Sponsored Scheme
CVD Countervailing Duty
CwP Currency with Public
D.Ed Diploma in Elementary Education
DARE Department of Agricultural Research andEducation
DB Doing Business
DBT Direct Benefit Transfer
DCIL Dredging Corporation of India Limited
DD Doordarshan
DDP Department of Defence Production
DDUGJY Deen Dayal Upadhyay Gram Jyoti Yojana
DE Departmental Enterprises
DEA Department of Economic Affairs
DGAD Directorate General of Anti-dumping and AlliedDuties
DGCA Directorate General of Civil Aviation
DGCI&S Directorate General of Commercial Intelligenceand Statistics
DGTR Directorate General of Trade Remedies
DIDF Dairy Processing and Infrastructure DevelopmentFund
(ix)

(x)
DIPAM Department of Investment and Public AssetManagement
DISC Defence India Start-up Challenges
DMEO Development Monitoring & Evaluation Office
DoE Department of Expenditure
DPIIT Department for Promotion of Industry and InternalTrade
DPSU Defence Public Sector Undertaking
DTH Direct to Home
DWT Dead Weight Tonnage
EaEU Eurasian Economic Union
EAG Empowered Action Group
EAP Externally Aided Projects
EBR Extra Budgetary Resources
ECBs External Commercial Borrowings
ECOWAS Economic Community of West African States
EFTA European Free Trade Association
ELVs End-of-Life Vehicles(s)
EM Emerging Market
EMDEs Emerging Market and Developing Economies
EME Emerging Market Economies
e-NAM Electronic National Agriculture Market
EPC Engineering, Procurement and Construction
EPF Employees' Provident Fund
EPR Extended Producer Responsibility
ESAG Educational Statistics at a Glance
ESDM Electronics System Design and Manufacturing
ESI Employees' State Insurance Scheme
ETCA Economic and Technology Cooperation Agreement
ETF Exchange Traded Funds
EU European Union
EY Ernst & Young
FALLCR Facility to Avail Liquidity for Liquidity CoverageRatio
FAO Food and Agriculture Organization
FC Financial Creditor
FCI Food Corporation of India
FDI Foreign Direct Investment
FFPI FAO Food Price Index
FICCI Federation of India Chambers of Commerce andIndustry
FIDF Fisheries and Aquaculture InfrastructureDevelopment Fund
FII Foreign Institutional Investors
FM Frequency Modulation
FMCG Fast Moving Consumer Goods
FMD Foot and Mouth Disease
FPI Foreign Portfolio Investment
FPO Further Public Offer
FPSs Fair Price Shops
FRBMA Fiscal Responsibility and Budget Management Act
FTA Free Trade Agreement
FTP Foreign Trade Policy
FY Financial Year
GCA Gross Cropped Area
GCF Gross Capital Formation
GDP Gross Domestic Product
GER Gross Enrolment Ratio
GFCE Government Final Consumption Expenditure
GFCF Gross Fixed Capital Formation
GFSI Global Food Security Index
Gg Gigagram
GHG Greenhouse Gas
GIP Graduate Insolvency Programme
GNI Gross National Income
GNPA Gross Non-Performing Assets
GPI Gender Parity Index
GPIs Grossly Polluting Industries
GRR Global Restructuring Review
GRSE Garden Reach Shipbuilders & Engineers Ltd
GRT Gross Registered Tonnage
GSAT Geosynchronous Satellites
G-Sec Government Security
GSLV Geosynchronous Satellite Launch Vehicle
GSMA Global System for Mobile CommunicationAssociation
GST Goods and Services Tax
GSTR Goods and Services Tax Return
GSVA Gross State Value Added
GTR Gross Tax Revenue
GTT Gross Terms of Trade
GVA Gross Value Added
Ha Hectare
HAM Hybrid Annuity Mode
HDI Human Development Index
HP-HT High Pressure-High Temperature
HPI Housing Price Index
HSCC Hospital Services Consultancy Corporation
IBBI Insolvency and Bankruptcy Board of India
IBC Insolvency and Bankruptcy Code
ICAR Indian Council of Agricultural Research
ICE Internal Combustion Engine
ICRA Investment Information and Credit Rating Agencyof India
ICRIER Indian Council for Research on InternationalEconomic Relations
ICT Information and Communications Technology
IDERA Irrevocable De-registration & Export RequestAuthorization
iDEX Innovation for Defence Excellence
IEBR Internal and Extra Budgetary Resources
IFPRI International Food Policy Research Institute
IFS International Financial Statistics
IGST Integrated Goods and Services Tax
IICA Indian Institute of Corporate Affairs
IIP International Investment Position
IL Industrial License
ILC Insolvency Law Committee
IMCECA India and Malaysia Implement ComprehensiveEconomic Cooperation Agreement
IMF International Monetary Fund
IMG Inter-Ministerial Group
InvITs Infrastructure Investment Trusts
IOCL Indian Oil Corporation Limited
IoT Internet-of-Things
IP Insured Persons
IPCC Intergovernmental Panel on Climate Change
IPO Initial Public Offer
IPPU Industrial Processes and Product Use
IR Indian Railways
IRCON Indian Railway Construction Company Limited
IRCTC Indian Railways Catering and Tourism Corporation
IRF Insolvency Research Foundation
IRFC Indian Railway Finance Corporation
ISA International Solar Alliance
ISLFTA India-Sri Lanka Free Trade Agreement
ISRO Indian Space Research organisation
IT Information Technology
ITA International Tourist Arrivals
IT-BPM Information Technology - Business ProcessManagement
ITC Input Tax Credit
ITT Income Terms of Trade
IU Information Utilities
IWMP Integrated Watershed Management Programme
IWP Irrigation Water Productivity
JFSG Joint Feasibility Study Group
KIOCL Kudremukh Iron Ore Company Limited
KVKs Krishi Vigyan Kendras
LAF Liquidity Adjustment Facility
LCO Local Cable Operators
LCR Liquidity Coverage Ratio
LFPR Labour Force Participation Rate
LIDAR Light Detection and Ranging
LPI Logistics Performance Index
LSG Local Self Government
LULUCF Land use, Land-Use Change and Forestry
M0 Reserve Money
M2M Machine-to-Machine
M3 Broad Money
MCA Ministry of Corporate Affairs
MeitY Ministry of Electronics and InformationTechnology
MEP Minimum Export Price
MGNREGA Mahatma Gandhi National Rural EmploymentGuarantee Act
MHA Ministry of Home Affairs
MI Micro Irrigation
MI Mission Indradhanush
MI Mixed Income
MIDHANI Mishra Dhatu Nigam
MLD Million Litres per Day
MMR Maternal Mortality Ratio
MMSCM Million Metric Standard Cubic Meters
MMT Million Metric Tonnes
MMTPA Million Metric Tonnes Per Annum
MNP Mobile Number Portability
MoEF&CC Ministry of Environment, Forest and ClimateChange
MoHUA Ministry of Housing and Urban Affairs
MoP Margin of Preference
MORTH Ministry of Road Transport and Highways
MOSPI Ministry of Statistics and ProgrammeImplementation
MOVCDNER Mission Organic Value Chain Development forNorth Eastern Region
MoWCD Ministry of Women and Child Development
MPC Monetary Policy Committee
MPI Municipal Performance Index
MRA Mutual Recognition Agreement
MRFs Material Recovery Facilities
MRO Maintenance, Repair & Overhaul
MSEI Metropolitan Stock Exchange of India Limited
MSF Marginal Standing Facility
MSME Micro Small Medium Enterprises
MSO Multi System Operators
MSP Minimum Support Price
MSTC Metal Scrap Trade Corporation
MT Metric Tonne
MT Million Tonnes
MTFP Medium Term Fiscal Policy
MTPA Million Tonnes per Annum
MW Mega Watt
MWP Minimum Work Programme
NAAQS National Ambient Air QualityStandards
NABARD National Bank for Agriculture and RuralDevelopment
NAFTA North America Free Trade Agreement
NALCO National Aluminium Company Limited
NAM National Ayush Mission
NAMP National Air Quality Monitoring Programme
NAPCC National Action Plan on Climate Change
NAS National Achievement Survey
NASSCOM National Association of Software and ServicesCompanies
NBCC National Buildings Construction Corporation
NBFC Non-Banking Financial Companies
NCAP National Clean Air Program
NCLAT National Company Law Appellate Tribunal
NCLT National Company Law Tribunal
NCR National Capital Region
NCTF National Committee on Trade Facilitation
NDE Non-Departmental Enterprises
NDTL Net Demand and Time Liabilities
NEEPCO North Eastern Electric Power Corporation Limited
NEER Nominal Effective Exchange Rate
NeSL National e-Governance Services Limited
NFC Non Food Credit
NFSA National Food Security Act
(xi)

NGNF Non-Governmental Non-Functional
NHAI National Highway Authority of India
NHB National Housing Bank
NHIDCL National Highways and InfrastructureDevelopment Corporation Limited
NHM National Health Mission
NHP National Hydrology Project
NHPC National Hydroelectric Power Corporation
NIFAP National lnland Fisheries and Aquaculture Policy
NIIP Net International Investment Position
NIUA National Institute of Urban Affairs
NIUA National Institute of Urban Affairs
NLC Neyveli Lignite Corporation Limited
NLH Number of Operational Land Holdings
NMCG National Mission for Clean Ganga
NMDC National Mineral Development Corporation
NMSA National Mission for Sustainable Agriculture
NNI Net National Income
NO2 Oxides of Nitrogen
NOCs National Oil Companies
NPA Non-Performing Assets
NPCC National Projects Construction CorporationLimited
NPCDCS National Programme for the Prevention andControl of Cancer, Diabetes, CardiovascularDiseases and Stroke
NPE National Policy on Electronics
NPS National Pension Scheme
NPT Net Production Tax
NRHM National Rural Health Mission
NRI Non-resident Indian
NSE National Stock Exchange
NSSF National Social Security Fund
NSSO National Sample Survey Office
NTT Net Terms of Trade
NUHM National Urban Health Mission
NUIH National Urban Innovation Hub
O&M Operation & Maintenance
OCEMS Online Continuous Effluent Monitoring Systems
ODA Official Development Assistance
OECD Organization for Economic Cooperation andDevelopment
OF Ordinance Factories
OFB Ordinance Factory Board
OFS Offer for Sale
OIL Oil India Limited
OMO Open Market Operations
OMSS Open Market Sale Scheme
ONGC Oil and Natural Gas Corporation
OOPE Out of Pocket Expenditure
OS Operating Surplus
OT Operation Theatre
OTT Over the Top
P Provisional
PA Provisional Actuals
PAN Permanent Account Number
PAWP Paris Agreement Work Programme
PDS ?Public Distribution System
PFC Power Finance Corporation Limited
PFCE Private Final Consumption Expenditure
PFRDA Pension Fund Regulatory and DevelopmentAuthority
PGI Performance Grading Index
PIP Pool Issue Price
PKVY Paramparagat Krishi Vikas Yojana
PLFS Periodic Labour Force Survey
PM10 Suspended Particulate Matter
PM2.5 Fine Particulate Matter
PMAY Pradhan Mantri Awas Yojana
PMAY- G Pradhan Mantri Awas Yojana (Gramin)
PMGSY Pradhan Mantri Gram Sadak Yojana
PMI Purchasing Managers' Index
PMJDY Pradhan Mantri Jan-Dhan Yojana
PM-KISAN Pradhan Mantri Kisan Samman Nidhi
PMKVY Pradhan Mantri Kaushal Vikas Yojana
PMSMA Pradhan Mantri Surakshit Matritva Abhiyan
PMUY Pradhan Mantri Ujjwala Yojana
POL Petroleum, Oil and Lubricants
PPP Public-Private Partnership
PPP Purchasing Power Parity
PPR Peste des Petis Ruminants
PRASHAD Pilgrimage Rejuvenation and Spiritual HeritageAugmentation Drive
PRO Producer Responsibility Organizations
PSB Public Sector Bank
PSF Price Stabilization Fund
PSLV Polar Satellite Launch Vehicle
PSU Public Sector Undertaking
PTA Preferential Trade Agreement
PTR Pupil Teacher Ratio
QE Quick Estimates
R & D Research and Development
RBI Reserve Bank of India
RCEP Regional Comprehensive Economic Partnership
RCS Regional Connectivity Scheme
RE Resource Efficiency
RE Revised Estimates
REC Rural Electrification Corporation
REER Real Effective Exchange Rate
REITs Real Estate Investment Trusts
ReMS Rashtriya e-Market Services
RERA Real Estate (Regulation and Development) Act
RGM Rashtriya Gokul Mission
RHS Right hand side
RITES Railway Infrastructure Technical & EconomicServices
RKM Route kilometers
RKVY Rashtriya Krishi Vikas Yojana
RMNCH+A Reproductive, Maternal, New-born, Child plusAdolescent Health
(xii)
RNI Registrar of Newspapers of India
RoA Return on Assets
RoE Return on Equity
ROGEP Regional Off-grid Electrification Project
RPK- Revenue Passenger Kilometers
RSA Restructured Standard Advances
RTWQMS Real Time Water Quality Monitoring Stations
RWA Resident Welfare Association
SA Stressed Advances
SAARC South Asian Association for Regional Cooperation
SACU Southern African Custom Union
SAPCC State Action Plans on Climate Change
SAUBHAGYA Sahaj Bijli Har Ghar Yojana
SBM Swachh Bharat Mission
SC Scheduled Caste
SCB Scheduled Commercial Bank
SCI Shipping Corporation of India
SCM Smart Cities Mission
SDG Sustainable Development Goals
SDR Special Drawing Right
SEBI Securities and Exchange Board of India
SECC Socio-Economic Caste Census
SHDI Subnational Human Development Index
SLSC State Level Sanctioning Committee
SMAM Sub Mission on Agricultural Mechanization
SO2 Sulphur Dioxide
SPCB State Pollution Control Board
SPMGs State Project Management Groups
SPP Sustainable Public Procurement
SPVs Special Purpose Vehicles
SRMI Solar Risk Mitigation Initiative
ST Scheduled Tribe
STPs Sewage Treatment Plants
TDS Tax Deduction at Source
TEPA Trade and Economic Partnership Agreement
TFA Trade Facilitation Agreement
THE Total Health Expenditure
TMT Thousand Metric Tonnes
ToT Terms of Trade
TPD Tons per Day
TPDS Targeted Public Distribution System
TRAI Telecom Regulatory Authority of India
TWRIS Telengana Water Resources Information &Management Systems
U5MR Under Five Mortality Rate
UAE United Arab Emirates
UBC Use Based Classification
UC Universal Control
UDAN Ude Desh ka Aam Naagarik
UDISE Unified District Information on School Education
ULBs Urban Local Bodies
UN United Nations
UNFCCC United Nations Framework Convention on ClimateChange
UNFPA United Nation Population Fund
USA United States of America
USD United States Dollar
UTs Union Territories
VFX Visual Effects
VR Virtual reality
WACR Weighted Average Call Rate
WAPCOS Water and Power Consultancy Services
WEF World Economic Forum
WEO World Economic Outlook
WPI Wholesale Price Index
WPR Worker Population Ratio
WTO World Trade Organization
YoY Year-on-Year
ZBNF Zero Budget Natural Farming
(xiii)

CHAPTER
01State of the Economy in 2018-19: A Macro View
OVERVIEW: GLOBAL ECONOMIC SCENARIO
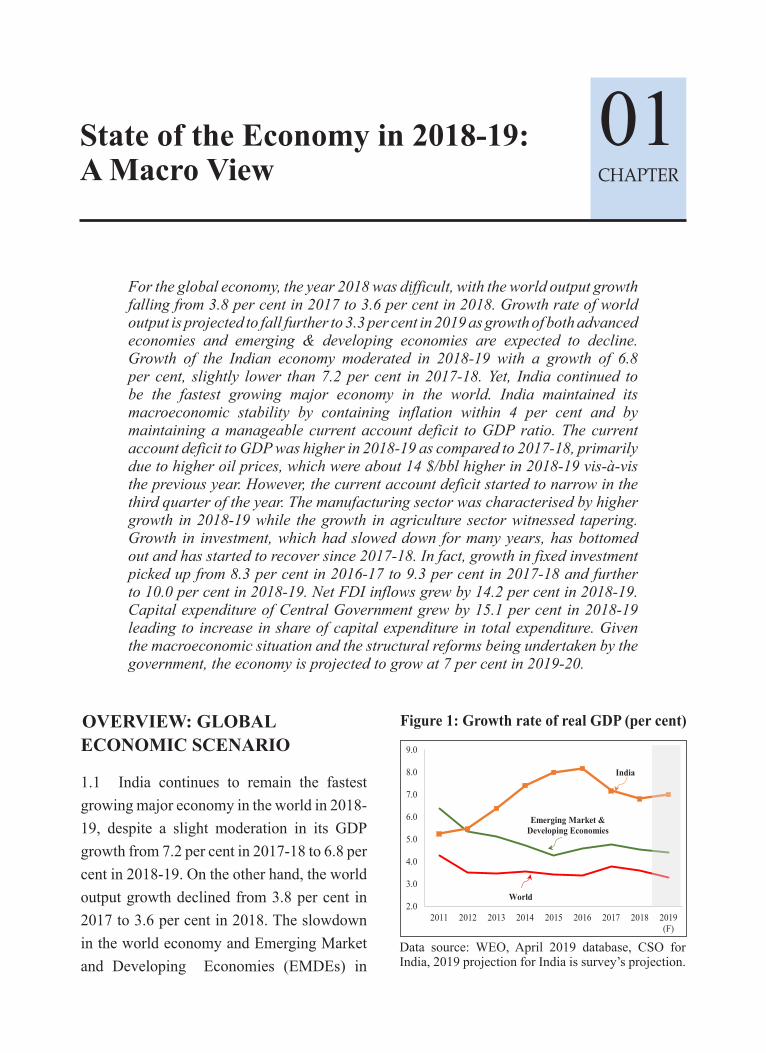
1.1 India continues to remain the fastest growing major economy in the world in 2018-19, despite a slight moderation in its GDP growth from 7.2 per cent in 2017-18 to 6.8 per cent in 2018-19. On the other hand, the world output growth declined from 3.8 per cent in 2017 to 3.6 per cent in 2018. The slowdown in the world economy and Emerging Market and Developing Economies (EMDEs) in
Figure 1: Growth rate of real GDP (per cent)
2.0
3.0
4.0
5.0
6.0
7.0
8.0
9.0
2011 2012 2013 2014 2015 2016 2017 2018 2019(F)
World
Emerging Market & Developing Economies
India
Data source: WEO, April 2019 database, CSO for India, 2019 projection for India is survey’s projection.
For the global economy, the year 2018 was difficult, with the world output growth falling from 3.8 per cent in 2017 to 3.6 per cent in 2018. Growth rate of world output is projected to fall further to 3.3 per cent in 2019 as growth of both advanced economies and emerging & developing economies are expected to decline. Growth of the Indian economy moderated in 2018-19 with a growth of 6.8 per cent, slightly lower than 7.2 per cent in 2017-18. Yet, India continued to be the fastest growing major economy in the world. India maintained its macroeconomic stability by containing inflation within 4 per cent and by maintaining a manageable current account deficit to GDP ratio. The current account deficit to GDP was higher in 2018-19 as compared to 2017-18, primarily due to higher oil prices, which were about 14 $/bbl higher in 2018-19 vis-à-vis the previous year. However, the current account deficit started to narrow in the third quarter of the year. The manufacturing sector was characterised by higher growth in 2018-19 while the growth in agriculture sector witnessed tapering. Growth in investment, which had slowed down for many years, has bottomed out and has started to recover since 2017-18. In fact, growth in fixed investment picked up from 8.3 per cent in 2016-17 to 9.3 per cent in 2017-18 and further to 10.0 per cent in 2018-19. Net FDI inflows grew by 14.2 per cent in 2018-19. Capital expenditure of Central Government grew by 15.1 per cent in 2018-19 leading to increase in share of capital expenditure in total expenditure. Given the macroeconomic situation and the structural reforms being undertaken by the government, the economy is projected to grow at 7 per cent in 2019-20.
2 Economic Survey 2018-19 Volume 2
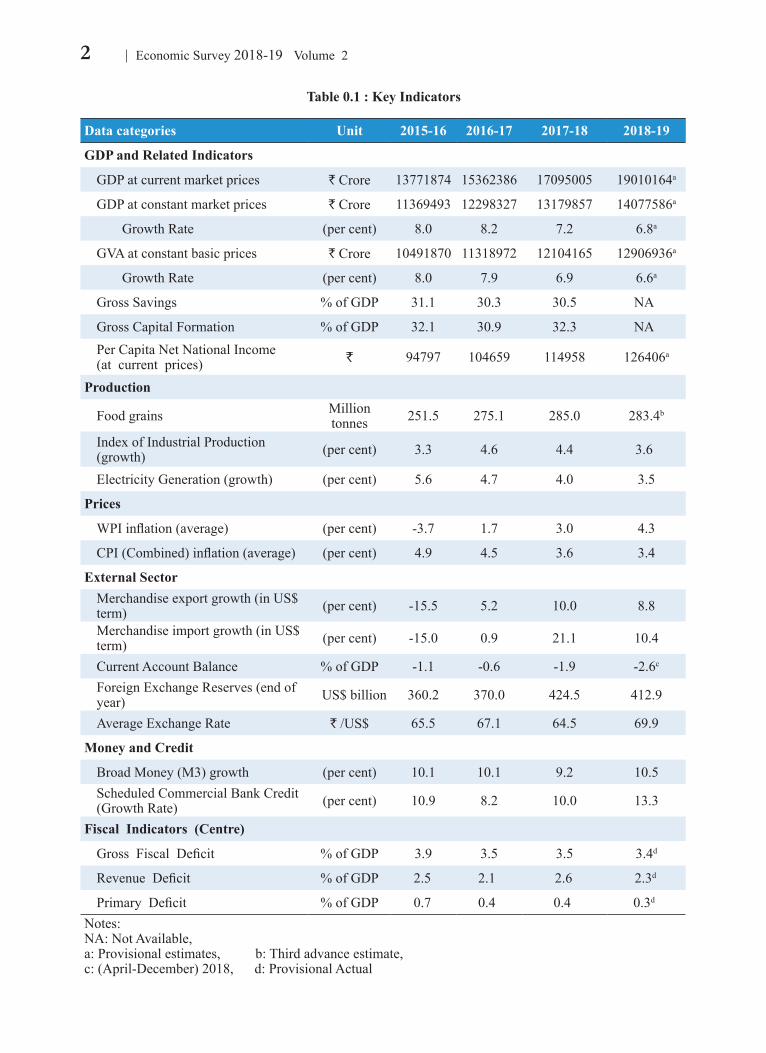
Table 0.1 : Key Indicators
Data categories Unit 2015-16 2016-17 2017-18 2018-19
GDP and Related Indicators
GDP at current market prices ` Crore 13771874 15362386 17095005 19010164a
GDP at constant market prices ` Crore 11369493 12298327 13179857 14077586a
Growth Rate (per cent) 8.0 8.2 7.2 6.8a
GVA at constant basic prices ` Crore 10491870 11318972 12104165 12906936a
Growth Rate (per cent) 8.0 7.9 6.9 6.6a
Gross Savings % of GDP 31.1 30.3 30.5 NA
Gross Capital Formation % of GDP 32.1 30.9 32.3 NAPer Capita Net National Income(at current prices) ` 94797 104659 114958 126406a
Production
Food grains Million tonnes 251.5 275.1 285.0 283.4b
Index of Industrial Production (growth) (per cent) 3.3 4.6 4.4 3.6
Electricity Generation (growth) (per cent) 5.6 4.7 4.0 3.5
Prices
WPI inflation (average) (per cent) -3.7 1.7 3.0 4.3
CPI (Combined) inflation (average) (per cent) 4.9 4.5 3.6 3.4
External SectorMerchandise export growth (in US$
term) (per cent) -15.5 5.2 10.0 8.8
Merchandise import growth (in US$ term) (per cent) -15.0 0.9 21.1 10.4
Current Account Balance % of GDP -1.1 -0.6 -1.9 -2.6c
Foreign Exchange Reserves (end of year) US$ billion 360.2 370.0 424.5 412.9
Average Exchange Rate ` /US$ 65.5 67.1 64.5 69.9
Money and Credit
Broad Money (M3) growth (per cent) 10.1 10.1 9.2 10.5Scheduled Commercial Bank Credit (Growth Rate) (per cent) 10.9 8.2 10.0 13.3
Fiscal Indicators (Centre)
Gross Fiscal Deficit % of GDP 3.9 3.5 3.5 3.4d
Revenue Deficit % of GDP 2.5 2.1 2.6 2.3d
Primary Deficit % of GDP 0.7 0.4 0.4 0.3d
Notes:NA: Not Available, a: Provisional estimates, b: Third advance estimate,c: (April-December) 2018, d: Provisional Actual
3State of the Economy in 2018-19: A Macro View
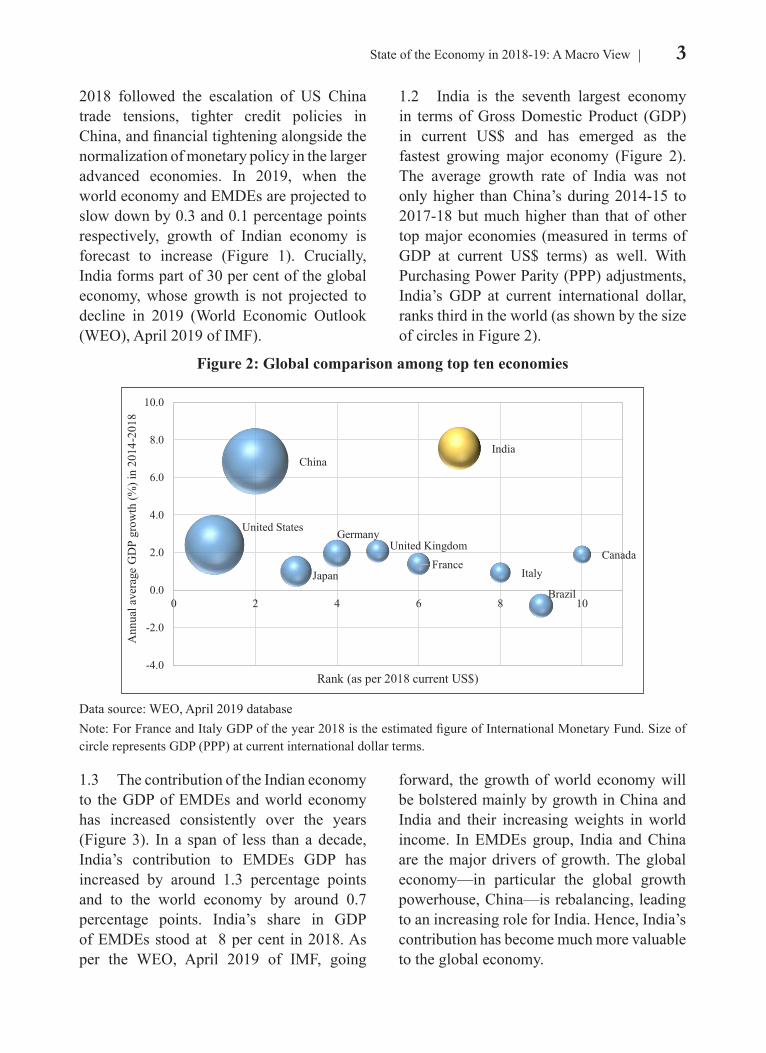
1.2 India is the seventh largest economy in terms of Gross Domestic Product (GDP) in current US$ and has emerged as the fastest growing major economy (Figure 2). The average growth rate of India was not only higher than China’s during 2014-15 to 2017-18 but much higher than that of other top major economies (measured in terms of GDP at current US$ terms) as well. With Purchasing Power Parity (PPP) adjustments, India’s GDP at current international dollar, ranks third in the world (as shown by the size of circles in Figure 2).
forward, the growth of world economy will be bolstered mainly by growth in China and India and their increasing weights in world income. In EMDEs group, India and China are the major drivers of growth. The global economy—in particular the global growth powerhouse, China—is rebalancing, leading to an increasing role for India. Hence, India’s contribution has become much more valuable to the global economy.
2018 followed the escalation of US China trade tensions, tighter credit policies in China, and financial tightening alongside the normalization of monetary policy in the larger advanced economies. In 2019, when the world economy and EMDEs are projected to slow down by 0.3 and 0.1 percentage points respectively, growth of Indian economy is forecast to increase (Figure 1). Crucially, India forms part of 30 per cent of the global economy, whose growth is not projected to decline in 2019 (World Economic Outlook (WEO), April 2019 of IMF).
1.3 The contribution of the Indian economy to the GDP of EMDEs and world economy has increased consistently over the years (Figure 3). In a span of less than a decade, India’s contribution to EMDEs GDP has increased by around 1.3 percentage points and to the world economy by around 0.7 percentage points. India’s share in GDP of EMDEs stood at 8 per cent in 2018. As per the WEO, April 2019 of IMF, going
Figure 2: Global comparison among top ten economies
United States
China
Japan
GermanyUnited Kingdom
France
India
Italy
Brazil
Canada
-4.0
-2.0
0.0
2.0
4.0
6.0
8.0
10.0
0 2 4 6 8 10
Ann
ual a
vera
ge G
DP
grow
th (%
) in
2014
-201
8
Rank (as per 2018 current US$)
Data source: WEO, April 2019 databaseNote: For France and Italy GDP of the year 2018 is the estimated figure of International Monetary Fund. Size of circle represents GDP (PPP) at current international dollar terms.

4 Economic Survey 2018-19 Volume 2
OVERVIEW: INDIAN ECONOMY
1.4 India’s growth of real GDP has been high with average growth of 7.5 per cent in the last 5 years (2014-15 onwards). The Indian economy grew at 6.8 per cent in 2018-19, thereby experiencing some moderation in growth when compared to the previous year. This moderation in growth momentum is mainly on account of lower growth in ‘Agriculture & allied’, ‘Trade, hotel, transport, storage, communication and services related to broadcasting’ and ‘Public administration & defence’ sectors. Acreage in 2018-19 for the rabi crop was marginally lower than last year, which affected agricultural performance. The contraction in
food prices may have contributed to inducing farmers to produce less. On the demand side, lower growth of GDP in 2018-19 was accounted for, by a decline in growth of government final consumption, change in stocks and contraction in valuables.
1.5 When we examine the growth pattern within the various quarters of 2018-19, we note that the moderation in real GDP growth has been experienced in all quarters of 2018-19 (Figure 4) with the fourth quarter (Q4)registering a growth of 5.8 per cent. The base effect arising from a high growth of 8.1 per cent in the Q4 of 2017-18 also led to this lower growth in Q4 of 2018-19. In this quarter, election related uncertainty may have also contributed to growth moderation.
1.6 There was contraction in ‘Agriculture & allied’ sector in the last quarter of 2018-19, though growth was reasonable in the previous
three quarters. Growth of industry sector also experienced tempering in successive quarters of 2018-19 mostly on account of
Figure 3: India’s share in GDP of EMDEs and World (per cent)
2.5 2.4 2.4 2.6 2.8 3.0 3.3 3.2
6.8 6.4 6.2 6.67.1
7.88.3 8.1
2011 2012 2013 2014 2015 2016 2017 2018
Contribution to World GDP Contribution to EMDE's GDP
Data source: WEO, April 2019 database
Figure 4: Quarterly real GDP growth (per cent)
5.5
6.0
6.5
7.0
7.5
8.0
8.5
9.0
9.5
Q1 Q2 Q3 Q4 Q1 Q2 Q3 Q4 Q1 Q2 Q3 Q4 Q1 Q2 Q3 Q4
2015-16 2016-17 2017-18 2018-19
Data source: Central Statistics Office
Table 1: Quarter-wise growth in Gross Value Added (per cent)
2017-18 2018-19
Q1 Q2 Q3 Q4 Q1 Q2 Q3 Q4Agriculture and allied 4.2 4.5 4.6 6.5 5.1 4.9 2.8 -0.1Industry 0.8 6.9 8.0 8.1 9.8 6.7 7.0 4.2 (of which) Manufacturing -1.7 7.1 8.6 9.5 12.1 6.9 6.4 3.1Services 9.4 6.8 8.0 8.2 7.1 7.3 7.2 8.4GVA at basic prices 5.9 6.6 7.3 7.9 7.7 6.9 6.3 5.7GDP at market prices 6.0 6.8 7.7 8.1 8.0 7.0 6.6 5.8
Source: Central Statistics Office
5State of the Economy in 2018-19: A Macro View
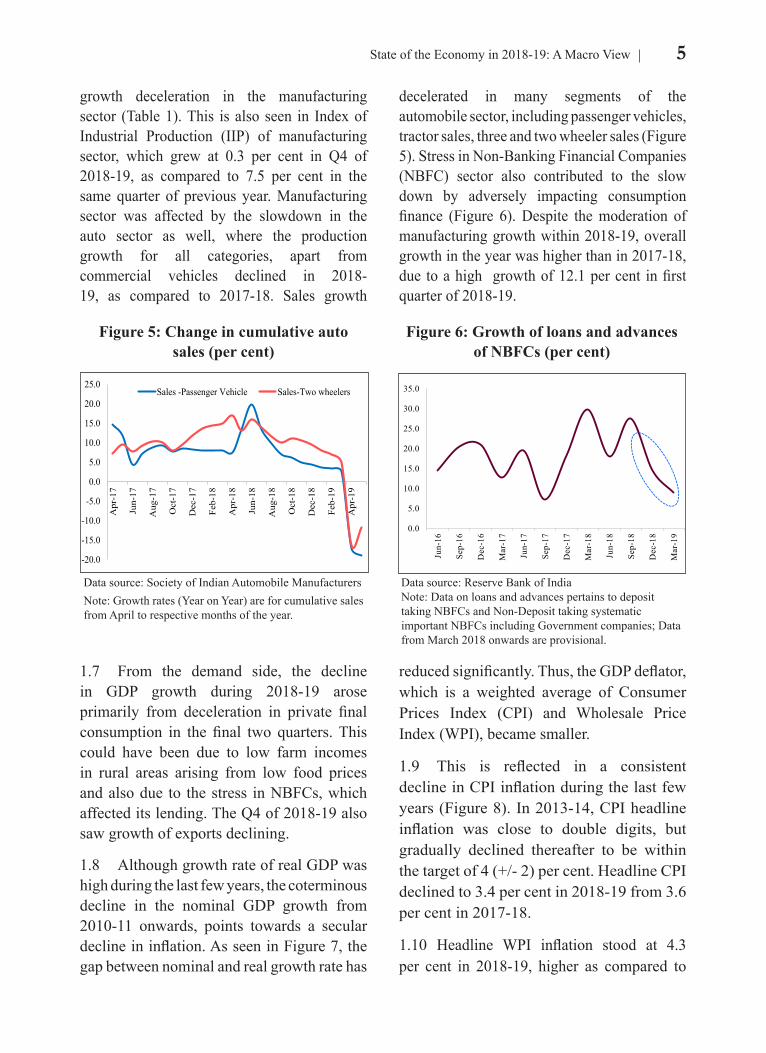
decelerated in many segments of the automobile sector, including passenger vehicles, tractor sales, three and two wheeler sales (Figure 5). Stress in Non-Banking Financial Companies (NBFC) sector also contributed to the slow down by adversely impacting consumption finance (Figure 6). Despite the moderation of manufacturing growth within 2018-19, overall growth in the year was higher than in 2017-18, due to a high growth of 12.1 per cent in first quarter of 2018-19.
growth deceleration in the manufacturing sector (Table 1). This is also seen in Index of Industrial Production (IIP) of manufacturing sector, which grew at 0.3 per cent in Q4 of 2018-19, as compared to 7.5 per cent in the same quarter of previous year. Manufacturing sector was affected by the slowdown in the auto sector as well, where the production growth for all categories, apart from commercial vehicles declined in 2018-19, as compared to 2017-18. Sales growth
1.7 From the demand side, the decline in GDP growth during 2018-19 arose primarily from deceleration in private final consumption in the final two quarters. This could have been due to low farm incomes in rural areas arising from low food prices and also due to the stress in NBFCs, which affected its lending. The Q4 of 2018-19 also saw growth of exports declining.
1.8 Although growth rate of real GDP was high during the last few years, the coterminous decline in the nominal GDP growth from 2010-11 onwards, points towards a secular decline in inflation. As seen in Figure 7, the gap between nominal and real growth rate has
reduced significantly. Thus, the GDP deflator, which is a weighted average of Consumer Prices Index (CPI) and Wholesale Price Index (WPI), became smaller.
1.9 This is reflected in a consistent decline in CPI inflation during the last few years (Figure 8). In 2013-14, CPI headline inflation was close to double digits, but gradually declined thereafter to be within the target of 4 (+/- 2) per cent. Headline CPI declined to 3.4 per cent in 2018-19 from 3.6 per cent in 2017-18.
1.10 Headline WPI inflation stood at 4.3 per cent in 2018-19, higher as compared to
Figure 5: Change in cumulative auto sales (per cent)
Figure 6: Growth of loans and advances of NBFCs (per cent)
-20.0
-15.0
-10.0
-5.0
0.0
5.0
10.0
15.0
20.0
25.0
Apr
-17
Jun-
17
Aug
-17
Oct
-17
Dec
-17
Feb-
18
Apr
-18
Jun-
18
Aug
-18
Oct
-18
Dec
-18
Feb-
19
Apr
-19
Sales -Passenger Vehicle Sales-Two wheelers
0.0
5.0
10.0
15.0
20.0
25.0
30.0
35.0
Jun-
16
Sep-
16
Dec
-16
Mar
-17
Jun-
17
Sep-
17
Dec
-17
Mar
-18
Jun-
18
Sep-
18
Dec
-18
Mar
-19
Data source: Society of Indian Automobile ManufacturersNote: Growth rates (Year on Year) are for cumulative sales from April to respective months of the year.
Data source: Reserve Bank of India Note: Data on loans and advances pertains to deposit taking NBFCs and Non-Deposit taking systematic important NBFCs including Government companies; Data from March 2018 onwards are provisional.
6 Economic Survey 2018-19 Volume 2
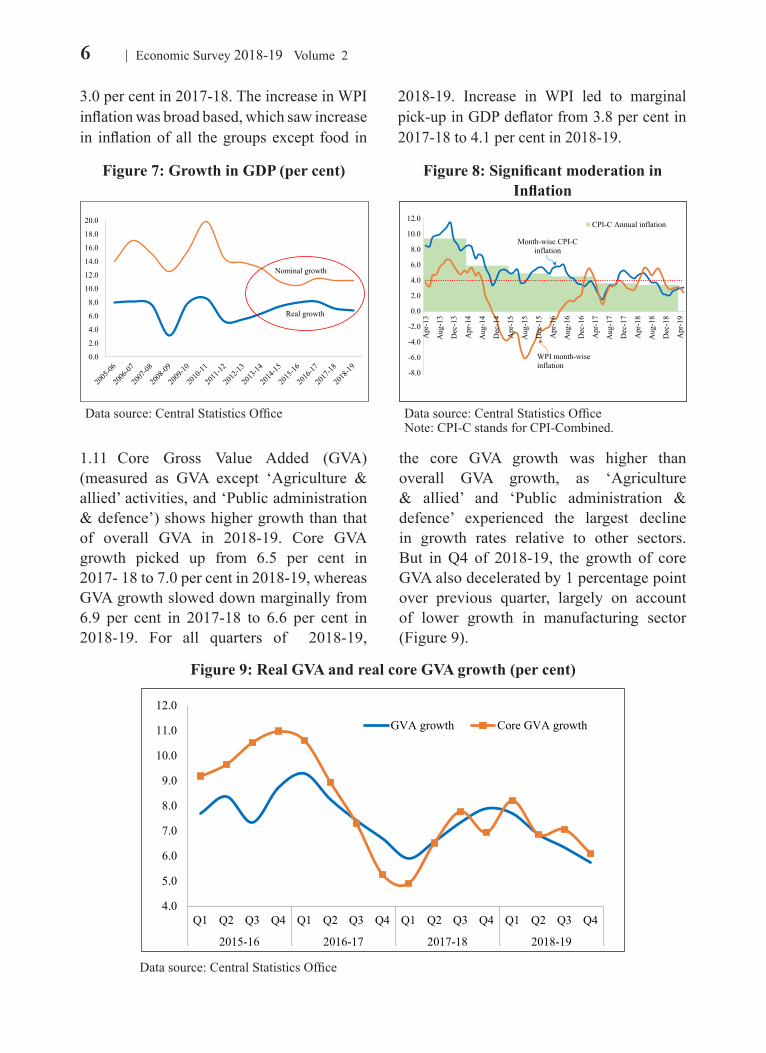
the core GVA growth was higher than overall GVA growth, as ‘Agriculture & allied’ and ‘Public administration & defence’ experienced the largest decline in growth rates relative to other sectors. But in Q4 of 2018-19, the growth of core GVA also decelerated by 1 percentage point over previous quarter, largely on account of lower growth in manufacturing sector (Figure 9).
1.11 Core Gross Value Added (GVA) (measured as GVA except ‘Agriculture & allied’ activities, and ‘Public administration & defence’) shows higher growth than that of overall GVA in 2018-19. Core GVA growth picked up from 6.5 per cent in 2017- 18 to 7.0 per cent in 2018-19, whereas GVA growth slowed down marginally from 6.9 per cent in 2017-18 to 6.6 per cent in 2018-19. For all quarters of 2018-19,
3.0 per cent in 2017-18. The increase in WPI inflation was broad based, which saw increase in inflation of all the groups except food in
2018-19. Increase in WPI led to marginal pick-up in GDP deflator from 3.8 per cent in 2017-18 to 4.1 per cent in 2018-19.
Figure 9: Real GVA and real core GVA growth (per cent)
4.0
5.0
6.0
7.0
8.0
9.0
10.0
11.0
12.0
Q1 Q2 Q3 Q4 Q1 Q2 Q3 Q4 Q1 Q2 Q3 Q4 Q1 Q2 Q3 Q4
2015-16 2016-17 2017-18 2018-19
GVA growth Core GVA growth
Data source: Central Statistics Office
Figure 7: Growth in GDP (per cent) Figure 8: Significant moderation in Inflation
0.0
2.0
4.0
6.0
8.0
10.0
12.0
14.0
16.0
18.0
20.0
Nominal growth
Real growth
-8.0
-6.0
-4.0
-2.0
0.0
2.0
4.0
6.0
8.0
10.0
12.0
Apr
-13
Aug
-13
Dec
-13
Apr
-14
Aug
-14
Dec
-14
Apr
-15
Aug
-15
Dec
-15
Apr
-16
Aug
-16
Dec
-16
Apr
-17
Aug
-17
Dec
-17
Apr
-18
Aug
-18
Dec
-18
Apr
-19
CPI-C Annual inflation
Month-wise CPI-C inflation
WPI month-wise inflation
Data source: Central Statistics Office Data source: Central Statistics OfficeNote: CPI-C stands for CPI-Combined.
7State of the Economy in 2018-19: A Macro View
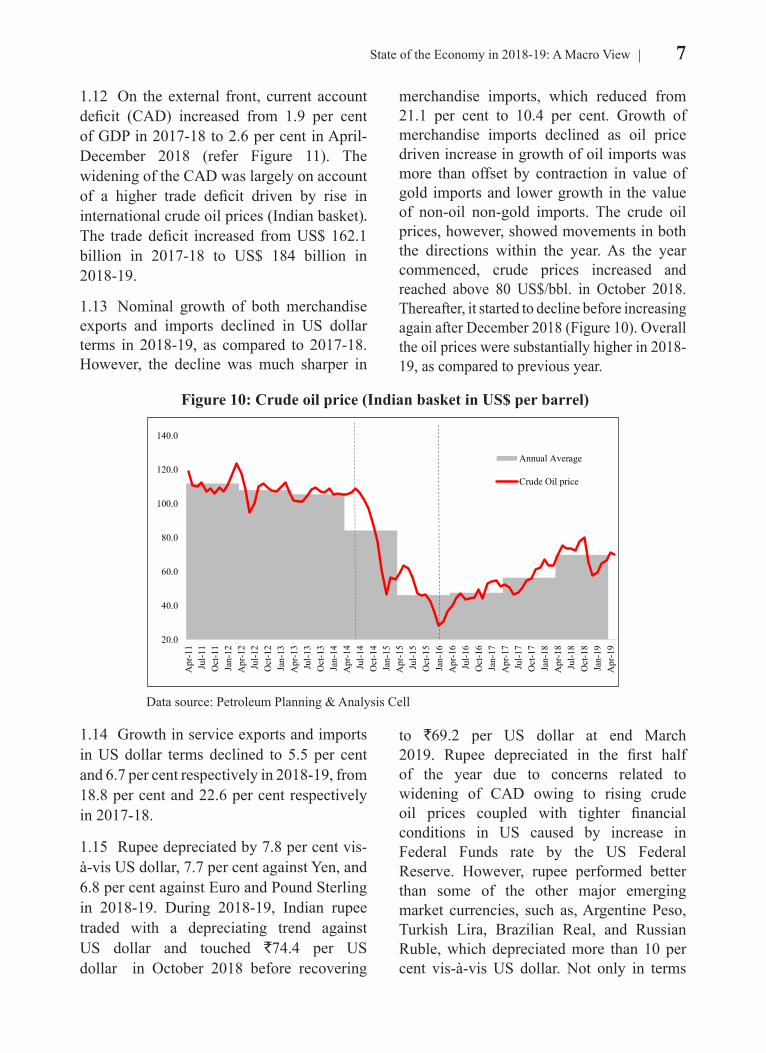
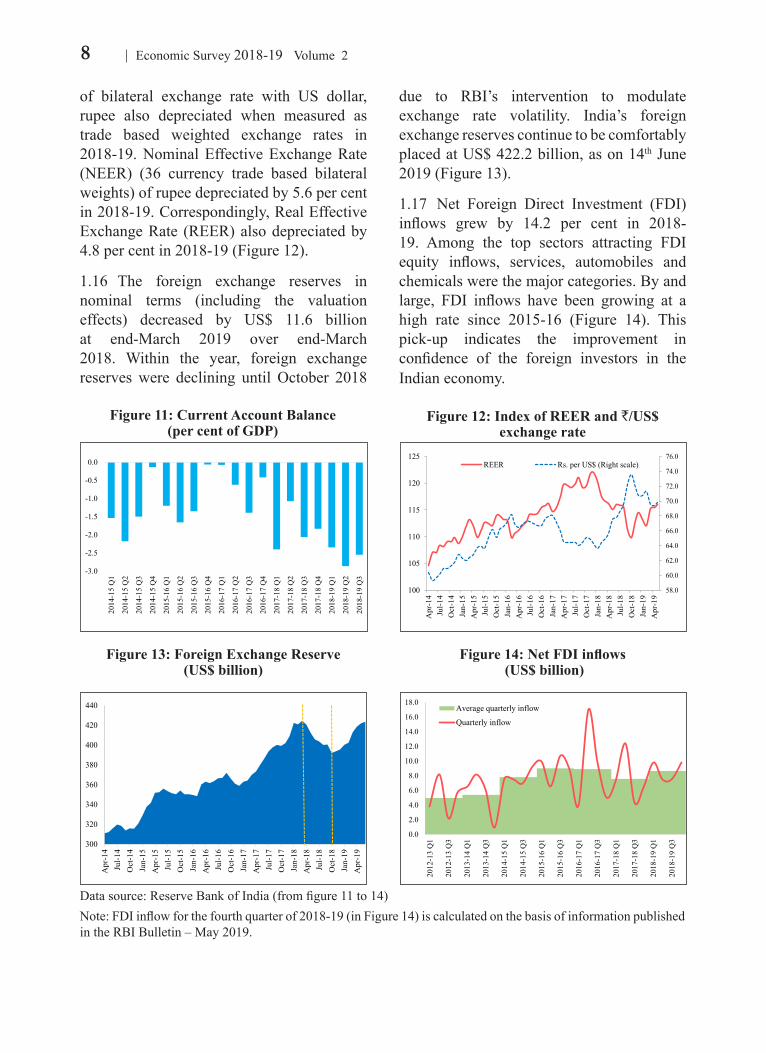
1.12 On the external front, current account deficit (CAD) increased from 1.9 per cent of GDP in 2017-18 to 2.6 per cent in April-December 2018 (refer Figure 11). The widening of the CAD was largely on account of a higher trade deficit driven by rise in international crude oil prices (Indian basket). The trade deficit increased from US$ 162.1 billion in 2017-18 to US$ 184 billion in 2018-19.
1.13 Nominal growth of both merchandise exports and imports declined in US dollar terms in 2018-19, as compared to 2017-18. However, the decline was much sharper in
merchandise imports, which reduced from 21.1 per cent to 10.4 per cent. Growth of merchandise imports declined as oil price driven increase in growth of oil imports was more than offset by contraction in value of gold imports and lower growth in the value of non-oil non-gold imports. The crude oil prices, however, showed movements in both the directions within the year. As the year commenced, crude prices increased and reached above 80 US$/bbl. in October 2018. Thereafter, it started to decline before increasing again after December 2018 (Figure 10). Overall the oil prices were substantially higher in 2018-19, as compared to previous year.
1.14 Growth in service exports and imports in US dollar terms declined to 5.5 per cent and 6.7 per cent respectively in 2018-19, from 18.8 per cent and 22.6 per cent respectively in 2017-18.
1.15 Rupee depreciated by 7.8 per cent vis-à-vis US dollar, 7.7 per cent against Yen, and 6.8 per cent against Euro and Pound Sterling in 2018-19. During 2018-19, Indian rupee traded with a depreciating trend against US dollar and touched `74.4 per US dollar in October 2018 before recovering
to `69.2 per US dollar at end March 2019. Rupee depreciated in the first half of the year due to concerns related to widening of CAD owing to rising crude oil prices coupled with tighter financial conditions in US caused by increase in Federal Funds rate by the US Federal Reserve. However, rupee performed better than some of the other major emerging market currencies, such as, Argentine Peso, Turkish Lira, Brazilian Real, and Russian Ruble, which depreciated more than 10 per cent vis-à-vis US dollar. Not only in terms
Figure 10: Crude oil price (Indian basket in US$ per barrel)
20.0
40.0
60.0
80.0
100.0
120.0
140.0
Apr
-11
Jul-1
1O
ct-1
1Ja
n-12
Apr
-12
Jul-1
2O
ct-1
2Ja
n-13
Apr
-13
Jul-1
3O
ct-1
3Ja
n-14
Apr
-14
Jul-1
4O
ct-1
4Ja
n-15
Apr
-15
Jul-1
5O
ct-1
5Ja
n-16
Apr
-16
Jul-1
6O
ct-1
6Ja
n-17
Apr
-17
Jul-1
7O
ct-1
7Ja
n-18
Apr
-18
Jul-1
8O
ct-1
8Ja
n-19
Apr
-19
Annual Average
Crude Oil price
Data source: Petroleum Planning & Analysis Cell
8 Economic Survey 2018-19 Volume 2
of bilateral exchange rate with US dollar, rupee also depreciated when measured as trade based weighted exchange rates in 2018-19. Nominal Effective Exchange Rate (NEER) (36 currency trade based bilateral weights) of rupee depreciated by 5.6 per cent in 2018-19. Correspondingly, Real Effective Exchange Rate (REER) also depreciated by 4.8 per cent in 2018-19 (Figure 12).
1.16 The foreign exchange reserves in nominal terms (including the valuation effects) decreased by US$ 11.6 billion at end-March 2019 over end-March 2018. Within the year, foreign exchange reserves were declining until October 2018
Figure 11: Current Account Balance (per cent of GDP)
Figure 12: Index of REER and `/US$ exchange rate
-3.0
-2.5
-2.0
-1.5
-1.0
-0.5
0.0
2014
-15
Q1
2014
-15
Q2
2014
-15
Q3
2014
-15
Q4
2015
-16
Q1
2015
-16
Q2
2015
-16
Q3
2015
-16
Q4
2016
-17
Q1
2016
-17
Q2
2016
-17
Q3
2016
-17
Q4
2017
-18
Q1
2017
-18
Q2
2017
-18
Q3
2017
-18
Q4
2018
-19
Q1
2018
-19
Q2
2018
-19
Q3
58.0
60.0
62.0
64.0
66.0
68.0
70.0
72.0
74.0
76.0
100
105
110
115
120
125
Apr
-14
Jul-1
4O
ct-1
4Ja
n-15
Apr
-15
Jul-1
5O
ct-1
5Ja
n-16
Apr
-16
Jul-1
6O
ct-1
6Ja
n-17
Apr
-17
Jul-1
7O
ct-1
7Ja
n-18
Apr
-18
Jul-1
8O
ct-1
8Ja
n-19
Apr
-19
REER Rs. per US$ (Right scale)
Figure 13: Foreign Exchange Reserve (US$ billion)
Figure 14: Net FDI inflows (US$ billion)
300
320
340
360
380
400
420
440
Apr
-14
Jul-1
4O
ct-1
4Ja
n-15
Apr
-15
Jul-1
5O
ct-1
5Ja
n-16
Apr
-16
Jul-1
6O
ct-1
6Ja
n-17
Apr
-17
Jul-1
7O
ct-1
7Ja
n-18
Apr
-18
Jul-1
8O
ct-1
8Ja
n-19
Apr
-19
0.0
2.0
4.0
6.0
8.0
10.0
12.0
14.0
16.0
18.0
2012
-13
Q1
2012
-13
Q3
2013
-14
Q1
2013
-14
Q3
2014
-15
Q1
2014
-15
Q3
2015
-16
Q1
2015
-16
Q3
2016
-17
Q1
2016
-17
Q3
2017
-18
Q1
2017
-18
Q3
2018
-19
Q1
2018
-19
Q3
Average quarterly inflow
Quarterly inflow
Data source: Reserve Bank of India (from figure 11 to 14)Note: FDI inflow for the fourth quarter of 2018-19 (in Figure 14) is calculated on the basis of information published in the RBI Bulletin – May 2019.
due to RBI’s intervention to modulate exchange rate volatility. India’s foreign exchange reserves continue to be comfortably placed at US$ 422.2 billion, as on 14th June 2019 (Figure 13).
1.17 Net Foreign Direct Investment (FDI) inflows grew by 14.2 per cent in 2018-19. Among the top sectors attracting FDI equity inflows, services, automobiles and chemicals were the major categories. By and large, FDI inflows have been growing at a high rate since 2015-16 (Figure 14). This pick-up indicates the improvement in confidence of the foreign investors in the Indian economy.
9State of the Economy in 2018-19: A Macro View
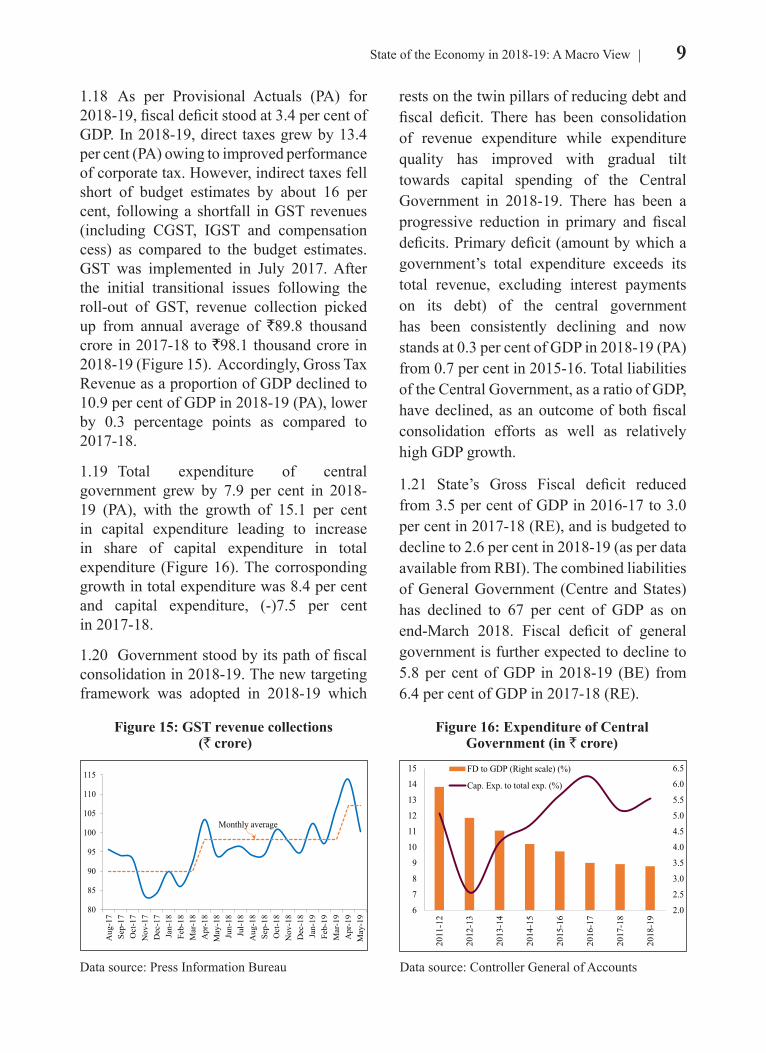
1.18 As per Provisional Actuals (PA) for 2018-19, fiscal deficit stood at 3.4 per cent of GDP. In 2018-19, direct taxes grew by 13.4 per cent (PA) owing to improved performance of corporate tax. However, indirect taxes fell short of budget estimates by about 16 per cent, following a shortfall in GST revenues (including CGST, IGST and compensation cess) as compared to the budget estimates. GST was implemented in July 2017. After the initial transitional issues following the roll-out of GST, revenue collection picked up from annual average of `89.8 thousand crore in 2017-18 to `98.1 thousand crore in 2018-19 (Figure 15). Accordingly, Gross Tax Revenue as a proportion of GDP declined to 10.9 per cent of GDP in 2018-19 (PA), lower by 0.3 percentage points as compared to 2017-18.
1.19 Total expenditure of central government grew by 7.9 per cent in 2018-19 (PA), with the growth of 15.1 per cent in capital expenditure leading to increase in share of capital expenditure in total expenditure (Figure 16). The corrosponding growth in total expenditure was 8.4 per cent and capital expenditure, (-)7.5 per cent in 2017-18.
1.20 Government stood by its path of fiscal consolidation in 2018-19. The new targeting framework was adopted in 2018-19 which
rests on the twin pillars of reducing debt and fiscal deficit. There has been consolidation of revenue expenditure while expenditure quality has improved with gradual tilt towards capital spending of the Central Government in 2018-19. There has been a progressive reduction in primary and fiscal deficits. Primary deficit (amount by which a government’s total expenditure exceeds its total revenue, excluding interest payments on its debt) of the central government has been consistently declining and now stands at 0.3 per cent of GDP in 2018-19 (PA) from 0.7 per cent in 2015-16. Total liabilities of the Central Government, as a ratio of GDP, have declined, as an outcome of both fiscal consolidation efforts as well as relatively high GDP growth.
1.21 State’s Gross Fiscal deficit reduced from 3.5 per cent of GDP in 2016-17 to 3.0 per cent in 2017-18 (RE), and is budgeted to decline to 2.6 per cent in 2018-19 (as per data available from RBI). The combined liabilities of General Government (Centre and States) has declined to 67 per cent of GDP as on end-March 2018. Fiscal deficit of general government is further expected to decline to 5.8 per cent of GDP in 2018-19 (BE) from 6.4 per cent of GDP in 2017-18 (RE).
Figure 15: GST revenue collections (` crore)
Figure 16: Expenditure of Central Government (in ` crore)
80
85
90
95
100
105
110
115
Aug
-17
Sep-
17O
ct-1
7N
ov-1
7D
ec-1
7Ja
n-18
Feb-
18M
ar-1
8A
pr-1
8M
ay-1
8Ju
n-18
Jul-1
8A
ug-1
8Se
p-18
Oct
-18
Nov
-18
Dec
-18
Jan-
19Fe
b-19
Mar
-19
Apr
-19
May
-19
Monthly average
2.0
2.5
3.0
3.5
4.0
4.5
5.0
5.5
6.0
6.5
6
7
8
9
10
11
12
13
14
15
2011
-12
2012
-13
2013
-14
2014
-15
2015
-16
2016
-17
2017
-18
2018
-19
FD to GDP (Right scale) (%)
Cap. Exp. to total exp. (%)
Data source: Press Information Bureau Data source: Controller General of Accounts

10 Economic Survey 2018-19 Volume 2
sector (domestic operations), and PSBs in particular, improved in 2018-19. NPAs as a percentage of Gross Advances of Scheduled Commercial Banks (SCBs) decreased from 11.5 per cent to 10.1 per cent between March 2018 and December 2018 (Figure 17). The decline was sharper for PSBs from 15.5 per cent to 13.9 per cent during the same period.
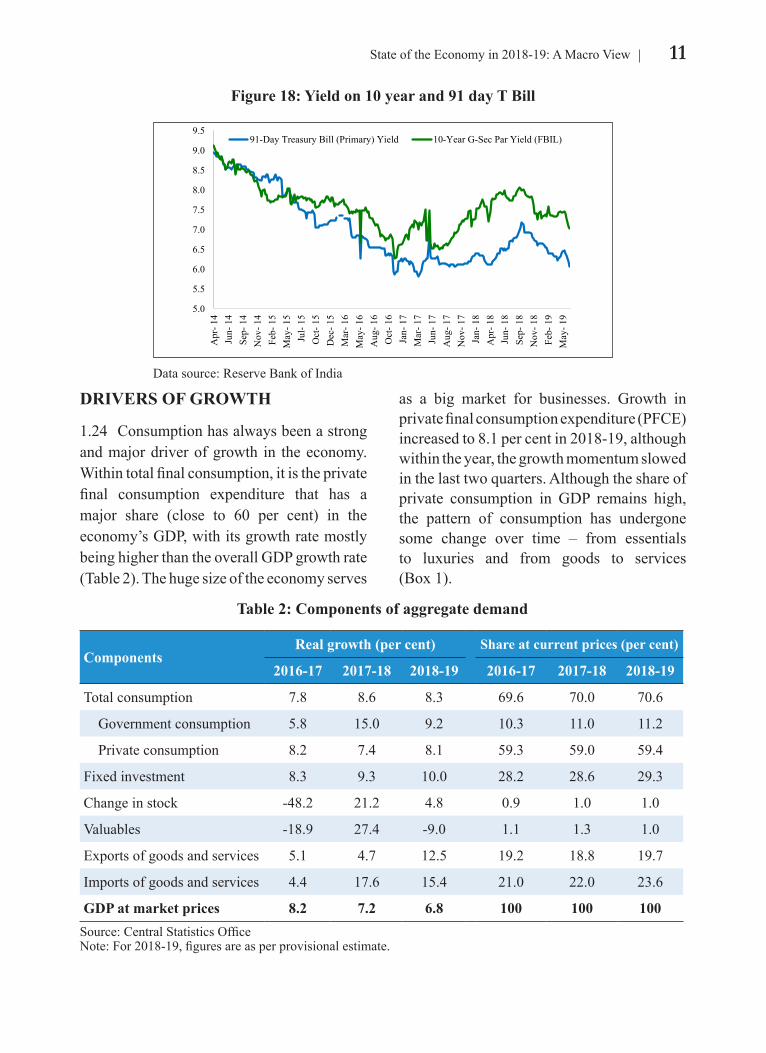
1.23 During 2018-19, the 10-year benchmark Government Security (G-Sec) yields was volatile (Figure 18) and closely tracked the movement in oil prices, domestic liquidity and rupee exchange rate. It hardened in the first quarter but witnessed intermittent softening in the second and third quarters. The hardening of yields in the first quarter may be attributed to rising crude oil prices, the firming up of US treasury yields, concerns regarding the pace of rate hikes by the US Fed, and upside risks to domestic inflation. Later, with the decline in crude oil prices in July 2018, and with the announcement of Open Market Operations (OMO) purchases, the yields softened in July. However, the currency depreciation in August 2018 due to rising crude oil prices and rising US interest rates, caused the yields
1.22 Indian banking sector has been dealing with twin balance sheet problem, which refers to stressed corporate and bank balance sheets. The increase in Non-Performing Assets (NPA) of banks led to stress on balance sheets of banks, with the Public Sector Banks (PSBs) taking in more stress. However, the performance of the banking
Figure 17: Non performing assets as a percentage of Gross Advances
0
2
4
6
8
10
12
2010
-11
2011
-12
2012
-13
2013
-14
2014
-15
2015
-16
2016
-17
2017
-18
2018
-19
Data source: Reserve Bank of India
to harden in August again which continued into September as well, increasing the yields from end-July to mid-September, by 40 bps. Yields started softening towards the end of September reflecting the measures taken for containing rupee volatility along with expectations of lower market borrowings by the central government in H2 of 2018-19. In the third quarter of 2018-19, the OMO purchase of `1.36 lakh crore along with the decline in crude oil prices and CPI inflation rate, caused the yields to soften once again. Consequent upon the policy rate cut announced by the Monetary Policy Committee in February, April and June 2019, the yields have further softened. The 10-year G-Sec yield dropped to 6.97 per cent as on 10 June 2019.
11State of the Economy in 2018-19: A Macro View
Figure 18: Yield on 10 year and 91 day T Bill
5.0
5.5
6.0
6.5
7.0
7.5
8.0
8.5
9.0
9.5
Apr
- 14
Jun-
14
Sep-
14
Nov
- 14
Feb-
15
May
- 15
Jul-
15O
ct- 1
5D
ec- 1
5M
ar- 1
6M
ay- 1
6A
ug- 1
6O
ct- 1
6Ja
n- 1
7M
ar- 1
7Ju
n- 1
7A
ug- 1
7N
ov- 1
7Ja
n- 1
8A
pr- 1
8Ju
n- 1
8Se
p- 1
8N
ov- 1
8Fe
b- 1
9M
ay- 1
9
91-Day Treasury Bill (Primary) Yield 10-Year G-Sec Par Yield (FBIL)
Data source: Reserve Bank of India
DRIVERS OF GROWTH
1.24 Consumption has always been a strong and major driver of growth in the economy. Within total final consumption, it is the private final consumption expenditure that has a major share (close to 60 per cent) in the economy’s GDP, with its growth rate mostly being higher than the overall GDP growth rate (Table 2). The huge size of the economy serves
as a big market for businesses. Growth in private final consumption expenditure (PFCE) increased to 8.1 per cent in 2018-19, although within the year, the growth momentum slowed in the last two quarters. Although the share of private consumption in GDP remains high, the pattern of consumption has undergone some change over time – from essentials to luxuries and from goods to services (Box 1).
Table 2: Components of aggregate demand
ComponentsReal growth (per cent) Share at current prices (per cent)
2016-17 2017-18 2018-19 2016-17 2017-18 2018-19
Total consumption 7.8 8.6 8.3 69.6 70.0 70.6
Government consumption 5.8 15.0 9.2 10.3 11.0 11.2
Private consumption 8.2 7.4 8.1 59.3 59.0 59.4
Fixed investment 8.3 9.3 10.0 28.2 28.6 29.3
Change in stock -48.2 21.2 4.8 0.9 1.0 1.0
Valuables -18.9 27.4 -9.0 1.1 1.3 1.0
Exports of goods and services 5.1 4.7 12.5 19.2 18.8 19.7
Imports of goods and services 4.4 17.6 15.4 21.0 22.0 23.6
GDP at market prices 8.2 7.2 6.8 100 100 100Source: Central Statistics OfficeNote: For 2018-19, figures are as per provisional estimate.
12 Economic Survey 2018-19 Volume 2
Box 1: India’s high income elasticity of consumption and its changing pattern over time
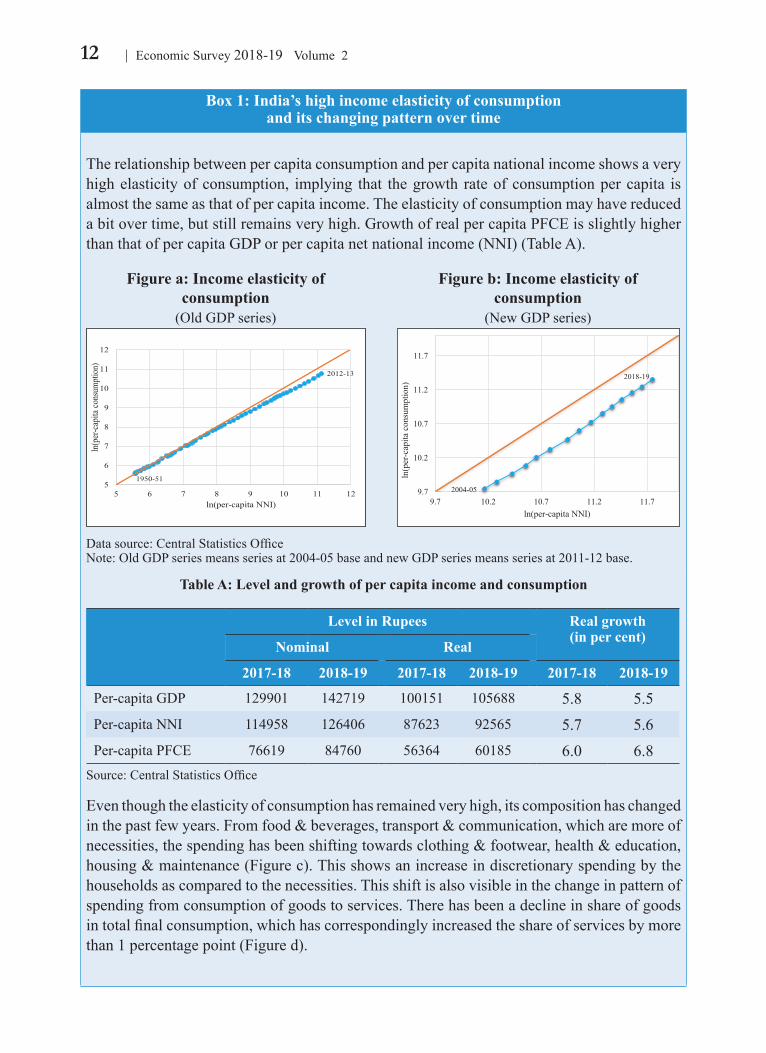
The relationship between per capita consumption and per capita national income shows a very high elasticity of consumption, implying that the growth rate of consumption per capita is almost the same as that of per capita income. The elasticity of consumption may have reduced a bit over time, but still remains very high. Growth of real per capita PFCE is slightly higher than that of per capita GDP or per capita net national income (NNI) (Table A).
Figure a: Income elasticity of consumption
(Old GDP series)
Figure b: Income elasticity of consumption
(New GDP series)
5
6
7
8
9
10
11
12
5 6 7 8 9 10 11 12
ln(p
er-c
apita
cons
umpt
ion)
ln(per-capita NNI)
1950-51
2012-13
9.7
10.2
10.7
11.2
11.7
9.7 10.2 10.7 11.2 11.7
ln(p
er-c
apita
con
sum
ptio
n)
ln(per-capita NNI)
2004-05
2018-19
Data source: Central Statistics OfficeNote: Old GDP series means series at 2004-05 base and new GDP series means series at 2011-12 base.
Table A: Level and growth of per capita income and consumption
Level in Rupees Real growth (in per cent)
Nominal Real
2017-18 2018-19 2017-18 2018-19 2017-18 2018-19
Per-capita GDP 129901 142719 100151 105688 5.8 5.5Per-capita NNI 114958 126406 87623 92565 5.7 5.6Per-capita PFCE 76619 84760 56364 60185 6.0 6.8
Source: Central Statistics Office
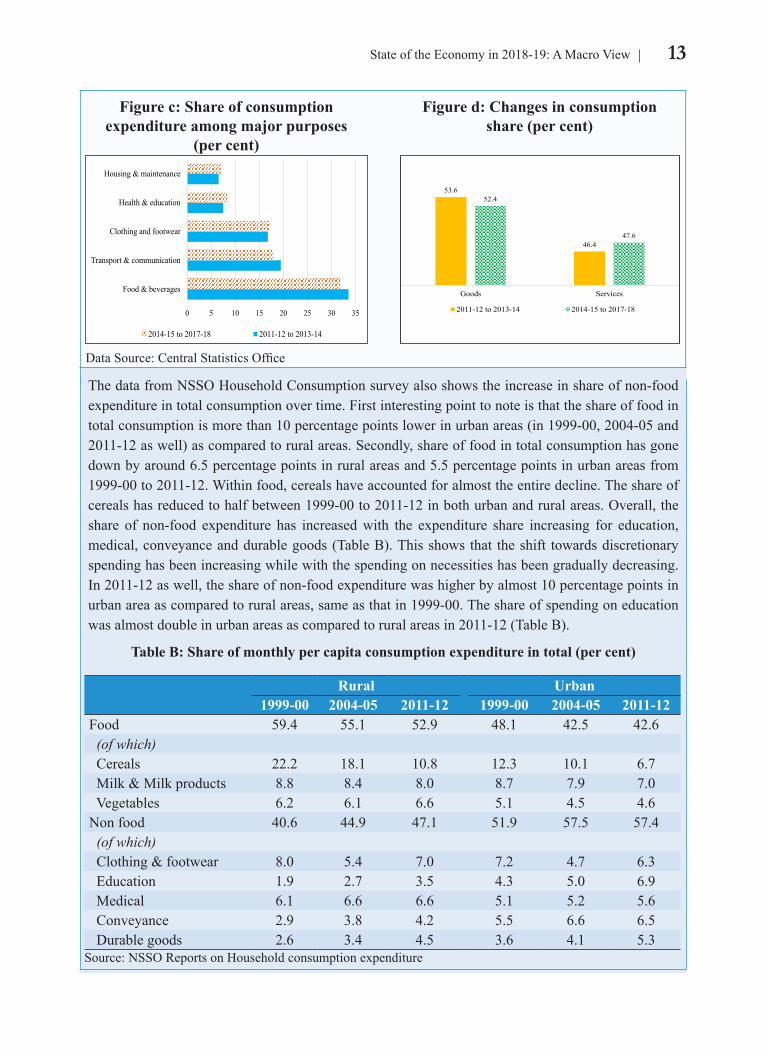
Even though the elasticity of consumption has remained very high, its composition has changed in the past few years. From food & beverages, transport & communication, which are more of necessities, the spending has been shifting towards clothing & footwear, health & education, housing & maintenance (Figure c). This shows an increase in discretionary spending by the households as compared to the necessities. This shift is also visible in the change in pattern of spending from consumption of goods to services. There has been a decline in share of goods in total final consumption, which has correspondingly increased the share of services by more than 1 percentage point (Figure d).
13State of the Economy in 2018-19: A Macro View
Figure c: Share of consumption expenditure among major purposes
(per cent)
Figure d: Changes in consumption share (per cent)
0 5 10 15 20 25 30 35
Food & beverages
Transport & communication
Clothing and footwear
Health & education
Housing & maintenance
2014-15 to 2017-18 2011-12 to 2013-14
53.6
46.4
52.4
47.6
Goods Services
2011-12 to 2013-14 2014-15 to 2017-18
Data Source: Central Statistics Office
The data from NSSO Household Consumption survey also shows the increase in share of non-food expenditure in total consumption over time. First interesting point to note is that the share of food in total consumption is more than 10 percentage points lower in urban areas (in 1999-00, 2004-05 and 2011-12 as well) as compared to rural areas. Secondly, share of food in total consumption has gone down by around 6.5 percentage points in rural areas and 5.5 percentage points in urban areas from 1999-00 to 2011-12. Within food, cereals have accounted for almost the entire decline. The share of cereals has reduced to half between 1999-00 to 2011-12 in both urban and rural areas. Overall, the share of non-food expenditure has increased with the expenditure share increasing for education, medical, conveyance and durable goods (Table B). This shows that the shift towards discretionary spending has been increasing while with the spending on necessities has been gradually decreasing. In 2011-12 as well, the share of non-food expenditure was higher by almost 10 percentage points in urban area as compared to rural areas, same as that in 1999-00. The share of spending on education was almost double in urban areas as compared to rural areas in 2011-12 (Table B).
Table B: Share of monthly per capita consumption expenditure in total (per cent)
Rural Urban1999-00 2004-05 2011-12 1999-00 2004-05 2011-12
Food 59.4 55.1 52.9 48.1 42.5 42.6 (of which) Cereals 22.2 18.1 10.8 12.3 10.1 6.7 Milk & Milk products 8.8 8.4 8.0 8.7 7.9 7.0 Vegetables 6.2 6.1 6.6 5.1 4.5 4.6Non food 40.6 44.9 47.1 51.9 57.5 57.4 (of which) Clothing & footwear 8.0 5.4 7.0 7.2 4.7 6.3 Education 1.9 2.7 3.5 4.3 5.0 6.9 Medical 6.1 6.6 6.6 5.1 5.2 5.6 Conveyance 2.9 3.8 4.2 5.5 6.6 6.5 Durable goods 2.6 3.4 4.5 3.6 4.1 5.3
Source: NSSO Reports on Household consumption expenditure
14 Economic Survey 2018-19 Volume 2
1.25 The second component of consumption is the government final consumption expenditure (GFCE). Growth of GFCE decelerated from 15.0 per cent in 2017-18 to 9.2 per cent in 2018-19. GFCE is calculated using growth of revenue expenditure net of interest payments and subsidies. GFCE comprises government’s (revenue) expenditure on compensation of employees, net purchase of goods and services and consumption of fixed capital. This lower growth in GFCE is consistent with lower revenue expenditure growth of the government in 2018-19. On average, annual growth of GFCE in the last 5 years has been 9.0 per cent.
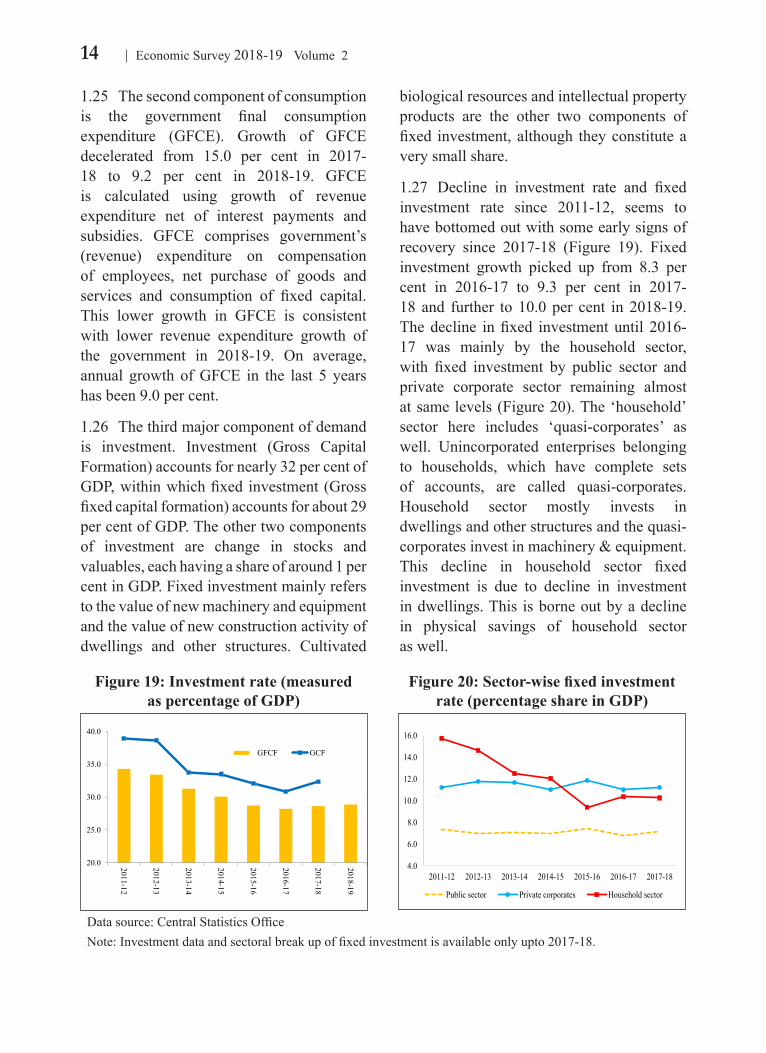
1.26 The third major component of demand is investment. Investment (Gross Capital Formation) accounts for nearly 32 per cent of GDP, within which fixed investment (Gross fixed capital formation) accounts for about 29 per cent of GDP. The other two components of investment are change in stocks and valuables, each having a share of around 1 per cent in GDP. Fixed investment mainly refers to the value of new machinery and equipment and the value of new construction activity of dwellings and other structures. Cultivated
biological resources and intellectual property products are the other two components of fixed investment, although they constitute a very small share.
1.27 Decline in investment rate and fixed investment rate since 2011-12, seems to have bottomed out with some early signs of recovery since 2017-18 (Figure 19). Fixed investment growth picked up from 8.3 per cent in 2016-17 to 9.3 per cent in 2017-18 and further to 10.0 per cent in 2018-19. The decline in fixed investment until 2016-17 was mainly by the household sector, with fixed investment by public sector and private corporate sector remaining almost at same levels (Figure 20). The ‘household’ sector here includes ‘quasi-corporates’ as well. Unincorporated enterprises belonging to households, which have complete sets of accounts, are called quasi-corporates. Household sector mostly invests in dwellings and other structures and the quasi-corporates invest in machinery & equipment. This decline in household sector fixed investment is due to decline in investment in dwellings. This is borne out by a decline in physical savings of household sector as well.
Figure 19: Investment rate (measured as percentage of GDP)
Figure 20: Sector-wise fixed investment rate (percentage share in GDP)
20.0
25.0
30.0
35.0
40.0
2011-12
2012-13
2013-14
2014-15
2015-16
2016-17
2017-18
2018-19
GFCF GCF
4.0
6.0
8.0
10.0
12.0
14.0
16.0
2011-12 2012-13 2013-14 2014-15 2015-16 2016-17 2017-18
Public sector Private corporates Household sector
Data source: Central Statistics Office Note: Investment data and sectoral break up of fixed investment is available only upto 2017-18.
15State of the Economy in 2018-19: A Macro View
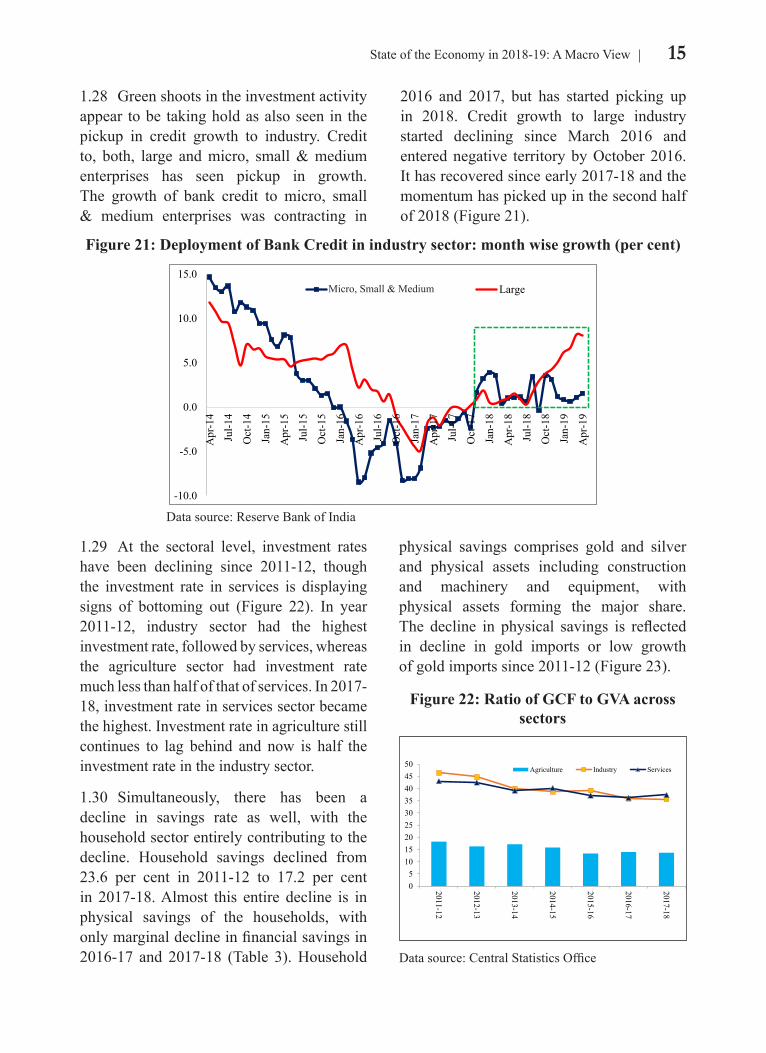
1.28 Green shoots in the investment activity appear to be taking hold as also seen in the pickup in credit growth to industry. Credit to, both, large and micro, small & medium enterprises has seen pickup in growth. The growth of bank credit to micro, small & medium enterprises was contracting in
2016 and 2017, but has started picking up in 2018. Credit growth to large industry started declining since March 2016 and entered negative territory by October 2016. It has recovered since early 2017-18 and the momentum has picked up in the second half of 2018 (Figure 21).
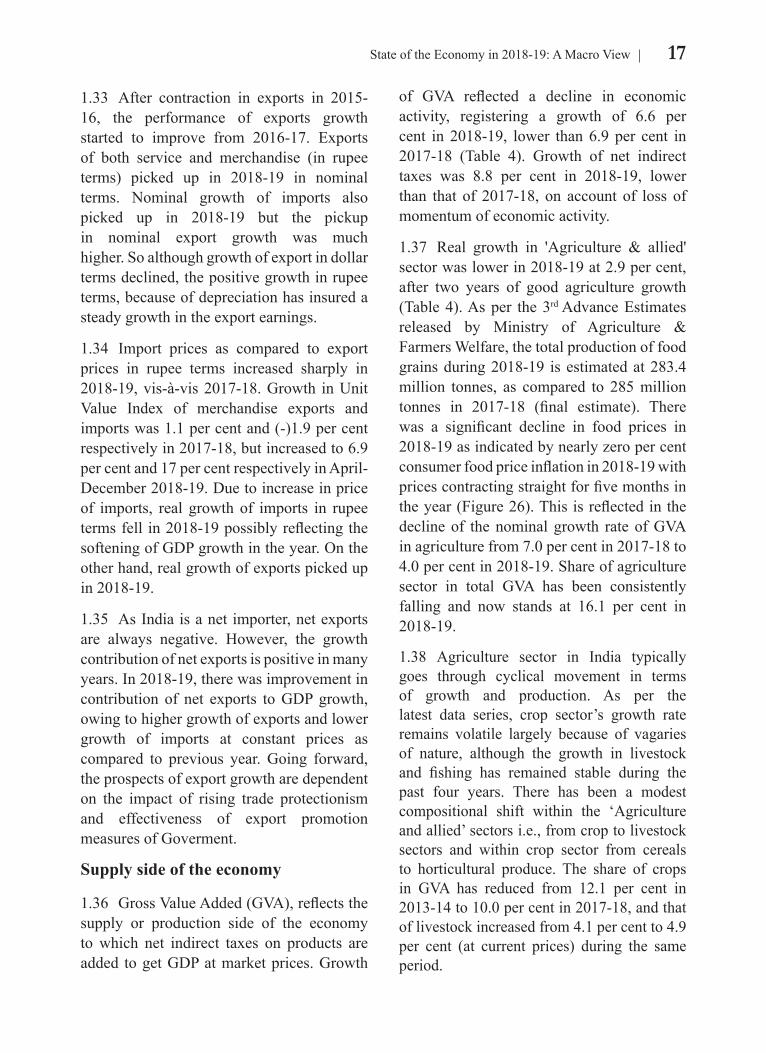
1.29 At the sectoral level, investment rates have been declining since 2011-12, though the investment rate in services is displaying signs of bottoming out (Figure 22). In year 2011-12, industry sector had the highest investment rate, followed by services, whereas the agriculture sector had investment rate much less than half of that of services. In 2017-18, investment rate in services sector became the highest. Investment rate in agriculture still continues to lag behind and now is half the investment rate in the industry sector.
1.30 Simultaneously, there has been a decline in savings rate as well, with the household sector entirely contributing to the decline. Household savings declined from 23.6 per cent in 2011-12 to 17.2 per cent in 2017-18. Almost this entire decline is in physical savings of the households, with only marginal decline in financial savings in 2016-17 and 2017-18 (Table 3). Household
physical savings comprises gold and silver and physical assets including construction and machinery and equipment, with physical assets forming the major share. The decline in physical savings is reflected in decline in gold imports or low growth of gold imports since 2011-12 (Figure 23).
Figure 21: Deployment of Bank Credit in industry sector: month wise growth (per cent)
-10.0
-5.0
0.0
5.0
10.0
15.0
Apr
-14
Jul-1
4
Oct
-14
Jan-
15
Apr
-15
Jul-1
5
Oct
-15
Jan-
16
Apr
-16
Jul-1
6
Oct
-16
Jan-
17
Apr
-17
Jul-1
7
Oct
-17
Jan-
18
Apr
-18
Jul-1
8
Oct
-18
Jan-
19
Apr
-19
Medium, Micro & Small Large
Data source: Reserve Bank of India
Micro, Small & Medium
Figure 22: Ratio of GCF to GVA across sectors
05
101520253035404550
2011-12
2012-13
2013-14
2014-15
2015-16
2016-17
2017-18
Agriculture Industry Services
Data source: Central Statistics Office

16 Economic Survey 2018-19 Volume 2
1.31 As the saving rate has declined, so has the investment rate. However, the decline in investment rate has been greater than the decline in the saving rate leading to continuous narrowing of the saving-investment gap. The saving investment gap narrowed from (-)4.8 per cent of GDP in 2012-13 to (-)1.8 per cent in 2017-18. This is also reflected in the narrowing
of current account deficit to GDP ratio.
1.32 The fourth component of demand is net exports. Exports are the external component of demand of domestic goods, and imports are a leakage of income of the country for demand of products from other countries. The contribution of exports and imports to GDP would matter in rupee terms for national accounting purposes rather than US dollar. Hence, the discussion in this section is based on growth in rupee terms. Interestingly, the trend of growth of exports and imports was different in 2018-19 in rupee and US dollar terms (Figure 24 & 25). While the growth of both export and import declined in US$ terms, it increased in rupee terms (at current prices) in 2018-19.This happened due to the depreciation of rupee vis-à-vis US dollar in 2018-19 (Figure 12).
Table 3: Gross Savings as percentage of GDP
2011-12 2014-15 2015-16 2016-17 2017-18Gross Savings 34.6 32.2 31.1 30.3 30.5Public 1.5 1.0 1.2 1.7 1.7Private corporates 9.5 11.7 11.9 11.5 11.6Household sector 23.6 19.6 18.0 17.1 17.2 Net financial savings 7.4 7.1 8.1 6.3 6.6 Physical savings 16.3 12.5 9.9 10.8 10.6
Source: Central Statistics Office
Figure 23: Gold imports (in US$ billion)
10.0
20.0
30.0
40.0
50.0
60.0
2007
-08
2008
-09
2009
-10
2010
-11
2011
-12
2012
-13
2013
-14
2014
-15
2015
-16
2016
-17
2017
-18
2018
-19
Data source: Directorate General of Commercial Intelligence and Statistics, Kolkata
Figure 24: Nominal Growth in exports and imports in USD terms (per cent)
Figure 25: Nominal Growth in exports and imports in Rupee terms (per cent)
-15.0
-10.0
-5.0
0.0
5.0
10.0
15.0
20.0
25.0
2011
-12
2012
-13
2013
-14
2014
-15
2015
-16
2016
-17
2017
-18
2018
-19
Exports Imports
-10.0
-5.0
0.0
5.0
10.0
15.0
20.0
25.0
30.0
35.0
2011
-12
2012
-13
2013
-14
2014
-15
2015
-16
2016
-17
2017
-18
2018
-19
Exports Imports
Data source: Reserve Bank of India Data source: Central Statistics Office
17State of the Economy in 2018-19: A Macro View
1.33 After contraction in exports in 2015-16, the performance of exports growth started to improve from 2016-17. Exports of both service and merchandise (in rupee terms) picked up in 2018-19 in nominal terms. Nominal growth of imports also picked up in 2018-19 but the pickup in nominal export growth was much higher. So although growth of export in dollar terms declined, the positive growth in rupee terms, because of depreciation has insured a steady growth in the export earnings.
1.34 Import prices as compared to export prices in rupee terms increased sharply in 2018-19, vis-à-vis 2017-18. Growth in Unit Value Index of merchandise exports and imports was 1.1 per cent and (-)1.9 per cent respectively in 2017-18, but increased to 6.9 per cent and 17 per cent respectively in April-December 2018-19. Due to increase in price of imports, real growth of imports in rupee terms fell in 2018-19 possibly reflecting the softening of GDP growth in the year. On the other hand, real growth of exports picked up in 2018-19.
1.35 As India is a net importer, net exports are always negative. However, the growth contribution of net exports is positive in many years. In 2018-19, there was improvement in contribution of net exports to GDP growth, owing to higher growth of exports and lower growth of imports at constant prices as compared to previous year. Going forward, the prospects of export growth are dependent on the impact of rising trade protectionism and effectiveness of export promotion measures of Goverment.
Supply side of the economy
1.36 Gross Value Added (GVA), reflects the supply or production side of the economy to which net indirect taxes on products are added to get GDP at market prices. Growth
of GVA reflected a decline in economic activity, registering a growth of 6.6 per cent in 2018-19, lower than 6.9 per cent in 2017-18 (Table 4). Growth of net indirect taxes was 8.8 per cent in 2018-19, lower than that of 2017-18, on account of loss of momentum of economic activity.
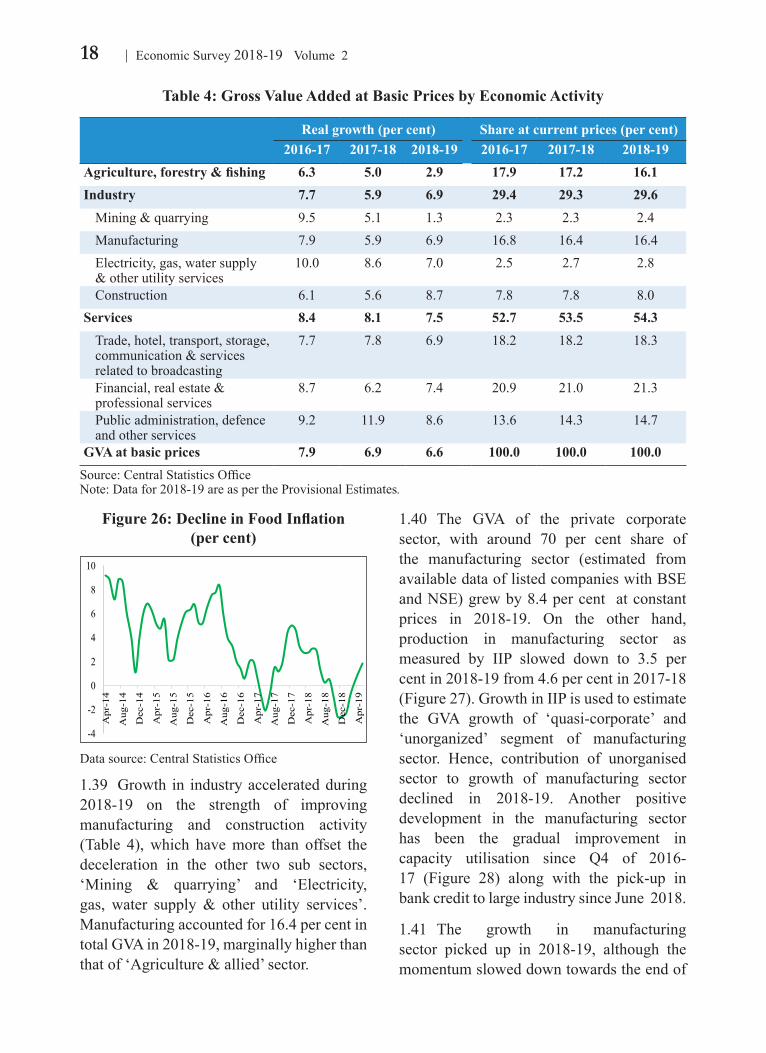
1.37 Real growth in 'Agriculture & allied' sector was lower in 2018-19 at 2.9 per cent, after two years of good agriculture growth (Table 4). As per the 3rd Advance Estimates released by Ministry of Agriculture & Farmers Welfare, the total production of food grains during 2018-19 is estimated at 283.4 million tonnes, as compared to 285 million tonnes in 2017-18 (final estimate). There was a significant decline in food prices in 2018-19 as indicated by nearly zero per cent consumer food price inflation in 2018-19 with prices contracting straight for five months in the year (Figure 26). This is reflected in the decline of the nominal growth rate of GVA in agriculture from 7.0 per cent in 2017-18 to 4.0 per cent in 2018-19. Share of agriculture sector in total GVA has been consistently falling and now stands at 16.1 per cent in 2018-19.
1.38 Agriculture sector in India typically goes through cyclical movement in terms of growth and production. As per the latest data series, crop sector’s growth rate remains volatile largely because of vagaries of nature, although the growth in livestock and fishing has remained stable during the past four years. There has been a modest compositional shift within the ‘Agriculture and allied’ sectors i.e., from crop to livestock sectors and within crop sector from cereals to horticultural produce. The share of crops in GVA has reduced from 12.1 per cent in 2013-14 to 10.0 per cent in 2017-18, and that of livestock increased from 4.1 per cent to 4.9 per cent (at current prices) during the same period.
18 Economic Survey 2018-19 Volume 2
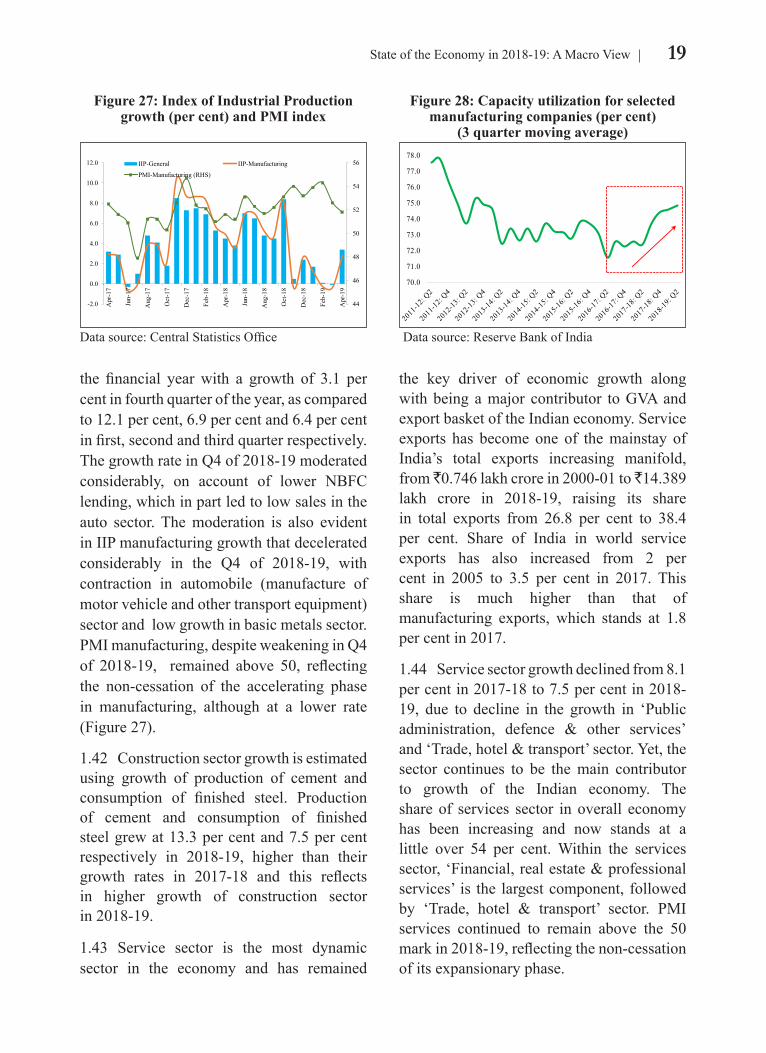
1.40 The GVA of the private corporate sector, with around 70 per cent share of the manufacturing sector (estimated from available data of listed companies with BSE and NSE) grew by 8.4 per cent at constant prices in 2018-19. On the other hand, production in manufacturing sector as measured by IIP slowed down to 3.5 per cent in 2018-19 from 4.6 per cent in 2017-18 (Figure 27). Growth in IIP is used to estimate the GVA growth of ‘quasi-corporate’ and ‘unorganized’ segment of manufacturing sector. Hence, contribution of unorganised sector to growth of manufacturing sector declined in 2018-19. Another positive development in the manufacturing sector has been the gradual improvement in capacity utilisation since Q4 of 2016-17 (Figure 28) along with the pick-up in bank credit to large industry since June 2018.
1.41 The growth in manufacturing sector picked up in 2018-19, although the momentum slowed down towards the end of
Table 4: Gross Value Added at Basic Prices by Economic Activity
Real growth (per cent) Share at current prices (per cent)2016-17 2017-18 2018-19 2016-17 2017-18 2018-19
Agriculture, forestry & fishing 6.3 5.0 2.9 17.9 17.2 16.1Industry 7.7 5.9 6.9 29.4 29.3 29.6
Mining & quarrying 9.5 5.1 1.3 2.3 2.3 2.4Manufacturing 7.9 5.9 6.9 16.8 16.4 16.4Electricity, gas, water supply & other utility services
10.0 8.6 7.0 2.5 2.7 2.8
Construction 6.1 5.6 8.7 7.8 7.8 8.0Services 8.4 8.1 7.5 52.7 53.5 54.3
Trade, hotel, transport, storage, communication & services related to broadcasting
7.7 7.8 6.9 18.2 18.2 18.3
Financial, real estate & professional services
8.7 6.2 7.4 20.9 21.0 21.3
Public administration, defence and other services
9.2 11.9 8.6 13.6 14.3 14.7
GVA at basic prices 7.9 6.9 6.6 100.0 100.0 100.0Source: Central Statistics OfficeNote: Data for 2018-19 are as per the Provisional Estimates.
1.39 Growth in industry accelerated during 2018-19 on the strength of improving manufacturing and construction activity (Table 4), which have more than offset the deceleration in the other two sub sectors, ‘Mining & quarrying’ and ‘Electricity, gas, water supply & other utility services’. Manufacturing accounted for 16.4 per cent in total GVA in 2018-19, marginally higher than that of ‘Agriculture & allied’ sector.
Figure 26: Decline in Food Inflation (per cent)
-4
-2
0
2
4
6
8
10
Apr
-14
Aug
-14
Dec
-14
Apr
-15
Aug
-15
Dec
-15
Apr
-16
Aug
-16
Dec
-16
Apr
-17
Aug
-17
Dec
-17
Apr
-18
Aug
-18
Dec
-18
Apr
-19
Data source: Central Statistics Office
19State of the Economy in 2018-19: A Macro View
the financial year with a growth of 3.1 per cent in fourth quarter of the year, as compared to 12.1 per cent, 6.9 per cent and 6.4 per cent in first, second and third quarter respectively. The growth rate in Q4 of 2018-19 moderated considerably, on account of lower NBFC lending, which in part led to low sales in the auto sector. The moderation is also evident in IIP manufacturing growth that decelerated considerably in the Q4 of 2018-19, with contraction in automobile (manufacture of motor vehicle and other transport equipment) sector and low growth in basic metals sector.PMI manufacturing, despite weakening in Q4 of 2018-19, remained above 50, reflecting the non-cessation of the accelerating phase in manufacturing, although at a lower rate (Figure 27).
1.42 Construction sector growth is estimated using growth of production of cement and consumption of finished steel. Production of cement and consumption of finished steel grew at 13.3 per cent and 7.5 per cent respectively in 2018-19, higher than their growth rates in 2017-18 and this reflects in higher growth of construction sector in 2018-19.
1.43 Service sector is the most dynamic sector in the economy and has remained
the key driver of economic growth along with being a major contributor to GVA and export basket of the Indian economy. Service exports has become one of the mainstay of India’s total exports increasing manifold, from ̀ 0.746 lakh crore in 2000-01 to ̀ 14.389 lakh crore in 2018-19, raising its share in total exports from 26.8 per cent to 38.4 per cent. Share of India in world service exports has also increased from 2 per cent in 2005 to 3.5 per cent in 2017. This share is much higher than that of manufacturing exports, which stands at 1.8 per cent in 2017.
1.44 Service sector growth declined from 8.1 per cent in 2017-18 to 7.5 per cent in 2018-19, due to decline in the growth in ‘Public administration, defence & other services’ and ‘Trade, hotel & transport’ sector. Yet, the sector continues to be the main contributor to growth of the Indian economy. The share of services sector in overall economy has been increasing and now stands at a little over 54 per cent. Within the services sector, ‘Financial, real estate & professional services’ is the largest component, followed by ‘Trade, hotel & transport’ sector. PMI services continued to remain above the 50 mark in 2018-19, reflecting the non-cessation of its expansionary phase.
Figure 27: Index of Industrial Production growth (per cent) and PMI index
Figure 28: Capacity utilization for selected manufacturing companies (per cent)
(3 quarter moving average)
44
46
48
50
52
54
56
-2.0
0.0
2.0
4.0
6.0
8.0
10.0
12.0
Apr
-17
Jun-
17
Aug
-17
Oct
-17
Dec
-17
Feb-
18
Apr
-18
Jun-
18
Aug
-18
Oct
-18
Dec
-18
Feb-
19
Apr
-19
IIP-General IIP-Manufacturing
PMI-Manufacturing (RHS)
70.0
71.0
72.0
73.0
74.0
75.0
76.0
77.0
78.0
Data source: Central Statistics Office Data source: Reserve Bank of India
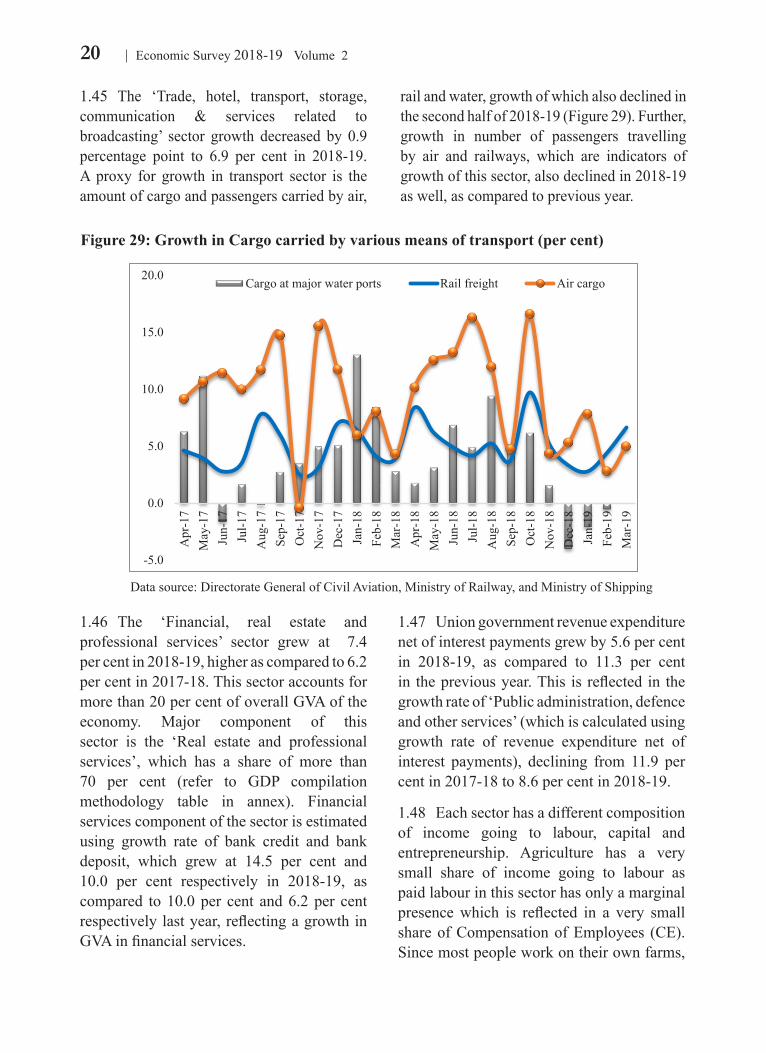
20 Economic Survey 2018-19 Volume 2
1.45 The ‘Trade, hotel, transport, storage, communication & services related to broadcasting’ sector growth decreased by 0.9 percentage point to 6.9 per cent in 2018-19. A proxy for growth in transport sector is the amount of cargo and passengers carried by air,
1.46 The ‘Financial, real estate and professional services’ sector grew at 7.4 per cent in 2018-19, higher as compared to 6.2 per cent in 2017-18. This sector accounts for more than 20 per cent of overall GVA of the economy. Major component of this sector is the ‘Real estate and professional services’, which has a share of more than 70 per cent (refer to GDP compilation methodology table in annex). Financial services component of the sector is estimated using growth rate of bank credit and bank deposit, which grew at 14.5 per cent and 10.0 per cent respectively in 2018-19, as compared to 10.0 per cent and 6.2 per cent respectively last year, reflecting a growth in GVA in financial services.
1.47 Union government revenue expenditure net of interest payments grew by 5.6 per cent in 2018-19, as compared to 11.3 per cent in the previous year. This is reflected in the growth rate of ‘Public administration, defence and other services’ (which is calculated using growth rate of revenue expenditure net of interest payments), declining from 11.9 per cent in 2017-18 to 8.6 per cent in 2018-19.
1.48 Each sector has a different composition of income going to labour, capital and entrepreneurship. Agriculture has a very small share of income going to labour as paid labour in this sector has only a marginal presence which is reflected in a very small share of Compensation of Employees (CE). Since most people work on their own farms,
rail and water, growth of which also declined in the second half of 2018-19 (Figure 29). Further, growth in number of passengers travelling by air and railways, which are indicators of growth of this sector, also declined in 2018-19 as well, as compared to previous year.
Figure 29: Growth in Cargo carried by various means of transport (per cent)
-5.0
0.0
5.0
10.0
15.0
20.0
Apr
-17
May
-17
Jun-
17Ju
l-17
Aug
-17
Sep-
17O
ct-1
7N
ov-1
7D
ec-1
7Ja
n-18
Feb-
18M
ar-1
8A
pr-1
8M
ay-1
8Ju
n-18
Jul-1
8A
ug-1
8Se
p-18
Oct
-18
Nov
-18
Dec
-18
Jan-
19Fe
b-19
Mar
-19
Cargo at major water ports Rail freight Air cargo
Data source: Directorate General of Civil Aviation, Ministry of Railway, and Ministry of Shipping
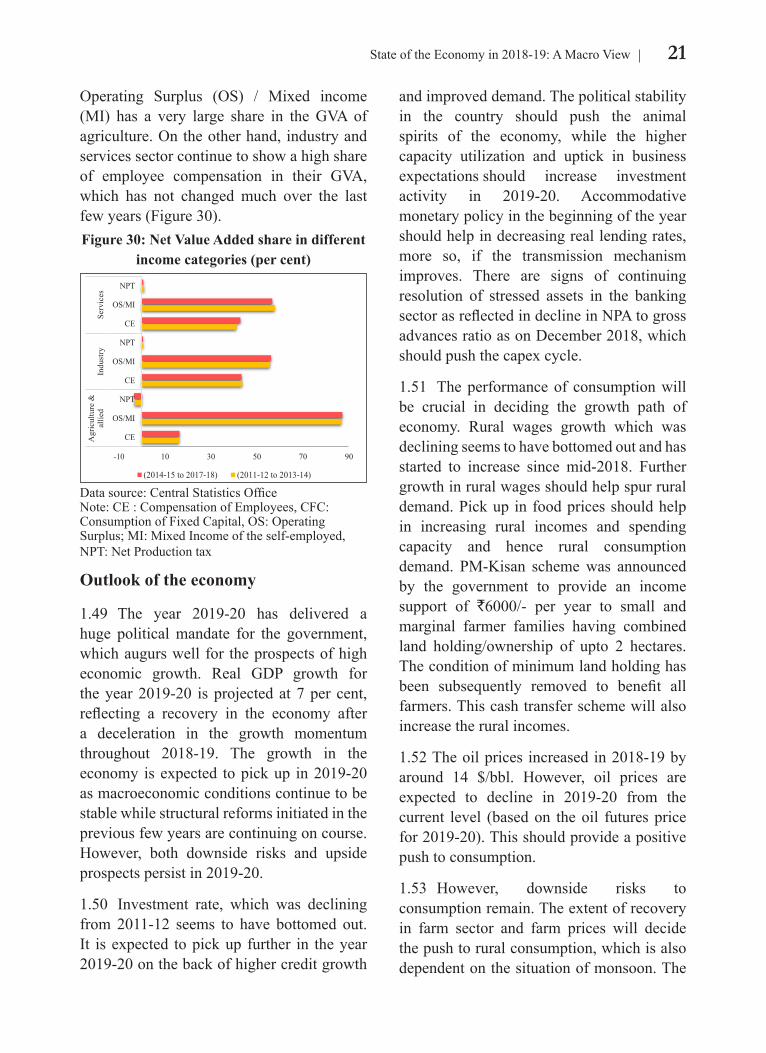
21State of the Economy in 2018-19: A Macro View
Operating Surplus (OS) / Mixed income (MI) has a very large share in the GVA of agriculture. On the other hand, industry and services sector continue to show a high share of employee compensation in their GVA, which has not changed much over the last few years (Figure 30).
and improved demand. The political stability in the country should push the animal spirits of the economy, while the higher capacity utilization and uptick in business expectations should increase investment activity in 2019-20. Accommodative monetary policy in the beginning of the year should help in decreasing real lending rates, more so, if the transmission mechanism improves. There are signs of continuing resolution of stressed assets in the banking sector as reflected in decline in NPA to gross advances ratio as on December 2018, which should push the capex cycle.
1.51 The performance of consumption will be crucial in deciding the growth path of economy. Rural wages growth which was declining seems to have bottomed out and has started to increase since mid-2018. Further growth in rural wages should help spur rural demand. Pick up in food prices should help in increasing rural incomes and spending capacity and hence rural consumption demand. PM-Kisan scheme was announced by the government to provide an income support of `6000/- per year to small and marginal farmer families having combined land holding/ownership of upto 2 hectares. The condition of minimum land holding has been subsequently removed to benefit all farmers. This cash transfer scheme will also increase the rural incomes.
1.52 The oil prices increased in 2018-19 by around 14 $/bbl. However, oil prices are expected to decline in 2019-20 from the current level (based on the oil futures price for 2019-20). This should provide a positive push to consumption.
1.53 However, downside risks to consumption remain. The extent of recovery in farm sector and farm prices will decide the push to rural consumption, which is also dependent on the situation of monsoon. The
Figure 30: Net Value Added share in different income categories (per cent)
-10 10 30 50 70 90
CE
OS/MI
NPT
CE
OS/MI
NPT
CE
OS/MI
NPT
Agr
icul
ture
&al
lied
Indu
stry
Serv
ices
(2014-15 to 2017-18) (2011-12 to 2013-14)
Data source: Central Statistics OfficeNote: CE : Compensation of Employees, CFC: Consumption of Fixed Capital, OS: Operating Surplus; MI: Mixed Income of the self-employed, NPT: Net Production tax
Outlook of the economy
1.49 The year 2019-20 has delivered a huge political mandate for the government, which augurs well for the prospects of high economic growth. Real GDP growth for the year 2019-20 is projected at 7 per cent, reflecting a recovery in the economy after a deceleration in the growth momentum throughout 2018-19. The growth in the economy is expected to pick up in 2019-20 as macroeconomic conditions continue to be stable while structural reforms initiated in the previous few years are continuing on course. However, both downside risks and upside prospects persist in 2019-20.
1.50 Investment rate, which was declining from 2011-12 seems to have bottomed out. It is expected to pick up further in the year 2019-20 on the back of higher credit growth
22 Economic Survey 2018-19 Volume 2
meteorological department has predicted that the rainfall over the country as a whole is likely to be near normal this year. This should lead to improvement in agriculture sector growth. However, according to IMD, some regions are expected to receive less than normal rains. This could prove to be detrimental for crop production in certain affected areas. If the impact of stress in the NBFC sector spills over to this year as well, it may lead to lower credit offtake from NBFCs, which may dampen growth in consumption spending.
1.54 Prospects of export growth remain weak for 2019-20 if status quo is maintained. However, reorientation of export policies to target countries/markets based on our own relative comparative advantage and the
importing country’s exposure to Indian goods can foster export performance. Under status quo, the outlook for the global economy is bleak in 2019, with most of the countries projected to slow down. The major threat facing the world economy is the increase in trade tensions between U.S. and China, which could lead to large disruptions in global value chains, outcome of Brexit and downside risk to China’s growth. The lower global growth and the increased uncertainty about trade tensions may negatively affect export demand, including that of India’s, which in turn will further lower GDP growth rates of several countries.
1.55 On balance, the prospects of the economy should improve with growth of the economy expected to be 7 per cent in 2019-20.
CHAPTER AT A GLANCE
Growth of GDP moderated to 6.8 per cent in 2018-19 from 7.2 per cent in 2017-18. However, India was still the fastest growing major economy.
This moderation in growth momentum is mainly on account of lower growth in ‘Agriculture & allied’, ‘Trade, hotel, transport, storage, communication and services related to broadcasting’ and ‘Public administration & defence’ sectors.
Growth in investment, which had slowed down for many years, has bottomed out and has started to recover since 2017-18. Growth in fixed investment picked up from 8.3 per cent in 2016-17 to 9.3 per cent in 2017-18 and further to 10.0 per cent in 2018-19.
India maintained its macroeconomic stability by containing inflation within 4 per cent and by maintaining a manageable current account deficit to GDP ratio.
Fiscal deficit of Central Government stood at a 3.4 per cent of GDP in 2018-19. Current account deficit was 2.6 per cent in April-December 2018.
Non-Performing Assets as percentage of Gross Advances reduced to 10.1 per cent at end December 2018 from 11.5 per cent at end March 2018.
Outlook of Indian economy appears bright with prospects of pickup in growth in 2019-20 on back of pick up in private investment and robust consumption growth.
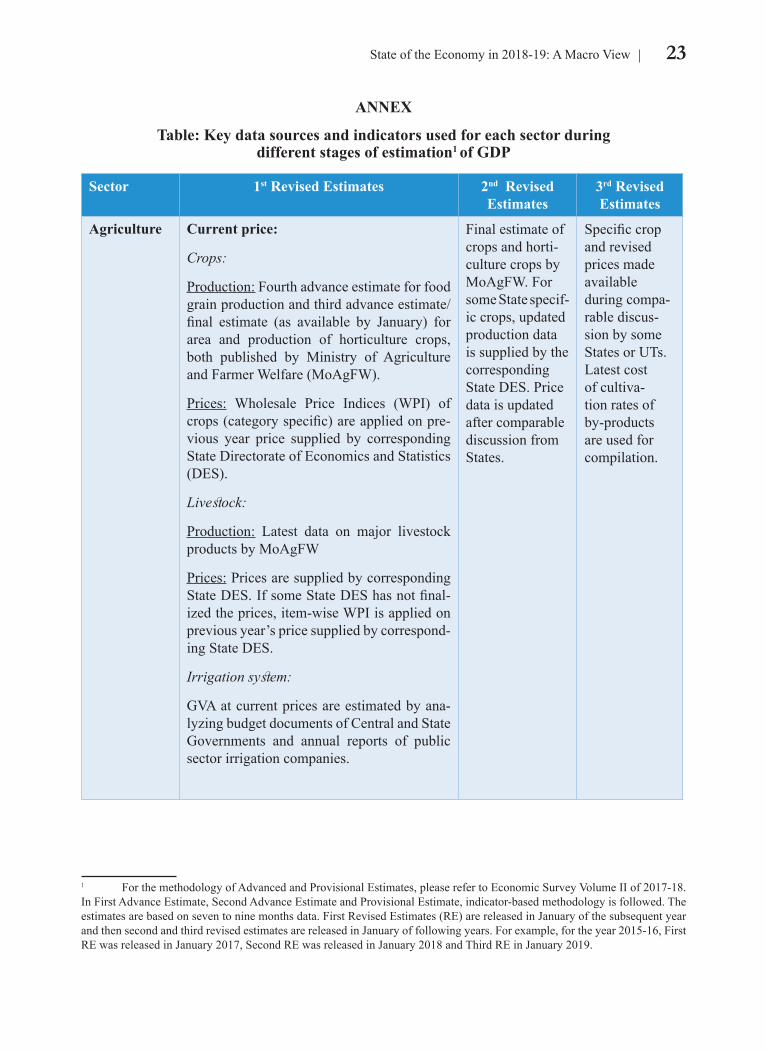
23State of the Economy in 2018-19: A Macro View
ANNEX
Table: Key data sources and indicators used for each sector during different stages of estimation1 of GDP
Sector 1st Revised Estimates 2nd Revised Estimates
3rd Revised Estimates
Agriculture Current price:
Crops:
Production: Fourth advance estimate for food grain production and third advance estimate/ final estimate (as available by January) for area and production of horticulture crops, both published by Ministry of Agriculture and Farmer Welfare (MoAgFW).
Prices: Wholesale Price Indices (WPI) of crops (category specific) are applied on pre-vious year price supplied by corresponding State Directorate of Economics and Statistics (DES).
Livestock:
Production: Latest data on major livestock products by MoAgFW
Prices: Prices are supplied by corresponding State DES. If some State DES has not final-ized the prices, item-wise WPI is applied on previous year’s price supplied by correspond-ing State DES.
Irrigation system:
GVA at current prices are estimated by ana-lyzing budget documents of Central and State Governments and annual reports of public sector irrigation companies.
Final estimate of crops and horti-culture crops by MoAgFW. For some State specif-ic crops, updated production data is supplied by the corresponding State DES. Price data is updated after comparable discussion from States.
Specific crop and revised prices made available during compa-rable discus-sion by some States or UTs. Latest cost of cultiva-tion rates of by-products are used for compilation.
1 For the methodology of Advanced and Provisional Estimates, please refer to Economic Survey Volume II of 2017-18. In First Advance Estimate, Second Advance Estimate and Provisional Estimate, indicator-based methodology is followed. The estimates are based on seven to nine months data. First Revised Estimates (RE) are released in January of the subsequent year and then second and third revised estimates are released in January of following years. For example, for the year 2015-16, First RE was released in January 2017, Second RE was released in January 2018 and Third RE in January 2019.
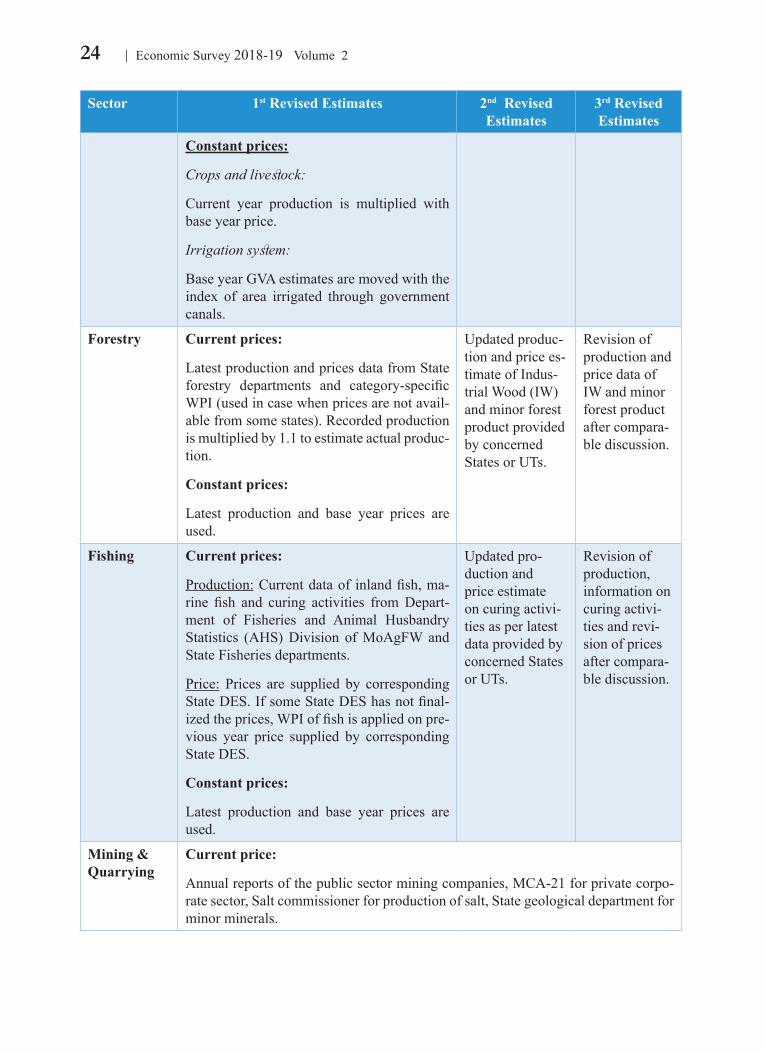
24 Economic Survey 2018-19 Volume 2
Sector 1st Revised Estimates 2nd Revised Estimates
3rd Revised Estimates
Constant prices:
Crops and livestock:
Current year production is multiplied with base year price.
Irrigation system:
Base year GVA estimates are moved with the index of area irrigated through government canals.
Forestry Current prices:
Latest production and prices data from State forestry departments and category-specific WPI (used in case when prices are not avail-able from some states). Recorded production is multiplied by 1.1 to estimate actual produc-tion.
Constant prices:
Latest production and base year prices are used.
Updated produc-tion and price es-timate of Indus-trial Wood (IW) and minor forest product provided by concerned States or UTs.
Revision of production and price data of IW and minor forest product after compara-ble discussion.
Fishing Current prices:
Production: Current data of inland fish, ma-rine fish and curing activities from Depart-ment of Fisheries and Animal Husbandry Statistics (AHS) Division of MoAgFW and State Fisheries departments.
Price: Prices are supplied by corresponding State DES. If some State DES has not final-ized the prices, WPI of fish is applied on pre-vious year price supplied by corresponding State DES.
Constant prices:
Latest production and base year prices are used.
Updated pro-duction and price estimate on curing activi-ties as per latest data provided by concerned States or UTs.
Revision of production, information on curing activi-ties and revi-sion of prices after compara-ble discussion.
Mining & Quarrying
Current price:
Annual reports of the public sector mining companies, MCA-21 for private corpo-rate sector, Salt commissioner for production of salt, State geological department for minor minerals.
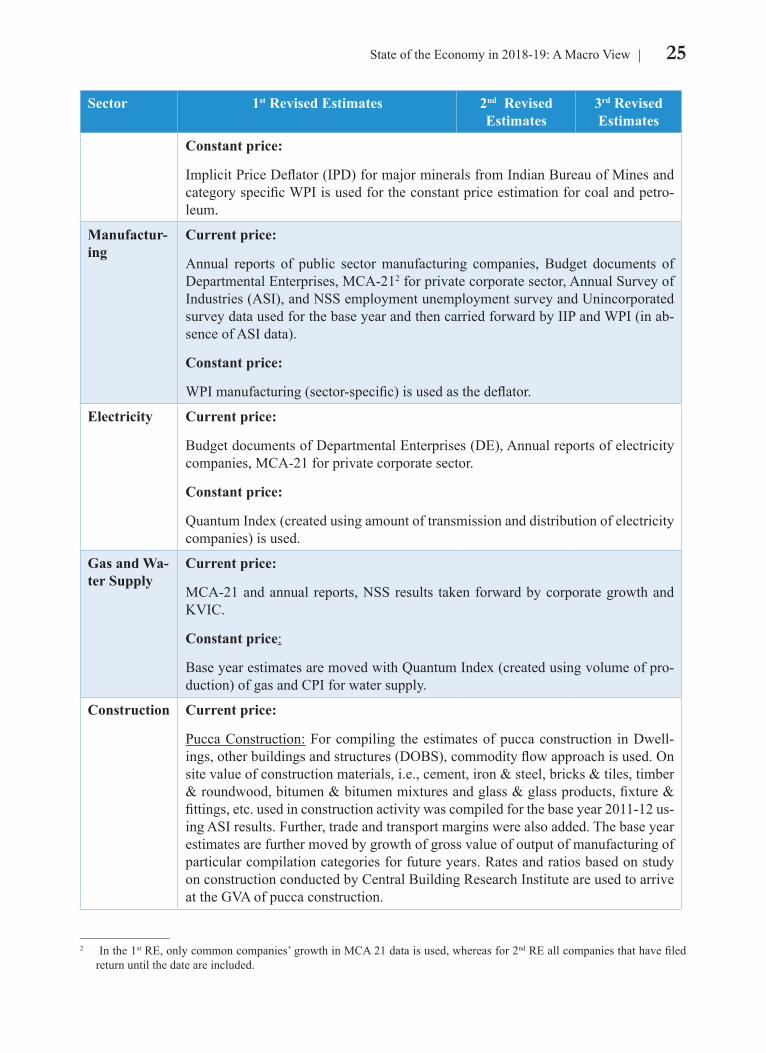
25State of the Economy in 2018-19: A Macro View
Sector 1st Revised Estimates 2nd Revised Estimates
3rd Revised Estimates
Constant price:
Implicit Price Deflator (IPD) for major minerals from Indian Bureau of Mines and category specific WPI is used for the constant price estimation for coal and petro-leum.
Manufactur-ing
Current price:
Annual reports of public sector manufacturing companies, Budget documents of Departmental Enterprises, MCA-212 for private corporate sector, Annual Survey of Industries (ASI), and NSS employment unemployment survey and Unincorporated survey data used for the base year and then carried forward by IIP and WPI (in ab-sence of ASI data).
Constant price:
WPI manufacturing (sector-specific) is used as the deflator.
Electricity Current price:
Budget documents of Departmental Enterprises (DE), Annual reports of electricity companies, MCA-21 for private corporate sector.
Constant price:
Quantum Index (created using amount of transmission and distribution of electricity companies) is used.
Gas and Wa-ter Supply
Current price:
MCA-21 and annual reports, NSS results taken forward by corporate growth and KVIC.
Constant price:
Base year estimates are moved with Quantum Index (created using volume of pro-duction) of gas and CPI for water supply.
Construction Current price:
Pucca Construction: For compiling the estimates of pucca construction in Dwell-ings, other buildings and structures (DOBS), commodity flow approach is used. On site value of construction materials, i.e., cement, iron & steel, bricks & tiles, timber & roundwood, bitumen & bitumen mixtures and glass & glass products, fixture & fittings, etc. used in construction activity was compiled for the base year 2011-12 us-ing ASI results. Further, trade and transport margins were also added. The base year estimates are further moved by growth of gross value of output of manufacturing of particular compilation categories for future years. Rates and ratios based on study on construction conducted by Central Building Research Institute are used to arrive at the GVA of pucca construction.
_______________2 In the 1st RE, only common companies’ growth in MCA 21 data is used, whereas for 2nd RE all companies that have filed
return until the date are included.
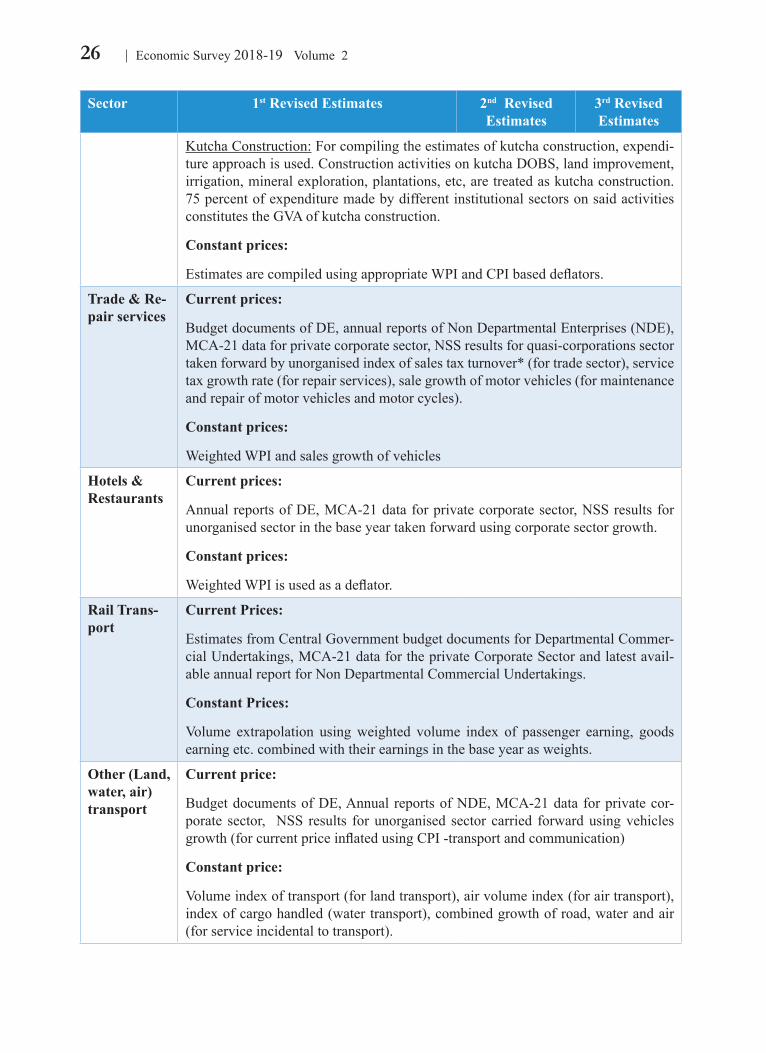
26 Economic Survey 2018-19 Volume 2
Sector 1st Revised Estimates 2nd Revised Estimates
3rd Revised Estimates
Kutcha Construction: For compiling the estimates of kutcha construction, expendi-ture approach is used. Construction activities on kutcha DOBS, land improvement, irrigation, mineral exploration, plantations, etc, are treated as kutcha construction. 75 percent of expenditure made by different institutional sectors on said activities constitutes the GVA of kutcha construction.
Constant prices:
Estimates are compiled using appropriate WPI and CPI based deflators.
Trade & Re-pair services
Current prices:
Budget documents of DE, annual reports of Non Departmental Enterprises (NDE), MCA-21 data for private corporate sector, NSS results for quasi-corporations sector taken forward by unorganised index of sales tax turnover* (for trade sector), service tax growth rate (for repair services), sale growth of motor vehicles (for maintenance and repair of motor vehicles and motor cycles).
Constant prices:
Weighted WPI and sales growth of vehicles
Hotels & Restaurants
Current prices:
Annual reports of DE, MCA-21 data for private corporate sector, NSS results for unorganised sector in the base year taken forward using corporate sector growth.
Constant prices:
Weighted WPI is used as a deflator.
Rail Trans-port
Current Prices:
Estimates from Central Government budget documents for Departmental Commer-cial Undertakings, MCA-21 data for the private Corporate Sector and latest avail-able annual report for Non Departmental Commercial Undertakings.
Constant Prices:
Volume extrapolation using weighted volume index of passenger earning, goods earning etc. combined with their earnings in the base year as weights.
Other (Land, water, air) transport
Current price:
Budget documents of DE, Annual reports of NDE, MCA-21 data for private cor-porate sector, NSS results for unorganised sector carried forward using vehicles growth (for current price inflated using CPI -transport and communication)
Constant price:
Volume index of transport (for land transport), air volume index (for air transport), index of cargo handled (water transport), combined growth of road, water and air (for service incidental to transport).
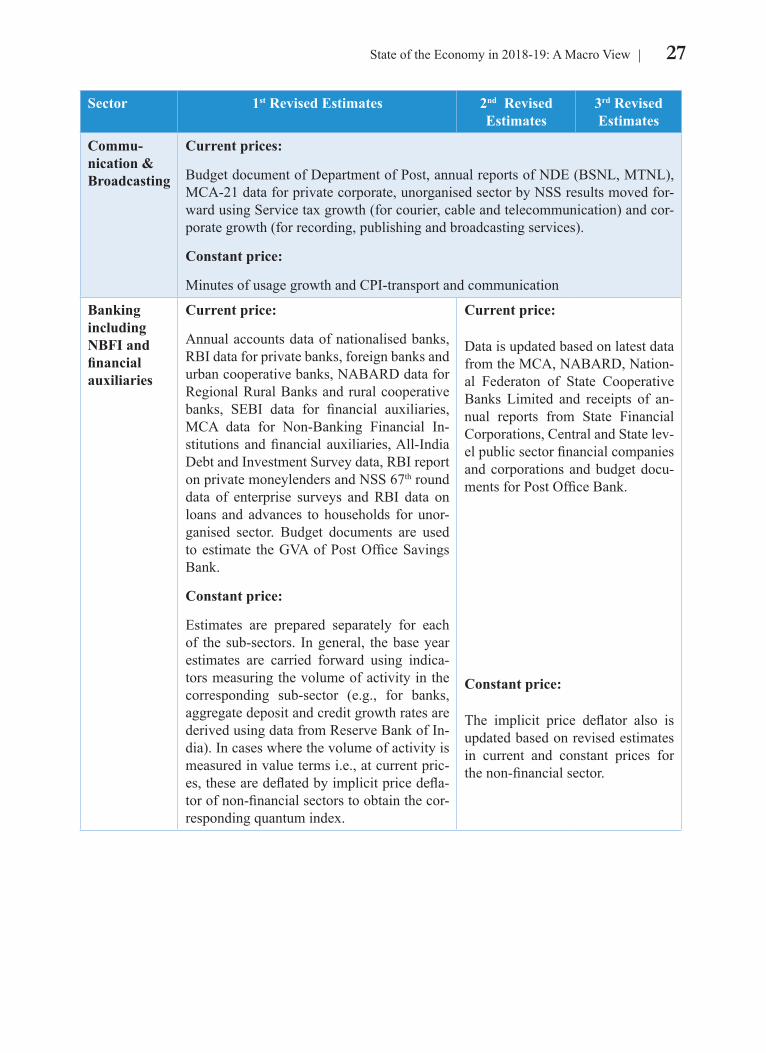
27State of the Economy in 2018-19: A Macro View
Sector 1st Revised Estimates 2nd Revised Estimates
3rd Revised Estimates
Commu-nication & Broadcasting
Current prices:
Budget document of Department of Post, annual reports of NDE (BSNL, MTNL), MCA-21 data for private corporate, unorganised sector by NSS results moved for-ward using Service tax growth (for courier, cable and telecommunication) and cor-porate growth (for recording, publishing and broadcasting services).
Constant price:
Minutes of usage growth and CPI-transport and communication
Banking including NBFI and financial auxiliaries
Current price:
Annual accounts data of nationalised banks, RBI data for private banks, foreign banks and urban cooperative banks, NABARD data for Regional Rural Banks and rural cooperative banks, SEBI data for financial auxiliaries, MCA data for Non-Banking Financial In-stitutions and financial auxiliaries, All-India Debt and Investment Survey data, RBI report on private moneylenders and NSS 67th round data of enterprise surveys and RBI data on loans and advances to households for unor-ganised sector. Budget documents are used to estimate the GVA of Post Office Savings Bank.
Constant price:
Estimates are prepared separately for each of the sub-sectors. In general, the base year estimates are carried forward using indica-tors measuring the volume of activity in the corresponding sub-sector (e.g., for banks, aggregate deposit and credit growth rates are derived using data from Reserve Bank of In-dia). In cases where the volume of activity is measured in value terms i.e., at current pric-es, these are deflated by implicit price defla-tor of non-financial sectors to obtain the cor-responding quantum index.
Current price:
Data is updated based on latest data from the MCA, NABARD, Nation-al Federaton of State Cooperative Banks Limited and receipts of an-nual reports from State Financial Corporations, Central and State lev-el public sector financial companies and corporations and budget docu-ments for Post Office Bank.
Constant price:
The implicit price deflator also is updated based on revised estimates in current and constant prices for the non-financial sector.
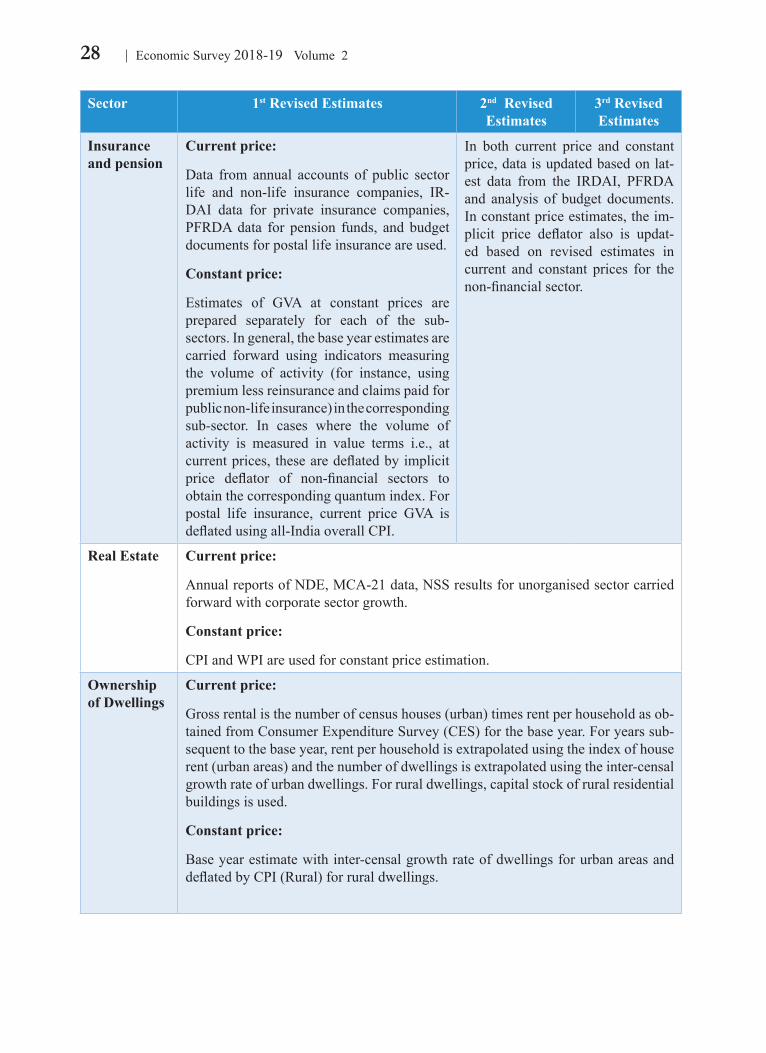
28 Economic Survey 2018-19 Volume 2
Sector 1st Revised Estimates 2nd Revised Estimates
3rd Revised Estimates
Insurance and pension
Current price:
Data from annual accounts of public sector life and non-life insurance companies, IR-DAI data for private insurance companies, PFRDA data for pension funds, and budget documents for postal life insurance are used.
Constant price:
Estimates of GVA at constant prices are prepared separately for each of the sub-sectors. In general, the base year estimates are carried forward using indicators measuring the volume of activity (for instance, using premium less reinsurance and claims paid for public non-life insurance) in the corresponding sub-sector. In cases where the volume of activity is measured in value terms i.e., at current prices, these are deflated by implicit price deflator of non-financial sectors to obtain the corresponding quantum index. For postal life insurance, current price GVA is deflated using all-India overall CPI.
In both current price and constant price, data is updated based on lat-est data from the IRDAI, PFRDA and analysis of budget documents. In constant price estimates, the im-plicit price deflator also is updat-ed based on revised estimates in current and constant prices for the non-financial sector.
Real Estate Current price:
Annual reports of NDE, MCA-21 data, NSS results for unorganised sector carried forward with corporate sector growth.
Constant price:
CPI and WPI are used for constant price estimation.
Ownership of Dwellings
Current price:
Gross rental is the number of census houses (urban) times rent per household as ob-tained from Consumer Expenditure Survey (CES) for the base year. For years sub-sequent to the base year, rent per household is extrapolated using the index of house rent (urban areas) and the number of dwellings is extrapolated using the inter-censal growth rate of urban dwellings. For rural dwellings, capital stock of rural residential buildings is used.
Constant price:
Base year estimate with inter-censal growth rate of dwellings for urban areas and deflated by CPI (Rural) for rural dwellings.
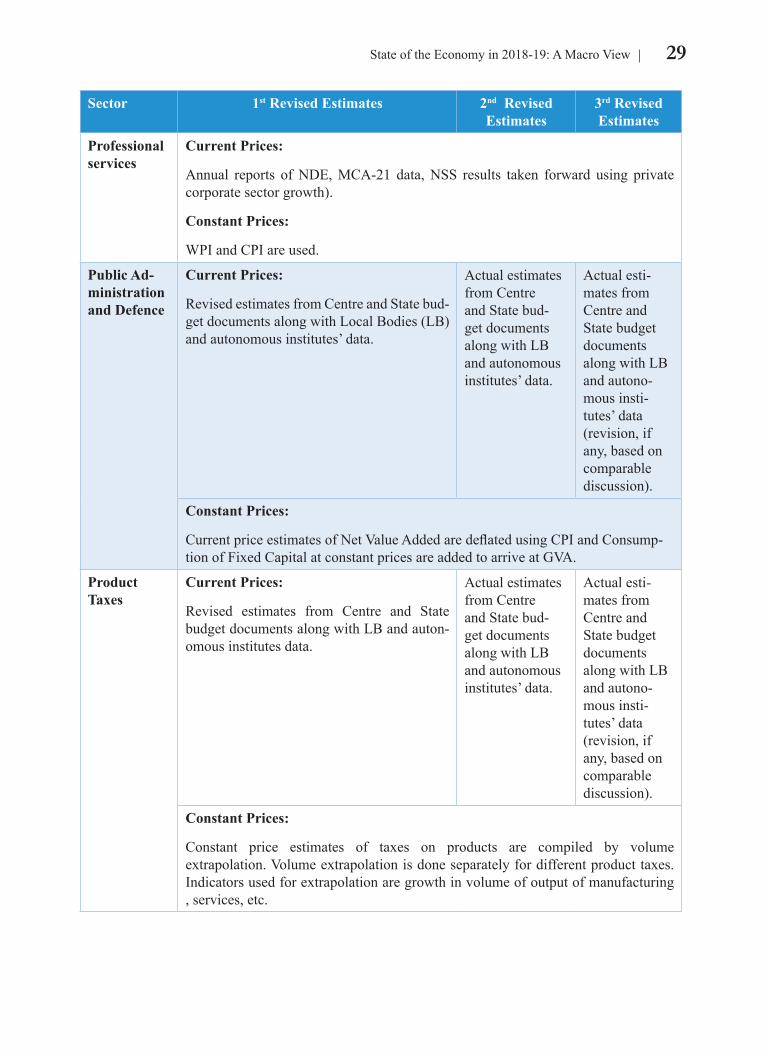
29State of the Economy in 2018-19: A Macro View
Sector 1st Revised Estimates 2nd Revised Estimates
3rd Revised Estimates
Professional services
Current Prices:
Annual reports of NDE, MCA-21 data, NSS results taken forward using private corporate sector growth).
Constant Prices:
WPI and CPI are used.
Public Ad-ministration and Defence
Current Prices:
Revised estimates from Centre and State bud-get documents along with Local Bodies (LB) and autonomous institutes’ data.
Actual estimates from Centre and State bud-get documents along with LB and autonomous institutes’ data.
Actual esti-mates from Centre and State budget documents along with LB and autono-mous insti-tutes’ data (revision, if any, based on comparable discussion).
Constant Prices:
Current price estimates of Net Value Added are deflated using CPI and Consump-tion of Fixed Capital at constant prices are added to arrive at GVA.
Product Taxes
Current Prices:
Revised estimates from Centre and State budget documents along with LB and auton-omous institutes data.
Actual estimates from Centre and State bud-get documents along with LB and autonomous institutes’ data.
Actual esti-mates from Centre and State budget documents along with LB and autono-mous insti-tutes’ data (revision, if any, based on comparable discussion).
Constant Prices:
Constant price estimates of taxes on products are compiled by volume extrapolation. Volume extrapolation is done separately for different product taxes. Indicators used for extrapolation are growth in volume of output of manufacturing , services, etc.
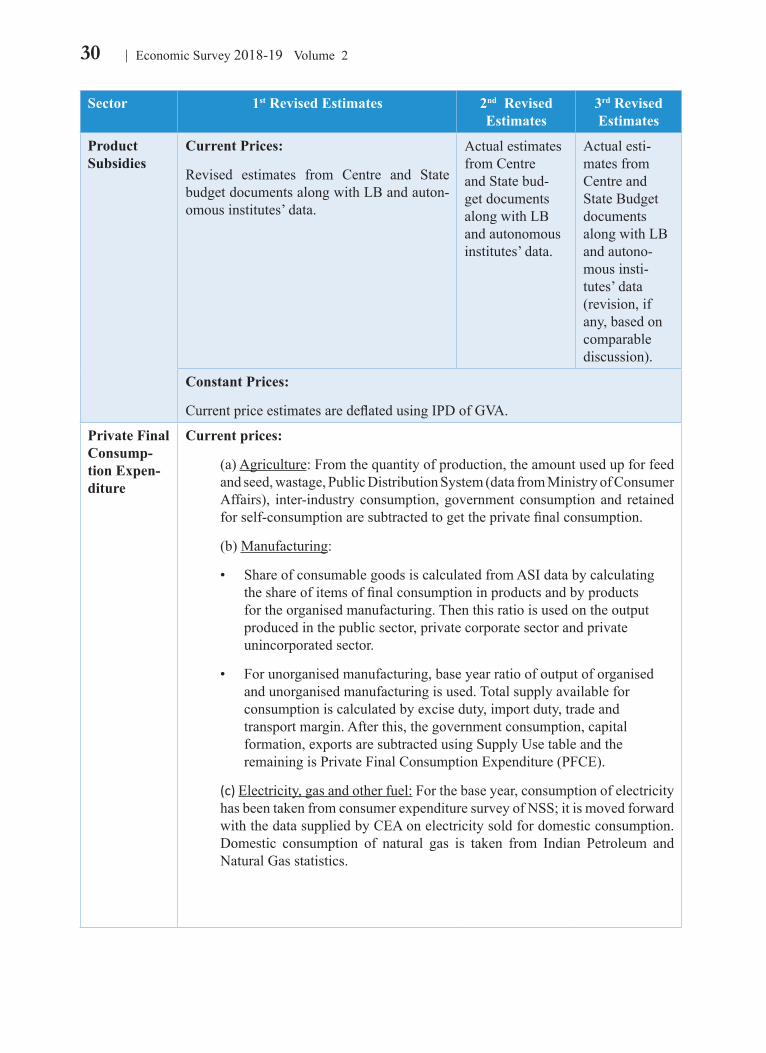
30 Economic Survey 2018-19 Volume 2
Sector 1st Revised Estimates 2nd Revised Estimates
3rd Revised Estimates
Product Subsidies
Current Prices:
Revised estimates from Centre and State budget documents along with LB and auton-omous institutes’ data.
Actual estimates from Centre and State bud-get documents along with LB and autonomous institutes’ data.
Actual esti-mates from Centre and State Budget documents along with LB and autono-mous insti-tutes’ data (revision, if any, based on comparable discussion).
Constant Prices:
Current price estimates are deflated using IPD of GVA.
Private Final Consump-tion Expen-diture
Current prices:
(a) Agriculture: From the quantity of production, the amount used up for feed and seed, wastage, Public Distribution System (data from Ministry of Consumer Affairs), inter-industry consumption, government consumption and retained for self-consumption are subtracted to get the private final consumption.
(b) Manufacturing:
• Share of consumable goods is calculated from ASI data by calculating the share of items of final consumption in products and by products for the organised manufacturing. Then this ratio is used on the output produced in the public sector, private corporate sector and private unincorporated sector.
• For unorganised manufacturing, base year ratio of output of organised and unorganised manufacturing is used. Total supply available for consumption is calculated by excise duty, import duty, trade and transport margin. After this, the government consumption, capital formation, exports are subtracted using Supply Use table and the remaining is Private Final Consumption Expenditure (PFCE).
(c) Electricity, gas and other fuel: For the base year, consumption of electricity has been taken from consumer expenditure survey of NSS; it is moved forward with the data supplied by CEA on electricity sold for domestic consumption. Domestic consumption of natural gas is taken from Indian Petroleum and Natural Gas statistics.
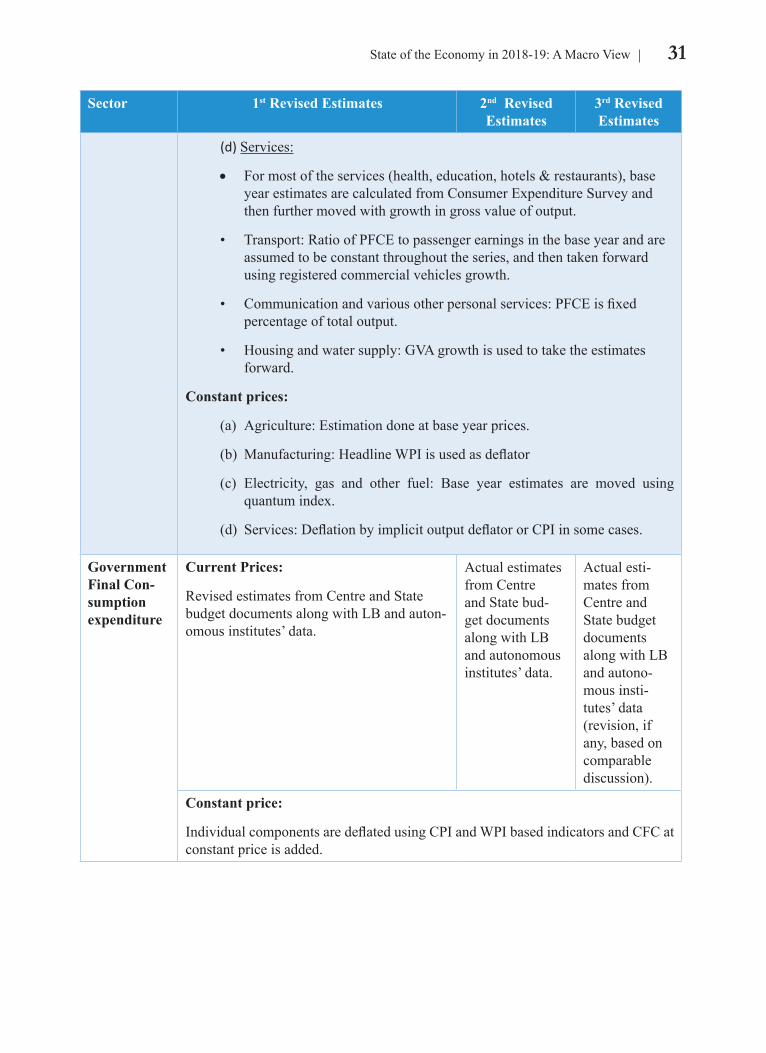
31State of the Economy in 2018-19: A Macro View
Sector 1st Revised Estimates 2nd Revised Estimates
3rd Revised Estimates
(d) Services:
• For most of the services (health, education, hotels & restaurants), base year estimates are calculated from Consumer Expenditure Survey and then further moved with growth in gross value of output.
• Transport: Ratio of PFCE to passenger earnings in the base year and are assumed to be constant throughout the series, and then taken forward using registered commercial vehicles growth.
• Communication and various other personal services: PFCE is fixed percentage of total output.
• Housing and water supply: GVA growth is used to take the estimates forward.
Constant prices:
(a) Agriculture: Estimation done at base year prices.
(b) Manufacturing: Headline WPI is used as deflator
(c) Electricity, gas and other fuel: Base year estimates are moved using quantum index.
(d) Services: Deflation by implicit output deflator or CPI in some cases.
Government Final Con-sumption expenditure
Current Prices:
Revised estimates from Centre and State budget documents along with LB and auton-omous institutes’ data.
Actual estimates from Centre and State bud-get documents along with LB and autonomous institutes’ data.
Actual esti-mates from Centre and State budget documents along with LB and autono-mous insti-tutes’ data (revision, if any, based on comparable discussion).
Constant price:
Individual components are deflated using CPI and WPI based indicators and CFC at constant price is added.
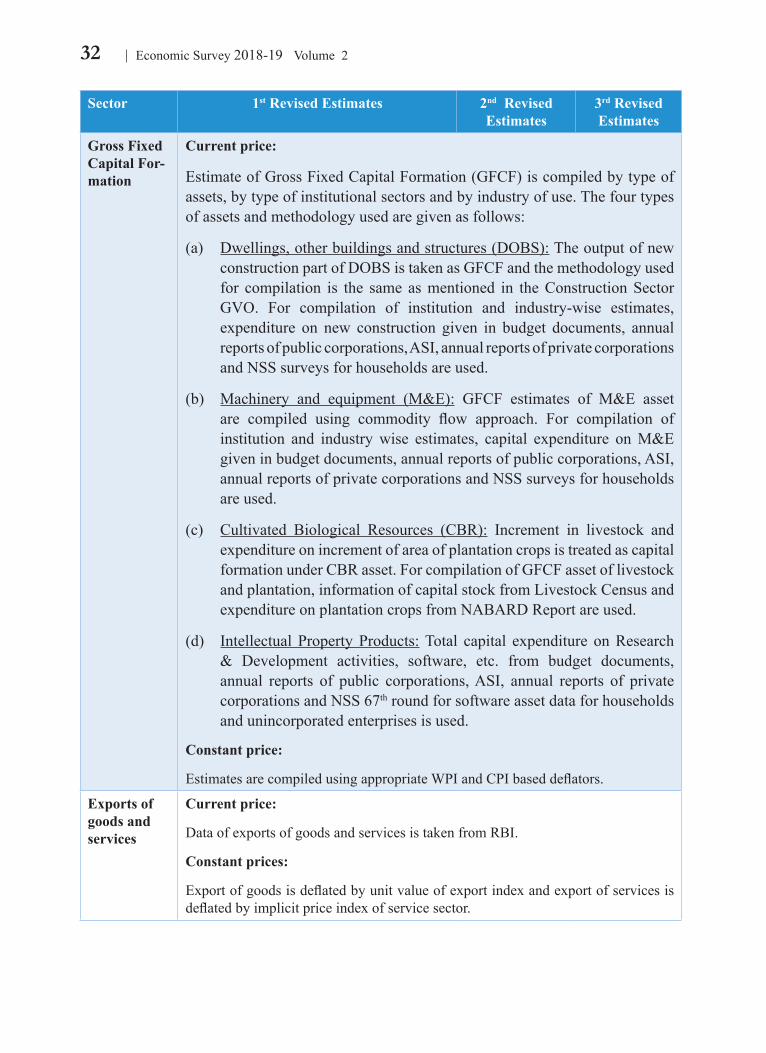
32 Economic Survey 2018-19 Volume 2
Sector 1st Revised Estimates 2nd Revised Estimates
3rd Revised Estimates
Gross Fixed Capital For-mation
Current price:
Estimate of Gross Fixed Capital Formation (GFCF) is compiled by type of assets, by type of institutional sectors and by industry of use. The four types of assets and methodology used are given as follows:
(a) Dwellings, other buildings and structures (DOBS): The output of new construction part of DOBS is taken as GFCF and the methodology used for compilation is the same as mentioned in the Construction Sector GVO. For compilation of institution and industry-wise estimates, expenditure on new construction given in budget documents, annual reports of public corporations, ASI, annual reports of private corporations and NSS surveys for households are used.
(b) Machinery and equipment (M&E): GFCF estimates of M&E asset are compiled using commodity flow approach. For compilation of institution and industry wise estimates, capital expenditure on M&E given in budget documents, annual reports of public corporations, ASI, annual reports of private corporations and NSS surveys for households are used.
(c) Cultivated Biological Resources (CBR): Increment in livestock and expenditure on increment of area of plantation crops is treated as capital formation under CBR asset. For compilation of GFCF asset of livestock and plantation, information of capital stock from Livestock Census and expenditure on plantation crops from NABARD Report are used.
(d) Intellectual Property Products: Total capital expenditure on Research & Development activities, software, etc. from budget documents, annual reports of public corporations, ASI, annual reports of private corporations and NSS 67th round for software asset data for households and unincorporated enterprises is used.
Constant price:
Estimates are compiled using appropriate WPI and CPI based deflators.
Exports of goods and services
Current price:
Data of exports of goods and services is taken from RBI.
Constant prices:
Export of goods is deflated by unit value of export index and export of services is deflated by implicit price index of service sector.
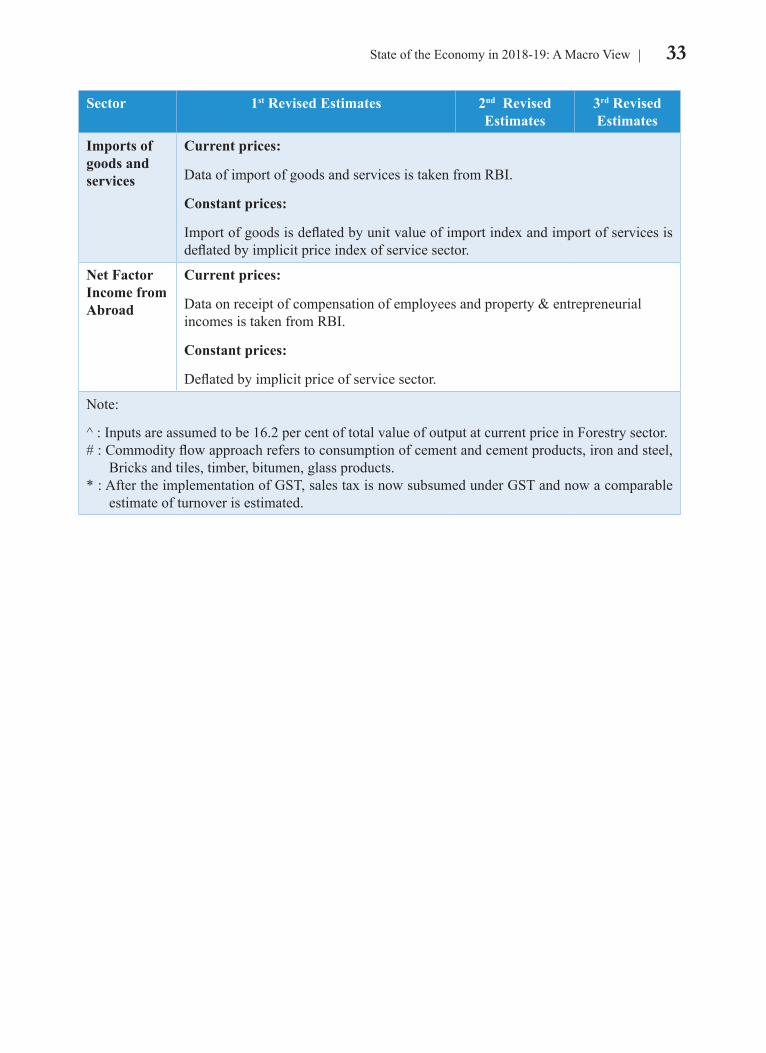
33State of the Economy in 2018-19: A Macro View
Sector 1st Revised Estimates 2nd Revised Estimates
3rd Revised Estimates
Imports of goods and services
Current prices:
Data of import of goods and services is taken from RBI.
Constant prices:
Import of goods is deflated by unit value of import index and import of services is deflated by implicit price index of service sector.
Net Factor Income from Abroad
Current prices:
Data on receipt of compensation of employees and property & entrepreneurial incomes is taken from RBI.
Constant prices:
Deflated by implicit price of service sector.
Note:
^ : Inputs are assumed to be 16.2 per cent of total value of output at current price in Forestry sector.# : Commodity flow approach refers to consumption of cement and cement products, iron and steel,
Bricks and tiles, timber, bitumen, glass products.* : After the implementation of GST, sales tax is now subsumed under GST and now a comparable
estimate of turnover is estimated.
CHAPTER
02Fiscal Developments
“In the happiness of his subjects lies his happiness; in their welfare his welfare; whatever pleases himself he shall not consider as good, but whatever pleases his subjects he shall consider as good. Hence the king shall ever be active and discharge his duties; the root of wealth is activity, and of evil its reverse.”
-Kautilya’s Arthasastra, Chapter XIX, ‘The Duties of a King’ in Book I, ‘Concerning Discipline’.
Tabled in the backdrop of an optimistic global scenario of the investment and trade cycle, Budget 2018-19 reiterated the objective of fiscal consolidation with introduction of a new fiscal targeting framework. Revenue augmentation and expenditure reprioritisation and rationalisation continue to be integral to fiscal reforms. Broadening and deepening the direct tax base and stabilisation of Goods and Services tax are the other priorities. Over the last six years, budgetary expenditure of the Central Government, as per cent of GDP, has seen considerable moderation with most of the reduction in the revenue expenditure.Total expenditure fell by 0.3 percentage points in 2018-19 PA (Provisional Actuals) over 2017-18, with 0.4 percentage points reduction in revenue expenditure and 0.1 percentage points increase in capital expenditure. Within revenue expenditure, major subsidies comprising food, fertiliser and petroleum continued their downward trend and have further declined by 0.1 percentage point of GDP in 2018-19 PA over 2017-18. Improving the quality of expenditure remains the key priority. Meeting allocational requirements without diversion from the newly revised fiscal glide path remains the foremost challenge.
2.1 Budget 2018-19 was presented in the backdrop of upswing in global investment and trade in the second half of 2017. The global growth was expected to continue its momentum in 2018. Despite several headwinds, Indian economy is expected to grow at 6.8 per cent (as per provisional estimates released by Central Statistics Office) in 2018-19 while maintaining
macro-economic stability. The growth with macro-stability stems mainly from ongoing structural reform, fiscal discipline, efficient delivery of services and financial inclusion.
2.2 The Budget 2018-19 affirmed Government’s intent on fiscal consolidation. It aimed to revert to the path of fiscal rectitude after the temporary blip in 2018-19. The new
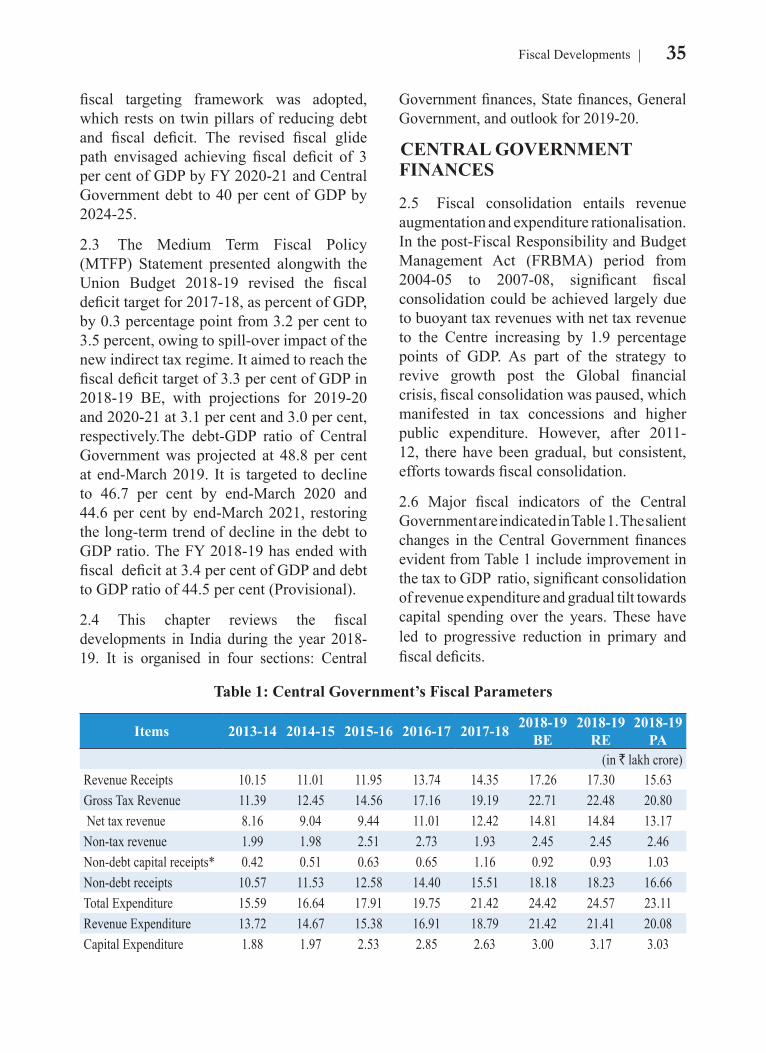
35Fiscal Developments
fiscal targeting framework was adopted, which rests on twin pillars of reducing debt and fiscal deficit. The revised fiscal glide path envisaged achieving fiscal deficit of 3 per cent of GDP by FY 2020-21 and Central Government debt to 40 per cent of GDP by 2024-25.
2.3 The Medium Term Fiscal Policy (MTFP) Statement presented alongwith the Union Budget 2018-19 revised the fiscal deficit target for 2017-18, as percent of GDP, by 0.3 percentage point from 3.2 per cent to 3.5 percent, owing to spill-over impact of the new indirect tax regime. It aimed to reach the fiscal deficit target of 3.3 per cent of GDP in 2018-19 BE, with projections for 2019-20 and 2020-21 at 3.1 per cent and 3.0 per cent, respectively.The debt-GDP ratio of Central Government was projected at 48.8 per cent at end-March 2019. It is targeted to decline to 46.7 per cent by end-March 2020 and 44.6 per cent by end-March 2021, restoring the long-term trend of decline in the debt to GDP ratio. The FY 2018-19 has ended with fiscal deficit at 3.4 per cent of GDP and debt to GDP ratio of 44.5 per cent (Provisional).
2.4 This chapter reviews the fiscal developments in India during the year 2018-19. It is organised in four sections: Central
Government finances, State finances, General Government, and outlook for 2019-20.
CENTRAL GOVERNMENT FINANCES
2.5 Fiscal consolidation entails revenue augmentation and expenditure rationalisation. In the post-Fiscal Responsibility and Budget Management Act (FRBMA) period from 2004-05 to 2007-08, significant fiscal consolidation could be achieved largely due to buoyant tax revenues with net tax revenue to the Centre increasing by 1.9 percentage points of GDP. As part of the strategy to revive growth post the Global financial crisis, fiscal consolidation was paused, which manifested in tax concessions and higher public expenditure. However, after 2011-12, there have been gradual, but consistent, efforts towards fiscal consolidation.
2.6 Major fiscal indicators of the Central Government are indicated in Table 1. The salient changes in the Central Government finances evident from Table 1 include improvement in the tax to GDP ratio, significant consolidation of revenue expenditure and gradual tilt towards capital spending over the years. These have led to progressive reduction in primary and fiscal deficits.
Table 1: Central Government’s Fiscal Parameters
Items 2013-14 2014-15 2015-16 2016-17 2017-18 2018-19 BE
2018-19 RE
2018-19 PA
(in ` lakh crore)Revenue Receipts 10.15 11.01 11.95 13.74 14.35 17.26 17.30 15.63Gross Tax Revenue 11.39 12.45 14.56 17.16 19.19 22.71 22.48 20.80 Net tax revenue 8.16 9.04 9.44 11.01 12.42 14.81 14.84 13.17Non-tax revenue 1.99 1.98 2.51 2.73 1.93 2.45 2.45 2.46Non-debt capital receipts* 0.42 0.51 0.63 0.65 1.16 0.92 0.93 1.03Non-debt receipts 10.57 11.53 12.58 14.40 15.51 18.18 18.23 16.66Total Expenditure 15.59 16.64 17.91 19.75 21.42 24.42 24.57 23.11Revenue Expenditure 13.72 14.67 15.38 16.91 18.79 21.42 21.41 20.08Capital Expenditure 1.88 1.97 2.53 2.85 2.63 3.00 3.17 3.03
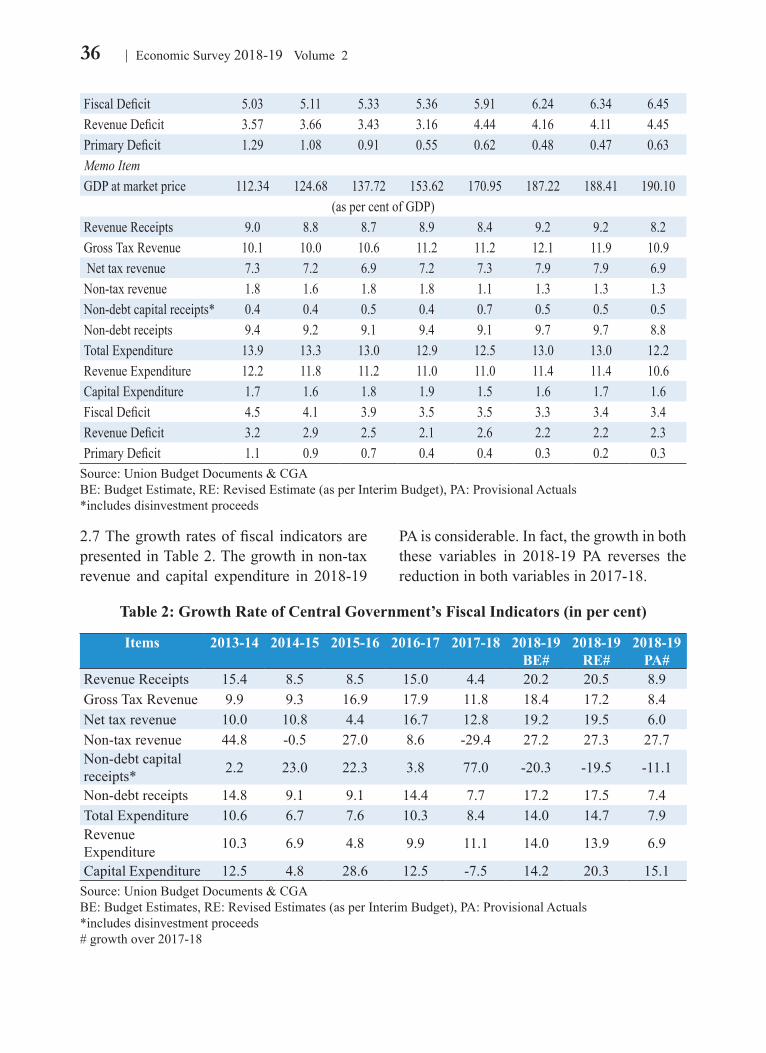
36 Economic Survey 2018-19 Volume 2
2.7 The growth rates of fiscal indicators are presented in Table 2. The growth in non-tax revenue and capital expenditure in 2018-19
PA is considerable. In fact, the growth in both these variables in 2018-19 PA reverses the reduction in both variables in 2017-18.
Fiscal Deficit 5.03 5.11 5.33 5.36 5.91 6.24 6.34 6.45Revenue Deficit 3.57 3.66 3.43 3.16 4.44 4.16 4.11 4.45Primary Deficit 1.29 1.08 0.91 0.55 0.62 0.48 0.47 0.63Memo ItemGDP at market price 112.34 124.68 137.72 153.62 170.95 187.22 188.41 190.10
(as per cent of GDP)Revenue Receipts 9.0 8.8 8.7 8.9 8.4 9.2 9.2 8.2Gross Tax Revenue 10.1 10.0 10.6 11.2 11.2 12.1 11.9 10.9 Net tax revenue 7.3 7.2 6.9 7.2 7.3 7.9 7.9 6.9Non-tax revenue 1.8 1.6 1.8 1.8 1.1 1.3 1.3 1.3Non-debt capital receipts* 0.4 0.4 0.5 0.4 0.7 0.5 0.5 0.5Non-debt receipts 9.4 9.2 9.1 9.4 9.1 9.7 9.7 8.8Total Expenditure 13.9 13.3 13.0 12.9 12.5 13.0 13.0 12.2Revenue Expenditure 12.2 11.8 11.2 11.0 11.0 11.4 11.4 10.6Capital Expenditure 1.7 1.6 1.8 1.9 1.5 1.6 1.7 1.6Fiscal Deficit 4.5 4.1 3.9 3.5 3.5 3.3 3.4 3.4Revenue Deficit 3.2 2.9 2.5 2.1 2.6 2.2 2.2 2.3Primary Deficit 1.1 0.9 0.7 0.4 0.4 0.3 0.2 0.3
Source: Union Budget Documents & CGABE: Budget Estimate, RE: Revised Estimate (as per Interim Budget), PA: Provisional Actuals*includes disinvestment proceeds
Table 2: Growth Rate of Central Government’s Fiscal Indicators (in per cent)
Items 2013-14 2014-15 2015-16 2016-17 2017-18 2018-19 BE#
2018-19 RE#
2018-19 PA#
Revenue Receipts 15.4 8.5 8.5 15.0 4.4 20.2 20.5 8.9Gross Tax Revenue 9.9 9.3 16.9 17.9 11.8 18.4 17.2 8.4Net tax revenue 10.0 10.8 4.4 16.7 12.8 19.2 19.5 6.0Non-tax revenue 44.8 -0.5 27.0 8.6 -29.4 27.2 27.3 27.7Non-debt capital receipts* 2.2 23.0 22.3 3.8 77.0 -20.3 -19.5 -11.1
Non-debt receipts 14.8 9.1 9.1 14.4 7.7 17.2 17.5 7.4Total Expenditure 10.6 6.7 7.6 10.3 8.4 14.0 14.7 7.9Revenue Expenditure 10.3 6.9 4.8 9.9 11.1 14.0 13.9 6.9
Capital Expenditure 12.5 4.8 28.6 12.5 -7.5 14.2 20.3 15.1Source: Union Budget Documents & CGABE: Budget Estimates, RE: Revised Estimates (as per Interim Budget), PA: Provisional Actuals*includes disinvestment proceeds# growth over 2017-18
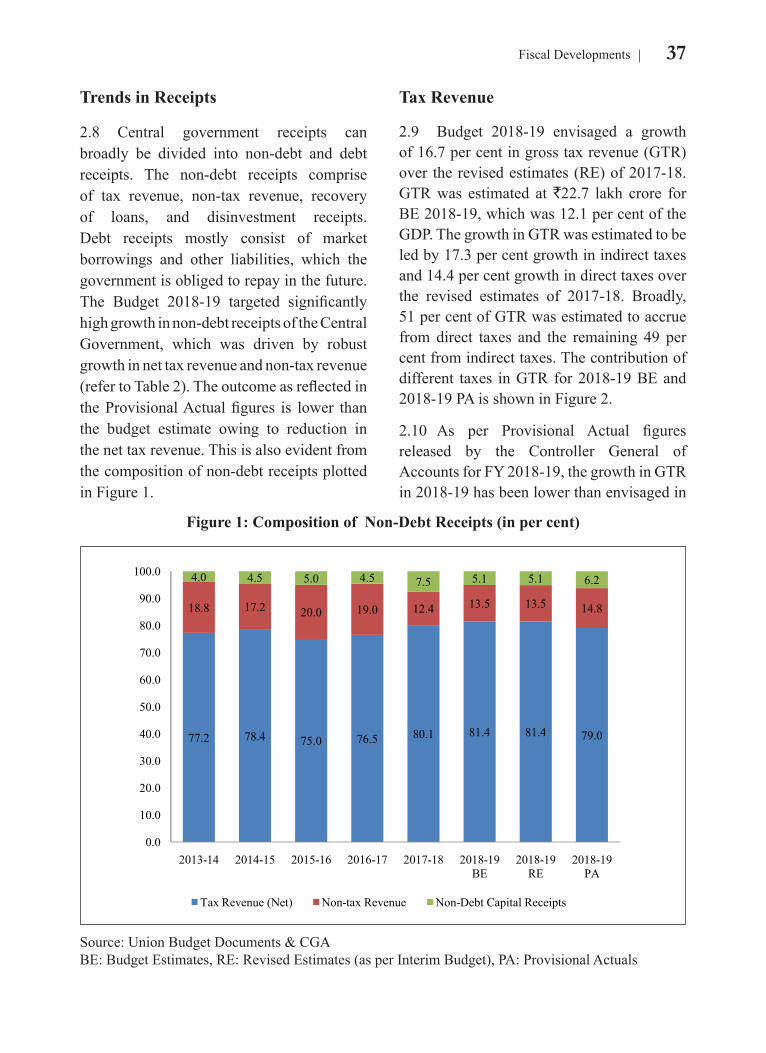
37Fiscal Developments
Trends in Receipts
2.8 Central government receipts can broadly be divided into non-debt and debt receipts. The non-debt receipts comprise of tax revenue, non-tax revenue, recovery of loans, and disinvestment receipts. Debt receipts mostly consist of market borrowings and other liabilities, which the government is obliged to repay in the future. The Budget 2018-19 targeted significantly high growth in non-debt receipts of the Central Government, which was driven by robust growth in net tax revenue and non-tax revenue (refer to Table 2). The outcome as reflected in the Provisional Actual figures is lower than the budget estimate owing to reduction in the net tax revenue. This is also evident from the composition of non-debt receipts plotted in Figure 1.
Tax Revenue
2.9 Budget 2018-19 envisaged a growth of 16.7 per cent in gross tax revenue (GTR) over the revised estimates (RE) of 2017-18. GTR was estimated at `22.7 lakh crore for BE 2018-19, which was 12.1 per cent of the GDP. The growth in GTR was estimated to be led by 17.3 per cent growth in indirect taxes and 14.4 per cent growth in direct taxes over the revised estimates of 2017-18. Broadly, 51 per cent of GTR was estimated to accrue from direct taxes and the remaining 49 per cent from indirect taxes. The contribution of different taxes in GTR for 2018-19 BE and 2018-19 PA is shown in Figure 2.
2.10 As per Provisional Actual figures released by the Controller General of Accounts for FY 2018-19, the growth in GTR in 2018-19 has been lower than envisaged in
Figure 1: Composition of Non-Debt Receipts (in per cent)
77.2 78.4 75.0 76.5 80.1 81.4 81.4 79.0
18.8 17.2 20.0 19.0 12.4 13.5 13.5 14.8
4.0 4.5 5.0 4.5 7.5 5.1 5.1 6.2
0.0
10.0
20.0
30.0
40.0
50.0
60.0
70.0
80.0
90.0
100.0
2013-14 2014-15 2015-16 2016-17 2017-18 2018-19 BE
2018-19 RE
2018-19 PA
Tax Revenue (Net) Non-tax Revenue Non-Debt Capital Receipts
Source: Union Budget Documents & CGABE: Budget Estimates, RE: Revised Estimates (as per Interim Budget), PA: Provisional Actuals

38 Economic Survey 2018-19 Volume 2
2.11 Though there has been improvement in tax to GDP ratio over the last six years (Figure 3), GTR as a proportion of GDP has declined by 0.3 percentage points in 2018-19 PA over 2017-18. Indirect taxes have fallen by 0.4 percentage points of GDP primarily due to shortfall in GST collections. This has been partly offset by 0.1 percentage points increase in direct taxes. Trends in major taxes in relation to GDP displayed in Figure 4 show that receipts from corporate tax have considerably improved in 2018-19 PA. Better tax administration, widening of TDS carried over the years, anti-tax evasion measures and increase in effective tax payers base have contributed to direct tax buoyancy. Widening of tax base due to increase in the number of
indirect tax filers in the GST regime has also led to improved tax buoyancy. Going forward, sustaining improvement in tax collection will depend on the revenue buoyancy of GST.
the budget (refer to Table 2). Direct taxes have grown by 13.4 per cent owing to improved performance of corporate tax. However, indirect taxes have fallen short of budget estimates by about 16 per cent. This is largely owing to the shortfall in GST revenues1. The GST collections are yet to stabilise and several
changes have been carried out following decisions of the GST Council during the course of the year. These changes, inter alia, relate to rate rationalisation for goods and services, changes in the threshold limits and exemptions granted, which are detailed in Annex I.
_________________1 Includes CGST, IGST and compensation cess.
Figure 2: Composition of Gross Tax Revenue
5%12%
33%
6%
11%
28%27%
23%
32%
23%
Corporate Tax
Taxes on income other than Corporate taxCustoms
Union Excise Duties
GST
2018-19 PA
2018-19 BE
Corporate Tax
Taxes on income other than
Union Excise Duties
Source: Union Budget Documents & CGABE: Budget Estimates, PA: Provisional Actuals
Figure 3: Tax to GDP ratio (in per cent)
4.0
4.5
5.0
5.5
6.0
6.5
9.8
10.3
10.8
11.3
11.8
12.3
2013-14 2014-15 2015-16 2016-17 2017-18 2018-19 PA
Tax-GDP ratio Direct taxes/GDP (RHS) Indirect Taxes/GDP (RHS)
Source: Union Budget Documents & CGAPA: Provisional Actuals
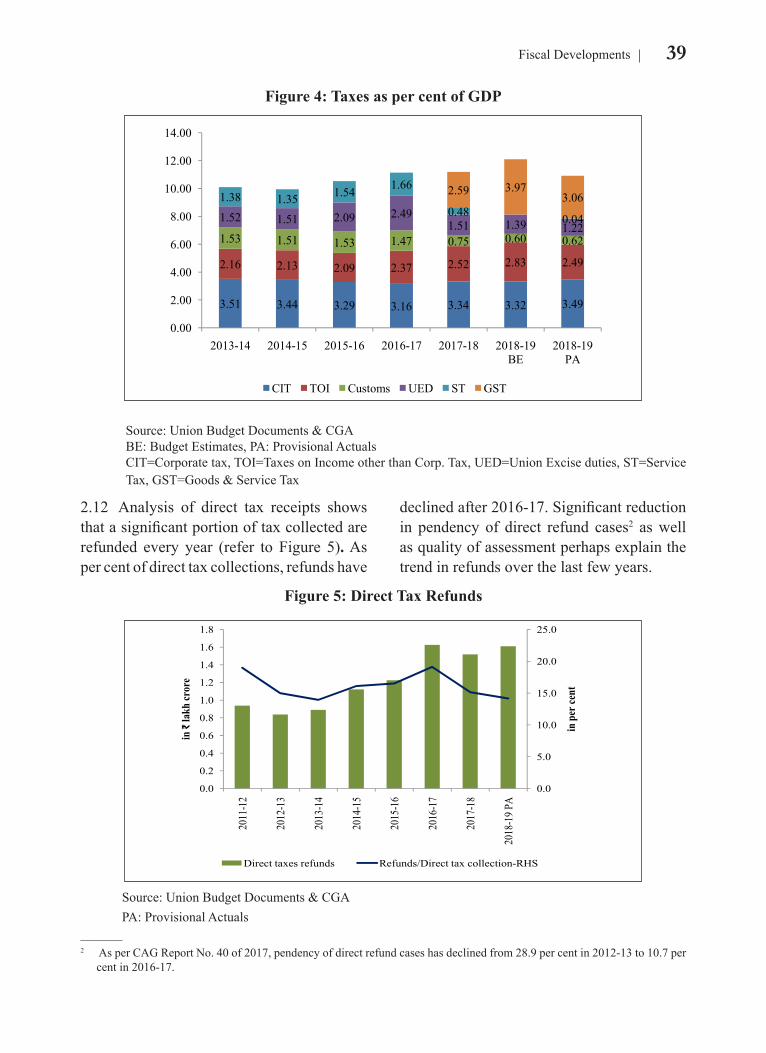
39Fiscal Developments
2.12 Analysis of direct tax receipts shows that a significant portion of tax collected are refunded every year (refer to Figure 5). As per cent of direct tax collections, refunds have
declined after 2016-17. Significant reduction in pendency of direct refund cases2 as well as quality of assessment perhaps explain the trend in refunds over the last few years.
_______2 As per CAG Report No. 40 of 2017, pendency of direct refund cases has declined from 28.9 per cent in 2012-13 to 10.7 per
cent in 2016-17.
Figure 4: Taxes as per cent of GDP
3.51 3.44 3.29 3.16 3.34 3.32 3.49
2.16 2.13 2.09 2.37 2.52 2.83 2.49
1.53 1.51 1.53 1.47 0.75 0.60 0.62
1.52 1.51 2.09 2.491.51 1.39 1.22
1.38 1.35 1.54 1.66
0.48 0.04
2.59 3.973.06
0.00
2.00
4.00
6.00
8.00
10.00
12.00
14.00
2013-14 2014-15 2015-16 2016-17 2017-18 2018-19 BE
2018-19 PA
CIT TOI Customs UED ST GST
Source: Union Budget Documents & CGABE: Budget Estimates, PA: Provisional ActualsCIT=Corporate tax, TOI=Taxes on Income other than Corp. Tax, UED=Union Excise duties, ST=Service Tax, GST=Goods & Service Tax
Figure 5: Direct Tax Refunds
0.0
5.0
10.0
15.0
20.0
25.0
0.0
0.2
0.4
0.6
0.8
1.0
1.2
1.4
1.6
1.8
2011
-12
2012
-13
2013
-14
2014
-15
2015
-16
2016
-17
2017
-18
2018
-19 P
A
in p
er ce
nt
in ₹
lakh
cror
e
Direct taxes refunds Refunds/Direct tax collection-RHS
Source: Union Budget Documents & CGAPA: Provisional Actuals
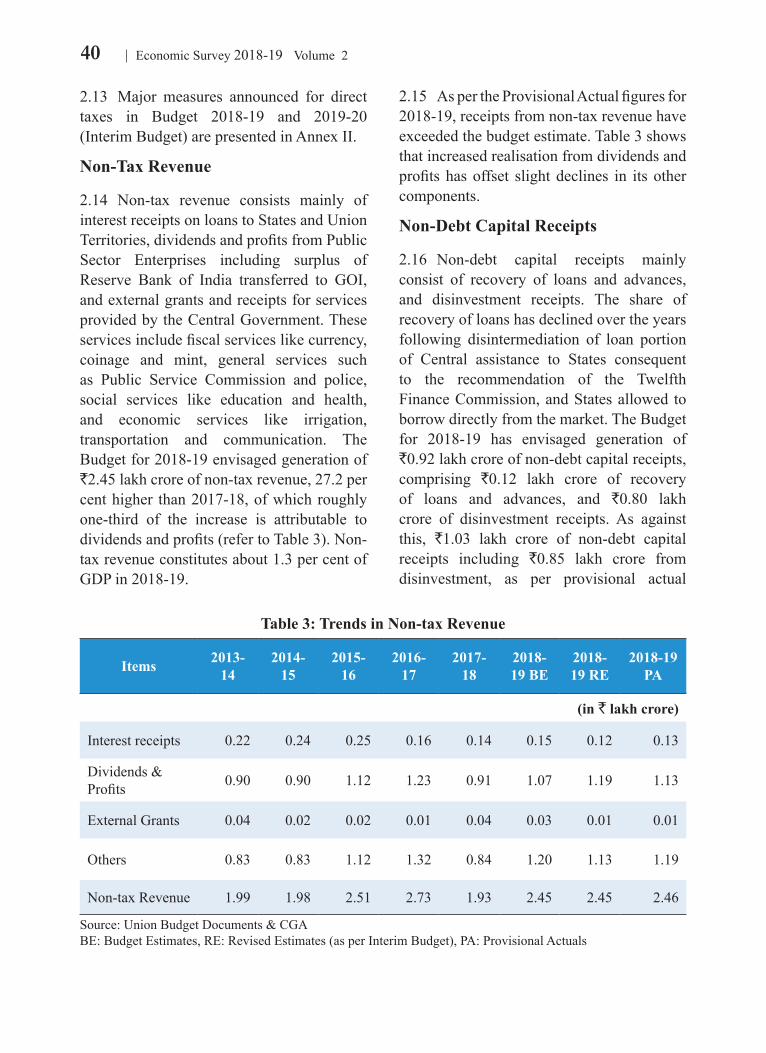
40 Economic Survey 2018-19 Volume 2
2.13 Major measures announced for direct taxes in Budget 2018-19 and 2019-20 (Interim Budget) are presented in Annex II.
Non-Tax Revenue
2.14 Non-tax revenue consists mainly of interest receipts on loans to States and Union Territories, dividends and profits from Public Sector Enterprises including surplus of Reserve Bank of India transferred to GOI, and external grants and receipts for services provided by the Central Government. These services include fiscal services like currency, coinage and mint, general services such as Public Service Commission and police, social services like education and health, and economic services like irrigation, transportation and communication. The Budget for 2018-19 envisaged generation of `2.45 lakh crore of non-tax revenue, 27.2 per cent higher than 2017-18, of which roughly one-third of the increase is attributable to dividends and profits (refer to Table 3). Non-tax revenue constitutes about 1.3 per cent of GDP in 2018-19.
2.15 As per the Provisional Actual figures for 2018-19, receipts from non-tax revenue have exceeded the budget estimate. Table 3 shows that increased realisation from dividends and profits has offset slight declines in its other components.
Non-Debt Capital Receipts
2.16 Non-debt capital receipts mainly consist of recovery of loans and advances, and disinvestment receipts. The share of recovery of loans has declined over the years following disintermediation of loan portion of Central assistance to States consequent to the recommendation of the Twelfth Finance Commission, and States allowed to borrow directly from the market. The Budget for 2018-19 has envisaged generation of `0.92 lakh crore of non-debt capital receipts, comprising `0.12 lakh crore of recovery of loans and advances, and `0.80 lakh crore of disinvestment receipts. As against this, `1.03 lakh crore of non-debt capital receipts including `0.85 lakh crore from disinvestment, as per provisional actual
Table 3: Trends in Non-tax Revenue
Items 2013-14
2014-15
2015-16
2016-17
2017-18
2018-19 BE
2018-19 RE
2018-19 PA
(in ` lakh crore)
Interest receipts 0.22 0.24 0.25 0.16 0.14 0.15 0.12 0.13
Dividends & Profits 0.90 0.90 1.12 1.23 0.91 1.07 1.19 1.13
External Grants 0.04 0.02 0.02 0.01 0.04 0.03 0.01 0.01
Others 0.83 0.83 1.12 1.32 0.84 1.20 1.13 1.19
Non-tax Revenue 1.99 1.98 2.51 2.73 1.93 2.45 2.45 2.46
Source: Union Budget Documents & CGABE: Budget Estimates, RE: Revised Estimates (as per Interim Budget), PA: Provisional Actuals
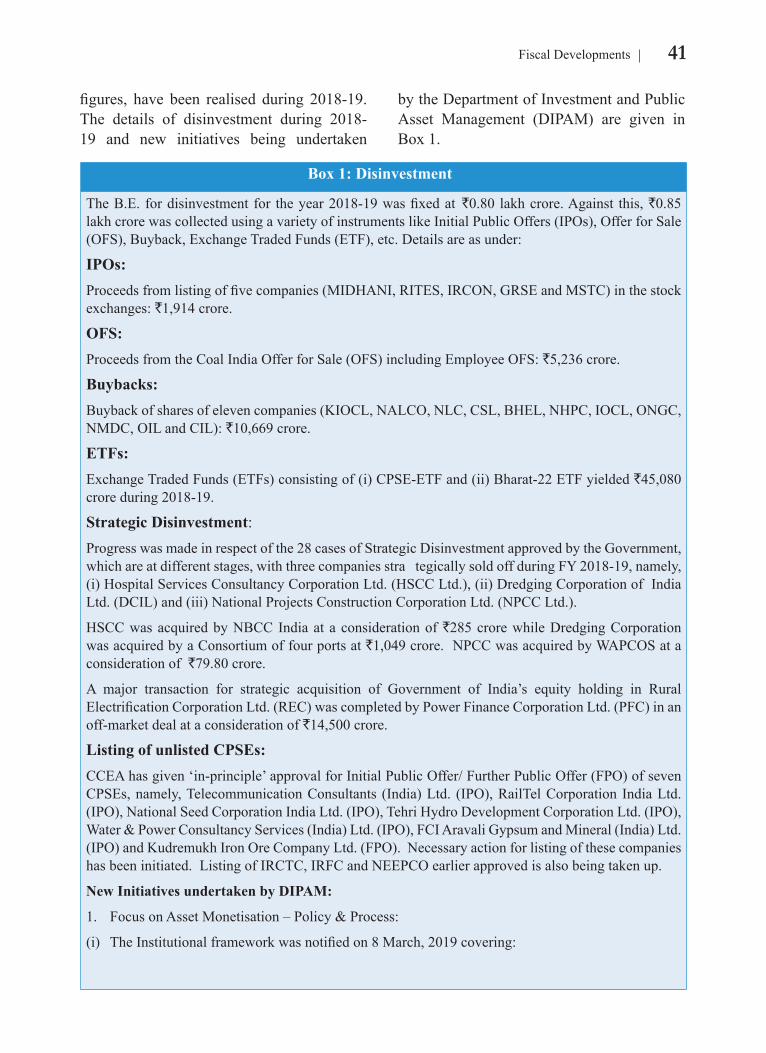
41Fiscal Developments
figures, have been realised during 2018-19. The details of disinvestment during 2018-19 and new initiatives being undertaken
by the Department of Investment and Public Asset Management (DIPAM) are given in Box 1.
Box 1: Disinvestment
The B.E. for disinvestment for the year 2018-19 was fixed at `0.80 lakh crore. Against this, `0.85 lakh crore was collected using a variety of instruments like Initial Public Offers (IPOs), Offer for Sale (OFS), Buyback, Exchange Traded Funds (ETF), etc. Details are as under:
IPOs:Proceeds from listing of five companies (MIDHANI, RITES, IRCON, GRSE and MSTC) in the stock exchanges: `1,914 crore.
OFS:Proceeds from the Coal India Offer for Sale (OFS) including Employee OFS: `5,236 crore.
Buybacks:Buyback of shares of eleven companies (KIOCL, NALCO, NLC, CSL, BHEL, NHPC, IOCL, ONGC, NMDC, OIL and CIL): `10,669 crore.
ETFs:Exchange Traded Funds (ETFs) consisting of (i) CPSE-ETF and (ii) Bharat-22 ETF yielded `45,080 crore during 2018-19.
Strategic Disinvestment:Progress was made in respect of the 28 cases of Strategic Disinvestment approved by the Government, which are at different stages, with three companies stra tegically sold off during FY 2018-19, namely, (i) Hospital Services Consultancy Corporation Ltd. (HSCC Ltd.), (ii) Dredging Corporation of India Ltd. (DCIL) and (iii) National Projects Construction Corporation Ltd. (NPCC Ltd.).
HSCC was acquired by NBCC India at a consideration of `285 crore while Dredging Corporation was acquired by a Consortium of four ports at `1,049 crore. NPCC was acquired by WAPCOS at a consideration of `79.80 crore.
A major transaction for strategic acquisition of Government of India’s equity holding in Rural Electrification Corporation Ltd. (REC) was completed by Power Finance Corporation Ltd. (PFC) in an off-market deal at a consideration of `14,500 crore.
Listing of unlisted CPSEs:CCEA has given ‘in-principle’ approval for Initial Public Offer/ Further Public Offer (FPO) of seven CPSEs, namely, Telecommunication Consultants (India) Ltd. (IPO), RailTel Corporation India Ltd. (IPO), National Seed Corporation India Ltd. (IPO), Tehri Hydro Development Corporation Ltd. (IPO), Water & Power Consultancy Services (India) Ltd. (IPO), FCI Aravali Gypsum and Mineral (India) Ltd. (IPO) and Kudremukh Iron Ore Company Ltd. (FPO). Necessary action for listing of these companies has been initiated. Listing of IRCTC, IRFC and NEEPCO earlier approved is also being taken up.
New Initiatives undertaken by DIPAM:
1. Focus on Asset Monetisation – Policy & Process:
(i) The Institutional framework was notified on 8 March, 2019 covering:
42 Economic Survey 2018-19 Volume 2
efficiency and utilisation of defence expenditure, promote self-reliance, and encourage private sector participation in the defence sector. These are detailed in Box 2. Expenditures on salaries, pensions and interest payments are, by and large, committed in nature and have limited headroom for creation of additional fiscal space. Subsidies have seen significant moderation through improved targeting (refer to Figure 8). There has been considerable restructuring and reclassification of Central sector and Centrally Sponsored Schemes in the recent past. Even capital expenditure3 was rationalised in 2017-18, wherein support provided to Railways and the mechanism for transferring Externally Aided Project loans to States were rationalised.
Trends in Expenditure
2.17 Rationalisation and reprioritisation of government expenditure is integral to fiscal reforms. As India’s tax to GDP ratio is low, Government faces the challenge of providing sufficient funds for investment and infrastructure expansion while maintaining fiscal discipline. Therefore, improving the composition and quality of expenditure towards capital spending becomes significant.
2.18 The composition of government expenditure (refer to Figure 7) reveals that expenditure on defence, salaries, pensions, interest payments and subsidies account for more than sixty per cent of total expenditure.Several initiatives have been undertaken by the Ministry of Defence to improve _____________3 There was a reduction to the tune of approximately `15,000 crore in Government of India’s support to Railways as it was
decided that the Railways would access the market directly to transition towards greater financial autonomy. With respect to Externally Aided Projects (EAP) loans to States, the BE was `18,500 crore. This expenditure, under a loan Major Head (7601), was actually in the nature of pass through as the states could only borrow externally against the guarantee of the Consolidated Fund of India. Therefore, this arrangement was impacting the fiscal deficit of the Government of India, when the loans were the liabilities of the state governments. This arrangement was changed to reflect the fact that only final repayments to the international organisations amounting to `4,500 crore would form part of the expenditure of the Government of India. This accounting arrangement would reflect as a reduced capital expenditure for Central Government.
(a) Identified non-core assets of CPSEs under Strategic Disinvestment.
(b) Immovable Enemy Property under the custody of CEPI, MHA.
(c) Assets of other CPSEs/PSUs/other Government Organization including sick/loss making CPSEs.
(ii) Process has been set in motion:
(a) Alternative Mechanism (AM), Inter-ministerial Group (IMG) and Consultative Groups have been notified;
(b) Hiring of intermediaries for Asset Monetisation Cell started.
(c) Process of identification of potential assets to be monetized has been started.
2. Debt- ETF:
Following an announcement in the Budget Speech of Finance Minister in February 2018, DIPAM is in the process of creating a Debt-ETF to enable CPSEs to access the debt/ bond market to partially meet the capital expenditure needs by leveraging their aggregate strength. Adviser, Legal Adviser, and AMC have been appointed.
Source: Department of Investment and Public Asset Management (DIPAM)
43Fiscal Developments
Box 2: Defence Initiatives
Budget• The allocation for Defence Budget, including Civil estimates and Pensions for 2018-19 is
`4,04,364.71 crore, which is `44,510.50 crore over BE 2017-18.
• Capital Expenditure in absolute terms has gone up in the past few years. The allocated Capital Budget has been fully utilized since 2016-17, reversing the previous trends of surrender of funds.
• The trend of underutilization of Defence Budget has also been reversed in FY 2016-17 and 2017-18.
• Delegation of enhanced financial powers to Vice-Chiefs of the three Services has been done primarily to expedite the decision-making process involved in revenue procurements of the Armed Forces. With the latest delegation, the Vice-Chiefs now have powers up to `500 crore for revenue procurement. On the capital side also, the ceiling has been enhanced to `300 crore from `150 crore.
• Ministry of Defence has comprehensively reviewed the Defence Procurement Procedure 2016. Several measures as part of “Business Process Re-engineering” have been undertaken to make the acquisition process industry friendly, provide a level playing field for various stakeholders and reduce the complexities and time lines in provisioning of defence platforms, equipment and systems for modernization of the Indian Armed Forces.
Self-Reliance• To achieve self-reliance in the defence sector and make India a global hub in defence
manufacturing, the Ordinance Factories (OFs), Defence Public Sector Undertakings (DPSUs) and the private industry ecosystem have enhanced their capabilities and widened the product range. A large number of major products have been developed through Research and Development initiatives. In addition, a number of products and equipment are being produced through transfer of technology.
• As a policy, DPSUs and OFs have been outsourcing many of their requirements and have over the years, developed a wide vendor base that includes a large number of medium and small scale enterprises and large scale industries. In addition, the DPSUs and OFs are also striving to increase the indigenous content in the equipments and products manufactured by them.
Policy Initiative
• In order to encourage participation of Indian industry in design and development of defence items, a ‘Make-II’ procedure was notified in February 2018 wherein a number of industry friendly provisions have been introduced, such as relaxation of eligibility criteria, minimal documentation, and provision for consideration of suo-moto proposals suggested by industry/individual. The framework for implementation of Make-II at OFs and DPSUs level has been issued in February 2019. The framework will enable OFs & DPSUs to undertake indigenization of the items, particularly of the import substitution nature, through Indian private industry.
44 Economic Survey 2018-19 Volume 2
2.19 Comparison of Provisional Actuals with budget estimates for the year 2018-19 reveals that Government has been able to contain fiscal deficit at 3.4 per cent of GDP through compression of Government expenditure. The entire reduction is in revenue expenditure (refer to Table 1). As per cent of GDP, total expenditure fell by 0.3
percentage points in 2018-19 PA over 2017-18, with 0.4 percentage points reduction in revenue expenditure and 0.1 percentage point increase in capital expenditure. Over 2017-18, total expenditure has grown by 7.9 per cent in 2018-19 PA with its capital component growing at more than twice the rate of growth in revenue (refer to Table 2).
• An innovation ecosystem for Defence, titled “Innovation for Defence Excellence” (iDEX) was launched in April 2018 by the Hon’ble PM. iDEX is aimed at creating an ecosystem to foster innovation and technology development in Defence and Aerospace. iDEX intends to engage industries including MSMEs, Start-ups, Individual Innovators, R&D institutes and Academia and provide them grants/funding and other support to carry out R&D, which has potential for future adoption for Indian defence and aerospace needs. The iDEX programme has been operationalized through launch of the ‘Defence India Startup Challenges (DISC)’ in two legs, wherein innovators, organizations as well as individuals have been presented with ‘Problem Statements’ for resolution.
• A Defence Investor Cell has been made functional in the Department of Defence Production (DDP) since January 2018. It has played an important role as one-stop solution for all types of defence production related queries.
Private Sector Participation
• To achieve the goal of self-reliance in the Defence sector, continuous efforts are being made to increase indigenization wherever technologically feasible and economically viable. To facilitate private sector participation, several measures have been undertaken:
• In May 2001, the Defence Industry sector, which was hitherto reserved for the public sector, was opened upto 100 per cent for Indian private sector participation, with Foreign Direct Investment (FDI) upto 26 per cent, both subject to licensing. FDI policy was further liberalized and has been allowed under automatic route upto 49 per cent, and above 49 per cent wherever it is likely to result in access to modern technology or for other reasons to be recorded.
• After opening of the Defence Industry Sector for Indian private sector participation, so far 42 FDI proposals/Joint Ventures have been approved in defence sector for manufacture of various defence equipment, both in public and private sectors. DPIIT has issued 439 Industrial Licenses (ILs) to private companies till March 2019 for manufacture of a wide range of defence items, which were 214 till the end of March 2014.
Export Promotion• Exports from Ordinance Factory Board (OFB), DPSUs and the private sector (based on
authorization issued by DDP) in the Financial Year 2017-18 had increased to `4,682 crore from `1,522 crore in the financial year 2016-17. Further, exports have more than doubled in 2018-19 to `10,746 crore over the previous year.
Source: Ministry of Defence
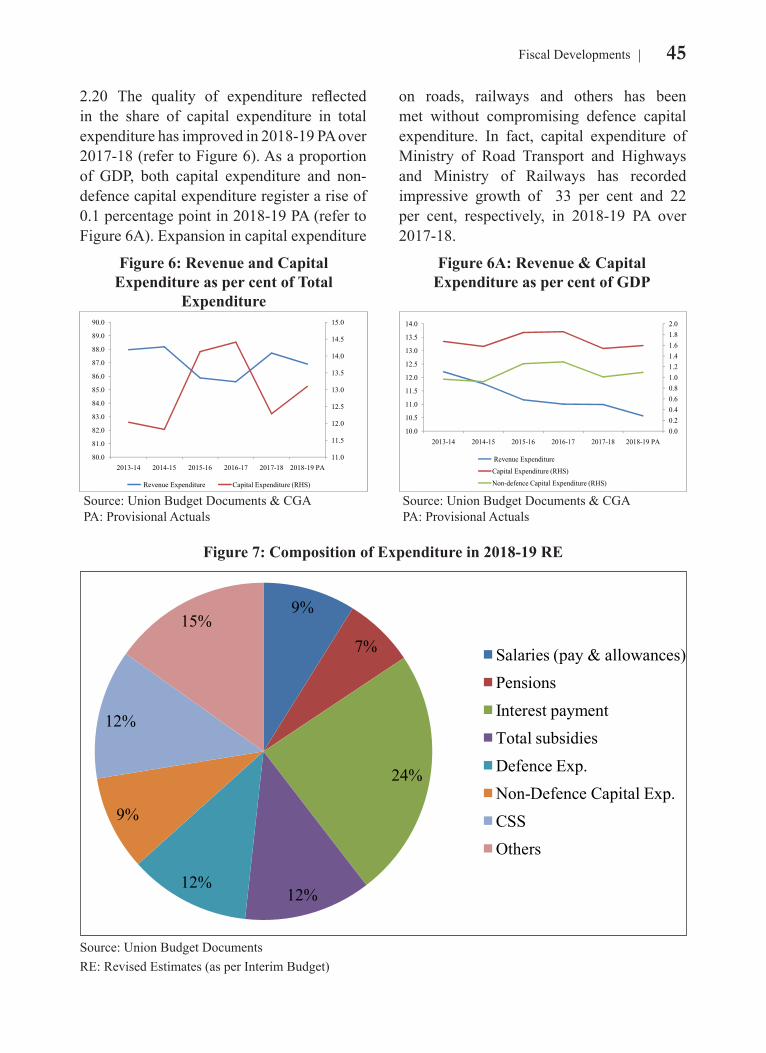
45Fiscal Developments
2.20 The quality of expenditure reflected in the share of capital expenditure in total expenditure has improved in 2018-19 PA over 2017-18 (refer to Figure 6). As a proportion of GDP, both capital expenditure and non-defence capital expenditure register a rise of 0.1 percentage point in 2018-19 PA (refer to Figure 6A). Expansion in capital expenditure
on roads, railways and others has been met without compromising defence capital expenditure. In fact, capital expenditure of Ministry of Road Transport and Highways and Ministry of Railways has recorded impressive growth of 33 per cent and 22 per cent, respectively, in 2018-19 PA over 2017-18.
Figure 6: Revenue and Capital Expenditure as per cent of Total
Expenditure
Figure 6A: Revenue & Capital Expenditure as per cent of GDP
11.0
11.5
12.0
12.5
13.0
13.5
14.0
14.5
15.0
80.0
81.0
82.0
83.0
84.0
85.0
86.0
87.0
88.0
89.0
90.0
2013-14 2014-15 2015-16 2016-17 2017-18 2018-19 PA
Revenue Expenditure Capital Expenditure (RHS)
0.00.20.40.60.81.01.21.41.61.82.0
10.0
10.5
11.0
11.5
12.0
12.5
13.0
13.5
14.0
2013-14 2014-15 2015-16 2016-17 2017-18 2018-19 PA
Revenue ExpenditureCapital Expenditure (RHS)Non-defence Capital Expenditure (RHS)
Source: Union Budget Documents & CGAPA: Provisional Actuals
Source: Union Budget Documents & CGAPA: Provisional Actuals
Figure 7: Composition of Expenditure in 2018-19 RE
9%
7%
24%
12%12%
9%
12%
15%
Salaries (pay & allowances)PensionsInterest paymentTotal subsidiesDefence Exp.Non-Defence Capital Exp.CSS Others
Source: Union Budget Documents RE: Revised Estimates (as per Interim Budget)
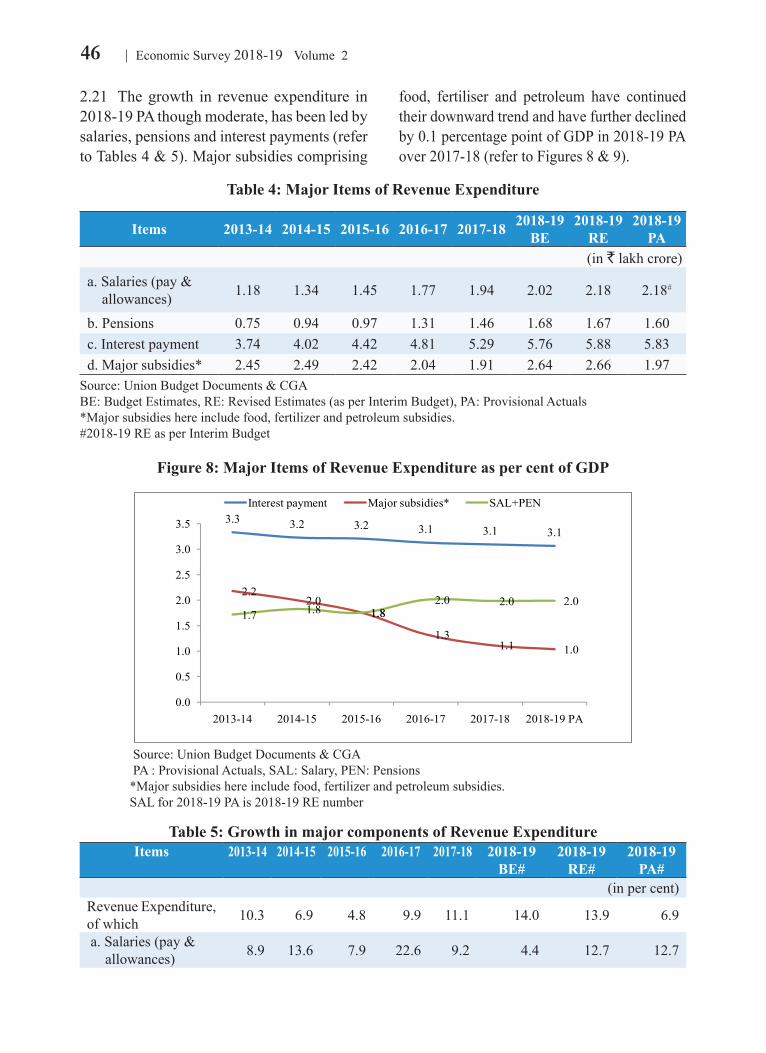
46 Economic Survey 2018-19 Volume 2
2.21 The growth in revenue expenditure in 2018-19 PA though moderate, has been led by salaries, pensions and interest payments (refer to Tables 4 & 5). Major subsidies comprising
food, fertiliser and petroleum have continued their downward trend and have further declined by 0.1 percentage point of GDP in 2018-19 PA over 2017-18 (refer to Figures 8 & 9).
Table 4: Major Items of Revenue Expenditure
Items 2013-14 2014-15 2015-16 2016-17 2017-18 2018-19 BE
2018-19 RE
2018-19 PA
(in ` lakh crore) a. Salaries (pay & allowances) 1.18 1.34 1.45 1.77 1.94 2.02 2.18 2.18#
b. Pensions 0.75 0.94 0.97 1.31 1.46 1.68 1.67 1.60 c. Interest payment 3.74 4.02 4.42 4.81 5.29 5.76 5.88 5.83 d. Major subsidies* 2.45 2.49 2.42 2.04 1.91 2.64 2.66 1.97
Source: Union Budget Documents & CGABE: Budget Estimates, RE: Revised Estimates (as per Interim Budget), PA: Provisional Actuals*Major subsidies here include food, fertilizer and petroleum subsidies.#2018-19 RE as per Interim Budget
Figure 8: Major Items of Revenue Expenditure as per cent of GDP
3.3 3.2 3.2 3.1 3.1 3.1
2.22.0
1.8
1.31.1 1.0
1.7 1.8 1.82.0 2.0 2.0
0.0
0.5
1.0
1.5
2.0
2.5
3.0
3.5
2013-14 2014-15 2015-16 2016-17 2017-18 2018-19 PA
Interest payment Major subsidies* SAL+PEN
Source: Union Budget Documents & CGA PA : Provisional Actuals, SAL: Salary, PEN: Pensions *Major subsidies here include food, fertilizer and petroleum subsidies. SAL for 2018-19 PA is 2018-19 RE number
Table 5: Growth in major components of Revenue ExpenditureItems 2013-14 2014-15 2015-16 2016-17 2017-18 2018-19
BE#2018-19
RE#2018-19
PA#(in per cent)
Revenue Expenditure, of which 10.3 6.9 4.8 9.9 11.1 14.0 13.9 6.9
a. Salaries (pay & allowances) 8.9 13.6 7.9 22.6 9.2 4.4 12.7 12.7
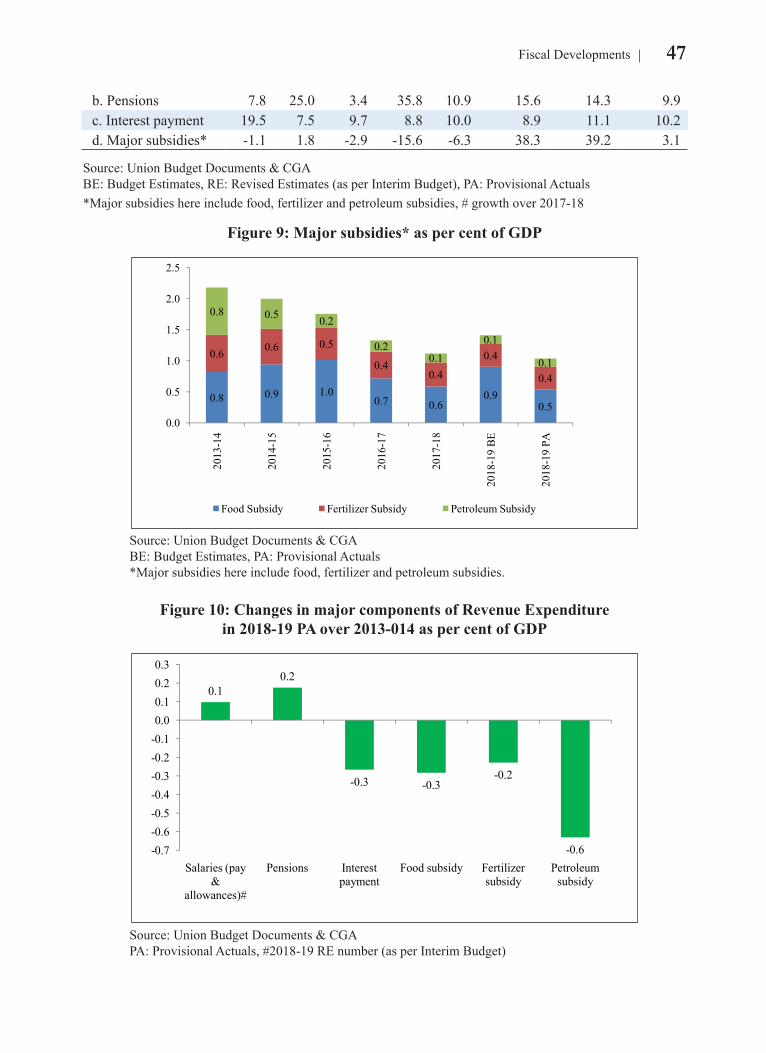
47Fiscal Developments
b. Pensions 7.8 25.0 3.4 35.8 10.9 15.6 14.3 9.9 c. Interest payment 19.5 7.5 9.7 8.8 10.0 8.9 11.1 10.2 d. Major subsidies* -1.1 1.8 -2.9 -15.6 -6.3 38.3 39.2 3.1
Source: Union Budget Documents & CGABE: Budget Estimates, RE: Revised Estimates (as per Interim Budget), PA: Provisional Actuals*Major subsidies here include food, fertilizer and petroleum subsidies, # growth over 2017-18
Figure 9: Major subsidies* as per cent of GDP
0.8 0.9 1.00.7 0.6
0.90.5
0.6 0.6 0.5
0.40.4
0.4
0.4
0.8 0.5 0.2
0.20.1
0.1
0.1
0.0
0.5
1.0
1.5
2.0
2.5
2013
-14
2014
-15
2015
-16
2016
-17
2017
-18
2018
-19
BE
2018
-19
PA
Food Subsidy Fertilizer Subsidy Petroleum Subsidy
Source: Union Budget Documents & CGA BE: Budget Estimates, PA: Provisional Actuals *Major subsidies here include food, fertilizer and petroleum subsidies.
Figure 10: Changes in major components of Revenue Expenditure in 2018-19 PA over 2013-014 as per cent of GDP
0.10.2
-0.3 -0.3-0.2
-0.6-0.7-0.6-0.5-0.4-0.3-0.2-0.10.00.10.20.3
Salaries (pay &
allowances)#
Pensions Interest payment
Food subsidy Fertilizer subsidy
Petroleum subsidy
Source: Union Budget Documents & CGA PA: Provisional Actuals, #2018-19 RE number (as per Interim Budget)
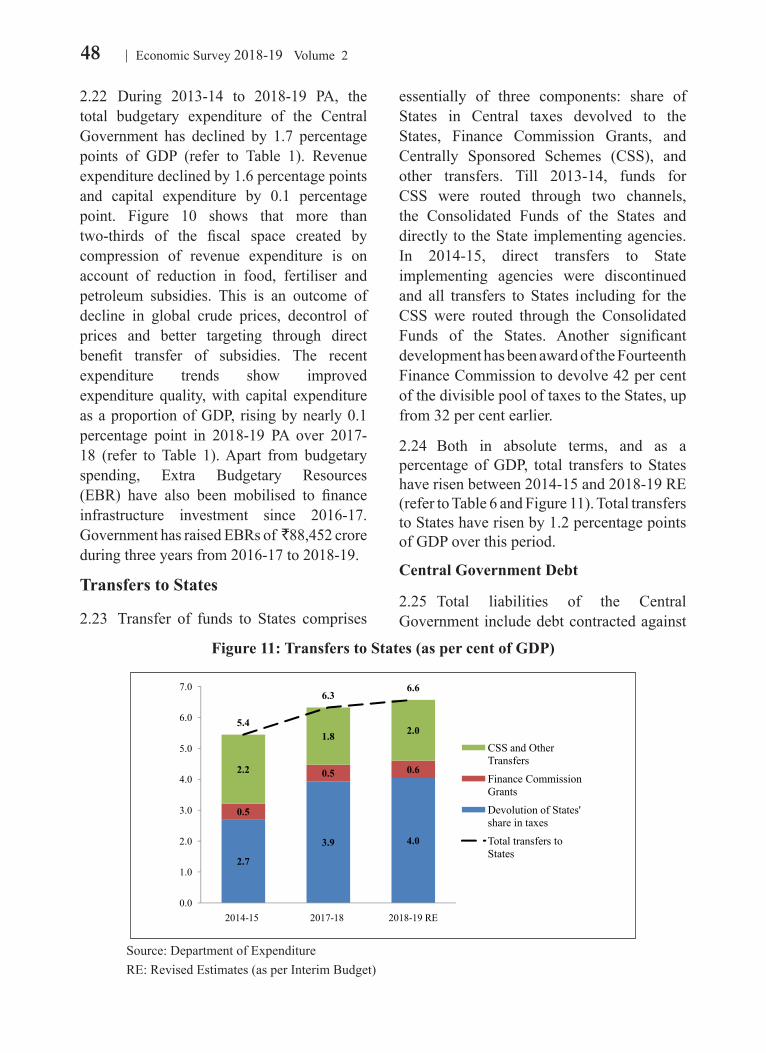
48 Economic Survey 2018-19 Volume 2
2.22 During 2013-14 to 2018-19 PA, the total budgetary expenditure of the Central Government has declined by 1.7 percentage points of GDP (refer to Table 1). Revenue expenditure declined by 1.6 percentage points and capital expenditure by 0.1 percentage point. Figure 10 shows that more than two-thirds of the fiscal space created by compression of revenue expenditure is on account of reduction in food, fertiliser and petroleum subsidies. This is an outcome of decline in global crude prices, decontrol of prices and better targeting through direct benefit transfer of subsidies. The recent expenditure trends show improved expenditure quality, with capital expenditure as a proportion of GDP, rising by nearly 0.1 percentage point in 2018-19 PA over 2017-18 (refer to Table 1). Apart from budgetary spending, Extra Budgetary Resources (EBR) have also been mobilised to finance infrastructure investment since 2016-17. Government has raised EBRs of ̀ 88,452 crore during three years from 2016-17 to 2018-19.
Transfers to States
2.23 Transfer of funds to States comprises
essentially of three components: share of States in Central taxes devolved to the States, Finance Commission Grants, and Centrally Sponsored Schemes (CSS), and other transfers. Till 2013-14, funds for CSS were routed through two channels, the Consolidated Funds of the States and directly to the State implementing agencies. In 2014-15, direct transfers to State implementing agencies were discontinued and all transfers to States including for the CSS were routed through the Consolidated Funds of the States. Another significant development has been award of the Fourteenth Finance Commission to devolve 42 per cent of the divisible pool of taxes to the States, up from 32 per cent earlier.
2.24 Both in absolute terms, and as a percentage of GDP, total transfers to States have risen between 2014-15 and 2018-19 RE (refer to Table 6 and Figure 11). Total transfers to States have risen by 1.2 percentage points of GDP over this period.
Central Government Debt
2.25 Total liabilities of the Central Government include debt contracted against
Figure 11: Transfers to States (as per cent of GDP)
2.7
3.9 4.0
0.5
0.5 0.62.2
1.8 2.05.4
6.36.6
0.0
1.0
2.0
3.0
4.0
5.0
6.0
7.0
2014-15 2017-18 2018-19 RE
CSS and Other TransfersFinance Commission GrantsDevolution of States' share in taxesTotal transfers to States
Source: Department of Expenditure RE: Revised Estimates (as per Interim Budget)
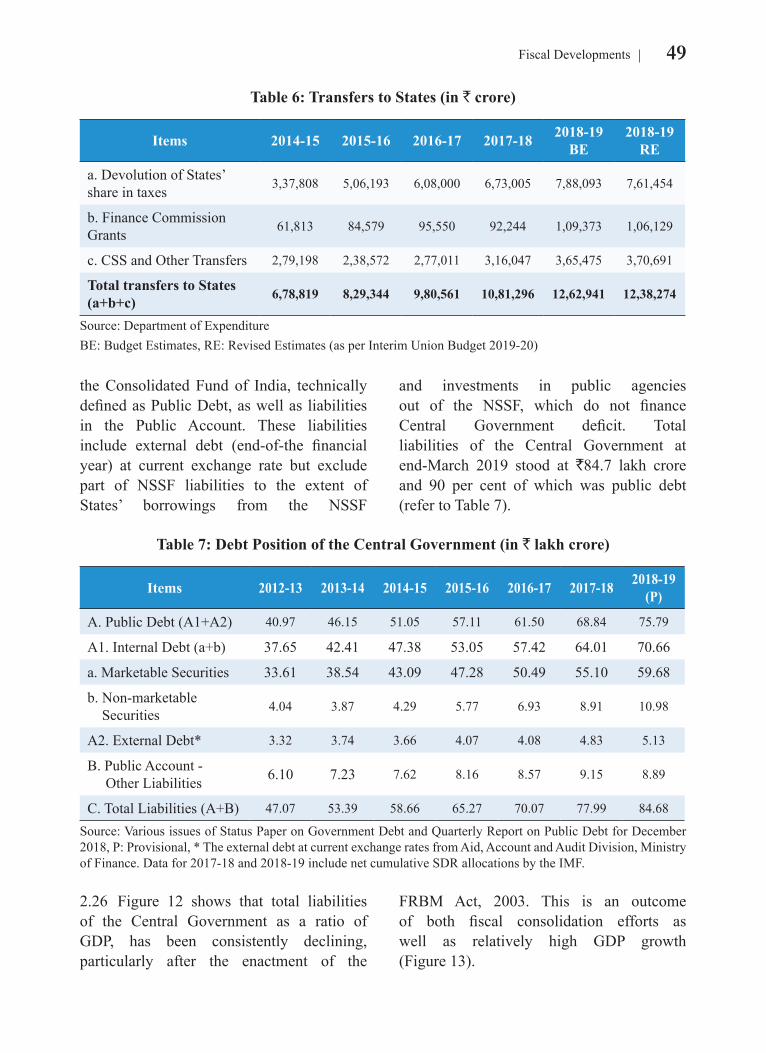
49Fiscal Developments
2.26 Figure 12 shows that total liabilities of the Central Government as a ratio of GDP, has been consistently declining, particularly after the enactment of the
FRBM Act, 2003. This is an outcome of both fiscal consolidation efforts as well as relatively high GDP growth (Figure 13).
the Consolidated Fund of India, technically defined as Public Debt, as well as liabilities in the Public Account. These liabilities include external debt (end-of-the financial year) at current exchange rate but exclude part of NSSF liabilities to the extent of States’ borrowings from the NSSF
and investments in public agencies out of the NSSF, which do not finance Central Government deficit. Total liabilities of the Central Government at end-March 2019 stood at `84.7 lakh crore and 90 per cent of which was public debt (refer to Table 7).
Table 6: Transfers to States (in ` crore)
Items 2014-15 2015-16 2016-17 2017-18 2018-19 BE
2018-19 RE
a. Devolution of States’ share in taxes 3,37,808 5,06,193 6,08,000 6,73,005 7,88,093 7,61,454
b. Finance Commission Grants 61,813 84,579 95,550 92,244 1,09,373 1,06,129
c. CSS and Other Transfers 2,79,198 2,38,572 2,77,011 3,16,047 3,65,475 3,70,691
Total transfers to States (a+b+c) 6,78,819 8,29,344 9,80,561 10,81,296 12,62,941 12,38,274
Source: Department of ExpenditureBE: Budget Estimates, RE: Revised Estimates (as per Interim Union Budget 2019-20)
Table 7: Debt Position of the Central Government (in ` lakh crore)
Items 2012-13 2013-14 2014-15 2015-16 2016-17 2017-18 2018-19 (P)
A. Public Debt (A1+A2) 40.97 46.15 51.05 57.11 61.50 68.84 75.79
A1. Internal Debt (a+b) 37.65 42.41 47.38 53.05 57.42 64.01 70.66
a. Marketable Securities 33.61 38.54 43.09 47.28 50.49 55.10 59.68
b. Non-marketable Securities 4.04 3.87 4.29 5.77 6.93 8.91 10.98
A2. External Debt* 3.32 3.74 3.66 4.07 4.08 4.83 5.13
B. Public Account - Other Liabilities 6.10 7.23 7.62 8.16 8.57 9.15 8.89
C. Total Liabilities (A+B) 47.07 53.39 58.66 65.27 70.07 77.99 84.68
Source: Various issues of Status Paper on Government Debt and Quarterly Report on Public Debt for December 2018, P: Provisional, * The external debt at current exchange rates from Aid, Account and Audit Division, Ministry of Finance. Data for 2017-18 and 2018-19 include net cumulative SDR allocations by the IMF.
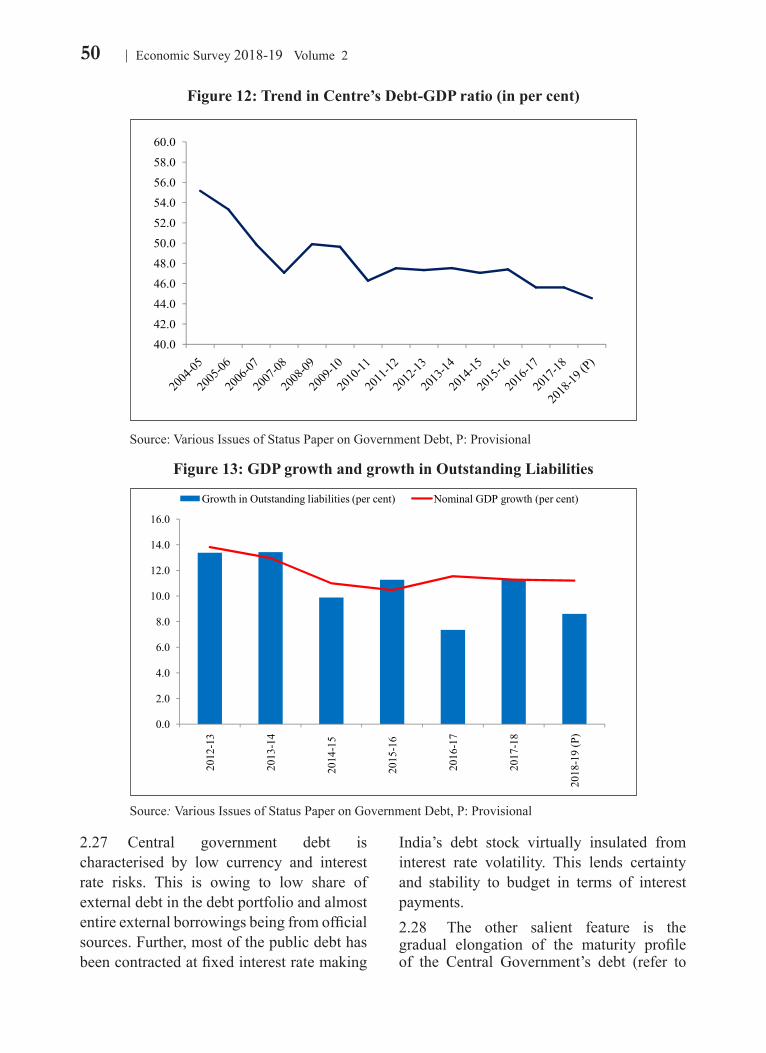
50 Economic Survey 2018-19 Volume 2
2.27 Central government debt is characterised by low currency and interest rate risks. This is owing to low share of external debt in the debt portfolio and almost entire external borrowings being from official sources. Further, most of the public debt has been contracted at fixed interest rate making
India’s debt stock virtually insulated from interest rate volatility. This lends certainty and stability to budget in terms of interest payments. 2.28 The other salient feature is the gradual elongation of the maturity profile of the Central Government’s debt (refer to
Figure 12: Trend in Centre’s Debt-GDP ratio (in per cent)
40.0
42.0
44.0
46.0
48.0
50.0
52.0
54.0
56.0
58.0
60.0
Source: Various Issues of Status Paper on Government Debt, P: Provisional
Figure 13: GDP growth and growth in Outstanding Liabilities
0.0
2.0
4.0
6.0
8.0
10.0
12.0
14.0
16.0
2012
-13
2013
-14
2014
-15
2015
-16
2016
-17
2017
-18
2018
-19
(P)
Growth in Outstanding liabilities (per cent) Nominal GDP growth (per cent)
Source: Various Issues of Status Paper on Government Debt, P: Provisional
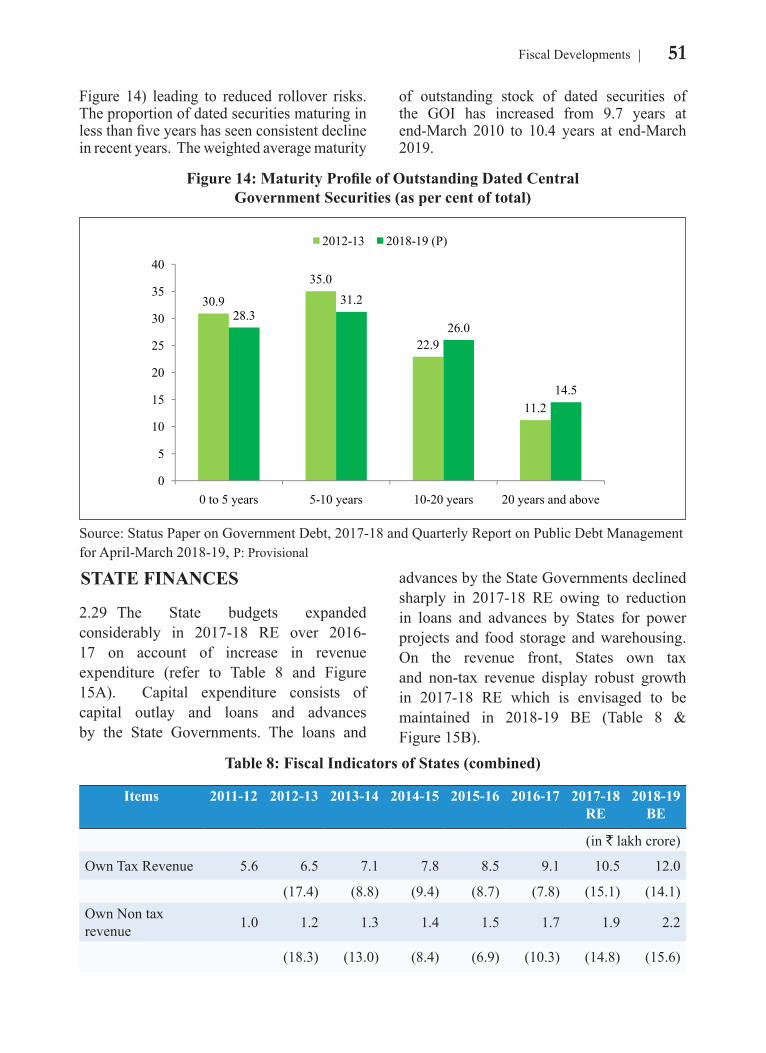
51Fiscal Developments
advances by the State Governments declined sharply in 2017-18 RE owing to reduction in loans and advances by States for power projects and food storage and warehousing. On the revenue front, States own tax and non-tax revenue display robust growth in 2017-18 RE which is envisaged to be maintained in 2018-19 BE (Table 8 & Figure 15B).
Figure 14) leading to reduced rollover risks. The proportion of dated securities maturing in less than five years has seen consistent decline in recent years. The weighted average maturity
of outstanding stock of dated securities of the GOI has increased from 9.7 years at end-March 2010 to 10.4 years at end-March 2019.
STATE FINANCES
2.29 The State budgets expanded considerably in 2017-18 RE over 2016-17 on account of increase in revenue expenditure (refer to Table 8 and Figure 15A). Capital expenditure consists of capital outlay and loans and advances by the State Governments. The loans and
Figure 14: Maturity Profile of Outstanding Dated Central Government Securities (as per cent of total)
30.9
35.0
22.9
11.2
28.331.2
26.0
14.5
0
5
10
15
20
25
30
35
40
0 to 5 years 5-10 years 10-20 years 20 years and above
2012-13 2018-19 (P)
Source: Status Paper on Government Debt, 2017-18 and Quarterly Report on Public Debt Management for April-March 2018-19, P: Provisional
Table 8: Fiscal Indicators of States (combined)
Items 2011-12 2012-13 2013-14 2014-15 2015-16 2016-17 2017-18 RE
2018-19 BE
(in ` lakh crore)
Own Tax Revenue 5.6 6.5 7.1 7.8 8.5 9.1 10.5 12.0
(17.4) (8.8) (9.4) (8.7) (7.8) (15.1) (14.1)Own Non tax revenue 1.0 1.2 1.3 1.4 1.5 1.7 1.9 2.2
(18.3) (13.0) (8.4) (6.9) (10.3) (14.8) (15.6)

52 Economic Survey 2018-19 Volume 2
2.30 The RBI study on State Finances points to the deterioration in fiscal deficit to GDP ratio in 2017-18 RE when compared to the budget estimate. This deterioration occurred due to the overshooting of revenue expenditure mainly due to farm loan waiver and pay revisions. However, over 2016-17, there is consolidation in fiscal deficit by about
0.4 percentage points (refer to Figure 16 A).
2.31 States have budgeted for fiscal deficit of 2.6 per cent of GDP in 2018-19 BE. Consolidation is mainly due to posting of surplus of about 0.2 percentage points of GDP on the revenue account (refer to Figure 16 B).
Revenue Expenditure 10.7 12.3 13.8 16.4 18.4 20.9 25.2 27.8
(14.6) (12.0) (18.7) (12.3) (13.5) (20.7) (10.5)Capital Expenditure 2.1 2.2 2.4 3.0 4.2 5.1 5.1 5.8
(6.2) (9.6) (23.3) (40.5) (20.4) (-0.1) (12.9)Total Expenditure 12.8 14.5 16.2 19.4 22.6 26.0 30.3 33.6
(13.2) (11.6) (19.4) (16.7) (14.8) (16.6) (10.9)Source: RBI State Finances: A Study of Budgets, RE : Revised Estimates, BE : Budget EstimatesNumbers in parenthesis are growth rates
Figure 15A : States' Expenditure in ` lakh crore
Figure 15B : Own Tax & Non-tax Revenue of States (combined) in ` lakh
crore
12.3 13.8 16.4 18.4 20.925.2 27.82.2
2.43.0
4.25.1
5.15.8
0.0
5.0
10.0
15.0
20.0
25.0
30.0
35.0
40.0
2012-13 2013-14 2014-15 2015-16 2016-17 2017-18 RE2018-19 BE
Revenue Expenditure Capital Expenditure
6.57.1
7.88.5
9.110.5
12.0
1.2 1.3 1.4 1.5 1.7 1.9 2.2
0.0
2.0
4.0
6.0
8.0
10.0
12.0
14.0
2012-13 2013-14 2014-15 2015-16 2016-17 2017-18 RE2018-19 BE
Own Tax Revenue Own Non tax revenue
Source: RBI State Finances: A Study of Budgets, RE : Revised Estimates, BE : Budget Estimates
Figure 16A: Gross Fiscal Deficit of States (as per cent of GDP)
Figure 16B: Revenue Deficit of States (as per cent of GDP)
2.02.2
2.6
3.1
3.5
3.1
2.6
0.0
0.5
1.0
1.5
2.0
2.5
3.0
3.5
4.0
2012-13 2013-14 2014-15 2015-16 2016-17 2017-18 RE
2018-19 BE
-0.2
0.1
0.4
0.0
0.3
0.4
-0.2
-0.3
-0.2
-0.1
0.0
0.1
0.2
0.3
0.4
0.5
2012-13 2013-14 2014-15 2015-16 2016-17 2017-18 RE
2018-19 BE
Source: RBI State Finances: A Study of Budgets, RE : Revised Estimates, BE : Budget Estimates

53Fiscal Developments
GENERAL GOVERNMENT FINANCES
2.33 The General Government (Centre plus States) has been on the path of fiscal consolidation and fiscal discipline. The combined liabilities of Centre and States
have declined to 67 per cent of GDP as on end-March 2018 from 68.5 per cent of GDP as on end-March 2016 (refer to Table 9). The fiscal deficit of General Government is further expected to decline from 6.4 per cent of GDP in 2017-18 RE to 5.8 per cent of GDP in 2018-19 BE (Figure 19).
2.32 Figure 17 shows that outstanding liabilities of states, as per cent of GDP, has increased after 2014-15. The issuance of UDAY bonds in 2015-16 and 2016-17, farm loan waivers, and the implementation of pay commission awards have led to higher debt to GDP ratio. Economic Survey
2016-17 had estimated impact of UDAY bonds on fiscal deficit to be 0.7 percentage points of GDP. However, despite rising States’ debt to GDP ratio, interest payment as proportion of revenue receipts has not deteriorated (refer to Figure 18).
Figure 17: Total Outstanding liabilities of the State Governments (as per cent of
GDP)
Figure 18: Interest Payments/Revenue Receipts (in per cent)
22.8
22.2 22.021.7
23.423.8 24.0
24.3
20.020.521.021.522.022.523.023.524.024.525.0
2011
-12
2012
-13
2013
-14
2014
-15
2015
-16
2016
-17
2017
-18 R
E
2018
-19 B
E
Source: RBI State Finances: A Study of Budgets, Union Budget Documents, RE : Revised Estimates, BE : Budget Estimates
Table 9: Total outstanding liabilities of Centre and States (as per cent of GDP)
Year Liabilities of Centre Liabilities of StatesCombined
Liabilities of the Centre & States
2011-12 47.5 22.8 67.42012-13 47.3 22.2 66.72013-14 47.5 22.0 67.12014-15 47.1 21.7 66.62015-16 47.4 23.4 68.52016-17 45.6 23.8 67.02017-18 45.6 24.0 (RE) 67.0
Source: Various Issues of Status Paper on Government Debt & RBI State Finances: A Study of Budgets RE : Revised Estimates
10
15
20
25
30
35
40
45
50
55
Centre States
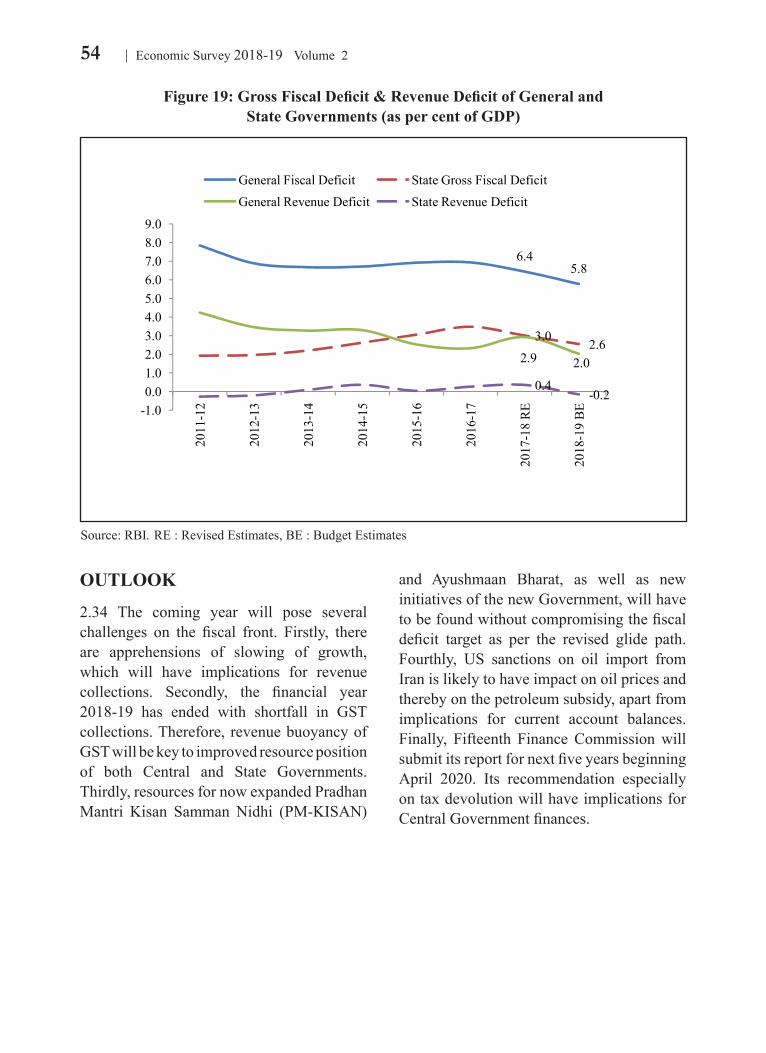
54 Economic Survey 2018-19 Volume 2
OUTLOOK
2.34 The coming year will pose several challenges on the fiscal front. Firstly, there are apprehensions of slowing of growth, which will have implications for revenue collections. Secondly, the financial year 2018-19 has ended with shortfall in GST collections. Therefore, revenue buoyancy of GST will be key to improved resource position of both Central and State Governments. Thirdly, resources for now expanded Pradhan Mantri Kisan Samman Nidhi (PM-KISAN)
and Ayushmaan Bharat, as well as new initiatives of the new Government, will have to be found without compromising the fiscal deficit target as per the revised glide path. Fourthly, US sanctions on oil import from Iran is likely to have impact on oil prices and thereby on the petroleum subsidy, apart from implications for current account balances. Finally, Fifteenth Finance Commission will submit its report for next five years beginning April 2020. Its recommendation especially on tax devolution will have implications for Central Government finances.
Figure 19: Gross Fiscal Deficit & Revenue Deficit of General and State Governments (as per cent of GDP)
6.45.8
3.0 2.62.9 2.0
0.4-0.2
-1.00.01.02.03.04.05.06.07.08.09.0
2011
-12
2012
-13
2013
-14
2014
-15
2015
-16
2016
-17
2017
-18
RE
2018
-19
BE
General Fiscal Deficit State Gross Fiscal DeficitGeneral Revenue Deficit State Revenue Deficit
Source: RBI. RE : Revised Estimates, BE : Budget Estimates
55Fiscal Developments
CHAPTER AT A GLANCE The revised fiscal glide path envisages achieving fiscal deficit of 3 per cent of GDP by FY 2020-
21 and Central Government debt to 40 per cent of GDP by 2024-25. The FY 2018-19 has ended with fiscal deficit at 3.4 per cent of GDP and debt to GDP ratio of 44.5 per cent (Provisional).
As per cent of GDP, total Central Government expenditure fell by 0.3 percentage points in 2018-19 PA over 2017-18, with 0.4 percentage points reduction in revenue expenditure and 0.1 percentage point increase in capital expenditure.
With respect to States finances, their own tax and non-tax revenue display robust growth in 2017-18 RE which is envisaged to be maintained in 2018-19 BE.
The General Government (Centre plus States) has been on the path of fiscal consolidation and fiscal discipline.
Several challenges on the fiscal front in 2019-20 include revenue implications on account of apprehensions of slowing of growth, revenue buoyancy of GST and provisioning for schemes such as PM-KISAN without compromising the fiscal deficit target.
56 Economic Survey 2018-19 Volume 2
Annex I∗: Status of implementation of GST and Recent Initiatives in Customs DutyA. Implementation Status of GST
Facilitation measures in GST
(i) Threshold limit of aggregate turnover for exemption from registration and payment of GST for the suppliers of goods has been enhanced from `10 lakhs to `20 lakhs (in the States of Arunachal Pradesh, Manipur, Meghalaya, Mizoram, Nagaland, Puducherry, Sikkim, Telangana, Tripura and Uttarakhand) and from `20 lakhs to `40 lakhs for other States, with effect from 01.04.2019.
(ii) Composition scheme has been formulated for small businessman - supplier of goods and restaurant services. Under the scheme, persons with turnover up to ̀ 1.5 crore (`75 lakhs in States of Arunachal Pradesh, Manipur, Meghalaya, Mizoram, Nagaland, Sikkim, Tripura and Uttarakhand) need to pay tax equal to 1 per cent to 5 per cent on his turnover and to file returns annually, with quarterly payment from FY 2019-20.
(iii) Composition scheme has been formulated for suppliers of services. Under the scheme, persons with turnover up to `50 lakhs need to pay tax equal to 6 per cent on their turnover and need to file their returns annually with quarterly payment from financial year 2019-20.
(iv) GST Council once again allowed the migration process for taxpayers from erstwhile tax regimes. Due dates for furnishing return in Form GSTR-3B & Form GSTR-1 (for taxpayers with turnover more than `1.5 crore) for such newly migrated taxpayers for the months from July, 2017 to December, 2018 was extended till 31.03.2019. Similarly, Form GSTR-1 (for taxpayers with turnover upto `1.5 crore) for the quarters from July, 2017 to December, 2018 was extended till 31.03.2019.
(v) As per the new return filing system, there would be only one return form to be filed monthly. Frequency for filing of return for small taxpayers having turnover upto `5 crore in previous FY will be quarterly [Sahaj (only B2C), Sugam (B2B and B2C) and normal quarterly]. In the new system, supplier will be allowed to upload the invoices continuously anytime during the month and the recipient would also be able to continuously view the uploaded invoice. Misuse of ITC due to default in payment of tax by the supplier shall be controlled primarily by recovery of tax from the supplier. However, reversal of credit from buyer shall also be an option available with the revenue authorities in certain exceptional circumstances. The new return system will be implemented on a trial basis from 01.04.2019 and will be mandatory from 01.07.2019.
(vi) Government has been very pro-active in ensuring that GST gets implemented smoothly. GST Law / Rules / procedures have been adapted to the needs of the trade and industry. To this effect, since the date of introduction, Centre has issued 495 notifications, 101 circulars, 18 orders, 12 removal of difficulties orders & more than 125 press releases (as on 28.02.2019).
(vii) Exemption from TDS has been granted in case of supply made by any Government authority / PSU to another Government authority / PSU.
____________* The tax measures and rate changes given in this Annex are only meant for general readers and will not serve as reference
points for tax payers.
57Fiscal Developments
Measures under GST to boost exports
(i) Relief has been given to exporters by giving them an option to export without payment of tax, by submitting a simple letter of undertaking on their letter heads. This is in line with the philosophy of charging no tax on exports.
(ii) Glitches in the refund process were overcome by devising a manual process for the same. Requisite circulars were issued in order to bring clarity and make the procedure certain. A concerted drive was undertaken to make refund to the taxpayers.
(iii) Total amount of RFD-01A claims disposed by Centre and States is `65,567 crore (approximately). Further, IGST refund claims to the tune of ̀ 68,014 crore (approximately) have also been disposed. Thus, refund claims totalling to `1,33,581 crore have been disposed of till 31.03.2019.
(iv) Merchant exporters have to pay nominal GST of 0.1 per cent for procuring goods from domestic suppliers for export. This was done in order to provide a big thrust to the growth of the export sector and resolve their working capital issues. The permanent solution to cash blockage is “e-Wallet” scheme, which is proposed to be launched with effect from 01.04.2020.
GST rate rationalization
Goods
(i) With the expansion of tax base and the stabilization of revenues under GST, a continuous rationalization of GST rate structure has been done. Today, only about 32 items are remaining in the 28 per cent slab. Bulk of the items remaining in this category are either luxury or sin goods.
(ii) The major rate reductions during the financial year 2018-19 are as follows:
a. 28 per cent to 18 per cent/12 per cent/5 per cent: The GST rates were reduced to lower the cost to the consumers, thereby increasing purchasing power of consumers, this has added to the increased consumption in the economy. Some of the items on which the rates were brought down from 28 per cent were consumer goods such as televisions upto the size of 68 cm, refrigerators, freezers and other refrigerating equipment including water coolers, milk coolers, washing machines, vacuum cleaners, domestic electrical appliances such as food grinders and mixers etc., storage water heaters, immersion heaters, hair dryers, digital cameras and video camera recorders, etc. Certain other industrial use items were also removed from the 28 per cent list such as pulleys, transmission shafts and cranks, gear boxes etc., lithium ion batteries, refrigerating equipment for the leather industry, ice cream freezers, special purpose motor vehicles, works trucks [self-propelled, not fitted with lifting or handling equipment] of the type used in factories, warehouses, dock areas or airports, fuel cell vehicle, re-treaded or used pneumatic tyres of rubber etc.
b. 18 per cent to 12 per cent/5 per cent/nil: GST rates were rationalized to avoid classification disputes on cork (roughly squared or debagged), articles of natural cork, agglomerated cork and marble rubble. Similarly, for the benefit of masses, the GST rates have been
58 Economic Survey 2018-19 Volume 2
rationalized for stone/marble/wooden deities, bamboo flooring, brass kerosene pressure stove, hand operated rubber roller, zip and slide fasteners etc.
c. 12 per cent to 5 per cent: GST rates on natural cork, walking stick, fly-ash blocks, handloom dari, fertilizer grade phosphoric acid, knitted cap/topi having retail sale value less than `1000 have been rationalised.
d. Other significant rationalization measures under GST:
• Considering the difficulty faced by the Fabric sector on account of the blocking of input tax credit on fabrics arising out of the inverted duty structure, the GST Council in its 28th meeting held on 21st July, 2018 recommended allowing refund to fabrics on account of inverted duty structure. The refund of accumulated ITC was allowed only with the prospective effect on the purchases made after the notification is issued.
• GST rates have been rationalized on specified handicraft items.
• IGST @5per cent on Pool Issue Price (PIP) of Urea imported on Govt. account for direct agriculture use, instead of assessable value plus custom duty.
(iii) Exemption from the levy of GST on goods
• The GST Council recommended granting exemption to the following goods used by the common man, namely, sanitary napkins, coir pith compost, sal leaves, siali leaves and their products and sabai rope, phool bhari jhadoo, khalidona, music books, vegetables (uncooked or cooked by steaming or boiling in water, frozen, branded and put in a unit container), vegetable provisionally preserved (for example by sulphur dioxide gas, in brine, in sulphur water or in other preservative solutions), but unsuitable in that state for immediate consumption etc.
• Clarifications/ amendments as regards the applicability of GST rate in respect of certain goods such as sprinkler system consisting of nozzles, lateral and other components, movement of rigs, tools & spares and all goods on wheels on own account, LPG supplied in bulk to an OMC by refiners/fractioners for bottling for further supply, etc.
Services
(i) After implementation of GST regime, rates have been rationalized significantly to address the concerns of trade and consumers. The major rate reductions during the financial year 2018-19 are as follows:
• The GST rate on services provided by restaurants (except by restaurants in hotels having tariff of `7500 per unit per day or more) have been reduced from 18 per cent to 5 per cent.
• With effect from 1st April, 2019, effective GST rate on construction of affordable houses has been reduced from 8per cent to 1 per cent and on other houses i.e. not in the affordable category, from 12 per cent to 5 per cent. Affordable houses have been defined as houses having carpet area of 60 sqm in metropolitan areas and upto 90 sqm in non-metro areas and having cost of upto `45 lakhs.

59Fiscal Developments
• GST rate on cinema theatres having entry ticket of upto `100 has been prescribed at reduced rate of 18 per cent.
• GST rate on services provided by amusement parks including theme parks, water parks, joy rides, merry go rounds, go carting and ballet has been reduced from 28 per cent to 18 per cent.
(ii) Exemption from the levy of GST on Services:
Two major services consumed by the common man, namely, health care services provided by clinical establishments and educational services provided by educational institutions are exempted from GST.
In addition, following services consumed by the common man have been completely exempted from GST:
(a) Services received from a provider of service located by way of supply of online educational journals or periodicals to a higher educational institution (i.e., other than an institution providing pre-school education and education up to higher secondary school or equivalent).
(b) Services provided by an educational institution by way of conduct of entrance examination against consideration in the form of entrance fee.
(c) Services provided to an educational institution, by way of supply of services relating to admission to, or conduct of examination by all educational institutions.
(d) Services provided by Fair Price Shops to Central Government, State Government or Union Territory by way of sale of food grains, kerosene, sugar, edible oil, etc. under Public Distribution System against consideration in the form of commission or margin.
(e) Services by way of giving on hire motor vehicle for transport of students, faculty and staff, to a person providing services of transportation of students, faculty and staff to an educational institution providing services by way of pre-school education and education upto higher secondary school or equivalent (sub-contractor will also be exempt from GST).
(f) Services by way of admission to a protected monument so declared under the Ancient Monuments and Archaeological Sites and Remains Act 1958 or any of the State Acts, for the time being in force.
(g) Services by way of right to admission to circus, dance, or theatrical performance including drama or ballet; award function, concert, pageant, musical performance or any sporting event other than a recognised sporting event; recognised sporting event; planetarium, where the consideration for right to admission to the events or places is not more than `500 per person.
(h) Services of life insurance business provided by way of annuity under National Pension System regulated by PFRDA is exempt.
(i) Services of a Resident Welfare Associations (RWA) to its members against contribution of an amount upto `7500 per month.
60 Economic Survey 2018-19 Volume 2
(iii) Multiple reliefs from GST taxation have been provided to following categories of services:
(i) Agriculture, farming and food processing industry,
(ii) Education, training and skill development,
(iii) Pension, social security and old age support.
(iv) Banking/ Finance/ Insurance services,
(v) Government Services,
(vi) Tourism and hospitality services,
(vii) Construction and works contract services,
(viii) Transportation services.
B. Customs Duty• There has been concerted effort from the Government to avoid inverted duty structure on
goods imported into India. The Basic Customs Duty (BCD) rates have been rationalized to the rate of 2.5 per cent/5 per cent/7.5 per cent on most of the inputs and intermediate products like industrial chemicals, ores and concentrates, fuels for industrial use, textile fibres and yarns etc. used in industries for manufacturing.
• Government has followed a conscious policy to promote the “Make in India” initiative. Therefore, several end use-based exemptions and lower rates of customs duty have been prescribed on goods imported for further processing in India and higher import duties on finished products. The customs duty was increased on finished products like footwear, processed foods, cellular mobile phones, perfumes, cosmetics and other toilet preparations, watches, furniture, toys, light fittings etc., in Union Budget 2018-19. In October, 2018, duties were increased on plastic articles, washing machine, refrigerator, air conditioners, speakers, telecom equipment and certain other items that are largely imported from China.
• The customs duty rates on most of the electronic and IT products imported from China have been increased several times over the last two years. There has been an increase in customs duty on finished electronics goods and consumer durables like cellular mobile phones, LED TVs, microwave ovens, refrigerators, air conditioners etc. to promote domestic value addition.
• Further the customs duty on 298 tariff lines of man-made fibre fabrics was increased from 10 per cent to 20 per cent for protecting domestic industry from imports. Further BCD was increased on 504 tariff lines of textile articles including garments.
61Fiscal Developments
Annex II∗: Recent Initiatives in Direct Taxes in Budget 2018-19 and 2019-20 (Interim Budget)
A. Summary of important measures announced in the Union Budget 2018-19:• The rate of income-tax for companies with a turnover up to `250 crores in FY 2016-17 was
reduced to 25 per cent.
• To allow a standard deduction upto `40,000/- or the amount of salary received, whichever is less and rationalised exemption in respect of transport allowance and reimbursement of miscellaneous medical expenses.
• The following incentives have been provided for senior citizens:
The limit of deduction for health insurance premium and/or medical expenditure has been increased from `30,000/- to `50,000.
The limit of deduction for medical expenditure in respect of certain critical illnesses has been increased up to `1,00,000/- in the case of all senior citizens (of the age of 60 years or more).
A deduction of `50,000/- has been provided to senior citizens on interest income from deposits with banks, co-operative societies and post offices.
The threshold limit for deduction of tax at source on interest income for senior citizens has been increased from `10,000/- to `50,000/-.
A senior citizen having pension income shall be eligible to claim standard deduction of upto `40,000/- or the amount of pension received, whichever is less.
• It is provided that every person, not being an individual, which enters into a financial transaction of an amount aggregating to `2.5 lakh or more in a financial year, and the managing director, director, partner, trustee, author, founder, karta, chief executive officer, principal officer or office bearer or any person competent to act on behalf of such person shall be required to apply for allotment of PAN.
• It is provided that in the case of an amalgamated company, accumulated profits, whether capitalised or not, or losses as the case may be, shall be increased by the accumulated profits of the amalgamating company, whether capitalized or not, on the date of amalgamation.
• It is provided to bring deemed dividends also under the scope of dividend distribution tax and to tax such deemed dividend at the rate of 30 per cent (without grossing up) in order to prevent camouflaging dividend in various ways such as loans and advances.
• The exemption under section 10(38) of the Act has been withdrawn and a new section 112A has been inserted in the Act to provide that long term capital gains arising from transfer of a long term capital asset being an equity share in a company or a unit of an equity oriented fund or a unit of a business trust shall be taxed at 10 per cent of such capital
____________* The tax measures and rate changes given in this Annex are only meant for general readers and will not serve as reference
points for tax payers.
62 Economic Survey 2018-19 Volume 2
gains exceeding one lakh rupees. Foreign Institutional Investors (FIIs) will also be liable to tax on such long term capital gains only in respect of amount of such gains exceeding one lakh rupees. Further, it is also provided that where any income is distributed by an equity-oriented Mutual Fund, the mutual fund shall be liable to pay additional income tax at the rate of 10 per cent on income so distributed.
• To tackle the direct tax challenges arising in digital businesses, the scope of the definition of business connection was enlarged to provide that a non-resident is taxable in India if it has a 'Significant Economic Presence' in India.
• The conditions for availing the deduction of 30 per cent under section 80JJAA of the Act have been relaxed by allowing the benefit for a new employee who is employed for less than the minimum period during the first year but continues to remain employed for the minimum period in subsequent year. The minimum period of employment of 150 days has been extended to footwear and leather industry.
• Following changes in the taxation regime for the start-ups under section 80IAC have been made:
The benefits would also be available to start ups incorporated on or after 1st April 2019 but before 1st April, 2021;
The requirement of the turnover not exceeding `25 Crore would apply to the previous year relevant to the assessment year to which deduction under this section is claimed;
The definition of eligible business has been expanded to provide that the benefit would be available if the start-up is engaged in innovation, development or improvement of products or processes or services, or a scalable business model with a high potential of employment generation or wealth creation.
B. Summary of important measures announced in the Interim Budget 2019-20:
• Enhanced the amount of tax rebate for an individual taxpayer from `2,500 to `12,500.
• Increased the limit of standard deduction from `40,000 to `50,000.
• There will be no tax on notional rent of two self-occupied houses instead of currently available one self-occupied house. However, the existing limit for deduction of interest of ̀ 2 lakhs shall continue.
• One-time option provided for investment of the entire capital gain in purchase or construction of two residential houses under section 54 of the Act where capital gains from the sale of residential property do not exceed `2 crore.
• Threshold limit for application of TDS on bank interest, etc., increased from `10,000 to `40,000 and
• Threshold limit increased for application of TDS on rental income from `1.8 lakh to `2.4 lakh.
63Fiscal Developments
C. Other measures taken during the year 2018 and 2019.
• The Centralised Verification Scheme, 2019 has been notified for setting up of a centre for centralised issuance of notice and for processing of information or documents and making available the outcome of the processing to the Assessing Officer.
• The process of PAN allotment has been relaxed so that an applicant, having mother as ‘single parent’, may apply for PAN by furnishing mother’s name only. Before this, furnishing of father’s name was mandatory for all applicants.
• The process of issuance of certificate for no deduction of tax or deduction/collection of tax at lower rate has been rationalised. Now, the entire process of filing of an application to the generation of appropriate certificate has been made electronic. This shall minimise the human interface and reduce the compliance burden on the applicant.
• Form for application filed for the registration of a charitable trust or institution under section 12A of the Act has been rationalised and electronic filing thereof has been enabled as well.
• Forms for filing appeal to the Appellate Tribunal have been rationalised to make them more informative.
• In order to facilitate the conversion of Indian branch of foreign bank, the Notification S.O. 6053(E) dated 06.12.2018 has been issued specifying the conditions to be fulfilled by the conversion and also specifying modifications, exceptions, etc., in applicability of certain provisions of the Act to such conversion.
• Part B of Form No 16 and Annexure-II of Form No 24Q were amended for enabling e-issuance of salary TDS certificate in Form No 16 and for enabling the pre-filing of Income-tax returns on the basis of information furnished in Form No 24Q.
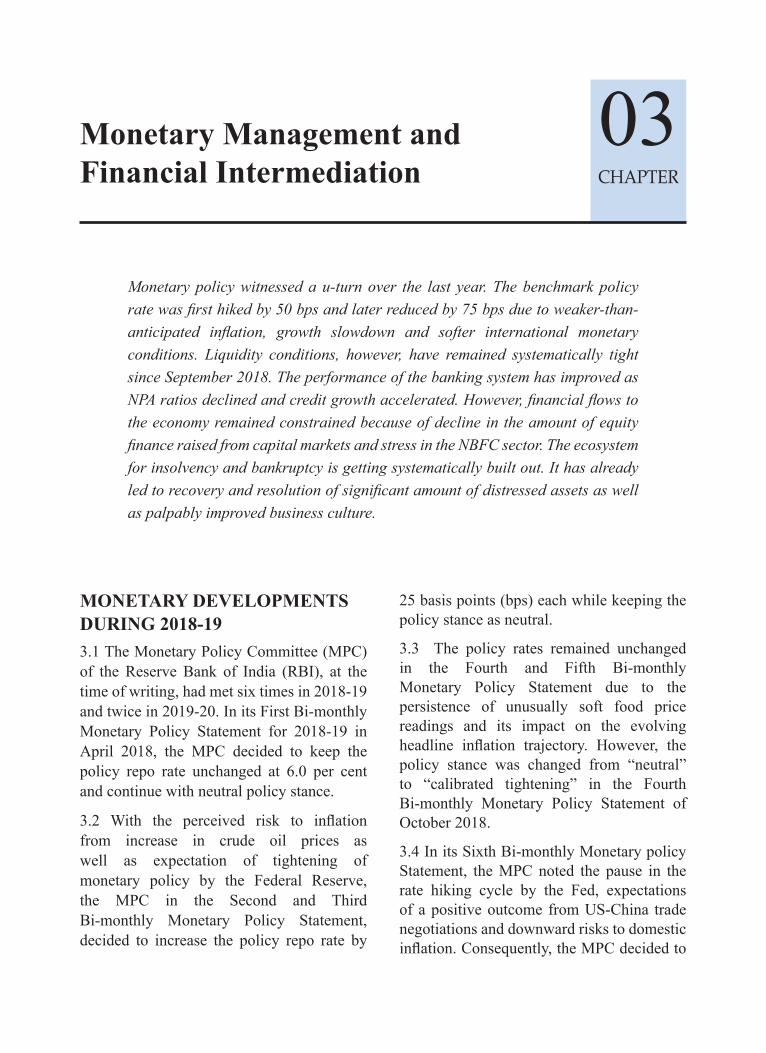
CHAPTER
Monetary Management and Financial Intermediation
03
Monetary policy witnessed a u-turn over the last year. The benchmark policy rate was first hiked by 50 bps and later reduced by 75 bps due to weaker-than-anticipated inflation, growth slowdown and softer international monetary conditions. Liquidity conditions, however, have remained systematically tight since September 2018. The performance of the banking system has improved as NPA ratios declined and credit growth accelerated. However, financial flows to the economy remained constrained because of decline in the amount of equity finance raised from capital markets and stress in the NBFC sector. The ecosystem for insolvency and bankruptcy is getting systematically built out. It has already led to recovery and resolution of significant amount of distressed assets as well as palpably improved business culture.
MONETARY DEVELOPMENTS DURING 2018-193.1 The Monetary Policy Committee (MPC) of the Reserve Bank of India (RBI), at the time of writing, had met six times in 2018-19 and twice in 2019-20. In its First Bi-monthly Monetary Policy Statement for 2018-19 in April 2018, the MPC decided to keep the policy repo rate unchanged at 6.0 per cent and continue with neutral policy stance.
3.2 With the perceived risk to inflation from increase in crude oil prices as well as expectation of tightening of monetary policy by the Federal Reserve, the MPC in the Second and Third Bi-monthly Monetary Policy Statement, decided to increase the policy repo rate by
25 basis points (bps) each while keeping the policy stance as neutral.
3.3 The policy rates remained unchanged in the Fourth and Fifth Bi-monthly Monetary Policy Statement due to the persistence of unusually soft food price readings and its impact on the evolving headline inflation trajectory. However, the policy stance was changed from “neutral” to “calibrated tightening” in the Fourth Bi-monthly Monetary Policy Statement of October 2018.
3.4 In its Sixth Bi-monthly Monetary policy Statement, the MPC noted the pause in the rate hiking cycle by the Fed, expectations of a positive outcome from US-China trade negotiations and downward risks to domestic inflation. Consequently, the MPC decided to
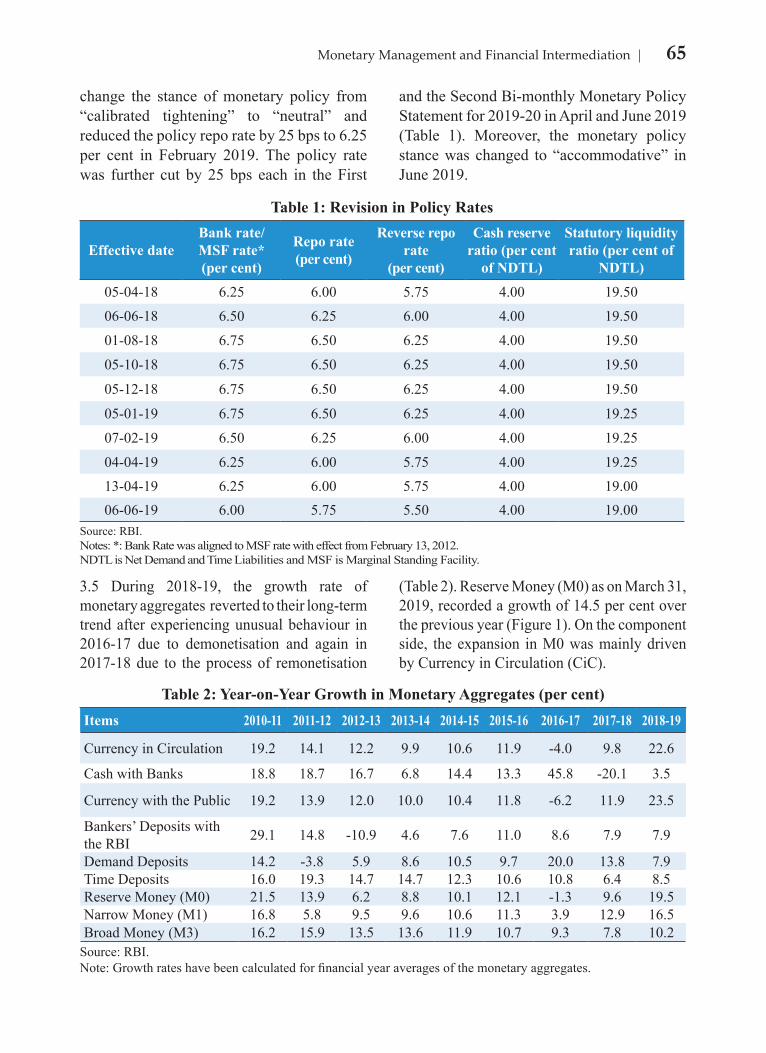
65Monetary Management and Financial Intermediation
change the stance of monetary policy from “calibrated tightening” to “neutral” and reduced the policy repo rate by 25 bps to 6.25 per cent in February 2019. The policy rate was further cut by 25 bps each in the First
and the Second Bi-monthly Monetary Policy Statement for 2019-20 in April and June 2019 (Table 1). Moreover, the monetary policy stance was changed to “accommodative” in June 2019.
3.5 During 2018-19, the growth rate of monetary aggregates reverted to their long-term trend after experiencing unusual behaviour in 2016-17 due to demonetisation and again in 2017-18 due to the process of remonetisation
(Table 2). Reserve Money (M0) as on March 31, 2019, recorded a growth of 14.5 per cent over the previous year (Figure 1). On the component side, the expansion in M0 was mainly driven by Currency in Circulation (CiC).
Table 1: Revision in Policy Rates
Effective dateBank rate/ MSF rate* (per cent)
Repo rate (per cent)
Reverse repo rate
(per cent)
Cash reserve ratio (per cent
of NDTL)
Statutory liquidity ratio (per cent of
NDTL)05-04-18 6.25 6.00 5.75 4.00 19.50
06-06-18 6.50 6.25 6.00 4.00 19.50
01-08-18 6.75 6.50 6.25 4.00 19.50
05-10-18 6.75 6.50 6.25 4.00 19.50
05-12-18 6.75 6.50 6.25 4.00 19.50
05-01-19 6.75 6.50 6.25 4.00 19.25
07-02-19 6.50 6.25 6.00 4.00 19.25
04-04-19 6.25 6.00 5.75 4.00 19.2513-04-19 6.25 6.00 5.75 4.00 19.0006-06-19 6.00 5.75 5.50 4.00 19.00
Source: RBI.Notes: *: Bank Rate was aligned to MSF rate with effect from February 13, 2012.NDTL is Net Demand and Time Liabilities and MSF is Marginal Standing Facility.
Table 2: Year-on-Year Growth in Monetary Aggregates (per cent)Items 2010-11 2011-12 2012-13 2013-14 2014-15 2015-16 2016-17 2017-18 2018-19
Currency in Circulation 19.2 14.1 12.2 9.9 10.6 11.9 -4.0 9.8 22.6
Cash with Banks 18.8 18.7 16.7 6.8 14.4 13.3 45.8 -20.1 3.5
Currency with the Public 19.2 13.9 12.0 10.0 10.4 11.8 -6.2 11.9 23.5
Bankers’ Deposits with the RBI 29.1 14.8 -10.9 4.6 7.6 11.0 8.6 7.9 7.9
Demand Deposits 14.2 -3.8 5.9 8.6 10.5 9.7 20.0 13.8 7.9Time Deposits 16.0 19.3 14.7 14.7 12.3 10.6 10.8 6.4 8.5Reserve Money (M0) 21.5 13.9 6.2 8.8 10.1 12.1 -1.3 9.6 19.5Narrow Money (M1) 16.8 5.8 9.5 9.6 10.6 11.3 3.9 12.9 16.5Broad Money (M3) 16.2 15.9 13.5 13.6 11.9 10.7 9.3 7.8 10.2
Source: RBI.Note: Growth rates have been calculated for financial year averages of the monetary aggregates.
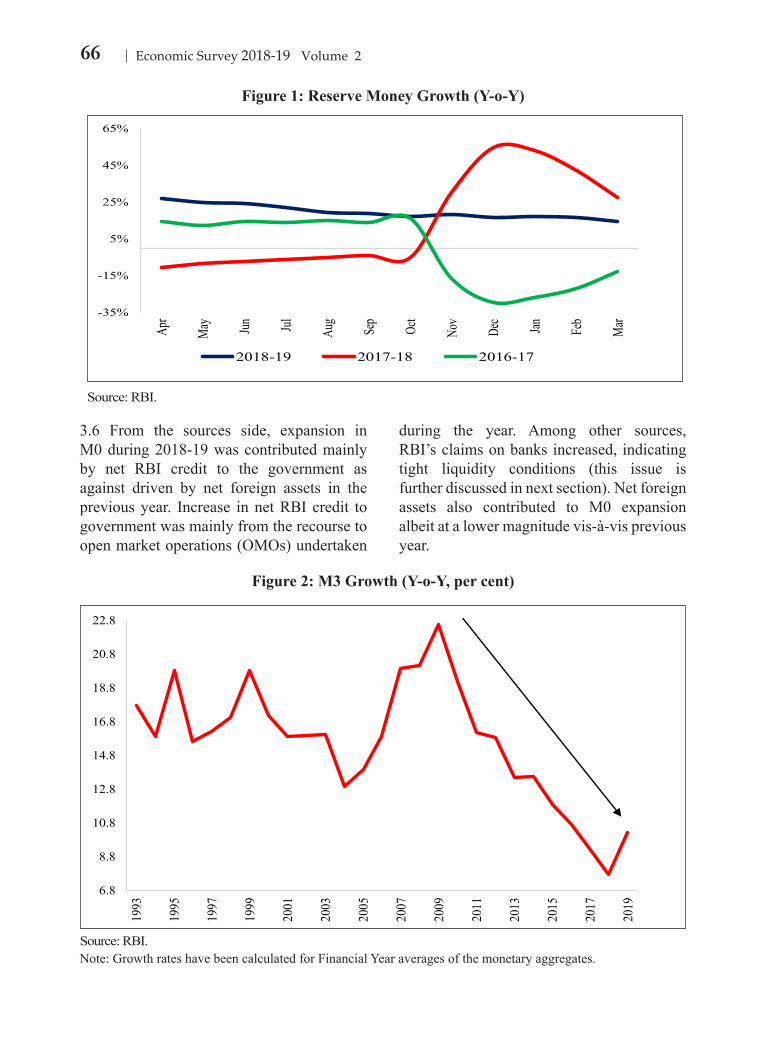
66 Economic Survey 2018-19 Volume 2
3.6 From the sources side, expansion in M0 during 2018-19 was contributed mainly by net RBI credit to the government as against driven by net foreign assets in the previous year. Increase in net RBI credit to government was mainly from the recourse to open market operations (OMOs) undertaken
during the year. Among other sources, RBI’s claims on banks increased, indicating tight liquidity conditions (this issue is further discussed in next section). Net foreign assets also contributed to M0 expansion albeit at a lower magnitude vis-à-vis previous year.
Figure 1: Reserve Money Growth (Y-o-Y)
-35%
-15%
5%
25%
45%
65%
Apr
May Jun Jul
Aug
Sep
Oct
Nov
Dec
Jan Feb
Mar
2018-19 2017-18 2016-17
Source: RBI.
Figure 2: M3 Growth (Y-o-Y, per cent)
6.8
8.8
10.8
12.8
14.8
16.8
18.8
20.8
22.8
1993
1995
1997
1999
2001
2003
2005
2007
2009
2011
2013
2015
2017
2019
Source: RBI.Note: Growth rates have been calculated for Financial Year averages of the monetary aggregates.

67Monetary Management and Financial Intermediation
3.7 Broad money growth (M3) has been on declining trend since 2009. However, in 20018-19, M3 improved marginally driven mainly by aggregate deposits (Figure 2). From the component side, the expansion in M3 during the year was broad-based, contributed by both currency and deposits. Deposits with the banking system, both demand and time, recorded acceleration in their growth leading
to an increase in aggregate deposits by 9.6 per cent in 2018-19 vis-à-vis the 5.8 per cent during 2017-18 (Figure 3). Amongst sources, credit from scheduled commercial banks (SCBs) to the commercial sector primarily contributed to an increase in M3 during the year. Bank credit to government, mainly from RBI, also supplemented M3 expansion.
3.8 The money multiplier (M3/M0) expanded sharply between 1996 and 2003 and stabilizing thereafter till 2008. It started rising again till 2017 but declined for two successive years in 2017-18 and 2018-19, reflecting expansion in M0 at faster pace than M3. As on March 31, 2019, it stood lower at
5.7 per cent, converging broadly to its average level recorded during 2013-16 (Figure 4). Trends in money multiplier is an area of further investigation but the tightening of bank capital and regulatory norms may have contributed to it.
Figure 3: Y-o-Y Variation in Deposits
0%
7%
14%
21%
28%
35%
42%
Apr-1
6
Sep-
16
Feb-
17
Jul-1
7
Dec-
17
May
-18
Oct-1
8
Mar
-19
DD TD AD
Source: RBI.Note: AD– Aggregate Deposits, DD– Demand Deposits, TD– Time Deposits.
Figure 4: Money Multiplier
3.0
3.5
4.0
4.5
5.0
5.5
6.0
6.5
1992
1995
1998
2001
2004
2007
2010
2013
2016
2019
Source: RBI.
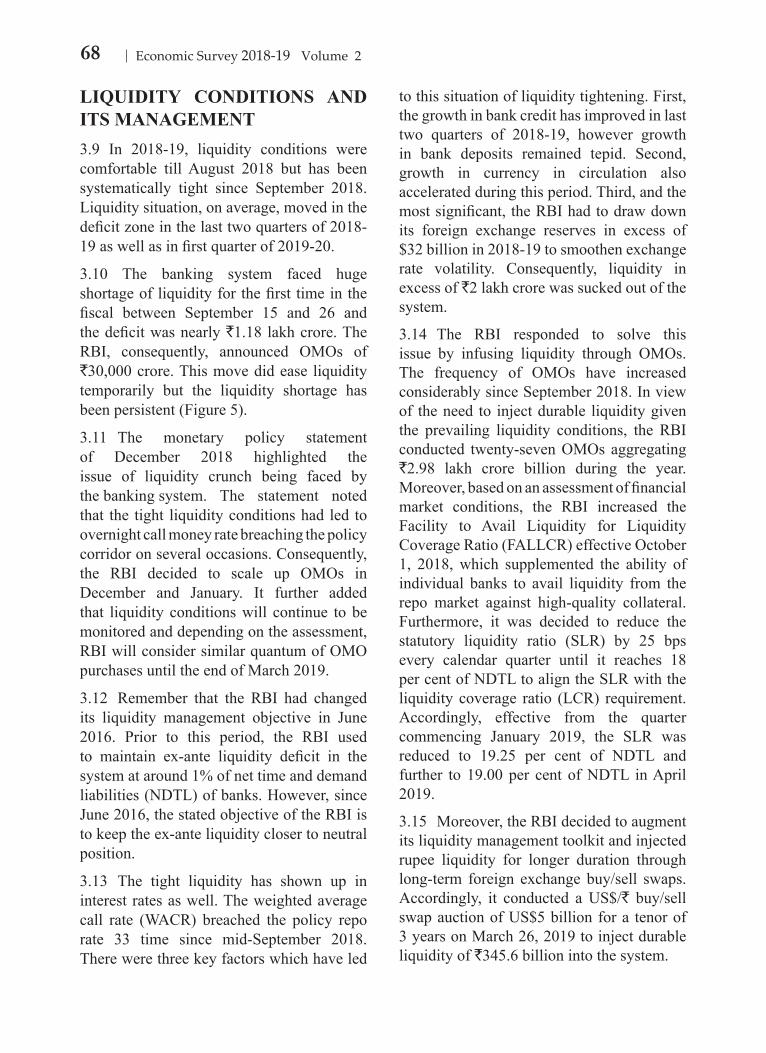
68 Economic Survey 2018-19 Volume 2
LIQUIDITY CONDITIONS AND ITS MANAGEMENT3.9 In 2018-19, liquidity conditions were comfortable till August 2018 but has been systematically tight since September 2018. Liquidity situation, on average, moved in the deficit zone in the last two quarters of 2018-19 as well as in first quarter of 2019-20.
3.10 The banking system faced huge shortage of liquidity for the first time in the fiscal between September 15 and 26 and the deficit was nearly `1.18 lakh crore. The RBI, consequently, announced OMOs of `30,000 crore. This move did ease liquidity temporarily but the liquidity shortage has been persistent (Figure 5).
3.11 The monetary policy statement of December 2018 highlighted the issue of liquidity crunch being faced by the banking system. The statement noted that the tight liquidity conditions had led to overnight call money rate breaching the policy corridor on several occasions. Consequently, the RBI decided to scale up OMOs in December and January. It further added that liquidity conditions will continue to be monitored and depending on the assessment, RBI will consider similar quantum of OMO purchases until the end of March 2019.
3.12 Remember that the RBI had changed its liquidity management objective in June 2016. Prior to this period, the RBI used to maintain ex-ante liquidity deficit in the system at around 1% of net time and demand liabilities (NDTL) of banks. However, since June 2016, the stated objective of the RBI is to keep the ex-ante liquidity closer to neutral position.
3.13 The tight liquidity has shown up in interest rates as well. The weighted average call rate (WACR) breached the policy repo rate 33 time since mid-September 2018. There were three key factors which have led
to this situation of liquidity tightening. First, the growth in bank credit has improved in last two quarters of 2018-19, however growth in bank deposits remained tepid. Second, growth in currency in circulation also accelerated during this period. Third, and the most significant, the RBI had to draw down its foreign exchange reserves in excess of $32 billion in 2018-19 to smoothen exchange rate volatility. Consequently, liquidity in excess of `2 lakh crore was sucked out of the system.
3.14 The RBI responded to solve this issue by infusing liquidity through OMOs. The frequency of OMOs have increased considerably since September 2018. In view of the need to inject durable liquidity given the prevailing liquidity conditions, the RBI conducted twenty-seven OMOs aggregating `2.98 lakh crore billion during the year. Moreover, based on an assessment of financial market conditions, the RBI increased the Facility to Avail Liquidity for Liquidity Coverage Ratio (FALLCR) effective October 1, 2018, which supplemented the ability of individual banks to avail liquidity from the repo market against high-quality collateral. Furthermore, it was decided to reduce the statutory liquidity ratio (SLR) by 25 bps every calendar quarter until it reaches 18 per cent of NDTL to align the SLR with the liquidity coverage ratio (LCR) requirement. Accordingly, effective from the quarter commencing January 2019, the SLR was reduced to 19.25 per cent of NDTL and further to 19.00 per cent of NDTL in April 2019.
3.15 Moreover, the RBI decided to augment its liquidity management toolkit and injected rupee liquidity for longer duration through long-term foreign exchange buy/sell swaps. Accordingly, it conducted a US$/` buy/sell swap auction of US$5 billion for a tenor of 3 years on March 26, 2019 to inject durable liquidity of `345.6 billion into the system.
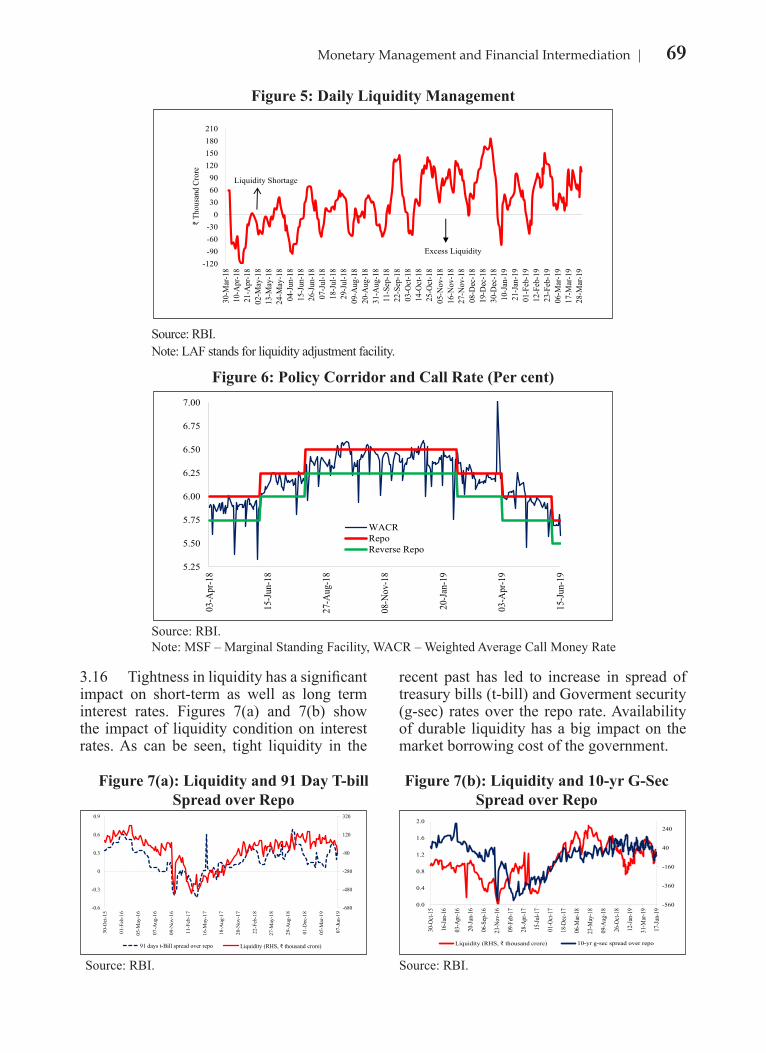
69Monetary Management and Financial Intermediation
3.16 Tightness in liquidity has a significant impact on short-term as well as long term interest rates. Figures 7(a) and 7(b) show the impact of liquidity condition on interest rates. As can be seen, tight liquidity in the
recent past has led to increase in spread of treasury bills (t-bill) and Goverment security (g-sec) rates over the repo rate. Availability of durable liquidity has a big impact on the market borrowing cost of the government.
Figure 5: Daily Liquidity Management
-120-90-60-30
0306090
120150180210
30-M
ar-1
810
-Apr
-18
21-A
pr-1
802
-May
-18
13-M
ay-1
824
-May
-18
04-J
un-1
815
-Jun
-18
26-J
un-1
807
-Jul
-18
18-J
ul-1
829
-Jul
-18
09-A
ug-1
820
-Aug
-18
31-A
ug-1
811
-Sep
-18
22-S
ep-1
803
-Oct
-18
14-O
ct-1
825
-Oct
-18
05-N
ov-1
816
-Nov
-18
27-N
ov-1
808
-Dec
-18
19-D
ec-1
830
-Dec
-18
10-J
an-1
921
-Jan
-19
01-F
eb-1
912
-Feb
-19
23-F
eb-1
906
-Mar
-19
17-M
ar-1
928
-Mar
-19
₹ Th
ousa
nd C
rore
Liquidity Shortage
Excess Liquidity
Source: RBI.Note: LAF stands for liquidity adjustment facility.
Figure 6: Policy Corridor and Call Rate (Per cent)
5.25
5.50
5.75
6.00
6.25
6.50
6.75
7.00
03-A
pr-1
8
15-J
un-1
8
27-A
ug-1
8
08-N
ov-1
8
20-J
an-1
9
03-A
pr-1
9
15-J
un-1
9
WACRRepoReverse Repo
Source: RBI.Note: MSF – Marginal Standing Facility, WACR – Weighted Average Call Money Rate
Figure 7(a): Liquidity and 91 Day T-bill Spread over Repo
Figure 7(b): Liquidity and 10-yr G-Sec Spread over Repo
-680
-480
-280
-80
120
320
-0.6
-0.3
0
0.3
0.6
0.9
30-O
ct-1
5
01-F
eb-1
6
05-M
ay-1
6
07-A
ug-1
6
09-N
ov-1
6
11-F
eb-1
7
16-M
ay-1
7
18-A
ug-1
7
20-N
ov-1
7
22-F
eb-1
8
27-M
ay-1
8
29-A
ug-1
8
01-D
ec-1
8
05-M
ar-1
9
07-J
un-1
9
91 days t-Bill spread over repo Liquidity (RHS, ₹ thousand crore)
-560
-360
-160
40
240
0.0
0.4
0.8
1.2
1.6
2.0
30-O
ct-15
16-Ja
n-16
03-A
pr-1
6
20-Ju
n-16
06-S
ep-1
6
23-N
ov-1
6
09-F
eb-1
7
28-A
pr-1
7
15-Ju
l-17
01-O
ct-17
18-D
ec-1
7
06-M
ar-1
8
23-M
ay-1
8
09-A
ug-1
8
26-O
ct-18
12-Ja
n-19
31-M
ar-1
9
17-Ju
n-19
Liquidity (RHS, ₹ thousand crore) 10-yr g-sec spread over repo
Source: RBI. Source: RBI.
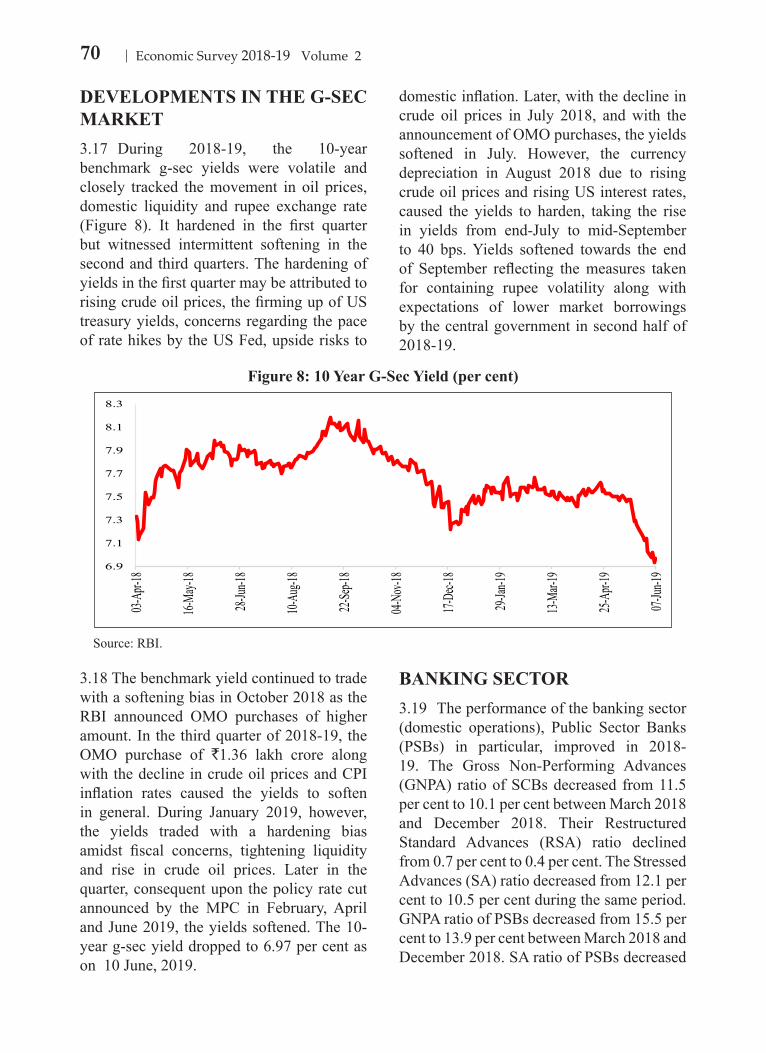
70 Economic Survey 2018-19 Volume 2
DEVELOPMENTS IN THE G-SEC MARKET3.17 During 2018-19, the 10-year benchmark g-sec yields were volatile and closely tracked the movement in oil prices, domestic liquidity and rupee exchange rate (Figure 8). It hardened in the first quarter but witnessed intermittent softening in the second and third quarters. The hardening of yields in the first quarter may be attributed to rising crude oil prices, the firming up of US treasury yields, concerns regarding the pace of rate hikes by the US Fed, upside risks to
domestic inflation. Later, with the decline in crude oil prices in July 2018, and with the announcement of OMO purchases, the yields softened in July. However, the currency depreciation in August 2018 due to rising crude oil prices and rising US interest rates, caused the yields to harden, taking the rise in yields from end-July to mid-September to 40 bps. Yields softened towards the end of September reflecting the measures taken for containing rupee volatility along with expectations of lower market borrowings by the central government in second half of 2018-19.
3.18 The benchmark yield continued to trade with a softening bias in October 2018 as the RBI announced OMO purchases of higher amount. In the third quarter of 2018-19, the OMO purchase of `1.36 lakh crore along with the decline in crude oil prices and CPI inflation rates caused the yields to soften in general. During January 2019, however, the yields traded with a hardening bias amidst fiscal concerns, tightening liquidity and rise in crude oil prices. Later in the quarter, consequent upon the policy rate cut announced by the MPC in February, April and June 2019, the yields softened. The 10-year g-sec yield dropped to 6.97 per cent as on 10 June, 2019.
BANKING SECTOR3.19 The performance of the banking sector (domestic operations), Public Sector Banks (PSBs) in particular, improved in 2018-19. The Gross Non-Performing Advances (GNPA) ratio of SCBs decreased from 11.5 per cent to 10.1 per cent between March 2018 and December 2018. Their Restructured Standard Advances (RSA) ratio declined from 0.7 per cent to 0.4 per cent. The Stressed Advances (SA) ratio decreased from 12.1 per cent to 10.5 per cent during the same period. GNPA ratio of PSBs decreased from 15.5 per cent to 13.9 per cent between March 2018 and December 2018. SA ratio of PSBs decreased
Figure 8: 10 Year G-Sec Yield (per cent)
6.9
7.1
7.3
7.5
7.7
7.9
8.1
8.3
03-A
pr-18
16-M
ay-18
28-Ju
n-18
10-A
ug-18
22-Se
p-18
04-N
ov-18
17-D
ec-18
29-Ja
n-19
13-M
ar-19
25-A
pr-19
07-Ju
n-19
Source: RBI.
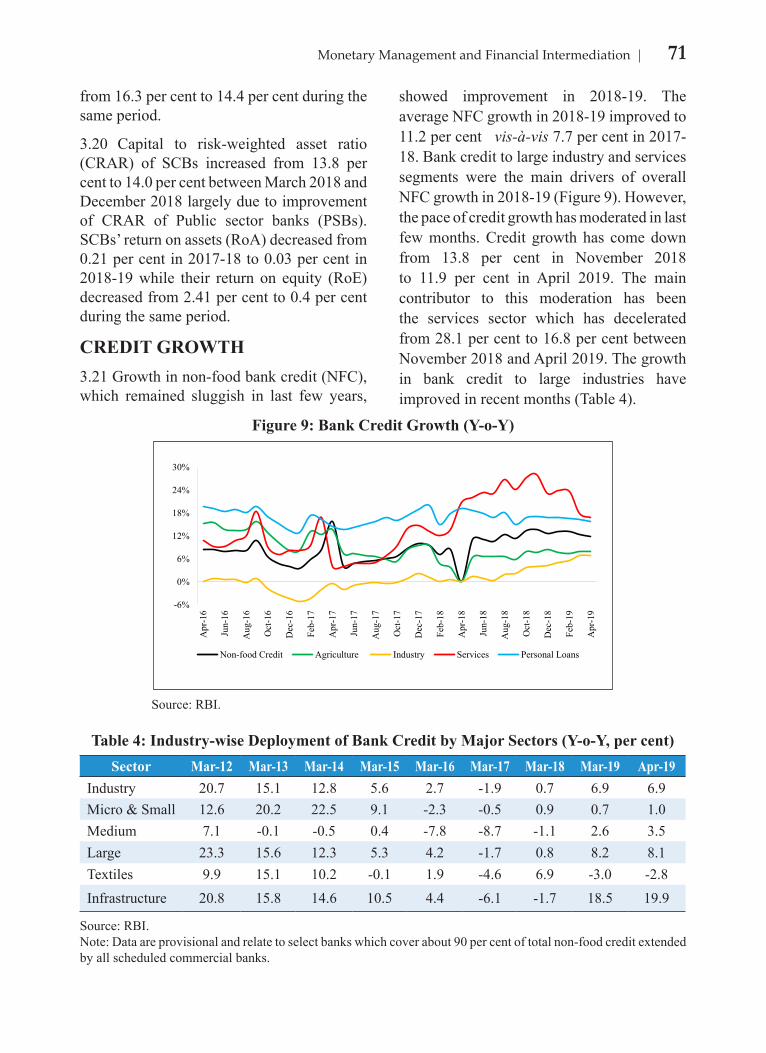
71Monetary Management and Financial Intermediation
from 16.3 per cent to 14.4 per cent during the same period.
3.20 Capital to risk-weighted asset ratio (CRAR) of SCBs increased from 13.8 per cent to 14.0 per cent between March 2018 and December 2018 largely due to improvement of CRAR of Public sector banks (PSBs). SCBs’ return on assets (RoA) decreased from 0.21 per cent in 2017-18 to 0.03 per cent in 2018-19 while their return on equity (RoE) decreased from 2.41 per cent to 0.4 per cent during the same period.
CREDIT GROWTH3.21 Growth in non-food bank credit (NFC), which remained sluggish in last few years,
showed improvement in 2018-19. The average NFC growth in 2018-19 improved to 11.2 per cent vis-à-vis 7.7 per cent in 2017-18. Bank credit to large industry and services segments were the main drivers of overall NFC growth in 2018-19 (Figure 9). However, the pace of credit growth has moderated in last few months. Credit growth has come down from 13.8 per cent in November 2018 to 11.9 per cent in April 2019. The main contributor to this moderation has been the services sector which has decelerated from 28.1 per cent to 16.8 per cent between November 2018 and April 2019. The growth in bank credit to large industries have improved in recent months (Table 4).
Figure 9: Bank Credit Growth (Y-o-Y)
-6%
0%
6%
12%
18%
24%
30%
Apr
-16
Jun-
16
Aug
-16
Oct
-16
Dec
-16
Feb-
17
Apr
-17
Jun-
17
Aug
-17
Oct
-17
Dec
-17
Feb-
18
Apr
-18
Jun-
18
Aug
-18
Oct
-18
Dec
-18
Feb-
19
Apr
-19
Non-food Credit Agriculture Industry Services Personal Loans
Source: RBI.
Table 4: Industry-wise Deployment of Bank Credit by Major Sectors (Y-o-Y, per cent)Sector Mar-12 Mar-13 Mar-14 Mar-15 Mar-16 Mar-17 Mar-18 Mar-19 Apr-19
Industry 20.7 15.1 12.8 5.6 2.7 -1.9 0.7 6.9 6.9Micro & Small 12.6 20.2 22.5 9.1 -2.3 -0.5 0.9 0.7 1.0Medium 7.1 -0.1 -0.5 0.4 -7.8 -8.7 -1.1 2.6 3.5Large 23.3 15.6 12.3 5.3 4.2 -1.7 0.8 8.2 8.1Textiles 9.9 15.1 10.2 -0.1 1.9 -4.6 6.9 -3.0 -2.8Infrastructure 20.8 15.8 14.6 10.5 4.4 -6.1 -1.7 18.5 19.9
Source: RBI.Note: Data are provisional and relate to select banks which cover about 90 per cent of total non-food credit extended by all scheduled commercial banks.
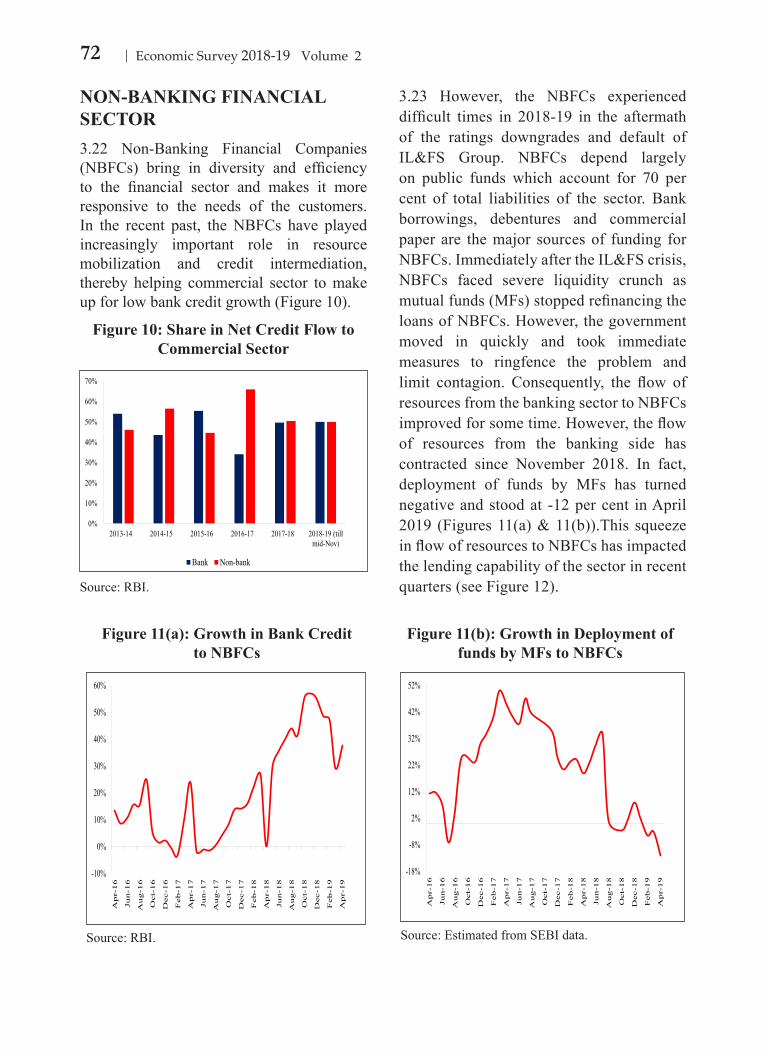
72 Economic Survey 2018-19 Volume 2
NON-BANKING FINANCIAL SECTOR3.22 Non-Banking Financial Companies (NBFCs) bring in diversity and efficiency to the financial sector and makes it more responsive to the needs of the customers. In the recent past, the NBFCs have played increasingly important role in resource mobilization and credit intermediation, thereby helping commercial sector to make up for low bank credit growth (Figure 10).
3.23 However, the NBFCs experienced difficult times in 2018-19 in the aftermath of the ratings downgrades and default of IL&FS Group. NBFCs depend largely on public funds which account for 70 per cent of total liabilities of the sector. Bank borrowings, debentures and commercial paper are the major sources of funding for NBFCs. Immediately after the IL&FS crisis, NBFCs faced severe liquidity crunch as mutual funds (MFs) stopped refinancing the loans of NBFCs. However, the government moved in quickly and took immediate measures to ringfence the problem and limit contagion. Consequently, the flow of resources from the banking sector to NBFCs improved for some time. However, the flow of resources from the banking side has contracted since November 2018. In fact, deployment of funds by MFs has turned negative and stood at -12 per cent in April 2019 (Figures 11(a) & 11(b)).This squeeze in flow of resources to NBFCs has impacted the lending capability of the sector in recent quarters (see Figure 12).
Figure 10: Share in Net Credit Flow to Commercial Sector
0%
10%
20%
30%
40%
50%
60%
70%
2013-14 2014-15 2015-16 2016-17 2017-18 2018-19 (tillmid-Nov)
Bank Non-bank
Source: RBI.
Figure 11(a): Growth in Bank Credit to NBFCs
Figure 11(b): Growth in Deployment of funds by MFs to NBFCs
-10%
0%
10%
20%
30%
40%
50%
60%
Ap
r-16
Jun-1
6
Au
g-1
6
Oct-
16
Dec-1
6
Feb
-17
Ap
r-17
Jun-1
7
Au
g-1
7
Oct-
17
Dec-1
7
Feb
-18
Ap
r-18
Jun-1
8
Au
g-1
8
Oct-
18
Dec-1
8
Feb
-19
Ap
r-19
Source: RBI.
-18%
-8%
2%
12%
22%
32%
42%
52%
Ap
r-16
Jun-1
6
Au
g-1
6
Oct
-16
Dec
-16
Feb
-17
Ap
r-17
Jun-1
7
Au
g-1
7
Oct
-17
Dec
-17
Feb
-18
Ap
r-18
Jun-1
8
Au
g-1
8
Oct
-18
Dec
-18
Feb
-19
Ap
r-19
Source: Estimated from SEBI data.
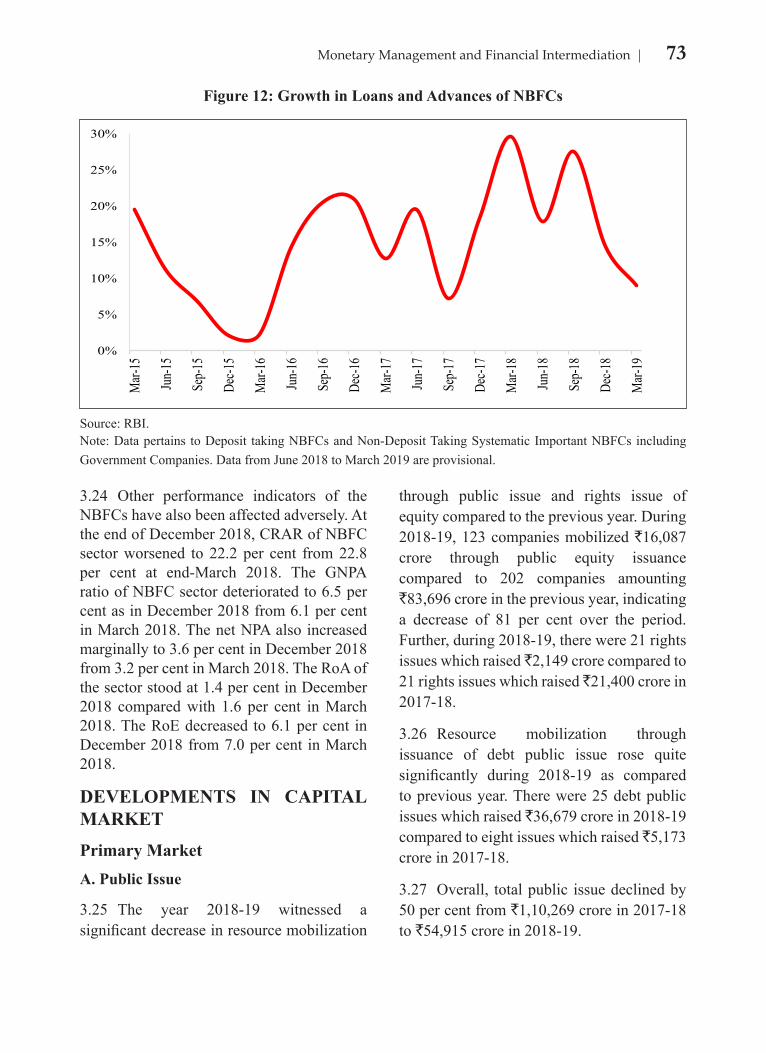
73Monetary Management and Financial Intermediation
3.24 Other performance indicators of the NBFCs have also been affected adversely. At the end of December 2018, CRAR of NBFC sector worsened to 22.2 per cent from 22.8 per cent at end-March 2018. The GNPA ratio of NBFC sector deteriorated to 6.5 per cent as in December 2018 from 6.1 per cent in March 2018. The net NPA also increased marginally to 3.6 per cent in December 2018 from 3.2 per cent in March 2018. The RoA of the sector stood at 1.4 per cent in December 2018 compared with 1.6 per cent in March 2018. The RoE decreased to 6.1 per cent in December 2018 from 7.0 per cent in March 2018.
DEVELOPMENTS IN CAPITAL MARKET
Primary MarketA. Public Issue
3.25 The year 2018-19 witnessed a significant decrease in resource mobilization
through public issue and rights issue of equity compared to the previous year. During 2018-19, 123 companies mobilized `16,087 crore through public equity issuance compared to 202 companies amounting `83,696 crore in the previous year, indicating a decrease of 81 per cent over the period. Further, during 2018-19, there were 21 rights issues which raised ̀ 2,149 crore compared to 21 rights issues which raised ̀ 21,400 crore in 2017-18.
3.26 Resource mobilization through issuance of debt public issue rose quite significantly during 2018-19 as compared to previous year. There were 25 debt public issues which raised `36,679 crore in 2018-19 compared to eight issues which raised `5,173 crore in 2017-18.
3.27 Overall, total public issue declined by 50 per cent from `1,10,269 crore in 2017-18 to `54,915 crore in 2018-19.
Figure 12: Growth in Loans and Advances of NBFCs
0%
5%
10%
15%
20%
25%
30%M
ar-15
Jun-
15
Sep-
15
Dec-1
5
Mar-
16
Jun-
16
Sep-
16
Dec-1
6
Mar-
17
Jun-
17
Sep-
17
Dec-1
7
Mar-
18
Jun-
18
Sep-
18
Dec-1
8
Mar-
19
Source: RBI.Note: Data pertains to Deposit taking NBFCs and Non-Deposit Taking Systematic Important NBFCs including Government Companies. Data from June 2018 to March 2019 are provisional.
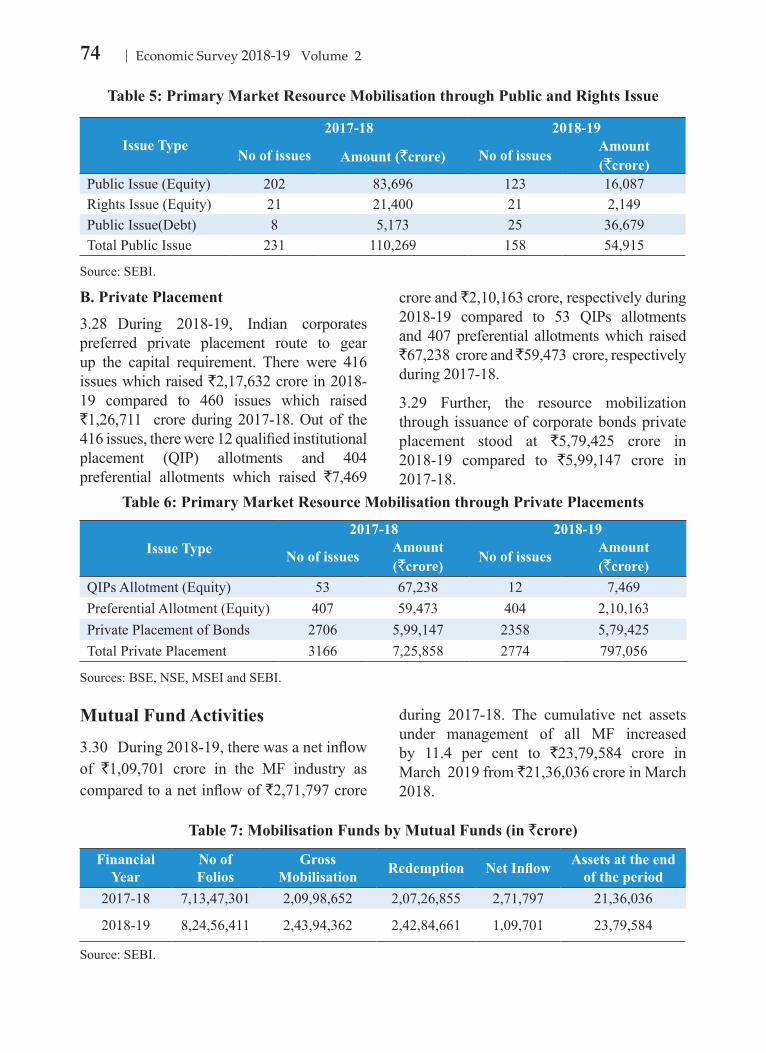
74 Economic Survey 2018-19 Volume 2
B. Private Placement
3.28 During 2018-19, Indian corporates preferred private placement route to gear up the capital requirement. There were 416 issues which raised `2,17,632 crore in 2018-19 compared to 460 issues which raised `1,26,711 crore during 2017-18. Out of the 416 issues, there were 12 qualified institutional placement (QIP) allotments and 404 preferential allotments which raised `7,469
crore and `2,10,163 crore, respectively during 2018-19 compared to 53 QIPs allotments and 407 preferential allotments which raised `67,238 crore and ̀ 59,473 crore, respectively during 2017-18.
3.29 Further, the resource mobilization through issuance of corporate bonds private placement stood at `5,79,425 crore in 2018-19 compared to `5,99,147 crore in 2017-18.
Mutual Fund Activities
3.30 During 2018-19, there was a net inflow of `1,09,701 crore in the MF industry as compared to a net inflow of `2,71,797 crore
during 2017-18. The cumulative net assets under management of all MF increased by 11.4 per cent to `23,79,584 crore in March 2019 from `21,36,036 crore in March 2018.
Table 5: Primary Market Resource Mobilisation through Public and Rights Issue
Issue Type2017-18 2018-19
No of issues Amount (`crore) No of issues Amount (`crore)
Public Issue (Equity) 202 83,696 123 16,087Rights Issue (Equity) 21 21,400 21 2,149Public Issue(Debt) 8 5,173 25 36,679Total Public Issue 231 110,269 158 54,915
Source: SEBI.
Table 6: Primary Market Resource Mobilisation through Private Placements
Issue Type2017-18 2018-19
No of issues Amount (`crore) No of issues Amount
(`crore)QIPs Allotment (Equity) 53 67,238 12 7,469Preferential Allotment (Equity) 407 59,473 404 2,10,163Private Placement of Bonds 2706 5,99,147 2358 5,79,425Total Private Placement 3166 7,25,858 2774 797,056
Sources: BSE, NSE, MSEI and SEBI.
Table 7: Mobilisation Funds by Mutual Funds (in `crore)
Financial Year
No of Folios
Gross Mobilisation Redemption Net Inflow Assets at the end
of the period2017-18 7,13,47,301 2,09,98,652 2,07,26,855 2,71,797 21,36,036
2018-19 8,24,56,411 2,43,94,362 2,42,84,661 1,09,701 23,79,584
Source: SEBI.
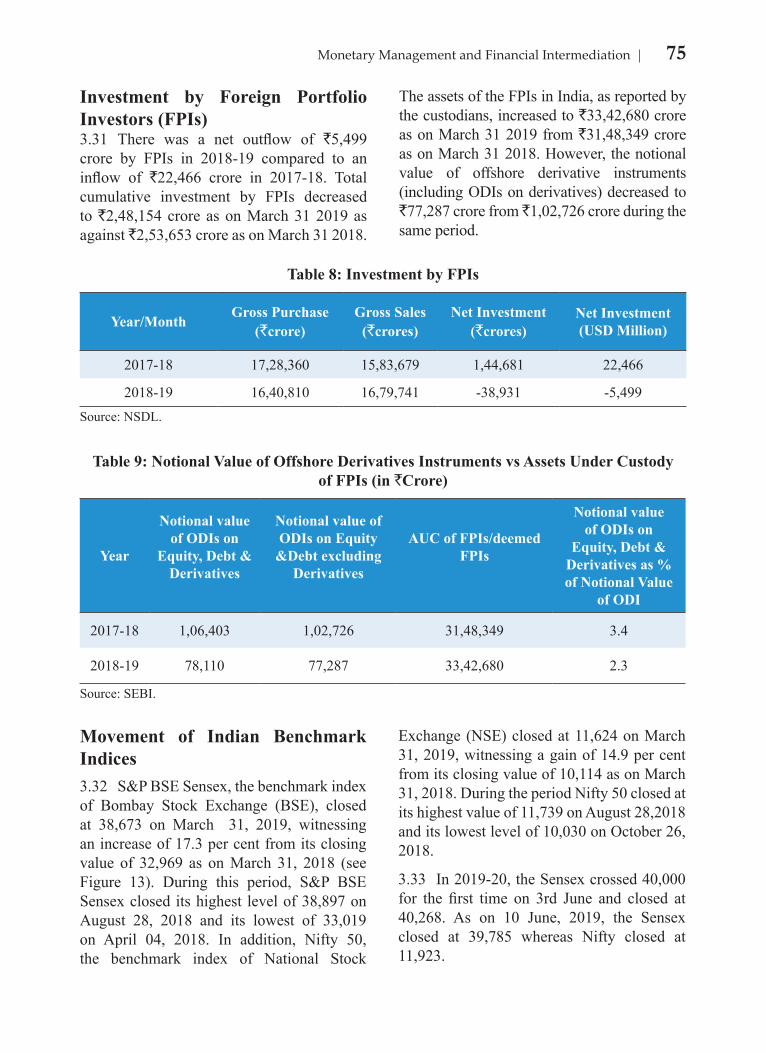
75Monetary Management and Financial Intermediation
Investment by Foreign Portfolio Investors (FPIs)3.31 There was a net outflow of `5,499 crore by FPIs in 2018-19 compared to an inflow of `22,466 crore in 2017-18. Total cumulative investment by FPIs decreased to `2,48,154 crore as on March 31 2019 as against ̀ 2,53,653 crore as on March 31 2018.
The assets of the FPIs in India, as reported by the custodians, increased to `33,42,680 crore as on March 31 2019 from `31,48,349 crore as on March 31 2018. However, the notional value of offshore derivative instruments (including ODIs on derivatives) decreased to `77,287 crore from ̀ 1,02,726 crore during the same period.
Movement of Indian Benchmark Indices3.32 S&P BSE Sensex, the benchmark index of Bombay Stock Exchange (BSE), closed at 38,673 on March 31, 2019, witnessing an increase of 17.3 per cent from its closing value of 32,969 as on March 31, 2018 (see Figure 13). During this period, S&P BSE Sensex closed its highest level of 38,897 on August 28, 2018 and its lowest of 33,019 on April 04, 2018. In addition, Nifty 50, the benchmark index of National Stock
Exchange (NSE) closed at 11,624 on March 31, 2019, witnessing a gain of 14.9 per cent from its closing value of 10,114 as on March 31, 2018. During the period Nifty 50 closed at its highest value of 11,739 on August 28,2018 and its lowest level of 10,030 on October 26, 2018.
3.33 In 2019-20, the Sensex crossed 40,000 for the first time on 3rd June and closed at 40,268. As on 10 June, 2019, the Sensex closed at 39,785 whereas Nifty closed at 11,923.
Table 8: Investment by FPIs
Year/Month Gross Purchase (`crore)
Gross Sales (`crores)
Net Investment (`crores)
Net Investment (USD Million)
2017-18 17,28,360 15,83,679 1,44,681 22,466
2018-19 16,40,810 16,79,741 -38,931 -5,499Source: NSDL.
Table 9: Notional Value of Offshore Derivatives Instruments vs Assets Under Custody of FPIs (in `Crore)
Year
Notional value of ODIs on
Equity, Debt & Derivatives
Notional value of ODIs on Equity
&Debt excluding Derivatives
AUC of FPIs/deemed FPIs
Notional value of ODIs on
Equity, Debt & Derivatives as % of Notional Value
of ODI
2017-18 1,06,403 1,02,726 31,48,349 3.4
2018-19 78,110 77,287 33,42,680 2.3
Source: SEBI.
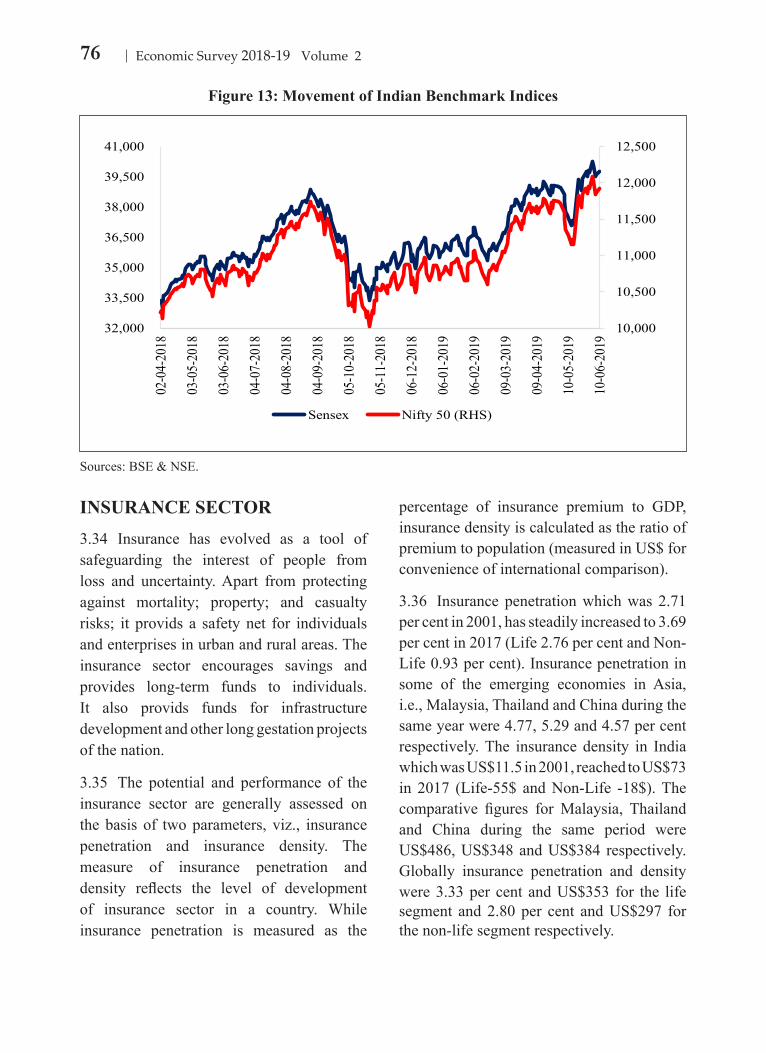
76 Economic Survey 2018-19 Volume 2
INSURANCE SECTOR3.34 Insurance has evolved as a tool of safeguarding the interest of people from loss and uncertainty. Apart from protecting against mortality; property; and casualty risks; it provids a safety net for individuals and enterprises in urban and rural areas. The insurance sector encourages savings and provides long-term funds to individuals. It also provids funds for infrastructure development and other long gestation projects of the nation.
3.35 The potential and performance of the insurance sector are generally assessed on the basis of two parameters, viz., insurance penetration and insurance density. The measure of insurance penetration and density reflects the level of development of insurance sector in a country. While insurance penetration is measured as the
percentage of insurance premium to GDP, insurance density is calculated as the ratio of premium to population (measured in US$ for convenience of international comparison).
3.36 Insurance penetration which was 2.71 per cent in 2001, has steadily increased to 3.69 per cent in 2017 (Life 2.76 per cent and Non-Life 0.93 per cent). Insurance penetration in some of the emerging economies in Asia, i.e., Malaysia, Thailand and China during the same year were 4.77, 5.29 and 4.57 per cent respectively. The insurance density in India which was US$11.5 in 2001, reached to US$73 in 2017 (Life-55$ and Non-Life -18$). The comparative figures for Malaysia, Thailand and China during the same period were US$486, US$348 and US$384 respectively. Globally insurance penetration and density were 3.33 per cent and US$353 for the life segment and 2.80 per cent and US$297 for the non-life segment respectively.
Figure 13: Movement of Indian Benchmark Indices
10,000
10,500
11,000
11,500
12,000
12,500
32,000
33,500
35,000
36,500
38,000
39,500
41,00002
-04-
2018
03-0
5-20
18
03-0
6-20
18
04-0
7-20
18
04-0
8-20
18
04-0
9-20
18
05-1
0-20
18
05-1
1-20
18
06-1
2-20
18
06-0
1-20
19
06-0
2-20
19
09-0
3-20
19
09-0
4-20
19
10-0
5-20
19
10-0
6-20
19
Sensex Nifty 50 (RHS)
Sources: BSE & NSE.
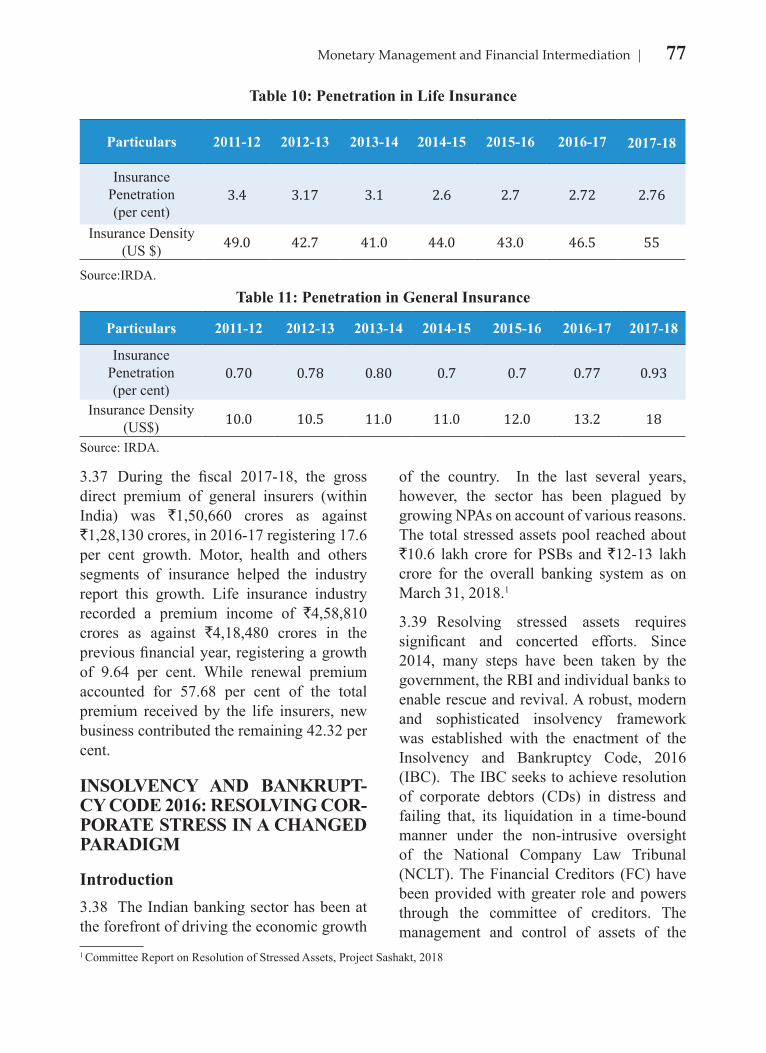
77Monetary Management and Financial Intermediation
3.37 During the fiscal 2017-18, the gross direct premium of general insurers (within India) was `1,50,660 crores as against `1,28,130 crores, in 2016-17 registering 17.6 per cent growth. Motor, health and others segments of insurance helped the industry report this growth. Life insurance industry recorded a premium income of `4,58,810 crores as against `4,18,480 crores in the previous financial year, registering a growth of 9.64 per cent. While renewal premium accounted for 57.68 per cent of the total premium received by the life insurers, new business contributed the remaining 42.32 per cent.
INSOLVENCY AND BANKRUPT-CY CODE 2016: RESOLVING COR-PORATE STRESS IN A CHANGED PARADIGM
Introduction3.38 The Indian banking sector has been at the forefront of driving the economic growth
of the country. In the last several years, however, the sector has been plagued by growing NPAs on account of various reasons. The total stressed assets pool reached about `10.6 lakh crore for PSBs and `12-13 lakh crore for the overall banking system as on March 31, 2018.1
3.39 Resolving stressed assets requires significant and concerted efforts. Since 2014, many steps have been taken by the government, the RBI and individual banks to enable rescue and revival. A robust, modern and sophisticated insolvency framework was established with the enactment of the Insolvency and Bankruptcy Code, 2016 (IBC). The IBC seeks to achieve resolution of corporate debtors (CDs) in distress and failing that, its liquidation in a time-bound manner under the non-intrusive oversight of the National Company Law Tribunal (NCLT). The Financial Creditors (FC) have been provided with greater role and powers through the committee of creditors. The management and control of assets of the
1 Committee Report on Resolution of Stressed Assets, Project Sashakt, 2018
Table 10: Penetration in Life Insurance
Particulars 2011-12 2012-13 2013-14 2014-15 2015-16 2016-17 2017-18
Insurance Penetration (per cent)
3.4 3.17 3.1 2.6 2.7 2.72 2.76
Insurance Density(US $) 49.0 42.7 41.0 44.0 43.0 46.5 55
Source:IRDA.
Table 11: Penetration in General Insurance
Particulars 2011-12 2012-13 2013-14 2014-15 2015-16 2016-17 2017-18
Insurance Penetration (per cent)
0.70 0.78 0.80 0.7 0.7 0.77 0.93
Insurance Density(US$) 10.0 10.5 11.0 11.0 12.0 13.2 18
Source: IRDA.
78 Economic Survey 2018-19 Volume 2
debtor are handed over to an Insolvency Professional (IP) who is responsible for operating the debtor’s enterprise as a going concern and managing the corporate insolvency resolution process (CIRP) besides performing other crucial functions. Although based on global principles, the IBC has been customized for Indian conditions to make it compatible with local conditions. It is one of the most important economic reforms of recent times designed to effectively deal with non-performing CDs and the resultant logjam in the availability of credit.
3.40 An effective bilateral work-out restructuring mechanism can complement the robust insolvency framework. In June 2017, the RBI substituted harmonized and simplified generic framework for resolution of stressed assets. Sashakt - the resolution scheme to resolve the problem of NPAs through a market-led approach, was introduced in July 2018. Sashakt entails participating banks to work together under an Inter-Creditor Agreement (ICA). As of March 31, 2019, 35 banks had signed the ICA. Further, the notification on "Prudential Framework for Resolution of Stressed Assets" was released by RBI dated June 7, 2019 2.
Implementation of IBC3.41 The success of any law depends on its implementation. The IBC was enacted on May 28, 2016. The Government moved quickly to operationalize the IBC. On June 1, 2016, the National Company Law Appellate Tribunal (NCLAT), the Principal Bench of NCLT at New Delhi, and 11 benches of NCLT – two at New Delhi and one each at Ahmedabad, Allahabad, Bengaluru, Chandigarh, Chennai, Guwahati, Hyderabad, Kolkata, and Mumbai were constituted.
3.42 The Insolvency and Bankruptcy Board of India (IBBI) – the regulator, was established on October 1, 2016. It registered three Insolvency Professional Agencies (IPAs), namely, the Indian Institute of Insolvency Professionals of Institute of Chartered Accountants of India (IIIP of ICAI), the Institute of Company Secretaries of India’s Institute of Insolvency Professionals (ICSI IIP), and the Insolvency Professional Agency of Institute of Cost Accountants of India (IPA of ICMAI), were registered in November, 2016. With a view to make available a cadre of IPs, 977 individuals with professional qualifications and 15 years of experience were granted temporary registration. The IBBI commenced the Limited Insolvency Examination (LIE) on December 31, 2016. The professionals with ten years of experience and has passed the Limited Insolvency Examination were granted regular registration as IPs from January 2017. The subordinate legislation relating to eco-system as well as the corporate insolvency processes under the Code was put in place by the IBBI and the corporate processes commenced on December 1, 2016.3.43 An important concern of many observers was the ability of the new framework to withstand the legal challenges. However, the Hon’ble Supreme Court upheld the Constitutional validity of the IBC in entirety in the matter of Swiss Ribbons Pvt. Ltd. & Anr. Vs. UoI & Ors.Progress Made3.44 The first case under the IBC was admitted by NCLT3 on January 17, 2017, in just over a month from the operationalization of the IBC, and the first insolvency resolution plan was approved on August 2, 2017.4 The Banking Regulations Act, 1949 was amended
2 The Supreme Court vide its judgment dated April 8, 2019 held that the RBI circular dated February 12, 2018 was ultra vires. 3 ICICI Bank Limited vs. Innoventive Industries Limited.4 Synergies-Dooray Automotive Ltd.
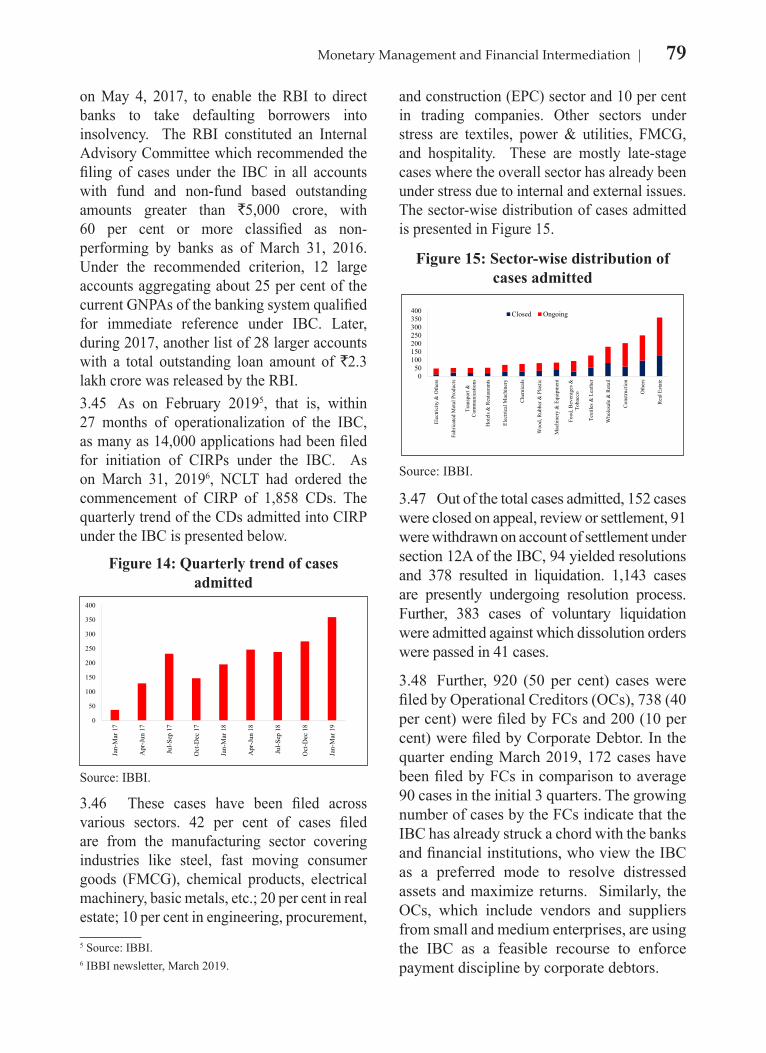
79Monetary Management and Financial Intermediation
on May 4, 2017, to enable the RBI to direct banks to take defaulting borrowers into insolvency. The RBI constituted an Internal Advisory Committee which recommended the filing of cases under the IBC in all accounts with fund and non-fund based outstanding amounts greater than `5,000 crore, with 60 per cent or more classified as non-performing by banks as of March 31, 2016. Under the recommended criterion, 12 large accounts aggregating about 25 per cent of the current GNPAs of the banking system qualified for immediate reference under IBC. Later, during 2017, another list of 28 larger accounts with a total outstanding loan amount of `2.3 lakh crore was released by the RBI. 3.45 As on February 20195, that is, within 27 months of operationalization of the IBC, as many as 14,000 applications had been filed for initiation of CIRPs under the IBC. As on March 31, 20196, NCLT had ordered the commencement of CIRP of 1,858 CDs. The quarterly trend of the CDs admitted into CIRP under the IBC is presented below.
and construction (EPC) sector and 10 per cent in trading companies. Other sectors under stress are textiles, power & utilities, FMCG, and hospitality. These are mostly late-stage cases where the overall sector has already been under stress due to internal and external issues. The sector-wise distribution of cases admitted is presented in Figure 15.
5 Source: IBBI.6 IBBI newsletter, March 2019.
3.46 These cases have been filed across various sectors. 42 per cent of cases filed are from the manufacturing sector covering industries like steel, fast moving consumer goods (FMCG), chemical products, electrical machinery, basic metals, etc.; 20 per cent in real estate; 10 per cent in engineering, procurement,
Figure 14: Quarterly trend of cases admitted
0
50
100
150
200
250
300
350
400
Jan-
Mar
17
Apr
-Jun
17
Jul-S
ep 1
7
Oct
-Dec
17
Jan-
Mar
18
Apr
-Jun
18
Jul-S
ep 1
8
Oct
-Dec
18
Jan-
Mar
19
Source: IBBI.
Figure 15: Sector-wise distribution of cases admitted
050
100150200250300350400
Elec
trici
ty &
Oth
ers
Fabr
icat
ed M
etal
Pro
duct
s
Tran
spor
t &C
omm
unic
atio
ns
Hot
els &
Res
taur
ants
Elec
trica
l Mac
hine
ry
Che
mic
als
Woo
d, R
ubbe
r & P
lasti
c
Mac
hine
ry &
Equ
ipm
ent
Food
, Bev
erag
es &
Toba
cco
Text
iles &
Lea
ther
Who
lesa
le &
Ret
ail
Con
stru
ctio
n
Oth
ers
Rea
l Est
ate
Closed Ongoing
Source: IBBI.
3.47 Out of the total cases admitted, 152 cases were closed on appeal, review or settlement, 91 were withdrawn on account of settlement under section 12A of the IBC, 94 yielded resolutions and 378 resulted in liquidation. 1,143 cases are presently undergoing resolution process. Further, 383 cases of voluntary liquidation were admitted against which dissolution orders were passed in 41 cases.
3.48 Further, 920 (50 per cent) cases were filed by Operational Creditors (OCs), 738 (40 per cent) were filed by FCs and 200 (10 per cent) were filed by Corporate Debtor. In the quarter ending March 2019, 172 cases have been filed by FCs in comparison to average 90 cases in the initial 3 quarters. The growing number of cases by the FCs indicate that the IBC has already struck a chord with the banks and financial institutions, who view the IBC as a preferred mode to resolve distressed assets and maximize returns. Similarly, the OCs, which include vendors and suppliers from small and medium enterprises, are using the IBC as a feasible recourse to enforce payment discipline by corporate debtors.
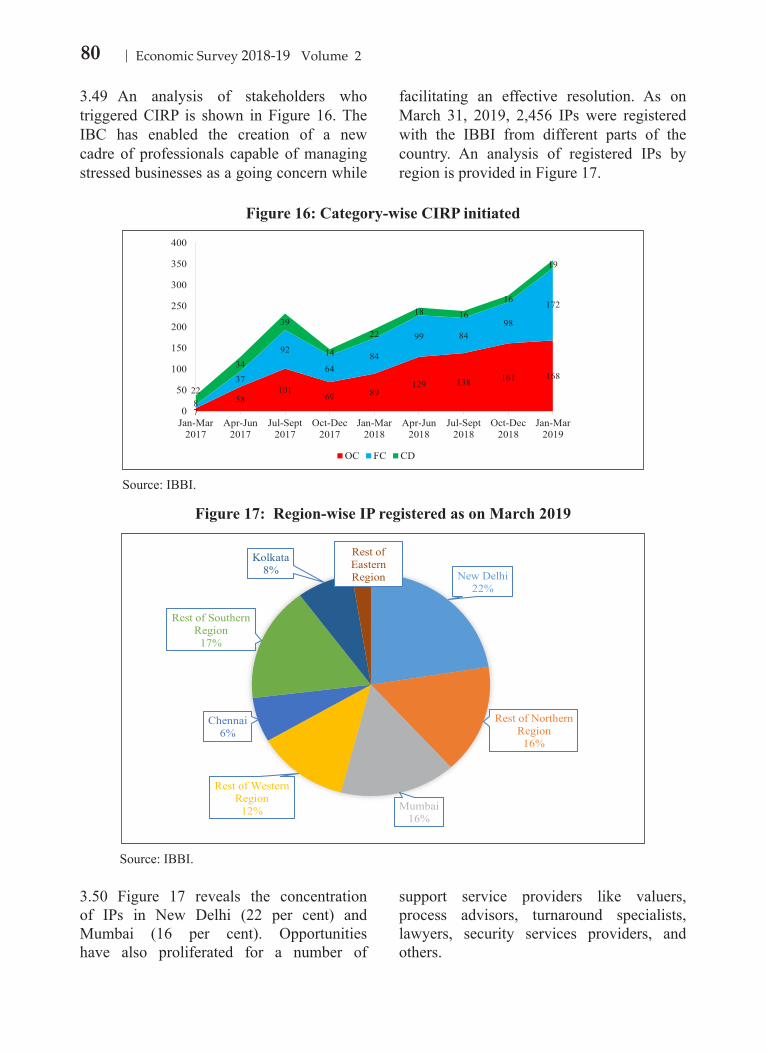
80 Economic Survey 2018-19 Volume 2
3.49 An analysis of stakeholders who triggered CIRP is shown in Figure 16. The IBC has enabled the creation of a new cadre of professionals capable of managing stressed businesses as a going concern while
facilitating an effective resolution. As on March 31, 2019, 2,456 IPs were registered with the IBBI from different parts of the country. An analysis of registered IPs by region is provided in Figure 17.
3.50 Figure 17 reveals the concentration of IPs in New Delhi (22 per cent) and Mumbai (16 per cent). Opportunities have also proliferated for a number of
support service providers like valuers, process advisors, turnaround specialists, lawyers, security services providers, and others.
Figure 16: Category-wise CIRP initiated
758
10169 89
129 138 161 168
8
37
92
6484
99 8498
172
22
34
39
14
22
18 16
16
19
0
50
100
150
200
250
300
350
400
Jan-Mar2017
Apr-Jun2017
Jul-Sept2017
Oct-Dec2017
Jan-Mar2018
Apr-Jun2018
Jul-Sept2018
Oct-Dec2018
Jan-Mar2019
OC FC CD
Source: IBBI.
Figure 17: Region-wise IP registered as on March 2019
New Delhi22%
Rest of Northern Region
16%
Mumbai16%
Rest of Western Region
12%
Chennai6%
Rest of Southern Region
17%
Kolkata 8%
Rest of Eastern Region
Source: IBBI.
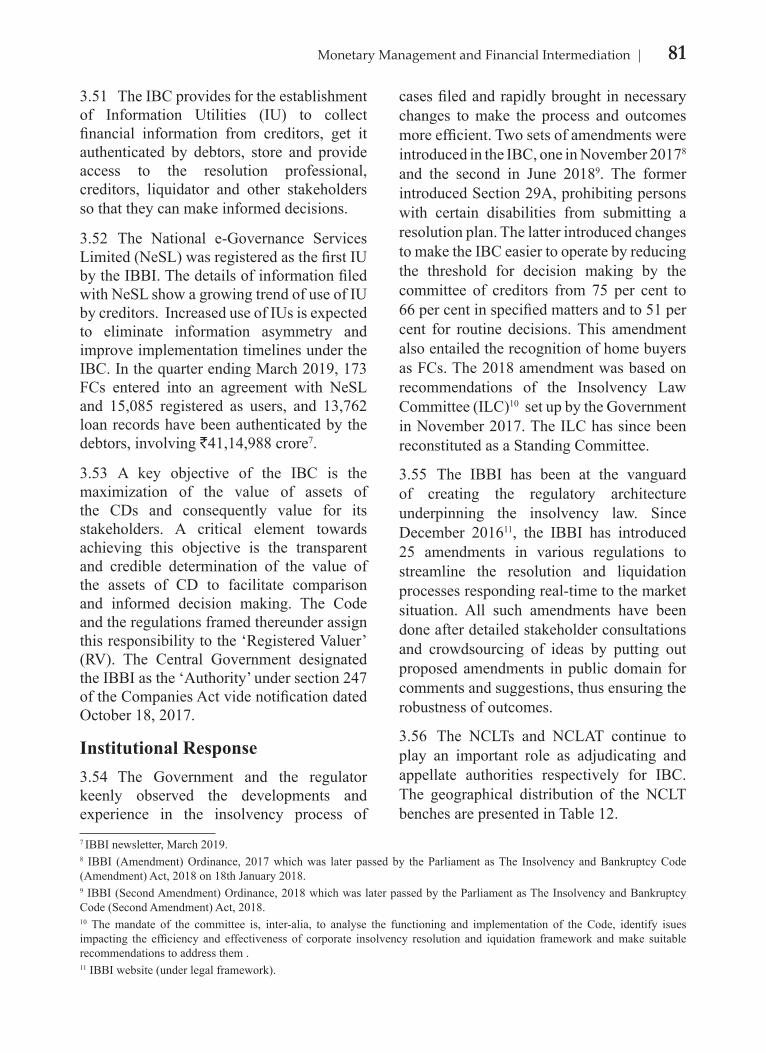
81Monetary Management and Financial Intermediation
3.51 The IBC provides for the establishment of Information Utilities (IU) to collect financial information from creditors, get it authenticated by debtors, store and provide access to the resolution professional, creditors, liquidator and other stakeholders so that they can make informed decisions.
3.52 The National e-Governance Services Limited (NeSL) was registered as the first IU by the IBBI. The details of information filed with NeSL show a growing trend of use of IU by creditors. Increased use of IUs is expected to eliminate information asymmetry and improve implementation timelines under the IBC. In the quarter ending March 2019, 173 FCs entered into an agreement with NeSL and 15,085 registered as users, and 13,762 loan records have been authenticated by the debtors, involving R41,14,988 crore7.
3.53 A key objective of the IBC is the maximization of the value of assets of the CDs and consequently value for its stakeholders. A critical element towards achieving this objective is the transparent and credible determination of the value of the assets of CD to facilitate comparison and informed decision making. The Code and the regulations framed thereunder assign this responsibility to the ‘Registered Valuer’ (RV). The Central Government designated the IBBI as the ‘Authority’ under section 247 of the Companies Act vide notification dated October 18, 2017.
Institutional Response3.54 The Government and the regulator keenly observed the developments and experience in the insolvency process of
cases filed and rapidly brought in necessary changes to make the process and outcomes more efficient. Two sets of amendments were introduced in the IBC, one in November 20178 and the second in June 20189. The former introduced Section 29A, prohibiting persons with certain disabilities from submitting a resolution plan. The latter introduced changes to make the IBC easier to operate by reducing the threshold for decision making by the committee of creditors from 75 per cent to 66 per cent in specified matters and to 51 per cent for routine decisions. This amendment also entailed the recognition of home buyers as FCs. The 2018 amendment was based on recommendations of the Insolvency Law Committee (ILC)10 set up by the Government in November 2017. The ILC has since been reconstituted as a Standing Committee.
3.55 The IBBI has been at the vanguard of creating the regulatory architecture underpinning the insolvency law. Since December 201611, the IBBI has introduced 25 amendments in various regulations to streamline the resolution and liquidation processes responding real-time to the market situation. All such amendments have been done after detailed stakeholder consultations and crowdsourcing of ideas by putting out proposed amendments in public domain for comments and suggestions, thus ensuring the robustness of outcomes.
3.56 The NCLTs and NCLAT continue to play an important role as adjudicating and appellate authorities respectively for IBC. The geographical distribution of the NCLT benches are presented in Table 12.
7 IBBI newsletter, March 2019.8 IBBI (Amendment) Ordinance, 2017 which was later passed by the Parliament as The Insolvency and Bankruptcy Code (Amendment) Act, 2018 on 18th January 2018.9 IBBI (Second Amendment) Ordinance, 2018 which was later passed by the Parliament as The Insolvency and Bankruptcy Code (Second Amendment) Act, 2018.10 The mandate of the committee is, inter-alia, to analyse the functioning and implementation of the Code, identify isues impacting the efficiency and effectiveness of corporate insolvency resolution and iquidation framework and make suitable recommendations to address them .11 IBBI website (under legal framework).
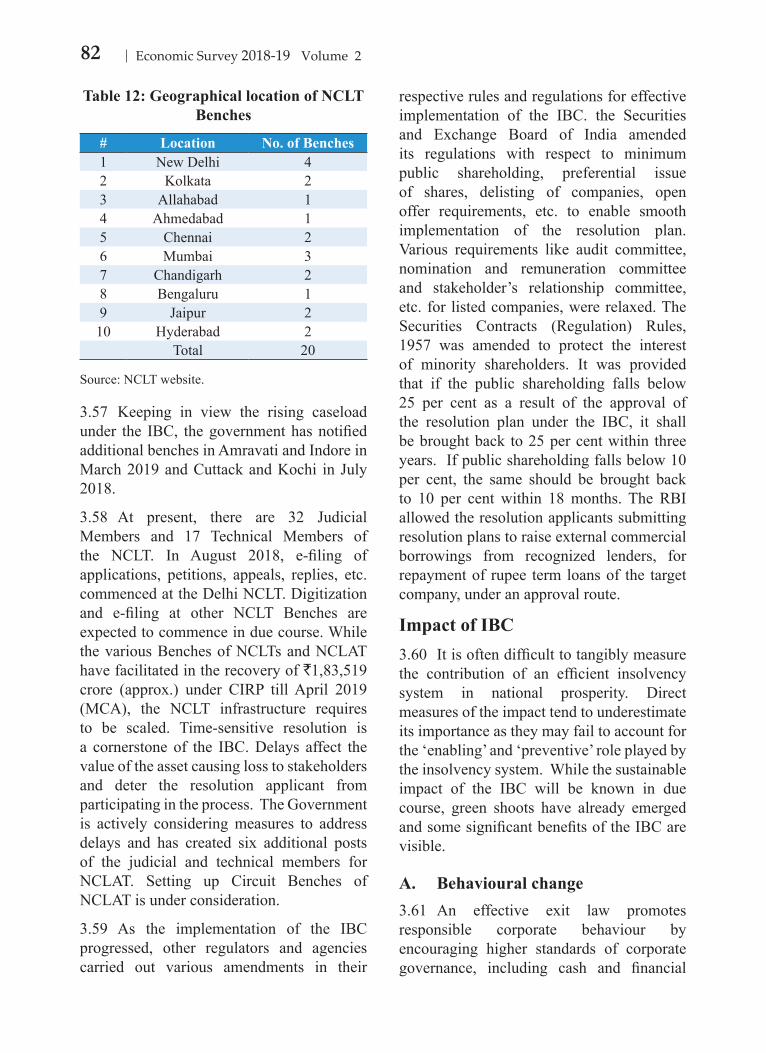
82 Economic Survey 2018-19 Volume 2
3.57 Keeping in view the rising caseload under the IBC, the government has notified additional benches in Amravati and Indore in March 2019 and Cuttack and Kochi in July 2018.
3.58 At present, there are 32 Judicial Members and 17 Technical Members of the NCLT. In August 2018, e-filing of applications, petitions, appeals, replies, etc. commenced at the Delhi NCLT. Digitization and e-filing at other NCLT Benches are expected to commence in due course. While the various Benches of NCLTs and NCLAT have facilitated in the recovery of `1,83,519 crore (approx.) under CIRP till April 2019 (MCA), the NCLT infrastructure requires to be scaled. Time-sensitive resolution is a cornerstone of the IBC. Delays affect the value of the asset causing loss to stakeholders and deter the resolution applicant from participating in the process. The Government is actively considering measures to address delays and has created six additional posts of the judicial and technical members for NCLAT. Setting up Circuit Benches of NCLAT is under consideration.
3.59 As the implementation of the IBC progressed, other regulators and agencies carried out various amendments in their
respective rules and regulations for effective implementation of the IBC. the Securities and Exchange Board of India amended its regulations with respect to minimum public shareholding, preferential issue of shares, delisting of companies, open offer requirements, etc. to enable smooth implementation of the resolution plan. Various requirements like audit committee, nomination and remuneration committee and stakeholder’s relationship committee, etc. for listed companies, were relaxed. The Securities Contracts (Regulation) Rules, 1957 was amended to protect the interest of minority shareholders. It was provided that if the public shareholding falls below 25 per cent as a result of the approval of the resolution plan under the IBC, it shall be brought back to 25 per cent within three years. If public shareholding falls below 10 per cent, the same should be brought back to 10 per cent within 18 months. The RBI allowed the resolution applicants submitting resolution plans to raise external commercial borrowings from recognized lenders, for repayment of rupee term loans of the target company, under an approval route.
Impact of IBC3.60 It is often difficult to tangibly measure the contribution of an efficient insolvency system in national prosperity. Direct measures of the impact tend to underestimate its importance as they may fail to account for the ‘enabling’ and ‘preventive’ role played by the insolvency system. While the sustainable impact of the IBC will be known in due course, green shoots have already emerged and some significant benefits of the IBC are visible.
A. Behavioural change3.61 An effective exit law promotes responsible corporate behaviour by encouraging higher standards of corporate governance, including cash and financial
Table 12: Geographical location of NCLT Benches
# Location No. of Benches1 New Delhi 42 Kolkata 23 Allahabad 14 Ahmedabad 15 Chennai 26 Mumbai 37 Chandigarh 28 Bengaluru 19 Jaipur 210 Hyderabad 2
Total 20
Source: NCLT website.
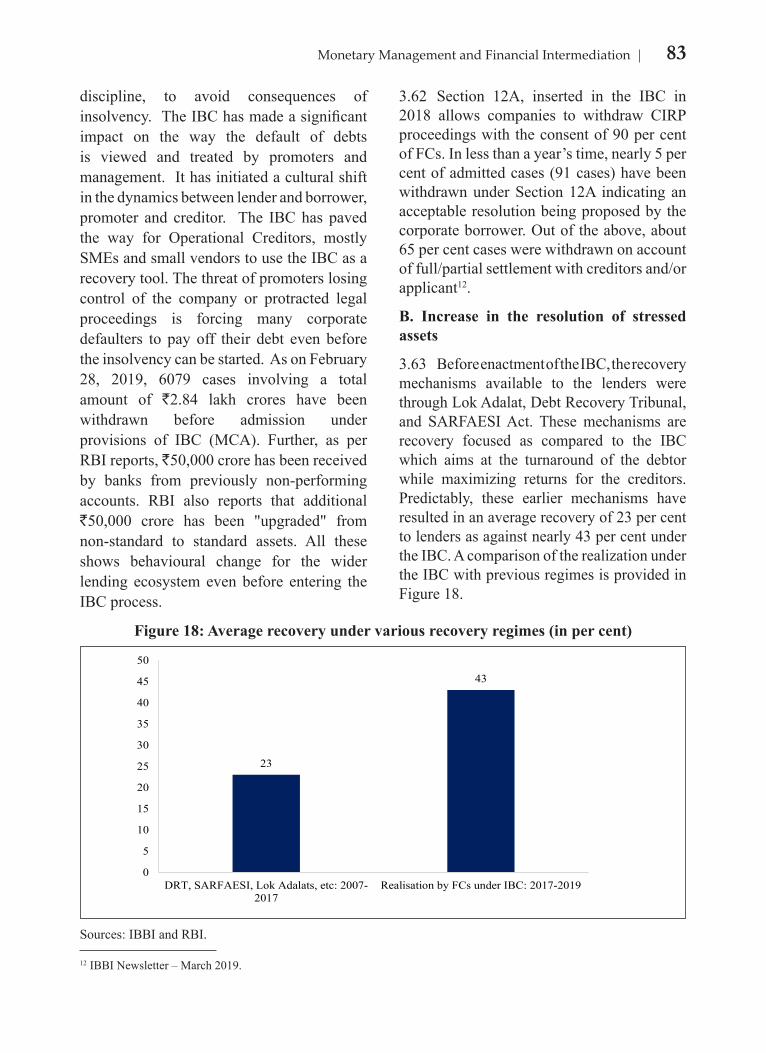
83Monetary Management and Financial Intermediation
discipline, to avoid consequences of insolvency. The IBC has made a significant impact on the way the default of debts is viewed and treated by promoters and management. It has initiated a cultural shift in the dynamics between lender and borrower, promoter and creditor. The IBC has paved the way for Operational Creditors, mostly SMEs and small vendors to use the IBC as a recovery tool. The threat of promoters losing control of the company or protracted legal proceedings is forcing many corporate defaulters to pay off their debt even before the insolvency can be started. As on February 28, 2019, 6079 cases involving a total amount of R2.84 lakh crores have been withdrawn before admission under provisions of IBC (MCA). Further, as per RBI reports, R50,000 crore has been received by banks from previously non-performing accounts. RBI also reports that additional R50,000 crore has been "upgraded" from non-standard to standard assets. All these shows behavioural change for the wider lending ecosystem even before entering the IBC process.
3.62 Section 12A, inserted in the IBC in 2018 allows companies to withdraw CIRP proceedings with the consent of 90 per cent of FCs. In less than a year’s time, nearly 5 per cent of admitted cases (91 cases) have been withdrawn under Section 12A indicating an acceptable resolution being proposed by the corporate borrower. Out of the above, about 65 per cent cases were withdrawn on account of full/partial settlement with creditors and/or applicant12.
B. Increase in the resolution of stressed assets
3.63 Before enactment of the IBC, the recovery mechanisms available to the lenders were through Lok Adalat, Debt Recovery Tribunal, and SARFAESI Act. These mechanisms are recovery focused as compared to the IBC which aims at the turnaround of the debtor while maximizing returns for the creditors. Predictably, these earlier mechanisms have resulted in an average recovery of 23 per cent to lenders as against nearly 43 per cent under the IBC. A comparison of the realization under the IBC with previous regimes is provided in Figure 18.
Figure 18: Average recovery under various recovery regimes (in per cent)
23
43
0
5
10
15
20
25
30
35
40
45
50
DRT, SARFAESI, Lok Adalats, etc: 2007-2017
Realisation by FCs under IBC: 2017-2019
Sources: IBBI and RBI.
12 IBBI Newsletter – March 2019.
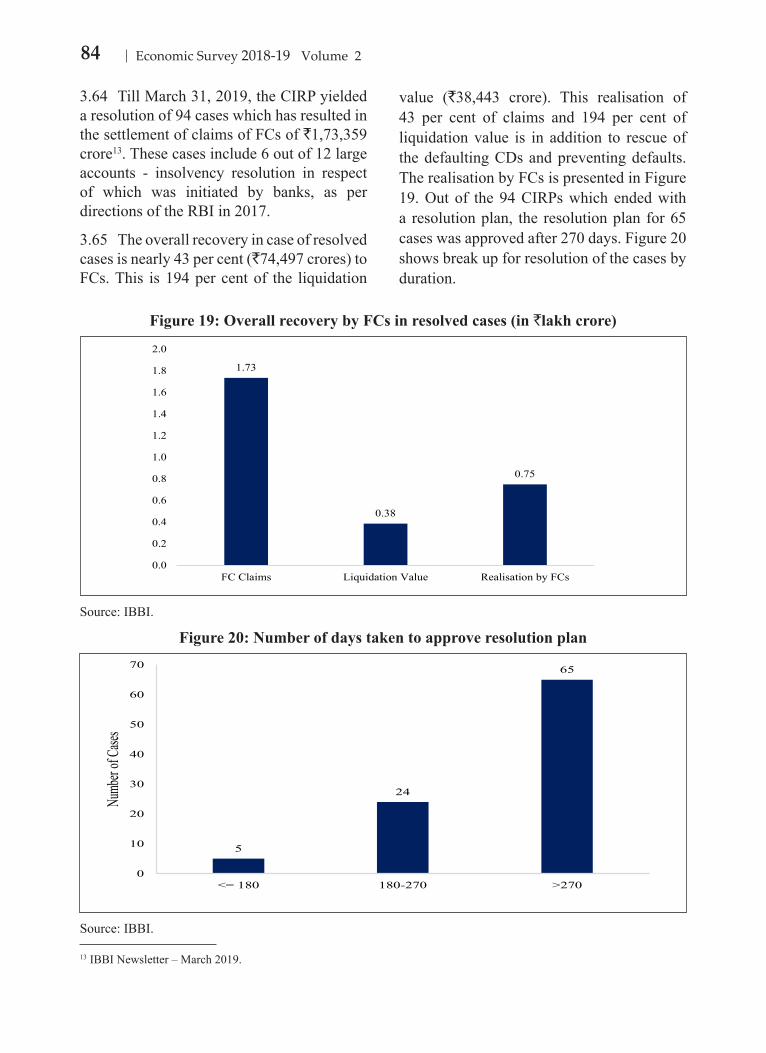
84 Economic Survey 2018-19 Volume 2
3.64 Till March 31, 2019, the CIRP yielded a resolution of 94 cases which has resulted in the settlement of claims of FCs of `1,73,359 crore13. These cases include 6 out of 12 large accounts - insolvency resolution in respect of which was initiated by banks, as per directions of the RBI in 2017.
3.65 The overall recovery in case of resolved cases is nearly 43 per cent (`74,497 crores) to FCs. This is 194 per cent of the liquidation
value (`38,443 crore). This realisation of 43 per cent of claims and 194 per cent of liquidation value is in addition to rescue of the defaulting CDs and preventing defaults. The realisation by FCs is presented in Figure 19. Out of the 94 CIRPs which ended with a resolution plan, the resolution plan for 65 cases was approved after 270 days. Figure 20 shows break up for resolution of the cases by duration.
Figure 19: Overall recovery by FCs in resolved cases (in `lakh crore)
1.73
0.38
0.75
0.0
0.2
0.4
0.6
0.8
1.0
1.2
1.4
1.6
1.8
2.0
FC Claims Liquidation Value Realisation by FCs
Source: IBBI.
Figure 20: Number of days taken to approve resolution plan
5
24
65
0
10
20
30
40
50
60
70
<= 180 180-270 >270
Numb
er of
Cases
Source: IBBI.
13 IBBI Newsletter – March 2019.
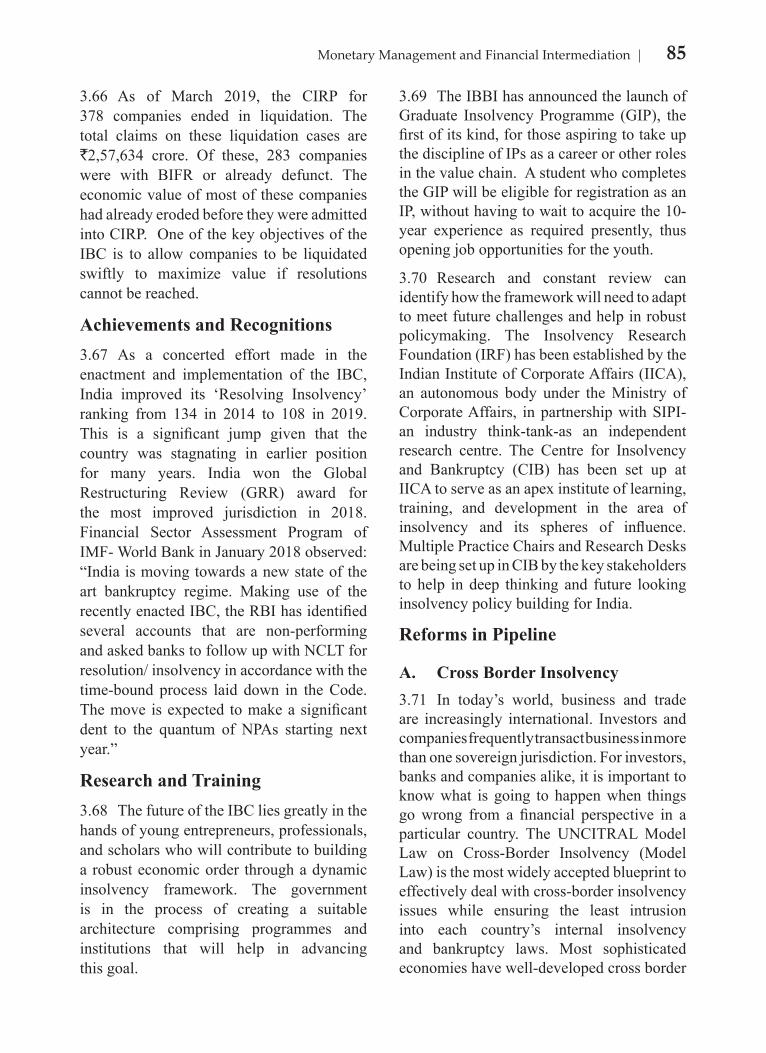
85Monetary Management and Financial Intermediation
3.66 As of March 2019, the CIRP for 378 companies ended in liquidation. The total claims on these liquidation cases are `2,57,634 crore. Of these, 283 companies were with BIFR or already defunct. The economic value of most of these companies had already eroded before they were admitted into CIRP. One of the key objectives of the IBC is to allow companies to be liquidated swiftly to maximize value if resolutions cannot be reached.
Achievements and Recognitions3.67 As a concerted effort made in the enactment and implementation of the IBC, India improved its ‘Resolving Insolvency’ ranking from 134 in 2014 to 108 in 2019. This is a significant jump given that the country was stagnating in earlier position for many years. India won the Global Restructuring Review (GRR) award for the most improved jurisdiction in 2018. Financial Sector Assessment Program of IMF- World Bank in January 2018 observed: “India is moving towards a new state of the art bankruptcy regime. Making use of the recently enacted IBC, the RBI has identified several accounts that are non-performing and asked banks to follow up with NCLT for resolution/ insolvency in accordance with the time-bound process laid down in the Code. The move is expected to make a significant dent to the quantum of NPAs starting next year.”
Research and Training3.68 The future of the IBC lies greatly in the hands of young entrepreneurs, professionals, and scholars who will contribute to building a robust economic order through a dynamic insolvency framework. The government is in the process of creating a suitable architecture comprising programmes and institutions that will help in advancing this goal.
3.69 The IBBI has announced the launch of Graduate Insolvency Programme (GIP), the first of its kind, for those aspiring to take up the discipline of IPs as a career or other roles in the value chain. A student who completes the GIP will be eligible for registration as an IP, without having to wait to acquire the 10-year experience as required presently, thus opening job opportunities for the youth.
3.70 Research and constant review can identify how the framework will need to adapt to meet future challenges and help in robust policymaking. The Insolvency Research Foundation (IRF) has been established by the Indian Institute of Corporate Affairs (IICA), an autonomous body under the Ministry of Corporate Affairs, in partnership with SIPI- an industry think-tank-as an independent research centre. The Centre for Insolvency and Bankruptcy (CIB) has been set up at IICA to serve as an apex institute of learning, training, and development in the area of insolvency and its spheres of influence. Multiple Practice Chairs and Research Desks are being set up in CIB by the key stakeholders to help in deep thinking and future looking insolvency policy building for India.
Reforms in Pipeline
A. Cross Border Insolvency3.71 In today’s world, business and trade are increasingly international. Investors and companies frequently transact business in more than one sovereign jurisdiction. For investors, banks and companies alike, it is important to know what is going to happen when things go wrong from a financial perspective in a particular country. The UNCITRAL Model Law on Cross-Border Insolvency (Model Law) is the most widely accepted blueprint to effectively deal with cross-border insolvency issues while ensuring the least intrusion into each country’s internal insolvency and bankruptcy laws. Most sophisticated economies have well-developed cross border
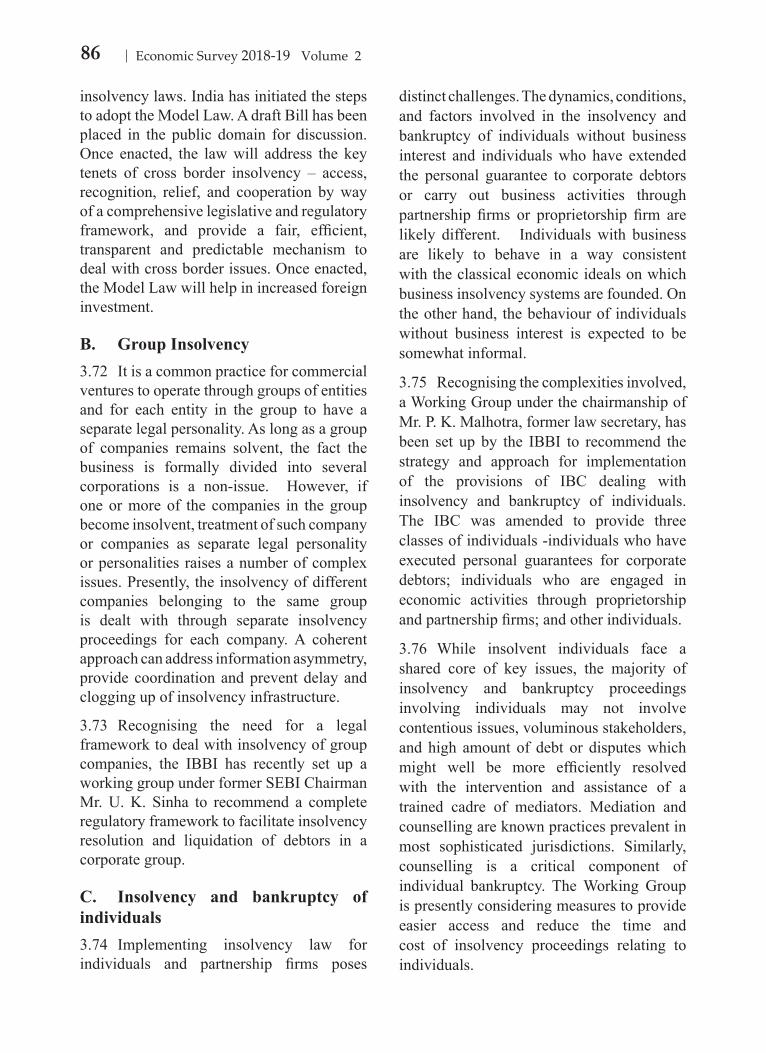
86 Economic Survey 2018-19 Volume 2
insolvency laws. India has initiated the steps to adopt the Model Law. A draft Bill has been placed in the public domain for discussion. Once enacted, the law will address the key tenets of cross border insolvency – access, recognition, relief, and cooperation by way of a comprehensive legislative and regulatory framework, and provide a fair, efficient, transparent and predictable mechanism to deal with cross border issues. Once enacted, the Model Law will help in increased foreign investment.
B. Group Insolvency3.72 It is a common practice for commercial ventures to operate through groups of entities and for each entity in the group to have a separate legal personality. As long as a group of companies remains solvent, the fact the business is formally divided into several corporations is a non-issue. However, if one or more of the companies in the group become insolvent, treatment of such company or companies as separate legal personality or personalities raises a number of complex issues. Presently, the insolvency of different companies belonging to the same group is dealt with through separate insolvency proceedings for each company. A coherent approach can address information asymmetry, provide coordination and prevent delay and clogging up of insolvency infrastructure.
3.73 Recognising the need for a legal framework to deal with insolvency of group companies, the IBBI has recently set up a working group under former SEBI Chairman Mr. U. K. Sinha to recommend a complete regulatory framework to facilitate insolvency resolution and liquidation of debtors in a corporate group.
C. Insolvency and bankruptcy of individuals3.74 Implementing insolvency law for individuals and partnership firms poses
distinct challenges. The dynamics, conditions, and factors involved in the insolvency and bankruptcy of individuals without business interest and individuals who have extended the personal guarantee to corporate debtors or carry out business activities through partnership firms or proprietorship firm are likely different. Individuals with business are likely to behave in a way consistent with the classical economic ideals on which business insolvency systems are founded. On the other hand, the behaviour of individuals without business interest is expected to be somewhat informal.
3.75 Recognising the complexities involved, a Working Group under the chairmanship of Mr. P. K. Malhotra, former law secretary, has been set up by the IBBI to recommend the strategy and approach for implementation of the provisions of IBC dealing with insolvency and bankruptcy of individuals. The IBC was amended to provide three classes of individuals -individuals who have executed personal guarantees for corporate debtors; individuals who are engaged in economic activities through proprietorship and partnership firms; and other individuals.
3.76 While insolvent individuals face a shared core of key issues, the majority of insolvency and bankruptcy proceedings involving individuals may not involve contentious issues, voluminous stakeholders, and high amount of debt or disputes which might well be more efficiently resolved with the intervention and assistance of a trained cadre of mediators. Mediation and counselling are known practices prevalent in most sophisticated jurisdictions. Similarly, counselling is a critical component of individual bankruptcy. The Working Group is presently considering measures to provide easier access and reduce the time and cost of insolvency proceedings relating to individuals.
87Monetary Management and Financial Intermediation
D. Improving NCLT capacity3.77 While 32 Members have been appointed to the NCLT recently and 6 additional posts have been sanctioned for NCLAT, the capacity of the NCLT and NCLAT will have to review from time to time and necessary infrastructure support provided. A centralized research wing can assist NCLT to stay abreast with the international best practices. This will be more crucial with the enactment of the Model
Law. Although technology is being used to an extent by the NCLT and the IBBI, it is crucial to advance the application of technology to enhance case management by the NCLT for strict timekeeping of insolvency cases. Technology can also be used for data mining and analysis for constant review of the IBC impact on the ground. IPs should be encouraged to use technology to speed up data collection and access for the purpose of efficient CIRP.
CHAPTER AT A GLANCE Monetary policy witnessed a u-turn over the last year as the benchmark policy rate was
first hiked by 50 bps and later reduced by 75 bps due to weaker-than-anticipated inflation, growth slowdown and softer international monetary conditions.
Liquidity conditions, however, have remained systematically tight since September 2018 (as illustrated by the LAF data) thereby impacting the yields on government papers.
The performance of the banking system has improved as NPA ratios declined and credit growth accelerated.
However, financial flows to the economy remained constrained because of decline in the amount of equity finance raised from capital markets and stress in the NBFC sector. Capital mobilized through public equity issuance declined by 81 per cent in 2018-19. Credit growth rate y-o-y of the NBFCs have declined from 30 per cent in March 2018 to 9 per cent in March 2019.
The ecosystem for insolvency and bankruptcy is getting systematically built out with recovery and resolution of significant amount of distressed assets as well as palpably improved business culture. Till March 31, 2019, the CIRP yielded a resolution of 94 cases which has resulted in the settlement of claims of FCs of `1,73,359 crore.
Moreover, as on February 28, 2019, 6079 cases involving a total amount of `2.84 lakh crores have been withdrawn before admission under provisions of IBC. Further, as per RBI reports, `50,000 crore has been received by banks from previously non-performing accounts. RBI also reports that additional `50,000 crore has been "upgraded" from non-standard to standard assets. All these shows behavioural change for the wider lending ecosystem even before entering the IBC process.

CHAPTER
04Prices and Inflation
“The Superintendent of Commerce shall ascertain demand or absence of demand for, and rise or fall in the price of, various kinds of merchandise which may be the products either of land or of water and which may have been brought in either by land or by water path. He shall also ascertain the time suitable for their distribution, centralisation, purchase, and sale.”
- Kautilya’s Arthasástra, Chapter XVI, ‘the Superintendent of Commerce,’ in Book II, ‘The Duties of Government Superintendents.’
During FY 19 headline (CPI-C) inflation continued its downward trajectory on the back of low food inflation. Core inflation which was above 6 per cent in the six out of first seven months of FY 19 started moderating November onwards. Services and goods are trending differently. Rural inflation moderated but urban inflation rose in 2018-19 over the previous year. States too witnessed decline in inflation during the year.
INTRODUCTION
4.1 The economy witnessed a gradual transition from a period of high and variable inflation to more stable and low level of inflation in the last five years. Headline inflation based on the Consumer Price Index – Combined (CPI-C) has been declining continuously for the last five years. Headline CPI inflation declined to 3.4 per cent in 2018-19 from 3.6 per cent in 2017-18, 4.5 per cent in 2016-17, 4.9 per cent in 2015-16 and 5.9 per cent in 2014-15. It stood at 2.9 per cent in April 2019 as compared to 4.6 per cent in April 2018. Food inflation based on
Consumer Food Price Index (CFPI) declined to a low of 0.1 per cent during the financial year (FY) 2018-19.
4.2 Inflation based on Wholesale Price Index (WPI) remained moderate at 3.0 per cent in 2017-18 compared to 1.7 per cent in 2016-17, (-)3.7 per cent in 2015-16 and 1.2 per cent in 2014-15. During the FY 2018-19, WPI inflation stood at 4.3 per cent. Inflation based on the major series of the price indices for the last seven years are given in Table 1 and the movement of WPI and CPI inflation since April 2014 is displayed in Figure 1.
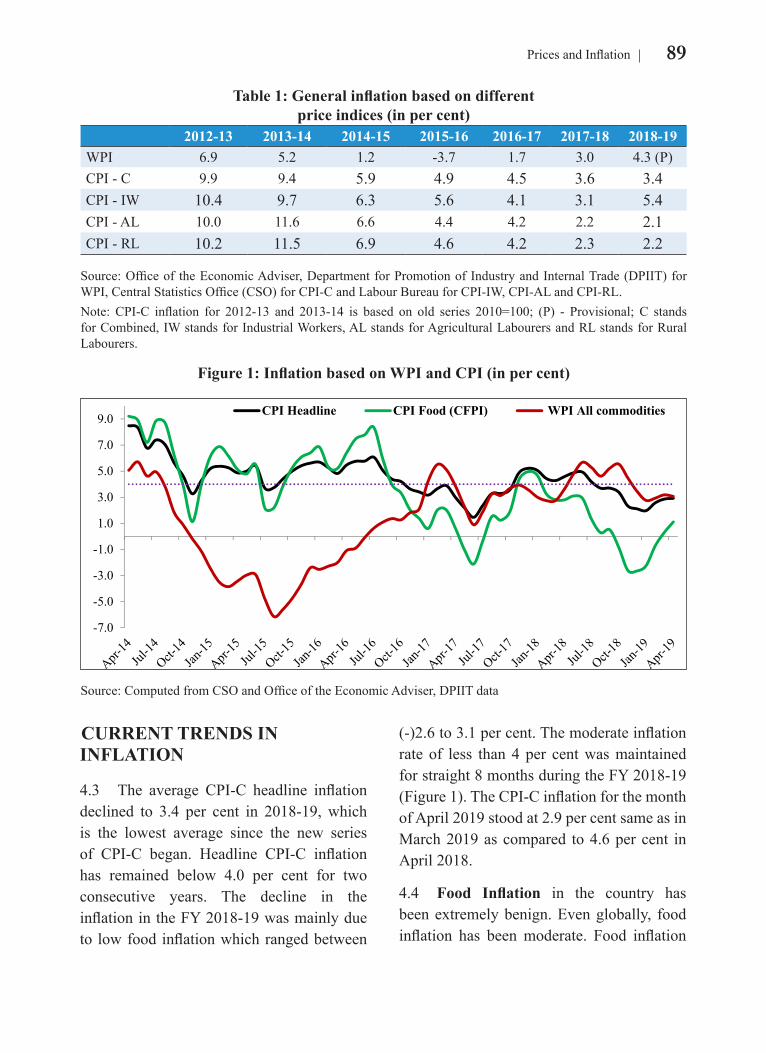
89Prices and Inflation
CURRENT TRENDS IN INFLATION
4.3 The average CPI-C headline inflation declined to 3.4 per cent in 2018-19, which is the lowest average since the new series of CPI-C began. Headline CPI-C inflation has remained below 4.0 per cent for two consecutive years. The decline in the inflation in the FY 2018-19 was mainly due to low food inflation which ranged between
(-)2.6 to 3.1 per cent. The moderate inflation rate of less than 4 per cent was maintained for straight 8 months during the FY 2018-19 (Figure 1). The CPI-C inflation for the month of April 2019 stood at 2.9 per cent same as in March 2019 as compared to 4.6 per cent in April 2018.
4.4 Food Inflation in the country has been extremely benign. Even globally, food inflation has been moderate. Food inflation
Table 1: General inflation based on different price indices (in per cent)
2012-13 2013-14 2014-15 2015-16 2016-17 2017-18 2018-19WPI 6.9 5.2 1.2 -3.7 1.7 3.0 4.3 (P)CPI - C 9.9 9.4 5.9 4.9 4.5 3.6 3.4CPI - IW 10.4 9.7 6.3 5.6 4.1 3.1 5.4CPI - AL 10.0 11.6 6.6 4.4 4.2 2.2 2.1CPI - RL 10.2 11.5 6.9 4.6 4.2 2.3 2.2
Source: Office of the Economic Adviser, Department for Promotion of Industry and Internal Trade (DPIIT) for WPI, Central Statistics Office (CSO) for CPI-C and Labour Bureau for CPI-IW, CPI-AL and CPI-RL.Note: CPI-C inflation for 2012-13 and 2013-14 is based on old series 2010=100; (P) - Provisional; C stands for Combined, IW stands for Industrial Workers, AL stands for Agricultural Labourers and RL stands for Rural Labourers.
Figure 1: Inflation based on WPI and CPI (in per cent)
-7.0
-5.0
-3.0
-1.0
1.0
3.0
5.0
7.0
9.0 CPI Headline CPI Food (CFPI) WPI All commodities
Source: Computed from CSO and Office of the Economic Adviser, DPIIT data
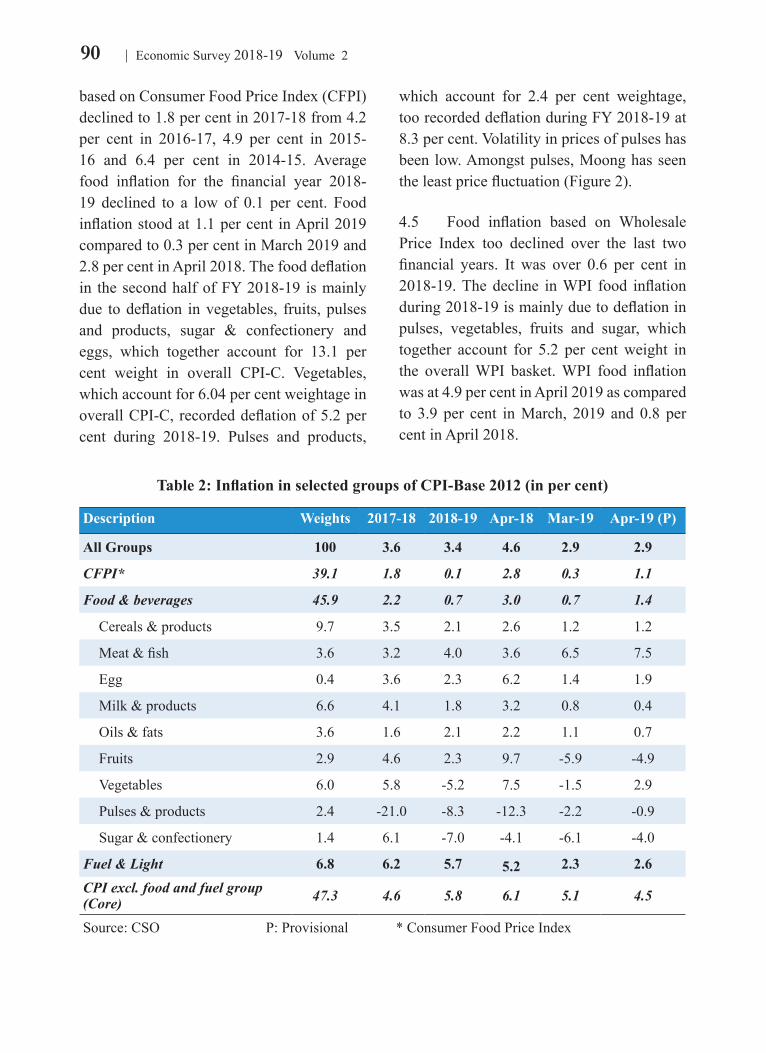
90 Economic Survey 2018-19 Volume 2
which account for 2.4 per cent weightage, too recorded deflation during FY 2018-19 at 8.3 per cent. Volatility in prices of pulses has been low. Amongst pulses, Moong has seen the least price fluctuation (Figure 2).
4.5 Food inflation based on Wholesale Price Index too declined over the last two financial years. It was over 0.6 per cent in 2018-19. The decline in WPI food inflation during 2018-19 is mainly due to deflation in pulses, vegetables, fruits and sugar, which together account for 5.2 per cent weight in the overall WPI basket. WPI food inflation was at 4.9 per cent in April 2019 as compared to 3.9 per cent in March, 2019 and 0.8 per cent in April 2018.
based on Consumer Food Price Index (CFPI) declined to 1.8 per cent in 2017-18 from 4.2 per cent in 2016-17, 4.9 per cent in 2015-16 and 6.4 per cent in 2014-15. Average food inflation for the financial year 2018-19 declined to a low of 0.1 per cent. Food inflation stood at 1.1 per cent in April 2019 compared to 0.3 per cent in March 2019 and 2.8 per cent in April 2018. The food deflation in the second half of FY 2018-19 is mainly due to deflation in vegetables, fruits, pulses and products, sugar & confectionery and eggs, which together account for 13.1 per cent weight in overall CPI-C. Vegetables, which account for 6.04 per cent weightage in overall CPI-C, recorded deflation of 5.2 per cent during 2018-19. Pulses and products,
Table 2: Inflation in selected groups of CPI-Base 2012 (in per cent)
Description Weights 2017-18 2018-19 Apr-18 Mar-19 Apr-19 (P)
All Groups 100 3.6 3.4 4.6 2.9 2.9
CFPI* 39.1 1.8 0.1 2.8 0.3 1.1
Food & beverages 45.9 2.2 0.7 3.0 0.7 1.4
Cereals & products 9.7 3.5 2.1 2.6 1.2 1.2
Meat & fish 3.6 3.2 4.0 3.6 6.5 7.5
Egg 0.4 3.6 2.3 6.2 1.4 1.9
Milk & products 6.6 4.1 1.8 3.2 0.8 0.4
Oils & fats 3.6 1.6 2.1 2.2 1.1 0.7
Fruits 2.9 4.6 2.3 9.7 -5.9 -4.9
Vegetables 6.0 5.8 -5.2 7.5 -1.5 2.9
Pulses & products 2.4 -21.0 -8.3 -12.3 -2.2 -0.9
Sugar & confectionery 1.4 6.1 -7.0 -4.1 -6.1 -4.0
Fuel & Light 6.8 6.2 5.7 5.2 2.3 2.6CPI excl. food and fuel group (Core) 47.3 4.6 5.8 6.1 5.1 4.5
Source: CSO P: Provisional * Consumer Food Price Index
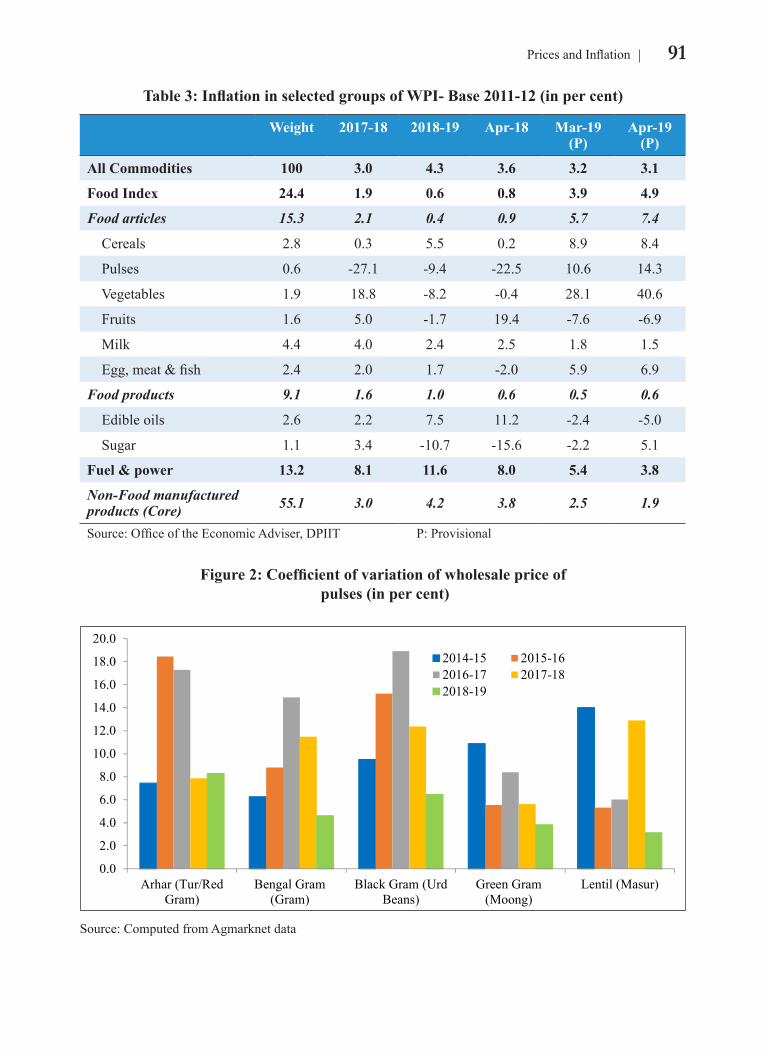
91Prices and Inflation
Table 3: Inflation in selected groups of WPI- Base 2011-12 (in per cent)
Weight 2017-18 2018-19 Apr-18 Mar-19 (P)
Apr-19 (P)
All Commodities 100 3.0 4.3 3.6 3.2 3.1
Food Index 24.4 1.9 0.6 0.8 3.9 4.9
Food articles 15.3 2.1 0.4 0.9 5.7 7.4
Cereals 2.8 0.3 5.5 0.2 8.9 8.4
Pulses 0.6 -27.1 -9.4 -22.5 10.6 14.3
Vegetables 1.9 18.8 -8.2 -0.4 28.1 40.6
Fruits 1.6 5.0 -1.7 19.4 -7.6 -6.9
Milk 4.4 4.0 2.4 2.5 1.8 1.5
Egg, meat & fish 2.4 2.0 1.7 -2.0 5.9 6.9
Food products 9.1 1.6 1.0 0.6 0.5 0.6
Edible oils 2.6 2.2 7.5 11.2 -2.4 -5.0
Sugar 1.1 3.4 -10.7 -15.6 -2.2 5.1
Fuel & power 13.2 8.1 11.6 8.0 5.4 3.8
Non-Food manufactured products (Core) 55.1 3.0 4.2 3.8 2.5 1.9
Source: Office of the Economic Adviser, DPIIT P: Provisional
Figure 2: Coefficient of variation of wholesale price of pulses (in per cent)
0.0
2.0
4.0
6.0
8.0
10.0
12.0
14.0
16.0
18.0
20.0
Arhar (Tur/RedGram)
Bengal Gram(Gram)
Black Gram (UrdBeans)
Green Gram(Moong)
Lentil (Masur)
2014-15 2015-162016-17 2017-182018-19
Source: Computed from Agmarknet data
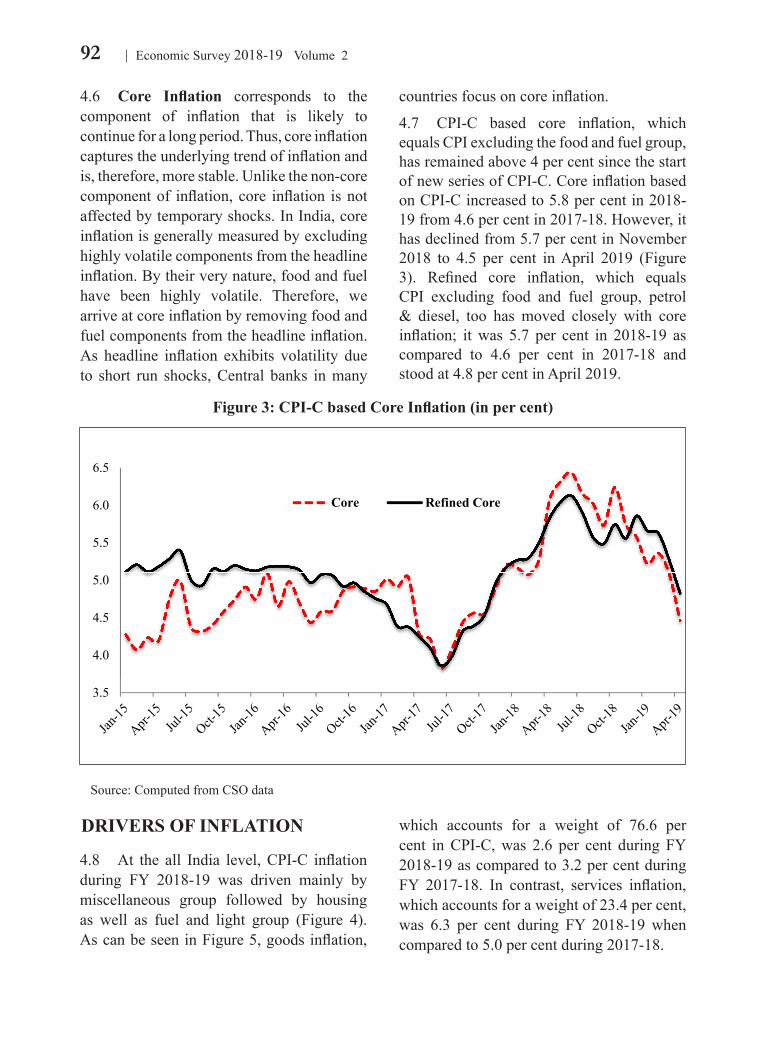
92 Economic Survey 2018-19 Volume 2
countries focus on core inflation.
4.7 CPI-C based core inflation, which equals CPI excluding the food and fuel group, has remained above 4 per cent since the start of new series of CPI-C. Core inflation based on CPI-C increased to 5.8 per cent in 2018-19 from 4.6 per cent in 2017-18. However, it has declined from 5.7 per cent in November 2018 to 4.5 per cent in April 2019 (Figure 3). Refined core inflation, which equals CPI excluding food and fuel group, petrol & diesel, too has moved closely with core inflation; it was 5.7 per cent in 2018-19 as compared to 4.6 per cent in 2017-18 and stood at 4.8 per cent in April 2019.
4.6 Core Inflation corresponds to the component of inflation that is likely to continue for a long period. Thus, core inflation captures the underlying trend of inflation and is, therefore, more stable. Unlike the non-core component of inflation, core inflation is not affected by temporary shocks. In India, core inflation is generally measured by excluding highly volatile components from the headline inflation. By their very nature, food and fuel have been highly volatile. Therefore, we arrive at core inflation by removing food and fuel components from the headline inflation. As headline inflation exhibits volatility due to short run shocks, Central banks in many
DRIVERS OF INFLATION
4.8 At the all India level, CPI-C inflation during FY 2018-19 was driven mainly by miscellaneous group followed by housing as well as fuel and light group (Figure 4). As can be seen in Figure 5, goods inflation,
which accounts for a weight of 76.6 per cent in CPI-C, was 2.6 per cent during FY 2018-19 as compared to 3.2 per cent during FY 2017-18. In contrast, services inflation, which accounts for a weight of 23.4 per cent, was 6.3 per cent during FY 2018-19 when compared to 5.0 per cent during 2017-18.
Figure 3: CPI-C based Core Inflation (in per cent)
3.5
4.0
4.5
5.0
5.5
6.0
6.5
Core Refined Core
Source: Computed from CSO data
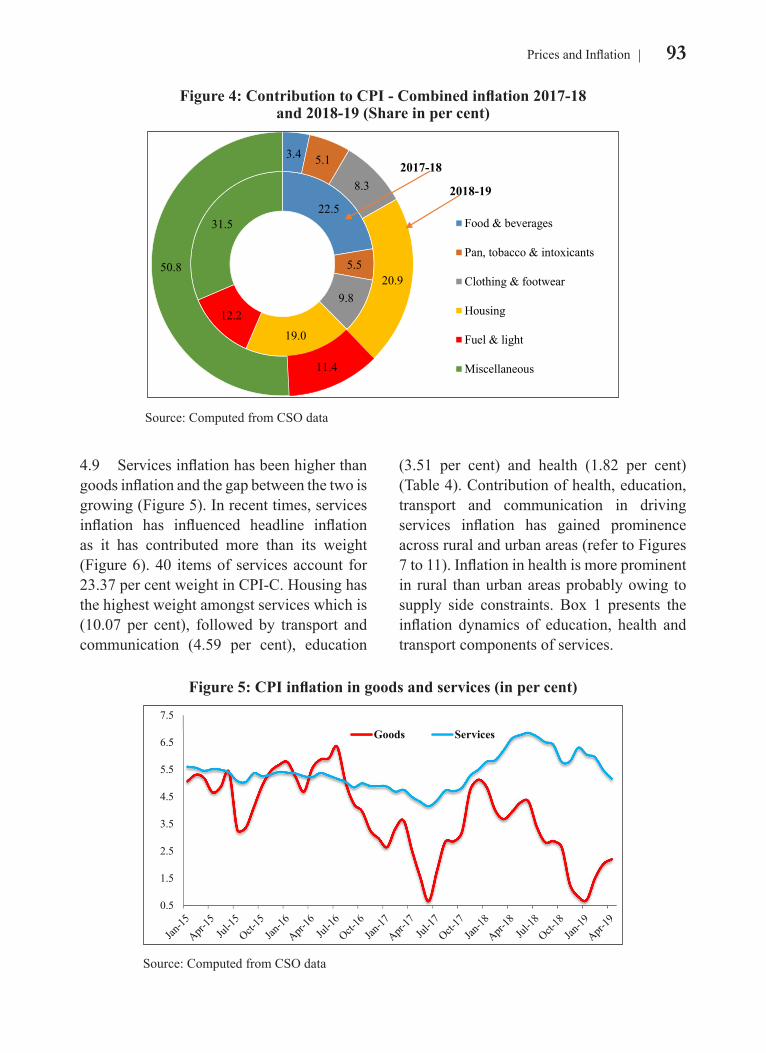
93Prices and Inflation
(3.51 per cent) and health (1.82 per cent) (Table 4). Contribution of health, education, transport and communication in driving services inflation has gained prominence across rural and urban areas (refer to Figures 7 to 11). Inflation in health is more prominent in rural than urban areas probably owing to supply side constraints. Box 1 presents the inflation dynamics of education, health and transport components of services.
4.9 Services inflation has been higher than goods inflation and the gap between the two is growing (Figure 5). In recent times, services inflation has influenced headline inflation as it has contributed more than its weight (Figure 6). 40 items of services account for 23.37 per cent weight in CPI-C. Housing has the highest weight amongst services which is (10.07 per cent), followed by transport and communication (4.59 per cent), education
Figure 4: Contribution to CPI - Combined inflation 2017-18 and 2018-19 (Share in per cent)
22.5
5.5
9.8
19.0
12.2
31.5
3.4 5.1
8.3
20.9
11.4
50.8
Food & beverages
Pan, tobacco & intoxicants
Clothing & footwear
Housing
Fuel & light
Miscellaneous
2018-19
2017-18
Source: Computed from CSO data
Figure 5: CPI inflation in goods and services (in per cent)
0.5
1.5
2.5
3.5
4.5
5.5
6.5
7.5
Goods Services
Source: Computed from CSO data
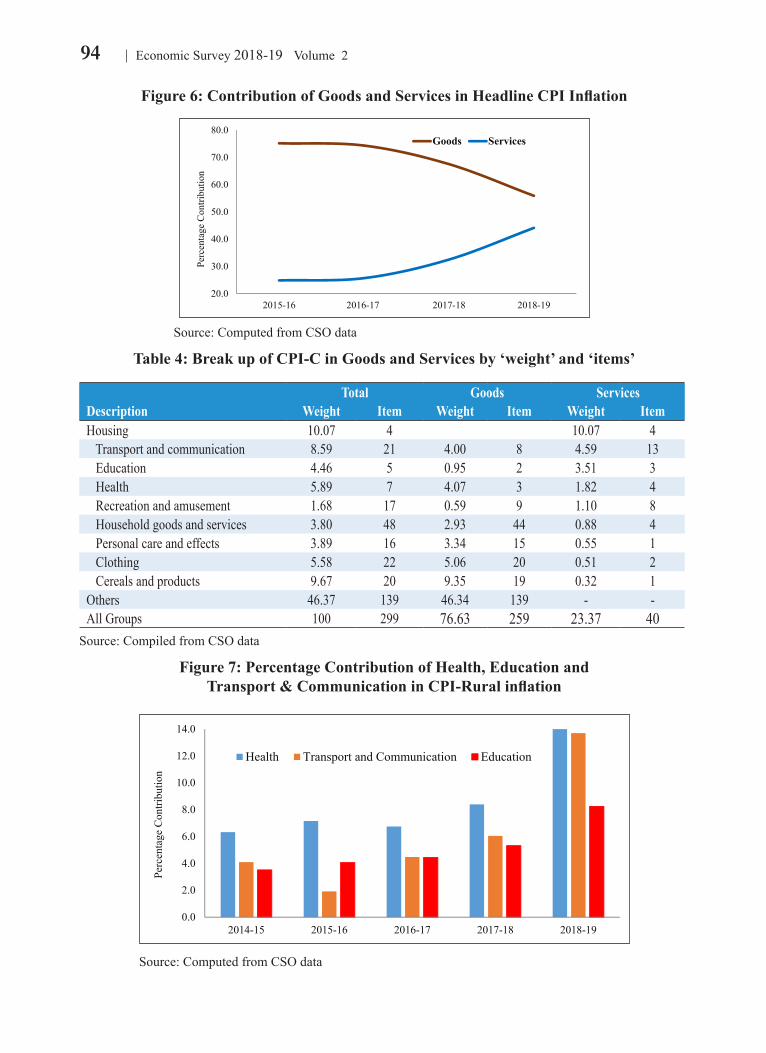
94 Economic Survey 2018-19 Volume 2
Figure 6: Contribution of Goods and Services in Headline CPI Inflation
20.0
30.0
40.0
50.0
60.0
70.0
80.0
2015-16 2016-17 2017-18 2018-19
Perc
enta
ge C
ontri
butio
n
Goods Services
Source: Computed from CSO data
Table 4: Break up of CPI-C in Goods and Services by ‘weight’ and ‘items’
Total Goods Services Description Weight Item Weight Item Weight ItemHousing 10.07 4 10.07 4 Transport and communication 8.59 21 4.00 8 4.59 13 Education 4.46 5 0.95 2 3.51 3 Health 5.89 7 4.07 3 1.82 4 Recreation and amusement 1.68 17 0.59 9 1.10 8 Household goods and services 3.80 48 2.93 44 0.88 4 Personal care and effects 3.89 16 3.34 15 0.55 1 Clothing 5.58 22 5.06 20 0.51 2 Cereals and products 9.67 20 9.35 19 0.32 1Others 46.37 139 46.34 139 - -All Groups 100 299 76.63 259 23.37 40
Source: Compiled from CSO data
Figure 7: Percentage Contribution of Health, Education and Transport & Communication in CPI-Rural inflation
0.0
2.0
4.0
6.0
8.0
10.0
12.0
14.0
2014-15 2015-16 2016-17 2017-18 2018-19
Perc
enta
ge C
ontri
butio
n
Health Transport and Communication Education
Source: Computed from CSO data
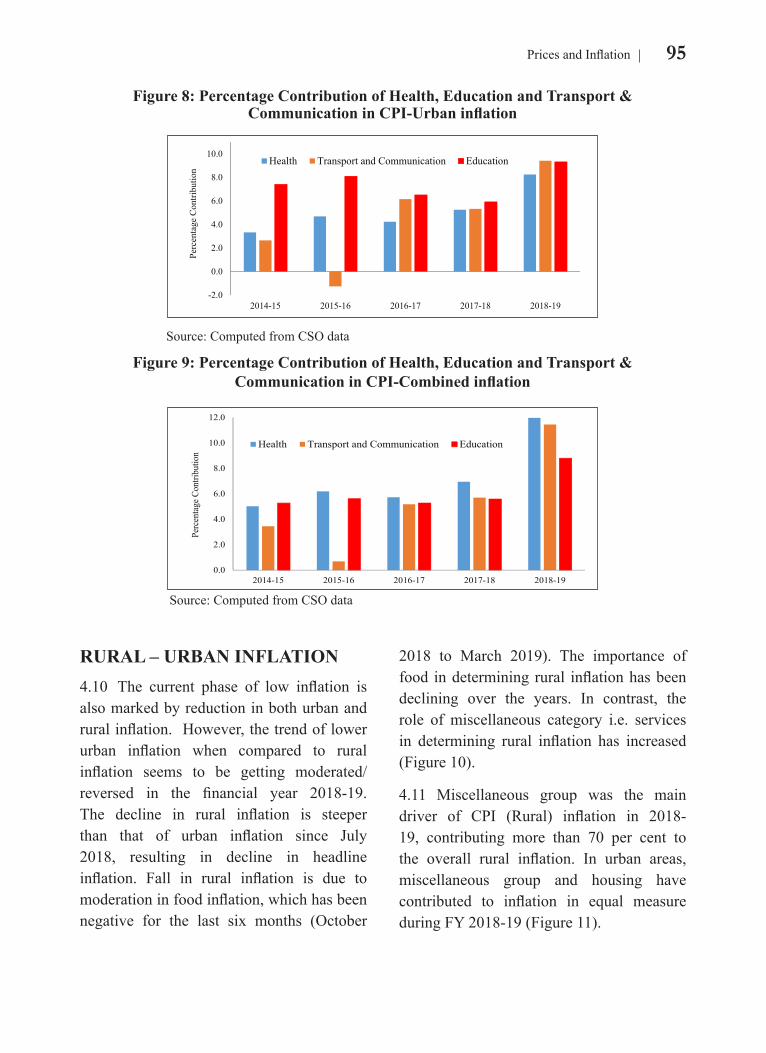
95Prices and Inflation
RURAL – URBAN INFLATION4.10 The current phase of low inflation is also marked by reduction in both urban and rural inflation. However, the trend of lower urban inflation when compared to rural inflation seems to be getting moderated/ reversed in the financial year 2018-19. The decline in rural inflation is steeper than that of urban inflation since July 2018, resulting in decline in headline inflation. Fall in rural inflation is due to moderation in food inflation, which has been negative for the last six months (October
2018 to March 2019). The importance of food in determining rural inflation has been declining over the years. In contrast, the role of miscellaneous category i.e. services in determining rural inflation has increased (Figure 10).
4.11 Miscellaneous group was the main driver of CPI (Rural) inflation in 2018-19, contributing more than 70 per cent to the overall rural inflation. In urban areas, miscellaneous group and housing have contributed to inflation in equal measure during FY 2018-19 (Figure 11).
Figure 8: Percentage Contribution of Health, Education and Transport & Communication in CPI-Urban inflation
-2.0
0.0
2.0
4.0
6.0
8.0
10.0
2014-15 2015-16 2016-17 2017-18 2018-19
Perc
enta
ge C
ontri
butio
n
Health Transport and Communication Education
Source: Computed from CSO data
Figure 9: Percentage Contribution of Health, Education and Transport & Communication in CPI-Combined inflation
0.0
2.0
4.0
6.0
8.0
10.0
12.0
2014-15 2015-16 2016-17 2017-18 2018-19
Perc
enta
ge C
ontri
butio
n
Health Transport and Communication Education
Source: Computed from CSO data
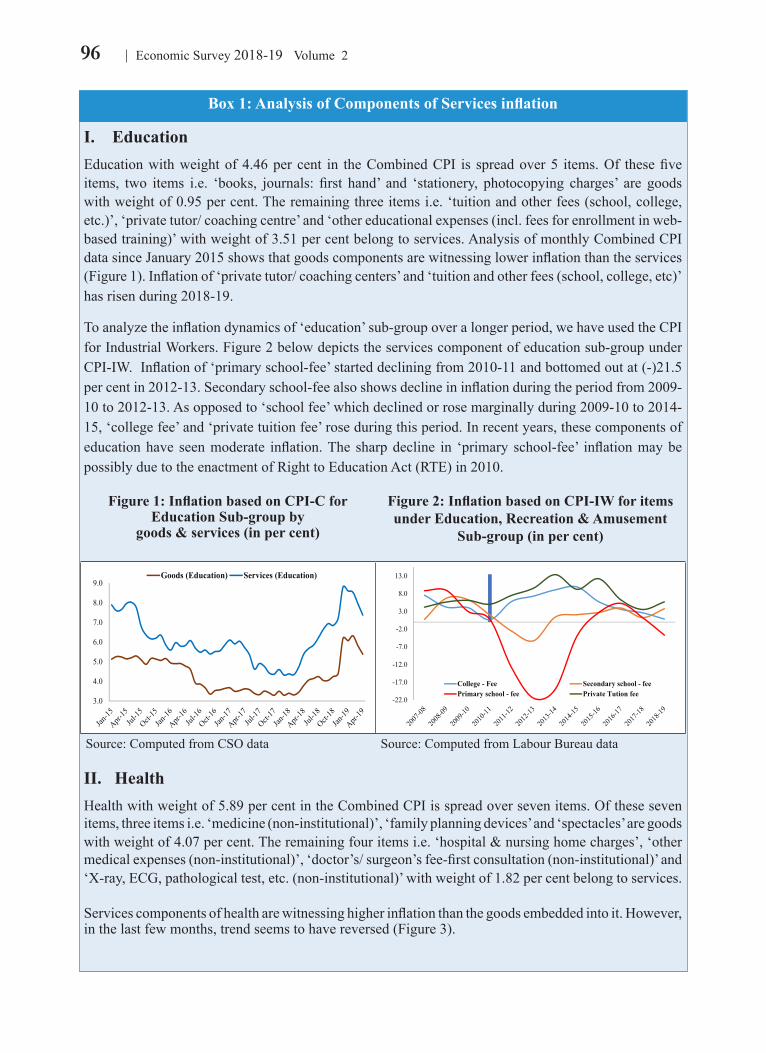
96 Economic Survey 2018-19 Volume 2
Box 1: Analysis of Components of Services inflation
I. EducationEducation with weight of 4.46 per cent in the Combined CPI is spread over 5 items. Of these five items, two items i.e. ‘books, journals: first hand’ and ‘stationery, photocopying charges’ are goods with weight of 0.95 per cent. The remaining three items i.e. ‘tuition and other fees (school, college, etc.)’, ‘private tutor/ coaching centre’ and ‘other educational expenses (incl. fees for enrollment in web-based training)’ with weight of 3.51 per cent belong to services. Analysis of monthly Combined CPI data since January 2015 shows that goods components are witnessing lower inflation than the services (Figure 1). Inflation of ‘private tutor/ coaching centers’ and ‘tuition and other fees (school, college, etc)’ has risen during 2018-19.
To analyze the inflation dynamics of ‘education’ sub-group over a longer period, we have used the CPI for Industrial Workers. Figure 2 below depicts the services component of education sub-group under CPI-IW. Inflation of ‘primary school-fee’ started declining from 2010-11 and bottomed out at (-)21.5 per cent in 2012-13. Secondary school-fee also shows decline in inflation during the period from 2009-10 to 2012-13. As opposed to ‘school fee’ which declined or rose marginally during 2009-10 to 2014-15, ‘college fee’ and ‘private tuition fee’ rose during this period. In recent years, these components of education have seen moderate inflation. The sharp decline in ‘primary school-fee’ inflation may be possibly due to the enactment of Right to Education Act (RTE) in 2010.
Figure 1: Inflation based on CPI-C for Education Sub-group by
goods & services (in per cent)
Figure 2: Inflation based on CPI-IW for items under Education, Recreation & Amusement
Sub-group (in per cent)
3.0
4.0
5.0
6.0
7.0
8.0
9.0Goods (Education) Services (Education)
-22.0
-17.0
-12.0
-7.0
-2.0
3.0
8.0
13.0
College - Fee Secondary school - feePrimary school - fee Private Tution fee
Source: Computed from CSO data Source: Computed from Labour Bureau data
II. Health Health with weight of 5.89 per cent in the Combined CPI is spread over seven items. Of these seven items, three items i.e. ‘medicine (non-institutional)’, ‘family planning devices’ and ‘spectacles’ are goods with weight of 4.07 per cent. The remaining four items i.e. ‘hospital & nursing home charges’, ‘other medical expenses (non-institutional)’, ‘doctor’s/ surgeon’s fee-first consultation (non-institutional)’ and ‘X-ray, ECG, pathological test, etc. (non-institutional)’ with weight of 1.82 per cent belong to services.
Services components of health are witnessing higher inflation than the goods embedded into it. However, in the last few months, trend seems to have reversed (Figure 3).
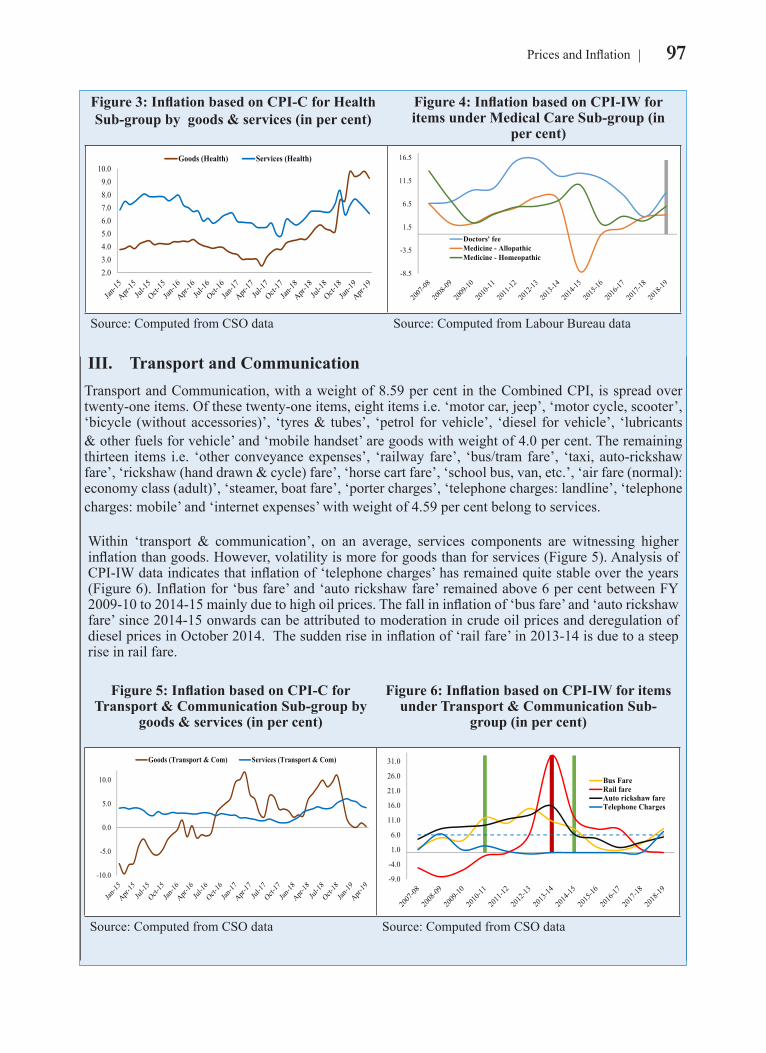
97Prices and Inflation
Figure 3: Inflation based on CPI-C for Health Sub-group by goods & services (in per cent)
Figure 4: Inflation based on CPI-IW for items under Medical Care Sub-group (in
per cent)
2.03.04.05.06.07.08.09.0
10.0Goods (Health) Services (Health)
-8.5
-3.5
1.5
6.5
11.5
16.5
Doctors' feeMedicine - AllopathicMedicine - Homeopathic
Source: Computed from CSO data Source: Computed from Labour Bureau data
III. Transport and Communication Transport and Communication, with a weight of 8.59 per cent in the Combined CPI, is spread over twenty-one items. Of these twenty-one items, eight items i.e. ‘motor car, jeep’, ‘motor cycle, scooter’, ‘bicycle (without accessories)’, ‘tyres & tubes’, ‘petrol for vehicle’, ‘diesel for vehicle’, ‘lubricants & other fuels for vehicle’ and ‘mobile handset’ are goods with weight of 4.0 per cent. The remaining thirteen items i.e. ‘other conveyance expenses’, ‘railway fare’, ‘bus/tram fare’, ‘taxi, auto-rickshaw fare’, ‘rickshaw (hand drawn & cycle) fare’, ‘horse cart fare’, ‘school bus, van, etc.’, ‘air fare (normal): economy class (adult)’, ‘steamer, boat fare’, ‘porter charges’, ‘telephone charges: landline’, ‘telephone charges: mobile’ and ‘internet expenses’ with weight of 4.59 per cent belong to services.
Within ‘transport & communication’, on an average, services components are witnessing higher inflation than goods. However, volatility is more for goods than for services (Figure 5). Analysis of CPI-IW data indicates that inflation of ‘telephone charges’ has remained quite stable over the years (Figure 6). Inflation for ‘bus fare’ and ‘auto rickshaw fare’ remained above 6 per cent between FY 2009-10 to 2014-15 mainly due to high oil prices. The fall in inflation of ‘bus fare’ and ‘auto rickshaw fare’ since 2014-15 onwards can be attributed to moderation in crude oil prices and deregulation of diesel prices in October 2014. The sudden rise in inflation of ‘rail fare’ in 2013-14 is due to a steep rise in rail fare.
Figure 5: Inflation based on CPI-C for Transport & Communication Sub-group by
goods & services (in per cent)
Figure 6: Inflation based on CPI-IW for items under Transport & Communication Sub-
group (in per cent)
-10.0
-5.0
0.0
5.0
10.0
Goods (Transport & Com) Services (Transport & Com)
-9.0
-4.0
1.0
6.0
11.0
16.0
21.0
26.0
31.0
Bus FareRail fareAuto rickshaw fareTelephone Charges
Source: Computed from CSO data Source: Computed from CSO data
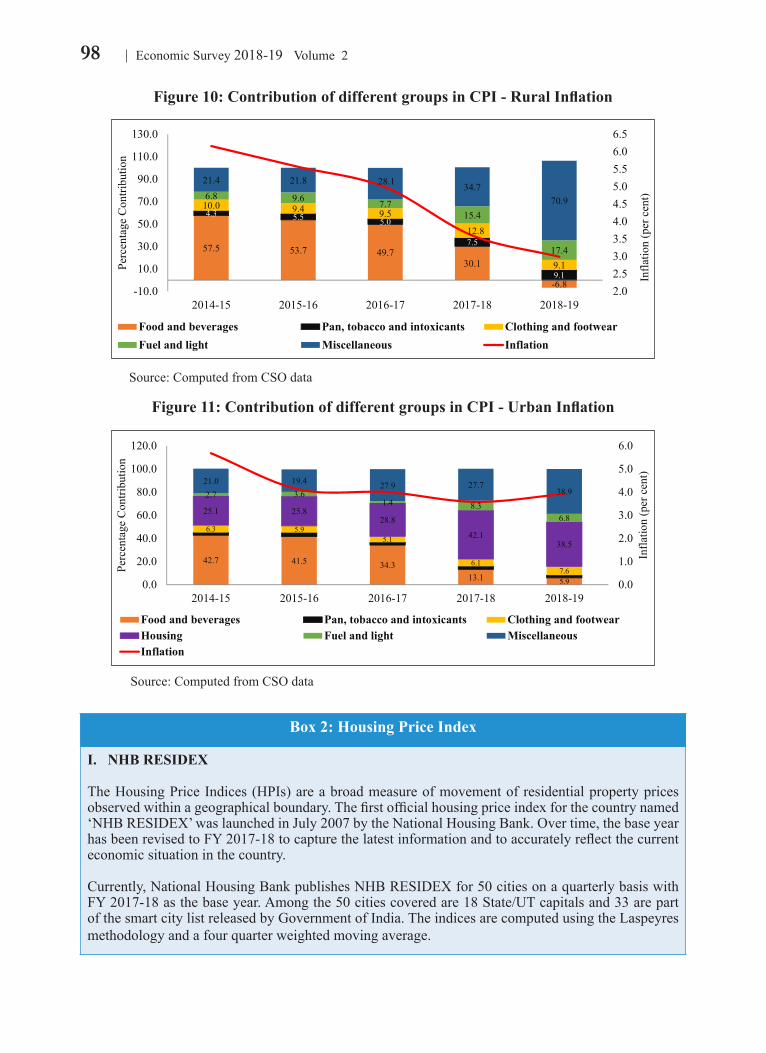
98 Economic Survey 2018-19 Volume 2
Figure 10: Contribution of different groups in CPI - Rural Inflation
57.5 53.7 49.730.1
-6.8
4.3 5.5 5.0
7.5
9.1
10.0 9.4 9.5
12.8
9.1
6.8 9.6 7.715.4
17.4
21.4 21.8 28.1 34.770.9
2.02.53.03.54.04.55.05.56.06.5
-10.0
10.0
30.0
50.0
70.0
90.0
110.0
130.0
2014-15 2015-16 2016-17 2017-18 2018-19
Infla
tion
(per
cen
t)
Perc
enta
ge C
ontri
butio
n
Food and beverages Pan, tobacco and intoxicants Clothing and footwearFuel and light Miscellaneous Inflation
Source: Computed from CSO data
Figure 11: Contribution of different groups in CPI - Urban Inflation
42.7 41.5 34.313.1 5.9
6.3 5.95.1
6.17.6
25.1 25.828.8
42.138.5
2.7 3.61.4 8.3
6.8
21.0 19.4 27.9 27.738.9
0.0
1.0
2.0
3.0
4.0
5.0
6.0
0.0
20.0
40.0
60.0
80.0
100.0
120.0
2014-15 2015-16 2016-17 2017-18 2018-19
Infla
tion
(per
cen
t)
Perc
enta
ge C
ontri
butio
n
Food and beverages Pan, tobacco and intoxicants Clothing and footwearHousing Fuel and light MiscellaneousInflation
Source: Computed from CSO data
Box 2: Housing Price Index
I. NHB RESIDEX
The Housing Price Indices (HPIs) are a broad measure of movement of residential property prices observed within a geographical boundary. The first official housing price index for the country named ‘NHB RESIDEX’ was launched in July 2007 by the National Housing Bank. Over time, the base year has been revised to FY 2017-18 to capture the latest information and to accurately reflect the current economic situation in the country.
Currently, National Housing Bank publishes NHB RESIDEX for 50 cities on a quarterly basis with FY 2017-18 as the base year. Among the 50 cities covered are 18 State/UT capitals and 33 are part of the smart city list released by Government of India. The indices are computed using the Laspeyres methodology and a four quarter weighted moving average.
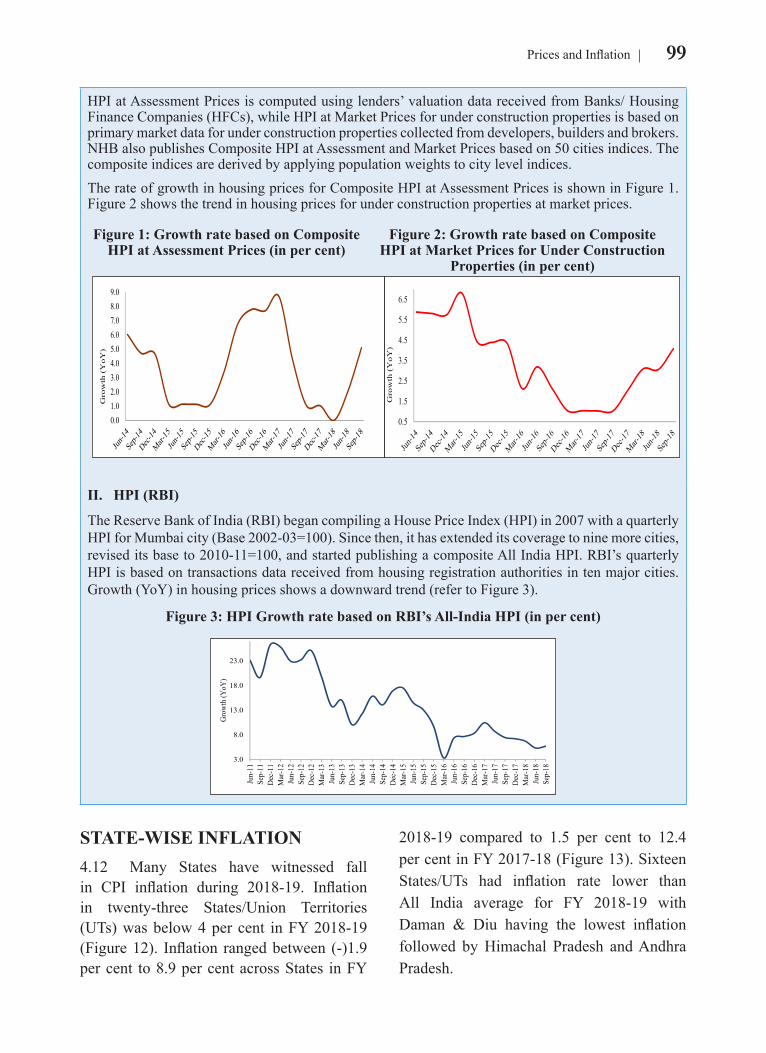
99Prices and Inflation
HPI at Assessment Prices is computed using lenders’ valuation data received from Banks/ Housing Finance Companies (HFCs), while HPI at Market Prices for under construction properties is based on primary market data for under construction properties collected from developers, builders and brokers. NHB also publishes Composite HPI at Assessment and Market Prices based on 50 cities indices. The composite indices are derived by applying population weights to city level indices.The rate of growth in housing prices for Composite HPI at Assessment Prices is shown in Figure 1. Figure 2 shows the trend in housing prices for under construction properties at market prices.
Figure 1: Growth rate based on Composite HPI at Assessment Prices (in per cent)
Figure 2: Growth rate based on Composite HPI at Market Prices for Under Construction
Properties (in per cent)
0.5
1.5
2.5
3.5
4.5
5.5
6.5
Gro
wth
(Y
oY)
II. HPI (RBI)
The Reserve Bank of India (RBI) began compiling a House Price Index (HPI) in 2007 with a quarterly HPI for Mumbai city (Base 2002-03=100). Since then, it has extended its coverage to nine more cities, revised its base to 2010-11=100, and started publishing a composite All India HPI. RBI’s quarterly HPI is based on transactions data received from housing registration authorities in ten major cities. Growth (YoY) in housing prices shows a downward trend (refer to Figure 3).
Figure 3: HPI Growth rate based on RBI’s All-India HPI (in per cent)
3.0
8.0
13.0
18.0
23.0
Jun-
11Se
p-11
Dec
-11
Mar
-12
Jun-
12Se
p-12
Dec
-12
Mar
-13
Jun-
13Se
p-13
Dec
-13
Mar
-14
Jun-
14Se
p-14
Dec
-14
Mar
-15
Jun-
15Se
p-15
Dec
-15
Mar
-16
Jun-
16Se
p-16
Dec
-16
Mar
-17
Jun-
17Se
p-17
Dec
-17
Mar
-18
Jun-
18Se
p-18
Gro
wth
(YoY
)
STATE-WISE INFLATION4.12 Many States have witnessed fall in CPI inflation during 2018-19. Inflation in twenty-three States/Union Territories (UTs) was below 4 per cent in FY 2018-19 (Figure 12). Inflation ranged between (-)1.9 per cent to 8.9 per cent across States in FY
2018-19 compared to 1.5 per cent to 12.4 per cent in FY 2017-18 (Figure 13). Sixteen States/UTs had inflation rate lower than All India average for FY 2018-19 with Daman & Diu having the lowest inflation followed by Himachal Pradesh and Andhra Pradesh.
0.01.02.03.04.05.06.07.08.09.0
Gro
wth
(Y
oY
)
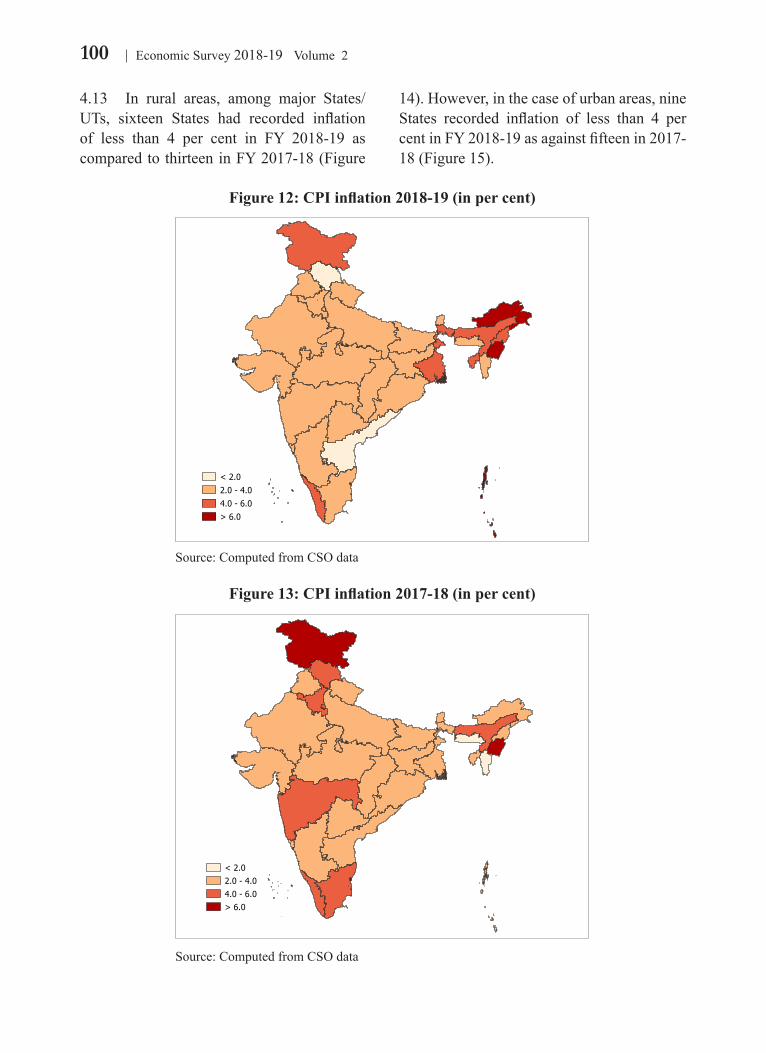
100 Economic Survey 2018-19 Volume 2
4.13 In rural areas, among major States/ UTs, sixteen States had recorded inflation of less than 4 per cent in FY 2018-19 as compared to thirteen in FY 2017-18 (Figure
14). However, in the case of urban areas, nine States recorded inflation of less than 4 per cent in FY 2018-19 as against fifteen in 2017-18 (Figure 15).
Figure 12: CPI inflation 2018-19 (in per cent)
CPI-C Inflation
< 2.0
2.0 - 4.0
4.0 - 6.0
> 6.0
Source: Computed from CSO data
Figure 13: CPI inflation 2017-18 (in per cent)
CPI-C Inflation
< 2.0
2.0 - 4.0
4.0 - 6.0
> 6.0
Source: Computed from CSO data
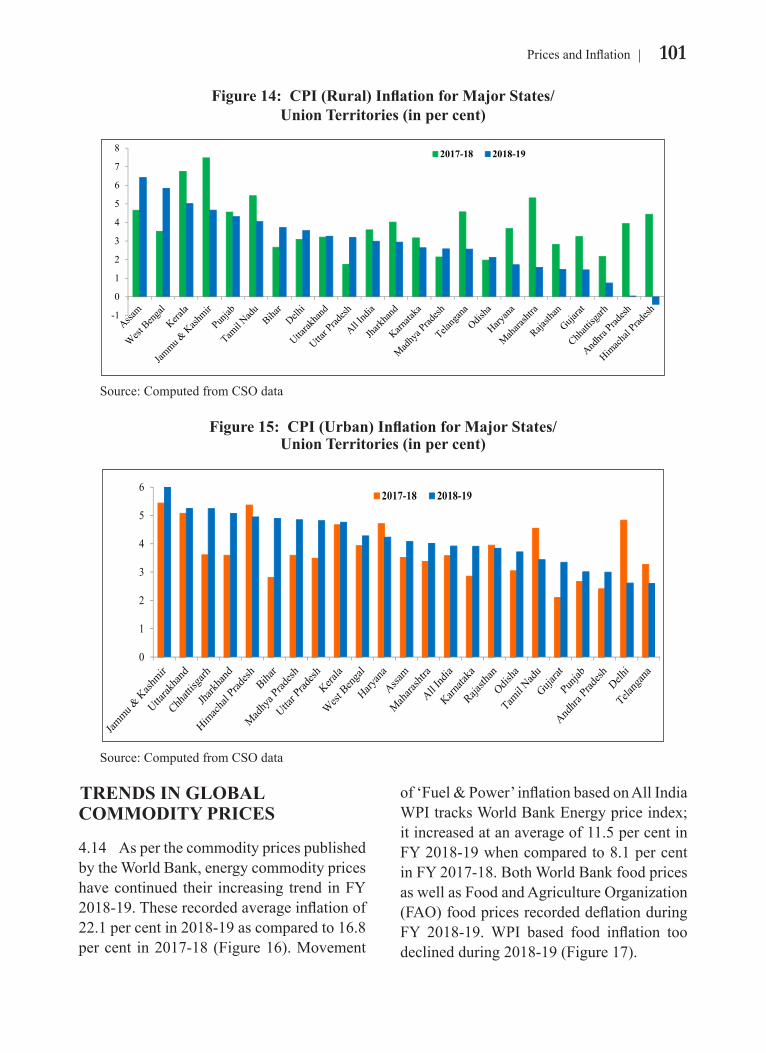
101Prices and Inflation
TRENDS IN GLOBAL COMMODITY PRICES
4.14 As per the commodity prices published by the World Bank, energy commodity prices have continued their increasing trend in FY 2018-19. These recorded average inflation of 22.1 per cent in 2018-19 as compared to 16.8 per cent in 2017-18 (Figure 16). Movement
of ‘Fuel & Power’ inflation based on All India WPI tracks World Bank Energy price index; it increased at an average of 11.5 per cent in FY 2018-19 when compared to 8.1 per cent in FY 2017-18. Both World Bank food prices as well as Food and Agriculture Organization (FAO) food prices recorded deflation during FY 2018-19. WPI based food inflation too declined during 2018-19 (Figure 17).
Figure 14: CPI (Rural) Inflation for Major States/ Union Territories (in per cent)
-1
0
1
2
3
4
5
6
7
8 2017-18 2018-19
Source: Computed from CSO data
Figure 15: CPI (Urban) Inflation for Major States/ Union Territories (in per cent)
0
1
2
3
4
5
62017-18 2018-19
Source: Computed from CSO data
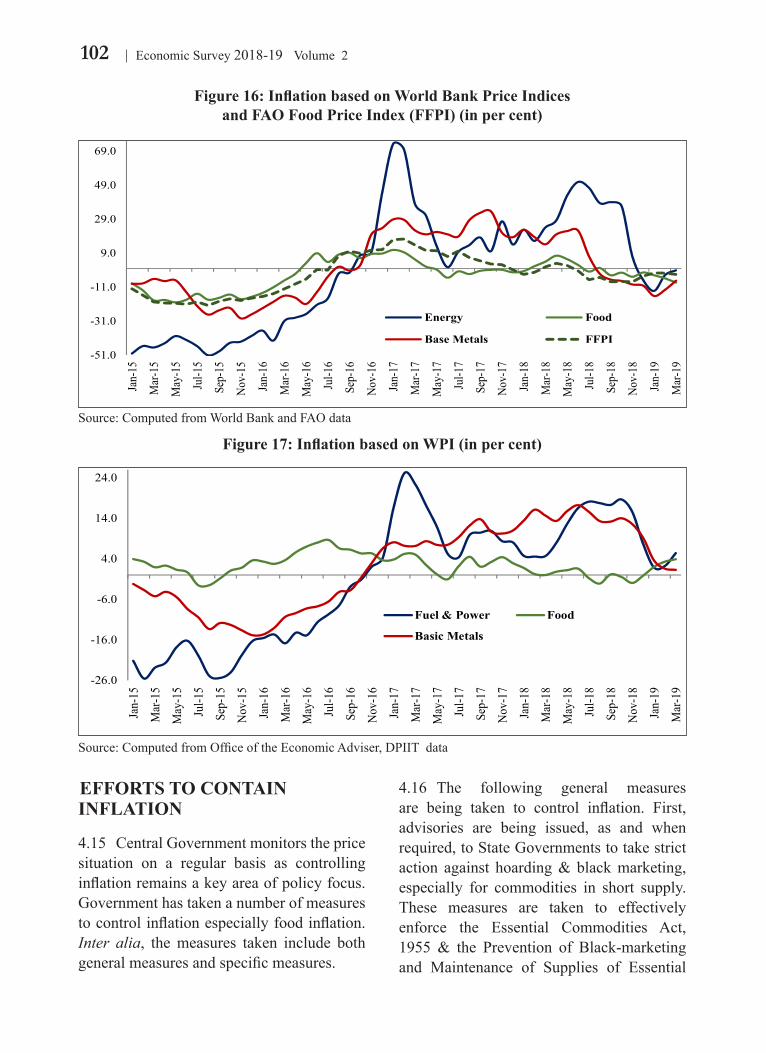
102 Economic Survey 2018-19 Volume 2
EFFORTS TO CONTAIN INFLATION
4.15 Central Government monitors the price situation on a regular basis as controlling inflation remains a key area of policy focus. Government has taken a number of measures to control inflation especially food inflation. Inter alia, the measures taken include both general measures and specific measures.
4.16 The following general measures are being taken to control inflation. First, advisories are being issued, as and when required, to State Governments to take strict action against hoarding & black marketing, especially for commodities in short supply. These measures are taken to effectively enforce the Essential Commodities Act, 1955 & the Prevention of Black-marketing and Maintenance of Supplies of Essential
Figure 16: Inflation based on World Bank Price Indices and FAO Food Price Index (FFPI) (in per cent)
-51.0
-31.0
-11.0
9.0
29.0
49.0
69.0
Jan-
15
Mar
-15
May
-15
Jul-1
5
Sep-
15
Nov-
15
Jan-
16
Mar
-16
May
-16
Jul-1
6
Sep-
16
Nov-
16
Jan-
17
Mar
-17
May
-17
Jul-1
7
Sep-
17
Nov-
17
Jan-
18
Mar
-18
May
-18
Jul-1
8
Sep-
18
Nov-
18
Jan-
19
Mar
-19
Energy Food
Base Metals FFPI
Source: Computed from World Bank and FAO data
Figure 17: Inflation based on WPI (in per cent)
-26.0
-16.0
-6.0
4.0
14.0
24.0
Jan-
15
Mar
-15
May
-15
Jul-1
5
Sep-
15
Nov
-15
Jan-
16
Mar
-16
May
-16
Jul-1
6
Sep-
16
Nov
-16
Jan-
17
Mar
-17
May
-17
Jul-1
7
Sep-
17
Nov
-17
Jan-
18
Mar
-18
May
-18
Jul-1
8
Sep-
18
Nov
-18
Jan-
19
Mar
-19
Fuel & Power Food
Basic Metals
Source: Computed from Office of the Economic Adviser, DPIIT data
103Prices and Inflation
Commodities Act, 1980. Second, regular review meetings on prices and availability of key commodities are held at the highest level, including at the level of Ministers, Committee of Secretaries, Inter Ministerial Committee, Price Stabilization Fund Management Committee (PSFMC), and other Departmental level review meetings to take stock of the prevailing price and availability situation and recommend appropriate policy intervention. Third, higher Minimum Support Price (MSP) for pulses and other crops has been announced so as to incentivize production and thereby enhance availability of food items, which may help moderate prices. And finally, Government has set up Price Stabilization Fund (PSF) for procurement of agri-horticultural commodities including potatoes, onions and pulses for its release during lean period to improve availability and moderate their prices.
4.17 The specific measures taken by the Government include the following. First, during lean periods of 2017-18 and 2018-19, to control the rise in onion prices, onions were released at reasonable prices from the stock procured under PSF. Second, pulses from the buffer are utilized for strategic
market intervention for price management, meeting institutional requirements like supplies to State Governments/UTs for Mid-Day Meal Scheme (MDM), Integrated Child Development Services (ICDS) Scheme, and Public Distribution System (PDS), and through Open Market Sale, etc. In addition, pulses from the buffer are being utilized to meet the requirement of Army and Central Para-Military Forces. Third, prohibition on export has been withdrawn in April 2018 on all varieties of edible oils, except mustard oil. Export of mustard oil in branded consumer packs of up to 5 kgs is permitted with a Minimum Export Price (MEP) of United States Dollar (USD) 900 per million ton (MT). Finally, the order empowering States/ UTs to impose controls including Stock Limits on Edible Oils and Edible Oilseeds has been withdrawn vide Notification dated June 13, 2018.
CONCLUSION4.18 FY 2018-19 saw low headline as well as food inflation. The year witnessed deflation in prices of pulses, vegetables and sugar. Core inflation averaged higher than the previous year.
CHAPTER AT A GLANCE Headline inflation based on CPI-C continued its declining trend for fifth straight financial
year. It has remained below 4.0 per cent in the last two years. Food inflation based on Consumer Food Price Index (CFPI) too declined over the last
five years, and has remained below 2.0 per cent for the last two consecutive years. CPI-C based core inflation (CPI excluding the food and fuel group) increased during
FY 2018-19 as compared to FY 2017-18. However, it has started declining since March 2019.
Main contributors of headline inflation based on CPI-C during FY 2018-19 are miscellaneous, housing, and fuel and light groups. Relative importance of services in shaping up headline inflation has increased.
CPI rural inflation declined during FY 2018-19 over FY 2017-18. However, CPI urban inflation increased marginally during FY 2018-19. Many States witnessed fall in CPI inflation during FY 2018-19.
CHAPTERSustainable Development and Climate Change
05
INTRODUCTION5.1 The 2030 Agenda for Sustainable Development and its 17 SDGs adopted by World leaders in 2015 presents a roadmap for future development trajectory to all nations with focus on poverty eradication, environmental sustainability, peace and prosperity. The achievement of these goals is an imperative for, not just, any particular country but the global community as a whole. The need for global cooperation in helping the developing countries in achieving the
climate targets cannot be overstated. India’s development agenda has for long been based on principles that are closely related to those that have been propounded in the 2030 Development Agenda. Climate change requires concerted global efforts and India has been preserving to address the climate challenges along with other developmental imperatives. The country has been making substantial additions to its installation of renewable power capacity. Increasing growth rate and rapid urbanization in India have
“You know that India is one sixth of the global community. Our development needs are enormous. Our poverty or prosperity will have direct impact on the global poverty or prosperity. People in India have waited too long for access to modern amenities and means of development. We have committed to complete this task sooner than anticipated. However, we have also said that we will do all this in a cleaner and greener way”
- Prime Minister Narendra Modi (2018)In adoption of 2030 global agenda, the countries are moving forward for achieving a world free from poverty, gender inequality and economic inequality and thereby ensuring a healthy planet for future generations. These goals are multi-dimensional and integrate various social, economic and environmental dimensions. India continues to target and maintain its economic growth by introducing and implementing various policies and measures relating to sustainable development, climate change, resource efficiency and air pollution. India has been progressing rapidly towards achieving the Sustainable Development Goals (SDGs). With increasing demand for resources to cater to the different developmental needs, policies need to nudge economic agents towards achieving the maximum output from the available resources. Developing countries like India need to endeavor to do the best possible within their own domestic resources, keeping in mind the sustainable development imperatives. It is time for the global community to exhibit the requisite momentum to act upon their responsibilities on establishing the enabling environment for sustainable development and climate actions.
105Sustainable Development and Climate Change
spurred the demand for natural resources, exerting pressures on the environment and raising sustainability concerns. Resource efficiency can be a major tool to meet the resource needs of the country at the least possible cost to the environment. Air pollution has emerged as a serious issue in India. National Clean Air Program (NCAP) has been launched by the Government as a pan-India, time bound, national level initiative to address the country-wide issues of air pollution in a comprehensive manner.
ACHIEVING THE SDGs
5.2 The SDGs are global goals, built upon the erstwhile Millennium Development Goals. They are exhaustive, universal and integrated and emphasize on core areas of poverty and inequality, economic growth, innovation, sustainable consumption and production, climate change, peace and justice and partnerships.
5.3 Estimates suggest that US$5 to US$7 trillion per year is required for financing these goals worldwide and US$3.9 trillion per year in developing countries. However, the current investment in developing countries is around US$1.4 trillion leading to a shortfall of US$2.5 trillion per year (UNCTAD, 2014). Global action of this scale requires strong coordination between different governments, development institutions, private sector and financial institutions for the effective financing and implementation across the globe.
India’s Progress towards the SDGs
5.4 Sustainable development requires every nation to prioritize their targets and carefully implement various schemes/programmes in accordance with local challenges, capacities and available resources. India follows a holistic approach for achieving the SDGs
by implementing a comprehensive array of schemes. Current flagship policies and programmes of Government of India such as Swachh Bharat Mission (SBM), Beti Bachao Beti Padhao (BBBP), Pradhan Mantri Awas Yojana (PMAY), Pradhan Mantri Jan-Dhan Yojana (PMJDY), Deen Dayal Upadhyay Gram Jyoti Yojana (DDUGJY) and Pradhan Mantri Ujjwala Yojana (PMUY) have substantially contributed to India’s progress in this regard.
5.5 In the federal context of India, programmes and schemes are basically implemented at the level of States and Union Territories. Tracking of progress on different SDGs, therefore, is important for appropriate policy actions and building up a competitive spirit among the States and UTs. NITI Aayog has come up with a single measurable index to track the progress of all the States and UTs across 13 out of 17 SDGs (excluding Goal 12, 13, 14 and 17 on account of unavailability of comparable data across States/UTs). This SDG index provides an aggregate assessment of India’s progress. This index helps in informed policy formulations as it captures status of both national and state-level social, economic, and environmental parameters across a set of 62 select indicators. The score varies from 0 to 100. States with scores equal to/greater than 65 are considered as Front-Runners (in Green); as Performers (in Yellow) in the range of 50-64 and as Aspirants (in Red) if the score is less than 50. States with an index score of 100 are classified as Achievers (in Blue) i.e. the states have achieved the national target set for 2030. A score of 0 denotes worst performance. The SDG Index Score ranges between 42 and 69 for States and between 57 and 68 for UTs and is presented in Table 1 below.
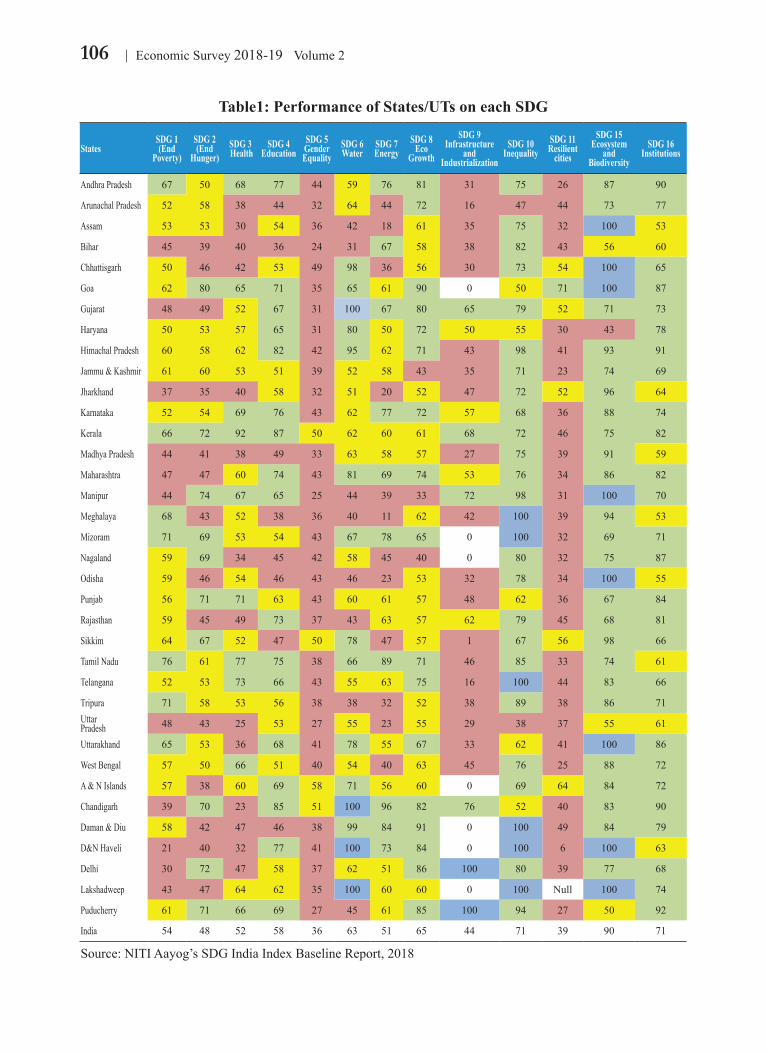
106 Economic Survey 2018-19 Volume 2
Table1: Performance of States/UTs on each SDG
States SDG 1 (End
Poverty)
SDG 2(End
Hunger) SDG 3 Health
SDG 4Education
SDG 5Gender Equality
SDG 6Water
SDG 7Energy
SDG 8Eco
Growth
SDG 9Infrastructure
and Industrialization
SDG 10Inequality
SDG 11Resilient
cities
SDG 15Ecosystem
and Biodiversity
SDG 16Institutions
Andhra Pradesh 67 50 68 77 44 59 76 81 31 75 26 87 90
Arunachal Pradesh 52 58 38 44 32 64 44 72 16 47 44 73 77
Assam 53 53 30 54 36 42 18 61 35 75 32 100 53
Bihar 45 39 40 36 24 31 67 58 38 82 43 56 60
Chhattisgarh 50 46 42 53 49 98 36 56 30 73 54 100 65
Goa 62 80 65 71 35 65 61 90 0 50 71 100 87
Gujarat 48 49 52 67 31 100 67 80 65 79 52 71 73
Haryana 50 53 57 65 31 80 50 72 50 55 30 43 78
Himachal Pradesh 60 58 62 82 42 95 62 71 43 98 41 93 91
Jammu & Kashmir 61 60 53 51 39 52 58 43 35 71 23 74 69
Jharkhand 37 35 40 58 32 51 20 52 47 72 52 96 64
Karnataka 52 54 69 76 43 62 77 72 57 68 36 88 74
Kerala 66 72 92 87 50 62 60 61 68 72 46 75 82
Madhya Pradesh 44 41 38 49 33 63 58 57 27 75 39 91 59
Maharashtra 47 47 60 74 43 81 69 74 53 76 34 86 82
Manipur 44 74 67 65 25 44 39 33 72 98 31 100 70
Meghalaya 68 43 52 38 36 40 11 62 42 100 39 94 53
Mizoram 71 69 53 54 43 67 78 65 0 100 32 69 71
Nagaland 59 69 34 45 42 58 45 40 0 80 32 75 87
Odisha 59 46 54 46 43 46 23 53 32 78 34 100 55
Punjab 56 71 71 63 43 60 61 57 48 62 36 67 84
Rajasthan 59 45 49 73 37 43 63 57 62 79 45 68 81
Sikkim 64 67 52 47 50 78 47 57 1 67 56 98 66
Tamil Nadu 76 61 77 75 38 66 89 71 46 85 33 74 61
Telangana 52 53 73 66 43 55 63 75 16 100 44 83 66
Tripura 71 58 53 56 38 38 32 52 38 89 38 86 71Uttar Pradesh 48 43 25 53 27 55 23 55 29 38 37 55 61
Uttarakhand 65 53 36 68 41 78 55 67 33 62 41 100 86
West Bengal 57 50 66 51 40 54 40 63 45 76 25 88 72
A & N Islands 57 38 60 69 58 71 56 60 0 69 64 84 72
Chandigarh 39 70 23 85 51 100 96 82 76 52 40 83 90
Daman & Diu 58 42 47 46 38 99 84 91 0 100 49 84 79
D&N Haveli 21 40 32 77 41 100 73 84 0 100 6 100 63
Delhi 30 72 47 58 37 62 51 86 100 80 39 77 68
Lakshadweep 43 47 64 62 35 100 60 60 0 100 Null 100 74
Puducherry 61 71 66 69 27 45 61 85 100 94 27 50 92
India 54 48 52 58 36 63 51 65 44 71 39 90 71
Source: NITI Aayog’s SDG India Index Baseline Report, 2018
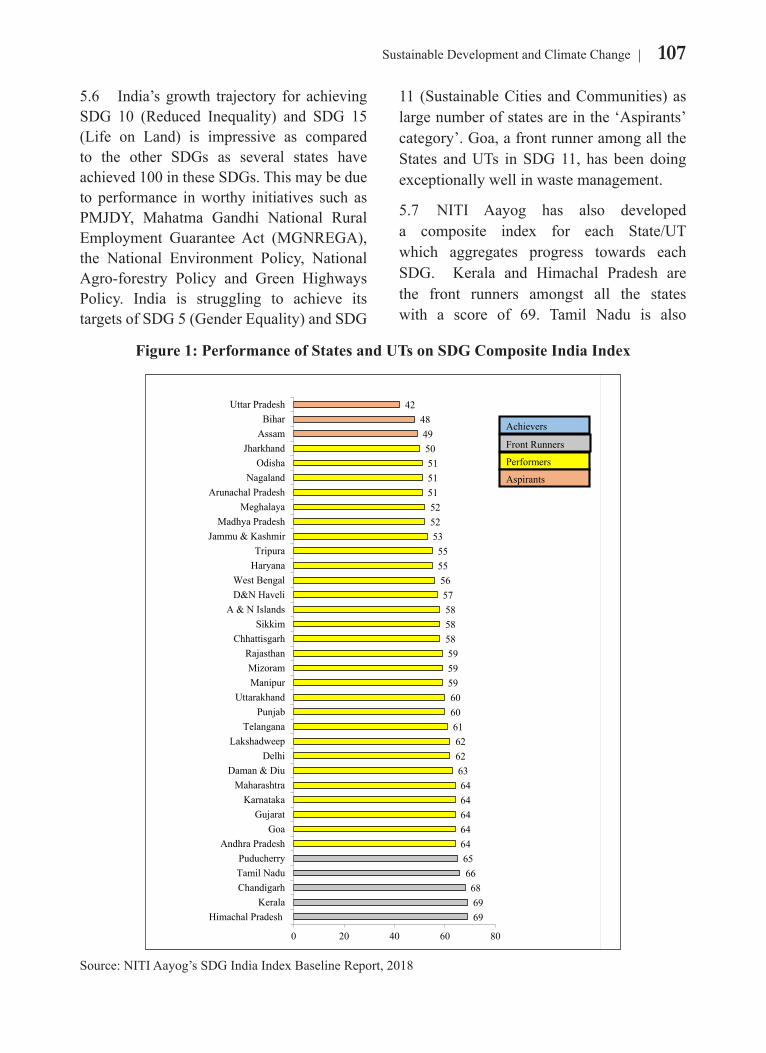
107Sustainable Development and Climate Change
5.6 India’s growth trajectory for achieving SDG 10 (Reduced Inequality) and SDG 15 (Life on Land) is impressive as compared to the other SDGs as several states have achieved 100 in these SDGs. This may be due to performance in worthy initiatives such as PMJDY, Mahatma Gandhi National Rural Employment Guarantee Act (MGNREGA), the National Environment Policy, National Agro-forestry Policy and Green Highways Policy. India is struggling to achieve its targets of SDG 5 (Gender Equality) and SDG
11 (Sustainable Cities and Communities) as large number of states are in the ‘Aspirants’ category’. Goa, a front runner among all the States and UTs in SDG 11, has been doing exceptionally well in waste management.
5.7 NITI Aayog has also developed a composite index for each State/UT which aggregates progress towards each SDG. Kerala and Himachal Pradesh are the front runners amongst all the states with a score of 69. Tamil Nadu is also
Figure 1: Performance of States and UTs on SDG Composite India Index
696968
6665646464646463626261606059595958585857565555
535252515151504948
42
0 20 40 60 80
Himachal PradeshKerala
ChandigarhTamil NaduPuducherry
Andhra PradeshGoa
GujaratKarnataka
MaharashtraDaman & Diu
DelhiLakshadweep
TelanganaPunjab
UttarakhandManipurMizoram
RajasthanChhattisgarh
SikkimA & N Islands
D&N HaveliWest Bengal
HaryanaTripura
Jammu & KashmirMadhya Pradesh
MeghalayaArunachal Pradesh
NagalandOdisha
JharkhandAssamBihar
Uttar Pradesh
Front Runners
Performers
Aspirants
Achievers
Source: NITI Aayog’s SDG India Index Baseline Report, 2018
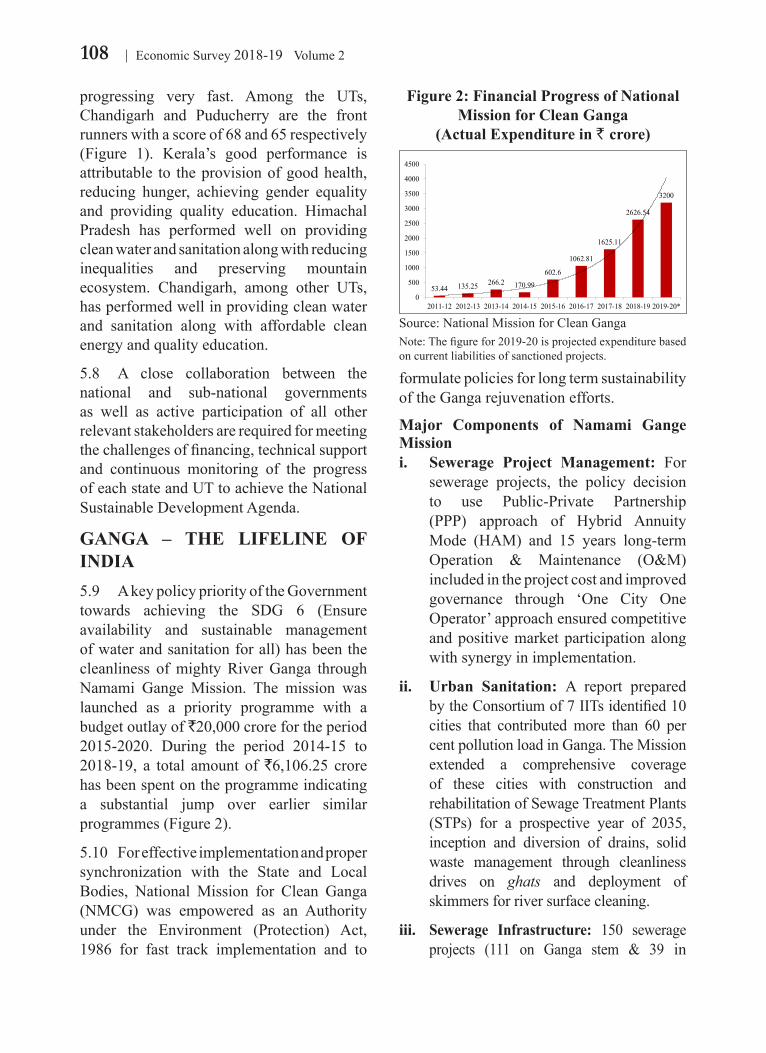
108 Economic Survey 2018-19 Volume 2
progressing very fast. Among the UTs, Chandigarh and Puducherry are the front runners with a score of 68 and 65 respectively (Figure 1). Kerala’s good performance is attributable to the provision of good health, reducing hunger, achieving gender equality and providing quality education. Himachal Pradesh has performed well on providing clean water and sanitation along with reducing inequalities and preserving mountain ecosystem. Chandigarh, among other UTs, has performed well in providing clean water and sanitation along with affordable clean energy and quality education.
5.8 A close collaboration between the national and sub-national governments as well as active participation of all other relevant stakeholders are required for meeting the challenges of financing, technical support and continuous monitoring of the progress of each state and UT to achieve the National Sustainable Development Agenda.
GANGA – THE LIFELINE OF INDIA5.9 A key policy priority of the Government towards achieving the SDG 6 (Ensure availability and sustainable management of water and sanitation for all) has been the cleanliness of mighty River Ganga through Namami Gange Mission. The mission was launched as a priority programme with a budget outlay of `20,000 crore for the period 2015-2020. During the period 2014-15 to 2018-19, a total amount of `6,106.25 crore has been spent on the programme indicating a substantial jump over earlier similar programmes (Figure 2).
5.10 For effective implementation and proper synchronization with the State and Local Bodies, National Mission for Clean Ganga (NMCG) was empowered as an Authority under the Environment (Protection) Act, 1986 for fast track implementation and to
Source: National Mission for Clean GangaNote: The figure for 2019-20 is projected expenditure based on current liabilities of sanctioned projects.
53.44 135.25 266.2 170.99
602.6
1062.81
1625.11
2626.54
3200
0
500
1000
1500
2000
2500
3000
3500
4000
4500
2011-12 2012-13 2013-14 2014-15 2015-16 2016-17 2017-18 2018-19 2019-20*
Actual Expenditure (in Rs crore)
Figure 2: Financial Progress of National Mission for Clean Ganga
(Actual Expenditure in ` crore)
formulate policies for long term sustainability of the Ganga rejuvenation efforts.
Major Components of Namami Gange Missioni. Sewerage Project Management: For
sewerage projects, the policy decision to use Public-Private Partnership (PPP) approach of Hybrid Annuity Mode (HAM) and 15 years long-term Operation & Maintenance (O&M) included in the project cost and improved governance through ‘One City One Operator’ approach ensured competitive and positive market participation along with synergy in implementation.
ii. Urban Sanitation: A report prepared by the Consortium of 7 IITs identified 10 cities that contributed more than 60 per cent pollution load in Ganga. The Mission extended a comprehensive coverage of these cities with construction and rehabilitation of Sewage Treatment Plants (STPs) for a prospective year of 2035, inception and diversion of drains, solid waste management through cleanliness drives on ghats and deployment of skimmers for river surface cleaning.
iii. Sewerage Infrastructure: 150 sewerage projects (111 on Ganga stem & 39 in
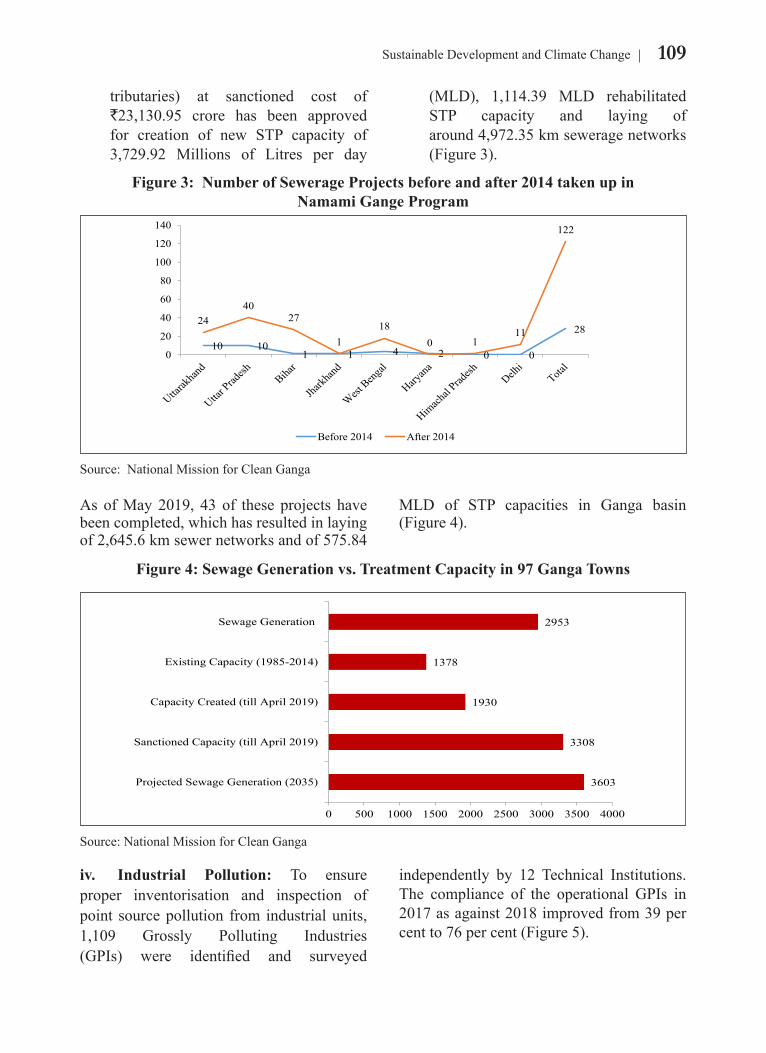
109Sustainable Development and Climate Change
tributaries) at sanctioned cost of `23,130.95 crore has been approved for creation of new STP capacity of 3,729.92 Millions of Litres per day
(MLD), 1,114.39 MLD rehabilitated STP capacity and laying of around 4,972.35 km sewerage networks (Figure 3).
As of May 2019, 43 of these projects have been completed, which has resulted in laying of 2,645.6 km sewer networks and of 575.84
MLD of STP capacities in Ganga basin (Figure 4).
iv. Industrial Pollution: To ensure proper inventorisation and inspection of point source pollution from industrial units, 1,109 Grossly Polluting Industries (GPIs) were identified and surveyed
independently by 12 Technical Institutions. The compliance of the operational GPIs in 2017 as against 2018 improved from 39 per cent to 76 per cent (Figure 5).
Figure 3: Number of Sewerage Projects before and after 2014 taken up in Namami Gange Program
Uttarakhand Uttar Pradesh Bihar Jharkhand
West Bengal Haryana
Himachal Pradesh Delhi Total
Before 2014 10 10 1 1 4 2 0 0 28 After 2014 24 40 27 1 18 0 1 11 122
10 101 1 4 2 0 0
2824
4027
118
0 111
122
0
20
40
60
80
100
120
140
Before 2014 After 2014
Source: National Mission for Clean Ganga
Figure 4: Sewage Generation vs. Treatment Capacity in 97 Ganga Towns
3603
3308
1930
1378
2953
0 500 1000 1500 2000 2500 3000 3500 4000
Projected Sewage Generation (2035)
Sanctioned Capacity (till April 2019)
Capacity Created (till April 2019)
Existing Capacity (1985-2014)
Sewage Generation
Source: National Mission for Clean Ganga
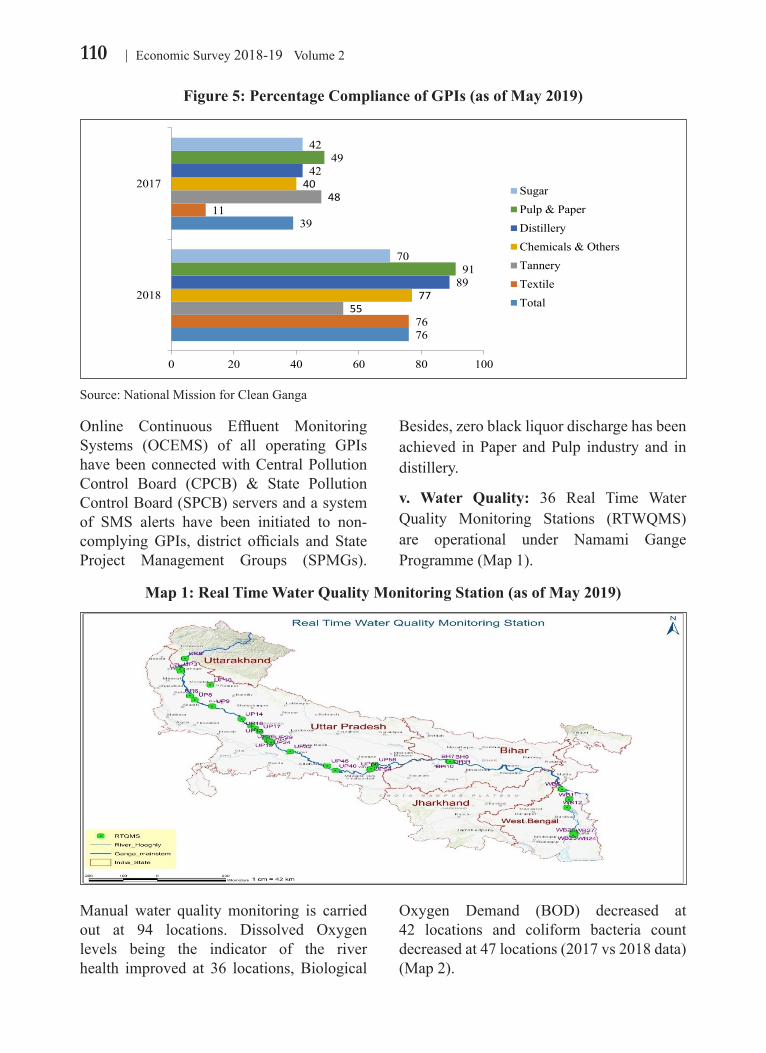
110 Economic Survey 2018-19 Volume 2
Online Continuous Effluent Monitoring Systems (OCEMS) of all operating GPIs have been connected with Central Pollution Control Board (CPCB) & State Pollution Control Board (SPCB) servers and a system of SMS alerts have been initiated to non-complying GPIs, district officials and State Project Management Groups (SPMGs).
Besides, zero black liquor discharge has been achieved in Paper and Pulp industry and in distillery.
v. Water Quality: 36 Real Time Water Quality Monitoring Stations (RTWQMS) are operational under Namami Gange Programme (Map 1).
Manual water quality monitoring is carried out at 94 locations. Dissolved Oxygen levels being the indicator of the river health improved at 36 locations, Biological
Oxygen Demand (BOD) decreased at 42 locations and coliform bacteria count decreased at 47 locations (2017 vs 2018 data) (Map 2).
Figure 5: Percentage Compliance of GPIs (as of May 2019)
76
39
76
11
55
48
77
40
89
42
91
49
70
42
0 20 40 60 80 100
2018
2017 SugarPulp & PaperDistilleryChemicals & OthersTanneryTextileTotal
Source: National Mission for Clean Ganga
Map 1: Real Time Water Quality Monitoring Station (as of May 2019)
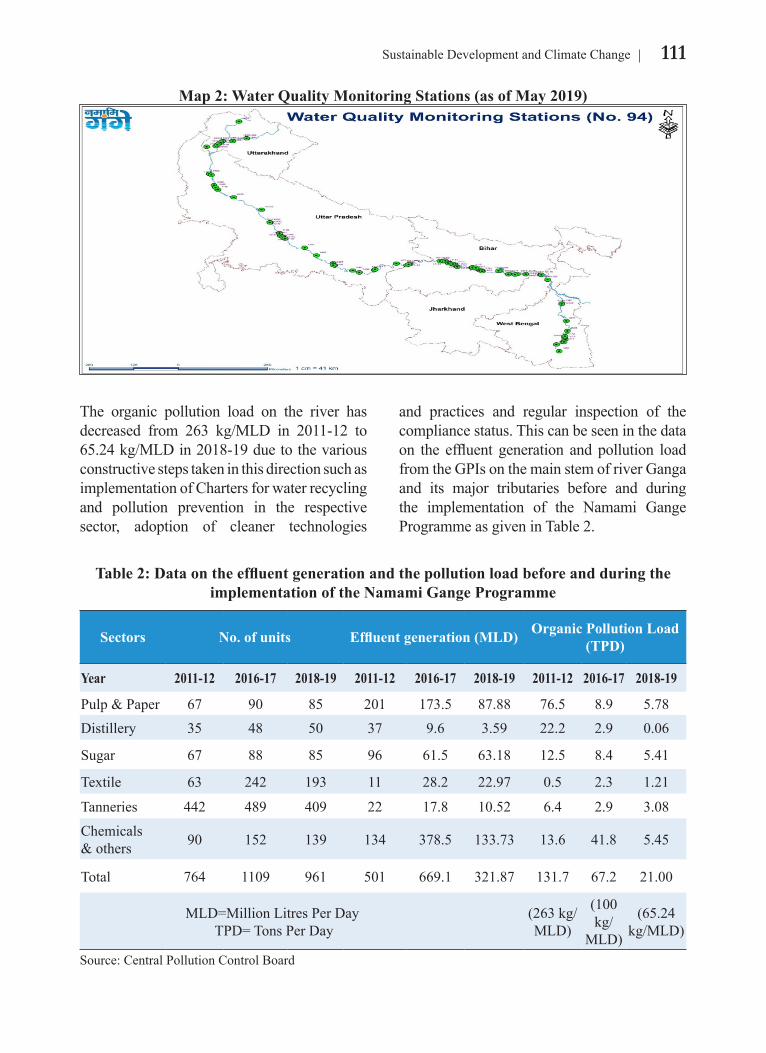
111Sustainable Development and Climate Change
The organic pollution load on the river has decreased from 263 kg/MLD in 2011-12 to 65.24 kg/MLD in 2018-19 due to the various constructive steps taken in this direction such as implementation of Charters for water recycling and pollution prevention in the respective sector, adoption of cleaner technologies
and practices and regular inspection of the compliance status. This can be seen in the data on the effluent generation and pollution load from the GPIs on the main stem of river Ganga and its major tributaries before and during the implementation of the Namami Gange Programme as given in Table 2.
Map 2: Water Quality Monitoring Stations (as of May 2019)
Table 2: Data on the effluent generation and the pollution load before and during the implementation of the Namami Gange Programme
Sectors No. of units Effluent generation (MLD) Organic Pollution Load (TPD)
Year 2011-12 2016-17 2018-19 2011-12 2016-17 2018-19 2011-12 2016-17 2018-19
Pulp & Paper 67 90 85 201 173.5 87.88 76.5 8.9 5.78Distillery 35 48 50 37 9.6 3.59 22.2 2.9 0.06
Sugar 67 88 85 96 61.5 63.18 12.5 8.4 5.41
Textile 63 242 193 11 28.2 22.97 0.5 2.3 1.21
Tanneries 442 489 409 22 17.8 10.52 6.4 2.9 3.08
Chemicals & others 90 152 139 134 378.5 133.73 13.6 41.8 5.45
Total 764 1109 961 501 669.1 321.87 131.7 67.2 21.00
MLD=Million Litres Per Day TPD= Tons Per Day
(263 kg/MLD)
(100 kg/
MLD)
(65.24 kg/MLD)
Source: Central Pollution Control Board
112 Economic Survey 2018-19 Volume 2
vi. River as Public Space: 143 ghats have been taken up under the Mission out of which 100 have been completed. Under the Mission, 54 crematories have also been taken up for ensuring safe crematory rituals. Supporting the sanitation initiative during Kumbh 2019, NMCG sanctioned financial assistance of `116.6 crore for the construction of 27,500 toilets, 20,000 urinals and 16,000 dustbins and lining bags. Innovative campaigns of ‘Paint My City’ and other exhibitions to connect people with the city and the river were also organized.
vii. Rural Sanitation: Under Namami Gange, 4,465 villages on the Ganga stem have been declared ODF with completion of construction of about 11 lakh independent toilets. Support is also being extended to 1,662 Gram Panchayats along Ganga for solid and liquid waste management.
viii. Ecosystem Conservation: Afforestation along banks of Ganga has been taken up scientifically with the help of Forest Research Institute, Dehradun. Local communities have been involved in massive afforestation drive undertaken in the five Ganga States with total plantation of 96,46,607 leading to increase in forested area of 8,631 hectares.
ix. Urban River Management: NMCG, in partnership with National Institute of Urban Affairs (NIUA), is preparing an Urban River Management Plan to protect and enhance the status of river health within the city, to prevent their deterioration and to ensure sustainable use of water resources. A comprehensive survey for generating high-resolution Light Detection and Ranging (LIDAR) maps of the entire Ganga stretch to create a baseline of its spatial status has also been initiated.
x. Water Use Efficiency: A market for reuse of treated wastewater is being developed and the re-use of 20 MLD of treated wastewater in Mathura Refinery is a
milestone in propagating this waste-to-wealth approach as well as saving the water-stressed Yamuna river.
xi. Clean Ganga Fund: Clean Ganga Fund has been set up for encouraging and facilitating corporates and individuals to join the efforts of rejuvenation of Ganga by contributing to this Fund and sponsoring certain projects. A total of `371 crore has been received in the Clean Ganga Fund as of April 2019 of which, `101.59 crore has been received in 2018-19.
RESOURCE EFFICIENCY5.11 Resource Efficiency (RE) has emerged as one of the key strategies towards the 2030 Agenda of achieving the SDGs. SDG 12 aims to ‘Ensure Sustainable Consumption and Production Patterns’ along with the eight other SDG goals (2, 6, 7, 8, 9, 11, 14 and 15) have a bearing on resource efficiency. Sustainable consumption and production is also a priority for the Government of India and is reflected in various policies/programme announcements like Make in India, Zero Effect-Zero Defect Scheme, Smart Cities, Swachh Bharat, and Ganga Rejuvenation Mission. A resource efficient development approach essentially means a transition of the management of natural resources with a progressive minimization of waste in both consumption and production processes through various policies and measures.
5.12 Economic growth and urbanization in India have spurred the demand for natural resources. This growing demand has resulted in high imports, in particular, imports of fossil fuels and metals. Against this background, the availability and accessibility of primary raw materials have become major concerns. Integrated, concerted and collaborative policy of resource efficiency could be a suitable response strategy to address resource security and the growing demand with the limited
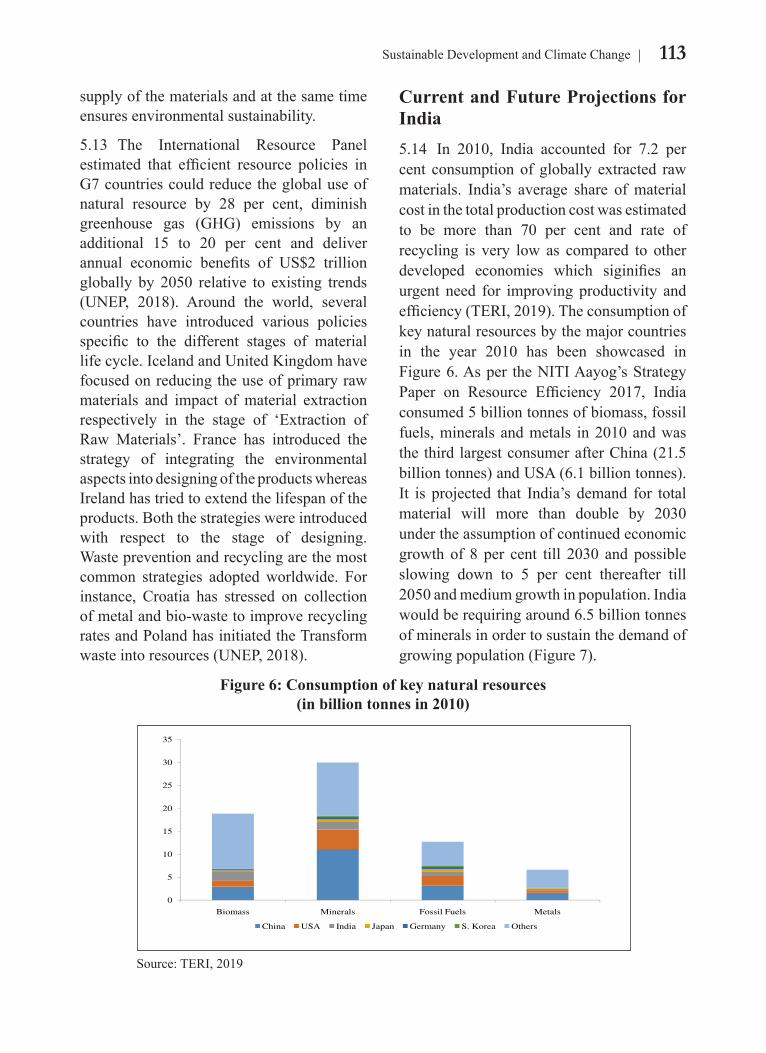
113Sustainable Development and Climate Change
supply of the materials and at the same time ensures environmental sustainability.
5.13 The International Resource Panel estimated that efficient resource policies in G7 countries could reduce the global use of natural resource by 28 per cent, diminish greenhouse gas (GHG) emissions by an additional 15 to 20 per cent and deliver annual economic benefits of US$2 trillion globally by 2050 relative to existing trends (UNEP, 2018). Around the world, several countries have introduced various policies specific to the different stages of material life cycle. Iceland and United Kingdom have focused on reducing the use of primary raw materials and impact of material extraction respectively in the stage of ‘Extraction of Raw Materials’. France has introduced the strategy of integrating the environmental aspects into designing of the products whereas Ireland has tried to extend the lifespan of the products. Both the strategies were introduced with respect to the stage of designing. Waste prevention and recycling are the most common strategies adopted worldwide. For instance, Croatia has stressed on collection of metal and bio-waste to improve recycling rates and Poland has initiated the Transform waste into resources (UNEP, 2018).
Current and Future Projections for India5.14 In 2010, India accounted for 7.2 per cent consumption of globally extracted raw materials. India’s average share of material cost in the total production cost was estimated to be more than 70 per cent and rate of recycling is very low as compared to other developed economies which siginifies an urgent need for improving productivity and efficiency (TERI, 2019). The consumption of key natural resources by the major countries in the year 2010 has been showcased in Figure 6. As per the NITI Aayog’s Strategy Paper on Resource Efficiency 2017, India consumed 5 billion tonnes of biomass, fossil fuels, minerals and metals in 2010 and was the third largest consumer after China (21.5 billion tonnes) and USA (6.1 billion tonnes). It is projected that India’s demand for total material will more than double by 2030 under the assumption of continued economic growth of 8 per cent till 2030 and possible slowing down to 5 per cent thereafter till 2050 and medium growth in population. India would be requiring around 6.5 billion tonnes of minerals in order to sustain the demand of growing population (Figure 7).
0
5
10
15
20
25
30
35
Biomass Minerals Fossil Fuels Metals
China USA India Japan Germany S. Korea Others
Figure 6: Consumption of key natural resources (in billion tonnes in 2010)
Source: TERI, 2019
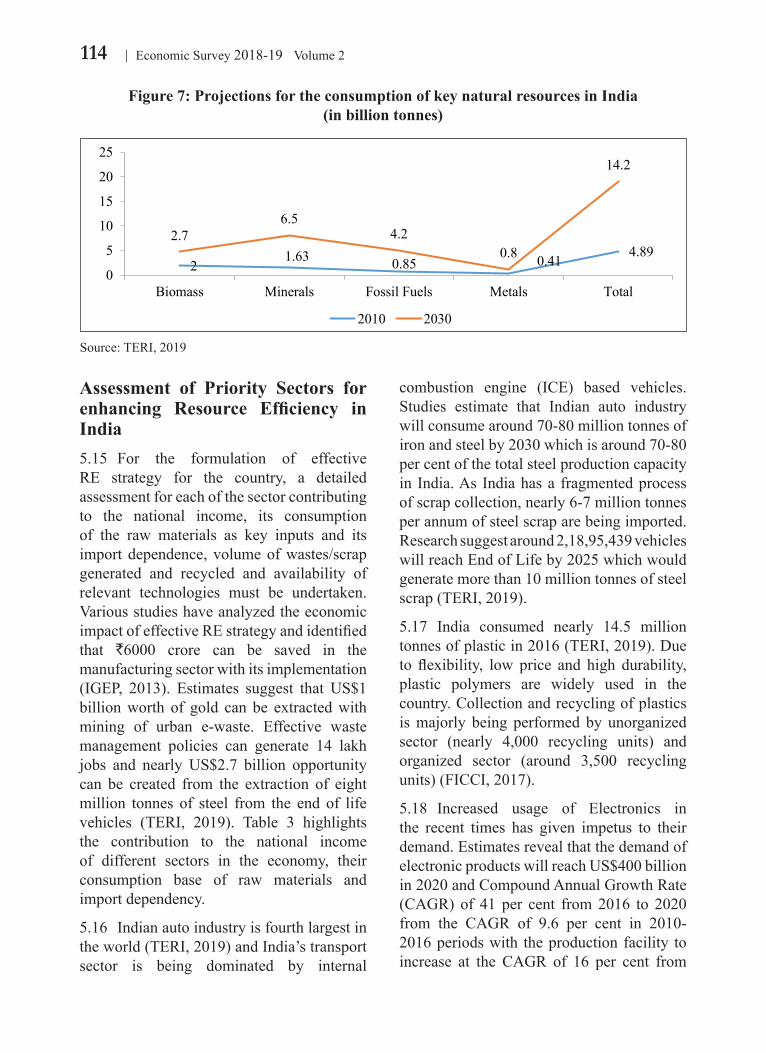
114 Economic Survey 2018-19 Volume 2
Assessment of Priority Sectors for enhancing Resource Efficiency in India5.15 For the formulation of effective RE strategy for the country, a detailed assessment for each of the sector contributing to the national income, its consumption of the raw materials as key inputs and its import dependence, volume of wastes/scrap generated and recycled and availability of relevant technologies must be undertaken. Various studies have analyzed the economic impact of effective RE strategy and identified that `6000 crore can be saved in the manufacturing sector with its implementation (IGEP, 2013). Estimates suggest that US$1 billion worth of gold can be extracted with mining of urban e-waste. Effective waste management policies can generate 14 lakh jobs and nearly US$2.7 billion opportunity can be created from the extraction of eight million tonnes of steel from the end of life vehicles (TERI, 2019). Table 3 highlights the contribution to the national income of different sectors in the economy, their consumption base of raw materials and import dependency.
5.16 Indian auto industry is fourth largest in the world (TERI, 2019) and India’s transport sector is being dominated by internal
combustion engine (ICE) based vehicles. Studies estimate that Indian auto industry will consume around 70-80 million tonnes of iron and steel by 2030 which is around 70-80 per cent of the total steel production capacity in India. As India has a fragmented process of scrap collection, nearly 6-7 million tonnes per annum of steel scrap are being imported. Research suggest around 2,18,95,439 vehicles will reach End of Life by 2025 which would generate more than 10 million tonnes of steel scrap (TERI, 2019).
5.17 India consumed nearly 14.5 million tonnes of plastic in 2016 (TERI, 2019). Due to flexibility, low price and high durability, plastic polymers are widely used in the country. Collection and recycling of plastics is majorly being performed by unorganized sector (nearly 4,000 recycling units) and organized sector (around 3,500 recycling units) (FICCI, 2017).
5.18 Increased usage of Electronics in the recent times has given impetus to their demand. Estimates reveal that the demand of electronic products will reach US$400 billion in 2020 and Compound Annual Growth Rate (CAGR) of 41 per cent from 2016 to 2020 from the CAGR of 9.6 per cent in 2010-2016 periods with the production facility to increase at the CAGR of 16 per cent from
Figure 7: Projections for the consumption of key natural resources in India (in billion tonnes)
21.63 0.85 0.41 4.89
2.76.5
4.20.8
14.2
0
5
10
15
20
25
Biomass Minerals Fossil Fuels Metals Total
2010 2030
Source: TERI, 2019
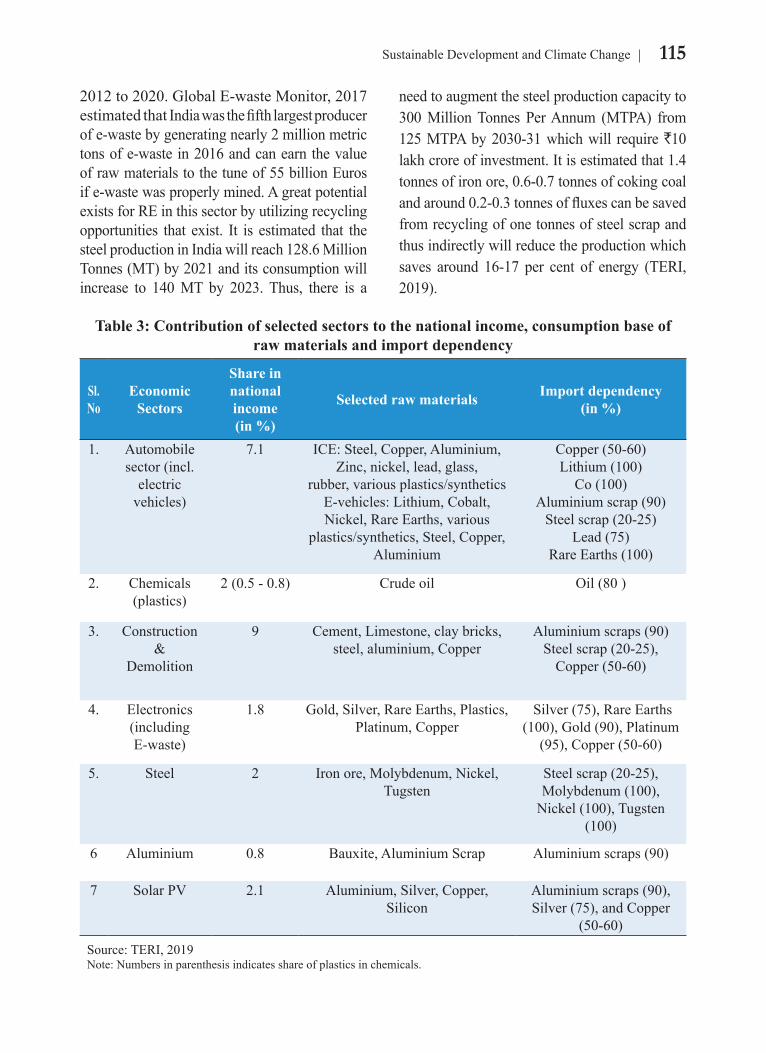
115Sustainable Development and Climate Change
2012 to 2020. Global E-waste Monitor, 2017 estimated that India was the fifth largest producer of e-waste by generating nearly 2 million metric tons of e-waste in 2016 and can earn the value of raw materials to the tune of 55 billion Euros if e-waste was properly mined. A great potential exists for RE in this sector by utilizing recycling opportunities that exist. It is estimated that the steel production in India will reach 128.6 Million Tonnes (MT) by 2021 and its consumption will increase to 140 MT by 2023. Thus, there is a
need to augment the steel production capacity to 300 Million Tonnes Per Annum (MTPA) from 125 MTPA by 2030-31 which will require `10 lakh crore of investment. It is estimated that 1.4 tonnes of iron ore, 0.6-0.7 tonnes of coking coal and around 0.2-0.3 tonnes of fluxes can be saved from recycling of one tonnes of steel scrap and thus indirectly will reduce the production which saves around 16-17 per cent of energy (TERI, 2019).
Table 3: Contribution of selected sectors to the national income, consumption base of raw materials and import dependency
Sl. No
Economic Sectors
Share in national income (in %)
Selected raw materials Import dependency (in %)
1. Automobile sector (incl.
electric vehicles)
7.1 ICE: Steel, Copper, Aluminium, Zinc, nickel, lead, glass,
rubber, various plastics/synthetics E-vehicles: Lithium, Cobalt, Nickel, Rare Earths, various
plastics/synthetics, Steel, Copper, Aluminium
Copper (50-60) Lithium (100)
Co (100) Aluminium scrap (90)
Steel scrap (20-25) Lead (75)
Rare Earths (100)
2. Chemicals (plastics)
2 (0.5 - 0.8) Crude oil Oil (80 )
3. Construction &
Demolition
9 Cement, Limestone, clay bricks, steel, aluminium, Copper
Aluminium scraps (90) Steel scrap (20-25),
Copper (50-60)
4. Electronics (including E-waste)
1.8 Gold, Silver, Rare Earths, Plastics, Platinum, Copper
Silver (75), Rare Earths (100), Gold (90), Platinum
(95), Copper (50-60)
5. Steel 2 Iron ore, Molybdenum, Nickel, Tugsten
Steel scrap (20-25), Molybdenum (100),
Nickel (100), Tugsten (100)
6 Aluminium 0.8 Bauxite, Aluminium Scrap Aluminium scraps (90)
7 Solar PV 2.1 Aluminium, Silver, Copper, Silicon
Aluminium scraps (90), Silver (75), and Copper
(50-60)Source: TERI, 2019Note: Numbers in parenthesis indicates share of plastics in chemicals.
116 Economic Survey 2018-19 Volume 2
5.19 NITI Aayog’s Status Paper “Circular Economy (CE) and Resource Efficiency (RE)- Current Status and Way Forward” (January, 2019) has reviewed the status, concerns and opportunities of four focus sectors/areas- steel, aluminium, e-waste and construction & demolition (C&D) waste in fulfilling the goals of RE. The paper suggests a way forward to achieve RE with sustainability of the growth process. While there are already provisions made to promote RE in some of the national policies (national mineral policy, national steel policy, national housing and
habitat policy, etc.), in many cases these policy elements are implicit and may need to be explicitly stated. The Paper argues in favour of a harmonized overarching national policy on RE, building upon the existing policies to address multiple sectors. Specific recommendations have been made by NITI Aayog for mainstreaming RE approach in the development pathway for achieving SDGs and also steering a new paradigm of economic development by generating wealth from waste and for promoting recycling industry (Box 1).
Policiesi. Formulate a national policy on RE for all types of resources (biotic, abiotic) addressing various
lifecycle stages and key stakeholders
ii. Formulate a national policy on Sustainable Public Procurement (SPP) to minimize consumption of resources, reduce waste generation and GHG emissions, as well as contribute to innovation in materials and technology in the space of RE.
iii. Strengthen existing sectoral policies and programmes of Ministry of Mines by incorporating RE principles.
iv. Formulate a national policy for End-of-Life Vehicles (ELVs).
v. Formulate a Waste to Resource Management Directive based on existing waste and hazardous substance management rules/regulations following a lifecycle approach targeting relevant stakeholders and focusing on RE.
Programmes and Mainstreamingi. Mainstream RE initiatives by leveraging existing flagship programmes and schemes like
Swachh Bharat Abhiyan, Smart Cities, Make in India, Start-up India, Digital India and others.
ii. Industry may leverage Corporate Social Responsibility (CSR), Corporate Environmental Responsibility (CER) and Extended Producer Responsibility (EPR) for RE initiatives.
iii. Build on the National Chemical Management Plan being drafted by Ministry of Environment, Forest and Climate Change (MoEF&CC) to develop a strategy, framework and guidelines for the safe and circular management of chemicals.
iv. Leverage the national clean energy and environment fund to finance infrastructure, clean technologies and related RE initiatives.
Regulationsi. Establish a national coordinating body- Bureau of Resource Efficiency (BRE) between various
ministries to identify, implement and achieve national RE goals.
ii. Establish State Level coordinating bodies to identify, implement and achieve State level RE goals.
Box 1: Six Pillars for a Resource Efficiency Framework in India
117Sustainable Development and Climate Change
iii. Large and resource intensive industries and bulk waste generators may be mandated to file the Resource Use and Efficiency Statement.
iv. Establish and mandate a ‘Consent to Close’ requirement for medium and large industries in the ‘RED’ category to ensure that waste streams are responsibly managed and recycled before closure.
v. Rationalise tax regime on critical virgin raw materials to make secondary raw materials price competitive.
Setting up a Dynamic Recycling Industryi. Promote the establishment of Material Recovery Facilities (MRFs) with the allocation of land
in urban areas and industrial estates.
ii. Facilitate Urban Local Bodies (ULBs) to undertake urban mining and create secure landfills.
iii. Facilitate the establishment of Producer Responsibility Organizations (PRO) for waste recycling and for engagement with the informal sector.
iv. Facilitate innovation to enhance resource recovery and improve working conditions by integrating the informal sector into the waste value chain.
v. Establish a remanufacturing council or association to catalyse the growth of the remanufacturing industry.
vi. Establish and manage platforms for waste exchange by expanding the SBM portal.
R&D and Technology Developmenti. Support R&D to develop scalable technologies for RE.
ii. Create and manage knowledge platforms that facilitate open innovation, provide access to experts, and engage academia to support the transition towards RE.
iii. Leverage technologies like Artificial Intelligence (AI), robotics, block-chain etc. for the recycling industry.
Capacity Development, Outreach & Monitoringi. Facilitate creation of accredited laboratories that could conduct testing (especially for recycled
products) as well as provide advisory services.
ii. Provide capacity development support on RE for ministries/departments at the National and State levels.
iii. Develop and promote programmes and certifications for informal sector skill development in RE.
iv. Develop and launch citizen awareness programmes on RE.
v. Foster inter-governmental collaboration and knowledge exchange with the G20, RE dialogue and other bodies like International Resource Panel and other national and international forums.
vi. Develop monitoring and outcome indicators for tracking progress on RE.
vii. Establish and mandate the certification for operators managing waste-to-resource recycling centres to ensure safe, efficient, and net positive operations.
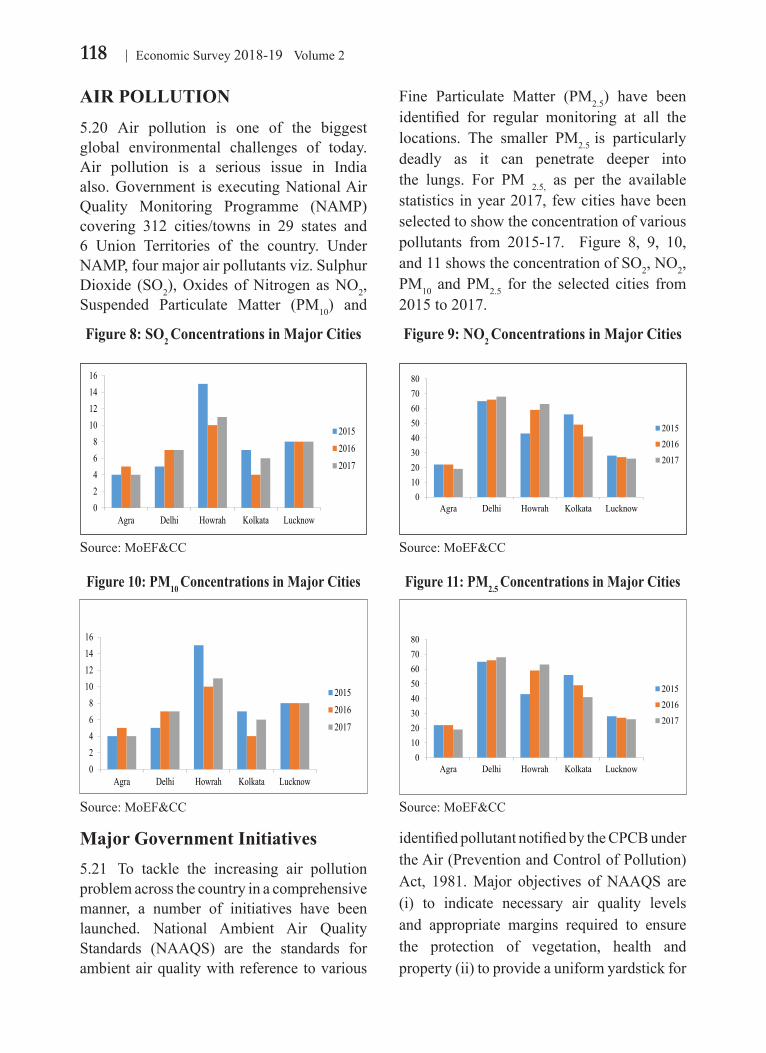
118 Economic Survey 2018-19 Volume 2
AIR POLLUTION5.20 Air pollution is one of the biggest global environmental challenges of today. Air pollution is a serious issue in India also. Government is executing National Air Quality Monitoring Programme (NAMP) covering 312 cities/towns in 29 states and 6 Union Territories of the country. Under NAMP, four major air pollutants viz. Sulphur Dioxide (SO2), Oxides of Nitrogen as NO2, Suspended Particulate Matter (PM10) and
Fine Particulate Matter (PM2.5) have been identified for regular monitoring at all the locations. The smaller PM2.5 is particularly deadly as it can penetrate deeper into the lungs. For PM 2.5, as per the available statistics in year 2017, few cities have been selected to show the concentration of various pollutants from 2015-17. Figure 8, 9, 10, and 11 shows the concentration of SO2, NO2, PM10 and PM2.5 for the selected cities from 2015 to 2017.
Figure 8: SO2 Concentrations in Major Cities Figure 9: NO2 Concentrations in Major Cities
02468
10121416
Agra Delhi Howrah Kolkata Lucknow
201520162017
01020304050607080
Agra Delhi Howrah Kolkata Lucknow
201520162017
Source: MoEF&CC Source: MoEF&CC
Figure 10: PM10 Concentrations in Major Cities Figure 11: PM2.5 Concentrations in Major Cities
02468
10121416
Agra Delhi Howrah Kolkata Lucknow
201520162017
01020304050607080
Agra Delhi Howrah Kolkata Lucknow
201520162017
Source: MoEF&CC Source: MoEF&CC
Major Government Initiatives5.21 To tackle the increasing air pollution problem across the country in a comprehensive manner, a number of initiatives have been launched. National Ambient Air Quality Standards (NAAQS) are the standards for ambient air quality with reference to various
identified pollutant notified by the CPCB under the Air (Prevention and Control of Pollution) Act, 1981. Major objectives of NAAQS are (i) to indicate necessary air quality levels and appropriate margins required to ensure the protection of vegetation, health and property (ii) to provide a uniform yardstick for
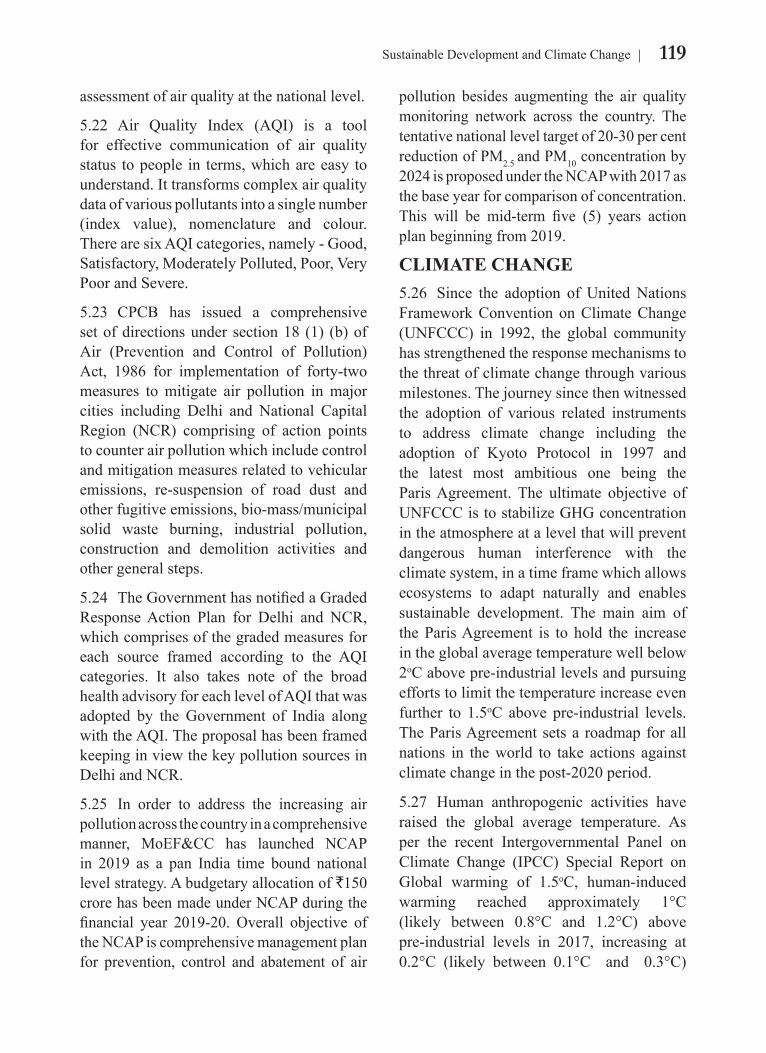
119Sustainable Development and Climate Change
assessment of air quality at the national level.
5.22 Air Quality Index (AQI) is a tool for effective communication of air quality status to people in terms, which are easy to understand. It transforms complex air quality data of various pollutants into a single number (index value), nomenclature and colour. There are six AQI categories, namely - Good, Satisfactory, Moderately Polluted, Poor, Very Poor and Severe.
5.23 CPCB has issued a comprehensive set of directions under section 18 (1) (b) of Air (Prevention and Control of Pollution) Act, 1986 for implementation of forty-two measures to mitigate air pollution in major cities including Delhi and National Capital Region (NCR) comprising of action points to counter air pollution which include control and mitigation measures related to vehicular emissions, re-suspension of road dust and other fugitive emissions, bio-mass/municipal solid waste burning, industrial pollution, construction and demolition activities and other general steps.
5.24 The Government has notified a Graded Response Action Plan for Delhi and NCR, which comprises of the graded measures for each source framed according to the AQI categories. It also takes note of the broad health advisory for each level of AQI that was adopted by the Government of India along with the AQI. The proposal has been framed keeping in view the key pollution sources in Delhi and NCR.
5.25 In order to address the increasing air pollution across the country in a comprehensive manner, MoEF&CC has launched NCAP in 2019 as a pan India time bound national level strategy. A budgetary allocation of `150 crore has been made under NCAP during the financial year 2019-20. Overall objective of the NCAP is comprehensive management plan for prevention, control and abatement of air
pollution besides augmenting the air quality monitoring network across the country. The tentative national level target of 20-30 per cent reduction of PM2.5 and PM10 concentration by 2024 is proposed under the NCAP with 2017 as the base year for comparison of concentration. This will be mid-term five (5) years action plan beginning from 2019.
CLIMATE CHANGE5.26 Since the adoption of United Nations Framework Convention on Climate Change (UNFCCC) in 1992, the global community has strengthened the response mechanisms to the threat of climate change through various milestones. The journey since then witnessed the adoption of various related instruments to address climate change including the adoption of Kyoto Protocol in 1997 and the latest most ambitious one being the Paris Agreement. The ultimate objective of UNFCCC is to stabilize GHG concentration in the atmosphere at a level that will prevent dangerous human interference with the climate system, in a time frame which allows ecosystems to adapt naturally and enables sustainable development. The main aim of the Paris Agreement is to hold the increase in the global average temperature well below 2oC above pre-industrial levels and pursuing efforts to limit the temperature increase even further to 1.5oC above pre-industrial levels. The Paris Agreement sets a roadmap for all nations in the world to take actions against climate change in the post-2020 period.
5.27 Human anthropogenic activities have raised the global average temperature. As per the recent Intergovernmental Panel on Climate Change (IPCC) Special Report on Global warming of 1.5oC, human-induced warming reached approximately 1°C (likely between 0.8°C and 1.2°C) above pre-industrial levels in 2017, increasing at 0.2°C (likely between 0.1°C and 0.3°C)
120 Economic Survey 2018-19 Volume 2
per decade (high confidence). The report has warned of a warmer planet and has raised the demand for unprecedented efforts to reduce GHG emissions. In line with the global trends, during the year 2018, annual mean surface air temperature of India was +0.41°C, significantly above normal. The year 2018 was the sixth warmest year on record since the nation-wide records commenced in 1901.
India’s Climate Actions5.28 India has continuously demonstrated its responsibility towards acknowledging the emerging threats from climate change and implementing the climate actions on the basis of the principles of Equity and Common but Differentiated Responsiblities for improving efficiency of the economy and its engines of growth. India has been actively promoting clean energy and clean technology as well as continuing the flagship schemes on combating climate change in both adaptation and mitigation fronts. The major policies and plans include National Action Plan on Climate Change (NAPCC), launched in 2008, formulated in the backdrop of India’s voluntary commitment to reduce emission intensity of its GDP by 20 to 25 per cent by 2020 over 2005 levels. It was also meant to focus on key adaptation requirements and creation of scientific knowledge and preparedness for dealing with climate change. States/Union Territories have also State Action Plans on Climate Change (SAPCC) in line with the NAPCC taking into account State’s specific issues relating to climate change. So far, 33 States/UTs have prepared their SAPCCs. Central sector scheme called Climate Change Action Programme (CCAP) has been launched in 2014 with a total cost of `290 crore, with the objective to build and support capacity at central and state levels, strengthening scientific and analytical capacity for climate
change assessment, establishing appropriate institutional framework and implementing climate related actions in the context of sustainable development. The budget outlay of CCAP scheme for the period of three years from 2017-18 to 2019-20 is `132.40 crore. A National Adaptation Fund on Climate Change was established in 2015 to meet the cost of adaptation to climate change for the State and Union Territories that are particularly vulnerable to the adverse effects of climate change. The Scheme will continue till 31 March 2020 with a financial implication of `364 crore. Till date, 30 adaptation projects have been approved at a total cost of `847 crore covering vulnerable sectors such as Water, Agriculture and Animal Husbandry, Forestry Ecosystems and Biodiversity. Out of which, Government of India has released an amount of `437 crore. Renewable energy sources are strategic to India’s national policies on effective climate action. A detailed analysis on this is elaborated in Economic Survey volume-1, Chapter 9.
5.29 The outcomes of these initiatives are reflected in India’s Second Biennial Update Report (BUR) submitted to UNFCCC in December 2018 as per the reporting obligations under the Convention. The report shows that emission intensity of India’s GDP came down by 21 per cent between 2005 & 2014 and its achievement of climate goal for pre-2020 period is on track. A total of 2.607 billion tons of CO2 equivalent of GHGs were emitted from all activities (excluding Land use, Land-Use Change, and Forestry (LULUCF)) in India. Energy sector accounted for 73 per cent, Industrial Processes and Product Use (IPPU) 8 per cent, agriculture 16 per cent and waste sector 3 per cent. About 12 per cent of emissions were offset by the carbon sink action of forestland, cropland and settlements (Table 4).
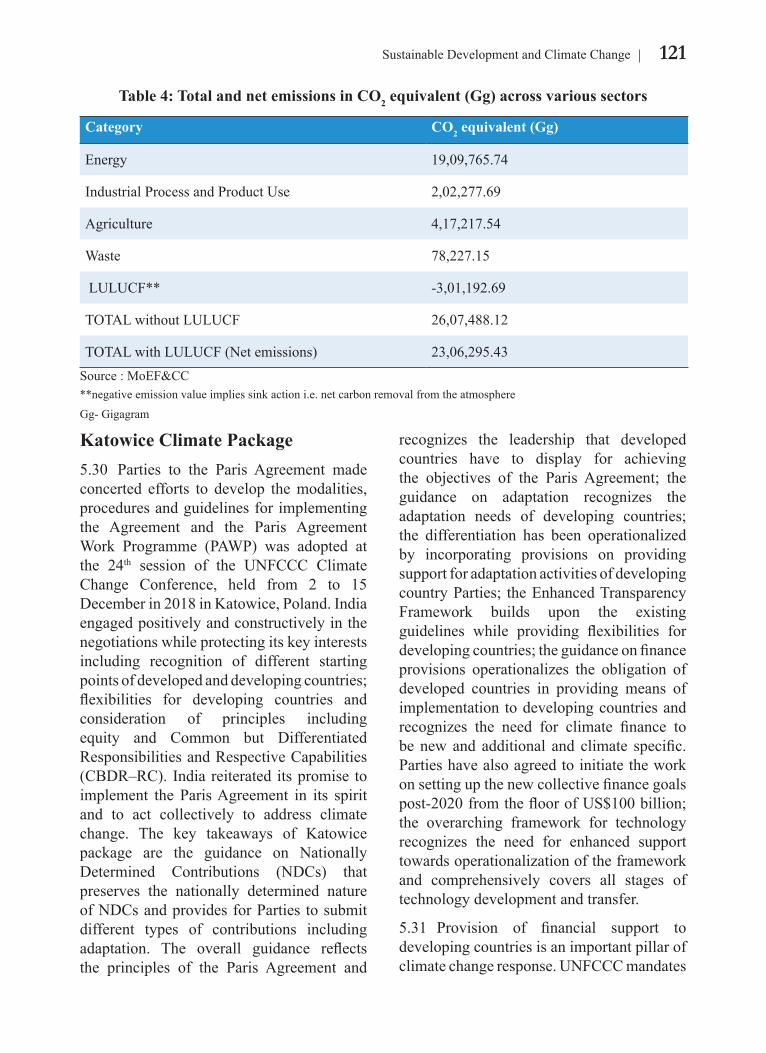
121Sustainable Development and Climate Change
Katowice Climate Package5.30 Parties to the Paris Agreement made concerted efforts to develop the modalities, procedures and guidelines for implementing the Agreement and the Paris Agreement Work Programme (PAWP) was adopted at the 24th session of the UNFCCC Climate Change Conference, held from 2 to 15 December in 2018 in Katowice, Poland. India engaged positively and constructively in the negotiations while protecting its key interests including recognition of different starting points of developed and developing countries; flexibilities for developing countries and consideration of principles including equity and Common but Differentiated Responsibilities and Respective Capabilities (CBDR–RC). India reiterated its promise to implement the Paris Agreement in its spirit and to act collectively to address climate change. The key takeaways of Katowice package are the guidance on Nationally Determined Contributions (NDCs) that preserves the nationally determined nature of NDCs and provides for Parties to submit different types of contributions including adaptation. The overall guidance reflects the principles of the Paris Agreement and
recognizes the leadership that developed countries have to display for achieving the objectives of the Paris Agreement; the guidance on adaptation recognizes the adaptation needs of developing countries; the differentiation has been operationalized by incorporating provisions on providing support for adaptation activities of developing country Parties; the Enhanced Transparency Framework builds upon the existing guidelines while providing flexibilities for developing countries; the guidance on finance provisions operationalizes the obligation of developed countries in providing means of implementation to developing countries and recognizes the need for climate finance to be new and additional and climate specific. Parties have also agreed to initiate the work on setting up the new collective finance goals post-2020 from the floor of US$100 billion; the overarching framework for technology recognizes the need for enhanced support towards operationalization of the framework and comprehensively covers all stages of technology development and transfer.
5.31 Provision of financial support to developing countries is an important pillar of climate change response. UNFCCC mandates
Table 4: Total and net emissions in CO2 equivalent (Gg) across various sectors
Category CO2 equivalent (Gg)
Energy 19,09,765.74
Industrial Process and Product Use 2,02,277.69
Agriculture 4,17,217.54
Waste 78,227.15
LULUCF** -3,01,192.69
TOTAL without LULUCF 26,07,488.12
TOTAL with LULUCF (Net emissions) 23,06,295.43Source : MoEF&CC**negative emission value implies sink action i.e. net carbon removal from the atmosphere
Gg- Gigagram
122 Economic Survey 2018-19 Volume 2
that countries in Annex-II (industrialized countries) provide financial resources, including for the transfer of technology, needed by the developing country Parties to take climate actions. Paris Agreement also emphasizes the role of climate finance in strengthening the global response to climate change. Though the international community witnessed various claims by developed countries about climate finance flows, the actual amount of flows is far from these claims. In fact, without sufficient climate finance, the proposed NDCs would
not fructify. Yet there are calls for enhanced climate action by developing countries. However, the means to achieve the climate goals is not commensurate to the urgency shown, nor do we witness the seriousness required in the discourse on climate finance. Global action on climate change is contingent on the delivery of timely and adequate finance. The Scope, Scale and Speed of climate finance required to take climate actions effectively is lacking in the debate on climate actions (Box 2).
i) Scope
Climate finance should support both the adaptation and mitigation activities of the developing countries in accordance with the country needs and priorities. The Paris Agreement gives equal weightage to adaptation and mitigation. Under the UNFCCC, the intent and obligation of climate finance is unambiguous, that developed country Parties shall provide financial resources to developing countries; but what constitutes of financial resources and its key elements for climate finance itself are very broadly defined. The essential elements that need to be taken up as parameters for accounting climate finance are -public grants, unrequited equity and grant-equivalent values of loans. Also counting only such transfers of finance ex-post that are formalized in entry in a book of accounts as specifically climate finance and actual disbursements of such finance crossing borders in a particular year need to be ensured. Some more important parameters such as how to treat private climate finance flows that are ‘mobilized’ or ‘leveraged’, the clarity on “new and additional” also need to be understood in this context.
ii) Scale
Developing countries have myriad developmental challenges and climate change puts additional burden on the already scarce resources. The climate finance requirements of developing countries are likely to be enormous. Even preliminary estimates by simply summing the finance needs in NDCs with a conditional component, comes to around US$4.4 trillion (Weischer et al., 2016). A recent report by Oxfam, 2018 indicated, “People in poorer countries are on average five times more likely than people in rich countries to be displaced by extreme weather events. Adaptation costs in developing countries are expected to be US$140 - 300 billion a year by 2025/30. By mid-century, the costs of climate change to developing countries are estimated to exceed US$1trillion per year, even if global average temperature remains below 2°C.”
iii) Speed
To answer the question, whether the speed of climate finance in the multilateral climate regime is sufficient, we need to understand if the developed countries have fulfilled their commitments and the progress of delivery of finance is from developed to developing countries. As of February 2019, the pledge and approval of multilateral climate change funds shows lagged performance.
Box 2: Three Essential ‘S’s of Climate Finance
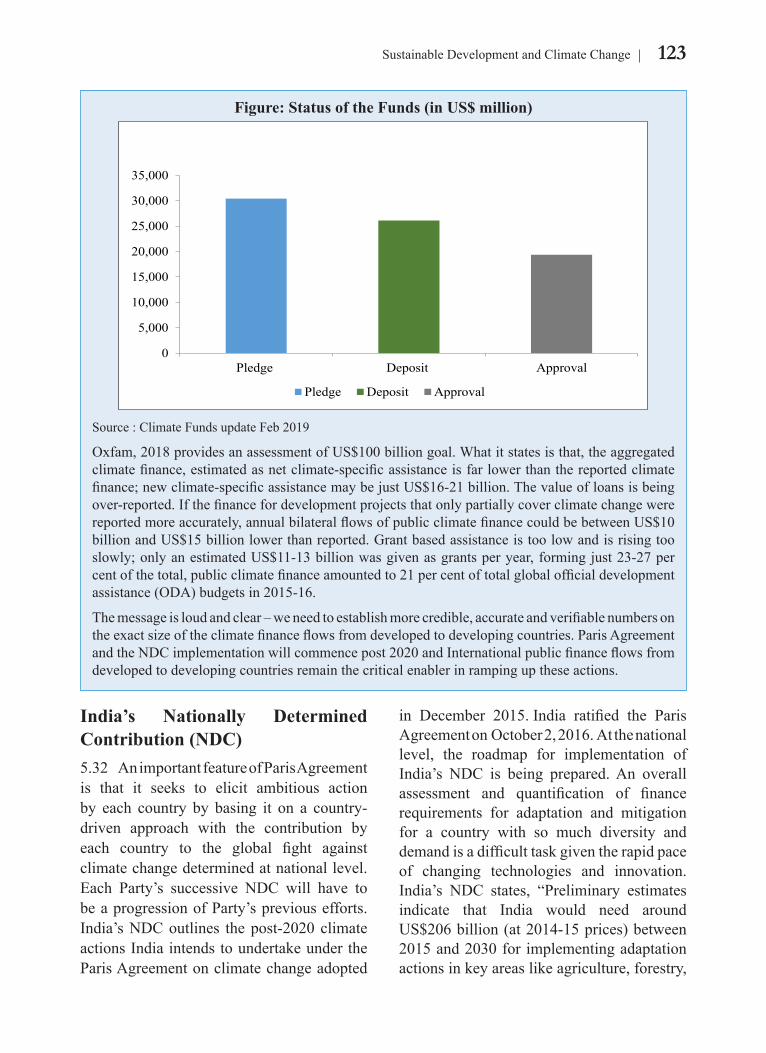
123Sustainable Development and Climate Change
India’s Nationally Determined Contribution (NDC)5.32 An important feature of Paris Agreement is that it seeks to elicit ambitious action by each country by basing it on a country-driven approach with the contribution by each country to the global fight against climate change determined at national level. Each Party’s successive NDC will have to be a progression of Party’s previous efforts. India’s NDC outlines the post-2020 climate actions India intends to undertake under the Paris Agreement on climate change adopted
Figure: Status of the Funds (in US$ million)
0
5,000
10,000
15,000
20,000
25,000
30,000
35,000
Pledge Deposit Approval
Pledge Deposit Approval
Source : Climate Funds update Feb 2019
Oxfam, 2018 provides an assessment of US$100 billion goal. What it states is that, the aggregated climate finance, estimated as net climate-specific assistance is far lower than the reported climate finance; new climate-specific assistance may be just US$16-21 billion. The value of loans is being over-reported. If the finance for development projects that only partially cover climate change were reported more accurately, annual bilateral flows of public climate finance could be between US$10 billion and US$15 billion lower than reported. Grant based assistance is too low and is rising too slowly; only an estimated US$11-13 billion was given as grants per year, forming just 23-27 per cent of the total, public climate finance amounted to 21 per cent of total global official development assistance (ODA) budgets in 2015-16.
The message is loud and clear – we need to establish more credible, accurate and verifiable numbers on the exact size of the climate finance flows from developed to developing countries. Paris Agreement and the NDC implementation will commence post 2020 and International public finance flows from developed to developing countries remain the critical enabler in ramping up these actions.
in December 2015. India ratified the Paris Agreement on October 2, 2016. At the national level, the roadmap for implementation of India’s NDC is being prepared. An overall assessment and quantification of finance requirements for adaptation and mitigation for a country with so much diversity and demand is a difficult task given the rapid pace of changing technologies and innovation. India’s NDC states, “Preliminary estimates indicate that India would need around US$206 billion (at 2014-15 prices) between 2015 and 2030 for implementing adaptation actions in key areas like agriculture, forestry,

124 Economic Survey 2018-19 Volume 2
fisheries infrastructure, water resources and ecosystems.” Apart from this there will be additional investments needed for strengthening resilience and disaster management. NDC further provides the preliminary total estimates for meeting India’s climate change actions between now and 2030 which is at US$2.5 trillion (at 2014-15 prices). Finding required financial resources is going to be a daunting challenge for the country.
Developments in the Sustainable Finance Arena5.33 Implementing 2030 Sustainable Development Agenda and the Paris Agreement requires investments of scale and size which is unprecedented. This essentially means that along with domestic public budgets and international public finance, resources would have to be mobilized from a variety of sources, in particular, private sector. Currently, private sector financing has been mostly done by the banks and resides on their balance sheets. However, in future to increase the scale of sustainable investments there may be funding capacity problems for the banks if they are the primary provider of sustainable debt. Therefore, capital market products are required to free-up the banks’ balance sheet capacity and allow them to underwrite loans to meet the accelerating demands for new sustainable investments. Further, by doing so institutional investors and certain retail investors can get access to sustainable debt as institutional investors are well situated to hold long term sustainable debt and they look to match long term liability funding requirements with long term assets.
5.34 Globally, the green bond market has seen remarkable growth over the past 5 years as increasing number of investors have sought environmentally sustainable investments without having to sacrifice financial returns.
In the first quarter (Q1) of 2019, green bond issuance reached US$47.9 billion, and surpassed Q1 2018 volume of US$33.8 billion by 42 per cent, on a clear upward trend. 81 per cent of volume came from developed markets issuers. USA, France and Canada topped the country rankings, accounting for 48 per cent of Q1 2019 global issuance.
5.35 In markets in which regulators have provided a favorable environment for green bonds, supply has increased. green bonds makes way for investors to create environmentally aware portfolios without having to compromise on risk and return objectives that may fit nicely into a core bond allocation. Over the past few years regulators, stock exchanges and market associations have stepped in to provide some guidance to market participants for the green debt issuance process. In India, SEBI has provided a regulatory environment for issuance of green bonds in May 2017, the fruits of which are reflected in the cumulative issuance of green bonds in India. India stands at 11th position in global country ranking and accounts for 33 per cent of the Certified Climate bonds by number in emerging markets. Going forward, possible capital market structures for sustainable finance may include Real Estate Investment Trusts (REITs) and Infrastructure Investment Trusts (InvITs) which can be leveraged for transfer of green and sustainable assets such as energy efficient buildings, renewable power projects, mass transportation systems, etc. to the institutional investors. Another option is that banks and financial institutions may securitize the future cash flows emanating from their existing set of assets, thereby selling such securitized debt instruments to the investors including institutional investors. This provides investors with an opportunity to invest in regular yielding investment which is backed by sustainable assets.
125Sustainable Development and Climate Change
INTERNATIONAL SOLAR ALLIANCE (ISA) 5.36 ISA is the first treaty-based International Intergovernmental Organization launched by India and France on 30 November, 2015 in Paris and entered into force on 6 December, 2017. As on June 2019, 75 countries have signed and out of which, 52 countries have ratified the ISA Framework Agreement. The first Assembly of the ISA was convened on October 3, 2018. ISA’s motto is, “let us together make the sun brighter”. ISA has launched five programmes so far: 1) Scaling Solar Applications for Agriculture Use; 2) Affordable Finance at Scale; 3) Scaling Solar Mini Grids; 4) Scaling Solar Rooftop, and 5) Scaling Solar in E-mobility and Storage.
Key Initiatives• ISA has been working with various
financial institutions for scaling up financing, lowering the cost of capital, and designing innovative financial instruments to accelerate the massive deployment of solar energy. ISA’s engagement with Indian Diplomatic Missions in member countries, financing by the Export Import Bank of India, among others, resulted in development of a portfolio of 27 solar projects in 15 countries. These projects are being supported with India’s concessional financing of US$ 1.4 billion.
• In addition, “Action to Transaction” meets, an innovative platform where project developers and bankers were brought together, facilitated 238 projects in ISA countries. France has also committed 1.5 billion Euros for financing solar projects and thereby, 27 projects have been funded by the French Development Financing Agency for approximately 720 million Euros.
• A task force was constituted to design a
Common Risk Mitigation Mechanism to reduce risks and financial cost of solar projects. Also, the World Bank and Agence Française de Dévelopment (AFD) are developing a joint Global Solar Risk Mitigation Initiative (SRMI), an integrated approach to tackle policy, technical and financial issues. As a first implementation phase of the SRMI, the World Bank has launched in April 2019, US$337 million risk mitigation fund for 23 West African countries focusing on Regional Off-grid Electrification Project (ROGEP).
• The ISA is also working with the European Investment Bank and the EU Commission to launch an off-grid fund, initially for four Asian member countries of the ISA, to rapidly scale up to Africa and Latin America.
• A project pipeline of US$5 billion in mini-grids and rooftops is created.
• ISA has forged financial partnerships with various MDBs, UN agencies, Climate Parliament, European Commission, Commonwealth Secretariat and other International and Intergovernmental organizations.
• ISA Solar Award has been instituted for Solar Scientists doing extraordinary work across ISA countries with a one-time corpus contribution of US$1.5 million from the Government of Haryana.
5.37 Efforts for mobilizing financial resources for ISA activities resulted in augmenting initial corpus of US$16 million (Government of India contribution) to US$27 million, wherein US$3 million came from Japanese and Chinese companies. True to its motto, ISA from scratch has now transformed into an action oriented international organization, scaling newer heights under the collective leadership and supervision of the member countries.
126 Economic Survey 2018-19 Volume 2
WAY FORWARD5.38 India has been progressing rapidly towards achieving the SDGs. India’s progress in achieving SDG 10 (Reduced Inequality) and SDG 15 (Life on Land) has been impressive. However, there has been a wide variation in the way different states have performed. It is important that in the race towards SDGs no State is left behind. At the global level, given the myriad developmental challenges faced by the developing economies, lack of adequate resources is a major challenge in achieving the SDGs and international cooperation is essential in achieving these goals.
5.39 Efficient utilization of resources also plays an important role. With increasing demand for resources to cater to the different developmental needs, policies need to
nudge economic agents towards achieving the maximum output from the available resources. India’s policies have already taken the correct initiatives in this direction.5.41 India’s NDC has set clear targets for achieving its climate goals. However, a substantial scaling up of financial resources and technology are needed to implement this target by 2030. The fulfillment of pledges by developed countries through provision of ‘new and additional’ financial resources is an important contingent factor. The developing countries like India will endeavor to do the best possible within their own domestic resources, keeping in mind the sustainable development imperatives. It is time for the global community to exhibit the requisite momentum to act upon their responsibilities on establishing the enabling environment for climate action.
CHAPTER AT A GLANCE
India follows a holistic approach towards its 2030 SDG targets by launching various schemes.
India’s SDG Index Score ranges between 42 and 69 for States and between 57 and 68 for UTs.
Kerala and Himachal Pradesh are the front runners amongst all the states with a score of 69, Chandigarh and Puducherry are the front runners with a score of 68 and 65 respectively among the UT’s.
Namami Gange Mission- a key policy priority towards achieving the SDG 6 - was launched as a priority programme with a budget outlay of `20,000 crore for the period 2015-2020.
A harmonized overarching national policy on Resource Efficiency, building upon the existing policies to address multiple sectors should be devised for mainstreaming Resource Efficiency approach in the development pathway for achieving SDGs.
In order to address the increasing air pollution across the country in a comprehensive manner, the Government of India has launched NCAP in 2019 as a pan India time bound national level strategy for prevention, control and abatement of air pollution besides augmenting the air quality monitoring network across the country.
India has continuously demonstrated its responsibility towards acknowledging the emerging threats from climate change and implementing climate actions, on the basis of the principles of Equity and Common but Differentiated Responsibilities.

127Sustainable Development and Climate Change
India’s positive engagement at CoP 24 negotiations in Katowice, Poland in 2018 resulted in protection of key interests including recognition of different starting points for developed and developing countries; flexibilities for developing countries and consideration of principles including equity and Common but Differentiated Responsibilities and Respective Capabilities.
Paris Agreement also emphasizes the role of climate finance in strengthening the global response to climate change. Though the international community witnessed various claims by developed countries about climate finance flows, the actual amount of flows is far from these claims. In fact, without sufficient climate finance, the proposed NDCs would not fructify.
Implementing India’s NDC requires investments of scale and size which is unprecedented. This essentially means that along with domestic public budgets, international public finance and private sector resources would have to be mobilized from a variety of sources.
REFERENCES
[IGEP] Indo-German Environment Programme. (2013). “India’s Future Needs for Resources: Dimensions, Challenges and Possible Solutions,” New Delhi: GIZ.: https://igep.in/live/hrdpmp/hrdpmaster/igep/content/e48745/e50194/e58089/ResourceEfficiency_ Report_Final.pdf
Climate Bond Initiative. 2018. “Green Bonds Policy: Highlights from 2018.” https://www.climatebonds.net/ resources/reports/2018-green-bond-market-highlights
Climate Bond Initiative. 2019. “Green Bonds Market Summary Q1 2019.” https://www.climatebonds.net/ resources/reports/green-bonds-market-summary-q1-2019
Climate Bond Initiative. 2019. “Growing green bond markets: The development of taxonomies to identify green assets.” https://www.climatebonds.net/ resources/reports/growing-green-bond-markets-development-taxonomies-identify-green-assets
CPCB. 2019. “Air Quality Index on May 08, 2019 @ 4 PM.” http://cpcb.nic.in//upload/Downloads/ AQI_Bulletin_20190508.pdf
Development Alternatives Group. 2015. “Achieving the Sustainable Development Goals in India-A Study of Financial Requirements and Gaps.”
FICCI. 2017. “3rd National Conference on Sustainable Infrastructure with Plastics.” http://ficci.in/ spdocument/20872/report-Plastic-infrastructure-2017-ficci.pdf
India Innovation Lab for Green Finance. “Sustainable Energy Bonds.” https:// www.climatefinancelab.org/project/ sustainable-energy-bonds-seb/NITI Aayog, 2018, “Meeting with States/UTs: Improving Implementation of SDGs”
International Resource Panel (IRP). 2017. “Resource Efficiency: Potential and Economic Implications.” http://www. resourcepanel.org/sites/default/files/ documents/document/media/resource_ efficiency_report_march_2017_web_ res.pdf
International Resource Panel (IRP). 2019. “Global Resources Outlook Natural Resources for the Future we want.” http://www.resourcepanel.org/ reports/global-resources-outlook
IPCC. 2019. “Global Warming of 1.5 ºC.” https://www.ipcc.ch/sr15/
128 Economic Survey 2018-19 Volume 2
UNEP. 2013. “Global Environment Outlook“. https://wedocs.unep.org/bitstream/handle/20.500.11822/27539/ G E O 6 _ 2 0 1 9.pdf?sequence=1&isAllowed=y
UNEP. 2018. “Resource Efficiency for Sustainable Development: Key Messages for the Group of 20.” http://www.resourcepanel.org/sites/default/ files/documents/document/media/thinkpiece_-_resource_efficiency_-_ key_messages_for_the_g20_270818. pdf
UNEP. 2019. “Global Environment Outlook 2019.” .https://www.unenvironment.org/resources/global-environment-outlook-6
United Nations University. 2017. “Global E Waste Monitor 2017.” https:// www.itu.int/en/ITU-D/Climate-Change/ Documents/G E M % 2 0 2 0 1 7 / G l o b a l - E - w a s t e % 2 0Monitor%202017%20.pdf
NITI Aayog. 2017. “Strategy Paper on Resource Efficiency.” http://niti. gov.in/writereaddata/files/document_ publication/Strategy%20Paper%20 on%20Resource%20Efficiency.pdf
NITI Aayog. 2018. “Meeting with States/UTs: Improving Implementation of SDGs.”
NITI Aayog. 2018. “SDG India Index Baseline Report, 2018.”
NITI Aayog. 2019. “Circular Economy & Resource Efficiency.”
TERI. 2019. “Reference Report for “Integrated Resource Efficiency Policy for India.”. https://www.teriin.org/sites/default/files/2019-01/Reference%20 Report%20fo r%20In t eg ra t ed%20Resource%20Efficiency%20Policy%20 for%20India_0.pdf
CHAPTERExternal Sector06
GLOBAL ECONOMIC ENVIRONMENT
Increasing Trade Protectionism and Slowing down of Global Output
6.1 2018-19 has closed with growth in world output on a downward trajectory. The World Economic Outlook (WEO) in its April 2019 issue has projected growth in world output at 3.3 per cent in 2019, down from 3.6 per cent obtained in 2018. Heightened US-China trade tensions has been stated as one of
the reasons behind the global slowdown that has spilled into other economies including India through the channel of exports. Beginning 2019 global slowdown has made advanced countries persist with their accommodative monetary policy stance. This has escalated portfolio investment into emerging market economies making their currencies stronger and imports cheaper.
6.2 The WEO further states that growing trade protectionism in the world, of which US-China trade tensions is the most recent
India’s macroeconomic situation on the external side continues to be stable. Though the current account deficit is projected at 2.4 per cent of GDP in 2018-19, up from 1.8 per cent in 2017-18, this is within reasonable levels. The widening of the current account deficit has been driven by a deterioration of trade deficit from 6.0 per cent of GDP to 6.7 per cent across the two years. Rise in crude prices in Q4 of 2018-19 and a decline in the growth of merchandize exports have led to the deterioration of trade deficit. The acceleration in the growth of remittances has offset the deterioration of the current account deficit. In funding the current account deficit, the total liabilities-to-GDP ratio, inclusive of both debt and non-debt components, has declined from 43 per cent in 2015 to about 38 per cent at end of 2018. The share of foreign direct investment has risen and that of net portfolio investment has fallen in total liabilities, thereby reflecting a transition to more stable sources of funding the current account deficit. In sum, although the current account deficit to GDP ratio has started to increase lately, the external indebtedness continues to be on a declining path. India’s foreign exchange reserves continue to be comfortably placed in excess of US$400 billion. The Indian Rupee traded in the range of 65-68 per US$ in 2017-18 but depreciated to a range of 70-74 in 2018-19. The Real Effective Exchange Rate also depreciated in 2018-19, making India’s exports potentially more competitive. The income terms of trade, a metric that measures the purchasing power to import, has been on a rising trend, possibly because the growth of crude prices has still not exceeded the growth of India’s export prices. The exchange rate in 2018-19 has been more volatile than in the previous year, mainly due to volatility in crude prices, but not much due to net portfolio flows. The composition of India’s exports and import basket has almost remained unchanged in 2018-19 over 2017-18. Petroleum products, precious stones, drug formulations, gold and other precious metals continue to be top export items. Crude petroleum, pearl, precious, semi-precious stones and gold remain as top import items. India’s main trading partners continue to be the US, China, Hong Kong, the UAE and Saudi Arabia.
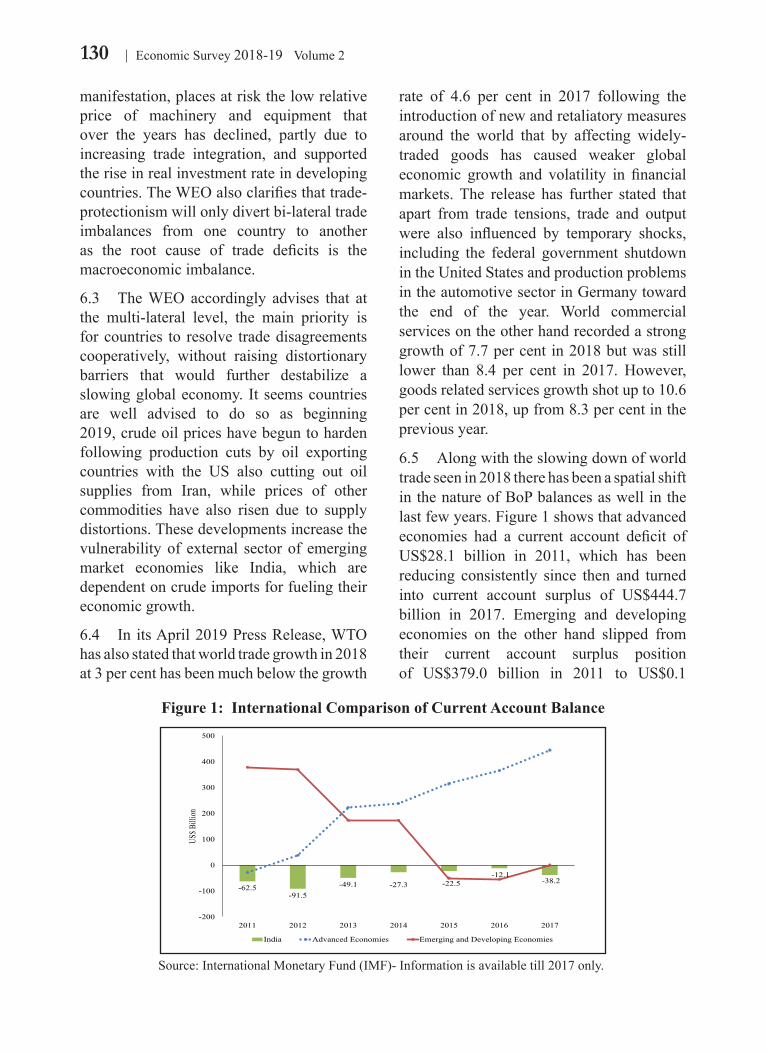
130 Economic Survey 2018-19 Volume 2
manifestation, places at risk the low relative price of machinery and equipment that over the years has declined, partly due to increasing trade integration, and supported the rise in real investment rate in developing countries. The WEO also clarifies that trade-protectionism will only divert bi-lateral trade imbalances from one country to another as the root cause of trade deficits is the macroeconomic imbalance.
6.3 The WEO accordingly advises that at the multi-lateral level, the main priority is for countries to resolve trade disagreements cooperatively, without raising distortionary barriers that would further destabilize a slowing global economy. It seems countries are well advised to do so as beginning 2019, crude oil prices have begun to harden following production cuts by oil exporting countries with the US also cutting out oil supplies from Iran, while prices of other commodities have also risen due to supply distortions. These developments increase the vulnerability of external sector of emerging market economies like India, which are dependent on crude imports for fueling their economic growth.
6.4 In its April 2019 Press Release, WTO has also stated that world trade growth in 2018 at 3 per cent has been much below the growth
rate of 4.6 per cent in 2017 following the introduction of new and retaliatory measures around the world that by affecting widely-traded goods has caused weaker global economic growth and volatility in financial markets. The release has further stated that apart from trade tensions, trade and output were also influenced by temporary shocks, including the federal government shutdown in the United States and production problems in the automotive sector in Germany toward the end of the year. World commercial services on the other hand recorded a strong growth of 7.7 per cent in 2018 but was still lower than 8.4 per cent in 2017. However, goods related services growth shot up to 10.6 per cent in 2018, up from 8.3 per cent in the previous year.
6.5 Along with the slowing down of world trade seen in 2018 there has been a spatial shift in the nature of BoP balances as well in the last few years. Figure 1 shows that advanced economies had a current account deficit of US$28.1 billion in 2011, which has been reducing consistently since then and turned into current account surplus of US$444.7 billion in 2017. Emerging and developing economies on the other hand slipped from their current account surplus position of US$379.0 billion in 2011 to US$0.1
Figure 1: International Comparison of Current Account Balance
-62.5-91.5
-49.1 -27.3 -22.5-12.1
-38.2
-200
-100
0
100
200
300
400
500
2011 2012 2013 2014 2015 2016 2017
US$ B
illion
India Advanced Economies Emerging and Developing Economies
Source: International Monetary Fund (IMF)- Information is available till 2017 only.
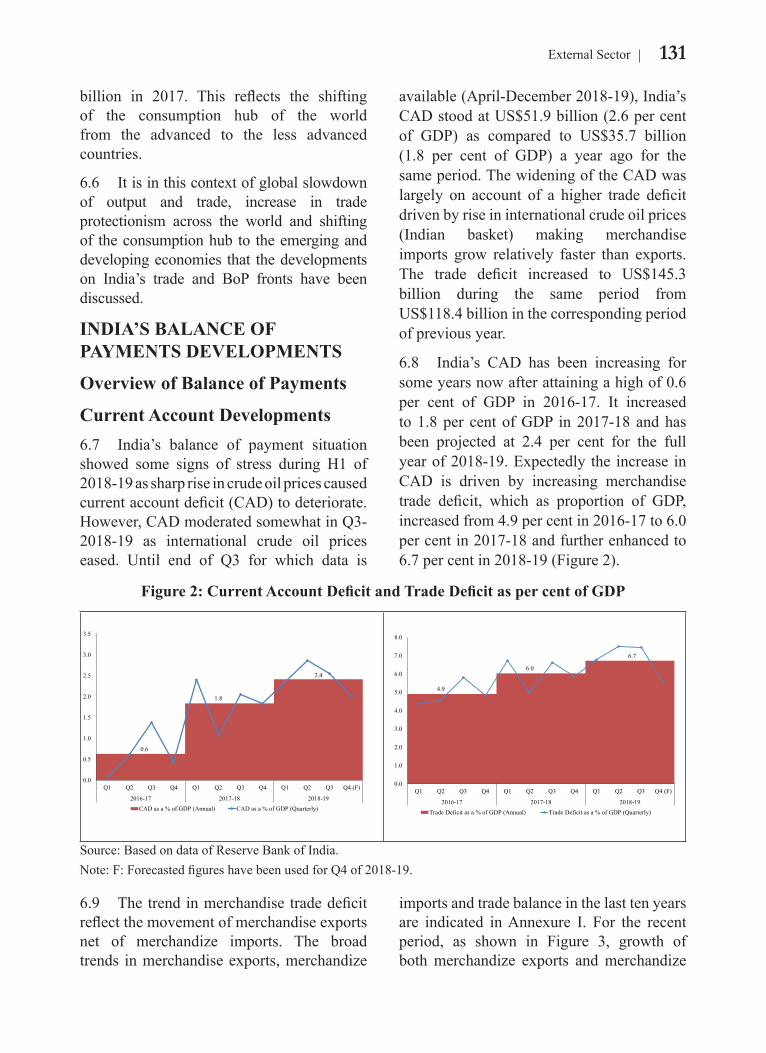
131External Sector
billion in 2017. This reflects the shifting of the consumption hub of the world from the advanced to the less advanced countries.
6.6 It is in this context of global slowdown of output and trade, increase in trade protectionism across the world and shifting of the consumption hub to the emerging and developing economies that the developments on India’s trade and BoP fronts have been discussed.
INDIA’S BALANCE OF PAYMENTS DEVELOPMENTS
Overview of Balance of Payments
Current Account Developments6.7 India’s balance of payment situation showed some signs of stress during H1 of 2018-19 as sharp rise in crude oil prices caused current account deficit (CAD) to deteriorate. However, CAD moderated somewhat in Q3-2018-19 as international crude oil prices eased. Until end of Q3 for which data is
available (April-December 2018-19), India’s CAD stood at US$51.9 billion (2.6 per cent of GDP) as compared to US$35.7 billion (1.8 per cent of GDP) a year ago for the same period. The widening of the CAD was largely on account of a higher trade deficit driven by rise in international crude oil prices (Indian basket) making merchandise imports grow relatively faster than exports. The trade deficit increased to US$145.3 billion during the same period from US$118.4 billion in the corresponding period of previous year.
6.8 India’s CAD has been increasing for some years now after attaining a high of 0.6 per cent of GDP in 2016-17. It increased to 1.8 per cent of GDP in 2017-18 and has been projected at 2.4 per cent for the full year of 2018-19. Expectedly the increase in CAD is driven by increasing merchandise trade deficit, which as proportion of GDP, increased from 4.9 per cent in 2016-17 to 6.0 per cent in 2017-18 and further enhanced to 6.7 per cent in 2018-19 (Figure 2).
6.9 The trend in merchandise trade deficit reflect the movement of merchandise exports net of merchandize imports. The broad trends in merchandise exports, merchandize
imports and trade balance in the last ten years are indicated in Annexure I. For the recent period, as shown in Figure 3, growth of both merchandize exports and merchandize
Figure 2: Current Account Deficit and Trade Deficit as per cent of GDP
0.6
1.8
2.4
0.0
0.5
1.0
1.5
2.0
2.5
3.0
3.5
Q1 Q2 Q3 Q4 Q1 Q2 Q3 Q4 Q1 Q2 Q3 Q4 (F)
2016-17 2017-18 2018-19CAD as a % of GDP (Annual) CAD as a % of GDP (Quarterly)
4.9
6.0
6.7
0.0
1.0
2.0
3.0
4.0
5.0
6.0
7.0
8.0
Q1 Q2 Q3 Q4 Q1 Q2 Q3 Q4 Q1 Q2 Q3 Q4 (F)
2016-17 2017-18 2018-19Trade Deficit as a % of GDP (Annual) Trade Deficit as a % of GDP (Quarterly)
Source: Based on data of Reserve Bank of India.Note: F: Forecasted figures have been used for Q4 of 2018-19.
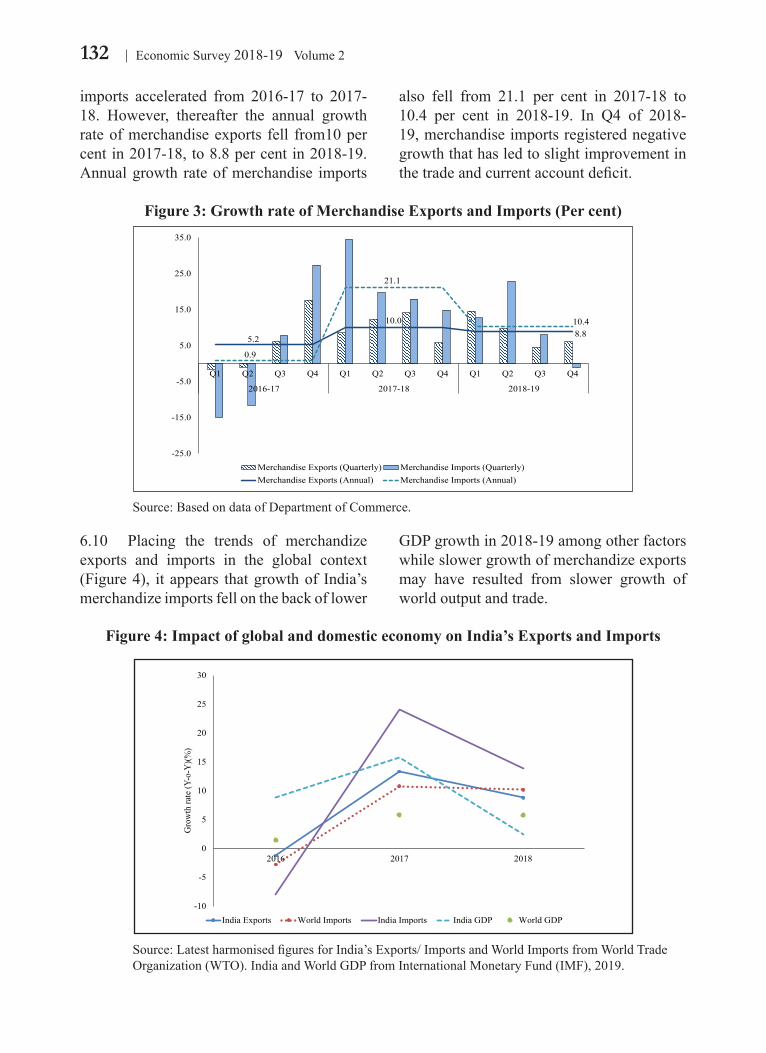
132 Economic Survey 2018-19 Volume 2
imports accelerated from 2016-17 to 2017-18. However, thereafter the annual growth rate of merchandise exports fell from10 per cent in 2017-18, to 8.8 per cent in 2018-19. Annual growth rate of merchandise imports
also fell from 21.1 per cent in 2017-18 to 10.4 per cent in 2018-19. In Q4 of 2018-19, merchandise imports registered negative growth that has led to slight improvement in the trade and current account deficit.
6.10 Placing the trends of merchandize exports and imports in the global context (Figure 4), it appears that growth of India’s merchandize imports fell on the back of lower
GDP growth in 2018-19 among other factors while slower growth of merchandize exports may have resulted from slower growth of world output and trade.
Figure 3: Growth rate of Merchandise Exports and Imports (Per cent)
5.2
10.08.8
0.9
21.1
10.4
-25.0
-15.0
-5.0
5.0
15.0
25.0
35.0
Q1 Q2 Q3 Q4 Q1 Q2 Q3 Q4 Q1 Q2 Q3 Q4
2016-17 2017-18 2018-19
Merchandise Exports (Quarterly) Merchandise Imports (Quarterly)Merchandise Exports (Annual) Merchandise Imports (Annual)
Source: Based on data of Department of Commerce.
Figure 4: Impact of global and domestic economy on India’s Exports and Imports
-10
-5
0
5
10
15
20
25
30
2016 2017 2018
Gro
wth
rate
(Y-o
-Y)(%
)
India Exports World Imports India Imports India GDP World GDP
Source: Latest harmonised figures for India’s Exports/ Imports and World Imports from World Trade Organization (WTO). India and World GDP from International Monetary Fund (IMF), 2019.
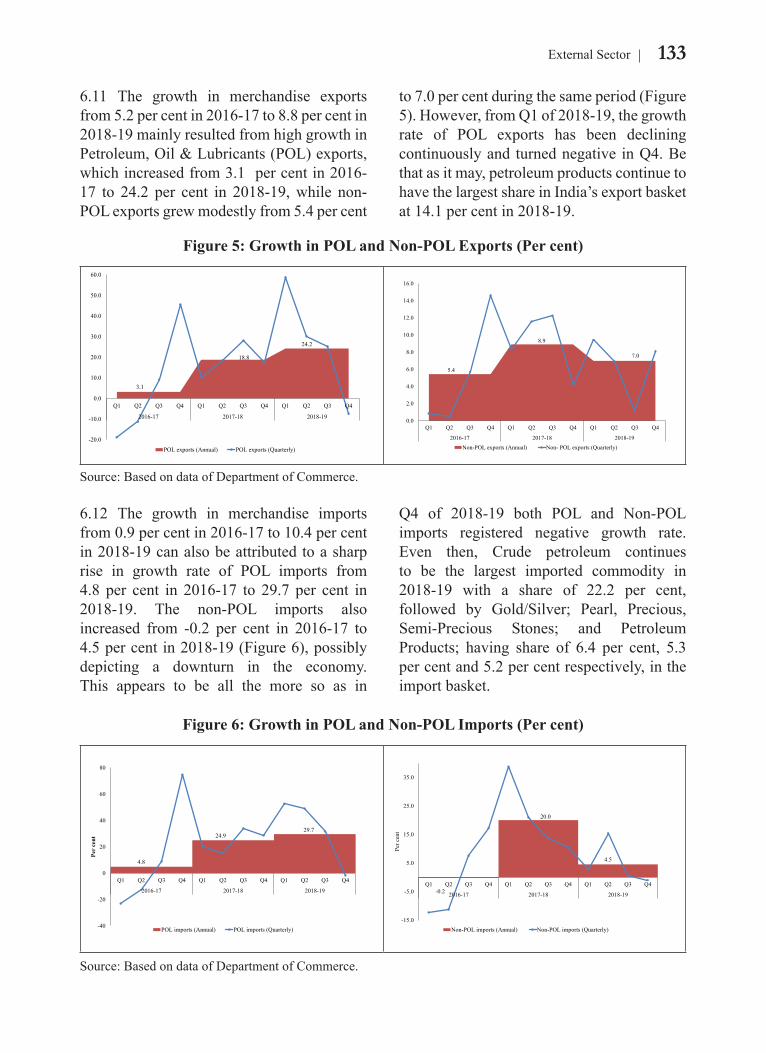
133External Sector
6.11 The growth in merchandise exports from 5.2 per cent in 2016-17 to 8.8 per cent in 2018-19 mainly resulted from high growth in Petroleum, Oil & Lubricants (POL) exports, which increased from 3.1 per cent in 2016-17 to 24.2 per cent in 2018-19, while non-POL exports grew modestly from 5.4 per cent
to 7.0 per cent during the same period (Figure 5). However, from Q1 of 2018-19, the growth rate of POL exports has been declining continuously and turned negative in Q4. Be that as it may, petroleum products continue to have the largest share in India’s export basket at 14.1 per cent in 2018-19.
6.12 The growth in merchandise imports from 0.9 per cent in 2016-17 to 10.4 per cent in 2018-19 can also be attributed to a sharp rise in growth rate of POL imports from 4.8 per cent in 2016-17 to 29.7 per cent in 2018-19. The non-POL imports also increased from -0.2 per cent in 2016-17 to 4.5 per cent in 2018-19 (Figure 6), possibly depicting a downturn in the economy. This appears to be all the more so as in
Q4 of 2018-19 both POL and Non-POL imports registered negative growth rate. Even then, Crude petroleum continues to be the largest imported commodity in 2018-19 with a share of 22.2 per cent, followed by Gold/Silver; Pearl, Precious, Semi-Precious Stones; and Petroleum Products; having share of 6.4 per cent, 5.3 per cent and 5.2 per cent respectively, in the import basket.
Figure 5: Growth in POL and Non-POL Exports (Per cent)
3.1
18.8
24.2
-20.0
-10.0
0.0
10.0
20.0
30.0
40.0
50.0
60.0
Q1 Q2 Q3 Q4 Q1 Q2 Q3 Q4 Q1 Q2 Q3 Q4
2016-17 2017-18 2018-19
POL exports (Annual) POL exports (Quarterly)
5.4
8.9
7.0
0.0
2.0
4.0
6.0
8.0
10.0
12.0
14.0
16.0
Q1 Q2 Q3 Q4 Q1 Q2 Q3 Q4 Q1 Q2 Q3 Q4
2016-17 2017-18 2018-19Non-POL exports (Annual) Non- POL exports (Quarterly)
Source: Based on data of Department of Commerce.
Figure 6: Growth in POL and Non-POL Imports (Per cent)
4.8
24.929.7
-40
-20
0
20
40
60
80
Q1 Q2 Q3 Q4 Q1 Q2 Q3 Q4 Q1 Q2 Q3 Q4
2016-17 2017-18 2018-19
Per
cent
POL imports (Annual) POL imports (Quarterly)
-0.2
20.0
4.5
-15.0
-5.0
5.0
15.0
25.0
35.0
Q1 Q2 Q3 Q4 Q1 Q2 Q3 Q4 Q1 Q2 Q3 Q4
2016-17 2017-18 2018-19
Per c
ent
Non-POL imports (Annual) Non-POL imports (Quarterly)
Source: Based on data of Department of Commerce.
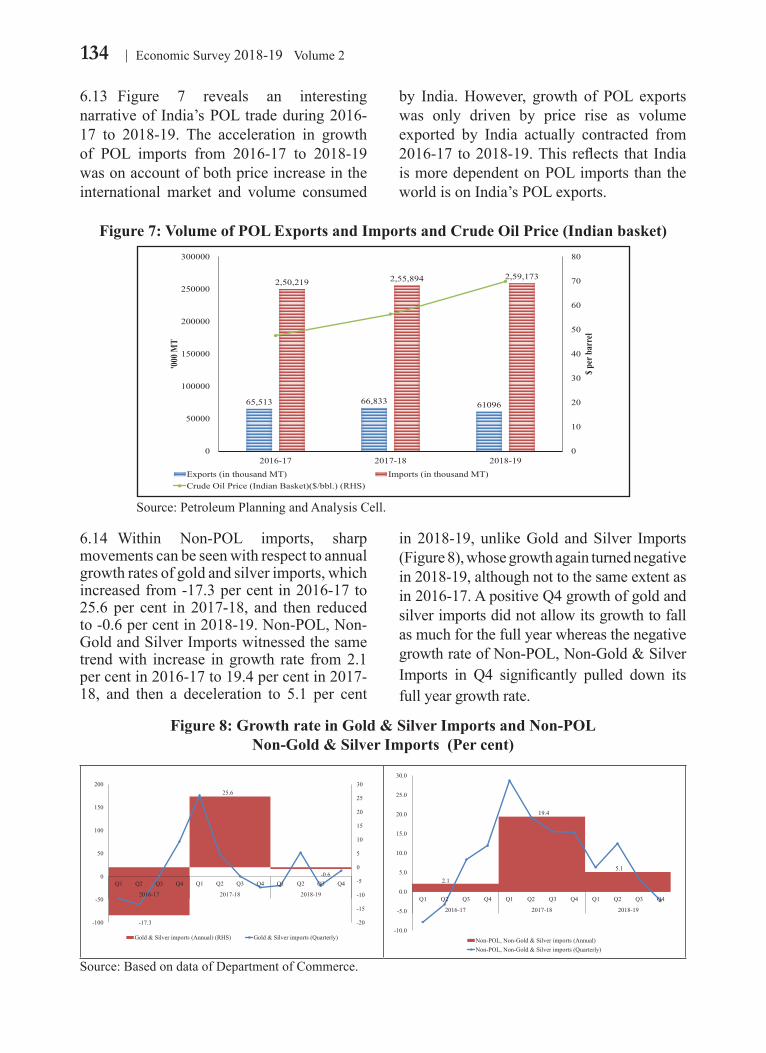
134 Economic Survey 2018-19 Volume 2
6.13 Figure 7 reveals an interesting narrative of India’s POL trade during 2016-17 to 2018-19. The acceleration in growth of POL imports from 2016-17 to 2018-19 was on account of both price increase in the international market and volume consumed
by India. However, growth of POL exports was only driven by price rise as volume exported by India actually contracted from 2016-17 to 2018-19. This reflects that India is more dependent on POL imports than the world is on India’s POL exports.
6.14 Within Non-POL imports, sharp movements can be seen with respect to annual growth rates of gold and silver imports, which increased from -17.3 per cent in 2016-17 to 25.6 per cent in 2017-18, and then reduced to -0.6 per cent in 2018-19. Non-POL, Non-Gold and Silver Imports witnessed the same trend with increase in growth rate from 2.1 per cent in 2016-17 to 19.4 per cent in 2017-18, and then a deceleration to 5.1 per cent
in 2018-19, unlike Gold and Silver Imports (Figure 8), whose growth again turned negative in 2018-19, although not to the same extent as in 2016-17. A positive Q4 growth of gold and silver imports did not allow its growth to fall as much for the full year whereas the negative growth rate of Non-POL, Non-Gold & Silver Imports in Q4 significantly pulled down its full year growth rate.
Figure 7: Volume of POL Exports and Imports and Crude Oil Price (Indian basket)
65,513 66,833 61096
2,50,219 2,55,894 2,59,173
0
10
20
30
40
50
60
70
80
0
50000
100000
150000
200000
250000
300000
2016-17 2017-18 2018-19
$ per
bar
rel
'000
MT
Exports (in thousand MT) Imports (in thousand MT)Crude Oil Price (Indian Basket)($/bbl.) (RHS)
Source: Petroleum Planning and Analysis Cell.
Figure 8: Growth rate in Gold & Silver Imports and Non-POL Non-Gold & Silver Imports (Per cent)
-17.3
25.6
-0.6
-20
-15
-10
-5
0
5
10
15
20
25
30
-100
-50
0
50
100
150
200
Q1 Q2 Q3 Q4 Q1 Q2 Q3 Q4 Q1 Q2 Q3 Q4
2016-17 2017-18 2018-19
Gold & Silver imports (Annual) (RHS) Gold & Silver imports (Quarterly)
2.1
19.4
5.1
-10.0
-5.0
0.0
5.0
10.0
15.0
20.0
25.0
30.0
Q1 Q2 Q3 Q4 Q1 Q2 Q3 Q4 Q1 Q2 Q3 Q4
2016-17 2017-18 2018-19
Non-POL, Non-Gold & Silver imports (Annual)Non-POL, Non-Gold & Silver imports (Quarterly)
Source: Based on data of Department of Commerce.
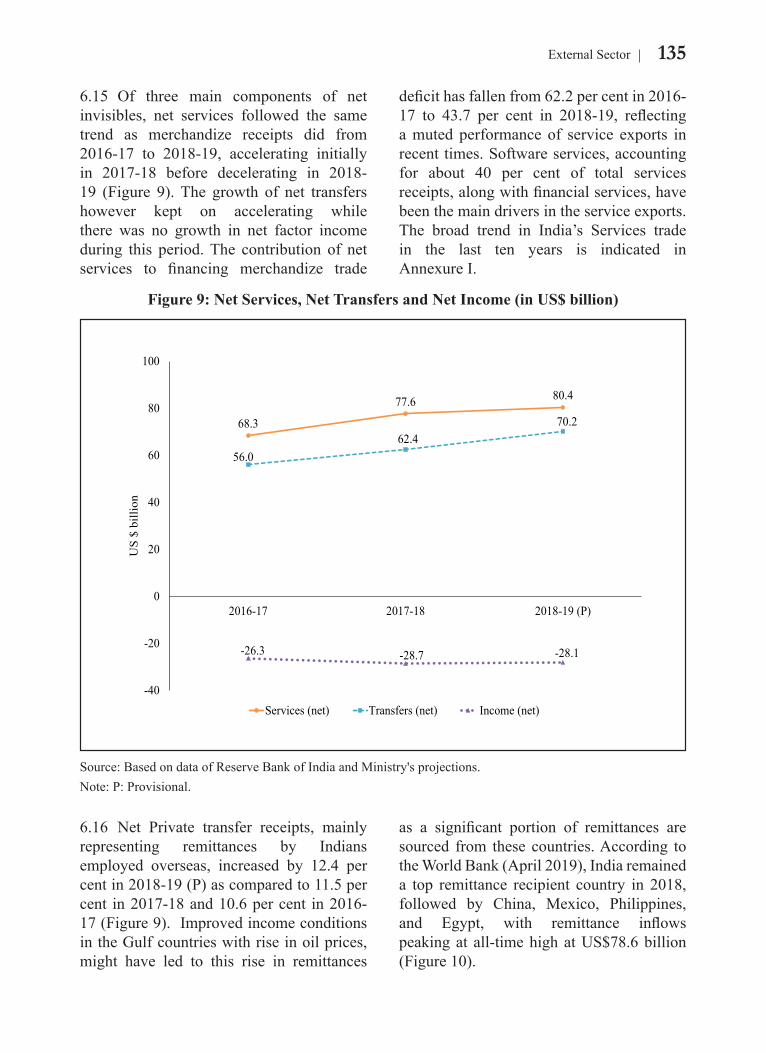
135External Sector
6.15 Of three main components of net invisibles, net services followed the same trend as merchandize receipts did from 2016-17 to 2018-19, accelerating initially in 2017-18 before decelerating in 2018-19 (Figure 9). The growth of net transfers however kept on accelerating while there was no growth in net factor income during this period. The contribution of net services to financing merchandize trade
deficit has fallen from 62.2 per cent in 2016-17 to 43.7 per cent in 2018-19, reflecting a muted performance of service exports in recent times. Software services, accounting for about 40 per cent of total services receipts, along with financial services, have been the main drivers in the service exports. The broad trend in India’s Services trade in the last ten years is indicated in Annexure I.
6.16 Net Private transfer receipts, mainly representing remittances by Indians employed overseas, increased by 12.4 per cent in 2018-19 (P) as compared to 11.5 per cent in 2017-18 and 10.6 per cent in 2016-17 (Figure 9). Improved income conditions in the Gulf countries with rise in oil prices, might have led to this rise in remittances
as a significant portion of remittances are sourced from these countries. According to the World Bank (April 2019), India remained a top remittance recipient country in 2018, followed by China, Mexico, Philippines, and Egypt, with remittance inflows peaking at all-time high at US$78.6 billion (Figure 10).
Figure 9: Net Services, Net Transfers and Net Income (in US$ billion)
68.3
77.6 80.4
56.062.4
70.2
-26.3 -28.7 -28.1
-40
-20
0
20
40
60
80
100
2016-17 2017-18 2018-19 (P)
US
$ bi
llion
Services (net) Transfers (net) Income (net)
Source: Based on data of Reserve Bank of India and Ministry's projections.Note: P: Provisional.
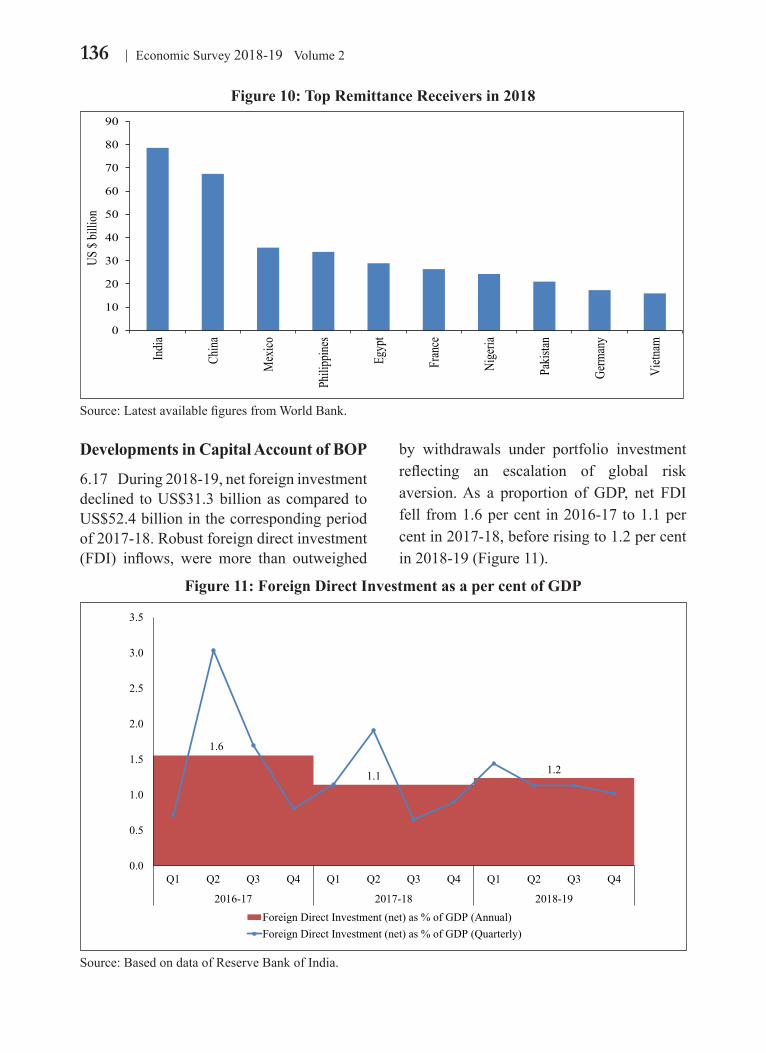
136 Economic Survey 2018-19 Volume 2
Developments in Capital Account of BOP
6.17 During 2018-19, net foreign investment declined to US$31.3 billion as compared to US$52.4 billion in the corresponding period of 2017-18. Robust foreign direct investment (FDI) inflows, were more than outweighed
by withdrawals under portfolio investment reflecting an escalation of global risk aversion. As a proportion of GDP, net FDI fell from 1.6 per cent in 2016-17 to 1.1 per cent in 2017-18, before rising to 1.2 per cent in 2018-19 (Figure 11).
Figure 10: Top Remittance Receivers in 2018
0
10
20
30
40
50
60
70
80
90
India
China
Mex
ico
Phili
ppine
s
Egyp
t
Fran
ce
Nige
ria
Pakis
tan
Germ
any
Vietn
am
US $
billio
n
Source: Latest available figures from World Bank.
Figure 11: Foreign Direct Investment as a per cent of GDP
1.6
1.1 1.2
0.0
0.5
1.0
1.5
2.0
2.5
3.0
3.5
Q1 Q2 Q3 Q4 Q1 Q2 Q3 Q4 Q1 Q2 Q3 Q4
2016-17 2017-18 2018-19Foreign Direct Investment (net) as % of GDP (Annual)Foreign Direct Investment (net) as % of GDP (Quarterly)
Source: Based on data of Reserve Bank of India.
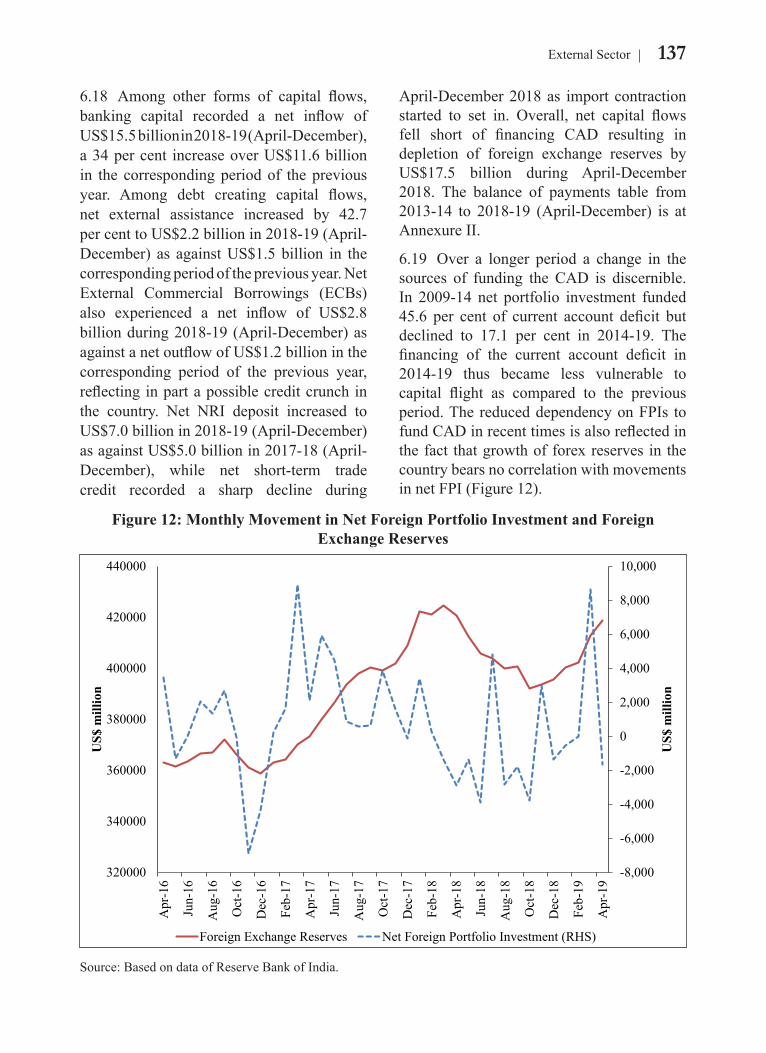
137External Sector
6.18 Among other forms of capital flows, banking capital recorded a net inflow of US$15.5 billion in 2018-19 (April-December), a 34 per cent increase over US$11.6 billion in the corresponding period of the previous year. Among debt creating capital flows, net external assistance increased by 42.7 per cent to US$2.2 billion in 2018-19 (April-December) as against US$1.5 billion in the corresponding period of the previous year. Net External Commercial Borrowings (ECBs) also experienced a net inflow of US$2.8 billion during 2018-19 (April-December) as against a net outflow of US$1.2 billion in the corresponding period of the previous year, reflecting in part a possible credit crunch in the country. Net NRI deposit increased to US$7.0 billion in 2018-19 (April-December) as against US$5.0 billion in 2017-18 (April-December), while net short-term trade credit recorded a sharp decline during
April-December 2018 as import contraction started to set in. Overall, net capital flows fell short of financing CAD resulting in depletion of foreign exchange reserves by US$17.5 billion during April-December 2018. The balance of payments table from 2013-14 to 2018-19 (April-December) is at Annexure II.
6.19 Over a longer period a change in the sources of funding the CAD is discernible. In 2009-14 net portfolio investment funded 45.6 per cent of current account deficit but declined to 17.1 per cent in 2014-19. The financing of the current account deficit in 2014-19 thus became less vulnerable to capital flight as compared to the previous period. The reduced dependency on FPIs to fund CAD in recent times is also reflected in the fact that growth of forex reserves in the country bears no correlation with movements in net FPI (Figure 12).
Figure 12: Monthly Movement in Net Foreign Portfolio Investment and Foreign Exchange Reserves
-8,000
-6,000
-4,000
-2,000
0
2,000
4,000
6,000
8,000
10,000
320000
340000
360000
380000
400000
420000
440000
Apr
-16
Jun-
16
Aug
-16
Oct
-16
Dec
-16
Feb-
17
Apr
-17
Jun-
17
Aug
-17
Oct
-17
Dec
-17
Feb-
18
Apr
-18
Jun-
18
Aug
-18
Oct
-18
Dec
-18
Feb-
19
Apr
-19
US$
mill
ion
US$
mill
ion
Foreign Exchange Reserves Net Foreign Portfolio Investment (RHS)
Source: Based on data of Reserve Bank of India.
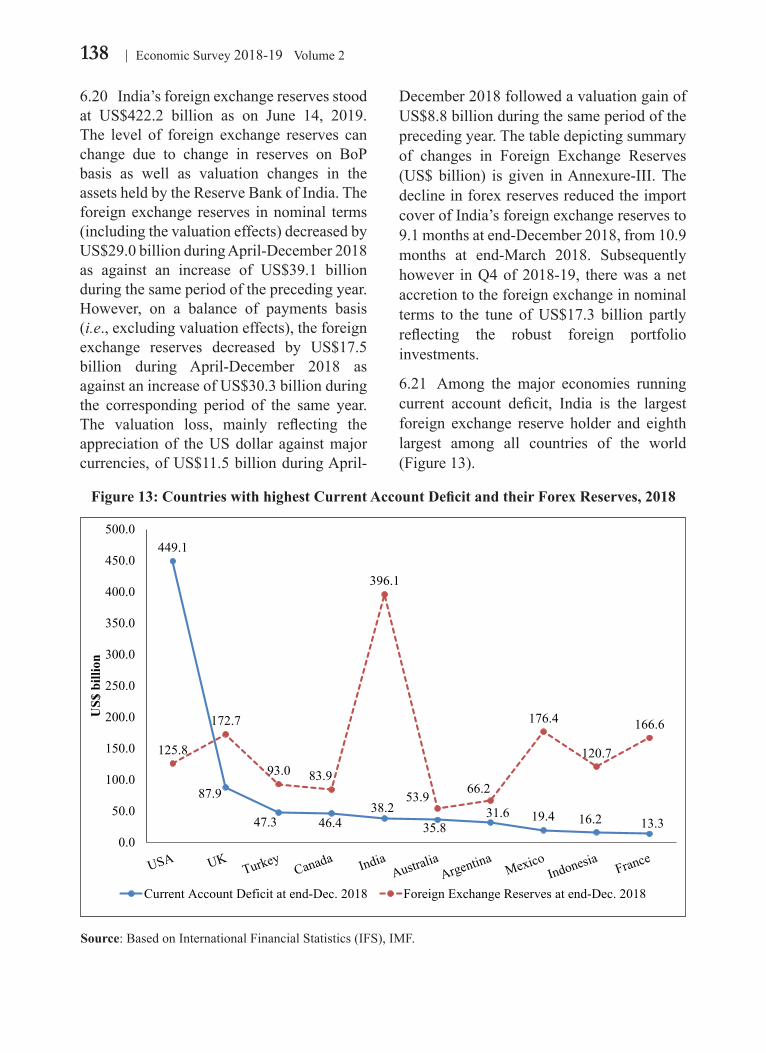
138 Economic Survey 2018-19 Volume 2
6.20 India’s foreign exchange reserves stood at US$422.2 billion as on June 14, 2019. The level of foreign exchange reserves can change due to change in reserves on BoP basis as well as valuation changes in the assets held by the Reserve Bank of India. The foreign exchange reserves in nominal terms (including the valuation effects) decreased by US$29.0 billion during April-December 2018 as against an increase of US$39.1 billion during the same period of the preceding year. However, on a balance of payments basis (i.e., excluding valuation effects), the foreign exchange reserves decreased by US$17.5 billion during April-December 2018 as against an increase of US$30.3 billion during the corresponding period of the same year. The valuation loss, mainly reflecting the appreciation of the US dollar against major currencies, of US$11.5 billion during April-
December 2018 followed a valuation gain of US$8.8 billion during the same period of the preceding year. The table depicting summary of changes in Foreign Exchange Reserves (US$ billion) is given in Annexure-III. The decline in forex reserves reduced the import cover of India’s foreign exchange reserves to 9.1 months at end-December 2018, from 10.9 months at end-March 2018. Subsequently however in Q4 of 2018-19, there was a net accretion to the foreign exchange in nominal terms to the tune of US$17.3 billion partly reflecting the robust foreign portfolio investments.
6.21 Among the major economies running current account deficit, India is the largest foreign exchange reserve holder and eighth largest among all countries of the world (Figure 13).
Figure 13: Countries with highest Current Account Deficit and their Forex Reserves, 2018
449.1
87.9
47.3 46.438.2
35.831.6 19.4 16.2 13.3
125.8
172.7
93.0 83.9
396.1
53.9 66.2
176.4
120.7
166.6
0.0
50.0
100.0
150.0
200.0
250.0
300.0
350.0
400.0
450.0
500.0
US$
bill
ion
Current Account Deficit at end-Dec. 2018 Foreign Exchange Reserves at end-Dec. 2018
Source: Based on International Financial Statistics (IFS), IMF.
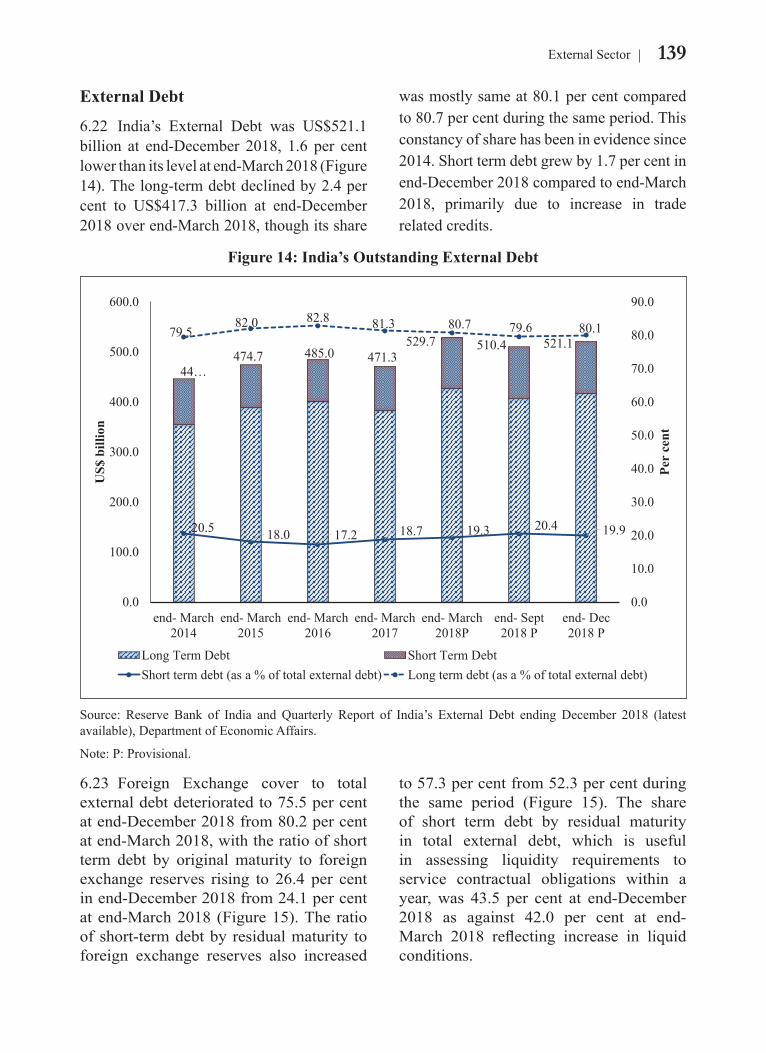
139External Sector
External Debt
6.22 India’s External Debt was US$521.1 billion at end-December 2018, 1.6 per cent lower than its level at end-March 2018 (Figure 14). The long-term debt declined by 2.4 per cent to US$417.3 billion at end-December 2018 over end-March 2018, though its share
was mostly same at 80.1 per cent compared to 80.7 per cent during the same period. This constancy of share has been in evidence since 2014. Short term debt grew by 1.7 per cent in end-December 2018 compared to end-March 2018, primarily due to increase in trade related credits.
6.23 Foreign Exchange cover to total external debt deteriorated to 75.5 per cent at end-December 2018 from 80.2 per cent at end-March 2018, with the ratio of short term debt by original maturity to foreign exchange reserves rising to 26.4 per cent in end-December 2018 from 24.1 per cent at end-March 2018 (Figure 15). The ratio of short-term debt by residual maturity to foreign exchange reserves also increased
to 57.3 per cent from 52.3 per cent during the same period (Figure 15). The share of short term debt by residual maturity in total external debt, which is useful in assessing liquidity requirements to service contractual obligations within a year, was 43.5 per cent at end-December 2018 as against 42.0 per cent at end-March 2018 reflecting increase in liquid conditions.
Figure 14: India’s Outstanding External Debt
44…474.7 485.0 471.3
529.7 510.4 521.1
20.5 18.0 17.2 18.7 19.3 20.4 19.9
79.582.0 82.8 81.3 80.7 79.6 80.1
0.0
10.0
20.0
30.0
40.0
50.0
60.0
70.0
80.0
90.0
0.0
100.0
200.0
300.0
400.0
500.0
600.0
end- March2014
end- March2015
end- March2016
end- March2017
end- March2018P
end- Sept2018 P
end- Dec2018 P
Per
cent
US$
bill
ion
Long Term Debt Short Term DebtShort term debt (as a % of total external debt) Long term debt (as a % of total external debt)
Source: Reserve Bank of India and Quarterly Report of India’s External Debt ending December 2018 (latest available), Department of Economic Affairs.
Note: P: Provisional.

140 Economic Survey 2018-19 Volume 2
6.24 International comparison of external debt based on World Bank data shows that among the top twenty developing debtor countries in 2017, India’s external debt to Gross National Income (GNI) ratio at 19.8 per cent was fourth lowest, while China continues to have the lowest ratio of 14 per cent (Figure 16). In terms of the foreign exchange reserves cover to external debt, India’s position is fifth highest at 75.9 per cent, whereas India has fifth lowest short-term
debt to foreign exchange reserves at 25.1 per cent among the top twenty developing debtor countries (Figure 16). Again as per the World Bank data, though India is the third largest debtor country (in absolute amounts) among developing countries (after China and Brazil), its average-age of debt is much higher given that its ratio of short-term debt to total debt is only about 19.0 while that of China is 69 per cent. Higher age of debt reduces the roll-over risk.
Figure 15: Foreign Exchange Reserves and Debt
68.272.0 74.3
78.5 80.2 78.575.5
30.125.0 23.2 23.8 24.1 26.1 26.4
58.253.5
57.452.9 52.3
55.8 57.3
0.0
10.0
20.0
30.0
40.0
50.0
60.0
70.0
80.0
90.0
end-March2014
end-March2015
end-March2016
end-March2017
end-March2018P
end- Sept2018 P
end- Dec2018 P
Per c
ent
Foreign Exchange Reserves to Total DebtShort-term Debt (original maturity) to Foreign Exchange ReservesShort-term debt (residual maturity) to Foreign Exchange Reserves
Source: Reserve Bank of India and Quarterly Report of India’s External Debt ending December 2018 (latest available), DEANote: P: Provisional. The foreign exchange reserves as on 14 June, 2019 is US$422.2 billion.
Figure 16: Cross- Country Comparison of External Debt Indicators in 2017
India
India
India
0
20
40
60
80
100
120
140
160
180
200
0 200 400 600 800 1000 1200 1400 1600 1800
Per c
ent
US $ billionTotal external debt to GNI (%)Foreign exchange reserves to Total debt (%)Short term debt to Foreign Exchange Reserves (%)
China
China
China
Source: International Debt Statistics, 2019, World Bank.
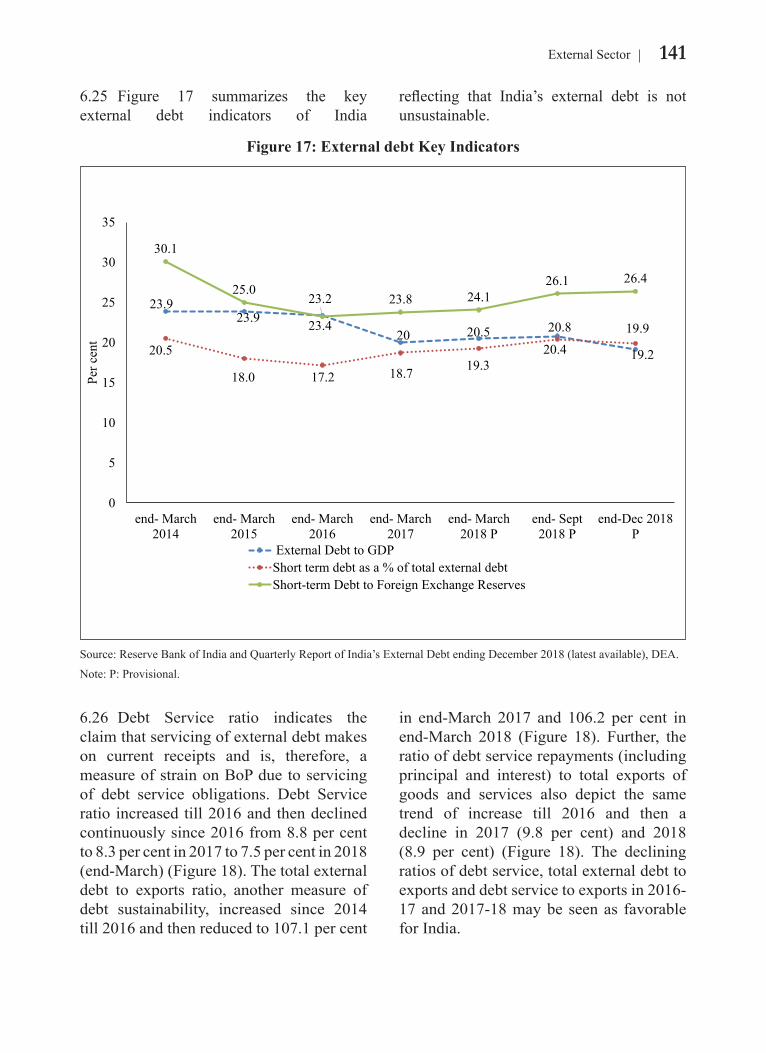
141External Sector
reflecting that India’s external debt is not unsustainable.
6.25 Figure 17 summarizes the key external debt indicators of India
6.26 Debt Service ratio indicates the claim that servicing of external debt makes on current receipts and is, therefore, a measure of strain on BoP due to servicing of debt service obligations. Debt Service ratio increased till 2016 and then declined continuously since 2016 from 8.8 per cent to 8.3 per cent in 2017 to 7.5 per cent in 2018 (end-March) (Figure 18). The total external debt to exports ratio, another measure of debt sustainability, increased since 2014 till 2016 and then reduced to 107.1 per cent
in end-March 2017 and 106.2 per cent in end-March 2018 (Figure 18). Further, the ratio of debt service repayments (including principal and interest) to total exports of goods and services also depict the same trend of increase till 2016 and then a decline in 2017 (9.8 per cent) and 2018 (8.9 per cent) (Figure 18). The declining ratios of debt service, total external debt to exports and debt service to exports in 2016-17 and 2017-18 may be seen as favorable for India.
Figure 17: External debt Key Indicators
23.923.9 23.4
20 20.5 20.8
19.220.5
18.0 17.2 18.7 19.320.4
19.9
30.1
25.023.2 23.8 24.1
26.1 26.4
0
5
10
15
20
25
30
35
end- March2014
end- March2015
end- March2016
end- March2017
end- March2018 P
end- Sept2018 P
end-Dec 2018P
Per c
ent
External Debt to GDPShort term debt as a % of total external debtShort-term Debt to Foreign Exchange Reserves
Source: Reserve Bank of India and Quarterly Report of India’s External Debt ending December 2018 (latest available), DEA.
Note: P: Provisional.

142 Economic Survey 2018-19 Volume 2
Net International Investment Position 6.27 The International Investment Position (IIP) is a statistical statement that shows at a point in time the value of financial assets of residents of an economy that are claims on non-residents or are gold bullion held as reserve assets; and the liabilities of residents of an economy to non-residents (International Monetary Fund (IMF)). The difference between the assets and liabilities is the net position in the IIP and represents either a net claim on or a net liability to the rest of the world. A positive NIIP value indicates a nation is a creditor nation, while a negative value
indicates it is a debtor nation.
6.28 Among the top ten economies having Net IIP deficit in 2018, United States is ranked first with net IIP deficit of US$9.7 trillion, followed by Spain (US$1.1 trillion) and Australia (US$0.7 trillion) (Figure 19). India’s net international investment deficit is the eighth highest in 2018, that however has been increasing consistently from US$323.2 billion in 2013 to US$438.4 billion in 2018, an increase of 35.6 per cent. In comparison to previous year 2017, India’s net IIP deficit increased by 2.8 per cent from US$426.6 billion in 2017 to US$438.4 billion in 2018.
Figure 18: Indicators of Debt Sustainability
5.9
7.6
8.8 8.37.56.9
9.1
10.69.8
8.9
95.7 101.3
116.4107.1 106.2
0.0
20.0
40.0
60.0
80.0
100.0
120.0
140.0
0
2
4
6
8
10
12
end-March 2014 end-March 2015 end-March 2016 end-March 2017 end-March 2018P
Per c
ent
Per c
ent
Debt Service RatioDebt Service Repayments to Total Exports RatioExternal Debt to Exports of Goods and Services Ratio (RHS)
Source: Based on data of Reserve Bank of India.Note: P: Provisional.
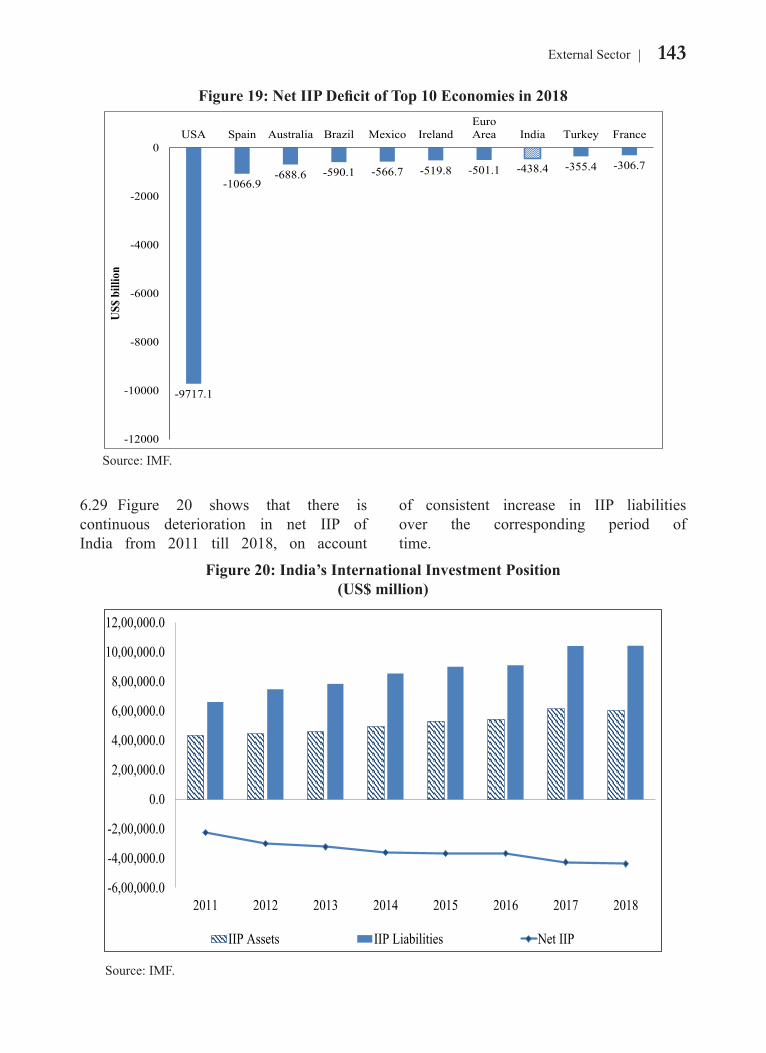
143External Sector
6.29 Figure 20 shows that there is continuous deterioration in net IIP of India from 2011 till 2018, on account
of consistent increase in IIP liabilities over the corresponding period of time.
Figure 19: Net IIP Deficit of Top 10 Economies in 2018
-9717.1
-1066.9-688.6 -590.1 -566.7 -519.8 -501.1 -438.4 -355.4 -306.7
-12000
-10000
-8000
-6000
-4000
-2000
0USA Spain Australia Brazil Mexico Ireland
EuroArea India Turkey France
US$
bill
ion
Source: IMF.
Figure 20: India’s International Investment Position (US$ million)
-6,00,000.0
-4,00,000.0
-2,00,000.0
0.0
2,00,000.0
4,00,000.0
6,00,000.0
8,00,000.0
10,00,000.0
12,00,000.0
2011 2012 2013 2014 2015 2016 2017 2018
IIP Assets IIP Liabilities Net IIP
Source: IMF.
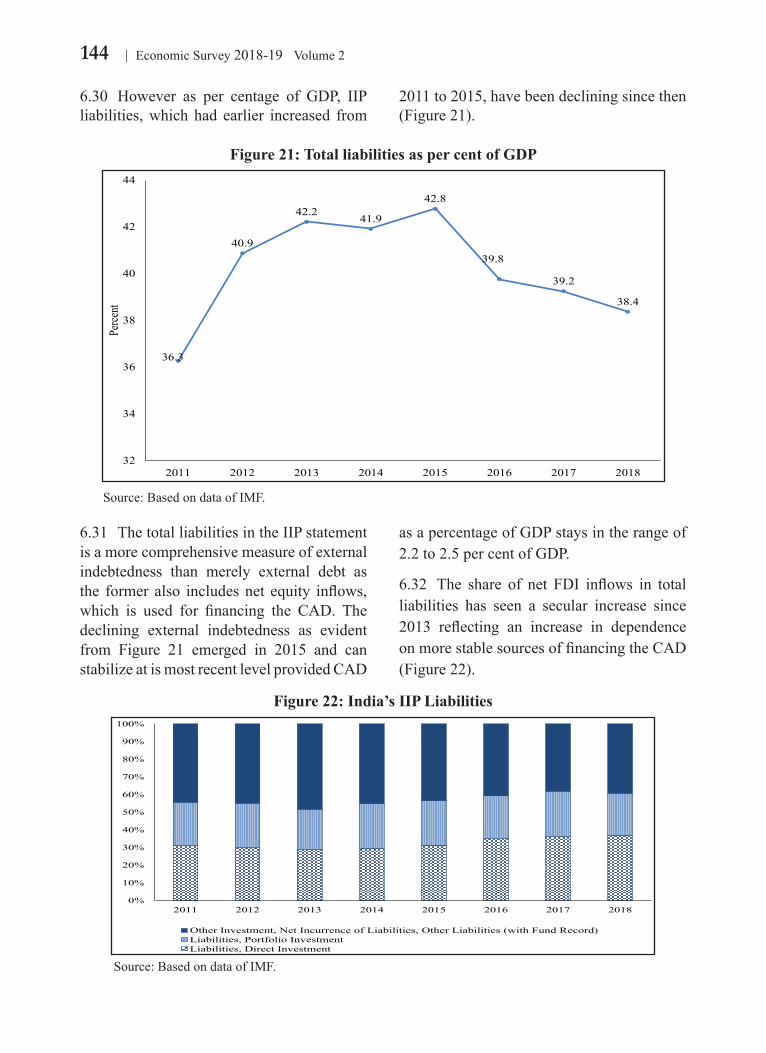
144 Economic Survey 2018-19 Volume 2
6.30 However as per centage of GDP, IIP liabilities, which had earlier increased from
2011 to 2015, have been declining since then (Figure 21).
6.31 The total liabilities in the IIP statement is a more comprehensive measure of external indebtedness than merely external debt as the former also includes net equity inflows, which is used for financing the CAD. The declining external indebtedness as evident from Figure 21 emerged in 2015 and can stabilize at is most recent level provided CAD
as a percentage of GDP stays in the range of 2.2 to 2.5 per cent of GDP.
6.32 The share of net FDI inflows in total liabilities has seen a secular increase since 2013 reflecting an increase in dependence on more stable sources of financing the CAD (Figure 22).
Figure 21: Total liabilities as per cent of GDP
36.3
40.9
42.241.9
42.8
39.8
39.2
38.4
32
34
36
38
40
42
44
2011 2012 2013 2014 2015 2016 2017 2018
Perce
nt
Source: Based on data of IMF.
Figure 22: India’s IIP Liabilities
0%
10%
20%
30%
40%
50%
60%
70%
80%
90%
100%
2011 2012 2013 2014 2015 2016 2017 2018
Other Investment, Net Incurrence of Liabilities, Other Liabilities (with Fund Record)Liabilities, Portfolio InvestmentLiabilities, Direct Investment
Source: Based on data of IMF.
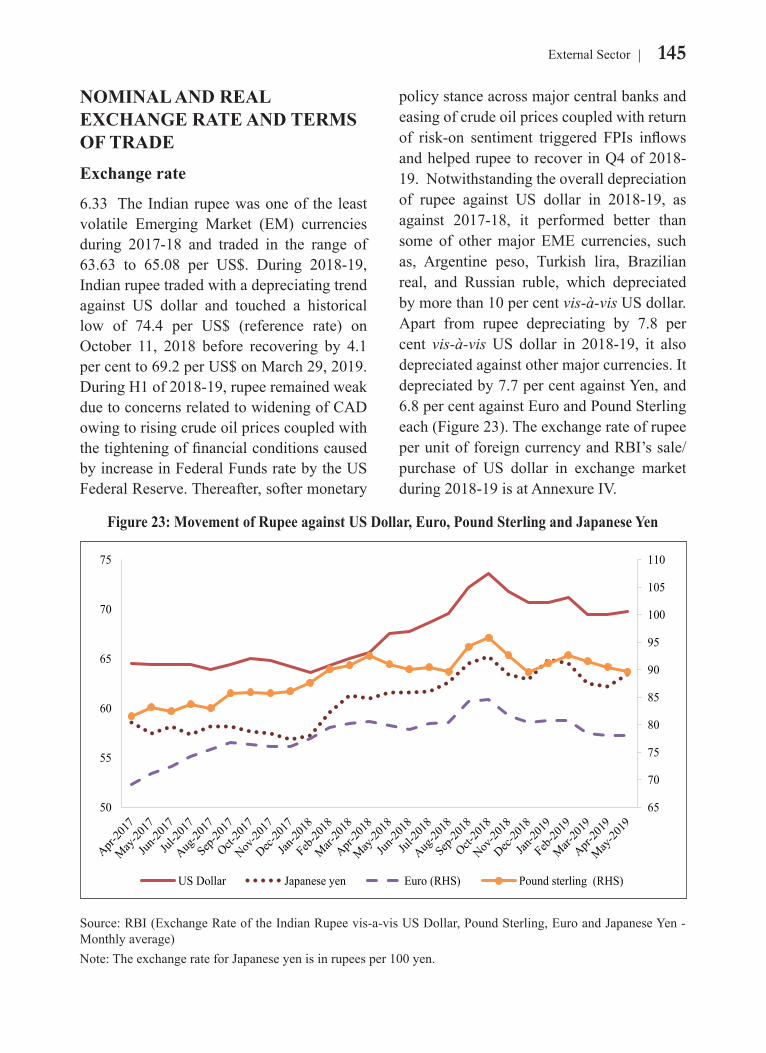
145External Sector
NOMINAL AND REAL EXCHANGE RATE AND TERMS OF TRADEExchange rate
6.33 The Indian rupee was one of the least volatile Emerging Market (EM) currencies during 2017-18 and traded in the range of 63.63 to 65.08 per US$. During 2018-19, Indian rupee traded with a depreciating trend against US dollar and touched a historical low of 74.4 per US$ (reference rate) on October 11, 2018 before recovering by 4.1 per cent to 69.2 per US$ on March 29, 2019. During H1 of 2018-19, rupee remained weak due to concerns related to widening of CAD owing to rising crude oil prices coupled with the tightening of financial conditions caused by increase in Federal Funds rate by the US Federal Reserve. Thereafter, softer monetary
policy stance across major central banks and easing of crude oil prices coupled with return of risk-on sentiment triggered FPIs inflows and helped rupee to recover in Q4 of 2018-19. Notwithstanding the overall depreciation of rupee against US dollar in 2018-19, as against 2017-18, it performed better than some of other major EME currencies, such as, Argentine peso, Turkish lira, Brazilian real, and Russian ruble, which depreciated by more than 10 per cent vis-à-vis US dollar. Apart from rupee depreciating by 7.8 per cent vis-à-vis US dollar in 2018-19, it also depreciated against other major currencies. It depreciated by 7.7 per cent against Yen, and 6.8 per cent against Euro and Pound Sterling each (Figure 23). The exchange rate of rupee per unit of foreign currency and RBI’s sale/ purchase of US dollar in exchange market during 2018-19 is at Annexure IV.
Figure 23: Movement of Rupee against US Dollar, Euro, Pound Sterling and Japanese Yen
65
70
75
80
85
90
95
100
105
110
50
55
60
65
70
75
US Dollar Japanese yen Euro (RHS) Pound sterling (RHS)
Source: RBI (Exchange Rate of the Indian Rupee vis-a-vis US Dollar, Pound Sterling, Euro and Japanese Yen - Monthly average)Note: The exchange rate for Japanese yen is in rupees per 100 yen.
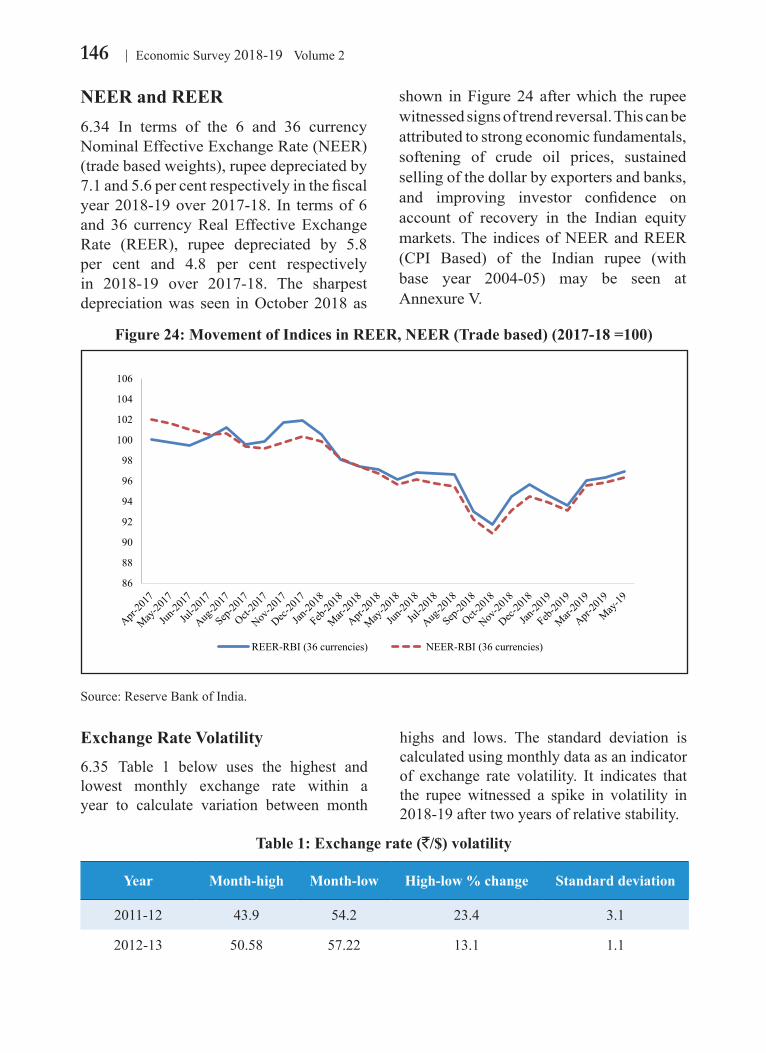
146 Economic Survey 2018-19 Volume 2
NEER and REER6.34 In terms of the 6 and 36 currency Nominal Effective Exchange Rate (NEER) (trade based weights), rupee depreciated by 7.1 and 5.6 per cent respectively in the fiscal year 2018-19 over 2017-18. In terms of 6 and 36 currency Real Effective Exchange Rate (REER), rupee depreciated by 5.8 per cent and 4.8 per cent respectively in 2018-19 over 2017-18. The sharpest depreciation was seen in October 2018 as
shown in Figure 24 after which the rupee witnessed signs of trend reversal. This can be attributed to strong economic fundamentals, softening of crude oil prices, sustained selling of the dollar by exporters and banks, and improving investor confidence on account of recovery in the Indian equity markets. The indices of NEER and REER (CPI Based) of the Indian rupee (with base year 2004-05) may be seen at Annexure V.
Exchange Rate Volatility6.35 Table 1 below uses the highest and lowest monthly exchange rate within a year to calculate variation between month
highs and lows. The standard deviation is calculated using monthly data as an indicator of exchange rate volatility. It indicates that the rupee witnessed a spike in volatility in 2018-19 after two years of relative stability.
Figure 24: Movement of Indices in REER, NEER (Trade based) (2017-18 =100)
86
88
90
92
94
96
98
100
102
104
106
REER-RBI (36 currencies) NEER-RBI (36 currencies)
Source: Reserve Bank of India.
Table 1: Exchange rate (`/$) volatility
Year Month-high Month-low High-low % change Standard deviation
2011-12 43.9 54.2 23.4 3.1
2012-13 50.58 57.22 13.1 1.1
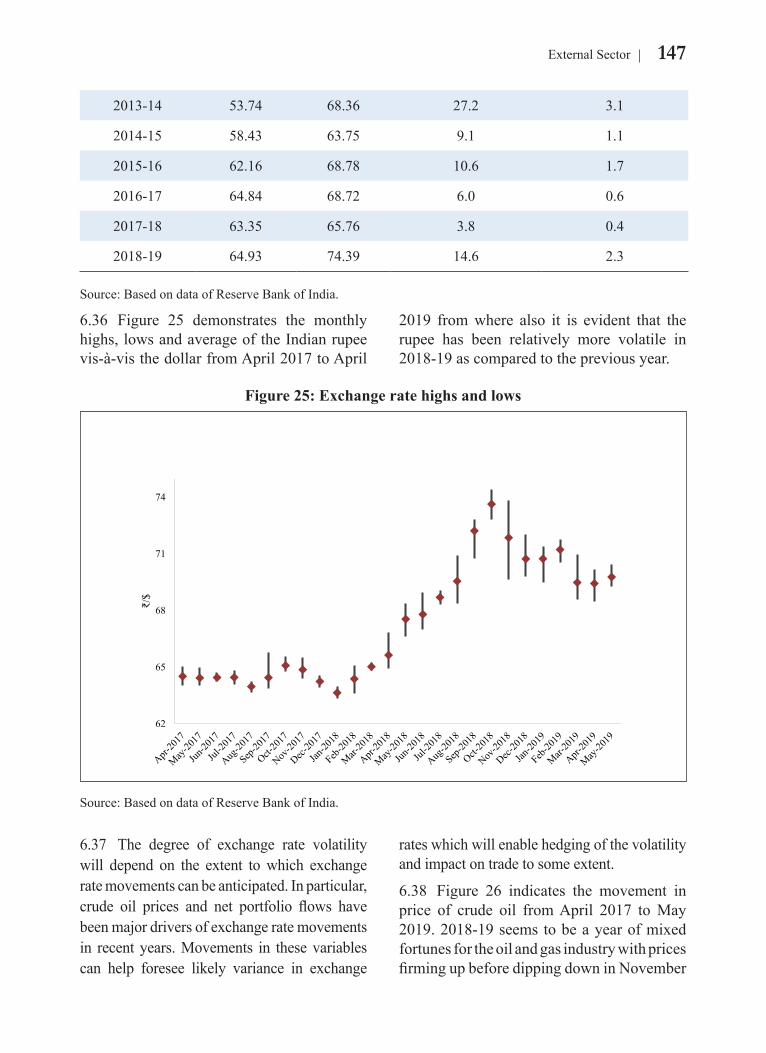
147External Sector
6.36 Figure 25 demonstrates the monthly highs, lows and average of the Indian rupee vis-à-vis the dollar from April 2017 to April
2019 from where also it is evident that the rupee has been relatively more volatile in 2018-19 as compared to the previous year.
6.37 The degree of exchange rate volatility will depend on the extent to which exchange rate movements can be anticipated. In particular, crude oil prices and net portfolio flows have been major drivers of exchange rate movements in recent years. Movements in these variables can help foresee likely variance in exchange
rates which will enable hedging of the volatility and impact on trade to some extent.
6.38 Figure 26 indicates the movement in price of crude oil from April 2017 to May 2019. 2018-19 seems to be a year of mixed fortunes for the oil and gas industry with prices firming up before dipping down in November
2013-14 53.74 68.36 27.2 3.1
2014-15 58.43 63.75 9.1 1.1
2015-16 62.16 68.78 10.6 1.7
2016-17 64.84 68.72 6.0 0.6
2017-18 63.35 65.76 3.8 0.4
2018-19 64.93 74.39 14.6 2.3
Source: Based on data of Reserve Bank of India.
Figure 25: Exchange rate highs and lows
62
65
68
71
74
₹/$
Source: Based on data of Reserve Bank of India.
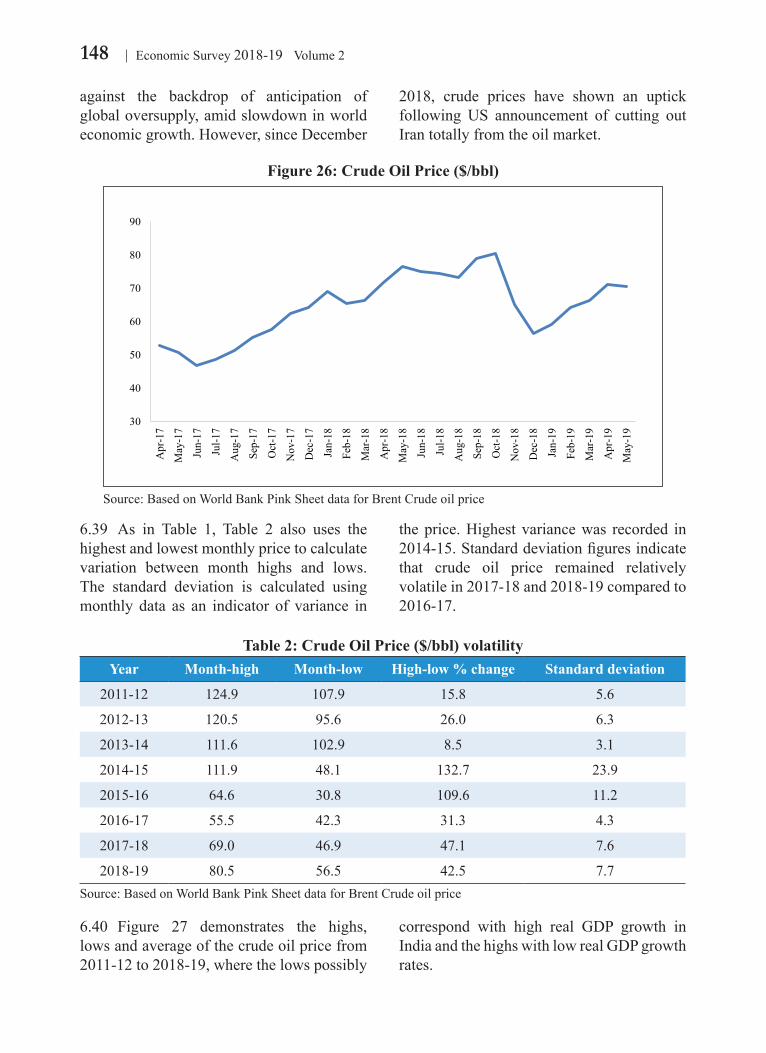
148 Economic Survey 2018-19 Volume 2
6.39 As in Table 1, Table 2 also uses the highest and lowest monthly price to calculate variation between month highs and lows. The standard deviation is calculated using monthly data as an indicator of variance in
the price. Highest variance was recorded in 2014-15. Standard deviation figures indicate that crude oil price remained relatively volatile in 2017-18 and 2018-19 compared to 2016-17.
against the backdrop of anticipation of global oversupply, amid slowdown in world economic growth. However, since December
2018, crude prices have shown an uptick following US announcement of cutting out Iran totally from the oil market.
6.40 Figure 27 demonstrates the highs, lows and average of the crude oil price from 2011-12 to 2018-19, where the lows possibly
correspond with high real GDP growth in India and the highs with low real GDP growth rates.
Figure 26: Crude Oil Price ($/bbl)
30
40
50
60
70
80
90
Apr
-17
May
-17
Jun-
17
Jul-1
7
Aug
-17
Sep-
17
Oct
-17
Nov
-17
Dec
-17
Jan-
18
Feb-
18
Mar
-18
Apr
-18
May
-18
Jun-
18
Jul-1
8
Aug
-18
Sep-
18
Oct
-18
Nov
-18
Dec
-18
Jan-
19
Feb-
19
Mar
-19
Apr
-19
May
-19
Source: Based on World Bank Pink Sheet data for Brent Crude oil price
Table 2: Crude Oil Price ($/bbl) volatilityYear Month-high Month-low High-low % change Standard deviation
2011-12 124.9 107.9 15.8 5.6
2012-13 120.5 95.6 26.0 6.3
2013-14 111.6 102.9 8.5 3.1
2014-15 111.9 48.1 132.7 23.9
2015-16 64.6 30.8 109.6 11.2
2016-17 55.5 42.3 31.3 4.3
2017-18 69.0 46.9 47.1 7.6
2018-19 80.5 56.5 42.5 7.7Source: Based on World Bank Pink Sheet data for Brent Crude oil price
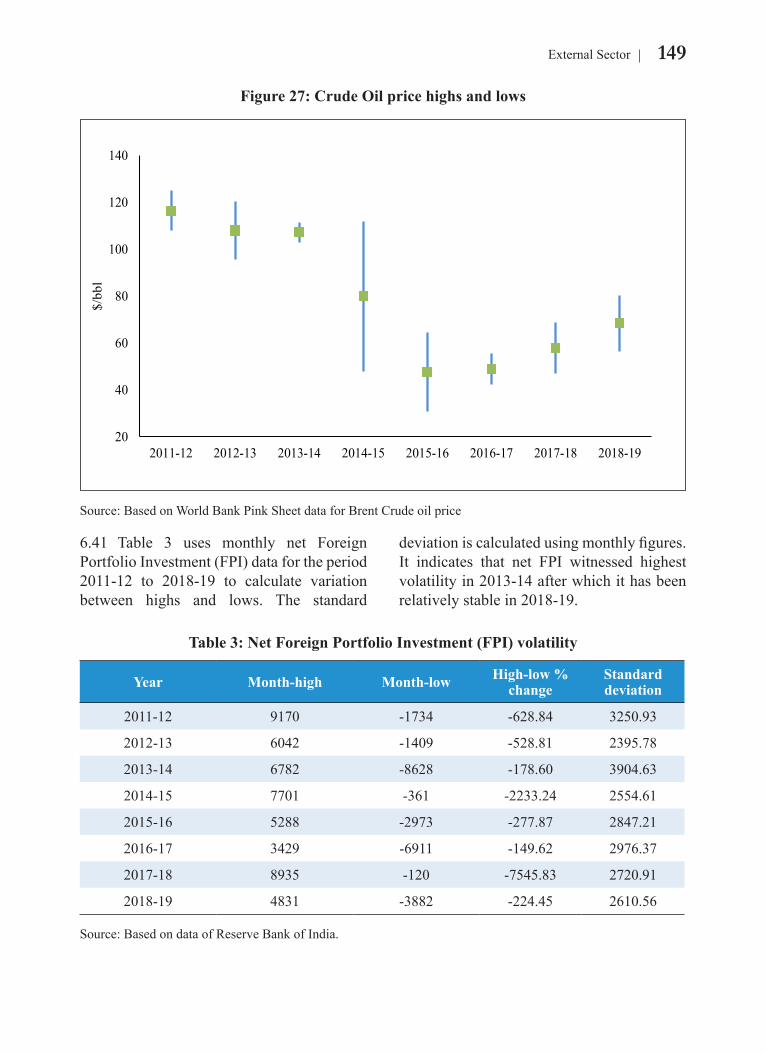
149External Sector
6.41 Table 3 uses monthly net Foreign Portfolio Investment (FPI) data for the period 2011-12 to 2018-19 to calculate variation between highs and lows. The standard
deviation is calculated using monthly figures. It indicates that net FPI witnessed highest volatility in 2013-14 after which it has been relatively stable in 2018-19.
Figure 27: Crude Oil price highs and lows
20
40
60
80
100
120
140
2011-12 2012-13 2013-14 2014-15 2015-16 2016-17 2017-18 2018-19
$/bb
l
Source: Based on World Bank Pink Sheet data for Brent Crude oil price
Table 3: Net Foreign Portfolio Investment (FPI) volatility
Year Month-high Month-low High-low % change
Standard deviation
2011-12 9170 -1734 -628.84 3250.93
2012-13 6042 -1409 -528.81 2395.78
2013-14 6782 -8628 -178.60 3904.63
2014-15 7701 -361 -2233.24 2554.61
2015-16 5288 -2973 -277.87 2847.21
2016-17 3429 -6911 -149.62 2976.37
2017-18 8935 -120 -7545.83 2720.91
2018-19 4831 -3882 -224.45 2610.56
Source: Based on data of Reserve Bank of India.
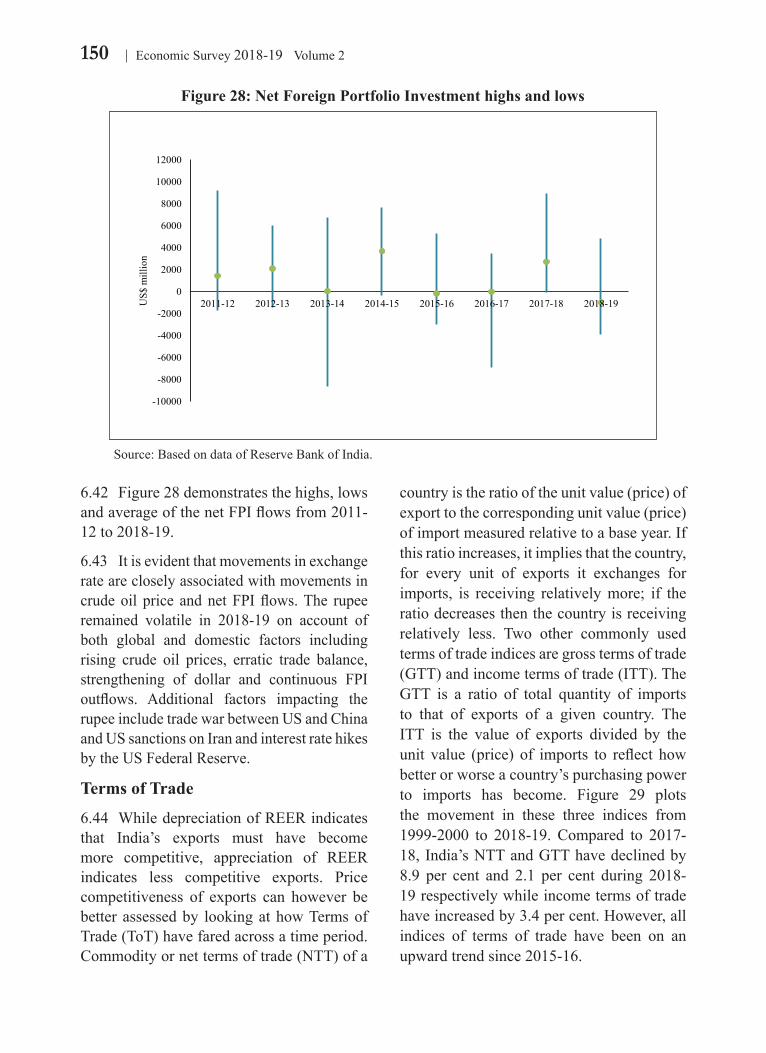
150 Economic Survey 2018-19 Volume 2
6.42 Figure 28 demonstrates the highs, lows and average of the net FPI flows from 2011-12 to 2018-19.
6.43 It is evident that movements in exchange rate are closely associated with movements in crude oil price and net FPI flows. The rupee remained volatile in 2018-19 on account of both global and domestic factors including rising crude oil prices, erratic trade balance, strengthening of dollar and continuous FPI outflows. Additional factors impacting the rupee include trade war between US and China and US sanctions on Iran and interest rate hikes by the US Federal Reserve.
Terms of Trade
6.44 While depreciation of REER indicates that India’s exports must have become more competitive, appreciation of REER indicates less competitive exports. Price competitiveness of exports can however be better assessed by looking at how Terms of Trade (ToT) have fared across a time period.Commodity or net terms of trade (NTT) of a
country is the ratio of the unit value (price) of export to the corresponding unit value (price) of import measured relative to a base year. If this ratio increases, it implies that the country, for every unit of exports it exchanges for imports, is receiving relatively more; if the ratio decreases then the country is receiving relatively less. Two other commonly used terms of trade indices are gross terms of trade (GTT) and income terms of trade (ITT). The GTT is a ratio of total quantity of imports to that of exports of a given country. The ITT is the value of exports divided by the unit value (price) of imports to reflect how better or worse a country’s purchasing power to imports has become. Figure 29 plots the movement in these three indices from 1999-2000 to 2018-19. Compared to 2017-18, India’s NTT and GTT have declined by 8.9 per cent and 2.1 per cent during 2018-19 respectively while income terms of trade have increased by 3.4 per cent. However, all indices of terms of trade have been on an upward trend since 2015-16.
Figure 28: Net Foreign Portfolio Investment highs and lows
-10000
-8000
-6000
-4000
-2000
0
2000
4000
6000
8000
10000
12000
2011-12 2012-13 2013-14 2014-15 2015-16 2016-17 2017-18 2018-19US$
mill
ion
Source: Based on data of Reserve Bank of India.
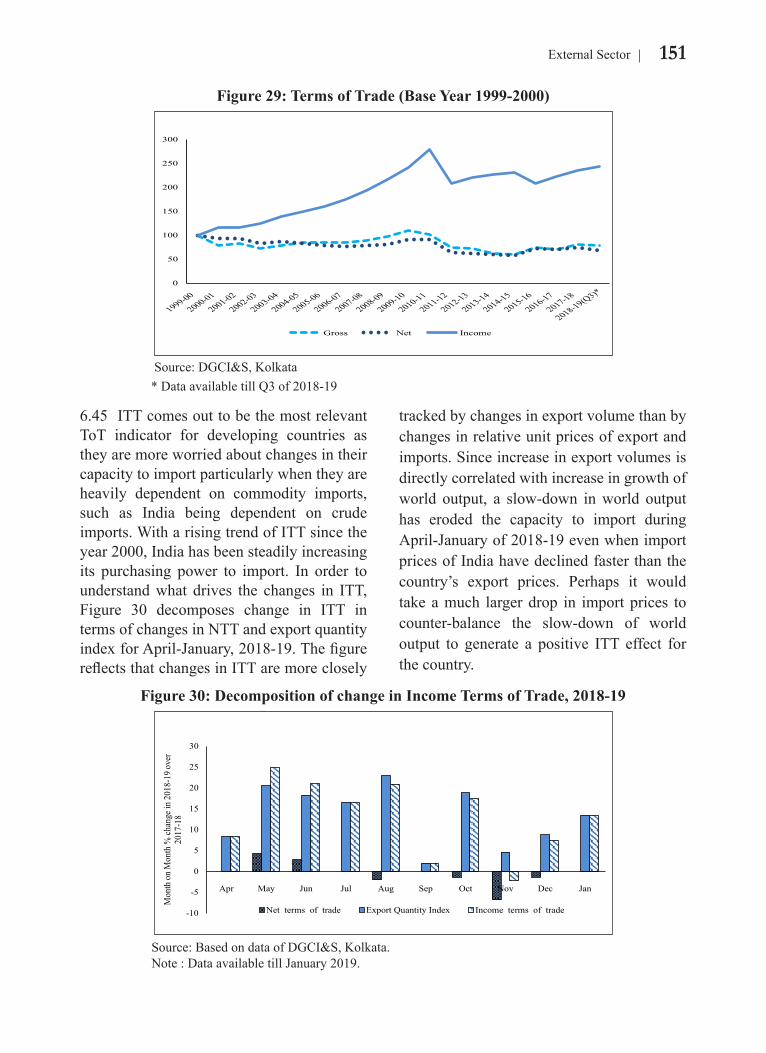
151External Sector
6.45 ITT comes out to be the most relevant ToT indicator for developing countries as they are more worried about changes in their capacity to import particularly when they are heavily dependent on commodity imports, such as India being dependent on crude imports. With a rising trend of ITT since the year 2000, India has been steadily increasing its purchasing power to import. In order to understand what drives the changes in ITT, Figure 30 decomposes change in ITT in terms of changes in NTT and export quantity index for April-January, 2018-19. The figure reflects that changes in ITT are more closely
tracked by changes in export volume than by changes in relative unit prices of export and imports. Since increase in export volumes is directly correlated with increase in growth of world output, a slow-down in world output has eroded the capacity to import during April-January of 2018-19 even when import prices of India have declined faster than the country’s export prices. Perhaps it would take a much larger drop in import prices to counter-balance the slow-down of world output to generate a positive ITT effect for the country.
Figure 29: Terms of Trade (Base Year 1999-2000)
0
50
100
150
200
250
300
Gross Net Income
Source: DGCI&S, Kolkata * Data available till Q3 of 2018-19
Figure 30: Decomposition of change in Income Terms of Trade, 2018-19
-10
-5
0
5
10
15
20
25
30
Apr May Jun Jul Aug Sep Oct Nov Dec Jan
Mon
th o
n M
onth
% ch
ange
in 2
018-
19 ov
er
2017
-18
Net terms of trade Export Quantity Index Income terms of trade
Source: Based on data of DGCI&S, Kolkata.Note : Data available till January 2019.
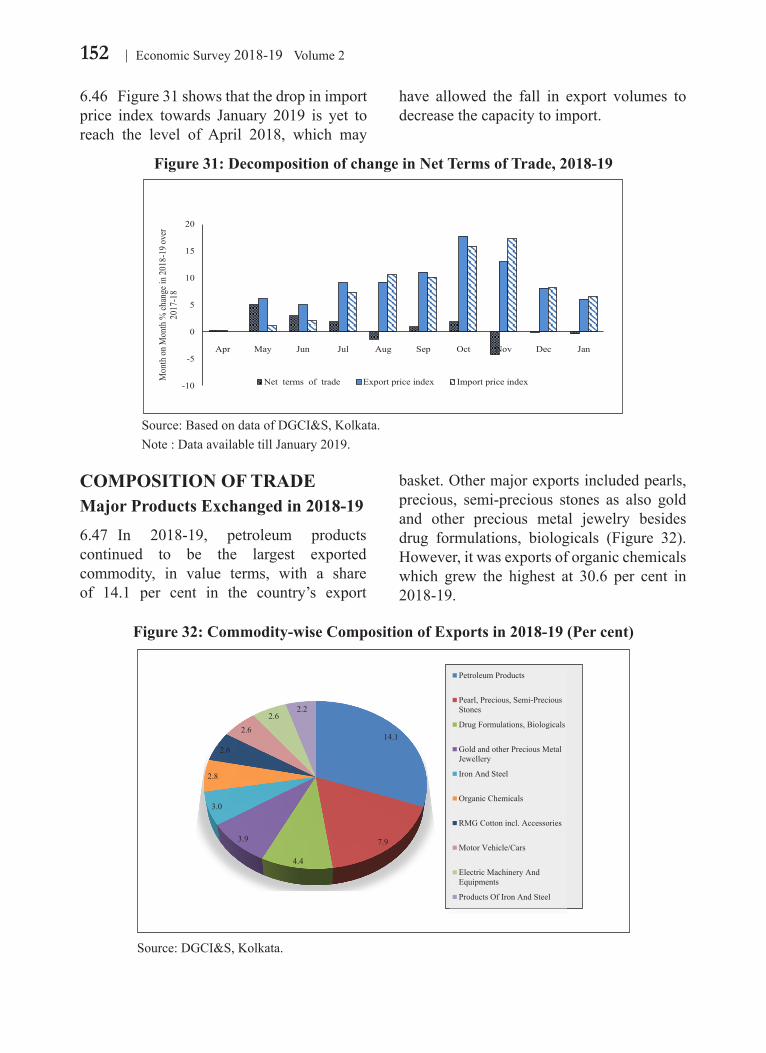
152 Economic Survey 2018-19 Volume 2
6.46 Figure 31 shows that the drop in import price index towards January 2019 is yet to reach the level of April 2018, which may
have allowed the fall in export volumes to decrease the capacity to import.
COMPOSITION OF TRADE Major Products Exchanged in 2018-196.47 In 2018-19, petroleum products continued to be the largest exported commodity, in value terms, with a share of 14.1 per cent in the country’s export
basket. Other major exports included pearls, precious, semi-precious stones as also gold and other precious metal jewelry besides drug formulations, biologicals (Figure 32). However, it was exports of organic chemicals which grew the highest at 30.6 per cent in 2018-19.
Figure 32: Commodity-wise Composition of Exports in 2018-19 (Per cent)
14.1
7.9
4.4
3.9
3.0
2.8
2.6
2.6
2.62.2
Petroleum Products
Pearl, Precious, Semi-PreciousStones
Drug Formulations, Biologicals
Gold and other Precious MetalJewellery
Iron And Steel
Organic Chemicals
RMG Cotton incl. Accessories
Motor Vehicle/Cars
Electric Machinery AndEquipments
Products Of Iron And Steel
Source: DGCI&S, Kolkata.
Figure 31: Decomposition of change in Net Terms of Trade, 2018-19
-10
-5
0
5
10
15
20
Apr May Jun Jul Aug Sep Oct Nov Dec Jan
Mon
th o
n M
onth
% ch
ange
in 2
018-
19 ov
er
2017
-18
Net terms of trade Export price index Import price index
Source: Based on data of DGCI&S, Kolkata. Note : Data available till January 2019.
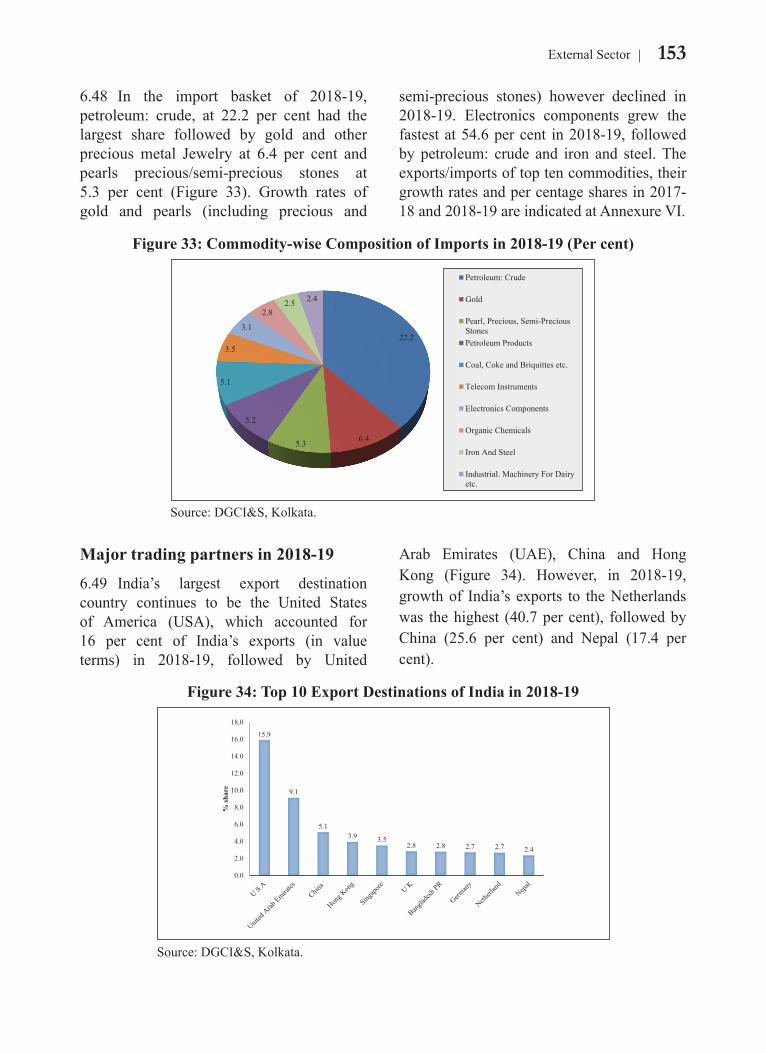
153External Sector
6.48 In the import basket of 2018-19, petroleum: crude, at 22.2 per cent had the largest share followed by gold and other precious metal Jewelry at 6.4 per cent and pearls precious/semi-precious stones at 5.3 per cent (Figure 33). Growth rates of gold and pearls (including precious and
semi-precious stones) however declined in 2018-19. Electronics components grew the fastest at 54.6 per cent in 2018-19, followed by petroleum: crude and iron and steel. The exports/imports of top ten commodities, their growth rates and per centage shares in 2017-18 and 2018-19 are indicated at Annexure VI.
Major trading partners in 2018-196.49 India’s largest export destination country continues to be the United States of America (USA), which accounted for 16 per cent of India’s exports (in value terms) in 2018-19, followed by United
Arab Emirates (UAE), China and Hong Kong (Figure 34). However, in 2018-19, growth of India’s exports to the Netherlands was the highest (40.7 per cent), followed by China (25.6 per cent) and Nepal (17.4 per cent).
Figure 33: Commodity-wise Composition of Imports in 2018-19 (Per cent)
22.2
6.45.3
5.2
5.1
3.5
3.1
2.82.5 2.4
Petroleum: Crude
Gold
Pearl, Precious, Semi-PreciousStonesPetroleum Products
Coal, Coke and Briquittes etc.
Telecom Instruments
Electronics Components
Organic Chemicals
Iron And Steel
Industrial. Machinery For Dairyetc.
Source: DGCI&S, Kolkata.
Figure 34: Top 10 Export Destinations of India in 2018-19
15.9
9.1
5.13.9 3.5
2.8 2.8 2.7 2.7 2.4
0.0
2.0
4.0
6.0
8.0
10.0
12.0
14.0
16.0
18.0
% sh
are
Source: DGCI&S, Kolkata.
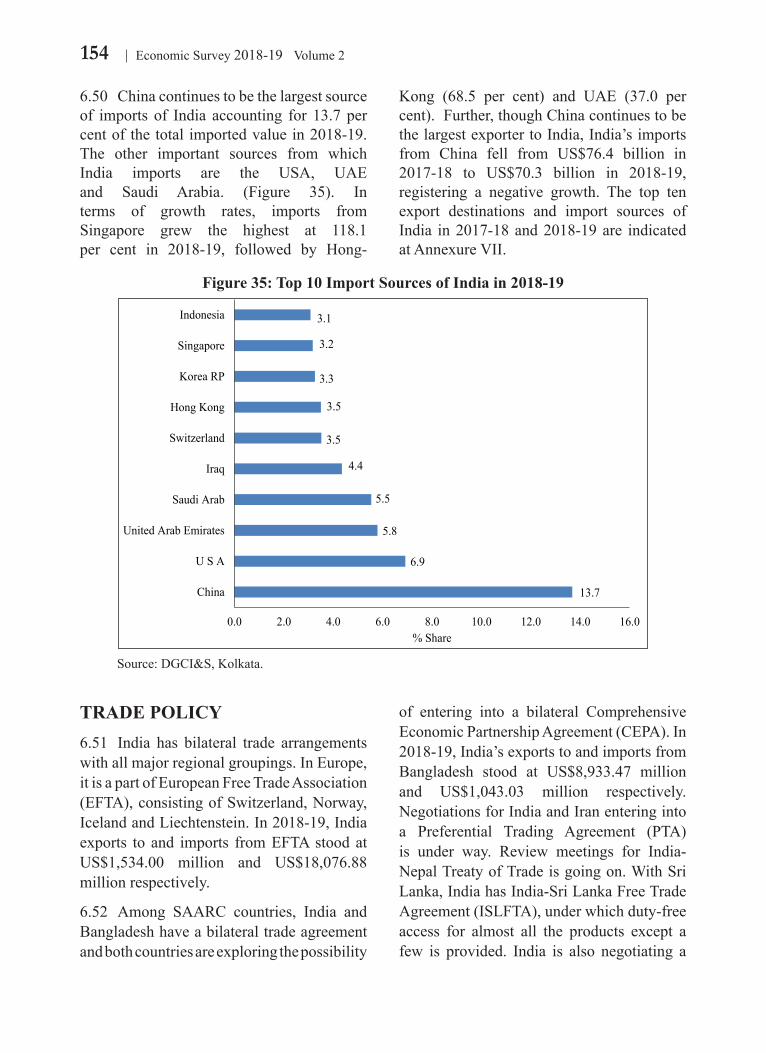
154 Economic Survey 2018-19 Volume 2
6.50 China continues to be the largest source of imports of India accounting for 13.7 per cent of the total imported value in 2018-19. The other important sources from which India imports are the USA, UAE and Saudi Arabia. (Figure 35). In terms of growth rates, imports from Singapore grew the highest at 118.1 per cent in 2018-19, followed by Hong-
Kong (68.5 per cent) and UAE (37.0 per cent). Further, though China continues to be the largest exporter to India, India’s imports from China fell from US$76.4 billion in 2017-18 to US$70.3 billion in 2018-19, registering a negative growth. The top ten export destinations and import sources of India in 2017-18 and 2018-19 are indicated at Annexure VII.
TRADE POLICY6.51 India has bilateral trade arrangements with all major regional groupings. In Europe, it is a part of European Free Trade Association (EFTA), consisting of Switzerland, Norway, Iceland and Liechtenstein. In 2018-19, India exports to and imports from EFTA stood at US$1,534.00 million and US$18,076.88 million respectively.
6.52 Among SAARC countries, India and Bangladesh have a bilateral trade agreement and both countries are exploring the possibility
of entering into a bilateral Comprehensive Economic Partnership Agreement (CEPA). In 2018-19, India’s exports to and imports from Bangladesh stood at US$8,933.47 million and US$1,043.03 million respectively. Negotiations for India and Iran entering into a Preferential Trading Agreement (PTA) is under way. Review meetings for India-Nepal Treaty of Trade is going on. With Sri Lanka, India has India-Sri Lanka Free Trade Agreement (ISLFTA), under which duty-free access for almost all the products except a few is provided. India is also negotiating a
Figure 35: Top 10 Import Sources of India in 2018-19
13.7
6.9
5.8
5.5
4.4
3.5
3.5
3.3
3.2
3.1
0.0 2.0 4.0 6.0 8.0 10.0 12.0 14.0 16.0
China
U S A
United Arab Emirates
Saudi Arab
Iraq
Switzerland
Hong Kong
Korea RP
Singapore
Indonesia
% Share
Source: DGCI&S, Kolkata.
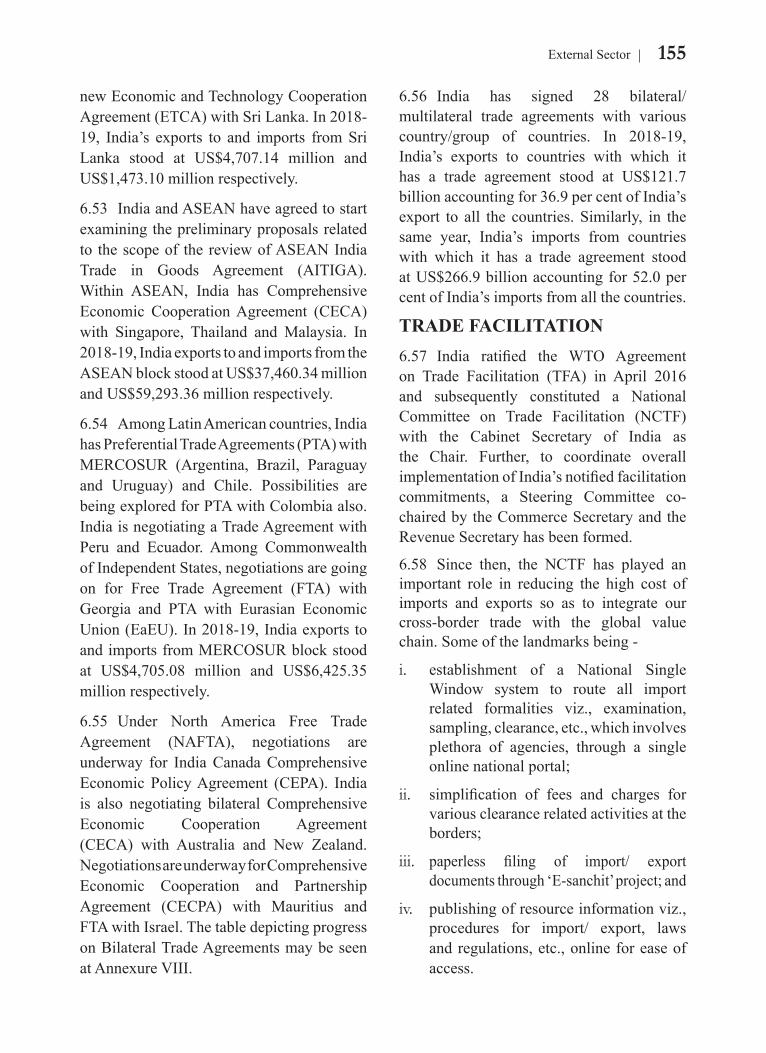
155External Sector
new Economic and Technology Cooperation Agreement (ETCA) with Sri Lanka. In 2018-19, India’s exports to and imports from Sri Lanka stood at US$4,707.14 million and US$1,473.10 million respectively.
6.53 India and ASEAN have agreed to start examining the preliminary proposals related to the scope of the review of ASEAN India Trade in Goods Agreement (AITIGA). Within ASEAN, India has Comprehensive Economic Cooperation Agreement (CECA) with Singapore, Thailand and Malaysia. In 2018-19, India exports to and imports from the ASEAN block stood at US$37,460.34 million and US$59,293.36 million respectively.
6.54 Among Latin American countries, India has Preferential Trade Agreements (PTA) with MERCOSUR (Argentina, Brazil, Paraguay and Uruguay) and Chile. Possibilities are being explored for PTA with Colombia also. India is negotiating a Trade Agreement with Peru and Ecuador. Among Commonwealth of Independent States, negotiations are going on for Free Trade Agreement (FTA) with Georgia and PTA with Eurasian Economic Union (EaEU). In 2018-19, India exports to and imports from MERCOSUR block stood at US$4,705.08 million and US$6,425.35 million respectively.
6.55 Under North America Free Trade Agreement (NAFTA), negotiations are underway for India Canada Comprehensive Economic Policy Agreement (CEPA). India is also negotiating bilateral Comprehensive Economic Cooperation Agreement (CECA) with Australia and New Zealand. Negotiations are underway for Comprehensive Economic Cooperation and Partnership Agreement (CECPA) with Mauritius and FTA with Israel. The table depicting progress on Bilateral Trade Agreements may be seen at Annexure VIII.
6.56 India has signed 28 bilateral/ multilateral trade agreements with various country/group of countries. In 2018-19, India’s exports to countries with which it has a trade agreement stood at US$121.7 billion accounting for 36.9 per cent of India’s export to all the countries. Similarly, in the same year, India’s imports from countries with which it has a trade agreement stood at US$266.9 billion accounting for 52.0 per cent of India’s imports from all the countries.
TRADE FACILITATION 6.57 India ratified the WTO Agreement on Trade Facilitation (TFA) in April 2016 and subsequently constituted a National Committee on Trade Facilitation (NCTF) with the Cabinet Secretary of India as the Chair. Further, to coordinate overall implementation of India’s notified facilitation commitments, a Steering Committee co-chaired by the Commerce Secretary and the Revenue Secretary has been formed.
6.58 Since then, the NCTF has played an important role in reducing the high cost of imports and exports so as to integrate our cross-border trade with the global value chain. Some of the landmarks being -
i. establishment of a National Single Window system to route all import related formalities viz., examination, sampling, clearance, etc., which involves plethora of agencies, through a single online national portal;
ii. simplification of fees and charges for various clearance related activities at the borders;
iii. paperless filing of import/ export documents through ‘E-sanchit’ project; and
iv. publishing of resource information viz., procedures for import/ export, laws and regulations, etc., online for ease of access.
156 Economic Survey 2018-19 Volume 2
6.59 Consistent trade facilitation efforts have resulted in substantive improvement of India’s performance in Trading Across Borders indicator from 146 in 2017 to 80 in the year 2018. Further, these initiatives have also contributed to overall improvement in ‘Ease of Doing Business’ environment in the country, as also recognized by the World Bank.
TRADE RELATED LOGISTICS 6.60 The Indian logistics sector is on a big growth tide. According to the domestic rating agency ICRA, Indian logistics sector is expected to grow at a rate of 8-10 per cent over the medium term. This is an improvement over the compound annual growth rate (CAGR) of 7.8 per cent at which the industry grew during the last five years. The logistics industry of India is currently estimated to be around US$215 billion.
6.61 The last few years have seen significant development for this industry which is reflected in the global rankings. According to the Global Ranking of the World Bank’s 2016 Logistics Performance Index, India jumped to 35th rank in 2016 from 54th rank in 2014 in terms of overall logistics performance. In 2018, India stood at 44th rank. Experts predict that the logistics sector can be the largest job creator by 2022.The sector currently provides employment to more than 72 crore people in the country.
6.62 Government of India has announced a draft National Logistics policy for which a national logistics action plan is being developed. The key objective is to drive economic growth and trade competitiveness of the country through a truly integrated, seamless, efficient, reliable and cost effective logistics network, leveraging best in class technology, processes and skilled manpower. Various logistics schemes have
been introduced, which are as under:
i. The Government has launched many flagship programmes like the Bharatmala Yojana, the Sagarmala Yojana and the Dedicated Freight Corridors. The objective of these programmes is to develop infrastructure to meet the growing demand of logistics in the country and to make a modal shift on more cost effective modes of transport.
ii. 111 waterways have been identified for development.
iii. Infrastructure status has been given to select logistics activities like warehousing, cold chains, Multi modal logistics parks and slurry pipelines.
iv. Subsidy is provided to develop cold chains and pack houses.
6.63 Indian logistics industry is a sunshine sector and there are multiple factors on both demand and supply side that are driving this sector. On the demand side, the reduction in truck turnaround time following GST is a major stimulus to logistics growth as also pick up in industrial production. On the supply side, the outsourcing of non-core activities like warehousing is allowing main players to focus on improving efficiency of transportation. Automation of large warehouses is also adding to the efficiency of the logistics sector.
6.64 According to Bowersox, Calantone and Rodrigues, India’s logistics cost as a per centage of GDP was 15.4 in 1997 and 17 per cent in the year 2000. As per an international market research conducted by Armstrong & Associates (October 2017), India’s logistics cost as a per centage of GDP is estimated to be 13 per cent. A comparison of India with the rest of the world, taking 2016 as reference year, is in Table 4.
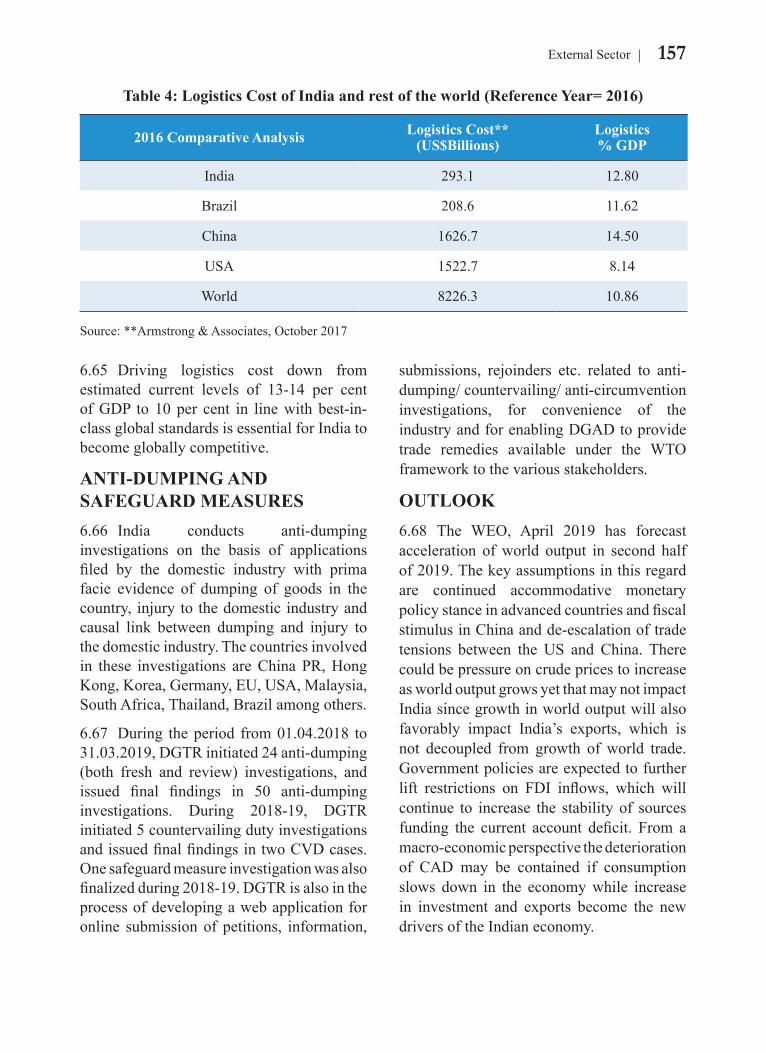
157External Sector
6.65 Driving logistics cost down from estimated current levels of 13-14 per cent of GDP to 10 per cent in line with best-in-class global standards is essential for India to become globally competitive.
ANTI-DUMPING AND SAFEGUARD MEASURES 6.66 India conducts anti-dumping investigations on the basis of applications filed by the domestic industry with prima facie evidence of dumping of goods in the country, injury to the domestic industry and causal link between dumping and injury to the domestic industry. The countries involved in these investigations are China PR, Hong Kong, Korea, Germany, EU, USA, Malaysia, South Africa, Thailand, Brazil among others.
6.67 During the period from 01.04.2018 to 31.03.2019, DGTR initiated 24 anti-dumping (both fresh and review) investigations, and issued final findings in 50 anti-dumping investigations. During 2018-19, DGTR initiated 5 countervailing duty investigations and issued final findings in two CVD cases. One safeguard measure investigation was also finalized during 2018-19. DGTR is also in the process of developing a web application for online submission of petitions, information,
submissions, rejoinders etc. related to anti-dumping/ countervailing/ anti-circumvention investigations, for convenience of the industry and for enabling DGAD to provide trade remedies available under the WTO framework to the various stakeholders.
OUTLOOK 6.68 The WEO, April 2019 has forecast acceleration of world output in second half of 2019. The key assumptions in this regard are continued accommodative monetary policy stance in advanced countries and fiscal stimulus in China and de-escalation of trade tensions between the US and China. There could be pressure on crude prices to increase as world output grows yet that may not impact India since growth in world output will also favorably impact India’s exports, which is not decoupled from growth of world trade. Government policies are expected to further lift restrictions on FDI inflows, which will continue to increase the stability of sources funding the current account deficit. From a macro-economic perspective the deterioration of CAD may be contained if consumption slows down in the economy while increase in investment and exports become the new drivers of the Indian economy.
Table 4: Logistics Cost of India and rest of the world (Reference Year= 2016)
2016 Comparative Analysis Logistics Cost** (US$Billions)
Logistics % GDP
India 293.1 12.80
Brazil 208.6 11.62
China 1626.7 14.50
USA 1522.7 8.14
World 8226.3 10.86
Source: **Armstrong & Associates, October 2017
158 Economic Survey 2018-19 Volume 2
CHAPTER AT A GLANCE As per WTO, World trade growth has slowed down to 3 per cent in 2018, much below the growth
rate of 4.6 per cent in 2017, following the introduction of new and retaliatory tariff measures, heightened US-China trade tensions, weaker global economic growth and volatility in financial markets.
India’s balance of payment situation witnessed some signs of deterioration during H1 of 2018-19 due to the sharp rise in crude oil prices causing higher current account deficit (CAD). However, CAD moderated somewhat in Q3-2018-19 as international crude oil prices eased sequentially in November and December 2018. The widening of the CAD was largely on account of a higher trade deficit driven by rise in international crude oil prices (Indian basket).
The growth rate of merchandise exports and imports fell in 2018-19 compared to previous year, attributable to the slower growth of world output and trade, accompanied with lower domestic GDP growth in 2018-19, among other factors.
The contribution of net services to financing merchandize trade deficit has fallen from 62.2 per cent in 2016-17 to 43.7 per cent in 2018-19 reflecting a muted performance of service exports in recent times.
Net capital flows moderated in April-December of 2018-19 despite robust foreign direct investment (FDI) inflows, outweighed by withdrawals under portfolio investment.
The net remittances by Indians employed overseas increased in 2018-19 (P) compared to last year, possibly due to improved income conditions in the Gulf countries along with rise in oil prices. India remained a top remittance recipient country in 2018.
Among the major economies running current account deficit, India is the largest foreign exchange reserve holder and eighth largest among all countries of the world.
India’s External Debt was US$521.1 billion at end-December 2018, 1.6 per cent lower than its level at end-March 2018. The key external debt indicators reflect that India’s external debt is not unsustainable.
The total liabilities-to-GDP ratio, inclusive of both debt and non-debt components, has declined from 43 per cent in 2015 to about 38 per cent at end of 2018. The share of foreign direct investment has risen and that of net portfolio investment has fallen in total liabilities, thereby reflecting a transition to more stable sources of funding the current account deficit.
The Indian Rupee traded in the range of 65-68 per US$ in 2017-18 but depreciated to a range of 70-74 in 2018-19. During H1 of 2018-19, rupee remained weak due to concerns related to widening of CAD owing to rising crude oil prices coupled with the tightening of financial conditions caused by increase in Federal Funds rate by the US Federal Reserve.
The income terms of trade, a metric that measures the purchasing power to import, has been on a rising trend, possibly because the growth of crude prices has still not exceeded the growth of India’s export prices. The exchange rate in 2018-19 has been more volatile than in the previous year, mainly due to volatility in crude prices, but not much due to net portfolio flows.
The composition of India’s exports and import basket has almost remained unchanged in 2018-19 over 2017-18. Petroleum products, precious stones, drug formulations, gold and other precious metals continue to be top export items. Crude petroleum, pearl, precious, semi-precious stones and gold remain as top import items. India’s main trading partners continue to be the US, China, Hong Kong, the UAE and Saudi Arabia.
India has signed 28 bilateral/multilateral trade agreements with various country/group of countries. In 2018-19, India’s exports to countries with which it has a trade agreement stood at US$121.7 billion accounting for 36.9 per cent of India’s export to all the countries. Similarly, in the same year, India’s imports from countries with which it has a trade agreement stood at US$266.9 billion accounting for 52.0 per cent of India’s imports from all the countries.
The logistics industry of India is currently estimated to be around US$215 billion. The significant developments in this industry led to an increase in the ranking of India in overall logistics performance, according to the Global Ranking of the World Bank's 2016 Logistics Performance Index. In 2018, India stood at 44th rank.
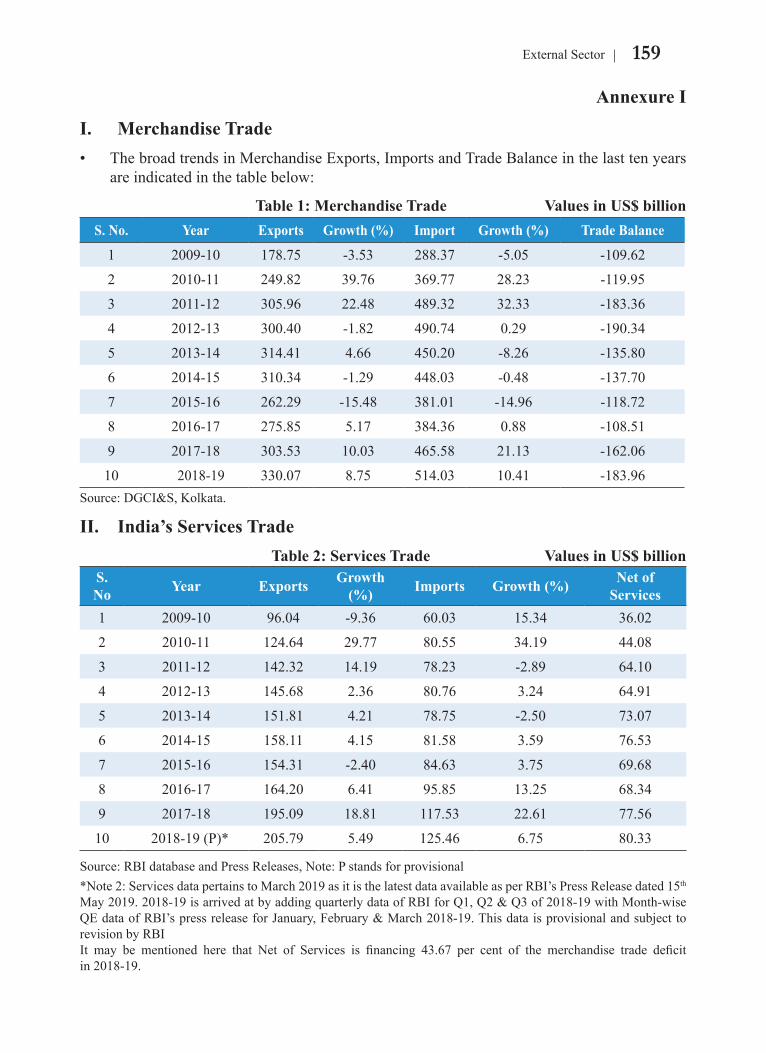
159External Sector
Annexure I
I. Merchandise Trade• The broad trends in Merchandise Exports, Imports and Trade Balance in the last ten years
are indicated in the table below:
Table 1: Merchandise Trade Values in US$ billionS. No. Year Exports Growth (%) Import Growth (%) Trade Balance
1 2009-10 178.75 -3.53 288.37 -5.05 -109.62
2 2010-11 249.82 39.76 369.77 28.23 -119.95
3 2011-12 305.96 22.48 489.32 32.33 -183.36
4 2012-13 300.40 -1.82 490.74 0.29 -190.34
5 2013-14 314.41 4.66 450.20 -8.26 -135.80
6 2014-15 310.34 -1.29 448.03 -0.48 -137.70
7 2015-16 262.29 -15.48 381.01 -14.96 -118.72
8 2016-17 275.85 5.17 384.36 0.88 -108.51
9 2017-18 303.53 10.03 465.58 21.13 -162.06
10 2018-19 330.07 8.75 514.03 10.41 -183.96Source: DGCI&S, Kolkata.
II. India’s Services Trade Table 2: Services Trade Values in US$ billion
S. No Year Exports Growth
(%) Imports Growth (%) Net of Services
1 2009-10 96.04 -9.36 60.03 15.34 36.02
2 2010-11 124.64 29.77 80.55 34.19 44.08
3 2011-12 142.32 14.19 78.23 -2.89 64.10
4 2012-13 145.68 2.36 80.76 3.24 64.91
5 2013-14 151.81 4.21 78.75 -2.50 73.07
6 2014-15 158.11 4.15 81.58 3.59 76.53
7 2015-16 154.31 -2.40 84.63 3.75 69.68
8 2016-17 164.20 6.41 95.85 13.25 68.34
9 2017-18 195.09 18.81 117.53 22.61 77.56
10 2018-19 (P)* 205.79 5.49 125.46 6.75 80.33
Source: RBI database and Press Releases, Note: P stands for provisional*Note 2: Services data pertains to March 2019 as it is the latest data available as per RBI’s Press Release dated 15th May 2019. 2018-19 is arrived at by adding quarterly data of RBI for Q1, Q2 & Q3 of 2018-19 with Month-wise QE data of RBI’s press release for January, February & March 2018-19. This data is provisional and subject to revision by RBIIt may be mentioned here that Net of Services is financing 43.67 per cent of the merchandise trade deficit in 2018-19.
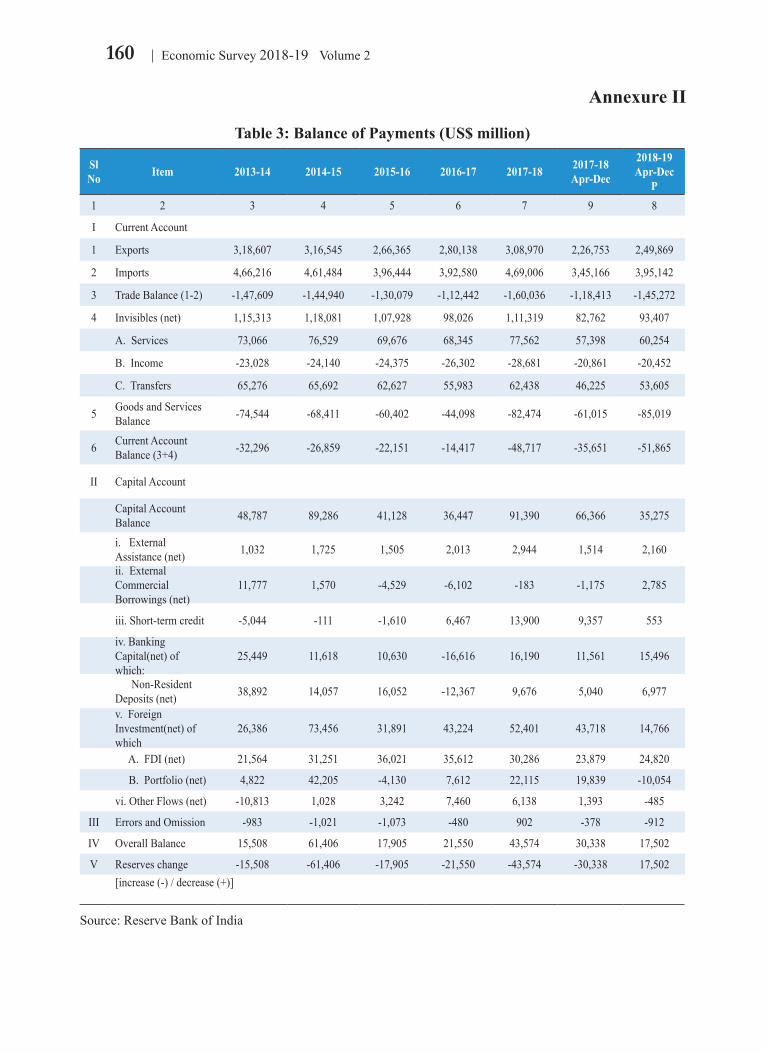
160 Economic Survey 2018-19 Volume 2
Annexure II
Table 3: Balance of Payments (US$ million)
Sl No Item 2013-14 2014-15 2015-16 2016-17 2017-18 2017-18
Apr-Dec
2018-19Apr-Dec
P1 2 3 4 5 6 7 9 8
I Current Account
1 Exports 3,18,607 3,16,545 2,66,365 2,80,138 3,08,970 2,26,753 2,49,869
2 Imports 4,66,216 4,61,484 3,96,444 3,92,580 4,69,006 3,45,166 3,95,142
3 Trade Balance (1-2) -1,47,609 -1,44,940 -1,30,079 -1,12,442 -1,60,036 -1,18,413 -1,45,272
4 Invisibles (net) 1,15,313 1,18,081 1,07,928 98,026 1,11,319 82,762 93,407
A. Services 73,066 76,529 69,676 68,345 77,562 57,398 60,254
B. Income -23,028 -24,140 -24,375 -26,302 -28,681 -20,861 -20,452
C. Transfers 65,276 65,692 62,627 55,983 62,438 46,225 53,605
5 Goods and Services Balance -74,544 -68,411 -60,402 -44,098 -82,474 -61,015 -85,019
6 Current Account Balance (3+4) -32,296 -26,859 -22,151 -14,417 -48,717 -35,651 -51,865
II Capital Account
Capital Account Balance 48,787 89,286 41,128 36,447 91,390 66,366 35,275
i. External Assistance (net) 1,032 1,725 1,505 2,013 2,944 1,514 2,160
ii. External Commercial Borrowings (net)
11,777 1,570 -4,529 -6,102 -183 -1,175 2,785
iii. Short-term credit -5,044 -111 -1,610 6,467 13,900 9,357 553
iv. Banking Capital(net) of which:
25,449 11,618 10,630 -16,616 16,190 11,561 15,496
Non-Resident Deposits (net) 38,892 14,057 16,052 -12,367 9,676 5,040 6,977
v. Foreign Investment(net) of which
26,386 73,456 31,891 43,224 52,401 43,718 14,766
A. FDI (net) 21,564 31,251 36,021 35,612 30,286 23,879 24,820
B. Portfolio (net) 4,822 42,205 -4,130 7,612 22,115 19,839 -10,054
vi. Other Flows (net) -10,813 1,028 3,242 7,460 6,138 1,393 -485
III Errors and Omission -983 -1,021 -1,073 -480 902 -378 -912
IV Overall Balance 15,508 61,406 17,905 21,550 43,574 30,338 17,502
V Reserves change -15,508 -61,406 -17,905 -21,550 -43,574 -30,338 17,502
[increase (-) / decrease (+)]
Source: Reserve Bank of India
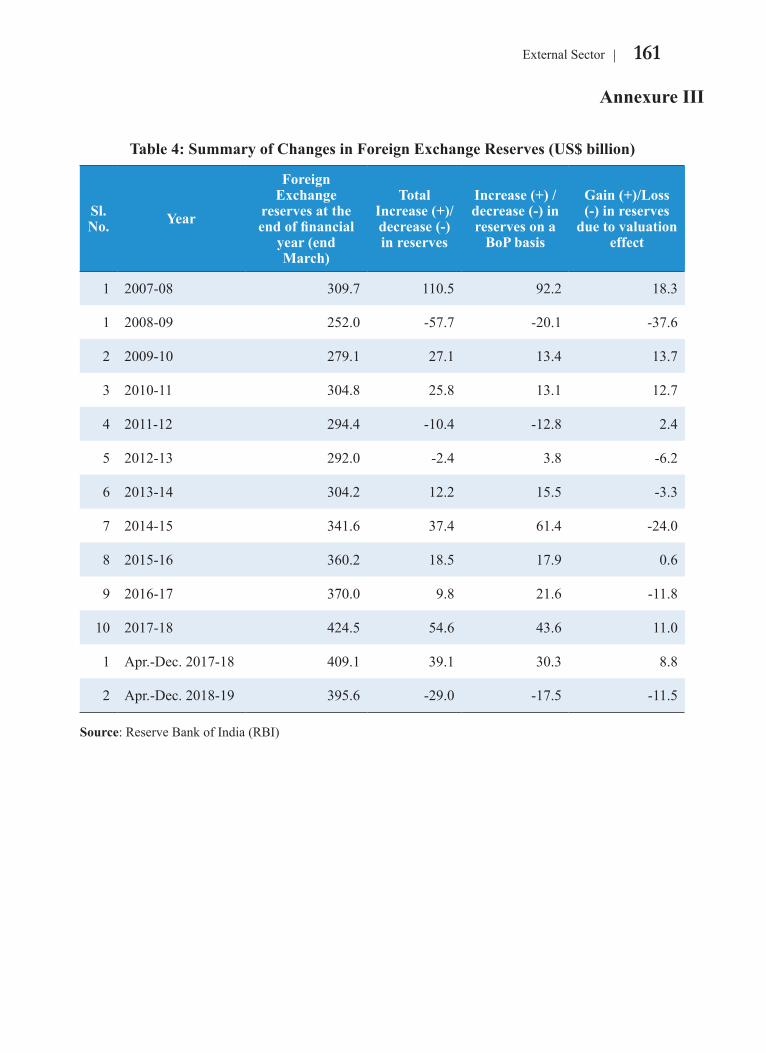
161External Sector
Annexure III
Table 4: Summary of Changes in Foreign Exchange Reserves (US$ billion)
Sl. No. Year
Foreign Exchange
reserves at the end of financial
year (end March)
Total Increase (+)/ decrease (-) in reserves
Increase (+) /decrease (-) in reserves on a
BoP basis
Gain (+)/Loss (-) in reserves
due to valuation effect
1 2007-08 309.7 110.5 92.2 18.3
1 2008-09 252.0 -57.7 -20.1 -37.6
2 2009-10 279.1 27.1 13.4 13.7
3 2010-11 304.8 25.8 13.1 12.7
4 2011-12 294.4 -10.4 -12.8 2.4
5 2012-13 292.0 -2.4 3.8 -6.2
6 2013-14 304.2 12.2 15.5 -3.3
7 2014-15 341.6 37.4 61.4 -24.0
8 2015-16 360.2 18.5 17.9 0.6
9 2016-17 370.0 9.8 21.6 -11.8
10 2017-18 424.5 54.6 43.6 11.0
1 Apr.-Dec. 2017-18 409.1 39.1 30.3 8.8
2 Apr.-Dec. 2018-19 395.6 -29.0 -17.5 -11.5
Source: Reserve Bank of India (RBI)
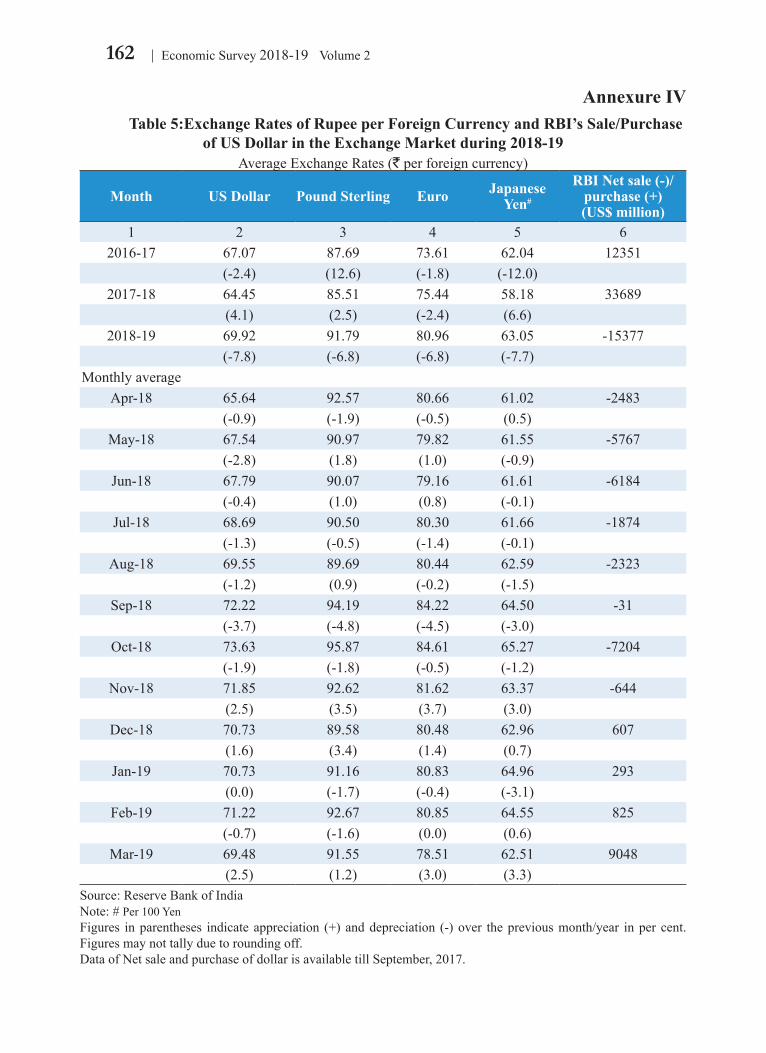
162 Economic Survey 2018-19 Volume 2
Annexure IV Table 5:Exchange Rates of Rupee per Foreign Currency and RBI’s Sale/Purchase
of US Dollar in the Exchange Market during 2018-19Average Exchange Rates (` per foreign currency)
Month US Dollar Pound Sterling Euro Japanese Yen#
RBI Net sale (-)/ purchase (+) (US$ million)
1 2 3 4 5 62016-17 67.07 87.69 73.61 62.04 12351
(-2.4) (12.6) (-1.8) (-12.0) 2017-18 64.45 85.51 75.44 58.18 33689
(4.1) (2.5) (-2.4) (6.6) 2018-19 69.92 91.79 80.96 63.05 -15377
(-7.8) (-6.8) (-6.8) (-7.7)Monthly average
Apr-18 65.64 92.57 80.66 61.02 -2483(-0.9) (-1.9) (-0.5) (0.5)
May-18 67.54 90.97 79.82 61.55 -5767(-2.8) (1.8) (1.0) (-0.9)
Jun-18 67.79 90.07 79.16 61.61 -6184(-0.4) (1.0) (0.8) (-0.1)
Jul-18 68.69 90.50 80.30 61.66 -1874(-1.3) (-0.5) (-1.4) (-0.1)
Aug-18 69.55 89.69 80.44 62.59 -2323(-1.2) (0.9) (-0.2) (-1.5)
Sep-18 72.22 94.19 84.22 64.50 -31(-3.7) (-4.8) (-4.5) (-3.0)
Oct-18 73.63 95.87 84.61 65.27 -7204(-1.9) (-1.8) (-0.5) (-1.2)
Nov-18 71.85 92.62 81.62 63.37 -644(2.5) (3.5) (3.7) (3.0)
Dec-18 70.73 89.58 80.48 62.96 607(1.6) (3.4) (1.4) (0.7)
Jan-19 70.73 91.16 80.83 64.96 293(0.0) (-1.7) (-0.4) (-3.1)
Feb-19 71.22 92.67 80.85 64.55 825(-0.7) (-1.6) (0.0) (0.6)
Mar-19 69.48 91.55 78.51 62.51 9048(2.5) (1.2) (3.0) (3.3)
Source: Reserve Bank of IndiaNote: # Per 100 YenFigures in parentheses indicate appreciation (+) and depreciation (-) over the previous month/year in per cent. Figures may not tally due to rounding off.Data of Net sale and purchase of dollar is available till September, 2017.
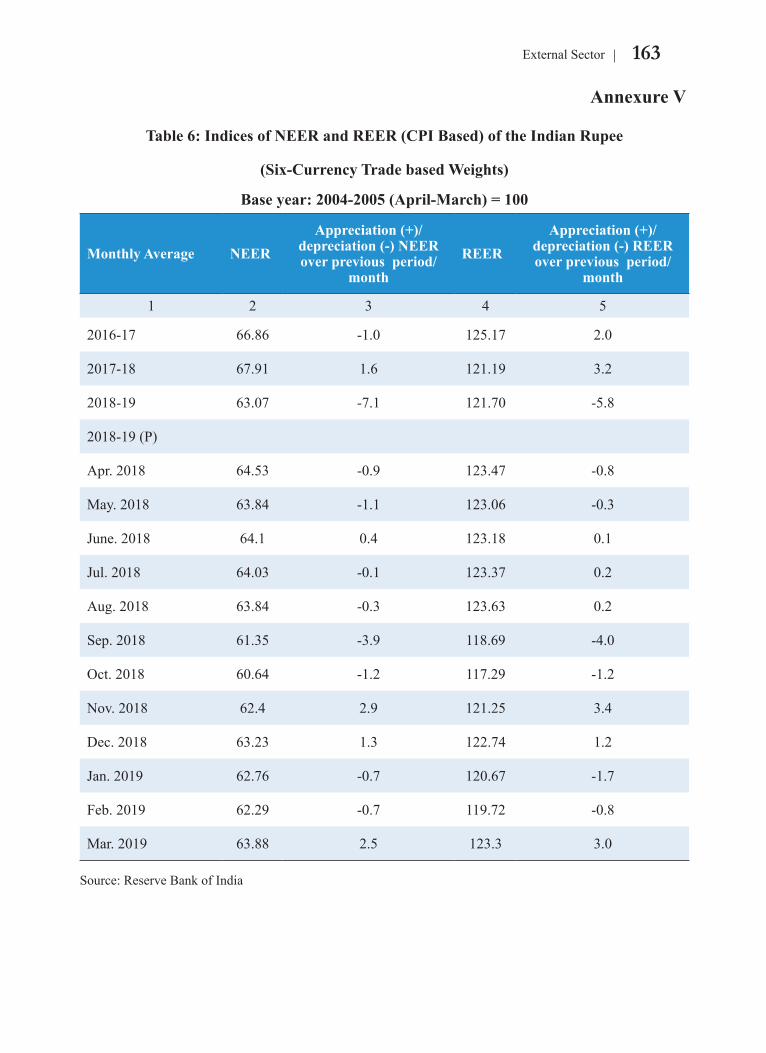
163External Sector
Annexure V
Table 6: Indices of NEER and REER (CPI Based) of the Indian Rupee
(Six-Currency Trade based Weights)
Base year: 2004-2005 (April-March) = 100
Monthly Average NEERAppreciation (+)/
depreciation (-) NEER over previous period/
monthREER
Appreciation (+)/ depreciation (-) REER over previous period/
month
1 2 3 4 5
2016-17 66.86 -1.0 125.17 2.0
2017-18 67.91 1.6 121.19 3.2
2018-19 63.07 -7.1 121.70 -5.8
2018-19 (P)
Apr. 2018 64.53 -0.9 123.47 -0.8
May. 2018 63.84 -1.1 123.06 -0.3
June. 2018 64.1 0.4 123.18 0.1
Jul. 2018 64.03 -0.1 123.37 0.2
Aug. 2018 63.84 -0.3 123.63 0.2
Sep. 2018 61.35 -3.9 118.69 -4.0
Oct. 2018 60.64 -1.2 117.29 -1.2
Nov. 2018 62.4 2.9 121.25 3.4
Dec. 2018 63.23 1.3 122.74 1.2
Jan. 2019 62.76 -0.7 120.67 -1.7
Feb. 2019 62.29 -0.7 119.72 -0.8
Mar. 2019 63.88 2.5 123.3 3.0
Source: Reserve Bank of India

164 Economic Survey 2018-19 Volume 2
Annexure VII. Exports of Top Ten Commodities in 2017-18
Values in US$ billion
Rank Commodity 2016-17 2017-18 %Growth % Share
1 Petroleum Products 31.55 37.47 18.77 12.34
2 Pearl, Precious, Semi-Precious Stones 24.92 25.87 3.8 8.52
3 Drug Formulations, Biologicals 12.67 12.91 1.92 4.25
4 Gold and other Precious Metal Jewellery 11.93 12.81 7.31 4.22
5 Iron And Steel 8.68 11.24 29.5 3.7
6 RMG Cotton incl. Accessories 8.51 8.51 -0.03 2.8
7 Motor Vehicle/Cars 7.55 8.47 12.26 2.798 Marine Products 5.90 7.39 25.18 2.439 Organic Chemicals 4.84 7.14 47.44 2.35
10 Products Of Iron And Steel 5.90 6.77 14.84 2.23
Source: DGCI&S, Kolkata
II. Exports of Top Ten Commodities in 2018-19Values in US$ billion
Rank Commodity 2017-18 2018-19 %Growth %Share
1 Petroleum Products 37.47 46.54 24.23 14.10
2 Pearl, Precious, Semi-Precious Stones 25.87 25.98 0.43 7.87
3 Drug Formulations, Biologicals 12.91 14.39 11.46 4.36
4 Gold and other Precious Metal Jewellery 12.81 12.94 1.02 3.92
5 Iron And Steel 11.24 9.74 -13.36 2.956 Organic Chemicals 7.14 9.33 30.58 2.837 RMG Cotton incl. Accessories 8.51 8.69 2.16 2.638 Motor Vehicle/Cars 8.47 8.50 0.32 2.589 Electric Machinery And Equipments 6.71 8.42 25.58 2.5510 Products Of Iron And Steel 6.77 7.26 7.22 2.2
Source: DGCI&S, Kolkata
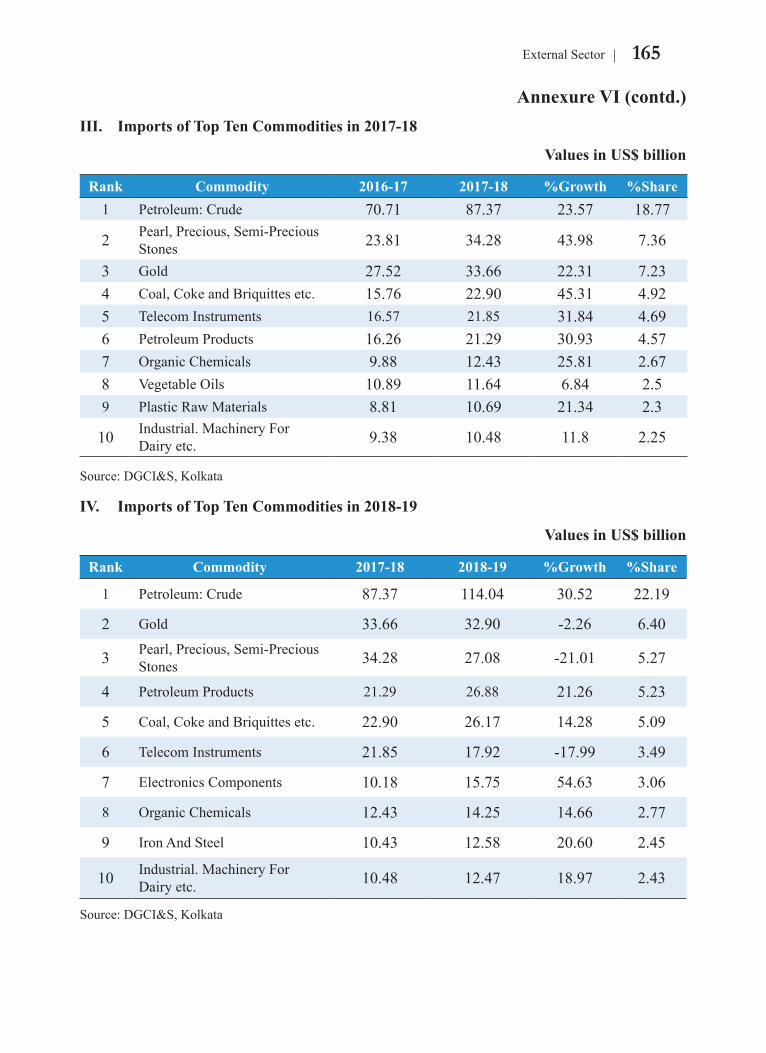
165External Sector
Annexure VI (contd.)III. Imports of Top Ten Commodities in 2017-18
Values in US$ billion
Rank Commodity 2016-17 2017-18 %Growth %Share1 Petroleum: Crude 70.71 87.37 23.57 18.77
2 Pearl, Precious, Semi-Precious Stones 23.81 34.28 43.98 7.36
3 Gold 27.52 33.66 22.31 7.234 Coal, Coke and Briquittes etc. 15.76 22.90 45.31 4.925 Telecom Instruments 16.57 21.85 31.84 4.696 Petroleum Products 16.26 21.29 30.93 4.577 Organic Chemicals 9.88 12.43 25.81 2.678 Vegetable Oils 10.89 11.64 6.84 2.59 Plastic Raw Materials 8.81 10.69 21.34 2.3
10 Industrial. Machinery For Dairy etc. 9.38 10.48 11.8 2.25
Source: DGCI&S, Kolkata
IV. Imports of Top Ten Commodities in 2018-19
Values in US$ billion
Rank Commodity 2017-18 2018-19 %Growth %Share
1 Petroleum: Crude 87.37 114.04 30.52 22.19
2 Gold 33.66 32.90 -2.26 6.40
3 Pearl, Precious, Semi-Precious Stones 34.28 27.08 -21.01 5.27
4 Petroleum Products 21.29 26.88 21.26 5.23
5 Coal, Coke and Briquittes etc. 22.90 26.17 14.28 5.09
6 Telecom Instruments 21.85 17.92 -17.99 3.49
7 Electronics Components 10.18 15.75 54.63 3.06
8 Organic Chemicals 12.43 14.25 14.66 2.77
9 Iron And Steel 10.43 12.58 20.60 2.45
10 Industrial. Machinery For Dairy etc. 10.48 12.47 18.97 2.43
Source: DGCI&S, Kolkata
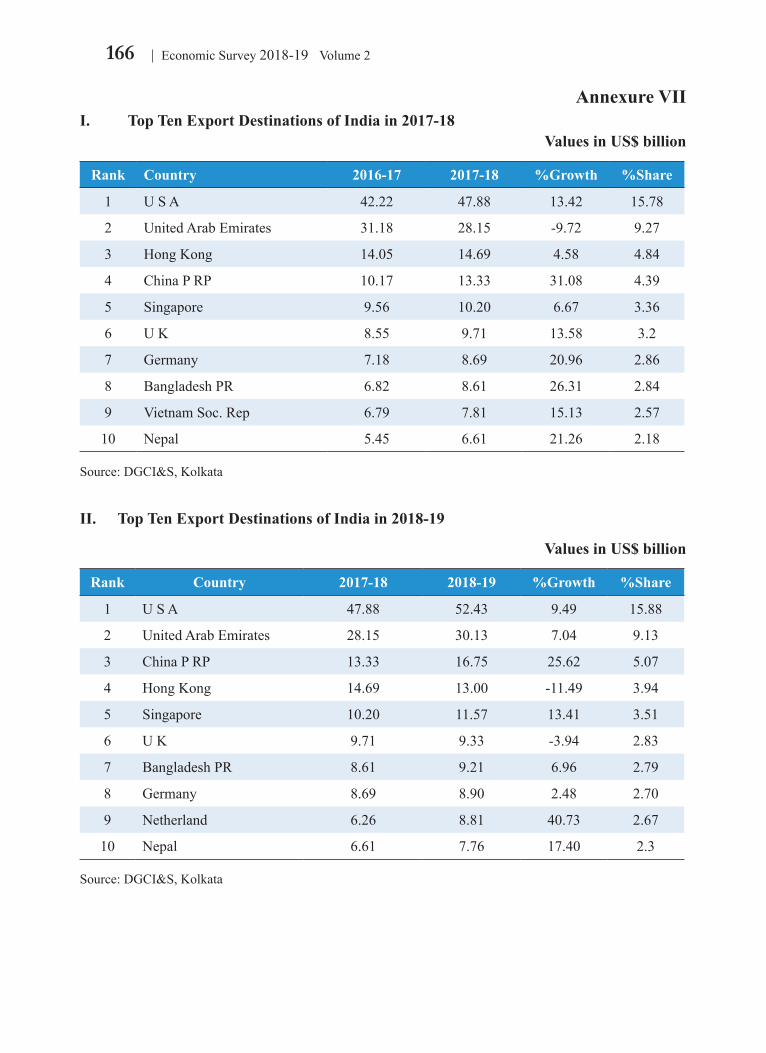
166 Economic Survey 2018-19 Volume 2
Annexure VIII. Top Ten Export Destinations of India in 2017-18
Values in US$ billion
Rank Country 2016-17 2017-18 %Growth %Share
1 U S A 42.22 47.88 13.42 15.78
2 United Arab Emirates 31.18 28.15 -9.72 9.27
3 Hong Kong 14.05 14.69 4.58 4.84
4 China P RP 10.17 13.33 31.08 4.39
5 Singapore 9.56 10.20 6.67 3.36
6 U K 8.55 9.71 13.58 3.2
7 Germany 7.18 8.69 20.96 2.86
8 Bangladesh PR 6.82 8.61 26.31 2.84
9 Vietnam Soc. Rep 6.79 7.81 15.13 2.57
10 Nepal 5.45 6.61 21.26 2.18
Source: DGCI&S, Kolkata
II. Top Ten Export Destinations of India in 2018-19
Values in US$ billion
Rank Country 2017-18 2018-19 %Growth %Share
1 U S A 47.88 52.43 9.49 15.88
2 United Arab Emirates 28.15 30.13 7.04 9.13
3 China P RP 13.33 16.75 25.62 5.07
4 Hong Kong 14.69 13.00 -11.49 3.94
5 Singapore 10.20 11.57 13.41 3.51
6 U K 9.71 9.33 -3.94 2.83
7 Bangladesh PR 8.61 9.21 6.96 2.79
8 Germany 8.69 8.90 2.48 2.70
9 Netherland 6.26 8.81 40.73 2.67
10 Nepal 6.61 7.76 17.40 2.3
Source: DGCI&S, Kolkata
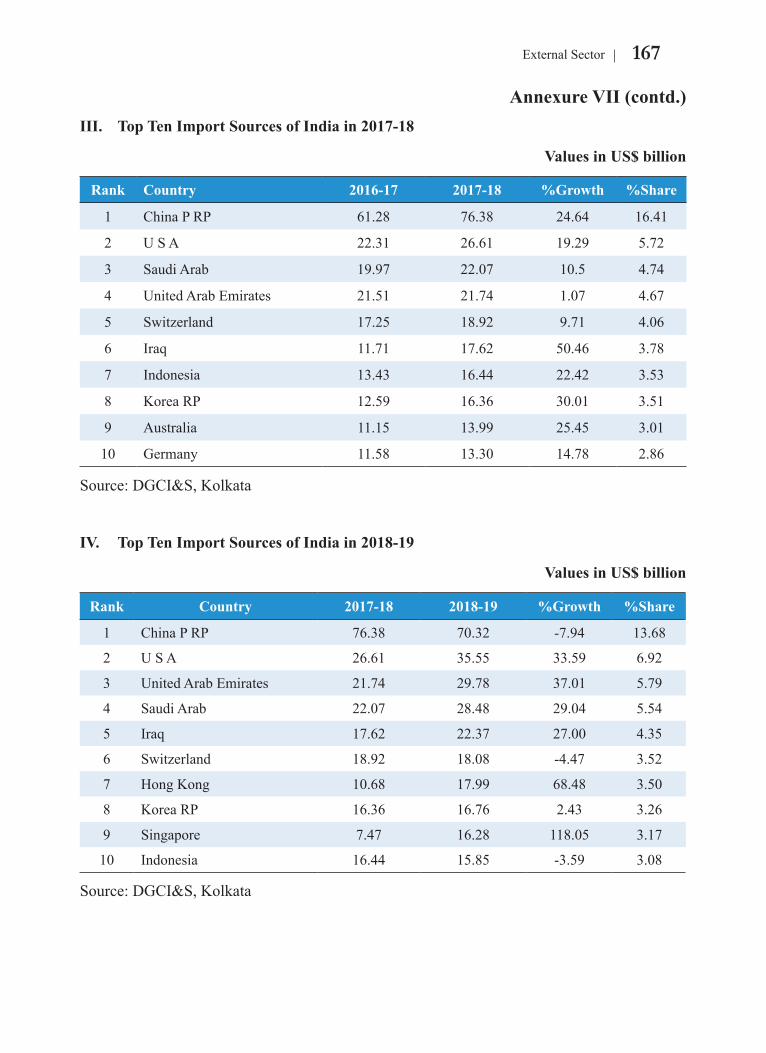
167External Sector
Annexure VII (contd.)III. Top Ten Import Sources of India in 2017-18
Values in US$ billion
Rank Country 2016-17 2017-18 %Growth %Share
1 China P RP 61.28 76.38 24.64 16.41
2 U S A 22.31 26.61 19.29 5.72
3 Saudi Arab 19.97 22.07 10.5 4.74
4 United Arab Emirates 21.51 21.74 1.07 4.67
5 Switzerland 17.25 18.92 9.71 4.06
6 Iraq 11.71 17.62 50.46 3.78
7 Indonesia 13.43 16.44 22.42 3.53
8 Korea RP 12.59 16.36 30.01 3.51
9 Australia 11.15 13.99 25.45 3.01
10 Germany 11.58 13.30 14.78 2.86
Source: DGCI&S, Kolkata
IV. Top Ten Import Sources of India in 2018-19
Values in US$ billion
Rank Country 2017-18 2018-19 %Growth %Share
1 China P RP 76.38 70.32 -7.94 13.68
2 U S A 26.61 35.55 33.59 6.92
3 United Arab Emirates 21.74 29.78 37.01 5.79
4 Saudi Arab 22.07 28.48 29.04 5.54
5 Iraq 17.62 22.37 27.00 4.35
6 Switzerland 18.92 18.08 -4.47 3.52
7 Hong Kong 10.68 17.99 68.48 3.50
8 Korea RP 16.36 16.76 2.43 3.26
9 Singapore 7.47 16.28 118.05 3.17
10 Indonesia 16.44 15.85 -3.59 3.08
Source: DGCI&S, Kolkata
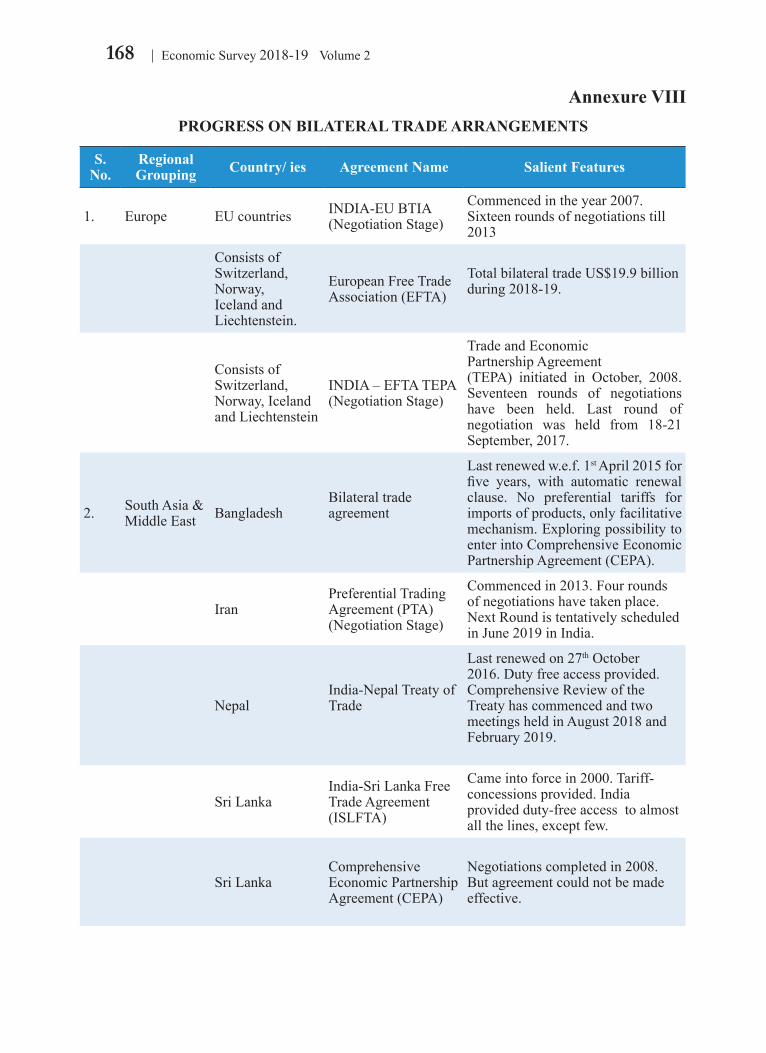
168 Economic Survey 2018-19 Volume 2
Annexure VIIIPROGRESS ON BILATERAL TRADE ARRANGEMENTS
S. No.
Regional Grouping Country/ ies Agreement Name Salient Features
1. Europe EU countries INDIA-EU BTIA(Negotiation Stage)
Commenced in the year 2007. Sixteen rounds of negotiations till 2013
Consists of Switzerland, Norway, Iceland and Liechtenstein.
European Free Trade Association (EFTA)
Total bilateral trade US$19.9 billion during 2018-19.
Consists of Switzerland, Norway, Iceland and Liechtenstein
INDIA – EFTA TEPA(Negotiation Stage)
Trade and Economic Partnership Agreement (TEPA) initiated in October, 2008. Seventeen rounds of negotiations have been held. Last round of negotiation was held from 18-21 September, 2017.
2. South Asia & Middle East Bangladesh
Bilateral trade agreement
Last renewed w.e.f. 1st April 2015 for five years, with automatic renewal clause. No preferential tariffs for imports of products, only facilitative mechanism. Exploring possibility to enter into Comprehensive Economic Partnership Agreement (CEPA).
IranPreferential Trading Agreement (PTA) (Negotiation Stage)
Commenced in 2013. Four rounds of negotiations have taken place. Next Round is tentatively scheduled in June 2019 in India.
NepalIndia-Nepal Treaty of Trade
Last renewed on 27th October 2016. Duty free access provided. Comprehensive Review of the Treaty has commenced and two meetings held in August 2018 and February 2019.
Sri LankaIndia-Sri Lanka Free Trade Agreement (ISLFTA)
Came into force in 2000. Tariff- concessions provided. India provided duty-free access to almost all the lines, except few.
Sri LankaComprehensive Economic Partnership Agreement (CEPA)
Negotiations completed in 2008. But agreement could not be made effective.
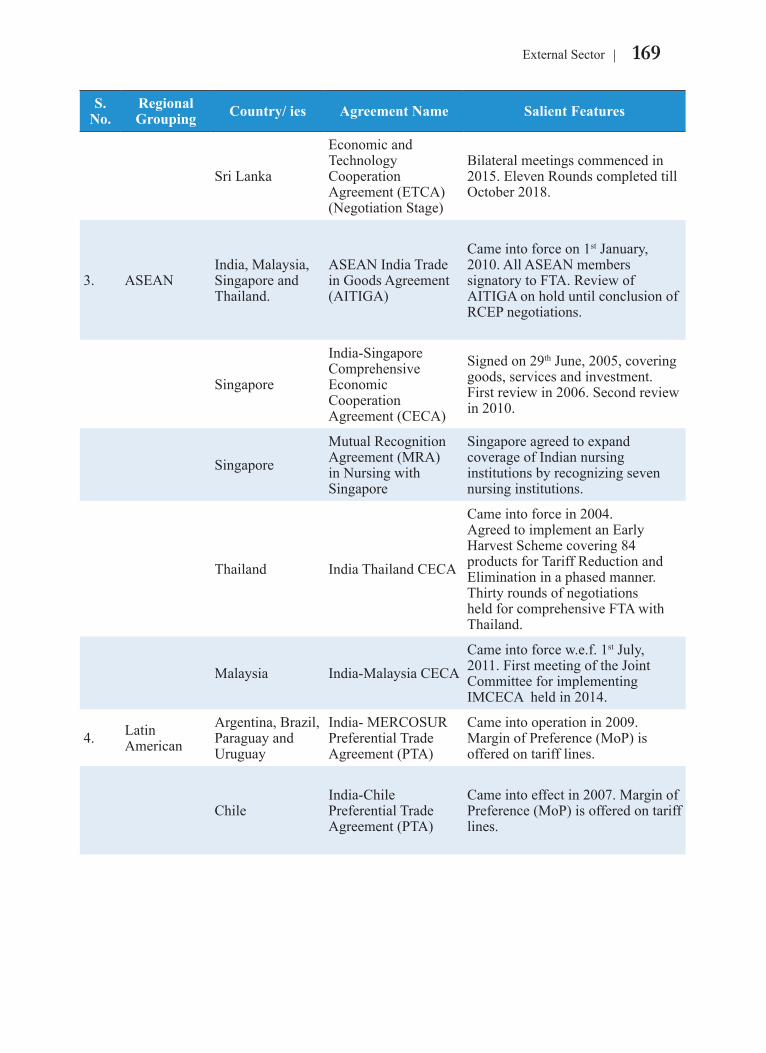
169External Sector
S. No.
Regional Grouping Country/ ies Agreement Name Salient Features
Sri Lanka
Economic and Technology Cooperation Agreement (ETCA) (Negotiation Stage)
Bilateral meetings commenced in 2015. Eleven Rounds completed till October 2018.
3. ASEANIndia, Malaysia, Singapore and Thailand.
ASEAN India Trade in Goods Agreement (AITIGA)
Came into force on 1st January, 2010. All ASEAN members signatory to FTA. Review of AITIGA on hold until conclusion of RCEP negotiations.
Singapore
India-Singapore Comprehensive Economic Cooperation Agreement (CECA)
Signed on 29th June, 2005, covering goods, services and investment. First review in 2006. Second review in 2010.
SingaporeMutual Recognition Agreement (MRA) in Nursing with Singapore
Singapore agreed to expand coverage of Indian nursing institutions by recognizing seven nursing institutions.
Thailand India Thailand CECA
Came into force in 2004.Agreed to implement an Early Harvest Scheme covering 84 products for Tariff Reduction and Elimination in a phased manner.Thirty rounds of negotiations held for comprehensive FTA with Thailand.
Malaysia India-Malaysia CECACame into force w.e.f. 1st July, 2011. First meeting of the Joint Committee for implementing IMCECA held in 2014.
4. Latin American
Argentina, Brazil, Paraguay and Uruguay
India- MERCOSUR Preferential Trade Agreement (PTA)
Came into operation in 2009. Margin of Preference (MoP) is offered on tariff lines.
ChileIndia-Chile Preferential Trade Agreement (PTA)
Came into effect in 2007. Margin of Preference (MoP) is offered on tariff lines.
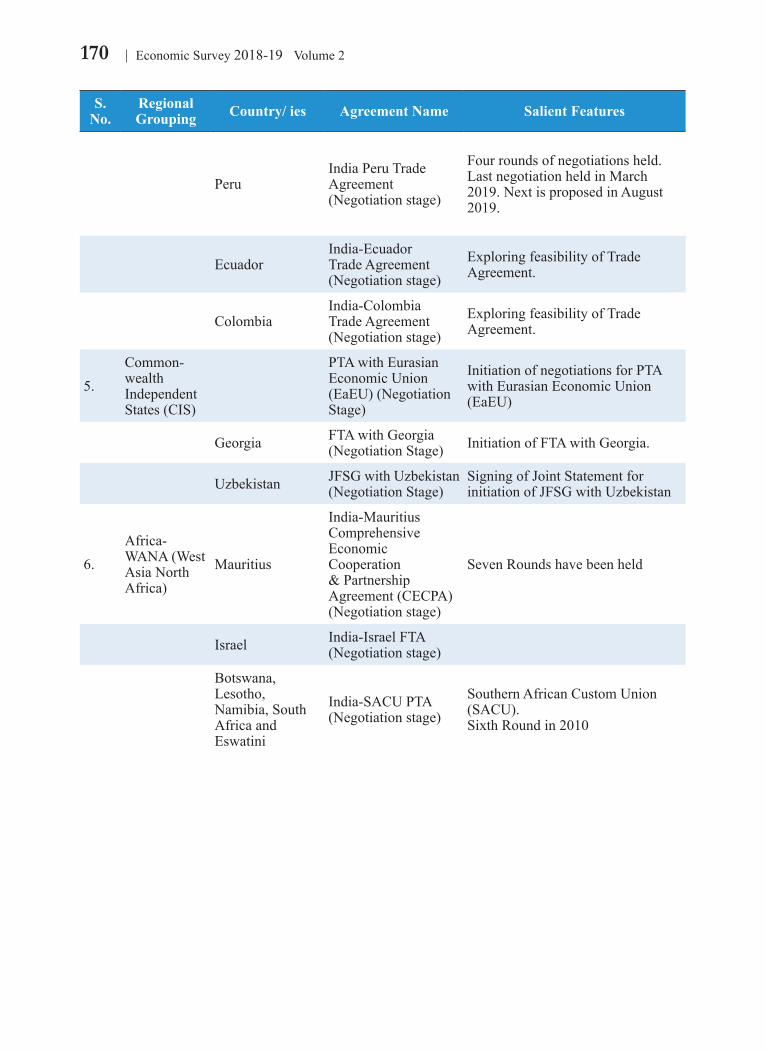
170 Economic Survey 2018-19 Volume 2
S. No.
Regional Grouping Country/ ies Agreement Name Salient Features
PeruIndia Peru Trade Agreement (Negotiation stage)
Four rounds of negotiations held. Last negotiation held in March 2019. Next is proposed in August 2019.
EcuadorIndia-Ecuador Trade Agreement (Negotiation stage)
Exploring feasibility of Trade Agreement.
ColombiaIndia-Colombia Trade Agreement (Negotiation stage)
Exploring feasibility of Trade Agreement.
5.Common-wealth Independent States (CIS)
PTA with Eurasian Economic Union (EaEU) (Negotiation Stage)
Initiation of negotiations for PTA with Eurasian Economic Union (EaEU)
Georgia FTA with Georgia (Negotiation Stage) Initiation of FTA with Georgia.
Uzbekistan JFSG with Uzbekistan (Negotiation Stage)
Signing of Joint Statement for initiation of JFSG with Uzbekistan
6.Africa-WANA (West Asia North Africa)
Mauritius
India-Mauritius Comprehensive Economic Cooperation & Partnership Agreement (CECPA) (Negotiation stage)
Seven Rounds have been held
Israel India-Israel FTA (Negotiation stage)
Botswana, Lesotho, Namibia, South Africa and Eswatini
India-SACU PTA(Negotiation stage)
Southern African Custom Union (SACU).Sixth Round in 2010
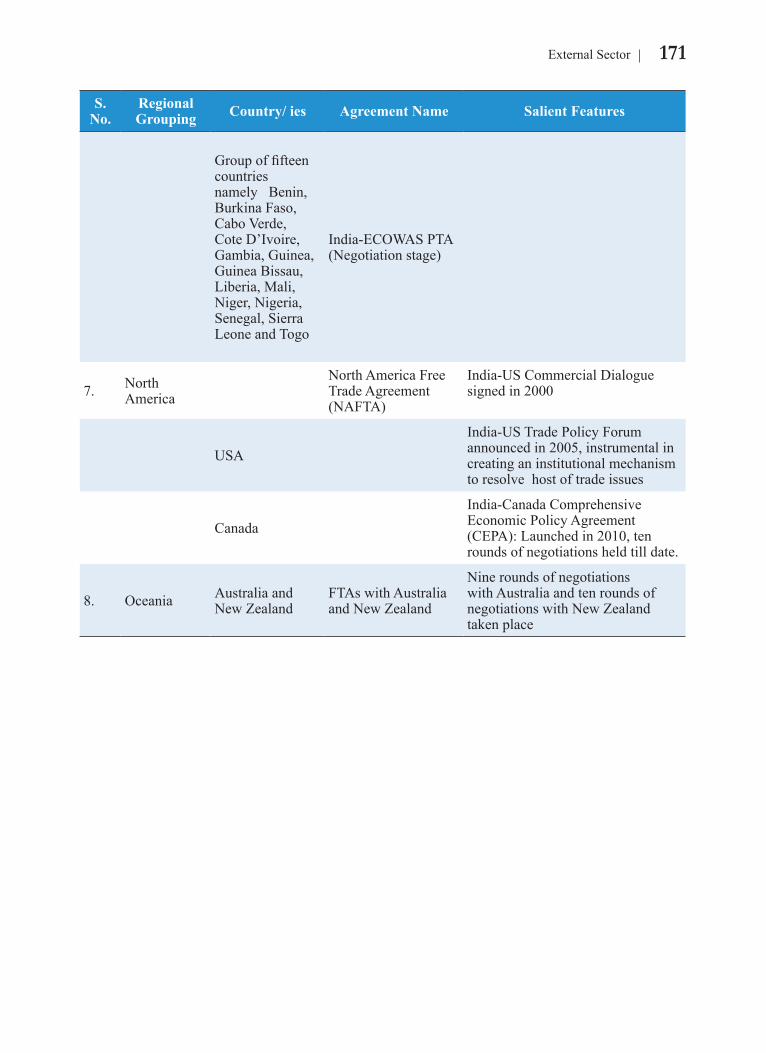
171External Sector
S. No.
Regional Grouping Country/ ies Agreement Name Salient Features
Group of fifteen countries namely Benin, Burkina Faso, Cabo Verde, Cote D’Ivoire, Gambia, Guinea, Guinea Bissau, Liberia, Mali, Niger, Nigeria, Senegal, Sierra Leone and Togo
India-ECOWAS PTA(Negotiation stage)
7. North America
North America Free Trade Agreement (NAFTA)
India-US Commercial Dialogue signed in 2000
USAIndia-US Trade Policy Forum announced in 2005, instrumental in creating an institutional mechanism to resolve host of trade issues
CanadaIndia-Canada Comprehensive Economic Policy Agreement (CEPA): Launched in 2010, ten rounds of negotiations held till date.
8. Oceania Australia and New Zealand
FTAs with Australia and New Zealand
Nine rounds of negotiations with Australia and ten rounds of negotiations with New Zealand taken place
CHAPTER
07
INTRODUCTION7.1 Agriculture and allied sectors are critical in terms of employment and livelihoods for the small and marginal farmers, who dominate the agriculture ecosystem in India. To attain the Sustainable Development Goals (SDGs) of ending poverty and bringing in inclusive growth, activities related to agriculture need to be closely integrated with the SDG targets. With decline in the size of
landholdings in agriculture, India has to focus on resource efficiency in smallholder farming to meet the SDG targets and also to attain sustainability in agriculture. A combination of resource efficient methods, dynamic cropping patterns, farming that is responsive to climate change and intensive use of ICTs should be the backbone of smallholder farming in India. For a safe and food secure future, the agriculture landscape has to undergo tremendous transformation and shift
“Since nature has the most sustainable ecosystem and since ultimately agriculture comes out of nature, our standard for a sustainable world should be nature’s own ecosystem”
-Wes Jackson1
Agriculture remains the pre-dominant occupation in India for vast sections of the population. Over the years, several new challenges have emerged before the sector. With fragmentation of agricultural holdings and depletion of water resources, the adoption of a resource-efficient, ICT based climate-smart agriculture can enhance agricultural productivity and sustainability. Smallholder farming can be a lucrative livelihood opportunity with the application of appropriate technologies and adoption of natural, organic and Zero Budget Natural Farming. To transform the rural economy, greater emphasis should be given to allied sectors with a major focus on dairy, poultry, fisheries and rearing of small ruminants. The rationalisation of food subsidy and greater use of technology in food management will ensure food security for all.
1 Co-founder of The Land Institute and a prominent leader of the international sustainable agriculture movement.
Agriculture and Food Management
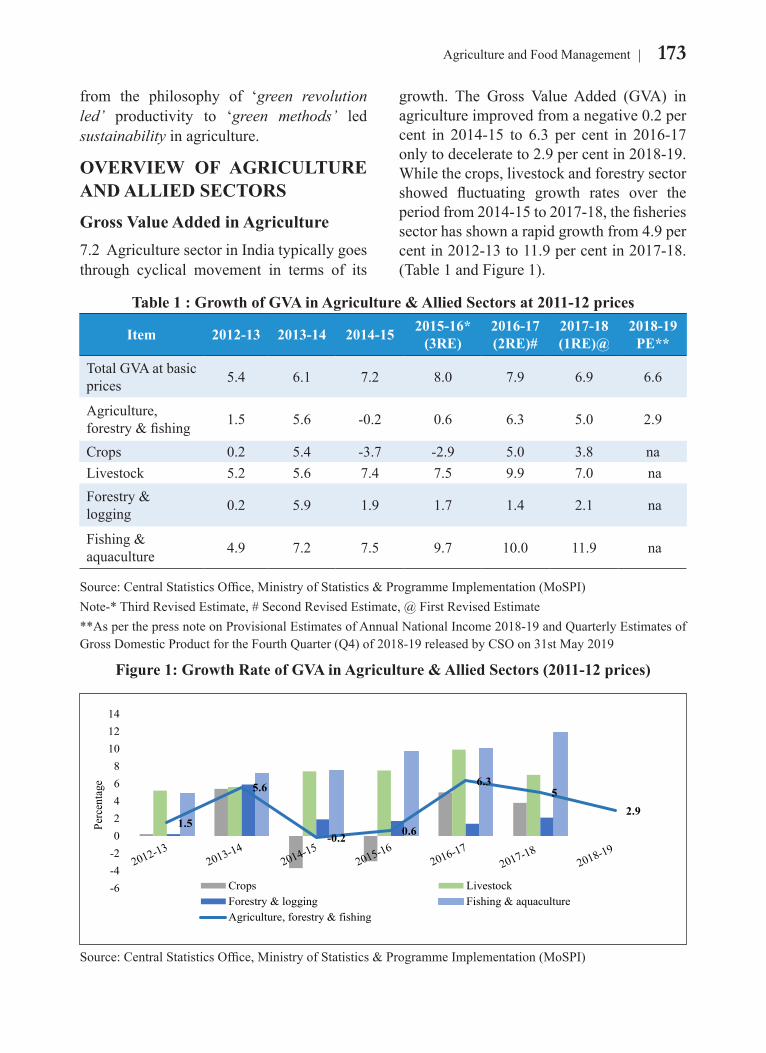
173Agriculture and Food Management
from the philosophy of ‘green revolution led’ productivity to ‘green methods’ led sustainability in agriculture.
OVERVIEW OF AGRICULTURE AND ALLIED SECTORS
Gross Value Added in Agriculture7.2 Agriculture sector in India typically goes through cyclical movement in terms of its
growth. The Gross Value Added (GVA) in agriculture improved from a negative 0.2 per cent in 2014-15 to 6.3 per cent in 2016-17 only to decelerate to 2.9 per cent in 2018-19. While the crops, livestock and forestry sector showed fluctuating growth rates over the period from 2014-15 to 2017-18, the fisheries sector has shown a rapid growth from 4.9 per cent in 2012-13 to 11.9 per cent in 2017-18.(Table 1 and Figure 1).
Table 1 : Growth of GVA in Agriculture & Allied Sectors at 2011-12 prices
Item 2012-13 2013-14 2014-15 2015-16* (3RE)
2016-17 (2RE)#
2017-18 (1RE)@
2018-19 PE**
Total GVA at basic prices 5.4 6.1 7.2 8.0 7.9 6.9 6.6
Agriculture, forestry & fishing 1.5 5.6 -0.2 0.6 6.3 5.0 2.9
Crops 0.2 5.4 -3.7 -2.9 5.0 3.8 naLivestock 5.2 5.6 7.4 7.5 9.9 7.0 naForestry & logging 0.2 5.9 1.9 1.7 1.4 2.1 na
Fishing & aquaculture 4.9 7.2 7.5 9.7 10.0 11.9 na
Source: Central Statistics Office, Ministry of Statistics & Programme Implementation (MoSPI)Note-* Third Revised Estimate, # Second Revised Estimate, @ First Revised Estimate**As per the press note on Provisional Estimates of Annual National Income 2018-19 and Quarterly Estimates of Gross Domestic Product for the Fourth Quarter (Q4) of 2018-19 released by CSO on 31st May 2019
Figure 1: Growth Rate of GVA in Agriculture & Allied Sectors (2011-12 prices)
1.5
5.6
-0.2 0.6
6.35
2.9
-6-4-202468
101214
Perc
enta
ge
Crops LivestockForestry & logging Fishing & aquacultureAgriculture, forestry & fishing
Source: Central Statistics Office, Ministry of Statistics & Programme Implementation (MoSPI)
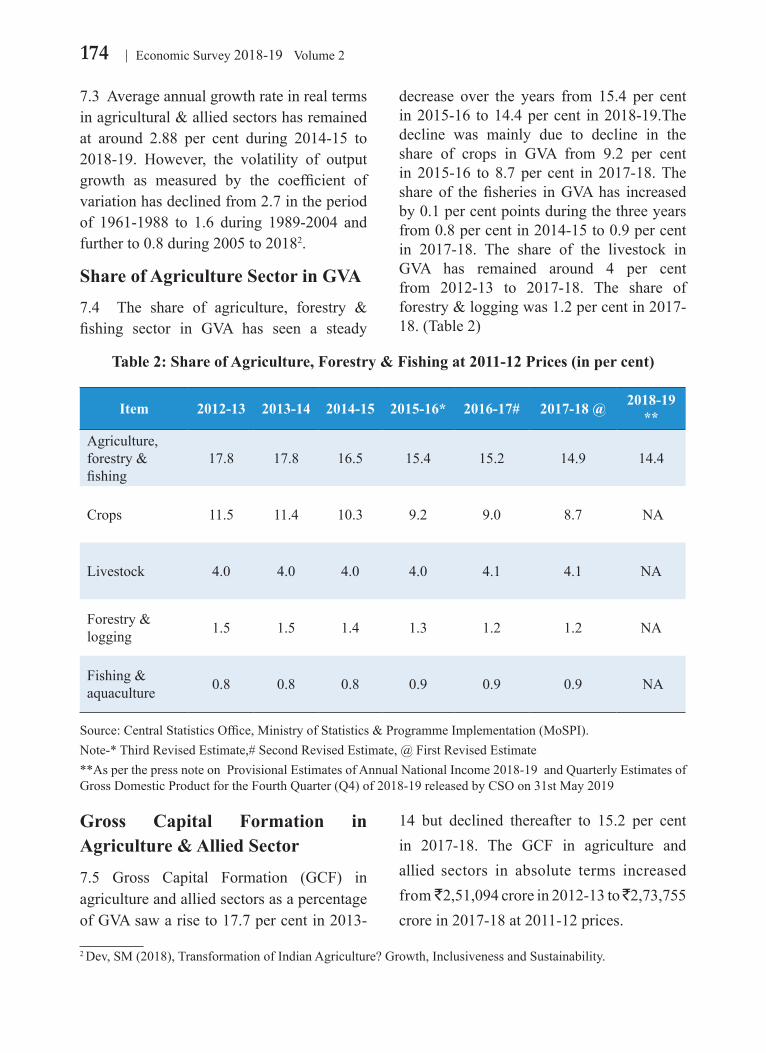
174 Economic Survey 2018-19 Volume 2
7.3 Average annual growth rate in real terms in agricultural & allied sectors has remained at around 2.88 per cent during 2014-15 to 2018-19. However, the volatility of output growth as measured by the coefficient of variation has declined from 2.7 in the period of 1961-1988 to 1.6 during 1989-2004 and further to 0.8 during 2005 to 20182.
Share of Agriculture Sector in GVA7.4 The share of agriculture, forestry & fishing sector in GVA has seen a steady
2 Dev, SM (2018), Transformation of Indian Agriculture? Growth, Inclusiveness and Sustainability.
decrease over the years from 15.4 per cent in 2015-16 to 14.4 per cent in 2018-19.The decline was mainly due to decline in the share of crops in GVA from 9.2 per cent in 2015-16 to 8.7 per cent in 2017-18. The share of the fisheries in GVA has increased by 0.1 per cent points during the three years from 0.8 per cent in 2014-15 to 0.9 per cent in 2017-18. The share of the livestock in GVA has remained around 4 per cent from 2012-13 to 2017-18. The share of forestry & logging was 1.2 per cent in 2017-18. (Table 2)
Gross Capital Formation in Agriculture & Allied Sector
7.5 Gross Capital Formation (GCF) in agriculture and allied sectors as a percentage of GVA saw a rise to 17.7 per cent in 2013-
14 but declined thereafter to 15.2 per cent in 2017-18. The GCF in agriculture and allied sectors in absolute terms increased from ̀ 2,51,094 crore in 2012-13 to ̀ 2,73,755 crore in 2017-18 at 2011-12 prices.
Table 2: Share of Agriculture, Forestry & Fishing at 2011-12 Prices (in per cent)
Item 2012-13 2013-14 2014-15 2015-16* 2016-17# 2017-18 @ 2018-19 **
Agriculture, forestry & fishing
17.8 17.8 16.5 15.4 15.2 14.9 14.4
Crops 11.5 11.4 10.3 9.2 9.0 8.7 NA
Livestock 4.0 4.0 4.0 4.0 4.1 4.1 NA
Forestry & logging 1.5 1.5 1.4 1.3 1.2 1.2 NA
Fishing & aquaculture 0.8 0.8 0.8 0.9 0.9 0.9 NA
Source: Central Statistics Office, Ministry of Statistics & Programme Implementation (MoSPI).Note-* Third Revised Estimate,# Second Revised Estimate, @ First Revised Estimate**As per the press note on Provisional Estimates of Annual National Income 2018-19 and Quarterly Estimates of Gross Domestic Product for the Fourth Quarter (Q4) of 2018-19 released by CSO on 31st May 2019
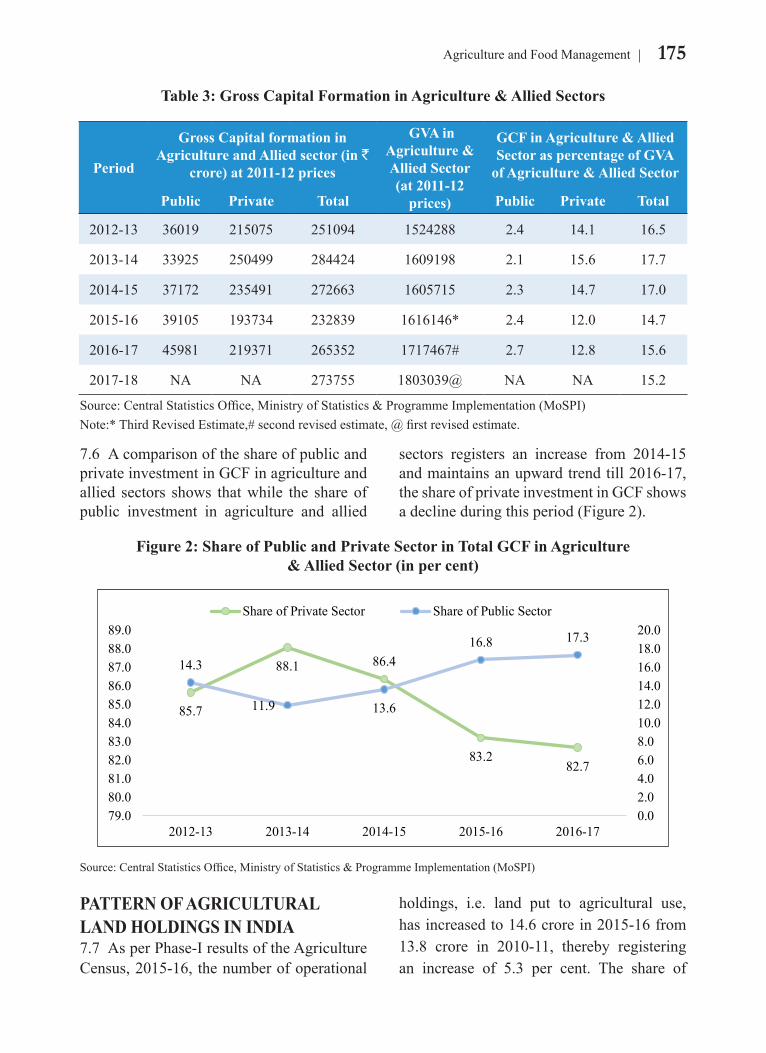
175Agriculture and Food Management
7.6 A comparison of the share of public and private investment in GCF in agriculture and allied sectors shows that while the share of public investment in agriculture and allied
sectors registers an increase from 2014-15 and maintains an upward trend till 2016-17, the share of private investment in GCF shows a decline during this period (Figure 2).
PATTERN OF AGRICULTURAL LAND HOLDINGS IN INDIA7.7 As per Phase-I results of the Agriculture Census, 2015-16, the number of operational
holdings, i.e. land put to agricultural use, has increased to 14.6 crore in 2015-16 from 13.8 crore in 2010-11, thereby registering an increase of 5.3 per cent. The share of
Table 3: Gross Capital Formation in Agriculture & Allied Sectors
Period
Gross Capital formation in Agriculture and Allied sector (in `
crore) at 2011-12 prices
GVA in Agriculture & Allied Sector (at 2011-12
prices)
GCF in Agriculture & Allied Sector as percentage of GVA
of Agriculture & Allied Sector
Public Private Total Public Private Total
2012-13 36019 215075 251094 1524288 2.4 14.1 16.5
2013-14 33925 250499 284424 1609198 2.1 15.6 17.7
2014-15 37172 235491 272663 1605715 2.3 14.7 17.0
2015-16 39105 193734 232839 1616146* 2.4 12.0 14.7
2016-17 45981 219371 265352 1717467# 2.7 12.8 15.6
2017-18 NA NA 273755 1803039@ NA NA 15.2
Source: Central Statistics Office, Ministry of Statistics & Programme Implementation (MoSPI)Note:* Third Revised Estimate,# second revised estimate, @ first revised estimate.
Figure 2: Share of Public and Private Sector in Total GCF in Agriculture & Allied Sector (in per cent)
85.7
88.1 86.4
83.282.7
14.3
11.9 13.6
16.8 17.3
0.02.04.06.08.010.012.014.016.018.020.0
79.080.081.082.083.084.085.086.087.088.089.0
2012-13 2013-14 2014-15 2015-16 2016-17
Share of Private Sector Share of Public Sector
Source: Central Statistics Office, Ministry of Statistics & Programme Implementation (MoSPI)
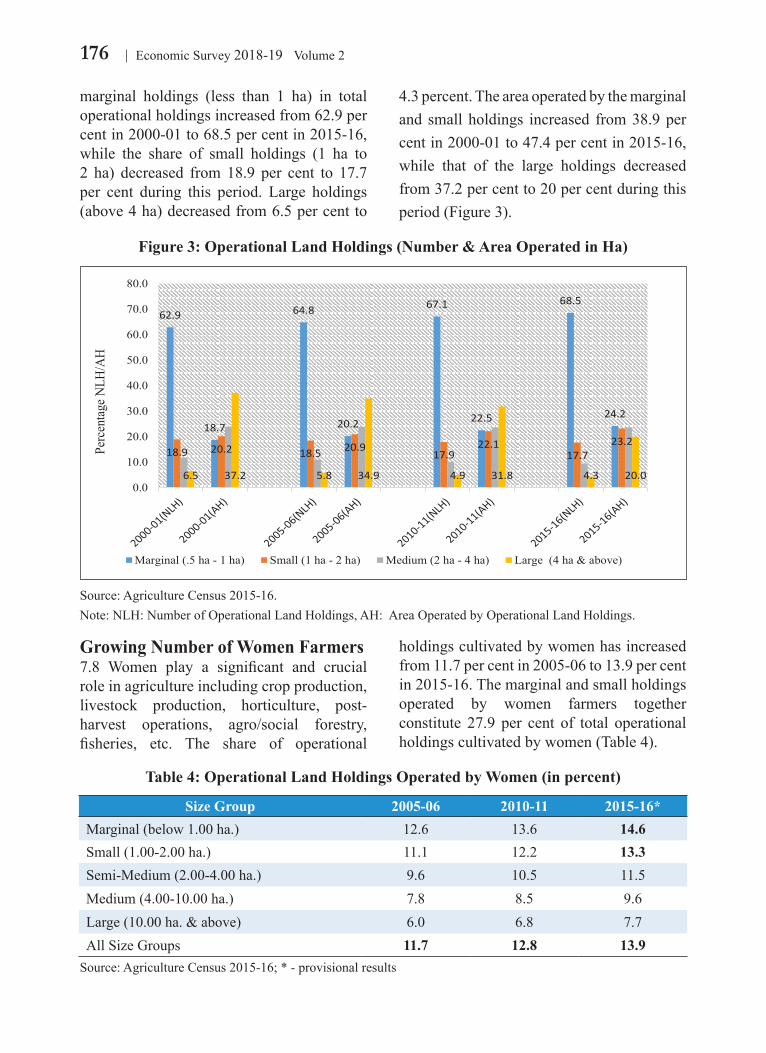
176 Economic Survey 2018-19 Volume 2
marginal holdings (less than 1 ha) in total operational holdings increased from 62.9 per cent in 2000-01 to 68.5 per cent in 2015-16, while the share of small holdings (1 ha to 2 ha) decreased from 18.9 per cent to 17.7 per cent during this period. Large holdings (above 4 ha) decreased from 6.5 per cent to
4.3 percent. The area operated by the marginal and small holdings increased from 38.9 per cent in 2000-01 to 47.4 per cent in 2015-16, while that of the large holdings decreased from 37.2 per cent to 20 per cent during this period (Figure 3).
Growing Number of Women Farmers7.8 Women play a significant and crucial role in agriculture including crop production, livestock production, horticulture, post-harvest operations, agro/social forestry, fisheries, etc. The share of operational
holdings cultivated by women has increased from 11.7 per cent in 2005-06 to 13.9 per cent in 2015-16. The marginal and small holdings operated by women farmers together constitute 27.9 per cent of total operational holdings cultivated by women (Table 4).
Table 4: Operational Land Holdings Operated by Women (in percent)
Size Group 2005-06 2010-11 2015-16*Marginal (below 1.00 ha.) 12.6 13.6 14.6Small (1.00-2.00 ha.) 11.1 12.2 13.3Semi-Medium (2.00-4.00 ha.) 9.6 10.5 11.5Medium (4.00-10.00 ha.) 7.8 8.5 9.6Large (10.00 ha. & above) 6.0 6.8 7.7All Size Groups 11.7 12.8 13.9
Source: Agriculture Census 2015-16; * - provisional results
Figure 3: Operational Land Holdings (Number & Area Operated in Ha)
62.9
18.7
64.8
20.2
67.1
22.5
68.5
24.2
18.9 20.2 18.5 20.917.9
22.117.7
23.2
6.5 37.2 5.8 34.9 4.9 31.8 4.3 20.00.0
10.0
20.0
30.0
40.0
50.0
60.0
70.0
80.0
Perc
enta
ge N
LH/A
H
Marginal (.5 ha - 1 ha) Small (1 ha - 2 ha) Medium (2 ha - 4 ha) Large (4 ha & above)
Source: Agriculture Census 2015-16.Note: NLH: Number of Operational Land Holdings, AH: Area Operated by Operational Land Holdings.
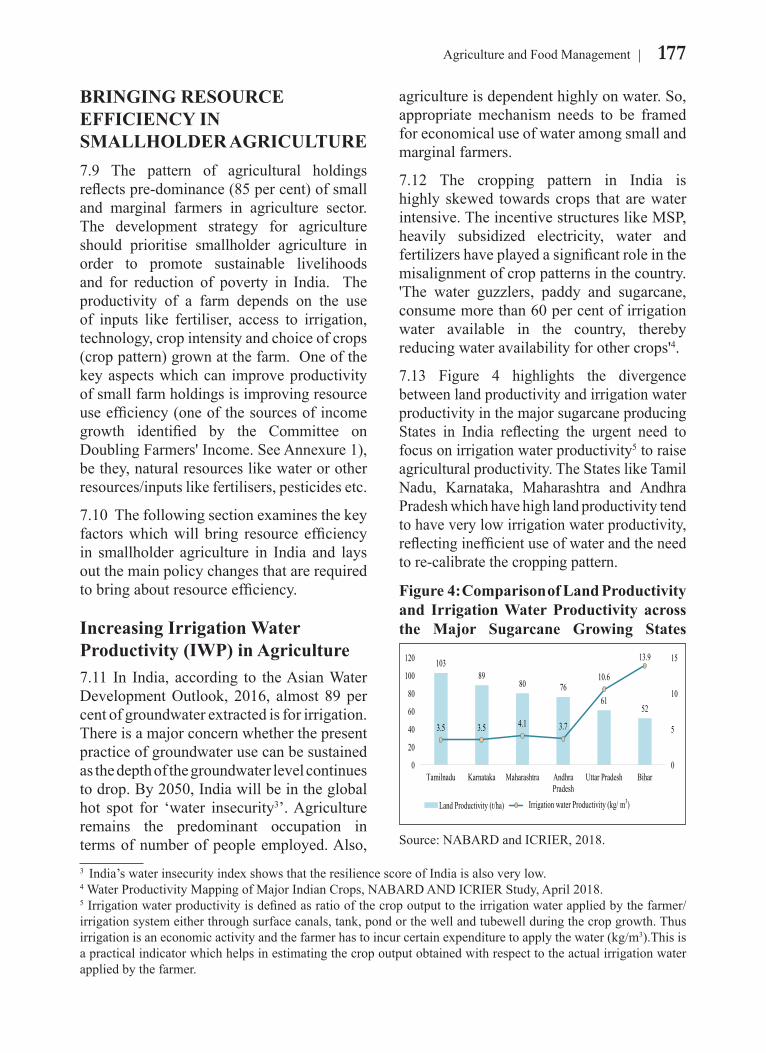
177Agriculture and Food Management
BRINGING RESOURCE EFFICIENCY IN SMALLHOLDER AGRICULTURE7.9 The pattern of agricultural holdings reflects pre-dominance (85 per cent) of small and marginal farmers in agriculture sector. The development strategy for agriculture should prioritise smallholder agriculture in order to promote sustainable livelihoods and for reduction of poverty in India. The productivity of a farm depends on the use of inputs like fertiliser, access to irrigation, technology, crop intensity and choice of crops (crop pattern) grown at the farm. One of the key aspects which can improve productivity of small farm holdings is improving resource use efficiency (one of the sources of income growth identified by the Committee on Doubling Farmers' Income. See Annexure 1), be they, natural resources like water or other resources/inputs like fertilisers, pesticides etc.
7.10 The following section examines the key factors which will bring resource efficiency in smallholder agriculture in India and lays out the main policy changes that are required to bring about resource efficiency.
Increasing Irrigation Water Productivity (IWP) in Agriculture 7.11 In India, according to the Asian Water Development Outlook, 2016, almost 89 per cent of groundwater extracted is for irrigation.There is a major concern whether the present practice of groundwater use can be sustained as the depth of the groundwater level continues to drop. By 2050, India will be in the global hot spot for ‘water insecurity3’. Agriculture remains the predominant occupation in terms of number of people employed. Also,
agriculture is dependent highly on water. So, appropriate mechanism needs to be framed for economical use of water among small and marginal farmers.
7.12 The cropping pattern in India is highly skewed towards crops that are water intensive. The incentive structures like MSP, heavily subsidized electricity, water and fertilizers have played a significant role in the misalignment of crop patterns in the country. 'The water guzzlers, paddy and sugarcane, consume more than 60 per cent of irrigation water available in the country, thereby reducing water availability for other crops'4.
7.13 Figure 4 highlights the divergence between land productivity and irrigation water productivity in the major sugarcane producing States in India reflecting the urgent need to focus on irrigation water productivity5 to raise agricultural productivity. The States like Tamil Nadu, Karnataka, Maharashtra and Andhra Pradesh which have high land productivity tend to have very low irrigation water productivity, reflecting inefficient use of water and the need to re-calibrate the cropping pattern.
3 India’s water insecurity index shows that the resilience score of India is also very low.4 Water Productivity Mapping of Major Indian Crops, NABARD AND ICRIER Study, April 2018.5 Irrigation water productivity is defined as ratio of the crop output to the irrigation water applied by the farmer/ irrigation system either through surface canals, tank, pond or the well and tubewell during the crop growth. Thus irrigation is an economic activity and the farmer has to incur certain expenditure to apply the water (kg/m3).This is a practical indicator which helps in estimating the crop output obtained with respect to the actual irrigation water applied by the farmer.
Figure 4: Comparison of Land Productivity and Irrigation Water Productivity across the Major Sugarcane Growing States
103 89
80 76 61
52
3.5 3.5 4.1 3.7
10.6
13.9
0
5
10
15
0
20
40
60
80
100
120
Tamilnadu Karnataka Maharashtra Andhra Pradesh
Uttar Pradesh Bihar
Land Productivity (t/ha) Irrigation Water Productivity (kg/cu.m) Irrigation water Productivity (kg/ m3)
Source: NABARD and ICRIER, 2018.
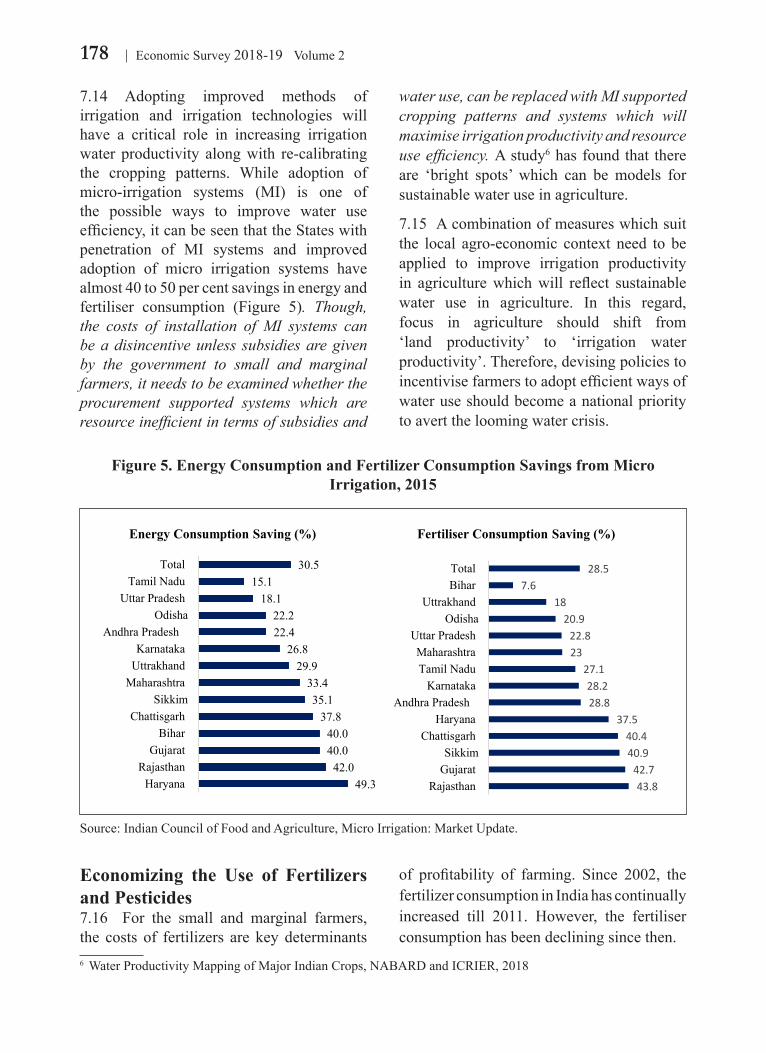
178 Economic Survey 2018-19 Volume 2
7.14 Adopting improved methods of irrigation and irrigation technologies will have a critical role in increasing irrigation water productivity along with re-calibrating the cropping patterns. While adoption of micro-irrigation systems (MI) is one of the possible ways to improve water use efficiency, it can be seen that the States with penetration of MI systems and improved adoption of micro irrigation systems have almost 40 to 50 per cent savings in energy and fertiliser consumption (Figure 5). Though, the costs of installation of MI systems can be a disincentive unless subsidies are given by the government to small and marginal farmers, it needs to be examined whether the procurement supported systems which are resource inefficient in terms of subsidies and
water use, can be replaced with MI supported cropping patterns and systems which will maximise irrigation productivity and resource use efficiency. A study6 has found that there are ‘bright spots’ which can be models for sustainable water use in agriculture.
7.15 A combination of measures which suit the local agro-economic context need to be applied to improve irrigation productivity in agriculture which will reflect sustainable water use in agriculture. In this regard, focus in agriculture should shift from ‘land productivity’ to ‘irrigation water productivity’. Therefore, devising policies to incentivise farmers to adopt efficient ways of water use should become a national priority to avert the looming water crisis.
Economizing the Use of Fertilizers and Pesticides7.16 For the small and marginal farmers, the costs of fertilizers are key determinants
of profitability of farming. Since 2002, the fertilizer consumption in India has continually increased till 2011. However, the fertiliser consumption has been declining since then.
6 Water Productivity Mapping of Major Indian Crops, NABARD and ICRIER, 2018
Figure 5. Energy Consumption and Fertilizer Consumption Savings from Micro Irrigation, 2015
49.342.0
40.040.0
37.835.1
33.429.9
26.822.422.2
18.115.1
30.5
Haryana Rajasthan
Gujarat Bihar
ChattisgarhSikkim
Maharashtra Uttrakhand Karnataka
Andhra PradeshOdisha
Uttar Pradesh Tamil Nadu
Total
Energy Consumption Saving (%)
43.842.7
40.940.4
37.528.828.2
27.12322.8
20.918
7.628.5
Rajasthan Gujarat
Sikkim Chattisgarh
Haryana Andhra Pradesh
Karnataka Tamil Nadu Maharashtra
Uttar PradeshOdisha
Uttrakhand BiharTotal
Fertiliser Consumption Saving (%)
Source: Indian Council of Food and Agriculture, Micro Irrigation: Market Update.
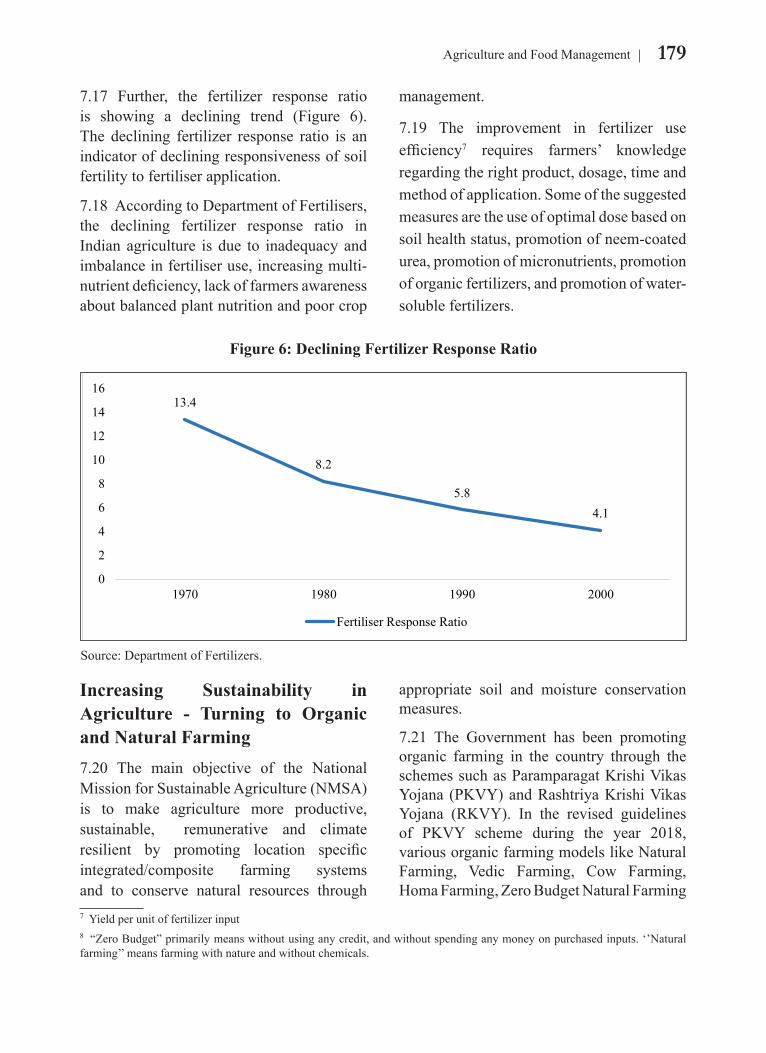
179Agriculture and Food Management
7.17 Further, the fertilizer response ratio is showing a declining trend (Figure 6). The declining fertilizer response ratio is an indicator of declining responsiveness of soil fertility to fertiliser application.
7.18 According to Department of Fertilisers, the declining fertilizer response ratio in Indian agriculture is due to inadequacy and imbalance in fertiliser use, increasing multi-nutrient deficiency, lack of farmers awareness about balanced plant nutrition and poor crop
management.
7.19 The improvement in fertilizer use efficiency7 requires farmers’ knowledge regarding the right product, dosage, time and method of application. Some of the suggested measures are the use of optimal dose based on soil health status, promotion of neem-coated urea, promotion of micronutrients, promotion of organic fertilizers, and promotion of water-soluble fertilizers.
7 Yield per unit of fertilizer input8 “Zero Budget” primarily means without using any credit, and without spending any money on purchased inputs. ‘’Natural farming’’ means farming with nature and without chemicals.
Increasing Sustainability in Agriculture - Turning to Organic and Natural Farming7.20 The main objective of the National Mission for Sustainable Agriculture (NMSA) is to make agriculture more productive, sustainable, remunerative and climate resilient by promoting location specific integrated/composite farming systems and to conserve natural resources through
appropriate soil and moisture conservation measures.
7.21 The Government has been promoting organic farming in the country through the schemes such as Paramparagat Krishi Vikas Yojana (PKVY) and Rashtriya Krishi Vikas Yojana (RKVY). In the revised guidelines of PKVY scheme during the year 2018, various organic farming models like Natural Farming, Vedic Farming, Cow Farming, Homa Farming, Zero Budget Natural Farming
Figure 6: Declining Fertilizer Response Ratio
13.4
8.2
5.84.1
0
2
4
6
8
10
12
14
16
1970 1980 1990 2000
Fertiliser Response Ratio
Source: Department of Fertilizers.
180 Economic Survey 2018-19 Volume 2
(ZBNF)8 etc. have been included wherein flexibility lies with the States to adopt any model of Organic Farming depending on the farmer’s choice. Under the RKVY scheme, organic farming/natural farming project components are considered by the respective State Level Sanctioning Committee (SLSC) according to their priority/choice.
7.22 The main aim of Zero Budget Natural Farming (ZBNF) is elimination of chemical pesticides and promotion of good agronomic practices. ZBNF also aims to sustain agriculture production with eco-friendly processes in tune with nature to produce agricultural produce free of chemicals. Soil fertility & soil organic matter is restored by pursuing ZBNF. Less water is required under ZBNF and it is a climate friendly agriculture system.The programme is being implemented in 131 clusters covering 704 villages under RKVY and 1300 clusters covering 268 villages under PKVY. So far, 1,63,034 farmers are practicing ZBNF. Organic farming is also being promoted through the scheme Mission Organic Value Chain Development for North Eastern Region (MOVCDNER) under National Mission for Sustainable Agriculture (NMSA).
7.23 Some of the States which are progressively practicing ZBNF are Karnataka, Himachal Pradesh and Andhra Pradesh. After ZBNF, Andhra Pradesh has witnessed a sharp decline in input costs and improvement in yields (Government of Telangana, 2017).
Adopting Appropriate Technologies for Smallholder Farms
7.24 In smallholder farms, resource efficiency can be brought about through adoption of appropriate technologies. However, use of technology, investment in costly farm machinery, or scaling up the existing technology may not be economically feasible for small and marginal farmers. Hence, there is need to promote use of environment-friendly automated farm machinery tools suited to small scale operations. The Custom Hiring Centers (CHCs) can be set up to promote use of high-tech machinery for the mechanization of small and marginal farm holdings, especially in difficult terrains. From 2014-15 to 2017-18, a total of 8162 CHCs were established under the Sub Mission on Agricultural Mechanization (SMAM) scheme.
7.25 To facilitate communication and reduce transaction costs, the ICT (Information and Communication Technology) applications are crucial in smallholder farming. The spread of mobile phones in rural areas has already impacted the way the small and marginal farmers get access to information about soil health, weather and prices. In the context of poor infrastructure, adoption of ICT in agriculture will promote market access, facilitate financial inclusion and contribute significantly to early warning signals that are critical for the development of smallholder community. Technology can play a critical role in bridging the information gaps that
Coffee Board has launched blockchain based coffee e-marketplace. This is a pilot project which is likely to help integrate the farmers with markets in a transparent manner and lead to realization of fair price for the coffee producer. It will also reduce the number of layers between coffee growers and buyers and help farmers double their income.
India is the only country in the world where entire coffee is grown under shade, handpicked and sun dried. Coffee is produced in India by small coffee growers, tribal farmers adjacent to National Parks and Wildlife Sanctuaries in Western and Eastern Ghats, which are two of the major bio-
Box 1: Coffee Board Activates Blockchain Based Marketplace in India
181Agriculture and Food Management
prevail in agricultural markets. The use of blockchain technology in the coffee market represents one such example (Box.1).
Improving Infrastructure and Access to Markets
7.26 The informal actors like local traders and input dealers are more prominent in the marketing channels of the smallholder farmers. However, if farmers’ access to markets are improved through better
diversity hot spots in the world. Indian coffee is highly valued in the world market and sold as premium coffee. However, the share of farmers in the final returns from coffee is very meagre.
Blockchain based market place app for trading of Indian coffees is intended to bring in transparency in the trade of Indian coffee, maintain the traceability of Indian coffee from bean to cup so as consumer tastes real Indian coffee, the grower is paid fairly for his coffee produced. This initiative will reduce grower’s dependency on intermediaries by providing direct access to buyers at a fair price for their produce. The initiative will also help coffee producers find exporters within the stipulated time to meet the growing demands and in building greater trust through increased transparency.
Coffee Board is in the process of developing Blockchain based marketplace application. This platform has already registered a group of 15-20 coffee farmers, exporters, importers and retailers are already registered on the platform from India and abroad. India is one of the few coffee blockchain processors for coffee in the world, after France and Ethiopia.
The stakeholders like coffee farmers, traders, exporters register on platform to make trade transactions. The coffee farmers register credentials like place where coffee is grown, details of crop, elevation etc. A block is created for each lot farmer sells. The credentials of the lot are stored on the blockchain throughout its journey and is immutable.
NITI Aayog launched in 2016 an index to rank States and UTs based on implementation of seven provisions proposed under model APMC Act like joining e-NAM initiative, special treatment to fruits and vegetables for marketing and level of taxes in mandis. These indicators reveal ease of doing agribusiness as well as opportunities for farmers to benefit from modern trade and commerce and have wider option for sale of her/his produce. These indicators also represent competitiveness, efficiency and transparency in agri markets. The second area of reforms captured by the index include facilitation and liberalization of land lease. The third area included in the index represent freedom given to farmers for felling and transit of trees grown on private land. This represent opportunity to diversify farm business.
The Index is named as “Agricultural Marketing and Farmer Friendly Reforms Index (AMFFRI)” and it has a score that can have minimum value “0” implying no reforms and maximum value “100” implying complete reforms in the selected areas. States and UTs have been ranked using this index.
connectivity to nearby mandis, it will help farmers fetch better prices for their agricultural produce. A combination of enhancing rural infrastructure to improve connectivity, Information, Communication Technology (ICT) to provide timely information about prices, aggregation and storage facilities can help small and marginal farmers in overcoming the marketing bottlenecks.
Box 2. Agricultural Marketing and Farmer Friendly Reforms Index (AMFFRI)

182 Economic Survey 2018-19 Volume 2
0.010.020.030.040.050.060.070.080.090.0
Mah
aras
htr
aG
uja
rat
Raj
asth
anM
adh
ya P
rad
esh
Har
yan
aH
imac
hal
Pra
des
hA
ndh
ra P
rade
shK
arn
atak
aT
elan
gana
Go
aC
hha
ttis
gar
hJh
arkh
and
Utt
ar P
rade
shP
unja
bA
ssam
Miz
oram
Nag
alan
dS
ikk
imW
est
Ben
gal
Tri
pura
Od
isha
Utt
arak
hand
Aru
nach
al P
rad
esh
Ch
and
igar
hT
amil
Nad
uM
egh
alay
aJa
mm
u &
Kas
hm
irL
aksh
adw
eep
Del
hi
UT
Pud
uche
rry
Source: NITI Aayog Study Report on Agricultural Marketing and Farmer Friendly Reforms across Indian States and UTs, October, 2016.
Ranking of States based on AMFFRI
No state in the country has implemented the entire set of market reforms. Also, land leasing and harvest and marketing of some tree species on private farm land are subjected to various degrees of restrictions in almost all the States/UTs. The State of Maharashtra achieved first rank in implementation of various reforms. The State has implemented most of the marketing reforms and it offers best environment for doing agri-business among all the States/UTs. Gujarat ranks second with a score of 71.5 out of 100, closely followed by Rajasthan and Madhya Pradesh.
The State of Karnataka, which is considered progressive in implementing market reforms, did not figure among the top states for two reasons. It is lagging in liberalization of land lease and restrictions on felling of trees on private land. Two, it is not yet integrated with eNAM. However, the State has its own Unified Market Platform operated by ReMS, which has all the provisions as envisaged under eNAM. If this reform in the State is treated at par with eNAM, then Karnataka earns additional score of 7.4. This increases the score of the State in AMFFRI from 55.5 to 62.9 and raises its rank from 8th place to the 6th place.
Agriculturally developed State of Punjab ranks 14th with a score of 43.9. This is because of poor implementation of market reforms in the State.
Almost two third States/UTs could not reach even halfway mark of reforms score. Major States like U.P., Punjab, West Bengal, Assam, Jharkhand, Tamil Nadu and J&K are in this group. It is also pertinent to mention that some States/UTs do not have APMC Act. It is a challenge to provide ranking to these States in market reforms.
Ranking of States in terms of implementation of marketing and other farmer friendly reforms
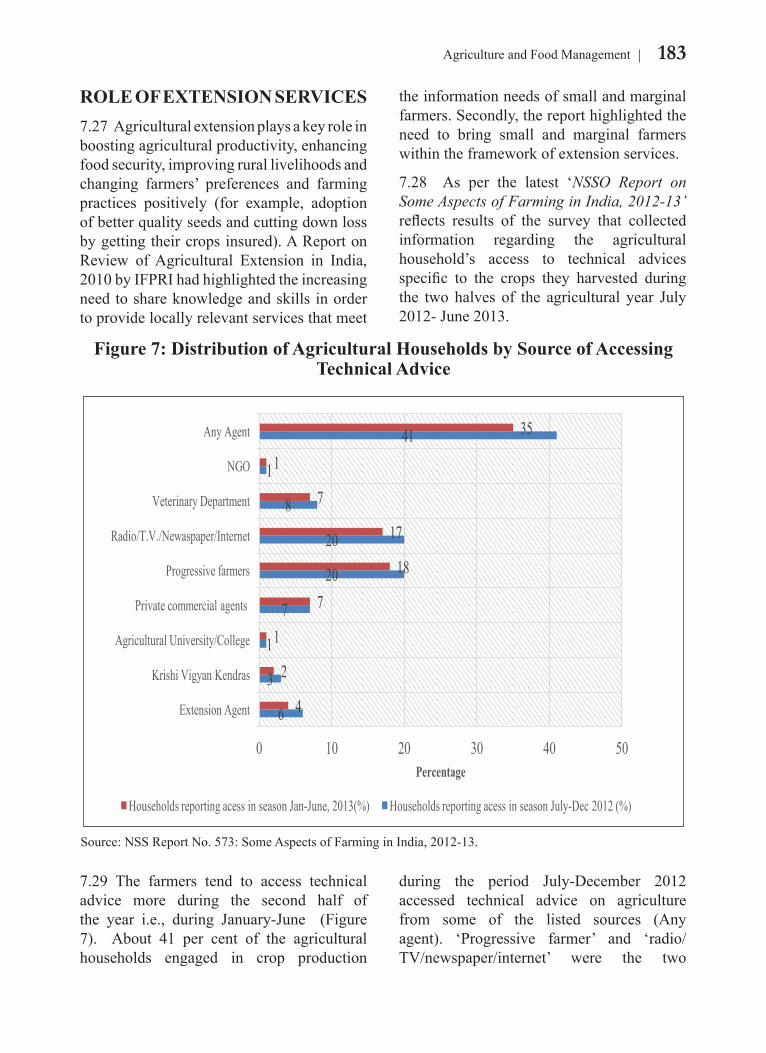
183Agriculture and Food Management
ROLE OF EXTENSION SERVICES7.27 Agricultural extension plays a key role in boosting agricultural productivity, enhancing food security, improving rural livelihoods and changing farmers’ preferences and farming practices positively (for example, adoption of better quality seeds and cutting down loss by getting their crops insured). A Report on Review of Agricultural Extension in India, 2010 by IFPRI had highlighted the increasing need to share knowledge and skills in order to provide locally relevant services that meet
the information needs of small and marginal farmers. Secondly, the report highlighted the need to bring small and marginal farmers within the framework of extension services.
7.28 As per the latest ‘NSSO Report on Some Aspects of Farming in India, 2012-13’ reflects results of the survey that collected information regarding the agricultural household’s access to technical advices specific to the crops they harvested during the two halves of the agricultural year July 2012- June 2013.
7.29 The farmers tend to access technical advice more during the second half of the year i.e., during January-June (Figure 7). About 41 per cent of the agricultural households engaged in crop production
during the period July-December 2012 accessed technical advice on agriculture from some of the listed sources (Any agent). ‘Progressive farmer’ and ‘radio/TV/newspaper/internet’ were the two
Figure 7: Distribution of Agricultural Households by Source of Accessing Technical Advice
6
3
1
7
20
20
8
1
41
4
2
1
7
18
17
7
1
35
0 10 20 30 40 50
Extension Agent
Krishi Vigyan Kendras
Agricultural University/College
Private commercial agents
Progressive farmers
Radio/T.V./Newaspaper/Internet
Veterinary Department
NGO
Any Agent
Percentage
Households reporting acess in season Jan-June, 2013(%) Households reporting acess in season July-Dec 2012 (%)
Source: NSS Report No. 573: Some Aspects of Farming in India, 2012-13.
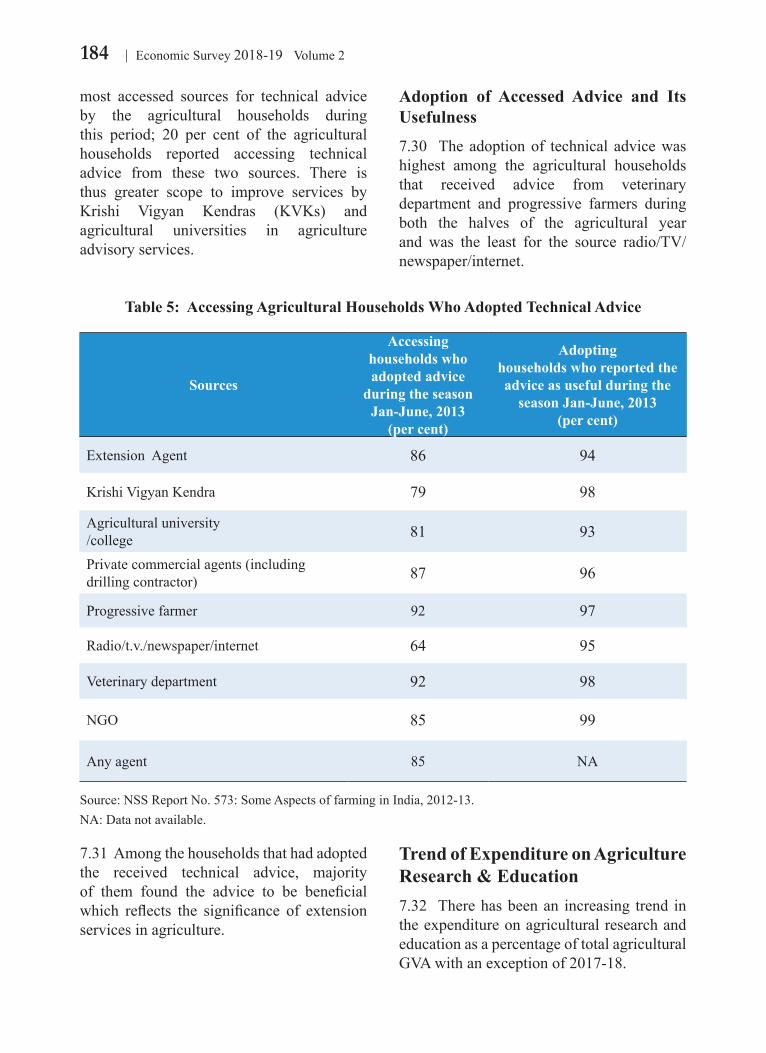
184 Economic Survey 2018-19 Volume 2
most accessed sources for technical advice by the agricultural households during this period; 20 per cent of the agricultural households reported accessing technical advice from these two sources. There is thus greater scope to improve services by Krishi Vigyan Kendras (KVKs) and agricultural universities in agriculture advisory services.
Adoption of Accessed Advice and Its Usefulness7.30 The adoption of technical advice was highest among the agricultural households that received advice from veterinary department and progressive farmers during both the halves of the agricultural year and was the least for the source radio/TV/newspaper/internet.
7.31 Among the households that had adopted the received technical advice, majority of them found the advice to be beneficial which reflects the significance of extension services in agriculture.
Trend of Expenditure on Agriculture Research & Education7.32 There has been an increasing trend in the expenditure on agricultural research and education as a percentage of total agricultural GVA with an exception of 2017-18.
Table 5: Accessing Agricultural Households Who Adopted Technical Advice
Sources
Accessing households who adopted advice
during the season Jan-June, 2013
(per cent)
Adopting households who reported the advice as useful during the
season Jan-June, 2013(per cent)
Extension Agent 86 94
Krishi Vigyan Kendra 79 98
Agricultural university /college 81 93
Private commercial agents (including drilling contractor) 87 96
Progressive farmer 92 97
Radio/t.v./newspaper/internet 64 95
Veterinary department 92 98
NGO 85 99
Any agent 85 NA
Source: NSS Report No. 573: Some Aspects of farming in India, 2012-13. NA: Data not available.
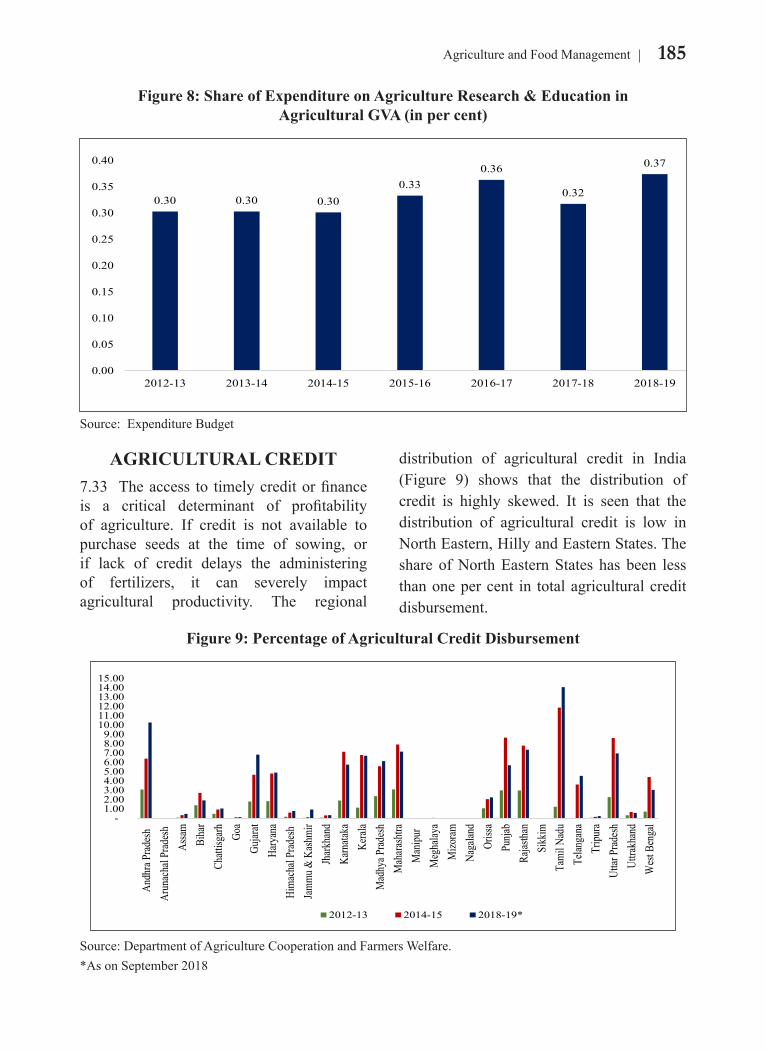
185Agriculture and Food Management
AGRICULTURAL CREDIT 7.33 The access to timely credit or finance is a critical determinant of profitability of agriculture. If credit is not available to purchase seeds at the time of sowing, or if lack of credit delays the administering of fertilizers, it can severely impact agricultural productivity. The regional
distribution of agricultural credit in India (Figure 9) shows that the distribution of credit is highly skewed. It is seen that the distribution of agricultural credit is low in North Eastern, Hilly and Eastern States. The share of North Eastern States has been less than one per cent in total agricultural credit disbursement.
Figure 9: Percentage of Agricultural Credit Disbursement
- 1.00 2.00 3.00 4.00 5.00 6.00 7.00 8.00 9.00
10.00 11.00 12.00 13.00 14.00 15.00
Andh
ra Pr
ades
hAr
unac
hal P
rades
hAs
sam
Biha
rCh
attisg
arh Goa
Gujar
atHa
ryan
aHi
mach
al Pr
ades
hJa
mmu
& K
ashm
irJh
arkha
ndKa
rnata
kaKe
rala
Mad
hya P
rades
hM
ahar
asht
raM
anip
urM
egha
laya
Mizo
ram
Naga
land
Oriss
aPu
njab
Rajas
than
Sikk
imTa
mil N
adu
Telan
gana
Tripu
raUt
tar P
rades
hUt
trakh
and
Wes
t Ben
gal
2012-13 2014-15 2018-19*
Source: Department of Agriculture Cooperation and Farmers Welfare.*As on September 2018
Figure 8: Share of Expenditure on Agriculture Research & Education in Agricultural GVA (in per cent)
0.30 0.30 0.300.33
0.36
0.32
0.37
0.00
0.05
0.10
0.15
0.20
0.25
0.30
0.35
0.40
2012-13 2013-14 2014-15 2015-16 2016-17 2017-18 2018-19
Source: Expenditure Budget
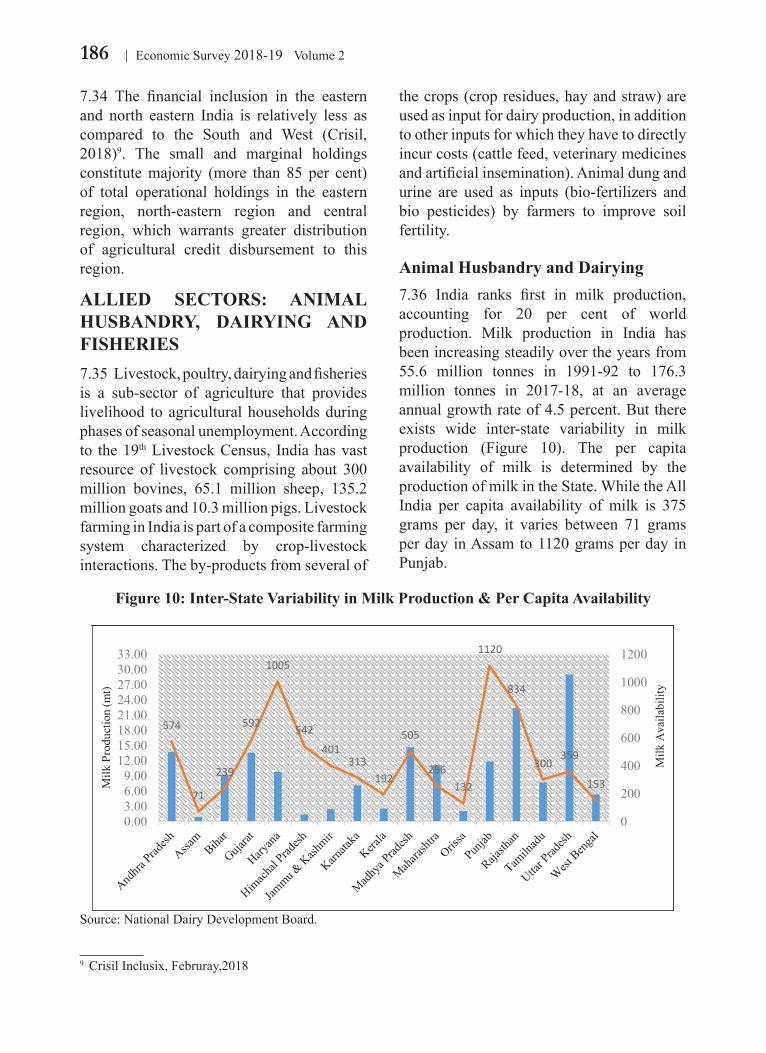
186 Economic Survey 2018-19 Volume 2
7.34 The financial inclusion in the eastern and north eastern India is relatively less as compared to the South and West (Crisil, 2018)9. The small and marginal holdings constitute majority (more than 85 per cent) of total operational holdings in the eastern region, north-eastern region and central region, which warrants greater distribution of agricultural credit disbursement to this region.
ALLIED SECTORS: ANIMAL HUSBANDRY, DAIRYING AND FISHERIES7.35 Livestock, poultry, dairying and fisheries is a sub-sector of agriculture that provides livelihood to agricultural households during phases of seasonal unemployment. According to the 19th Livestock Census, India has vast resource of livestock comprising about 300 million bovines, 65.1 million sheep, 135.2 million goats and 10.3 million pigs. Livestock farming in India is part of a composite farming system characterized by crop-livestock interactions. The by-products from several of
the crops (crop residues, hay and straw) are used as input for dairy production, in addition to other inputs for which they have to directly incur costs (cattle feed, veterinary medicines and artificial insemination). Animal dung and urine are used as inputs (bio-fertilizers and bio pesticides) by farmers to improve soil fertility.
Animal Husbandry and Dairying7.36 India ranks first in milk production, accounting for 20 per cent of world production. Milk production in India has been increasing steadily over the years from 55.6 million tonnes in 1991-92 to 176.3 million tonnes in 2017-18, at an average annual growth rate of 4.5 percent. But there exists wide inter-state variability in milk production (Figure 10). The per capita availability of milk is determined by the production of milk in the State. While the All India per capita availability of milk is 375 grams per day, it varies between 71 grams per day in Assam to 1120 grams per day in Punjab.
9 Crisil Inclusix, Februray,2018
Figure 10: Inter-State Variability in Milk Production & Per Capita Availability
574
71
239
592
1005
542401
313192
505
256132
1120
834
300359
153
0
200
400
600
800
1000
1200
0.003.006.009.00
12.0015.0018.0021.0024.0027.0030.0033.00
Milk
Ava
ilabi
lity
Milk
Pro
duct
ion
(mt)
Milk Production (million tonnes) Per Capita Milk avilability (gms/day)Source: National Dairy Development Board.
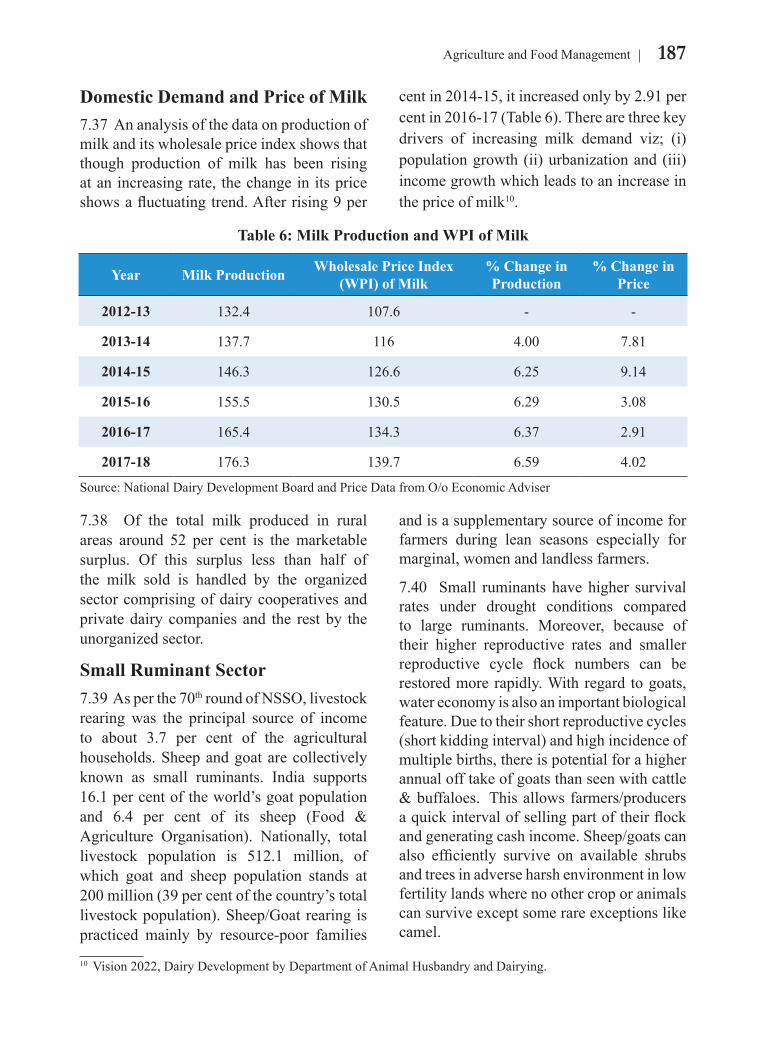
187Agriculture and Food Management
Domestic Demand and Price of Milk 7.37 An analysis of the data on production of milk and its wholesale price index shows that though production of milk has been rising at an increasing rate, the change in its price shows a fluctuating trend. After rising 9 per
cent in 2014-15, it increased only by 2.91 per cent in 2016-17 (Table 6). There are three key drivers of increasing milk demand viz; (i) population growth (ii) urbanization and (iii) income growth which leads to an increase in the price of milk10.
7.38 Of the total milk produced in rural areas around 52 per cent is the marketable surplus. Of this surplus less than half of the milk sold is handled by the organized sector comprising of dairy cooperatives and private dairy companies and the rest by the unorganized sector.
Small Ruminant Sector7.39 As per the 70th round of NSSO, livestock rearing was the principal source of income to about 3.7 per cent of the agricultural households. Sheep and goat are collectively known as small ruminants. India supports 16.1 per cent of the world’s goat population and 6.4 per cent of its sheep (Food & Agriculture Organisation). Nationally, total livestock population is 512.1 million, of which goat and sheep population stands at 200 million (39 per cent of the country’s total livestock population). Sheep/Goat rearing is practiced mainly by resource-poor families
and is a supplementary source of income for farmers during lean seasons especially for marginal, women and landless farmers.
7.40 Small ruminants have higher survival rates under drought conditions compared to large ruminants. Moreover, because of their higher reproductive rates and smaller reproductive cycle flock numbers can be restored more rapidly. With regard to goats, water economy is also an important biological feature. Due to their short reproductive cycles (short kidding interval) and high incidence of multiple births, there is potential for a higher annual off take of goats than seen with cattle & buffaloes. This allows farmers/producers a quick interval of selling part of their flock and generating cash income. Sheep/goats can also efficiently survive on available shrubs and trees in adverse harsh environment in low fertility lands where no other crop or animals can survive except some rare exceptions like camel.
10 Vision 2022, Dairy Development by Department of Animal Husbandry and Dairying.
Table 6: Milk Production and WPI of Milk
Year Milk Production Wholesale Price Index (WPI) of Milk
% Change in Production
% Change in Price
2012-13 132.4 107.6 - -
2013-14 137.7 116 4.00 7.81
2014-15 146.3 126.6 6.25 9.14
2015-16 155.5 130.5 6.29 3.08
2016-17 165.4 134.3 6.37 2.91
2017-18 176.3 139.7 6.59 4.02
Source: National Dairy Development Board and Price Data from O/o Economic Adviser
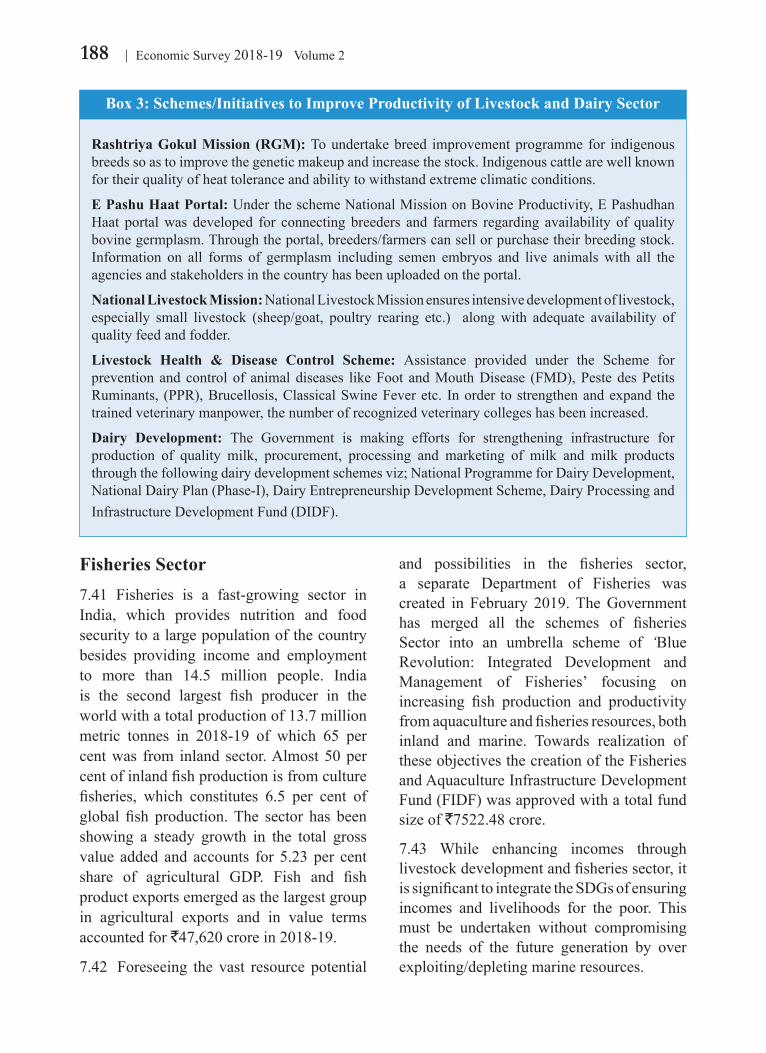
188 Economic Survey 2018-19 Volume 2
Fisheries Sector7.41 Fisheries is a fast-growing sector in India, which provides nutrition and food security to a large population of the country besides providing income and employment to more than 14.5 million people. India is the second largest fish producer in the world with a total production of 13.7 million metric tonnes in 2018-19 of which 65 per cent was from inland sector. Almost 50 per cent of inland fish production is from culture fisheries, which constitutes 6.5 per cent of global fish production. The sector has been showing a steady growth in the total gross value added and accounts for 5.23 per cent share of agricultural GDP. Fish and fish product exports emerged as the largest group in agricultural exports and in value terms accounted for `47,620 crore in 2018-19.
7.42 Foreseeing the vast resource potential
Rashtriya Gokul Mission (RGM): To undertake breed improvement programme for indigenous breeds so as to improve the genetic makeup and increase the stock. Indigenous cattle are well known for their quality of heat tolerance and ability to withstand extreme climatic conditions.
E Pashu Haat Portal: Under the scheme National Mission on Bovine Productivity, E Pashudhan Haat portal was developed for connecting breeders and farmers regarding availability of quality bovine germplasm. Through the portal, breeders/farmers can sell or purchase their breeding stock. Information on all forms of germplasm including semen embryos and live animals with all the agencies and stakeholders in the country has been uploaded on the portal.
National Livestock Mission: National Livestock Mission ensures intensive development of livestock, especially small livestock (sheep/goat, poultry rearing etc.) along with adequate availability of quality feed and fodder.
Livestock Health & Disease Control Scheme: Assistance provided under the Scheme for prevention and control of animal diseases like Foot and Mouth Disease (FMD), Peste des Petits Ruminants, (PPR), Brucellosis, Classical Swine Fever etc. In order to strengthen and expand the trained veterinary manpower, the number of recognized veterinary colleges has been increased.
Dairy Development: The Government is making efforts for strengthening infrastructure for production of quality milk, procurement, processing and marketing of milk and milk products through the following dairy development schemes viz; National Programme for Dairy Development, National Dairy Plan (Phase-I), Dairy Entrepreneurship Development Scheme, Dairy Processing and Infrastructure Development Fund (DIDF).
and possibilities in the fisheries sector, a separate Department of Fisheries was created in February 2019. The Government has merged all the schemes of fisheries Sector into an umbrella scheme of ‘Blue Revolution: Integrated Development and Management of Fisheries’ focusing on increasing fish production and productivity from aquaculture and fisheries resources, both inland and marine. Towards realization of these objectives the creation of the Fisheries and Aquaculture Infrastructure Development Fund (FIDF) was approved with a total fund size of `7522.48 crore.
7.43 While enhancing incomes through livestock development and fisheries sector, it is significant to integrate the SDGs of ensuring incomes and livelihoods for the poor. This must be undertaken without compromising the needs of the future generation by over exploiting/depleting marine resources.
Box 3: Schemes/Initiatives to Improve Productivity of Livestock and Dairy Sector
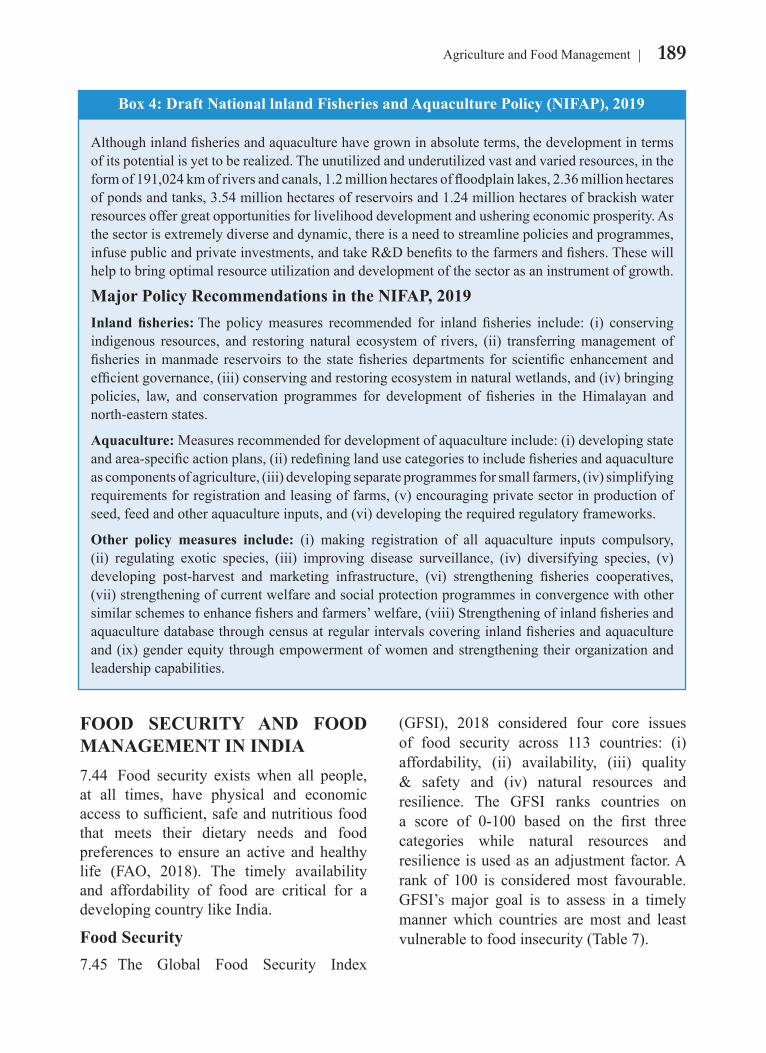
189Agriculture and Food Management
FOOD SECURITY AND FOOD MANAGEMENT IN INDIA7.44 Food security exists when all people, at all times, have physical and economic access to sufficient, safe and nutritious food that meets their dietary needs and food preferences to ensure an active and healthy life (FAO, 2018). The timely availability and affordability of food are critical for a developing country like India.
Food Security7.45 The Global Food Security Index
(GFSI), 2018 considered four core issues of food security across 113 countries: (i) affordability, (ii) availability, (iii) quality & safety and (iv) natural resources and resilience. The GFSI ranks countries on a score of 0-100 based on the first three categories while natural resources and resilience is used as an adjustment factor. A rank of 100 is considered most favourable. GFSI’s major goal is to assess in a timely manner which countries are most and least vulnerable to food insecurity (Table 7).
Although inland fisheries and aquaculture have grown in absolute terms, the development in terms of its potential is yet to be realized. The unutilized and underutilized vast and varied resources, in the form of 191,024 km of rivers and canals, 1.2 million hectares of floodplain lakes, 2.36 million hectares of ponds and tanks, 3.54 million hectares of reservoirs and 1.24 million hectares of brackish water resources offer great opportunities for livelihood development and ushering economic prosperity. As the sector is extremely diverse and dynamic, there is a need to streamline policies and programmes, infuse public and private investments, and take R&D benefits to the farmers and fishers. These will help to bring optimal resource utilization and development of the sector as an instrument of growth.
Major Policy Recommendations in the NIFAP, 2019Inland fisheries: The policy measures recommended for inland fisheries include: (i) conserving indigenous resources, and restoring natural ecosystem of rivers, (ii) transferring management of fisheries in manmade reservoirs to the state fisheries departments for scientific enhancement and efficient governance, (iii) conserving and restoring ecosystem in natural wetlands, and (iv) bringing policies, law, and conservation programmes for development of fisheries in the Himalayan and north-eastern states.
Aquaculture: Measures recommended for development of aquaculture include: (i) developing state and area-specific action plans, (ii) redefining land use categories to include fisheries and aquaculture as components of agriculture, (iii) developing separate programmes for small farmers, (iv) simplifying requirements for registration and leasing of farms, (v) encouraging private sector in production of seed, feed and other aquaculture inputs, and (vi) developing the required regulatory frameworks.
Other policy measures include: (i) making registration of all aquaculture inputs compulsory, (ii) regulating exotic species, (iii) improving disease surveillance, (iv) diversifying species, (v) developing post-harvest and marketing infrastructure, (vi) strengthening fisheries cooperatives, (vii) strengthening of current welfare and social protection programmes in convergence with other similar schemes to enhance fishers and farmers’ welfare, (viii) Strengthening of inland fisheries and aquaculture database through census at regular intervals covering inland fisheries and aquaculture and (ix) gender equity through empowerment of women and strengthening their organization and leadership capabilities.
Box 4: Draft National lnland Fisheries and Aquaculture Policy (NIFAP), 2019

190 Economic Survey 2018-19 Volume 2
Table 7: India’s Food Security Score, 2018
Category India(Score)
Score of All
Countries (average)
India’sRank out
of 113 Countries
OVERALL 50.1 58.4 76
1) Affordability 46.4 56.3 73
2) Availability 54.1 60.3 70
3) Quality and Safety 48.2 58.2 79
1) AFFORDABILITY
1.1) Food consumption as a share of household expenditure 53.5 55.6 61
1.2) Proportion of population under global poverty line 66.0 80.9 87
1.3) Gross domestic product per capita (US$ PPP) 5.0 16.7 73
1.4) Agricultural import tariffs 46.4 75.4 108
1.5) Presence of food safety net programmes 50.0 65.5 66
1.6) Access to financing for farmers 75.0 62.6 43
2) AVAILABILITY
2.1) Sufficiency of supply 27.4 56.8 100
2.2) Public expenditure on agricultural R&D* 0.0 15.6 62
2.3) Agricultural infrastructure 41.7 58.7 78
2.4) Volatility of agricultural production 93.5 86.4 39
2.5) Political stability risk 70.6 46.8 18
2.6) Corruption 25.0 37.6 49
2.7) Urban absorption capacity 94.8 76.9 3
2.8) Food loss 86.4 84.9 70
3) QUALITY AND SAFETY
3.1) Diet diversification 39.7 56.0 81
3.2) Nutritional standards 100.0 80.1 1
3.3) Micronutrient availability 26.5 43.9 98
3.4) Protein quality** 18.5 47.2 98
3.5) Food safety 91.3 80.3 70Source: Global Food Security Index, 2018, Economic Intelligence Unit, The Economist Note: * It is a measure of govt spending on R&D taken as a per cent of GDP. Taken from OECD and Agricultural Science & Technology Indicators. ** measures the amount of high-quality protein in the average national diet.
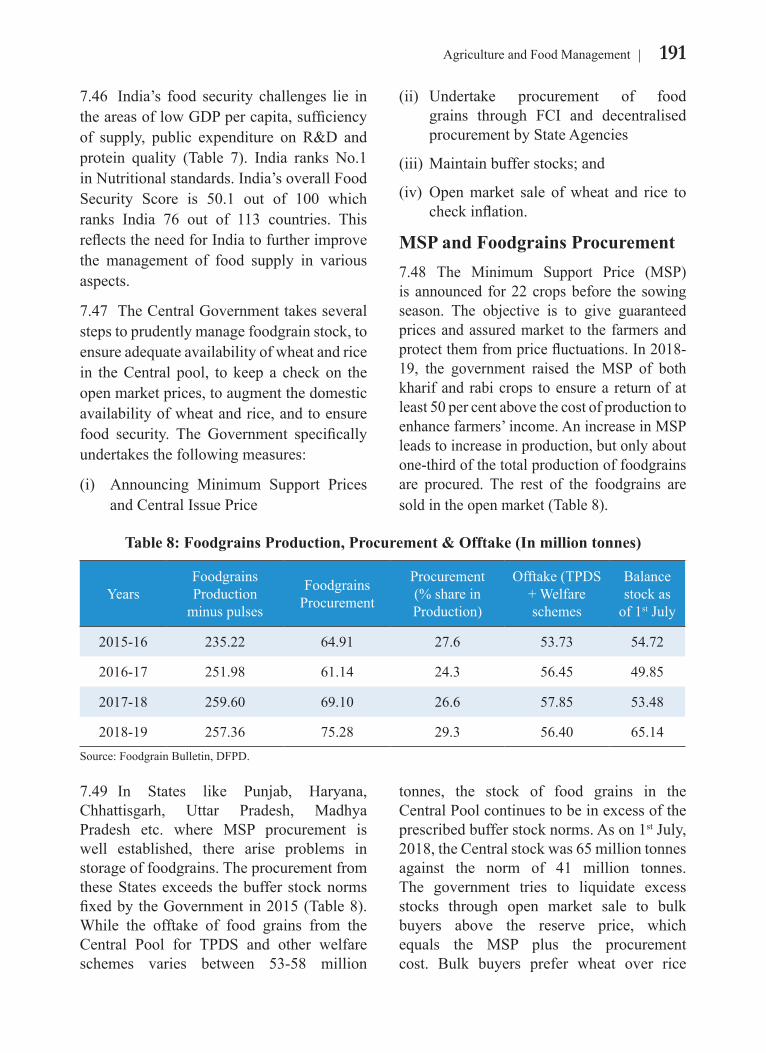
191Agriculture and Food Management
7.46 India’s food security challenges lie in the areas of low GDP per capita, sufficiency of supply, public expenditure on R&D and protein quality (Table 7). India ranks No.1 in Nutritional standards. India’s overall Food Security Score is 50.1 out of 100 which ranks India 76 out of 113 countries. This reflects the need for India to further improve the management of food supply in various aspects.
7.47 The Central Government takes several steps to prudently manage foodgrain stock, to ensure adequate availability of wheat and rice in the Central pool, to keep a check on the open market prices, to augment the domestic availability of wheat and rice, and to ensure food security. The Government specifically undertakes the following measures:
(i) Announcing Minimum Support Prices and Central Issue Price
(ii) Undertake procurement of food grains through FCI and decentralised procurement by State Agencies
(iii) Maintain buffer stocks; and
(iv) Open market sale of wheat and rice to check inflation.
MSP and Foodgrains Procurement 7.48 The Minimum Support Price (MSP) is announced for 22 crops before the sowing season. The objective is to give guaranteed prices and assured market to the farmers and protect them from price fluctuations. In 2018-19, the government raised the MSP of both kharif and rabi crops to ensure a return of at least 50 per cent above the cost of production to enhance farmers’ income. An increase in MSP leads to increase in production, but only about one-third of the total production of foodgrains are procured. The rest of the foodgrains are sold in the open market (Table 8).
7.49 In States like Punjab, Haryana, Chhattisgarh, Uttar Pradesh, Madhya Pradesh etc. where MSP procurement is well established, there arise problems in storage of foodgrains. The procurement from these States exceeds the buffer stock norms fixed by the Government in 2015 (Table 8). While the offtake of food grains from the Central Pool for TPDS and other welfare schemes varies between 53-58 million
tonnes, the stock of food grains in the Central Pool continues to be in excess of the prescribed buffer stock norms. As on 1st July, 2018, the Central stock was 65 million tonnes against the norm of 41 million tonnes. The government tries to liquidate excess stocks through open market sale to bulk buyers above the reserve price, which equals the MSP plus the procurement cost. Bulk buyers prefer wheat over rice
Table 8: Foodgrains Production, Procurement & Offtake (In million tonnes)
YearsFoodgrains Production
minus pulses
Foodgrains Procurement
Procurement (% share in Production)
Offtake (TPDS + Welfare schemes
Balance stock as
of 1st July
2015-16 235.22 64.91 27.6 53.73 54.72
2016-17 251.98 61.14 24.3 56.45 49.85
2017-18 259.60 69.10 26.6 57.85 53.48
2018-19 257.36 75.28 29.3 56.40 65.14Source: Foodgrain Bulletin, DFPD.

192 Economic Survey 2018-19 Volume 2
and in 2018-19 about nine million tonnes was sold in the open market of which 8.2 million tonnes was wheat. Exports of food grains by FCI at prices lower than the reserve price would effectively imply and
export subsidy. Moreover, this would expose India to disputes in the multilateral trade framework. Exports of food grains by FCI either as aid or commercial sale has been less than 1 million tonnes.
7.50 According to an Evaluation Study on Minimum Support Price conducted by Development Monitoring & Evaluation Office (DMEO), NITI Aayog (January 2016), in majority of the sample states, farmers are unaware of the MSP announcement before the sowing season. In Eastern India, in States such as Assam, West Bengal, the poor impact of the scheme could be judged from the fact that none of the selected farmers were even aware of the existence of such a scheme. In certain cases, though aware of the MSP, the absence of procurement centres in the villages, transportation costs, reluctance of mill owners to buy small quantities from the farmers remain stumbling blocks.
Food Subsidy7.51 Food subsidy comprises of two main components. The first component includes subsidy provided to the Food Corporation of India (FCI) for procurement and distribution of wheat and rice under the National Food Security Act (NFSA), 2013 and other welfare schemes and for maintaining the buffer stock of food grains as a measure of food security. The second component comprises subsidy
provided to States undertaking decentralized procurement. The acquisition and distribution costs of procuring food grains for the central pool constitute the economic cost. The difference between the per quintal economic cost and the per quintal Central Issue Price (CIP) gives the quantum of per quintal consumer subsidy.
7.52 The economic cost of wheat for FCI operations has increased from `1908.32 per quintal in 2013-14 to `2435.23 per quintal in 2018-19. Similarly, the economic cost of rice has increased from `2615.51 per quintal in 2013-14 to `3472.94 per quintal in 2018-19. However, the CIP of wheat and rice for NFSA beneficiaries has not been revised from `200 per quintal in case of wheat and `300 per quintal in case of rice. These rates were fixed under the National Food Security Act, 2013 initially for a period of three years from the date of commencement of the Act (July 13, 2013). Thereafter, they were to be fixed by the Central Government from time to time, while not exceeding the minimum support price.
Table 9: Foodgrains Stocking Norms for Central Pool from January, 2015
(in million tonnes)
Date Rice WheatTotal food
grainsOperational stocks
Strategic Reserve Total Operational
stocksStrategic Reserve Total
1st April 11.58 2.00 13.58 4.46 3.00 7.46 21.04
1st July 11.54 2.00 13.54 24.58 3.00 27.58 41.12
1st October 8.25 2.00 10.25 17.52 3.00 20.52 30.77
1st January 5.61 2.00 7.61 10.8 3.00 13.80 21.41Source: Department of Food and Public Distribution.
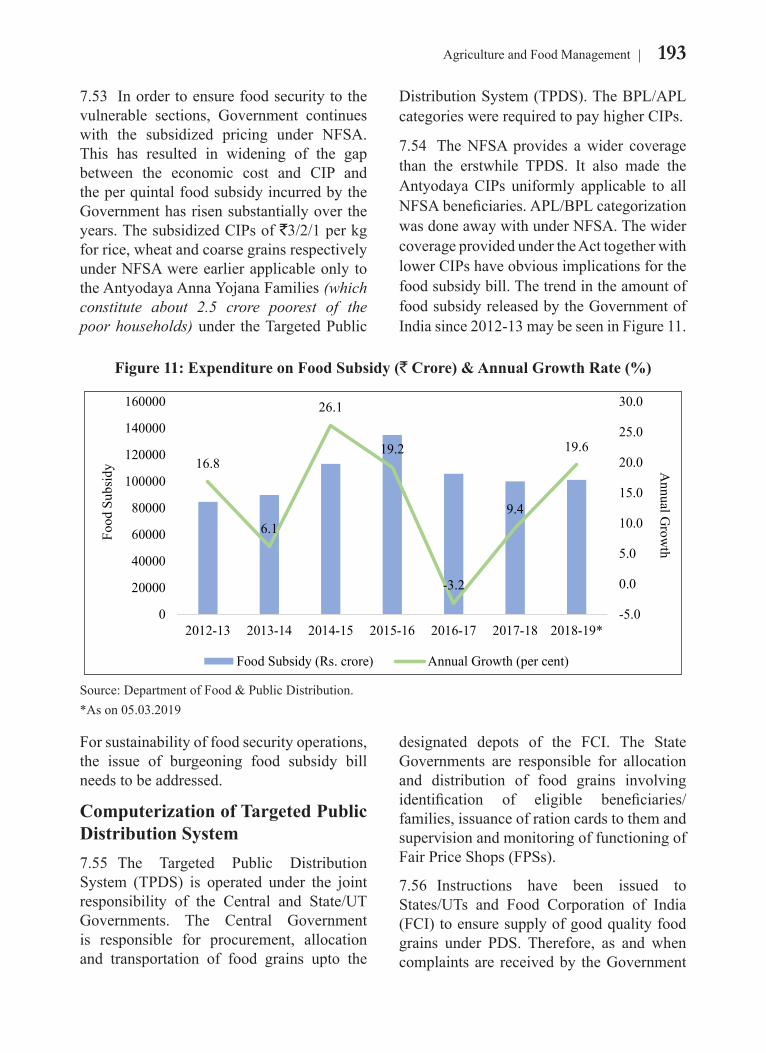
193Agriculture and Food Management
7.53 In order to ensure food security to the vulnerable sections, Government continues with the subsidized pricing under NFSA. This has resulted in widening of the gap between the economic cost and CIP and the per quintal food subsidy incurred by the Government has risen substantially over the years. The subsidized CIPs of `3/2/1 per kg for rice, wheat and coarse grains respectively under NFSA were earlier applicable only to the Antyodaya Anna Yojana Families (which constitute about 2.5 crore poorest of the poor households) under the Targeted Public
Distribution System (TPDS). The BPL/APL categories were required to pay higher CIPs.
7.54 The NFSA provides a wider coverage than the erstwhile TPDS. It also made the Antyodaya CIPs uniformly applicable to all NFSA beneficiaries. APL/BPL categorization was done away with under NFSA. The wider coverage provided under the Act together with lower CIPs have obvious implications for the food subsidy bill. The trend in the amount of food subsidy released by the Government of India since 2012-13 may be seen in Figure 11.
For sustainability of food security operations, the issue of burgeoning food subsidy bill needs to be addressed.
Computerization of Targeted Public Distribution System7.55 The Targeted Public Distribution System (TPDS) is operated under the joint responsibility of the Central and State/UT Governments. The Central Government is responsible for procurement, allocation and transportation of food grains upto the
designated depots of the FCI. The State Governments are responsible for allocation and distribution of food grains involving identification of eligible beneficiaries/families, issuance of ration cards to them and supervision and monitoring of functioning of Fair Price Shops (FPSs).
7.56 Instructions have been issued to States/UTs and Food Corporation of India (FCI) to ensure supply of good quality food grains under PDS. Therefore, as and when complaints are received by the Government
Figure 11: Expenditure on Food Subsidy (` Crore) & Annual Growth Rate (%)
16.8
6.1
26.1
19.2
-3.2
9.4
19.6
-5.0
0.0
5.0
10.0
15.0
20.0
25.0
30.0
0
20000
40000
60000
80000
100000
120000
140000
160000
2012-13 2013-14 2014-15 2015-16 2016-17 2017-18 2018-19*
Food Subsidy (Rs. crore) Annual Growth (per cent)
Food
Sub
sidy A
nnual Grow
th
Source: Department of Food & Public Distribution.*As on 05.03.2019
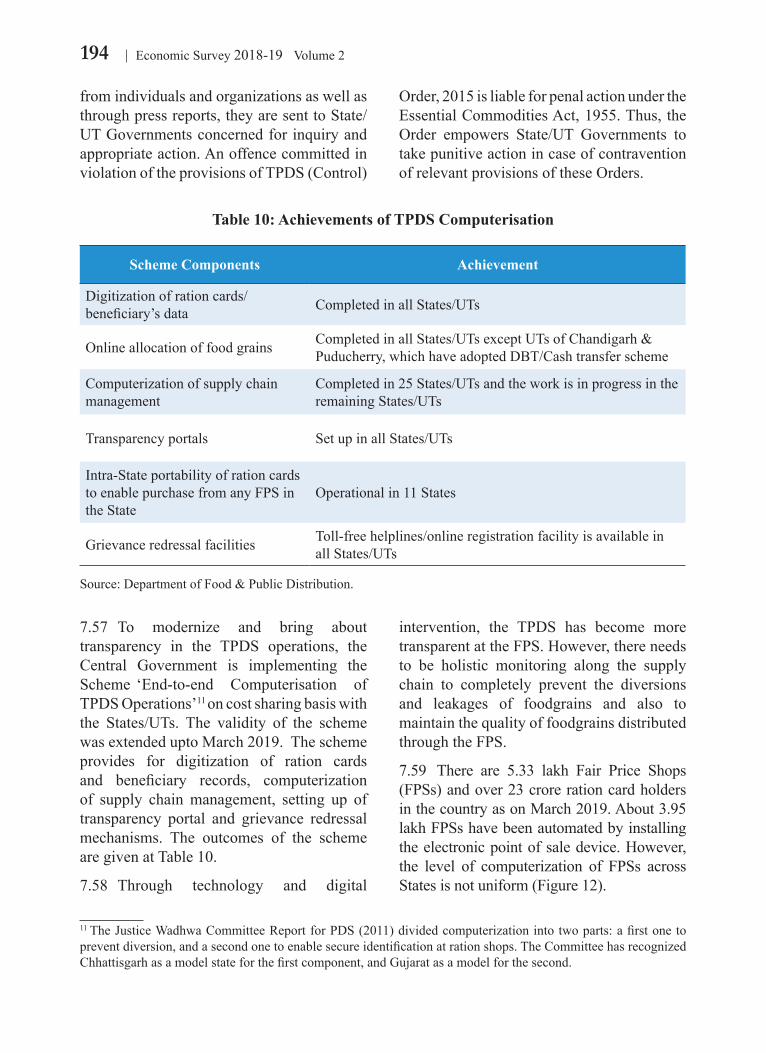
194 Economic Survey 2018-19 Volume 2
from individuals and organizations as well as through press reports, they are sent to State/UT Governments concerned for inquiry and appropriate action. An offence committed in violation of the provisions of TPDS (Control)
Order, 2015 is liable for penal action under the Essential Commodities Act, 1955. Thus, the Order empowers State/UT Governments to take punitive action in case of contravention of relevant provisions of these Orders.
7.57 To modernize and bring about transparency in the TPDS operations, the Central Government is implementing the Scheme ‘End-to-end Computerisation of TPDS Operations’11 on cost sharing basis with the States/UTs. The validity of the scheme was extended upto March 2019. The scheme provides for digitization of ration cards and beneficiary records, computerization of supply chain management, setting up of transparency portal and grievance redressal mechanisms. The outcomes of the scheme are given at Table 10.
7.58 Through technology and digital
11 The Justice Wadhwa Committee Report for PDS (2011) divided computerization into two parts: a first one to prevent diversion, and a second one to enable secure identification at ration shops. The Committee has recognized Chhattisgarh as a model state for the first component, and Gujarat as a model for the second.
intervention, the TPDS has become more transparent at the FPS. However, there needs to be holistic monitoring along the supply chain to completely prevent the diversions and leakages of foodgrains and also to maintain the quality of foodgrains distributed through the FPS.
7.59 There are 5.33 lakh Fair Price Shops (FPSs) and over 23 crore ration card holders in the country as on March 2019. About 3.95 lakh FPSs have been automated by installing the electronic point of sale device. However, the level of computerization of FPSs across States is not uniform (Figure 12).
Table 10: Achievements of TPDS Computerisation
Scheme Components Achievement
Digitization of ration cards/beneficiary’s data Completed in all States/UTs
Online allocation of food grains Completed in all States/UTs except UTs of Chandigarh & Puducherry, which have adopted DBT/Cash transfer scheme
Computerization of supply chain management
Completed in 25 States/UTs and the work is in progress in the remaining States/UTs
Transparency portals Set up in all States/UTs
Intra-State portability of ration cards to enable purchase from any FPS in the State
Operational in 11 States
Grievance redressal facilities Toll-free helplines/online registration facility is available in all States/UTs
Source: Department of Food & Public Distribution.
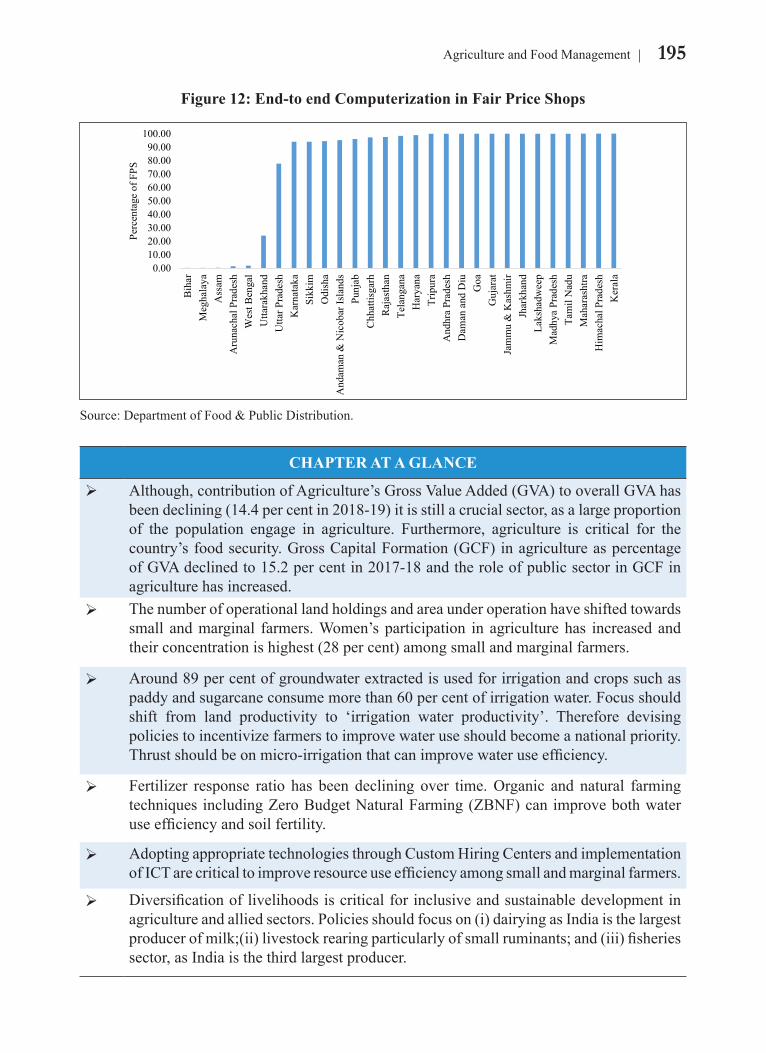
195Agriculture and Food Management
Figure 12: End-to end Computerization in Fair Price Shops
0.0010.0020.0030.0040.0050.0060.0070.0080.0090.00
100.00
Bih
arM
egha
laya
Ass
amA
runa
chal
Pra
desh
Wes
t Ben
gal
Utta
rakh
and
Utta
r Pra
desh
Kar
nata
kaSi
kkim
Odi
sha
And
aman
& N
icob
ar Is
land
sPu
njab
Chh
attis
garh
Raj
asth
anTe
lang
ana
Har
yana
Trip
ura
And
hra
Prad
esh
Dam
an a
nd D
iuG
oaG
ujar
atJa
mm
u &
Kas
hmir
Jhar
khan
dLa
ksha
dwee
pM
adhy
a Pr
ades
hTa
mil
Nad
uM
ahar
asht
raH
imac
hal P
rade
shK
eral
a
Perc
enta
ge o
f FPS
Source: Department of Food & Public Distribution.
CHAPTER AT A GLANCE
Although, contribution of Agriculture’s Gross Value Added (GVA) to overall GVA has been declining (14.4 per cent in 2018-19) it is still a crucial sector, as a large proportion of the population engage in agriculture. Furthermore, agriculture is critical for the country’s food security. Gross Capital Formation (GCF) in agriculture as percentage of GVA declined to 15.2 per cent in 2017-18 and the role of public sector in GCF in agriculture has increased.
The number of operational land holdings and area under operation have shifted towards small and marginal farmers. Women’s participation in agriculture has increased and their concentration is highest (28 per cent) among small and marginal farmers.
Around 89 per cent of groundwater extracted is used for irrigation and crops such as paddy and sugarcane consume more than 60 per cent of irrigation water. Focus should shift from land productivity to ‘irrigation water productivity’. Therefore devising policies to incentivize farmers to improve water use should become a national priority. Thrust should be on micro-irrigation that can improve water use efficiency.
Fertilizer response ratio has been declining over time. Organic and natural farming techniques including Zero Budget Natural Farming (ZBNF) can improve both water use efficiency and soil fertility.
Adopting appropriate technologies through Custom Hiring Centers and implementation of ICT are critical to improve resource use efficiency among small and marginal farmers.
Diversification of livelihoods is critical for inclusive and sustainable development in agriculture and allied sectors. Policies should focus on (i) dairying as India is the largest producer of milk;(ii) livestock rearing particularly of small ruminants; and (iii) fisheries sector, as India is the third largest producer.
196 Economic Survey 2018-19 Volume 2
ANNEXURE-1
ACTION PLAN FOR DOUBLING THE INCOME OF FARMERSThe Government has set a target of doubling of farmers’ income by the year 2022. For the said purpose, the Government had constituted an Inter-Ministerial Committee to examine issues relating to Doubling of Farmers’ Income (DFI) and recommend strategies. The Committee has identified seven sources of income growth viz, improvement in crop productivity; improvement in livestock productivity; resource use efficiency or savings in the cost of production; increase in the cropping intensity; diversification towards high value crops; improvement in real prices received by farmers; and shift from farm to non-farm occupations. Several initiatives have already been rolled out on the recommendations of DFI Committee which inter-alia include advocating progressive market reforms through the State Governments, Encouraging contract farming through the State Governments by promulgating of Model Contract Farming Act, Up-gradation of Gramin Haats to work as centers of aggregation and for direct purchase of agricultural commodities from the farmers, e-NAM to provide farmers an electronic online trading platform, Distribution of Soil health Cards to farmers so that the use of fertilizers can be rationalized, Increase water efficiency through Pradhan Mantri Krishi Sinchayee Yojana (PMKSY)-“ Per drop more crop”, Better insurance coverage to crops for risk mitigation under Pradhan Mantri Fasal Bima Yojana (PMFBY), providing total interest subvention up to 5 per cent (inclusive of 3 per cent prompt repayment incentive) on short-term crop loans up to R3 lakh, thus making loan available to farmers at a reduced rate of 4 per cent per annum and extended the facility of Kisan Credit Card (KCC) for animal husbandry and fisheries related activities as well as Interest Subvention facilities to such categories of farmers.
Giving a major boost for the farmers’ income, the Government has approved the increase in the Minimum Support Price (MSPs) for all Kharif & Rabi crops for 2018-19 season at a level of at least one and half times of the cost of production.
Further, with a view to provide social security net for small and marginal farmers as they have minimal or no savings to provide for old age and to support them in the event of consequent loss of livelihood, the Government has decided to implement a new Central Sector Scheme for providing old age pension of R3000/- to the eligible small and marginal farmers, subject to certain exclusion clauses, on attaining the age of 60 years. The scheme aims to cover around 5 crore beneficiaries in the first three years. It would be a voluntary and contributory pension scheme, with entry age of 18 to 40 years. The Government has approved a budgetary provision of R10774.50 crore for the scheme till March 2022.
The Government has constituted an Empowered Body on 23.01.2019 for monitoring the implementation of the recommendations of the DFI Strategy.
Source: Ministry of Agriculture & Farmers Welfare.
CHAPTER
08Industry and Infrastructure
Sloth makes all things difficult, but industry, all things easy. — Benjamin Franklin
The king shall promote trade and commerce by setting up trade routes by land and by water and market town/ports.
— The Arthashastra
The story of economic growth is half-documented without narrating the story of industry-infrastructure nexus. India, being home to more than 133 crore people, needs to build a robust industry with a buoyant and resilient infrastructure. The industrial growth rate in terms of Index of Industrial Production (IIP) during 2018-19 stood at 3.6 per cent as compared to 4.4 per cent growth rate in 2017-18. The moderation in 2018-19 has been mainly due to subdued manufacturing activities in Q3 and Q4 due to slower credit flow to medium and small industries, reduced lending by NBFCs owing to liquidity crunch, tapering of domestic demand for key sectors such as automotive sector, pharmaceuticals, and machinery and equipment, volatility in international crude oil prices etc. Meanwhile, the eight core infrastructure supportive industries have achieved the overall growth rate of 4.3 per cent during 2018-19 similar to the increase achieved in 2017-18. The Government has initiated a number of measures in crucial sectors to accelerate higher manufacturing growth such as Start-up India, Ease of doing Business, Make in India, Foreign Direct Investment Policy reforms. India has considerably improved its ranking to 77th position in 2018 among 190 countries assessed by the World Bank Doing Business Report, 2019 in which India has leapt 23 ranks over its rank of 100 in 2017.
A robust and resilient Infrastructure is fundamental and essential for budding industries. While India has invested in its infrastructure over the years, the challenge is to mobilize adequate investment in infrastructure sector which runs into several trillions of dollars. The investment gaps in the infrastructure would have to be addressed through various innovative approaches with the collaboration of both public and private sector.
INDIAN INDUSTRY: AN OVERVIEW 8.1 Industry plays a decisive role in determining the overall growth of an economy. The industrial sector performance during 2018-19 has improved as compared to 2017-18. As per the provisional estimates
of the Annual National Income 2018-19 released by Central Statistics Office (CSO), the growth of industry real Gross Value Added (GVA) was higher at 6.9 per cent in 2018-19 as compared to 5.9 per cent in 2017-18 (Table 1). Construction and manufacturing
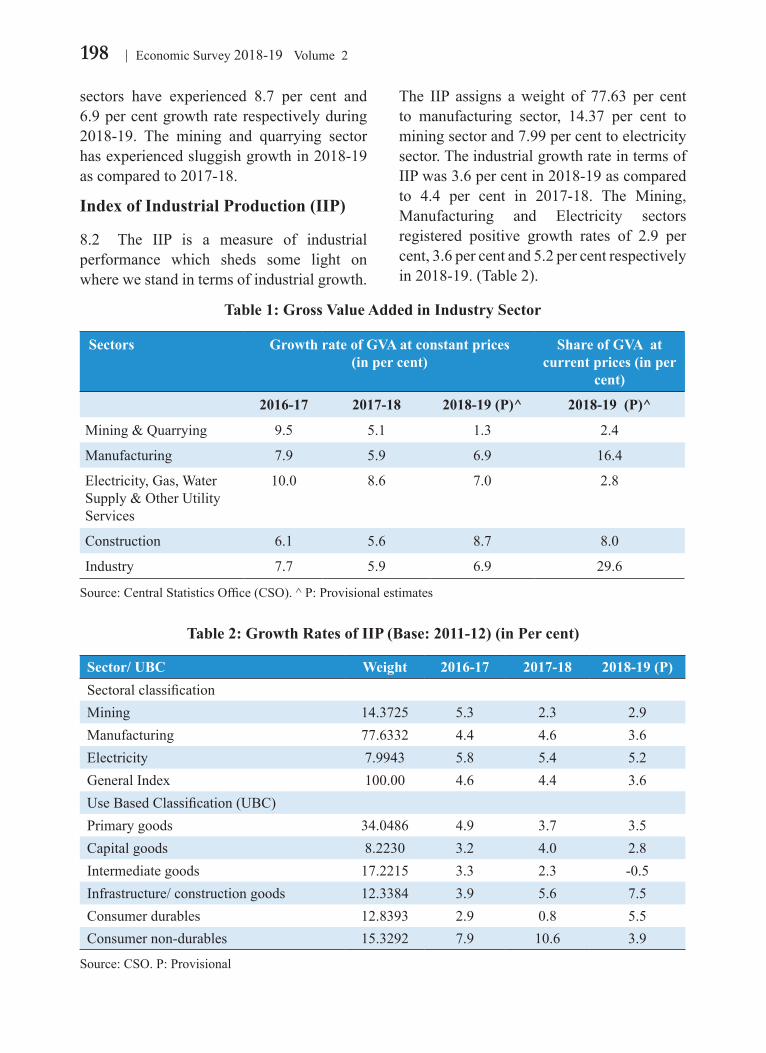
198 Economic Survey 2018-19 Volume 2
The IIP assigns a weight of 77.63 per cent to manufacturing sector, 14.37 per cent to mining sector and 7.99 per cent to electricity sector. The industrial growth rate in terms of IIP was 3.6 per cent in 2018-19 as compared to 4.4 per cent in 2017-18. The Mining, Manufacturing and Electricity sectors registered positive growth rates of 2.9 per cent, 3.6 per cent and 5.2 per cent respectively in 2018-19. (Table 2).
sectors have experienced 8.7 per cent and 6.9 per cent growth rate respectively during 2018-19. The mining and quarrying sector has experienced sluggish growth in 2018-19 as compared to 2017-18.
Index of Industrial Production (IIP)
8.2 The IIP is a measure of industrial performance which sheds some light on where we stand in terms of industrial growth.
Table 1: Gross Value Added in Industry Sector
Sectors Growth rate of GVA at constant prices(in per cent)
Share of GVA at current prices (in per
cent)
2016-17 2017-18 2018-19 (P)^ 2018-19 (P)^
Mining & Quarrying 9.5 5.1 1.3 2.4
Manufacturing 7.9 5.9 6.9 16.4
Electricity, Gas, Water Supply & Other Utility Services
10.0 8.6 7.0 2.8
Construction 6.1 5.6 8.7 8.0
Industry 7.7 5.9 6.9 29.6
Source: Central Statistics Office (CSO). ^ P: Provisional estimates
Table 2: Growth Rates of IIP (Base: 2011-12) (in Per cent)
Sector/ UBC Weight 2016-17 2017-18 2018-19 (P)Sectoral classificationMining 14.3725 5.3 2.3 2.9Manufacturing 77.6332 4.4 4.6 3.6Electricity 7.9943 5.8 5.4 5.2General Index 100.00 4.6 4.4 3.6Use Based Classification (UBC)Primary goods 34.0486 4.9 3.7 3.5Capital goods 8.2230 3.2 4.0 2.8Intermediate goods 17.2215 3.3 2.3 -0.5Infrastructure/ construction goods 12.3384 3.9 5.6 7.5Consumer durables 12.8393 2.9 0.8 5.5Consumer non-durables 15.3292 7.9 10.6 3.9
Source: CSO. P: Provisional
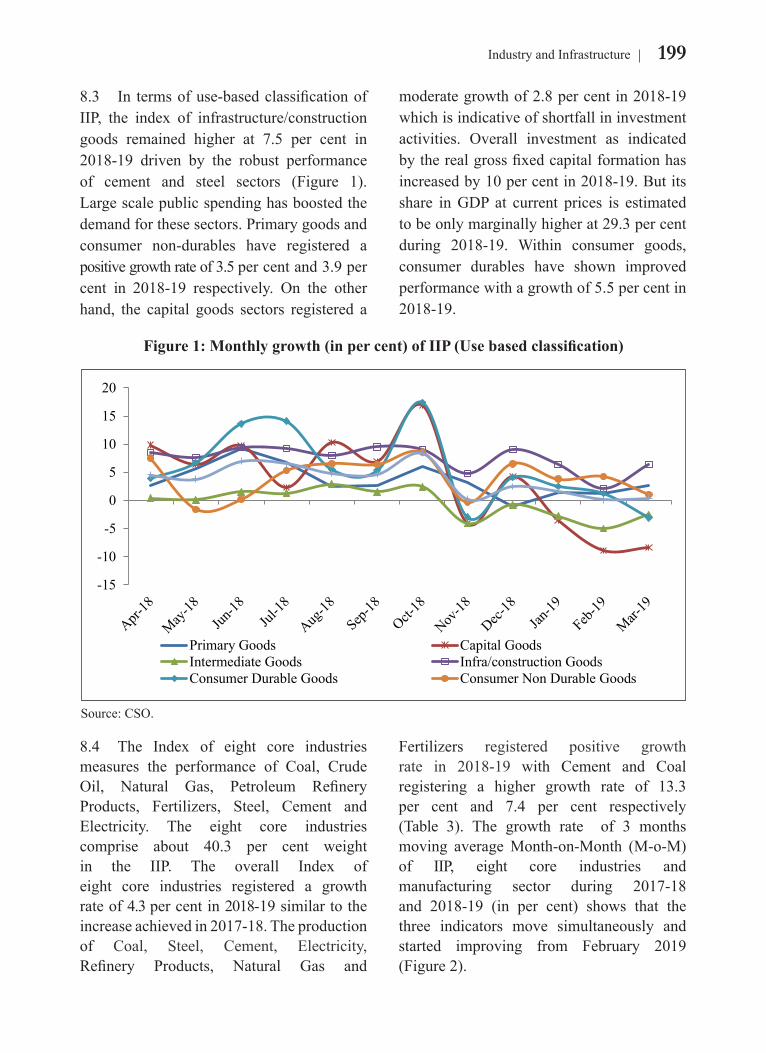
199Industry and Infrastructure
moderate growth of 2.8 per cent in 2018-19 which is indicative of shortfall in investment activities. Overall investment as indicated by the real gross fixed capital formation has increased by 10 per cent in 2018-19. But its share in GDP at current prices is estimated to be only marginally higher at 29.3 per cent during 2018-19. Within consumer goods, consumer durables have shown improved performance with a growth of 5.5 per cent in 2018-19.
8.3 In terms of use-based classification of IIP, the index of infrastructure/construction goods remained higher at 7.5 per cent in 2018-19 driven by the robust performance of cement and steel sectors (Figure 1). Large scale public spending has boosted the demand for these sectors. Primary goods and consumer non-durables have registered a positive growth rate of 3.5 per cent and 3.9 per cent in 2018-19 respectively. On the other hand, the capital goods sectors registered a
8.4 The Index of eight core industries measures the performance of Coal, Crude Oil, Natural Gas, Petroleum Refinery Products, Fertilizers, Steel, Cement and Electricity. The eight core industries comprise about 40.3 per cent weight in the IIP. The overall Index of eight core industries registered a growth rate of 4.3 per cent in 2018-19 similar to the increase achieved in 2017-18. The production of Coal, Steel, Cement, Electricity, Refinery Products, Natural Gas and
Fertilizers registered positive growth rate in 2018-19 with Cement and Coal registering a higher growth rate of 13.3 per cent and 7.4 per cent respectively (Table 3). The growth rate of 3 months moving average Month-on-Month (M-o-M) of IIP, eight core industries and manufacturing sector during 2017-18 and 2018-19 (in per cent) shows that the three indicators move simultaneously and started improving from February 2019 (Figure 2).
Figure 1: Monthly growth (in per cent) of IIP (Use based classification)
-15
-10
-5
0
5
10
15
20
Primary Goods Capital GoodsIntermediate Goods Infra/construction GoodsConsumer Durable Goods Consumer Non Durable Goods
Source: CSO.
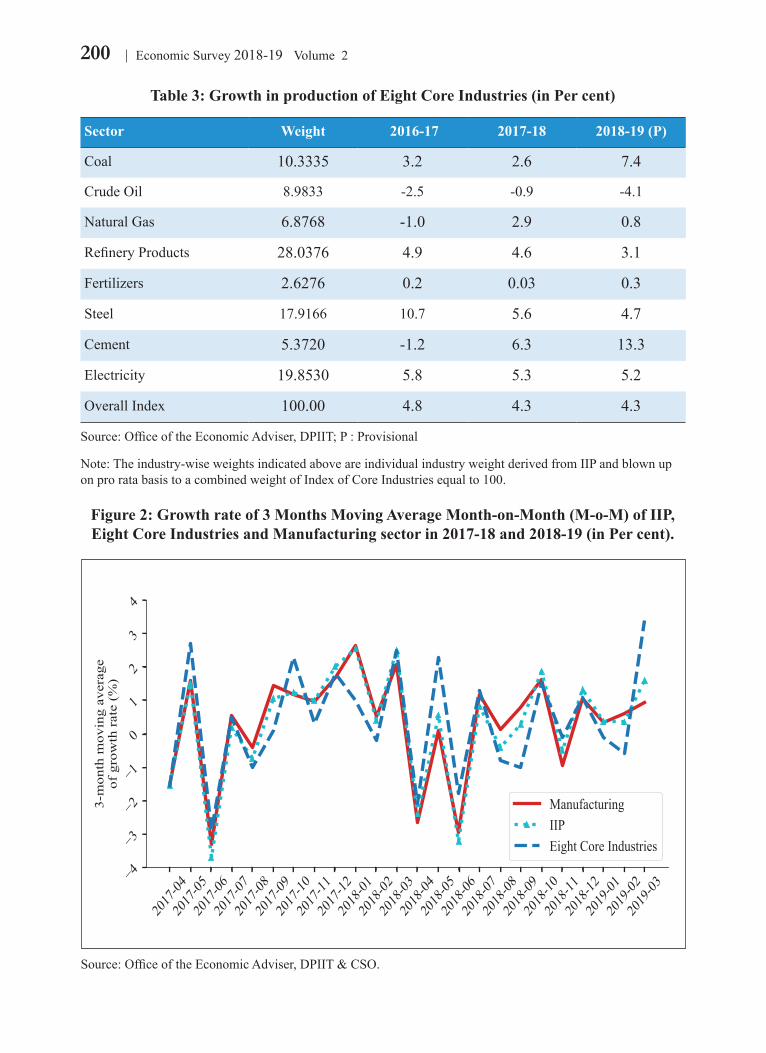
200 Economic Survey 2018-19 Volume 2
Table 3: Growth in production of Eight Core Industries (in Per cent)
Sector Weight 2016-17 2017-18 2018-19 (P)
Coal 10.3335 3.2 2.6 7.4
Crude Oil 8.9833 -2.5 -0.9 -4.1
Natural Gas 6.8768 -1.0 2.9 0.8
Refinery Products 28.0376 4.9 4.6 3.1
Fertilizers 2.6276 0.2 0.03 0.3
Steel 17.9166 10.7 5.6 4.7
Cement 5.3720 -1.2 6.3 13.3
Electricity 19.8530 5.8 5.3 5.2
Overall Index 100.00 4.8 4.3 4.3
Source: Office of the Economic Adviser, DPIIT; P : Provisional
Note: The industry-wise weights indicated above are individual industry weight derived from IIP and blown up on pro rata basis to a combined weight of Index of Core Industries equal to 100.
Source: Office of the Economic Adviser, DPIIT & CSO.
Figure 2: Growth rate of 3 Months Moving Average Month-on-Month (M-o-M) of IIP, Eight Core Industries and Manufacturing sector in 2017-18 and 2018-19 (in Per cent).
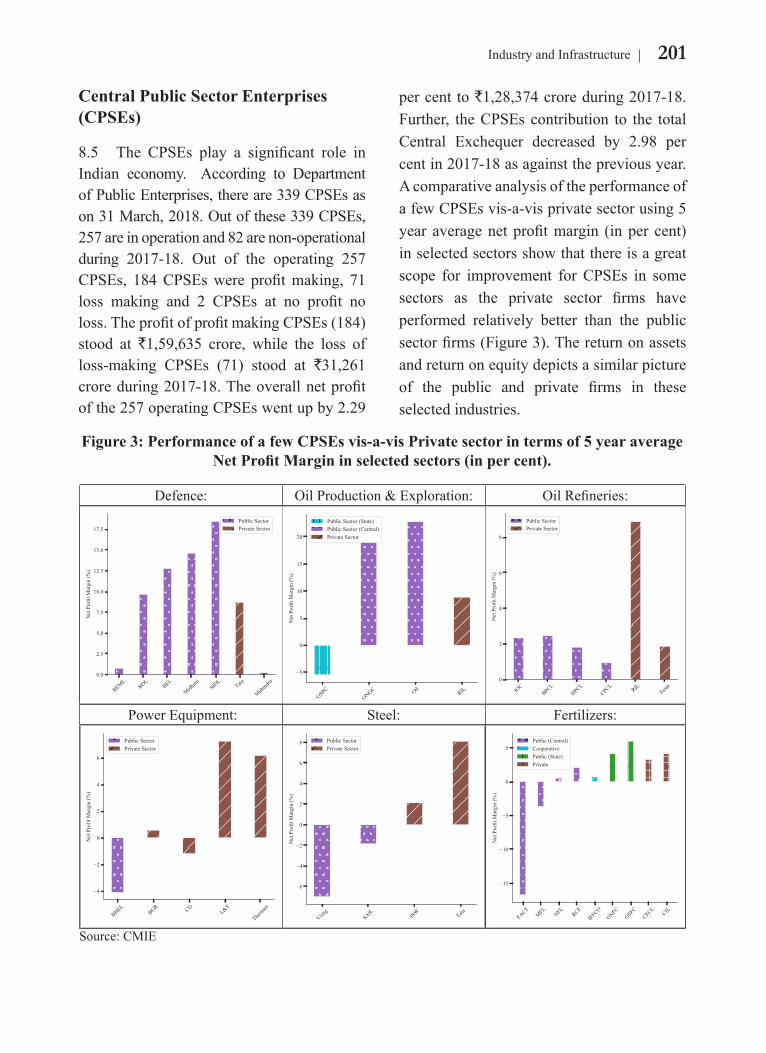
201Industry and Infrastructure
Central Public Sector Enterprises (CPSEs)
8.5 The CPSEs play a significant role in Indian economy. According to Department of Public Enterprises, there are 339 CPSEs as on 31 March, 2018. Out of these 339 CPSEs, 257 are in operation and 82 are non-operational during 2017-18. Out of the operating 257 CPSEs, 184 CPSEs were profit making, 71 loss making and 2 CPSEs at no profit no loss. The profit of profit making CPSEs (184) stood at `1,59,635 crore, while the loss of loss-making CPSEs (71) stood at `31,261 crore during 2017-18. The overall net profit of the 257 operating CPSEs went up by 2.29
per cent to `1,28,374 crore during 2017-18. Further, the CPSEs contribution to the total Central Exchequer decreased by 2.98 per cent in 2017-18 as against the previous year. A comparative analysis of the performance of a few CPSEs vis-a-vis private sector using 5 year average net profit margin (in per cent) in selected sectors show that there is a great scope for improvement for CPSEs in some sectors as the private sector firms have performed relatively better than the public sector firms (Figure 3). The return on assets and return on equity depicts a similar picture of the public and private firms in these selected industries.
Figure 3: Performance of a few CPSEs vis-a-vis Private sector in terms of 5 year average Net Profit Margin in selected sectors (in per cent).
Defence: Oil Production & Exploration: Oil Refineries:
Power Equipment: Steel: Fertilizers:
Source: CMIE
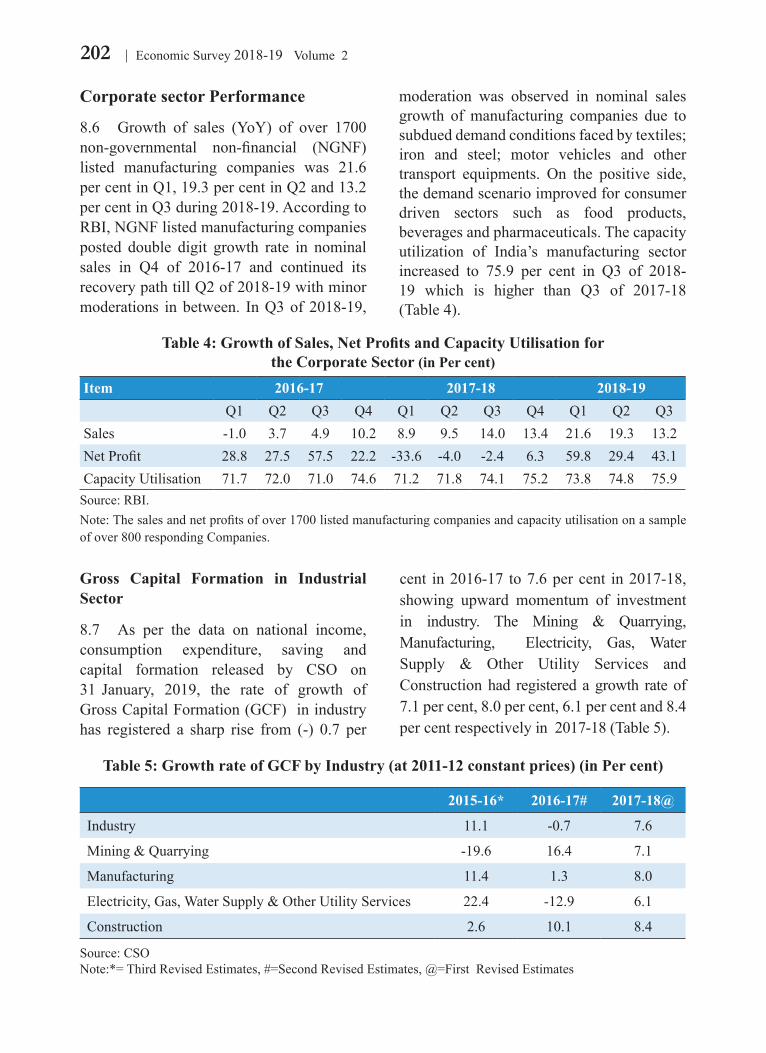
202 Economic Survey 2018-19 Volume 2
Corporate sector Performance
8.6 Growth of sales (YoY) of over 1700 non-governmental non-financial (NGNF) listed manufacturing companies was 21.6 per cent in Q1, 19.3 per cent in Q2 and 13.2 per cent in Q3 during 2018-19. According to RBI, NGNF listed manufacturing companies posted double digit growth rate in nominal sales in Q4 of 2016-17 and continued its recovery path till Q2 of 2018-19 with minor moderations in between. In Q3 of 2018-19,
moderation was observed in nominal sales growth of manufacturing companies due to subdued demand conditions faced by textiles; iron and steel; motor vehicles and other transport equipments. On the positive side, the demand scenario improved for consumer driven sectors such as food products, beverages and pharmaceuticals. The capacity utilization of India’s manufacturing sector increased to 75.9 per cent in Q3 of 2018-19 which is higher than Q3 of 2017-18 (Table 4).
Gross Capital Formation in Industrial Sector
8.7 As per the data on national income, consumption expenditure, saving and capital formation released by CSO on 31 January, 2019, the rate of growth of Gross Capital Formation (GCF) in industry has registered a sharp rise from (-) 0.7 per
cent in 2016-17 to 7.6 per cent in 2017-18, showing upward momentum of investment in industry. The Mining & Quarrying, Manufacturing, Electricity, Gas, Water Supply & Other Utility Services and Construction had registered a growth rate of 7.1 per cent, 8.0 per cent, 6.1 per cent and 8.4 per cent respectively in 2017-18 (Table 5).
Table 4: Growth of Sales, Net Profits and Capacity Utilisation for the Corporate Sector (in Per cent)
Item 2016-17 2017-18 2018-19 Q1 Q2 Q3 Q4 Q1 Q2 Q3 Q4 Q1 Q2 Q3Sales -1.0 3.7 4.9 10.2 8.9 9.5 14.0 13.4 21.6 19.3 13.2Net Profit 28.8 27.5 57.5 22.2 -33.6 -4.0 -2.4 6.3 59.8 29.4 43.1Capacity Utilisation 71.7 72.0 71.0 74.6 71.2 71.8 74.1 75.2 73.8 74.8 75.9
Source: RBI.Note: The sales and net profits of over 1700 listed manufacturing companies and capacity utilisation on a sample of over 800 responding Companies.
Table 5: Growth rate of GCF by Industry (at 2011-12 constant prices) (in Per cent)
2015-16* 2016-17# 2017-18@
Industry 11.1 -0.7 7.6
Mining & Quarrying -19.6 16.4 7.1
Manufacturing 11.4 1.3 8.0
Electricity, Gas, Water Supply & Other Utility Services 22.4 -12.9 6.1
Construction 2.6 10.1 8.4
Source: CSONote:*= Third Revised Estimates, #=Second Revised Estimates, @=First Revised Estimates
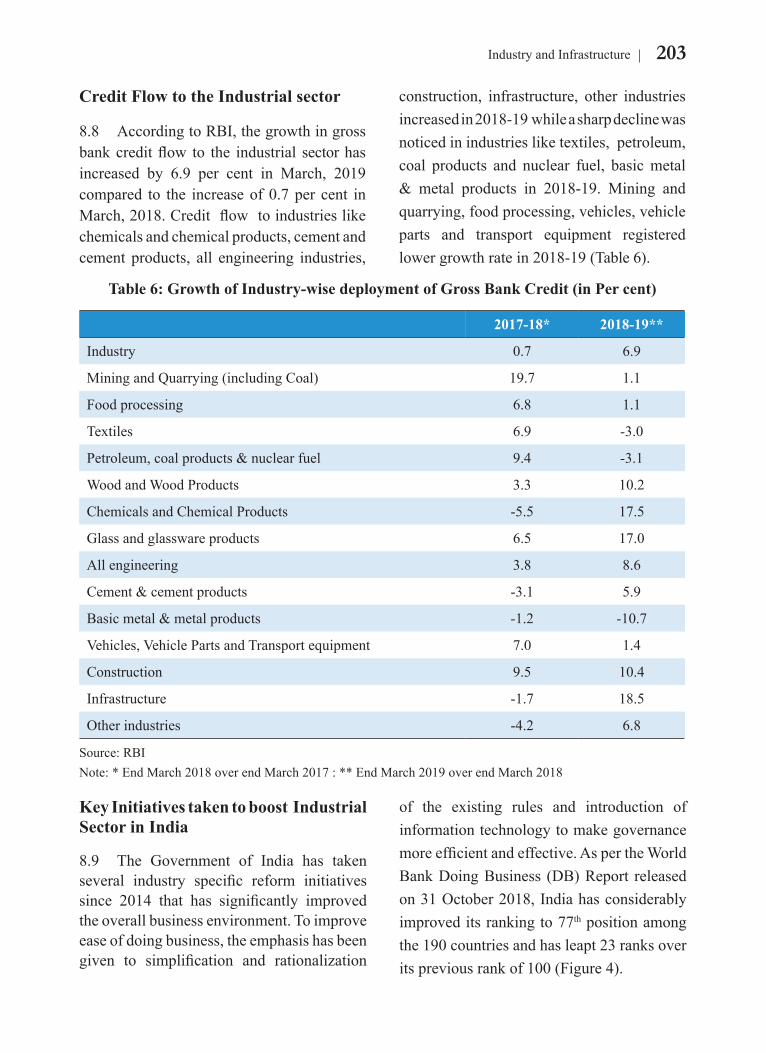
203Industry and Infrastructure
Credit Flow to the Industrial sector
8.8 According to RBI, the growth in gross bank credit flow to the industrial sector has increased by 6.9 per cent in March, 2019 compared to the increase of 0.7 per cent in March, 2018. Credit flow to industries like chemicals and chemical products, cement and cement products, all engineering industries,
construction, infrastructure, other industries increased in 2018-19 while a sharp decline was noticed in industries like textiles, petroleum, coal products and nuclear fuel, basic metal & metal products in 2018-19. Mining and quarrying, food processing, vehicles, vehicle parts and transport equipment registered lower growth rate in 2018-19 (Table 6).
Key Initiatives taken to boost Industrial Sector in India
8.9 The Government of India has taken several industry specific reform initiatives since 2014 that has significantly improved the overall business environment. To improve ease of doing business, the emphasis has been given to simplification and rationalization
of the existing rules and introduction of information technology to make governance more efficient and effective. As per the World Bank Doing Business (DB) Report released on 31 October 2018, India has considerably improved its ranking to 77th position among the 190 countries and has leapt 23 ranks over its previous rank of 100 (Figure 4).
Table 6: Growth of Industry-wise deployment of Gross Bank Credit (in Per cent)
2017-18* 2018-19**
Industry 0.7 6.9
Mining and Quarrying (including Coal) 19.7 1.1
Food processing 6.8 1.1
Textiles 6.9 -3.0
Petroleum, coal products & nuclear fuel 9.4 -3.1
Wood and Wood Products 3.3 10.2
Chemicals and Chemical Products -5.5 17.5
Glass and glassware products 6.5 17.0
All engineering 3.8 8.6
Cement & cement products -3.1 5.9
Basic metal & metal products -1.2 -10.7
Vehicles, Vehicle Parts and Transport equipment 7.0 1.4
Construction 9.5 10.4
Infrastructure -1.7 18.5
Other industries -4.2 6.8
Source: RBINote: * End March 2018 over end March 2017 : ** End March 2019 over end March 2018
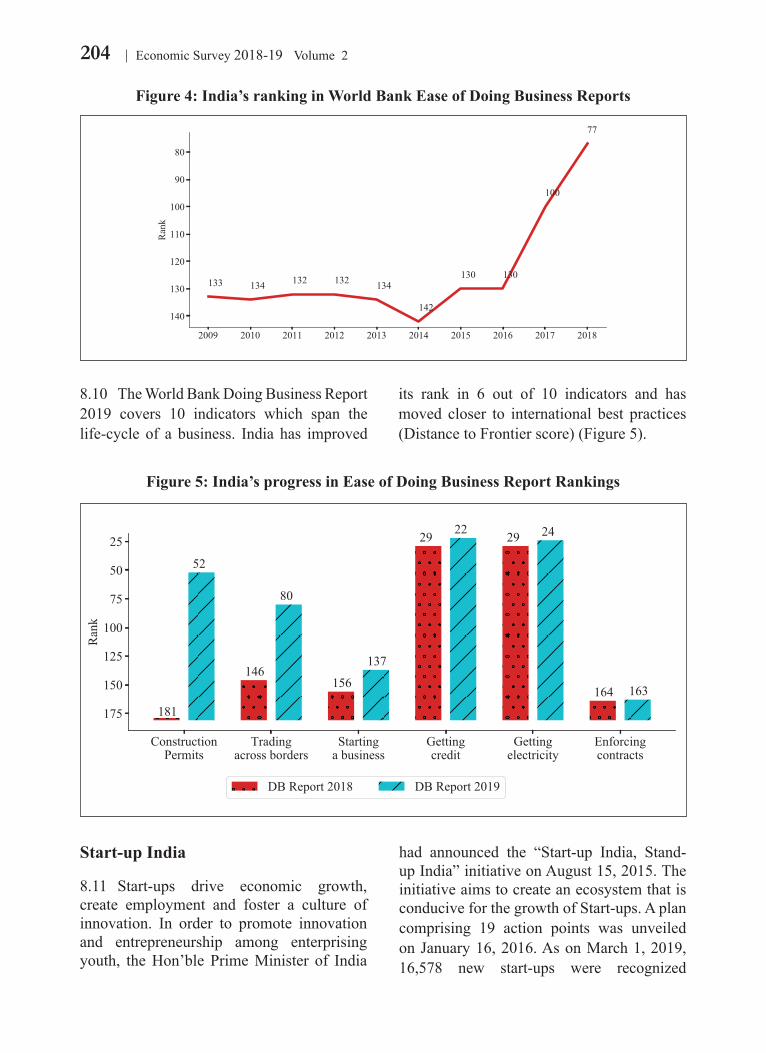
204 Economic Survey 2018-19 Volume 2
8.10 The World Bank Doing Business Report 2019 covers 10 indicators which span the life-cycle of a business. India has improved
its rank in 6 out of 10 indicators and has moved closer to international best practices (Distance to Frontier score) (Figure 5).
Start-up India
8.11 Start-ups drive economic growth, create employment and foster a culture of innovation. In order to promote innovation and entrepreneurship among enterprising youth, the Hon’ble Prime Minister of India
had announced the “Start-up India, Stand-up India” initiative on August 15, 2015. The initiative aims to create an ecosystem that is conducive for the growth of Start-ups. A plan comprising 19 action points was unveiled on January 16, 2016. As on March 1, 2019, 16,578 new start-ups were recognized
Figure 4: India’s ranking in World Bank Ease of Doing Business Reports
Figure 5: India’s progress in Ease of Doing Business Report Rankings
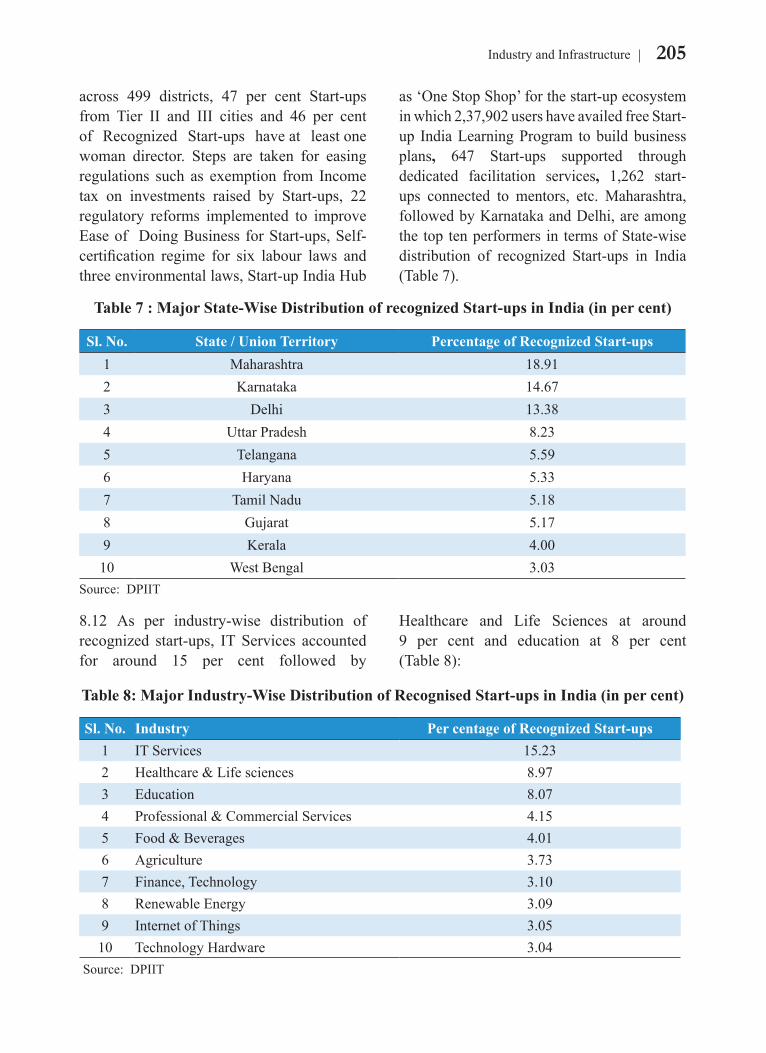
205Industry and Infrastructure
across 499 districts, 47 per cent Start-ups from Tier II and III cities and 46 per cent of Recognized Start-ups have at least one woman director. Steps are taken for easing regulations such as exemption from Income tax on investments raised by Start-ups, 22 regulatory reforms implemented to improve Ease of Doing Business for Start-ups, Self-certification regime for six labour laws and three environmental laws, Start-up India Hub
as ‘One Stop Shop’ for the start-up ecosystem in which 2,37,902 users have availed free Start-up India Learning Program to build business plans, 647 Start-ups supported through dedicated facilitation services, 1,262 start-ups connected to mentors, etc. Maharashtra, followed by Karnataka and Delhi, are among the top ten performers in terms of State-wise distribution of recognized Start-ups in India (Table 7).
8.12 As per industry-wise distribution of recognized start-ups, IT Services accounted for around 15 per cent followed by
Healthcare and Life Sciences at around 9 per cent and education at 8 per cent (Table 8):
Table 7 : Major State-Wise Distribution of recognized Start-ups in India (in per cent)
Sl. No. State / Union Territory Percentage of Recognized Start-ups1 Maharashtra 18.912 Karnataka 14.673 Delhi 13.384 Uttar Pradesh 8.235 Telangana 5.596 Haryana 5.337 Tamil Nadu 5.188 Gujarat 5.179 Kerala 4.0010 West Bengal 3.03
Source: DPIIT
Table 8: Major Industry-Wise Distribution of Recognised Start-ups in India (in per cent)
Sl. No. Industry Per centage of Recognized Start-ups1 IT Services 15.232 Healthcare & Life sciences 8.973 Education 8.074 Professional & Commercial Services 4.155 Food & Beverages 4.016 Agriculture 3.737 Finance, Technology 3.108 Renewable Energy 3.099 Internet of Things 3.0510 Technology Hardware 3.04
Source: DPIIT
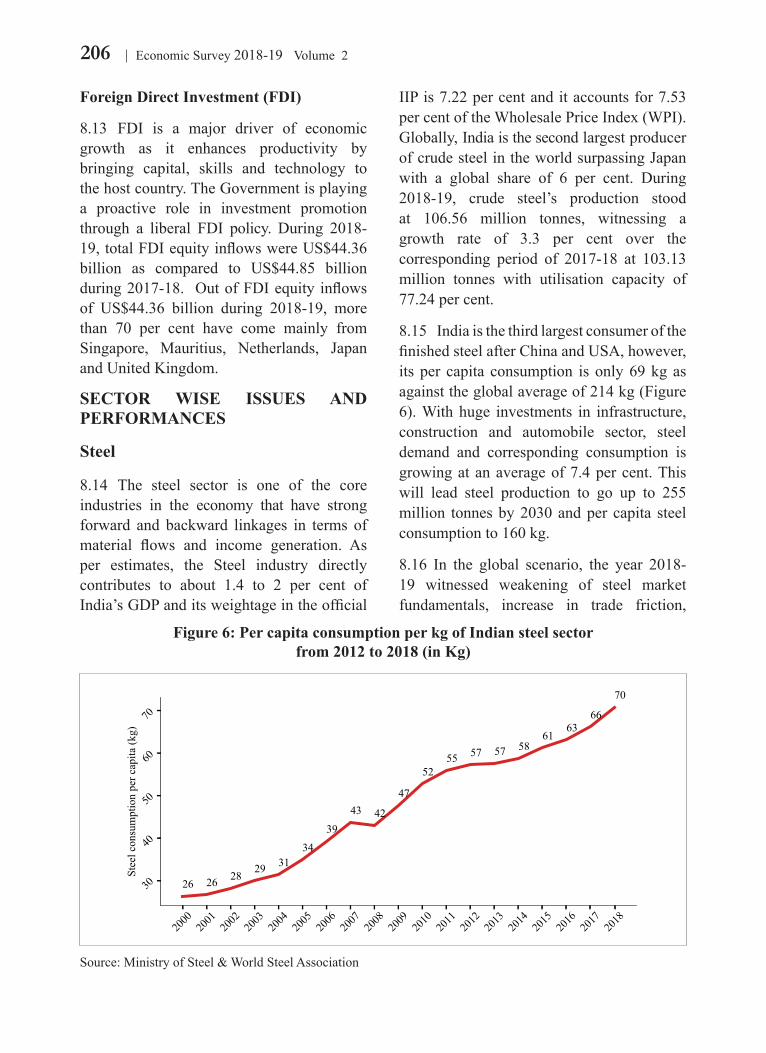
206 Economic Survey 2018-19 Volume 2
Foreign Direct Investment (FDI)
8.13 FDI is a major driver of economic growth as it enhances productivity by bringing capital, skills and technology to the host country. The Government is playing a proactive role in investment promotion through a liberal FDI policy. During 2018-19, total FDI equity inflows were US$44.36 billion as compared to US$44.85 billion during 2017-18. Out of FDI equity inflows of US$44.36 billion during 2018-19, more than 70 per cent have come mainly from Singapore, Mauritius, Netherlands, Japan and United Kingdom.
SECTOR WISE ISSUES AND PERFORMANCES
Steel
8.14 The steel sector is one of the core industries in the economy that have strong forward and backward linkages in terms of material flows and income generation. As per estimates, the Steel industry directly contributes to about 1.4 to 2 per cent of India’s GDP and its weightage in the official
IIP is 7.22 per cent and it accounts for 7.53 per cent of the Wholesale Price Index (WPI). Globally, India is the second largest producer of crude steel in the world surpassing Japan with a global share of 6 per cent. During 2018-19, crude steel’s production stood at 106.56 million tonnes, witnessing a growth rate of 3.3 per cent over the corresponding period of 2017-18 at 103.13 million tonnes with utilisation capacity of 77.24 per cent.
8.15 India is the third largest consumer of the finished steel after China and USA, however, its per capita consumption is only 69 kg as against the global average of 214 kg (Figure 6). With huge investments in infrastructure, construction and automobile sector, steel demand and corresponding consumption is growing at an average of 7.4 per cent. This will lead steel production to go up to 255 million tonnes by 2030 and per capita steel consumption to 160 kg.
8.16 In the global scenario, the year 2018-19 witnessed weakening of steel market fundamentals, increase in trade friction,
Figure 6: Per capita consumption per kg of Indian steel sector from 2012 to 2018 (in Kg)
Source: Ministry of Steel & World Steel Association
207Industry and Infrastructure
imposition of protectionist measures and excess steel capacity. Pursuant to the imposition of trade restrictive measures by USA, European Union and Canada, India’s exports have declined. The total export with highest volume of 9.62 million tonnes during 2017-18 fell to 6.36 million tonnes during 2018-19. On the other hand, imports have gone up particularly from Korea, Japan and ASEAN countries. India remained an importer of finished steel at 7.84 million tonnes during 2018-19 as against 7.48 million tonnes during 2017-18.
8.17 The National Steel Policy, 2017 gives broad policy directives to the industry for encouraging long-term growth for Indian steel on both supply and demand fronts. It envisages focus on domestic production especially of value added steel in order to meet the growing demand. Further, there is a need for investment in capacity addition and infusion of modern technology for production.
8.18 Some of the key challenges faced by the Indian steel Industry are capacity expansion as the demand for steel is bound to rise with economic growth. High grade and value-added steel are used in power, defence and automobile which is currently imported. Difficulties in acquiring mining lease and high dependency on import of coking coal add to cost of steel production. High logistics costs also act as a major constraint.
Leather and Footwear
8.19 Indian leather and footwear industry, a highly employment intensive sector, is the second largest producer of footwear, second largest exporter of leather garments and fifth largest exporter of leather goods. The global demand for footwear is moving towards non leather footwear, while Indian tax policies favour leather footwear production. India
faces high tariffs in partner country markets for leather goods and non-leather footwear. In order to address these challenges, a special package of `2600 crore under the scheme Indian Footwear and Accessories Development Programme is being implemented (2017-20). The special package for the leather industry has the potential to generate 3.24 lakh new jobs in three years and assist in formalization of 2 lakh jobs.
Gems and Jewellery
8.20 The gem and jewellery sector contributes to exports and employment generation of around 5 million. During the year 2017-18, the gem and jewellery exports were 13.69 per cent of total merchandise exports in the country. With a view to strengthen the sector, the Government has taken a number of steps, such as establishment of Special Notified Zone, setting up of Common Facility Centres for gems and jewellery sector, creation of separate ITC HS Code for lab grown diamond, reduction of GST rates for cut and polished diamonds and precious stones, exempting Integrated Goods and Service Tax on import of gold by specified agencies and banks, exemption from GST on supply of gold by nominated agencies to exporters and providing financial assistance for participation of international fairs. To strengthen the domestic manufacturing and to help organise the small scale based domestic jewellery industry, a Domestic Council for Gems & Jewellery has been envisaged and launched in January 2019.
MSME
8.21 The Micro, Small and Medium Enterprises (MSME) sector in India plays a crucial role by providing large employment opportunities, industrialization of rural
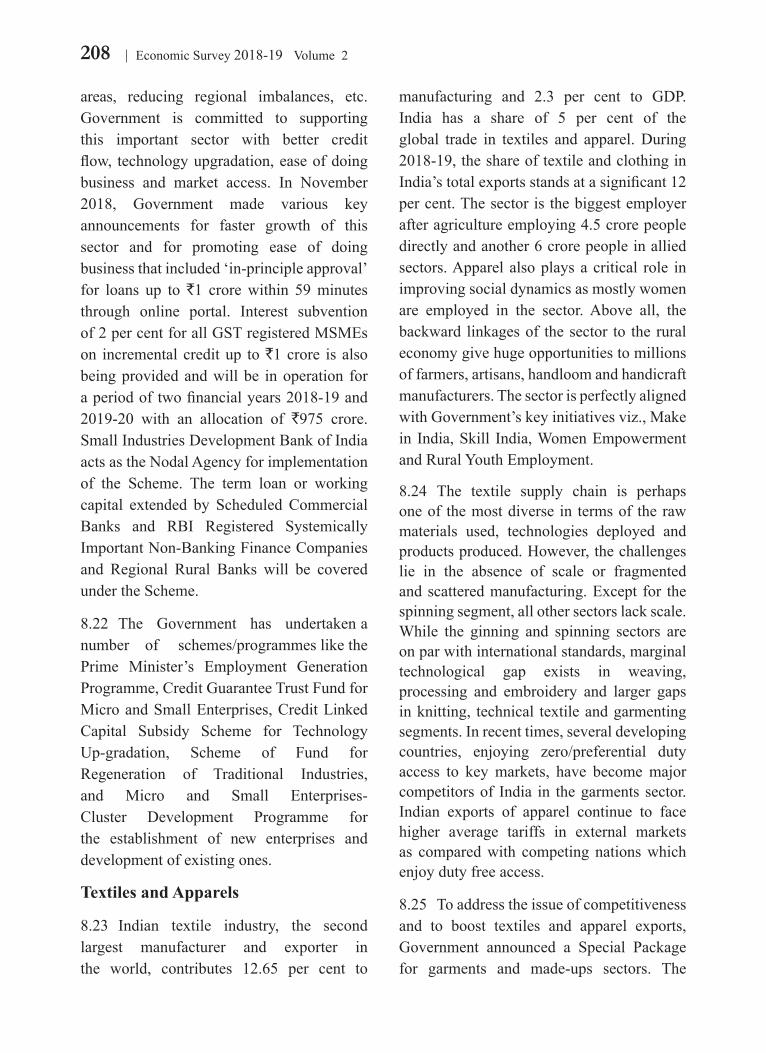
208 Economic Survey 2018-19 Volume 2
manufacturing and 2.3 per cent to GDP. India has a share of 5 per cent of the global trade in textiles and apparel. During 2018-19, the share of textile and clothing in India’s total exports stands at a significant 12 per cent. The sector is the biggest employer after agriculture employing 4.5 crore people directly and another 6 crore people in allied sectors. Apparel also plays a critical role in improving social dynamics as mostly women are employed in the sector. Above all, the backward linkages of the sector to the rural economy give huge opportunities to millions of farmers, artisans, handloom and handicraft manufacturers. The sector is perfectly aligned with Government’s key initiatives viz., Make in India, Skill India, Women Empowerment and Rural Youth Employment.
8.24 The textile supply chain is perhaps one of the most diverse in terms of the raw materials used, technologies deployed and products produced. However, the challenges lie in the absence of scale or fragmented and scattered manufacturing. Except for the spinning segment, all other sectors lack scale. While the ginning and spinning sectors are on par with international standards, marginal technological gap exists in weaving, processing and embroidery and larger gaps in knitting, technical textile and garmenting segments. In recent times, several developing countries, enjoying zero/preferential duty access to key markets, have become major competitors of India in the garments sector. Indian exports of apparel continue to face higher average tariffs in external markets as compared with competing nations which enjoy duty free access.
8.25 To address the issue of competitiveness and to boost textiles and apparel exports, Government announced a Special Package for garments and made-ups sectors. The
areas, reducing regional imbalances, etc. Government is committed to supporting this important sector with better credit flow, technology upgradation, ease of doing business and market access. In November 2018, Government made various key announcements for faster growth of this sector and for promoting ease of doing business that included ‘in-principle approval’ for loans up to `1 crore within 59 minutes through online portal. Interest subvention of 2 per cent for all GST registered MSMEs on incremental credit up to `1 crore is also being provided and will be in operation for a period of two financial years 2018-19 and 2019-20 with an allocation of `975 crore. Small Industries Development Bank of India acts as the Nodal Agency for implementation of the Scheme. The term loan or working capital extended by Scheduled Commercial Banks and RBI Registered Systemically Important Non-Banking Finance Companies and Regional Rural Banks will be covered under the Scheme.
8.22 The Government has undertaken a number of schemes/programmes like the Prime Minister’s Employment Generation Programme, Credit Guarantee Trust Fund for Micro and Small Enterprises, Credit Linked Capital Subsidy Scheme for Technology Up-gradation, Scheme of Fund for Regeneration of Traditional Industries, and Micro and Small Enterprises- Cluster Development Programme for the establishment of new enterprises and development of existing ones.
Textiles and Apparels
8.23 Indian textile industry, the second largest manufacturer and exporter in the world, contributes 12.65 per cent to
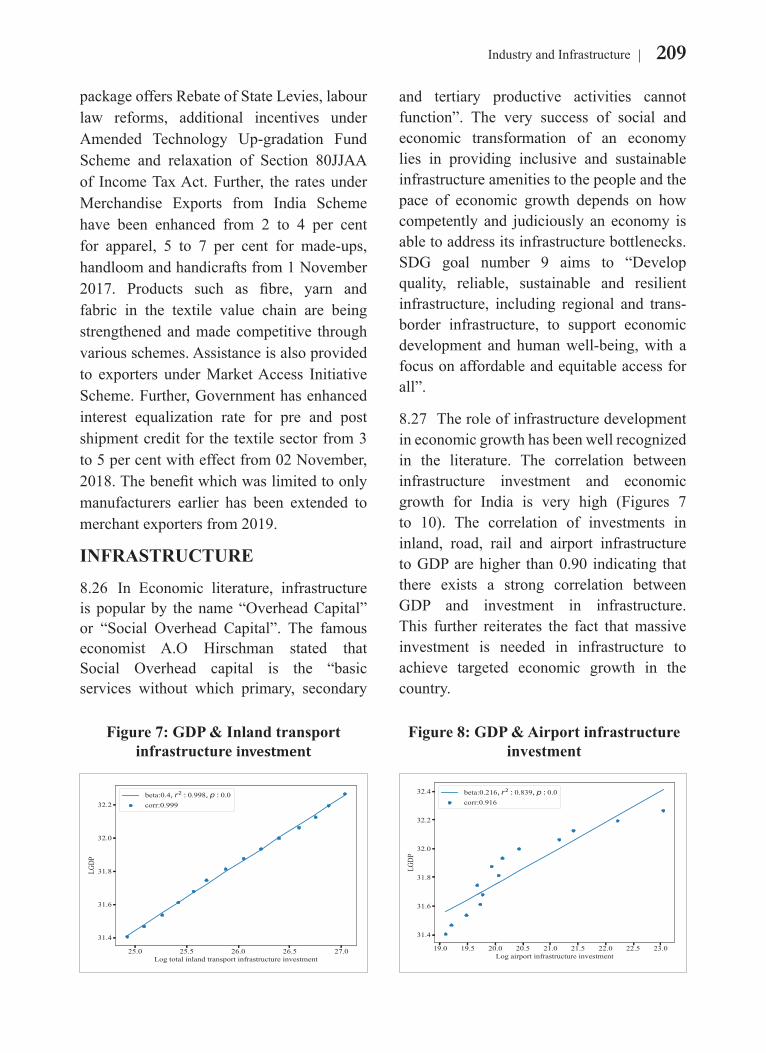
209Industry and Infrastructure
package offers Rebate of State Levies, labour law reforms, additional incentives under Amended Technology Up-gradation Fund Scheme and relaxation of Section 80JJAA of Income Tax Act. Further, the rates under Merchandise Exports from India Scheme have been enhanced from 2 to 4 per cent for apparel, 5 to 7 per cent for made-ups, handloom and handicrafts from 1 November 2017. Products such as fibre, yarn and fabric in the textile value chain are being strengthened and made competitive through various schemes. Assistance is also provided to exporters under Market Access Initiative Scheme. Further, Government has enhanced interest equalization rate for pre and post shipment credit for the textile sector from 3 to 5 per cent with effect from 02 November, 2018. The benefit which was limited to only manufacturers earlier has been extended to merchant exporters from 2019.
INFRASTRUCTURE
8.26 In Economic literature, infrastructure is popular by the name “Overhead Capital” or “Social Overhead Capital”. The famous economist A.O Hirschman stated that Social Overhead capital is the “basic services without which primary, secondary
and tertiary productive activities cannot function”. The very success of social and economic transformation of an economy lies in providing inclusive and sustainable infrastructure amenities to the people and the pace of economic growth depends on how competently and judiciously an economy is able to address its infrastructure bottlenecks. SDG goal number 9 aims to “Develop quality, reliable, sustainable and resilient infrastructure, including regional and trans-border infrastructure, to support economic development and human well-being, with a focus on affordable and equitable access for all”.
8.27 The role of infrastructure development in economic growth has been well recognized in the literature. The correlation between infrastructure investment and economic growth for India is very high (Figures 7 to 10). The correlation of investments in inland, road, rail and airport infrastructure to GDP are higher than 0.90 indicating that there exists a strong correlation between GDP and investment in infrastructure. This further reiterates the fact that massive investment is needed in infrastructure to achieve targeted economic growth in the country.
Figure 7: GDP & Inland transport infrastructure investment
Figure 8: GDP & Airport infrastructure investment
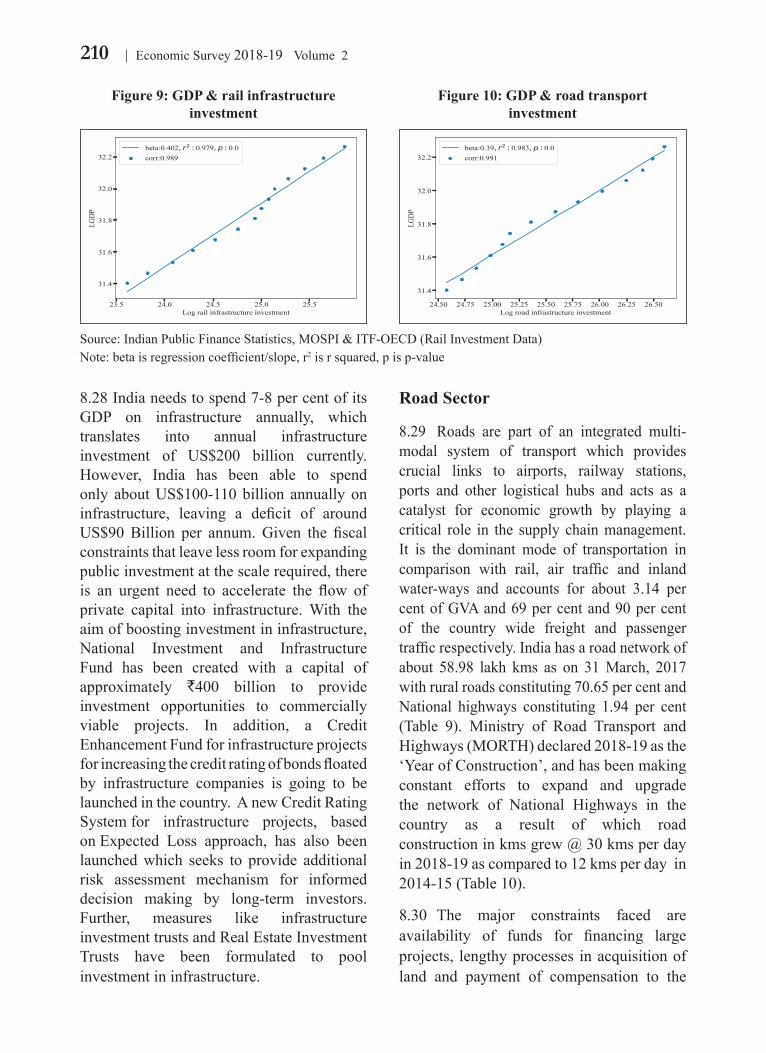
210 Economic Survey 2018-19 Volume 2
8.28 India needs to spend 7-8 per cent of its GDP on infrastructure annually, which translates into annual infrastructure investment of US$200 billion currently. However, India has been able to spend only about US$100-110 billion annually on infrastructure, leaving a deficit of around US$90 Billion per annum. Given the fiscal constraints that leave less room for expanding public investment at the scale required, there is an urgent need to accelerate the flow of private capital into infrastructure. With the aim of boosting investment in infrastructure, National Investment and Infrastructure Fund has been created with a capital of approximately `400 billion to provide investment opportunities to commercially viable projects. In addition, a Credit Enhancement Fund for infrastructure projects for increasing the credit rating of bonds floated by infrastructure companies is going to be launched in the country. A new Credit Rating System for infrastructure projects, based on Expected Loss approach, has also been launched which seeks to provide additional risk assessment mechanism for informed decision making by long-term investors. Further, measures like infrastructure investment trusts and Real Estate Investment Trusts have been formulated to pool investment in infrastructure.
Road Sector
8.29 Roads are part of an integrated multi-modal system of transport which provides crucial links to airports, railway stations, ports and other logistical hubs and acts as a catalyst for economic growth by playing a critical role in the supply chain management. It is the dominant mode of transportation in comparison with rail, air traffic and inland water-ways and accounts for about 3.14 per cent of GVA and 69 per cent and 90 per cent of the country wide freight and passenger traffic respectively. India has a road network of about 58.98 lakh kms as on 31 March, 2017 with rural roads constituting 70.65 per cent and National highways constituting 1.94 per cent (Table 9). Ministry of Road Transport and Highways (MORTH) declared 2018-19 as the ‘Year of Construction’, and has been making constant efforts to expand and upgrade the network of National Highways in the country as a result of which road construction in kms grew @ 30 kms per day in 2018-19 as compared to 12 kms per day in 2014-15 (Table 10).
8.30 The major constraints faced are availability of funds for financing large projects, lengthy processes in acquisition of land and payment of compensation to the
Figure 9: GDP & rail infrastructure investment
Figure 10: GDP & road transport investment
Source: Indian Public Finance Statistics, MOSPI & ITF-OECD (Rail Investment Data)Note: beta is regression coefficient/slope, r2 is r squared, p is p-value
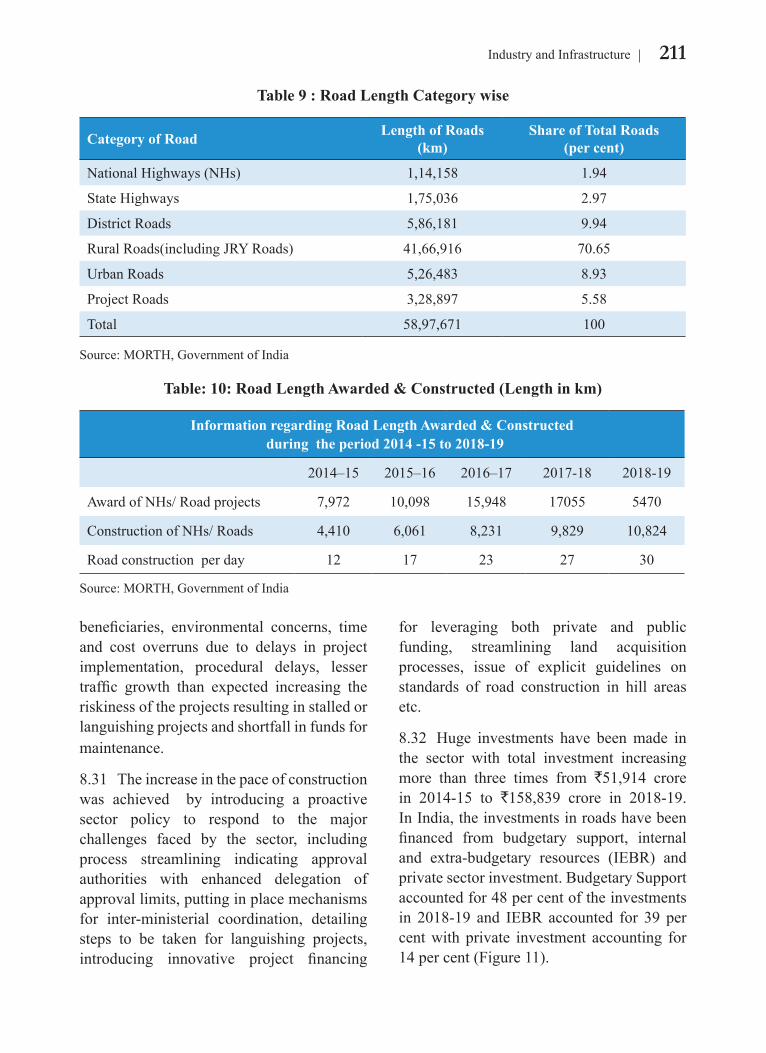
211Industry and Infrastructure
beneficiaries, environmental concerns, time and cost overruns due to delays in project implementation, procedural delays, lesser traffic growth than expected increasing the riskiness of the projects resulting in stalled or languishing projects and shortfall in funds for maintenance.
8.31 The increase in the pace of construction was achieved by introducing a proactive sector policy to respond to the major challenges faced by the sector, including process streamlining indicating approval authorities with enhanced delegation of approval limits, putting in place mechanisms for inter-ministerial coordination, detailing steps to be taken for languishing projects, introducing innovative project financing
for leveraging both private and public funding, streamlining land acquisition processes, issue of explicit guidelines on standards of road construction in hill areas etc.
8.32 Huge investments have been made in the sector with total investment increasing more than three times from `51,914 crore in 2014-15 to `158,839 crore in 2018-19. In India, the investments in roads have been financed from budgetary support, internal and extra-budgetary resources (IEBR) and private sector investment. Budgetary Support accounted for 48 per cent of the investments in 2018-19 and IEBR accounted for 39 per cent with private investment accounting for 14 per cent (Figure 11).
Table 9 : Road Length Category wise
Category of Road Length of Roads (km)
Share of Total Roads (per cent)
National Highways (NHs) 1,14,158 1.94
State Highways 1,75,036 2.97
District Roads 5,86,181 9.94
Rural Roads(including JRY Roads) 41,66,916 70.65
Urban Roads 5,26,483 8.93
Project Roads 3,28,897 5.58
Total 58,97,671 100
Source: MORTH, Government of India
Table: 10: Road Length Awarded & Constructed (Length in km)
Information regarding Road Length Awarded & Constructed during the period 2014 -15 to 2018-19
2014–15 2015–16 2016–17 2017-18 2018-19
Award of NHs/ Road projects 7,972 10,098 15,948 17055 5470
Construction of NHs/ Roads 4,410 6,061 8,231 9,829 10,824
Road construction per day 12 17 23 27 30
Source: MORTH, Government of India
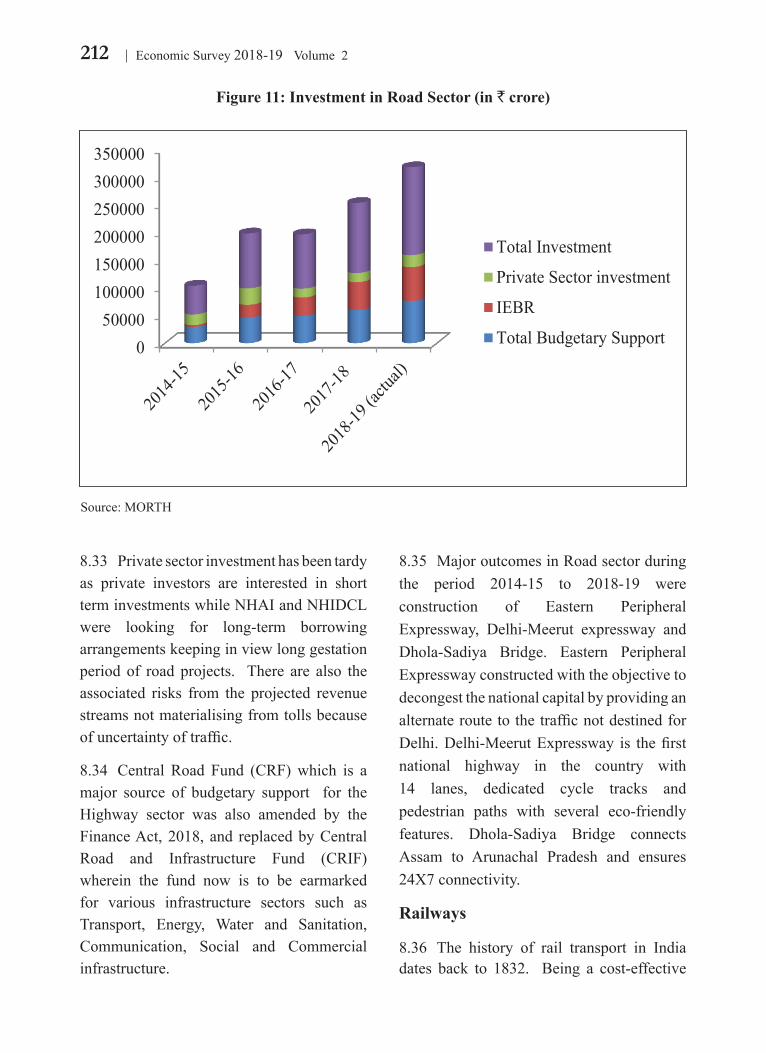
212 Economic Survey 2018-19 Volume 2
8.33 Private sector investment has been tardy as private investors are interested in short term investments while NHAI and NHIDCL were looking for long-term borrowing arrangements keeping in view long gestation period of road projects. There are also the associated risks from the projected revenue streams not materialising from tolls because of uncertainty of traffic.
8.34 Central Road Fund (CRF) which is a major source of budgetary support for the Highway sector was also amended by the Finance Act, 2018, and replaced by Central Road and Infrastructure Fund (CRIF) wherein the fund now is to be earmarked for various infrastructure sectors such as Transport, Energy, Water and Sanitation, Communication, Social and Commercial infrastructure.
8.35 Major outcomes in Road sector during the period 2014-15 to 2018-19 were construction of Eastern Peripheral Expressway, Delhi-Meerut expressway and Dhola-Sadiya Bridge. Eastern Peripheral Expressway constructed with the objective to decongest the national capital by providing an alternate route to the traffic not destined for Delhi. Delhi-Meerut Expressway is the first national highway in the country with 14 lanes, dedicated cycle tracks and pedestrian paths with several eco-friendly features. Dhola-Sadiya Bridge connects Assam to Arunachal Pradesh and ensures 24X7 connectivity.
Railways
8.36 The history of rail transport in India dates back to 1832. Being a cost-effective
Figure 11: Investment in Road Sector (in ` crore)
050000
100000150000200000250000300000350000
Total Investment
Private Sector investment
IEBR
Total Budgetary Support
Source: MORTH
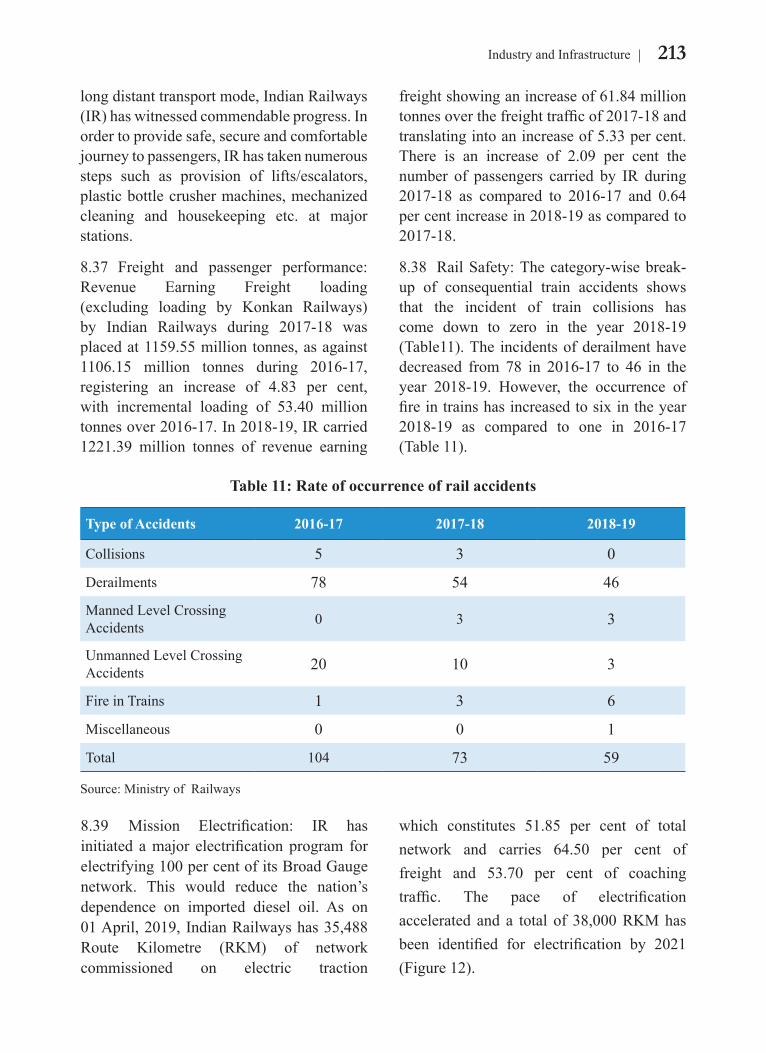
213Industry and Infrastructure
long distant transport mode, Indian Railways (IR) has witnessed commendable progress. In order to provide safe, secure and comfortable journey to passengers, IR has taken numerous steps such as provision of lifts/escalators, plastic bottle crusher machines, mechanized cleaning and housekeeping etc. at major stations.
8.37 Freight and passenger performance: Revenue Earning Freight loading (excluding loading by Konkan Railways) by Indian Railways during 2017-18 was placed at 1159.55 million tonnes, as against 1106.15 million tonnes during 2016-17, registering an increase of 4.83 per cent, with incremental loading of 53.40 million tonnes over 2016-17. In 2018-19, IR carried 1221.39 million tonnes of revenue earning
freight showing an increase of 61.84 million tonnes over the freight traffic of 2017-18 and translating into an increase of 5.33 per cent. There is an increase of 2.09 per cent the number of passengers carried by IR during 2017-18 as compared to 2016-17 and 0.64 per cent increase in 2018-19 as compared to 2017-18.
8.38 Rail Safety: The category-wise break-up of consequential train accidents shows that the incident of train collisions has come down to zero in the year 2018-19 (Table11). The incidents of derailment have decreased from 78 in 2016-17 to 46 in the year 2018-19. However, the occurrence of fire in trains has increased to six in the year 2018-19 as compared to one in 2016-17 (Table 11).
8.39 Mission Electrification: IR has initiated a major electrification program for electrifying 100 per cent of its Broad Gauge network. This would reduce the nation’s dependence on imported diesel oil. As on 01 April, 2019, Indian Railways has 35,488 Route Kilometre (RKM) of network commissioned on electric traction
which constitutes 51.85 per cent of total network and carries 64.50 per cent of freight and 53.70 per cent of coaching traffic. The pace of electrification accelerated and a total of 38,000 RKM has been identified for electrification by 2021 (Figure 12).
Table 11: Rate of occurrence of rail accidents
Type of Accidents 2016-17 2017-18 2018-19
Collisions 5 3 0
Derailments 78 54 46
Manned Level Crossing Accidents 0 3 3
Unmanned Level Crossing Accidents 20 10 3
Fire in Trains 1 3 6
Miscellaneous 0 0 1
Total 104 73 59
Source: Ministry of Railways
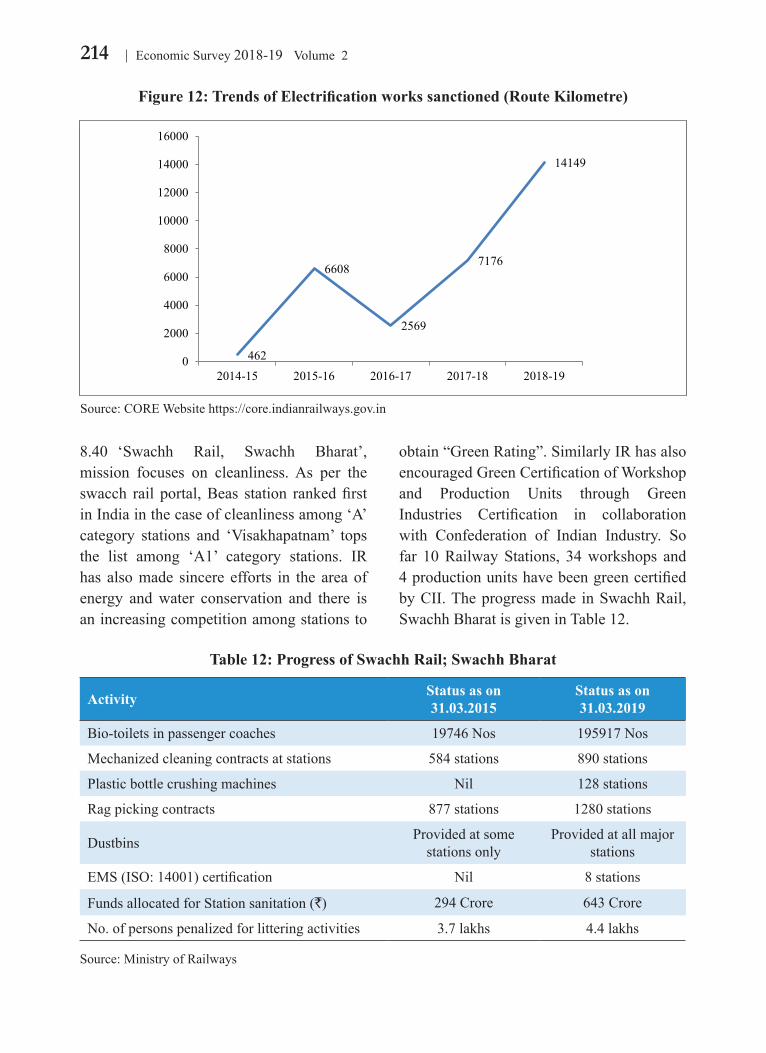
214 Economic Survey 2018-19 Volume 2
8.40 ‘Swachh Rail, Swachh Bharat’, mission focuses on cleanliness. As per the swacch rail portal, Beas station ranked first in India in the case of cleanliness among ‘A’ category stations and ‘Visakhapatnam’ tops the list among ‘A1’ category stations. IR has also made sincere efforts in the area of energy and water conservation and there is an increasing competition among stations to
obtain “Green Rating”. Similarly IR has also encouraged Green Certification of Workshop and Production Units through Green Industries Certification in collaboration with Confederation of Indian Industry. So far 10 Railway Stations, 34 workshops and 4 production units have been green certified by CII. The progress made in Swachh Rail, Swachh Bharat is given in Table 12.
Figure 12: Trends of Electrification works sanctioned (Route Kilometre)
Table 12: Progress of Swachh Rail; Swachh Bharat
Activity Status as on 31.03.2015
Status as on 31.03.2019
Bio-toilets in passenger coaches 19746 Nos 195917 Nos
Mechanized cleaning contracts at stations 584 stations 890 stations
Plastic bottle crushing machines Nil 128 stations
Rag picking contracts 877 stations 1280 stations
Dustbins Provided at some stations only
Provided at all major stations
EMS (ISO: 14001) certification Nil 8 stations
Funds allocated for Station sanitation (`) 294 Crore 643 Crore
No. of persons penalized for littering activities 3.7 lakhs 4.4 lakhs
Source: Ministry of Railways
Source: CORE Website https://core.indianrailways.gov.in
462
6608
2569
7176
14149
0
2000
4000
6000
8000
10000
12000
14000
16000
2014-15 2015-16 2016-17 2017-18 2018-19

215Industry and Infrastructure
Civil Aviation
8.41 India’s scheduled domestic air transportation for passengers and goods has grown by 14 per cent and 12 per cent respectively in 2018-19. Domestic passenger traffic in revenue passenger kilometre (RPK) recorded the fastest growth in the world at about 20 per cent for over 50 consecutive months up to December 2018, which has positively impacted India’s economy. Total domestic and international passengers were 204 million in 2018-19. To meet the surging demand and providing air connectivity to remote regions, new Greenfield airports are being rapidly developed. At the end of
2018-19, a total of 107 airports provided scheduled airline operations. Based on the performance of joint ventures in the airport sector, Government has decided to lease out six brownfield airports of Airports Authority of India (AAI) in Public-Private Partnership on Operation, Maintenance and Development model (Guwahati, Lucknow, Jaipur, Ahmedabad, Mangalore and Thiruvananthapuram), which is expected to enhance service quality at these airports besides bringing enhanced revenue to AAI. The demand and supply trends in civil aviation shows that passenger demand is higher than the seat supply (Figure 13).
8.42 UDAN: Under “Ude Desh ka Aam Naagrik-UDAN”, a total of 719 routes have been awarded in three rounds of bidding for regional connectivity, 182 of which are operational (Table 13). The routes are widely spread geographically providing connectivity country-wide and ensuring balanced regional growth, while making air travel convenient and affordable. Currently, connectivity has
already been provided to more than 22 States/UTs. Once all routes are operationalized, more than 1 crore RCS-UDAN seats will be provided annually, and 21 States would have more than 3 operational airports each. Prior to UDAN, only 7 States had more than 3 operational airports each. Overall, the scheme has provided connectivity to 23 unserved airports out of the aim to operationalize 100
Figure 13: Indian Aviation Demand and Supply Trends
60 6571
8290
2014-15 2015-16 2016-17 2017-18 2018-19
RPK of Scheduled International Services (Bn)
76 8291
102112
2014-15 2015-16 2016-17 2017-18 2018-19
ASK of Scheduled International Services (Bn)
6781
99117
135
2014-15 2015-16 2016-17 2017-18 2018-19
RPK of Scheduled Domestic Services (Bn)
8598
117135
157
2014-15 2015-16 2016-17 2017-18 2018-19
ASK of Scheduled Domestic Services (Bn)
Source: DGCA data, 2019ASK: Available Seat Kilometres; RPK: Revenue Passenger Kilometres
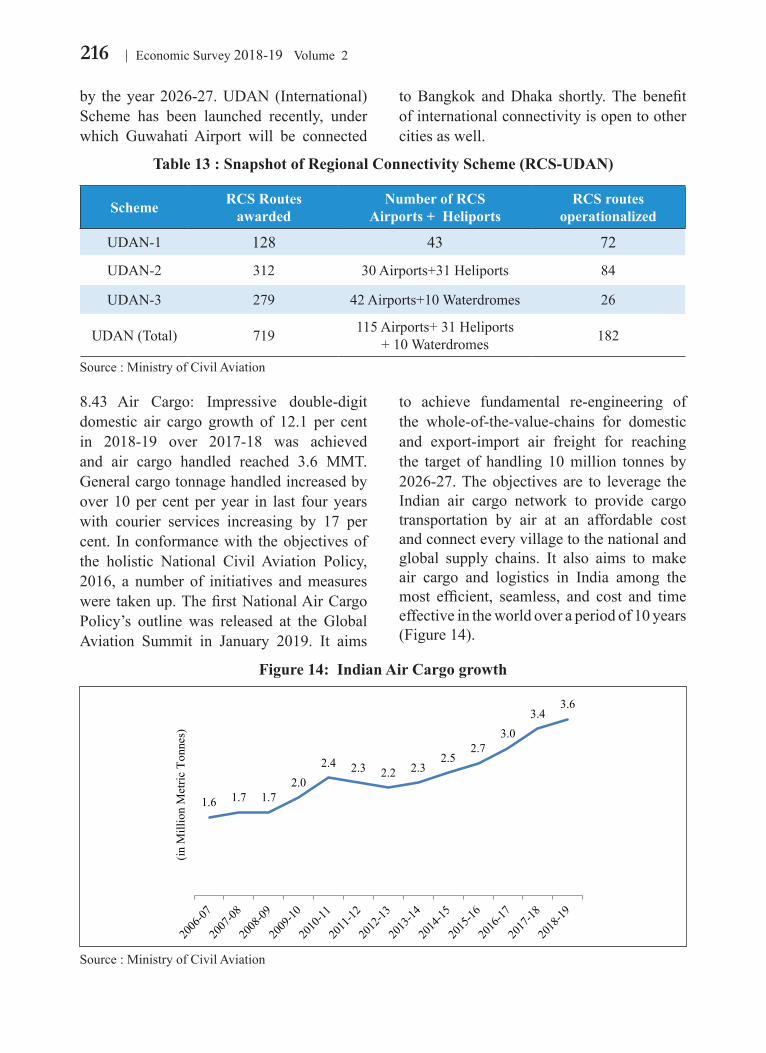
216 Economic Survey 2018-19 Volume 2
by the year 2026-27. UDAN (International) Scheme has been launched recently, under which Guwahati Airport will be connected
to Bangkok and Dhaka shortly. The benefit of international connectivity is open to other cities as well.
8.43 Air Cargo: Impressive double-digit domestic air cargo growth of 12.1 per cent in 2018-19 over 2017-18 was achieved and air cargo handled reached 3.6 MMT. General cargo tonnage handled increased by over 10 per cent per year in last four years with courier services increasing by 17 per cent. In conformance with the objectives of the holistic National Civil Aviation Policy, 2016, a number of initiatives and measures were taken up. The first National Air Cargo Policy’s outline was released at the Global Aviation Summit in January 2019. It aims
to achieve fundamental re-engineering of the whole-of-the-value-chains for domestic and export-import air freight for reaching the target of handling 10 million tonnes by 2026-27. The objectives are to leverage the Indian air cargo network to provide cargo transportation by air at an affordable cost and connect every village to the national and global supply chains. It also aims to make air cargo and logistics in India among the most efficient, seamless, and cost and time effective in the world over a period of 10 years (Figure 14).
Table 13 : Snapshot of Regional Connectivity Scheme (RCS-UDAN)
Scheme RCS Routesawarded
Number of RCS Airports + Heliports
RCS routes operationalized
UDAN-1 128 43 72
UDAN-2 312 30 Airports+31 Heliports 84
UDAN-3 279 42 Airports+10 Waterdromes 26
UDAN (Total) 719 115 Airports+ 31 Heliports+ 10 Waterdromes 182
Source : Ministry of Civil Aviation
Figure 14: Indian Air Cargo growth
Source : Ministry of Civil Aviation
1.6 1.7 1.72.0
2.4 2.3 2.2 2.32.5
2.73.0
3.43.6
(in M
illio
n M
etric
Ton
nes)

217Industry and Infrastructure
8.44 MRO: High airport tariffs, royalty and other charges, shortages of certain skilled manpower in civil aviation sector and recourse to overseas suppliers of Maintenance Repair & Overhaul (MRO) facilities, particularly for periodic engine, landing gears, propellers and airframes, besides the intensive and multiple checks at the end of lease tenor of aircraft, have contributed to engendering cut-throat
competition amongst domestic airlines.Currently annual import of MRO services by airlines in India is about `9,700 crore.With airlines’ fleet growing annually by 100, the size of domestic and imported Indian airline MRO is set to grow annually to `21,600 crore in the next five years and to `36,000 crore once the fleet size reaches 2,000 aircraft (Figure 15).
Figure 15. India MRO as of May 2019
Engine 42%
Components
24%
Air frame 17%
Line 17%
Global MRO Sub-sectors (in per cent)
Line 17%
Engine 34%
Airframe 34%
Components 15%
Indian MRO Sub-sectors (in per cent)
Source : Ministry of Civil Aviation
8.45 Aviation Turbine Fuel: High and unpredictable change in global crude oil prices during 2018-19 have been compounded by a high domestic tax regime on aviation turbine fuel. These have led to the demand from airline carriers and general aviation to bring the fuel within the ambit of GST with input tax credit in order to create a level playing field for them vis-à-vis international carriers.
Shipping
8.46 Shipping plays a pivotal role in India’s trade dynamics. As per the Indian Shipping Statistics 2018, “India had a fleet strength of 1400 vessels with gross registered tonnage (GRT) of 12.68 million as compared to fleet strength of 1371 vessels with 12.35 million GRT at the end of December 2017”. As on
January 31, 2019, India had a fleet strength of 1405 ships with dead weight tonnage (DWT) of 19.22 million (12.74 million GT) including Indian controlled tonnage, with Shipping Corporation of India (SCI) having the largest share of around 30.52 per cent. Of this, around 458 ships of 17.58 million DWT (11.26 million GT) cater to India’s overseas trade and the rest to coastal trade.
8.47 Ports Sector: Port sector development is very crucial for the development of any economy. Ports handle around 90 per cent of EXIM Cargo by volume and 70 per cent by value. In order to meet the ever increasing trade requirements, expansion of Port Capacity has been accorded the highest priority with implementation of well-conceived infrastructure development projects like
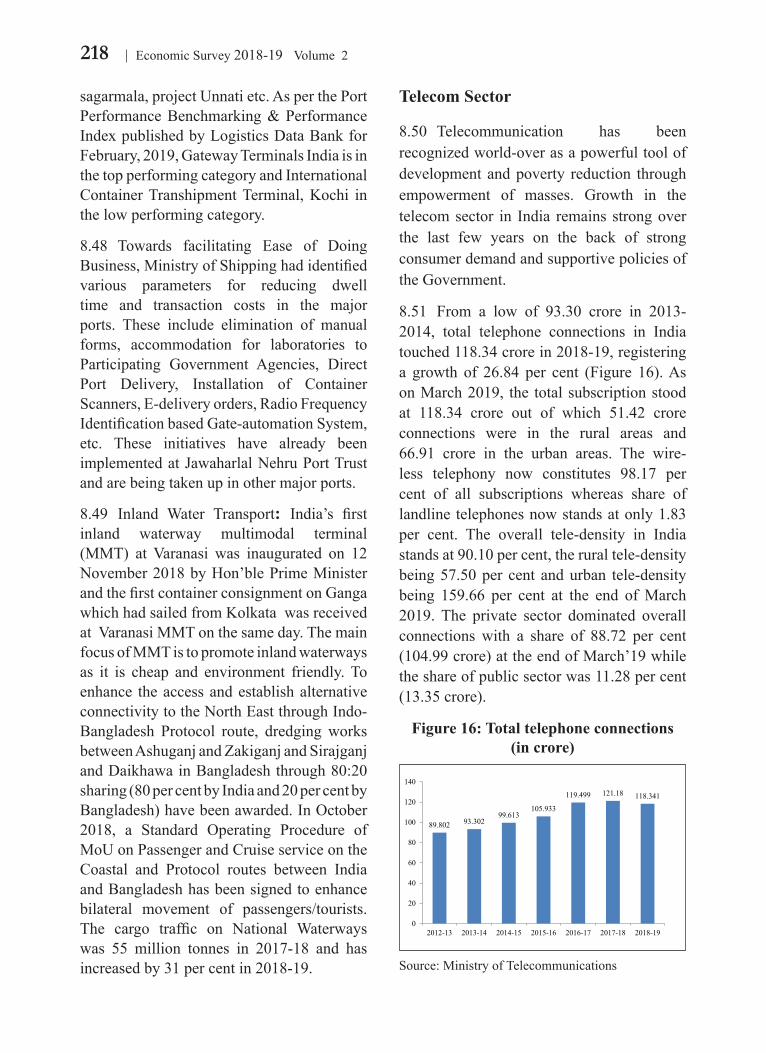
218 Economic Survey 2018-19 Volume 2
sagarmala, project Unnati etc. As per the Port Performance Benchmarking & Performance Index published by Logistics Data Bank for February, 2019, Gateway Terminals India is in the top performing category and International Container Transhipment Terminal, Kochi in the low performing category.
8.48 Towards facilitating Ease of Doing Business, Ministry of Shipping had identified various parameters for reducing dwell time and transaction costs in the major ports. These include elimination of manual forms, accommodation for laboratories to Participating Government Agencies, Direct Port Delivery, Installation of Container Scanners, E-delivery orders, Radio Frequency Identification based Gate-automation System, etc. These initiatives have already been implemented at Jawaharlal Nehru Port Trust and are being taken up in other major ports.
8.49 Inland Water Transport: India’s first inland waterway multimodal terminal (MMT) at Varanasi was inaugurated on 12 November 2018 by Hon’ble Prime Minister and the first container consignment on Ganga which had sailed from Kolkata was received at Varanasi MMT on the same day. The main focus of MMT is to promote inland waterways as it is cheap and environment friendly. To enhance the access and establish alternative connectivity to the North East through Indo-Bangladesh Protocol route, dredging works between Ashuganj and Zakiganj and Sirajganj and Daikhawa in Bangladesh through 80:20 sharing (80 per cent by India and 20 per cent by Bangladesh) have been awarded. In October 2018, a Standard Operating Procedure of MoU on Passenger and Cruise service on the Coastal and Protocol routes between India and Bangladesh has been signed to enhance bilateral movement of passengers/tourists. The cargo traffic on National Waterways was 55 million tonnes in 2017-18 and has increased by 31 per cent in 2018-19.
Telecom Sector
8.50 Telecommunication has been recognized world-over as a powerful tool of development and poverty reduction through empowerment of masses. Growth in the telecom sector in India remains strong over the last few years on the back of strong consumer demand and supportive policies of the Government.
8.51 From a low of 93.30 crore in 2013-2014, total telephone connections in India touched 118.34 crore in 2018-19, registering a growth of 26.84 per cent (Figure 16). As on March 2019, the total subscription stood at 118.34 crore out of which 51.42 crore connections were in the rural areas and 66.91 crore in the urban areas. The wire-less telephony now constitutes 98.17 per cent of all subscriptions whereas share of landline telephones now stands at only 1.83 per cent. The overall tele-density in India stands at 90.10 per cent, the rural tele-density being 57.50 per cent and urban tele-density being 159.66 per cent at the end of March 2019. The private sector dominated overall connections with a share of 88.72 per cent (104.99 crore) at the end of March’19 while the share of public sector was 11.28 per cent (13.35 crore).
89.802 93.302 99.613
105.933
119.499 121.18 118.341
0
20
40
60
80
100
120
140
2012-13 2013-14 2014-15 2015-16 2016-17 2017-18 2018-19
Source: Ministry of Telecommunications
Figure 16: Total telephone connections (in crore)
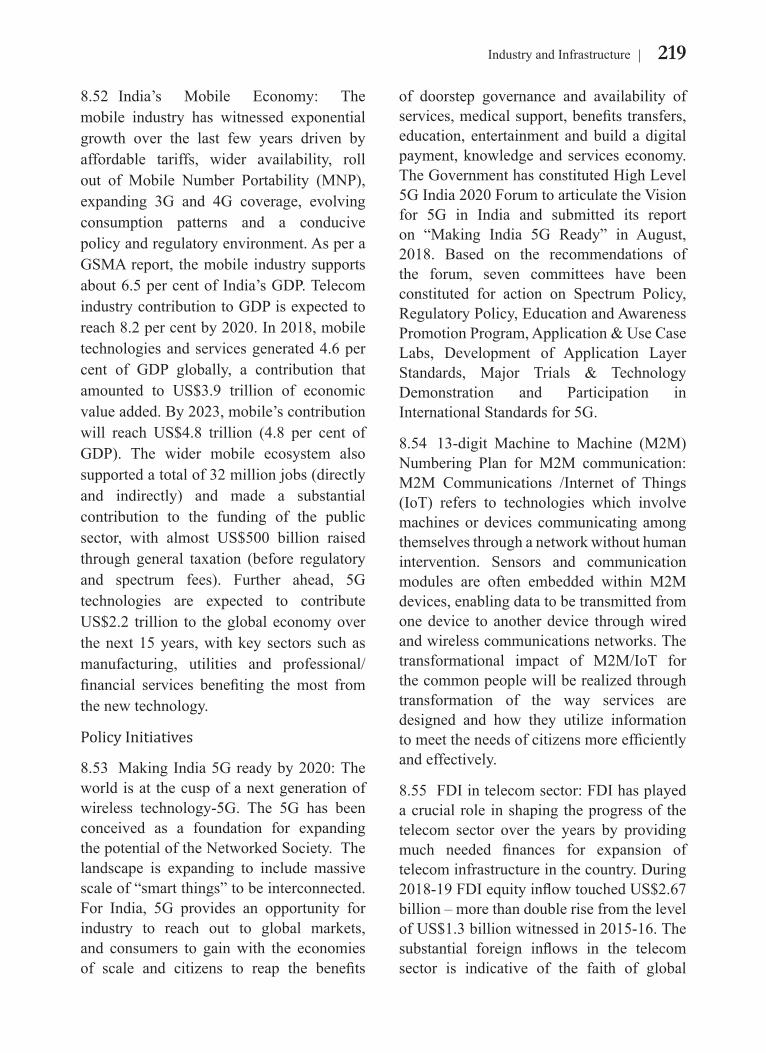
219Industry and Infrastructure
8.52 India’s Mobile Economy: The mobile industry has witnessed exponential growth over the last few years driven by affordable tariffs, wider availability, roll out of Mobile Number Portability (MNP), expanding 3G and 4G coverage, evolving consumption patterns and a conducive policy and regulatory environment. As per a GSMA report, the mobile industry supports about 6.5 per cent of India’s GDP. Telecom industry contribution to GDP is expected to reach 8.2 per cent by 2020. In 2018, mobile technologies and services generated 4.6 per cent of GDP globally, a contribution that amounted to US$3.9 trillion of economic value added. By 2023, mobile’s contribution will reach US$4.8 trillion (4.8 per cent of GDP). The wider mobile ecosystem also supported a total of 32 million jobs (directly and indirectly) and made a substantial contribution to the funding of the public sector, with almost US$500 billion raised through general taxation (before regulatory and spectrum fees). Further ahead, 5G technologies are expected to contribute US$2.2 trillion to the global economy over the next 15 years, with key sectors such as manufacturing, utilities and professional/financial services benefiting the most from the new technology.
Policy Initiatives
8.53 Making India 5G ready by 2020: The world is at the cusp of a next generation of wireless technology-5G. The 5G has been conceived as a foundation for expanding the potential of the Networked Society. The landscape is expanding to include massive scale of “smart things” to be interconnected. For India, 5G provides an opportunity for industry to reach out to global markets, and consumers to gain with the economies of scale and citizens to reap the benefits
of doorstep governance and availability of services, medical support, benefits transfers, education, entertainment and build a digital payment, knowledge and services economy. The Government has constituted High Level 5G India 2020 Forum to articulate the Vision for 5G in India and submitted its report on “Making India 5G Ready” in August, 2018. Based on the recommendations of the forum, seven committees have been constituted for action on Spectrum Policy, Regulatory Policy, Education and Awareness Promotion Program, Application & Use Case Labs, Development of Application Layer Standards, Major Trials & Technology Demonstration and Participation in International Standards for 5G.
8.54 13-digit Machine to Machine (M2M) Numbering Plan for M2M communication: M2M Communications /Internet of Things (IoT) refers to technologies which involve machines or devices communicating among themselves through a network without human intervention. Sensors and communication modules are often embedded within M2M devices, enabling data to be transmitted from one device to another device through wired and wireless communications networks. The transformational impact of M2M/IoT for the common people will be realized through transformation of the way services are designed and how they utilize information to meet the needs of citizens more efficiently and effectively.
8.55 FDI in telecom sector: FDI has played a crucial role in shaping the progress of the telecom sector over the years by providing much needed finances for expansion of telecom infrastructure in the country. During 2018-19 FDI equity inflow touched US$2.67 billion – more than double rise from the level of US$1.3 billion witnessed in 2015-16. The substantial foreign inflows in the telecom sector is indicative of the faith of global
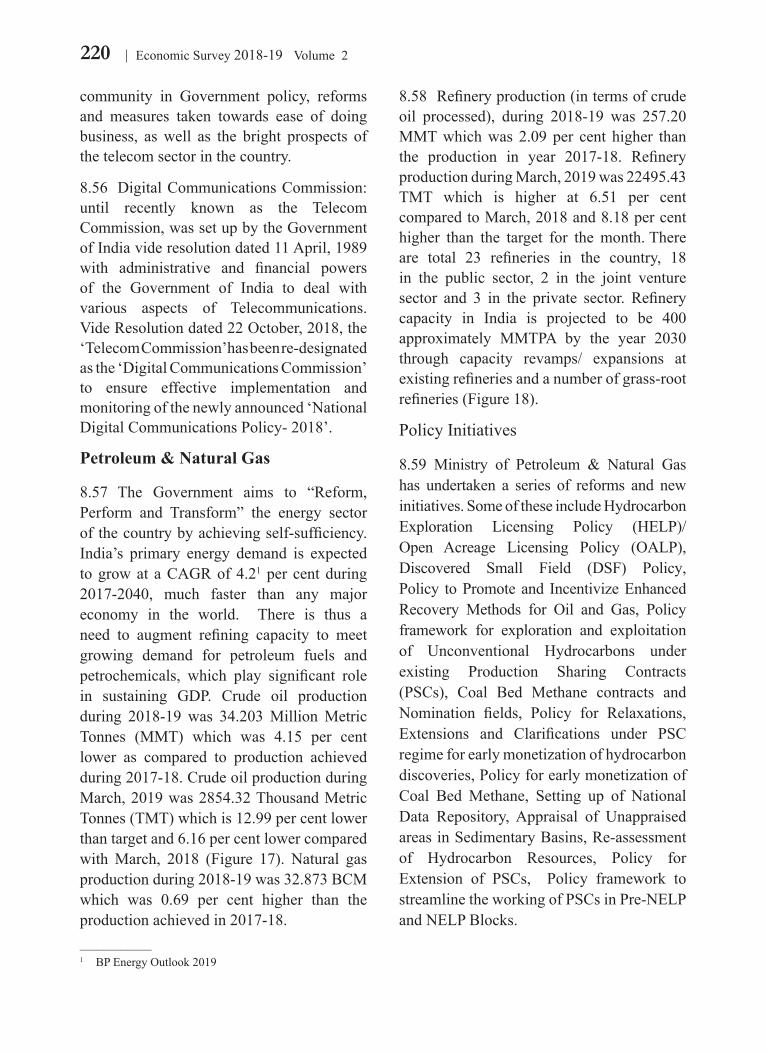
220 Economic Survey 2018-19 Volume 2
community in Government policy, reforms and measures taken towards ease of doing business, as well as the bright prospects of the telecom sector in the country.
8.56 Digital Communications Commission: until recently known as the Telecom Commission, was set up by the Government of India vide resolution dated 11 April, 1989 with administrative and financial powers of the Government of India to deal with various aspects of Telecommunications. Vide Resolution dated 22 October, 2018, the ‘Telecom Commission’ has been re-designated as the ‘Digital Communications Commission’ to ensure effective implementation and monitoring of the newly announced ‘National Digital Communications Policy- 2018’.
Petroleum & Natural Gas
8.57 The Government aims to “Reform, Perform and Transform” the energy sector of the country by achieving self-sufficiency. India’s primary energy demand is expected to grow at a CAGR of 4.21 per cent during 2017-2040, much faster than any major economy in the world. There is thus a need to augment refining capacity to meet growing demand for petroleum fuels and petrochemicals, which play significant role in sustaining GDP. Crude oil production during 2018-19 was 34.203 Million Metric Tonnes (MMT) which was 4.15 per cent lower as compared to production achieved during 2017-18. Crude oil production during March, 2019 was 2854.32 Thousand Metric Tonnes (TMT) which is 12.99 per cent lower than target and 6.16 per cent lower compared with March, 2018 (Figure 17). Natural gas production during 2018-19 was 32.873 BCM which was 0.69 per cent higher than the production achieved in 2017-18.
8.58 Refinery production (in terms of crude oil processed), during 2018-19 was 257.20 MMT which was 2.09 per cent higher than the production in year 2017-18. Refinery production during March, 2019 was 22495.43 TMT which is higher at 6.51 per cent compared to March, 2018 and 8.18 per cent higher than the target for the month. There are total 23 refineries in the country, 18 in the public sector, 2 in the joint venture sector and 3 in the private sector. Refinery capacity in India is projected to be 400 approximately MMTPA by the year 2030 through capacity revamps/ expansions at existing refineries and a number of grass-root refineries (Figure 18).
Policy Initiatives
8.59 Ministry of Petroleum & Natural Gas has undertaken a series of reforms and new initiatives. Some of these include Hydrocarbon Exploration Licensing Policy (HELP)/ Open Acreage Licensing Policy (OALP), Discovered Small Field (DSF) Policy, Policy to Promote and Incentivize Enhanced Recovery Methods for Oil and Gas, Policy framework for exploration and exploitation of Unconventional Hydrocarbons under existing Production Sharing Contracts (PSCs), Coal Bed Methane contracts and Nomination fields, Policy for Relaxations, Extensions and Clarifications under PSC regime for early monetization of hydrocarbon discoveries, Policy for early monetization of Coal Bed Methane, Setting up of National Data Repository, Appraisal of Unappraised areas in Sedimentary Basins, Re-assessment of Hydrocarbon Resources, Policy for Extension of PSCs, Policy framework to streamline the working of PSCs in Pre-NELP and NELP Blocks.
____________1 BP Energy Outlook 2019
221Industry and Infrastructure
Figure 17: Monthly Crude Oil Production (Quantity in TMT)
2854.32
3041.65
2500
2600
2700
2800
2900
3000
3100
3200 2018-19 2017-18
Source: Monthly Report, MoP&NG
Figure 18: Monthly Refinery Production (Quantity in TMT)
22495.43
21120.72
18000
19000
20000
21000
22000
23000
24000
2018-19 2017-18
Source: Monthly Report, MoP&NG
Programme reduced.
(iv) No production and revenue sharing, only statutory levies except in case of windfall gain.
(v) Full marketing and pricing freedom at Arm’s Length basis based on competitive bidding.
(vi) Grant of concessional royalty, if production commences within 4 years / 5 years.
(vii) National Oil Companies (NOCs) have been given freedom to choose field specific implementation model
8.60 With a view to promote exploration, early monetization, incentivise production, streamline procedure and promote ease of doing business, a series of policy decisions have been taken by the Government on 19 February, 2019 in the hydrocarbon sector, the highlights of which are given below:
(i) Weightage to Minimum Work Programme (MWP) has been enhanced.
(ii) Revenue sharing ceiling at highest revenue point to be set at 50 per cent.
(iii) The timeline for completion of committing Minimum Work
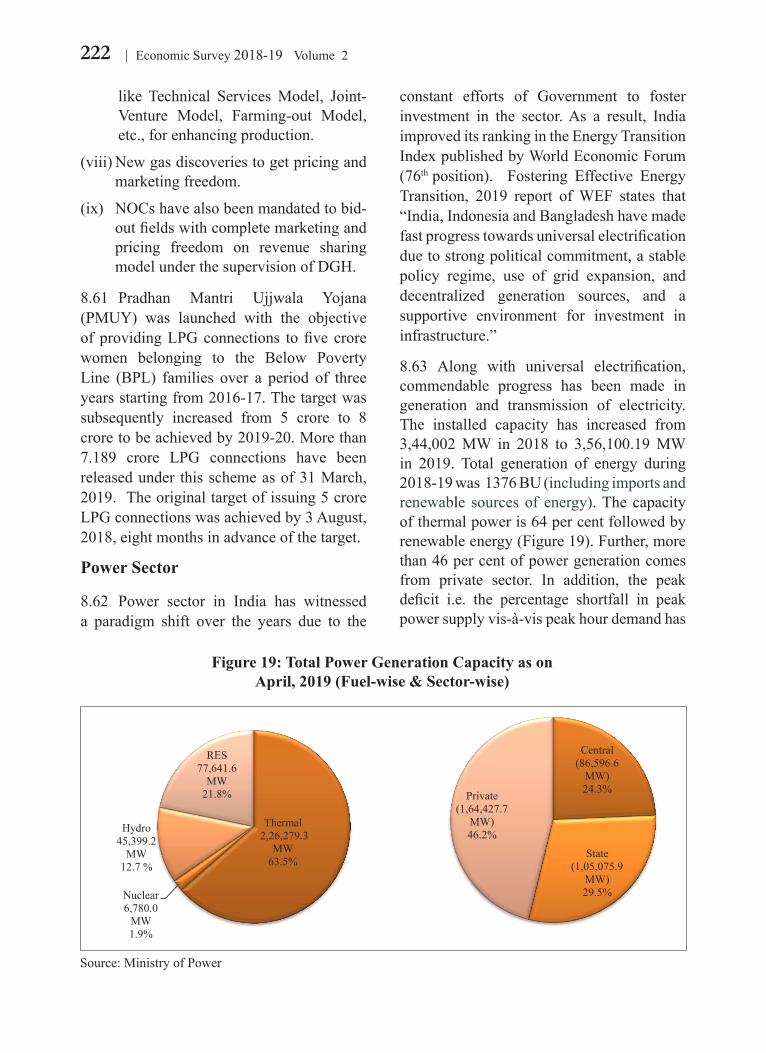
222 Economic Survey 2018-19 Volume 2
like Technical Services Model, Joint-Venture Model, Farming-out Model, etc., for enhancing production.
(viii) New gas discoveries to get pricing and marketing freedom.
(ix) NOCs have also been mandated to bid-out fields with complete marketing and pricing freedom on revenue sharing model under the supervision of DGH.
8.61 Pradhan Mantri Ujjwala Yojana (PMUY) was launched with the objective of providing LPG connections to five crore women belonging to the Below Poverty Line (BPL) families over a period of three years starting from 2016-17. The target was subsequently increased from 5 crore to 8 crore to be achieved by 2019-20. More than 7.189 crore LPG connections have been released under this scheme as of 31 March, 2019. The original target of issuing 5 crore LPG connections was achieved by 3 August, 2018, eight months in advance of the target.
Power Sector
8.62 Power sector in India has witnessed a paradigm shift over the years due to the
constant efforts of Government to foster investment in the sector. As a result, India improved its ranking in the Energy Transition Index published by World Economic Forum (76th position). Fostering Effective Energy Transition, 2019 report of WEF states that “India, Indonesia and Bangladesh have made fast progress towards universal electrification due to strong political commitment, a stable policy regime, use of grid expansion, and decentralized generation sources, and a supportive environment for investment in infrastructure.”
8.63 Along with universal electrification, commendable progress has been made in generation and transmission of electricity. The installed capacity has increased from 3,44,002 MW in 2018 to 3,56,100.19 MW in 2019. Total generation of energy during 2018-19 was 1376 BU (including imports and renewable sources of energy). The capacity of thermal power is 64 per cent followed by renewable energy (Figure 19). Further, more than 46 per cent of power generation comes from private sector. In addition, the peak deficit i.e. the percentage shortfall in peak power supply vis-à-vis peak hour demand has
Thermal 2,26,279.3
MW 63.5%
Nuclear 6,780.0
MW 1.9%
Hydro 45,399.2
MW 12.7 %
RES 77,641.6
MW 21.8%
Central (86,596.6
MW) 24.3%
State (1,05,075.9
MW) 29.5%
Private (1,64,427.7
MW) 46.2%
Source: Ministry of Power
Figure 19: Total Power Generation Capacity as on April, 2019 (Fuel-wise & Sector-wise)
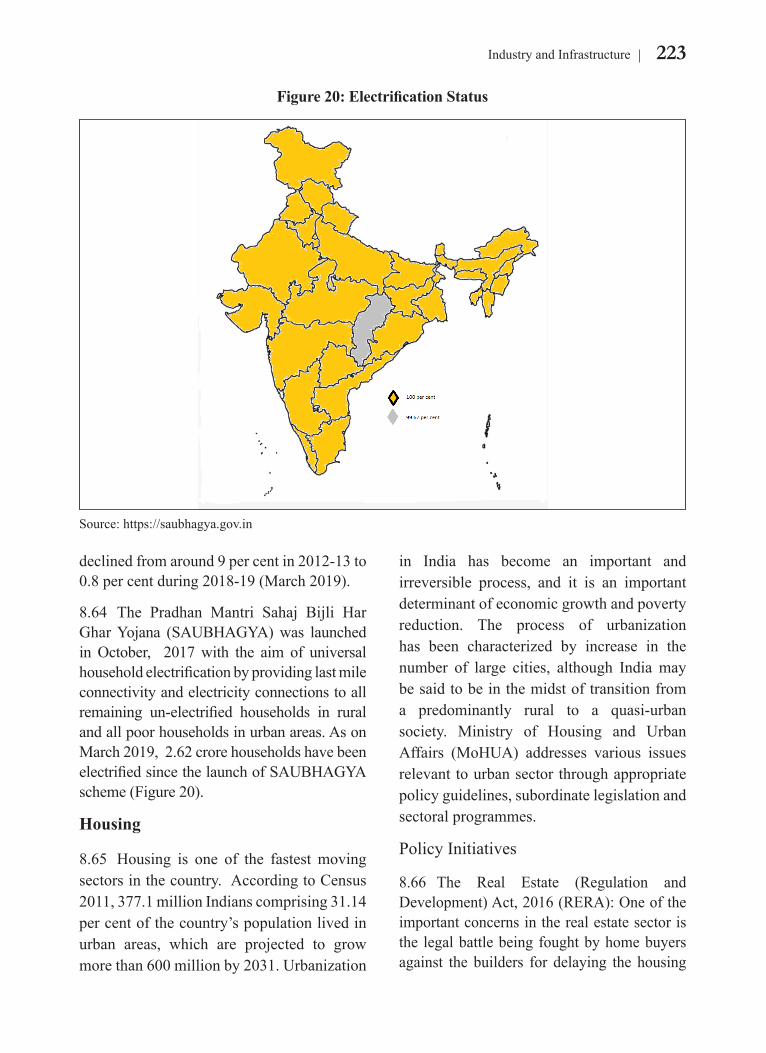
223Industry and Infrastructure
Figure 20: Electrification Status
Source: https://saubhagya.gov.in
declined from around 9 per cent in 2012-13 to 0.8 per cent during 2018-19 (March 2019).
8.64 The Pradhan Mantri Sahaj Bijli Har Ghar Yojana (SAUBHAGYA) was launched in October, 2017 with the aim of universal household electrification by providing last mile connectivity and electricity connections to all remaining un-electrified households in rural and all poor households in urban areas. As on March 2019, 2.62 crore households have been electrified since the launch of SAUBHAGYA scheme (Figure 20).
Housing
8.65 Housing is one of the fastest moving sectors in the country. According to Census 2011, 377.1 million Indians comprising 31.14 per cent of the country’s population lived in urban areas, which are projected to grow more than 600 million by 2031. Urbanization
in India has become an important and irreversible process, and it is an important determinant of economic growth and poverty reduction. The process of urbanization has been characterized by increase in the number of large cities, although India may be said to be in the midst of transition from a predominantly rural to a quasi-urban society. Ministry of Housing and Urban Affairs (MoHUA) addresses various issues relevant to urban sector through appropriate policy guidelines, subordinate legislation and sectoral programmes.
Policy Initiatives
8.66 The Real Estate (Regulation and Development) Act, 2016 (RERA): One of the important concerns in the real estate sector is the legal battle being fought by home buyers against the builders for delaying the housing
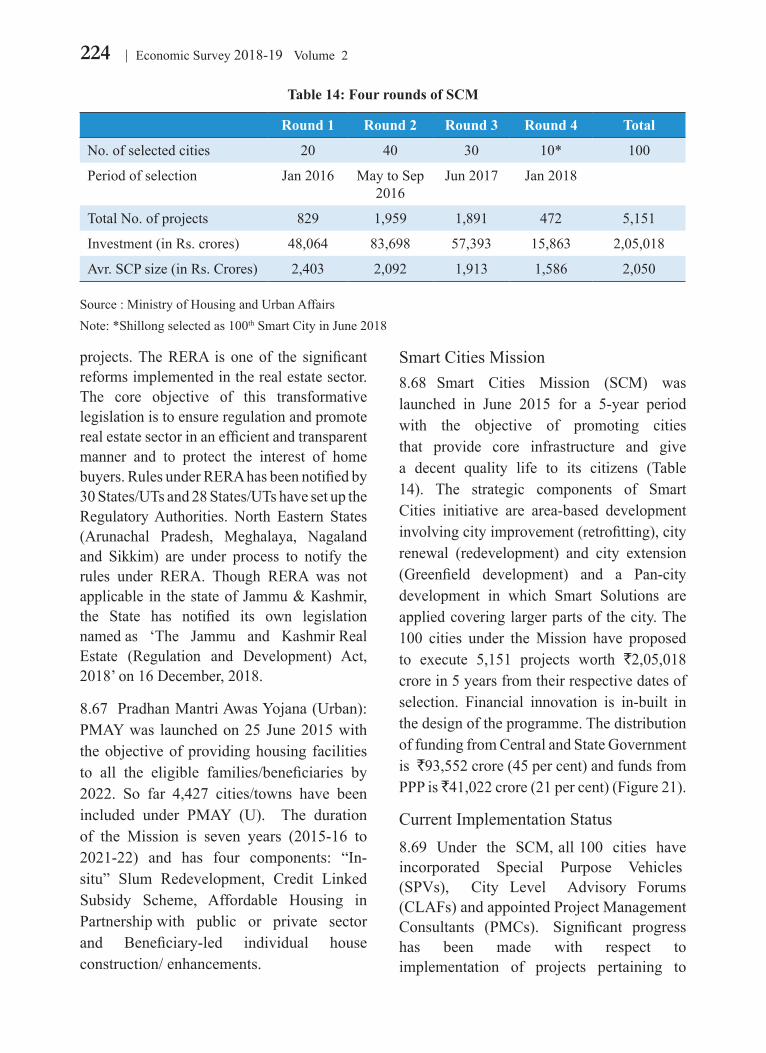
224 Economic Survey 2018-19 Volume 2
projects. The RERA is one of the significant reforms implemented in the real estate sector. The core objective of this transformative legislation is to ensure regulation and promote real estate sector in an efficient and transparent manner and to protect the interest of home buyers. Rules under RERA has been notified by 30 States/UTs and 28 States/UTs have set up the Regulatory Authorities. North Eastern States (Arunachal Pradesh, Meghalaya, Nagaland and Sikkim) are under process to notify the rules under RERA. Though RERA was not applicable in the state of Jammu & Kashmir, the State has notified its own legislation named as ‘The Jammu and Kashmir Real Estate (Regulation and Development) Act, 2018’ on 16 December, 2018.
8.67 Pradhan Mantri Awas Yojana (Urban): PMAY was launched on 25 June 2015 with the objective of providing housing facilities to all the eligible families/beneficiaries by 2022. So far 4,427 cities/towns have been included under PMAY (U). The duration of the Mission is seven years (2015-16 to 2021-22) and has four components: “In-situ” Slum Redevelopment, Credit Linked Subsidy Scheme, Affordable Housing in Partnership with public or private sector and Beneficiary-led individual house construction/ enhancements.
Smart Cities Mission8.68 Smart Cities Mission (SCM) was launched in June 2015 for a 5-year period with the objective of promoting cities that provide core infrastructure and give a decent quality life to its citizens (Table 14). The strategic components of Smart Cities initiative are area-based development involving city improvement (retrofitting), city renewal (redevelopment) and city extension (Greenfield development) and a Pan-city development in which Smart Solutions are applied covering larger parts of the city. The 100 cities under the Mission have proposed to execute 5,151 projects worth `2,05,018 crore in 5 years from their respective dates of selection. Financial innovation is in-built in the design of the programme. The distribution of funding from Central and State Government is `93,552 crore (45 per cent) and funds from PPP is ̀ 41,022 crore (21 per cent) (Figure 21).
Current Implementation Status8.69 Under the SCM, all 100 cities have incorporated Special Purpose Vehicles (SPVs), City Level Advisory Forums (CLAFs) and appointed Project Management Consultants (PMCs). Significant progress has been made with respect to implementation of projects pertaining to
Table 14: Four rounds of SCM
Round 1 Round 2 Round 3 Round 4 Total
No. of selected cities 20 40 30 10* 100
Period of selection Jan 2016 May to Sep 2016
Jun 2017 Jan 2018
Total No. of projects 829 1,959 1,891 472 5,151
Investment (in Rs. crores) 48,064 83,698 57,393 15,863 2,05,018
Avr. SCP size (in Rs. Crores) 2,403 2,092 1,913 1,586 2,050
Source : Ministry of Housing and Urban AffairsNote: *Shillong selected as 100th Smart City in June 2018
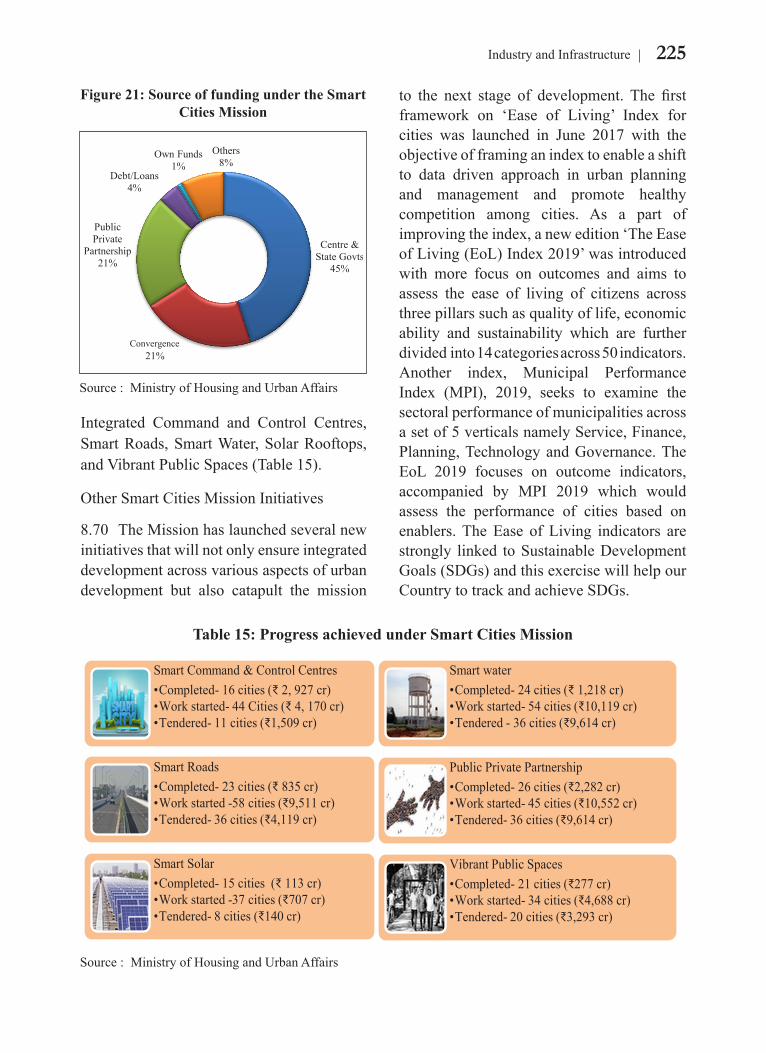
225Industry and Infrastructure
Figure 21: Source of funding under the Smart Cities Mission
Centre & State Govts
45%
Convergence 21%
Public Private
Partnership 21%
Debt/Loans 4%
Own Funds 1%
Others 8%
Source : Ministry of Housing and Urban Affairs
Integrated Command and Control Centres, Smart Roads, Smart Water, Solar Rooftops, and Vibrant Public Spaces (Table 15).
Other Smart Cities Mission Initiatives
8.70 The Mission has launched several new initiatives that will not only ensure integrated development across various aspects of urban development but also catapult the mission
to the next stage of development. The first framework on ‘Ease of Living’ Index for cities was launched in June 2017 with the objective of framing an index to enable a shift to data driven approach in urban planning and management and promote healthy competition among cities. As a part of improving the index, a new edition ‘The Ease of Living (EoL) Index 2019’ was introduced with more focus on outcomes and aims to assess the ease of living of citizens across three pillars such as quality of life, economic ability and sustainability which are further divided into 14 categories across 50 indicators. Another index, Municipal Performance Index (MPI), 2019, seeks to examine the sectoral performance of municipalities across a set of 5 verticals namely Service, Finance, Planning, Technology and Governance. The EoL 2019 focuses on outcome indicators, accompanied by MPI 2019 which would assess the performance of cities based on enablers. The Ease of Living indicators are strongly linked to Sustainable Development Goals (SDGs) and this exercise will help our Country to track and achieve SDGs.
Table 15: Progress achieved under Smart Cities Mission
Smart Command & Control Centres •Completed- 16 cities (₹ 2, 927 cr) •Work started- 44 Cities (₹ 4, 170 cr) •Tendered- 11 cities (₹1,509 cr)
Smart Roads •Completed- 23 cities (₹ 835 cr) •Work started -58 cities (₹9,511 cr) •Tendered- 36 cities (₹4,119 cr)
Smart Solar •Completed- 15 cities (₹ 113 cr) •Work started -37 cities (₹707 cr) •Tendered- 8 cities (₹140 cr)
Smart water •Completed- 24 cities (₹ 1,218 cr) •Work started- 54 cities (₹10,119 cr) •Tendered - 36 cities (₹9,614 cr)
Public Private Partnership •Completed- 26 cities (₹2,282 cr) •Work started- 45 cities (₹10,552 cr) •Tendered- 36 cities (₹9,614 cr)
Vibrant Public Spaces •Completed- 21 cities (₹277 cr) •Work started- 34 cities (₹4,688 cr) •Tendered- 20 cities (₹3,293 cr)
Source : Ministry of Housing and Urban Affairs
226 Economic Survey 2018-19 Volume 2
8.71 To drive the new urban transformation agenda of the Government through innovation and delivery, there is a growing need to nurture a well-knit ecosystem of urban innovation to encourage innovation in technology, governance, financing, and citizen engagement. It is envisaged that NUIH with necessary physical and digital infrastructure will anchor the innovation efforts and build necessary capacity for urban transformation. NUIH will be the apex national level institution that will drive the MoHUA’s whole-of -system innovation through a Hub-and-Spoke network across states and UTs and for delivering the capacity building and governance reforms in urban sector.
Infrastructure Financing: Public Private Partnerships (PPPs)
8.72 Private investment in infrastructure has come mainly in the form of PPPs. More than a third of the infrastructure investment in India in the past decade has come from the private sector. PPPs help in addressing the infrastructure gap as well as improving efficiency in infrastructure service delivery. As per the Private Participation in Infrastructure database of World Bank, India is ranked second among developing countries both by the number of PPP Projects as well as the associated investments. Indian private participation in infrastructure program supports a number of PPP models including management contracts, Build-Operate-Transfer (BOT) contracts, Design-Build-Finance-Operate-Transfer contracts, Rehabilitate - Operate - Transfer, Hybrid Annuity Model, and Toll-Operate-Transfer model. Under the BOT model, there are two variants – BOT (Toll) and BOT (Annuity) depending on who bears the traffic risk. In the case of BOT (Toll), the traffic risk is borne by the PPP concessionaire while in the case of BOT (Annuity), it is borne by the Government (Public Authority).
8.73 One of the challenges facing this sector is to devise a comprehensive resolution/ settlement option for projects which are either stuck-up mid-way or wherein the arbitral disputes/ claims have not been settled. The need is to establish an institutional mechanism to deal with time-bound resolution of disputes in infrastructure sectors. Further, private developers have faced issues of leveraged balance sheets and aggressive bidding making it difficult for them to mobilize resources for completion of projects. Accordingly, Government has adopted the Hybrid Annuity Mode of PPP to encourage private participation in infrastructure projects. Government contributes 40 per cent of the total project cost in the construction period, remaining 60 per cent is paid as biannual annuity after the completion of the project construction. The HAM model is considerably de-risked for the private concessionaires. In order to discourage aggressive bidding under HAM model, there is a provision of Additional Performance Security which will be applicable in case the Bid Project Cost of the Lowest Bidder is lower by more than 10 per cent with respect to the estimated project Cost.
WAY FORWARD
8.74 In a fast moving world to maintain growth momentum, India has to develop its industry and infrastructure. As an emerging economy, the scope for Industry 4.0 and Next generation infrastructure are enormous. To experience the potential of the perfect blend of Industry 4.0 and next generation infrastructure, it is necessary to clear the decks which are obstructing the way forward. Industry 4.0 encompasses automation in industrial sectors whereas next generation infrastructure brings physical infrastructure and technology like internet of things, automation together to maximize

227Industry and Infrastructure
the efficiency of physical infrastructure. For a smooth and fast travelling, India needs adequate and timely investment in quality infrastructure.
8.75 In order to create a ten trillion dollar economy by 2032, India needs a robust and resilient infrastructure. Public investment cannot fund the entire infrastructure investment requirements of the country. Further, private players are usually
CHAPTER AT A GLANCE The industrial growth in terms of Index of Industrial Production (IIP) registered 3.6 per cent in
2018-19 as compared to 4.4 per cent growth rate in 2017-18. The moderation in IIP growth is mainly due to subdued manufacturing activities in Q3 and Q4 of 2018-19.
The overall Index of Eight Core Industries registered a growth rate of 4.3 per cent in 2018-19 similar to the increase achieved in 2017-18.
India has considerably improved its ranking to 77th position in 2018 among 190 countries assessed by the World Bank Doing Business (DB) Report, 2019 in which India has leapt 23 ranks over its rank of 100 in 2017.
Building sustainable and resilient infrastructure has been given due importance with the formulation of sector specific programmes such as SAUBHAGYA scheme, PMAY etc.
Road construction in kms grew @ 30 kms per day in 2018-19 as compared to 12 kms per day in 2014-15.
Rail freight and passenger traffic grew by 5.33 per cent and 0.64 per cent respectively in 2018-19 as compared to 2017-18.
Total telephone connections in India touched 118.34 crore in 2018-19.
The installed capacity of electricity has increased from 3,44,002 MW in 2018 to 3,56,100 MW in 2019.
Public Private Partnerships are quintessential for addressing infrastructure gaps in the country.
There is a need for establishing an institutional mechanism to deal with time-bound resolution of disputes in infrastructure sectors.
eager to bring their capital into developed Indian states as compared to less developed states. Therefore, the real challenge lies in bringing adequate private investment across the country with the collaboration of public sector. Along with physical infrastructure; provision of social infrastructure is also equally important as these two would determine where India will be placed in the world by 2030.
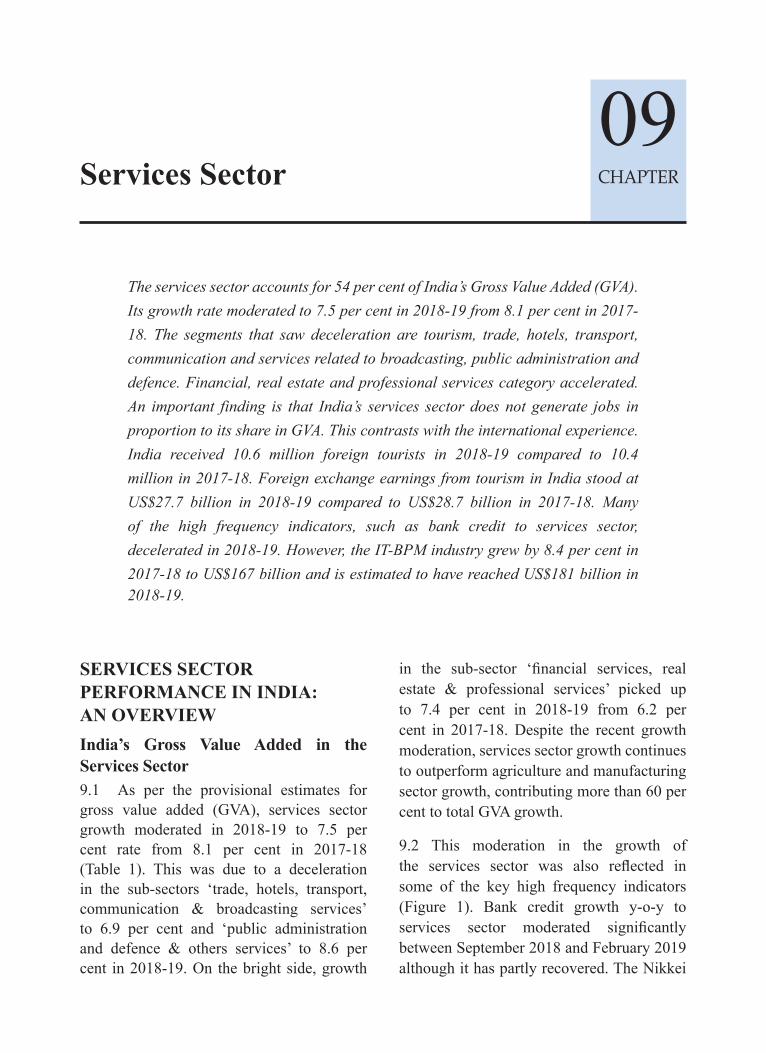
CHAPTERServices Sector09
The services sector accounts for 54 per cent of India’s Gross Value Added (GVA). Its growth rate moderated to 7.5 per cent in 2018-19 from 8.1 per cent in 2017-18. The segments that saw deceleration are tourism, trade, hotels, transport, communication and services related to broadcasting, public administration and defence. Financial, real estate and professional services category accelerated. An important finding is that India’s services sector does not generate jobs in proportion to its share in GVA. This contrasts with the international experience. India received 10.6 million foreign tourists in 2018-19 compared to 10.4 million in 2017-18. Foreign exchange earnings from tourism in India stood at US$27.7 billion in 2018-19 compared to US$28.7 billion in 2017-18. Many of the high frequency indicators, such as bank credit to services sector, decelerated in 2018-19. However, the IT-BPM industry grew by 8.4 per cent in 2017-18 to US$167 billion and is estimated to have reached US$181 billion in 2018-19.
SERVICES SECTOR PERFORMANCE IN INDIA: AN OVERVIEWIndia’s Gross Value Added in the Services Sector9.1 As per the provisional estimates for gross value added (GVA), services sector growth moderated in 2018-19 to 7.5 per cent rate from 8.1 per cent in 2017-18 (Table 1). This was due to a deceleration in the sub-sectors ‘trade, hotels, transport, communication & broadcasting services’ to 6.9 per cent and ‘public administration and defence & others services’ to 8.6 per cent in 2018-19. On the bright side, growth
in the sub-sector ‘financial services, real estate & professional services’ picked up to 7.4 per cent in 2018-19 from 6.2 per cent in 2017-18. Despite the recent growth moderation, services sector growth continues to outperform agriculture and manufacturing sector growth, contributing more than 60 per cent to total GVA growth.
9.2 This moderation in the growth of the services sector was also reflected in some of the key high frequency indicators (Figure 1). Bank credit growth y-o-y to services sector moderated significantly between September 2018 and February 2019 although it has partly recovered. The Nikkei
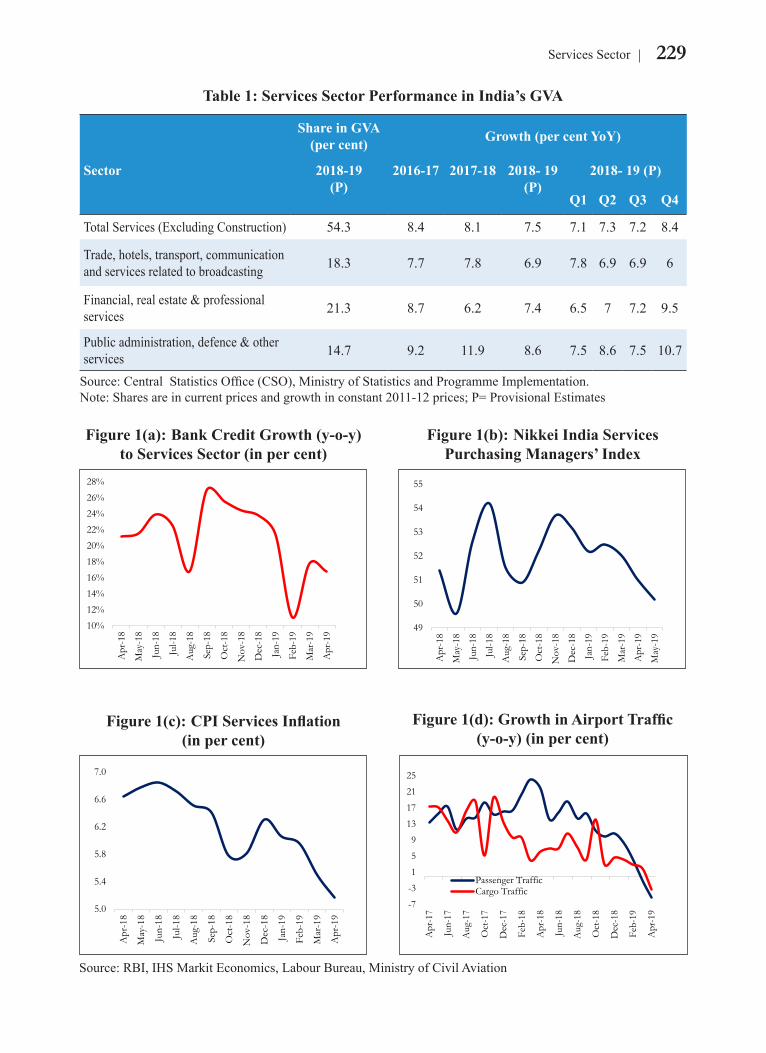
229Services Sector
Table 1: Services Sector Performance in India’s GVA
Share in GVA (per cent) Growth (per cent YoY)
Sector 2018-19 (P)
2016-17 2017-18 2018- 19 (P)
2018- 19 (P)
Q1 Q2 Q3 Q4
Total Services (Excluding Construction) 54.3 8.4 8.1 7.5 7.1 7.3 7.2 8.4
Trade, hotels, transport, communication and services related to broadcasting 18.3 7.7 7.8 6.9 7.8 6.9 6.9 6
Financial, real estate & professional services 21.3 8.7 6.2 7.4 6.5 7 7.2 9.5
Public administration, defence & other services 14.7 9.2 11.9 8.6 7.5 8.6 7.5 10.7
Source: Central Statistics Office (CSO), Ministry of Statistics and Programme Implementation. Note: Shares are in current prices and growth in constant 2011-12 prices; P= Provisional Estimates
10%12%
14%16%18%
20%22%24%26%
28%
Apr
-18
May
-18
Jun-
18
Jul-1
8
Aug
-18
Sep-
18
Oct
-18
Nov
-18
Dec
-18
Jan-
19
Feb-
19
Mar
-19
Apr
-19
Figure 1(a): Bank Credit Growth (y-o-y) to Services Sector (in per cent)
Figure 1(c): CPI Services Inflation (in per cent)
49
50
51
52
53
54
55
Apr-18
May-18
Jun-18
Jul-18
Aug-18
Sep-18
Oct-18
Nov-18
Dec-18
Jan-19
Feb-19
Mar-19
Apr-19
May-19
Figure 1(b): Nikkei India Services Purchasing Managers’ Index
Figure 1(d): Growth in Airport Traffic (y-o-y) (in per cent)
Source: RBI, IHS Markit Economics, Labour Bureau, Ministry of Civil Aviation
5.0
5.4
5.8
6.2
6.6
7.0
Apr-18
May-18
Jun-18
Jul-18
Aug-18
Sep-18
Oct-18
Nov-18
Dec-18
Jan-19
Feb-19
Mar-19
Apr-19
-7-3159
13172125
Apr
-17
Jun-
17
Aug
-17
Oct
-17
Dec
-17
Feb-
18
Apr
-18
Jun-
18
Aug
-18
Oct
-18
Dec
-18
Feb-
19
Apr
-19
Passenger TrafficCargo Traffic
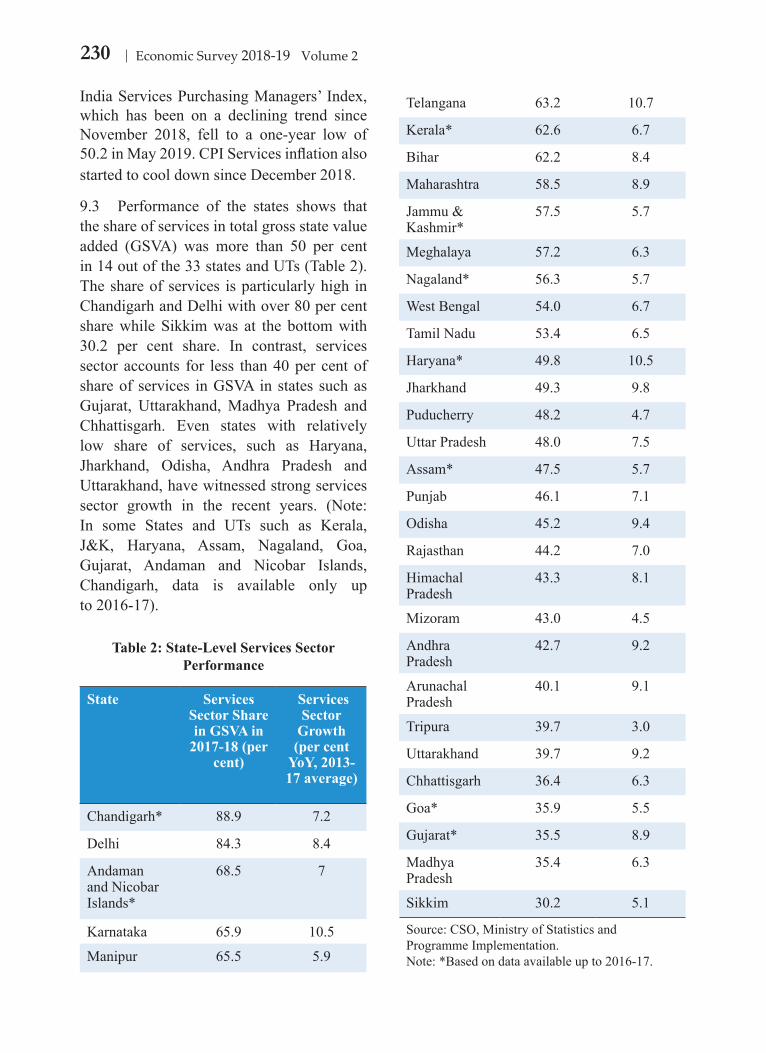
230 Economic Survey 2018-19 Volume 2
India Services Purchasing Managers’ Index, which has been on a declining trend since November 2018, fell to a one-year low of 50.2 in May 2019. CPI Services inflation also started to cool down since December 2018.
9.3 Performance of the states shows that the share of services in total gross state value added (GSVA) was more than 50 per cent in 14 out of the 33 states and UTs (Table 2). The share of services is particularly high in Chandigarh and Delhi with over 80 per cent share while Sikkim was at the bottom with 30.2 per cent share. In contrast, services sector accounts for less than 40 per cent of share of services in GSVA in states such as Gujarat, Uttarakhand, Madhya Pradesh and Chhattisgarh. Even states with relatively low share of services, such as Haryana, Jharkhand, Odisha, Andhra Pradesh and Uttarakhand, have witnessed strong services sector growth in the recent years. (Note: In some States and UTs such as Kerala, J&K, Haryana, Assam, Nagaland, Goa, Gujarat, Andaman and Nicobar Islands, Chandigarh, data is available only up to 2016-17).
Table 2: State-Level Services Sector Performance
State Services Sector Share in GSVA in
2017-18 (per cent)
Services Sector
Growth (per cent
YoY, 2013-17 average)
Chandigarh* 88.9 7.2
Delhi 84.3 8.4
Andaman and Nicobar Islands*
68.5 7
Karnataka 65.9 10.5
Manipur 65.5 5.9
Telangana 63.2 10.7
Kerala* 62.6 6.7
Bihar 62.2 8.4
Maharashtra 58.5 8.9
Jammu & Kashmir*
57.5 5.7
Meghalaya 57.2 6.3
Nagaland* 56.3 5.7
West Bengal 54.0 6.7
Tamil Nadu 53.4 6.5
Haryana* 49.8 10.5
Jharkhand 49.3 9.8
Puducherry 48.2 4.7
Uttar Pradesh 48.0 7.5
Assam* 47.5 5.7
Punjab 46.1 7.1
Odisha 45.2 9.4
Rajasthan 44.2 7.0
Himachal Pradesh
43.3 8.1
Mizoram 43.0 4.5
Andhra Pradesh
42.7 9.2
Arunachal Pradesh
40.1 9.1
Tripura 39.7 3.0
Uttarakhand 39.7 9.2
Chhattisgarh 36.4 6.3
Goa* 35.9 5.5
Gujarat* 35.5 8.9
Madhya Pradesh
35.4 6.3
Sikkim 30.2 5.1
Source: CSO, Ministry of Statistics and Programme Implementation.Note: *Based on data available up to 2016-17.
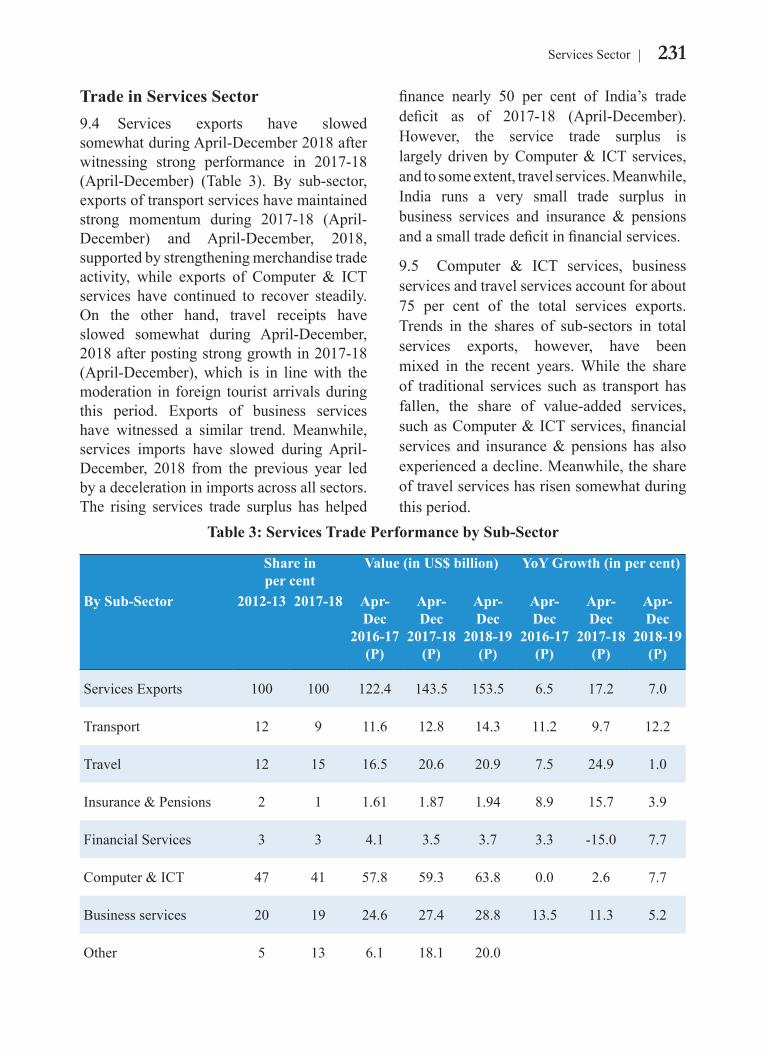
231Services Sector
Trade in Services Sector 9.4 Services exports have slowed somewhat during April-December 2018 after witnessing strong performance in 2017-18 (April-December) (Table 3). By sub-sector, exports of transport services have maintained strong momentum during 2017-18 (April-December) and April-December, 2018, supported by strengthening merchandise trade activity, while exports of Computer & ICT services have continued to recover steadily. On the other hand, travel receipts have slowed somewhat during April-December, 2018 after posting strong growth in 2017-18 (April-December), which is in line with the moderation in foreign tourist arrivals during this period. Exports of business services have witnessed a similar trend. Meanwhile, services imports have slowed during April-December, 2018 from the previous year led by a deceleration in imports across all sectors. The rising services trade surplus has helped
finance nearly 50 per cent of India’s trade deficit as of 2017-18 (April-December). However, the service trade surplus is largely driven by Computer & ICT services, and to some extent, travel services. Meanwhile, India runs a very small trade surplus in business services and insurance & pensions and a small trade deficit in financial services.
9.5 Computer & ICT services, business services and travel services account for about 75 per cent of the total services exports. Trends in the shares of sub-sectors in total services exports, however, have been mixed in the recent years. While the share of traditional services such as transport has fallen, the share of value-added services, such as Computer & ICT services, financial services and insurance & pensions has also experienced a decline. Meanwhile, the share of travel services has risen somewhat during this period.
Table 3: Services Trade Performance by Sub-Sector
Share inper cent
Value (in US$ billion) YoY Growth (in per cent)
By Sub-Sector 2012-13 2017-18 Apr-Dec
2016-17 (P)
Apr-Dec
2017-18 (P)
Apr-Dec
2018-19 (P)
Apr-Dec
2016-17 (P)
Apr-Dec
2017-18 (P)
Apr-Dec
2018-19 (P)
Services Exports 100 100 122.4 143.5 153.5 6.5 17.2 7.0
Transport 12 9 11.6 12.8 14.3 11.2 9.7 12.2
Travel 12 15 16.5 20.6 20.9 7.5 24.9 1.0
Insurance & Pensions 2 1 1.61 1.87 1.94 8.9 15.7 3.9
Financial Services 3 3 4.1 3.5 3.7 3.3 -15.0 7.7
Computer & ICT 47 41 57.8 59.3 63.8 0.0 2.6 7.7
Business services 20 19 24.6 27.4 28.8 13.5 11.3 5.2
Other 5 13 6.1 18.1 20.0
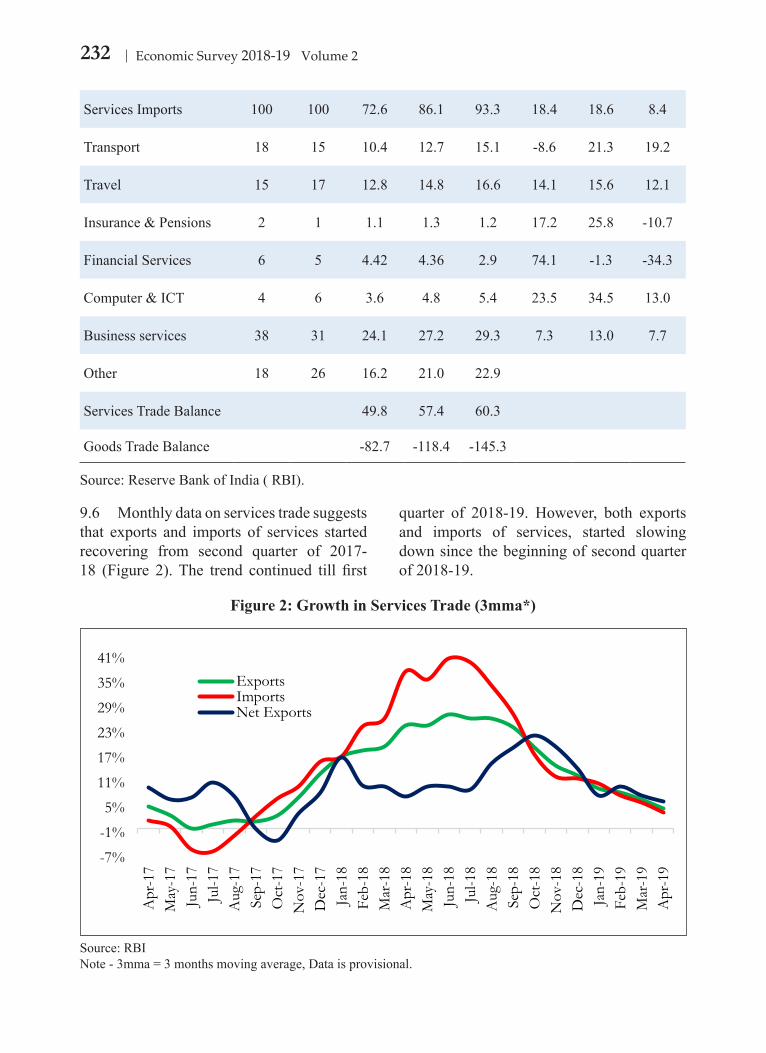
232 Economic Survey 2018-19 Volume 2
9.6 Monthly data on services trade suggests that exports and imports of services started recovering from second quarter of 2017-18 (Figure 2). The trend continued till first
quarter of 2018-19. However, both exports and imports of services, started slowing down since the beginning of second quarter of 2018-19.
Services Imports 100 100 72.6 86.1 93.3 18.4 18.6 8.4
Transport 18 15 10.4 12.7 15.1 -8.6 21.3 19.2
Travel 15 17 12.8 14.8 16.6 14.1 15.6 12.1
Insurance & Pensions 2 1 1.1 1.3 1.2 17.2 25.8 -10.7
Financial Services 6 5 4.42 4.36 2.9 74.1 -1.3 -34.3
Computer & ICT 4 6 3.6 4.8 5.4 23.5 34.5 13.0
Business services 38 31 24.1 27.2 29.3 7.3 13.0 7.7
Other 18 26 16.2 21.0 22.9
Services Trade Balance 49.8 57.4 60.3
Goods Trade Balance -82.7 -118.4 -145.3
Source: Reserve Bank of India ( RBI).
Figure 2: Growth in Services Trade (3mma*)
-7%-1%5%
11%17%23%29%35%41%
Apr
-17
May
-17
Jun-
17Ju
l-17
Aug
-17
Sep-
17O
ct-1
7N
ov-1
7D
ec-1
7Ja
n-18
Feb-
18M
ar-1
8A
pr-1
8M
ay-1
8Ju
n-18
Jul-1
8A
ug-1
8Se
p-18
Oct
-18
Nov
-18
Dec
-18
Jan-
19Fe
b-19
Mar
-19
Apr
-19
ExportsImportsNet Exports
Source: RBINote - 3mma = 3 months moving average, Data is provisional.
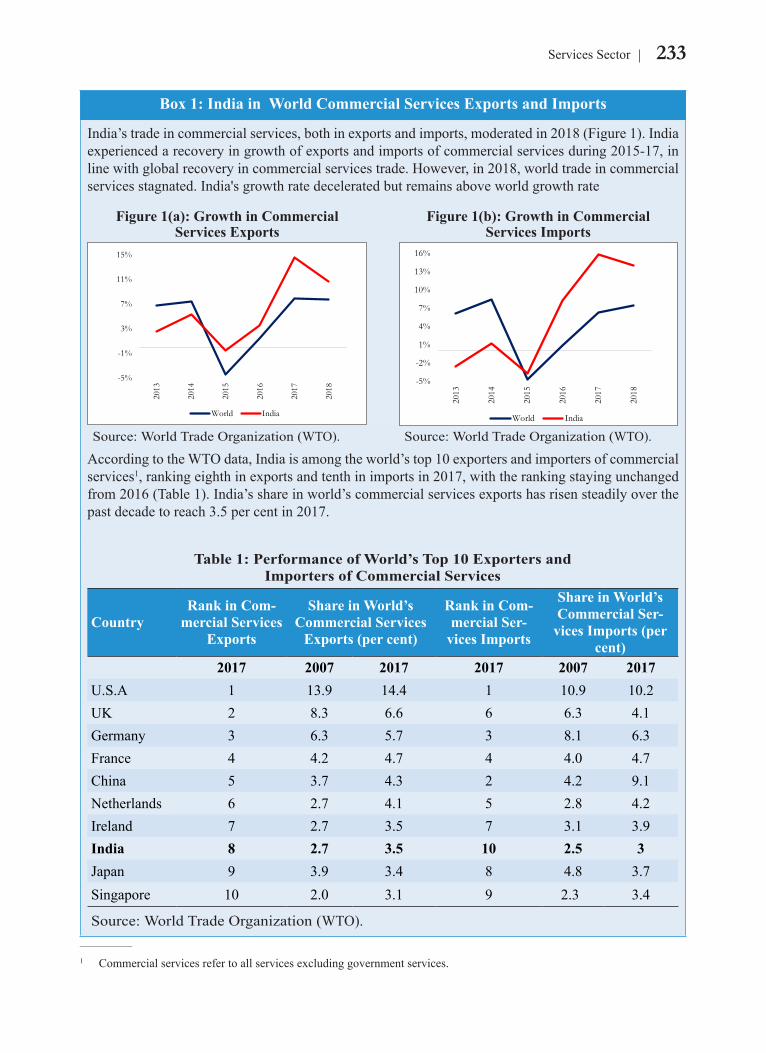
233Services Sector
Box 1: India in World Commercial Services Exports and Imports
India’s trade in commercial services, both in exports and imports, moderated in 2018 (Figure 1). India experienced a recovery in growth of exports and imports of commercial services during 2015-17, in line with global recovery in commercial services trade. However, in 2018, world trade in commercial services stagnated. India's growth rate decelerated but remains above world growth rate
Figure 1(a): Growth in Commercial Services Exports
Figure 1(b): Growth in Commercial Services Imports
-5%
-1%
3%
7%
11%
15%
2013
2014
2015
2016
2017
2018
World India
-5%
-2%
1%
4%
7%
10%
13%
16%
2013
2014
2015
2016
2017
2018
World India
Source: World Trade Organization (WTO). Source: World Trade Organization (WTO).
According to the WTO data, India is among the world’s top 10 exporters and importers of commercial services1, ranking eighth in exports and tenth in imports in 2017, with the ranking staying unchanged from 2016 (Table 1). India’s share in world’s commercial services exports has risen steadily over the past decade to reach 3.5 per cent in 2017.
Table 1: Performance of World’s Top 10 Exporters and Importers of Commercial Services
CountryRank in Com-
mercial Services Exports
Share in World’s Commercial Services
Exports (per cent)
Rank in Com-mercial Ser-
vices Imports
Share in World’s Commercial Ser-
vices Imports (per cent)
2017 2007 2017 2017 2007 2017U.S.A 1 13.9 14.4 1 10.9 10.2UK 2 8.3 6.6 6 6.3 4.1Germany 3 6.3 5.7 3 8.1 6.3France 4 4.2 4.7 4 4.0 4.7China 5 3.7 4.3 2 4.2 9.1Netherlands 6 2.7 4.1 5 2.8 4.2Ireland 7 2.7 3.5 7 3.1 3.9India 8 2.7 3.5 10 2.5 3Japan 9 3.9 3.4 8 4.8 3.7Singapore 10 2.0 3.1 9 2.3 3.4
Source: World Trade Organization (WTO)._______________
1 Commercial services refer to all services excluding government services.
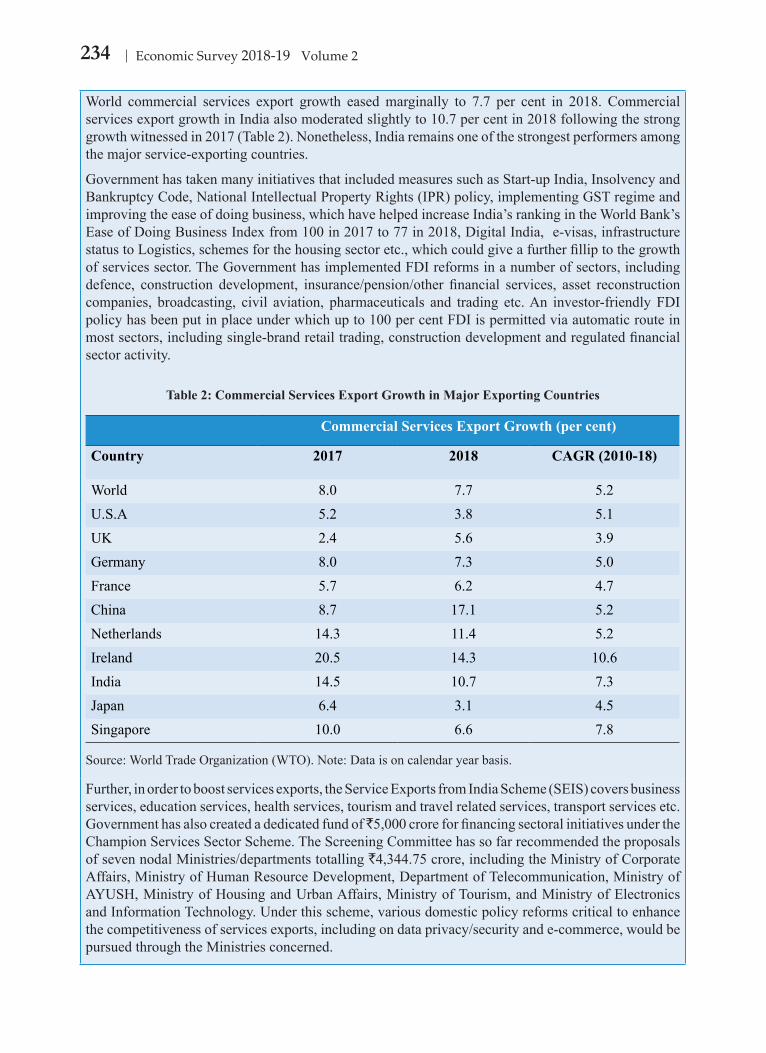
234 Economic Survey 2018-19 Volume 2
World commercial services export growth eased marginally to 7.7 per cent in 2018. Commercial services export growth in India also moderated slightly to 10.7 per cent in 2018 following the strong growth witnessed in 2017 (Table 2). Nonetheless, India remains one of the strongest performers among the major service-exporting countries.
Government has taken many initiatives that included measures such as Start-up India, Insolvency and Bankruptcy Code, National Intellectual Property Rights (IPR) policy, implementing GST regime and improving the ease of doing business, which have helped increase India’s ranking in the World Bank’s Ease of Doing Business Index from 100 in 2017 to 77 in 2018, Digital India, e-visas, infrastructure status to Logistics, schemes for the housing sector etc., which could give a further fillip to the growth of services sector. The Government has implemented FDI reforms in a number of sectors, including defence, construction development, insurance/pension/other financial services, asset reconstruction companies, broadcasting, civil aviation, pharmaceuticals and trading etc. An investor-friendly FDI policy has been put in place under which up to 100 per cent FDI is permitted via automatic route in most sectors, including single-brand retail trading, construction development and regulated financial sector activity.
Table 2: Commercial Services Export Growth in Major Exporting Countries
Commercial Services Export Growth (per cent)
Country 2017 2018 CAGR (2010-18)
World 8.0 7.7 5.2U.S.A 5.2 3.8 5.1UK 2.4 5.6 3.9Germany 8.0 7.3 5.0France 5.7 6.2 4.7China 8.7 17.1 5.2Netherlands 14.3 11.4 5.2Ireland 20.5 14.3 10.6India 14.5 10.7 7.3Japan 6.4 3.1 4.5Singapore 10.0 6.6 7.8
Source: World Trade Organization (WTO). Note: Data is on calendar year basis.
Further, in order to boost services exports, the Service Exports from India Scheme (SEIS) covers business services, education services, health services, tourism and travel related services, transport services etc. Government has also created a dedicated fund of ̀ 5,000 crore for financing sectoral initiatives under the Champion Services Sector Scheme. The Screening Committee has so far recommended the proposals of seven nodal Ministries/departments totalling `4,344.75 crore, including the Ministry of Corporate Affairs, Ministry of Human Resource Development, Department of Telecommunication, Ministry of AYUSH, Ministry of Housing and Urban Affairs, Ministry of Tourism, and Ministry of Electronics and Information Technology. Under this scheme, various domestic policy reforms critical to enhance the competitiveness of services exports, including on data privacy/security and e-commerce, would be pursued through the Ministries concerned.
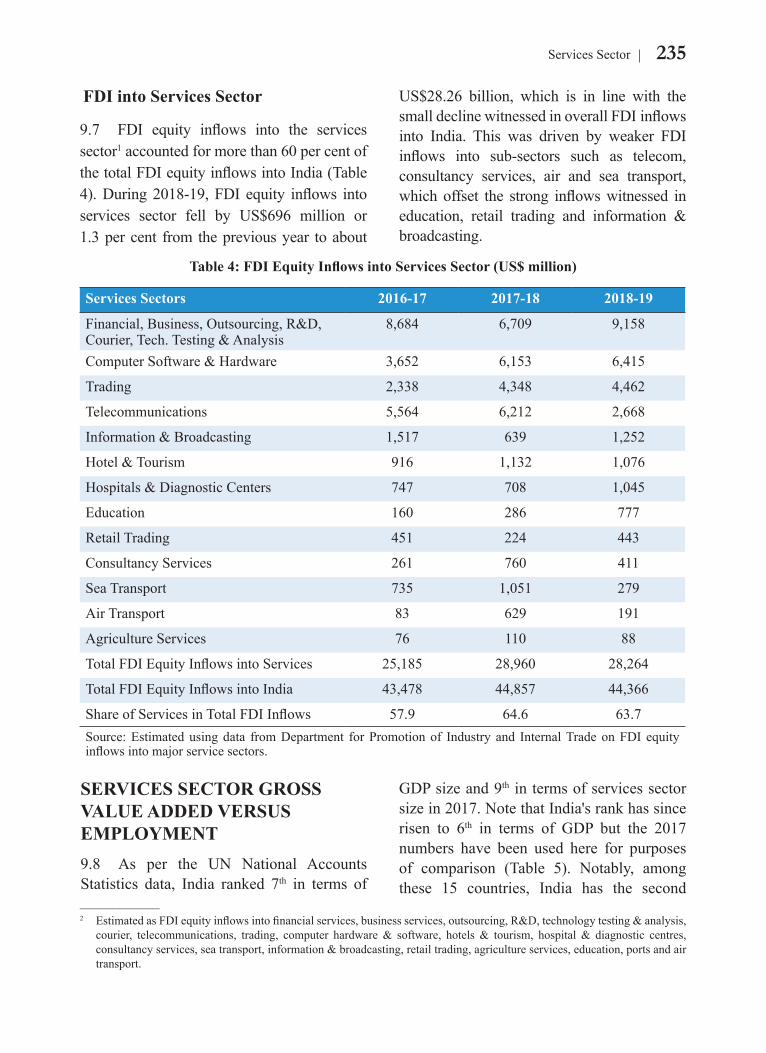
235Services Sector
US$28.26 billion, which is in line with the small decline witnessed in overall FDI inflows into India. This was driven by weaker FDI inflows into sub-sectors such as telecom, consultancy services, air and sea transport, which offset the strong inflows witnessed in education, retail trading and information & broadcasting.
FDI into Services Sector
9.7 FDI equity inflows into the services sector1 accounted for more than 60 per cent of the total FDI equity inflows into India (Table 4). During 2018-19, FDI equity inflows into services sector fell by US$696 million or 1.3 per cent from the previous year to about
____________2 Estimated as FDI equity inflows into financial services, business services, outsourcing, R&D, technology testing & analysis,
courier, telecommunications, trading, computer hardware & software, hotels & tourism, hospital & diagnostic centres, consultancy services, sea transport, information & broadcasting, retail trading, agriculture services, education, ports and air transport.
SERVICES SECTOR GROSS VALUE ADDED VERSUS EMPLOYMENT9.8 As per the UN National Accounts Statistics data, India ranked 7th in terms of
GDP size and 9th in terms of services sector size in 2017. Note that India's rank has since risen to 6th in terms of GDP but the 2017 numbers have been used here for purposes of comparison (Table 5). Notably, among these 15 countries, India has the second
Table 4: FDI Equity Inflows into Services Sector (US$ million)
Services Sectors 2016-17 2017-18 2018-19
Financial, Business, Outsourcing, R&D, Courier, Tech. Testing & Analysis
8,684 6,709 9,158
Computer Software & Hardware 3,652 6,153 6,415
Trading 2,338 4,348 4,462
Telecommunications 5,564 6,212 2,668
Information & Broadcasting 1,517 639 1,252
Hotel & Tourism 916 1,132 1,076
Hospitals & Diagnostic Centers 747 708 1,045
Education 160 286 777
Retail Trading 451 224 443
Consultancy Services 261 760 411
Sea Transport 735 1,051 279
Air Transport 83 629 191
Agriculture Services 76 110 88
Total FDI Equity Inflows into Services 25,185 28,960 28,264
Total FDI Equity Inflows into India 43,478 44,857 44,366
Share of Services in Total FDI Inflows 57.9 64.6 63.7Source: Estimated using data from Department for Promotion of Industry and Internal Trade on FDI equity inflows into major service sectors.
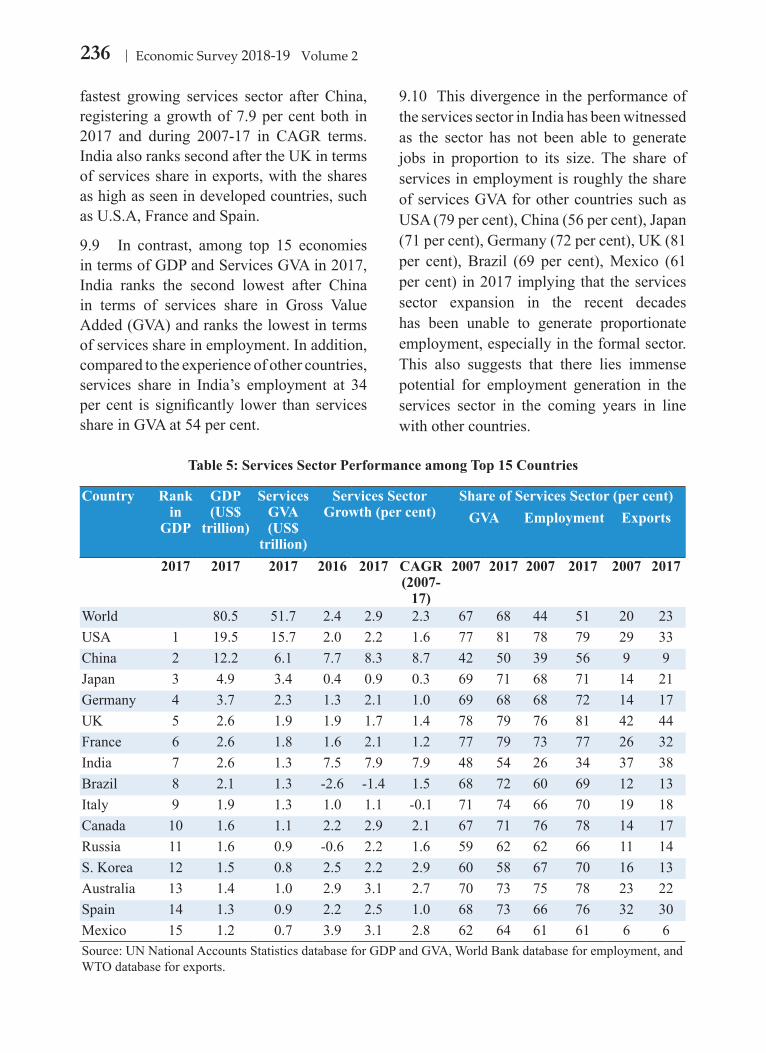
236 Economic Survey 2018-19 Volume 2
fastest growing services sector after China, registering a growth of 7.9 per cent both in 2017 and during 2007-17 in CAGR terms. India also ranks second after the UK in terms of services share in exports, with the shares as high as seen in developed countries, such as U.S.A, France and Spain.
9.9 In contrast, among top 15 economies in terms of GDP and Services GVA in 2017, India ranks the second lowest after China in terms of services share in Gross Value Added (GVA) and ranks the lowest in terms of services share in employment. In addition, compared to the experience of other countries, services share in India’s employment at 34 per cent is significantly lower than services share in GVA at 54 per cent.
9.10 This divergence in the performance of the services sector in India has been witnessed as the sector has not been able to generate jobs in proportion to its size. The share of services in employment is roughly the share of services GVA for other countries such as USA (79 per cent), China (56 per cent), Japan (71 per cent), Germany (72 per cent), UK (81 per cent), Brazil (69 per cent), Mexico (61 per cent) in 2017 implying that the services sector expansion in the recent decades has been unable to generate proportionate employment, especially in the formal sector. This also suggests that there lies immense potential for employment generation in the services sector in the coming years in line with other countries.
Table 5: Services Sector Performance among Top 15 Countries
Country Rank in
GDP
GDP (US$
trillion)
Services GVA (US$
trillion)
Services Sector Growth (per cent)
Share of Services Sector (per cent)GVA Employment Exports
2017 2017 2017 2016 2017 CAGR (2007-
17)
2007 2017 2007 2017 2007 2017
World 80.5 51.7 2.4 2.9 2.3 67 68 44 51 20 23USA 1 19.5 15.7 2.0 2.2 1.6 77 81 78 79 29 33China 2 12.2 6.1 7.7 8.3 8.7 42 50 39 56 9 9Japan 3 4.9 3.4 0.4 0.9 0.3 69 71 68 71 14 21Germany 4 3.7 2.3 1.3 2.1 1.0 69 68 68 72 14 17UK 5 2.6 1.9 1.9 1.7 1.4 78 79 76 81 42 44France 6 2.6 1.8 1.6 2.1 1.2 77 79 73 77 26 32India 7 2.6 1.3 7.5 7.9 7.9 48 54 26 34 37 38Brazil 8 2.1 1.3 -2.6 -1.4 1.5 68 72 60 69 12 13Italy 9 1.9 1.3 1.0 1.1 -0.1 71 74 66 70 19 18Canada 10 1.6 1.1 2.2 2.9 2.1 67 71 76 78 14 17Russia 11 1.6 0.9 -0.6 2.2 1.6 59 62 62 66 11 14S. Korea 12 1.5 0.8 2.5 2.2 2.9 60 58 67 70 16 13Australia 13 1.4 1.0 2.9 3.1 2.7 70 73 75 78 23 22Spain 14 1.3 0.9 2.2 2.5 1.0 68 73 66 76 32 30Mexico 15 1.2 0.7 3.9 3.1 2.8 62 64 61 61 6 6Source: UN National Accounts Statistics database for GDP and GVA, World Bank database for employment, and WTO database for exports.
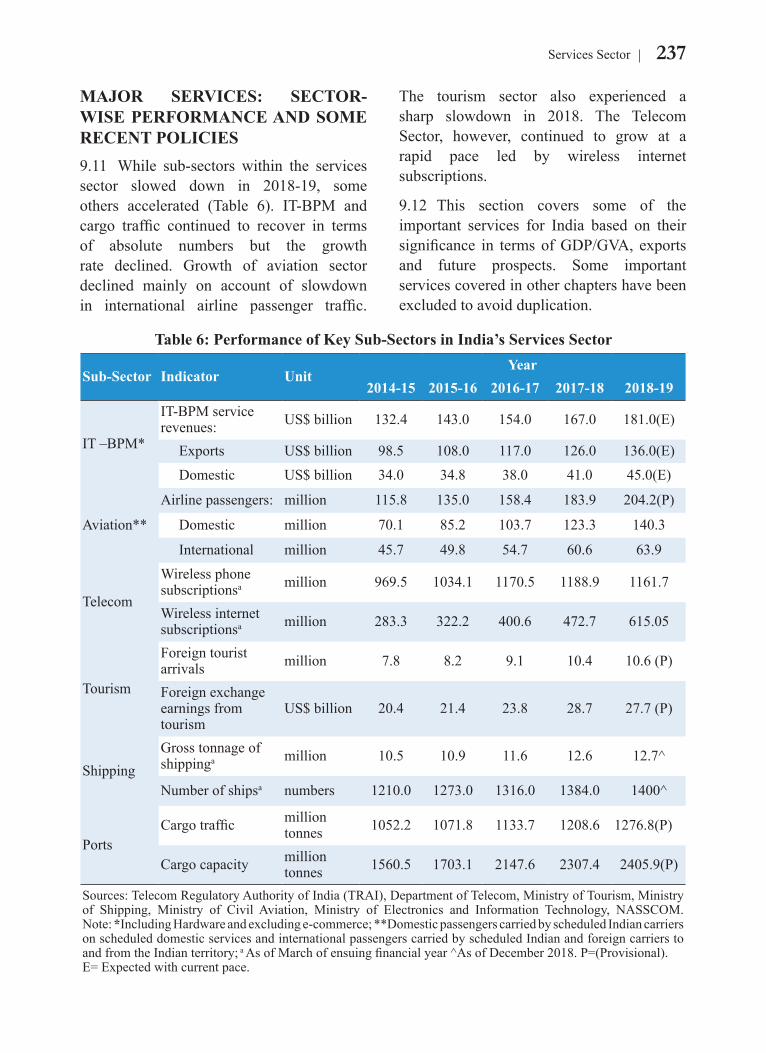
237Services Sector
MAJOR SERVICES: SECTOR-WISE PERFORMANCE AND SOME RECENT POLICIES 9.11 While sub-sectors within the services sector slowed down in 2018-19, some others accelerated (Table 6). IT-BPM and cargo traffic continued to recover in terms of absolute numbers but the growth rate declined. Growth of aviation sector declined mainly on account of slowdown in international airline passenger traffic.
The tourism sector also experienced a sharp slowdown in 2018. The Telecom Sector, however, continued to grow at a rapid pace led by wireless internet subscriptions.
9.12 This section covers some of the important services for India based on their significance in terms of GDP/GVA, exports and future prospects. Some important services covered in other chapters have been excluded to avoid duplication.
Table 6: Performance of Key Sub-Sectors in India’s Services Sector
Sub-Sector Indicator UnitYear
2014-15 2015-16 2016-17 2017-18 2018-19
IT –BPM*
IT-BPM service revenues: US$ billion 132.4 143.0 154.0 167.0 181.0(E)
Exports US$ billion 98.5 108.0 117.0 126.0 136.0(E)
Domestic US$ billion 34.0 34.8 38.0 41.0 45.0(E)
Aviation**
Airline passengers: million 115.8 135.0 158.4 183.9 204.2(P)
Domestic million 70.1 85.2 103.7 123.3 140.3
International million 45.7 49.8 54.7 60.6 63.9
Telecom
Wireless phone subscriptionsa million 969.5 1034.1 1170.5 1188.9 1161.7
Wireless internet subscriptionsa million 283.3 322.2 400.6 472.7 615.05
Tourism
Foreign tourist arrivals million 7.8 8.2 9.1 10.4 10.6 (P)
Foreign exchange earnings from tourism
US$ billion 20.4 21.4 23.8 28.7 27.7 (P)
ShippingGross tonnage of shippinga million 10.5 10.9 11.6 12.6 12.7^
Number of shipsa numbers 1210.0 1273.0 1316.0 1384.0 1400^
PortsCargo traffic million
tonnes 1052.2 1071.8 1133.7 1208.6 1276.8(P)
Cargo capacity million tonnes 1560.5 1703.1 2147.6 2307.4 2405.9(P)
Sources: Telecom Regulatory Authority of India (TRAI), Department of Telecom, Ministry of Tourism, Ministry of Shipping, Ministry of Civil Aviation, Ministry of Electronics and Information Technology, NASSCOM. Note: *Including Hardware and excluding e-commerce; **Domestic passengers carried by scheduled Indian carriers on scheduled domestic services and international passengers carried by scheduled Indian and foreign carriers to and from the Indian territory; a As of March of ensuing financial year ^As of December 2018. P=(Provisional).E= Expected with current pace.
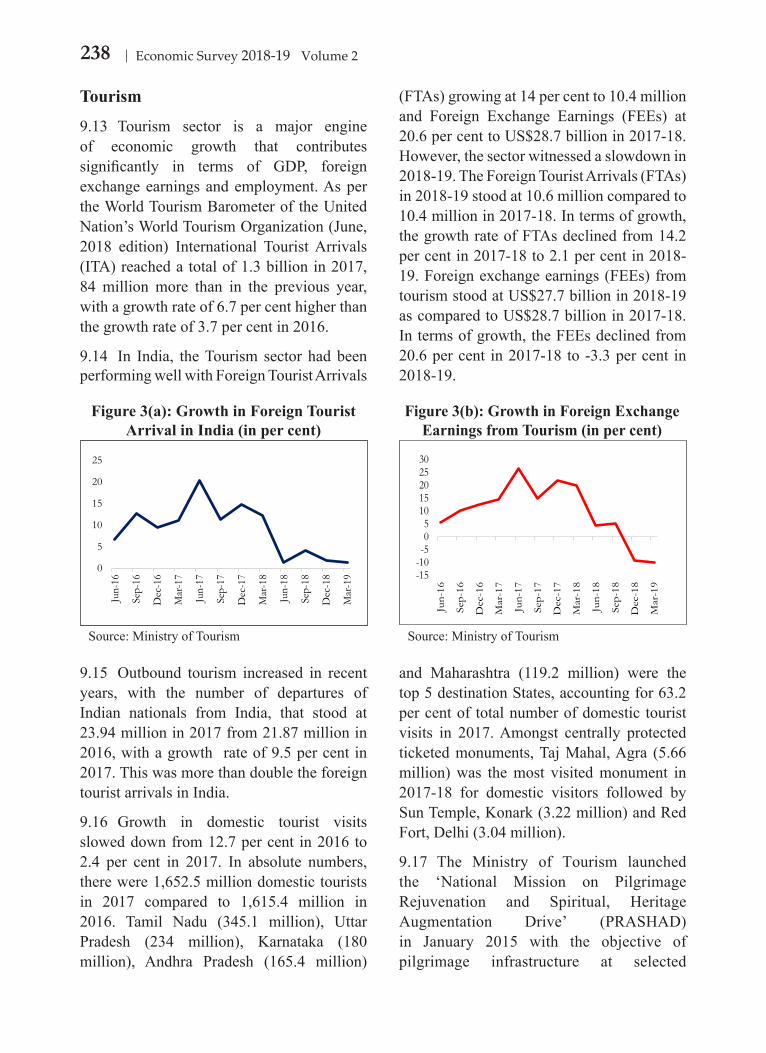
238 Economic Survey 2018-19 Volume 2
Tourism
9.13 Tourism sector is a major engine of economic growth that contributes significantly in terms of GDP, foreign exchange earnings and employment. As per the World Tourism Barometer of the United Nation’s World Tourism Organization (June, 2018 edition) International Tourist Arrivals (ITA) reached a total of 1.3 billion in 2017, 84 million more than in the previous year, with a growth rate of 6.7 per cent higher than the growth rate of 3.7 per cent in 2016.
9.14 In India, the Tourism sector had been performing well with Foreign Tourist Arrivals
(FTAs) growing at 14 per cent to 10.4 million and Foreign Exchange Earnings (FEEs) at 20.6 per cent to US$28.7 billion in 2017-18. However, the sector witnessed a slowdown in 2018-19. The Foreign Tourist Arrivals (FTAs) in 2018-19 stood at 10.6 million compared to 10.4 million in 2017-18. In terms of growth, the growth rate of FTAs declined from 14.2 per cent in 2017-18 to 2.1 per cent in 2018-19. Foreign exchange earnings (FEEs) from tourism stood at US$27.7 billion in 2018-19 as compared to US$28.7 billion in 2017-18. In terms of growth, the FEEs declined from 20.6 per cent in 2017-18 to -3.3 per cent in 2018-19.
9.15 Outbound tourism increased in recent years, with the number of departures of Indian nationals from India, that stood at 23.94 million in 2017 from 21.87 million in 2016, with a growth rate of 9.5 per cent in 2017. This was more than double the foreign tourist arrivals in India.
9.16 Growth in domestic tourist visits slowed down from 12.7 per cent in 2016 to 2.4 per cent in 2017. In absolute numbers, there were 1,652.5 million domestic tourists in 2017 compared to 1,615.4 million in 2016. Tamil Nadu (345.1 million), Uttar Pradesh (234 million), Karnataka (180 million), Andhra Pradesh (165.4 million)
and Maharashtra (119.2 million) were the top 5 destination States, accounting for 63.2 per cent of total number of domestic tourist visits in 2017. Amongst centrally protected ticketed monuments, Taj Mahal, Agra (5.66 million) was the most visited monument in 2017-18 for domestic visitors followed by Sun Temple, Konark (3.22 million) and Red Fort, Delhi (3.04 million).
9.17 The Ministry of Tourism launched the ‘National Mission on Pilgrimage Rejuvenation and Spiritual, Heritage Augmentation Drive’ (PRASHAD) in January 2015 with the objective of pilgrimage infrastructure at selected
Figure 3(a): Growth in Foreign Tourist Arrival in India (in per cent)
Figure 3(b): Growth in Foreign Exchange Earnings from Tourism (in per cent)
0
5
10
15
20
25
Jun-16
Sep-16
Dec-16
Mar-17
Jun-17
Sep-17
Dec-17
Mar-18
Jun-18
Sep-18
Dec-18
Mar-19
-15-10-5051015202530
Jun-16
Sep-16
Dec-16
Mar-17
Jun-17
Sep-17
Dec-17
Mar-18
Jun-18
Sep-18
Dec-18
Mar-19
Source: Ministry of Tourism Source: Ministry of Tourism
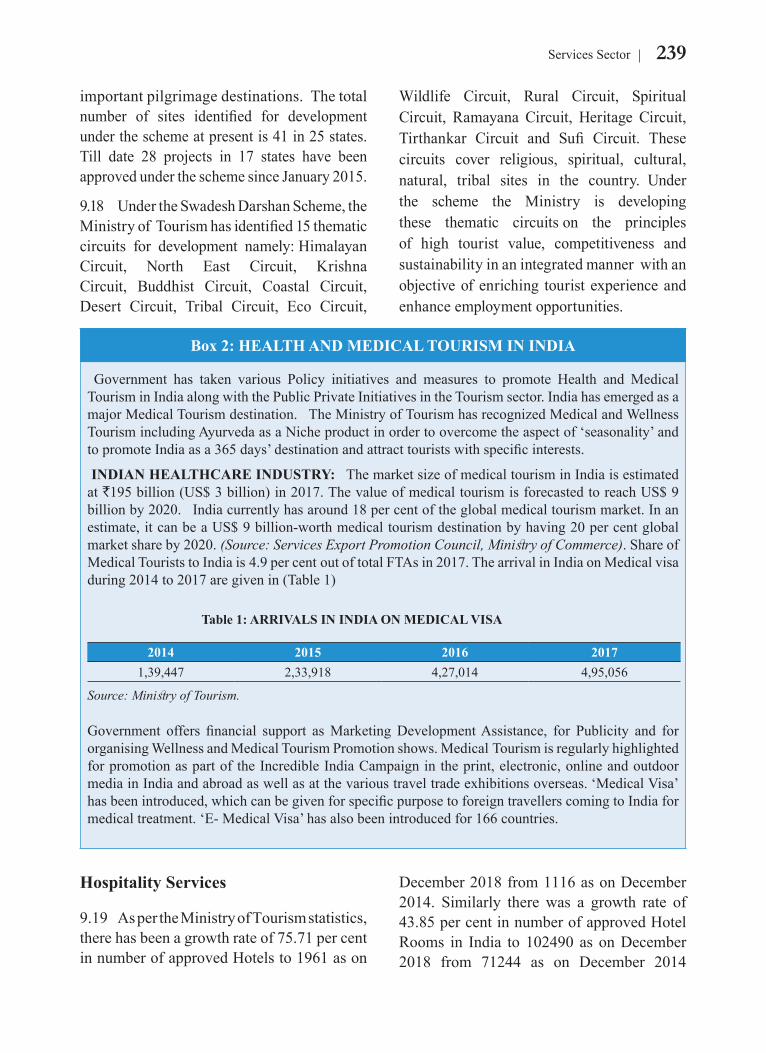
239Services Sector
important pilgrimage destinations. The total number of sites identified for development under the scheme at present is 41 in 25 states. Till date 28 projects in 17 states have been approved under the scheme since January 2015.
9.18 Under the Swadesh Darshan Scheme, the Ministry of Tourism has identified 15 thematic circuits for development namely: Himalayan Circuit, North East Circuit, Krishna Circuit, Buddhist Circuit, Coastal Circuit, Desert Circuit, Tribal Circuit, Eco Circuit,
Wildlife Circuit, Rural Circuit, Spiritual Circuit, Ramayana Circuit, Heritage Circuit, Tirthankar Circuit and Sufi Circuit. These circuits cover religious, spiritual, cultural, natural, tribal sites in the country. Under the scheme the Ministry is developing these thematic circuits on the principles of high tourist value, competitiveness and sustainability in an integrated manner with an objective of enriching tourist experience and enhance employment opportunities.
Hospitality Services
9.19 As per the Ministry of Tourism statistics, there has been a growth rate of 75.71 per cent in number of approved Hotels to 1961 as on
December 2018 from 1116 as on December 2014. Similarly there was a growth rate of 43.85 per cent in number of approved Hotel Rooms in India to 102490 as on December 2018 from 71244 as on December 2014
Box 2: HEALTH AND MEDICAL TOURISM IN INDIA
Government has taken various Policy initiatives and measures to promote Health and Medical Tourism in India along with the Public Private Initiatives in the Tourism sector. India has emerged as a major Medical Tourism destination. The Ministry of Tourism has recognized Medical and Wellness Tourism including Ayurveda as a Niche product in order to overcome the aspect of ‘seasonality’ and to promote India as a 365 days’ destination and attract tourists with specific interests.
INDIAN HEALTHCARE INDUSTRY: The market size of medical tourism in India is estimated at `195 billion (US$ 3 billion) in 2017. The value of medical tourism is forecasted to reach US$ 9 billion by 2020. India currently has around 18 per cent of the global medical tourism market. In an estimate, it can be a US$ 9 billion-worth medical tourism destination by having 20 per cent global market share by 2020. (Source: Services Export Promotion Council, Ministry of Commerce). Share of Medical Tourists to India is 4.9 per cent out of total FTAs in 2017. The arrival in India on Medical visa during 2014 to 2017 are given in (Table 1)
Table 1: ARRIVALS IN INDIA ON MEDICAL VISA
2014 2015 2016 20171,39,447 2,33,918 4,27,014 4,95,056
Source: Ministry of Tourism.
Government offers financial support as Marketing Development Assistance, for Publicity and for organising Wellness and Medical Tourism Promotion shows. Medical Tourism is regularly highlighted for promotion as part of the Incredible India Campaign in the print, electronic, online and outdoor media in India and abroad as well as at the various travel trade exhibitions overseas. ‘Medical Visa’ has been introduced, which can be given for specific purpose to foreign travellers coming to India for medical treatment. ‘E- Medical Visa’ has also been introduced for 166 countries.
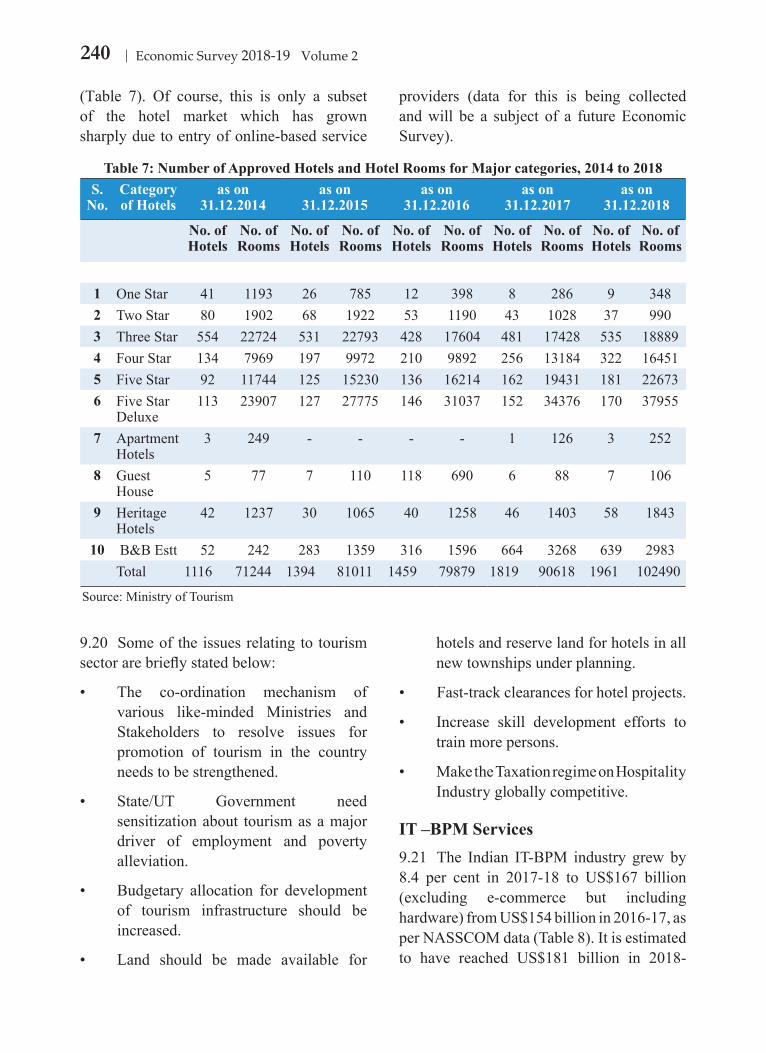
240 Economic Survey 2018-19 Volume 2
(Table 7). Of course, this is only a subset of the hotel market which has grown sharply due to entry of online-based service
providers (data for this is being collected and will be a subject of a future Economic Survey).
9.20 Some of the issues relating to tourism sector are briefly stated below:
• The co-ordination mechanism of various like-minded Ministries and Stakeholders to resolve issues for promotion of tourism in the country needs to be strengthened.
• State/UT Government need sensitization about tourism as a major driver of employment and poverty alleviation.
• Budgetary allocation for development of tourism infrastructure should be increased.
• Land should be made available for
hotels and reserve land for hotels in all new townships under planning.
• Fast-track clearances for hotel projects.
• Increase skill development efforts to train more persons.
• Make the Taxation regime on Hospitality Industry globally competitive.
IT –BPM Services9.21 The Indian IT-BPM industry grew by 8.4 per cent in 2017-18 to US$167 billion (excluding e-commerce but including hardware) from US$154 billion in 2016-17, as per NASSCOM data (Table 8). It is estimated to have reached US$181 billion in 2018-
Table 7: Number of Approved Hotels and Hotel Rooms for Major categories, 2014 to 2018 S.
No.Category of Hotels
as on 31.12.2014
as on 31.12.2015
as on 31.12.2016
as on 31.12.2017
as on 31.12.2018
No. of Hotels
No. of Rooms
No. of Hotels
No. of Rooms
No. of Hotels
No. of Rooms
No. of Hotels
No. of Rooms
No. of Hotels
No. of Rooms
1 One Star 41 1193 26 785 12 398 8 286 9 3482 Two Star 80 1902 68 1922 53 1190 43 1028 37 9903 Three Star 554 22724 531 22793 428 17604 481 17428 535 188894 Four Star 134 7969 197 9972 210 9892 256 13184 322 164515 Five Star 92 11744 125 15230 136 16214 162 19431 181 226736 Five Star
Deluxe113 23907 127 27775 146 31037 152 34376 170 37955
7 Apartment Hotels
3 249 - - - - 1 126 3 252
8 Guest House
5 77 7 110 118 690 6 88 7 106
9 Heritage Hotels
42 1237 30 1065 40 1258 46 1403 58 1843
10 B&B Estt 52 242 283 1359 316 1596 664 3268 639 2983Total 1116 71244 1394 81011 1459 79879 1819 90618 1961 102490
Source: Ministry of Tourism
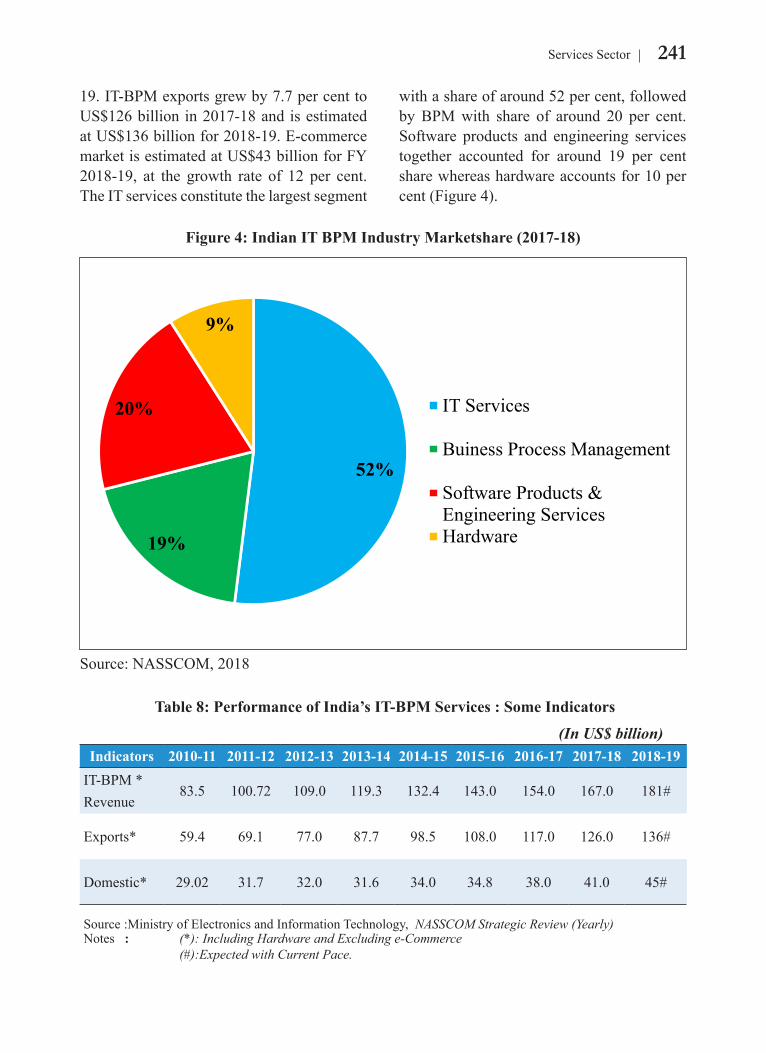
241Services Sector
19. IT-BPM exports grew by 7.7 per cent to US$126 billion in 2017-18 and is estimated at US$136 billion for 2018-19. E-commerce market is estimated at US$43 billion for FY 2018-19, at the growth rate of 12 per cent. The IT services constitute the largest segment
with a share of around 52 per cent, followed by BPM with share of around 20 per cent. Software products and engineering services together accounted for around 19 per cent share whereas hardware accounts for 10 per cent (Figure 4).
Figure 4: Indian IT BPM Industry Marketshare (2017-18)
52%
19%
20%
9%
IT Services
Buiness Process Management
Software Products &Engineering ServicesHardware
Source: NASSCOM, 2018
Table 8: Performance of India’s IT-BPM Services : Some Indicators
(In US$ billion)Indicators 2010-11 2011-12 2012-13 2013-14 2014-15 2015-16 2016-17 2017-18 2018-19
IT-BPM * Revenue
83.5 100.72 109.0 119.3 132.4 143.0 154.0 167.0 181#
Exports* 59.4 69.1 77.0 87.7 98.5 108.0 117.0 126.0 136#
Domestic* 29.02 31.7 32.0 31.6 34.0 34.8 38.0 41.0 45#
Source :Ministry of Electronics and Information Technology, NASSCOM Strategic Review (Yearly)Notes : (*): Including Hardware and Excluding e-Commerce
(#):Expected with Current Pace.
242 Economic Survey 2018-19 Volume 2
9.22 The Indian Information Technology / Information Technology enabled Services (IT/ ITeS) industry has contributed immensely in positioning the country as a preferred investment destination amongst global investors and creating huge job opportunities in India, as well as in the USA, Europe and other parts of the world. USA, UK and EU account for ~ 90 per cent of the total IT-ITeS exports. However, there are new challenges surfacing in these traditional geographies. Demand from APAC, Latin America and Middle East Asia is growing and new opportunities are emerging for expanding in continental Europe, Japan, China and Africa. Efforts are being made to further strengthen existing markets, and simultaneously diversify and increase presence in the new and emerging markets in Europe (besides UK which is a mature market), Africa, South America, Israel, Australia, China and Japan through market development and industry repositioning initiative.
9.23 India’s digital economy has received a tremendous boost through various Government initiatives such as Digital India covering e-Government services, common service centres, BPO promotion schemes, digital payments, electronic manufacturing, Digital Saksharta Abhiyaan, e-commerce, GST network, Make in India, Start-up India, e-health, Smart Cities, and e-agriculture market place/ digital mandis. These initiatives coupled with new and emerging technologies are enhancing the digital economy of the country and are creating IT and electronics led new opportunities for revenue and job creation in both traditional as well as new sectors of the economy such as transport, health, power, agriculture, and tourism.
9.24 The National Policy on Electronics 2019 (NPE 2019) has been notified on February 2019 by the Ministry of Electronics and Information Technology (MeitY) inter-
alia include creating eco-system for globally competitive ESDM sector; promotion of electronic components manufacturing ecosystem; special package of incentives for mega projects; encouraging industry-led R&D and innovation and promoting start-up eco-system in all sub-sectors of electronics, including emerging technology areas such as 5G, IoT/ Sensors, artificial intelligence (AI), machine learning, augmented reality (AR) and virtual reality (VR), drones, robotics, additive manufacturing, gaming and entertainment, photonics, nano-based devices, medical electronics, defence and strategic electronics, automotive electronics, cyber security, power electronics and automation; providing incentives and support for skill development including re-skilling, in the ESDM sector; promoting research, innovation and support to industry for green processes and sustainable e-waste management, emphasis on cyber security and promoting trusted electronics value chain initiatives to improve India’s national cyber security profile etc.
Media & Entertainment Services
9.25 The Media and Entertainment sector comprises mainly of television, print, radio, films, music, digital advertising, over the top (OTT-film and television content delivered over internet), visual effects (VFX) and gaming. Technology has rapidly changed the profile of this sector especially in the area of content and carriage. As per the FICCI-EY Media and Entertainment Report 2019, the size of the Industry has increased from `91,810 crore in 2013 to `1,67,500 crore in 2018, a growth of 82.44 per cent in the last 5 years. The size composition of the various components of the Industry can be seen in the Figure 5. Audio–visual services have been identified by the Government (2018) as one among the 12 Champion Service sectors for focused development so as to reap its full potential.
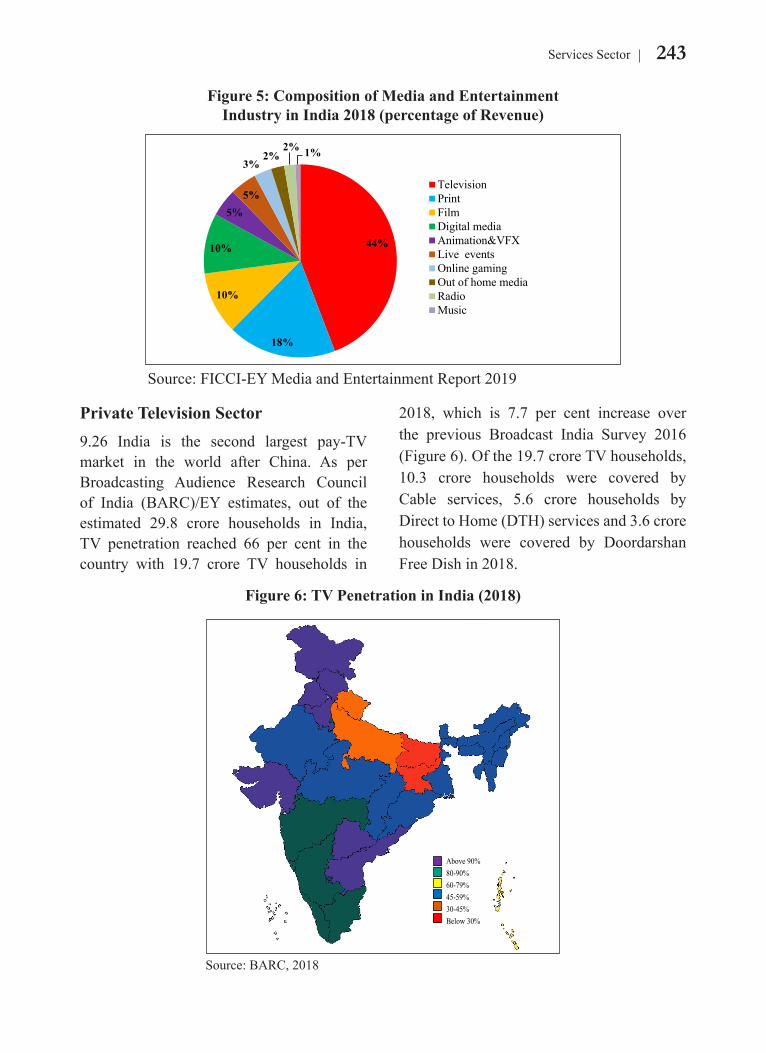
243Services Sector
Private Television Sector 9.26 India is the second largest pay-TV market in the world after China. As per Broadcasting Audience Research Council of India (BARC)/EY estimates, out of the estimated 29.8 crore households in India, TV penetration reached 66 per cent in the country with 19.7 crore TV households in
2018, which is 7.7 per cent increase over the previous Broadcast India Survey 2016 (Figure 6). Of the 19.7 crore TV households, 10.3 crore households were covered by Cable services, 5.6 crore households by Direct to Home (DTH) services and 3.6 crore households were covered by Doordarshan Free Dish in 2018.
Figure 6: TV Penetration in India (2018)
Above 90% 80-90% 60-79% 45-59% 30-45% Below 30%
Source: BARC, 2018
Figure 5: Composition of Media and Entertainment Industry in India 2018 (percentage of Revenue)
44%
18%
10%
10%
5%5%
3%2%
2% 1%
TelevisionPrintFilmDigital mediaAnimation&VFXLive eventsOnline gamingOut of home mediaRadioMusic
Source: FICCI-EY Media and Entertainment Report 2019
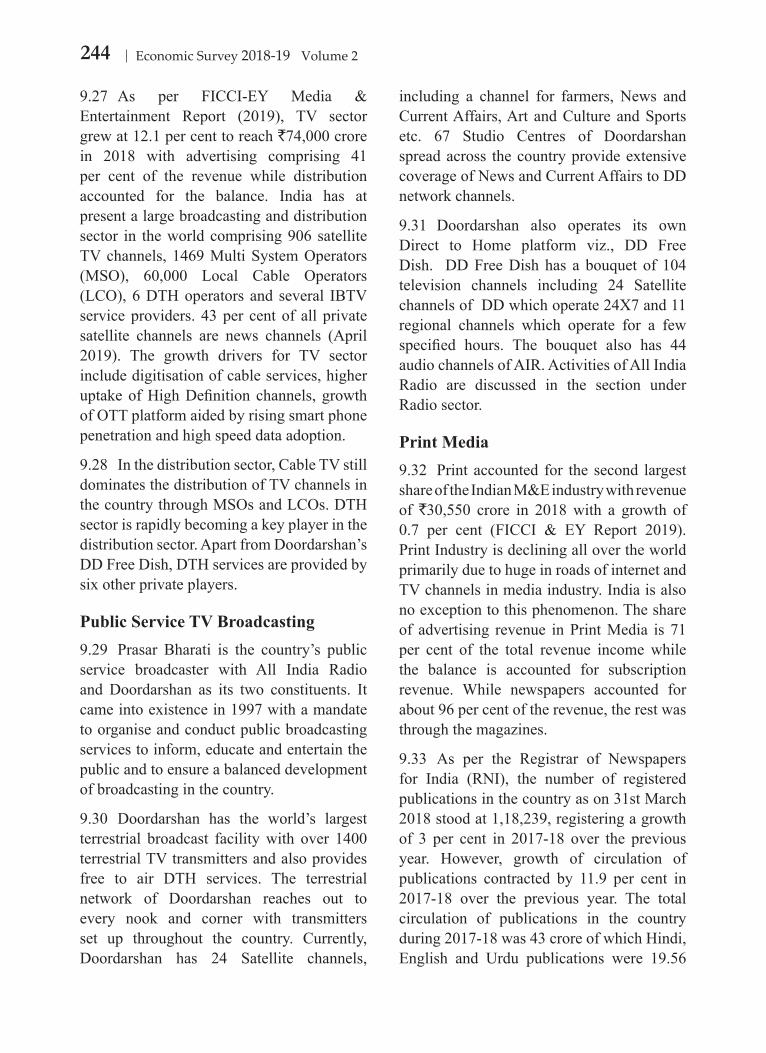
244 Economic Survey 2018-19 Volume 2
9.27 As per FICCI-EY Media & Entertainment Report (2019), TV sector grew at 12.1 per cent to reach `74,000 crore in 2018 with advertising comprising 41 per cent of the revenue while distribution accounted for the balance. India has at present a large broadcasting and distribution sector in the world comprising 906 satellite TV channels, 1469 Multi System Operators (MSO), 60,000 Local Cable Operators (LCO), 6 DTH operators and several IBTV service providers. 43 per cent of all private satellite channels are news channels (April 2019). The growth drivers for TV sector include digitisation of cable services, higher uptake of High Definition channels, growth of OTT platform aided by rising smart phone penetration and high speed data adoption.
9.28 In the distribution sector, Cable TV still dominates the distribution of TV channels in the country through MSOs and LCOs. DTH sector is rapidly becoming a key player in the distribution sector. Apart from Doordarshan’s DD Free Dish, DTH services are provided by six other private players.
Public Service TV Broadcasting9.29 Prasar Bharati is the country’s public service broadcaster with All India Radio and Doordarshan as its two constituents. It came into existence in 1997 with a mandate to organise and conduct public broadcasting services to inform, educate and entertain the public and to ensure a balanced development of broadcasting in the country.
9.30 Doordarshan has the world’s largest terrestrial broadcast facility with over 1400 terrestrial TV transmitters and also provides free to air DTH services. The terrestrial network of Doordarshan reaches out to every nook and corner with transmitters set up throughout the country. Currently, Doordarshan has 24 Satellite channels,
including a channel for farmers, News and Current Affairs, Art and Culture and Sports etc. 67 Studio Centres of Doordarshan spread across the country provide extensive coverage of News and Current Affairs to DD network channels.
9.31 Doordarshan also operates its own Direct to Home platform viz., DD Free Dish. DD Free Dish has a bouquet of 104 television channels including 24 Satellite channels of DD which operate 24X7 and 11 regional channels which operate for a few specified hours. The bouquet also has 44 audio channels of AIR. Activities of All India Radio are discussed in the section under Radio sector.
Print Media9.32 Print accounted for the second largest share of the Indian M&E industry with revenue of `30,550 crore in 2018 with a growth of 0.7 per cent (FICCI & EY Report 2019). Print Industry is declining all over the world primarily due to huge in roads of internet and TV channels in media industry. India is also no exception to this phenomenon. The share of advertising revenue in Print Media is 71 per cent of the total revenue income while the balance is accounted for subscription revenue. While newspapers accounted for about 96 per cent of the revenue, the rest was through the magazines.
9.33 As per the Registrar of Newspapers for India (RNI), the number of registered publications in the country as on 31st March 2018 stood at 1,18,239, registering a growth of 3 per cent in 2017-18 over the previous year. However, growth of circulation of publications contracted by 11.9 per cent in 2017-18 over the previous year. The total circulation of publications in the country during 2017-18 was 43 crore of which Hindi, English and Urdu publications were 19.56
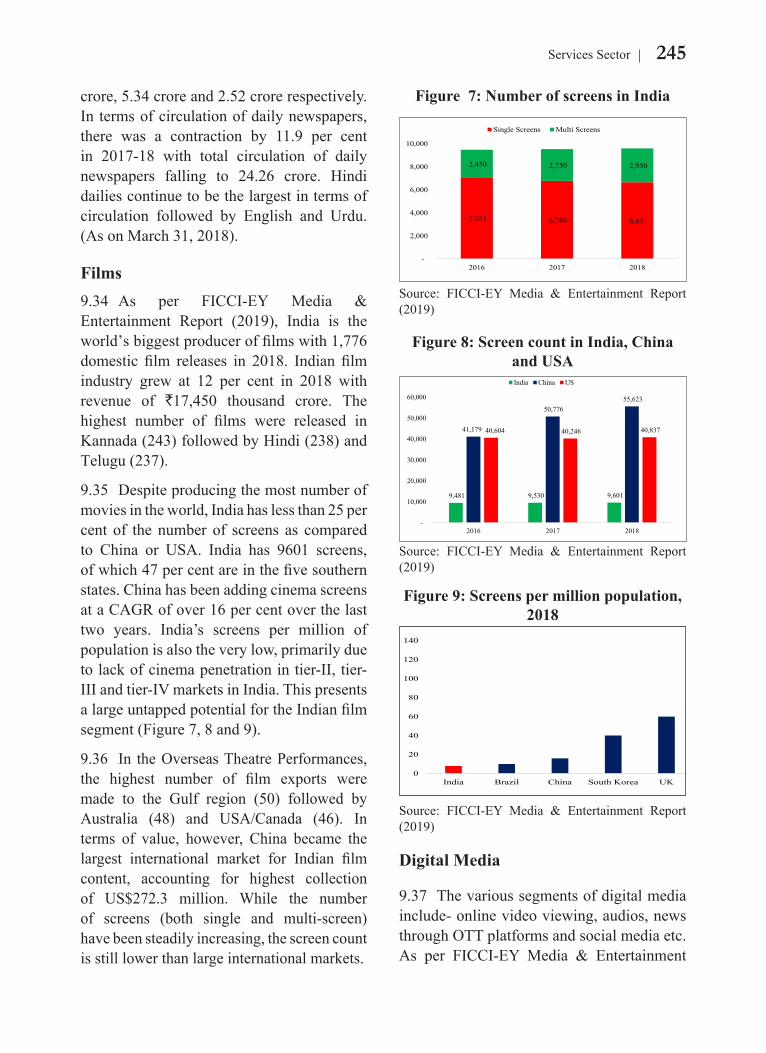
245Services Sector
crore, 5.34 crore and 2.52 crore respectively. In terms of circulation of daily newspapers, there was a contraction by 11.9 per cent in 2017-18 with total circulation of daily newspapers falling to 24.26 crore. Hindi dailies continue to be the largest in terms of circulation followed by English and Urdu. (As on March 31, 2018).
Films9.34 As per FICCI-EY Media & Entertainment Report (2019), India is the world’s biggest producer of films with 1,776 domestic film releases in 2018. Indian film industry grew at 12 per cent in 2018 with revenue of `17,450 thousand crore. The highest number of films were released in Kannada (243) followed by Hindi (238) and Telugu (237).
9.35 Despite producing the most number of movies in the world, India has less than 25 per cent of the number of screens as compared to China or USA. India has 9601 screens, of which 47 per cent are in the five southern states. China has been adding cinema screens at a CAGR of over 16 per cent over the last two years. India’s screens per million of population is also the very low, primarily due to lack of cinema penetration in tier-II, tier-III and tier-IV markets in India. This presents a large untapped potential for the Indian film segment (Figure 7, 8 and 9).
9.36 In the Overseas Theatre Performances, the highest number of film exports were made to the Gulf region (50) followed by Australia (48) and USA/Canada (46). In terms of value, however, China became the largest international market for Indian film content, accounting for highest collection of US$272.3 million. While the number of screens (both single and multi-screen) have been steadily increasing, the screen count is still lower than large international markets.
7,031 6,780 6,651
2,450 2,750 2,950
-
2,000
4,000
6,000
8,000
10,000
2016 2017 2018
Single Screens Multi Screens
Figure 7: Number of screens in India
Source: FICCI-EY Media & Entertainment Report (2019)
9,481 9,530 9,601
41,179
50,776 55,623
40,604 40,246 40,837
-
10,000
20,000
30,000
40,000
50,000
60,000
2016 2017 2018
India China US
Figure 8: Screen count in India, China and USA
Source: FICCI-EY Media & Entertainment Report (2019)
0
20
40
60
80
100
120
140
India Brazil China South Korea UK US
Source: FICCI-EY Media & Entertainment Report (2019)
Figure 9: Screens per million population, 2018
Digital Media
9.37 The various segments of digital media include- online video viewing, audios, news through OTT platforms and social media etc. As per FICCI-EY Media & Entertainment
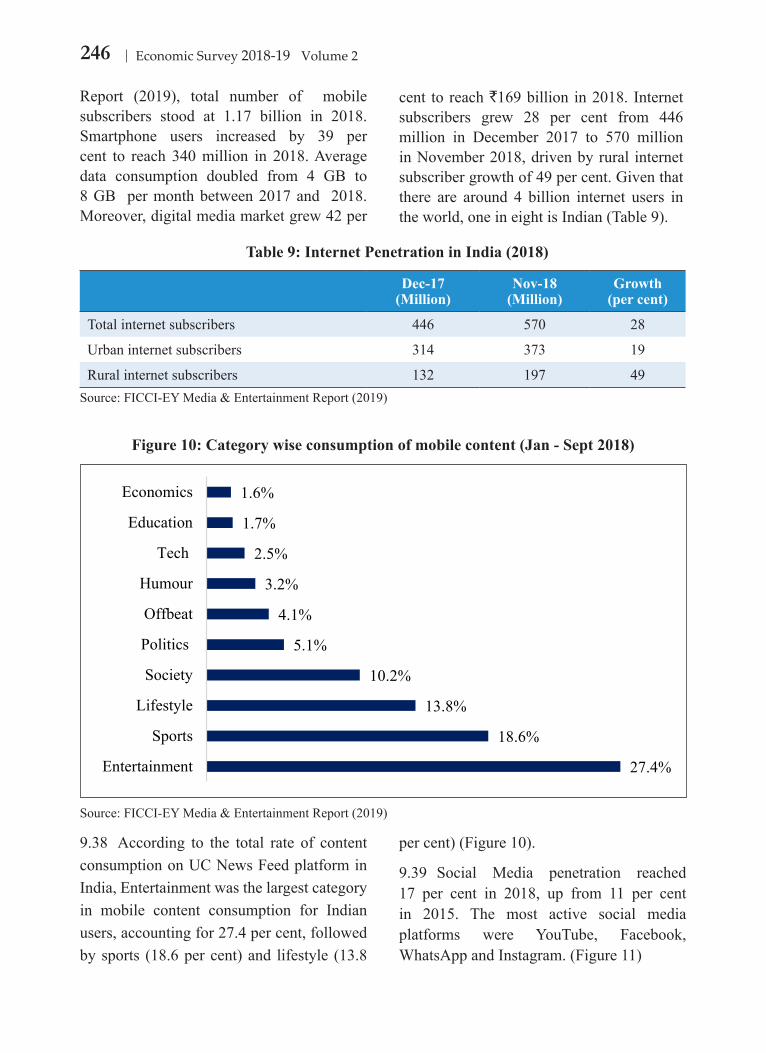
246 Economic Survey 2018-19 Volume 2
Report (2019), total number of mobile subscribers stood at 1.17 billion in 2018. Smartphone users increased by 39 per cent to reach 340 million in 2018. Average data consumption doubled from 4 GB to 8 GB per month between 2017 and 2018. Moreover, digital media market grew 42 per
cent to reach `169 billion in 2018. Internet subscribers grew 28 per cent from 446 million in December 2017 to 570 million in November 2018, driven by rural internet subscriber growth of 49 per cent. Given that there are around 4 billion internet users in the world, one in eight is Indian (Table 9).
9.38 According to the total rate of content consumption on UC News Feed platform in India, Entertainment was the largest category in mobile content consumption for Indian users, accounting for 27.4 per cent, followed by sports (18.6 per cent) and lifestyle (13.8
per cent) (Figure 10).
9.39 Social Media penetration reached 17 per cent in 2018, up from 11 per cent in 2015. The most active social media platforms were YouTube, Facebook, WhatsApp and Instagram. (Figure 11)
Table 9: Internet Penetration in India (2018)
Dec-17 (Million)
Nov-18 (Million)
Growth (per cent)
Total internet subscribers 446 570 28
Urban internet subscribers 314 373 19
Rural internet subscribers 132 197 49Source: FICCI-EY Media & Entertainment Report (2019)
Figure 10: Category wise consumption of mobile content (Jan - Sept 2018)
27.4%
18.6%
13.8%
10.2%
5.1%
4.1%
3.2%
2.5%
1.7%
1.6%
Entertainment
Sports
Lifestyle
Society
Politics
Offbeat
Humour
Tech
Education
Economics
Source: FICCI-EY Media & Entertainment Report (2019)
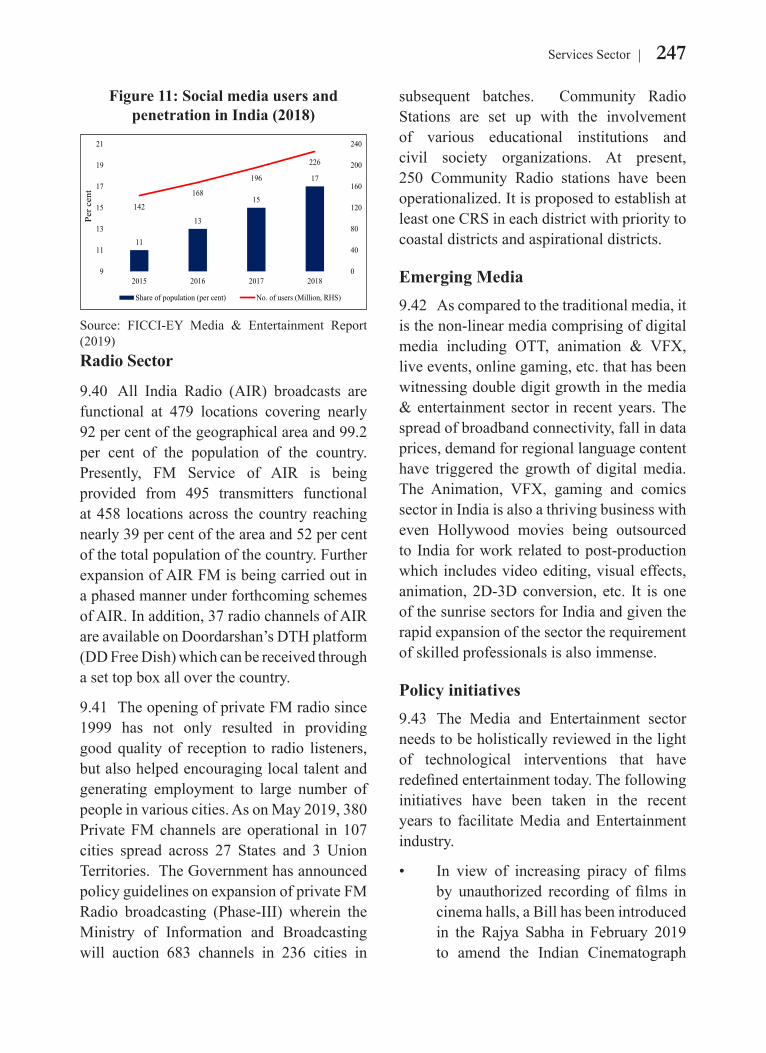
247Services Sector
Radio Sector
9.40 All India Radio (AIR) broadcasts are functional at 479 locations covering nearly 92 per cent of the geographical area and 99.2 per cent of the population of the country. Presently, FM Service of AIR is being provided from 495 transmitters functional at 458 locations across the country reaching nearly 39 per cent of the area and 52 per cent of the total population of the country. Further expansion of AIR FM is being carried out in a phased manner under forthcoming schemes of AIR. In addition, 37 radio channels of AIR are available on Doordarshan’s DTH platform (DD Free Dish) which can be received through a set top box all over the country.
9.41 The opening of private FM radio since 1999 has not only resulted in providing good quality of reception to radio listeners, but also helped encouraging local talent and generating employment to large number of people in various cities. As on May 2019, 380 Private FM channels are operational in 107 cities spread across 27 States and 3 Union Territories. The Government has announced policy guidelines on expansion of private FM Radio broadcasting (Phase-III) wherein the Ministry of Information and Broadcasting will auction 683 channels in 236 cities in
subsequent batches. Community Radio Stations are set up with the involvement of various educational institutions and civil society organizations. At present, 250 Community Radio stations have been operationalized. It is proposed to establish at least one CRS in each district with priority to coastal districts and aspirational districts.
Emerging Media 9.42 As compared to the traditional media, it is the non-linear media comprising of digital media including OTT, animation & VFX, live events, online gaming, etc. that has been witnessing double digit growth in the media & entertainment sector in recent years. The spread of broadband connectivity, fall in data prices, demand for regional language content have triggered the growth of digital media. The Animation, VFX, gaming and comics sector in India is also a thriving business with even Hollywood movies being outsourced to India for work related to post-production which includes video editing, visual effects, animation, 2D-3D conversion, etc. It is one of the sunrise sectors for India and given the rapid expansion of the sector the requirement of skilled professionals is also immense.
Policy initiatives 9.43 The Media and Entertainment sector needs to be holistically reviewed in the light of technological interventions that have redefined entertainment today. The following initiatives have been taken in the recent years to facilitate Media and Entertainment industry.
• In view of increasing piracy of films by unauthorized recording of films in cinema halls, a Bill has been introduced in the Rajya Sabha in February 2019 to amend the Indian Cinematograph
Figure 11: Social media users and penetration in India (2018)
11
13
15
17
142
168
196
226
0
40
80
120
160
200
240
9
11
13
15
17
19
21
2015 2016 2017 2018
Share of population (per cent) No. of users (Million, RHS)
Per c
ent
Source: FICCI-EY Media & Entertainment Report (2019)
248 Economic Survey 2018-19 Volume 2
Act 1952. The Bill has since then referred to the Standing Committee on Information Technology for detailed examination.
• Audio–visual service has been identified by the Government as one among the 12 Champion Service sectors identified for focused development so as to reap its full potential. Ministry of Information & Broadcasting is proposing various incentives to promote audio-visual services. These include: Audio-visual co-production with foreign countries, incentives for shooting of foreign films in India, organization of global film summit and promotion of single screens in Tier II and Tier III cities.
• With the objective of imparting world class education in animation, gaming, visual effects and employment generation in the sector, Government of India is in the process of setting up National Centre of Excellence (NCOE) for Animation, Visual Effects, Gaming and Comics. Government of India has taken over the possession of land from Government of Maharashtra in March, 2018 at Goregaon, Mumbai. The project is being executed through Indian Institute of Mass Communication, New Delhi.
• As part of the initiative to encourage talent among youngsters of the North East in the sector of film and television, the Government of India has decided to establish a Film and Television Institute in Arunachal Pradesh. The project has been sanctioned at an estimated cost of `204.32 crore. Foundation stone for FTI, Arunachal Pradesh was laid in February 2019. A temporary campus has been set up in Itanagar where short courses have been conducted.
Space Services
9.44 Indian Space Programme contributes to National Development, through the application of space technology, comprising of earth observation, communication and navigation to address issues related to socio-economic development from macro to micro levels. Over the last three decades, space technology has matured from providing simple mapping applications to development of complex models, decision support and early warning systems, incorporating space and derived inputs. Satellite launch services and satellite database mapping and Geospatial services are areas in which India is making a mark and has huge potential for the future. India has achieved significant milestones in space transportation capability through the operationalization of Polar Satellite Launch Vehicle (PSLV), Geosynchronous Satellite Launch Vehicle (GSLV) and Geosynchronous Satellite Launch Vehicle Mark III (GSLV Mk-III) for launching satellites for earth observation, communication, navigation and space exploration. India became the sixth nation to develop this highly coveted complex cryogenic rocket propulsion technology and also paved the way for the development of a high thrust Cryogenic engine & stage for the next generation launch vehicle i.e. GSLV Mk-III.
9.45 In the case of Satellite Launching, as on March 2019, PSLV had cumulatively launched 324 satellites that include 45 National Satellites, 10 student satellites built by Universities/Academic institutions and 269 International customer satellites from 32 Countries. PSLV also holds the distinction of launching the highest number of satellites, 104, in a single launch. GSLV Mk-III has successfully completed a sub-orbital experimental flight followed by two developmental flights. In its second

249Services Sector
developmental flight on November 14, 2018, GSLV Mk- III launched the heaviest satellite from Indian soil, GSAT-29, and has entered the operational phase. The first operational flight is slated to launch Chandrayaan-2 in 2019, which is India’s second lunar mission and the first landing mission to the moon.
Bhuvan Services9.46 ISRO’s Bhuvan Geo-portal provides multi sensor, multi-platform and multi temporal Satellite Imagery, thematic maps and satellite data-derived information related to Earth Observation & Disaster Management Support. Since its launch in 2009, it has grown horizontally in diverse areas of applications, and vertically, in terms of number of images and thematic & disaster services including high-resolution satellite data. Presently, more than 6500 map services offered by Bhuvan are being used under various applications. Bhuvan has enriched portals of more than 20 Central Ministries/Departments and 30 States, and is also providing Geospatial support for many flagship programmes of the Government.
Mapping and Geospatial Services9.47 Satellite data, synchronous with ground data, are used to estimate crop acreage in-season forecasting of production for 8 major crops in the country viz. wheat, rice (kharif & rabi), mustard, rabi sorghum, jute, winter
potato, sugarcane, cotton in the country. Using the techniques developed by ISRO, the Mahalanobis National Crop Forecast Centre (under Ministry of Agriculture & Farmers Welfare) regularly generates crop forecasts at District/State/National level and provides to the Government for planning and decision making. Some of the major satellite data based mapping/Geospatial services developed include Horticulture Crop Inventory, Hydro-informatic products under National Hydrology Project (NHP), Village level Ground Water Prospects, Telegana and Andhra Pradesh Water Resources Information & Management Systems (TWRIS/APWRIMS), Watershed Monitoring under Integrated Watershed Management Programme (IWMP), Monitoring of progress of road construction under PMGSY, GIS implementation of MGNREGA (GeoMGNREGA), Inventory & site Management plans for heritage sites & monuments, Monitoring of stage of construction of benefeciary houses under Housing for All-Urban (PMAY), Geospatial database for Urban Master Plan formulation under AMRUT, etc.
9.48 Periodic assessment of state of natural resources like vegetation, land cover, snow & glaciar and wetland is also being carried out, in addition to national level assessment of status of wastelands and land degradation.
CHAPTER AT A GLANCE
Services sector (excluding construction) has a share of 54.3 per cent in India’s GVA and contributed more than half of GVA growth in 2018-19.
The services sector growth declined marginally to 7.5 per cent in 2018-19 from 8.1 per cent in 2017-18 due to deceleration in the growth of sub sectors such as trade, hotels, transport, communication and broadcasting services. However, growth of financial services, real estate and professional services accelerated.
250 Economic Survey 2018-19 Volume 2
India’s services sector does not generate jobs in proportion to its share in GVA. Services share in employment is 34 per cent in 2017 which is significantly lesser that its share of 54 per cent in GVA
The moderation in services growth are reflected in various other high frequency indicators such as bank credit to services sector, Nikkei India Services PMI, air passenger traffic etc.
During 2018-19, FDI equity inflows into service sector fell by US$696 million or 1.3 per cent from the previous year to about US$28.26 billion.
India received 10.6 million foreign tourists in 2018-19 compared to 10.4 million in 2017-18. The foreign exchange earnings from tourism stood at US$27.7 billion in 2018-19 compared to US$28.7 billion in 2017-18.
The IT-BPM industry grew by 8.4 per cent in 2017-18 to US$167 billion and is estimated to reach US$181 billion in 2018-19.
CHAPTER
Social Infrastructure, Employment and Human Development
10
INTRODUCTION10.1 The 2030 Agenda for Sustainable Development as reflected in the 17 Sustainable Development Goals (SDGs) and 169 targets, calls for global partnership to ensure peace and prosperity for people and the planet, now and into the future. It is recognized that ending poverty and other deprivations must go hand-in-hand with strategies that improve health and education, reduce inequality and spur economic growth in a sustainable manner. India is committed to achieve these SDGs and a strong social infrastructure is key to achieve them. The Government has been focusing
on provisioning of assets such as schools, institutes of higher learning, hospitals, access to sanitation, water supply, road connectivity, affordable housing, skills and livelihood opportunities. This gains significance given the fact that India is home to the world’s youngest population as half of its population is below the age of 25. It has also been estimated that demographic advantage in India is available for five decades from 2005-06 to 2055-56, longer than any other country in the world (UNFPA, 2018). This demographic advantage can be reaped only if education, skilling and employment opportunities are provided to the young population.
“More than ever before, there is a global understanding that long-term social, economic, and environmental development would be impossible without healthy families, communities and countries.”
Gro Harlem Brundtland1
Inclusiveness has been the cornerstone of India’s development agenda. Over the last few years, efforts in this direction have been accelerated by the Government through the mantra of inclusiveness ‘Sabka Sath, Sabka Vikas’, further elaborated by ensuring ‘Sabka Vishwas’. As India is a developing economy with resource constraints, we have to prioritize and optimize the expenditure on social infrastructure to promote sustainable and inclusive growth. It is critical at this juncture to focus on public investments in human capital and strengthen the delivery mechanisms of government interventions to ensure transparency and accountability. With India having the demographic advantage, improving educational standards, skilling the youth, enhancing job opportunities, reducing disease burden and empowering women will help in realizing the potential of a buoyant economy in the future.
1 First female Prime Minister of Norway. Brundtland Commission submitted its report ‘Our Common Future’ which brought the concept of Sustainable Development in the global agenda.
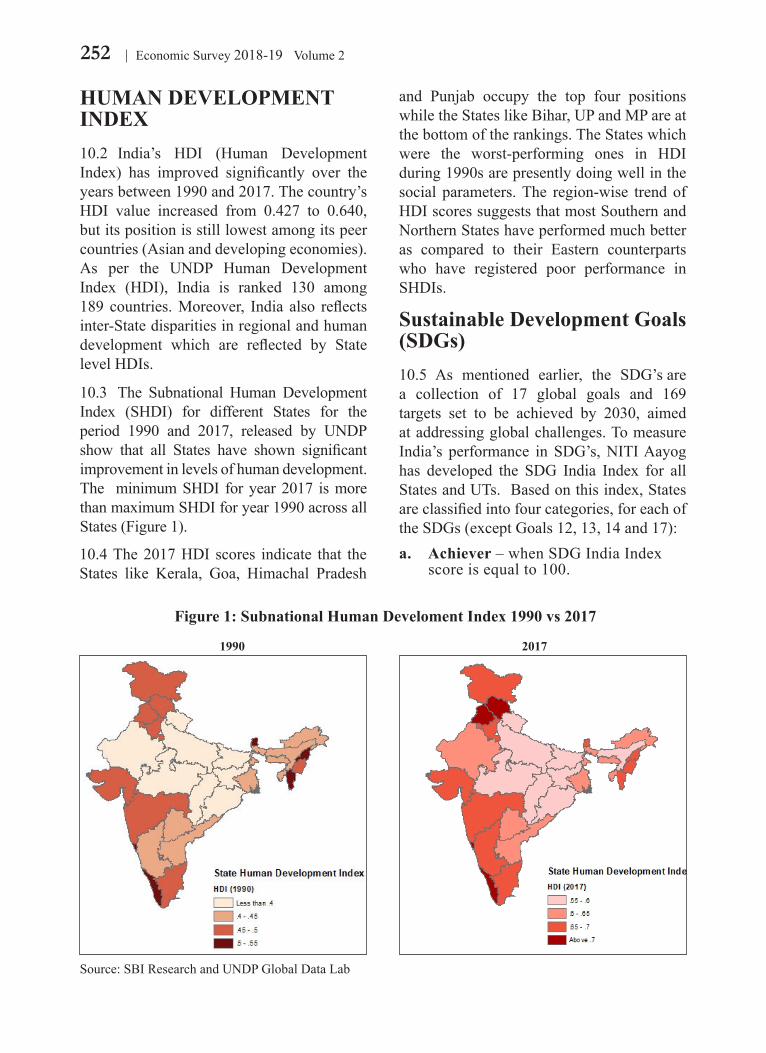
252 Economic Survey 2018-19 Volume 2
HUMAN DEVELOPMENT INDEX10.2 India’s HDI (Human Development Index) has improved significantly over the years between 1990 and 2017. The country’s HDI value increased from 0.427 to 0.640, but its position is still lowest among its peer countries (Asian and developing economies). As per the UNDP Human Development Index (HDI), India is ranked 130 among 189 countries. Moreover, India also reflects inter-State disparities in regional and human development which are reflected by State level HDIs.
10.3 The Subnational Human Development Index (SHDI) for different States for the period 1990 and 2017, released by UNDP show that all States have shown significant improvement in levels of human development. The minimum SHDI for year 2017 is more than maximum SHDI for year 1990 across all States (Figure 1).
10.4 The 2017 HDI scores indicate that the States like Kerala, Goa, Himachal Pradesh
and Punjab occupy the top four positions while the States like Bihar, UP and MP are at the bottom of the rankings. The States which were the worst-performing ones in HDI during 1990s are presently doing well in the social parameters. The region-wise trend of HDI scores suggests that most Southern and Northern States have performed much better as compared to their Eastern counterparts who have registered poor performance in SHDIs.
Sustainable Development Goals (SDGs)10.5 As mentioned earlier, the SDG’s are a collection of 17 global goals and 169 targets set to be achieved by 2030, aimed at addressing global challenges. To measure India’s performance in SDG’s, NITI Aayog has developed the SDG India Index for all States and UTs. Based on this index, States are classified into four categories, for each of the SDGs (except Goals 12, 13, 14 and 17):a. Achiever – when SDG India Index
score is equal to 100.
Figure 1: Subnational Human Develoment Index 1990 vs 2017
1990 2017
Source: SBI Research and UNDP Global Data Lab
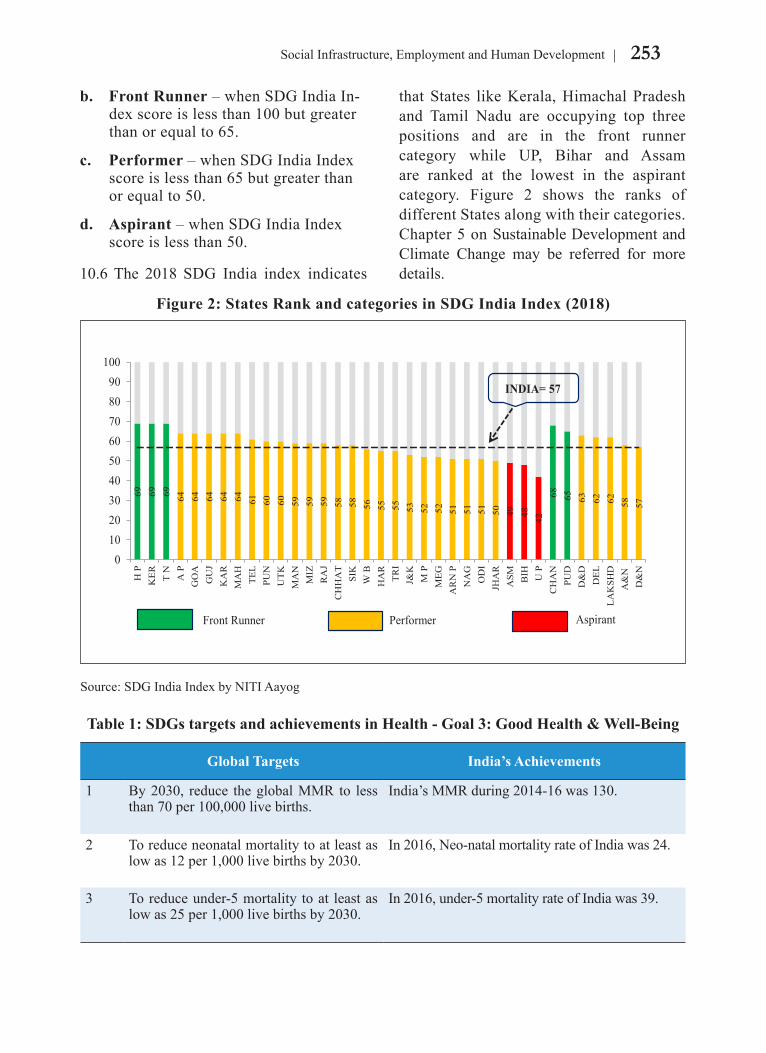
253Social Infrastructure, Employment and Human Development
b. Front Runner – when SDG India In-dex score is less than 100 but greater than or equal to 65.
c. Performer – when SDG India Index score is less than 65 but greater than or equal to 50.
d. Aspirant – when SDG India Index score is less than 50.
10.6 The 2018 SDG India index indicates
that States like Kerala, Himachal Pradesh and Tamil Nadu are occupying top three positions and are in the front runner category while UP, Bihar and Assam are ranked at the lowest in the aspirant category. Figure 2 shows the ranks of different States along with their categories. Chapter 5 on Sustainable Development and Climate Change may be referred for more details.
Figure 2: States Rank and categories in SDG India Index (2018)
69
69
69
64
64
64
64
64
61
60
60
59
59
59
58
58
56
55
55
53
52
52
51
51
51
50
49
48
42
68
65
63
62
62
58
57
0102030405060708090
100
H P
KER T
NA
PG
OA
GU
JK
AR
MA
HTE
LPU
NU
TKM
AN
MIZ
RA
JC
HH
AT
SIK
W B
HA
RTR
IJ&
KM
PM
EGA
RN
PN
AG
OD
IJH
AR
ASM BIH U P
CH
AN
PUD
D&
DD
ELLA
KSH
DA
&N
D&
N
INDIA= 57
Front Runner Performer Aspirant
Source: SDG India Index by NITI Aayog
Table 1: SDGs targets and achievements in Health - Goal 3: Good Health & Well-Being
Global Targets India’s Achievements
1 By 2030, reduce the global MMR to less than 70 per 100,000 live births.
India’s MMR during 2014-16 was 130.
2 To reduce neonatal mortality to at least as low as 12 per 1,000 live births by 2030.
In 2016, Neo-natal mortality rate of India was 24.
3 To reduce under-5 mortality to at least as low as 25 per 1,000 live births by 2030.
In 2016, under-5 mortality rate of India was 39.
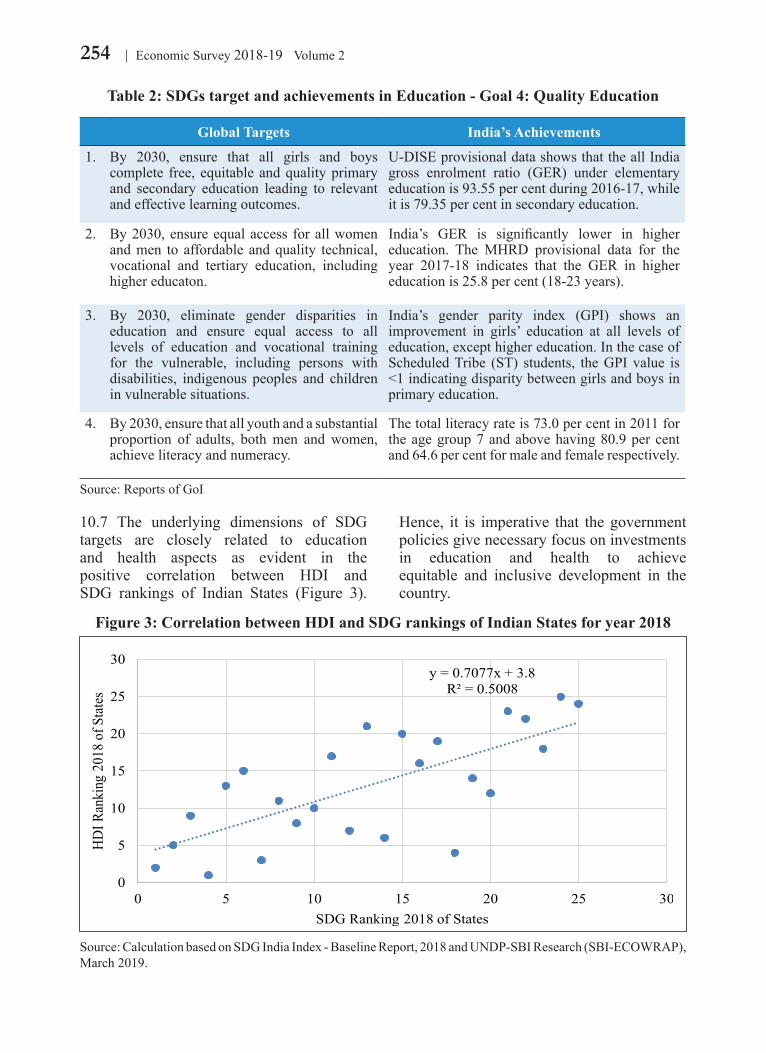
254 Economic Survey 2018-19 Volume 2
10.7 The underlying dimensions of SDG targets are closely related to education and health aspects as evident in the positive correlation between HDI and SDG rankings of Indian States (Figure 3).
Hence, it is imperative that the government policies give necessary focus on investments in education and health to achieve equitable and inclusive development in the country.
Table 2: SDGs target and achievements in Education - Goal 4: Quality Education
Global Targets India’s Achievements
1. By 2030, ensure that all girls and boys complete free, equitable and quality primary and secondary education leading to relevant and effective learning outcomes.
U-DISE provisional data shows that the all India gross enrolment ratio (GER) under elementary education is 93.55 per cent during 2016-17, while it is 79.35 per cent in secondary education.
2. By 2030, ensure equal access for all women and men to affordable and quality technical, vocational and tertiary education, including higher educaton.
India’s GER is significantly lower in higher education. The MHRD provisional data for the year 2017-18 indicates that the GER in higher education is 25.8 per cent (18-23 years).
3. By 2030, eliminate gender disparities in education and ensure equal access to all levels of education and vocational training for the vulnerable, including persons with disabilities, indigenous peoples and children in vulnerable situations.
India’s gender parity index (GPI) shows an improvement in girls’ education at all levels of education, except higher education. In the case of Scheduled Tribe (ST) students, the GPI value is <1 indicating disparity between girls and boys in primary education.
4. By 2030, ensure that all youth and a substantial proportion of adults, both men and women, achieve literacy and numeracy.
The total literacy rate is 73.0 per cent in 2011 for the age group 7 and above having 80.9 per cent and 64.6 per cent for male and female respectively.
Source: Reports of GoI
Figure 3: Correlation between HDI and SDG rankings of Indian States for year 2018
Source: Calculation based on SDG India Index - Baseline Report, 2018 and UNDP-SBI Research (SBI-ECOWRAP), March 2019.
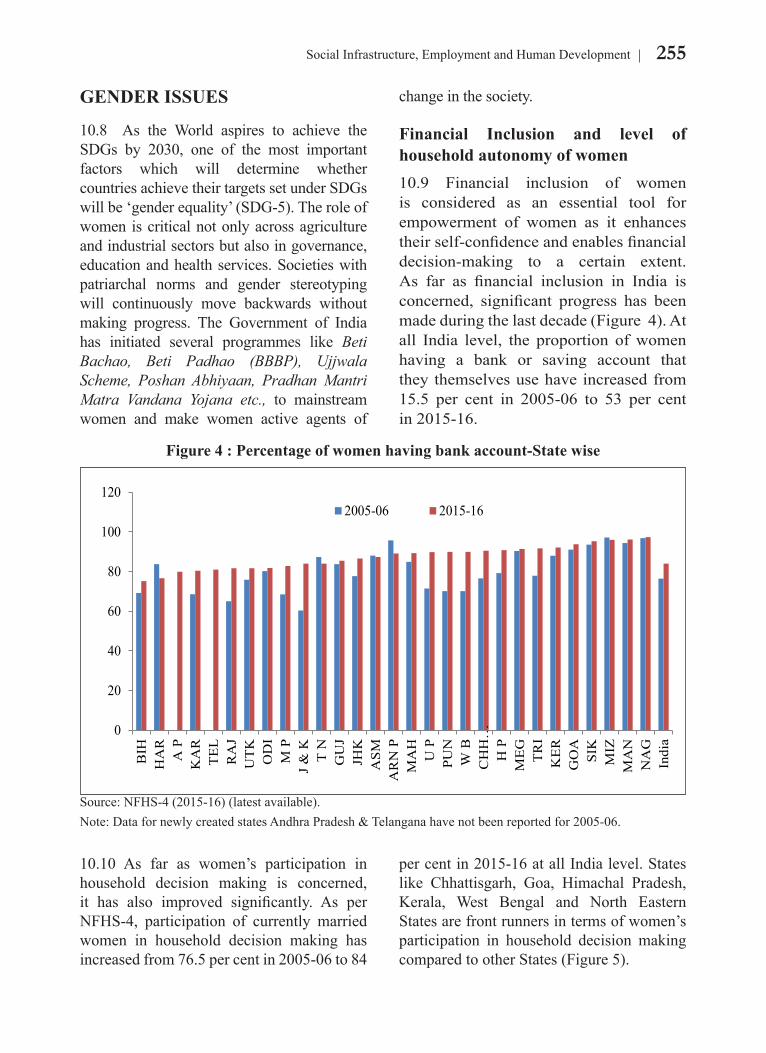
255Social Infrastructure, Employment and Human Development
GENDER ISSUES
10.8 As the World aspires to achieve the SDGs by 2030, one of the most important factors which will determine whether countries achieve their targets set under SDGs will be ‘gender equality’ (SDG-5). The role of women is critical not only across agriculture and industrial sectors but also in governance, education and health services. Societies with patriarchal norms and gender stereotyping will continuously move backwards without making progress. The Government of India has initiated several programmes like Beti Bachao, Beti Padhao (BBBP), Ujjwala Scheme, Poshan Abhiyaan, Pradhan Mantri Matra Vandana Yojana etc., to mainstream women and make women active agents of
change in the society.
Financial Inclusion and level of household autonomy of women10.9 Financial inclusion of women is considered as an essential tool for empowerment of women as it enhances their self-confidence and enables financial decision-making to a certain extent. As far as financial inclusion in India is concerned, significant progress has been made during the last decade (Figure 4). At all India level, the proportion of women having a bank or saving account that they themselves use have increased from 15.5 per cent in 2005-06 to 53 per cent in 2015-16.
10.10 As far as women’s participation in household decision making is concerned, it has also improved significantly. As per NFHS-4, participation of currently married women in household decision making has increased from 76.5 per cent in 2005-06 to 84
per cent in 2015-16 at all India level. States like Chhattisgarh, Goa, Himachal Pradesh, Kerala, West Bengal and North Eastern States are front runners in terms of women’s participation in household decision making compared to other States (Figure 5).
Figure 4 : Percentage of women having bank account-State wise
0
20
40
60
80
100
120
BIH
HA
RA
PK
AR
TE
LR
AJ
UT
KO
DI
M P
J &
KT
NG
UJ
JHK
ASM
AR
N P
MA
HU
PPU
NW
BC
HH
…H
PM
EG
TR
IK
ER
GO
ASI
KM
IZM
AN
NA
GIn
dia
2005-06 2015-16
Source: NFHS-4 (2015-16) (latest available).Note: Data for newly created states Andhra Pradesh & Telangana have not been reported for 2005-06.
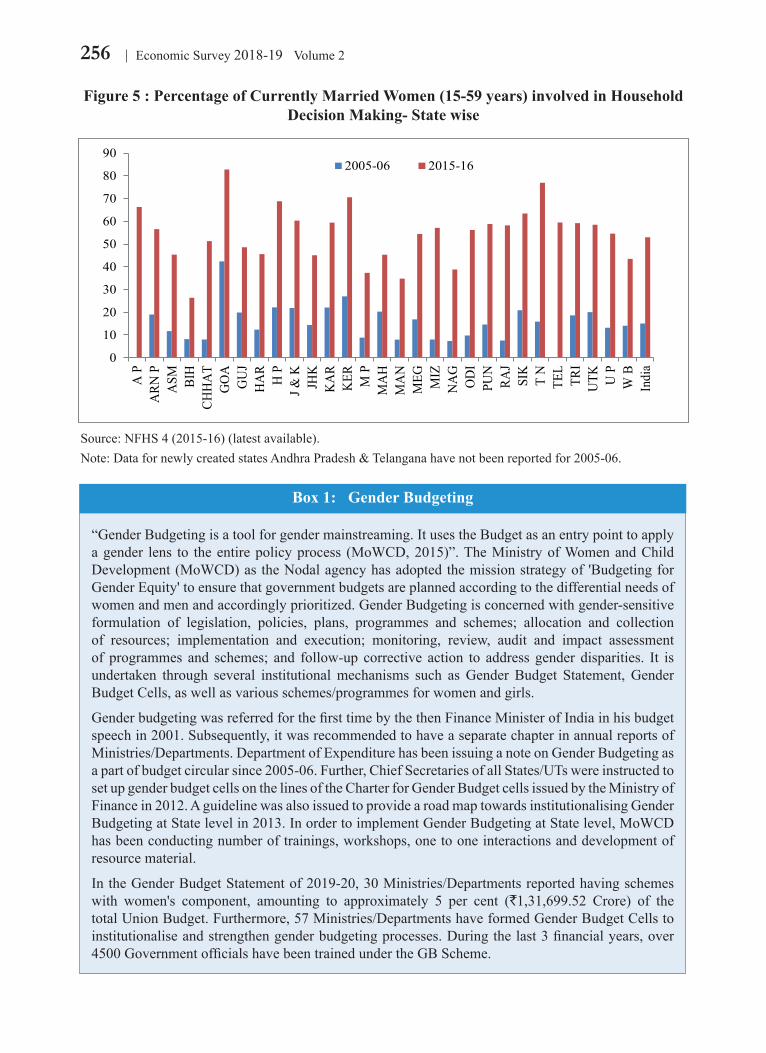
256 Economic Survey 2018-19 Volume 2
Figure 5 : Percentage of Currently Married Women (15-59 years) involved in Household Decision Making- State wise
Figure 5
0
10
20
30
40
50
60
70
80
90A
PA
RN P
ASM BI
HCH
HA
TG
OA
GU
JH
AR
H P
J & K
JHK
KA
RK
ER M P
MA
HM
AN
MEG MIZ
NA
GO
DI
PUN
RAJ
SIK
T N
TEL
TRI
UTK U
PW
BIn
dia
2005-06 2015-16
Source: NFHS 4 (2015-16) (latest available).Note: Data for newly created states Andhra Pradesh & Telangana have not been reported for 2005-06.
“Gender Budgeting is a tool for gender mainstreaming. It uses the Budget as an entry point to apply a gender lens to the entire policy process (MoWCD, 2015)”. The Ministry of Women and Child Development (MoWCD) as the Nodal agency has adopted the mission strategy of 'Budgeting for Gender Equity' to ensure that government budgets are planned according to the differential needs of women and men and accordingly prioritized. Gender Budgeting is concerned with gender-sensitive formulation of legislation, policies, plans, programmes and schemes; allocation and collection of resources; implementation and execution; monitoring, review, audit and impact assessment of programmes and schemes; and follow-up corrective action to address gender disparities. It is undertaken through several institutional mechanisms such as Gender Budget Statement, Gender Budget Cells, as well as various schemes/programmes for women and girls.
Gender budgeting was referred for the first time by the then Finance Minister of India in his budget speech in 2001. Subsequently, it was recommended to have a separate chapter in annual reports of Ministries/Departments. Department of Expenditure has been issuing a note on Gender Budgeting as a part of budget circular since 2005-06. Further, Chief Secretaries of all States/UTs were instructed to set up gender budget cells on the lines of the Charter for Gender Budget cells issued by the Ministry of Finance in 2012. A guideline was also issued to provide a road map towards institutionalising Gender Budgeting at State level in 2013. In order to implement Gender Budgeting at State level, MoWCD has been conducting number of trainings, workshops, one to one interactions and development of resource material.
In the Gender Budget Statement of 2019-20, 30 Ministries/Departments reported having schemes with women's component, amounting to approximately 5 per cent (`1,31,699.52 Crore) of the total Union Budget. Furthermore, 57 Ministries/Departments have formed Gender Budget Cells to institutionalise and strengthen gender budgeting processes. During the last 3 financial years, over 4500 Government officials have been trained under the GB Scheme.
Box 1: Gender Budgeting
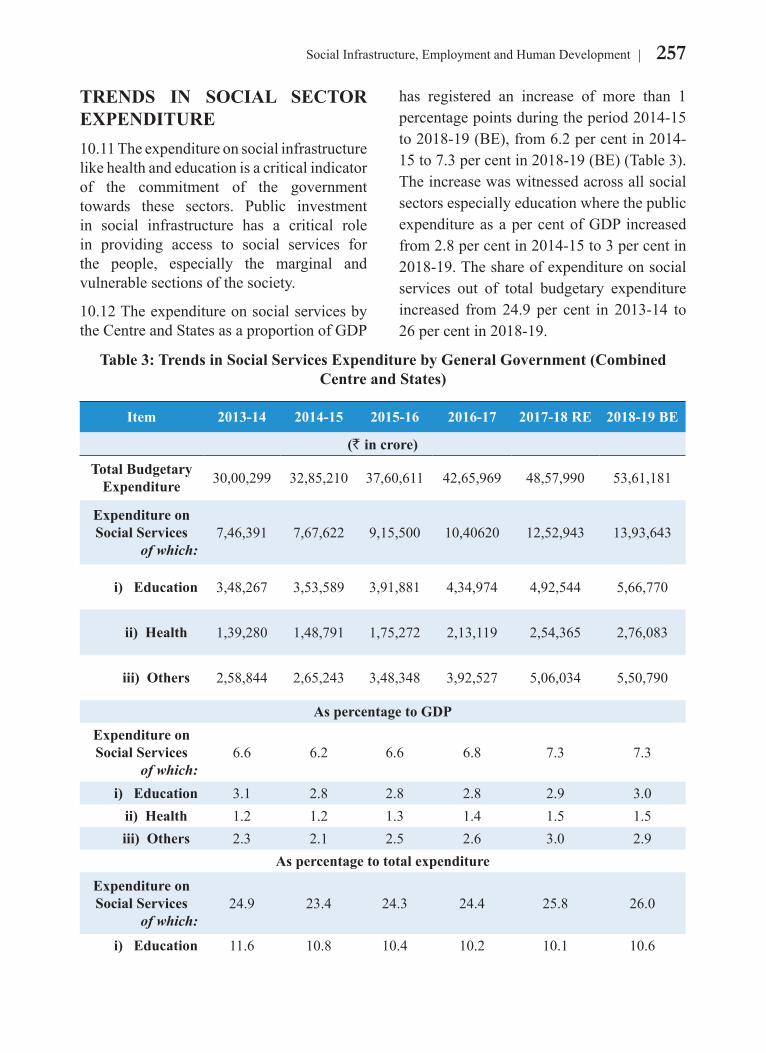
257Social Infrastructure, Employment and Human Development
TRENDS IN SOCIAL SECTOR EXPENDITURE 10.11 The expenditure on social infrastructure like health and education is a critical indicator of the commitment of the government towards these sectors. Public investment in social infrastructure has a critical role in providing access to social services for the people, especially the marginal and vulnerable sections of the society.
10.12 The expenditure on social services by the Centre and States as a proportion of GDP
has registered an increase of more than 1 percentage points during the period 2014-15 to 2018-19 (BE), from 6.2 per cent in 2014-15 to 7.3 per cent in 2018-19 (BE) (Table 3). The increase was witnessed across all social sectors especially education where the public expenditure as a per cent of GDP increased from 2.8 per cent in 2014-15 to 3 per cent in 2018-19. The share of expenditure on social services out of total budgetary expenditure increased from 24.9 per cent in 2013-14 to 26 per cent in 2018-19.
Table 3: Trends in Social Services Expenditure by General Government (Combined Centre and States)
Item 2013-14 2014-15 2015-16 2016-17 2017-18 RE 2018-19 BE
(` in crore)
Total Budgetary Expenditure 30,00,299 32,85,210 37,60,611 42,65,969 48,57,990 53,61,181
Expenditure on Social Services
of which:7,46,391 7,67,622 9,15,500 10,40620 12,52,943 13,93,643
i) Education 3,48,267 3,53,589 3,91,881 4,34,974 4,92,544 5,66,770
ii) Health 1,39,280 1,48,791 1,75,272 2,13,119 2,54,365 2,76,083
iii) Others 2,58,844 2,65,243 3,48,348 3,92,527 5,06,034 5,50,790
As percentage to GDPExpenditure on Social Services
of which:6.6 6.2 6.6 6.8 7.3 7.3
i) Education 3.1 2.8 2.8 2.8 2.9 3.0 ii) Health 1.2 1.2 1.3 1.4 1.5 1.5 iii) Others 2.3 2.1 2.5 2.6 3.0 2.9
As percentage to total expenditure
Expenditure on Social Services
of which:24.9 23.4 24.3 24.4 25.8 26.0
i) Education 11.6 10.8 10.4 10.2 10.1 10.6
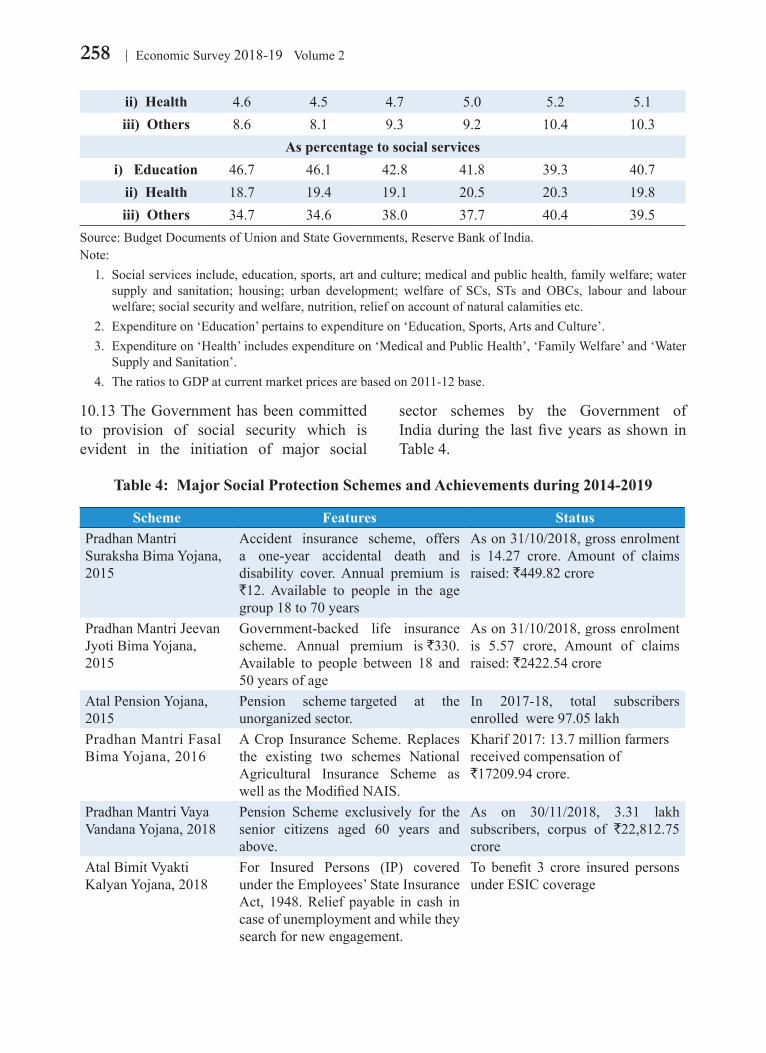
258 Economic Survey 2018-19 Volume 2
10.13 The Government has been committed to provision of social security which is evident in the initiation of major social
sector schemes by the Government of India during the last five years as shown in Table 4.
ii) Health 4.6 4.5 4.7 5.0 5.2 5.1 iii) Others 8.6 8.1 9.3 9.2 10.4 10.3
As percentage to social services i) Education 46.7 46.1 42.8 41.8 39.3 40.7
ii) Health 18.7 19.4 19.1 20.5 20.3 19.8 iii) Others 34.7 34.6 38.0 37.7 40.4 39.5
Source: Budget Documents of Union and State Governments, Reserve Bank of India.Note:
1. Social services include, education, sports, art and culture; medical and public health, family welfare; water supply and sanitation; housing; urban development; welfare of SCs, STs and OBCs, labour and labour welfare; social security and welfare, nutrition, relief on account of natural calamities etc.
2. Expenditure on ‘Education’ pertains to expenditure on ‘Education, Sports, Arts and Culture’.3. Expenditure on ‘Health’ includes expenditure on ‘Medical and Public Health’, ‘Family Welfare’ and ‘Water
Supply and Sanitation’.4. The ratios to GDP at current market prices are based on 2011-12 base.
Table 4: Major Social Protection Schemes and Achievements during 2014-2019
Scheme Features StatusPradhan Mantri Suraksha Bima Yojana, 2015
Accident insurance scheme, offers a one-year accidental death and disability cover. Annual premium is `12. Available to people in the age group 18 to 70 years
As on 31/10/2018, gross enrolment is 14.27 crore. Amount of claims raised: `449.82 crore
Pradhan Mantri Jeevan Jyoti Bima Yojana, 2015
Government-backed life insurance scheme. Annual premium is `330. Available to people between 18 and 50 years of age
As on 31/10/2018, gross enrolment is 5.57 crore, Amount of claims raised: `2422.54 crore
Atal Pension Yojana, 2015
Pension scheme targeted at the unorganized sector.
In 2017-18, total subscribers enrolled were 97.05 lakh
Pradhan Mantri Fasal Bima Yojana, 2016
A Crop Insurance Scheme. Replaces the existing two schemes National Agricultural Insurance Scheme as well as the Modified NAIS.
Kharif 2017: 13.7 million farmers received compensation of `17209.94 crore.
Pradhan Mantri Vaya Vandana Yojana, 2018
Pension Scheme exclusively for the senior citizens aged 60 years and above.
As on 30/11/2018, 3.31 lakh subscribers, corpus of `22,812.75 crore
Atal Bimit Vyakti Kalyan Yojana, 2018
For Insured Persons (IP) covered under the Employees’ State Insurance Act, 1948. Relief payable in cash in case of unemployment and while they search for new engagement.
To benefit 3 crore insured persons under ESIC coverage
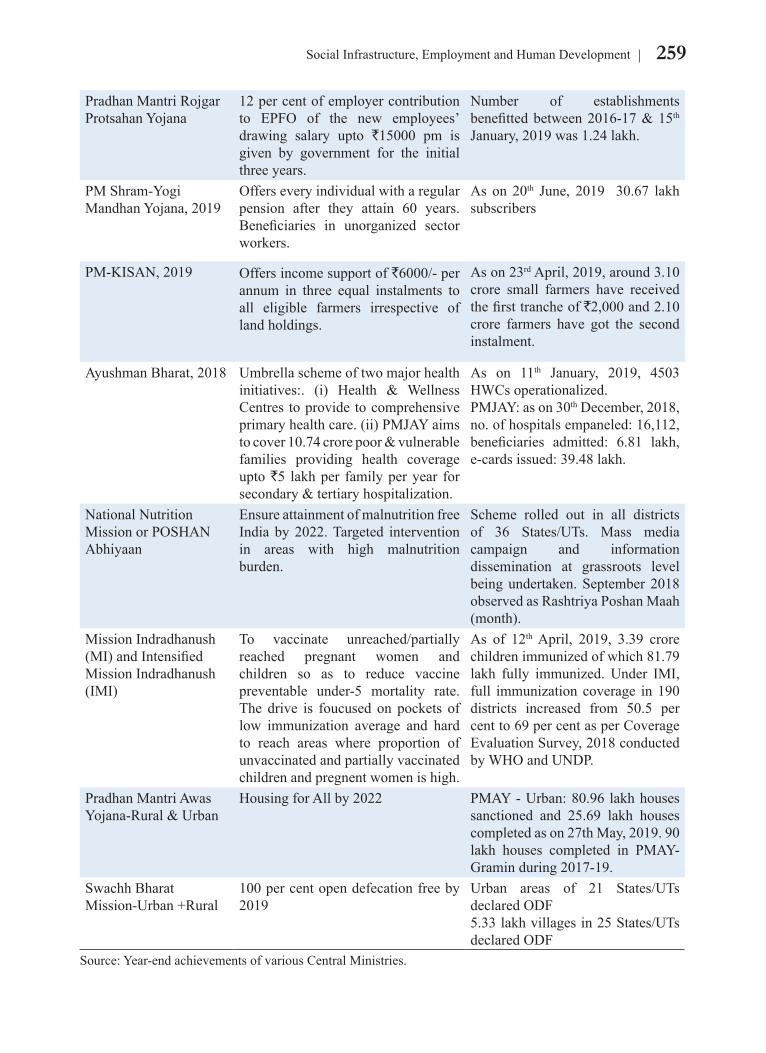
259Social Infrastructure, Employment and Human Development
Pradhan Mantri Rojgar Protsahan Yojana
12 per cent of employer contribution to EPFO of the new employees’ drawing salary upto `15000 pm is given by government for the initial three years.
Number of establishments benefitted between 2016-17 & 15th January, 2019 was 1.24 lakh.
PM Shram-Yogi Mandhan Yojana, 2019
Offers every individual with a regular pension after they attain 60 years. Beneficiaries in unorganized sector workers.
As on 20th June, 2019 30.67 lakh subscribers
PM-KISAN, 2019 Offers income support of `6000/- per annum in three equal instalments to all eligible farmers irrespective of land holdings.
As on 23rd April, 2019, around 3.10 crore small farmers have received the first tranche of `2,000 and 2.10 crore farmers have got the second instalment.
Ayushman Bharat, 2018 Umbrella scheme of two major health initiatives:. (i) Health & Wellness Centres to provide to comprehensive primary health care. (ii) PMJAY aims to cover 10.74 crore poor & vulnerable families providing health coverage upto `5 lakh per family per year for secondary & tertiary hospitalization.
As on 11th January, 2019, 4503 HWCs operationalized. PMJAY: as on 30th December, 2018, no. of hospitals empaneled: 16,112, beneficiaries admitted: 6.81 lakh, e-cards issued: 39.48 lakh.
National Nutrition Mission or POSHAN Abhiyaan
Ensure attainment of malnutrition free India by 2022. Targeted intervention in areas with high malnutrition burden.
Scheme rolled out in all districts of 36 States/UTs. Mass media campaign and information dissemination at grassroots level being undertaken. September 2018 observed as Rashtriya Poshan Maah (month).
Mission Indradhanush (MI) and Intensified Mission Indradhanush (IMI)
To vaccinate unreached/partially reached pregnant women and children so as to reduce vaccine preventable under-5 mortality rate. The drive is foucused on pockets of low immunization average and hard to reach areas where proportion of unvaccinated and partially vaccinated children and pregnent women is high.
As of 12th April, 2019, 3.39 crore children immunized of which 81.79 lakh fully immunized. Under IMI, full immunization coverage in 190 districts increased from 50.5 per cent to 69 per cent as per Coverage Evaluation Survey, 2018 conducted by WHO and UNDP.
Pradhan Mantri Awas Yojana-Rural & Urban
Housing for All by 2022 PMAY - Urban: 80.96 lakh houses sanctioned and 25.69 lakh houses completed as on 27th May, 2019. 90 lakh houses completed in PMAY-Gramin during 2017-19.
Swachh Bharat Mission-Urban +Rural
100 per cent open defecation free by 2019
Urban areas of 21 States/UTs declared ODF5.33 lakh villages in 25 States/UTs declared ODF
Source: Year-end achievements of various Central Ministries.

260 Economic Survey 2018-19 Volume 2
EDUCATION FOR ALL10.14 Goal 4 of Sustainable Development Goals (SDGs) on education requires ensuring equitable, inclusive and quality education along with promotion of lifelong learning opportunities for all by 2030.
Status of Education in India10.15 As per Educational Statistics at a Glance (ESAG), 2018, the thrust on
providing primary education has yielded results across social categories and gender in Gross Enrolment Rate (GER). Over the years, remarkable progress has been made in respect of female participation up-to secondary level and GER for girls has exceeded that of boys (Table 5). But girls’ enrolment rate is lower than that of boys at the higher education level. At this level, the gap is visible across the social categories too (Figure 6).
_______________
2 Key Indicators of Social Consumption in India: Education, 2014.
10.16 The drop-out rates are very high for boys at the secondary school level. According to NSSO 71st round2 (2014), the reasons for male students dropping out are economic activities, lack of interest in education and financial constraints. The transition rate from secondary school to senior secondary and further to higher education is also very low. The Pupil Teacher Ratio (PTR) at national level for primary schools is 23, 17 for upper primary, 27 for secondary and 37 for senior secondary schools. While the PTR appears to be satisfactory, it is clear that while there are sufficient teachers, the main issue is their balanced deployment based on student strength.
Table 5: GER (per cent), Drop-out Rate (per cent) and Pupil Teacher Ratio at levels of schooling
Level GER (2016-17) Drop-Out Rate (2016-17)
Pupil Teacher Ratio (Norm) 2015-16
Primary Male: 94.02 Male: 6.323 (30 - RTE)
Female: 96.35 Female: 6.4
Upper Primary Male: 86.90 Male: 4.9717 (35 - RTE)
Female: 95.19 Female: 6.42
SecondaryMale: 78.51 Male: 19.97 27 (30 – Secondary level
laid down in the relevant Scheme)Female: 80.29 Female: 19.81
Senior Secondary
Male: 54.93 Male: .6.3737
Female: 55.91 Female: 5.49Higher Education
Male: 26.3 NA30
Female: 25.4 NASource: Educational Statistics at a Glance 2018, U-DISE 2016-17 and AISHE 2017-18 (latest available).
Figure 6: GER at Higher Education Level (per cent) 2017-18
Fig 6
0
5
10
15
20
25
30
General Schedule Caste Schedule Tribe
26.3
22.2
17 25.4
21.4
14.9
25.8
21.8
15.9
Male Female Total
Source: AISHE, 2017-18 (Ministry of Human Resource Development)
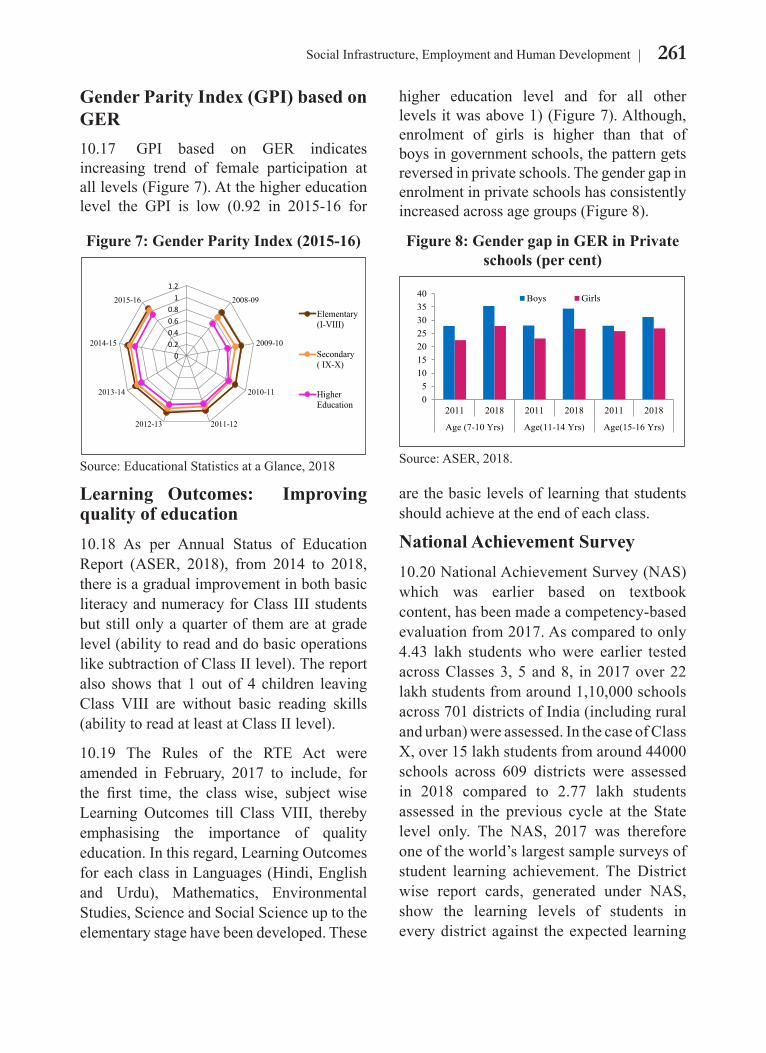
261Social Infrastructure, Employment and Human Development
Gender Parity Index (GPI) based on GER10.17 GPI based on GER indicates increasing trend of female participation at all levels (Figure 7). At the higher education level the GPI is low (0.92 in 2015-16 for
higher education level and for all other levels it was above 1) (Figure 7). Although, enrolment of girls is higher than that of boys in government schools, the pattern gets reversed in private schools. The gender gap in enrolment in private schools has consistently increased across age groups (Figure 8).
Learning Outcomes: Improving quality of education10.18 As per Annual Status of Education Report (ASER, 2018), from 2014 to 2018, there is a gradual improvement in both basic literacy and numeracy for Class III students but still only a quarter of them are at grade level (ability to read and do basic operations like subtraction of Class II level). The report also shows that 1 out of 4 children leaving Class VIII are without basic reading skills (ability to read at least at Class II level).
10.19 The Rules of the RTE Act were amended in February, 2017 to include, for the first time, the class wise, subject wise Learning Outcomes till Class VIII, thereby emphasising the importance of quality education. In this regard, Learning Outcomes for each class in Languages (Hindi, English and Urdu), Mathematics, Environmental Studies, Science and Social Science up to the elementary stage have been developed. These
are the basic levels of learning that students should achieve at the end of each class.
National Achievement Survey10.20 National Achievement Survey (NAS) which was earlier based on textbook content, has been made a competency-based evaluation from 2017. As compared to only 4.43 lakh students who were earlier tested across Classes 3, 5 and 8, in 2017 over 22 lakh students from around 1,10,000 schools across 701 districts of India (including rural and urban) were assessed. In the case of Class X, over 15 lakh students from around 44000 schools across 609 districts were assessed in 2018 compared to 2.77 lakh students assessed in the previous cycle at the State level only. The NAS, 2017 was therefore one of the world’s largest sample surveys of student learning achievement. The District wise report cards, generated under NAS, show the learning levels of students in every district against the expected learning
Figure 7: Gender Parity Index (2015-16)
Fig 7
00.20.40.60.8
11.2
2008-09
2009-10
2010-11
2011-122012-13
2013-14
2014-15
2015-16
Elementary(I-VIII)
Secondary( IX-X)
HigherEducation
Source: Educational Statistics at a Glance, 2018
Figure 8: Gender gap in GER in Private schools (per cent)
Figure 8
05
10152025303540
2011 2018 2011 2018 2011 2018
Age (7-10 Yrs) Age(11-14 Yrs) Age(15-16 Yrs)
Boys Girls
Source: ASER, 2018.
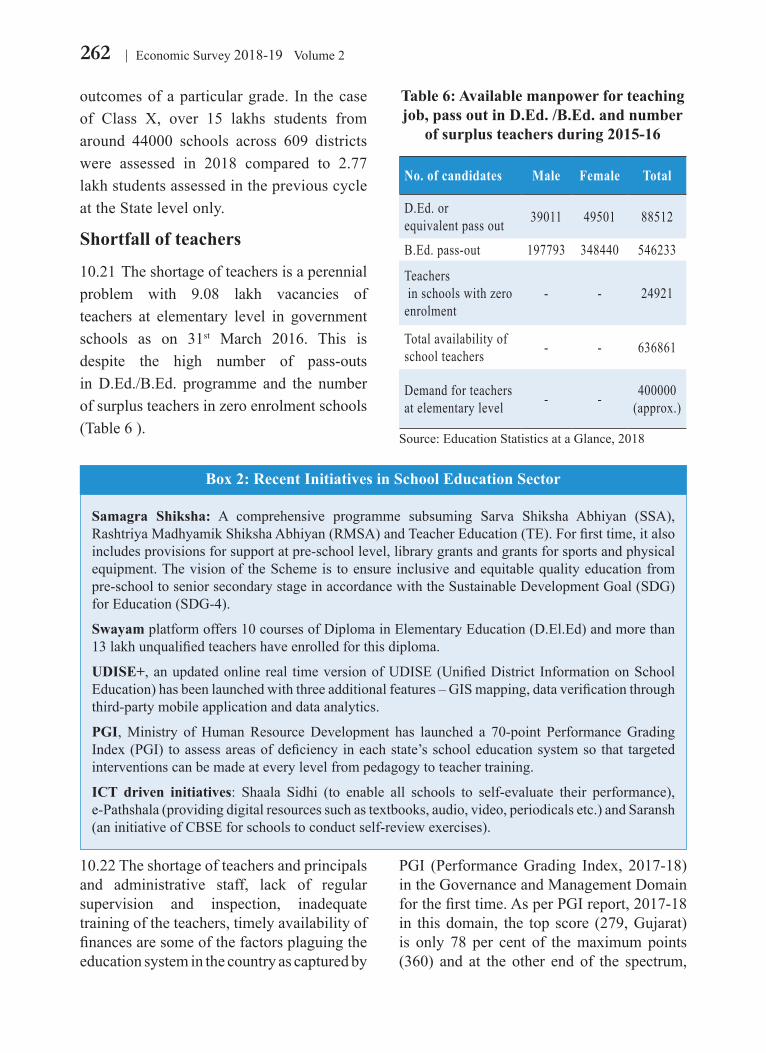
262 Economic Survey 2018-19 Volume 2
outcomes of a particular grade. In the case of Class X, over 15 lakhs students from around 44000 schools across 609 districts were assessed in 2018 compared to 2.77 lakh students assessed in the previous cycle at the State level only.
Shortfall of teachers
10.21 The shortage of teachers is a perennial problem with 9.08 lakh vacancies of teachers at elementary level in government schools as on 31st March 2016. This is despite the high number of pass-outs in D.Ed./B.Ed. programme and the number of surplus teachers in zero enrolment schools (Table 6 ).
Samagra Shiksha: A comprehensive programme subsuming Sarva Shiksha Abhiyan (SSA), Rashtriya Madhyamik Shiksha Abhiyan (RMSA) and Teacher Education (TE). For first time, it also includes provisions for support at pre-school level, library grants and grants for sports and physical equipment. The vision of the Scheme is to ensure inclusive and equitable quality education from pre-school to senior secondary stage in accordance with the Sustainable Development Goal (SDG) for Education (SDG-4).
Swayam platform offers 10 courses of Diploma in Elementary Education (D.El.Ed) and more than 13 lakh unqualified teachers have enrolled for this diploma.
UDISE+, an updated online real time version of UDISE (Unified District Information on School Education) has been launched with three additional features – GIS mapping, data verification through third-party mobile application and data analytics.
PGI, Ministry of Human Resource Development has launched a 70-point Performance Grading Index (PGI) to assess areas of deficiency in each state’s school education system so that targeted interventions can be made at every level from pedagogy to teacher training.
ICT driven initiatives: Shaala Sidhi (to enable all schools to self-evaluate their performance), e-Pathshala (providing digital resources such as textbooks, audio, video, periodicals etc.) and Saransh (an initiative of CBSE for schools to conduct self-review exercises).
10.22 The shortage of teachers and principals and administrative staff, lack of regular supervision and inspection, inadequate training of the teachers, timely availability of finances are some of the factors plaguing the education system in the country as captured by
PGI (Performance Grading Index, 2017-18) in the Governance and Management Domain for the first time. As per PGI report, 2017-18 in this domain, the top score (279, Gujarat) is only 78 per cent of the maximum points (360) and at the other end of the spectrum,
Table 6: Available manpower for teaching job, pass out in D.Ed. /B.Ed. and number
of surplus teachers during 2015-16
No. of candidates Male Female Total
D.Ed. or equivalent pass out 39011 49501 88512
B.Ed. pass-out 197793 348440 546233
Teachers in schools with zero enrolment
- - 24921
Total availability of school teachers - - 636861
Demand for teachers at elementary level - - 400000
(approx.)
Source: Education Statistics at a Glance, 2018
Box 2: Recent Initiatives in School Education Sector
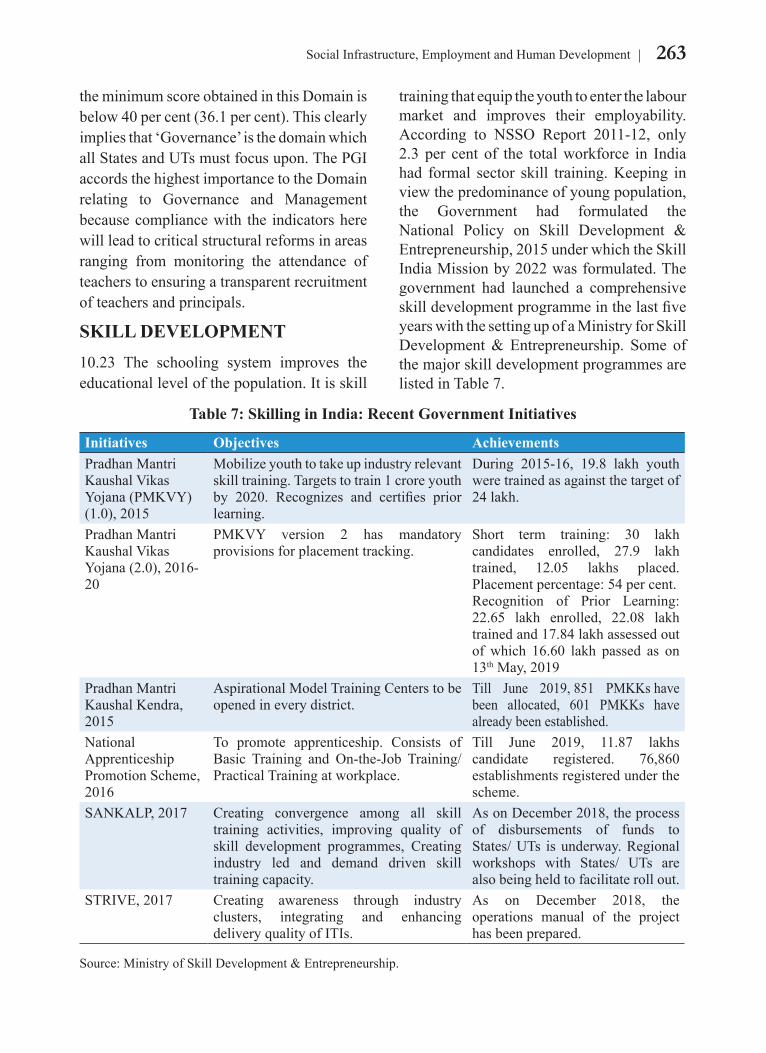
263Social Infrastructure, Employment and Human Development
the minimum score obtained in this Domain is below 40 per cent (36.1 per cent). This clearly implies that ‘Governance’ is the domain which all States and UTs must focus upon. The PGI accords the highest importance to the Domain relating to Governance and Management because compliance with the indicators here will lead to critical structural reforms in areas ranging from monitoring the attendance of teachers to ensuring a transparent recruitment of teachers and principals.
SKILL DEVELOPMENT10.23 The schooling system improves the educational level of the population. It is skill
training that equip the youth to enter the labour market and improves their employability. According to NSSO Report 2011-12, only 2.3 per cent of the total workforce in India had formal sector skill training. Keeping in view the predominance of young population, the Government had formulated the National Policy on Skill Development & Entrepreneurship, 2015 under which the Skill India Mission by 2022 was formulated. The government had launched a comprehensive skill development programme in the last five years with the setting up of a Ministry for Skill Development & Entrepreneurship. Some of the major skill development programmes are listed in Table 7.
Table 7: Skilling in India: Recent Government Initiatives
Initiatives Objectives Achievements Pradhan Mantri Kaushal Vikas Yojana (PMKVY) (1.0), 2015
Mobilize youth to take up industry relevant skill training. Targets to train 1 crore youth by 2020. Recognizes and certifies prior learning.
During 2015-16, 19.8 lakh youth were trained as against the target of 24 lakh.
Pradhan Mantri Kaushal Vikas Yojana (2.0), 2016-20
PMKVY version 2 has mandatory provisions for placement tracking.
Short term training: 30 lakh candidates enrolled, 27.9 lakh trained, 12.05 lakhs placed. Placement percentage: 54 per cent.Recognition of Prior Learning: 22.65 lakh enrolled, 22.08 lakh trained and 17.84 lakh assessed out of which 16.60 lakh passed as on 13th May, 2019
Pradhan Mantri Kaushal Kendra, 2015
Aspirational Model Training Centers to be opened in every district.
Till June 2019, 851 PMKKs have been allocated, 601 PMKKs have already been established.
National Apprenticeship Promotion Scheme, 2016
To promote apprenticeship. Consists of Basic Training and On-the-Job Training/Practical Training at workplace.
Till June 2019, 11.87 lakhs candidate registered. 76,860 establishments registered under the scheme.
SANKALP, 2017 Creating convergence among all skill training activities, improving quality of skill development programmes, Creating industry led and demand driven skill training capacity.
As on December 2018, the process of disbursements of funds to States/ UTs is underway. Regional workshops with States/ UTs are also being held to facilitate roll out.
STRIVE, 2017 Creating awareness through industry clusters, integrating and enhancing delivery quality of ITIs.
As on December 2018, the operations manual of the project has been prepared.
Source: Ministry of Skill Development & Entrepreneurship.
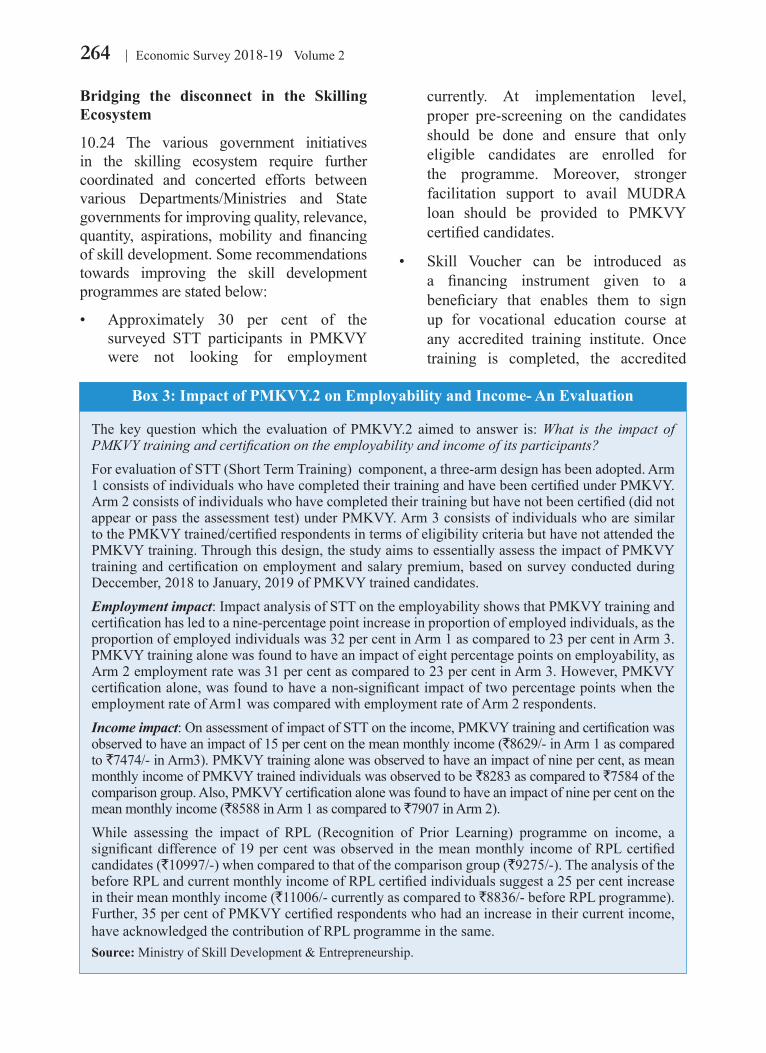
264 Economic Survey 2018-19 Volume 2
Bridging the disconnect in the Skilling Ecosystem
10.24 The various government initiatives in the skilling ecosystem require further coordinated and concerted efforts between various Departments/Ministries and State governments for improving quality, relevance, quantity, aspirations, mobility and financing of skill development. Some recommendations towards improving the skill development programmes are stated below:
• Approximately 30 per cent of the surveyed STT participants in PMKVY were not looking for employment
The key question which the evaluation of PMKVY.2 aimed to answer is: What is the impact of PMKVY training and certification on the employability and income of its participants?For evaluation of STT (Short Term Training) component, a three-arm design has been adopted. Arm 1 consists of individuals who have completed their training and have been certified under PMKVY. Arm 2 consists of individuals who have completed their training but have not been certified (did not appear or pass the assessment test) under PMKVY. Arm 3 consists of individuals who are similar to the PMKVY trained/certified respondents in terms of eligibility criteria but have not attended the PMKVY training. Through this design, the study aims to essentially assess the impact of PMKVY training and certification on employment and salary premium, based on survey conducted during Deccember, 2018 to January, 2019 of PMKVY trained candidates.Employment impact: Impact analysis of STT on the employability shows that PMKVY training and certification has led to a nine-percentage point increase in proportion of employed individuals, as the proportion of employed individuals was 32 per cent in Arm 1 as compared to 23 per cent in Arm 3. PMKVY training alone was found to have an impact of eight percentage points on employability, as Arm 2 employment rate was 31 per cent as compared to 23 per cent in Arm 3. However, PMKVY certification alone, was found to have a non-significant impact of two percentage points when the employment rate of Arm1 was compared with employment rate of Arm 2 respondents. Income impact: On assessment of impact of STT on the income, PMKVY training and certification was observed to have an impact of 15 per cent on the mean monthly income (`8629/- in Arm 1 as compared to `7474/- in Arm3). PMKVY training alone was observed to have an impact of nine per cent, as mean monthly income of PMKVY trained individuals was observed to be `8283 as compared to `7584 of the comparison group. Also, PMKVY certification alone was found to have an impact of nine per cent on the mean monthly income (`8588 in Arm 1 as compared to `7907 in Arm 2). While assessing the impact of RPL (Recognition of Prior Learning) programme on income, a significant difference of 19 per cent was observed in the mean monthly income of RPL certified candidates (`10997/-) when compared to that of the comparison group (`9275/-). The analysis of the before RPL and current monthly income of RPL certified individuals suggest a 25 per cent increase in their mean monthly income (`11006/- currently as compared to `8836/- before RPL programme). Further, 35 per cent of PMKVY certified respondents who had an increase in their current income, have acknowledged the contribution of RPL programme in the same. Source: Ministry of Skill Development & Entrepreneurship.
currently. At implementation level, proper pre-screening on the candidates should be done and ensure that only eligible candidates are enrolled for the programme. Moreover, stronger facilitation support to avail MUDRA loan should be provided to PMKVY certified candidates.
• Skill Voucher can be introduced as a financing instrument given to a beneficiary that enables them to sign up for vocational education course at any accredited training institute. Once training is completed, the accredited
Box 3: Impact of PMKVY.2 on Employability and Income- An Evaluation
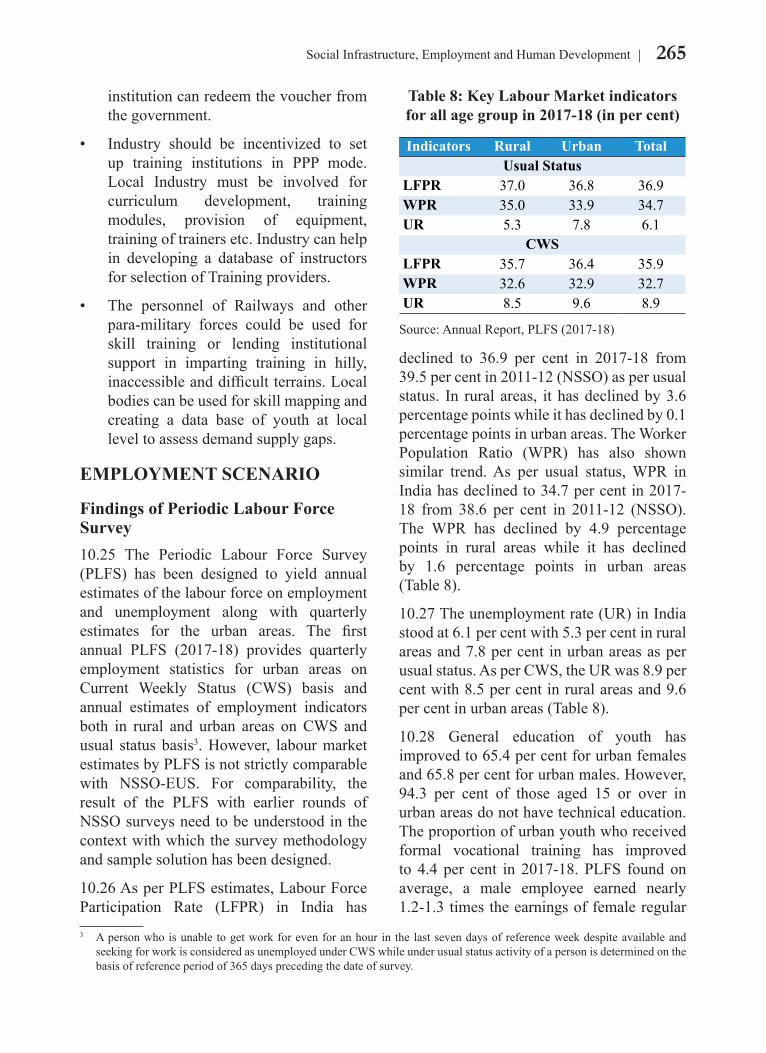
265Social Infrastructure, Employment and Human Development
institution can redeem the voucher from the government.
• Industry should be incentivized to set up training institutions in PPP mode. Local Industry must be involved for curriculum development, training modules, provision of equipment, training of trainers etc. Industry can help in developing a database of instructors for selection of Training providers.
• The personnel of Railways and other para-military forces could be used for skill training or lending institutional support in imparting training in hilly, inaccessible and difficult terrains. Local bodies can be used for skill mapping and creating a data base of youth at local level to assess demand supply gaps.
EMPLOYMENT SCENARIO
Findings of Periodic Labour Force Survey10.25 The Periodic Labour Force Survey (PLFS) has been designed to yield annual estimates of the labour force on employment and unemployment along with quarterly estimates for the urban areas. The first annual PLFS (2017-18) provides quarterly employment statistics for urban areas on Current Weekly Status (CWS) basis and annual estimates of employment indicators both in rural and urban areas on CWS and usual status basis3. However, labour market estimates by PLFS is not strictly comparable with NSSO-EUS. For comparability, the result of the PLFS with earlier rounds of NSSO surveys need to be understood in the context with which the survey methodology and sample solution has been designed.
10.26 As per PLFS estimates, Labour Force Participation Rate (LFPR) in India has
declined to 36.9 per cent in 2017-18 from 39.5 per cent in 2011-12 (NSSO) as per usual status. In rural areas, it has declined by 3.6 percentage points while it has declined by 0.1 percentage points in urban areas. The Worker Population Ratio (WPR) has also shown similar trend. As per usual status, WPR in India has declined to 34.7 per cent in 2017-18 from 38.6 per cent in 2011-12 (NSSO). The WPR has declined by 4.9 percentage points in rural areas while it has declined by 1.6 percentage points in urban areas (Table 8).
10.27 The unemployment rate (UR) in India stood at 6.1 per cent with 5.3 per cent in rural areas and 7.8 per cent in urban areas as per usual status. As per CWS, the UR was 8.9 per cent with 8.5 per cent in rural areas and 9.6 per cent in urban areas (Table 8).
10.28 General education of youth has improved to 65.4 per cent for urban females and 65.8 per cent for urban males. However, 94.3 per cent of those aged 15 or over in urban areas do not have technical education. The proportion of urban youth who received formal vocational training has improved to 4.4 per cent in 2017-18. PLFS found on average, a male employee earned nearly 1.2-1.3 times the earnings of female regular
3 A person who is unable to get work for even for an hour in the last seven days of reference week despite available and seeking for work is considered as unemployed under CWS while under usual status activity of a person is determined on the basis of reference period of 365 days preceding the date of survey.
Table 8: Key Labour Market indicators for all age group in 2017-18 (in per cent)
Indicators Rural Urban TotalUsual Status
LFPR 37.0 36.8 36.9WPR 35.0 33.9 34.7UR 5.3 7.8 6.1
CWSLFPR 35.7 36.4 35.9WPR 32.6 32.9 32.7UR 8.5 9.6 8.9
Source: Annual Report, PLFS (2017-18)
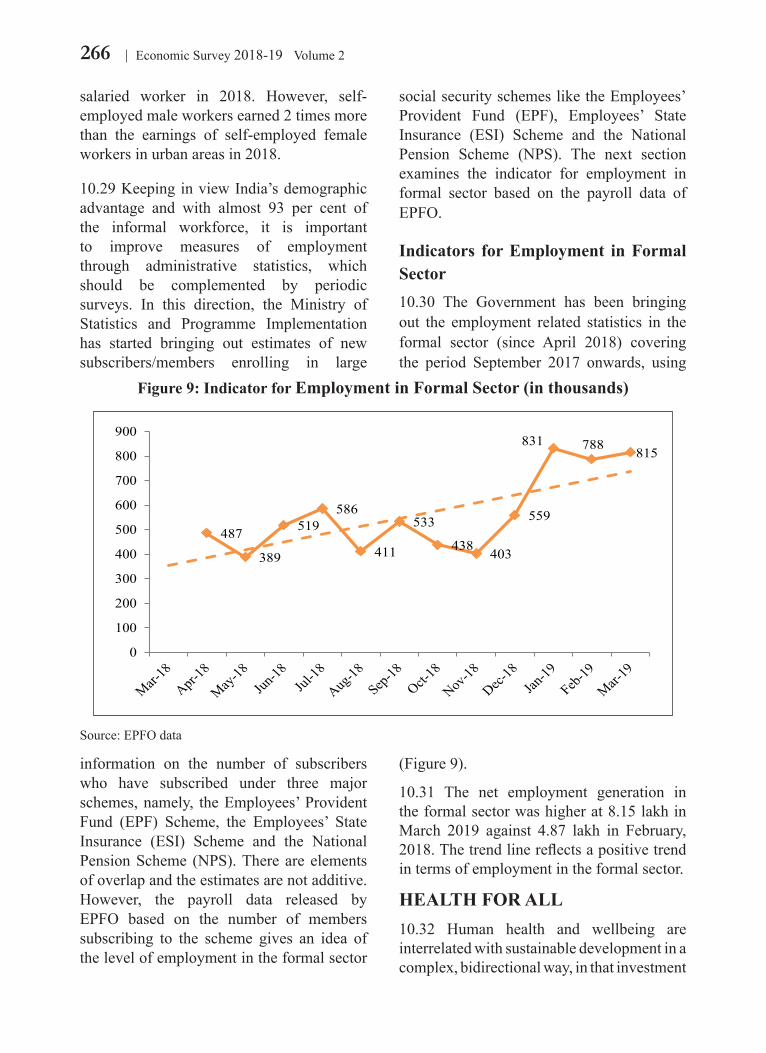
266 Economic Survey 2018-19 Volume 2
salaried worker in 2018. However, self-employed male workers earned 2 times more than the earnings of self-employed female workers in urban areas in 2018.
10.29 Keeping in view India’s demographic advantage and with almost 93 per cent of the informal workforce, it is important to improve measures of employment through administrative statistics, which should be complemented by periodic surveys. In this direction, the Ministry of Statistics and Programme Implementation has started bringing out estimates of new subscribers/members enrolling in large
social security schemes like the Employees’ Provident Fund (EPF), Employees’ State Insurance (ESI) Scheme and the National Pension Scheme (NPS). The next section examines the indicator for employment in formal sector based on the payroll data of EPFO.
Indicators for Employment in Formal Sector10.30 The Government has been bringing out the employment related statistics in the formal sector (since April 2018) covering the period September 2017 onwards, using
Figure 9: Indicator for Employment in Formal Sector (in thousands)
Source: EPFO data
information on the number of subscribers who have subscribed under three major schemes, namely, the Employees’ Provident Fund (EPF) Scheme, the Employees’ State Insurance (ESI) Scheme and the National Pension Scheme (NPS). There are elements of overlap and the estimates are not additive. However, the payroll data released by EPFO based on the number of members subscribing to the scheme gives an idea of the level of employment in the formal sector
(Figure 9).
10.31 The net employment generation in the formal sector was higher at 8.15 lakh in March 2019 against 4.87 lakh in February, 2018. The trend line reflects a positive trend in terms of employment in the formal sector.
HEALTH FOR ALL10.32 Human health and wellbeing are interrelated with sustainable development in a complex, bidirectional way, in that investment
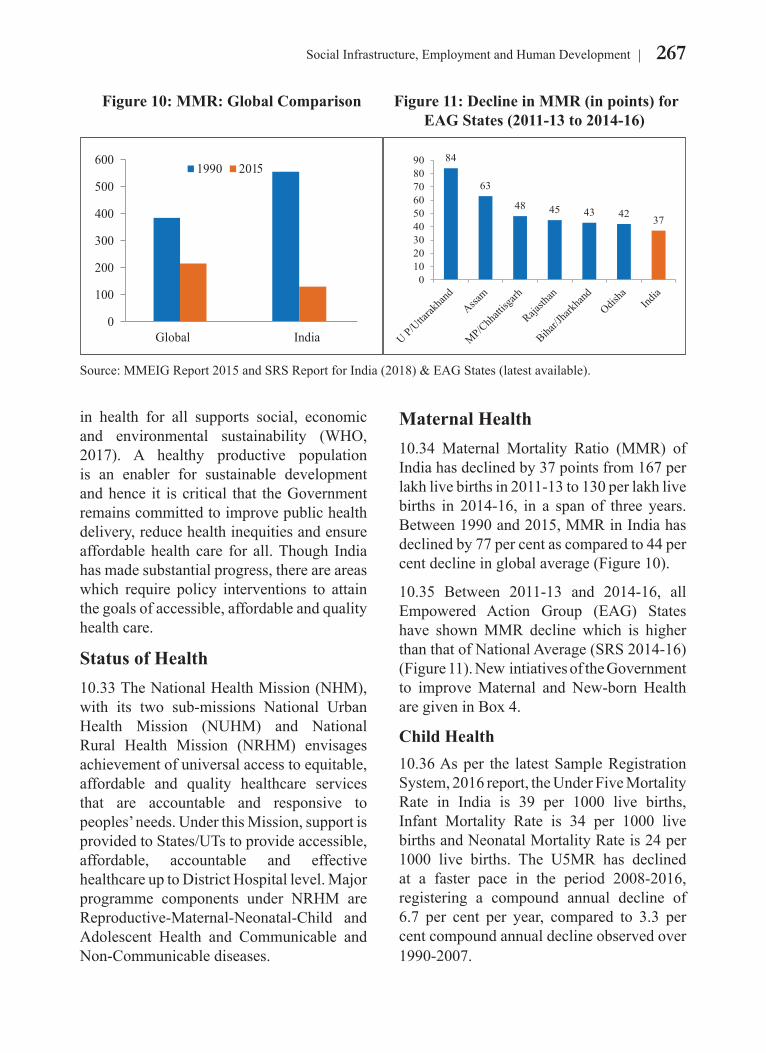
267Social Infrastructure, Employment and Human Development
in health for all supports social, economic and environmental sustainability (WHO, 2017). A healthy productive population is an enabler for sustainable development and hence it is critical that the Government remains committed to improve public health delivery, reduce health inequities and ensure affordable health care for all. Though India has made substantial progress, there are areas which require policy interventions to attain the goals of accessible, affordable and quality health care.
Status of Health 10.33 The National Health Mission (NHM), with its two sub-missions National Urban Health Mission (NUHM) and National Rural Health Mission (NRHM) envisages achievement of universal access to equitable, affordable and quality healthcare services that are accountable and responsive to peoples’ needs. Under this Mission, support is provided to States/UTs to provide accessible, affordable, accountable and effective healthcare up to District Hospital level. Major programme components under NRHM are Reproductive-Maternal-Neonatal-Child and Adolescent Health and Communicable and Non-Communicable diseases.
Maternal Health10.34 Maternal Mortality Ratio (MMR) of India has declined by 37 points from 167 per lakh live births in 2011-13 to 130 per lakh live births in 2014-16, in a span of three years. Between 1990 and 2015, MMR in India has declined by 77 per cent as compared to 44 per cent decline in global average (Figure 10).
10.35 Between 2011-13 and 2014-16, all Empowered Action Group (EAG) States have shown MMR decline which is higher than that of National Average (SRS 2014-16) (Figure 11). New intiatives of the Government to improve Maternal and New-born Health are given in Box 4.
Child Health 10.36 As per the latest Sample Registration System, 2016 report, the Under Five Mortality Rate in India is 39 per 1000 live births, Infant Mortality Rate is 34 per 1000 live births and Neonatal Mortality Rate is 24 per 1000 live births. The U5MR has declined at a faster pace in the period 2008-2016, registering a compound annual decline of 6.7 per cent per year, compared to 3.3 per cent compound annual decline observed over 1990-2007.
Figure 10: MMR: Global Comparison Figure 11: Decline in MMR (in points) for EAG States (2011-13 to 2014-16)
Source: MMEIG Report 2015 and SRS Report for India (2018) & EAG States (latest available).
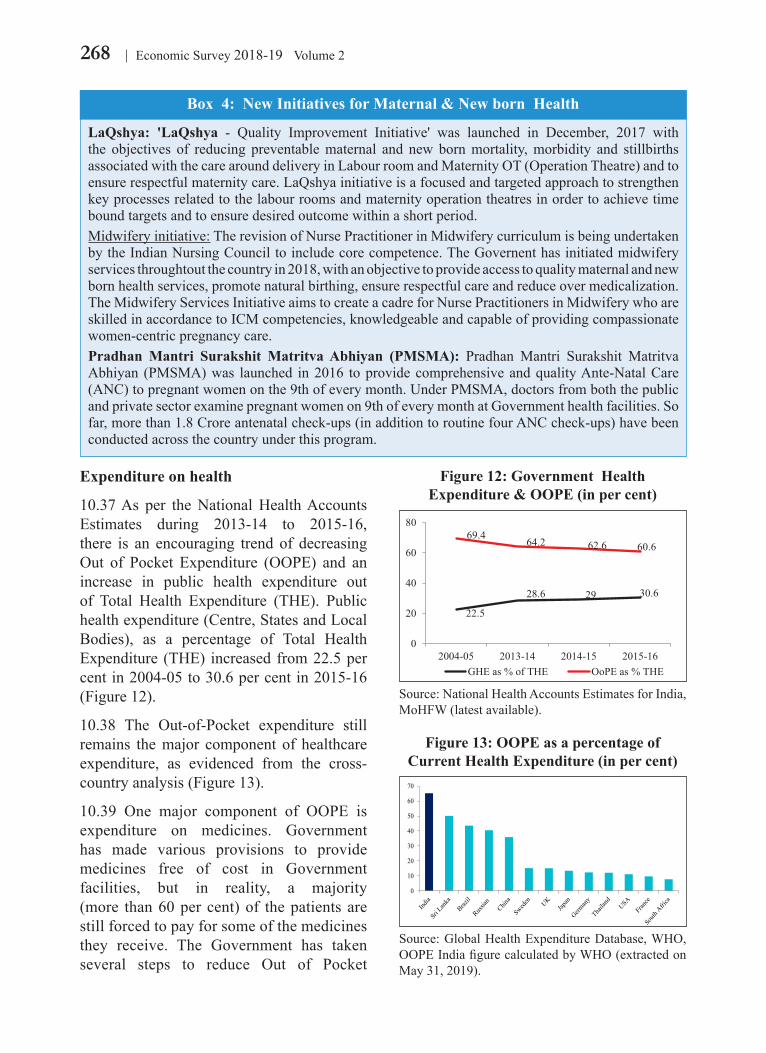
268 Economic Survey 2018-19 Volume 2
Expenditure on health
10.37 As per the National Health Accounts Estimates during 2013-14 to 2015-16, there is an encouraging trend of decreasing Out of Pocket Expenditure (OOPE) and an increase in public health expenditure out of Total Health Expenditure (THE). Public health expenditure (Centre, States and Local Bodies), as a percentage of Total Health Expenditure (THE) increased from 22.5 per cent in 2004-05 to 30.6 per cent in 2015-16 (Figure 12).
10.38 The Out-of-Pocket expenditure still remains the major component of healthcare expenditure, as evidenced from the cross-country analysis (Figure 13).
10.39 One major component of OOPE is expenditure on medicines. Government has made various provisions to provide medicines free of cost in Government facilities, but in reality, a majority (more than 60 per cent) of the patients are still forced to pay for some of the medicines they receive. The Government has taken several steps to reduce Out of Pocket
LaQshya: 'LaQshya - Quality Improvement Initiative' was launched in December, 2017 with the objectives of reducing preventable maternal and new born mortality, morbidity and stillbirths associated with the care around delivery in Labour room and Maternity OT (Operation Theatre) and to ensure respectful maternity care. LaQshya initiative is a focused and targeted approach to strengthen key processes related to the labour rooms and maternity operation theatres in order to achieve time bound targets and to ensure desired outcome within a short period. Midwifery initiative: The revision of Nurse Practitioner in Midwifery curriculum is being undertaken by the Indian Nursing Council to include core competence. The Governent has initiated midwifery services throughtout the country in 2018, with an objective to provide access to quality maternal and new born health services, promote natural birthing, ensure respectful care and reduce over medicalization. The Midwifery Services Initiative aims to create a cadre for Nurse Practitioners in Midwifery who are skilled in accordance to ICM competencies, knowledgeable and capable of providing compassionate women-centric pregnancy care.Pradhan Mantri Surakshit Matritva Abhiyan (PMSMA): Pradhan Mantri Surakshit Matritva Abhiyan (PMSMA) was launched in 2016 to provide comprehensive and quality Ante-Natal Care (ANC) to pregnant women on the 9th of every month. Under PMSMA, doctors from both the public and private sector examine pregnant women on 9th of every month at Government health facilities. So far, more than 1.8 Crore antenatal check-ups (in addition to routine four ANC check-ups) have been conducted across the country under this program.
Figure 12: Government Health Expenditure & OOPE (in per cent)
22.5
28.6 29 30.6
69.4 64.2 62.6 60.6
0
20
40
60
80
2004-05 2013-14 2014-15 2015-16GHE as % of THE OoPE as % THE
Source: National Health Accounts Estimates for India, MoHFW (latest available).
Figure 13: OOPE as a percentage of Current Health Expenditure (in per cent)
Fig 13
0
10
20
30
40
50
60
70
Source: Global Health Expenditure Database, WHO, OOPE India figure calculated by WHO (extracted on May 31, 2019).
Box 4: New Initiatives for Maternal & New born Health
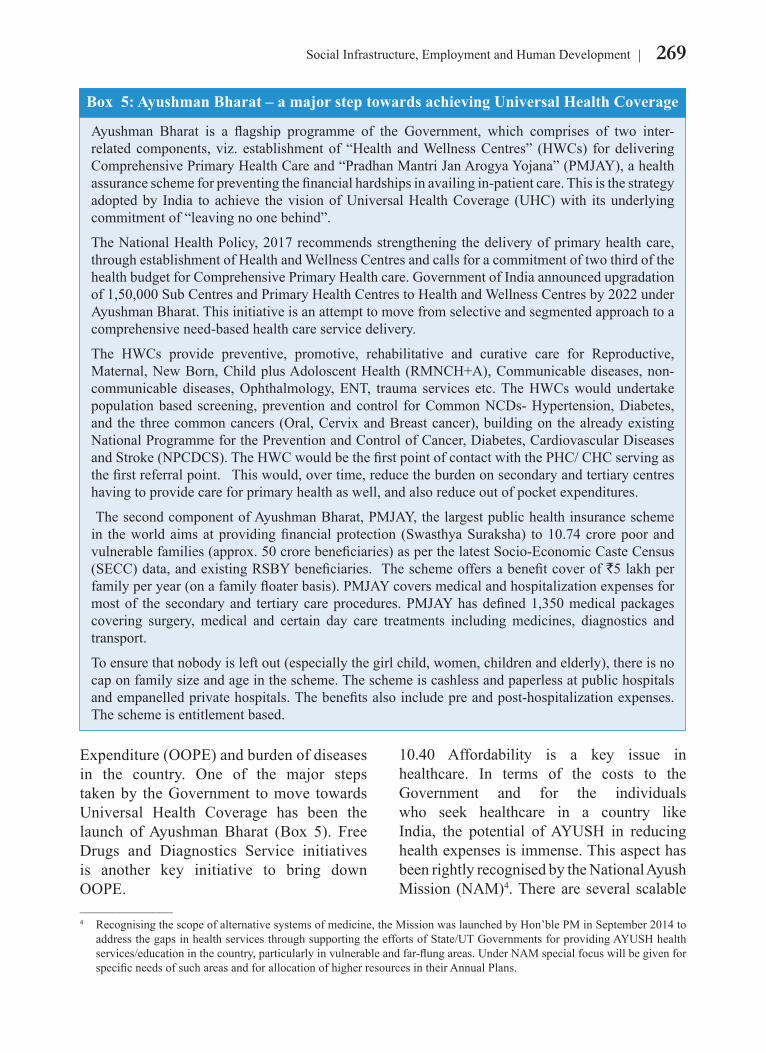
269Social Infrastructure, Employment and Human Development
Ayushman Bharat is a flagship programme of the Government, which comprises of two inter-related components, viz. establishment of “Health and Wellness Centres” (HWCs) for delivering Comprehensive Primary Health Care and “Pradhan Mantri Jan Arogya Yojana” (PMJAY), a health assurance scheme for preventing the financial hardships in availing in-patient care. This is the strategy adopted by India to achieve the vision of Universal Health Coverage (UHC) with its underlying commitment of “leaving no one behind”.
The National Health Policy, 2017 recommends strengthening the delivery of primary health care, through establishment of Health and Wellness Centres and calls for a commitment of two third of the health budget for Comprehensive Primary Health care. Government of India announced upgradation of 1,50,000 Sub Centres and Primary Health Centres to Health and Wellness Centres by 2022 under Ayushman Bharat. This initiative is an attempt to move from selective and segmented approach to a comprehensive need-based health care service delivery.
The HWCs provide preventive, promotive, rehabilitative and curative care for Reproductive, Maternal, New Born, Child plus Adoloscent Health (RMNCH+A), Communicable diseases, non-communicable diseases, Ophthalmology, ENT, trauma services etc. The HWCs would undertake population based screening, prevention and control for Common NCDs- Hypertension, Diabetes, and the three common cancers (Oral, Cervix and Breast cancer), building on the already existing National Programme for the Prevention and Control of Cancer, Diabetes, Cardiovascular Diseases and Stroke (NPCDCS). The HWC would be the first point of contact with the PHC/ CHC serving as the first referral point. This would, over time, reduce the burden on secondary and tertiary centres having to provide care for primary health as well, and also reduce out of pocket expenditures.
The second component of Ayushman Bharat, PMJAY, the largest public health insurance scheme in the world aims at providing financial protection (Swasthya Suraksha) to 10.74 crore poor and vulnerable families (approx. 50 crore beneficiaries) as per the latest Socio-Economic Caste Census (SECC) data, and existing RSBY beneficiaries. The scheme offers a benefit cover of `5 lakh per family per year (on a family floater basis). PMJAY covers medical and hospitalization expenses for most of the secondary and tertiary care procedures. PMJAY has defined 1,350 medical packages covering surgery, medical and certain day care treatments including medicines, diagnostics and transport.
To ensure that nobody is left out (especially the girl child, women, children and elderly), there is no cap on family size and age in the scheme. The scheme is cashless and paperless at public hospitals and empanelled private hospitals. The benefits also include pre and post-hospitalization expenses. The scheme is entitlement based.
Expenditure (OOPE) and burden of diseases in the country. One of the major steps taken by the Government to move towards Universal Health Coverage has been the launch of Ayushman Bharat (Box 5). Free Drugs and Diagnostics Service initiatives is another key initiative to bring down OOPE.
10.40 Affordability is a key issue in healthcare. In terms of the costs to the Government and for the individuals who seek healthcare in a country like India, the potential of AYUSH in reducing health expenses is immense. This aspect has been rightly recognised by the National Ayush Mission (NAM)4. There are several scalable
______________4 Recognising the scope of alternative systems of medicine, the Mission was launched by Hon’ble PM in September 2014 to
address the gaps in health services through supporting the efforts of State/UT Governments for providing AYUSH health services/education in the country, particularly in vulnerable and far-flung areas. Under NAM special focus will be given for specific needs of such areas and for allocation of higher resources in their Annual Plans.
Box 5: Ayushman Bharat – a major step towards achieving Universal Health Coverage

270 Economic Survey 2018-19 Volume 2
The role of AYUSH in preventive and promotive healthcare has not received the attention which is due to it, owing to the market driven supply systems that have emerged in health sector. As per NSSO, 71st round, only 5 to 7 per cent usage of ‘other’ including AYUSH (Ayurveda, Yoga or Naturopathy Unani, Siddha and homoeopathy) has been reported both in rural and urban areas. In terms of costs, the average out of pocket expenditure on AYUSH medicines per treated person is lower compared to non-AYUSH medicine as can be seen below:
Average out of pocket expenditure on AYUSH medicines and other (non-AYUSH) medicines per treated person in the last 15 days by sex and place of residence, 2014
OOP expenditure (in `)
System of medicine Rural Urban
Male Female All Male Female All
AYUSH medicine 322 228 270 462 311 378Other (non-AYUSH)
medicine 381 402 392 485 430 454
Source: NSSO 71st Round on Social Consumption: Health (2014).
Further, there are scalable projects which can be replicated in other States depending on the local traditional preference/acceptability for the systems, like Unani in Uttar Pradesh, Sidhha in Tamil Nadu and Ayurveda across India, since it is India’s own system of medicine.
‘JANANI’5 scheme of Government of Kerala is an exemplar which has popularised the system of homeopathy treatment for infertility in public health facilities6. In July to December 2012, the launch year of the pilot project JANANI, the number of cases at Kannur district was less than 100. However, over time there has been exponential growth in the number of infertility cases being registered and treated (see Figure) at Kannur District Homeopathy Hospital.
There is immense scope and potential in expanding the AYUSH systems of treatment for attaining the universal healthcare goals set by India. Recognising the significance of alternative systems, government has approved the continuation of National Ayush Mission (NAM) from 01.04.2017 to 31.03.2020 with an outlay of `2400 crore over the 3 year period.
______________________
5 Mother and child’ Pilot project for Homeopathic Intervention in infertility launched in Kannur District Homeopathy Hospital in 2012; Newsletter, Dept. of Homeopathy, Government of Kerala, February 2019.
6 Government of Kerala, Survey data show, in Kerala 10.25% of women face the problem of infertility but more than 60% of couples in Kerala resort to modern system of treatment, which entails huge costs for infertility treatment and hospitalization charges.
projects in the areas of infertility treatments, NCDs etc. which can be adopted across India by co-locating AYUSH healthcare services under single roof so that people are free
to choose, what is appropriate for them, thus making healthcare more accessible, accountable, affordable and customised (Box 6).
Box 6: Promoting AYUSH: An Affordable Healthcare Option for All
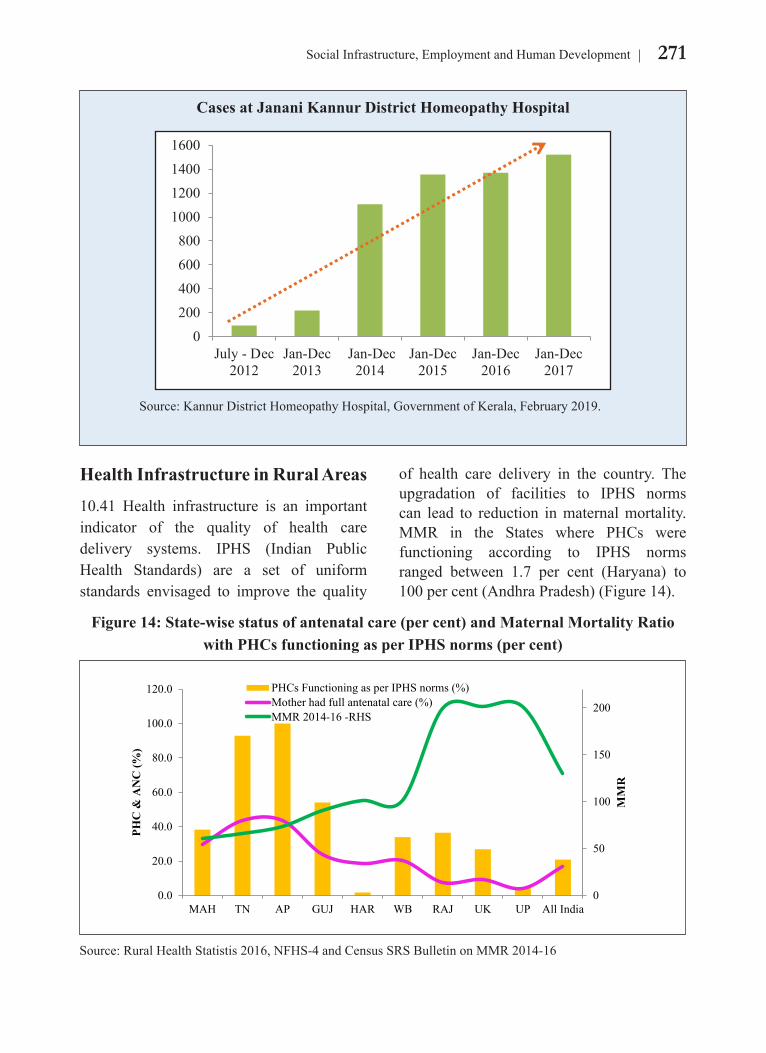
271Social Infrastructure, Employment and Human Development
Health Infrastructure in Rural Areas10.41 Health infrastructure is an important indicator of the quality of health care delivery systems. IPHS (Indian Public Health Standards) are a set of uniform standards envisaged to improve the quality
Cases at Janani Kannur District Homeopathy Hospital
Source: Kannur District Homeopathy Hospital, Government of Kerala, February 2019.
of health care delivery in the country. The upgradation of facilities to IPHS norms can lead to reduction in maternal mortality. MMR in the States where PHCs were functioning according to IPHS norms ranged between 1.7 per cent (Haryana) to 100 per cent (Andhra Pradesh) (Figure 14).
Figure 14: State-wise status of antenatal care (per cent) and Maternal Mortality Ratio with PHCs functioning as per IPHS norms (per cent)
Fig 14
0
50
100
150
200
0.0
20.0
40.0
60.0
80.0
100.0
120.0
MAH TN AP GUJ HAR WB RAJ UK UP All India
MM
R
PHC
& A
NC
(%)
PHCs Functioning as per IPHS norms (%)Mother had full antenatal care (%)MMR 2014-16 -RHS
Source: Rural Health Statistis 2016, NFHS-4 and Census SRS Bulletin on MMR 2014-16
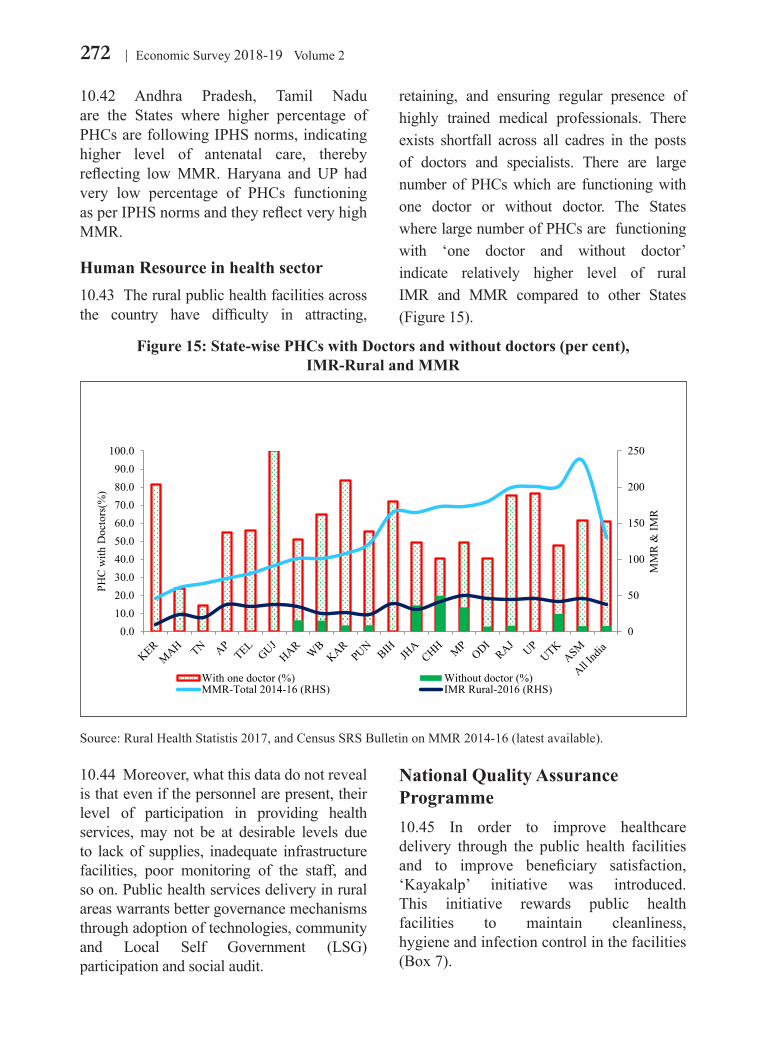
272 Economic Survey 2018-19 Volume 2
10.42 Andhra Pradesh, Tamil Nadu are the States where higher percentage of PHCs are following IPHS norms, indicating higher level of antenatal care, thereby reflecting low MMR. Haryana and UP had very low percentage of PHCs functioning as per IPHS norms and they reflect very high MMR.
Human Resource in health sector10.43 The rural public health facilities across the country have difficulty in attracting,
retaining, and ensuring regular presence of highly trained medical professionals. There exists shortfall across all cadres in the posts of doctors and specialists. There are large number of PHCs which are functioning with one doctor or without doctor. The States where large number of PHCs are functioning with ‘one doctor and without doctor’ indicate relatively higher level of rural IMR and MMR compared to other States (Figure 15).
10.44 Moreover, what this data do not reveal is that even if the personnel are present, their level of participation in providing health services, may not be at desirable levels due to lack of supplies, inadequate infrastructure facilities, poor monitoring of the staff, and so on. Public health services delivery in rural areas warrants better governance mechanisms through adoption of technologies, community and Local Self Government (LSG) participation and social audit.
National Quality Assurance Programme10.45 In order to improve healthcare delivery through the public health facilities and to improve beneficiary satisfaction, ‘Kayakalp’ initiative was introduced. This initiative rewards public health facilities to maintain cleanliness, hygiene and infection control in the facilities (Box 7).
Figure 15: State-wise PHCs with Doctors and without doctors (per cent), IMR-Rural and MMR
0
50
100
150
200
250
0.010.020.030.040.050.060.070.080.090.0
100.0
MM
R &
IMR
PHC
with
Doc
tors
(%)
With one doctor (%) Without doctor (%)MMR-Total 2014-16 (RHS) IMR Rural-2016 (RHS)
Source: Rural Health Statistis 2017, and Census SRS Bulletin on MMR 2014-16 (latest available).
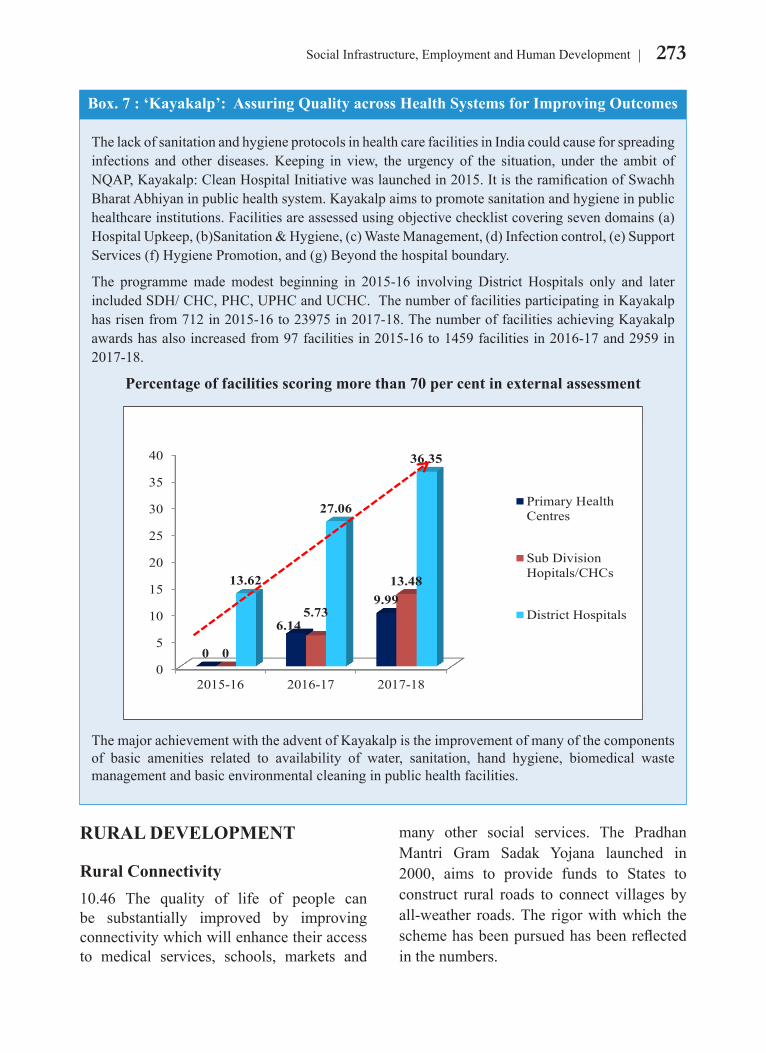
273Social Infrastructure, Employment and Human Development
The lack of sanitation and hygiene protocols in health care facilities in India could cause for spreading infections and other diseases. Keeping in view, the urgency of the situation, under the ambit of NQAP, Kayakalp: Clean Hospital Initiative was launched in 2015. It is the ramification of Swachh Bharat Abhiyan in public health system. Kayakalp aims to promote sanitation and hygiene in public healthcare institutions. Facilities are assessed using objective checklist covering seven domains (a) Hospital Upkeep, (b)Sanitation & Hygiene, (c) Waste Management, (d) Infection control, (e) Support Services (f) Hygiene Promotion, and (g) Beyond the hospital boundary.
The programme made modest beginning in 2015-16 involving District Hospitals only and later included SDH/ CHC, PHC, UPHC and UCHC. The number of facilities participating in Kayakalp has risen from 712 in 2015-16 to 23975 in 2017-18. The number of facilities achieving Kayakalp awards has also increased from 97 facilities in 2015-16 to 1459 facilities in 2016-17 and 2959 in 2017-18.
Percentage of facilities scoring more than 70 per cent in external assessmentBox
0
5
10
15
20
25
30
35
40
2015-16 2016-17 2017-18
0
6.14
9.99
0
5.73
13.48 13.62
27.06
36.35
Primary HealthCentres
Sub DivisionHopitals/CHCs
District Hospitals
The major achievement with the advent of Kayakalp is the improvement of many of the components of basic amenities related to availability of water, sanitation, hand hygiene, biomedical waste management and basic environmental cleaning in public health facilities.
RURAL DEVELOPMENT
Rural Connectivity10.46 The quality of life of people can be substantially improved by improving connectivity which will enhance their access to medical services, schools, markets and
many other social services. The Pradhan Mantri Gram Sadak Yojana launched in 2000, aims to provide funds to States to construct rural roads to connect villages by all-weather roads. The rigor with which the scheme has been pursued has been reflected in the numbers.
Box. 7 : ‘Kayakalp’: Assuring Quality across Health Systems for Improving Outcomes
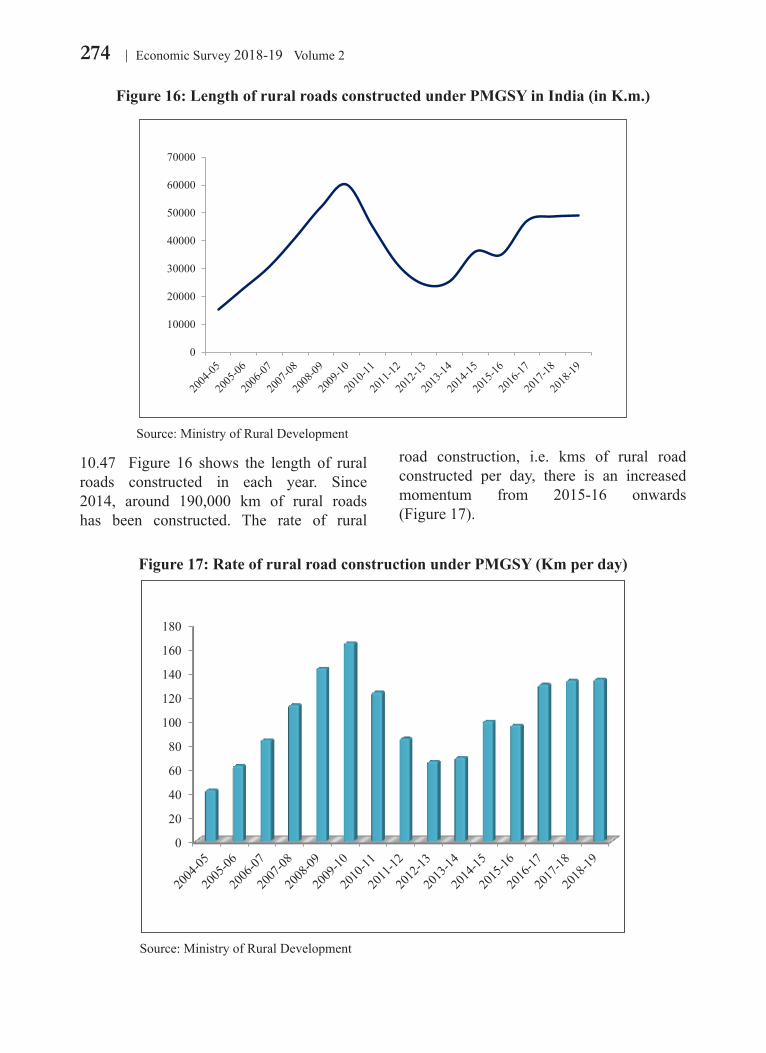
274 Economic Survey 2018-19 Volume 2
10.47 Figure 16 shows the length of rural roads constructed in each year. Since 2014, around 190,000 km of rural roads has been constructed. The rate of rural
road construction, i.e. kms of rural road constructed per day, there is an increased momentum from 2015-16 onwards (Figure 17).
Figure 16: Length of rural roads constructed under PMGSY in India (in K.m.)
0
10000
20000
30000
40000
50000
60000
70000
Source: Ministry of Rural Development
Figure 17: Rate of rural road construction under PMGSY (Km per day)
0
20
40
60
80
100
120
140
160
180
Source: Ministry of Rural Development
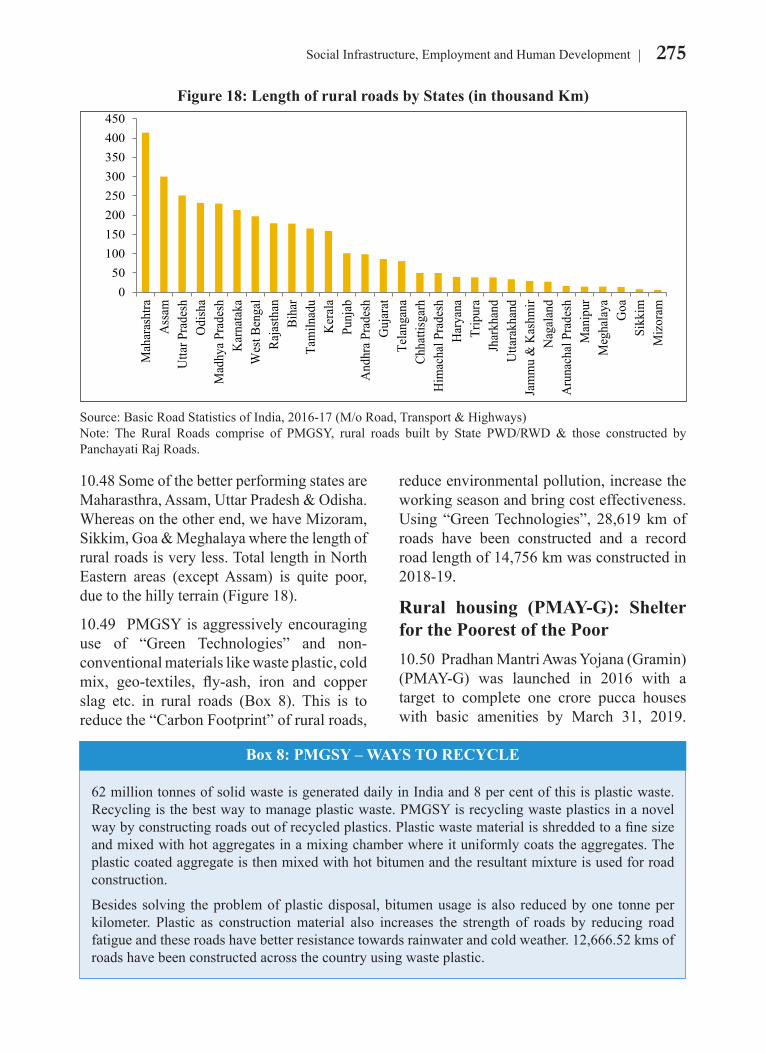
275Social Infrastructure, Employment and Human Development
62 million tonnes of solid waste is generated daily in India and 8 per cent of this is plastic waste. Recycling is the best way to manage plastic waste. PMGSY is recycling waste plastics in a novel way by constructing roads out of recycled plastics. Plastic waste material is shredded to a fine size and mixed with hot aggregates in a mixing chamber where it uniformly coats the aggregates. The plastic coated aggregate is then mixed with hot bitumen and the resultant mixture is used for road construction.
Besides solving the problem of plastic disposal, bitumen usage is also reduced by one tonne per kilometer. Plastic as construction material also increases the strength of roads by reducing road fatigue and these roads have better resistance towards rainwater and cold weather. 12,666.52 kms of roads have been constructed across the country using waste plastic.
10.48 Some of the better performing states are Maharasthra, Assam, Uttar Pradesh & Odisha. Whereas on the other end, we have Mizoram, Sikkim, Goa & Meghalaya where the length of rural roads is very less. Total length in North Eastern areas (except Assam) is quite poor, due to the hilly terrain (Figure 18).
10.49 PMGSY is aggressively encouraging use of “Green Technologies” and non-conventional materials like waste plastic, cold mix, geo-textiles, fly-ash, iron and copper slag etc. in rural roads (Box 8). This is to reduce the “Carbon Footprint” of rural roads,
reduce environmental pollution, increase the working season and bring cost effectiveness. Using “Green Technologies”, 28,619 km of roads have been constructed and a record road length of 14,756 km was constructed in 2018-19.
Rural housing (PMAY-G): Shelter for the Poorest of the Poor10.50 Pradhan Mantri Awas Yojana (Gramin) (PMAY-G) was launched in 2016 with a target to complete one crore pucca houses with basic amenities by March 31, 2019.
Figure 18: Length of rural roads by States (in thousand Km)
050
100150200250300350400450
Mah
aras
htra
Ass
amU
ttar P
rade
shO
dish
aM
adhy
a Pr
ades
hK
arna
taka
Wes
t Ben
gal
Raja
sthan
Biha
rTa
miln
adu
Ker
ala
Punj
abA
ndhr
a Pr
ades
hG
ujar
atTe
lang
ana
Chha
ttisg
arh
Him
acha
l Pra
desh
Har
yana
Trip
ura
Jhar
khan
dU
ttara
khan
dJa
mm
u &
Kas
hmir
Nag
alan
dA
runa
chal
Pra
desh
Man
ipur
Meg
hala
yaG
oaSi
kkim
Miz
oram
Source: Basic Road Statistics of India, 2016-17 (M/o Road, Transport & Highways)Note: The Rural Roads comprise of PMGSY, rural roads built by State PWD/RWD & those constructed by Panchayati Raj Roads.
Box 8: PMGSY – WAYS TO RECYCLE
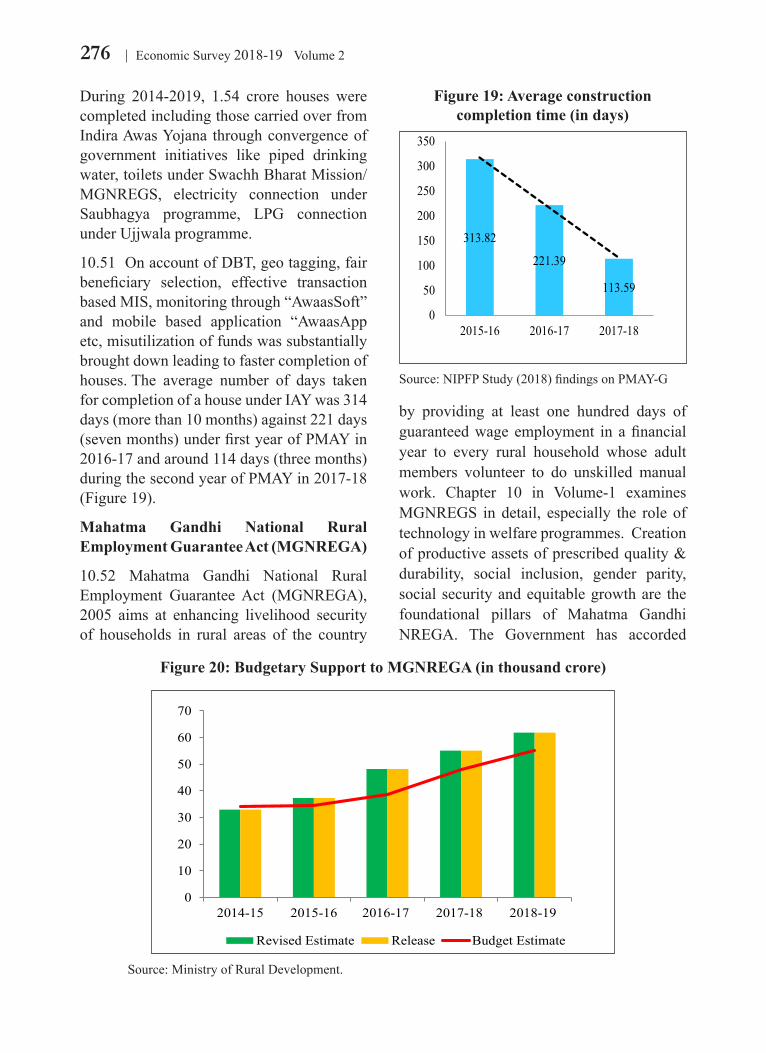
276 Economic Survey 2018-19 Volume 2
During 2014-2019, 1.54 crore houses were completed including those carried over from Indira Awas Yojana through convergence of government initiatives like piped drinking water, toilets under Swachh Bharat Mission/MGNREGS, electricity connection under Saubhagya programme, LPG connection under Ujjwala programme.
10.51 On account of DBT, geo tagging, fair beneficiary selection, effective transaction based MIS, monitoring through “AwaasSoft” and mobile based application “AwaasApp etc, misutilization of funds was substantially brought down leading to faster completion of houses. The average number of days taken for completion of a house under IAY was 314 days (more than 10 months) against 221 days (seven months) under first year of PMAY in 2016-17 and around 114 days (three months) during the second year of PMAY in 2017-18 (Figure 19).
Mahatma Gandhi National Rural Employment Guarantee Act (MGNREGA)
10.52 Mahatma Gandhi National Rural Employment Guarantee Act (MGNREGA), 2005 aims at enhancing livelihood security of households in rural areas of the country
by providing at least one hundred days of guaranteed wage employment in a financial year to every rural household whose adult members volunteer to do unskilled manual work. Chapter 10 in Volume-1 examines MGNREGS in detail, especially the role of technology in welfare programmes. Creation of productive assets of prescribed quality & durability, social inclusion, gender parity, social security and equitable growth are the foundational pillars of Mahatma Gandhi NREGA. The Government has accorded
Figure 19: Average construction completion time (in days)
Fig 19
313.82
221.39
113.59
0
50
100
150
200
250
300
350
2015-16 2016-17 2017-18
Source: NIPFP Study (2018) findings on PMAY-G
Figure 20: Budgetary Support to MGNREGA (in thousand crore)
0
10
20
30
40
50
60
70
2014-15 2015-16 2016-17 2017-18 2018-19
Revised Estimate Release Budget Estimate
Source: Ministry of Rural Development.
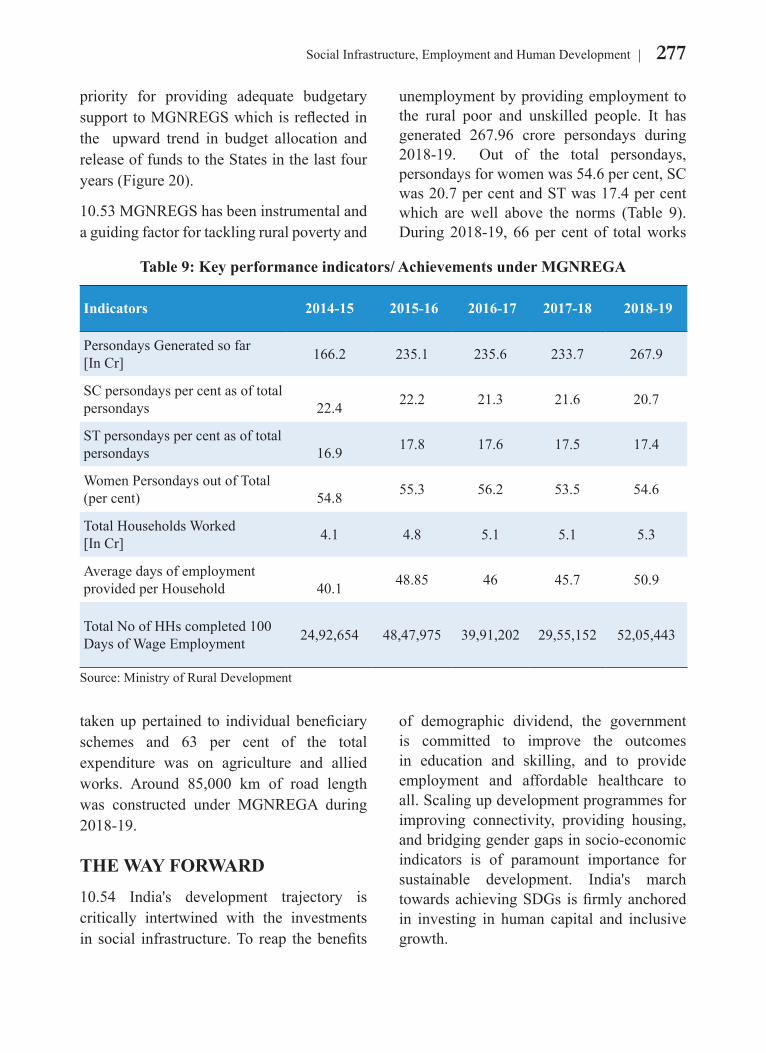
277Social Infrastructure, Employment and Human Development
priority for providing adequate budgetary support to MGNREGS which is reflected in the upward trend in budget allocation and release of funds to the States in the last four years (Figure 20).
10.53 MGNREGS has been instrumental and a guiding factor for tackling rural poverty and
unemployment by providing employment to the rural poor and unskilled people. It has generated 267.96 crore persondays during 2018-19. Out of the total persondays, persondays for women was 54.6 per cent, SC was 20.7 per cent and ST was 17.4 per cent which are well above the norms (Table 9). During 2018-19, 66 per cent of total works
taken up pertained to individual beneficiary schemes and 63 per cent of the total expenditure was on agriculture and allied works. Around 85,000 km of road length was constructed under MGNREGA during 2018-19.
THE WAY FORWARD10.54 India's development trajectory is critically intertwined with the investments in social infrastructure. To reap the benefits
of demographic dividend, the government is committed to improve the outcomes in education and skilling, and to provide employment and affordable healthcare to all. Scaling up development programmes for improving connectivity, providing housing, and bridging gender gaps in socio-economic indicators is of paramount importance for sustainable development. India's march towards achieving SDGs is firmly anchored in investing in human capital and inclusive growth.
Table 9: Key performance indicators/ Achievements under MGNREGA
Indicators 2014-15 2015-16 2016-17 2017-18 2018-19
Persondays Generated so far [In Cr] 166.2 235.1 235.6 233.7 267.9
SC persondays per cent as of total persondays 22.4 22.2 21.3 21.6 20.7
ST persondays per cent as of total persondays 16.9 17.8 17.6 17.5 17.4
Women Persondays out of Total (per cent) 54.8 55.3 56.2 53.5 54.6
Total Households Worked [In Cr] 4.1 4.8 5.1 5.1 5.3
Average days of employment provided per Household 40.1 48.85 46 45.7 50.9
Total No of HHs completed 100 Days of Wage Employment 24,92,654 48,47,975 39,91,202 29,55,152 52,05,443
Source: Ministry of Rural Development
278 Economic Survey 2018-19 Volume 2
CHAPTER AT A GLANCE
The public investments in social infrastructure like education, health, housing and connectivity have a critical role in ensuring inclusive development in a developing country like India.
The 17 SDGs (Sustainable Development Goals) and 169 targets envisaged in the Agenda 2030, are closely interrelated with social infrastructure. With the underlying dimensions of education and health embedded in SDGs, the improvement in HDI is also interlinked to SDGs as evidenced in the correlation between SDG rankings and HDI rankings of the States.
India being a developing economy, the percentage of GDP expended on education has remained stagnant at around 3 per cent while that on health has hovered around 1 per cent during the past few years.
With the available resources, India has made substantial progress in both quantitative and qualitative indicators of education. This is reflected in the improvements in Gross Enrolment Ratios, Gender Parity Indices and learning outcomes at primary school levels. The rural urban disparities in access to quality schooling and drop out rates at senior secondary levels are areas of concern.
The Skilling ecosystem in India is equipping the youth to meet the challenges of a dynamic labour market by providing various short term and long term skilling under programmes like Pradhan Mantri Kaushal Vikas Yojana. PMKVY has had positive impact on employment and incomes of the youth as per evaluation studies.
The PLFS has reported declining LFPR along with increasing unemployment rate. For a healthy India, accessible, affordable and quality healthcare are being provided
by the Government under the National Health Mission and through new schemes like Ayushman Bharat. The select health indicators like MMR, IMR, U5MR have shown tremendous improvement over the past few years.
Household autonomy of women is the first step towards achieving empowerment and becoming agents of change in patriarchal socieities like India. Financial inclusion has improved the household autonomy of women as reflected by the NFHS data.
Connectivity is critical for rural areas to improve quality of lives of the poor by enhancing access to various social services, education, health and access to markets. PMGSY has played a crucial role in connecting the unconnected in rural India and enhanced their livelihood opportunities.
Government has accorded highest priority to rural housing, by providing dwelling with all basic facilities to the most needy under PMAY-G.
Government has also prioritized employment programmes like MGNREGS which is reflected in the upward trend in budget allocation and release of funds to the States in the last four years.
ECONOMIC SURVEY 2018-19STATISTICAL APPENDIX
ECONOMIC SURVEY 2018-19STATISTICAL APPENDIX

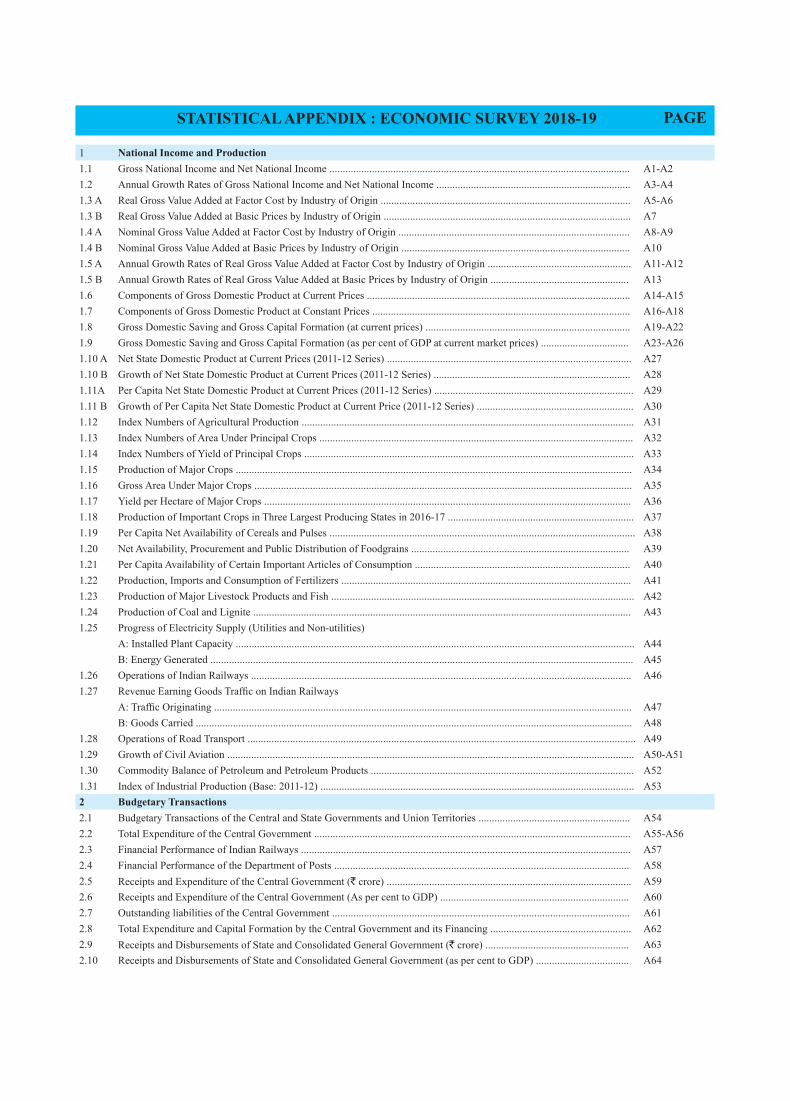
1 National Income and Production1.1 Gross National Income and Net National Income ................................................................................................................. A1-A21.2 Annual Growth Rates of Gross National Income and Net National Income ......................................................................... A3-A41.3 A Real Gross Value Added at Factor Cost by Industry of Origin .............................................................................................. A5-A61.3 B Real Gross Value Added at Basic Prices by Industry of Origin ............................................................................................. A71.4 A Nominal Gross Value Added at Factor Cost by Industry of Origin ....................................................................................... A8-A91.4 B Nominal Gross Value Added at Basic Prices by Industry of Origin ...................................................................................... A101.5 A Annual Growth Rates of Real Gross Value Added at Factor Cost by Industry of Origin ...................................................... A11-A121.5 B Annual Growth Rates of Real Gross Value Added at Basic Prices by Industry of Origin .................................................... A131.6 Components of Gross Domestic Product at Current Prices ................................................................................................... A14-A151.7 Components of Gross Domestic Product at Constant Prices ................................................................................................. A16-A181.8 Gross Domestic Saving and Gross Capital Formation (at current prices) ............................................................................. A19-A221.9 Gross Domestic Saving and Gross Capital Formation (as per cent of GDP at current market prices) ................................. A23-A261.10 A Net State Domestic Product at Current Prices (2011-12 Series) ............................................................................................ A271.10 B Growth of Net State Domestic Product at Current Prices (2011-12 Series) .......................................................................... A281.11A Per Capita Net State Domestic Product at Current Prices (2011-12 Series) ........................................................................... A291.11 B Growth of Per Capita Net State Domestic Product at Current Price (2011-12 Series) ........................................................... A301.12 Index Numbers of Agricultural Production ............................................................................................................................. A311.13 Index Numbers of Area Under Principal Crops ...................................................................................................................... A321.14 Index Numbers of Yield of Principal Crops ............................................................................................................................ A331.15 Production of Major Crops ..................................................................................................................................................... A341.16 Gross Area Under Major Crops .............................................................................................................................................. A351.17 Yield per Hectare of Major Crops .......................................................................................................................................... A361.18 Production of Important Crops in Three Largest Producing States in 2016-17 ...................................................................... A371.19 Per Capita Net Availability of Cereals and Pulses ................................................................................................................... A381.20 Net Availability, Procurement and Public Distribution of Foodgrains .................................................................................. A391.21 Per Capita Availability of Certain Important Articles of Consumption ................................................................................. A401.22 Production, Imports and Consumption of Fertilizers ............................................................................................................. A411.23 Production of Major Livestock Products and Fish .................................................................................................................. A421.24 Production of Coal and Lignite .............................................................................................................................................. A431.25 Progress of Electricity Supply (Utilities and Non-utilities)
A: Installed Plant Capacity ...................................................................................................................................................... A44B: Energy Generated ............................................................................................................................................................... A45
1.26 Operations of Indian Railways ............................................................................................................................................... A461.27 Revenue Earning Goods Traffic on Indian Railways
A: Traffic Originating ............................................................................................................................................................. A47B: Goods Carried .................................................................................................................................................................... A48
1.28 Operations of Road Transport .................................................................................................................................................. A491.29 Growth of Civil Aviation ......................................................................................................................................................... A50-A511.30 Commodity Balance of Petroleum and Petroleum Products ................................................................................................... A521.31 Index of Industrial Production (Base: 2011-12) ...................................................................................................................... A532 Budgetary Transactions2.1 Budgetary Transactions of the Central and State Governments and Union Territories ......................................................... A542.2 Total Expenditure of the Central Government ....................................................................................................................... A55-A562.3 Financial Performance of Indian Railways ............................................................................................................................ A572.4 Financial Performance of the Department of Posts ............................................................................................................... A582.5 Receipts and Expenditure of the Central Government (` crore) ............................................................................................ A592.6 Receipts and Expenditure of the Central Government (As per cent to GDP) ....................................................................... A602.7 Outstanding liabilities of the Central Government ................................................................................................................ A612.8 Total Expenditure and Capital Formation by the Central Government and its Financing ..................................................... A622.9 Receipts and Disbursements of State and Consolidated General Government (` crore) ...................................................... A632.10 Receipts and Disbursements of State and Consolidated General Government (as per cent to GDP) ................................... A64
STATISTICAL APPENDIX : ECONOMIC SURVEY 2018-19 PAGE
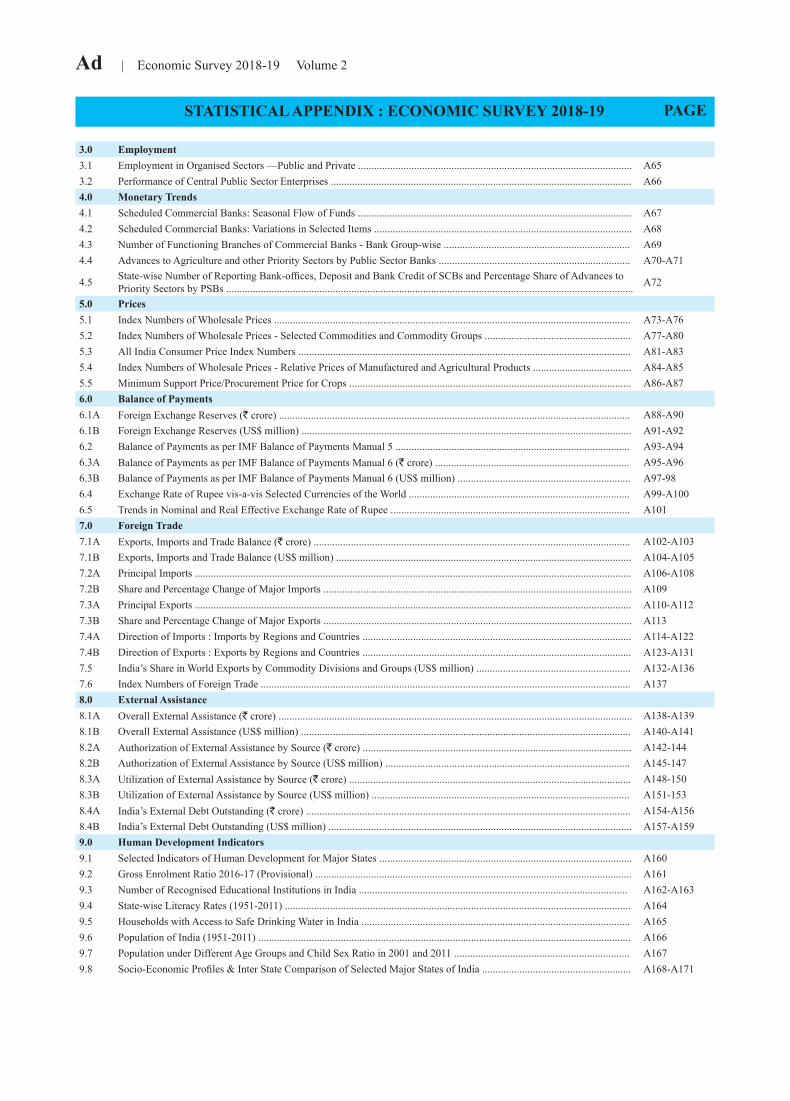
Ad | Economic Survey 2018-19 Volume 2
3.0 Employment3.1 Employment in Organised Sectors —Public and Private ....................................................................................................... A653.2 Performance of Central Public Sector Enterprises ................................................................................................................. A664.0 Monetary Trends4.1 Scheduled Commercial Banks: Seasonal Flow of Funds ....................................................................................................... A674.2 Scheduled Commercial Banks: Variations in Selected Items ................................................................................................. A684.3 Number of Functioning Branches of Commercial Banks - Bank Group-wise ...................................................................... A694.4 Advances to Agriculture and other Priority Sectors by Public Sector Banks ........................................................................ A70-A71
4.5 State-wise Number of Reporting Bank-offices, Deposit and Bank Credit of SCBs and Percentage Share of Advances to Priority Sectors by PSBs ......................................................................................................................................................... A72
5.0 Prices5.1 Index Numbers of Wholesale Prices ...................................................................................................................................... A73-A765.2 Index Numbers of Wholesale Prices - Selected Commodities and Commodity Groups ....................................................... A77-A805.3 All India Consumer Price Index Numbers ............................................................................................................................. A81-A835.4 Index Numbers of Wholesale Prices - Relative Prices of Manufactured and Agricultural Products ..................................... A84-A855.5 Minimum Support Price/Procurement Price for Crops .......................................................................................................... A86-A876.0 Balance of Payments6.1A Foreign Exchange Reserves (` crore) .................................................................................................................................... A88-A906.1B Foreign Exchange Reserves (US$ million) ............................................................................................................................ A91-A926.2 Balance of Payments as per IMF Balance of Payments Manual 5 ........................................................................................ A93-A946.3A Balance of Payments as per IMF Balance of Payments Manual 6 (` crore) ......................................................................... A95-A966.3B Balance of Payments as per IMF Balance of Payments Manual 6 (US$ million) ................................................................. A97-986.4 Exchange Rate of Rupee vis-a-vis Selected Currencies of the World ................................................................................... A99-A1006.5 Trends in Nominal and Real Effective Exchange Rate of Rupee .......................................................................................... A1017.0 Foreign Trade7.1A Exports, Imports and Trade Balance (` crore) ....................................................................................................................... A102-A1037.1B Exports, Imports and Trade Balance (US$ million) ............................................................................................................... A104-A1057.2A Principal Imports .................................................................................................................................................................... A106-A1087.2B Share and Percentage Change of Major Imports .................................................................................................................... A1097.3A Principal Exports .................................................................................................................................................................... A110-A1127.3B Share and Percentage Change of Major Exports .................................................................................................................... A1137.4A Direction of Imports : Imports by Regions and Countries ..................................................................................................... A114-A1227.4B Direction of Exports : Exports by Regions and Countries ..................................................................................................... A123-A1317.5 India’s Share in World Exports by Commodity Divisions and Groups (US$ million) .......................................................... A132-A1367.6 Index Numbers of Foreign Trade ........................................................................................................................................... A1378.0 External Assistance8.1A Overall External Assistance (` crore) ..................................................................................................................................... A138-A1398.1B Overall External Assistance (US$ million) ............................................................................................................................ A140-A1418.2A Authorization of External Assistance by Source (` crore) ..................................................................................................... A142-1448.2B Authorization of External Assistance by Source (US$ million) ............................................................................................ A145-1478.3A Utilization of External Assistance by Source (` crore) .......................................................................................................... A148-1508.3B Utilization of External Assistance by Source (US$ million) ................................................................................................. A151-1538.4A India’s External Debt Outstanding (` crore) .......................................................................................................................... A154-A1568.4B India’s External Debt Outstanding (US$ million) .................................................................................................................. A157-A1599.0 Human Development Indicators9.1 Selected Indicators of Human Development for Major States ............................................................................................... A1609.2 Gross Enrolment Ratio 2016-17 (Provisional) ....................................................................................................................... A1619.3 Number of Recognised Educational Institutions in India ..................................................................................................... A162-A1639.4 State-wise Literacy Rates (1951-2011) .................................................................................................................................. A1649.5 Households with Access to Safe Drinking Water in India ..................................................................................................... A1659.6 Population of India (1951-2011) ............................................................................................................................................ A1669.7 Population under Different Age Groups and Child Sex Ratio in 2001 and 2011 .................................................................. A1679.8 Socio-Economic Profiles & Inter State Comparison of Selected Major States of India ........................................................ A168-A171
STATISTICAL APPENDIX : ECONOMIC SURVEY 2018-19 PAGE
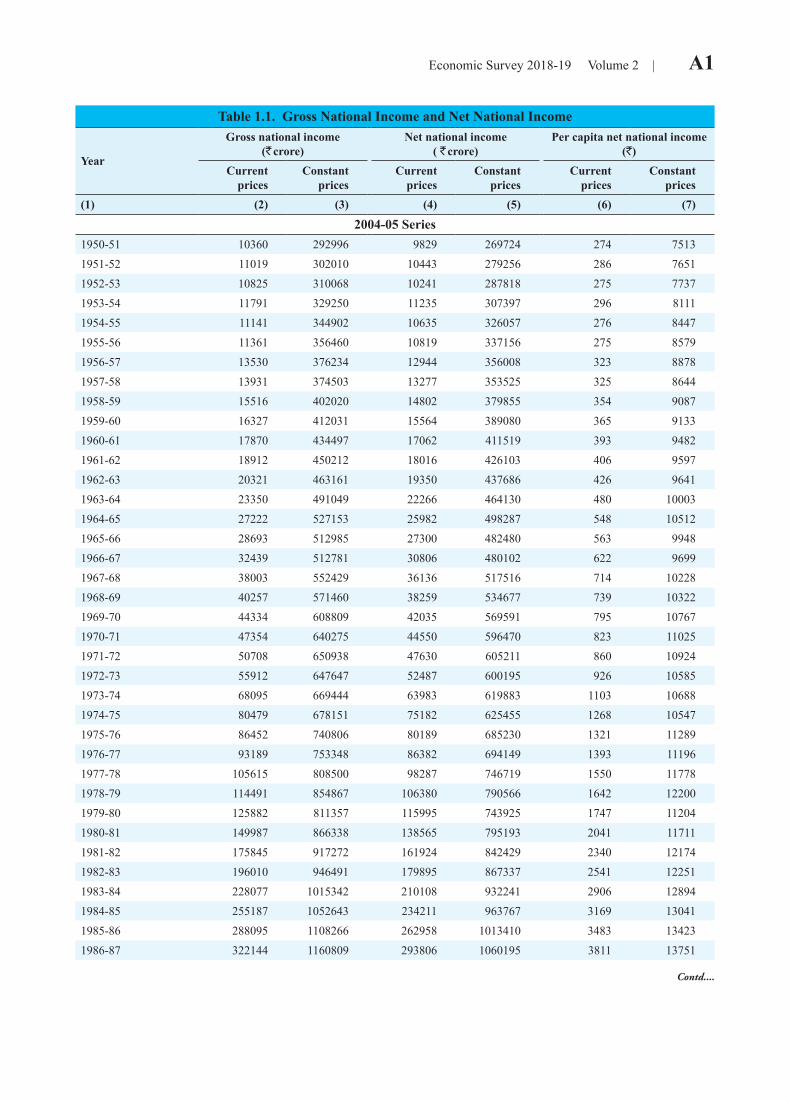
Economic Survey 2018-19 Volume 2 | A1
Table 1.1. Gross National Income and Net National Income
Year
Gross national income(` crore)
Net national income( ` crore)
Per capita net national income (`)
Currentprices
Constantprices
Currentprices
Constantprices
Currentprices
Constantprices
(1) (2) (3) (4) (5) (6) (7)
2004-05 Series1950-51 10360 292996 9829 269724 274 75131951-52 11019 302010 10443 279256 286 76511952-53 10825 310068 10241 287818 275 77371953-54 11791 329250 11235 307397 296 81111954-55 11141 344902 10635 326057 276 84471955-56 11361 356460 10819 337156 275 85791956-57 13530 376234 12944 356008 323 88781957-58 13931 374503 13277 353525 325 86441958-59 15516 402020 14802 379855 354 90871959-60 16327 412031 15564 389080 365 91331960-61 17870 434497 17062 411519 393 94821961-62 18912 450212 18016 426103 406 95971962-63 20321 463161 19350 437686 426 96411963-64 23350 491049 22266 464130 480 100031964-65 27222 527153 25982 498287 548 105121965-66 28693 512985 27300 482480 563 99481966-67 32439 512781 30806 480102 622 96991967-68 38003 552429 36136 517516 714 102281968-69 40257 571460 38259 534677 739 103221969-70 44334 608809 42035 569591 795 107671970-71 47354 640275 44550 596470 823 110251971-72 50708 650938 47630 605211 860 109241972-73 55912 647647 52487 600195 926 105851973-74 68095 669444 63983 619883 1103 106881974-75 80479 678151 75182 625455 1268 105471975-76 86452 740806 80189 685230 1321 112891976-77 93189 753348 86382 694149 1393 111961977-78 105615 808500 98287 746719 1550 117781978-79 114491 854867 106380 790566 1642 122001979-80 125882 811357 115995 743925 1747 112041980-81 149987 866338 138565 795193 2041 117111981-82 175845 917272 161924 842429 2340 121741982-83 196010 946491 179895 867337 2541 122511983-84 228077 1015342 210108 932241 2906 128941984-85 255187 1052643 234211 963767 3169 130411985-86 288095 1108266 262958 1013410 3483 134231986-87 322144 1160809 293806 1060195 3811 13751
Contd....
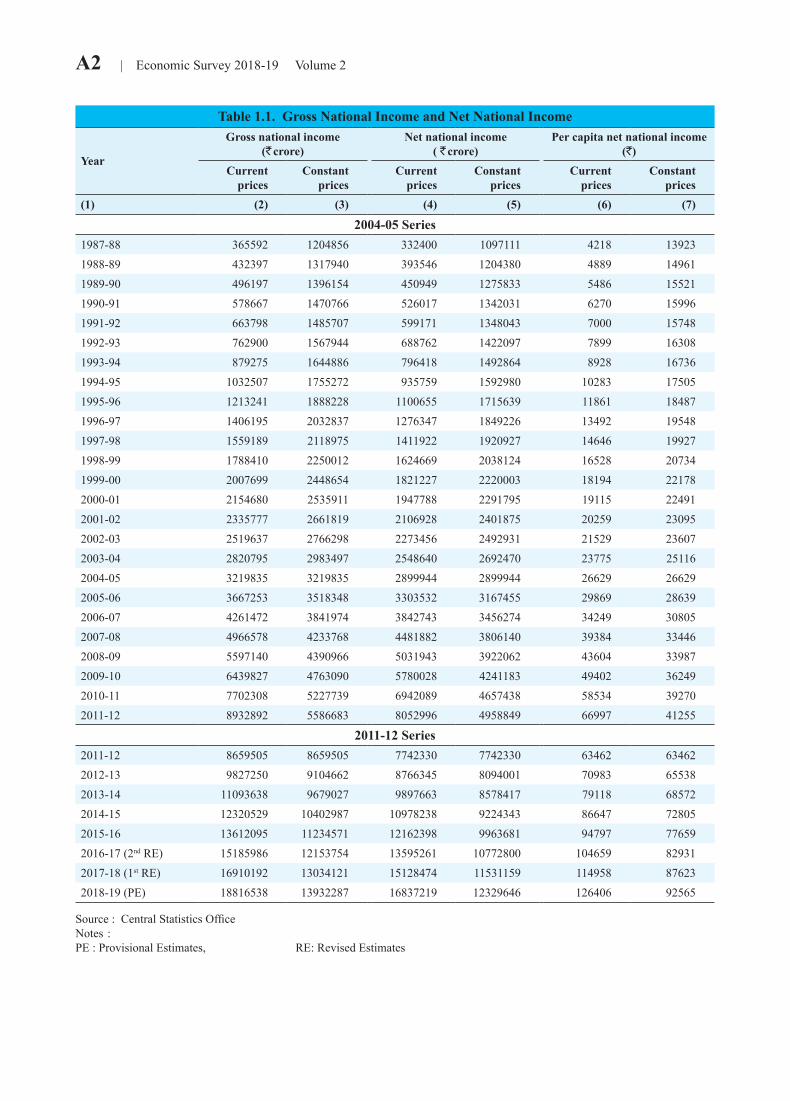
A2 | Economic Survey 2018-19 Volume 2
Table 1.1. Gross National Income and Net National Income
Year
Gross national income(` crore)
Net national income( ` crore)
Per capita net national income (`)
Currentprices
Constantprices
Currentprices
Constantprices
Currentprices
Constantprices
(1) (2) (3) (4) (5) (6) (7)
2004-05 Series 1987-88 365592 1204856 332400 1097111 4218 139231988-89 432397 1317940 393546 1204380 4889 149611989-90 496197 1396154 450949 1275833 5486 155211990-91 578667 1470766 526017 1342031 6270 159961991-92 663798 1485707 599171 1348043 7000 157481992-93 762900 1567944 688762 1422097 7899 163081993-94 879275 1644886 796418 1492864 8928 167361994-95 1032507 1755272 935759 1592980 10283 175051995-96 1213241 1888228 1100655 1715639 11861 184871996-97 1406195 2032837 1276347 1849226 13492 195481997-98 1559189 2118975 1411922 1920927 14646 199271998-99 1788410 2250012 1624669 2038124 16528 207341999-00 2007699 2448654 1821227 2220003 18194 221782000-01 2154680 2535911 1947788 2291795 19115 224912001-02 2335777 2661819 2106928 2401875 20259 230952002-03 2519637 2766298 2273456 2492931 21529 236072003-04 2820795 2983497 2548640 2692470 23775 251162004-05 3219835 3219835 2899944 2899944 26629 266292005-06 3667253 3518348 3303532 3167455 29869 286392006-07 4261472 3841974 3842743 3456274 34249 308052007-08 4966578 4233768 4481882 3806140 39384 334462008-09 5597140 4390966 5031943 3922062 43604 339872009-10 6439827 4763090 5780028 4241183 49402 362492010-11 7702308 5227739 6942089 4657438 58534 392702011-12 8932892 5586683 8052996 4958849 66997 41255
2011-12 Series 2011-12 8659505 8659505 7742330 7742330 63462 634622012-13 9827250 9104662 8766345 8094001 70983 655382013-14 11093638 9679027 9897663 8578417 79118 685722014-15 12320529 10402987 10978238 9224343 86647 728052015-16 13612095 11234571 12162398 9963681 94797 776592016-17 (2nd RE) 15185986 12153754 13595261 10772800 104659 829312017-18 (1st RE) 16910192 13034121 15128474 11531159 114958 876232018-19 (PE) 18816538 13932287 16837219 12329646 126406 92565
Source : Central Statistics OfficeNotes :PE : Provisional Estimates, RE: Revised Estimates
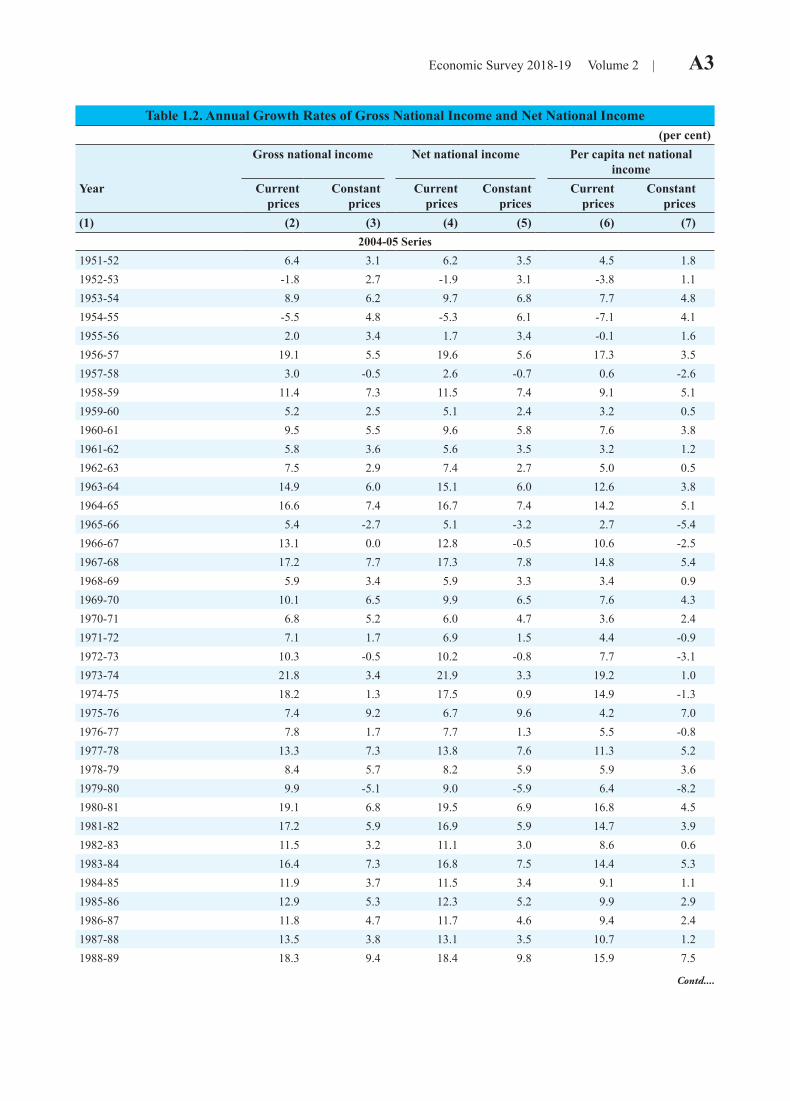
Economic Survey 2018-19 Volume 2 | A3
Table 1.2. Annual Growth Rates of Gross National Income and Net National Income(per cent)
Gross national income Net national income Per capita net national income
Year Currentprices
Constantprices
Currentprices
Constantprices
Currentprices
Constantprices
(1) (2) (3) (4) (5) (6) (7)2004-05 Series
1951-52 6.4 3.1 6.2 3.5 4.5 1.81952-53 -1.8 2.7 -1.9 3.1 -3.8 1.11953-54 8.9 6.2 9.7 6.8 7.7 4.81954-55 -5.5 4.8 -5.3 6.1 -7.1 4.11955-56 2.0 3.4 1.7 3.4 -0.1 1.61956-57 19.1 5.5 19.6 5.6 17.3 3.51957-58 3.0 -0.5 2.6 -0.7 0.6 -2.61958-59 11.4 7.3 11.5 7.4 9.1 5.11959-60 5.2 2.5 5.1 2.4 3.2 0.51960-61 9.5 5.5 9.6 5.8 7.6 3.81961-62 5.8 3.6 5.6 3.5 3.2 1.21962-63 7.5 2.9 7.4 2.7 5.0 0.51963-64 14.9 6.0 15.1 6.0 12.6 3.81964-65 16.6 7.4 16.7 7.4 14.2 5.11965-66 5.4 -2.7 5.1 -3.2 2.7 -5.41966-67 13.1 0.0 12.8 -0.5 10.6 -2.51967-68 17.2 7.7 17.3 7.8 14.8 5.41968-69 5.9 3.4 5.9 3.3 3.4 0.91969-70 10.1 6.5 9.9 6.5 7.6 4.31970-71 6.8 5.2 6.0 4.7 3.6 2.41971-72 7.1 1.7 6.9 1.5 4.4 -0.91972-73 10.3 -0.5 10.2 -0.8 7.7 -3.11973-74 21.8 3.4 21.9 3.3 19.2 1.01974-75 18.2 1.3 17.5 0.9 14.9 -1.31975-76 7.4 9.2 6.7 9.6 4.2 7.01976-77 7.8 1.7 7.7 1.3 5.5 -0.81977-78 13.3 7.3 13.8 7.6 11.3 5.21978-79 8.4 5.7 8.2 5.9 5.9 3.61979-80 9.9 -5.1 9.0 -5.9 6.4 -8.21980-81 19.1 6.8 19.5 6.9 16.8 4.51981-82 17.2 5.9 16.9 5.9 14.7 3.91982-83 11.5 3.2 11.1 3.0 8.6 0.61983-84 16.4 7.3 16.8 7.5 14.4 5.31984-85 11.9 3.7 11.5 3.4 9.1 1.11985-86 12.9 5.3 12.3 5.2 9.9 2.91986-87 11.8 4.7 11.7 4.6 9.4 2.41987-88 13.5 3.8 13.1 3.5 10.7 1.21988-89 18.3 9.4 18.4 9.8 15.9 7.5
Contd....

A4 | Economic Survey 2018-19 Volume 2
Table 1.2. Annual Growth Rates of Gross National Income and Net National Income(per cent)
Gross national income Net national income Per capita net national income
Year Currentprices
Constantprices
Currentprices
Constantprices
Currentprices
Constantprices
(1) (2) (3) (4) (5) (6) (7)2004-05 Series
1989-90 14.8 5.9 14.6 5.9 12.2 3.71990-91 16.6 5.3 16.6 5.2 14.3 3.11991-92 14.7 1.0 13.9 0.4 11.6 -1.51992-93 14.9 5.5 15.0 5.5 12.8 3.61993-94 15.3 4.9 15.6 5.0 13.0 2.61994-95 17.4 6.7 17.5 6.7 15.2 4.61995-96 17.5 7.6 17.6 7.7 15.3 5.61996-97 15.9 7.7 16.0 7.8 13.8 5.71997-98 10.9 4.2 10.6 3.9 8.6 1.91998-99 14.7 6.2 15.1 6.1 12.8 4.11999-00 12.3 8.8 12.1 8.9 10.1 7.02000-01 7.3 3.6 6.9 3.2 5.1 1.42001-02 8.4 5.0 8.2 4.8 6.0 2.72002-03 7.9 3.9 7.9 3.8 6.3 2.22003-04 12.0 7.9 12.1 8.0 10.4 6.42004-05 14.1 7.9 13.8 7.7 12.0 6.02005-06 13.9 9.3 13.9 9.2 12.2 7.52006-07 16.2 9.2 16.3 9.1 14.7 7.62007-08 16.5 10.2 16.6 10.1 15.0 8.62008-09 12.7 3.7 12.3 3.0 10.7 1.62009-10 15.1 8.5 14.9 8.1 13.3 6.72010-11 19.6 9.8 20.1 9.8 18.5 8.32011-12 16.0 6.9 16.0 6.5 14.5 5.1
2011-12 Series2012-13 13.5 5.1 13.2 4.5 11.9 3.32013-14 12.9 6.3 12.9 6.0 11.5 4.62014-15 11.1 7.5 10.9 7.5 9.5 6.22015-16 10.5 8.0 10.8 8.0 9.4 6.72016-17 (2nd RE) 11.6 8.2 11.8 8.1 10.4 6.82017-18 (1st RE) 11.4 7.2 11.3 7.0 9.8 5.72018-19 (PE) 11.3 6.9 11.3 6.9 10.0 5.6
Source : Central Statistics Office,Notes :PE : Provisional Estimates, RE: Revised Estimates
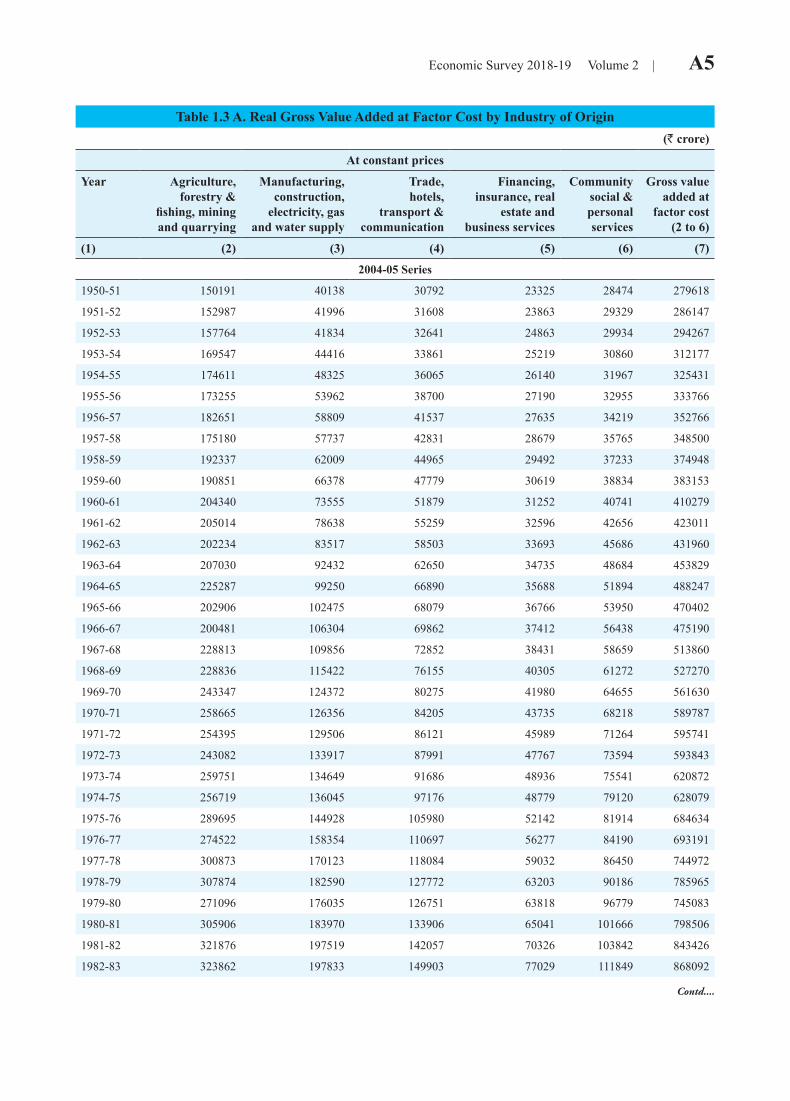
Economic Survey 2018-19 Volume 2 | A5
Table 1.3 A. Real Gross Value Added at Factor Cost by Industry of Origin(R crore)
At constant prices
Year Agriculture,forestry &
fishing, miningand quarrying
Manufacturing,construction,
electricity, gasand water supply
Trade,hotels,
transport &communication
Financing,insurance, real
estate andbusiness services
Communitysocial &personalservices
Gross valueadded at
factor cost(2 to 6)
(1) (2) (3) (4) (5) (6) (7)2004-05 Series
1950-51 150191 40138 30792 23325 28474 279618
1951-52 152987 41996 31608 23863 29329 286147
1952-53 157764 41834 32641 24863 29934 294267
1953-54 169547 44416 33861 25219 30860 312177
1954-55 174611 48325 36065 26140 31967 325431
1955-56 173255 53962 38700 27190 32955 333766
1956-57 182651 58809 41537 27635 34219 352766
1957-58 175180 57737 42831 28679 35765 348500
1958-59 192337 62009 44965 29492 37233 374948
1959-60 190851 66378 47779 30619 38834 383153
1960-61 204340 73555 51879 31252 40741 410279
1961-62 205014 78638 55259 32596 42656 423011
1962-63 202234 83517 58503 33693 45686 431960
1963-64 207030 92432 62650 34735 48684 453829
1964-65 225287 99250 66890 35688 51894 488247
1965-66 202906 102475 68079 36766 53950 470402
1966-67 200481 106304 69862 37412 56438 475190
1967-68 228813 109856 72852 38431 58659 513860
1968-69 228836 115422 76155 40305 61272 527270
1969-70 243347 124372 80275 41980 64655 561630
1970-71 258665 126356 84205 43735 68218 589787
1971-72 254395 129506 86121 45989 71264 595741
1972-73 243082 133917 87991 47767 73594 593843
1973-74 259751 134649 91686 48936 75541 620872
1974-75 256719 136045 97176 48779 79120 628079
1975-76 289695 144928 105980 52142 81914 684634
1976-77 274522 158354 110697 56277 84190 693191
1977-78 300873 170123 118084 59032 86450 744972
1978-79 307874 182590 127772 63203 90186 785965
1979-80 271096 176035 126751 63818 96779 745083
1980-81 305906 183970 133906 65041 101666 798506
1981-82 321876 197519 142057 70326 103842 843426
1982-83 323862 197833 149903 77029 111849 868092
Contd....
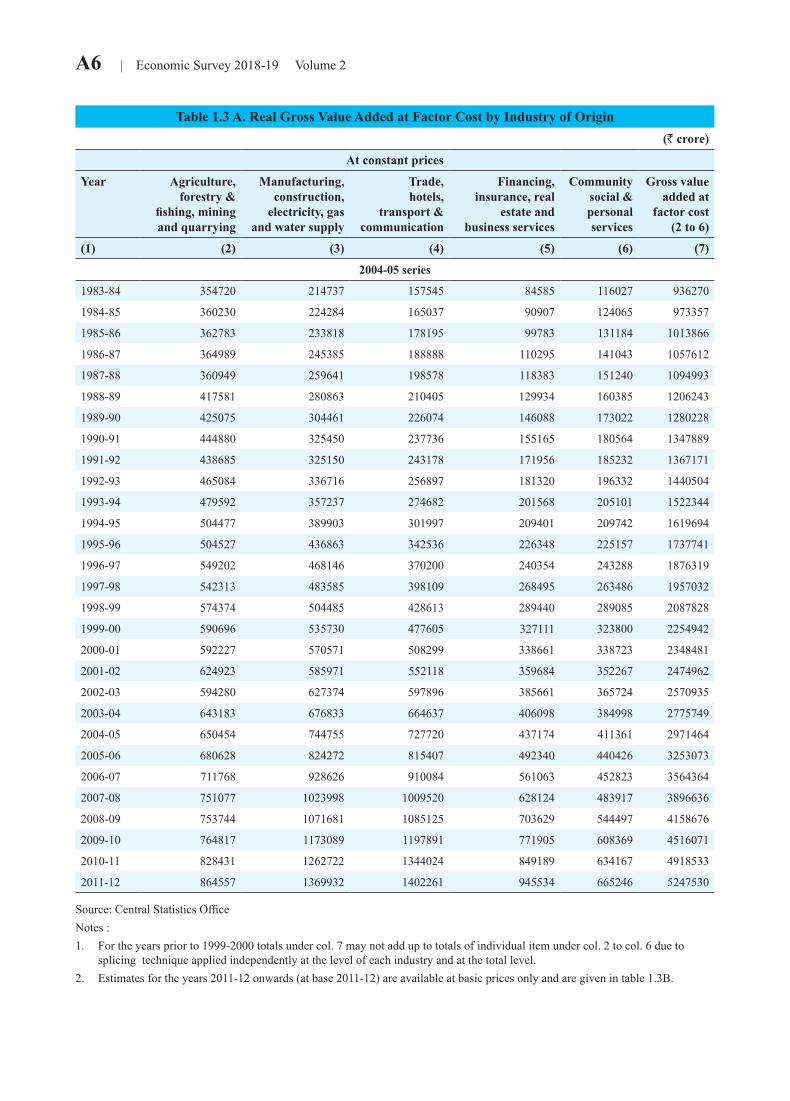
A6 | Economic Survey 2018-19 Volume 2
Table 1.3 A. Real Gross Value Added at Factor Cost by Industry of Origin(R crore)
At constant prices
Year Agriculture,forestry &
fishing, miningand quarrying
Manufacturing,construction,
electricity, gasand water supply
Trade,hotels,
transport &communication
Financing,insurance, real
estate andbusiness services
Communitysocial &personalservices
Gross valueadded at
factor cost(2 to 6)
(1) (2) (3) (4) (5) (6) (7)
2004-05 series
1983-84 354720 214737 157545 84585 116027 936270
1984-85 360230 224284 165037 90907 124065 973357
1985-86 362783 233818 178195 99783 131184 1013866
1986-87 364989 245385 188888 110295 141043 1057612
1987-88 360949 259641 198578 118383 151240 1094993
1988-89 417581 280863 210405 129934 160385 1206243
1989-90 425075 304461 226074 146088 173022 1280228
1990-91 444880 325450 237736 155165 180564 1347889
1991-92 438685 325150 243178 171956 185232 1367171
1992-93 465084 336716 256897 181320 196332 1440504
1993-94 479592 357237 274682 201568 205101 1522344
1994-95 504477 389903 301997 209401 209742 1619694
1995-96 504527 436863 342536 226348 225157 1737741
1996-97 549202 468146 370200 240354 243288 1876319
1997-98 542313 483585 398109 268495 263486 1957032
1998-99 574374 504485 428613 289440 289085 2087828
1999-00 590696 535730 477605 327111 323800 2254942
2000-01 592227 570571 508299 338661 338723 2348481
2001-02 624923 585971 552118 359684 352267 2474962
2002-03 594280 627374 597896 385661 365724 2570935
2003-04 643183 676833 664637 406098 384998 2775749
2004-05 650454 744755 727720 437174 411361 2971464
2005-06 680628 824272 815407 492340 440426 3253073
2006-07 711768 928626 910084 561063 452823 3564364
2007-08 751077 1023998 1009520 628124 483917 3896636
2008-09 753744 1071681 1085125 703629 544497 4158676
2009-10 764817 1173089 1197891 771905 608369 4516071
2010-11 828431 1262722 1344024 849189 634167 4918533
2011-12 864557 1369932 1402261 945534 665246 5247530
Source: Central Statistics OfficeNotes :1. For the years prior to 1999-2000 totals under col. 7 may not add up to totals of individual item under col. 2 to col. 6 due to
splicing technique applied independently at the level of each industry and at the total level.2. Estimates for the years 2011-12 onwards (at base 2011-12) are available at basic prices only and are given in table 1.3B.
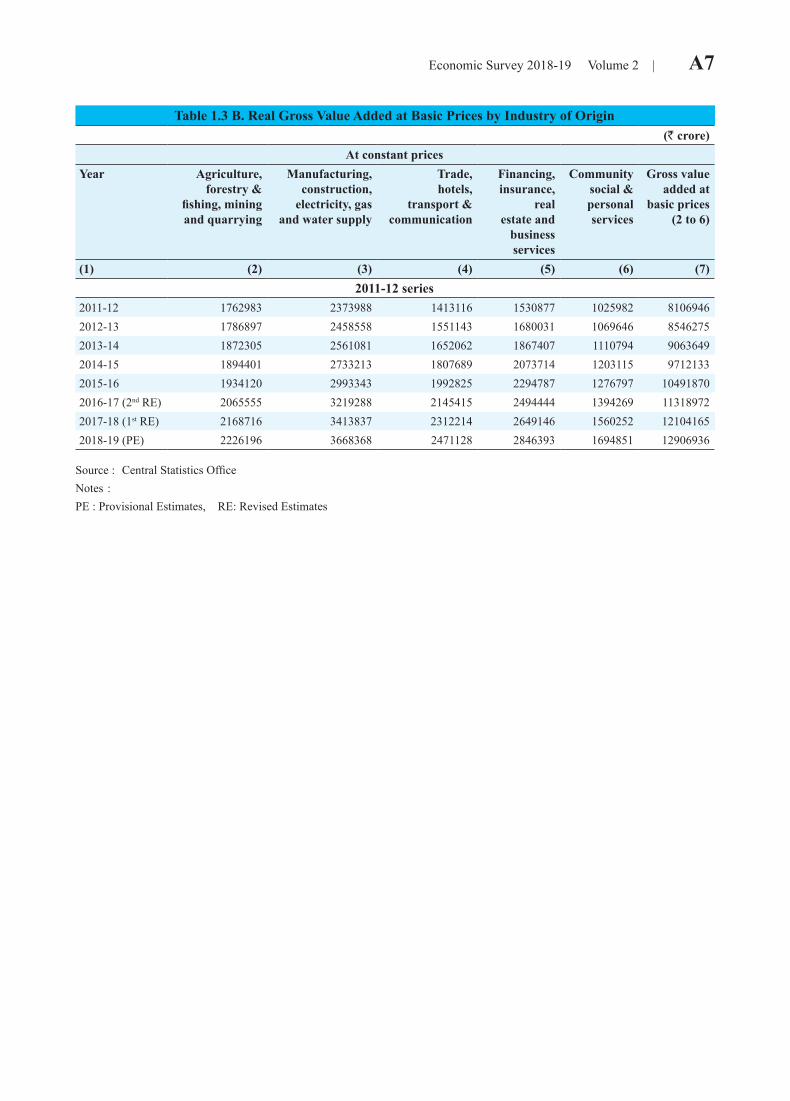
Economic Survey 2018-19 Volume 2 | A7
Table 1.3 B. Real Gross Value Added at Basic Prices by Industry of Origin(R crore)
At constant pricesYear Agriculture,
forestry &fishing, miningand quarrying
Manufacturing,construction,
electricity, gasand water supply
Trade,hotels,
transport &communication
Financing,insurance,
realestate and
business services
Communitysocial &personalservices
Gross valueadded at
basic prices(2 to 6)
(1) (2) (3) (4) (5) (6) (7)2011-12 series
2011-12 1762983 2373988 1413116 1530877 1025982 81069462012-13 1786897 2458558 1551143 1680031 1069646 85462752013-14 1872305 2561081 1652062 1867407 1110794 90636492014-15 1894401 2733213 1807689 2073714 1203115 97121332015-16 1934120 2993343 1992825 2294787 1276797 104918702016-17 (2nd RE) 2065555 3219288 2145415 2494444 1394269 113189722017-18 (1st RE) 2168716 3413837 2312214 2649146 1560252 121041652018-19 (PE) 2226196 3668368 2471128 2846393 1694851 12906936
Source : Central Statistics OfficeNotes :PE : Provisional Estimates, RE: Revised Estimates
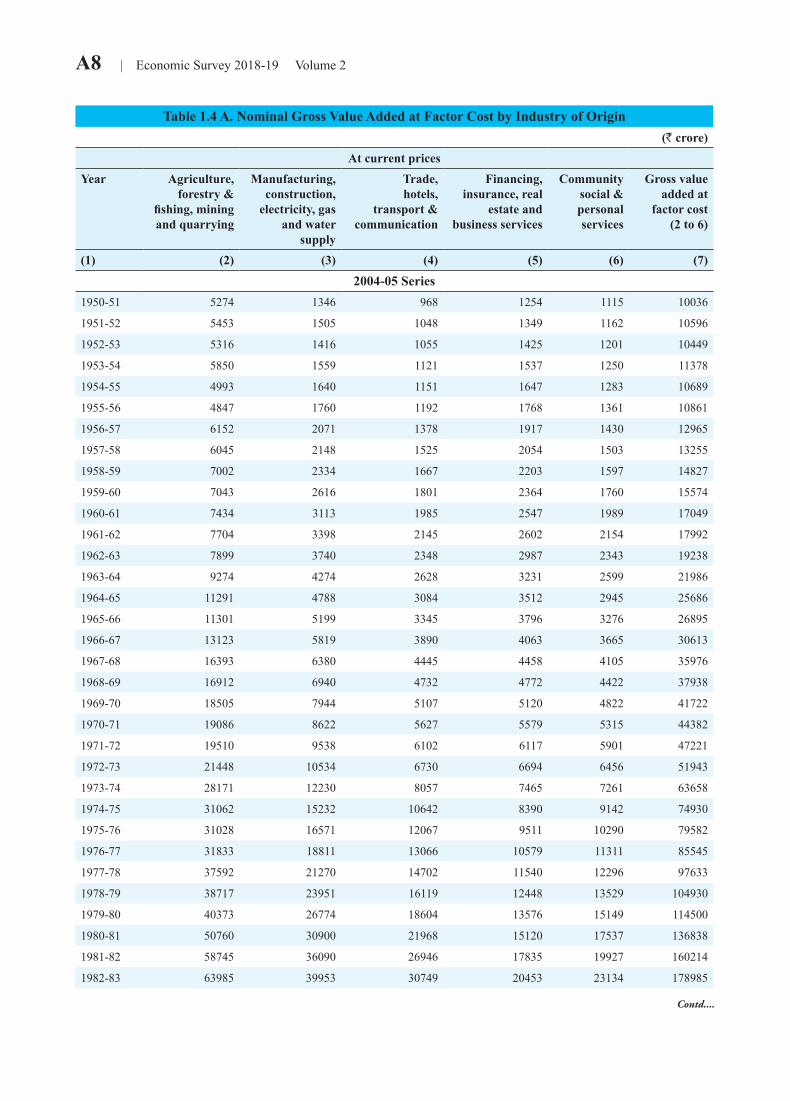
A8 | Economic Survey 2018-19 Volume 2
Table 1.4 A. Nominal Gross Value Added at Factor Cost by Industry of Origin(R crore)
At current pricesYear Agriculture,
forestry &fishing, miningand quarrying
Manufacturing,construction,
electricity, gasand water
supply
Trade,hotels,
transport &communication
Financing,insurance, real
estate andbusiness services
Communitysocial &personalservices
Gross valueadded at
factor cost(2 to 6)
(1) (2) (3) (4) (5) (6) (7)
2004-05 Series1950-51 5274 1346 968 1254 1115 10036
1951-52 5453 1505 1048 1349 1162 10596
1952-53 5316 1416 1055 1425 1201 10449
1953-54 5850 1559 1121 1537 1250 11378
1954-55 4993 1640 1151 1647 1283 10689
1955-56 4847 1760 1192 1768 1361 10861
1956-57 6152 2071 1378 1917 1430 12965
1957-58 6045 2148 1525 2054 1503 13255
1958-59 7002 2334 1667 2203 1597 14827
1959-60 7043 2616 1801 2364 1760 15574
1960-61 7434 3113 1985 2547 1989 17049
1961-62 7704 3398 2145 2602 2154 17992
1962-63 7899 3740 2348 2987 2343 19238
1963-64 9274 4274 2628 3231 2599 21986
1964-65 11291 4788 3084 3512 2945 25686
1965-66 11301 5199 3345 3796 3276 26895
1966-67 13123 5819 3890 4063 3665 30613
1967-68 16393 6380 4445 4458 4105 35976
1968-69 16912 6940 4732 4772 4422 37938
1969-70 18505 7944 5107 5120 4822 41722
1970-71 19086 8622 5627 5579 5315 44382
1971-72 19510 9538 6102 6117 5901 47221
1972-73 21448 10534 6730 6694 6456 51943
1973-74 28171 12230 8057 7465 7261 63658
1974-75 31062 15232 10642 8390 9142 74930
1975-76 31028 16571 12067 9511 10290 79582
1976-77 31833 18811 13066 10579 11311 85545
1977-78 37592 21270 14702 11540 12296 97633
1978-79 38717 23951 16119 12448 13529 104930
1979-80 40373 26774 18604 13576 15149 114500
1980-81 50760 30900 21968 15120 17537 136838
1981-82 58745 36090 26946 17835 19927 160214
1982-83 63985 39953 30749 20453 23134 178985
Contd....
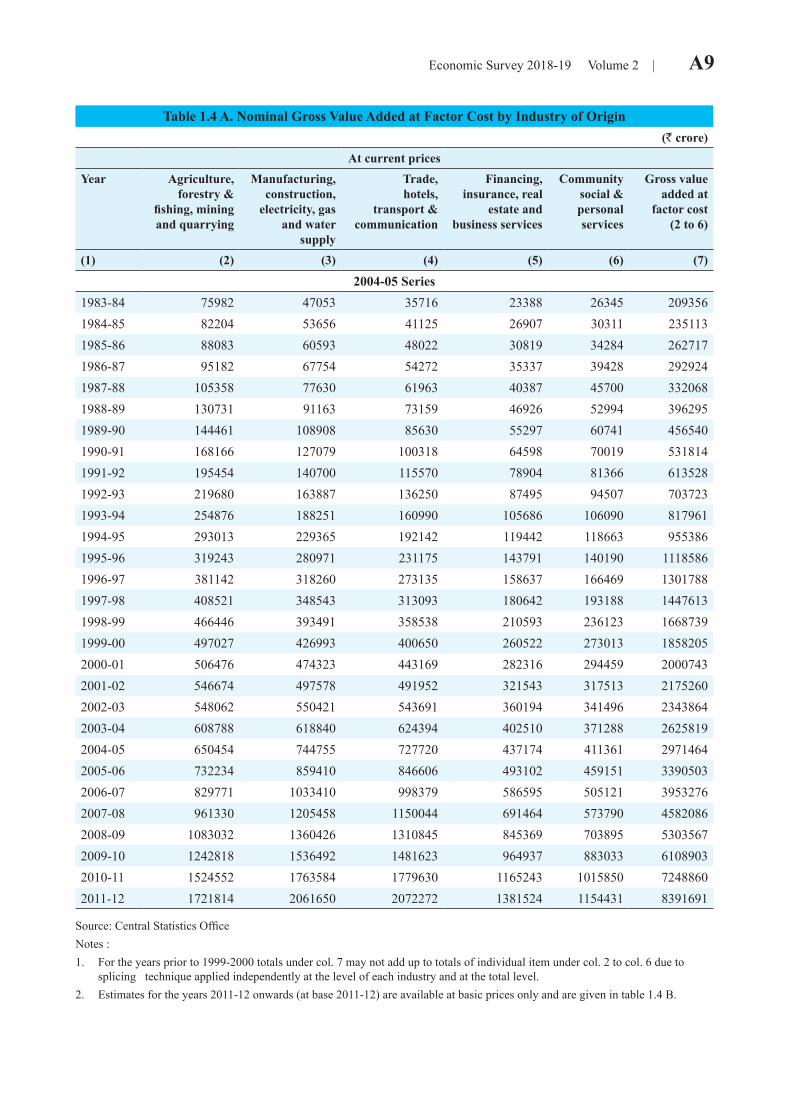
Economic Survey 2018-19 Volume 2 | A9
Table 1.4 A. Nominal Gross Value Added at Factor Cost by Industry of Origin(R crore)
At current pricesYear Agriculture,
forestry &fishing, miningand quarrying
Manufacturing,construction,
electricity, gasand water
supply
Trade,hotels,
transport &communication
Financing,insurance, real
estate andbusiness services
Communitysocial &personalservices
Gross valueadded at
factor cost(2 to 6)
(1) (2) (3) (4) (5) (6) (7)
2004-05 Series1983-84 75982 47053 35716 23388 26345 2093561984-85 82204 53656 41125 26907 30311 2351131985-86 88083 60593 48022 30819 34284 2627171986-87 95182 67754 54272 35337 39428 2929241987-88 105358 77630 61963 40387 45700 3320681988-89 130731 91163 73159 46926 52994 3962951989-90 144461 108908 85630 55297 60741 4565401990-91 168166 127079 100318 64598 70019 5318141991-92 195454 140700 115570 78904 81366 6135281992-93 219680 163887 136250 87495 94507 7037231993-94 254876 188251 160990 105686 106090 8179611994-95 293013 229365 192142 119442 118663 9553861995-96 319243 280971 231175 143791 140190 11185861996-97 381142 318260 273135 158637 166469 13017881997-98 408521 348543 313093 180642 193188 14476131998-99 466446 393491 358538 210593 236123 16687391999-00 497027 426993 400650 260522 273013 18582052000-01 506476 474323 443169 282316 294459 20007432001-02 546674 497578 491952 321543 317513 21752602002-03 548062 550421 543691 360194 341496 23438642003-04 608788 618840 624394 402510 371288 26258192004-05 650454 744755 727720 437174 411361 29714642005-06 732234 859410 846606 493102 459151 33905032006-07 829771 1033410 998379 586595 505121 39532762007-08 961330 1205458 1150044 691464 573790 45820862008-09 1083032 1360426 1310845 845369 703895 53035672009-10 1242818 1536492 1481623 964937 883033 61089032010-11 1524552 1763584 1779630 1165243 1015850 72488602011-12 1721814 2061650 2072272 1381524 1154431 8391691
Source: Central Statistics OfficeNotes :1. For the years prior to 1999-2000 totals under col. 7 may not add up to totals of individual item under col. 2 to col. 6 due to
splicing technique applied independently at the level of each industry and at the total level.2. Estimates for the years 2011-12 onwards (at base 2011-12) are available at basic prices only and are given in table 1.4 B.
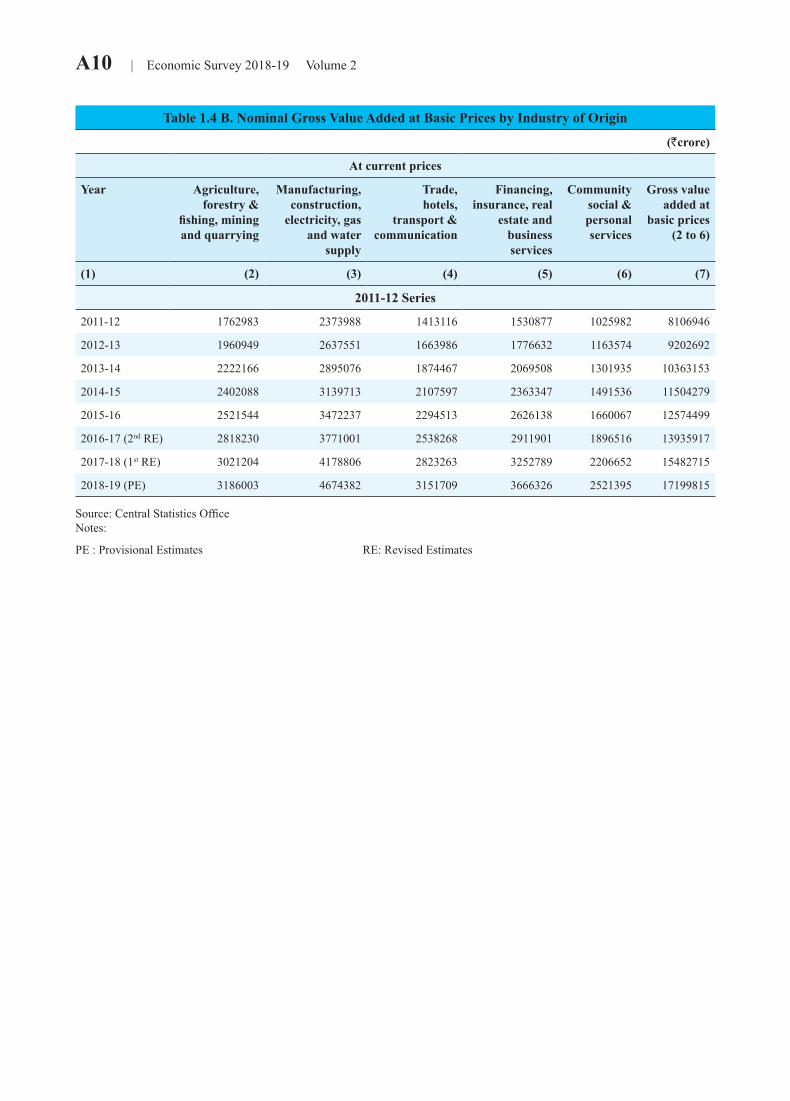
A10 | Economic Survey 2018-19 Volume 2
Table 1.4 B. Nominal Gross Value Added at Basic Prices by Industry of Origin
(Rcrore)
At current prices
Year Agriculture,forestry &
fishing, miningand quarrying
Manufacturing,construction,
electricity, gasand water
supply
Trade,hotels,
transport &communication
Financing,insurance, real
estate andbusiness services
Communitysocial &personalservices
Gross valueadded at
basic prices(2 to 6)
(1) (2) (3) (4) (5) (6) (7)
2011-12 Series
2011-12 1762983 2373988 1413116 1530877 1025982 8106946
2012-13 1960949 2637551 1663986 1776632 1163574 9202692
2013-14 2222166 2895076 1874467 2069508 1301935 10363153
2014-15 2402088 3139713 2107597 2363347 1491536 11504279
2015-16 2521544 3472237 2294513 2626138 1660067 12574499
2016-17 (2nd RE) 2818230 3771001 2538268 2911901 1896516 13935917
2017-18 (1st RE) 3021204 4178806 2823263 3252789 2206652 15482715
2018-19 (PE) 3186003 4674382 3151709 3666326 2521395 17199815
Source: Central Statistics OfficeNotes:
PE : Provisional Estimates RE: Revised Estimates
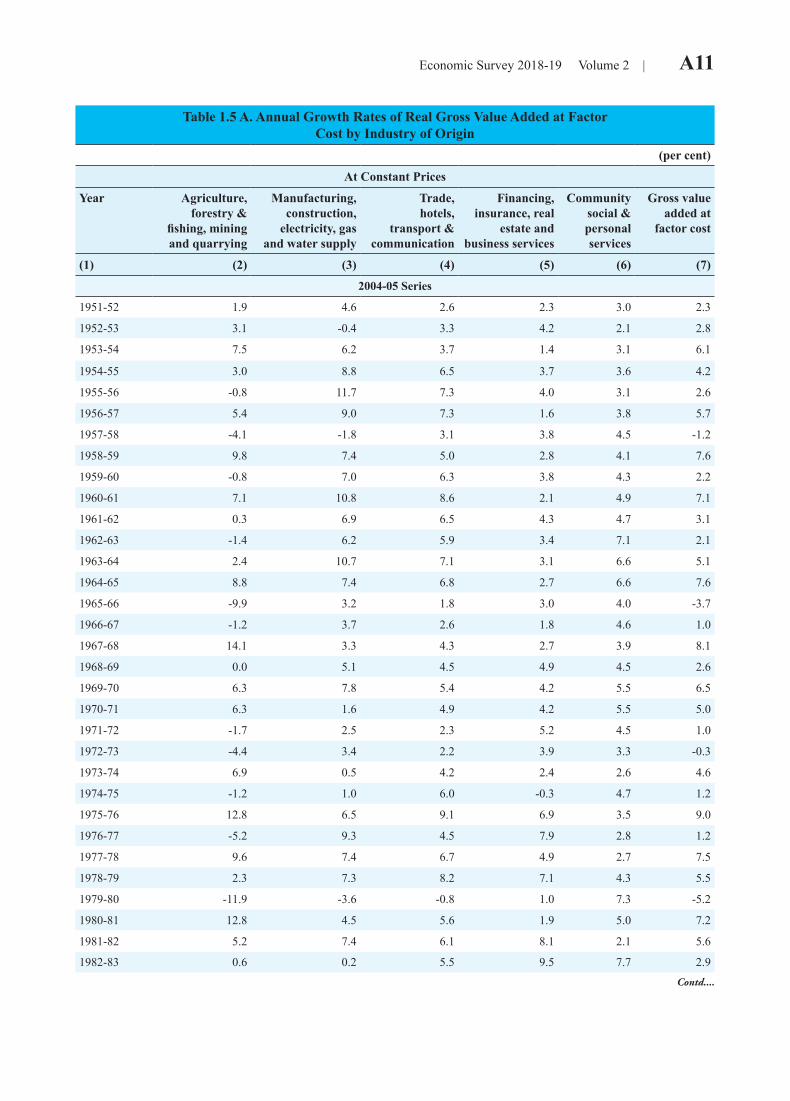
Economic Survey 2018-19 Volume 2 | A11
Table 1.5 A. Annual Growth Rates of Real Gross Value Added at Factor Cost by Industry of Origin
(per cent)
At Constant Prices
Year Agriculture,forestry &
fishing, miningand quarrying
Manufacturing,construction,
electricity, gasand water supply
Trade,hotels,
transport &communication
Financing,insurance, real
estate andbusiness services
Communitysocial &personalservices
Gross valueadded at
factor cost
(1) (2) (3) (4) (5) (6) (7)2004-05 Series
1951-52 1.9 4.6 2.6 2.3 3.0 2.3
1952-53 3.1 -0.4 3.3 4.2 2.1 2.8
1953-54 7.5 6.2 3.7 1.4 3.1 6.1
1954-55 3.0 8.8 6.5 3.7 3.6 4.2
1955-56 -0.8 11.7 7.3 4.0 3.1 2.6
1956-57 5.4 9.0 7.3 1.6 3.8 5.7
1957-58 -4.1 -1.8 3.1 3.8 4.5 -1.2
1958-59 9.8 7.4 5.0 2.8 4.1 7.6
1959-60 -0.8 7.0 6.3 3.8 4.3 2.2
1960-61 7.1 10.8 8.6 2.1 4.9 7.1
1961-62 0.3 6.9 6.5 4.3 4.7 3.1
1962-63 -1.4 6.2 5.9 3.4 7.1 2.1
1963-64 2.4 10.7 7.1 3.1 6.6 5.1
1964-65 8.8 7.4 6.8 2.7 6.6 7.6
1965-66 -9.9 3.2 1.8 3.0 4.0 -3.7
1966-67 -1.2 3.7 2.6 1.8 4.6 1.0
1967-68 14.1 3.3 4.3 2.7 3.9 8.1
1968-69 0.0 5.1 4.5 4.9 4.5 2.6
1969-70 6.3 7.8 5.4 4.2 5.5 6.5
1970-71 6.3 1.6 4.9 4.2 5.5 5.0
1971-72 -1.7 2.5 2.3 5.2 4.5 1.0
1972-73 -4.4 3.4 2.2 3.9 3.3 -0.3
1973-74 6.9 0.5 4.2 2.4 2.6 4.6
1974-75 -1.2 1.0 6.0 -0.3 4.7 1.2
1975-76 12.8 6.5 9.1 6.9 3.5 9.0
1976-77 -5.2 9.3 4.5 7.9 2.8 1.2
1977-78 9.6 7.4 6.7 4.9 2.7 7.5
1978-79 2.3 7.3 8.2 7.1 4.3 5.5
1979-80 -11.9 -3.6 -0.8 1.0 7.3 -5.2
1980-81 12.8 4.5 5.6 1.9 5.0 7.2
1981-82 5.2 7.4 6.1 8.1 2.1 5.6
1982-83 0.6 0.2 5.5 9.5 7.7 2.9Contd....
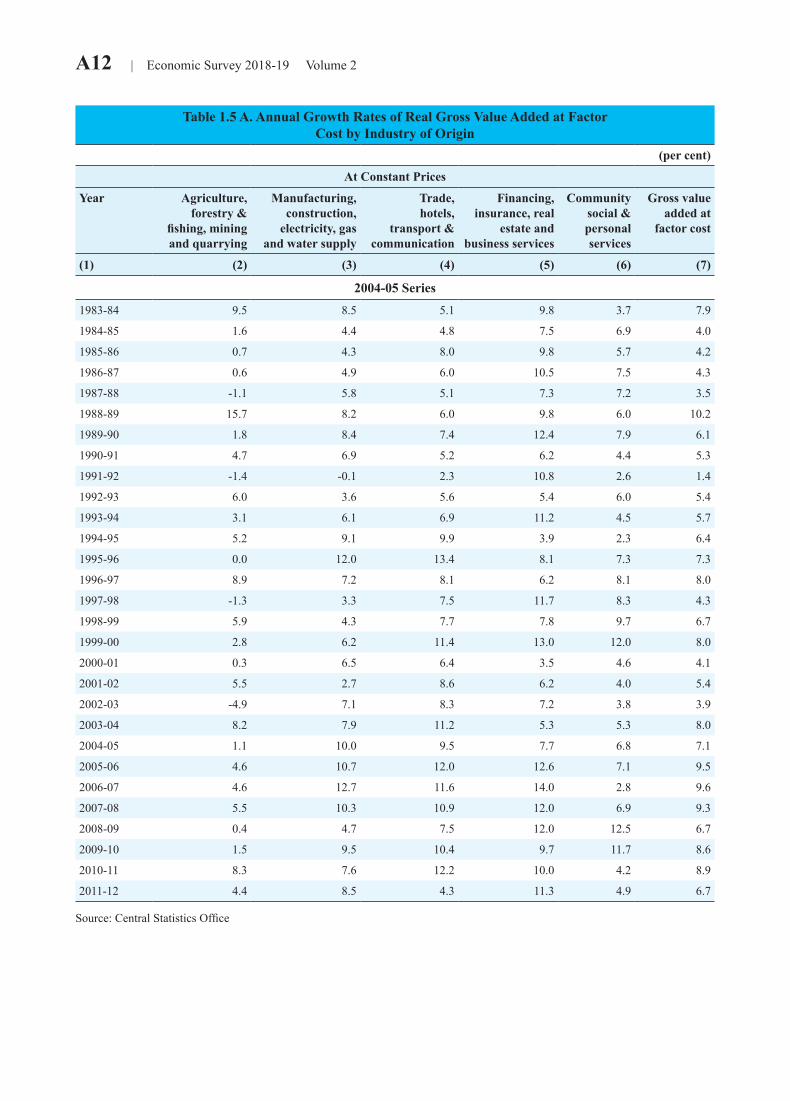
A12 | Economic Survey 2018-19 Volume 2
Table 1.5 A. Annual Growth Rates of Real Gross Value Added at Factor Cost by Industry of Origin
(per cent)
At Constant Prices
Year Agriculture,forestry &
fishing, miningand quarrying
Manufacturing,construction,
electricity, gasand water supply
Trade,hotels,
transport &communication
Financing,insurance, real
estate andbusiness services
Communitysocial &personalservices
Gross valueadded at
factor cost
(1) (2) (3) (4) (5) (6) (7)
2004-05 Series1983-84 9.5 8.5 5.1 9.8 3.7 7.9
1984-85 1.6 4.4 4.8 7.5 6.9 4.0
1985-86 0.7 4.3 8.0 9.8 5.7 4.2
1986-87 0.6 4.9 6.0 10.5 7.5 4.3
1987-88 -1.1 5.8 5.1 7.3 7.2 3.5
1988-89 15.7 8.2 6.0 9.8 6.0 10.2
1989-90 1.8 8.4 7.4 12.4 7.9 6.1
1990-91 4.7 6.9 5.2 6.2 4.4 5.3
1991-92 -1.4 -0.1 2.3 10.8 2.6 1.4
1992-93 6.0 3.6 5.6 5.4 6.0 5.4
1993-94 3.1 6.1 6.9 11.2 4.5 5.7
1994-95 5.2 9.1 9.9 3.9 2.3 6.4
1995-96 0.0 12.0 13.4 8.1 7.3 7.3
1996-97 8.9 7.2 8.1 6.2 8.1 8.0
1997-98 -1.3 3.3 7.5 11.7 8.3 4.3
1998-99 5.9 4.3 7.7 7.8 9.7 6.7
1999-00 2.8 6.2 11.4 13.0 12.0 8.0
2000-01 0.3 6.5 6.4 3.5 4.6 4.1
2001-02 5.5 2.7 8.6 6.2 4.0 5.4
2002-03 -4.9 7.1 8.3 7.2 3.8 3.9
2003-04 8.2 7.9 11.2 5.3 5.3 8.0
2004-05 1.1 10.0 9.5 7.7 6.8 7.1
2005-06 4.6 10.7 12.0 12.6 7.1 9.5
2006-07 4.6 12.7 11.6 14.0 2.8 9.6
2007-08 5.5 10.3 10.9 12.0 6.9 9.3
2008-09 0.4 4.7 7.5 12.0 12.5 6.7
2009-10 1.5 9.5 10.4 9.7 11.7 8.6
2010-11 8.3 7.6 12.2 10.0 4.2 8.9
2011-12 4.4 8.5 4.3 11.3 4.9 6.7
Source: Central Statistics Office
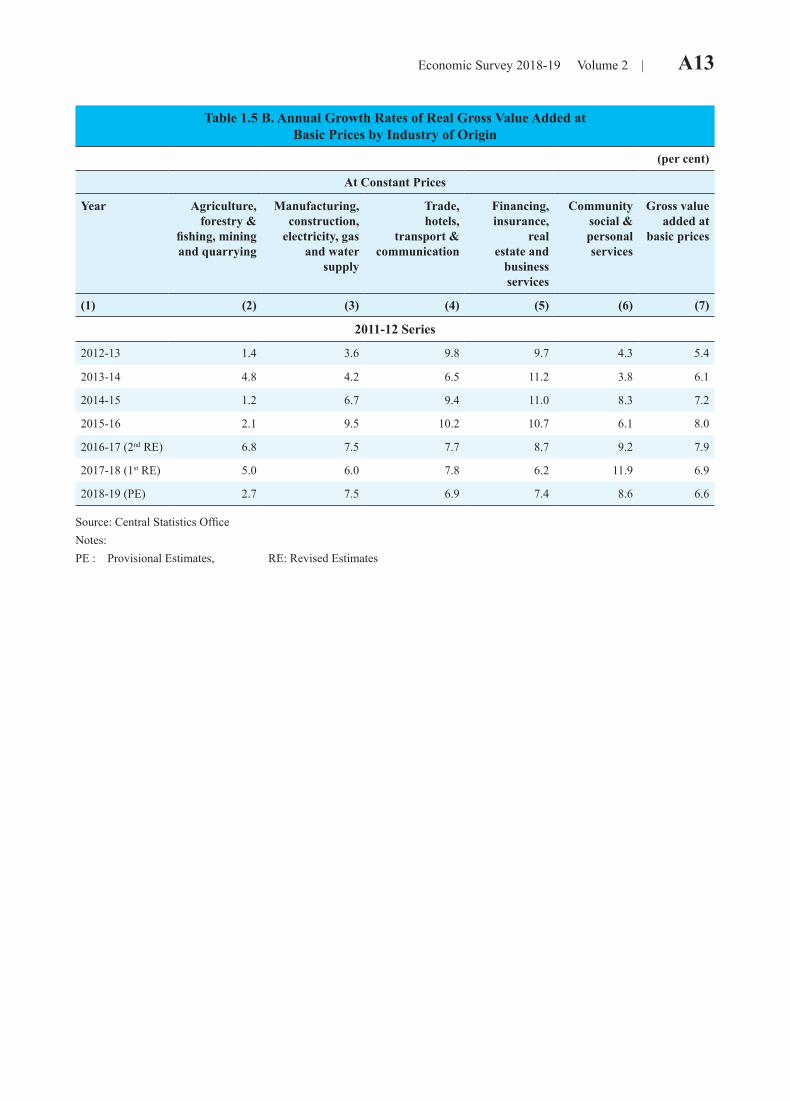
Economic Survey 2018-19 Volume 2 | A13
Table 1.5 B. Annual Growth Rates of Real Gross Value Added at Basic Prices by Industry of Origin
(per cent)
At Constant Prices
Year Agriculture,forestry &
fishing, miningand quarrying
Manufacturing,construction,
electricity, gasand water
supply
Trade,hotels,
transport &communication
Financing,insurance,
realestate and
business services
Communitysocial &personalservices
Gross valueadded at
basic prices
(1) (2) (3) (4) (5) (6) (7)
2011-12 Series
2012-13 1.4 3.6 9.8 9.7 4.3 5.4
2013-14 4.8 4.2 6.5 11.2 3.8 6.1
2014-15 1.2 6.7 9.4 11.0 8.3 7.2
2015-16 2.1 9.5 10.2 10.7 6.1 8.0
2016-17 (2nd RE) 6.8 7.5 7.7 8.7 9.2 7.9
2017-18 (1st RE) 5.0 6.0 7.8 6.2 11.9 6.9
2018-19 (PE) 2.7 7.5 6.9 7.4 8.6 6.6
Source: Central Statistics OfficeNotes: PE : Provisional Estimates, RE: Revised Estimates
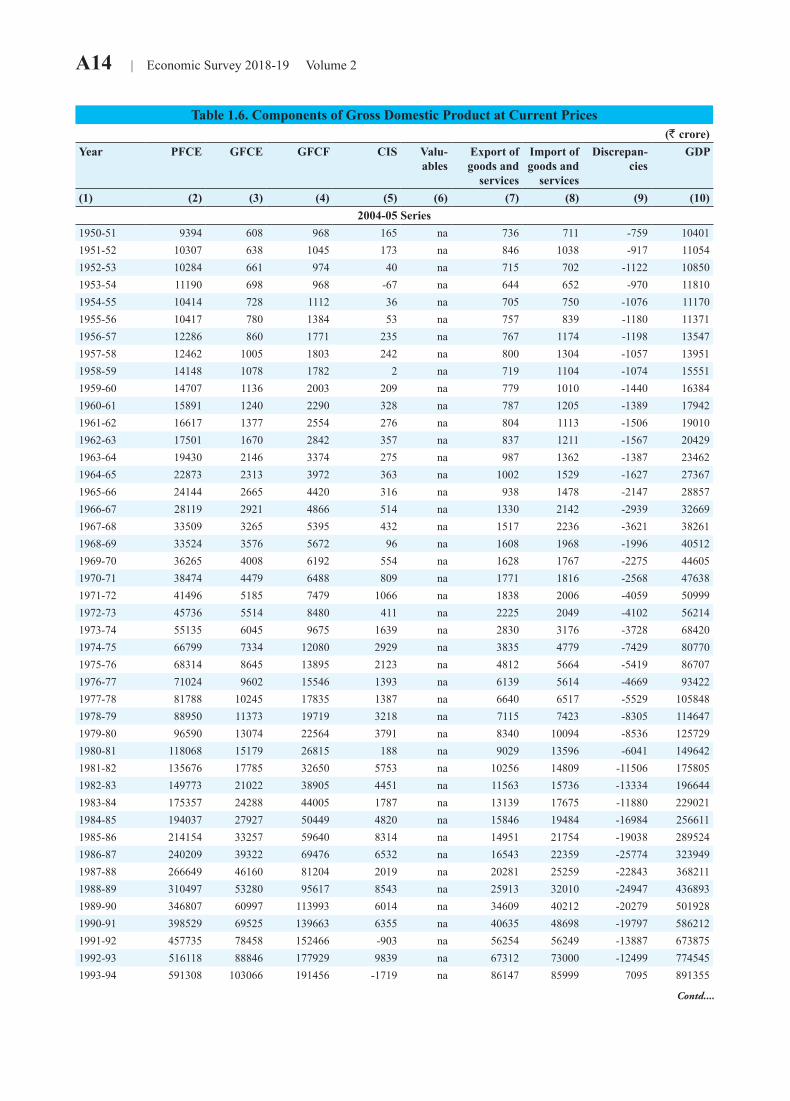
A14 | Economic Survey 2018-19 Volume 2
Table 1.6. Components of Gross Domestic Product at Current Prices(` crore)
Year PFCE GFCE GFCF CIS Valu-ables
Export of goods and
services
Import of goods and
services
Discrepan-cies
GDP
(1) (2) (3) (4) (5) (6) (7) (8) (9) (10)2004-05 Series
1950-51 9394 608 968 165 na 736 711 -759 104011951-52 10307 638 1045 173 na 846 1038 -917 110541952-53 10284 661 974 40 na 715 702 -1122 108501953-54 11190 698 968 -67 na 644 652 -970 118101954-55 10414 728 1112 36 na 705 750 -1076 111701955-56 10417 780 1384 53 na 757 839 -1180 113711956-57 12286 860 1771 235 na 767 1174 -1198 135471957-58 12462 1005 1803 242 na 800 1304 -1057 139511958-59 14148 1078 1782 2 na 719 1104 -1074 155511959-60 14707 1136 2003 209 na 779 1010 -1440 163841960-61 15891 1240 2290 328 na 787 1205 -1389 179421961-62 16617 1377 2554 276 na 804 1113 -1506 190101962-63 17501 1670 2842 357 na 837 1211 -1567 204291963-64 19430 2146 3374 275 na 987 1362 -1387 234621964-65 22873 2313 3972 363 na 1002 1529 -1627 273671965-66 24144 2665 4420 316 na 938 1478 -2147 288571966-67 28119 2921 4866 514 na 1330 2142 -2939 326691967-68 33509 3265 5395 432 na 1517 2236 -3621 382611968-69 33524 3576 5672 96 na 1608 1968 -1996 405121969-70 36265 4008 6192 554 na 1628 1767 -2275 446051970-71 38474 4479 6488 809 na 1771 1816 -2568 476381971-72 41496 5185 7479 1066 na 1838 2006 -4059 509991972-73 45736 5514 8480 411 na 2225 2049 -4102 562141973-74 55135 6045 9675 1639 na 2830 3176 -3728 684201974-75 66799 7334 12080 2929 na 3835 4779 -7429 807701975-76 68314 8645 13895 2123 na 4812 5664 -5419 867071976-77 71024 9602 15546 1393 na 6139 5614 -4669 934221977-78 81788 10245 17835 1387 na 6640 6517 -5529 1058481978-79 88950 11373 19719 3218 na 7115 7423 -8305 1146471979-80 96590 13074 22564 3791 na 8340 10094 -8536 1257291980-81 118068 15179 26815 188 na 9029 13596 -6041 1496421981-82 135676 17785 32650 5753 na 10256 14809 -11506 1758051982-83 149773 21022 38905 4451 na 11563 15736 -13334 1966441983-84 175357 24288 44005 1787 na 13139 17675 -11880 2290211984-85 194037 27927 50449 4820 na 15846 19484 -16984 2566111985-86 214154 33257 59640 8314 na 14951 21754 -19038 2895241986-87 240209 39322 69476 6532 na 16543 22359 -25774 3239491987-88 266649 46160 81204 2019 na 20281 25259 -22843 3682111988-89 310497 53280 95617 8543 na 25913 32010 -24947 4368931989-90 346807 60997 113993 6014 na 34609 40212 -20279 5019281990-91 398529 69525 139663 6355 na 40635 48698 -19797 5862121991-92 457735 78458 152466 -903 na 56254 56249 -13887 6738751992-93 516118 88846 177929 9839 na 67312 73000 -12499 7745451993-94 591308 103066 191456 -1719 na 86147 85999 7095 891355
Contd....
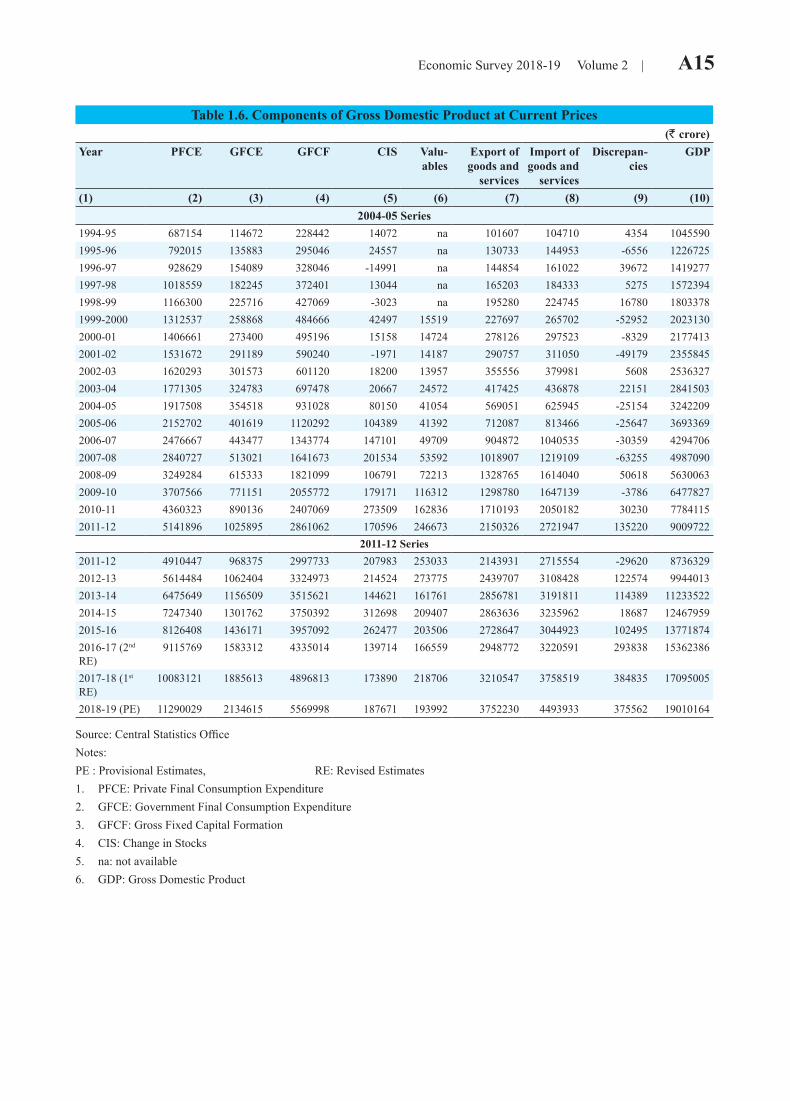
Economic Survey 2018-19 Volume 2 | A15
Table 1.6. Components of Gross Domestic Product at Current Prices(` crore)
Year PFCE GFCE GFCF CIS Valu-ables
Export of goods and
services
Import of goods and
services
Discrepan-cies
GDP
(1) (2) (3) (4) (5) (6) (7) (8) (9) (10)2004-05 Series
1994-95 687154 114672 228442 14072 na 101607 104710 4354 10455901995-96 792015 135883 295046 24557 na 130733 144953 -6556 12267251996-97 928629 154089 328046 -14991 na 144854 161022 39672 14192771997-98 1018559 182245 372401 13044 na 165203 184333 5275 15723941998-99 1166300 225716 427069 -3023 na 195280 224745 16780 18033781999-2000 1312537 258868 484666 42497 15519 227697 265702 -52952 20231302000-01 1406661 273400 495196 15158 14724 278126 297523 -8329 21774132001-02 1531672 291189 590240 -1971 14187 290757 311050 -49179 23558452002-03 1620293 301573 601120 18200 13957 355556 379981 5608 25363272003-04 1771305 324783 697478 20667 24572 417425 436878 22151 28415032004-05 1917508 354518 931028 80150 41054 569051 625945 -25154 32422092005-06 2152702 401619 1120292 104389 41392 712087 813466 -25647 36933692006-07 2476667 443477 1343774 147101 49709 904872 1040535 -30359 42947062007-08 2840727 513021 1641673 201534 53592 1018907 1219109 -63255 49870902008-09 3249284 615333 1821099 106791 72213 1328765 1614040 50618 56300632009-10 3707566 771151 2055772 179171 116312 1298780 1647139 -3786 64778272010-11 4360323 890136 2407069 273509 162836 1710193 2050182 30230 77841152011-12 5141896 1025895 2861062 170596 246673 2150326 2721947 135220 9009722
2011-12 Series2011-12 4910447 968375 2997733 207983 253033 2143931 2715554 -29620 87363292012-13 5614484 1062404 3324973 214524 273775 2439707 3108428 122574 99440132013-14 6475649 1156509 3515621 144621 161761 2856781 3191811 114389 112335222014-15 7247340 1301762 3750392 312698 209407 2863636 3235962 18687 124679592015-16 8126408 1436171 3957092 262477 203506 2728647 3044923 102495 137718742016-17 (2nd RE)
9115769 1583312 4335014 139714 166559 2948772 3220591 293838 15362386
2017-18 (1st RE)
10083121 1885613 4896813 173890 218706 3210547 3758519 384835 17095005
2018-19 (PE) 11290029 2134615 5569998 187671 193992 3752230 4493933 375562 19010164
Source: Central Statistics OfficeNotes:PE : Provisional Estimates, RE: Revised Estimates1. PFCE: Private Final Consumption Expenditure2. GFCE: Government Final Consumption Expenditure3. GFCF: Gross Fixed Capital Formation4. CIS: Change in Stocks5. na: not available6. GDP: Gross Domestic Product
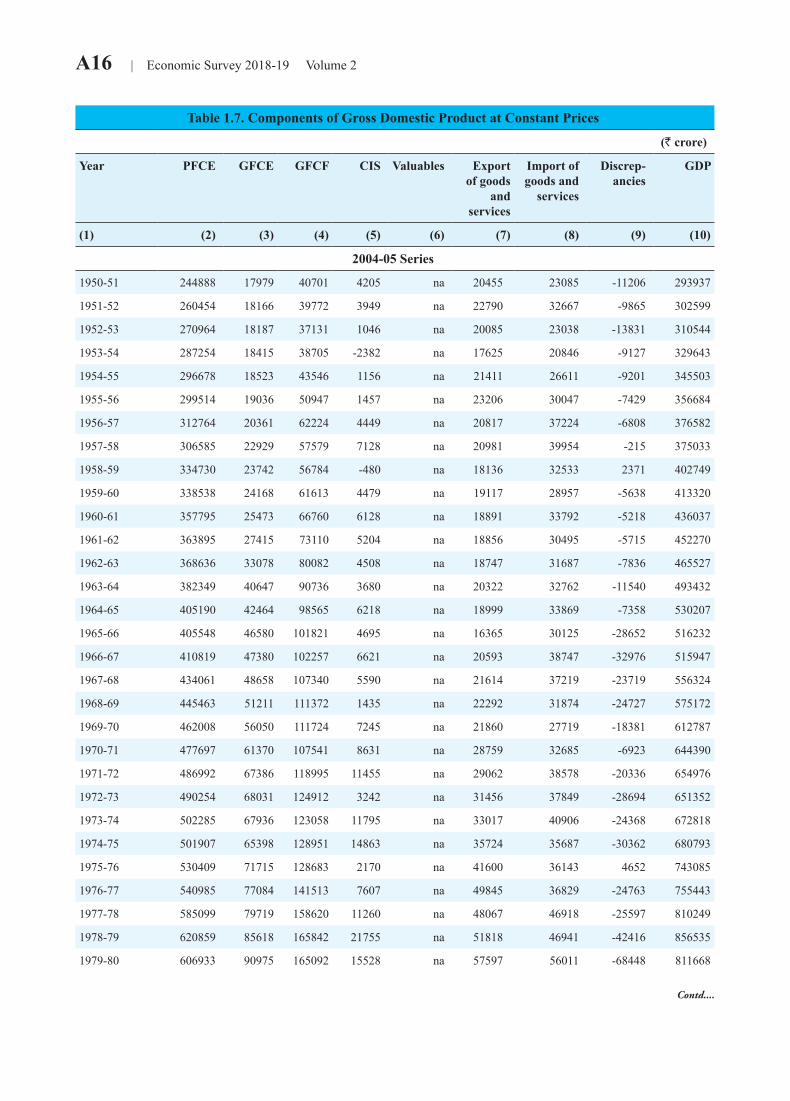
A16 | Economic Survey 2018-19 Volume 2
Table 1.7. Components of Gross Domestic Product at Constant Prices
(R crore)
Year PFCE GFCE GFCF CIS Valuables Export of goods
and services
Import of goods and
services
Discrep-ancies
GDP
(1) (2) (3) (4) (5) (6) (7) (8) (9) (10)
2004-05 Series
1950-51 244888 17979 40701 4205 na 20455 23085 -11206 293937
1951-52 260454 18166 39772 3949 na 22790 32667 -9865 302599
1952-53 270964 18187 37131 1046 na 20085 23038 -13831 310544
1953-54 287254 18415 38705 -2382 na 17625 20846 -9127 329643
1954-55 296678 18523 43546 1156 na 21411 26611 -9201 345503
1955-56 299514 19036 50947 1457 na 23206 30047 -7429 356684
1956-57 312764 20361 62224 4449 na 20817 37224 -6808 376582
1957-58 306585 22929 57579 7128 na 20981 39954 -215 375033
1958-59 334730 23742 56784 -480 na 18136 32533 2371 402749
1959-60 338538 24168 61613 4479 na 19117 28957 -5638 413320
1960-61 357795 25473 66760 6128 na 18891 33792 -5218 436037
1961-62 363895 27415 73110 5204 na 18856 30495 -5715 452270
1962-63 368636 33078 80082 4508 na 18747 31687 -7836 465527
1963-64 382349 40647 90736 3680 na 20322 32762 -11540 493432
1964-65 405190 42464 98565 6218 na 18999 33869 -7358 530207
1965-66 405548 46580 101821 4695 na 16365 30125 -28652 516232
1966-67 410819 47380 102257 6621 na 20593 38747 -32976 515947
1967-68 434061 48658 107340 5590 na 21614 37219 -23719 556324
1968-69 445463 51211 111372 1435 na 22292 31874 -24727 575172
1969-70 462008 56050 111724 7245 na 21860 27719 -18381 612787
1970-71 477697 61370 107541 8631 na 28759 32685 -6923 644390
1971-72 486992 67386 118995 11455 na 29062 38578 -20336 654976
1972-73 490254 68031 124912 3242 na 31456 37849 -28694 651352
1973-74 502285 67936 123058 11795 na 33017 40906 -24368 672818
1974-75 501907 65398 128951 14863 na 35724 35687 -30362 680793
1975-76 530409 71715 128683 2170 na 41600 36143 4652 743085
1976-77 540985 77084 141513 7607 na 49845 36829 -24763 755443
1977-78 585099 79719 158620 11260 na 48067 46918 -25597 810249
1978-79 620859 85618 165842 21755 na 51818 46941 -42416 856535
1979-80 606933 90975 165092 15528 na 57597 56011 -68448 811668
Contd....
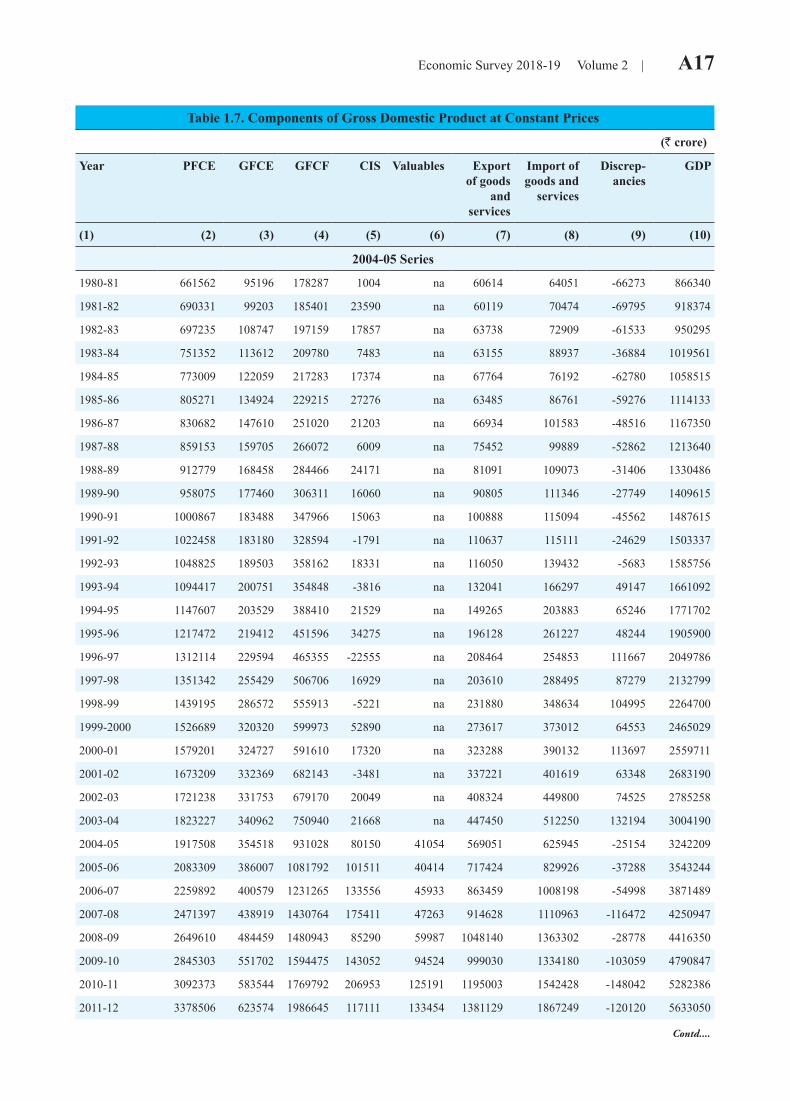
Economic Survey 2018-19 Volume 2 | A17
Table 1.7. Components of Gross Domestic Product at Constant Prices
(R crore)
Year PFCE GFCE GFCF CIS Valuables Export of goods
and services
Import of goods and
services
Discrep-ancies
GDP
(1) (2) (3) (4) (5) (6) (7) (8) (9) (10)
2004-05 Series
1980-81 661562 95196 178287 1004 na 60614 64051 -66273 866340
1981-82 690331 99203 185401 23590 na 60119 70474 -69795 918374
1982-83 697235 108747 197159 17857 na 63738 72909 -61533 950295
1983-84 751352 113612 209780 7483 na 63155 88937 -36884 1019561
1984-85 773009 122059 217283 17374 na 67764 76192 -62780 1058515
1985-86 805271 134924 229215 27276 na 63485 86761 -59276 1114133
1986-87 830682 147610 251020 21203 na 66934 101583 -48516 1167350
1987-88 859153 159705 266072 6009 na 75452 99889 -52862 1213640
1988-89 912779 168458 284466 24171 na 81091 109073 -31406 1330486
1989-90 958075 177460 306311 16060 na 90805 111346 -27749 1409615
1990-91 1000867 183488 347966 15063 na 100888 115094 -45562 1487615
1991-92 1022458 183180 328594 -1791 na 110637 115111 -24629 1503337
1992-93 1048825 189503 358162 18331 na 116050 139432 -5683 1585756
1993-94 1094417 200751 354848 -3816 na 132041 166297 49147 1661092
1994-95 1147607 203529 388410 21529 na 149265 203883 65246 1771702
1995-96 1217472 219412 451596 34275 na 196128 261227 48244 1905900
1996-97 1312114 229594 465355 -22555 na 208464 254853 111667 2049786
1997-98 1351342 255429 506706 16929 na 203610 288495 87279 2132799
1998-99 1439195 286572 555913 -5221 na 231880 348634 104995 2264700
1999-2000 1526689 320320 599973 52890 na 273617 373012 64553 2465029
2000-01 1579201 324727 591610 17320 na 323288 390132 113697 2559711
2001-02 1673209 332369 682143 -3481 na 337221 401619 63348 2683190
2002-03 1721238 331753 679170 20049 na 408324 449800 74525 2785258
2003-04 1823227 340962 750940 21668 na 447450 512250 132194 3004190
2004-05 1917508 354518 931028 80150 41054 569051 625945 -25154 3242209
2005-06 2083309 386007 1081792 101511 40414 717424 829926 -37288 3543244
2006-07 2259892 400579 1231265 133556 45933 863459 1008198 -54998 3871489
2007-08 2471397 438919 1430764 175411 47263 914628 1110963 -116472 4250947
2008-09 2649610 484459 1480943 85290 59987 1048140 1363302 -28778 4416350
2009-10 2845303 551702 1594475 143052 94524 999030 1334180 -103059 4790847
2010-11 3092373 583544 1769792 206953 125191 1195003 1542428 -148042 5282386
2011-12 3378506 623574 1986645 117111 133454 1381129 1867249 -120120 5633050
Contd....

A18 | Economic Survey 2018-19 Volume 2
Table 1.7. Components of Gross Domestic Product at Constant Prices
(R crore)
Year PFCE GFCE GFCF CIS Valuables Export of goods
and services
Import of goods and
services
Discrep-ancies
GDP
(1) (2) (3) (4) (5) (6) (7) (8) (9) (10)
2011-12 Series
2011-12 4910447 968375 2997733 207983 253033 2143931 2715554 -29620 8736329
2012-13 5179091 974263 3145793 201528 259949 2289836 2879079 41635 9213017
2013-14 5557329 979825 3194924 129758 148879 2468269 2644555 -33060 9801370
2014-15 5912657 1054151 3278096 274751 187957 2512145 2667595 -24487 10527674
2015-16 6381419 1132802 3492183 239557 185986 2370282 2511540 78804 11369493
2016-17 (2nd RE)
6904085 1199041 3783778 124087 150784 2490437 2621586 267700 12298327
2017-18 (1st RE)
7417489 1378563 4136572 150417 192120 2607310 3083560 380947 13179857
2018-19 (PE) 8016674 1506035 4548452 157637 174780 2933969 3557901 297939 14077586
Source: Central Statistics OfficeNotes: PE : Provisional Estimates, RE: Revised Estimates1. PFCE: Private Final Consumption Expenditure 2. GFCE: Government Final Consumption Expenditure 3. GFCF: Gross Fixed Capital Formation 4. CIS: Change in Stocks 5. na: not available 6. GDP: Gross Domestic Product

Economic Survey 2018-19 Volume 2 | A19 Ta
ble
1.8.
Gro
ss D
omes
tic S
avin
g an
d G
ross
Cap
ital F
orm
atio
n (a
t cur
rent
pri
ces)
(` c
rore
)
Year
Gro
ss d
omes
tic sa
ving
Gro
ss fi
xed
capi
tal f
orm
a-tio
nC
hang
e in
stoc
ksG
ross
cap
ital f
orm
atio
nG
ross
dom
estic
prod
uct
Hou
se-
hold
sect
or
Priv
ate
corp
o-ra
tese
ctor
Publ
icse
ctor
Tota
l(2
+3+4
)Pu
blic
sect
orPr
ivat
ese
ctor
Tota
l(6
+7)
Publ
icse
ctor
Priv
ate
sect
orTo
tal
(9+1
0)Pu
blic
sect
orPr
ivat
ese
ctor
Valu
-ab
les
Tota
l(1
2+13
+14)
Err
ors &
omis
-si
ons
Adj
ust- ed
tota
l(1
5+16
)
(1)
(2)
(3)
(4)
(5)
(6)
(7)
(8)
(9)
(10)
(11)
(12)
(13)
(14)
(15)
(16)
(17)
(18)
2004
-05
seri
es
1950
-51
681
9321
598
926
470
496
826
140
165
290
844
na11
33-1
6596
810
401
1951
-52
634
136
309
1079
304
741
1045
3014
317
333
488
4na
1218
4412
6211
054
1952
-53
695
6419
595
432
465
097
4-1
859
4030
670
9na
1014
-95
920
1085
0
1953
-54
672
9018
194
338
158
796
8-2
6-4
2-6
735
554
5na
901
2993
011
810
1954
-55
774
118
213
1105
453
659
1112
45-9
3649
865
0na
1148
-28
1121
1117
0
1955
-56
1041
134
247
1422
619
765
1384
-25
7753
594
842
na14
3724
1461
1137
1
1956
-57
1222
155
318
1696
721
1050
1771
3719
823
575
812
48na
2006
4920
5613
547
1957
-58
1028
121
336
1485
752
1051
1803
139
103
242
891
1154
na20
45-8
719
5813
951
1958
-59
986
140
325
1450
817
965
1782
83-8
12
900
884
na17
8442
1826
1555
1
1959
-60
1267
185
351
1803
1045
958
2003
1219
820
910
5711
56na
2212
-178
2034
1638
4
1960
-61
1226
281
572
2079
1215
1075
2290
6326
532
812
7813
40na
2618
-58
2560
1794
2
1961
-62
1237
320
654
2211
1269
1285
2554
2924
727
612
9815
32na
2830
-274
2556
1901
0
1962
-63
1519
344
750
2613
1510
1332
2842
9726
035
716
0715
92na
3199
-146
3053
2042
9
1963
-64
1589
394
929
2912
1794
1580
3374
8718
827
518
8117
68na
3649
-297
3352
2346
2
1964
-65
1897
389
1072
3358
2106
1866
3972
9027
236
321
9621
38na
4335
-377
3958
2736
7
1965
-66
2596
405
1085
4086
2348
2072
4420
124
192
316
2472
2264
na47
36-5
146
8528
857
1966
-67
3161
424
941
4526
2360
2506
4866
6445
051
424
2429
56na
5380
6954
4932
669
1967
-68
3275
410
944
4629
2320
3075
5395
233
199
432
2553
3274
na58
27-3
6154
6638
261
1968
-69
3277
439
1165
4881
2431
3241
5672
4155
9624
7232
96na
5768
-471
5297
4051
2
Con
td....
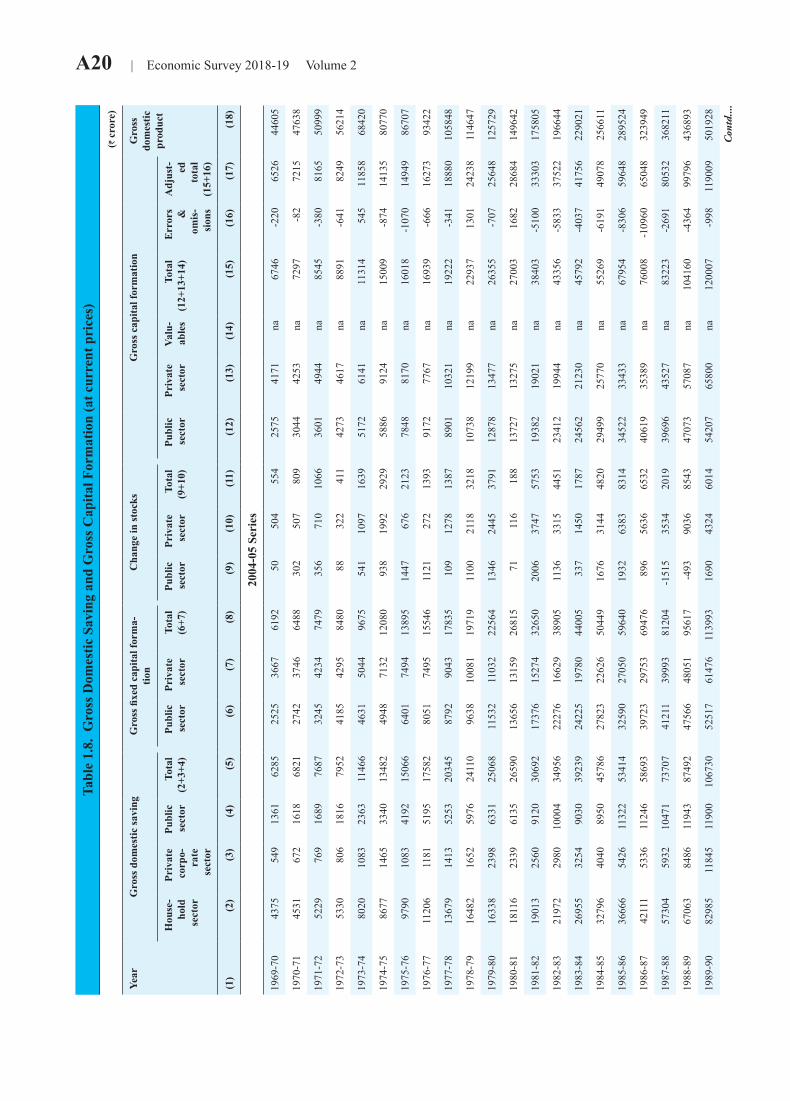
A20 | Economic Survey 2018-19 Volume 2
Tabl
e 1.
8. G
ross
Dom
estic
Sav
ing
and
Gro
ss C
apita
l For
mat
ion
(at c
urre
nt p
rice
s)(`
cro
re)
Year
Gro
ss d
omes
tic sa
ving
Gro
ss fi
xed
capi
tal f
orm
a-tio
nC
hang
e in
stoc
ksG
ross
cap
ital f
orm
atio
nG
ross
dom
estic
prod
uct
Hou
se-
hold
sect
or
Priv
ate
corp
o-ra
tese
ctor
Publ
icse
ctor
Tota
l(2
+3+4
)Pu
blic
sect
orPr
ivat
ese
ctor
Tota
l(6
+7)
Publ
icse
ctor
Priv
ate
sect
orTo
tal
(9+1
0)Pu
blic
sect
orPr
ivat
ese
ctor
Valu
-ab
les
Tota
l(1
2+13
+14)
Err
ors &
omis
-si
ons
Adj
ust- ed
tota
l(1
5+16
)
(1)
(2)
(3)
(4)
(5)
(6)
(7)
(8)
(9)
(10)
(11)
(12)
(13)
(14)
(15)
(16)
(17)
(18)
2004
-05
Seri
es
1969
-70
4375
549
1361
6285
2525
3667
6192
5050
455
425
7541
71na
6746
-220
6526
4460
5
1970
-71
4531
672
1618
6821
2742
3746
6488
302
507
809
3044
4253
na72
97-8
272
1547
638
1971
-72
5229
769
1689
7687
3245
4234
7479
356
710
1066
3601
4944
na85
45-3
8081
6550
999
1972
-73
5330
806
1816
7952
4185
4295
8480
8832
241
142
7346
17na
8891
-641
8249
5621
4
1973
-74
8020
1083
2363
1146
646
3150
4496
7554
110
9716
3951
7261
41na
1131
454
511
858
6842
0
1974
-75
8677
1465
3340
1348
249
4871
3212
080
938
1992
2929
5886
9124
na15
009
-874
1413
580
770
1975
-76
9790
1083
4192
1506
664
0174
9413
895
1447
676
2123
7848
8170
na16
018
-107
014
949
8670
7
1976
-77
1120
611
8151
9517
582
8051
7495
1554
611
2127
213
9391
7277
67na
1693
9-6
6616
273
9342
2
1977
-78
1367
914
1352
5320
345
8792
9043
1783
510
912
7813
8789
0110
321
na19
222
-341
1888
010
5848
1978
-79
1648
216
5259
7624
110
9638
1008
119
719
1100
2118
3218
1073
812
199
na22
937
1301
2423
811
4647
1979
-80
1633
823
9863
3125
068
1153
211
032
2256
413
4624
4537
9112
878
1347
7na
2635
5-7
0725
648
1257
29
1980
-81
1811
623
3961
3526
590
1365
613
159
2681
571
116
188
1372
713
275
na27
003
1682
2868
414
9642
1981
-82
1901
325
6091
2030
692
1737
615
274
3265
020
0637
4757
5319
382
1902
1na
3840
3-5
100
3330
317
5805
1982
-83
2197
229
8010
004
3495
622
276
1662
938
905
1136
3315
4451
2341
219
944
na43
356
-583
337
522
1966
44
1983
-84
2695
532
5490
3039
239
2422
519
780
4400
533
714
5017
8724
562
2123
0na
4579
2-4
037
4175
622
9021
1984
-85
3279
640
4089
5045
786
2782
322
626
5044
916
7631
4448
2029
499
2577
0na
5526
9-6
191
4907
825
6611
1985
-86
3666
654
2611
322
5341
432
590
2705
059
640
1932
6383
8314
3452
233
433
na67
954
-830
659
648
2895
24
1986
-87
4211
153
3611
246
5869
339
723
2975
369
476
896
5636
6532
4061
935
389
na76
008
-109
6065
048
3239
49
1987
-88
5730
459
3210
471
7370
741
211
3999
381
204
-151
535
3420
1939
696
4352
7na
8322
3-2
691
8053
236
8211
1988
-89
6706
384
8611
943
8749
247
566
4805
195
617
-493
9036
8543
4707
357
087
na10
4160
-436
499
796
4368
93
1989
-90
8298
511
845
1190
010
6730
5251
761
476
1139
9316
9043
2460
1454
207
6580
0na
1200
07-9
9811
9009
5019
28
Con
td....
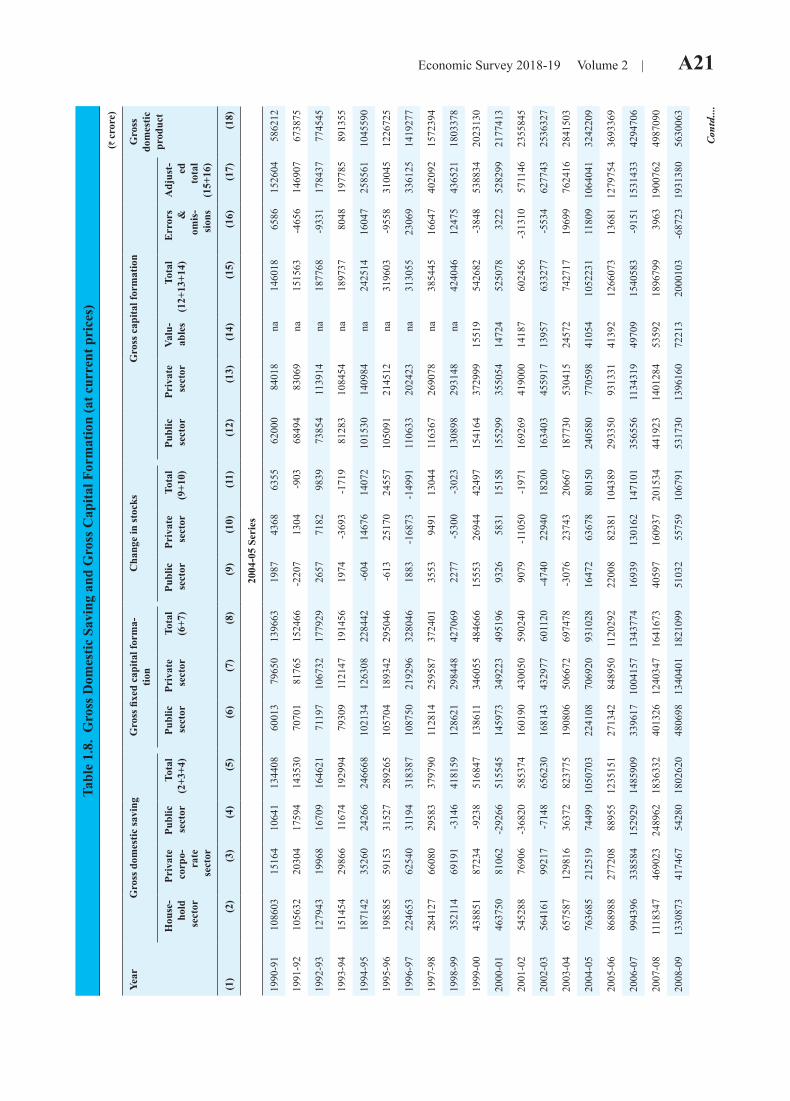
Economic Survey 2018-19 Volume 2 | A21 Ta
ble
1.8.
Gro
ss D
omes
tic S
avin
g an
d G
ross
Cap
ital F
orm
atio
n (a
t cur
rent
pri
ces)
(` c
rore
)
Year
Gro
ss d
omes
tic sa
ving
Gro
ss fi
xed
capi
tal f
orm
a-tio
nC
hang
e in
stoc
ksG
ross
cap
ital f
orm
atio
nG
ross
dom
estic
prod
uct
Hou
se-
hold
sect
or
Priv
ate
corp
o-ra
tese
ctor
Publ
icse
ctor
Tota
l(2
+3+4
)Pu
blic
sect
orPr
ivat
ese
ctor
Tota
l(6
+7)
Publ
icse
ctor
Priv
ate
sect
orTo
tal
(9+1
0)Pu
blic
sect
orPr
ivat
ese
ctor
Valu
-ab
les
Tota
l(1
2+13
+14)
Err
ors &
omis
-si
ons
Adj
ust- ed
tota
l(1
5+16
)
(1)
(2)
(3)
(4)
(5)
(6)
(7)
(8)
(9)
(10)
(11)
(12)
(13)
(14)
(15)
(16)
(17)
(18)
2004
-05
Seri
es
1990
-91
1086
0315
164
1064
113
4408
6001
379
650
1396
6319
8743
6863
5562
000
8401
8na
1460
1865
8615
2604
5862
12
1991
-92
1056
3220
304
1759
414
3530
7070
181
765
1524
66-2
207
1304
-903
6849
483
069
na15
1563
-465
614
6907
6738
75
1992
-93
1279
4319
968
1670
916
4621
7119
710
6732
1779
2926
5771
8298
3973
854
1139
14na
1877
68-9
331
1784
3777
4545
1993
-94
1514
5429
866
1167
419
2994
7930
911
2147
1914
5619
74-3
693
-171
981
283
1084
54na
1897
3780
4819
7785
8913
55
1994
-95
1871
4235
260
2426
624
6668
1021
3412
6308
2284
42-6
0414
676
1407
210
1530
1409
84na
2425
1416
047
2585
6110
4559
0
1995
-96
1985
8559
153
3152
728
9265
1057
0418
9342
2950
46-6
1325
170
2455
710
5091
2145
12na
3196
03-9
558
3100
4512
2672
5
1996
-97
2246
5362
540
3119
431
8387
1087
5021
9296
3280
4618
83-1
6873
-149
9111
0633
2024
23na
3130
5523
069
3361
2514
1927
7
1997
-98
2841
2766
080
2958
337
9790
1128
1425
9587
3724
0135
5394
9113
044
1163
6726
9078
na38
5445
1664
740
2092
1572
394
1998
-99
3521
1469
191
-314
641
8159
1286
2129
8448
4270
6922
77-5
300
-302
313
0898
2931
48na
4240
4612
475
4365
2118
0337
8
1999
-00
4388
5187
234
-923
851
6847
1386
1134
6055
4846
6615
553
2694
442
497
1541
6437
2999
1551
954
2682
-384
853
8834
2023
130
2000
-01
4637
5081
062
-292
6651
5545
1459
7334
9223
4951
9693
2658
3115
158
1552
9935
5054
1472
452
5078
3222
5282
9921
7741
3
2001
-02
5452
8876
906
-368
2058
5374
1601
9043
0050
5902
4090
79-1
1050
-197
116
9269
4190
0014
187
6024
56-3
1310
5711
4623
5584
5
2002
-03
5641
6199
217
-714
865
6230
1681
4343
2977
6011
20-4
740
2294
018
200
1634
0345
5917
1395
763
3277
-553
462
7743
2536
327
2003
-04
6575
8712
9816
3637
282
3775
1908
0650
6672
6974
78-3
076
2374
320
667
1877
3053
0415
2457
274
2717
1969
976
2416
2841
503
2004
-05
7636
8521
2519
7449
910
5070
322
4108
7069
2093
1028
1647
263
678
8015
024
0580
7705
9841
054
1052
231
1180
910
6404
132
4220
9
2005
-06
8689
8827
7208
8895
512
3515
127
1342
8489
5011
2029
222
008
8238
110
4389
2933
5093
1331
4139
212
6607
313
681
1279
754
3693
369
2006
-07
9943
9633
8584
1529
2914
8590
933
9617
1004
157
1343
774
1693
913
0162
1471
0135
6556
1134
319
4970
915
4058
3-9
151
1531
433
4294
706
2007
-08
1118
347
4690
2324
8962
1836
332
4013
2612
4034
716
4167
340
597
1609
3720
1534
4419
2314
0128
453
592
1896
799
3963
1900
762
4987
090
2008
-09
1330
873
4174
6754
280
1802
620
4806
9813
4040
118
2109
951
032
5575
910
6791
5317
3013
9616
072
213
2000
103
-687
2319
3138
056
3006
3
Con
td....
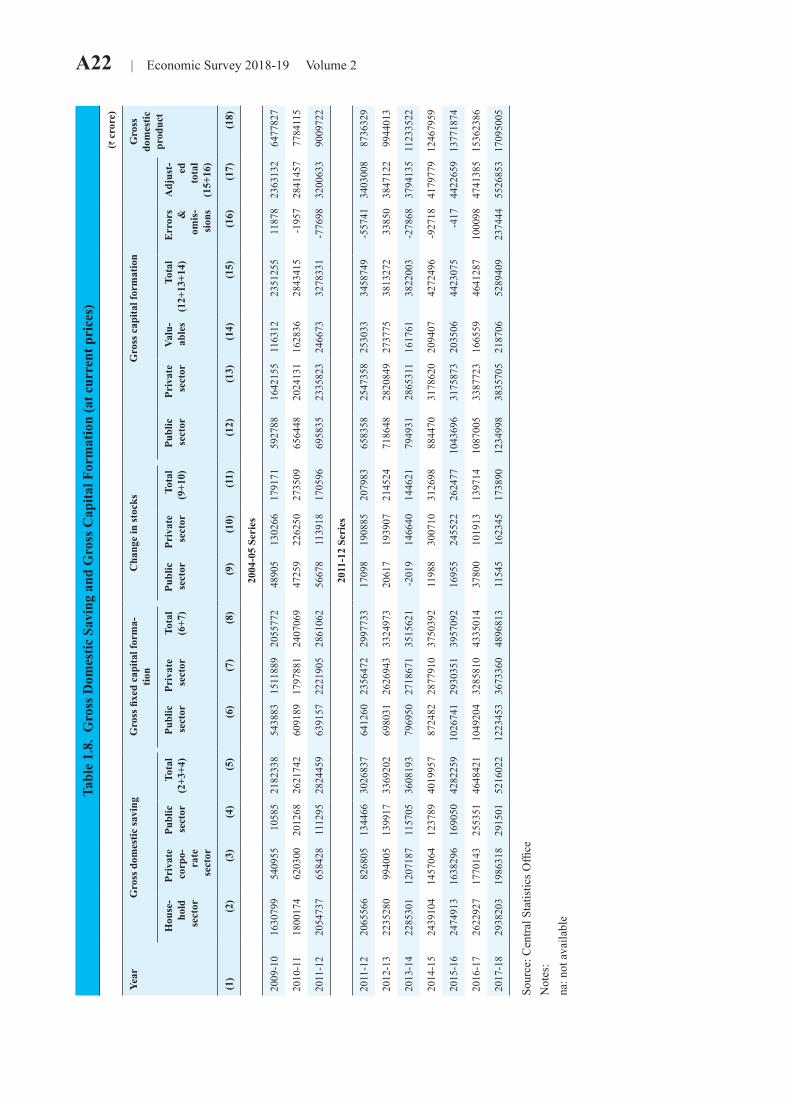
A22 | Economic Survey 2018-19 Volume 2
Tabl
e 1.
8. G
ross
Dom
estic
Sav
ing
and
Gro
ss C
apita
l For
mat
ion
(at c
urre
nt p
rice
s)(`
cro
re)
Year
Gro
ss d
omes
tic sa
ving
Gro
ss fi
xed
capi
tal f
orm
a-tio
nC
hang
e in
stoc
ksG
ross
cap
ital f
orm
atio
nG
ross
dom
estic
prod
uct
Hou
se-
hold
sect
or
Priv
ate
corp
o-ra
tese
ctor
Publ
icse
ctor
Tota
l(2
+3+4
)Pu
blic
sect
orPr
ivat
ese
ctor
Tota
l(6
+7)
Publ
icse
ctor
Priv
ate
sect
orTo
tal
(9+1
0)Pu
blic
sect
orPr
ivat
ese
ctor
Valu
-ab
les
Tota
l(1
2+13
+14)
Err
ors &
omis
-si
ons
Adj
ust- ed
tota
l(1
5+16
)
(1)
(2)
(3)
(4)
(5)
(6)
(7)
(8)
(9)
(10)
(11)
(12)
(13)
(14)
(15)
(16)
(17)
(18)
2004
-05
Seri
es
2009
-10
1630
799
5409
5510
585
2182
338
5438
8315
1188
920
5577
248
905
1302
6617
9171
5927
8816
4215
511
6312
2351
255
1187
823
6313
264
7782
7
2010
-11
1800
174
6203
0020
1268
2621
742
6091
8917
9788
124
0706
947
259
2262
5027
3509
6564
4820
2413
116
2836
2843
415
-195
728
4145
777
8411
5
2011
-12
2054
737
6584
2811
1295
2824
459
6391
5722
2190
528
6106
256
678
1139
1817
0596
6958
3523
3582
324
6673
3278
331
-776
9832
0063
390
0972
2
2011
-12
Seri
es
2011
-12
2065
566
8268
0513
4466
3026
837
6412
6023
5647
229
9773
317
098
1908
8520
7983
6583
5825
4735
825
3033
3458
749
-557
4134
0300
887
3632
9
2012
-13
2235
280
9940
0513
9917
3369
202
6980
3126
2694
333
2497
320
617
1939
0721
4524
7186
4828
2084
927
3775
3813
272
3385
038
4712
299
4401
3
2013
-14
2285
301
1207
187
1157
0536
0819
379
6950
2718
671
3515
621
-201
914
6640
1446
2179
4931
2865
311
1617
6138
2200
3-2
7868
3794
135
1123
3522
2014
-15
2439
104
1457
064
1237
8940
1995
787
2482
2877
910
3750
392
1198
830
0710
3126
9888
4470
3178
620
2094
0742
7249
6-9
2718
4179
779
1246
7959
2015
-16
2474
913
1638
296
1690
5042
8225
910
2674
129
3035
139
5709
216
955
2455
2226
2477
1043
696
3175
873
2035
0644
2307
5-4
1744
2265
913
7718
74
2016
-17
2622
927
1770
143
2553
5146
4842
110
4920
432
8581
043
3501
437
800
1019
1313
9714
1087
005
3387
723
1665
5946
4128
710
0098
4741
385
1536
2386
2017
-18
2938
203
1986
318
2915
0152
1602
212
2345
336
7336
048
9681
311
545
1623
4517
3890
1234
998
3835
705
2187
0652
8940
923
7444
5526
853
1709
5005
Sour
ce: C
entra
l Sta
tistic
s Offi
ceN
otes
:na
: not
ava
ilabl
e
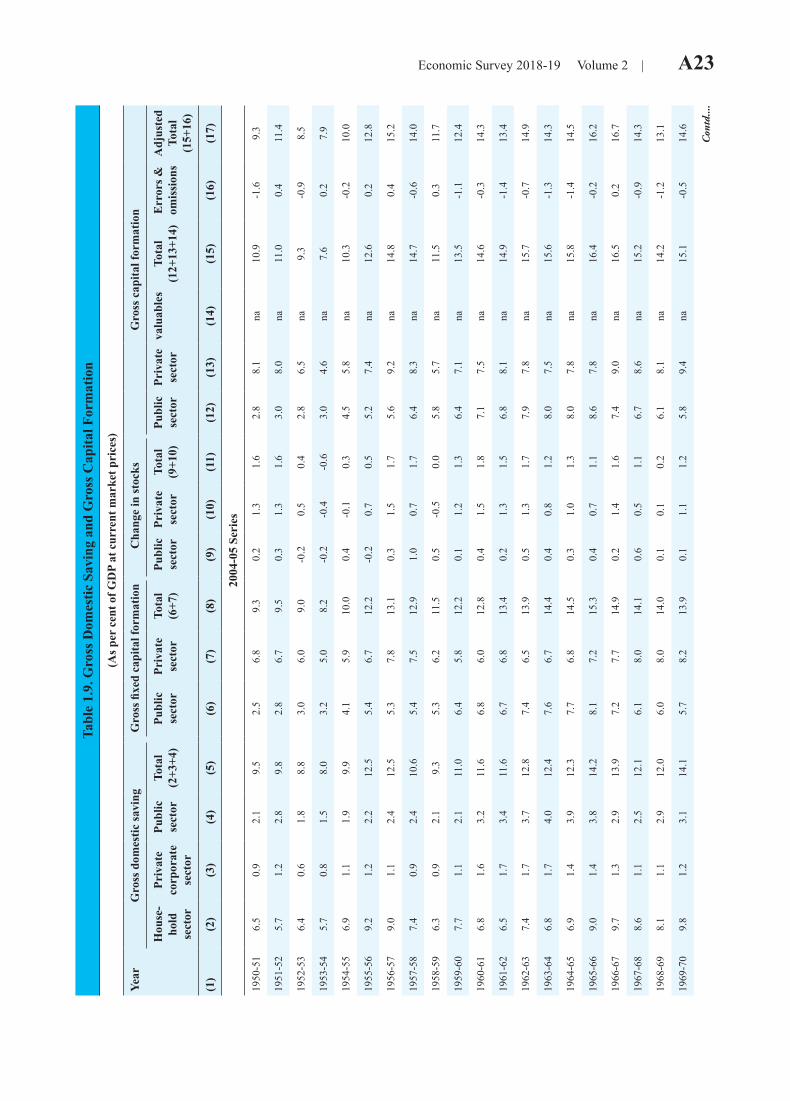
Economic Survey 2018-19 Volume 2 | A23 Ta
ble
1.9.
Gro
ss D
omes
tic S
avin
g an
d G
ross
Cap
ital F
orm
atio
n
(As p
er c
ent o
f GD
P at
cur
rent
mar
ket p
rice
s)
Year
Gro
ss d
omes
tic sa
ving
Gro
ss fi
xed
capi
tal f
orm
atio
n C
hang
e in
stoc
ks
Gro
ss c
apita
l for
mat
ion
Hou
se-
hold
sect
or
Priv
ate
corp
orat
ese
ctor
Publ
icse
ctor
Tota
l(2
+3+4
)Pu
blic
sect
orPr
ivat
ese
ctor
Tota
l(6
+7)
Publ
icse
ctor
Priv
ate
sect
orTo
tal
(9+1
0)Pu
blic
sect
orPr
ivat
e se
ctor
valu
able
sTo
tal
(12+
13+1
4)E
rror
s &om
issi
ons
Adj
uste
dTo
tal
(15+
16)
(1)
(2)
(3)
(4)
(5)
(6)
(7)
(8)
(9)
(10)
(11)
(12)
(13)
(14)
(15)
(16)
(17)
2004
-05
Seri
es
1950
-51
6.5
0.9
2.1
9.5
2.5
6.8
9.3
0.2
1.3
1.6
2.8
8.1
na10
.9-1
.69.
3
1951
-52
5.7
1.2
2.8
9.8
2.8
6.7
9.5
0.3
1.3
1.6
3.0
8.0
na11
.00.
411
.4
1952
-53
6.4
0.6
1.8
8.8
3.0
6.0
9.0
-0.2
0.5
0.4
2.8
6.5
na9.
3-0
.98.
5
1953
-54
5.7
0.8
1.5
8.0
3.2
5.0
8.2
-0.2
-0.4
-0.6
3.0
4.6
na7.
60.
27.
9
1954
-55
6.9
1.1
1.9
9.9
4.1
5.9
10.0
0.4
-0.1
0.3
4.5
5.8
na10
.3-0
.210
.0
1955
-56
9.2
1.2
2.2
12.5
5.4
6.7
12.2
-0.2
0.7
0.5
5.2
7.4
na12
.60.
212
.8
1956
-57
9.0
1.1
2.4
12.5
5.3
7.8
13.1
0.3
1.5
1.7
5.6
9.2
na14
.80.
415
.2
1957
-58
7.4
0.9
2.4
10.6
5.4
7.5
12.9
1.0
0.7
1.7
6.4
8.3
na14
.7-0
.614
.0
1958
-59
6.3
0.9
2.1
9.3
5.3
6.2
11.5
0.5
-0.5
0.0
5.8
5.7
na11
.50.
311
.7
1959
-60
7.7
1.1
2.1
11.0
6.4
5.8
12.2
0.1
1.2
1.3
6.4
7.1
na13
.5-1
.112
.4
1960
-61
6.8
1.6
3.2
11.6
6.8
6.0
12.8
0.4
1.5
1.8
7.1
7.5
na14
.6-0
.314
.3
1961
-62
6.5
1.7
3.4
11.6
6.7
6.8
13.4
0.2
1.3
1.5
6.8
8.1
na14
.9-1
.413
.4
1962
-63
7.4
1.7
3.7
12.8
7.4
6.5
13.9
0.5
1.3
1.7
7.9
7.8
na15
.7-0
.714
.9
1963
-64
6.8
1.7
4.0
12.4
7.6
6.7
14.4
0.4
0.8
1.2
8.0
7.5
na15
.6-1
.314
.3
1964
-65
6.9
1.4
3.9
12.3
7.7
6.8
14.5
0.3
1.0
1.3
8.0
7.8
na15
.8-1
.414
.5
1965
-66
9.0
1.4
3.8
14.2
8.1
7.2
15.3
0.4
0.7
1.1
8.6
7.8
na16
.4-0
.216
.2
1966
-67
9.7
1.3
2.9
13.9
7.2
7.7
14.9
0.2
1.4
1.6
7.4
9.0
na16
.50.
216
.7
1967
-68
8.6
1.1
2.5
12.1
6.1
8.0
14.1
0.6
0.5
1.1
6.7
8.6
na15
.2-0
.914
.3
1968
-69
8.1
1.1
2.9
12.0
6.0
8.0
14.0
0.1
0.1
0.2
6.1
8.1
na14
.2-1
.213
.1
1969
-70
9.8
1.2
3.1
14.1
5.7
8.2
13.9
0.1
1.1
1.2
5.8
9.4
na15
.1-0
.514
.6
Con
td....
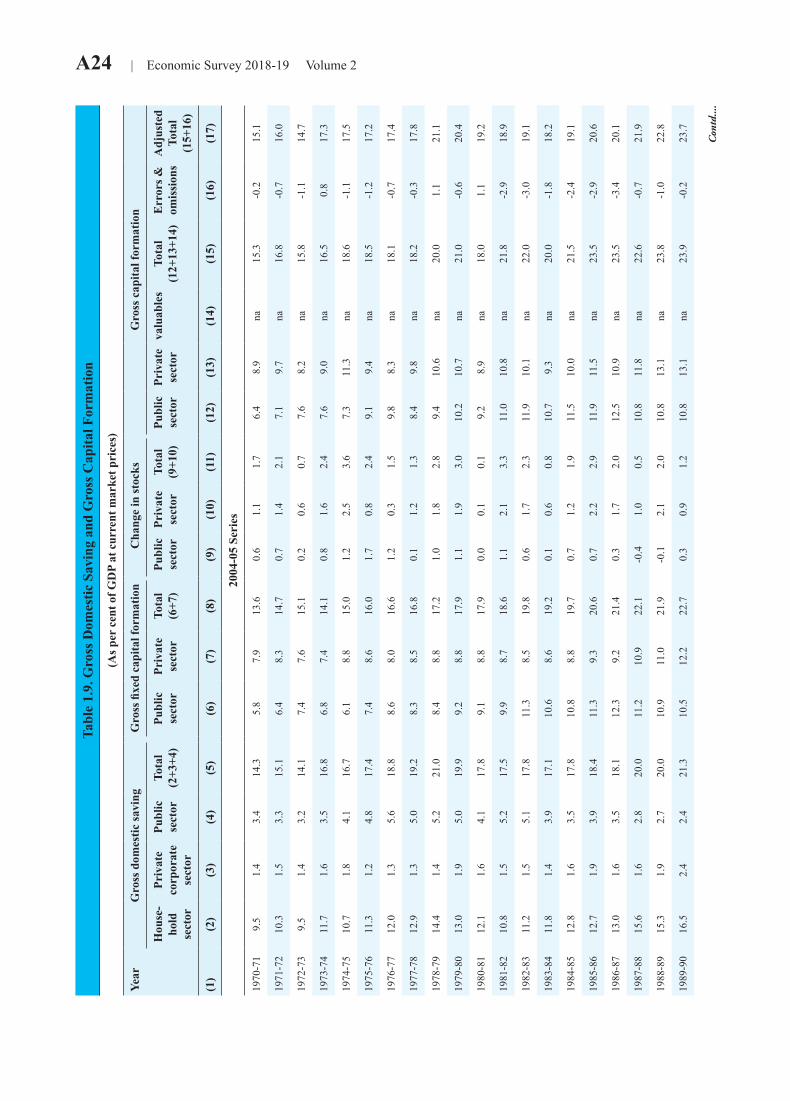
A24 | Economic Survey 2018-19 Volume 2
Tabl
e 1.
9. G
ross
Dom
estic
Sav
ing
and
Gro
ss C
apita
l For
mat
ion
(As p
er c
ent o
f GD
P at
cur
rent
mar
ket p
rice
s)
Year
Gro
ss d
omes
tic sa
ving
Gro
ss fi
xed
capi
tal f
orm
atio
n C
hang
e in
stoc
ks
Gro
ss c
apita
l for
mat
ion
Hou
se-
hold
sect
or
Priv
ate
corp
orat
ese
ctor
Publ
icse
ctor
Tota
l(2
+3+4
)Pu
blic
sect
orPr
ivat
ese
ctor
Tota
l(6
+7)
Publ
icse
ctor
Priv
ate
sect
orTo
tal
(9+1
0)Pu
blic
sect
orPr
ivat
e se
ctor
valu
able
sTo
tal
(12+
13+1
4)E
rror
s &om
issi
ons
Adj
uste
dTo
tal
(15+
16)
(1)
(2)
(3)
(4)
(5)
(6)
(7)
(8)
(9)
(10)
(11)
(12)
(13)
(14)
(15)
(16)
(17)
2004
-05
Seri
es
1970
-71
9.5
1.4
3.4
14.3
5.8
7.9
13.6
0.6
1.1
1.7
6.4
8.9
na15
.3-0
.215
.1
1971
-72
10.3
1.5
3.3
15.1
6.4
8.3
14.7
0.7
1.4
2.1
7.1
9.7
na16
.8-0
.716
.0
1972
-73
9.5
1.4
3.2
14.1
7.4
7.6
15.1
0.2
0.6
0.7
7.6
8.2
na15
.8-1
.114
.7
1973
-74
11.7
1.6
3.5
16.8
6.8
7.4
14.1
0.8
1.6
2.4
7.6
9.0
na16
.50.
817
.3
1974
-75
10.7
1.8
4.1
16.7
6.1
8.8
15.0
1.2
2.5
3.6
7.3
11.3
na18
.6-1
.117
.5
1975
-76
11.3
1.2
4.8
17.4
7.4
8.6
16.0
1.7
0.8
2.4
9.1
9.4
na18
.5-1
.217
.2
1976
-77
12.0
1.3
5.6
18.8
8.6
8.0
16.6
1.2
0.3
1.5
9.8
8.3
na18
.1-0
.717
.4
1977
-78
12.9
1.3
5.0
19.2
8.3
8.5
16.8
0.1
1.2
1.3
8.4
9.8
na18
.2-0
.317
.8
1978
-79
14.4
1.4
5.2
21.0
8.4
8.8
17.2
1.0
1.8
2.8
9.4
10.6
na20
.01.
121
.1
1979
-80
13.0
1.9
5.0
19.9
9.2
8.8
17.9
1.1
1.9
3.0
10.2
10.7
na21
.0-0
.620
.4
1980
-81
12.1
1.6
4.1
17.8
9.1
8.8
17.9
0.0
0.1
0.1
9.2
8.9
na18
.01.
119
.2
1981
-82
10.8
1.5
5.2
17.5
9.9
8.7
18.6
1.1
2.1
3.3
11.0
10.8
na21
.8-2
.918
.9
1982
-83
11.2
1.5
5.1
17.8
11.3
8.5
19.8
0.6
1.7
2.3
11.9
10.1
na22
.0-3
.019
.1
1983
-84
11.8
1.4
3.9
17.1
10.6
8.6
19.2
0.1
0.6
0.8
10.7
9.3
na20
.0-1
.818
.2
1984
-85
12.8
1.6
3.5
17.8
10.8
8.8
19.7
0.7
1.2
1.9
11.5
10.0
na21
.5-2
.419
.1
1985
-86
12.7
1.9
3.9
18.4
11.3
9.3
20.6
0.7
2.2
2.9
11.9
11.5
na23
.5-2
.920
.6
1986
-87
13.0
1.6
3.5
18.1
12.3
9.2
21.4
0.3
1.7
2.0
12.5
10.9
na23
.5-3
.420
.1
1987
-88
15.6
1.6
2.8
20.0
11.2
10.9
22.1
-0.4
1.0
0.5
10.8
11.8
na22
.6-0
.721
.9
1988
-89
15.3
1.9
2.7
20.0
10.9
11.0
21.9
-0.1
2.1
2.0
10.8
13.1
na23
.8-1
.022
.8
1989
-90
16.5
2.4
2.4
21.3
10.5
12.2
22.7
0.3
0.9
1.2
10.8
13.1
na23
.9-0
.223
.7
Con
td....
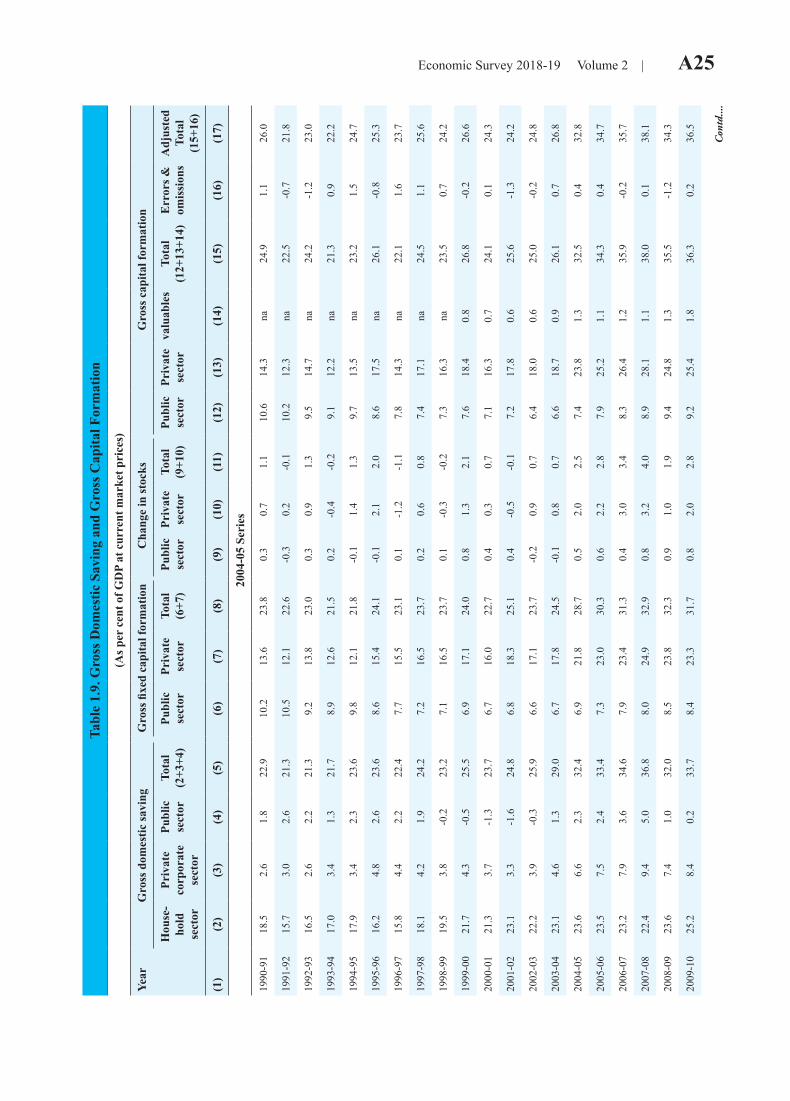
Economic Survey 2018-19 Volume 2 | A25 Ta
ble
1.9.
Gro
ss D
omes
tic S
avin
g an
d G
ross
Cap
ital F
orm
atio
n
(As p
er c
ent o
f GD
P at
cur
rent
mar
ket p
rice
s)
Year
Gro
ss d
omes
tic sa
ving
Gro
ss fi
xed
capi
tal f
orm
atio
n C
hang
e in
stoc
ks
Gro
ss c
apita
l for
mat
ion
Hou
se-
hold
sect
or
Priv
ate
corp
orat
ese
ctor
Publ
icse
ctor
Tota
l(2
+3+4
)Pu
blic
sect
orPr
ivat
ese
ctor
Tota
l(6
+7)
Publ
icse
ctor
Priv
ate
sect
orTo
tal
(9+1
0)Pu
blic
sect
orPr
ivat
e se
ctor
valu
able
sTo
tal
(12+
13+1
4)E
rror
s &om
issi
ons
Adj
uste
dTo
tal
(15+
16)
(1)
(2)
(3)
(4)
(5)
(6)
(7)
(8)
(9)
(10)
(11)
(12)
(13)
(14)
(15)
(16)
(17)
2004
-05
Seri
es
1990
-91
18.5
2.6
1.8
22.9
10.2
13.6
23.8
0.3
0.7
1.1
10.6
14.3
na24
.91.
126
.0
1991
-92
15.7
3.0
2.6
21.3
10.5
12.1
22.6
-0.3
0.2
-0.1
10.2
12.3
na22
.5-0
.721
.8
1992
-93
16.5
2.6
2.2
21.3
9.2
13.8
23.0
0.3
0.9
1.3
9.5
14.7
na24
.2-1
.223
.0
1993
-94
17.0
3.4
1.3
21.7
8.9
12.6
21.5
0.2
-0.4
-0.2
9.1
12.2
na21
.30.
922
.2
1994
-95
17.9
3.4
2.3
23.6
9.8
12.1
21.8
-0.1
1.4
1.3
9.7
13.5
na23
.21.
524
.7
1995
-96
16.2
4.8
2.6
23.6
8.6
15.4
24.1
-0.1
2.1
2.0
8.6
17.5
na26
.1-0
.825
.3
1996
-97
15.8
4.4
2.2
22.4
7.7
15.5
23.1
0.1
-1.2
-1.1
7.8
14.3
na22
.11.
623
.7
1997
-98
18.1
4.2
1.9
24.2
7.2
16.5
23.7
0.2
0.6
0.8
7.4
17.1
na24
.51.
125
.6
1998
-99
19.5
3.8
-0.2
23.2
7.1
16.5
23.7
0.1
-0.3
-0.2
7.3
16.3
na23
.50.
724
.2
1999
-00
21.7
4.3
-0.5
25.5
6.9
17.1
24.0
0.8
1.3
2.1
7.6
18.4
0.8
26.8
-0.2
26.6
2000
-01
21.3
3.7
-1.3
23.7
6.7
16.0
22.7
0.4
0.3
0.7
7.1
16.3
0.7
24.1
0.1
24.3
2001
-02
23.1
3.3
-1.6
24.8
6.8
18.3
25.1
0.4
-0.5
-0.1
7.2
17.8
0.6
25.6
-1.3
24.2
2002
-03
22.2
3.9
-0.3
25.9
6.6
17.1
23.7
-0.2
0.9
0.7
6.4
18.0
0.6
25.0
-0.2
24.8
2003
-04
23.1
4.6
1.3
29.0
6.7
17.8
24.5
-0.1
0.8
0.7
6.6
18.7
0.9
26.1
0.7
26.8
2004
-05
23.6
6.6
2.3
32.4
6.9
21.8
28.7
0.5
2.0
2.5
7.4
23.8
1.3
32.5
0.4
32.8
2005
-06
23.5
7.5
2.4
33.4
7.3
23.0
30.3
0.6
2.2
2.8
7.9
25.2
1.1
34.3
0.4
34.7
2006
-07
23.2
7.9
3.6
34.6
7.9
23.4
31.3
0.4
3.0
3.4
8.3
26.4
1.2
35.9
-0.2
35.7
2007
-08
22.4
9.4
5.0
36.8
8.0
24.9
32.9
0.8
3.2
4.0
8.9
28.1
1.1
38.0
0.1
38.1
2008
-09
23.6
7.4
1.0
32.0
8.5
23.8
32.3
0.9
1.0
1.9
9.4
24.8
1.3
35.5
-1.2
34.3
2009
-10
25.2
8.4
0.2
33.7
8.4
23.3
31.7
0.8
2.0
2.8
9.2
25.4
1.8
36.3
0.2
36.5
Con
td....
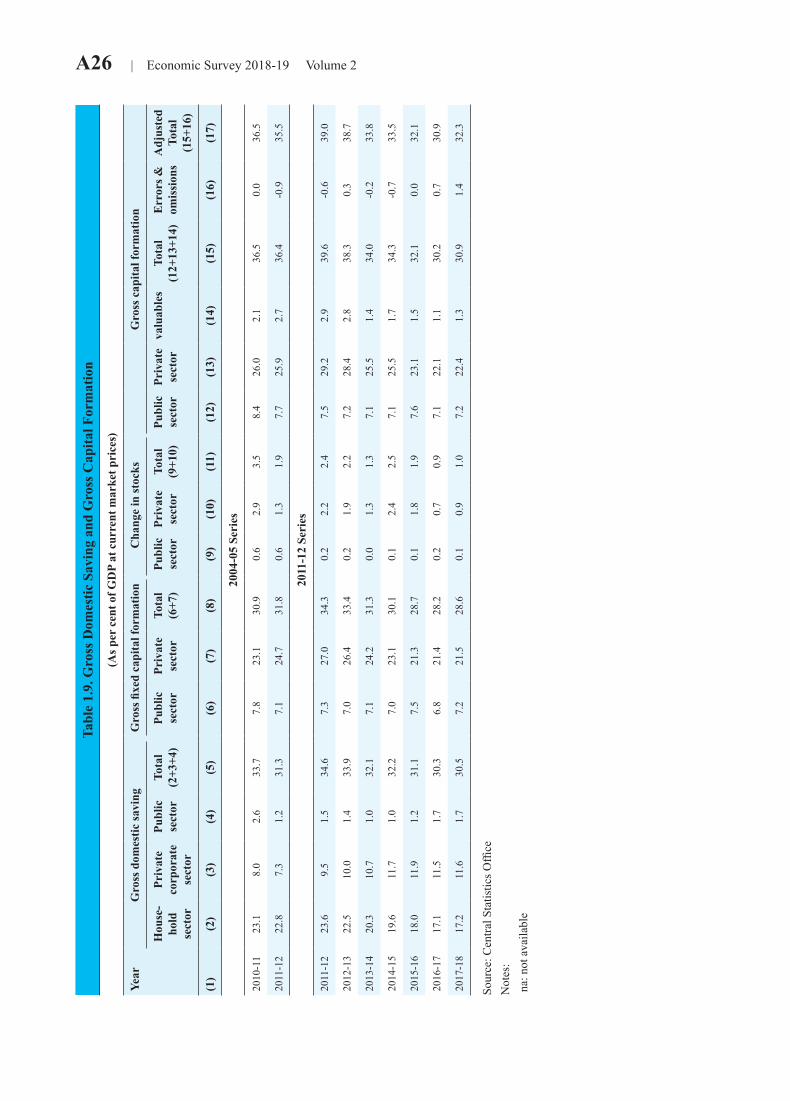
A26 | Economic Survey 2018-19 Volume 2
Tabl
e 1.
9. G
ross
Dom
estic
Sav
ing
and
Gro
ss C
apita
l For
mat
ion
(As p
er c
ent o
f GD
P at
cur
rent
mar
ket p
rice
s)
Year
Gro
ss d
omes
tic sa
ving
Gro
ss fi
xed
capi
tal f
orm
atio
n C
hang
e in
stoc
ks
Gro
ss c
apita
l for
mat
ion
Hou
se-
hold
sect
or
Priv
ate
corp
orat
ese
ctor
Publ
icse
ctor
Tota
l(2
+3+4
)Pu
blic
sect
orPr
ivat
ese
ctor
Tota
l(6
+7)
Publ
icse
ctor
Priv
ate
sect
orTo
tal
(9+1
0)Pu
blic
sect
orPr
ivat
e se
ctor
valu
able
sTo
tal
(12+
13+1
4)E
rror
s &om
issi
ons
Adj
uste
dTo
tal
(15+
16)
(1)
(2)
(3)
(4)
(5)
(6)
(7)
(8)
(9)
(10)
(11)
(12)
(13)
(14)
(15)
(16)
(17)
2004
-05
Seri
es
2010
-11
23.1
8.0
2.6
33.7
7.8
23.1
30.9
0.6
2.9
3.5
8.4
26.0
2.1
36.5
0.0
36.5
2011
-12
22.8
7.3
1.2
31.3
7.1
24.7
31.8
0.6
1.3
1.9
7.7
25.9
2.7
36.4
-0.9
35.5
2011
-12
Seri
es
2011
-12
23.6
9.5
1.5
34.6
7.3
27.0
34.3
0.2
2.2
2.4
7.5
29.2
2.9
39.6
-0.6
39.0
2012
-13
22.5
10.0
1.4
33.9
7.0
26.4
33.4
0.2
1.9
2.2
7.2
28.4
2.8
38.3
0.3
38.7
2013
-14
20.3
10.7
1.0
32.1
7.1
24.2
31.3
0.0
1.3
1.3
7.1
25.5
1.4
34.0
-0.2
33.8
2014
-15
19.6
11.7
1.0
32.2
7.0
23.1
30.1
0.1
2.4
2.5
7.1
25.5
1.7
34.3
-0.7
33.5
2015
-16
18.0
11.9
1.2
31.1
7.5
21.3
28.7
0.1
1.8
1.9
7.6
23.1
1.5
32.1
0.0
32.1
2016
-17
17.1
11.5
1.7
30.3
6.8
21.4
28.2
0.2
0.7
0.9
7.1
22.1
1.1
30.2
0.7
30.9
2017
-18
17.2
11.6
1.7
30.5
7.2
21.5
28.6
0.1
0.9
1.0
7.2
22.4
1.3
30.9
1.4
32.3
Sour
ce: C
entra
l Sta
tistic
s Offi
ceN
otes
: n
a: n
ot a
vaila
ble
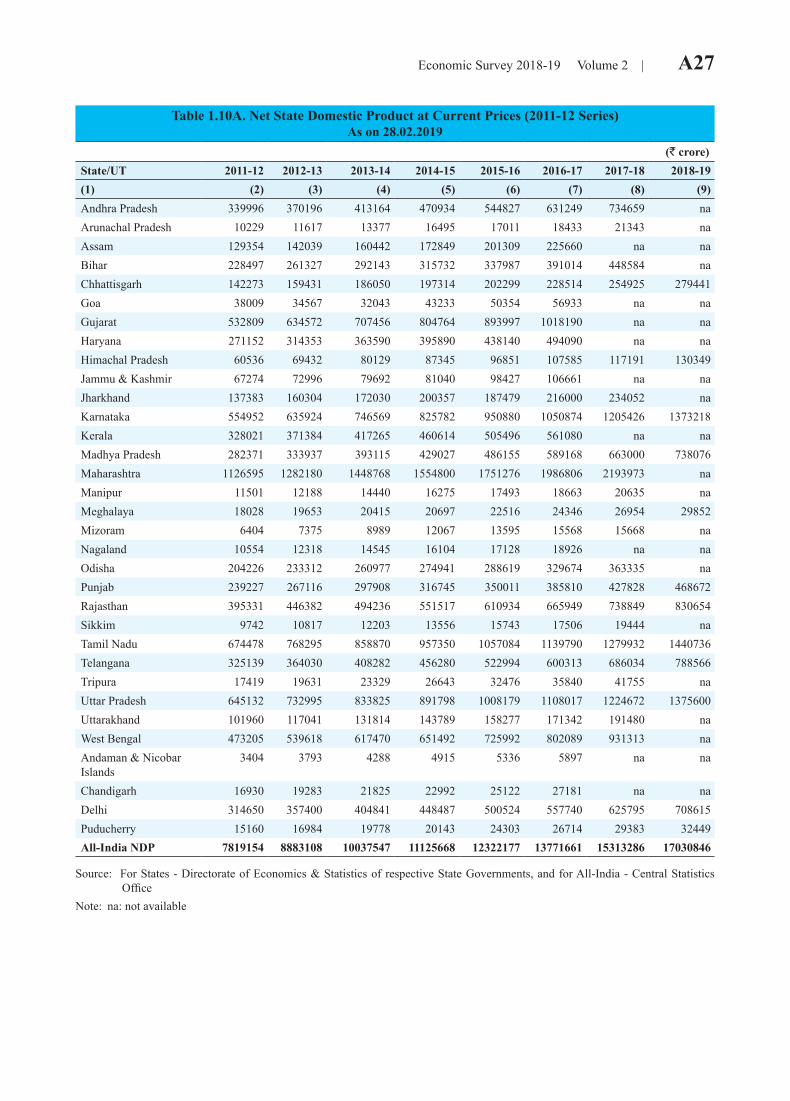
Economic Survey 2018-19 Volume 2 | A27
Table 1.10A. Net State Domestic Product at Current Prices (2011-12 Series)As on 28.02.2019
(` crore)State/UT 2011-12 2012-13 2013-14 2014-15 2015-16 2016-17 2017-18 2018-19(1) (2) (3) (4) (5) (6) (7) (8) (9)Andhra Pradesh 339996 370196 413164 470934 544827 631249 734659 naArunachal Pradesh 10229 11617 13377 16495 17011 18433 21343 naAssam 129354 142039 160442 172849 201309 225660 na naBihar 228497 261327 292143 315732 337987 391014 448584 naChhattisgarh 142273 159431 186050 197314 202299 228514 254925 279441Goa 38009 34567 32043 43233 50354 56933 na naGujarat 532809 634572 707456 804764 893997 1018190 na naHaryana 271152 314353 363590 395890 438140 494090 na naHimachal Pradesh 60536 69432 80129 87345 96851 107585 117191 130349Jammu & Kashmir 67274 72996 79692 81040 98427 106661 na naJharkhand 137383 160304 172030 200357 187479 216000 234052 naKarnataka 554952 635924 746569 825782 950880 1050874 1205426 1373218Kerala 328021 371384 417265 460614 505496 561080 na naMadhya Pradesh 282371 333937 393115 429027 486155 589168 663000 738076Maharashtra 1126595 1282180 1448768 1554800 1751276 1986806 2193973 naManipur 11501 12188 14440 16275 17493 18663 20635 naMeghalaya 18028 19653 20415 20697 22516 24346 26954 29852Mizoram 6404 7375 8989 12067 13595 15568 15668 naNagaland 10554 12318 14545 16104 17128 18926 na naOdisha 204226 233312 260977 274941 288619 329674 363335 naPunjab 239227 267116 297908 316745 350011 385810 427828 468672Rajasthan 395331 446382 494236 551517 610934 665949 738849 830654Sikkim 9742 10817 12203 13556 15743 17506 19444 naTamil Nadu 674478 768295 858870 957350 1057084 1139790 1279932 1440736Telangana 325139 364030 408282 456280 522994 600313 686034 788566Tripura 17419 19631 23329 26643 32476 35840 41755 naUttar Pradesh 645132 732995 833825 891798 1008179 1108017 1224672 1375600Uttarakhand 101960 117041 131814 143789 158277 171342 191480 naWest Bengal 473205 539618 617470 651492 725992 802089 931313 naAndaman & Nicobar Islands
3404 3793 4288 4915 5336 5897 na na
Chandigarh 16930 19283 21825 22992 25122 27181 na naDelhi 314650 357400 404841 448487 500524 557740 625795 708615Puducherry 15160 16984 19778 20143 24303 26714 29383 32449All-India NDP 7819154 8883108 10037547 11125668 12322177 13771661 15313286 17030846
Source: For States - Directorate of Economics & Statistics of respective State Governments, and for All-India - Central Statistics Office
Note: na: not available
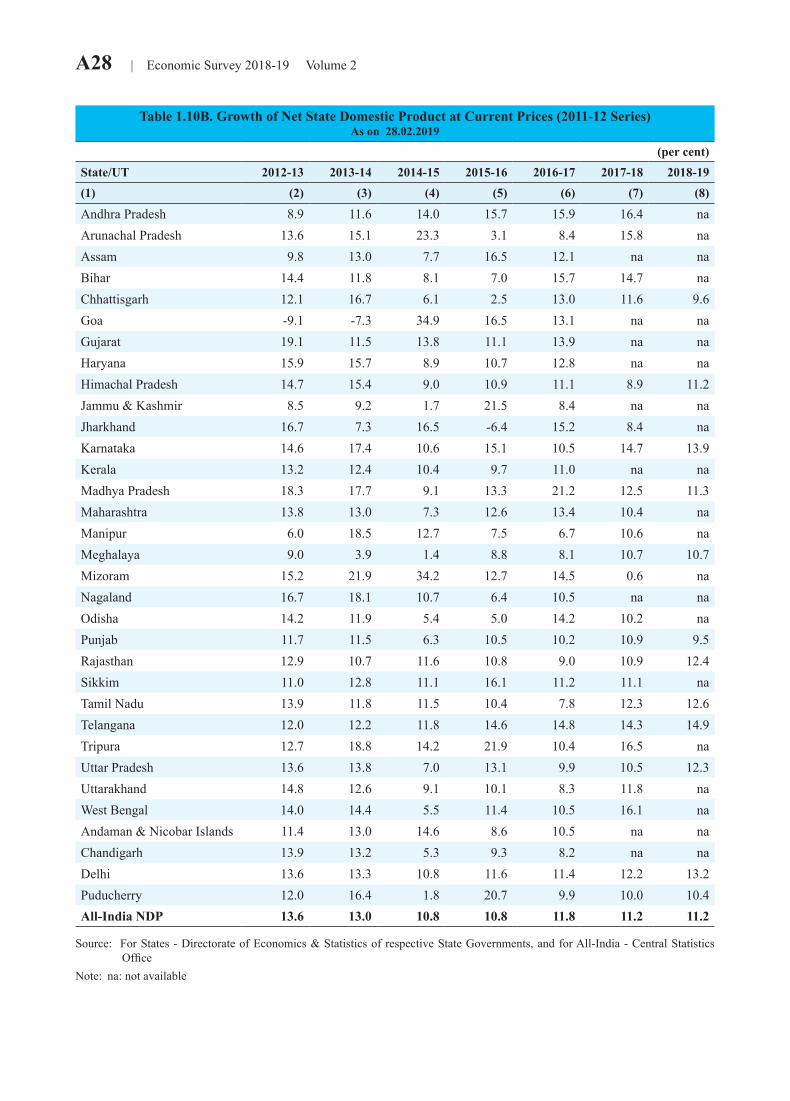
A28 | Economic Survey 2018-19 Volume 2
Table 1.10B. Growth of Net State Domestic Product at Current Prices (2011-12 Series)As on 28.02.2019
(per cent)State/UT 2012-13 2013-14 2014-15 2015-16 2016-17 2017-18 2018-19(1) (2) (3) (4) (5) (6) (7) (8)
Andhra Pradesh 8.9 11.6 14.0 15.7 15.9 16.4 naArunachal Pradesh 13.6 15.1 23.3 3.1 8.4 15.8 naAssam 9.8 13.0 7.7 16.5 12.1 na naBihar 14.4 11.8 8.1 7.0 15.7 14.7 naChhattisgarh 12.1 16.7 6.1 2.5 13.0 11.6 9.6Goa -9.1 -7.3 34.9 16.5 13.1 na naGujarat 19.1 11.5 13.8 11.1 13.9 na naHaryana 15.9 15.7 8.9 10.7 12.8 na naHimachal Pradesh 14.7 15.4 9.0 10.9 11.1 8.9 11.2Jammu & Kashmir 8.5 9.2 1.7 21.5 8.4 na naJharkhand 16.7 7.3 16.5 -6.4 15.2 8.4 naKarnataka 14.6 17.4 10.6 15.1 10.5 14.7 13.9Kerala 13.2 12.4 10.4 9.7 11.0 na naMadhya Pradesh 18.3 17.7 9.1 13.3 21.2 12.5 11.3Maharashtra 13.8 13.0 7.3 12.6 13.4 10.4 naManipur 6.0 18.5 12.7 7.5 6.7 10.6 naMeghalaya 9.0 3.9 1.4 8.8 8.1 10.7 10.7Mizoram 15.2 21.9 34.2 12.7 14.5 0.6 naNagaland 16.7 18.1 10.7 6.4 10.5 na naOdisha 14.2 11.9 5.4 5.0 14.2 10.2 naPunjab 11.7 11.5 6.3 10.5 10.2 10.9 9.5Rajasthan 12.9 10.7 11.6 10.8 9.0 10.9 12.4Sikkim 11.0 12.8 11.1 16.1 11.2 11.1 naTamil Nadu 13.9 11.8 11.5 10.4 7.8 12.3 12.6Telangana 12.0 12.2 11.8 14.6 14.8 14.3 14.9Tripura 12.7 18.8 14.2 21.9 10.4 16.5 naUttar Pradesh 13.6 13.8 7.0 13.1 9.9 10.5 12.3Uttarakhand 14.8 12.6 9.1 10.1 8.3 11.8 naWest Bengal 14.0 14.4 5.5 11.4 10.5 16.1 naAndaman & Nicobar Islands 11.4 13.0 14.6 8.6 10.5 na naChandigarh 13.9 13.2 5.3 9.3 8.2 na naDelhi 13.6 13.3 10.8 11.6 11.4 12.2 13.2Puducherry 12.0 16.4 1.8 20.7 9.9 10.0 10.4All-India NDP 13.6 13.0 10.8 10.8 11.8 11.2 11.2
Source: For States - Directorate of Economics & Statistics of respective State Governments, and for All-India - Central Statistics Office
Note: na: not available
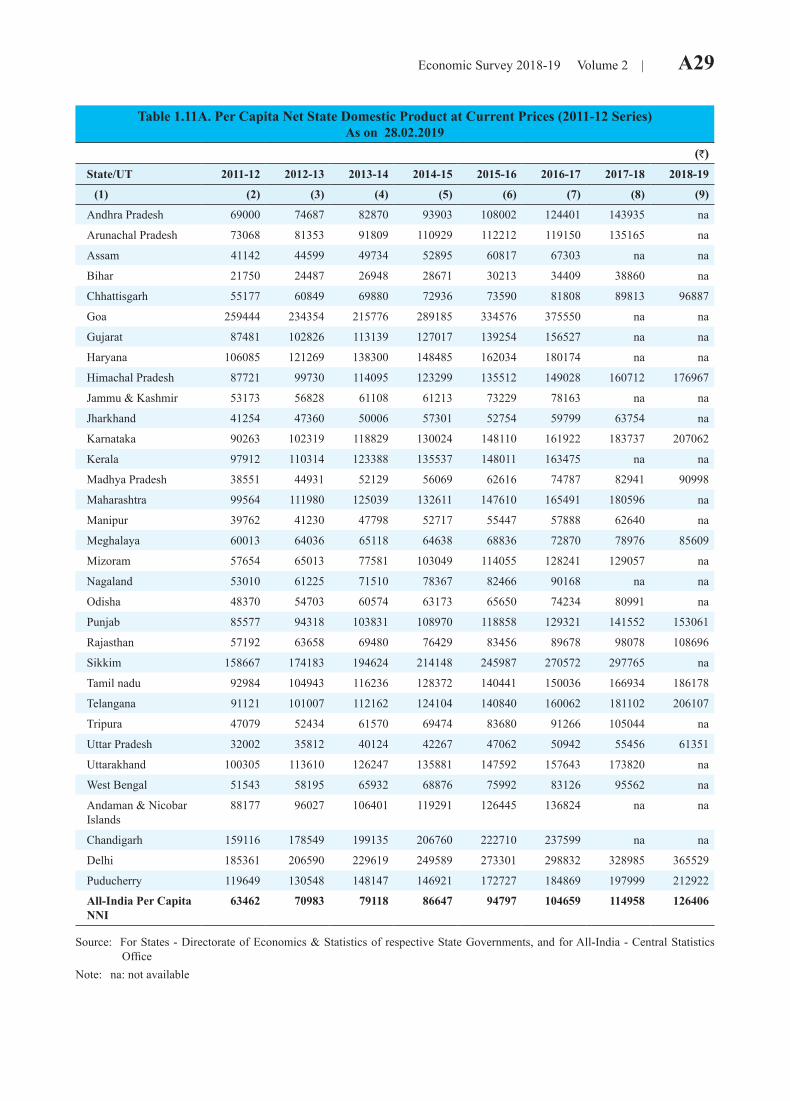
Economic Survey 2018-19 Volume 2 | A29
Table 1.11A. Per Capita Net State Domestic Product at Current Prices (2011-12 Series)As on 28.02.2019
(`)State/UT 2011-12 2012-13 2013-14 2014-15 2015-16 2016-17 2017-18 2018-19
(1) (2) (3) (4) (5) (6) (7) (8) (9)
Andhra Pradesh 69000 74687 82870 93903 108002 124401 143935 na
Arunachal Pradesh 73068 81353 91809 110929 112212 119150 135165 na
Assam 41142 44599 49734 52895 60817 67303 na na
Bihar 21750 24487 26948 28671 30213 34409 38860 na
Chhattisgarh 55177 60849 69880 72936 73590 81808 89813 96887
Goa 259444 234354 215776 289185 334576 375550 na na
Gujarat 87481 102826 113139 127017 139254 156527 na na
Haryana 106085 121269 138300 148485 162034 180174 na na
Himachal Pradesh 87721 99730 114095 123299 135512 149028 160712 176967
Jammu & Kashmir 53173 56828 61108 61213 73229 78163 na na
Jharkhand 41254 47360 50006 57301 52754 59799 63754 na
Karnataka 90263 102319 118829 130024 148110 161922 183737 207062
Kerala 97912 110314 123388 135537 148011 163475 na na
Madhya Pradesh 38551 44931 52129 56069 62616 74787 82941 90998
Maharashtra 99564 111980 125039 132611 147610 165491 180596 na
Manipur 39762 41230 47798 52717 55447 57888 62640 na
Meghalaya 60013 64036 65118 64638 68836 72870 78976 85609
Mizoram 57654 65013 77581 103049 114055 128241 129057 na
Nagaland 53010 61225 71510 78367 82466 90168 na na
Odisha 48370 54703 60574 63173 65650 74234 80991 na
Punjab 85577 94318 103831 108970 118858 129321 141552 153061
Rajasthan 57192 63658 69480 76429 83456 89678 98078 108696
Sikkim 158667 174183 194624 214148 245987 270572 297765 na
Tamil nadu 92984 104943 116236 128372 140441 150036 166934 186178
Telangana 91121 101007 112162 124104 140840 160062 181102 206107
Tripura 47079 52434 61570 69474 83680 91266 105044 na
Uttar Pradesh 32002 35812 40124 42267 47062 50942 55456 61351
Uttarakhand 100305 113610 126247 135881 147592 157643 173820 na
West Bengal 51543 58195 65932 68876 75992 83126 95562 na
Andaman & Nicobar Islands
88177 96027 106401 119291 126445 136824 na na
Chandigarh 159116 178549 199135 206760 222710 237599 na na
Delhi 185361 206590 229619 249589 273301 298832 328985 365529
Puducherry 119649 130548 148147 146921 172727 184869 197999 212922
All-India Per Capita NNI
63462 70983 79118 86647 94797 104659 114958 126406
Source: For States - Directorate of Economics & Statistics of respective State Governments, and for All-India - Central Statistics Office
Note: na: not available
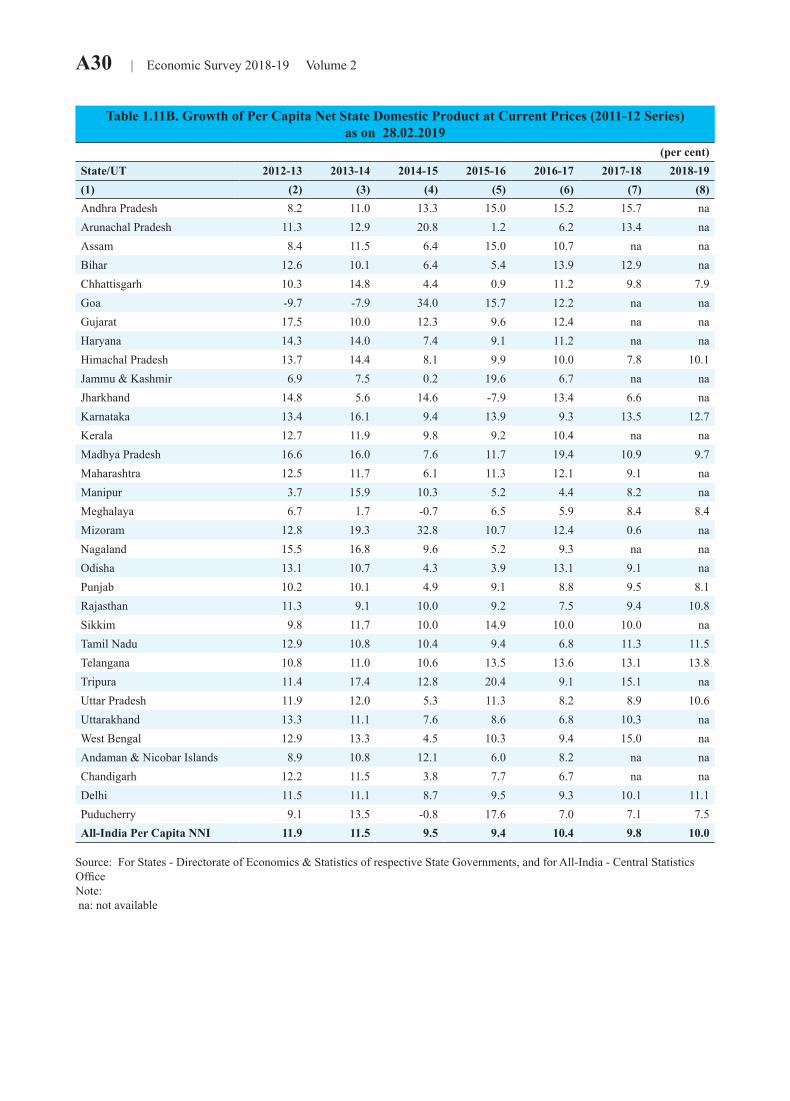
A30 | Economic Survey 2018-19 Volume 2
Table 1.11B. Growth of Per Capita Net State Domestic Product at Current Prices (2011-12 Series)as on 28.02.2019
(per cent)State/UT 2012-13 2013-14 2014-15 2015-16 2016-17 2017-18 2018-19(1) (2) (3) (4) (5) (6) (7) (8)Andhra Pradesh 8.2 11.0 13.3 15.0 15.2 15.7 naArunachal Pradesh 11.3 12.9 20.8 1.2 6.2 13.4 naAssam 8.4 11.5 6.4 15.0 10.7 na naBihar 12.6 10.1 6.4 5.4 13.9 12.9 naChhattisgarh 10.3 14.8 4.4 0.9 11.2 9.8 7.9Goa -9.7 -7.9 34.0 15.7 12.2 na naGujarat 17.5 10.0 12.3 9.6 12.4 na naHaryana 14.3 14.0 7.4 9.1 11.2 na naHimachal Pradesh 13.7 14.4 8.1 9.9 10.0 7.8 10.1Jammu & Kashmir 6.9 7.5 0.2 19.6 6.7 na naJharkhand 14.8 5.6 14.6 -7.9 13.4 6.6 naKarnataka 13.4 16.1 9.4 13.9 9.3 13.5 12.7Kerala 12.7 11.9 9.8 9.2 10.4 na naMadhya Pradesh 16.6 16.0 7.6 11.7 19.4 10.9 9.7Maharashtra 12.5 11.7 6.1 11.3 12.1 9.1 naManipur 3.7 15.9 10.3 5.2 4.4 8.2 naMeghalaya 6.7 1.7 -0.7 6.5 5.9 8.4 8.4Mizoram 12.8 19.3 32.8 10.7 12.4 0.6 naNagaland 15.5 16.8 9.6 5.2 9.3 na naOdisha 13.1 10.7 4.3 3.9 13.1 9.1 naPunjab 10.2 10.1 4.9 9.1 8.8 9.5 8.1Rajasthan 11.3 9.1 10.0 9.2 7.5 9.4 10.8Sikkim 9.8 11.7 10.0 14.9 10.0 10.0 naTamil Nadu 12.9 10.8 10.4 9.4 6.8 11.3 11.5Telangana 10.8 11.0 10.6 13.5 13.6 13.1 13.8Tripura 11.4 17.4 12.8 20.4 9.1 15.1 naUttar Pradesh 11.9 12.0 5.3 11.3 8.2 8.9 10.6Uttarakhand 13.3 11.1 7.6 8.6 6.8 10.3 naWest Bengal 12.9 13.3 4.5 10.3 9.4 15.0 naAndaman & Nicobar Islands 8.9 10.8 12.1 6.0 8.2 na naChandigarh 12.2 11.5 3.8 7.7 6.7 na naDelhi 11.5 11.1 8.7 9.5 9.3 10.1 11.1Puducherry 9.1 13.5 -0.8 17.6 7.0 7.1 7.5All-India Per Capita NNI 11.9 11.5 9.5 9.4 10.4 9.8 10.0
Source: For States - Directorate of Economics & Statistics of respective State Governments, and for All-India - Central Statistics Office Note: na: not available
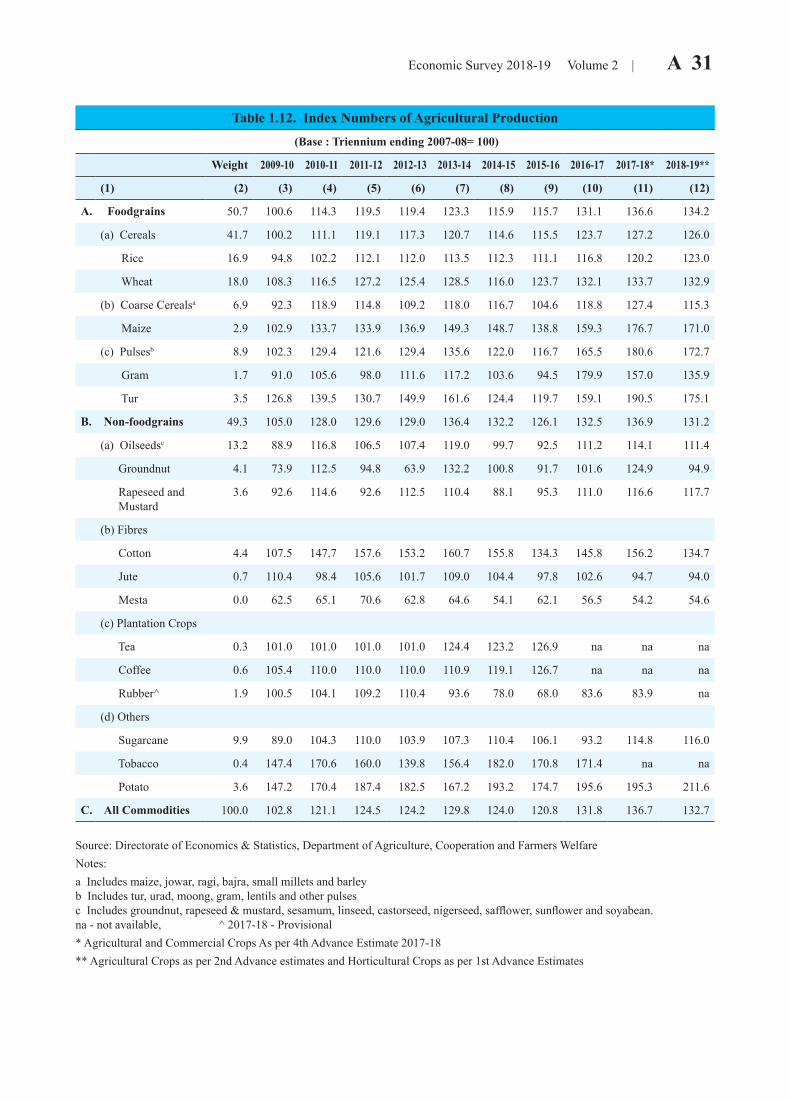
Economic Survey 2018-19 Volume 2 | A 31
Table 1.12. Index Numbers of Agricultural Production
(Base : Triennium ending 2007-08= 100)
Weight 2009-10 2010-11 2011-12 2012-13 2013-14 2014-15 2015-16 2016-17 2017-18* 2018-19**
(1) (2) (3) (4) (5) (6) (7) (8) (9) (10) (11) (12)
A. Foodgrains 50.7 100.6 114.3 119.5 119.4 123.3 115.9 115.7 131.1 136.6 134.2
(a) Cereals 41.7 100.2 111.1 119.1 117.3 120.7 114.6 115.5 123.7 127.2 126.0
Rice 16.9 94.8 102.2 112.1 112.0 113.5 112.3 111.1 116.8 120.2 123.0
Wheat 18.0 108.3 116.5 127.2 125.4 128.5 116.0 123.7 132.1 133.7 132.9
(b) Coarse Cerealsa 6.9 92.3 118.9 114.8 109.2 118.0 116.7 104.6 118.8 127.4 115.3
Maize 2.9 102.9 133.7 133.9 136.9 149.3 148.7 138.8 159.3 176.7 171.0
(c) Pulsesb 8.9 102.3 129.4 121.6 129.4 135.6 122.0 116.7 165.5 180.6 172.7
Gram 1.7 91.0 105.6 98.0 111.6 117.2 103.6 94.5 179.9 157.0 135.9
Tur 3.5 126.8 139.5 130.7 149.9 161.6 124.4 119.7 159.1 190.5 175.1
B. Non-foodgrains 49.3 105.0 128.0 129.6 129.0 136.4 132.2 126.1 132.5 136.9 131.2
(a) Oilseedsc 13.2 88.9 116.8 106.5 107.4 119.0 99.7 92.5 111.2 114.1 111.4
Groundnut 4.1 73.9 112.5 94.8 63.9 132.2 100.8 91.7 101.6 124.9 94.9
Rapeseed and Mustard
3.6 92.6 114.6 92.6 112.5 110.4 88.1 95.3 111.0 116.6 117.7
(b) Fibres
Cotton 4.4 107.5 147.7 157.6 153.2 160.7 155.8 134.3 145.8 156.2 134.7
Jute 0.7 110.4 98.4 105.6 101.7 109.0 104.4 97.8 102.6 94.7 94.0
Mesta 0.0 62.5 65.1 70.6 62.8 64.6 54.1 62.1 56.5 54.2 54.6
(c) Plantation Crops
Tea 0.3 101.0 101.0 101.0 101.0 124.4 123.2 126.9 na na na
Coffee 0.6 105.4 110.0 110.0 110.0 110.9 119.1 126.7 na na na
Rubber^ 1.9 100.5 104.1 109.2 110.4 93.6 78.0 68.0 83.6 83.9 na
(d) Others
Sugarcane 9.9 89.0 104.3 110.0 103.9 107.3 110.4 106.1 93.2 114.8 116.0
Tobacco 0.4 147.4 170.6 160.0 139.8 156.4 182.0 170.8 171.4 na na
Potato 3.6 147.2 170.4 187.4 182.5 167.2 193.2 174.7 195.6 195.3 211.6
C. All Commodities 100.0 102.8 121.1 124.5 124.2 129.8 124.0 120.8 131.8 136.7 132.7
Source: Directorate of Economics & Statistics, Department of Agriculture, Cooperation and Farmers WelfareNotes: a Includes maize, jowar, ragi, bajra, small millets and barley b Includes tur, urad, moong, gram, lentils and other pulses c Includes groundnut, rapeseed & mustard, sesamum, linseed, castorseed, nigerseed, safflower, sunflower and soyabean. na - not available, ^ 2017-18 - Provisional * Agricultural and Commercial Crops As per 4th Advance Estimate 2017-18 ** Agricultural Crops as per 2nd Advance estimates and Horticultural Crops as per 1st Advance Estimates
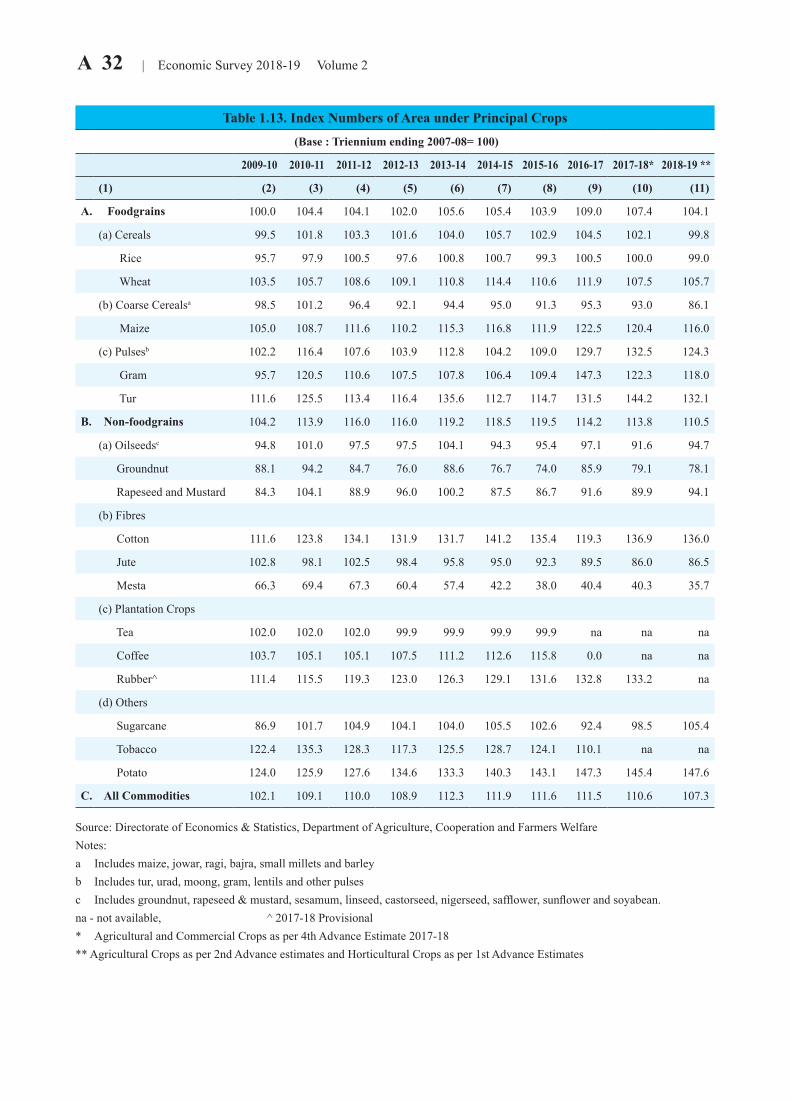
A 32 | Economic Survey 2018-19 Volume 2
Table 1.13. Index Numbers of Area under Principal Crops
(Base : Triennium ending 2007-08= 100)
2009-10 2010-11 2011-12 2012-13 2013-14 2014-15 2015-16 2016-17 2017-18* 2018-19 **
(1) (2) (3) (4) (5) (6) (7) (8) (9) (10) (11)
A. Foodgrains 100.0 104.4 104.1 102.0 105.6 105.4 103.9 109.0 107.4 104.1
(a) Cereals 99.5 101.8 103.3 101.6 104.0 105.7 102.9 104.5 102.1 99.8
Rice 95.7 97.9 100.5 97.6 100.8 100.7 99.3 100.5 100.0 99.0
Wheat 103.5 105.7 108.6 109.1 110.8 114.4 110.6 111.9 107.5 105.7
(b) Coarse Cerealsa 98.5 101.2 96.4 92.1 94.4 95.0 91.3 95.3 93.0 86.1
Maize 105.0 108.7 111.6 110.2 115.3 116.8 111.9 122.5 120.4 116.0
(c) Pulsesb 102.2 116.4 107.6 103.9 112.8 104.2 109.0 129.7 132.5 124.3
Gram 95.7 120.5 110.6 107.5 107.8 106.4 109.4 147.3 122.3 118.0
Tur 111.6 125.5 113.4 116.4 135.6 112.7 114.7 131.5 144.2 132.1
B. Non-foodgrains 104.2 113.9 116.0 116.0 119.2 118.5 119.5 114.2 113.8 110.5
(a) Oilseedsc 94.8 101.0 97.5 97.5 104.1 94.3 95.4 97.1 91.6 94.7
Groundnut 88.1 94.2 84.7 76.0 88.6 76.7 74.0 85.9 79.1 78.1
Rapeseed and Mustard 84.3 104.1 88.9 96.0 100.2 87.5 86.7 91.6 89.9 94.1
(b) Fibres
Cotton 111.6 123.8 134.1 131.9 131.7 141.2 135.4 119.3 136.9 136.0
Jute 102.8 98.1 102.5 98.4 95.8 95.0 92.3 89.5 86.0 86.5
Mesta 66.3 69.4 67.3 60.4 57.4 42.2 38.0 40.4 40.3 35.7
(c) Plantation Crops
Tea 102.0 102.0 102.0 99.9 99.9 99.9 99.9 na na na
Coffee 103.7 105.1 105.1 107.5 111.2 112.6 115.8 0.0 na na
Rubber^ 111.4 115.5 119.3 123.0 126.3 129.1 131.6 132.8 133.2 na
(d) Others
Sugarcane 86.9 101.7 104.9 104.1 104.0 105.5 102.6 92.4 98.5 105.4
Tobacco 122.4 135.3 128.3 117.3 125.5 128.7 124.1 110.1 na na
Potato 124.0 125.9 127.6 134.6 133.3 140.3 143.1 147.3 145.4 147.6
C. All Commodities 102.1 109.1 110.0 108.9 112.3 111.9 111.6 111.5 110.6 107.3
Source: Directorate of Economics & Statistics, Department of Agriculture, Cooperation and Farmers WelfareNotes: a Includes maize, jowar, ragi, bajra, small millets and barley b Includes tur, urad, moong, gram, lentils and other pulsesc Includes groundnut, rapeseed & mustard, sesamum, linseed, castorseed, nigerseed, safflower, sunflower and soyabean. na - not available, ^ 2017-18 Provisional * Agricultural and Commercial Crops as per 4th Advance Estimate 2017-18 ** Agricultural Crops as per 2nd Advance estimates and Horticultural Crops as per 1st Advance Estimates

Economic Survey 2018-19 Volume 2 | A 33
Table 1.14. Index Numbers of Yield of Principal Crops
(Base : Triennium ending 2007-08= 100)
2009-10 2010-11 2011-12 2012-13 2013-14 2014-15 2015-16 2016-17 2017-18* 2018-19 **
(1) (2) (3) (4) (5) (6) (7) (8) (9) (10) (11)
A. Foodgrains 100.6 109.5 114.9 117.1 116.8 110.0 111.3 120.3 127.1 128.9
(a) Cereals 100.7 109.1 115.3 115.4 116.0 108.5 112.3 118.3 124.6 126.3
Rice 99.1 104.4 111.5 114.8 112.6 111.5 111.9 116.2 120.2 124.2
Wheat 104.7 110.2 117.2 115.0 116.0 101.4 111.9 118.0 124.3 125.7
(b) Coarse Cerealsa 93.8 117.5 119.1 118.6 125.0 122.9 114.5 124.7 137.0 133.9
Maize 97.9 122.9 119.9 124.2 129.5 127.4 124.0 130.1 146.7 147.4
(c) Pulsesb 100.1 111.2 113.1 124.6 120.2 117.0 107.0 127.6 136.3 138.9
Gram 95.1 87.6 88.6 103.8 108.7 97.4 86.4 122.1 128.4 115.2
Tur 113.7 111.2 115.3 128.7 119.2 110.4 104.4 121.0 132.1 132.5
B. Non-foodgrains 100.7 112.4 111.7 111.2 114.4 111.6 105.5 116.1 120.2 118.7
(a) Oilseedsc 93.8 115.7 109.3 110.1 114.3 105.7 97.0 114.5 124.5 117.6
Groundnut 83.8 119.4 111.9 84.1 149.3 131.3 123.9 118.2 158.0 121.5
Rapeseed and Mustard 109.9 110.2 104.1 117.3 110.2 100.7 109.9 121.1 129.8 125.1
(b) Fibres
Cotton 96.4 119.4 117.5 116.1 122.0 110.3 99.2 122.3 114.1 99.0
Jute 107.4 100.4 103.0 103.3 113.7 109.9 105.9 114.6 110.1 108.7
Mesta 94.3 93.8 105.0 104.0 112.6 128.1 163.5 139.9 134.5 152.7
(c) Plantation Crops
Tea 99.0 99.0 99.0 101.1 124.6 123.4 127.1 na na na
Coffee 101.7 104.6 104.6 102.3 99.7 105.7 109.4 na na na
Rubber^ 90.2 90.2 91.6 89.8 74.1 60.4 51.6 62.9 63.0 na
(d) Others
Sugarcane 102.4 102.5 104.8 99.8 103.2 104.6 103.5 100.9 116.5 110.1
Tobacco 120.4 126.1 124.6 119.2 124.6 141.4 137.6 155.7 na na
Potato 118.7 135.3 146.8 135.5 125.4 137.7 122.1 132.8 134.3 143.4
C. All Commodities 100.7 111.0 113.2 114.0 115.5 110.8 108.3 118.1 123.6 123.7
Source: Directorate of Economics & Statistics, Department of Agriculture, Cooperation and Farmers WelfareNotes: a Includes maize, jowar, ragi, bajra, small millets and barley b Includes tur, urad, moong, gram, lentils and other pulses c Includes groundnut, rapeseed & mustard, sesamum, linseed, castorseed, nigerseed, safflower, sunflower and soyabean. na - not available, ^ 2017-18 Provisional * Agricultural and Commercial Crops as per 4th Advance Estimate 2017-18 ** Agricultural Crops as per 2nd Advance estimates and Horticultural Crops as per 1st Advance Estimates

A 34 | Economic Survey 2018-19 Volume 2
Table 1.15. Production of Major Crops(Million Tonnes)
Group/Commodity 1990-91 2000-01 2010-11 2011-12 2012-13 2013-14 2014-15 2015-16 2016-17 2017-18* 2018-19**(1) (2) (3) (4) (5) (6) (7) (8) (9) (10) (11) (12)Foodgrainsa 176.4 196.8 244.5 259.3 257.1 265.0 252.0 251.6 275.1 284.8 281.4 Kharif 99.4 102.1 120.9 131.3 128.1 128.7 128.1 125.1 138.3 140.7 142.3 Rabi 77.0 94.7 123.6 128.0 129.1 136.4 124.0 126.5 136.8 144.1 139.1Cerealsb 162.1 185.7 226.3 242.2 238.8 245.8 234.8 235.2 252.0 259.6 257.4 Kharif 94.0 97.6 113.8 125.2 122.2 122.7 122.3 119.6 128.7 131.4 133.3 Rabi 68.1 88.1 112.5 117.0 116.6 123.1 112.5 115.7 123.2 128.2 124.1Coarse Cerealsc 32.7 31.1 43.4 42.0 40.0 43.3 42.9 38.5 43.8 47.0 42.6 Kharif 27.7 24.9 33.1 32.4 29.8 31.2 30.9 28.2 32.4 33.9 31.3 Rabi 5.0 6.2 10.3 9.6 10.3 12.1 11.9 10.4 11.3 13.1 11.3Pulsesd 14.3 11.0 18.2 17.1 18.3 19.3 17.2 16.4 23.1 25.2 24.0 Kharif 5.4 4.4 7.1 6.1 5.9 6.0 5.7 5.5 9.6 9.3 9.0 Rabi 8.9 6.6 11.1 11.0 12.4 13.3 11.4 10.8 13.6 15.9 15.0Rice 74.3 85.0 96.0 105.3 105.2 106.6 105.5 104.4 109.7 112.9 115.6 Kharif 66.3 72.8 80.7 92.8 92.4 91.5 91.4 91.4 96.3 97.5 102.0 Rabi 8.0 12.2 15.3 12.5 12.9 15.1 14.1 13.0 13.4 15.4 13.6Wheat 55.1 69.7 86.9 93.5 93.5 95.8 86.5 92.3 98.5 99.7 99.1Jowar 11.7 7.5 7.0 6.0 5.3 5.5 5.5 4.2 4.6 5.0 3.8 Kharif 8.3 4.5 3.4 3.3 2.8 2.4 2.3 1.8 2.0 2.1 1.9 Rabi 3.4 3.0 3.6 2.7 2.4 3.1 3.2 2.4 2.6 2.9 1.8Maize 6.9 6.8 10.4 10.3 8.7 9.3 9.2 8.1 9.7 9.1 7.5Bajra 9.0 12.0 21.7 21.8 22.3 24.3 24.2 22.6 25.9 28.7 27.8Gram 2.4 2.2 2.9 2.7 3.0 3.2 2.8 2.6 4.9 4.3 3.7Tur 5.4 3.9 8.2 7.7 8.8 9.5 7.3 7.1 9.4 11.2 10.3Oilseedse 18.6 18.4 32.5 29.8 30.9 32.7 27.5 25.3 31.3 31.3 31.5 Kharif 9.8 11.9 21.9 20.7 20.8 22.6 19.2 16.8 21.5 21.0 21.3 Rabi 8.8 6.5 10.6 9.1 10.2 10.1 8.3 8.6 9.8 10.3 10.2Groundnut 7.5 6.4 8.3 7.0 4.7 9.7 7.4 6.7 7.5 9.2 7.0 Kharif 5.1 4.9 6.6 5.1 3.2 8.1 5.9 5.4 6.0 7.5 5.4 Rabi 2.4 1.5 1.6 1.8 1.5 1.7 1.5 1.4 1.4 1.6 1.5Rapeseed and Mustard 5.2 4.2 8.2 6.6 8.0 7.9 6.3 6.8 7.9 8.3 8.4Sugarcane 241.0 296.0 342.4 361.0 341.2 352.1 362.3 348.4 306.1 376.9 380.8Cottonf 9.8 9.5 33.0 35.2 34.2 35.9 34.8 30.0 32.6 34.9 30.1Jute and Mestag 9.2 10.5 10.6 11.4 10.9 11.7 11.1 10.5 11.0 10.1 10.1 Jute 7.9 9.3 10.0 10.7 10.3 11.1 10.6 9.9 10.4 9.6 9.6 Mesta 1.3 1.2 0.6 0.7 0.6 0.6 0.5 0.6 0.5 0.5 0.5Plantation Crops Tea 0.7 0.8 1.0 1.0 1.0 1.2 1.2 1.2 na na na Coffee 0.2 0.3 0.3 0.3 0.3 0.3 0.3 0.3 na na na Rubber^ 0.3 0.6 0.8 0.9 0.9 0.8 0.6 0.6 0.7 0.7 naPotato 15.2 22.5 42.3 46.6 45.3 41.6 48.0 43.4 48.6 51.3 52.6
Source: Directorate of Economics & Statistics, Department of Agriculture, Cooperation and Farmers Welfare Notes:a Includes cereals, coarse cereals and pulses b Includes rice and wheat na - not available, ^ 2017-18 - Provisional c Includes maize, jowar, ragi, bajra, small millets and barley d Includes tur, urad, moong, gram, lentils and other pulses e Includes groundnut, rapeseed & mustard, sesamum, linseed, castorseed, nigerseed, safflower, sunflower and soyabean. f Bales of 170 Kgs. g Bales of 180 Kgs. * Agricultural Crops as per 4th Advance Estimates 2017-18 ** As per 2nd Advance Estimate 2018-19 & Horticultural Crops as per 1st Advance Estimate 2018-19
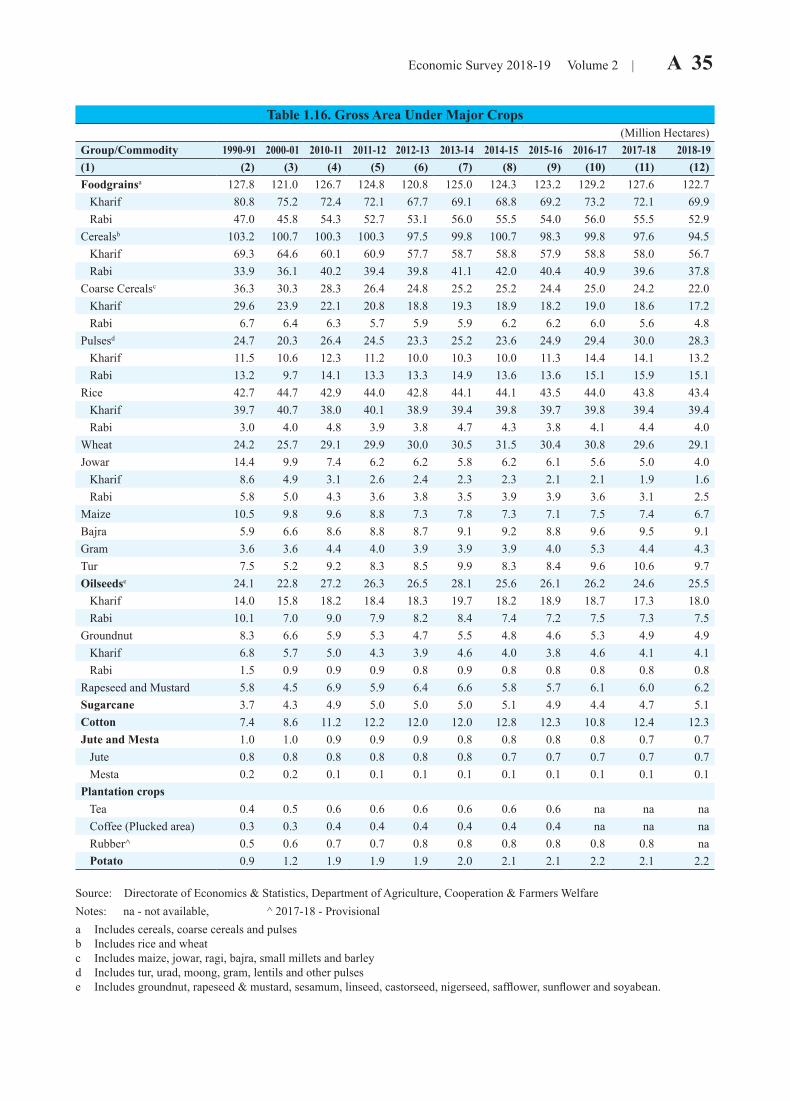
Economic Survey 2018-19 Volume 2 | A 35
Table 1.16. Gross Area Under Major Crops(Million Hectares)
Group/Commodity 1990-91 2000-01 2010-11 2011-12 2012-13 2013-14 2014-15 2015-16 2016-17 2017-18 2018-19(1) (2) (3) (4) (5) (6) (7) (8) (9) (10) (11) (12)Foodgrainsa 127.8 121.0 126.7 124.8 120.8 125.0 124.3 123.2 129.2 127.6 122.7 Kharif 80.8 75.2 72.4 72.1 67.7 69.1 68.8 69.2 73.2 72.1 69.9 Rabi 47.0 45.8 54.3 52.7 53.1 56.0 55.5 54.0 56.0 55.5 52.9Cerealsb 103.2 100.7 100.3 100.3 97.5 99.8 100.7 98.3 99.8 97.6 94.5 Kharif 69.3 64.6 60.1 60.9 57.7 58.7 58.8 57.9 58.8 58.0 56.7 Rabi 33.9 36.1 40.2 39.4 39.8 41.1 42.0 40.4 40.9 39.6 37.8Coarse Cerealsc 36.3 30.3 28.3 26.4 24.8 25.2 25.2 24.4 25.0 24.2 22.0 Kharif 29.6 23.9 22.1 20.8 18.8 19.3 18.9 18.2 19.0 18.6 17.2 Rabi 6.7 6.4 6.3 5.7 5.9 5.9 6.2 6.2 6.0 5.6 4.8Pulsesd 24.7 20.3 26.4 24.5 23.3 25.2 23.6 24.9 29.4 30.0 28.3 Kharif 11.5 10.6 12.3 11.2 10.0 10.3 10.0 11.3 14.4 14.1 13.2 Rabi 13.2 9.7 14.1 13.3 13.3 14.9 13.6 13.6 15.1 15.9 15.1Rice 42.7 44.7 42.9 44.0 42.8 44.1 44.1 43.5 44.0 43.8 43.4 Kharif 39.7 40.7 38.0 40.1 38.9 39.4 39.8 39.7 39.8 39.4 39.4 Rabi 3.0 4.0 4.8 3.9 3.8 4.7 4.3 3.8 4.1 4.4 4.0Wheat 24.2 25.7 29.1 29.9 30.0 30.5 31.5 30.4 30.8 29.6 29.1Jowar 14.4 9.9 7.4 6.2 6.2 5.8 6.2 6.1 5.6 5.0 4.0 Kharif 8.6 4.9 3.1 2.6 2.4 2.3 2.3 2.1 2.1 1.9 1.6 Rabi 5.8 5.0 4.3 3.6 3.8 3.5 3.9 3.9 3.6 3.1 2.5Maize 10.5 9.8 9.6 8.8 7.3 7.8 7.3 7.1 7.5 7.4 6.7Bajra 5.9 6.6 8.6 8.8 8.7 9.1 9.2 8.8 9.6 9.5 9.1Gram 3.6 3.6 4.4 4.0 3.9 3.9 3.9 4.0 5.3 4.4 4.3Tur 7.5 5.2 9.2 8.3 8.5 9.9 8.3 8.4 9.6 10.6 9.7Oilseedse 24.1 22.8 27.2 26.3 26.5 28.1 25.6 26.1 26.2 24.6 25.5 Kharif 14.0 15.8 18.2 18.4 18.3 19.7 18.2 18.9 18.7 17.3 18.0 Rabi 10.1 7.0 9.0 7.9 8.2 8.4 7.4 7.2 7.5 7.3 7.5Groundnut 8.3 6.6 5.9 5.3 4.7 5.5 4.8 4.6 5.3 4.9 4.9 Kharif 6.8 5.7 5.0 4.3 3.9 4.6 4.0 3.8 4.6 4.1 4.1 Rabi 1.5 0.9 0.9 0.9 0.8 0.9 0.8 0.8 0.8 0.8 0.8Rapeseed and Mustard 5.8 4.5 6.9 5.9 6.4 6.6 5.8 5.7 6.1 6.0 6.2Sugarcane 3.7 4.3 4.9 5.0 5.0 5.0 5.1 4.9 4.4 4.7 5.1Cotton 7.4 8.6 11.2 12.2 12.0 12.0 12.8 12.3 10.8 12.4 12.3Jute and Mesta 1.0 1.0 0.9 0.9 0.9 0.8 0.8 0.8 0.8 0.7 0.7 Jute 0.8 0.8 0.8 0.8 0.8 0.8 0.7 0.7 0.7 0.7 0.7 Mesta 0.2 0.2 0.1 0.1 0.1 0.1 0.1 0.1 0.1 0.1 0.1Plantation crops Tea 0.4 0.5 0.6 0.6 0.6 0.6 0.6 0.6 na na na Coffee (Plucked area) 0.3 0.3 0.4 0.4 0.4 0.4 0.4 0.4 na na na Rubber^ 0.5 0.6 0.7 0.7 0.8 0.8 0.8 0.8 0.8 0.8 na Potato 0.9 1.2 1.9 1.9 1.9 2.0 2.1 2.1 2.2 2.1 2.2
Source: Directorate of Economics & Statistics, Department of Agriculture, Cooperation & Farmers Welfare Notes: na - not available, ^ 2017-18 - Provisional a Includes cereals, coarse cereals and pulsesb Includes rice and wheat c Includes maize, jowar, ragi, bajra, small millets and barley d Includes tur, urad, moong, gram, lentils and other pulses e Includes groundnut, rapeseed & mustard, sesamum, linseed, castorseed, nigerseed, safflower, sunflower and soyabean.
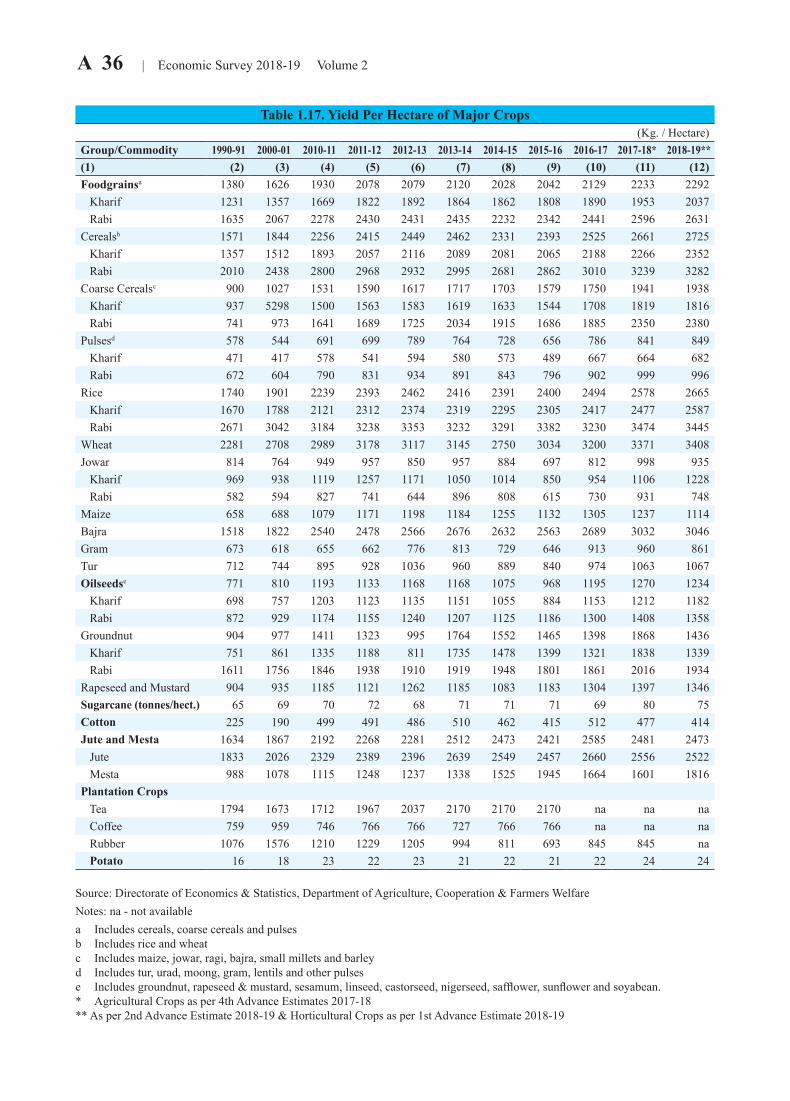
A 36 | Economic Survey 2018-19 Volume 2
Table 1.17. Yield Per Hectare of Major Crops(Kg. / Hectare)
Group/Commodity 1990-91 2000-01 2010-11 2011-12 2012-13 2013-14 2014-15 2015-16 2016-17 2017-18* 2018-19**(1) (2) (3) (4) (5) (6) (7) (8) (9) (10) (11) (12)Foodgrainsa 1380 1626 1930 2078 2079 2120 2028 2042 2129 2233 2292 Kharif 1231 1357 1669 1822 1892 1864 1862 1808 1890 1953 2037 Rabi 1635 2067 2278 2430 2431 2435 2232 2342 2441 2596 2631Cerealsb 1571 1844 2256 2415 2449 2462 2331 2393 2525 2661 2725 Kharif 1357 1512 1893 2057 2116 2089 2081 2065 2188 2266 2352 Rabi 2010 2438 2800 2968 2932 2995 2681 2862 3010 3239 3282Coarse Cerealsc 900 1027 1531 1590 1617 1717 1703 1579 1750 1941 1938 Kharif 937 5298 1500 1563 1583 1619 1633 1544 1708 1819 1816 Rabi 741 973 1641 1689 1725 2034 1915 1686 1885 2350 2380Pulsesd 578 544 691 699 789 764 728 656 786 841 849 Kharif 471 417 578 541 594 580 573 489 667 664 682 Rabi 672 604 790 831 934 891 843 796 902 999 996Rice 1740 1901 2239 2393 2462 2416 2391 2400 2494 2578 2665 Kharif 1670 1788 2121 2312 2374 2319 2295 2305 2417 2477 2587 Rabi 2671 3042 3184 3238 3353 3232 3291 3382 3230 3474 3445Wheat 2281 2708 2989 3178 3117 3145 2750 3034 3200 3371 3408Jowar 814 764 949 957 850 957 884 697 812 998 935 Kharif 969 938 1119 1257 1171 1050 1014 850 954 1106 1228 Rabi 582 594 827 741 644 896 808 615 730 931 748Maize 658 688 1079 1171 1198 1184 1255 1132 1305 1237 1114Bajra 1518 1822 2540 2478 2566 2676 2632 2563 2689 3032 3046Gram 673 618 655 662 776 813 729 646 913 960 861Tur 712 744 895 928 1036 960 889 840 974 1063 1067Oilseedse 771 810 1193 1133 1168 1168 1075 968 1195 1270 1234 Kharif 698 757 1203 1123 1135 1151 1055 884 1153 1212 1182 Rabi 872 929 1174 1155 1240 1207 1125 1186 1300 1408 1358Groundnut 904 977 1411 1323 995 1764 1552 1465 1398 1868 1436 Kharif 751 861 1335 1188 811 1735 1478 1399 1321 1838 1339 Rabi 1611 1756 1846 1938 1910 1919 1948 1801 1861 2016 1934Rapeseed and Mustard 904 935 1185 1121 1262 1185 1083 1183 1304 1397 1346Sugarcane (tonnes/hect.) 65 69 70 72 68 71 71 71 69 80 75Cotton 225 190 499 491 486 510 462 415 512 477 414Jute and Mesta 1634 1867 2192 2268 2281 2512 2473 2421 2585 2481 2473 Jute 1833 2026 2329 2389 2396 2639 2549 2457 2660 2556 2522 Mesta 988 1078 1115 1248 1237 1338 1525 1945 1664 1601 1816Plantation Crops Tea 1794 1673 1712 1967 2037 2170 2170 2170 na na na Coffee 759 959 746 766 766 727 766 766 na na na Rubber 1076 1576 1210 1229 1205 994 811 693 845 845 na Potato 16 18 23 22 23 21 22 21 22 24 24
Source: Directorate of Economics & Statistics, Department of Agriculture, Cooperation & Farmers Welfare Notes: na - not availablea Includes cereals, coarse cereals and pulses b Includes rice and wheat c Includes maize, jowar, ragi, bajra, small millets and barley d Includes tur, urad, moong, gram, lentils and other pulses e Includes groundnut, rapeseed & mustard, sesamum, linseed, castorseed, nigerseed, safflower, sunflower and soyabean.* Agricultural Crops as per 4th Advance Estimates 2017-18 ** As per 2nd Advance Estimate 2018-19 & Horticultural Crops as per 1st Advance Estimate 2018-19
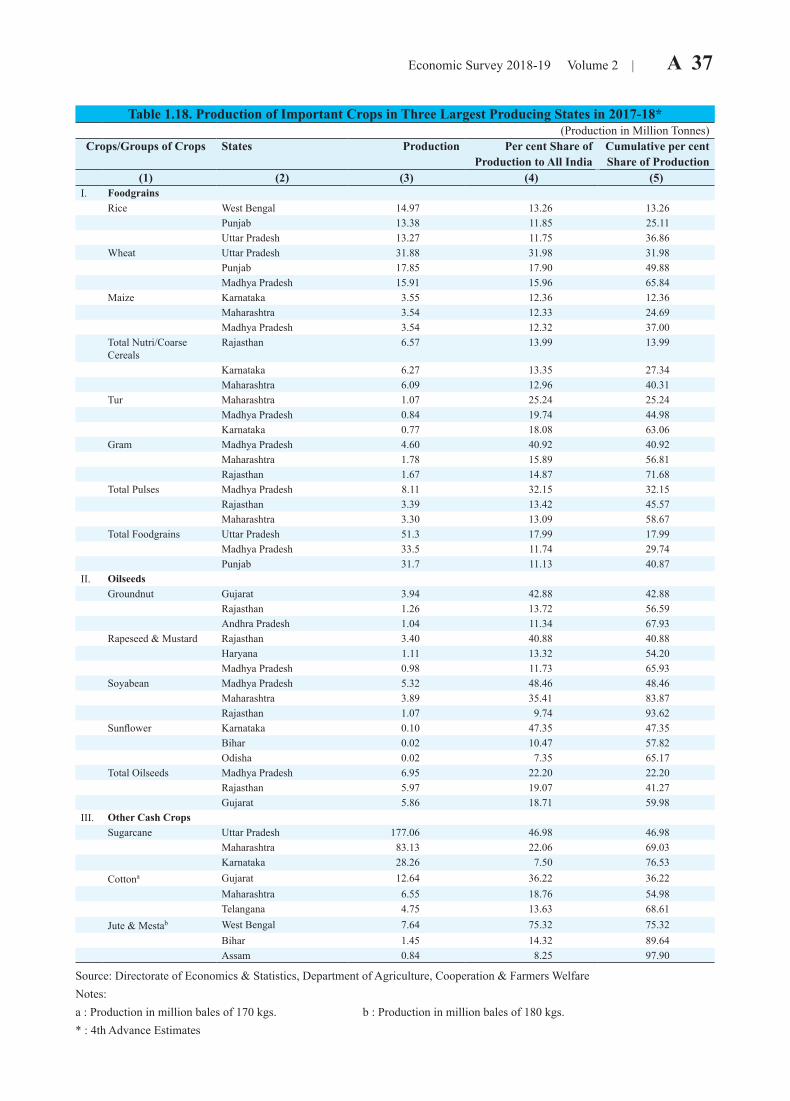
Economic Survey 2018-19 Volume 2 | A 37
Table 1.18. Production of Important Crops in Three Largest Producing States in 2017-18*(Production in Million Tonnes)
Crops/Groups of Crops States Production Per cent Share of Cumulative per centProduction to All India Share of Production
(1) (2) (3) (4) (5)I. Foodgrains
Rice West Bengal 14.97 13.26 13.26Punjab 13.38 11.85 25.11Uttar Pradesh 13.27 11.75 36.86
Wheat Uttar Pradesh 31.88 31.98 31.98Punjab 17.85 17.90 49.88Madhya Pradesh 15.91 15.96 65.84
Maize Karnataka 3.55 12.36 12.36Maharashtra 3.54 12.33 24.69Madhya Pradesh 3.54 12.32 37.00
Total Nutri/Coarse Cereals
Rajasthan 6.57 13.99 13.99
Karnataka 6.27 13.35 27.34Maharashtra 6.09 12.96 40.31
Tur Maharashtra 1.07 25.24 25.24Madhya Pradesh 0.84 19.74 44.98Karnataka 0.77 18.08 63.06
Gram Madhya Pradesh 4.60 40.92 40.92Maharashtra 1.78 15.89 56.81Rajasthan 1.67 14.87 71.68
Total Pulses Madhya Pradesh 8.11 32.15 32.15Rajasthan 3.39 13.42 45.57Maharashtra 3.30 13.09 58.67
Total Foodgrains Uttar Pradesh 51.3 17.99 17.99Madhya Pradesh 33.5 11.74 29.74Punjab 31.7 11.13 40.87
II. OilseedsGroundnut Gujarat 3.94 42.88 42.88
Rajasthan 1.26 13.72 56.59Andhra Pradesh 1.04 11.34 67.93
Rapeseed & Mustard Rajasthan 3.40 40.88 40.88Haryana 1.11 13.32 54.20Madhya Pradesh 0.98 11.73 65.93
Soyabean Madhya Pradesh 5.32 48.46 48.46Maharashtra 3.89 35.41 83.87Rajasthan 1.07 9.74 93.62
Sunflower Karnataka 0.10 47.35 47.35Bihar 0.02 10.47 57.82Odisha 0.02 7.35 65.17
Total Oilseeds Madhya Pradesh 6.95 22.20 22.20Rajasthan 5.97 19.07 41.27Gujarat 5.86 18.71 59.98
III. Other Cash CropsSugarcane Uttar Pradesh 177.06 46.98 46.98
Maharashtra 83.13 22.06 69.03Karnataka 28.26 7.50 76.53
Cottona Gujarat 12.64 36.22 36.22Maharashtra 6.55 18.76 54.98Telangana 4.75 13.63 68.61
Jute & Mestab West Bengal 7.64 75.32 75.32Bihar 1.45 14.32 89.64Assam 0.84 8.25 97.90
Source: Directorate of Economics & Statistics, Department of Agriculture, Cooperation & Farmers WelfareNotes:a : Production in million bales of 170 kgs. b : Production in million bales of 180 kgs. * : 4th Advance Estimates

A 38 | Economic Survey 2018-19 Volume 2
1.19. Per Capita Net Availability of Foodgrains*(000 TONNES UNLESS OTHERWISE STATED) (As on 19.11.2018)
Year Population in thousand
persons
Production Net Imports Change of Stocks
Net availability
Per capita net availability#Gross Net Kg. per year Grams per
dayRICE
2015 1259108 105480 97464 -11032 946 85486 67.9 186.02016 1273986 104410 96475 -10043 786 85646 67.2 184.22017 1288522 109700 101363 -12581 2731 86051 66.8 183.02018(P) 1302896 112910 104329 -12683 1792 89854 69.0 188.9
WHEAT2015 1259108 86530 76060 -176 -1325 77209 61.3 168.02016 1273986 92290 81123 1693 -10041 92857 72.9 199.72017 1288522 98510 86590 5134 5815 85909 66.7 182.72018(P) 1302896 99700 87636 1420 5172 83884 64.4 176.4
OTHER CEREALS2015 1259108 42860 36753 -1189 -156 35720 28.4 77.72016 1273986 38520 33705 -349 45 33311 26.1 71.62017 1288522 43770 38299 -373 18 37908 29.4 80.62018(P) 1302896 46990 41116 -555 -48 40609 31.2 85.4
CEREALS2015 1259108 234870 205511 -12397 -535 193649 153.8 421.42016 1273986 235220 205818 -8699 -9210 206329 162.0 443.72017 1288522 251980 220483 -7820 8564 204099 158.4 434.02018(P) 1302896 259590 227141 -11818 6916 208407 160.0 438.2
PULSES2015 1259108 17150 15006 5115 0 20121 16.0 43.82016 1273986 16350 14306 5951 241 20016 15.7 43.02017 1288522 23130 20239 6811 1314 25736 20.0 54.72018(P) 1302896 25230 22076 5428 939 26565 20.4 55.9
FOODGRAINS2015 1259108 252020 220518 -7282 -535 213771 169.8 465.12016 1273986 251570 220124 -2748 -8969 226345 177.7 486.82017 1288522 275110 240721 -1009 9878 229834 178.4 488.72018(P) 1302896 284820 249218 -6390 7855 234973 180.3 494.1
P - Provisional figures is based on 4th Advance Estimates of production for 2017-18, Net Import for April 2017 to March 2018 and stock position as on 01.04.2018.
* The net availability of foodgrains is estimated to be Gross Production (-) seed, feed & wastage, (-) exports (+) imports, (+/-) change in stocks. The net availability of foodgrains divided by the population estimates for a particular year indicate per capita availability of foodgrains in terms of kg/year. Net availability, thus worked out is further divided by the number of days in a year i.e., 365 days which is taken as net availaility of foodgrains in terms of grams/day.
# Figures in respect of per capita net availability given above are not strictly representative of actual level of consumption in the country especially as they do not take in to account any change in stocks in possession of traders, producers and consumers.
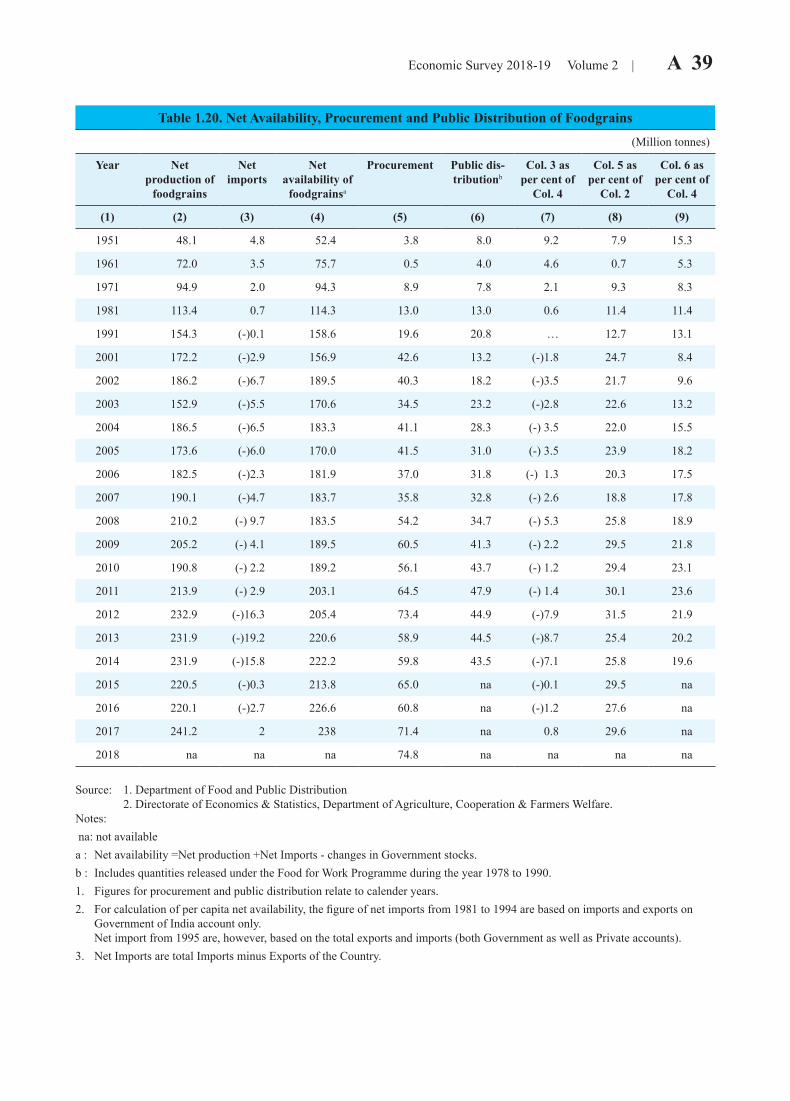
Economic Survey 2018-19 Volume 2 | A 39
Table 1.20. Net Availability, Procurement and Public Distribution of Foodgrains
(Million tonnes)
Year Net production of
foodgrains
Net imports
Net availability of
foodgrainsa
Procurement Public dis-tributionb
Col. 3 as per cent of
Col. 4
Col. 5 as per cent of
Col. 2
Col. 6 as per cent of
Col. 4
(1) (2) (3) (4) (5) (6) (7) (8) (9)
1951 48.1 4.8 52.4 3.8 8.0 9.2 7.9 15.3
1961 72.0 3.5 75.7 0.5 4.0 4.6 0.7 5.3
1971 94.9 2.0 94.3 8.9 7.8 2.1 9.3 8.3
1981 113.4 0.7 114.3 13.0 13.0 0.6 11.4 11.4
1991 154.3 (-)0.1 158.6 19.6 20.8 … 12.7 13.1
2001 172.2 (-)2.9 156.9 42.6 13.2 (-)1.8 24.7 8.4
2002 186.2 (-)6.7 189.5 40.3 18.2 (-)3.5 21.7 9.6
2003 152.9 (-)5.5 170.6 34.5 23.2 (-)2.8 22.6 13.2
2004 186.5 (-)6.5 183.3 41.1 28.3 (-) 3.5 22.0 15.5
2005 173.6 (-)6.0 170.0 41.5 31.0 (-) 3.5 23.9 18.2
2006 182.5 (-)2.3 181.9 37.0 31.8 (-) 1.3 20.3 17.5
2007 190.1 (-)4.7 183.7 35.8 32.8 (-) 2.6 18.8 17.8
2008 210.2 (-) 9.7 183.5 54.2 34.7 (-) 5.3 25.8 18.9
2009 205.2 (-) 4.1 189.5 60.5 41.3 (-) 2.2 29.5 21.8
2010 190.8 (-) 2.2 189.2 56.1 43.7 (-) 1.2 29.4 23.1
2011 213.9 (-) 2.9 203.1 64.5 47.9 (-) 1.4 30.1 23.6
2012 232.9 (-)16.3 205.4 73.4 44.9 (-)7.9 31.5 21.9
2013 231.9 (-)19.2 220.6 58.9 44.5 (-)8.7 25.4 20.2
2014 231.9 (-)15.8 222.2 59.8 43.5 (-)7.1 25.8 19.6
2015 220.5 (-)0.3 213.8 65.0 na (-)0.1 29.5 na
2016 220.1 (-)2.7 226.6 60.8 na (-)1.2 27.6 na
2017 241.2 2 238 71.4 na 0.8 29.6 na
2018 na na na 74.8 na na na na
Source: 1. Department of Food and Public Distribution 2. Directorate of Economics & Statistics, Department of Agriculture, Cooperation & Farmers Welfare. Notes: na: not available a : Net availability =Net production +Net Imports - changes in Government stocks. b : Includes quantities released under the Food for Work Programme during the year 1978 to 1990. 1. Figures for procurement and public distribution relate to calender years. 2. For calculation of per capita net availability, the figure of net imports from 1981 to 1994 are based on imports and exports on
Government of India account only. Net import from 1995 are, however, based on the total exports and imports (both Government as well as Private accounts).
3. Net Imports are total Imports minus Exports of the Country.
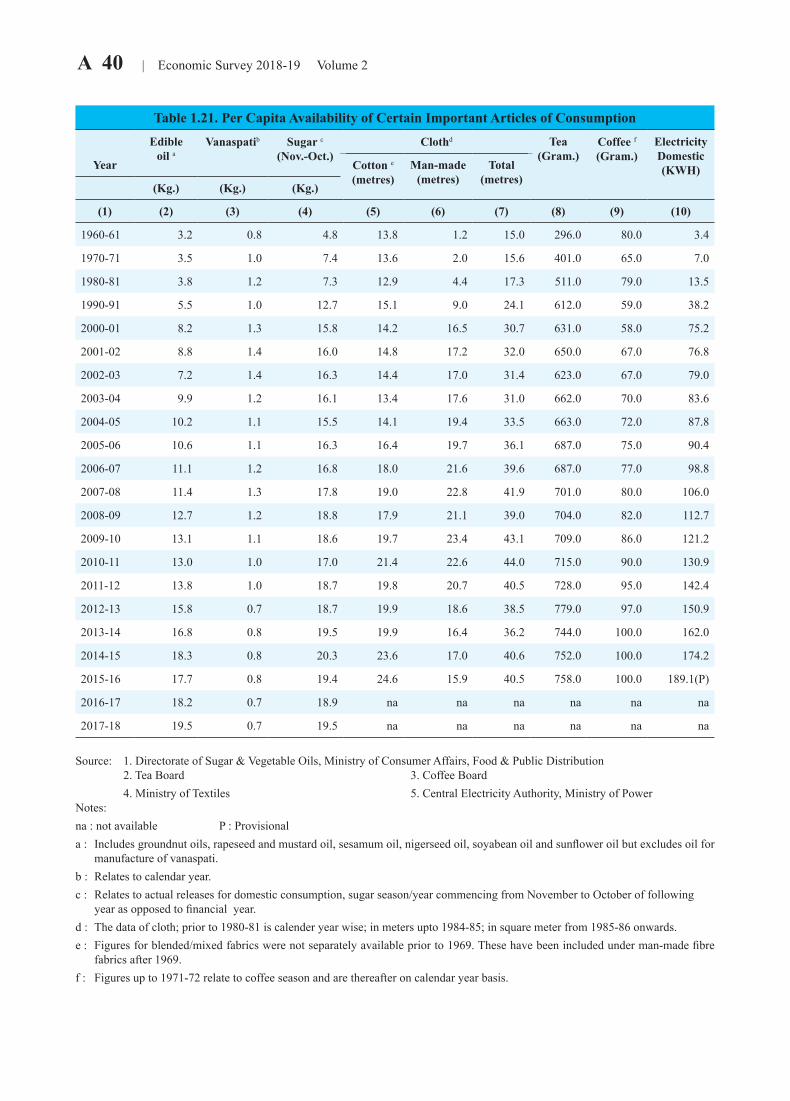
A 40 | Economic Survey 2018-19 Volume 2
Table 1.21. Per Capita Availability of Certain Important Articles of Consumption
Edible oil a
Vanaspatib Sugar c
(Nov.-Oct.)Clothd Tea
(Gram.) Coffee f
(Gram.)ElectricityDomestic(KWH)Year Cotton e
(metres)Man-made
(metres)Total
(metres)(Kg.) (Kg.) (Kg.)
(1) (2) (3) (4) (5) (6) (7) (8) (9) (10)
1960-61 3.2 0.8 4.8 13.8 1.2 15.0 296.0 80.0 3.4
1970-71 3.5 1.0 7.4 13.6 2.0 15.6 401.0 65.0 7.0
1980-81 3.8 1.2 7.3 12.9 4.4 17.3 511.0 79.0 13.5
1990-91 5.5 1.0 12.7 15.1 9.0 24.1 612.0 59.0 38.2
2000-01 8.2 1.3 15.8 14.2 16.5 30.7 631.0 58.0 75.2
2001-02 8.8 1.4 16.0 14.8 17.2 32.0 650.0 67.0 76.8
2002-03 7.2 1.4 16.3 14.4 17.0 31.4 623.0 67.0 79.0
2003-04 9.9 1.2 16.1 13.4 17.6 31.0 662.0 70.0 83.6
2004-05 10.2 1.1 15.5 14.1 19.4 33.5 663.0 72.0 87.8
2005-06 10.6 1.1 16.3 16.4 19.7 36.1 687.0 75.0 90.4
2006-07 11.1 1.2 16.8 18.0 21.6 39.6 687.0 77.0 98.8
2007-08 11.4 1.3 17.8 19.0 22.8 41.9 701.0 80.0 106.0
2008-09 12.7 1.2 18.8 17.9 21.1 39.0 704.0 82.0 112.7
2009-10 13.1 1.1 18.6 19.7 23.4 43.1 709.0 86.0 121.2
2010-11 13.0 1.0 17.0 21.4 22.6 44.0 715.0 90.0 130.9
2011-12 13.8 1.0 18.7 19.8 20.7 40.5 728.0 95.0 142.4
2012-13 15.8 0.7 18.7 19.9 18.6 38.5 779.0 97.0 150.9
2013-14 16.8 0.8 19.5 19.9 16.4 36.2 744.0 100.0 162.0
2014-15 18.3 0.8 20.3 23.6 17.0 40.6 752.0 100.0 174.2
2015-16 17.7 0.8 19.4 24.6 15.9 40.5 758.0 100.0 189.1(P)
2016-17 18.2 0.7 18.9 na na na na na na
2017-18 19.5 0.7 19.5 na na na na na na
Source: 1. Directorate of Sugar & Vegetable Oils, Ministry of Consumer Affairs, Food & Public Distribution 2. Tea Board 3. Coffee Board
4. Ministry of Textiles 5. Central Electricity Authority, Ministry of Power Notes: na : not available P : Provisional a : Includes groundnut oils, rapeseed and mustard oil, sesamum oil, nigerseed oil, soyabean oil and sunflower oil but excludes oil for
manufacture of vanaspati. b : Relates to calendar year. c : Relates to actual releases for domestic consumption, sugar season/year commencing from November to October of following
year as opposed to financial year. d : The data of cloth; prior to 1980-81 is calender year wise; in meters upto 1984-85; in square meter from 1985-86 onwards.e : Figures for blended/mixed fabrics were not separately available prior to 1969. These have been included under man-made fibre
fabrics after 1969. f : Figures up to 1971-72 relate to coffee season and are thereafter on calendar year basis.
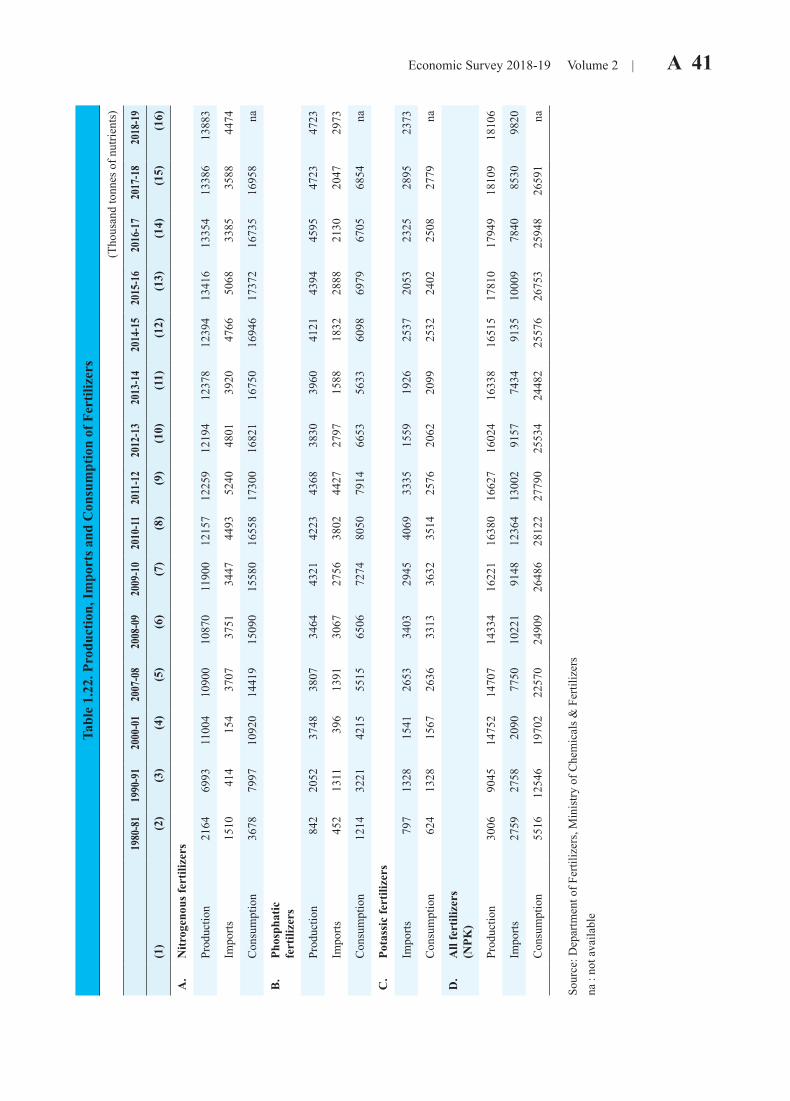
Economic Survey 2018-19 Volume 2 | A 41 Ta
ble
1.22
. Pro
duct
ion,
Impo
rts a
nd C
onsu
mpt
ion
of F
ertil
izer
s
(Tho
usan
d to
nnes
of n
utrie
nts)
1980
-81
1990
-91
2000
-01
2007
-08
2008
-09
2009
-10
2010
-1120
11-1
220
12-1
320
13-1
420
14-1
5 20
15-1
6 20
16-1
720
17-1
820
18-1
9
(1)
(2)
(3)
(4)
(5)
(6)
(7)
(8)
(9)
(10)
(11)
(12)
(13)
(14)
(15)
(16)
A.
Nitr
ogen
ous f
ertil
izer
s
Prod
uctio
n21
6469
9311
004
1090
010
870
1190
012
157
1225
912
194
1237
812
394
1341
613
354
1338
613
883
Impo
rts15
1041
415
437
0737
5134
4744
9352
4048
0139
2047
6650
6833
8535
8844
74
Con
sum
ptio
n36
7879
9710
920
1441
915
090
1558
016
558
1730
016
821
1675
016
946
1737
216
735
1695
8na
B.
Phos
phat
ic
fert
ilize
rs
Prod
uctio
n84
220
5237
4838
0734
6443
2142
2343
6838
3039
6041
2143
9445
9547
2347
23
Impo
rts45
213
1139
613
9130
6727
5638
0244
2727
9715
8818
3228
8821
3020
4729
73
Con
sum
ptio
n12
1432
2142
1555
1565
0672
7480
5079
1466
5356
3360
9869
7967
0568
54na
C.
Pota
ssic
fert
ilize
rs
Impo
rts79
713
2815
4126
5334
0329
4540
6933
3515
5919
2625
3720
5323
2528
9523
73
Con
sum
ptio
n62
413
2815
6726
3633
1336
3235
1425
7620
6220
9925
3224
0225
0827
79na
D.
All
fert
ilize
rs
(NPK
)
Prod
uctio
n30
0690
4514
752
1470
714
334
1622
116
380
1662
716
024
1633
816
515
1781
017
949
1810
918
106
Impo
rts27
5927
5820
9077
5010
221
9148
1236
413
002
9157
7434
9135
1000
978
4085
3098
20
Con
sum
ptio
n55
1612
546
1970
222
570
2490
926
486
2812
227
790
2553
424
482
2557
626
753
2594
826
591
na
Sour
ce: D
epar
tmen
t of F
ertil
izer
s, M
inis
try o
f Che
mic
als &
Fer
tiliz
ers
na :
not a
vaila
ble
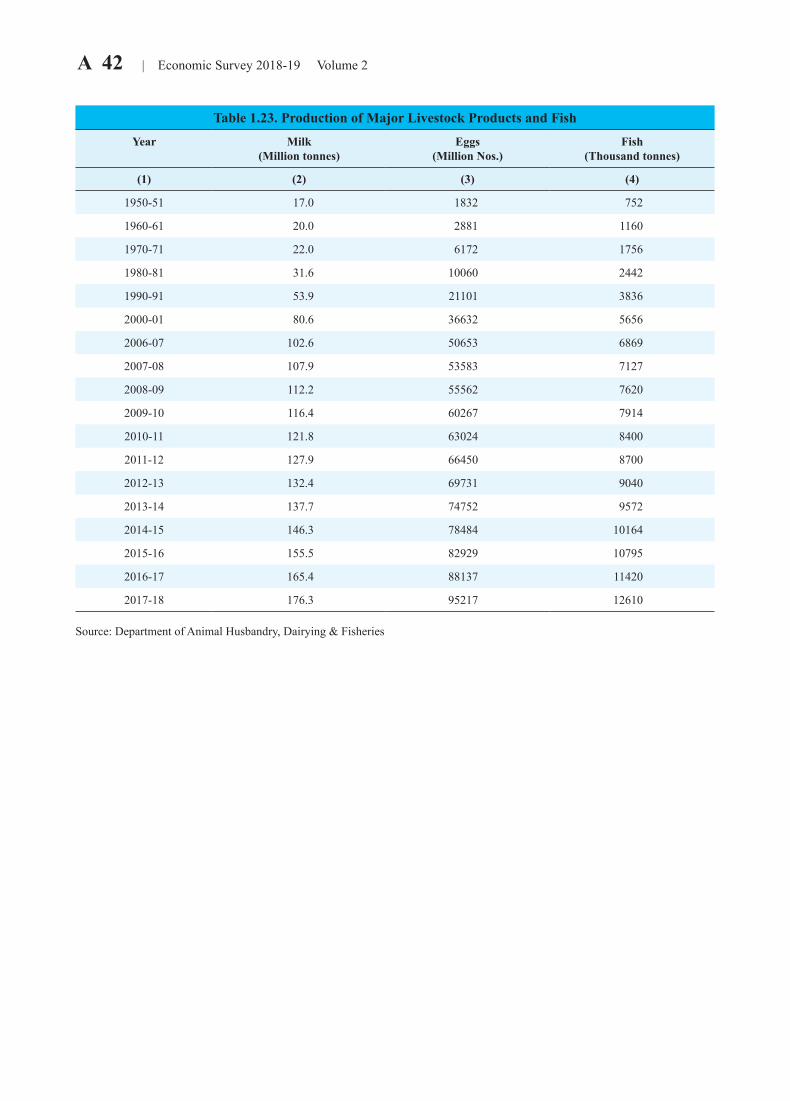
A 42 | Economic Survey 2018-19 Volume 2
Table 1.23. Production of Major Livestock Products and Fish
Year Milk (Million tonnes)
Eggs (Million Nos.)
Fish (Thousand tonnes)
(1) (2) (3) (4)
1950-51 17.0 1832 752
1960-61 20.0 2881 1160
1970-71 22.0 6172 1756
1980-81 31.6 10060 2442
1990-91 53.9 21101 3836
2000-01 80.6 36632 5656
2006-07 102.6 50653 6869
2007-08 107.9 53583 7127
2008-09 112.2 55562 7620
2009-10 116.4 60267 7914
2010-11 121.8 63024 8400
2011-12 127.9 66450 8700
2012-13 132.4 69731 9040
2013-14 137.7 74752 9572
2014-15 146.3 78484 10164
2015-16 155.5 82929 10795
2016-17 165.4 88137 11420
2017-18 176.3 95217 12610
Source: Department of Animal Husbandry, Dairying & Fisheries
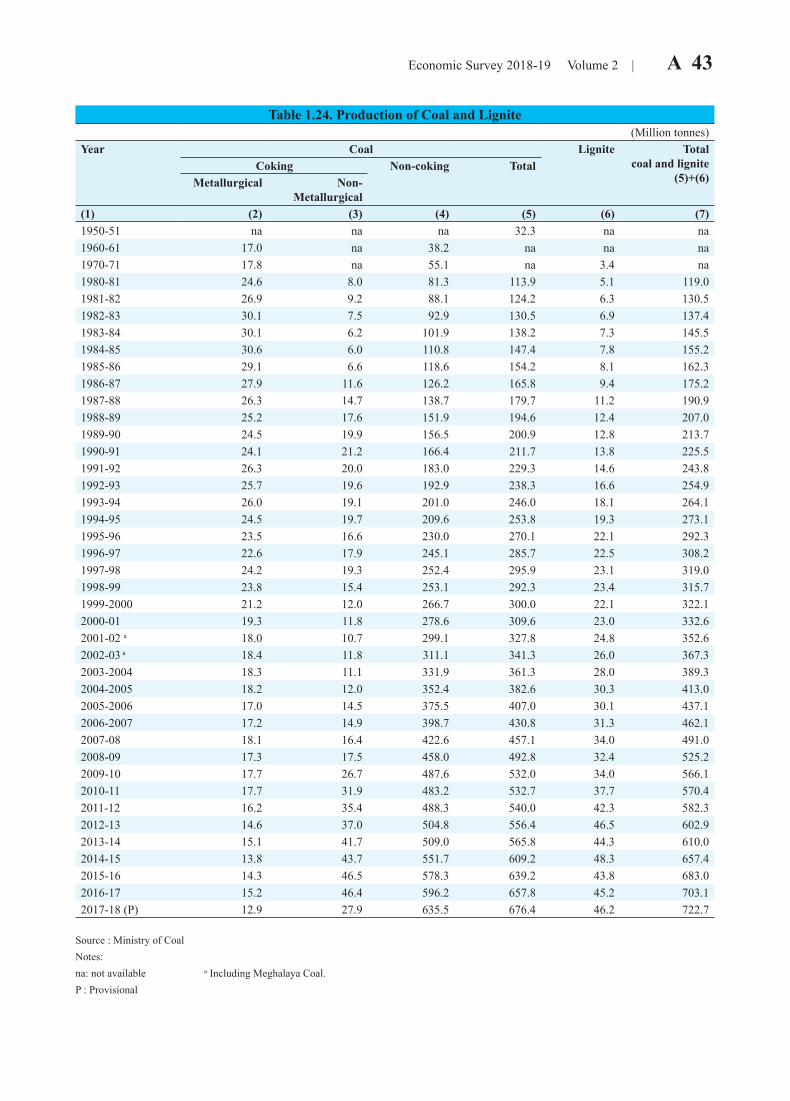
Economic Survey 2018-19 Volume 2 | A 43
Table 1.24. Production of Coal and Lignite(Million tonnes)
Year Coal Lignite Totalcoal and lignite
(5)+(6)Coking Non-coking Total
Metallurgical Non-Metallurgical
(1) (2) (3) (4) (5) (6) (7)1950-51 na na na 32.3 na na1960-61 17.0 na 38.2 na na na1970-71 17.8 na 55.1 na 3.4 na1980-81 24.6 8.0 81.3 113.9 5.1 119.01981-82 26.9 9.2 88.1 124.2 6.3 130.51982-83 30.1 7.5 92.9 130.5 6.9 137.41983-84 30.1 6.2 101.9 138.2 7.3 145.51984-85 30.6 6.0 110.8 147.4 7.8 155.21985-86 29.1 6.6 118.6 154.2 8.1 162.31986-87 27.9 11.6 126.2 165.8 9.4 175.21987-88 26.3 14.7 138.7 179.7 11.2 190.91988-89 25.2 17.6 151.9 194.6 12.4 207.01989-90 24.5 19.9 156.5 200.9 12.8 213.71990-91 24.1 21.2 166.4 211.7 13.8 225.51991-92 26.3 20.0 183.0 229.3 14.6 243.81992-93 25.7 19.6 192.9 238.3 16.6 254.91993-94 26.0 19.1 201.0 246.0 18.1 264.11994-95 24.5 19.7 209.6 253.8 19.3 273.11995-96 23.5 16.6 230.0 270.1 22.1 292.31996-97 22.6 17.9 245.1 285.7 22.5 308.21997-98 24.2 19.3 252.4 295.9 23.1 319.01998-99 23.8 15.4 253.1 292.3 23.4 315.71999-2000 21.2 12.0 266.7 300.0 22.1 322.12000-01 19.3 11.8 278.6 309.6 23.0 332.62001-02 a 18.0 10.7 299.1 327.8 24.8 352.62002-03 a 18.4 11.8 311.1 341.3 26.0 367.32003-2004 18.3 11.1 331.9 361.3 28.0 389.32004-2005 18.2 12.0 352.4 382.6 30.3 413.02005-2006 17.0 14.5 375.5 407.0 30.1 437.12006-2007 17.2 14.9 398.7 430.8 31.3 462.12007-08 18.1 16.4 422.6 457.1 34.0 491.02008-09 17.3 17.5 458.0 492.8 32.4 525.22009-10 17.7 26.7 487.6 532.0 34.0 566.12010-11 17.7 31.9 483.2 532.7 37.7 570.42011-12 16.2 35.4 488.3 540.0 42.3 582.32012-13 14.6 37.0 504.8 556.4 46.5 602.92013-14 15.1 41.7 509.0 565.8 44.3 610.02014-15 13.8 43.7 551.7 609.2 48.3 657.42015-16 14.3 46.5 578.3 639.2 43.8 683.02016-17 15.2 46.4 596.2 657.8 45.2 703.12017-18 (P) 12.9 27.9 635.5 676.4 46.2 722.7
Source : Ministry of Coal Notes:na: not available a Including Meghalaya Coal.P : Provisional
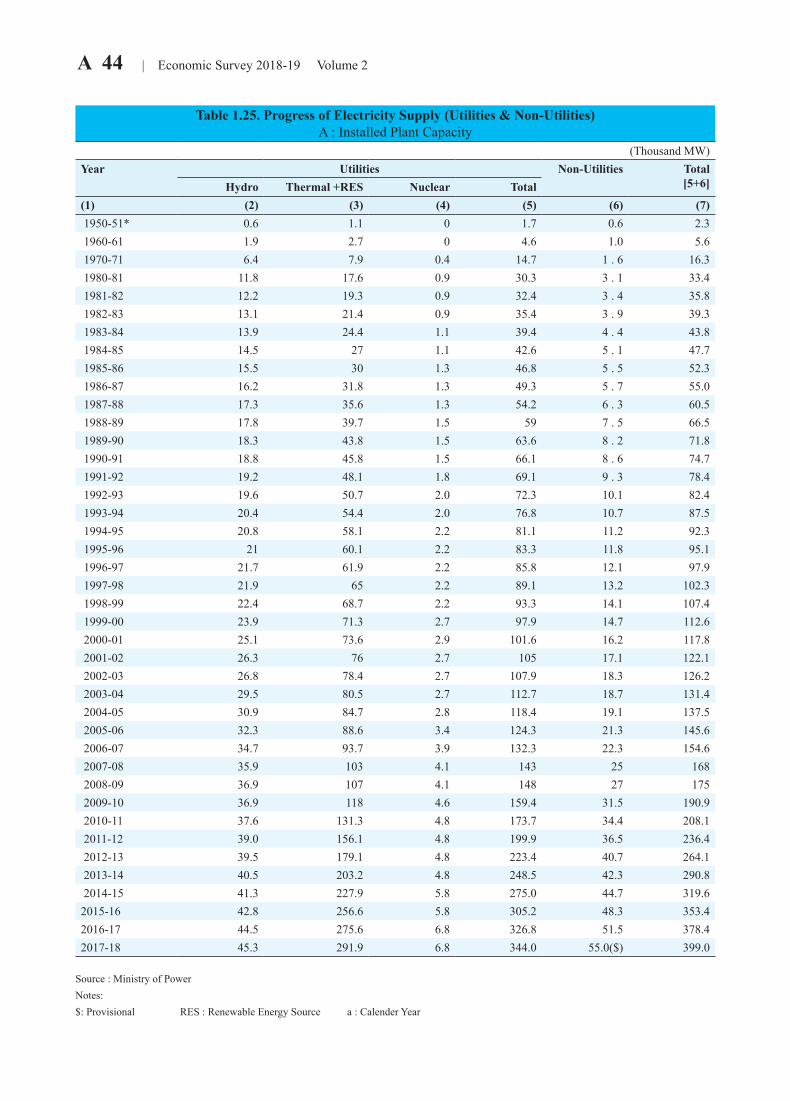
A 44 | Economic Survey 2018-19 Volume 2
Table 1.25. Progress of Electricity Supply (Utilities & Non-Utilities)A : Installed Plant Capacity
(Thousand MW)Year Utilities Non-Utilities Total
[5+6]Hydro Thermal +RES Nuclear Total(1) (2) (3) (4) (5) (6) (7) 1950-51* 0.6 1.1 0 1.7 0.6 2.3 1960-61 1.9 2.7 0 4.6 1.0 5.6 1970-71 6.4 7.9 0.4 14.7 1 . 6 16.3 1980-81 11.8 17.6 0.9 30.3 3 . 1 33.4 1981-82 12.2 19.3 0.9 32.4 3 . 4 35.8 1982-83 13.1 21.4 0.9 35.4 3 . 9 39.3 1983-84 13.9 24.4 1.1 39.4 4 . 4 43.8 1984-85 14.5 27 1.1 42.6 5 . 1 47.7 1985-86 15.5 30 1.3 46.8 5 . 5 52.3 1986-87 16.2 31.8 1.3 49.3 5 . 7 55.0 1987-88 17.3 35.6 1.3 54.2 6 . 3 60.5 1988-89 17.8 39.7 1.5 59 7 . 5 66.5 1989-90 18.3 43.8 1.5 63.6 8 . 2 71.8 1990-91 18.8 45.8 1.5 66.1 8 . 6 74.7 1991-92 19.2 48.1 1.8 69.1 9 . 3 78.4 1992-93 19.6 50.7 2.0 72.3 10.1 82.4 1993-94 20.4 54.4 2.0 76.8 10.7 87.5 1994-95 20.8 58.1 2.2 81.1 11.2 92.3 1995-96 21 60.1 2.2 83.3 11.8 95.1 1996-97 21.7 61.9 2.2 85.8 12.1 97.9 1997-98 21.9 65 2.2 89.1 13.2 102.3 1998-99 22.4 68.7 2.2 93.3 14.1 107.4 1999-00 23.9 71.3 2.7 97.9 14.7 112.6 2000-01 25.1 73.6 2.9 101.6 16.2 117.8 2001-02 26.3 76 2.7 105 17.1 122.1 2002-03 26.8 78.4 2.7 107.9 18.3 126.2 2003-04 29.5 80.5 2.7 112.7 18.7 131.4 2004-05 30.9 84.7 2.8 118.4 19.1 137.5 2005-06 32.3 88.6 3.4 124.3 21.3 145.6 2006-07 34.7 93.7 3.9 132.3 22.3 154.6 2007-08 35.9 103 4.1 143 25 168 2008-09 36.9 107 4.1 148 27 175 2009-10 36.9 118 4.6 159.4 31.5 190.9 2010-11 37.6 131.3 4.8 173.7 34.4 208.1 2011-12 39.0 156.1 4.8 199.9 36.5 236.4 2012-13 39.5 179.1 4.8 223.4 40.7 264.1 2013-14 40.5 203.2 4.8 248.5 42.3 290.8 2014-15 41.3 227.9 5.8 275.0 44.7 319.62015-16 42.8 256.6 5.8 305.2 48.3 353.42016-17 44.5 275.6 6.8 326.8 51.5 378.42017-18 45.3 291.9 6.8 344.0 55.0($) 399.0
Source : Ministry of Power Notes: $: Provisional RES : Renewable Energy Source a : Calender Year
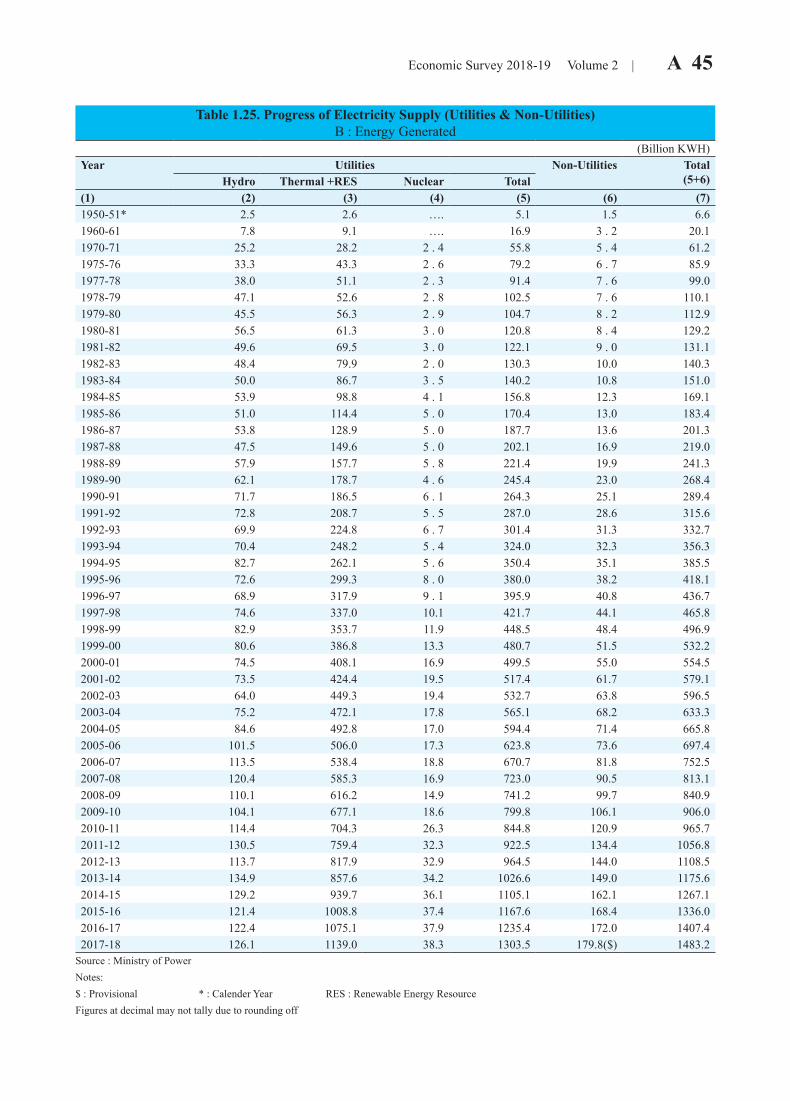
Economic Survey 2018-19 Volume 2 | A 45
Table 1.25. Progress of Electricity Supply (Utilities & Non-Utilities)B : Energy Generated
(Billion KWH)Year Utilities Non-Utilities Total
(5+6)Hydro Thermal +RES Nuclear Total(1) (2) (3) (4) (5) (6) (7)1950-51* 2.5 2.6 …. 5.1 1.5 6.61960-61 7.8 9.1 …. 16.9 3 . 2 20.11970-71 25.2 28.2 2 . 4 55.8 5 . 4 61.21975-76 33.3 43.3 2 . 6 79.2 6 . 7 85.91977-78 38.0 51.1 2 . 3 91.4 7 . 6 99.01978-79 47.1 52.6 2 . 8 102.5 7 . 6 110.11979-80 45.5 56.3 2 . 9 104.7 8 . 2 112.91980-81 56.5 61.3 3 . 0 120.8 8 . 4 129.21981-82 49.6 69.5 3 . 0 122.1 9 . 0 131.11982-83 48.4 79.9 2 . 0 130.3 10.0 140.31983-84 50.0 86.7 3 . 5 140.2 10.8 151.01984-85 53.9 98.8 4 . 1 156.8 12.3 169.11985-86 51.0 114.4 5 . 0 170.4 13.0 183.41986-87 53.8 128.9 5 . 0 187.7 13.6 201.31987-88 47.5 149.6 5 . 0 202.1 16.9 219.01988-89 57.9 157.7 5 . 8 221.4 19.9 241.31989-90 62.1 178.7 4 . 6 245.4 23.0 268.41990-91 71.7 186.5 6 . 1 264.3 25.1 289.41991-92 72.8 208.7 5 . 5 287.0 28.6 315.61992-93 69.9 224.8 6 . 7 301.4 31.3 332.71993-94 70.4 248.2 5 . 4 324.0 32.3 356.31994-95 82.7 262.1 5 . 6 350.4 35.1 385.51995-96 72.6 299.3 8 . 0 380.0 38.2 418.11996-97 68.9 317.9 9 . 1 395.9 40.8 436.71997-98 74.6 337.0 10.1 421.7 44.1 465.81998-99 82.9 353.7 11.9 448.5 48.4 496.91999-00 80.6 386.8 13.3 480.7 51.5 532.22000-01 74.5 408.1 16.9 499.5 55.0 554.52001-02 73.5 424.4 19.5 517.4 61.7 579.12002-03 64.0 449.3 19.4 532.7 63.8 596.52003-04 75.2 472.1 17.8 565.1 68.2 633.32004-05 84.6 492.8 17.0 594.4 71.4 665.82005-06 101.5 506.0 17.3 623.8 73.6 697.42006-07 113.5 538.4 18.8 670.7 81.8 752.52007-08 120.4 585.3 16.9 723.0 90.5 813.12008-09 110.1 616.2 14.9 741.2 99.7 840.92009-10 104.1 677.1 18.6 799.8 106.1 906.02010-11 114.4 704.3 26.3 844.8 120.9 965.72011-12 130.5 759.4 32.3 922.5 134.4 1056.82012-13 113.7 817.9 32.9 964.5 144.0 1108.52013-14 134.9 857.6 34.2 1026.6 149.0 1175.62014-15 129.2 939.7 36.1 1105.1 162.1 1267.12015-16 121.4 1008.8 37.4 1167.6 168.4 1336.02016-17 122.4 1075.1 37.9 1235.4 172.0 1407.42017-18 126.1 1139.0 38.3 1303.5 179.8($) 1483.2
Source : Ministry of Power Notes: $ : Provisional * : Calender Year RES : Renewable Energy Resource Figures at decimal may not tally due to rounding off
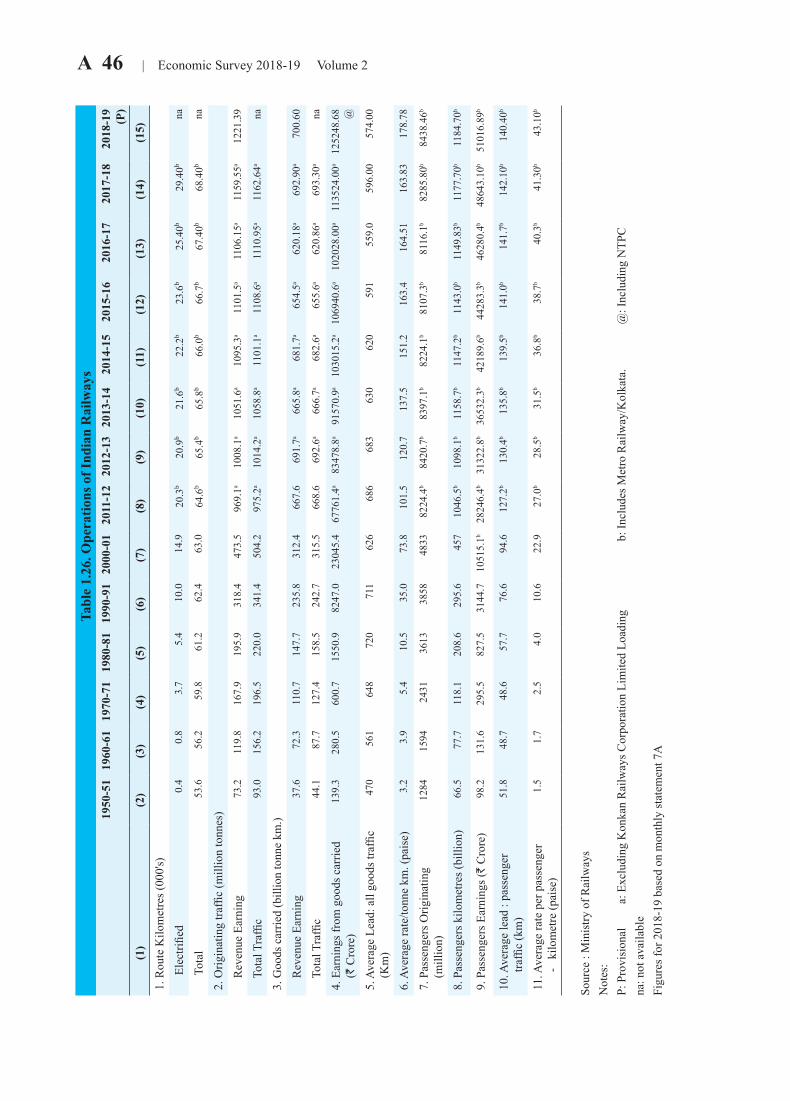
A 46 | Economic Survey 2018-19 Volume 2
T
able
1.2
6. O
pera
tions
of I
ndia
n R
ailw
ays
1950
-51
1960
-61
1970
-71
1980
-81
1990
-91
2000
-01
2011
-12
2012
-13
2013
-14
2014
-15
2015
-16
2016
-17
2017
-18
2018
-19
(P)
(1)
(2)
(3)
(4)
(5)
(6)
(7)
(8)
(9)
(10)
(11)
(12)
(13)
(14)
(15)
1. R
oute
Kilo
met
res (
000'
s)
Ele
ctrifi
ed0.
40.
83.
75.
410
.014
.920
.3b
20.9
b21
.6b
22.2
b23
.6b
25.4
0b29
.40b
na
T
otal
53.6
56.2
59.8
61.2
62.4
63.0
64.6
b65
.4b
65.8
b66
.0b
66.7
b67
.40b
68.4
0bna
2. O
rigin
atin
g tra
ffic
(mill
ion
tonn
es)
R
even
ue E
arni
ng
73.2
119.
816
7.9
195.
931
8.4
473.
596
9.1a
1008
.1a
1051
.6a
1095
.3a
1101
.5a
1106
.15a
1159
.55a
1221
.39
T
otal
Tra
ffic
93.0
156.
219
6.5
220.
034
1.4
504.
297
5.2a
1014
.2a
1058
.8a
1101
.1a
1108
.6a
1110
.95a
1162
.64a
na
3. G
oods
car
ried
(bill
ion
tonn
e km
.)
Rev
enue
Ear
ning
37
.672
.311
0.7
147.
723
5.8
312.
466
7.6
691.
7a66
5.8a
681.
7a65
4.5a
620.
18a
692.
90a
700.
60
T
otal
Tra
ffic
44.1
87.7
127.
415
8.5
242.
731
5.5
668.
669
2.6a
666.
7a68
2.6a
655.
6a62
0.86
a69
3.30
ana
4. E
arni
ngs f
rom
goo
ds c
arrie
d
(R
Cro
re)
139.
328
0.5
600.
715
50.9
8247
.023
045.
467
761.
4a83
478.
8a91
570.
9a10
3015
.2a
1069
40.6
a10
2028
.00a
1135
24.0
0a12
5248
.68 @
5. A
vera
ge L
ead:
all
good
s tra
ffic
(K
m)
470
561
648
720
711
626
686
683
630
620
591
559.
059
6.00
574.
00
6. A
vera
ge ra
te/to
nne
km. (
pais
e)3.
23.
95.
410
.535
.073
.810
1.5
120.
713
7.5
151.
216
3.4
164.
5116
3.83
178.
78
7. P
asse
nger
s Orig
inat
ing
(m
illio
n)
1284
1594
2431
3613
3858
4833
8224
.4b
8420
.7b
8397
.1b
8224
.1b
8107
.3b
8116
.1b
8285
.80b
8438
.46b
8. P
asse
nger
s kilo
met
res (
billi
on)
66.5
77.7
118.
120
8.6
295.
645
710
46.5
b10
98.1
b11
58.7
b11
47.2
b11
43.0
b11
49.8
3b11
77.7
0b11
84.7
0b
9. P
asse
nger
s Ear
ning
s (R
Cro
re)
98.2
131.
629
5.5
827.
531
44.7
1051
5.1b
2824
6.4b
3132
2.8b
3653
2.3b
4218
9.6b
4428
3.3b
4628
0.4b
4864
3.10
b51
016.
89b
10. A
vera
ge le
ad :
pass
enge
r
tra
ffic
(km
)51
.848
.748
.657
.776
.694
.612
7.2b
130.
4b13
5.8b
139.
5b14
1.0b
141.
7b14
2.10
b14
0.40
b
11. A
vera
ge ra
te p
er p
asse
nger
-
kilo
met
re (p
aise
)1.
51.
72.
54.
010
.622
.927
.0b
28.5
b31
.5b
36.8
b38
.7b
40.3
b41
.30b
43.1
0b
Sour
ce :
Min
istry
of R
ailw
ays
N
otes
:
P: P
rovi
sion
al
a
: Exc
ludi
ng K
onka
n R
ailw
ays C
orpo
ratio
n Li
mite
d Lo
adin
g
b: I
nclu
des M
etro
Rai
lway
/Kol
kata
.
@
: Inc
ludi
ng N
TPC
na: n
ot a
vaila
ble
Fi
gure
s for
201
8-19
bas
ed o
n m
onth
ly st
atem
ent 7
A
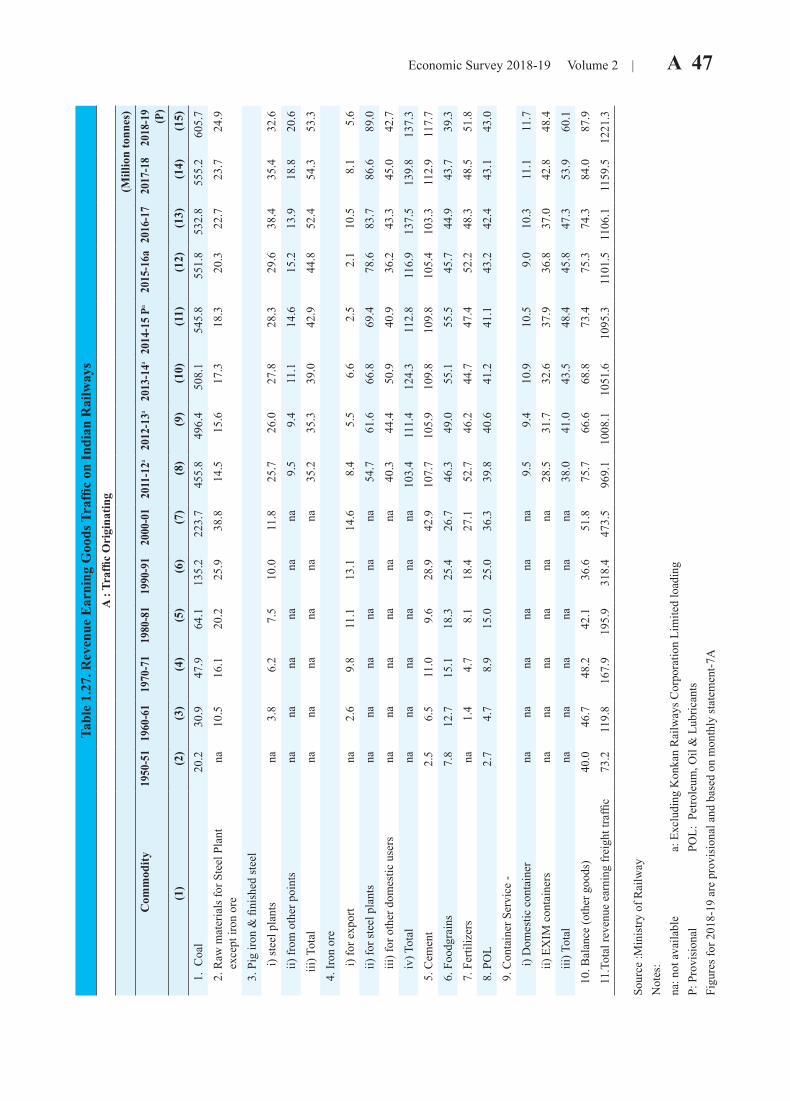
Economic Survey 2018-19 Volume 2 | A 47 Ta
ble
1.27
. Rev
enue
Ear
ning
Goo
ds T
raffi
c on
Indi
an R
ailw
ays
A :
Traf
fic O
rigi
natin
g
(Mill
ion
tonn
es)
Com
mod
ity19
50-5
119
60-6
119
70-7
119
80-8
119
90-9
120
00-0
120
11-1
2a20
12-1
3a20
13-1
4a20
14-1
5 Pa
2015
-16a
2016
-17
2017
-18
2018
-19
(P)
(1)
(2)
(3)
(4)
(5)
(6)
(7)
(8)
(9)
(10)
(11)
(12)
(13)
(14)
(15)
1.
Coa
l20
.230
.947
.964
.113
5.2
223.
745
5.8
496.
450
8.1
545.
855
1.8
532.
855
5.2
605.
7
2. R
aw m
ater
ials
for S
teel
Pla
nt
exc
ept i
ron
ore
na10
.516
.120
.225
.938
.814
.515
.617
.318
.320
.322
.723
.724
.9
3.
Pig
iron
& fi
nish
ed st
eel
i) s
teel
pla
nts
na3.
86.
27.
510
.011
.825
.726
.027
.828
.329
.638
.435
.432
.6
ii
) fro
m o
ther
poi
nts
nana
nana
nana
9.5
9.4
11.1
14.6
15.2
13.9
18.8
20.6
iii) T
otal
nana
nana
nana
35.2
35.3
39.0
42.9
44.8
52.4
54.3
53.3
4.
Iron
ore
i
) for
exp
ort
na2.
69.
811
.113
.114
.68.
45.
56.
62.
52.
110
.58.
15.
6
ii
) for
stee
l pla
nts
nana
nana
nana
54.7
61.6
66.8
69.4
78.6
83.7
86.6
89.0
iii)
for o
ther
dom
estic
use
rsna
nana
nana
na40
.344
.450
.940
.936
.243
.345
.042
.7
iv
) Tot
alna
nana
nana
na10
3.4
111.
412
4.3
112.
811
6.9
137.
513
9.8
137.
3
5. C
emen
t2.
56.
511
.09.
628
.942
.910
7.7
105.
910
9.8
109.
810
5.4
103.
311
2.9
117.
7
6. F
oodg
rain
s7.
812
.715
.118
.325
.426
.746
.349
.055
.155
.545
.744
.943
.739
.3
7. F
ertil
izer
sna
1.4
4.7
8.1
18.4
27.1
52.7
46.2
44.7
47.4
52.2
48.3
48.5
51.8
8.
PO
L2.
74.
78.
915
.025
.036
.339
.840
.641
.241
.143
.242
.443
.143
.0
9. C
onta
iner
Ser
vice
-
i
) Dom
estic
con
tain
erna
nana
nana
na9.
59.
410
.910
.59.
010
.311
.111
.7
ii
) EX
IM c
onta
iner
sna
nana
nana
na28
.531
.732
.637
.936
.837
.042
.848
.4
ii
i) To
tal
nana
nana
nana
38.0
41.0
43.5
48.4
45.8
47.3
53.9
60.1
10.
Bal
ance
(oth
er g
oods
)40
.046
.748
.242
.136
.651
.875
.766
.668
.873
.475
.374
.384
.087
.9 1
1.To
tal r
even
ue e
arni
ng fr
eigh
t tra
ffic
73.2
119.
816
7.9
195.
931
8.4
473.
596
9.1
1008
.110
51.6
1095
.311
01.5
1106
.111
59.5
1221
.3
Sour
ce :M
inis
try o
f Rai
lway
N
otes
:
na: n
ot a
vaila
ble
a:
Exc
ludi
ng K
onka
n R
ailw
ays C
orpo
ratio
n Li
mite
d lo
adin
g P:
Pro
visi
onal
POL:
Pet
role
um, O
il &
Lub
rican
ts
Fi
gure
s for
201
8-19
are
pro
visi
onal
and
bas
ed o
n m
onth
ly st
atem
ent-7
A
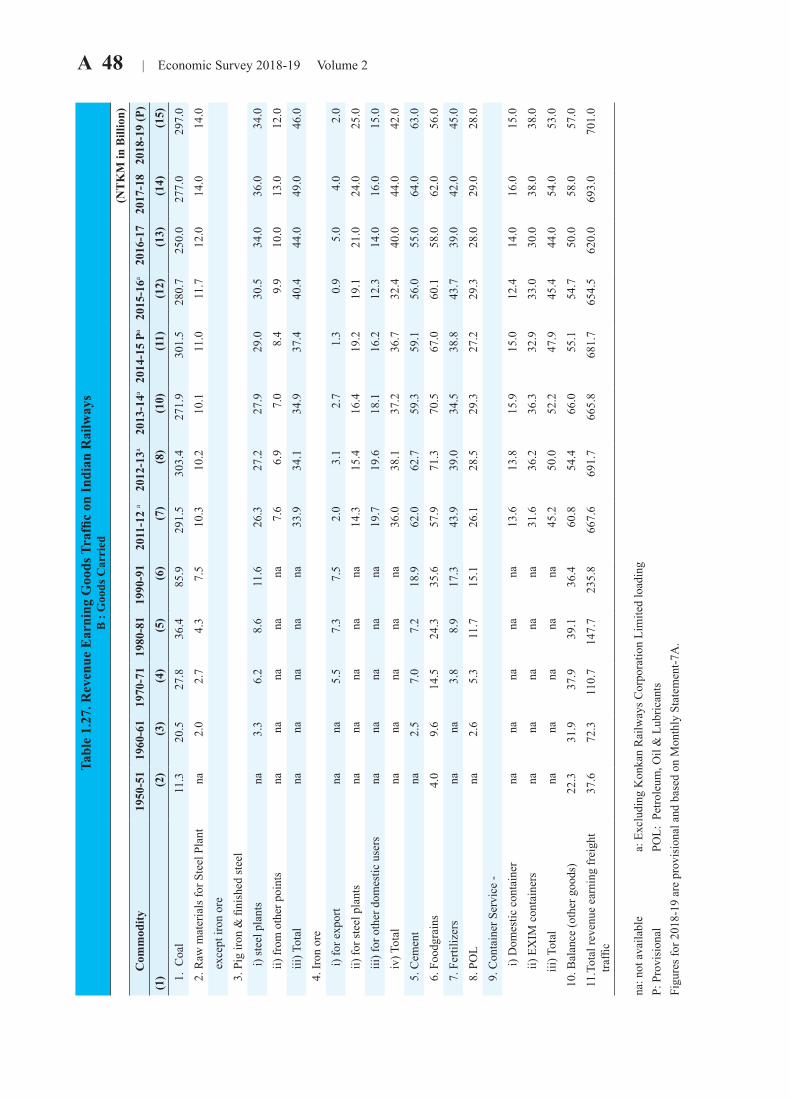
A 48 | Economic Survey 2018-19 Volume 2Ta
ble
1.27
. Rev
enue
Ear
ning
Goo
ds T
raffi
c on
Indi
an R
ailw
ays
B :
Goo
ds C
arri
ed
(N
TK
M in
Bill
ion)
Com
mod
ity19
50-5
119
60-6
119
70-7
119
80-8
119
90-9
120
11-1
2 a
2012
-13a
2013
-14a
2014
-15
Pa20
15-1
6a20
16-1
720
17-1
820
18-1
9 (P
)(1
)(2
)(3
)(4
)(5
)(6
)(7
)(8
)(1
0)(1
1)(1
2)(1
3)(1
4)(1
5)
1. C
oal
11.3
20.5
27.8
36.4
85.9
291.
530
3.4
271.
930
1.5
280.
725
0.0
277.
029
7.0
2.
Raw
mat
eria
ls fo
r Ste
el P
lant
na2.
02.
74.
37.
510
.310
.210
.111
.011
.712
.014
.014
.0
e
xcep
t iro
n or
e
3. P
ig ir
on &
fini
shed
stee
l
i
) ste
el p
lant
sna
3.3
6.2
8.6
11.6
26.3
27.2
27.9
29.0
30.5
34.0
36.0
34.0
ii) f
rom
oth
er p
oint
sna
nana
nana
7.6
6.9
7.0
8.4
9.9
10.0
13.0
12.0
iii)
Tota
lna
nana
nana
33.9
34.1
34.9
37.4
40.4
44.0
49.0
46.0
4.
Iron
ore
i
) for
exp
ort
nana
5.5
7.3
7.5
2.0
3.1
2.7
1.3
0.9
5.0
4.0
2.0
ii) f
or st
eel p
lant
sna
nana
nana
14.3
15.4
16.4
19.2
19.1
21.0
24.0
25.0
iii)
for o
ther
dom
estic
use
rsna
nana
nana
19.7
19.6
18.1
16.2
12.3
14.0
16.0
15.0
iv) T
otal
nana
nana
na36
.038
.137
.236
.732
.440
.044
.042
.0
5. C
emen
tna
2.5
7.0
7.2
18.9
62.0
62.7
59.3
59.1
56.0
55.0
64.0
63.0
6.
Foo
dgra
ins
4.0
9.6
14.5
24.3
35.6
57.9
71.3
70.5
67.0
60.1
58.0
62.0
56.0
7.
Fer
tiliz
ers
nana
3.8
8.9
17.3
43.9
39.0
34.5
38.8
43.7
39.0
42.0
45.0
8.
PO
Lna
2.6
5.3
11.7
15.1
26.1
28.5
29.3
27.2
29.3
28.0
29.0
28.0
9.
Con
tain
er S
ervi
ce -
i) D
omes
tic c
onta
iner
nana
nana
na13
.613
.815
.915
.012
.414
.016
.015
.0
ii
) EX
IM c
onta
iner
sna
nana
nana
31.6
36.2
36.3
32.9
33.0
30.0
38.0
38.0
iii) T
otal
nana
nana
na45
.250
.052
.247
.945
.444
.054
.053
.0 1
0. B
alan
ce (o
ther
goo
ds)
22.3
31.9
37.9
39.1
36.4
60.8
54.4
66.0
55.1
54.7
50.0
58.0
57.0
11.
Tota
l rev
enue
ear
ning
frei
ght
traffi
c37
.672
.311
0.7
147.
723
5.8
667.
669
1.7
665.
868
1.7
654.
562
0.0
693.
070
1.0
na: n
ot a
vaila
ble
a:
Exc
ludi
ng K
onka
n R
ailw
ays C
orpo
ratio
n Li
mite
d lo
adin
g
P:
Pro
visi
onal
POL:
Pet
role
um, O
il &
Lub
rican
ts
Fi
gure
s for
201
8-19
are
pro
visi
onal
and
bas
ed o
n M
onth
ly S
tate
men
t-7A
.
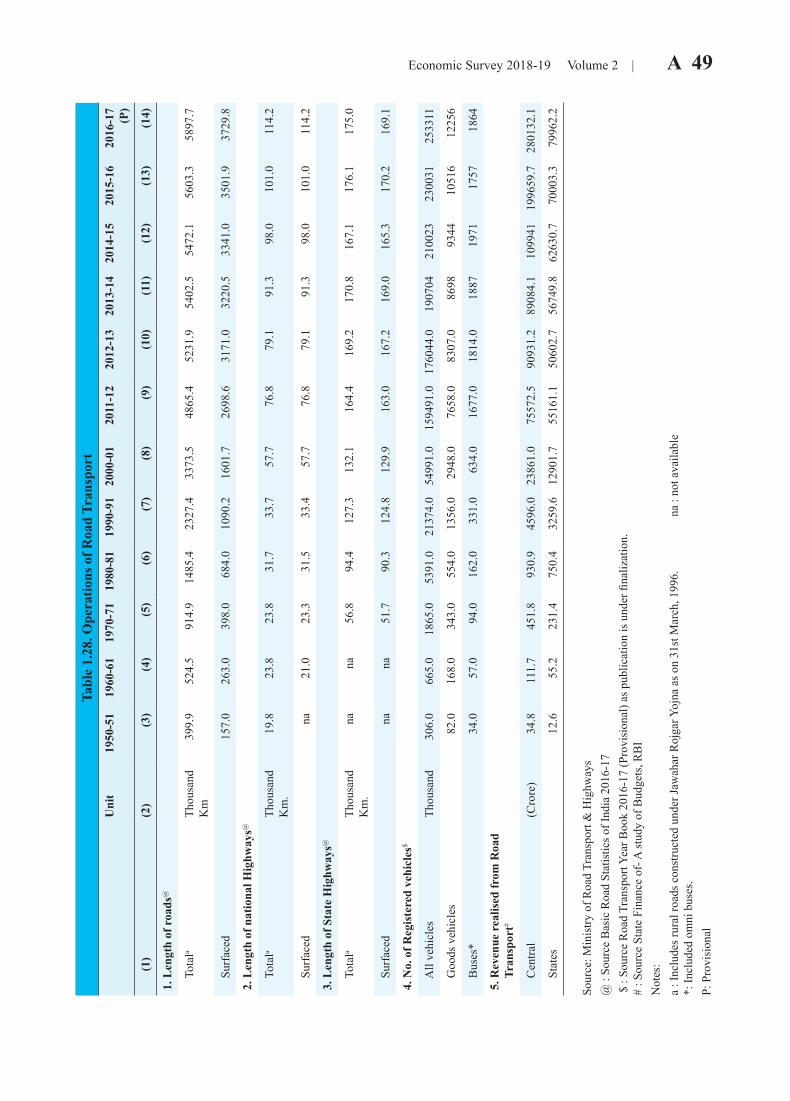
Economic Survey 2018-19 Volume 2 | A 49 Ta
ble
1.28
. Ope
ratio
ns o
f Roa
d Tr
ansp
ort
Uni
t 1
950-
5119
60-6
119
70-7
119
80-8
1 1
990-
9120
00-0
120
11-1
220
12-1
3 20
13-1
420
14-1
520
15-1
620
16-1
7 (P
)
(1)
(2)
(3)
(4)
(5)
(6)
(7)
(8)
(9)
(10)
(11)
(12)
(13)
(14)
1. L
engt
h of
roa
ds@
T
otal
aTh
ousa
nd
Km
399.
952
4.5
914.
914
85.4
2327
.433
73.5
4865
.452
31.9
5402
.554
72.1
5603
.358
97.7
S
urfa
ced
157.
026
3.0
398.
068
4.0
1090
.216
01.7
2698
.631
71.0
3220
.533
41.0
3501
.937
29.8
2. L
engt
h of
nat
iona
l Hig
hway
s@
T
otal
aTh
ousa
nd
Km
.19
.823
.823
.831
.733
.757
.776
.879
.191
.398
.010
1.0
114.
2
S
urfa
ced
na21
.023
.331
.533
.457
.776
.879
.191
.398
.010
1.0
114.
2
3. L
engt
h of
Sta
te H
ighw
ays@
T
otal
aTh
ousa
nd
Km
.na
na56
.894
.412
7.3
132.
116
4.4
169.
217
0.8
167.
117
6.1
175.
0
S
urfa
ced
nana
51.7
90.3
124.
812
9.9
163.
016
7.2
169.
016
5.3
170.
216
9.1
4. N
o. o
f Reg
iste
red
vehi
cles
$
A
ll ve
hicl
esTh
ousa
nd30
6.0
665.
018
65.0
5391
.021
374.
054
991.
015
9491
.017
6044
.019
0704
2100
2323
0031
2533
11
G
oods
veh
icle
s82
.016
8.0
343.
055
4.0
1356
.029
48.0
7658
.083
07.0
8698
9344
1051
612
256
B
uses
*34
.057
.094
.016
2.0
331.
063
4.0
1677
.018
14.0
1887
1971
1757
1864
5. R
even
ue r
ealis
ed fr
om R
oad
T
rans
port
#
C
entra
l (C
rore
)34
.811
1.7
451.
893
0.9
4596
.023
861.
075
572.
590
931.
289
084.
110
9941
1996
59.7
2801
32.1
S
tate
s12
.655
.223
1.4
750.
432
59.6
1290
1.7
5516
1.1
5060
2.7
5674
9.8
6263
0.7
7000
3.3
7996
2.2
Sour
ce: M
inis
try o
f Roa
d Tr
ansp
ort &
Hig
hway
s
@
: So
urce
Bas
ic R
oad
Stat
istic
s of I
ndia
201
6-17
$
: So
urce
Roa
d Tr
ansp
ort Y
ear B
ook
2016
-17
(Pro
visi
onal
) as p
ublic
atio
n is
und
er fi
naliz
atio
n.
#
: Sou
rce
Stat
e Fi
nanc
e of
- A st
udy
of B
udge
ts, R
BI
Not
es:
a : I
nclu
des r
ural
road
s con
stru
cted
und
er Ja
wah
ar R
ojga
r Yoj
na a
s on
31st
Mar
ch, 1
996.
na :
not a
vaila
ble
*:
Incl
uded
om
ni b
uses
.
P:
Pro
visi
onal
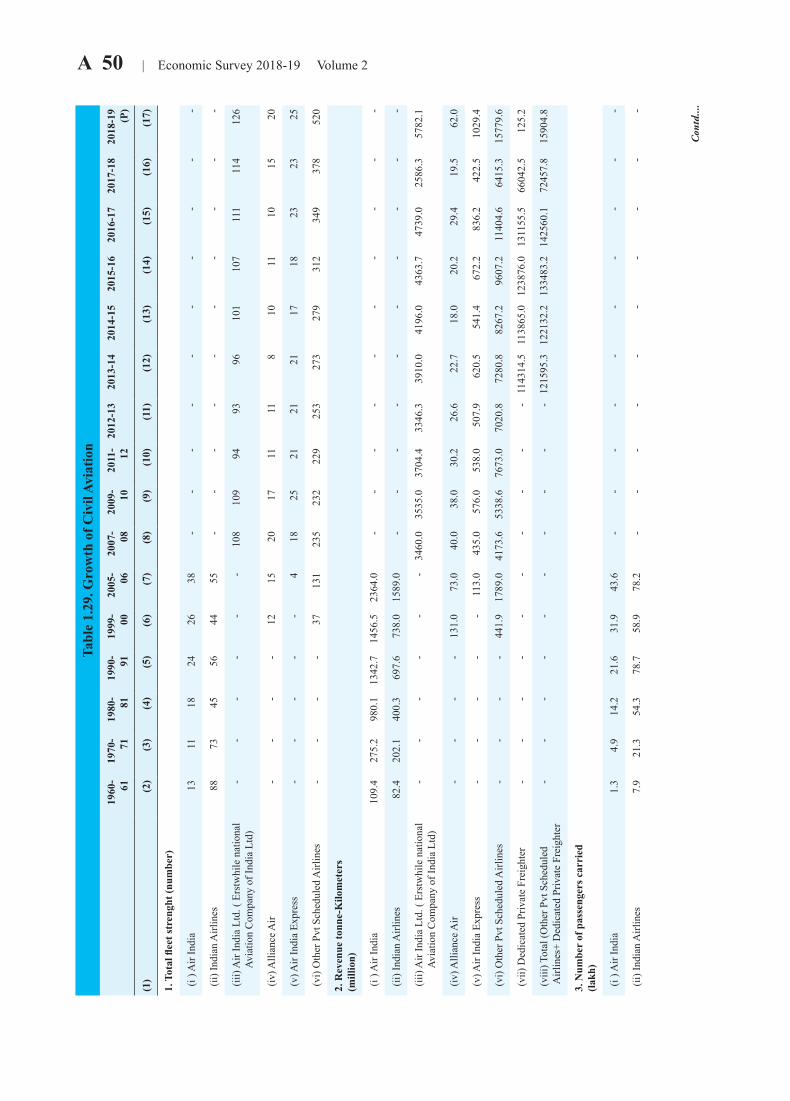
A 50 | Economic Survey 2018-19 Volume 2
Tabl
e 1.
29. G
row
th o
f Civ
il Av
iatio
n19
60-
6119
70-
7119
80-
8119
90-
9119
99-
0020
05-
0620
07-
0820
09-
1020
11-
1220
12-1
320
13-1
420
14-1
520
15-1
620
16-1
720
17-1
820
18-1
9 (P
)
(1)
(2)
(3)
(4)
(5)
(6)
(7)
(8)
(9)
(10)
(11)
(12)
(13)
(14)
(15)
(16)
(17)
1. T
otal
flee
t str
engh
t (nu
mbe
r)
(i )
Air
Indi
a13
1118
2426
38-
--
--
--
--
-
(ii)
Indi
an A
irlin
es88
7345
5644
55-
--
--
--
--
-
(iii
) Air
Indi
a Lt
d. (
Erst
whi
le n
atio
nal
Av
iatio
n C
ompa
ny o
f Ind
ia L
td)
--
--
--
108
109
9493
9610
110
711
111
412
6
(iv
) Alli
ance
Air
--
--
1215
2017
1111
810
1110
1520
(v)
Air
Indi
a Ex
pres
s-
--
--
418
2521
2121
1718
2323
25
(vi
) Oth
er P
vt S
ched
uled
Airl
ines
--
--
3713
123
523
222
925
327
327
931
234
937
852
0
2. R
even
ue to
nne-
Kilo
met
ers
(mill
ion)
(i )
Air
Indi
a10
9.4
275.
298
0.1
1342
.714
56.5
2364
.0-
--
--
--
--
-
(ii)
Indi
an A
irlin
es82
.420
2.1
400.
369
7.6
738.
015
89.0
--
--
--
--
--
(iii
) Air
Indi
a Lt
d. (
Erst
whi
le n
atio
nal
Av
iatio
n C
ompa
ny o
f Ind
ia L
td)
--
--
--
3460
.035
35.0
3704
.433
46.3
3910
.041
96.0
4363
.747
39.0
2586
.357
82.1
(iv
) Alli
ance
Air
--
--
131.
073
.040
.038
.030
.226
.622
.718
.020
.229
.419
.562
.0
(v)
Air
Indi
a Ex
pres
s-
--
--
113.
043
5.0
576.
053
8.0
507.
962
0.5
541.
467
2.2
836.
242
2.5
1029
.4
(vi
) Oth
er P
vt S
ched
uled
Airl
ines
--
--
441.
917
89.0
4173
.653
38.6
7673
.070
20.8
7280
.882
67.2
9607
.211
404.
664
15.3
1577
9.6
(vi
i) D
edic
ated
Priv
ate
Frei
ghte
r-
--
--
--
--
-11
4314
.511
3865
.012
3876
.013
1155
.566
042.
512
5.2
(vi
ii) T
otal
(Oth
er P
vt S
ched
uled
Airl
ines
+ D
edic
ated
Priv
ate
Frei
ghte
r-
--
--
--
--
-12
1595
.312
2132
.213
3483
.214
2560
.172
457.
815
904.
8
3. N
umbe
r of
pas
seng
ers c
arri
ed
(lakh
)
(i )
Air
Indi
a1.
34.
914
.221
.631
.943
.6-
--
--
--
--
-
(ii)
Indi
an A
irlin
es7.
921
.354
.378
.758
.978
.2-
--
--
--
--
-
Con
td....
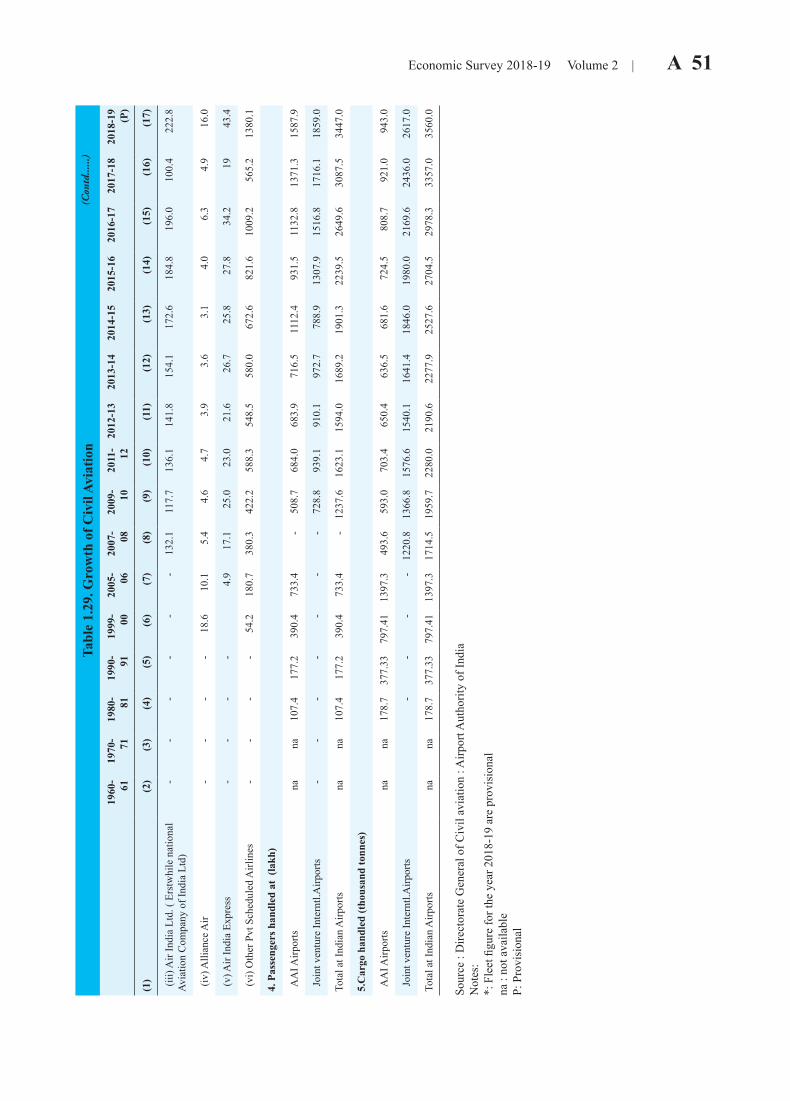
Economic Survey 2018-19 Volume 2 | A 51 Ta
ble
1.29
. Gro
wth
of C
ivil
Avia
tion
1960
-61
1970
-71
1980
-81
1990
-91
1999
-00
2005
-06
2007
-08
2009
-10
2011
-12
2012
-13
2013
-14
2014
-15
2015
-16
2016
-17
2017
-18
2018
-19
(P)
(1)
(2)
(3)
(4)
(5)
(6)
(7)
(8)
(9)
(10)
(11)
(12)
(13)
(14)
(15)
(16)
(17)
(iii
) Air
Indi
a Lt
d. (
Erst
whi
le n
atio
nal
Avia
tion
Com
pany
of I
ndia
Ltd
)-
--
--
-13
2.1
117.
713
6.1
141.
815
4.1
172.
618
4.8
196.
010
0.4
222.
8
(iv
) Alli
ance
Air
--
--
18.6
10.1
5.4
4.6
4.7
3.9
3.6
3.1
4.0
6.3
4.9
16.0
(v)
Air
Indi
a Ex
pres
s-
--
-4.
917
.125
.023
.021
.626
.725
.827
.834
.219
43.4
(vi
) Oth
er P
vt S
ched
uled
Airl
ines
--
--
54.2
180.
738
0.3
422.
258
8.3
548.
558
0.0
672.
682
1.6
1009
.256
5.2
1380
.1
4. P
asse
nger
s han
dled
at
(lakh
)
AA
I Airp
orts
nana
107.
417
7.2
390.
473
3.4
-50
8.7
684.
068
3.9
716.
511
12.4
931.
511
32.8
1371
.315
87.9
Joi
nt v
entu
re In
tern
tl.A
irpor
ts-
--
--
--
728.
893
9.1
910.
197
2.7
788.
913
07.9
1516
.817
16.1
1859
.0
Tota
l at I
ndia
n A
irpor
tsna
na10
7.4
177.
239
0.4
733.
4-
1237
.616
23.1
1594
.016
89.2
1901
.322
39.5
2649
.630
87.5
3447
.0
5.C
argo
han
dled
(tho
usan
d to
nnes
)
AA
I Airp
orts
nana
178.
737
7.33
797.
4113
97.3
493.
659
3.0
703.
465
0.4
636.
568
1.6
724.
580
8.7
921.
094
3.0
Joi
nt v
entu
re In
tern
tl.A
irpor
ts-
--
-12
20.8
1366
.815
76.6
1540
.116
41.4
1846
.019
80.0
2169
.624
36.0
2617
.0
Tota
l at I
ndia
n A
irpor
tsna
na17
8.7
377.
3379
7.41
1397
.317
14.5
1959
.722
80.0
2190
.622
77.9
2527
.627
04.5
2978
.333
57.0
3560
.0
Sour
ce :
Dire
ctor
ate
Gen
eral
of C
ivil
avia
tion
: Airp
ort A
utho
rity
of In
dia
N
otes
:
*: F
leet
figu
re fo
r the
yea
r 201
8-19
are
pro
visi
onal
na
: no
t ava
ilabl
e
P: P
rovi
sion
al
(Con
td......)
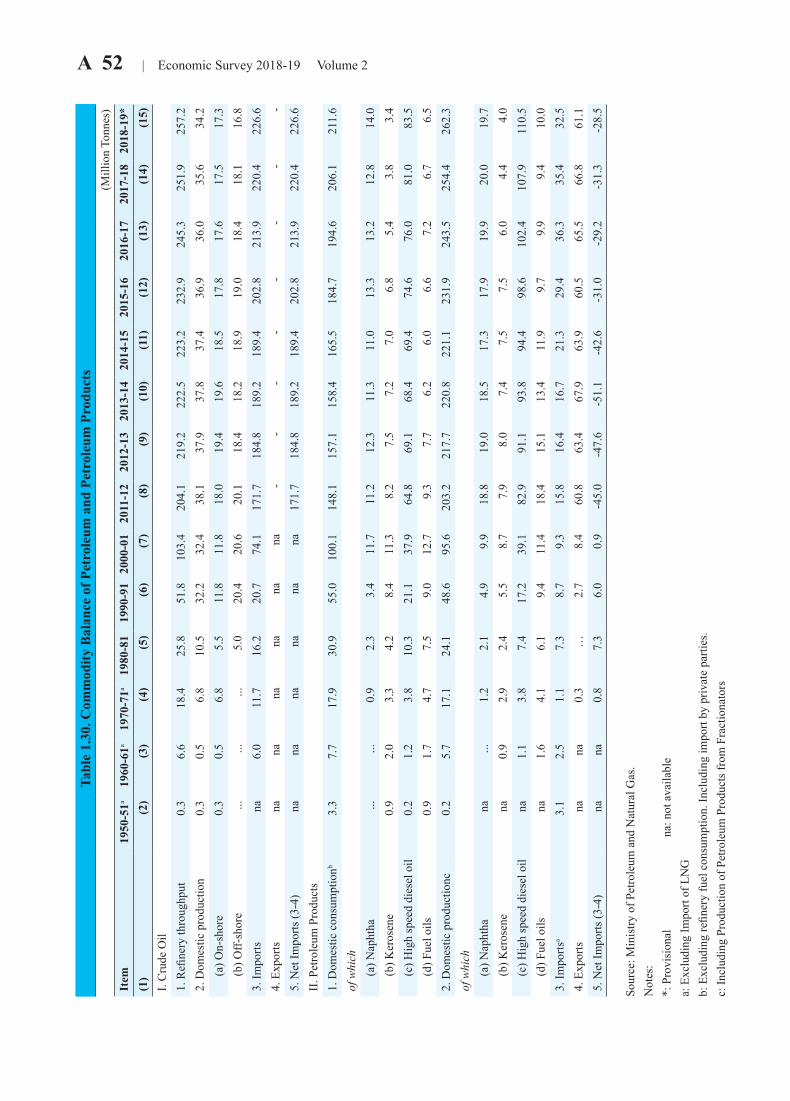
A 52 | Economic Survey 2018-19 Volume 2Ta
ble
1.30
. Com
mod
ity B
alan
ce o
f Pet
role
um a
nd P
etro
leum
Pro
duct
s (M
illio
n To
nnes
)It
em19
50-5
1a19
60-6
1a19
70-7
1a19
80-8
119
90-9
120
00-0
120
11-1
220
12-1
320
13-1
420
14-1
5 20
15-1
6 20
16-1
720
17-1
820
18-1
9*(1
)(2
)(3
)(4
)(5
)(6
)(7
)(8
)(9
)(1
0)(1
1)(1
2)(1
3)(1
4)(1
5)I.
Cru
de O
il1.
Refi
nery
thro
ughp
ut0.
36.
618
.425
.851
.810
3.4
204.
121
9.2
222.
522
3.2
232.
924
5.3
251.
925
7.2
2. D
omes
tic p
rodu
ctio
n0.
30.
56.
810
.532
.232
.438
.137
.937
.837
.436
.936
.035
.634
.2
(a)
On-
shor
e0.
30.
56.
85.
511
.811
.818
.019
.419
.618
.517
.817
.617
.517
.3
(b)
Off-
shor
e...
......
5.0
20.4
20.6
20.1
18.4
18.2
18.9
19.0
18.4
18.1
16.8
3. Im
ports
na6.
011
.716
.220
.774
.117
1.7
184.
818
9.2
189.
420
2.8
213.
922
0.4
226.
64.
Exp
orts
nana
nana
nana
--
--
--
--
5. N
et Im
ports
(3-4
)na
nana
nana
na17
1.7
184.
818
9.2
189.
420
2.8
213.
922
0.4
226.
6II
. Pet
role
um P
rodu
cts
1. D
omes
tic c
onsu
mpt
ionb
3.3
7.7
17.9
30.9
55.0
100.
114
8.1
157.
115
8.4
165.
518
4.7
194.
620
6.1
211.
6of
whi
ch
(a)
Nap
htha
...
...0.
92.
33.
411
.711
.212
.311
.311
.013
.313
.212
.814
.0
(b)
Ker
osen
e0.
92.
03.
34.
28.
411
.38.
27.
57.
27.
06.
85.
43.
83.
4
(c)
Hig
h sp
eed
dies
el o
il0.
21.
23.
810
.321
.137
.964
.869
.168
.469
.474
.676
.081
.083
.5
(d)
Fue
l oils
0.9
1.7
4.7
7.5
9.0
12.7
9.3
7.7
6.2
6.0
6.6
7.2
6.7
6.5
2. D
omes
tic p
rodu
ctio
nc
0.2
5.7
17.1
24.1
48.6
95.6
203.
221
7.7
220.
822
1.1
231.
924
3.5
254.
426
2.3
of w
hich
(
a) N
apht
hana
...1.
22.
14.
99.
918
.819
.018
.517
.317
.919
.920
.019
.7
(b)
Ker
osen
ena
0.9
2.9
2.4
5.5
8.7
7.9
8.0
7.4
7.5
7.5
6.0
4.4
4.0
(
c) H
igh
spee
d di
esel
oil
na1.
13.
87.
417
.239
.182
.991
.193
.894
.498
.610
2.4
107.
911
0.5
(
d) F
uel o
ilsna
1.6
4.1
6.1
9.4
11.4
18.4
15.1
13.4
11.9
9.7
9.9
9.4
10.0
3. Im
ports
a3.
12.
51.
17.
38.
79.
315
.816
.416
.721
.329
.436
.335
.432
.54.
Exp
orts
nana
0.3
…2.
78.
460
.863
.467
.963
.960
.565
.566
.861
.15.
Net
Impo
rts (3
-4)
nana
0.8
7.3
6.0
0.9
-45.
0-4
7.6
-51.
1-4
2.6
-31.
0-2
9.2
-31.
3-2
8.5
Sour
ce: M
inis
try o
f Pet
role
um a
nd N
atur
al G
as.
Not
es:
*: P
rovi
sion
al
n
a: n
ot a
vaila
ble
a: E
xclu
ding
Impo
rt of
LN
G
b:
Exc
ludi
ng re
finer
y fu
el c
onsu
mpt
ion.
Incl
udin
g im
port
by p
rivat
e pa
rties
.
c: In
clud
ing
Prod
uctio
n of
Pet
role
um P
rodu
cts f
rom
Fra
ctio
nato
rs
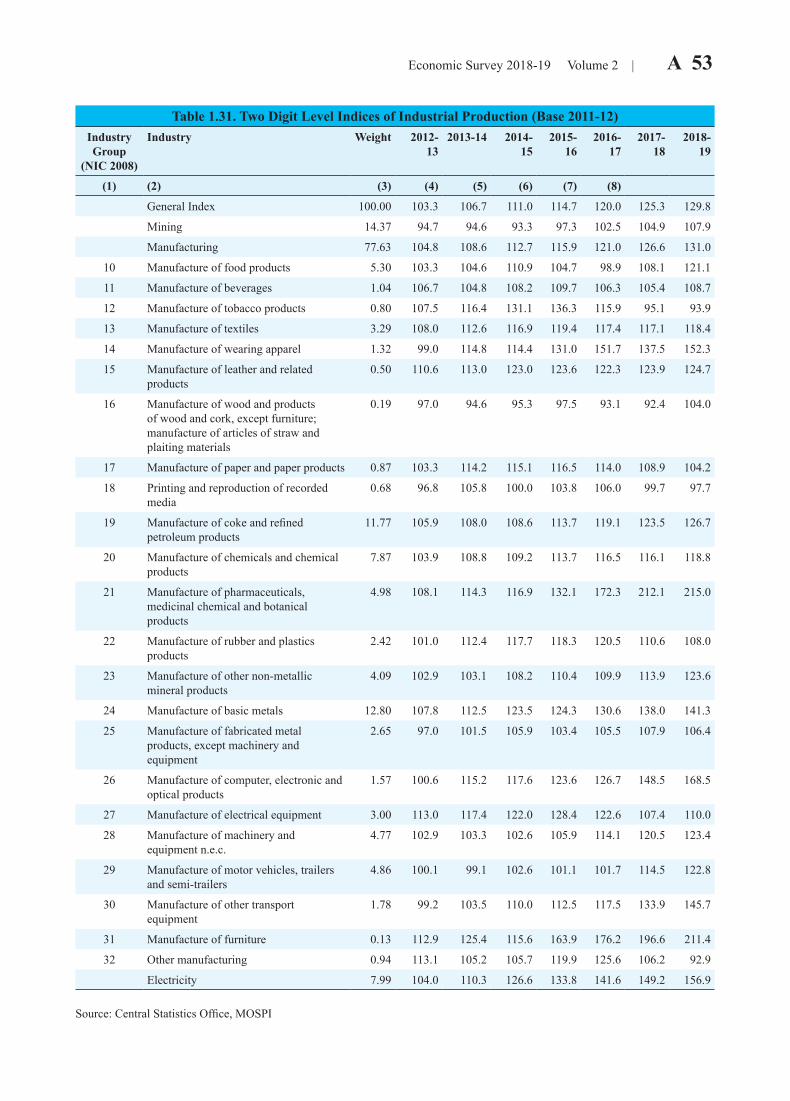
Economic Survey 2018-19 Volume 2 | A 53
Table 1.31. Two Digit Level Indices of Industrial Production (Base 2011-12)Industry Group
(NIC 2008)
Industry Weight 2012-13
2013-14 2014-15
2015-16
2016-17
2017-18
2018-19
(1) (2) (3) (4) (5) (6) (7) (8)
General Index 100.00 103.3 106.7 111.0 114.7 120.0 125.3 129.8
Mining 14.37 94.7 94.6 93.3 97.3 102.5 104.9 107.9
Manufacturing 77.63 104.8 108.6 112.7 115.9 121.0 126.6 131.0
10 Manufacture of food products 5.30 103.3 104.6 110.9 104.7 98.9 108.1 121.1
11 Manufacture of beverages 1.04 106.7 104.8 108.2 109.7 106.3 105.4 108.7
12 Manufacture of tobacco products 0.80 107.5 116.4 131.1 136.3 115.9 95.1 93.9
13 Manufacture of textiles 3.29 108.0 112.6 116.9 119.4 117.4 117.1 118.4
14 Manufacture of wearing apparel 1.32 99.0 114.8 114.4 131.0 151.7 137.5 152.3
15 Manufacture of leather and related products
0.50 110.6 113.0 123.0 123.6 122.3 123.9 124.7
16 Manufacture of wood and products of wood and cork, except furniture; manufacture of articles of straw and plaiting materials
0.19 97.0 94.6 95.3 97.5 93.1 92.4 104.0
17 Manufacture of paper and paper products 0.87 103.3 114.2 115.1 116.5 114.0 108.9 104.2
18 Printing and reproduction of recorded media
0.68 96.8 105.8 100.0 103.8 106.0 99.7 97.7
19 Manufacture of coke and refined petroleum products
11.77 105.9 108.0 108.6 113.7 119.1 123.5 126.7
20 Manufacture of chemicals and chemical products
7.87 103.9 108.8 109.2 113.7 116.5 116.1 118.8
21 Manufacture of pharmaceuticals, medicinal chemical and botanical products
4.98 108.1 114.3 116.9 132.1 172.3 212.1 215.0
22 Manufacture of rubber and plastics products
2.42 101.0 112.4 117.7 118.3 120.5 110.6 108.0
23 Manufacture of other non-metallic mineral products
4.09 102.9 103.1 108.2 110.4 109.9 113.9 123.6
24 Manufacture of basic metals 12.80 107.8 112.5 123.5 124.3 130.6 138.0 141.3
25 Manufacture of fabricated metal products, except machinery and equipment
2.65 97.0 101.5 105.9 103.4 105.5 107.9 106.4
26 Manufacture of computer, electronic and optical products
1.57 100.6 115.2 117.6 123.6 126.7 148.5 168.5
27 Manufacture of electrical equipment 3.00 113.0 117.4 122.0 128.4 122.6 107.4 110.0
28 Manufacture of machinery and equipment n.e.c.
4.77 102.9 103.3 102.6 105.9 114.1 120.5 123.4
29 Manufacture of motor vehicles, trailers and semi-trailers
4.86 100.1 99.1 102.6 101.1 101.7 114.5 122.8
30 Manufacture of other transport equipment
1.78 99.2 103.5 110.0 112.5 117.5 133.9 145.7
31 Manufacture of furniture 0.13 112.9 125.4 115.6 163.9 176.2 196.6 211.4
32 Other manufacturing 0.94 113.1 105.2 105.7 119.9 125.6 106.2 92.9
Electricity 7.99 104.0 110.3 126.6 133.8 141.6 149.2 156.9
Source: Central Statistics Office, MOSPI
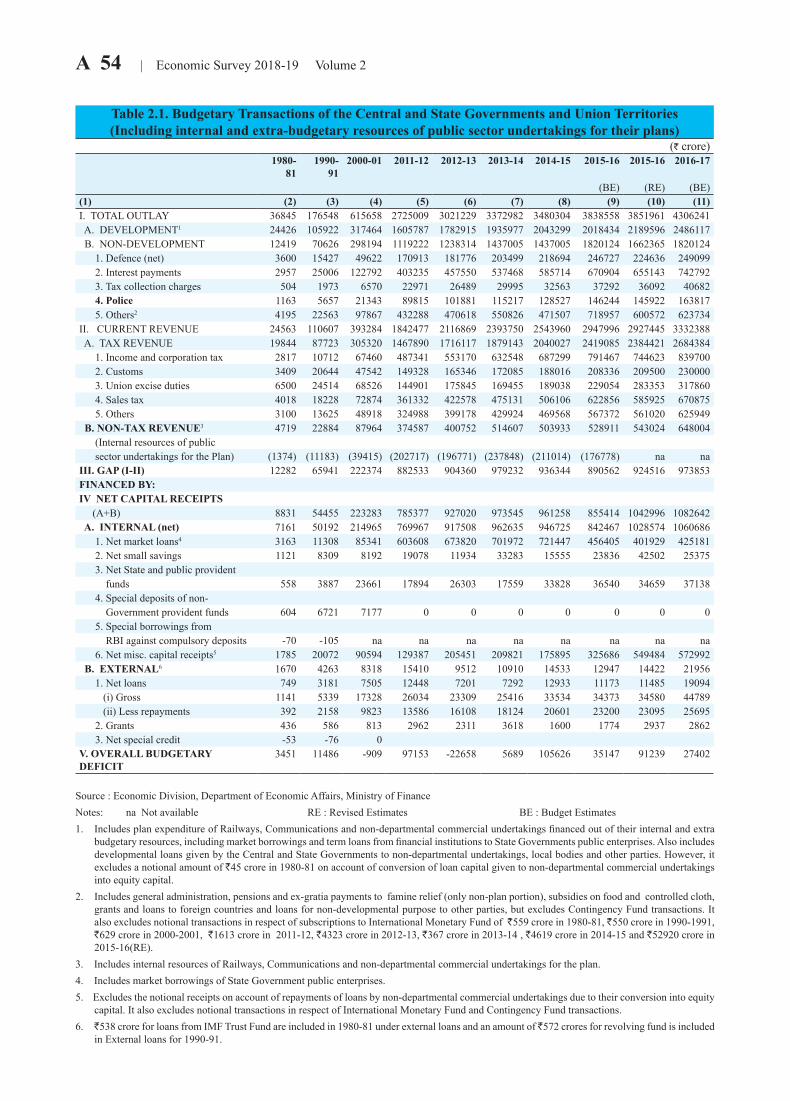
A 54 | Economic Survey 2018-19 Volume 2
Table 2.1. Budgetary Transactions of the Central and State Governments and Union Territories(Including internal and extra-budgetary resources of public sector undertakings for their plans)
(` crore)1980-
811990-
912000-01 2011-12 2012-13 2013-14 2014-15 2015-16 2015-16 2016-17
(BE) (RE) (BE)(1) (2) (3) (4) (5) (6) (7) (8) (9) (10) (11)I. TOTAL OUTLAY 36845 176548 615658 2725009 3021229 3372982 3480304 3838558 3851961 4306241 A. DEVELOPMENT1 24426 105922 317464 1605787 1782915 1935977 2043299 2018434 2189596 2486117 B. NON-DEVELOPMENT 12419 70626 298194 1119222 1238314 1437005 1437005 1820124 1662365 1820124 1. Defence (net) 3600 15427 49622 170913 181776 203499 218694 246727 224636 249099 2. Interest payments 2957 25006 122792 403235 457550 537468 585714 670904 655143 742792 3. Tax collection charges 504 1973 6570 22971 26489 29995 32563 37292 36092 40682 4. Police 1163 5657 21343 89815 101881 115217 128527 146244 145922 163817 5. Others2 4195 22563 97867 432288 470618 550826 471507 718957 600572 623734II. CURRENT REVENUE 24563 110607 393284 1842477 2116869 2393750 2543960 2947996 2927445 3332388 A. TAX REVENUE 19844 87723 305320 1467890 1716117 1879143 2040027 2419085 2384421 2684384 1. Income and corporation tax 2817 10712 67460 487341 553170 632548 687299 791467 744623 839700 2. Customs 3409 20644 47542 149328 165346 172085 188016 208336 209500 230000 3. Union excise duties 6500 24514 68526 144901 175845 169455 189038 229054 283353 317860 4. Sales tax 4018 18228 72874 361332 422578 475131 506106 622856 585925 670875 5. Others 3100 13625 48918 324988 399178 429924 469568 567372 561020 625949 B. NON-TAX REVENUE3 4719 22884 87964 374587 400752 514607 503933 528911 543024 648004 (Internal resources of public sector undertakings for the Plan) (1374) (11183) (39415) (202717) (196771) (237848) (211014) (176778) na naIII. GAP (I-II) 12282 65941 222374 882533 904360 979232 936344 890562 924516 973853FINANCED BY:IV NET CAPITAL RECEIPTS (A+B) 8831 54455 223283 785377 927020 973545 961258 855414 1042996 1082642 A. INTERNAL (net) 7161 50192 214965 769967 917508 962635 946725 842467 1028574 1060686 1. Net market loans4 3163 11308 85341 603608 673820 701972 721447 456405 401929 425181 2. Net small savings 1121 8309 8192 19078 11934 33283 15555 23836 42502 25375 3. Net State and public provident funds 558 3887 23661 17894 26303 17559 33828 36540 34659 37138 4. Special deposits of non- Government provident funds 604 6721 7177 0 0 0 0 0 0 0 5. Special borrowings from RBI against compulsory deposits -70 -105 na na na na na na na na 6. Net misc. capital receipts5 1785 20072 90594 129387 205451 209821 175895 325686 549484 572992 B. EXTERNAL6 1670 4263 8318 15410 9512 10910 14533 12947 14422 21956 1. Net loans 749 3181 7505 12448 7201 7292 12933 11173 11485 19094 (i) Gross 1141 5339 17328 26034 23309 25416 33534 34373 34580 44789 (ii) Less repayments 392 2158 9823 13586 16108 18124 20601 23200 23095 25695 2. Grants 436 586 813 2962 2311 3618 1600 1774 2937 2862 3. Net special credit -53 -76 0V. OVERALL BUDGETARY DEFICIT
3451 11486 -909 97153 -22658 5689 105626 35147 91239 27402
Source : Economic Division, Department of Economic Affairs, Ministry of Finance Notes: na Not available RE : Revised Estimates BE : Budget Estimates1. Includes plan expenditure of Railways, Communications and non-departmental commercial undertakings financed out of their internal and extra
budgetary resources, including market borrowings and term loans from financial institutions to State Governments public enterprises. Also includes developmental loans given by the Central and State Governments to non-departmental undertakings, local bodies and other parties. However, it excludes a notional amount of R45 crore in 1980-81 on account of conversion of loan capital given to non-departmental commercial undertakings into equity capital.
2. Includes general administration, pensions and ex-gratia payments to famine relief (only non-plan portion), subsidies on food and controlled cloth, grants and loans to foreign countries and loans for non-developmental purpose to other parties, but excludes Contingency Fund transactions. It also excludes notional transactions in respect of subscriptions to International Monetary Fund of R559 crore in 1980-81, R550 crore in 1990-1991, R629 crore in 2000-2001, R1613 crore in 2011-12, R4323 crore in 2012-13, R367 crore in 2013-14 , R4619 crore in 2014-15 and R52920 crore in 2015-16(RE).
3. Includes internal resources of Railways, Communications and non-departmental commercial undertakings for the plan. 4. Includes market borrowings of State Government public enterprises.5. Excludes the notional receipts on account of repayments of loans by non-departmental commercial undertakings due to their conversion into equity
capital. It also excludes notional transactions in respect of International Monetary Fund and Contingency Fund transactions. 6. R538 crore for loans from IMF Trust Fund are included in 1980-81 under external loans and an amount of R572 crores for revolving fund is included
in External loans for 1990-91.
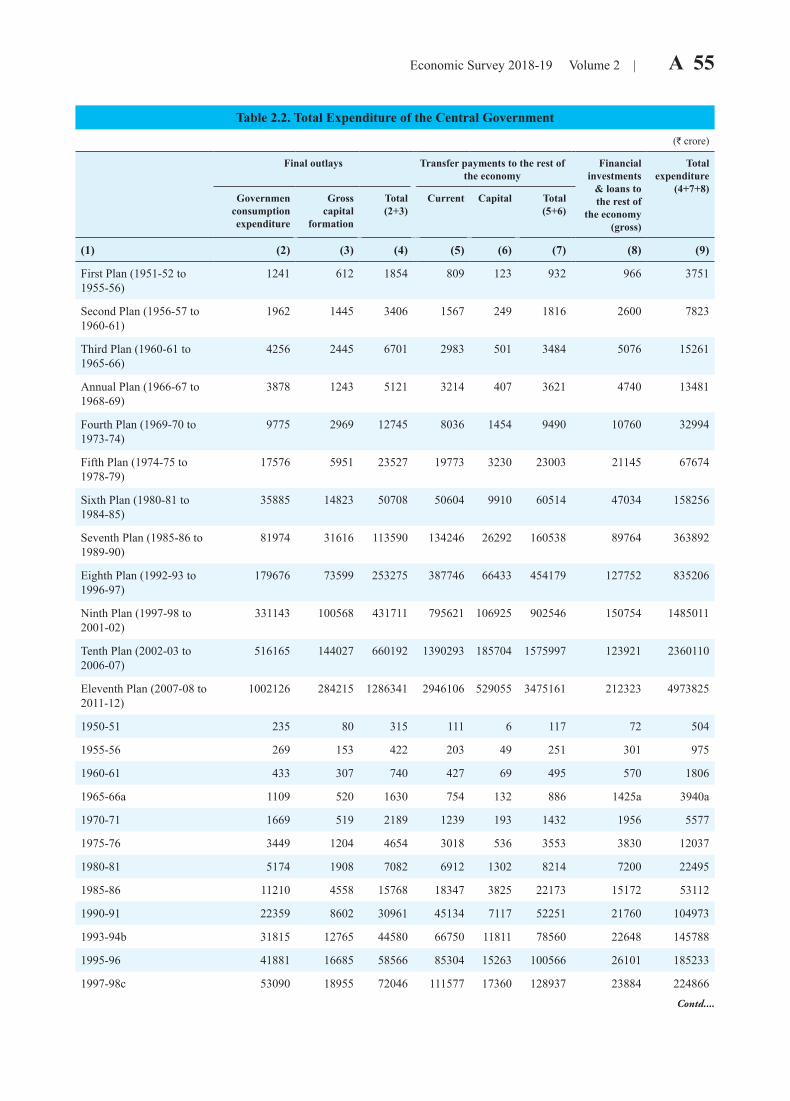
Economic Survey 2018-19 Volume 2 | A 55
Table 2.2. Total Expenditure of the Central Government
(` crore)
Final outlays Transfer payments to the rest of the economy
Financialinvestments
& loans to the rest of
the economy(gross)
Totalexpenditure
(4+7+8)Governmen
consumptionexpenditure
Grosscapital
formation
Total(2+3)
Current Capital Total(5+6)
(1) (2) (3) (4) (5) (6) (7) (8) (9)
First Plan (1951-52 to 1955-56)
1241 612 1854 809 123 932 966 3751
Second Plan (1956-57 to 1960-61)
1962 1445 3406 1567 249 1816 2600 7823
Third Plan (1960-61 to 1965-66)
4256 2445 6701 2983 501 3484 5076 15261
Annual Plan (1966-67 to 1968-69)
3878 1243 5121 3214 407 3621 4740 13481
Fourth Plan (1969-70 to 1973-74)
9775 2969 12745 8036 1454 9490 10760 32994
Fifth Plan (1974-75 to 1978-79)
17576 5951 23527 19773 3230 23003 21145 67674
Sixth Plan (1980-81 to 1984-85)
35885 14823 50708 50604 9910 60514 47034 158256
Seventh Plan (1985-86 to 1989-90)
81974 31616 113590 134246 26292 160538 89764 363892
Eighth Plan (1992-93 to 1996-97)
179676 73599 253275 387746 66433 454179 127752 835206
Ninth Plan (1997-98 to 2001-02)
331143 100568 431711 795621 106925 902546 150754 1485011
Tenth Plan (2002-03 to 2006-07)
516165 144027 660192 1390293 185704 1575997 123921 2360110
Eleventh Plan (2007-08 to 2011-12)
1002126 284215 1286341 2946106 529055 3475161 212323 4973825
1950-51 235 80 315 111 6 117 72 504
1955-56 269 153 422 203 49 251 301 975
1960-61 433 307 740 427 69 495 570 1806
1965-66a 1109 520 1630 754 132 886 1425a 3940a
1970-71 1669 519 2189 1239 193 1432 1956 5577
1975-76 3449 1204 4654 3018 536 3553 3830 12037
1980-81 5174 1908 7082 6912 1302 8214 7200 22495
1985-86 11210 4558 15768 18347 3825 22173 15172 53112
1990-91 22359 8602 30961 45134 7117 52251 21760 104973
1993-94b 31815 12765 44580 66750 11811 78560 22648 145788
1995-96 41881 16685 58566 85304 15263 100566 26101 185233
1997-98c 53090 18955 72046 111577 17360 128937 23884 224866Contd....
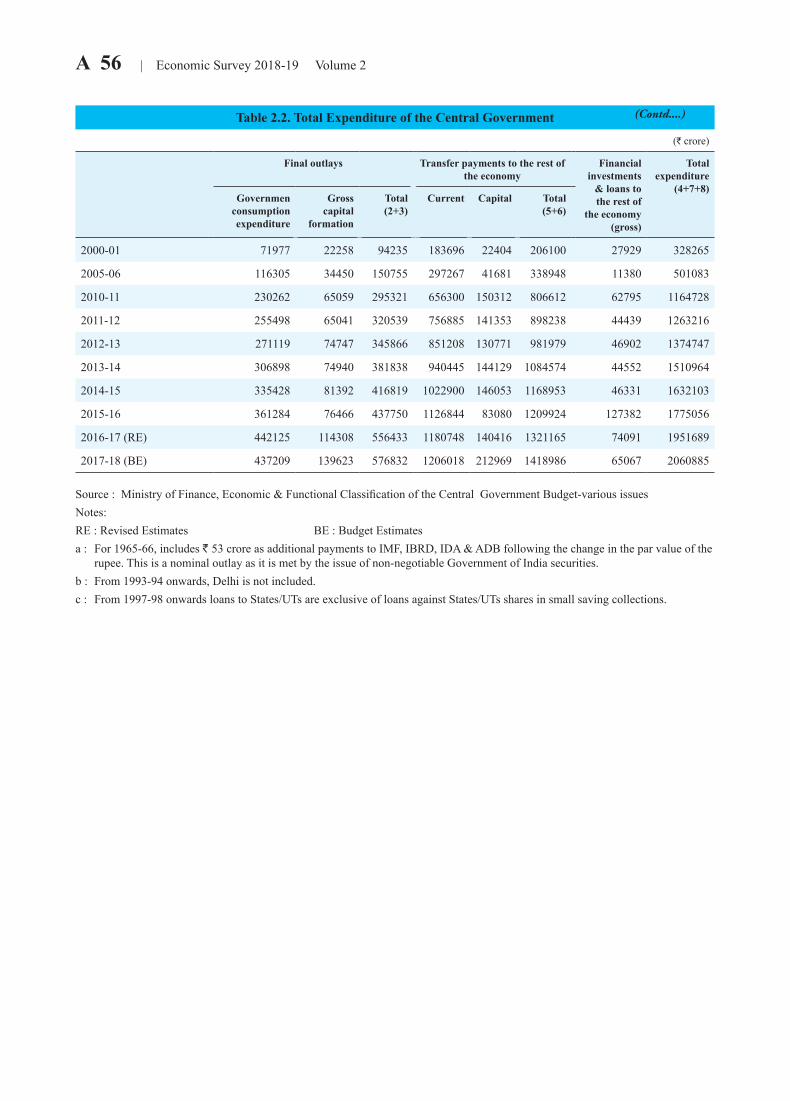
A 56 | Economic Survey 2018-19 Volume 2
Table 2.2. Total Expenditure of the Central Government
(` crore)
Final outlays Transfer payments to the rest of the economy
Financialinvestments
& loans to the rest of
the economy(gross)
Totalexpenditure
(4+7+8)Governmen
consumptionexpenditure
Grosscapital
formation
Total(2+3)
Current Capital Total(5+6)
2000-01 71977 22258 94235 183696 22404 206100 27929 328265
2005-06 116305 34450 150755 297267 41681 338948 11380 501083
2010-11 230262 65059 295321 656300 150312 806612 62795 1164728
2011-12 255498 65041 320539 756885 141353 898238 44439 1263216
2012-13 271119 74747 345866 851208 130771 981979 46902 1374747
2013-14 306898 74940 381838 940445 144129 1084574 44552 1510964
2014-15 335428 81392 416819 1022900 146053 1168953 46331 1632103
2015-16 361284 76466 437750 1126844 83080 1209924 127382 1775056
2016-17 (RE) 442125 114308 556433 1180748 140416 1321165 74091 1951689
2017-18 (BE) 437209 139623 576832 1206018 212969 1418986 65067 2060885
Source : Ministry of Finance, Economic & Functional Classification of the Central Government Budget-various issuesNotes: RE : Revised Estimates BE : Budget Estimatesa : For 1965-66, includes R 53 crore as additional payments to IMF, IBRD, IDA & ADB following the change in the par value of the
rupee. This is a nominal outlay as it is met by the issue of non-negotiable Government of India securities. b : From 1993-94 onwards, Delhi is not included. c : From 1997-98 onwards loans to States/UTs are exclusive of loans against States/UTs shares in small saving collections.
(Contd....)

Economic Survey 2018-19 Volume 2 | A 57 Ta
b 2.
3 Fi
nanc
ial P
erfo
rman
ce o
f Ind
ian
Rai
lway
s (R
cro
re)
Part
icul
ars
1980
-81
1990
-91
2001
-02
2013
-14
2014
-15
2015
-16
2016
-17
2017
-18
(1)
(2)
(3)
(4)
(5)
(6)
(7)
(8)
(9)
1G
ross
Tra
ffic
Rec
eipt
s26
2412
096
3783
713
9558
1567
1116
4334
1652
9217
8725
(i) P
asse
nger
Coa
chin
g82
731
4711
197
3653
242
190
4428
346
280
4864
3(ii
) Oth
er C
oach
ing
116
336
872
3679
3998
4371
4312
4314
(iii)
Goo
ds16
1884
0824
845
9390
610
5791
1092
0810
4339
1170
55(iv
) Oth
er E
arni
ngs
8224
294
457
2150
9359
2910
368
8688
(v) S
uspe
nse A
ccou
nt-1
9-3
7-2
1-2
80-3
6154
3-7
242
Wor
king
Exp
ense
s25
3711
154
3629
313
0321
1429
9614
7836
1590
3017
5834
(i) O
rdin
ary
Wor
king
Exp
ense
s22
3382
3428
703
9757
110
5996
1077
3611
8830
1284
97 (i
i) A
ppro
pria
tion
to d
epre
ciat
ion
rese
rve
fund
220
1950
2000
7900
7775
5600
5200
1540
(iii)
App
ropr
iatio
n to
Pen
sion
Fun
d84
970
5590
2485
029
225
3450
035
000
4579
83
Net
Tra
ffic
Rec
eipt
s (1-
2)87
942
1544
9237
1371
516
498
6263
2891
4N
et M
isce
llane
ous R
ecei
pts
4017
179
325
1231
2427
31-1
350
-122
55
Net
Rev
enue
(3+4
)12
711
1323
3711
749
1683
819
228
4913
1666
6D
ivid
end
(i) P
ayab
le to
gen
eral
reve
nues
325
938
2337
8009
9174
8723
***
***
(ii) P
aym
ent o
f def
erre
d di
vide
nd0
00
0 (i
ii) D
efer
red
divi
dend
00
1000
00
00
(iv)
Net
div
iden
d pa
yabl
e32
593
813
3780
0991
7487
230
07
Surp
lus (
+) o
r Defi
cit(-
)-1
9817
510
0037
4076
6510
506
4913
1666
8 (i
) Cap
ital a
t cha
rge
6096
1612
637
757
1701
6819
7992
2246
8524
9008
2712
76 (i
i) In
vest
men
t fro
m c
apita
l fun
d0
010
390
3867
644
125
5045
053
450
5345
0 (i
ii) T
otal
8(i)
+8(ii
)60
9616
126
4814
720
8844
2421
1727
5135
3024
5832
4726
9Ite
m 5
as %
of I
tem
8(ii
i) 2.
16.
94.
95.
67
72
110
item
7 a
s % o
f ite
m 8
(iii)
-3.2
1.1
2.1
1.8
34
21
Sour
ce :
Min
istry
of R
ailw
ays
N
otes
:
***
Div
iden
d Pa
ymen
t has
bee
n do
ne a
way
with
as p
er B
udge
t mer
ger c
ondi
tions
and
hen
ce n
o di
vide
nd p
aym
ent f
rom
201
6-17
.
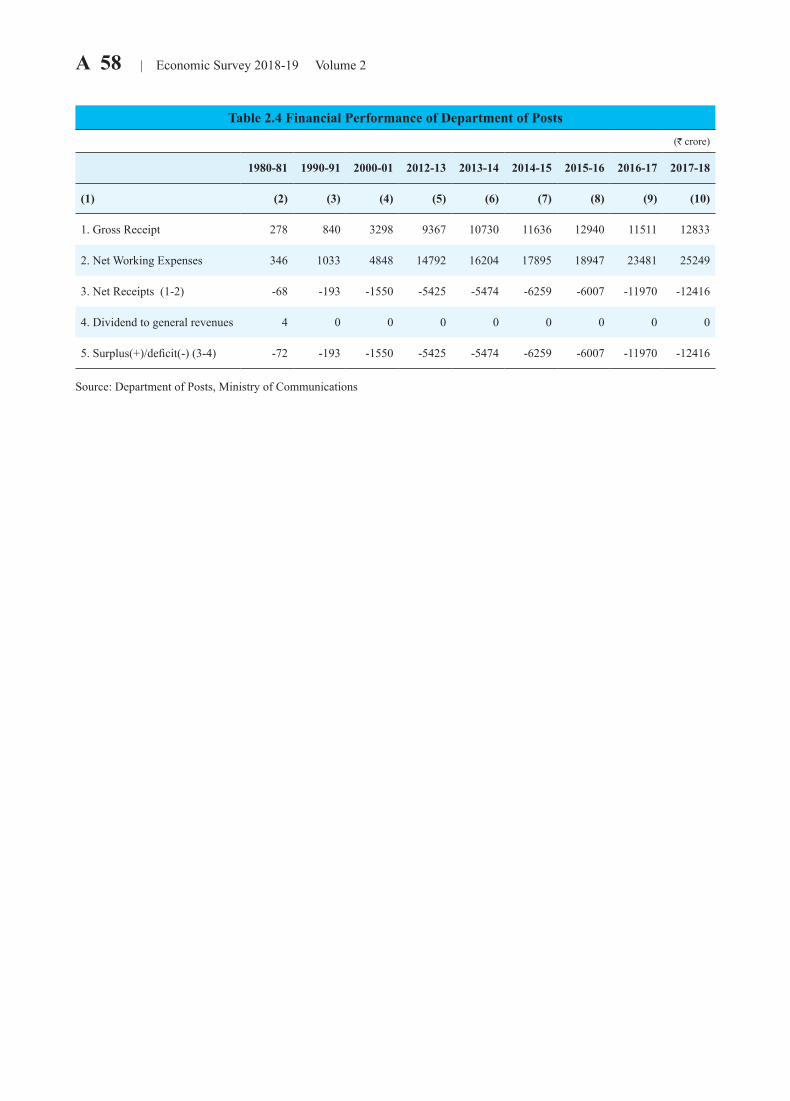
A 58 | Economic Survey 2018-19 Volume 2
Table 2.4 Financial Performance of Department of Posts (` crore)
1980-81 1990-91 2000-01 2012-13 2013-14 2014-15 2015-16 2016-17 2017-18
(1) (2) (3) (4) (5) (6) (7) (8) (9) (10)
1. Gross Receipt 278 840 3298 9367 10730 11636 12940 11511 12833
2. Net Working Expenses 346 1033 4848 14792 16204 17895 18947 23481 25249
3. Net Receipts (1-2) -68 -193 -1550 -5425 -5474 -6259 -6007 -11970 -12416
4. Dividend to general revenues 4 0 0 0 0 0 0 0 0
5. Surplus(+)/deficit(-) (3-4) -72 -193 -1550 -5425 -5474 -6259 -6007 -11970 -12416
Source: Department of Posts, Ministry of Communications
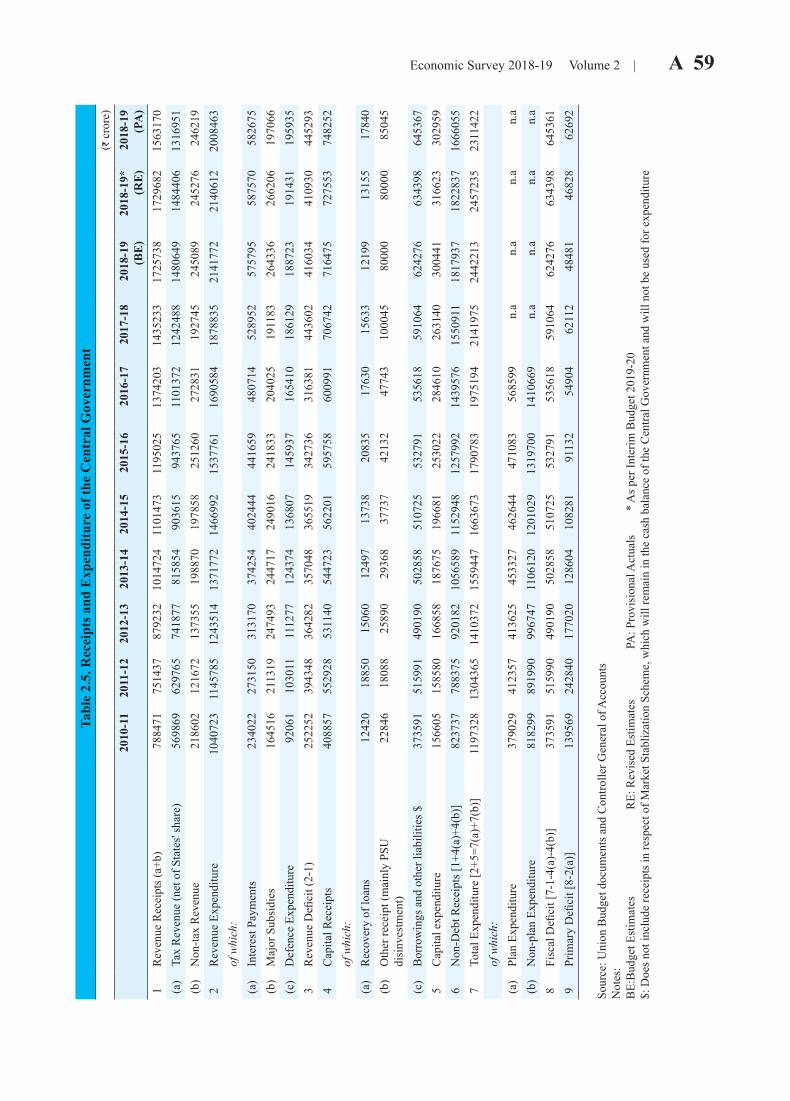
Economic Survey 2018-19 Volume 2 | A 59 Ta
ble
2.5.
Rec
eipt
s and
Exp
endi
ture
of t
he C
entr
al G
over
nmen
t
(`
cro
re)
2010
-11
2011
-12
2012
-13
2013
-14
2014
-15
2015
-16
2016
-17
2017
-18
2018
-19
(BE
)20
18-1
9*
(RE
)20
18-1
9 (P
A)
1R
even
ue R
ecei
pts (
a+b)
7884
7175
1437
8792
3210
1472
411
0147
311
9502
513
7420
314
3523
317
2573
817
2968
215
6317
0(a
)Ta
x R
even
ue (n
et o
f Sta
tes'
shar
e)56
9869
6297
6574
1877
8158
5490
3615
9437
6511
0137
212
4248
814
8064
914
8440
613
1695
1(b
)N
on-ta
x R
even
ue21
8602
1216
7213
7355
1988
7019
7858
2512
6027
2831
1927
4524
5089
2452
7624
6219
2R
even
ue E
xpen
ditu
re10
4072
311
4578
512
4351
413
7177
214
6699
215
3776
116
9058
418
7883
521
4177
221
4061
220
0846
3of
whi
ch:
(a)
Inte
rest
Pay
men
ts23
4022
2731
5031
3170
3742
5440
2444
4416
5948
0714
5289
5257
5795
5875
7058
2675
(b)
Maj
or S
ubsi
dies
1645
1621
1319
2474
9324
4717
2490
1624
1833
2040
2519
1183
2643
3626
6206
1970
66(c
) D
efen
ce E
xpen
ditu
re92
061
1030
1111
1277
1243
7413
6807
1459
3716
5410
1861
2918
8723
1914
3119
5935
3R
even
ue D
efici
t (2-
1)25
2252
3943
4836
4282
3570
4836
5519
3427
3631
6381
4436
0241
6034
4109
3044
5293
4C
apita
l Rec
eipt
s40
8857
5529
2853
1140
5447
2356
2201
5957
5860
0991
7067
4271
6475
7275
5374
8252
of w
hich
:(a
) R
ecov
ery
of lo
ans
1242
018
850
1506
012
497
1373
820
835
1763
015
633
1219
913
155
1784
0(b
)O
ther
rece
ipt (
mai
nly
PSU
di
sinv
estm
ent)
2284
618
088
2589
029
368
3773
742
132
4774
310
0045
8000
080
000
8504
5
(c)
Bor
row
ings
and
oth
er li
abili
ties $
3735
9151
5991
4901
9050
2858
5107
2553
2791
5356
1859
1064
6242
7663
4398
6453
675
Cap
ital e
xpen
ditu
re15
6605
1585
8016
6858
1876
7519
6681
2530
2228
4610
2631
4030
0441
3166
2330
2959
6N
on-D
ebt R
ecei
pts [
1+4(
a)+4
(b)]
8237
3778
8375
9201
8210
5658
911
5294
812
5799
214
3957
615
5091
118
1793
718
2283
716
6605
57
Tota
l Exp
endi
ture
[2+5
=7(a
)+7(
b)]
1197
328
1304
365
1410
372
1559
447
1663
673
1790
783
1975
194
2141
975
2442
213
2457
235
2311
422
of w
hich
:(a
)Pl
an E
xpen
ditu
re37
9029
4123
5741
3625
4533
2746
2644
4710
8356
8599
n.a
n.a
n.a
n.a
(b)
Non
-pla
n Ex
pend
iture
8182
9989
1990
9967
4711
0612
012
0102
913
1970
014
1066
9n.
an.
an.
an.
a8
Fisc
al D
efici
t [7-
1-4(
a)-4
(b)]
3735
9151
5990
4901
9050
2858
5107
2553
2791
5356
1859
1064
6242
7663
4398
6453
619
Prim
ary
Defi
cit [
8-2(
a)]
1395
6924
2840
1770
2012
8604
1082
8191
132
5490
462
112
4848
146
828
6269
2
Sour
ce: U
nion
Bud
get d
ocum
ents
and
Con
trolle
r Gen
eral
of A
ccou
nts
Not
es:
BE:
Bud
get E
stim
ates
R
E: R
evis
ed E
stim
ates
P
A: P
rovi
sion
al A
ctua
ls
*
As p
er In
terim
Bud
get 2
019-
20
$: D
oes n
ot in
clud
e re
ceip
ts in
resp
ect o
f Mar
ket S
tabl
izat
ion
Sche
me,
whi
ch w
ill re
mai
n in
the
cash
bal
ance
of t
he C
entra
l Gov
ernm
ent a
nd w
ill n
ot b
e us
ed fo
r exp
endi
ture
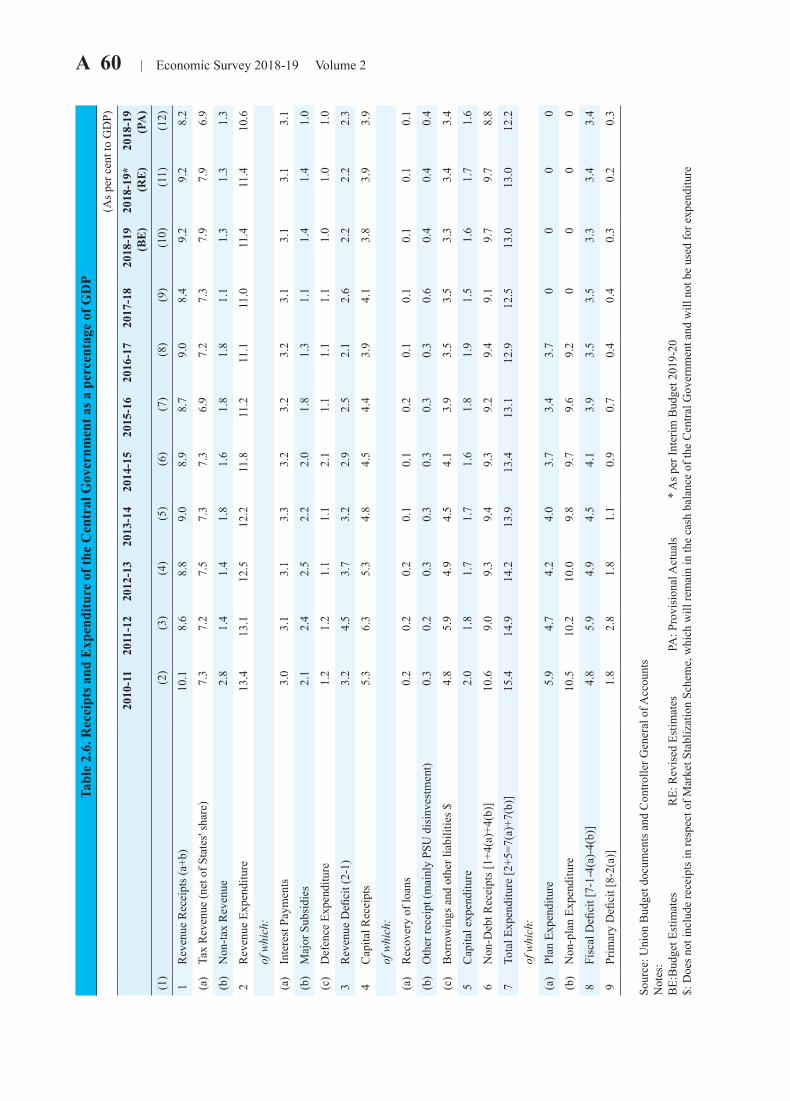
A 60 | Economic Survey 2018-19 Volume 2Ta
ble
2.6.
Rec
eipt
s and
Exp
endi
ture
of t
he C
entr
al G
over
nmen
t as a
per
cent
age
of G
DP
(As p
er c
ent t
o G
DP)
2010
-11
2011
-12
2012
-13
2013
-14
2014
-15
2015
-16
2016
-17
2017
-18
2018
-19
(BE
)20
18-1
9*
(RE
)20
18-1
9 (P
A)
(1)
(2)
(3)
(4)
(5)
(6)
(7)
(8)
(9)
(10)
(11)
(12)
1R
even
ue R
ecei
pts (
a+b)
10.1
8.6
8.8
9.0
8.9
8.7
9.0
8.4
9.2
9.2
8.2
(a)
Tax
Rev
enue
(net
of S
tate
s' sh
are)
7.3
7.2
7.5
7.3
7.3
6.9
7.2
7.3
7.9
7.9
6.9
(b)
Non
-tax
Rev
enue
2.8
1.4
1.4
1.8
1.6
1.8
1.8
1.1
1.3
1.3
1.3
2R
even
ue E
xpen
ditu
re13
.413
.112
.512
.211
.811
.211
.111
.011
.411
.410
.6
of w
hich
:
(a)
Inte
rest
Pay
men
ts3.
03.
13.
13.
33.
23.
23.
23.
13.
13.
13.
1
(b)
Maj
or S
ubsi
dies
2.1
2.4
2.5
2.2
2.0
1.8
1.3
1.1
1.4
1.4
1.0
(c)
Def
ence
Exp
endi
ture
1.2
1.2
1.1
1.1
2.1
1.1
1.1
1.1
1.0
1.0
1.0
3R
even
ue D
efici
t (2-
1)3.
24.
53.
73.
22.
92.
52.
12.
62.
22.
22.
3
4C
apita
l Rec
eipt
s5.
36.
35.
34.
84.
54.
43.
94.
13.
83.
93.
9
of w
hich
:
(a)
Rec
over
y of
loan
s0.
20.
20.
20.
10.
10.
20.
10.
10.
10.
10.
1
(b)
Oth
er re
ceip
t (m
ainl
y PS
U d
isin
vest
men
t)0.
30.
20.
30.
30.
30.
30.
30.
60.
40.
40.
4
(c)
Bor
row
ings
and
oth
er li
abili
ties $
4.8
5.9
4.9
4.5
4.1
3.9
3.5
3.5
3.3
3.4
3.4
5C
apita
l exp
endi
ture
2.0
1.8
1.7
1.7
1.6
1.8
1.9
1.5
1.6
1.7
1.6
6N
on-D
ebt R
ecei
pts [
1+4(
a)+4
(b)]
10.6
9.0
9.3
9.4
9.3
9.2
9.4
9.1
9.7
9.7
8.8
7To
tal E
xpen
ditu
re [2
+5=7
(a)+
7(b)
]15
.414
.914
.213
.913
.413
.112
.912
.513
.013
.012
.2
of w
hich
:
(a)
Plan
Exp
endi
ture
5.9
4.7
4.2
4.0
3.7
3.4
3.7
00
00
(b)
Non
-pla
n Ex
pend
iture
10.5
10.2
10.0
9.8
9.7
9.6
9.2
00
00
8Fi
scal
Defi
cit [
7-1-
4(a)
-4(b
)]4.
85.
94.
94.
54.
13.
93.
53.
53.
33.
43.
4
9Pr
imar
y D
efici
t [8-
2(a)
]1.
82.
81.
81.
10.
90.
70.
40.
40.
30.
20.
3
Sour
ce: U
nion
Bud
get d
ocum
ents
and
Con
trolle
r Gen
eral
of A
ccou
nts
Not
es:
BE:
Bud
get E
stim
ates
R
E: R
evis
ed E
stim
ates
PA
: Pro
visi
onal
Act
uals
* A
s per
Inte
rim B
udge
t 201
9-20
$:
Doe
s not
incl
ude
rece
ipts
in re
spec
t of M
arke
t Sta
bliz
atio
n Sc
hem
e, w
hich
will
rem
ain
in th
e ca
sh b
alan
ce o
f the
Cen
tral G
over
nmen
t and
will
not
be
used
for e
xpen
ditu
re
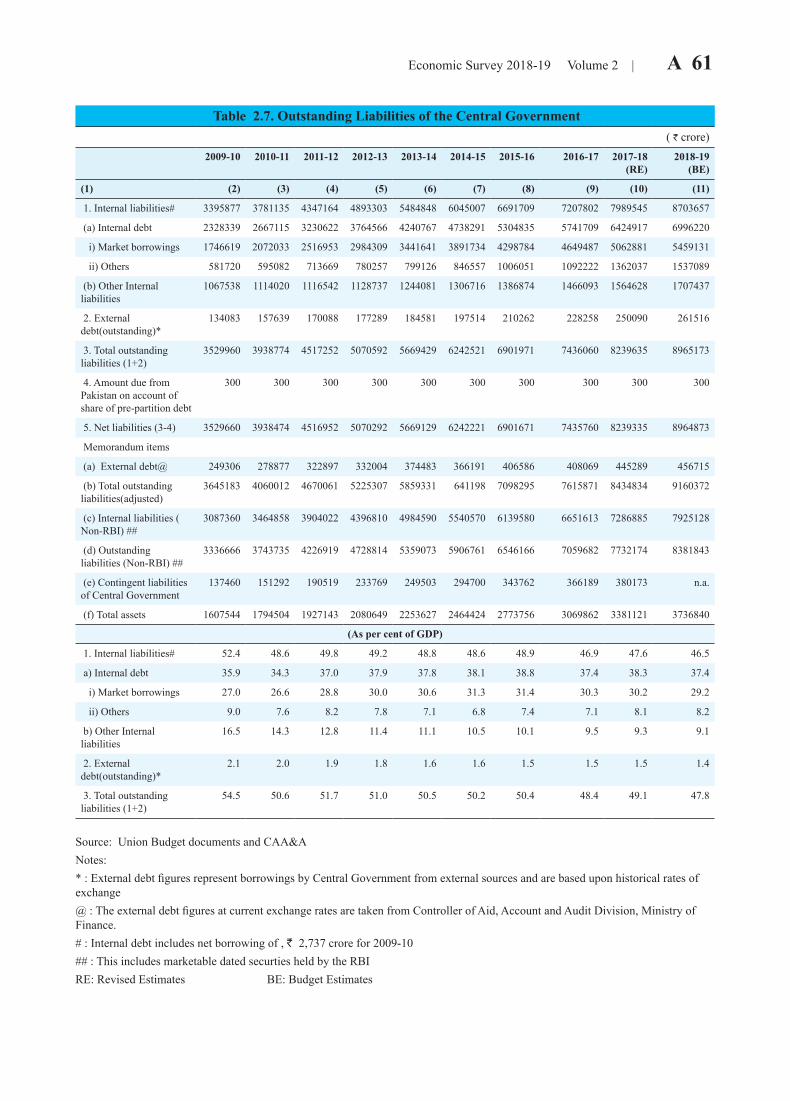
Economic Survey 2018-19 Volume 2 | A 61
Table 2.7. Outstanding Liabilities of the Central Government ( ` crore)
2009-10 2010-11 2011-12 2012-13 2013-14 2014-15 2015-16 2016-17 2017-18 (RE)
2018-19 (BE)
(1) (2) (3) (4) (5) (6) (7) (8) (9) (10) (11)
1. Internal liabilities# 3395877 3781135 4347164 4893303 5484848 6045007 6691709 7207802 7989545 8703657
(a) Internal debt 2328339 2667115 3230622 3764566 4240767 4738291 5304835 5741709 6424917 6996220
i) Market borrowings 1746619 2072033 2516953 2984309 3441641 3891734 4298784 4649487 5062881 5459131
ii) Others 581720 595082 713669 780257 799126 846557 1006051 1092222 1362037 1537089
(b) Other Internal liabilities
1067538 1114020 1116542 1128737 1244081 1306716 1386874 1466093 1564628 1707437
2. External debt(outstanding)*
134083 157639 170088 177289 184581 197514 210262 228258 250090 261516
3. Total outstanding liabilities (1+2)
3529960 3938774 4517252 5070592 5669429 6242521 6901971 7436060 8239635 8965173
4. Amount due from Pakistan on account of share of pre-partition debt
300 300 300 300 300 300 300 300 300 300
5. Net liabilities (3-4) 3529660 3938474 4516952 5070292 5669129 6242221 6901671 7435760 8239335 8964873
Memorandum items
(a) External debt@ 249306 278877 322897 332004 374483 366191 406586 408069 445289 456715
(b) Total outstanding liabilities(adjusted)
3645183 4060012 4670061 5225307 5859331 641198 7098295 7615871 8434834 9160372
(c) Internal liabilities ( Non-RBI) ##
3087360 3464858 3904022 4396810 4984590 5540570 6139580 6651613 7286885 7925128
(d) Outstanding liabilities (Non-RBI) ##
3336666 3743735 4226919 4728814 5359073 5906761 6546166 7059682 7732174 8381843
(e) Contingent liabilities of Central Government
137460 151292 190519 233769 249503 294700 343762 366189 380173 n.a.
(f) Total assets 1607544 1794504 1927143 2080649 2253627 2464424 2773756 3069862 3381121 3736840
(As per cent of GDP)
1. Internal liabilities# 52.4 48.6 49.8 49.2 48.8 48.6 48.9 46.9 47.6 46.5
a) Internal debt 35.9 34.3 37.0 37.9 37.8 38.1 38.8 37.4 38.3 37.4
i) Market borrowings 27.0 26.6 28.8 30.0 30.6 31.3 31.4 30.3 30.2 29.2
ii) Others 9.0 7.6 8.2 7.8 7.1 6.8 7.4 7.1 8.1 8.2
b) Other Internal liabilities
16.5 14.3 12.8 11.4 11.1 10.5 10.1 9.5 9.3 9.1
2. External debt(outstanding)*
2.1 2.0 1.9 1.8 1.6 1.6 1.5 1.5 1.5 1.4
3. Total outstanding liabilities (1+2)
54.5 50.6 51.7 51.0 50.5 50.2 50.4 48.4 49.1 47.8
Source: Union Budget documents and CAA&ANotes: * : External debt figures represent borrowings by Central Government from external sources and are based upon historical rates of exchange @ : The external debt figures at current exchange rates are taken from Controller of Aid, Account and Audit Division, Ministry of Finance. # : Internal debt includes net borrowing of , R 2,737 crore for 2009-10 ## : This includes marketable dated securties held by the RBI RE: Revised Estimates BE: Budget Estimates
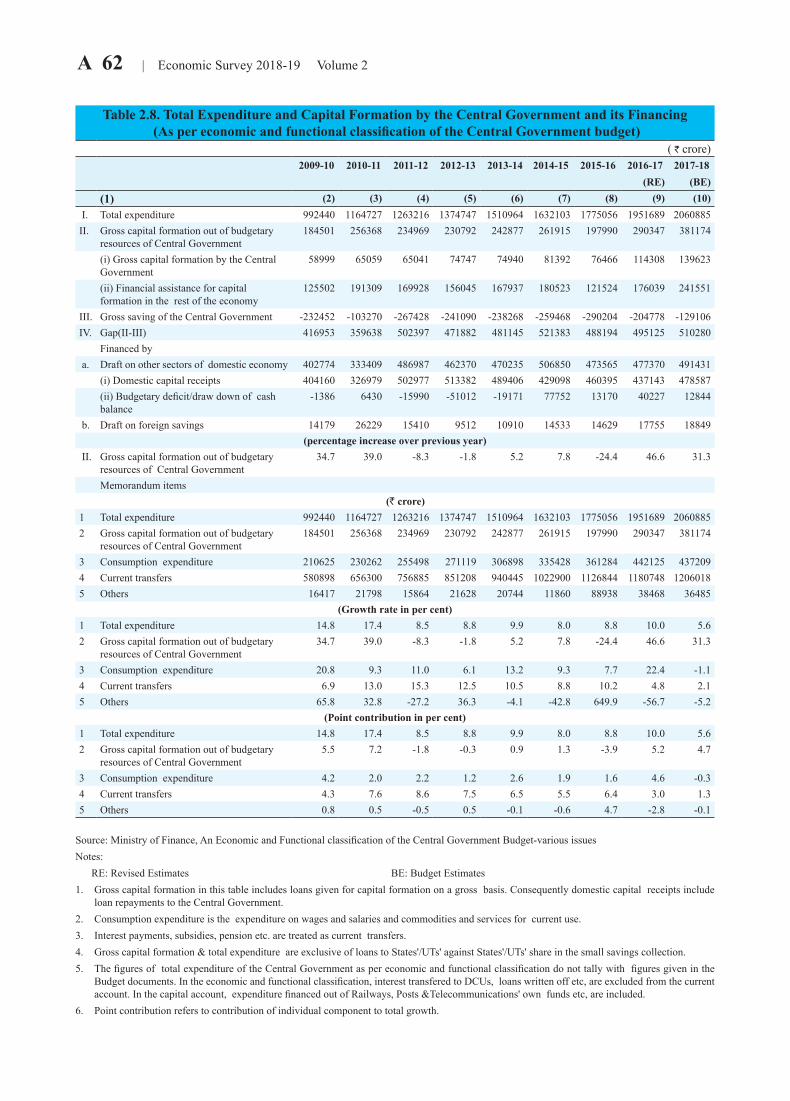
A 62 | Economic Survey 2018-19 Volume 2
Table 2.8. Total Expenditure and Capital Formation by the Central Government and its Financing (As per economic and functional classification of the Central Government budget)
( ` crore) 2009-10 2010-11 2011-12 2012-13 2013-14 2014-15 2015-16 2016-17 2017-18
(RE) (BE)(1) (2) (3) (4) (5) (6) (7) (8) (9) (10)
I. Total expenditure 992440 1164727 1263216 1374747 1510964 1632103 1775056 1951689 2060885II. Gross capital formation out of budgetary
resources of Central Government184501 256368 234969 230792 242877 261915 197990 290347 381174
(i) Gross capital formation by the Central Government
58999 65059 65041 74747 74940 81392 76466 114308 139623
(ii) Financial assistance for capital formation in the rest of the economy
125502 191309 169928 156045 167937 180523 121524 176039 241551
III. Gross saving of the Central Government -232452 -103270 -267428 -241090 -238268 -259468 -290204 -204778 -129106IV. Gap(II-III) 416953 359638 502397 471882 481145 521383 488194 495125 510280
Financed by a. Draft on other sectors of domestic economy 402774 333409 486987 462370 470235 506850 473565 477370 491431
(i) Domestic capital receipts 404160 326979 502977 513382 489406 429098 460395 437143 478587(ii) Budgetary deficit/draw down of cash balance
-1386 6430 -15990 -51012 -19171 77752 13170 40227 12844
b. Draft on foreign savings 14179 26229 15410 9512 10910 14533 14629 17755 18849(percentage increase over previous year)
II. Gross capital formation out of budgetary resources of Central Government
34.7 39.0 -8.3 -1.8 5.2 7.8 -24.4 46.6 31.3
Memorandum items(R crore)
1 Total expenditure 992440 1164727 1263216 1374747 1510964 1632103 1775056 1951689 20608852 Gross capital formation out of budgetary
resources of Central Government184501 256368 234969 230792 242877 261915 197990 290347 381174
3 Consumption expenditure 210625 230262 255498 271119 306898 335428 361284 442125 4372094 Current transfers 580898 656300 756885 851208 940445 1022900 1126844 1180748 12060185 Others 16417 21798 15864 21628 20744 11860 88938 38468 36485
(Growth rate in per cent)1 Total expenditure 14.8 17.4 8.5 8.8 9.9 8.0 8.8 10.0 5.6 2 Gross capital formation out of budgetary
resources of Central Government34.7 39.0 -8.3 -1.8 5.2 7.8 -24.4 46.6 31.3
3 Consumption expenditure 20.8 9.3 11.0 6.1 13.2 9.3 7.7 22.4 -1.1 4 Current transfers 6.9 13.0 15.3 12.5 10.5 8.8 10.2 4.8 2.1 5 Others 65.8 32.8 -27.2 36.3 -4.1 -42.8 649.9 -56.7 -5.2
(Point contribution in per cent)1 Total expenditure 14.8 17.4 8.5 8.8 9.9 8.0 8.8 10.0 5.6 2 Gross capital formation out of budgetary
resources of Central Government5.5 7.2 -1.8 -0.3 0.9 1.3 -3.9 5.2 4.7
3 Consumption expenditure 4.2 2.0 2.2 1.2 2.6 1.9 1.6 4.6 -0.3 4 Current transfers 4.3 7.6 8.6 7.5 6.5 5.5 6.4 3.0 1.3 5 Others 0.8 0.5 -0.5 0.5 -0.1 -0.6 4.7 -2.8 -0.1
Source: Ministry of Finance, An Economic and Functional classification of the Central Government Budget-various issuesNotes: RE: Revised Estimates BE: Budget Estimates 1. Gross capital formation in this table includes loans given for capital formation on a gross basis. Consequently domestic capital receipts include
loan repayments to the Central Government.2. Consumption expenditure is the expenditure on wages and salaries and commodities and services for current use.3. Interest payments, subsidies, pension etc. are treated as current transfers.4. Gross capital formation & total expenditure are exclusive of loans to States'/UTs' against States'/UTs' share in the small savings collection. 5. The figures of total expenditure of the Central Government as per economic and functional classification do not tally with figures given in the
Budget documents. In the economic and functional classification, interest transfered to DCUs, loans written off etc, are excluded from the current account. In the capital account, expenditure financed out of Railways, Posts &Telecommunications' own funds etc, are included.
6. Point contribution refers to contribution of individual component to total growth.

Economic Survey 2018-19 Volume 2 | A 63
Table 2.9. Receipts and Disbursements of States and consolidated General Government(R crore)
2010-11 2011-12 2012-13 2013-14 2014-15 2015-16 2016-17 2017-18 RE
2018-19 BE
(1) (2) (3) (4) (5) (6) (7) (8) (9) (10)State Governments Total Receipts (A+B) 1173575 1367917 1557338 1688047 2008065 2390845 2721784 3051897 3519646A. Revenue Receipts (1+2) 935347 1098531 1252024 1369187 1591583 1832885 2046401 2457718 28129941. Tax Receipts 680198 812987 946081 1030692 1117113 1353336 1520773 1743769 2013453of whichStates' Own Tax Revenue 460709 557396 654551 712419 779278 847145 912912 1050350 11987962. Non-tax Receipts 255149 285544 305943 338495 474471 479549 525628 713949 799540of whichInterest Receipts 15625 18582 24118 27215 24135 18216 24560 25012 27773B. Capital Receipts 238228 269385 305314 318860 416482 557960 675383 594179 706652of whichRecovery of Loans and Advances 4995 17157 7265 6896 18916 7180 15835 56174 58518II. Total Disbursements (a+b+c) 1158730 1351612 1534255 1706145 2025783 2360229 2708215 3177407 3559726a) Revenue 932297 1074571 1231702 1379750 1637288 1838267 2086892 2518797 2783775b) Capital 207617 238150 272576 302402 358856 431743 503458 619610 738304c. Loans and Advances 18816 38891 29977 23992 29638 90219 117866 39000 37647III. Revenue Deficit -3051 -23960 -20322 10563 45704 5382 40491 61079 -29219IV. Gross Fiscal Deficit 161461 168353 195470 247852 327191 420670 534332 514316 486513General GovernmentI. Total Receipts (A + B) 2153561 2454062 2769029 3001372 3189737 3778049 4288432 4771859 5278035 A. Revenue Receipts (1+2) 1578820 1692679 1971619 2211475 2387693 2748374 3132201 3592382 41185411. Tax Receipts 1250067 1442752 1687959 1846545 2020728 2297101 2622145 3013223 3494102 2. Non-Tax Receipts 328753 249927 283660 364930 366965 451272 510056 579159 624438of whichInterest Receipts 25078 28870 35543 40162 39622 35779 33220 31610 36835B. Capital Receipts 574742 761383 797410 789897 802044 1029675 1156231 1179477 1159494 of which a) Disinvestment proceeds 24087 18753 25991 29728 38883 43266 48122 100303 81193 b) Recovery of Loans & Advances 8206 25370 12929 9385 22072 16561 20942 64880 61650II. Total Disbursements (a+b+c) 2145145 2421768 2694934 3000299 3285210 3760611 4265969 4857990 5361181 a) Revenue 1828020 2063068 2315578 2579086 2798917 3096491 3489073 4092338 4505357 b) Capital 268328 291818 328324 377545 426949 539375 616988 670218 765487 c) Loans and advances 48797 66883 51031 43668 59345 124745 159907 95434 90338III. Revenue Deficit 249200 370388 343959 367611 411224 348117 356872 499956 386816IV. Gross Fiscal Deficit 534032 684966 684395 749711 836563 952410 1064704 1100425 1099797
Source: Reserve Bank of IndiaNotes: RE: Revised Estimates BE: Budget Estimates(1) Negative (-) sign indicates surplus in deficit indicators.(2) The ratios to GDP at current market prices are based on CSO's National Accounts 2004-05 series and data from 2011-12 onwards
are based on new base 2011-12.(3) Capital Receipts include public account on a net basis.(4) Capital disbursements are exclusive of public accounts.(5) Data pertains to budgets of 29 States.
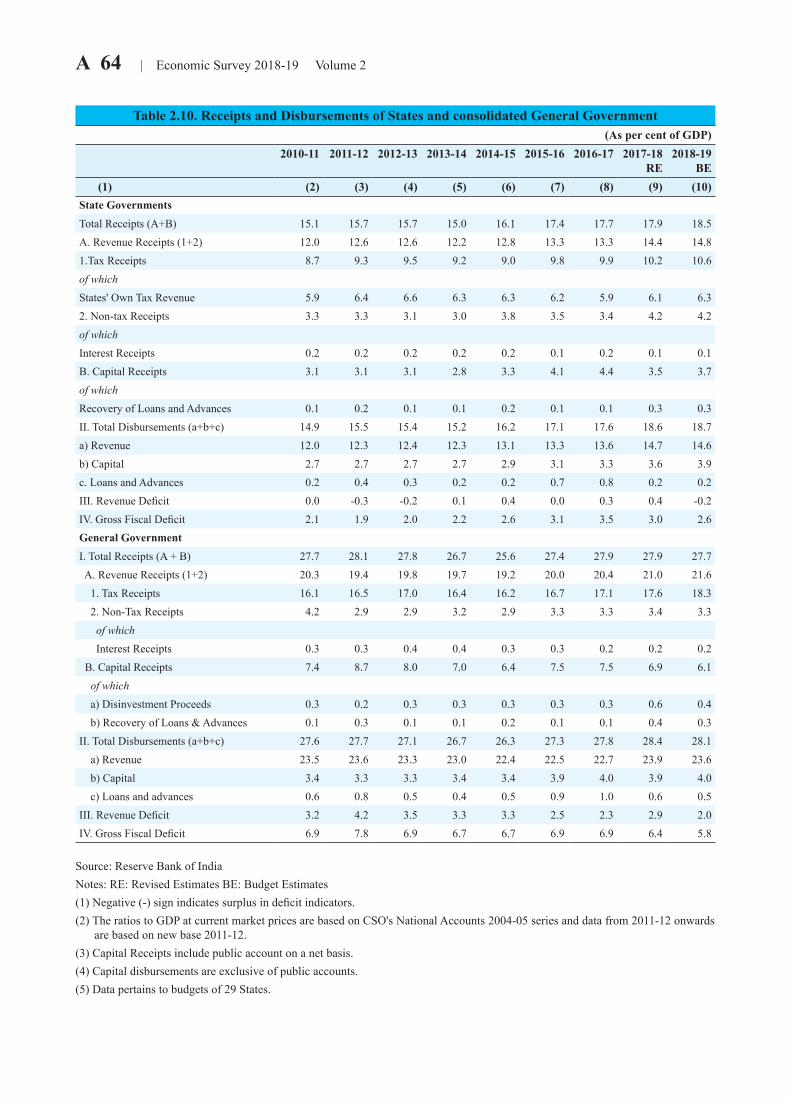
A 64 | Economic Survey 2018-19 Volume 2
Table 2.10. Receipts and Disbursements of States and consolidated General Government(As per cent of GDP)
2010-11 2011-12 2012-13 2013-14 2014-15 2015-16 2016-17 2017-18 RE
2018-19 BE
(1) (2) (3) (4) (5) (6) (7) (8) (9) (10)State Governments Total Receipts (A+B) 15.1 15.7 15.7 15.0 16.1 17.4 17.7 17.9 18.5A. Revenue Receipts (1+2) 12.0 12.6 12.6 12.2 12.8 13.3 13.3 14.4 14.81.Tax Receipts 8.7 9.3 9.5 9.2 9.0 9.8 9.9 10.2 10.6of whichStates' Own Tax Revenue 5.9 6.4 6.6 6.3 6.3 6.2 5.9 6.1 6.32. Non-tax Receipts 3.3 3.3 3.1 3.0 3.8 3.5 3.4 4.2 4.2of whichInterest Receipts 0.2 0.2 0.2 0.2 0.2 0.1 0.2 0.1 0.1B. Capital Receipts 3.1 3.1 3.1 2.8 3.3 4.1 4.4 3.5 3.7of whichRecovery of Loans and Advances 0.1 0.2 0.1 0.1 0.2 0.1 0.1 0.3 0.3II. Total Disbursements (a+b+c) 14.9 15.5 15.4 15.2 16.2 17.1 17.6 18.6 18.7a) Revenue 12.0 12.3 12.4 12.3 13.1 13.3 13.6 14.7 14.6b) Capital 2.7 2.7 2.7 2.7 2.9 3.1 3.3 3.6 3.9c. Loans and Advances 0.2 0.4 0.3 0.2 0.2 0.7 0.8 0.2 0.2III. Revenue Deficit 0.0 -0.3 -0.2 0.1 0.4 0.0 0.3 0.4 -0.2IV. Gross Fiscal Deficit 2.1 1.9 2.0 2.2 2.6 3.1 3.5 3.0 2.6General GovernmentI. Total Receipts (A + B) 27.7 28.1 27.8 26.7 25.6 27.4 27.9 27.9 27.7 A. Revenue Receipts (1+2) 20.3 19.4 19.8 19.7 19.2 20.0 20.4 21.0 21.6 1. Tax Receipts 16.1 16.5 17.0 16.4 16.2 16.7 17.1 17.6 18.3 2. Non-Tax Receipts 4.2 2.9 2.9 3.2 2.9 3.3 3.3 3.4 3.3 of which Interest Receipts 0.3 0.3 0.4 0.4 0.3 0.3 0.2 0.2 0.2 B. Capital Receipts 7.4 8.7 8.0 7.0 6.4 7.5 7.5 6.9 6.1 of which a) Disinvestment Proceeds 0.3 0.2 0.3 0.3 0.3 0.3 0.3 0.6 0.4 b) Recovery of Loans & Advances 0.1 0.3 0.1 0.1 0.2 0.1 0.1 0.4 0.3II. Total Disbursements (a+b+c) 27.6 27.7 27.1 26.7 26.3 27.3 27.8 28.4 28.1 a) Revenue 23.5 23.6 23.3 23.0 22.4 22.5 22.7 23.9 23.6 b) Capital 3.4 3.3 3.3 3.4 3.4 3.9 4.0 3.9 4.0 c) Loans and advances 0.6 0.8 0.5 0.4 0.5 0.9 1.0 0.6 0.5III. Revenue Deficit 3.2 4.2 3.5 3.3 3.3 2.5 2.3 2.9 2.0IV. Gross Fiscal Deficit 6.9 7.8 6.9 6.7 6.7 6.9 6.9 6.4 5.8
Source: Reserve Bank of India Notes: RE: Revised Estimates BE: Budget Estimates(1) Negative (-) sign indicates surplus in deficit indicators. (2) The ratios to GDP at current market prices are based on CSO's National Accounts 2004-05 series and data from 2011-12 onwards
are based on new base 2011-12. (3) Capital Receipts include public account on a net basis. (4) Capital disbursements are exclusive of public accounts. (5) Data pertains to budgets of 29 States.
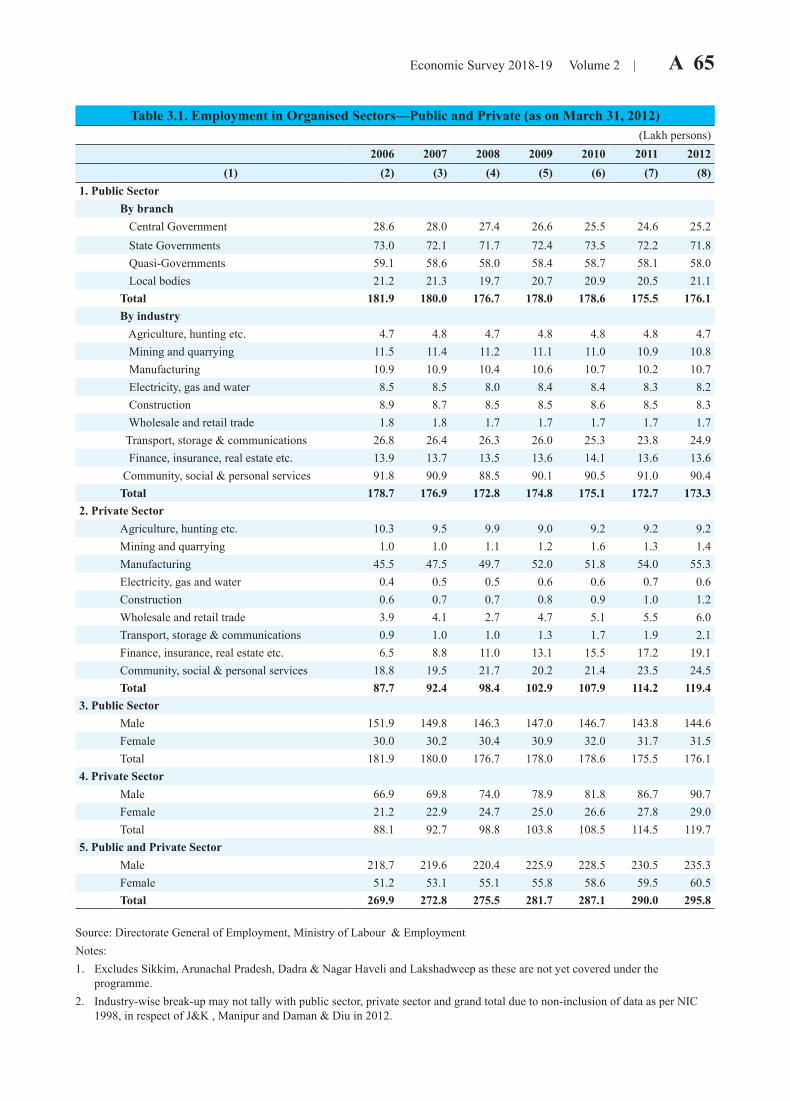
Economic Survey 2018-19 Volume 2 | A 65
Table 3.1. Employment in Organised Sectors—Public and Private (as on March 31, 2012)(Lakh persons)
2006 2007 2008 2009 2010 2011 2012(1) (2) (3) (4) (5) (6) (7) (8)
1. Public SectorBy branch Central Government 28.6 28.0 27.4 26.6 25.5 24.6 25.2 State Governments 73.0 72.1 71.7 72.4 73.5 72.2 71.8 Quasi-Governments 59.1 58.6 58.0 58.4 58.7 58.1 58.0 Local bodies 21.2 21.3 19.7 20.7 20.9 20.5 21.1Total 181.9 180.0 176.7 178.0 178.6 175.5 176.1By industry Agriculture, hunting etc. 4.7 4.8 4.7 4.8 4.8 4.8 4.7 Mining and quarrying 11.5 11.4 11.2 11.1 11.0 10.9 10.8 Manufacturing 10.9 10.9 10.4 10.6 10.7 10.2 10.7 Electricity, gas and water 8.5 8.5 8.0 8.4 8.4 8.3 8.2 Construction 8.9 8.7 8.5 8.5 8.6 8.5 8.3 Wholesale and retail trade 1.8 1.8 1.7 1.7 1.7 1.7 1.7 Transport, storage & communications 26.8 26.4 26.3 26.0 25.3 23.8 24.9 Finance, insurance, real estate etc. 13.9 13.7 13.5 13.6 14.1 13.6 13.6 Community, social & personal services 91.8 90.9 88.5 90.1 90.5 91.0 90.4Total 178.7 176.9 172.8 174.8 175.1 172.7 173.3
2. Private SectorAgriculture, hunting etc. 10.3 9.5 9.9 9.0 9.2 9.2 9.2Mining and quarrying 1.0 1.0 1.1 1.2 1.6 1.3 1.4Manufacturing 45.5 47.5 49.7 52.0 51.8 54.0 55.3Electricity, gas and water 0.4 0.5 0.5 0.6 0.6 0.7 0.6Construction 0.6 0.7 0.7 0.8 0.9 1.0 1.2Wholesale and retail trade 3.9 4.1 2.7 4.7 5.1 5.5 6.0Transport, storage & communications 0.9 1.0 1.0 1.3 1.7 1.9 2.1Finance, insurance, real estate etc. 6.5 8.8 11.0 13.1 15.5 17.2 19.1Community, social & personal services 18.8 19.5 21.7 20.2 21.4 23.5 24.5Total 87.7 92.4 98.4 102.9 107.9 114.2 119.4
3. Public SectorMale 151.9 149.8 146.3 147.0 146.7 143.8 144.6Female 30.0 30.2 30.4 30.9 32.0 31.7 31.5Total 181.9 180.0 176.7 178.0 178.6 175.5 176.1
4. Private SectorMale 66.9 69.8 74.0 78.9 81.8 86.7 90.7Female 21.2 22.9 24.7 25.0 26.6 27.8 29.0Total 88.1 92.7 98.8 103.8 108.5 114.5 119.7
5. Public and Private SectorMale 218.7 219.6 220.4 225.9 228.5 230.5 235.3Female 51.2 53.1 55.1 55.8 58.6 59.5 60.5Total 269.9 272.8 275.5 281.7 287.1 290.0 295.8
Source: Directorate General of Employment, Ministry of Labour & EmploymentNotes:1. Excludes Sikkim, Arunachal Pradesh, Dadra & Nagar Haveli and Lakshadweep as these are not yet covered under the
programme.2. Industry-wise break-up may not tally with public sector, private sector and grand total due to non-inclusion of data as per NIC
1998, in respect of J&K , Manipur and Daman & Diu in 2012.
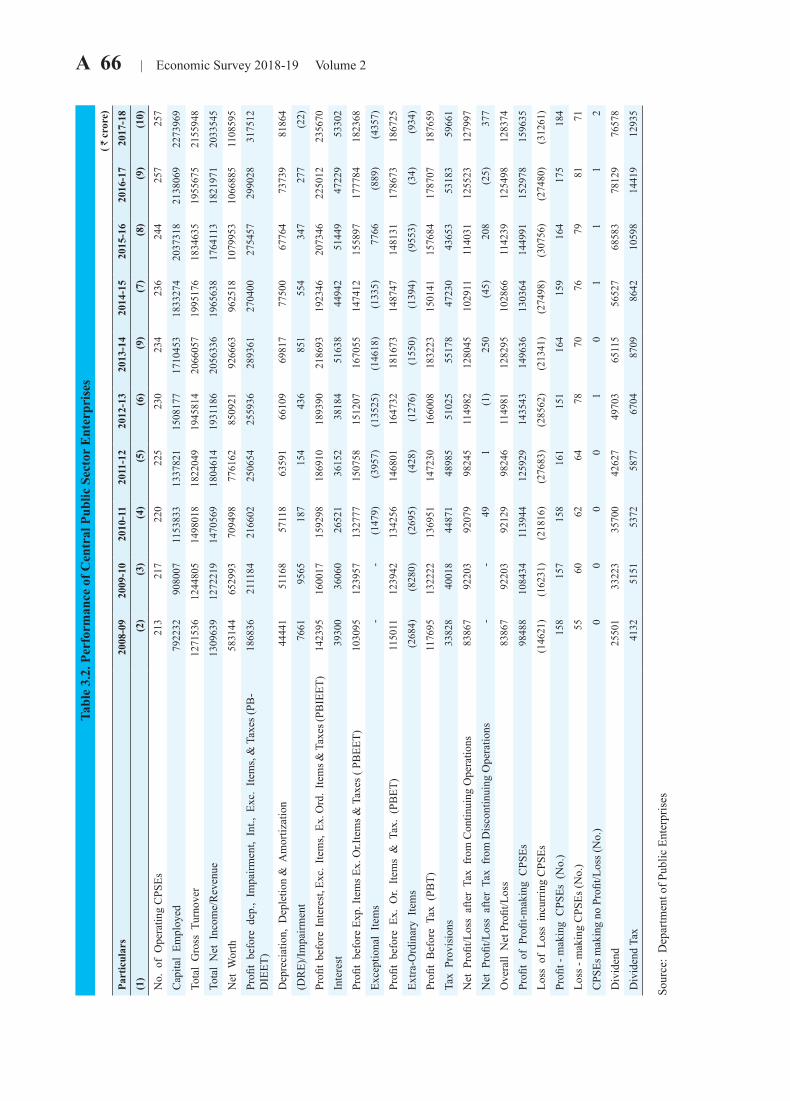
A 66 | Economic Survey 2018-19 Volume 2Ta
ble
3.2.
Per
form
ance
of C
entr
al P
ublic
Sec
tor
Ent
erpr
ises
( ` c
rore
)
Part
icul
ars
2008
-09
2009
-10
2010
-11
2011
-12
2012
-13
2013
-14
2014
-15
2015
-16
2016
-17
2017
-18
(1)
(2)
(3)
(4)
(5)
(6)
(9)
(7)
(8)
(9)
(10)
No.
of
Ope
ratin
g C
PSEs
213
217
220
225
230
234
236
244
257
257
Cap
ital
Empl
oyed
7922
32
9080
07
1153
833
1337
821
1508
177
1710
453
1833
274
2037
318
2138
069
2273
969
Tota
l G
ross
Tur
nove
r12
7153
6 12
4480
5 14
9801
8 18
2204
9 19
4581
4 20
6605
7 19
9517
6 18
3463
519
5567
5 21
5594
8
Tota
l N
et I
ncom
e/R
even
ue13
0963
9 12
7221
9 14
7056
9 18
0461
4 19
3118
6 20
5633
6 19
6563
8 17
6411
318
2197
1 20
3354
5
Net
Wor
th58
3144
65
2993
70
9498
77
6162
85
0921
92
6663
96
2518
10
7995
310
6688
5 11
0859
5
Profi
t be
fore
dep
., Im
pairm
ent,
Int.,
Exc
. Ite
ms,
& T
axes
(PB
-D
IEET
)18
6836
21
1184
21
6602
25
0654
25
5936
28
9361
27
0400
27
5457
2990
28
3175
12
Dep
reci
atio
n, D
eple
tion
& A
mor
tizat
ion
4444
1 51
168
5711
8 63
591
6610
9 69
817
7750
0 67
764
7373
9 81
864
(DR
E)/Im
pairm
ent
7661
95
65
187
154
436
851
554
347
277
(22)
Profi
t be
fore
Int
eres
t, Ex
c. I
tem
s, E
x. O
rd. I
tem
s & T
axes
(PB
IEET
)14
2395
16
0017
15
9298
18
6910
18
9390
21
8693
19
2346
20
7346
2250
12
2356
70
Inte
rest
3930
0 36
060
2652
1 36
152
3818
4 51
638
4494
2 51
449
4722
9 53
302
Profi
t be
fore
Exp
. Ite
ms E
x. O
r.Ite
ms &
Tax
es (
PBEE
T)10
3095
12
3957
13
2777
15
0758
15
1207
16
7055
14
7412
15
5897
1777
84
1823
68
Exce
ptio
nal
Item
s-
-(1
479)
(395
7)(1
3525
)(1
4618
)(1
335)
7766
(889
)(4
357)
Profi
t be
fore
Ex.
Or.
Item
s &
Tax
. (P
BET
)11
5011
12
3942
13
4256
14
6801
16
4732
18
1673
14
8747
14
8131
1786
73
1867
25
Extra
-Ord
inar
y It
ems
(268
4)(8
280)
(269
5)(4
28)
(127
6)(1
550)
(139
4)(9
553)
(34)
(934
)
Profi
t B
efor
e T
ax (
PBT)
1176
95
1322
22
1369
51
1472
30
1660
08
1832
23
1501
41
1576
8417
8707
18
7659
Tax
Pro
visi
ons
3382
8 40
018
4487
1 48
985
5102
5 55
178
4723
0 43
653
5318
3 59
661
Net
Pro
fit/L
oss
afte
r Ta
x fr
om C
ontin
uing
Ope
ratio
ns83
867
9220
3 92
079
9824
5 11
4982
12
8045
10
2911
11
4031
1255
23
1279
97
Net
Pro
fit/L
oss
afte
r Ta
x fr
om D
isco
ntin
uing
Ope
ratio
ns-
-49
1
(1)
250
(45)
208
(25)
377
Ove
rall
Net
Pro
fit/L
oss
8386
7 92
203
9212
9 98
246
1149
81
1282
95
1028
66
1142
3912
5498
12
8374
Profi
t of
Pro
fit-m
akin
g C
PSEs
9848
8 10
8434
11
3944
12
5929
14
3543
14
9636
13
0364
14
4991
1529
78
1596
35
Loss
of
Loss
inc
urrin
g C
PSEs
(146
21)
(162
31)
(218
16)
(276
83)
(285
62)
(213
41)
(274
98)
(307
56)
(274
80)
(312
61)
Profi
t - m
akin
g C
PSEs
(N
o.)
158
157
158
161
151
164
159
164
175
184
Loss
- m
akin
g C
PSEs
(No.
)55
60
62
64
78
70
76
79
81
71
CPS
Es m
akin
g no
Pro
fit/L
oss (
No.
)0
0 0
0 1
0 1
11
2
Div
iden
d25
501
3322
3 35
700
4262
7 49
703
6511
5 56
527
6858
378
129
7657
8
Div
iden
d Ta
x41
32
5151
53
72
5877
67
04
8709
86
42
1059
814
419
1293
5
Sour
ce:
Dep
artm
ent o
f Pub
lic E
nter
pris
es
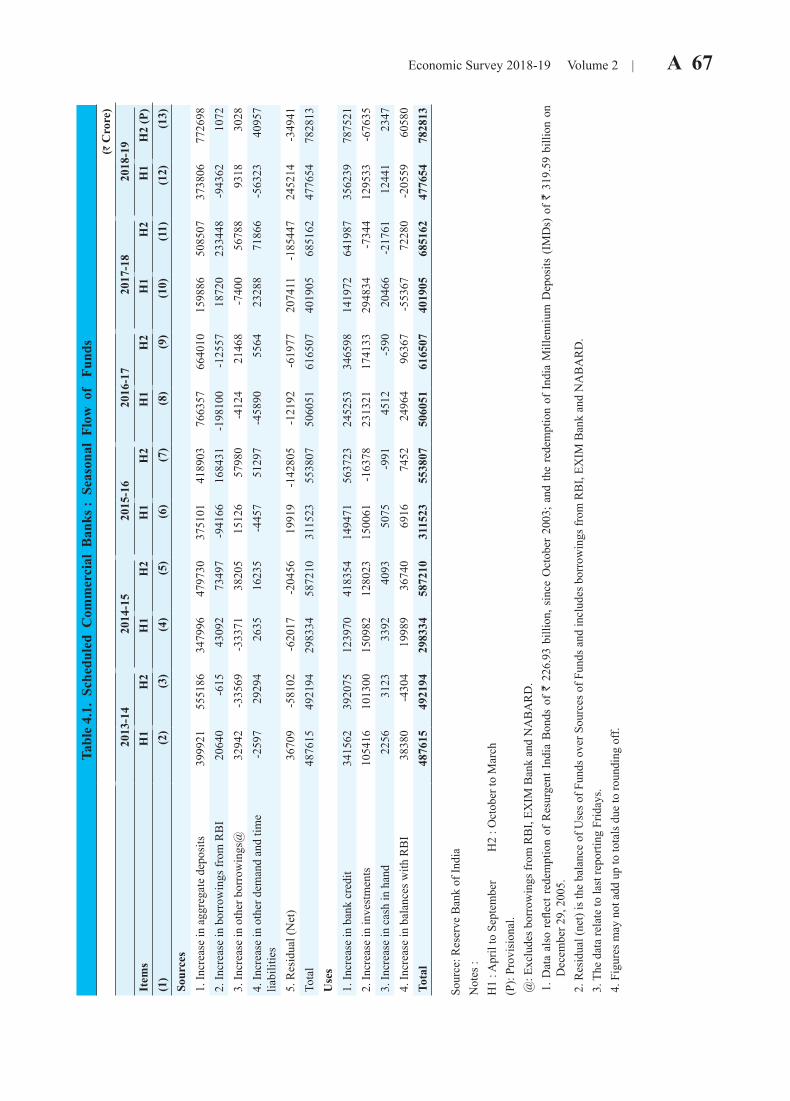
Economic Survey 2018-19 Volume 2 | A 67 Ta
ble
4.1.
Sch
edul
ed C
omm
erci
al B
anks
: S
easo
nal
Flow
of
Fun
ds(`
Cro
re)
2013
-14
2014
-15
2015
-16
2016
-17
2017
-18
2018
-19
Item
sH
1H
2H
1H
2H
1H
2H
1H
2H
1H
2H
1H
2 (P
)(1
)(2
)(3
)(4
) (5
)(6
)(7
)(8
)(9
) (1
0)(1
1) (1
2)(1
3)So
urce
s1.
Incr
ease
in a
ggre
gate
dep
osits
3999
2155
5186
3479
9647
9730
3751
0141
8903
7663
5766
4010
1598
8650
8507
3738
0677
2698
2. In
crea
se in
bor
row
ings
from
RB
I20
640
-615
4309
273
497
-941
6616
8431
-198
100
-125
5718
720
2334
48-9
4362
1072
3. In
crea
se in
oth
er b
orro
win
gs@
3294
2-3
3569
-333
7138
205
1512
657
980
-412
421
468
-740
056
788
9318
3028
4. In
crea
se in
oth
er d
eman
d an
d tim
e lia
bilit
ies
-259
729
294
2635
1623
5-4
457
5129
7-4
5890
5564
2328
871
866
-563
2340
957
5. R
esid
ual (
Net
)36
709
-581
02-6
2017
-204
5619
919
-142
805
-121
92-6
1977
2074
11-1
8544
724
5214
-349
41To
tal
4876
1549
2194
2983
3458
7210
3115
2355
3807
5060
5161
6507
4019
0568
5162
4776
5478
2813
Use
s1.
Incr
ease
in b
ank
cred
it34
1562
3920
7512
3970
4183
5414
9471
5637
2324
5253
3465
9814
1972
6419
8735
6239
7875
212.
Incr
ease
in in
vest
men
ts10
5416
1013
0015
0982
1280
2315
0061
-163
7823
1321
1741
3329
4834
-734
412
9533
-676
353.
Incr
ease
in c
ash
in h
and
2256
3123
3392
4093
5075
-991
4512
-590
2046
6-2
1761
1244
123
474.
Incr
ease
in b
alan
ces w
ith R
BI
3838
0-4
304
1998
936
740
6916
7452
2496
496
367
-553
6772
280
-205
5960
580
Tota
l48
7615
4921
9429
8334
5872
1031
1523
5538
0750
6051
6165
0740
1905
6851
6247
7654
7828
13
Sour
ce: R
eser
ve B
ank
of In
dia
Not
es :
H1
: Apr
il to
Sep
tem
ber
H2
: Oct
ober
to M
arch
(P):
Prov
isio
nal.
@: E
xclu
des b
orro
win
gs fr
om R
BI,
EXIM
Ban
k an
d N
AB
AR
D.
1. D
ata
also
refl
ect r
edem
ptio
n of
Res
urge
nt I
ndia
Bon
ds o
f R
226.
93 b
illio
n, s
ince
Oct
ober
200
3; a
nd th
e re
dem
ptio
n of
Ind
ia M
illen
nium
Dep
osits
(IM
Ds)
of
R 31
9.59
bill
ion
on
Dec
embe
r 29,
200
5.
2. R
esid
ual (
net)
is th
e ba
lanc
e of
Use
s of F
unds
ove
r Sou
rces
of F
unds
and
incl
udes
bor
row
ings
from
RB
I, EX
IM B
ank
and
NA
BA
RD
. 3
. The
dat
a re
late
to la
st re
porti
ng F
riday
s.
4. F
igur
es m
ay n
ot a
dd u
p to
tota
ls d
ue to
roun
ding
off.
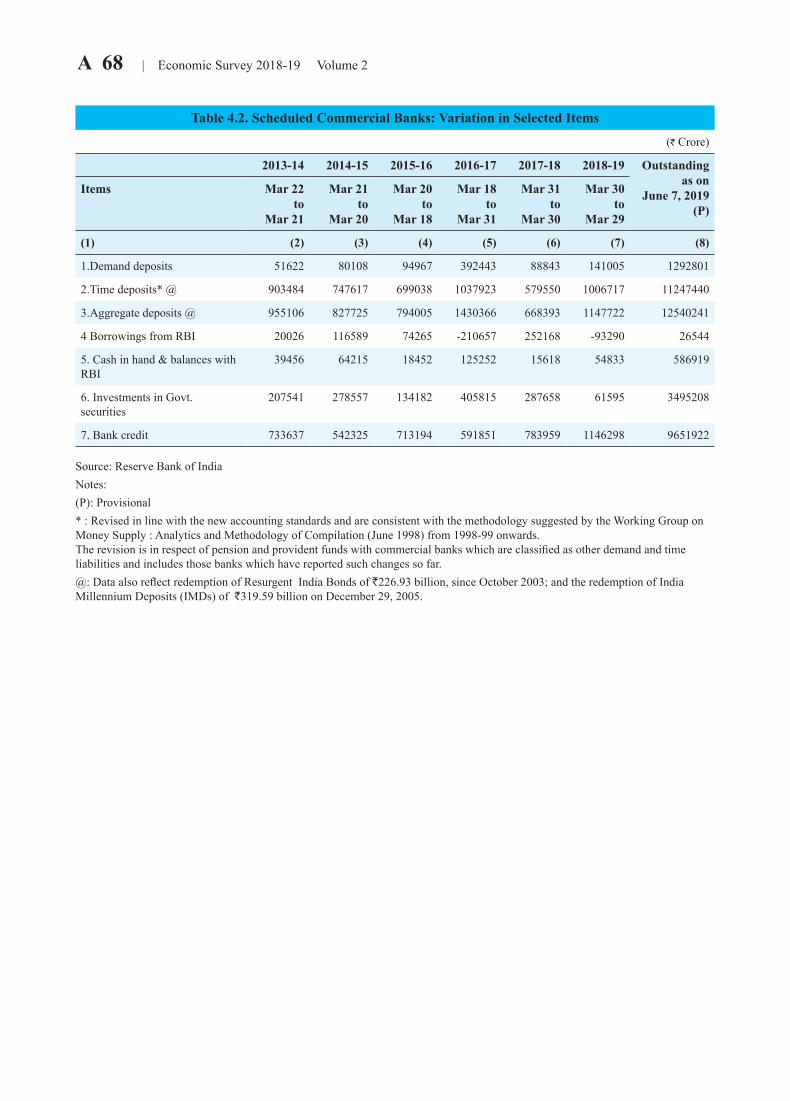
A 68 | Economic Survey 2018-19 Volume 2
Table 4.2. Scheduled Commercial Banks: Variation in Selected Items
(` Crore)
2013-14 2014-15 2015-16 2016-17 2017-18 2018-19 Outstanding as on
June 7, 2019 (P)
Items Mar 22to
Mar 21
Mar 21to
Mar 20
Mar 20to
Mar 18
Mar 18to
Mar 31
Mar 31to
Mar 30
Mar 30to
Mar 29
(1) (2) (3) (4) (5) (6) (7) (8)
1.Demand deposits 51622 80108 94967 392443 88843 141005 1292801
2.Time deposits* @ 903484 747617 699038 1037923 579550 1006717 11247440
3.Aggregate deposits @ 955106 827725 794005 1430366 668393 1147722 12540241
4 Borrowings from RBI 20026 116589 74265 -210657 252168 -93290 26544
5. Cash in hand & balances with RBI
39456 64215 18452 125252 15618 54833 586919
6. Investments in Govt. securities
207541 278557 134182 405815 287658 61595 3495208
7. Bank credit 733637 542325 713194 591851 783959 1146298 9651922
Source: Reserve Bank of India Notes: (P): Provisional * : Revised in line with the new accounting standards and are consistent with the methodology suggested by the Working Group on Money Supply : Analytics and Methodology of Compilation (June 1998) from 1998-99 onwards. The revision is in respect of pension and provident funds with commercial banks which are classified as other demand and time liabilities and includes those banks which have reported such changes so far.@: Data also reflect redemption of Resurgent India Bonds of R226.93 billion, since October 2003; and the redemption of India Millennium Deposits (IMDs) of R319.59 billion on December 29, 2005.

Economic Survey 2018-19 Volume 2 | A 69
Table 4.3. Number of Functioning Branches of Commercial Banks - Bank Group-wise
Branches as on End March
2014 2015 2016 2017 2018 Rural % of Rural Branches to
Total Total Total Total Total Total
(1) (2) (3) (4) (5) (6) (7) (8)
Public Sector Banks 83201 88612 91638 94113 93137 28784 30.9
Regional Rural Banks 19292 20387 21254 21743 22082 15218 68.9
Private Sector Banks 20076 22333 27452 29799 31420 6557 20.9
Foreign Banks 322 329 332 301 299 10 3.3
Local Area Banks 89 104 115 76 87 11 12.6
Small Finance Banks -- -- -- 410 1733 354 20.4
Payments Banks -- -- -- 3 156 14 9.0
Total 122980 131765 140791 146445 148914 50948 34.2
Source: RBI, Master Office File (MOF) SystemNotes: 1. Data include ‘Administrative Offices’ 2. Population groups are defined as follows: 'Rural' includes centres with population of less than 10,000, 'Semi-Urban' includes cen-tres with population of 10,000 and above but less than of one lakh, 'Urban' includes centres with population of one lakh and above but less than of ten lakhs, and 'Metropolitan' includes centres with population of 10 lakhs and above. All population figures are as per census 2011. 3. ‘Public Sector banks’ comprises of State Bank of India (and its’ erstwhile associates and Bhartiya Mahila Bank prior to April 1, 2017), IDBI bank and nationalized banks, excluding Regional Rural Banks.4. MOF data are dynamic in nature. It is updated based on information as received from banks.

A 70 | Economic Survey 2018-19 Volume 2
Con
td....
Tab
le 4
.4. A
dvan
ces t
o A
gric
ultu
re a
nd O
ther
Pri
ority
Sec
tors
by
Publ
ic S
ecto
r B
anks
N
umbe
r of
Acc
ount
s (in
thou
sand
)A
mou
nt O
utst
andi
ng (R
cro
re)
Sect
ors
Mar
chM
arch
M
arch
Mar
chM
arch
Mar
chM
arch
M
arch
Mar
chM
arch
2014
2015
2016
2017
2018
2014
2015
2016
2017
2018
(1)
(2)
(3)
(4)
(5)
(6)
(7)
(8)
(9)
(10)
(11)
1.A
gric
ultu
re48
336
5123
151
363
5259
454
846
7025
4174
3577
9023
3194
6850
9610
761
(a) D
irect
Fin
ance
a47
581
5053
5na
nana
5256
5258
0164
nana
na1
(b) I
ndire
ct F
inan
ce a
755
696
nana
na17
6889
1634
13na
nana
2. S
mal
l Sca
le In
dust
ries b
3.
Mic
ro &
Sm
all E
nter
pris
es83
5883
2910
592
1112
311
026
5934
1064
7855
7331
6474
1958
7553
174.
Set
ting
up o
f Ind
ustri
al E
stat
es
5. S
mal
l roa
d &
wat
er tr
ansp
ort O
pera
tors
6.
Ret
ail T
rade
7. S
mal
l Bus
ines
s
8. P
rofe
ssio
nal &
self
empl
oyed
per
sons
9.
Mic
ro C
redi
t
10. E
duca
tion
2555
2536
2435
2384
2293
5511
256
997
5930
660
010
5956
311
.Con
sum
ptio
n
12. S
tate
spon
sore
d C
orpn
s/O
rgan
isat
ions
for o
n le
ndin
g to
O
ther
Prio
rity
Sect
or
13. S
tate
spon
sore
d or
gani
satio
n fo
r SC
/ST
purc
hase
&
supp
ly o
f inp
uts &
mar
ketin
g of
out
puts
14. H
ousi
ng L
oans
4009
4082
4187
4221
4152
2354
8424
7887
2738
3529
4149
2987
2115
. Fun
ds p
rovi
ded
to R
RB
s
16. A
dvan
ces t
o Se
lf H
elp
Gro
ups
17
. Adv
ance
s to
Softw
are
Indu
strie
s
18.A
dvan
ces t
o Fo
od &
Agr
o Pr
oces
sing
Sec
tor
19
. Inv
estm
ent i
n Ve
ntur
e C
apita
l
20. T
otal
Prio
rity
Sect
or A
dvan
ces c
6434
667
151
6930
570
806
7291
116
0290
717
0748
919
8125
620
4347
421
9920
121
. AN
BC
d41
1059
145
8497
350
5659
453
2971
653
5029
0Pe
rcen
tage
to A
NB
C
1.A
gric
ultu
re17
.09
16.2
217
.84
17.7
717
.96
1 (a
) Dire
ct F
inan
ce a
12.7
912
.65
nana
na1
(b) I
ndire
ct F
inan
ce a
4.30
3.56
nana
na
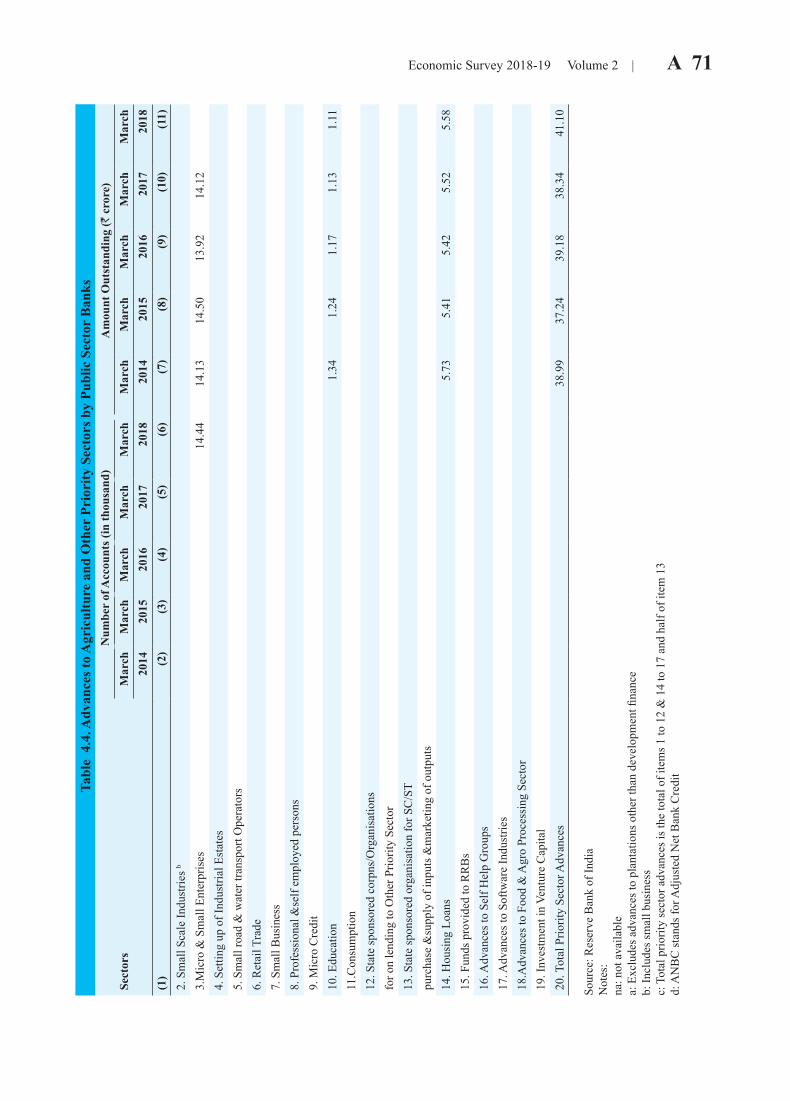
Economic Survey 2018-19 Volume 2 | A 71
T
able
4.4
. Adv
ance
s to
Agr
icul
ture
and
Oth
er P
rior
ity S
ecto
rs b
y Pu
blic
Sec
tor
Ban
ks
Num
ber
of A
ccou
nts (
in th
ousa
nd)
Am
ount
Out
stan
ding
(R c
rore
)Se
ctor
sM
arch
Mar
ch
Mar
chM
arch
Mar
chM
arch
Mar
ch
Mar
chM
arch
Mar
ch20
1420
1520
1620
1720
1820
1420
1520
1620
1720
18(1
)(2
)(3
)(4
) (5
)(6
)(7
)(8
)(9
) (1
0)(1
1)2.
Sm
all S
cale
Indu
strie
s b
3.M
icro
& S
mal
l Ent
erpr
ises
14.4
414
.13
14.5
013
.92
14.1
24.
Set
ting
up o
f Ind
ustri
al E
stat
es
5. S
mal
l roa
d &
wat
er tr
ansp
ort O
pera
tors
6.
Ret
ail T
rade
7.
Sm
all B
usin
ess
8.
Pro
fess
iona
l &se
lf em
ploy
ed p
erso
ns
9. M
icro
Cre
dit
10
. Edu
catio
n1.
341.
241.
171.
131.
1111
.Con
sum
ptio
n
12. S
tate
spon
sore
d co
rpns
/Org
anis
atio
ns
for o
n le
ndin
g to
Oth
er P
riorit
y Se
ctor
13
. Sta
te sp
onso
red
orga
nisa
tion
for S
C/S
T
purc
hase
&su
pply
of i
nput
s &m
arke
ting
of o
utpu
ts
14. H
ousi
ng L
oans
5.73
5.41
5.42
5.52
5.58
15. F
unds
pro
vide
d to
RR
Bs
16
. Adv
ance
s to
Self
Hel
p G
roup
s
17. A
dvan
ces t
o So
ftwar
e In
dust
ries
18
.Adv
ance
s to
Food
& A
gro
Proc
essi
ng S
ecto
r
19. I
nves
tmen
t in
Vent
ure
Cap
ital
20
. Tot
al P
riorit
y Se
ctor
Adv
ance
s
38.9
937
.24
39.1
838
.34
41.1
0
Sour
ce: R
eser
ve B
ank
of In
dia
Not
es:
na: n
ot a
vaila
ble
a: E
xclu
des a
dvan
ces t
o pl
anta
tions
oth
er th
an d
evel
opm
ent fi
nanc
eb:
Incl
udes
smal
l bus
ines
sc:
Tot
al p
riorit
y se
ctor
adv
ance
s is t
he to
tal o
f ite
ms 1
to 1
2 &
14
to 1
7 an
d ha
lf of
item
13
d: A
NB
C st
ands
for A
djus
ted
Net
Ban
k C
redi
t
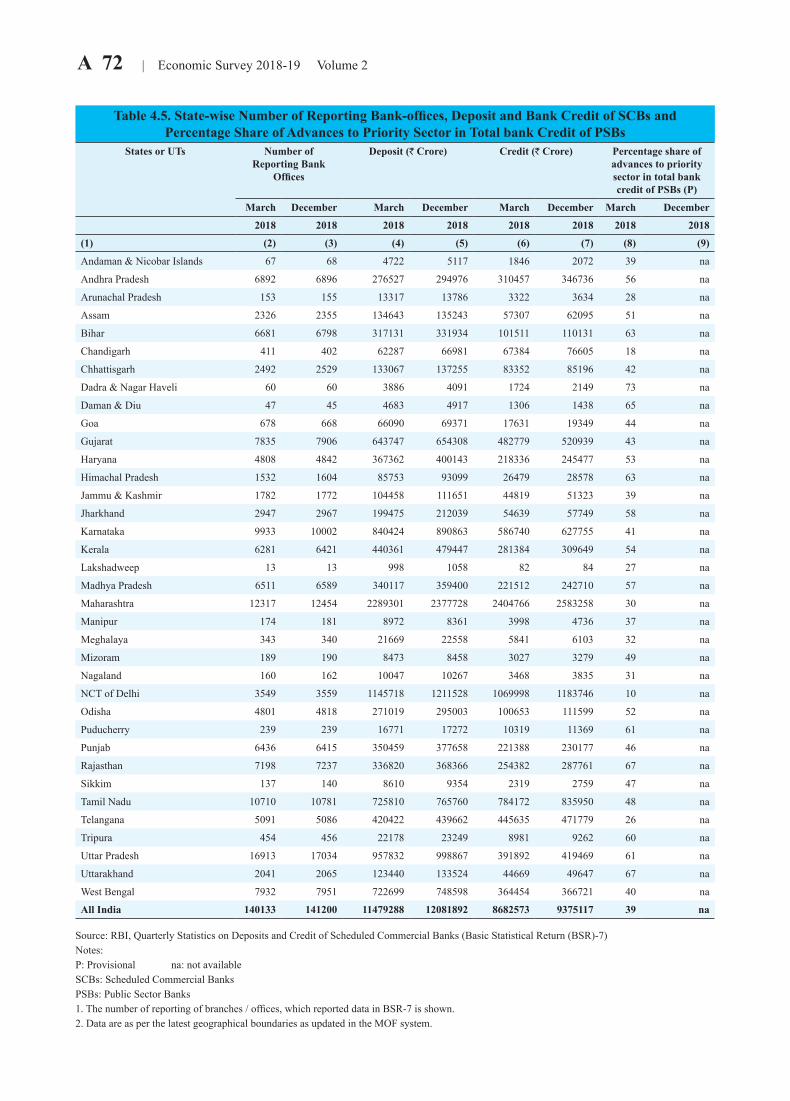
A 72 | Economic Survey 2018-19 Volume 2
Table 4.5. State-wise Number of Reporting Bank-offices, Deposit and Bank Credit of SCBs and Percentage Share of Advances to Priority Sector in Total bank Credit of PSBs
States or UTs Number of Reporting Bank
Offices
Deposit (` Crore) Credit (` Crore) Percentage share of advances to priority sector in total bank credit of PSBs (P)
March December March December March December March December
2018 2018 2018 2018 2018 2018 2018 2018
(1) (2) (3) (4) (5) (6) (7) (8) (9)
Andaman & Nicobar Islands 67 68 4722 5117 1846 2072 39 na
Andhra Pradesh 6892 6896 276527 294976 310457 346736 56 na
Arunachal Pradesh 153 155 13317 13786 3322 3634 28 na
Assam 2326 2355 134643 135243 57307 62095 51 na
Bihar 6681 6798 317131 331934 101511 110131 63 na
Chandigarh 411 402 62287 66981 67384 76605 18 na
Chhattisgarh 2492 2529 133067 137255 83352 85196 42 na
Dadra & Nagar Haveli 60 60 3886 4091 1724 2149 73 na
Daman & Diu 47 45 4683 4917 1306 1438 65 na
Goa 678 668 66090 69371 17631 19349 44 na
Gujarat 7835 7906 643747 654308 482779 520939 43 na
Haryana 4808 4842 367362 400143 218336 245477 53 na
Himachal Pradesh 1532 1604 85753 93099 26479 28578 63 na
Jammu & Kashmir 1782 1772 104458 111651 44819 51323 39 na
Jharkhand 2947 2967 199475 212039 54639 57749 58 na
Karnataka 9933 10002 840424 890863 586740 627755 41 na
Kerala 6281 6421 440361 479447 281384 309649 54 na
Lakshadweep 13 13 998 1058 82 84 27 na
Madhya Pradesh 6511 6589 340117 359400 221512 242710 57 na
Maharashtra 12317 12454 2289301 2377728 2404766 2583258 30 na
Manipur 174 181 8972 8361 3998 4736 37 na
Meghalaya 343 340 21669 22558 5841 6103 32 na
Mizoram 189 190 8473 8458 3027 3279 49 na
Nagaland 160 162 10047 10267 3468 3835 31 na
NCT of Delhi 3549 3559 1145718 1211528 1069998 1183746 10 na
Odisha 4801 4818 271019 295003 100653 111599 52 na
Puducherry 239 239 16771 17272 10319 11369 61 na
Punjab 6436 6415 350459 377658 221388 230177 46 na
Rajasthan 7198 7237 336820 368366 254382 287761 67 na
Sikkim 137 140 8610 9354 2319 2759 47 na
Tamil Nadu 10710 10781 725810 765760 784172 835950 48 na
Telangana 5091 5086 420422 439662 445635 471779 26 na
Tripura 454 456 22178 23249 8981 9262 60 na
Uttar Pradesh 16913 17034 957832 998867 391892 419469 61 na
Uttarakhand 2041 2065 123440 133524 44669 49647 67 na
West Bengal 7932 7951 722699 748598 364454 366721 40 na
All India 140133 141200 11479288 12081892 8682573 9375117 39 na
Source: RBI, Quarterly Statistics on Deposits and Credit of Scheduled Commercial Banks (Basic Statistical Return (BSR)-7) Notes: P: Provisional na: not availableSCBs: Scheduled Commercial Banks PSBs: Public Sector Banks 1. The number of reporting of branches / offices, which reported data in BSR-7 is shown. 2. Data are as per the latest geographical boundaries as updated in the MOF system.
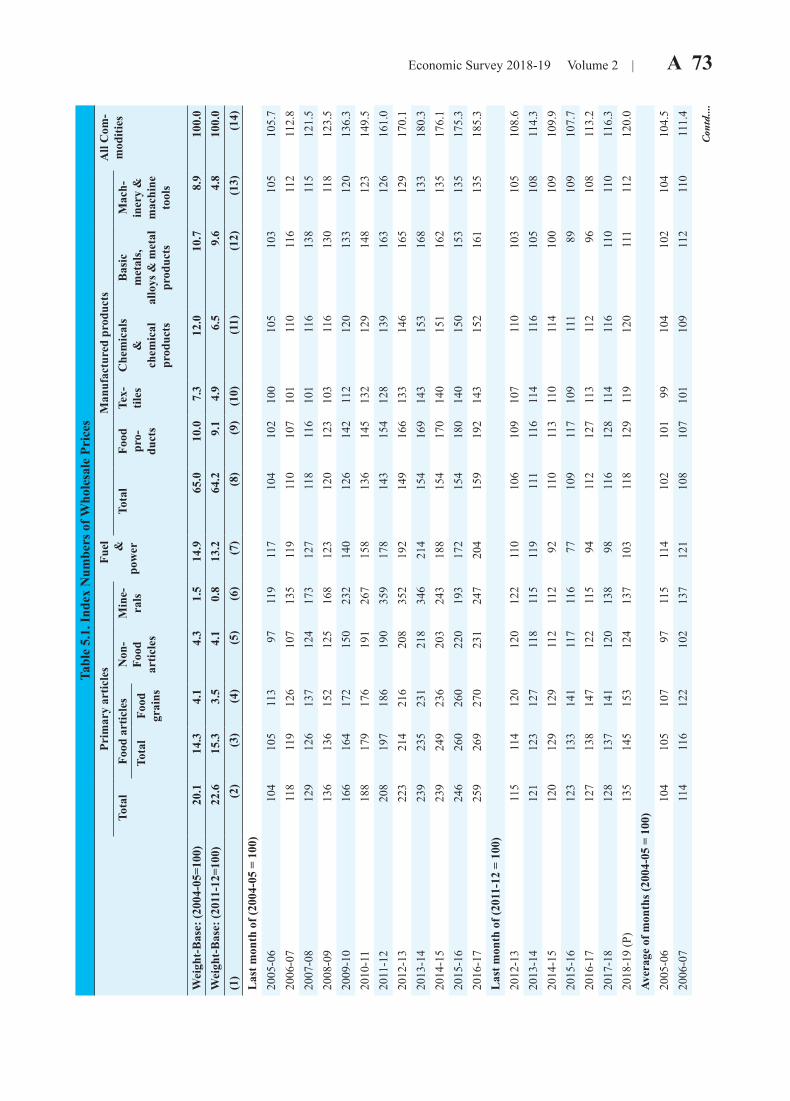
Economic Survey 2018-19 Volume 2 | A 73 Ta
ble
5.1.
Inde
x N
umbe
rs o
f Who
lesa
le P
rice
sPr
imar
y ar
ticle
sFu
el
&po
wer
Man
ufac
ture
d pr
oduc
tsA
ll C
om-
mod
ities
Tota
lFo
od a
rtic
les
Non
-Fo
odar
ticle
s
Min
e-ra
lsTo
tal
Food
pro-
duct
s
Tex-
tiles
Che
mic
als
&ch
emic
alpr
oduc
ts
Bas
icm
etal
s,al
loys
& m
etal
prod
ucts
Mac
h-in
ery
&m
achi
neto
ols
Tota
lFo
odgr
ains
Wei
ght-
Bas
e: (2
004-
05=1
00)
20.1
14.3
4.1
4.3
1.5
14.9
65.0
10.0
7.3
12.0
10.7
8.9
100.
0W
eigh
t-B
ase:
(201
1-12
=100
)22
.615
.33.
54.
10.
813
.264
.29.
14.
96.
59.
64.
810
0.0
(1)
(2)
(3)
(4)
(5)
(6)
(7)
(8)
(9)
(10)
(11)
(12)
(13)
(14)
Las
t mon
th o
f (20
04-0
5 =
100)
2005
-06
104
105
113
9711
911
710
410
210
010
510
310
510
5.7
2006
-07
118
119
126
107
135
119
110
107
101
110
116
112
112.
820
07-0
812
912
613
712
417
312
711
811
610
111
613
811
512
1.5
2008
-09
136
136
152
125
168
123
120
123
103
116
130
118
123.
520
09-1
016
616
417
215
023
214
012
614
211
212
013
312
013
6.3
2010
-11
188
179
176
191
267
158
136
145
132
129
148
123
149.
520
11-1
220
819
718
619
035
917
814
315
412
813
916
312
616
1.0
2012
-13
223
214
216
208
352
192
149
166
133
146
165
129
170.
120
13-1
423
923
523
121
834
621
415
416
914
315
316
813
318
0.3
2014
-15
239
249
236
203
243
188
154
170
140
151
162
135
176.
120
15-1
624
626
026
022
019
317
215
418
014
015
015
313
517
5.3
2016
-17
259
269
270
231
247
204
159
192
143
152
161
135
185.
3L
ast m
onth
of (
2011
-12
= 10
0)20
12-1
311
511
412
012
012
211
010
610
910
711
010
310
510
8.6
2013
-14
121
123
127
118
115
119
111
116
114
116
105
108
114.
320
14-1
512
012
912
911
211
292
110
113
110
114
100
109
109.
920
15-1
612
313
314
111
711
677
109
117
109
111
8910
910
7.7
2016
-17
127
138
147
122
115
9411
212
711
311
296
108
113.
220
17-1
812
813
714
112
013
898
116
128
114
116
110
110
116.
320
18-1
9 (P
)13
514
515
312
413
710
311
812
911
912
011
111
212
0.0
Aver
age
of m
onth
s (20
04-0
5 =
100)
2005
-06
104
105
107
9711
511
410
210
199
104
102
104
104.
520
06-0
711
411
612
210
213
712
110
810
710
110
911
211
011
1.4
Con
td....
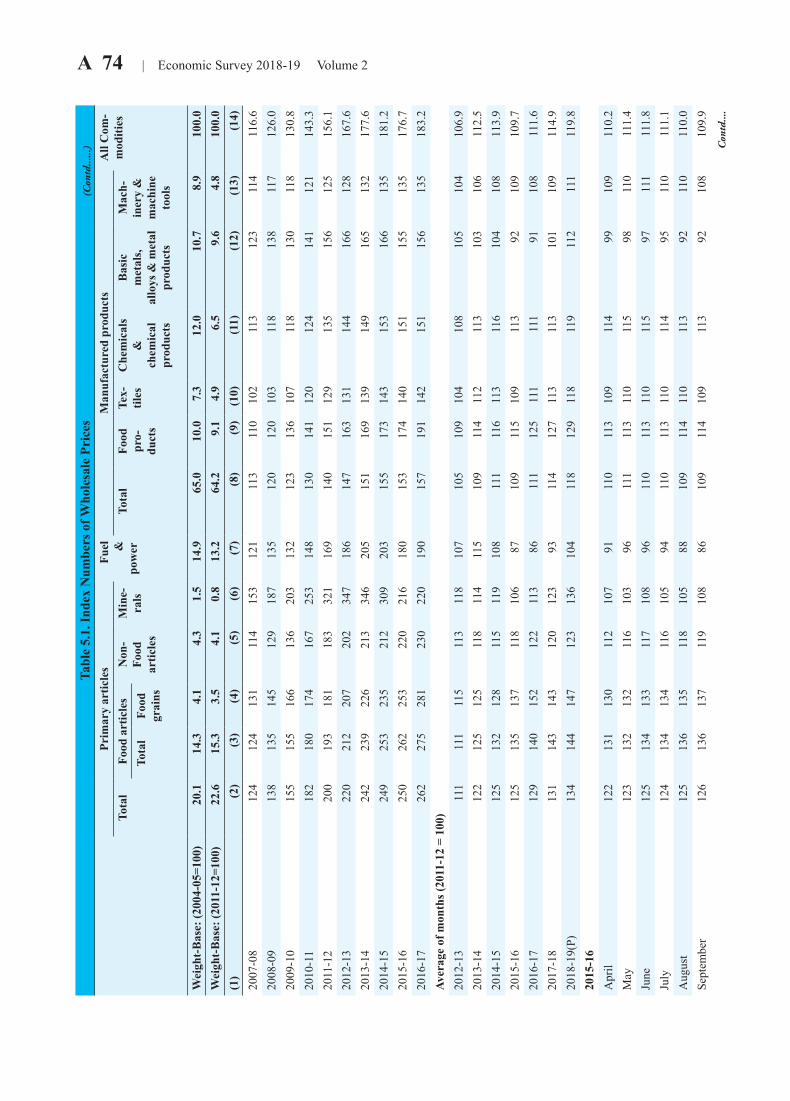
A 74 | Economic Survey 2018-19 Volume 2Ta
ble
5.1.
Inde
x N
umbe
rs o
f Who
lesa
le P
rice
sPr
imar
y ar
ticle
sFu
el
&po
wer
Man
ufac
ture
d pr
oduc
tsA
ll C
om-
mod
ities
Tota
lFo
od a
rtic
les
Non
-Fo
odar
ticle
s
Min
e-ra
lsTo
tal
Food
pro-
duct
s
Tex-
tiles
Che
mic
als
&ch
emic
alpr
oduc
ts
Bas
icm
etal
s,al
loys
& m
etal
prod
ucts
Mac
h-in
ery
&m
achi
neto
ols
Tota
lFo
odgr
ains
Wei
ght-
Bas
e: (2
004-
05=1
00)
20.1
14.3
4.1
4.3
1.5
14.9
65.0
10.0
7.3
12.0
10.7
8.9
100.
0W
eigh
t-B
ase:
(201
1-12
=100
)22
.615
.33.
54.
10.
813
.264
.29.
14.
96.
59.
64.
810
0.0
(1)
(2)
(3)
(4)
(5)
(6)
(7)
(8)
(9)
(10)
(11)
(12)
(13)
(14)
2007
-08
124
124
131
114
153
121
113
110
102
113
123
114
116.
620
08-0
913
813
514
512
918
713
512
012
010
311
813
811
712
6.0
2009
-10
155
155
166
136
203
132
123
136
107
118
130
118
130.
820
10-1
118
218
017
416
725
314
813
014
112
012
414
112
114
3.3
2011
-12
200
193
181
183
321
169
140
151
129
135
156
125
156.
120
12-1
322
021
220
720
234
718
614
716
313
114
416
612
816
7.6
2013
-14
242
239
226
213
346
205
151
169
139
149
165
132
177.
620
14-1
524
925
323
521
230
920
315
517
314
315
316
613
518
1.2
2015
-16
250
262
253
220
216
180
153
174
140
151
155
135
176.
720
16-1
726
227
528
123
022
019
015
719
114
215
115
613
518
3.2
Aver
age
of m
onth
s (20
11-1
2 =
100)
2012
-13
111
111
115
113
118
107
105
109
104
108
105
104
106.
920
13-1
412
212
512
511
811
411
510
911
411
211
310
310
611
2.5
2014
-15
125
132
128
115
119
108
111
116
113
116
104
108
113.
920
15-1
612
513
513
711
810
687
109
115
109
113
9210
910
9.7
2016
-17
129
140
152
122
113
8611
112
511
111
191
108
111.
620
17-1
813
114
314
312
012
393
114
127
113
113
101
109
114.
920
18-1
9(P)
134
144
147
123
136
104
118
129
118
119
112
111
119.
820
15-1
6A
pril
122
131
130
112
107
9111
011
310
911
499
109
110.
2M
ay12
313
213
211
610
396
111
113
110
115
9811
011
1.4
June
125
134
133
117
108
9611
011
311
011
597
111
111.
8Ju
ly12
413
413
411
610
594
110
113
110
114
9511
011
1.1
Aug
ust
125
136
135
118
105
8810
911
411
011
392
110
110.
0Se
ptem
ber
126
136
137
119
108
8610
911
410
911
392
108
109.
9Con
td....
(Con
td......)
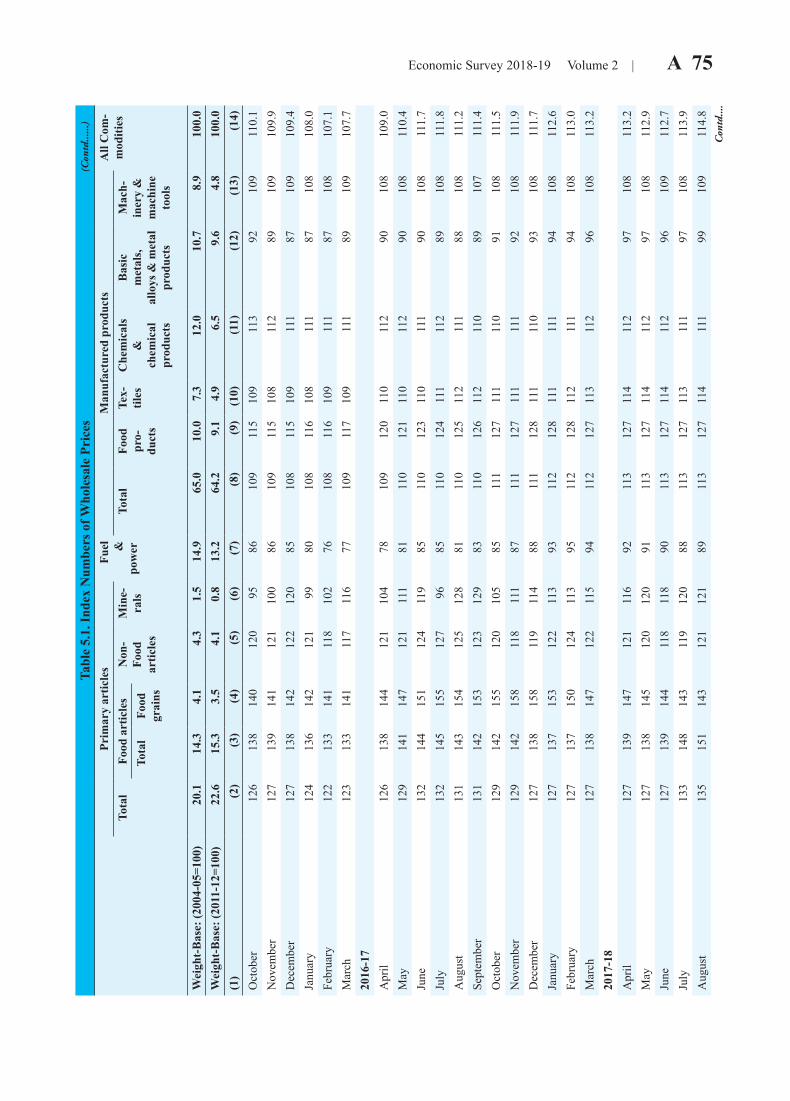
Economic Survey 2018-19 Volume 2 | A 75 Ta
ble
5.1.
Inde
x N
umbe
rs o
f Who
lesa
le P
rice
sPr
imar
y ar
ticle
sFu
el
&po
wer
Man
ufac
ture
d pr
oduc
tsA
ll C
om-
mod
ities
Tota
lFo
od a
rtic
les
Non
-Fo
odar
ticle
s
Min
e-ra
lsTo
tal
Food
pro-
duct
s
Tex-
tiles
Che
mic
als
&ch
emic
alpr
oduc
ts
Bas
icm
etal
s,al
loys
& m
etal
prod
ucts
Mac
h-in
ery
&m
achi
neto
ols
Tota
lFo
odgr
ains
Wei
ght-
Bas
e: (2
004-
05=1
00)
20.1
14.3
4.1
4.3
1.5
14.9
65.0
10.0
7.3
12.0
10.7
8.9
100.
0W
eigh
t-B
ase:
(201
1-12
=100
)22
.615
.33.
54.
10.
813
.264
.29.
14.
96.
59.
64.
810
0.0
(1)
(2)
(3)
(4)
(5)
(6)
(7)
(8)
(9)
(10)
(11)
(12)
(13)
(14)
Oct
ober
12
613
814
012
095
8610
911
510
911
392
109
110.
1N
ovem
ber
127
139
141
121
100
8610
911
510
811
289
109
109.
9D
ecem
ber
127
138
142
122
120
8510
811
510
911
187
109
109.
4Ja
nuar
y12
413
614
212
199
8010
811
610
811
187
108
108.
0Fe
brua
ry
122
133
141
118
102
7610
811
610
911
187
108
107.
1M
arch
123
133
141
117
116
7710
911
710
911
189
109
107.
720
16-1
7A
pril
126
138
144
121
104
7810
912
011
011
290
108
109.
0M
ay12
914
114
712
111
181
110
121
110
112
9010
811
0.4
June
132
144
151
124
119
8511
012
311
011
190
108
111.
7Ju
ly13
214
515
512
796
8511
012
411
111
289
108
111.
8A
ugus
t13
114
315
412
512
881
110
125
112
111
8810
811
1.2
Sept
embe
r13
114
215
312
312
983
110
126
112
110
8910
711
1.4
Oct
ober
12
914
215
512
010
585
111
127
111
110
9110
811
1.5
Nov
embe
r12
914
215
811
811
187
111
127
111
111
9210
811
1.9
Dec
embe
r12
713
815
811
911
488
111
128
111
110
9310
811
1.7
Janu
ary
127
137
153
122
113
9311
212
811
111
194
108
112.
6Fe
brua
ry12
713
715
012
411
395
112
128
112
111
9410
811
3.0
Mar
ch
127
138
147
122
115
9411
212
711
311
296
108
113.
220
17-1
8A
pril
127
139
147
121
116
9211
312
711
411
297
108
113.
2M
ay12
713
814
512
012
091
113
127
114
112
9710
811
2.9
June
12
713
914
411
811
890
113
127
114
112
9610
911
2.7
July
133
148
143
119
120
8811
312
711
311
197
108
113.
9A
ugus
t13
515
114
312
112
189
113
127
114
111
9910
911
4.8
(Con
td......)
Con
td....

A 76 | Economic Survey 2018-19 Volume 2Ta
ble
5.1.
Inde
x N
umbe
rs o
f Who
lesa
le P
rice
sPr
imar
y ar
ticle
sFu
el
&po
wer
Man
ufac
ture
d pr
oduc
tsA
ll C
om-
mod
ities
Tota
lFo
od a
rtic
les
Non
-Fo
odar
ticle
s
Min
e-ra
lsTo
tal
Food
pro-
duct
s
Tex-
tiles
Che
mic
als
&ch
emic
alpr
oduc
ts
Bas
icm
etal
s,al
loys
& m
etal
prod
ucts
Mac
h-in
ery
&m
achi
neto
ols
Tota
lFo
odgr
ains
Wei
ght-
Bas
e: (2
004-
05=1
00)
20.1
14.3
4.1
4.3
1.5
14.9
65.0
10.0
7.3
12.0
10.7
8.9
100.
0W
eigh
t-B
ase:
(201
1-12
=100
)22
.615
.33.
54.
10.
813
.264
.29.
14.
96.
59.
64.
810
0.0
(1)
(2)
(3)
(4)
(5)
(6)
(7)
(8)
(9)
(10)
(11)
(12)
(13)
(14)
Sept
embe
r13
214
514
412
012
992
114
128
113
111
101
109
114.
9O
ctob
er
134
148
143
119
122
9411
412
811
311
210
110
911
5.6
Nov
embe
r 13
615
114
211
712
295
114
128
113
112
101
109
116.
4D
ecem
ber
132
144
141
119
122
9611
412
711
311
310
310
911
5.7
Janu
ary
130
141
140
121
120
9811
512
711
311
410
611
011
6.0
Febr
uary
128
138
140
121
122
9911
612
711
411
510
911
011
6.1
Mar
ch12
813
714
112
013
898
116
128
114
116
110
110
116.
320
18-1
9A
pril
131
140
140
120
140
9911
612
811
511
611
011
011
7.3
May
131
140
141
120
130
102
117
127
116
117
112
110
118.
3Ju
ne13
314
214
112
312
310
411
712
911
611
811
311
111
9.1
July
135
145
143
124
135
104
118
129
118
118
112
111
119.
9A
ugus
t13
514
514
512
412
910
511
813
011
811
911
211
112
0.1
Sept
embe
r13
614
514
512
413
010
811
813
011
912
011
411
212
0.9
Oct
ober
137
146
147
123
140
111
119
130
119
121
115
112
122.
0N
ovem
ber
137
146
149
125
151
109
119
129
119
121
114
112
121.
6D
ecem
ber
134
144
150
124
139
103
118
128
119
120
112
112
119.
7Ja
nuar
y13
414
415
212
313
799
118
128
119
120
110
112
119.
2Fe
brua
ry13
414
415
412
314
410
111
812
911
912
011
111
211
9.5
Mar
ch(P
)13
514
515
312
413
710
311
812
911
912
011
111
212
0.0
Apr
il(P)
139
150
154
127
144
103
118
129
119
120
111
112
120.
9
Sour
ce :
Offi
ce o
f the
Eco
nom
ic A
dvis
er, M
inis
try o
f Com
mer
ce &
Indu
stry
. N
ote:
P: P
rovi
sion
al
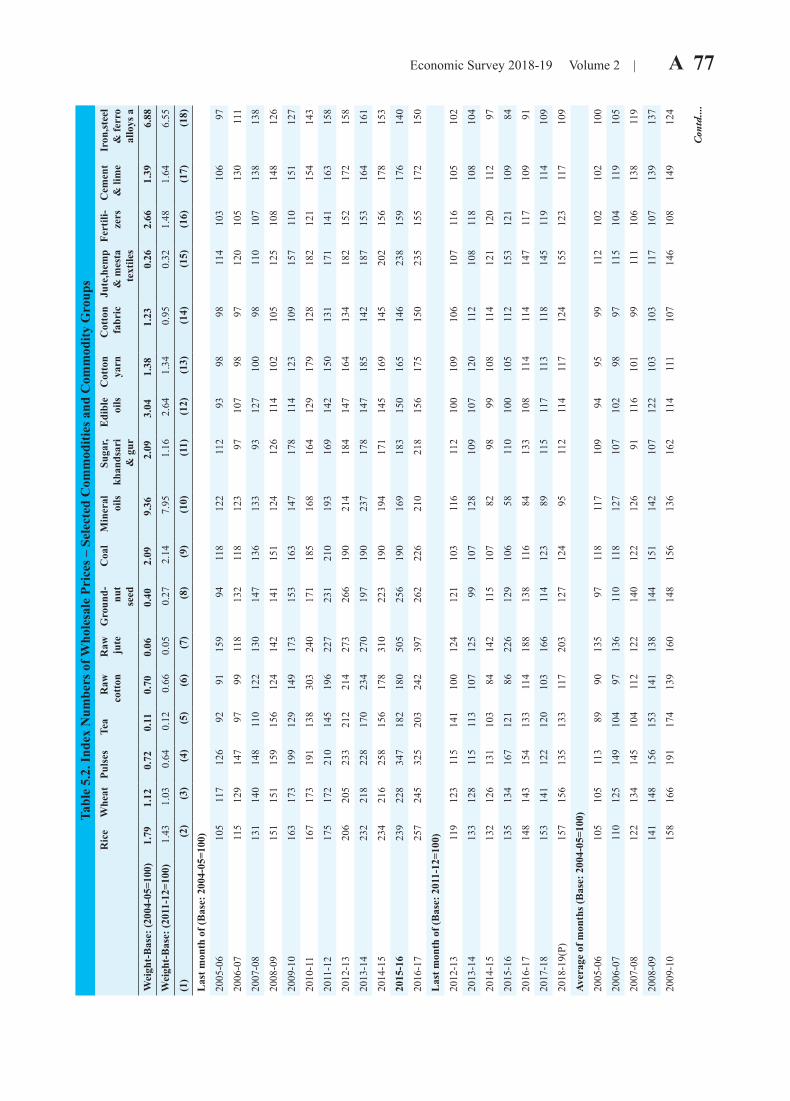
Economic Survey 2018-19 Volume 2 | A 77 Ta
ble
5.2.
Inde
x N
umbe
rs o
f Who
lesa
le P
rice
s – S
elec
ted
Com
mod
ities
and
Com
mod
ity G
roup
sR
ice
Whe
atPu
lses
Tea
Raw
cott
onR
aw jute
Gro
und- nu
tse
ed
Coa
lM
iner
aloi
lsSu
gar,
khan
dsar
i&
gur
Edi
ble
oils
Cot
ton
yarn
Cot
ton
fabr
icJu
te,h
emp
& m
esta
text
iles
Fert
ili-
zers
Cem
ent
& li
me
Iron
,stee
l&
ferr
oal
loys
a
Wei
ght-
Bas
e: (2
004-
05=1
00)
1.79
1.12
0.72
0.11
0.70
0.06
0.40
2.09
9.36
2.09
3.04
1.38
1.23
0.26
2.66
1.39
6.88
Wei
ght-
Bas
e: (2
011-
12=1
00)
1.43
1.03
0.64
0.12
0.66
0.05
0.27
2.14
7.95
1.16
2.64
1.34
0.95
0.32
1.48
1.64
6.55
(1)
(2)
(3)
(4)
(5)
(6)
(7)
(8)
(9)
(10)
(11)
(12)
(13)
(14)
(15)
(16)
(17)
(18)
Las
t mon
th o
f (B
ase:
200
4-05
=100
)
2005
-06
105
117
126
9291
159
9411
812
211
293
9898
114
103
106
97
2006
-07
115
129
147
9799
118
132
118
123
9710
798
9712
010
513
011
1
2007
-08
131
140
148
110
122
130
147
136
133
9312
710
098
110
107
138
138
2008
-09
151
151
159
156
124
142
141
151
124
126
114
102
105
125
108
148
126
2009
-10
163
173
199
129
149
173
153
163
147
178
114
123
109
157
110
151
127
2010
-11
167
173
191
138
303
240
171
185
168
164
129
179
128
182
121
154
143
2011
-12
175
172
210
145
196
227
231
210
193
169
142
150
131
171
141
163
158
2012
-13
206
205
233
212
214
273
266
190
214
184
147
164
134
182
152
172
158
2013
-14
232
218
228
170
234
270
197
190
237
178
147
185
142
187
153
164
161
2014
-15
234
216
258
156
178
310
223
190
194
171
145
169
145
202
156
178
153
2015
-16
239
228
347
182
180
505
256
190
169
183
150
165
146
238
159
176
140
2016
-17
257
245
325
203
242
397
262
226
210
218
156
175
150
235
155
172
150
Las
t mon
th o
f (B
ase:
201
1-12
=100
)
2012
-13
119
123
115
141
100
124
121
103
116
112
100
109
106
107
116
105
102
2013
-14
133
128
115
113
107
125
9910
712
810
910
712
011
210
811
810
810
4
2014
-15
132
126
131
103
8414
211
510
782
9899
108
114
121
120
112
97
2015
-16
135
134
167
121
8622
612
910
658
110
100
105
112
153
121
109
84
2016
-17
148
143
154
133
114
188
138
116
8413
310
811
411
414
711
710
991
2017
-18
153
141
122
120
103
166
114
123
8911
511
711
311
814
511
911
410
9
2018
-19(
P)15
715
613
513
311
720
312
712
495
112
114
117
124
155
123
117
109
Aver
age
of m
onth
s (B
ase:
200
4-05
=100
)
2005
-06
105
105
113
8990
135
9711
811
710
994
9599
112
102
102
100
2006
-07
110
125
149
104
9713
611
011
812
710
710
298
9711
510
411
910
5
2007
-08
122
134
145
104
112
122
140
122
126
9111
610
199
111
106
138
119
2008
-09
141
148
156
153
141
138
144
151
142
107
122
103
103
117
107
139
137
2009
-10
158
166
191
174
139
160
148
156
136
162
114
111
107
146
108
149
124
Con
td....
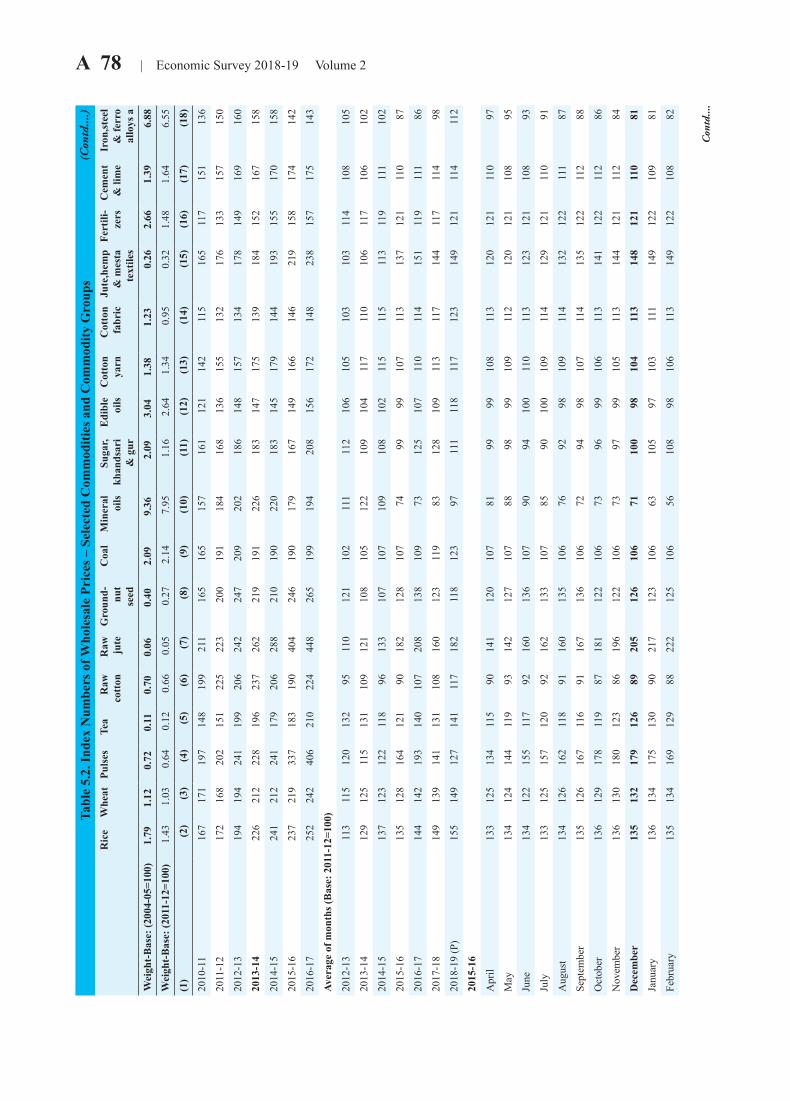
A 78 | Economic Survey 2018-19 Volume 2Ta
ble
5.2.
Inde
x N
umbe
rs o
f Who
lesa
le P
rice
s – S
elec
ted
Com
mod
ities
and
Com
mod
ity G
roup
sR
ice
Whe
atPu
lses
Tea
Raw
cott
onR
aw jute
Gro
und- nu
tse
ed
Coa
lM
iner
aloi
lsSu
gar,
khan
dsar
i&
gur
Edi
ble
oils
Cot
ton
yarn
Cot
ton
fabr
icJu
te,h
emp
& m
esta
text
iles
Fert
ili-
zers
Cem
ent
& li
me
Iron
,stee
l&
ferr
oal
loys
a
Wei
ght-
Bas
e: (2
004-
05=1
00)
1.79
1.12
0.72
0.11
0.70
0.06
0.40
2.09
9.36
2.09
3.04
1.38
1.23
0.26
2.66
1.39
6.88
Wei
ght-
Bas
e: (2
011-
12=1
00)
1.43
1.03
0.64
0.12
0.66
0.05
0.27
2.14
7.95
1.16
2.64
1.34
0.95
0.32
1.48
1.64
6.55
(1)
(2)
(3)
(4)
(5)
(6)
(7)
(8)
(9)
(10)
(11)
(12)
(13)
(14)
(15)
(16)
(17)
(18)
2010
-11
167
171
197
148
199
211
165
165
157
161
121
142
115
165
117
151
136
2011
-12
172
168
202
151
225
223
200
191
184
168
136
155
132
176
133
157
150
2012
-13
194
194
241
199
206
242
247
209
202
186
148
157
134
178
149
169
160
2013
-14
226
212
228
196
237
262
219
191
226
183
147
175
139
184
152
167
158
2014
-15
241
212
241
179
206
288
210
190
220
183
145
179
144
193
155
170
158
2015
-16
237
219
337
183
190
404
246
190
179
167
149
166
146
219
158
174
142
2016
-17
252
242
406
210
224
448
265
199
194
208
156
172
148
238
157
175
143
Aver
age
of m
onth
s (B
ase:
201
1-12
=100
)
2012
-13
113
115
120
132
9511
012
110
211
111
210
610
510
310
311
410
810
5
2013
-14
129
125
115
131
109
121
108
105
122
109
104
117
110
106
117
106
102
2014
-15
137
123
122
118
9613
310
710
710
910
810
211
511
511
311
911
110
2
2015
-16
135
128
164
121
9018
212
810
774
9999
107
113
137
121
110
87
2016
-17
144
142
193
140
107
208
138
109
7312
510
711
011
415
111
911
186
2017
-18
149
139
141
131
108
160
123
119
8312
810
911
311
714
411
711
498
2018
-19
(P)
155
149
127
141
117
182
118
123
9711
111
811
712
314
912
111
411
2
2015
-16
Apr
il13
312
513
411
590
141
120
107
8199
9910
811
312
012
111
097
May
134
124
144
119
9314
212
710
788
9899
109
112
120
121
108
95
June
134
122
155
117
9216
013
610
790
9410
011
011
312
312
110
893
July
133
125
157
120
9216
213
310
785
9010
010
911
412
912
111
091
Aug
ust
134
126
162
118
9116
013
510
676
9298
109
114
132
122
111
87
Sept
embe
r13
512
616
711
691
167
136
106
7294
9810
711
413
512
211
288
Oct
ober
13
612
917
811
987
181
122
106
7396
9910
611
314
112
211
286
Nov
embe
r 13
613
018
012
386
196
122
106
7397
9910
511
314
412
111
284
Dec
embe
r 13
513
217
912
689
205
126
106
7110
098
104
113
148
121
110
81
Janu
ary
136
134
175
130
9021
712
310
663
105
9710
311
114
912
210
981
Febr
uary
13
513
416
912
988
222
125
106
5610
898
106
113
149
122
108
82
(Con
td....)
Con
td....
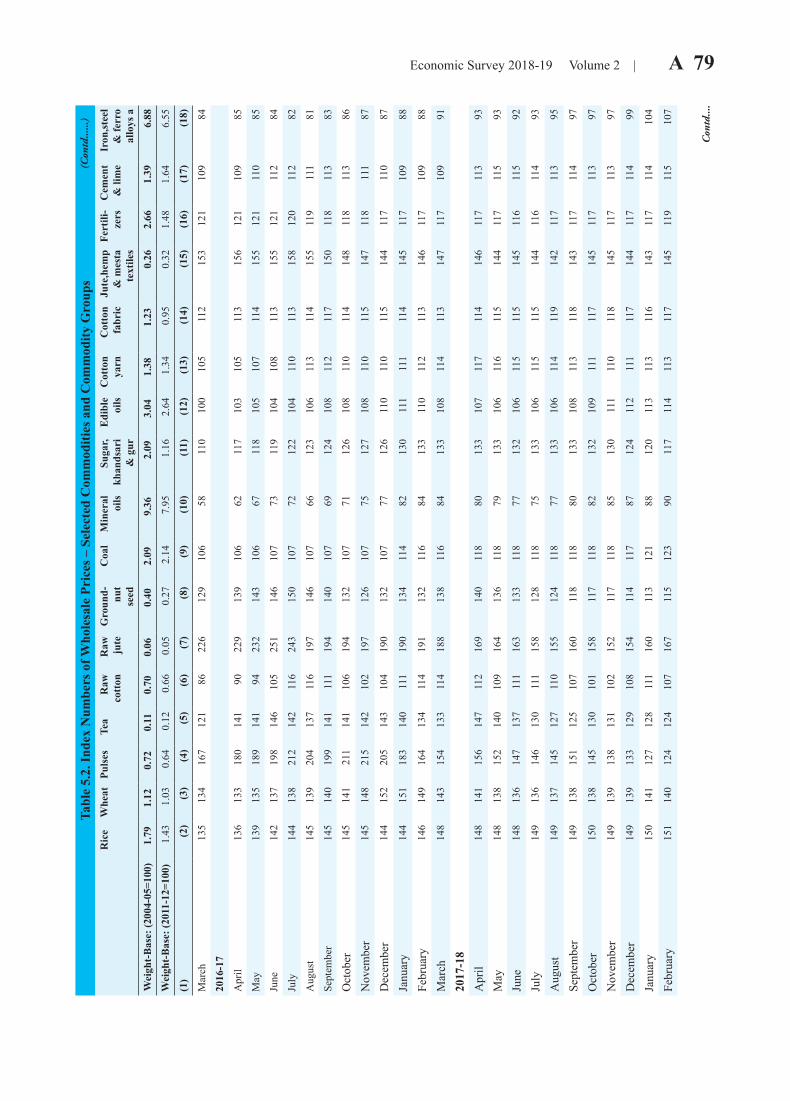
Economic Survey 2018-19 Volume 2 | A 79 Ta
ble
5.2.
Inde
x N
umbe
rs o
f Who
lesa
le P
rice
s – S
elec
ted
Com
mod
ities
and
Com
mod
ity G
roup
sR
ice
Whe
atPu
lses
Tea
Raw
cott
onR
aw jute
Gro
und- nu
tse
ed
Coa
lM
iner
aloi
lsSu
gar,
khan
dsar
i&
gur
Edi
ble
oils
Cot
ton
yarn
Cot
ton
fabr
icJu
te,h
emp
& m
esta
text
iles
Fert
ili-
zers
Cem
ent
& li
me
Iron
,stee
l&
ferr
oal
loys
a
Wei
ght-
Bas
e: (2
004-
05=1
00)
1.79
1.12
0.72
0.11
0.70
0.06
0.40
2.09
9.36
2.09
3.04
1.38
1.23
0.26
2.66
1.39
6.88
Wei
ght-
Bas
e: (2
011-
12=1
00)
1.43
1.03
0.64
0.12
0.66
0.05
0.27
2.14
7.95
1.16
2.64
1.34
0.95
0.32
1.48
1.64
6.55
(1)
(2)
(3)
(4)
(5)
(6)
(7)
(8)
(9)
(10)
(11)
(12)
(13)
(14)
(15)
(16)
(17)
(18)
Mar
ch13
513
416
712
186
226
129
106
5811
010
010
511
215
312
110
984
2016
-17
Apr
il13
613
318
014
190
229
139
106
6211
710
310
511
315
612
110
985
May
139
135
189
141
9423
214
310
667
118
105
107
114
155
121
110
85
June
142
137
198
146
105
251
146
107
7311
910
410
811
315
512
111
284
July
144
138
212
142
116
243
150
107
7212
210
411
011
315
812
011
282
Aug
ust
145
139
204
137
116
197
146
107
6612
310
611
311
415
511
911
181
Sept
embe
r14
514
019
914
111
119
414
010
769
124
108
112
117
150
118
113
83
Oct
ober
14
514
121
114
110
619
413
210
771
126
108
110
114
148
118
113
86
Nov
embe
r14
514
821
514
210
219
712
610
775
127
108
110
115
147
118
111
87
Dec
embe
r14
415
220
514
310
419
013
210
777
126
110
110
115
144
117
110
87
Janu
ary
144
151
183
140
111
190
134
114
8213
011
111
111
414
511
710
988
Febr
uary
146
149
164
134
114
191
132
116
8413
311
011
211
314
611
710
988
Mar
ch
148
143
154
133
114
188
138
116
8413
310
811
411
314
711
710
991
2017
-18
Apr
il 14
814
115
614
711
216
914
011
880
133
107
117
114
146
117
113
93
May
148
138
152
140
109
164
136
118
7913
310
611
611
514
411
711
593
June
14
813
614
713
711
116
313
311
877
132
106
115
115
145
116
115
92
July
149
136
146
130
111
158
128
118
7513
310
611
511
514
411
611
493
Aug
ust
149
137
145
127
110
155
124
118
7713
310
611
411
914
211
711
395
Sept
embe
r14
913
815
112
510
716
011
811
880
133
108
113
118
143
117
114
97
Oct
ober
15
013
814
513
010
115
811
711
882
132
109
111
117
145
117
113
97
Nov
embe
r 14
913
913
813
110
215
211
711
885
130
111
110
118
145
117
113
97
Dec
embe
r14
913
913
312
910
815
411
411
787
124
112
111
117
144
117
114
99
Janu
ary
150
141
127
128
111
160
113
121
8812
011
311
311
614
311
711
410
4
Febr
uary
151
140
124
124
107
167
115
123
9011
711
411
311
714
511
911
510
7
(Con
td......)
Con
td....
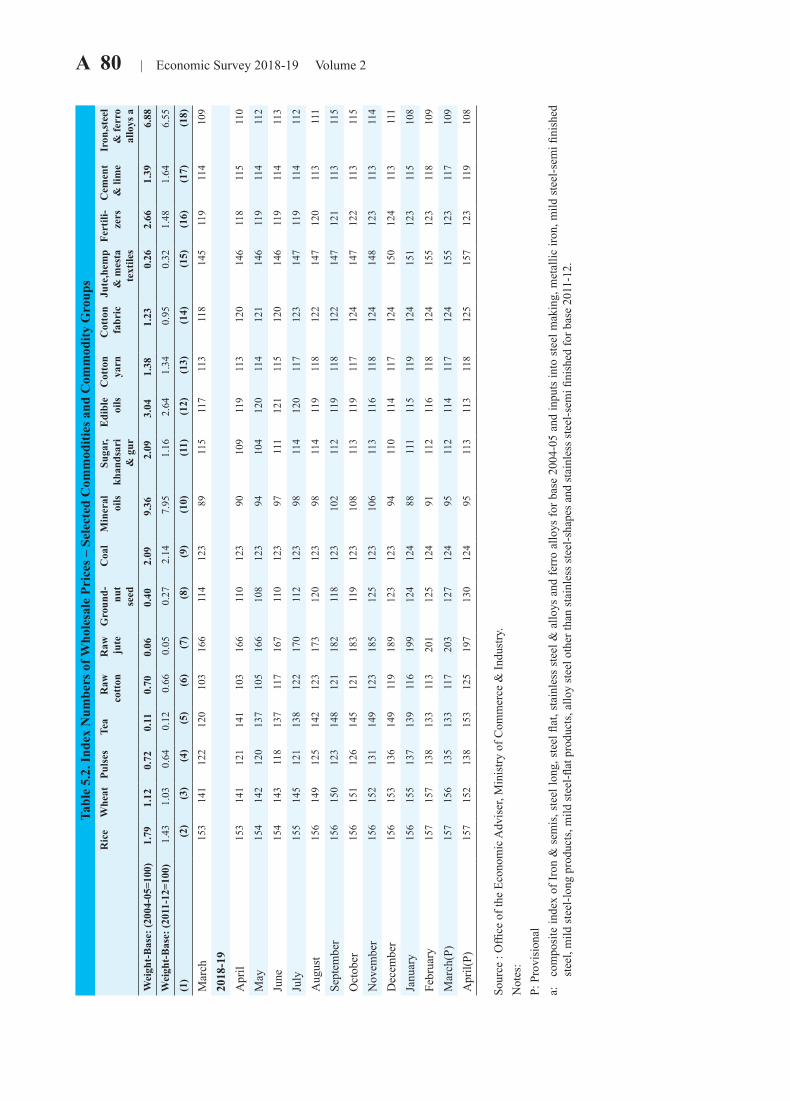
A 80 | Economic Survey 2018-19 Volume 2Ta
ble
5.2.
Inde
x N
umbe
rs o
f Who
lesa
le P
rice
s – S
elec
ted
Com
mod
ities
and
Com
mod
ity G
roup
sR
ice
Whe
atPu
lses
Tea
Raw
cott
onR
aw jute
Gro
und- nu
tse
ed
Coa
lM
iner
aloi
lsSu
gar,
khan
dsar
i&
gur
Edi
ble
oils
Cot
ton
yarn
Cot
ton
fabr
icJu
te,h
emp
& m
esta
text
iles
Fert
ili-
zers
Cem
ent
& li
me
Iron
,stee
l&
ferr
oal
loys
a
Wei
ght-
Bas
e: (2
004-
05=1
00)
1.79
1.12
0.72
0.11
0.70
0.06
0.40
2.09
9.36
2.09
3.04
1.38
1.23
0.26
2.66
1.39
6.88
Wei
ght-
Bas
e: (2
011-
12=1
00)
1.43
1.03
0.64
0.12
0.66
0.05
0.27
2.14
7.95
1.16
2.64
1.34
0.95
0.32
1.48
1.64
6.55
(1)
(2)
(3)
(4)
(5)
(6)
(7)
(8)
(9)
(10)
(11)
(12)
(13)
(14)
(15)
(16)
(17)
(18)
Mar
ch15
314
112
212
010
316
611
412
389
115
117
113
118
145
119
114
109
2018
-19
Apr
il15
314
112
114
110
316
611
012
390
109
119
113
120
146
118
115
110
May
154
142
120
137
105
166
108
123
9410
412
011
412
114
611
911
411
2
June
154
143
118
137
117
167
110
123
9711
112
111
512
014
611
911
411
3
July
155
145
121
138
122
170
112
123
9811
412
011
712
314
711
911
411
2
Aug
ust
156
149
125
142
123
173
120
123
9811
411
911
812
214
712
011
311
1
Sept
embe
r15
615
012
314
812
118
211
812
310
211
211
911
812
214
712
111
311
5
Oct
ober
156
151
126
145
121
183
119
123
108
113
119
117
124
147
122
113
115
Nov
embe
r15
615
213
114
912
318
512
512
310
611
311
611
812
414
812
311
311
4
Dec
embe
r15
615
313
614
911
918
912
312
394
110
114
117
124
150
124
113
111
Janu
ary
156
155
137
139
116
199
124
124
8811
111
511
912
415
112
311
510
8
Febr
uary
157
157
138
133
113
201
125
124
9111
211
611
812
415
512
311
810
9
Mar
ch(P
)15
715
613
513
311
720
312
712
495
112
114
117
124
155
123
117
109
Apr
il(P)
157
152
138
153
125
197
130
124
9511
311
311
812
515
712
311
910
8
Sour
ce :
Offi
ce o
f the
Eco
nom
ic A
dvis
er, M
inis
try o
f Com
mer
ce &
Indu
stry
. N
otes
:
P:
Pro
visi
onal
a:
co
mpo
site
inde
x of
Iron
& s
emis
, ste
el lo
ng, s
teel
flat
, sta
inle
ss s
teel
& a
lloys
and
ferr
o al
loys
for b
ase
2004
-05
and
inpu
ts in
to s
teel
mak
ing,
met
allic
iron
, mild
ste
el-s
emi fi
nish
ed
stee
l, m
ild st
eel-l
ong
prod
ucts
, mild
stee
l-flat
pro
duct
s, al
loy
stee
l oth
er th
an st
ainl
ess s
teel
-sha
pes a
nd st
ainl
ess s
teel
-sem
i fini
shed
for b
ase
2011
-12.
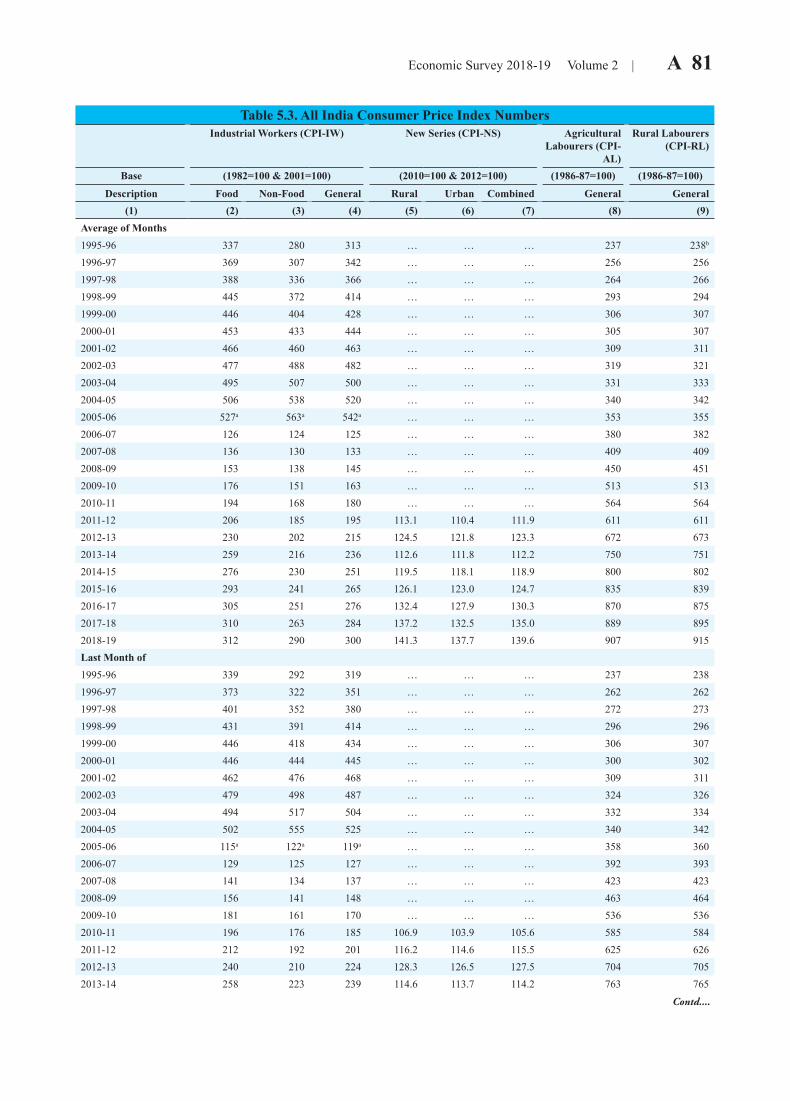
Economic Survey 2018-19 Volume 2 | A 81
Table 5.3. All India Consumer Price Index NumbersIndustrial Workers (CPI-IW) New Series (CPI-NS) Agricultural
Labourers (CPI-AL)
Rural Labourers (CPI-RL)
Base (1982=100 & 2001=100) (2010=100 & 2012=100) (1986-87=100) (1986-87=100)
Description Food Non-Food General Rural Urban Combined General General (1) (2) (3) (4) (5) (6) (7) (8) (9)
Average of Months1995-96 337 280 313 … … … 237 238b
1996-97 369 307 342 … … … 256 2561997-98 388 336 366 … … … 264 2661998-99 445 372 414 … … … 293 2941999-00 446 404 428 … … … 306 3072000-01 453 433 444 … … … 305 3072001-02 466 460 463 … … … 309 3112002-03 477 488 482 … … … 319 3212003-04 495 507 500 … … … 331 3332004-05 506 538 520 … … … 340 3422005-06 527a 563a 542a … … … 353 3552006-07 126 124 125 … … … 380 3822007-08 136 130 133 … … … 409 4092008-09 153 138 145 … … … 450 4512009-10 176 151 163 … … … 513 5132010-11 194 168 180 … … … 564 5642011-12 206 185 195 113.1 110.4 111.9 611 6112012-13 230 202 215 124.5 121.8 123.3 672 6732013-14 259 216 236 112.6 111.8 112.2 750 7512014-15 276 230 251 119.5 118.1 118.9 800 8022015-16 293 241 265 126.1 123.0 124.7 835 8392016-17 305 251 276 132.4 127.9 130.3 870 8752017-18 310 263 284 137.2 132.5 135.0 889 8952018-19 312 290 300 141.3 137.7 139.6 907 915Last Month of1995-96 339 292 319 … … … 237 2381996-97 373 322 351 … … … 262 2621997-98 401 352 380 … … … 272 2731998-99 431 391 414 … … … 296 2961999-00 446 418 434 … … … 306 3072000-01 446 444 445 … … … 300 3022001-02 462 476 468 … … … 309 3112002-03 479 498 487 … … … 324 3262003-04 494 517 504 … … … 332 3342004-05 502 555 525 … … … 340 3422005-06 115a 122a 119a … … … 358 3602006-07 129 125 127 … … … 392 3932007-08 141 134 137 … … … 423 4232008-09 156 141 148 … … … 463 4642009-10 181 161 170 … … … 536 5362010-11 196 176 185 106.9 103.9 105.6 585 5842011-12 212 192 201 116.2 114.6 115.5 625 6262012-13 240 210 224 128.3 126.5 127.5 704 7052013-14 258 223 239 114.6 113.7 114.2 763 765
Contd....
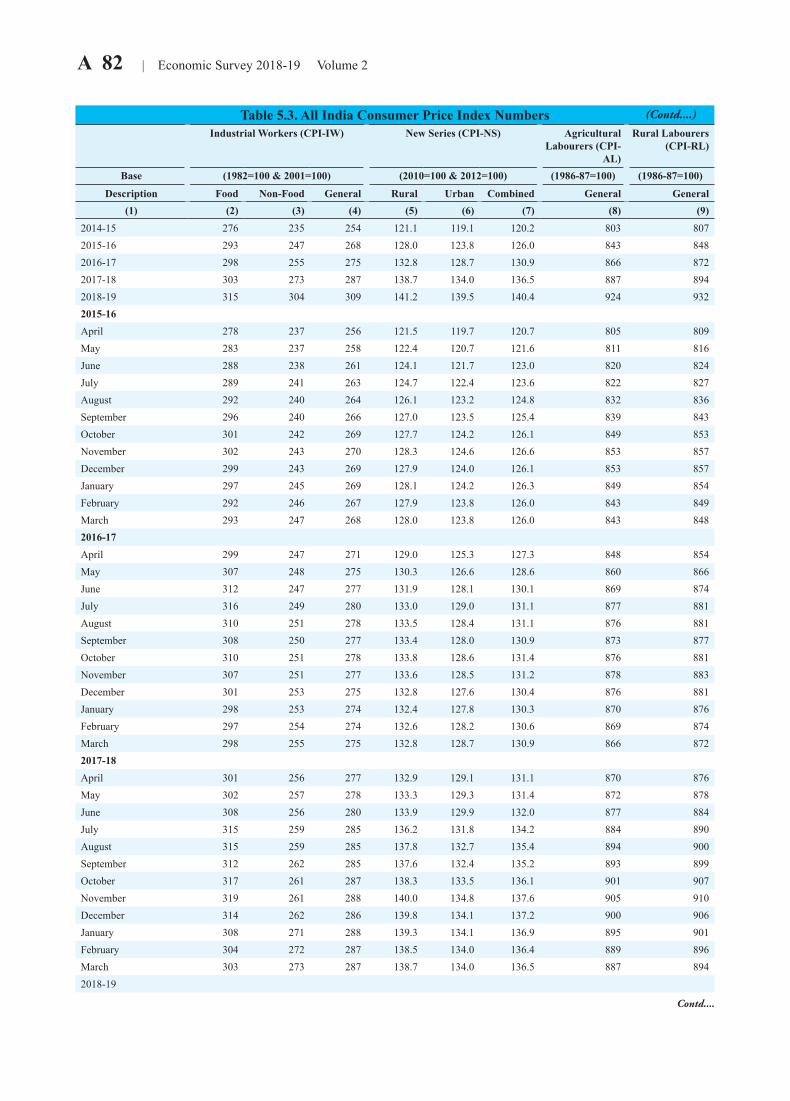
A 82 | Economic Survey 2018-19 Volume 2
Table 5.3. All India Consumer Price Index NumbersIndustrial Workers (CPI-IW) New Series (CPI-NS) Agricultural
Labourers (CPI-AL)
Rural Labourers (CPI-RL)
Base (1982=100 & 2001=100) (2010=100 & 2012=100) (1986-87=100) (1986-87=100)
Description Food Non-Food General Rural Urban Combined General General (1) (2) (3) (4) (5) (6) (7) (8) (9)
2014-15 276 235 254 121.1 119.1 120.2 803 8072015-16 293 247 268 128.0 123.8 126.0 843 8482016-17 298 255 275 132.8 128.7 130.9 866 8722017-18 303 273 287 138.7 134.0 136.5 887 8942018-19 315 304 309 141.2 139.5 140.4 924 9322015-16April 278 237 256 121.5 119.7 120.7 805 809May 283 237 258 122.4 120.7 121.6 811 816June 288 238 261 124.1 121.7 123.0 820 824July 289 241 263 124.7 122.4 123.6 822 827August 292 240 264 126.1 123.2 124.8 832 836September 296 240 266 127.0 123.5 125.4 839 843October 301 242 269 127.7 124.2 126.1 849 853November 302 243 270 128.3 124.6 126.6 853 857December 299 243 269 127.9 124.0 126.1 853 857January 297 245 269 128.1 124.2 126.3 849 854February 292 246 267 127.9 123.8 126.0 843 849March 293 247 268 128.0 123.8 126.0 843 8482016-17April 299 247 271 129.0 125.3 127.3 848 854May 307 248 275 130.3 126.6 128.6 860 866June 312 247 277 131.9 128.1 130.1 869 874July 316 249 280 133.0 129.0 131.1 877 881August 310 251 278 133.5 128.4 131.1 876 881September 308 250 277 133.4 128.0 130.9 873 877October 310 251 278 133.8 128.6 131.4 876 881November 307 251 277 133.6 128.5 131.2 878 883December 301 253 275 132.8 127.6 130.4 876 881January 298 253 274 132.4 127.8 130.3 870 876February 297 254 274 132.6 128.2 130.6 869 874March 298 255 275 132.8 128.7 130.9 866 8722017-18April 301 256 277 132.9 129.1 131.1 870 876May 302 257 278 133.3 129.3 131.4 872 878June 308 256 280 133.9 129.9 132.0 877 884July 315 259 285 136.2 131.8 134.2 884 890August 315 259 285 137.8 132.7 135.4 894 900September 312 262 285 137.6 132.4 135.2 893 899October 317 261 287 138.3 133.5 136.1 901 907November 319 261 288 140.0 134.8 137.6 905 910December 314 262 286 139.8 134.1 137.2 900 906January 308 271 288 139.3 134.1 136.9 895 901February 304 272 287 138.5 134.0 136.4 889 896March 303 273 287 138.7 134.0 136.5 887 8942018-19
(Contd....)
Contd....
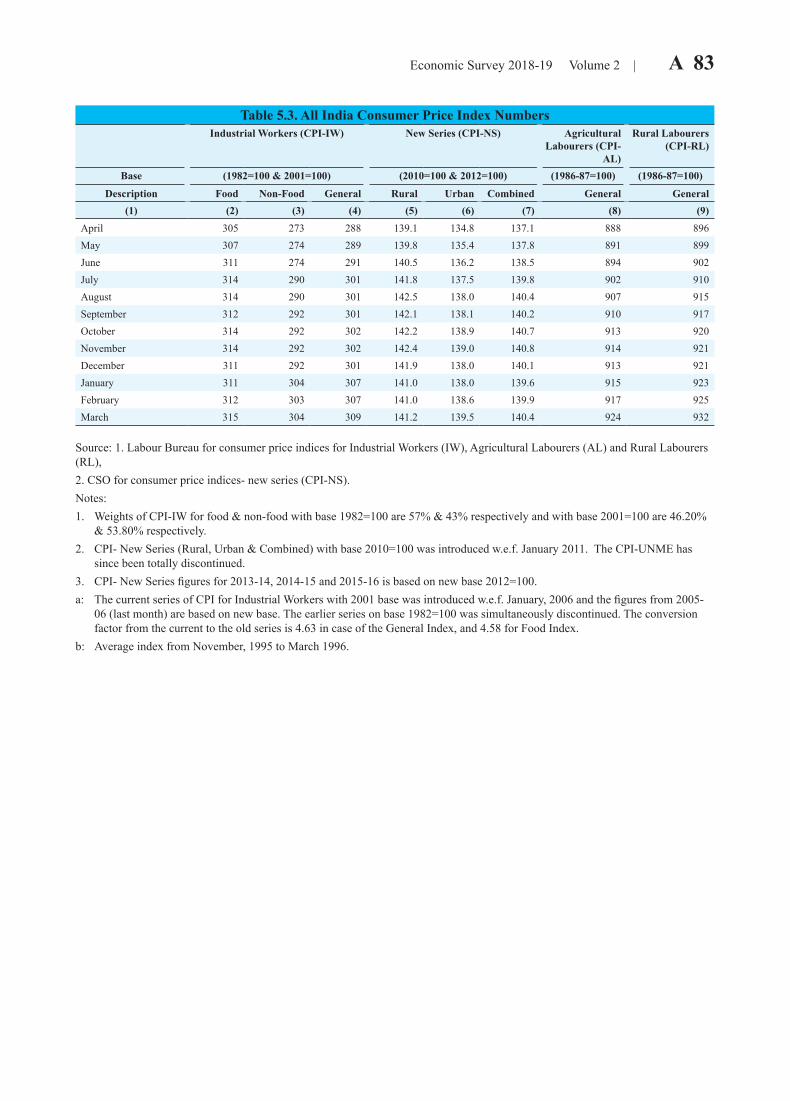
Economic Survey 2018-19 Volume 2 | A 83
Table 5.3. All India Consumer Price Index NumbersIndustrial Workers (CPI-IW) New Series (CPI-NS) Agricultural
Labourers (CPI-AL)
Rural Labourers (CPI-RL)
Base (1982=100 & 2001=100) (2010=100 & 2012=100) (1986-87=100) (1986-87=100)
Description Food Non-Food General Rural Urban Combined General General (1) (2) (3) (4) (5) (6) (7) (8) (9)
April 305 273 288 139.1 134.8 137.1 888 896May 307 274 289 139.8 135.4 137.8 891 899June 311 274 291 140.5 136.2 138.5 894 902July 314 290 301 141.8 137.5 139.8 902 910August 314 290 301 142.5 138.0 140.4 907 915September 312 292 301 142.1 138.1 140.2 910 917October 314 292 302 142.2 138.9 140.7 913 920November 314 292 302 142.4 139.0 140.8 914 921December 311 292 301 141.9 138.0 140.1 913 921January 311 304 307 141.0 138.0 139.6 915 923February 312 303 307 141.0 138.6 139.9 917 925March 315 304 309 141.2 139.5 140.4 924 932
Source: 1. Labour Bureau for consumer price indices for Industrial Workers (IW), Agricultural Labourers (AL) and Rural Labourers (RL), 2. CSO for consumer price indices- new series (CPI-NS).Notes: 1. Weights of CPI-IW for food & non-food with base 1982=100 are 57% & 43% respectively and with base 2001=100 are 46.20%
& 53.80% respectively.2. CPI- New Series (Rural, Urban & Combined) with base 2010=100 was introduced w.e.f. January 2011. The CPI-UNME has
since been totally discontinued. 3. CPI- New Series figures for 2013-14, 2014-15 and 2015-16 is based on new base 2012=100. a: The current series of CPI for Industrial Workers with 2001 base was introduced w.e.f. January, 2006 and the figures from 2005-
06 (last month) are based on new base. The earlier series on base 1982=100 was simultaneously discontinued. The conversion factor from the current to the old series is 4.63 in case of the General Index, and 4.58 for Food Index.
b: Average index from November, 1995 to March 1996.
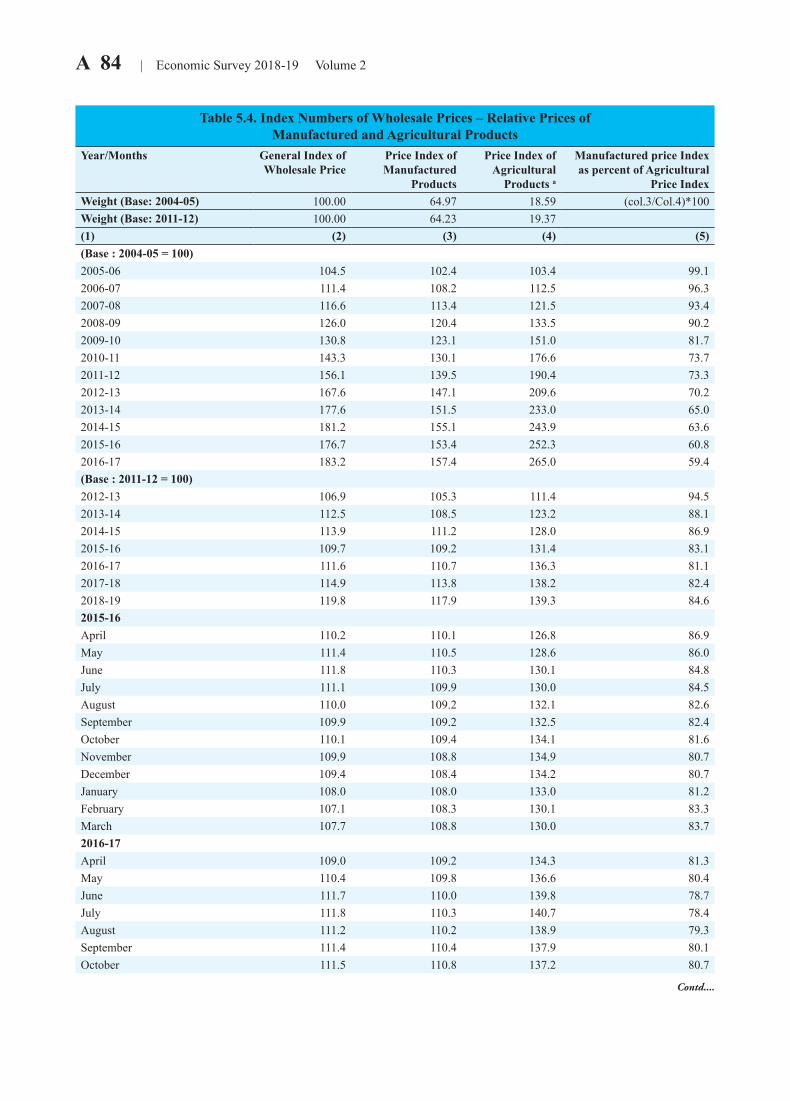
A 84 | Economic Survey 2018-19 Volume 2
Table 5.4. Index Numbers of Wholesale Prices – Relative Prices of Manufactured and Agricultural Products
Year/Months General Index of Wholesale Price
Price Index of Manufactured
Products
Price Index of Agricultural
Products a
Manufactured price Index as percent of Agricultural
Price IndexWeight (Base: 2004-05) 100.00 64.97 18.59 (col.3/Col.4)*100Weight (Base: 2011-12) 100.00 64.23 19.37(1) (2) (3) (4) (5)(Base : 2004-05 = 100)2005-06 104.5 102.4 103.4 99.12006-07 111.4 108.2 112.5 96.32007-08 116.6 113.4 121.5 93.42008-09 126.0 120.4 133.5 90.22009-10 130.8 123.1 151.0 81.72010-11 143.3 130.1 176.6 73.72011-12 156.1 139.5 190.4 73.32012-13 167.6 147.1 209.6 70.22013-14 177.6 151.5 233.0 65.02014-15 181.2 155.1 243.9 63.62015-16 176.7 153.4 252.3 60.82016-17 183.2 157.4 265.0 59.4(Base : 2011-12 = 100)2012-13 106.9 105.3 111.4 94.52013-14 112.5 108.5 123.2 88.12014-15 113.9 111.2 128.0 86.92015-16 109.7 109.2 131.4 83.12016-17 111.6 110.7 136.3 81.12017-18 114.9 113.8 138.2 82.42018-19 119.8 117.9 139.3 84.62015-16April 110.2 110.1 126.8 86.9May 111.4 110.5 128.6 86.0June 111.8 110.3 130.1 84.8July 111.1 109.9 130.0 84.5August 110.0 109.2 132.1 82.6September 109.9 109.2 132.5 82.4October 110.1 109.4 134.1 81.6November 109.9 108.8 134.9 80.7December 109.4 108.4 134.2 80.7January 108.0 108.0 133.0 81.2February 107.1 108.3 130.1 83.3March 107.7 108.8 130.0 83.72016-17April 109.0 109.2 134.3 81.3May 110.4 109.8 136.6 80.4June 111.7 110.0 139.8 78.7July 111.8 110.3 140.7 78.4August 111.2 110.2 138.9 79.3September 111.4 110.4 137.9 80.1October 111.5 110.8 137.2 80.7
Contd....
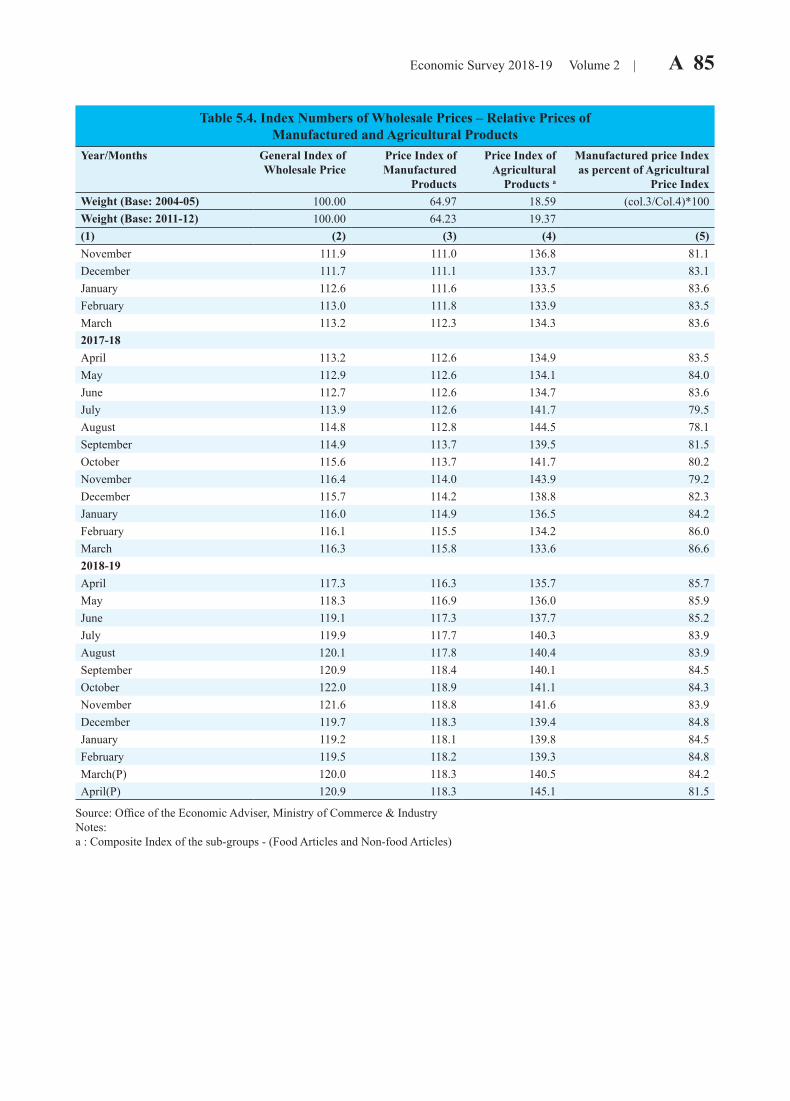
Economic Survey 2018-19 Volume 2 | A 85
Table 5.4. Index Numbers of Wholesale Prices – Relative Prices of Manufactured and Agricultural Products
Year/Months General Index of Wholesale Price
Price Index of Manufactured
Products
Price Index of Agricultural
Products a
Manufactured price Index as percent of Agricultural
Price IndexWeight (Base: 2004-05) 100.00 64.97 18.59 (col.3/Col.4)*100Weight (Base: 2011-12) 100.00 64.23 19.37(1) (2) (3) (4) (5)November 111.9 111.0 136.8 81.1December 111.7 111.1 133.7 83.1January 112.6 111.6 133.5 83.6February 113.0 111.8 133.9 83.5March 113.2 112.3 134.3 83.62017-18April 113.2 112.6 134.9 83.5May 112.9 112.6 134.1 84.0June 112.7 112.6 134.7 83.6July 113.9 112.6 141.7 79.5August 114.8 112.8 144.5 78.1September 114.9 113.7 139.5 81.5October 115.6 113.7 141.7 80.2November 116.4 114.0 143.9 79.2December 115.7 114.2 138.8 82.3January 116.0 114.9 136.5 84.2February 116.1 115.5 134.2 86.0March 116.3 115.8 133.6 86.62018-19April 117.3 116.3 135.7 85.7May 118.3 116.9 136.0 85.9June 119.1 117.3 137.7 85.2July 119.9 117.7 140.3 83.9August 120.1 117.8 140.4 83.9September 120.9 118.4 140.1 84.5October 122.0 118.9 141.1 84.3November 121.6 118.8 141.6 83.9December 119.7 118.3 139.4 84.8January 119.2 118.1 139.8 84.5February 119.5 118.2 139.3 84.8March(P) 120.0 118.3 140.5 84.2April(P) 120.9 118.3 145.1 81.5
Source: Office of the Economic Adviser, Ministry of Commerce & Industry Notes: a : Composite Index of the sub-groups - (Food Articles and Non-food Articles)
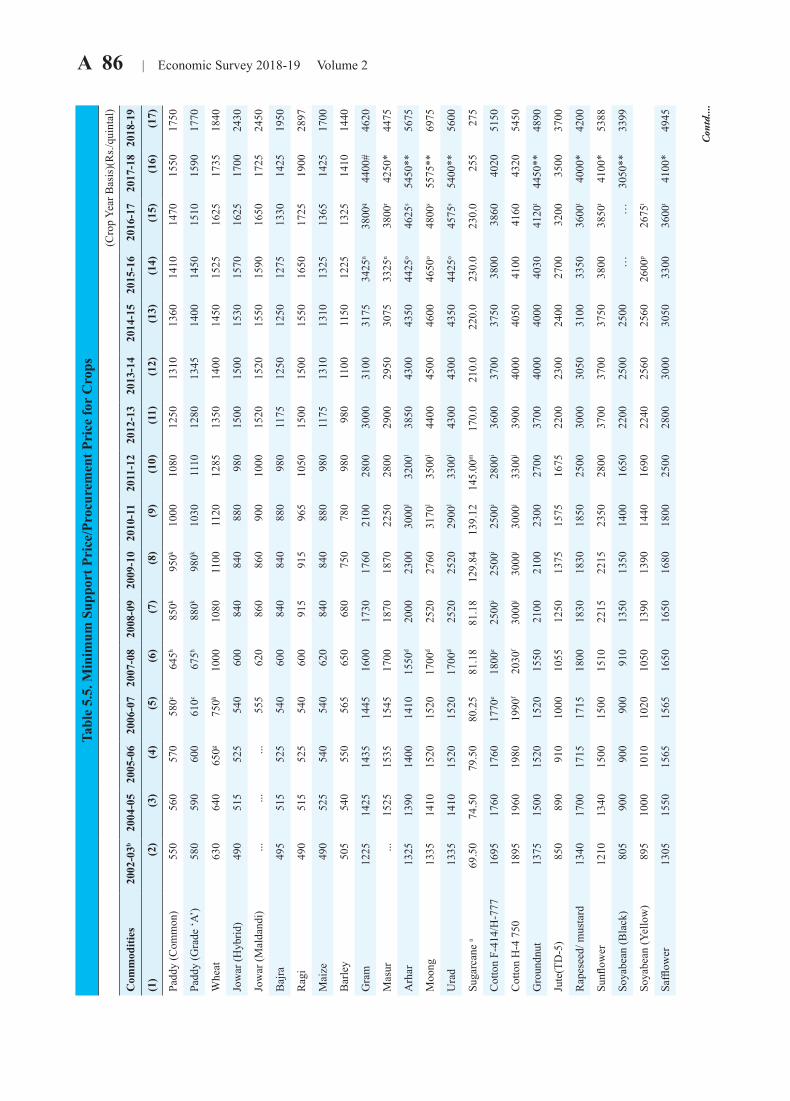
A 86 | Economic Survey 2018-19 Volume 2
Tabl
e 5.
5. M
inim
um S
uppo
rt P
rice
/Pro
cure
men
t Pri
ce fo
r C
rops
(Cro
p Ye
ar B
asis
)(R
s./qu
inta
l)
Com
mod
ities
2002
-03b
2004
-05
2005
-06
2006
-07
2007
-08
2008
-09
2009
-10
2010
-11
2011
-12
2012
-13
2013
-14
2014
-15
2015
-16
2016
-17
2017
-18
2018
-19
(1)
(2)
(3)
(4)
(5)
(6)
(7)
(8)
(9)
(10)
(11)
(12)
(13)
(14)
(15)
(16)
(17)
Padd
y (C
omm
on)
550
560
570
580c
645h
850k
950k
1000
1080
1250
1310
1360
1410
1470
1550
1750
Padd
y (G
rade
‘A’)
58
059
060
061
0c67
5h88
0k98
0k10
3011
1012
8013
4514
0014
5015
1015
9017
70
Whe
at
630
640
650g
750h
1000
1080
1100
1120
1285
1350
1400
1450
1525
1625
1735
1840
Jow
ar (H
ybrid
)49
051
552
554
060
084
084
088
098
015
0015
0015
3015
7016
2517
0024
30
Jow
ar (M
alda
ndi)
......
...55
562
086
086
090
010
0015
2015
2015
5015
9016
5017
2524
50
Baj
ra49
551
552
554
060
084
084
088
098
011
7512
5012
5012
7513
3014
2519
50
Rag
i49
051
552
554
060
091
591
596
510
5015
0015
0015
5016
5017
2519
0028
97
Mai
ze
490
525
540
540
620
840
840
880
980
1175
1310
1310
1325
1365
1425
1700
Bar
ley
505
540
550
565
650
680
750
780
980
980
1100
1150
1225
1325
1410
1440
Gra
m
1225
1425
1435
1445
1600
1730
1760
2100
2800
3000
3100
3175
3425
n38
00q
4400
#46
20
Mas
ur...
1525
1535
1545
1700
1870
1870
2250
2800
2900
2950
3075
3325
n38
00r
4250
*44
75
Arh
ar
1325
1390
1400
1410
1550
d20
0023
0030
00l
3200
l38
5043
0043
5044
25o
4625
s54
50**
5675
Moo
ng
1335
1410
1520
1520
1700
d25
2027
6031
70l
3500
l44
0045
0046
0046
50o
4800
s55
75**
6975
Ura
d 13
3514
1015
2015
2017
00d
2520
2520
2900
l33
00l
4300
4300
4350
4425
o45
75s
5400
**56
00
Suga
rcan
e a
69.5
074
.50
79.5
080
.25
81.1
881
.18
129.
8413
9.12
145.
00m
170.
021
0.0
220.
023
0.0
230.
025
527
5
Cot
ton
F-41
4/H
-777
16
9517
6017
6017
70e
1800
e25
00i
2500
i25
00i
2800
i36
0037
0037
5038
0038
6040
2051
50
Cot
ton
H-4
750
18
9519
6019
8019
90f
2030
f30
00j
3000
j30
00j
3300
j39
0040
0040
5041
0041
6043
2054
50
Gro
undn
ut
1375
1500
1520
1520
1550
2100
2100
2300
2700
3700
4000
4000
4030
4120
t44
50**
4890
Jute
(TD
-5)
850
890
910
1000
1055
1250
1375
1575
1675
2200
2300
2400
2700
3200
3500
3700
Rap
esee
d/ m
usta
rd
1340
1700
1715
1715
1800
1830
1830
1850
2500
3000
3050
3100
3350
3600
t40
00*
4200
Sunfl
ower
12
1013
4015
0015
0015
1022
1522
1523
5028
0037
0037
0037
5038
0038
50t
4100
*53
88
Soya
bean
(Bla
ck)
805
900
900
900
910
1350
1350
1400
1650
2200
2500
2500
……
3050
**33
99
Soya
bean
(Yel
low
) 89
510
0010
1010
2010
5013
9013
9014
4016
9022
4025
6025
6026
00p
2675
t
Saffl
ower
13
0515
5015
6515
6516
5016
5016
8018
0025
0028
0030
0030
5033
0036
00t
4100
*49
45
Con
td....
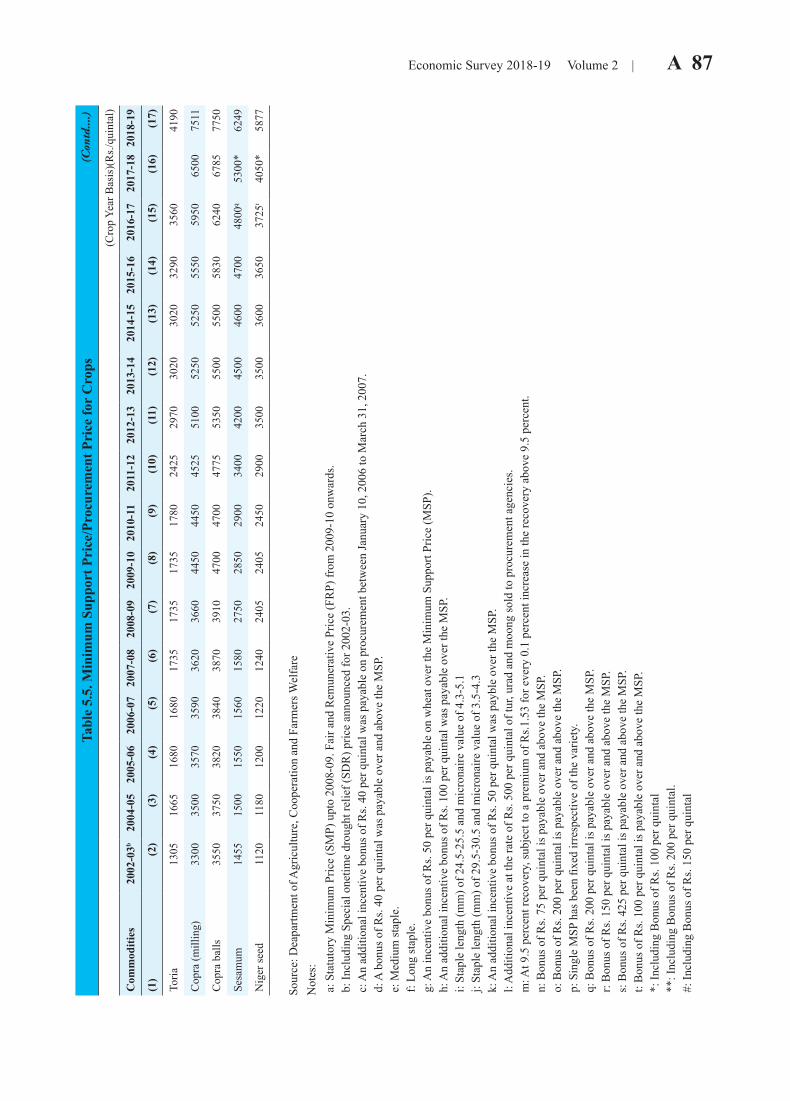
Economic Survey 2018-19 Volume 2 | A 87 Ta
ble
5.5.
Min
imum
Sup
port
Pri
ce/P
rocu
rem
ent P
rice
for
Cro
ps(C
rop
Year
Bas
is)(
Rs./
quin
tal)
Com
mod
ities
2002
-03b
2004
-05
2005
-06
2006
-07
2007
-08
2008
-09
2009
-10
2010
-11
2011
-12
2012
-13
2013
-14
2014
-15
2015
-16
2016
-17
2017
-18
2018
-19
(1)
(2)
(3)
(4)
(5)
(6)
(7)
(8)
(9)
(10)
(11)
(12)
(13)
(14)
(15)
(16)
(17)
Toria
13
0516
6516
8016
8017
3517
3517
3517
8024
2529
7030
2030
2032
9035
6041
90
Cop
ra (m
illin
g)
3300
3500
3570
3590
3620
3660
4450
4450
4525
5100
5250
5250
5550
5950
6500
7511
Cop
ra b
alls
35
5037
5038
2038
4038
7039
1047
0047
0047
7553
5055
0055
0058
3062
4067
8577
50
Sesa
mum
14
5515
0015
5015
6015
8027
5028
5029
0034
0042
0045
0046
0047
0048
00q
5300
*62
49
Nig
er se
ed
1120
1180
1200
1220
1240
2405
2405
2450
2900
3500
3500
3600
3650
3725
t40
50*
5877
Sour
ce: D
eapa
rtmen
t of A
gric
ultu
re, C
oope
ratio
n an
d Fa
rmer
s Wel
fare
N
otes
:
a
: Sta
tuto
ry M
inim
um P
rice
(SM
P) u
pto
2008
-09.
Fai
r and
Rem
uner
ativ
e Pr
ice
(FR
P) fr
om 2
009-
10 o
nwar
ds.
b: I
nclu
ding
Spe
cial
one
time
drou
ght r
elie
f (SD
R) p
rice
anno
unce
d fo
r 200
2-03
.
c: A
n ad
ditio
nal i
ncen
tive
bonu
s of R
s. 40
per
qui
ntal
was
pay
able
on
proc
urem
ent b
etw
een
Janu
ary
10, 2
006
to M
arch
31,
200
7.
d
: A b
onus
of R
s. 40
per
qui
ntal
was
pay
able
ove
r and
abo
ve th
e M
SP.
e: M
ediu
m st
aple
.
f: L
ong
stap
le.
g
: An
ince
ntiv
e bo
nus o
f Rs.
50 p
er q
uint
al is
pay
able
on
whe
at o
ver t
he M
inim
um S
uppo
rt Pr
ice
(MSP
).
h
: An
addi
tiona
l inc
entiv
e bo
nus o
f Rs.
100
per q
uint
al w
as p
ayab
le o
ver t
he M
SP.
i:
Sta
ple
leng
th (m
m) o
f 24.
5-25
.5 a
nd m
icro
naire
val
ue o
f 4.3
-5.1
j:
Sta
ple
leng
th (m
m) o
f 29.
5-30
.5 a
nd m
icro
naire
val
ue o
f 3.5
-4.3
k: A
n ad
ditio
nal i
ncen
tive
bonu
s of R
s. 50
per
qui
ntal
was
pay
ble
over
the
MSP
.
l: A
dditi
onal
ince
ntiv
e at
the
rate
of R
s. 50
0 pe
r qui
ntal
of t
ur, u
rad
and
moo
ng so
ld to
pro
cure
men
t age
ncie
s.
m: A
t 9.5
per
cent
reco
very
, sub
ject
to a
pre
miu
m o
f Rs.1
.53
for e
very
0.1
per
cent
incr
ease
in th
e re
cove
ry a
bove
9.5
per
cent
.
n: B
onus
of R
s. 75
per
qui
ntal
is p
ayab
le o
ver a
nd a
bove
the
MSP
.
o: B
onus
of R
s. 20
0 pe
r qui
ntal
is p
ayab
le o
ver a
nd a
bove
the
MSP
.
p: S
ingl
e M
SP h
as b
een
fixed
irre
spec
tive
of th
e va
riety
.
q: B
onus
of R
s. 20
0 pe
r qui
ntal
is p
ayab
le o
ver a
nd a
bove
the
MSP
.
r: B
onus
of R
s. 15
0 pe
r qui
ntal
is p
ayab
le o
ver a
nd a
bove
the
MSP
.
s:
Bon
us o
f Rs.
425
per q
uint
al is
pay
able
ove
r and
abo
ve th
e M
SP.
t:
Bon
us o
f Rs.
100
per q
uint
al is
pay
able
ove
r and
abo
ve th
e M
SP.
*
: Inc
ludi
ng B
onus
of R
s. 10
0 pe
r qui
ntal
**:
Incl
udin
g B
onus
of R
s. 20
0 pe
r qui
ntal
. #
: Inc
ludi
ng B
onus
of R
s. 15
0 pe
r qui
ntal
(Con
td....)
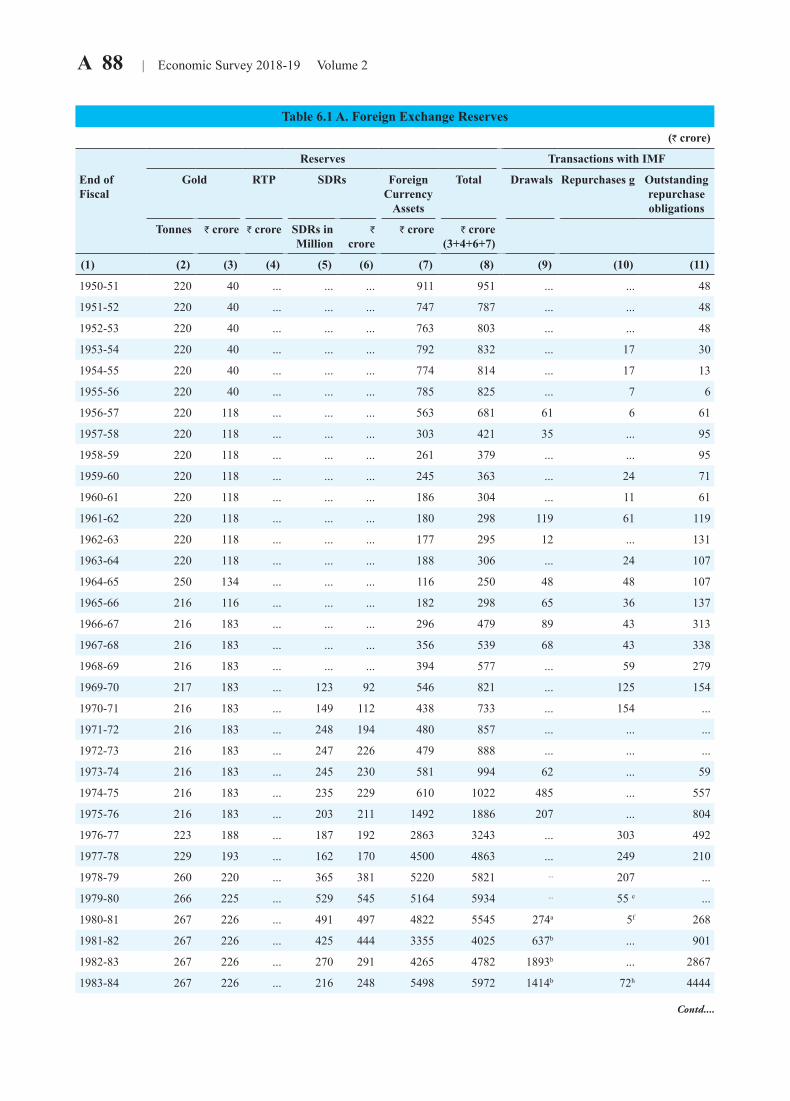
A 88 | Economic Survey 2018-19 Volume 2
Table 6.1 A. Foreign Exchange Reserves(` crore)
Reserves Transactions with IMF
End of Fiscal
Gold RTP SDRs Foreign Currency
Assets
Total Drawals Repurchases g Outstanding repurchase obligations
Tonnes ` crore ` crore SDRs in Million
` crore
` crore ` crore (3+4+6+7)
(1) (2) (3) (4) (5) (6) (7) (8) (9) (10) (11)
1950-51 220 40 ... ... ... 911 951 ... ... 48
1951-52 220 40 ... ... ... 747 787 ... ... 48
1952-53 220 40 ... ... ... 763 803 ... ... 48
1953-54 220 40 ... ... ... 792 832 ... 17 30
1954-55 220 40 ... ... ... 774 814 ... 17 13
1955-56 220 40 ... ... ... 785 825 ... 7 6
1956-57 220 118 ... ... ... 563 681 61 6 61
1957-58 220 118 ... ... ... 303 421 35 ... 95
1958-59 220 118 ... ... ... 261 379 ... ... 95
1959-60 220 118 ... ... ... 245 363 ... 24 71
1960-61 220 118 ... ... ... 186 304 ... 11 61
1961-62 220 118 ... ... ... 180 298 119 61 119
1962-63 220 118 ... ... ... 177 295 12 ... 131
1963-64 220 118 ... ... ... 188 306 ... 24 107
1964-65 250 134 ... ... ... 116 250 48 48 107
1965-66 216 116 ... ... ... 182 298 65 36 137
1966-67 216 183 ... ... ... 296 479 89 43 313
1967-68 216 183 ... ... ... 356 539 68 43 338
1968-69 216 183 ... ... ... 394 577 ... 59 279
1969-70 217 183 ... 123 92 546 821 ... 125 154
1970-71 216 183 ... 149 112 438 733 ... 154 ...
1971-72 216 183 ... 248 194 480 857 ... ... ...
1972-73 216 183 ... 247 226 479 888 ... ... ...
1973-74 216 183 ... 245 230 581 994 62 ... 59
1974-75 216 183 ... 235 229 610 1022 485 ... 557
1975-76 216 183 ... 203 211 1492 1886 207 ... 804
1976-77 223 188 ... 187 192 2863 3243 ... 303 492
1977-78 229 193 ... 162 170 4500 4863 ... 249 210
1978-79 260 220 ... 365 381 5220 5821 ... 207 ...
1979-80 266 225 ... 529 545 5164 5934 ... 55 e ...
1980-81 267 226 ... 491 497 4822 5545 274a 5f 268
1981-82 267 226 ... 425 444 3355 4025 637b ... 901
1982-83 267 226 ... 270 291 4265 4782 1893b ... 2867
1983-84 267 226 ... 216 248 5498 5972 1414b 72h 4444
Contd....
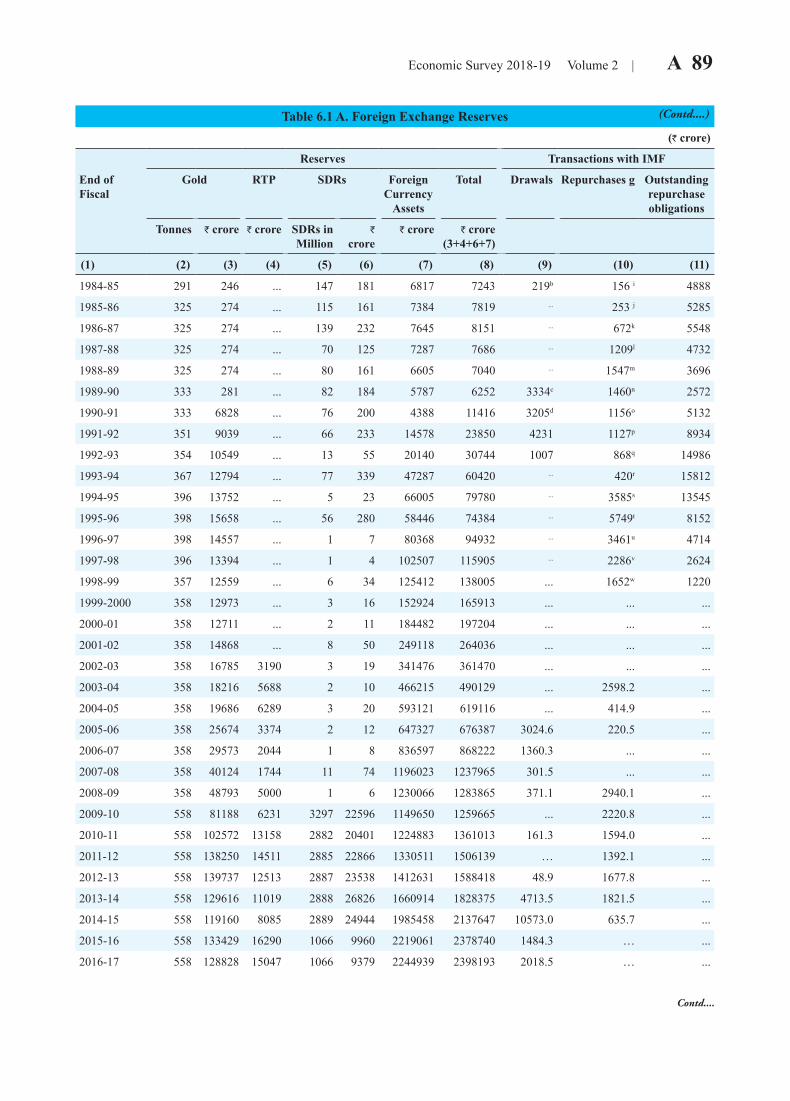
Economic Survey 2018-19 Volume 2 | A 89
Table 6.1 A. Foreign Exchange Reserves(` crore)
Reserves Transactions with IMF
End of Fiscal
Gold RTP SDRs Foreign Currency
Assets
Total Drawals Repurchases g Outstanding repurchase obligations
Tonnes ` crore ` crore SDRs in Million
` crore
` crore ` crore (3+4+6+7)
(1) (2) (3) (4) (5) (6) (7) (8) (9) (10) (11)
1984-85 291 246 ... 147 181 6817 7243 219b 156 i 4888
1985-86 325 274 ... 115 161 7384 7819 ... 253 j 5285
1986-87 325 274 ... 139 232 7645 8151 ... 672k 5548
1987-88 325 274 ... 70 125 7287 7686 ... 1209l 4732
1988-89 325 274 ... 80 161 6605 7040 ... 1547m 3696
1989-90 333 281 ... 82 184 5787 6252 3334c 1460n 2572
1990-91 333 6828 ... 76 200 4388 11416 3205d 1156o 5132
1991-92 351 9039 ... 66 233 14578 23850 4231 1127p 8934
1992-93 354 10549 ... 13 55 20140 30744 1007 868q 14986
1993-94 367 12794 ... 77 339 47287 60420 ... 420r 15812
1994-95 396 13752 ... 5 23 66005 79780 ... 3585s 13545
1995-96 398 15658 ... 56 280 58446 74384 ... 5749t 8152
1996-97 398 14557 ... 1 7 80368 94932 ... 3461u 4714
1997-98 396 13394 ... 1 4 102507 115905 ... 2286v 2624
1998-99 357 12559 ... 6 34 125412 138005 ... 1652w 1220
1999-2000 358 12973 ... 3 16 152924 165913 ... ... ...
2000-01 358 12711 ... 2 11 184482 197204 ... ... ...
2001-02 358 14868 ... 8 50 249118 264036 ... ... ...
2002-03 358 16785 3190 3 19 341476 361470 ... ... ...
2003-04 358 18216 5688 2 10 466215 490129 ... 2598.2 ...
2004-05 358 19686 6289 3 20 593121 619116 ... 414.9 ...
2005-06 358 25674 3374 2 12 647327 676387 3024.6 220.5 ...
2006-07 358 29573 2044 1 8 836597 868222 1360.3 ... ...
2007-08 358 40124 1744 11 74 1196023 1237965 301.5 ... ...
2008-09 358 48793 5000 1 6 1230066 1283865 371.1 2940.1 ...
2009-10 558 81188 6231 3297 22596 1149650 1259665 ... 2220.8 ...
2010-11 558 102572 13158 2882 20401 1224883 1361013 161.3 1594.0 ...
2011-12 558 138250 14511 2885 22866 1330511 1506139 … 1392.1 ...
2012-13 558 139737 12513 2887 23538 1412631 1588418 48.9 1677.8 ...
2013-14 558 129616 11019 2888 26826 1660914 1828375 4713.5 1821.5 ...
2014-15 558 119160 8085 2889 24944 1985458 2137647 10573.0 635.7 ...
2015-16 558 133429 16290 1066 9960 2219061 2378740 1484.3 … ...
2016-17 558 128828 15047 1066 9379 2244939 2398193 2018.5 … ...
(Contd....)
Contd....
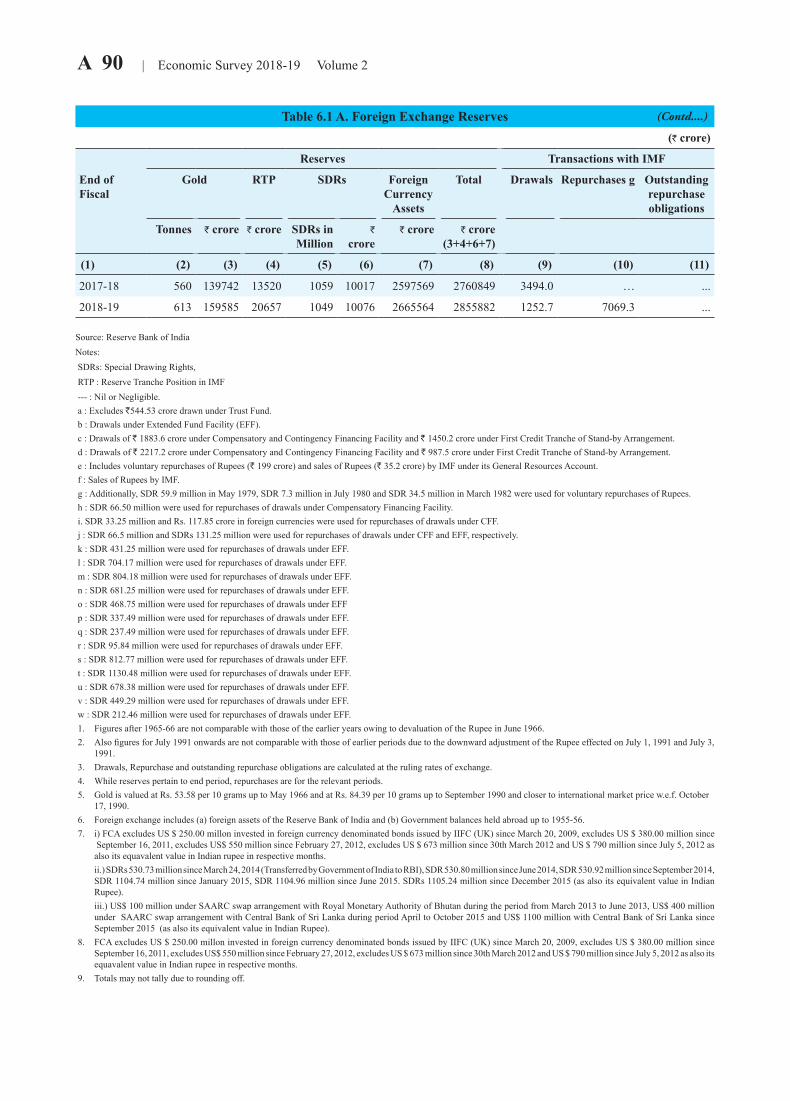
A 90 | Economic Survey 2018-19 Volume 2
Table 6.1 A. Foreign Exchange Reserves(` crore)
Reserves Transactions with IMF
End of Fiscal
Gold RTP SDRs Foreign Currency
Assets
Total Drawals Repurchases g Outstanding repurchase obligations
Tonnes ` crore ` crore SDRs in Million
` crore
` crore ` crore (3+4+6+7)
(1) (2) (3) (4) (5) (6) (7) (8) (9) (10) (11)
2017-18 560 139742 13520 1059 10017 2597569 2760849 3494.0 … ...
2018-19 613 159585 20657 1049 10076 2665564 2855882 1252.7 7069.3 ...
Source: Reserve Bank of IndiaNotes: SDRs: Special Drawing Rights, RTP : Reserve Tranche Position in IMF --- : Nil or Negligible. a : Excludes $544.53 crore drawn under Trust Fund. b : Drawals under Extended Fund Facility (EFF). c : Drawals of $ 1883.6 crore under Compensatory and Contingency Financing Facility and $ 1450.2 crore under First Credit Tranche of Stand-by Arrangement. d : Drawals of $ 2217.2 crore under Compensatory and Contingency Financing Facility and $ 987.5 crore under First Credit Tranche of Stand-by Arrangement. e : Includes voluntary repurchases of Rupees ($ 199 crore) and sales of Rupees ($ 35.2 crore) by IMF under its General Resources Account. f : Sales of Rupees by IMF. g : Additionally, SDR 59.9 million in May 1979, SDR 7.3 million in July 1980 and SDR 34.5 million in March 1982 were used for voluntary repurchases of Rupees. h : SDR 66.50 million were used for repurchases of drawals under Compensatory Financing Facility. i. SDR 33.25 million and Rs. 117.85 crore in foreign currencies were used for repurchases of drawals under CFF. j : SDR 66.5 million and SDRs 131.25 million were used for repurchases of drawals under CFF and EFF, respectively. k : SDR 431.25 million were used for repurchases of drawals under EFF. l : SDR 704.17 million were used for repurchases of drawals under EFF. m : SDR 804.18 million were used for repurchases of drawals under EFF. n : SDR 681.25 million were used for repurchases of drawals under EFF. o : SDR 468.75 million were used for repurchases of drawals under EFF p : SDR 337.49 million were used for repurchases of drawals under EFF. q : SDR 237.49 million were used for repurchases of drawals under EFF. r : SDR 95.84 million were used for repurchases of drawals under EFF. s : SDR 812.77 million were used for repurchases of drawals under EFF. t : SDR 1130.48 million were used for repurchases of drawals under EFF. u : SDR 678.38 million were used for repurchases of drawals under EFF. v : SDR 449.29 million were used for repurchases of drawals under EFF. w : SDR 212.46 million were used for repurchases of drawals under EFF. 1. Figures after 1965-66 are not comparable with those of the earlier years owing to devaluation of the Rupee in June 1966. 2. Also figures for July 1991 onwards are not comparable with those of earlier periods due to the downward adjustment of the Rupee effected on July 1, 1991 and July 3,
1991. 3. Drawals, Repurchase and outstanding repurchase obligations are calculated at the ruling rates of exchange. 4. While reserves pertain to end period, repurchases are for the relevant periods. 5. Gold is valued at Rs. 53.58 per 10 grams up to May 1966 and at Rs. 84.39 per 10 grams up to September 1990 and closer to international market price w.e.f. October
17, 1990. 6. Foreign exchange includes (a) foreign assets of the Reserve Bank of India and (b) Government balances held abroad up to 1955-56. 7. i) FCA excludes US $ 250.00 millon invested in foreign currency denominated bonds issued by IIFC (UK) since March 20, 2009, excludes US $ 380.00 million since
September 16, 2011, excludes US$ 550 million since February 27, 2012, excludes US $ 673 million since 30th March 2012 and US $ 790 million since July 5, 2012 as also its equavalent value in Indian rupee in respective months.
ii.) SDRs 530.73 million since March 24, 2014 (Transferred by Government of India to RBI), SDR 530.80 million since June 2014, SDR 530.92 million since September 2014, SDR 1104.74 million since January 2015, SDR 1104.96 million since June 2015. SDRs 1105.24 million since December 2015 (as also its equivalent value in Indian Rupee).
iii.) US$ 100 million under SAARC swap arrangement with Royal Monetary Authority of Bhutan during the period from March 2013 to June 2013, US$ 400 million under SAARC swap arrangement with Central Bank of Sri Lanka during period April to October 2015 and US$ 1100 million with Central Bank of Sri Lanka since September 2015 (as also its equivalent value in Indian Rupee).
8. FCA excludes US $ 250.00 millon invested in foreign currency denominated bonds issued by IIFC (UK) since March 20, 2009, excludes US $ 380.00 million since September 16, 2011, excludes US$ 550 million since February 27, 2012, excludes US $ 673 million since 30th March 2012 and US $ 790 million since July 5, 2012 as also its equavalent value in Indian rupee in respective months.
9. Totals may not tally due to rounding off.
(Contd....)
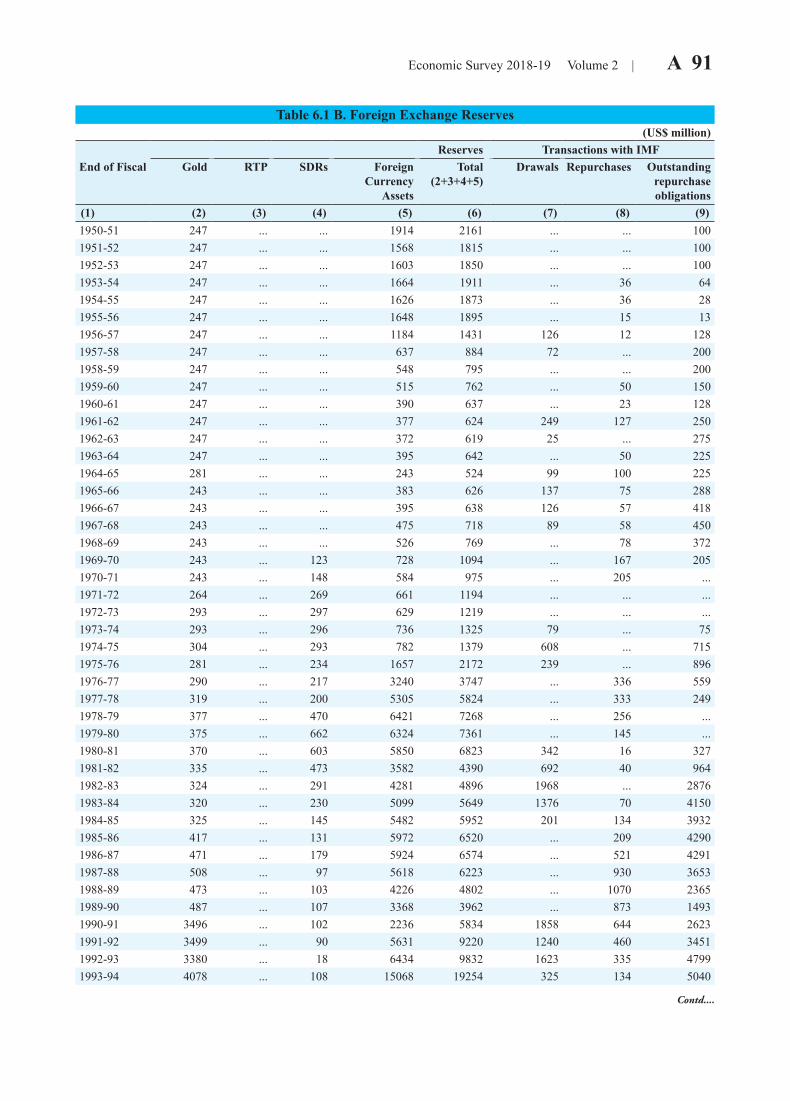
Economic Survey 2018-19 Volume 2 | A 91
Table 6.1 B. Foreign Exchange Reserves(US$ million)
Reserves Transactions with IMFEnd of Fiscal Gold RTP SDRs Foreign
Currency Assets
Total (2+3+4+5)
Drawals Repurchases Outstanding repurchase obligations
(1) (2) (3) (4) (5) (6) (7) (8) (9)1950-51 247 ... ... 1914 2161 ... ... 1001951-52 247 ... ... 1568 1815 ... ... 1001952-53 247 ... ... 1603 1850 ... ... 1001953-54 247 ... ... 1664 1911 ... 36 641954-55 247 ... ... 1626 1873 ... 36 281955-56 247 ... ... 1648 1895 ... 15 131956-57 247 ... ... 1184 1431 126 12 1281957-58 247 ... ... 637 884 72 ... 2001958-59 247 ... ... 548 795 ... ... 2001959-60 247 ... ... 515 762 ... 50 1501960-61 247 ... ... 390 637 ... 23 1281961-62 247 ... ... 377 624 249 127 2501962-63 247 ... ... 372 619 25 ... 2751963-64 247 ... ... 395 642 ... 50 2251964-65 281 ... ... 243 524 99 100 2251965-66 243 ... ... 383 626 137 75 2881966-67 243 ... ... 395 638 126 57 4181967-68 243 ... ... 475 718 89 58 4501968-69 243 ... ... 526 769 ... 78 3721969-70 243 ... 123 728 1094 ... 167 2051970-71 243 ... 148 584 975 ... 205 ...1971-72 264 ... 269 661 1194 ... ... ...1972-73 293 ... 297 629 1219 ... ... ...1973-74 293 ... 296 736 1325 79 ... 751974-75 304 ... 293 782 1379 608 ... 7151975-76 281 ... 234 1657 2172 239 ... 8961976-77 290 ... 217 3240 3747 ... 336 5591977-78 319 ... 200 5305 5824 ... 333 2491978-79 377 ... 470 6421 7268 ... 256 ...1979-80 375 ... 662 6324 7361 ... 145 ...1980-81 370 ... 603 5850 6823 342 16 3271981-82 335 ... 473 3582 4390 692 40 9641982-83 324 ... 291 4281 4896 1968 ... 28761983-84 320 ... 230 5099 5649 1376 70 41501984-85 325 ... 145 5482 5952 201 134 39321985-86 417 ... 131 5972 6520 ... 209 42901986-87 471 ... 179 5924 6574 ... 521 42911987-88 508 ... 97 5618 6223 ... 930 36531988-89 473 ... 103 4226 4802 ... 1070 23651989-90 487 ... 107 3368 3962 ... 873 14931990-91 3496 ... 102 2236 5834 1858 644 26231991-92 3499 ... 90 5631 9220 1240 460 34511992-93 3380 ... 18 6434 9832 1623 335 47991993-94 4078 ... 108 15068 19254 325 134 5040
Contd....
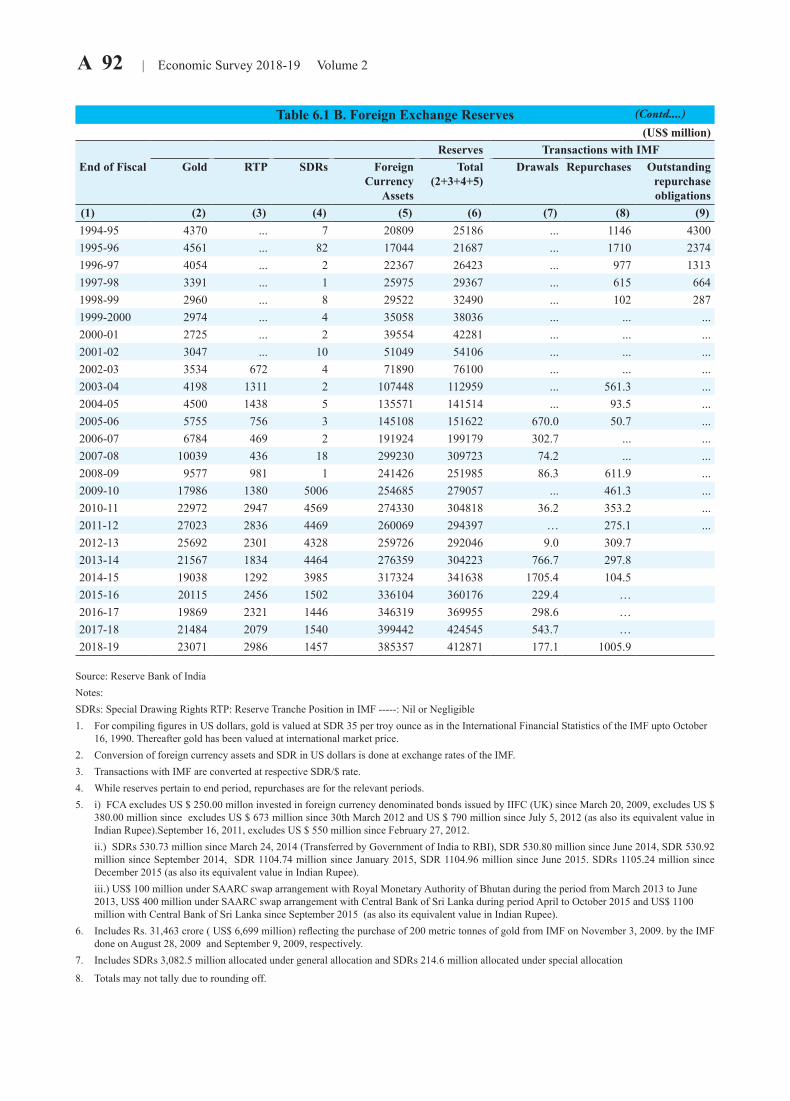
A 92 | Economic Survey 2018-19 Volume 2
Table 6.1 B. Foreign Exchange Reserves(US$ million)
Reserves Transactions with IMFEnd of Fiscal Gold RTP SDRs Foreign
Currency Assets
Total (2+3+4+5)
Drawals Repurchases Outstanding repurchase obligations
(1) (2) (3) (4) (5) (6) (7) (8) (9)1994-95 4370 ... 7 20809 25186 ... 1146 43001995-96 4561 ... 82 17044 21687 ... 1710 23741996-97 4054 ... 2 22367 26423 ... 977 13131997-98 3391 ... 1 25975 29367 ... 615 6641998-99 2960 ... 8 29522 32490 ... 102 2871999-2000 2974 ... 4 35058 38036 ... ... ...2000-01 2725 ... 2 39554 42281 ... ... ...2001-02 3047 ... 10 51049 54106 ... ... ...2002-03 3534 672 4 71890 76100 ... ... ...2003-04 4198 1311 2 107448 112959 ... 561.3 ...2004-05 4500 1438 5 135571 141514 ... 93.5 ...2005-06 5755 756 3 145108 151622 670.0 50.7 ...2006-07 6784 469 2 191924 199179 302.7 ... ...2007-08 10039 436 18 299230 309723 74.2 ... ...2008-09 9577 981 1 241426 251985 86.3 611.9 ...2009-10 17986 1380 5006 254685 279057 ... 461.3 ...2010-11 22972 2947 4569 274330 304818 36.2 353.2 ...2011-12 27023 2836 4469 260069 294397 … 275.1 ...2012-13 25692 2301 4328 259726 292046 9.0 309.72013-14 21567 1834 4464 276359 304223 766.7 297.82014-15 19038 1292 3985 317324 341638 1705.4 104.52015-16 20115 2456 1502 336104 360176 229.4 …2016-17 19869 2321 1446 346319 369955 298.6 …2017-18 21484 2079 1540 399442 424545 543.7 …2018-19 23071 2986 1457 385357 412871 177.1 1005.9
Source: Reserve Bank of IndiaNotes:SDRs: Special Drawing Rights RTP: Reserve Tranche Position in IMF -----: Nil or Negligible 1. For compiling figures in US dollars, gold is valued at SDR 35 per troy ounce as in the International Financial Statistics of the IMF upto October
16, 1990. Thereafter gold has been valued at international market price. 2. Conversion of foreign currency assets and SDR in US dollars is done at exchange rates of the IMF. 3. Transactions with IMF are converted at respective SDR/$ rate. 4. While reserves pertain to end period, repurchases are for the relevant periods. 5. i) FCA excludes US $ 250.00 millon invested in foreign currency denominated bonds issued by IIFC (UK) since March 20, 2009, excludes US $
380.00 million since excludes US $ 673 million since 30th March 2012 and US $ 790 million since July 5, 2012 (as also its equivalent value in Indian Rupee).September 16, 2011, excludes US $ 550 million since February 27, 2012.
ii.) SDRs 530.73 million since March 24, 2014 (Transferred by Government of India to RBI), SDR 530.80 million since June 2014, SDR 530.92 million since September 2014, SDR 1104.74 million since January 2015, SDR 1104.96 million since June 2015. SDRs 1105.24 million since December 2015 (as also its equivalent value in Indian Rupee).
iii.) US$ 100 million under SAARC swap arrangement with Royal Monetary Authority of Bhutan during the period from March 2013 to June 2013, US$ 400 million under SAARC swap arrangement with Central Bank of Sri Lanka during period April to October 2015 and US$ 1100 million with Central Bank of Sri Lanka since September 2015 (as also its equivalent value in Indian Rupee).
6. Includes Rs. 31,463 crore ( US$ 6,699 million) reflecting the purchase of 200 metric tonnes of gold from IMF on November 3, 2009. by the IMF done on August 28, 2009 and September 9, 2009, respectively.
7. Includes SDRs 3,082.5 million allocated under general allocation and SDRs 214.6 million allocated under special allocation
8. Totals may not tally due to rounding off.
(Contd....)
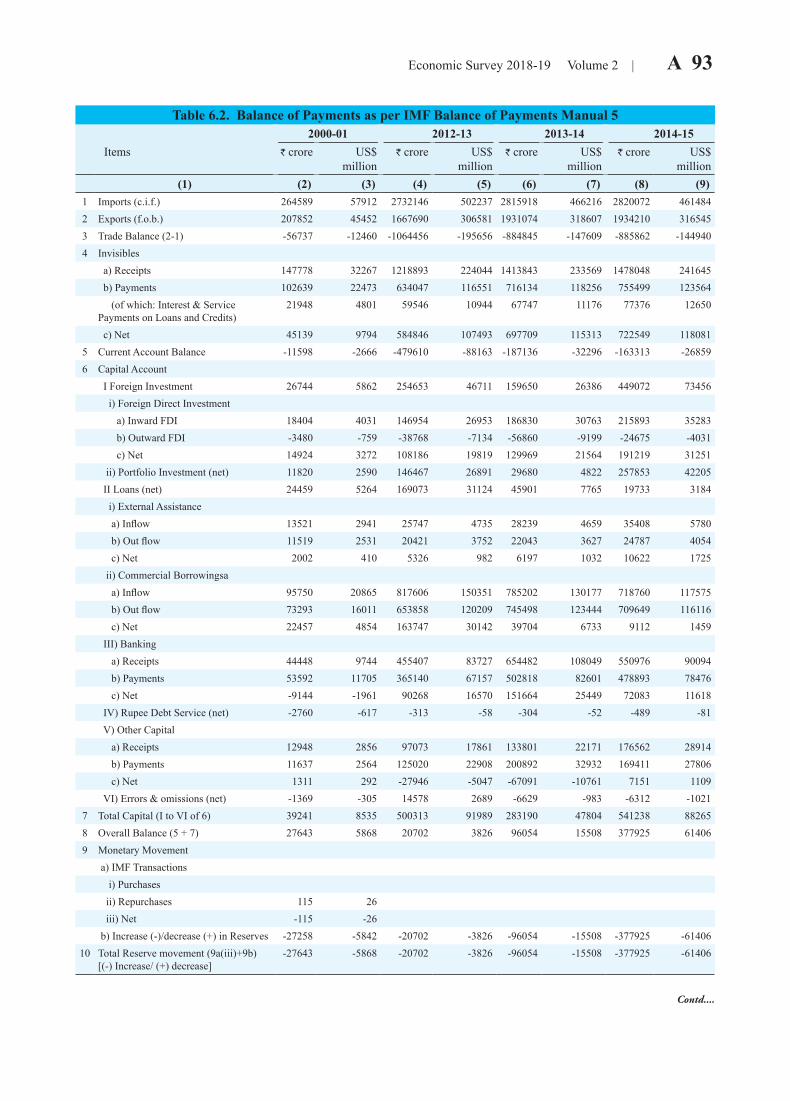
Economic Survey 2018-19 Volume 2 | A 93
Table 6.2. Balance of Payments as per IMF Balance of Payments Manual 5 2000-01 2012-13 2013-14 2014-15
Items ` crore US$ million
` crore US$ million
` crore US$ million
` crore US$ million
(1) (2) (3) (4) (5) (6) (7) (8) (9)1 Imports (c.i.f.) 264589 57912 2732146 502237 2815918 466216 2820072 4614842 Exports (f.o.b.) 207852 45452 1667690 306581 1931074 318607 1934210 3165453 Trade Balance (2-1) -56737 -12460 -1064456 -195656 -884845 -147609 -885862 -1449404 Invisibles
a) Receipts 147778 32267 1218893 224044 1413843 233569 1478048 241645 b) Payments 102639 22473 634047 116551 716134 118256 755499 123564 (of which: Interest & Service Payments on Loans and Credits)
21948 4801 59546 10944 67747 11176 77376 12650
c) Net 45139 9794 584846 107493 697709 115313 722549 1180815 Current Account Balance -11598 -2666 -479610 -88163 -187136 -32296 -163313 -268596 Capital Account
I Foreign Investment 26744 5862 254653 46711 159650 26386 449072 73456 i) Foreign Direct Investment a) Inward FDI 18404 4031 146954 26953 186830 30763 215893 35283 b) Outward FDI -3480 -759 -38768 -7134 -56860 -9199 -24675 -4031 c) Net 14924 3272 108186 19819 129969 21564 191219 31251 ii) Portfolio Investment (net) 11820 2590 146467 26891 29680 4822 257853 42205 II Loans (net) 24459 5264 169073 31124 45901 7765 19733 3184 i) External Assistance a) Inflow 13521 2941 25747 4735 28239 4659 35408 5780 b) Out flow 11519 2531 20421 3752 22043 3627 24787 4054 c) Net 2002 410 5326 982 6197 1032 10622 1725 ii) Commercial Borrowingsa a) Inflow 95750 20865 817606 150351 785202 130177 718760 117575 b) Out flow 73293 16011 653858 120209 745498 123444 709649 116116 c) Net 22457 4854 163747 30142 39704 6733 9112 1459 III) Banking a) Receipts 44448 9744 455407 83727 654482 108049 550976 90094 b) Payments 53592 11705 365140 67157 502818 82601 478893 78476 c) Net -9144 -1961 90268 16570 151664 25449 72083 11618 IV) Rupee Debt Service (net) -2760 -617 -313 -58 -304 -52 -489 -81 V) Other Capital a) Receipts 12948 2856 97073 17861 133801 22171 176562 28914 b) Payments 11637 2564 125020 22908 200892 32932 169411 27806 c) Net 1311 292 -27946 -5047 -67091 -10761 7151 1109 VI) Errors & omissions (net) -1369 -305 14578 2689 -6629 -983 -6312 -1021
7 Total Capital (I to VI of 6) 39241 8535 500313 91989 283190 47804 541238 882658 Overall Balance (5 + 7) 27643 5868 20702 3826 96054 15508 377925 614069 Monetary Movement
a) IMF Transactions i) Purchases ii) Repurchases 115 26 iii) Net -115 -26 b) Increase (-)/decrease (+) in Reserves -27258 -5842 -20702 -3826 -96054 -15508 -377925 -61406
10 Total Reserve movement (9a(iii)+9b) [(-) Increase/ (+) decrease]
-27643 -5868 -20702 -3826 -96054 -15508 -377925 -61406
Contd....
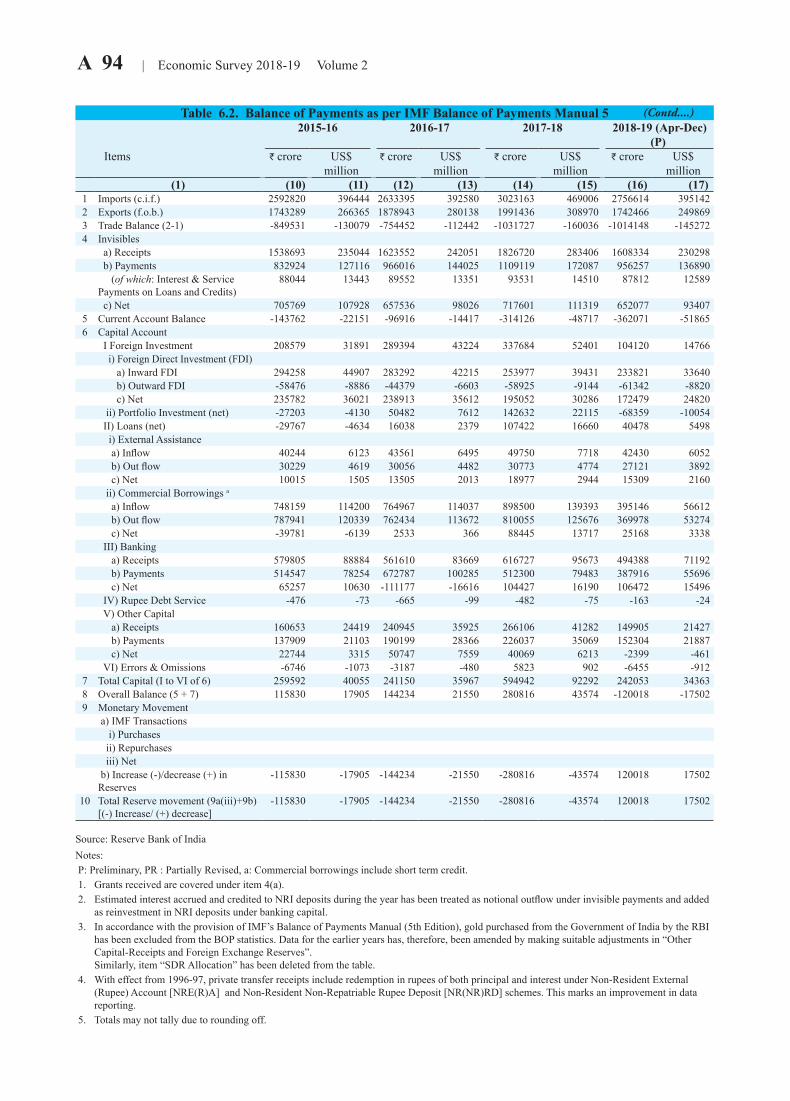
A 94 | Economic Survey 2018-19 Volume 2
Table 6.2. Balance of Payments as per IMF Balance of Payments Manual 52015-16 2016-17 2017-18 2018-19 (Apr-Dec)
(P) Items ` crore US$
million` crore US$
million` crore US$
million` crore US$
million(1) (10) (11) (12) (13) (14) (15) (16) (17)
1 Imports (c.i.f.) 2592820 396444 2633395 392580 3023163 469006 2756614 3951422 Exports (f.o.b.) 1743289 266365 1878943 280138 1991436 308970 1742466 2498693 Trade Balance (2-1) -849531 -130079 -754452 -112442 -1031727 -160036 -1014148 -1452724 Invisibles
a) Receipts 1538693 235044 1623552 242051 1826720 283406 1608334 230298 b) Payments 832924 127116 966016 144025 1109119 172087 956257 136890 (of which: Interest & Service Payments on Loans and Credits)
88044 13443 89552 13351 93531 14510 87812 12589
c) Net 705769 107928 657536 98026 717601 111319 652077 934075 Current Account Balance -143762 -22151 -96916 -14417 -314126 -48717 -362071 -518656 Capital Account
I Foreign Investment 208579 31891 289394 43224 337684 52401 104120 14766 i) Foreign Direct Investment (FDI) a) Inward FDI 294258 44907 283292 42215 253977 39431 233821 33640 b) Outward FDI -58476 -8886 -44379 -6603 -58925 -9144 -61342 -8820 c) Net 235782 36021 238913 35612 195052 30286 172479 24820 ii) Portfolio Investment (net) -27203 -4130 50482 7612 142632 22115 -68359 -10054 II) Loans (net) -29767 -4634 16038 2379 107422 16660 40478 5498 i) External Assistance a) Inflow 40244 6123 43561 6495 49750 7718 42430 6052 b) Out flow 30229 4619 30056 4482 30773 4774 27121 3892 c) Net 10015 1505 13505 2013 18977 2944 15309 2160 ii) Commercial Borrowings a
a) Inflow 748159 114200 764967 114037 898500 139393 395146 56612 b) Out flow 787941 120339 762434 113672 810055 125676 369978 53274 c) Net -39781 -6139 2533 366 88445 13717 25168 3338 III) Banking a) Receipts 579805 88884 561610 83669 616727 95673 494388 71192 b) Payments 514547 78254 672787 100285 512300 79483 387916 55696 c) Net 65257 10630 -111177 -16616 104427 16190 106472 15496 IV) Rupee Debt Service -476 -73 -665 -99 -482 -75 -163 -24 V) Other Capital a) Receipts 160653 24419 240945 35925 266106 41282 149905 21427 b) Payments 137909 21103 190199 28366 226037 35069 152304 21887 c) Net 22744 3315 50747 7559 40069 6213 -2399 -461 VI) Errors & Omissions -6746 -1073 -3187 -480 5823 902 -6455 -912
7 Total Capital (I to VI of 6) 259592 40055 241150 35967 594942 92292 242053 343638 Overall Balance (5 + 7) 115830 17905 144234 21550 280816 43574 -120018 -175029 Monetary Movement
a) IMF Transactions i) Purchases ii) Repurchases iii) Net b) Increase (-)/decrease (+) in Reserves
-115830 -17905 -144234 -21550 -280816 -43574 120018 17502
10 Total Reserve movement (9a(iii)+9b) [(-) Increase/ (+) decrease]
-115830 -17905 -144234 -21550 -280816 -43574 120018 17502
Source: Reserve Bank of India Notes: P: Preliminary, PR : Partially Revised, a: Commercial borrowings include short term credit. 1. Grants received are covered under item 4(a). 2. Estimated interest accrued and credited to NRI deposits during the year has been treated as notional outflow under invisible payments and added
as reinvestment in NRI deposits under banking capital. 3. In accordance with the provision of IMF’s Balance of Payments Manual (5th Edition), gold purchased from the Government of India by the RBI
has been excluded from the BOP statistics. Data for the earlier years has, therefore, been amended by making suitable adjustments in “Other Capital-Receipts and Foreign Exchange Reserves”. Similarly, item “SDR Allocation” has been deleted from the table.
4. With effect from 1996-97, private transfer receipts include redemption in rupees of both principal and interest under Non-Resident External (Rupee) Account [NRE(R)A] and Non-Resident Non-Repatriable Rupee Deposit [NR(NR)RD] schemes. This marks an improvement in data reporting.
5. Totals may not tally due to rounding off.
(Contd....)
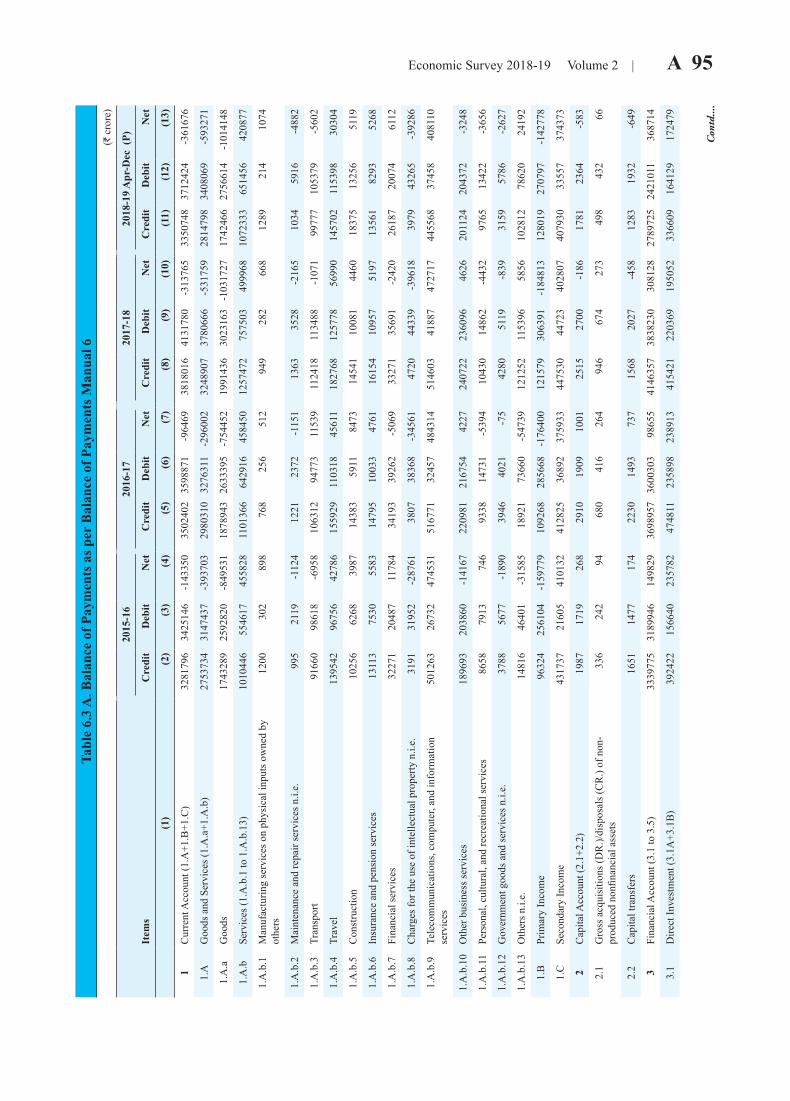
Economic Survey 2018-19 Volume 2 | A 95 Ta
ble
6.3
A. B
alan
ce o
f Pay
men
ts a
s per
Bal
ance
of P
aym
ents
Man
ual 6
(`
cro
re)
2015
-16
2016
-17
2017
-18
2018
-19
Apr
-Dec
(P)
Item
sC
redi
tD
ebit
Net
Cre
dit
Deb
itN
etC
redi
tD
ebit
Net
Cre
dit
Deb
itN
et
(1)
(2)
(3)
(4)
(5)
(6)
(7)
(8)
(9)
(10)
(11)
(12)
(13)
1C
urre
nt A
ccou
nt (1
.A+1
.B+1
.C)
3281
796
3425
146
-143
350
3502
402
3598
871
-964
6938
1801
641
3178
0-3
1376
533
5074
837
1242
4-3
6167
6
1.A
G
oods
and
Ser
vice
s (1.
A.a
+1.A
.b)
2753
734
3147
437
-393
703
2980
310
3276
311
-296
002
3248
907
3780
666
-531
759
2814
798
3408
069
-593
271
1.A
.a
Goo
ds
1743
289
2592
820
-849
531
1878
943
2633
395
-754
452
1991
436
3023
163
-103
1727
1742
466
2756
614
-101
4148
1.A
.b
Serv
ices
(1.A
.b.1
to 1
.A.b
.13)
1010
446
5546
1745
5828
1101
366
6429
1645
8450
1257
472
7575
0349
9968
1072
333
6514
5642
0877
1.A
.b.1
M
anuf
actu
ring
serv
ices
on
phys
ical
inpu
ts o
wne
d by
ot
hers
1200
302
898
768
256
512
949
282
668
1289
214
1074
1.A
.b.2
M
aint
enan
ce a
nd re
pair
serv
ices
n.i.
e.99
521
19-1
124
1221
2372
-115
113
6335
28-2
165
1034
5916
-488
2
1.A
.b.3
Tr
ansp
ort
9166
098
618
-695
810
6312
9477
311
539
1124
1811
3488
-107
199
777
1053
79-5
602
1.A
.b.4
Tr
avel
1395
4296
756
4278
615
5929
1103
1845
611
1827
6812
5778
5699
014
5702
1153
9830
304
1.A
.b.5
C
onst
ruct
ion
1025
662
6839
8714
383
5911
8473
1454
110
081
4460
1837
513
256
5119
1.A
.b.6
In
sura
nce
and
pens
ion
serv
ices
1311
375
3055
8314
795
1003
347
6116
154
1095
751
9713
561
8293
5268
1.A
.b.7
Fi
nanc
ial s
ervi
ces
3227
120
487
1178
434
193
3926
2-5
069
3327
135
691
-242
026
187
2007
461
12
1.A
.b.8
C
harg
es fo
r the
use
of i
ntel
lect
ual p
rope
rty n
.i.e.
3191
3195
2-2
8761
3807
3836
8-3
4561
4720
4433
9-3
9618
3979
4326
5-3
9286
1.A
.b.9
Te
leco
mm
unic
atio
ns, c
ompu
ter,
and
info
rmat
ion
serv
ices
50
1263
2673
247
4531
5167
7132
457
4843
1451
4603
4188
747
2717
4455
6837
458
4081
10
1.A
.b.1
0 O
ther
bus
ines
s ser
vice
s18
9693
2038
60-1
4167
2209
8121
6754
4227
2407
2223
6096
4626
2011
2420
4372
-324
8
1.A
.b.1
1 Pe
rson
al, c
ultu
ral,
and
recr
eatio
nal s
ervi
ces
8658
7913
746
9338
1473
1-5
394
1043
014
862
-443
297
6513
422
-365
6
1.A
.b.1
2 G
over
nmen
t goo
ds a
nd se
rvic
es n
.i.e.
3788
5677
-189
039
4640
21-7
542
8051
19-8
3931
5957
86-2
627
1.A
.b.1
3 O
ther
s n.i.
e.14
816
4640
1-3
1585
1892
173
660
-547
3912
1252
1153
9658
5610
2812
7862
024
192
1.B
Pr
imar
y In
com
e 96
324
2561
04-1
5977
910
9268
2856
68-1
7640
012
1579
3063
91-1
8481
312
8019
2707
97-1
4277
8
1.C
Se
cond
ary
Inco
me
4317
3721
605
4101
3241
2825
3689
237
5933
4475
3044
723
4028
0740
7930
3355
737
4373
2C
apita
l Acc
ount
(2.1
+2.2
)19
8717
1926
829
1019
0910
0125
1527
00-1
8617
8123
64-5
83
2.1
Gro
ss a
cqui
sitio
ns (D
R.)/
disp
osal
s (C
R.)
of n
on-
prod
uced
non
finan
cial
ass
ets
336
242
9468
041
626
494
667
427
349
843
266
2.2
Cap
ital t
rans
fers
16
5114
7717
422
3014
9373
715
6820
27-4
5812
8319
32-6
49
3Fi
nanc
ial A
ccou
nt (3
.1 to
3.5
)33
3977
531
8994
614
9829
3698
957
3600
303
9865
541
4635
738
3823
030
8128
2789
725
2421
011
3687
14
3.1
Dire
ct In
vest
men
t (3.
1A+3
.1B
)39
2422
1566
4023
5782
4748
1123
5898
2389
1341
5421
2203
6919
5052
3366
0916
4129
1724
79
Con
td....
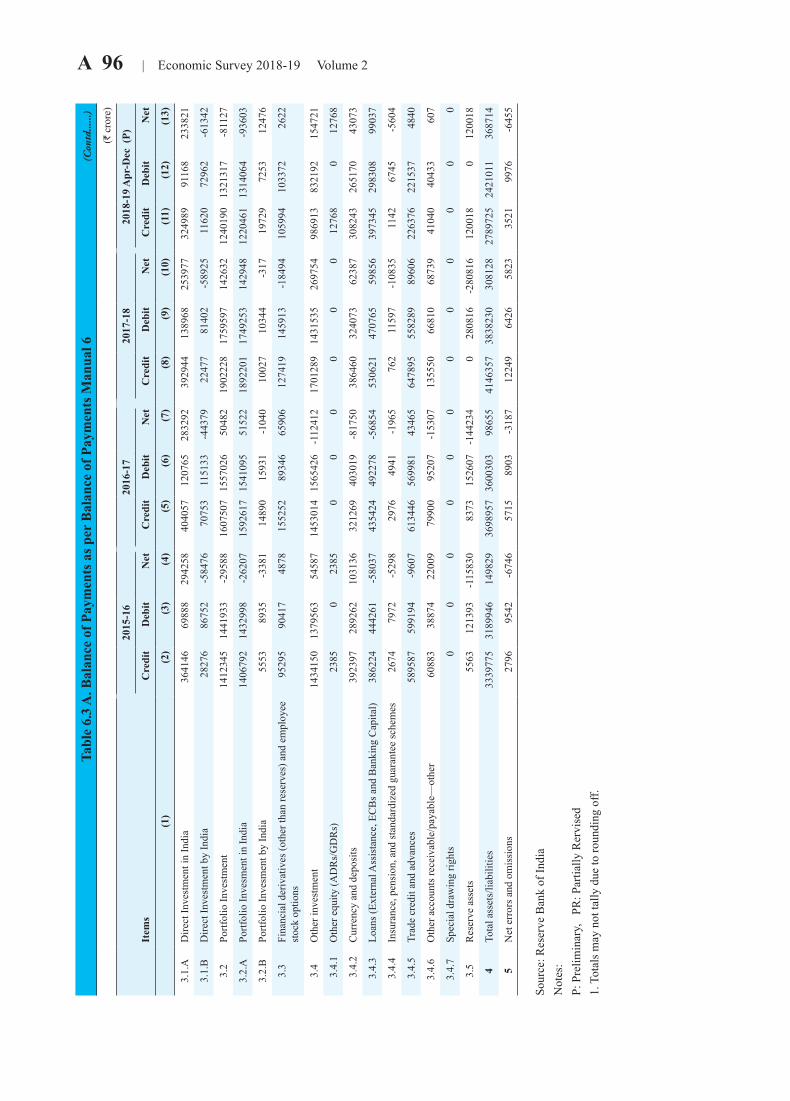
A 96 | Economic Survey 2018-19 Volume 2Ta
ble
6.3
A. B
alan
ce o
f Pay
men
ts a
s per
Bal
ance
of P
aym
ents
Man
ual 6
(`
cro
re)
2015
-16
2016
-17
2017
-18
2018
-19
Apr
-Dec
(P)
Item
sC
redi
tD
ebit
Net
Cre
dit
Deb
itN
etC
redi
tD
ebit
Net
Cre
dit
Deb
itN
et
(1)
(2)
(3)
(4)
(5)
(6)
(7)
(8)
(9)
(10)
(11)
(12)
(13)
3.1.
A
Dire
ct In
vest
men
t in
Indi
a36
4146
6988
829
4258
4040
5712
0765
2832
9239
2944
1389
6825
3977
3249
8991
168
2338
21
3.1.
B
Dire
ct In
vest
men
t by
Indi
a28
276
8675
2-5
8476
7075
311
5133
-443
7922
477
8140
2-5
8925
1162
072
962
-613
42
3.2
Portf
olio
Inve
stm
ent
1412
345
1441
933
-295
8816
0750
715
5702
650
482
1902
228
1759
597
1426
3212
4019
013
2131
7-8
1127
3.2.
A
Portf
olio
Inve
smen
t in
Indi
a14
0679
214
3299
8-2
6207
1592
617
1541
095
5152
218
9220
117
4925
314
2948
1220
461
1314
064
-936
03
3.2.
B
Portf
olio
Inve
smen
t by
Indi
a55
5389
35-3
381
1489
015
931
-104
010
027
1034
4-3
1719
729
7253
1247
6
3.3
Fina
ncia
l der
ivat
ives
(oth
er th
an re
serv
es) a
nd e
mpl
oyee
st
ock
optio
ns
9529
590
417
4878
1552
5289
346
6590
612
7419
1459
13-1
8494
1059
9410
3372
2622
3.4
Oth
er in
vest
men
t14
3415
013
7956
354
587
1453
014
1565
426
-112
412
1701
289
1431
535
2697
5498
6913
8321
9215
4721
3.
4.1
Oth
er e
quity
(AD
Rs/
GD
Rs)
2385
023
850
00
00
012
768
012
768
3.
4.2
Cur
renc
y an
d de
posi
ts
3923
9728
9262
1031
3632
1269
4030
19-8
1750
3864
6032
4073
6238
730
8243
2651
7043
073
3.4
.3
Loan
s (Ex
tern
al A
ssis
tanc
e, E
CB
s and
Ban
king
Cap
ital)
3862
2444
4261
-580
3743
5424
4922
78-5
6854
5306
2147
0765
5985
639
7345
2983
0899
037
3.4
.4
Insu
ranc
e, p
ensi
on, a
nd st
anda
rdiz
ed g
uara
ntee
sche
mes
2674
7972
-529
829
7649
41-1
965
762
1159
7-1
0835
1142
6745
-560
4
3.4
.5
Trad
e cr
edit
and
adva
nces
5895
8759
9194
-960
761
3446
5699
8143
465
6478
9555
8289
8960
622
6376
2215
3748
40
3.4
.6
Oth
er a
ccou
nts r
ecei
vabl
e/pa
yabl
e—ot
her
6088
338
874
2200
979
900
9520
7-1
5307
1355
5066
810
6873
941
040
4043
360
7
3.4
.7
Spec
ial d
raw
ing
right
s0
00
00
00
00
00
0
3.5
Res
erve
ass
ets
5563
1213
93-1
1583
083
7315
2607
-144
234
028
0816
-280
816
1200
180
1200
18
4To
tal a
sset
s/lia
bilit
ies
3339
775
3189
946
1498
2936
9895
736
0030
398
655
4146
357
3838
230
3081
2827
8972
524
2101
136
8714
5N
et e
rror
s and
om
issi
ons
2796
9542
-674
657
1589
03-3
187
1224
964
2658
2335
2199
76-6
455
Sour
ce: R
eser
ve B
ank
of In
dia
Not
es:
P: P
relim
inar
y,
PR: P
artia
lly R
ervi
sed
1. T
otal
s may
not
tally
due
to ro
undi
ng o
ff.
(Con
td......)
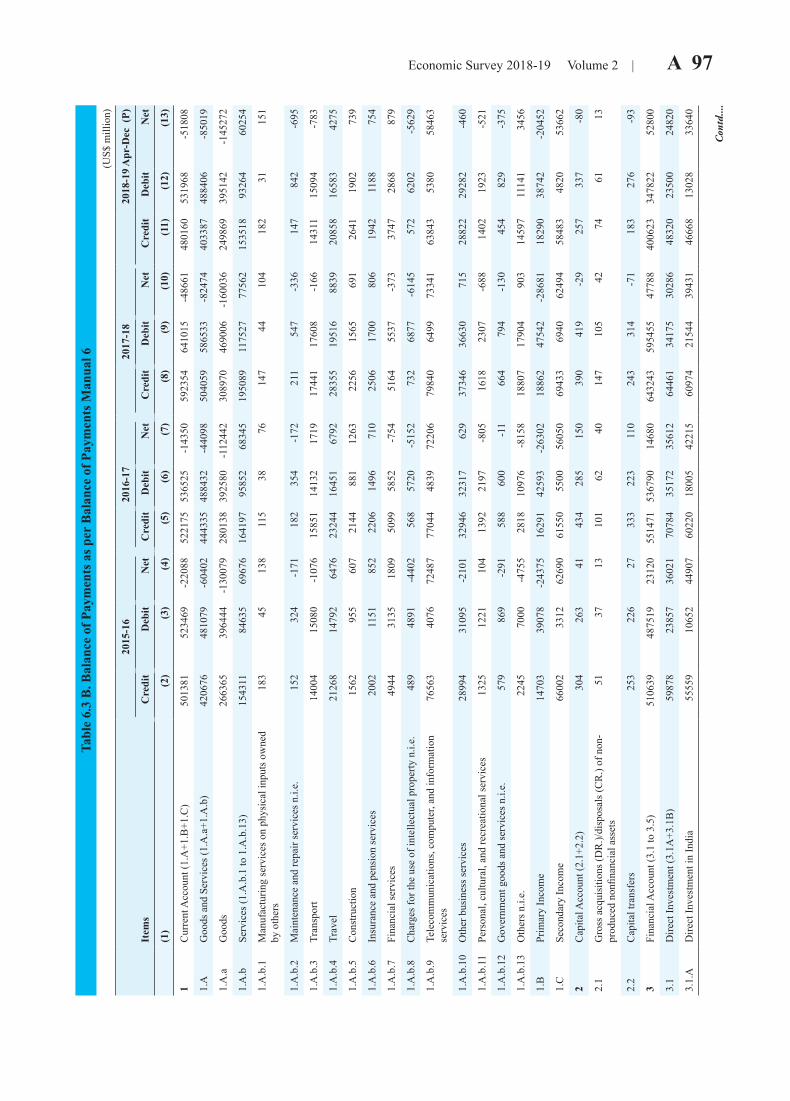
Economic Survey 2018-19 Volume 2 | A 97 Ta
ble
6.3
B. B
alan
ce o
f Pay
men
ts a
s per
Bal
ance
of P
aym
ents
Man
ual 6
(U
S$ m
illio
n)
2015
-16
2016
-17
2017
-18
2018
-19
Apr
-Dec
(P)
Item
sC
redi
tD
ebit
Net
Cre
dit
Deb
itN
etC
redi
tD
ebit
Net
Cre
dit
Deb
itN
et
(1)
(2)
(3)
(4)
(5)
(6)
(7)
(8)
(9)
(10)
(11)
(12)
(13)
1C
urre
nt A
ccou
nt (1
.A+1
.B+1
.C)
5013
8152
3469
-220
8852
2175
5365
25-1
4350
5923
5464
1015
-486
6148
0160
5319
68-5
1808
1.A
G
oods
and
Ser
vice
s (1.
A.a
+1.A
.b)
4206
7648
1079
-604
0244
4335
4884
32-4
4098
5040
5958
6533
-824
7440
3387
4884
06-8
5019
1.A
.a
Goo
ds
2663
6539
6444
-130
079
2801
3839
2580
-112
442
3089
7046
9006
-160
036
2498
6939
5142
-145
272
1.A
.b
Serv
ices
(1.A
.b.1
to 1
.A.b
.13)
1543
1184
635
6967
616
4197
9585
268
345
1950
8911
7527
7756
215
3518
9326
460
254
1.A
.b.1
M
anuf
actu
ring
serv
ices
on
phys
ical
inpu
ts o
wne
d by
oth
ers
183
4513
811
538
7614
744
104
182
3115
1
1.A
.b.2
M
aint
enan
ce a
nd re
pair
serv
ices
n.i.
e.15
232
4-1
7118
235
4-1
7221
154
7-3
3614
784
2-6
95
1.A
.b.3
Tr
ansp
ort
1400
415
080
-107
615
851
1413
217
1917
441
1760
8-1
6614
311
1509
4-7
83
1.A
.b.4
Tr
avel
2126
814
792
6476
2324
416
451
6792
2835
519
516
8839
2085
816
583
4275
1.A
.b.5
C
onst
ruct
ion
1562
955
607
2144
881
1263
2256
1565
691
2641
1902
739
1.A
.b.6
In
sura
nce
and
pens
ion
serv
ices
2002
1151
852
2206
1496
710
2506
1700
806
1942
1188
754
1.A
.b.7
Fi
nanc
ial s
ervi
ces
4944
3135
1809
5099
5852
-754
5164
5537
-373
3747
2868
879
1.A
.b.8
C
harg
es fo
r the
use
of i
ntel
lect
ual p
rope
rty n
.i.e.
489
4891
-440
256
857
20-5
152
732
6877
-614
557
262
02-5
629
1.A
.b.9
Te
leco
mm
unic
atio
ns, c
ompu
ter,
and
info
rmat
ion
serv
ices
76
563
4076
7248
777
044
4839
7220
679
840
6499
7334
163
843
5380
5846
3
1.A
.b.1
0 O
ther
bus
ines
s ser
vice
s28
994
3109
5-2
101
3294
632
317
629
3734
636
630
715
2882
229
282
-460
1.A
.b.1
1 Pe
rson
al, c
ultu
ral,
and
recr
eatio
nal s
ervi
ces
1325
1221
104
1392
2197
-805
1618
2307
-688
1402
1923
-521
1.A
.b.1
2 G
over
nmen
t goo
ds a
nd se
rvic
es n
.i.e.
579
869
-291
588
600
-11
664
794
-130
454
829
-375
1.A
.b.1
3 O
ther
s n.i.
e.22
4570
00-4
755
2818
1097
6-8
158
1880
717
904
903
1459
711
141
3456
1.B
Pr
imar
y In
com
e 14
703
3907
8-2
4375
1629
142
593
-263
0218
862
4754
2-2
8681
1829
038
742
-204
52
1.C
Se
cond
ary
Inco
me
6600
233
1262
690
6155
055
0056
050
6943
369
4062
494
5848
348
2053
662
2C
apita
l Acc
ount
(2.1
+2.2
)30
426
341
434
285
150
390
419
-29
257
337
-80
2.1
Gro
ss a
cqui
sitio
ns (D
R.)/
disp
osal
s (C
R.)
of n
on-
prod
uced
non
finan
cial
ass
ets
5137
1310
162
4014
710
542
7461
13
2.2
Cap
ital t
rans
fers
25
322
627
333
223
110
243
314
-71
183
276
-93
3Fi
nanc
ial A
ccou
nt (3
.1 to
3.5
)51
0639
4875
1923
120
5514
7153
6790
1468
064
3243
5954
5547
788
4006
2334
7822
5280
0
3.1
Dire
ct In
vest
men
t (3.
1A+3
.1B
)59
878
2385
736
021
7078
435
172
3561
264
461
3417
530
286
4832
023
500
2482
0
3.1.
A
Dire
ct In
vest
men
t in
Indi
a55
559
1065
244
907
6022
018
005
4221
560
974
2154
439
431
4666
813
028
3364
0
Con
td....
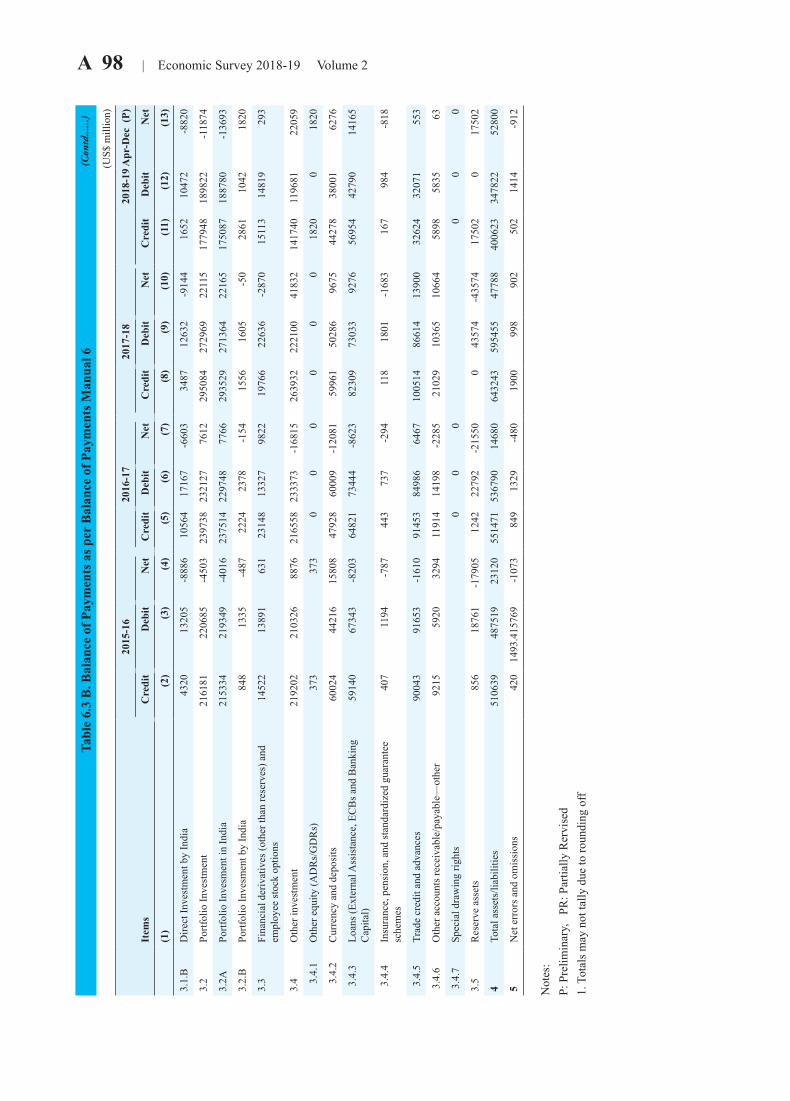
A 98 | Economic Survey 2018-19 Volume 2Ta
ble
6.3
B. B
alan
ce o
f Pay
men
ts a
s per
Bal
ance
of P
aym
ents
Man
ual 6
(U
S$ m
illio
n)
2015
-16
2016
-17
2017
-18
2018
-19
Apr
-Dec
(P)
Item
sC
redi
tD
ebit
Net
Cre
dit
Deb
itN
etC
redi
tD
ebit
Net
Cre
dit
Deb
itN
et
(1)
(2)
(3)
(4)
(5)
(6)
(7)
(8)
(9)
(10)
(11)
(12)
(13)
3.1.
B
Dire
ct In
vest
men
t by
Indi
a43
2013
205
-888
610
564
1716
7-6
603
3487
1263
2-9
144
1652
1047
2-8
820
3.2
Portf
olio
Inve
stm
ent
2161
8122
0685
-450
323
9738
2321
2776
1229
5084
2729
6922
115
1779
4818
9822
-118
74
3.2A
Po
rtfol
io In
vesm
ent i
n In
dia
2153
3421
9349
-401
623
7514
2297
4877
6629
3529
2713
6422
165
1750
8718
8780
-136
93
3.2.
B
Portf
olio
Inve
smen
t by
Indi
a84
813
35-4
8722
2423
78-1
5415
5616
05-5
028
6110
4218
20
3.3
Fina
ncia
l der
ivat
ives
(oth
er th
an re
serv
es) a
nd
empl
oyee
stoc
k op
tions
14
522
1389
163
123
148
1332
798
2219
766
2263
6-2
870
1511
314
819
293
3.4
Oth
er in
vest
men
t21
9202
2103
2688
7621
6558
2333
73-1
6815
2639
3222
2100
4183
214
1740
1196
8122
059
3.
4.1
Oth
er e
quity
(AD
Rs/
GD
Rs)
373
373
00
00
00
1820
018
20
3.
4.2
Cur
renc
y an
d de
posi
ts
6002
444
216
1580
847
928
6000
9-1
2081
5996
150
286
9675
4427
838
001
6276
3.4
.3
Loan
s (Ex
tern
al A
ssis
tanc
e, E
CB
s and
Ban
king
C
apita
l)59
140
6734
3-8
203
6482
173
444
-862
382
309
7303
392
7656
954
4279
014
165
3.4
.4
Insu
ranc
e, p
ensi
on, a
nd st
anda
rdiz
ed g
uara
ntee
sc
hem
es40
711
94-7
8744
373
7-2
9411
818
01-1
683
167
984
-818
3.4
.5
Trad
e cr
edit
and
adva
nces
9004
391
653
-161
091
453
8498
664
6710
0514
8661
413
900
3262
432
071
553
3.4
.6
Oth
er a
ccou
nts r
ecei
vabl
e/pa
yabl
e—ot
her
9215
5920
3294
1191
414
198
-228
521
029
1036
510
664
5898
5835
63
3.4
.7
Spec
ial d
raw
ing
right
s0
00
00
0
3.5
Res
erve
ass
ets
856
1876
1-1
7905
1242
2279
2-2
1550
043
574
-435
7417
502
017
502
4To
tal a
sset
s/lia
bilit
ies
5106
3948
7519
2312
055
1471
5367
9014
680
6432
4359
5455
4778
840
0623
3478
2252
800
5N
et e
rror
s and
om
issi
ons
420
1493
.415
769
-107
384
913
29-4
8019
0099
890
250
214
14-9
12
Not
es:
P: P
relim
inar
y,
PR: P
artia
lly R
ervi
sed
1. T
otal
s may
not
tally
due
to ro
undi
ng o
ff
(Con
td......)
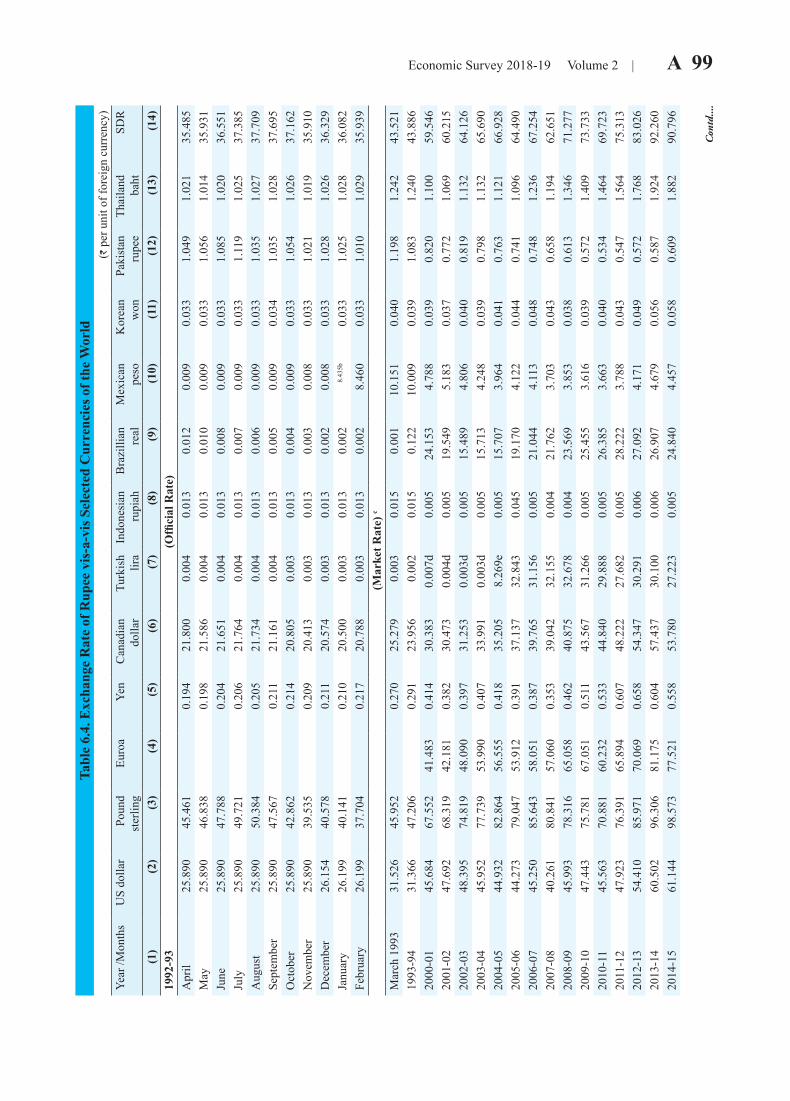
Economic Survey 2018-19 Volume 2 | A 99 Ta
ble
6.4.
Exc
hang
e R
ate
of R
upee
vis
-a-v
is S
elec
ted
Cur
renc
ies o
f the
Wor
ld(`
per
uni
t of f
orei
gn c
urre
ncy)
Year
/Mon
ths
US
dolla
rPo
und
ster
ling
Euro
aYe
nC
anad
ian
dolla
rTu
rkis
h lir
aIn
done
sian
ru
piah
Bra
zilli
an
real
Mex
ican
pe
soK
orea
n w
onPa
kist
an
rupe
eTh
aila
nd
baht
SDR
(1)
(2)
(3)
(4)
(5)
(6)
(7)
(8)
(9)
(10)
(11)
(12)
(13)
(14)
1992
-93
(Offi
cial
Rat
e)A
pril
25.8
9045
.461
0.19
421
.800
0.00
40.
013
0.01
20.
009
0.03
31.
049
1.02
135
.485
May
25.8
9046
.838
0.19
821
.586
0.00
40.
013
0.01
00.
009
0.03
31.
056
1.01
435
.931
June
25.8
9047
.788
0.20
421
.651
0.00
40.
013
0.00
80.
009
0.03
31.
085
1.02
036
.551
July
25.8
9049
.721
0.20
621
.764
0.00
40.
013
0.00
70.
009
0.03
31.
119
1.02
537
.385
Aug
ust
25.8
9050
.384
0.20
521
.734
0.00
40.
013
0.00
60.
009
0.03
31.
035
1.02
737
.709
Sept
embe
r25
.890
47.5
670.
211
21.1
610.
004
0.01
30.
005
0.00
90.
034
1.03
51.
028
37.6
95O
ctob
er25
.890
42.8
620.
214
20.8
050.
003
0.01
30.
004
0.00
90.
033
1.05
41.
026
37.1
62N
ovem
ber
25.8
9039
.535
0.20
920
.413
0.00
30.
013
0.00
30.
008
0.03
31.
021
1.01
935
.910
Dec
embe
r26
.154
40.5
780.
211
20.5
740.
003
0.01
30.
002
0.00
80.
033
1.02
81.
026
36.3
29Ja
nuar
y 26
.199
40.1
410.
210
20.5
000.
003
0.01
30.
002
8.43
5b0.
033
1.02
51.
028
36.0
82Fe
brua
ry26
.199
37.7
040.
217
20.7
880.
003
0.01
30.
002
8.46
00.
033
1.01
01.
029
35.9
39(M
arke
t Rat
e) c
Mar
ch 1
993
31.5
2645
.952
0.27
025
.279
0.00
30.
015
0.00
110
.151
0.04
01.
198
1.24
243
.521
1993
-94
31.3
6647
.206
0.29
123
.956
0.00
20.
015
0.12
210
.009
0.03
91.
083
1.24
043
.886
2000
-01
45.6
8467
.552
41.4
830.
414
30.3
830.
007d
0.00
524
.153
4.78
80.
039
0.82
01.
100
59.5
4620
01-0
247
.692
68.3
1942
.181
0.38
230
.473
0.00
4d0.
005
19.5
495.
183
0.03
70.
772
1.06
960
.215
2002
-03
48.3
9574
.819
48.0
900.
397
31.2
530.
003d
0.00
515
.489
4.80
60.
040
0.81
91.
132
64.1
2620
03-0
445
.952
77.7
3953
.990
0.40
733
.991
0.00
3d0.
005
15.7
134.
248
0.03
90.
798
1.13
265
.690
2004
-05
44.9
3282
.864
56.5
550.
418
35.2
058.
269e
0.00
515
.707
3.96
40.
041
0.76
31.
121
66.9
2820
05-0
644
.273
79.0
4753
.912
0.39
137
.137
32.8
430.
045
19.1
704.
122
0.04
40.
741
1.09
664
.490
2006
-07
45.2
5085
.643
58.0
510.
387
39.7
6531
.156
0.00
521
.044
4.11
30.
048
0.74
81.
236
67.2
5420
07-0
840
.261
80.8
4157
.060
0.35
339
.042
32.1
550.
004
21.7
623.
703
0.04
30.
658
1.19
462
.651
2008
-09
45.9
9378
.316
65.0
580.
462
40.8
7532
.678
0.00
423
.569
3.85
30.
038
0.61
31.
346
71.2
7720
09-1
047
.443
75.7
8167
.051
0.51
143
.567
31.2
660.
005
25.4
553.
616
0.03
90.
572
1.40
973
.733
2010
-11
45.5
6370
.881
60.2
320.
533
44.8
4029
.888
0.00
526
.385
3.66
30.
040
0.53
41.
464
69.7
2320
11-1
247
.923
76.3
9165
.894
0.60
748
.222
27.6
820.
005
28.2
223.
788
0.04
30.
547
1.56
475
.313
2012
-13
54.4
1085
.971
70.0
690.
658
54.3
4730
.291
0.00
627
.092
4.17
10.
049
0.57
21.
768
83.0
2620
13-1
460
.502
96.3
0681
.175
0.60
457
.437
30.1
000.
006
26.9
074.
679
0.05
60.
587
1.92
492
.260
2014
-15
61.1
4498
.573
77.5
210.
558
53.7
8027
.223
0.00
524
.840
4.45
70.
058
0.60
91.
882
90.7
96
Con
td....
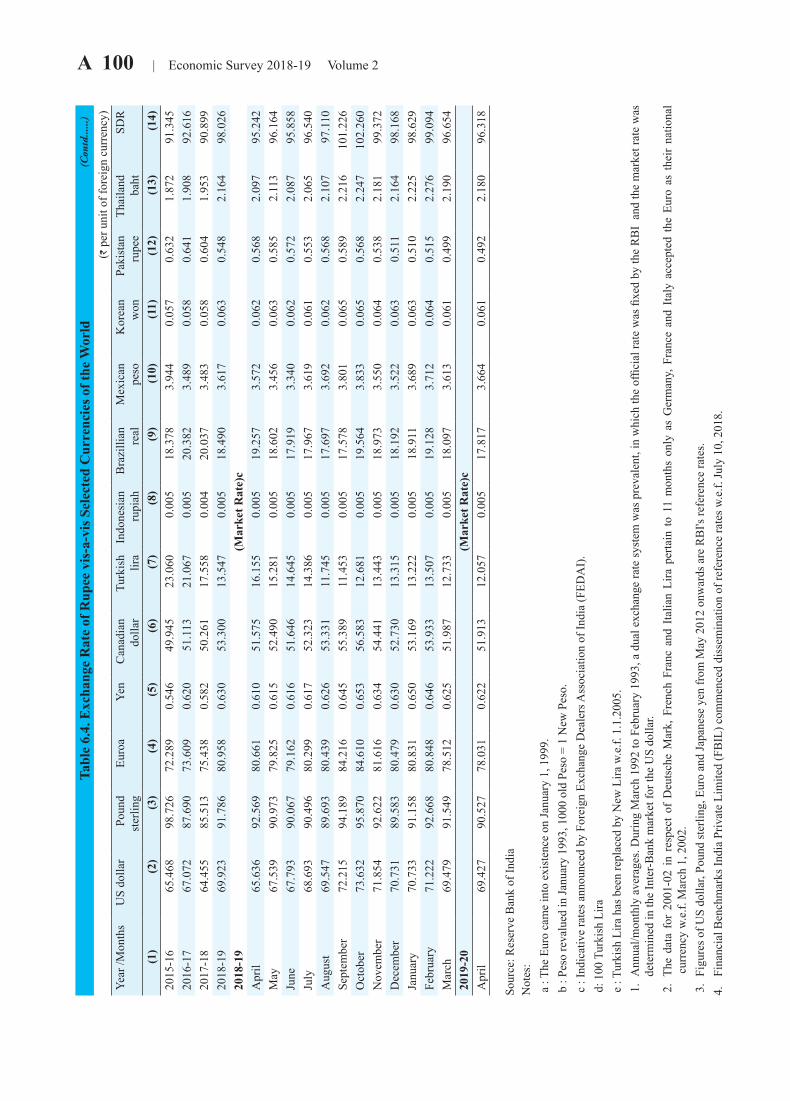
A 100 | Economic Survey 2018-19 Volume 2Ta
ble
6.4.
Exc
hang
e R
ate
of R
upee
vis
-a-v
is S
elec
ted
Cur
renc
ies o
f the
Wor
ld(`
per
uni
t of f
orei
gn c
urre
ncy)
Year
/Mon
ths
US
dolla
rPo
und
ster
ling
Euro
aYe
nC
anad
ian
dolla
rTu
rkis
h lir
aIn
done
sian
ru
piah
Bra
zilli
an
real
Mex
ican
pe
soK
orea
n w
onPa
kist
an
rupe
eTh
aila
nd
baht
SDR
(1)
(2)
(3)
(4)
(5)
(6)
(7)
(8)
(9)
(10)
(11)
(12)
(13)
(14)
2015
-16
65.4
6898
.726
72.2
890.
546
49.9
4523
.060
0.00
518
.378
3.94
40.
057
0.63
21.
872
91.3
4520
16-1
767
.072
87.6
9073
.609
0.62
051
.113
21.0
670.
005
20.3
823.
489
0.05
80.
641
1.90
892
.616
2017
-18
64.4
5585
.513
75.4
380.
582
50.2
6117
.558
0.00
420
.037
3.48
30.
058
0.60
41.
953
90.8
9920
18-1
969
.923
91.7
8680
.958
0.63
053
.300
13.5
470.
005
18.4
903.
617
0.06
30.
548
2.16
498
.026
2018
-19
(Mar
ket R
ate)
cA
pril
65.6
3692
.569
80.6
610.
610
51.5
7516
.155
0.00
519
.257
3.57
20.
062
0.56
82.
097
95.2
42M
ay67
.539
90.9
7379
.825
0.61
552
.490
15.2
810.
005
18.6
023.
456
0.06
30.
585
2.11
396
.164
June
67.7
9390
.067
79.1
620.
616
51.6
4614
.645
0.00
517
.919
3.34
00.
062
0.57
22.
087
95.8
58Ju
ly68
.693
90.4
9680
.299
0.61
752
.323
14.3
860.
005
17.9
673.
619
0.06
10.
553
2.06
596
.540
Aug
ust
69.5
4789
.693
80.4
390.
626
53.3
3111
.745
0.00
517
.697
3.69
20.
062
0.56
82.
107
97.1
10Se
ptem
ber
72.2
1594
.189
84.2
160.
645
55.3
8911
.453
0.00
517
.578
3.80
10.
065
0.58
92.
216
101.
226
Oct
ober
73.6
3295
.870
84.6
100.
653
56.5
8312
.681
0.00
519
.564
3.83
30.
065
0.56
82.
247
102.
260
Nov
embe
r71
.854
92.6
2281
.616
0.63
454
.441
13.4
430.
005
18.9
733.
550
0.06
40.
538
2.18
199
.372
Dec
embe
r70
.731
89.5
8380
.479
0.63
052
.730
13.3
150.
005
18.1
923.
522
0.06
30.
511
2.16
498
.168
Janu
ary
70.7
3391
.158
80.8
310.
650
53.1
6913
.222
0.00
518
.911
3.68
90.
063
0.51
02.
225
98.6
29Fe
brua
ry71
.222
92.6
6880
.848
0.64
653
.933
13.5
070.
005
19.1
283.
712
0.06
40.
515
2.27
699
.094
Mar
ch69
.479
91.5
4978
.512
0.62
551
.987
12.7
330.
005
18.0
973.
613
0.06
10.
499
2.19
096
.654
2019
-20
(Mar
ket R
ate)
cA
pril
69.4
2790
.527
78.0
310.
622
51.9
1312
.057
0.00
517
.817
3.66
40.
061
0.49
22.
180
96.3
18
Sour
ce: R
eser
ve B
ank
of In
dia
Not
es:
a
: Th
e Eu
ro c
ame
into
exi
sten
ce o
n Ja
nuar
y 1,
199
9. b
: Pe
so re
valu
ed in
Janu
ary
1993
, 100
0 ol
d Pe
so =
1 N
ew P
eso.
c :
Indi
cativ
e ra
tes a
nnou
nced
by
Fore
ign
Exch
ange
Dea
lers
Ass
ocia
tion
of In
dia
(FED
AI)
. d
: 100
Tur
kish
Lira
e :
Turk
ish
Lira
has
bee
n re
plac
ed b
y N
ew L
ira w
.e.f.
1.1
.200
5. 1
. A
nnua
l/mon
thly
ave
rage
s. D
urin
g M
arch
199
2 to
Feb
ruar
y 19
93, a
dua
l exc
hang
e ra
te sy
stem
was
pre
vale
nt, i
n w
hich
the
offic
ial r
ate
was
fixe
d by
the
RB
I an
d th
e m
arke
t rat
e w
as
dete
rmin
ed in
the
Inte
r-Ban
k m
arke
t for
the
US
dolla
r. 2
. Th
e da
ta f
or 2
001-
02 i
n re
spec
t of
Deu
tsch
e M
ark,
Fre
nch
Fran
c an
d Ita
lian
Lira
per
tain
to
11 m
onth
s on
ly a
s G
erm
any,
Fra
nce
and
Italy
acc
epte
d th
e Eu
ro a
s th
eir
natio
nal
cur
renc
y w.
e.f.
Mar
ch 1
, 200
2. 3
. Fi
gure
s of U
S do
llar,
Poun
d st
erlin
g, E
uro
and
Japa
nese
yen
from
May
201
2 on
war
ds a
re R
BI's
refe
renc
e ra
tes.
4.
Fina
ncia
l Ben
chm
arks
Indi
a Pr
ivat
e Li
mite
d (F
BIL
) com
men
ced
diss
emin
atio
n of
refe
renc
e ra
tes w
.e.f.
July
10,
201
8.
(Con
td......)
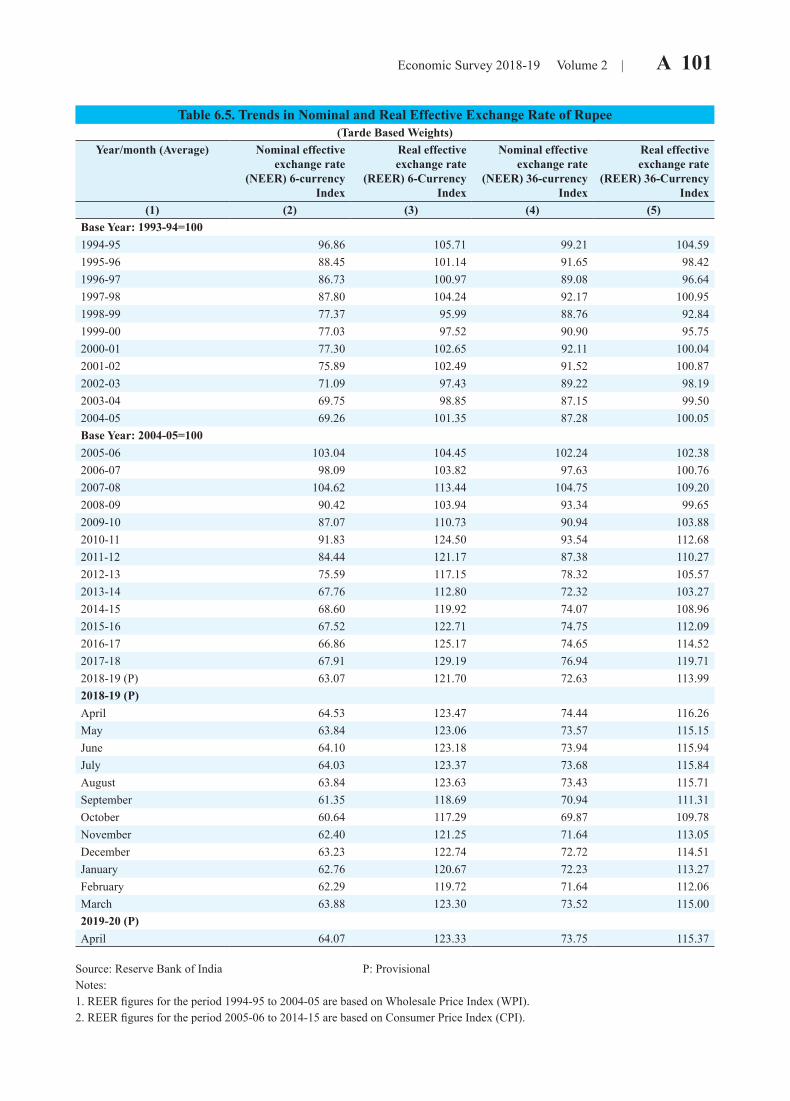
Economic Survey 2018-19 Volume 2 | A 101
Table 6.5. Trends in Nominal and Real Effective Exchange Rate of Rupee(Tarde Based Weights)
Year/month (Average) Nominal effective exchange rate
(NEER) 6-currency Index
Real effective exchange rate
(REER) 6-Currency Index
Nominal effective exchange rate
(NEER) 36-currency Index
Real effective exchange rate
(REER) 36-Currency Index
(1) (2) (3) (4) (5)Base Year: 1993-94=1001994-95 96.86 105.71 99.21 104.591995-96 88.45 101.14 91.65 98.421996-97 86.73 100.97 89.08 96.641997-98 87.80 104.24 92.17 100.951998-99 77.37 95.99 88.76 92.841999-00 77.03 97.52 90.90 95.752000-01 77.30 102.65 92.11 100.042001-02 75.89 102.49 91.52 100.872002-03 71.09 97.43 89.22 98.192003-04 69.75 98.85 87.15 99.502004-05 69.26 101.35 87.28 100.05Base Year: 2004-05=1002005-06 103.04 104.45 102.24 102.382006-07 98.09 103.82 97.63 100.762007-08 104.62 113.44 104.75 109.202008-09 90.42 103.94 93.34 99.652009-10 87.07 110.73 90.94 103.882010-11 91.83 124.50 93.54 112.682011-12 84.44 121.17 87.38 110.272012-13 75.59 117.15 78.32 105.572013-14 67.76 112.80 72.32 103.272014-15 68.60 119.92 74.07 108.962015-16 67.52 122.71 74.75 112.092016-17 66.86 125.17 74.65 114.522017-18 67.91 129.19 76.94 119.712018-19 (P) 63.07 121.70 72.63 113.992018-19 (P)April 64.53 123.47 74.44 116.26May 63.84 123.06 73.57 115.15June 64.10 123.18 73.94 115.94July 64.03 123.37 73.68 115.84August 63.84 123.63 73.43 115.71September 61.35 118.69 70.94 111.31October 60.64 117.29 69.87 109.78November 62.40 121.25 71.64 113.05December 63.23 122.74 72.72 114.51January 62.76 120.67 72.23 113.27February 62.29 119.72 71.64 112.06March 63.88 123.30 73.52 115.002019-20 (P)April 64.07 123.33 73.75 115.37
Source: Reserve Bank of India P: Provisional Notes: 1. REER figures for the period 1994-95 to 2004-05 are based on Wholesale Price Index (WPI). 2. REER figures for the period 2005-06 to 2014-15 are based on Consumer Price Index (CPI).
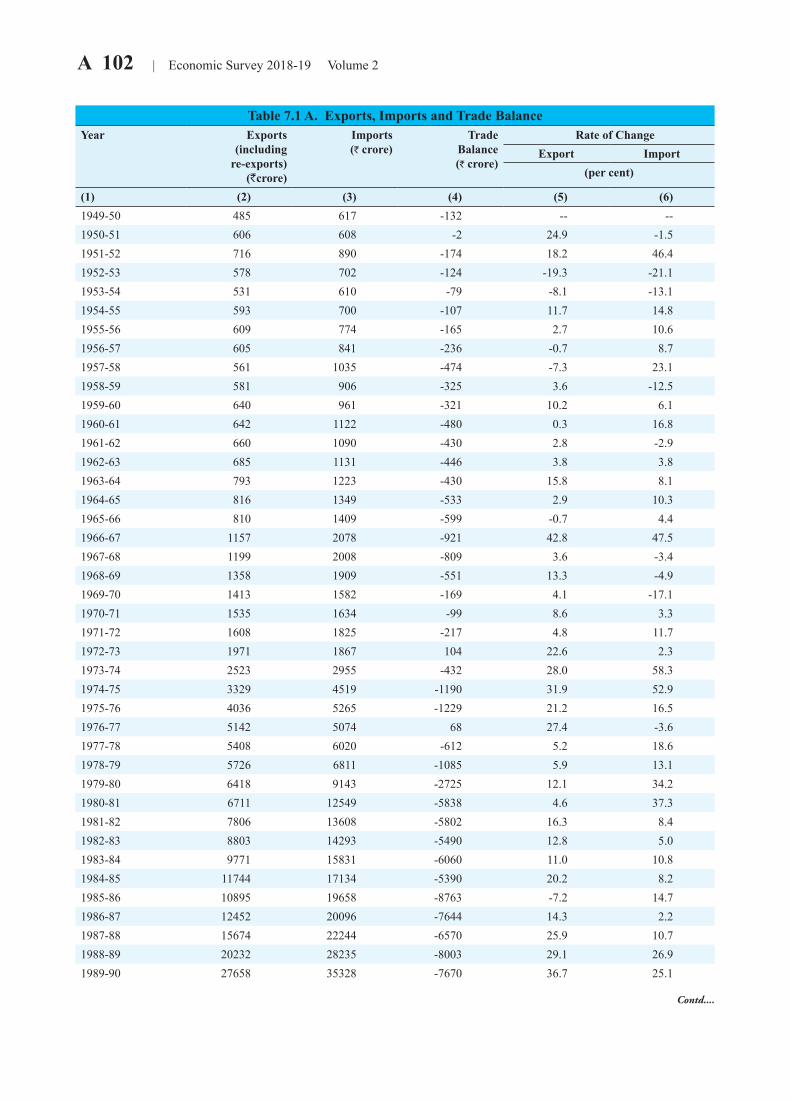
A 102 | Economic Survey 2018-19 Volume 2
Table 7.1 A. Exports, Imports and Trade BalanceYear Exports
(includingre-exports)
(Rcrore)
Imports(` crore)
TradeBalance(` crore)
Rate of ChangeExport Import
(per cent)
(1) (2) (3) (4) (5) (6)1949-50 485 617 -132 -- --1950-51 606 608 -2 24.9 -1.51951-52 716 890 -174 18.2 46.41952-53 578 702 -124 -19.3 -21.11953-54 531 610 -79 -8.1 -13.11954-55 593 700 -107 11.7 14.81955-56 609 774 -165 2.7 10.61956-57 605 841 -236 -0.7 8.71957-58 561 1035 -474 -7.3 23.11958-59 581 906 -325 3.6 -12.51959-60 640 961 -321 10.2 6.11960-61 642 1122 -480 0.3 16.81961-62 660 1090 -430 2.8 -2.91962-63 685 1131 -446 3.8 3.81963-64 793 1223 -430 15.8 8.11964-65 816 1349 -533 2.9 10.31965-66 810 1409 -599 -0.7 4.41966-67 1157 2078 -921 42.8 47.51967-68 1199 2008 -809 3.6 -3.41968-69 1358 1909 -551 13.3 -4.91969-70 1413 1582 -169 4.1 -17.11970-71 1535 1634 -99 8.6 3.31971-72 1608 1825 -217 4.8 11.71972-73 1971 1867 104 22.6 2.31973-74 2523 2955 -432 28.0 58.31974-75 3329 4519 -1190 31.9 52.91975-76 4036 5265 -1229 21.2 16.51976-77 5142 5074 68 27.4 -3.61977-78 5408 6020 -612 5.2 18.61978-79 5726 6811 -1085 5.9 13.11979-80 6418 9143 -2725 12.1 34.21980-81 6711 12549 -5838 4.6 37.31981-82 7806 13608 -5802 16.3 8.41982-83 8803 14293 -5490 12.8 5.01983-84 9771 15831 -6060 11.0 10.81984-85 11744 17134 -5390 20.2 8.21985-86 10895 19658 -8763 -7.2 14.71986-87 12452 20096 -7644 14.3 2.21987-88 15674 22244 -6570 25.9 10.71988-89 20232 28235 -8003 29.1 26.91989-90 27658 35328 -7670 36.7 25.1
Contd....

Economic Survey 2018-19 Volume 2 | A 103
Table 7.1 A. Exports, Imports and Trade BalanceYear Exports
(includingre-exports)
(Rcrore)
Imports(` crore)
TradeBalance(` crore)
Rate of ChangeExport Import
(per cent)
(1) (2) (3) (4) (5) (6)1990-91 32553 43198 -10645 17.7 22.31991-92 44041 47851 -3810 35.3 10.81992-93 53688 63375 -9687 21.9 32.41993-94 69751 73101 -3350 29.9 15.31994-95 82674 89971 -7297 18.5 23.11995-96 106353 122678 -16325 28.6 36.41996-97 118817 138920 -20103 11.7 13.21997-98 130100 154176 -24076 9.5 11.01998-99 139752 178332 -38580 7.4 15.71999-00 159095 215529 -56434 13.8 20.92000-01 201356 228307 -26950 26.6 5.92001-02 209018 245200 -36182 3.8 7.42002-03 255137 297206 -42069 22.1 21.22003-04 293367 359108 -65741 15.0 20.82004-05 375340 501065 -125725 27.9 39.52005-06 456418 660409 -203991 21.6 31.82006-07 571779 840506 -268727 25.3 27.32007-08 655864 1012312 -356448 14.7 20.42008-09 840755 1374436 -533681 28.2 35.82009-10 845534 1363736 -518202 0.6 -0.82010-11 1142922 1683467 -540545 35.2 23.42011-12 1465959 2345463 -879504 28.3 39.32012-13 1634319 2669162 -1034843 11.5 13.82013-14 1905011 2715434 -810423 16.6 1.72014-15 1896348 2737087 -840738 -0.5 0.82015-16 1716384 2490306 -773921 -9.5 -9.02016-17 1849434 2577675 -728242 7.8 3.52017-18 1956515 3001033 -1044519 5.8 16.42018-19 (P) 2307663 3594373 -1286710 18.0 19.8
Source : Directorate General of Commercial Intelligence & Statistics (DGCI&S), Kolkata Notes: P: Provisional.1. For the years 1956-57, 1957-58, 1958-59 and 1959-60, the data are as per the Fourteenth Report of the Estimates Committee (1971-
72) of the erstwhile Ministry of Foreign Trade.
(Contd....)
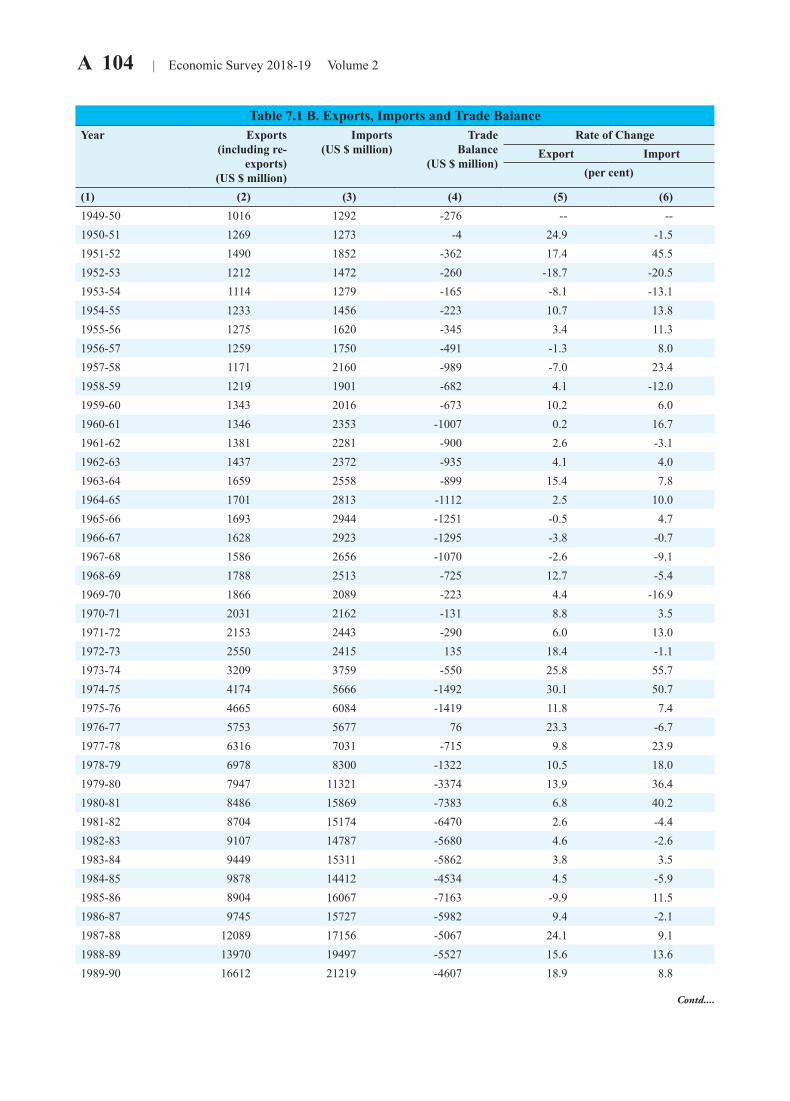
A 104 | Economic Survey 2018-19 Volume 2
Table 7.1 B. Exports, Imports and Trade BalanceYear Exports
(including re-exports)
(US $ million)
Imports (US $ million)
TradeBalance
(US $ million)
Rate of ChangeExport Import
(per cent)
(1) (2) (3) (4) (5) (6)1949-50 1016 1292 -276 -- --1950-51 1269 1273 -4 24.9 -1.51951-52 1490 1852 -362 17.4 45.51952-53 1212 1472 -260 -18.7 -20.51953-54 1114 1279 -165 -8.1 -13.11954-55 1233 1456 -223 10.7 13.81955-56 1275 1620 -345 3.4 11.31956-57 1259 1750 -491 -1.3 8.01957-58 1171 2160 -989 -7.0 23.41958-59 1219 1901 -682 4.1 -12.01959-60 1343 2016 -673 10.2 6.01960-61 1346 2353 -1007 0.2 16.71961-62 1381 2281 -900 2.6 -3.11962-63 1437 2372 -935 4.1 4.01963-64 1659 2558 -899 15.4 7.81964-65 1701 2813 -1112 2.5 10.01965-66 1693 2944 -1251 -0.5 4.71966-67 1628 2923 -1295 -3.8 -0.71967-68 1586 2656 -1070 -2.6 -9.11968-69 1788 2513 -725 12.7 -5.41969-70 1866 2089 -223 4.4 -16.91970-71 2031 2162 -131 8.8 3.51971-72 2153 2443 -290 6.0 13.01972-73 2550 2415 135 18.4 -1.11973-74 3209 3759 -550 25.8 55.71974-75 4174 5666 -1492 30.1 50.71975-76 4665 6084 -1419 11.8 7.41976-77 5753 5677 76 23.3 -6.71977-78 6316 7031 -715 9.8 23.91978-79 6978 8300 -1322 10.5 18.01979-80 7947 11321 -3374 13.9 36.41980-81 8486 15869 -7383 6.8 40.21981-82 8704 15174 -6470 2.6 -4.41982-83 9107 14787 -5680 4.6 -2.61983-84 9449 15311 -5862 3.8 3.51984-85 9878 14412 -4534 4.5 -5.91985-86 8904 16067 -7163 -9.9 11.51986-87 9745 15727 -5982 9.4 -2.11987-88 12089 17156 -5067 24.1 9.11988-89 13970 19497 -5527 15.6 13.61989-90 16612 21219 -4607 18.9 8.8
Contd....

Economic Survey 2018-19 Volume 2 | A 105
Table 7.1 B. Exports, Imports and Trade BalanceYear Exports
(including re-exports)
(US $ million)
Imports (US $ million)
TradeBalance
(US $ million)
Rate of ChangeExport Import
(per cent)
(1) (2) (3) (4) (5) (6)1990-91 18143 24075 -5932 9.2 13.51991-92 17865 19411 -1546 -1.5 -19.41992-93 18537 21882 -3345 3.8 12.71993-94 22238 23306 -1068 20.0 6.51994-95 26330 28654 -2324 18.4 22.91995-96 31797 36678 -4881 20.8 28.01996-97 33470 39133 -5663 5.3 6.71997-98 35006 41484 -6478 4.6 6.01998-99 33218 42389 -9171 -5.1 2.21999-2000 36715 49738 -13023 10.5 17.32000-01 44076 49975 -5899 20.0 0.52001-02 43827 51413 -7587 -0.6 2.92002-03 52719 61412 -8693 20.3 19.42003-04 63843 78149 -14307 21.1 27.32004-05 83536 111517 -27981 30.8 42.72005-06 103091 149166 -46075 23.4 33.82006-07 126414 185735 -59321 22.6 24.52007-08 163132 251654 -88522 29.0 35.52008-09 185295 303696 -118401 13.6 20.72009-10 178751 288373 -109621 -3.5 -5.02010-11 251136 369769 -118633 40.5 28.22011-12 305964 489319 -183356 21.8 32.32012-13 300401 490737 -190336 -1.8 0.32013-14 314405 450200 -135794 4.7 -8.32014-15 310338 448033 -137695 -1.3 -0.52015-16 262291 381008 -118717 -15.5 -15.02016-17 275852 384357 -108505 5.2 0.92017-18 303526 465581 -162055 10.0 21.12018-19 (P) 329536 514034 -184498 8.8 10.4
Source : DGCI&S, Kolkata Notes: P: Provisional.1. For the years 1956-57, 1957-58, 1958-59 and 1959-60, the data are as per the Fourteenth Report of the Estimates Committee
(1971-72) of the erstwhile Ministry of Foreign Trade.
(Contd....)
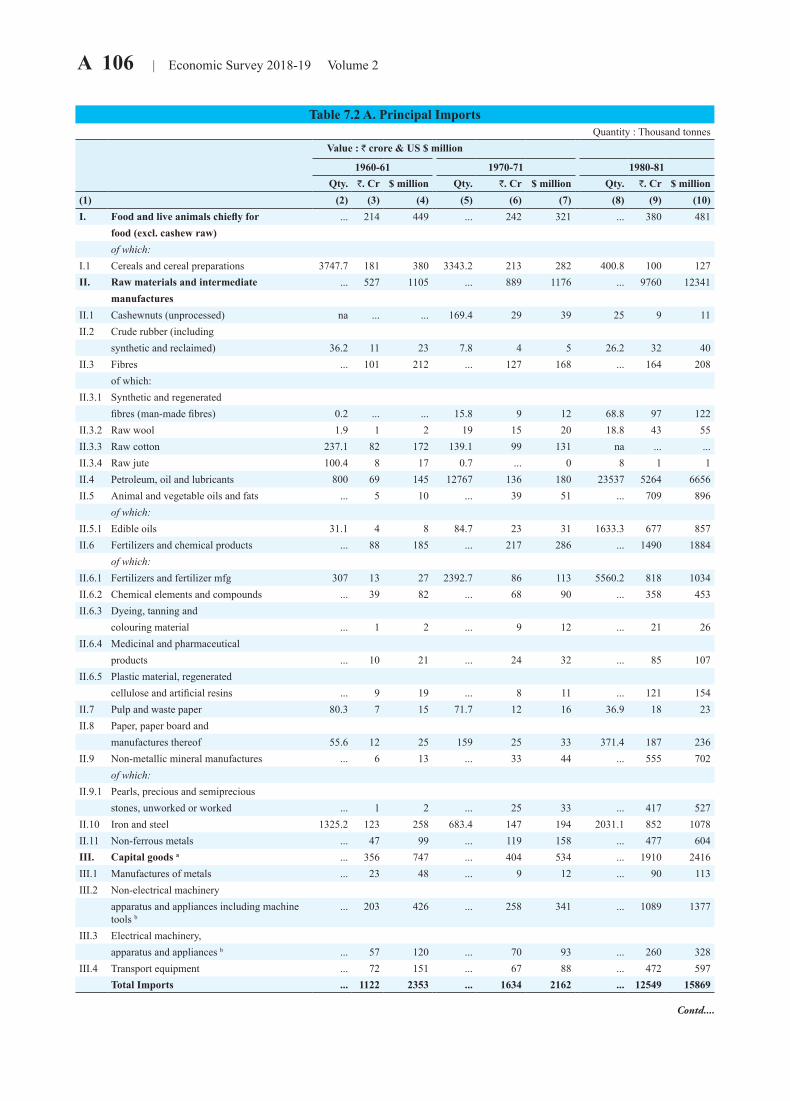
A 106 | Economic Survey 2018-19 Volume 2
Table 7.2 A. Principal ImportsQuantity : Thousand tonnes
Value : ` crore & US $ million
1960-61 1970-71 1980-81Qty. `. Cr $ million Qty. `. Cr $ million Qty. `. Cr $ million
(1) (2) (3) (4) (5) (6) (7) (8) (9) (10)I. Food and live animals chiefly for ... 214 449 ... 242 321 ... 380 481
food (excl. cashew raw)of which:
I.1 Cereals and cereal preparations 3747.7 181 380 3343.2 213 282 400.8 100 127II. Raw materials and intermediate ... 527 1105 ... 889 1176 ... 9760 12341
manufacturesII.1 Cashewnuts (unprocessed) na ... ... 169.4 29 39 25 9 11II.2 Crude rubber (including
synthetic and reclaimed) 36.2 11 23 7.8 4 5 26.2 32 40II.3 Fibres ... 101 212 ... 127 168 ... 164 208
of which:II.3.1 Synthetic and regenerated
fibres (man-made fibres) 0.2 ... ... 15.8 9 12 68.8 97 122II.3.2 Raw wool 1.9 1 2 19 15 20 18.8 43 55II.3.3 Raw cotton 237.1 82 172 139.1 99 131 na ... ...II.3.4 Raw jute 100.4 8 17 0.7 ... 0 8 1 1II.4 Petroleum, oil and lubricants 800 69 145 12767 136 180 23537 5264 6656II.5 Animal and vegetable oils and fats ... 5 10 ... 39 51 ... 709 896
of which:II.5.1 Edible oils 31.1 4 8 84.7 23 31 1633.3 677 857II.6 Fertilizers and chemical products ... 88 185 ... 217 286 ... 1490 1884
of which:II.6.1 Fertilizers and fertilizer mfg 307 13 27 2392.7 86 113 5560.2 818 1034II.6.2 Chemical elements and compounds ... 39 82 ... 68 90 ... 358 453II.6.3 Dyeing, tanning and
colouring material ... 1 2 ... 9 12 ... 21 26II.6.4 Medicinal and pharmaceutical
products ... 10 21 ... 24 32 ... 85 107II.6.5 Plastic material, regenerated
cellulose and artificial resins ... 9 19 ... 8 11 ... 121 154II.7 Pulp and waste paper 80.3 7 15 71.7 12 16 36.9 18 23II.8 Paper, paper board and
manufactures thereof 55.6 12 25 159 25 33 371.4 187 236II.9 Non-metallic mineral manufactures ... 6 13 ... 33 44 ... 555 702
of which:II.9.1 Pearls, precious and semiprecious
stones, unworked or worked ... 1 2 ... 25 33 ... 417 527II.10 Iron and steel 1325.2 123 258 683.4 147 194 2031.1 852 1078II.11 Non-ferrous metals ... 47 99 ... 119 158 ... 477 604III. Capital goods a ... 356 747 ... 404 534 ... 1910 2416III.1 Manufactures of metals ... 23 48 ... 9 12 ... 90 113III.2 Non-electrical machinery
apparatus and appliances including machine tools b
... 203 426 ... 258 341 ... 1089 1377
III.3 Electrical machinery,apparatus and appliances b ... 57 120 ... 70 93 ... 260 328
III.4 Transport equipment ... 72 151 ... 67 88 ... 472 597Total Imports ... 1122 2353 ... 1634 2162 ... 12549 15869
Contd....
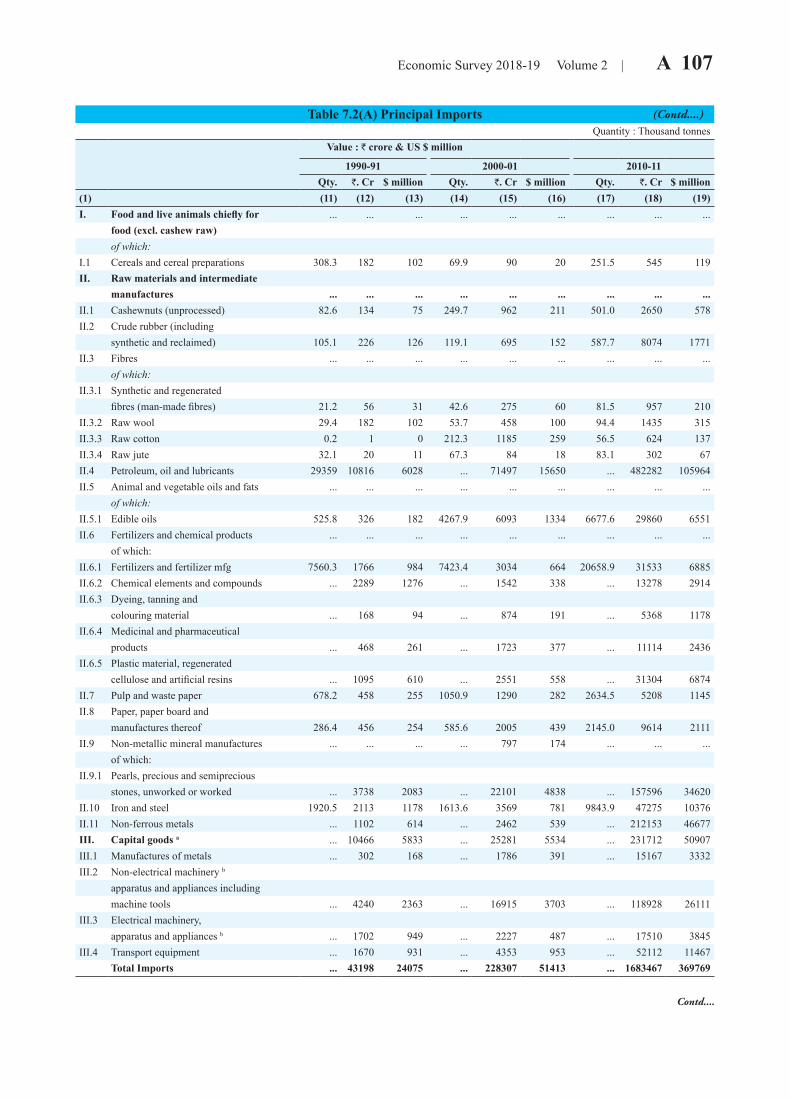
Economic Survey 2018-19 Volume 2 | A 107
Table 7.2(A) Principal ImportsQuantity : Thousand tonnes
Value : ` crore & US $ million
1990-91 2000-01 2010-11Qty. `. Cr $ million Qty. `. Cr $ million Qty. `. Cr $ million
(1) (11) (12) (13) (14) (15) (16) (17) (18) (19)I. Food and live animals chiefly for ... ... ... ... ... ... ... ... ...
food (excl. cashew raw)of which:
I.1 Cereals and cereal preparations 308.3 182 102 69.9 90 20 251.5 545 119II. Raw materials and intermediate
manufactures ... ... ... ... ... ... ... ... ...II.1 Cashewnuts (unprocessed) 82.6 134 75 249.7 962 211 501.0 2650 578II.2 Crude rubber (including
synthetic and reclaimed) 105.1 226 126 119.1 695 152 587.7 8074 1771II.3 Fibres ... ... ... ... ... ... ... ... ...
of which:II.3.1 Synthetic and regenerated
fibres (man-made fibres) 21.2 56 31 42.6 275 60 81.5 957 210II.3.2 Raw wool 29.4 182 102 53.7 458 100 94.4 1435 315II.3.3 Raw cotton 0.2 1 0 212.3 1185 259 56.5 624 137II.3.4 Raw jute 32.1 20 11 67.3 84 18 83.1 302 67II.4 Petroleum, oil and lubricants 29359 10816 6028 ... 71497 15650 ... 482282 105964II.5 Animal and vegetable oils and fats ... ... ... ... ... ... ... ... ...
of which:II.5.1 Edible oils 525.8 326 182 4267.9 6093 1334 6677.6 29860 6551II.6 Fertilizers and chemical products ... ... ... ... ... ... ... ... ...
of which:II.6.1 Fertilizers and fertilizer mfg 7560.3 1766 984 7423.4 3034 664 20658.9 31533 6885II.6.2 Chemical elements and compounds ... 2289 1276 ... 1542 338 ... 13278 2914II.6.3 Dyeing, tanning and
colouring material ... 168 94 ... 874 191 ... 5368 1178II.6.4 Medicinal and pharmaceutical
products ... 468 261 ... 1723 377 ... 11114 2436II.6.5 Plastic material, regenerated
cellulose and artificial resins ... 1095 610 ... 2551 558 ... 31304 6874II.7 Pulp and waste paper 678.2 458 255 1050.9 1290 282 2634.5 5208 1145II.8 Paper, paper board and
manufactures thereof 286.4 456 254 585.6 2005 439 2145.0 9614 2111II.9 Non-metallic mineral manufactures ... ... ... ... 797 174 ... ... ...
of which:II.9.1 Pearls, precious and semiprecious
stones, unworked or worked ... 3738 2083 ... 22101 4838 ... 157596 34620II.10 Iron and steel 1920.5 2113 1178 1613.6 3569 781 9843.9 47275 10376II.11 Non-ferrous metals ... 1102 614 ... 2462 539 ... 212153 46677III. Capital goods a ... 10466 5833 ... 25281 5534 ... 231712 50907III.1 Manufactures of metals ... 302 168 ... 1786 391 ... 15167 3332III.2 Non-electrical machinery b
apparatus and appliances includingmachine tools ... 4240 2363 ... 16915 3703 ... 118928 26111
III.3 Electrical machinery,apparatus and appliances b ... 1702 949 ... 2227 487 ... 17510 3845
III.4 Transport equipment ... 1670 931 ... 4353 953 ... 52112 11467Total Imports ... 43198 24075 ... 228307 51413 ... 1683467 369769
Contd....
(Contd....)
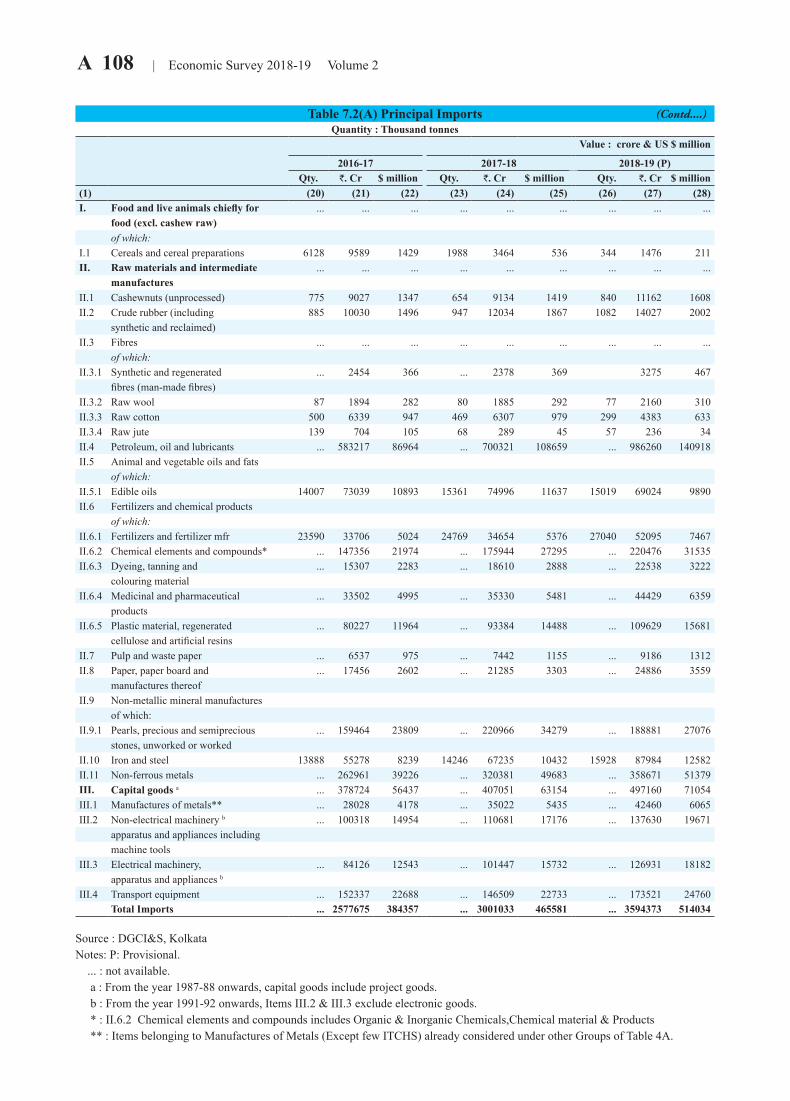
A 108 | Economic Survey 2018-19 Volume 2
Table 7.2(A) Principal ImportsQuantity : Thousand tonnes
Value : crore & US $ million
2016-17 2017-18 2018-19 (P) Qty. `. Cr $ million Qty. `. Cr $ million Qty. `. Cr $ million
(1) (20) (21) (22) (23) (24) (25) (26) (27) (28)I. Food and live animals chiefly for ... ... ... ... ... ... ... ... ...
food (excl. cashew raw)of which:
I.1 Cereals and cereal preparations 6128 9589 1429 1988 3464 536 344 1476 211II. Raw materials and intermediate ... ... ... ... ... ... ... ... ...
manufacturesII.1 Cashewnuts (unprocessed) 775 9027 1347 654 9134 1419 840 11162 1608II.2 Crude rubber (including 885 10030 1496 947 12034 1867 1082 14027 2002
synthetic and reclaimed)II.3 Fibres ... ... ... ... ... ... ... ... ...
of which:II.3.1 Synthetic and regenerated ... 2454 366 ... 2378 369 3275 467
fibres (man-made fibres)II.3.2 Raw wool 87 1894 282 80 1885 292 77 2160 310II.3.3 Raw cotton 500 6339 947 469 6307 979 299 4383 633II.3.4 Raw jute 139 704 105 68 289 45 57 236 34II.4 Petroleum, oil and lubricants ... 583217 86964 ... 700321 108659 ... 986260 140918II.5 Animal and vegetable oils and fats
of which:II.5.1 Edible oils 14007 73039 10893 15361 74996 11637 15019 69024 9890II.6 Fertilizers and chemical products
of which:II.6.1 Fertilizers and fertilizer mfr 23590 33706 5024 24769 34654 5376 27040 52095 7467II.6.2 Chemical elements and compounds* ... 147356 21974 ... 175944 27295 ... 220476 31535II.6.3 Dyeing, tanning and ... 15307 2283 ... 18610 2888 ... 22538 3222
colouring materialII.6.4 Medicinal and pharmaceutical ... 33502 4995 ... 35330 5481 ... 44429 6359
productsII.6.5 Plastic material, regenerated ... 80227 11964 ... 93384 14488 ... 109629 15681
cellulose and artificial resinsII.7 Pulp and waste paper ... 6537 975 ... 7442 1155 ... 9186 1312II.8 Paper, paper board and ... 17456 2602 ... 21285 3303 ... 24886 3559
manufactures thereofII.9 Non-metallic mineral manufactures
of which:II.9.1 Pearls, precious and semiprecious ... 159464 23809 ... 220966 34279 ... 188881 27076
stones, unworked or workedII.10 Iron and steel 13888 55278 8239 14246 67235 10432 15928 87984 12582II.11 Non-ferrous metals ... 262961 39226 ... 320381 49683 ... 358671 51379III. Capital goods a ... 378724 56437 ... 407051 63154 ... 497160 71054III.1 Manufactures of metals** ... 28028 4178 ... 35022 5435 ... 42460 6065III.2 Non-electrical machinery b ... 100318 14954 ... 110681 17176 ... 137630 19671
apparatus and appliances includingmachine tools
III.3 Electrical machinery, ... 84126 12543 ... 101447 15732 ... 126931 18182apparatus and appliances b
III.4 Transport equipment ... 152337 22688 ... 146509 22733 ... 173521 24760Total Imports ... 2577675 384357 ... 3001033 465581 ... 3594373 514034
Source : DGCI&S, Kolkata Notes: P: Provisional. ... : not available. a : From the year 1987-88 onwards, capital goods include project goods. b : From the year 1991-92 onwards, Items III.2 & III.3 exclude electronic goods. * : II.6.2 Chemical elements and compounds includes Organic & Inorganic Chemicals,Chemical material & Products ** : Items belonging to Manufactures of Metals (Except few ITCHS) already considered under other Groups of Table 4A.
(Contd....)
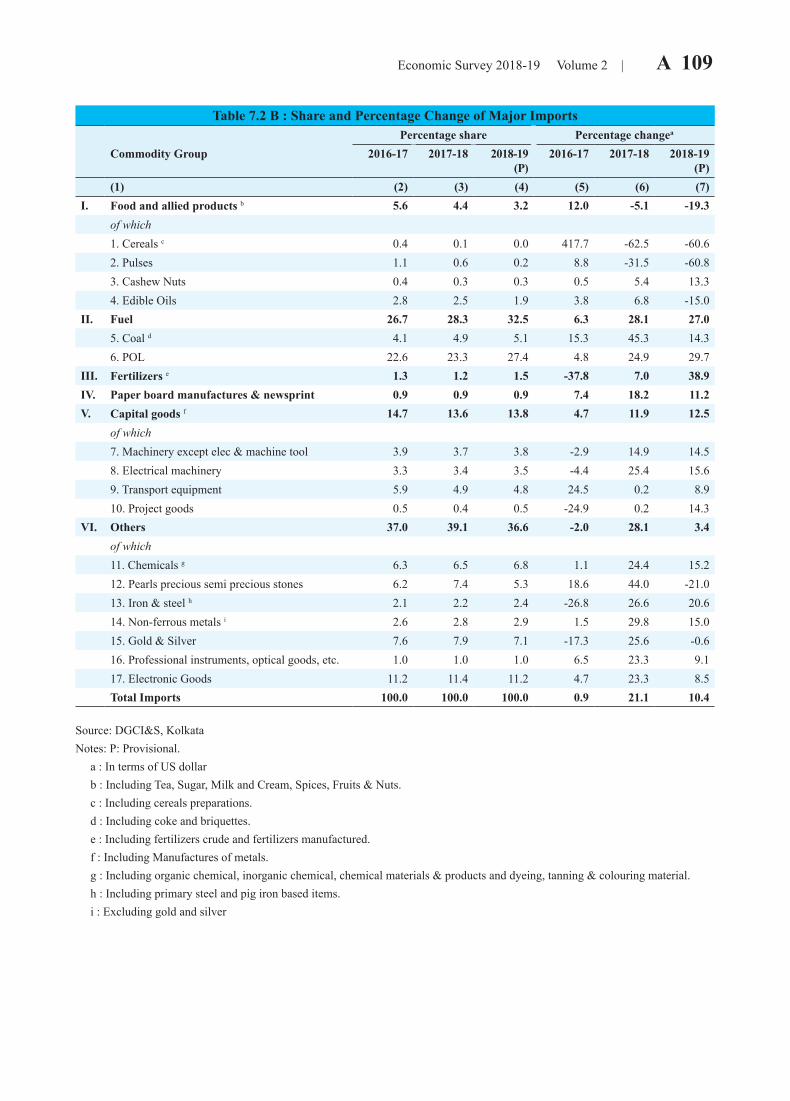
Economic Survey 2018-19 Volume 2 | A 109
Table 7.2 B : Share and Percentage Change of Major Imports Percentage share Percentage changea
Commodity Group 2016-17 2017-18 2018-19 (P)
2016-17 2017-18 2018-19 (P)
(1) (2) (3) (4) (5) (6) (7)I. Food and allied products b 5.6 4.4 3.2 12.0 -5.1 -19.3
of which1. Cereals c 0.4 0.1 0.0 417.7 -62.5 -60.62. Pulses 1.1 0.6 0.2 8.8 -31.5 -60.83. Cashew Nuts 0.4 0.3 0.3 0.5 5.4 13.34. Edible Oils 2.8 2.5 1.9 3.8 6.8 -15.0
II. Fuel 26.7 28.3 32.5 6.3 28.1 27.05. Coal d 4.1 4.9 5.1 15.3 45.3 14.36. POL 22.6 23.3 27.4 4.8 24.9 29.7
III. Fertilizers e 1.3 1.2 1.5 -37.8 7.0 38.9IV. Paper board manufactures & newsprint 0.9 0.9 0.9 7.4 18.2 11.2V. Capital goods f 14.7 13.6 13.8 4.7 11.9 12.5
of which7. Machinery except elec & machine tool 3.9 3.7 3.8 -2.9 14.9 14.58. Electrical machinery 3.3 3.4 3.5 -4.4 25.4 15.69. Transport equipment 5.9 4.9 4.8 24.5 0.2 8.910. Project goods 0.5 0.4 0.5 -24.9 0.2 14.3
VI. Others 37.0 39.1 36.6 -2.0 28.1 3.4of which11. Chemicals g 6.3 6.5 6.8 1.1 24.4 15.212. Pearls precious semi precious stones 6.2 7.4 5.3 18.6 44.0 -21.013. Iron & steel h 2.1 2.2 2.4 -26.8 26.6 20.614. Non-ferrous metals i 2.6 2.8 2.9 1.5 29.8 15.015. Gold & Silver 7.6 7.9 7.1 -17.3 25.6 -0.616. Professional instruments, optical goods, etc. 1.0 1.0 1.0 6.5 23.3 9.117. Electronic Goods 11.2 11.4 11.2 4.7 23.3 8.5Total Imports 100.0 100.0 100.0 0.9 21.1 10.4
Source: DGCI&S, Kolkata Notes: P: Provisional. a : In terms of US dollar b : Including Tea, Sugar, Milk and Cream, Spices, Fruits & Nuts. c : Including cereals preparations. d : Including coke and briquettes. e : Including fertilizers crude and fertilizers manufactured. f : Including Manufactures of metals. g : Including organic chemical, inorganic chemical, chemical materials & products and dyeing, tanning & colouring material. h : Including primary steel and pig iron based items. i : Excluding gold and silver
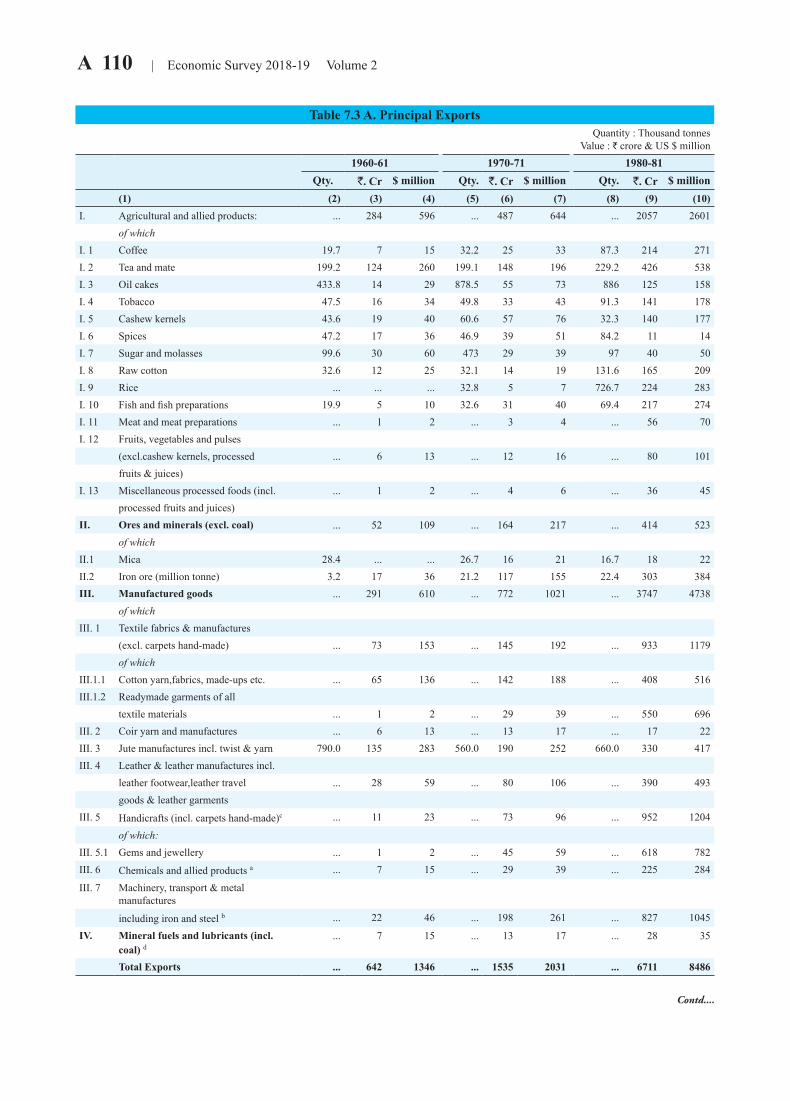
A 110 | Economic Survey 2018-19 Volume 2
Table 7.3 A. Principal Exports Quantity : Thousand tonnes
Value : ` crore & US $ million1960-61 1970-71 1980-81
Qty. `. Cr $ million Qty. `. Cr $ million Qty. `. Cr $ million(1) (2) (3) (4) (5) (6) (7) (8) (9) (10)
I. Agricultural and allied products: ... 284 596 ... 487 644 ... 2057 2601of which
I. 1 Coffee 19.7 7 15 32.2 25 33 87.3 214 271I. 2 Tea and mate 199.2 124 260 199.1 148 196 229.2 426 538I. 3 Oil cakes 433.8 14 29 878.5 55 73 886 125 158I. 4 Tobacco 47.5 16 34 49.8 33 43 91.3 141 178I. 5 Cashew kernels 43.6 19 40 60.6 57 76 32.3 140 177I. 6 Spices 47.2 17 36 46.9 39 51 84.2 11 14I. 7 Sugar and molasses 99.6 30 60 473 29 39 97 40 50I. 8 Raw cotton 32.6 12 25 32.1 14 19 131.6 165 209I. 9 Rice ... ... ... 32.8 5 7 726.7 224 283I. 10 Fish and fish preparations 19.9 5 10 32.6 31 40 69.4 217 274I. 11 Meat and meat preparations ... 1 2 ... 3 4 ... 56 70I. 12 Fruits, vegetables and pulses
(excl.cashew kernels, processed ... 6 13 ... 12 16 ... 80 101fruits & juices)
I. 13 Miscellaneous processed foods (incl. ... 1 2 ... 4 6 ... 36 45processed fruits and juices)
II. Ores and minerals (excl. coal) ... 52 109 ... 164 217 ... 414 523of which
II.1 Mica 28.4 ... ... 26.7 16 21 16.7 18 22II.2 Iron ore (million tonne) 3.2 17 36 21.2 117 155 22.4 303 384III. Manufactured goods ... 291 610 ... 772 1021 ... 3747 4738
of whichIII. 1 Textile fabrics & manufactures
(excl. carpets hand-made) ... 73 153 ... 145 192 ... 933 1179of which
III.1.1 Cotton yarn,fabrics, made-ups etc. ... 65 136 ... 142 188 ... 408 516III.1.2 Readymade garments of all
textile materials ... 1 2 ... 29 39 ... 550 696III. 2 Coir yarn and manufactures ... 6 13 ... 13 17 ... 17 22III. 3 Jute manufactures incl. twist & yarn 790.0 135 283 560.0 190 252 660.0 330 417III. 4 Leather & leather manufactures incl.
leather footwear,leather travel ... 28 59 ... 80 106 ... 390 493goods & leather garments
III. 5 Handicrafts (incl. carpets hand-made)c ... 11 23 ... 73 96 ... 952 1204
of which:III. 5.1 Gems and jewellery ... 1 2 ... 45 59 ... 618 782III. 6 Chemicals and allied products a ... 7 15 ... 29 39 ... 225 284
III. 7 Machinery, transport & metal manufactures
including iron and steel b ... 22 46 ... 198 261 ... 827 1045
IV. Mineral fuels and lubricants (incl.coal) d
... 7 15 ... 13 17 ... 28 35
Total Exports ... 642 1346 ... 1535 2031 ... 6711 8486
Contd....
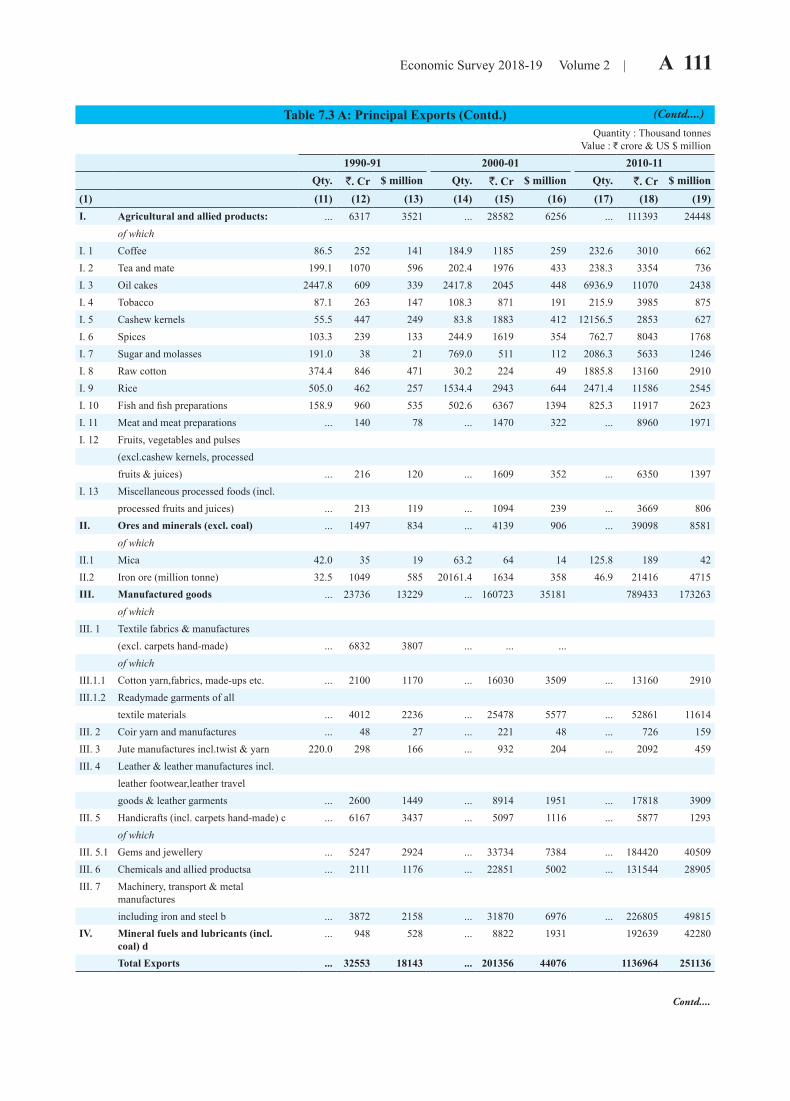
Economic Survey 2018-19 Volume 2 | A 111
Table 7.3 A: Principal Exports (Contd.)Quantity : Thousand tonnes
Value : ` crore & US $ million1990-91 2000-01 2010-11
Qty. `. Cr $ million Qty. `. Cr $ million Qty. `. Cr $ million(1) (11) (12) (13) (14) (15) (16) (17) (18) (19)I. Agricultural and allied products: ... 6317 3521 ... 28582 6256 ... 111393 24448
of whichI. 1 Coffee 86.5 252 141 184.9 1185 259 232.6 3010 662I. 2 Tea and mate 199.1 1070 596 202.4 1976 433 238.3 3354 736I. 3 Oil cakes 2447.8 609 339 2417.8 2045 448 6936.9 11070 2438I. 4 Tobacco 87.1 263 147 108.3 871 191 215.9 3985 875I. 5 Cashew kernels 55.5 447 249 83.8 1883 412 12156.5 2853 627I. 6 Spices 103.3 239 133 244.9 1619 354 762.7 8043 1768I. 7 Sugar and molasses 191.0 38 21 769.0 511 112 2086.3 5633 1246I. 8 Raw cotton 374.4 846 471 30.2 224 49 1885.8 13160 2910I. 9 Rice 505.0 462 257 1534.4 2943 644 2471.4 11586 2545I. 10 Fish and fish preparations 158.9 960 535 502.6 6367 1394 825.3 11917 2623I. 11 Meat and meat preparations ... 140 78 ... 1470 322 ... 8960 1971I. 12 Fruits, vegetables and pulses
(excl.cashew kernels, processedfruits & juices) ... 216 120 ... 1609 352 ... 6350 1397
I. 13 Miscellaneous processed foods (incl.processed fruits and juices) ... 213 119 ... 1094 239 ... 3669 806
II. Ores and minerals (excl. coal) ... 1497 834 ... 4139 906 ... 39098 8581of which
II.1 Mica 42.0 35 19 63.2 64 14 125.8 189 42II.2 Iron ore (million tonne) 32.5 1049 585 20161.4 1634 358 46.9 21416 4715III. Manufactured goods ... 23736 13229 ... 160723 35181 789433 173263
of whichIII. 1 Textile fabrics & manufactures
(excl. carpets hand-made) ... 6832 3807 ... ... ...of which
III.1.1 Cotton yarn,fabrics, made-ups etc. ... 2100 1170 ... 16030 3509 ... 13160 2910III.1.2 Readymade garments of all
textile materials ... 4012 2236 ... 25478 5577 ... 52861 11614III. 2 Coir yarn and manufactures ... 48 27 ... 221 48 ... 726 159III. 3 Jute manufactures incl.twist & yarn 220.0 298 166 ... 932 204 ... 2092 459III. 4 Leather & leather manufactures incl.
leather footwear,leather travelgoods & leather garments ... 2600 1449 ... 8914 1951 ... 17818 3909
III. 5 Handicrafts (incl. carpets hand-made) c ... 6167 3437 ... 5097 1116 ... 5877 1293of which
III. 5.1 Gems and jewellery ... 5247 2924 ... 33734 7384 ... 184420 40509III. 6 Chemicals and allied productsa ... 2111 1176 ... 22851 5002 ... 131544 28905III. 7 Machinery, transport & metal
manufacturesincluding iron and steel b ... 3872 2158 ... 31870 6976 ... 226805 49815
IV. Mineral fuels and lubricants (incl.coal) d
... 948 528 ... 8822 1931 192639 42280
Total Exports ... 32553 18143 ... 201356 44076 1136964 251136
Contd....
(Contd....)
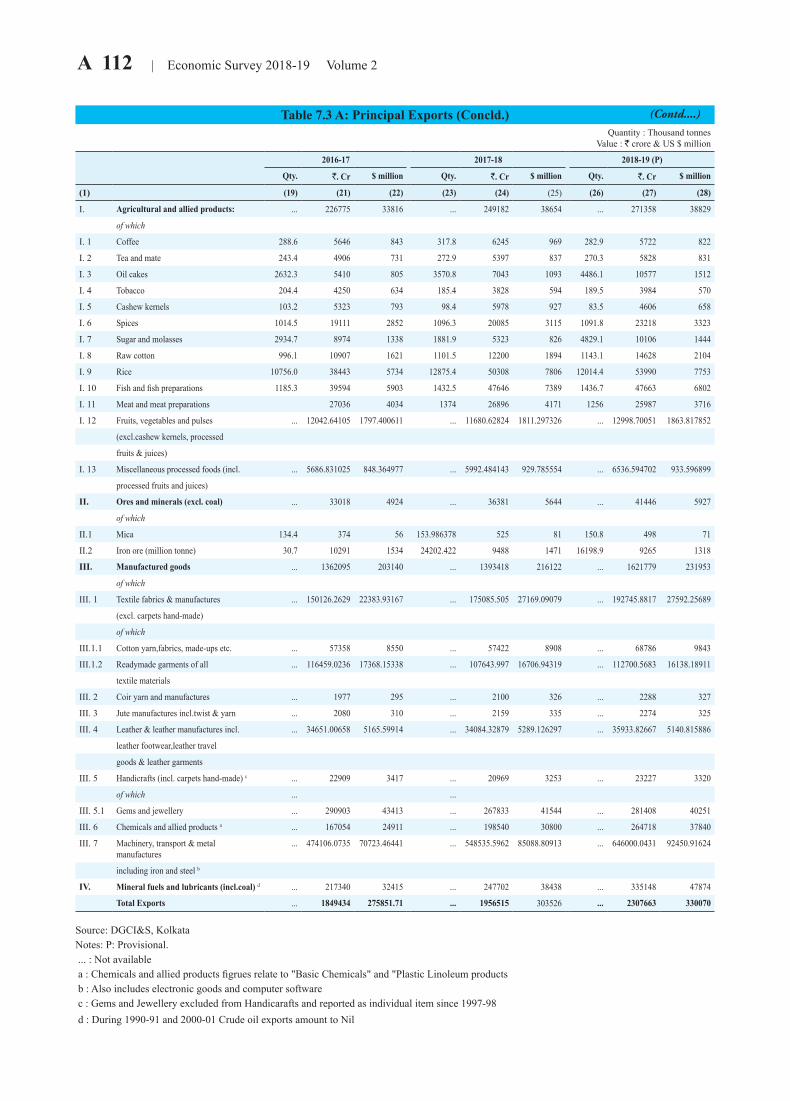
A 112 | Economic Survey 2018-19 Volume 2
Table 7.3 A: Principal Exports (Concld.)Quantity : Thousand tonnes
Value : ` crore & US $ million
2016-17 2017-18 2018-19 (P)
Qty. `. Cr $ million Qty. `. Cr $ million Qty. `. Cr $ million
(1) (19) (21) (22) (23) (24) (25) (26) (27) (28)
I. Agricultural and allied products: ... 226775 33816 ... 249182 38654 ... 271358 38829
of which
I. 1 Coffee 288.6 5646 843 317.8 6245 969 282.9 5722 822
I. 2 Tea and mate 243.4 4906 731 272.9 5397 837 270.3 5828 831
I. 3 Oil cakes 2632.3 5410 805 3570.8 7043 1093 4486.1 10577 1512
I. 4 Tobacco 204.4 4250 634 185.4 3828 594 189.5 3984 570
I. 5 Cashew kernels 103.2 5323 793 98.4 5978 927 83.5 4606 658
I. 6 Spices 1014.5 19111 2852 1096.3 20085 3115 1091.8 23218 3323
I. 7 Sugar and molasses 2934.7 8974 1338 1881.9 5323 826 4829.1 10106 1444
I. 8 Raw cotton 996.1 10907 1621 1101.5 12200 1894 1143.1 14628 2104
I. 9 Rice 10756.0 38443 5734 12875.4 50308 7806 12014.4 53990 7753
I. 10 Fish and fish preparations 1185.3 39594 5903 1432.5 47646 7389 1436.7 47663 6802
I. 11 Meat and meat preparations 27036 4034 1374 26896 4171 1256 25987 3716
I. 12 Fruits, vegetables and pulses ... 12042.64105 1797.400611 ... 11680.62824 1811.297326 ... 12998.70051 1863.817852
(excl.cashew kernels, processed
fruits & juices)
I. 13 Miscellaneous processed foods (incl. ... 5686.831025 848.364977 ... 5992.484143 929.785554 ... 6536.594702 933.596899
processed fruits and juices)
II. Ores and minerals (excl. coal) ... 33018 4924 ... 36381 5644 ... 41446 5927
of which
II.1 Mica 134.4 374 56 153.986378 525 81 150.8 498 71
II.2 Iron ore (million tonne) 30.7 10291 1534 24202.422 9488 1471 16198.9 9265 1318
III. Manufactured goods ... 1362095 203140 ... 1393418 216122 ... 1621779 231953
of which
III. 1 Textile fabrics & manufactures ... 150126.2629 22383.93167 ... 175085.505 27169.09079 ... 192745.8817 27592.25689
(excl. carpets hand-made)
of which
III.1.1 Cotton yarn,fabrics, made-ups etc. ... 57358 8550 ... 57422 8908 ... 68786 9843
III.1.2 Readymade garments of all ... 116459.0236 17368.15338 ... 107643.997 16706.94319 ... 112700.5683 16138.18911
textile materials
III. 2 Coir yarn and manufactures ... 1977 295 ... 2100 326 ... 2288 327
III. 3 Jute manufactures incl.twist & yarn ... 2080 310 ... 2159 335 ... 2274 325
III. 4 Leather & leather manufactures incl. ... 34651.00658 5165.59914 ... 34084.32879 5289.126297 ... 35933.82667 5140.815886
leather footwear,leather travel
goods & leather garments
III. 5 Handicrafts (incl. carpets hand-made) c ... 22909 3417 ... 20969 3253 ... 23227 3320
of which ... ...
III. 5.1 Gems and jewellery ... 290903 43413 ... 267833 41544 ... 281408 40251
III. 6 Chemicals and allied products a ... 167054 24911 ... 198540 30800 ... 264718 37840
III. 7 Machinery, transport & metal manufactures
... 474106.0735 70723.46441 ... 548535.5962 85088.80913 ... 646000.0431 92450.91624
including iron and steel b
IV. Mineral fuels and lubricants (incl.coal) d ... 217340 32415 ... 247702 38438 ... 335148 47874
Total Exports ... 1849434 275851.71 ... 1956515 303526 ... 2307663 330070
Source: DGCI&S, KolkataNotes: P: Provisional. ... : Not available a : Chemicals and allied products figrues relate to "Basic Chemicals" and "Plastic Linoleum products b : Also includes electronic goods and computer software c : Gems and Jewellery excluded from Handicarafts and reported as individual item since 1997-98 d : During 1990-91 and 2000-01 Crude oil exports amount to Nil
(Contd....)
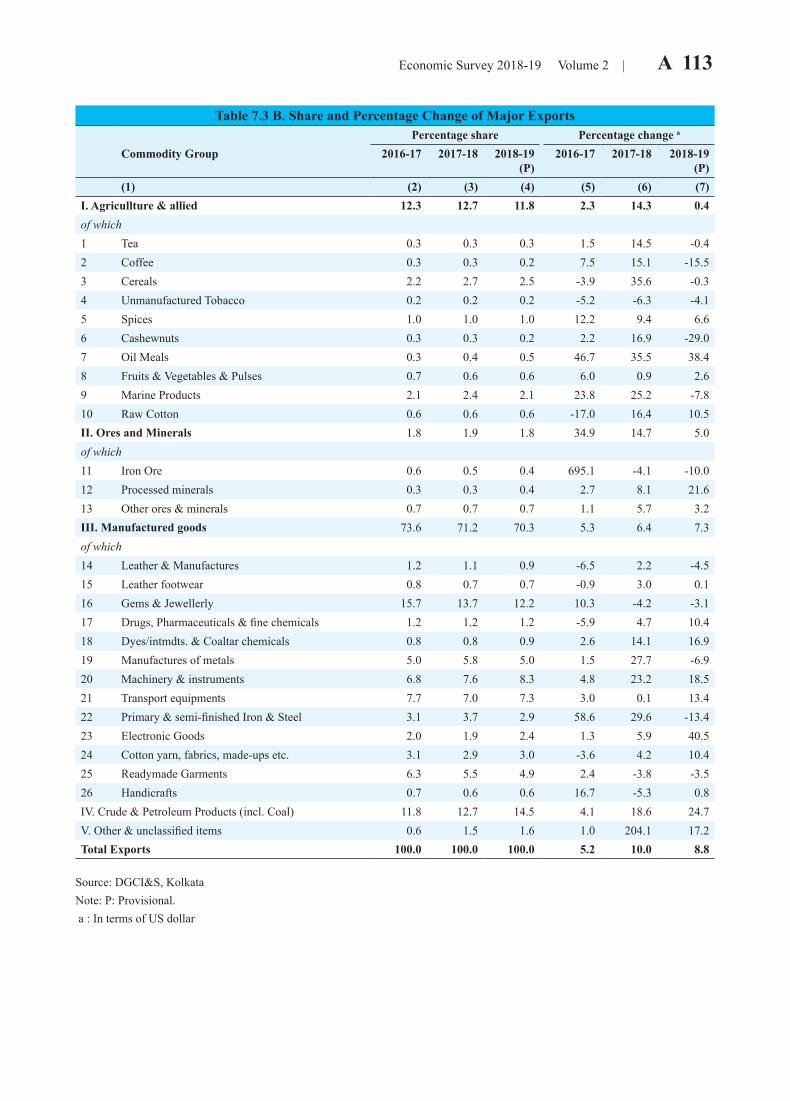
Economic Survey 2018-19 Volume 2 | A 113
Table 7.3 B. Share and Percentage Change of Major Exports Percentage share Percentage change a
Commodity Group 2016-17 2017-18 2018-19 (P)
2016-17 2017-18 2018-19 (P)
(1) (2) (3) (4) (5) (6) (7)I. Agricullture & allied 12.3 12.7 11.8 2.3 14.3 0.4of which1 Tea 0.3 0.3 0.3 1.5 14.5 -0.42 Coffee 0.3 0.3 0.2 7.5 15.1 -15.53 Cereals 2.2 2.7 2.5 -3.9 35.6 -0.34 Unmanufactured Tobacco 0.2 0.2 0.2 -5.2 -6.3 -4.15 Spices 1.0 1.0 1.0 12.2 9.4 6.66 Cashewnuts 0.3 0.3 0.2 2.2 16.9 -29.07 Oil Meals 0.3 0.4 0.5 46.7 35.5 38.48 Fruits & Vegetables & Pulses 0.7 0.6 0.6 6.0 0.9 2.69 Marine Products 2.1 2.4 2.1 23.8 25.2 -7.810 Raw Cotton 0.6 0.6 0.6 -17.0 16.4 10.5II. Ores and Minerals 1.8 1.9 1.8 34.9 14.7 5.0of which11 Iron Ore 0.6 0.5 0.4 695.1 -4.1 -10.012 Processed minerals 0.3 0.3 0.4 2.7 8.1 21.613 Other ores & minerals 0.7 0.7 0.7 1.1 5.7 3.2III. Manufactured goods 73.6 71.2 70.3 5.3 6.4 7.3of which14 Leather & Manufactures 1.2 1.1 0.9 -6.5 2.2 -4.515 Leather footwear 0.8 0.7 0.7 -0.9 3.0 0.116 Gems & Jewellerly 15.7 13.7 12.2 10.3 -4.2 -3.117 Drugs, Pharmaceuticals & fine chemicals 1.2 1.2 1.2 -5.9 4.7 10.418 Dyes/intmdts. & Coaltar chemicals 0.8 0.8 0.9 2.6 14.1 16.919 Manufactures of metals 5.0 5.8 5.0 1.5 27.7 -6.920 Machinery & instruments 6.8 7.6 8.3 4.8 23.2 18.521 Transport equipments 7.7 7.0 7.3 3.0 0.1 13.422 Primary & semi-finished Iron & Steel 3.1 3.7 2.9 58.6 29.6 -13.423 Electronic Goods 2.0 1.9 2.4 1.3 5.9 40.524 Cotton yarn, fabrics, made-ups etc. 3.1 2.9 3.0 -3.6 4.2 10.425 Readymade Garments 6.3 5.5 4.9 2.4 -3.8 -3.526 Handicrafts 0.7 0.6 0.6 16.7 -5.3 0.8IV. Crude & Petroleum Products (incl. Coal) 11.8 12.7 14.5 4.1 18.6 24.7V. Other & unclassified items 0.6 1.5 1.6 1.0 204.1 17.2Total Exports 100.0 100.0 100.0 5.2 10.0 8.8
Source: DGCI&S, Kolkata Note: P: Provisional. a : In terms of US dollar
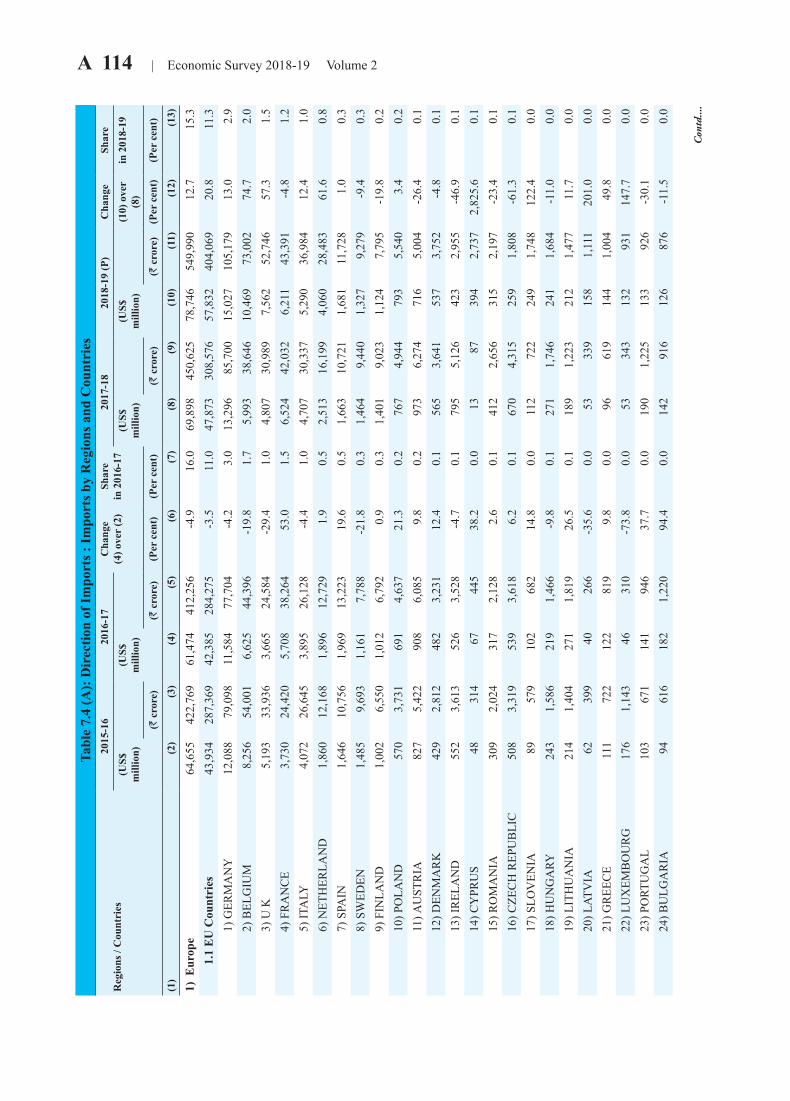
A 114 | Economic Survey 2018-19 Volume 2
Con
td....
Tabl
e 7.
4 (A
): D
irec
tion
of Im
port
s : Im
port
s by
Reg
ions
and
Cou
ntri
es R
egio
ns /
Cou
ntri
es20
15-1
620
16-1
7C
hang
e(4
) ove
r (2
)Sh
are
in 2
016-
1720
17-1
820
18-1
9 (P
)C
hang
e Sh
are
(US$
mill
ion)
(US$
mill
ion)
(US$
mill
ion)
(US$
mill
ion)
(10)
ove
r (8
) in
201
8-19
(R c
rore
)(R
cro
re)
(Per
cen
t)(P
er c
ent)
(R c
rore
)(R
cro
re)
(Per
cen
t)(P
er c
ent)
(1)
(2)
(3)
(4)
(5)
(6)
(7)
(8)
(9)
(10)
(11)
(12)
(13)
1) E
urop
e64
,655
422,
769
61,4
7441
2,25
6-4
.916
.069
,898
450,
625
78,7
4654
9,99
012
.715
.3
1.1
EU
Cou
ntri
es43
,934
287,
369
42,3
8528
4,27
5-3
.511
.047
,873
308,
576
57,8
3240
4,06
920
.811
.3
1
) GER
MA
NY
12,0
8879
,098
11,5
8477
,704
-4.2
3.0
13,2
9685
,700
15,0
2710
5,17
913
.02.
9
2
) BEL
GIU
M8,
256
54,0
016,
625
44,3
96-1
9.8
1.7
5,99
338
,646
10,4
6973
,002
74.7
2.0
3) U
K5,
193
33,9
363,
665
24,5
84-2
9.4
1.0
4,80
730
,989
7,56
252
,746
57.3
1.5
4) F
RA
NC
E3,
730
24,4
205,
708
38,2
6453
.01.
56,
524
42,0
326,
211
43,3
91-4
.81.
2
5
) ITA
LY4,
072
26,6
453,
895
26,1
28-4
.41.
04,
707
30,3
375,
290
36,9
8412
.41.
0
6
) NET
HER
LAN
D1,
860
12,1
681,
896
12,7
291.
90.
52,
513
16,1
994,
060
28,4
8361
.60.
8
7
) SPA
IN1,
646
10,7
561,
969
13,2
2319
.60.
51,
663
10,7
211,
681
11,7
281.
00.
3
8
) SW
EDEN
1,48
59,
693
1,16
17,
788
-21.
80.
31,
464
9,44
01,
327
9,27
9-9
.40.
3
9
) FIN
LAN
D1,
002
6,55
01,
012
6,79
20.
90.
31,
401
9,02
31,
124
7,79
5-1
9.8
0.2
10)
PO
LAN
D57
03,
731
691
4,63
721
.30.
276
74,
944
793
5,54
03.
40.
2
1
1) A
UST
RIA
827
5,42
290
86,
085
9.8
0.2
973
6,27
471
65,
004
-26.
40.
1
1
2) D
ENM
AR
K42
92,
812
482
3,23
112
.40.
156
53,
641
537
3,75
2-4
.80.
1
1
3) IR
ELA
ND
552
3,61
352
63,
528
-4.7
0.1
795
5,12
642
32,
955
-46.
90.
1
1
4) C
YPR
US
4831
467
445
38.2
0.0
1387
394
2,73
72,
825.
60.
1
1
5) R
OM
AN
IA30
92,
024
317
2,12
82.
60.
141
22,
656
315
2,19
7-2
3.4
0.1
16)
CZE
CH
REP
UB
LIC
508
3,31
953
93,
618
6.2
0.1
670
4,31
525
91,
808
-61.
30.
1
1
7) S
LOV
ENIA
8957
910
268
214
.80.
011
272
224
91,
748
122.
40.
0
1
8) H
UN
GA
RY24
31,
586
219
1,46
6-9
.80.
127
11,
746
241
1,68
4-1
1.0
0.0
19)
LIT
HU
AN
IA21
41,
404
271
1,81
926
.50.
118
91,
223
212
1,47
711
.70.
0
2
0) L
ATV
IA62
399
4026
6-3
5.6
0.0
5333
915
81,
111
201.
00.
0
2
1) G
REE
CE
111
722
122
819
9.8
0.0
9661
914
41,
004
49.8
0.0
22)
LU
XEM
BO
UR
G17
61,
143
4631
0-7
3.8
0.0
5334
313
293
114
7.7
0.0
23)
PO
RTU
GA
L10
367
114
194
637
.70.
019
01,
225
133
926
-30.
10.
0
2
4) B
ULG
AR
IA94
616
182
1,22
094
.40.
014
291
612
687
6-1
1.5
0.0

Economic Survey 2018-19 Volume 2 | A 115 Ta
ble
7.4
(A):
Dir
ectio
n of
Impo
rts :
Impo
rts b
y R
egio
ns a
nd C
ount
ries
Reg
ions
/ C
ount
ries
2015
-16
2016
-17
Cha
nge
(4) o
ver
(2)
Shar
ein
201
6-17
2017
-18
2018
-19
(P)
Cha
nge
Shar
e
(US$
mill
ion)
(US$
mill
ion)
(US$
mill
ion)
(US$
mill
ion)
(10)
ove
r (8
) in
201
8-19
(R c
rore
)(R
cro
re)
(Per
cen
t)(P
er c
ent)
(R c
rore
)(R
cro
re)
(Per
cen
t)(P
er c
ent)
(1)
(2)
(3)
(4)
(5)
(6)
(7)
(8)
(9)
(10)
(11)
(12)
(13)
25)
EST
ON
IA14
291
310
268
7-2
7.9
0.0
6139
010
875
578
.70.
0
2
6) S
LOVA
K R
EP65
423
6946
06.
00.
095
614
5740
2-3
9.7
0.0
27)
MA
LTA
2617
422
150
-15.
40.
016
103
4430
817
4.4
0.0
28)
CR
OAT
IA36
236
2517
0-2
9.6
0.0
3220
639
268
21.4
0.0
1.
2 E
urop
ean
Free
Tra
de
A
ssoc
iatip
n (E
FTA
)19
,890
129,
967
17,8
2111
9,47
3-1
0.4
4.6
19,7
7412
7,50
118
,456
128,
752
-6.7
3.6
1) S
WIT
ZER
LAN
D19
,299
126,
074
17,2
4911
5,61
9-1
0.6
4.5
18,9
2312
2,01
818
,077
126,
098
-4.5
3.5
2) N
ORW
AY58
53,
858
567
3,81
6-3
.20.
184
25,
425
366
2,56
9-5
6.5
0.1
3) I
CEL
AN
D4
275
3210
.10.
07
489
6117
.20.
0
4
) LIE
CH
TEN
STEI
N1
81
6-2
7.1
0.0
210
425
125.
00.
0
1.3
Oth
er E
urop
ean
Cou
ntri
es83
15,
433
1,26
98,
507
52.7
0.3
2,25
114
,548
2,45
917
,168
9.3
0.5
1) T
UR
KEY
777
5,08
01,
207
8,09
755
.40.
32,
132
13,7
852,
388
16,6
7012
.00.
5
2
) MA
CED
ON
IA7
4624
162
240.
80.
047
301
2416
9-4
8.3
0.0
3) A
LBA
NIA
1711
47
44-6
2.2
0.0
3925
123
160
-41.
80.
0
4
) SER
BIA
2214
427
183
21.9
0.0
2415
521
151
-11.
10.
0
5
) BO
SNIA
-HR
ZGO
VIN
429
322
-24.
50.
09
562
17-7
2.0
0.0
6) M
ON
TEN
EGR
O0
00
00.
00.
00
00
11,
200.
00.
0
7
) UN
ION
OF
SER
BIA
&
MO
NTE
NEG
RO
319
00
-98
00
00
0#D
IV/0
!0.
0
2) A
fric
a31
,667
206,
498
28,8
4519
3,45
6-8
.97.
537
,789
243,
655
41,1
3028
7,36
48.
88.
0
2.1
Sout
hern
Afr
ican
Cus
tom
s
Uni
on (S
AC
U)
6,54
742
,692
7,25
648
,652
10.8
1.9
8,63
455
,654
7,55
852
,793
-12.
51.
5
1) S
OU
TH A
FRIC
A5,
948
38,7
855,
834
39,1
17-1
.91.
56,
835
44,0
566,
520
45,5
41-4
.61.
3
2
) BO
TSW
AN
A54
23,
539
1,30
78,
766
141.
10.
31,
638
10,5
6197
46,
810
-40.
50.
2
3
) NA
MIB
IA10
6850
338
382.
80.
062
401
5437
5-1
3.9
0.0
4) S
WA
ZILA
ND
4126
839
264
-3.9
0.0
958
1067
7.6
0.0
5) L
ESO
THO
532
2516
740
4.3
0.0
9057
80
0-1
00.0
0.0
(Con
td....)
Con
td....
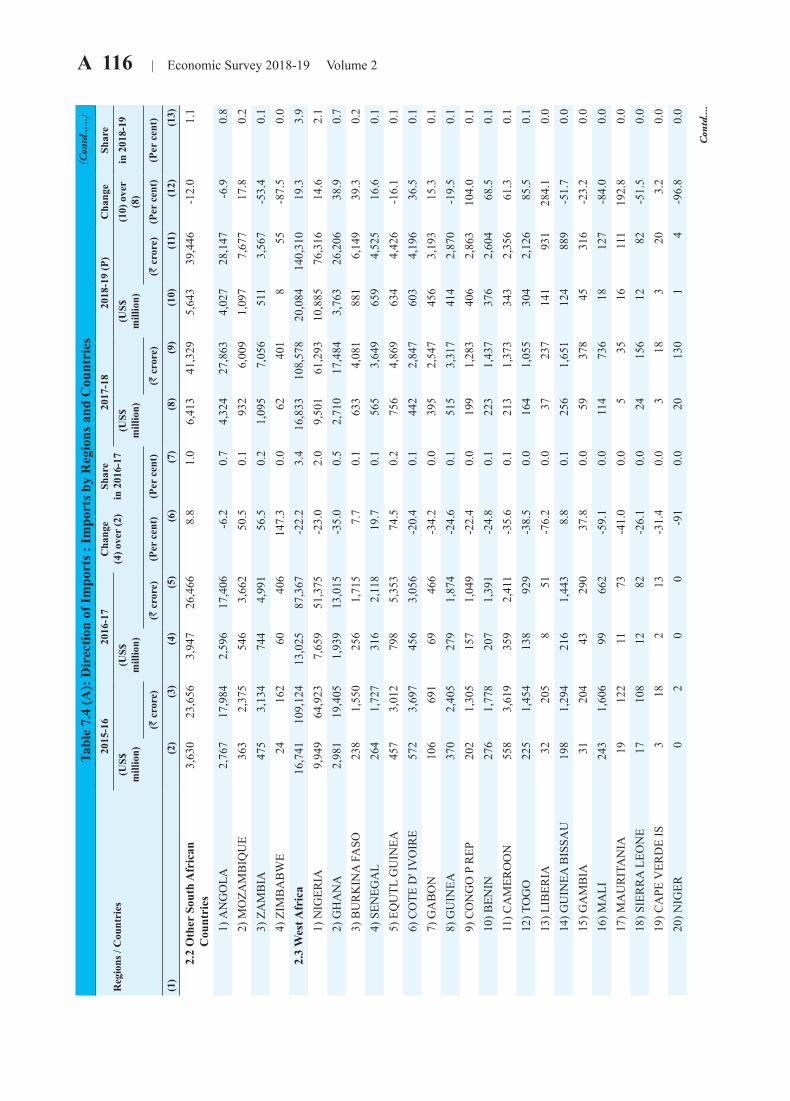
A 116 | Economic Survey 2018-19 Volume 2Ta
ble
7.4
(A):
Dir
ectio
n of
Impo
rts :
Impo
rts b
y R
egio
ns a
nd C
ount
ries
Reg
ions
/ C
ount
ries
2015
-16
2016
-17
Cha
nge
(4) o
ver
(2)
Shar
ein
201
6-17
2017
-18
2018
-19
(P)
Cha
nge
Shar
e
(US$
mill
ion)
(US$
mill
ion)
(US$
mill
ion)
(US$
mill
ion)
(10)
ove
r (8
) in
201
8-19
(R c
rore
)(R
cro
re)
(Per
cen
t)(P
er c
ent)
(R c
rore
)(R
cro
re)
(Per
cen
t)(P
er c
ent)
(1)
(2)
(3)
(4)
(5)
(6)
(7)
(8)
(9)
(10)
(11)
(12)
(13)
2.
2 O
ther
Sou
th A
fric
an
C
ount
ries
3,63
023
,656
3,94
726
,466
8.8
1.0
6,41
341
,329
5,64
339
,446
-12.
01.
1
1) A
NG
OLA
2,76
717
,984
2,59
617
,406
-6.2
0.7
4,32
427
,863
4,02
728
,147
-6.9
0.8
2) M
OZA
MB
IQU
E36
32,
375
546
3,66
250
.50.
193
26,
009
1,09
77,
677
17.8
0.2
3) Z
AM
BIA
475
3,13
474
44,
991
56.5
0.2
1,09
57,
056
511
3,56
7-5
3.4
0.1
4) Z
IMB
AB
WE
2416
260
406
147.
30.
062
401
855
-87.
50.
0
2.3
Wes
t Afr
ica
16,7
4110
9,12
413
,025
87,3
67-2
2.2
3.4
16,8
3310
8,57
820
,084
140,
310
19.3
3.9
1) N
IGER
IA9,
949
64,9
237,
659
51,3
75-2
3.0
2.0
9,50
161
,293
10,8
8576
,316
14.6
2.1
2) G
HA
NA
2,98
119
,405
1,93
913
,015
-35.
00.
52,
710
17,4
843,
763
26,2
0638
.90.
7
3
) BU
RK
INA
FA
SO23
81,
550
256
1,71
57.
70.
163
34,
081
881
6,14
939
.30.
2
4
) SEN
EGA
L26
41,
727
316
2,11
819
.70.
156
53,
649
659
4,52
516
.60.
1
5
) EQ
UTL
GU
INEA
457
3,01
279
85,
353
74.5
0.2
756
4,86
963
44,
426
-16.
10.
1
6
) CO
TE D
' IV
OIR
E57
23,
697
456
3,05
6-2
0.4
0.1
442
2,84
760
34,
196
36.5
0.1
7) G
AB
ON
106
691
6946
6-3
4.2
0.0
395
2,54
745
63,
193
15.3
0.1
8) G
UIN
EA37
02,
405
279
1,87
4-2
4.6
0.1
515
3,31
741
42,
870
-19.
50.
1
9
) CO
NG
O P
REP
202
1,30
515
71,
049
-22.
40.
019
91,
283
406
2,86
310
4.0
0.1
10)
BEN
IN27
61,
778
207
1,39
1-2
4.8
0.1
223
1,43
737
62,
604
68.5
0.1
11)
CA
MER
OO
N55
83,
619
359
2,41
1-3
5.6
0.1
213
1,37
334
32,
356
61.3
0.1
12)
TO
GO
225
1,45
413
892
9-3
8.5
0.0
164
1,05
530
42,
126
85.5
0.1
13)
LIB
ERIA
3220
58
51-7
6.2
0.0
3723
714
193
128
4.1
0.0
14)
GU
INEA
BIS
SAU
198
1,29
421
61,
443
8.8
0.1
256
1,65
112
488
9-5
1.7
0.0
15)
GA
MB
IA31
204
4329
037
.80.
059
378
4531
6-2
3.2
0.0
16)
MA
LI24
31,
606
9966
2-5
9.1
0.0
114
736
1812
7-8
4.0
0.0
17)
MA
UR
ITA
NIA
1912
211
73-4
1.0
0.0
535
1611
119
2.8
0.0
18)
SIE
RR
A L
EON
E17
108
1282
-26.
10.
024
156
1282
-51.
50.
0
1
9) C
APE
VER
DE
IS3
182
13-3
1.4
0.0
318
320
3.2
0.0
20)
NIG
ER0
20
0-9
10.
020
130
14
-96.
80.
0
Con
td....
(Con
td......)
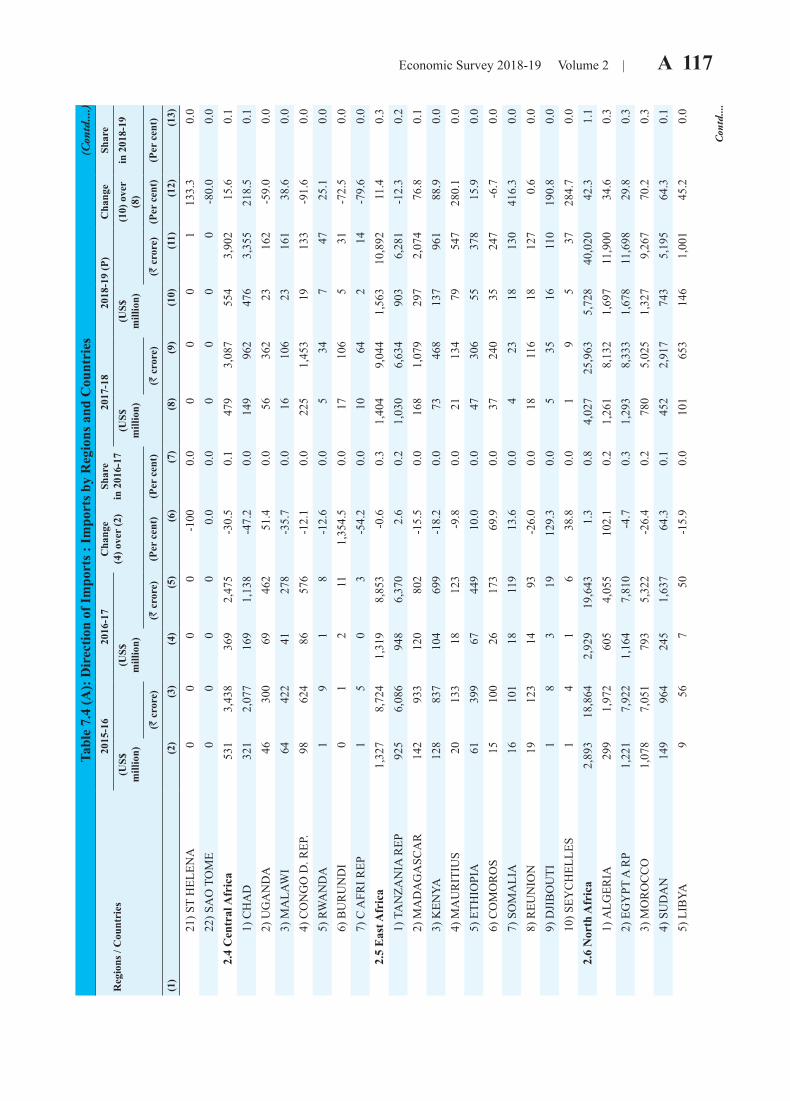
Economic Survey 2018-19 Volume 2 | A 117 Ta
ble
7.4
(A):
Dir
ectio
n of
Impo
rts :
Impo
rts b
y R
egio
ns a
nd C
ount
ries
Reg
ions
/ C
ount
ries
2015
-16
2016
-17
Cha
nge
(4) o
ver
(2)
Shar
ein
201
6-17
2017
-18
2018
-19
(P)
Cha
nge
Shar
e
(US$
mill
ion)
(US$
mill
ion)
(US$
mill
ion)
(US$
mill
ion)
(10)
ove
r (8
) in
201
8-19
(R c
rore
)(R
cro
re)
(Per
cen
t)(P
er c
ent)
(R c
rore
)(R
cro
re)
(Per
cen
t)(P
er c
ent)
(1)
(2)
(3)
(4)
(5)
(6)
(7)
(8)
(9)
(10)
(11)
(12)
(13)
21)
ST
HEL
ENA
00
00
-100
0.0
00
01
133.
30.
0
2
2) S
AO
TO
ME
00
00
0.0
0.0
00
00
-80.
00.
0
2.4
Cen
tral
Afr
ica
531
3,43
836
92,
475
-30.
50.
147
93,
087
554
3,90
215
.60.
1
1
) CH
AD
321
2,07
716
91,
138
-47.
20.
014
996
247
63,
355
218.
50.
1
2
) UG
AN
DA
4630
069
462
51.4
0.0
5636
223
162
-59.
00.
0
3
) MA
LAW
I64
422
4127
8-3
5.7
0.0
1610
623
161
38.6
0.0
4) C
ON
GO
D. R
EP.
9862
486
576
-12.
10.
022
51,
453
1913
3-9
1.6
0.0
5) R
WA
ND
A1
91
8-1
2.6
0.0
534
747
25.1
0.0
6) B
UR
UN
DI
01
211
1,35
4.5
0.0
1710
65
31-7
2.5
0.0
7) C
AFR
I REP
15
03
-54.
20.
010
642
14-7
9.6
0.0
2.
5 E
ast A
fric
a1,
327
8,72
41,
319
8,85
3-0
.60.
31,
404
9,04
41,
563
10,8
9211
.40.
3
1
) TA
NZA
NIA
REP
925
6,08
694
86,
370
2.6
0.2
1,03
06,
634
903
6,28
1-1
2.3
0.2
2) M
AD
AG
ASC
AR
142
933
120
802
-15.
50.
016
81,
079
297
2,07
476
.80.
1
3
) KEN
YA12
883
710
469
9-1
8.2
0.0
7346
813
796
188
.90.
0
4
) MA
UR
ITIU
S20
133
1812
3-9
.80.
021
134
7954
728
0.1
0.0
5) E
THIO
PIA
6139
967
449
10.0
0.0
4730
655
378
15.9
0.0
6) C
OM
OR
OS
1510
026
173
69.9
0.0
3724
035
247
-6.7
0.0
7) S
OM
ALI
A16
101
1811
913
.60.
04
2318
130
416.
30.
0
8
) REU
NIO
N19
123
1493
-26.
00.
018
116
1812
70.
60.
0
9
) DJI
BO
UTI
18
319
129.
30.
05
3516
110
190.
80.
0
1
0) S
EYC
HEL
LES
14
16
38.8
0.0
19
537
284.
70.
0
2.6
Nor
th A
fric
a2,
893
18,8
642,
929
19,6
431.
30.
84,
027
25,9
635,
728
40,0
2042
.31.
1
1
) ALG
ERIA
299
1,97
260
54,
055
102.
10.
21,
261
8,13
21,
697
11,9
0034
.60.
3
2
) EG
YPT
A R
P1,
221
7,92
21,
164
7,81
0-4
.70.
31,
293
8,33
31,
678
11,6
9829
.80.
3
3
) MO
RO
CC
O1,
078
7,05
179
35,
322
-26.
40.
278
05,
025
1,32
79,
267
70.2
0.3
4) S
UD
AN
149
964
245
1,63
764
.30.
145
22,
917
743
5,19
564
.30.
1
5
) LIB
YA9
567
50-1
5.9
0.0
101
653
146
1,00
145
.20.
0
Con
td....
(Con
td....)
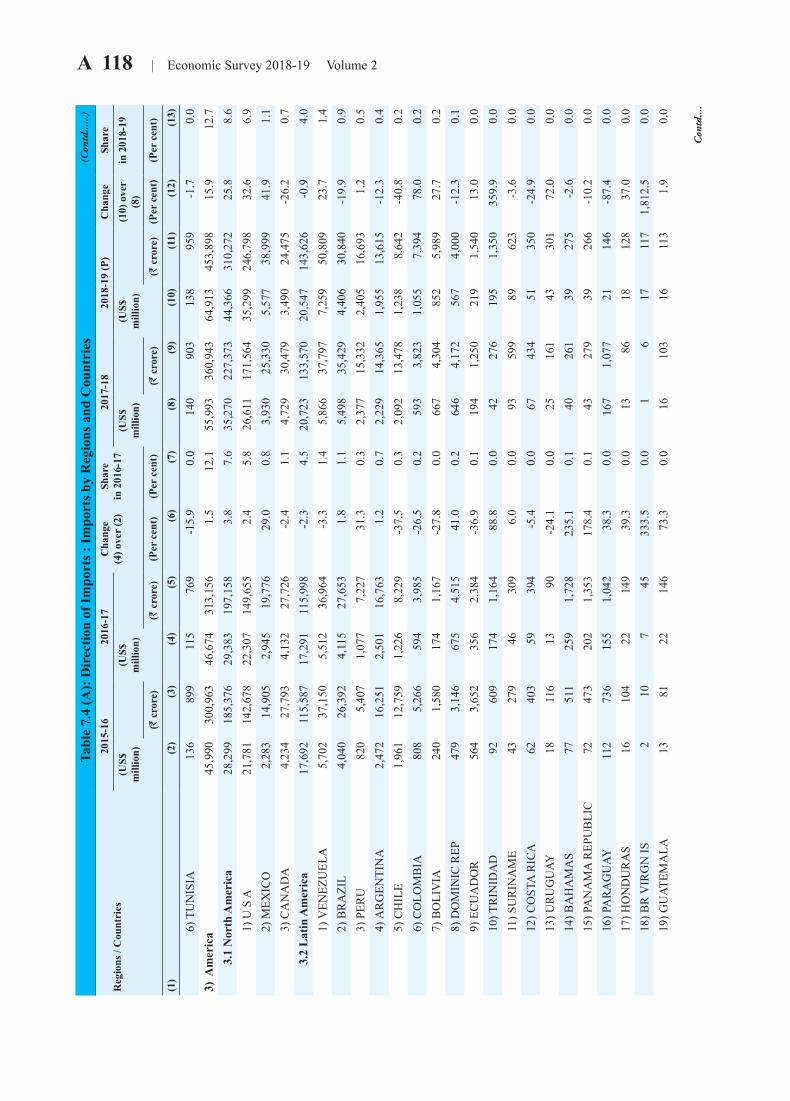
A 118 | Economic Survey 2018-19 Volume 2Ta
ble
7.4
(A):
Dir
ectio
n of
Impo
rts :
Impo
rts b
y R
egio
ns a
nd C
ount
ries
Reg
ions
/ C
ount
ries
2015
-16
2016
-17
Cha
nge
(4) o
ver
(2)
Shar
ein
201
6-17
2017
-18
2018
-19
(P)
Cha
nge
Shar
e
(US$
mill
ion)
(US$
mill
ion)
(US$
mill
ion)
(US$
mill
ion)
(10)
ove
r (8
) in
201
8-19
(R c
rore
)(R
cro
re)
(Per
cen
t)(P
er c
ent)
(R c
rore
)(R
cro
re)
(Per
cen
t)(P
er c
ent)
(1)
(2)
(3)
(4)
(5)
(6)
(7)
(8)
(9)
(10)
(11)
(12)
(13)
6) T
UN
ISIA
136
899
115
769
-15.
90.
014
090
313
895
9-1
.70.
03)
Am
eric
a45
,990
300,
963
46,6
7431
3,15
61.
512
.155
,993
360,
943
64,9
1345
3,89
815
.912
.7
3.1
Nor
th A
mer
ica
28,2
9918
5,37
629
,383
197,
158
3.8
7.6
35,2
7022
7,37
344
,366
310,
272
25.8
8.6
1) U
S A
21,7
8114
2,67
822
,307
149,
655
2.4
5.8
26,6
1117
1,56
435
,299
246,
798
32.6
6.9
2) M
EXIC
O2,
283
14,9
052,
945
19,7
7629
.00.
83,
930
25,3
305,
577
38,9
9941
.91.
1
3
) CA
NA
DA
4,23
427
,793
4,13
227
,726
-2.4
1.1
4,72
930
,479
3,49
024
,475
-26.
20.
7
3.2
Lat
in A
mer
ica
17,6
9211
5,58
717
,291
115,
998
-2.3
4.5
20,7
2313
3,57
020
,547
143,
626
-0.9
4.0
1) V
ENEZ
UEL
A5,
702
37,1
505,
512
36,9
64-3
.31.
45,
866
37,7
977,
259
50,8
0923
.71.
4
2
) BR
AZI
L4,
040
26,3
924,
115
27,6
531.
81.
15,
498
35,4
294,
406
30,8
40-1
9.9
0.9
3) P
ERU
820
5,40
71,
077
7,22
731
.30.
32,
377
15,3
322,
405
16,6
931.
20.
5
4
) AR
GEN
TIN
A2,
472
16,2
512,
501
16,7
631.
20.
72,
229
14,3
651,
955
13,6
15-1
2.3
0.4
5) C
HIL
E1,
961
12,7
591,
226
8,22
9-3
7.5
0.3
2,09
213
,478
1,23
88,
642
-40.
80.
2
6
) CO
LOM
BIA
808
5,26
659
43,
985
-26.
50.
259
33,
823
1,05
57,
394
78.0
0.2
7) B
OLI
VIA
240
1,58
017
41,
167
-27.
80.
066
74,
304
852
5,98
927
.70.
2
8
) DO
MIN
IC R
EP47
93,
146
675
4,51
541
.00.
264
64,
172
567
4,00
0-1
2.3
0.1
9) E
CU
AD
OR
564
3,65
235
62,
384
-36.
90.
119
41,
250
219
1,54
013
.00.
0
1
0) T
RIN
IDA
D92
609
174
1,16
488
.80.
042
276
195
1,35
035
9.9
0.0
11)
SU
RIN
AM
E43
279
4630
96.
00.
093
599
8962
3-3
.60.
0
1
2) C
OST
A R
ICA
6240
359
394
-5.4
0.0
6743
451
350
-24.
90.
0
1
3) U
RU
GU
AY18
116
1390
-24.
10.
025
161
4330
172
.00.
0
1
4) B
AH
AM
AS
7751
125
91,
728
235.
10.
140
261
3927
5-2
.60.
0
1
5) P
AN
AM
A R
EPU
BLI
C72
473
202
1,35
317
8.4
0.1
4327
939
266
-10.
20.
0
1
6) P
AR
AG
UAY
112
736
155
1,04
238
.30.
016
71,
077
2114
6-8
7.4
0.0
17)
HO
ND
UR
AS
1610
422
149
39.3
0.0
1386
1812
837
.00.
0
1
8) B
R V
IRG
N IS
210
745
333.
50.
01
617
117
1,81
2.5
0.0
19)
GU
ATEM
ALA
1381
2214
673
.30.
016
103
1611
31.
90.
0
Con
td....
(Con
td......)

Economic Survey 2018-19 Volume 2 | A 119 Ta
ble
7.4
(A):
Dir
ectio
n of
Impo
rts :
Impo
rts b
y R
egio
ns a
nd C
ount
ries
Reg
ions
/ C
ount
ries
2015
-16
2016
-17
Cha
nge
(4) o
ver
(2)
Shar
ein
201
6-17
2017
-18
2018
-19
(P)
Cha
nge
Shar
e
(US$
mill
ion)
(US$
mill
ion)
(US$
mill
ion)
(US$
mill
ion)
(10)
ove
r (8
) in
201
8-19
(R c
rore
)(R
cro
re)
(Per
cen
t)(P
er c
ent)
(R c
rore
)(R
cro
re)
(Per
cen
t)(P
er c
ent)
(1)
(2)
(3)
(4)
(5)
(6)
(7)
(8)
(9)
(10)
(11)
(12)
(13)
20)
HA
ITI
321
424
10.1
0.0
853
1497
66.5
0.0
21)
NET
HER
LAN
DA
NTI
L59
395
6744
612
.60.
08
5310
6817
.70.
0
2
2) B
ERM
UD
A0
00
00.
00.
00
08
53#D
IV/0
!0.
0
2
3) G
UYA
NA
1812
114
97-2
1.6
0.0
743
645
-2.6
0.0
24)
JAM
AIC
A2
101
8-2
4.5
0.0
428
535
15.2
0.0
25)
EL
SALV
AD
OR
640
639
-6.6
0.0
958
429
-53.
40.
0
2
6) C
UB
A1
91
9-1
.50.
02
134
2784
.50.
0
2
7) N
ICA
RA
GU
A4
253
18-3
1.9
0.0
427
425
-13.
70.
0
2
8) F
R G
UIA
NA
18
110
25.0
0.0
16
213
114.
10.
0
2
9) B
AR
BA
DO
S0
10
15.
90.
00
12
1277
0.0
0.0
30)
MA
RTIN
IQU
E0
00
00
00
01
61,
520.
00.
0
3
1) V
IRG
IN IS
US
17
530
319.
40.
00
21
517
1.4
0.0
32)
BEL
IZE
17
13
-48.
50.
01
91
5-5
2.2
0.0
33)
ST
LUC
IA0
30
2-4
6.7
0.0
02
14
78.1
0.0
34)
GR
ENA
DA
00
00
20.0
0.0
02
03
77.8
0.0
35)
GU
AD
ELO
UPE
00
00
-17
00
00
33,
600.
00.
0
3
6) D
OM
INIC
A0
11
567
0.0
0.0
02
02
10.7
0.0
37)
CAY
MA
N IS
00
00
-60.
00.
06
420
2-9
6.4
0.0
38)
AN
TIG
UA
00
00
-100
.00.
00
00
165
0.0
0.0
39)
MO
NTS
ERR
AT0
00
00
00
00
020
.00.
0
4
0) S
T V
INC
ENT
00
00
00
00
00
-60.
00.
0
4
1) S
T K
ITT
N A
01
00
-93.
80.
00
00
0#D
IV/0
!0.
0
4
2) T
UR
KS
C IS
00
00
50.0
0.0
00
00
150.
00
43)
FA
LKLA
ND
IS2
110
0-9
70
00
00
0.0
04)
Asi
a22
2,62
91,
455,
063
230,
571
1,54
6,33
43.
660
.027
9,66
71,
802,
415
318,
655
2,22
9,14
913
.962
.1
4.1
Eas
t Asi
a (O
cean
ia)
9,70
363
,430
11,8
2879
,387
21.9
3.1
14,9
0296
,058
13,9
1497
,108
-6.6
2.7
Con
td....
(Con
td....)
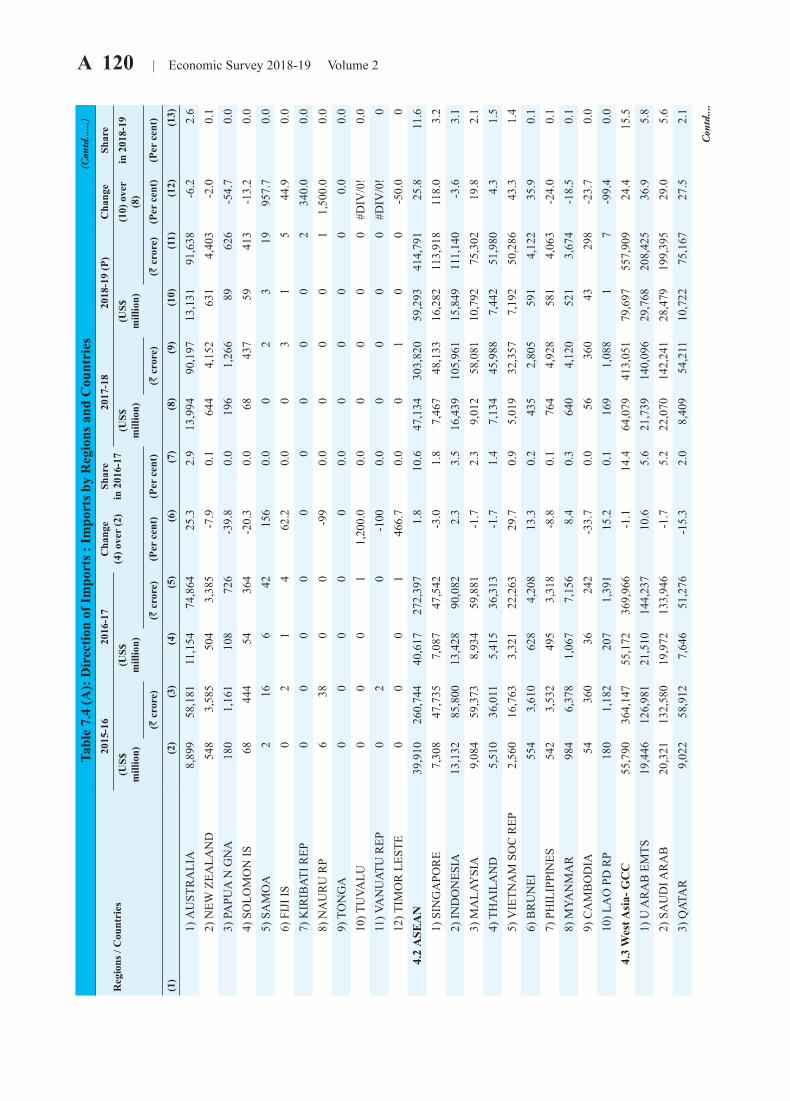
A 120 | Economic Survey 2018-19 Volume 2Ta
ble
7.4
(A):
Dir
ectio
n of
Impo
rts :
Impo
rts b
y R
egio
ns a
nd C
ount
ries
Reg
ions
/ C
ount
ries
2015
-16
2016
-17
Cha
nge
(4) o
ver
(2)
Shar
ein
201
6-17
2017
-18
2018
-19
(P)
Cha
nge
Shar
e
(US$
mill
ion)
(US$
mill
ion)
(US$
mill
ion)
(US$
mill
ion)
(10)
ove
r (8
) in
201
8-19
(R c
rore
)(R
cro
re)
(Per
cen
t)(P
er c
ent)
(R c
rore
)(R
cro
re)
(Per
cen
t)(P
er c
ent)
(1)
(2)
(3)
(4)
(5)
(6)
(7)
(8)
(9)
(10)
(11)
(12)
(13)
1) A
UST
RA
LIA
8,89
958
,181
11,1
5474
,864
25.3
2.9
13,9
9490
,197
13,1
3191
,638
-6.2
2.6
2) N
EW Z
EALA
ND
548
3,58
550
43,
385
-7.9
0.1
644
4,15
263
14,
403
-2.0
0.1
3) P
APU
A N
GN
A18
01,
161
108
726
-39.
80.
019
61,
266
8962
6-5
4.7
0.0
4) S
OLO
MO
N IS
6844
454
364
-20.
30.
068
437
5941
3-1
3.2
0.0
5) S
AM
OA
216
642
156
0.0
02
319
957.
70.
0
6
) FIJ
I IS
02
14
62.2
0.0
03
15
44.9
0.0
7) K
IRIB
ATI R
EP0
00
00
00
00
234
0.0
0.0
8) N
AU
RU
RP
638
00
-99
0.0
00
01
1,50
0.0
0.0
9) T
ON
GA
00
00
00.
00
00
00.
00.
0
1
0) T
UVA
LU0
00
11,
200.
00.
00
00
0#D
IV/0
!0.
0
1
1) V
AN
UAT
U R
EP0
20
-100
0.0
00
00
#DIV
/0!
0
1
2) T
IMO
R L
ESTE
00
01
466.
70.
00
10
0-5
0.0
0
4.2
ASE
AN
39,9
1026
0,74
440
,617
272,
397
1.8
10.6
47,1
3430
3,82
059
,293
414,
791
25.8
11.6
1) S
ING
APO
RE
7,30
847
,735
7,08
747
,542
-3.0
1.8
7,46
748
,133
16,2
8211
3,91
811
8.0
3.2
2) I
ND
ON
ESIA
13,1
3285
,800
13,4
2890
,082
2.3
3.5
16,4
3910
5,96
115
,849
111,
140
-3.6
3.1
3) M
ALA
YSI
A9,
084
59,3
738,
934
59,8
81-1
.72.
39,
012
58,0
8110
,792
75,3
0219
.82.
1
4
) TH
AIL
AN
D5,
510
36,0
115,
415
36,3
13-1
.71.
47,
134
45,9
887,
442
51,9
804.
31.
5
5
) VIE
TNA
M S
OC
REP
2,56
016
,763
3,32
122
,263
29.7
0.9
5,01
932
,357
7,19
250
,286
43.3
1.4
6) B
RU
NEI
554
3,61
062
84,
208
13.3
0.2
435
2,80
559
14,
122
35.9
0.1
7) P
HIL
IPPI
NES
542
3,53
249
53,
318
-8.8
0.1
764
4,92
858
14,
063
-24.
00.
1
8
) MYA
NM
AR
984
6,37
81,
067
7,15
68.
40.
364
04,
120
521
3,67
4-1
8.5
0.1
9) C
AM
BO
DIA
5436
036
242
-33.
70.
056
360
4329
8-2
3.7
0.0
10)
LA
O P
D R
P18
01,
182
207
1,39
115
.20.
116
91,
088
17
-99.
40.
0
4.3
Wes
t Asi
a- G
CC
55,7
9036
4,14
755
,172
369,
966
-1.1
14.4
64,0
7941
3,05
179
,697
557,
909
24.4
15.5
1) U
AR
AB
EM
TS19
,446
126,
981
21,5
1014
4,23
710
.65.
621
,739
140,
096
29,7
6820
8,42
536
.95.
8
2
) SA
UD
I AR
AB
20,3
2113
2,58
019
,972
133,
946
-1.7
5.2
22,0
7014
2,24
128
,479
199,
395
29.0
5.6
3) Q
ATA
R9,
022
58,9
127,
646
51,2
76-1
5.3
2.0
8,40
954
,211
10,7
2275
,167
27.5
2.1
Con
td....
(Con
td......)
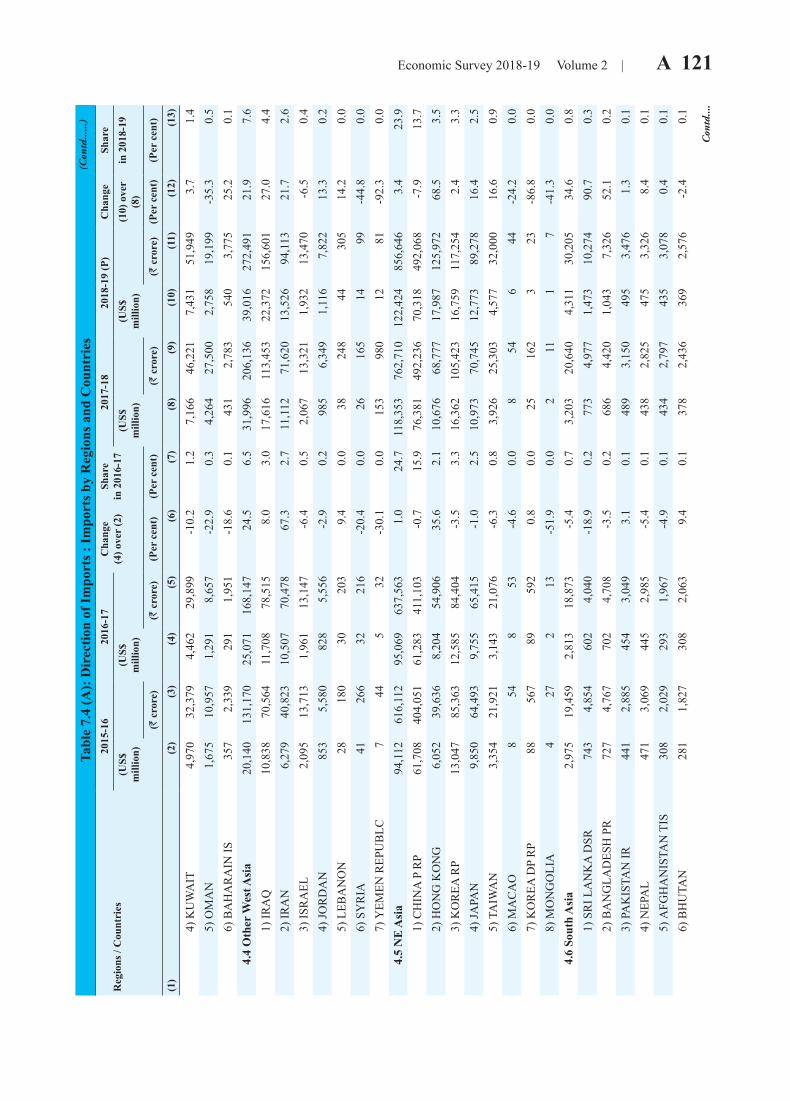
Economic Survey 2018-19 Volume 2 | A 121 Ta
ble
7.4
(A):
Dir
ectio
n of
Impo
rts :
Impo
rts b
y R
egio
ns a
nd C
ount
ries
Reg
ions
/ C
ount
ries
2015
-16
2016
-17
Cha
nge
(4) o
ver
(2)
Shar
ein
201
6-17
2017
-18
2018
-19
(P)
Cha
nge
Shar
e
(US$
mill
ion)
(US$
mill
ion)
(US$
mill
ion)
(US$
mill
ion)
(10)
ove
r (8
) in
201
8-19
(R c
rore
)(R
cro
re)
(Per
cen
t)(P
er c
ent)
(R c
rore
)(R
cro
re)
(Per
cen
t)(P
er c
ent)
(1)
(2)
(3)
(4)
(5)
(6)
(7)
(8)
(9)
(10)
(11)
(12)
(13)
4) K
UW
AIT
4,97
032
,379
4,46
229
,899
-10.
21.
27,
166
46,2
217,
431
51,9
493.
71.
4
5
) OM
AN
1,67
510
,957
1,29
18,
657
-22.
90.
34,
264
27,5
002,
758
19,1
99-3
5.3
0.5
6) B
AH
AR
AIN
IS35
72,
339
291
1,95
1-1
8.6
0.1
431
2,78
354
03,
775
25.2
0.1
4.
4 O
ther
Wes
t Asi
a20
,140
131,
170
25,0
7116
8,14
724
.56.
531
,996
206,
136
39,0
1627
2,49
121
.97.
6
1
) IR
AQ
10,8
3870
,564
11,7
0878
,515
8.0
3.0
17,6
1611
3,45
322
,372
156,
601
27.0
4.4
2) I
RA
N6,
279
40,8
2310
,507
70,4
7867
.32.
711
,112
71,6
2013
,526
94,1
1321
.72.
6
3
) ISR
AEL
2,09
513
,713
1,96
113
,147
-6.4
0.5
2,06
713
,321
1,93
213
,470
-6.5
0.4
4) J
OR
DA
N85
35,
580
828
5,55
6-2
.90.
298
56,
349
1,11
67,
822
13.3
0.2
5) L
EBA
NO
N28
180
3020
39.
40.
038
248
4430
514
.20.
0
6
) SY
RIA
4126
632
216
-20.
40.
026
165
1499
-44.
80.
0
7
) YEM
EN R
EPU
BLC
744
532
-30.
10.
015
398
012
81-9
2.3
0.0
4.
5 N
E A
sia
94,1
1261
6,11
295
,069
637,
563
1.0
24.7
118,
353
762,
710
122,
424
856,
646
3.4
23.9
1) C
HIN
A P
RP
61,7
0840
4,05
161
,283
411,
103
-0.7
15.9
76,3
8149
2,23
670
,318
492,
068
-7.9
13.7
2) H
ON
G K
ON
G6,
052
39,6
368,
204
54,9
0635
.62.
110
,676
68,7
7717
,987
125,
972
68.5
3.5
3) K
OR
EA R
P13
,047
85,3
6312
,585
84,4
04-3
.53.
316
,362
105,
423
16,7
5911
7,25
42.
43.
3
4
) JA
PAN
9,85
064
,493
9,75
565
,415
-1.0
2.5
10,9
7370
,745
12,7
7389
,278
16.4
2.5
5) T
AIW
AN
3,35
421
,921
3,14
321
,076
-6.3
0.8
3,92
625
,303
4,57
732
,000
16.6
0.9
6) M
AC
AO
854
853
-4.6
0.0
854
644
-24.
20.
0
7
) KO
REA
DP
RP
8856
789
592
0.8
0.0
2516
23
23-8
6.8
0.0
8) M
ON
GO
LIA
427
213
-51.
90.
02
111
7-4
1.3
0.0
4.
6 So
uth
Asi
a2,
975
19,4
592,
813
18,8
73-5
.40.
73,
203
20,6
404,
311
30,2
0534
.60.
8
1
) SR
I LA
NK
A D
SR74
34,
854
602
4,04
0-1
8.9
0.2
773
4,97
71,
473
10,2
7490
.70.
3
2
) BA
NG
LAD
ESH
PR
727
4,76
770
24,
708
-3.5
0.2
686
4,42
01,
043
7,32
652
.10.
2
3
) PA
KIS
TAN
IR44
12,
885
454
3,04
93.
10.
148
93,
150
495
3,47
61.
30.
1
4
) NEP
AL
471
3,06
944
52,
985
-5.4
0.1
438
2,82
547
53,
326
8.4
0.1
5) A
FGH
AN
ISTA
N T
IS30
82,
029
293
1,96
7-4
.90.
143
42,
797
435
3,07
80.
40.
1
6
) BH
UTA
N28
11,
827
308
2,06
39.
40.
137
82,
436
369
2,57
6-2
.40.
1
(Con
td......)
Con
td....
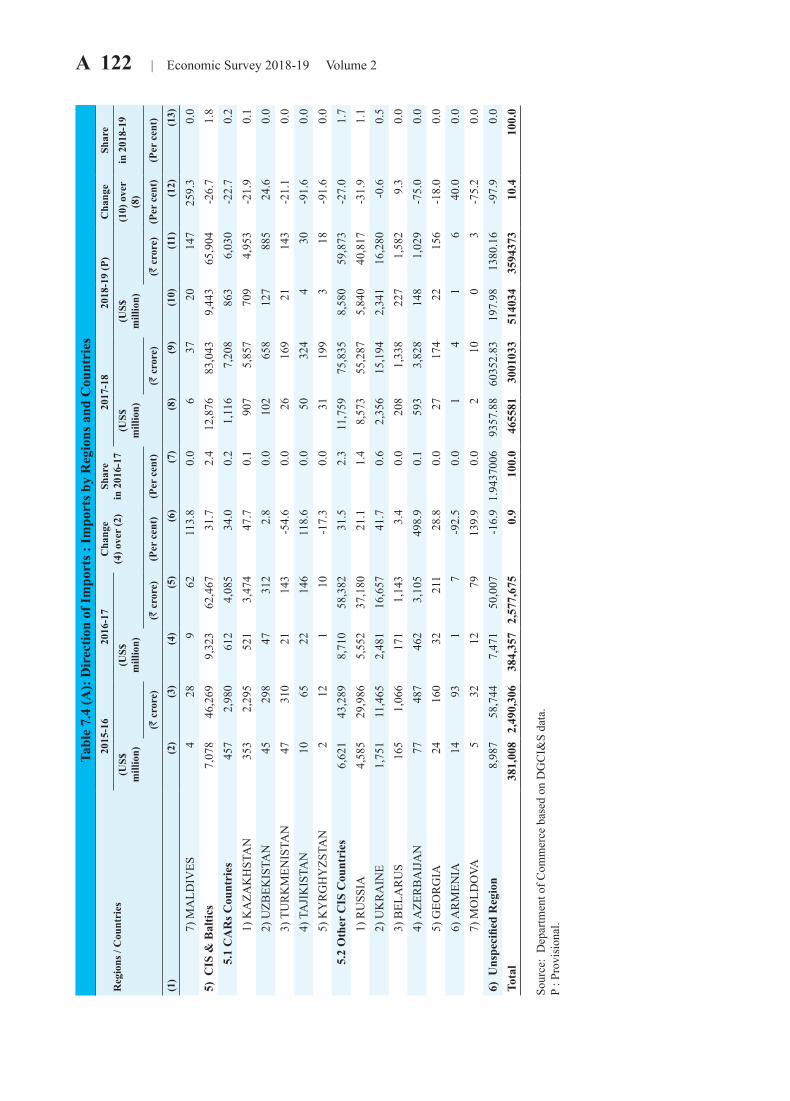
A 122 | Economic Survey 2018-19 Volume 2Ta
ble
7.4
(A):
Dir
ectio
n of
Impo
rts :
Impo
rts b
y R
egio
ns a
nd C
ount
ries
Reg
ions
/ C
ount
ries
2015
-16
2016
-17
Cha
nge
(4) o
ver
(2)
Shar
ein
201
6-17
2017
-18
2018
-19
(P)
Cha
nge
Shar
e
(US$
mill
ion)
(US$
mill
ion)
(US$
mill
ion)
(US$
mill
ion)
(10)
ove
r (8
) in
201
8-19
(R c
rore
)(R
cro
re)
(Per
cen
t)(P
er c
ent)
(R c
rore
)(R
cro
re)
(Per
cen
t)(P
er c
ent)
(1)
(2)
(3)
(4)
(5)
(6)
(7)
(8)
(9)
(10)
(11)
(12)
(13)
7) M
ALD
IVES
428
962
113.
80.
06
3720
147
259.
30.
05)
CIS
& B
altic
s7,
078
46,2
699,
323
62,4
6731
.72.
412
,876
83,0
439,
443
65,9
04-2
6.7
1.8
5.
1 C
AR
s Cou
ntri
es45
72,
980
612
4,08
534
.00.
21,
116
7,20
886
36,
030
-22.
70.
2
1
) KA
ZAK
HST
AN
353
2,29
552
13,
474
47.7
0.1
907
5,85
770
94,
953
-21.
90.
1
2
) UZB
EKIS
TAN
4529
847
312
2.8
0.0
102
658
127
885
24.6
0.0
3) T
UR
KM
ENIS
TAN
4731
021
143
-54.
60.
026
169
2114
3-2
1.1
0.0
4) T
AJI
KIS
TAN
1065
2214
611
8.6
0.0
5032
44
30-9
1.6
0.0
5) K
YR
GH
YZS
TAN
212
110
-17.
30.
031
199
318
-91.
60.
0
5.2
Oth
er C
IS C
ount
ries
6,62
143
,289
8,71
058
,382
31.5
2.3
11,7
5975
,835
8,58
059
,873
-27.
01.
7
1
) RU
SSIA
4,58
529
,986
5,55
237
,180
21.1
1.4
8,57
355
,287
5,84
040
,817
-31.
91.
1
2
) UK
RA
INE
1,75
111
,465
2,48
116
,657
41.7
0.6
2,35
615
,194
2,34
116
,280
-0.6
0.5
3) B
ELA
RU
S16
51,
066
171
1,14
33.
40.
020
81,
338
227
1,58
29.
30.
0
4
) AZE
RB
AIJ
AN
7748
746
23,
105
498.
90.
159
33,
828
148
1,02
9-7
5.0
0.0
5) G
EOR
GIA
2416
032
211
28.8
0.0
2717
422
156
-18.
00.
0
6
) AR
MEN
IA14
931
7-9
2.5
0.0
14
16
40.0
0.0
7) M
OLD
OVA
532
1279
139.
90.
02
100
3-7
5.2
0.0
6) U
nspe
cifie
d R
egio
n8,
987
58,7
447,
471
50,0
07-1
6.9
1.94
3700
693
57.8
860
352.
8319
7.98
1380
.16
-97.
90.
0To
tal
381,
008
2,49
0,30
638
4,35
72,
577,
675
0.9
100.
046
5581
3001
033
5140
3435
9437
310
.410
0.0
Sour
ce:
Dep
artm
ent o
f Com
mer
ce b
ased
on
DG
CI&
S da
ta.
P : P
rovi
sion
al.
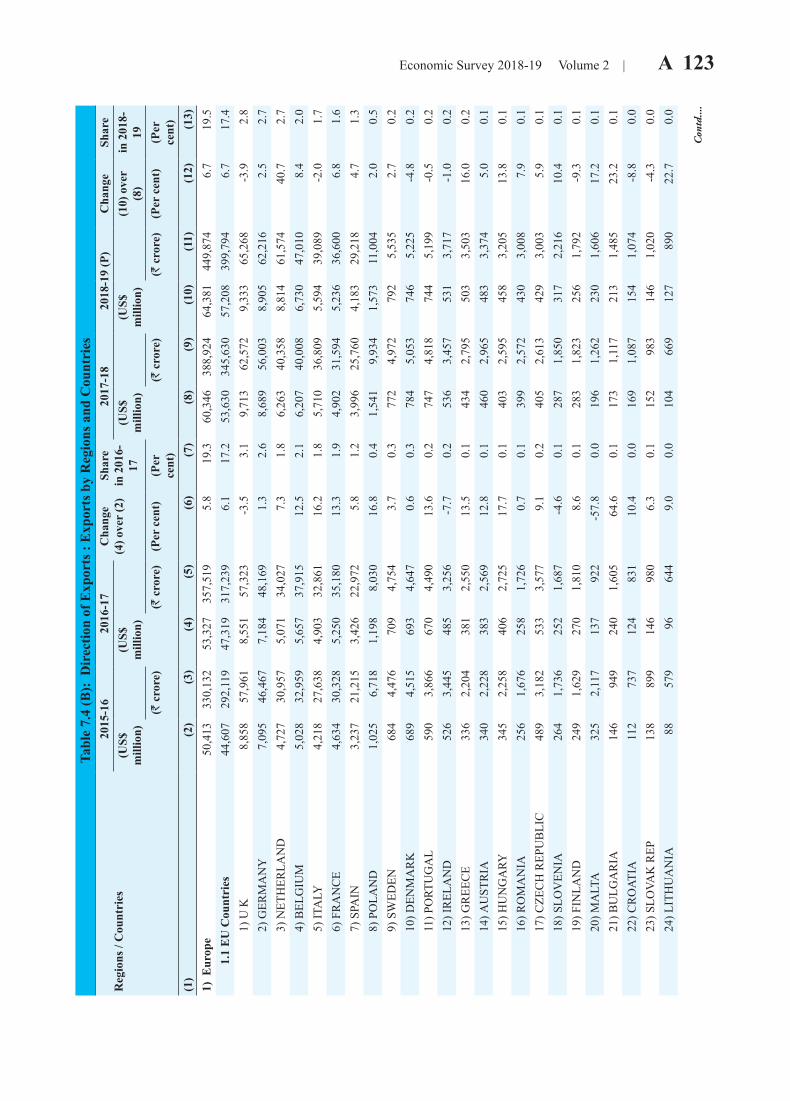
Economic Survey 2018-19 Volume 2 | A 123 Ta
ble
7.4
(B):
Dir
ectio
n of
Exp
orts
: E
xpor
ts b
y R
egio
ns a
nd C
ount
ries
R
egio
ns /
Cou
ntri
es20
15-1
620
16-1
7C
hang
e(4
) ove
r (2
)Sh
are
in 2
016-
17
2017
-18
2018
-19
(P)
Cha
nge
Shar
e(U
S$m
illio
n)(U
S$m
illio
n)(U
S$m
illio
n)(U
S$m
illio
n)(1
0) o
ver
(8)
in 2
018-
19(R
cro
re)
(R c
rore
)(P
er c
ent)
(Per
ce
nt)
(R c
rore
)(R
cro
re)
(Per
cen
t)(P
er
cent
)(1
)(2
)(3
)(4
)(5
)(6
)(7
)(8
)(9
)(1
0)(1
1)(1
2)(1
3)1)
Eur
ope
50,4
1333
0,13
253
,327
357,
519
5.8
19.3
60,3
4638
8,92
464
,381
449,
874
6.7
19.5
1.
1 E
U C
ount
ries
44,6
0729
2,11
947
,319
317,
239
6.1
17.2
53,6
3034
5,63
057
,208
399,
794
6.7
17.4
1) U
K8,
858
57,9
618,
551
57,3
23-3
.53.
19,
713
62,5
729,
333
65,2
68-3
.92.
8
2
) GER
MA
NY
7,09
546
,467
7,18
448
,169
1.3
2.6
8,68
956
,003
8,90
562
,216
2.5
2.7
3) N
ETH
ERLA
ND
4,72
730
,957
5,07
134
,027
7.3
1.8
6,26
340
,358
8,81
461
,574
40.7
2.7
4) B
ELG
IUM
5,02
832
,959
5,65
737
,915
12.5
2.1
6,20
740
,008
6,73
047
,010
8.4
2.0
5) I
TALY
4,21
827
,638
4,90
332
,861
16.2
1.8
5,71
036
,809
5,59
439
,089
-2.0
1.7
6) F
RA
NC
E4,
634
30,3
285,
250
35,1
8013
.31.
94,
902
31,5
945,
236
36,6
006.
81.
6
7
) SPA
IN3,
237
21,2
153,
426
22,9
725.
81.
23,
996
25,7
604,
183
29,2
184.
71.
3
8
) PO
LAN
D1,
025
6,71
81,
198
8,03
016
.80.
41,
541
9,93
41,
573
11,0
042.
00.
5
9
) SW
EDEN
684
4,47
670
94,
754
3.7
0.3
772
4,97
279
25,
535
2.7
0.2
10)
DEN
MA
RK
689
4,51
569
34,
647
0.6
0.3
784
5,05
374
65,
225
-4.8
0.2
11)
PO
RTU
GA
L59
03,
866
670
4,49
013
.60.
274
74,
818
744
5,19
9-0
.50.
2
1
2) IR
ELA
ND
526
3,44
548
53,
256
-7.7
0.2
536
3,45
753
13,
717
-1.0
0.2
13)
GR
EEC
E33
62,
204
381
2,55
013
.50.
143
42,
795
503
3,50
316
.00.
2
1
4) A
UST
RIA
340
2,22
838
32,
569
12.8
0.1
460
2,96
548
33,
374
5.0
0.1
15)
HU
NG
ARY
345
2,25
840
62,
725
17.7
0.1
403
2,59
545
83,
205
13.8
0.1
16)
RO
MA
NIA
256
1,67
625
81,
726
0.7
0.1
399
2,57
243
03,
008
7.9
0.1
17)
CZE
CH
REP
UB
LIC
489
3,18
253
33,
577
9.1
0.2
405
2,61
342
93,
003
5.9
0.1
18)
SLO
VEN
IA26
41,
736
252
1,68
7-4
.60.
128
71,
850
317
2,21
610
.40.
1
1
9) F
INLA
ND
249
1,62
927
01,
810
8.6
0.1
283
1,82
325
61,
792
-9.3
0.1
20)
MA
LTA
325
2,11
713
792
2-5
7.8
0.0
196
1,26
223
01,
606
17.2
0.1
21)
BU
LGA
RIA
146
949
240
1,60
564
.60.
117
31,
117
213
1,48
523
.20.
1
2
2) C
RO
ATIA
112
737
124
831
10.4
0.0
169
1,08
715
41,
074
-8.8
0.0
23)
SLO
VAK
REP
138
899
146
980
6.3
0.1
152
983
146
1,02
0-4
.30.
0
2
4) L
ITH
UA
NIA
8857
996
644
9.0
0.0
104
669
127
890
22.7
0.0
Con
td....
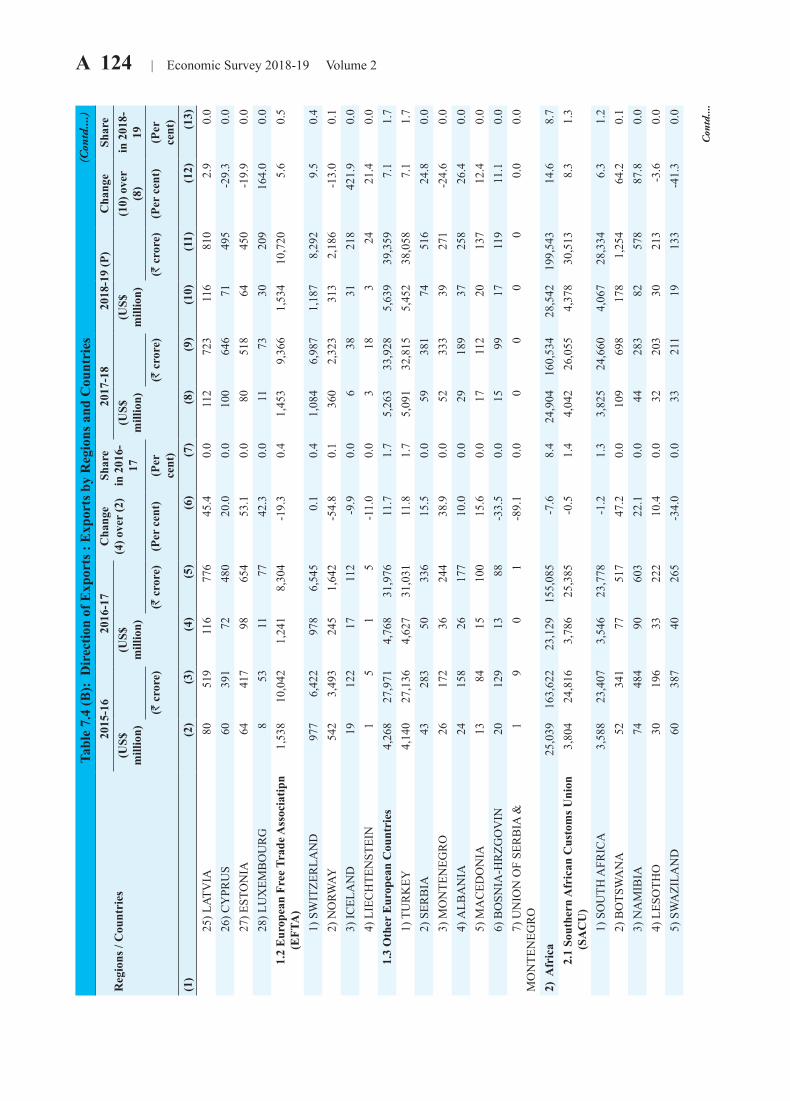
A 124 | Economic Survey 2018-19 Volume 2Ta
ble
7.4
(B):
Dir
ectio
n of
Exp
orts
: E
xpor
ts b
y R
egio
ns a
nd C
ount
ries
R
egio
ns /
Cou
ntri
es20
15-1
620
16-1
7C
hang
e(4
) ove
r (2
)Sh
are
in 2
016-
17
2017
-18
2018
-19
(P)
Cha
nge
Shar
e(U
S$m
illio
n)(U
S$m
illio
n)(U
S$m
illio
n)(U
S$m
illio
n)(1
0) o
ver
(8)
in 2
018-
19(R
cro
re)
(R c
rore
)(P
er c
ent)
(Per
ce
nt)
(R c
rore
)(R
cro
re)
(Per
cen
t)(P
er
cent
)(1
)(2
)(3
)(4
)(5
)(6
)(7
)(8
)(9
)(1
0)(1
1)(1
2)(1
3)
2
5) L
ATV
IA80
519
116
776
45.4
0.0
112
723
116
810
2.9
0.0
26)
CY
PRU
S60
391
7248
020
.00.
010
064
671
495
-29.
30.
0
2
7) E
STO
NIA
6441
798
654
53.1
0.0
8051
864
450
-19.
90.
0
2
8) L
UX
EMB
OU
RG
853
1177
42.3
0.0
1173
3020
916
4.0
0.0
1.
2 E
urop
ean
Free
Tra
de A
ssoc
iatip
n
(
EFT
A)
1,53
810
,042
1,24
18,
304
-19.
30.
41,
453
9,36
61,
534
10,7
205.
60.
5
1) S
WIT
ZER
LAN
D97
76,
422
978
6,54
50.
10.
41,
084
6,98
71,
187
8,29
29.
50.
4
2
) NO
RWAY
542
3,49
324
51,
642
-54.
80.
136
02,
323
313
2,18
6-1
3.0
0.1
3) I
CEL
AN
D19
122
1711
2-9
.90.
06
3831
218
421.
90.
0
4
) LIE
CH
TEN
STEI
N1
51
5-1
1.0
0.0
318
324
21.4
0.0
1.
3 O
ther
Eur
opea
n C
ount
ries
4,26
827
,971
4,76
831
,976
11.7
1.7
5,26
333
,928
5,63
939
,359
7.1
1.7
1) T
UR
KEY
4,14
027
,136
4,62
731
,031
11.8
1.7
5,09
132
,815
5,45
238
,058
7.1
1.7
2) S
ERB
IA43
283
5033
615
.50.
059
381
7451
624
.80.
0
3
) MO
NTE
NEG
RO
2617
236
244
38.9
0.0
5233
339
271
-24.
60.
0
4
) ALB
AN
IA24
158
2617
710
.00.
029
189
3725
826
.40.
0
5
) MA
CED
ON
IA13
8415
100
15.6
0.0
1711
220
137
12.4
0.0
6) B
OSN
IA-H
RZG
OV
IN20
129
1388
-33.
50.
015
9917
119
11.1
0.0
7) U
NIO
N O
F SE
RB
IA &
M
ON
TEN
EGR
O1
90
1-8
9.1
0.0
00
00
0.0
0.0
2) A
fric
a25
,039
163,
622
23,1
2915
5,08
5-7
.68.
424
,904
160,
534
28,5
4219
9,54
314
.68.
7
2.1
Sout
hern
Afr
ican
Cus
tom
s Uni
on
(SA
CU
)3,
804
24,8
163,
786
25,3
85-0
.51.
44,
042
26,0
554,
378
30,5
138.
31.
3
1) S
OU
TH A
FRIC
A3,
588
23,4
073,
546
23,7
78-1
.21.
33,
825
24,6
604,
067
28,3
346.
31.
2
2
) BO
TSW
AN
A52
341
7751
747
.20.
010
969
817
81,
254
64.2
0.1
3) N
AM
IBIA
7448
490
603
22.1
0.0
4428
382
578
87.8
0.0
4) L
ESO
THO
3019
633
222
10.4
0.0
3220
330
213
-3.6
0.0
5) S
WA
ZILA
ND
6038
740
265
-34.
00.
033
211
1913
3-4
1.3
0.0
Con
td....
(Con
td....)
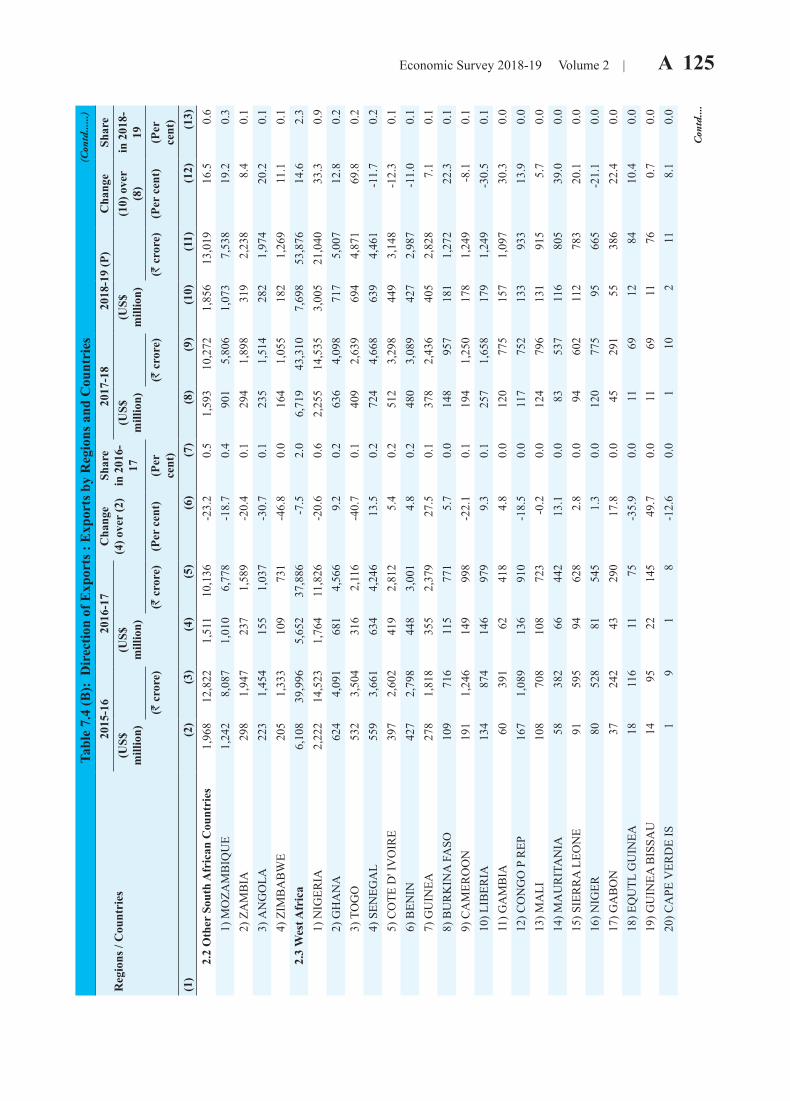
Economic Survey 2018-19 Volume 2 | A 125 Ta
ble
7.4
(B):
Dir
ectio
n of
Exp
orts
: E
xpor
ts b
y R
egio
ns a
nd C
ount
ries
R
egio
ns /
Cou
ntri
es20
15-1
620
16-1
7C
hang
e(4
) ove
r (2
)Sh
are
in 2
016-
17
2017
-18
2018
-19
(P)
Cha
nge
Shar
e(U
S$m
illio
n)(U
S$m
illio
n)(U
S$m
illio
n)(U
S$m
illio
n)(1
0) o
ver
(8)
in 2
018-
19(R
cro
re)
(R c
rore
)(P
er c
ent)
(Per
ce
nt)
(R c
rore
)(R
cro
re)
(Per
cen
t)(P
er
cent
)(1
)(2
)(3
)(4
)(5
)(6
)(7
)(8
)(9
)(1
0)(1
1)(1
2)(1
3)
2.2
Oth
er S
outh
Afr
ican
Cou
ntri
es1,
968
12,8
221,
511
10,1
36-2
3.2
0.5
1,59
310
,272
1,85
613
,019
16.5
0.6
1) M
OZA
MB
IQU
E1,
242
8,08
71,
010
6,77
8-1
8.7
0.4
901
5,80
61,
073
7,53
819
.20.
3
2
) ZA
MB
IA29
81,
947
237
1,58
9-2
0.4
0.1
294
1,89
831
92,
238
8.4
0.1
3) A
NG
OLA
223
1,45
415
51,
037
-30.
70.
123
51,
514
282
1,97
420
.20.
1
4
) ZIM
BA
BW
E20
51,
333
109
731
-46.
80.
016
41,
055
182
1,26
911
.10.
1
2.3
Wes
t Afr
ica
6,10
839
,996
5,65
237
,886
-7.5
2.0
6,71
943
,310
7,69
853
,876
14.6
2.3
1) N
IGER
IA2,
222
14,5
231,
764
11,8
26-2
0.6
0.6
2,25
514
,535
3,00
521
,040
33.3
0.9
2) G
HA
NA
624
4,09
168
14,
566
9.2
0.2
636
4,09
871
75,
007
12.8
0.2
3) T
OG
O53
23,
504
316
2,11
6-4
0.7
0.1
409
2,63
969
44,
871
69.8
0.2
4) S
ENEG
AL
559
3,66
163
44,
246
13.5
0.2
724
4,66
863
94,
461
-11.
70.
2
5
) CO
TE D
' IV
OIR
E39
72,
602
419
2,81
25.
40.
251
23,
298
449
3,14
8-1
2.3
0.1
6) B
ENIN
427
2,79
844
83,
001
4.8
0.2
480
3,08
942
72,
987
-11.
00.
1
7
) GU
INEA
278
1,81
835
52,
379
27.5
0.1
378
2,43
640
52,
828
7.1
0.1
8) B
UR
KIN
A F
ASO
109
716
115
771
5.7
0.0
148
957
181
1,27
222
.30.
1
9
) CA
MER
OO
N19
11,
246
149
998
-22.
10.
119
41,
250
178
1,24
9-8
.10.
1
1
0) L
IBER
IA13
487
414
697
99.
30.
125
71,
658
179
1,24
9-3
0.5
0.1
11)
GA
MB
IA60
391
6241
84.
80.
012
077
515
71,
097
30.3
0.0
12)
CO
NG
O P
REP
167
1,08
913
691
0-1
8.5
0.0
117
752
133
933
13.9
0.0
13)
MA
LI10
870
810
872
3-0
.20.
012
479
613
191
55.
70.
0
1
4) M
AU
RIT
AN
IA58
382
6644
213
.10.
083
537
116
805
39.0
0.0
15)
SIE
RR
A L
EON
E91
595
9462
82.
80.
094
602
112
783
20.1
0.0
16)
NIG
ER80
528
8154
51.
30.
012
077
595
665
-21.
10.
0
1
7) G
AB
ON
3724
243
290
17.8
0.0
4529
155
386
22.4
0.0
18)
EQ
UTL
GU
INEA
1811
611
75-3
5.9
0.0
1169
1284
10.4
0.0
19)
GU
INEA
BIS
SAU
1495
2214
549
.70.
011
6911
760.
70.
0
2
0) C
APE
VER
DE
IS1
91
8-1
2.6
0.0
110
211
8.1
0.0
Con
td....
(Con
td......)
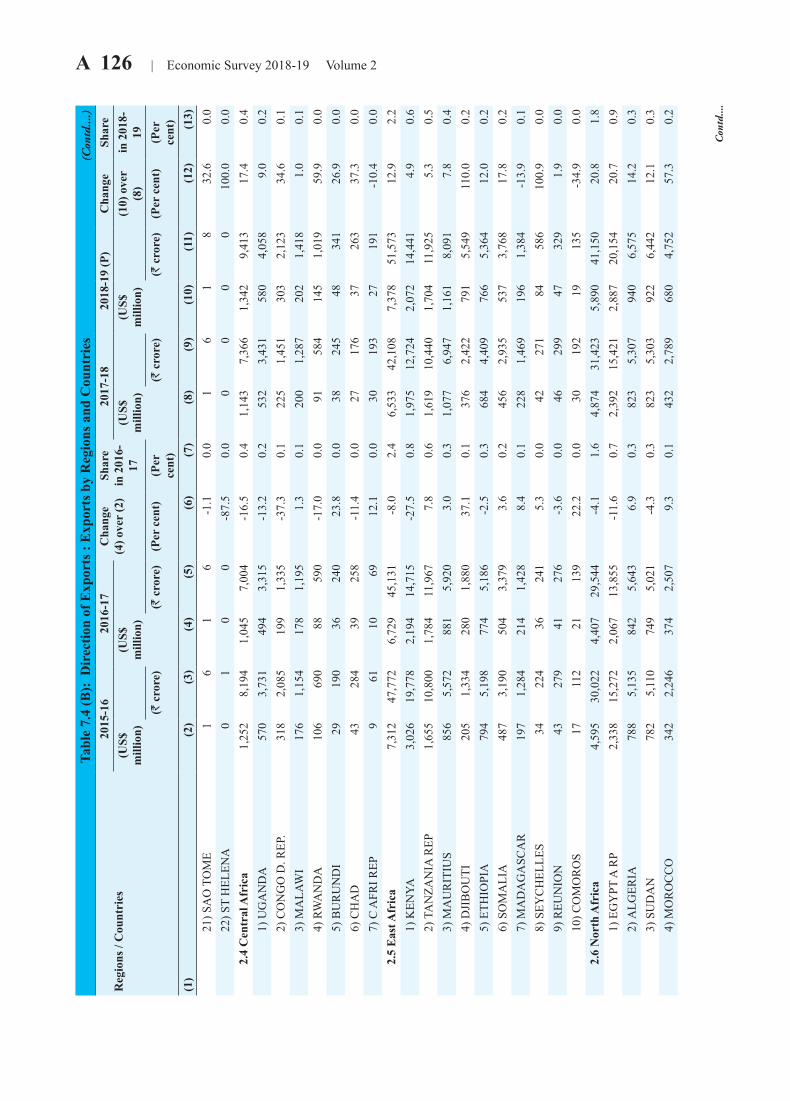
A 126 | Economic Survey 2018-19 Volume 2Ta
ble
7.4
(B):
Dir
ectio
n of
Exp
orts
: E
xpor
ts b
y R
egio
ns a
nd C
ount
ries
R
egio
ns /
Cou
ntri
es20
15-1
620
16-1
7C
hang
e(4
) ove
r (2
)Sh
are
in 2
016-
17
2017
-18
2018
-19
(P)
Cha
nge
Shar
e(U
S$m
illio
n)(U
S$m
illio
n)(U
S$m
illio
n)(U
S$m
illio
n)(1
0) o
ver
(8)
in 2
018-
19(R
cro
re)
(R c
rore
)(P
er c
ent)
(Per
ce
nt)
(R c
rore
)(R
cro
re)
(Per
cen
t)(P
er
cent
)(1
)(2
)(3
)(4
)(5
)(6
)(7
)(8
)(9
)(1
0)(1
1)(1
2)(1
3)
2
1) S
AO
TO
ME
16
16
-1.1
0.0
16
18
32.6
0.0
22)
ST
HEL
ENA
01
00
-87.
50.
00
00
010
0.0
0.0
2.
4 C
entr
al A
fric
a1,
252
8,19
41,
045
7,00
4-1
6.5
0.4
1,14
37,
366
1,34
29,
413
17.4
0.4
1) U
GA
ND
A57
03,
731
494
3,31
5-1
3.2
0.2
532
3,43
158
04,
058
9.0
0.2
2) C
ON
GO
D. R
EP.
318
2,08
519
91,
335
-37.
30.
122
51,
451
303
2,12
334
.60.
1
3
) MA
LAW
I17
61,
154
178
1,19
51.
30.
120
01,
287
202
1,41
81.
00.
1
4
) RW
AN
DA
106
690
8859
0-1
7.0
0.0
9158
414
51,
019
59.9
0.0
5) B
UR
UN
DI
2919
036
240
23.8
0.0
3824
548
341
26.9
0.0
6) C
HA
D43
284
3925
8-1
1.4
0.0
2717
637
263
37.3
0.0
7) C
AFR
I REP
961
1069
12.1
0.0
3019
327
191
-10.
40.
0
2.5
Eas
t Afr
ica
7,31
247
,772
6,72
945
,131
-8.0
2.4
6,53
342
,108
7,37
851
,573
12.9
2.2
1) K
ENYA
3,02
619
,778
2,19
414
,715
-27.
50.
81,
975
12,7
242,
072
14,4
414.
90.
6
2
) TA
NZA
NIA
REP
1,65
510
,800
1,78
411
,967
7.8
0.6
1,61
910
,440
1,70
411
,925
5.3
0.5
3) M
AU
RIT
IUS
856
5,57
288
15,
920
3.0
0.3
1,07
76,
947
1,16
18,
091
7.8
0.4
4) D
JIB
OU
TI20
51,
334
280
1,88
037
.10.
137
62,
422
791
5,54
911
0.0
0.2
5) E
THIO
PIA
794
5,19
877
45,
186
-2.5
0.3
684
4,40
976
65,
364
12.0
0.2
6) S
OM
ALI
A48
73,
190
504
3,37
93.
60.
245
62,
935
537
3,76
817
.80.
2
7
) MA
DA
GA
SCA
R19
71,
284
214
1,42
88.
40.
122
81,
469
196
1,38
4-1
3.9
0.1
8) S
EYC
HEL
LES
3422
436
241
5.3
0.0
4227
184
586
100.
90.
0
9
) REU
NIO
N43
279
4127
6-3
.60.
046
299
4732
91.
90.
0
1
0) C
OM
OR
OS
1711
221
139
22.2
0.0
3019
219
135
-34.
90.
0
2.6
Nor
th A
fric
a4,
595
30,0
224,
407
29,5
44-4
.11.
64,
874
31,4
235,
890
41,1
5020
.81.
8
1
) EG
YPT
A R
P2,
338
15,2
722,
067
13,8
55-1
1.6
0.7
2,39
215
,421
2,88
720
,154
20.7
0.9
2) A
LGER
IA78
85,
135
842
5,64
36.
90.
382
35,
307
940
6,57
514
.20.
3
3
) SU
DA
N78
25,
110
749
5,02
1-4
.30.
382
35,
303
922
6,44
212
.10.
3
4
) MO
RO
CC
O34
22,
246
374
2,50
79.
30.
143
22,
789
680
4,75
257
.30.
2
Con
td....
(Con
td....)
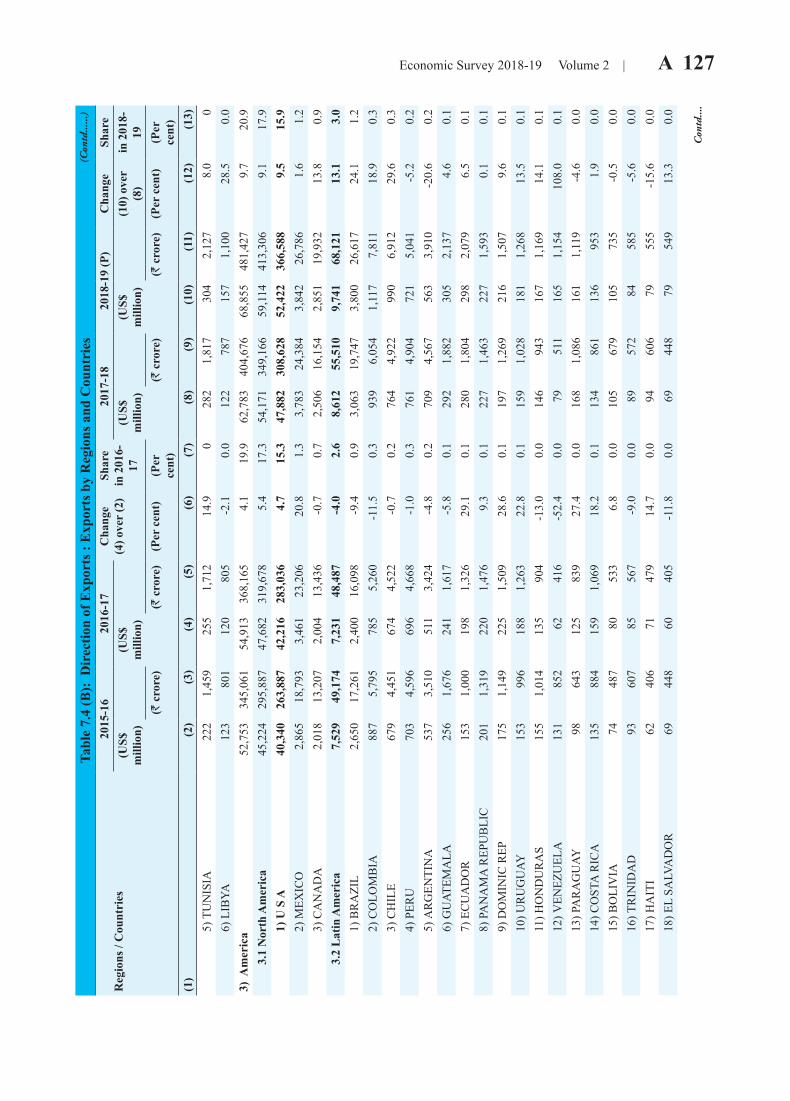
Economic Survey 2018-19 Volume 2 | A 127 Ta
ble
7.4
(B):
Dir
ectio
n of
Exp
orts
: E
xpor
ts b
y R
egio
ns a
nd C
ount
ries
R
egio
ns /
Cou
ntri
es20
15-1
620
16-1
7C
hang
e(4
) ove
r (2
)Sh
are
in 2
016-
17
2017
-18
2018
-19
(P)
Cha
nge
Shar
e(U
S$m
illio
n)(U
S$m
illio
n)(U
S$m
illio
n)(U
S$m
illio
n)(1
0) o
ver
(8)
in 2
018-
19(R
cro
re)
(R c
rore
)(P
er c
ent)
(Per
ce
nt)
(R c
rore
)(R
cro
re)
(Per
cen
t)(P
er
cent
)(1
)(2
)(3
)(4
)(5
)(6
)(7
)(8
)(9
)(1
0)(1
1)(1
2)(1
3)
5
) TU
NIS
IA22
21,
459
255
1,71
214
.90
282
1,81
730
42,
127
8.0
0
6
) LIB
YA12
380
112
080
5-2
.10.
012
278
715
71,
100
28.5
0.0
3) A
mer
ica
52,7
5334
5,06
154
,913
368,
165
4.1
19.9
62,7
8340
4,67
668
,855
481,
427
9.7
20.9
3.
1 N
orth
Am
eric
a45
,224
295,
887
47,6
8231
9,67
85.
417
.354
,171
349,
166
59,1
1441
3,30
69.
117
.9
1
) U S
A40
,340
263,
887
42,2
1628
3,03
64.
715
.347
,882
308,
628
52,4
2236
6,58
89.
515
.9
2
) MEX
ICO
2,86
518
,793
3,46
123
,206
20.8
1.3
3,78
324
,384
3,84
226
,786
1.6
1.2
3) C
AN
AD
A2,
018
13,2
072,
004
13,4
36-0
.70.
72,
506
16,1
542,
851
19,9
3213
.80.
9
3.2
Lat
in A
mer
ica
7,52
949
,174
7,23
148
,487
-4.0
2.6
8,61
255
,510
9,74
168
,121
13.1
3.0
1) B
RA
ZIL
2,65
017
,261
2,40
016
,098
-9.4
0.9
3,06
319
,747
3,80
026
,617
24.1
1.2
2) C
OLO
MB
IA88
75,
795
785
5,26
0-1
1.5
0.3
939
6,05
41,
117
7,81
118
.90.
3
3
) CH
ILE
679
4,45
167
44,
522
-0.7
0.2
764
4,92
299
06,
912
29.6
0.3
4) P
ERU
703
4,59
669
64,
668
-1.0
0.3
761
4,90
472
15,
041
-5.2
0.2
5) A
RG
ENTI
NA
537
3,51
051
13,
424
-4.8
0.2
709
4,56
756
33,
910
-20.
60.
2
6
) GU
ATEM
ALA
256
1,67
624
11,
617
-5.8
0.1
292
1,88
230
52,
137
4.6
0.1
7) E
CU
AD
OR
153
1,00
019
81,
326
29.1
0.1
280
1,80
429
82,
079
6.5
0.1
8) P
AN
AM
A R
EPU
BLI
C20
11,
319
220
1,47
69.
30.
122
71,
463
227
1,59
30.
10.
1
9
) DO
MIN
IC R
EP17
51,
149
225
1,50
928
.60.
119
71,
269
216
1,50
79.
60.
1
1
0) U
RU
GU
AY15
399
618
81,
263
22.8
0.1
159
1,02
818
11,
268
13.5
0.1
11)
HO
ND
UR
AS
155
1,01
413
590
4-1
3.0
0.0
146
943
167
1,16
914
.10.
1
1
2) V
ENEZ
UEL
A13
185
262
416
-52.
40.
079
511
165
1,15
410
8.0
0.1
13)
PA
RA
GU
AY98
643
125
839
27.4
0.0
168
1,08
616
11,
119
-4.6
0.0
14)
CO
STA
RIC
A13
588
415
91,
069
18.2
0.1
134
861
136
953
1.9
0.0
15)
BO
LIV
IA74
487
8053
36.
80.
010
567
910
573
5-0
.50.
0
1
6) T
RIN
IDA
D93
607
8556
7-9
.00.
089
572
8458
5-5
.60.
0
1
7) H
AIT
I62
406
7147
914
.70.
094
606
7955
5-1
5.6
0.0
18)
EL
SALV
AD
OR
6944
860
405
-11.
80.
069
448
7954
913
.30.
0
Con
td....
(Con
td......)
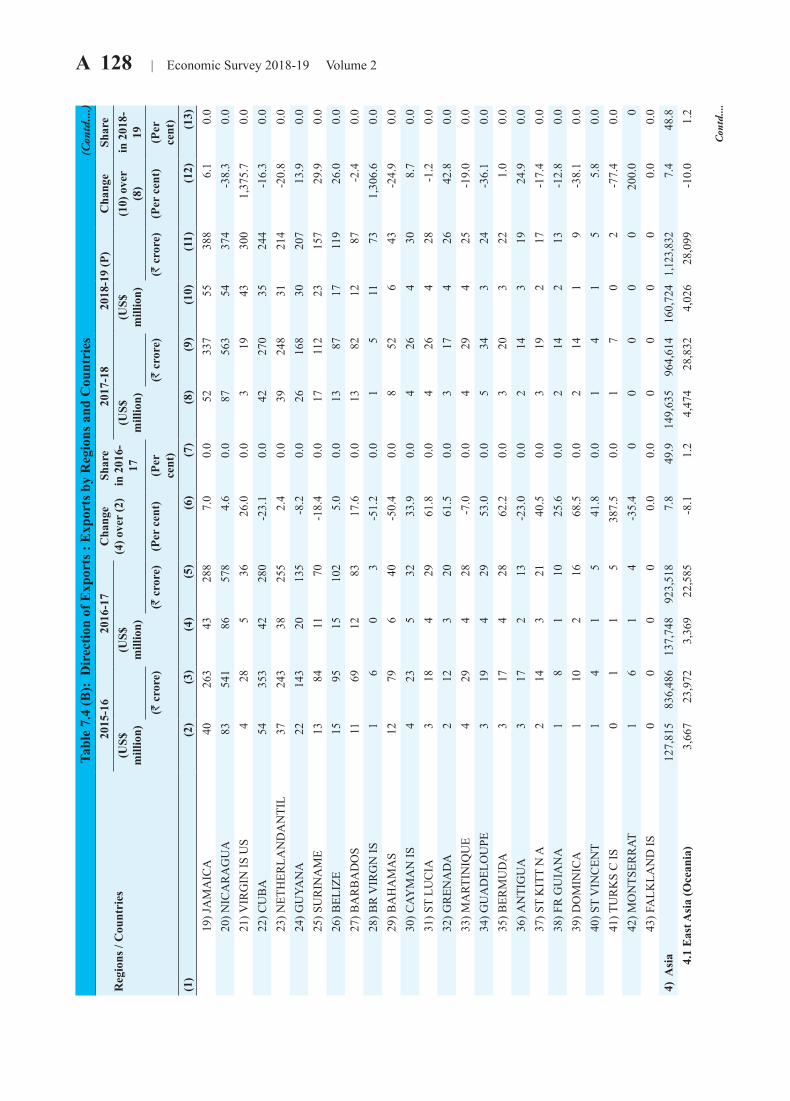
A 128 | Economic Survey 2018-19 Volume 2Ta
ble
7.4
(B):
Dir
ectio
n of
Exp
orts
: E
xpor
ts b
y R
egio
ns a
nd C
ount
ries
R
egio
ns /
Cou
ntri
es20
15-1
620
16-1
7C
hang
e(4
) ove
r (2
)Sh
are
in 2
016-
17
2017
-18
2018
-19
(P)
Cha
nge
Shar
e(U
S$m
illio
n)(U
S$m
illio
n)(U
S$m
illio
n)(U
S$m
illio
n)(1
0) o
ver
(8)
in 2
018-
19(R
cro
re)
(R c
rore
)(P
er c
ent)
(Per
ce
nt)
(R c
rore
)(R
cro
re)
(Per
cen
t)(P
er
cent
)(1
)(2
)(3
)(4
)(5
)(6
)(7
)(8
)(9
)(1
0)(1
1)(1
2)(1
3)
1
9) JA
MA
ICA
4026
343
288
7.0
0.0
5233
755
388
6.1
0.0
20)
NIC
AR
AG
UA
8354
186
578
4.6
0.0
8756
354
374
-38.
30.
0
2
1) V
IRG
IN IS
US
428
536
26.0
0.0
319
4330
01,
375.
70.
0
2
2) C
UB
A54
353
4228
0-2
3.1
0.0
4227
035
244
-16.
30.
0
2
3) N
ETH
ERLA
ND
AN
TIL
3724
338
255
2.4
0.0
3924
831
214
-20.
80.
0
2
4) G
UYA
NA
2214
320
135
-8.2
0.0
2616
830
207
13.9
0.0
25)
SU
RIN
AM
E13
8411
70-1
8.4
0.0
1711
223
157
29.9
0.0
26)
BEL
IZE
1595
1510
25.
00.
013
8717
119
26.0
0.0
27)
BA
RB
AD
OS
1169
1283
17.6
0.0
1382
1287
-2.4
0.0
28)
BR
VIR
GN
IS1
60
3-5
1.2
0.0
15
1173
1,30
6.6
0.0
29)
BA
HA
MA
S12
796
40-5
0.4
0.0
852
643
-24.
90.
0
3
0) C
AYM
AN
IS4
235
3233
.90.
04
264
308.
70.
0
3
1) S
T LU
CIA
318
429
61.8
0.0
426
428
-1.2
0.0
32)
GR
ENA
DA
212
320
61.5
0.0
317
426
42.8
0.0
33)
MA
RTIN
IQU
E4
294
28-7
.00.
04
294
25-1
9.0
0.0
34)
GU
AD
ELO
UPE
319
429
53.0
0.0
534
324
-36.
10.
0
3
5) B
ERM
UD
A3
174
2862
.20.
03
203
221.
00.
0
3
6) A
NTI
GU
A3
172
13-2
3.0
0.0
214
319
24.9
0.0
37)
ST
KIT
T N
A2
143
2140
.50.
03
192
17-1
7.4
0.0
38)
FR
GU
IAN
A1
81
1025
.60.
02
142
13-1
2.8
0.0
39)
DO
MIN
ICA
110
216
68.5
0.0
214
19
-38.
10.
0
4
0) S
T V
INC
ENT
14
15
41.8
0.0
14
15
5.8
0.0
41)
TU
RK
S C
IS0
11
538
7.5
0.0
17
02
-77.
40.
0
4
2) M
ON
TSER
RAT
16
14
-35.
40
00
00
200.
00
43)
FA
LKLA
ND
IS0
00
00.
00.
00
00
00.
00.
04)
Asi
a12
7,81
583
6,48
613
7,74
892
3,51
87.
849
.914
9,63
596
4,61
416
0,72
41,
123,
832
7.4
48.8
4.
1 E
ast A
sia
(Oce
ania
)3,
667
23,9
723,
369
22,5
85-8
.11.
24,
474
28,8
324,
026
28,0
99-1
0.0
1.2
Con
td....
(Con
td....)
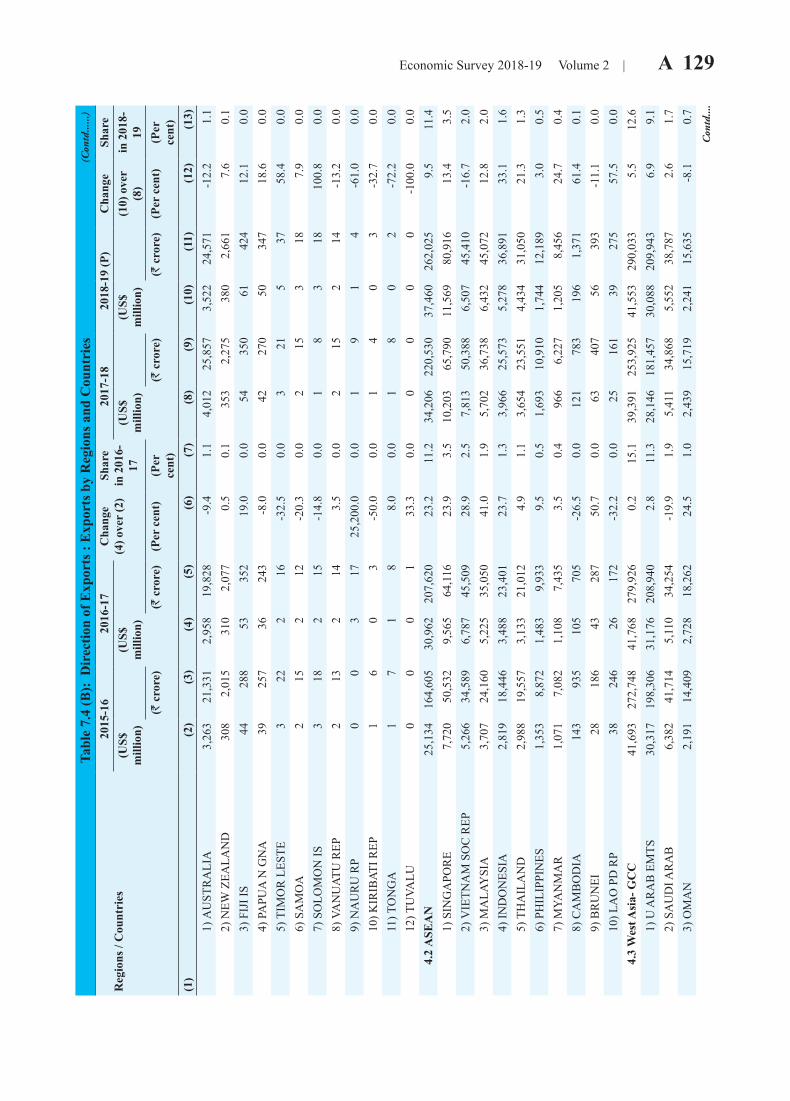
Economic Survey 2018-19 Volume 2 | A 129 Ta
ble
7.4
(B):
Dir
ectio
n of
Exp
orts
: E
xpor
ts b
y R
egio
ns a
nd C
ount
ries
R
egio
ns /
Cou
ntri
es20
15-1
620
16-1
7C
hang
e(4
) ove
r (2
)Sh
are
in 2
016-
17
2017
-18
2018
-19
(P)
Cha
nge
Shar
e(U
S$m
illio
n)(U
S$m
illio
n)(U
S$m
illio
n)(U
S$m
illio
n)(1
0) o
ver
(8)
in 2
018-
19(R
cro
re)
(R c
rore
)(P
er c
ent)
(Per
ce
nt)
(R c
rore
)(R
cro
re)
(Per
cen
t)(P
er
cent
)(1
)(2
)(3
)(4
)(5
)(6
)(7
)(8
)(9
)(1
0)(1
1)(1
2)(1
3)
1
) AU
STR
ALI
A3,
263
21,3
312,
958
19,8
28-9
.41.
14,
012
25,8
573,
522
24,5
71-1
2.2
1.1
2) N
EW Z
EALA
ND
308
2,01
531
02,
077
0.5
0.1
353
2,27
538
02,
661
7.6
0.1
3) F
IJI I
S44
288
5335
219
.00.
054
350
6142
412
.10.
0
4
) PA
PUA
N G
NA
3925
736
243
-8.0
0.0
4227
050
347
18.6
0.0
5) T
IMO
R L
ESTE
322
216
-32.
50.
03
215
3758
.40.
0
6
) SA
MO
A2
152
12-2
0.3
0.0
215
318
7.9
0.0
7) S
OLO
MO
N IS
318
215
-14.
80.
01
83
1810
0.8
0.0
8) V
AN
UAT
U R
EP2
132
143.
50.
02
152
14-1
3.2
0.0
9) N
AU
RU
RP
00
317
25,2
00.0
0.0
19
14
-61.
00.
0
1
0) K
IRIB
ATI R
EP1
60
3-5
0.0
0.0
14
03
-32.
70.
0
1
1) T
ON
GA
17
18
8.0
0.0
18
02
-72.
20.
0
1
2) T
UVA
LU0
00
133
.30.
00
00
0-1
00.0
0.0
4.
2 A
SEA
N25
,134
164,
605
30,9
6220
7,62
023
.211
.234
,206
220,
530
37,4
6026
2,02
59.
511
.4
1
) SIN
GA
POR
E7,
720
50,5
329,
565
64,1
1623
.93.
510
,203
65,7
9011
,569
80,9
1613
.43.
5
2
) VIE
TNA
M S
OC
REP
5,26
634
,589
6,78
745
,509
28.9
2.5
7,81
350
,388
6,50
745
,410
-16.
72.
0
3
) MA
LAY
SIA
3,70
724
,160
5,22
535
,050
41.0
1.9
5,70
236
,738
6,43
245
,072
12.8
2.0
4) I
ND
ON
ESIA
2,81
918
,446
3,48
823
,401
23.7
1.3
3,96
625
,573
5,27
836
,891
33.1
1.6
5) T
HA
ILA
ND
2,98
819
,557
3,13
321
,012
4.9
1.1
3,65
423
,551
4,43
431
,050
21.3
1.3
6) P
HIL
IPPI
NES
1,35
38,
872
1,48
39,
933
9.5
0.5
1,69
310
,910
1,74
412
,189
3.0
0.5
7) M
YAN
MA
R1,
071
7,08
21,
108
7,43
53.
50.
496
66,
227
1,20
58,
456
24.7
0.4
8) C
AM
BO
DIA
143
935
105
705
-26.
50.
012
178
319
61,
371
61.4
0.1
9) B
RU
NEI
2818
643
287
50.7
0.0
6340
756
393
-11.
10.
0
1
0) L
AO
PD
RP
3824
626
172
-32.
20.
025
161
3927
557
.50.
0
4.3
Wes
t Asi
a- G
CC
41,6
9327
2,74
841
,768
279,
926
0.2
15.1
39,3
9125
3,92
541
,553
290,
033
5.5
12.6
1) U
AR
AB
EM
TS30
,317
198,
306
31,1
7620
8,94
02.
811
.328
,146
181,
457
30,0
8820
9,94
36.
99.
1
2
) SA
UD
I AR
AB
6,38
241
,714
5,11
034
,254
-19.
91.
95,
411
34,8
685,
552
38,7
872.
61.
7
3
) OM
AN
2,19
114
,409
2,72
818
,262
24.5
1.0
2,43
915
,719
2,24
115
,635
-8.1
0.7
Con
td....
(Con
td......)
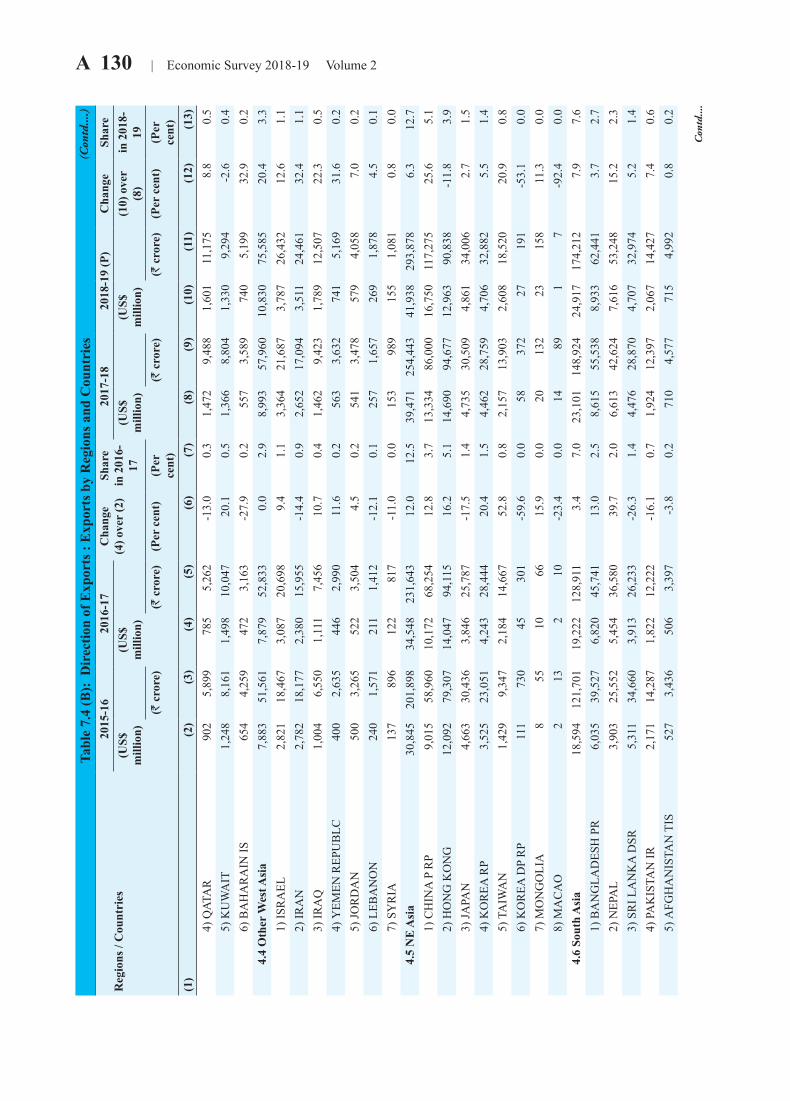
A 130 | Economic Survey 2018-19 Volume 2Ta
ble
7.4
(B):
Dir
ectio
n of
Exp
orts
: E
xpor
ts b
y R
egio
ns a
nd C
ount
ries
R
egio
ns /
Cou
ntri
es20
15-1
620
16-1
7C
hang
e(4
) ove
r (2
)Sh
are
in 2
016-
17
2017
-18
2018
-19
(P)
Cha
nge
Shar
e(U
S$m
illio
n)(U
S$m
illio
n)(U
S$m
illio
n)(U
S$m
illio
n)(1
0) o
ver
(8)
in 2
018-
19(R
cro
re)
(R c
rore
)(P
er c
ent)
(Per
ce
nt)
(R c
rore
)(R
cro
re)
(Per
cen
t)(P
er
cent
)(1
)(2
)(3
)(4
)(5
)(6
)(7
)(8
)(9
)(1
0)(1
1)(1
2)(1
3)
4
) QAT
AR
902
5,89
978
55,
262
-13.
00.
31,
472
9,48
81,
601
11,1
758.
80.
5
5
) KU
WA
IT1,
248
8,16
11,
498
10,0
4720
.10.
51,
366
8,80
41,
330
9,29
4-2
.60.
4
6
) BA
HA
RA
IN IS
654
4,25
947
23,
163
-27.
90.
255
73,
589
740
5,19
932
.90.
2
4.4
Oth
er W
est A
sia
7,88
351
,561
7,87
952
,833
0.0
2.9
8,99
357
,960
10,8
3075
,585
20.4
3.3
1) I
SRA
EL2,
821
18,4
673,
087
20,6
989.
41.
13,
364
21,6
873,
787
26,4
3212
.61.
1
2
) IR
AN
2,78
218
,177
2,38
015
,955
-14.
40.
92,
652
17,0
943,
511
24,4
6132
.41.
1
3
) IR
AQ
1,00
46,
550
1,11
17,
456
10.7
0.4
1,46
29,
423
1,78
912
,507
22.3
0.5
4) Y
EMEN
REP
UB
LC40
02,
635
446
2,99
011
.60.
256
33,
632
741
5,16
931
.60.
2
5
) JO
RD
AN
500
3,26
552
23,
504
4.5
0.2
541
3,47
857
94,
058
7.0
0.2
6) L
EBA
NO
N24
01,
571
211
1,41
2-1
2.1
0.1
257
1,65
726
91,
878
4.5
0.1
7) S
YR
IA13
789
612
281
7-1
1.0
0.0
153
989
155
1,08
10.
80.
0
4.5
NE
Asi
a30
,845
201,
898
34,5
4823
1,64
312
.012
.539
,471
254,
443
41,9
3829
3,87
86.
312
.7
1
) CH
INA
P R
P9,
015
58,9
6010
,172
68,2
5412
.83.
713
,334
86,0
0016
,750
117,
275
25.6
5.1
2) H
ON
G K
ON
G12
,092
79,3
0714
,047
94,1
1516
.25.
114
,690
94,6
7712
,963
90,8
38-1
1.8
3.9
3) J
APA
N4,
663
30,4
363,
846
25,7
87-1
7.5
1.4
4,73
530
,509
4,86
134
,006
2.7
1.5
4) K
OR
EA R
P3,
525
23,0
514,
243
28,4
4420
.41.
54,
462
28,7
594,
706
32,8
825.
51.
4
5
) TA
IWA
N1,
429
9,34
72,
184
14,6
6752
.80.
82,
157
13,9
032,
608
18,5
2020
.90.
8
6
) KO
REA
DP
RP
111
730
4530
1-5
9.6
0.0
5837
227
191
-53.
10.
0
7
) MO
NG
OLI
A8
5510
6615
.90.
020
132
2315
811
.30.
0
8
) MA
CA
O2
132
10-2
3.4
0.0
1489
17
-92.
40.
0
4.6
Sout
h A
sia
18,5
9412
1,70
119
,222
128,
911
3.4
7.0
23,1
0114
8,92
424
,917
174,
212
7.9
7.6
1) B
AN
GLA
DES
H P
R6,
035
39,5
276,
820
45,7
4113
.02.
58,
615
55,5
388,
933
62,4
413.
72.
7
2
) NEP
AL
3,90
325
,552
5,45
436
,580
39.7
2.0
6,61
342
,624
7,61
653
,248
15.2
2.3
3) S
RI L
AN
KA
DSR
5,31
134
,660
3,91
326
,233
-26.
31.
44,
476
28,8
704,
707
32,9
745.
21.
4
4
) PA
KIS
TAN
IR2,
171
14,2
871,
822
12,2
22-1
6.1
0.7
1,92
412
,397
2,06
714
,427
7.4
0.6
5) A
FGH
AN
ISTA
N T
IS52
73,
436
506
3,39
7-3
.80.
271
04,
577
715
4,99
20.
80.
2
(Con
td....)
Con
td....
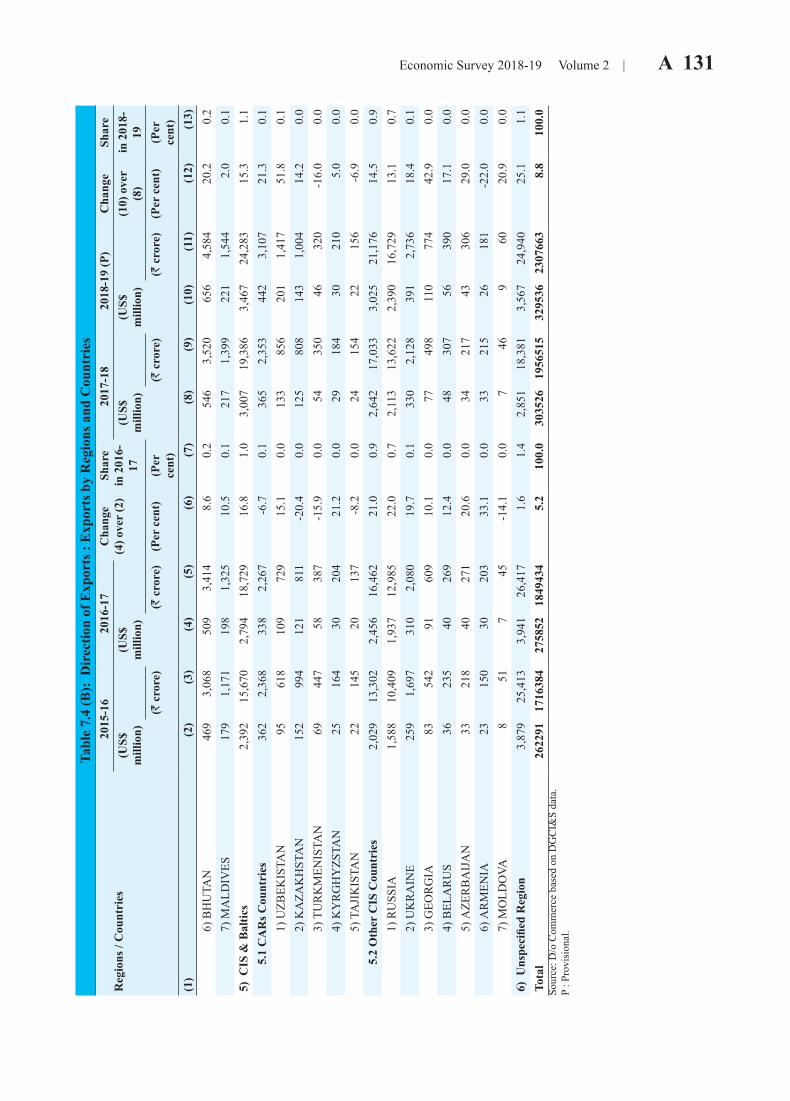
Economic Survey 2018-19 Volume 2 | A 131 Ta
ble
7.4
(B):
Dir
ectio
n of
Exp
orts
: E
xpor
ts b
y R
egio
ns a
nd C
ount
ries
R
egio
ns /
Cou
ntri
es20
15-1
620
16-1
7C
hang
e(4
) ove
r (2
)Sh
are
in 2
016-
17
2017
-18
2018
-19
(P)
Cha
nge
Shar
e(U
S$m
illio
n)(U
S$m
illio
n)(U
S$m
illio
n)(U
S$m
illio
n)(1
0) o
ver
(8)
in 2
018-
19(R
cro
re)
(R c
rore
)(P
er c
ent)
(Per
ce
nt)
(R c
rore
)(R
cro
re)
(Per
cen
t)(P
er
cent
)(1
)(2
)(3
)(4
)(5
)(6
)(7
)(8
)(9
)(1
0)(1
1)(1
2)(1
3)
6
) BH
UTA
N46
93,
068
509
3,41
48.
60.
254
63,
520
656
4,58
420
.20.
2
7
) MA
LDIV
ES17
91,
171
198
1,32
510
.50.
121
71,
399
221
1,54
42.
00.
15)
CIS
& B
altic
s2,
392
15,6
702,
794
18,7
2916
.81.
03,
007
19,3
863,
467
24,2
8315
.31.
1
5.1
CA
Rs C
ount
ries
362
2,36
833
82,
267
-6.7
0.1
365
2,35
344
23,
107
21.3
0.1
1) U
ZBEK
ISTA
N95
618
109
729
15.1
0.0
133
856
201
1,41
751
.80.
1
2
) KA
ZAK
HST
AN
152
994
121
811
-20.
40.
012
580
814
31,
004
14.2
0.0
3) T
UR
KM
ENIS
TAN
6944
758
387
-15.
90.
054
350
4632
0-1
6.0
0.0
4) K
YR
GH
YZS
TAN
2516
430
204
21.2
0.0
2918
430
210
5.0
0.0
5) T
AJI
KIS
TAN
2214
520
137
-8.2
0.0
2415
422
156
-6.9
0.0
5.
2 O
ther
CIS
Cou
ntri
es2,
029
13,3
022,
456
16,4
6221
.00.
92,
642
17,0
333,
025
21,1
7614
.50.
9
1
) RU
SSIA
1,58
810
,409
1,93
712
,985
22.0
0.7
2,11
313
,622
2,39
016
,729
13.1
0.7
2) U
KR
AIN
E25
91,
697
310
2,08
019
.70.
133
02,
128
391
2,73
618
.40.
1
3
) GEO
RG
IA83
542
9160
910
.10.
077
498
110
774
42.9
0.0
4) B
ELA
RU
S36
235
4026
912
.40.
048
307
5639
017
.10.
0
5
) AZE
RB
AIJ
AN
3321
840
271
20.6
0.0
3421
743
306
29.0
0.0
6) A
RM
ENIA
2315
030
203
33.1
0.0
3321
526
181
-22.
00.
0
7
) MO
LDO
VA8
517
45-1
4.1
0.0
746
960
20.9
0.0
6) U
nspe
cifie
d R
egio
n3,
879
25,4
133,
941
26,4
171.
61.
42,
851
18,3
813,
567
24,9
4025
.11.
1To
tal
2622
9117
1638
427
5852
1849
434
5.2
100.
030
3526
1956
515
3295
3623
0766
38.
810
0.0
Sour
ce: D
/o C
omm
erce
bas
ed o
n D
GC
I&S
data
.P
: Pro
visi
onal
.
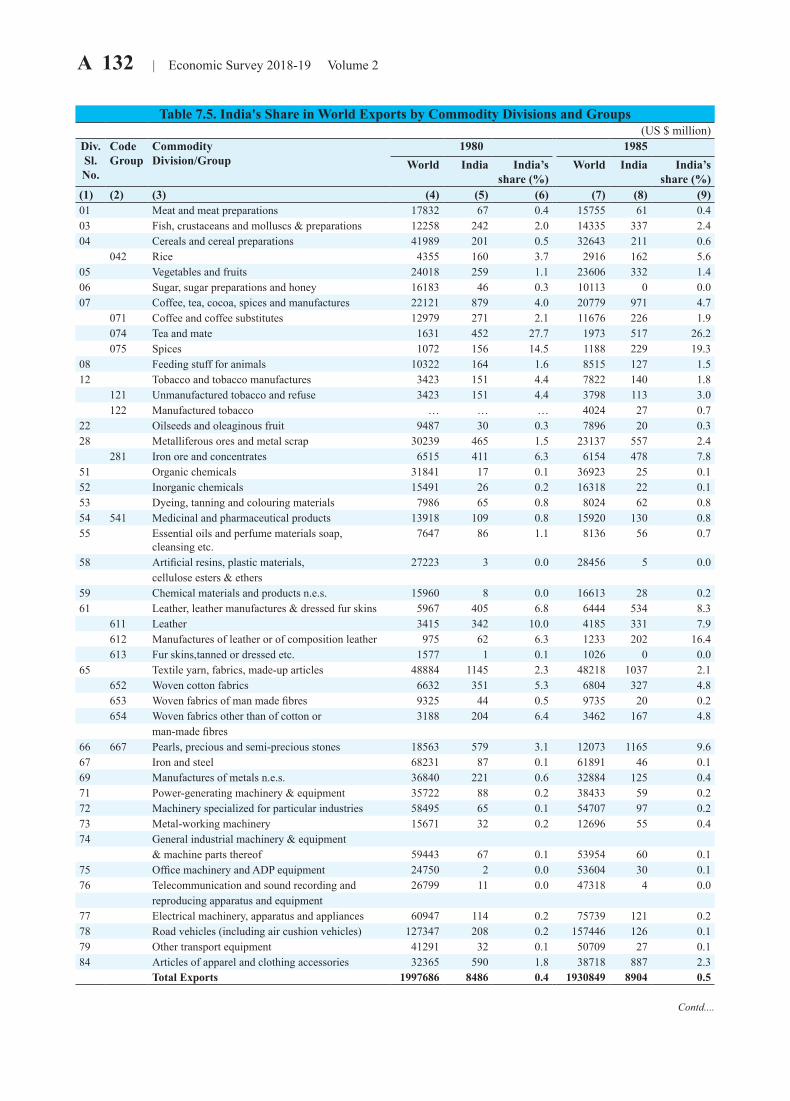
A 132 | Economic Survey 2018-19 Volume 2
Table 7.5. India's Share in World Exports by Commodity Divisions and Groups (US $ million)
Div.Sl. No.
CodeGroup
CommodityDivision/Group
1980 1985World India India’s
share (%)World India India’s
share (%)(1) (2) (3) (4) (5) (6) (7) (8) (9)01 Meat and meat preparations 17832 67 0.4 15755 61 0.403 Fish, crustaceans and molluscs & preparations 12258 242 2.0 14335 337 2.404 Cereals and cereal preparations 41989 201 0.5 32643 211 0.6
042 Rice 4355 160 3.7 2916 162 5.605 Vegetables and fruits 24018 259 1.1 23606 332 1.406 Sugar, sugar preparations and honey 16183 46 0.3 10113 0 0.007 Coffee, tea, cocoa, spices and manufactures 22121 879 4.0 20779 971 4.7
071 Coffee and coffee substitutes 12979 271 2.1 11676 226 1.9074 Tea and mate 1631 452 27.7 1973 517 26.2075 Spices 1072 156 14.5 1188 229 19.3
08 Feeding stuff for animals 10322 164 1.6 8515 127 1.512 Tobacco and tobacco manufactures 3423 151 4.4 7822 140 1.8
121 Unmanufactured tobacco and refuse 3423 151 4.4 3798 113 3.0122 Manufactured tobacco … … … 4024 27 0.7
22 Oilseeds and oleaginous fruit 9487 30 0.3 7896 20 0.328 Metalliferous ores and metal scrap 30239 465 1.5 23137 557 2.4
281 Iron ore and concentrates 6515 411 6.3 6154 478 7.851 Organic chemicals 31841 17 0.1 36923 25 0.152 Inorganic chemicals 15491 26 0.2 16318 22 0.153 Dyeing, tanning and colouring materials 7986 65 0.8 8024 62 0.854 541 Medicinal and pharmaceutical products 13918 109 0.8 15920 130 0.855 Essential oils and perfume materials soap,
cleansing etc.7647 86 1.1 8136 56 0.7
58 Artificial resins, plastic materials, 27223 3 0.0 28456 5 0.0cellulose esters & ethers
59 Chemical materials and products n.e.s. 15960 8 0.0 16613 28 0.261 Leather, leather manufactures & dressed fur skins 5967 405 6.8 6444 534 8.3
611 Leather 3415 342 10.0 4185 331 7.9612 Manufactures of leather or of composition leather 975 62 6.3 1233 202 16.4613 Fur skins,tanned or dressed etc. 1577 1 0.1 1026 0 0.0
65 Textile yarn, fabrics, made-up articles 48884 1145 2.3 48218 1037 2.1652 Woven cotton fabrics 6632 351 5.3 6804 327 4.8653 Woven fabrics of man made fibres 9325 44 0.5 9735 20 0.2654 Woven fabrics other than of cotton or 3188 204 6.4 3462 167 4.8
man-made fibres66 667 Pearls, precious and semi-precious stones 18563 579 3.1 12073 1165 9.667 Iron and steel 68231 87 0.1 61891 46 0.169 Manufactures of metals n.e.s. 36840 221 0.6 32884 125 0.471 Power-generating machinery & equipment 35722 88 0.2 38433 59 0.272 Machinery specialized for particular industries 58495 65 0.1 54707 97 0.273 Metal-working machinery 15671 32 0.2 12696 55 0.474 General industrial machinery & equipment
& machine parts thereof 59443 67 0.1 53954 60 0.175 Office machinery and ADP equipment 24750 2 0.0 53604 30 0.176 Telecommunication and sound recording and 26799 11 0.0 47318 4 0.0
reproducing apparatus and equipment77 Electrical machinery, apparatus and appliances 60947 114 0.2 75739 121 0.278 Road vehicles (including air cushion vehicles) 127347 208 0.2 157446 126 0.179 Other transport equipment 41291 32 0.1 50709 27 0.184 Articles of apparel and clothing accessories 32365 590 1.8 38718 887 2.3
Total Exports 1997686 8486 0.4 1930849 8904 0.5
Contd....
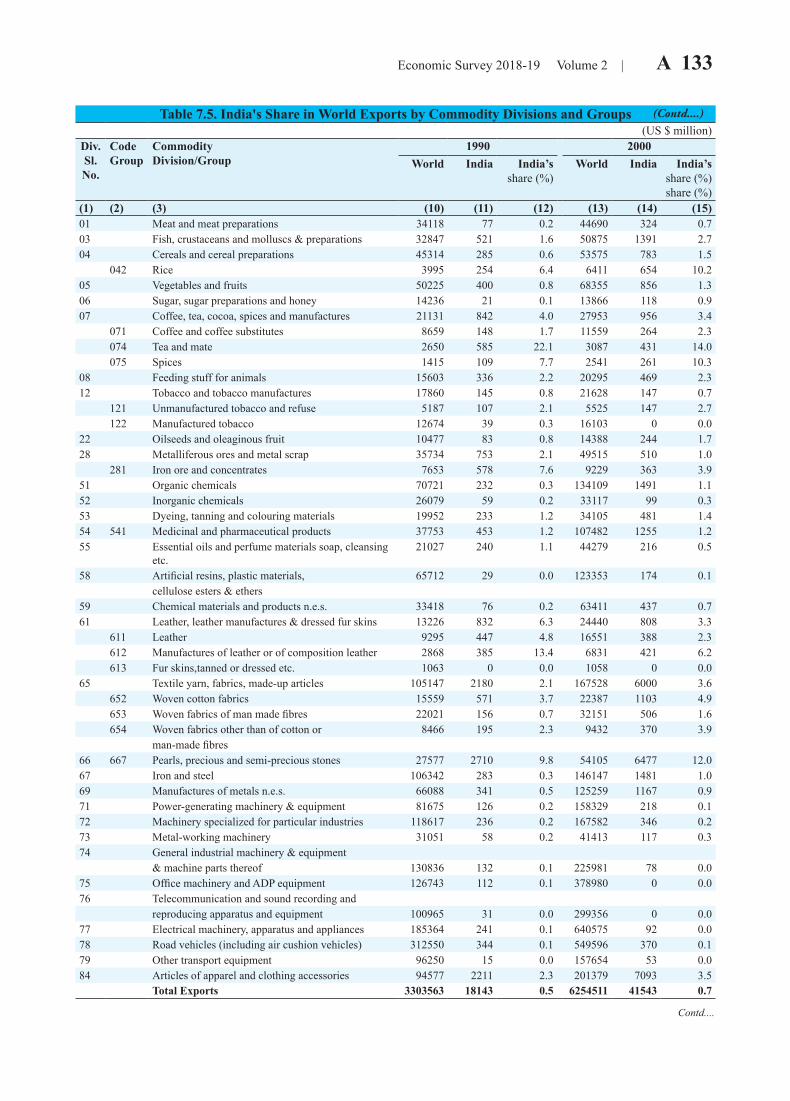
Economic Survey 2018-19 Volume 2 | A 133
Table 7.5. India's Share in World Exports by Commodity Divisions and Groups(US $ million)
Div.Sl. No.
CodeGroup
CommodityDivision/Group
1990 2000World India India’s
share (%)World India India’s
share (%)share (%)
(1) (2) (3) (10) (11) (12) (13) (14) (15)01 Meat and meat preparations 34118 77 0.2 44690 324 0.703 Fish, crustaceans and molluscs & preparations 32847 521 1.6 50875 1391 2.704 Cereals and cereal preparations 45314 285 0.6 53575 783 1.5
042 Rice 3995 254 6.4 6411 654 10.205 Vegetables and fruits 50225 400 0.8 68355 856 1.306 Sugar, sugar preparations and honey 14236 21 0.1 13866 118 0.907 Coffee, tea, cocoa, spices and manufactures 21131 842 4.0 27953 956 3.4
071 Coffee and coffee substitutes 8659 148 1.7 11559 264 2.3074 Tea and mate 2650 585 22.1 3087 431 14.0075 Spices 1415 109 7.7 2541 261 10.3
08 Feeding stuff for animals 15603 336 2.2 20295 469 2.312 Tobacco and tobacco manufactures 17860 145 0.8 21628 147 0.7
121 Unmanufactured tobacco and refuse 5187 107 2.1 5525 147 2.7122 Manufactured tobacco 12674 39 0.3 16103 0 0.0
22 Oilseeds and oleaginous fruit 10477 83 0.8 14388 244 1.728 Metalliferous ores and metal scrap 35734 753 2.1 49515 510 1.0
281 Iron ore and concentrates 7653 578 7.6 9229 363 3.951 Organic chemicals 70721 232 0.3 134109 1491 1.152 Inorganic chemicals 26079 59 0.2 33117 99 0.353 Dyeing, tanning and colouring materials 19952 233 1.2 34105 481 1.454 541 Medicinal and pharmaceutical products 37753 453 1.2 107482 1255 1.255 Essential oils and perfume materials soap, cleansing
etc.21027 240 1.1 44279 216 0.5
58 Artificial resins, plastic materials, 65712 29 0.0 123353 174 0.1cellulose esters & ethers
59 Chemical materials and products n.e.s. 33418 76 0.2 63411 437 0.761 Leather, leather manufactures & dressed fur skins 13226 832 6.3 24440 808 3.3
611 Leather 9295 447 4.8 16551 388 2.3612 Manufactures of leather or of composition leather 2868 385 13.4 6831 421 6.2613 Fur skins,tanned or dressed etc. 1063 0 0.0 1058 0 0.0
65 Textile yarn, fabrics, made-up articles 105147 2180 2.1 167528 6000 3.6652 Woven cotton fabrics 15559 571 3.7 22387 1103 4.9653 Woven fabrics of man made fibres 22021 156 0.7 32151 506 1.6654 Woven fabrics other than of cotton or 8466 195 2.3 9432 370 3.9
man-made fibres66 667 Pearls, precious and semi-precious stones 27577 2710 9.8 54105 6477 12.067 Iron and steel 106342 283 0.3 146147 1481 1.069 Manufactures of metals n.e.s. 66088 341 0.5 125259 1167 0.971 Power-generating machinery & equipment 81675 126 0.2 158329 218 0.172 Machinery specialized for particular industries 118617 236 0.2 167582 346 0.273 Metal-working machinery 31051 58 0.2 41413 117 0.374 General industrial machinery & equipment
& machine parts thereof 130836 132 0.1 225981 78 0.075 Office machinery and ADP equipment 126743 112 0.1 378980 0 0.076 Telecommunication and sound recording and
reproducing apparatus and equipment 100965 31 0.0 299356 0 0.077 Electrical machinery, apparatus and appliances 185364 241 0.1 640575 92 0.078 Road vehicles (including air cushion vehicles) 312550 344 0.1 549596 370 0.179 Other transport equipment 96250 15 0.0 157654 53 0.084 Articles of apparel and clothing accessories 94577 2211 2.3 201379 7093 3.5
Total Exports 3303563 18143 0.5 6254511 41543 0.7
Contd....
(Contd....)
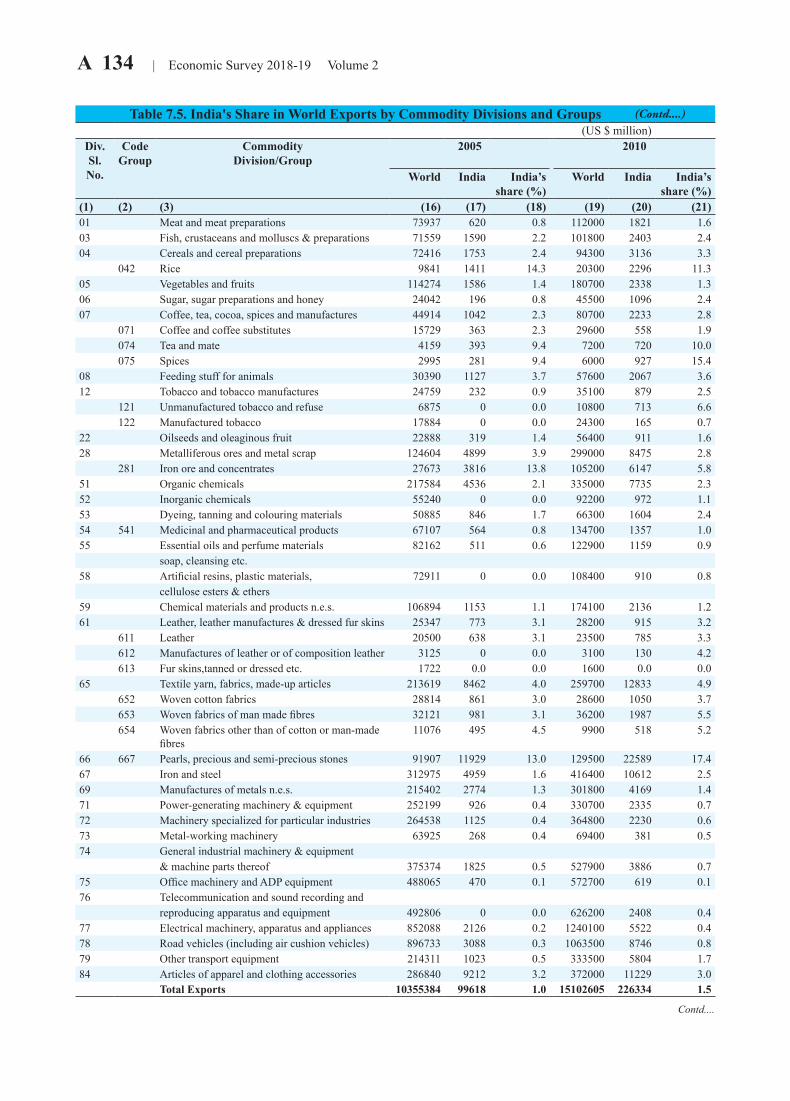
A 134 | Economic Survey 2018-19 Volume 2
Table 7.5. India's Share in World Exports by Commodity Divisions and Groups(US $ million)
Div.Sl. No.
CodeGroup
CommodityDivision/Group
2005 2010
World India India’sshare (%)
World
India India’sshare (%)
(1) (2) (3) (16) (17) (18) (19) (20) (21)01 Meat and meat preparations 73937 620 0.8 112000 1821 1.603 Fish, crustaceans and molluscs & preparations 71559 1590 2.2 101800 2403 2.404 Cereals and cereal preparations 72416 1753 2.4 94300 3136 3.3
042 Rice 9841 1411 14.3 20300 2296 11.305 Vegetables and fruits 114274 1586 1.4 180700 2338 1.306 Sugar, sugar preparations and honey 24042 196 0.8 45500 1096 2.407 Coffee, tea, cocoa, spices and manufactures 44914 1042 2.3 80700 2233 2.8
071 Coffee and coffee substitutes 15729 363 2.3 29600 558 1.9074 Tea and mate 4159 393 9.4 7200 720 10.0075 Spices 2995 281 9.4 6000 927 15.4
08 Feeding stuff for animals 30390 1127 3.7 57600 2067 3.612 Tobacco and tobacco manufactures 24759 232 0.9 35100 879 2.5
121 Unmanufactured tobacco and refuse 6875 0 0.0 10800 713 6.6122 Manufactured tobacco 17884 0 0.0 24300 165 0.7
22 Oilseeds and oleaginous fruit 22888 319 1.4 56400 911 1.628 Metalliferous ores and metal scrap 124604 4899 3.9 299000 8475 2.8
281 Iron ore and concentrates 27673 3816 13.8 105200 6147 5.851 Organic chemicals 217584 4536 2.1 335000 7735 2.352 Inorganic chemicals 55240 0 0.0 92200 972 1.153 Dyeing, tanning and colouring materials 50885 846 1.7 66300 1604 2.454 541 Medicinal and pharmaceutical products 67107 564 0.8 134700 1357 1.055 Essential oils and perfume materials 82162 511 0.6 122900 1159 0.9
soap, cleansing etc.58 Artificial resins, plastic materials, 72911 0 0.0 108400 910 0.8
cellulose esters & ethers59 Chemical materials and products n.e.s. 106894 1153 1.1 174100 2136 1.261 Leather, leather manufactures & dressed fur skins 25347 773 3.1 28200 915 3.2
611 Leather 20500 638 3.1 23500 785 3.3612 Manufactures of leather or of composition leather 3125 0 0.0 3100 130 4.2613 Fur skins,tanned or dressed etc. 1722 0.0 0.0 1600 0.0 0.0
65 Textile yarn, fabrics, made-up articles 213619 8462 4.0 259700 12833 4.9652 Woven cotton fabrics 28814 861 3.0 28600 1050 3.7653 Woven fabrics of man made fibres 32121 981 3.1 36200 1987 5.5654 Woven fabrics other than of cotton or man-made
fibres11076 495 4.5 9900 518 5.2
66 667 Pearls, precious and semi-precious stones 91907 11929 13.0 129500 22589 17.467 Iron and steel 312975 4959 1.6 416400 10612 2.569 Manufactures of metals n.e.s. 215402 2774 1.3 301800 4169 1.471 Power-generating machinery & equipment 252199 926 0.4 330700 2335 0.772 Machinery specialized for particular industries 264538 1125 0.4 364800 2230 0.673 Metal-working machinery 63925 268 0.4 69400 381 0.574 General industrial machinery & equipment
& machine parts thereof 375374 1825 0.5 527900 3886 0.775 Office machinery and ADP equipment 488065 470 0.1 572700 619 0.176 Telecommunication and sound recording and
reproducing apparatus and equipment 492806 0 0.0 626200 2408 0.477 Electrical machinery, apparatus and appliances 852088 2126 0.2 1240100 5522 0.478 Road vehicles (including air cushion vehicles) 896733 3088 0.3 1063500 8746 0.879 Other transport equipment 214311 1023 0.5 333500 5804 1.784 Articles of apparel and clothing accessories 286840 9212 3.2 372000 11229 3.0
Total Exports 10355384 99618 1.0 15102605 226334 1.5
Contd....
(Contd....)
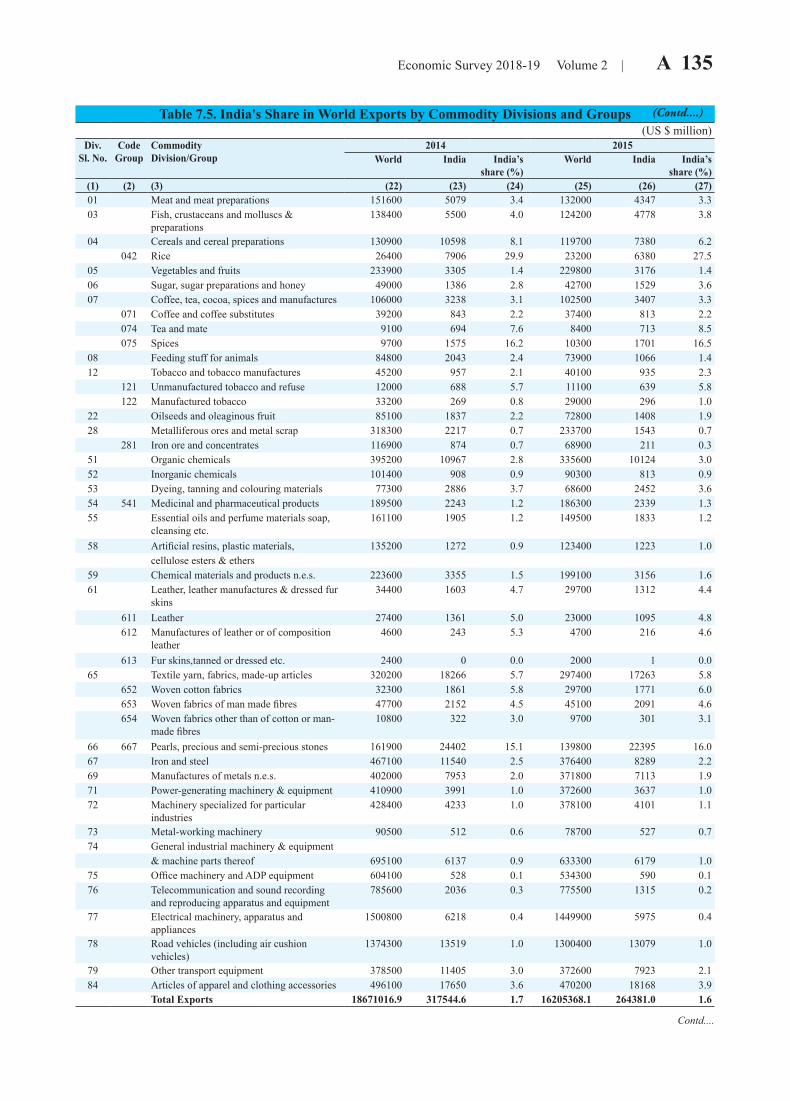
Economic Survey 2018-19 Volume 2 | A 135
Contd....
Table 7.5. India's Share in World Exports by Commodity Divisions and Groups(US $ million)
Div.Sl. No.
CodeGroup
CommodityDivision/Group
2014 2015 World India India’s
share (%)World India India’s
share (%)(1) (2) (3) (22) (23) (24) (25) (26) (27)01 Meat and meat preparations 151600 5079 3.4 132000 4347 3.303 Fish, crustaceans and molluscs &
preparations138400 5500 4.0 124200 4778 3.8
04 Cereals and cereal preparations 130900 10598 8.1 119700 7380 6.2042 Rice 26400 7906 29.9 23200 6380 27.5
05 Vegetables and fruits 233900 3305 1.4 229800 3176 1.406 Sugar, sugar preparations and honey 49000 1386 2.8 42700 1529 3.607 Coffee, tea, cocoa, spices and manufactures 106000 3238 3.1 102500 3407 3.3
071 Coffee and coffee substitutes 39200 843 2.2 37400 813 2.2074 Tea and mate 9100 694 7.6 8400 713 8.5075 Spices 9700 1575 16.2 10300 1701 16.5
08 Feeding stuff for animals 84800 2043 2.4 73900 1066 1.412 Tobacco and tobacco manufactures 45200 957 2.1 40100 935 2.3
121 Unmanufactured tobacco and refuse 12000 688 5.7 11100 639 5.8122 Manufactured tobacco 33200 269 0.8 29000 296 1.0
22 Oilseeds and oleaginous fruit 85100 1837 2.2 72800 1408 1.928 Metalliferous ores and metal scrap 318300 2217 0.7 233700 1543 0.7
281 Iron ore and concentrates 116900 874 0.7 68900 211 0.351 Organic chemicals 395200 10967 2.8 335600 10124 3.052 Inorganic chemicals 101400 908 0.9 90300 813 0.953 Dyeing, tanning and colouring materials 77300 2886 3.7 68600 2452 3.654 541 Medicinal and pharmaceutical products 189500 2243 1.2 186300 2339 1.355 Essential oils and perfume materials soap,
cleansing etc.161100 1905 1.2 149500 1833 1.2
58 Artificial resins, plastic materials, 135200 1272 0.9 123400 1223 1.0cellulose esters & ethers
59 Chemical materials and products n.e.s. 223600 3355 1.5 199100 3156 1.661 Leather, leather manufactures & dressed fur
skins34400 1603 4.7 29700 1312 4.4
611 Leather 27400 1361 5.0 23000 1095 4.8612 Manufactures of leather or of composition
leather4600 243 5.3 4700 216 4.6
613 Fur skins,tanned or dressed etc. 2400 0 0.0 2000 1 0.065 Textile yarn, fabrics, made-up articles 320200 18266 5.7 297400 17263 5.8
652 Woven cotton fabrics 32300 1861 5.8 29700 1771 6.0653 Woven fabrics of man made fibres 47700 2152 4.5 45100 2091 4.6654 Woven fabrics other than of cotton or man-
made fibres10800 322 3.0 9700 301 3.1
66 667 Pearls, precious and semi-precious stones 161900 24402 15.1 139800 22395 16.067 Iron and steel 467100 11540 2.5 376400 8289 2.269 Manufactures of metals n.e.s. 402000 7953 2.0 371800 7113 1.971 Power-generating machinery & equipment 410900 3991 1.0 372600 3637 1.072 Machinery specialized for particular
industries428400 4233 1.0 378100 4101 1.1
73 Metal-working machinery 90500 512 0.6 78700 527 0.774 General industrial machinery & equipment
& machine parts thereof 695100 6137 0.9 633300 6179 1.075 Office machinery and ADP equipment 604100 528 0.1 534300 590 0.176 Telecommunication and sound recording
and reproducing apparatus and equipment785600 2036 0.3 775500 1315 0.2
77 Electrical machinery, apparatus and appliances
1500800 6218 0.4 1449900 5975 0.4
78 Road vehicles (including air cushion vehicles)
1374300 13519 1.0 1300400 13079 1.0
79 Other transport equipment 378500 11405 3.0 372600 7923 2.184 Articles of apparel and clothing accessories 496100 17650 3.6 470200 18168 3.9
Total Exports 18671016.9 317544.6 1.7 16205368.1 264381.0 1.6
(Contd....)
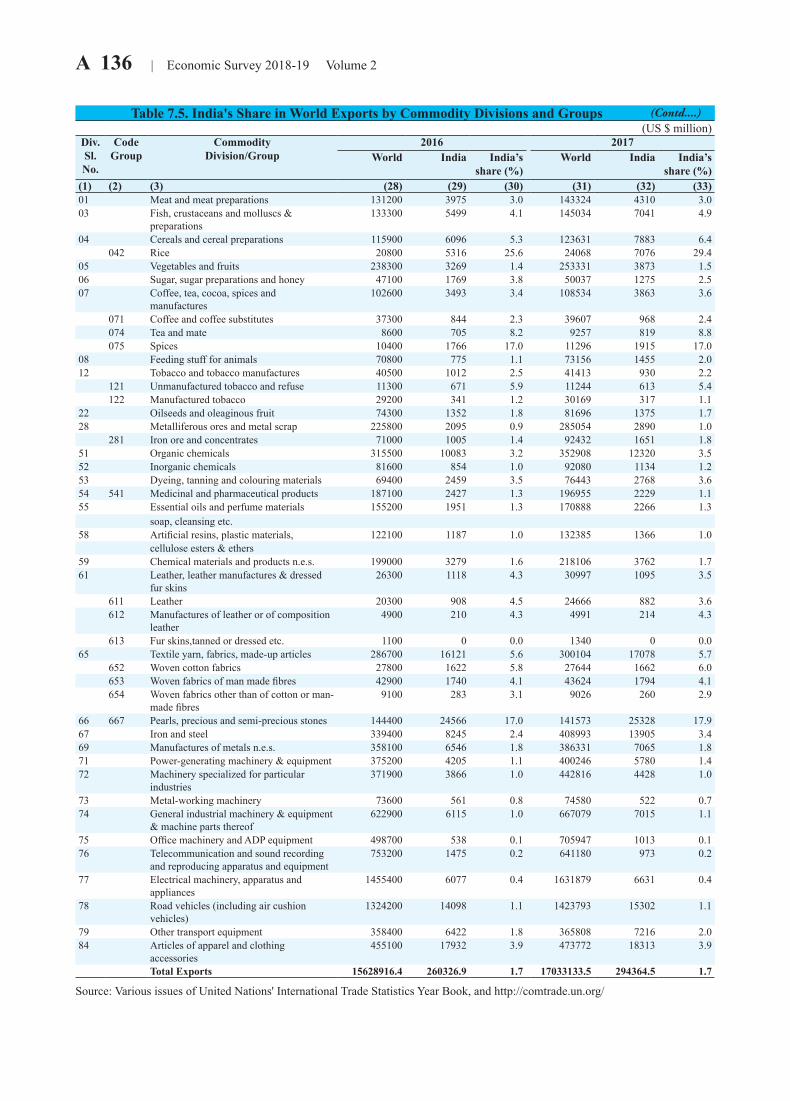
A 136 | Economic Survey 2018-19 Volume 2
Table 7.5. India's Share in World Exports by Commodity Divisions and Groups(US $ million)
Div.Sl. No.
CodeGroup
CommodityDivision/Group
2016 2017World India India’s
share (%)World
India India’s
share (%)(1) (2) (3) (28) (29) (30) (31) (32) (33)01 Meat and meat preparations 131200 3975 3.0 143324 4310 3.003 Fish, crustaceans and molluscs &
preparations133300 5499 4.1 145034 7041 4.9
04 Cereals and cereal preparations 115900 6096 5.3 123631 7883 6.4042 Rice 20800 5316 25.6 24068 7076 29.4
05 Vegetables and fruits 238300 3269 1.4 253331 3873 1.506 Sugar, sugar preparations and honey 47100 1769 3.8 50037 1275 2.507 Coffee, tea, cocoa, spices and
manufactures102600 3493 3.4 108534 3863 3.6
071 Coffee and coffee substitutes 37300 844 2.3 39607 968 2.4074 Tea and mate 8600 705 8.2 9257 819 8.8075 Spices 10400 1766 17.0 11296 1915 17.0
08 Feeding stuff for animals 70800 775 1.1 73156 1455 2.012 Tobacco and tobacco manufactures 40500 1012 2.5 41413 930 2.2
121 Unmanufactured tobacco and refuse 11300 671 5.9 11244 613 5.4122 Manufactured tobacco 29200 341 1.2 30169 317 1.1
22 Oilseeds and oleaginous fruit 74300 1352 1.8 81696 1375 1.728 Metalliferous ores and metal scrap 225800 2095 0.9 285054 2890 1.0
281 Iron ore and concentrates 71000 1005 1.4 92432 1651 1.851 Organic chemicals 315500 10083 3.2 352908 12320 3.552 Inorganic chemicals 81600 854 1.0 92080 1134 1.253 Dyeing, tanning and colouring materials 69400 2459 3.5 76443 2768 3.654 541 Medicinal and pharmaceutical products 187100 2427 1.3 196955 2229 1.155 Essential oils and perfume materials 155200 1951 1.3 170888 2266 1.3
soap, cleansing etc.58 Artificial resins, plastic materials, 122100 1187 1.0 132385 1366 1.0
cellulose esters & ethers59 Chemical materials and products n.e.s. 199000 3279 1.6 218106 3762 1.761 Leather, leather manufactures & dressed
fur skins26300 1118 4.3 30997 1095 3.5
611 Leather 20300 908 4.5 24666 882 3.6612 Manufactures of leather or of composition
leather4900 210 4.3 4991 214 4.3
613 Fur skins,tanned or dressed etc. 1100 0 0.0 1340 0 0.065 Textile yarn, fabrics, made-up articles 286700 16121 5.6 300104 17078 5.7
652 Woven cotton fabrics 27800 1622 5.8 27644 1662 6.0653 Woven fabrics of man made fibres 42900 1740 4.1 43624 1794 4.1654 Woven fabrics other than of cotton or man-
made fibres9100 283 3.1 9026 260 2.9
66 667 Pearls, precious and semi-precious stones 144400 24566 17.0 141573 25328 17.967 Iron and steel 339400 8245 2.4 408993 13905 3.469 Manufactures of metals n.e.s. 358100 6546 1.8 386331 7065 1.871 Power-generating machinery & equipment 375200 4205 1.1 400246 5780 1.472 Machinery specialized for particular
industries371900 3866 1.0 442816 4428 1.0
73 Metal-working machinery 73600 561 0.8 74580 522 0.774 General industrial machinery & equipment
& machine parts thereof622900 6115 1.0 667079 7015 1.1
75 Office machinery and ADP equipment 498700 538 0.1 705947 1013 0.176 Telecommunication and sound recording
and reproducing apparatus and equipment753200 1475 0.2 641180 973 0.2
77 Electrical machinery, apparatus and appliances
1455400 6077 0.4 1631879 6631 0.4
78 Road vehicles (including air cushion vehicles)
1324200 14098 1.1 1423793 15302 1.1
79 Other transport equipment 358400 6422 1.8 365808 7216 2.084 Articles of apparel and clothing
accessories455100 17932 3.9 473772 18313 3.9
Total Exports 15628916.4 260326.9 1.7 17033133.5 294364.5 1.7
Source: Various issues of United Nations' International Trade Statistics Year Book, and http://comtrade.un.org/
(Contd....)
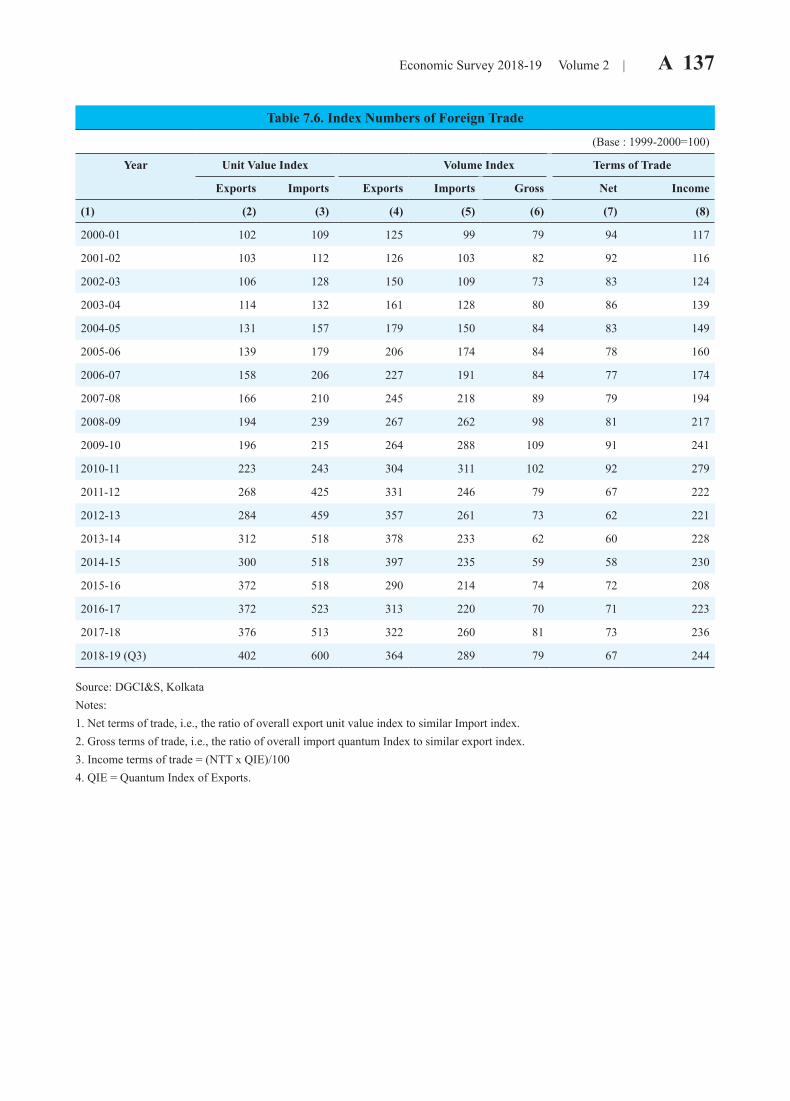
Economic Survey 2018-19 Volume 2 | A 137
Table 7.6. Index Numbers of Foreign Trade
(Base : 1999-2000=100)
Year Unit Value Index Volume Index Terms of Trade
Exports Imports Exports Imports Gross Net Income
(1) (2) (3) (4) (5) (6) (7) (8)
2000-01 102 109 125 99 79 94 117
2001-02 103 112 126 103 82 92 116
2002-03 106 128 150 109 73 83 124
2003-04 114 132 161 128 80 86 139
2004-05 131 157 179 150 84 83 149
2005-06 139 179 206 174 84 78 160
2006-07 158 206 227 191 84 77 174
2007-08 166 210 245 218 89 79 194
2008-09 194 239 267 262 98 81 217
2009-10 196 215 264 288 109 91 241
2010-11 223 243 304 311 102 92 279
2011-12 268 425 331 246 79 67 222
2012-13 284 459 357 261 73 62 221
2013-14 312 518 378 233 62 60 228
2014-15 300 518 397 235 59 58 230
2015-16 372 518 290 214 74 72 208
2016-17 372 523 313 220 70 71 223
2017-18 376 513 322 260 81 73 236
2018-19 (Q3) 402 600 364 289 79 67 244
Source: DGCI&S, Kolkata Notes:1. Net terms of trade, i.e., the ratio of overall export unit value index to similar Import index.2. Gross terms of trade, i.e., the ratio of overall import quantum Index to similar export index.3. Income terms of trade = (NTT x QIE)/100 4. QIE = Quantum Index of Exports.
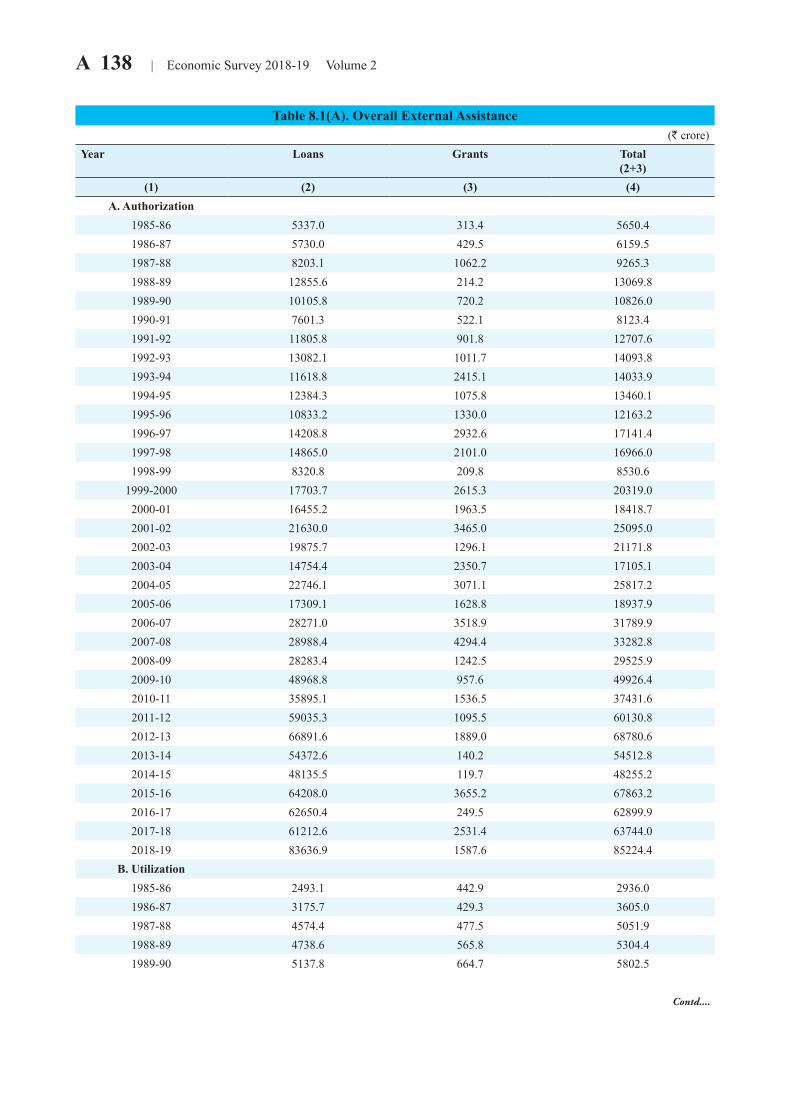
A 138 | Economic Survey 2018-19 Volume 2
Table 8.1(A). Overall External Assistance(R crore)
Year Loans Grants Total(2+3)
(1) (2) (3) (4)A. Authorization
1985-86 5337.0 313.4 5650.41986-87 5730.0 429.5 6159.51987-88 8203.1 1062.2 9265.31988-89 12855.6 214.2 13069.81989-90 10105.8 720.2 10826.01990-91 7601.3 522.1 8123.41991-92 11805.8 901.8 12707.61992-93 13082.1 1011.7 14093.81993-94 11618.8 2415.1 14033.91994-95 12384.3 1075.8 13460.11995-96 10833.2 1330.0 12163.21996-97 14208.8 2932.6 17141.41997-98 14865.0 2101.0 16966.01998-99 8320.8 209.8 8530.6
1999-2000 17703.7 2615.3 20319.02000-01 16455.2 1963.5 18418.72001-02 21630.0 3465.0 25095.02002-03 19875.7 1296.1 21171.82003-04 14754.4 2350.7 17105.12004-05 22746.1 3071.1 25817.22005-06 17309.1 1628.8 18937.92006-07 28271.0 3518.9 31789.92007-08 28988.4 4294.4 33282.82008-09 28283.4 1242.5 29525.92009-10 48968.8 957.6 49926.42010-11 35895.1 1536.5 37431.62011-12 59035.3 1095.5 60130.82012-13 66891.6 1889.0 68780.62013-14 54372.6 140.2 54512.82014-15 48135.5 119.7 48255.22015-16 64208.0 3655.2 67863.22016-17 62650.4 249.5 62899.92017-18 61212.6 2531.4 63744.02018-19 83636.9 1587.6 85224.4
B. Utilization1985-86 2493.1 442.9 2936.01986-87 3175.7 429.3 3605.01987-88 4574.4 477.5 5051.91988-89 4738.6 565.8 5304.41989-90 5137.8 664.7 5802.5
Contd....
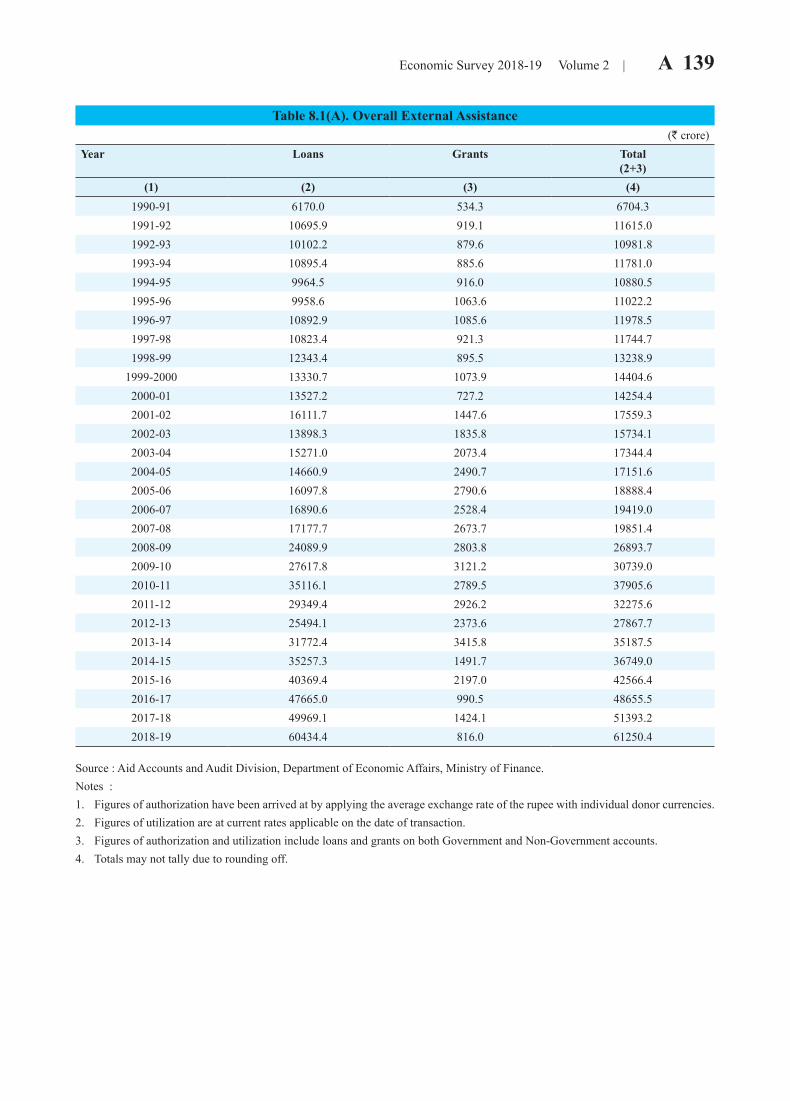
Economic Survey 2018-19 Volume 2 | A 139
Table 8.1(A). Overall External Assistance(R crore)
Year Loans Grants Total(2+3)
(1) (2) (3) (4)1990-91 6170.0 534.3 6704.31991-92 10695.9 919.1 11615.01992-93 10102.2 879.6 10981.81993-94 10895.4 885.6 11781.01994-95 9964.5 916.0 10880.51995-96 9958.6 1063.6 11022.21996-97 10892.9 1085.6 11978.51997-98 10823.4 921.3 11744.71998-99 12343.4 895.5 13238.9
1999-2000 13330.7 1073.9 14404.62000-01 13527.2 727.2 14254.42001-02 16111.7 1447.6 17559.32002-03 13898.3 1835.8 15734.12003-04 15271.0 2073.4 17344.42004-05 14660.9 2490.7 17151.62005-06 16097.8 2790.6 18888.42006-07 16890.6 2528.4 19419.02007-08 17177.7 2673.7 19851.42008-09 24089.9 2803.8 26893.72009-10 27617.8 3121.2 30739.02010-11 35116.1 2789.5 37905.62011-12 29349.4 2926.2 32275.62012-13 25494.1 2373.6 27867.72013-14 31772.4 3415.8 35187.52014-15 35257.3 1491.7 36749.02015-16 40369.4 2197.0 42566.42016-17 47665.0 990.5 48655.52017-18 49969.1 1424.1 51393.22018-19 60434.4 816.0 61250.4
Source : Aid Accounts and Audit Division, Department of Economic Affairs, Ministry of Finance. Notes : 1. Figures of authorization have been arrived at by applying the average exchange rate of the rupee with individual donor currencies. 2. Figures of utilization are at current rates applicable on the date of transaction. 3. Figures of authorization and utilization include loans and grants on both Government and Non-Government accounts.4. Totals may not tally due to rounding off.
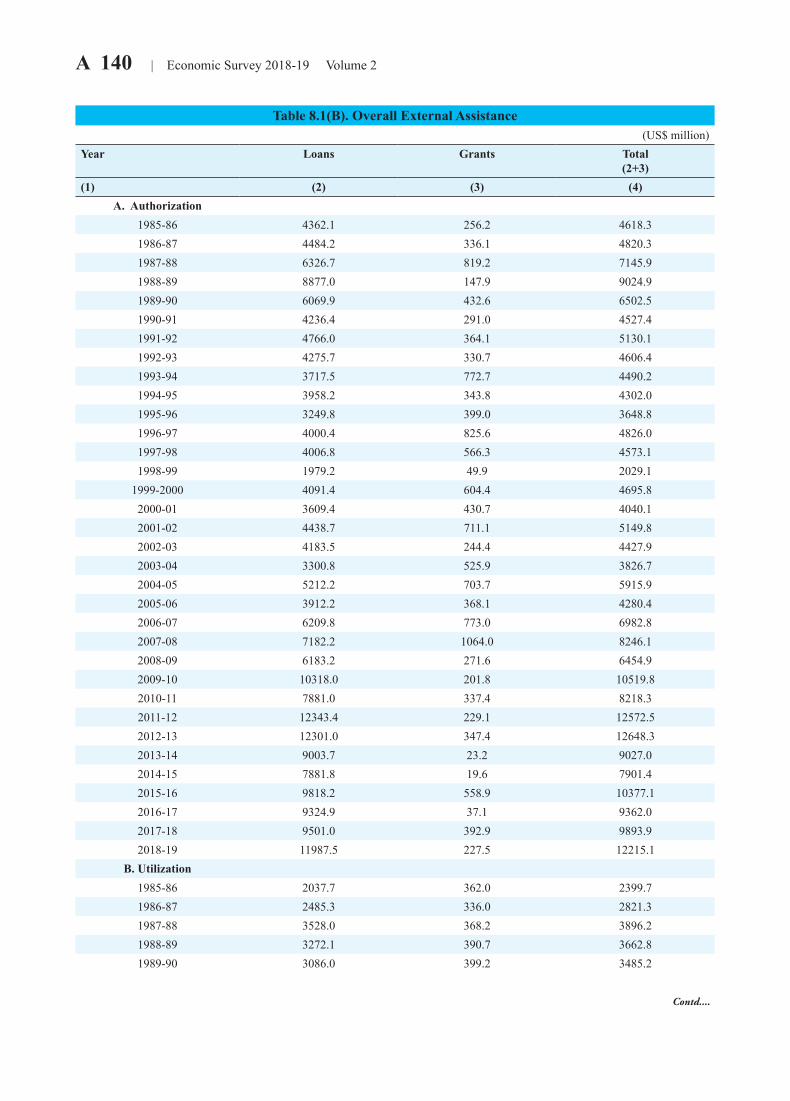
A 140 | Economic Survey 2018-19 Volume 2
Table 8.1(B). Overall External Assistance(US$ million)
Year Loans Grants Total(2+3)
(1) (2) (3) (4)A. Authorization
1985-86 4362.1 256.2 4618.31986-87 4484.2 336.1 4820.31987-88 6326.7 819.2 7145.91988-89 8877.0 147.9 9024.91989-90 6069.9 432.6 6502.51990-91 4236.4 291.0 4527.41991-92 4766.0 364.1 5130.11992-93 4275.7 330.7 4606.41993-94 3717.5 772.7 4490.21994-95 3958.2 343.8 4302.01995-96 3249.8 399.0 3648.81996-97 4000.4 825.6 4826.01997-98 4006.8 566.3 4573.11998-99 1979.2 49.9 2029.1
1999-2000 4091.4 604.4 4695.82000-01 3609.4 430.7 4040.12001-02 4438.7 711.1 5149.82002-03 4183.5 244.4 4427.92003-04 3300.8 525.9 3826.72004-05 5212.2 703.7 5915.92005-06 3912.2 368.1 4280.42006-07 6209.8 773.0 6982.82007-08 7182.2 1064.0 8246.12008-09 6183.2 271.6 6454.92009-10 10318.0 201.8 10519.82010-11 7881.0 337.4 8218.32011-12 12343.4 229.1 12572.52012-13 12301.0 347.4 12648.32013-14 9003.7 23.2 9027.02014-15 7881.8 19.6 7901.42015-16 9818.2 558.9 10377.12016-17 9324.9 37.1 9362.02017-18 9501.0 392.9 9893.92018-19 11987.5 227.5 12215.1
B. Utilization1985-86 2037.7 362.0 2399.71986-87 2485.3 336.0 2821.31987-88 3528.0 368.2 3896.21988-89 3272.1 390.7 3662.81989-90 3086.0 399.2 3485.2
Contd....
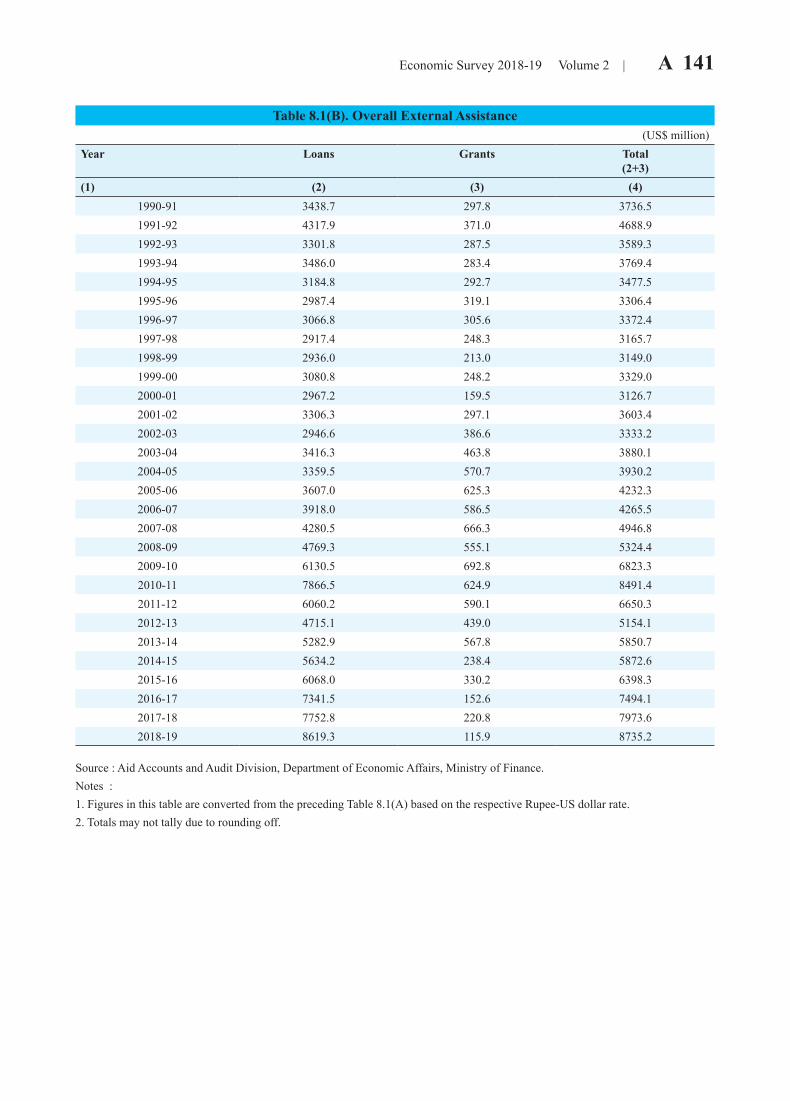
Economic Survey 2018-19 Volume 2 | A 141
Table 8.1(B). Overall External Assistance(US$ million)
Year Loans Grants Total(2+3)
(1) (2) (3) (4)1990-91 3438.7 297.8 3736.51991-92 4317.9 371.0 4688.91992-93 3301.8 287.5 3589.31993-94 3486.0 283.4 3769.41994-95 3184.8 292.7 3477.51995-96 2987.4 319.1 3306.41996-97 3066.8 305.6 3372.41997-98 2917.4 248.3 3165.71998-99 2936.0 213.0 3149.01999-00 3080.8 248.2 3329.02000-01 2967.2 159.5 3126.72001-02 3306.3 297.1 3603.42002-03 2946.6 386.6 3333.22003-04 3416.3 463.8 3880.12004-05 3359.5 570.7 3930.22005-06 3607.0 625.3 4232.32006-07 3918.0 586.5 4265.52007-08 4280.5 666.3 4946.82008-09 4769.3 555.1 5324.42009-10 6130.5 692.8 6823.32010-11 7866.5 624.9 8491.42011-12 6060.2 590.1 6650.32012-13 4715.1 439.0 5154.12013-14 5282.9 567.8 5850.72014-15 5634.2 238.4 5872.62015-16 6068.0 330.2 6398.32016-17 7341.5 152.6 7494.12017-18 7752.8 220.8 7973.62018-19 8619.3 115.9 8735.2
Source : Aid Accounts and Audit Division, Department of Economic Affairs, Ministry of Finance. Notes :1. Figures in this table are converted from the preceding Table 8.1(A) based on the respective Rupee-US dollar rate.2. Totals may not tally due to rounding off.
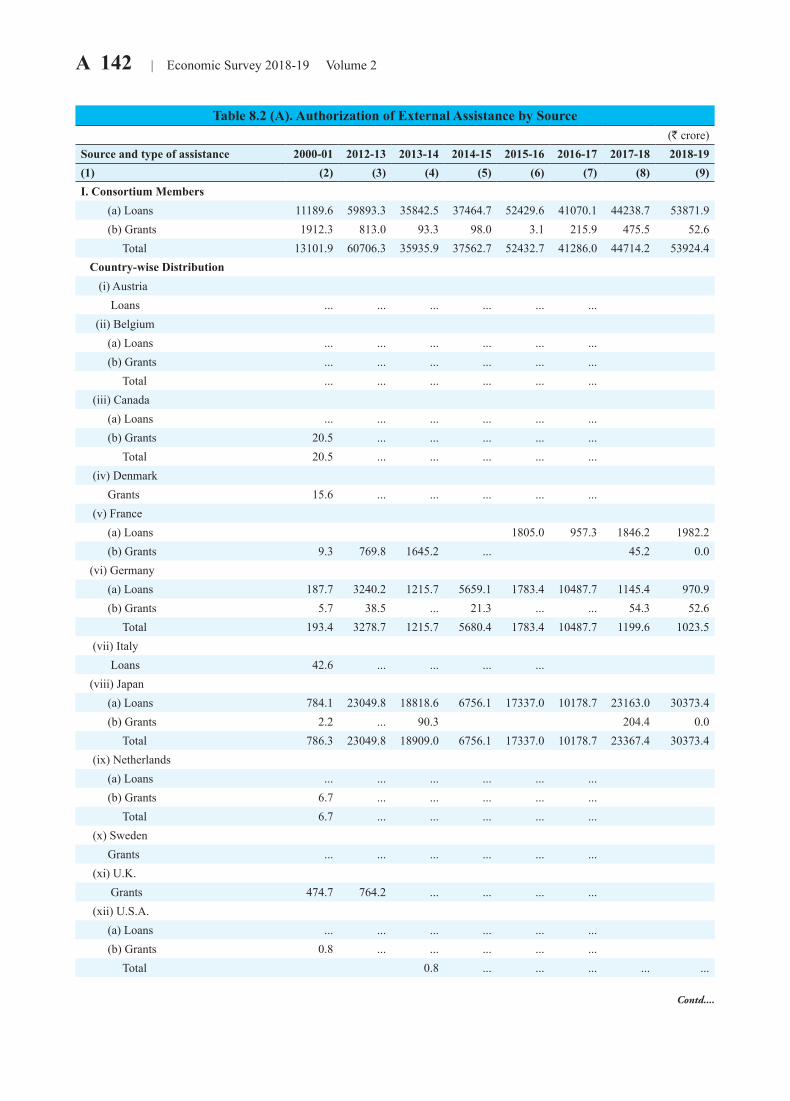
A 142 | Economic Survey 2018-19 Volume 2
Table 8.2 (A). Authorization of External Assistance by Source(R crore)
Source and type of assistance 2000-01 2012-13 2013-14 2014-15 2015-16 2016-17 2017-18 2018-19(1) (2) (3) (4) (5) (6) (7) (8) (9)I. Consortium Members (a) Loans 11189.6 59893.3 35842.5 37464.7 52429.6 41070.1 44238.7 53871.9 (b) Grants 1912.3 813.0 93.3 98.0 3.1 215.9 475.5 52.6 Total 13101.9 60706.3 35935.9 37562.7 52432.7 41286.0 44714.2 53924.4 Country-wise Distribution (i) Austria Loans ... ... ... ... ... ... (ii) Belgium (a) Loans ... ... ... ... ... ... (b) Grants ... ... ... ... ... ... Total ... ... ... ... ... ... (iii) Canada (a) Loans ... ... ... ... ... ... (b) Grants 20.5 ... ... ... ... ... Total 20.5 ... ... ... ... ... (iv) Denmark Grants 15.6 ... ... ... ... ... (v) France (a) Loans 1805.0 957.3 1846.2 1982.2 (b) Grants 9.3 769.8 1645.2 ... 45.2 0.0 (vi) Germany (a) Loans 187.7 3240.2 1215.7 5659.1 1783.4 10487.7 1145.4 970.9 (b) Grants 5.7 38.5 ... 21.3 ... ... 54.3 52.6 Total 193.4 3278.7 1215.7 5680.4 1783.4 10487.7 1199.6 1023.5 (vii) Italy Loans 42.6 ... ... ... ... (viii) Japan (a) Loans 784.1 23049.8 18818.6 6756.1 17337.0 10178.7 23163.0 30373.4 (b) Grants 2.2 ... 90.3 204.4 0.0 Total 786.3 23049.8 18909.0 6756.1 17337.0 10178.7 23367.4 30373.4 (ix) Netherlands (a) Loans ... ... ... ... ... ... (b) Grants 6.7 ... ... ... ... ... Total 6.7 ... ... ... ... ... (x) Sweden Grants ... ... ... ... ... ... (xi) U.K. Grants 474.7 764.2 ... ... ... ... (xii) U.S.A. (a) Loans ... ... ... ... ... ... (b) Grants 0.8 ... ... ... ... ... Total 0.8 ... ... ... ... ...
Contd....
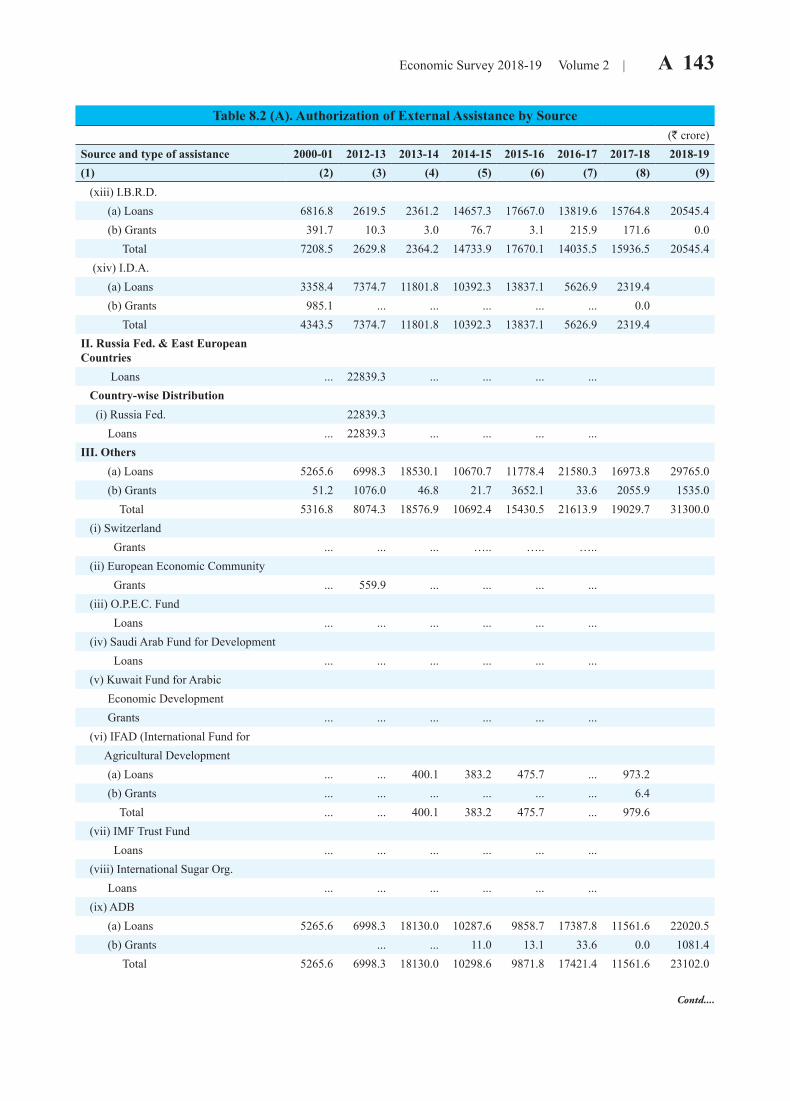
Economic Survey 2018-19 Volume 2 | A 143
Contd....
Table 8.2 (A). Authorization of External Assistance by Source(R crore)
Source and type of assistance 2000-01 2012-13 2013-14 2014-15 2015-16 2016-17 2017-18 2018-19(1) (2) (3) (4) (5) (6) (7) (8) (9) (xiii) I.B.R.D. (a) Loans 6816.8 2619.5 2361.2 14657.3 17667.0 13819.6 15764.8 20545.4 (b) Grants 391.7 10.3 3.0 76.7 3.1 215.9 171.6 0.0 Total 7208.5 2629.8 2364.2 14733.9 17670.1 14035.5 15936.5 20545.4 (xiv) I.D.A. (a) Loans 3358.4 7374.7 11801.8 10392.3 13837.1 5626.9 2319.4 (b) Grants 985.1 ... ... ... ... ... 0.0 Total 4343.5 7374.7 11801.8 10392.3 13837.1 5626.9 2319.4II. Russia Fed. & East European Countries
Loans ... 22839.3 ... ... ... ... Country-wise Distribution (i) Russia Fed. 22839.3 Loans ... 22839.3 ... ... ... ...III. Others (a) Loans 5265.6 6998.3 18530.1 10670.7 11778.4 21580.3 16973.8 29765.0 (b) Grants 51.2 1076.0 46.8 21.7 3652.1 33.6 2055.9 1535.0 Total 5316.8 8074.3 18576.9 10692.4 15430.5 21613.9 19029.7 31300.0 (i) Switzerland Grants ... ... ... ….. ….. ….. (ii) European Economic Community Grants ... 559.9 ... ... ... ... (iii) O.P.E.C. Fund Loans ... ... ... ... ... ... (iv) Saudi Arab Fund for Development Loans ... ... ... ... ... ... (v) Kuwait Fund for Arabic Economic Development Grants ... ... ... ... ... ... (vi) IFAD (International Fund for Agricultural Development (a) Loans ... ... 400.1 383.2 475.7 ... 973.2 (b) Grants ... ... ... ... ... ... 6.4 Total ... ... 400.1 383.2 475.7 ... 979.6 (vii) IMF Trust Fund Loans ... ... ... ... ... ... (viii) International Sugar Org. Loans ... ... ... ... ... ... (ix) ADB (a) Loans 5265.6 6998.3 18130.0 10287.6 9858.7 17387.8 11561.6 22020.5 (b) Grants ... ... 11.0 13.1 33.6 0.0 1081.4 Total 5265.6 6998.3 18130.0 10298.6 9871.8 17421.4 11561.6 23102.0
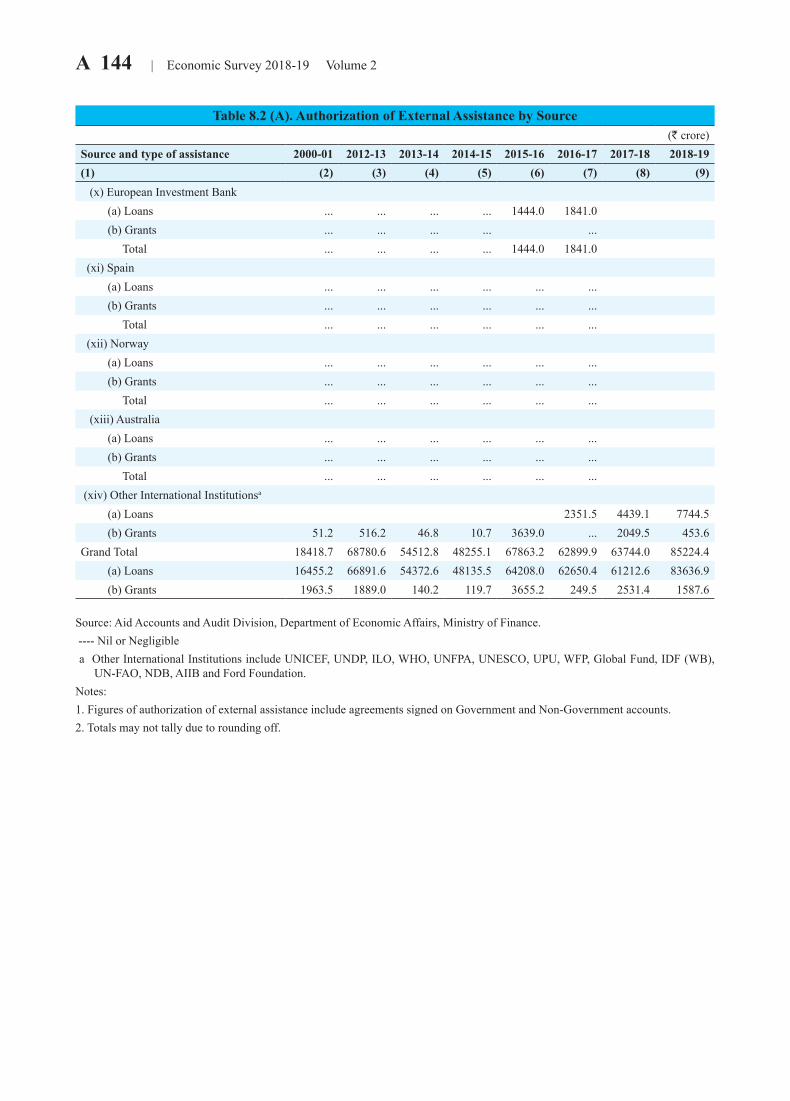
A 144 | Economic Survey 2018-19 Volume 2
Table 8.2 (A). Authorization of External Assistance by Source(R crore)
Source and type of assistance 2000-01 2012-13 2013-14 2014-15 2015-16 2016-17 2017-18 2018-19(1) (2) (3) (4) (5) (6) (7) (8) (9) (x) European Investment Bank (a) Loans ... ... ... ... 1444.0 1841.0 (b) Grants ... ... ... ... ... Total ... ... ... ... 1444.0 1841.0 (xi) Spain (a) Loans ... ... ... ... ... ... (b) Grants ... ... ... ... ... ... Total ... ... ... ... ... ... (xii) Norway (a) Loans ... ... ... ... ... ... (b) Grants ... ... ... ... ... ... Total ... ... ... ... ... ... (xiii) Australia (a) Loans ... ... ... ... ... ... (b) Grants ... ... ... ... ... ... Total ... ... ... ... ... ... (xiv) Other International Institutionsa
(a) Loans 2351.5 4439.1 7744.5 (b) Grants 51.2 516.2 46.8 10.7 3639.0 ... 2049.5 453.6Grand Total 18418.7 68780.6 54512.8 48255.1 67863.2 62899.9 63744.0 85224.4 (a) Loans 16455.2 66891.6 54372.6 48135.5 64208.0 62650.4 61212.6 83636.9 (b) Grants 1963.5 1889.0 140.2 119.7 3655.2 249.5 2531.4 1587.6
Source: Aid Accounts and Audit Division, Department of Economic Affairs, Ministry of Finance. ---- Nil or Negligible a Other International Institutions include UNICEF, UNDP, ILO, WHO, UNFPA, UNESCO, UPU, WFP, Global Fund, IDF (WB),
UN-FAO, NDB, AIIB and Ford Foundation. Notes: 1. Figures of authorization of external assistance include agreements signed on Government and Non-Government accounts.2. Totals may not tally due to rounding off.
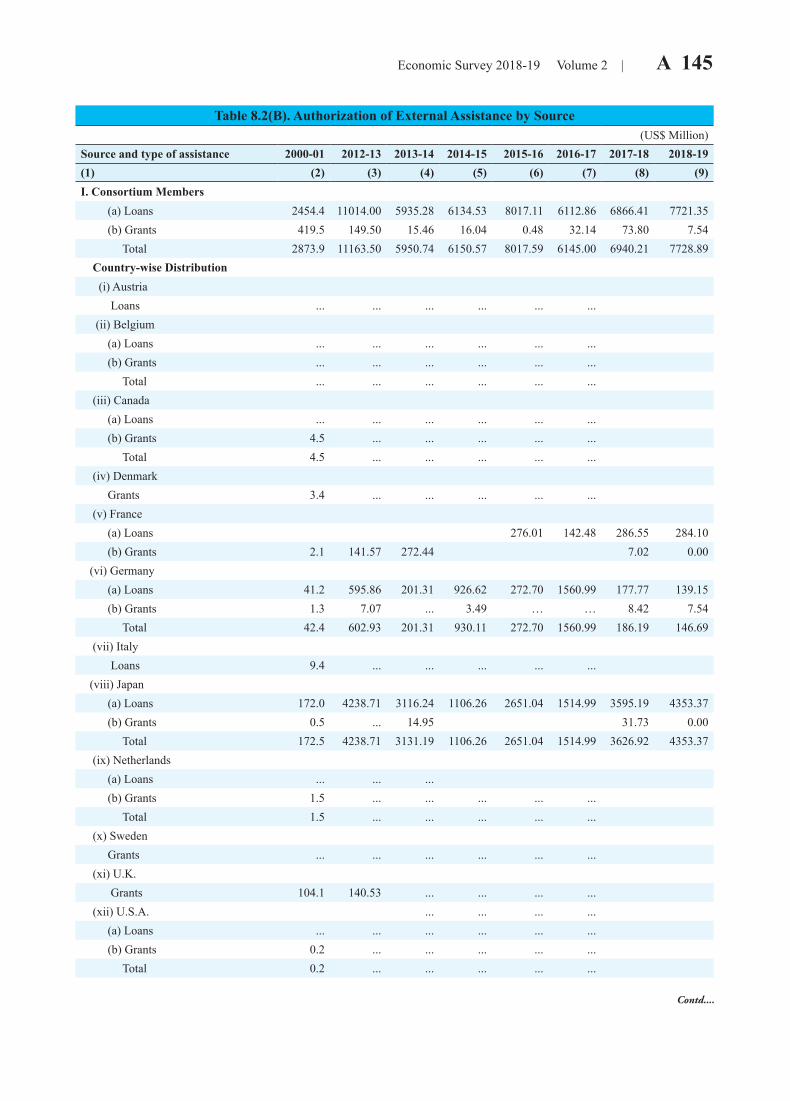
Economic Survey 2018-19 Volume 2 | A 145
Contd....
Table 8.2(B). Authorization of External Assistance by Source(US$ Million)
Source and type of assistance 2000-01 2012-13 2013-14 2014-15 2015-16 2016-17 2017-18 2018-19(1) (2) (3) (4) (5) (6) (7) (8) (9)I. Consortium Members (a) Loans 2454.4 11014.00 5935.28 6134.53 8017.11 6112.86 6866.41 7721.35 (b) Grants 419.5 149.50 15.46 16.04 0.48 32.14 73.80 7.54 Total 2873.9 11163.50 5950.74 6150.57 8017.59 6145.00 6940.21 7728.89 Country-wise Distribution (i) Austria Loans ... ... ... ... ... ... (ii) Belgium (a) Loans ... ... ... ... ... ... (b) Grants ... ... ... ... ... ... Total ... ... ... ... ... ... (iii) Canada (a) Loans ... ... ... ... ... ... (b) Grants 4.5 ... ... ... ... ... Total 4.5 ... ... ... ... ... (iv) Denmark Grants 3.4 ... ... ... ... ... (v) France (a) Loans 276.01 142.48 286.55 284.10 (b) Grants 2.1 141.57 272.44 7.02 0.00 (vi) Germany (a) Loans 41.2 595.86 201.31 926.62 272.70 1560.99 177.77 139.15 (b) Grants 1.3 7.07 ... 3.49 … … 8.42 7.54 Total 42.4 602.93 201.31 930.11 272.70 1560.99 186.19 146.69 (vii) Italy Loans 9.4 ... ... ... ... ... (viii) Japan (a) Loans 172.0 4238.71 3116.24 1106.26 2651.04 1514.99 3595.19 4353.37 (b) Grants 0.5 ... 14.95 31.73 0.00 Total 172.5 4238.71 3131.19 1106.26 2651.04 1514.99 3626.92 4353.37 (ix) Netherlands (a) Loans ... ... ... (b) Grants 1.5 ... ... ... ... ... Total 1.5 ... ... ... ... ... (x) Sweden Grants ... ... ... ... ... ... (xi) U.K. Grants 104.1 140.53 ... ... ... ... (xii) U.S.A. ... ... ... ... (a) Loans ... ... ... ... ... ... (b) Grants 0.2 ... ... ... ... ... Total 0.2 ... ... ... ... ...
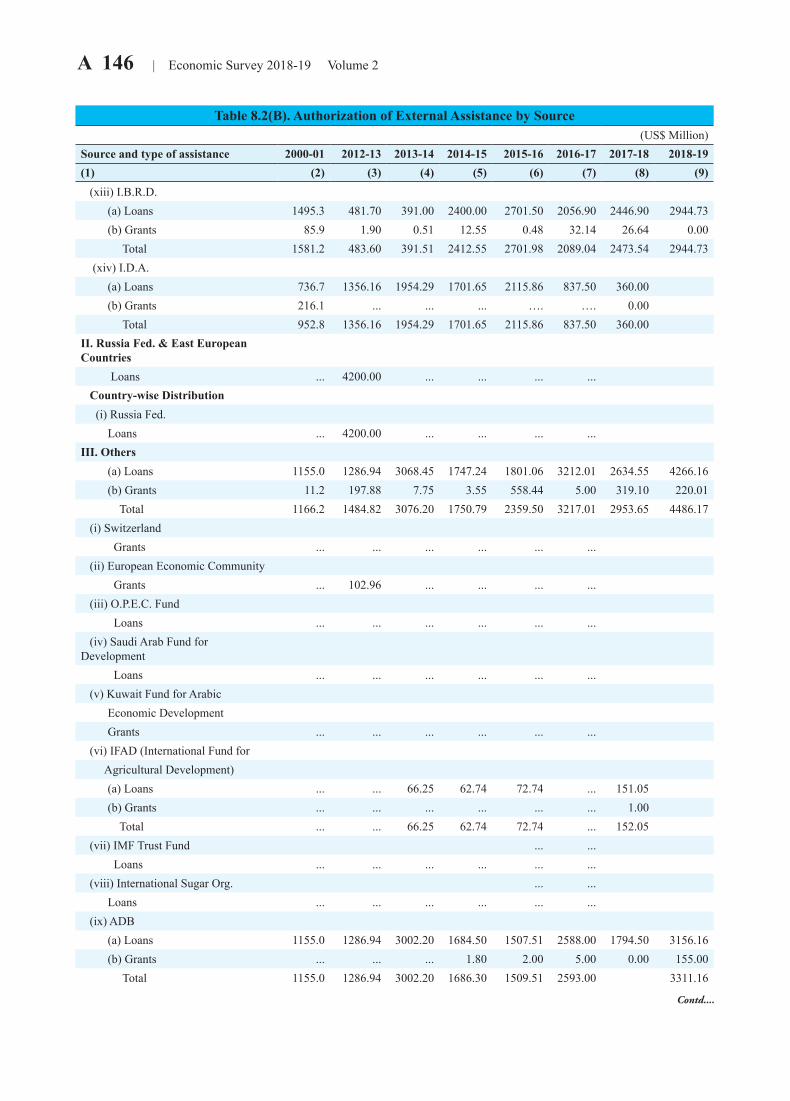
A 146 | Economic Survey 2018-19 Volume 2
Table 8.2(B). Authorization of External Assistance by Source(US$ Million)
Source and type of assistance 2000-01 2012-13 2013-14 2014-15 2015-16 2016-17 2017-18 2018-19(1) (2) (3) (4) (5) (6) (7) (8) (9) (xiii) I.B.R.D. (a) Loans 1495.3 481.70 391.00 2400.00 2701.50 2056.90 2446.90 2944.73 (b) Grants 85.9 1.90 0.51 12.55 0.48 32.14 26.64 0.00 Total 1581.2 483.60 391.51 2412.55 2701.98 2089.04 2473.54 2944.73 (xiv) I.D.A. (a) Loans 736.7 1356.16 1954.29 1701.65 2115.86 837.50 360.00 (b) Grants 216.1 ... ... ... …. …. 0.00 Total 952.8 1356.16 1954.29 1701.65 2115.86 837.50 360.00II. Russia Fed. & East European Countries Loans ... 4200.00 ... ... ... ... Country-wise Distribution (i) Russia Fed. Loans ... 4200.00 ... ... ... ...III. Others (a) Loans 1155.0 1286.94 3068.45 1747.24 1801.06 3212.01 2634.55 4266.16 (b) Grants 11.2 197.88 7.75 3.55 558.44 5.00 319.10 220.01 Total 1166.2 1484.82 3076.20 1750.79 2359.50 3217.01 2953.65 4486.17 (i) Switzerland Grants ... ... ... ... ... ... (ii) European Economic Community Grants ... 102.96 ... ... ... ... (iii) O.P.E.C. Fund Loans ... ... ... ... ... ... (iv) Saudi Arab Fund for Development Loans ... ... ... ... ... ... (v) Kuwait Fund for Arabic Economic Development Grants ... ... ... ... ... ... (vi) IFAD (International Fund for Agricultural Development) (a) Loans ... ... 66.25 62.74 72.74 ... 151.05 (b) Grants ... ... ... ... ... ... 1.00 Total ... ... 66.25 62.74 72.74 ... 152.05 (vii) IMF Trust Fund ... ... Loans ... ... ... ... ... ... (viii) International Sugar Org. ... ... Loans ... ... ... ... ... ... (ix) ADB (a) Loans 1155.0 1286.94 3002.20 1684.50 1507.51 2588.00 1794.50 3156.16 (b) Grants ... ... ... 1.80 2.00 5.00 0.00 155.00 Total 1155.0 1286.94 3002.20 1686.30 1509.51 2593.00 3311.16
Contd....
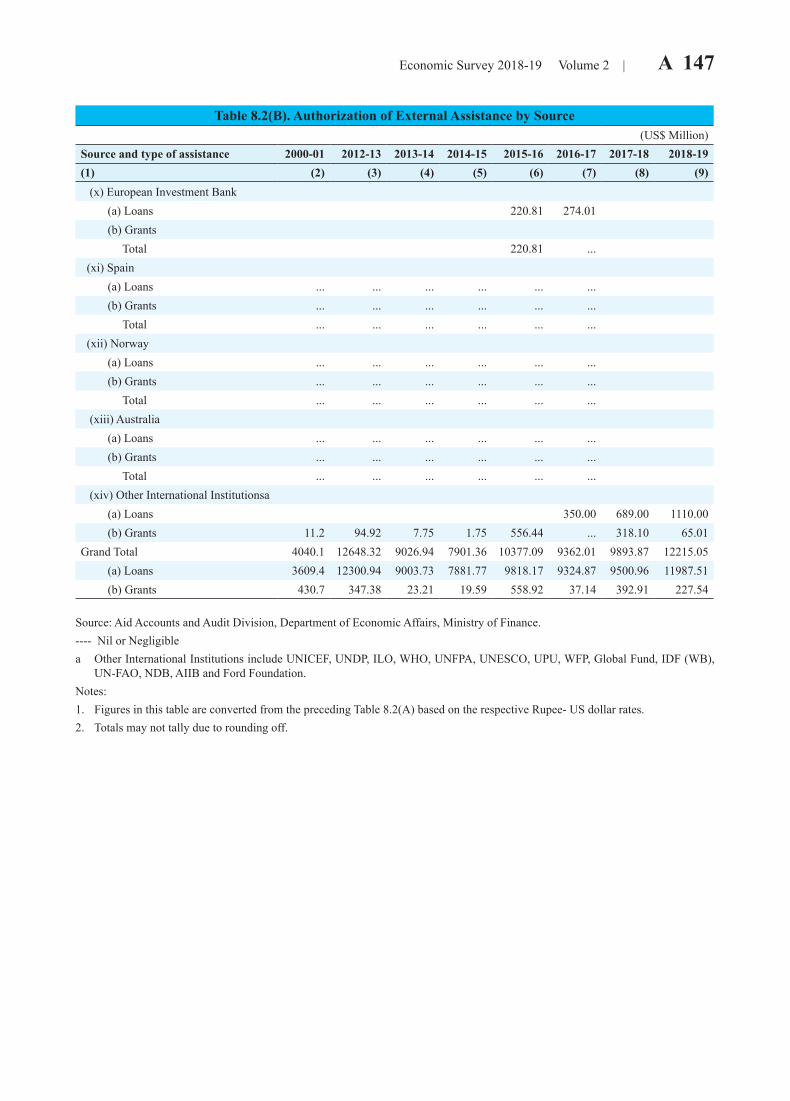
Economic Survey 2018-19 Volume 2 | A 147
Table 8.2(B). Authorization of External Assistance by Source(US$ Million)
Source and type of assistance 2000-01 2012-13 2013-14 2014-15 2015-16 2016-17 2017-18 2018-19(1) (2) (3) (4) (5) (6) (7) (8) (9) (x) European Investment Bank (a) Loans 220.81 274.01 (b) Grants Total 220.81 ... (xi) Spain (a) Loans ... ... ... ... ... ... (b) Grants ... ... ... ... ... ... Total ... ... ... ... ... ... (xii) Norway (a) Loans ... ... ... ... ... ... (b) Grants ... ... ... ... ... ... Total ... ... ... ... ... ... (xiii) Australia (a) Loans ... ... ... ... ... ... (b) Grants ... ... ... ... ... ... Total ... ... ... ... ... ... (xiv) Other International Institutionsa (a) Loans 350.00 689.00 1110.00 (b) Grants 11.2 94.92 7.75 1.75 556.44 ... 318.10 65.01Grand Total 4040.1 12648.32 9026.94 7901.36 10377.09 9362.01 9893.87 12215.05 (a) Loans 3609.4 12300.94 9003.73 7881.77 9818.17 9324.87 9500.96 11987.51 (b) Grants 430.7 347.38 23.21 19.59 558.92 37.14 392.91 227.54
Source: Aid Accounts and Audit Division, Department of Economic Affairs, Ministry of Finance. ---- Nil or Negligible a Other International Institutions include UNICEF, UNDP, ILO, WHO, UNFPA, UNESCO, UPU, WFP, Global Fund, IDF (WB),
UN-FAO, NDB, AIIB and Ford Foundation. Notes: 1. Figures in this table are converted from the preceding Table 8.2(A) based on the respective Rupee- US dollar rates.2. Totals may not tally due to rounding off.
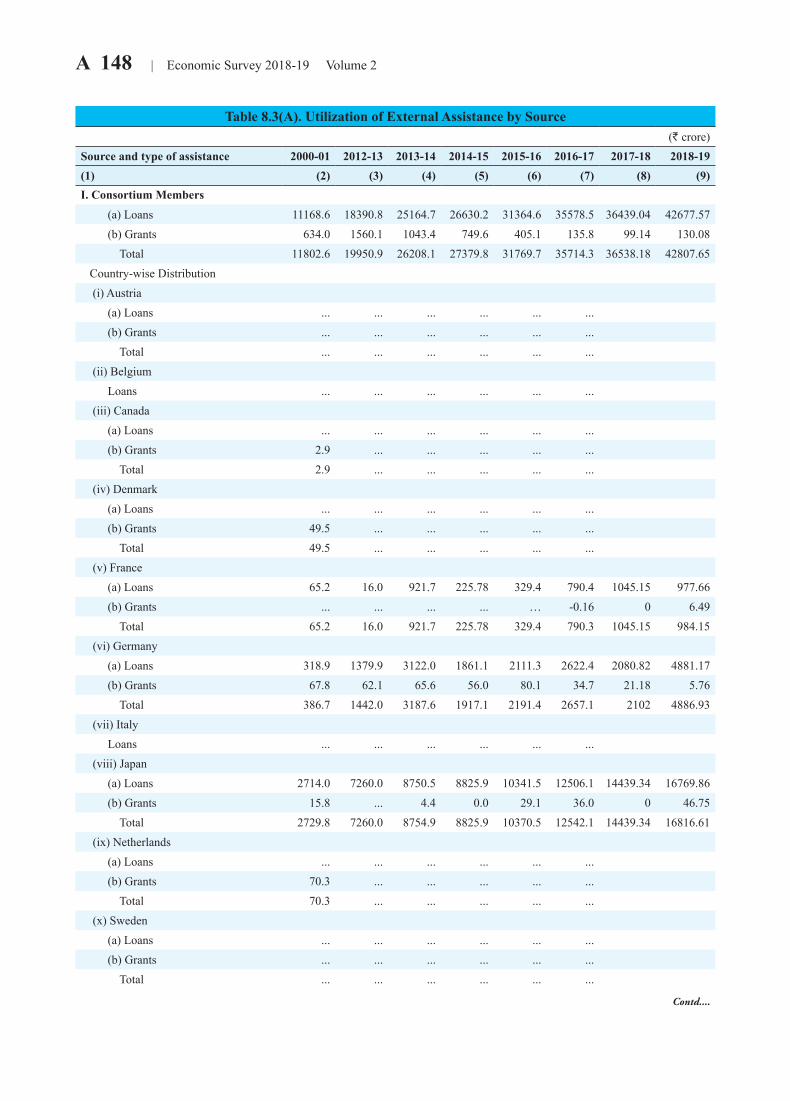
A 148 | Economic Survey 2018-19 Volume 2
Table 8.3(A). Utilization of External Assistance by Source(R crore)
Source and type of assistance 2000-01 2012-13 2013-14 2014-15 2015-16 2016-17 2017-18 2018-19(1) (2) (3) (4) (5) (6) (7) (8) (9)I. Consortium Members (a) Loans 11168.6 18390.8 25164.7 26630.2 31364.6 35578.5 36439.04 42677.57 (b) Grants 634.0 1560.1 1043.4 749.6 405.1 135.8 99.14 130.08 Total 11802.6 19950.9 26208.1 27379.8 31769.7 35714.3 36538.18 42807.65 Country-wise Distribution (i) Austria (a) Loans ... ... ... ... ... ... (b) Grants ... ... ... ... ... ... Total ... ... ... ... ... ... (ii) Belgium Loans ... ... ... ... ... ... (iii) Canada (a) Loans ... ... ... ... ... ... (b) Grants 2.9 ... ... ... ... ... Total 2.9 ... ... ... ... ... (iv) Denmark (a) Loans ... ... ... ... ... ... (b) Grants 49.5 ... ... ... ... ... Total 49.5 ... ... ... ... ... (v) France (a) Loans 65.2 16.0 921.7 225.78 329.4 790.4 1045.15 977.66 (b) Grants ... ... ... ... … -0.16 0 6.49 Total 65.2 16.0 921.7 225.78 329.4 790.3 1045.15 984.15 (vi) Germany (a) Loans 318.9 1379.9 3122.0 1861.1 2111.3 2622.4 2080.82 4881.17 (b) Grants 67.8 62.1 65.6 56.0 80.1 34.7 21.18 5.76 Total 386.7 1442.0 3187.6 1917.1 2191.4 2657.1 2102 4886.93 (vii) Italy Loans ... ... ... ... ... ... (viii) Japan (a) Loans 2714.0 7260.0 8750.5 8825.9 10341.5 12506.1 14439.34 16769.86 (b) Grants 15.8 ... 4.4 0.0 29.1 36.0 0 46.75 Total 2729.8 7260.0 8754.9 8825.9 10370.5 12542.1 14439.34 16816.61 (ix) Netherlands (a) Loans ... ... ... ... ... ... (b) Grants 70.3 ... ... ... ... ... Total 70.3 ... ... ... ... ... (x) Sweden (a) Loans ... ... ... ... ... ... (b) Grants ... ... ... ... ... ... Total ... ... ... ... ... ...
Contd....
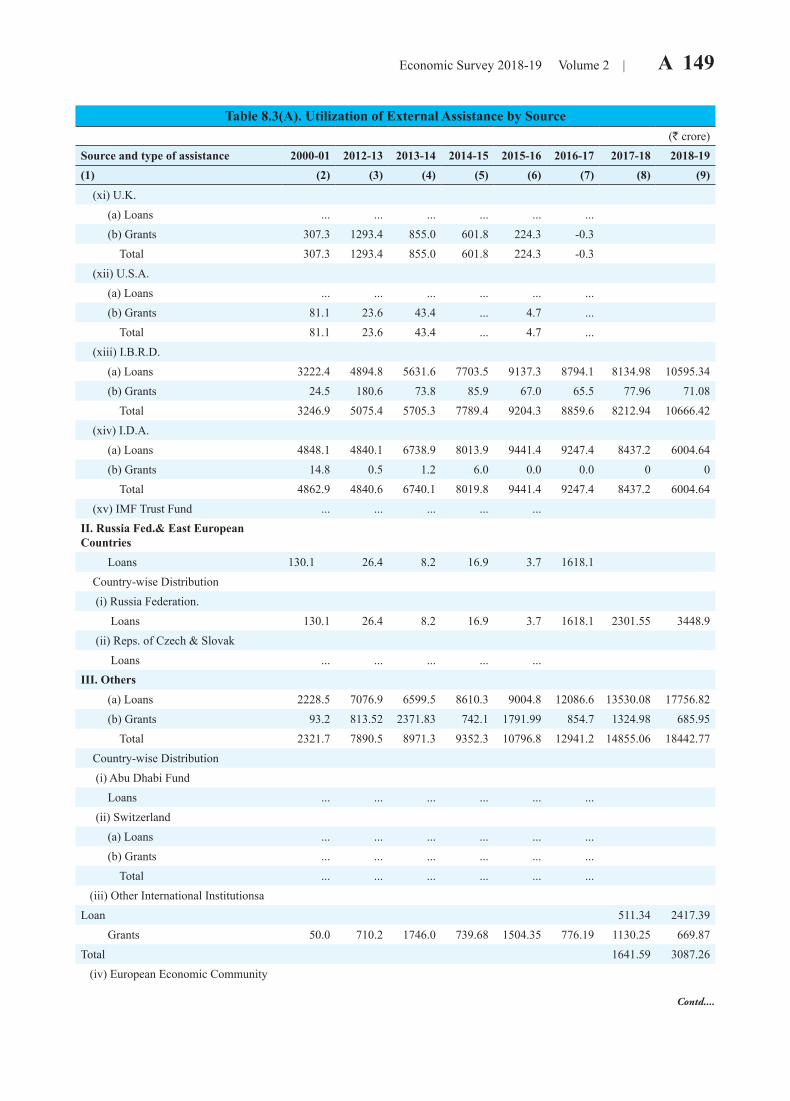
Economic Survey 2018-19 Volume 2 | A 149
Table 8.3(A). Utilization of External Assistance by Source(R crore)
Source and type of assistance 2000-01 2012-13 2013-14 2014-15 2015-16 2016-17 2017-18 2018-19(1) (2) (3) (4) (5) (6) (7) (8) (9)
(xi) U.K. (a) Loans ... ... ... ... ... ... (b) Grants 307.3 1293.4 855.0 601.8 224.3 -0.3 Total 307.3 1293.4 855.0 601.8 224.3 -0.3 (xii) U.S.A. (a) Loans ... ... ... ... ... ... (b) Grants 81.1 23.6 43.4 ... 4.7 ... Total 81.1 23.6 43.4 ... 4.7 ... (xiii) I.B.R.D. (a) Loans 3222.4 4894.8 5631.6 7703.5 9137.3 8794.1 8134.98 10595.34 (b) Grants 24.5 180.6 73.8 85.9 67.0 65.5 77.96 71.08 Total 3246.9 5075.4 5705.3 7789.4 9204.3 8859.6 8212.94 10666.42 (xiv) I.D.A. (a) Loans 4848.1 4840.1 6738.9 8013.9 9441.4 9247.4 8437.2 6004.64 (b) Grants 14.8 0.5 1.2 6.0 0.0 0.0 0 0 Total 4862.9 4840.6 6740.1 8019.8 9441.4 9247.4 8437.2 6004.64 (xv) IMF Trust Fund ... ... ... ... ...II. Russia Fed.& East European Countries Loans 130.1 26.4 8.2 16.9 3.7 1618.1 Country-wise Distribution (i) Russia Federation. Loans 130.1 26.4 8.2 16.9 3.7 1618.1 2301.55 3448.9 (ii) Reps. of Czech & Slovak Loans ... ... ... ... ...III. Others (a) Loans 2228.5 7076.9 6599.5 8610.3 9004.8 12086.6 13530.08 17756.82 (b) Grants 93.2 813.52 2371.83 742.1 1791.99 854.7 1324.98 685.95 Total 2321.7 7890.5 8971.3 9352.3 10796.8 12941.2 14855.06 18442.77 Country-wise Distribution (i) Abu Dhabi Fund Loans ... ... ... ... ... ... (ii) Switzerland (a) Loans ... ... ... ... ... ... (b) Grants ... ... ... ... ... ... Total ... ... ... ... ... ... (iii) Other International InstitutionsaLoan 511.34 2417.39 Grants 50.0 710.2 1746.0 739.68 1504.35 776.19 1130.25 669.87Total 1641.59 3087.26 (iv) European Economic Community
Contd....
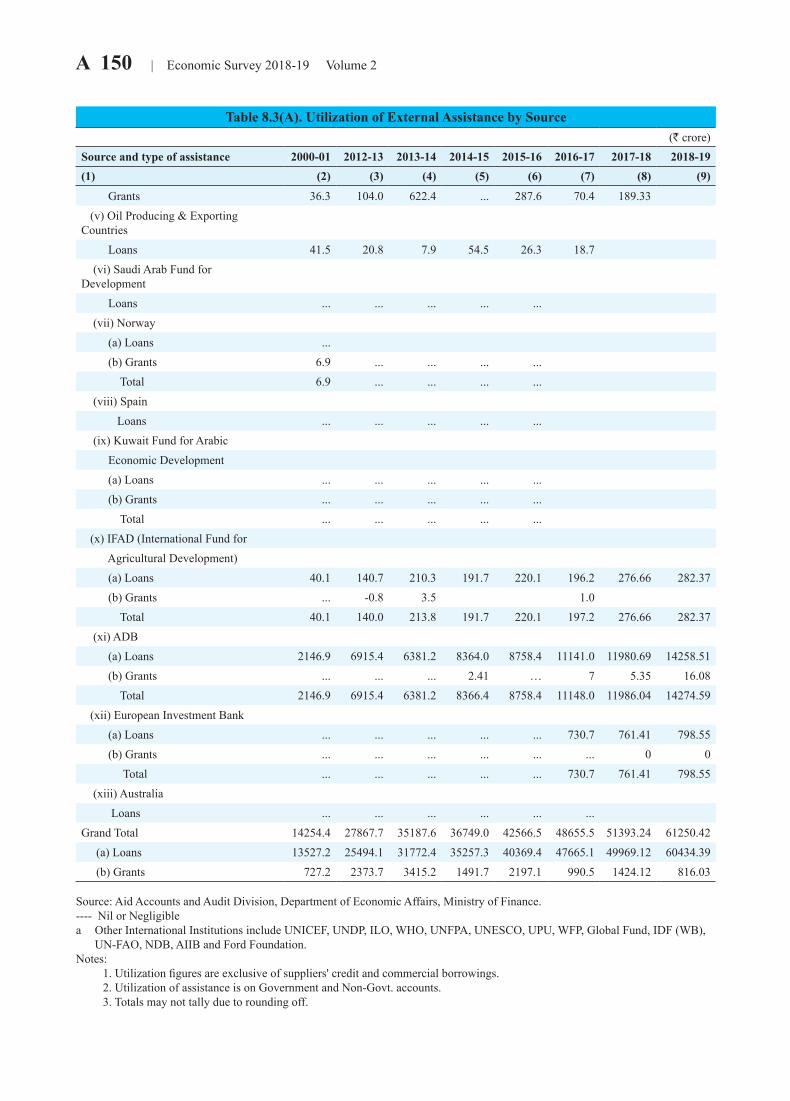
A 150 | Economic Survey 2018-19 Volume 2
Table 8.3(A). Utilization of External Assistance by Source(R crore)
Source and type of assistance 2000-01 2012-13 2013-14 2014-15 2015-16 2016-17 2017-18 2018-19(1) (2) (3) (4) (5) (6) (7) (8) (9)
Grants 36.3 104.0 622.4 ... 287.6 70.4 189.33 (v) Oil Producing & Exporting Countries Loans 41.5 20.8 7.9 54.5 26.3 18.7 (vi) Saudi Arab Fund for Development Loans ... ... ... ... ... (vii) Norway (a) Loans ... (b) Grants 6.9 ... ... ... ... Total 6.9 ... ... ... ... (viii) Spain Loans ... ... ... ... ... (ix) Kuwait Fund for Arabic Economic Development (a) Loans ... ... ... ... ... (b) Grants ... ... ... ... ... Total ... ... ... ... ... (x) IFAD (International Fund for Agricultural Development) (a) Loans 40.1 140.7 210.3 191.7 220.1 196.2 276.66 282.37 (b) Grants ... -0.8 3.5 1.0 Total 40.1 140.0 213.8 191.7 220.1 197.2 276.66 282.37 (xi) ADB (a) Loans 2146.9 6915.4 6381.2 8364.0 8758.4 11141.0 11980.69 14258.51 (b) Grants ... ... ... 2.41 … 7 5.35 16.08 Total 2146.9 6915.4 6381.2 8366.4 8758.4 11148.0 11986.04 14274.59 (xii) European Investment Bank (a) Loans ... ... ... ... ... 730.7 761.41 798.55 (b) Grants ... ... ... ... ... ... 0 0 Total ... ... ... ... ... 730.7 761.41 798.55 (xiii) Australia Loans ... ... ... ... ... ...Grand Total 14254.4 27867.7 35187.6 36749.0 42566.5 48655.5 51393.24 61250.42 (a) Loans 13527.2 25494.1 31772.4 35257.3 40369.4 47665.1 49969.12 60434.39 (b) Grants 727.2 2373.7 3415.2 1491.7 2197.1 990.5 1424.12 816.03
Source: Aid Accounts and Audit Division, Department of Economic Affairs, Ministry of Finance.---- Nil or Negligible a Other International Institutions include UNICEF, UNDP, ILO, WHO, UNFPA, UNESCO, UPU, WFP, Global Fund, IDF (WB),
UN-FAO, NDB, AIIB and Ford Foundation. Notes: 1. Utilization figures are exclusive of suppliers' credit and commercial borrowings. 2. Utilization of assistance is on Government and Non-Govt. accounts. 3. Totals may not tally due to rounding off.
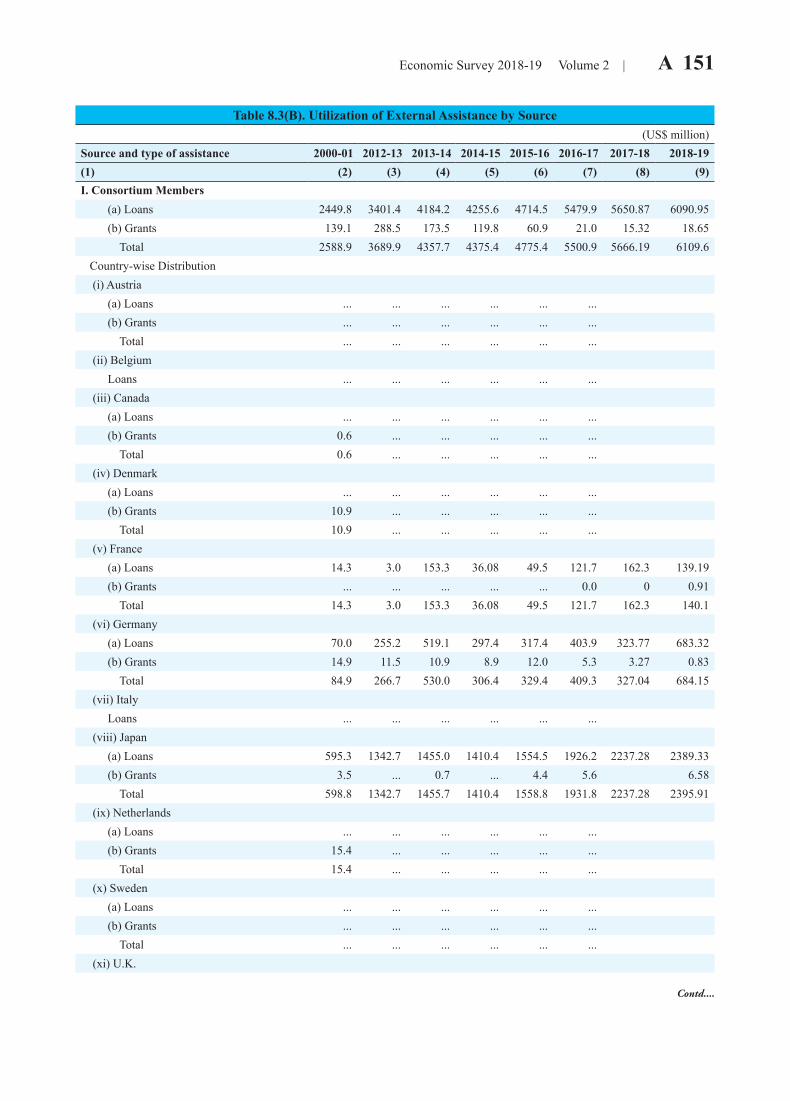
Economic Survey 2018-19 Volume 2 | A 151
Table 8.3(B). Utilization of External Assistance by Source(US$ million)
Source and type of assistance 2000-01 2012-13 2013-14 2014-15 2015-16 2016-17 2017-18 2018-19(1) (2) (3) (4) (5) (6) (7) (8) (9)I. Consortium Members (a) Loans 2449.8 3401.4 4184.2 4255.6 4714.5 5479.9 5650.87 6090.95 (b) Grants 139.1 288.5 173.5 119.8 60.9 21.0 15.32 18.65 Total 2588.9 3689.9 4357.7 4375.4 4775.4 5500.9 5666.19 6109.6 Country-wise Distribution (i) Austria (a) Loans ... ... ... ... ... ... (b) Grants ... ... ... ... ... ... Total ... ... ... ... ... ... (ii) Belgium Loans ... ... ... ... ... ... (iii) Canada (a) Loans ... ... ... ... ... ... (b) Grants 0.6 ... ... ... ... ... Total 0.6 ... ... ... ... ... (iv) Denmark (a) Loans ... ... ... ... ... ... (b) Grants 10.9 ... ... ... ... ... Total 10.9 ... ... ... ... ... (v) France (a) Loans 14.3 3.0 153.3 36.08 49.5 121.7 162.3 139.19 (b) Grants ... ... ... ... ... 0.0 0 0.91 Total 14.3 3.0 153.3 36.08 49.5 121.7 162.3 140.1 (vi) Germany (a) Loans 70.0 255.2 519.1 297.4 317.4 403.9 323.77 683.32 (b) Grants 14.9 11.5 10.9 8.9 12.0 5.3 3.27 0.83 Total 84.9 266.7 530.0 306.4 329.4 409.3 327.04 684.15 (vii) Italy Loans ... ... ... ... ... ... (viii) Japan (a) Loans 595.3 1342.7 1455.0 1410.4 1554.5 1926.2 2237.28 2389.33 (b) Grants 3.5 ... 0.7 ... 4.4 5.6 6.58 Total 598.8 1342.7 1455.7 1410.4 1558.8 1931.8 2237.28 2395.91 (ix) Netherlands (a) Loans ... ... ... ... ... ... (b) Grants 15.4 ... ... ... ... ... Total 15.4 ... ... ... ... ... (x) Sweden (a) Loans ... ... ... ... ... ... (b) Grants ... ... ... ... ... ... Total ... ... ... ... ... ... (xi) U.K.
Contd....
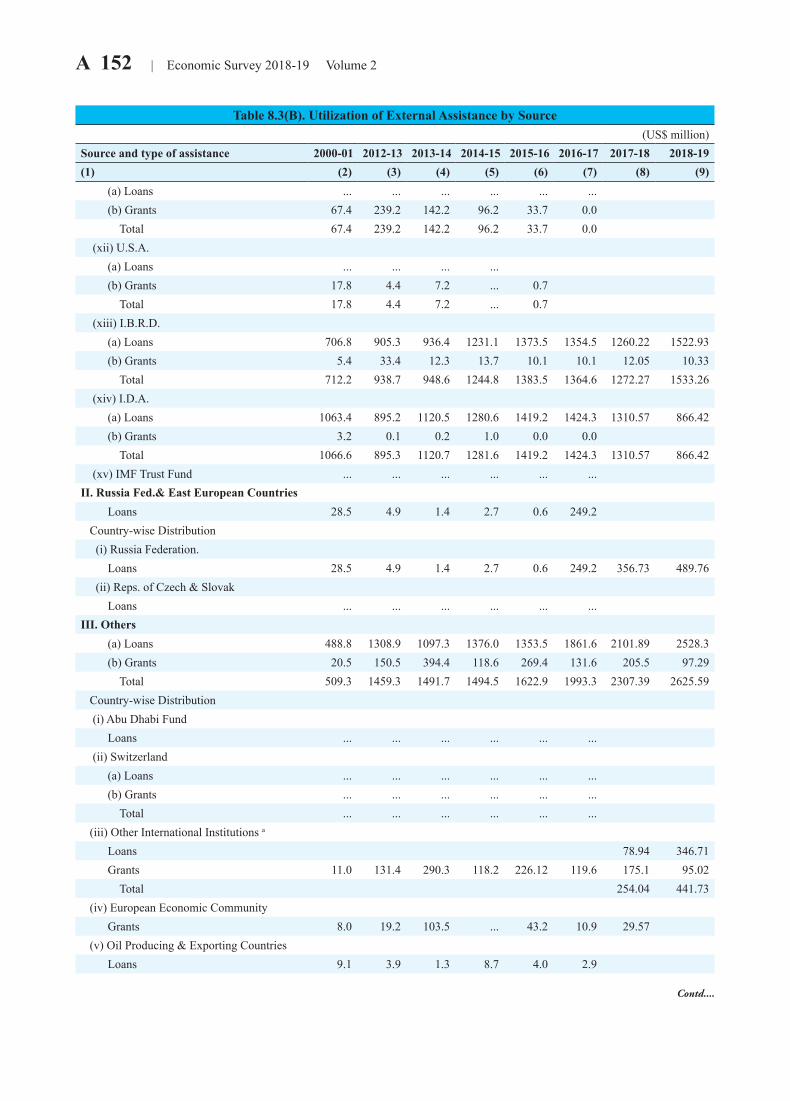
A 152 | Economic Survey 2018-19 Volume 2
Table 8.3(B). Utilization of External Assistance by Source(US$ million)
Source and type of assistance 2000-01 2012-13 2013-14 2014-15 2015-16 2016-17 2017-18 2018-19(1) (2) (3) (4) (5) (6) (7) (8) (9) (a) Loans ... ... ... ... ... ... (b) Grants 67.4 239.2 142.2 96.2 33.7 0.0 Total 67.4 239.2 142.2 96.2 33.7 0.0 (xii) U.S.A. (a) Loans ... ... ... ... (b) Grants 17.8 4.4 7.2 ... 0.7 Total 17.8 4.4 7.2 ... 0.7 (xiii) I.B.R.D. (a) Loans 706.8 905.3 936.4 1231.1 1373.5 1354.5 1260.22 1522.93 (b) Grants 5.4 33.4 12.3 13.7 10.1 10.1 12.05 10.33 Total 712.2 938.7 948.6 1244.8 1383.5 1364.6 1272.27 1533.26 (xiv) I.D.A. (a) Loans 1063.4 895.2 1120.5 1280.6 1419.2 1424.3 1310.57 866.42 (b) Grants 3.2 0.1 0.2 1.0 0.0 0.0 Total 1066.6 895.3 1120.7 1281.6 1419.2 1424.3 1310.57 866.42 (xv) IMF Trust Fund ... ... ... ... ... ...II. Russia Fed.& East European Countries Loans 28.5 4.9 1.4 2.7 0.6 249.2 Country-wise Distribution (i) Russia Federation. Loans 28.5 4.9 1.4 2.7 0.6 249.2 356.73 489.76 (ii) Reps. of Czech & Slovak Loans ... ... ... ... ... ...III. Others (a) Loans 488.8 1308.9 1097.3 1376.0 1353.5 1861.6 2101.89 2528.3 (b) Grants 20.5 150.5 394.4 118.6 269.4 131.6 205.5 97.29 Total 509.3 1459.3 1491.7 1494.5 1622.9 1993.3 2307.39 2625.59 Country-wise Distribution (i) Abu Dhabi Fund Loans ... ... ... ... ... ... (ii) Switzerland (a) Loans ... ... ... ... ... ... (b) Grants ... ... ... ... ... ... Total ... ... ... ... ... ... (iii) Other International Institutions a
Loans 78.94 346.71 Grants 11.0 131.4 290.3 118.2 226.12 119.6 175.1 95.02 Total 254.04 441.73 (iv) European Economic Community Grants 8.0 19.2 103.5 ... 43.2 10.9 29.57 (v) Oil Producing & Exporting Countries Loans 9.1 3.9 1.3 8.7 4.0 2.9
Contd....
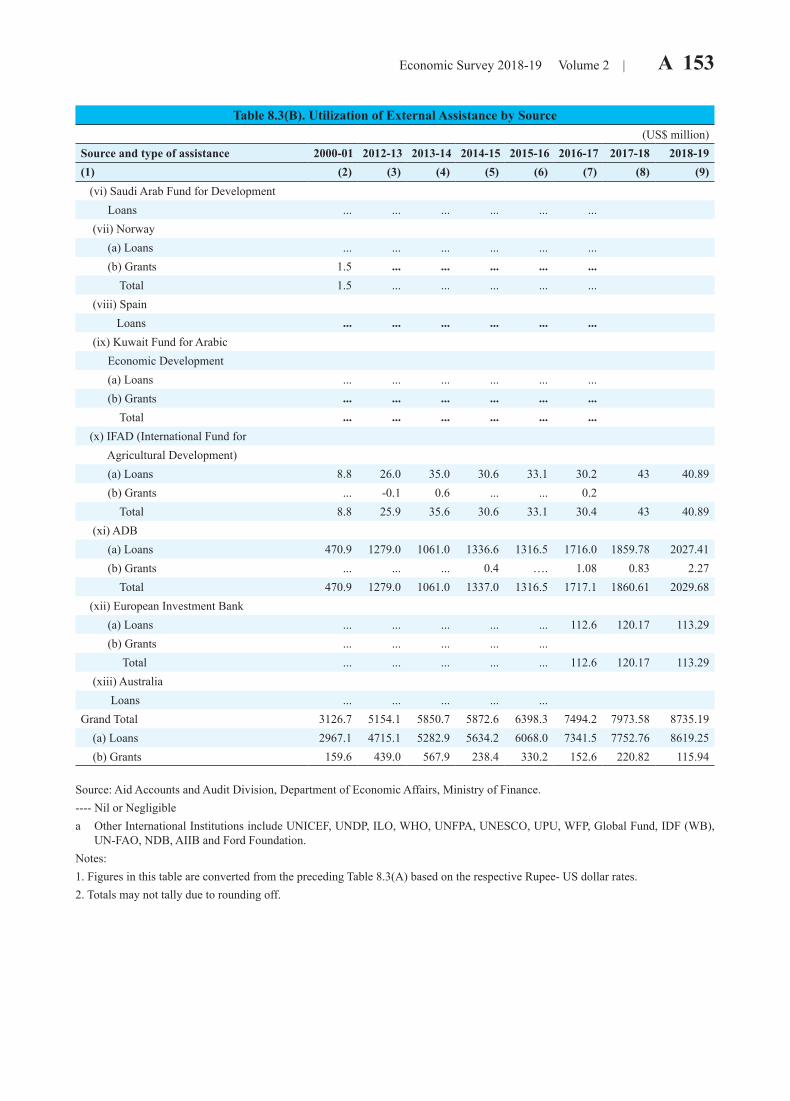
Economic Survey 2018-19 Volume 2 | A 153
Table 8.3(B). Utilization of External Assistance by Source(US$ million)
Source and type of assistance 2000-01 2012-13 2013-14 2014-15 2015-16 2016-17 2017-18 2018-19(1) (2) (3) (4) (5) (6) (7) (8) (9) (vi) Saudi Arab Fund for Development Loans ... ... ... ... ... ... (vii) Norway (a) Loans ... ... ... ... ... ... (b) Grants 1.5 ... ... ... ... ... Total 1.5 ... ... ... ... ... (viii) Spain Loans ... ... ... ... ... ... (ix) Kuwait Fund for Arabic Economic Development (a) Loans ... ... ... ... ... ... (b) Grants ... ... ... ... ... ... Total ... ... ... ... ... ... (x) IFAD (International Fund for Agricultural Development) (a) Loans 8.8 26.0 35.0 30.6 33.1 30.2 43 40.89 (b) Grants ... -0.1 0.6 ... ... 0.2 Total 8.8 25.9 35.6 30.6 33.1 30.4 43 40.89 (xi) ADB (a) Loans 470.9 1279.0 1061.0 1336.6 1316.5 1716.0 1859.78 2027.41 (b) Grants ... ... ... 0.4 …. 1.08 0.83 2.27 Total 470.9 1279.0 1061.0 1337.0 1316.5 1717.1 1860.61 2029.68 (xii) European Investment Bank (a) Loans ... ... ... ... ... 112.6 120.17 113.29 (b) Grants ... ... ... ... ... Total ... ... ... ... ... 112.6 120.17 113.29 (xiii) Australia Loans ... ... ... ... ...Grand Total 3126.7 5154.1 5850.7 5872.6 6398.3 7494.2 7973.58 8735.19 (a) Loans 2967.1 4715.1 5282.9 5634.2 6068.0 7341.5 7752.76 8619.25 (b) Grants 159.6 439.0 567.9 238.4 330.2 152.6 220.82 115.94
Source: Aid Accounts and Audit Division, Department of Economic Affairs, Ministry of Finance.---- Nil or Negligiblea Other International Institutions include UNICEF, UNDP, ILO, WHO, UNFPA, UNESCO, UPU, WFP, Global Fund, IDF (WB),
UN-FAO, NDB, AIIB and Ford Foundation.Notes:1. Figures in this table are converted from the preceding Table 8.3(A) based on the respective Rupee- US dollar rates.2. Totals may not tally due to rounding off.
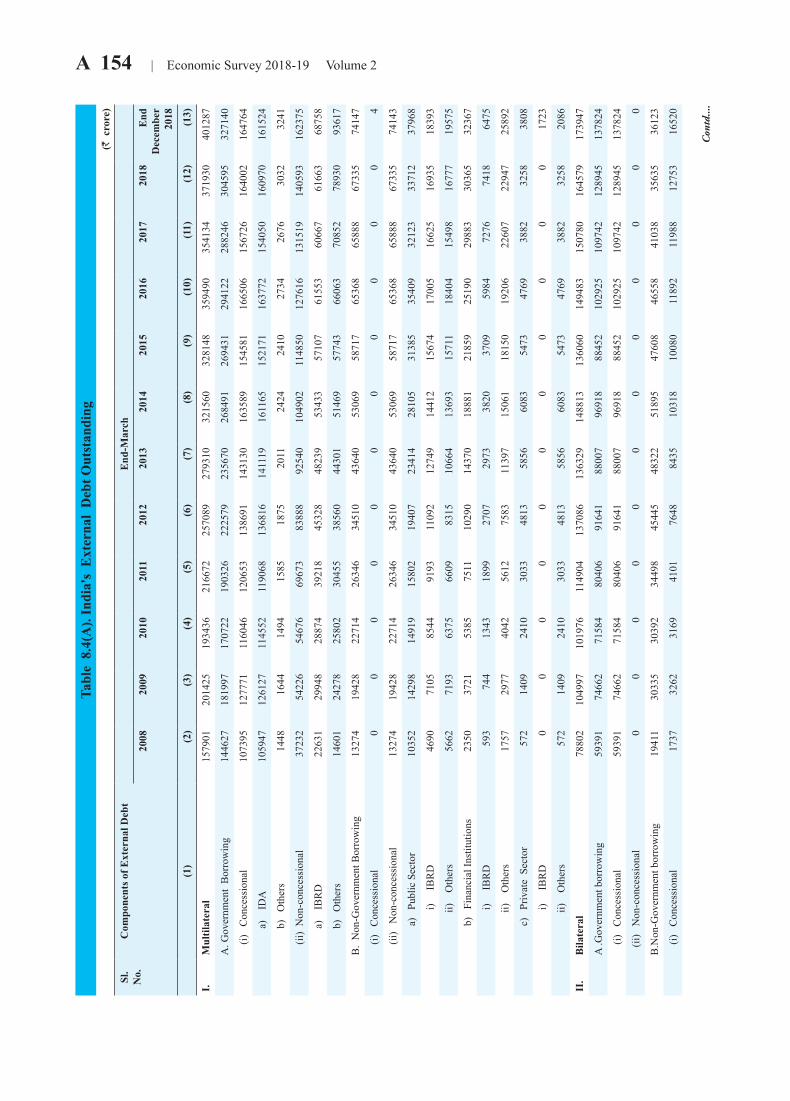
A 154 | Economic Survey 2018-19 Volume 2Ta
ble
8.4
(A).
Indi
a's
Ext
erna
l D
ebt O
utst
andi
ng
(R c
rore
)
Sl.
No.
Com
pone
nts o
f Ext
erna
l Deb
tE
nd-M
arch
2008
2009
2010
2011
2012
2013
2014
2015
2016
2017
2018
End
D
ecem
ber
2018
(1)
(2)
(3)
(4)
(5)
(6)
(7)
(8)
(9)
(10)
(11)
(12)
(13)
I.M
ultil
ater
al15
7901
2014
2519
3436
2166
7225
7089
2793
1032
1560
3281
4835
9490
3541
3437
1930
4012
87
A. G
over
nmen
t B
orro
win
g14
4627
1819
9717
0722
1903
2622
2579
2356
7026
8491
2694
3129
4122
2882
4630
4595
3271
40
(i
) C
once
ssio
nal
1073
9512
7771
1160
4612
0653
1386
9114
3130
1635
8915
4581
1665
0615
6726
1640
0216
4764
a
) I
DA
1059
4712
6127
1145
5211
9068
1368
1614
1119
1611
6515
2171
1637
7215
4050
1609
7016
1524
b
) O
ther
s14
4816
4414
9415
8518
7520
1124
2424
1027
3426
7630
3232
41
(i
i) N
on-c
once
ssio
nal
3723
254
226
5467
669
673
8388
892
540
1049
0211
4850
1276
1613
1519
1405
9316
2375
a
) I
BR
D22
631
2994
828
874
3921
845
328
4823
953
433
5710
761
553
6066
761
663
6875
8
b
) O
ther
s14
601
2427
825
802
3045
538
560
4430
151
469
5774
366
063
7085
278
930
9361
7
B.
Non
-Gov
ernm
ent B
orro
win
g
1327
419
428
2271
426
346
3451
043
640
5306
958
717
6536
865
888
6733
574
147
(i
) C
once
ssio
nal
00
00
00
00
00
04
(i
i) N
on-c
once
ssio
nal
1327
419
428
2271
426
346
3451
043
640
5306
958
717
6536
865
888
6733
574
143
a
) P
ublic
Sec
tor
1035
214
298
1491
915
802
1940
723
414
2810
531
385
3540
932
123
3371
237
968
i
)
IBR
D46
9071
0585
4491
9311
092
1274
914
412
1567
417
005
1662
516
935
1839
3
ii
) O
ther
s56
6271
9363
7566
0983
1510
664
1369
315
711
1840
415
498
1677
719
575
b
) F
inan
cial
Inst
itutio
ns23
5037
2153
8575
1110
290
1437
018
881
2185
925
190
2988
330
365
3236
7
i
)
IBR
D59
374
413
4318
9927
0729
7338
2037
0959
8472
7674
1864
75
ii
) O
ther
s17
5729
7740
4256
1275
8311
397
1506
118
150
1920
622
607
2294
725
892
c
) P
rivat
e S
ecto
r57
214
0924
1030
3348
1358
5660
8354
7347
6938
8232
5838
08
i
)
IBR
D0
00
00
00
00
00
1723
ii
) O
ther
s57
214
0924
1030
3348
1358
5660
8354
7347
6938
8232
5820
86
II.
Bila
tera
l78
802
1049
9710
1976
1149
0413
7086
1363
2914
8813
1360
6014
9483
1507
8016
4579
1739
47
A .G
over
nmen
t bor
row
ing
5939
174
662
7158
480
406
9164
188
007
9691
888
452
1029
2510
9742
1289
4513
7824
(i
) C
once
ssio
nal
5939
174
662
7158
480
406
9164
188
007
9691
888
452
1029
2510
9742
1289
4513
7824
(ii
) N
on-c
once
ssio
nal
00
00
00
00
00
00
B.N
on-G
over
nmen
t bor
row
ing
1941
130
335
3039
234
498
4544
548
322
5189
547
608
4655
841
038
3563
536
123
(i
) C
once
ssio
nal
1737
3262
3169
4101
7648
8435
1031
810
080
1189
211
988
1275
316
520
Con
td....

Economic Survey 2018-19 Volume 2 | A 155 Ta
ble
8.4
(A).
Indi
a's
Ext
erna
l D
ebt O
utst
andi
ng
(R c
rore
)
Sl.
No.
Com
pone
nts o
f Ext
erna
l Deb
tE
nd-M
arch
2008
2009
2010
2011
2012
2013
2014
2015
2016
2017
2018
End
D
ecem
ber
2018
(1)
(2)
(3)
(4)
(5)
(6)
(7)
(8)
(9)
(10)
(11)
(12)
(13)
a) P
ublic
Sec
tor
1226
1156
1121
1621
4963
5916
7763
7546
9052
6758
7586
1110
7
b
) Fin
anci
al In
stitu
tions
511
2106
2048
2480
2685
2519
2555
2534
2840
5230
5167
5413
c
) Pr
ivat
e Se
ctor
00
00
00
00
00
00
(i
i) N
on-c
once
ssio
nal
1767
427
073
2722
330
397
3779
739
887
4157
737
528
3466
629
049
2288
119
603
a) P
ublic
Sec
tor
1009
715
076
1384
513
789
1420
013
010
1337
411
561
1084
894
7285
1879
75
b
) Fin
anci
al In
stitu
tions
3735
4311
3436
3754
3886
4206
4361
3323
3119
3167
2507
2401
c
) Pr
ivat
e Se
ctor
3842
7686
9942
1285
419
711
2267
123
842
2264
420
699
1641
011
856
9227
III.
IMFa
4479
5188
2726
428
163
3152
832
439
3691
034
350
3717
735
129
3771
638
719
IV.
Exp
ort C
redi
t 41
296
7377
276
011
8311
297
117
9655
693
275
7891
570
612
6232
461
511
5678
4
a) B
uyer
s' cr
edit
3313
464
046
6684
973
273
8589
684
667
8006
966
006
5557
446
688
4353
337
786
b) S
uppl
iers
' cre
dit
2998
3234
2937
2847
3252
4236
4779
5217
6088
6093
6766
7014
c) E
xpor
t cre
dit c
ompo
nent
of
bi
late
ral c
redi
t51
6464
9262
2569
9279
6976
5384
2776
9289
5095
4311
213
1198
5
V.
C
omm
erci
al B
orro
win
gs24
9243
3182
0931
9221
4484
4861
4623
7621
2889
7744
1128
501
1199
043
1117
547
1315
594
1360
643
a) C
omm
erci
al b
ank
loan
s b16
0577
2199
2520
2350
2616
7837
3194
4544
5058
2644
6352
4664
7567
5689
8755
1922
6164
96
b) S
ecur
itize
d bo
rrow
ings
c82
641
9128
611
3177
1835
0423
8849
3060
7031
3416
4908
9554
9076
5462
6176
1439
7419
76
c) L
oans
/sec
uriti
zed
borr
owin
gs e
tc.,
with
mul
tilat
eral
/bila
tera
l gua
rant
ee +
IF
C(W
)
6025
6998
3694
3266
2580
1608
1684
2360
2400
2299
2233
2171
VI.
NR
I Dep
osits
d (A
bove
one
yea
r M
atur
ity)
1746
2321
0118
2170
6223
0812
2998
4038
5202
6241
0172
0997
8419
5575
7751
8207
3788
0145
VII
.R
upee
Deb
t e80
6577
6074
8071
4769
2268
3988
2694
2684
7979
6278
8675
90
a) D
efen
ce71
7269
3567
0964
1662
2061
6481
7988
0778
8773
9873
5070
81
b) C
ivili
an89
382
577
173
170
267
564
761
959
256
453
650
9
VII
I.To
tal L
ong
Term
Deb
t (I T
O V
II)
7144
0992
1469
9424
5011
2925
814
4420
516
9880
321
3122
924
3639
726
6623
924
8562
627
7995
429
1911
6
IX.
Shor
t-Te
rm D
ebt
1828
8122
0656
2361
8829
0149
3999
6252
5931
5509
8553
5145
5530
4457
1387
6645
7572
4821
a) T
rade
-Rel
ated
Cre
dits
16
7540
2033
4521
4267
2610
0633
3202
4720
2649
1271
5109
3853
0806
5607
8165
2969
7044
95
Con
td....
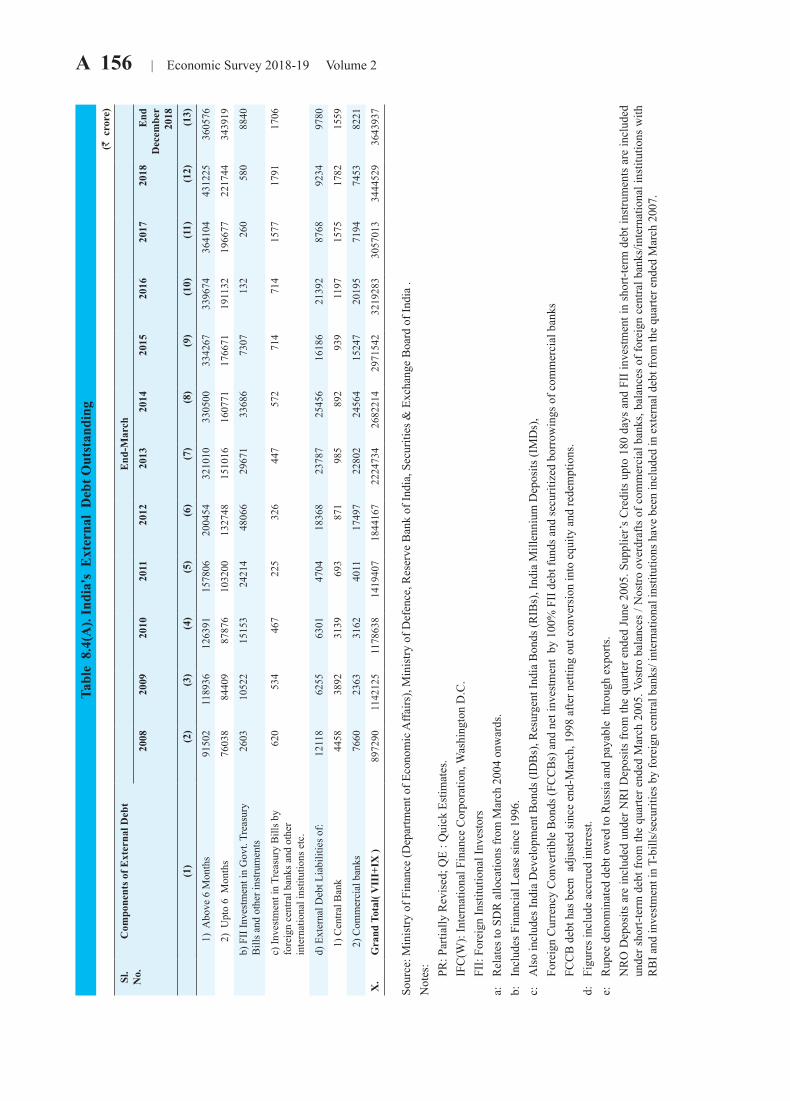
A 156 | Economic Survey 2018-19 Volume 2Ta
ble
8.4
(A).
Indi
a's
Ext
erna
l D
ebt O
utst
andi
ng
(R c
rore
)
Sl.
No.
Com
pone
nts o
f Ext
erna
l Deb
tE
nd-M
arch
2008
2009
2010
2011
2012
2013
2014
2015
2016
2017
2018
End
D
ecem
ber
2018
(1)
(2)
(3)
(4)
(5)
(6)
(7)
(8)
(9)
(10)
(11)
(12)
(13)
1
) A
bove
6 M
onth
s91
502
1189
3612
6391
1578
0620
0454
3210
1033
0500
3342
6733
9674
3641
0443
1225
3605
76
2
) U
pto
6 M
onth
s76
038
8440
987
876
1032
0013
2748
1510
1616
0771
1766
7119
1132
1966
7722
1744
3439
19
b) F
II In
vest
men
t in
Gov
t. Tr
easu
ry
Bill
s and
oth
er in
stru
men
ts
2603
1052
215
153
2421
448
066
2967
133
686
7307
132
260
580
8840
c) In
vest
men
t in
Trea
sury
Bill
s by
fore
ign
cent
ral b
anks
and
oth
er
inte
rnat
iona
l ins
titut
ions
etc
.
620
534
467
225
326
447
572
714
714
1577
1791
1706
d) E
xter
nal D
ebt L
iabi
litie
s of:
1211
862
5563
0147
0418
368
2378
725
456
1618
621
392
8768
9234
9780
1)
Cen
tral B
ank
4458
3892
3139
693
871
985
892
939
1197
1575
1782
1559
2)
Com
mer
cial
ban
ks76
6023
6331
6240
1117
497
2280
224
564
1524
720
195
7194
7453
8221
X.
Gra
nd T
otal
( VII
I+IX
)89
7290
1142
125
1178
638
1419
407
1844
167
2224
734
2682
214
2971
542
3219
283
3057
013
3444
529
3643
937
Sour
ce: M
inis
try o
f Fin
ance
(Dep
artm
ent o
f Eco
nom
ic A
ffairs
), M
inis
try o
f Def
ence
, Res
erve
Ban
k of
Indi
a, S
ecur
ities
& E
xcha
nge
Boa
rd o
f Ind
ia .
Not
es:
PR
: Par
tially
Rev
ised
; QE
: Qui
ck E
stim
ates
.
IFC
(W):
Inte
rnat
iona
l Fin
ance
Cor
pora
tion,
Was
hing
ton
D.C
.
FII:
Fore
ign
Inst
itutio
nal I
nves
tors
a:
Rel
ates
to S
DR
allo
catio
ns fr
om M
arch
200
4 on
war
ds.
b:
Incl
udes
Fin
anci
al L
ease
sinc
e 19
96.
c:
Als
o in
clud
es In
dia
Dev
elop
men
t Bon
ds (I
DB
s), R
esur
gent
Indi
a B
onds
(RIB
s), I
ndia
Mill
enni
um D
epos
its (I
MD
s),
Fo
reig
n C
urre
ncy
Con
verti
ble
Bon
ds (F
CC
Bs)
and
net
inve
stm
ent
by 1
00%
FII
deb
t fun
ds a
nd se
curit
ized
bor
row
ings
of c
omm
erci
al b
anks
FC
CB
deb
t has
bee
n a
djus
ted
sinc
e en
d-M
arch
, 199
8 af
ter n
ettin
g ou
t con
vers
ion
into
equ
ity a
nd re
dem
ptio
ns.
d:
Figu
res i
nclu
de a
ccru
ed in
tere
st.
e:
Rup
ee d
enom
inat
ed d
ebt o
wed
to R
ussi
a an
d pa
yabl
e th
roug
h ex
ports
.
NR
O D
epos
its a
re in
clud
ed u
nder
NR
I Dep
osits
from
the
quar
ter e
nded
Jun
e 20
05. S
uppl
ier’s
Cre
dits
upt
o 18
0 da
ys a
nd F
II in
vest
men
t in
shor
t-ter
m d
ebt i
nstru
men
ts a
re in
clud
ed
unde
r sho
rt-te
rm d
ebt f
rom
the
quar
ter e
nded
Mar
ch 2
005.
Vos
tro b
alan
ces
/ Nos
tro o
verd
rafts
of c
omm
erci
al b
anks
, bal
ance
s of
fore
ign
cent
ral b
anks
/inte
rnat
iona
l ins
titut
ions
with
R
BI a
nd in
vest
men
t in
T-bi
lls/s
ecur
ities
by
fore
ign
cent
ral b
anks
/ int
erna
tiona
l ins
titut
ions
hav
e be
en in
clud
ed in
ext
erna
l deb
t fro
m th
e qu
arte
r end
ed M
arch
200
7.
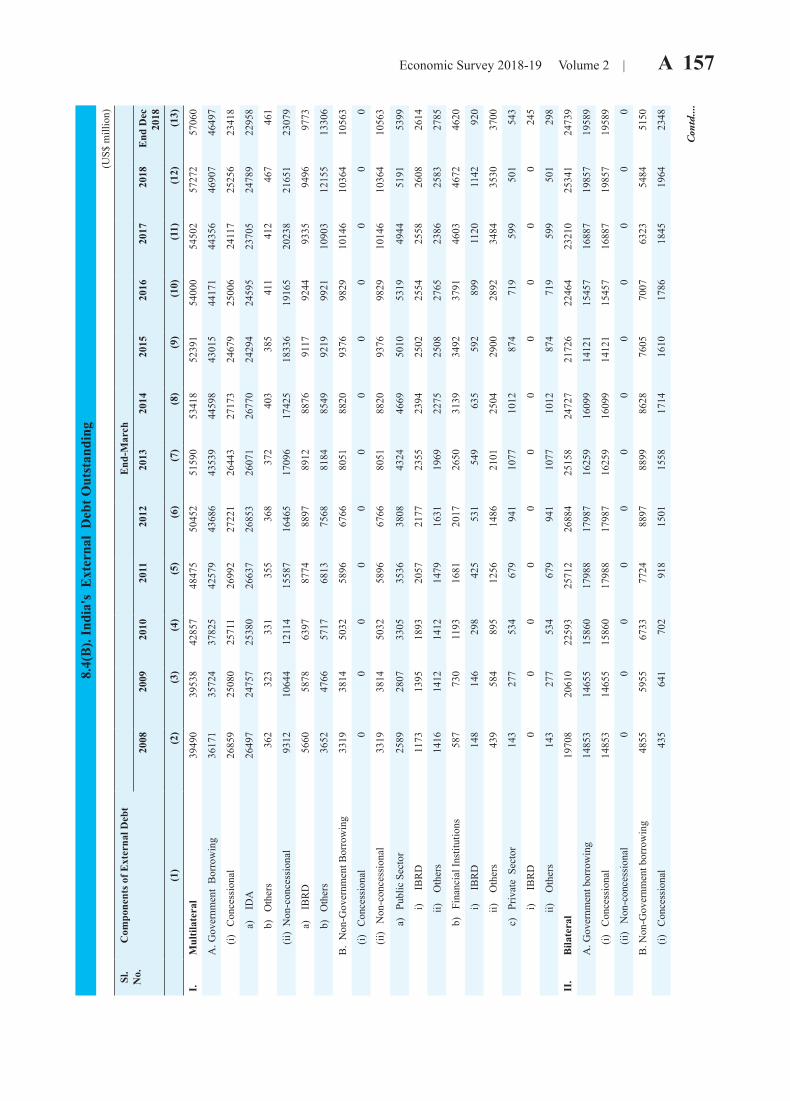
Economic Survey 2018-19 Volume 2 | A 157 8.
4(B
). In
dia'
s E
xter
nal
Deb
t Out
stan
ding
(U
S$ m
illio
n)
Sl.
No.
Com
pone
nts o
f Ext
erna
l Deb
tE
nd-M
arch
2008
2009
2010
2011
2012
2013
2014
2015
2016
2017
2018
End
Dec
20
18
(1)
(2)
(3)
(4)
(5)
(6)
(7)
(8)
(9)
(10)
(11)
(12)
(13)
I.M
ultil
ater
al39
490
3953
842
857
4847
550
452
5159
053
418
5239
154
000
5450
257
272
5706
0
A. G
over
nmen
t B
orro
win
g36
171
3572
437
825
4257
943
686
4353
944
598
4301
544
171
4435
646
907
4649
7
(i
) C
once
ssio
nal
2685
925
080
2571
126
992
2722
126
443
2717
324
679
2500
624
117
2525
623
418
a
) I
DA
2649
724
757
2538
026
637
2685
326
071
2677
024
294
2459
523
705
2478
922
958
b
) O
ther
s36
232
333
135
536
837
240
338
541
141
246
746
1
(i
i) N
on-c
once
ssio
nal
9312
1064
412
114
1558
716
465
1709
617
425
1833
619
165
2023
821
651
2307
9
a
) I
BR
D56
6058
7863
9787
7488
9789
1288
7691
1792
4493
3594
9697
73
b
) O
ther
s36
5247
6657
1768
1375
6881
8485
4992
1999
2110
903
1215
513
306
B.
Non
-Gov
ernm
ent B
orro
win
g
3319
3814
5032
5896
6766
8051
8820
9376
9829
1014
610
364
1056
3
(i
) C
once
ssio
nal
00
00
00
00
00
00
(i
i) N
on-c
once
ssio
nal
3319
3814
5032
5896
6766
8051
8820
9376
9829
1014
610
364
1056
3
a
) P
ublic
Sec
tor
2589
2807
3305
3536
3808
4324
4669
5010
5319
4944
5191
5399
i
)
IBR
D11
7313
9518
9320
5721
7723
5523
9425
0225
5425
5826
0826
14
ii
) O
ther
s14
1614
1214
1214
7916
3119
6922
7525
0827
6523
8625
8327
85
b
) F
inan
cial
Inst
itutio
ns58
773
011
9316
8120
1726
5031
3934
9237
9146
0346
7246
20
i
)
IBR
D14
814
629
842
553
154
963
559
289
911
2011
4292
0
ii
) O
ther
s43
958
489
512
5614
8621
0125
0429
0028
9234
8435
3037
00
c
) P
rivat
e S
ecto
r14
327
753
467
994
110
7710
1287
471
959
950
154
3
i
)
IBR
D0
00
00
00
00
00
245
ii
) O
ther
s14
327
753
467
994
110
7710
1287
471
959
950
129
8
II.
Bila
tera
l19
708
2061
022
593
2571
226
884
2515
824
727
2172
622
464
2321
025
341
2473
9
A. G
over
nmen
t bor
row
ing
1485
314
655
1586
017
988
1798
716
259
1609
914
121
1545
716
887
1985
719
589
(i
) C
once
ssio
nal
1485
314
655
1586
017
988
1798
716
259
1609
914
121
1545
716
887
1985
719
589
(i
i) N
on-c
once
ssio
nal
00
00
00
00
00
00
B. N
on-G
over
nmen
t bor
row
ing
4855
5955
6733
7724
8897
8899
8628
7605
7007
6323
5484
5150
(i
) C
once
ssio
nal
435
641
702
918
1501
1558
1714
1610
1786
1845
1964
2348
Con
td....
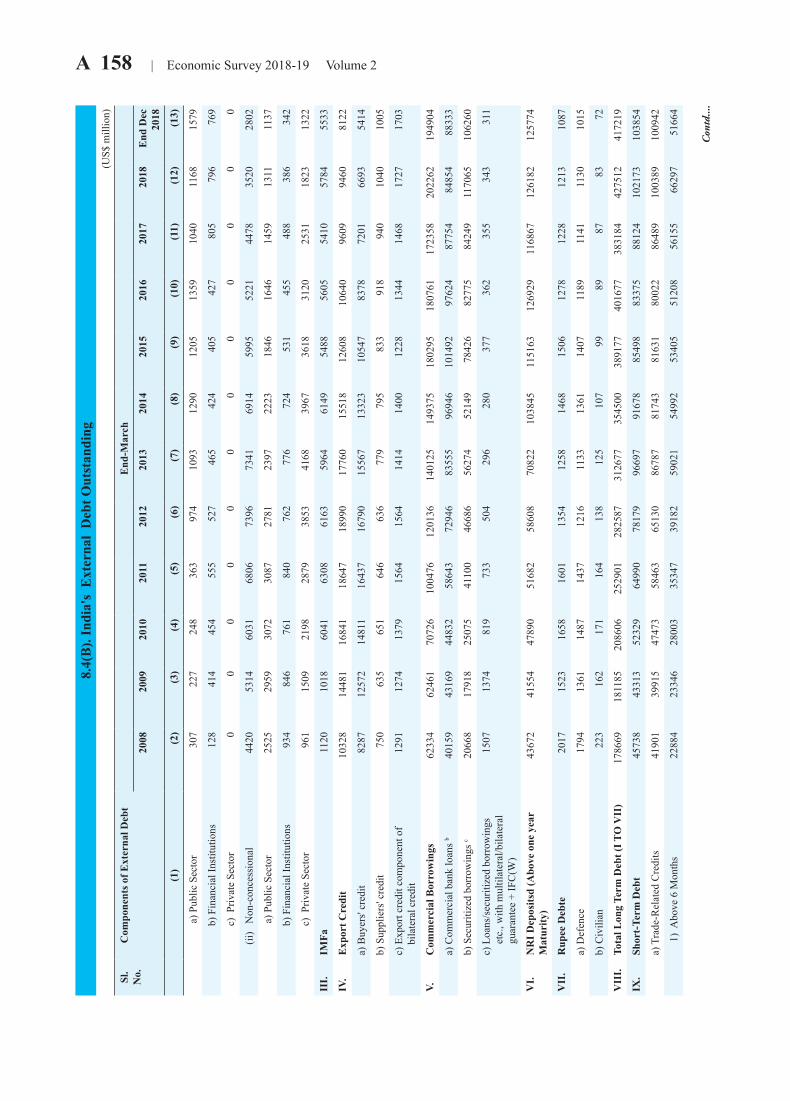
A 158 | Economic Survey 2018-19 Volume 28.
4(B
). In
dia'
s E
xter
nal
Deb
t Out
stan
ding
(U
S$ m
illio
n)
Sl.
No.
Com
pone
nts o
f Ext
erna
l Deb
tE
nd-M
arch
2008
2009
2010
2011
2012
2013
2014
2015
2016
2017
2018
End
Dec
20
18
(1)
(2)
(3)
(4)
(5)
(6)
(7)
(8)
(9)
(10)
(11)
(12)
(13)
a) P
ublic
Sec
tor
307
227
248
363
974
1093
1290
1205
1359
1040
1168
1579
b
) Fin
anci
al In
stitu
tions
128
414
454
555
527
465
424
405
427
805
796
769
c
) Pr
ivat
e Se
ctor
00
00
00
00
00
00
(i
i) N
on-c
once
ssio
nal
4420
5314
6031
6806
7396
7341
6914
5995
5221
4478
3520
2802
a) P
ublic
Sec
tor
2525
2959
3072
3087
2781
2397
2223
1846
1646
1459
1311
1137
b
) Fin
anci
al In
stitu
tions
934
846
761
840
762
776
724
531
455
488
386
342
c
) Pr
ivat
e Se
ctor
961
1509
2198
2879
3853
4168
3967
3618
3120
2531
1823
1322
III.
IMFa
1120
1018
6041
6308
6163
5964
6149
5488
5605
5410
5784
5533
IV.
Exp
ort C
redi
t10
328
1448
116
841
1864
718
990
1776
015
518
1260
810
640
9609
9460
8122
a) B
uyer
s' cr
edit
8287
1257
214
811
1643
716
790
1556
713
323
1054
783
7872
0166
9354
14
b) S
uppl
iers
' cre
dit
750
635
651
646
636
779
795
833
918
940
1040
1005
c) E
xpor
t cre
dit c
ompo
nent
of
bila
tera
l cre
dit
1291
1274
1379
1564
1564
1414
1400
1228
1344
1468
1727
1703
V.
C
omm
erci
al B
orro
win
gs62
334
6246
170
726
1004
7612
0136
1401
2514
9375
1802
9518
0761
1723
5820
2262
1949
04
a) C
omm
erci
al b
ank
loan
s b40
159
4316
944
832
5864
372
946
8355
596
946
1014
9297
624
8775
484
854
8833
3
b) S
ecur
itize
d bo
rrow
ings
c20
668
1791
825
075
4110
046
686
5627
452
149
7842
682
775
8424
911
7065
1062
60
c) L
oans
/sec
uriti
zed
borr
owin
gs
etc.
, with
mul
tilat
eral
/bila
tera
l gu
aran
tee
+ IF
C(W
)
1507
1374
819
733
504
296
280
377
362
355
343
311
VI.
NR
I Dep
osits
d (A
bove
one
yea
r M
atur
ity)
4367
241
554
4789
051
682
5860
870
822
1038
4511
5163
1269
2911
6867
1261
8212
5774
VII
.R
upee
Deb
te20
1715
2316
5816
0113
5412
5814
6815
0612
7812
2812
1310
87
a) D
efen
ce17
9413
6114
8714
3712
1611
3313
6114
0711
8911
4111
3010
15
b) C
ivili
an22
316
217
116
413
812
510
799
8987
8372
VII
I.To
tal L
ong
Term
Deb
t (I T
O V
II)
1786
6918
1185
2086
0625
2901
2825
8731
2677
3545
0038
9177
4016
7738
3184
4275
1241
7219
IX.
Shor
t-Te
rm D
ebt
4573
843
313
5232
964
990
7817
996
697
9167
885
498
8337
588
124
1021
7310
3854
a) T
rade
-Rel
ated
Cre
dits
41
901
3991
547
473
5846
365
130
8678
781
743
8163
180
022
8648
910
0389
1009
42
1
) A
bove
6 M
onth
s22
884
2334
628
003
3534
739
182
5902
154
992
5340
551
208
5615
566
297
5166
4
Con
td....
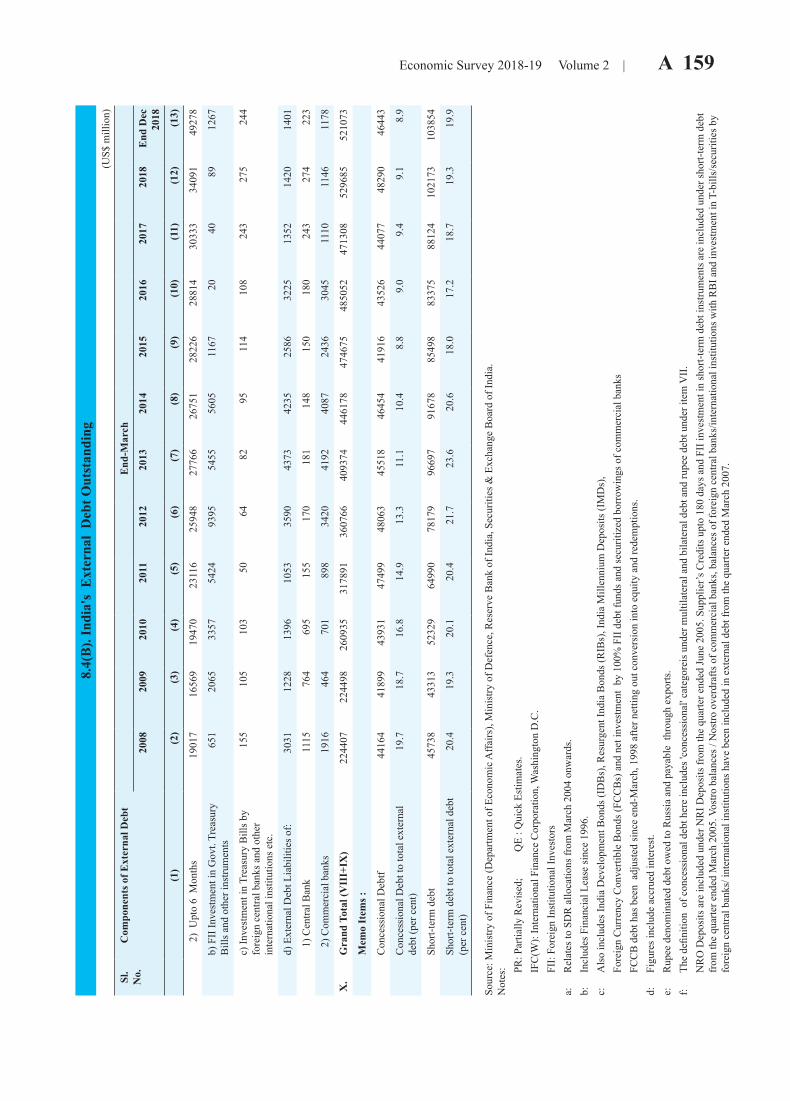
Economic Survey 2018-19 Volume 2 | A 159 8.
4(B
). In
dia'
s E
xter
nal
Deb
t Out
stan
ding
(U
S$ m
illio
n)
Sl.
No.
Com
pone
nts o
f Ext
erna
l Deb
tE
nd-M
arch
2008
2009
2010
2011
2012
2013
2014
2015
2016
2017
2018
End
Dec
20
18
(1)
(2)
(3)
(4)
(5)
(6)
(7)
(8)
(9)
(10)
(11)
(12)
(13)
2
) U
pto
6 M
onth
s19
017
1656
919
470
2311
625
948
2776
626
751
2822
628
814
3033
334
091
4927
8
b) F
II In
vest
men
t in
Gov
t. Tr
easu
ry
Bill
s and
oth
er in
stru
men
ts
651
2065
3357
5424
9395
5455
5605
1167
2040
8912
67
c) In
vest
men
t in
Trea
sury
Bill
s by
fore
ign
cent
ral b
anks
and
oth
er
inte
rnat
iona
l ins
titut
ions
etc
.
155
105
103
5064
8295
114
108
243
275
244
d) E
xter
nal D
ebt L
iabi
litie
s of:
3031
1228
1396
1053
3590
4373
4235
2586
3225
1352
1420
1401
1)
Cen
tral B
ank
1115
764
695
155
170
181
148
150
180
243
274
223
2)
Com
mer
cial
ban
ks19
1646
470
189
834
2041
9240
8724
3630
4511
1011
4611
78
X.
Gra
nd T
otal
(VII
I+IX
)22
4407
2244
9826
0935
3178
9136
0766
4093
7444
6178
4746
7548
5052
4713
0852
9685
5210
73
Mem
o It
ems :
Con
cess
iona
l Deb
tf44
164
4189
943
931
4749
948
063
4551
846
454
4191
643
526
4407
748
290
4644
3
Con
cess
iona
l Deb
t to
tota
l ext
erna
l de
bt (p
er c
ent)
19.7
18.7
16.8
14.9
13.3
11.1
10.4
8.8
9.0
9.4
9.1
8.9
Shor
t-ter
m d
ebt
4573
843
313
5232
964
990
7817
996
697
9167
885
498
8337
588
124
1021
7310
3854
Shor
t-ter
m d
ebt t
o to
tal e
xter
nal d
ebt
(per
cen
t)20
.419
.320
.120
.421
.723
.620
.618
.017
.218
.719
.319
.9
Sour
ce: M
inis
try o
f Fin
ance
(Dep
artm
ent o
f Eco
nom
ic A
ffairs
), M
inis
try o
f Def
ence
, Res
erve
Ban
k of
Indi
a, S
ecur
ities
& E
xcha
nge
Boa
rd o
f Ind
ia.
Not
es:
PR
: Par
tially
Rev
ised
; Q
E : Q
uick
Est
imat
es.
IF
C(W
): In
tern
atio
nal F
inan
ce C
orpo
ratio
n, W
ashi
ngto
n D
.C.
FI
I: Fo
reig
n In
stitu
tiona
l Inv
esto
rsa:
R
elat
es to
SD
R a
lloca
tions
from
Mar
ch 2
004
onw
ards
.b:
In
clud
es F
inan
cial
Lea
se si
nce
1996
.c:
A
lso
incl
udes
Indi
a D
evel
opm
ent B
onds
(ID
Bs)
, Res
urge
nt In
dia
Bon
ds (R
IBs)
, Ind
ia M
illen
nium
Dep
osits
(IM
Ds)
,
Fore
ign
Cur
renc
y C
onve
rtibl
e B
onds
(FC
CB
s) a
nd n
et in
vest
men
t by
100
% F
II d
ebt f
unds
and
secu
ritiz
ed b
orro
win
gs o
f com
mer
cial
ban
ks
FCC
B d
ebt h
as b
een
adj
uste
d si
nce
end-
Mar
ch, 1
998
afte
r net
ting
out c
onve
rsio
n in
to e
quity
and
rede
mpt
ions
.d:
Fi
gure
s inc
lude
acc
rued
inte
rest
.e:
R
upee
den
omin
ated
deb
t ow
ed to
Rus
sia
and
paya
ble
thro
ugh
expo
rts.
f: Th
e de
finiti
on o
f con
cess
iona
l deb
t her
e in
clud
es 'c
once
ssio
nal'
cate
gore
is u
nder
mul
tilat
eral
and
bila
tera
l deb
t and
rupe
e de
bt u
nder
item
VII
.
NR
O D
epos
its a
re in
clud
ed u
nder
NR
I Dep
osits
from
the
quar
ter e
nded
June
200
5. S
uppl
ier’s
Cre
dits
upt
o 18
0 da
ys a
nd F
II in
vest
men
t in
shor
t-ter
m d
ebt i
nstru
men
ts a
re in
clud
ed u
nder
shor
t-ter
m d
ebt
from
the
quar
ter e
nded
Mar
ch 2
005.
Vos
tro b
alan
ces /
Nos
tro o
verd
rafts
of c
omm
erci
al b
anks
, bal
ance
s of f
orei
gn c
entra
l ban
ks/in
tern
atio
nal i
nstit
utio
ns w
ith R
BI a
nd in
vest
men
t in
T-bi
lls/s
ecur
ities
by
fore
ign
cent
ral b
anks
/ int
erna
tiona
l ins
titut
ions
hav
e be
en in
clud
ed in
ext
erna
l deb
t fro
m th
e qu
arte
r end
ed M
arch
200
7.

A 160 | Economic Survey 2018-19 Volume 2Ta
ble
9.1.
Sel
ecte
d In
dica
tors
of H
uman
Dev
elop
men
t for
Maj
or S
tate
sSt
ate
Life
exp
ecta
ncy
at b
irth
(in
yea
rs)
Infa
nt m
orta
lity
rate
(p
er 1
000
live
birt
hs)
Bir
th r
ate
(per
100
0)D
eath
rat
e(p
er 1
000)
Tota
l fer
tility
ra
te (T
FR)
2008
-12
2012
-16
2007
2017
2007
2017
2007
2017
2005
2016
Mal
eFe
mal
eTo
tal
Mal
eFe
mal
eTo
tal
Mal
eFe
mal
eTo
tal
Mal
eFe
mal
eTo
tal
Tota
lTo
tal
Tota
lTo
tal
Tota
lTo
tal
(1)
(2)
(3)
(4)
(5)
(6)
(7)
(8)
(9)
(10)
(11)
(12)
(13)
(14)
(15)
(16)
(17)
(18)
(19)
And
hra
Prad
esh
64.7
69.4
67.0
68.0
71.4
69.6
5455
5431
3332
18.7
16.2
7.4
7.2
2.0
1.7
Ass
am61
.264
.862
.764
.466
.865
.564
6756
4146
4424
.321
.28.
66.
52.
92.
3
Bih
ar66
.767
.667
.268
.968
.568
.757
5858
3437
3529
.426
.47.
55.
84.
33.
3
Guj
arat
65.5
70.1
67.7
67.4
71.8
69.5
5054
5530
3030
23.0
19.9
7.3
6.2
2.8
2.2
Har
yana
65.4
70.1
67.6
67.2
72.0
69.4
5556
5528
3130
23.4
20.5
6.6
5.8
2.8
2.3
Him
acha
l Pra
desh
68.3
72.7
70.5
69.4
75.5
72.3
4549
4722
2322
17.4
15.8
7.1
6.6
2.2
1.7
Jam
mu
& K
ashm
ir69
.972
.471
.071
.676
.273
.549
5251
2224
2319
.015
.45.
84.
82.
41.
7
Kar
nata
ka65
.870
.368
.067
.670
.769
.146
4747
2426
2519
.917
.47.
36.
52.
21.
8
Ker
ala
71.6
77.7
74.7
72.2
77.9
75.1
1213
139
1010
14.7
14.2
6.8
6.8
1.7
1.8
Mad
hya
Prad
esh
61.9
65.0
63.3
63.7
67.2
65.4
7272
7248
4547
28.5
24.8
8.7
6.8
3.6
2.8
Mah
aras
htra
68.8
72.9
70.8
70.8
73.7
72.2
3335
3418
1919
18.1
15.7
6.6
5.7
2.2
1.8
Odi
sha
63.4
65.3
64.3
66.2
69.1
67.6
7072
7140
4141
21.5
18.3
9.2
7.4
2.6
2.0
Punj
ab68
.172
.970
.371
.074
.272
.542
4543
2022
2117
.614
.97.
07.
02.
11.
7
Raj
asth
an65
.269
.467
.266
.170
.768
.363
6765
3740
3827
.924
.16.
86.
03.
72.
7
Tam
il N
adu
67.9
71.9
69.8
69.5
73.4
71.4
3436
3517
1616
15.8
14.9
7.2
6.7
1.7
1.6
Utta
r Pra
desh
62.3
64.8
63.5
63.9
65.6
64.8
6770
6939
4341
29.5
25.9
8.5
6.7
4.2
3.1
Wes
t Ben
gal
68.1
71.5
69.7
69.8
71.9
70.8
3637
3723
2424
17.9
15.2
6.3
5.8
2.1
1.6
All
Indi
a65
.468
.867
.067
.470
.268
.755
5655
3234
3323
.120
.27.
46.
32.
92.
3
Sour
ce :
Offi
ce o
f the
Reg
istra
r Gen
eral
of I
ndia
, Min
istry
of H
ome A
ffairs
Not
e : A
ndhr
a Pr
ades
h in
clud
es T
elan
gana
.
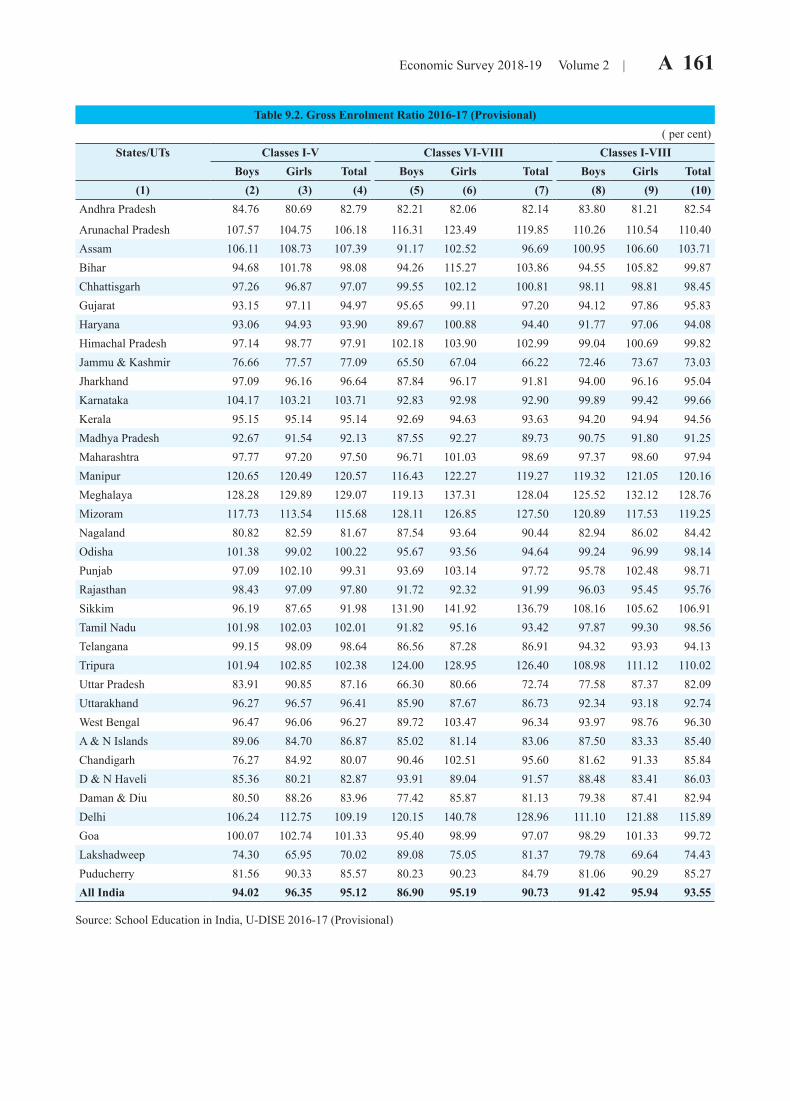
Economic Survey 2018-19 Volume 2 | A 161
Table 9.2. Gross Enrolment Ratio 2016-17 (Provisional) ( per cent)
States/UTs Classes I-V Classes VI-VIII Classes I-VIIIBoys Girls Total Boys Girls Total Boys Girls Total
(1) (2) (3) (4) (5) (6) (7) (8) (9) (10)Andhra Pradesh 84.76 80.69 82.79 82.21 82.06 82.14 83.80 81.21 82.54
Arunachal Pradesh 107.57 104.75 106.18 116.31 123.49 119.85 110.26 110.54 110.40Assam 106.11 108.73 107.39 91.17 102.52 96.69 100.95 106.60 103.71Bihar 94.68 101.78 98.08 94.26 115.27 103.86 94.55 105.82 99.87Chhattisgarh 97.26 96.87 97.07 99.55 102.12 100.81 98.11 98.81 98.45Gujarat 93.15 97.11 94.97 95.65 99.11 97.20 94.12 97.86 95.83Haryana 93.06 94.93 93.90 89.67 100.88 94.40 91.77 97.06 94.08Himachal Pradesh 97.14 98.77 97.91 102.18 103.90 102.99 99.04 100.69 99.82Jammu & Kashmir 76.66 77.57 77.09 65.50 67.04 66.22 72.46 73.67 73.03Jharkhand 97.09 96.16 96.64 87.84 96.17 91.81 94.00 96.16 95.04Karnataka 104.17 103.21 103.71 92.83 92.98 92.90 99.89 99.42 99.66Kerala 95.15 95.14 95.14 92.69 94.63 93.63 94.20 94.94 94.56Madhya Pradesh 92.67 91.54 92.13 87.55 92.27 89.73 90.75 91.80 91.25Maharashtra 97.77 97.20 97.50 96.71 101.03 98.69 97.37 98.60 97.94Manipur 120.65 120.49 120.57 116.43 122.27 119.27 119.32 121.05 120.16Meghalaya 128.28 129.89 129.07 119.13 137.31 128.04 125.52 132.12 128.76Mizoram 117.73 113.54 115.68 128.11 126.85 127.50 120.89 117.53 119.25Nagaland 80.82 82.59 81.67 87.54 93.64 90.44 82.94 86.02 84.42Odisha 101.38 99.02 100.22 95.67 93.56 94.64 99.24 96.99 98.14Punjab 97.09 102.10 99.31 93.69 103.14 97.72 95.78 102.48 98.71Rajasthan 98.43 97.09 97.80 91.72 92.32 91.99 96.03 95.45 95.76Sikkim 96.19 87.65 91.98 131.90 141.92 136.79 108.16 105.62 106.91Tamil Nadu 101.98 102.03 102.01 91.82 95.16 93.42 97.87 99.30 98.56Telangana 99.15 98.09 98.64 86.56 87.28 86.91 94.32 93.93 94.13Tripura 101.94 102.85 102.38 124.00 128.95 126.40 108.98 111.12 110.02Uttar Pradesh 83.91 90.85 87.16 66.30 80.66 72.74 77.58 87.37 82.09Uttarakhand 96.27 96.57 96.41 85.90 87.67 86.73 92.34 93.18 92.74West Bengal 96.47 96.06 96.27 89.72 103.47 96.34 93.97 98.76 96.30A & N Islands 89.06 84.70 86.87 85.02 81.14 83.06 87.50 83.33 85.40Chandigarh 76.27 84.92 80.07 90.46 102.51 95.60 81.62 91.33 85.84D & N Haveli 85.36 80.21 82.87 93.91 89.04 91.57 88.48 83.41 86.03Daman & Diu 80.50 88.26 83.96 77.42 85.87 81.13 79.38 87.41 82.94Delhi 106.24 112.75 109.19 120.15 140.78 128.96 111.10 121.88 115.89Goa 100.07 102.74 101.33 95.40 98.99 97.07 98.29 101.33 99.72Lakshadweep 74.30 65.95 70.02 89.08 75.05 81.37 79.78 69.64 74.43Puducherry 81.56 90.33 85.57 80.23 90.23 84.79 81.06 90.29 85.27All India 94.02 96.35 95.12 86.90 95.19 90.73 91.42 95.94 93.55
Source: School Education in India, U-DISE 2016-17 (Provisional)
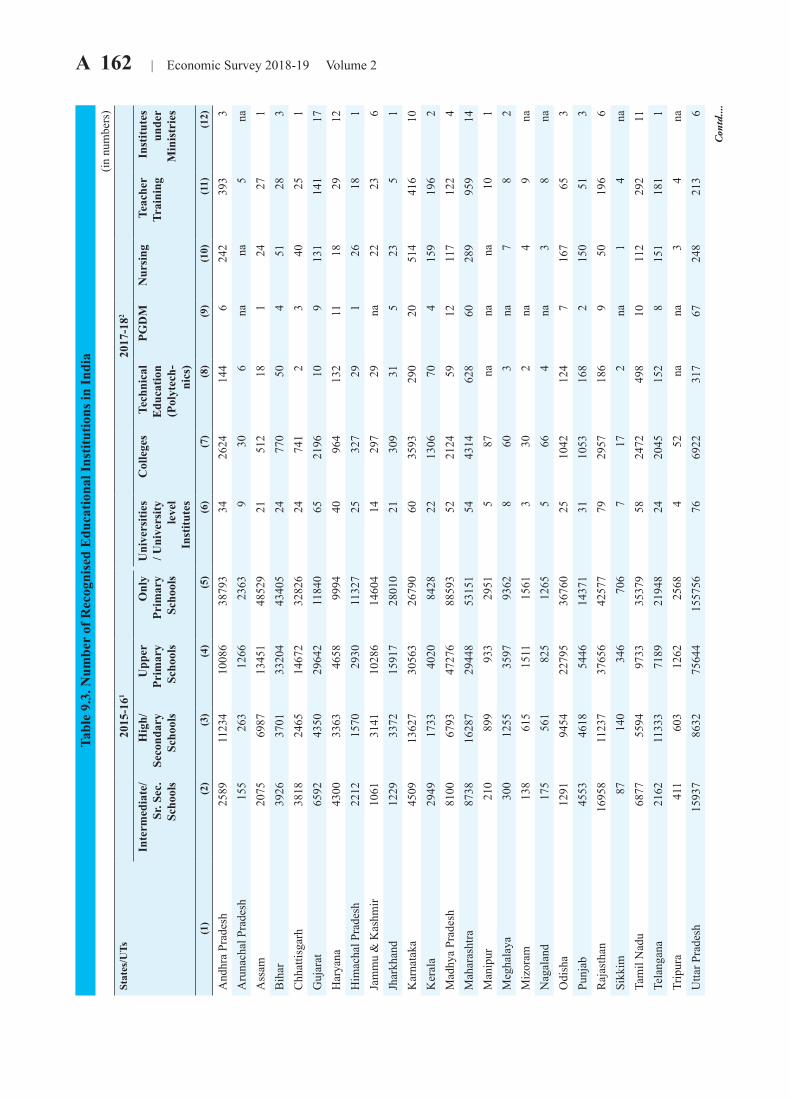
A 162 | Economic Survey 2018-19 Volume 2Ta
ble
9.3.
Num
ber
of R
ecog
nise
d E
duca
tiona
l Ins
titut
ions
in In
dia
(in n
umbe
rs)
Stat
es/U
Ts20
15-1
6120
17-1
82
Inte
rmed
iate
/Sr
. Sec
. Sc
hool
s
Hig
h/
Seco
ndar
y Sc
hool
s
Upp
er
Prim
ary
Scho
ols
Onl
y Pr
imar
y Sc
hool
s
Uni
vers
ities
/ U
nive
rsity
le
vel
Inst
itute
s
Col
lege
s Te
chni
cal
Edu
catio
n (P
olyt
ech-
nics
)
PGD
MN
ursi
ngTe
ache
r Tr
aini
ngIn
stitu
tes
unde
r M
inis
trie
s
(1)
(2)
(3)
(4)
(5)
(6)
(7)
(8)
(9)
(10)
(11)
(12)
And
hra
Prad
esh
2589
1123
410
086
3879
334
2624
144
624
239
33
Aru
nach
al P
rade
sh15
526
312
6623
639
306
nana
5na
Ass
am20
7569
8713
451
4852
921
512
181
2427
1B
ihar
3926
3701
3320
443
405
2477
050
451
283
Chh
attis
garh
3818
2465
1467
232
826
2474
12
340
251
Guj
arat
6592
4350
2964
211
840
6521
9610
913
114
117
Har
yana
4300
3363
4658
9994
4096
413
211
1829
12H
imac
hal P
rade
sh22
1215
7029
3011
327
2532
729
126
181
Jam
mu
& K
ashm
ir10
6131
4110
286
1460
414
297
29na
2223
6Jh
arkh
and
1229
3372
1591
728
010
2130
931
523
51
Kar
nata
ka45
0913
627
3056
326
790
6035
9329
020
514
416
10K
eral
a29
4917
3340
2084
2822
1306
704
159
196
2M
adhy
a Pr
ades
h81
0067
9347
276
8859
352
2124
5912
117
122
4M
ahar
asht
ra87
3816
287
2944
853
151
5443
1462
860
289
959
14M
anip
ur21
089
993
329
515
87na
nana
101
Meg
hala
ya30
012
5535
9793
628
603
na7
82
Miz
oram
138
615
1511
1561
330
2na
49
naN
agal
and
175
561
825
1265
566
4na
38
naO
dish
a12
9194
5422
795
3676
025
1042
124
716
765
3Pu
njab
4553
4618
5446
1437
131
1053
168
215
051
3R
ajas
than
1695
811
237
3765
642
577
7929
5718
69
5019
66
Sikk
im87
140
346
706
717
2na
14
naTa
mil
Nad
u68
7755
9497
3335
379
5824
7249
810
112
292
11Te
lang
ana
2162
1133
371
8921
948
2420
4515
28
151
181
1Tr
ipur
a41
160
312
6225
684
52na
na3
4na
Utta
r Pra
desh
1593
786
3275
644
1557
5676
6922
317
6724
821
36
Con
td....
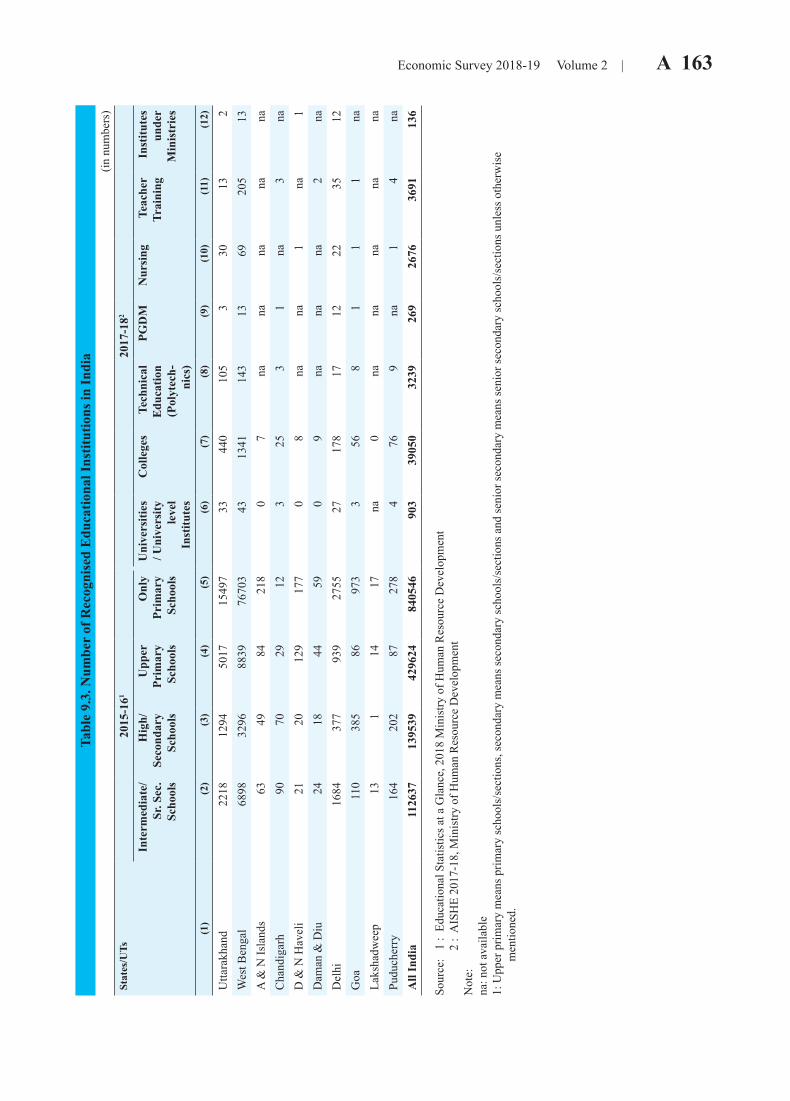
Economic Survey 2018-19 Volume 2 | A 163 Ta
ble
9.3.
Num
ber
of R
ecog
nise
d E
duca
tiona
l Ins
titut
ions
in In
dia
(in n
umbe
rs)
Stat
es/U
Ts20
15-1
6120
17-1
82
Inte
rmed
iate
/Sr
. Sec
. Sc
hool
s
Hig
h/
Seco
ndar
y Sc
hool
s
Upp
er
Prim
ary
Scho
ols
Onl
y Pr
imar
y Sc
hool
s
Uni
vers
ities
/ U
nive
rsity
le
vel
Inst
itute
s
Col
lege
s Te
chni
cal
Edu
catio
n (P
olyt
ech-
nics
)
PGD
MN
ursi
ngTe
ache
r Tr
aini
ngIn
stitu
tes
unde
r M
inis
trie
s
(1)
(2)
(3)
(4)
(5)
(6)
(7)
(8)
(9)
(10)
(11)
(12)
Utta
rakh
and
2218
1294
5017
1549
733
440
105
330
132
Wes
t Ben
gal
6898
3296
8839
7670
343
1341
143
1369
205
13A
& N
Isla
nds
6349
8421
80
7na
nana
nana
Cha
ndig
arh
9070
2912
325
31
na3
naD
& N
Hav
eli
2120
129
177
08
nana
1na
1D
aman
& D
iu24
1844
590
9na
nana
2na
Del
hi16
8437
793
927
5527
178
1712
2235
12G
oa11
038
586
973
356
81
11
naLa
ksha
dwee
p13
114
17na
0na
nana
nana
Pudu
cher
ry16
420
287
278
476
9na
14
naA
ll In
dia
1126
3713
9539
4296
2484
0546
903
3905
032
3926
926
7636
9113
6
Sour
ce:
1 :
Edu
catio
nal S
tatis
tics a
t a G
lanc
e, 2
018
Min
istry
of H
uman
Res
ourc
e D
evel
opm
ent
2
: A
ISH
E 20
17-1
8, M
inis
try o
f Hum
an R
esou
rce
Dev
elop
men
tN
ote:
na: n
ot a
vaila
ble
1: U
pper
prim
ary
mea
ns p
rimar
y sc
hool
s/se
ctio
ns, s
econ
dary
mea
ns se
cond
ary
scho
ols/
sect
ions
and
seni
or se
cond
ary
mea
ns se
nior
seco
ndar
y sc
hool
s/se
ctio
ns u
nles
s oth
erw
ise
men
tione
d.
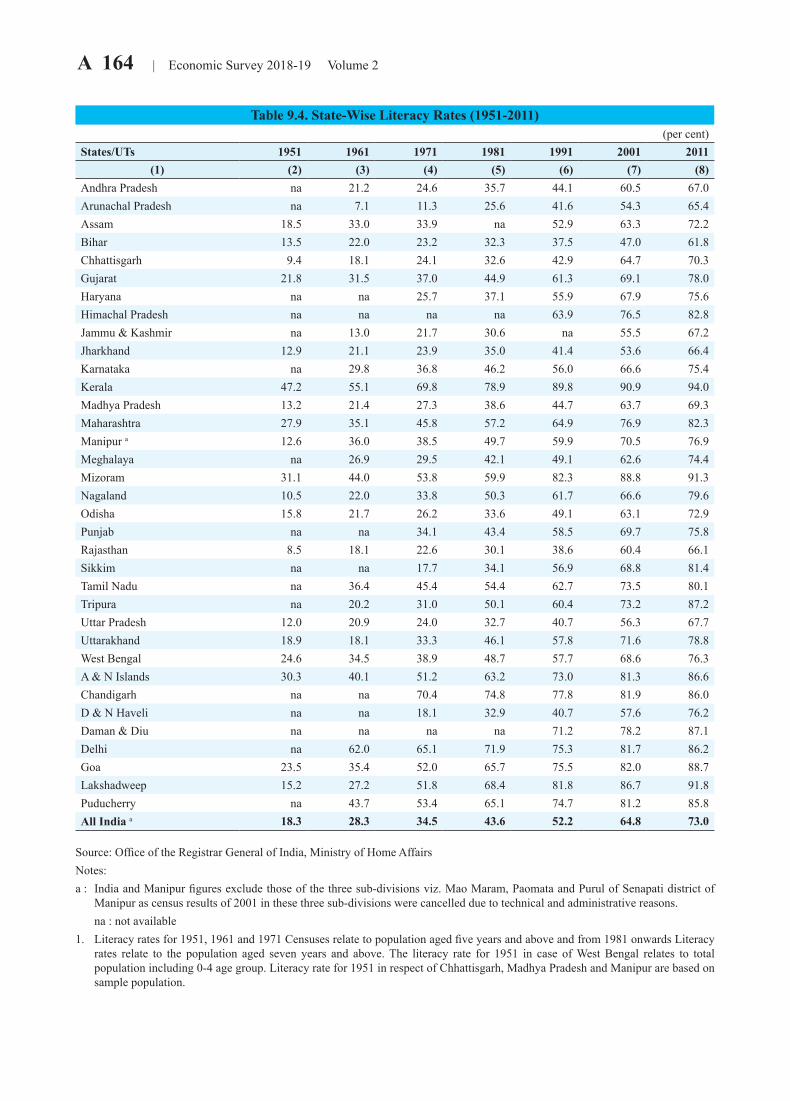
A 164 | Economic Survey 2018-19 Volume 2
Table 9.4. State-Wise Literacy Rates (1951-2011)(per cent)
States/UTs 1951 1961 1971 1981 1991 2001 2011(1) (2) (3) (4) (5) (6) (7) (8)
Andhra Pradesh na 21.2 24.6 35.7 44.1 60.5 67.0Arunachal Pradesh na 7.1 11.3 25.6 41.6 54.3 65.4Assam 18.5 33.0 33.9 na 52.9 63.3 72.2Bihar 13.5 22.0 23.2 32.3 37.5 47.0 61.8Chhattisgarh 9.4 18.1 24.1 32.6 42.9 64.7 70.3Gujarat 21.8 31.5 37.0 44.9 61.3 69.1 78.0Haryana na na 25.7 37.1 55.9 67.9 75.6Himachal Pradesh na na na na 63.9 76.5 82.8Jammu & Kashmir na 13.0 21.7 30.6 na 55.5 67.2Jharkhand 12.9 21.1 23.9 35.0 41.4 53.6 66.4Karnataka na 29.8 36.8 46.2 56.0 66.6 75.4Kerala 47.2 55.1 69.8 78.9 89.8 90.9 94.0Madhya Pradesh 13.2 21.4 27.3 38.6 44.7 63.7 69.3Maharashtra 27.9 35.1 45.8 57.2 64.9 76.9 82.3Manipur a 12.6 36.0 38.5 49.7 59.9 70.5 76.9Meghalaya na 26.9 29.5 42.1 49.1 62.6 74.4Mizoram 31.1 44.0 53.8 59.9 82.3 88.8 91.3Nagaland 10.5 22.0 33.8 50.3 61.7 66.6 79.6Odisha 15.8 21.7 26.2 33.6 49.1 63.1 72.9Punjab na na 34.1 43.4 58.5 69.7 75.8Rajasthan 8.5 18.1 22.6 30.1 38.6 60.4 66.1Sikkim na na 17.7 34.1 56.9 68.8 81.4Tamil Nadu na 36.4 45.4 54.4 62.7 73.5 80.1Tripura na 20.2 31.0 50.1 60.4 73.2 87.2Uttar Pradesh 12.0 20.9 24.0 32.7 40.7 56.3 67.7Uttarakhand 18.9 18.1 33.3 46.1 57.8 71.6 78.8West Bengal 24.6 34.5 38.9 48.7 57.7 68.6 76.3A & N Islands 30.3 40.1 51.2 63.2 73.0 81.3 86.6Chandigarh na na 70.4 74.8 77.8 81.9 86.0D & N Haveli na na 18.1 32.9 40.7 57.6 76.2Daman & Diu na na na na 71.2 78.2 87.1Delhi na 62.0 65.1 71.9 75.3 81.7 86.2Goa 23.5 35.4 52.0 65.7 75.5 82.0 88.7Lakshadweep 15.2 27.2 51.8 68.4 81.8 86.7 91.8Puducherry na 43.7 53.4 65.1 74.7 81.2 85.8All India a 18.3 28.3 34.5 43.6 52.2 64.8 73.0
Source: Office of the Registrar General of India, Ministry of Home AffairsNotes:a : India and Manipur figures exclude those of the three sub-divisions viz. Mao Maram, Paomata and Purul of Senapati district of
Manipur as census results of 2001 in these three sub-divisions were cancelled due to technical and administrative reasons. na : not available1. Literacy rates for 1951, 1961 and 1971 Censuses relate to population aged five years and above and from 1981 onwards Literacy
rates relate to the population aged seven years and above. The literacy rate for 1951 in case of West Bengal relates to total population including 0-4 age group. Literacy rate for 1951 in respect of Chhattisgarh, Madhya Pradesh and Manipur are based on sample population.
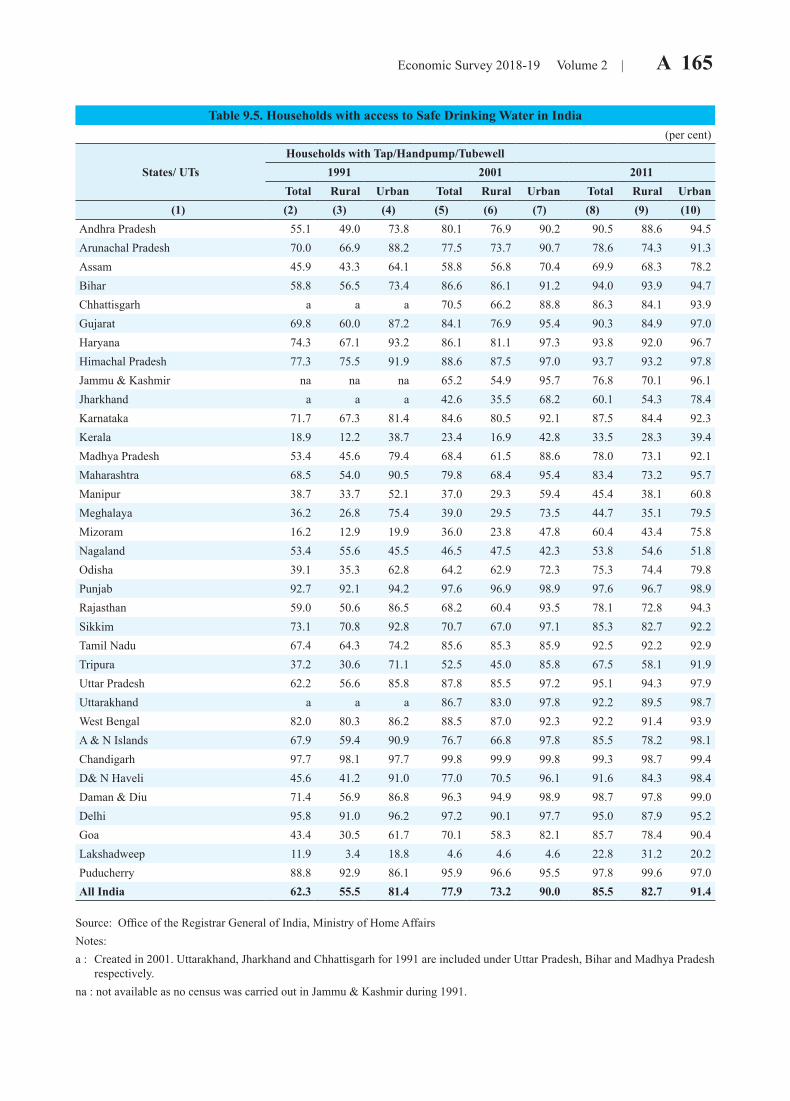
Economic Survey 2018-19 Volume 2 | A 165
Table 9.5. Households with access to Safe Drinking Water in India(per cent)
Households with Tap/Handpump/TubewellStates/ UTs 1991 2001 2011
Total Rural Urban Total Rural Urban Total Rural Urban(1) (2) (3) (4) (5) (6) (7) (8) (9) (10)
Andhra Pradesh 55.1 49.0 73.8 80.1 76.9 90.2 90.5 88.6 94.5Arunachal Pradesh 70.0 66.9 88.2 77.5 73.7 90.7 78.6 74.3 91.3Assam 45.9 43.3 64.1 58.8 56.8 70.4 69.9 68.3 78.2Bihar 58.8 56.5 73.4 86.6 86.1 91.2 94.0 93.9 94.7Chhattisgarh a a a 70.5 66.2 88.8 86.3 84.1 93.9Gujarat 69.8 60.0 87.2 84.1 76.9 95.4 90.3 84.9 97.0Haryana 74.3 67.1 93.2 86.1 81.1 97.3 93.8 92.0 96.7Himachal Pradesh 77.3 75.5 91.9 88.6 87.5 97.0 93.7 93.2 97.8Jammu & Kashmir na na na 65.2 54.9 95.7 76.8 70.1 96.1Jharkhand a a a 42.6 35.5 68.2 60.1 54.3 78.4Karnataka 71.7 67.3 81.4 84.6 80.5 92.1 87.5 84.4 92.3Kerala 18.9 12.2 38.7 23.4 16.9 42.8 33.5 28.3 39.4Madhya Pradesh 53.4 45.6 79.4 68.4 61.5 88.6 78.0 73.1 92.1Maharashtra 68.5 54.0 90.5 79.8 68.4 95.4 83.4 73.2 95.7Manipur 38.7 33.7 52.1 37.0 29.3 59.4 45.4 38.1 60.8Meghalaya 36.2 26.8 75.4 39.0 29.5 73.5 44.7 35.1 79.5Mizoram 16.2 12.9 19.9 36.0 23.8 47.8 60.4 43.4 75.8Nagaland 53.4 55.6 45.5 46.5 47.5 42.3 53.8 54.6 51.8Odisha 39.1 35.3 62.8 64.2 62.9 72.3 75.3 74.4 79.8Punjab 92.7 92.1 94.2 97.6 96.9 98.9 97.6 96.7 98.9Rajasthan 59.0 50.6 86.5 68.2 60.4 93.5 78.1 72.8 94.3Sikkim 73.1 70.8 92.8 70.7 67.0 97.1 85.3 82.7 92.2Tamil Nadu 67.4 64.3 74.2 85.6 85.3 85.9 92.5 92.2 92.9Tripura 37.2 30.6 71.1 52.5 45.0 85.8 67.5 58.1 91.9Uttar Pradesh 62.2 56.6 85.8 87.8 85.5 97.2 95.1 94.3 97.9Uttarakhand a a a 86.7 83.0 97.8 92.2 89.5 98.7West Bengal 82.0 80.3 86.2 88.5 87.0 92.3 92.2 91.4 93.9A & N Islands 67.9 59.4 90.9 76.7 66.8 97.8 85.5 78.2 98.1Chandigarh 97.7 98.1 97.7 99.8 99.9 99.8 99.3 98.7 99.4D& N Haveli 45.6 41.2 91.0 77.0 70.5 96.1 91.6 84.3 98.4Daman & Diu 71.4 56.9 86.8 96.3 94.9 98.9 98.7 97.8 99.0Delhi 95.8 91.0 96.2 97.2 90.1 97.7 95.0 87.9 95.2Goa 43.4 30.5 61.7 70.1 58.3 82.1 85.7 78.4 90.4Lakshadweep 11.9 3.4 18.8 4.6 4.6 4.6 22.8 31.2 20.2Puducherry 88.8 92.9 86.1 95.9 96.6 95.5 97.8 99.6 97.0All India 62.3 55.5 81.4 77.9 73.2 90.0 85.5 82.7 91.4
Source: Office of the Registrar General of India, Ministry of Home AffairsNotes:a : Created in 2001. Uttarakhand, Jharkhand and Chhattisgarh for 1991 are included under Uttar Pradesh, Bihar and Madhya Pradesh
respectively.na : not available as no census was carried out in Jammu & Kashmir during 1991.
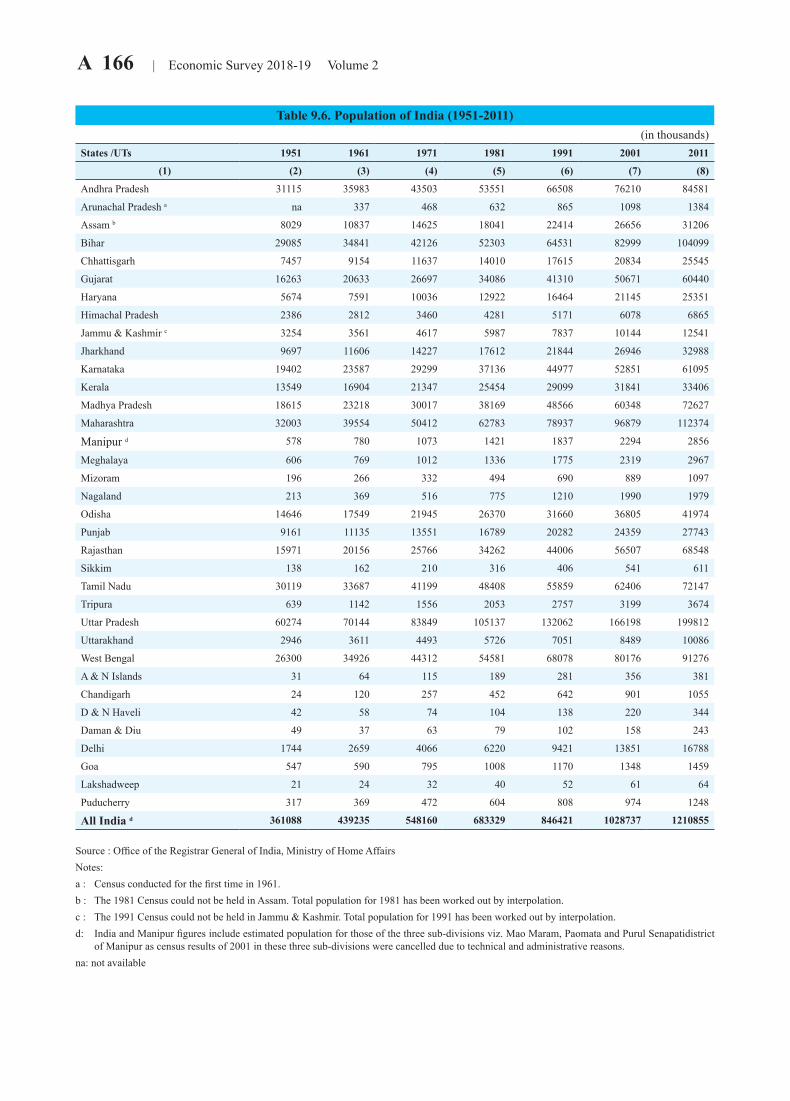
A 166 | Economic Survey 2018-19 Volume 2
Table 9.6. Population of India (1951-2011)(in thousands)
States /UTs 1951 1961 1971 1981 1991 2001 2011
(1) (2) (3) (4) (5) (6) (7) (8)
Andhra Pradesh 31115 35983 43503 53551 66508 76210 84581
Arunachal Pradesh a na 337 468 632 865 1098 1384
Assam b 8029 10837 14625 18041 22414 26656 31206
Bihar 29085 34841 42126 52303 64531 82999 104099
Chhattisgarh 7457 9154 11637 14010 17615 20834 25545
Gujarat 16263 20633 26697 34086 41310 50671 60440
Haryana 5674 7591 10036 12922 16464 21145 25351
Himachal Pradesh 2386 2812 3460 4281 5171 6078 6865
Jammu & Kashmir c 3254 3561 4617 5987 7837 10144 12541
Jharkhand 9697 11606 14227 17612 21844 26946 32988
Karnataka 19402 23587 29299 37136 44977 52851 61095
Kerala 13549 16904 21347 25454 29099 31841 33406
Madhya Pradesh 18615 23218 30017 38169 48566 60348 72627
Maharashtra 32003 39554 50412 62783 78937 96879 112374
Manipur d 578 780 1073 1421 1837 2294 2856
Meghalaya 606 769 1012 1336 1775 2319 2967
Mizoram 196 266 332 494 690 889 1097
Nagaland 213 369 516 775 1210 1990 1979
Odisha 14646 17549 21945 26370 31660 36805 41974
Punjab 9161 11135 13551 16789 20282 24359 27743
Rajasthan 15971 20156 25766 34262 44006 56507 68548
Sikkim 138 162 210 316 406 541 611
Tamil Nadu 30119 33687 41199 48408 55859 62406 72147
Tripura 639 1142 1556 2053 2757 3199 3674
Uttar Pradesh 60274 70144 83849 105137 132062 166198 199812
Uttarakhand 2946 3611 4493 5726 7051 8489 10086
West Bengal 26300 34926 44312 54581 68078 80176 91276
A & N Islands 31 64 115 189 281 356 381
Chandigarh 24 120 257 452 642 901 1055
D & N Haveli 42 58 74 104 138 220 344
Daman & Diu 49 37 63 79 102 158 243
Delhi 1744 2659 4066 6220 9421 13851 16788
Goa 547 590 795 1008 1170 1348 1459
Lakshadweep 21 24 32 40 52 61 64
Puducherry 317 369 472 604 808 974 1248
All India d 361088 439235 548160 683329 846421 1028737 1210855
Source : Office of the Registrar General of India, Ministry of Home AffairsNotes:a : Census conducted for the first time in 1961.b : The 1981 Census could not be held in Assam. Total population for 1981 has been worked out by interpolation.c : The 1991 Census could not be held in Jammu & Kashmir. Total population for 1991 has been worked out by interpolation.d: India and Manipur figures include estimated population for those of the three sub-divisions viz. Mao Maram, Paomata and Purul Senapatidistrict
of Manipur as census results of 2001 in these three sub-divisions were cancelled due to technical and administrative reasons.na: not available
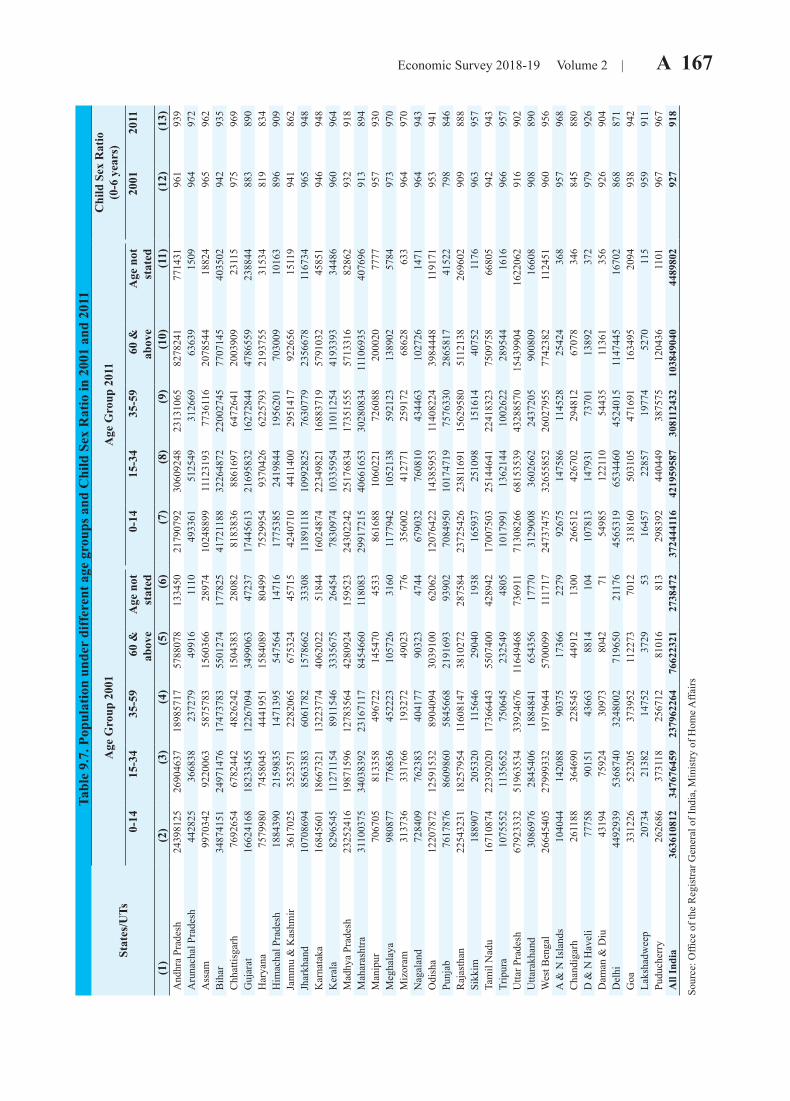
Economic Survey 2018-19 Volume 2 | A 167 T
able
9.7
. Pop
ulat
ion
unde
r di
ffer
ent a
ge g
roup
s and
Chi
ld S
ex R
atio
in 2
001
and
2011
Stat
es/U
TsA
ge G
roup
200
1A
ge G
roup
201
1C
hild
Sex
Rat
io
(0-6
yea
rs)
0-14
15-3
435
-59
60 &
ab
ove
Age
not
st
ated
0-14
15-3
435
-59
60 &
ab
ove
Age
not
st
ated
2001
2011
(1)
(2)
(3)
(4)
(5)
(6)
(7)
(8)
(9)
(10)
(11)
(12)
(13)
And
hra
Prad
esh
2439
8125
2690
4637
1898
5717
5788
078
1334
5021
7907
9230
6092
4823
1310
6582
7824
177
1431
961
939
Aru
nach
al P
rade
sh44
2825
3668
3823
7279
4991
611
1049
3361
5125
4931
2669
6363
915
0996
497
2A
ssam
9970
342
9220
063
5875
783
1560
366
2897
410
2488
9911
1231
9377
3611
620
7854
418
824
965
962
Bih
ar34
8741
5124
9714
7617
4737
8355
0127
417
7825
4172
1188
3226
4872
2200
2745
7707
145
4035
0294
293
5C
hhat
tisga
rh76
9265
467
8244
248
2624
215
0438
328
082
8183
836
8861
697
6472
641
2003
909
2311
597
596
9G
ujar
at16
6241
6818
2334
5512
2670
9434
9906
347
237
1744
5613
2169
5832
1627
2844
4786
559
2388
4488
389
0H
arya
na75
7998
074
5804
544
4195
115
8408
980
499
7529
954
9370
426
6225
793
2193
755
3153
481
983
4H
imac
hal P
rade
sh18
8439
021
5983
514
7139
554
7564
1471
617
7538
524
1984
419
5620
170
3009
1016
389
690
9Ja
mm
u &
Kas
hmir
3617
025
3523
571
2282
065
6753
2445
715
4240
710
4411
400
2951
417
9226
5615
119
941
862
Jhar
khan
d10
7086
9485
6338
360
6178
215
7866
233
308
1189
1118
1099
2825
7630
779
2356
678
1167
3496
594
8K
arna
taka
1684
5601
1866
7321
1322
3774
4062
022
5184
416
0248
7422
3498
2116
8837
1957
9103
245
851
946
948
Ker
ala
8296
545
1127
1154
8911
546
3335
675
2645
478
3097
410
3359
5411
0112
5441
9339
334
486
960
964
Mad
hya
Prad
esh
2325
2416
1987
1596
1278
3564
4280
924
1595
2324
3022
4225
1768
3417
3515
5557
1331
682
862
932
918
Mah
aras
htra
3110
0375
3403
8392
2316
7117
8454
660
1180
8329
9172
1540
6616
5330
2808
3411
1069
3540
7696
913
894
Man
ipur
7067
0581
3358
4967
2214
5470
4533
8616
8810
6022
172
6088
2000
2077
7795
793
0M
egha
laya
9808
7777
6836
4522
2310
5726
3160
1177
942
1052
138
5921
2313
8902
5784
973
970
Miz
oram
3137
3633
1766
1932
7249
023
776
3560
0241
2771
2591
7268
628
633
964
970
Nag
alan
d72
8409
7623
8340
4177
9032
347
4467
9032
7608
1043
4463
1027
2614
7196
494
3O
dish
a12
2078
7212
5915
3289
0409
430
3910
062
062
1207
6422
1438
5953
1140
8224
3984
448
1191
7195
394
1Pu
njab
7617
876
8609
860
5845
668
2191
693
9390
270
8495
010
1747
1975
7633
028
6581
741
522
798
846
Raj
asth
an22
5432
3118
2579
5411
6081
4738
1027
228
7584
2372
5426
2381
1691
1562
9580
5112
138
2696
0290
988
8Si
kkim
1889
0720
5320
1156
4629
040
1938
1659
3725
1098
1516
1440
752
1176
963
957
Tam
il N
adu
1671
0874
2239
2020
1736
6443
5507
400
4289
4217
0075
0325
1446
4122
4183
2375
0975
866
805
942
943
Trip
ura
1075
552
1135
652
7506
4523
2549
4805
1017
991
1362
144
1002
622
2895
4416
1696
695
7U
ttar P
rade
sh67
9233
3251
9635
3433
9246
7611
6494
6873
6911
7130
8266
6815
3539
4328
8570
1543
9904
1622
062
916
902
Utta
rakh
and
3086
976
2845
406
1884
841
6543
5617
770
3129
008
3602
662
2437
205
9008
0916
608
908
890
Wes
t Ben
gal
2664
5405
2799
9332
1971
9644
5700
099
1117
1724
7374
7532
6558
5226
0279
5577
4238
211
2451
960
956
A &
N Is
land
s10
4044
1420
8890
375
1736
622
7992
675
1475
8611
4528
2542
436
895
796
8C
hand
igar
h26
1188
3646
9022
8545
4491
213
0026
6512
4267
0229
4812
6707
834
684
588
0D
& N
Hav
eli
7775
890
151
4366
388
1410
410
7813
1479
3173
701
1389
237
297
992
6D
aman
& D
iu43
194
7592
430
973
8042
7154
985
1221
1054
435
1136
135
692
690
4D
elhi
4492
939
5368
740
3248
002
7196
5021
176
4565
319
6534
460
4524
015
1147
445
1670
286
887
1G
oa33
1226
5232
0537
3952
1122
7370
1231
8160
5031
0547
1691
1634
9520
9493
894
2La
ksha
dwee
p20
734
2138
214
752
3729
5316
457
2285
719
774
5270
115
959
911
Pudu
cher
ry26
2686
3731
1825
6712
8101
681
329
8392
4404
4938
7575
1204
3611
0196
796
7A
ll In
dia
3636
1081
234
7676
459
2379
6226
476
6223
2127
3847
237
2444
116
4219
5958
730
8112
432
1038
4904
044
8980
292
791
8
Sour
ce: O
ffice
of t
he R
egis
trar G
ener
al o
f Ind
ia, M
inis
try o
f Hom
e Affa
irs
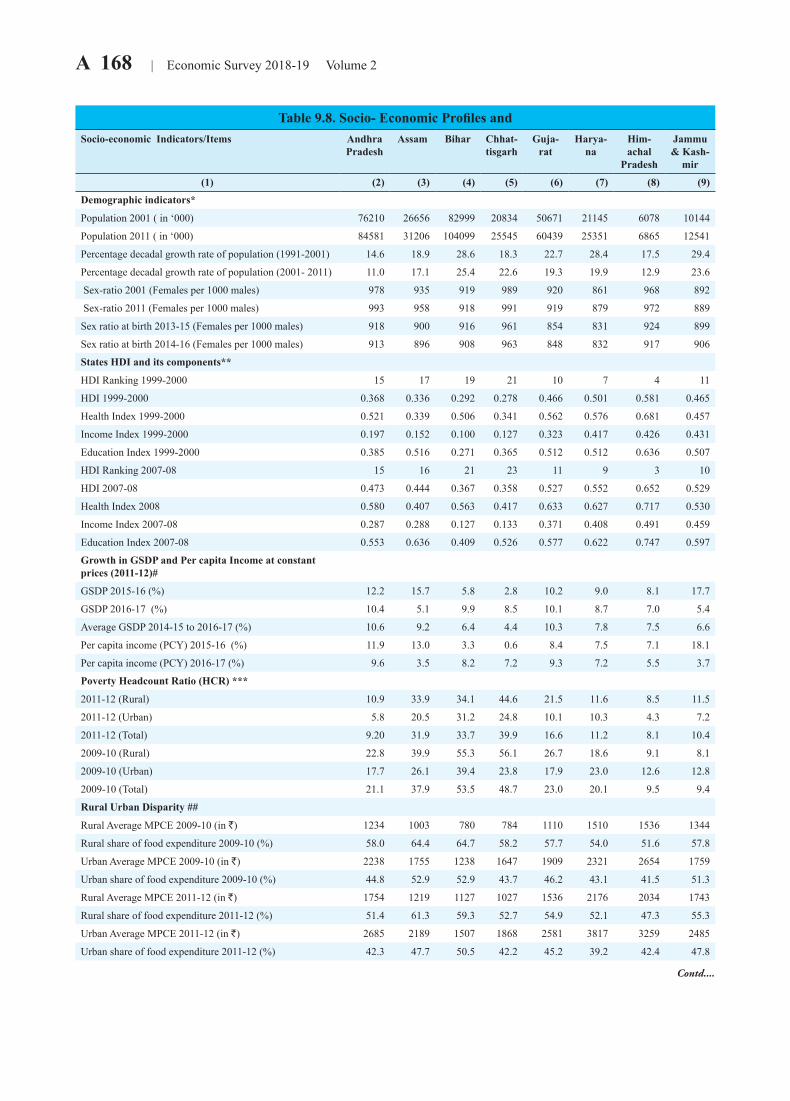
A 168 | Economic Survey 2018-19 Volume 2
Table 9.8. Socio- Economic Profiles and Inter-State Comparison of Selected Major States of IndiaSocio-economic Indicators/Items Andhra
PradeshAssam Bihar Chhat-
tisgarhGuja-
ratHarya-
naHim-achal
Pradesh
Jammu & Kash-
mir
Jharkhand Karna-taka
Kerala Madhya Pradesh
Maha-rashtra
Odisha Punjab Rajast-han
Tamil Nadu
Uttar Pradesh
Uttara-khand
West Bengal
All India
(1) (2) (3) (4) (5) (6) (7) (8) (9) (10) (11) (12) (13) (14) (15) (16) (17) (18) (19) (20) (21) (22)Demographic indicators*
Population 2001 ( in ‘000) 76210 26656 82999 20834 50671 21145 6078 10144 26946 52851 31841 60348 96879 36805 24359 56507 62406 166198 8489 80176 1028737
Population 2011 ( in ‘000) 84581 31206 104099 25545 60439 25351 6865 12541 32988 61095 33406 72627 112374 41974 27743 68548 72147 199812 10086 91276 1210855
Percentage decadal growth rate of population (1991-2001) 14.6 18.9 28.6 18.3 22.7 28.4 17.5 29.4 23.4 17.5 9.4 24.3 22.7 16.3 20.1 28.4 11.7 25.9 20.4 17.8 21.5
Percentage decadal growth rate of population (2001- 2011) 11.0 17.1 25.4 22.6 19.3 19.9 12.9 23.6 22.4 15.6 4.9 20.3 16.0 14.0 13.9 21.3 15.6 20.2 18.8 13.8 17.7
Sex-ratio 2001 (Females per 1000 males) 978 935 919 989 920 861 968 892 941 965 1058 919 922 972 876 921 987 898 962 934 933
Sex-ratio 2011 (Females per 1000 males) 993 958 918 991 919 879 972 889 948 973 1084 931 929 979 895 928 996 912 963 950 943
Sex ratio at birth 2013-15 (Females per 1000 males) 918 900 916 961 854 831 924 899 902 939 967 919 878 950 889 861 911 879 844 951 900
Sex ratio at birth 2014-16 (Females per 1000 males) 913 896 908 963 848 832 917 906 918 935 959 922 876 948 893 857 915 882 850 937 898
States HDI and its components**
HDI Ranking 1999-2000 15 17 19 21 10 7 4 11 23 12 2 20 6 22 5 14 8 18 16 13
HDI 1999-2000 0.368 0.336 0.292 0.278 0.466 0.501 0.581 0.465 0.268 0.432 0.677 0.285 0.501 0.275 0.543 0.387 0.480 0.316 0.339 0.422 0.387
Health Index 1999-2000 0.521 0.339 0.506 0.341 0.562 0.576 0.681 0.457 0.434 0.567 0.782 0.363 0.601 0.376 0.632 0.520 0.586 0.398 0.465 0.600 0.497
Income Index 1999-2000 0.197 0.152 0.100 0.127 0.323 0.417 0.426 0.431 0.100 0.260 0.458 0.127 0.297 0.076 0.455 0.293 0.285 0.179 0.179 0.210 0.223
Education Index 1999-2000 0.385 0.516 0.271 0.365 0.512 0.512 0.636 0.507 0.271 0.468 0.789 0.365 0.606 0.372 0.542 0.348 0.570 0.371 0.371 0.455 0.442
HDI Ranking 2007-08 15 16 21 23 11 9 3 10 19 12 1 20 7 22 5 17 8 18 14 13
HDI 2007-08 0.473 0.444 0.367 0.358 0.527 0.552 0.652 0.529 0.376 0.519 0.790 0.375 0.572 0.362 0.605 0.434 0.570 0.380 0.490 0.492 0.467
Health Index 2008 0.580 0.407 0.563 0.417 0.633 0.627 0.717 0.530 0.500 0.627 0.817 0.430 0.650 0.450 0.667 0.587 0.637 0.473 0.530 0.650 0.563
Income Index 2007-08 0.287 0.288 0.127 0.133 0.371 0.408 0.491 0.459 0.142 0.326 0.629 0.173 0.351 0.139 0.495 0.253 0.355 0.175 0.302 0.252 0.271
Education Index 2007-08 0.553 0.636 0.409 0.526 0.577 0.622 0.747 0.597 0.485 0.605 0.924 0.522 0.715 0.499 0.654 0.462 0.719 0.492 0.638 0.575 0.568
Growth in GSDP and Per capita Income at constant prices (2011-12)#
GSDP 2015-16 (%) 12.2 15.7 5.8 2.8 10.2 9.0 8.1 17.7 -6.2 11.1 6.8 9.1 7.6 8.2 5.7 8.1 8.2 8.8 8.1 6.1 8.0
GSDP 2016-17 (%) 10.4 5.1 9.9 8.5 10.1 8.7 7.0 5.4 11.2 7.6 7.4 12.5 10.0 10.4 7.2 5.5 4.3 7.3 6.0 7.9 8.2
Average GSDP 2014-15 to 2016-17 (%) 10.6 9.2 6.4 4.4 10.3 7.8 7.5 6.6 5.8 8.3 6.2 8.9 8.0 6.8 5.7 6.9 5.8 6.7 6.5 5.6 7.9
Per capita income (PCY) 2015-16 (%) 11.9 13.0 3.3 0.6 8.4 7.5 7.1 18.1 -8.7 10.5 6.4 7.7 6.8 7.3 4.5 6.4 7.9 6.8 6.9 5.0 6.7
Per capita income (PCY) 2016-17 (%) 9.6 3.5 8.2 7.2 9.3 7.2 5.5 3.7 10.4 6.2 7.4 11.5 8.6 9.5 5.7 3.6 2.8 5.5 4.3 7.0 6.8
Poverty Headcount Ratio (HCR) ***
2011-12 (Rural) 10.9 33.9 34.1 44.6 21.5 11.6 8.5 11.5 40.8 24.5 9.1 35.7 24.2 35.7 7.7 16.1 15.8 30.4 11.6 22.5 25.7
2011-12 (Urban) 5.8 20.5 31.2 24.8 10.1 10.3 4.3 7.2 24.8 15.3 4.9 21.0 9.1 17.3 9.2 10.7 6.5 26.1 10.5 14.7 13.7
2011-12 (Total) 9.20 31.9 33.7 39.9 16.6 11.2 8.1 10.4 36.9 20.9 7.1 31.7 17.4 32.6 8.3 14.7 11.3 29.4 11.3 19.9 21.9
2009-10 (Rural) 22.8 39.9 55.3 56.1 26.7 18.6 9.1 8.1 41.6 26.1 12.0 42.0 29.5 39.2 14.6 26.4 21.2 39.4 14.9 28.8 33.8
2009-10 (Urban) 17.7 26.1 39.4 23.8 17.9 23.0 12.6 12.8 31.1 19.6 12.1 22.9 18.3 25.9 18.1 19.9 12.8 31.7 25.2 22.0 20.9
2009-10 (Total) 21.1 37.9 53.5 48.7 23.0 20.1 9.5 9.4 39.1 23.6 12.0 36.7 24.5 37.0 15.9 24.8 17.1 37.7 18.0 26.7 29.8
Rural Urban Disparity ##
Rural Average MPCE 2009-10 (in R) 1234 1003 780 784 1110 1510 1536 1344 825 1020 1835 903 1153 818 1649 1179 1160 899 1747 952 1054
Rural share of food expenditure 2009-10 (%) 58.0 64.4 64.7 58.2 57.7 54.0 51.6 57.8 60.9 56.5 45.9 55.8 54.0 61.9 48.2 54.8 54.7 57.9 45.1 63.4 57.0
Urban Average MPCE 2009-10 (in R) 2238 1755 1238 1647 1909 2321 2654 1759 1584 2053 2413 1666 2437 1548 2109 1663 1948 1574 1745 1965 1984
Urban share of food expenditure 2009-10 (%) 44.8 52.9 52.9 43.7 46.2 43.1 41.5 51.3 51.5 42.3 40.2 41.7 41.0 48.4 44.3 48.0 45.0 46.3 48.5 46.2 44.4
Rural Average MPCE 2011-12 (in R) 1754 1219 1127 1027 1536 2176 2034 1743 1006 1561 2669 1152 1619 1003 2345 1598 1693 1156 1726 1291 1430
Rural share of food expenditure 2011-12 (%) 51.4 61.3 59.3 52.7 54.9 52.1 47.3 55.3 58.4 51.4 43.0 52.9 52.4 57.2 44.1 50.5 51.5 53.0 49.6 58.2 52.9
Urban Average MPCE 2011-12 (in R) 2685 2189 1507 1868 2581 3817 3259 2485 2018 3026 3408 2058 3189 1941 2794 2442 2622 2051 2339 2591 2630
Urban share of food expenditure 2011-12 (%) 42.3 47.7 50.5 42.2 45.2 39.2 42.4 47.8 46.5 40.1 37.0 42.2 41.6 45.4 41.0 44.8 42.7 44.0 46.3 44.2 42.6
Contd....
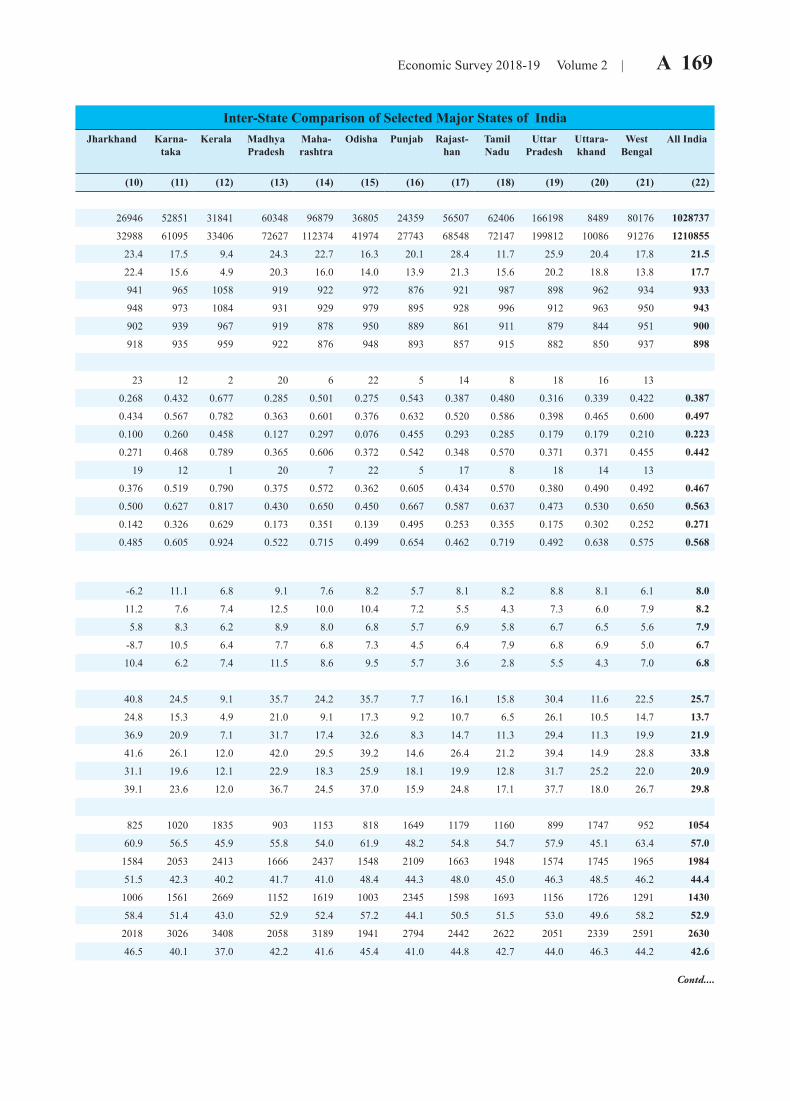
Economic Survey 2018-19 Volume 2 | A 169
Contd....
Table 9.8. Socio- Economic Profiles and Inter-State Comparison of Selected Major States of IndiaSocio-economic Indicators/Items Andhra
PradeshAssam Bihar Chhat-
tisgarhGuja-
ratHarya-
naHim-achal
Pradesh
Jammu & Kash-
mir
Jharkhand Karna-taka
Kerala Madhya Pradesh
Maha-rashtra
Odisha Punjab Rajast-han
Tamil Nadu
Uttar Pradesh
Uttara-khand
West Bengal
All India
(1) (2) (3) (4) (5) (6) (7) (8) (9) (10) (11) (12) (13) (14) (15) (16) (17) (18) (19) (20) (21) (22)Demographic indicators*
Population 2001 ( in ‘000) 76210 26656 82999 20834 50671 21145 6078 10144 26946 52851 31841 60348 96879 36805 24359 56507 62406 166198 8489 80176 1028737
Population 2011 ( in ‘000) 84581 31206 104099 25545 60439 25351 6865 12541 32988 61095 33406 72627 112374 41974 27743 68548 72147 199812 10086 91276 1210855
Percentage decadal growth rate of population (1991-2001) 14.6 18.9 28.6 18.3 22.7 28.4 17.5 29.4 23.4 17.5 9.4 24.3 22.7 16.3 20.1 28.4 11.7 25.9 20.4 17.8 21.5
Percentage decadal growth rate of population (2001- 2011) 11.0 17.1 25.4 22.6 19.3 19.9 12.9 23.6 22.4 15.6 4.9 20.3 16.0 14.0 13.9 21.3 15.6 20.2 18.8 13.8 17.7
Sex-ratio 2001 (Females per 1000 males) 978 935 919 989 920 861 968 892 941 965 1058 919 922 972 876 921 987 898 962 934 933
Sex-ratio 2011 (Females per 1000 males) 993 958 918 991 919 879 972 889 948 973 1084 931 929 979 895 928 996 912 963 950 943
Sex ratio at birth 2013-15 (Females per 1000 males) 918 900 916 961 854 831 924 899 902 939 967 919 878 950 889 861 911 879 844 951 900
Sex ratio at birth 2014-16 (Females per 1000 males) 913 896 908 963 848 832 917 906 918 935 959 922 876 948 893 857 915 882 850 937 898
States HDI and its components**
HDI Ranking 1999-2000 15 17 19 21 10 7 4 11 23 12 2 20 6 22 5 14 8 18 16 13
HDI 1999-2000 0.368 0.336 0.292 0.278 0.466 0.501 0.581 0.465 0.268 0.432 0.677 0.285 0.501 0.275 0.543 0.387 0.480 0.316 0.339 0.422 0.387
Health Index 1999-2000 0.521 0.339 0.506 0.341 0.562 0.576 0.681 0.457 0.434 0.567 0.782 0.363 0.601 0.376 0.632 0.520 0.586 0.398 0.465 0.600 0.497
Income Index 1999-2000 0.197 0.152 0.100 0.127 0.323 0.417 0.426 0.431 0.100 0.260 0.458 0.127 0.297 0.076 0.455 0.293 0.285 0.179 0.179 0.210 0.223
Education Index 1999-2000 0.385 0.516 0.271 0.365 0.512 0.512 0.636 0.507 0.271 0.468 0.789 0.365 0.606 0.372 0.542 0.348 0.570 0.371 0.371 0.455 0.442
HDI Ranking 2007-08 15 16 21 23 11 9 3 10 19 12 1 20 7 22 5 17 8 18 14 13
HDI 2007-08 0.473 0.444 0.367 0.358 0.527 0.552 0.652 0.529 0.376 0.519 0.790 0.375 0.572 0.362 0.605 0.434 0.570 0.380 0.490 0.492 0.467
Health Index 2008 0.580 0.407 0.563 0.417 0.633 0.627 0.717 0.530 0.500 0.627 0.817 0.430 0.650 0.450 0.667 0.587 0.637 0.473 0.530 0.650 0.563
Income Index 2007-08 0.287 0.288 0.127 0.133 0.371 0.408 0.491 0.459 0.142 0.326 0.629 0.173 0.351 0.139 0.495 0.253 0.355 0.175 0.302 0.252 0.271
Education Index 2007-08 0.553 0.636 0.409 0.526 0.577 0.622 0.747 0.597 0.485 0.605 0.924 0.522 0.715 0.499 0.654 0.462 0.719 0.492 0.638 0.575 0.568
Growth in GSDP and Per capita Income at constant prices (2011-12)#
GSDP 2015-16 (%) 12.2 15.7 5.8 2.8 10.2 9.0 8.1 17.7 -6.2 11.1 6.8 9.1 7.6 8.2 5.7 8.1 8.2 8.8 8.1 6.1 8.0
GSDP 2016-17 (%) 10.4 5.1 9.9 8.5 10.1 8.7 7.0 5.4 11.2 7.6 7.4 12.5 10.0 10.4 7.2 5.5 4.3 7.3 6.0 7.9 8.2
Average GSDP 2014-15 to 2016-17 (%) 10.6 9.2 6.4 4.4 10.3 7.8 7.5 6.6 5.8 8.3 6.2 8.9 8.0 6.8 5.7 6.9 5.8 6.7 6.5 5.6 7.9
Per capita income (PCY) 2015-16 (%) 11.9 13.0 3.3 0.6 8.4 7.5 7.1 18.1 -8.7 10.5 6.4 7.7 6.8 7.3 4.5 6.4 7.9 6.8 6.9 5.0 6.7
Per capita income (PCY) 2016-17 (%) 9.6 3.5 8.2 7.2 9.3 7.2 5.5 3.7 10.4 6.2 7.4 11.5 8.6 9.5 5.7 3.6 2.8 5.5 4.3 7.0 6.8
Poverty Headcount Ratio (HCR) ***
2011-12 (Rural) 10.9 33.9 34.1 44.6 21.5 11.6 8.5 11.5 40.8 24.5 9.1 35.7 24.2 35.7 7.7 16.1 15.8 30.4 11.6 22.5 25.7
2011-12 (Urban) 5.8 20.5 31.2 24.8 10.1 10.3 4.3 7.2 24.8 15.3 4.9 21.0 9.1 17.3 9.2 10.7 6.5 26.1 10.5 14.7 13.7
2011-12 (Total) 9.20 31.9 33.7 39.9 16.6 11.2 8.1 10.4 36.9 20.9 7.1 31.7 17.4 32.6 8.3 14.7 11.3 29.4 11.3 19.9 21.9
2009-10 (Rural) 22.8 39.9 55.3 56.1 26.7 18.6 9.1 8.1 41.6 26.1 12.0 42.0 29.5 39.2 14.6 26.4 21.2 39.4 14.9 28.8 33.8
2009-10 (Urban) 17.7 26.1 39.4 23.8 17.9 23.0 12.6 12.8 31.1 19.6 12.1 22.9 18.3 25.9 18.1 19.9 12.8 31.7 25.2 22.0 20.9
2009-10 (Total) 21.1 37.9 53.5 48.7 23.0 20.1 9.5 9.4 39.1 23.6 12.0 36.7 24.5 37.0 15.9 24.8 17.1 37.7 18.0 26.7 29.8
Rural Urban Disparity ##
Rural Average MPCE 2009-10 (in R) 1234 1003 780 784 1110 1510 1536 1344 825 1020 1835 903 1153 818 1649 1179 1160 899 1747 952 1054
Rural share of food expenditure 2009-10 (%) 58.0 64.4 64.7 58.2 57.7 54.0 51.6 57.8 60.9 56.5 45.9 55.8 54.0 61.9 48.2 54.8 54.7 57.9 45.1 63.4 57.0
Urban Average MPCE 2009-10 (in R) 2238 1755 1238 1647 1909 2321 2654 1759 1584 2053 2413 1666 2437 1548 2109 1663 1948 1574 1745 1965 1984
Urban share of food expenditure 2009-10 (%) 44.8 52.9 52.9 43.7 46.2 43.1 41.5 51.3 51.5 42.3 40.2 41.7 41.0 48.4 44.3 48.0 45.0 46.3 48.5 46.2 44.4
Rural Average MPCE 2011-12 (in R) 1754 1219 1127 1027 1536 2176 2034 1743 1006 1561 2669 1152 1619 1003 2345 1598 1693 1156 1726 1291 1430
Rural share of food expenditure 2011-12 (%) 51.4 61.3 59.3 52.7 54.9 52.1 47.3 55.3 58.4 51.4 43.0 52.9 52.4 57.2 44.1 50.5 51.5 53.0 49.6 58.2 52.9
Urban Average MPCE 2011-12 (in R) 2685 2189 1507 1868 2581 3817 3259 2485 2018 3026 3408 2058 3189 1941 2794 2442 2622 2051 2339 2591 2630
Urban share of food expenditure 2011-12 (%) 42.3 47.7 50.5 42.2 45.2 39.2 42.4 47.8 46.5 40.1 37.0 42.2 41.6 45.4 41.0 44.8 42.7 44.0 46.3 44.2 42.6

A 170 | Economic Survey 2018-19 Volume 2
Table 9.8. Socio- Economic Profiles and Inter-State Comparison of Selected Major States of IndiaSocio-economic Indicators/Items Andhra
PradeshAssam Bihar Chhat-
tisgarhGuja-
ratHarya-
naHim-achal
Pradesh
Jammu & Kash-
mir
Jharkhand Karna-taka
Kerala Madhya Pradesh
Maha-rashtra
Odisha Punjab Rajast-han
Tamil Nadu
Uttar Pradesh
Uttara-khand
West Bengal
All India
(1) (2) (3) (4) (5) (6) (7) (8) (9) (10) (11) (12) (13) (14) (15) (16) (17) (18) (19) (20) (21) (22)
WPR 2017-18 (15 Years & above) @
Rural (%) 61.0 43.8 35.6 65.5 49.1 41.3 60.2 53.2 43.2 51.9 41.9 57.3 55.0 45.6 41.1 50.3 53.7 42.5 41.5 48.5 48.1
Urban (%) 49.3 42.8 34.7 50.0 45.1 42.4 48.3 43.6 36.0 44.9 40.2 45.3 44.7 41.1 45.8 41.5 47.9 39.3 38.5 46.1 43.9
Total (%) 57.2 43.7 35.5 62.4 47.4 41.7 58.9 51.0 41.7 49.1 41.2 54.3 50.5 44.9 42.9 48.2 51.0 41.8 40.6 47.8 46.8
Unemployment Rate 2015-16 (15 Years & above) @
Rural (%) 3.6 8.1 6.8 2.5 5.2 9.2 5.2 4.3 6.8 3.9 10.0 3.4 3.2 6.9 7.6 4.4 7.9 5.4 6.9 3.8 5.3
Urban (%) 6.6 6.3 9.0 7.5 4.2 6.9 8.7 9.9 10.4 6.5 13.2 7.6 7.4 8.4 7.7 7.2 6.9 9.5 9.5 6.4 7.7
Total (%) 4.5 7.9 7.0 3.3 4.8 8.4 5.5 5.4 7.5 4.8 11.4 4.3 4.8 7.1 7.7 5.0 7.5 6.2 7.6 4.6 6.0
Health related *
Male Life expectancy at birth (2011-15) 67.1 63.5 68.5 63.6 66.9 66.9 69.1 71.2 67.0 67.2 72.2 63.2 70.3 65.6 70.3 65.7 69.1 63.4 68.9 69.4 66.9
Female Life expectancy at birth (2011-15) 71.2 66.2 68.3 66.8 71.6 71.9 75.2 76.1 67.5 70.9 78.2 66.5 73.9 68.3 74.2 70.4 73.0 65.6 74.9 71.8 70.0
Total Life expectancy at birth (2011-15) 69.0 64.7 68.4 65.2 69.1 69.1 72.0 73.2 67.2 69.0 75.2 64.8 72.0 66.9 72.1 67.9 71.0 64.5 71.8 70.5 68.3
Male Life expectancy at birth (2012-16) 68.0 64.4 68.9 63.6 67.4 67.2 69.4 71.6 67.8 67.6 72.2 63.7 70.8 66.2 71.0 66.1 69.5 63.9 68.5 69.8 67.4
Female Life expectancy at birth (2012-16) 71.4 66.8 68.5 66.8 71.8 72.0 75.5 76.2 68.0 70.7 77.9 67.2 73.7 69.1 74.2 70.7 73.4 65.6 74.8 71.9 70.2
Total Life expectancy at birth (2012-16) 69.6 65.5 68.7 65.2 69.5 69.4 72.3 73.5 67.9 69.1 75.1 65.4 72.2 67.6 72.5 68.3 71.4 64.8 71.5 70.8 68.7
Infant Mortality Rates (per 1000 live births) 2016 34 44 38 39 30 33 25 24 29 24 10 47 19 44 21 41 17 43 38 25 34
Infant Mortality Rates (per 1000 live births) 2017 32 44 35 38 30 30 22 23 29 25 10 47 19 41 21 38 16 41 32 24 33
Birth Rate (per 1000) 2016 16.4 21.7 26.8 22.8 20.1 20.7 16.0 15.7 22.9 17.6 14.3 25.1 15.9 18.6 14.9 24.3 15.0 26.2 16.6 15.4 20.4
Death Rate (per 1000) 2016 6.8 6.7 6.0 7.4 6.1 5.9 6.8 5.0 5.5 6.7 7.6 7.1 5.9 7.8 6.0 6.1 6.4 6.9 6.7 5.8 6.4
Birth Rate (per 1000) 2017 16.2 21.2 26.4 22.7 19.9 20.5 15.8 15.4 22.7 17.4 14.2 24.8 15.7 18.3 14.9 24.1 14.9 25.9 17.3 15.2 20.2
Death Rate (per 1000) 2017 7.2 6.5 5.8 7.5 6.2 5.8 6.6 4.8 5.5 6.5 6.8 6.8 5.7 7.4 7.0 6 6.7 6.7 6.7 5.8 6.3
Education related $
GER (I-V Class) (2016-17) 82.79 107.39 98.08 97.07 94.97 93.90 97.91 77.09 96.64 103.71 95.14 92.13 97.50 100.22 99.31 97.80 102.01 87.16 96.41 96.27 95.12
GER(VI-VIII Class) (2016-17) 82.14 96.69 103.86 100.81 97.20 94.40 102.99 66.22 91.81 92.90 93.63 89.73 98.69 94.64 97.72 91.99 93.42 72.74 86.73 96.34 90.73
GER(IX-X Class) (2016-17) 76.30 78.56 76.71 87.65 74.54 86.34 103.86 61.65 63.50 84.44 99.36 80.15 91.74 79.91 87.08 76.63 93.87 67.82 84.40 78.56 79.35
Pupil-Teacher Ratio (2015-16) Primary School 21 21 36 20 19 20 12 9 27 19 18 20 24 17 18 17 18 39 18 25 23
Pupil-Teacher Ratio (2015-16) Upper Primary School 16 13 24 17 13 13 10 6 19 13 14 18 17 14 12 10 15 31 17 27 17
Pupil-Teacher Ratio (2015-16) High School 20 14 66 33 34 15 18 15 62 16 17 39 23 20 16 21 21 56 16 39 27
GER (I-V Class) (2015-16) 83.84 105.63 106.56 99.69 96.72 91.43 98.13 86.33 108.16 102.47 95.17 94.48 97.98 102.72 101.86 100.25 103.05 93.03 99.86 101.94 99.02
GER(VI-VIII Class) (2015-16) 80.21 90.95 104.84 101.45 95.35 91.69 103.01 70.72 99.55 92.00 94.55 94.00 98.34 92.39 98.12 89.79 94.23 75.38 87.41 101.58 91.82
GER(IX-X Class) (2015-16) 74.08 76.43 77.42 91.60 73.79 83.61 105.72 66.01 72.47 82.10 102.00 80.49 89.48 78.28 85.96 75.48 93.15 67.62 85.37 81.72 79.30
Pupil-Teacher Ratio (2014-15) Primary School 21 24 35 21 20 22 12 9 29 18 17 22 25 19 19 17 18 39 19 25 24
Pupil-Teacher Ratio (2014-15) Upper Primary School 15 14 23 18 13 14 10 6 20 13 14 19 17 14 12 10 15 33 17 28 17
Pupil-Teacher Ratio (2014-15) High School 19 13 59 33 34 14 19 16 61 16 17 40 23 20 17 23 21 57 18 37 27
Source: * : Office of Registrar General of India(RGI). Andhra Pradesh excludes Telangana for Sex ratio at birth 2014-16,** : India HDR 2011 & 1999-2000,*** : NITI Aayog (Planning Commission),$ : School Education in India, U-DISE Flash Statistics 2016-17 (Provisional) and Educational Statisics at a Glance 2018,# : CSO,## National Statistical Office (NSO), Monthly per capita expenditure (MPCE) is based on mixed modified recall period,@ : Periodic Labour Force Survey 2017-18 (NSO); WPR (Worker Participation Rate) and Unemployment Rate are based on Usual Principal & Subsidiary Status (UPSS).
Note:na: not available.
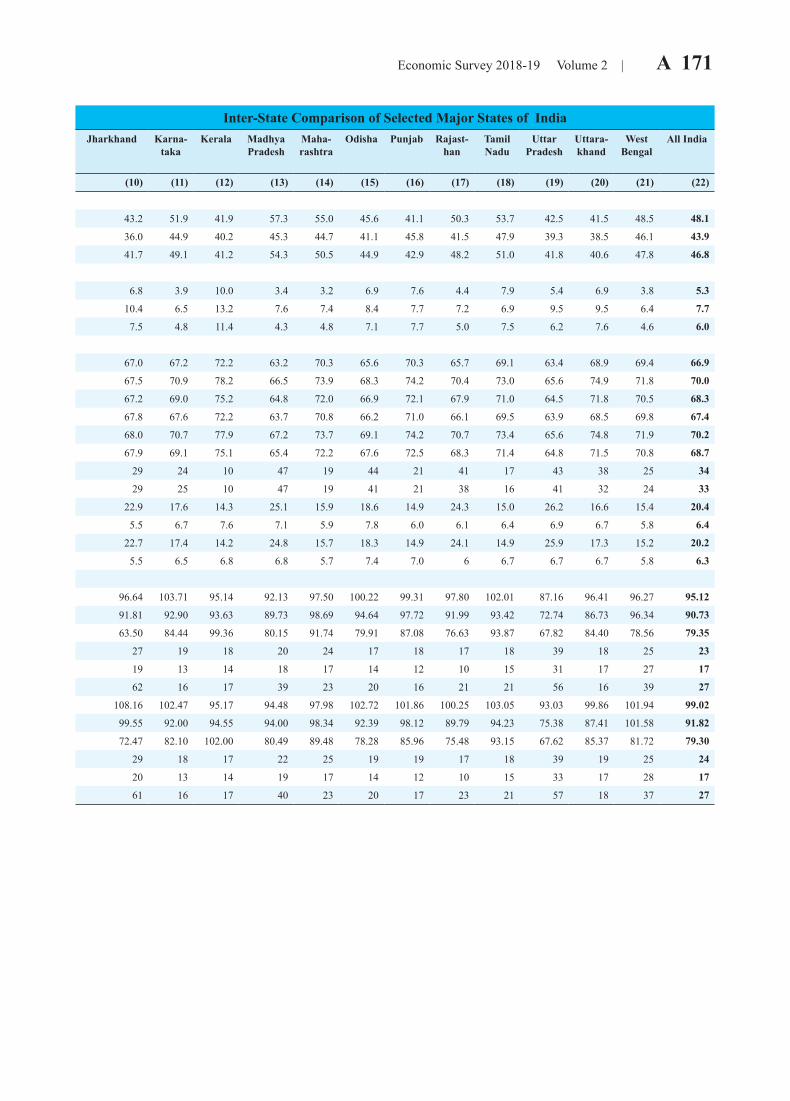
Economic Survey 2018-19 Volume 2 | A 171
Table 9.8. Socio- Economic Profiles and Inter-State Comparison of Selected Major States of IndiaSocio-economic Indicators/Items Andhra
PradeshAssam Bihar Chhat-
tisgarhGuja-
ratHarya-
naHim-achal
Pradesh
Jammu & Kash-
mir
Jharkhand Karna-taka
Kerala Madhya Pradesh
Maha-rashtra
Odisha Punjab Rajast-han
Tamil Nadu
Uttar Pradesh
Uttara-khand
West Bengal
All India
(1) (2) (3) (4) (5) (6) (7) (8) (9) (10) (11) (12) (13) (14) (15) (16) (17) (18) (19) (20) (21) (22)
WPR 2017-18 (15 Years & above) @
Rural (%) 61.0 43.8 35.6 65.5 49.1 41.3 60.2 53.2 43.2 51.9 41.9 57.3 55.0 45.6 41.1 50.3 53.7 42.5 41.5 48.5 48.1
Urban (%) 49.3 42.8 34.7 50.0 45.1 42.4 48.3 43.6 36.0 44.9 40.2 45.3 44.7 41.1 45.8 41.5 47.9 39.3 38.5 46.1 43.9
Total (%) 57.2 43.7 35.5 62.4 47.4 41.7 58.9 51.0 41.7 49.1 41.2 54.3 50.5 44.9 42.9 48.2 51.0 41.8 40.6 47.8 46.8
Unemployment Rate 2015-16 (15 Years & above) @
Rural (%) 3.6 8.1 6.8 2.5 5.2 9.2 5.2 4.3 6.8 3.9 10.0 3.4 3.2 6.9 7.6 4.4 7.9 5.4 6.9 3.8 5.3
Urban (%) 6.6 6.3 9.0 7.5 4.2 6.9 8.7 9.9 10.4 6.5 13.2 7.6 7.4 8.4 7.7 7.2 6.9 9.5 9.5 6.4 7.7
Total (%) 4.5 7.9 7.0 3.3 4.8 8.4 5.5 5.4 7.5 4.8 11.4 4.3 4.8 7.1 7.7 5.0 7.5 6.2 7.6 4.6 6.0
Health related *
Male Life expectancy at birth (2011-15) 67.1 63.5 68.5 63.6 66.9 66.9 69.1 71.2 67.0 67.2 72.2 63.2 70.3 65.6 70.3 65.7 69.1 63.4 68.9 69.4 66.9
Female Life expectancy at birth (2011-15) 71.2 66.2 68.3 66.8 71.6 71.9 75.2 76.1 67.5 70.9 78.2 66.5 73.9 68.3 74.2 70.4 73.0 65.6 74.9 71.8 70.0
Total Life expectancy at birth (2011-15) 69.0 64.7 68.4 65.2 69.1 69.1 72.0 73.2 67.2 69.0 75.2 64.8 72.0 66.9 72.1 67.9 71.0 64.5 71.8 70.5 68.3
Male Life expectancy at birth (2012-16) 68.0 64.4 68.9 63.6 67.4 67.2 69.4 71.6 67.8 67.6 72.2 63.7 70.8 66.2 71.0 66.1 69.5 63.9 68.5 69.8 67.4
Female Life expectancy at birth (2012-16) 71.4 66.8 68.5 66.8 71.8 72.0 75.5 76.2 68.0 70.7 77.9 67.2 73.7 69.1 74.2 70.7 73.4 65.6 74.8 71.9 70.2
Total Life expectancy at birth (2012-16) 69.6 65.5 68.7 65.2 69.5 69.4 72.3 73.5 67.9 69.1 75.1 65.4 72.2 67.6 72.5 68.3 71.4 64.8 71.5 70.8 68.7
Infant Mortality Rates (per 1000 live births) 2016 34 44 38 39 30 33 25 24 29 24 10 47 19 44 21 41 17 43 38 25 34
Infant Mortality Rates (per 1000 live births) 2017 32 44 35 38 30 30 22 23 29 25 10 47 19 41 21 38 16 41 32 24 33
Birth Rate (per 1000) 2016 16.4 21.7 26.8 22.8 20.1 20.7 16.0 15.7 22.9 17.6 14.3 25.1 15.9 18.6 14.9 24.3 15.0 26.2 16.6 15.4 20.4
Death Rate (per 1000) 2016 6.8 6.7 6.0 7.4 6.1 5.9 6.8 5.0 5.5 6.7 7.6 7.1 5.9 7.8 6.0 6.1 6.4 6.9 6.7 5.8 6.4
Birth Rate (per 1000) 2017 16.2 21.2 26.4 22.7 19.9 20.5 15.8 15.4 22.7 17.4 14.2 24.8 15.7 18.3 14.9 24.1 14.9 25.9 17.3 15.2 20.2
Death Rate (per 1000) 2017 7.2 6.5 5.8 7.5 6.2 5.8 6.6 4.8 5.5 6.5 6.8 6.8 5.7 7.4 7.0 6 6.7 6.7 6.7 5.8 6.3
Education related $
GER (I-V Class) (2016-17) 82.79 107.39 98.08 97.07 94.97 93.90 97.91 77.09 96.64 103.71 95.14 92.13 97.50 100.22 99.31 97.80 102.01 87.16 96.41 96.27 95.12
GER(VI-VIII Class) (2016-17) 82.14 96.69 103.86 100.81 97.20 94.40 102.99 66.22 91.81 92.90 93.63 89.73 98.69 94.64 97.72 91.99 93.42 72.74 86.73 96.34 90.73
GER(IX-X Class) (2016-17) 76.30 78.56 76.71 87.65 74.54 86.34 103.86 61.65 63.50 84.44 99.36 80.15 91.74 79.91 87.08 76.63 93.87 67.82 84.40 78.56 79.35
Pupil-Teacher Ratio (2015-16) Primary School 21 21 36 20 19 20 12 9 27 19 18 20 24 17 18 17 18 39 18 25 23
Pupil-Teacher Ratio (2015-16) Upper Primary School 16 13 24 17 13 13 10 6 19 13 14 18 17 14 12 10 15 31 17 27 17
Pupil-Teacher Ratio (2015-16) High School 20 14 66 33 34 15 18 15 62 16 17 39 23 20 16 21 21 56 16 39 27
GER (I-V Class) (2015-16) 83.84 105.63 106.56 99.69 96.72 91.43 98.13 86.33 108.16 102.47 95.17 94.48 97.98 102.72 101.86 100.25 103.05 93.03 99.86 101.94 99.02
GER(VI-VIII Class) (2015-16) 80.21 90.95 104.84 101.45 95.35 91.69 103.01 70.72 99.55 92.00 94.55 94.00 98.34 92.39 98.12 89.79 94.23 75.38 87.41 101.58 91.82
GER(IX-X Class) (2015-16) 74.08 76.43 77.42 91.60 73.79 83.61 105.72 66.01 72.47 82.10 102.00 80.49 89.48 78.28 85.96 75.48 93.15 67.62 85.37 81.72 79.30
Pupil-Teacher Ratio (2014-15) Primary School 21 24 35 21 20 22 12 9 29 18 17 22 25 19 19 17 18 39 19 25 24
Pupil-Teacher Ratio (2014-15) Upper Primary School 15 14 23 18 13 14 10 6 20 13 14 19 17 14 12 10 15 33 17 28 17
Pupil-Teacher Ratio (2014-15) High School 19 13 59 33 34 14 19 16 61 16 17 40 23 20 17 23 21 57 18 37 27
Source: * : Office of Registrar General of India(RGI). Andhra Pradesh excludes Telangana for Sex ratio at birth 2014-16,** : India HDR 2011 & 1999-2000,*** : NITI Aayog (Planning Commission),$ : School Education in India, U-DISE Flash Statistics 2016-17 (Provisional) and Educational Statisics at a Glance 2018,# : CSO,## National Statistical Office (NSO), Monthly per capita expenditure (MPCE) is based on mixed modified recall period,@ : Periodic Labour Force Survey 2017-18 (NSO); WPR (Worker Participation Rate) and Unemployment Rate are based on Usual Principal & Subsidiary Status (UPSS).
Note:na: not available.