
Are Securitized Real Estate Returns more Predictable than Stock Returns?
95
International Journal of Economic Sciences and Applied Research 4 (1): 95-120
Economic Returns and Risks to Investment in Education:
An Application of the Multifactor CAPM
Antonios Athanassiadis1
Abstract Considering the investment in education as uncertain financial decision making we modify the short-cut method of calculating rates of return to education by incorporating the risk premium. Recognizing that market risk isn’t the only factor affecting returns, we estimate the returns to education in fifteen member - states of the European Union and the Organisation for Economic Co-operation and Development during the period 2005 – 2007 as seen from a macroeconomic point of view using Multifactor CAPM. Following this model we assess, except market risk, the impact of three key macroeconomic variables (investments, productivity and unemployment) on returns and, using panel data regression techniques, we investigate whether this holds true with respect to investment in education. We also evaluate the risk – adjusted performance of investment in education and the role of returns as well as that of the key macroeconomic variables to economic development. The results tend to confirm the theoretical expectations and empirical literature. The purpose of the present study is twofold: first, to estimate the relationship between education returns and risk and second to measure the impact of return and key macro factors on real GDP growth rate, therefore casting light in the channels through which the economic growth can be affected. Keywords: CAPM, Human Capital Theory, GMM JEL Classification: I22, G11, C23 1. Introduction
The study intends to assess the profitability of investing in education and the trade - off relationship between risks and return in education in the framework of the Multifactor Capital Asset Pricing Model. Regarding education as an investment on human capital (although human capital includes education, health, and aspects of “social capital”, the 1 PhD. Candidate, Department of Accounting and Finance, University of Macedonia 156, Egnatia Street, 54006 Thessaloniki, GREECE, [email protected]
Volume 4 issue 1.indd 95Volume 4 issue 1.indd 95 30/3/2011 10:24:59 πμ30/3/2011 10:24:59 πμ

96
Antonios Athanassiadis
main focus of the present study is on education) we deal with education, the stock of competences, knowledge and personality attributes gained by a worker according to his level of education, the same way as the financial assets (i.e. stock market). Therefore, education, like asset portfolios, comprises a wide range of assets, where each individual selects the specific asset that matches his preferred amalgam of risk and return in terms of future income..
Considering the education as an asset portfolio, we looked at individual returns on education. We take into account not only the direct gains and costs in money terms according to short – cut method (Psacharopoulos, 1992), but also the aspect of unemployment as a constituent element of risk premium i.e. the additional economic gains an individual may have by investing on their higher education level1.
The subject of returns to investment in education, in the modern / human capital sense of the term, has been discussed broadly and estimated since the late 1950s. Since the human capital revolution, economists have viewed education as an investment as well as consumption good. In the 50 - plus year history of estimates of returns to investment in education, there have been numerous reviews of the empirical results in attempts to validate patterns (see, Psacharopoulos, 1973; 1985; 1994; 2002).
The computation of rates of return and their usage in educational planning and policy making is generally conducted within the framework of human capital theory, which, since its formulation, has drawn attention to the importance of economic considerations in educational decision making both at private and social level.
On the other hand, it is remarkable and it must be taken into account that human capital theory does not examine uncertainty and risk in its return function in depth. The empirical evidence on the importance of uncertainty is still emerging. However, most of the papers suggest a substantial role for uncertainty in producing ex post returns.
Relatively little is known about the properties of human capital returns despite the vast amount of evidence suggesting the importance of human capital to the structure and evolution of earnings, employment, productivity, fertility, and economic growth; Rosen (1987), Becker (1993)2.
Based on our present knowledge there are only few papers that investigate the risk - return trade - off on human capital investments in a way similar to ours. Palacios - Huerta (2003c) bring to light that frictions on human capital markets help explain the risk - adjusted return on human capital. Palacios - Huerta (2003a) uses mean - variance spanning tests to compare the properties of the returns to various human capital assets by comparing the efficient frontier in the mean - variance space spanned by a subset of assets to that spanned by all assets. For example, human capital assets of white males are
1 Investment of money may come from the individual, the public or private sector or a combination of both. Gains can be measured in terms of increased job opportunities and higher wages. 2 On top of that, human capital has a dominant position in the aggregate wealth portfolio. Becker (1993) estimates the value of human capital to be three to four times the combined value of stocks, bonds, and other assets.
Volume 4 issue 1.indd 96Volume 4 issue 1.indd 96 30/3/2011 10:24:59 πμ30/3/2011 10:24:59 πμ
97
Economic Returns and Risks to Investment in Education:An Application of the Multifactor CAPM
compared to those of white males and white females in order to examine whether the mean - variance trade - off would be more favourable had the choice set been extended. He finds a wide diffusion in the return per unit of risk for distinctive human capital assets.
The main purpose of this paper is to shed more light on the risk - return trade - off in human capital investment as estimated from the available dataset. Drawing upon national data from 15 European countries (Austria, Denmark, Finland, France, Germany, Greece, Ireland, Italy, the Netherlands, Hungary, Spain, Sweden, Slovakia and the UK), in the first part, the study examines the trends concerning returns and risk on tertiary and secondary education as well as their impact on the labour market in terms of the levels and dispersion of inequality in wages, taking into account some key macro variables. In the second part, the impact of return to investment in education and specific macro factors on real GDP growth rate is tested, in an attempt to shed light in the channels through which the economic growth can be affected.
Thus, the mainstream literature about the fundamentals of financial economics approach to the risk - return trade - off according to the CAPM, the meaning of human capital and the estimation methods of return and systematic risk to human capital investments are presented in section 2. Then, methodological issues and the concept of the approach employed in the design and implementation of various empirical tests are included in section 3. The empirical results are presented in section 4. In section 5 a brief introduction is followed by the literature review and the results. The last section constitutes a summary: the results of empirical tests confirm the theory. 2. Literature Review 2.1 The Fundamentals of Financial Economics Approach to the Risk-Return Trade - off
The empirical analysis is based on the mean - variance model of Markowitz (1952) because it is widely accepted and very helpful in studying human capital assets (Christiansen, Joensen and Nielsen, 2006). The well - known Capital Asset Pricing Model (CAPM) of Sharpe (1964) and Lintner (1965) is a popular generalization of the mean - variance model, which is often applied to portfolio analysis in financial economics.
The CAPM builds on the model of portfolio choice developed by Harry Markowitz (1959). In Markowitz’s model, an investor selects a portfolio at time 1t that yields a stochastic return at time t . The model assumes investors are risk averse and, when choosing among portfolios, they care only about the mean and variance of their one - period investment return. Therefore, investors choose “mean - variance efficient” portfolios, in the sense that the portfolios: 1) minimize the variance of portfolio return given expected return, and 2) maximize expected return given variance. Thus, the Markowitz approach is often called a “mean - variance model.” The portfolio model supplies an algebraic condition on asset weights in mean- variance efficient portfolios.
Volume 4 issue 1.indd 97Volume 4 issue 1.indd 97 30/3/2011 10:24:59 πμ30/3/2011 10:24:59 πμ

98
Antonios Athanassiadis
The CAPM turns this algebraic statement into a testable prediction about the relation between risk and expected return by identifying a portfolio that must be efficient if asset prices are to clear the market of all assets.
Sharpe (1964) and Lintner (1965) add two key assumptions to the Markowitz model to identify a portfolio that must be mean - variance efficient. The first assumption is complete agreement: given market clearing asset prices at 1t , investors agree on the joint distribution of asset returns from 1t to t . In addition, this distribution is the true one, that is, it is the distribution from which the returns are drawn in order to test the model. The second assumption is that there is borrowing and lending at a risk free rate, which is the same for all investors and does not depend on the amount borrowed or lent. In general form, CAPM states that ( ) [ ( ) ]i f i m fE r r E r r (1)
or, in words: The relation of expected return and beta is linear. Beta suffices to explain differences in returns among securities or portfolios. The expected return of an asset or portfolio with zero beta is fr . The expected return of an asset or portfolio with beta one is the same as
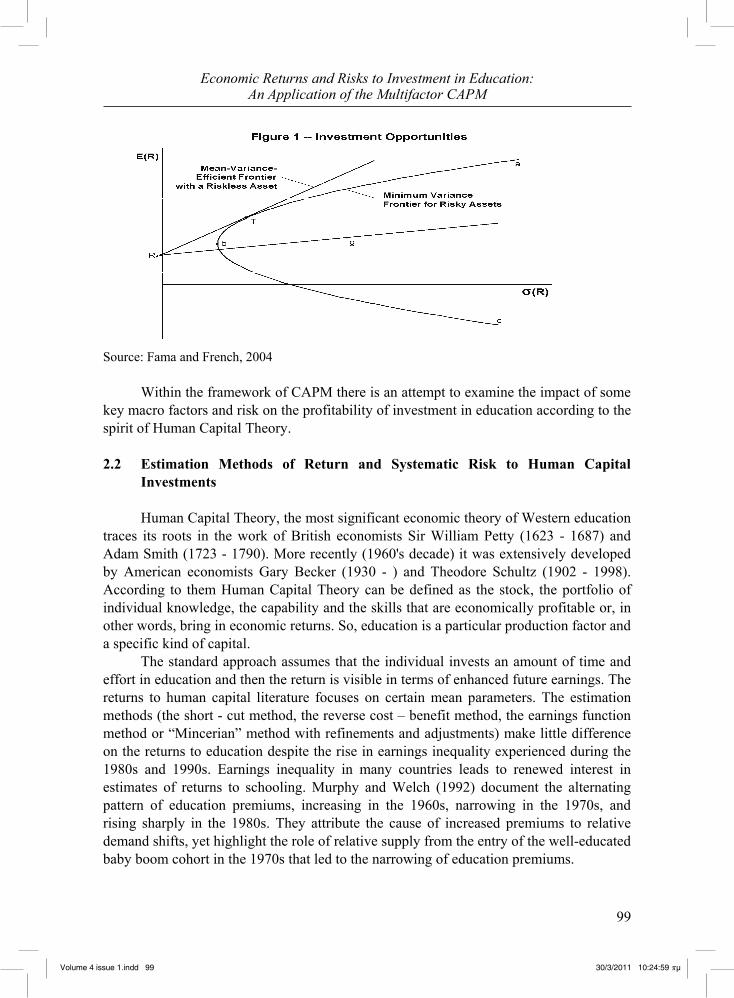
the expected return on the market. Figure 1 describes portfolio opportunities and tells the CAPM story. The horizontal
axis shows portfolio risk, measured by the standard deviation of portfolio return; the vertical axis shows expected return. The curve abc , which is called the minimum variance frontier, traces combinations of expected return and risk for portfolios of risky assets that minimize return variance at different levels of expected return. (These portfolios do not include risk free borrowing and lending). The trade - off between risk and expected return for minimum variance portfolios is apparent. For example, an investor who wants a high-expected return, perhaps at point a , must accept high volatility. At point T , the investor can have an intermediate expected return with lower volatility. If there is no risk free borrowing or lending, only portfolios above b along abc are mean – variance efficient, since these portfolios also maximize expected return, given their return variances (adding risk free borrowing and lending turns the efficient set into a straight line).
Volume 4 issue 1.indd 98Volume 4 issue 1.indd 98 30/3/2011 10:24:59 πμ30/3/2011 10:24:59 πμ
99
Economic Returns and Risks to Investment in Education:An Application of the Multifactor CAPM
Source: Fama and French, 2004
Within the framework of CAPM there is an attempt to examine the impact of some key macro factors and risk on the profitability of investment in education according to the spirit of Human Capital Theory. 2.2 Estimation Methods of Return and Systematic Risk to Human Capital Investments
Human Capital Theory, the most significant economic theory of Western education traces its roots in the work of British economists Sir William Petty (1623 - 1687) and Adam Smith (1723 - 1790). More recently (1960's decade) it was extensively developed by American economists Gary Becker (1930 - ) and Theodore Schultz (1902 - 1998). According to them Human Capital Theory can be defined as the stock, the portfolio of individual knowledge, the capability and the skills that are economically profitable or, in other words, bring in economic returns. So, education is a particular production factor and a specific kind of capital.
The standard approach assumes that the individual invests an amount of time and effort in education and then the return is visible in terms of enhanced future earnings. The returns to human capital literature focuses on certain mean parameters. The estimation methods (the short - cut method, the reverse cost – benefit method, the earnings function method or “Mincerian” method with refinements and adjustments) make little difference on the returns to education despite the rise in earnings inequality experienced during the 1980s and 1990s. Earnings inequality in many countries leads to renewed interest in estimates of returns to schooling. Murphy and Welch (1992) document the alternating pattern of education premiums, increasing in the 1960s, narrowing in the 1970s, and rising sharply in the 1980s. They attribute the cause of increased premiums to relative demand shifts, yet highlight the role of relative supply from the entry of the well-educated baby boom cohort in the 1970s that led to the narrowing of education premiums.
Volume 4 issue 1.indd 99Volume 4 issue 1.indd 99 30/3/2011 10:24:59 πμ30/3/2011 10:24:59 πμ
100
Antonios Athanassiadis
A more selective rate of return estimate review focusing on the causality debate between schooling and earnings (Card, 2001) restates Griliches’ (1970) conclusion that the effect of ability and related factors does not exceed 10% of the estimated schooling coefficient. Instrumental variable (IV) estimates of the returns to education based on family background are higher than classic OLS (Ordinary Least Squares) estimates (based on Mincer - Becker - Chiswick). The finding that the IV estimates exceed the OLS estimates may arise because the instruments are based on policy interventions that affect the educational choices of people with low levels of education (Card, 2001). A second explanation of the larger IV in comparison to OLS estimates is that the schooling variable contains random measurement error, which leads to a downward bias in the OLS estimates. As long as the instruments for schooling are not correlated with this error, the IV procedure eliminates this bias (Card, 1999; 2001). A third explanation is that there may be spillover effects in the sense that the health outcome of an individual depends on the average schooling of individuals in their area as well as on his own schooling or that of his parents (Acemoglu, 1996; Acemoglu and Angrist, 2000). Currie and Moretti (2003) show that IV estimates of this combined effect based on area - level instruments are consistent with it, while OLS estimates understate it.
While estimation methods of return to investment in education have been modified and developed over the years, estimation methods of risk have been examined less thoroughly despite the fact that expenditure on training and education is costly and the returns are uncertain. Becker (1962) was the first to remark that investment in human capital declines with age. Apparently, due to the fact that younger workers earn the returns to education over a longer period, the investment risk increases with age, which implies that older workers discount future earnings with higher discount rate (Zucker, 1967). Briefly, by looking at risk - return trade - off from the microeconomic point of view, reducing marginal returns and growing marginal costs lead to an optimal amount of human capital investment which is inversely related to age (Mincer, 1970). However, human capital investment may not monotonically fall off with age if the aggregate human capital is comparatively specific than general. While profitability of general skills depends on the length of working life, the profitability of specific skills only depends on the expected duration of the current job (Bartel and Borjas, 1977). Other studies, for example Carneiro et al. (2001), Harmon et al. (2001), distinguish between the level and the years of education and incorporate uncertainty in Mincer’s Model (1974). As the human capital market includes a wide range of assets, i.e. educations, each individual is permitted to choose the assets that match their preferred combination of risk and returns in terms of future income without a priori limits and restrictions from factors like age or years of education.
Human capital has been termed as a specific sort of capital, a real asset investment because: it is sluggish (it only changes slowly), it may be depreciated, its current expenditures3 are exchanged with future returns and its accumulation affects earnings. It 3 Of course, expenditure for education does not only have a character of reproducible capital which produces return on investment, but it is also a component of consumption and contributes to the development of many socio-economic areas, (Araki, 1962).
Volume 4 issue 1.indd 100Volume 4 issue 1.indd 100 30/3/2011 10:24:59 πμ30/3/2011 10:24:59 πμ
101
Economic Returns and Risks to Investment in Education:An Application of the Multifactor CAPM
is only distinguished from other real capital in that it cannot be sold, or mortgaged, or separated from its owner. Dissimilar equity investments, investing in a specific education is a binary choice variable: either you invest in a certain education or you do not. Moreover, this investment in education is irreversible: once you hold a certain education, you are not able to sell it again. Concisely and generally speaking, you can only exploit human capital by ‘renting’ it out, not selling it. Only two limitations characterize human capital compared to real capital; diversification and gearing4 disability. For example, gearing is not possible. By gearing it is meant that the investment cannot be scaled arbitrarily as arbitrage opportunities are done away with in financial markets.
Recently, such an argument has been used to consolidate uncertainty in human capital models. More specifically, the return to investment in education examined within the traditional framework either by allowing returns to education to be stochastic (Carneiro et al, 2001; 2003, and Harmon, Hogan and Walker, 2001) or estimating the risk compensation in incomes (Hartog and Vjiverberg, 2002). In fact, unlike the finance literature, it is not yet well - established considering risk and uncertainty in studies of return to human capital investments. In order to be able to explain why human capital theory does not examine uncertainty in its return function thoroughly we must keep in mind that human capital theory was developed before the tools of dynamic decision making under uncertainty were fully developed. Concepts that are central to human capital theory like the internal rate of return are not appropriate for the evaluation of investment programs under sequential resolution of uncertainty.
The absence of the dimensions of risk and uncertainty is apparent in the traditional methods of estimating rates of return. According to these methods, the private rate of return to an investment in a given level of education can be estimated by finding the rate of discount ( r ) that equalizes the stream of discounted benefits to the stream of costs at a given point in time. In the case of university education lasting n years the formula is:
1 1
( ) ( ) (1 ) ,(1 )
n ntu s t
s u ttt t
W W W C rr
(2)
where ( )u sW W is the earnings differential between a university graduate (subscript u ) and a secondary school graduate (subscript s , the control group) in length of time n periods (roughly equal to the potential working lifetime of a person). uC represents the direct costs of university education (for example the cost of tuition, fees, books etc.) and
sW denotes the student’s forgone earnings or indirect costs. The streams of earnings and costs are considered certain through time. In a similar way, in the classic “Mincerian” (see Mincer, 1974) earnings function is given as:
20 1 2 3ln i i i i iW S X X (3)
4The gearing ratio measures the percentage of capital employed that is financed by debt and long term finance. Traditionally, the higher the level of gearing, the higher the level of financial risk due to the increased volatility of profits.
Volume 4 issue 1.indd 101Volume 4 issue 1.indd 101 30/3/2011 10:25:00 πμ30/3/2011 10:25:00 πμ
102
Antonios Athanassiadis
where 2~ (0, )i N iW denotes wages, iX denotes years of experience, and iS years of schooling. It is implicitly assumed that future earnings streams are perfectly certain. In this function, the 1a coefficient (years of schooling) can be interpreted as the average rate of return to an additional year of schooling. Since 1 ( ln / )a W S , this is the relative increase in wages following an increase in S , or the rate of return to the marginal year of schooling. This method assumes that forgone earnings represent the only cost of education, and therefore measures only the private rate of return, and assumes further that individuals have an infinite time horizon.
Experiments conducted to incorporate uncertainty in the return to schooling within the established Mincer (1974) framework provide empirical evidence that risk is indeed compensated resulting in a positive risk - return trade - off. More analytically, Carneiro, Hansen, and Heckman (2001) and Harmon, Hogan and Walker (2001) base their studies on random coefficients while distinguishing level or years of education. Additionally, focusing on levels of education, Palacios - Huerta estimated the return per unit of marginal risk, and found that it was higher for investment in human capital compared to financial capital, and higher for males than females. Hartog and Vjiverberg (2002) estimate risk compensation by using occupation - education cells, where education is measured in years. This is a proxy for detailed career choices, but in reality, the job-related choice follows completion of education. Utilizing education specific cells and applying a range of various risk measures, Diaz-Serrano, Hartog and Nielsen (2003) find a positive risk compensation for both permanent and transitory income shocks.
Pereira and Martins (2002), in a cross-country study estimate the return using equation (1). Risk is measured as the divergence in returns between the 90th and 10th percentile estimates from quantile regressions. This is an appropriate measure of income risk if individuals do not know where they will end up in the conditional income distribution before entering the labour market. The authors report a positive relationship between risk and return across countries. However, since we show that a lot of this income risk is predictable ex - ante by the type of education the individual is holding, this is not a suitable risk measure (Christiansen, Joensen and Nielsen, 2006).
Weiss (1972) applied the Mincerian coefficient of variation to correct the return to education across age and educational groups within a sample of scientists. Yet, the original Mincer (1974) model entertained the possibility that returns varied in the population. Chiswick (1974) and Chiswick and Mincer (1972) estimate variation in rates of return as a contributing factor to overall income inequality. Recent developments in the literature use rich panel data to estimate distributions of the response of earnings to schooling using the modern theory of econometric counterfactuals. They disclose substantial variability in ex post returns to schooling.
Several modifications have been added to the given framework. The return to education has been calculated using mainly the Mincer (1974) model taking the average annual income for workers within a given educational group and the systematic risk as the standard deviation of the annual income for workers within the same group. Then,
Volume 4 issue 1.indd 102Volume 4 issue 1.indd 102 30/3/2011 10:25:00 πμ30/3/2011 10:25:00 πμ
103
Economic Returns and Risks to Investment in Education:An Application of the Multifactor CAPM
both the Markowitzian efficient frontiers as well as the Sharpian performance measure are transferred to the human capital investment problem. 3. Methodology
According to our present knowledge Psacharopoulos (1981) used the simplest method for calculating individual rates of return to education, the short-cut method. This method focuses on the net earnings differential at graduation and can be used with mean lifetime earnings (varying with different levels of education) without reference to age. The formula used to compute the rate of return to higher education is the following (Psacharopoulos, 1992):
( )
h s
s h
E ErN E C
(4)
where Eh and Es stand for the annual mean earnings of graduates of higher and secondary education respectively, Ch represents the direct annual cost of higher education and N refers to the number of years of the educational investment. This approximation of the rate of return is based on the assumption that discounted earnings over a long time period do not count much if discounted to the present. The short - cut method has the advantage that it can be used with already tabulated or summarised data on the earnings of workers (despite the fact that it does not take into account unemployment of groups of workers even if they have an identical level of education), thus making it unnecessary for individual earnings data to be provided (Psacharopoulos, 1981).
Nevertheless, a major weakness of the method is that it ignores the fact that age - earnings profiles are concave. Moreover, its focus on early earnings inevitably leads to less accurate rate of return estimates relative to other methods. Nonetheless, in our case, we study time series (2005 – 2007) using the average annual income of each educational level from Greece and other fourteen European countries – members of European Union (EU) and Organisation for Economic Co-operation and Development (OECD) within a group of workers at age between 18 and 64 years with the same educational level. The average annual net income was attributed to all workers reflecting the combined effect of employment, occupation, sector, and wage outcomes. Hence, the major weakness of the method is solved. In addition, the number of years of the educational investment is taken into account according to the official data from OECD for the average duration of tertiary studies (in years) in each country.
The precise sums of expense per student of Tertiary Education emanate also from OECD data. It is assumed that the total direct annual cost of higher education per country is a more representative and valuable indicator of estimated expenses. Unfortunately, there is no absolute accurate and precise indicator of total real expenses. It is well known that cost-sharing between participants in the education system and society as a whole is an issue under discussion in many countries. Moreover, at the tertiary level, students' living costs and precise foregone earnings can also account for a significant proportion of
Volume 4 issue 1.indd 103Volume 4 issue 1.indd 103 30/3/2011 10:25:00 πμ30/3/2011 10:25:00 πμ
104
Antonios Athanassiadis
the costs of education. All such expenditure outside educational institutions, even if publicly subsidised, is excluded from this indicator. Therefore, total direct annual cost of higher education per country could be considered as a proxy variable for cost.
We treat the investment in education as a process of decision making under risk and we present an approach for estimating a rate of return that takes into account not only earnings and cost but also a form of uncertainty. Decision making under risk can be viewed as a choice between future earnings prospects. A prospect ( , ; ,h h s sw p w p ) is the annual labour that yields outcome iw with probability ip , where 1h sp p . The value of
each probability ip , ( ,i h s ), was calculated using the formula iip where i is the
employment level corresponding to educational level ,i h s and h s . In addition, we suppose that the investor is risk – averse, so dislikes risk and
therefore will stay away from adding high-risk investments to his portfolio. Let [ ]E w z denote the expected income, with given choice of alternative z. Let the individual risk aversion be described by a concave utility function say U w . Then a measure of individual risk premium5 is given by the difference: w w , where w is the (unconditional) expected income, 2w u is the certainty-equivalence income and
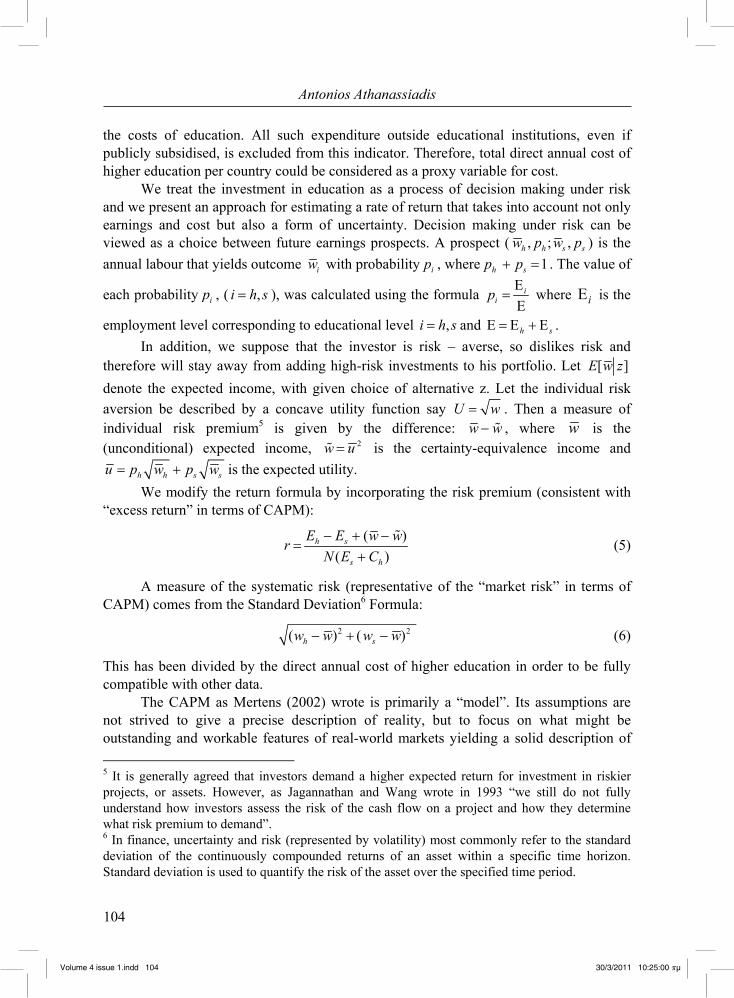
h h s su p w p w is the expected utility. We modify the return formula by incorporating the risk premium (consistent with
“excess return” in terms of CAPM):
( )( )
h s
s h
E E w wrN E C
(5)
A measure of the systematic risk (representative of the “market risk” in terms of CAPM) comes from the Standard Deviation6 Formula:
2 2( ) )h sw w w w (6)
This has been divided by the direct annual cost of higher education in order to be fully compatible with other data.
The CAPM as Mertens (2002) wrote is primarily a “model”. Its assumptions are not strived to give a precise description of reality, but to focus on what might be outstanding and workable features of real-world markets yielding a solid description of 5 It is generally agreed that investors demand a higher expected return for investment in riskier projects, or assets. However, as Jagannathan and Wang wrote in 1993 “we still do not fully understand how investors assess the risk of the cash flow on a project and how they determine what risk premium to demand”. 6 In finance, uncertainty and risk (represented by volatility) most commonly refer to the standard deviation of the continuously compounded returns of an asset within a specific time horizon. Standard deviation is used to quantify the risk of the asset over the specified time period.
Volume 4 issue 1.indd 104Volume 4 issue 1.indd 104 30/3/2011 10:25:00 πμ30/3/2011 10:25:00 πμ
105
Economic Returns and Risks to Investment in Education:An Application of the Multifactor CAPM
asset prices. Like any other model, it should not be judged by the validity of its assumptions but by the accuracy of its prediction.7
CAPM uses a single factor, the market beta as an index, as a measure of systematic (not diversifiable, uncontrollable) risk. For empirical purposes CAPM is expressed as
( )i f i m f iR r R r u and the theory tells us that if the actual return is equal to required return (given risk) we should find 0 (Jensen, 1968). Investors, however, are usually concerned with other risks that will affect their returns. In general, there are two types of systematic risks: Static (temporal) - Market risk Dynamic (intertemporal) - Changes in investment opportunities.
Investors demand to be rewarded for bearing both types of risks. So, we can add factors to the regression model to give a better r - squared fit8. In this spirit, we construct a model in order to explain the returns of investment in education from the macroeconomic perspective. In general, the returns to education using the macro approach are estimated by either (a) an aggregate production function explaining GDP of the type Y = f (conventional inputs, an education measure), or (b) an aggregate “macro-Mincerian” earnings function of the type lnY a bS , where the units of observation are individual countries, and Y and S are mean earnings and years of schooling within each country (Heckman and Klenow, 1998; Krueger and Lindahl, 2001). In our approach, a version of the CAPM derived by Robert Merton (1976), a multifactor CAPM9 that includes risks from three key macroeconomic variables (investment, productivity, unemployment, variables left out in other versions of the CAPM), are used as conventional inputs combined with risk (the measure of the systematic risk to return of the investment in education comes from the Standard Deviation Formula) in order to capture the cross - sectional variation in average returns. Multi-factor CAPM tries to model the two types of systematic risk and how these risks are priced. The macroeconomic variables are called factors, and in our case are included in the model for the estimation of risk-return trade - off to investment in education.
Practically the multifactor extension of the CAPM formula represents the mean return of an asset as a linear combination of the mean returns of several factors, not just a single factor (the market portfolio) as in the standard CAPM. The multifactor formula can be derived from equilibrium conditions similarly as in the standard CAPM, or,
7 Perhaps it is reasonable to say that assumptions may not be valid, but they should not be implausible either. In search for parsimonious models we need to make simplifications, but we should not assume away anything important. This is indeed a thin line where we tread on in order to improve our models if they fail to yield a satisfactory description of the world (Mertens, 2002). 8 The best - known approach like this is the three-factor model developed by Fama and French (1992). 9 The multifactor CAPM says that investors want to be compensated for the risk associated with each source of extra - market risk, in addition to market risk.
Volume 4 issue 1.indd 105Volume 4 issue 1.indd 105 30/3/2011 10:25:00 πμ30/3/2011 10:25:00 πμ
106
Antonios Athanassiadis
alternatively, it can be shown that it has to hold approximately in a model with many assets, in the absence of arbitrage10.
The multifactor CAPM is an attractive model since it recognizes that market risk is not the sole factor affecting returns. There are other factors besides market risks that affect returns, like macro variables. The prices of these factors with the market risks all together reflect the total risk premium. Unfortunately, it is impossible to identify all extra-market risks and to value each of these risks empirically.
The effect of some key factors and more specifically the significance of total investment, unemployment, and the rate of return to education, to growth rate of GDP volume (as percentage change on previous year) is also tested. Generalized Method of Moments (GMM) and Fama - MacBeth two - step panel regression are implemented to test the models empirically.
In addition, we measure the risk – adjusted performance of investment in education based on the Sharpe ratio (Sharpe, 1965). The Sharpe ratio is considered to be the standardized excess return above the risk - free return by the volatility:
: i f
i
r rSharpe ratio (7)
The Sharpe ratio is a direct measure of the performance of a portfolio against risk over a given period of time. The Sharpe ratio also contributed to the systematization of the CAPM. Under certain assumptions, the Capital Asset Pricing Model suggests that the optimal risky portfolio (with the highest Sharpe ratio) must be the market portfolio. A higher Sharpe ratio indicates better historical risk - adjusted performance11 and this is the important aspect of the Sharpe Index: this performance indicator takes the risk of the portfolio into consideration.
In the present case, in order to calculate the Sharpe ratio according to type (7), three figures are used; the average annual income ir (as the computed percentage
calculated with the modified short – cut method ( )( )
h s
s h
E E w wrN E C
), the risk - free
rate of return fr (as the average of net replacement rates over 60 months of unemployment multiplied by the average annual income ir ) and the volatility which is used to quantify the risk of the investment in education over the specified time period. The volatility of the investment in education annual returns (annual returns according to the educational attainment) has been calculated by using the standard deviation formula
2 2( ) )h sw w w w (a measure of the systematic risk) divided by the direct annual cost of higher education in order to be fully compatible with other data. Then, the
10 The latter is called the Arbitrage Pricing Model, or APT. 11 Palacios – Huerta (2003a) notes that human capital assets tend to have higher returns and lower variances than financial assets, i.e. they have higher Sharpe ratios.
Volume 4 issue 1.indd 106Volume 4 issue 1.indd 106 30/3/2011 10:25:00 πμ30/3/2011 10:25:00 πμ
107
Economic Returns and Risks to Investment in Education:An Application of the Multifactor CAPM
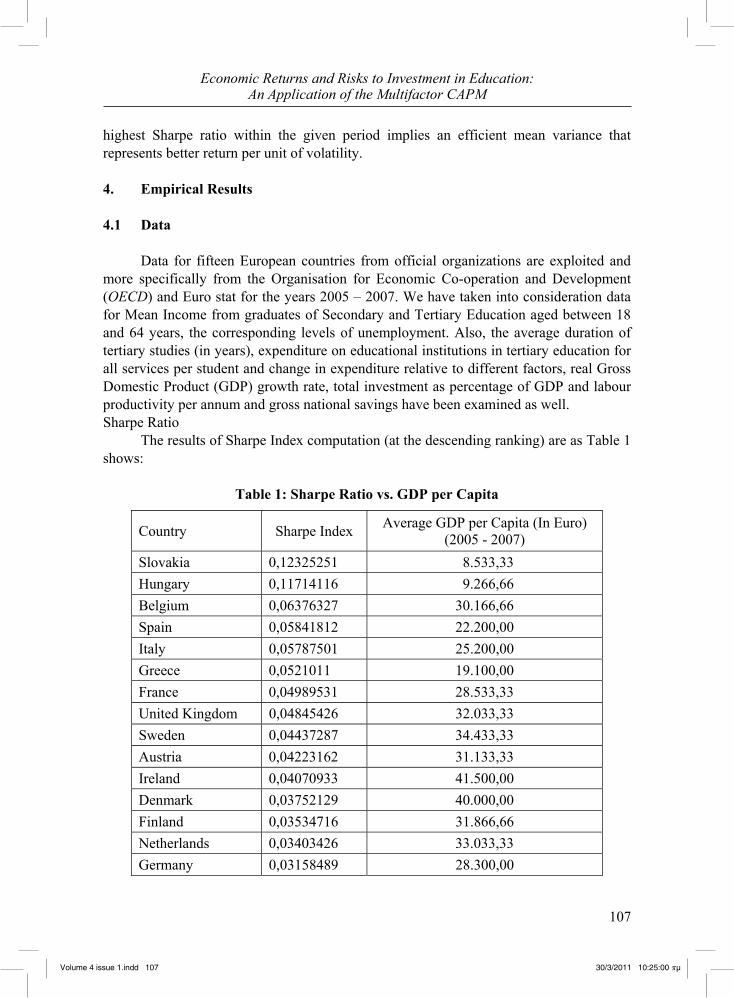
highest Sharpe ratio within the given period implies an efficient mean variance that represents better return per unit of volatility. 4. Empirical Results 4.1 Data
Data for fifteen European countries from official organizations are exploited and more specifically from the Organisation for Economic Co-operation and Development (OECD) and Euro stat for the years 2005 – 2007. We have taken into consideration data for Mean Income from graduates of Secondary and Tertiary Education aged between 18 and 64 years, the corresponding levels of unemployment. Also, the average duration of tertiary studies (in years), expenditure on educational institutions in tertiary education for all services per student and change in expenditure relative to different factors, real Gross Domestic Product (GDP) growth rate, total investment as percentage of GDP and labour productivity per annum and gross national savings have been examined as well. Sharpe Ratio
The results of Sharpe Index computation (at the descending ranking) are as Table 1 shows:
Table 1: Sharpe Ratio vs. GDP per Capita
Country Sharpe Index Average GDP per Capita (In Euro) (2005 - 2007)
Slovakia 0,12325251 8.533,33 Hungary 0,11714116 9.266,66 Belgium 0,06376327 30.166,66 Spain 0,05841812 22.200,00 Italy 0,05787501 25.200,00 Greece 0,0521011 19.100,00 France 0,04989531 28.533,33 United Kingdom 0,04845426 32.033,33 Sweden 0,04437287 34.433,33 Austria 0,04223162 31.133,33 Ireland 0,04070933 41.500,00 Denmark 0,03752129 40.000,00 Finland 0,03534716 31.866,66 Netherlands 0,03403426 33.033,33 Germany 0,03158489 28.300,00
Volume 4 issue 1.indd 107Volume 4 issue 1.indd 107 30/3/2011 10:25:00 πμ30/3/2011 10:25:00 πμ
108
Antonios Athanassiadis
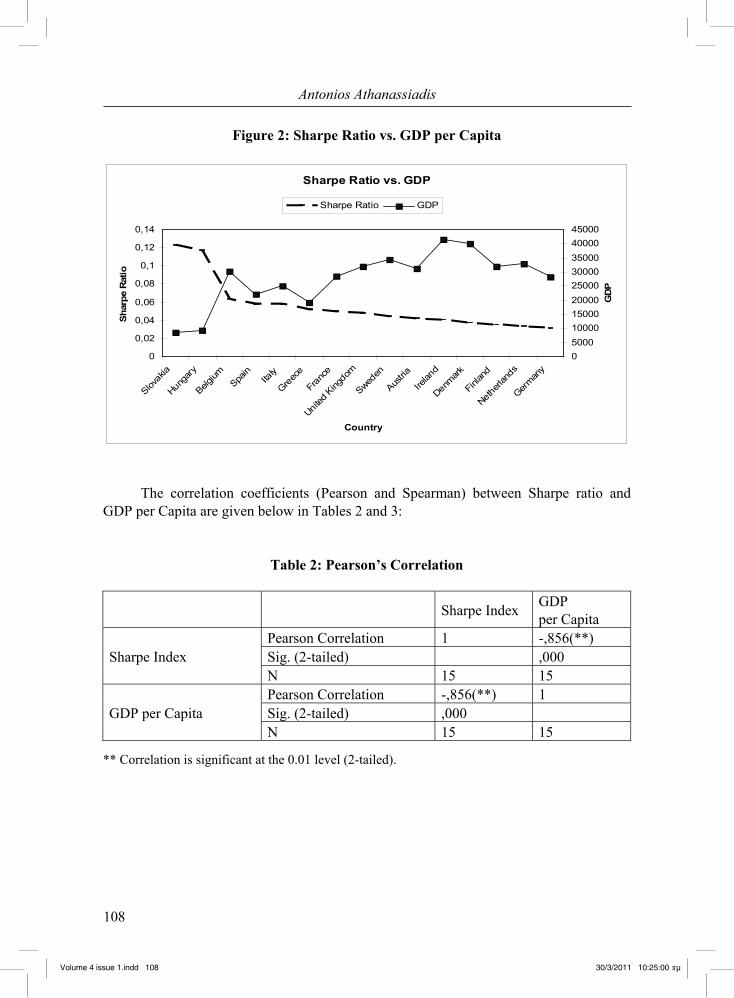
Figure 2: Sharpe Ratio vs. GDP per Capita
Sharpe Ratio vs. GDP
0
0,02
0,04
0,06
0,08
0,1
0,12
0,14
Slovak
ia
Hunga
ry
Belgium
Spain
Italy
Greec
e
Fran
ce
United
King
dom
Sweden
Austria
Irelan
d
Denmark
Finlan
d
Netherl
ands
German
y
Country
Shar
pe R
atio
050001000015000200002500030000350004000045000
GD
P
Sharpe Ratio GDP
The correlation coefficients (Pearson and Spearman) between Sharpe ratio and GDP per Capita are given below in Tables 2 and 3:
Table 2: Pearson’s Correlation
Sharpe Index GDP per Capita
Sharpe Index Pearson Correlation 1 -,856(**) Sig. (2-tailed) ,000 N 15 15
GDP per Capita Pearson Correlation -,856(**) 1 Sig. (2-tailed) ,000 N 15 15
** Correlation is significant at the 0.01 level (2-tailed).
Volume 4 issue 1.indd 108Volume 4 issue 1.indd 108 30/3/2011 10:25:00 πμ30/3/2011 10:25:00 πμ
109
Economic Returns and Risks to Investment in Education:An Application of the Multifactor CAPM
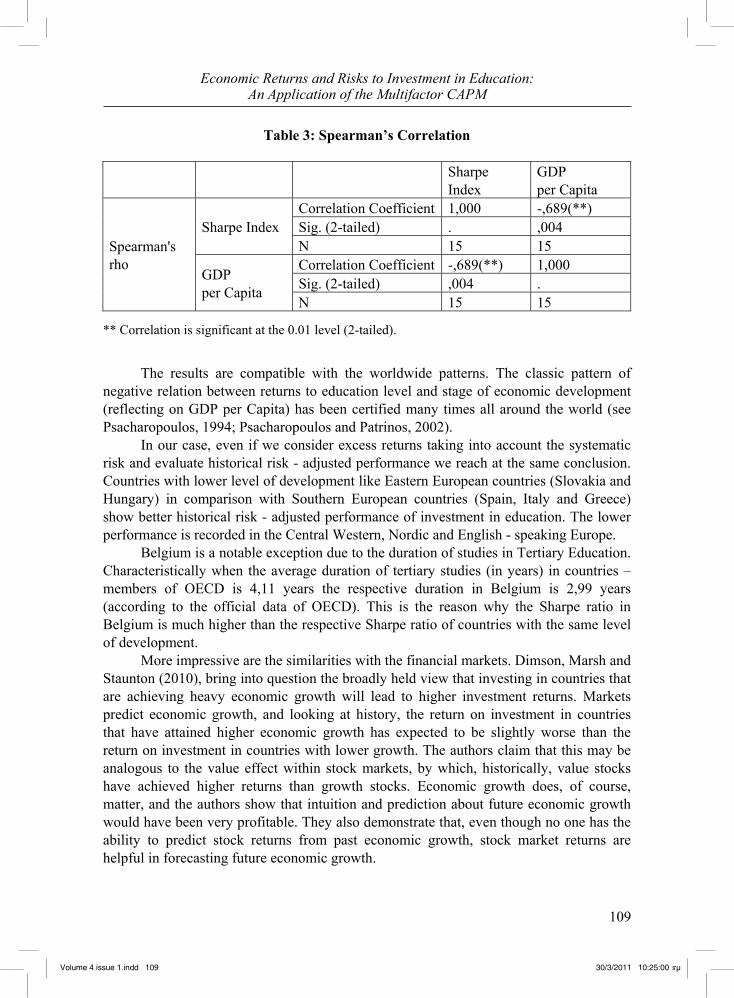
Table 3: Spearman’s Correlation
Sharpe Index
GDP per Capita
Spearman's rho
Sharpe Index Correlation Coefficient 1,000 -,689(**) Sig. (2-tailed) . ,004 N 15 15
GDP per Capita
Correlation Coefficient -,689(**) 1,000 Sig. (2-tailed) ,004 . N 15 15
** Correlation is significant at the 0.01 level (2-tailed).
The results are compatible with the worldwide patterns. The classic pattern of
negative relation between returns to education level and stage of economic development (reflecting on GDP per Capita) has been certified many times all around the world (see Psacharopoulos, 1994; Psacharopoulos and Patrinos, 2002).
In our case, even if we consider excess returns taking into account the systematic risk and evaluate historical risk - adjusted performance we reach at the same conclusion. Countries with lower level of development like Eastern European countries (Slovakia and Hungary) in comparison with Southern European countries (Spain, Italy and Greece) show better historical risk - adjusted performance of investment in education. The lower performance is recorded in the Central Western, Nordic and English - speaking Europe.
Belgium is a notable exception due to the duration of studies in Tertiary Education. Characteristically when the average duration of tertiary studies (in years) in countries – members of OECD is 4,11 years the respective duration in Belgium is 2,99 years (according to the official data of OECD). This is the reason why the Sharpe ratio in Belgium is much higher than the respective Sharpe ratio of countries with the same level of development.
More impressive are the similarities with the financial markets. Dimson, Marsh and Staunton (2010), bring into question the broadly held view that investing in countries that are achieving heavy economic growth will lead to higher investment returns. Markets predict economic growth, and looking at history, the return on investment in countries that have attained higher economic growth has expected to be slightly worse than the return on investment in countries with lower growth. The authors claim that this may be analogous to the value effect within stock markets, by which, historically, value stocks have achieved higher returns than growth stocks. Economic growth does, of course, matter, and the authors show that intuition and prediction about future economic growth would have been very profitable. They also demonstrate that, even though no one has the ability to predict stock returns from past economic growth, stock market returns are helpful in forecasting future economic growth.
Volume 4 issue 1.indd 109Volume 4 issue 1.indd 109 30/3/2011 10:25:00 πμ30/3/2011 10:25:00 πμ
110
Antonios Athanassiadis
4.2 Multifactor CAPM & Panel Data Estimation
Panel has the form , 1,..., & 1,....,itX i N t T where i is the individual (country) dimension and t is the time (specific period) dimension. A general panel data regression model is written as 1 1 2 2 3 3 4 4it it it it it itY a u . Different assumptions can be made on the precise structure of this general model. Two important models are the fixed effects model and the random effects model.
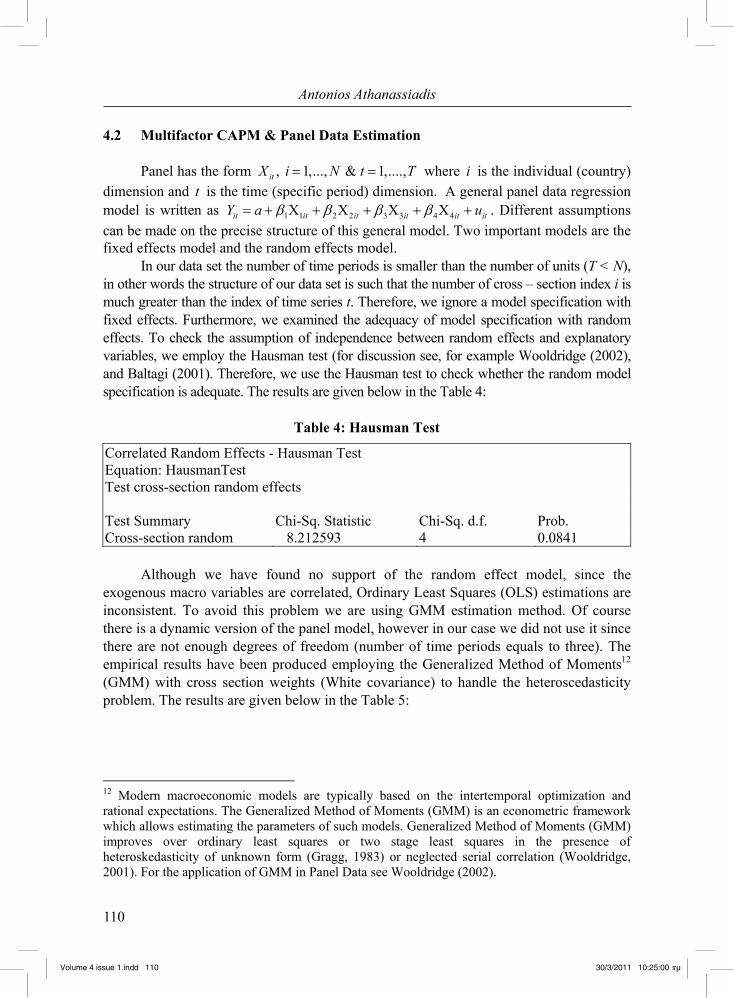
In our data set the number of time periods is smaller than the number of units (T < N), in other words the structure of our data set is such that the number of cross – section index i is much greater than the index of time series t. Therefore, we ignore a model specification with fixed effects. Furthermore, we examined the adequacy of model specification with random effects. To check the assumption of independence between random effects and explanatory variables, we employ the Hausman test (for discussion see, for example Wooldridge (2002), and Baltagi (2001). Therefore, we use the Hausman test to check whether the random model specification is adequate. The results are given below in the Table 4:
Table 4: Hausman Test
Correlated Random Effects - Hausman Test Equation: HausmanTest Test cross-section random effects Test Summary Chi-Sq. Statistic Chi-Sq. d.f. Prob. Cross-section random 8.212593 4 0.0841
Although we have found no support of the random effect model, since the exogenous macro variables are correlated, Ordinary Least Squares (OLS) estimations are inconsistent. To avoid this problem we are using GMM estimation method. Of course there is a dynamic version of the panel model, however in our case we did not use it since there are not enough degrees of freedom (number of time periods equals to three). The empirical results have been produced employing the Generalized Method of Moments12 (GMM) with cross section weights (White covariance) to handle the heteroscedasticity problem. The results are given below in the Table 5:
12 Modern macroeconomic models are typically based on the intertemporal optimization and rational expectations. The Generalized Method of Moments (GMM) is an econometric framework which allows estimating the parameters of such models. Generalized Method of Moments (GMM) improves over ordinary least squares or two stage least squares in the presence of heteroskedasticity of unknown form (Gragg, 1983) or neglected serial correlation (Wooldridge, 2001). For the application of GMM in Panel Data see Wooldridge (2002).
Volume 4 issue 1.indd 110Volume 4 issue 1.indd 110 30/3/2011 10:25:00 πμ30/3/2011 10:25:00 πμ
111
Economic Returns and Risks to Investment in Education:An Application of the Multifactor CAPM
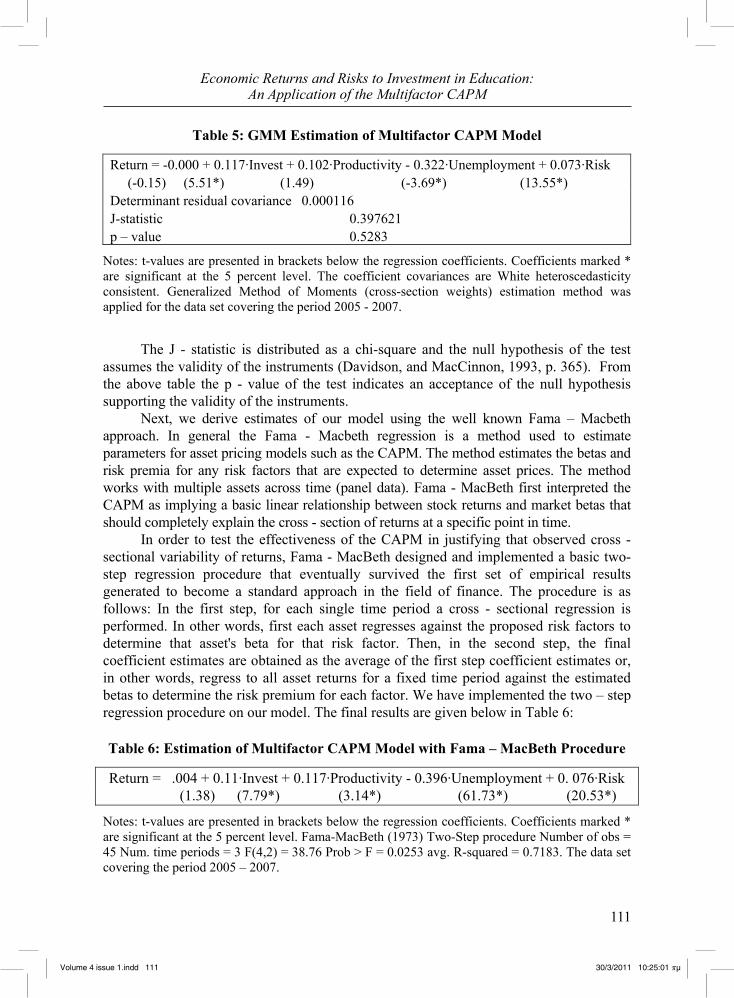
Table 5: GMM Estimation of Multifactor CAPM Model
Return = -0.000 + 0.117·Invest + 0.102·Productivity - 0.322·Unemployment + 0.073·Risk (-0.15) (5.51*) (1.49) (-3.69*) (13.55*) Determinant residual covariance 0.000116 J-statistic 0.397621 p – value 0.5283
Notes: t-values are presented in brackets below the regression coefficients. Coefficients marked * are significant at the 5 percent level. The coefficient covariances are White heteroscedasticity consistent. Generalized Method of Moments (cross-section weights) estimation method was applied for the data set covering the period 2005 - 2007.
The J - statistic is distributed as a chi-square and the null hypothesis of the test
assumes the validity of the instruments (Davidson, and MacCinnon, 1993, p. 365). From the above table the p - value of the test indicates an acceptance of the null hypothesis supporting the validity of the instruments.
Next, we derive estimates of our model using the well known Fama – Macbeth approach. In general the Fama - Macbeth regression is a method used to estimate parameters for asset pricing models such as the CAPM. The method estimates the betas and risk premia for any risk factors that are expected to determine asset prices. The method works with multiple assets across time (panel data). Fama - MacBeth first interpreted the CAPM as implying a basic linear relationship between stock returns and market betas that should completely explain the cross - section of returns at a specific point in time.
In order to test the effectiveness of the CAPM in justifying that observed cross - sectional variability of returns, Fama - MacBeth designed and implemented a basic two-step regression procedure that eventually survived the first set of empirical results generated to become a standard approach in the field of finance. The procedure is as follows: In the first step, for each single time period a cross - sectional regression is performed. In other words, first each asset regresses against the proposed risk factors to determine that asset's beta for that risk factor. Then, in the second step, the final coefficient estimates are obtained as the average of the first step coefficient estimates or, in other words, regress to all asset returns for a fixed time period against the estimated betas to determine the risk premium for each factor. We have implemented the two – step regression procedure on our model. The final results are given below in Table 6:
Table 6: Estimation of Multifactor CAPM Model with Fama – MacBeth Procedure
Return = .004 + 0.11·Invest + 0.117·Productivity - 0.396·Unemployment + 0. 076·Risk (1.38) (7.79*) (3.14*) (61.73*) (20.53*)
Notes: t-values are presented in brackets below the regression coefficients. Coefficients marked * are significant at the 5 percent level. Fama-MacBeth (1973) Two-Step procedure Number of obs = 45 Num. time periods = 3 F(4,2) = 38.76 Prob > F = 0.0253 avg. R-squared = 0.7183. The data set covering the period 2005 – 2007.
Volume 4 issue 1.indd 111Volume 4 issue 1.indd 111 30/3/2011 10:25:01 πμ30/3/2011 10:25:01 πμ

112
Antonios Athanassiadis
From the equation, according to both GMM method and Fama – MacBeth two-step regression procedure we can see that the estimators - except productivity as reported by the results of GMM method - are highly statistically significant (significantly greater than zero). The intercept term turns out statistically insignificant (i.e. statistically equal to zero), so for all practical purposes we have a regression through the origin. The multifactor CAPM model for the returns of investment in education is supported from the empirical results. Risk variable is considering being an important factor affecting positively the returns of education. In addition, investment has a positive impact and this is explained by the theory. It seems plausible that returns for workers of a given quality, as represented by the level of education, are affected positively by higher investments. It is widely believed in the literature that higher investment is likely to increase the productivity of workers through spread of knowledge and technology and overall wages and therefore returns of education rise (Baldwin, R. E., 1995).
In general, the theory of human capital holds that investment in education directly augments individual productivity13 and, therefore, earnings (Schultz, 1961; Ben - Porath, 1967; Becker, 1964 and 1967; Mincer, 1974). Productivity has been initially quantified by Becker (1964) and Mincer (1974) in the form of anticipated increase in future earnings either as a result of general education or firm - specific training.
Educational investment may not only result in increasing the educational level and returns of the labour force, but also in greater productivity of physical capital and more efficient management. The positive relationship between returns and productivity is not surprising in view of the marginal productivity theory of labour economics. Economic theory says that the wage a worker earns, measured in units of output, equals the amount of output the worker can produce (Mankiw, 2006).
On the contrary, the phenomenon of unemployment has a negative influence on the returns of investment in education as corollary of the “wage curve”. The wage curve is a stable, negative relationship between unemployment and pay level. Through random samples of nearly four million people from sixteen countries, Blanchflower and Oswald (1994) find that the local unemployment rate affects pay level such that “A worker who is employed in an area of high unemployment earns less than an identical individual who works in a region with low joblessness” (Blanchflower and Oswald, 1994, p. 5). Their major finding is that the log of wages is a monotonically decreasing and convex function of local unemployment rates. The elasticity of pay with respect to unemployment - that is, the percentage amount that pay will change as unemployment changes - is minus ten percent (-0.10). Therefore, hypothetically, a region with an unemployment rate one percentage point higher than another region will have wages that are ten percent lower. Hence, our empirical findings are in line with this theoretical setup.
13 There is, however, an alternative line of thought. The ‘sorting’ hypothesis attests that education also ‘signals’ or ‘screens’ intrinsic productivity (Spence, 1974; Arrow, 1973; Stiglitz, 1975). Higher levels of education are associated with higher earnings, not because they raise productivity, but because they certify that the worker has the qualification to do high standard work.
Volume 4 issue 1.indd 112Volume 4 issue 1.indd 112 30/3/2011 10:25:01 πμ30/3/2011 10:25:01 πμ
113
Economic Returns and Risks to Investment in Education:An Application of the Multifactor CAPM
4.3 Returns of Investment in Education, Income and Savings
It is well known that savings from income of households and individuals are potential investments and contribute to economic development (Barkoulas, Filiztekin, Murphy, 1993; Nelson, 2009). A considerable part of the increase in national income caused by improved human capabilities is attributable to the increased level of education of the labour force, while the rise in the educational level or standard of the labour force is indirectly demonstrated by the increase in the stock and return of educational capital. The increase in the stock of educational capital brings a corresponding increase in its economic return from education. This increase in economic return from education contributes in its turn to the increase in national income and gross national savings. Moreover, Becker (2003) in his lattermost work stressed the role of education in decisions pertaining to savings and investments.
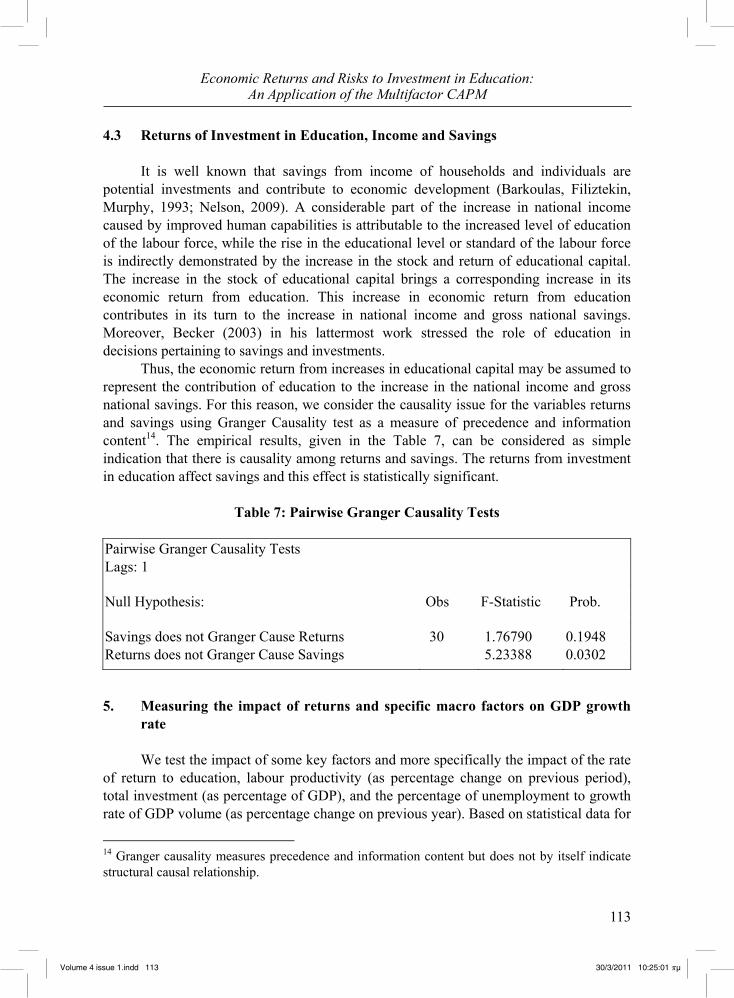
Thus, the economic return from increases in educational capital may be assumed to represent the contribution of education to the increase in the national income and gross national savings. For this reason, we consider the causality issue for the variables returns and savings using Granger Causality test as a measure of precedence and information content14. The empirical results, given in the Table 7, can be considered as simple indication that there is causality among returns and savings. The returns from investment in education affect savings and this effect is statistically significant.
Table 7: Pairwise Granger Causality Tests
Pairwise Granger Causality Tests Lags: 1
Null Hypothesis: Obs F-Statistic Prob.
Savings does not Granger Cause Returns 30 1.76790 0.1948 Returns does not Granger Cause Savings 5.23388 0.0302
5. Measuring the impact of returns and specific macro factors on GDP growth rate
We test the impact of some key factors and more specifically the impact of the rate of return to education, labour productivity (as percentage change on previous period), total investment (as percentage of GDP), and the percentage of unemployment to growth rate of GDP volume (as percentage change on previous year). Based on statistical data for
14 Granger causality measures precedence and information content but does not by itself indicate structural causal relationship.
Volume 4 issue 1.indd 113Volume 4 issue 1.indd 113 30/3/2011 10:25:01 πμ30/3/2011 10:25:01 πμ
114
Antonios Athanassiadis
the period 2005 – 2007 we try to investigate the rate of return to education - investment - growth rate relationship in case of OECD members and in the same time to verify some hypotheses widely used in standard economic literature about the determinant factors of economic growth.
Our interest is stimulated by the considerable amount of cross-country evidence internationally which points to a positive association between investment in education and economic growth (see, for example, Barro and Sala-I-Martin, 1995; Barro, 1991; Bassanini and Scarpenta, 2001). In many OECD countries, the impact of increases in educational attainment on economic growth is stronger than the impact which other factors have on economic growth such as trade exposure, variability of inflation or the investment share (OECD, 2002). Moreover higher education seems to be the most relevant education variable in highly developed countries. 5.1 Literature Review
Countries with higher average years of education tend on average to grow faster (Barro, 1991). Furthermore, OECD countries, which expanded their higher education sector more rapidly from the 1960s, experienced faster growth and greater fall (or smaller rise) in unemployment than countries with less tertiary expansion (Ischinger, 2007). Other studies find that education is more important via its effects on productivity than directly as a factor input (Sweetman, 2002). Additionally, education is found to be positively affecting physical investment in the economy, which in turn further increases growth rates (Mankiw, 2006). However, the estimates from the literature are subject to wide margins of uncertainty and there is also a potential problem of reverse causality (Gemmell, 1997).
Furthermore, in specialised literature, unemployment and investment are among the central variables influencing growth rates. As a popular macroeconomic topic, the significant role of education as the determinant of economic growth has been tested and proven comprehensively by many researchers, for example Romer (1990), Barro (1997), Stevens and Weal (2003). It is widely acceptable that growth regressions should control for the steady state level of income and returns, for example Barro and Sala-i-Martin (1995); Mankiew, Romer, and Weil (1992). Thus, a growth-rate regression model typically includes investment ratio, initial income, unemployment and measures of policy outcomes like academy enrolment and the black - market exchange - rate premium as regressors.
In his empirical work Barro (2002) analyzed the determinants of economic growth and investment in a panel of around 100 countries observed from 1960 to 1995. Generally, the importance of investment to economic growth (according to neo-classical growth model or exogenous growth model, the new growth theory like endogenous growth theory, Keynesian Formula etc.) is well known and generally accepted. Also, mainly according to classic Neo-Keynesian economic theory, when the economy is experiencing rapid growth in real GDP, employment will increase, and therefore
Volume 4 issue 1.indd 114Volume 4 issue 1.indd 114 30/3/2011 10:25:01 πμ30/3/2011 10:25:01 πμ
115
Economic Returns and Risks to Investment in Education:An Application of the Multifactor CAPM
unemployment will decrease. In contrast, during tough periods of the business cycle the economy is experiencing declines in real GDP, and unemployment rates are high. As Altig et al (1997) notes, this is often formally summarized by the statistical relationship known as “Okun's law15”. 5.2 Results
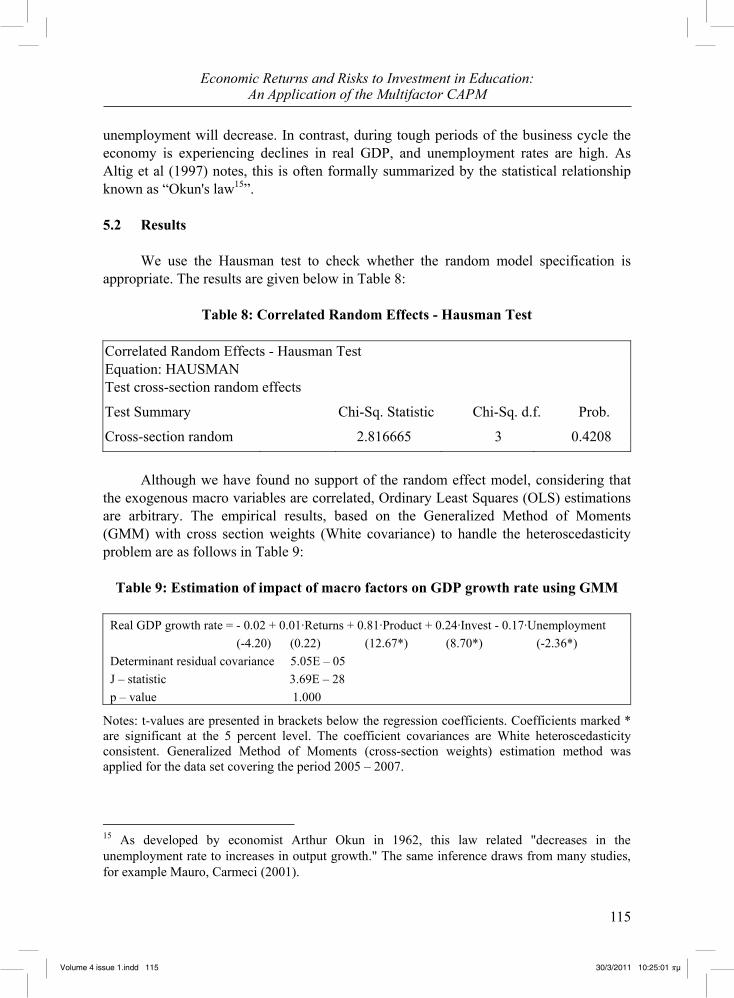
We use the Hausman test to check whether the random model specification is appropriate. The results are given below in Table 8:
Table 8: Correlated Random Effects - Hausman Test Correlated Random Effects - Hausman Test Equation: HAUSMAN Test cross-section random effects
Test Summary Chi-Sq. Statistic Chi-Sq. d.f. Prob.
Cross-section random 2.816665 3 0.4208
Although we have found no support of the random effect model, considering that
the exogenous macro variables are correlated, Ordinary Least Squares (OLS) estimations are arbitrary. The empirical results, based on the Generalized Method of Moments (GMM) with cross section weights (White covariance) to handle the heteroscedasticity problem are as follows in Table 9:
Table 9: Estimation of impact of macro factors on GDP growth rate using GMM
Real GDP growth rate = - 0.02 + 0.01·Returns + 0.81·Product + 0.24·Invest - 0.17·Unemployment (-4.20) (0.22) (12.67*) (8.70*) (-2.36*) Determinant residual covariance 5.05E – 05 J – statistic 3.69E – 28 p – value 1.000
Notes: t-values are presented in brackets below the regression coefficients. Coefficients marked * are significant at the 5 percent level. The coefficient covariances are White heteroscedasticity consistent. Generalized Method of Moments (cross-section weights) estimation method was applied for the data set covering the period 2005 – 2007.
15 As developed by economist Arthur Okun in 1962, this law related "decreases in the unemployment rate to increases in output growth." The same inference draws from many studies, for example Mauro, Carmeci (2001).
Volume 4 issue 1.indd 115Volume 4 issue 1.indd 115 30/3/2011 10:25:01 πμ30/3/2011 10:25:01 πμ
116
Antonios Athanassiadis
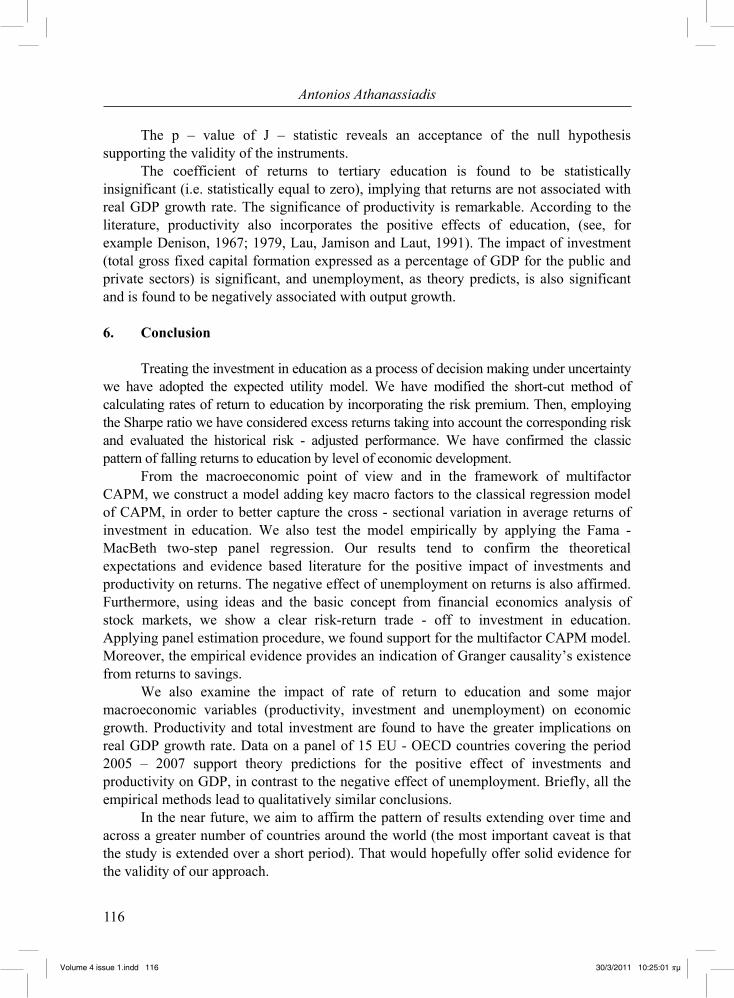
The p – value of J – statistic reveals an acceptance of the null hypothesis supporting the validity of the instruments.
The coefficient of returns to tertiary education is found to be statistically insignificant (i.e. statistically equal to zero), implying that returns are not associated with real GDP growth rate. The significance of productivity is remarkable. According to the literature, productivity also incorporates the positive effects of education, (see, for example Denison, 1967; 1979, Lau, Jamison and Laut, 1991). The impact of investment (total gross fixed capital formation expressed as a percentage of GDP for the public and private sectors) is significant, and unemployment, as theory predicts, is also significant and is found to be negatively associated with output growth. 6. Conclusion
Treating the investment in education as a process of decision making under uncertainty we have adopted the expected utility model. We have modified the short-cut method of calculating rates of return to education by incorporating the risk premium. Then, employing the Sharpe ratio we have considered excess returns taking into account the corresponding risk and evaluated the historical risk - adjusted performance. We have confirmed the classic pattern of falling returns to education by level of economic development.
From the macroeconomic point of view and in the framework of multifactor CAPM, we construct a model adding key macro factors to the classical regression model of CAPM, in order to better capture the cross - sectional variation in average returns of investment in education. We also test the model empirically by applying the Fama - MacBeth two-step panel regression. Our results tend to confirm the theoretical expectations and evidence based literature for the positive impact of investments and productivity on returns. The negative effect of unemployment on returns is also affirmed. Furthermore, using ideas and the basic concept from financial economics analysis of stock markets, we show a clear risk-return trade - off to investment in education. Applying panel estimation procedure, we found support for the multifactor CAPM model. Moreover, the empirical evidence provides an indication of Granger causality’s existence from returns to savings.
We also examine the impact of rate of return to education and some major macroeconomic variables (productivity, investment and unemployment) on economic growth. Productivity and total investment are found to have the greater implications on real GDP growth rate. Data on a panel of 15 EU - OECD countries covering the period 2005 – 2007 support theory predictions for the positive effect of investments and productivity on GDP, in contrast to the negative effect of unemployment. Briefly, all the empirical methods lead to qualitatively similar conclusions.
In the near future, we aim to affirm the pattern of results extending over time and across a greater number of countries around the world (the most important caveat is that the study is extended over a short period). That would hopefully offer solid evidence for the validity of our approach.
Volume 4 issue 1.indd 116Volume 4 issue 1.indd 116 30/3/2011 10:25:01 πμ30/3/2011 10:25:01 πμ
117
Economic Returns and Risks to Investment in Education:An Application of the Multifactor CAPM
Acknowledgments
I would like to thank an anonymous referee for his constructive and detailed comments. Of course, any remaining error is my own responsibility.
References Baltagi, B.H., ed., 2002, Recent Developments in the Econometrics of Panel Data,
Volumes I and II (Edward Elgar Publishing, Cheltenham). Becker, G., 1993, Human Capital: A Theoretical and Empirical Analysis with Special
Reference to Education. Columbia UP: New York, Third edition, 1993. Belanger, P. and Tuijnman, A., 1997, ‘The Silent Explosion of Adult Learning’, P.
Belanger, and A. Tujinman (Ed.), New Patterns of Adult Learning: A Six-Country Comparative Study: 1-16, Oxford: Pergamon.
Blanchflower, D.G, and Oswald, A.J., 1994, ‘The wage curve’, Massachusetts Institute of Technology, Cambridge, p. 5.
Card, D., 2001, ‘Estimating the Return to Schooling: Progress on Some Persistent Econometric Problems’, Econometrica 69, 5, pp. 1127-1160.
Carneiro, P., Hansen, K. T. and Heckman, J. J., 2001, ‘Educational Attainment and Labor Market Outcomes: Estimating Distributions of the Returns to Educational Interventions’, Manuscript, the University of Chicago.
Carneiro, P., Hansen, K. T., and Heckman, J. J., 2003, ‘Estimating Distributions of Treatment Effects with an Application to the Returns to Schooling and Measurement of the Effects of Uncertainty on College Choice’, International Economic Review 44, 2, pp. 361-422.
Christiansen, Ch., Nielsen, H. S., and Joensen, J. S. S., 2006, The Risk - Return Trade - off in Human Capital Investment, IZA Discussion Paper, No. 1962.
Davidson, R. and MacCinnon J. G., 1993, Estimation and Inference in Econometrics, Oxford University Press, pp. 583-620.
Fama, E. and French, K., 2004, ‘The Capital Asset Pricing Model: Theory and Evidence’, Journal of Economic Perspective, 18, pp. 25-46.
Fama E., MacBeth J., 1973, Risk, Return, and Equilibrium: Empirical Tests, Journal of Political Economy, 81, 3, pp. 607-636.
Gragg, 1983, More efficient estimation in the presence of Heteroskedasticity of unknown form, Econometrica, May, 51, 3, pp. 751-63
Greene, W. H., 2002, LIMDEP, version 8.0. Econometric Modeling Guide, 1, Plainview, NY: Econometric Software, Inc., pp. E14 - 9 – E 14 - 11.
Griliches, Z. (Ed.), Output Measurement in the Services Sector: 303-338, Chicago, I.L.: The University of Chicago Press.
Griliches, Z., 1970, ‘Notes on the Role of Education in Production Functions and Growth Accounting’, W.L. Hansen, ed., Education, Income and Human Capital, New York: National Bureau of Economic Research.
Volume 4 issue 1.indd 117Volume 4 issue 1.indd 117 30/3/2011 10:25:01 πμ30/3/2011 10:25:01 πμ

118
Antonios Athanassiadis
Harmon, C., Hogan, V. and Walker, I., 2001, ‘Dispersion in the Economic Return to Schooling’, Working Paper 01-16, University College Dublin.
Hartog, J. and Vjiverberg, W., 2002, ‘Do Wages Really Compensate For Risk Aversion and Skewness Affection’, IZA WP426, The Institute for Studies of Labor, Bonn, Germany.
Ischinger, B., 2007, OECD, Education at a Glance 2007, Paris. Jensen, M., 1968, ‘The Performance of Mutual Funds in the Period 1945-1964’, Journal
of Finance, 23, 2, pp. 389-416. Lau, Jamison and Laut, 1991, Working Paper, World Bank Publications, Washington
DC. Lev B. and Schwartz A., 1971, ‘On the Use of the Economic Concept of Human Capita in
Financial Statements’, The Accounting Review, January, pp. 103-12. Machlup, F., 1962, ‘The Production and Distribution of Knowledge in the United States’,
Princeton, N.J.: Princeton University Press. Machlup, F., 1984, ‘The Economics of Information and Human Capital’, Princeton, N.J.
(3): Princeton University Press. Markowitz, H., 1952, ‘Portfolio Selection’, Journal of Finance, 7, 1, pp. 77-99. Mertens, E., 2002, The CAPM and Regression Tests, University of Basel. Menon Eliophotou, M., 1997, Perceived Rates of Return to Higher Education in Cyprus,
Economics of Education Review, 16, 4, pp. 425-430. Mincer, J. A., 1974, Schooling, Experience, and Earnings, Columbia UP: New York. Murphy, K. and Welch, F., 1992, ‘The Structure of Wages’, Quarterly Journal of
Economics, 107, pp. 285-326. Nevine M. E., 2008, ‘ Capital Asset Pricing Model An Application on the Efficiency of
Financing Higher Public Education in Egypt’. Working Paper No. 8 OECD, 2008a, Education at a Glance: OECD Indicators 2008. Paris: OECD. Palacios-Huerta, I., 2003a, ‘An Empirical Analysis of the Risk Properties of Human
Capital Returns’, American Economic Review 93, pp. 948-964. Palacios-Huerta, I., 2003b, ‘The Robustness of the Conditional CAPM with Human
Capital’, Journal of Financial Econometrics, 1, pp. 272-289. Palacios-Huerta, I., 2003c, ‘Risk and Market Frictions as Determinants of the Human
Capital Premium’. Manuscript, Brown University. Papanastasiou, J., 2008, ‘The Economics of Uncertainty and Information’, ISBN 978 –
960 – 930965 - 3. Pereira, P. T. and Martins, P. S., 2002, ‘Is there a Return-Risk Link in Education?’
Economics Letters, 75, 1, pp. 31-37. Psacharopoulos, G. and Patrinos, H.A., 2004, ‘Returns to investment in education: a
further update’, Education Economics, Taylor and Francis Journals, 12, 2, pp. 111-134, August.
Psacharopoulos, G., 1981, Returns to education: An updated international comparison. Comparative Education, 17, pp. 321-341.
Psacharopoulos, G., 1985, ‘Returns to Education: A further International Update and Implications’, Journal of Human Resources, 20, 40, pp. 583-604.
Volume 4 issue 1.indd 118Volume 4 issue 1.indd 118 30/3/2011 10:25:01 πμ30/3/2011 10:25:01 πμ
119
Economic Returns and Risks to Investment in Education:An Application of the Multifactor CAPM
Psacharopoulos, G., 1992, Rate-of-return studies, In The Encyclopedia of Higher Education, Eds. B. Clark and G. Neave, pp. 999-1003. Pergamon Press, Oxford.
Psacharopoulos, G., 1973, Returns to Education: An International Comparison. Amsterdam: Elsevier.
Psacharopoulos, G., 1994, ‘Returns to Investment in Education: A Global Update’, World Development, 22, 9, pp. 1325-43.
Psacharopoulos, G., 1996, ‘A Reply to Bennell’. World Development, 24, 1, pp. 201. Psacharopoulos, G., 2000, ‘The Economic Costs of Child Labor’. In By the Sweat and
Toil of Children. Washington, DC: Department of Labor. Psacharopoulos, G. and Mattson, R., 1998, ‘Estimating the Returns to Education: A
Sensitivity Analysis of Methods and Sample Size’, Journal of Educational Development and Administration, 12, 3, pp. 271-287.
Psacharopoulos, G., Velez, E., Panagides A., and Yang, H., 1996, ‘The Returns to Education during Boom and Recession: Mexico 1984, 1989 and 1992’, Education Economics, 4, 3, pp. 219-230.
Rosen, S, 1986, ‘The Theory of Equalizing Differences’ in Handbook of Labour Economics, vol. 1, ed. O. Ashenfelter and R. Layard, pp. 641-692, Amsterdam: North - Holland.
Schultz, T. W., 1961, ‘Investment in Human Capital’, American Economic Review, 51, 1, pp. 1-17.
Sharpe, W. F., 1964, ‘Capital Asset Prices: A Theory of Market Equilibrium under Conditions of Risk’, Journal of Finance, 19, 3, pp. 425-442.
Sharpe, W. F., 1965, ‘Mutual Fund Performance’, Journal of Business, 39, 1, pp. 119-138.
Weiss, Y., 1972, ‘The Risk Element in Occupational and Educational Choices’, Journal of Political Economy, 80, pp. 1203-13.
Wooldridge, 2001, Applications of generalized method of Moments Estimation, Journal of Economic Perspectives. 15, 4, pp. 87-100.
Woolridge, J., 2002, Econometric Analysis of Cross-Section and Panel Data, MIT Press, pp. 130, 279, 420-449.
Volume 4 issue 1.indd 119Volume 4 issue 1.indd 119 30/3/2011 10:25:01 πμ30/3/2011 10:25:01 πμ

120
Antonios Athanassiadis
Data Appendix Country statistical profiles 2009 http://stats.oecd.org/Index.aspx?DataSetCode=CSP2009 (accessed 5/9/2010) (OECD.Stat includes data and metadata for OECD countries and selected non-
member economies). Data Base of Eurostat http://epp.eurostat.ec.europa.eu/portal/page/portal/product_details/dataset?p_produ
ct_code=ILC_DI08 (accessed 5/9/2010) Education by OECD http://www.oecd.org/topic/0,3373,en_2649_37455_1_1_1_1_37455,00.html
(accessed 5/9/2010) Statistics Portal of OECD http://www.oecd.org/statsportal/0,3352,en_2825_293564_1_1_1_1_1,00.html
(accessed 5/9/2010) Expenditure on Education http://lysander.sourceoecd.org/vl=12267833/cl=23/nw=1/rpsv/factbook2009/09/02/
01/index.htm (accessed 5/9/2010) Education at a Glance by OECD http://www.oecd.org/document/9/0,3343,en_2649_39263238_41266761_1_1_1_1,
00.html (accessed 5/9/2010) Harmonised Unemployment Rate by Eurostat
http://epp.eurostat.ec.europa.eu/tgm/table.do?tab=table&init=1&plugin=1&language=en&pcode=teilm020 (accessed 5/9/2010)
Mean and Median Income by Education Level http://appsso.eurostat.ec.europa.eu/nui/show.do?dataset=ilc_di08&lang=en (accessed 5/9/2010)
OECD Economic Outlook, http://www.oecd.org/document/61/0,3343,en_2649_34573_2483901_1_1_1_1,00.h
tml (accessed 5/9/2010) OECD Education Statistics, http://www.oecd-ilibrary.org/education/data/oecd-education-statistics_edu-data-en
(accessed 5/9/2010) The OECD's Online Library of Statistical Databases, Books and Periodicals http://lysander.sourceoecd.org/vl=12128461/cl=20/nw=1/rpsv/home.htm (accessed
5/9/2010) UNESCO Institute for Statistics http://stats.uis.unesco.org/unesco/TableViewer/document.aspx?ReportId=143&IF_
Language=eng (accessed 5/9/2010) Real GDP Growth Rate by Eurostat
http://epp.eurostat.ec.europa.eu/tgm/table.do?tab=table&init=1&plugin=1&language=en&pcode=tsieb020 (accessed 5/9/2010)
Volume 4 issue 1.indd 120Volume 4 issue 1.indd 120 30/3/2011 10:25:01 πμ30/3/2011 10:25:01 πμ
Copyright © 2022 FDOKUMEN