Phytosanitary protocols and constraints relating to apple exports
eScholarship provides open access, scholarly publishingservices to the University of California and delivers a dynamicresearch platform to scholars worldwide.
Department of Agricultural and ResourceEconomics, UCB
UC Berkeley
Title:Economic Impacts of Reduced Delta Exports Resulting from the Wanger Interim Order for DeltaSmelt
Author:Sunding, David L., University of California, Berkeley and Giannini FoundationAjami, Newsha K, University of California, BerkeleyHatchett, Steve, WREcon, Davis, CAMitchell, David, M Cubed, Oakland, CAZilberman, David, University of California, Berkeley and Giannini Foundation
Publication Date:05-15-2009
Series:CUDARE Working Papers
Permalink:http://escholarship.org/uc/item/1dp6r5mg
Keywords:water transfers, water supply, water demand, water conservation
Local Identifier:CUDARE Working Paper No. 1083
Copyright Information:All rights reserved unless otherwise indicated. Contact the author or original publisher for anynecessary permissions. eScholarship is not the copyright owner for deposited works. Learn moreat http://www.escholarship.org/help_copyright.html#reuse
Department of Agricultural &Resource Economics, UCB
CUDARE Working Papers(University of California, Berkeley)
Year Paper
Economic Impacts of Reduced Delta
Exports Resulting from the Wanger
Interim Order for Delta Smelt
David Sunding ∗ Newsha K. Ajami † Steve Hatchett ‡
David Mitchell ∗∗ David Zilberman ††
∗University of California - Berkeley†University of California, Berkeley‡WREcon, Davis, CA
∗∗M Cubed, Oakland, CA††University of California - Berkeley
This paper is posted at the eScholarship Repository, University of California.
http://repositories.cdlib.org/are ucb/1083
Copyright c©2009 by the authors.
1
Economic Impacts of Reduced Delta Exports Resulting from theWanger Interim Order for Delta Smelt
May 15, 2009
David Sunding
Newsha Ajami
Steve Hatchett
David MItchell
David Zilberman
________________
Sunding: Department of Agricultural and Resource Economics, UC Berkeley; Ajami,Berkeley Water Center, UC Berkeley; Hatchett: WREcon, Davis, CA; Mitchell: MCubed, Oakland, CA; Zilberman: Department of Agricultural and Resource Economics,UC Berkeley. Sunding and Zilberman are members of the Giannini Foundation ofAgricultural Economics. The authors acknowledge helpful conversations with TerryErliwine, David Fullerton, Brandon Goshi, Cindy Kao, Eric Cartwright and Lloyd Fryer.

2
Executive Summary
On December 14, 2007, Judge Oliver Wanger issued an Interim Remedial OrderFollowing Summary Judgment and Evidentiary Hearing (the “Interim Order” or the“Wanger Decision”). To protect the threatened Delta smelt, the Interim Order restrictswater exports from the Delta to agricultural and urban customers of the State WaterProject (“SWP”) and the Central Valley Project (“CVP”).
Modeling based on the California Department of Water Resources’ CALSIM IIframework is used to measure supply losses in different types of water years. CALSIM IIpredicts the change in water deliveries over the hydrologic record in California from1922 to 2003. The supply losses presented here are for the mid-point between the low-and high-flow targets on the Old Middle River specified in the Wanger decision.
In an average water year, the Wanger decision for Delta smelt results in the loss of 586thousand acre-feet of SWP and CVP supply. Losses can exceed 1 million acre-feet insome wet years. Generally, impacts to the SWP exceed impacts to the CVP in bothabsolute and proportional terms.
Table A supplies are the basic water supplies delivered by the State Water Project. TheInterim Order for Delta smelt significantly reduces the reliability of Table A deliveries.The mean annual reduction in Table A deliveries is 320 thousand acre-feet. Table Adeliveries are reduced in nearly all years, and decline by an average of 11%.
The Monterey Amendment stipulates that any SWP contractor is entitled to wateravailable to the SWP when excess water to the Delta exceeds the State Water Project’soperational requirements. Article 21 water supplies are severely impacted by the Wangerdecision. Article 21 supplies are reduced by 96 thousand acre-feet on average, and aretotally eliminated in many years.
Changes in CVP deliveries are evaluated using the same CALSIM II model runs used tocalculate impacts to SWP deliveries. The Interim Order reduces CVP water supply by170 thousand acre-feet in an average year, with an average reduction of 6%.
Generally, the water supply impacts of the Interim Order for Delta smelt are largest inabove average water years. Wet year supplies are generally used to replenishgroundwater and fill off-stream storage facilities. Thus, the loss of wet year watersupplies can have consequences that “spill over” into subsequent dry years.
It should be emphasized that these supply loss estimates only cover restrictions resultingfrom conservation of the Delta smelt. There are several other species, including salmonand longfin smelt, that are candidates for additional protections that may increase thesupply losses presented here. Further, other factors such as the revisions to the Long-Term Operations Criteria and Plan for the SWP and CVP will affect water supplyreliability as well.
The SWP and CVP are important sources of water supplies to agricultural and urbancustomers in Southern California, the San Joaquin Valley and the San Francisco BayArea. This report details the economic effects of the supply restrictions resulting fromDelta pumping constraints related to conservation of the Delta smelt. The analysis showsthat near term economic effects average more than $500 million annually, and can exceed$3 billion in a prolonged dry period such as the one experienced from 1987-1992.

3
Municipal and industrial impacts of the Interim Order are calculated using the Least CostPlanning Simulation Model (LCPSIM) developed by the California Department of WaterResources (DWR). LCPSIM measures the change in water supply cost and shortagelosses for two regions in California: the San Francisco Bay Area and the South Coast.The South Coast region corresponds roughly to the service area of the MetropolitanWater District of Southern California (MWD). For the San Francisco Bay Area, theversion of LCPSIM used in this report includes three South Bay agencies – Santa ClaraValley Water District, Alameda County Water District, and Zone 7 Water District.
LCPSIM allows for water agencies to invest in conservation and alternative water supplyprograms to cope with future shortages. The model also attempts to capture existingconservation and recycling programs, as well as existing storage and water transferarrangements. Two configurations of LCPSIM were employed in this analysis. In theshort run configuration, recycling, conservation and storage programs are set at currentlevels, and spot water transfers can be implemented to avoid shortages. In the long runconfiguration of LCPSIM, agencies can make additional investments in conservation andalternative water supply options to enhance reliability and reduce shortage losses.
The South Coast region is especially vulnerable to the water supply losses resulting fromInterim Order. LCPSIM calculates these losses at $467.3 million per year on average,assuming current levels of demand, conservation, storage and recycling. These costsresult from a combination of increased water rates and an increased frequency ofepisodes of rationing and mandatory conservation. Over a longer horizon, as wateragencies in the South Coast region have time to make desired investments inconservation, recycling and alternative supplies in response to the Interim Order, averageannual losses can be brought under $100 million.
The actual impacts of the Wanger decision to urban water users will depend on whetherfuture years are wet or dry. While the average near-term impacts are $467.3 million,annual losses could exceed $3 billion should the state enter a prolonged dry period, suchas the one experienced in 1987-1992. Thus, the Interim Order poses significant new risksto Southern California's water system. In the long run scenario, annual losses to SouthCoast water consumers can still exceed $800 million in a drought.
LCPSIM calculates generally smaller impacts to the southern San Francisco Bay Areaagencies: roughly $5 million per year under the short-run scenario and $1 million peryear in the long-run. In a long-term drought, annual impacts to Bay Area agencies canreach $200 million. Bay Area agencies have already made significant investments inlocal and San Joaquin Valley groundwater storage and recovery projects. These projectsprovide a water supply reserve that helps them cope with the supply losses imposed bythe Interim Order.
The analysis of agricultural impacts was conducted using the Central Valley ProductionModel (CVPM), a standard modeling framework used to assess changes in farm watersupplies in California. Combining effects across SWP and CVP service areas, CVPMcalculates average economic losses as $48.4 million annually. Farmers will cope withreduced water supplies in part by reducing levels of crop production (i.e., fallowing) andjob losses will occur as a result. The analysis addresses these anticipated lob losses by

4
using the IMpact analysis for PLANning (IMPLAN) model developed by the U.S. ForestService. IMPLAN calculates that 720 jobs will be lost in the San Joaquin Valley as aresult of the Interim Order. The large majority of these farm jobs are held by low-wageworkers living in economically depressed areas.
Table ES-1 summarizes the economic impacts of the water supply losses resulting fromJudge Wanger’s Interim Order. In the short-run, the Interim Order results in economiclosses greater than $500 million per year, most of which occur in the South Coast region.Losses are, however, distributed widely across the State. Extensive preventiveinvestments in conservation, recycling and more aggressive banking and transferprograms in urban areas reduce expected losses to around $140 million annually.
Table ES-1: Summary of Average Annual Economic Impacts
Sector Annual Impact (millions)Agriculture $48.4Municipal & Industrial
South CoastShort Run $467.3 (maximum $3 billion)Long Run $90.3 (maximum $839 million)
San Francisco Bay AreaShort Run $5.4 (maximum $200 million)Long Run $1.2 (maximum $44 million)
Total: Short Run $521.1Total: Long Run $139.9
I. Introduction
On December 14, 2007, Judge Wanger of the United States District Court for the EasternDistrict of California issued an Interim Remedial Order Following Summary Judgmentand Evidentiary Hearing (the “Interim Order” or the “Wanger Decision”). To protect thethreatened Delta smelt, the Interim Order remanded the U.S. Fish and Wildlife Service’s(FWS) 2005 Biological Opinion on the effects of the Central Valley Project (CVP) andState Water Project (SWP) on the Delta smelt. The conditions in the Interim Order wereto remain in place until the FWS issued a new Biological Opinion on September 15,2008. The deadline to issue the new Biological Opinion subsequently was extended toDecember 15, 2008.
The conditions that have the greatest affect on water exports from the Sacramento-SanJoaquin Rivers Delta (the Delta) are as follows:
1. During the winter, when the average daily water turbidity in the Delta exceeds 12nephelometric turbidity units (NTUs), the Bureau of Reclamation (Reclamation)and the California Department of Water Resources (DWR) must modify “winter

5
pulse flow” operations of the CVP and SWP to achieve an average net upstream(reverse) flow in Old and Middle Rivers (OMR) that is less than 2,000 cubic feetper second (cfs), as long as the three-day average flow in the Sacramento River isless than 80,000 cfs. This modified operation flow remains in place for ten days,or when one of three conditions (based on environmental factors) is met.
2. By January 15th, at the conclusion of the winter flow restrictions and before theonset of Delta smelt spawning, Reclamation and DWR must operate the CVP andSWP to achieve a daily average net upstream flow in the OMR of less than 5,000cfs, as long as the three-day average flow in the Sacramento River is less than80,000 cfs.
3. Upon the onset of spawning and until June 20th or the entrainment risk to Deltasmelt at each pumping facility is abated, Reclamation and DWR have to operatethe CVP and SWP to achieve a daily reverse flow in the OMR of between 750and 5,000 cfs.1
In the Courts Findings of Fact and Conclusions of Law Regarding the Interim Remediesfor the Delta Smelt ESA Remand and Reconsultation (the “Court Findings of Fact”),which were issued contemporaneously with the Interim Order, the Court determined thatwhen the flow of the OMR is negative and high (i.e. in the direction of the CVP and SWPpumping facilities) Delta smelt are at risk of being drawn toward the facilities where theyare entrained. Based on testimony from FWS and DWR, the Court Findings of Factconcluded that this phenomenon is a likely cause of the smelt’s record low population inrecent years and that it poses a significant threat to the Delta smelt and its habitat.
The Court Findings of Fact stated that the strong negative flows in the OMR andcorresponding entrainment of smelt can be mitigated by reducing diversions at the CVPand SWP export facilities. The Court Findings of Fact focused on the benefits to the pre-spawning adult smelt of reducing the winter pulse flows from the facilities and thebenefits to larval and juvenile smelt of curtailing water exports from the CVP and SWPfrom mid-April to mid-May.2
II. Impacts to SWP and CVP Water Supplies
The OMR flow targets in the Interim Order will reduce the reliability of SWP and CVPwater supplies. This section of the report describes the water supply changes resultingfrom the Court-imposed restrictions on federal and state pumping from the Delta.
The results described here are based on CALSIM II modeling runs commissioned by theMetropolitan Water District of Southern California (“MWD”) in late 2007 and performedby CH2MHill. The CALSIM II framework is the standard hydrologic model used inCalifornia water planning. The model evaluates changes to project operations over the
1 United States District Court for the Eastern District of California, “Interim Remedial Order FollowingSummary Judgment and Evidentiary Hearing,” filed December 14, 2007, accessed at:http://www.fws.gov/sacramento/es/delta_smelt.htm.2 United States District Court Eastern District of California, “Findings of Fact and Conclusions of Law REthe Interim Remedies RE: Delta Smelt ESA Remand and Reconsultation,” filed December 14, 2007,accessed at: http://www.fws.gov/sacramento/es/delta_smelt.htm.

6
historic record and uses those data to forecast changes in future deliveries. The modelsimulation period is 1922 to 2003.
II.A Impacts to SWP Deliveries
State Water Project Table A and Article 21 supplies were modeled under two scenarios:1) baseline conditions, and 2) the midpoint of the high- and low-OMR flow targets in theInterim Order. It is important to note that baseline conditions used in these runs to notcorrespond precisely to the analysis in DWR’s 2005 Reliability Report. Numerouschanges to CALSIM II make the 2005 figures not directly comparable to more recentanalyses. Rather, our water supply estimates are based on baseline and post-Wanger runsusing the same CALSIM II configuration.
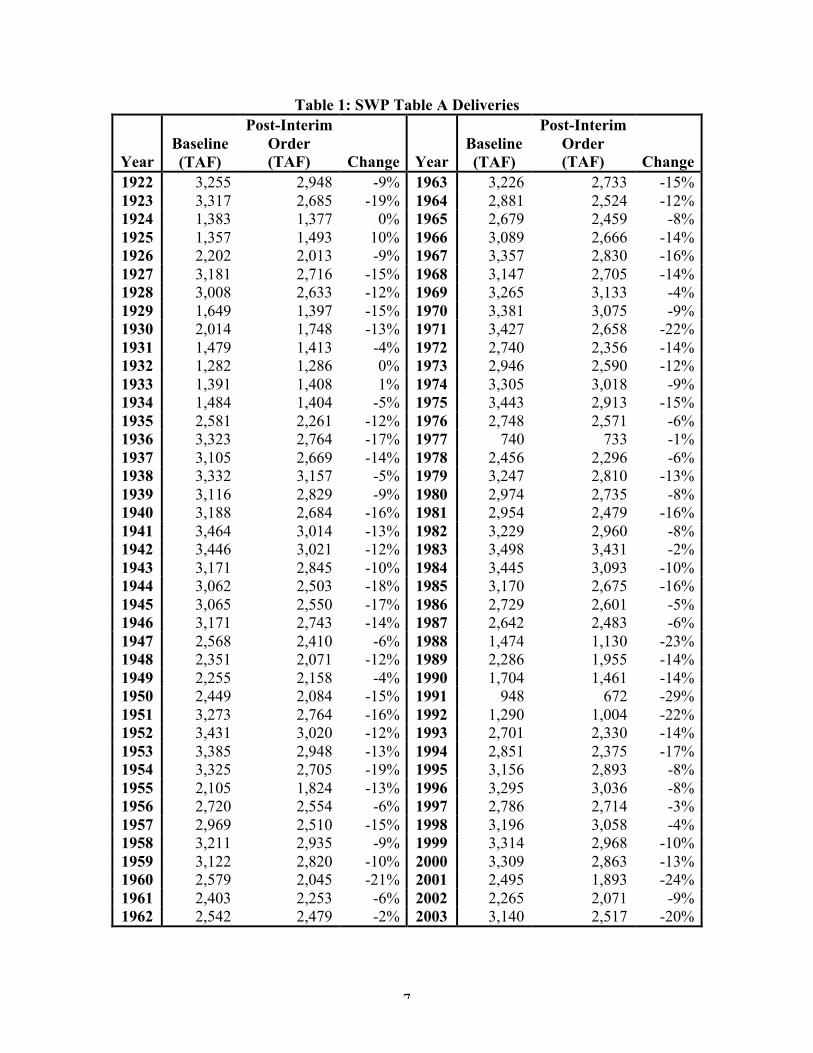
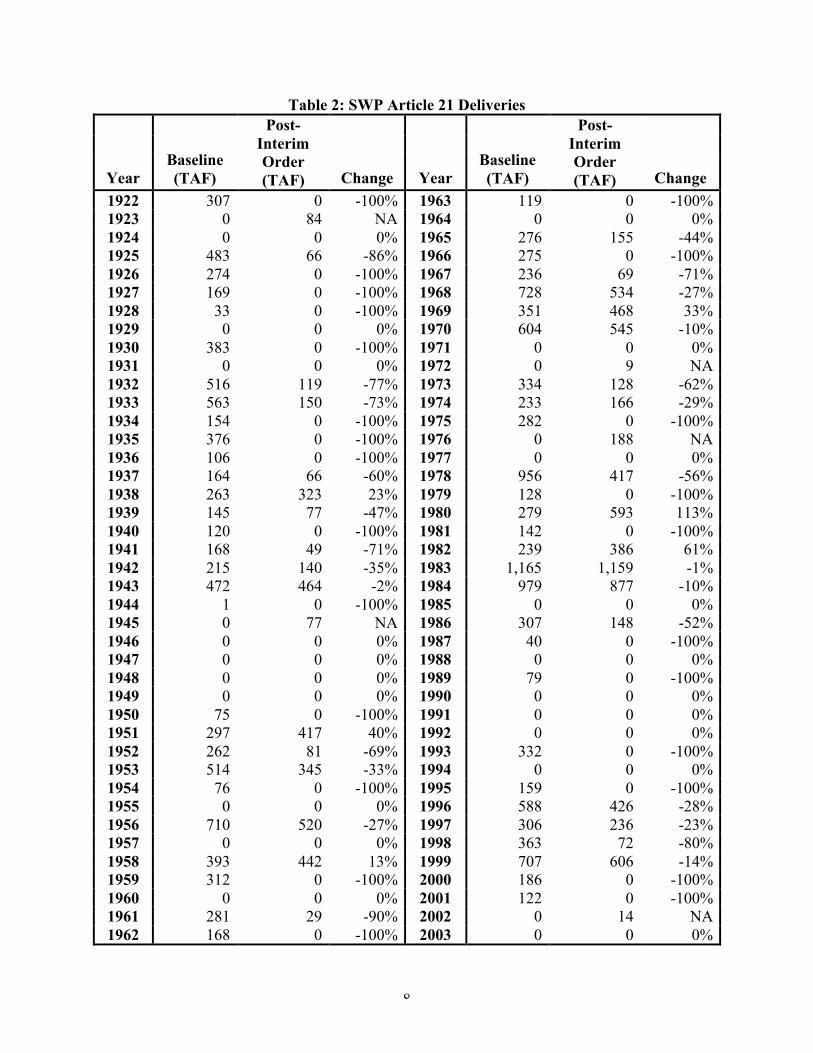
Tables 1 and 2 show the changes in Table A and Article 21 deliveries. The Interim Ordersignificantly reduces the reliability of Table A supplies. The mean annual reduction inTable A deliveries across all simulated years is 320 thousand acre-feet (TAF). AnnualTable A deliveries are reduced in nearly all years, with an average reduction of 11%. Therange of annual percentage changes varies from -29% to 5%. Article 21 deliveries aremore impacted, with an average annual reduction of 96 TAF, or 44%. Article 21deliveries are totally eliminated in many years.
Figure 1 shows the likelihood of given levels of supply reductions. Figure 1a presentsTable A deliveries, which will be reduced in 79 out of 82 simulated years. Article 21deliveries are shown in Figure 1b. The Interim Order has a greater overall proportionalimpact on SWP Article 21 deliveries.
7
Table 1: SWP Table A Deliveries
YearBaseline(TAF)
Post-InterimOrder(TAF) Change Year
Baseline(TAF)
Post-InterimOrder(TAF) Change
1922 3,255 2,948 -9% 1963 3,226 2,733 -15%1923 3,317 2,685 -19% 1964 2,881 2,524 -12%1924 1,383 1,377 0% 1965 2,679 2,459 -8%1925 1,357 1,493 10% 1966 3,089 2,666 -14%1926 2,202 2,013 -9% 1967 3,357 2,830 -16%1927 3,181 2,716 -15% 1968 3,147 2,705 -14%1928 3,008 2,633 -12% 1969 3,265 3,133 -4%1929 1,649 1,397 -15% 1970 3,381 3,075 -9%1930 2,014 1,748 -13% 1971 3,427 2,658 -22%1931 1,479 1,413 -4% 1972 2,740 2,356 -14%1932 1,282 1,286 0% 1973 2,946 2,590 -12%1933 1,391 1,408 1% 1974 3,305 3,018 -9%1934 1,484 1,404 -5% 1975 3,443 2,913 -15%1935 2,581 2,261 -12% 1976 2,748 2,571 -6%1936 3,323 2,764 -17% 1977 740 733 -1%1937 3,105 2,669 -14% 1978 2,456 2,296 -6%1938 3,332 3,157 -5% 1979 3,247 2,810 -13%1939 3,116 2,829 -9% 1980 2,974 2,735 -8%1940 3,188 2,684 -16% 1981 2,954 2,479 -16%1941 3,464 3,014 -13% 1982 3,229 2,960 -8%1942 3,446 3,021 -12% 1983 3,498 3,431 -2%1943 3,171 2,845 -10% 1984 3,445 3,093 -10%1944 3,062 2,503 -18% 1985 3,170 2,675 -16%1945 3,065 2,550 -17% 1986 2,729 2,601 -5%1946 3,171 2,743 -14% 1987 2,642 2,483 -6%1947 2,568 2,410 -6% 1988 1,474 1,130 -23%1948 2,351 2,071 -12% 1989 2,286 1,955 -14%1949 2,255 2,158 -4% 1990 1,704 1,461 -14%1950 2,449 2,084 -15% 1991 948 672 -29%1951 3,273 2,764 -16% 1992 1,290 1,004 -22%1952 3,431 3,020 -12% 1993 2,701 2,330 -14%1953 3,385 2,948 -13% 1994 2,851 2,375 -17%1954 3,325 2,705 -19% 1995 3,156 2,893 -8%1955 2,105 1,824 -13% 1996 3,295 3,036 -8%1956 2,720 2,554 -6% 1997 2,786 2,714 -3%1957 2,969 2,510 -15% 1998 3,196 3,058 -4%1958 3,211 2,935 -9% 1999 3,314 2,968 -10%1959 3,122 2,820 -10% 2000 3,309 2,863 -13%1960 2,579 2,045 -21% 2001 2,495 1,893 -24%1961 2,403 2,253 -6% 2002 2,265 2,071 -9%1962 2,542 2,479 -2% 2003 3,140 2,517 -20%
8
Table 2: SWP Article 21 Deliveries
YearBaseline(TAF)
Post-InterimOrder(TAF) Change Year
Baseline(TAF)
Post-InterimOrder(TAF) Change
1922 307 0 -100% 1963 119 0 -100%1923 0 84 NA 1964 0 0 0%1924 0 0 0% 1965 276 155 -44%1925 483 66 -86% 1966 275 0 -100%1926 274 0 -100% 1967 236 69 -71%1927 169 0 -100% 1968 728 534 -27%1928 33 0 -100% 1969 351 468 33%1929 0 0 0% 1970 604 545 -10%1930 383 0 -100% 1971 0 0 0%1931 0 0 0% 1972 0 9 NA1932 516 119 -77% 1973 334 128 -62%1933 563 150 -73% 1974 233 166 -29%1934 154 0 -100% 1975 282 0 -100%1935 376 0 -100% 1976 0 188 NA1936 106 0 -100% 1977 0 0 0%1937 164 66 -60% 1978 956 417 -56%1938 263 323 23% 1979 128 0 -100%1939 145 77 -47% 1980 279 593 113%1940 120 0 -100% 1981 142 0 -100%1941 168 49 -71% 1982 239 386 61%1942 215 140 -35% 1983 1,165 1,159 -1%1943 472 464 -2% 1984 979 877 -10%1944 1 0 -100% 1985 0 0 0%1945 0 77 NA 1986 307 148 -52%1946 0 0 0% 1987 40 0 -100%1947 0 0 0% 1988 0 0 0%1948 0 0 0% 1989 79 0 -100%1949 0 0 0% 1990 0 0 0%1950 75 0 -100% 1991 0 0 0%1951 297 417 40% 1992 0 0 0%1952 262 81 -69% 1993 332 0 -100%1953 514 345 -33% 1994 0 0 0%1954 76 0 -100% 1995 159 0 -100%1955 0 0 0% 1996 588 426 -28%1956 710 520 -27% 1997 306 236 -23%1957 0 0 0% 1998 363 72 -80%1958 393 442 13% 1999 707 606 -14%1959 312 0 -100% 2000 186 0 -100%1960 0 0 0% 2001 122 0 -100%1961 281 29 -90% 2002 0 14 NA1962 168 0 -100% 2003 0 0 0%

9
Change in the SWP Table A Deliveries
-800 -600 -400 -200 0 2000
0.1
0.2
0.3
Probability
Change in Deliveries (TAF)
-600 -400 -200 0 200 4000
0.1
0.2
0.3
Change in Deliveries (TAF)
Probability
Change in the SWP Article 21 Deliveries
Figure 1: Change in SWP Table A and Article 21 Deliveries Resulting from the InterimOrder
(a)
(b)
10
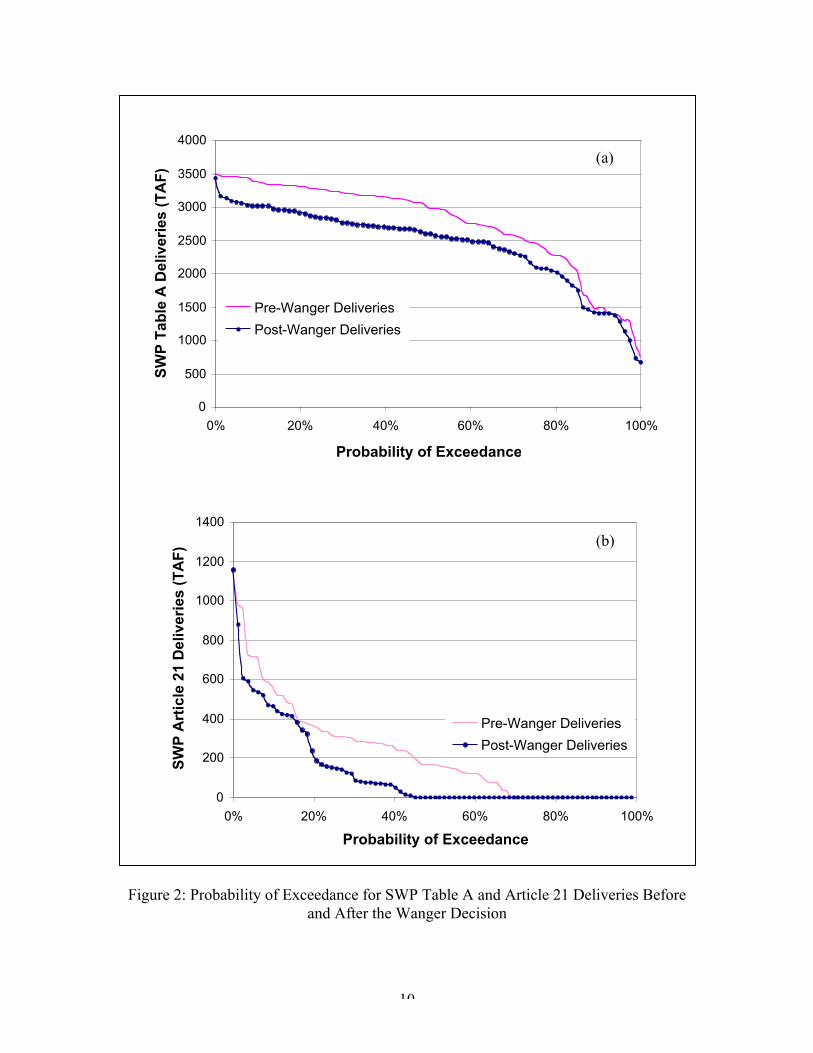
Figure 2: Probability of Exceedance for SWP Table A and Article 21 Deliveries Beforeand After the Wanger Decision
0
500
1000
1500
2000
2500
3000
3500
4000
0% 20% 40% 60% 80% 100%
Probability of Exceedance
SW
P T
able
A D
eliv
erie
s (T
AF
)
Pre-Wanger Deliveries
Post-Wanger Deliveries
0
200
400
600
800
1000
1200
1400
0% 20% 40% 60% 80% 100%
Probability of Exceedance
SW
P A
rtic
le 2
1 D
eliv
erie
s (T
AF
)
Pre-Wanger Deliveries
Post-Wanger Deliveries
(a)
(b)

11
The Interim Order will also affect surplus deliveries. Projected deliveries from the SWPare published each year and vary depending on the amount of water available and thepredicted level of precipitation. Figures 2a and 2b illustrate the probability of SWPdeliveries exceeding the certain annual levels in the future.
As shown in Figure 2a for Table A deliveries, the probability of exceedance is greaterthan 80% for deliveries less than 2,000 TAF. This circumstance implies that SWP TableA deliveries in wet and average years (where deliveries are above 2,000 TAF) will bereduced more than deliveries in dry years (where deliveries are below 2,000 TAF).
II.B Impacts to CVP Deliveries
Changes to CVP deliveries are evaluated using the same CALSIM II model runs used tocalculate impacts to SWP deliveries. As shown in Table 3, the Interim Order changesCVP deliveries between -24% to 5%, with an average reduction of 6%. This meanreduction is less than that predicted for the SWP.
Figure 3 depicts annual reductions in CVP supplies. The Interim Order reduces annualCVP deliveries by an average of 170 TAF. The CALSIM II runs indicate that deliveriesdecreased in 74 of the 82 simulated years.
Figure 4 shows the impact of the Interim Order on the probability that annual CVPsupplies exceed given levels. For instance, there is roughly a 70% chance that the totalCVP supply will exceed 2,500 TAF in the baseline; this probability is reduced to roughly40% under the Interim Order.

12
Table 3: CVP Deliveries
YearBaseline(TAF)
Post-InterimOrder(TAF) Change Year
Baseline(TAF)
Post-InterimOrder(TAF) Change
1922 3,268 2,943 -10% 1963 2,877 2,460 -14%1923 2,976 2,560 -14% 1964 2,495 2,354 -6%1924 1,603 1,514 -6% 1965 2,738 2,498 -9%1925 2,112 2,112 0% 1966 2,844 2,556 -10%1926 1,960 1,964 0% 1967 3,229 2,866 -11%1927 2,647 2,344 -11% 1968 3,042 2,715 -11%1928 2,848 2,480 -13% 1969 3,401 3,339 -2%1929 1,806 1,795 -1% 1970 2,978 2,882 -3%1930 1,955 1,942 -1% 1971 2,652 2,295 -13%1931 1,470 1,464 0% 1972 2,772 2,507 -10%1932 1,418 1,337 -6% 1973 2,751 2,478 -10%1933 1,288 1,267 -2% 1974 3,017 2,880 -5%1934 1,326 1,392 5% 1975 2,825 2,502 -11%1935 1,962 1,972 1% 1976 2,058 1,983 -4%1936 2,495 2,388 -4% 1977 1,433 1,432 0%1937 2,312 2,324 0% 1978 2,965 2,760 -7%1938 3,258 3,268 0% 1979 2,874 2,686 -7%1939 2,582 2,481 -4% 1980 3,090 2,985 -3%1940 2,571 2,405 -6% 1981 2,977 2,630 -12%1941 2,973 2,911 -2% 1982 3,365 3,278 -3%1942 3,024 2,867 -5% 1983 3,396 3,394 0%1943 3,178 2,911 -8% 1984 2,960 2,788 -6%1944 2,480 2,441 -2% 1985 2,680 2,421 -10%1945 2,760 2,448 -11% 1986 2,806 2,780 -1%1946 2,725 2,461 -10% 1987 2,474 2,437 -1%1947 2,452 2,360 -4% 1988 1,815 1,834 1%1948 2,593 2,202 -15% 1989 2,098 1,862 -11%1949 2,730 2,417 -11% 1990 1,604 1,544 -4%1950 2,386 2,221 -7% 1991 1,468 1,441 -2%1951 2,786 2,572 -8% 1992 1,926 1,473 -24%1952 3,236 3,178 -2% 1993 2,542 2,394 -6%1953 2,824 2,659 -6% 1994 2,843 2,473 -13%1954 2,788 2,483 -11% 1995 3,225 3,153 -2%1955 2,380 2,249 -6% 1996 3,250 3,159 -3%1956 2,762 2,704 -2% 1997 2,865 2,817 -2%1957 2,919 2,612 -10% 1998 3,255 3,247 0%1958 3,245 3,151 -3% 1999 2,914 2,762 -5%1959 2,916 2,593 -11% 2000 2,925 2,582 -12%1960 2,173 2,019 -7% 2001 2,399 2,396 0%1961 2,596 2,215 -15% 2002 2,701 2,394 -11%1962 2,689 2,384 -11% 2003 2,680 2,285 -15%

13
-500 -400 -300 -200 -100 0 1000
0.1
0.2
0.3
Change in Deliveries (TAF)
Probability
Figure 3: Change in CVP Deliveries Resulting from the Interim Order
0
500
1,000
1,500
2,000
2,500
3,000
3,500
4,000
0% 20% 40% 60% 80% 100%
Probability of Exceedance
CV
P D
eliv
erie
s (T
AF
)
Pre-Wanger Deliveries
Post-Wanger Deliveries
Figure 4: Probability of Exceedance for CVP Deliveries Before and After the WangerDecision

14
II.C Summary of Water Supply Impacts
The Interim Order reduces the reliability of water deliveries from both the SWP andCVP. Supply effects are larger in both proportional and absolute terms for the SWP. Forboth state and federal projects, supply reductions resulting from Delta pumpingconstraints are largest in years with near-average water supplies. SWP Article 21deliveries are significantly decreased by the Interim Order, and are eliminated entirely inmany years.
Table 4: Change in CVP and SWP Table A Deliveriesfor Different Water-Year Types
Water-YearTotal changein deliveries
(TAF/yr)
Percentchange indeliveries
Wet -319 -10%Above
Average-414 -14%
BelowAverage
-399 -14%
Dry -277 -11%
Critical -183 -11%
SWPTable
A
Averageacross all year
types318 -11%
Wet -146 -5%Above
Average-263 -9%
BelowAverage
-238 -9%
Dry -146 -6%
Critical -86 -5%
Del
iver
y P
roje
ct
CVP
Averageacross all year
types170 -6%
Table 4 summarizes the impact of the Interim Order on SWP Table A and CVP deliveriesfor various water-year types. While the Interim Order results in a larger percentagereduction of SWP supplies, the absolute and proportional reductions occurring on bothsystems are largest in above average and below average water-years. The number ofyears in which Table A deliveries are less than 2,000 TAF/yr increases by 25%.

15
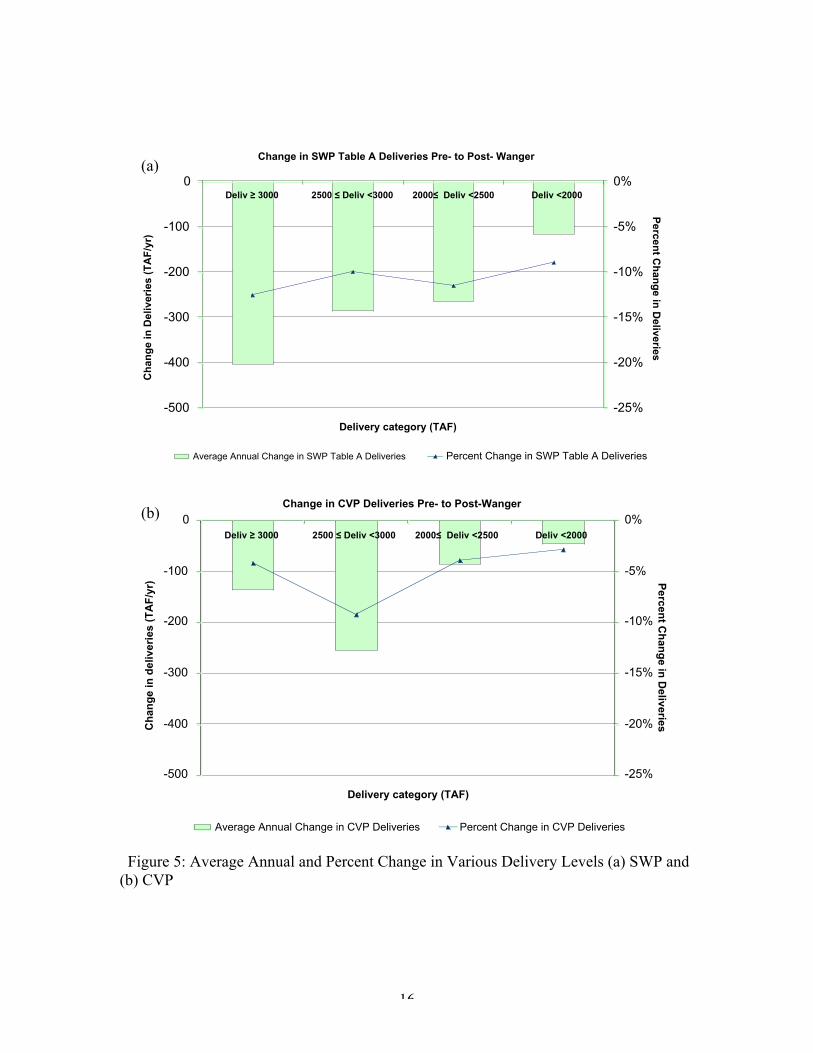
SWP and CVP deliveries were divided into various intervals and the impact of theInterim Order within each interval was evaluated. The pattern of reductions is somewhatdifferent than that shown in Table 4 due to the difference in observing delivery amountsas opposed to water-year categories. Figure 5(a) shows that for the SWP, the largestabsolute supply reductions occur in the years with the largest deliveries, and that fairlyequal proportional reductions in deliveries occur across the spectrum of supply quantities.The pattern of supply reductions is different for the CVP, as shown in Figure 5(b). Thelargest absolute reductions in federal water deliveries occur in years with baselinedeliveries between 2,500 and 3,000 TAF. In the years with the smallest baselinedeliveries, the Interim Order reduces CVP supplies by less than 5%.
16
Change in SWP Table A Deliveries Pre- to Post- Wanger
-500
-400
-300
-200
-100
0Deliv ≥ 3000 2500 ≤ Deliv <3000 2000≤ Deliv <2500 Deliv <2000
Delivery category (TAF)
Ch
ang
e in
Del
iver
ies
(TA
F/y
r)
-25%
-20%
-15%
-10%
-5%
0%
Percen
t Ch
ang
e in D
eliveries
Average Annual Change in SWP Table A Deliveries Percent Change in SWP Table A Deliveries
Change in CVP Deliveries Pre- to Post-Wanger
-500
-400
-300
-200
-100
0Deliv ≥ 3000 2500 ≤ Deliv <3000 2000≤ Deliv <2500 Deliv <2000
Delivery category (TAF)
Ch
ang
e in
del
iver
ies
(TA
F/y
r)
-25%
-20%
-15%
-10%
-5%
0%
Percen
t Ch
ang
e in D
eliveries
Average Annual Change in CVP Deliveries Percent Change in CVP Deliveries
Figure 5: Average Annual and Percent Change in Various Delivery Levels (a) SWP and(b) CVP
(a)
(b)

17
III. Direct Economic Costs of Reductions in M&I Water Supplies
Impacts to municipal and industrial (M&I) customers receiving Delta exports arecalculated using the Least-Cost Planning Simulation Model (LCPSIM) developed andmaintained by the California Department of Water Resources and CH2MHill. LCPSIM issimilar to load-planning models used in the electricity industry, and simulates adynamically optimal portfolio of water supplies.
LCPSIM has been developed for two regions in California: the South Coast and the SanFrancisco Bay Area. In this report, we consider only the southern portion of the Bay Areato focus attention on the urban contractors receiving water via the South Bay Aqueduct.These agencies include Alameda County Water District, Santa Clara Valley WaterDistrict and Zone 7 Water District. The study regions are shown in Figure 6.
Figure 6: LCPSIM Model Regions
III.A Model Framework
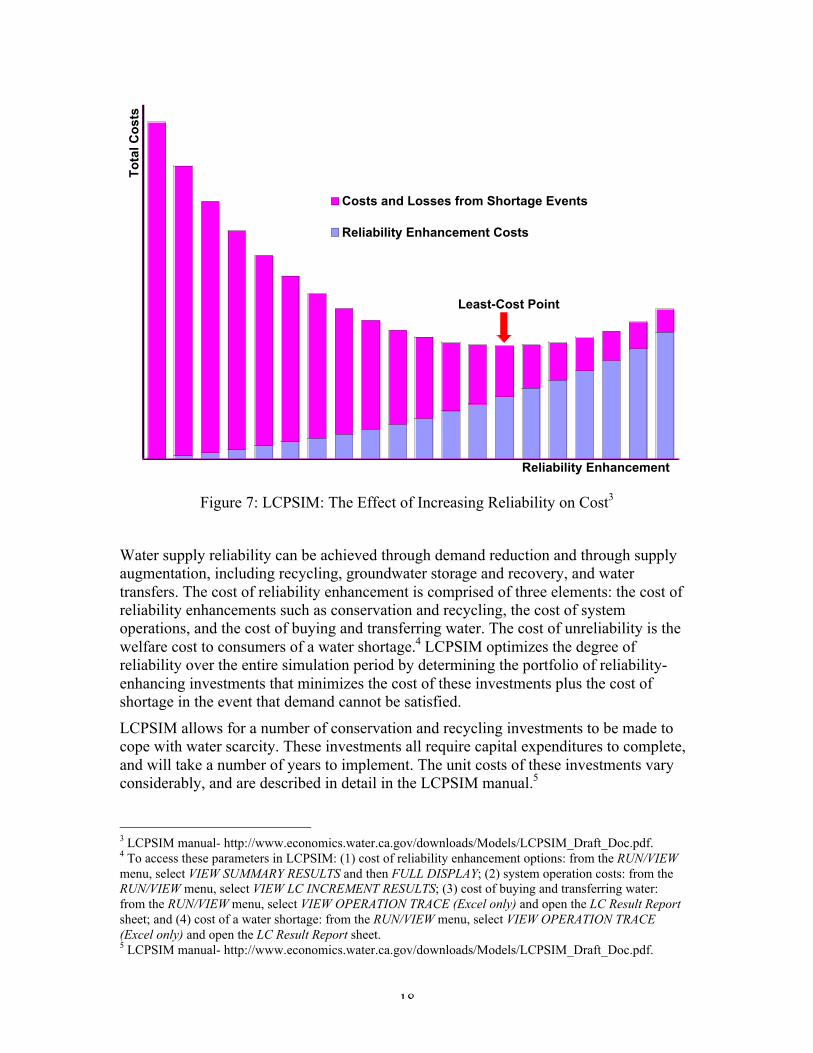
LCPSIM is a yearly time-step simulation model that was developed to estimate theeconomic benefits and costs of improving urban water service reliability at the regionallevel. The primary objective of the model is to develop an economically efficient regionalwater management plan by minimizing the total cost of reliability management (seeFigure 7 below for illustration of LCPSIM’s cost minimization objective). The total costis the sum of two categories: the cost of reliability enhancement and the cost of unreliableservice associated with water shortage events.
South Coast
South SF Bay Area
18
Reliability Enhancement
To
tal C
ost
s
Costs and Losses from Shortage Events
Reliability Enhancement Costs
Least-Cost Management PointLeast-Cost Point
Figure 7: LCPSIM: The Effect of Increasing Reliability on Cost3
Water supply reliability can be achieved through demand reduction and through supplyaugmentation, including recycling, groundwater storage and recovery, and watertransfers. The cost of reliability enhancement is comprised of three elements: the cost ofreliability enhancements such as conservation and recycling, the cost of systemoperations, and the cost of buying and transferring water. The cost of unreliability is thewelfare cost to consumers of a water shortage.4 LCPSIM optimizes the degree ofreliability over the entire simulation period by determining the portfolio of reliability-enhancing investments that minimizes the cost of these investments plus the cost ofshortage in the event that demand cannot be satisfied.
LCPSIM allows for a number of conservation and recycling investments to be made tocope with water scarcity. These investments all require capital expenditures to complete,and will take a number of years to implement. The unit costs of these investments varyconsiderably, and are described in detail in the LCPSIM manual.5
3 LCPSIM manual- http://www.economics.water.ca.gov/downloads/Models/LCPSIM_Draft_Doc.pdf.4 To access these parameters in LCPSIM: (1) cost of reliability enhancement options: from the RUN/VIEWmenu, select VIEW SUMMARY RESULTS and then FULL DISPLAY; (2) system operation costs: from theRUN/VIEW menu, select VIEW LC INCREMENT RESULTS; (3) cost of buying and transferring water:from the RUN/VIEW menu, select VIEW OPERATION TRACE (Excel only) and open the LC Result Reportsheet; and (4) cost of a water shortage: from the RUN/VIEW menu, select VIEW OPERATION TRACE(Excel only) and open the LC Result Report sheet.5 LCPSIM manual- http://www.economics.water.ca.gov/downloads/Models/LCPSIM_Draft_Doc.pdf.
19
Spot water transfers from the Central Valley are also available to address potential watershortages. For the South Coast region, we set these transfers at a maximum of 600 TAFper year in the baseline. The Interim Order impacts the potential size of the spot watermarket because of restrictions on through-Delta conveyance. Hence we decreased themaximum water transfers to 300 TAF for the post-Interim Order scenario. For the SanFrancisco Bay Area region, we set water transfer limits at 50 TAF. While these transfervolumes are considerably higher than direct transfers to MWD and Bay Area wateragencies in recent years, note that they are theoretical limits and LCPSIM endogenouslydetermines how much water to transfer to minimize costs.
Direct impacts on M&I users are calculated under two scenarios which we term short-runand long-run. In the short-run scenario, it is assumed that water transfers and currentlyexisting storage, conservation and recycling programs are available to deal with periodicshortage. In the long-run scenario, we allow for investment in the full range ofconservation, recycling and groundwater storage options specified in the South Coast andBay Area versions of LCPSIM.
Our rationale for distinguishing between short- and long-run impacts is to highlight thecentral role of investments in conservation, recycling and transfer/storage opportunities.While such options may be technically feasible, they take time to implement. In the caseof certain recycling facilities or groundwater storage programs, for instance, the time topermit and build these options may be a decade or more. The Interim Order may havesignificantly larger costs should a drought occur before these options are constructed.
Moreover, the current legal climate with respect to water supplies in California is notideal for making billions of dollars in capital investments. The Interim Order is relativelyrecent, and it is unclear how DWR and USBR intend to deal with the associated pumpingrestrictions. A state program of investment in alternative conveyance in the Delta, forexample, would leave many such investments “stranded” in the sense that they would notbe ex post optimal. Water agencies may wait to see how events in the Delta play outbefore committing their ratepayers to significant investments in new recycling,conservation, and storage projects.
III.B Results for the South Coast Region
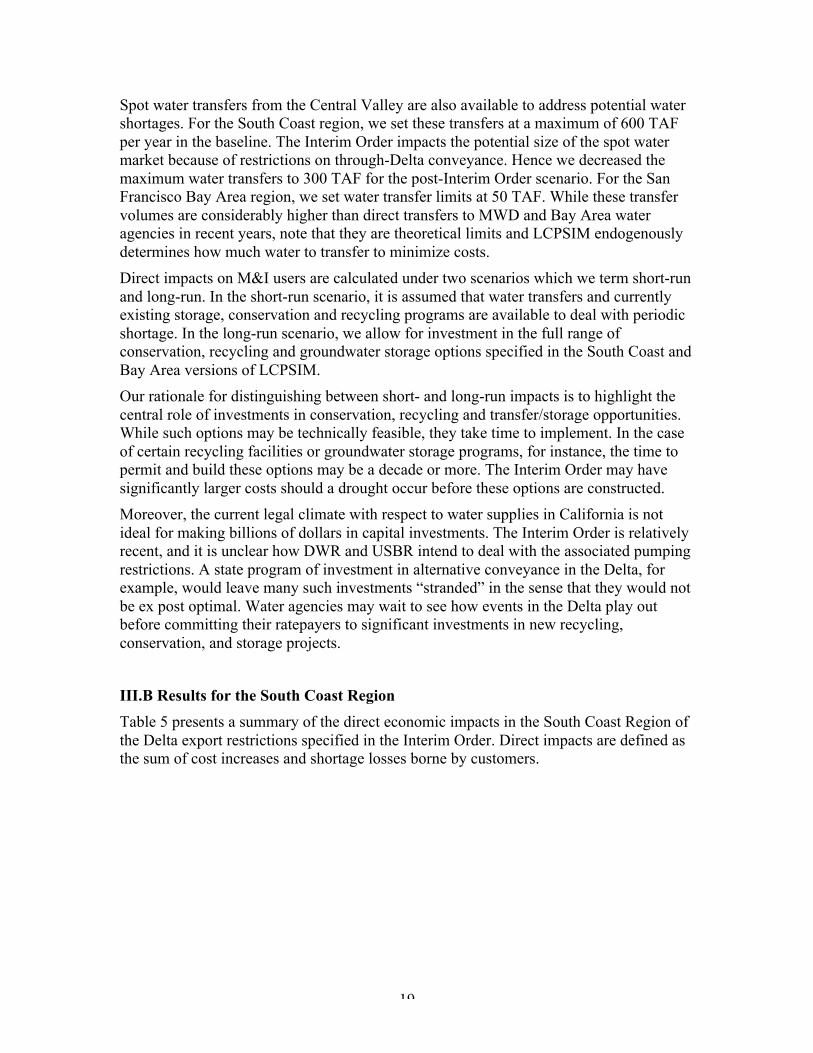
Table 5 presents a summary of the direct economic impacts in the South Coast Region ofthe Delta export restrictions specified in the Interim Order. Direct impacts are defined asthe sum of cost increases and shortage losses borne by customers.
20
Table 5: Direct Economic Impacts to the South Coast Region
ImpactEconomic Impact
Short Run (million $)
Economic ImpactLong Run(million $)
Average Direct Impacts $467.3 $90.3
Average Increase in Water Market Cost $7.2 $2.7
Average Shortage Losses $508.6 $46.6
Average Increase in System Operational Cost -$48.5* -$24.7*
Average Increase in Option Cost $0** $65.7
*The system operational cost decreases due to reduced delivery volumes.** No options are available in the short-run scenario
Short-run losses in the South Coast area are $467 million per year on average, accordingto the LCPSIM. The majority of this cost is in shortage losses experienced by consumers.This result is illustrated by Figure 8 below, which shows South Coast water shortagesover the simulation period under the assumption that capital investments are not availableto deal with shortages and water transfers are limited to historic quantities. The InterimOrder significantly increases the magnitude and frequency of water shortages, implyingthat it will destabilize water supplies available to this region.
The long-run analysis of the LCPSIM indicates that recycling and conservation optionscan reduce the cost of the Interim Order to around $90 million annually, on average.Most of the cost under this scenario is accounted for by the investments in conservationand alternative supplies, amounting to $66 million per year. Relative to the short-runscenario, slightly less water is purchased on the transfer market. Average shortage lossesare reduced from $509 million to $47 million annually. Figure 9 below comparesshortages in the South Coast pre- and post-Interim Order in the long-run scenario.

21
Percent Shortage Under Short-Run Analysis - South Coast
0.0%
5.0%
10.0%
15.0%
20.0%
25.0%
30.0%
35.0%
40.0%
45.0%
1922
1927
1932
1937
1942
1947
1952
1957
1962
1967
1972
1977
1982
1987
1992
1997
2002
Year
Per
cen
t S
ho
rtag
e
Pre-Wanger Percent Shortage Post-Wanger Percent Shortage
Figure 8: Annual Short-run Percent Shortage in the South Coast Region
Percent Shortage Under Long-Run Analysis - South Coast
0.0%
5.0%
10.0%
15.0%
20.0%
25.0%
30.0%
35.0%
40.0%
45.0%
1922
1927
1932
1937
1942
1947
1952
1957
1962
1967
1972
1977
1982
1987
1992
1997
2002
Year
Per
cen
t S
ho
rtag
e
Pre-Wanger Percent Shortage Post-Wanger Percent Shortage
Figure 9: Annual Long-run Percent Shortage in the South Coast Region
The average annual impacts shown in Table 5 are informative. However, the averageimpacts mask the significant variation in losses experienced over the simulation period.
22
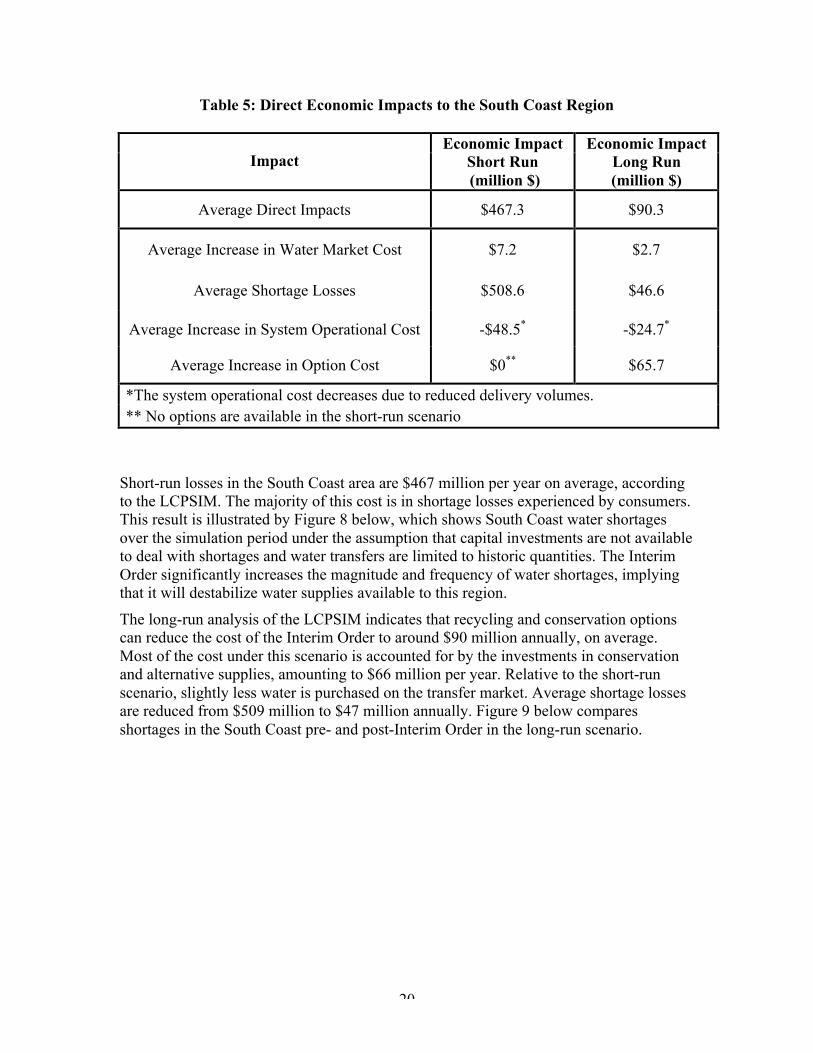
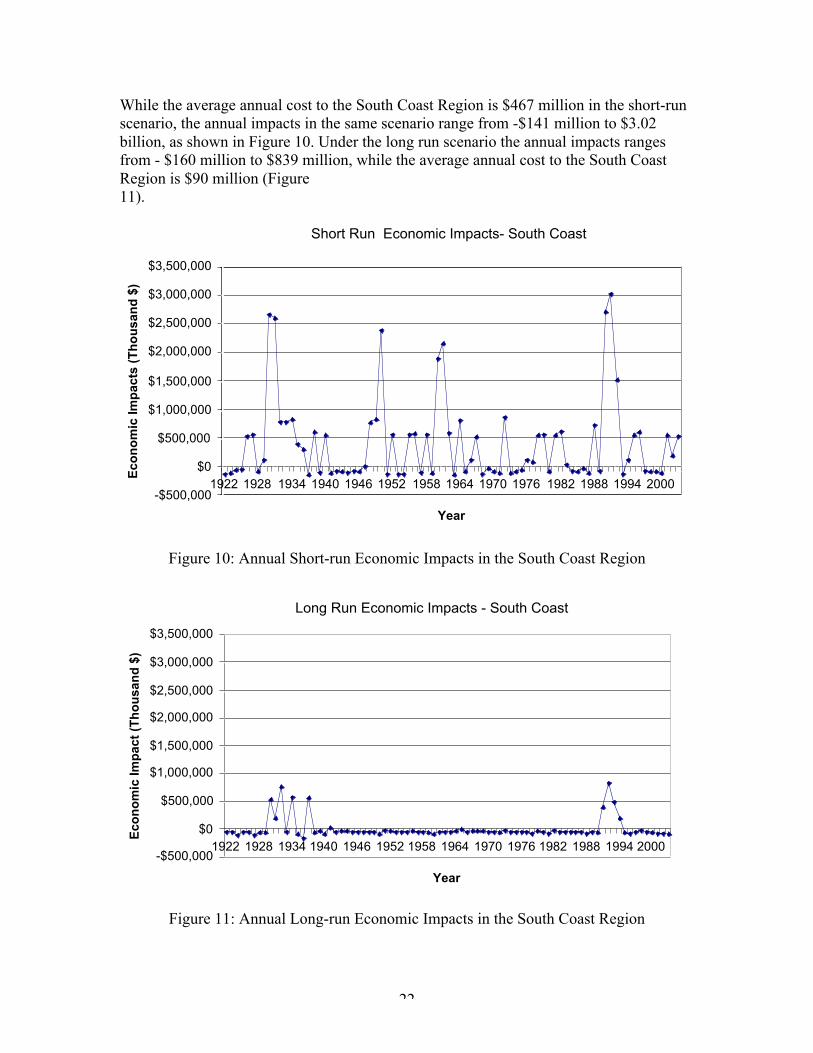
While the average annual cost to the South Coast Region is $467 million in the short-runscenario, the annual impacts in the same scenario range from -$141 million to $3.02billion, as shown in Figure 10. Under the long run scenario the annual impacts rangesfrom - $160 million to $839 million, while the average annual cost to the South CoastRegion is $90 million (Figure11).
Short Run Economic Impacts- South Coast
-$500,000
$0
$500,000
$1,000,000
$1,500,000
$2,000,000
$2,500,000
$3,000,000
$3,500,000
1922 1928 1934 1940 1946 1952 1958 1964 1970 1976 1982 1988 1994 2000
Year
Eco
no
mic
Imp
acts
(T
ho
usa
nd
$)
Figure 10: Annual Short-run Economic Impacts in the South Coast Region
Long Run Economic Impacts - South Coast
-$500,000
$0
$500,000
$1,000,000
$1,500,000
$2,000,000
$2,500,000
$3,000,000
$3,500,000
1922 1928 1934 1940 1946 1952 1958 1964 1970 1976 1982 1988 1994 2000
Year
Eco
no
mic
Imp
act
(Th
ou
san
d $
)
Figure 11: Annual Long-run Economic Impacts in the South Coast Region

23
This fluctuation in annual impacts highlights the additional risk associated with theInterim Order. If hydrologic conditions are unfavorable in a given year, the Delta exportreductions would impose large costs on the South Coast region. With current levels ofconservation, recycling and storage, the estimated impacts of the Interim Order exceed $3billion during a prolonged drought. Even with significant new investments in alternativesupplies and additional conservation, annual losses can exceed $800 million during avery dry period.
III.C Results for the San Francisco Bay-South Region
The economic impact of the Interim Order in the San Francisco Bay Area was alsoevaluated. According to the LCPSIM model, Alameda County and Zone 7 water districtswill both be impacted by the restrictions on the SWP deliveries while Santa Clara ValleyWater District also will be affected by CVP delivery reductions. San Francisco Bay Areasupplies from the SWP were modeled by reducing the SWP Table A and Article 21deliveries based on the percentage reductions associated with the Interim Order presentedin Tables 1 and 2. The change in CVP deliveries resulting from the Interim Order werebased on the CVP delivery changes presented in Table 3 and post-processing calculationsprovided by Santa Clara Valley Water District.
As with the South Coast model, the LCPSIM was run under short- and long-runconfigurations with the reliability enhancement options available in the long-runscenario. Table 6 presents the direct impacts to the San Francisco Bay Area – Southregion.
Table 6: Direct Economic Impacts to the San Francisco Bay Area – South Region
ImpactEconomic Impact
Short Run (million $)
Economic ImpactLong Run(million $)
Total Direct Impacts $5.4 $1.2
Increase in Water Market Cost $0.5 $0.1
Shortage Losses $5.6 $0.6
Increase in System Operation Cost -$0.2* - $0.8*
Increase in Option Cost $0** $1.3
*The system operational cost decreases due to reduced delivery volumes.** Only current conservation and recycling options are available in the short-runscenario.
24
The impacts of the Interim Order, as estimated by LCPSIM, are generally smaller in theSan Francisco Bay Area region as compared to the South Coast region. This finding isdue in part to the fact that Bay Area water agencies have invested heavily in local andSan Joaquin Valley groundwater storage facilities (e.g., Semitropic), which provides aneffective buffer against the types of supply disruptions considered in this report.Nonetheless, under current conditions, annual losses to Bay Area urban customers canreach $200 million during a multi-year drought.
There are certain features of LCPSIM that may cause the model to underestimate impactsto Bay Area agencies and their customers. Notably, the model aggregates the threeprincipal agencies receiving Delta exports into a single entity. Thus, groundwater storageavailable to Santa Clara is assumed to be made available to Alameda County WaterDistrict as well. In reality, the agencies are more independent, and impacts can be moresevere as a result.
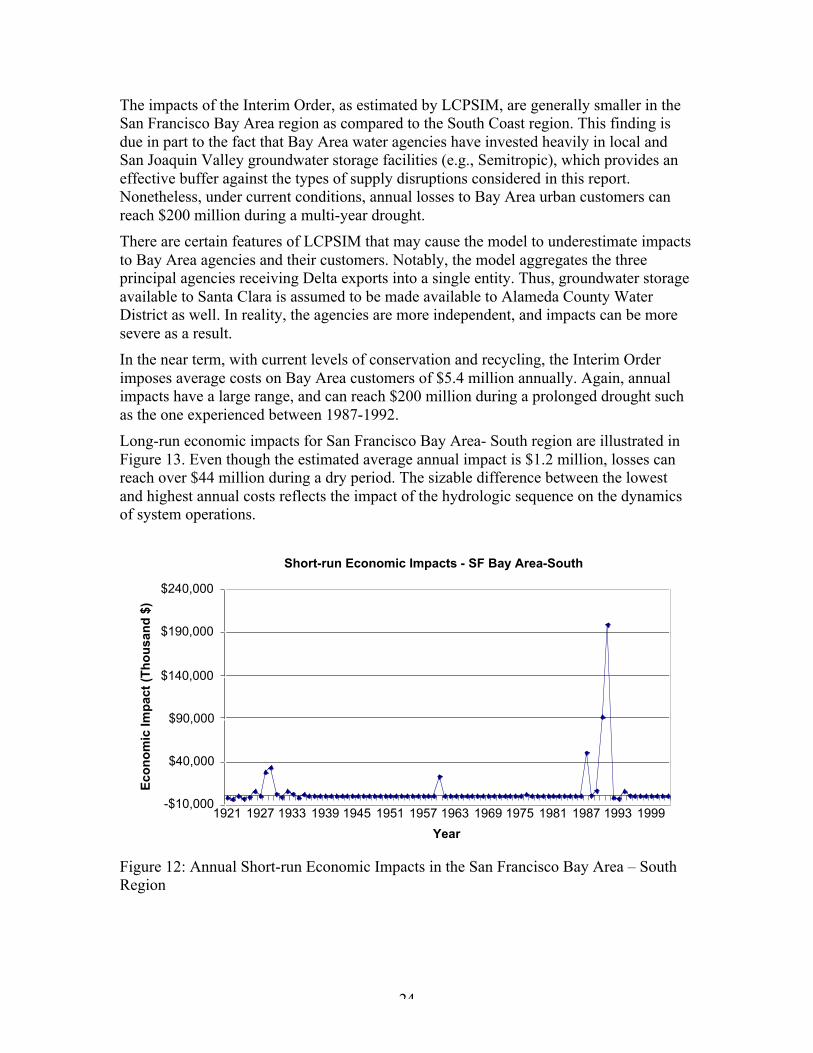
In the near term, with current levels of conservation and recycling, the Interim Orderimposes average costs on Bay Area customers of $5.4 million annually. Again, annualimpacts have a large range, and can reach $200 million during a prolonged drought suchas the one experienced between 1987-1992.
Long-run economic impacts for San Francisco Bay Area- South region are illustrated inFigure 13. Even though the estimated average annual impact is $1.2 million, losses canreach over $44 million during a dry period. The sizable difference between the lowestand highest annual costs reflects the impact of the hydrologic sequence on the dynamicsof system operations.
Short-run Economic Impacts - SF Bay Area-South
-$10,000
$40,000
$90,000
$140,000
$190,000
$240,000
1921 1927 1933 1939 1945 1951 1957 1963 1969 1975 1981 1987 1993 1999
Year
Eco
no
mic
Imp
act
(Th
ou
san
d $
)
Figure 12: Annual Short-run Economic Impacts in the San Francisco Bay Area – SouthRegion

25
Long-run Economic Impacts - SF Bay Area-South
-$10,000
$0
$10,000
$20,000
$30,000
$40,000
$50,000
1922 1928 1934 1940 1946 1952 1958 1964 1970 1976 1982 1988 1994 2000
Year
Eco
no
mic
Imp
act
(Th
ou
san
d $
)
Figure 13: Annual Long-Run Economic Impacts in the San Francisco Bay Area Region
III.D. Indirect Economic Impacts
Indirect economic impacts resulting from changes in M&I deliveries are more complexthan impacts resulting from changes in agricultural water supplies. As described above,one of the main responses of urban districts to reduced SWP and CVP deliveries is toincrease investment in alternative water supply and conservation options. While suchinvestments increase the cost of water supply and therefore result in an economic loss,they can also stimulate spending and employment in the region.
The changes in water supply costs in the South Coast and San Francisco Bay – Southregions presented above are the result of three factors: (1) purchases of replacement wateron the water market, (2) development and operation of additional water supply,6 and (3)changes in system operational costs.7
The change in the cost of M&I water supply impacts statewide economic activity inseveral different ways. First, development and operation of new water supply by M&Iwater providers increases statewide economic activity. Higher costs for M&I water havethe opposite effect on economic activity by reducing household disposable income, local,state, and federal discretionary spending, and potentially corporate profits. The net impactmay be positive or negative depending on the import/export connections associated withincreased and decreased spending activities of the different economic sectors and
6 Primarily recycled water and conservation.7 The urban sector analysis also describes changes in levels of consumer surplus resulting from watershortages. Consumer surplus provides a measure of the change in economic welfare, which cannot bedirectly translated into changes in economic activity. The economic welfare losses from water shortageswere therefore excluded from the statewide economic impact analysis.

26
institutions affected.8 IMPLAN calculations conducted as part of this study indicate thatthe net effect of these changes in expenditures is small measured in terms of employmentor income.
The incremental water shortages resulting from the Wanger decision may haveemployment impacts. More frequent shortages may depress economic activity or promptfirms to locate in other regions with a more stable resource base. Calculation of theseimpacts would require information on how shortages are allocated at the retail level forurban water agencies receiving Delta exports. In the case of Southern California, thisexercise would entail going beyond MWD and contacting its member agencies and othersreceiving SWP water indirectly within the MWD service area.
IV. Direct Economic Costs of Reductions in Agricultural Water Supplies
The agricultural economy in the San Joaquin Valley depends in large part on waterexports from the Delta. This section of the report quantifies the direct impacts onagricultural activities resulting from Judge Wanger’s Interim Order for Delta smelt.
The Central Valley Production Model (CVPM) was used to estimate the direct economiccosts of the Interim Order to agricultural customers receiving water supplies from theDelta. CVPM is an optimization model that simulates the profit-maximizing decisions ofgrowers in the Central Valley, subject to constraints on land and water availability. Theanalysis considers impacts to growers in both the SWP and CVP service areas. Thissection describes the procedure used to set up and calibrate the CVPM, and the results ofthe analysis.
IV.A Central Valley Production Model
This analysis uses the version of CVPM developed for DWRs Common Assumptions forSurface Storage Investigations and specifically being used by Reclamation for evaluatingthe San Luis Low Point Project. However, that version of CVPM uses data from the basecalibration period, consisting of the three water years 1998, 2000, and 2001. All price andcost data had been indexed to 2002 levels. Three significant updates were made to thedata for purposes of the analysis here.
IV.A.1 Prices and Production Costs
Real crop prices received by California growers and real input costs have risendramatically in the last three years relative to their levels in the year 2002. Some portionof the price rise is likely to be temporary and related to droughts and commodity marketuncertainty. However, most analysts believe a portion of the price rise is permanent and aresult of fundamental shifts in global demand and supply. We do not attempt to identifypermanent from temporary changes, but we have escalated crop prices and variable cropproduction costs up to 2007 levels, using prices paid and prices received indexes
8 Import/export leakages refer to dollars that flow outside of the regional economy, in this case California,because of sector purchases and disbursements.

27
published by the U.S Department of Agriculture.9 Table 7 summarizes the crop and inputprice escalation factors used.
Table 7: Factors Used to Escalate Crop Prices and Costs
CategoryEscalation Factor
2002 to 2007CropGrain 1.79Rice 1.79Cotton 1.45Sugar Beets 1.03Corn 1.53Dry Beans 0.98Safflower 1.56Other Field 1.53Alfalfa 1.53Pasture 1.53Processing Tomatoes 1.11Fresh Tomatoes 1.11Cucurbits 1.11Onions and Garlic 1.11Potatoes 0.98Other Truck 1.11Almonds andPistachios 1.48Other Deciduous 1.48Sub Tropical 1.48Vine 1.48
Input Costs 1.33Source: USDA National Agricultural StatisticsService, 2008. Prices Paid and Prices ReceivedIndexes.
IV.A.2 Crop Acreage
Cropping patterns in the San Joaquin Valley have changed substantially since 2000. Inparticular, the shift toward permanent crops has been large, especially in some of theCVP delivery areas. Crop acreage used for CVPM calibration is based on the detailedland and water use analysis conducted by DWR in support of the California Water Planupdate (DWR, 2005). Years 1998, 2000, and 2001 were used in that report. DWR hassince updated crop acreage estimates for 2003. Unfortunately, such detailed crop acreage 9 The National Agricultural Statistics Service (NASS), Agricultural Statistics Board, U.S. Department ofAgriculture, “Agricultural Prices, Indexes of Prices Received by Farmers, by Month and Annual Average,”released January 30, 2004, January 31, 2007, and April 30, 2008.

28
and water use estimates are not available for more recent years. In order to represent themore recent crop mix, additional data sources were used.
Westlands Water District produces and publishes its own crop survey and 2007 acreage isthe most recent year available. The most striking changes between the calibration years(1999, 2000, and 2001) and 2007 are:
• Orchard and vineyard acreage increased dramatically. Almond and Pistachioacreage increased by a factor of about 2.5. Total acreage of permanent crops isnow almost 120,000 acres, almost one quarter of the irrigated acres in the District(up from about 50,000 in 2000).
• Cotton acreage dropped by almost half, from over 200,000 acres to about100,000 in 2007.10
The Kern County Agricultural Commissioner has also published on its website its mostrecent (2008) county-wide crop statistics.11 Whereas these are not broken down by waterdistrict or CVPM region, they can be used to create update factors that will produce abetter, though not precise, estimate of 2007 crop acres and crop mix. Patterns are similarto those observed for Westlands, though the percentage increase in permanent crops isnot as dramatic. Cotton also fell to less than half its acreage of less than a decade earlier.Alfalfa, corn and grain silage, and other field crops also increased substantially.Permanent crops (orchards and vineyards) now represent just over one quarter of theirrigated acres in Kern County.
IV.A.3 Groundwater Pumping
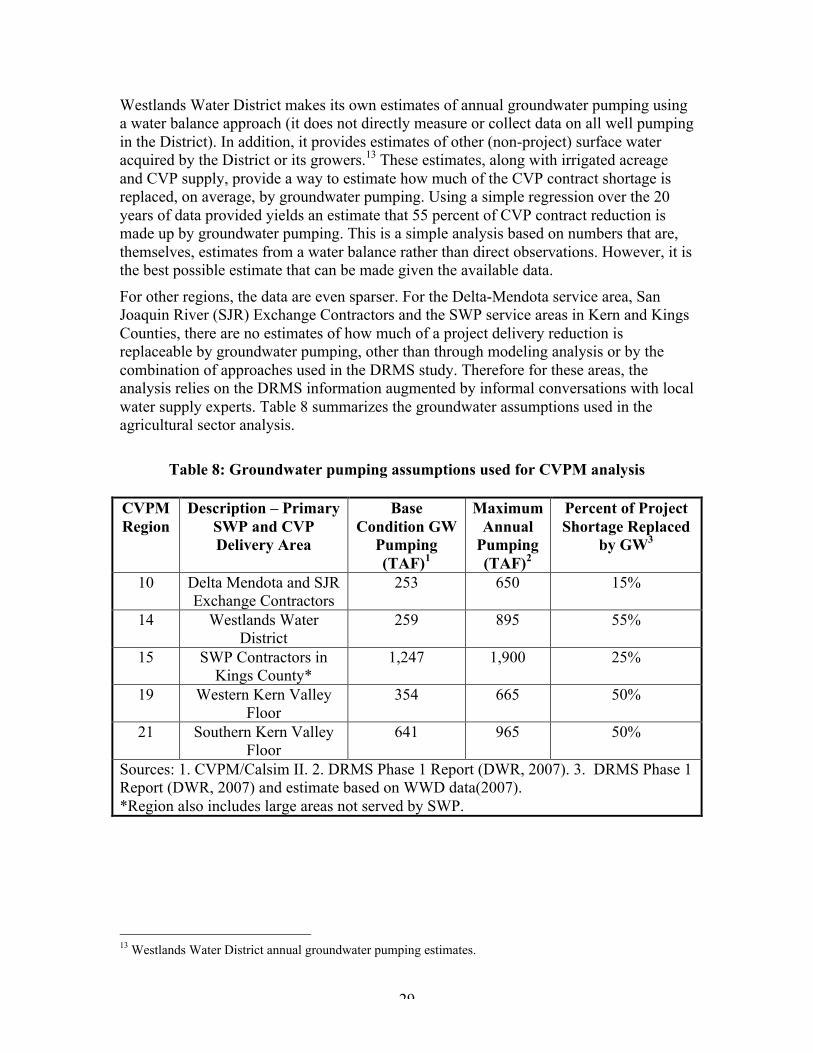
One of the most important issues affecting the cost of surface water reduction is theextent to which growers can replace that loss with groundwater pumping. Unfortunately,no comprehensive and reliable data are gathered on groundwater pumping that can beused to estimate this based on actual observations. In the past, CVPM has been usediteratively with a groundwater model to assess the hydrologic effects of and limitationson groundwater replacement. DWR and others have estimated groundwater pumpingbased on water balance calculations and on changes in depth to groundwater inobservation wells.
Recently, groundwater and agriculture experts estimated the availability of groundwaterin the Delta export region to replace a loss of surface water from SWP and CVP deliveryfacilities.12 The Delta Risk Management Strategy (DRMS) Phase 1 report used acombination of districts’ responses to a survey, water balance and depth-to-watercalculations, and groundwater model estimates to derive groundwater pumpingparameters by CVPM region. For each region they provided an estimate of monthly andannual pumping capacity, cost, and drawdown. In addition, survey respondents providedan estimate of the portion of their district with access to usable groundwater.
10 Westlands Water District 2007 Crop Survey11 Kern County Agricultural Commissioner 2008 Crop Statistics12 The Delta Risk Management Strategy Phase 1 Report
29
Westlands Water District makes its own estimates of annual groundwater pumping usinga water balance approach (it does not directly measure or collect data on all well pumpingin the District). In addition, it provides estimates of other (non-project) surface wateracquired by the District or its growers.13 These estimates, along with irrigated acreageand CVP supply, provide a way to estimate how much of the CVP contract shortage isreplaced, on average, by groundwater pumping. Using a simple regression over the 20years of data provided yields an estimate that 55 percent of CVP contract reduction ismade up by groundwater pumping. This is a simple analysis based on numbers that are,themselves, estimates from a water balance rather than direct observations. However, it isthe best possible estimate that can be made given the available data.
For other regions, the data are even sparser. For the Delta-Mendota service area, SanJoaquin River (SJR) Exchange Contractors and the SWP service areas in Kern and KingsCounties, there are no estimates of how much of a project delivery reduction isreplaceable by groundwater pumping, other than through modeling analysis or by thecombination of approaches used in the DRMS study. Therefore for these areas, theanalysis relies on the DRMS information augmented by informal conversations with localwater supply experts. Table 8 summarizes the groundwater assumptions used in theagricultural sector analysis.
Table 8: Groundwater pumping assumptions used for CVPM analysis
CVPMRegion
Description – PrimarySWP and CVPDelivery Area
BaseCondition GW
Pumping(TAF)1
MaximumAnnual
Pumping(TAF)2
Percent of ProjectShortage Replaced
by GW3
10 Delta Mendota and SJRExchange Contractors
253 650 15%
14 Westlands WaterDistrict
259 895 55%
15 SWP Contractors inKings County*
1,247 1,900 25%
19 Western Kern ValleyFloor
354 665 50%
21 Southern Kern ValleyFloor
641 965 50%
Sources: 1. CVPM/Calsim II. 2. DRMS Phase 1 Report (DWR, 2007). 3. DRMS Phase 1Report (DWR, 2007) and estimate based on WWD data(2007).*Region also includes large areas not served by SWP.
13 Westlands Water District annual groundwater pumping estimates.

30
IV.B Modeling Framework
After CVPM was modified to incorporate the changes just described, the model was runincrementally imposing 5% project (SWP and CVP) supply reductions. CVPM estimatedacres taken out of agricultural production, increased groundwater pumping, and theoverall value per acre-foot of water supply lost. This last value is also referred to ineconomics as the marginal value of water, often termed by economists the “shadowprice” of water. The shadow price is an estimate of the economic value to agriculturalproduction of one additional acre-foot of water supply. “Economic value to agriculture”in this sense means the additional net revenue and consumer benefits gained from havingthe extra acre-foot of water available for crop production. Correspondingly, whenagricultural water supply is reduced as a result of additional restrictions on Delta exports,the shadow price is an estimate of the economic cost per acre-foot of water supply lost.
CVPM estimates the shadow price of water for each region, based on its internalcalculation (estimation) of how growers in that region will respond to a reduction insurface water delivery. In CVPM, the response can be a combination of reducedproduction, increased groundwater pumping, and increased irrigation efficiency.14
The model was run in increments of project water supply reduction in order to generate aspectrum of shadow price estimates that could be applied to different delivery years overthe 82-year hydrologic sequence. The shadow price is relatively low in wet and abovenormal water years and becomes much larger in dry and critically dry years. The rate atwhich the shadow price increases with increasing shortage depends on the availabilityand cost of replacement supply (groundwater) and the net revenue of crops that arefallowed rather than irrigated with groundwater (for example, if groundwater is notavailable or usable, or is more expensive than the crop is worth).
The steps in the analysis were the following:
1. Revise CVPM to incorporate the three data updates described above.
2. Run CVPM in increments of project water reduction, saving the total projectwater delivered and the shadow price of water. Estimate functional relationshipbetween shadow price and project delivery for SWP and CVP areas.
3. Estimate how much of the total annual SWP or CVP delivery predicted by theCALSIM II runs represents agricultural delivery.
4. Estimate the SWP and CVP agricultural delivery for each year in the CALSIM IIpre-Interim Order condition results.
5. Use the CALSIM II-assigned water-year types to calculate an average pre-InterimOrder SWP and CVP agricultural delivery by water-year type.
6. Use the functional relationship in step 2 above to calculate the implied shadowprice by year type for SWP and CVP agricultural delivery by water-year type (seeFigures 14 and 15 below).
14 CVPM does not estimate water transfers from outside a region as an endogenous calculation of the model– the quantity of any transferred water must be estimated separately and provided as an input to CVPM.Another version of CVPM does estimate interregional transfers, but that model has not been updated inrecent years and is not available for use in this report.

31
7. Estimate the agricultural portion of delivery reductions (difference between pre-Interim Order and post-Interim Order CALSIM II results) by year and calculatethe average by water-year type (see Figure 16 below).
8. Multiply the reductions estimated in step 7 by the shadow prices from step 6 tocalculate direct agricultural economic costs of the Interim Order, by year type, forboth SWP and CVP delivery areas (see Figures 17 and 18 below).
IV.C SWP Agricultural Deliveries
Based on the revisions to allocation and shortage criteria adopted as part of the MontereyAmendments, agricultural and municipal and industrial (M&I) contractors receive equalpercentage allocations of their SWP Table A contract amounts.15 According to the SWPTable A amounts listed in Bulletin 132-05 (California DWR, 2006), contract quantities toagricultural suppliers in the Delta export area are approximately 28% of the sum of SWPagricultural and M&I deliveries. Two other significant SWP delivery quantities inCALSIM II are so-called Article 21 surplus water deliveries and Article 56 voluntarycarry-over deliveries. The agricultural proportion of these two categories varies from yearto year. For purposes of this analysis, the SWP agricultural deliveries are estimated as afixed proportion (28%) of total SWP deliveries reported by CALSIM II.
IV.D CVP Agricultural Deliveries
The available CALSIM II results include a time series of the percent of contract quantitydelivered to CVP agricultural contractors south of the Delta (excluding San Joaquin RiverExchange contract deliveries). For purposes of this analysis, we have used the followingassumptions to generate a time series of CVP agricultural deliveries in the Delta exportregions:
• All CVP agricultural water service contractors south of the Delta receive the samepercent delivery (that is, no transfers, exchanges, or other arrangements amongcontractors, and no delivery restrictions that would vary the percent of contractdelivery across contractors).
• Contract totals are as reported in the Bureau of Reclamation’s 2005 IrrigationRate Book (USBR, 2005).16
IV.E Direct Agricultural Impacts
CVPM was used to generate estimates of the marginal value, or shadow price, of water intwo regions as surrogates for SWP delivery areas and CVP delivery areas respectively.CVPM Region 19 includes a significant amount of Kern County Water Agency’s SWPagricultural delivery. The region includes Belridge Water Storage District, BerrendaMesa Water District, Devil’s Den WD, Lost Hills WD, Semitropic WSD, and portions of
15 Monterey Amendments16 Bureau of Reclamation, Irrigation Rate Book, USBR, 2005; More recent rate books did not reportcontract maximum quantities as part of their projected deliveries.

32
Buena Vista WSD and West Kern WD. It receives no CVP delivery and has limitedaccess to other local surface water supplies.
As illustrated in Figure 14, the estimated shadow price of water ranges from about $120per acre-foot in wet years to just over $200 per acre-foot in critically dry years. TheseCVPM estimates assume that the available groundwater in the region can be used tooffset some of the SWP shortage, either directly or through within-region exchanges. Inreality, some areas within this region have good access to groundwater replacement at alower cost than $200 per acre-foot, while other areas do not and would suffer aneconomic loss higher than $200 per acre-foot.
Figure 14: Shadow Price of Water in CVPM Region 19 by Water Year Type
CVPM Region 14 represents Westlands Water District, a CVP water service contractorthat receives no SWP water and has limited access to other surface supplies throughexchanges and transfers. As illustrated in Figure 15, the marginal value of water, asestimated by CVPM, ranges from $115 per acre-foot in wet years to over $300 per acre-foot in critically dry years. Similar to Region 19 described above, these estimates assumethat some limited amount of groundwater is available to replace some of the reductions inCVP supply, either directly or through exchanges within the region. Actual price valueswill vary across the region.
Direct Agricultural Cost per Acre Foot of SWP Delivery Reductionby Year Type, in $/AF
0
50
100
150
200
250
Wet Above Normal Below Normal Dry Critical
Water Year Type
$/A
F

33
Figure 15: Shadow Price of Water in Westlands Water District by Water Year Type
IV.F Direct Impacts on Agricultural Water Users
The CALSIM II results were used to calculate the difference between deliveries in thepre-Interim Order model run versus the post-Interim Order run. Figure 16 summarizes thetotal reduction in SWP and CVP deliveries for Delta export irrigation, using theassumptions described above. The largest volume of reductions is in the wet, above-normal, and below-normal years.
Direct Agricultural Cost per Acre Foot of CVP Delivery Reductionby Year Type, in $/AF
0
50
100
150
200
250
300
350
Wet Above Normal Below Normal Dry Critically Dry
Water Year Type
$/A
F

34
Figure 16: Estimated SWP Irrigation Delivery Reductions by Year Type
For each project and year type, the direct economic costs were calculated by multiplyingthe volume of reduction in irrigation deliveries by the shadow price of water. Note that,although the shadow prices were estimated for the surrogate regions, they are multipliedby the total estimated reduction in deliveries to all affected areas (not only the surrogateregions).
Figure 17 summarizes the results for the SWP Delta export agricultural deliveries, andFigure 18 summarizes the results for the CVP. Table 9 contains an overall summary of
Annual SWP Irrigation Delivery Reductionby Year Type, in Acre Feet
-200,000
-150,000
-100,000
-50,000
0
Wet Above Normal Below Normal Dry Critical
Water Year Type
Acr
e F
eet
Annual CVP Irrigation Delivery Reductionby Year Type, in Acre Feet
-300,000
-250,000
-200,000
-150,000
-100,000
-50,000
0
Wet Above Normal Below Normal Dry Critically Dry
Water Year Type
Acr
e F
eet

35
direct economic costs of the delivery reductions, for each year type and for the overallaverage.
Figure 17: Estimated Direct Economic Cost of SWP Irrigation Delivery Reductions byYear Type
Figure 18: Estimated Direct Economic Cost of CVP Irrigation Delivery Reductions byYear Type
Annual Direct Agricultural Cost of SWP Delivery Reductionby Year Type, in Million Dollars
-25
-20
-15
-10
-5
0
Wet Above Normal Below Normal Dry Critical
Water Year Type
Mill
ion
$
Annual Direct Agricultural Cost of CVP Delivery Reductionby Year Type, in Million Dollars
-50
-40
-30
-20
-10
0
Wet Above Normal Below Normal Dry Critically Dry
Water Year Type
Mill
ion
$

36
Table 9: Summary of Direct Agricultural Economic Costs from SWP and CVPIrrigation Delivery Reductions
AnnualAverage Wet
AboveNormal
BelowNormal Dry
CriticallyDry
SWP Direct Agricultural CostsReduction inDelivery TAF 139 143 175 157 127 86Direct Cost perAF $/AF $ 141 $ 121 $ 130 $ 135 $ 161 $ 202Total DirectCost
million$ $ 19.5 $ 17.3 $ 22.8 $ 21.3 $ 20.5 $ 17.3
CVP Direct Agricultural CostsChange inDelivery TAF 161 144 250 226 139 63Direct Cost perAF $/AF $ 180 $ 116 $ 166 $ 187 $ 239 $ 332Total DirectCost
million$ $ 28.9 $ 16.6 $ 41.4 $ 42.1 $ 33.2 $ 21.0
Total Direct Agricultural CostsChange inDelivery TAF 299 287 426 383 266 149Total DirectCost
million$ $ 48.4 $ 34.0 $ 64.3 $ 63.4 $ 53.7 $ 38.3
IV.G Dynamic Considerations Relating to Groundwater Pumping
Groundwater management involves dynamic considerations because pumping in one yearcan affect economic decisions in other, subsequent years. Such intertemporal effectstypically occur through changes in the stock of groundwater over time. When the stock ofgroundwater affects profitability (usually because groundwater elevation affects pumpingcosts), measuring economic impacts with reference to a single year can underestimate theactual effects of a change in the water management regime.
Westlands Water District provides a good example of this phenomenon. District staffmembers report that the safe yield of the aquifers underlying the district is about 175,000acre-feet annually. As described above, the CVPM incorporates the assumption thatWestlands farmers may, at least temporarily, extract groundwater at a rate well in excessof the safe yield. There are several physical consequences of such groundwater depletion.First, by reducing the stock of groundwater, pumping in excess of safe yield will lowerthe elevation of groundwater and increase pumping costs. Second, overdraft can result inland subsidence, at least at a local scale. This circumstance may have economicconsequences, involving a permanent loss of storage capacity in at least a portion of theaquifer, and damage to canals, roads, foundations and other infrastructure.
37
The CVPM does not incorporate these dynamic effects. Rather, the model treatsgroundwater as a reserve supply that is available up to some defined monthly pumpingcapacity. In the model, the cost of switching to groundwater is the difference between thecost of groundwater and the cost of surface supplies. If groundwater and water transfersare unable to return farmers to their original level of water use, then fallowing is assumedto occur. Growers lose net income (revenues minus variable costs) when they are forcedto fallow their land.
In this context, it is important to note that the economic value of Article 21 supplies isunderestimated by CVPM. Article 21 supplies are primarily available in wet years, andCVPM treats these supplies as used in the year they are delivered. This assumption isfactually incorrect, as Article 21 supplies are banked for use in future years. To estimatethe magnitude of the undervaluation of Article 21 supplies, consider the shadow values ofwater presented in Figure 6. Assuming that the marginal value of banked water is $250per acre-foot in dry years, the cost of storage and extraction is $100 per acre-foot, Article21 water is purchased at $28 per acre-foot, and the net value of Article 21 water is $122per acre-foot. In years in which Article 21 water is available, the Interim Order reducesArticle 21 supplies by just over 150,000 acre-feet annually. Under the assumption thatagriculture receives 28% of Article 21 supplies, a static model like CVPM that treatsArticle 21 and Table A water the same would underestimate the value of Article 21 waterby just over $5.1 million annually.
IV.H. Indirect and Employment Impacts of Delivery Reductions
The indirect and labor market impacts of the Interim Order are calculated using theIMpact analysis for PLANning (IMPLAN) framework developed by the U.S. ForestService. IMPLAN is a standard model for measuring regional economic impacts, and isbased on a Social Accounting Matrix, or input-output framework. The IMPLAN modelcan be used to calculate the employment losses associated with the reductions in watersupplies.
Changes in farm revenues were measured using the same CVPM framework that wasused to calculate producer losses in the agricultural sector. Table 10 summarizes theseresults by crop category. The pattern of impacts differs between the SWP and CVPservice areas. In SWP districts, the largest revenue losses occur in the forage and cottonsectors due to the relative abundance of these crops and their low value per unit of water.In the CVP service area, the largest impacts are in the cotton and vegetable sectors. Thisfinding is significant from an indirect impacts perspective because vegetable cropsrequire much more input application per acre than field crops. Thus, the impact offallowing on the rest of the economy can be larger.

38
Table 10: Average Annual Crop Revenue Losses from SWP/CVP DeliveryReductions (Mil $/Yr)
Cotton
FoodGrain
s
FeedGrain
sForag
eFruits/Nuts Veg
SugarCrops
OilSeeds Total
SWPServiceArea $5.63 $1.82 $2.32 $9.37 $2.78 $0.66 $0.01 $0.00
$22.60
CVPServiceArea $14.53 $1.86 $2.71 $4.12 $3.73 $11.32 $0.28 $0.22
$38.75
Total $20.16 $3.67 $5.03 $13.49 $6.51 $11.98 $0.29 $0.22$61.3
5
Table 11 summarizes the impacts to employment, which were calculated in IMPLAN,using the CVPM revenue losses as an input. The analysis indicates that 720 jobs are lostas a result of changes in irrigation water supplies resulting from the Interim Order. Joblosses are larger for CVP impacts (even though water supply losses are less for the CVPsystem) because CVPM predicts that vegetable acreage is fallowed to conserve water.
Table 11: Job Losses in the San Joaquin Valley
CVP SWP TotalLost Jobs 458 262 720
Copyright © 2022 FDOKUMEN