Economic Costs to Society. of Alcohol and Drug Abuse and ...
242
, 'i r ., .. " ':1 " 'r' ; .. " ." ' .. r' : t .. • I • ... : I , c. p .. .. , ': .. " o /17g- 21J RESEARCH TRIANGLE INSTITUTE : , . :.!. June 1984 , .. Economic Costs to Society. of Alcohol and Drug Abuse and Mental Illness: 1980 C-R-SENT 01-oS-90 POST OFFICE BOX 12194 - U,S, Department of Justice National Instliute of Justice 117820 This document has been reproduced exacJly as received from the or organization originating it. Points of view or opinions stated In this document, are thos,e of the authors and do not necessarily the official position or policies of the National Institute of Juslice, Permission to reproduce this copyrighted material has been granted by Research Triangle Institute to the National Criminal JusJlce Reference Service (NCJRS), Further reproduction outside of the NCJRS system requires permis- sion of the copyright owner, Henrick J. Harwood Dia"e M. Napolitano Patricia L Kristiansen James J. Collins RESEARCH TRIANGLE PARK. NORTH CAROLINA 27709 If you have issues viewing or accessing this file contact us at NCJRS.gov.
-
Upload
khangminh22 -
Category
Documents
-
view
0 -
download
0
Transcript of Economic Costs to Society. of Alcohol and Drug Abuse and ...

~ ,
'i r
.,
.. " ':1
"
'r' ; .. "
." ' ..
r' :
t .. • I • ~
... : I
,
c.
p ..
.. , ': ..
"
o
/17g- 21J
RESEARCH TRIANGLE INSTITUTE
: ,
. :.!.
June 1984 RTl/2i.34/~FR
, ..
Economic Costs to Society. of Alcohol and Drug Abuse and Mental Illness: 1980
C-R-SENT 01-oS-90
~r\
POST OFFICE BOX 12194
-
U,S, Department of Justice National Instliute of Justice
117820
This document has been reproduced exacJly as received from the pers~n or organization originating it. Points of view or opinions stated In this document, are thos,e of the authors and do not necessarily repr~sent the official position or policies of the National Institute of Juslice,
Permission to reproduce this copyrighted material has been granted by
Research Triangle Institute
to the National Criminal JusJlce Reference Service (NCJRS),
Further reproduction outside of the NCJRS system requires permission of the copyright owner,
Henrick J. Harwood Dia"e M. Napolitano Patricia L Kristiansen
James J. Collins
RESEARCH TRIANGLE PARK. NORTH CAROLINA 27709
If you have issues viewing or accessing this file contact us at NCJRS.gov.

June 1984 RTIl27J4Ico-o1FR
Econom"ic Costs to Society of Alcohol and Drug Abuse and Mental Illness: 1980
•
" Submitted by:
Henrick J. Harw:xx:f Diane M. Napolitano
Patricia L Krist:iar..sen James J. Collins
Research Triangle Institute
Submitted to: Alcohol, Drug Abuse, and Mental Health kiministration
Office of Program Planning and Coordination Parkfawn Building, Room 13C·15
5600 Fishers Lane Rockville, MD 20857
Under terms of Contract No. ADM 283-83-0002

ACKNOWLEDGEMENTS
The authors waul d 1 i ke to express thei r thanks to severa 1 persons for their assistance in this project. As Project Officer, Mr. Mel Segal, a Senior Program Analyst in the Alcohol, Drug Abuse, and Mental Health Administration, has provided guidance throughout the study and was invaluable in coordinating review of the work by the respective national institutes. Review of the project was, p~vided by Mr. Loran Areh~r, Ms. Barbara Sauter, and Ms. Joan White of the National Institute on Alcohol Abuse and Alcoholjsm, Dr. Richard Lindblad and Ms. Susan Becker of the National Institute on Drug Abuse and Mr. Paul Widem and Or. Carl Taube of the National Institute on Mental Health. The study benefitted fram the assistance and review offered 'by Dr •. Thomas Hodgson of the National Center for Health Sta,tistics and Dr. lra Raskin of the National Center for Health Services Research. Many other persons in these agencies also facilitated the work.
The authors had both the privilege and benefit' of working'with ·an adivsory panel of distinguished researchers in the initial phase of the project: Dr. Cherry Lowman, Dr. Ira Cisin, Dr. Richard Clayton, Dr. Jerome Jaffe, Or. George Banziger, Or. Jeffrey Rubin, and Or. Herbert Schlesinger. They participated in a review of the study methodology and made recommendations for future improvements. Their contributions are primarily reflected in section V.
Finally, this effort has benefitted from the detailed review and assistance of many colleagues at the Research Triangle Instttute. These include Ms. Elizabeth Cavanaugh, Dr. Alvin M., Cruze, Mr. J. Valley Rachal, and Dr. Robert Hubbard, all of whom contributed their experience and expertise.

I.
II.
III.
TABLE OF CONTENTS
INTRODUCTION AND SUMMARY • • •
A. B. c. D. E.
Background • • • • • • • Objectives and Approach •• Resul ts . . . . . . . . . . . Comparison With Previous Study Organization of This Report • •
Page
1
1 1 3 6
.11
CONCEPTUAL PRINCIPLES FOR COST OF ILLNESS STUDIES 13
A. Background..... B. Conceptual Framework C. Specific Issues . • • D. Definition of ADM. E. Prevalence of ADM •••
COST ESTIMATES • . • . • •
• • • • 13 • • .. 15
19 Z3 24
. . . . .. 33
A. Introducti an • • • • • . • . • • • 33 B. Core Direct Costs--Treatment . • •• •• 33 C. Core Direct Casts-Support. • • • • .• , 44 D. Core Indi rect . Costs-MQrta 1 i tY • . • • . 44 E. Core Indirect Costs-Morbidity • • . . • • • . .53 F. Other Related Direct Costs • •. •• • • 71 G. Other Related Indi rea Costs • • as
IV. FRAMEWORK FOR EXTENSION OF RESULTS TO PROGRAM EVALUA-TION AND PUBLIC POLICY OECISIONMAKING • • . • 95
A. B. C. D. E. .. 1".
G. H. I. J. K.
Define the Problem •.•..• State Objectives •. .• • . . Identify Alternatives ..•.. Analyze Benefits and Effects . . . . . • Analyze Costs • • • . • • . . • • • • Differentiate Perspective of Analysis Perform DiscDunting •• Analyze Unce~inties . Address Ethical Issues Interpret Results • • • Conclusion • • • • ••
· . .. 98 98 99
101 104 105
· 107 · . • . 108
• 109 • 110 • 110
V. FUTURE DIRECTIONS IN ADM COST OF ILLNESS STUDIES .• 113
A. B. C. D. E. F. G.
Overlaps in the ADM Populations ..... . The Effect of ADM in the Workplace ... . ADM Overlaps in Specialty Treatment Settings ADM and ather Health Problems •...• Crime and ADM • . . • . . . . . . . . . Fetal Alcohol Syndrome in Adult Cohorts Conclusions
REFERENCES . . . .
ii
113 115 117
• • 118 . . 119
· 120 121
· 123

APPENDIX
SECTION A:
SECTION B:
SECTION C:
SECTION 0:
SECTION F:
SEmON F:
SECTION G:
THE IMPACT OF ALCOHOL AND DRUG ABUSE ON PRODUCTIvm IN THE WORKFORCE • • • • • • A-l
A. Introduction................ A-3 B. Cast of Illness Studies and Productivi~ •• A-3 C. Approach of thi s Study • • A-7 D. Discussion..... • • • • A-24
FETAL ALCOHOL SYNDROME • • • •
A. B.
Incidence of FAS • • • • • • Economic Implications of FAS ••
RESEARCH DEVELOPMENTS ON THE RELATIONSHIPS
8-1
B-3 B-5
AMONG MENTAL ILLNESS, DRUG ABUSE, AND CRIME. •• C-' A. Introduction........... • C-3 B. Mental Illness and Crime. • • . • • • . Ce 3 C. Drug Abuse and Vi alent Cri me • ~ • .'. . C-S
ADMINISTRATIVE COSTS'O~ PUBLIC SOCIAL WELFARE PROGRA.MS • • • • • • • • • • • • • • • • • • •• 0"1
OTHER IMPACTS OF ADM ON THE ECONOMY ••
A. B.
C.
D. E.
Introducti on . . . . . . . . . . . . . . Expenditures on' Alcoholic Beverages and 111 i ci t Drugs • • • . • • . • . . • . • • . Property Crime Transfers Associated with Drug Addiction . . . . • • • • . • • • • Public Transfer Payments to ADM Victims Sources of Payments for Health Care Expendi tures • • • • • • • • • • • • • •
ALCOHOL ABUSE RELATED GASTROIN'TESTINAL TRACT . CANCERS • • • • .. • • • • • •
E-l ,
E-3
E-3
E-G E-9
E-ll
F-l
A. Introduction..... F-3 B. Evidence on the Link • • • • • • F-3 C. Potenti a 1 Costs • • • • • • • • F-4
PROTOCOL FOR UPDATING COST ESTIMATES G-l
A. Introduction....... . .. ... G-3 B. Sources of Changes in the ADM Cost Estimates
Over Time . . . . . . • . • . . . G-4 C. A Simplified Cost Update Protocol .... G-6 O. An Example of Using the Protocol G-11 E. A Fi na,1 Cauti onary Note. .... G-13
iii
J.

UST OF TABLES
Table ,.-Costs to Society of Alcohol Abuse, Drug Abuse and Mental III ness, )980 • • 0 • ••• • • • • • ','
I"l 4
Change in Cost to Society of Alcohol Abuse, 1977-1980 • • • • • • • • • • • • •
1-2 7
Change in Cost to Society of Drug Abuse, ,1977-1980 .•••• " •••.•. ! ••
1-3 • • • •• 10
Change in Cost to Society of Mental Illness, 19n-1980 . . . " . . . . . . . . . . . . .
1-4 10
11-1 Cost Elements for Cost-af-Il1ness Studies . 20
11-2 Six Manth Prevalence of Mental Illness, Alcohol Abuse/Dependence and Drug Abuse/Dependence in Three COlDIDun; ti es •.• • • • • • .. • .. • • • • • • • • • ... 26
II-3 Prevalence of Problems Associated with Drinking in the Past 12 Months for Males and Females in the 1967 and 1979 National Surveys. " .• ' •. : . • ..•. ~7
II-4 Trends in Alcohol Consumption, 1971-1979, by Type of Drinker and Sex (in Percentages) •••.•• 29
11-5 Prevalence of Drug Abuse by Type ot Drug and Age Group, 1982 . . . • . • . • . • . . • . • . . • • .. 30
1I-6
III-l
III-2
Use of Drugs in Past Month, 1972-1982, by Young Adults ................. e .... .
Costs to Society of Alcohol Abuse, Drug Abuse, and Mental Illness, 1980 ••••.••
Table Reference List for Chapter 3 ••
31
34
35
111-3 Sources of Costs and Diagnostic Data Used to Estimate Costs for ADM Settings, 1-980 • . . . • . . . • • • . . 36
III-4
1II-5
1II-6
III-7
III-8
Diagnostic Categories Used to Estimate ADM Treatment Costs •••••••••• .• • • • • • .
ADM Costs by Setting, 1980 ........ .
Support Costs for ADM Health Care Provision, 1980
Causes of Mortality Related to Alcohol Abuse.
Causes of MOT·tality Related to Drug Abuse .
iv
40
43
45
46
49

Table -111-9 Causes of Mortality Related to Mental Illness • • •• Sl
III-10
III-ll
III-l2
III" 1 3
III-14
III-1S
II1-16
Present Values of Expected Future Lifetime Earni ngs and Housekeepi ng Servi ces Accardi ng to . Age, Sex, .and Discount Rate. 1980 • • • • • • • • •• 54
Economic Casts of Mortalities Due to Alcohol Abuse -for Various Discount Rates, 1980 •••••••••
Economic Cost of Mortalities Due to Drug Abuse.-for Various Discount Rates, 1980 •••••••••
Economic Cost of Mortalities Due to Mental Illness -for Various Discount Rates, 1980 •••••••••
Values of Market and Household Productivity by Age and Sex Cohort, 1980 • • • • • • • • • • • • • • •
S5
56
57
58
u.s. Labor Force and Employment by Age and Sex, 19~0. 59
Proportions of Age-Sex Cohorts with Problems Due to Alcohol Abuse ..•••.•••••.•••.•
• 60
111-17 Proportions of Age-Sex Cohorts'wit~ Productivity Reductions Due to Alcohol Abuse • • • • • • • • • 61 .
11I-18 Reduced Productivity i".1980: Alcohol Abuse . Number of Problem Drinkers and Value of Reduced Productivity, by Age and Sex Cohort • . . • • • 63
111-19 Lost Employment in 1980: Victims of Alcohol-Related Trauma (Accidents and Violence) . . • • • . • • 64
I1I-20 Lost Employment in 1980: Persons with Physical Impairments Due to Alcohol Abuse. • • • • 65
111-21 Value of Lost Employment in 1980: Alcohol Abusers
III-22
III-Z3
III-24
III-25
in Residential Treatment • . • • • • • • • • • 66
Labor Force Age-Sex Cohorts with Productivity Reductions Due to Drug Abuse • • . • • • • . • . • •• 67
Reduced Productivity in 1980: Drug Abuse Number of Problem Users and Value of Reduced Productivity, by Age and Sex Cohort . • . . 68
Value of Lost Employment in 1980: Drug Abusers in Residential Treatment . . . . . . . . . . . 69
Reduced Productivity in 1980: Mental Illness, Partial Work Disability, Number of Persons and Value of Reduced Productivity . . ..
v
72

!!ill III-26
III-Z7
UI-Z8
III-Z9
III-30
III-31
1II-32
III-33
1II-34
I II" 35
1II-36
1II-37
III-38
III-39
Lost Employment in 1980: Menta1 Illness, Complete Work Disability, Number of Persons and Value of Lo~t Emp 1 oyment • • • •. • • • • • • • • • • • • • •• 73
lost Employment in 1980: Mental Illness, Number of Adults (aged 16-64) Institutionalizea and Value of lost Employment • • • • • • • • • • • • • • • • • • • 74
Motor Vehicle Crash Costs Due to Alcohol Abuse, 1980 0 75
Alcohol Abuse: Other Related Direct Costs .. Public Financed Criminal Justice System, 1980 0 • • • • 76
Drug Abuse: Other Related Direct Costs .. Public Financed Criminal Justice System, 1980 •.• 0 • 79
Mental Illness: Other' Related Direct Costs - Public Financed Criminal Justice System, 1980 . 0 0 • 0 81
Private Expenditures Related to Crime in 1980 8Z
Property Destruction Due to Crime .in 1980 0 0 84 . Public Program Social Welfare Administrative Expenditures and Costs Due to. ADM Problems, 1980 0 • 0 • 0 • 85
Public Program Social Welfare Administrative Expendi-tures and Costs Due to ADM Prob 1 ems, 1977 0 • 0 86
Additional Other Related Direct Costs Due to A 1 coho 1 and Drug Abuse and Mental III ness i 1980 0 0 ~, 87
Lost Work Ti me Due to Cri me in 1980: Number of ;-.t:: Persons and Value of Reduced Productivity 0 0 '0 •• 7 89
Drug Abuse Costs of lost Productivity Due to Crime Careers in 1980: Number of Persons Fore.goi ng Leg; ti-mate Productive Pursuits and Value of Loss 0 • 0 90
Lost Productivity Due to Incarcerations in 1980: Number and Proportions of Incarcerations Due to Alcohol and Drug Abuse and Value of Loss •• 0 • 93
IV-l Examples of ADM Public Strategies and Programs .•.. lOa
IV-2 Benefits and Costs to be Assessed in CBA or CEA Ana 1 ys is. . . . . . . . 0 • • • • • • •
102
vi
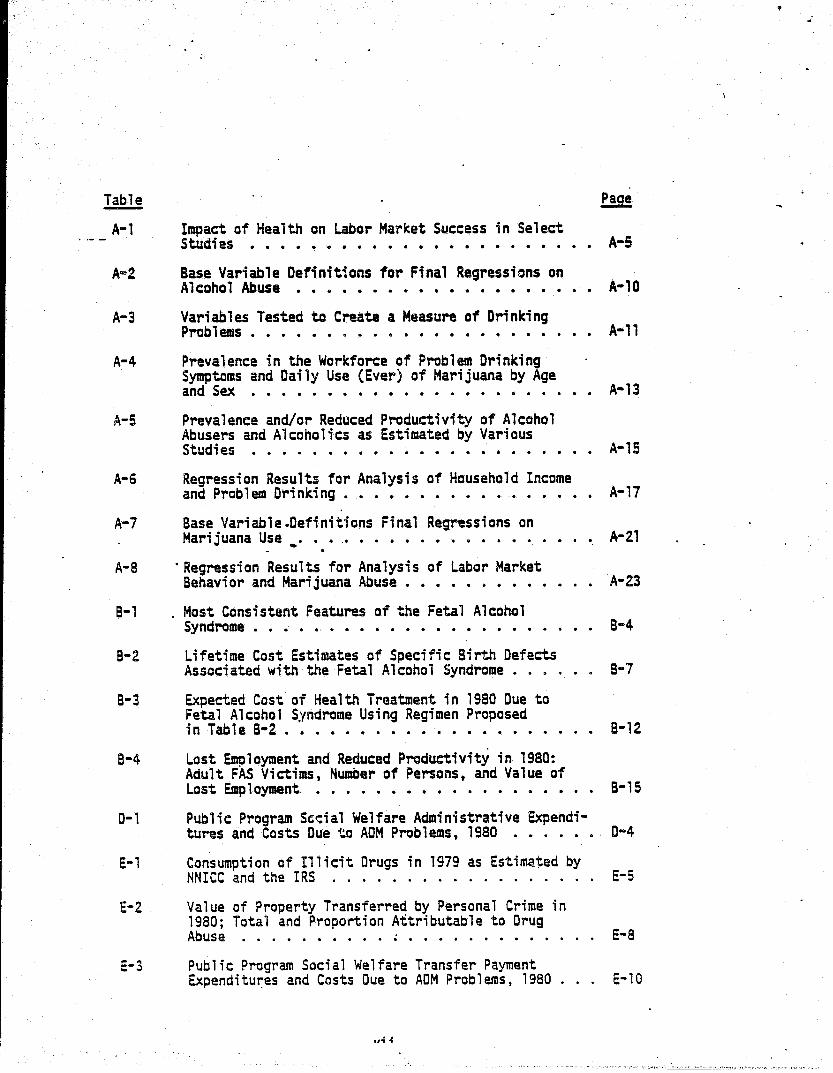
A-l Impact of Health on Labor MarKet Success in Select S tucli es .. . . . .. . . . . . . . . . . . . . . . .. A-S
A~2 Base Variable Definitions for Final Regressions on Alcohol Abuse • • • • • • • • • • • • • • • • • • A-l0
A-3 Variables Tested to Create a Measure of Drinking Prob 1 ems . . . . • • . • . • . • . . • • • . • . . A-ll
A-4 Prevalence in the Workforce of Problem Drinking Symptoms and Daily Use (Ever) of Marijuana by Age and Sex . • . • • • • • • • • • • • • • • 0 • • • A-13
A-5 Prevalence and/or Reduced Productivity of Alcohol Abusers and Alcoholics as Estimated by Various Stud; es . . . . . . . . . . . . . . . . • . . . . .. A-15
A-6 Regression Results for Analysis of Household Income and Prob 1 em Dri nki ng • • 0 • 0 • 0 • • 0 o· • 0 • 0 •• A-17
A-7 Base Variable.Definitions Final Regressions on Marijuana Use .. 0 0 .0 • 0 • 0 • • • • • • 0 • 0 .'\-21
A-a . Regression Results for Analysis of Labor Market Behavior and Marijuana Abuse ••• 0 0 ••• 0 • A-Z3
B-1 Most Consistent Features of the Fetal Alcohol Syndrome • • .. • •. • • • • • • • • • • • • • • B"4
B-2 Lifetime Cost Estimates of Specific Birth Defects Associated with the Fetal Alcohol Syndrome • • . . B-7
B-3 Expected Cost of Health Treatment in 1980 Due to Fetal Alcohol Syndrome Using Regimen Proposed in Table B-2 0 ••••••••••• 0 • 0 • • • 0 B-12
8-4 Lost Employment and Reduced Productivity in 1980: Adult FAS Victims, Number of Persons, and Value of Lost Emp 1 oyment 0 0 • • • • • • 0 • • 0 0 0 • 0 0 0 0 B-1 S
0-1 Pub 1 i c Program Sed a 1 Welfare Admi ni strati ve Expendi-tures and Costs Due to ADM Problems, 1980 0 • 0 • 0 •• 0-4
E-l
E-2
E-3
Consumption of Illicit Drugs in 1979 as Estimated by NNICC and the IRS . . . . . . . . . . . . . . . .
Value of Property Transferred by Personal Crime in 1980; Total and Proportion Attributable to Drug Abuse . . . . . . . . . . ~ . . • . . . . . . . .
Public Program Social Welfare Transfer Payment Expenditu~es and Costs Due to ADM Problems, 1980
,,~ .;
E-5
E-8
E-10

!!lli E-4
E-5
Funding for All Alcoholism and Drug Abuse Treatment Units by Source of Funds in 1980 • • • • • • • • • •• E8 12·
Source of Operating Funds Federally Funded Community Mental Heal th Centers in 1980 • • • • • • • • • • . E-13
E-6 Estimates of Funds far Alcohai Abuse by Setting and Source, 1980 • . • • • • • • • • . • • • . • E-15
£-7 Estimates of Funds for Drug Abuse by Setting and Source, 1980 • • • . • . • • • • • • • • • • • • E-16
E-8 Estimates of Funds for Mental Illness by Setting and Source, 1980 . . . . . . . . . ... . . . . . . . . E-17
E-9 . ADM Related Hospital Loss Reimbursed by Medicare, 1980 . . e'. • • • • • • • IS • • • • • • • • • • • E-20
F-' N~ers and Economic Cost of Premature Mortality Due to Malignant Neoplasms Related to Alcohol Abuse,. 1980 . . • • . 0 • • • • • • • • • '" • • • • • • • F-S
F.-2 Oirect.Treatment Costs for Alcohol-Abuse Related Neap 1 asms °
0• • • • • • • • • • • • • • • • • • F-6
G-l
G-2
G-3
G-4
G-S
Adjustment Factors for Updating ADM Economic Costs to Soc; ety Estimates • . • • • • • • . . • • • •. •
Historical Data Series of Adjustment Factors for Update Protocol .•••.•..•••••..••
Updated Costs to Society of Alcohol Abuse, Drug Abuse, and Menta·l !1 1 ness, 1981 .....
Up~ated Costs to Society of Alcohol Abuse, Drug Abuse, and Mental Illness, 1982 •.•..
Updated Costs to Society of Alcohol Abuse, Drug Abuse, and Men~l I11ness, 1983 .....
vi ii
G-8
G-12
G-14
G-15
G-16
,

. ,_-_. ---~
I. INTRODUCTION AND SUMMARY
A. Background There are many serious consequences of alcohol and drug abuse, and
mental illness. Society suffers the burden of health problE~S, death, debilitation and incapacitation, crime, motor vehi~le crashes .. family disruption, pain and suffering and other social problems. Certain aspects of these health problems can be assigned economic values thilt estimate their impact on our society I s economic well-being. The pri~lIary emphasis of this report is on identifYing and estimating the economic costs to society of alcohol and drug abuse and mental illness (ADM).
There have been several economic analyses of ADM prob14!Dls. The lIIost comprehensive was a 1981 study by Cruze, Harwocd, Kristiansen, Collins, and Jones* in which costs were estimated for 1977. At the time of the research, 1977 was the most recent year for which necessary data were available.
Prior to the 1981 RTI study, a number ~f monographs had separately analy~ed the costs· of alcohol abuse or drug abuse or mental illness. These WOt'KS developed progressively more inciusjve e·stimates of the economic impacts of the disorders, identifYing tangible ADM conseque.nces, and .using "established economic principles to assign monetary values. Eaeh new study improved on its predecessor.
The 1981 RTI study produced the first cost estimates for the three disorders that were generally comparable to each other. Comparabi1ity was accompi;shed in three steps: first, a meticulous review and analysis of the most recent studies on the separate disorders was performed; second, a single consistent methodology for cast estimation was developed; and finally, the estimates of ~conomic cost to society were made. B. Objectives and Approach
The purpose of this project has been very specific: To improve the methodology to update the 1977 estimates of the economic costs of alcohol and drug abuse and mental illness (ADM), to seek better and more comprehensive data sources, and to develop a procedural guide for updating the cost estimates.
*Henceforth, the Cruze, Harwood, Kristiansen, Collins, and Jones study will be referred to as the 1981 RTI study.
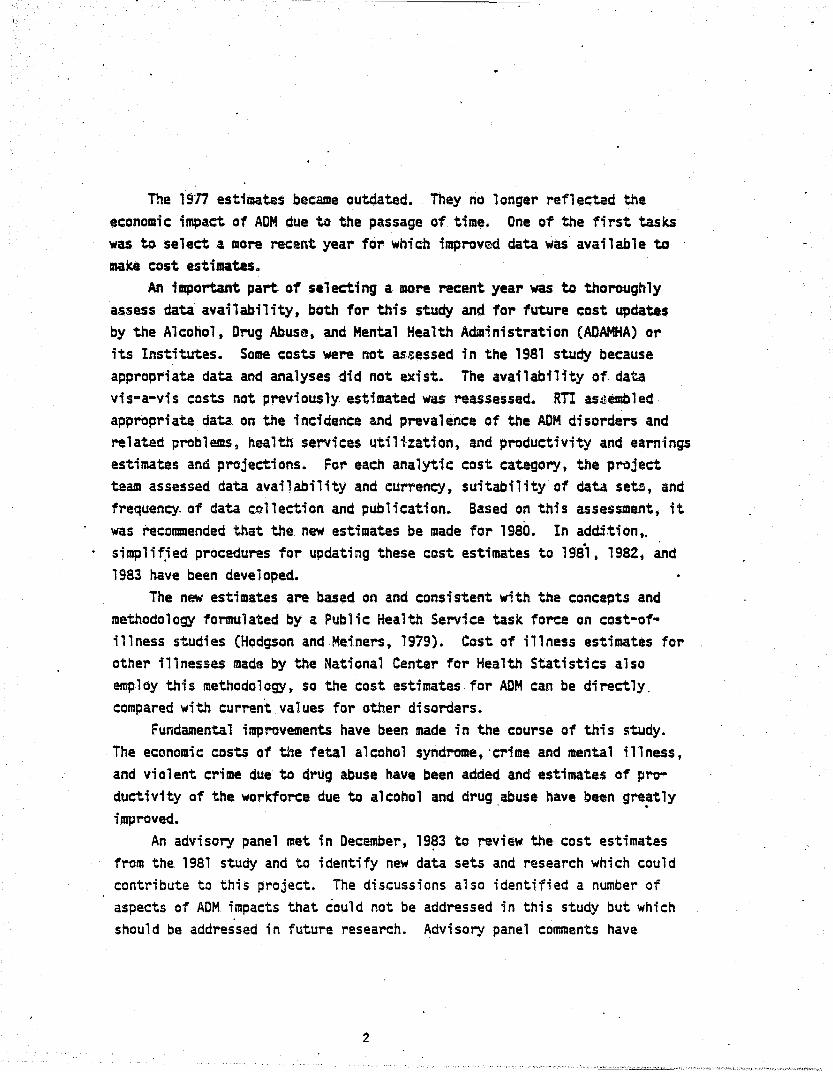
The 1tjfn estimates became outdated. They no longer reflected the economic impact of ADM due to the passage of time. One of the first tasks was to select a more recent year for which improved data was available to
make cost estimates. An important part of selecting a iIIOre recent year was to thoroughly
assess data availability, bath for this study and for future cast updates by the Alcohol, Drug Abuse, and Mental Health Administration (ADAMHA) or its Institutes. Some casts were not assessed in the 1981 study because appropriate data and analyses did not exist. The availability of data vis"a-vis costs not previously. estimated was reassessed. m as~etnbled
appropriate data on the incidence and prevalence of the ADM disorders and related problems, health services utiHzation, and productivity and earnings estimates and projections. For each analytic cost category, the project team assessed data availability and currency, suitability of data sets, and frequency. of data collection and publication. Based on this assessment, it was recommended that the new estimates be made for 1980. In addjtion,.
. simplif,ied procedures for updating these cost estimates to 198·', 1982, and 1983 have been developed.
The new estimates are based on and consistent with the concepts and methodology formulated by a Public Health Service task force on cost-ofillness studies (Hodgson and Meiners, 1979). Cost of illness estimates for other illnesses made by the National Center for Health Statistics also employ this methodology, so the cost estimates for ADM can be directly. compared with current values for other disorders.
Fundamental improvements have been made in the course of this 5tudy. The economic costs of the fetal alcohol syndrome, 'crime and mental illness, and violent crime due to drug abuse have been added and estimates of productivity of the workforce due to alcohol and drug abuse have .been greatly . . improved.
An advisory panel met in December, 19~3 to review the cost estimates from the 1981 study and to identify new data sets and research which could contribute to this project. The discussions also identified a number of aspects of ADM impacts that could not be addressed in this study but which should be addressed in future research. Advisory panel comments have
2
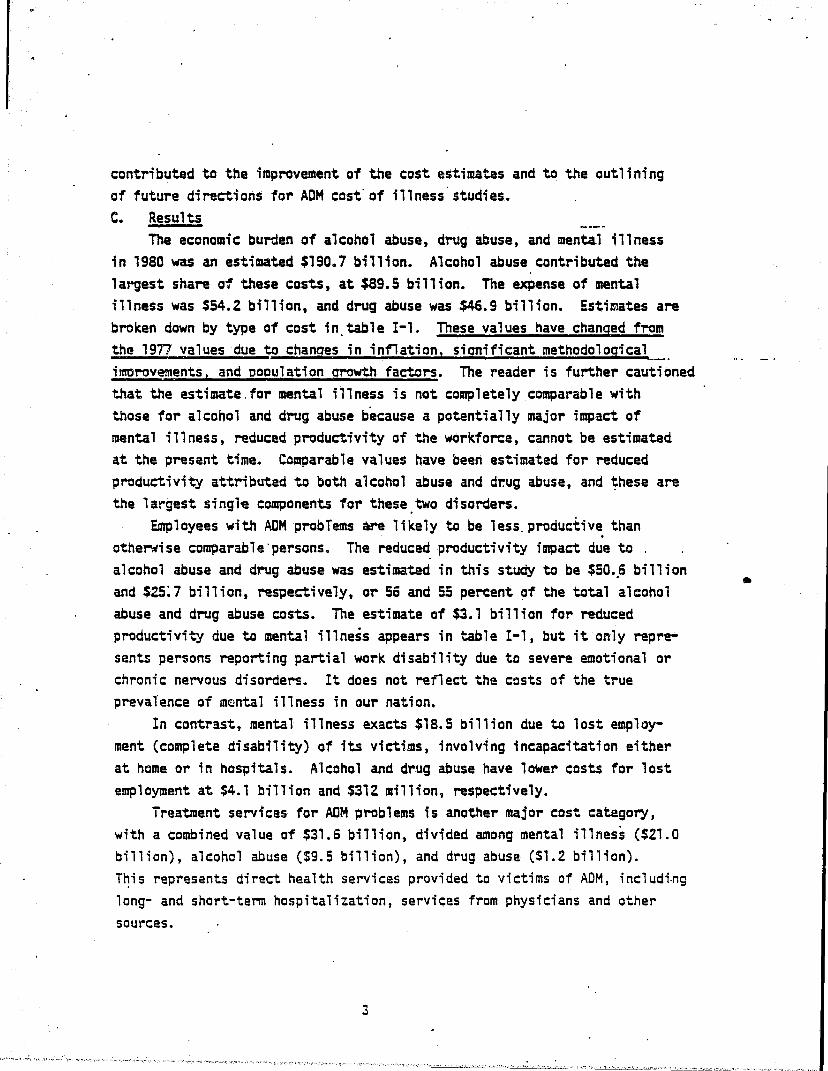
contributed to the improvement of the cost estimates and to the outlining of future directions for ADM cost' of illness' studies. c. Results
The economic burden of alcohol abuse, drug abuse, and mental illness in 1980 was an estimated $190.7 billion. Alcohol abuse contributed the largest share 01 these costs, at $89.5 billion. The expense of mental illness was $54.2 billion, and drug abuse was $46.9 bi11ion. Estimates are broken down by type of cost in, table I-l. These values have changed from the 1977 values due to changes in inflation, significant methodological imcrovements, and poculation arowth factors. The reader is further cautioned that the estimate.for mental illness is nat completely comparable with those for alcohol and drug abuse because a potentially major impact of mental illness, reduced productivity of the workforce, cannot be estimated at the present time. Comparable values have been estimated for reduced productivity attributed to both alcohol abuse and dr.ug abuse, and ~hese are the largest singl~ components for these,two disorders.
Employees with ADM probTems are likely to be less. productive than otherwise comparable"persons. The reduced productivity impact due to . alcohol abuse and drug abuse was estimated in this study to be $50.,6 bi11ion and $25:7 billion, respectively, or 56 and 55 percent ~f the total alcohol abuse and drug abuse costs. The estimate of $3.1 billion for reduced productivity due to mental illness appears in table I-l, but it only represents persons reporting partial work disability due to severe emotional or chronic nervous disorders. It does not reflect the costs of the true prevalence of m~ntal illness in our nation.
In contrast, mental illness exacts $18.5 billion due to lost employment (complete disability) of its victims, involving incapacitation either at home or in hospitals. Alcohol and drug abuse have lower costs for lost employment at $4.1 billion and $312 million, respectively.
Treatment services for ADM problems is another major cost category, with a combined value of $31.6 billion, divided among mental illness ($21.0 billion), alcohol abuse ($9.5 billion), and drug abuse ($1.2 billion). T~; s represents di rect health servi ces pray; ded to vi cti ms of ADM t ; ncl udi.ng long- and short-term hospitalization, services from physicians and other sources.
3
•

T~ble I-l Costs to Society of Alcohol Abuse, Drug Abuse
and Men~l Illness, 1980 . ($ in mi 11 ; ons )
Alcohol Drug Mental --_ .. -.-Abuse Abuse Illness Total
Care Costs $79,607 $29,451 $52,418 $161,476 - . -..
Direct Treatment 9,487 1,200 20,961 31,647 Support 984 243 2,597 l,823
Indirect Mortalitya 14,456 1,980 7,196 23,632 Morbi di tyb 54,680 26,028 21,664 102,372
Reduced productivity (SO,57S)c (25,716)c (3,122)c (79,413) Lost employment (4,105) (312) (18,542) (22,959)
Other Related Costs 9,919 17,48:5 1,S18 29,222
Direct Motor vehicle crashes. 2,185 d 2,185
(p~perty loss) Crirue 2,347 5,910 870 9,127
Public (2,062) (4,454) (635) (7,151 ) Private (261) (l,345) (235) (1,841 ) . Prope~y 1 ossl damage (24) (111 ) (-) (135)
Social welfare program 38 2 201 241 Other 2,912 537 659 4,108
Indirect Victims of Crime 172 845 1,017 Crime careers 8,725 8,725 Incarceration 1,SOl 1,466 88 3,356 Motor vehicle crashes 464 d 464
(time 1055)
Total $89,526c $46,936c $54,236c $190,698
Totals may not add due to rounding. aAt 6 percent discount rate. As suggested by the PHS Guidelines document, the present value of lost future productivity due to premature mortality was also calculated using discount rates of 10 and 4 percent. The use of a 10 percent rate decreases indirect costs by the following amounts: alcohol abuse--$4,88l million; drug abuse--$704 million; and mehtal illness--$2,444 million. The use of a 4 percent rate increases indirect costs by the following amounts: alcohol abuse--$4,455 million; drug abuse--$638 million; and mental i'lness--$2,177 million. bComponents are indicated in parentheses. ~he total costs to society for each of the three ADM disorders are not comparable, since the completeness of data available for each cost category varied significantly. For example, the estimate of reduced productivity is relatively complete for alcohol abuse, only partially complete for drug abuse, and incomplete for mental illness. dAlthough costs are hypothesized to occur in this category, sufficient data are not available to develop a reliable estimate. Sour~e: Research Triangle Institute.
4 . .
.
'·"'~~~","'2:_'~<·:':'.L~.3i",-'·c~."c'!.l~;';;.li~<C::L~'.;',.:~\'~~~ d-,,;;<,;.:,-::.;<.·.!,l.l'_.":' .. :!""~I"(':<l'.w:':."\.~~·i~-.;v..";l",li;:J".!3"~'''''''''~'-'~\l~':;'''''i':(,'.<''..!U:.7Ji..~>.~'''''1.\l:_1,',;,~{:_,,-",,'
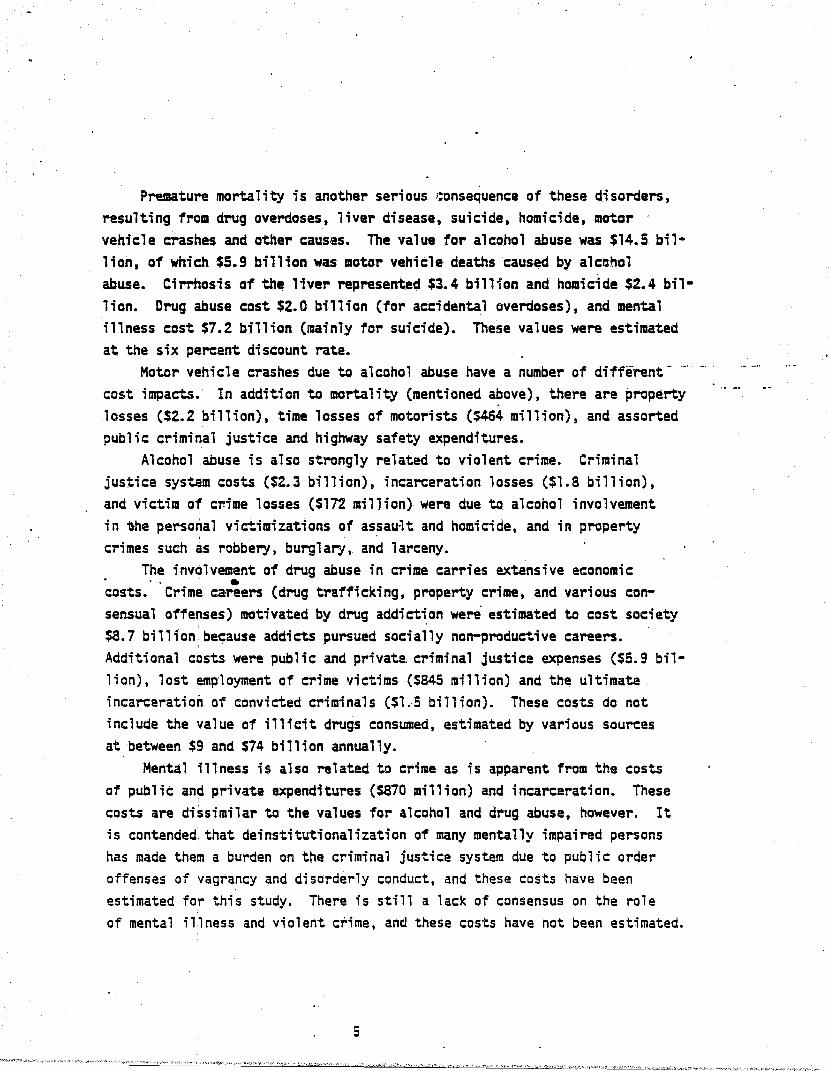
Premature mortal i ty is another seri ous ;;:onsequence of these di sorders, resulting from drug overdoses, liver disease, suicide, homicide, motor . vehicle crashes and other causes. The value for alcohol abuse was $14.5 billion, of which $5.9 billion was motor vehicle deaths caused by alcahol abuse. Cirrhosis of the liver represented $3.4 billion and homicide $2.4 billion. Drug abuse cast $2.0 billion (for accidental overdoses), and mental illness cost $7.2 billion (mainly for suicide). These values were estimated at the six percent discount rate.
Motor vehicle crashes due to alcohol abuse have a number of different --' _ .. cost impacts. In addition to mortality (mentioned above), there are property losses ($2.2 billion), time lasses of motorists ($464 million), and assorted public criminal justice and highway safety expenditures.
Alcohol abuse is also strongly related to violent crime. Criminal justice system costs ($2.3 billion), incarceration losses ($1.8 billion), and victim at cr.ime losses ($172 million) were due to alcohol involvement
I in \he personal victimizations of as~au1t and homicide, and iA property crimes such as robbery I bur~n ar-y , and 1 arceny .
The involvement of drug abuse in crime carries extensive economic '. .
costs. Crime a·reers (drug trafficking, property crime, and vario.us con-sensual offenses) motivated by drug addiction were estimated to cost society $8.7 billion. because addicts pursued socially non-productive careers. Additional costs were public and privata criminal justice expenses ($5.9 billion), lost employment of crime victims ($845 million) and the ultimate incarceration of convicted criminals ($1 .. 5 billion). These costs do not include the value of illicit drugs consumed, estimated by various sources at between $9 and $74 billion annually.
Mental illness is also related to crime as is apparent from the costs of public and private expenditures ($870 million) and incarceration. These costs are dissimilar to the values for alcohol and drug abuse, however. It is contended, that deinstitutionalization ot many mentally impaired persons has made them a burden on the criminal justice system due to public order offenses of vagrancy and disorderly conduct, and these costs have been estimated for this study. There is still a lack of consensus on the role of mental illness and violent crime, and these costs have not been estimated.
5

D. Comoarison With Previous Study 1. General
Economic cast studies of ADM should nat, in general, be used as indicators of changes in the severi~ of these disorders aver time. While these estimates do convey important knowledge of thfl relative magnitude of the problems at a point in time, there are many changes aver tilDe that make interpretation of decreases and increases difficult. One of these factors is inflation in prices and wages, which may change at different rates for different components. Other factors that may contribute to interpretation of cost changes over time include changes in the true prevalence of the problem, population growth, and the age and sex distribution of the popula-tion who suffer from these problems.
Changes in the severity and nature of alcohol and drug abuse are routinely moni:tored in our society. The National Institute on Alcohol Abuse and Alcoholism (NIAAA) and the National Institute on Drug Abuse (NIDA) sponsor recurrent surveys on the incidence" prevalence, and, impacts of alcohol abuse and drug abuse in our society~ Both series use survey methodologies that are consistent from year to year, making these appropriate vehicles for monitoring trends in the levels and severity of the two disorders.
The trend in problems from alcohol abuse was constant during the 1970s. The most recent study in the series concluded that there was no indication that the lever or severity of alcohol problems in the United States changed throughout the 1970s. The prevalence rates of problem drinking and its specific consequences 'remained relatively constant over the period studies. However, the total magnitude 'of the problem has in-
. creased with population growth. Throughout the 19705 there was an upward trend in the use of psychoac
tive substances. Analysis has indicated that drug use peaked in 1979 and that there was a statistically significant decline in use bet~een 1979 and
'~82. The level and severity ~f mental illness in our society have not been
followed on as regular a basis. However, the National Institute of Mental Health has recently begun the Epidemiologic Catchment Area surveys (Eaton, Regier, Locke, and Taube, 1981), which may ultimately yield methodologies and data useful for making periodic estimates of the prevalence of mental illness as well as alcohol abuse and drug abuse in the United States.
6

Table I-2
Change in Cast to Society of Alcohol Abuse, 1977-1980 ($ in lIillions)
Share of Change Cost Items Value (percent)
Total in 1980. $89,526
Total in 1977 49,374
Change 1977c 1980 40,152 100.0
Change due to
Inflation 15,286 38. 1
New methodology for
Reduced productivity 18,872 47.0
Fetal alcohol syndrome 3,236. 8.1
(Subtotal, changes above) (37,394) (93.1)
ather changes 2,758 6.9
Source: Research Triangle Institute
7

2. Chanaes in Specific Cost Comoonents __ .,. The economic burden an society of ADM was an estimated $1'90. 7 ~i1-
lion in 1980. To identifY differences between the 1977 and 1980 estimates, each 1977 cost component estimate was adjusted upward by an appropriate price index to reflect 1980 dol1ars. Using this methodology, inf1ation between 1977 and 1980 was estimated at $32.872 billion for the three disorders. This increase (38.8 percent) was the largest single factor in the three-year change.
No cast change is authoritatively attributed.to change in the incidence, prevalence, or severity of the disorders. However, improvements in knowledge about the disorders have made it possible to include the value of impacts that were omitted from the 1977 estimates. Among these, the largest were reduced productivity in the work farce, due to alcohol abuse and drug abuse. These contributed 22.3 percent and 26.0 percent of the $84.7 billion increase, respectively. Other new estimates, changes in methodology, and new data sources accounted for the' balance of the change between 1977 and 1980; within this group, 'the addition of estimates for' fetal alcohol syndrome was ~he largest factor, accounting for 3.8 percent of the total 1977-1980 increase.
The total cost of alcohol abuse and alcoholism in 1980 was estimated at $89.5 billion. The 1977 estimate was $49.4 billion. The difference of $40.1 billion was almost completely due to inflation and a change in the methodology for estimating the effect of alcohol abuse in the workforce (table 1-2). Inflation accounted for $15.3 billion of the total increase, or 38. 1 percent.
Productivity losses in the economy were the largest source of change in total casts with growth aver inflation of the 1977 value at $18.9 billion (47.0 percent of total growth). New analyses performed as part of this study found that alcohol abuse affects productivity by more than had been previously estimated. It is now estimated that problem drinking reduces individual productivity 21 percent below that of otherwise similar persons. The prior estimated impact was a 14 percent reduction.
Inclusion of fetal alcohol syndrome (FAS) in the study was the other major change in methodology, accounting for cost increases of $3.2 billion (8.1 percent of the total increase). FAS is a serious combination of birth defects that researchers have linked to maternal alcohol use during pregnancy_
Q

Both physical and mental defects are involved. In addition to the health treatment required by FAS victims, the associated mental impairment requires special education, training, and support services throughout their lives. The mental impairment causes reduced productivity and in some cases institutionalization.
These th~e factars--inflation, reduced productivity in the workforce, and fetal alcohol syndrome--accaunt for 93 percent of the differences between the 1977 and 1980 estimates. Of the remainder, 3 percent can be attributed to population growth. The final 4 percent is due to other minor changes.
Cost estimates for drug abuse in 1980 are $46.9 billion, a 286 percent increase over the 1977 estimate of $16.4 billion. Simply inflating the 1977 estimates would have led to an increase of $5 billion (16.4 percent of the total increase). All changes are itemized in table I-3.
!-he change of $22 billion resulted from findings in this study that high.levels af marijuana abuse are related to reduced.productivity in the workfor,ce. Although the problem h~d been suspected, it-had not been r1gor-· ously studied previously. It was found that persons ~ho had ever used marijuana daily for a month or longer had household incomes 27.9.percent lower than persons with otherwise similar characteristics.
Violent crime has been increasingly linked to illicit drugs. Costs due to this problem have been included in this study for the first time. The violent crime-drug link is estimated to have cost society Sl.3 billion in 1980 (4.4 percent of the increase).
The remaining change of $2.2 billion (7.2 percent) is due to changes in a number of different components, including the effect of 3 percent population growth.
The costs of mental illness grew from $40.3 billion to $54.2 billion, 34.6 percent over the three-year period 1977-1980. Virtually all of the growth was due to inflation. Merely adjusting the 1977 figures for inflation accounts for 90.2 percent of the increase (table I-4). There were changes in two components that bear further discussion. The value for reduced productivity increased by $962 million over inflation. The assumed leve1 of impairment of the partially disabled mentaliy ill was increased fro~ 14 percent to 24 percent.
9

\1
Table I-3 Change in Cost to Society of Drug Abuse, 1977-1980
($ i n IIi 11 ions)
Cost Items
Total in 1980 Total in 1977 Change, 1977-1980
Change due to
Inflation New methodology for
Reduced productivity Violent crime
(Subtotal, cnanges above) . . Other changes
Value
$46,936 16,387 30,549
5,010
22,003 1,338
(28,351) 2,198
Source: Researchir'~ngle Institute
Table I-4 •
Share af Change <percent)
100.0
16.4
72.0 4.4
(92.8) 7.2
Change in Cost. to Society of Mental Illness, 1977-1980 ($ in mi 11 ions)
Cost Items
Total in 1980 Total in 1977 Change, 1977-1980
Change due to Inflation New methodology for
Reduced productivity Social welfare
administration (Subtotal, changes above) Other c;hanges
Source: Researcn Triangle Institute
10
Value
$54,236 40,287 13,949
1%,576
962
-506 (13,032)
917
Share of Change (percent)
100.0
90.2 .
6.9
-3.6 (93.4)
6.6

The cost of admi ni steri ng sod a 1 we 1 far'e benefi ts to the mentally ill declined by $506 million, or about 3.6 percent of the total increase. This major change occurred because better data about the cost of these programs were used and not because benefits or levels of service changed.
The major increases in costs between the 1977 and 1980 studies are due primarilv to changes in methodology. or to inflation in waaes and prices and pODulation growth. The authors do not attribute any of the growth in costs to changes in the incidence. prevalence, or severity of ACM. Making such a determination is extremely difficult due to the large number of different cost impacts studied and th~ many different data sets used.~ Because many of the values used in preparing cost estimates are derived ·from sample estimates, sampling error must be taken into ac~ount if costs are to be compared. That task is beyond the scope of th~ present effort. E. Organization of This Recort
. The following chapter (II) provides an introduction to the concepts involved in estimating the economic costs o'f ADM and 'of all illnesses in genera 1. Specifi c topi c:s di scussed i n.cl ude pri ar ADM cost studi es, the nature of economic costs (versus transfers), direct versus indirect costs and double counting. ~n examination of recent findings about the prevalence of alcohol and drug abuse and mental illness follows this disc~ssion.
The majority of this report (chapter III) describes the methodology used to estimate costs in this project. Because this project is primarily an update of a prior study, the text focuses on any improvements on or modifications of the previous study's methodology and does not offer detail about the rationale for including particular costs or the specific computations performed. Details not found here are documented in the 1981 study.
There are strong implications of cost of illness studies for evaluations of public interventions. These implications are explored in chapter IV in a discussion of the application of cost benefit and cost effectiveness analysis to ADM public policies. Suggested areas for further research in ADM costQof-;11ness studies are discussed in the last chapter. A series of appendices that present selected details of the application of the cost-of-i 11 ness approach to ADM prob 1 ems conc 1 ur.t~::i.; thi s report.
A protocol for producing updated cost estimates for ADM also appears in the appendix. The protocol has been used to calculate values for 1981, 1982, and 1983, which are included in the appendix.
11
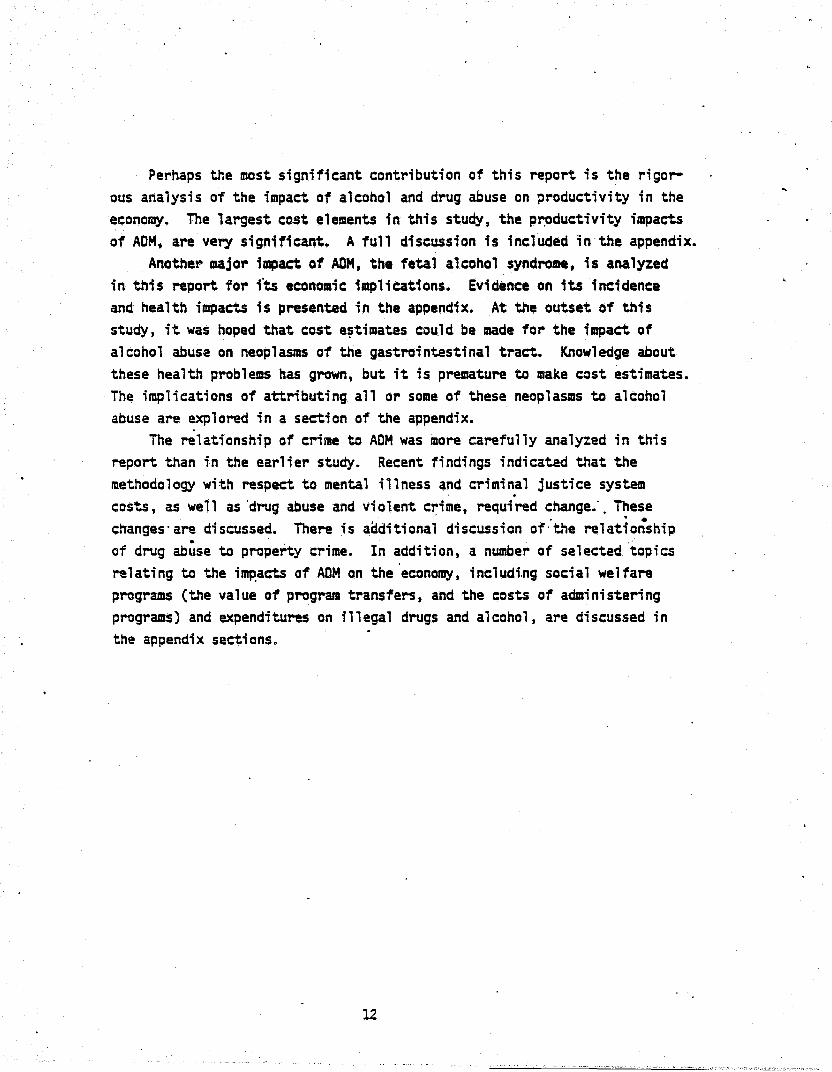
Perhaps the most significant contribution of this report is the rigorous analysis of the impact of alcohol and drug abuse on productivity in the economy. The largest cost elements in this study. the p~ductivity impacts of ADM, are ver,y significant. A full discussion is included in the appendix.
Another major impact of ADM, the fetal alcohol syndrome, is analyzed in this report for fts economic implications. Evidence on its incidence and health impacts is presented in the appendix. At the outset of this study, it was hoped that cost e~tilllates cou.ld be made for the impact of alcohol abuse on neoplasms of the gastrointestinal tract. Knowledge about these health problems has grown, but it is premature to make cost estimates. The implications of attributing all or some of these neoplasms to alcohol abuse are explored in a section of the appendix.
The relationship of crime to ADM was more carefully analyzed in this report than in the earlier study. Recent findings indicated that the methodology with respect to mental illness and criminal justice system . . costs, as well as 'drug abuse and violent crime, required change:. These . .. . changes· are discussed. There is aaditional discussion of·the relationship of drug ab~se to property crime. In addition, a number of selected 'topics re1ating to the impacts of ADM on the 'economy, includi.ng social welfare programs (the value of program transfers, and the costs of administering programs) and expenditures on illegal drugs and alcohol, are discussed in the appendix sections.
12

II. CONCEPTUAL PRINCIPLES FOR COST OF ILLNESS STUDIES
Alcohol and drug abuse and mental illness are disorders which pervade every level of our society, with many different manifestations in all age groups - infants, children, adults, and the elderly. It has been estimated that up to 20 percent (Regier, Goldberg, and Taube, 1978) of the adult population experience these problems during a year. The dimensions of the disorders seem limitless - causing thousands of deaths and legal,.personal, and occupati'onal problems and requiring enormous amounts of health-care resources.
One particular dimension of these 'disorders, the economic cost, has been singled out for study because it offers a framework for integrating many of the problems. The economic framework offers a manner of valuing the real resources that are affected by the disorders and makes it possible to make comparisons between different health problems at a point in time or a single health problem at differe"t times.
o. A. 8aclc.around '. One of the earliest cDst-of-illness·studies was performe~ by Rashi
Fein (1958) on·~e cast of mental illness. At that time, he estimated that the direct and indirect costs were well in excess of $3 billion. However, this was considered a conservative estimate since many costs could not be calculated due to data limitations.
The pioneering work by Fein was further developed by Rice (1965, 1966) in her studies of cardiovascular illnesses and, s'ubsequently, all illnesses. Rice's cost analyses laid a solid methodological base on which more recent estimates of the costs of illnesses (notably, Coo~er and Rice, 1976, and Paringer and Berk, 1977) have been built.
Rice (1966), Cooper and Rice (1976), and Paringer and Berk (1977) estimated the costs of mental illness. These studies indicated that the costs of mental illness were close to 10 percent of the nation's health expenditures. Each of these studies included some of the costs of alcohol and drug abuse in addition to the other clinically diagnosed mental disorders,. but. these costs were not distinguished. The unique nature and problems associated with alcohol and drug abuse motivated the performance of separate cost-of-illness stUdies for the two disorders.
13

A Research Triangle Institute (Rufener, Rachal, and Cruze, 1977) study of drug abuse indicated that high proportions of actual economic casts were nat reflected in the traditional cost-of-illness framework. The authors tdentified cast components related to manifestations of trauma (e.g., drug overdoses), employment problems, and large nonhealth social casts (e.g., disability and support ~ayments and criminal justice casts), and crime careers.
The economic costs of drug abuse had been previously assessed in examinations by Lemkau, Amsel, Sanders, Amsel, and Seif (1974), Rufener et al. (1977), and Goldman (1978). A number of manifestations of drug abuse were included in these studies, such as the more general categories of mental illness, different kinds of trauma (accidental overdoses and suicidal overdoses of drugs), ~Jd activities outside the health sector. As with alcohol abuse, many of the impacts of drug abuse involve crime.
A study of "the costs of alcohol abuse bY,Benoy and-Boland (l977) identified large cost components due to alcohol abuse that had been in~luded previously under illnesses. "other than mental dis~rders", or that had been " entirely ignored by the health cost stUdies. Examples of these misclassified or i.gnored costs included alcohol abuse-related trauma (accidents, violence and poisoning), productivity losses in the work place, and other nonhealth social costs.
Levine and Levine (1975) gave mare detailed analyses of the economic cost of mental illness than that offered by Rice (l966), Cooper and Rice (1976) and Paringer and Berk (l977). Levine and Levine used essentially the same estimation approach as the "studies of all illnesses, although they looked beyond the formal mental illness-related diagnostic codes to examine the costs and relationship of suicide (which in cost-of-illness studies ;s traditionally classified as trauma along with accidents, violence and poisoning). However, there was no identification of mental illness costs associated with alcohol abuse and drug abuse.
The first study to make comparable, consistent economic cost estimates for alcohol and drug abuse and mental illness was performed by the Research iriangle Institute (Cruze et al., 1981). This cost analysis started with a thorough analysis ~f the three principal cost stUdies for each disorder (mentioned ilMlediately above), examining them for methodology, cost framework, conceptual development and data sources. The three studies were
14
•

~~\----------~~----------------------------------------------~---------
carefully compared for substantive differences in approach, and the reasons for these differences were noted. In particular, they were compared with· respect to a document produced by the Public Health Service on guidelines for cost-af-illness studies (Hodgson and Meiners, 1979). The guidelines document established an analytical framework, laid out conceptual and methodological issues, and recommended procedures for cost estimation that were all intended to assist researchers in producing cost studies that were consistent and readily comparable.
The study by the Research Triangle Institute developed a methodology for estimating costs of the three disorders that was consistent with the guidelines and produced comparative cost estimates fo~ the three problems. This methodology was reviewed and accepted for implementation by an advisory panel from the institutes of ADAMHAo
Other key features of this study were identification and documentation of alternative cost estimation methodologies, analysis of further interactions of alcohol and drug abuse and mental illness with the economy, and identification of cost components of the three disorde~ for which there were insufficient data to make estimates~ Cost overlaps between the three disorders were identified and eliminated from the final cost estimations.. In addition, cost components were specifically defined so that the estimates could be compared with each other, and with estimates for other illnesses. B. ConceDtual Framework
A number of conceptual issues must be addressed regardless of the speci.fic procedures used to develop estimates of the economic costs to society of alcohol and drug abuse and mental illness (ADM). These are discussed in two parts. The first outlines an overall conceptual framework for qeveloping cost-of-illness estimates, moving from general principles of cost and cost-of-i'lness measurement to the application .of these principles to ADM problems. The second section discusses five specific conceptual issues that must be addressed in est; mati ng the econom·l c costs to sod ety of ADM problems.
1. Princioles for Economic Analvsis The first step in developing an overall framework for measuring
the costs of ADM disorders is to select .the basic theories and concepts for measuring these costs. A basic assumption of the economic theory underlying the concepts used in this study is that resources are finite or "scarce."
15
o

Therefore, when resources are allocated to the production of certain goods and services, they are consumed and cannot be used in the production of other goods and services. The loss of the opportunity to use resources for another purpose ; s the .. opportuni ty cost. U
Economic 'transfers, as the name implies, do not represent a consumption of resources e!,r !! but only the shift in control over the use of resou~es from one segment of society to another. Because they are distinct from economic costs, it is inappropriate to include transfers in an estimate of the economic cost to society of an illness. Previous estimates of the value of property stolen due to drug abuse, for example, have been as high as $6.2 billion per year. Although these l~sses are legitimate costs to the individuals from whom the property is stolen, from society·s perspective the property is transferred from one individual to another and no social cost is incurred. However, resources are used to administer property insurance programs, and resources are required to r!place lost or'damaged proper:y. PrOcedures for estimating these real costs will be detailed in
, thi s study. Economic or opportunity costs may be measured from .various perspectives.
Employers incu: costs when treatment is provided for employees with ADM or other health problems at company expense or when production is lost due to factors such as lowered productivity or absenteeism. Costs are borne by an entire society as current resources are used for prevention, treatment, and rehabilitation and as potential resaurces a~e lost due to lower productivity, ab~enteeism, or withdrawal from the workforce because of death or disability. Since the primarY purpose of this study is to provide information for policy making and resource allocation decisions within ADAMHA and other government agencies, costs from the perspective of our entire society are the most relevant and will be explored in this study.
Costs are either direct or indirect. A direct or explicit cost is one in which resources are consumed, and a formal payment is made in cash or in kind (i. e., through the direct provision of some commod'ity or servica). When resources are used to treat an ill person, the labor is paid for in wages, the materials used are paid for as direct purchases, and the capital used is paid for in principal and interest payments~ On the other hand, an indirect or implicit, cost is one in which no formal payment is made for resources used. For example, hospital patients are not paid for the value
16

~------------------------;,
of the goods and services they would have produced had they not been in treatment. Indirect costs include the value of foregone production of household goods and services. When alternative resources (e.g., housekeepers, babysitters, launderers) are hired to supply household services to family members, the foregone production is a cost.
Indirect costs are frequently incurred over a period of time. The principal example of this is foregone production due -to premature death.' In this situation, the lost stream of future earnings is counted as a cost in the year the death occurs. This technique reduces or IIdiscounts ll the value of a dollar in a future time period into an appropriate value for the current time period.
Illness and disease frequently cause a wide variety of psychosocial problems whose cost cannot be readily measured in monetary terms. Social costs include loss of a body part or speech, disfigurement, anticipation of death, pain, and grief. In addition, the environment created by an illness reduces self-esteem and feelin~ of well-bei.nGil.and induces anxiety, re~ent-
ment, and. emotional problems that often require psychotherapy. Problems of living may develoPt leading to family conflict, antisocial behavior, or suicide. Despite rehabilitation efforts, the quality of life enjoyed before the illness may not be restored. Although social factors are important components of the total burden of an illness, appropriate measures of these social costs are not well developed. The focus of this study, therefore, is on estimating the economic cQsts which can be readily quantified in dollars. These will be referred to ~s economic costs to society throughout the remainder of this report.
Z. Principles for Cost-of-Illness Studies . In applying the above general principles to the estimation of the
cost of an i 11 ness., it becomes apparent that the costs of an i 1i ness or disease may be divid~d into two major categories: "core costs," primarily those occurri n\l in the health sector, and II other re 1 ated" costs. Each category contains both direct and indirect costs.
As outlined in the PHS guidelines document on cost-of-illness stUdies (~odgson and Meiners, 1979), direct core costs are the costs of diagnosis, treatment, continuing care, rehabilitation, and terminal care for illness and trauma. These include expenditures for hospitalization; outpatient clinical care; nursing home care; home health care; services of primary
17

physicians and specialists, dentists, and other professionals; drugs and drug sundries; rehabilitation couns~ling; and other rehabilitation costs to·
overcome ill ness-re 1 ated impai rments. Indirect core costs result from losses in oUtput as time is lost from
paid work, or household services are not provided because of treatment, injuries, premature mortality., or other reasons. As indicated above~ the measures of output loss are foregone earriings and the imputed market value of unperformed housekeeping services. In addition to extended time lost from work, indirect core costs may also be incurred when an illness lessens productivity on the job or causes excessive absenteeism.
Other related direct costs in the nonhealth seC-war which must be borne by patients and other individuals include costs of: transportation to health providers; hiring household help for cleaning, laundering, cooking, and babysitting; special diets; items for rehabilitation and comfort; and vocational,' social, and family counseling services. These direct costs may also include the value of property damaged or destroyed in vehicular accidents or crimes caused by. drug or alcohol abuse .
. Examples of other related indirect 'costs include the opportunity cost of ~ime spent in prison or pursuing a criminal career and of time spent by family members and friends in visiting hospital patients, their physicians, or other health professionals.
3. ApDlication of ConceDts to ADM Problems The concepts summarized above may be readily incorporated into a
conceptual framework to estimate ADM costs. Direct core cests include primarily the costs of treatment for the various ADM problems. In the case of mental illness, these costs are incurred as a d~rect consequence of the illness as individuals 'seek treatment in public and private mental health treatment facilities. In the case of alcohol abuse and drug abuse,. these costs are incurred as individuals seek treatment for problems directly and indiT"ectly caused by their substance abuse. In addition, the direct core costs include costs for such supportive·activities as prevention and the various research, training, and administrative functions that are carried out by both public and private agencies to support ADM treatment activities.
Indirect core costs for ADM problems arise primarily from morbidity or premature mortality, measured in terms' of both foregone earnings and the imputed market value of lost household services. Additional indirect costs
18

•
may occur from lost work or household production due to outpatient or inpatient treatment or from lowered productivity for those with ADM' prob'lems who continue to work or perform household activities.
Other related direct costs for ADM problems are quite diverse. The two largest categories of these costs stem from ADM-induced crimes and from property destruction (e.g., due to vehicular accidents or crime). In addition, other related dir.ect costs include an appropriate share of the administrative costs of various social welfare programs providing services to individuals with ADM problems.
Other related indirect costs involve time and productivity losses not directly related to the health of the ADM victim. ' There is a very significant cost for drug abusers whose crime careers and incar.ceration take them away from productive activities and constitute a loss for society as a whole that is causally related to drug addiction or to the drug trade. This cost compon,ent is not very large for alcohol abuse and mental illness.
A summary of the specific cost elements suggested for use in cost-ofillness studie~ is provided in table II-l. These costs are organized, according,to the.core costs/other related costs framework presented in the PHS gui de 1 i nes document.' C. 50ecific Issues
1. Definitions By definition, ADM exists when a diagnosis of the disorder is
made by a health professional using professionally accepted criteria. Established diagnostic systems include the International Classification of Diseases - 9th Edition (ICD-9) and the Diagnostic and Statistical Manual III (OSH-III). Most health system diagnostic data are, now maintained using the ICD-9 system. There is a cross-reference to data that were coded using earlier editions. The use of OSH-III is advocated by mental health professionals because there are spedfic. codes and ,criteria for alcohol and drug abuse and mental illness. The ADM diagnostic conditions used in this study are based on ICD-9 and are specified in tables 11I-4, 1II-7, 1II-8, and 1II-9. The ADM-specific conditions are primarily those in the large category of mental illness (codes 290-316). Because ADM effects many aspects of health, other conditions are defined as "ADM-related." These are completely 'or partially attributed to ADM in the cost estimates. Notable examples are liver ,cirrhosis, drug overdoses, suicide, and other trauma.
19

Table II-l
Cost Elements for Cost-of-Illness Studies
I. CORE COSTS
A. Direct 1. Hospitalization 2. Outpatient clinical care 3. Nursing home care 4. Home health care S. Services of primary physicians, specialists, and other
professionals 6. Drugs and drug sundries 7. Rehabilitation counseling 8. Rehabilitation aids
B. Indirect Last productivity due to: 1. Mortality . 2. Morbidity (lost productivity)
a. Reduced productivity b. Lost productive time •
II. OTHER RELATED COSTS
A. Direct
1. Transportation 2. Household expenditures and help for the household 3. Special equipment or alteration of property for rehabilita
tion or comfort 4. Counseling, retraining, and reeducation 5. .Property losses (destruction, for instance, from vehicular
accidents or criminal activity) 6. Criminal justice system 7. Welfare system administration (not the transfers themselves)
B. Indirect
1. Lost productivity of family and friends 2. Lost productivity resulting from incarceration due to ADM
problem 3. Lost productivity from full-time pursuit of a crime career
in order to support a drug habit 4. Lost productivity of persons other than crash victims due to
ADM-caused motor vehicle accidents
Source: Derived from Hodgson and Meiners (1979).
20

Consequences of ADM putside of the health sector have been determined based on established causal links between ADM (chronic or episodic) and tangible consequences (for example, drinking and d~iving, and drugs and crime). - •
2. Incidence and Prevalence In estimating these costs to society, the distinction between
incidenc~ and prevalence of ADM has been carefully made. Strictly speaking, incidence of an ADM problem is defined as the number of new cases of a problem that occur in a given period of time. Prevalence refers to the total number of cases at a point in time or over a given period of time. Since the purpose of this study has been to estimate the casts to society of ADM problems, we were primarily interested in the prevalence of each of the ADM problems for a sp~cific time period (i.e., 1981).
It would be interesting to examine the pattern of costs caused by an individual·s problem over time from a benefit/cost perspective. The benefits derived from successful treatment of a problem could then-be subtracted from the costs. However, incidence data are not readi-ly available, ;and the primary emphasis of this study is on prevalence.
3. Association and Causality Behaviors may be caused by ADM problems or they may merely be
associated with them. The importance of distinguishing between cause and association has been pointed out in previous efforts. In addition, the literature review conducted for the previous RTI study indicated the difficulty in establishing valid measures of causality. Despite these problems, this study has attempted to estimate costs to soc1ety by using measures of caus~lity rather than correlation or association. Wherever possible, the results of previous stUdies that have used appropriate designs and analytic techniques to develop estimates of the degree of causality were incorporated into the estimation procedure. Nonetheless, the ideal of establishing causality could not always be achieved due to current state-of-the-art limitations. When ·no reasonable causality estimate was available, rational assumptions and indirect statistical techniques were used to approximate the extent of causality. Whenever simple associations were relied upon, that fact is noted.
4. Foregone Earnings As indicated earlier, a critical input to estimating the indirect
costs of ADM is the value of foregone earnings of individuals with ADM
21
. _"""~~'._.,,",>~.h.", '" .. _ ••.• , ... _~"_,, •..... ,," •. >.<' ••••

problems who die prematurely or ~ho for other reasons become unproductive. In order to develop a consistent approach to estimating the value of this cost component across the three ADM problem areas, a single set of earnings profiles for the general population subgroups (e.g., classifi.ed by age, sex, race, educational attainment) was used. The profiles were then adjusted to reflect the demographic characteristics of the populations with each of the three ADM problems. Choices have been made on the Use of adjustments for expected labor force participation and unemployment for populations with ADM problems and for a less than full employment national economy, discount rates for future earnings values, and rates of labor productivity growth. Additional decisions were made on the conceptual bases for esti-
. mating the costs of lowered on-thE:-job productivity due to ADM problems, the costs of foregone household production by individuals not in the officially-defined labor force, and the value of production lost when individuals
.volunteer to worK in,the ADM treatment/prevention system. Recently developed unpubl i shed data on the present va1ues of ag.e/sex--·
earnings profiles.preparea by·the staff of the National Center for.Health Statistics provided an appropriate source for estimating many of these indirect costs. The ass~tions underlying the development of these profiles were carerully reviewed, and the resulting profiles were found to be appropriate for USE: in this study.
5. Double Counting The final problem addressed was that of double counting the costs
of a given condition in developing the total cost of ADM problems. This might happen, for example, when foregone earnings· are counted in the general estimate of premature death from alcohol abuse and again in specific estimates of traffic fatalities. This double counting might also occur in situations in which an individual with an ADM problem (e.g., an alcoholic) is treated in a specialty setting that is not organized primarily to treat the problem (e.g., a Community Mental Health Center). This personls costs would be counted twice in estimating the costs to society of ADM problems (e.g., once as an alcoho'J abuse cost and again as a mental illness cost). Such situations should be identified and the double counting eliminated in developing a composite estimate of the costs to society of ADM. One possible appr.oach is to specifically identify the various specialty settings in which more than one ADM problem is treated and the proportions of treatment

resour~es used to treat the separate ADM problems in each of these spec1alty settings.· This procedure enables us to develop estimates of both the treatment costs for,each ADM problem and the treatment costs for each type of specialized ADM facility.
Double counting may also occur in situations where it is difficult to specify to which of the three ADM problems a particular cost element should be assigned. Where, for example. should the costs for the treatment of an individual with IDOre than one ADM problem be assigned? The costs might be reported as an unallocated total and not be included in the.cost estimates of the separate ADM problems, or they may be assigned to a single problem (such as the primar,y diagnosis) or to multipl~ problems according to appropriat~ procedures. A second example is the difficulty in assigning the costs of administration of an agency concerned with more than one ADM prob1em. Here, too, the costs might be a$5igned to an unallocated total
: and not to separate ADM problems, or they can be assigned to one ADM problem :by some T"'Jle. ,A third alternat'ive is to allocate them to the separate ~M components in p~portion to other direct agency costs. O. Definition of ADM
One of the most difficult facets of this economic cost study is defin· i n9 the nature of a l'coho 1, drug acuse, anll menta" i1 1 ness 1 n order. to . di s'cern • the incidence or prevalence rates of these disorders and in order • to estimate their economic impact~
Mental d.~sorder is generally defined tq. inc}ude alc:ohol abuse and · a 1 coho 1 dependence I as we 11 as drug abuse and drug dependence. The 1 arge · category in the International Clas·sifi·cation of Diseases, AMental I1lness,D
includes specific subcategories for alc:oholic psychoses, alcoholism, and alcohol acuse, as wen as drug abuse, and drug dependence. A widely used classification system, OSM-IIl, gi.ves distinct diagnostic criteria for diagnoses of alcohol abuse, alc:ohol dependency, drug abuse, and drug dependency.
One of the greatest challenges in performing ~ economic cost study is ! in clearly differentiating among diagnoses. but it is not uncommon for an
individual to suffer f~m.more than one mental disorder at a time. For example, schizophrenics may ?-lso abuse al.cohol and/or drugs. Where it is desirable to differentiate between alcohol abuse/dependence, drug abuse/ dependence, and other mental disorders, the definitional probrems become enormous.
.'
I
I I i
I , I , j i t i ~ v " ~ j
! • ~ .. r

The distinctions among multiple disorders are a major problem in the fields under study. Nonetheless, an attempt to differentiate among the d-; fferent types of di sorders was Jnade in thi s study, and the resu 1 ts reported
. _ ·In._~~_balance of this report reflect our best attempts. Fortunately, the diagnostic data typically used in studies of these populations usually distinguish between the disorders. Unfortunately, although patients or individuals whose ADM problems have economic impacts usually have a primary diagnosis, they may also have additional diagnoses secondary to the primary cause or equivalent to it. In some data sets, multiple diagnoses are made, with no indication of their order of importance.
In this study, an individual's "principal" problem is defined as the IIprimary" diagnosis or, if there is no priority given, the IIfirst listed" diagnosis. The cost estimates made for alcohol abuse, drug abuse, or other mental disorders using this rule. are somewhat arbitrary_ For the present, ·these imprecisions are unavoidable. E. ,preva 1 enee of ADM
Recent stUdies have estimated an unduplicated count for alCOhol abusers, drug abusers, and other mental illnesses at 15 percent of the population. A study by Regier et al. (1978) estimated that 1S percent of the U.S. population, including individuals of all ages, experienced alcohol and/or drug abuse problems or a mental disorder during 1975. While it excluded alcohol and drug abusers who received treatment only in clinics specializing in those disorders, it included people with alcoho'i and drug abuse problems seen in other specialty mental health sectors and in the general health sector. It was estimated that 6.7 million persons were treated in the specialty mental health sector, 1.1 million were inpatients in general hospitals or nursing homes, and 19.2 million received outpatient services in the general health sector. Another 6.9 million individuals were judged to have not received treatment. These estimates included adjustments to avoid duplications for individuals seen across different settings and sectors.
The epidemiological catchment area (ECA) s~udies supported by NIMH have yielded data supporting the 15 percent prevalence estimate. The ECA studies use the recently developed Diagnostic Interview Schedule (DIS) which contains information necessary to·make OSM-III diagnoses of specific mental disorders. Myers et al. (1983) estimated the 12-month prevalence
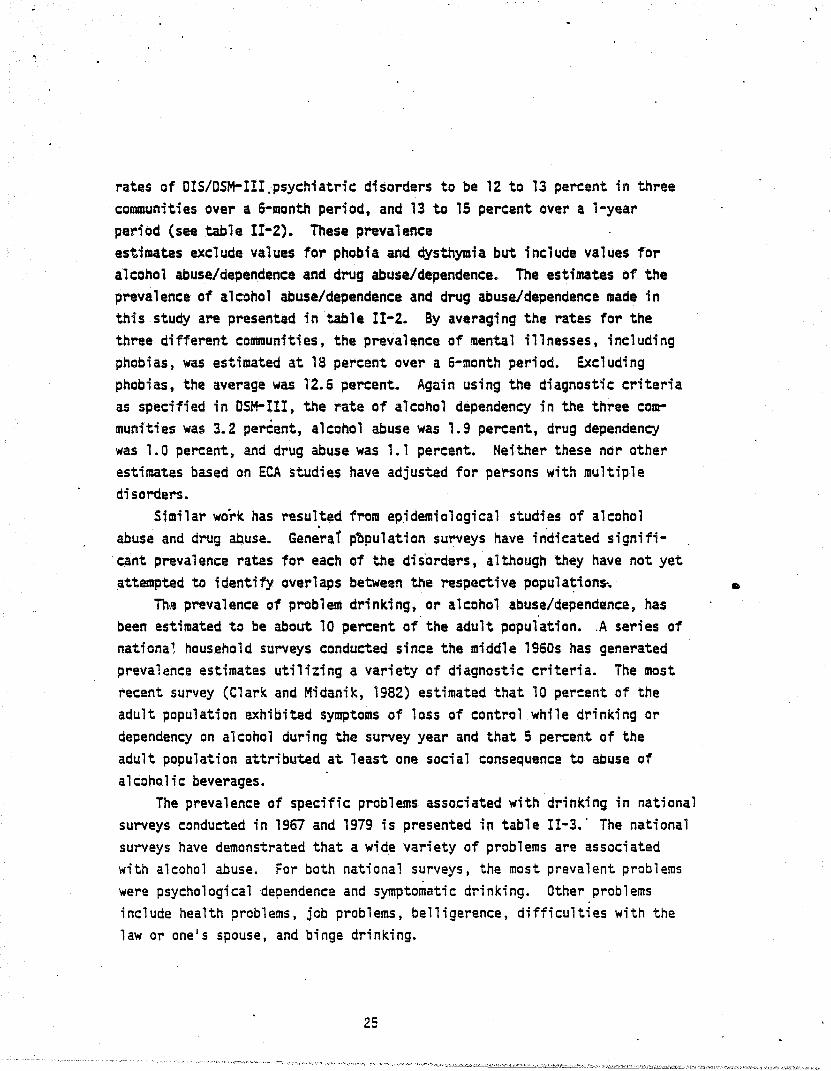
rates of OIS/DSM-III,psychiatric disorders to be 12 to 13 percent in three communities over a 6-month period, and 13 to 15 percent over a l-year period (see table II-2). These prevalence estimates exclude values for phobia and dysthymia but include values for alcohol abuse/dependence and drug abuse/dependence. The estimates of the prevalence of alcohol abuse/dependence and drug abuse/dependence made in this study are presented in table I1-2. By averaging the rates for the three different communities, the prevalence of mental illnesses, including phobias, was estimated at 18 percent over a 6-month period. Excluding phobias, the average was 12.6 percent. Again using the diagnostic criteria as specified in aSH-III, the rate of alcohol dependency in the three communities was 3.2 percent, alcohol abuse was 1.9 percent, drug dependency was 1.0 percent, and drug abuse was 1.1 percent. Neither these nor other estimates based on ECA stUdies have adjusted for persons with multiple disorders.
Similar work has resul,ted from epjdemiological studi,es of alcohol abuse and drug ab,use. General p'bpulation surveys have indicated signifi'c~nt prevalence rates for each of the disorders, although they have not yet attempted to identify overlaps between the respective popula~i.ons'. •
Thl!! prevalence of prob 1 em dri nlti ng t or a 1 coho 1 abuse/dependence, has , ,
been estimated to be about 10 percent of the adult population. .A series of nationa\ household surveys conducted since the middle 1960s has generated prevalence estimates utilizing a variety of diagnostic criteria. The most recent survey (Clark and Midanik, 1982) estimated that 10 percent of the adult population exhibited symptoms of loss of control while drinking or dependency on alcohol during the survey year and that 5 percent of the adult population attributed at least one social consequence to abuse of alcoholic beverages.
The prevalence of specific problems associated with drinking in national surveys conducted in 1967 and 1979 is presented in table 1I-3.' The national surveys have demonstrated that a wide variety of problems are associated with alcohol abuse. For both national surveys, the most prevalent problems were psychological dependence and symptomatic drinking. Other problems include health problems, job problems, belligerence, difficulties with the law or onels spouse, and binge drinking.
2.5

Table II-2
Six Month Prevalence of Mental Illness, Alcohol Abuse/Dependence and Drug Abuse/Dependence in Three Communities
Simple New Haven Baltimore st. Louis Average
Any Mental I11ness1 16.9 22.6 14.8 18.1
Any Mental Illness 2 13.2 12.9 " .6 12.6
Alcohol Abuse/Dependence 4.8 6. 1 4.5 5. 1
Alcohol Dependence 2.8 4.2 2.6 3.2
(Alcohol Abuse)3 (2.0) (1.9) (1.9) (1. 9)
Drug Abuse/Dependence 1.8 2.:3 2.2 2. 1
Drug Dependence 1.1 0.8 1.1 1.0
(Drug .Abuse)3 ( .7) (1.5) (1.1) (1. 1)
lExcludes dysthmyia (DSH-III, an episode of depression that does not meet diagnostic criteria for "Major Depression").
2Exc·ludes dysthymia and phobia (large variation in prevalence estimates for phobia were obtained from three sites, suggesting caution in use of its estimates) •
3This value is the difference between the two prior values.
Source: Myers, Weisman, Tischler, Holzer, Leaf, Orvaschel, Anthony, Boyd, Burke, Kramer, and Stoltzman (1983)
26
...... . .....

Table II-3
Prevalence of Problems Associated with Drinking in the Past 12 Months for Males and Females in the 1967 and 1979
National Surveys (in Percentages) ---.. -.. _----- .
Problem Area Rale 1967 Survet FeJDa 1 e ota 1 Rale
1979 SurveX Female Total
Health problems 6 5 5 4 2 3
Belligerence associated with drinking 5 3 4 8 4 6
Problems with friends 2 *. 1 3 1 2
Symptomatic drinking 11 5 8 20 9 14
Psychological dependence 49 29 37 26 17 21
Job probl ems 3 2 2 7 2 4
PrQblems with the law, police, accidents 1 * * 2 1
Binge drinking 1 * 1 1 :III: 1 lib
Problems with sPQuse~ 1 0 1 2 :III: 1
. (!i) (751) (608) (1,359) (762) (1,010) (1,n2)
Note: The percentages are weighted figures and may not total to 100 percent Ci'Ueto roundi'ng; totals shown are the actual number of cases. Slight variations in these totals occur because of nonresponse, etc.
*Less than 0.5 percent.
**Last 2-1/2 years for National 1967; last 3 years for National 1979.
Source: Clark and Midanik, 1982.
27
-

"
. ,
A series of national studies conducted between 1971 and 1979 which examined·'b.rends in alcohol consumption (Se1! table 11-4) fauna little change in the level of drinking over that time. While an upward trend in heavier drinking ~ males was Se1!n between 1971 and 1976, the 1979 national survey
'indicated that heavier drfnking by males reverted ta the 1971 and 1972 levels.
The prevalence of use of ill i d t. drugs was man; tared between 1972 and 1982 by a series of national household surveys. The 1982 national survey (Miller. Cisin, Gardner-Keaton, HarT~ll, Wirtz, Abelson, and Fishburne, 1983) indicated that 10.9 pel"Cent 011 a1" adults used marijuan~ within ~he month prior to the survey. 'fbis inCluded 27.4 percent of young adults (ages 18 to 25) and 6.5 percent of older adults (see table I1-5). The s~rveys indicated that current use of marijuana by youth and young adults peaked in 1979 and dropped significantly by 1982 (see table II-6). Data indicated no statistic~11y significant change in the level of use by older
. . ", I •
adults. The national SUrvf~yS also assessed use of cocaine, heroin, and hallu
cinogens, as well as ncnmedic:al use of various prescription drugs. Current ~eroin use for youth in 1982 was below one-half of 1 percent, and current use of each of the other drugs (use in past IDOnth') was between 1 and 2 percent. ,Current use of drugs by young adult.s 'Was in the same range for everything except cocaine (6.8 percent) and stimulants (4.7 percent). The drop in cocaine use by young adults from the 9.3 percent observed in 1979 was statistically significant. Abuse of other drugs by older adults in the month prior to the survey was less than i percent for everything except cocaine (1.1 percent).
Studies of alcohol abuse have focused on both lifetime patterns and current levels of consumption as well as impacts of alcohol c:ansump·tion on social functioning. Alcohol abuse has been increasingly defined in terms of its consequences. Close attention has been paid to undesirable impacts on family, friends, strangers, and those in the household and at work, as well as in social situations.
The diagnostic criteria used in making prevalence estimates for drug abuse differed significantly from those used for alcohol abuse and other. mental illnesses estimates. In the field of drug abuse, primary emphasis has been placed on lifetime patterns and recency of use of illicit sub-

I-·~~···---
Table II-4
Trends in Alcohol Consumption, 1971-1979, by Type of Drinker and Sex (i n Percentages)
Harris 1971
Harris 1972
Harris spr1ng Fall 1973 1973
Ha rri s --- ORC 1974 1975
RAe Hat, ana 1 -1976 1979
Type of Drinker Abstainer 36 36 34 37 36 36 33 33 Lighter 34 32 29 30 28 31 38 34 Moderate 20 2J 23 21 28 21 19 24 Heavier 10 10 14 11 11 12 10 9
(N)lIr (2.195) (1,544) (1,583) (1,603) (1,578) (1,071) (2,510) (1,772)
Males -Abstainer 30 28 2S 26 24 27 26 25 Lighter 29 29 24 29· 24 27 33 29 Moderate 26 28 29 26 34 26 24 31 Heavier 15 15 22 19 18 20 18H 14
Females 'Abstainer 42 44 42 47 42 45 39 40
Lighter 40 34 35 32 32 ··35 . --44·-- 38··- . Moderate 13 18 17 17 21 15 15 18 Heavier 5 4 6 4 5 4 3 4
Note. Percentage are weighted figures and may not .total to 1 00% due to rounding.
lIrN I S presented are the same as i'n the Thi rd Speci a 1 Report to the U. S. Congress on Alcohol and Health (Hoble, 1978); however, actual HiS used in this analysis varied slightly.
**Statistical1y significant linear trend (p<.05), indicating an increase (excluding 1979 survey).
Source: Clark and Midanik, 1982.
29

,,---------:(~,
Table II-5
Prevalence of Drug Abuse by Type of Drug and Age Groups, 1982 (in Percentages) .
.... -... '----Youth Young Adults Older Adults
~age 12-172 ~age 18-252 (age 2S.) sed sed Used
Ever Month Ever Month Ever Month
Marijuana 26.7 11.5 64. 1 27.4 23.0 6.6 Ha 1 1 uci nogens 5.2 1.4 21. l. 1.7 6.4 ~
Cocaine 6.5 1.6 28.3 6.8 8.5 , .2
Heroin * ~ 1.2 ~ 1.1 ~
Nonmedical use of: Stimulants 6.7 2.6 18.0 4.7 6.2 .6 'Sedatives 5.8 1.3 18.7 2.6 4.8 * Tranquilizers 4-.9 .9 15 •. 1 1.6 3.6 * Ana 1 ges ; cs· 4,2 ',7 12. 1 1.0 3.2 *
Any Nonmedical Use 10.3 3.~ 28.4 7.0 8.8 1.2 •
Alcohol 65.2 26.9 94.6 67.9 88.2 56.7 Cigarettes 59.5 14.7 76.9 39.5 78.7 34.6
*Less than 5%.
Source: Miller et a1. , 1983.

Table II-S
Use of Drugs in Past Month, 1972-1982, by Young Adults
Young Adults: 1972 1974 1976 19n 1979 1982 Age 18-25 tim -em) tm) (TStm) (mtr) em!)
Marijuana 27.8 25.2 25.0 27.4 35.4 27.4 Hallucinogens t 2.5 1.1 2.0 4.4 . 1-.7'
Cocaine t 3. 1 2.0 3.7 9.3 6.8 Heroin t * * * * *
Nonmedical Use of: Stimulants x 3.7 4.7 2.5- 3.5 4.7 Sedatives x 1.6 2.3 2.S- 2.S 2.6 Tranqui1izers x 1.2 2.6 2.4- 2. 1 1.6 Analgesics x x :It X 1.0 1.0
Any Nonmedical Use xx xx xx. xx 6.2 7.0
Alcohof x 69.3 69.0 70.0 75.9# 67.9# Cigarettes x 38.8 39.3 . 37.2 39.5
(Alternate Definition-Ciga~ttes)-- (42.6) (38.0).
*Less than .5% xNot asked.
Change '79-'82**
SSS SSS
S
§ §
fi §
\. §
SSS
(S)
XXSince questions on use of analgesics were not asked in surveys prior to 1979, the nonmedical tise of any psychotherapeutic (including analgesicsl.could not be reported for these earl ier year's. tHot tabulated ·19n .estimates based on split sample: N=750. ··In 1979, recency of cigarette use was asked only of those who had smoked at least five packs during their lifetime. In all other years, no such restriction was iapplied. For 1982, this version was calculated separately.
#In both 1979' and 1982, private answer sheets were used for alcohol questions; in earlier years respondents answered these questions aloud. lIrlit'Significance levels: SSS, .001; SS, .. 01; S, 05; $, .10; NS, not significant; §, significance test not performed (79-82 procedures not comparable).
Source: Miller et al., 1983.
31
.0 _____

stances or nonmedical use of various prescription drugs. While undesirable impacts of drug abuse are hypothesized and, in fact, observed, they have not been rigorously examined in a manner analogous to that for alcohol abuse. The inclusion of drug abuse and drug dependency in DSM-III and, in the ECA projects, the Diagnostic Interview Schedule uy lead to notable developments in the drug abuse field. As the DSM-III is refined, and eventually implemented through community-wide and nationwide surveys, it can be expected that an increasingly better understanding of the extent and manifestations of drug abuse will be gained •
•
•

III. COST ESTIMATES
A. Introduction The estimates produced in this cost study have been generated using
the 'general methodology described in the 1981 RTI study. The report of the previous study documents the rationale behind individual cost componen~, the equations used to generate the e~tilDates, and the sources of data that were utilized. The reader is encouraged to review' this methodology. Wherever possible, this study has used the same or similar data sources. New data sources and minor modifications to the 1981 methodology are described below.
Significant changes and extensions in cost estimation have been made for several components. The basic estimates and computations for these components are presented in this section. More detailed discussion and documentation appears in the appendix on fetal alcohol syndrome, reduced producti v,i ty due to a 1 coho 1 abuse and drug abuse, the re 1 ati,onshi p of
homi ci de and other vi 01 ent cri mes to drug abuse t mental' ill nes sand cri me" , and the cqst ~f admin~stering social, welfare benefits to ADM victims.
Total cost estimates are pre~ented in table 111-1. A guide to these data and tables used to derive the final estimates are provided in table III-2. For a specific cost component of interest in table IU-l, . identifY the component name and the ADM disorder, and refer to table 1II-2 to obtain the reference table numbers. B. Core ~irect Costs--Treatment
Inpatient and outpatient services are available from many types of institutions and healt~ 'treatment and service provjders. A first step in the prior study was to identifY a consistent and reasonably exhaustive set of treatment settings that provide health care. After adjusting the data using information from NIMH, a list of settings consistent with data maintained by the Health Care Financing Administration ,(HCFA) of DHHS, NlAAA, NIDA, and NIMH was established.
For each setting, the study team accumulated information on the total value of goods and services provided. These values were obtained from HCFA, NIDA, NIAAA, and NIMH (see table II1-3 for sources). For the same settings., data on service utilization by individuals with p'articular diseases and illnesses (ICD-9 diagnostic codes) were also obtained '(see table III-3
33

Table III-l Costs to Society of Alcohol Abuse, Drug Abuse
and Mental Illness, 1980 . ($ in millions)
Alcohol Drug Mental Abuse Abuse Illness Total
. ~ .. ~---...
Core Costs $79,607
Direct Treatment 9,487 Support 984
Indirect Mortal ity 14,456
. Morbidityb 54,680
Reduced productivity Lost employment
(50,575) \ (4,105)
Other Related Costs 9 t 919
Direct Motor vehicle crashes 2,185 . (prsperty loss) Crime . 2,347
Public (2,062) Private (261) Property loss/damage (24)
Social welfare program 38 Other 2,912
Indirect Victims of Crime 172 Crime career! Incarceration 1,801 Motor vehicle crashes 464
(time loss)
Total $89,526c
Totals may not add due to rounding.
$Z9,451
',200 243
1,980 26,028
(25,716) (312)
17,485
- a
.5,910
(4,454) (l,345)
(111 )
2 537
845 8,725 1,466
a
$46,936c
$52,418. $161,476
20,961 31,647 .2,597 3,823
7,196 23,632 21,664 102,372
'(3,122) (79,413) (18,542) (22,959)
1,818 29.,222
870
(635) (235)
('" )
201 659
. -88
2,185
9,127
(7,151 ) (l ,841)
(135)
241 4,108
1,017 8,725 3,356
464
$190,698
aAlthough costs are hypothesized to occur in this category, sufficient data are not available to develop a reliab1e estimate. bComponents are indicated in parentheses. cTMe total costs to society for each of the three ADM disorders are not comparable, since the completeness of data available for each cost category varied significantly. For example, the estimate of reduced productivity is relatively complete for alcohol abuse, only partially complete for drug abuse, and incomplete for mental ;~lness.
Source: Research Triangle Institute.
.. - - .

Table II!-2
Table Reference List for Chapter 3
---------------------------------,---- ---'
Core Costs
Treatment Support
Mortality Morbidityb
Reduced productivity Lost employment
Other Related Costs
Motor vehicle crashes - (prgperty 1,oss) Crime
Public Private Property loss/damage
Social welfare program Other
Victims of crime Crime careers Incarceration
Alcohol Abuse
3,4,5 6
7,10,,11
14,15,16,17 t 18 19,20,21,37
28
29 32 33
34,35 36
37
39
35
Drug Abuse
3,4,5 6
8,10,12
14,15,22,23 24,37
30 32 33
34,35 36
37 38 39
Mental nlness
3,4,5 6
9,10,13
14,15,25 26,27
31 32
34,35 36
39

Table 111-] Sources of Cost and Diagnostic Data Used to Estillate Costs for· ADM Settings, 1980 ,
ADM faci li ties lIospital-based
Setting
Slale and CIIlunll' psychiatric hospitals Private psychlalric hospitals VA neuropsy.:hialrtc hospitals Uon-Federal general hospitals with separate psychiatric
units Other ADM facilities and services
Data Sources Costs ~--Dlagnoses
NIHIl' NIHlllo
NIHlll NIHlI10
NIHil' NU'II'o
NIHil' NIHlI'o
w Federa lly funded CHiles m NIHil' NIHIl"
Residentfill treatment centers for children lIalfway houses Freestand~ng facilities
Other fad 11 ties ADM units in correctional factl~tie5 Private practice psychiatrists Private practice psychologists
General health facilities lIosflital-based Uon-federal community hospitals (excluding psychiatric units) VA general hospitals and other facilities
Other federal facilities
NIHil'
NIHlll. NIDA2. NIMAs.
'NIHil'. NIDA2, NIAAAs NIDA2. NIAAAs
NIIE4 ADAfi
IUlE4 Statistical Abstract8
NIHIl'
NIDA2. NlAAA3. NnUI10
NIHIl'. NIDA2, NIAMs NIDA2. NIAMs
NCIISl2
NCtlS l2
NCIIS13
Special data analysfs7 Special data analysis7
Federal agencies8
Statistical AbstractS Federal agencies'4

W '-I
Table 111-3 (continued)
Setting
Other general health faci1iti~s and services
Nursing homes
Private pradice physicians'
Dentists
Other health professionals
Drugs and drug sundries
Other health services
Volunteer services
'U. S. OnIiS. NIHil (1983a).
2U. S. OIlIlS" NIDA. special data ana lys Is of 1980 NOATUS f.i les •
. 3U.S. 011115, NIAM, special data analysis of 1980 NDATUS files.
iGibson and Waldo (1981).
sVandenbos, Stapp, and Kilburg (1981).
6U.S .• DOC, DOC, Statistical Abstract (1982).
7Special dat~ analysis, VA o~partAlent of Medicine and Surgery.
Data Sources Costs Dlagnoses
NII04 N[IIS1&
NIlE4 H[IIS12
NIIE4 EsUmatedlS
NIIE4 EsUilated18
NIIE4 EsUllated'6
NIIE4 EsUllated'S
ACTlON9 EsUmated'S
8le tlers from: Oepartllent of the Air Force, Navy, Army, Public lIealth Service, and Indian lIC!alth Service.
~ACTION (1975j 1976).
IOU. S. ollIlS. NIHil (1983b).
"U. S. OIIIIS. NUIII (1981).
12U.S. 011115. NCIIS, unpublished 1980 Ambulatory Care Survey data.
13U.S. 011115. NeilS. unpublished 1980 lIospHal Discharge Survey. data.

w en
Table [11-3 (continued)
"'Unpub 11 shed reports froll:
Public tlealth Service
Indian lIealth Service
Department of the Army Selected Diannos1s. Patients in
Department of
Department of the Navy
ISU.S. DlIEW. NeilS (1979).
16Estimates based upon distribution of ADM illness costs In VA general hospitals, community hospitals, and for physician services.
•

o.
for sources). Total expenditures within a given setting were allocated to alcohol abuse, drug abuse, and mental illness ·on the basis of service utilization data. This approach involved identifying specific diseases and illnesses that are related to alcohol, drug abuse and mental illness (see table 11I-4) and allocating costs based on the portions of the illnesses or diseases that are ADM-related. The causal relationship factors used here are identical to those in the 1981 study, except for the addition of alcoholic cardiomyopathy. For this study, HCFA provided 1980 expenditure data for most health care settings. For a number of ADM speciality settings (community mental health centers and various freestanding facilities), expenditure data were obtained from NIMH for 1979, the most recent year for which data had been collected. The 1979 estimates were inflated to 1980 values using the health care component ind~~ of the Consumer Price Index.
Sou~es of current utilization data included the Hospital Discharge Survey data for general hospitals, the Ambulato~ Care Survey data for private practice physician visits, and inpatient data for all ho.spitals run by the Veterans Administration. Health care providers ,covered by these three data sources accounted for nearly 60 percent of all health care services utilized in the United States in 1977. Where 1980 data were unavailable, the 1977 utilization data for these settings were used.
Costs estimated using national expenditure and utilization data are presented in table 1II-5. The total costs for alcohol abuse, drug abuse, and mental illness, respectively, were $8.8 billion, $1.2 billion, and $21.0 billion, respectively, for a total of $30.9 billion. ADM accounted for approximately 14 percent of the $223.8 bi1lio~ spent on personal health care for all illnesses in 1980.
Nearly half of· total expenditures for mental illness ($21.0 billion) were for specialized services ($10.0 billion) such as psychiatric hospitals, CMHC's, and psychiatrists and psychologists. In contrast, 38 percent of expenditures for drug abuse and 12 percent for alcohol abuse were in specia1ized settings.
A major modification was made to this cost component with the introduc~ion of cost estimates for the fetal alcoho1 syndrome (FAS). FAS may be described as a IIsetll of serious birth defects including mental impairment,
39

A. ALCOHOL ABUSE
ICOA-8 ICO-9-CM Code Code
291 291 303 303
305.0 571.0 571.0 571.0 571.1 571.0 571.2 571.0 571.3 980.0 . 980.0
Cancer
140-149
150 151 153 154
155.0 157
Mental
296 300
425.5
140-149
150 151 153 154
155.0 157
Disorders
296 300
Infectious Diseases
all all 012 012 480-486 480-486
Tab1 e 1II-4
Diagnostic Categories Used to Estimate ADM Treatment Costs
1. Alcohol Abuse-Scecific Jllnesses
Percent Associated Diagnosis with Alcohol Abuse
Alcohol psychosis 100 Alcohol dependence syndrome 100 Alcohol abuse 100 Alcoholic fatty liver 100 Acute alcoholic hepatitis 100 Alcoholic cirrhosis of liver 100 Alcholic liver damage, unspecified 100 Toxic effects of ethyl alcohol A l.coho 1 i c cardi omyopathy 100
,. . .. 2. A1cohol Abus~-Related Illnesses
Malignant neoplasm of lip, oral and pharynx Malignant neoplasm of esophagus Malignant neoplasm of stomach Malignant neoplasm of colon Malignant neoplasm of rectum, rectosigmoid junction, and anus Liver, primary Malignant neoplasm of pancreas
Affective psychoses Neurotic disorders
Pulmonary tuberculosis Other respiratory tuberculosis
. Pneumonia
cavity 2 to 43
28.8 to 80 .3 to 20
.3
.3
12.6 1.2 to 75
2.8 to 42 5.6
10.2 to 70 10.2 to :]0 1. 1 to 4

Table 111-4 (continued)
ICOA-8 1CO-9-CM Code Code Diagnosis
Percent Associated with Alcohol Abuse
Gastrointestinal Tract
456 456 531 531 536 536 532 532 533 . 533 534 534 535 535 577 577
Liver Disease
571 571
Nervolls Disease
345 345
~~
427.4 427.3
~ocrine System
240-246 240-246 250-258 250-259
Varicose veins of other sites Gastric ulcers Disorders of function of stomach Duodenal ulcer Peptic ulcer, site unspecified Gastrojejunal ulcer Gastritis and duodenitis Diseases af pancreas
Chronic liver disease and cirrhosis
. Epilepsy
cardiac arrhythmias
Disease of thyroid gland Diseases of other endocrine glands>
Nutritional Deficiency
260-269 260-269 274 274 275 273
SOO-999 800-999
Nutritional deficiencies Gout Other and unspecified metabolic diseases
3. Alcohol Abuse-Related Trauma
I.njury and poi soning
41
26.7 1.2 .8
.8 to 6.7
.6 to 24.4 1.8 2.9
11.6 to 68
64.75
3.3
1.3 to 3.7
.8 to 34.8
.8 to 34.S
4.3 to 60 1. 7 to 25.3
1.4
10
..

Table 111-4 (continued)
ICDA-8 1CD-9-CM Code. 'Code
B. DRUG ABU~E
304 304 292 305
960-977 960-977
C. MENTAL ILLNESS
290
295 . 296 297 298
·299 . 300 301 302 305
306
307
794
290
293 294 295 296 297. 298 299 300 :~01 302 306
307 308 309 310
311 312 313
314 315 316
794
Diagnosis
Drug dependence Drug psychosis Nondependent abuse of drugs Poisonings of drugs, medicinal and biological substances
Senile and presenile organic psychotic disorders Transient organic psychotic conditions Other organic psychotic conditions Schizoph~~ic disorders
. Affective psychoses . Paranoid states Other nonarganic psychoses Psychoses with origin specific to childhood Neurotic disorders Personality disorders Sexual deviations and disorders Physiological malfunction arising from menta 1 di sorders Special s.ymptoms 'or syndromes, nec Acute reaction to stress Adjustment reaction Specific nonpsychotic mental disorders due to organic brain damage Depressive disorders, nec Disturbance of conduct, nec Di sturbance of eDloti on speci fi c ·to chi 1 dhood and adolescence Hyperkinetic syndrome of childhood Specific delays in development Psychic factors associated with diseases classified elsewhere Seni"lity without mention of psychosis
Source: Research Triangle Institute.
o
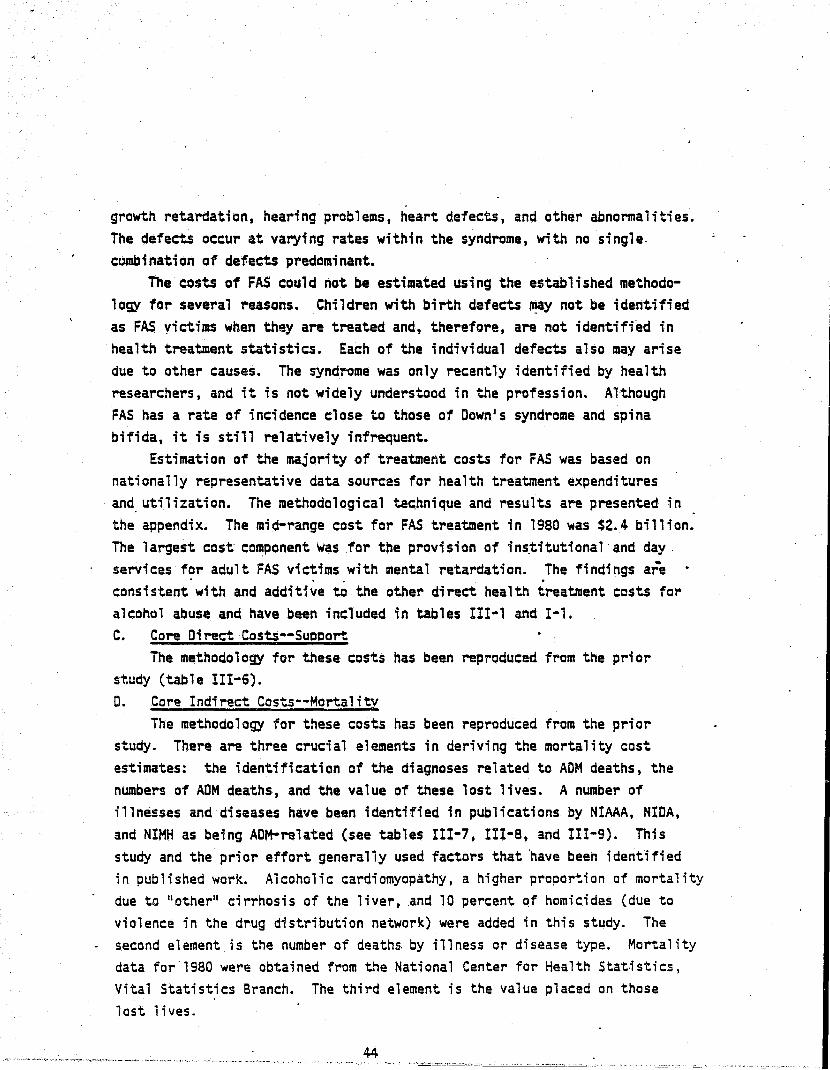
growth retardation, hearing problems, heart defects, and other abnormalities. The defects occur at varying rates within the syndrome, with no single, combination of defects predominant.
The costs of FAS could not be estimated using the established methodology for several reasons. Children with birth defects ~y not be iden~ified as FAS victims when they are treated and, therefore, are not identified in health treatment statistics. Each of the individual defects also may arise due to other causes. The syndrome was only recently identified by health researchers, and it is not widely understood in the profession. Although FAS has a rate of incidence close to those of Downls syndrome and spina bifida, it is still relatively infrequent.
Estimation of the majority of treatment costs for FAS was based on nationally representative data sources for health treatment expenditures
, and utilization. The methodological te~hnique and results are presented in the appendix. The mid-range cost for FAS treatment in 1980 was $2.4 billion. The largest cast' component was for the provision of ins,titutional' and day, services for adult FAS victims with mental retardation. The findings are
. . . . consistent with and additive to the other direct health treatment costs for alcohol abuse and have been included in tables III-' and I-l. C. Core Direct Costs--Succort
The methodology for these costs has been reproduced from the prior study (tab 1 e III-6). D. Core Indirect Costs--Mortalitx
The methodology for these costs has been reproduced from the prior study. There are three crucial elements in deriving the mortality cost estimates: the identification of the diagnoses related to ADM deaths, the numbers of ADM deaths, and the value of these lost lives. A number of illnesses and diseases have been identified in publications by NlAAA, NIDA, and NIMH as being ADM-related (see tables 111-7, III-B, and 1II-9). This study and the prior effort generally used factors that 'have been identified in published work. Alcoholic cardiomyopathy, a higher proportion of mortality due to II other" ci rrhos is of the 1 i ver, ,and 10 percent Qf homi ci des (due to violence in the drug distribution network) were added in this study. The
- second element is the number of deaths, by illness or disease type. Mortality data for'1980 were obtained from the National Center for Health Stat,;stics, Vital Statistics Branch. The third element is the value placed on those lost 1 ives.
44

Tlbl. 111-5
ADM Costl by Selling, 1980 U In .1II10ns)
Alcohol Cosh
All Alcohol Alcohol Alcohol Abus. Abulil Abu,. Abus. Sf"lflc Reliled .. lllld Drug Kenlal An An
SeLtlngs I llneul5 I Ineu .. TrllJlla IIlnen Abus. l11nen AIlH IIlnenu
AIlI4 faclHtln 1I,05B !LID L-. L.!! Llli 110,020 !!Llli I 12.315 lIosp Ilal-bued 341 341 B5 5,665 '.090 6,549
Slate and counly psychiatric hospitals 211 211 54 3,fi05 3,816 ~,161 Private psychiatric hospltlll U 41 11 111 161 824 VA neurosychl drlc hasp III 11 II 31 8 5U 584 628 Han-Federal general hospll ... "Ith Ilplnt.
psychiatric units 48 48 12 004 864 929 Other ADM facilities and servlc •• 111 610 1 41 361 4,351 5.440 5,821
Federally funded CHIles IBI 101 50 991 1.228 1.481 Residential trealaent cenlerl for chlldr.n 0 0 0 484 4a4 484 freeSlandl", facllitl~s 319 319 265 565 1.20a 1,254 Olher fadl lies 49 49 33J 179 261 216
... ADH unlls In correctional 'lellltl.1 2 2 8 1O 10 ... Private practice psychlltrhll 58 H 1 41 6 1.150 1.211 1,286 Private practice psychologlill 49 49 5 982 1.036 1.016
General heallh fadlltles 1.110 ~.44~ 1.188 2.500 ill 10.940 , J9,41l 211,390 lIosp Ita I-based ,.800 2.386 882 I.5lZ 521 5,OB8 lO,4Ui 93,046
Hon-Federal cOllillunlly h05plll" ""cludlng psychiatric unlls) 3,919 1.195 822 . 1,362 421 3,933 1.132 81.500
VA general hospllals andbolhlr 'lcllltl'l 544 US 18 91 46 861 I,tsl 5,3U Olher Federal facilities . 218 151 U 18 60 294 '31 4.2ll
Other general health 'adUlIli Ind lIulcll 2.9]0 1.056 ·906 968 221 5.852 t,002 118.350 Hun Ing hoa85 161 105 62 2,10) 2.951 20,100 Prlvale practice physlclan5 126 61 313 291 28 810 1.624 45.514 Denllsh (2) 211 144 206 59 610 1.350 15.900
ff
Other 'Ieallh professlonlll m 14 19 51 16 184 311 4.364 Drugs and drug sundrle5 150 321 In 249 11 810 1.'1I 19,200 Olher heallh services 359 151 83 119 34 388 181 9.195
Ii Volunteer services U6 59 31 45 13 146 295 3.412 I; It
lolal 11.181 ",451 $1.188 12.546 II.ZoO $20.961 $30.941 1223.110 I
!i[
Hole: Totals aay nol add dUI to rounding.
aless lhan $.5 .llIlon.
bA ,aall port·lon of these were In non-h05plhl-bi5e~ "cllllIu.
Source: Rl!search Irlanale Instltule.
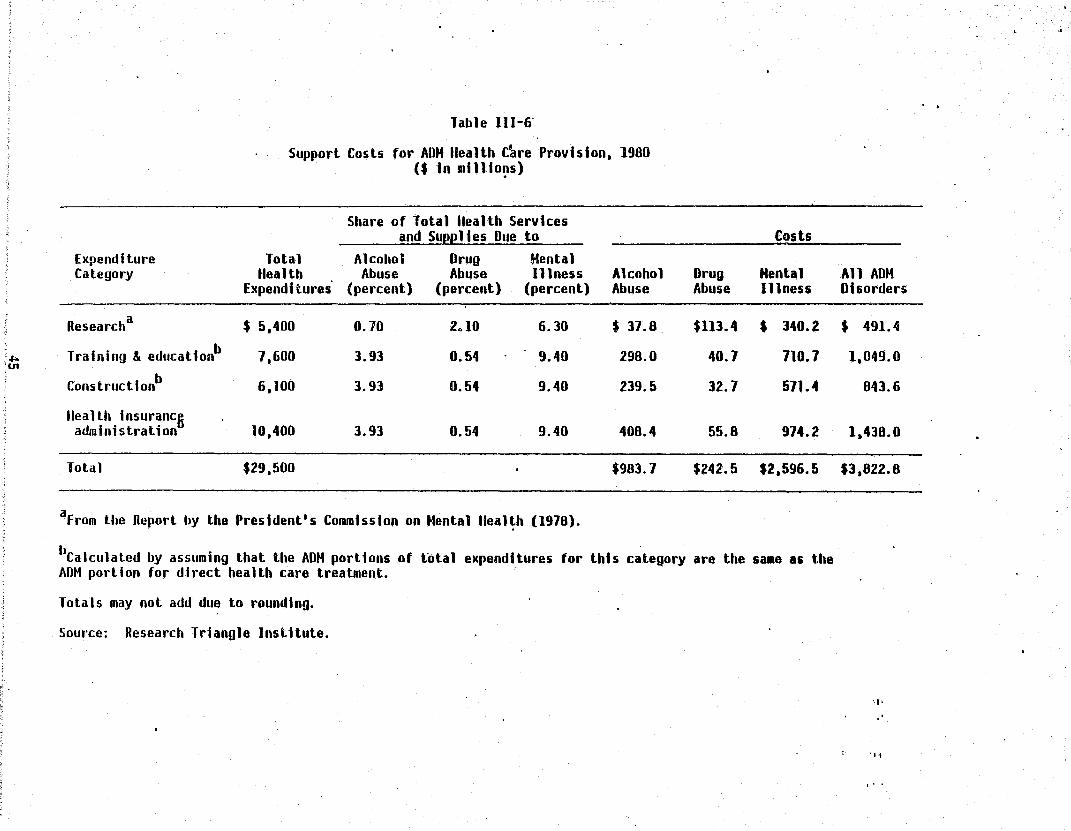
. .J>. ;U1
Table 111-6'
Support Costs for ADM lIealth [~re Provision. 1980 ($ In 1l11110~s)
Share of Total lIealth Services and Suee 11 es Due to Costs
Expenditure Total Alcohol Drug Hental Category Health Abuse Abuse Illness Alcohol Drug Mental
Expend. tures' (percent) (percent) (percent) Abuse Abuse Illness
Researcha $ 5,400 0.70 2.10 6.30 $ 37.8. $113.4 $ 340.2
Training & educatlonb 7.600 3.93 0.54 9.40 298.0 40.7 710.7
Constructionb 6,100 3.93 0.54 9.40 239.5 32.7 571.4
lIeallh insuranc6 administration 10,400 3.93 0.54 9.40 400.4 55.8 974.2
Total $29,500 $983.7 $242.5 $2.596.5
aFrom the Report by the President's Commission on Hental lIeal~h (1978).
llCalculated by assuming that the ADM portions of total expenditures for thh category are the salle as the AOM portion for direct health care treatment.
Totals may not add due to rounding.
Source: Research Triangle Institute.
· .
All ADM Disorders
$ 491.4
1,049.0
843.6
1.430.0
$3,022.0
'I'
., 1
o. 0

Table III-7
Causes of Mortality Related to Alcohol Abuse
I .. .. ...... _. Proporti on of Marta li ties
Due to Alcohol Abu!e Mortalities ICDA-8 ICO-9
Cause (percent) in 1980 Code Code
Direct causes - primary Alcoholic psychoses 100.0 454 291 291 Alcoholism 100.0 4,345 303 303 Cirrhosis, alcoholic 100.0 12,705 571.0 571.0-571.3 Accidental poisoning by
alcohol 100.0 343 E860 E860 Cardi omyopathy, a 1 coho.1 i c 100.0 650 425 425.5
Direct causes - secondary Cirrhosis, other . 64.3 16,170 571.8,571. 9 571.4-571.9 Resp?ratory tuberculosis 25.0 1,634 011-012 011-012 Neoplasm
Tongue, malignant 1,874 141 141 Mouth, floor malignant 509 144 144-Mouth, other, malignant 1,399 145 145 Pharynx, mal ignant, oro 1,127 146 146 Pharynx, ilia 1 i gnant, naso sas 147 147 Pharynx, malignant, hypo 634 148 148 Pharynx, malignant, unspecified 1,501 149 149.0 Esophagus, malignant 7,985 150 150 Stomach, malignant 14,372 151 151 Rectum, malignant 7,435 154. 1 154. 1 Liver, malignant, pri~ary 56.0 2,395 155.0 155.0 Liver, bile duct type 455 155. 1 155. 1 Pancreas, malignant 19,640 157.9 157.9 Larynx, malignant 3,412 161 161 Liver, malignant, unspecified 197.8 197.7 Esr.!phagus, begi gn 211.0 211.0 Liver, benign l' 21'.5 211.5 Rectum, benign 1 211.4 211.4 Pancreas, benign 9 211.6 211.6 Larynx, benign 1 ·212 212. 1
. Stomach, unspeci fi ed 2 230 230.2 Esophagus, unspecified 1 230.0 230. 1 Live~, unspecified 230.5 230.8 Pancreas, unspecified 230.6 230.9 Rectum, unspecified 230.4 230.4 Larynx, unspecifiedb 1 231 231.0 Tongue, unspecified 4 239 230

"
Table III-7 (continued)
._-Proporti on of Mortalities
Due to Alcohol Abule Mortalities ICDA-8 ICD-9
Cause (perCent) in 1980 Code Code
Hypoglycemia 'bspontaneous 167 251 251. 0, 251.2 Malabsorption 11 261 265.1 Beriberi 2 261 265.0 Po 1 yneuropathyb 11 261 265.1 Niacin deficiencyb 4 262 265.2 Pellagra 4 262 265.2 Malabsorption 4 263.8 266.2
Cyanocobalamine defic~encyb Folic acid deficiency
Other vitamin B deficiencies, unspecified 263.9 266.9
Wernicke's encephalopathyb 263.9 266.9 Ascorbic acid deficiency 4 264 '267 Malabsorption syndrome, •
unspecified . 269. 1 Pl~sma protein abnormalities - 375 275 273 Other and unspecified
metabo 1 i c di seases' 1,361 279 277 Folic acid deficiency anemia 14 281.2 281.2 Other acquired hemolytic anemias 25 283.9 283.9 Progressive muscular dystrophy 589 330.3 359.1 Other demyelinating diseases
of central nervous !ystem 182 341 341 Marchiafava's disease 4 341 341.8 Other and unspecified diseases
of peripheral nerve except autonomic 109 357.9 356.8, 356.9
Hypertension~ 2,840 401 401 0; seasesof cap; llari es -. 45 448 448 Inflammatory diseases of
esophagus 248 530.1 ' 530. 1 Gastritis and duodenitis 695 535 535 Pancreatitis, acute 35.5 1,390 577.0 577.0 Pancreatitis, chronic 35.5 261 577.1 577.1 Rosacea . 0 695.3 695.3 Chronic ulcer of skin, otherb 70 707.9 707.8, 707.9 Other and unspecified disease
of muscle, tendon, and fascia -. 72 733.9 728.8, 728.9
47

Table 1II-7 (continued)
Proportion of Mortalities
Due to Alcohol Abule . Mortalities
Cause (percent) in 1980 ICDA-S ICD-9 Code Code
Myopathy, primary 72 733.9 72S.S, 72B.9 Myopathy, p~gressive 72 Convulsions 354 Keto-acidosis, alcoholicb 710
733.9 728. S " 728.9 7S0.2 7S0.3 7SS.0 276.2
Senility without mention of psychosis 1,233 794 797
Indirect causes Motor vehicle crashes 37 52,979 ES10- ES10-
ES23 ES25 Accidental falls 44.4· 13,312 ESSO- ESSO-
, E887 ESSS Accidents caused by fires .25.9 5,S65
and flames ES90- • ES90-E899 E899
Homicide 30.0 23,902 E960~ E960-E969 E969
Other accidents 11.1 30,573 E830- ESOO-EMS, ES07 E910- ES30-E929 ES45
EES60-ES79 E900-E949
Suicide o 26,S52
aaecause the proportion of mortalities due to alcohol abuse is unknown, some cells in this column lack a number giving a proportion. These causes are excluded from the analysis.
brhis illness is a subcategory of the ICD-9 class for which mortality data are available. Therefore, the number of deaths due to this cause is less than the value listed.
Source: Keller (1971; 1974); Noble (197S); unpublished mortality data from the Vital Statistics files provided by' NCHS (U.S. DHHS, NCHS, no date) .

Table III-S Causes of Mortality Related to Drug Abuse
Froportion of Mortalities
Due to .
Cause Drug AbUS! Mortalities (percent) in 19S0
Drua Deoendence laO 629
Ac:idental Overdose of Psvcnoac~'ve Drugs
Heroin laO Methadone 100 Other opiates and related
narcotics 100 ather nonnarcotic analgesics 100 Other specific analgesics and
ant; pyret i cs 100 Unspeci fi"ed anal ges ; cs and
ant i pyret i cs 100 Barbiturates 100 Other sedatives and hypnotics 100 'Tranquil izers 100 ather psychotropic agentS
(inc. antidepressants) 100 Other drugs acting on central and
autonomic nervous system 100 Agricultural and horticultural
chemical and pharmaceutical preparations other than plant foods and fertilizers 100
Accidental Overdose of Drugs and, Medicaments
Acc~dental poisoning by antibiotics
Accidental poisoning by other anti-infectives
Hormones and synthetic substitutes
Primarily systemic agents Agents primarily affecting blood
constituents Sa li cyl ates Aromatic analgesics, nee Pyrazole derivatives Antineumat;cs
laO
100
100 100
100 100 100 100 100
49
322 75
21 o
97
a 154 59
110
161
159
24
50
7
20 12
17 2 2
117 o
ICOA-S ICO-9-CM Code Code
304 304
ESS3.0 E8S3.0
E853.0
ESS8.9
E·853.9 ES54.0 ESS4 ES55.1 .
ESS5.2
E856
E865
ES50
ESSO
ES51 E8S2
ES52 E853.1 ESS3.4 E853.5
e8S0.0 ESSO.l
ESSO.2 ESSO.7
ES50.S
EB50.9 ESS1 ESS2 ESS3
ES54
ESS5
ES63
ES56
EB57
EBSS.O E8S8.1
eSSS.2 E850.3 E850.4 E850.5 E850.6

I
Table 111-8 (continued)
Cause
Agents primarily affecting cardiovascular system
Agents primarily affecting gastrointestinal system
Water ~ineral and uric acid metabolism drugs
Agents primarily acting on
Proport i on of Mortalities
Due to Drug AbusS Mortalities (percent) in 1980
100
100
lOa
190
3
13
the smooth and skeletal muscles and respiratory system 100
100 13 9 Agents primarily affecting
skin and mucus membrane ophtha·lra010gical, otorhinolaryngological, and dental drugs
Other specified drugs Unspecified drug
Injury Undetermined Whether Accidental or Purposely Inflicted
Analgesics, antipyretics and antiheumatics
Barbiturates Other sedatives and hypnotics Tranquilizers and other
psychotropic agents Other specified drugs and
medicinal substances Unspecified drug or medicinal
substance All other solid or liquid
substances
100 100
100 100 100
100
100
100
100
.. 404
201 65 28
140
174
217
S07
1CDA-8 1CD-9-CM Code Code
E8S7
E8S8
E859.3
EBS9.4 ESS9.5 E8S9.6 EBS9.7
ES59.S ESS9.9
E9S0. 1 E9S0.0
E980.2
E980.3
E980.3
E980
E858.3
E8S8.4
EBS8.S
ESS8.6 ESS8.7
ESS8.S ESS8.S
E980.0 E980.1 E980.2
E9S0.3
E9S0.4
E9S0.S
E9S0
Source: Unpublished mortality data from the Vital Statistics files provided by NCHS (U.S. DHHS, NCHS, no date).
so
-

Table 1II-9
Causes of Mortality Related .to Mental Illness
.... - "'--'-' -Praparti an of. Mortalities
. due to Mental 111nlsS Mortalities 1COA-8 1CD-9-CM
Cause (percent) in 1980 Code .. __ .C~de
Psychoses , Senile and presenile organic
psychotic 100 1 t 713 290 290 Transient organic psychotic
conditions 100 2 293 Other organic psychotic
conditions 100 41 294 Schizophrenic disorders 100 165 295 295 Affective psychoses 100 48 296 296 Paranoid states 100 7' 297 297 Oth.cr nanorganic psychoses 100 437 298 298 Psychoses with origin specific . to chi 1 dhood 100 1 299 299
Neuroses Neurotic disorde~ 100 66 300 300 Personality disorde~ 100 2 301 301 Sexual deviations and disorde~ lOa , 302 302
Physiological malfunction arising from mental disorders 100 25 305 306
Special symptoms or syndromes, nec 100 162 306 307
Acute reaction to stress 100 32 308 Adjustment reaction lOa 2. 307 309 Specific nonpsychotic mental
di sorders due to organ; c brain damage 100 4,170 794 310
Depressive disorders, nec 100 217 311 Disturbance of conduct, nec 100 a 312 Disturbance of emotion
specific to childhood and adolescence 100 a 313
Hyperkinetic syndrome of childhood 100 a 314
Specific delays in develop· ment 100 4 315
Psychic factors associated with diseases classified elsewhere 100 0 316
51

Tab 1 e rIl-9 (continued)
Prop~n·ti on of Mortalities
Due to Menul Inniss Mortalities ICOA-8 ICO-9-CM
.. Cause (percent) in 1980 Code Code
Suicide and self-inflicted poisoning by solid or 100 216 E950.4 E950.6 liquid substances E9S0.9 E9S0.9
Suicide and self-inflicted poisoning by: analgesics, lOa 607 E9S0.1 E9S0.1 antipyretics, and antiheu- E950.0 E9S0. 1 matics, barbiturates, other· E950.2 sedatives and hynotics
Tranquilizers and other psycho-trap i c agents 100 754 E950.2 E950.3
Other specified drugs and medicinal substances 100 562 E950.3 E9S0.4
Unspecified drug or medicinal substances . lOP 538 E9S0.3 E950.S
Suicide: (excluding· drug over-doses): E9S0.1, E950.2, lOa 24,391 ' E9S0-E950.3, E9S0.4, E950.5 E959
Source: Unpublished mortality data from the Vital Statistics files provided by NCHS (U.S. OHHS, NCHS, no date).

This study and its predecessors used the human capital approac:h which sums the present discounted value of productivity over the expected remaining lifet"tllle. In this approach, a value is assigned to production lost due to premature death. These factors were obtained from Dr. Thomas Hodgson of NCHS (see table 111-10). The cost estimates are presented as tables III-l1, III~12, and 1II-13, respectively, for alcohol. drug abuse, and mental illness. E. Core Indirect Costs--Morbidity
1. Alcohol Abuse Reduced Productivity Alcohol abuse is recognized as a significant problem in the
w~rkplace. This component ~stimates the losses to society due to impaired productivity on the job of persons that mayor may not be recognized by employers as problem drinkers. A detailed discussion of the issues and methodo logy is found ; n the appendi.x.
This component was estimated at $50.6 billion in 1980, a. 114 percent . .. .. ·increase over the 1911' estimates •. As the res~1tof an. analysis reported in the appendix, the 1mpact of problem drinking on producti~ity in the workforce is now estimated at 21 percent instead of the 14 percent·figure used in the previous study. 'The overall prevalence rate has not changed: . ,it is estimated to be 10 percent of the workforce (see table III-17 for the age/sex prevalence).
Several other changes were made. Wages, salaries, and employee benefits increased by 31 percent between 1977 and 1980, and the workforce grew by 8 percent. To be consistent with the prior estimates for alcohol- and mental illness-related disabilities, costs were imputed to all problem drinkers in the labor force (an ~xtra 9 percent), not just to those who were emp 1 oyed.
Fundamental information used in these calculations is found in tables III-14 to III-18. Average expected productivity rates by age and sex are shown in table 1II-14, while the total age/sex distribution 'of the labor force is shown in table II1-15. Basic rates of problem drinking in the adult U.S. ' population from the most recent national household survey (Clark and Midanik, 1982) are found in table III-16. These are presented for comparison to the prevalence rates developed in that s~udy (table !!I-17).
53
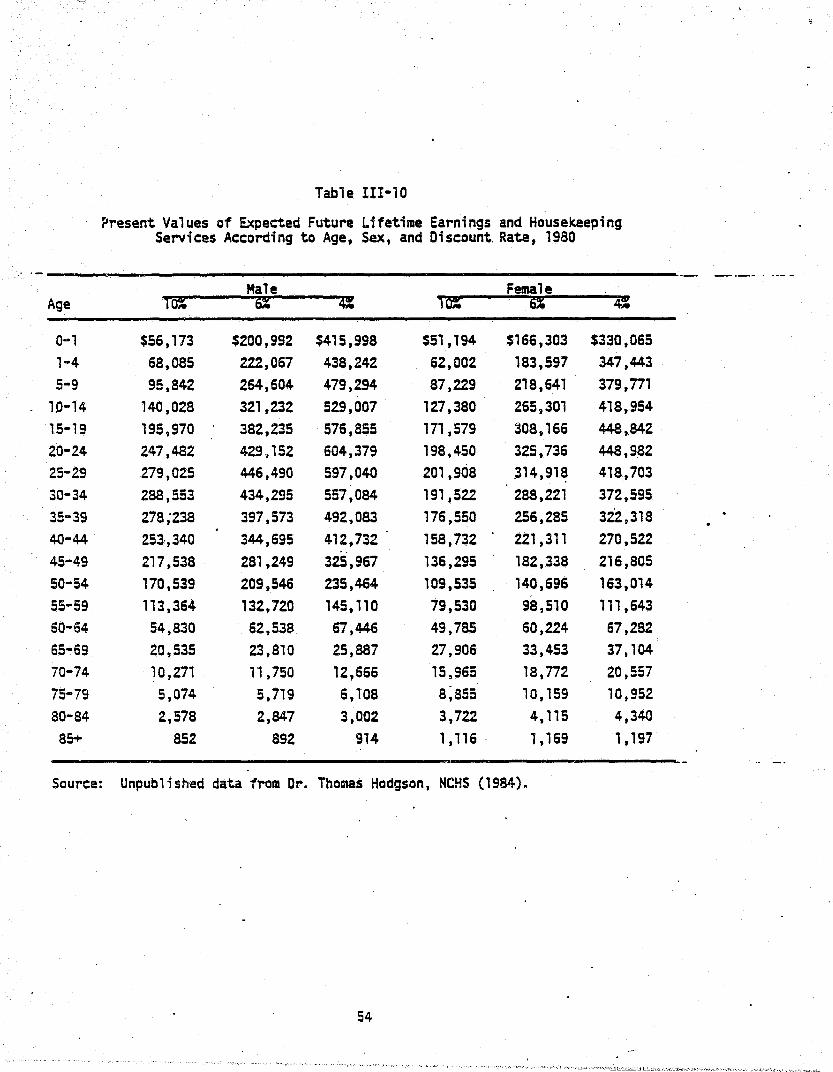
'.::::.
Table III-10
?resent Values of Expected Future Lifetime Earnings and Housekeeping Services According to Age, Sex, and Discount. Rate, 1980
-- _ .. _- .. ---Male Female
Age ,~ ~ 4: ,~ ~ 4: O~l $56,173 $200,992 $415,998 $51,194 $166,303 $330,065 1-4 68,085 222,067 438,242 62,002 183,597 347,443 5-9 95,842 264,604 479,294 87,229 218,641 379,n1
10-14 140,028 321,232 529,007 127,380 265,301 418,954 15-19 195,970 382,235 576,855 171,579 208,166 448,842 20-24 247,482 429,152 604,379 198,450 325,736 448,982 25-29 279,025 446,490 597,040 201,908 314,91~ 418,703 30-34 288,553 434,295 557,084 191,522 288,221 372,595 35-39 278;238 397,573 492,083 176,550 256,285 322,318 40-44 253·,340 344,695 412,732 158,732 221,311 270,522 .. 45-49 217,538 281,249 325,967 136,295 182,338 216,805 SO-54 170,539 209,546 235,464 109,535 . 140,696 163,014 55-59 113,364 132,720 145,110 79,530 98,510 111,643 60-64 54,830 62,538 67 ,446 49,785 60,224 67,282 65-69 20,535 23,810 25,887 2.7,906 33,453 37,104 70-74 10,271 1',750 12,666 15,965 18,n2 20,557 75-79 5,074 5,719 6,108 8;a55 10,159 10,952 80-84 2,578 2,847 3,002 3,722 4,115 4,340 85+ 852 892 914 1,116 . 1,169 1,197
Source: Unpublished data from Dr. Thomas Hodgson, NCHS (1984).
54

.. U1 , U1
Table 111-11 Economic Cost of Mortalities Due to Alcohol Abuse - for Variolls Discount Rales. 1980
($ in lit 11 ions)
Cause of Dealh -Primary Diagnosis
Oirect Primary Causes
Alcohol psychosis Alcoho 11sm Alcohol cirrhosis of liver Alcohol poisoning Alcoholic cardiomyopathy
Oirect Secondary Causes
Cinhosis of liver-other Malignant primary liver neoplas.
. Other malignant neoplasms of gastrointestinal tract
Pancreali ti s flespiralory tuberculosis Other associated diseases
Indirect Causes
Holor vehicle crashes falls f iresh Olher lIomicide Suicide
Tolal
Hortalities in 1980 Attributed to Alcohol Abuse
Total Percent Humber
18.497 454
4.345 12.705
343 650
92,218
16.170 2.395
60,958 1,651 1.634 9.410
153,483
52,919 13,312 5,865
30,573 23,902 26.852
264,198
100 100 . 100 100 100 100
, 64.J 56
a 35.5 25 a
37 44.4 25.9 11.1 30 o
18,497 454
4,345 12,705
343 650
13,086
10,397 1.341
939 409
'31,597
• 19,602 5,911 1,519 3,394 ·7.171
$69,180
aValues of causal factors unknown and are assumed to be zero tor this dudy.
Discount Rates ~---6%----«
$2.325 60
564 1,555
59 87
1,183
1,002 78
79 24
6,067
3,596 311 169 485
1,500 o
$9,575
$3,076 80
748 2,041
85 115
1,563 I.J21
104
107 31
9,817
5,919 462 287 789
2.J58
$3.645 96
.888 2,418
107 136
1,856
1,565 126
129 36
1;1,410 8,162
594 413
1,090 3,148
o
!$14.456 $18,911
, h .
Includes all accidents not listed above but excludes accidents Incurred In lIIedtcal and surgical procedures ami psychoac t i ve drugs. i
rolals nlay not add due to rounding. • I
Source: Research Triangle Institutei unpublished 1I0rtality data from the Vital Statistics files provided' by NeilS (U.S. OIlIlS. t.eus, no da te) . .

U1 at
Tab 18 111-12
Economic Cost of Mortalities Due to Drug Abuse -for Various Qlscount Rates, 1980
($ In millions)
Hortallties tn 1980 AHr16uted to
Cause of Death - DrulI" Abuse Primary Diagnosis" Total Percent Rum6er
Drug dependence 629 100 629
Accidental overdose of psycho-active drugs 1,182 100 1.182
Accidental overdose of other drugs and medicaments 859 100 859
Suicidal overdose of drugs and medicaments 2,461 0 0
Overdose of drugs and medicaments. reason undetermined 1,332 100 1,332
tlomidde 23,902 10 2,390
10%
$151
239
129
0
251
500
Total 30,365 6,392 $1,216
Tolals may not add due to rounding.
Discount Rates 6~ ~~
$242 $311
311 490
200 265
0 0
381 491
186 1.049
$1.980 $2.618
Source: Research Triangle Institute; unpublished mortality data from the Vital Statistics file provided by NeilS (U.S. DIlIIS, NCIIS. no date).

c.n "-J
Table 111-13
Economic Cost of Hortalities Due to Hental Illness -for Various DI~count Rates. 1980
($ in 1111 Hons)
Horta It ttes Attribu·ted Cause of Death - All to Mental Illness Dhcoupt Riites Primary. Diagnosis Hortalfties Percent Number 10% 6i
Psychoses and neurosesa 1.095 100 7.0S5 $108 $141
Alcoholic psychoses and alcoholisil 454 0 ·0 0 0
Drug dependence 629 0, 0 0 0
Suicide (excluding drug overdoses) 24.391 100 24,391 4.242 6.460
Suicidal overdose of drugs or 403 medicaments 2.461 100 28461 595 .
lIomlcide 23.902 O· . 0 0 0
Tolal 58.932 33,947 $4,752 $7.196
Tolals may not add due to rounding.
aExc1udfng alcohol and drug abuse-related deaths.
Source: Research Triangle Instittltei unpublished .0rtaHty data from the Vital Statistics fHe provided by "CHS (U.S .. DIIIIS, NCIIS, no date).·
41
$169
0
0
8.441
763
0
$9.373

Table 'III-14
Values of Market and Household Productivity by Age and Sex Cohort, 1980
Males Females Full·-t1me full-t1me Earnings Imputed Earnings Employed Nonemployed with ~age Household with Wage Household Household
Age Supp 1 enlent Value Supplement Value Value
15-"9 $10,572 $ 70 $ 8,225 $ 89 $ 9,902
20-24 15,529 807 11,712 1,959 11,113
25-29 21,293 1,685 15,307 5,657 12,233
30-34 25,243 1,925 15,161 6,745 11 ,921
35-39 27_,221 1,~60 14,SSS . 7,070· 11 ,429
40-44 28,733 1,8S3 14,994 6,658 10,697
45-49 29,121 1,825 15,054 6,253 10,011
50-54 28,074 1,817 15,219 5,840 9,369
55-59 27,173 1,633 14,460 5,430 8,768
60-64 ·25,030 1,593 14,373 4,189 6,416
Sources: Paringer and Berk (1977); (September, 1983).
U.S. DOL, BLS, Monthly Labor Review

;·tI.
Table III-15
U.S. Labor Force and Employment by Age and Sex, 1980 (number in thousands)
Males Females Lacor tabar
Age Force Unemployed Employed Force Unemployed Employed
16-17 2.,069 419 ',649 1,740 340 1,400
18-19 ' 3,121 477 2,644 2,618 404 2,214
2.0-24 9,022 1,033 7,989 7,170 733 6,437
2.5-34 16,943 1,094 15,849 11,890 852 11 ,038
35-44 11 ,901 474 11 ,42.6 8,605 460 8,145
45-54 . 9,98S" 361 9,627 6~974 316 6,658
55-64 7,165 2.41 6,925 4,592 150 4,441
65+ 1,877 58 1,819 1,444 36 1,1 108
Total 62,087 4,157 57,928 44,733 3,291 41,441
Source: U. S. DOL, BLS, Employment'and Earnings (1981 ).
59

Table III-16
Proportions of Age-Sex Cohorts with Problems Due to Alcohol Abuse
. . ., - . . Proportion with
Proportion with Lass of Control Social ConseQuences or Dependence
Age Males Females Males Females
18-20 15 5 35 16.
21-25 13 6 25 13
26-30 10 .3 25 7
31-40 8 5 16 8
41~50 2 4 8 5
51-60 '3 1 5 4·
61-70 S 0 6 0 , 10+ 4 0 2 0
Total 7 3 lS 6
Source: Research Triangle Institute; Clark and Midanitc., 1982.

Table III-17
Proportions of Age-Sex Cohorts with Productivity Reductions Due to Alcohol Abuse
Proportion with One 01'" MOT"e Problem Drinking Symctoms
Age Males -Females
18-19 16.4 5.7
20-24 21. a 15.4
25-34 18.5 4.5
35-44 11.9 8.2
45-54 13.3 5.S
55-64" S.O 0.8
SOUT"Ce: Research Tr'iang1e Institute; analysis of 1979 national household sUT"Vey on alcohol abuse (Clark and.Midanik, 1982).
61

The cost estimates of reduced productivity by age and sex are in tab·le III-18. The number of persons in the workforce in each age/sex group was . multiplied by the problem drinker prevalence rate for that group to indicate the number of problem drinkers. That number was then multiplied by the productivity values of III-14 and the rate of impainnent (21 percent) to yield the value of their reduced productivity. The values in table I1l-18 for age groups 18 to 34 are reduced by 25· percent to adjust for the occurrence of alcohol abuse and drug abuse in the same people in this age range.
Another element was added to this cost component. The productivity of adult FAS victims is impaired ·due to their mental deficiencies. Impairments for minimal brain dysfunction, and mild and moderate mental retardation were assumed to be 10, 25 and 50 percent, respectively. The 219,000 non-institutionalized FAS victims had costs of $749 million. See the appendix for discussion of these estimates.
Lost Emoloyment fhere are four elements of this component: persons who experience
acute problems and losses of productive time due to injuries frOm motor vehicle accidents, work place accidents, home accidents, violent crimes, or other kinds of trauma (table I11-19); persons with chronic physical impqJrments which either prevent them from werking or impair their ability to work (table I11-20); persons out of the labor force receiving inpatient treatment (table 111-21). and adult FAS victims severely/profoundly mentally retarded.
Acute ~hort-term loss of employment due to trauma was estimated at $938 million in 1980, a 72 percent increase over the 1977 estimate of $545 million. The growth is due primarily to increases in wages and salaries in the labor force; however, the estimate also increased by an additional 30 per~ent due to better data from the U.S. OOJ, BJS (1984) on work loss due to violent crimes (see table 111-37).
Lost employment due to phYSical impairments resulted in estimated co~ts of $2.2 billion in 1980 compared to $1.6 billion in 1977. This is an increase of about 37.5 percent, representing the combined effects of increases .in wages and salaries and labor force growth over the three-yea~ period.
62

Age
18-19
20-24
25-34
35-44
45-54
55"64
Total
Table III-18 .
Reduced Productivity in 1980: Alcohol Abuse Humber of Problem Drinkers and Value of Reduced
Productivity, by Age and Sex Cohort (Humber in thousands, $ in millions)
Females Males ~D"o;ted HouseWlves
Number value Number Value Value
699 $ 858 240 $ 195 $ 42 J
Z,178 4,875 1,596 2,378 554
3,Z85 12,338 . 817 1,804 476
1,482 8,852 1,078 3,232 783
1,456 8,487 652 1,737 470
594 Z,525 89 150 69
9,694 $37,935 4,471 $9,496 $2,394
Total Number Value
939- --$1,096
3,n3 7,806
4,102 14,619
2,560 12,868
.2,108 10,694
683 2v 743
14,165- $49,826
Totals ~ay not add due to rounding.
Source: Research Triarlgle Institute; special analysis of the 1979 national household survey on alcohol abuse (Clark and Midanik, 1982).
63
. __ .-

Table III-19
Last Employment in 1980: Victims of Alcohol-Related Trauma (Accidents and Violence)
(Humber in thousands, $ in millions)
Person Years Cost
Motor vehicle accidents 8.2 $147.7
Work place accidents 9.9 178.7
Home acc.idents 9. 1 157.2
Other accidents 14.5 256.8
V-j 01 ent cri mes 11.2 198.0a
Total 52.9 $938.4
. Source:. Research Trfangle Institute; U.S. CHEW, NCHS; U.S. OOJ, LEAA, 1979c.
aunpublished data from the U:S. OQJ, BJS.·
64
• e
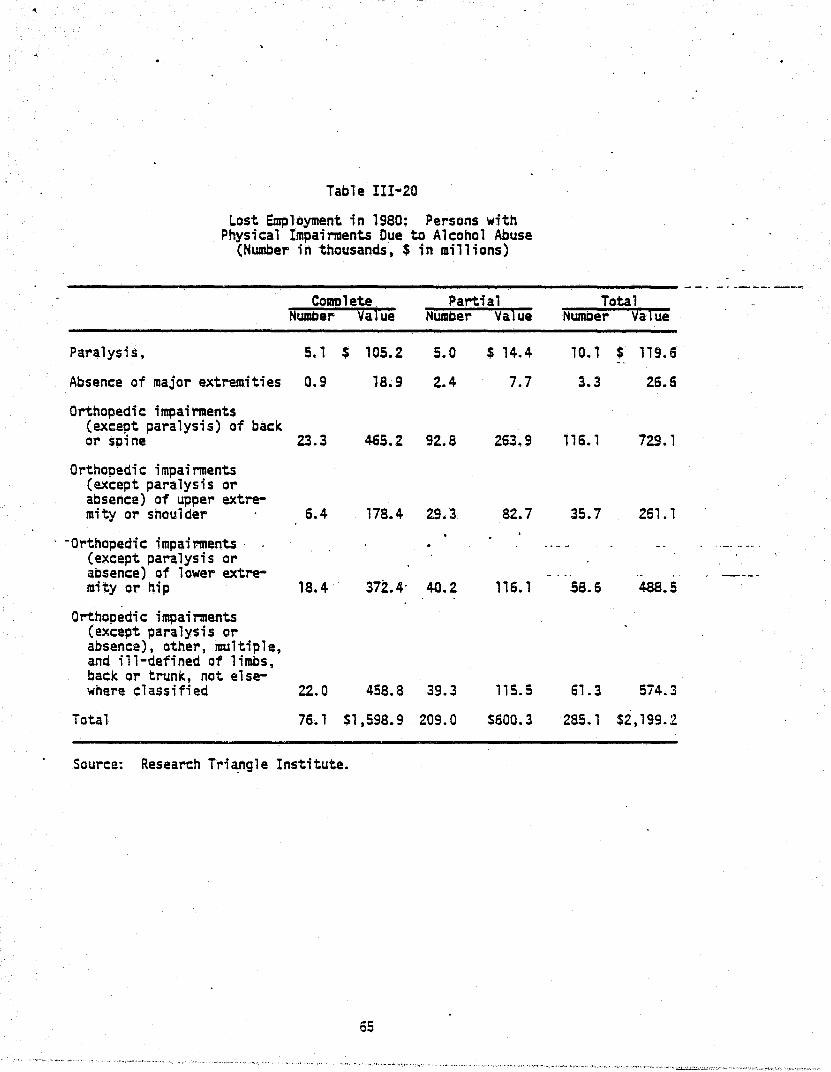
Table I II" 20
Lost Employment in 1980: Persons with Physical Impairments Due to Alcohol Abuse
(Number in thousands, $ in millions)
- -. _ .... ---- -_.-Comolete Partial Total
NumDer Qa1ue Number Value Number va1ue
Paralysis, 5. 1 $ 105.2 5.0 $ 14.4 10.1 $ 119.6 --Absence of major extremities 0.9 18.9 2.4 7.7 3.3 26.6
Orthopedic impairments (except paralysis) of back or spine 23.3 465.2 92.8 263.9 116.1 729.1
Orthopedic impairments (except paralysis or absence) of upper extre-mity or shoulder 6.4 178.4 29.3 82.7 35.7 261.1
. -Orthopedic impairments . . ,-_ .... -.. (except paralysis or absence) of lower extre- ----mity or hip 18.4 372.4· 40.2 116.1 58.6 48S.5
Orthopedic impairments (except paralysis or absence), other, multiple, and ill-defined of limbs, back or trunk, not else-where classified 22.0 458.8 39.3 115.5 61.3 574.3
Total 76. 1 $1,598.9 209.0 $600.3 285. 1 $2,199.2
Source: Research Tr;~gle Institute.
65

Table III-2l
Value of Lost Employment in 1980: Alcohol Abusers in Residential Treatment
($ in lIillions)
Males Females Total Age Number . Value Number Value Number Value
18-19 1,887 $ 15 542 $ 3 2,429 $ 18
20-24 4,330 62 , ,244- 15 5,575 76
25-34- 8,138 195 2,338 42 10,475 236
35-44 8,138 232 2,332; 41 10,475 273
45-54· 4,964 138 1,4261 23 6,391 161
55-64 4,038 84 1 , , 601 14 5,199 98 .
65+ 728 0 209 0 9~7 0
Total 32,m $725 9,259 $138 41,481 ·$863
Totals may not add due to rounding.
Source: Research Triangle Institute; NOATUS; verbal communication with Pat Reed of NIAAA.

• •
. .
Age Number
l'nder 18 546
18-19 1,218
20-24 2,521
25-34 4,623
35-44 4,623
45-54 4,196
55-64 3,518
65+ 718
Total 21,963
'.
ERRATA
Ta bl.e III-21 Value of Lost Employment in 1980:
A1·,;ohol Abusers in Residential Treatment ($ in millions)
Males F'ema1es Value Number Value
$ a 150 $ 0
10 283 2
36 542 7
111 1,023 18
132 1,023 1-8
117 678 11
73 527 6
0 104 0
$478 4,330 $62
Totals may not add due to rounding.
Total Number
696
1,501
3,O64
.5,64,6
5,646
4,874
4,044
822
26,293
SClurce: Research Triangle Institute; NDATUS (unpublished data from NI.~~).
Revised October 1, 1984
Value
$ a
12
43
129
150
128
79
0
S540

Table 111-22
labor Force Age-Sex Cohorts with Produ~ivity Reductions Due to Drug Abuse
o
------------------------------ ._---------_. Age
lB-19
20-24
25-34
35-44-
45-54
55-64
Proportion with· Dally Use (Ever) of Marijuana Males Females
18.9 14.3
21.8 11. a 12.5 4.5
0.0 0.0
0.0 0.0
0.0 0.0
Source: Research Triangle Institute: analysis of 1982 National Househola Survey (Miller et ~l., 1983).
67

Age
18-19
20-24
25-34
35-44
45-54
55-64
Total
Table III-23
Reduced Productivity in 1980: Drug Abuse Number of Problem Users and Value af Reduced
Productivit¥, by Age and Sex Cohort (Number in thousands, $ in millions)
Females Males ~e'o~ed Housewives
Nulllber Value Number va·lue Value
806 $ 1,313 601 $ 651 $ 140
2,261 6,723 1,140 2,256 526
2,220 11 ,076 817 2,396 633
0 a a a a
0 0 a a a 0 0 0 0 a -
S,;Z86 $19,112 2.557 $5,303 $1.299
Tota1s may not add due to rounding.
Source: Research Tri"angle Institute; special analysis of the Household Survey (Miller et al •• 1983).
68
"
Total Number vaiue
1,407 $2,105
3,400 9,505
3.036 14,106
0 0
a 0
0 0
. 7,844 $25,716
1982 National

Table 1II-24
Value of Lost Employment in 1980: Drug Abusers in Residential Treatment
($ 1 n 1111 1 ions)
Males Females Total Age Numeer Value Numeer Value Nwneer Value
18-19 1,206 $ 9 391 $ 3 1,597 $ 12
20-24 3,462 49 1,014 12 4,476 61
25-29 ' 2,837 62 788 14 3,625 76
30+ 3,015 79 588 11 3,603 89
Total 10 " 520 $199 2,781 $39 13,301 $238
Totals may not add due to rounding.
Source: "Research Tri:angle Institute; verbal communication with' NIDA.
69

I
Lost employment due to inpatient treatment cost an estimated $863 million in 1980, compared to an estimated $328 million in 1977. The prior· study estimated that there were about 19,000 adults in residential facilities. The most recent data from CODAP indicate that nearly 39,000 adults received residential tl~atment in 1980. The remainder of the change can be attributed to wage inflation.
It is estimated that there were 6,000 adults with severe/profound mental retardation attributable to fetal alcohol syndrome. The expected productivity of these persons was $104.3 million (see the appendix, table B-4).
2. Drug Abuse Reduced Productivity Drug abuse is hypothesized to impair productivity of workers in a
manner similar to the impact of alcohol abuse. State-of-the-art analysis reported in the appendix supports this ~ontention.
It was found that individuals wkfo reported that they had ever used ~rijuana daily for.at least a month had household incomes 27.9 percent lower than those of persons with similar characteristics who had not used marijuana. The prevalence T"ates reported in table III"'22, which indicate 7.8 million yaung men and women aged 18-34 had used marijuana at that level. The number in each age/sex group af table 1I1-23 was multiplied by the (1) labor force participation rate (to adjust for persons unlikely to pursue employment), (2) age/sex productivity rates, and (3) impairment rate (27.9 percent) to obtain a value for reduced market productivity of $25.7 billion.
The prior study estimated that 17 percent of males aged 18-24 had an marijuana abuse-related productivity impaiment of 14 percent (identical to the alcohol abuse i~airment rate in that s~udy), a cost of $2.8 billion. This study has found a prevalence rate of approximately 21 percent for males aged 18-24, and an impairment rate of 27.9 percent, twice that of the previous study. This study has included 12.5 percent of males aged 25-3~ and approximately 8 percent of females aged 18-34 with productivity losses due to marijuana abuse. These latter estimates were not previously made.
Lost Employment This figure has increased only marg;nally~ from $223 million in 1977
to $238 million in 1980 (table III-24). The growth OT 6.7 percent is much
70

smaller than the increase in wages of 31 percent over the period. ' The difference is attributable to a decrease of over 20 percent in the,population of drug abusers in residential facilities between 1977 and 1980.
3. Mental Illness Estimates of indirect IIIOrbidity costs for IIIf!ntal illness in
creased with inflation and population growth over the 1977-80 period. Costs of partial disability grew from $1.6 billion in 1977 to $3.1 billion in 1980, while costs of complete disability grew from $12.7 to $-16.8 billion. Losses due to institutionalization of the mentally ill were estimated at $1.3 billion in 1977. Updating these estimates for the effects of inf}ation yielded a 1980 estimate of $1.1 billion for ~is component (see tables 1I1~25 to III-27).
Potentially, the largest component of economic cost from mental illness is that of reduced productivity in the work force. These costs are potentially of the same magnitude as est)mates of reduced productivity due to alcohol abus.e. Unfortunately, at the present time the lack of good data, makes it difficult to assess productivity impairments associated with diagnoses of mental illness. F. Other Related Direct Costs
1. Motor Vehicle Crashe~ These costs increased from $1.8 billion in 1977 to $2.2 billion
in 1980 (table II1-28). This was an increase of 22 percent, which was severa 1 percentage poi nts below the general i nfl ati on rate of 27.6 pI'!rcent over the same time period.
The cost estimates are based on a recently completed study by the U.S. Department of Transportation (U. S. OOT, NHTSA, 198'3) of the costs of motor vehicle crashes. These estimates used the causal factors developed by Berry and Boland and used ; n the pr'j or RT1 study.,
2. £r:iI!!!! Criminal justice system costs related to alcohol abuse increased
from $1.5 billion in 1977 to an estimated $2.1 billion in 1980, an increase of 39.4 percent (table I1I-29). The largest components of this increase were. felonious assault (which includes various types of interpersonal violence such as spouse and child abuse), driving under the influence, and public drunkenness.
71

Age
18-19
20-24
25-34
35-44
45-54
, 55.>064
Total
Table 1II-25
Reduced PT~ductivity in 1980: Men·l;.:al Il1 ness, Partial Work Oi saDi 1 ity,
Number of Persons and Value of Reduced Productivity (Number in thousands, $ in millions)
Females Males Emo'o~ed Housewives Total
Number Value Number Va1ue Value Number Va1ue -. 16 31 10 $ 12 $ :3 26 $ 46
40 138 24 56 13 64 207
75 441 73 252 S8 148 760
58 403 78 271 66 135 740
71 483 85 264 71 156 818
64 319 . 81 158 73 145 551
324 $1,814 350 $1,013 $294 674 $3,122
Totals may nat add due to rounding.
Source: Research Triangle Institute; Rehab Group Inc. (1979).
72

rio
Table III-26
Lost Employment in 1980: Mental Illness, Complete WOT"K Disability,
Number of Persons and Value of Lost Employment (Humber in thousands, $ in millions)
Females Males Emcloved HouseW1ves Total
Age Number Value Number Value Value Number Value
18-19 11 $ 85 10 $ 51 $ 11 21 $ 147
20-24 27 3n 24 230 54 51 661
25-34 66 1,611 78 1,090 293 143 2,994
35-44 62 1,750 84 1,197 290 145 3,238
45-54 113 3,133 168 2,1,9 576 2~1 5,838
55-64 ' 102 2,066 160 1,283 - 594 262 3,942
Total 380 $9,022 523 $5,981 $1,818 903 $16,821
Totals may not add due to rcunding.
Source: Re~earch Triangle Institute; Rehab Group Inc. (1979).
73

Type of Institution
Nursing Homes
Table, III-27
Lost Employment in 1980: Mental Illness Number of Adults (aged 16-64) Institutionalized
and Value of Lost Employment ' (Number in thousands, $ in millions)
Males Females uDer Cost RumEer Cost
76.5 $ 328. 90.7 $286
Psychiatric Hospitals 31. 1 732 25.4 375
Total 107.8 $1,060 116.1 $661
Totals may not add due to rounding.
Total RumDer 1!Ost
167.2 $ 614
56.7 1,107
223.9 $1,721
Source: U.S~ coe, BOe (1979); unpubljshed data from NIMH (U.S. CHHS, NIMH, 1981); U.S. COL, BLS, Monthly Labor Review, 1983.
_. __ 0· __
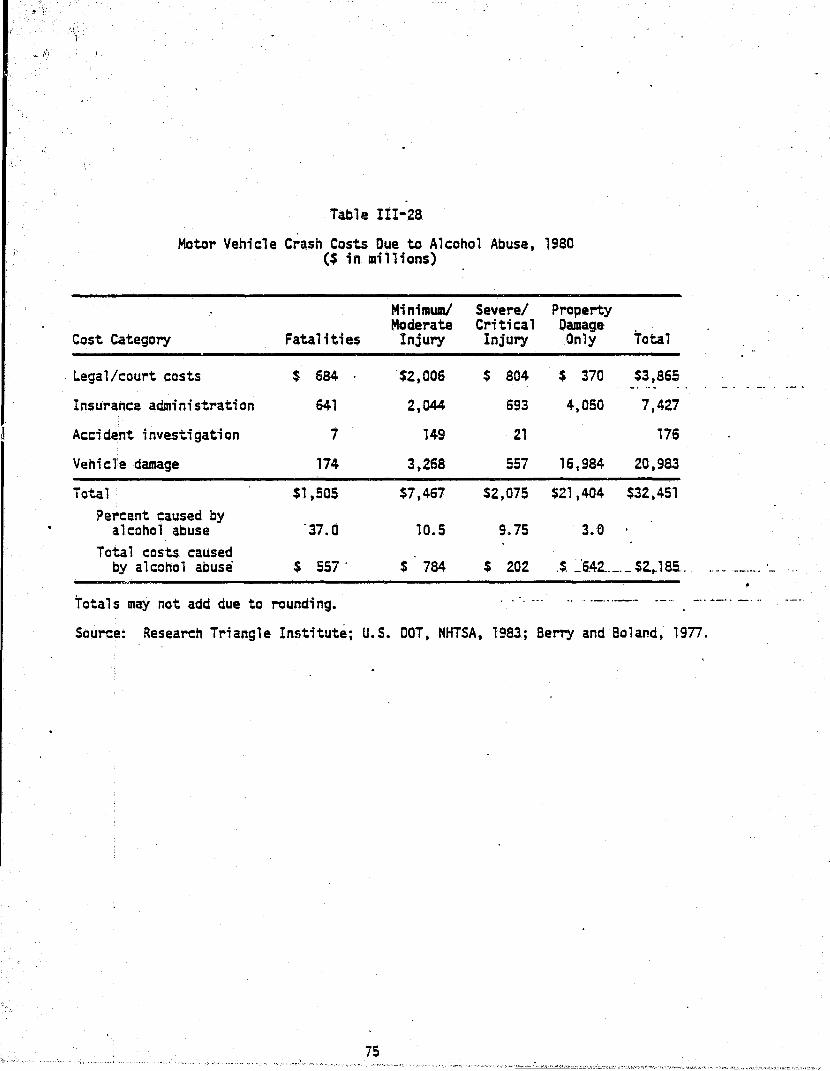
J'
Table III-28
Motor Vehicle Crash Costs Due to Alcohol Abuse, 1980 ($ in millions)
Minimwnl Severel Property Moderate Critical Damage
Cost Category Fatalities Injury Injury Only Total
Legal/court costs $ 684 $2,006 $ 804 $ 370 $3,865
Insurance administration 641 2,044 693 4,050 7,427
Accident investigation 7 149 21 176
VehicTe damage 174 3,268 557 16,984 20,983
Total $1,505 $7,467 $2,075 $21,404 $32,451 ?e~cent caused by
alcohol abuse '37.0 10.5 9.75 3.e Total costs caused
by alcohol abuse $ 557 . $ 784 $ 202 .$. _'6.42 .. _._ $2..J8S. ..
Totals may not add due to rounding. . . . . ~ .. .. .. - .... _.- -_ .. '
- . . -.
.. -- ._- ..... _.
__ . J._ .. __
Source: Research Triangle Institute; u.s. DOT, NHTSA, 1983; Berry and Boland, 1977.
7S
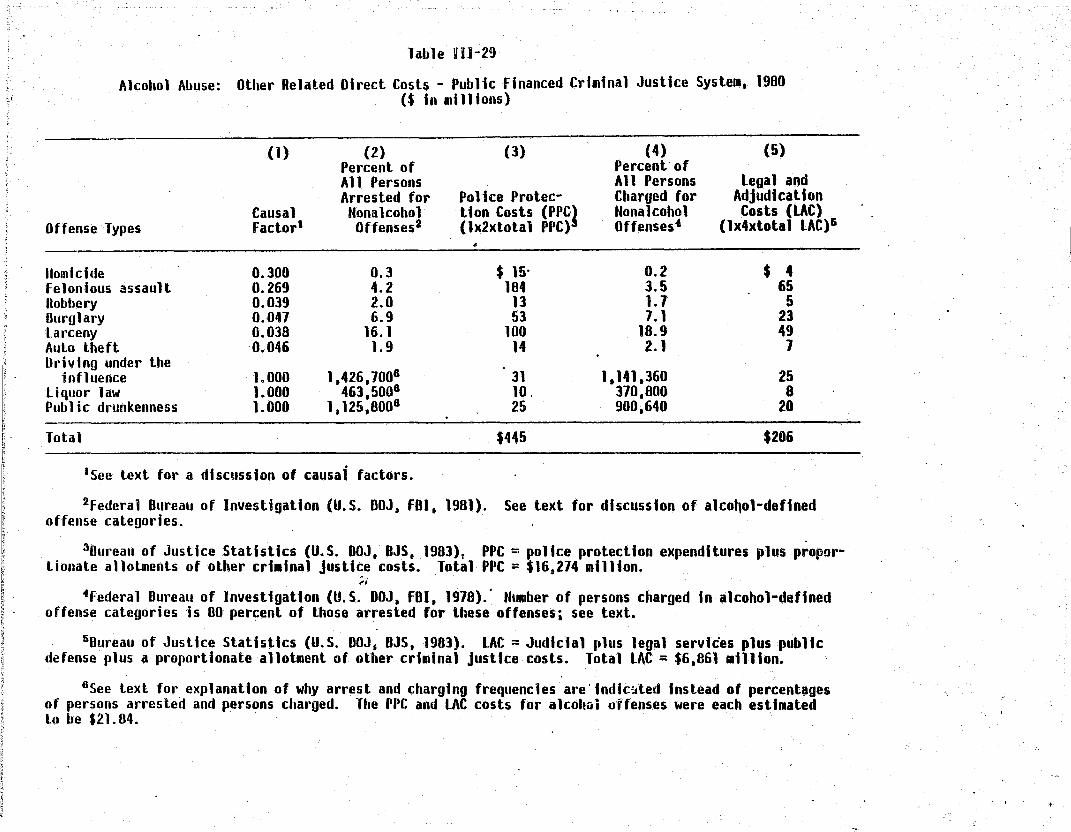
; ~ l
Table llH-29
Alcohol Abuse: Other Related Direct Cosh - Public Financed Criminal Justice SysteJl, 1980 ($ In millions)
Offense Types
lIomidde felonious assault Ilobbery Durglary larceny Aulo theft Driving under the
influence liquor law Public drunkenness
Total
(1)
Causal Factorl
0.300 0.269 0.039 0.041 0.038 '0.046
1.000 1.000 1.000
(2) Percent of All Persons Arrested for Honalcohol Offenses2
0.3 4.2 2.0 6.9
16.1 1.9
1,426,1006
463,5006
1,125,8006
·See text for a discussion of causal factors.
(3)
Police Protec-tion Costs (PPC,} (1x2xtotal PPC)
•
$ 15' 184
13 53
100 14
31 10. 25
$445
(4) (5) Percent' of All Persons Legal and Charged for Adjudication Honalcohol Costs (LAC) Offenses4 (lx4xtola 1 LAC)'
0.2 $ 4 3.5 65 1.1 5 1.1 23
18.9 49 2. 1 7
1.141,360 25 370,800 8 900.640 20
$206
2federal Bureau of Investigation (U.S. DOJ. FBI. 1981). See text for discussion of alco~ol-defined offense categories.
30ureau of Justice Statistics (U.S. DOJ, BJS. 1983)t PPC = police protection expenditures plus proportionate allotments of other crt.tnal justice costs. Tolal PPC = $16 0 274 million.
;. 4federal Dureau of Investigation (U.S. DOJ, FBI, 1918).· Humber of persons charged In alcohol-defined
offense categories is 80 percent of those arrested for these offenses; see text.
5Dureau of Justice Statistics (U.S. DOJ, 8JS, 1981). LAC = Judicial plus legal services plus public defense plus a proportionate allotment of other criminal justtce costs. Total LAC = $6.861 .ll1ton.
6See text for explanation of why arrest and charging frequencies are' Indtc~ted Instead of percent~ges of persons arrested and persons charged. The PPC and LAC costs for alcohGi offenses were each estiJlated Lo be $21. 84.
"

~-:
~
I;
1'-Ii i~ ,.
:j
Table 111-29 (conlinued)
(6) (7) (8) Percent of State and
(9) (10) Local Total Public
State and Federal Correc- Percent of Correctional Crialnal Justice Federal tional Costs (SCC) All Persons
Offense Types Irwates 1 (1x6xtotal SCC)I Charged9 Costs (lCC) Costs (Alcohol)
(lx8xtotal LCC)IO (3*5+1+9)
lIomidde 17.6 $255 0.10 $ 1 $ 275 felonious assault 12.6 164 2.30 16 429 Robbery 24.9 47 1.20 I 66 Ollrglary 18. 1 41 4.70 6 123
-larceny 4.8 9 .1.30 1 159 Auto lheft 1.9 4 1.40 2 26 Oriving under the
influence 0.0 0 10.70 274 330 Li quo,' law . 0.0 0 5.90 151 169 Public drunkenness 0.0 0 11.20 440 485
Tolal $520 $892 $2,062
78ureau of Justice Statistics (U. S. OOJ, US, 1982). Few individuals are incarcerated In state and federal institutions for alcohol-defined offenses.
aOureau of Justice Statistics (U. S. OOJ, BJS, 1983). Other criminal justice costs have been proportionately distributed. Total SCC = $4,847 million.
9Federal 8ureau of Investigation (U.S. OOJ, FBI, 1978). lOBureau of Justice Statistics (U.S. DOJ, BJS, 1983). i Other criminal
alely distributed. Total LCC = $2.558 al1lion. r
Totals RI~y not add due to rounding. I
Source: Research Triangle Institute.
justice costs have beeq proportion~
"

There is no information to indicate that the causal relationship of alcohol abuse to criminality has changed since the prior report •. Therefore', -the assumptions for the causal factors used in the previous study have been used for this effort.
The estimate of direct criminal justice systelll costs in 1980 incorporates a change in methodology. Recent studies have implicated drug traffic in homicide and other violent crimes (this is discussed in the appendix). The new estimates reflect a 10 percent causal factor for drug abuse in homicide and assault, responsible for an increase of $250 million in the criminal justice system costs. Total direct criminal justice system costs due to drug abuse increased by 33 percent over three years, from $3.3 billion to $4.5 billion (table I11-30). The low rate of increase was primarily due to a reduction in expenditures related to the enforcement of the drug laws~ Drug related arrests declined as a proportion of all arrests during this period. Drug law offenders made up a smaller proportion of all prison inmates in the most recent prison survey (1978) than in the p.rior survey (1974).
Another change is introduced for mental illness (see table III-31). Persons arrested for the minor offenses of disorderly conduct, vagrancy, and others are often found to be mentally incompetent or ill and become the responsibility of the criminal justice system. 'ihis is also discussed in the appendix.
Private expenditures for legal services and protection against crime, which are estimated as a proportion of public expenditures, are relatively small. It has been estimated that private protection expenditures are 56.4 percent of public expenditures on police protection (Goldman, 1978). This suggests that alcohol abuse related private protection expenditures were $251 million in 1980 compared to $177 million in 1977 (table 11I-32). Correspondingly, drug abuse related private protection expenditures grew. from $1.0 billion to $1.3 billion in 1980. The mental illness cost was $227 million.
Private expenditures on legal defense were al so relati,,'ely small. FoY'" alcohol abuse, this cost component was estimatea at $.10 million in 1980. The comparable figures were $48 million for drug abuse and $8 million for
mental illness.

\
~
ij ...
i~l , 1 i' -~ I'
l; I; r:
"~-:-:.::~ ,
Drug AlJuse:
Offense TYP2S
lIomicide felonious assault
" Robbery
Table 111-30
Other Related Direct Costs - Public Ffnanced Criminal Justice System, 1980 ($ in lIIillions)
(1)
Causal Factorl
(2) Percent of All Persons Arrested for
Honalcohol Offenses2
0.3 4.2 2.0
(3)
Pollee Protec-tion Costs (PPC} (1x2xtotal PPC)
"$ 6 68 a7
(4) (5) Percent of All Persons legal and Charged for Adjudication Honalcohol Costs (LAC) Offenses· (1x4xtotal LAC)&
0.2 $ 1 3.5 24 1.7 31 .....
lD Durglary
0.010 0.010 0.268 0.224 0.186 0.186 0.186 0.128 1.000
6.9 252 1.1 109 larceny Auto theft Stolen goods" ProsU tution Drug law
Total
16.1 1.9 1.1 1.2 7.8
·See text for a discussion of causal factors.
487 56 51 25
1.269
$2.300
2federal 8ureau of Investigation (U.S. DOJ, FOI. 1981).
18.9 241 2. 1 21 1.3 17 1.0 9 1.5 515
$974
30ureau of Justice Statistics (U.S. DOJ. OJS, 1983). PPC = police protection expenditures plus proportionate allolments of other criminal justice costs." Total rpC = $16.274 million.
4Federal Dureau of Investigation (U.S. DOJ. FBI. 1~78). .
50ureau of Justice Statistics (U. S. DOJ. DJS. 1983. LAC = Judidal plus legal services plus public defense plus a p.'oportionate allotment of other crt.inal justice costs. Total LAC = $6,861 .nlion.
"

::0 :J
Table-III-30 (continued)
(6) (7) (8) (9) OO} Percent of State and Local Total Publtc State and Federal Correc- Percent of Correctional Criminal Justice Federal tional Costs (SCC) All Persons Costs (LeC) Costs (Oru~s)
Offense Types Inmates6 (lx6xtotal SCC); Charged8 (1x8xtotal LCC)9 (3"'5"7"9 .. .
lIomicide 17.6 $ 84 O. 1 $ 1 $ 91 Felonious assault 12.6 61 2.3 6 159 Robbery 24.' 323 1.2 8 449 Burglary 18. 1 197 4.7 27 585 larceny 4.8 43 1.3 6 717 Auto theft 1.9 17 1.4 7 107 Stolen goods .01 0 0.9 4 72 Prosti tution .01 0 0.1 2 36 Orug taw 5.7 276 5.0 128 2.178
Tolal $1.001 $189 $4.454
6Bureau of Justice Statistics (U.S. DOJ. 8JS. 1982). 1Bureau of Justice Statistics (U.S. DOJ. 8JS. 1983). Other criminal justice costs have been proportion
ately distributed. Total sec = $4.847 million.
8Federal Bureau of Investigation (U. S. DOJ. F8I. 1978). 90ureau of Justice Statistics (U.S. DOJ. 8JS. 1983). Other criminal justice costs have been proportlon
ate1y dislributed. lotal LCC = $2,558 million.
Totals may not add due to rounding.
Source: Research Triangle Instttute. I-
I.
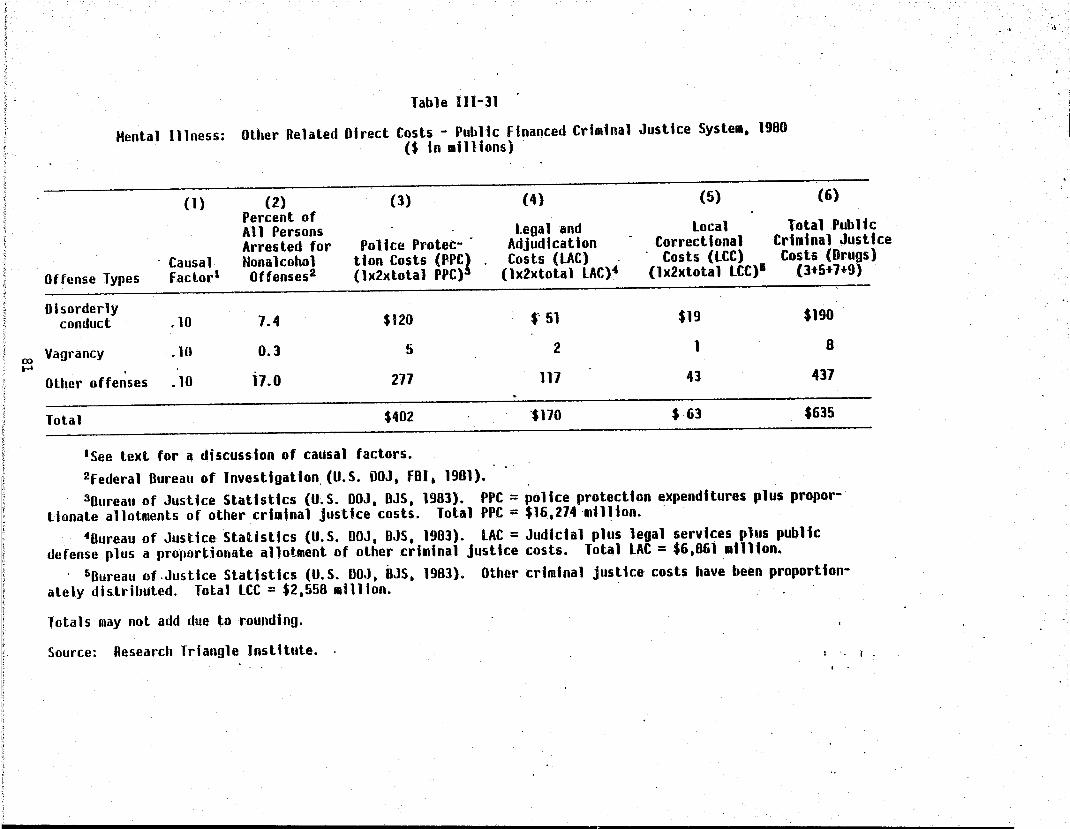
Table 111-31
Mental Illness: Other Related Direct Costs - Public financed Criminal Justice System. 1980 ($ In millions)
(1) (2) (3) (4) (5) (6)
Causal Offense Types factor'
Percent of All Persons legal and local Total Public Arresled for Police Prolec- Adjudication Correctional Criminal Justice Nonalcohol tlon Costs (fPC} Costs (LAC) Costs (LCC) Costs (Dru~s) Oftenses2 (1x2xtolal PPC) (1x2xtotal LACl' (1x2xtotal LCC)· (lt5t 7t 9
Disorderly conduct .10 7.4 $120 $-·51 $19 $190
ro Vagrancy .10 0.3 5 2 1 8 .....
Other offenses .10 17.0 277 117 43 437
Total $402 -$170 $ 63 $635
lSee text for a discussion of causal factors. 2federal Bureau of Investlgatlo~(U.S. OOJ. fBI. 1981). 3Bureau of Justice Statistics (U.S. DOJ, BJS, 1983). PPC = police protection expenditures plus propor
tionate allotments of other criminal justice costs. Total PPC = $16.214 ·mll~lon. . 4Bureau of Justice Statistics (U.S. DOJ, DJS, 1983). LAC = JUdicial plus legal services plus public
defense plus a proportionate allotment of other criminal justice costs. Total LAC = $6.861 million • . 5Dureau of.Justice StatIstics (U.S. DOJ. BJS. 1983). Other criminal justice costs have been proportion
ately distributed. Total LCe = $2.558 million.
Totals may not add due to rounding.
Source: Research Triangle Jnsti tute. ( .
.. "

•
Alcohol Abuse
Drug Abuse
Mental Illness
Total
Table 1II-32
Private Expenditures Rt'!lated to Crime in 1980 ($ in millions)
Protection Legal Defense Public Privatea Public Privateb
$ 445 $ 251 $ 20 $10
2,300 1,297 95 48
402 227 ,16 8
$3,147 $1,n5 $131 $66
,aCalculated as 56.4,percent of public expenditures •
bCalculated as 50.7 percent of public expenditures.
Total Private
$ 261
1,345
235
$1,841
Source: U.S. DOJ, BJS (1983), Go1dinan (1918), analysi,!; by Research Triangle Institute.
82

Another element of crime costs is due to destruction of property. This value has grown from $15 to $24 million for alcohol abuse, and from $73 to $111 million for drug abuse (table 111-33). All data are from the National Crime Survey program (U.S. DOJ, BJS, 1984). The causal factors have remained the same.
3. Other Direct Costs The estimated costs of social welfare programs in 1980 were
5201 million for mental illness, $38 million for alcohol abuse and 52 million for drug abuse (table 1II-34). The prior estimates (for 1977) were reported as $548 million, $142 million, and $12 million respectively. This represents an apparent decrease of substantia·l proportion over the 3-year period.
Using the same data sources as for the 1980 estimates, the figures for 1977 ware reassessed at $184· million, $35 million, and 52 million, respectively. The growth over 3 years between 1977 and 1980, then, was 9.2 for ~ental illness, nothing for alcohol abuse, and 8.6 percent for drug abuse.
. . The increased cost in administration of all funds li-sted i~ table 1II-34 was 16 percent: ~3.2 billion to 53.7 billion). For purposes of comparison, the revised figures for 1977 are included in table 111-35.
F.rom 1977 .to 1980, fi re losses, fi re protect10n and hi ghway safety expenditures attributed to alcohol abuse increased from an estimated $832.0 million to Sl.23 billion, an increase of 48 percent( table 1II-36). Expenditure data for 1980 were obtained from the National Fire Protection Association: 1<arter, 1981) and the Statistical Abstract of the United States (U.S. DOC, BOC, 1982).
The fetal alcohol syndrome caused extra expenditures of 51.7 billion for special-education, training, and rehabilitation programs. These estimates are highly contingent on the estimated prevalence of FAS in juvenile and adult cohorts, which must be confirmed in future studies. See the appendix for a discussion of how these costs were estimated. This value was not estimated previously.
There was a 73 percent increase in drug traffic control expenditures between 1977 and 1980, from $311 million to S537 million. Expenditures for 1980 were obtained from a report prepared for the President by the Strategy Council on Drug Abuse (Drug Abuse Policy Office, 1982).
83
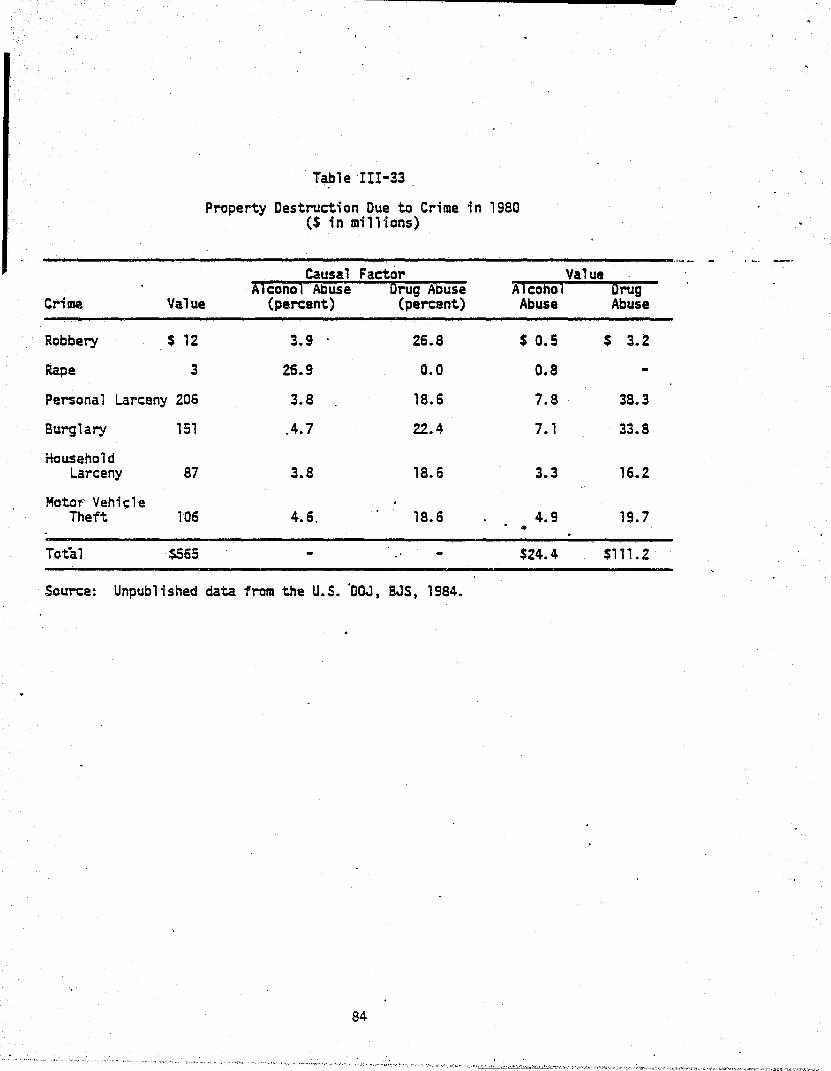
Crime Value
Robbery $ 12
Rape 3
Personal Larceny 206
Burglary 151
Household Larceny 87
MoteT" Vehit;le Theft 106
Total $565
Table III-33
Property Destruction Due to Crime in 1980 ($ in millions)
Causal Factor Value Alcohol Abuse Drug Abuse Alcohol Drug
(percent) (percent)
3.9 26.8
26.9 0.0
3.8 18.6
04.7 22.4
3.8 18.6
4.6. 18.6
Abuse Abuse
$ 0.5
O.S
7.S
7.1
3.3
4.9 •
$24.4
$ 3.2
38.3
33.8
16.2
19.7
$111. 2
Source: Unpublished data trom the U.S. °DOJ, SJS, 1984.
84

~
~. !f ~ 'I II . J ~ ~I '1 4
il 1 l
i ! 1 j '~
1
I j "
'" OJ
labll 111-34 . 'ubllc Progra. Social Wel'arl Adainlilralivi (Mpen~ltur'i and Cosl' OUI te ADM Problea5, 1980
(S In .llllons) . .
Percent lotal Tolal
P"ogna bpend I ture:l!) Adalnistrativi Adainlil~tlvi
CQSli Co'l~
IlASPIIl-dlublllty pay.enh $15,411 2.4 I no Unemployaent Insuranco 16,50) 91.0 1,815 Railroad Leqloury disability
Insunnce 6t 1.8 5
Stale te~lorary dilability Ins ur anl:l.~ I.:no l.~ u
Workers coapensatlo,~ . 9,5B8 4.40 4Z2 Public 1I55lstanc.!9 I,Z19 15.1 186 Supple.enlal security Inco.e 1,446 8.8 655 food stalllfls 644 4.4 28 VeLeran', penlloni and
c9~pensatlon 11.106 0.8 90
Vocational rehabilitatlol~ 916 4.70 46
lotal ,6t,51J U.661
COSli Alcohol Abuse
'Irclnt AQOunl
l.t
l.t
1.4
t.8 0.8
4.8
9.1
112
(j)
9
5
I
, U8
COili Drug Abusl
Perclnt-~ijii[
@
G>
®
0.5 @
0.5·
0.9
IQ).
CD
(J)
I (j)
(i)
U
CDsource: Social Security Adalnlltratlon, O"lcl of a.tlreaent and Survlvora Inlurinci. p.r50nal ca.aunlcatlon. ~e~s than 1.5 alllion. ete55 than .0005.
Gixcludes hospital Ind IUdlcll blnefltl. ~xcludei vendor aedlcal pay.enll and aoclal 'Irvlc.~ • ~ercenl doe5 not exclude baspltal and .ealcal progr .. adalnlatratlve cOltl. (-) No causal relallon5hlp la IllUDed. Dr no bene'lclariel reported ADH al prl.arY caUie 0' ellglblilly.
ToLah aay not idd due to rounding. Source: Research Trianol. In5tllull.
•
Cll~h HenlaD 1I1n155
'Irclrot Aaount
1.9 III
8.' a
8.' 4
4.1 , 18.8 121 4.7 I
2).6 21
19.) 9
1201
.,
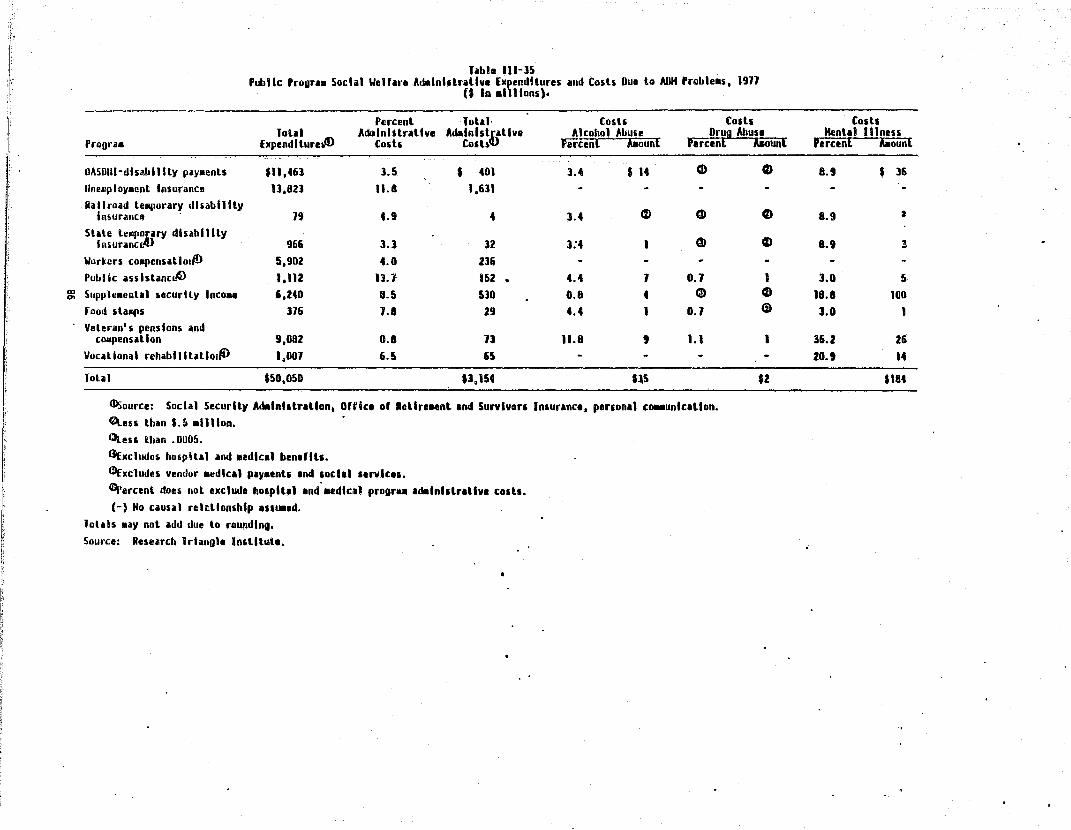
r}
11 I; I; I" I' l~ I~
I I·
Tabl. 111-]5 PubHc ProgUB Socii' WeUne Adelnhlrltlv. Expenditures lind C05h Due to AflH 'robleB5, 1911
U In a 111 Ions).
Percent lolll [osli Codl lolll AiblnhlraUve Adltlnhtl/tlve Alcohol Abu,e Drug Abusl
Proora. ExpendltureJD Cod, COlb Fercen[ baun[ 'ercenl lieun[
OASOllhJlnltlilly ply.enLs $" ,461 3.5 • 401 3.4 ... CD 0 IInellploy.enl Insurance 13,82J 11.8 1,631 Railroad le.porary disability
Insunn", - 19 4.9 4 3.4 C%) CD 0 Slale tell"::Hrv disabllily
Insurane 96& 3.1 12 3:4 1 CD t)
Wor~er5 coapensatlol~ 5,902 4.0 236 Public asslslaneL~ 1,112 n.1 152 • 4.4 1 0.1 1
m Supple.ental ueurlty Inco .. ',240 8.5 530 O.B 4 Ci9 ~
rood ilallPS 116 1.a 29 4.4 I 0.1 Ci)
Veleran's pensions and cOlilpensallon 9,082 0.8 n 11.8 , 1.1 I
Vocational rehablillillol~ 1,001 6.5 65
lolal $50,050 U.154 U5 $I
Illsource: Social Security Adalnl,lrltlon. O"(ce 0' Rellre_nt Ind Survivors Inlurlnce, perlonll ca.aunlcltlon. ~e5s thin $.5 Billion. etteu lltan .0005.
GExcludcs hospltll and aedicil bendlh. ~xcludes vendor .edicil ply.entl Ind ,oclll 'trvlce,. ~ercent does nol exclude hOEpltl1 Ind-.. dlcll progr .. ldalnlllriliv. COltS. (-) No causal rel~llon5hlp l'IUBld.
Ioliis .ay nol add due to rounding. Source: Research Trlanole In'tllnte.
Cods Henta1 IIlnen
Percenl AIiount
8.9 • 36
8.9 2
B.9 3
3.0 5 18.8 100 J.O 1
36.2 26
20.' 14
$184

Table III-36
Additional Other Related Direct Costs Due to Alcohol and Drug Abuse and Mental Illness, 1980
($ in millions)
Total % Due to . Cost El ement Expenditures Source Disorder
Alcohol Abuse
Fire losses $6,2.54 Karter (1981) 6. 1
Fire protection 5,718 Statistical Ab- " .2 stract of U.S. (U.S. DOC, BOC 1982)
Highway safety 1,126 Statistical Ab- 18.5 stract of U.S. (U.S. DOC, BOC ... '1982)" ,
Drug Abuse
Drug traffic control 537 Drug Abuse 100.0-Polir::y Office (1982)
Menta 1 111 ness
Education 659 Frank and Kamlet 100.0 (1984)
Source: Research Triangle Institute and references in above table.
87
Amount
$1,229
381
640
208
$537
537
$659
659
In addition, a value of $659 million has been included for special care of the mentally ill in the education system. This value was produced by Frank and Kamlet (1984). No figure was estimated in 1977. G. Other Related Indirect Costs
1. Lost Work Time Due to Crime· Victims of crime of~en are uncompensated, even though they exper- .
ience short term hardships from their victimization. This represents an important cost to the victim which has no offsetting transfer. The National Crime Survey performs victimization surveys to evaluate the extent of this hardship. They estimated the total number of victimizations for 1980 and wor~ time lost (U.S. aOJ, BJS, 1984).
Using the crime/drug and crime/alcohol ~ttribution factors developed in the 1981 report, the value of victim time by type of crime has been calculated (see table III-37). The value for drug abuse property crime was $845 million, and for the violent crime of felonious assault it was $74 million. These same figures for alcohol abuse were $172 million and $198 mill ion.
2. Crime Careers: 'Drug Abuse These costs increased from $5.1 billion in 1977 to $8.7 billion
in 1980 (table III-38). There are several reasons for this large increase. First, the number of opiate addicts was estimated to have increased by about 10 percent, from 450,000 in 1977 to 492,000 in 1980. Secondly, wage inflation was greater than 30 percent over the three-year span.
For heroin addicts, these costs reflect the time spent engaged in crime, rather than legal employment, motivated primarily by their addiction. Studies of this population generally find that heroin addicts commit a large number of income-generating crimes, but more and more surveys also find that these individuals often have jobs. The Treatment Outcome Prospectives Survey (TOPS) (Rachal, Hubbard, Cavanaugh, Bray, Collins, Allison, and Craddock, 1981) has found that while large proportions of opiate abusers report illegal activities as· their major source of income, it is not their only income source. In fact, a significant proportion report jobs as a primary activity.
For estimation of the fast productivity due to crime careers of heroin addicts, we distributed the estimated popUlation of 492,000 in 1980 across sex and age groups in proportion to CODAP (U.S. DHHS, NIDA, 1981) admissions of opiate abusers. Analysis of TOPS data indicates that in the 1979 cohort
R8

Table III.-37
Lost Work Time Due to Crime in 19BO: Number of Persons and Value of Reduced Productivity
Proportion of Value Offenses Due to Attributed to
Numbera Average Workb Alcohol Drug Alcohol Drug Abuse Abuse Abuse Abuse
Type (thousands) Days Lost (percent) ($ in millions)
Rape 171 3.3 26.9 10.0 $(1nc .$ (4)c
Assault 4,732 2. 1 26.9 10.0 (187)c (7Q)c
Robbery 1,038 3. 1 3.9 26.B 9 61
Burglary 6,704 2.0 4.7 22.4 45 215
Larceny 26,402 1,.5 3.B 18.6 lOB 527
Auto Theft 1,365 2.3 "4.6. lB.6 ' 10 42
Total 40,412 '14.3 $172 $845 ,
auata from 1978 victimization series.
bValue of average daily productivity (employment p.lus hquseho.ld) in 1980,was $21,675 for ma1es, $14,798 for females, or an average of $70' per day for both.
CThese values have been included as lost employment due to violent crimes under core indirect costs in table 111-19.
Source: Unpublished data, U.S. OOJ, BJS, 19B4.
89

Aue
< 18
18~19
20-24 ... o 25-29
10-44
) 44
lotil
Source:
Hales "uroer 'li1Iii
t.201 $ 0
],839 16
48,B09 315
128,195 i,506
158,925 2,361
11,38] 21)
]58,43B $4,550
labia 111-]0
Drug Abuse Cosh of Lolt Productivity OUI to Cri •• Clretn In 1900: N~er 01 Per50ni foregoing hrlU.ate Productive 'unulh .and Vltue of Lou
( In .11I10n')
Oe1llu Feeales lolal Hal11
Honoe IIlIi5 Feaall1 Tobl Total
Ruaber Value Ru.6er Vllul Rllllbir Vllu. Hudler V.lue RiiiiJier V.lue Alltber
884 I 0 2,091 • 0 88,509 I 0 49.]94 I 0 131.902 , 0 139,99] I
1.110 8 1.009 24 54.]91 195 19,514 ]6 11,912 211 ,80.981
11,422 IU BO,lIZ 511 _ 121,099 192 38,608 131 159,106 922 240,011
53.]6Z 365 181,551 1.1112 15,6]4 151 25,946 132 101.560 889 281.136
41,560 288 200,505 2,669 69,301. 684 24,560 121 91,861 I,on 294,365
3,.44 20 20,521 291 19,605 260 1,6]0 37 27,235 291 . 47,162
U],562 1025 .92,000 IS,U4 428.545 12,888 165,111 1462 594,256 $1.350 1.086,256
Research Trll~ol. In5lltulli U.S. DialS. NIOA. COOAr (1931).
Value
0
255
1,440
2,lGI
3,680
589
18,125

54 percent of male opiate abusers reported crime as their major source of income, as did 39 percent of the females. These proportions were· assumed to be involved in crime full time, consequently putting no time into productive activity. The value of this time was estimated at $5.374 billion in 1980.
The other large contribution to the increase in this cost component was an increase in the estimated size of the nonopiate drug'abuser population. To make a lower bound estimate of the entire nonopiate user population, it was assumed that nonopiate drug users are as likely to require treatment during the course of a year as opiate addicts. Of the estimated 1980 opiate addict populatJon of 492,000, 115,000 were admitted to treatment for a penetration rate of 23 percent. Assuming that the 23 percent penetration rate applies to the nonopiate user population, the 139,000 admissions of nonopiate users reported in COOAP in 1980 would come from a population of nearly 600,000 nonopiate users. The large increase in productivity losses due to crime careers is attributable 'to the 65 percent increase since 1977 in ncnopiate. users' admissions to drug abuse treatment.
Some perspectiv~ is gained on these estimates by recalling that the ECA study (Myers et al., 1983) yielded a rough estimate that 1 percent of the population surveyed were drug dependent. Application of this rate to the 162.8 million adults found in the 1980 Census predicts a total of 1.628 million drug dependent persons. NIOA estimates that there were 492,000 heroin addicts in 1980, leaving about 1.136 million nonopiate drug dependent persons in 1980. This estimate is likely to be too high because the early ECA survey results are from urban areas. The NIDA national surveys have consistently found lower prevalence of drug abuse in smaller urban and rural areas than in large urban areas. Given these caveats, the estimates of 600 thousand nonopiate drug abusers may be considered conservative.
Nonopiate users also engage in income-generating crime, although not to the extent that heroin addicts do. TOPS has reported that 46 percent of the male and 29 percent of the female nonop~ate abusers claimed that crime was their major source of income. Again, these proportions of the population are assumed to be entirely involved in crime and not engaged in market or household activity. When applying sex- and age-specific productivity rates, the lost productivity was estimated at $3:35 billion for 1980.
91

3. Incarceration The productivity of incarcerated individuals is usually entirely
lost to society. The value of this cost component for alcohol abuse increased to $l.8 billion in 1980, a 27 percent increase over the 1977 value of $1.4 billion (table 1II-39). Lost productivity from incarceration due to drug abuse increased from $1.3 million in 1977 to an estimated $1.5 million in 1980. The prior study estimated that nearly 38,000 persons were incarcerated during 1977 for violation of drug laws, compared with a 1980 estimate of 26,000, a decrease of almost 12,000. The 1977 estimates were developed from data from the 1974 Census of Prisons and Jails, while the 1980 estimates of incarceration were developed from data in the 1978 Census of Prisons and Jails, published in 1982.
4. Motor Vehicle Crashes: Alcohol Abuse The 1977 estimate of $354 million was inflated to $464 million
based on the inf1ation factor fqr wages and salar~es. There are no data yet with whi~h to estimate the number and cost of drug-related motor vehicle crashes.
"' ..

Jabll 1I1-~9 LOll ,roductlvlll nUl to InClrClrltloni "In 1980: Number Ind pror:rlloni
or Intlreerlt Oill OUI lo Alcohol Ind Orut Abu'l .. nd V .. lul of on U 'n .1I1I0ns .
Penon Ylln Adull, Inclrelrlled Proportion of Served In 1980 V.IIII
DUI to O"ensl In Offeh5u OUI to for Crl.e Due to AUrlbuted to fed"r" IfCoJi01-Urug Henlal l1CiiJiii~rug Henlal Alcohol Drug Henlal .. Stilll Loed Abu'l AbuSI Illnen Abu'l Abu~1 IHnen Abusl Abusl IHnen
Offense Prhon' Jails ToLai (percenl) (penon Ylln) (I In aillionl)
!lo.lclde 53,059 181 51,242 30.0 10:0 0.0 15,625 5,208 0 $ 111 • 104 $ 0 relonlous Issiult 31,985 4,212 42,191 26.9 10.0 0.0 11,099 ',126 0 220 82 0 RolJbery 75,066 2,197 71,264 l.t 26.1 0.0 2,941 20,254 0 59 401 0 lIurg1ary 54,56& ',607 61,111 4.7 22.4 0.0' 2,90] n.81S 0 57 214 0 I arteny 14,471 2,381 1&,851 1.8 18.' .0.0 626 1,064 0 12 61 0
<0 AuLa Lheft 5,128 2,564 8,292 4.& 18.& 0.0 111 1,501 0 7 30 0 .... Drug hW5 11.184 ",156 26,340 0.0 100.0 0.0 0 25.129 0 0 SOl 0
Receiving 5l01en properLy 301 1,648 1,950 0.0 18.& 0.0 0 151 0 0 7 0 Pro~tlLutlon 101 1,282 1,583 0.0 12.1 0,0 0 198 0 0 • 0 Drilling under lhe 'nHuencs' 0 1',594 19,594 100,0 0.0 0.0 19,086 0 0 359 0 0 ll'luor laws 0 10,804 10,804 100.0 0.0 0.0 10,524 0 0 198 0 0 Pllh II c drunkenne 5$ 0 l1,491 31,491 100.0 0.0 0.0 30,680 0 0 517 0 0 Disorderly Conduct 0 11,500 n,500 0.0 0.0 10.0 0 0 1,350 0 0 26 Vagrancy 0 539 519 0.0 0.0 10.0 0 0 54 0 0 1 All OLher Offenses 0 11,140 11,140 0.0 0.0 10.0 0 0 J,lI4 0 0 61 Olher 42,809 41,819 86,628 0.0 0.0 0.0 0 0 0 0 0 0
lolal 301,410 181,124 484,594 91,861 14,211 ',518 11,801 11,466 $88
a . . Due Lo Lhe exceedingly low proport'on of prllon .entenel' for plraon, Irrllted for driving whlll under thl 'nfluenc. 01 Ilcohol. thl Cenlu, of
Prisons did nol reporl this .i In Indlvidull cllegory. lolals .ay noL Idd due to rounding. Source: Researell Trlangl. Inililuti. U.S. DOJ •• BJS, Sourcebook 01 Crl.ln.' JU5l'c, Slltlltici (1981).
" o

94

IV. FRAMEWORK FOR EXTENSION OF RESULTS TO PROGRAM EVALUATION AND ~UBLIC POLICY OECISIONMAKING
The results of this study indicate that ADM has major impacts on the econ-omi c: we ll-bei ng of our soci ety, due to the costs associ ated wi th both the undesirable consequences of ADM and society's efforts to address these disorders. The total value of ail costs in 1980 was $190.1 billion, or S89.S billion for alcohol abuse, $46.9 billion for drug abuse, and $54.2 billion for mental illness. In the health sector alone, expenditures on personal health services were $31.S'billion, with another $3.8 billion spent on research, training, and construction of facilities. These re~l expenditures of $35.4 billion were 14.3 percent of all health expenditures, and 1.3 percent of u.s. gross national product in 1980.
Cost, ·benefit and cost effectiveness analyses (CBA and CEA) are natural1y related to cost of illness (~OI) studies such as the present one. COl estimates the total cost (eco·nomi c impact) 'of a di sord~rby fi rst i de~ti fyi ng , ,
the tangible consequences of an illness, then quantifying their 'level of occurrence and, finany, assigning appropriate values to them. CBA uses the same three steps to indicate the relative effectiveness of intervention strategies at reducing total costs to society. The first step is to identify the consequences of the disorder which the intervention might effect. The second step is to quantify the effects, and the third step is to assign values to the different intervention effects so that expenses of the intervention (costs) can be compared to the value of the avoided consequences (benefits). The benefits and costs may be directly compared because they are expressed in common units. Cost benefit analysis (CRA) may be used to answer questions such as:
• How do the economic benefits to society compare to the costs of a new treatment regimen?
• Which of two or more alternative public strategies has a higher ratio of benefits to costs?
• What is the benefit or cost to society of increasing (or decreasing) the size of particular-programs?
• Given some sum of money, which of- several alternative programs will yield the greatest economic benefit to society?
95

In contrast, cost effectiveness analysis (CEA) has a narrower use. Its purpose is to find the cost of achieving a single dimension outcome. The outcome is expressed in physical terms such as improvement in health· status, or number of patients treated, rather than being translated into do 11 ars saved on treatment or econollli closs assoc"; ated wi th i 11 ness. The emphasis is on how to identify the least-cost program, intervention, or technique for achieving the specific objective. CEA answers questions such as:
• To save 5,000 alcohol-related deaths from motor vehicle crashes, is it least expensive to institute safety features in cars, reduce the speed limit, or increase law enforcement efforts?
• Can manic depressives be treated less expensively (with equal effectiveness) as inpatients or outpatients?
Of course, some. impacts of public policies have no market value and can not be assigned a dollar value for incorporation into cost benefit studies. These.intangible impacts of public policies may be more, less, or equa 11 y as "; mportant as economi c benefi ts in shapi ng po 1 icy deci s ions.· Whenever an economic cost benefit study is performed, it is essential that the noneconomic impacts of policies also be assessed so that policy ~ecisionmakers may weigh them simultaneously with economic benefits.
Increasing emphasis has been placed on cost benefit and cost effectiveness analysis in the past 15 years. Particular emphasis has been placed on use of these studies in health policymaking. National health axpenditures grew from $42 billion in 1965 to $247 billion in 1980 (Gibson and Waldo, 1981). As a share of gross national product, health exp~nditures increased from 6 percent in 1965 to approximately 9.S percent in 1980.
Interest in cost effectiveness and cost benefit analysis has bee·" further spurred by the rapid advances made in medical technology. Organ transplants have been performed suc~essful1y and failing organs have been successfully assisted by technologies such as kidney dialysis, respirators, and now potentially artificial hearts. Increasingly complex technology is often very expensive.
Probably a greater motivation for the federal government1s interest in cost benefit analysis is that its share of the nation1s health bill has expanded dramatically, from 10.1 percent in 1965 to 28.7 percent in 1980 due to the expansion of the Medicare and Medicaid programs. The shares
96
- ..

paid by state and local government. (about 11 percent) and private health insurance (about ZS percent) remained roughly constant over the entire 15 year period though total dollars have increased. A recent study performed under the auspices of the Office of Technology Assessment (OTA) l''esulted in a multiple volume report that examined the theory and practice of cost benefit and cost effectiveness analysis as applied to-a number of . specific health problems (U.S. Congress, OTA, 1980a). The work produced general outlines for performance of CBA and CEA studies, as well as reviewing and producing some state-of-the-art studies for Congress.
A limited set of conclusions was, offered in another study commissioned by OTA (Saxe, 1983) which examined the approaches to alcohol treatment, research on treatment benefits, costs and benefits of treatment, and reimbursement issues. The study concluded that results of evaluations performed to date are mixed.
The 1980 OTA study (U.S. Congress, OTA, 1980b) similarly concluded . that though studies performed to date: are not completely comparable due to
~ . . . '
differences in evaluation design, the costs and benefits examined, and the. method of placing a v~lue on those costs and benefits, it appears that psychotherapy has positive effeC+~. The studies of drug abuse treatment reviewed in this volume were found to be in accord with psychotherapy CBA and CEA studies which have found favorable cost benafit ratios for treatment.
A useful product of the OTA stUdies was a set of ten general principles of analysis for CEA/CBfl methodology. The principles are:
• Define problem
• State objectives
• Identify alternatives
• Analyze benefits/effects
• Analyze costs
• Differentiate perspective of analysis
• Perform discounting 5 Analyze uncertainties
• Address ethical issues and
• Interpret results.
These principles establish a solid foundation upon which cost effectiveness and cost benefit analysis of intervention strategies for ADM
97

problems can be based. An in-depth presentation of these principles can be: obtained from the OTA study. This chapter will discuss how the framework and cast concepts used in this ADM cost-of-il1ness study fit into, and .. complement, the perfo~ce of cost benefit and cost effectiveness studies of ADM interventions. The remaining materials are organized around the 10 principles of the OTA study. A. Define the Problem
A CBA or CEA should only be undertaken when there are alternative approaches to a problem that can be clearly and logically defined. Both CBA and CEA yield measures that compare the relative costs, benefits, and impacts of alternative strategies to addressing the problem. Where there are alternative strategies to address a well-defined problem, CBA and CEA allow them to be compared on economic criteria. Where there is only one ·way to address a particular problem, the problem is probably defined too narrowly and should be respecified.
The first step in performing a cost benefit o~ cost ~ffectiveness . . . .
analysis is to determine the scope of the pro~lem and to define it at.a level that is suitabHe to the intended intervention, program, or strategy which is to be analyzed. For instance, in a comprehensive study examining drug abuse policy alternatives, the problem might be lithe economic burden of drug abuse on society.1I With such a broad definition of the problem, the analyst must examine a full range of consequences of drug abuse, starting with health problems and drug overdoses, proceeding to criminal careers, impacts on the criminal justice system, and incarceration of criminals, as well as the effect of drug abuse on productivity .in the workforce. A more narrowly defined problem would be that of heroin addiction, with its attendant consequences. A still narrower problem definition would be the issue of marijuana use and its effect in the workplace.
A problem definition for alcohol abuse may have similar breadth or specificity. One might examine all of the cost-related consequences of alcohol abuse or on1y specific problems such as drinking and driving, brain dysfunction, chronic hepatitis, pancreatitis, or liver cirrhosis. B. State Objectives
The objectives of the evaluation of a particular public policy should be clearly defined. The objectives may be very broad in scope, or very specific. A very broad scope objective may be IIreduce the economic cost to
·'

;society. II More specific objectives can be used in -evaluating similar intervention s'trategies. A narrowly defined objective would be to reduce the number of motor vehi c 1 e crash deaths due to a 1 coho 1 abuse. ather' objectives might be to increase enrollment of heroin addicts in treatment, or to encourage depressed persons to seek assistance. •
A strategy would be evaluated vis-a-vis its impact on the consequences that can be assigned econo~ic values such as utilization of health care treatment, premature mortal ity, productivity at home and in the workforce, and a series of other impacts including criminality and motor vehicle crashes. C. Identify Alternatives
Many different approaches can be taken to reduce the impact of alcohol abuse, drug abuse, and mental illness. The CSA or CEA must specify which alternatives can be targeted to the defined scope of the problem and policy objectives. Evaluations should focus on those options that are most likely to ~irectJY achieve policy objectives. Table IV-l lists various strategies employed to combat ADM·.in the United States. These range from inpati~nt
and outpatient treatment to legal restrictions and sanctions, and to education and other preventio~ efforts •.
There are a variety of strategies for reducing mental illness. These include treatment in assorted inpatient settings, including long-term and short-term facilities, and from a growing variety of outpatient care providers such as psychiatrists and psychologists social workers, counselors, and various therapists. Drug therapy has also been found useful in treating various mental illnesses, a notable example being the lithium treatment for manic depression.
A major technique for public intervention into mental illness occurs when the government pays some or all of the price for treatment from various providers. This occurs for individuals who are eligible for treatment under Medicare or Medicaid, for example. Subsidized services may also be obtained in some circumstances from community mental health centers and other free standing facilities. Of course, a significant proportion of the population ;s not eligible for subsidized health care services and must cover the expenses either through private insurance or out-of-pocket payments.
99

Table IV-l
Examples of ADM Public Strategies and Programs
Subsidize special treatments with utilization at own option (may be subsidized by government or private entities)
Inpatient (long or short term) State, county, or private mental hospitals Intermediate term specialized facilities Short term general facilities
Outpatient (vario~s types of providers) Psychiatrists Psychologists Social workers Other (specialized or not)
Supplies (drugs or prostheses) Methadone Antabuse-disulfiram . Lithium
. . Mandate specific treatment regimes
IICQmmitmentll to inpatient facility Health Corrections
Probation to an outpatient program Care of a professional (health or criminal justice) Treatment at program Complete education (drinking and driving)
Supply raduction/restriction
Alcoholic beverage laws Age restrictions Zoning and licensing restrictions. License (and tax) production
Drug laws Regulate/restrict domestic production Drug interdiction
Other deterrence
Differential penalties for alcohol-related consequences Differential penalties fOr d~ug~related consequences
Education and other prevention efforts
Research and develooment
t - _ ... _--- .. _-,.

A range of strategies· comparable to those for mental illness are offered for.the addictive disorders. Strong emphasis has been placed on drug demand reduction strategies such as providing drug abuse treatment .... programs and preventing new "startsll through education. Substantial resources have been put into education and other prevention efforts intended to reduce the incidence and prevalence of substance abuse and to
ultimately reduce their social consequences. For instance, t~ere have been concerted efforts made through the various media to convey the message that drunk driving is a threat to self and society. A similar set of public service messages has been used to discourage drug abuse. Another example of prevention efforts is the information that is provided to young women about the association of birth defects and substance abuse.
Pub 1 i c po 1i ci es that address a 1. coho 1 and drug abuse also ; nc 1 ude supply reduction efforts for both alcohol and drug abuse. All levels of government, !or example, are mandated to interdict the flow of illegal d~gs in order is to reduce their availability and, presumably, to increase thefr price, discouraging consumption. Nonmedical consumption·of a long 1 i st of psychoac"tj ve substances is also proscri bed; wi th sanctions· for possession, consumption, and distribution.
There is a comparable set of supply reduction laws for alcohol abuse. ·First of all, purchase, possession, and consumption of alcohol by those who are underage" is forbidden by law. Rules regarding where, when and under· what conditions alcohol can be purchased and consumed affect all drinkers. Secondly, alcoholic beverages are taxed, increasing the price and potentially reducing consumption. The manufacture of alcoholic beverages is licensed and regulated. Furthermore, retailers are subject· to licensing and zoning laws. O. Analyze Benefits and Effects
The economic benefits from any public intervention strategy are the reduction in unfavorable consequences of those disorders which can be assigned a market value. Avoiding the tangible consequences consti·tutes a benefit to society of the intervention strategy. A ~ajor contTibution of the present study for cost benefit analysis is the enumeration and identification of a number of these consequences of the ADM disorders. These assigned economic values are shown in chapter III of this report. A short list of these is repeated in table IV-2.
101

..
Table IV-2
Benefits and Costs to be Assessed in CBA or CEA Analysis
Quantifiable benefits and costs
. Health consequences framework
Health treatment Mortality Morbidity Property destruction (crime or accidents) Criminal justice response Victim l s time Crime career Incarceration Other
Other impactS
Transfers of.income via social welfare programs Amoun~value of substances illicitly consumed Crimes commited
Number by type Value of property. transferred
Generally nonqu,antifiable benefits and casts
Pain and suffering Bereavement Psychosocial development Familial health
l02

Intervention strategies may reduce the need for health treatment services or for more expensive treatment strategies by persons with ADM problems. For example, the introduction of antidepressive·drugs has allowed people to be treated as outpatients, thereby avoiding the cost of maintaining them in residential treatment facilities. Other benefits may include allowing persons to return to productive endeavors and to prevent suicide.
Another very significant impact of ADM is premature mortal ity. An intervention strategy that can reduce premature mortality can be said to avoid the loss in market and household productivity associated with those deaths. Some strategies may reduce the number of premature deaths due to alcohol-related trauma such as death from motor vehicle accidents, falls, fires, drownings, and other accidents. Such strategies would include public interventions (for ex~le; identification of drinking drivers and referral to treatment, and changes in drinking age laws) as well as community and school based prevention efforts.
, The ACM ~isorders can cause productivity losses th~ugh lost emplo~ ment (while incapacitated either at an inpatient facility or at home) or
. reduced productivity.while at ~ork or in the home. Again, an"intervention strategy that can improve the productivity of ADM victims 'or make it possible for them to rejoin the workforce "avoids ll those costs. This avoidance is considered the benefit of the intervention.
Certainly, the backbone of any evaluation is establishing the effectiveness of an intervention. The impact of a program, strategy, or technology should be quantified along all consequences that it might affect. The nature, degree, and value of changes must be accurately measured and related to the size, duration, strength and cost of the intervention undertaken. The CBA or CEA must establish a clear causal link between the intervention and abatement of consequences that can be reasonably expected to be achieved at full scale operation. Evaluation designs need to be very rigorous to meet this requirement.
After identifying the potential benefits from intervention strategies ;s the equally important step of quantify.ing the benefits. The issues become: How much impact will an intervention strategy of a particular level have on the tangible consequences of the ADM prob1em? 'How much drug use will be avoided or mitigated by prevention efforts? Will intervention strategies result in fewer drug overdoses, fewer medical costs involving
1Q3
toxic doses, and fewer premature mortalities? Will the efforts eventually prevent people from abusing the most dangerous drugs at high frequencies·, behaviors which are associated with impairments in productivity and psychological and physiological dependence?
Many of the benefits of prevention efforts effect future years as· well as the present year. Alcohol abuse, drug addiction, and mental illness often are long-term problems with impacts over many years. Problem drinking may adversely affect a person·s productivity over his/her entire lifetime., Prevention or treatment which is partially or completely successful may yield benefits over many years to tne problem drinker and society. Preventing the start of a criminal career or drug use prevents future consequences as well as current consequences. Effective outpatient treatment for mental illness allows those in treatment to remain ~roductively involved in society and yields long-term benefits that ought to be included in current evaluations of the alternative interventions. The expected future benefits from current interventions a~ vital for rigorous cost benefit studies.
Other benefits of ADM intervention strategies may be valued above and beyond their contribution to social costs. These include transf~rs of income through social welfare programs, the ~ount and value.of psychoactive substances which are illicitly consumed, and the number of crimes committed due to ADM. It should be emphas·ized that each of these impacts has already been assigned a value, discussed above, that would constitute a benefit under the cost benefit criteria. However, additional aspects of these impacts are. also important for policy evaluation and should be quantified for their additional contribution to the economic cost. Finally, even though the avoidance of intangible consequences such as the pain and suffering associated with ADM is not ordinarily assigned a value, these dimensions are affected to the extent that the incidence, prevalence, and consequences of ADM disorders are reduced. E. Analyze Costs
So far, we have discussed the benefits of an intervention strategy. In determining the other part of the ratio, cost, tne market cost of operating an intervention strategy should be used. These costs shou1d include, not only the expense of providing direct services to individuals, but also the accruals, overhead expenses, and capital costs that are connected to the servi ceo
104
Average and marginal costs must be distinguished in evaluating a program or a strategy. For existing programs, average cost data are most. readily available. The average costs are equal to the total costs of operating a program at its current level divided by the uniui of services produced or delivered. This yields a cost per service unit. Marginal' costs are most appropriate in evaluating ~e potential expansion or contraction of an existing program. Marginal cost is the anticipated cost for increasing or decreasing (but n~t eliminating) services produced or delivered.
Marginal cost analysis can be highly significant in studying the expansion or contraction of an inpatient or outpatient program. Sucn a program is likely to have large ·fixed costs for buildings, equipment, property, and administrative personnel. If the program has excess. physical capacity and ample administrative support, an increase in the level of services delivered may not substantially affect any of ~hese fixed factors but may on~y involve costs for additional treatment personnel and assorted supplies; Some treatment 'programs, however, m~y be at maximwn capaCity and expansion ma~ only be possible by moving to bigger quarters, i~roving record systems, adding managerial staff, etc. A decreased lev~l of services (that is, fewer clients and/or fewer units of service delivered), however, could raise the unit cost of services delivered because fixed costs often remain the same. F. Differentiate Persoectivp. of Analysis
The costs and benefits of an intervention strategy in AOM problems differ depending on whether they are viewed from the perspective of the person with the problem, the perspective of the people or organizations who contact that person, or the perspective of the society as a whole.
An important example of thi~ principle occurs with employed substance abusers and employed mentally ill persons that do not obtain treatment for their ADM problem. Such persons are often unable to meet the demands of the work environment. Normally, when an employer first discovers an employee is a substance abuser or mentally ill, the problem is ignored. Sometimes workers leave "voluntarily" because they are unable to cope with the working environment, but if the problem persists and reprima~ds are'ignored, the worker is fired. This is particularly true for 10wer--leve1 jobs where
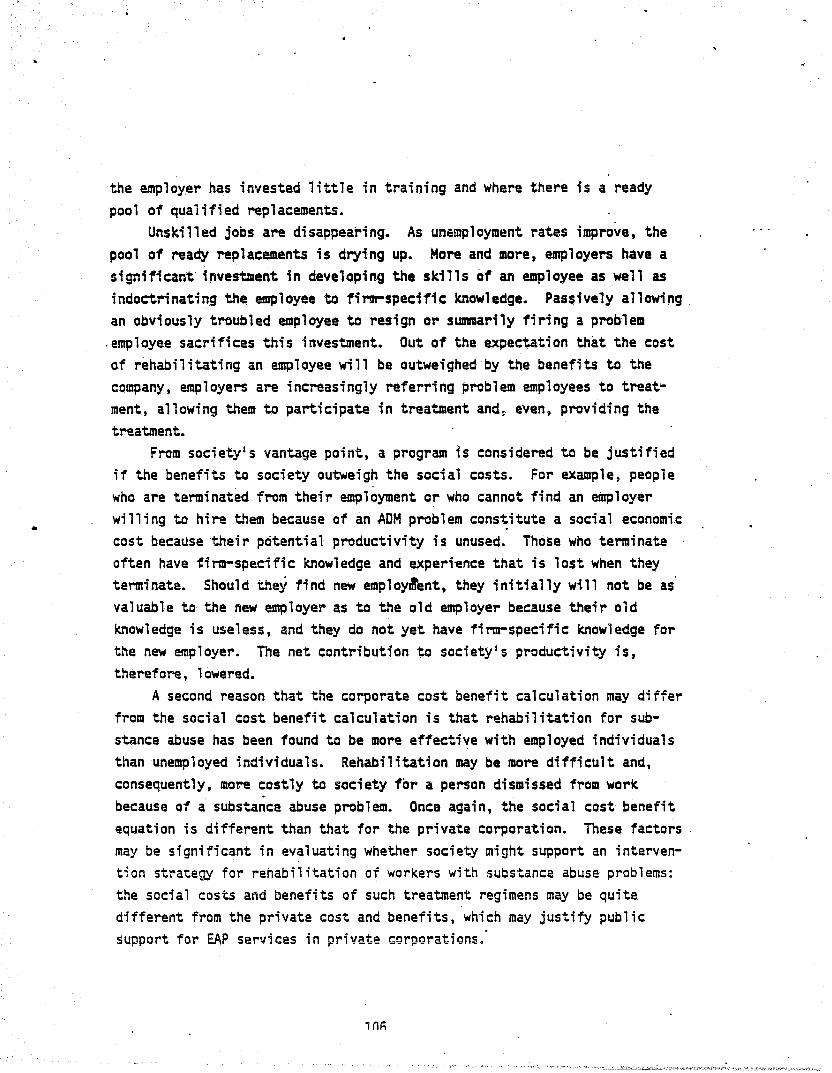
•
the employer has invested little in training and where there is a ready pool of qualified replacements.
Unskilled jobs are disappearing. As unemployment rates improve, the pool of ready replacements is drying up. More and lIIore, employers have a significant' investment in developing the skills of an employee as well as indoctrinating the employee to firm-specific Knowledge. Passively allowing an obviously troubled employee to resign or summarily firing a problem
.employee sacrifices this investment. Out of the expectation that the cost of rehabilitating an employee will be outweighed by the benefits to the company, employers are increasingly referring problem employees to treatment, allowing them t.O participate in treatment and~ even, providing the treatment.
From society·s vantage point, a program is considered to be justified if the benefits to society outweigh the social costs. For example, people who are terminat~ from their employment o~ who cannot find an employer willing to hire them because of an ADM problem cons~itute a social economi.c cost because their pcitential productivity is unused. Those who terminate often have firm-specific Knowledge and experi~nce that is lost when they terminate. Should they find new employ'ent, they initially will not be as' valuable to the new employer as to the old employer because their old knowledge is useless, and they do not yet have firm-specific knowledge for the new employer. The net contribution to society·s productivity is, therefore, lowered.
A second reason that the corporate cost benefit calculation may differ from the social cost benefit calculation is that rehabilitation for substance abuse has been found to be more effective with employed individuals than unemployed individuals. Rehabilitation may be more difficult and, consequently, more costly to society for a person dismissed from work because of a substance abuse problem. Once again, the social cost benefit equation is different than that for the private corporation. These factors. may be significant in evaluating whether society might support an intervention strategy for rehabilitation of workers with substance abuse problems: the social costs and benefits of such treatment regimens may be quite different from the private cost and benefits, which may justify public support for EAP services in private corporations.
1M;

"
In this study, social (rather than private or individual) economic costs are weighed. Voluntary and involuntary transfers of income are not part of that equation. Only the loss of resources while effecting th~ transfer and administration costs (or property damage) is a dead weight· loss to all concerned. Nonetheless, it may be relevant to identify transfers that occur because policymakers may consider them significant factors in evaluating the impact of public policies. This is particularly the case when one particular segment of society (income group, racial group, or resident of a particular area such as cities) gains or loses at the expense of another segment.
The net value of income transferred to recipients does not constitute a cost from society's perspective. The income received by beneficiaries for their use has been simply transferred to them from the taxpayers. These transfers occur through public subsidization of treatment services, social welfare programs, and drug-related crime. From society's perspective, one group gains what. the othe~ loses~ with a net slippage equal to the administrative costs. These administrative expenses (a small proportion of the value of funds transferred between the two groups) yield no benefit to those who paid for the social welfare programs and no benefits. to the reCipients: it is simply a dead weight loss in effecting the transfer between the two groups.
In involuntary transfers through crime, the value of resources gained ty criminals is roughly equal to the value of resources lost by the victims. One segment of society gains approximately what the other loses. The net slippage in this transfer is the value of property destroyed or damaged in the commission of the crime, a loss to both the criminal and the victim. G. Perform Discounting
Social intervention strategies may involve long-term and short-term benefits. In economic analysis it is appropriate to adjust benefits ac~ru-ing over different time periods to reflect their present benefit to soci~ty because many of the consequences of the ADM disorders are long lasting, and there is reason to believe that effective interventions yield long-term, as well as, current benefits. The most obvious example is that of prematu\e mortality where alcoho,l abuse, drug abuse, and mental illness exact s-ubstantial tolls from suicide, homicide, motor vehicle crashes, cirrhosis of the liver, and drug overdoses. A rationale for discounting future benefits to
107

the present is ••• "the observation that, all things being equa] , people prefer benefits (including health benefits) today rather than at. a future time. u (U.S. Congress, OTA, 1580a.)
Future benefits are discounted into present values using an appro-. priate rate of interest. Usually calculations are made with several dis· count rates: recommended rates are 2.5 percent, 6 percent, and 10 percent.
Even if the ADM disorders do not result in premature death, they may have longo-term impacts on employment and productivity. Timely rehabilitation of alcohol and drug abusers may save them from a lifetime of marginal and erratic participation in productive society. Appropriate and timely treatment of addictive and mental disorders may save victims from incapacitation or long-term institutionalization.
With drug abuse, the most feared consequence is death. Almost as important is the fear that an abuser will become a9dicted to expensive drugs and be prope11ed into a life of crime. A crime-career involves extensive economic cost for society over a long period of time, including damage and·destruction of property; injuries to victimsj-expenditures for police protection, prosecution and adjudication of court -case.s, incarcera- , tion of crimina1!3; and the time that addicted' criminals spend incarcerated or in criminal activities rather than socially-approved productive pursuits. Obviously, the economic impacts of drug-related crime are enormous. The estimates presented i'n this report indicate that over one-third of the economic costs of drug abuse are crime-related.
Public intervention strategies that prevent or interrupt addiction crime careers have current year benefits as well as benefits that accrue over the expected balance of the crime career. For purposes of making cost benefit estimates, the avoided future economic impacts of crime careers are discounted to the year in which the intervention strategy becomes effective.
The future costs of implementing intervention strategies should also be discounted to the present if expenditures stretch into the future. These costs of the intervention strategies are discounted in a manner completely parallel to that for discounting future benefits. H. Analvze Uncertainties
The impact and effectiveness of ADM intervention strategies are, at best·, estimated with some margin for error. The values of important relationships are measured under the best of circumstances with some confidence
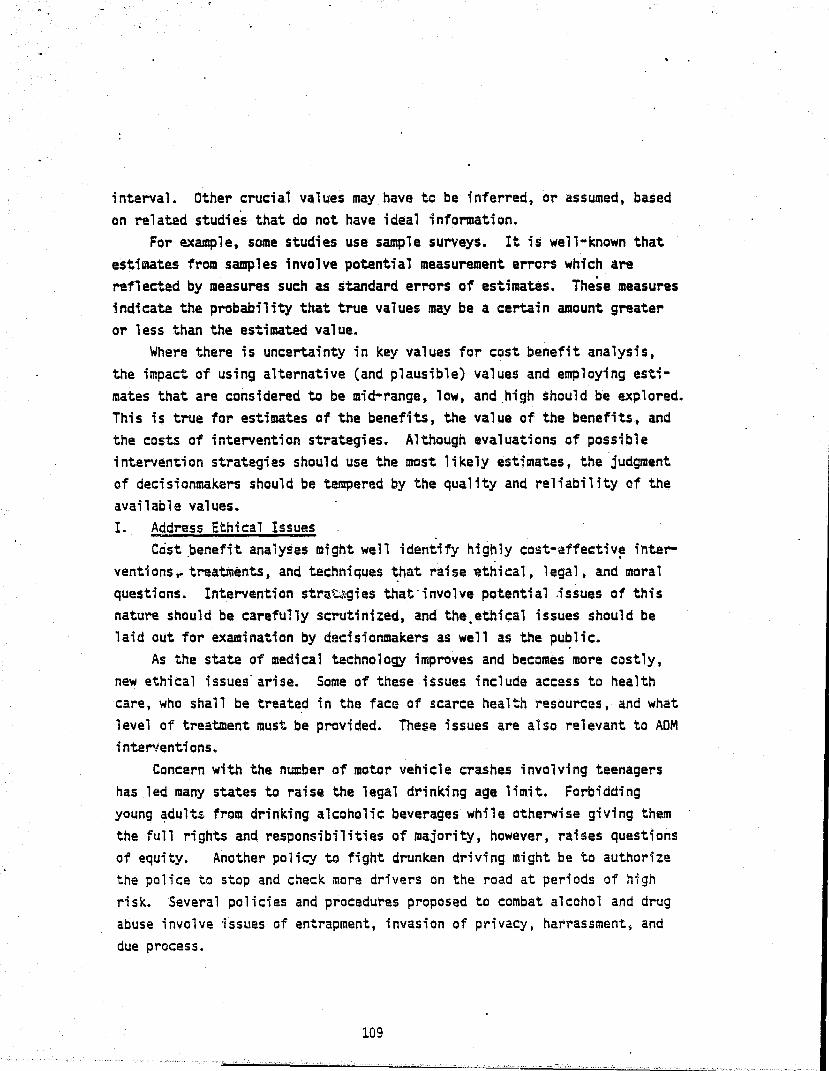
interval. Other crucial values may have to be inferred, or assumed, based on related studies that do not have ideal information.
For example, some studies use sample surveys. It is well-known that estimates from samples involve potential measurement errors which are reflected by measures such as standard errors of estimates. These measures indicate the probability that true values may be a certain amount greater or less than the estimated value.
Where there is uncertainty in key values for cost benefit analysis, the impact of using alternative (and plausible) values and employing estimates that are considered to be mid-range, low, and ,high should be explored. This is true for estimates of the benefits, the value of the benefits, and the costs of intervention strategies. Although evaluations of possible intervention strategies should use the most likely estimates, the judgment of decisionmakers should be tempered by the quality and reliability of the available values. I. ~dress Ethical Issues
Cost ,benefit analyses might well identify highly cost-effec:tiv!! i"nterventions~ treatments, and techniques ~hat raise ~thical, legal, and moral questions. Intervention stra.~~gies that'involve potential .issues of this nature should be carefully scrutinized, and the. ethical issues should be laid out for examination by decisionmakers as well as the public.
As the state of medical technology improves and becomes more costly, new ethical issues' arise. Some of these issues include access to health care, who shall be treated in the face of scarce health resources, and what level of treatment must be provided. These issues are also relevant to ADM interventions.
Concern with the number of motor vehicle crashes involving teenagers has led many states to raise the legal drinking age limit. Forbidding young ~dults from drinking alcoholic beverages while otherwise giving them the full rights and responsibilities of majority, however, raises questions of equity. Another policy to fight drunken driving might be to authorize the police to stop and check more drivers on the road at periods of high risk. Several policies and procedures proposed to combat alcohol and drug abuse involve issues of entrapment, invasion of privacy, harrassment~ and due process.
109

There may also be ethical problems with utiliza-tion of randomized clinical trials to evaluate alternative treatment regimens. Random assignment of human participants to different types and levels of treatment withunknown levels of effectiveness poses questions for our society.
Such issues must be identified and their merits and demerits debated in parallel-with a cost benefit analysis of any proposed public interven-' tion strategy. J. Interpret Results
The Office of Technology Assessment 'study points out that cost benefit analyses are used by policymakers and health professionals in deciding what intervention strategies to use, and at what levels. Moreover, the results will be used by the media, and laypeople in the course of debating the merits and demeri~ of particular programs.
The final responsibility of a professional preparing a cost benefit analysis or cost effectiveness, analysis is'to provide a car,eful t clear statement cif the findings. The underlying principle of these types of ' studies should be identical to that for any thorough research'study. The . -procedur2s and assumptions employed should be documented in sufficient detail to enable an independent party to reproduce the results of the CBA or CEA. The documentation of the results of this and the previous RTI ADM cost-af-illness study has been developed with this principle in mind. K. Conclusion
The ADM cost-of-illness studies,to date are essential inputs to the performance.of CSAlCEA analysis and program evaluation. Greater availability of disaggregated data and refinement of methods to estimate indirect and intangible costs should allow continued improvement in computation of ADM cost of illness.
The overall magnitude of ADM cost of illness provides a sense of the relative amount and the nature of resources consumed'in the process and treatment of disease. The team of expert consultants who assisted the current study emphasized the need to disaggregate data. to unravel the joint possibility of multiple ADM disorders, and to explore the systemic effects of illness. Available data are certainly not precise enough to account for the overlapping among drug abuse, alcohol abuse, and mental health problems. Consequently, the cost-of-illness estimates (with respect to indirect economic costs) are probably overstated. Better data and
econometric technique will help to alleviate this problem in future 'studies. Program administration and evaluCttion ca'J'l benefit from the improved
estimation and analysis of cost of illness. Estimates of COI, however, ' , often are referred to without specificity as to which cost components may, be affected by program actions. What costs can be lessened by existing or proposed health programs? A "magic bullet ll will not, unfortunately, reduce the costs of ADM illness to zero. The use of CBA/CEA wi" permit the analysis of alternative actions by a health agency when less than complete eradication of disease is an acceptable and realistic goal.
III

V. FUTURE DIRECTIONS IN ADM COST OF ILLNESS STlIDIES
Crucial and difficult issues regarding the economic costs of ADM to society remain to be addressed. State-of-the-art estimates have been developed and presented in the preceding sections. In performing the analysis, even more issues have been identified. Many of these were mentioned in appropriate portions of earlier sections of this report.
A final objective of the present study is to highlight methodological issues that should be addressed in order to improve future cost-af-illness estimates. The issues to be highlighted are:
• Overlaps in the ADM populations • ADM in the workp 1 ace • ADM overlaps in specialty treatment settings • ADM and other health problems .
• Crime . • Fetal alcohol' syndrome in adult cohorts.
These are not the only remaining issues for future cost studies of ADM. All of the data and analysis used in these computations can be improved by more intensive and periodical study. These highlighted problems have been studied before, and this report has benefitted from recent advances. They deserve .further attendon primarily because they are associa'ted with major costs estimated in this study, and the potential for making significant improvements seems high. A. Overlaos in the ADM Populations
The ADM disorders are often treated as three very separate problems for society although, i.n fact, they are very clos"ely intertwined •. The present study and its predecessor have made separate estimates for tne economic costs of alcohol abuse, drug abuse, and mental illness. These have.been modeled on cost stUdies stretching back to 1958 that treated mental illness, alcohol abuse, and drug abuse separately.
The objective of making separate but concurrent cost estimates for each of the ADM disorders required the disentanglements at the overlaps. The data used in these attempts have not been entirely satisfactory for this purpose, making this an important area for improvement in future cost studies.
113

.",
The most obvious examples where overlaps are important is in the periodic· national household surveys of alcohol abuse and drug· abuse. These. are extremely important data sourc~s about the extent and· nature of these two addictive disorders in our society. However, neither the survey on alcohol abuse nor the survey on drug abuse adequately addresses the issue of the abuse of a broad range of substances. The 1979 National Survey on Alcohol Abuse included no questions about abuse of psychoactive substances other than alcoholic beverages.
The 1982 National Household Survey an Drug Abuse included a very small set of questions about alcohol abuse by respondents. However, it has insufficient detail to determine whether an individual might be an alcohol abuser by any of the commonly used criteria.
It has been established in surveys of youth (Rachal, Guess, Hubbard, Maistc, Cavanaugh, Waddell, and Benrud, 1980) that there is a substantial overlap be~een heavier drinkers and marijuana users. Up to half of the heavier·drinkersa1so use marijuan~ at least once a week., an~ a third of the youth who use marijuana mare than once a month also are classed as . healli.er drink.ers. Data from the 1982 National Household Survey on Drug Abuse (Miller et a1., 1983) indicate that up to 50 percent of young adults that are heavier users of marijuana are ·heavier drinkers.
In the face of such wide overlaps between young alcohol and drug abuse populations, it is essential to study the incidence, prevalence, and consequences ·of bath disorders in the same popUlations, and for the same individuals.
There are likely to be equally significant overlaps between other ·mental illnes~es and alcohol and drug abuse although the nature of the overlap is not well understood. The Treatment Outcome Prospective Survey (Rachal et al., 1981) found a high prevalence of symptoms of depression among drug abuse treatment populations. Similarly, Collins and Sch1enger (1983) indicated that there is significant overlap between the addictive disorders and other mental disorders in prison populations.
Probably the best hope for identifying and potentially disentangling the overlap between alcohol abuse, drug abuse, and other mental disorders ;s the epidemiologic catchment area program being sponsored by NIMH (Eaton et al., 1981). Preliminary analysis by Myers et al. (1983) suggests that the presence of multiple ADM disorders is a possibility, since their findings

show that the sum of the prevalence rates for a number of distinct-mental disorders (including alcohol and drug abuse) is greater than the rate for the presence of any mental disorder. That research has no~ yet addressed the overlap issue,- although it will be possible to indicate the magnitude of the overlap between alcohol and drug abuse, and other mental disorders in the future •.
Given the strong indications of overlap between the young alcohol abusing and drug abusing populations, it would also be a significant advance if the national surveys of each of the disorders would collect some baseline information on the other disorders. Ideally, information would also be collected about mental disorders. B. The Effect of ADM in the WorkD-l!£!
The largest cost component for each of the separate disorders was lost employment and reduced productivity. From an economic perspective, these are the most significant cost components and, in fact, estimation-of this ~ost component for alcohoi and drug acuse was a major effort in this study. Within this general topic there are areas demanding further investigation. - -The most important of these is reduced productivity due to mental illness.
State-of-the-art econometric estimates of the impact of alcohol and drug abuse on productivity were made in the present study, but only partial estimates could be made for the impact of mental illness in the workforce. The part that could be estimated was for individuals who were institutionalized and for noninstitutionalized persons who indicated that they suffered a complete or partial work disability due to severe emotional disorders or chronic nervous disorders. These cost impacts totaled $22 bil-
'lion for 1980. These estimates represented only a fraction of the adult population who have been estimated to experience mental disorders during the course of a year. The ECA stUdies (Myers et al., 1983) found that 12 to 18 percent of the adult population experienced symptoms of a mental disorder over a six-month period (this includes alcohol, and drug abuse, which were not estimated separately). The estimates in this study of productivity losses due to mental illness include less then 1 percent o.f the adult population,·a very small proportion of the total who are believed to experience mental disorders.
It is hypothesized that mental illness significantly affects the productivity of its victims, even though they may not seek clinical assist-
115

ance or acknowledge that they have a problem. This problem can be addressed in the near future as the data sets from the epidemiologic catchment area studi~3 beco~e available for public analysis.
State-of-the-art econometric estimates of the impact of alcohol and drug abuse on worker productivity have been produced as part of the current effort. The research represents- the most comprehensive examination ~ade to date. It has been found that particular patterns of alcohol abuse and drug abuse significantly affect the household incomes of ADM victims. This is true even after controlling for other factors known to be significantly related to labor market success.
These state-of-the-art estimates can be improved in several ways. First, slightly different information on labor market participation, earnings, and income should be obtained in future cycles of the NlAAA and NIDA household surveys. Since both Institutes plan to perform future national surveys, this change could be implemented with negligible effort and cost.
Anot~er issue is the difference in the nature and amount of diagnostic information obtained by the respective. national surveys. As noted previously, neither syrvey obtains detailed information about ~~e other addictive disorder. Both surveys obtain relatively complete information about patterns of use and abuse of the respective substances, including current use, and lifetime patte~s.
A significant strength of the NlAAA survey is that it collects a great deal of detailed information about many symptoms and potential consequences of alcohol abuse: symptomatic drinking, interpersonal problems, drinking and driving, belligerence, family disputes, and impacts on work.
The survey sponsored by NIDA obtains much less information of this nature about the impacts and consequences of an individual's drug abuse problem on herself/himself, family, friends, and society at large. The 1979 and 1982 national surveys began to investigate some consequences, such as driving and drug abuse and the amotivational syndrome, but there' is still a large gap between the quantity and quality of information on tangible impacts obtained by the two nat:onal surveys.
For both alcohol and drug abuse, there is a remaining question of whether other factors such as personal values, personality traits, attitudes, and risk-taking behaviors underlie both the substance abuse itself and the tangible consequences such as productivity losses. Factors like
'1~

I
these may have preceded substance abuse problems and, in fact, contributed to them. They are probably also determinants of labor market success. Furthermore, attitudes, values, and other behaviors may not change when an individual modifies his or her substance abuse problem. If factors such as these are underlying C3Y5eS of both substance abuse and level of success in the labor market, then a rigorous study of the impact of substance abuse on labor market success must control for these items to give unbiased estimates of the impact of substance abuse.
These issues will have to be addressed in future studies, since the large scale surveys performed to date have not collected information on substance abuse, employment and income, attitudes, personality, and behaviors which are neces,sary to make a full study of these relationships. c. ADM Overlaps in Soecialtv Treatment Settings
The overlap of alcoh,ol abuse, drug abuse, and mental illness constitutes a problem for estimating the direct treatment costs associated with each disorder. Extensive data are collected and maintained about-the utilization of health care treatment in the United Stat~s.A major fo~us of these efforts has been to identify the total magnitude of services
, provided in the United States a.nd to estimate the r:1i~tl"'ibl,\ti(," t:)f these services among different health care problems. These national ,data bases have been the foundation for the estimates developed and presented in this study.
Utilization data are usually presented by the health problem and by the initial primary diagnosis made by the health care professional. This pr'actice is not readily compatible with the problem of multiple disorders. Typically, a health care professional makes a primary diagnosi sand 1 ists secondary prc,lems as well. Alternatively, professionals _may list multiple diagnoses. In practice, when multiple diagnoses are given, the first listed diagnosis becomes the primary diagnosis for reporting and analysis purposes.
While ADM specialty settings may have a particular orientation, specializing in alcohol abuse, drug abuse, or other mental disorders, because of the overlap problem they are likely to be treating people with any or all of the ADM disorders. The convention of using and analyzing data based on primary diagnosis or a first listed-diagnosis will not accurately reflect the nature of a patient1s problems nor the level of resources required to treat them.
117

The cost implications of treating multiple ADM disorders should be' studied in the future. Improved cost estimates can be produced by identif.ying services provided to persons with multiple ADM disorders. In addi-' tion to analyzing treatment utilization by "primary" and "first-listed" diagnosis, data could be generated showing service delivery to persons with single disorders (with no overlaps) and those with various combinations of disorders (any two of the three ADM disorders, or all at the same time). Making these improvements requires that treatment facilities and clinicians maintain and be able to report data on multiple disorders. In effect, "primaryU or "first-listed" diagnoses would have to include "combinedll
categories. Dividing the costs for ov'erlapping diagnoses would be a challenge for
further analysis. It ~~y be more meaningful to report overlapping costs separat~ly and not art'ificially assign costs to a single disorder. D. ADM and Other Hea'tth Problems
The ov~la~ prob1l!1II in general' health care settings is identical to
that in the ADM speciality sector. An additional factor in the general . health care sector is that alcohol and drug abuse are each related to other,
health care problems. rne relationship of alcohGl abuse to other health care problems receives intense scru'tiny in the medical profession, and results are regularly summarized in the NlAAA reports on alcohol and health. Alcohol has been indicated as an underlying cause of a number of health problems that also have other causes. Ongoing epidemiological research includes a thorough analysis of these data to discover the proportions of other illness that might be attributable to alcohol abuse. Cost attributions for these other illnesses can be made ,to alcohol abuse using those established relationships. Alcohol abuse also has cost implications when it exacerbates health problems that it does not necessarily cause. Some preliminary stUdies on this problem using data maintained by health care insurance companies have compared health care utilization in households where some member has received treatment for alcohol abuse with other households. Further insights into the problems associated with al~chol abuse will be gained from this avenue of research.
Important research into the relations~ip between alcohol abuse as a complicating factor in other illnesses is being performed by NIAAA. Initial findings indicate that alcohol-specific illnesses such as liver cirrhosis,

alcoholic psychosis, and alcoholism are seconda~ causes of death for about two-thirds again as many mortalities as they are primary causes. Some proportion of these mortalities should be attributable to alcohol abuse •. _Analogously, where alcohol abuse complicates health care treatment f~r other illnesses, some proportion of those costs should be identified and included in future cost studies.
Knowledge about drug abuse and health problems is not as advanced as that for alcohol abuse. Drug overdoses are a well-known consequence of drug abuse. Further health problems involved with abusing various drugs are hypothesized but require further research, documentation, and summarization.
The health effects of the mast widely abused illicit substance-marijuana--were recently reviewed by a committee of the Institute of Medicine (Institute of Medicine, 1982). Conclusions reached in that study were that, while there are. "a broad range of psychological and biological effects," it is not known hO'll extensive the health.problems is or· II how ,serious this risk may be;u The state of knowledge regardi.ng b.iological ~ffects of other illicit SUbstances is comParable. While effec~ of various types have been observed, there is a lack of epidemiological evidence about their extent and severity.
. Overlaps of mental illness with substance abuse should be dealt with in the future. It is not known in which direction overlaps may have biased the current cost estimates for mental illness. E. Crime and ADM
The strong relationship between ADM and crime has received intense study over the last ten years and is a continuing topic of debate. Significant improvements have been made in the course of this study in estimating the economic costs associated with ADM. Despite the improvements in data and methodology, important issues remain open for continued analysis.
Mental illness has been linked to violent crime. A study of a prison population by Collins and Schlenger (1983) indicated that nearly 70 percent of the inmates exhibited some disorder, ranging from alcohol and drug abuse, to antisocial behavior disorder or other mental disorders. Nonetheless, the difficult question remaining to be answered is what proportion of various types of crimes is attributable to mental illness? Only when this question ;s answered can costs be assigned to mental illness and crime_
119

( I,
ihe drug abuse/crime relationship has been analyzed by interviewing prison inmates, studying the drug usage patterns of arrestee!, analyzing the behavior of drug abuse treatment populations, and conducting intense" ethnographic studies of small groups of drug addicts on the streets. All of these studies indicate a high involvement of drug abusers with criminal activities. However, mast of these studies have focused an a limited and not necessarily representative segments of either the drug abuse population or the criminal population. Both of these populations are extremely difficult to identify, and members have little incentive to give reliable data on their antisocial patterns of behavior. Studies of drug abuse should carefully examine the implications of their findings for crime and viceversa, and the results should be compared with other sources of data such as th~ victimization surveys performed by the Bureau of Justice Statistics and the r~gularly compiled data from the Uniform Crime Reports. io establish reliability and validity of the microlevel stUdies of select populations, the implications from the study groups"must be ,extrapolated to a regional or national revel and compared for consistency with aggregate information - . on the value and number of crimes' committed. F. Fetal Alcohol SYndrome in Adult Cohorts
Economic implications of the fetal alcohol syndrome have ~een explored for the first time in this study, building on and modifying the cost information collected by Russell (1980). The estimated costs for FAS are over 2 percent of the total value for all of alcohol abuse. Although all of the estimates for FAS are state-of-the-art and subject to revision given further study, there are several aspects of FAS that are most critical for these types of cost of illness studies.
The subject of increasing concern since the early 1970s, research on incidence and prevalence of the fetal alcohol syndrome has focused primarily on new birth cohorts. FAS, however, effects symptomatic individuals throughout life, imposing costs on them, their families, and on society. We must ask whether it is possible to identify FAS victims in older birth cohorts, including juveniles, teens, and adults. Since FAS is identified by a set of permanent defects and deformities, ,t is hypothesized that prevalence estimates can be made for these older cohorts.
The single aspect of the syndrome that is most economically significant ;s mental deficiency. Research indiCates that all FAS victims experi-

•
ence some kind of mental deficiency, ranging from minimal brain dysfuNction to severe/profound mental retardation. To make more precise estimates of FAS costs, more reliable estimates must be made of the prevalence of various degrees of mentaT deficiency. Moreover, reliable information is needed about the level of functionality that FAS victims may achieve ,in society. The severely and profoundly retarded victims are likely to have a minimal capability to function in society and would, therefore, be institutionalized. Lower levels of mental deficiency should involve greate~ capability to function in society. It must be ascertained whether FAS victims can do skilled or unskilled work, and whether they must work in a sheltered workshop environment. G. Conclusions
The research needs identified in this section have strong implications for cost stUdies of alcohol and drug abuse and mental illness. Rigorous ana]ysis of th~se issues could yield higher or lower new estimates. The overlap problem,may-require costs assigned to one disorder to be spTit . . . with Or attributed to ~~othar disorder. Changes may 'occur as knowledge about the very complicated ADM disorders expands.
The issues identifi'ed here represent a short but important list of research needs for improving'future cost of ADM studies:
• Overlaps in the ADM populations • ADM in the workplace • ADM overlaps in specialty treatment settings • AOM and other health problems
• Crime • Fetal alcohol syndrome in adult cohorts.'
Major advances have been made in the present study on some of these topics. Yet, this work has served more to define how much more must be done than to y~eld definitive results.
121

.,,,,,
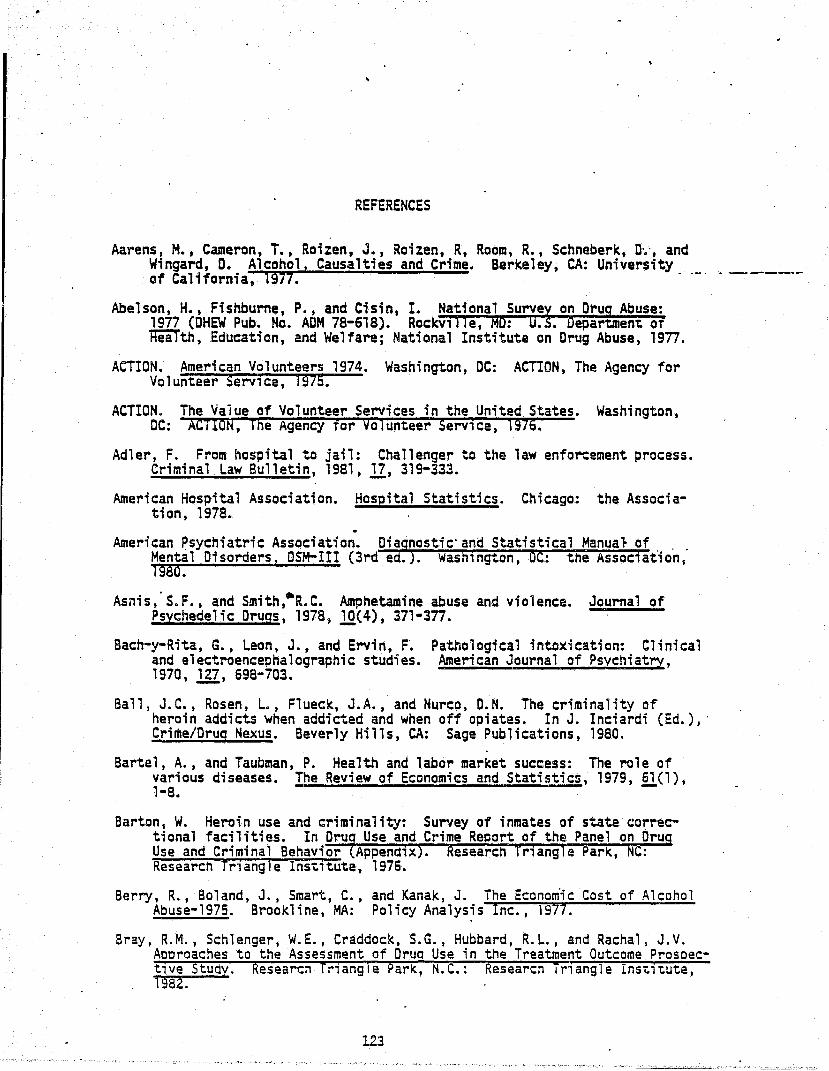
REFERENCES
Aarens, M., Cameron, T., Roizen, J., Roizen, R, Room, R., Schneberk, D~o, and Wingard, D. Alcohol, Causalties and Crime. Berkeley, CA: University of California, 1977.
Abelson, H., Fishburne, P., and Cisin, I. National surveX on Drug Abuse: 1977 (DHEW Pub. No. ADM 78-618). Rockvl11e, MD: 0 .. Department of RiiTth, Education, and Welfare; National Institute on Drug Abuse, 1977.
ACTION. American Volunteers 1974. Washington, DC: ACTlON, The Agency for Volunteer Service, 1975.
ACTION. The Vaiue of Volunteer Services in the United States. Washington, DC: ACTION, The Agency Tor Volunteer Serv1ce, 1976.
Adler, F. From hospital to jail: Challenger to the law enforcement process. Criminal Law Bulletin, 1981, lZ, 319-333.
American Hospital Association. Hospital Statistics. Chicago! the Association, 1978. .
American psychiatric Association. Diagnostic" ana Statistical Manua} of 0 0
Mental Disorders, DSM-III (3rd ed. ). Wash,ngton, DC~ the AssociatOion. 1980.
Asnis,"S.F., and Smith,·R.C. Amphetamine abuse and violence. Journal of Psychedelic Druas, 1978, lQ(4), 371-377.
Bach-y-Rita, G., Leon, J., and Ervin, FO. and electroencephalographic studies. 1970, ~, 698-703.
Pathological intoxication: Clinical American Journal of PsYchiatry,
Ball, J.C., Rosen, L., Flueck, J.A., and Nurco, D.N. The criminality of heroin addicts when addicted and when off opiates. In J. Inciardi (Ed.), 0
Crime/Drug Nexus. Beverly Hills, CA: Sage Publications, 1980.
Bartel, A., and Taubman, P. Health and labor market success: The role of various diseases. The Review of Economics and Statistics, 1979, 61(1), 1-8. - - -
Barton, W. Heroin use and criminality: Survey of inmates of state correctional facilities. In Dru Use and Crime Recort of the Panel on Drug Use and Criminal Behavior Appendlx. Research Park, NC: Research Triangle Institute, 1976.
Berry, R., Boland, J., Smart, C., and Kanak, J. The Economoic Cost of A1S£h2J. Abuse-1975. Brookline, MA: Policy Analysis Inc., 1977.
Bray, R.M., Schlenger, W.E., Craddock, S.G., Hubbard, R.L., and Rachal I J.V. Aocroaches to the Assessment of Drua Use in the Treatment Outcome Prosoec· tive Study. Researcn Triangle Park, N.C.: Researcn ir1ang1e ins~i~ute, 1982.
123
.Bruininks, R. 1982 National Survey of Residential Facilities for Mentally --- Retarded PeoDle. Minneapoils, MN: University of Minnesota at Minneapolls,
Department of Educational Psychology, no date. - .--
Burt, M., and Biegel, M •. ~W~or~l~dw~i_d_e..;S~u~rv~e"""-'l~~~~~~T~"""i-~~~~;';';';;;_ Use Among MilitarY Personne : 1980.
Cahalan, D. Problem Drinkers: A National Survey. San Francisco! Jossey· Bass, Inc., 1970.
Cahalan, 0., and Room, R. Problem Drinkina Among American Men. New BrunswicK, ~J: Rutgers University, Rutgers Center of Alcohol Studies, 1974.
Cahalan, D., Cisin, I., and Crossley, H. American Drinkina Practices. New BrunswiCK, NJ: Rutgers University, Rutgers Center of Alcohol Studies, 1969.
Chaiken, J., and Chaiken, M. Varieties of criminal behavior. Draft. Santa Monica, CA: Rand, OC:~cer 1981.
Clark, W., and Midanik.,"L. Alcohol use and alcohol problems among U.S. adults: Results of tne 1979 national survey. In Alcohol and Health Monoaraoh No.1. Alcohol Consumotion and Related Problems. RoCkvl11e, MD: Na~ional Institu~e on Alcohol Abuse'and Alcohplism, 1982.
Clark, W., Midanik, L., and Knupfer, G. Alcohol Use and Alcohol Problems amona U.S. Adults: Results of the 1979 Natlonal SurveX. Draft. Berkeley, CA: the Universlty, ~pr,l 1981.
Clarren, S.K., and Smith, D.W. The fetal alcohol syndrome. New England Journal of Medicine, 1978, 298, 1063-1067.
Collins, J. (Ed.). Drinking and Crime: Persoectives on the Relationshio Between Alcohol Consumotion and Criminal Behavior. New York: Guilford Press, 196 1.
Collins, J. The Relationshio Between Drug Use Patterns and Violent Crime. Paper presented at the American society of Criminology Annual Meeting, Toronto, Canada, November 1982.
Collins, J., Hubbard, R.L. t and Rachal, J.V. Heroin and Cocaine Use and Il1eaal Income. Research Triangle Park, Ne: Research Triangle Institute, 1984.
Collins, J., and Schlenger, W.E. The Prevalence of Psvchiatric Disorder Amana Admissions to Prison. Research Triangle Park, NC: Research Triangle Ins~itute, 1963.
Conley, B. The value of human life in the demand for safety. American Economic Review, 1976, 66, 45-55.
Cook, P. The value of human life in the demand for safety: Comment. The. American Economic Review, 1978, 68, 710-711.
124.


Frank, R., and Kam1et, M. Direct Costs and Exoenditures for Mental Health in the United States 1980. Rockville, MD: the National Institute of Mental Health, 1984.
Gandossy, R., Williams, J., Cahen, J. t and Harwood, H. Druas and Crime: ~ Survey and Analysis of the Literature. W~shington, OC: .. U.S. O~~~~~:_ ment of Justlce, National Instltute of Justlce, 1980.
The General Electric Company and the National Institute on Alcohol and Alcohol . Abuse. ImolicatedAlcohol and Disease Entities Alcohol as a Risk Factor in the Nat1on 1s Heal~h. Rockv111e, MO: the Institute, March 1980.
Gerkin, K.P., Church, M.W., and Murrans, L.E. Hearing Deficits in Some Children with Fetal Alcohol Syndrome (FAS). Paper ~o be presented to the Amer1can Speech a~d Hear1ng Association Convention, 1984.
Gibson, R. National health expenditures, 1978. Health Care Financing Review, SUlIIDer 1979.
Gibson, R., and Waldo, D. National health expenditures, 1980. ~~ . Care Financing Review. September 1981.
Goldman, F. The Social Costs of Drug Abuse, 1976. Draft. NY: Columbia University, 1978.
Gottschalk, L., McGuire, F., Heiser, J., Dinovo, E., Abuse Deaths in Nine Cities: A Survey Reoort. 29. Rockv111e, MO: u.s. Department of Health, National Institute on Drug Abuse, 1979.
and' Birch, H. Drug NIDA Research Monograph Education, and Welfare;
Greenberg, S. Alcohol and crime: A methodological critique of the literature. In J. Collins (Ed.), Drinking and Crime: Perscectives on the Relationship Between Alcohol Consumotion 'and Criminal Behavior. New York: Guilford Press, 1981.
Gualtieri, P., Mannella, T., and Seaman, F. Literature Review to Deve10D . __ . Methodology for Determining Costs of Drua Abuse to Industry (Vol. 1).
Washington, DC: University Research Corporation, 1979.
Hamilton, C., and Collins, J. The role of alcohol in wife-beating and child abuse: A review of the literature. In J. Collins (Ed.), Drinking and Crime: Perscect;ves on the Re1ationshio Between Alcohol Consumotion and Criminal Behavior. New York: Guilford Press, 1981.
Hanson, J.W., Streissguth, A.P., and Smith, D.W. The effects of moderate alcohol consumption during pregnancy on fetal growth and morphogenesis. Journal of Pediatrics, 1978, ~(3), 457-460.
Hare, R.D. Diagnosis of antisocial personality disorder in two prison populations. American Journal of Psvchiatry, 1983, 140(7), 887-890.
126

Harlap, S., Shiono, P.H., and Ramcharan, S. Alcohol and spontaneous abortions. Abstract. Am@rican Journal of EoidemiologY, 1979, llQ(3). 372.
_.H,eavy drinking, smoking linked with oral cancer. Medical Association, 1976, 236(5), 435. -
Journal- ot the American
Hindelang, M., Dunn, C., Aumick, A., and Sutton, L. Sourcebook of Criminal Justice Statistics - 1974. Washington, DC: U.S. Department of Justice, Na~1onal Cr1mlnal Justlce Information and Statistics Service, 1975.
Hodgson, T., and Meiners, M. Guidelines for Cost-of-I11ness Studies in the Public Health Service. Bethesda, MO: Public Health Servlce Task Force on Cost-or-Illness Studies, 1979.
Hubbard, R., Harwood, J., and Cruze, A. Imcacts of Drug Use, Drug Treatment and Vocational Services on ~~olovment Related Sehavlors or Drug Abusers and AddlCt5. Researcn Irlangle Park, NC: Research Trlangle Instltute, 19i7. '
Institute for Scientific Analysis. Drinking Patterns and Criminal Careers: A Study of 310 Imcrisoned Male Felons. San Franclsco, tA: SClentl'fiC Analysls Corporatl0n, 1978.
Institutes of Medicine. Marijuana and Health. Washington, DC: National . . Academy Press, 1982.
James, J .. F'., Gregory, D., and Jones, R.K. Psychiatric morbidity in prisons. Hospital and Community PSYChiatry, 1980, 11(10), 674-677 •.
Jessor, R.. Marihuana: A review of recent psychological research. In R. DuPont, A. Goldstein, and J. OIDonnell (Eds.), Handbook on Drug on Drug Abuse. Rockville, MD: National Institute' on Drug Abuse, 1979.
Johnson, B.D., and Goldstein, P.J. Hiahliahts from the Final Reoort: Economic Behavior of Street Ooiate Users. NY: Narcotlc and Drug Research, Inc. and New York State o1vislon of Substance Abuse Services, February 1984.
Johnston, L.D., Bachman, J.G., and OIMalley, P.M. Student DruQ Use in America, 1975-1981 (DHHS Pub. No. ADM 82~12Z1). Rockvil1~, MO: National Inst1tute on Drug Abuse, 1981.
Jones, K.L., and Smith, D.W. The fetal alcohol syndrome. Teratology, 1975, 12(1), 1-10.
Jones, R., and Joscelyn, K. Alcohol and Highway Safety 1978: A Review of the State of Knowledae Summary Volume. Ann Arbor, MI: ihe University of MiChigan, Highway Safety Research Institute, 1978.
Jones-Lee, M. The Value of Life. An Economic Analysis. Chicago: University of Chlcago Press, 1976.
127

JQscelyn K., Donelson, A., Jones, R., McNair, J., and Ruschmann, P. 9rugs and Hiahway Safety 1980. Ann Arbor, MI: The University of Mic1!}.gan, Highway Safety Research Institute, 198Q.
and Carney, H.F. Cost of Santa Mon1ca!_CA:
Kaminski, H., Rumeau-Rouquette, C., and Schwartz, D. Letter: Effects of alcohol on the fetus. New England Journal of Medicine, 1978, ~(1), 55-56.
Karter, M. Fire loss in the United S~tes during 1980. Fire Journal, September 1981.
Keller, M. (Ed.). First Soecial Reoort to the U.S. eOMOreSS on Alcohol and Health (DHEW Pub. No. HSM 72-9099). Roc~ville, MO: U.5. uepartment of Health, Education, and Welfare; Alcohol, Drug Abuse, and Mental Health Administration, 1971.
Keller, M. (Ed.). Second Soecial Reoort to the U.S. Conoress on Alcohol and Health (DHEW PUb. No. ADM 75-212). Roc~v,'le, MD: u.S. Department of Health, Education, and Welfare; Alcohol, Drug Abuse, and Mental Health Administration, 1974.
King, W., and Tucker, K. Dental problems of alcoholic and nonalcoholic psychiatric patients. Quarterly Journal of Studies on Alcohol, 1973, ~, 1208-1211.
Kline, J., Shrout, P., Stein, Z., Susser, M., and Warburton, D •. Drinking during pregnancy and spontaneous abortion. Lancet, 1980, ~, 176-180.
Kochhar, S. 81indand disabled persons awarded federally administered 5SI payments, 1975. Social Security Bulletin, 1979, ~, 13-23.
Landesman-Dwyer, S., and Emanuel, I. Smoking during pregnancy. Teratology, 1979, 19, ll9-l2S.
Lemkau, P., Amsel, Z., Sanders, B., Amsel, J., and Seif, T. Social and Economic Costs of Drug Abuse. Baltimore, MO: the Johns Hopkins University, Department of Mental Hygiene, School of Hygiene and Public Health, 1974. .
Lp.vine, D., and Levine, D. The Cost of Mental Illness - 1971 (DHEW Pub. No. ADM 76-265). Rockville, MD: U.S. Department of Health, Education, and Welfare; Alcohol, Drug Abuse, and Mental Health Administration, 1975.
Loser, H., and Majewski, F. Type and frequency of cardiac defects in embryofetal alcohol syndrome. Report of 16 cases. British Heart Journal, 1977, 39, 1374-1379.
Luft, H. The impact of poor health on earnings. The Review of Economics and Health, 1975, 43-57.

_~~cAndrew, C., and Edgerton, R. Drunken Comoortment: A Social Exolanation. Chicago: Aldine, 1969.
Majewski, F., Bierich, J., Loser, H., Michaelis, R., Leiber, B., and Bettecken, F. Di agnasi 5 and pathogen'!si s of a 1 coho 1 embryopathy-- Report of 68 cases. NIAAA, NCALl, STIAR 5. Munchener Medizinische Worchenschrift, 1976, ~(50); l635-l642.
Mannello, T., and Seaman, F. .f:revalence, Costs6
and Handling of Drinking Problems on Seven Railroad.s. Washinguln, c: University Research Corporation, 1979.· -
McBride, D. Druas and Violence. Paper presented at the American Society of Criminology Annual Meetlng, Denver, Colorado, November 1983. .- , -
McBride, D.C. Drugs and violence. In J.A. Inciardi (Ed.), The Drug-Crime Connection (Vol. 5). Beverly Hills, CA: Sage Publicatlons, 1981.
McCaghy, C. Drinking and deviance disavowal: The case of child molesters. Social Problems, 1968, j§, 43-49.
McGarry, A.L., Schwitzgebel, R.K., Lipsett, P.O., and Lelos, D. Civil, Commitment and Social Policy (OHHS Pub. No. ADM 81-1011). ROcKv111e, MO: the Nat10nal rnst1tute of Mental Health, l~al.
McGuire, P. New York City Homicides: Drua !nvolvement Indicators. ' Paper presented a~ the American Soclety of crlminology Annual Meetlng, Denver, Colorado, 1983.., -
McManus, L.. The Effects of Disabilit¥ on Lifetime Earninas. Washington, DC: U.S. Department of Health, Educatl0n, and Welfare; Soc,al Security Administration, Office of Research and Statistics, 1978.
McMillan, A., and Bixby, A. Social welfare expenditures, fiscal year 1978. Social Security Bulletin, 1980, ~, 3-38.
Mezey, £., Jow, E., Slavin, R., and Tobin, F. Pancreatic function and intestinal absorption in chronic alcoholism.' Gastroenterology. 1970, 59(5),'657-664. - ,
Miller, J., Cisin, I., Gardner-Keaton, H., Harrell, A., Wirtz, P., Abelson, H., and, Fishburne, P. National Survey on Drug Abuse: Main F.indinas 1982. Rockville, MD: ihe National Ins~i~ute on Drug Abuse, 1953.
Mishan, E. Evaluation of life and limb: A theoretical approach. Journal of Political EconomY, 1971, 79, 687-705.
Monforte, J.R., and Spitz, W.U. Narcotic abuse among homicide victims in - Detroit. Journal of Forensic Sciences, 1975, 20, 186-190.
Mott, C., Sarles, H., Tiscornia, 0., and Gullo, L. Inhibitory action of alcohol on human exocrine pancreatic secretion. American Journal of Digestive Diseases, 1972, 11, 902-910.
129

. ..,
Costs of Education Parts I and fr. Wash-
National Council on Alcoholism. Prevalence of alcoholism among employees in business, industry, and civilian government. Labor-Management ~ces Bulletin, March 18, 1971. __ . __ .,_
National Safety Council. Accident Facts 1979 Edition. Chicago: the Co unci 1, 1979.
Noble, E. (Ed). Third Soecial Recort to the U.S. Conaress on Alcohol and . Health (OHEW Pub. No •. ADM lB-!:)69). Rockv1 lle, MD: u.s. Department
of Health, Education, and Welfare; Alcohol, Drug Abuse, and Mental Health Administration, 1978.
01egard, R. t Sabel, K.G., Arronsson, M., Sandin, B., Johansson,. P.R' j
Carisson, C., Kyllerman, M., Iverson, K., and Hrbek, A. Effects on the child of alcohol abuse during pregnancy. Acta Paediatr Scand (Sueel), 1979, ill, 112-:-121. .
• Oulette, E.M., Rosett, H.L., Rosman,. N.P., and Weiner, L. Adverse effects
on· offspring of maternal alcohol abuse during pregnancy. New England Journal of Medicine, 1977, 297(10), 528-530.
Paringer, L., and Berk~ A. Cost of Illness and Disease. Fiscal Year 1975. Washington, DC: George~wn Un1vers1ty, Publ1C Services Laboratory, 1977.
Pernanen, K. Alcohol and crimes of violence. In B. Kissen, and H. Begleiter (Eds.), The Biology of Alcoholism, Volume 4: Social Asoects of Alcoholism. New York: Plenum Press, 1976.
Pernanen, K. Theoretical aspects of the relationship between alcohol abuse and crime. In J. Collins (Ed.), Drinking and Crime: Perseectives on the Relationshic Between Alcohol Consumotion and Criminal Behavior. New York: Guilford Press, 1981
Petersilia, J., Greenwood, P.W., and Lavin, M. Criminal Careers of Habitual Fe1ons. Washington, DC: U.S. Government Printing Office, 1978.
The President's Commission on Mental Health. Reoort to the President from the President's Commission on Mental Heal~ol. I). Washington, DC: D.s. Government Printing Office, 1978.
Rachal, J., Hubbard, R., Cavanaugh, E., Bray, R., and Craddock, G. Characteristics, Behaviors of Clients in TOPS - 1979 Admission Cohort. NC: Research iriang1e Institute, 1981.
Collins, J., Allison, M., and Intreatment Outcomes Research iriangle Park,

Rachal, J.V., Guess, L.L., Hubbard, R.L., Maisto, S.A., Cavanaugh, E.R., Waddell, R., and Benrud, C.H. Adolescent Drinking Behavior - Volume I. The Extent and Nature of Adolescent Alcohol and brug Use: The 1974 Natlonal ~amcle Studies. Researcn Trlangle Park, Ne: Research Trungle Instltute, 1980. (NTIS No. PB 81-199267) -- ","., ",
Rachal, J.V., Maisto, S.A., Guess, l.L., and Hubbard, R.l. Alcohol and Health Monoaracn 1. Alcohol Consumction and Related Problems (bHHS PuS. No. ADR 82-1190). wasrilngton, DC: U.S. Government prlnting Offi ce, 1982.
Rehab Group, Inc. Oieest of Data on Persons with Disabilities. Washington, DC: Library of ongress, Congresslonal Research Servlce, 1979.
Regier, 0., Goldberg, I., and Taube, C. The de facto U.S. mental health service system. Archives of General Psychiatry, 1978, ~, 685-693.
Ri cd, L. (Ed.). Arbor, MI: tute, 1980.
Rice, 0,. Economic Costs of Cardiovascular Diseases and cancera 1962. - WashingtOn, DC: U.S. Department of Health, ~duca~10n, an Welfare;
Public Health Service; D;vi~idn of Community Health Services; Health Economics Branch, 1965.
Rice, O. ,Estimatina the Cost of Illness. Washington, DC: U.S. Department ot Health, Education, and Welfare, Public Health Service; Division of Medical Care Administration, 1966.
Riedel l M., and Zahn, M.A. Nature and Patterns of American Homicide. Unpublished report. Wasrilngton, DC: Department or Justlce, 1983.
Roggin, G.M, Iber, F.L., and Linscheer, W.G. Intraluminal fat digestion in the chronic alcoholic. ~,1972, 11, 107-111.
Roizen, J. Estimating Alcohol Involvement in Serious Events. Background paper for Fourth Spec1al Report to tne u.s. Congress on Alcohol and Health. Rockville, MD: U.S. Department of Health and Human Services; Alcohol, Drug Abuse, and Mental Health Administration t 1981.
Roizen~ J., and Schneberk, D. Alcohol and C~ime. Special report to the National Institute on Alcohol Abuse and Alcoholism. Rockville, MD: U.S. Department of Health, Education, and Welfare; National Institute on Alcohol Abuse and Alcoholism, 1978.
Roizen, J.', and Schneberk, D. Special data analysis for the National Institute on Alcohol Abuse and Alcoholism. Rockville, MD: U.S. Department of Health, Education, and Welfare; National Institute on Alcohol Abuse and Alcoholism, 1979.
Roth, L.H. Mental health commitment: The state of the debate, 1980. Hoscital and Community Psychiatry, 1980, ~(6).
131

Rothman, K., and Keller, A. The effect of joint exposure to alcohol and tobacco on risk of cancer of the mouth and pharynx. Journal Chronic Disability, 1972, ~(12), 7ll-716.
Russell, M. The impact of alcohol-related birth defects (ARBD) on New . York State. Nel!'!"'Obehavioral Toxi col OC!Y. 1980. ~(3) i 277-283.
Schelling, T. The life you save may be your own. In S. Chase (Ed.), Problems in Public ExDenditure Analysis. Washington, DC: Brookings, 1968.
Schramm, C. Evaluating Treatment Outcomes in Industrial Alcoholi5m~ Report No.8, Employee Health Program Research Work1ng Paper. washfngton, DC: Johns Hopkins University,.1974. . .
• Seidenberg, J., and Majewski, F. Frequency of alcohol embryopathy in the different phases of maternal alcoholism. NlAAA, NCALI, STIAR 26 •. Suchtcefahren, 1978, .~, 65-75. .
Shah, S.A. Legal and mental health system interactions~ Major developments and research needs. International Journal of Law and PsYchiatry, 1981, !.
Skelton, W. Alcohol, violent behavior and the electroencephalogram. Southern Medical Journal, 1970, ~, 465-466.
Swersey, A.J. Homicide in Harlem and New York City. Unpublished paper. New Haven, CT: Yale Scnool of Organizat10n and Management, September 1981.
Swint, J., and Nelson. W. Prospective evaluation of alcoholism rehabilitation efforts. The role of cost benefit and cost effectiveness analysis. Journal of Studies on Alcohol, 1977, ~, 1386-1404.
Thornberry, T., and Jacoby, J. The Criminally Insane. A Communitv Fa1lowuo of Mentally III Offenders. Chicago: The university of Chicago Press, 1979.
Thornton, C., Long, D., and Maller; C. Technical Report K. A Comoarative Evaluation of the Benefits and Costs of Job Corps After Eiahteen Months of Postoroaram Observatl0n. Princeton, NJ: Mathematica Policy Research, Inc., 1980.

Tinkleberg, J. t Roth, W., Koppe11, B., and Murphy, P. Cannabis and alcohol effects on assaultiveness in adolescent delinquents. Annals of the New York Academy of Sciences, 1976, ~, 85-94.
U.S. Congress, Office of Technology Assessment. The Imclications of CostEffectiveness Analysis of Medical Technology. Washlngton, DC: the afflCe, 1980a. .
U.S. Congress, Office of Technology Assessment. The Imolications of Cost Effectiveness Analysis of Medical Technolo;? Background Pacer #3: The Erflcacv and Cost Effectlveness ~ PSYCnO~heraDv. Wash i ng'ton, DC: the Off; ce, 1980b. .
u. S.
U.S. Department of the Air Force. Total Inoatient Discharaes and Total Bed Days at Air Force Medical Treatment Facilities by Dlaanosis Class and for Selected 01agnosis Within Selected Classes, Worldwide: F'i' 1977. Washington, DC: the Air Force, 1980. .
u.s.
U.S. Department of Commerce, Bureau of the Census. Survey of Income and Education, 1976. Washington, DC: the Bureau, 1978.
U.s. Department of Commerce, Bureau of the Census. of the United States: 1979. Washington, DC:
Statistical Abstract the Bureau, 1979.
U.S. Department of Commerce, Bureau of the Census. Statistical Abstract of the United States: 1982-1983. Washington, D.C.: the Bureau, 1982.
U.S. Department of Health, Education, and Welfare; National Center for Health Statistics. Eicrhth Revision of International Classification of Oiseases. Hyattsvi11e, MD: the Center, 1968.
U.S. Department of Health, Education, and Welfare; National Center for Health Statistics. Mortality series #20. Vital and Health Statistics. Hyattsville, MO: the Center, 1970-1978.
U.S. Department of Health, Education, and Welfare; National Center for Health Statistics. Selected symptoms of psychological distress, United States. Vital and Health Statistics. Hyattsville, MD: the Center, 1970.
133

U.S. Oepartment of Health, Education, and Welfare; National Center for Health Statistics. Current estimates from the Health Interview . Survey: United States - 1977. Vital and Health Statistics. Hyattsville, MO: the Center, 1979.
U.S. Department of Health, Education, and Welfare; National Center for Health Statistics. Detailed Diagnoses and Surgical Procedures for Patient Discharaed from Short-staY Hosoitals: United States, 1977. Hyattsv111e, MD: the Center, 197~a.
U.S. Department of Health, Education, and Welfare; National Center for Health Statistics. The national nursing home survey, 1977". Vftal" and Health Statistics. Hyattsville, M~: the Center, 1979b. -----
U.S.
U.S. Department of Health, Education, and Welfare; National Center for Health Statistics. Basic data on depressive symptomatology United States, 1974-75. Vital and Health·Statistics. Hyattsville, MO: the Center, 1980b. . .
U.S. Department of Health,·Education, and Welfare; National Center for Health Statistics. Unpublished mortality data. Hyattsville, MD: the Center, no date.
U. S.
U.S. Department of Health, Education, and Welfare; National Institute on Alcohol Abuse and Alcoholism. SAPIS Volume II National Status Reoort Uodate. RocKville, MD: the Inst1tute, Sept~Der 1978.
U. s.
U.S. Department of Health, Education, and Welfare; National Institute on Drug Abuse. Data from the Client Oriented Data Acouisition Process (CODAP). Rockville, MD: the Institute, 197ab.
u.s. Department of Health, Education, and Welfare; National Mental Health; Division of Biometry and Epidemiology. state and county mental hospital data. Rockville, MO: 1979.
Institute of Unpublished the Institute,

.'
U.'S. Department of Health, Education, ment Services. State Vocational
"-' - ---.- -- ----- Fiscal Year 19n. ashlngton,
of Human Deve~op~ . Pro ram Data
U~S. Department of Health, Education, and Welfare; Social Security Administration. Social Security Bulletin. Annual Statistical Sueplement, 1976. Baltimore, MD: the Admin1stration, 1976.
u.s. Department of Health and Human Services, Indian Health Service. In-8atient Reeort 2B - Number of Discharges and Hoseital Davs by External ause of Current InJury. by Age Graue. Rockv,11e, MD: the ~~.·vice,
no date a.
u.S.
U.S. Department of Health and Human Services, National Center for Health Statistics~ Unpublished data from the 1980 National Ambulatorv Medical Care Survey. Hyattsville, MD: the Center, l§aOa.
u.s. Department of Health and Human Services, National Center for Health Statistics'. Unpublished "data from the 1980 Hoscital Discharae Survel; Hyattsville, MD: the Center, 1980b. .
U.S. Depa~tment of Health and. Human Services, National Center for Health Statistics. Prevalence of Selected Imeairments United States 19n (DHHS Pub. No. PHS 81-1562). Hyattsville, MD: the Cen·ter, 1981.
U.S. Department of Health and Human Services, National Center for Health Statistics. Unpublished 1980 mortality data. Hyattsville, MO: the Center, no date.
U.S. Department of Health and Human Services, National Institute on Alcohol Abuse and Alcoholism. National Drug and Alcohol Abuse Treatment Utilization Survey. Rockvil1e v MD: the Institute, 1979.
U.S. Department' of Health and Human Services, National Institute on Alcohol Abuse and Alcoholism. Unpublished data from the National Drug and Alcohol Abuse Treatment Utilization Survey. RocKville, MO: the Institute, 1980.
U.S. Department of Health and Human Services, National Institute on Alcohol Abuse and Alcoholism. National Drua and Alcohol Abuse Treatment Utilization Survey. Rockville, MD: tne Institute, 1983.
U.S. Department of Health and Human Services, National Institute on Drug Abuse. National Drua and Alcohol Abuse Treatment Utilization Survev. Rockville, MO: the Institute, 1979. ---
U.S. Department of Health and Human Services, National Institute on Drug Abuse. Unpublished data from the National Drua and Alcohol Abuse Treatment Utilization Survey. Rockville, MO: ~ne Institute, 1980.
135

U.S. Department of He~Jth and Human Services, National Institute on Drug Abuse. Data from the Client Oriented Data Acauisition Process
------ (COOAP). ROCKV1 11e, MD: the Institute, 1981. __
U.S. Department of Health and Human Services, National Institute on Drug Abuse. National Drug and Alcohol Abuse TreatmentUtili:ation Survey. RockVille, MD: the Inst1tute, 1983.
u.s. rOV1s1ona . the
U.S. Department of Health and Human Services, National Institute of Mental Health. Additions and Resident Patients at End of Year State and County Mental Hoso,~ls by Ace and Diagnosis, by Sta~e, Onlted States 1977. RocKvll1e, MO: the lnstltute, 19806.
U.S:
U.S. Department ~f Health an~ Human Services, National Institute of Mental .Health. Provisional Data on :Federany Funded Community Mental Health Centers 1978-1979. RocKv,11e, MD: the Institute, 1981a.
U.S. Department of Health and Human Services, National Institute of Mental Health. Unpublished data from the Division of Biometry and· Epidemiology. Rockville, Me: the Institute, 1981b.
U.S. Department of Health and Human Services, National Institute of Mental Health. Mental Health, United States 1983. ROCKville, MD: the Institute, 1 983a.
U.S. Department of Health and Human Services, National Institute of Mental Health. Additions and Resident Patients at End of Year State and County Mental HOSOltals by Ace and Diagnosls. bv State. United States 1980. RocKvil1e, MO: the Institute, 1 983b.
U.S. Department of Health and Human Services, Public Health Service. Primary Diacnosis by Sex and Ace Groue by Average Length of Stay for Single and Multiole Diagnosis October 1976 through Seetember 1977 •. Rockviile, MO: the Service, no date.
U.S. Department of Health and Human Services, Social Security Administration. Aid to fami1ies with dependent children~ Characteristics of recipients in 1979. Social Security Bulletin, 45, April 1982.
U.S. Department of Justice, Bureau of Justice Statistics. Prisons and prisoners. Bureau of Justice Statistics Bulletin, January 1982.
U.S. Department of Justice~ Bureau of Justice Statistics. Justice Exoenditures and Emoloyment in the U.S .• 1979. Washington, DC: the Bureau, June 1983a. -

U.S. Department of Justice, Bureau of Justice Statistics. Sourcebook of Criminal Justice Statistics. Washington, DC: the Adm1nistration. 1983b.
U.S. Department of Justice, Bureau of Justice Statistics. Prisoners and Drugs. Washington, DC: the Bureau, 1983c.
U.S. Department of Justice, Bureau of Justice Statistics. Unpublished data. Washington, DC: the Administration, 1984.
U.S. Department of Justice, Federal Bureau of Investigation. Crime in the United States, 1977: Uniform Crime Reports. Washington, Dc: the Bureau, 1978. -_ ...
u.S. Department of Justice, Federal Bureau of Investigation. Crime in the United States. 1980: Uniform Crime Reoorts. Washington, DC: the -Bureau, 1981.
U.S. Department of Justice, Law Enforcement Assistance Administration. Survey of Inmates in State Correctional Facilities 1974. Washington, Dc: the Adm'n,stra~,on, 1976.
U.S. Department of Justice, Law Enforcement Assistance Administration, National Criminal Justice Information and Statistics Service. Profile of State Prison Inmates: Sociodemograohic Findings from the 1974 Survey of .Inmates· of State Correctlonal Fad 1 ities. washington, DC: the Servlce, 1979a.
U.S. Department of Justice, Law Enforcement Assistance Administration, .National Criminal \1ust:ice Information and Statistics Service. Exoenditure and Emo1ovment Data for the Criminal Justice System 1977. Washington, DC: the Serv1ce, 1979b.
u.S. Department of Justice, Law Enforcement Assistance Administration, National Criminal Justice Information and Statistics Service. Criminal Victimization in the United States 1977. Washington, DC: the Servlce, , 979c.
U.s. Department of Justice, Law Enforcement Assistance Administration, National Criminal Justice Information and Statisti·cs Service. Prisoners in State and Federal Institutions on December 31, 1977. Washington, DC: the Service, 1979d.
U.s. Department of Labor, Bureau of Labor Statistics. Handbook of Labor Statistics 1978. Washington,. DC: the Bureau, 1979.
U.S. Department of Labor, Bureau of Labor Statistics. EmDloyment and Earnings. Washington, D.C.: the Bureau, 1981.
U.S. Department of Labor, Bureau of Labor Statistics. EmDloyment and Earninas. Washington, D.C.: the Bureau, 1982.
U.s. Department of Labor, Bureau of Labor Statistics. Emoloyment and Earnings. Washington, D.C.: the Bureau, 1983.
137

U.S. Department of Labor, Bureau of Labor Statistics. Monthly Labor Review. Washin~~n, D.C.: the Bureau, Sept. 1983.
U.S. Department of the Navy. Incidence; Patients Treated in Navy Medical Facilities by Patient Category.' 19 6. Wash,ngton, DC: the .~v~J ... ~_ . date.
U.S. Department of Transportation. National Highway Safety Administra-tion. The Economic Cost to Society of Motor Vehicle Accidents. Washington, D.C.: the Adminlstratlon, 1983.
U.S. Department of the Treasury, Internal Revenue Service. Income Tax Compliance Research. Washington, DC: the Serv'ice, 1983.
U.S. Office of Management and the Budget. The Budaet of the United States Government. 1979 (Appendix). Washington, DC: the Off1ce, 1978. .
Vandenbos, G., Stapp, J., and Kilburg, R. Health services providers in psychology. American Psvcholog~, 1981, ~, 1395-1418.
Ventura, L.A., and Jacoby, J.E. Convertina Potential Mental Patients to . Criminal Offenders .. - the Othel- birectl0n: Corrections and Mental
Health Process1ng of Mentally III Offenders 1n Lucas County, Ohio. Bowling Green, OH: Bowl1ng Green State Un1versity, Depar~ent of Sociology, November 1983.
Veteran's Administration. Annual Reoort 1976-78. Washington, DC: the . Administration, 1979 •.
Veteran's Administration, Department of Medicine and Surgery. Unpublished diagnostic and expenditure data. Washington, O.C.: the Administration, 1980.
Virkkunen, M. Alcohol as a factor precipitating aggression and conflict behavior leading to homicide. British Journal of Addiction, 1974, .§.§., 149-154.
Vischi, i., Jones, K., Shank, E., and Lima, L. The Alcohol! Drug Abuse l and Mental Health National Data Book. Rockville, MD: U.s. Department of Health and Human Services; Alcohol, O~ug Abuse, and Mental Health Administration, 1980.
Von Wiegand, R. Use job performance evaluation to spot the alcoholic worker. Occuoational Health and Safety, January/February 1976.
Winslow, W., Hayes, K., Prentice, L., Powdes; W., Seeman, W., and Ross, D. Some economic estimates of job disruption. Archives of Environmental Health, 1966, ~, 313-219.
Wish, E.D., Klumpp, K., Moorer, A., Brady, E., and Williams, K. An analysis of druas and crime among arrestees in the District of Columbia. Executive Summary. Rockvi11e, MO: U.S. Oepar~en~ of Hea1th and Human Services, National Institute on Drug Abuse, 1981.

Wolfgang, M. Patterns in Criminal Homicide. Ph;ladelphia,'PA: Unive~~ity of Pennyslvania Press, 1958.
Wynder, E.L., and Shigematsu, T. Environmental factors and cancer of the colon and rectum. Cancer, 1967, ~, 1520-1561.
Zahri g M.A., and Bencivenga, M. Violent death: A comparison between drug . users and nandrug users. Addictive Diseases 1974, 1(3), 283-296.
139

Appendix
A. THE IMPACT OF "ALCOHOL AND DRUG ABUSE ON PRODUCTIVITY IN .THE WORKFORCE
A-l

A-2

A. THE IMPACT OF ALCOHOL AND DRUG ABUSE ON PRODUCTIVm IN THE WORKFORCE
A. Introduction Although alcohol and drug abuse in the'workplace have been topics of
great concern, they have received surprisingly little study. Some limfted studies have examined the extent of problem drinking in the workplace, and others have made rough estimates of the costs to a company of having an alcoholic employee. The major cost-of-i11ness stUdies are reviewed here for their treatment of lost productivity. This is follo~ed by a discussion of some recent work that has examined how health affects labor market success of individuals.
This section examines the impact of alcohol and drug abuse on the labor market success of individuals. Individuals with a substance abuse problem~ it is contendea, are less prod~ctive than other people with the same 'characteristics because of impaired social, mental, and physical functioning. Alcohol or'drug abuse may cause prob'lems outside' the work-
, place tnat; nonetheless, affect functioning on-the job. The cause and effect relationships among alcohol and drug abuse, the work environment, and other social factors are not clear. Stress.and depression can affect an individual's ~roductivity and may also contribute to a'substance abuse problem. Too, the attitudes, values, and personality traits which underlie substance abuse behaviors as well as all others should be incorporated in future analysis; however, it was not possible with the data sets presently available. B. Cost of Illness Studies and Productivity
In studies of ADM, the largest .cost has been losses of p~ductivity in the workforce. In the 1981 study, over 50 percent of the economic cost of alcohol abuse was due to reduced productivity and lost employment; for mental illness, these components made up nearly 3S percent of the total cost, while for drug abuse they made up about 18 percent.
Other studies (Rice, 1966) have found that fully 25 percent of the economic costs for all illnesses was due to persons who were compl~tely unable to work for all or any portion of the year. A more recent report by Cooper and Rici (1976) estimated that in 1972 lost work time due to illness made up 22 percent of the total econom; c 'costs for a 11 i 11 nesses. The most
A-3
"

recent study of all illnesses (Paringer and Berk, 1977) also estimated that lost work time due to illness was 24 percent of the total economic costs of all illnesses.
Each of these studies also examined mental disorders--psychoses, neuroses, alcohol psychoses and dependence, drug dependence, and mental retardation. The three studies estimated that 64 percent, 45 percent, and 46 percent, respectively, of total costs were due to the lost work production of those experiencing mental disorders.
The indirect morbidity costs estimated in each of those stUdies only included lost productive time during which the individual could not perform his or her primary activity due to confinement in the home, in a short-term health facility such as a general hospital, or in a long-term residential facility such as a psychiatric hospital or nursing home.
More recent work by hea)th and labor economists has expanded the concept of economic productivity losses. Studies of employment and labor market success "have used measures of ,health status as an important determinant of factors such as labor fo~ce participation, hours and w~eks worked per year, and wage and salary rates. Examining all of these facets, Luft (1975) compared persons reporting long-term disability to the non-disabled and esti mated that the long-term di sab 1 ed , ost $23 bi 11 ion tn aggregate earnings in 1966. This estimate included components for nonparticipation in the labor force, limitations in the weeks and hours worked, and impacts on wage rates. Luft concluded that long-term disability affected all aspects of labor market success.
Luft1s study was similar to that of prior cost-of-i11ness studies in that it included the value of time when individuals could not work due to confinement at home and in hospitals. The unique contribution of this study was an analysis of earnings lost due to the reduced productivity of disabled individuals. Luft concluded that productivity losses due to long-term disability were 6.2 percent of total adult earnings in 1966. Comparing the disabled to the nondisabled, he found that white males had a reduction in annual earnings of 21 percent, black males a reduction of 24 percent, white females a reduction of 36 percent, and black females a reduction of 25 percent (see table A-l).
A-4

•
Table A-l
Impact of Health on Labor Market Success in Select Studies
-----------------------------"-----....... - ... - ., . Imcact of Health ~PraDortional Change2
Annual Wage Unemp 1 oy- Lacor Force Study Population Health Problem Earnings Rate lIIent Rate Participation
Luft (1975) Black Males Long-term Disa- -24.3 -10.3 +50.2 -28.8
bi1ity Black Females II -25. 1 +3.8 +34.3 -30.7 White Males .. -21.3 -11.6 +69.9 -18.6 ~Jhi te Females II -35.8 -9.8 +31.7 -30.2
Bartel and Taubman (1979) White Males Age First Diagnosed (46-56) Mental Disorder
1967-1973 -2:3..9. N.A. N.A. H.A. 1962-1967 -22.0 -16.4 +1.3% -5.0% 1955-1961 -13.3 N.A. N.A. N.A. 1948-1957 0.0 N.A. N.A. H.A. .:.
McManus (1978) White Male Workers Di sab 1 ed ,. Year N.A. -S.2 N. A. N. A.
Disabled 2 Years N.A. -9.2 N.A. N.A. Disabled 3 Years N.A. -12.2 N.A. N.A. Disabled 4 Years N.A. -14. 1 N.A. N.A. Disabled 5 Years N.A. -15. 1 N.A. N.A.
Berry and Boland (1977) Households with an Problem Drinker -18.41 N.A. N.A. N.A. Adult Male
lHousehold income. No other aspects were examined.
A-5

•
A study by McManus (1978) examined the impact of long-term disability on earnings. His primary focus was the impact of disability on the wage rates of those who remained in the workforce. The r~sults indicate that a person disabled for five years but still in the workforce has a wage rate 17 percent below that which he would have received otherwise.
A more recent report by Bartel and Taubman (1979) made a significant advance over prior studies by using incidence data for specific diseases as diagnosed by health providers. Although the study had excellent data both on employment and health, it was somewhat limited by being drawn from the National Academy of Science twin panel data set. Because the study population was only white veteran male twins born in the continental United States between 1917 and 1927, limited generalizations can be made from the study findings.
Nonetheless, Bartel and Taubman made some important findings'with respect to the impact of ment.a 1 :ill ness on earni ngs. They found that individuals who had a diagnos~s of a ps~chosis or ne~rosis (~xcluding alcoholism and 'drug dependence) experienced significant negative impa~ts -on their. earnings, wage rate, the amount of time worked per week, and their probability of being in the labor force. An initial diagnosis of mental illness five years prior to the survey reduced earnings by 24 percent. A first diagnosis five to ten years prior to the survey aff~cted earnings negatively by 22 percent, while a diagnosis ten to fifteen years previously reduced earnings by 12 percent. Diagnoses lIIore than fifteen years prior to the date of survey had no significant impact on earnings in the survey year. This finding, as in the studies by Luft and McManus, controlled for a number of sociodemographic factors which are known to be important determinants of labor market success. These included education, age, marital status, and occupation or socioeconomic status.
Bartel and Taubman (1979) estimated that $1.7 billion in earnings were lost due to psychoses/neuroses in 1972. They cautioned that their specific results had limitations in their generalizability due to the nature of the saffiple. Nonetheless, the robustness of their results indicates that mental illness affe~ts individuals· wage rates as well as their presence in the workforce or on the job at a particular time. Furthermore, it suggests that the impact may be very long lasting.
A-6
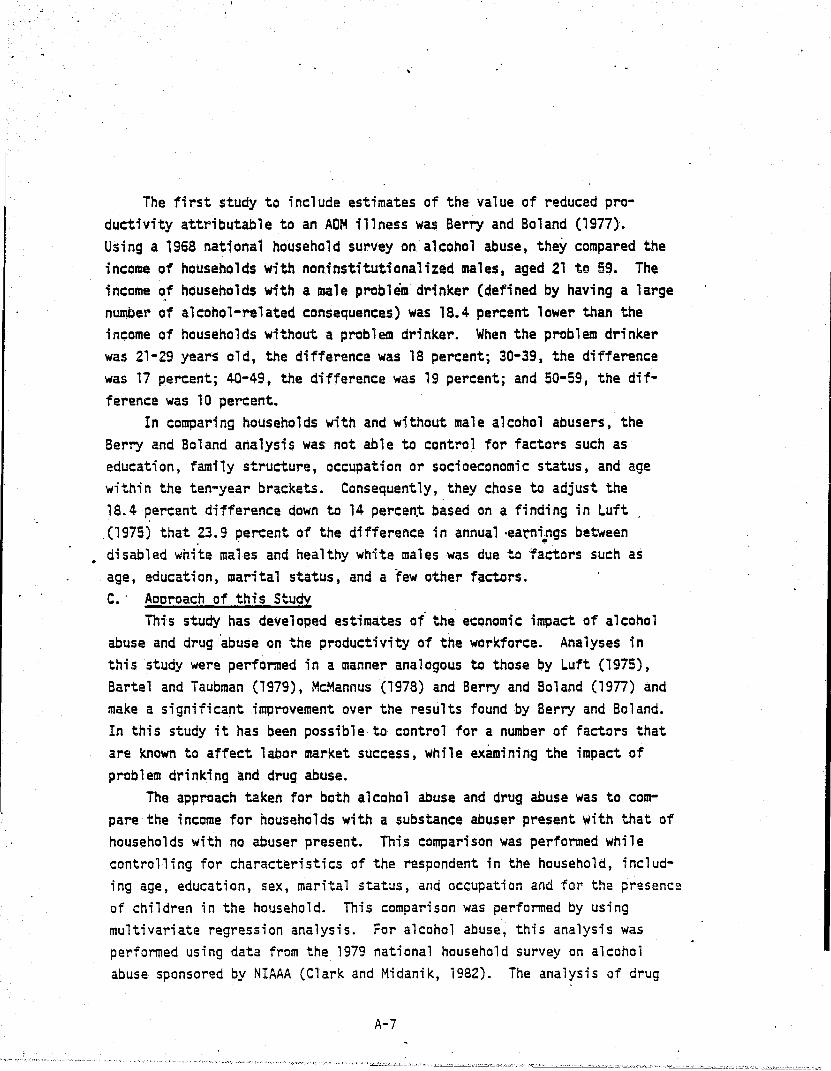
The first study to include estimates of the value of reduced productivity attributable to an ADM illness was Berry and Boland (1977J. Using a 1968 national household survey on alcohol abuse, they compared the income of households with noninstitutionalized males, aged 21 to 59. The income ~f households with a male problem drinker (defined by having a large number of alcohol-related consequences) was 18.4 percent lower than the income of households without a problem drinker. When the problem drinker was 21-29 years old, the difference was 18 percent; 30-39, the difference was 17 percent; 40-49, the difference was 19 percent; and 50-59, the difference was 10 percent.
In comparing households with and without male alcohol abusers, the Berry and Boland analysis was not able to control for factors such as education, family structure, occupation or socioeconomic status, and age within the ten-year brackets. Consequently, they chose to adjust the 18.4 percent difference down to 14 percent based on a finding in Luft .
. (1975) that .23.9 percent of the difference in annual oearni.ngs between disabled white males and healthy white males was due to factors such as age, education, marital status, and a few other factors. C.' Aocroach of this Study
This study has developed estimates of the economic impact of alcohol abuse and drug abuse on the productivity of the workforce. Analyses in this study were performed in a manner analogous to those by Luft (1975), Bartel and Taubman (1979), McMannus (1978) and Berry and Boland (1977) and make a significant improvement over the results found by Berry and Boland. In this study it has been possible to control for a number of factors that are known to affect labor market success, while examining the impact of problem drinking and drug abuse.
The approach taken for both alcohol abuse and drug abuse was to compare the income for households with a substance abuser present with that of households with no abuser present. This comparison was performed while controlling for characteristics of the respondent in the household, including age, education, sex, marital status,and occupation and for the presence of children in the hOllsehold. This comparison was performed by using multivariate regression analysis. For alcohol abuse, this analysis was performed using data from the 1979 national household survey on alcohol abuse sponsored by NIAAA (Clark and Midanik, 1982). The analysis of drug
A-7

abuse was performed using data from the 1982 national household survey sponsored by NIDA (Miller et al., 1983). Both data sets were used because neither had information about respondents I use "of both alcohol and illegal drugs. The 1982 national drug abuse survey asked a few questions about current alcohol consumptio~ but none about lifetime patterns and consequences of drinking. Similarly, the 1979 national alcohol abuse survey obtained no information at all about abuse (past or present) of illegal drugs but had very detailed information about alcohol use and consequences of dri nki ng.
The design of both national surveys presented specific limitations on this analysis. First of all, only one adult was interviewed per household. All information obtained thrQugh the questionnaire is specific to that individual. The 1979 survey asks about patterns of alcohol consumption, iife events, and impacts of aleoholie beverages on the respondent's functioning at home, in public, and on the job. Given thi$, annual earnings or wage rate should also be specific for ~e individual, but both surveys asked for only the annual household income with source of income unspecified.
Household income frequently includes the earnings of more than one individual and can include benefits received from social welfare programs (such as unemployment insurance, aid to families with dependent children, disability payments) as well as income from savings accounts, stocks, bonds, or trust funds (i.e., unearned income).
Berry and Boland were also forced to use household income. Their estimates are comparable to and limited in the same way as the estimates developed for this study. Thus, analysis of the impact of income on alcohol abuse must proceed very carefully.
In this study it has not been possible to control for unearned income, but it has been possible to control at least partially for the earnings of other, individuals within the household. The two surveys do obtain information about the marital status of the respondent and the presence of children under 12 within the household. Some assumptions can be made about income based on the presence of a spouse and young children.
1. Productivity Losses and Alcohol Abuse The first task in the analysis was to identify the sociodemo
graphic c::hara.cteristics that are known to affect labor market success.
A-8

, ...
Th.ese included education, age (coded as number of years since final year inschool), race, sex, marital status, presence of children under the age of 12 in the household and, if the survey respondent was in the labor force, occupation (see table A-2 for variable definitions). Using the 1979 survey, a regression of these variables on household income found the relationship to be very significant, with an F value of 36.6, and an R2 of .392. This basic set of sociodemographic factors was able to explain 39.2 percent of the variance in household income.
The second task in the analysis was to examine the impact of drinking patterns and problem drinking on income after controlling for all previous factors. The simplest approach for this analysis would be a simple comparison of sociodemographically similar households with and without alcoholics or problem. drinkers. Berry and Boland used this approach by applying a problem drinking index which Cahalan (1970) had developed for the specific survey that they used. That particular index aggregated a number of differe~t kinds of problems which obscures numerous facets of problem .drinking. The procedure in this study was to examine the. impact of specific problE!l!l drinking symptoms on household income while controlling for the sociodemo· graphic variables specified above. From~the many problem drinking symptoms obtained in the survey, only those on which te~ or more of the 1,772 survey respondents answered affirmatively were used. It was judged that any itp.m with ten or fewer positive responses, no matter how important an indicator, would most likely fail to be significant in statistical testing. Therefore, only a subset of all symptoms was examined.
Extensive testing was performed on many different kinds of problem drinking symptoms (see table A~3 for a partial list of variables tested). Symptoms were included in the regression model along with the controlling sociodemographic factors to indicate whether or not they were significantly related to household income. Although virtually all of the indicators tested had a negative relationship with household income, the vast majority did not have a statistically significant relationship to household income when soc;odemographic factors were controlled. However, four specific problem symptoms were jdentified as having the hypothesized negative affect on household earnings and being statistically significant. However, these four symptoms--bi nge dri nki ng, tardi ness or absence from WOT"~ because of a hangover, marital problems attributed to drinking, and arrests for driving
A-9

Table A-Z
Base Variable Definitions for Final Regressions on Alcohol Abuse
ED1-ED6: EDl: ED2: ED3:
.ED4: EOS: ED6:
POIDP: POTEXP2: NRACE:
PROF-lJ\BORER:
PROF: MAO: SALES: CLER: CRAFT: lJ\BFM: 'OPER: SERV:
KIDS:
00-03:
QF:
00: 01: 02: 03:
QFSQ: PO:
HANGOVER: MARPROBS:
DRIVE:
OINGEYR:
Du~ variables (0/1) indicating education level at~lin~d
Less than 7 years Some junior high school Some high school High school graduate Some college or university College graduate or beyond Computed as (Age minus Number of years of Education minus 5) Square term of POTEXP Race: White defined as zero, other defined as one Ou~ variables (0/1) indicating type of employment Business executive or professional Manager and administrator Retail or office worker Clerical Craftsman (includes men enlisted .in armed forces) Laborers and farmers . Operators Service . Dummy vari ab 1 e (0/1) i ndi cat i ng presence of chi 1 dr'en under the age of 12' in the household' , Variables created to represent the sex and marital status of individuals in the labor force Single males Married males Single females Married females Quantity/frequency variable measuring average daily alcohol consumptfon Square term of QF Dummy variable (0/1) created for persons with positive responses to 'one or more of the fo 11 owi ng components of problem drinking . Ever late to or miss work because of a hangover? Have problems with spouse or ex-spouse in the past year because of drinking? Ever arrested f~r driving while unoer the influence of alcohol? Have you gone on a drinking binge in the last 12 months?
Source: Research Triangle Institute.
A-10

,---
Hangover:
MarProbs:
Drive:
Bi ngeyr:
Symptoms:
Freqhigh:
Forget:
Worries:
Cheel"'up:
Tense:
Accident:
Arrest:
Drkdrive:
Table A-3
Variables Tested to Create a Measure of Drinking Problems
Ever missed or been late to work because of a hangover?
Had problems with spouse or ex-spouse because of drinking?
Ever arrested for driving while under the influence of alcohol?
Have you gone on a drinking binge in the last 12 months?
Aggregate of number of drinking symptoms in the past year
Frequency variable created measuring how often drunk in the past year
Query of why drink: to forget everything?
Query of-why drink: to forget worries?
Query of why drink: because helps to cheer you up?
Query of why drink: when tense and nervous?
Ever been involved in an accident after drinking?
Ever been arrested in connection with drinking?
Healthprob:
Ever been a passenger while driver was drunk?
Aggregate tested, a 1 ol1g w; 'th each i ndi vi dua 1 prob 1 em
Source: Clark and Midanik, 1982.
A-ll

while under the influence of alcohol--are strong indicators of problem drinking. The four significant symptoms were then combined into a singla indicator of the presence of one or more of the four symptoms.
'~' r
The survey included extensive information of drinking patterns as well as drinking impacts. Drinking patterns were examined for their relation-ship to household income. Tests were run on number of times drunk, the number of times high but not drunk in the last year, a quantity-frequency measure representing average daily consumption of absolute alcohol over the past year, and a quantity-frequency measure representing absolute daily consumption of alcohol during the past month. The first three pattern variables were not found to be significant. The last variable, representing the current level of consumption of alcohol, had a very strong relationship to household income, even when controlling for the sociodemographic characteristics.
Fully 10 percent of labor for-ce participants in the 1979 national survey had one or more of the 'four problem .dri nki og symptoms (tab 1 e A-4). This prevalence rate compares very closely to prior estimates of problem drinking and alcohol abuse. In 1979, young males had the highest prevalence of drinking problem symptoms. In general, males had h1gher rates than females. Females in the 20-24 year age group had the highest rate among women.
Recall that i~ the report by Clark and Midanik (1982) on the 1979 national survey, 10 percent of the adult population showed some symptom of loss of control which indicated alcohol dependence. The rate for males was 15 percent, and for females it was 6 percent (see table III-13). Similarly, 5 percent of the adult population (7 percent of males and 3 percent of females) experienced one or more social consequences that they directly attributed to alcohol abuse. There is some overlap between the estimates . for loss of control or dependence and that for social cons~quences.
From Clark and Midanik1s data it is clear that problem drinking symptoms are highest between ages 18 and 30. The lowest rates fer both males and fema·l es are for those aged 60 and above. Th; 5 age di stri but; on of problem drinking symptoms means that the prevalence would be even higher for adults between ages 30 and 60, the years in which they are most likely to be in the labor force. The study by Berry and Boland·(1977) found 17.5 percent of households with a male aged 21-59 had a problem drinker
A-12

Table A-4
Prevalence 1n the Workforce of Problem Drinking Symptoms and Daily Use (Ever) of Marijuana by Age and Sex (in Percentages)
Age
18-19
20-24
25-34
35-44
. 45-54
55-64
Problem Drinkin~ Indicatort Male emale
16.4 5.7
21. a 15.4
18.5 4.5
11.9 8.2
13.3 5.6"
6.0 0.8
Dailv Use ~Ever2 of Marijuana Male remale
18.9 14.3
21.8 11.0
12.5 4.5
0.0 0.0
0.0 0;0
0.0 0.0 ------------------.... ----------------------~-----------------. . Sources: Calculations from the 1979 Household Survey on alcohol abuse
funded by NIAAA, and the 1982 Household Sur~ey on drug abuse funded by NIDA. .
tSee PO variable definition, table A-2, for the definition of "Problem Drinking Symptoms. II
A-13

present (see table A-5). Assorted other studies have indicated 5 percent of those in the wOf'kforce were a 1 coho 1 i cs and, perhaps, another 5 percent were problem drinkers. Table A-S shows that many of these same stUdies a1:so estimated the impact of alcoholism or problem drinking on work.er prl:lductivity as being between 20 and 30 percent. The exception to this was an analysis of Berry and Boland, whose initial estimate was an impairment le~'el of 18.4 percent. However, they made another adjustment based on completely unrelated data which dropped their estimate of impairment to 14.0 percent. As stated previously, the estimates by Berry and Boland did not take into account important determinants of the labor market success which this analysis has been able to utilize.
The regression analysis of the impact of problem drinking on household income is summarized in table A-6. Only the results for drinking-related variables are presented there. The dependent variable in the relationship was the natural logarithm of household income. The independent variables were the ,items specified'in table A-Z (referr~d to as the "basel! variables) and the drinking related'variables. In a regressio·n using a }ogged dependent variable, coefficients of unlogged independent variables may be interpreted as the proportional impact of a 1 unit increase in that variable when the coefficients are relatively small (between +.10 and -.10). At values beyond that, the proportional 'impact is obtained by taking the antilog of the coefficient and then subtracting 111." Posit-ive coefficients represent an increase, and negative coefficients reflect a negative effect.
The analysis was performed on three somewhat diff2rent groups. The first was individuals in the labor market (table A-6, lines 1, 2, and 5), those employed as well as those un~loyed at the 'time of the survey. The second group was the total population (line 3). The third group was respondents that were employed (line 4). The first group is generally considered to be the best for addressing the current question because an individual must be working or looking for a job in order for substance abuse to affect his ,or her earnings. Included in this group are those who, though currently not working, have held a job recently and can reasonably be considered part of the labor force. ' Looking at the problem of lost earnings more comprehen~ sively, consideration should be given to those who have disabling ADM problems which have either caused them to be frequently terminated from jobs and, therefore, to be unemployed for various periods or caused them to
A-14
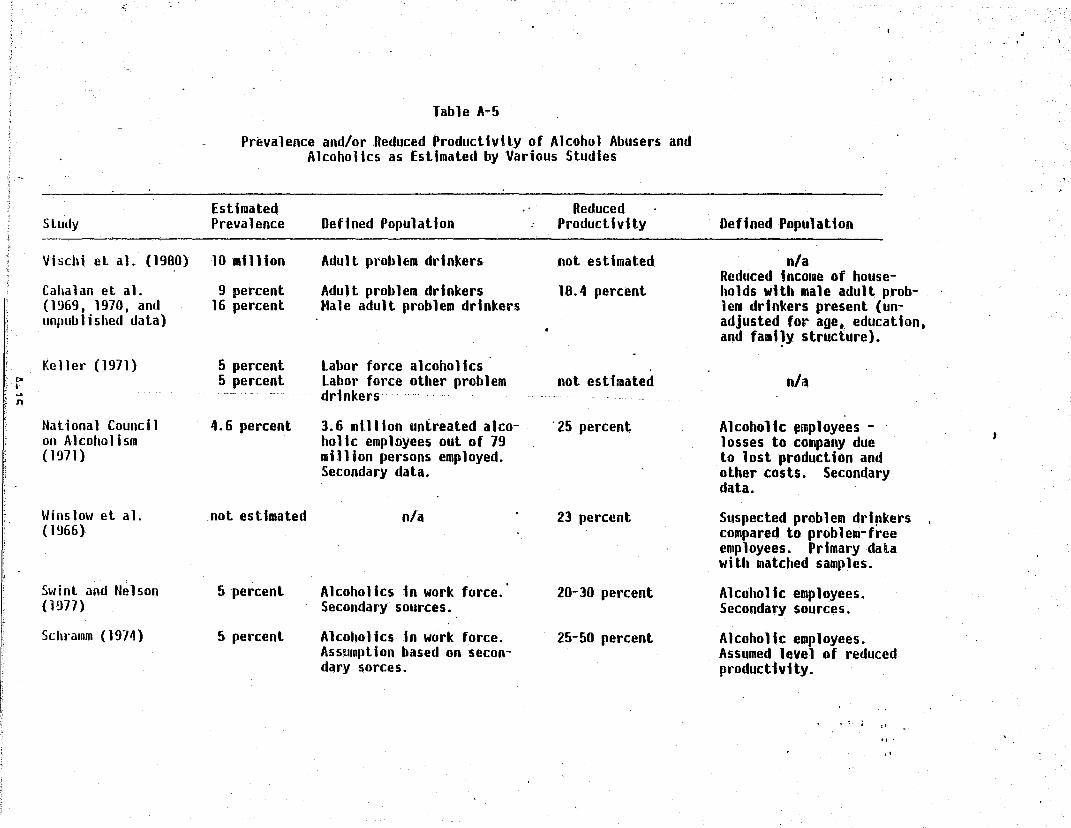
Table A-5
Prevalence and/or Reduced ProductlvHyof Alcohol Abusers and Alcoholics as Estimated by Various Studies
, " Estimated Reduced
Study Prevalence Defined PopUlation Productivity Defined Population
Vischi et al. (1980) 10 I1l1lion Adult problem drinkers not estimated nla Reduced income of house-
Cahalan at a1. 9 percent Adult problem drinkers 18.4 percent holds wHh male adult prob-(1~69. 1970, and 16 percent Hale adult problem drinkers lem drinkers present (un-unpublished data) adjusted for age. education.
and fami~y structure).
Keller (1971) 5 percent labor force alcoholics po 5 percent labor force other problem not estimated nla 1-... drinkers n
National Council 4.6 percent 3.6 IIllllon untreated alco- '25 percent Alcoholic ~rnployees -J on Alcoholism holic empl9yees out of 79 losses to company due
(1971) million persons employed. to lost production and Secondary data. other costs. Secondary
data.
Winslow et al. not estimated nla 23 percent Suspected problem drl~kers (1966) compared to problem-free
employees. Primary data with matched samples.
Swint and Nelson 5 percent Alcoholics in work force. 20-30 percent Alcoholic employees. (1977) Secondary sources. Secondary sources.
Schramm (1974) 5 percent Alcoholics In work force. 25-50 percent Alcoholic employees. Assumption based on secon- Assumed level of reduced dary sorces. productivity.
,I
.f

(continued)
Estimated Study Prevalence Defined Population
Hale adult problem drinkers Derry et al. (1977) 17.5 percent of households. Based on Social Research
Mannello and Seaman (1979)
VonWiegand (1916)
Swint and Nclson (1977)
with a male aged 21 to 59
19 percent
12 percent 15 percent 21 percent 9.3 percent
6 percent
5 percent
Source: Cruze et al., 1981.
Group's national probability • sample of households (Caha-lan. unplililished data)
ProbleR' drinking railway workers (using Cahalan et al. 1970) (using independent methoda1ogy) (by Program Directors standards) (combination I and 3) (workers· self-evaluations)
Alcoholic employees. Secondary sources.
Alcoholics in work force Secondary sources.
Reduced Productivity
14.0 percent
29 percf!nt
27.7 percent
20-30 percent
Defined Population
Reduced income of households with male adult problem drinkers present (adjusted for age, education, and family structure).
By evaluation of supervisors: problem drinkers versus average employees. Supervisors diagnosed likely problem drinkers. Not related to prevalence estimates.
Alcoholic employees. Cost due to lower productivity. absenteeism, accidents,' etc. Secondary sources.
Lower productivity of alcoholics (absenteeism and work output). Secondary sources.
", , ,
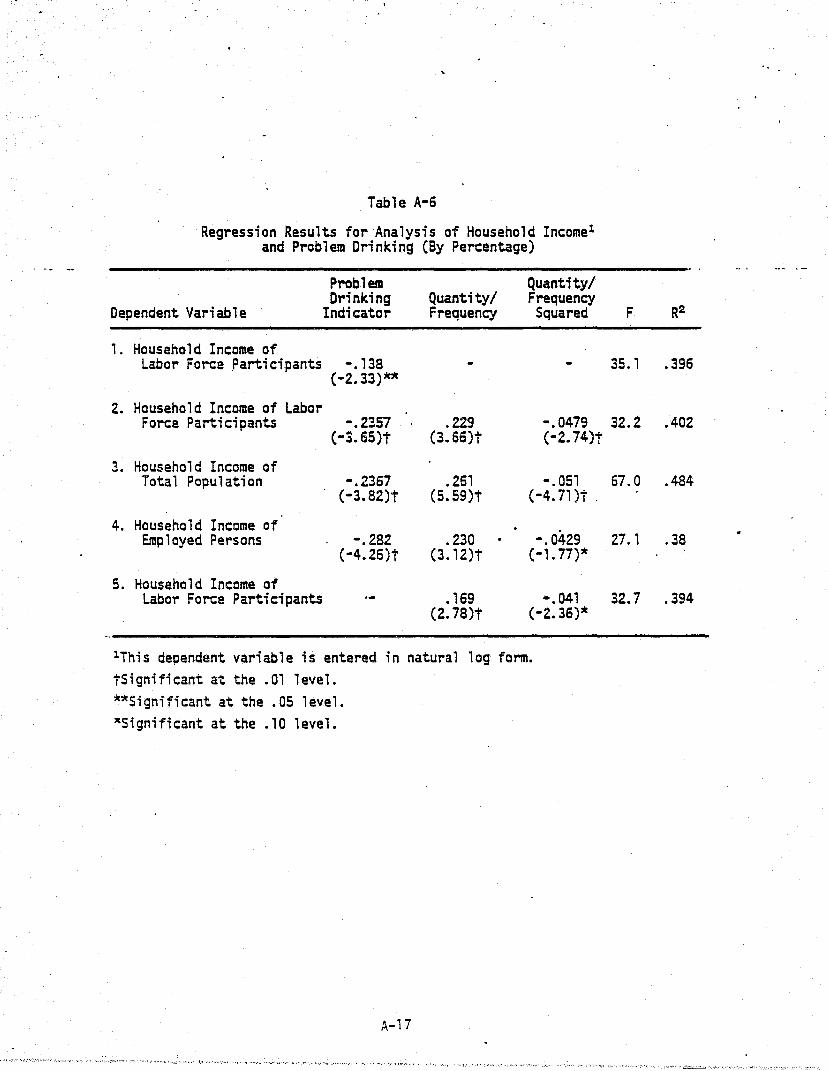
Table A-6
Regression Results for Analysis of Household Income1
and Problem Drinking (By Percentage)
Problem Quantity/ Drinking Quantity/ Frequency
Oependent Variable Indicator Frequency Squared
, . Household Income of Labor Force .Parti ci pants -.138
(-2.33)**
2. Household Income of Labor Force Participants -.2357 .229 -.0479
(-J.65)t (3.66)t (-2. 74)t
3. Household Income of Total Population -.2367 .261 -.051
(-3. 82)t (5.s9)t (-4.71)t .
4. Household Income of Employed Persons -.282 .230 -.0429
(-4.26)t (3.12)t (-1. 77)*
5. Household Income of Labor Force Participants .169 -.041
(2.78)t (-2. 36)lt
lThis dependent variable is entered in natural log form. tSignificant at the .01 level. **Significant at the .05 level. *Significant at the. 10 level.
A-17
F R2
35.1 .396
32.2 .402
67. a .484
27. 1 .38
32.7 .394

permanently leave the labor force. Oata sets to answer these last questions are not available.
Table A-6 is read from left to right. Lines 1 through 5 each. summarize a regression. The title next to the number defines the dependent variable for the regression and the population included in the regression. In the table column entitled "Problem Drinking Indicator" is the coefficient in that regression. Under Quantity/Frequency and Quantity/Frequency Squared are coefficients in those regressions. The "F" and "R211 values indicate the overall strength of the relationship between the dependent variable, and the "base:; and drinking vari<tbles. The base variables and their coefficients are not shown here in oreer to focus on the most important relationships between income and the drinking variables.
The results in table A-6 indicate that problem drink~rs identified through our analysis were consistently less successful in the labor market than non-problem dri~kers with the same characteristics. The initial
. comparison of household income between the two groups (on line 1) indjcates that the presence.of one of the four problem drinking symptoms. reduced household income by about 13 percent. This result was statistically signi· ficant. .When variables representing current consumption of alcohol were included (line 2), the impact of problem drinking was found to be much greater: a 21 percent decrement was experienced by the problem drinking households. Furthermore, the (line 2) relationship including current drinking variables indicated that where an individual consumed more than an average of 2.4 absolute ounces of alcohol daily, income was negatively affected whether or not they had' any problem drinking symptoms.
When the impact of level of current drinking' was assessed without the problem drinking indicator in the regrf~tasion (line 5), the negative effect of high levels of drinking was still found. At consumption levels beyond approximately 2 absolute ounces of alcohol daily, income fell as consumption rose.
The third and fourth lines have results for the total population and employed persons, respectively. Their results are similar to the relationship for labor force participants. In fact, it was found that problem drinking had an even larger impact on employed persons than it did for the total labor force. This suggests that problem drinkers were less likely to
A-18

be unemploy'ed than others, but that the hourly wage decrement was gre ::;er than expected.
These findings are consistent with previous studies of the impact of alcoholism and problem drinking in the workplace. The prevalence rate, based on the four significant problem drinking symptoms, and the level of reduced productivity are also similar to those estimated in prior studies (table A-5). Moreover, the estimates of the size of the impact of problem drinking are comparable to those cited earlier for long-term disability (Luft, 1975) and for psychoses and neuroses (Bartel and Taubman, 1979). The fact that the current estimates are the same order of magnitude as prior similar estimates adds credibility to the current results.
Productivity losses attributable to problem drinking in 1980 are presented in chapter, III. The computations were made by multiplying the number of individuals in the labor force for each age and sex group by the prevalence rate for our problem drinking indicator. This product was multiplied by the expected productivity (labor market plus h~usehold) of that' group and, fina1~y, by the i~pairment rate of 21 percent •. Separate computations were made for men and women in the labor force, and for those whose primary occupation was homemaking. Summing the losses across all groups indicated reduced productivity attributable to alcohol abuse of $57.7. billion in 1980. Of this total, $44 billion was due to problem drinking by males, and $13.7 billion was due to problem drinkin~~ by females.
These estimates are adjusted downward to $49.8 billion in the final report because m~ny young problem drinkers are also drug abusers--that is, because of double counting. This issue is addressed at the end of this section.
2. Productivity Losses Due to Drua Abuse A similar analysis has been performed to examine the impact of
-abuse of marijuana on the workforce. The 1982 national household survey on drug abuse focused on patterns of use and abuse of psychoactive substances including marijuana, cocaine, heroin, hallucinogens, and a variety of stimulants, sedatives, and analgesics. Questions,on income and sociodemographic factors, however, were almost identical to those in the 1979 alcohol abuse survey.
Like the study on alcohol abuse, the drug abuse study examined patterns of current and lifetime consumption, and patterns of use for a number of
A-19
.. ..

different psychoactive substances. The drug abuse study, unl i ke the s.tudy on alcohol abuse, obtained no information about untoward events they might have been due to abuse of drugs. Questions were not asked about areas in which abuse Qf alcohol is known to have an impact such as symptomatic drug consumption, 'i:.'t.arpersonai problems, difficulties in the household, legal entanglements, or problems on the job. By analogy, it would be predicted that drug abuse has impacts in the same areas as alcohol abuse, but this has not been examined by any of the national surveys on drug abuse.
Although the national surveys on alcohol abuse and drug abuse had similar sociodemographic information, in fact, the income information in the drug abuse survey was of poor quality for analysis such as this. In both surveys, the i ncollIe data were obtai ned ; n ranges'. The a 1 coho 1 abuse survey had ranges with $5,000 i.ntervals with a total of 11 categories. In the drug abuse survey, income data were in 7 categories, with some intervals as broad as $10,000. Grouping the income data makes it more difficult to obtain precise and statistically signi.ficant es.timates for relationships • .
The. prevalence rates of ever using marijuana daily by labor force' partiCipants are presented in table A-4. For males age 18-24, this prevalence was about 20 percent. Males aged 25-34 had a lower rate, 12.5 percent. Older males had an effective rate of "0". Rates for females were somewhat lower, although they were greater than 10 percent for women aged 18-24.
Multivariate regression analyses were completed for single males in the labor force, married males in the labor force, all males grouped together, si~gle females in the labor force, married females in the labor force, all females together, and all labor force participants. The sociodemographic control variables (listed in table A-7) were similar to those used for the anaiysis of alcohol abuse.
The statistical analysis of the impact of consumption of drugs other than marijuana yielded no significant results relating abuse of the drugs to household income. Perhaps this should have been anticipated. First of all, heavy drug users may have life styles that make them unlikely to be captured in household surveys. Second, prevalence of drug use other than marijuana is much lower than that for marijuana. The failure to find relationships was true for variables reflecting recency and frequency of
A-20

EDl-E06:
E01: ED2: E03: ED4: EDS: ED6: ED7:
POTEXP:
POTEXPZ: .
NRACE:
PROF- LAB.ORER:
PROF: MAO: SALES: CRAFT: SERVICE: LABORER:
KIDS:
00-03:
00: 01: 02: 03:
OAILYMJ:
MONTHMJ:
MONTHMJ2:
Table A-7
Base Variable Definitions Final Regressions on Marijuana Use
Dummy variables (0/1) indicating education level attained
No schooling Elementary school--8th grade or less Some high school High school graduate Vocational/technical school beyond high school Some college College graduate or beyond
Computed as (Age minus Number of years of Education minus 5)
Square term of POTEXP
Race: White defined as zero, others defined as one
Du~ variables (0/1) ~ndicating type.of employment
Business executive or professional Manager and similar Retail or· office worker Craftsman, foreman, skilled worker Service workers Laborer
Dummy variable (0/1) indicating presence of children under the age of 12 in the household
Variables created to represent the sex and marital status of individuals in the labor force
Single males Married males Single females Married females
Dummy variable (0/1) created for persons who had ever smoked marijuana daily for a month
Prequency variable calculated as the number of marijuana cigarettes smoked per day times the number of different days during the past 30 having smoked marijuana
Square term of MONTHMJ
Source: Research Triangle Institute.
A-21

current consumption, lifetime consumption of the substances, and abuse of substances in combination with alcohol or other drugs. Unfortunately, this was the extent of information obtained about consumption of each of the substances.
Table A-a is constructed and reads identically to table A-6. Again, a 11 appropri ate IIbasel! vari ab 1 es were used in the regressi on ana lyses reported in each line. (The variables and their coefficients are not printed here only to keep the presentation clear.) Analysis revealed a large and significant impact on current househ~ld income if an individual ever smoked" marijuana daily for a period of at least one month. Other variables reflecting current use ~atterns and lifetime use were not statistically significant. Some variables measuring use had the predicted negati~e, although insignificant, impacts on household income; some did not; and others indicated positive, though still insignificant, impacts.
The multiple regression results for labor force participants and the t~tal population and employed persons are ~"ummarized in table A-S. The predicted impacts of ever 'using marijuana daily were substantial.· In the analysis of household fncome of labor force participants (line 1), ever using marijuana daily had u highly significant coefficient of -.3276. This translated into a negative impact of 27.9 percent. Examining two alternative specifications, even larger impacts of ever using marijuana dai1y were inaicated. The coefficient in the regression of household income of the total popUlation (line 3) was -.397, a ~tatistically significant 33 percent deficit. The impact ;s even greater when examining the household income of employed persons (line 4): the coefficient of -.516 translates into a reduction of income of 40 percent.
These results have been used to calculate the reduced productivity due to daily marijuana use. Once again, the prevalence rates of ever using marijuana daily in the labor force by age and sex groups (see table A-4) were applied to the number of persons in the labor force from those groups that experienced reduced productivity. This number was multiplied by the expected productivity (in the workplace and in the household) and then by
the impai't'1Tlent rate (27.9 percent) to produce the final value. The loss due to marijuana abuse was estimated as $34.2 billion for 1980.
A-22

r •
Table A-8
Regression Results for Analysis of Labor Market Behavior and Marijuana Abuse (by Percentages)
Daily Use Current Current Dependent Variable Ever Use Use
1. Household Income of Labor Force Participants 1 -.3276
(-Z.83)t
2. Household Income of Labor Force - -.401 .0047 -.00001 Participants1 (-3.13)t (1.13) (-.70)
3. Household Income 2f -.397 .005 -.00001 iotal Population ("'2.61)t (1. 10) (0.53)
4. Household Income of Employed Persons 1 . ".516 .0085 -.000027
(-4.55)t (2.~9)* (1. 61)
lThis dependent variable is entered in natural log form. tSignificant at the .01 level. *Significant at the .05 level.
A-23
F
9.6
8.8
11.0
8.5
.- -- -.-
R2
.066
.067
. 061
.07

•
'.
As discussed below, these estimates will be'adjusted down by 25 percent to compensate for double counting of young drug abusers and young problem drinkers. o. Di scussi on
Both alcohol abuse and marijuana abuse have sign1fical'1t negative impacts on household income and productivity. Sociodemographic factors which themselves have a,strong relationship to labor market success and productivity were carefully controlled in the analyses presented here. The estimated impacts of alcohol abuse and drug abuse are considered to be marginal; that is, they are correlated with the symptoms of alcohol abuse and drug abuse even when other factors hypothesized to be related to alcohol and drug abuse are held constant.
It would be too simplistic to suggest that the impact reflected in the above regression analysis could only be due to alcohol abuse or to drug abuse. Plausible alternative explanations can be offered. One alternative
. ,
may be that ~lcohol abuse and drug abuse (either or both) may be symptomatic - ,
of other personal problems such as.stress or depression. Alcohol and drug abusers may be self-destructive or have other personality disorders, low orientation toward achievement or low motivation. Attitude alone may limit an individual's success in the labor market, regardless of any complications or problems experienced with substance abuse. Extensive research has documented that marijuana use, like alcohol use or abuse of other drugs, is predictable based on social, psychological, and behavioral characteristics observed before the onset of ~se (Jessor, 1979).
The finding that current marijuana-use has little impact on income and that past intensive use has a major impact also merits further discussion. To explain this pattern of results we clearly need a complex causal model that is beyond the scope of this report. It may be that early marijuana use directly causes some reduction in motivation, capacity, or level of performance that cannot be compensated by later achievement. Or, the relationship may be a result of other unmeasured factors. Former iAtensive marijuana users may maintain counter-cultural values and not seek jobs with high income as the primary reward. They may also have personality characteristics that are not compatible with many jobs.
- . Jessor (1979) concluded that marijuana use ~as associated with uncon-
ventional and more experimental behavior. Users also place a lower value
A-24

on achievement and have lower expectations of success. Jessor also cited involvement in other types of problem behaviors though these appear to' be part of a constellation of other r~sultant factors. Behavioral patterns could stigmatize problem individuals and reduce their opportunities to be selected for better jobs.
The analysis has revealed that lifetime, as well as current, problem drinking and marijuana abuse are significant predictors of reduced household income. Use of lifetime indicators is,somewhat at odds with current practices of focusing on current or most recent behavior and impacts. The prevailing theory in the analysis of labor market success in this report is that although current earnings' are the result of current behavior, they are strongly affected by antecedent life events. These would obviously include variables su(.:h as years of formal education, quality and type of education, experience in the work force (analogous to age), lapses in labor force participation~ tenure in present job and occupation, and ~urrent and past health problens that might impai~ productivity as well as factors like aptitude and motivation. The study by Bartel and Taubman (1979); discussed earlier) demonstrated that health pT~blems ten or even fifteen years in the past can have significant impacts on current earnings, just as education' has a lifelong effect.
The results presented here for both marijuana and alcohol abuse are strongly sugg~stive of long-lasting impacts of substance abuse on labor market succe'ss of individuals and their families. Intoxication can impair the ability to function in school, on the job, or in society. Poor school or job performance can limit future advancement, even if an individual stops abusing alcohol and/or drugs. The initial poor performance can have a permanent affect unless extraordinary measures are taken to counteract the problem (such as remedial or extra education or training). These lifetime impacts of ADM were briefly addressed in the 1981 study on ADM costs to society.
Finally, the social costs of both alcohol and drug abuse have been estimated separately. However, as many recent studies have shown, individuals with problems with alcohol or marijuana also tend to use other substances. For exampie, in a study of adolescents in 1978 (Rachal et al., 1980), about half of the heavier drinkers also used marijuana at least·once a week. Of the youth who used marijuana more than once a month, a third
A-25

also were classed as heavier drinkers. Of those who reported they had alcohol-related problems, half also reported current marijuana use. ·These data indicate that there is considerable overlap in the kinds of problems that can affect productivity.
Half or more of young problem drinkers may also have a marijuana problem. Similarly, half of the young marijuana abusers are likely to be alcohol abusers. Thus, the cost estimates for alcohol and drug abuse count many people twice. Assuming this is correct, we reduced each estimate for the age groups between 18 and 34 by 25 percent.
Unfortunately, national surveys of alcohol abuse (Clark and Midanik, 1982) and drug abuse (Miller ~t al., 1983) included adequate measures for either alcohol or marijuana use, but not both. In order to better gauge the independent and combined effects of alcohol and marijuana, a study must include measures of use and associat~d problems for both substances.
Referr;.ng back to table A-4, for an example, note that 21 percent of males aged 20-24 were estimated· to b~ problem: dri.nkers, and 21.8 percent were estimated to be problem marijuana users. With no overlap, 42.8 percent of this group would be in one or the other of our proble~ groups. However, with half of each group also in the other group, 10.5 percent are only problem drinkers, 10.7 percent are problem drinkers-users of marijuana, and 10.9 percent are o~ly problem drug abusers, for a total impairment rate in the age/sex group of 32.1 percent, or only three quarters of the duplicated total.
It ~emains a challenge to future researchers to discover the nature of the relationships among alcohol and drug abuse, attitudes, values, personality, basic socioeconomic and sociodemographic cnaracteristics, and success in the labor market.
A-26

B. FETAL· ALCOHO.L SYNDROME
8-1

•
•
8-2
..

SEC"'~I'JN B: FETAL ALCOHOL SYNDROME
The risk of alcohol-related birth defects is causing increasing concern·in the field of substance abuse. Although only identified in the early 19705, research over the last 10 years has conclusively established the fetal alcohol syndrome (FAS) as one of the most serious sets of birth' defects and one with a relatively high incidence rate for its degree of severity~
A. Incidence of FAS Varying estimates on ~he incidence rate of fetal alcohol syndrome
exist. C1a~ren and Smith (1978) estimate the number of children with FAS in the United States at between 1 and 2 live births per 1,000, with partial expressions at between 3 to 5. li,ve births per 1,000. In a Seattle sample, Hanson, Streissguth, and Smith (1978) repor.ted a rate, of 1 i.n 750 live births. A study in Sweden detected 1 FAS'infant per 600 live births (Olegard et al., 1979), and in Northern France, FAS was exhibited in 1 per' 1,000 births (Dehaene et .a1. ;' 1977).
e'
1. Numerous studies have explored the relationship between alcohol consumption and birth defects.
Z. Studies have also indicated that risks to the developing fetus are further complicated by mothers' smoking in addition to consuming alcohol (Landesman-Dwyer and Emanuel, 1979).
3. Consistent findings of decreased birth weight, length of torso, head circ'umference, significantly lower LQ.'s, cardiac effects, etc. have been documented •. Table B-1 indicates the most contis· tent features of FAS (C1arren and Smith,' 1978; Jones and Smith, '1975; Kaminski et a1. t '1978; Loser and Majewski, 1977).
The risks of stillbirth and spontaneous abortion have also been studied, although limited data are available. Kaminski et al. (1978) has reported that the risks of stillbirth are increased more than 2~ times for women who reported drinking an average of 3 or more drinks per day, smoked, came from lower socia-economic classes, had more prior pregnancies, or were older. A California study detected a significant increase in spontaneous abortions which increased with. the amount of reported maternal drinking even after adjusting for variables correlated with drinking (Harlap, Shinono, and Ramcharan, 1979). !n a study of 3 New York hospitals, Kline et al. (1980)
B-3

Table B-1
Mast Consistent Features ollhe Fetal Alcohol Syndrome
Cirowlh .. nd P"rform~nce
• I'h", ., .. , .. WKet l!'~'n tlfihCIt!lrM:y. ti'l"' .... li""""JltCf!I' !n ,~ rtt.," :n wet,..,t • Cn .... "" .. t.1nt m,cmcl"ph.ly (s"",11 '",lid' C:1rcumt.,.,nce) _" ,."en C"'r.:'Cted (c:r tn.·ll1 OOdy _!fit .. "0 lenc;tn • """, ... , .. , 1!1'OWf" d.I,c • ...cy ," .... ti.1 and lem:'''. u,UAlly 1Hl1_ Jrd r. .. cenille • ();ot..y 0' '"lelll!Clu.al d_OII .. "' .... 1/0' _I" d.hCleftq (mUll IQ 'rom Saltl. IillOy ::.;. 64, r~l. 16-i2) • ,.,.. motor GyllunctlOll (goar ~''''11OIt1
"'ead and Face
• Mocroc:rrH ... ly • Sh'_rI r>Alpal)tat tonurn I ..... _..,e ~IoI'1) • !.litH ... '~I (", .. ,II.,." 1tyfIo~ ... (underd......,pm."t 01 modl;ac,at "'1"'"' . e FI;'II"fN!d •• Ionpllld "",ltrum (I""OCI. 01 ulIII'II' 1.1') .... _lal'O woln tn.n. /Ul1'rOW wrrn"~" 11;:1 bora_ (lI.tt"'y S;l" .Clh~'~) "
e "M.no, .,a, aftOflWll_ .nctuChnl low sec •• "
Umbs
• ~h .. """.l' ""~It\' ," III .... ,Im 0' tIM "anet • M.no, p"nl o1nnn~'1f!')
. ~.,....m:t"'y (lrm_'"' ~,.,.nen 100000t_, c .. ...,../IC.yty (31........... I ....... '".· 01 "....,., .. t rf..:~1
~mDloa.ctyty (one or more h~ _CA""y lleaed ~t _ ~ __ ~n.:{! .. ,/Io"IS)
Hea"
Brain
• "It' "nee of etmM., callosum . • ".,.,',,c,,,"'.lu, (I'!.ce", nuod i" CU,-.ml • !lrlll" Clfll m"ratory ~DftorIftPI,"
Other
• , •• , ..... 1:"""111 a_lift • ...... " .. ".:, ....... (t ...... " tumors mll(le uo 01 blooct .... s.lsl i" 'nfancy
5OUHCE: Oal. lram Ken"el" L. Jones anet 0fticI W. Sno,III. The tfltal ,1coItoI sytWfrorne. T~'fOk.O'f, 120 i.;' • U. 1"15.
B-4
•

reported five ~imes the risk of spontaneous abortions when· 1· ounce of absolute alcohol was consumed twice a week. Harlap et a1:.: also· reported a·: significant increase for second trimester abortions when 1· to· 2 drinks were consumed per day. Both of these studies had controlled for confounding variables such as smoking.
Several studies have reported increased risks of physical malformations while indicating that FAS children with the most severe physical signs typically show the greatest degree of mental impairment (Hanson et al., 1978; Majewski et al., 1976). Although few FAS children have been studied as they grew older, Seidenberg and Majewski (1978) have reported that most continue to function at the same mental level even when good foster care and special school programs are provided.
Overall estimates for the risks of drinking duri.ng pregnancy are also limited. Oulette et al. (1977) has reported a 37 percent rate of major and minor birth defects for heavy drinkers as compared to 14 percent for moder-. . . ate drinkers and 9 percent for light drinkers.
Recent discussions with staff of NIAAA and physlcia~s . researching FAS suggest that a 1 in 1,000 rate of incidence is a conservative figure. In fact, it has been suggested that a mid-range estimate for the incidence rate is 1 in 500 to 600 births, and that when children having only some, bu~ net all, of the FAS symptoms are included, the upper limit on the incidence rate may be one-half of 1 percent. This 1 in 200 rate ;s extremely high, and it should be noted that no researchers have suggested that the full fetal alcohQl syndrome appears at this rate. B. Economic Imolications of FAS
Marsha Russell (1980) of th.e New York State Division of Alcoholism and Alcohol Abuse has analyzed the impact of alcohol-related birth defects on Mew York State. Russell's article carefully reviewed the state of knowledge about alcohol-related birth defects and identified limitations in knowledge about fetal alcohol syndrome. an the basis of that work, a more re~ent review of the literature on FAS and contacts with leading researchers, this study offers or~er af magnitude estimates of the national cost of FAS, al~hough a precise incidence rate has not yet been proposed.
Specific birth defects that occur as part of the fetal alcohol syndrome have been identified, along with the type of health treatment that would be required in order to meet the needs of the FAS child, the length of the
8-5

treatment period, and the age at which the treatments are' like1Y to' be necessa~. Estimated costs of particular treatments are also·presente~. -These values are presented in table B-2. The specific defects have been numbered from 1 through la, and treatment regimens are summarized in columns B, C, and D.
Since elements of the treatment and the age at which they would occur are specified along with the treatment costs and the probability of occurrence in a specific FAS case, it is possible to construct the cycle of treatments that a person with FAS would receive at different periods in his/her life. It is also possible to prepare an expected value of treatment received during specific age periods. This was calculated by identifying the treatments that a person would receive at each age and multiplying the cost of these treatments by the probability of occurrence.
It is expected that 80 percent of FAS children have prenatal and postnatal growth retardation that requires neonatal jnt~nsive care and a hospital, evaluation (Russell, 1980). All infan:ts should also be screened for potential audiological defects while fn the intensive care unit (personal communication, Michael Church).
Audito~ problems have been associated with fetal alcDhol syndrome. Studies have shown that 56 percent of FAS diagnosed children will require a series of audiological evaluations in the first year of life with annual checkups through adolescence, and corrective surge~. Thirty-three percent of FAS diagnosed children may also need hearing aids to correct for mild hearing loss (Gerkin et al., 1984) (personal communication, Michael Church).
F~S children are expected to have some degree of mental impairment, ranging from minimal brain dysfunction (MBD) to severe/profound mental retardation. Fifty-two and one-half percent of FAS children are expected to have learning difficulties related to deficiencies in attention, concentration, and memory, plus a histo~ of hyperactivity and impulsivity. Problems in attention, behavior, and learning have been designated as· minimal brain dysfunction (Russell, 1980; personal communication). It is expected that MBO children.would require some form of remedial education such as special education in a "resource room" environment in the public schools at an annual cost of $7,400 (Kahalik et al., 1981). It is also expected that these children would require services throughout their years of school attendance (personal communication, Anne Hocutt of the Research ir;angle Institute).
8-6
•

•
Table 0-2
lifetime Cost Estimates of ~pecific Birth Defects Associated with the fetal Alcohol Syndrome
(A) (8) (C) (0) Estimation of
specific Annual Cost length of Prevalence In FAS Birth Defect of Treatment Treatment Period U fetille Co~t (percent)
1. Prenatal growth Neonatal intensive Once $ 3,500 80 retardation care: 7adays at $500
per day
2. Postnatal growth lIospital evaluation Once 150 80 retardation $750
3. Auc.1i 0 1 og~ c 131 A. Neonatal intensive Once 105 100 • (J] deficits care: auditory I -.j screening at $105/
procedure , 8. Series of audiological
evaluations: 1st evaluation at $45/visl t. subsequent evalua-tions at $25/vlslt
Every 3 months for 120 56 1st year of .11 fe
Sem 1-annua 11 y through 600 56 adolescence
Serious otitis C. Surgery (myringotomies~ Once 400 56 media at $4aO/physlcians fee .. Mild sensori- O. lIearing aids at $500/ald Through ages 10-12 500 33 neural hearing including office visits loss

CD I
(Xl
(continued)
(A)
Speci fie DirLh Defect
Mental impairment:
4. Minimal brain dysfunction
5. Mild-moderate mental retardation
6. Severe mental retardation
7. tleart defects requiring surgery
O. Cleft pa~ale
9. . KidneY defects
(8)
Annual Cost of Treatment
Special education: "Resource raOlli1l at $7,400/year
A. Ambulatory care with special education at $15,OOO/year
O. 1I0me care with day services at $6.200/ year
C. Residential care with day services fat $18.500/year
Institutionalization at $25.000/year
$17.500 + $750 annual checkup
Series of operations plus speech therapy
Treatment required no t ye t known
(e)
Length of Treatment Period
Anes 5-18
Ages 3 to 21
Ages 22-65
Ages 22-f,l5 "
~ges 5-65
5 years
10-15 years
(D)
Lifetime Cost
103.600
270.000
272,800
814.000
1,500,000
21,250
45.000
N.A.
Estillation of Prevalence in FAS
(percent)
52.5
45
36
9
2.5
5h
12.5
N.A.
10. Neurotuhe $35,000 per year 5-10 years J 262,500 0.5 alhis is a very conservative estimate; Lhe average length of 'stay at Columbia Presbyterian Hospital tn New
York is 19 days (Cheryl Rice, personal conununicatlon).
bSource: GerkEn. K.P .• Church. H.W .• and Hurrans. l.E .• 1984; (personal communication. Hichael Church).
•

I·'
~.
to • 'U
(continued)
,cCos t estimate does not include hospital costs (e.g .• per diem rates, operating room charges.)
dSource: Kahalik. J.S., Furry, W.S., Thomas, H.t.. and Carney. H.F., 1981i (personal conununicatfon. Anne lIocult).
elhe cosl estimate is for day services only. It is based on an average daily rate of $11 per day. per cl ient for day services. Individual estimates are not currently available for costs of home care; (personal .conununicatlon. Charles lakin).
flhe type of services provided vary widely. Cost estillates are 'based on an average daily rate of $51.05 for residential care and day services. Source: 1977 and 1982 National Survey of Residential fadl fties for Mentally Retarded Peoplei (Charles lakin. personal convnunicatlon) ,
.9Actual costs for institutionalization have been estimated as high as $40.000 per individual per year with an average cost of $30.000 in 1984. (North Caro1fna Department of lIuman Resources, Oivision of· Mental lIeallh. Hental lIealth and Substance Abuse Services. personal convnunicatlon),
hThis estimate has been revised from a 10% estimate reported by Marcia Russell. Although 10% of heart problems may be associated with FAS. it has been suggested that a more conservative estimate (5%) be util hed to reflect cases actually requiring surgery (Or. Sterling· CJarren. persona 1 communication),
Source; Research Triangle Institute; Russell. 1980.
~
'.

Forty-five percent of FAS children are expected to have mild to moderate mental retardation which would require provision of ambulatory and residential care with special education between ~he ages of 3 and 21 years. This has an expected vahle of $6,750 per FAS child per year (Russell. 1980).
The type of services provided to mentally retarded adults varies widely. Studies have shown that nearly 80 percent of mild to moderately retarded individuals live in the home. Unfortunately, costs of'home care are not currently available. However, these individuals would require day services outside the home. These services may include sheltered workshops, adult,developmental activity programs, vocational rehabilitation training programs and others with an average daily rate of $17 per client (personal communication, the North Carolina Division of Mental Health and Charles Laki n).
Persons not in the home may receive a wide range of services from several sources. Residential ser.vices may include state public residential facilities, group homes, nursing homes, foster homes, IIBoard and Room 1
11
semi-independent accomodation,s, as well as personal care with' an average daily cost of $51.05 for residential care and day services (Bruininks, 1982) (Charles Lakin, personal communication). For the severely/profoundly mentally retarded (2.5 percent of FAS Children), lifetime institutionalization may be necessary at an annual cost of $25,000 per FAS child (Russell, 1980) .
Neurotube defects and cleft palate have also been associated with fetal alcohol syndrome. Treatment for these defects would begin in the first year of life. One of eight FAS children are expected to have a cleft palate which would require a series of corrective operations and speech therapy with costs estimated at $45,000 over a lS-year period. One-half of one percent of FAS children are expected to have neurotube defects that would require five to ten years of treatment at $35,000 per year. Treatment costs for heart defects are also extensive, with 5 percent of FAS children expected to need corrective surgery and annual examinations for a five-year period (Russell, 1980) (perso~al communication, Dr. Sterling Cl arren).
The expected cost of treatment at a particular age ;s computed as the probability of each birth defect requiring treatment multiplied by the cost
B-10

of the'treatment. The resulting products are then summed'across 'all defects and treatments. The expected cost of treatment peaks at age 5, at' $12,713 per year. Costs remain elevated while children are of school age and begin, , declining at age 18. Beyond this point, costs are composed of treatment for the mentally retarded: lifetime institutionalization for the severely mentally retarded, and residential care and day services for the mild to moderately retarded.
With the values just described, it is possible to establish some order of magnitude of current costs of FAS in the United States. Again, because there is g~at uncertainty about the incidence of FAS, results are presented for 3 rates: 1 in ,1,000, 1 in 600, and" in 200. The 1 in 200 value is much higher than has been suggested by anyone tor the incidence of the full fetal alcohol syndrome. Recent findings indicate that an incidence of 1 in 1,000 is probably conservative at this point in time. A mid-range incidence rate for FAS is 1 in 600.
It is assum,ed in this analysis that the 3 incidence' :ates ,selected can be applied to all birth cohorts in the United States. Although this is a strong assumption, it is a useful hypothesis for this exploratory analysis. Future studi as must estab.1 ish the true prevalence of FAS in age cohorts.
Results of the analysis are presented in table B-3. The table reflects the total direct costs of treatment for serVices delivered whether from the health sector or other sectors, e.g., day services and special education. Assuming a 1 in 1,000 incidence rate, there were approximately 3,600 neonates with FAS in 1980, accounting for health treatment costs of $14.8 million. Across all cohorts, there'were 68,000 FAS children aged 18 or under with total treatment costs of $670 million in 1980 ($7S'million in health care costs and $590 m~llion in educational services), and 160,000 FAS adults with treatment costs 01 $760 million' ($416 million in health services and $344 million in nonmedical services). The 1 in 600 incidence rate implies that there were 380,000 FAS individuals in 1980 with direct services costs of S2.4 billion: 114,000 FAS children with health treatment costs of $125 million, and educational service costs of $990 million; and 267,000 FAS adults with health treatment costs of $574 million, and other service. costs of $694 million. At a rate of 1 in 200, there were 340,000 FAS victims between the ages of 0 and 18, requirin~ $376 million in medical services and S3 billion in educational services. FAS adults numbered nearly 800,000
B-ll

Age
0 1 2
3-4 5
'. 6-1
8-9 10-14 15-18 19-21 22-64
651-
TOTAL
Source:
Table 0-3
Expected Cost of lIeallh Treatment in 1900 Due to Fetal Alcohol Syndrome Using Regimen Proposed In Table 0-2
($ In millions)
Annual Total Cost at Prevalence Rate Expected
Cost of Conservative Hid-Range IIlgh Persons Treatment Likely Treat- 1/1.000 1/600 1/200
(thousands) (dollars) ments at Age Persons Cost Persons Cost Persons Cost
3.590 $ 4.122 1.2.3A.30.8.10 3.598 $ 14.8 6.009 $ 24.8 17 ,990 $ 74.2 3,212 578 30.8.10 3,212 1.9 5,364 3. 1 16,060 9.3 3,212 967 30.3C.30.8.10 3.212 3.2 5.364 5.2 16.060 15.5 6.425 7,328 3D .51\.8.10 6.425 47.1 10.130 78.6 32.125 235.4 3.453 12.713 30.4,5A.6.7. 3,453 43.9 5.767 . 73.3 17 .265 219.5
8.10 6,906 11.876 30.4.5A.6.1. 6,906 82.0 11.533 137.0 34.530 410. 1
8.10 6,906 11.701 30.4.5A,6.7.8 6,906 80.8 11.533 135.0 34.530 404.0
11,046 11.663 30.4,5A,6.8 11,846 208. 1 29.803 347.6 89.230 1.040.1 16,483 11.260 4,51\.6 16,401 185.6 27.521 310.0 82,415 928.0 13,143 1.375 5A,6 13,143 96.9 21.949 161. 9 65,715 484.7
120.765 4.522 58,5C,6 120.765 546.1 201,678 912.0 603.825 2.130.5 25,108 4.522 50.5C,6 25,708 116.3 42.932 194. 1 128.540 581.3
227,651. $404,638 227,651 '$1.426.6 380.107 $2.382.4 1,138.285 $7.133.1
Treatment regimen and costs proposed III table 0-2; al:ternative prevalence rates suggested In discussions with Or. Robert Sokol; computations by Research Triangle Institute; U.S. DOC, U.S. Bureau of lhe Census: Statistical Abstract of the United Slates" 1902-1983.

with health care costs of $1.7 billion and nonmedical se'rvices of $2 billion. Costs are quite significant by these calculations.
The potential indirect costs from fetal alcohol syndrome are not quite as large as our estimates of the direct health treatment expenditures. The mental retardation associated with FAS means that these individuals are unlikely to achieve a level of productivity comparable to the general population. The 2.5 percent of FAS victims that are severely mentally retarded and, consequently, institutionalized, will certainly never be full participants in the work force. The 45 percent,that experience mild to moderate mental retardation not requiring institutionalization will, none~ theless, be much more limited ~an others in their age cohorts. They are likely to be partially disabled and may, at best, be able to function in a sheltered work environment. The 52.5 p'ercent of FAS victims characterized as having MBD are also expected to have reduced levels of productivity .
. Each level of mental impairment has been assign~d an expected level of productivity reduCtion. The'severe to profoundly mentally retarded are . ~. . . expected ,to be completely disabled (i.e., with a 100 percent ,reduction in productivity). The moderately retarded are considered to be 50 percent impaired, and the mildly retarded are assigned an. impainnent of 25 percent. (These rates are based on government classifications of moderately retarded i ndi vi dua 1 s as IItrai nab 1 ell and the mil dly retarded as II educab 1 e; II North Carolina Division of Mental Health, personal communication.) A productivity reduction of 10 percent is assumed for those with minimal brain dysfunction.
The worst case scenario for productivity losses by FAS victims occurs when we apply the high incidence rate of 1 in 200 births to the, population aged 18 to 64. This computation suggests that 671,000 adults would have impaired productivity in 1980. Using appropriate values for market and household productivity. and labor force participation, the indirect costs would be $2.6 billion. In comparison, this study has estimated other current productivity losses (excluding mortality) du~ to alcohol abuse at $55 ,billion, those due to drug abuse at $30 billion, and those due to other mental illneSSeS at just over $20 billion.
Applying the 1 in 1,000 incidence rate to the.adult population provides an alternate estimate of the indirect co~ts of fetal alcohol syndrome. This rate suggests that there would be 133,000 FAS adults. Using the same impairment rates, the indirect productivity losses would be S5l0.5 million.
B-13

The mid-range losses are estimated at $853 million, with 225,000 FAS victims of working age (18 to 64 years).
Of particular relevance in the estimation of lost productivity due to
mental impairment is the proportion of mental retardation in the general population that is actually attributable to fetal alcohol syndrome. A 3 percent incidence rate is often cited as a reasonable estimate of the proportion of mentally retarded individuals in the adult population of the United States (N.C. Division of Mental Health, personal communication). However, some researchers have suggested that this figure represents an overestimate ~nd that a 1 or 2 percent rate is more representative. On the basis of previously cited information that approximately 360,000 individuals or 20 percent of the mentally retarded are in residential care, a total estimate of 1.8 billion ~entally retarded individuals in the United States can be calculated. U.S. Census Departmen~ figures estimate that there are 163 million aduTts over the age of 18 in the United States, allowing the ca 1 cu 1 at i on of a 1. 1 percent i nci dence rate of mental retardation i n ~he adult popul~tion (U.S. DOC: BOC, 1982). Using a mid-range estimate of 1 in 600, table 9-4 illustra~s that there are 107,000 mentally retarded adults (profound/severe, moderate or mild) whose mental impairment is directly attributabre to fetal alcohol syndrome. This represents 5.6 percent of all mental retardation in the United States (utilizing the conservative estimate of 1.8 million mentally. retarded adults). Alternatively, a 3 percent prevalence rate of mental retardation due to FAS can be calculated using the 3 percent (4.9 million adults) prevalence rate of mental retardation in the adult population.
At the present time, it does not seem possible to create better estimates of the indirect productivity losses due to fetal alcohol syndrome. It is believed that use of the high FAS incidence rate of 1 in 200 births establishes an absolute upper bound on these costs. Without information on the pr~valence of FAS in adult cohorts and the degree of impairment actually experienced by these individuals, it is extremely difficult to determine how much lower these costs might be. The 1 in 600 FAS incidence rate is a current estimate. On the. basis of the 1 in 600 rate, the fetal alcohol syndrome appears with Down's syndrome and spina bifida as a leading cause ,of birth defects.
The range ·of cost estimates presented above has been developed in order to i'" ustrate the costs to soc; ety due to fetal al cohol syndrome.
8-14

OJ I
Table 0-4
Lost Employment and Reduced Productivity In 1980: Adu"it fAS Victims. Number of Persons, and Valu~ of Lost Employment
(Number in thousands, $ in millions)
Total Lost Productivity at Prevalence Rate Conservative 171000 Hid-Range 1/600 Uhf'" 17200
Hental Impairment Persons Va1ue Persons Value Persons Value
Hinimal brain disfunction 70 $130.3 lU! $217.1 352 $ 651.5
Mild mental retardation 52 240.1 87 402.2 260 1.203.5
~ Moderate mental retardation 8 71.2 14 129.1 42 386.3
Severe/profound mental retardation 3 62.3 6 104.3 11 312.1
All FAS 133 510.5 225 853.3 671 2,553.4
Source: Research Triangle Institute.

The model has been constructed in such a way that it can be readily modified to improve the precision of estimates when more and better information on the incidence of FAS in specific birth cohorts, the prevalence of particular birth cohorts within the fetal alcohol syndrome, the treatment regimen appropriate for these defects, and the cost of these treatments is available.
8-16

C. RESEARCH DEVELOPMENTS ON THE RELATIONSHIPS AMONG MENTAL ILLNESS, DRUG ABUSE, AND CRIME
C-l

C-2
SECTION C: RESEARCH DEVELOPMENTS ON CRIME AND MENTAL ILLNESS AND DRUG ABUSE
A. Introduction This section offers some new research findings about crime and mental
illness and drug abuse. The new contributions have led to improved estimates of the economic impact of these disorders on society. The findings were incorporated in the cost estimation of chapter III. Thi~ discussion is intended to offer further insights to the rationale behind the cost estimation. B. Mental· Illness and Crime
The approach to estimating costs of crime associated with mental illness is outlined in two sections below. In section one, the rationale and approach for estimating criminal justice system costs associated with mental illness and public order crime are presented. 1n section two, the reasons for not attri buti ng costs associ ated wi th vi 0.1 ent and. property crime to m;nta1 illness are discussed.
1. Mental Illness and Public Order Offenses Two recent developments have' changed the way we deal with the
mentally ill in U.S. society. Oeinstitutionalization and stringent civil rights statutes limiting the involuntary commitment of those thought to be mentally ill have meant fewer individuals are hospitalized in mental health facilities (McGarry et al. 1981; Roth, 1980; Shah, 1981). One result of deinstitutionalization and limited civil commitment has been that more individuals who exhibit mental disorder symptoms are dealt with by the criminal justice system.
Eaton (1980) uses the term IIbizarre behavio~ to refer to human activities that are odd, incongruous, unexpected, or culturally deviant. Bizarre behavior, often taken to be an indication of mental illness, is also likely to attract the attention of the police or private citizens who are concerned, frightened, or disturbed by the behavior and notify the police. Those who act in a disruptive or troublesome manner have always been" subject to detainment and arrest. Since deinstitutionalization and ti ghtened requi rements for i nvol untary' commitment, more of the mentally ill are in the community and subject to arrest. Adler (1981) discusses this IIhospital to jailll phenomenon.
C-3

In a study of mentally ill offenders in Lucas County, Ohio, the authors argued that II Potenti a 1, past and current mental health pat i-ents are of-ten" converted to the status of criminal offenders on the basis of minor misconduct" (Ventura and Jacoby, 1983:1). Legislation in Ohio and other states was designed to minimize institutionalization and protect patients'· rights had reduced mentally ill inpatient populations. Then, however, voluntary and involuntary commitments often could not be made because the number of treatment slots had been reduced and because the potential patient could. not be shown to be a danger to himself or others. Ventura and Jacoby proposed that the pol.ice be allowed to hold the apparently mentally ill in the local jail to gain time to find 'a suitable, alternative or until a crisis has passed.
There is considerable variation across the United States in legislation and policies toward institutional treatment and involuntary commitment of the mentally ill. The scenario described above for'Lucas County, Ohio may not be exactly replicat~d in other jurisdictions. It seems clear, however, that, in the face of mental hospital deinstitutionalization and limits on involuntary civil commitment, the mentally ill have often come to
. the 'attention of the police in a situation requiring intervention by the criminal justice system.
The manner and conditions under which the deinstitutionalized mentally ill encounter the criminal justice system suggest how the costs might be estimated. The scenarios described above indicate that the mentally ill are most likely to be arrested for offenses of disorderly conduct, vagrancy, and the set of public order offenses recorded in the Uniform Crime Reports as II other offenses. II Arrests for those catagori es' tota 11 ed 2.575 mi 11 ion in 1980, or 24.7 percent of all arrests. Implications of the citations above are that an appreciable although relatively low proportion of arrests for public order offenses was due to the exhibited behavior of the deinstitutionalized mentally ill persons.
This study makes the conservative assumption that 10 percent of arrests for these public order offenses repr.esents the number of mentally ill who are processed by the criminal justice system.
2. Mental Illness and Violent and Prooerty'Offenses Collins and Schlenger (1983), Hare (1983), and James et al.
(1980), using systematic diagnostic methodologies, found high rates of psychiatric disorder among prison inmates. The Cal1in~ and Schlenger
C-4

.. findings, for example, showed that 77.5 percent of 1,149 male felons entering North Carolina prisons between March and May, 1983 had, in their life- -times, received at least one psychiatric disorder diagnosis. This rate was twice as high as that for males in the Baltimore, Ne~ Haven, and St. Louis ·communities. In spite of this evidence that the prevalence of mental disorder is higher among criminal offenders than in the general population, no violent or property crime costs are assigned to mental illness.
There are t~o reasons for not assigning a crime causation factor to mental illness in spite of evidence that offenders are more likely to be diagnosed as having a psychiatric disorder than the general population. The first reason has to do ~ith double counting. Substantial percentages of the psychiatric disorder diagnoses found among offenders are for alcohol abuse/dependence and drug abuse/dependence. Lifetime prevalence disorder rates for these categories were 49.5 percent and 18.8 percent in the" North Carolina inmate sample. Alcohol abusers and drug abusers are not distinct from each other or all the mentally ill. Ascribing a criminogenic effect to merital fl1ness would result in double counting because alcoho'l and drug abuse categories are confounded' with other psychiatric disorder categories. Costs of crime associated with alcohol and drug abuse have already been estimated in conjunction with those problems.
The second reason for not ascribing crime costs to mental illness is the absence of any systematic explanation of how mental illness, other than that connected with alcohol or drug abuse, is responsible for involvement in criminal behavior. Schizophrenia, major depressive episodes, and obsessive compulsive disorders are not viewed as criminogenic. One disorder category that is associated with involvement in crime is antisocial per"" sonality. This disorder, however, is very often accompanied by an alcohol and/or drug abuse problem (American Psychiatric Association, 1980; Hare, 1983); therefore, the double counting of criminogenic effects is. again an issue for this disorder type. C. Druo Abuse and Violent Crime
In the 1981 report on the economic costs of ADM (Cruze et al., 1981), robbery was the only violent crime associated with drug abuse. Studies performed prior to 1981 indicating a causal connection between drug abuse and nonacquisitive violent crime were not convincing. It was and is clear that daily users of heroin engage in a great deal of property crime to help
C-5
finance expensive drug habits, but it was not clear that drug abuse explained significant numbers of nonacquisitive violent crimes such as homicide-and· assault.
Recent evidence suggests that significant numbers of homicides and assaults are caused by drug abuse. The drug abuse-violence connection is seen to occur in two ways: (1) between participants in the illegal drug distribution system to control or expand market share or to retaliate for being IIripped offll in a drug transaction, and (2) as a pharmacologic effect of the abuse of certain single nonnarcotic drugs and polydrug use.
Violence in illegal drug distribution appears to be a serious problem in certain cities. Swersey (1981) examined,the increase in homicides in Harlem from 1968 to 1973. He found that the increase was largely a function of an increase in deliberate kil1ings--many of them drug-related. McGuire (1983) reports an analysis of the circumstances of 1,656 homicides that occurred in New York City in 1981. Interviews with investigating police officers resulted in 23.7 percent being classified as drug-related homicides. Zahn and Bencivenga (1974) found that, 'between 1969 and 1972 in PhiladeJphia, homicide between drug users increased appreciably and in 1972 represented 30.8 percent of all homicides occurring in the city. Wish et al. (1981) analyzed data on arrestees in Washington, DC and found that; contrary to beliefs that drug users tend ~ to be involved in assaultive crimes, drug positive arrestees were arrested for homicide and assault at about the same rate as nonusers. Monforte and Spitz (1975) found that 43 percent of 753 homicide victims in Detroit in 1973 were narcotics users and that the percentage of homicides connected with narcotics traffic is very high. Ongoing work by McBride (1983) using data for Miami, Florida shows that drug distribution system violence is a very serious problem.
It is clear from the evidence that drug distribution system violence varies across locations and across time periods. Riedel and Z~hn (1983) studied homicide in eight American cities for 1978. They found considerable variation in the percentages of homicide victims found to have narcotics in their systems at medical examiner testing. The 1978 results for Philadelphia, one of the eight cities, showed the presence of narcotics in homicide victims was less than it had been in the earlier Zahn and Bencivengo (1974) study. Swersey1s (1981) study of Harlem homicide also indicated a decrease in homicides from 1973 to 1974 after several years of
C-6
~~~ .. ' , -" -' .'~-- '--'

·~.'.------c-----------------c
" I'
increase. This over-time and over-location variation for dru9:distribution system violence makes the choice of a single causal estimate'difficult.
There is evidence that the ~harmacolo9ic action of some drags or drug', combinations, in conjunction with other factors, is related to violent behavior. Although the evidence of an amphetamine relationship to violent behavior is not consistent, Ellinwood (1971) and Asnis and Smith (1978) found a direct relationship between amphetamine use and assaultive behavior. Tinklenberg (1973) found a clear association between baroiturate use and assaultive behavior. Chaiken and Chaiken (1981) also found a barbiturate use-assaultive crime relationship in a sample of prison inmates. Collins (1982) ,found that ; n a drug abuse treatment popul at ion, those whose proi mary drug problems were identified as amphetamines or barbiturates were significantly more lik~'y to report assaultive behavior than were those with other types of drug problems.
The 1979 Survey of Inmates of State Correctional Facilities (U.S. OOJ, . ,
BJS, 1983c) found that 30 percent of persons. incarcerated for. violent offenses had been under the i nfl uence of sam'e drug at the ti me of the crime.
The use of multiple psychoactive substances has become very common in recent years (Bray et al., 1982; Fishburne et al., 1980; Johnston et al., 1981). Drug abusers mix different drug types on the same drug use occasions and switch from one drug to another in serial fashion. .This polydrug use pattern increases the potential for unpredictable behavior as a result of drug interaction effects. Very little information exists about the behavioral effects of polydrug use, so it is somewhat specu~ative to attribute violent behavior to the use of multiple drugs. However, in combination with the evidence already cited, the potential for drug interaction effects that produce violent behavior is an additional reason for changing the position in the 1981 report that attributed no drug abuse-violent crime effect.
It is the position of the present report that 10 percent of homicides and serious assaults are caused by drug abuse. The relationship is ascribed to drug distribution system violence and pharmacologic effects of barbiturate, amphetamine, and polydrug use with drug distribution system. violence deemed most important. This 10 percent attribution is considered a conservative assumption made in.the absence of appropriate data. The stUdies cited above offer strong evidence about the involvement of drug abuse in violence; however, the extent of the relationship ;s not well determined.
C-7

..
o. ADMINISTRATIVE COSTS OF ·PUBL:IC SOCIAL WELFARE P-ROGRAMS
D-1

•
•
•
0-2

SECTION 0: ADMINISTRATIVE COSTS OF PUBLIC SOCIAL WELFARE PROGRAMS
Just as various levels of government assist ADM victims in paying for their health care treatment, public social welfare programs are available to supplement the income of ADM victims that are disabled for some period oOf time. ,The major programs that provide assistance are listed in table·D-1 and include unemployment insurance, disability payments, veterans pensions and compensation, workers compensation, and supplemental security income, among others. These programs accounted for cumulative expenditures of $65 billion in 1980. This is slightly more than half the contribution of governments to payments for personal health care expenditures •.
The purpose of these social welfare programs is to assist:'individuals who suffer from both long- and short-term problems and have low earnings and/or income. In determining whether needy individuals are eligible for particular programs~ information is filed on the nature of problems experi-
;
enced by individuals. This informati,on makes it possible to identify program expenditures that are due to ADM problems of benefi~iaries.
Within these social· welfare programs, a distinction must be made between two functions. First of all, the programs transfer income to needy individuals to make up for earnings or income that the individuals carn~ot prov,ide for themselves. This component of program expenditures constitutes a transfer of income from the government (and taxpayers) to program-eligible individuals. This issue is discussed further in section E of this appendix. Secondly, there are real costs (administrative expenses) in effecting the transfer of income.
Total ADM-related administrative costs foT' thes,e programs was $241 million in 1980 (Social Security Office, personal communication) (table 0-1). Of this value, $201 million was associated with mental illness, $2 million with drug abuse, and $38 million with alcohol abuse. This constitutes approximately 6.6 percent of the total cost to administer public social welfare programs to all recipients. Excluding unemployment insurance and workers compensation, total administrative costs were $1.4 billion. Mental illness accounted for almost 15 percent of all affected program administration costs. Alcohol abuse represented about 2.5 percent of these costs. The impact of drug abuse was negligible.
0-3

Ii It f;
'i' $>.
..
Table D-l 'IDIle Proora. Social Welfare AI~lnlilratlve EKpendlturei and C05li Due to AOH Proble~s, 1980
U lil .l1Ilon5)
Tobl Prograll bpend I Lures a
OASOIlI-d Isab II Hy paYlIents 115,411 Unellployment Insunnce 16,50l
Railroad lemporary disability Insurance 64
Slale lempoijary dlsaLlllly insurance l,llO
Workers eo~pensallond 9.588 Public aS5istancee 1.219 SUIIP lemcnli I Security Income 7.446 food stallljls 644 Veleran' 5 pens Ions' and
cOllpensatlon 11,306
Vocatlolllll rehabllltatlond 916
Tolal 164.51l
Percent 10lal Admlnlstrallve Adalnlsl,allve
Costs Costi
2.4 I 110
11.0 1.815
1.8 5
1.2' 41 ... ' 422 15.1 186
0.8 655 4.4 28
0.8 90
4.1' 46
13.661
Cosh Alcohol Abuse
Percenr-bOunt
3.4
3.4
3.4
4.8 0.8 4.8
9.1
112
b
9
5 I
9
U8
Cosh Drug Abuse
Percenl~oun[
c Ib
c: b
c b
0.5 1 c b
0.5 b
0.9
$Z
aSource: Social Securlly Adllnillrallon, OffiCI 01 Rellre.enl and Survlvori Insurance: periona' ca..unlcilion. b . less lhan '.5 .ll110n.
cLess than .0005.
dhcludJei hospital and .edln) beneUh. eExc )"d!!5 vendor .edlca) paymenli and 10CIli .ervlees. fPl:rcenL does nol elCclillle hospltll Illd lledlell progra. illblnhlrilivi cosh. (-) flo causal relationship h Issu.ed, or no bendlc:larlu reported ADH .. pri.uy nuse of eligibility • lolah may nol add due lo rounding. Source: Researcb Idangle Instllutl.
•
.
COils Henbl IHnen
Percent AaOunl
8.9 III
8.9 b
8.9 4
4.1 9 18.8 121 4.1
23.6 21 19.1 9
$201

E. OTHER IMPACTS OF ADM ON THE ECONOMY •. CI
E-l

E-2
SECTION E. OTHER IMPACTS OF ADM ON THE ECONOMY
A. Int~oduction -- -- .-.~-""
Consumers spend billions of dollars on alcoholic beverages and illicit drugs; a substantial proportion of property crime is committed by drug addicts; and ADM victims receive benefits f~om social welfare programs such as health treatment through Medicare. These expenditures might be considered to have impacts on the economy though they are intrinsically different from the costs measured in this report because they are indirect or are transferred resources rather than ~ resources. The discussion in the following sections is presented to allow the publie and policymakers to more completely assess the role of ADM in the economy although the costs discussed are not included in the framework established in this report to calculate the social cost of ADM. B. Exoenditures on Alcoholic Beveraaes and Illicit Druas
Total legal alcoholic beverage production and sales in 1979 were $45.0 billion (U.S. DOC, B~re!u"of the Census, 1982"); approxima~ely 50 percent of tha consumption was beer~ 39 percent was distilled spirits", and II percent was wine (DeLuca, 1981). Illegitimate production of alcohol ;s believed to be negligible, but illicit consumption of alcohol merits attention. It is illegal for those underage to.consume alcoholic beverages, and it is illegal to sell them alcoholic beverages. Among high school students in 1978, 31.2 percent were misusers of alcohol, 51. 7 percent drank but did
. not misuse, and 17.2 percent abstained. Male misusers reported consumption of 3.56 gallons of ethanol annually (1.25 ounces of ethanol, or approximately 2.5 "drinksll per day); female misusers reported consumption of 2.59 gallons annually. Male and female drinkers who did not" misuse consumed .74 and .48 gallons annually, respectively (Rachal, Maisto, Guess, and Hubbard; 1982). The U.S. Department of Commerce (1982) reports 13 million 15- to 17-year olds in 1978. These figures indicate total annual consumption of 16.5 million gallons (about 2 billion ounces) of ethanol.
Total U.S. sales in 1978 was 2.73 gallons of ethanol for each of the 174 million persons aged 14 or over. When comparing the self-reported consumption of 10th to 12th grade students (excluding l8-year olds) with reported sales of ethanol in the U.S. (Deluca, 1981), it appears that youth aged 14 to 17 yearp consumed 3.5 percent of all ethanol in the United
),.
States in 1978.
E-3

The value of purchases by underage youth is likely to be a smaller proportion of total expenditures than their share of volume of consumption. The contexts for drinking most often mentioned by youth were teenage, parties, nhangouts,1I at home on special occasions, school activities, and in cars at night - all with peers only except at home. These contexts would involve lower prices than locations more typical of adult consumption such as restaurants and cocktail lounges. Furthermore, youth consume a larger proportion of beer, which is a relatively inexpensive source of ethanol.
Surveys of adult populations (age 18 and above) indicate ve~ different drinking patterns than those of teenagers. Between 1971 and 1976 the average reported consumption (using quantity and frequency measures similar to those used to study youth) of all adults ranged from .40 to .50 ounces of alcohol per day (Noble, 1978). At 128 ounces per gallon, this represents approximately 1.3 gallons per year. The reported'consumption accounted for only half of what is manufactured and sold. The same results are found for the reported. consumption of adults and youth (age ~5 to 17).
Lower reports of consumptio~' than sales have been replicated in all of the national surveys, with the under-report ranging from 40 to' 60 percent. Because youth aged 15 to 17 reported consuming 3.5 percent of all alcohol sold, this value was adjusted to nearly 7 percent of all alcohol sold.
Estimates of illicit drug use have been made by two government agencies: an interagency task force entitled the National Narcotics Intelligence Consumers Committee (NNICe); and the Internal Revenue Service. Both estimates used similar estimation me~odologies and the same data sources.
NNICC estimated that the retail value of illicit drug consumption in 1979 ranged from $56 to $74 billion (see table E-1). Consumer expenditures for cocaine were $21.7 billion; for marijuana, $18.7 billion; for heroin,
. . $8.5 billion; for other drugs, $16 billion. Volume of consumption was also estimated. The NNICC values represented the value of drugs consumed at "street" prices by retail customers and at IIwholesale ll prices by the dealers themselves.
The Internal Revenue Service estimated the value of marijuana, cocaine, and heroin only. These values were $8.6 billion, $5.7 billion, and $7.2 billion, respectively (see table E-l). Again, this represents the value of drugs consumed at "street" prices and value of drugs consumed by dealers. These values are somewhat lower than the corresponding NNICC estimates for
E-4

Table E-l
° Consumption of Illicit Drugs in 1979 as Estimated by NNICC and the IRS
NNICC IRS Quant.ity Reta,l Value Quant1ty Reta,] Value
Type of Drug (metric tons) ($ in mi 11 ions) (metric tons) ($ in millions)
Heroin 3.4-4.0 $7,790-9,160 1. 9-4. 5 $1,160-13,260
Cocaine 25-31 19,500-24,180 5.2-12.8 3,280-8,080
Marijuana 10,000-13,600 15,480-21,930 6,647 4,490-12,650
Hashish 200 1,480 'N. E. N. E.
Dangerous Drugs 12,000-17,000 N. E. N. E.
Total $56,250-73,750 $8,930-33,990
• N.E.: Not Estimated.
Sources: NNICC (National Narcotics Inotelligence Consumers Committee) and Internal Revenue Service, Department of the Treasury, 1983.
E-S
--_ ....... - .

marijuana (by 54 percent), cocaine (by 74 percent) and heroin (by 15 percent). Differences between NNICC and the IRS are due primarily to differences in estimating the consumption of marijuana (the IRS is lower by 44 percent), cocaine (by 68 percent), and heroin (by 14 percent). The balance of the differences in total values is due to differences in the calculation of price.
While the differences between the illicit drug co'nsumption estimates of the NNICC and IRS are appreciable, both estimates are enormous. Both indicate the order of magnitude of the true values and establish a framework for improved estimates in the future. C. Prooertv Crime Transfers Associated with Orua Addiction
Property crime is one of the leading problems attributable to drug abuse and is of concern to society, the criminal justice system, the drug abuse treatment system, and policy makers. 'This report has estimated that nearly 35 percent of the costs to 50ciety of drug abuse are crime related. The value of property stolen due to drug addiction is relevant to understanding the impact on t~e economy of drug abuse; but because this value is a transfer payment, it is not directly estimated in this report.
Criminal career costs have been included as a cost to society. This component reflects the value of time diverted from legitimate (market and household) activities and used to pursue income through criminal activities including property crime, drug trafficking, and victimless crimes such as gambling and prostitution. Estimates in chapter III indicate that nearly 1.1 million addicts participated in a criminal career with a corresponding loss to society of $8.7 billion of productive effort.
Evidence on property crime and drug abuse has been collected from severa 1 sources. The Nat i ana 1 Cri me Survey inc 1, uded a househo 1 d component that gathered information on personal victimization by violent and property crimes and established an overall estimate of the value' of property stolen in 1980. The survey asked detailed questions on the type of victimization, the time and place of occurrence, the injury suffered, ,loss of valuables, damage to property, and whether the offense(s) was reported to the police. A series of reports has ~ssessed the extent of personal victimization in the United States on the basis of these data.
The nationally representative survey provides comprehensive estimates of the number and value of crimes for the type of offenses often associated
E-6

D
with drug abusers and addicts. Data on robbery, personal larceny, burglaryo, household larceny, and motor vehicle theft are also available.
There were 32.8 million victimizations in 1980 (see table E-2). The most frequent type of crime was personal larceny, with 14 million occurrences, one per every 16 persons in the u.s. The average value of property and cash stolen was SU6 with a total value of $1.6 billion. Burglary resulted in the largest total transfer of $3.2 billion from 6.5 million victimizations. The 1.3 million motor vehicle thefts in 1980 had the largest average loss at $938 per incident. The total value of theft from all types of personal offenses was $7.3 billion. These BJS estimates represent the most comprehensive data to date on the extent and value of personal crime.
The 1981 °RTI study reviewed evidence on the drug abuse-property crime link and concluded that one of five property crimes was attributable to drug addiction. Studies of arrestees, prison populations, drug abusers, and treatment populations were reviewed. Attributions to drug abuse-were made for °26 .8 percent of robberi es '0 22.4 percent of burgl ari es and 18.6 percent of larcenies and motor vehicle thefts (see table ~-2). Application of these rates to the nationwide value of personal property crime in 1980 yields an estimate of $1.5 billion attributable to drug addiction. This estimate is partial. It does not measure the dollars lost by crime victims to drug abusers, does not include offenses like forgery, fraud and other types of crime, and does not represent income from the illegal drug distribution system or from victimless crimes such as prostitution. These estimates are relatively consistent with other recent research findings on the economic behavior of heroin addicts.
Johnson and Goldstein (1984) estimated that daily heroin users sp~nd $13,189 on the drug per year, with those using heroin three to five days a week spending $6,431 per year on the drug. With an estimate of $10,000 a year as the average annual cost of heroin for addicts, 500,000 addicts spend SS billion a year for the drug.
Recent findings from the Treatment Outcome Prospective Study (TOPS) indicate that daily heroin users have $8,426 more in illegal income per year than nonusers or nondaily users of heroin (Collins, Hubbard, and Rachal, 1984). Based on an assumption that two-thirds of heroin users are daily users (500,000 X .667 = 333,500), this group has a total of $2.8 bil-
E-7

.. __ .- Type
Robbery
Personal Larceny
Burglary
Household "Larceny
Table E-2
Value of Property Transferred by Personal Crime in 1980; Total and Proportion Attributable to Drug Abuse
Attributed to Number Drug Abuse
of Crimes Average Total Value Value (thousand) Value ($ in millions) Percent ($ in millions)
1,138 $ 138 $ 157 26.8 $ 42
14,023 116 1,621 18.6 302
6,522 490 3,193 22.4 715
9,787 116 1,138 18.6 212
Motor Vehicle Theft 1,290 938 -1,210 18.6 225
Total 32,760 N.A. $7,319 N.A. $1,496
Source: U.S. aOJ, BJS, unpublished data, and U.S. DOJ, "BJS, NCJISS I 1983 and causal factors from Cruze et ale I 1981.
E-8
~ ... ..-.--
1; on in i 11 ega 1" income. For many heroi n addi cts, thi s ill ega 1 income. comes primarily from victimless crime and does not involve the direct victimization of others.
In comparison to extrapolations from Johnson and Goldstein (1984) and Collins et al. (1984), the $1.5 billion loss suffered by victims shown in
. . table E-2 seems small. It should be remembered, however, that the $1.5 billion estimate is for a limited number of offenses and do~s not include' illegal income earned from drug distribution, often a major income source for drug addicts. o. Pubiic Transfer PaYments to ADM Victims
Another impact of ADM on the economy is the social welfare program transfer payments received by ADM victims~ Victims are eligible to receive benefits under some social welfare programs. These values are not costs to society using the conceptual framework developed by the Public Health Service (Hodgson and Meiners, 1979). Clients usually qualify for transfer payments because of a consequence of ADM which is considered and totalled as a cost in this report. Adding the value of transfer payments to the cost estimates would result in "double count'ng" of t.le problem.
For .example, OASOHI-disability payments are made to compensate persons who are unable to work for their loss in earnings. The "lost employmentll
estimates included in the PHS framework represents the value of productivity that is lost because persons cannot function in the workplace and at home. The value of these transfers can be estimated using information on administrative expenses in public social welfare programs (see section 0 of this appendix).
Social welfare program transfers excluding unemployment insurance and workers compensation totaled $37 billion in 1980. ADM disorders accounted for $7.5 billion, or 20 percent (table E-3). Mental illness represented $5.6 billion in transfers, just over lS percent; alcohol represented 5 percent; the impact of drug abuse was negligible.
The administrative costs and the value of transfers from these programs were distributed among o.'l,:ohol abuse t arug abuse t and mental illness based on varying factors. For programs involving disability payments t the distributional factors w: °e equal to the. proportion of patient days attributable to the disorder spent in general hospitals and VA hospitals. More' specific data were available for programs related to vocational rehabilitation (U.S.
E-9

1,1J
~ K I; If
.... • 0
,lIbl. E-]
Public Prograa Social Wei tar. Trans'.r Payaent Expendltur., Ind Cosls Due to AD" Probleas. 1980 U In allllon5)
Percent Total Cosls Codl Tolil Tunsfer Tranda,
Progria bpendlturua COili tolll Alcohol Abuse Dru~ Abuse
Percent liiounl Percen - bounl
OASOIIl-dlublllty paYllenli $15.,4]1 91.6 '15.061 3.4 f 501 c • 2 Une.ployaanl InSUrAnce 16.50] 89.0 14.688 Aallroad temporary disability
insurance 64 92.2 59 3.4 2 c b Slate lempofiary disablilly
insllrAnce 1.3]0 96.8' 1.287 3.4 41 c b Wor~er5 coapensallond 9.588 95.6' 9,161 Public ISshlancee 1,219 8t.1 1,012 4.8 49 0.5 5 Supplemenlal ,ecurlty Inco.e 1,446 91.2 6,191 0.8 5] c 2 food shllps 644 95.6 6'6 4.8 29, 0.5 J Veteran's pensions and
99.2' cOllpensaUon 11,306 11,216 9.1 1,088 0.9 102 Vocallonal rehabilitationd 976 95.3 910
lolil '64.51l 160.851 U.ll. f.15
aSource: Social Security AII.fnlllratlon, Offlc. 0' Retlreaant Ind Survlvon bless than $.5 all lion.
Inlurlnc., plr,onl' cu..unlcilion.
cless lhan .0005. d[xclude5 hospllal and,aedlc.' benefits. , ebcludes vendor aedlcal payaenll Ind loci.1 IIrvlcu. 'Percent does nol exclude hosplt.1 .nd aedlcl' progrill'l binder COlli: (-) Ho causal' relAtionship II aUUlled, or no benetlclarle, reported AIIH II prlaery cause of eligibility. Totals .ay nol add due to rounding. Source: Reselrch .rlangl. In,tltut ••
. Coils i "ental IHnen
'ercent bounl
1.9 n,141 ..
1.9 5
B.9 115
4.1 49 18.8 1.219 4.1 29
21.6 2.651 1!i.l 119
15,648
I "

DOC, BOC, 1982) and social security income (U.S. DHHS, SSA, personal com-munication). These proportions are based on information collected on .. - . persons likely to receive assistance from these programs. E. Sources of PaYments for Health Care Exoenditures
In the main body of the report, values were assigned to the health treatment services received by ADM victims, regardless of the source of payment. The data on source' of payment describe how the cost burden is borne.
How much the government pays for the treatment of ADM victims is a relevant topic for policymaking. The size of the ADM treatment bill will be pertinent to the Federal government and private third-party insurers in deciding whether or not to provide coverage for these disorders.
This question has been addressed in the same fashion as in the 1981 study. The first step was to obtain financial data on health settings specializing in ADM treatment. The NOATUS survey obtains financia] infor-mation from specialty units which treat alcohol and drug abusers.
The, data for alcohol and drug abuse trea~ent specialtY.units,are presented in table .E-4. For·units primariLY providing alcohol abuse services, the largest single source of payments was private health insurance, at 26 percent of $1.1 billion in 1980. State, Federal, and local governments paid an additional 45 percent, with state government paying 21 percent. Client fees were the next largest source, at approximately 10 percent or $110 million.
Settings offering primarily drug abuse treatment are somewhat different (table E-4). Of funds totaling $534 million in 1980, 7 percent were client fees, 8 percent came from private health insurance., and the remai ni ng 81 percent was from a variety of government sources.
Community mental health centers primarily serve individuals with other mental disorders, although some alcohol and drug abusers are clients. The National Institute of Mental Health has collected information on funding for CMHCs. Their findings are presented in table E-5. Government funds, including grants for various purposes, provided 64 percent of the CMHC resources. Twenty-one percent were Federaliy funded with 34 percent from the state, and 9 percent from other governmental units. Direct services provided by CMHCs generated 32 percent of revenues (3.7 from patient fees and 7.3 percent from private insurance). The remaining 21 percent was from sources such as Medicare, Medicaid, schools, and other grants.
E-ll
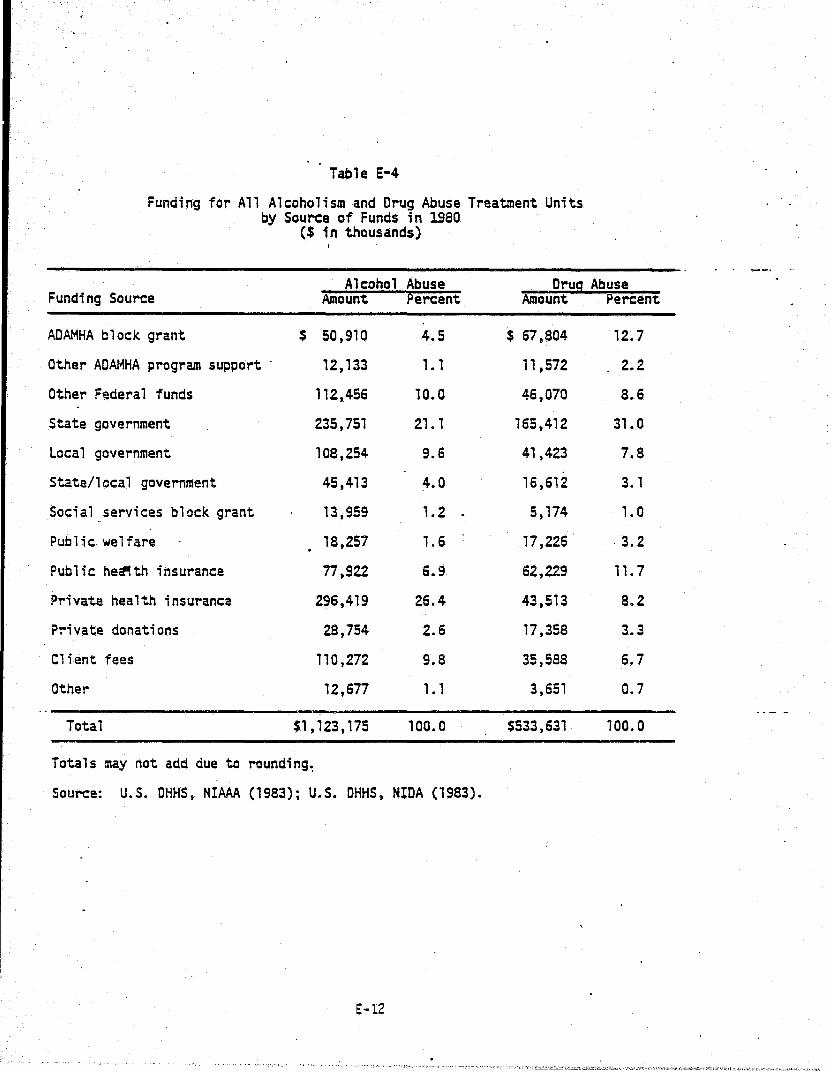
Table E-4
Funding for All Alcoholism and Drug Abuse Treatment Units by Source of Funds in 1980
($ in thousands) ,
Alcohol Abuse Drug Abuse Funding Source Amount ~ercent Amount Percent
AOAMHA block grant $ 50,910 4.5 $ 67,804 12.7
Other ADAMHA program support . 12,133 1.1 11 ,572 2.2
Other Federal funds 112,456 10.0 46,070 8.6
State government 235,751 21.1 165,412 31.0
Local government 108,254 9.6 4',423 7.8
State/local government 45,413 4.0 16,612 3. 1
Social services block grant 13,959 1.2 . 5,174 1.0
Public welfare 18,257 1.6 .17,226 ·3.2
Public he~th insurance 77 ,922 6.9 62,229 11.7
Private health insurance 296,419 26.4 43,513 8.2
P~ivate donations 28,754 2.6 17,358 3.3
Client fees 110,272 9.8 35,588 6.7
Other 12,677 1.1 3,651 0.7
Total $1,123,175 100.0 $533,631 100.0
Totals may not add due to rounding~
Source: U.S. DHHS, NlAAA (1983); U.S. OHHS, NIDA (1983).
E-12

Table E-5
Source of Operating Funds Federally Funded Community Health Centers
- in 1980
Source of Funds
Government funds ·Federal funds
Staffing grants Construction grants Children1s grants Research and training Othe~ Federal funds
State funds Local government funds ather government funds
.Receipts from direct services Patient fees Insurance (priv. & voluntary) Medicare Medicaid Schools Title XX Other receipts from services
Re-:eipts from indirect services· Schools ather receipts
Philanthropy ather fund raising ather receipts
Total
Totals may not add due to rounding.
Source: U.S. DHHS, NIMH (1981).
E-13
Percent
64.2 21.2 15.2 0.8 , .4 0.4 3.5
33.9 8.8 0.2
31.8
3.7 7.3 2.9
10.9 1.0 3.7 2.2
0.6 0.2 0.4
0.5 0.8 2.2
100.0
..

The types of health treatment settings discussed above represent ~ small proportion of an treatment services used by ADM victims. Data' on the other settings, including general hospitals, physicians' offices,' .. nursing homes, and other health providers and sundries, are maintained for all illnesses on an annual basis. This study has distributed the aggregate expenditures of alcohol abuse, drug abuse, and mental illness for each setting estimated above by the percentage distribution of national funding sources. The costs for alcohol abuse exclude fetal alcohol syndrome because costs were not estimated by setting for this disorder. Tables E-6 through E-8 report the expenditure for each setting and its di,stribution across out-of-pocket and various third party funds including Federal, state and local, and private. These funds are reported according to the distribution of illnesses being treated in that setting.
For alcohol abuse, of the $8 billion spent in settings for which we have data, the two largest payment sources are Federal funds and private third party fu~ds,'each contributing approximately ~l percent. This' is followed by individuals, and State a~d local third party funds which together provide approximately 12.5 percent of all resources.
Drug abuse treatment 'expenditure patterns are s+milar. Twenty percent of all payments are from out-of-pocket sources and more than 20 percent from state and local governments. Federal funds and private third party funds each contribute slightly more than 30 percent of the total budget. For mental health treatment, the largest payment source was from Federal funds, with approximately 33 percent. Out-of-pocket sources and private third party funds covered approximately 25 percent each, while state and local governments paid under 20 percent of all costs.
It has also b~en possible to obtain more specific information on payments from Medicare for ADM disorders. These data overlap with values discussed immediately above and represent the proportion of federal pay-ments for Medicare services in general hospitals. -Unpublished 1980 data on inpatient hospital discharges by Medicare eligible individuals indicate that ADM disorders accounted for 3.8 percent of all discharges (table E-9). Of 10.3 million total Medicare discharges, 129,000 or 1.3 percent were related to alcohol abuse as defined by diagnostic codes. Thirty-seven thousand discharges (0.4 percent) were associated with drug abuse, and 214,000 discharges (2. 1 percent) were associated with other
E-14

Table E-6
Estimates of Funds for Alcohol Abuse by Setting and Source,' 1980 ($ in millions)
Expenditures for Alcohol
Abuse Out of Third Party Funds
State && Setting Treatment Pocket Federal Local Private
ADM specialty hospitalsa
General hospitals
Other specialty facilities
~'1HCs
Alcohol abuse facilities
Other facilitiesa
Other general ,services
Nur~ing homes
Physician services
Dentist services
Other health professionals
Drug and drug sundries
Other health services
Volunteer services
Total
$4,800 '
181
385
167
726
621
171
750
359
$8,160
Totals may not add due to rounding.
$ 437
7
38
70
271
27"
101
620
$2,012
$1,982
38
SO
52
147
13
33
31
185,
$2,541
$ 624
•
81
118
43
45
10
13
30
80
$1,044
1,747
55
169
2
264
130
24
69
94
$2,554
aOata not available. Expenditures in ADM specialty hospitals and other facilities were over S6 billion.
Source: U.S. DHHS, NIAAA (1983); U.S. DHHS, NIMH (1981); Gibson and Waldo (1981).
E-IS

Table E-7
Estimates of Funds for Drug Abuse by Setting and Source, 1980 ($ in millions)
Expenditures for Drug Third Partv Funds Abuse Out of State &&
Setting Treatment Pocket Federal Local Private
ADM specialty hospitalsa
General hospitals $ 527 $248 $218 $ 69 192
Other specialty facilities
CMHCs 50 2 11 22 15
Drug abuse .facilities 295 20 69 114 92
Other facilities a '.,
qther general services
Physician services 28 10 6 2 11
Dentist services 59 45 1 1 12
Other health profes-sionals 16 10 3 1 2
Drug and drug sundries 71 58 3 3 7
Other health services 34 17 8 9
Volunteer services
Total $1,080 $193 $328 $220 $338
Totals may not add due to rounding.
aData not available. Expenditures in ADM specialty hospitals and other facilities were over $6 billion.
Source: U.S. DHHS, NIDA (1983); U.S. DHHS, NIMH (1981); Gibson and Waldo (1981).
E-16
. (-

e-
Table E-8
Estimates of Funds for Mental Illness by Setting and Source, 1980 ($ in mill ions)
------------------------------------ - . ..- - _. Expenditures for Mental Illness Out of
Setting Treatment Pocket
ADM specialty hospitalsa
General hospitals
Other specialty facilities
CMHCs
Other faci1ities a
Other general services
Nursing homes .
Physician s~rvices
Other health professionals
Drug and drug sundries
Other health services
Volunteer services
Total
$5,088
997
2,783
870
184
810
388
$11,120
Totals may not add due to rounding.
$ 463
37
1,166
315
109
670
$2,760
Third Party Funds State AI
Federal Local Private
$2~ 101
211
863
176
36
33
199
$3,619
$ _661
446
718
54
14
32
.87
$2,012
, ,862
303
46
326
26
74
102
$2,729
aOata not available. Expenditures in ADM specialty hospitals and other facilities were over $6 billion.
Source: U.S. DHHS, NIMH (1981); Gibson and Waldo (1981).
E-17,

~ental disorders. Applying these proportions to the $26.3 billion distributed by Medicare to pay for inpatient hospital stays, $332 million'were attributable to alcohol abuse, $95 million due to drug abuse, and $552 million due to mental illness.
These estimates suggest that Medicare payments for alcohol abuse accounted for $342 million out of the federal government total of $1,982 million (17 pe~ent). For drug abuse, the Medicare value of $95 million was 44 percent of federal payments for hospital services. Medicare paid $989 million, or 47 percent of the'federal share for mental illness of $2.1 billion.
E-18
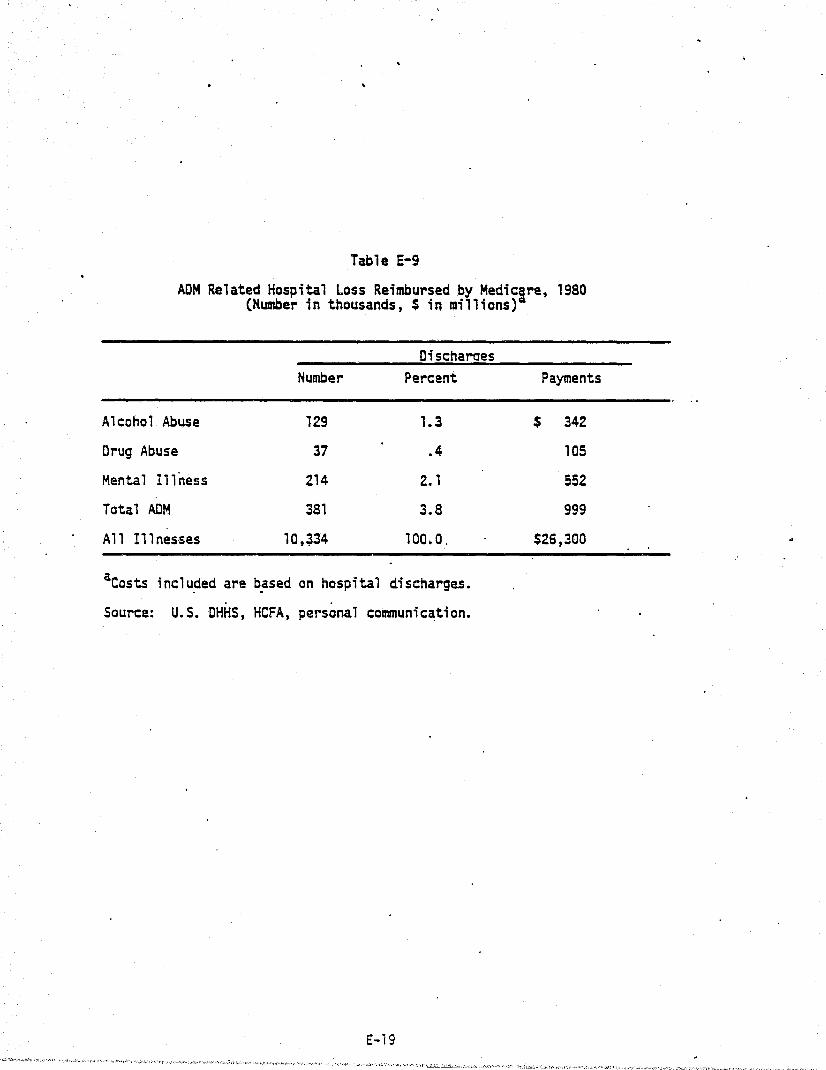
Table E-9
ADM Related Hospital Loss Reimbursed by Medicgre, 1980 (Humber in thousands, $ in millions)
Oischaraes Number Percent Payments
Alcohol Abuse 129 1.3 $ 342
Drug Abuse 37 .4 105
Mental Illness 214 2. 1 552
Total ADM 381 3.8 999
A 11 I1 1 nes'ses 10,~34 100.0. $26,300
aCosts inc1~ded are ~ased on hospita1 discharges. . .
Source: U.S. DHHS, HCFA, personal communication.
E-19

F. ALCOHOL ABUSE RE~TED GASTROINTESTINAL TRACT CANCERS
F-l

.'
F-2

better understood to disentangle the combined effects of both of these substances.
Malnutrition and anemia have also been associated with increased risk of oral, hypopharyngeal, and esophageal canCers. Nutritional defects, especially of vitamin-B complex and iron, have been associated with heavy alcohol intake (Wynder and Shigomatsu, 1967). Studies have reported that alcohol impairs the absorption of thiamine in the intestines, and that several intestinal enzymes that aid in the movement of nutritional factors into the blood streams are affe~ted by alcohol (Mezey et al., 1970; Mott et al., 1972; Roggen et al., 1972).
In studies of alcohol related cancer risks, authors have emphasized the need to clearly distinguish among the specific forms, amounts, and duration of drinking involved. Increasing knowledge about how cancer is caused and how it is related to alcohol abuse has not yet produced a con~ sensus on which cancers are caused by alcohol and what proportion of new cancers and of mortalities. are related to alcohol abuse. C. Potential Costs
Nonetheless-, it is possi'ble to examine the potential implications for the economic cost of alcohol abuse if alternative causal factors between alcohol and GI tract neoplasms are hypothesized.
A list of GI tract neoplasms that have been related to alcohol abuse is p~esented in table F-l. The number of mortalities by type of cancer, and the estimated total cost in 1980 for each type of cancer are also presented. These neoplasms caused more than 60,000 premature deaths in that year. Table F-2 presents estimates of the direct treatment costs in specific settings for 1980-1982 for the alcohol abuse-associated cancers of the GI tract. Another major cost which is associated with mortality is lost productivity.
The analyses indicate that if 100 percent of the specified cancers could be attributed to alcohol abuse, then the economic cost to society for alcohol abuse would be close to $900 million for direct treatment costs in 1980 and $4.9 billion for lost lifetime productivity. Should the estimates of the cost of treatment and mortality due to alcohol abuse-related gastrointestinal tract cancers be added to the already-calculated estimates of alcohol-related costs, the new total would be noticeably, but not overwhelmingly, larger.
F-4
. . ~. ~., ..... ,.., ..... ~,~~,~ -. '''~ ..... ,......, , ........ ,--._,-. -,.. ..... .,.-.. "., •. ~ -~-. '.-~'" _~n''''~'h -. '. \ ... ,'.~ '~'. _"..,.., 'fP.~_,...~.", ' .... ", .. ",~_ .. ' >

SECTION F: ALCOHOL ABUSE RELATED GASTROINTESTINAL TRACT CANCERS
A. Introduction Controversy exists on whether alcohol abuse is causally related to
cancers' of the gastrointestinal tract. While there is strong evidence that malignancies of the liver can be caused by alcohol abuse, research findings on other neoplasms are mixed. Costs of liver malignancies are represented in the main body of the report. In lieu of more definitive findings about alcohol abuse and other cancers, these costs were not included. This section outlines the potential magnitude ~f costs of other cancers of the· gastrointestinal tract. B. Evidence on the Link
S~veral stUdies have been performed in the last 20 years which indicate that alcohol abuse is related to cancer of the gastrointestinal tract. These studies have found a significant increase in risk associated with . . high levels of a.lcohol abuse, leadil1g to malignancies of the GI tr~ct. ·In" Alcohol and" Health III (Noble, 1978), i·t was estimated that over 50 percent of primary malignant liver cancers were due to alcohol abuse. However, studies have indicated both higher and lower levels of association.' A wide variation has been found in the association of other GI tract cancers to . a 1 coho 1 abus e.
A factor significantly aggravating the rel,ationship of alcohol abuseto cancer is consumption of tobacco. Epidemiological stUdies indicate that consumption of alcohol and tobacco increases the risk of contracting cancer over that of consumption of only one or the other product.
After studying the smoking and drinking habits of 483 people with cancer of the mouth and pharynx and 447 controls, Rothman and Keller (1972) reported that risks accelerated with increased exposure to each factor. They calculated that 76 percent of the disease in males might be eliminated if exposure to both alcohol and tobacco were avoided. Another study reported that women who. drink and smoke heavily may develop cancers of the buccal cavity and tongue 15 years earlier than women who abstain from both (JAMA, 1976).
The means by which alcohol acts on body tissues is still unclear. There are theories that specific ingredients in different types of alcohol are carcinogens. Similarly, the effect of tobacco on body tissues must be
F-3

•
Table F-l
Numbers and Economic Cost of Premature Mortality Due to Malignant Neoplasms Related to Alcohol Abuse, 1980
($ in millions)
Mortalities OiScounted va1ue
Type Number CHiD percentj ~,o percent)
Tongue, malignant 1,874 $ 145 $ 15
Mouth, floor malignant 509 39 4
Moutn, other, malignant 1,399 108 11
Pharynx, malignant, oro 1,127 87 9
Pharynx, malignant, naso 585 45 5
Pharynx,' malignant, hypo 634 49 5
Pharynx, malignant, unspecified 1,501 116 12
Esophagus, malignant 7,985 619 61
Stomach, malignant 14,372 1,115 111
Rectum, malignant 7,435 sn 58
Liver, malignant, primary 2,395 186 19
Liver, bile duct typeb 455 35 4
Pancreas, malignant 19,640 1,523 152
Larynx, malignant 3,412 264 26
Total 63,323 4,911 491
C56 percent)
$ 81
22
61
49
25
28
65
347
624
323
104
20
853
148
2,750
Source: Unpublished mortality statistics from the Vital Statistics fi' es provi ded by NCHS, present discounted values provided by NCHS.
,F-5
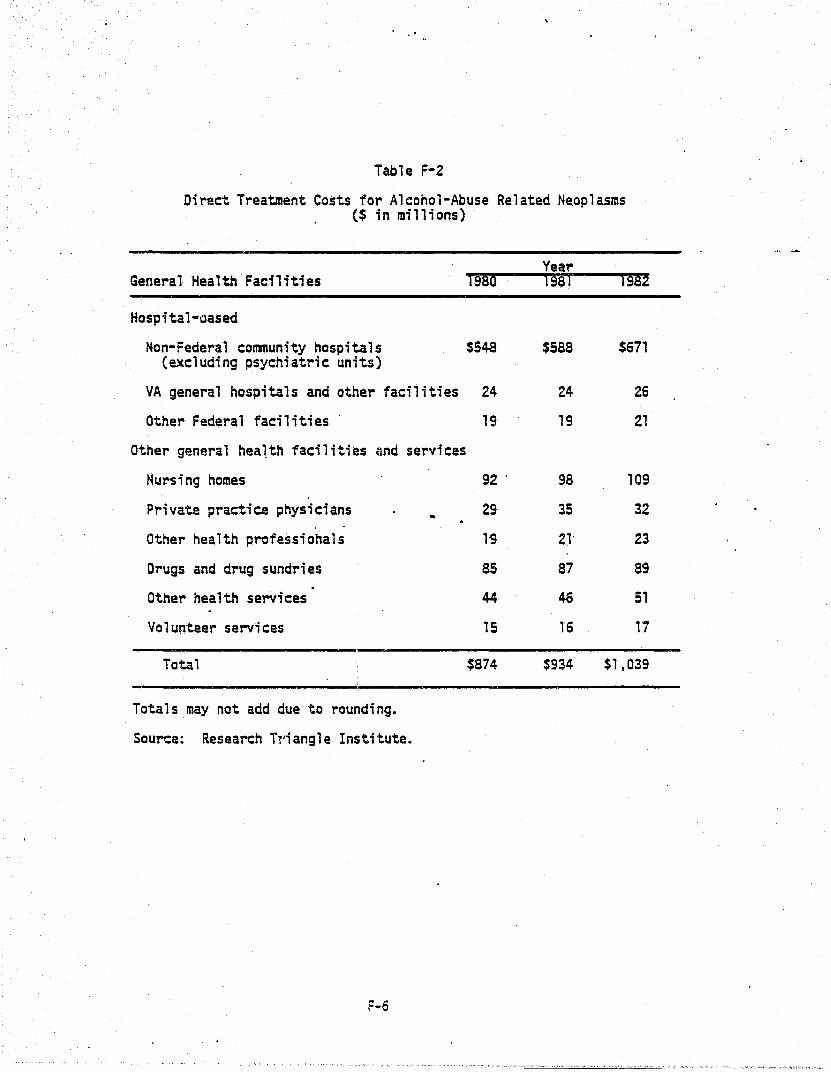
Table F-2
Direct Treatment Costs for Alcohol-Abuse Related Neoplasms ($ in millions)
YeaT' General Health Facilities 1980 1981 1982
HQspital-oased
Non-Federal community hospitals $548 $588 $671 (excluding psychiatric units)
VA general hospitals and other facilities 24 24 26
Other Federal facilities 19 19 21
Other general hea1th facilities and services
Nursing homes 92 . 98 109
Private practice physicians - 29 35 32
Other health professionals 1~ 2l 23
Drugs and drug sundries as 87 89
Other health services 44- 4Q 51
Volunteer services 15 16 17
Total $874 $934 $1,039
Totals may not add due to roundi ng.
Source: Research T'.'i angl e Institute.
F-6
The $874 million of treatment, costs for the selected GI cancers in 1980 1S somewhat more than 10 percent of total health treatment costs due· to other alcohol abuse related illnesses. These cancers represent a more significant although, again, not overwhelming impact on total mortality costs. The additional 63,000 mortalities attributable to alcohol abuse would almost double the number of deaths attributable to alcohol abuse. At 100 percent discount, however, there would be a $4.9 billion increase in mortality costs, already estimated at $13.9 billion. This would be a 35 percent increase in the mortality costs at the 6 percent discount rate.
The combined increase in treatment cost and mortality cost with a 100 percent attribution would be $5.8 billion. This is 6.7 percent of the total value already attributed to alcohol abuse.
At the other extreme, should only 10 percent of these GI neoplasms be attributable to alcohol abuse, then treatment cost would have been $87 million higher in 1980, and mortality cost would have been $491 million higher. The ~ombined increase wo~ld be .7 percent of .the cost estimated in this .. '
study. Another 4nteresting comparison is made by·taking the 56.percent causal
factor currently assigned to malignant primary liver neoplasms.· Should the 56 percent rate be appropriate for other GI tract neoplasms, then health treatment costs would be $490 million higher, and mortality costs would be $2.8 billion higher. The total increase would be just under 4 percent of the current estimate' for alcohol abuse.
F-7
, , '(""-~""", '0 '."'." .",.,<~,~, ' .. '~.'.' ", ......... .I'~. O',q", ~". ~",.~ ·,'·'V~~'~',_""'-,,~· '"<-'" ~"'d'" '"'~'<''~'V''''F~''' ,·.·,w~".: ~,~ __ "-:"'"<..,' "'~!::--'l,:'fY~l",.,L'--';:-C:-_' ~"_"C'i(c,::!_.::;-j;\i~"I'l':"r"~ ,~.'.,,~, '~'~'"l"".-""_!l"" "'~.~, •• ,,:-~ ...... '.'\ <".".' !" '~."',~.~r,"'." .~. ,: ';J.~,~;." "L"';;.:':f.'.:.-,w"o"'."';"'""~'''''' ."-'">',,,,,-,,"">-

• G. PROTOCOL FOR UPDATING COST ESTIMATES
G-l

G-2

SECTION G. 'PROTOCOL FOR UPDATING COST ESTIMATES
A. Introduction Having current data about the economic costs of ADM is essential.
Because the function of these values indicates the relative impact of the disorders on economic well-being, it is necessary to have relatively current estimates. Only by maintaining current estimates will it be possible to
compare the costs of alcohol and drug abuse, and mental illness to updated estimates of the costs of major disease categories produced by NCHS, and new estimates produced for narrowly defined disorders, such as particular infectious diseases.
The cost estimates presented in this volume have been constructed using a methodology tha't makes it possible to compare the ADM cost estimates with those for other disorders. The concepts and methodology are consistent with those recommended by the Public Health Service (Hodgson and Meiners, , 197~) and with the tr~dition ~f pre.vious cost of illness studies.
The best way to maintain current estimates of the economic burden. of alcohol abuse, drug abuse, and mental illness is 'to completely reestimate the costs for each year, utilizing the same methodology from year to year, and inserting the most current values from appropriate statistical series. Completely reestimating costs has essentially been the task of the present effort. This is both time consuming and relatively expensive if the sole function is to provide more recent estimates than the last comprehensive study.
A less expensive and less time intensive technique for maintaining current cost estimates is to make year-to·year adjustments in the values based on a small number of factors that have known relationships to the cost estimates. This is both possible and reasonable where there are a relatively small number of factors that could affect the cost estimates significantly. A.specific cost estimate will have some imprecision because adjustments will be made for only some of the most important change factors.
In this section, some of the factors that contribute to ~hanges in estimates of the economic costs of ADM are identified, and then a small number of adjustment factors are selected and their application for use in· maintaining current cost estimates is specified.
G-3
.'
Finally, the economic costs to society of ADM in 1981, 1982,. and "983
are estimated using the protocol developed in this study. B. Sources of Chanaes in the ADM Cost Estimates Over Time
The 1981 RTI study developed formulas fer estimating the costs of ADM. The elements.of those formulas delineate the variety of factors that are significant in making cost estimates. A short list of these includes:
o inflation in wages and prices; o growth in the population at risk; o sociodemographic distribution; o change in the prevalence or incidence rate; o causal factors; and o social responses to ADM. Changes in any and. all of these elements are incorporated when com
pletely new cost estimates are made. Inflation is the most obvious and inevitable source of change in
economic cost esti~tes. Market prices in our society continually change, 50metimes rapidly (at 'over 10 percent per year) a~d sometimes more slowly .. (potentially down to no change, or even a'negative change). Moreover, wages and different prices may change at different rates in the same period of time. Health pri.ces inaeased more rapidly than prices of other consumer goods during the last ZO years. Wages and salaries have grown at a rate faster than consumer prices because productivity of the workforce has improved. Although a single inflation rate may be calculated for the gross national product, different sections of the economy have different rates of inflation. Any methodology proposed to adjust for inflation should allow for differences in rates.
As the total population grows, the number of people pot~ntially affected by ADM also inaeases. However, some sections of the population ~ay be at higher risk than others. The growth in the total population may not reflect change in the numbers in those sUbpopulations at risk. For instance, total population grew 3.2 percent between 1977 and 1980, while the labor force increased by neariy 8 percent. Thus, the potential for losses from redu~ed
productivity grew by more during that period than did total population. Conversely, a population at very high risk of motor vehicle crashes--18 to 20 year olds--grew by only 3.7 percent over the.3-year period.
G-4
The sociodemographic characteristics of the population at risk can-be another source of variation in cost, although such distributions' may not change substantially over short periods of time. For instance, in calculating indirect losses, there are substantial differences between productivity values for older and younger workers, and males and females. Should the age/sex distribution of ADM change, while the total papulation prevalence rate remains the same, the cost to society would change.
Potentially, the true incidence and/or prevalence rates for ADM disorders could change from one year to the next. Completely apart from population growth, the proportion of the population at risk that experiences problems due to ADM may increase or decrease. The costs would change accordingly, even if there were no change in the population at risk, because a different share is affected.
A further c~mplicating factor is that the causal relationship between ADM and costly consequences may change. Apparent causal relationships might change either because ~here are ne~ data or analyses. Improv~dstudy
techniques may simply yield more reliable ~stimates of causal factors. Additionally, ADM might actually.ha~e a change in causal relationship with consequences.
Finally, society·s response to ADM may impact on any of these items. Social responses may serve to increase some cost components (where these costs reflect intervention efforts) and reduce other cost components (the result of successful interventions being to reduce certain undesirable impacts of ADM). There are many other ways in which the economic cost to society of ADM might be affected by public interv~ntions. A much debated example of this is the current proposal to make 21 the legal drinking age in all states. Such a change could have immediate cost impacts. The criminal justice system may bear higher costs in enforcing the laws, while there may be lower indirect costs due to reduced alcohol abuse-related trauma.
In updating cost estimates, it is recommended that only two of the six factors be adjusted--wage and price inflation and change in the population at risk.
Prices and population changes can be routinely adjusted because quality data are available on a very timely basis for these continuously changing factors.
G-5

The other four factors--inc;dence and prevalence rates, causal factors, soc;odemographic distributions, and social responses--are less likely to change significantly in a short time period than prices, wages, and population. Incidence and prevalence rates for the ADM disorders are not reestimated on an annual basis. It is recommended that detailed cost computations be made when the data from the periodic studies of alcohol and drug abuse become available. The causal relationships of AOM to their consequences are the subject of lI1uch scholarly study. New studies on causal relations.hips will tend to use different data sets, different time periods, and different analysis techniques. These factors make routine adjus~nents to causal factors unadvisable to undertake.
The impact of new interventions v;s-aovis the economic cost estimates ;s seldom well monitored, and it is very difficult to integrate the impact of changing social responses to AOM into the cost esti~ation framework. C. A Simolified Cost Uodate Protocol
A t\oio-factor update protocol is recommended. The first factor is an adjustment for inflation~ and the second is an adjustment for population growth or real change.
There are somewhat different sets of factors for the various types of cost components. The basic premise of this methodology is that proportional changes (over a period of time) in the adjustment factors are related to proportional changes in the values of the cost components. The period of time is the time between the base year (year with the most recent estimate for the cost component, referred to as "b.yearll
) and the update year (year' for which updated estimates for the cost component are desired, referred to as "u.year").
where
The general update formula is
C6. year = C6. year x (AF~.year + AF~.year) x (AFR6. year + AFR6.year)
C6. year = value of cast component (CC) in update year (u.year)
C~ a = value of cost component (CC) in base year (b.year) Il.ye r AF6 a = value of adjustment factor for inflation (AFI) in update
.ye r year (u.year)
G-6

..
AF! year = value of adjustment factor for inflation (AFI) in base year • (b.year) .
AFR6 year = value of. adjustment factor for real change (AFRe) in update • year (u.year)
AFR6.year = value of adjustment factor for real change (AFRe) in base year (b. year).
This formula applies proportional change adjustments for inflation
(AFb.year + AF~.year) and real change (AFRE.year +-AFR6.year) to the value of the cost component in the base year to produce a value for the update year.
Table G-l lists the cost components for ADM and specifies an adjustment factor to reflect change in inflation and a factor to reflect real change. The adjustment factors are in each case a data series that is routinely maintained and published by a government.agency .. Values for these data series are readily available from publicati~ns of these agencies (listed in the table) or by personal communication. The comp'lete r-eferences. for the publications and identification ~ the responsible agencies are on tne bottom of the table.
Separate adjustment factors are specified for the major compcnen~s of the costs of ADM. Different factors allow the various cost components to change at somewhat different rates, as dic+..ated by the factors "morell appropriate for each component.
For a given cost component, the same factors are suggested for adjusting estimates for each of the three ADM disorders. The two factors for each cost component reflect general influences that are likely to affect costs of the ADM disorder-s in similar, if not identical, ways. As stated above, there are many other factor-s likely to be relevant to cost changes; however, incorporating many or all of those changes in updated estimate~ would require r.ecalculating the costs from the start. This update protocol is only intended to reflect major, relatively unambiguous, changes that occur over a period of several years. Beyond three to four years, the full cost estimates should be performed again, with an assessment made of new findings and data about ADM.
To facilitate implementation of the update prptocol, historical values are presented for the recommended adjustment factors (see table G-2). Data
G-7

Table G-l
Adjustment Factors for Updating ADM Economic Costs to Society Estimates
Adjustment Cost Component Factor
Treatment and Succort Inflation && Real Change
Mortality Inflation
Morbiditv-Reduced Productivity and Lost Emcloyment
Real Change
Inflation
Real Change
Motor Vehicle Crashes Inflation -Oirect CAsts
Real Change
Crime Inflation -
Real Change
·Data Series
Total National Health Expenditures
Compensation per hour in the business sector
Total deaths
Compensation per hour in the business sector
U.s. Civilian Labor Force . -
Implicit price deflator for gross national product
Motor vehicle accidents (on the road)
Source
Health Care Financing Review
MonthlY Labor Review
Monthly Labor Review
Monthly Labor ReV1f£!
Survey of Cur;:er;t Business
Accident Facts
Implicit price deflators Survey of Cur-for gross national rent Business product: Government purchases of goods and servic~s (state and local)
Crime Index: Number of known offenses
Crime in the United States; Unifonn Crime Recorts

-----------------------------------------------------------------Cost Component
Adjustment Factor Data Series Source ---------------------------------- --'--'-- ._.---
Sod a 1 We 1 fare Programs
Other Direct Costs
Victims of Crime
Crime Careers (Drug Abuse only)
Incarceration
Inflation
Real Change
Inflation
, Rea 1 Change
Inflation
Real Change
Inflation
Real Change
Inflation
Real Change
Motor Vehicle Crashes Ini1ation -Indirect Costs
Real Change
1, .... ,_.,
Implicit priced deflators Monthly Labor for gross national Revlew . product: Government purchases of goods and services (state and local)
Adult population (18-64 years) (as of July 1, each year)
Current Poculatlon Reoorts, Serles P-Z5 .
Implicit price deflators Survev of Cur-for gross national pro- rent ~uslness duct
Adult population (18~64 years) (as of July 1, each year)
Compensation per hour in the business sector
C'rime Index: Number of known offenses
Current Pooulatlon Reoorts, Serles P-25
Month'ly Labor Revlew
Crime in the Unlted States: . Uniform Crime ReDor'ts
Compensation per hour in Monthlv Labor the business section Review
Heroin addicts in the United States
National Institute on Drug Abuse
Compensation per hour in Monthly Labor the business sector Review
Total population in state and federal prisons
Compensation per hour in the business sector
Motor vehicle accidents (on the road)
G-9
National Prisoner Sta'tistics: Bureau of Justice Statistics Bulletin
Monthlv Labor Review
Accident Facts -.

Data Sources for Uodating Costs
Accident Facts, National Safety Council, Chicago, Ill., annuaJ. •.... ___ _
Current Population Recorts, Series P-2S, Bureau of the Census, U.S. Department of Census.
Federal Bureau of Investigation, Crime in the United States: Uniform Crime Recorts, U.S. Department of Justice, annual.
Health Care Financina Review, Health Care Financing Administration, U.S. Depar~ent of Health and Human Services, periodical.
Monthlv Labor Review, Bureau of Labor Statistics, U.S. Department of Labor, monthly.
National Narcotics Information Consumers Committee Reoort, Drug Enforcement Aaministr~tion, U.S. Department of Justice, annual.
National Prisdner Statistics, Bureau of Justi~e Statistics Bulletin, Bureau of Justice StatistiCS, U.S. Department of Justice, periodical • . Survey of Current Business: Bureau of Economic Analysis, U.S. Department of Commerce, monthly. i. '.
Vital Statistics of the United States, National Center for Health Statistics, U. S·. Department of Hea 1 ttl and Human Serv; ces, annuaL.
G-10
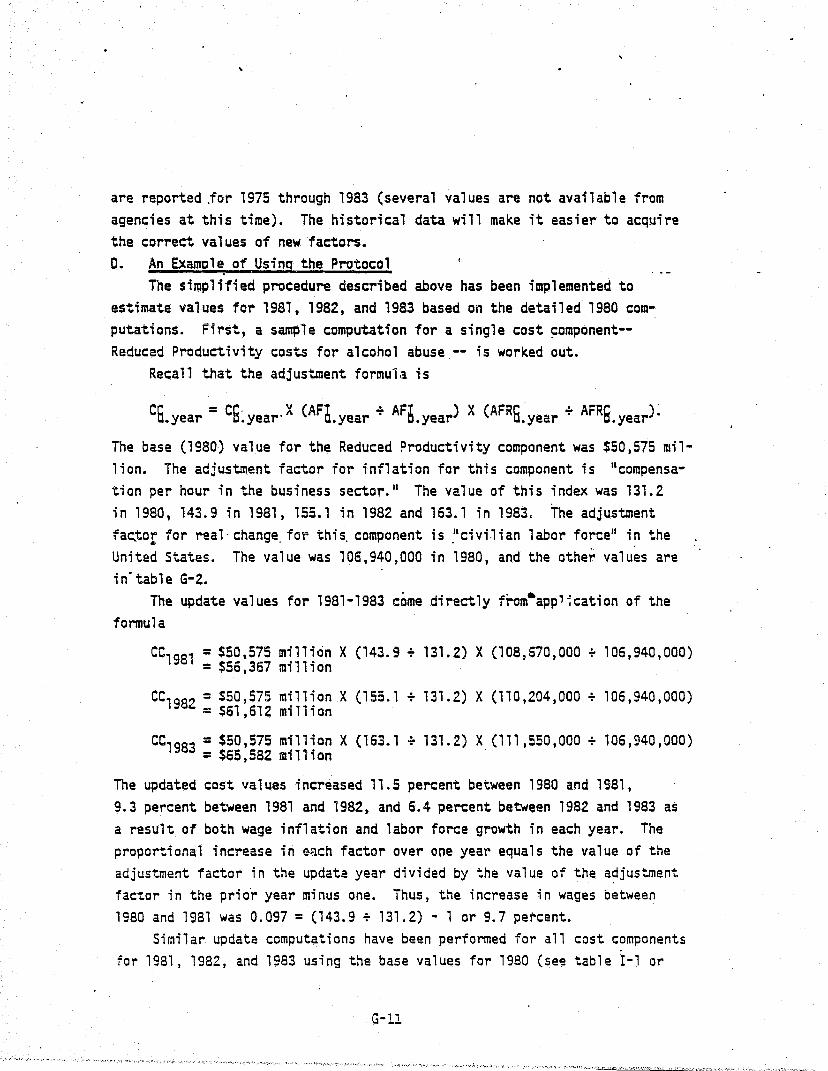
are reported ,for 1975 through 1983 (several values are not available from agencies at this time). The historical data will make it easier to acquire the correct values of new factors. O. An Examole of Using the Protocol
The simplified procedure described above has been implemented to estimate values for 1981, 1982, and 1983 based on the detailed 1980 computations. First, a sample computation for a single cost ~omponent-Reduced Productivity costs for alcohol abuse -- ;s worked out.
Recall that the adjustment formu1a is
C6. year = C6~year'X (AF~.year + AF~.year) X (AFRG.year + AFR6.year)·
The base (1980) value for the Reduced Productivity component was $50,575 million. The adjustment factor for inflation for this component is IIcompensation per hour in the business sector.1I The value of this index was 131.2 in 1980, 143.9 in 1981, 155.1 in 1982 and 163.1 ;n 1983. The adjustment fac.tor for real-change, for this, component;s ,"civi.lian labor force ll in the United States. The value was 106,940,000 in 1980, and the other values are in' table G-2.
The update values for 1981-1983 come directly from·app'~cation of the formula
CC1981 = $50,575 million X (143.9 + 131.2) X (108,670,000 + 106,940,000) = $56,367 million
CC1982 = $50,575 million X (155.1 + 131.2) X (110,204,000 + 106,940,000) = $61,612 million
CC1983 = $50,575 million X (163.1 + 131.2) X (111,550,000 + 106,940,000) = $65,582 mi 11 ; on -
The updated cost values increased 11.5 percent between 1980 and 1981, 9.3 percent between 1981 and 1982, and 6.4 percent between 1982 and 1983 as a result of both wage inflation and labor force growth in each year. The proportional increase in each factor over one year equals the value of the adjustment factor in the update year divided by the value of the a~justment factor in the prior year minus one. Thus, the increase in wages between 1980 and 1981 was 0.097 = (143.9 + 131.2) - 1 or 9.7 percent.
Similar update computations have been performed for all cost components for 1981, 1982, and 1983 using the base values for 1980 (see table I-lor
G-ll

~. r Ii
,.
~ ~ ~
~
hbllt' 6-2
Hlltorlcal Dati Serle, 01 AdJU$t.ent factor, for Updatl Protocol
18pllclt Price Deflator 'or l.pllclt
Cup en- Slite & tocll Price lolil uLlon per Governraent Dellator lor Adult Cri.. Ind8IC
Hational lIour In the Purchasu lor Gron Population U.S. IIU11ber Hotor Population J/ealth the BU51- of Goodl HaLlond (18-64 yun) lotal Civil lin 01 Known Vehicle Ileroin In Stale
bpendlLures ness Sector Ind Servlcl' Product (15 01 July 1) Duths Labor force Ol"n515 Accldenls Addlch Ind Feder,,1 Vear U In billions) (Index) (Index) (Index) Hhouund) (thouund) (lhouund) (lhousand) (.111 Ion,) (thouund) Prisons
191~ , 1l2.1 85.5 U9.4 125.8 125,604 1,891 91,115 11,251 16.5 550 II.A.
'P 1976 149.1 92.9 118.1 1l2.1 . 128,014 • 1,909 96,158 11,105 16.8 500 H.A . r;; 1977 169.2 100.0 148.4 140.1 110,401 1,900 99,009 10,916 11.' 495 100,024
1978 189 •. 1 IOB.6 159.1 150.4 132,820 1,928 102,251 11,141 18.1 410 301,216 1979 215.0 IIB.l 111.1 161.4 135.329 1,914 10',962 12,153 18.1 420 314,451 1980 249.0 111.l 191.6 110.6 131,842 1,990 106,940 13,295 11.' 492 329,821 1981 286.6 141.9 200.' 195.5 140,054 1,9811 108,610 13,290 18.0 4Ub 369,910 1902 5122.4 155.1 222.9 206.9 142,149 1,9061 110,204 12,851 18.1 49Zb 414,162 1981 Ull.Sc 161.1 ll6.' 215.6 144,022 2,0101 111,550 {I1,960)d M.A. 492b 41B,810
aPrell~lnary.
bl980 15 Lhe .ost recent yelr for thl' I,tl.ltl fro. HHICC. c .
Ihls value has been estl.atld by III bilid on Inflltlon In perlonll hll,th Clrl prlcel I~d urowlh !n totll populltlon. lhl 1983 vilul will be IVIII-able In AII!Just, 1984. .
dprellMlnary labulatlons a, of April. 19S4 Indlclted I 1 perclnl drop betweln 1902 .nd 1981. lhll lrln511tes Into I [rl •• Inde. of Ibout 11.960,000 known offenses.
H.A.: nol available.
.1

•
, ,.::."-,,, .
III-l), and the available data on adjustment factors. The results appear in tables G-3, G-4, and G-5.
Using this procedure, the economic costs to society of ADM are . estimated to increase from $190 billion in 1980 to $213 billion in 1981, $234 billion in 1982, and $249 billion in 1983. The estimates for alcohol abuse, drug abuse, and mental illness do not increase proportionally with the total over the three years of updating because growth in components is different.
The growth' in estimated total costs of ADM was greater than the overall rate of inflation in the economy. These estimates indicate growth of 12.1 percent bet~een 1980 and 1981, 9.9 percent between 1981 and 1982, and 6.4 percent bet~een 1982 and 1983. In contrast, inflation as measured by the lIimpl;cit price deflator for gross national productll was 9.5 percent, 5.S"percent, and 4.2 percent respectively. The difference bet~een overall inflation and the increase in cost estimated is due to population growth, other real. changes, and increase9 p'roductivity of the work force as reflected . . by the "compensationll adjustment. E. A Final Cautionary Note
Updated cost estimates allow the impact'of ADM to be roughly assessed in more current dollars and units. The protocol uses the readily made adjustments for the most fundamental changes. Whi 1 e these estimates will be used in place of current cost estimates (or because data for current estimates are unavailable), they are only a'substitute for current data. It ;s recommended that updated values only be used for, at most, three to four years, until it becomes propitious to make completely new estimates due to an accumulation of more recent data, and findings about the incidence, prevalence, and consequences of ADM in our society.
G-13

Table G-3
Updateld Costs to Soci ety of A 1 coho 1 Abuse, Drug Abuse, and Mental III ness, 1981 (dollars in millions)
Core Costs
Direct Treatment and Support
Indirect Mortali tya Reduced Productivity Lost Employment
Other Related Costs
'Oirect
Total
Motor Vehicle Crashes Crime Social Welfare Programs ather
Indirect
Victims of Crime Crime Careers Incarceration Motor Vehicle Crash
(time loss)
Totals may not add due to rounding.
aAi 6 percent discount rate ..
Alcohol Abuse
$12,052
15,832 56,367 4,575
2,405 2,548
42 3,239
189
2,216 512
$99,97Gb
Drug Abuse
$1,661
2,168 28,661
348
c
6,417 2
597
926 9,570 1,803
c
$52,154b
Mental Illness
$27,115
7,881 3,480
20,666
.. 945 222 733
108
$61,149b
Total
$ 40,828
25,880 88,508 25,589
2,405 9,909
266 4,569
1,115 9,570 4,127
512
$213,279
b
bThe total costs to society for each of the three ADM disorders are not comparable, . since the completeness of data available for each cost category varied significantly. For example, the estimate of .reduced productivity is relatively complete for alcohol abuse, only partially complete for drug abuse, and incomplete for mental illness. 'Although costs are hypothesized to occur in this category, sufficient data are not available to develop a reliable estimate. Source: Research Triangle Institute.