Economic consequences of public oversight of the auditing profession
134
Economic consequences of public oversight of the auditing profession Citation for published version (APA): Zou, L. (2017). Economic consequences of public oversight of the auditing profession: insights from the capital and audit market. Datawyse / Universitaire Pers Maastricht. https://doi.org/10.26481/dis.20171220lz Document status and date: Published: 01/01/2017 DOI: 10.26481/dis.20171220lz Document Version: Publisher's PDF, also known as Version of record Please check the document version of this publication: • A submitted manuscript is the version of the article upon submission and before peer-review. There can be important differences between the submitted version and the official published version of record. People interested in the research are advised to contact the author for the final version of the publication, or visit the DOI to the publisher's website. • The final author version and the galley proof are versions of the publication after peer review. • The final published version features the final layout of the paper including the volume, issue and page numbers. Link to publication General rights Copyright and moral rights for the publications made accessible in the public portal are retained by the authors and/or other copyright owners and it is a condition of accessing publications that users recognise and abide by the legal requirements associated with these rights. • Users may download and print one copy of any publication from the public portal for the purpose of private study or research. • You may not further distribute the material or use it for any profit-making activity or commercial gain • You may freely distribute the URL identifying the publication in the public portal. If the publication is distributed under the terms of Article 25fa of the Dutch Copyright Act, indicated by the “Taverne” license above, please follow below link for the End User Agreement: www.umlib.nl/taverne-license Take down policy If you believe that this document breaches copyright please contact us at: [email protected] providing details and we will investigate your claim. Download date: 11 Feb. 2022
-
Upload
khangminh22 -
Category
Documents
-
view
0 -
download
0
Transcript of Economic consequences of public oversight of the auditing profession

Economic consequences of public oversight of theauditing professionCitation for published version (APA):
Zou, L. (2017). Economic consequences of public oversight of the auditing profession: insights from thecapital and audit market. Datawyse / Universitaire Pers Maastricht.https://doi.org/10.26481/dis.20171220lz
Document status and date:Published: 01/01/2017
DOI:10.26481/dis.20171220lz
Document Version:Publisher's PDF, also known as Version of record
Please check the document version of this publication:
• A submitted manuscript is the version of the article upon submission and before peer-review. There canbe important differences between the submitted version and the official published version of record.People interested in the research are advised to contact the author for the final version of the publication,or visit the DOI to the publisher's website.• The final author version and the galley proof are versions of the publication after peer review.• The final published version features the final layout of the paper including the volume, issue and pagenumbers.Link to publication
General rightsCopyright and moral rights for the publications made accessible in the public portal are retained by the authors and/or other copyrightowners and it is a condition of accessing publications that users recognise and abide by the legal requirements associated with theserights.
• Users may download and print one copy of any publication from the public portal for the purpose of private study or research.• You may not further distribute the material or use it for any profit-making activity or commercial gain• You may freely distribute the URL identifying the publication in the public portal.
If the publication is distributed under the terms of Article 25fa of the Dutch Copyright Act, indicated by the “Taverne” license above,please follow below link for the End User Agreement:
www.umlib.nl/taverne-license
Take down policyIf you believe that this document breaches copyright please contact us at:
providing details and we will investigate your claim.
Download date: 11 Feb. 2022

Economic Consequences of Public Oversight
of the Auditing Profession:
Insights from the Capital and Audit Market
Lei Zou

© Lei Zou
Cover: Datawyse
Printing: Datawyse | Universitaire Pers Maastricht
ISBN: 978 94 6159 788 5
UNIVERSITAIREPERS MAASTRICHT
U P
M

ECONOMIC CONSEQUENCES OF PUBLIC OVERSIGHT
OF THE AUDITING PROFESSION:
Insights from the Capital and Audit Market
DISSERTATION
to obtain the degree of Doctor at Maastricht University,
on the authority of the Rector Magnificus,
Prof.dr. Rianne M. Letschert
in accordance with the decision of the Board of Deans,
to be defended in public
on Wednesday, December 20, 2017, at 13:30 hours
by
Lei Zou

Supervisor:
Prof.dr Ann Vanstraelen
Co-Supervisor:
Dr. Patrick Vorst
Assessment Committee:
Prof.dr. Roger Meuwissen (Chair)
Prof.dr. Kris Hardies, University of Antwerp, Belgium
Prof.dr. Stefanie Kleimeier
Prof.dr. Marleen Willekens, Katholieke Universiteit Leuven, Belgium

Acknowledgements
The past four years as a PhD student have been an adventure, fulfilled with ups and downs.
Although the process is often stressful, it was also a lot of fun. At this moment, I am very glad
to finally finish my dissertation. And of course, I am grateful to those people who have helped
me out through this journey. I would not be able to reach this point without you.
First and foremost, I would like to thank my promotor Ann Vanstraelen. Ann, thank you for
giving me the opportunity to pursue a PhD. Being your research assistant and master thesis
student, you always provided me support and guidance. Your motivating feedback and
enthusiasm for research is undoubtfully the most important thing that kept me going through
my PhD journey. You have always been my leading example of a researcher and supervisor.
Also, I would like to thank Patrick Vorst for being my co-promoter. I have learned a lot from
our academic discussions. At the same time, I also enjoyed a lot our after work drinking events,
our high quality lunch conversations and your continuous jokes. I would also like to thank
Robert Knechel. I am Robert grateful for the valuable input for my dissertation papers and the
opportunity to join the University of Florida as a visiting scholar. I would like to thank NWO
for financial support of my PhD.
I also extend my gratitude to the members of my assessment committee, Roger Meuwissen,
Kris Hardies, Stefanie Klemeier and Marleen Willekens, for their evaluation of my dissertation
and the timely and helpful feedback. Further, I would like to express my gratitude to my
colleagues at the Department of Accounting and Information Management for the supportive
environment and the research as well as personal related chats. I especially appreciated the help
from Caren, who provided me support for research, teaching and the job market endeavor.
In addition, I want to thank my fellow PhD students at Maastricht: Christoph, Judith, Lars and
Lars, Nadine, Olga, Raginee and Reka, most of whom I have shared an office with for a shorter
or longer period of time. I thank you for all the wonderful moments we have spent together
during and after office hours. Lars H., you are the first one who I shared an office with and you
have always been optimistic and confident, which had a significantly positive impact on my
PhD. Reka, you are the other one who shared an office with me during my first year. I enjoyed
our discussions about the other greater things in life in addition to research. Lars R., you are
the only other Nephalem in the department. In case I open one day a bed and breakfast in Tibet,
I will invite you to be my first guests. Olga, thanks for all the Boom Shakalaka moments in the
office. And Raginee, thanks for introducing Baileys as my new best friend. As junior PhD
students, I wish you both best of luck with the wonderful accounting research journey!
My special words of thanks go to Lu, Britt and Ulrike. Lu, it was wonderful to have you as my
colleague. Sharing Chinese food and talking about the ups and downs in our PhDs in our mother
tongue made my PhD journey feel much easier without any doubt. Britt, we were sharing a lot
of common things during our academic journey. Thank you for the delicious Indonesian food
as well as all the parties in your apartment, which I enjoyed a lot. Thank you for being one of
my paranymphs. And I hope one day we can make a trip together to the Himalaya area. And
finally, Ulrike, your amazing personality and your endless enthusiasm to research has provided

me great support during the last year of my PhD. Our coffee times together at UNSW also
provided me a lot of comfort for my relocation from Maastricht to Sydney. And I cannot wait
to have coffee again with you at Quad Food Court. And thanks for being my other paranymph.
Moreover, I would like to thank my friends and family for their support. Liu and Tingyu, we
have been best friends since high school. I will always remember our journeys together to
Shanghai and Kunming during my PhD and the many more journeys that will come. And I
know you will always be there whenever I need your help.
I want to express my deepest gratitude to my parents. I very much appreciate your love,
patience and support. And of course also to my husband Yi, with whom I started dating not
long before I decided to go to Maastricht for my master degree. We had a two years long
distance relationship, almost supported by Skype only. Your company meant a lot to me,
especially in the evening when I was home sick. We got married right before I started my PhD.
After that, you decided to move to Maastricht and to start a family with me. I hope that the
journey we share together will last a much longer time than my PhD journey.
Lei

Table of Contents
1
Table of Contents
Chapter 1: Introduction .......................................................................................................... 3
1.1 Introduction ................................................................................................................ 4
1.2 The informational value of public oversight .............................................................. 6
1.3 Public oversight and audit firm behavior ................................................................... 7
1.4 Research method and data ......................................................................................... 7
1.5 Main findings and controbutions ............................................................................... 8
1.6 Outline of the dissertation .......................................................................................... 9
Chapter 2: The Impact of PCAOB Inspections on Stock Market Liquidity over Time . 11
2.1 Introduction .............................................................................................................. 13
2.2 Prior literature and development of hypotheses....................................................... 15
2.3 Data and methodology ............................................................................................. 19
2.3.1 Data ...................................................................................................................... 19
2.3.2 Dependent variables ............................................................................................. 19
2.3.3 Research design and control variables ................................................................. 20
2.4 Empirical results ...................................................................................................... 22
2.4.1 Descriptive statistics ............................................................................................ 22
2.4.2 Univariate analysis ............................................................................................... 25
2.4.3 Multivariate analysis ............................................................................................ 26
2.5 Empirical results ...................................................................................................... 33
2.5.1 Initial year effect .................................................................................................. 33
2.5.2 Constant sample ................................................................................................... 34
2.5.3 Annual inspected audit firms ............................................................................... 40
2.6 Conclusion ............................................................................................................... 41
Chapter 3: PCAOB Inspections and Audit Firm Behavior: An Analysis of the First
Three Inspection Rounds of Small Audit Firms ................................................................. 45
3.1 Introduction .............................................................................................................. 47
3.2 Background .............................................................................................................. 50
3.3 Theoretical background and development of hypotheses ........................................ 52
3.4 Research design ....................................................................................................... 56
3.4.1 Sample selection .................................................................................................. 56

2
3.4.2 Empirical models ................................................................................................. 59
3.5 Empirical results ...................................................................................................... 61
3.5.1 Descriptive statistics ............................................................................................ 61
3.5.2 Univariate results ................................................................................................. 67
3.5.3 Multivariate results .............................................................................................. 68
3.6 Additional analyses .................................................................................................. 76
3.6.1 Personnel adjustments .......................................................................................... 76
3.6.2 Changes in the number of clients ......................................................................... 79
3.6.3 Total audit fee change .......................................................................................... 79
3.6.4 Financial risk of new clients after the inspections ............................................... 82
3.6.5 Other additional tests ........................................................................................... 83
3.7 Conclusion ............................................................................................................... 84
Chapter 4: Market Reactions to Public Oversight: Evidence from the Netherlands ...... 85
4.1 Introduction .............................................................................................................. 87
4.2 Background .............................................................................................................. 90
4.3 Prior literature and hypotheses development ........................................................... 91
4.4 Research design ....................................................................................................... 94
4.5 Data, sample and results .......................................................................................... 96
4.6 Additional analyses ................................................................................................ 100
4.6.1 Market reactions to PCAOB inspection reports................................................. 100
4.6.2 Cost of debt analyses ......................................................................................... 102
4.7 Conclusion ............................................................................................................. 106
Chapter 5: Conclusion ......................................................................................................... 109
5.1 Summary ................................................................................................................ 110
5.2 Contributions and future research .......................................................................... 111
References ............................................................................................................................. 113
Appendix 1: Variable definitions for Chapter2 ................................................................ 120
Appendix 2: Variable definitions for Chapter3 ................................................................ 122
Appendix 3: Variable definitions for Chapter4 ................................................................ 124
Appendix 4: Valorization-addendum ................................................................................. 125

Chapter 1: Introduction

Chapter 1
4
1.1 Introduction
In response to high profile financial reporting scandals that marked the turn of the 21st
century, independent public oversight of the auditing profession was installed in many
countries around the world. Motivated by the debate on the effectiveness of public oversight,
which is not uncontested, and the relatively limited empirical evidence, I examine in this
dissertation economic consequences of public oversight. In particular, I focus on the impact of
disclosure of inspection outcomes on information asymmetry and the cost of capital in the
equity and debt market, as well as on auditor behavior.
The agency relationship is one of the oldest and commonest codified modes of social
interaction (Ross 1973). According to agency theory, when managers hold little equity in the
firm and shareholders are too dispersed to enforce value maximization, corporate assets may
be deployed to benefit managers rather than shareholders (Morck et al. 1988), which is
commonly recognised as agency costs. An important mechanism to reduce agency costs is
through contracting. While these contracts may be implicit or explicit, they are often based on
accounting numbers (Lennox 2005). However, this may not be sufficient as the accounting
numbers on which contracts are based are prepared by managers. It gives managers incentives
to manipulate the accounting numbers when the numbers are not sufficient to guarantee
manager’s compensation. As a result, auditing conducted by independent auditors are
demanded to control the risk of misstatements in the accounting numbers (Jensen and Meckling
1976; Lennox 2005; Watts and Zimmerman 1983).
While an audit is designed to provide an independent view on the reliability of the
information provided in the financial statements, this function of audit is based on the premise
that investors trust the auditors. The higher the audit quality, the less likely that financial
statements contains material mistakes. However, if an audit is perceived to be of low quality,
the information provided is discounted. It may increase costs of capital, reduce capital market
participation and reduce the availability of capital which harms financial stability and the
wellbeing of individual companies (Offermanns 2011). While audit quality is not directly
observable to investors, auditor reputation and auditor size are commonly used proxies for audit
quality (Barton 2005; Francis and Wilson 1988).
There used to be a common notion that the threat of reputational losses and litigation from
investors in case of audit failure is sufficiently high to keep audit firms from providing
substandard audit quality (Offermanns and Peek 2011). However, the Enron scandal, which
became public in 2001 and is cited as the biggest audit failure, lead to the dissolution of Arthur
Andersen which was one of the biggest audit firms in the world. Consequently, the scandal
gave rise to the debate on the effectiveness of auditing and resulted in stricter regulations and
legislation in the US. One of the most important regulatory changes was the passing of the
Sarbanes-Oxley Act (hereafter referred to as SOX), which includes the foundation of the Public
Accounting Oversight Board (hereafter referred to as PCAOB).
Founded in 2003, the PCAOB carries the mission to oversee the audits of public companies
in order to protect the interests of investors and further the public interest in the preparation of
Introduction
5
informative, accurate, and independent audit reports (PCAOB 2011). By doing that, the
PCAOB aims to restore investors’ confidence in the auditing profession. The most important
responsibility of the PCAOB is to conduct periodical inspections on audit firms who have
public clients. Prior to the introduction of PCAOB inspection, audit firms were self-regulated
through peer reviews. According to SOX, audit firms must register with the PCAOB to prepare
or issue an audit report for a public company or another issuer, or a broker-dealer, or to play
certain roles in those audits. Specifically, audit firms who have more than 100 public clients
are inspected by the PCAOB annually and the remaining audit firms are inspected triennially.
The inspectors evaluate audit firms’ quality control policies and procedures as well as review
audit engagements selected based on characteristics of the client, its industry, practice office,
partner or prior inspection results (PCAOB 2009).
After the inspections, the PCAOB publishes its findings in an inspection report for each
audit firm, without disclosing the selected clients’ identity. There are three parts in an
inspection report. Part I of an inspection report contains information about engagement-specific
deficiencies. These deficiencies can either be related to failures in performing audit procedures
according to the General Accepted Auditing Standards or failures in detecting a material error
according to the General Accepted Accounting Principles. Part II of an inspection report
indicates whether deficiencies are identified in audit firm’s quality control system. However,
the PCAOB only publicly discloses those quality control deficiencies if audit firms fail to
remediate the deficiencies in a 12-month period.
Following the steps taken in the US, many other countries began to install public oversight
in auditing profession. Taking Europe as an example, the revised 8th EU Directive (2006) put
an end to self-regulation of the auditing profession in all EU member states. According to the
Directive, all member states of EU were required to install public oversight before June 2008
(European Union 2006). At an international level, the International Forum of Independent
Audit Regulators (IFIAR), established in 2006, currently comprises independent audit
regulators from 52 jurisdictions representing Africa, North America, South America, Asia,
Oceania, and Europe, with the mission to serve the public interest and enhance investor
protection by improving audit quality globally.
While independent public oversight bodies have a clear mission, it remains unclear
whether the potential benefits of the newly installed public oversight bodies outweigh its costs.
Taking the PCAOB inspections as an example, there are direct and indirect costs associated
with it. The direct costs are reflected in the PCAOB’s budget. Under Section 109 of the
Sarbanes-Oxley Act, the PCAOB is required to establish, with the approval of the Commission,
a reasonable accounting support fee to fund its operations. The fee is assessed annually on
issuers and registered broker-dealers. The accounting support fees have increased significantly
over time and currently reached US$ 268 million in 2017 starting from US$ 50 million in 2003
(SEC, 2016). The indirect costs can be related to potential increases in audit fees after the
installment of the PCAOB inspection. To gain further insights on the potential benefits of
public oversight, I investigate how the publication of the public oversight inspection reports
impact stock market liquidity and audit firm behavior in the US in my first and second study
of this dissertation, respectively. Additionally, to shed some light on whether institutional

Chapter 1
6
differences matter for public oversight, I examine in the third study of this dissertation how
investors react to the inspection reports in the Netherlands.
1.2 The informational value of public oversight
One of the main tasks of public oversight is to provide information about audit quality to
investors (DeFond 2010). Different oversight bodies have different ways of disclosing their
inspection findings. However, it is far from clear how capital markets perceive the information
in the inspection reports, which is the only mechanism through which inspections are visible
and communicated to investors. To gain more insights on this issue, I examine the
informational value of public disclosure of public oversight inspection results for the capital
markets in the first and third study of this dissertation.
Specifically, in my first study, I examine how the publication of PCAOB inspection reports
impact stock market liquidity over time, using the first three rounds of the PCAOB inspections.
In particular, I assume audit quality is not perfectly observable before the publication of the
inspection reports. Hence, if the PCAOB inspection report provides an informative, low-cost,
and easy to interpret signal to help investors update their belief about audit quality, stock market
liquidity can be expected to increase. Other than through changed perceived audit quality,
PCAOB inspections may also impact stock market liquidity through increased actual audit
quality, as high audit quality limits managers’ discretionary accounting choices and increases
accounting information precision (Barron and Qu 2014). Consistent with this argument, prior
literature indicated that audit quality increases after the installment of PCAOB inspections
(Carcello et al. 2011; Gunny and Zhang 2013; Gipper et al. 2015; Aobdia 2015).
As discussed above, many countries worldwide began to install public oversight following
the example of PCAOB inspections. However, given institutional differences between
countries, it is salient to investigate whether inspections achieve similar effects in different
countries. Thus, while in my first study, I test how the publication of PCAOB inspections
impact liquidity in the US, I investigate capital market reactions to public oversight in a non-
US setting in my third study. More specifically, I focus on the Dutch setting and investigate
whether the publication of inspection results and disclosure of fines imposed on the Big 4 audit
firms provide relevant information for capital market investors.
As a member state of the EU, the Netherlands installed public oversight in 2006, which is
regulated by the Audit Firm Supervision Act (AFS Act 2006). According to the Act, all audit
firms performing statutory audits need to be inspected by the Netherlands Authority for the
Financial Markets (hereafter referred to as AFM). Similar to PCAOB inspections, AFM
inspections cover selected audit engagements and quality control systems of audit firms.
However, there are important differences between them. Although the set-up of the inspection
structure in the Netherlands is similar to the set-up in the US, there are some important
differences between them. Firstly, the AFM inspects private clients as well as public clients,
while the PCAOB only inspects public clients. Secondly, the AFM publishes its inspection
outcomes on Big 4 audit firms in the Netherlands using a single report, while the PCAOB

Introduction
7
discloses a single report for each audit firm. Thirdly, quality control deficiencies are directly
disclosed in the AFM inspection reports, while not disclosed until the audit firm did not
remediate them in a 12-month period in the PCAOB inspection reports. Moreover, litigation
risks, which are considered to be the most significant drive of improving audit quality after the
inspection reports are published in the US (Acito et al. 2017; Gipper et al. 2015), are much
lower in the Netherlands. The differences in the format of inspections and in the institutional
environment are the underlying motivation of the study to advance our insights on the effects
of public oversight in a non-US setting.
1.3 Public oversight and audit firm behavior
Other than its intention to restore investors’ confidence in the auditing profession, in
other words to increase perceived audit quality, public oversight also aims to improve actual
audit quality. However, the extent to which this can be achieved depends on the extent to which
the inspection process triggers changes in auditor behavior, especially when deficiencies are
found during the inspection. In my second study of this dissertation, I examine how smaller
audit firms that are subject to triennial inspection respond to the findings of PCAOB
inspections. More specifically, I examine whether inspections affect the audit fees of smaller
audit firms charged to their clients, conditioning on the content of the inspection reports.
Conceptually, engagement specific deficiencies as well as audit firm quality control
deficiencies discovered during inspections and publicly disclosed in PCAOB inspection reports
can lead to changes in the auditor’s incentive structure and behavior, in response to the
increased litigation risks and regulatory sanctions (DeFond and Lennox 2011). Based on the
assumption that the audit market in the US is competitive, the increased costs should be
reflected in audit fees. However, a deficient PCAOB inspection report may lead to reputation
damage for audit firms, which may have an adverse effect on clients’ valuations (Dee et al.
2011) or may cause the firm to exit the audit market (DeFond and Lennox 2011). From this
point of view, although faced with increased costs, deficient audit firms will have difficulties
to pass the additional cost to their clients by increasing audit fees. Thus, I explore how the
changes in audit fees are conditional on the content of the inspection reports. Moreover, the
increased engagement costs related to compliance with PCAOB standards (e.g., documentation
requirements) as well as the additional investment in upgrading audit firms’ quality control
system to meet PCAOB standards may not necessarily further increase after each inspection
round unless the PCAOB becomes stricter over time. Hence, I also examine how audit fees
changes over time.
1.4 Research method and data
For my first study, I employed bid-ask spread, price impact, zero returns and total trading
cost to proxy for stock market liquidity. All the data were retrieved from CRSP. For my second
study, I obtained audit fee data from AuditAnalytics. For my third study, I collected financial

Chapter 1
8
information for the public companies in the Netherlands from DataStream to calculate
abnormal returns. For my first and second study, I manually coded the content of the PCAOB
inspection reports, which can be retrieved from the PCAOB website.
1.5 Main findings and controbutions
The findings of my dissertation show that the publication of the PCAOB inspection
results in the US can impact stock market liquidity as well as audit firm behavior. However,
the inspection reports appear to have limited informational value for investors in the
Netherlands.
Specially, in my first study, I find that stock market liquidity decreases after the
disclosure of the first round inspection results, implying that sophisticated and more informed
investors might be better able to process the information in the beginning. If in turn
unsophisticated investors have difficulty in interpreting the information, the return premium
they demand increases. After the second round of inspections, the results show a significant
increase in liquidity. This is in line with the intention of regulators to reduce uncertainty and
improve audit quality. However, after the publication of the third round inspection results,
liquidity appears to be no longer significantly influenced as most of the uncertainty is resolved
and future reports contain less new information that can help investors in updating their views
on audit quality. I further find that the magnitude of decrease in liquidity after the first round
inspection does not depend on the content of the inspection reports, suggesting that the direct
information effect is dominating in the first round inspection. For second round inspection
reports, I observe an increase only for companies with auditors who did not disagree with
PCAOB findings. Moreover, in case auditors do state a disagreement, liquidity increases,
suggesting a bad signal of future audit quality.
My first study contributes to the existing literature in several ways. First, I provide
insights on the perceived usefulness of inspection reports as signals of audit quality. Second, I
provide early empirical evidence on the long-term capital market effects around the publication
of the inspection reports. My study also provides some evidence that can guide regulators
concerning whether or not to publicly disclose the inspection reports and/or publicly disclose
sanctions imposed on audit firms.
The results of my second study indicate that audit fees increase on average after the
publication of inspection reports. This finding holds across the first three inspection rounds.
Moreover, the increase is mainly driven by audit firms without engagement deficiencies or
without publicly disclosed quality control deficiencies. However, for audit firms with disclosed
quality control deficiencies, audit fees decrease which suggest reputation damage. In my
additional analysis, I find that deficient audit firms experienced a decrease in the number of
CPAs, which may suggest a seeking for lower labor cost. On the contrary, for clean audit firms,
I document an increase in the number of CPAs, which would be consistent with higher auditor
effort. Interestingly, I find that while clean audit firms are able to increase audit fees and the
number of CPAs, their number of public clients decreases. If a clean PCAOB inspection report

Introduction
9
is an indication of higher audit quality, this finding would suggest that in the small audit firm
market, there appears to be a strong focus of clients on lowering audit fees instead of seeking
for higher audit quality.
My second study contributes to the growing body of literature on the economic effects
of PCAOB inspections by focusing on the smaller audit firm market segment and by
considering different dimensions of audit firm behavior. While recent studies mainly document
positive effects of PCAOB inspections for annually inspected audit firms (Acito et al. 2017;
Carcello et al. 2011), I show that the evidence for the small audit firm market is not unequivocal
positive, which is likely driven by the lower demand for audit quality in this market segment.
The results of my third study indicate that cumulative average abnormal returns (CAAR)
around the publication of the public oversight inspection results are not significantly different
from zero for the first AFM inspection and four fines announcements, suggesting that these
reports are not informative to investors. For the second AFM inspection report, on average,
CAAR is significantly negative, indicating that perceived audit quality decreased and auditors
suffer from reputation damage after the disclosure. Furthermore, using cross-sectional
regressions, I find no support that cumulative abnormal returns (CARs) are different across the
clients audited by different Big 4 audit firms. Overall, the results of my third study provide
limited support that AFM inspection reports change capital market investors’ perceived audit
quality.
My third study contributes to the literature on investigating the effect of public oversight,
and is one of the few studies relating to a non-US setting. I provide empirical evidence that the
publication of the AFM inspection reports and fines announcements against the Big 4 audit
firms do not change perceived audit quality in the capital market in the Netherlands, while prior
research suggests that the PCAOB inspection reports and fines decisions are valued in the US
market. To the best of my knowledge, this is the first paper to explore capital market reactions
to public oversight in a non-US setting. I also look into the debt market reaction to inspections,
which is important for practice since debt plays a key role in companies’ financing activities
(Pittman and Fortin 2004). My third study highlights the importance to consider different
institutional environments and inspection formats when assessing the impact of public
oversight, which is important for both regulators and researchers.
1.6 Outline of the dissertation
In the next three chapters, I present each of the three studies described above. Chapter 2
describes the first study on whether information asymmetry is influenced by the publication of
PCAOB inspection reports. Chapter 3 presents my second study on how audit firms react to
PCAOB inspection reports, conditional on the content of the inspection reports. Chapter 4
describes how the capital market reacts to public oversight in the Netherlands. Finally, I
conclude with a summary of the main findings of these studies, their contribution to the
literature and suggestions for future research.


Chapter 2: The Impact of PCAOB Inspections on Stock Market
Liquidity over Time

Chapter 2
12
Abstract1
This study examines whether and how the publication of PCAOB inspection reports of
triennially inspected audit firms changes the dynamics of client-company stock market
liquidity over time. We find that liquidity decreases after the first round inspections regardless
of the inspection outcomes, suggesting that the direct information effect is dominating. For the
second round inspections, we observe an increase in liquidity only for companies audited by
clean auditors and deficient auditors who do not disagree with the PCAOB’s findings. The third
round inspections do not appear to affect liquidity any longer. Overall, our results imply that
PCAOB inspection reports change investors’ perceptions of future audit quality. Moreover,
investors learn how to interpret the reports, but that ultimately the informational value fades
out after multiple rounds as most of the uncertainty is already resolved and future reports
contain less new information for investors to update their views on audit quality.
1 This chapter is based on a working paper together with Ann Vanstraelen and Patrick Vorst.

The Impact of PCAOB Inspections on Stock Market Liquidity over Time
13
2.1 Introduction
In this paper we examine the impact of publicly reporting PCAOB inspection results on
stock market liquidity over time. The Public Company Accounting Oversight Board (PCAOB),
which was created by the Sarbanes-Oxley Act of 2002, put an end to the self-regulation of the
auditing profession that was dominant for many decades. Subsequently, many other countries
followed the US example by installing independent public oversight in varying forms. These
initiatives are currently at different stages of development. However, in contrast to the US,
most countries do not publicly disclose the inspection reports and/or sanctions imposed on
audit firms. Ex ante, it is not clear what the economic consequences are of the level of
transparency on inspection outcomes (Maijoor and Vanstraelen 2012). Moreover, despite its
potential merits, public oversight has been, especially in the beginning, subject to criticism and
skepticism, such as a lack of expertise, inadequate transparency on the procedures used and
delays in the publication of inspection outcomes on an audit firm’s quality control system
(Glover et al. 2009; Daugherty and Tervo 2010).
Motivated by the debate on the effectiveness of public oversight, which is not
uncontested, and the limited, though growing number of empirical studies (Abernathy et al.
2013), we investigate the impact of public disclosure of inspection reports on stock market
liquidity. If the publication of inspection reports provides an accurate signal about audit quality
and changes investors’ perceptions of future audit quality, disclosure can have direct capital
market consequences. To empirically examine this, we use a US setting since the US is one of
the few countries where inspection reports of audit firms are publicly disclosed and where
inspections have been in place for nearly a decade. This allows us to also investigate how the
publication of PCAOB inspection reports of triennially inspected audit firms changes the
dynamics of client-company stock market liquidity over time. We focus on companies audited
by smaller audit firms (defined as audit firms that have less than 100 issuers as clients and that
are inspected triennially by the PCAOB) since not much is known about the quality of these
firms, despite the fact that they play a significant role in the competitive landscape of local
markets and influence the ability of Big 4 audit firms to collect a fee premium (Bills and
Stephens 2016). Furthermore, in contrast to annually inspected audit firms, there is variation
in their inspection outcomes. Despite the deficient inspection reports issued for annually
inspected audit firms, it is well- documented that global audit firm networks deliver higher
audit quality compared to smaller audit firms (Francis et al. 1999; Francis and Yu 2009)2. At
the same time, the common assumption to consider smaller audit firms as a homogeneous group
seems inappropriate as some audit firms receive clean PCAOB opinions while for others
deficiencies are flagged. Hence, small audit firms are an interesting group that warrants further
investigation.
2 We note that, using matching models, Lawrence, Minutti-Meza, and Zhang (2011) suggest that the difference in
audit quality between Big 4 and non-Big 4 auditors largely reflect client characteristics and, more specifically,
client size.

Chapter 2
14
We focus on stock market liquidity because it is directly linked to the cost of capital
(Butler, Grullon and Weston, 2005). Theory predicts that improved financial reporting quality
reduces adverse selection costs, resulting in a more efficient allocation of resources and a lower
cost of external financing (Myers and Majluf 1984). This is true even though the source of
information asymmetry may be firm-specific. Prior literature has shown that if investor
competition is low, as is likely the case in the small audit firm setting, firm-specific information
asymmetry has a direct effect on the cost of capital (Armstrong et al. 2011; Akins et al. 2012).
We investigate whether inspection reports serve as a signal of audit quality and reduce
uncertainty on financial reporting quality.
Our sample consists of client companies of triennial inspected US audit firms consisting
of 701 clients related to 200 first round inspection reports, 659 clients related to 175 second
round inspection reports and 498 clients related to 124 third round inspection reports, which
are issued between 2005 and 2014. Using this sample, we analyze the effect of the publication
and the content of the inspection reports on stock market liquidity, of which the direction of
change is an empirical question. We employ bid-ask spread, price impact, the likelihood of
zero return days, and total trading costs as proxies for stock market liquidity.
One important feature of the PCAOB inspections on small audit firms is the natural
staggered setting, in which the PCAOB inspects the small audit firms at different points in
time. Using this setting, we are not only able to compare the stock market liquidity change
from pre- to post- inspection for those client companies with auditors already being inspected
by the PCAOB, but we can use the liquidity in other companies whose auditor has not been
inspected yet at that time as a benchmark. We use the publication date of the inspection report
to determine whether the information regarding the inspection results is released to the market.
Both benchmarks help us to control for contemporaneous capital-market effects that are
unrelated to the publication of the PCAOB inspection reports. Moreover, we also include year-
and industry-fixed effects to account for the unobserved time- and industry-invariant
characteristics.
We find that stock market liquidity decreases after the disclosure of the first round of
inspection results, implying, on average, more market-wide uncertainty about audit quality.
After the second round of inspections, we find a significant increase in liquidity. This is in line
with the intention of regulators to reduce uncertainty about audit quality and ultimately improve
audit quality. However, after the publication of the third round inspection results, stock market
liquidity is no longer significantly influenced as most of the uncertainty is resolved and future
reports contain less new information that helps investors in updating their views on audit
quality. We further find that the magnitude of the decrease in liquidity after the first round
inspections does not depend on the content of the inspection reports, suggesting that the direct
information effect is dominating in these first round inspections. After the publication of the
second round inspection reports, we observe increases in liquidity for companies with auditors
who did not disagree with PCAOB findings and companies whose auditors have received clean
inspection reports. This implies that for the second round inspections, investors expect better
audit quality for these two types of audit firms. Interestingly, in case auditors disclose a
disagreement with PCAOB findings, stock market liquidity does not improve. For those

The Impact of PCAOB Inspections on Stock Market Liquidity over Time
15
auditors, investors arguably expect them not to take the necessary measures to improve audit
quality, which can explain the absence of a change in stock liquidity.
Our study contributes to the existing literature in several ways. First, we provide insights
on the perceived usefulness of inspection reports as signals of audit quality. This is important
in light of the current debate regarding the merits of public oversight and the informativeness
of the publications on public oversight outcomes. Second, while previous literature focused
more on the effect that the PCAOB has on audit quality from the audit firm side, we provide
early empirical evidence on the long-term capital market effects around the publication of the
inspection reports. Our study also provides some evidence that can guide regulators concerning
whether or not to publicly disclose the inspection reports and/or publicly disclose sanctions
imposed on audit firms.
The remainder of the paper is organized as follows. Section 2 reviews the prior literature
and develops the hypotheses. Section 3 presents the research sample and methodology to test
the hypotheses. Section 4 discusses the empirical results. Section 5 includes the additional
analysis. Section 6 concludes and outlines the implications and limitations of the study.
2.2 Prior literature and development of hypotheses
The PCAOB was installed by the Sarbanes-Oxley Act in 2002 as a means to improve
audit quality and protect investors’ interests. However, opinions on the effectiveness of
PCAOB inspections are mixed. The PCAOB has been criticized for its lack of expertise and
transparency, long delay of the inspection report publication (Glover et al. 2009; Palmrose
2005) and less informative reports than the AICPA peer reviews (Lennox and Pittman 2010).
In addition, the PCAOB was not perceived as cost effective since it uses the same approach for
both big and small audit firms and the small firms do not believe that PCAOB inspections
improve their audit practice (Daugherty and Tervo 2010).
Despite these criticisms, other studies find evidence to support the effectiveness of
PCAOB inspections. For example, non-Big 4 audit firms with PCAOB identified deficiencies
are more likely to issue going concern (GC) opinions for their financially distressed clients
subsequent to the PCAOB inspection than prior to the inspection (Gramling et al. 2011). The
more conservative behavior of auditors suggests that auditors became stricter on the important
reporting issues in clients’ financial statements. The finding that over 600 small auditors exit
the market following SOX lead DeFond and Lennox (2011) to conclude that PCAOB
inspections improve audit quality by incentivizing low quality auditors to exit the market.
Aobdia (2015) finds that both auditors and client issuers strongly react to the issuance of
PCAOB inspection reports with identified audit deficiencies. In particular, the audit firm
increases subsequent audit effort and the issuer client is more likely to switch auditors, often
to firms with high perceived quality. Gipper, Leuz, and Maffett (2015) conclude that the
PCAOB increases the credibility of financial reporting by showing that capital market
responses to unexpected earnings increase significantly following the introduction of the
PCAOB inspection regime.

Chapter 2
16
A major link between economic theory and contemporary accounting thought is the
notion that a firm's commitment to more disclosure should decrease information asymmetry
and thus increase liquidity (Leuz and Verrecchia 2000; Daske et al. 2008). In this study, we
investigate the relation between public disclosure of PCAOB inspection reports on audit firms
and stock market liquidity to examine whether investors value the information provided by
publicly available inspection reports.
Information asymmetry exists when investors possess different amounts of information
about a firm’s value (Akerlof 1970). It allows investors with superior information to trade
profitably at the expense of other investors. To compensate for these expected losses,
uninformed investors demand a return premium that is increasing in the risk of informed
trading (O’Hara 2003). As a result, information asymmetry implies higher trading cost and less
liquidity in the market. Thus, information asymmetry represents a real economic cost to
companies in the form of a higher cost of capital.
Accounting reporting regulation aims to reduce information asymmetry and improve
stock market liquidity by providing managers with a common language to communicate with
investors. Prior empirical studies suggest that financial reporting regulations that increase the
level of disclosure or its precision are associated with higher levels of liquidity. For example,
Bushee and Leuz (2005) find that after a regulatory change mandating OTCBB (Over-The-
Counter Bulletin Board) firms to comply with reporting requirements under the 1934 Securities
Exchange Act, information asymmetry decreases significantly. Mohd (2005) finds that after
the introduction of SFAS No. 86 in the US, which requires the capitalization of certain software
development costs, information asymmetry decreases for software firms relative to that of other
high-tech firms. Taking an international perspective, by turning from German GAAP to US
GAAP or IAS, which are commonly recognized as imposing a higher level of disclosure,
information asymmetry in German companies decreases (Leuz and Verrecchia 2000). Daske
et al. (2008) also conclude that IFRS adopters experience statistically significant increases in
market liquidity after IFRS became mandatory.
While regulated financial reports aim to provide new and relevant information to
investors, the conflict of interest between managers and investors creates an environment in
which auditors can provide investors with independent assurance about the precision of the
financial information disclosed by managers. Auditing narrows the scope of reporting
strategies managers can choose from and reduces uncertainty about accounting information
precision in the financial statements. For example, empirical studies in and outside the US
show that higher quality auditing enhances earnings quality (e.g., Francis et al. 1999; Van
Tendeloo and Vanstraelen 2005). Moreover, the value of high quality auditing is also reflected
in reduced information asymmetry and a lower cost of capital (Holthausen and Leftwich 1983;
Willenborg 1999; Mansi et al. 2004; Khurana and Raman 2004; Clinch et al. 2012; Zhou 2007).
There are several ways in which the publication of PCAOB inspection reports may
influence liquidity. First, if the PCAOB inspection report provides an informative, low-cost,
and easy to interpret signal of audit quality, stock market liquidity can be expected to increase.
Prior to the publication of the report, estimating audit quality (and hence firm reporting quality)

The Impact of PCAOB Inspections on Stock Market Liquidity over Time
17
may have been a difficult task for smaller uninformed investors. To the degree that the
disclosure of the inspection report levels the playing field for smaller uninformed investors and
larger informed investors, information asymmetry can be expected to decrease and liquidity
can be increased. Second, besides the direct informational effect, market liquidity can also be
influenced by PCAOB inspections through improvements in audit quality. Studies reporting
beneficial effects of the PCAOB include a decrease in abnormal accruals for client companies,
a higher probability of issuance of a GCO for financially distressed clients after a deficient
PCAOB inspection report, increased audit effort for deficient engagements, and increased
credibility of financial reporting (Carcello et al. 2011; Gunny and Zhang 2013; Gipper et al.
2015; Aobdia 2015). Based on these findings, the improved financial reporting quality after
the disclosure of the inspection reports can lead to increases in market liquidity. Moreover, we
argue both effects could happen to all clients as PCAOB inspection reports do not disclose the
specific name of the inspected engagement. Thus, investors are not likely to perceive the news
of the inspection reports as an isolated incident to a specific client of the audit firm.
However, there are also studies criticizing PCAOB inspections. In particular, the PCAOB
has been criticized for its lack of expertise and transparency, long delay of the inspection report
publication (Glover et al. 2009; Palmrose 2005) and less informative reports than the AICPA
peer reviews (Lennox and Pittman 2010). Hence, instead of creating an equal ground, the
disclosure of the PCAOB inspection reports could cause an increase in information asymmetry.
To the degree that larger and more informed investors are better able to interpret the
information in the inspection report, smaller investors will be made worse off by the public
disclosure. This in turn may cause these uninformed investors to increase the return premium
they demand, thereby decreasing market liquidity. Furthermore, the disclosure of the PCAOB
inspection reports can potentially change investors’ perceptions towards future audit quality,
which can influence market liquidity. As we have no priors on which of these effects
dominates, we formulate our first hypothesis as follows:
H1: The publication of PCAOB inspection reports changes stock market liquidity.
Since the PCAOB is issuing inspection reports for more than a decade now, we further
distinguish between whether the report relates to a first-time inspection of an audit firm or a
repeated inspection (i.e. second or third inspection round). The informational effects of publicly
disclosing second- and third-round PCAOB inspection reports on stock market liquidity
arguably depend on what happens initially. If the initial PCAOB inspection reports are
informative and easy to process, additional reports may only have a small incremental effect
on stock market liquidity. Most of the uncertainty would then be resolved after the publication
of the first inspection report and future reports may contain less new information that help
investors in updating their views on audit quality. Second, when even unsophisticated investors
are able to fully interpret information in the first report, there is no learning effect for
small/unsophisticated investors. All investors are able to fully interpret the information in the
inspection report as of the first report that is published. Alternatively, if PCAOB inspection
reports are difficult to process, information asymmetry may first raise which means a decrease
in liquidity, and subsequently decrease with additional reports being published if investors
learn to better process the information in the report. Hence, it is an empirical question how

Chapter 2
18
stock market liquidity is affected after the first, second and third inspection round. Therefore,
we formulate our second hypothesis as follows:
H2: The effect of PCAOB inspection reports on stock market liquidity changes over
time.
Being the only visible outcome of the inspection, a deficient PCAOB inspection report
implies that the audit firm did not fully comply with GAAS recommended audit procedures or
that GAAP violations were found in the financial statements of certain client firms. At the same
time, the PCAOB also gives the audit firms an opportunity to defend themselves. Audit firms
can provide responses to the PCAOB inspection findings and these responses are included at
the end of the inspection reports. The responses can generally be classified into two categories.
First, the audit firm can state that they do not agree with the inspection findings. Second, and
the most frequently used, the audit firm can claim that the deficiencies identified in the
inspection report were due to professional judgment or documentation and the firm has already
undertaken certain procedures (such as procedures according to AU390) to address the
problem.
Prior literature indicates that investors are less likely to reach consensus towards
negative information without prior experience (Chen et al. 2000). As a result, the magnitude of
a change in market liquidity through the informational effects of the PCAOB inspections can
be expected to be affected by the outcome of the report. This may be stronger for firms with
deficient reports as it is arguably a more ambiguous and difficult to interpret signal. In addition
to the factors described above, there is another factor that can affect liquidity during the years
following the publication of the inspection report. If the publicly available PCAOB inspection
reports induce audit firms to improve audit quality, stock market liquidity can also be affected.
High audit quality limits managers’ discretionary accounting choices and increases accounting
information precision. Barron and Qu (2014) find that information precision can reduce
information asymmetry among investors and thus improve market liquidity. According to prior
literature, PCAOB inspections do have an incremental effect on audit quality (Gramling et al.
2011; DeFond and Lennox 2011; Aobdia 2015; Gipper et al. 2015). As a result, besides the
direct effect of information provided by the inspection reports on market liquidity, inspections
may also improve audit quality thereby further increasing liquidity. This effect is arguably
stronger for deficient auditors as they may have more incentives to improve audit quality than
those without deficiencies due to the highly competitive audit market in the US. However, if
the audit firm responds that they do not agree with the deficient inspection findings, the
anticipated decrease maybe less profound as investors may view it as a bad signal of
unwillingness to improve audit quality and lower their expectations of future audit quality. This
could lead to a decreased anticipated financial reporting quality and thus lower market
liquidity.
Collectively, we expect that the magnitude of change in liquidity after the publication
of the inspection report depends on the content of the inspection report. We formulate our third
hypothesis as follows:

The Impact of PCAOB Inspections on Stock Market Liquidity over Time
19
H3: The stock market liquidity change after the publication of the inspection report
is different across clients of deficient audit firms stating disagreement with the
PCAOB’s findings, clients of deficient audit firms not stating disagreement with
PCAOB’s findings and clients of clean audit firms.
2.3 Data and methodology
2.3.1 Data
We hand-collect all first-round, second-round and third-round PCAOB inspection
reports published on the PCAOB website from 2005 to 2014. To test our third hypothesis, for
each inspection report, we further manually code the type of the report as “Deficient” or not,
depending on whether any GAAS-related deficiency or GAAP-related deficiency is disclosed
in Part I of the PCAOB inspection report3. We also manually code the audit firm responses as
“Disagree” or not. If the audit firms state that they disagree or if they state that they do not fully
agree with the PCAOB’s findings, we code the responses as 1 for “Disagree”. All other
responses are labeled as 0 for “Disagree”. We then match the reports with client information
from AuditAnalytics. Finally, we obtain security market information through CRSP and
exclude all auditor-client combinations which are not in CRSP. We further restrict our sample
to only include auditor-client combinations with at least one financial year-end available prior
to the report publication date. The final sample consists of 701 clients related to 200 first round
inspection reports, 659 clients related to 175 second round inspection reports and 498 clients
related to 124 third round inspection reports. Using this sample, we obtain analyst following
data from I/B/E/S and institutional holdings data from Thomson Reuters Institutional (13f)
Holdings.
2.3.2 Dependent variables
As outlined before, economic theory suggests that information asymmetry lowers
market liquidity and increases the cost of capital in the stock market. Previous accounting and
economics studies use various proxies to measure stock market liquidity (Leuz 2003; Brown
et al. 2004; Krishnaswami and Subramaniam 1999; Daske et al. 2008; Christensen et al. 2013).
Following Daske et al. (2008), we use four proxies to measure stock market liquidity: bid-ask
spread, price impact, zero returns and total trading costs.
Bid-ask spread is a commonly used proxy for information asymmetry and it is a direct
measure of the cost of trading that is well established in prior literature (Leuz and Verrecchia
2000; Leuz 2003; Mohd 2005; Fu et al. 2012). The bid-ask spread addresses the adverse
selection problem that arises from transactions in a firm’s shares in the presence of
asymmetrically informed investors (Leuz and Verrecchia 2000). Lower bid-ask spreads
3 Due to an insufficient number of observations, we are unable to investigate the market reaction to quality control
deficiencies for small audit firms.

Chapter 2
20
represent lower levels of information asymmetry and thus higher market liquidity. Following
Daske et al. (2008), we calculate the bid-ask spread as the yearly median of daily quoted
spreads. The daily quoted spreads are measured at the end of each trading day as the difference
between the bid and ask price divided by the midpoint.
Price impact is used as an indicator of liquidity. It is computed as the yearly median of
the liquidity measure proposed by Amihud (2002), which is the daily absolute stock return
divided by US$ trading volume.4 This variable captures the ability of an investor to trade in a
stock without moving its price. Higher price impact means lower liquidity.
Zero returns is calculated as the proportion of trading days with zero daily stock returns
out of all potential trading days in a given year. Lesmond, Ogden, and Trzcinka (1999) argue
that a manifestation of illiquidity will be infrequent trading as reflected in the number of days
without price movements. In other words, a higher proportion of zero return days represents
lower liquidity in the capital market.
The last proxy we use as dependent variable is total trading costs5, which is an estimate
of total round trip transaction costs (including bid-ask spreads, commissions, as well as implicit
costs from short-sale constraints or taxes) based on a yearly time-series regression of daily
stock returns on the aggregate market returns (Lesmond et al. 1999). This measure is based on
the logic that informed investors do not trade when the cost of trading exceeds the value of new
information. Since private information is not observable, we use log-likelihood estimation to
derive a proxy of total trading costs using a panel of firms’ daily stock returns and equal-
weighted local market index returns. A higher cost of trading implies lower liquidity in the
capital market.
Finally, following Daske et al. (2008), we aggregate the four proxies into a single
liquidity factor employing factor analysis with one oblique rotation, and use it as a dependent
variable in the analysis for simplification. We employ factor analysis and use the factor scores
from the first factor with the highest Eigenvalue (and the only one that is greater than one) as
dependent variable. of the dataset.
2.3.3 Research design and control variables
To test our first and second hypothesis, we define three dummy variables as our
variables of interest for the three rounds of inspections: Post1, Post2 and Post3. Post1
(Post2/Post3) takes a value of one if the observation belongs to the one year period after the
publication date of the first (second/third) round inspection reports and a value of zero if the
observation belongs to the one year period before the publication date of the first (second/third)
4 Following Amihud (2002), we compute price impact as the daily absolute price change in percent divided by
US$ trading volume. For expositional purpose the trading volume is measured at US$1,000. 5 Following previous research, we require at least 24 daily returns and 20% of the daily returns to be different
from zero per firm-year observation.

The Impact of PCAOB Inspections on Stock Market Liquidity over Time
21
round inspection reports. We use these three variables to capture the capital-market effects of
the publication of the inspection reports without considering the content of the inspection
reports. For our third hypothesis, we combine our manually coded variable, “Deficient”, with
the variable capturing the audit firm’s response in case of a deficient report, “Disagree/Other”,
to create three new variables of interest to test the impact of the content of the inspection reports
on stock market liquidity: Def_disagee, Def_other, and Clean. Def_disagree has a value of one
if the observation has a deficient auditor who disagreed with the inspection findings after the
publication of the inspection report, zero otherwise. Def_other has a value of one if the
observation has a deficient auditor who did not disagree with the inspection findings after the
publication of the inspection report, zero otherwise. Clean takes a value of one if the
observation has a clean auditor after the publication of each round’s inspection report, zero
otherwise.
To capture other firm characteristics that influence liquidity, we follow prior literature
and control for firm size, share turnover, return variability, and analyst following (Leuz and
Verrecchia 2000; Daske et al. 2008).6 First, large companies have a greater amount of
information available (Atiase 1987). Therefore, we expect firm size (Size) to be negatively
associated with our stock market liquidity proxies. Firm size (Size) is measured as the yearly
average of daily stock market price times the number of shares outstanding (in US$ millions).
Second, lower liquidity is related to lower share turnover (ShareTurnover), which is calculated
as the annual US$ trading volume divided by market value of outstanding equity, as
uninformed investors in the market would not choose to trade with a higher risk of a loss. Third,
stock market liquidity is positively related to stock price volatility (Volatility), measured by
the annual standard deviation of daily stock returns, as investors are more uncertain when
stocks are volatile. We expect the number of analysts (Analyst) following the client companies
to be negatively related to stock market liquidity as analysts increase the amount of firm
information that is publicly known and boost the trading (Roulstone 2003). We also control for
the percentage of stock owned by institutional holdings (Inst_holding). For the second and third
inspection analysis, we also control for the previous inspection results. Def1/2 has a value of
one if the audit firms have a deficient report in the first/second round inspection, zero
otherwise. Finally, we include industry (using the SIC two digit industry classification) and
year effects to capture common effects on our dependent variables in a particular year and
industry.
All variables are defined as stated in Appendix 1.
To test the first and second hypothesis, the regression model7 looks as follows:
6 We define firm size here as the yearly average of the market capitalization. In an untabulated analysis, we also
use the yearly median of the market capitalization and the results hold. 7 As is common in previous literature, we estimate the models in a log-linear specification. We use the natural
logarithm of the continuous variables and lag the independent variables by one period.

Chapter 2
22
IA Proxyi,t = 𝛼0 + 𝛼1𝑃𝑜𝑠𝑡𝑖,𝑡1/2/3+𝛼2 𝑆𝑖𝑧𝑒i,t−1 + 𝛼3𝑆ℎ𝑎𝑟𝑒𝑇𝑢𝑟𝑛𝑜𝑣𝑒𝑟i,t−1
+𝛼4 𝑉𝑜𝑙𝑎𝑡𝑖𝑙𝑖𝑡𝑦i,t−1 + 𝛼5𝐴𝑛𝑎𝑙𝑦𝑠𝑡i,t−1 + 𝛼5𝐼𝑛𝑠𝑡_ℎ𝑜𝑙𝑑𝑖𝑛𝑔i,t−1 + 𝑌𝑒𝑎𝑟 𝑓𝑖𝑥𝑒𝑑 𝑒𝑓𝑓𝑒𝑐𝑡𝑠 +
𝐼𝑛𝑑𝑢𝑠𝑡𝑟𝑦 𝑓𝑖𝑥𝑒𝑑 𝑒𝑓𝑓𝑒𝑐𝑡𝑠 + 𝛿 (2.1)
For the testing of hypothesis 3, we make use of the following regression model:
IA Proxyi,t = 𝛼0 + 𝛼1𝐷𝑒𝑓_𝑑𝑖𝑠𝑎𝑔𝑟𝑒𝑒𝑖 + 𝛼2𝐷𝑒𝑓_𝑜𝑡ℎ𝑒𝑟𝑖 + 𝛼3𝐶𝑙𝑒𝑎𝑛i+𝛼4𝑆𝑖𝑧𝑒i,t−1 +
𝛼5𝑆ℎ𝑎𝑟𝑒𝑇𝑢𝑟𝑛𝑜𝑣𝑒𝑟i,t−1 + 𝛼6 𝑉𝑜𝑙𝑎𝑡𝑖𝑙𝑖𝑡𝑦i,t−1 + 𝛼7𝐴𝑛𝑎𝑙𝑦𝑠𝑡i,t−1 + 𝛼8𝐼𝑛𝑠𝑡_ℎ𝑜𝑙𝑑𝑖𝑛𝑔i,t−1 +
𝑌𝑒𝑎𝑟 𝑓𝑖𝑥𝑒𝑑 𝑒𝑓𝑓𝑒𝑐𝑡𝑠 + 𝐼𝑛𝑑𝑢𝑠𝑡𝑟𝑦 𝑓𝑖𝑥𝑒𝑑 𝑒𝑓𝑓𝑒𝑐𝑡𝑠 + 𝛿 (2.2)
The PCAOB started to inspect small audit firms in 2005. Since the number of small
audit firms is quite large, the inspections were conducted at different time points. This natural
staggered setting gives us the opportunity to use client companies of small auditors that were
not yet inspected by the PCAOB as a benchmark. As a result, the setting mitigates to a large
extent the concern that the effects we are trying to identify are caused by other factors that are
not related to the publication of the PCAOB inspection reports.
2.4 Empirical results
2.4.1 Descriptive statistics
Table 2.1 describes the report type related characteristics for both the inspection reports
and the client companies. Panel A provides an overview of characteristics of the inspection
reports in the sample. The total sample includes 499 inspection reports of which 200 are first
round inspection reports, 175 are second round inspection reports and 124 are third round
inspection reports. Out of the 200 first round reports, 113 (56 percent) have PCAOB identified
deficiencies and among these 26 (13 percent) stated disagreement with the PCAOB, while out
of the 175 second round reports, only 60 (34 percent) have deficiencies and among them 12 (6
percent) stated disagreement with the PCAOB. For the third round inspection, 61 (49 percent)
out of the 124 inspection reports have deficiencies and among them 10 (8 percent) stated
disagreement with the PCAOB. Hence, there appears to be a clear indication of improvement
after the second round of inspections, as only 43 percent of the reports are clean in the first
round while the proportion increases to 66 percent in the second round. However, the
deficiency rate increases again after the third round. Overall, 234 out of 499 (47 percent) reports
have PCAOB identified audit deficiencies in the full sample. Interestingly, the proportion of
audit firms disagreeing with the PCAOB inspection findings has dropped significantly after the
first round from 13 percent to 6 (p<0.05) and 8 (p<0.10) percent in the second and third round,
respectively.
Table 2.1, panel B provides the report related statistics of the client companies in the
sample. For the first round of inspections, there are in total 701 client companies included of
which 99 (14 percent) are audited by audit firms receiving deficient reports and who indicate a
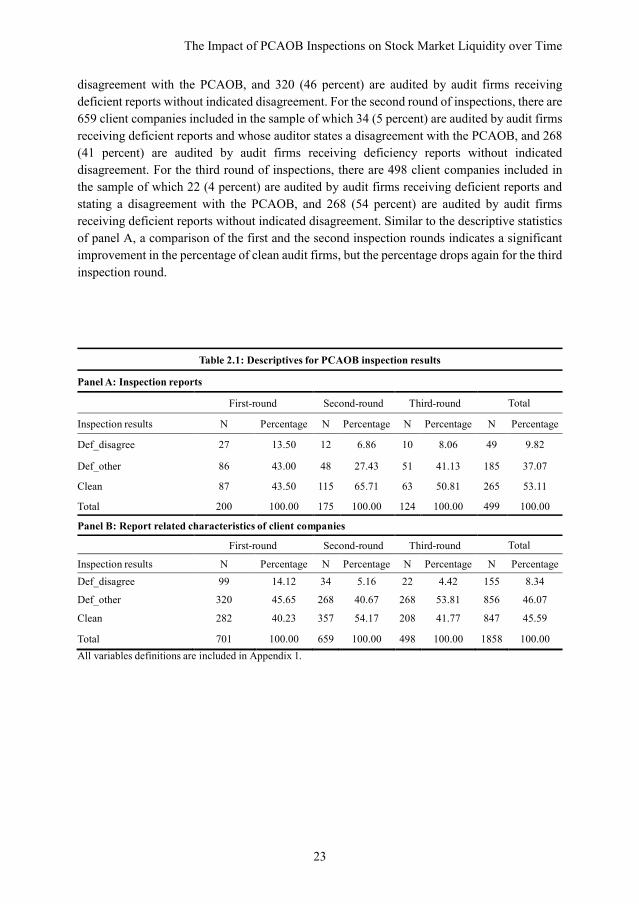
The Impact of PCAOB Inspections on Stock Market Liquidity over Time
23
disagreement with the PCAOB, and 320 (46 percent) are audited by audit firms receiving
deficient reports without indicated disagreement. For the second round of inspections, there are
659 client companies included in the sample of which 34 (5 percent) are audited by audit firms
receiving deficient reports and whose auditor states a disagreement with the PCAOB, and 268
(41 percent) are audited by audit firms receiving deficiency reports without indicated
disagreement. For the third round of inspections, there are 498 client companies included in
the sample of which 22 (4 percent) are audited by audit firms receiving deficient reports and
stating a disagreement with the PCAOB, and 268 (54 percent) are audited by audit firms
receiving deficient reports without indicated disagreement. Similar to the descriptive statistics
of panel A, a comparison of the first and the second inspection rounds indicates a significant
improvement in the percentage of clean audit firms, but the percentage drops again for the third
inspection round.
Table 2.1: Descriptives for PCAOB inspection results
Panel A: Inspection reports
First-round Second-round Third-round Total
Inspection results N Percentage N Percentage N Percentage N Percentage
Def_disagree 27 13.50 12 6.86 10 8.06 49 9.82
Def_other 86 43.00 48 27.43 51 41.13 185 37.07
Clean 87 43.50 115 65.71 63 50.81 265 53.11
Total 200 100.00 175 100.00 124 100.00 499 100.00
Panel B: Report related characteristics of client companies
First-round Second-round Third-round Total
Inspection results N Percentage N Percentage N Percentage N Percentage
Def_disagree 99 14.12 34 5.16 22 4.42 155 8.34
Def_other 320 45.65 268 40.67 268 53.81 856 46.07
Clean 282 40.23 357 54.17 208 41.77 847 45.59
Total 701 100.00 659 100.00 498 100.00 1858 100.00
All variables definitions are included in Appendix 1.

Chapter 2
24
Table 2.2 presents descriptive statistics on the variables used in the regression analysis
for the three rounds of inspections. The mean (median) value of bid-ask spread is 0.0425
(0.0378)/0.0504 (0.0461)/0.0366 (0.0317) for the first/second/third inspection respectively.
The mean (median) value of price impact is 0.00156 (0.000270)/0.00313 (0.000462)/0.00111
(0.000205) suggesting that, on average, a US$ 1,000 trade moves stock prices by 0.156%
(0.027%)/0.313% (0.046%)/0.111% (0.021%) for the first/second/third inspection
respectively. The mean (median) value of zero return is 0.0694 (0.0595)/ 0.0659 (0.0558)/
0.0571 (0.0520). Finally, the mean (median) value for total trading costs for the three inspection
rounds is 0.00990 (0.00557)/ 0.0123 (0.00784)/ 0.00659 (0.000429). Overall, the descriptives
of the liquidity measures show a pattern of decrease in liquidity around the second inspection
and an increase around the third inspection.
Table 2.2: Descriptive Statistics
VARIABLES N mean p50 sd min max
Panel A: First inspection
Bid_ask_spread 1,402 0.0425 0.0378 0.0272 0.00604 0.145
Price Impact 1,402 0.00156 0.000270 0.00413 1.74e-06 0.0303
Zero Return 1,402 0.0694 0.0595 0.0518 0.00395 0.250
Total Trading Costs 1,402 0.00990 0.00557 0.0122 0.000174 0.0695
Size 1,402 130.9 73.57 178.9 5.772 1,123
Share Turnover 1,402 1.250 0.474 2.274 0.0375 15.21
Volatility 1,402 0.0338 0.0287 0.0203 0.00707 0.107
Analyst 1,402 0.998 0.000 1.870 0.000 10.000
Inst_holding 1,402 0.154 0.0860 0.192 0.000 0.875
Panel B: Second inspection
Bid_ask_spread 1,318 0.0504 0.0461 0.0257 0.0117 0.141
Price Impact 1,318 0.00313 0.000462 0.00786 1.53e-06 0.0513
Zero Return 1,318 0.0659 0.0558 0.0469 0.000 0.234
Total Trading Costs 1,318 0.0123 0.00784 0.0141 0.000444 0.0799
Size 1,318 113.1 53.20 153.1 3.111 866.0
Share Turnover 1,318 1.180 0.454 2.218 0.0413 15.49
Volatility 1,318 0.0495 0.0436 0.0272 0.0117 0.162
Analyst 1,318 1.256 0.000 2.091 0.000 10.000
Inst_holding 1,318 0.192 0.121 0.209 0.000 0.877

The Impact of PCAOB Inspections on Stock Market Liquidity over Time
25
Table 2.2 Continued
Panel C: Third inspection
Bid_ask_spread 996 0.0366 0.0317 0.0201 0.00809 0.104
Price Impact 996 0.00111 0.000205 0.00258 7.95e-07 0.0178
Zero Return 996 0.0571 0.0520 0.0377 0.000 0.190
Total Trading Costs 996 0.00659 0.00429 0.00681 2.02e-07 0.0356
Size 996 144.8 55.68 256.9 3.623 1,577
Share Turnover 996 1.287 0.544 2.421 0.0468 16.04
Volatility 996 0.0367 0.0323 0.0197 0.0103 0.112
Analyst 996 1.666 1.000 2.546 0.000 12.000
Inst_holding 996 0.228 0.152 0.224 0.000 0.903
All continuous variables winsorized at the 1% and 99% level. All variables definitions can be found in Appendix 1.
2.4.2 Univariate analysis
We start our analysis with a univariate comparison of our liquidity measurements
before and after each round of inspection based on t-tests. Consistent with our main analysis,
the period before each round of inspection refers to one year period before the publication date
of the first (second/third) round inspection reports and the period after each round of inspection
refers to the one year period after the publication date of the first (second/third) round
inspection reports. The results are presented in Table 2.3. After the first inspection, we find a
significant increase in bid-ask spread, price impact and total trading cost. Consistently, our
liquidity factor increases significantly, suggesting that stock market liquidity is poorer after the
first inspection. After the second inspection, although we observe a weak decrease in bid-ask
spread, liquidity does not change significantly as measured by price impact, zero returns, total
trading cost and our liquidity factor. After the third inspection, all our liquidity measurements
decrease significantly, except for zero returns, suggesting increased liquidity. Overall, the
univariate results provide some preliminary support for our first and second hypotheses.

Chapter 2
26
Table 2.3 Univariate Analysis
First Inspection Second Inspection Third Inspection
Pre Post Diff Pre Post Diff Pre Post Diff
Log_Bid-ask
spread -3.493 -3.250 0.243*** -3.094 -3.135 -0.041* -3.431 -3.480 -0.049*
Log_Price impact -8.590 -8.088 0.502*** -7.847 -7.812 -0.035 -8.592 -8.868 -
0.276**
Zero return 0.070 0.069 -0.001 0.065 0.067 -0.002 0.059 0.055 -0.004*
Log_Trading cost -5.357 -5.102 0.255*** -4.932 -4.934 -0.002 -5.633 -5.712 -0.079
Liquidity factor -0.088 0.088 0.176*** -0.001 0.006 0.007 0.048 -0.044 -0.092*
All continuous variables winsorized at the 1% and 99% level. All variables definitions can be found in Appendix 1.
2.4.3 Multivariate analysis
We estimate the stock market liquidity proxies on our variables of interest and control
variables using OLS, and report t-statistics based on Huber-White standard errors. All
continuous variables are winsorized at the 1st and 99th percentile. All the control variables are
one-year-lagged values. For all the regression analyses, we further include year and industry
dummies to control for year and industry fixed-effects.
Table 2.4, panel A, reports the results for the first round of inspections. The models
explain between 39% and 81% of the variation. In all the regression models, the coefficients
on Period1 are highly significant and positive, except for the regression with zero returns as
the dependent variable. These results suggest that the stock market liquidity decreases after the
publication of the first round inspection reports.
Table 2.4, panel B, reports the results for the second round of inspections. The models
explain between 42% and 80% of the variation. In all the regression models, the coefficients
on Period2 are highly significant and negative, except for the regression with zero returns as
the dependent variable. Overall, the results suggest that stock market liquidity increases after
the publication of the second round inspection report.
Finally, Table 2.4, panel C, reports the results for the third round of inspections. The
models explain between 35% and 85% of the variation. In all the regression models, the
coefficients on Period3 are insignificant. The results suggest that stock market liquidity does
no longer significantly change after the publication of the third round inspection report.
In terms of economic significance, using the price impact as an example, the magnitude
of the coefficient on Post1 indicates that the total trading cost increased by 0.207% relative to
the pre-inspection. Biais, Glosten, and Spatt (2005) and Bhattacharya, Desai and Venkataraman
(2013) provide some perspective on interpreting these economic magnitudes. They note that
while the cost of any individual transaction can seem small, the overall economic effect of
trading cost on the cost of capital for corporations and the portfolio allocations for investors is
nontrivial, due to the huge volume of transactions. As an example, they report that a trading

The Impact of PCAOB Inspections on Stock Market Liquidity over Time
27
cost of only five cents for a $25 stock (approximate trading costs of 20 basis points) in 2002
implies a corresponding flow of 18 billion dollars for NYSE-listed firms alone. As a result, we
argue that in our setting the impact of the publication of PCAOB inspection reports on the
liquidity cost appears to be economically significant.
Table 2.4: Pooled regression results
VARIABLES Log_Bid-ask
spread
Log_Price
impact Zero return
Log_Trading
cost
Liquidity
factor
Panel A: First inspection
Post1 0.158*** 0.464*** -0.00107 0.207*** 0.150***
(4.436) (8.478) (-0.813) (3.519) (3.956)
Log(Sizet-1) 0.0459* -1.179*** -0.0205*** -0.481*** -0.442***
(1.749) (-20.72) (-6.523) (-7.101) (-8.048)
Log(Share_turnovert-1) -0.00425 -0.809*** -0.0136*** -0.286*** -0.272***
(-0.193) (-27.67) (-13.95) (-8.659) (-12.18)
Log(Volatilityt-1) 0.791*** 0.770*** 0.00347 0.665*** 0.430***
(23.75) (11.53) (0.537) (5.197) (4.384)
Log(Analystt-1) 0.0668*** -0.0508 -0.00288 -0.0278 -0.0329
(3.007) (-1.135) (-1.256) (-0.483) (-0.802)
Log(Inst_holding t-1) -0.165* -0.234 -0.0117 -0.537** -0.373**
(-1.781) (-1.007) (-1.103) (-2.348) (-2.121)
Constant -1.304*** -1.907*** 0.214*** -1.326*** 3.154***
(-5.765) (-3.204) (10.34) (-2.857) (9.166)
Observations 1,402 1,402 1,402 1,402 1,402
R-squared 0.712 0.814 0.420 0.599 0.640
Fixed effects Year/industry Year/industry Year/industry Year/industry Year/industry
R2 adjusted 0.698 0.805 0.393 0.580 0.623
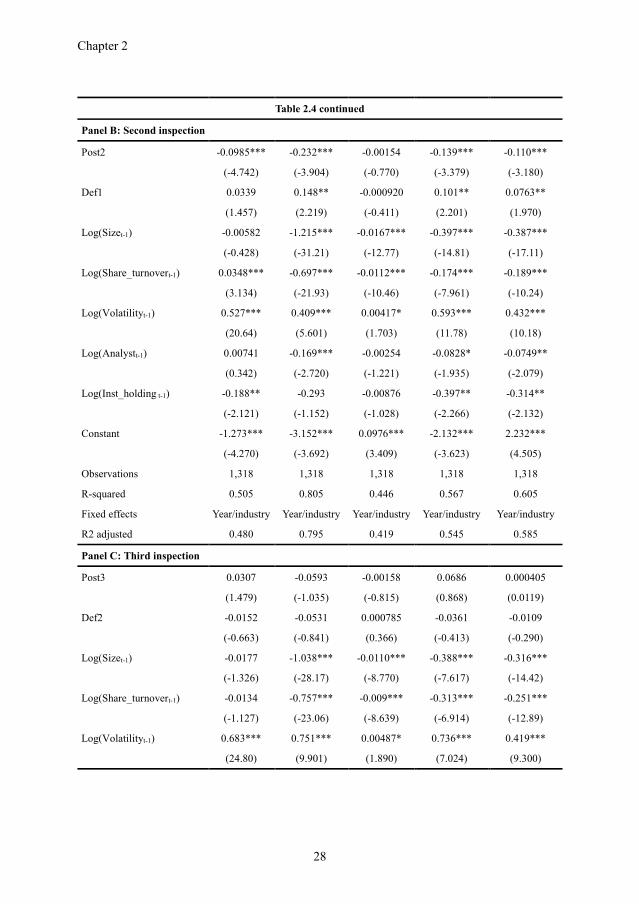
Chapter 2
28
Table 2.4 continued
Panel B: Second inspection
Post2 -0.0985*** -0.232*** -0.00154 -0.139*** -0.110***
(-4.742) (-3.904) (-0.770) (-3.379) (-3.180)
Def1 0.0339 0.148** -0.000920 0.101** 0.0763**
(1.457) (2.219) (-0.411) (2.201) (1.970)
Log(Sizet-1) -0.00582 -1.215*** -0.0167*** -0.397*** -0.387***
(-0.428) (-31.21) (-12.77) (-14.81) (-17.11)
Log(Share_turnovert-1) 0.0348*** -0.697*** -0.0112*** -0.174*** -0.189***
(3.134) (-21.93) (-10.46) (-7.961) (-10.24)
Log(Volatilityt-1) 0.527*** 0.409*** 0.00417* 0.593*** 0.432***
(20.64) (5.601) (1.703) (11.78) (10.18)
Log(Analystt-1) 0.00741 -0.169*** -0.00254 -0.0828* -0.0749**
(0.342) (-2.720) (-1.221) (-1.935) (-2.079)
Log(Inst_holding t-1) -0.188** -0.293 -0.00876 -0.397** -0.314**
(-2.121) (-1.152) (-1.028) (-2.266) (-2.132)
Constant -1.273*** -3.152*** 0.0976*** -2.132*** 2.232***
(-4.270) (-3.692) (3.409) (-3.623) (4.505)
Observations 1,318 1,318 1,318 1,318 1,318
R-squared 0.505 0.805 0.446 0.567 0.605
Fixed effects Year/industry Year/industry Year/industry Year/industry Year/industry
R2 adjusted 0.480 0.795 0.419 0.545 0.585
Panel C: Third inspection
Post3 0.0307 -0.0593 -0.00158 0.0686 0.000405
(1.479) (-1.035) (-0.815) (0.868) (0.0119)
Def2 -0.0152 -0.0531 0.000785 -0.0361 -0.0109
(-0.663) (-0.841) (0.366) (-0.413) (-0.290)
Log(Sizet-1) -0.0177 -1.038*** -0.0110*** -0.388*** -0.316***
(-1.326) (-28.17) (-8.770) (-7.617) (-14.42)
Log(Share_turnovert-1) -0.0134 -0.757*** -0.009*** -0.313*** -0.251***
(-1.127) (-23.06) (-8.639) (-6.914) (-12.89)
Log(Volatilityt-1) 0.683*** 0.751*** 0.00487* 0.736*** 0.419***
(24.80) (9.901) (1.890) (7.024) (9.300)

The Impact of PCAOB Inspections on Stock Market Liquidity over Time
29
Table 2.4 continued
Log(Analystt-1) 0.0911*** -0.262*** 0.000747 0.126 0.0185
(4.471) (-4.658) (0.392) (1.619) (0.554)
Log(Inst_holding t-1) -0.0151 -0.421* -0.0172** -1.338*** -0.516***
(-0.165) (-1.666) (-2.008) (-3.831) (-3.434)
Constant -0.399 -2.121*** 0.116*** -0.624 3.010***
(-1.367) (-2.635) (4.251) (-0.561) (6.294)
Observations 996 996 996 996 996
R-squared 0.682 0.858 0.390 0.463 0.667
Fixed effects Year/industry Year/industry Year/industry Year/industry Year/industry
R2 adjusted 0.663 0.850 0.352 0.430 0.646
t-statistics in parentheses
*** p<0.01, ** p<0.05, * p<0.1
All continuous variables winsorized at the 1% and 99% level.
All variables definitions can be found in Appendix 1.
Our finding that stock market liquidity decreases after the publication of the first round
inspection reports and increases after the second round of inspections suggests the presence of
a learning effect. After the publication of the first round inspection reports investors have
difficulties in interpreting the information. However, after the second round of inspections,
investors learn how to interpret and process the information disclosed. Hence, information
asymmetry decreases which leads to increases in liquidity. The findings on the third round
inspection reports suggest that no new information is provided, and thus that the information
value appears to fade out after multiple inspection rounds. Overall, we conclude that the results
provide support for H1 and H2.
To further analyze the impact on stock market liquidity, we distinguish between audit
firms with no deficiencies, audit firms disagreeing with the observed deficiencies, and audit
firms not disagreeing with observed deficiencies. We estimate the OLS regression with Model
2.2. Table 2.5, panel A, presents the results for the first inspection round. In all the regression
models, the coefficients on Def_disagree, Def_other and Clean are highly significant and
positive, except for the one using zero returns as the dependent variable. These results confirm
an overall increase in information asymmetry after the publication of the first round inspection
reports. Additionally, the F-tests show that there is limited support that the magnitude of
increase is significantly different between the three groups.
Table 2.5, panel B, provides the results for the second round inspections. The
coefficients on Def_disagree are not significant except in the zero return model where the
coefficient is significantly positive, implying that stock market liquidity does not improve for
companies with deficient auditors who disagree with the PCAOB findings. The coefficients on
Def_other are all significantly negative except in the zero return model. Hence, liquidity

Chapter 2
30
increases for companies with deficient auditors who did not indicate a disagreement with
PACOB findings. For Clean, the coefficients are also all significantly negative except in the
zero return model. Additionally, the magnitude of increase in liquidity is not significantly
different between the latter two groups. This implies that investors expect better quality for
clean auditors and deficient auditors not contesting the PCAOB findings. Overall, we conclude
that after the second round inspections stock market liquidity increases significantly for
companies with clean auditors and for companies with deficient auditors, conditional on the
auditors not disagreeing with the PCAOB findings in their response letters. Using an F-test, we
find that the magnitude of increase is not significantly different between these two groups.
However, the F-test does show that the magnitude of increase in liquidity is higher for client
companies of audit firms not disagreeing with PCAOB findings compared to client companies
of audit firms disagreeing with PCAOB findings.
Table 2.5, panel C, provides the results for the third round inspections. Overall, we find
little support that changes in stock market liquidity after the publication of the third inspection
report are different between companies with deficient auditors and companies with clean
auditors. The results are also consistent with our main analysis for the third inspection round,
indicating no significant change in liquidity.
Table 2.5: Regression with inspection reports content
Panel A: First inspection
VARIABLES Log_ Bid-
askspread
Log_Price
impact Zero return
Log_Trading
cost
Liquidity
factor
Def_disagree 0.221*** 0.704*** -0.00132 0.252** 0.190***
(3.805) (7.158) (-0.391) (2.681) (2.946)
Def_other 0.167*** 0.433*** -0.000333 0.217*** 0.155***
(6.018) (6.579) (-0.180) (3.563) (3.996)
Clean 0.127** 0.413*** -0.00179 0.180** 0.129**
(2.126) (4.910) (-1.288) (2.437) (2.567)
Log(Sizet-1) 0.0468* -1.177*** -0.0204*** -0.481*** -0.442***
(1.816) (-19.82) (-6.545) (-7.046) (-7.983)
Log(Share_turnovert-1) -0.00432 -0.809*** -0.0136*** -0.286*** -0.272***
(-0.195) (-27.41) (-13.99) (-8.646) (-12.15)
Log(Volatilityt-1) 0.790*** 0.777*** 0.00336 0.664*** 0.430***
(23.76) (11.53) (0.519) (5.182) (4.387)
Log(Analystt-1) 0.0639*** -0.0625 -0.00286 -0.0298 -0.0348
(2.887) (-1.304) (-1.229) (-0.508) (-0.829)
Log(Inst_holding t-1) -0.162* -0.226 -0.0117 -0.535** -0.372**
(-1.744) (-0.984) (-1.105) (-2.344) (-2.121)

The Impact of PCAOB Inspections on Stock Market Liquidity over Time
31
Table 2.5 continued
Constant -1.275*** -1.855*** 0.215*** -1.301*** 3.173***
(-5.399) (-3.169) (10.42) (-2.823) (9.237)
Observations 1,402 1,402 1,402 1,402 1,402
R-squared 0.712 0.815 0.420 0.599 0.640
Fixed effects Year/industr
y Year/industry Year/industry Year/industry Year/industry
R2 adjusted 0.699 0.806 0.392 0.580 0.623
F-test Def_disagree-Def_other 0.054 0.271*** 0.0001 0.035 0.035
F-test Def_other-Clean 0.040 0.020 0.0015 0.037 0.026
Panel B: Second inspection
Def_disagree -0.0554 0.0985 0.0179*** 0.220 0.214
(-1.013) (0.442) (2.934) (1.391) (1.660)
Def_other -0.127*** -0.344*** -0.00301 -0.207*** -0.167***
(-3.769) (-4.196) (-1.053) (-5.606) (-5.387)
Clean -0.0804*** -0.178* -0.00227 -0.120* -0.0969
(-3.385) (-1.790) (-0.965) (-1.718) (-1.612)
Def1 0.0361 0.159** -0.000589 0.110** 0.0836**
(1.383) (2.228) (-0.277) (2.284) (2.066)
Log(Sizet-1) -0.00666 -1.218*** -0.0167*** -0.400*** -0.389***
(-0.501) (-31.29) (-8.849) (-9.442) (-10.45)
Log(Share_turnovert-1) 0.0349** -0.697*** -0.0112*** -0.175*** -0.189***
(2.197) (-20.85) (-8.486) (-6.159) (-7.926)
Log(Volatilityt-1) 0.522*** 0.392*** 0.00396** 0.583*** 0.423***
(9.146) (4.393) (2.064) (13.51) (12.93)
Log(Analystt-1) 0.00944 -0.159*** -0.00224 -0.0750 -0.0682*
(0.531) (-3.056) (-1.119) (-1.630) (-1.893)
Log(Inst_holding t-1) -0.195** -0.326 -0.00975 -0.423* -0.337*
(-2.659) (-1.491) (-1.194) (-1.886) (-1.873)
Constant -1.287*** -3.197*** 0.0982*** -2.147*** 2.221***
(-6.174) (-6.828) (6.277) (-6.464) (7.708)
Observations 1,318 1,318 1,318 1,318 1,318
R-squared 0.506 0.806 0.451 0.570 0.608
Fixed effects Year/industr
y Year/industry Year/industry Year/industry Year/industry
R2 adjusted 0.481 0.796 0.422 0.548 0.588
F-test Def_disagree-Def_other 0.072 0.443** 0.021*** 0.427** 0.381***
F-test Def_other-Clean -0.047 -0.166 -0.001 -0.087 -0.070

Chapter 2
32
Table 2.5 continued
Panel C: Third inspection
Def_disagree 0.177** 0.104 0.00145 0.0262 0.0604
(2.448) (0.521) (0.213) (0.0946) (0.508)
Def_other -0.0458 -0.0986 0.00100 -0.0251 -0.0171
(-1.308) (-1.018) (0.305) (-0.188) (-0.297)
Clean -0.00471 0.00248 -0.000436 0.0635 0.0108
(-0.175) (0.0333) (-0.173) (0.617) (0.244)
Def2 -0.0197 -0.0536 0.000705 -0.0375 -0.0127
(-0.854) (-0.840) (0.325) (-0.426) (-0.335)
Log(Sizet-1) -0.0180 -1.036*** -0.0109*** -0.389*** -0.315***
(-1.354) (-28.11) (-8.733) (-7.641) (-14.41)
Log(Share_turnovert-1) -0.0138 -0.759*** -0.00967*** -0.312*** -0.252***
(-1.159) (-23.10) (-8.670) (-6.878) (-12.90)
Log(Volatilityt-1) 0.676*** 0.762*** 0.00507* 0.734*** 0.421***
(24.55) (10.01) (1.961) (6.977) (9.301)
Log(Analystt-1) 0.0937*** -0.258*** 0.000744 0.127 0.0197
(4.599) (-4.577) (0.389) (1.633) (0.589)
Log(Inst_holding t-1) -0.0128 -0.422* -0.0175** -1.325*** -0.515***
(-0.140) (-1.666) (-2.034) (-3.789) (-3.423)
Constant -0.398 -2.140*** 0.116*** -0.650 3.003***
(-1.367) (-2.655) (4.250) (-0.583) (6.270)
Observations 996 996 996 996 996
R-squared 0.684 0.858 0.390 0.463 0.667
Fixed effects Year/industr
y Year/industry Year/industry Year/industry Year/industry
R2 adjusted 0.664 0.849 0.351 0.429 0.646
F-test Def_disagree-Def_other 0.223** 0.203 0.0005 0.051 0.078
F-test Def_other-Clean -0.041 -0.101 0.0014 -0.089 -0.028
t-statistics in parentheses
*** p<0.01, ** p<0.05, * p<0.1
All continuous variables winsorized at the 1% and 99% level.
All variables definitions can be found in Appendix 1.

The Impact of PCAOB Inspections on Stock Market Liquidity over Time
33
In summary, we find that stock market liquidity decreases after the publication of the
first round of inspections and increases after the second round of inspections. These findings
provide support for the argumentation of a learning effect in understanding the information
contained in the inspection reports. Our evidence also suggests that investors appear to expect
audit quality increases for deficient auditors who did not disagree with the inspection findings.
Similarly, if audit firms disagree, there is no positive anticipation of future audit quality which
is reflected by an insignificant change in stock market liquidity after the publication of the
second round inspection reports. After the second round of inspections, most of the uncertainty
appears to be resolved and future reports contain less new information that help investors in
updating their views on audit quality. Collectively, these results provide some support for H3.
2.5 Empirical results
2.5.1 Initial year effect
We argue that the observed information asymmetry increase after the first round of
inspections is due to difficulties in processing this new information. There is a possibility that
this effect will decrease after the initial year that the PCAOB started to publish the inspection
reports, as investors already have experience in processing the information. To explore this
possibility, we exclude the initial year of publication, which is 2005 for the small audit firms,
and rerun the regression for the first round of inspections. The results are presented in table
2.6. The coefficients on Post1 are all significantly positive except in the zero return model.
Hence, the observed increase in stock market liquidity after the publication of the first round
inspection reports is not only due to the initial year effect.

Chapter 2
34
Table 2.6: First inspection excluding the initial year
VARIABLES Log_Bid-ask
spread
Log_Price
impact Zero return
Log_Trading
cost
Liquidity
factor
Post1 0.194*** 0.494*** -0.00215 0.238*** 0.166***
(6.074) (8.958) (-1.465) (4.302) (4.568)
Log(Sizet-1) 0.0504* -1.182*** -0.0208*** -0.473*** -0.439***
(1.918) (-19.33) (-6.271) (-6.256) (-7.224)
Log(Share_turnovert-1) 0.00429 -0.819*** -0.0147*** -0.305*** -0.288***
(0.167) (-26.17) (-11.12) (-7.397) (-10.08)
Log(Volatilityt-1) 0.771*** 0.770*** 0.00183 0.644*** 0.414***
(21.53) (9.815) (0.265) (4.595) (3.851)
Log(Analystt-1) 0.0656** -0.0518 -0.00220 -0.00874 -0.0192
(2.655) (-1.226) (-0.964) (-0.148) (-0.459)
Log(Inst_holding t-1) -0.185* -0.199 -0.0121 -0.571** -0.392**
(-2.010) (-0.814) (-1.057) (-2.321) (-2.056)
Constant -1.475*** -1.866** 0.215*** -1.511*** 3.054***
(-6.150) (-2.497) (9.744) (-3.161) (8.421)
Observations 1,254 1,254 1,254 1,254 1,254
R-squared 0.723 0.815 0.436 0.593 0.635
Fixed effects Year/industry Year/industry Year/industry Year/industry Year/industry
R2 adjusted 0.710 0.806 0.409 0.573 0.618
t-statistics in parentheses
*** p<0.01, ** p<0.05, * p<0.1
All continuous variables winsorized at the 1% and 99% level.
All variables definitions can be found in Appendix 1.
2.5.2 Constant sample
In our main analysis, the samples for the three inspections differ due to auditor switches
between the inspection rounds. As a result, we are not fully able to compare the liquidity after
the third inspection round to the liquidity in the period preceding the first inspection round.
Therefore, we construct a constant sample with only clients that do not switch audit firms from
at least one year before the publication of the first inspection report to one year after the
publication of the third round inspection report to compare the liquidity change over time. To
conduct our empirical tests, we first define three dummy variables as our variables of interest
for three rounds of inspections: Period1, Period2 and Period3. Period1 (Period2/Period3) takes
a value of one if the observation belongs to the period after the publication date of the first
(second/third) round inspection reports and before the publication of the second (third/one year
period after the publication of the third) round inspection reports, zero otherwise. We then
combine our manually coded variables “Deficient”, “Disagree” and the period dummies to
create three new variables of interests to test the impact of the content of the inspection reports

The Impact of PCAOB Inspections on Stock Market Liquidity over Time
35
on stock market liquidity. Def1_disagree (Def2_disagree/Def3_disagree) has a value of one if
the observation has a deficient auditor who disagreed with the inspection findings for the first
(second/third) round of inspection and belongs to the period after the publication of the first
(second/third) round inspection results and before the publication of the second (third/one year
period after the publication of the third) round inspection reports, zero otherwise. Def1_other
(Def2_other/Def3_other) has a value of one if the observation has a deficient auditor who did
not disagree with the inspection findings for the first (second/third) round of inspections and
belongs to the period after the publication of the first (second/third) round inspection results
and before the publication of the second (third/one year period after the publication of the third)
round inspection reports, zero otherwise. Clean1 (Clean2/Clean3) take a value of one if the
observation has a clean auditor for the first (second/third) round of inspection and belongs to
the period after the publication of the first (second/third) round inspection results and before
the publication of the second (third/one year period after the publication of the third) round
inspection reports, zero otherwise. As small audit firms are inspected every three years, the
period between the inspections are quite long. We include an additional variable “Days” to
count for the number of days between the publication of the current round and the next round
inspection reports.
Table 2.7 describes the report type related characteristics for both the inspection reports
and the client companies in the constant sample. Panel A provides an overview of
characteristics of the inspection reports in the sample. The constant sample includes 80
inspection reports. Out of the 80 inspection reports, 45 (56 percent) have PCAOB identified
deficiencies and among them 11 (14 percent) stated disagreement with the PCAOB for the first
round inspections, while only 28 (35 percent) have deficiencies and among them 3 (4 percent)
stated disagreement with the PCAOB for the second round inspections. For the third round
inspections, 40 (50 percent) reports have deficiencies and among them 5 (6 percent) stated
disagreement with the PCAOB. Consistent with our main analysis, there appears to be a clear
indication of improvement after the second inspection round and a decrease again after the
third inspection round.
Table 2.7, panel B provides the report related statistics of the 225 client companies in the
sample. For the first round inspections, 127 (56 percent) of them are audited by a firm receiving
a deficient report and 35 (16 percent) indicate a disagreement with the PCAOB. For the second
round inspections, 102 client companies (45 percent) are audited by a firm receiving a deficient
report and only 4 (2 percent) state a disagreement with the PCAOB. For the third round
inspections, 136 client companies (60 percent) are audited by a firm receiving a deficient report
and only 6 (3 percent) disagree with the PCAOB.

Chapter 2
36
Table 2.8: Descriptive Statistics for constant sample small audit firms
VARIABLES N mean p50 sd min max
Bid_ask_spread 900 0.0356 0.0317 0.0182 0.00777 0.0940
Price Impact 900 0.000942 0.000223 0.00213 1.06e-06 0.0149
Zero Return 900 0.0541 0.0479 0.0390 0.00103 0.191
Total Trading Costs 900 0.00704 0.00568 0.00527 0.000806 0.0304
Size 900 159.8 77.57 244.9 6.261 1,481
Share Turnover 900 1.760 0.764 2.716 0.0376 16.14
Volatility 900 0.0353 0.0309 0.0191 0.00923 0.111
Analyst 900 1.651 1 2.450 0 11
Inst_holding 900 0.211 0.143 0.220 0 0.890
Table 2.8 presents descriptive statistics on the variables used in the regression analysis.
The mean (median) value of bid-ask spread is 0.0356 (0.0317). The mean (median) value of
price impact is 0.000942 (0.000223) suggesting that, on average, a US$ 1,000 trade moves
Table 2.7: PCAOB inspection for constant sample
Panel A: Inspection reports
First-round Second-round Third-round
Inspection results N Percentage N Percentage N Percentage
Def_disagree 11 13.75 3 3.75 5 6.25
Def_other 34 42.50 25 31.25 35 43.75
Clean 35 43.75 52 65.00 40 50.00
Total 80 100.00 80 100.00 80 100.00
Panel B: Report related characteristics of client companies
First-round Second-round Third-round
Inspection results N Percentage N Percentage N Percentage
Def_disagree 35 15.56 4 1.78 6 2.67
Def_other 92 40.88 98 43.55 130 57.77
Clean 98 43.56 123 54.67 89 39.56
Total 225 100.00 225 100.00 225 100.00

The Impact of PCAOB Inspections on Stock Market Liquidity over Time
37
stock prices by 0.094% (0.022%). The mean (median) value of zero return is 0.0541 (0.0479).
Finally, for total trading cost, the mean (median) value is 0.00704 (0.00568).
Table 2.9 reports the OLS regression results. The models explain between 42% and 78%
of the variation. In all regression models, the coefficients on Period1 are significant and
positive, except for the regression with zero returns as the dependent variable. The coefficients
on Period2 are also significant and positive except for the regressions with bid-ask spread and
zero returns as the dependent variable. Moreover, a comparison of the coefficients of Period1
and Period2 shows that stock market liquidity is significantly lower (p<0.05) after the second
inspection compared to the period between the first and second inspection. Combining these
findings with the results of the main analysis, there appears to be a sharp decrease in liquidity
after the first inspection and a relative small increase after the second inspection. Hence, it
appears that the sharp decrease in liquidity after the first inspection round is not fully offset by
the increase in liquidity after the second round. Given that the coefficients on Period3 are
insignificant in all models, this suggests that the liquidity level after the third inspection round
has reached the same level again as before the start of the first inspection round. (i.e. one year
before the publication of the first round inspection reports). We emphasize that while using a
constant sample has its merits, it also has important limitations. First, the time between the start
of the first inspection and the end of the third inspection is very long implying that many factors
could affect stock market liquidity during this period. Furthermore, the constant sample is
limited in size because of clients switching auditors or leaving the market. Theoretically, we
also do not have reason to believe that the disclosure and content of inspection reports would
only affect the client companies in the constant sample. Therefore, we consider the sample and
the results of the main analysis theoretically and empirically more appropriate.
To further analyze the impact on stock market liquidity, we distinguish between audit
firms with no deficiencies, audit firms disagreeing with the observed deficiencies, and audit
firms which not disagreeing with observed deficiencies. Table 2.10 presents the OLS
regression results. In all the regression models, the coefficients on Def1_disagree, Def1_other
and Clean1 are significant and positive, except for the one using zero returns as the dependent
variable. Further, we find that the coefficients on Clean2, Def2_other and Def2_disagree are
significant and positive in most of the models. Finally, we find that the coefficients on
Def3_disagree, Def3_other and Clean3 are insignificant. Collectively, the findings are in line
with the reported results in Table 2.9.

Chapter 2
38
Table 2.9: Regression with for constant sample small audit firms
VARIABLES Log_ Bid-
askspread
Log_Price
impact Zero return
Log_Trading
cost
Liquidity
factor
Period1 0.293*** 0.669*** 0.000867 0.280*** 0.253***
(3.837) (4.550) (0.190) (3.286) (3.354)
Period2 0.141 1.123*** 0.00882 0.299* 0.393***
(1.523) (5.197) (1.178) (1.847) (3.458)
Period3 0.100 0.416 0.00449 0.149 0.178
(0.555) (0.985) (0.664) (0.571) (0.829)
Log(Sizet-1) 0.0414 -1.269*** -0.0166*** -0.252*** -0.454***
(1.215) (-25.67) (-5.204) (-6.658) (-9.611)
Log(Share_turnovert-1) 0.0239 -0.573*** -0.00845*** -0.0816** -0.201***
(1.083) (-11.04) (-7.489) (-2.245) (-7.972)
Log(Volatilityt-1) 0.514*** 0.282** 0.00256 0.415*** 0.289***
(21.93) (2.681) (0.877) (7.146) (5.190)
Log(Analystt-1) 0.0160 -0.102* 0.000942 -0.0316 -0.0179
(0.483) (-1.943) (0.738) (-0.671) (-0.544)
Log(Inst_holding t-1) -0.344*** -0.581*** -0.00822 -0.531* -0.423**
(-3.347) (-3.098) (-0.944) (-1.853) (-2.064)
Log(Days) -0.108 -0.331** 0.000248 -0.182** -0.134
(-1.614) (-2.220) (0.0483) (-2.379) (-1.370)
Constant -1.222*** -0.0961 0.141*** -1.026* 4.113***
(-2.767) (-0.102) (7.142) (-1.961) (8.363)
Observations 900 900 900 900 900
R-squared 0.615 0.788 0.460 0.455 0.646
Fixed effects Year/industry Year/industry Year/industry Year/industry Year/industry
R2 adjusted 0.590 0.774 0.424 0.419 0.622
F test Period2-Period1 -0.152*** 0.454*** 0.0079** 0.019 0.140**
F test Period3-Period2 -0.041 -0.707* -0.0043 -0.150 -0.215
t-statistics in parentheses
*** p<0.01, ** p<0.05, * p<0.1
All continuous variables winsorized at the 1% and 99% level.
All variables definitions can be found in Appendix 1.

The Impact of PCAOB Inspections on Stock Market Liquidity over Time
39
Table 2.10: Regression with for constant sample small audit firms
VARIABLES Log_ Bid-
askspread
Log_Price
impact Zero return
Log_Trading
cost
Liquidity
factor
def1_disagree 0.187*** 0.640** -0.00110 0.333*** 0.243**
(3.346) (2.701) (-0.246) (3.459) (2.418)
def1_other 0.317*** 0.701*** -0.000433 0.258*** 0.238***
(3.745) (4.646) (-0.0749) (2.750) (2.853)
clean1 0.433*** 0.683*** 0.000560 0.315** 0.280**
(4.977) (3.838) (0.0738) (2.683) (2.217)
def2_disagree 0.198 1.441** 0.0492*** 0.932* 1.109***
(1.132) (2.303) (5.306) (1.952) (3.066)
def2_other 0.156 1.082*** 0.0102* 0.230 0.373***
(1.328) (4.904) (1.732) (1.106) (3.297)
clean2 0.235** 1.154*** 0.00696 0.317** 0.396***
(2.525) (5.111) (0.689) (2.054) (2.792)
def3_disagree 0.246 0.559 0.01000 0.347 0.350
(0.973) (0.524) (0.661) (0.907) (0.897)
def3_other 0.101 0.435 0.00982 0.114 0.218
(0.570) (0.951) (1.139) (0.338) (0.768)
clean3 0.0973 0.365 0.00461 0.0802 0.142
(0.450) (0.855) (0.620) (0.259) (0.580)
Log(sizet-1) 0.0422 -1.271*** -0.0167*** -0.258*** -0.458***
(1.216) (-25.89) (-5.281) (-7.099) (-9.892)
Log(Share_turnovert-1) 0.0244 -0.573*** -0.00843*** -0.0782** -0.199***
(1.072) (-10.99) (-7.837) (-2.301) (-8.521)
Log(Volatilityt-1) 0.526*** 0.286** 0.00229 0.418*** 0.290***
(20.49) (2.563) (0.692) (6.645) (4.569)
Log(Analystt-1) 0.0166 -0.105** 0.000799 -0.0372 -0.0222
(0.497) (-2.027) (0.598) (-0.822) (-0.685)
Log(Inst_holding t-1) -0.334*** -0.562*** -0.00845 -0.500* -0.409**
(-3.253) (-2.843) (-0.971) (-1.792) (-2.032)
Log(Days) -0.164** -0.344** 0.00120 -0.202* -0.140
(-2.516) (-2.110) (0.181) (-1.902) (-1.097)
Constant -0.806* 0.0353 0.137*** -0.850 4.198***
(-1.857) (0.0325) (5.017) (-1.320) (6.459)
Observations 900 900 900 900 900
R-squared 0.622 0.789 0.465 0.460 0.649

Chapter 2
40
Table 2.10 continued
Fixed effects Year/industry Year/industry Year/industry Year/industry Year/industry
R2 adjusted 0.594 0.773 0.426 0.420 0.623
t-statistics in parentheses
*** p<0.01, ** p<0.05, * p<0.1
All continuous variables winsorized at the 1% and 99% level.
All variables definitions can be found in Appendix 1.
2.5.3 Annual inspected audit firms
In this paper, we mainly focus on the stock market liquidity effects of the disclosure of
inspection reports of the small audit firms. Although investors may already know more about
audit quality of large audit firms (i.e. audit firms with more than 100 issuer clients, which are
inspected on an annual basis) before the inspections, stock market liquidity may still increase
as audit quality has been documented to improve after the inspection (Carcello et al. 2011). To
empirically test this, we construct a constant sample for the first three rounds of inspections
(i.e. no auditor switches from one year before the publication of the first round inspection
reports until the publication of the fourth round inspections) for the annually inspected audit
firms. We define three variables of interest: Period1_annual, Period2_annual and
Period3_annual. Period1_annual (2/3) equals one when the observation belongs to the period
after the publication of the first (second/third) inspection report and before the publication of
the second (third/fourth) inspection report, zero otherwise.
The results in Table 2.11 show that stock market liquidity significantly increases after
the publication of the first inspection report, suggesting an increase in the investors’ perception
of future audit quality. While the coefficient of Period2_annual is significantly negative, it is
not significantly different from the coefficient on Period1_annual in the liquidity factor model.
This implies that after the publication of the second round inspection reports, liquidity does not
improve compared to the period after the first inspection. Furthermore, we find that after the
publication of the third round inspection reports, liquidity is unchanged compared to the
starting level (i.e., the one year period before the first inspection). Collectively, the results
suggest that investors do expect audit quality to increase for the annually inspected audit firms
after the first round of inspections. However, due to the continuously deficient inspection
reports coming out from the second and third round of inspections, the expected improvement
in audit quality disappears.

The Impact of PCAOB Inspections on Stock Market Liquidity over Time
41
Table 2.11: Regression with constant sample for annual inspected firms
VARIABLES Log_ Bid-
askspread
Log_Price
impact Zero return
Log_Trading
cost
Liquidity
factor
Period1_annual -0.0116 -0.130** -0.00403*** -0.113*** -0.0884***
(-0.621) (-2.548) (-3.520) (-2.849) (-4.694)
Period2_annual 0.0254 -0.0947 -0.00264 -0.184* -0.0752*
(0.669) (-1.546) (-1.030) (-1.966) (-1.844)
Period3_annual -0.0471 -0.184** -0.000409 -0.154 -0.0608
(-1.131) (-2.554) (-0.145) (-1.481) (-1.346)
Log(sizet-1) 0.00681 -1.050*** -0.00872*** -0.347*** -0.307***
(0.773) (-127.7) (-16.30) (-17.28) (-35.33)
Log(Share_turnovert-1) 0.00426 -0.869*** -0.00563*** -0.197*** -0.219***
(0.487) (-41.34) (-8.783) (-8.020) (-18.85)
Log(Return_variabilityt-1) 0.808*** 0.678*** -0.00481 0.587*** 0.211***
(54.19) (25.91) (-1.082) (5.653) (2.963)
Analyst_followingt-1 -0.00169 0.000973 0.000785*** 0.0149*** 0.0124***
(-1.128) (0.618) (10.78) (3.273) (9.046)
Log(Inst_holdingt-1) 0.0318 -0.451*** -0.0382*** -1.028*** -0.712***
(0.957) (-6.146) (-11.04) (-8.161) (-11.60)
Constant -0.934*** -3.222*** 0.0849*** -2.070*** 2.992***
(-12.68) (-28.77) (4.881) (-4.963) (10.69)
Observations 13,224 13,224 13,224 13,224 13,224
R-squared 0.790 0.939 0.465 0.333 0.713
Fixed effects Year/industry Year/industry Year/industry Year/industry Year/industry
R2 adjusted 0.788 0.938 0.462 0.329 0.711
t-statistics in parentheses
*** p<0.01, ** p<0.05, * p<0.1
All continuous variables winsorized at the 1% and 99% level.
All variables definitions can be found in Appendix 1.
2.6 Conclusion
We investigate the capital market effects of the publication of PCAOB inspection reports
over time. By performing a capital market based analysis, we aim to contribute to the ongoing
debate on the effectiveness and economic consequences of independent inspections (Abernathy
et al. 2013). Specifically, we investigate whether the publication of the inspection reports
increases capital market liquidity or decreases information asymmetry among investors, which

Chapter 2
42
would be in line with regulator intentions. We use bid-ask spread, price impact, zero returns
and total trading costs as proxies for stock market liquidity. We focus on the inspection reports
of the triennially inspected audit firms because they show variation in the inspection results.
This allows us to investigate the impact of this variation on market liquidity, while in prior
research smaller audit firms are generally treated as a homogeneous group. Moreover, they are
also economically important as they play a significant role in the competitive local audit
markets and significantly influence Big4 audit firms’ ability to collect a fee premium (Bills and
Stephens 2016). In addition, liquidity is priced in imperfect capital markets and this may be
more salient for the smaller audit firm market for which there is arguably more uncertainty on
audit quality (Akins et al. 2011; Armstrong et al. 2011).
The results of our study indicate that stock market liquidity decreases after the publication
of the first inspection reports, suggesting that not all investors are able to fully interpret this
new information. In contrast to the first inspection round, we find that after the publication of
the second round inspection reports, liquidity increases. These findings imply that there is a
learning process in the capital market when it comes to the interpretation of the inspection
reports. However, the changes in liquidity are only significant for companies with deficient
auditors who do not disagree in the response letters to the PCAOB and for companies with
clean auditors. If auditors state that they disagree with the PCAOB findings, liquidity does not
improve. Overall, these results imply that the first inspection reports resulted in an initial
decrease in liquidity, regardless of the content in the inspection reports. After the publication
of the second round inspection reports, investors are better able to interpret the information
disclosed which leads to an increase in liquidity. In addition, investors may anticipate a bigger
improvement in audit quality for deficient auditors without disagreement with PCAOB
findings. Hence, the expected benefits of disclosing the results of audit firm inspections only
seem to become visible after the disclosure of the second round inspection reports. At the same
time, we find that the informational value of inspection reports appears to fade out after the
third inspection round.
In an additional analysis, we report that the decrease in liquidity after the first round of
inspections is not due to the initial year effects. Moreover, we also construct a constant sample
for the triennially inspected audit firms. The results indicate that the liquidity level is lower
after the first and second inspections compared to the year before the publication of the reports
of the first inspection round and returns to the initial level after the third inspection. In
combination with the results of the main analysis, while the samples are not fully comparable,
these findings imply that the increase in liquidity after the second inspection round is not fully
offsetting the sharp decrease in liquidity after the first inspection round. Finally, we also
analyze changes in information asymmetry for the annually inspected audit firms. We find that
stock market liquidity is higher after the first and second round inspection reports but liquidity
does not further improve after the second round compared to the first round, and fades out after
the third inspection round. After the third round, the liquidity does not differ from the level
before the first inspections. These findings suggest that the expected improvement in audit
quality disappears potentially due to the continual deficient inspection reports.

The Impact of PCAOB Inspections on Stock Market Liquidity over Time
43
We contribute to the literature in several ways. First, we contribute to the literature on the
effectiveness of PCAOB inspections. We provide evidence that capital market participants
value the information provided by the inspection report and react to it accordingly. While our
results imply that investors learn how to interpret inspection reports, ultimately the information
value appears to fade out after multiple inspection rounds as most of the uncertainty is already
resolved and future reports contain less new information that may help investors in updating
their views on audit quality. Second, this paper examines the economic consequences of
disclosures on audit firm performance from the stock market investors’ perspective, which to
the best of our knowledge has not been addressed in prior research. This is also important for
practice since other countries are following the US example of installing independent public
oversight in varying forms and stages of development, for which insights on the potential
economic effects of public disclosure of the inspection results are relevant.
We are aware that our results are subject to a number of limitations. First, we do not have
a control group in our study since PCAOB inspections are mandatory for all audit firms who
have publicly listed clients. However, this issue is partly resolved with the unique feature of
the PCAOB inspection itself as the inspection reports are published at different points in time.
In addition, we are not able to investigate the market reaction to quality control deficiencies for
small audit firms due to an insufficient number of observations. Future research could
complement our understanding of the market consequences of inspection results by looking
into other type of countries (e.g., stakeholder countries, countries with lower investor
protection) or by performing a content analysis of the information disclosed in the inspection
reports.


45
Chapter 3: PCAOB Inspections and Audit Firm Behavior: An Analysis
of the First Three Inspection Rounds of Small Audit Firms

Chapter 3
46
Abstract8
This study examines the impact of PCAOB inspections on audit firm behavior over time. More
specifically, we investigate whether and how different inspection results affect audit fees.
While inspections arguably result in increased costs for audit firms to comply with PCAOB
standards, the impact on audit fees likely depends on audit firm reputation triggered by the
inspection report. Using a sample of audit firms subject to triennial inspection, we find, on
average, higher audit fees for companies without PCAOB Part I or Part II deficiencies before
the inspection, suggesting that PCAOB inspection results do reflect audit effort. When
classifying the inspection results based on Part I and Part II findings and considering the audit
firms’ response, we find, consistent with predictions, an increase in audit fees for audit firms
without quality control deficiencies. This increase in fees persists across the first three
inspection rounds. However, for Part I of the inspection reports, we find limited impact on audit
fees. To further corroborate these results, we find evidence of an increase in the number of
CPAs employed by audit firms who do not disagree with the PCAOB Part I findings and audit
firms who remediated the quality control deficiencies, suggesting increased audit effort. At the
same time, they are not able to charge higher fees for the additional effort, implying potential
reputation damage. While audit firms without quality control deficiencies are able to increase
their fees, the number of public clients decreases. If PCAOB inspection reports signal audit
quality, these findings imply that in the small audit firm market, there appears to be a strong
focus of public clients on negotiating for the lowest possible fee instead of searching for higher
audit quality. Collectively, we provide evidence that PCAOB inspections led to significant
changes in audit firm behavior and a redistribution of client companies in the small audit firm
market segment.
8 This chapter is based on a working paper together with Ann Vanstraelen.

PCAOB Inspections and Audit Firm Behavior: An Analysis of the First Three Inspection
Rounds of Small Audit Firms
47
3.1 Introduction
Since more than a decade the US Public Company Accounting Oversight Board
(PCAOB) is conducting periodic independent inspections of accounting firms that perform
audits of US registrants. The PCAOB is therefore considered as “a durable and significant part
of the regulatory landscape” (Coates and Srinivasan 2014). The mission of the inspections is
to improve audit quality and protect the interests of investors. Given the amount of resources
PCAOB inspections require, investigating whether the PCAOB has been effective in achieving
this mission over time as well as examining economic consequences (both intended and
unintended) of PCAOB inspections are important questions for academics, regulators and
society at large. A number of studies already looked into the impact of PCAOB inspections on
different audit quality outcome variables, including financial reporting quality (Lamoreaux
2016; Gipper et al. 2015; Carcello et al. 2011) and auditor reporting (Defond and Lennox 2017;
Gramling et al. 2011; Lamoreaux 2016). In this paper, we look into another dimension of audit
quality, audit fees, which is considered to be an input factor of audit quality (e.g., DeFond and
Zhang 2014). Furthermore, we investigate the impact of inspections on audit fees over time.
Prior research has typically focused on the impact of inspections after the first inspection round.
Hence, not much is currently known about the impact of inspections over time and whether the
effects fade out over time. We focus our study on the small audit firm setting. Not much is
known about these firms while they actually play a significant role in the competitive landscape
of local markets (Bills and Stephens 2016). Research on the impact of PCAOB inspections for
this type of audit firms is also relatively limited. Further, a focus on triennially inspected audit
firms allows to investigate the impact of inspections on audit fees conditional on the outcome
of the inspection report (clean or deficient). This is not possible for annually inspected firms
since they receive continuously deficient inspection reports over time. Interestingly, despite
these systematic deficient inspection reports, research findings suggest that audit quality of
annually inspected audit firms improves. In contrast, the evidence is much less conclusive for
triennially inspected audit firms. For example, while Gunny and Zhang (2013) do not find an
association between inspection reports and going concern opinions (GCO) as a measure of
audit quality, Gramling et al. (2011) document an increase in the likelihood of a GCO in the
post-inspection period for clients from triennially inspected audit firms with PCAOB
deficiencies. At the same time, Daugherty and Tervo (2010) document that small audit firms
do not perceive an improvement in audit quality or public confidence in the audit profession
following PCAOB inspections. Recently, Tanyi and Litt (2016) provide evidence of lower
quality and audit fees in the post-inspection period for non-Big 4 audit firms subject to triennial
inspection compared to non-Big 4 audit firms which are inspected on an annual basis.
Furthermore, the results of Tanyi and Litt show that small and midsize audit firms inspected
annually are more selective in their choice of new clients in the post-inspection period
compared to the triennially inspected firms. Using textual analysis, Acito et al. (2017) find that
PCAOB identified audit deficiencies lead to higher audit fees and higher turnover likelihood
for clients of Big 4 auditors.
The purpose of this study is to extend this line of research by examining how smaller
audit firms that are subject to triennial inspection respond to the findings of the PCAOB

Chapter 3
48
inspections. More specifically, we start our analyses with examining whether audit fees are
different before the inspections, conditional on the inspection outcomes. Then we continue to
investigate whether inspections affect the audit fees of smaller audit firms charged to their
clients, and whether this effect changes over time. We expect that the impact on audit fees is
conditional on audit firm reputation triggered by the type of inspection report received and the
public response of the audit firm on this inspection report. Finally, we construct our third set
of analyses to investigate whether the inspections can have long-term impact.
We argue that PCAOB inspections can lead to a change in audit fees for at least two
reasons. First, the cost of remaining within the public sector increases after the installment of
the PCAOB inspections, especially for small audit firms (DeFond and Lennox 2011). Indeed,
as explained by DeFond and Lennox (2011), audit firms with a smaller audit fee base are less
able to recover the fixed cost component of complying with the stricter regulatory standards
demanded by the PCAOB through higher fees and still remain competitive. Second, audit firms
face regulatory sanctions and penalties if serious deficiencies are not corrected (DeFond
2010).9 Assuming that the market in which small audit firms operate is competitive, the
increased costs are likely to lead to an increase in audit fees and this effect is arguably even
more pronounced for audit firms considered to be deficient by the PCAOB. On the other hand,
a number of recent studies show the importance of auditor reputation for providing firms with
incentives to supply high quality audits (Craswell et al. 1995; Skinner and Srinivasan 2012;
Weber et al. 2008; Francis et al. 2005). For audit firms with deficient inspection reports, it has
been documented that it can harm the auditor’s reputation resulting in an adverse effect on
clients’ valuations (Dee et al. 2011) or may cause the firm to exit the audit market (DeFond
and Lennox 2011). From this point of view, although faced with increased costs, deficient audit
firms will have difficulties to pass on these additional costs to their clients by increasing audit
fees.
At the same time, there may be reasons why a PCAOB inspection may not influence the
effort level for individual engagements. That is, the extent to which deficiencies create a
sufficient incentive for the auditor to adjust behavior, especially at the level of individual
engagements is uncertain for at least two reasons. First, there has been criticism on the PCAOB
inspectors’ technical and in-depth expertise (Glover et al., 2009) and firms may disagree with
the inspector’s findings as they pertain to specific audits. Second, it takes an extended period
of time before inspection results are published and the identity of the inspected clients remains
unknown, so it is not possible to link deficiencies to audit effort for individual clients.
Furthermore, in spite of a reputation for high quality, Big4 audit firms have repeatedly received
deficient inspection reports in the US so it remains unclear to what extent the inspection result
can cause severe damage to an audit firm’s reputation. For example, Lennox and Pittman
(2010) find no support for changes in audit firm market shares as a result of deficient inspection
9 Examples of such actions include notifying the SEC, the US Justice Department, and disciplinary proceedings
by the PCAOB such as censuring, suspending, and barring auditors, or revoking the registration of audit firms, all
of which can be accompanied with large monetary penalties. For example, Deloitte was assessed a $1 million
fine based on the inspection of the conduct of the 2003 audit of the public company Ligand Pharmaceuticals.

PCAOB Inspections and Audit Firm Behavior: An Analysis of the First Three Inspection
Rounds of Small Audit Firms
49
reports. Therefore, it is an empirical question whether audit firms are sufficiently incentivized
to change their behavior after the instalment of PCAOB inspections.
Using PCAOB inspection reports on small audit firms of the first three rounds published
from 2005 to 2014, we investigate whether and how the inspections affect audit fees, while
considering the different types of inspection outcomes. During this period, most of the small
audit firms were inspected for at least three rounds. For our first set of analyses, we use the
first round to study whether audit fees are different conditional on inspection results. For our
second and third set of analyses, we use all first three rounds and aim to investigate whether
PCAOB inspections have a long-term impact and whether the impact is influenced by the
inspection findings and audit firm’s responses to the inspection findings. While the costs of
complying with PCAOB quality control standards may mainly relate to the beginning period
of inspections, the increase in engagement costs is likely structural since more work is needed
on each engagement to meet PCAOB standards. The sample for the first set of analyses include
5,050 company-year observations relating to 1825 clients and 418 first round inspected audit
firms. Our sample for the second set of analyses includes 5,020 company-year observations
relating to 325 audit firms for the first inspection, 3,908 company-year observations relating to
259 audit firms for the second inspection and 3,118 company-year observations relating to 175
audit firms for the third inspection. Finally, we construct a constant sample without any auditor
switches from at least one fiscal year before the publication of the first inspection to at least
one year after the third inspection for our third set of analyses. This sample consists of 2597
client-year observations for 275 clients and 115 audit firms. For all the inspection reports
included in our analyses, we manually coded them based on Part I and Part II PCAOB findings
as well as the audit firms’ responses to those findings.
An important feature of the PCAOB inspections on small audit firms is the natural
staggered setting, in which the PCAOB inspects the small audit firms at different time points.
This specific setting not only allows us to compare the audit fee change from pre- to post-
inspection for those client companies with auditors already being inspected by the PCAOB,
but also enables us to benchmark the fees in other companies whose auditor has not been
inspected yet at that time. Both benchmarks help us to control for contemporaneous effects of
other changes in the audit market that are unrelated to the publication of the PCAOB inspection
reports. Moreover, we also include year- and industry-fixed effects to account for the
unobserved time- and industry-invariant characteristics.
Our results indicate that audit fees are higher on average before the publication of the
inspection reports for audit firms without any Part I or Part II deficiencies. Further, we find that
audit fees increase after the PCAOB inspections but show that this increase is mainly driven
by audit firms without any quality control deficiencies. To further corroborate these results, we
find in an additional analysis that deficient audit firms who do not state disagreement with the
engagement deficiencies and audit firms who remediated their identified quality control
deficiencies experienced increases in the number of CPAs, which suggest a seeking for
increased audit effort. However, combined with the main findings that audit fees do not change
significantly for these two groups, our results show that PCAOB identified deficiencies limit

Chapter 3
50
their ability to charge for the additional effort arguably due to reputation damage. Interestingly,
we find that while audit firms without quality control deficiencies are able to increase audit
fees, their number of public clients decreases. Furthermore, we show that new clients added to
the client portfolio of clean audit firms after the inspections have lower financial risks
compared to deficient audit firms. If a clean PCAOB inspection report is an indication of higher
audit quality, this finding would suggest that in the small audit firm market, there appears to
be a strong focus of clients on lowering the fees instead of seeking for higher audit quality.
Consistently, for those audit firms who react negatively to the PCAOB deficiencies by
disagreeing with the Part I findings or failing to address the quality control deficiencies, the
inspection does not have any significantly impact. At the same time, these two groups also
charge the lowest fee in the market.
Our study contributes to the growing body of literature on the economic effects of
PCAOB inspections by focusing on the smaller audit firm market segment and by considering
different dimensions of audit firms’ behavior. Recent studies mainly document positive effects
of PCAOB inspections, though most of these studies relate to annually inspected audit firms.
We show that the evidence for the small audit firm market is not unequivocally positive, which
appears to be driven by the lower demand for audit quality in this market segment. This would
also be consistent with the recent evidence of Tanyi and Litt (2016) showing that audit quality
and audit fees are lower for triennially inspected audit firms in the post-inspection period
compared to annually inspected non-Big 4 audit firms. While Acito et al. (2017) shows that
GAAP related deficiencies of Big 4 audit firms lead to higher audit fees due to the costs
associated with remediating those deficiencies, our results point out that small audit firms are
not able to do the same due to reputation loss. The remainder of the paper proceeds as follows.
Section 2 describes prior literature on the effects of PCAOB inspections. Next, we develop our
hypotheses in Section 3. The research design is outlined in Section 4, which is followed by a
discussion of the results in Section 5. Section 6 contains additional analyses and Section 7
provides conclusions and limitations.
3.2 Background
Under the provisions of SOX, the PCAOB conducts annual inspections of firms that
audit more than 100 issuers, and triennial inspections of the audit firms with fewer than 100
registrant clients (the latter referred to as “small audit firms” hereafter). Along with the
evaluation of an audit firm’s quality control policies and procedures, the inspection process
involves a review of some audits selected based on characteristics of the client, its industry,
practice office, partner, or prior inspection results (PCAOB 2009). The results of the inspection
process are publicly disclosed in a report for each audit firm. While not disclosing the identity
of inspected clients, Part I of the inspection report contains information about engagement-
specific deficiencies and Part II contains the existence of quality control deficiencies. Details
about quality control deficiencies are only made available to the public if the audit firm does
not sufficiently address the PCAOB’s concerns within a one-year period. At the end of the
inspection report, audit firms are allowed to provide their responses to the PCAOB findings.

PCAOB Inspections and Audit Firm Behavior: An Analysis of the First Three Inspection
Rounds of Small Audit Firms
51
In the course of this paper, the term “deficient” is used for inspection reports that contain one
or more engagement-specific deficiencies and the term “clean” (or non-deficient) for reports
without any engagement-specific deficiencies.
Prior research addresses the relationship between PCAOB inspections and audit quality
in different ways. From a conceptual point of view, researchers and practitioners have argued
both for and against the effectiveness of the inspection process, i.e., whether the process is able
to systematically identify meaningful audit deficiencies that can lead to an improvement in
audit quality. Some argue that the PCAOB inspection process is superior to the older peer
review system because it is independent and objective, has better access to auditor
documentation, and has more resources available for inspectors (Gunny and Zhang 2013;
Carcello et al. 2011). Others criticize the inspection process because of limited staff and
expertise, inadequate transparency of procedures and inspection outcomes, and the slow timing
of feedback (Glover et al. 2009; Oliverio and Newman 2009; Palmrose 2005; DeFond 2010).
This conceptual debate served as motivation for a number of studies examining the
association between inspection outcomes and various proxies for audit quality. Insights
obtained from these studies include that clients of audit firms with engagement deficiencies
discovered during the inspection process display higher levels of abnormal accruals (Gunny
and Zhang 2013). Further, it has been documented that auditor tenure and industry expertise
mitigates engagement deficiencies for non-Big4 auditors (Gunny, Krishnan, & Zhang, 2007).
However, there appears to be no association between PCAOB reports for triennially inspected
auditors and GCOs as a measure of audit quality (Gunny and Zhang 2013).
Additional insights can be obtained by examining reactions to inspections. The most
extreme reaction is that negative inspection outcomes for small audit firms have resulted in
deregistration with the PCAOB (DeFond and Lennox 2011). For audit firms remaining in the
market, Gramling et al. (2011) find that triennially inspected audit firms with PCAOB
deficiencies were more likely to issue a GC opinion for financially distressed clients subsequent
to their PCAOB inspection than prior to their inspection. Similarly, Carcello et al. (2011) find
that absolute abnormal accruals decrease following inspections for Big4 clients. These findings
would support the notion that PCAOB oversight and inspections are effective. On the other
hand, it has been documented that small audit firms do not perceive that the inspection process
improved audit quality or public confidence in the audit profession arising from the inspection
process (Daugherty and Tervo 2010). Recently, Tanyi and Litt (2016) show that non-Big 4
audit firms subject to triennial inspection have lower audit quality and audit fees in the post-
inspection period compared to non-Big 4 audit firms which are inspected on an annual basis.
In addition, Tanyi and Litt (2016) show that small and midsize audit firms inspected annually
are more selective in their choice of new clients in the post-inspection period compared to the
triennially inspected firms. Furthermore, it has been shown that clients with effective audit
committees or with high potential reporting quality of GAAP-deficient triennially inspected
auditors are more likely to switch to audit firms without GAAP related deficiencies (Abbott et
al. 2013). Finally, the capital market also appears to react to the PCAOB inspection reports.
Vanstraelen et al. (2016) find that stock market liquidity decreases after the publication of the

Chapter 3
52
first round inspection reports but increases after the publication of the second round inspection
reports. Capital market responses to unexpected earnings also significantly increase following
the introduction of the PCAOB inspection regime (Gipper et al. 2015).
3.3 Theoretical background and development of hypotheses
The audit production process comprises technology and effort as fixed and variable
factors of production (Hope et al. 2012). Even though advances in audit technology have
rendered auditing less labor intensive (Elliott 1998), human resource compensation is still a
major part of audit fees (Knechel et al. 2013). Audit firms have flexibility in adjusting human
resource inputs as a result of excess capacity, shifts of resources from non-public clients, and
new employee hires. Firms can alter audit effort by assigning more or better experienced
personnel to a client’s team, or let the existing team members conduct more work. In either
case, fees are likely to increase as extra time and more expensive staff is assigned to a client.
Using fees as a proxy for effort is based on the assumption that the market for audit services is
competitive (Simunic 1980; Elliott 1998; Craswell et al. 1995). This assumption is supported
by prior studies that indicate that the market in which smaller audit firms compete is highly
fragmented and competitive (Sirois and Simunic 2011). Competition implies that fee changes
are mainly caused by changes in cost rather than profit margin, and prior evidence corroborates
that fees are reflective of audit effort (Schelleman and Knechel 2010; Bell et al. 2001; Menon
and Williams 2001; Simunic and Stein 1996; Davis et al. 1993).
During the fieldwork, the PCAOB inspectors dissect the audit work papers, interact
frequently with the engagement team to improve their understanding of the work completed
during the audit (Aobdia 2016). Audit firms receiving a deficient Part I inspection report have,
in the opinion of the PCAOB inspectors, failed to “obtain sufficient competent evidential
matter to support its audit opinion”. In other words, deficiencies can be attributed to inadequate
effort, at least in the judgment of the inspectors. Following credence theory, Causholli et al.
(2010) argue that the level of effort needed to achieve a minimum standard of audit quality for
the particular client may be difficult to assess by a client and external parties. Hence,
insufficient audit effort may arise when clients are unable to observe the exact quality of their
audit. At the same time, given the credence attributes of an audit, the auditor may not only
under-audit, but can also overcharge or over-audit. Further, auditors and regulators may have
differing opinions as to what constitutes sufficient evidence and documentation since auditor’s
decisions related to a single engagement are potentially influenced by commercial
considerations when setting fees and scoping the audit work. For these reasons, independent
inspections are designed to check whether the level of audit effort is in accordance with quality
standards. Thus, we expect that audit fees are lower for clients with deficient auditors compared
to clients with clean auditors before the first inspection, as audit effort was arguably lower for
these clients.
The same reasoning applies to the clients of audit firms which have quality control
deficiencies (QCDs). An audit firm’s quality control system aims to provide reasonable

PCAOB Inspections and Audit Firm Behavior: An Analysis of the First Three Inspection
Rounds of Small Audit Firms
53
assurance that the firm’s personnel comply with applicable profession standards and the firm’s
standards of quality (PCAOB 2003, QC Section 20.03). The PCAOB’s evaluation of a firm’s
system of quality control typically includes a review of policies, procedures, and practices
concerning audit performance, training, compliance with independence requirements, client
acceptance and retention, and the establishment of policies and procedures (PCAOB 2012).
Compared to the engagement level deficiencies, QCDs are identified at the firm level and are
arguably even more likely to represent audit quality and audit effort since the quality control
system can be considered as the foundation for the way audits are performed within the firm.
As a result, we also expect that audit fees are lower for clients of auditors with quality control
deficiencies in the pre-inspection period (i.e. before the first inspection) compared to clients of
auditors without any quality control deficiencies before the first inspection. In summary, we
formulate our first hypothesis as following.
H1: Audit fees in the pre-inspection period are different conditional on the
inspection outcome.
For the triennially inspected audit firms, the cost of remaining within the public sector
increases after the instalment of the PCAOB inspections. In particular, the PCAOB’s strict
enforcement of compliance with auditing standards drives the costs upwards of audit firms
choosing to remain auditing public clients (Farrell and Shadab 2005). Stricter compliance
requires auditors to invest in a variety of practice areas that are closely monitored by the
PCAOB, such as procedures for client acceptance and retention, partner compensation and
review, auditor independence, and staff training (DeFond and Lennox 2011). Moreover,
compared to the big audit firms, the percentage of engagements being inspected is much larger
for small audit firms (Lennox and Pittman 2010). As PCAOB inspections have a disruptive
impact on auditors’ normal activities, examining a higher proportion of their clients imposes a
relatively greater cost on small auditors (DeFond and Lennox 2011). Furthermore, PCAOB
inspections are expected to increase the cost of an engagement since more work is required to
meet PCAOB standards (e.g., more documentation requirements). As a result, audit firms who
remain in the market and audit public clients are likely faced with increased costs, which could
result in higher fees. At the same time, audit fees are not only reflective of audit effort but also
of reputation. We argue that the extent to which the audit firm can pass on these increased costs
to the client will depend on audit firm reputation triggered by the inspection report. Clean audit
firms are arguably able to pass on the increased costs to the client as a clean inspection report
provides a positive signal about the audit firm’s reputation. This leads to our second hypothesis:
H2a: Clients of triennially inspected clean audit firms are associated with an increase
in audit fees in the post-inspection period, compared to the pre-inspection
period.
The auditor determines the level of effort supplied and fees charged for an audit based
on risk factors and reputation concerns (Stefaniak 2009; Hay et al. 2006; Nelson 2006; Lyon
and Maher 2005; Larcker and Richardson 2004; Johnstone and Bedard 2003; Seetharaman et
al. 2002; Reynolds and Francis 2001; Schelleman and Knechel 2010). Expected losses from
inadequate audit effort can arise from regulatory penalties and the potential loss of clients due
Chapter 3
54
to reputation loss. Consequently, the detection of deficiencies by PCAOB inspectors may cause
a change in the auditor’s assessment of expected losses from insufficient effort and provide ex-
ante incentives that could lead to a change in auditor behavior.
On the other hand, inspection reports are not intended to categorize audit firms into
high and low quality firms. This is partly due to the fact that the engagements and audit issues
selected for review are not random. Lennox and Pittman (2010) find no evidence of changes in
the market share of Big4 audit firms as a result of deficient inspection results. Thus, the extent
of the threat of client switching in response to deficiencies mentioned in the inspection report
may be limited. Even though clients might not switch in response to a deficient report, the
PCAOB is authorized to conduct disciplinary proceedings, impose sanctions, and communicate
inspection results to other regulatory agencies (Wegman 2008; Gunny and Zhang 2013; Farrell
and Shadab 2005). The PCAOB has demonstrated its willingness to impose sanctions for
violations of standards detected via inspections by revoking the registration of audit firms and
censuring, suspending, or barring auditors (Gilbertson and Herron 2009; PCAOB 2011).
Moreover, audit firms have an incentive to prevent publication of their deficiencies if they can
be addressed by changes in firm practices. In general, since detected deficiencies can raise the
probability that sanctions and penalties are imposed, it is likely that auditors will change their
behavior when presented with potential losses or penalties.
Auditors may have a number of options for addressing the issues raised in a deficiency
report. While the auditor might merely charge a fee premium to cover expected future losses
from deficient audits, clients are unlikely to accept fee changes without observable adjustments
to audit work. Further, such an approach is also unlikely to satisfy inspectors. The risk of
regulatory penalties as a result of PCAOB inspections is less remote than the risk of litigation,
given that a problem has already been detected. For that reason, the deficient inspection gives
audit firms a convincing argument for fee increases when having the annual meeting with the
audit committee to determine current year’s audit fees, i.e., previous fees may have been
artificially low and the auditor can convince the client that alternative auditors would have to
charge comparable fees. However, we expect this effect to be less profound if audit firms stated
in their responses to the PCAOB inspections that they disagree with the findings as it shows an
unwillingness to improve.
At the same time, audit firms receiving a deficient inspection report will likely suffer
from reputation loss. Indeed, since PCAOB inspection reports do not disclose the specific name
of the inspected engagement for the engagement deficiencies, clients are not likely to perceive
the news of the inspection reports an isolated incident to a specific client of the audit firm. As
a result, it may be difficult for audit firms to pass on increased costs to their clients. For
example, prior research shows that an audit firm experiences economic losses, including lower
fees, after incurring damage to their reputation (Davis and Simon 1992; Boone et al. 2015).
Instead of choosing to increase the audit effort and pay higher audit fees, audit committees of
the clients may still be focused on negotiating for the lowest fee and make full use of the
reputation damage caused by a deficient report, especially in the small audit firm market. Audit
firms not contesting the deficiencies identified by the PCAOB are arguably more likely to
increase audit effort to address the identified deficiencies. However, it remains unclear whether

PCAOB Inspections and Audit Firm Behavior: An Analysis of the First Three Inspection
Rounds of Small Audit Firms
55
they will be able to pass these higher costs to their clients because of reputation loss. Hence,
this is an empirical question and we therefore formulate our hypothesis in the null form:
H2b: There is no difference in audit fees for clients of triennially inspected deficient
audit firms not contesting the PCAOB findings in the post-inspection period,
compared to the pre-inspection period.
The predictions for audit firms disagreeing with the PCAOB findings are likely more
clear. In particular, it would seem very difficult, if not impossible, for this type of audit firms
to charge higher audit fees because of loss of reputation in combination with a low likelihood
that they will increase effort on individual engagements. Since these audit firms are unlikely to
change behavior, we expect that this will be reflected in lower audit fees. Hence, we
hypothesize that:
H2c: Clients of triennially inspected deficient audit firms disagreeing with the
PCAOB findings are associated with a decrease in audit fees in the post-
inspection period, compared to the pre-inspection period.
The same reasoning applies to audit firms which did not successfully address quality
control deficiencies. As we discussed earlier, QCDs are identified at the firm level and are
arguably even more likely to represent audit quality since the quality control system can be
considered as the foundation for the way audits are performed within the firm. Thus, it is
possible that audit fees increase for auditors who initially have QCDs identified during the
inspections while not publically disclosed later, as the firm established and implemented the
quality control upgrades that were agreed upon as part of its settlement with the PCAOB, and
managed to pass along these higher costs to its clients. But it still remains an empirical question
whether clients would accept this approach in a highly competitive market. Boone et al. (2015)
find that the public disclosure of QCDs for Deloitte caused reputation damage and a decrease
in Deloitte’s audit fee growth rates. We argue this could also apply to small audit firms with
QCDs. Indeed, the public disclosure of QCDs arguably causes reputation damage and is likely
also a signal of unwillingness to improve audit quality. As a result, audit fees are expected to
decrease. However, audit firms which addressed the QCDs are likely to have a convincing
argument to increase audit fees. Similarly, clean audit firms are also likely facing some
increased costs, though presumable to a smaller extent than firms with QCDs. Similar to our
reasoning for H2a, we expect that clean audit firms are likely to be able to pass the increased
costs to their clients since they received a positive signal about their reputation. This leads to
the following set of hypotheses:

Chapter 3
56
H3a: Clients of triennially inspected audit firms without identified quality control
deficiencies are associated with an increase in audit fees in the post-inspection
period, compared to the pre-inspection period.
H3b: Clients of triennially inspected audit firms with identified quality control
deficiencies which are addressed within one year are associated with an
increase in audit fees in the post-inspection period, compared to the pre-
inspection period.
H3c: Clients of triennially inspected audit firms with disclosed quality control
deficiencies are associated with a decrease in audit fees in the post-inspection
period, compared to the pre-inspection period.
Finally, we examine the impact of inspections on audit fees over time. As discussed
earlier, inspections are expected to result in increased costs. First, engagement costs are
expected to increase to comply with PCAOB standards (e.g., documentation requirements).
Second, audit firms will likely need to invest in their internal quality control system to meet
PCAOB standards. While the increase in engagements costs is arguably structural in nature,
these costs may not necessarily further increase after each inspection round unless the PCAOB
becomes stricter with each inspection round resulting in higher compliance costs over time.
Furthermore, the investments in the internal quality control system are not expected to further
increase over time once an appropriate system is in place. Overall, this would imply that the
impact of inspections on audit fees decreases over time. Hence, we hypothesize that:
H4: The magnitude of change in audit fees from pre- to post inspection decrease over
time.
3.4 Research design
3.4.1 Sample selection
The sample selection is based on the first three rounds of inspection on the US audit
firms that are inspected on a triennial basis (<100 registrant clients). We include all available
inspection reports on the PCAOB website as of December 2014. The inspected audit firms are
matched with their respective audit clients in Audit-Analytics and financial information is
retrieved from Compustat for the years 2003 through 2015. The final sample consist of the
observations contained in the intersection of these three data sources.10
10 As Audit-Analytics neither contains all inspected audit firms nor the full set of an audit firm’s clients, it is not
possible to match the inspected audit firms with all their clients. Furthermore, information is incomplete for certain
client observations due to missing data or missing identifiers for matching the different databases. Because of
these reasons, a number of inspection reports are excluded from the analysis.

PCAOB Inspections and Audit Firm Behavior: An Analysis of the First Three Inspection
Rounds of Small Audit Firms
57
To test our first hypothesis, only observations before the first inspection are included.
Table 3.1, Panel A provides detailed information about our sample selection procedure. We
start with 761 PCAOB inspection reports relating to all the first time inspected audit firms and
merge them with AuditAnalytics to get the clients sample. Next, we obtain all the client
financial information from Compustat and exclude all the observations that have missing
values for calculating the variables in our model. After that, we delete client observations with
a financial year-end after the first inspection and the observations belonging to the financial
institutions (SIC codes 6000–6700) or utilities (SIC codes 4000–4900). This gives us a sample
with 5050 client-year observations for 1825 clients and 418 audit firms. Table 3.1, Panel B
displays the composition of the sample for testing our second and third hypotheses. We start
again with 761 inspection reports for the first round, and further identity 537 inspection reports
for the second round and 373 for the third round. We exclude the audit firms that do not have
data available in AuditAnalytics. This gives us a sample of 666 audit firms with 9,639 clients
for the first inspection, 485 audit firms with 8,789 clients for the second inspection and 344
audit firms with 7,723 clients for the third inspection. Next, we retrieve the financial data from
Compustat and exclude all observations with missing values for variables in our empirical
model. This yields a sample of 505 audit firms with 3,282 clients for the first round, 400 audit
firms with 3,087 clients for the second round and 288 audit firms with 2,770 clients for the
third round. In addition, for each round of inspection, we exclude the client-year observations
that have a financial year-end before the previous round and after the next round.11 Moreover,
we exclude observations classified as financial institutions (SIC codes 6000–6700) or utilities
(SIC codes 4000–4900). To ensure proper representation of client firms in all time periods,
only auditor-client combinations that have at least one financial year-end before and after the
inspection are included in the samples for testing our other hypotheses. This yields a final
sample of 5,020 client-year observations for 1083 clients and 325 audit firms for the first round
inspection; 3,908 client-year observations for 931 clients and 259 audit firms for the second
round inspection; and 3,118 client-year observations for 759 clients and 175 audit firms for the
third round inspection. In addition, we constructed a constant sample with only clients that do
not switch audit firm from at least one year before the publication of the first inspection report
to one year after the publication of the third round inspection report to test our fourth
hypothesis. This sample consists of 2,597 client-year observations for 275 clients and 115 audit
firms.
For each inspection report, we manually code the type of the report as “DEF” or
“CLEAN”, depending on whether any engagement specific deficiency is disclosed in Part I of
the PCAOB inspection report. If the audit firms state that they disagree or they do not fully
agree with the PCAOB findings, they were coded as “DISAGREE”. Alternatively, if they do
not disagree, they were coded as “OTHER”. We further manually code the inspection reports
as “NON-QCD” if no quality control deficiency is identified during the inspection, “QCD” if
any quality control deficiency is identified, “QCD-D” if any quality control deficiency is
11 For example, for the second inspection sample, we excluded all the observations that have a fiscal-year end
before the publication of the first inspection and after the publication of the third round inspection.

Chapter 3
58
identified and disclosed later, “QCD-ND” if any quality control deficiency is identified but not
disclosed.12 We also create a variable “POST” to indicate whether the observation belongs to
the period before or after the publication of the inspection reports.
Table 3.1: Sample selection procedure
Panel A: Sample for H1
Number of Audit firms (number of clients) Pre-first inspection
Originally from PCAOB website 761
-without data from AuditAnalytics 666 (9639)
-without data from Compustat 578 (4131)
-missing values for variables used in the model 505 (3282)
-observations with year-end after the first
inspection 444 (2003)
-SIC 6000-6700 and SIC4000-4900 418 (1825)
Panel B: Samples for H2 and H3
Number of Audit firms (number of clients) First
inspection
Second
inspection
Third
inspection
Originally from PCAOB website 761 537 373
-without data from AuditAnalytics 666 (9639) 485 (8789) 344 (7723)
-without data from Compustat 578 (4131) 450 (3893) 329 (3513)
-missing values for variables used in the model 505 (3282) 400 (3087) 288 (2770)
-observations with year-end after the next inspection and
before previous inspection 487 (2603) 369 (2193) 252 (1739)
-SIC 6000-6700 and SIC4000-4900 465 (2383) 358 (2045) 242 (1640)
-observations without at least one fiscal year before and one
fiscal year after the inspection 325 (1083) 259 (931) 175 (759)
12 If audit firms have quality control deficiencies identified during the inspection reports, the PCAOB will state in
Part II of the inspection report “Any defects in, or criticisms of, the Firm's quality control system are discussed in
the nonpublic portion of this report and will remain nonpublic unless the Firm fails to address them to the Board's
satisfaction within 12 months of the date of this report”. If the audit firm does not have any quality control
deficiency identified, the PCAOB will state in part II of the inspection report: “The inspection team did not identify
anything that it considered to be a quality control defect that warrants discussion in a Board inspection report”.

PCAOB Inspections and Audit Firm Behavior: An Analysis of the First Three Inspection
Rounds of Small Audit Firms
59
3.4.2 Empirical models
We start our analyses with a benchmark model in the pre-inspection period to examine
whether audit fees are different conditional on the ex-post PCAOB inspection outcomes.
Following Francis et al. (2005) and Hay et al. (2006), we use the following audit fee model
using ordinary least squares regression:
LAFit=α0+α1CLEAN/NON-QCD+α2LOGASSETSit+α3LEVERAGEit+α4INVEREit+α5ROAit
+α6LOSSit+α7FOREIGNit+α8BUSYit+α9OPINIONit+α10LOGSEGit+α11SHORTit
+α12LOGAVG_ASSET+α12LOGTOTAL_FEE+Year fixed effects
+Industry fixed effects+𝛿 (3.1)
Where LAF is measured as the natural logarithm of audit fees (measured in US dollars)
as reported in AuditAnalytics. CLEAN/NON-QCD is our variable of interest. CLEAN/NON-
QCD is an indicator variable and is equal to 1 for clients of audit firms without any deficiencies
identified in Part I/Part II of the inspection reports. If audit fees were already higher before the
inspection for clients of auditors without Part I/Part II deficiencies, the coefficient on
CLEAN/NON-QCD will be positive. We include LOGASSETS, the natural logarithm of total
assets (measured in US dollars) to control for size. To account for client risk, we include
LEVERAGE, the sum of the company’s current and long term debt divided by total assets, and
INVERE, the sum of inventories and receivables scaled by total assets. We expect both of them
to be positively related to audit fees as they indicate higher audit risk. We include client
performance variables ROA, measured as net income divided by total assets, and LOSS, a
dummy variable for a loss in the current year. As less profitable companies exhibit more
financial risk, we expect audit fees to decrease with ROA and to increase with LOSS. Client
complexity is measured by LOGSEG, the natural logarithm of the number of business segments
reported and we expect it to be positively related to audit fees. Additional dummy variables
include OPINION, FOREIGN, and BUSY, where OPINION equals one when a going-concern
opinion is issued, FOREIGN equals one whenever foreign income is earned, and BUSY is set
to one for audits where the financial year-end is in December. We expect all of them to be
positively associated with audit fees. SHORTTENURE is one in the first year of the auditor-
client relationship to account for possible low-balling. Finally, we also add two variables
LOGAVG_ASSET and LOGTOTAL_FEE to control for audit firm size, calculated as the
natural logarithm of the average client size of the audit firm and the natural logarithm of the
total fee collected by the audit firm, respectively. These two variables are measured at audit
firm level, while all other control variables are measured at client company level. Additionally,
we also control for industry fixed effects for which we use the two digit SIC code and year
fixed effects. All the variables are winsorized at the 5 and 95 percent.13 The descriptions of all
variables used in the empirical analyses are included in Appendix 2.
13 We winsorize our data at the 5 and 95 percent to make sure that most of the continuous variables remain in the
range of three standard deviations from the means.

Chapter 3
60
To test hypotheses H2a, H2b and H2c, we use three variables of interest: CLEAN,
OTHER and POST replacing the variable CLEAN/NON-QCD in Model 3.1. POST is an
indicator variable and is equal to 1 for the fiscal years after the publication of the inspection
results. CLEAN and OTHER are equal to 1 for clients with clean Part I auditors and clients
with deficient auditors who do not state disagreement with the PCAOB Part I findings,
respectively. For the second and third inspection rounds, we also control for the previous round
Part I inspection report findings, and in particular whether the previous inspection report was
deficient or not. We interact CLEAN and OTHER with POST to see the audit fee change from
pre-inspection to post-inspection conditional on the Part I inspection findings.14 To test
hypotheses H3a, H3b, and H3c, we use the following three variables of interest: NON-QCD,
QCD_ND and POST, which replace again the variable CLEAN/NON-QCD in Model 3.1.
NON-QCD and QCD_ND are equal to 1 for clients with auditors who do not have any quality
control deficiencies identified and clients with auditors who have quality control deficiencies
identified but not disclosed.15 For the second and third inspection rounds, we also control for
the previous round Part II inspection report findings, and in particular whether the previous
inspection report had QCDs or not. We interact these two variables with POST to analyse the
fee change from pre- to post-inspection, conditional on the PCAOB Part II findings.16 The
regression models look as follows:
LAFit=α0+α1CLEAN + α2POST + α3CLEAN ∗ POST + α4OTHER
+α5OTHER ∗ POST+α6LOGASSETSit+α7LEVERAGEit+α8INVEREit+α9ROAit
+α10LOSSit+α11FOREIGNit+α12BUSYit+α13OPINIONit+α14LOGSEGit+α15SHORTit
+α16LOGAVG_ASSET+α17LOGTOTAL_FEE+Year fixed effects
+Industry fixed effects+δ (3.2)
LAFit=α0+α1NON_QCD + α2POST + α3NON_QCD ∗ POST + α4QCD_ND
+α5QCD_ND ∗ POST+α6LOGASSETSit+α7LEVERAGEit+α8INVEREit+α9ROAit
+α10LOSSit+α11FOREIGNit+α12BUSYit+α13OPINIONit+α14LOGSEGit+α15SHORTit
+α16LOGAVG_ASSET+α17LOGTOTAL_FEE+Year fixed effects
+Industry fixed effects+δ (3.3)
In order to compare the change of audit fees across the three inspection rounds, we
construct a constant sample with only clients that do not switch audit firm from at least one
year before the publication of the first inspection report to one year after the publication of the
third round inspection report to test our fourth hypothesis. To conduct our empirical tests, we
14 Clients with audit firms disagreeing the PCAOB Part I findings are used as control group. 15 The PCAOB (2003) stated that “Deficiencies in individual audit, attest, review, and compilation engagements
do not, in and of themselves, indicate that the firm's system of quality control is insufficient to provide it with
reasonable assurance that its personnel comply with applicable professional standards.” However, we find that
quality control deficiency and engagement level deficiency are highly correlated in our sample. As a result, we
do not include quality control deficiencies as control variables in our analysis on engagement deficiencies and
vice versa. 16 Clients of auditors with disclosed quality control deficiencies are used as control group.

PCAOB Inspections and Audit Firm Behavior: An Analysis of the First Three Inspection
Rounds of Small Audit Firms
61
first define three dummy variables as our variables of interest for three inspection rounds:
Period1, Period2 and Period3. Period1 (Period2/Period3) takes a value of one if the observation
belongs to the period after the publication date of the first (second/third) round inspection
reports and before the publication of the second round inspection reports (third/after the
publication of the third round inspection reports), zero otherwise. We also excluded the auditor-
client combinations that do not have at least one observation in each period of time. Then we
rerun our analysis using Model 3.1 replacing the variable CLEAN/NON-QCD with Period1,
Period2 and Period3. The empirical model looks as follows:
LAFit=α0+α1Period1 + α2Period2 + α3Period3+α4LOGASSETSit+α5LEVERAGEit
+α6INVEREit+α7ROAit+α8LOSSit+α9FOREIGNit+α10BUSYit+α11OPINIONit
+α12LOGSEGit+α13SHORTit+α14LOGAVG_ASSET+α15LOGTOTAL_FEE+Year fixed effects
+Industry fixed effects+𝛿 (3.4)
3.5 Empirical results
3.5.1 Descriptive statistics
Table 3.2, Panel A describes the report type related characteristics for both the
inspection reports and the client companies in the pre-inspection sample used for testing our
first hypothesis. Out of the 418 audit firms, 269 (64 percent) have Part I deficiencies and 324
(78 percent) have Part II deficiencies. For the 1,825 clients included in the sample, 1429 (78
percent) and 1517 (83 percent) have Part I and Part II deficiencies, respectively.
The remaining panels in Table 3.2 give the same type of information for the samples
used to testing our second and third hypotheses. Panel B and Panel C provide an overview of
Part I and Part II inspection results for the audit firms, respectively. The total sample includes
325 first round inspection reports, 259 second round inspection reports and 175 third round
inspection reports. Out of the 325 first round reports, 208 (64 percent) have PCAOB identified
deficiencies and among them 49 (15 percent) stated disagreement with the PCAOB, while out
of the 259 second round reports, only 115 (44 percent) have deficiencies and among them 24
stated disagreement with the PCAOB. For the third inspection round, 93 (53 percent) out of
the 175 inspection reports have deficiencies and among them 13 (7 percent) stated
disagreement with the PCAOB. Hence, there appears to be a clear indication of improvement
after the second inspection round, as only 36 percent of the reports are clean in the first round
while the proportion increases to 56 percent in the second. However, this rate drops again to
47 percent after the third round. Turning to the Part II inspection findings, 47 (14 percent) of
the first round inspected firms, 28 (11 percent) of the second round inspected firms and 18 (10
percent) of the third round inspected firms have disclosed quality control deficiencies (QCD).
The number of audit firms with QCD identified but not disclosed because the PCAOB
considers that they were satisfactorily addressed within a one year period is 200 (62 percent),
123 (48 percent) and 102 (58 percent) for the first three rounds of inspections, respectively.

Chapter 3
62
Table 3.2, Panel D and Panel E provide the report related statistics of the client
companies in the sample. For the first inspection round, there are in total 1,143 client companies
included. 239 (21 percent) of them are audited by audit firms receiving a deficiency report and
indicating a disagreement with the PCAOB, while 579 (51 percent) are audited by audit firms
receiving a deficiency report without indicated disagreement. 115 (10 percent) client
companies have audit firms with disclosed QCDs, while 847 (74 percent) are audited by firms
with QCDs identified but not disclosed. Out of the 968 client companies for the second
inspection round, 114 of them (12 percent) are audited by audit firms receiving a deficiency
report and stating a disagreement with the PCAOB and 376 (39 percent) are audited by audit
firms receiving a deficiency report without indicated disagreement. Regarding the Part II
findings, 86 (9 percent) have auditors with disclosed QCDs and 552 (57 percent) have auditors
with remediated QCDs. Turning to the third inspection round, the sample has 771 clients
included, of which 72 (9 percent) are audited by audit firms receiving a deficiency report and
stating a disagreement with the PCAOB, and 430 (56 percent) are audited by audit firms
receiving a deficiency report without indicated disagreement. The number of clients with
disclosed QCDs is 67 (9 percent) and the number of clients with no QCDs identified is 171 (22
percent). A comparison of the first and the second inspection round indicates a significant
improvement in the Part I inspection results, as in the first round only 28 percent of the
companies are audited by clean audit firms while this percentage increased to 49 percent for
the second inspection round. However, the percentage of clients audited by clean firms falls to
35 percent again for the third inspection round.

PCAOB Inspections and Audit Firm Behavior: An Analysis of the First Three Inspection
Rounds of Small Audit Firms
63
Table 3.2: Report related statistics
Panel A: Auditor and client characteristics for H1
Auditor characteristics Client characteristics
N Percentage N Percentage
DISAGREE 269 64.35 1429 78.30
CLEAN 149 35.65 396 21.70
Total 418 100 1825 100
QCD 324 77.51 1517 83.12
NON-QCD 94 22.49 308 16.88
Total 418 100 1825 100
Panel B: Auditor characteristics with Part I findings for H2 and H3
First-round Second-round Third-round
N Percentage N Percentage N Percentage
DISAGREE 49 15.08 24 9.27 13 7.43
OTHER 159 48.92 91 35.13 80 45.71
CLEAN 117 36 144 55.6 82 46.86
Total 325 100 259 100 175 100
Table 3.2 continued
Panel C: Auditor characteristics with Part II findings for H2 and H3
First-round Second-round Third-round
N Percentage N Percentage N Percentage
QCD_D 47 14.46 28 10.81 18 10.29
QCD_ND 200 61.54 123 47.5 102 58.29
NON-QCD 78 24 108 41.69 55 31.42
Total 325 100 259 100 175 100
Panel D: Client characteristics with Part I findings for H2 and H3
First-round Second-round Third-round
N Percentage N Percentage N Percentage
DISAGREE 239 20.91 114 11.78 72 9.34
OTHER 579 50.66 376 38.84 430 55.77
CLEAN 325 28.43 478 49.38 269 34.89
Total 1143 100 968 100 771 100

Chapter 3
64
Table 3.2 continued
Panel E: Clientcharacteristics with Part II findings for H2 and H3
First-round Second-round Third-round
N Percentage N Percentage N Percentage
QCD_D 115 10.06 86 8.88 67 8.69
QCD_ND 847 74.1 552 57.02 533 69.13
NON-QCD 181 15.84 330 34.1 171 22.18
Total 1143 100 968 100 771 100
Table 3.3 presents descriptive statistics for our samples. For illustration and brevity
reasons, we only describe the descriptives included in Panel A relating to pre-inspection sample
used for testing H1. Audit fees paid by the clients range from $10,000 to $415,048 with a mean
of $101,562. The average client in the period has total assets of around $28.5 million with
inventory and receivables representing 26 percent of that amount. Average leverage is 2.162
and the mean return on assets is -1.700. The average client reports 1.5 business segments.
Overall, 67 percent of the observations are loss-making, 36 percent receive going-concern
opinions and 9 percent report foreign income. Also, 64 percent of the audits are conducted
during busy season and 21 percent are first year new clients.

PCAOB Inspections and Audit Firm Behavior: An Analysis of the First Three Inspection
Rounds of Small Audit Firms
65
Table 3.3: Descriptive statistics
Panel A: Pre-inspection sample for H1
Variables N Mean Median SD Min Max
AUDITFEE 5,050 101,562 65,000 101,482 10,000 415,048
ASSETS 5,050 28,480,000 8,615,000 47,910,000 57,000 212,6000,000
LEVERAGE 5,050 2.162 0.527 4.670 0.0517 20.30
INVERE 5,050 0.255 0.195 0.238 0 0.728
ROA 5,050 -1.700 -0.166 3.875 -15.88 0.236
LOSS 5,050 0.665 1.00 0.472 0.00 1.00
OPINION 5,050 0.361 0.00 0.480 0.00 1.00
FOREIGN 5,050 0.085 0.00 0.279 0.00 1.00
BUSY 5,050 0.641 1.00 0.480 0.00 1.00
SEGMENT 5,050 1.531 1.00 1.123 0.00 11.00
SHORT 5,050 0.210 0.00 0.410 0.00 1.00
TOTAL_FEE 5,050 2,772,000 1,194,000 3,565,000 91,900 13,970,000
AVG_ASSET 5,050 70,800,000 20,890,000 129,200,000 1,019,000 558,5000,000
Panel B: First round inspection sample for H2 and H3
Variables N Mean Median SD Min Max
AUDITFEE 5,020 122,562 81,810 110,816 10,000 415,048
ASSETS 5,020 36,730,000 12,750,000 54,980,000 57,000 212,600,000
LEVERAGE 5,020 1.775 0.432 4.199 0.0517 20.30
INVERE 5,020 0.253 0.194 0.232 0.00 0.728
ROA 5,020 -1.289 -0.0992 3.370 -15.88 0.236
LOSS 5,020 0.624 1.00 0.484 0.00 1.00
OPINION 5,020 0.309 0.00 0.462 0.00 1.00
FOREIGN 5,020 0.116 0.00 0.320 0.00 1.00
BUSY 5,020 0.642 1.00 0.480 0.00 1.00
SEGMENT 5,020 1.607 1.00 1.300 0.00 11.00
SHORT 5,020 0.133 0.00 0.339 0.00 1.00
TOTAL_FEE 5,020 3,212,000 1,503,000 3,864,000 91,751 13,970,000
AVG_ASSET 5,020 90,220,000 31,530,000 142,400,000 1,019,000 558,500,000

Chapter 3
66
Table 3.3 Continued
Panel C: Second round inspection sample for H2 and H3
AUDITFEE 3,908 142,070 103,629 118,893 10,000 426,000
ASSETS 3,908 43,650,000 16,220,000 61,590,000 62,000 216,800,000
LEVERAGE 3,908 1.977 0.416 4.535 0.0511 19.40
INVERE 3,908 0.250 0.187 0.230 0.00 0.728
ROA 3,908 -1.424 -0.103 3.543 -15.11 0.235
LOSS 3,908 0.623 1.00 0.485 0.00 1.00
OPINION 3,908 0.301 0.00 0.459 0.00 1.00
FOREIGN 3,908 0.144 0.00 0.351 0.00 1.00
BUSY 3,908 0.622 1.00 0.485 0.00 1.00
SEGMENT 3,908 1.600 1.00 1.271 0.00 10.00
SHORT 3,908 0.0693 0.00 0.254 0.00 1.00
TOTAL_FEE 3,908 3,465,000 1,771,000 3,921,000 100,622 14,320,000
AVG_ASSET 3,908 114,300,000 47,840,000 162,600,000 1,012,000 584,200,000
Panel D: Third round inspection sample for H2 and H3
AUDITFEE 3,118 150,547 117,473 118,465 11,000 432,136
ASSETS 3,118 45,210,000 17,050,000 63,710,000 69,000 219,900,000
LEVERAGE 3,118 1.861 0.41 4.235 0.0493 18.49
INVERE 3,118 0.247 0.187 0.23 0.00 0.719
ROA 3,118 -1.378 -0.125 3.342 -14.5 0.238
LOSS 3,118 0.639 1.00 0.48 0.00 1.00
OPINION 3,118 0.296 0.00 0.456 0.00 1.00
FOREIGN 3,118 0.158 0.00 0.365 0.00 1.00
BUSY 3,118 0.637 1.00 0.481 0.00 1.00
SEGMENT 3,118 1.581 1.00 1.28 0.00 10.00
SHORT 3,118 0.0712 0.00 0.257 0.00 1.00
TOTAL_FEE 3,118 4,411,000 2,038,000 4,597,000 114,056 14,490,000
AVG_ASSET 3,118 138,100,000 66,540,000 178,900,000 1,229,000 600,900,000
Panel E: Constant sample for H4
AUDITFEE 2,597 161,334 112,000 137,461 22,950 521,000
ASSETS 2,597 60,800,000 22,470,000 89,900,000 270,000 341,600,000
LEVERAGE 2,597 1.069 0.345 2.169 0.0502 9.339
INVERE 2,597 0.263 0.209 0.227 0 0.718
ROA 2,597 -0.557 -0.0105 1.467 -6.316 0.238
LOSS 2,597 0.517 1.000 0.500 0.000 1.000
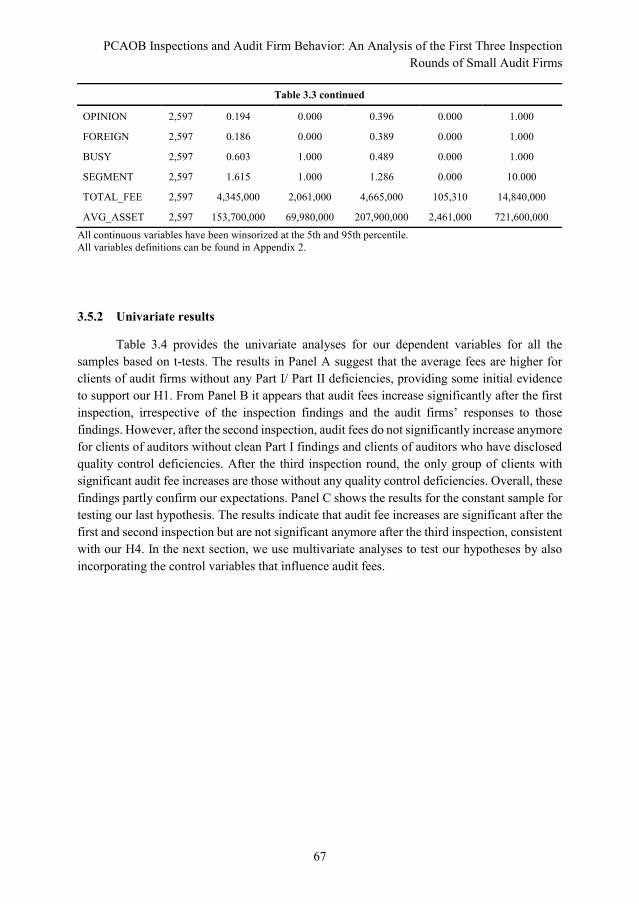
PCAOB Inspections and Audit Firm Behavior: An Analysis of the First Three Inspection
Rounds of Small Audit Firms
67
All continuous variables have been winsorized at the 5th and 95th percentile.
All variables definitions can be found in Appendix 2.
3.5.2 Univariate results
Table 3.4 provides the univariate analyses for our dependent variables for all the
samples based on t-tests. The results in Panel A suggest that the average fees are higher for
clients of audit firms without any Part I/ Part II deficiencies, providing some initial evidence
to support our H1. From Panel B it appears that audit fees increase significantly after the first
inspection, irrespective of the inspection findings and the audit firms’ responses to those
findings. However, after the second inspection, audit fees do not significantly increase anymore
for clients of auditors without clean Part I findings and clients of auditors who have disclosed
quality control deficiencies. After the third inspection round, the only group of clients with
significant audit fee increases are those without any quality control deficiencies. Overall, these
findings partly confirm our expectations. Panel C shows the results for the constant sample for
testing our last hypothesis. The results indicate that audit fee increases are significant after the
first and second inspection but are not significant anymore after the third inspection, consistent
with our H4. In the next section, we use multivariate analyses to test our hypotheses by also
incorporating the control variables that influence audit fees.
Table 3.3 continued
OPINION 2,597 0.194 0.000 0.396 0.000 1.000
FOREIGN 2,597 0.186 0.000 0.389 0.000 1.000
BUSY 2,597 0.603 1.000 0.489 0.000 1.000
SEGMENT 2,597 1.615 1.000 1.286 0.000 10.000
TOTAL_FEE 2,597 4,345,000 2,061,000 4,665,000 105,310 14,840,000
AVG_ASSET 2,597 153,700,000 69,980,000 207,900,000 2,461,000 721,600,000

Chapter 3
68
Table 3.4: Univariate analysis
Panel A: Pre-inspection sample for H1
Log_audit_fee DEF CLEAN Diff QCD NON-QCD Diff
11.000 11.321 0.321*** 11.064 11.179 0.115***
Panel B: Pre-inspection sample for H2 and H3
First inspection Second inspection Third inspection
Log_audit_fee Pre Post Diff Pre Post Diff Pre Post Diff
DISAGREE 11.065 11.371 0.306*** 11.069 11.137 0.068 11.255 11.390 0.135
OTHER 11.147 11.369 0.222*** 11.331 11.388 0.057 11.636 11.657 0.201
CLEAN 11.414 11.583 0.168*** 11.575 11.672 0.097*** 11.498 11.551 0.053
QCD-D 10.521 10.698 0.177** 10.502 10.617 0.115 11.484 11.311 -0.173
QCD-ND 11.273 11.493 0.220*** 11.500 11.580 0.080** 11.582 11.625 0.043
NON-QCD 11.253 11.600 0.374*** 11.501 11.610 0.109*** 11.486 11.572 0.086*
Panel C: Constant sample for H4 testing
Log_audit_fee Pre-inspection(1) Period1(2) Period2(3) Period3(4) (2)- (1) (3)- (2) (4)- (3)
11.369 11.670 11.806 11.748 0.301*** 0.136*** -0.058
* p<.1, ** p<0.05, *** p<0.01, based on two tailed test.
All continuous variables have been winsorized at the 5th and 95th percentile.
All variables definitions can be found in Appendix 2.
3.5.3 Multivariate results
In Table 3.5, the first column shows the regression results of the benchmark model to
test our first hypothesis regarding the Part I inspection findings. The regressions contain 5,050
observations and yield an R2 of 58 percent. CLEAN has a positive coefficient (0.172, p<0.01)
indicating that the average fees are higher for companies with clean auditors before the first
inspection compared to companies with deficient Part I findings. Similarly, the second column
reports the regression results based on the Part II inspection findings and the coefficient on
NON-QCD is also significant positive (0.151, p<0.01), suggesting that audit fees are also
higher for companies without any quality control deficiencies. These findings provide support
for our first hypothesis.

PCAOB Inspections and Audit Firm Behavior: An Analysis of the First Three Inspection
Rounds of Small Audit Firms
69
Table 3.5: Pre-inspection audit fee analysis
Log_audit_fee Part I findings Part II findings
CLEAN 0.172***
(7.673)
NON-QCD 0.151***
(5.017)
LOGASSETS 0.328*** 0.328***
(44.25) (43.60)
LEVERAGE 0.0145*** 0.0145***
(4.471) (4.244)
INVERE 0.248*** 0.257***
(5.706) (5.699)
ROA -0.0303*** -0.0303***
(-7.455) (-7.055)
LOSS 0.203*** 0.206***
(9.118) (8.936)
FOREIGN 0.197*** 0.203***
(5.629) (5.449)
BUSY 0.113*** 0.112***
(5.835) (5.738)
OPINION 0.157*** 0.157***
(6.962) (6.343)
LOGSEG 0.0460*** 0.0449***
(5.838) (5.961)
SHORT -0.0154 -0.0105
(-0.689) (-0.453)
LOGAVG_ASSET 0.0622*** 0.0715***
(7.771) (8.863)
LOGTOTAL_FEE 0.0977*** 0.0929***
(13.12) (12.23)
Constant 3.110*** 3.017***
(15.06) (15.50)
Observations 5,050 5,050
R-squared 0.580 0.577
Fixed effects Year/industry Year/industry
R2 adjusted 0.573 0.571
* p<.1, ** p<0.05, *** p<0.01, based on two tailed test.

Chapter 3
70
Table 3.6 presents the results of the regression analysis used to test hypotheses H2a,
H2b, and H2c. The coefficients on POST are all positive but only significant for the second
round inspection (0.096, p<0.10), providing no support for H2c.17 The coefficient on CLEAN
is positive for the first round inspections, which provides additional support to our first
hypothesis. However, the coefficients on the interaction terms between POST and CLEAN are
all insignificant. Moreover, the F-test on the total effect of CLEAN (i.e. Total effect CLEAN)
shows that the change in audit fees from pre- to post- inspection for clean auditors does not
change significantly which rejects H2a. For testing H2b, interestingly, the coefficients on
OTHER are significantly positive for the first and second inspection round, suggesting that
audit fees are higher for clients of audit firms who do not contest the identified Part I
deficiencies compared to clients of audit firms who disagree with the Part I findings before the
inspections. However, the coefficients on the interaction term between POST and OTHER are
all insignificant. We further use the F-test to examine the total effect of OTHER (i.e. Total
effect OTHER) on the audit fees from pre- and post- inspection, which is also not significant.
All the control variables have the expected signs. In summary, we conclude that the impact of
the publication of Part I findings on the change of audit fees is very limited. A possible
explanation is that Part I deficiencies are viewed as individual engagement related and they
have limited impact on the average fees for all clients. Since the PCAOB does not disclose the
names of the inspected engagements, we are not able to observe what effect the inspection can
have on these deficient engagements.
Table 3.6: Regression results with Part I findings
Log_audit_fee First inspection Second inspection Third inspection
POST 0.056 0.096* 0.020
(1.532) (1.659) (0.324)
CLEAN 0.190*** 0.277*** -0.036
(5.968) (7.060) (-0.811)
POST*CLEAN -0.004 -0.061 0.018
(-0.077) (-1.011) (0.279)
OTHER 0.149*** 0.092** -0.067
(5.442) (2.229) (-1.559)
POST*OTHER -0.024 -0.091 0.024
17 The coefficients on POST here present the changes in audit fees from pre- to post-inspections for clients of
auditors who disagree with the PCAOB Part I findings.

PCAOB Inspections and Audit Firm Behavior: An Analysis of the First Three Inspection
Rounds of Small Audit Firms
71
Table 3.6 continued
(-0.586) (-1.431) (0.379)
FIRST_DEF -0.124***
(-6.282)
SECOND_DEF -0.146***
(-7.605)
LOGASSETS 0.348*** 0.362*** 0.346***
(48.039) (45.086) (42.168)
LEVERAGE 0.026*** 0.029*** 0.023***
(6.783) (7.606) (5.376)
INVERE 0.221*** 0.250*** 0.296***
(5.213) (5.515) (6.221)
ROA -0.025*** -0.024*** -0.023***
(-5.080) (-4.767) (-3.721)
LOSS 0.167*** 0.136*** 0.064***
(8.574) (6.560) (2.914)
FOREIGN 0.256*** 0.238*** 0.204***
(9.297) (8.782) (7.804)
BUSY 0.085*** 0.036* 0.026
(4.831) (1.914) (1.310)
OPINION 0.173*** 0.180*** 0.134***
(7.006) (6.951) (5.063)
LOGSEG 0.031*** 0.029*** 0.007
(4.670) (3.608) (1.068)
SHORT -0.095*** -0.117*** -0.203***
(-3.625) (-2.981) (-4.661)
LOGAVG_ASSET 0.061*** 0.067*** 0.042***
(8.249) (8.039) (4.997)
LOGTOTAL_FEE 0.085*** 0.096*** 0.112***
(12.686) (12.601) (13.501)
Constant 2.798*** 2.420*** 3.173***
(12.925) (11.583) (7.352)
Observations 5,020 3,908 3,118
R-squared 0.648 0.705 0.735
Fixed effects Year/industry Year/industry Year/industry
R2 adjusted 0.642 0.699 0.729

Chapter 3
72
Table 3.6 continued
F test Total effect CLEAN 0.051 0.005 0.038
F test Total effect OTHER 0.032 0.005 0.044
* p<.1, ** p<0.05, *** p<0.01, based on two tailed test.
All continuous variables have been winsorized at the 5th and 95th percentile.
All variables definitions can be found in Appendix 2.
Table 3.7 provides the regression results for our hypotheses H3a, H3b, and H3c. The
coefficients on POST are insignificant for all three inspection rounds.18 In other words, audit
fees do not change significantly for clients of audit firms with disclosed quality control
deficiencies and it does not support our H3c. The coefficients on NON-QCD and QCD-ND are
both significantly positive for the first inspection round, suggesting that audit fees are higher
before the first/second inspection for clients of audit firms without QCDs and clients of audit
firms who remediated the QCDs than for clients of audit firms with disclosed QCDs. These
findings further support our first hypothesis that audit fees are different before the inspection,
conditional on the inspection outcomes. We continue to use an F-test to test the significance of
the total effect by adding up the coefficients on NON-QCD/QCD-ND with the coefficients on
the interaction terms. The results (Total effect NON-QCD) suggest that the total effect of NON-
QCD on audit fees is significantly positive for both the second and third inspection round. In
other words, for clients of audit firms with a clean Part II inspection report, audit fees increase
after the publication of the inspection report. Economically, the coefficient is 0.069/0.100 for
the second/third inspection, which means that on average audit fees are 7%/11% higher after
the second/third inspection for clients of audit firms with a clean Part II inspection report.19
These findings support our H3a. Similarly, we use an F-test to analyze the total effect of QCD-
ND to test our H3b. The results (Total effect QCD_ND) suggest that audit fees only increase
after the third inspection round for clients of audit firms who remediated their QCDs, providing
limited support for H3b. Economically, the coefficient is 0.049 suggesting that audit fees
increase by 5% for clients of audit firms who remediated their QCDs. Collectively, we
conclude that PCAOB inspections provide an opportunity for small audit firms to signal their
audit quality, especially when no quality control deficiencies are identified.
18 The coefficients on POST here present the changes in audit fees from pre- to post-inspections for clients of
auditors who have disclosed quality control deficiencies.
19 We calculate the percentages shift in audit fees in the regression model following Simon and Francis (1988) as
e^(-0.069)-1 and e^(-0.010)-1. The same methodology is used to calculate the percentage of fee increase in this
chapter.

PCAOB Inspections and Audit Firm Behavior: An Analysis of the First Three Inspection
Rounds of Small Audit Firms
73
Table 3.7: Regression results with Part II findings
Log_audit_fee First inspection Second inspection Third inspection
POST -0.045 0.072 0.043
(-0.796) (0.878) (0.584)
NON-QCD 0.220*** 0.412*** -0.061
(4.438) (7.483) (-1.325)
POST*NON-QCD 0.116* -0.003 0.057
(1.721) (-0.037) (0.723)
QCD-ND 0.171*** 0.337*** -0.028
(4.194) (6.257) (-0.715)
POST*QCD-ND 0.074 -0.028 0.006
(1.284) (-0.339) (0.086)
FIRST_QCD -0.101***
(-4.054)
SECOND_QCD -0.080***
(-4.166)
LOGASSETS 0.346*** 0.360*** 0.346***
(47.608) (44.875) (42.021)
LEVERAGE 0.024*** 0.029*** 0.023***
(6.320) (7.613) (5.429)
INVERE 0.242*** 0.250*** 0.312***
(5.740) (5.458) (6.518)
ROA -0.026*** -0.022*** -0.022***
(-5.324) (-4.352) (-3.674)
LOSS 0.173*** 0.145*** 0.067***
(8.892) (7.032) (3.009)
FOREIGN 0.253*** 0.255*** 0.202***
(9.159) (9.341) (7.640)
BUSY 0.086*** 0.029 0.018
(4.894) (1.575) (0.891)
OPINION 0.176*** 0.177*** 0.129***
(7.152) (6.770) (4.857)
LOGSEG 0.030*** 0.026*** 0.005
(4.521) (3.307) (0.734)
SHORT -0.092*** -0.125*** -0.197***
(-3.483) (-3.200) (-4.534)
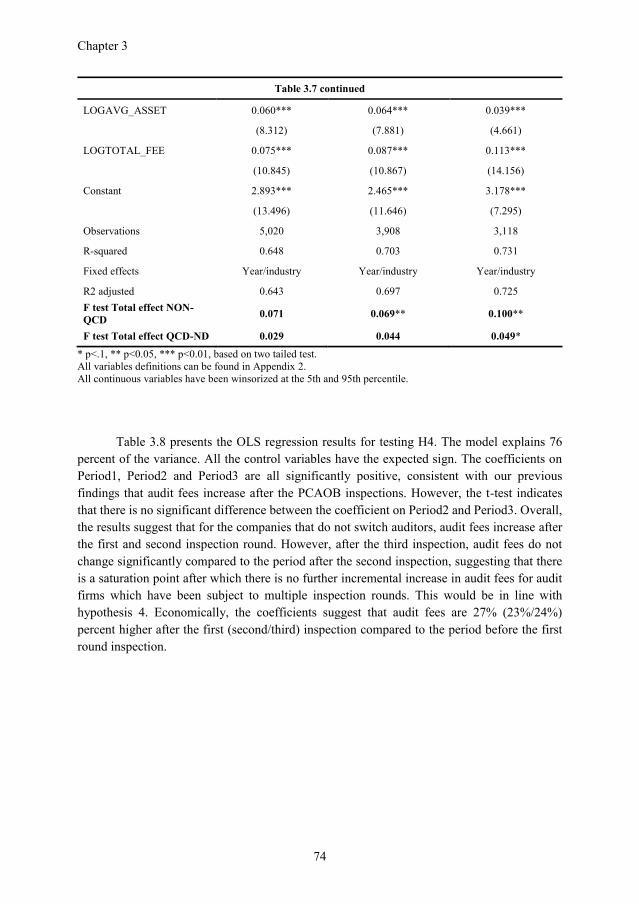
Chapter 3
74
Table 3.7 continued
LOGAVG_ASSET 0.060*** 0.064*** 0.039***
(8.312) (7.881) (4.661)
LOGTOTAL_FEE 0.075*** 0.087*** 0.113***
(10.845) (10.867) (14.156)
Constant 2.893*** 2.465*** 3.178***
(13.496) (11.646) (7.295)
Observations 5,020 3,908 3,118
R-squared 0.648 0.703 0.731
Fixed effects Year/industry Year/industry Year/industry
R2 adjusted 0.643 0.697 0.725
F test Total effect NON-
QCD 0.071 0.069** 0.100**
F test Total effect QCD-ND 0.029 0.044 0.049*
* p<.1, ** p<0.05, *** p<0.01, based on two tailed test.
All variables definitions can be found in Appendix 2.
All continuous variables have been winsorized at the 5th and 95th percentile.
Table 3.8 presents the OLS regression results for testing H4. The model explains 76
percent of the variance. All the control variables have the expected sign. The coefficients on
Period1, Period2 and Period3 are all significantly positive, consistent with our previous
findings that audit fees increase after the PCAOB inspections. However, the t-test indicates
that there is no significant difference between the coefficient on Period2 and Period3. Overall,
the results suggest that for the companies that do not switch auditors, audit fees increase after
the first and second inspection round. However, after the third inspection, audit fees do not
change significantly compared to the period after the second inspection, suggesting that there
is a saturation point after which there is no further incremental increase in audit fees for audit
firms which have been subject to multiple inspection rounds. This would be in line with
hypothesis 4. Economically, the coefficients suggest that audit fees are 27% (23%/24%)
percent higher after the first (second/third) inspection compared to the period before the first
round inspection.

PCAOB Inspections and Audit Firm Behavior: An Analysis of the First Three Inspection
Rounds of Small Audit Firms
75
Table 3.8: OLS regression with constant sample
Log_audit_fee
Period1 0.0875*
(1.862)
Period2 0.209***
(3.265)
Period3 0.218**
(2.707)
LOGASSETS 0.373***
(27.89)
LEVERAGE 0.0303**
(2.664)
INVERE 0.310***
(4.592)
ROA -0.0602**
(-2.262)
LOSS 0.112**
(2.528)
FOREIGN 0.296***
(4.800)
BUSY 0.0221
(0.528)
OPINION 0.117**
(2.039)
LOGSEG 0.00642
(0.591)
LOGAVG_ASSET 0.0152
(0.761)
LOGTOTAL_FEE 0.0970***
(3.679)
Constant 3.018***
(12.10)
Observations 2,597
R-squared 0.766
Fixed effects Year/industry
R2 adjusted 0.761
* p<.1, ** p<0.05, *** p<0.01, based on two tailed test.

Chapter 3
76
3.6 Additional analyses
3.6.1 Personnel adjustments
To further examine whether the expected change in audit fees is associated with a
change in audit effort, we investigate personnel adjustments of audit firms. Specifically, we
argue that an observed fee increase of an audit firm is likely to reflect an increase in effort when
we also observe an increase in human resources for that audit firm. At the same time, it is less
likely that a firm with a deficient inspection hires additional staff due to growth in its revenue
(Lennox and Pittman 2010), which is also reflected in our previous results that deficient audit
firms have problems in raising their audit fees. In line with this reasoning, we expect that
deficient firms are less likely to increase the number of professionals employed by the firm.
We examine changes in human resources (the number of CPAs) using the Form2 Data
published on the PCAOB website. All PCAOB registered audit firms are required to publish
this form which covers a 12-month period from April 1 to March 31 starting in 2010. These
reports contain information on the number of CPAs working for the firms. We regress the
natural logarithm of the number of CPAs on the indicator variables based on the Part I
inspection results and two audit firm level control variables:
LOGCPAS=α0+α1CLEAN#POST+α2OTHER#POST+α3LOGTOTAL_FEE
+α4LOGAVG_ASSET+ e (3.5)
Next, following our previous analysis, we use two variables of interest relating to the
Part II inspection findings: NON-QCD and QCD_ND replacing the two variables CLEAN and
OTHER in Model 3.5.
Table 3.9 and Table 3.10 present the results for the effect that Part I and Part II
inspection findings have on the number of CPAs of the audit firms, respectively. Table 3.9
shows that the number of CPAs does not change significantly after any of the inspection rounds
for deficient audit firms who state a disagreement with the PCAOB findings. For deficient audit
firms without public disagreement with the PCAOB findings, the number of CPAs only
experiences a weak increase after the second round of inspection. At the same time, it appears
that the number of CPAs significantly decreases for clean audit firms after the third round of
inspections. This provides some evidence that audit firms who do not disagree with the PCAOB
Part I findings put more effort to improve by turning to more expensive labor, irrespective of
their inability to charge clients for it.
Table 3.10 shows the regression results for how QCDs are associated with the number
of CPAs. The findings suggest that the number of CPAs increased after the second inspection
round for audit firms which successfully remediated their QCDs. For audit firms who have
disclosed QCDs and audit firms without any QCDs, the number of CPAs does not change
significantly. Collectively, we find some support to the notion that audit firms who remediated
the QCDs increase their effort after the publication of the inspection reports, at least through
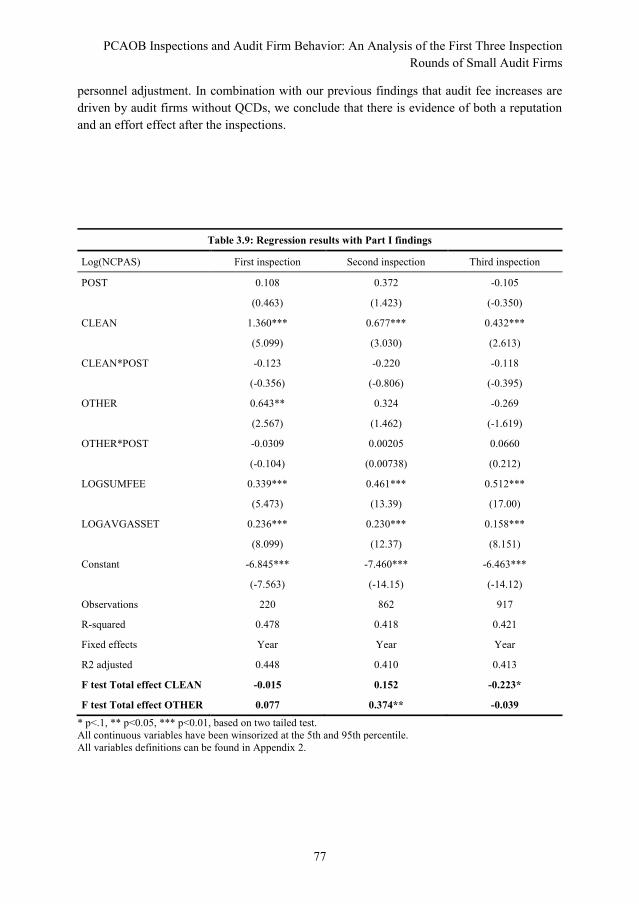
PCAOB Inspections and Audit Firm Behavior: An Analysis of the First Three Inspection
Rounds of Small Audit Firms
77
personnel adjustment. In combination with our previous findings that audit fee increases are
driven by audit firms without QCDs, we conclude that there is evidence of both a reputation
and an effort effect after the inspections.
Table 3.9: Regression results with Part I findings
Log(NCPAS) First inspection Second inspection Third inspection
POST 0.108 0.372 -0.105
(0.463) (1.423) (-0.350)
CLEAN 1.360*** 0.677*** 0.432***
(5.099) (3.030) (2.613)
CLEAN*POST -0.123 -0.220 -0.118
(-0.356) (-0.806) (-0.395)
OTHER 0.643** 0.324 -0.269
(2.567) (1.462) (-1.619)
OTHER*POST -0.0309 0.00205 0.0660
(-0.104) (0.00738) (0.212)
LOGSUMFEE 0.339*** 0.461*** 0.512***
(5.473) (13.39) (17.00)
LOGAVGASSET 0.236*** 0.230*** 0.158***
(8.099) (12.37) (8.151)
Constant -6.845*** -7.460*** -6.463***
(-7.563) (-14.15) (-14.12)
Observations 220 862 917
R-squared 0.478 0.418 0.421
Fixed effects Year Year Year
R2 adjusted 0.448 0.410 0.413
F test Total effect CLEAN -0.015 0.152 -0.223*
F test Total effect OTHER 0.077 0.374** -0.039
* p<.1, ** p<0.05, *** p<0.01, based on two tailed test.
All continuous variables have been winsorized at the 5th and 95th percentile.
All variables definitions can be found in Appendix 2.

Chapter 3
78
Table 3.10: Regression results with Part II findings
Log(NCPAS) First inspection Second inspection Third inspection
POST 0.382 0.346 0.043
(1.057) (1.456) (0.160)
NON-QCD 1.488*** 0.959*** 1.156***
(4.525) (4.803) (6.818)
POST*NON-QCD -0.561 -0.384 -0.223
(-1.047) (-1.478) (-0.797)
QCD-ND 0.589** 0.683*** 0.790***
(2.342) (3.661) (5.076)
POST*QCD-ND -0.283 -0.0299 -0.035
(-0.746) (-0.118) (-0.130)
LOGSUMFEE 0.339*** 0.449*** 0.490***
(4.440) (12.98) (16.77)
LOGAVGASSET 0.212*** 0.213*** 0.147***
(6.495) (10.84) (7.730)
Constant -6.263*** -7.246*** -6.678***
(-6.525) (-14.29) (-14.72)
Observations 220 862 917
R-squared 0.433 0.426 0.421
Fixed effects Year Year Year
R2 adjusted 0.400 0.418 0.413
F test Total effect NON-
QCD -0.179 -0.038 -0.180
F test Total effect QCD-ND 0.099 0.316* 0.008
* p<.1, ** p<0.05, *** p<0.01, based on two tailed test.
All continuous variables have been winsorized at the 5th and 95th percentile.
All variables definitions can be found in Appendix 2.

PCAOB Inspections and Audit Firm Behavior: An Analysis of the First Three Inspection
Rounds of Small Audit Firms
79
3.6.2 Changes in the number of clients
In addition to audit fee changes, we also investigate the clients’ reaction from another
side, which is the number of clients of the audit firms. Besides the number of CPAs, audit firms
also report the number of public clients in the annually published Form 2. We extract the data
and use the natural logarithm of the number of public clients as dependent variable instead of
the natural logarithm of the number of CPAs and rerun Model 3.5 for Part I and Part II
inspection findings. Table 3.11 and 3.12 show the regression results. Table 3.11 shows that the
number of clients increases after the first inspection and then decreases after the second
inspection for deficient audit firms who disagree with the PCAOB findings. At the same time,
there is a weak decrease in the number of clients for audit firms who do not contest the Part I
deficiencies after the second inspection round and the number of clients does not change
significantly for clean audit firms after any of the three inspections. Turning to Table 3.12, we
only find a weak decrease for audit firms without any QCDs. Interestingly, in combination with
the previous results in Table 3.9 and 3.10, we find that the number of CPAs is higher and the
number of clients is lower for audit firms without any deficiencies identified in Part I or Part II
of the inspection reports. In summary, the pattern in our results shows that the increase in audit
fees is accompanied by a drop in the number of clients. As a result, certain clients in the small
audit firm market seem to prefer lower audit fees rather than better audit quality.
3.6.3 Total audit fee change
As our results suggest that the audit firms without quality control deficiencies lose
clients while having an increase in audit fees for the remaining clients, we investigate how the
total audit fee collected by audit firms from their public clients change after the publication of
the inspection report, conditional on the Part II inspection findings. Table 3.13 displays our
results. Using the data from AuditAnalytics, we calculate the natural logarithm of the total audit
fees collected by each audit firm per year. We use t-tests to compare the total fees from pre- to
post-inspection based on the outcome of the inspection report. The results suggest that total
audit fees increase significantly for both auditors with remediated QCDs and auditors without
quality control deficiencies after the first round of inspection, while audit fees do not change
significantly for auditors with disclosed QCDs. After the second inspection, total audit fees
drop significantly for audit firms with disclosed QCD, while total audit fees do not change
significantly for both audit firms with remediated QCDs and audit firms without QCDs. After
the third inspection, total audit fees do not change significantly for auditors without QCDs and
drop significantly for deficient audit firms who do not state disagreement with the deficiencies
while there is no significant change for the two other types of audit firms. In summary, the
results give some indication that audit firms without QCDs are better off compared to the other
two groups of audit firms. This would imply that there is a net benefit of the increase in audit
fees despite the loss of public clients.

Chapter 3
80
Table 3.11: Regression results with Part I findings
Log(NCLIENTS) First inspection Second inspection Third inspection
POST 0.456** -0.308** 0.091
(2.239) (-2.092) (0.779)
CLEAN -0.438** -0.350*** -0.067
(-2.041) (-2.620) (-0.968)
CLEAN*POST -0.317 0.175 -0.182
(-1.171) (1.123) (-1.531)
OTHER -0.259 -0.130 0.079
(-1.330) (-1.003) (1.191)
OTHER*POST -0.431* 0.158 -0.134
(-1.783) (1.017) (-1.111)
LOGSUMFEE 0.820*** 0.768*** 0.777***
(18.86) (40.45) (47.36)
LOGAVGASSET -0.247*** -0.149*** -0.135***
(-11.68) (-13.74) (-11.62)
Constant -4.046*** -5.181*** -5.851***
(-6.976) (-17.71) (-23.05)
Observations 220 862 917
R-squared 0.706 0.688 0.737
Fixed effects Year Year Year
R2 adjusted 0.689 0.683 0.734
F test Total effect CLEAN 0.139 -0.133 -0.091
F test Total effect OTHER 0.025 -0.438* -0.043
* p<.1, ** p<0.05, *** p<0.01, based on two tailed test.
All continuous variables have been winsorized at the 5th and 95th percentile.
All variables definitions can be found in Appendix 2.

PCAOB Inspections and Audit Firm Behavior: An Analysis of the First Three Inspection
Rounds of Small Audit Firms
81
Table 3.12: Regression results with Part II findings
Log(NCLIENTS) First inspection Second inspection Third inspection
POST -0.0170 -0.108 -0.018
(-0.0609) (-0.734) (-0.121)
NON-QCD -0.550** -0.582*** -0.410***
(-2.054) (-4.071) (-4.016)
POST*NON-QCD 0.0990 0.0970 -0.132
(0.278) (0.594) (-0.815)
QCD-ND -0.319 -0.227* -0.343***
(-1.354) (-1.688) (-3.835)
POST*QCD-ND 0.272 -0.032 0.008
(0.957) (-0.204) (0.0518)
LOGSUMFEE 0.821*** 0.765*** 0.781***
(18.40) (38.68) (47.34)
LOGAVGASSET -0.231*** -0.132*** -0.126***
(-10.09) (-11.88) (-11.09)
Constant -4.305*** -5.329*** -5.747***
(-7.541) (-18.62) (-22.61)
Observations 220 862 917
R-squared 0.685 0.697 0.744
Fixed effects Year Year Year
R2 adjusted 0.667 0.693 0.740
F test Total effect NON-
QCD 0.082 -0.011 -0.150*
F test Total effect QCD-ND 0.255 -0.140 -0.010
* p<.1, ** p<0.05, *** p<0.01, based on two tailed test.
All continuous variables have been winsorized at the 5th and 95th percentile.
All variables definitions can be found in Appendix 2.

Chapter 3
82
Table 3.13: Change in total audit fees
Log(sumfee) Pre Post Diff p-value
Panel A: First inspection
QCD-D 12.18 12.34 0.16 0.126
QCD-ND 12.82 13.04 0.22 0.003
NON-QCD 12.47 12.77 0.30 0.002
Panel B: Second inspection
QCD-D 12.54 12.09 -0.45 0.013
QCD-ND 13.49 13.33 -0.16 0.102
NON-QCD 12.86 12.85 -0.01 0.476
Panel C: Third inspection
QCD-D 12.71 12.29 -0.42 0.098
QCD-ND 13.48 13.09 -0.39 0.003
NON-QCD 12.94 12.90 -0.04 0.412
* p<.1, ** p<0.05, *** p<0.01, based on two tailed test.
All continuous variables have been winsorized at the 5th and 95th percentile.
All variables definitions can be found in Appendix 2.
3.6.4 Financial risk of new clients after the inspections
In our main analysis, we restrict our sample to clients that do not switch audit firms
after the publication of the inspection report. To further corroborate our findings on how
disclosure of inspection outcomes affects audit firm’s behavior, we investigate the financial
risks of the new clients after each round of inspection. We identify the new clients from
AuditAnalytics and match them with the financial information from Compustat. Using t-tests,
we compare whether ROA, Loss and Leverage20 for the new clients are different across the
audit firms with different inspection outcomes. The results are presented in Table 3.14. In
general, the results show that the financial risks are lower for new clients of audit firms who
do not have QCDs, implying that these audit firms became more selective in their client
acceptance decisions, which is a key feature of a well-designed internal quality control system.
20 Following our main analysis, we winsorize our continuous variables at the 5 percent and 95 percent.

PCAOB Inspections and Audit Firm Behavior: An Analysis of the First Three Inspection
Rounds of Small Audit Firms
83
Table 3.14: Financial risks for the new clients after the inspections
Panel A: First inspection
QCD_D(1) QCD_ND(2) NON-QCD(3) Diff(1)-(2) Diff(1)-(3) Diff(2)-(3)
ROA -5.199 -3.054 -1.830 -2.145*** -3.368*** -1.224***
LEVERAGE 6.418 3.518 2.498 2.900*** 3.920 *** 1.020***
LOSS 0.736 0.721 0.515 0.015 0.221*** 0.206***
Panel B: Second inspection
ROA -6.211 -3.232 -3.469 -2.979*** 2.742*** -0.237
LEVERAGE 8.942 3.245 3.984 5.697*** 4.958*** -0.739*
LOSS 0.804 0.722 0.731 0.082** 0.073* 0.009
Panel C: Third inspection
ROA -5.664 -3.132 -2.519 -2.532*** -3.145**** -0.613
LEVERAGE 4.933 2.546 2.244 2.387*** 2.689*** 0.302
LOSS 0.810 0.800 0.775 0.100 0.025 0.035
* p<.1, ** p<0.05, *** p<0.01, based on two tailed test.
All continuous variables have been winsorized at the 5th and 95th percentile.
All variables definitions can be found in Appendix 2.
3.6.5 Other additional tests
To rule out the possibility that very small client companies’ might have different pricing
decisions, we exclude clients with assets less than one million US dollars. The untabulated
results show that our main results hold when excluding these small client companies.
Furthermore, the number of engagements being inspected by the PCAOB is larger for audit
firms with more clients. Therefore, these larger audit firms are more likely to get a deficient
Part I finding even though they do not supply lower quality audits. In an untabulated analysis,
we investigate whether the audit fee change depends on the percentage of deficient
engagements (number of deficient engagements divided by the total number of inspected
engagements). The results show that the percentage of deficient engagements is not significant,
implying that this is not driving our main findings.
Finally, we rerun our regression analysis by dropping the sample restriction used in the
main analysis to only include the audit-client combinations that have at least one fiscal year
end before and after the publication of the inspection report. The results remain unchanged
using the full panel without this restriction.

Chapter 3
84
3.7 Conclusion
In view of recent regulatory changes that established independent inspections of US
audit firms, we examine the impact of PCAOB inspections on audit firm behavior of triennially
inspected firms over time. We start by investigating whether audit fees are different before the
inspection conditional on the inspection outcomes, and find that PCAOB inspection findings
appear to be representative of audit effort. Next, we examine whether the inspection results
caused changes in audit fees. The findings of our study reveal that audit fees increase after the
PCAOB inspections, but that this increase is driven by audit firms without disclosed quality
control deficiencies. At the same time, the publication of Part I inspection findings appears to
have limited impact on audit fees. Furthermore, we observe an increase in the number of CPAs
employed by audit firms who do not contest with the PCAOB Part I findings and audit firms
who remediated the quality control deficiencies. However, the reputation damage caused by
the deficiencies limit their abilities to charge clients for the increased effort. Finally, we find
that, instead of attracting more clients, audit firms without QCDs experience a decrease in the
number of public clients while they do charge higher fees. This would suggest that in the small
audit firm market, clients seem to care more about obtaining a lower fee instead of higher
quality, which a clean inspection report is expected to reflect. Collectively, our evidence
suggests that PCAOB inspections led to important changes in audit firm behavior.
Our study is subject to several data limitations. First, it would be desirable to have a
fully balanced sample of audit clients across the period of investigation. Given limited data
availability, a reasonable sample size is only achievable by including all clients with not less
than one year of available data in each of the estimation, pre-, and post-inspection periods.
Secondly, the Form 2 data we used for analyzing the change in the number of CPAs and the
number of public clients is only available after 2010. So the analysis based on these data is
especially an issue for the first inspection round.
This study contributes to the literature on the effects of PCAOB inspections by focusing
on a number of potential changes in audit firm behavior. More generally, we add to the
literature on independent inspections of audit firms at a time when public oversight systems
are being discussed, established, and refined across the world. While prior studies have either
looked at client-level fees prior to inspections (Gunny et al. 2007), at fees at a single audit firm
level (Boone et al. 2015) or at fees for Big 4 audit firms (Acito et al. 2017), this study
contributes to the literature by showing that the established US inspection system changes small
audit firms’ behavior. While recent studies mainly relating to annually inspected audit firms
report a number of positive economic effects of PCAOB inspections, we conclude that for the
small audit firm market, the effects are not unequivocal positive. This seems to be driven by a
lower demand for high quality in this audit market segment. This paper therefore also extends
the literature on the potentially adverse effects of high fee pressure caused by competition and
client-specific demand characteristics. The insights can be useful to regulators and oversight
bodies throughout the world in setting guidelines regarding the detailed implementation and
future development of audit firm inspections.

85
Chapter 4: Market Reactions to Public Oversight: Evidence from the
Netherlands

Chapter 4
86
Abstract
This paper investigates the capital market reactions to the publication of AFM inspection
reports and AFM fine announcements against Big 4 in the Netherlands, using cumulative
average abnormal returns (CAARs). First, by using event studies, I find that CAARs are
insignificant from zero for the first inspection and four announcements of decisions on fines,
suggesting that these information does not change investors’ perception of audit quality. For
the second inspection, on average, CAARs are significantly negative, providing limited support
to the notion that auditor suffer from reputation damage after the disclosure. Second, I use a
cross-section analysis to investigate whether CARs are different across clients audited by
different audit firms. In general, the results suggest that the market reaction is not significantly
different.
87
4.1 Introduction
In response to the wave of high-profile accounting scandals in the early 2000s, the US
introduced independent public oversight of the auditing profession to replace the previous self-
regulation system. Public oversight is considered to be one of the most profound changes in
auditing profession in decades. According to SOX, all audit firms with public listed clients in
the US need to be inspected by the Public Company Accounting Oversight Board (referred to
as PCAOB) at least every three years. Following the SOX in the US, the revised 8th EU
Directive (EU 2006) ended self-regulation of the auditing profession in all EU member states,
and member states were given two years (up to June 2008) to implement the new Directive.
Similar to the PCAOB in the US, public oversight authorities in Europe now have ultimate
responsibility for approval and registration of audit firms, quality control of audit firms and
auditors, continuous education of auditors and investigative and disciplinary action against
audit firms (Van Opijnen 2016).
Since the aim of public oversight is to improve audit quality and protect investors, the
introduction of it has been of great interest to setters of auditing standards, audit firms and
researchers. There is an emerging literature investigating the impact of public oversight
including on financial reporting quality (Carcello et al. 2011; Gipper et al. 2015; Gunny and
Zhang 2013; Lamoreaux 2016; Carson, Simnett, Thürheimer and Vanstraelen 2017) and
auditor reporting behavior (DeFond and Lennox 2017; Gramling et al. 2011; Lamoreaux 2016).
Furthermore, studies show that the publication of the PCAOB inspection results, especially the
disclosure of quality control deficiencies, can negatively impact an audit firm’s reputation,
leading to lower audit fees and fewer clients (Boone, Khurana and Raman 2015; Vanstraelen
and Zou 2017).
Besides the aim to improve audit quality, an important role for public oversight is to
provide information to capital market investors (DeFond 2010). As the only visible products
of the PCAOB inspections, the publicly disclosed inspection reports provide a new source of
information on audit quality. Offermanns and Peek (2011) find that investors respond to
PCAOB inspection reports and at least part of the response to the publication of the inspection
results can be attributed to revisions in investors’ beliefs about accounting information quality.
While Offermans and Peek (2011) focuses on the US setting, this paper explores capital market
reactions to public oversight in a non-US setting, which has not been addressed in prior
literature. More specifically, the paper investigates whether the publication of the inspection
results and decisions to fine the Big 4 audit firms when serious deficiencies are identified
provide meaningful information for capital market investors, using the setting of the
Netherlands.
As a member state of the EU and one of the founding countries of the International
Forum of Independent Audit Regulators (IFIAR), the Netherlands introduced public oversight
in 2006, regulated by the Audit Firm Supervision Act (referred to as AFS Act 2006 hereafter).
According to the Act, all audit firms performing statutory audits need to be inspected by the
Autoriteit Financiële Markten (AFM). Inspections of audit firms in the Netherlands have been
Market Reactions to Public Oversight: Evidence from the Netherlands

Chapter 4
88
carried out twice since the introduction of the Act, with the first inspection results published in
2010 and the second inspection results in 2014.
There are several differences between the PCAOB and the AFM. Compared to the
PCAOB inspections in the US, in which only public company audit clients are inspected, a
major difference in the AFM inspection in the Netherlands is that private clients as well as
public clients are covered. While the PCAOB publishes an individual inspection report for each
audit firm, the AFM published its first round inspection outcomes on Big 4 audit firms in the
Netherlands using a single report. A unique feature of the AFM inspection is that the first
inspection report only disclosed the collective audit firm performance, while the second
inspection report published individual audit firm performances for the Big 4 firms. This unique
feature provides an opportunity to explore whether capital markets react differently to different
disclosure regimes. Quality control deficiencies are also directly disclosed in the AFM
inspection reports, but are only disclosed in the PCAOB inspection reports if the audit firm
does not remediate them within 12 months. Besides the periodical inspections, the AFM also
has the authority to impose fines and disciplinary actions on the audit firms if serious
deficiencies are identified. Between 2006 and 2015, the AFM published four decisions to fine
Big 4 firms, with two fines against EY, one against Deloitte, and one against KPMG. This
paper also explores whether these disclosures provide valuable information about audit quality
to capital market participants.
There are two ways that the publication of the inspection results and decisions on fines
can lead to capital market reactions. Firstly, since all the inspections point out that audit firms
did not collect adequate evidence to support their audit opinion and all the announcements of
fines document that audit firms have problems with their quality control systems, auditor
reputation can be damaged. The decreased reputation can lead to loss of confidence in the
audited financial statements, which can result in negative market reactions (Dee et al. 2011).
Secondly, negative inspection reports can increase investors’ perceptions of potential penalties
towards the Big 4 firms, which can result in a decreased valuation of the insurance based on
the audit firms’ “deep pockets” and lead to negative market reaction. As a result, I hypothesize
that capital market will react negatively to the publications of AFM inspection findings and
decisions on fines. Nevertheless, both arguments are based on the assumption that the AFM
inspections are considered by investors to be effective and to generate reliable information.
Event studies are used to examine the cumulative average abnormal returns (CAARs)
for all client companies of the audit firms over a three-day event window around the disclosures
of AFM inspection findings and AFM’s decisions on fines, beginning at the day before the
announcements through to the day after. The analyses cover all public clients listed in AEX of
Big 4 firms. The results of the event study indicate CAARs are not significantly different from
zero for the first AFM inspection and four announcements of fines, suggesting that these reports
are not informative to investors in the capital market in general. For the second AFM inspection
report, on average, CAARs are significantly negative, providing some support to the hypothesis
that the perceived audit quality decreased and the auditor suffered reputation damage after the
disclosure. Cross-section regressions are used to examine whether cumulative abnormal returns
(CARs) are different across the clients audited by different auditors in the Big 4 firms. In

89
general, the results suggest that the market reaction is not significantly different. A possible
reason is that market structure is different in the Netherlands compared to the US. With the
very small and concentrated public audit market in the Netherlands, the lack of competition
and alternative auditors may lead to investors not valuing the information about audit quality.
Another possible reason is that the AFM inspection covers both public and private companies.
However, no further detailed information is provided in the inspection reports about the
percentage of the public clients inspected with deficiencies. Due to the lack of relevant
information, capital market investors do not react accordingly.
The Big 4 audit firms in the Netherlands are also inspected by the PCAOB as they have
public clients in the US. Although the PCAOB only inspects audit clients listed in the US, it
provides an opportunity to investigate whether the PCAOB inspection reports can also change
investors’ perception of audit quality in the Netherlands. In additional analyses, I study the
market reactions to the publication of the PCAOB inspection reports and find no significant
results in general, suggesting that there is no information spillover effect.
Finally, the impact of the publication of the AFM and PCAOB inspection results on the
cost of debt for public companies is investigated. The results show that cost of debt decreases
after the publication of the first and second AFM inspections, suggesting an increase in
perceived audit quality, while the cost of debt increases after the publication of the PCAOB
inspection results, suggesting damage to auditor reputation. In summary, this suggests the audit
quality perceived by debt market investors changes after the publication of the audit inspection
results.
This paper contributes to the literature in several ways. Firstly, it provides empirical
evidence that the publication of the AFM inspection reports and announcements of fines against
the Big 4 firms do not change perceived audit quality in the capital market in the Netherlands,
while prior research suggests that the PCAOB inspection reports and decisions on fines are
valued in the US market. To the best of my knowledge, this is the first paper to explore the
capital market reaction to public oversight of the auditing profession in a non-US setting.
Secondly, the paper also examines the debt market reaction to the audit inspections, which is
important for practice since debt plays an important role in companies’ financing activities
(Pittman and Fortin 2004).
The remainder of the paper is organised as follows. Section 2 provides background
information about the AFM inspections and announcements of fines in the Netherlands. Section
3 reviews the prior literature and develops the hypotheses. Section 4 presents the methodology
to test the hypotheses. Section 5 describes the data and sample and discusses the empirical
results. Section 6 includes the additional analysis. Section 7 concludes and outlines the
implications and limitations of the study.
Market Reactions to Public Oversight: Evidence from the Netherlands

Chapter 4
90
4.2 Background
According to the AFS Act 2006, all audit firms performing statutory audits in the
Netherlands need to be inspected by the Autoriteit Financiële Markten (AFM). The Netherlands
AFM aims to promote fairness and transparency within financial markets, promoting investor
confidence in these markets (AFM 2010; AFM 2014). Similar to PCAOB inspections in the
US, the independent AFM inspectors not only examine the audit engagements performed by
the audit firms, but also inspect the quality control systems of the audit firms periodically. The
AFM inspectors also use a risk-based approach in selecting specific aspects of quality control
systems and audit engagements for review. After the inspection, an inspection report is publicly
disclosed on the AFM website, indicating whether any material mistakes were identified in the
engagements selected for inspection and the quality control systems in the audit firms based
on the ‘International Standard on Quality Control 1’ (IAASB 2009b). Where material mistakes
are identified, AFM may also decide to impose penalties and disciplinary action.
While there are many similarities between AFM inspections and PCAOB inspections,
they differ in the following areas. Firstly, while the PCAOB inspection only inspects public
client engagements, the AFM inspection covers both public and private companies. Secondly,
according to SOX, the Big 4 audit firms are inspected annually as they have more than 100
public clients. However, in the Netherlands, the Big 4 audit firms are only inspected every four
years recently. AFM and PCAOB also differ in publishing the inspection results. PCAOB
publishes a separate inspection report for each inspected audit firm, while AFM releases one
integrated inspection report after all Big 4 audit firms are inspected. When quality control
deficiencies are identified during the inspection, PCAOB gives the audit firm 12 months to
remediate the deficiencies before disclosing them publicly. However, AFM releases the
inspection findings on the engagement deficiencies and quality control deficiencies at the same
time.
The first AFM inspection on Big 4 audit firms was conducted in 2009 and the first half
of 2010 and the inspection report was published on 1 September 2010. AFM reviewed 46 audits
conducted by the Big 4 firms in 2008 and 29 of the 46 had deficiencies (AFM 2010). However,
the inspection report did not provide any further information on the performance of individual
audit firms. Between April 2013 and the end of July 2014, AFM carried out a second inspection
on the Big 4 firms. In the second inspection, AFM selected 10 audits at each of the Big 4 firms
and evaluated whether the audit firms collected sufficient audit evidence for any material part
to justify their audit opinions. The inspection result was published on the AFM website on 25
September 2014. In contrast to the first inspection report, the second inspection report disclosed
the results for each of the Big 4 firms separately: 4 out of 10 audits by Deloitte were regarded
as inadequate, 3 out of 10 audits by EY, 7 out of 10 audits by KPMG and 4 out of 10 audits by
PWC. Unlike the first inspection report, from which no information can be drawn on the
differences among the Big 4 firms, the second inspection report indicates that KPMG is clearly
worse than the other three Big 4 firms, with 70% of its audits inadequate.
In addition to performing regular inspections on Big 4 audit firms and publishing the
inspection findings, AFM also has the authority to impose fines and disciplinary action on audit
91
firms if serious deficiencies are identified. After the first AFM inspections, AFM announced
four decisions on fines against Big 4 firms up to 2015. On 26 January 2012, AFM published
its first fine decision against EY due to its non-compliance with the duty of care in its
engagements performed in 2007 and 2008. On 2 October 2012, AFM announced another fine
against EY for its lack of compliance officer from 2009 to 2010. Deloitte was also fined for its
non-compliance with the duty of care, which was publicly disclosed on 23 February 2012. On
3 June 2013, AFM revealed its fine decision against KPMG for its insufficient quality control
system. There are no disclosed fine decisions against PWC from 2006 to 2015.
4.3 Prior literature and hypotheses development
Research on the audit profession inspection has primarily focused on PCAOB
inspection in the US, with mixed results on the impact. Some studies suggest that PCAOB may
not be able to improve audit quality. For example, Glover, Prawitt and Taylor (2009) state that
the PCAOB decision to discard the strengths of the existing peer review process and use only
PCAOB staff in its inspections leads to inadequate expertise to effectively conduct “risk-based”
inspections. Based on interviews with auditors, Glover, Prawitt and Taylor (2009) find that
PCAOB inspectors often fail to look at the riskiest areas of an audit because the technical
complexity of such areas is beyond the inspection team’s expertise. At the same time, auditors
often respond to the PCAOB inspection deficiencies on documentation, which may not
necessarily affect the auditor’s opinion after remediation (Defond and Lennox 2017; Dowling,
Knechel and Moroney 2015). As PCAOB uses a risk-based approach to select the engagements
to be inspected, the inspection results are not representative of overall audit quality. As a result,
even if the deficiencies are remediated, the remediation might not improve overall audit quality
(Dowling, Knechel and Moroney 2015). On the other hand, some studies do find empirical
support that the introduction of PCAOB inspection improves audit quality for both Big 4 and
non-Big 4 audit firms, with audit quality proxied by abnormal accruals and going concern
opinions (Carcello et al. 2011; Gramling et al. 2011). DeFond and Lennox (2011) also provide
evidence that PCAOB inspection improves audit quality by providing incentives for audit firms
with low audit quality to exit the market.
In contrast to the studies on PCAOB inspections in the US, there is very limited research
about the impact of public oversight in non-US settings. De Fuentes et al. (2015) show that
auditors sanctioned by the Spanish Institute of Accounting and Auditing exhibit lower average
audit quality than non-sanctioned auditors. Van Opijnen (2016) finds no support that AFM
inspection in the Netherlands improves audit quality.
Despite the debate on whether public oversight is an effective mechanism to improve
actual audit quality, an important role for public oversight of the auditing profession is to
provide information to capital market investors (DeFond 2010). Thus, it is important to
investigate how the capital market reacts to the inspections. The informational value of public
oversight is realised after the inspection reports are published. Prior to the introduction of
public oversight, the auditing profession self-regulated through peer observation. Compared to
Market Reactions to Public Oversight: Evidence from the Netherlands

Chapter 4
92
the peer observation results, the PCAOB inspection results provide an informative, low cost
and more reliable signal about audit quality because of the independence of PCAOB
(Vanstraelen et al. 2017). Prior literature provides evidence that the publication of PCAOB
inspection reports and the subsequent sanctions change investors’ perceived audit quality.
Offermanns and Peek (2011) find evidence that investors react to the publication of PCAOB
inspection report immediately and at least part of the reaction can be attributed to the change
in perceived audit quality. Vanstraelen, Vorst and Zou (2017) find that stock market liquidity
decreases after the publication of the first round inspection reports but increases after the
publication of the second round inspection reports in US. Meanwhile, Gipper et al. (2015) find
that capital market responses to unexpected earnings also significantly increase following the
introduction of the PCAOB inspection regime. Dee et al. (2011) find that investors reacted
negatively to the news of the PCAOB sanctions against Deloitte.
This paper investigates whether the publication of audit inspection results and some
subsequent fine decisions can impact investors’ perception of audit quality, or auditor
reputation, in a non-US setting of the Netherlands. While Van Opijnen (2016) fails to find
support that AFM inspections improve actual audit quality in the Netherlands, it does not
necessarily mean that the capital market does not react to the publication of the inspection
findings due to possible changes in perceived audit quality. The ultimate purpose of auditing
is to provide insurance on the financial information on which investors base their investment
decisions. As audit quality is not directly observable by investors, auditor reputation is used as
an important proxy for audit quality and financial reporting credibility (DeAngelo 1981).
Another source of insurance that auditors provide is that auditors are generally considered to
have “deep pockets” as investors are able to sue the auditor to partially recover their loss in the
case of auditor failure (Dee et al. 2011; Palmrose 2005; DeAngelo 1981). It is also well
documented empirically in prior literature that auditor reputation is valued in the capital
market. For example, Knechel, Naiker and Pacheco (2007) find that firms switching between
Big 4 auditors experience significant positive abnormal returns when the successor auditor is
an industry specialist, and they experience significant negative abnormal returns when the
successor auditor is not a specialist. Krishnamurthy et al. (2006) find that the market reacted
negatively to Andersen clients after the news about Andersen’s indictment was released.
As discussed above, it is well documented that the publication of PCAOB inspection
reports and the following sanction decisions changed investors’ perceived audit quality in the
US. After two rounds of AFM inspections, all Big 4 audit firms in the Netherlands are revealed
to be inadequate in collecting enough evidence to support their audit opinion. On one hand,
such information could lead investors to update their belief about audit quality and question
the reliability of the financial statements. This loss of confidence in the audited financial
statements can lead investors to revise their valuation of the audit firms’ clients, which could
lead to negative market reaction (Dee et al. 2011). At the same time, according to the fine
decisions, the audit firms were punished due to either lack of compliance with the duty of care
or insufficient quality control systems. Thus, the same effect may be applied to the AFM fine
decisions. On the other hand, the negative inspection reports can increase investors’

93
perceptions of potential penalties towards the Big 4 firms, which will result in a decreased
valuation of the insurance based on the audit firms’ “deep pockets”.
However, there are some reasons that investors might not value the information
provided by AFM inspection reports and fine decisions. Firstly, while AFM inspects both
public and private companies, its inspection reports do not provide detailed information on the
percentage of deficient engagements for public and private companies separately. As a result,
investors of public companies may perceive the information to be less relevant. Secondly, the
audit market in the US is still very competitive, especially at the local market level (Sirois and
Simunic 2011; Bills and Stephens 2016), while the public audit market is relatively small and
highly concentrated in the Netherlands (European Commission 2017). The potential lack of
competition leads to limited choice of alternative auditors even if perceived audit quality is low
for the current auditor. In this case, the publication of inspection reports and fine decisions may
have limited capital market reactions as audit quality is not highly valued in general. Thirdly,
the “deep pockets” value of auditing is much weaker in the Netherlands compared to the US
due to the different legal environments. As a result, the perceived and actual fines may not
impact investor’ valuation of audit quality. Last but not least, it is possible that investors
consider the inspection reports and decisions on fines to be outdated by the time they become
public. All in all, whether the audit inspection reports and fine decisions help investors to
update their belief in audit quality remains an empirical question. Therefore, the paper
hypothesises that capital market reaction to the publication of both rounds of AFM inspections
and decisions on fines is significantly different from zero.
H1: Client firms’ market reaction after the publication of the AFM inspection reports
and decisions on fines is significantly different from zero.
A unique feature of AFM inspections is that AFM did not disclose individual audit firm
performance in its first inspection report. As a result, it is not possible for investors to
differentiate audit quality among the Big 4 firms. However, after the second inspection,
inspection findings were published for each Big 4 audit firm, providing additional information
for investors about the quality of individual audit firms. The most significant information in
the report is that 70% of KPMG’s audits were inadequate, significantly higher than all other
three audit firms. If the inspection reports provide information for investors, the market reaction
should be more negative for clients audited by KPMG. This high percentage may also increase
investors’ anticipation of regulatory penalties towards KPMG by a larger extent, compared to
other Big 4 audit firms. As a result, the second hypothesis is formulated as follows:
H2a: The clients’ magnitude of market reaction to the publication of the first AFM
inspection report is not different among the Big 4 audit firms.
H2b: The clients’ magnitude of market reaction to the publication of the second AFM
inspection report is different among the Big 4 audit firms.
Market Reactions to Public Oversight: Evidence from the Netherlands

Chapter 4
94
4.4 Research design
In this paper, I calculate capital market reactions following Brown and Warner (1985)
and DeFond et al. (2005) in computing cumulative abnormal returns (CARs) for the client
companies over a three-day event window, beginning the day before the announcement through
the day after.
Following Chaney and Philipich (2002), the market model is used to measure abnormal
returns to control for the effects of market wide fluctuations:
Rit = αi + βi Rmt + uit
where:
Rit = return for client i on day t
αi = intercept
βi = beta for firm i
Rmt = AEX market index on day t
uit = error term
The abnormal return on day t is the difference between the actual return and the
expected return derived from the market model, or formally:
ARit = Rit − (αi + βi Rmt)
Based on the abnormal return, the three-day cumulative abnormal return (CAR) is
computed as follows:
𝐶𝐴𝑅𝑖𝑡 = ∑ 𝐴𝑅𝑖𝑡
1
𝑡=−1
The estimation period I use for calculating the expected return starts from 142 trading
days before the events dates and ends 21 trading days before those dates. I drop the observations
which have less than 120 trading days in the estimation period.
To test my first hypothesis, I use cumulative average abnormal returns (CAAR), the
average CAR across all the client companies of the audit firms, which is calculated as follows:
𝐶𝐴𝐴𝑅 =1
𝑛∑ 𝐶𝐴𝑅𝑖𝑡
𝑛
𝑖=1
Where n equals to the numbers of clients of the audit firm(s) influenced by the six
events.
Following Kothari and Wasley (1989), I compute the t-statistics for CAAR as follows:

95
𝐶𝐴𝐴𝑅
𝑆(𝐶𝐴𝐴𝑅)/√𝑛
Where:
𝑆(𝐶𝐴𝐴𝑅) = √∑(𝐶𝐴𝑅𝑖𝑡 − 𝐶𝐴𝐴𝑅)2/(𝑛 − 1)
𝑛
𝑖=1
To test my second hypothesis, I use a cross-sectional regression analysis to explore
whether the cumulative abnormal returns are different across the client companies audited by
different audit firms. Specifically, the following model is used:
CARit = α + β1DTit + β2EYit+β3PWCit+β4SIZEit+β5LEVit+β6GROWTHit+𝛿 (3.1)
I use three variables to test my hypotheses: DT, EY and PWC. DT (EY/PWC) takes a
value of 1 if the client company is audited by DT (EY/PWC) and 0 otherwise. For the first
AFM inspection, as there is no information regarding individual audit firm’s performance in
the inspection report, I expect that the coefficients are insignificant for all three proxies. For
the second AFM inspection, as the percentage of inadequate audits is significantly higher for
KPMG compared to other three Big 4 auditors, I expect that the coefficients on all three proxies
are positive.
I also include a number of client firm variables to control for other factors that may
influence the market’s reaction to the publication of the inspection reports. Klock (1994) argues
that the greater the availability of information about a firm, the less likely incremental
information is contained in an event. Following Knechel, Naiker and Pacheco (2007) and
Defond et al. (2005), I include SIZE as a client firm control variable, which is calculated as the
natural log of total assets in the year prior to the events. Given that firm size is commonly used
as a proxy for information availability (Collins and Kothari 1989), an inverse relationship is
expected between firm size and abnormal returns (Freeman 1987). I also include LEV and
GROWTH as client firm control variables, capturing either greater need for a reputable auditor
or increased risk of auditor litigation. LEV is the company’s leverage ratio in the year before
the events, calculated as the total debt divided by total assets. GROWTH measures the growth
in revenues in the year prior to the events. Drawing on prior literature (DeFond et.al 2005; Dee
et.al 2011), greater need for a reputable auditor and increased litigation risks are associated
with more negative reactions to bad news related to audit quality.
Market Reactions to Public Oversight: Evidence from the Netherlands

Chapter 4
96
4.5 Data, sample and results
To explore investors’ assessments of AFM inspection reports, I examine the cumulative
average abnormal returns around the publication of the inspection reports. The first inspection
report is published on 1 September 2010 and the second inspection report is published on 25
September 2014. If the inspection findings do impact auditor reputation, it should apply to all
clients of the audit firms. Other than the inspection findings, AFM also disclosed four decisions
on fines: two against EY on 26 January 2012 and 2 October 2012, one against Deloitte on 23
February 2012 and one against KPMG on 3 June 2013. These announcements should only
influence the punished audit firms’ clients. Table 4.1 provides a summary of the six events.
Table 4.1: Events dates and summaries
Event date Event summary
1st September 2010 AFM disclosed its first inspection reports
26th January 2012 AFM disclosed its fine against EY
23th February 2012 AFM disclosed its fine against DT
2nd October 2012 AFM disclosed another fine against EY
3rd June 2013 AFM disclosed its fine against KPMG
25th September 2014 AFM disclosed its second inspection reports
To calculate abnormal returns around these six events, I first get all AEX listed
companies’ daily returns and the AEX index from DataStream. Then I collect the auditor
information from Orbis from 2009 to 2015. All the financial information used as control
variables in my cross-sectional analysis are also collected from DataStream.
Table 4.2 presents the sample composition for these six events. The final samples
include 85 clients for the first AFM inspection and 71 clients for the second AFM inspection.
For the first inspection, 14 clients are audited by Deloitte, 21 are audited by EY, 33 are audited
by KPMG and 17 are audited by PWC. For the second inspection, 16 clients are audited by
Deloitte and EY separately, 22 are audited by KPMG and 17 are audited by PWC. For the fines
against EY, the number of clients influenced is 14/15 for the first/second fine. DT has 16 clients
being influenced for its fine and KPMG has 21.
Table 4.2: Sample composition
Events Total DT EY KPMG PWC
First inspection 85 16 21 31 17
Second inspection 71 17 18 18 18
Fine 26th Jan 2012 -- -- 14 -- --
Fine 23th Feb 2012 -- 16 -- -- --
Fine 2nd Oct2012 -- -- 15 -- --
Fine 3rd Jun 2013 -- -- -- 21 --

97
Table 4.3 reports the results for my first hypothesis. Panel A shows the average
abnormal returns at the event day and CAARs around the publication of the first AFM
inspection report. At the event day, the average abnormal returns are all negative but
insignificant for all client companies, regardless of their auditors. For the whole sample, CAAR
is negative and insignificant on average. When I partitioned the sample based to audit firms,
the results suggest that clients of KPMG react negatively to the publication of the inspection
report, significant at the 10% level. However, the market reaction for the clients of all other
three audit firms are insignificant. In general, the results provide no support to my first
hypothesis. Panel B of Table 4.3 reports the statistic results for the publication of the second
AFM inspection report. The average abnormal returns are all positive at the event day but
insignificant for clients of Deloitte and EY while significant for clients of KPMG and PWC.
The average abnormal returns for the whole sample at that date is also positive and significant.
On the contrary, CAAR is significantly negative for the whole sample on average. However,
when the whole sample is divided into four sub-samples based on audit firms, the results
suggest CAARs are all not significant anymore, regardless of audit firms. In summary, the
results provide some but limited support to my first hypothesis.
Table 4.3: CAARs for AFM inspections
Panel A: First AFM inspection
Window Total DT EY KPMG PWC
Event day -0.0027 -0.0039 -0.0025 -0.0031 -0.0011
[t-stat] -1.18 -0.94 -0.51 -0.89 -0.17
CAAR -0.0055 0.0049 -0.0098 -0.0088* -0.0039
[t-stat] -1.26 0.45 -1.33 -1.97 -0.26
Panel B: Second AFM inspection
Window Total DT EY KPMG PWC
Event day 0.0057*** 0.0040 0.0061 0.0038* 0.0088*
[t-stat] 2.85 1.40 1.03 1.85 2.11
CAAR -0.0061 -0.0047 -0.0051 -0.0044 -0.0010
[t-stat] -1.73* -0.72 -0.59 -0.93 -1.25
Robust t-statistics in parentheses, *** p<0.01, ** p<0.05, * p<0.1
Table 4.4 presents the market reactions to the AFM’s announcement of fine decisions.
For the first fine announcement, in which AFM imposed a fine against EY, both the abnormal
market return on the event day and the cumulative abnormal returns over the three-day period
are insignificant. The results suggest that the market participant did not adjust their perceived
audit quality after the disclosure. The second fine imposed by AFM is against DT. The market
reacts negatively to the announcement on the event day. However, the insignificant CAAR
suggests the lack of evidence that investors downgrade their valuation of DT. On 2nd Oct 2012,
Market Reactions to Public Oversight: Evidence from the Netherlands

Chapter 4
98
AFM imposed a second fine on EY. Consistent with the reaction to the first fine on EY, the
reaction after this fine is insignificant, confirming that there is no reputation change for EY
after the announcements. The last fine that AFM imposed after the instalment of the inspection
and before the end of 2015 is against KPMG. The abnormal return at the event day and the
CAAR are all insignificant. In general, the results suggest that the market does not react to the
AFM’s announcements of fine decisions against the audit firms. In other word, the valuation
of auditing by the investors in the capital market does not change after the announcements.
Overall, the results provide no support for my first hypothesis.
Table 4.4: CAARs for AFM fines
Events Event day [t-stat] CAAR [t-stat]
26th Jan 2012 against EY -0.0043 -0.39 0.0178 1.52
23th Feb 2012 against DT -0.0150*** -2.99 -0.0034 -0.33
2nd Oct2012 against EY -0.0082 -1.69 -0.0449 -1.46
3rd Jun 2013 against KPMG -0.0010 -0.25 -0.0048 -0.73
Robust t-statistics in parentheses, *** p<0.01, ** p<0.05, * p<0.1
Table 4.5, Panel A provides the descriptive statistics for the first inspection sample for
testing my second hypothesis. For the first inspection, 83 clients are included in the analysis.21
Total assets of the companies range from 7.29 million US dollars to 1,154,000 million US
dollars with a mean of 22,100 million US dollars. Average leverage is 0.243 and median
leverage is 0.234. Overall, the companies have a decline in revenues for 0.27 percent on
average while half of the companies experience a decline for at least 5.26 percent in 2009. For
my dependent variable, the companies had a negative cumulative abnormal return of 0.27
percent on average.
Table 4.5, Panel B presents the descriptive statistics for the second AFM inspection
sample for testing my second hypothesis. For the second inspection, 69 clients are included in
the analysis.22 Total assets of the companies range from 0.04 million US dollars to 44,620
million US dollars with a mean of 4,548 million US dollars. Average leverage is 0.226 and
median leverage is 0.210. Overall, the companies have a decline in revenues for 17.5 percent
on average while half of the companies experienced a decline for 2.98 percent at the minimum
in 2013. And the companies had a negative mean cumulative abnormal return of 0.49 percent.
21 One observation is dropped out of the sample compared to the sample for testing the first hypothesis due to data
availability for GROWTH in 2009. 22 One observation is dropped out of the sample compared to the sample for testing the first hypothesis due to data
availability for total assets in 2013.

99
Table 4.5: Descriptive statistics for cross-section analysis
Panel A: First AFM inspection
VARIABLES N mean p50 sd min max
SIZE 84 2.210e+07 924,598 1.298e+08 7,296 1.154e+09
LEV 84 0.243 0.234 0.158 0 0.854
GROWTH 84 -0.277 -5.26 52.1 -56.2 423.7
CAR 84 -0.00272 -0.00352 0.0313 -0.103 0.0982
Panel B: Second AFM inspection
SIZE 69 4.548e+06 1.006e+06 8.708e+06 40 4.462e+07
LEV 69 0.226 0.210 0.156 0 0.597
GROWTH 69 -17.5 -2.98 90.9 -741.9 26.1
CAR 69 -0.00491 -0.00277 0.0281 -0.116 0.0703
SIZE is calculated as the natural log of total assets in the year prior to the events. LEV is the company’s leverage
ratio in the year before the events, calculated as the total debt divided by total assets. GROWTH measures the
growth in revenues in the year prior to the events. CAR is the cumulative abnormal returns over a three-day event
window, beginning the day before the announcement through the day after.
Table 4.6 reports the cross-sectional regression results for testing my second
hypothesis. For the first inspection, the coefficients are insignificant for DT and EY while
significantly positive for PWC. It suggests that CAR is significantly larger for clients of PWC
compared to clients of DT, EY and KPMG, providing no support for H2. The results in the
second column are all insignificant, suggesting that CAR is not different across the client
companies of different audit firms around the publication of the second AFM inspection report.
Taken together, these results are quite consistent with the event study results, suggesting that
the capital market participants do not take the information provided in AFM’s inspection
reports and announcements of fine decisions into consideration while value the auditors.
Market Reactions to Public Oversight: Evidence from the Netherlands

Chapter 4
100
Table 4.6: Regression results for H2
VARIABLES First inspection Second inspection
DT 0.013 0.003
(1.054) (0.366)
EY -0.001 -0.002
(-0.134) (-0.198)
PWC 0.018** -0.007
(2.447) (-0.723)
Log(SIZE) -0.000 0.000
(-0.207) (0.026)
LEV 0.026 -0.027
(1.093) (-0.808)
GROWTH 0.002 -0.001
(0.381) (-0.688)
Constant -0.010 0.002
(-0.534) (0.113)
Observations 84 69
R-squared 0.092 0.041
R2 adjusted 0.0208 -0.0520
Robust t-statistics in parentheses, *** p<0.01, ** p<0.05, * p<0.1
DT equals to 1 for companies audited by DT, 0 otherwise. EY equals to 1 for companies audited by EY, 0
otherwise. PWC equals 1 for companies audited by PWC, 0 otherwise. SIZE is calculated as the natural log of
total assets in the year prior to the events. LEV is the company’s leverage ratio in the year before the events,
calculated as the total debt divided by total assets. GROWTH measures the growth in revenues in the year prior to
the events. The dependent variable CAR is the cumulative abnormal returns over a three-day event window,
beginning the day before the announcement through the day after for each client company.
4.6 Additional analyses
4.6.1 Market reactions to PCAOB inspection reports
Except for conducting inspections on local audit firms with listed clients in the US,
PCAOB also aims to perform oversight on international audit firms whose clients listed in the
US. However, while not every country agrees to corporate with PCAOB, the Netherlands is
one of the countries who accept the inspections. As a result, the Dutch Big 4 audit firms are
not only inspected by AFM in the Netherlands, they are also inspected by PCAOB as they have
public clients listed in the US. In this section, I further investigate whether the PCAOB
inspection reports provide valuable information about audit quality to the capital market
investors in the Netherlands, using this unique setting.

101
Table 4.7 provides information about the publication of the PCAOB inspection reports
of the Big 4 audit firms in the Netherlands. The publication dates are 10 November 2014, 1
May 2014, 1 August 2013 and 1 July 2013 for DT, EY, KPMG and PWC separately. As the
time of disclosure in the inspection reports are local time at District of Columbia, United States,
the event days are identified as one day later at Amsterdam time. I employed the same
procedure as in my main analyses to identify the auditor clients from Orbis and get the return
data for calculating abnormal returns from DataStream. The number of clients are 16, 17, 22
and 18 for DT, EY, KPMG and PWC. Except for PWC, all other three audit firms have GAAS
related deficiencies disclosed in their inspection reports. At the same time, all four audit firms
have quality control deficiencies identified during the inspections. These quality control
deficiencies are all remediated in a 12-month period after the publication of the inspection
results and not publicly disclosed later on.
Table 4.7: PCAOB inspection information
Events Publication date US Event date Number of clients GAAS QCI
DT 10th Nov 2014 11th Nov 2014 16 1 1
EY 1st May 2014 2nd May 2014 17 1 1
KPMG 1st Aug 2013 2nd Aug 2013 22 1 1
PWC 1st Jul 2013 2nd Jul 2013 18 0 1
Table 4.8 presents the market reactions to the publication of the PCAOB inspection findings.
For DT, EY and PWC, the average abnormal returns are negative but not significant from zero
at the event day. And CAARs are also not significant from zero for clients of DT, EY and
PWC. However, the market reacts positively to KPMG’s inspection results, based on both the
average abnormal return on the event day and CAARs. To summarize, the results provide
limited support to the notion that PCAOB inspection reports on Big 4 audit firms in the
Netherlands impact
Robust t-statistics in parentheses, *** p<0.01, ** p<0.05, * p<0.1
Table 4.8: CAAR for PCAOB inspections
Auditor Event day [t-stat] CAAR [t-stat]
DT -0.0010 -0.33 0.0083 1.24
EY -0.0026 -0.35 -0.0016 -0.19
KPMG 0.0145** 2.26 0.0158*** 2.92
PWC -0.0033 -0.50 0.0086 1.40
Market Reactions to Public Oversight: Evidence from the Netherlands

Chapter 4
102
4.6.2 Cost of debt analyses
While audit plays a vital role in decreasing information asymmetry in the equity market,
it is also highly valued in the debt market. Extant literature has found extensive evidence that
cost of debt capital is lower for companies choosing a highly reputable auditor (Gul et al. 2013;
Minnis 2011; Pittman and Fortin 2004). As one important difference between AFM and
PCAOB inspections is that AFM also inspect audit firms’ private clients, I further investigate
whether the publication of the AFM and the PCAOB inspection reports are valued in the debt
market, employing cost of debt as a proxy in this section. Following Minnis (2011), I employ
the following model to test whether cost of debt for client companies of the audit firms changes
after the publication of the inspection reports:
Cost of debti.t+1=β0+β1*Posti,t+1+β2*InterestCoveragei,t+β3*CurrentRatioi,t+β4*PPEi,t+
β5*LEVi,t+β6*Ln(ASSETS)i.t +β7*GROWTHi,t+1 +β8*NegEquityi,t
+Year fixed effects +Industry fixed effects + δ (3.2)
Where:
Cost of debti,t+1=2*interest paidt+1 / (Total debtt+1+Total debtt)
Posti,t+1=1 for financial year ends after the publication of inspection results,0 otherwise
InterestCoveragei,t= EBITDA/interest paid in year t
CurrentRatioi,t= current assets/current liabilities in year t
PPEi,t= property, plant and equipment/total assets in year t
LEVi,t= total debts/total assets in year t
ASSETi,t=total assets in year t
GROWTHi,t+1= sales growth in year t
Neg-equityi,t=1 if total liability is larger than total assets in year t
The sample used to test the effect after the first AFM inspection includes all public
listed companies in AEX with available data from 2006 to 2013. The sample used to test the
effect after the second AFM inspection starts from 2010, which is the year that AFM published
its first inspection report, to 2015. For both samples, I only include those companies that have
at least one observation before and one observation after the first/second inspection. All the
continuous variables used are winsorized at the first and last 5 percent. As AFM only publish
one inspection report for all audit firms after each inspection round, I do not have a control
group to control for other common factors that influence cost of debt.

103
In contrast to the publications of AFM inspection finding, the variation in the
publication dates of PCAOB inspection results creates a natural diff-in-diff design to compare
the change in cost of debt. The sample period to test the effect of PCAOB inspections starts
from 2006 to 2015. And I only included those companies that have at least one observation
before and one observation after the publication of the inspection findings in the samples. All
the continuous variables are winsorized at the first and last 5 percent.
Table 4.9 reports the OLS regression results for the AFM inspections. The coefficients
on Post are all significantly negative for the first and second AFM inspection analyses,
indicating that cost of debt capital decreases after the publication of the inspection results. In
other words, perceived audit quality of borrowers increases after the inspections. A possible
explanation is that the borrowers believe that audit quality should increases after the
inspections, consistent with the AFM’s mission to improve capital market participants’
confidence. However, as I mentioned above, there is a lack of a control group for these
analyses. Except for the publications of AFM inspection findings, other important changes in
the audit market also happened during this period, including the disclosure of the audit firms’
transparency reports, the anticipated audit firm rotation etc. Without a control group, I am not
able to distinguish whether the change in perceived audit quality is only caused by inspections.
In summary, although the results suggest some positive effect of the publications of the
inspection reports, they should be interpreted with conscious.
Table 4.10 presents the empirical analysis result for the PCAOB inspections. The
coefficient on Post is positive and significant at the 10 percent level, suggesting that the
publication of PCAOB inspection reports do have spillover effect in the Netherlands’ debt
market. The deficient reports lead to reputation loss for Big 4 audit firms among the borrowers.
Compared to the results from AFM inspections, it suggests that PCAOB inspection reports
serve as an information role rather than supervision role which lead to increased perceived
audit quality. Moreover, the natural diff-in-diff design lends more credibility to interpret the
empirical results.
Market Reactions to Public Oversight: Evidence from the Netherlands

Chapter 4
104
Table 4.9: Cost of Debt analysis AFM inspections
VARIABLES First inspection Second inspection
Post -0.0143** -0.0129*
(-2.177) (-1.861)
Interest coverage 0.000146 -0.000249
(0.814) (-1.238)
Current ratio -0.00267 -0.0117**
(-0.487) (-2.256)
PPE -0.0472*** 0.0235
(-2.841) (1.232)
LEV -0.0650** -0.170***
(-2.015) (-5.389)
Log(ASSET) -0.00474*** -0.00153
(-2.704) (-0.975)
GROWTH 0.0364* -0.00834
(1.904) (-0.437)
Neg-equity 0.0759*** 0.0458***
(3.434) (2.896)
Constant 0.170*** 0.136***
(7.562) (4.704)
Observations 324 285
R-squared 0.325 0.312
Fixed effects Year/industry Year/industry
R2 adjusted 0.281 0.259
Robust t-statistics in parentheses, *** p<0.01, ** p<0.05, * p<0.1
Cost of debt in year t+1 equals to the interest paid in year t+1 divided by the average total debt in year t and year
t+1; Post equals 1 for financial year ends after the publication of inspection results,0 otherwise; Interest coverage
is calculated as the earnings before tax, depreciation and amortization divided by interest paid. Current ratio
equals to current asset divided by current liabilities; PPE is the percentage of property, plant and equipment out
of total assets; Growth is the increases in sales. Neg-equity equals to 1 if total liability is larger than total assets, 0
otherwise.

105
Table 4.10: Cost of Debt analysis PCAOB inspections
VARIABLES PCAOB inspection
Post 0.0130*
(1.657)
Interest coverage -0.000279**
(-2.023)
Current ratio -0.00476
(-1.122)
PPE -0.0199*
(-1.690)
LEV -0.0956***
(-4.166)
Log(ASSET) -0.00134
(-1.149)
GROWTH 0.00709
(0.502)
Neg-equity 0.0383***
(3.856)
Constant 0.128***
(5.981)
Observations 396
R-squared 0.239
Fixed effects Year/industry
R2 adjusted 0.191
Robust t-statistics in parentheses, *** p<0.01, ** p<0.05, * p<0.1
Cost of debt in year t+1 equals to the interest paid in year t+1 divided by the average total debt in year t and year
t+1; Post equals 1 for financial year ends after the publication of inspection results,0 otherwise; Interest coverage
is calculated as the earnings before tax, depreciation and amortization divided by interest paid. Current ratio
equals to current asset divided by current liabilities; PPE is the percentage of property, plant and equipment out
of total assets; Growth is the increases in sales. Neg-equity equals to 1 if total liability is larger than total assets, 0
otherwise.
Market Reactions to Public Oversight: Evidence from the Netherlands

Chapter 4
106
4.7 Conclusion
In this paper, I investigate the capital market reactions to the publication of AFM
inspection reports and AFM fine announcements against Big 4 in the Netherlands. By studying
the market reactions, I aim to contribute to the emerging literature on the effectiveness of
auditing profession oversight under a non-US setting. Specially, I examine the cumulative
abnormal returns over a three-day event window, beginning at the day before the
announcements through the day after.
The results of my event study indicate that CAARs are insignificant from zero for the
first inspection and four announcements of decisions on fines, suggesting that these information
does not change investors’ perception of audit quality. For the second inspection, on average,
CAARs is significantly negative, providing limited support to my hypothesis that auditor suffer
from reputation damage after the disclosure. As the second AFM inspection report point out
that the percentage of inadequate engagements is the highest for KPMG compared to other
audit firms, I use a cross-section analysis to investigate whether CARs is different across clients
audited by different audit firms. In general, the results suggest that the market reaction is not
significantly different. A possible explanation for the lack of reactions to the publications of
the reports is that the market structure is different in the Netherlands compared to the US. The
audit market in the Netherlands is highly concentrated with more than 90% of the public
companies audited by Big4. Unlike the US, in which the audit market is still very competitive
at the local level (Bill and Stephens, 2016), the Netherlands have a rather small audit firm
market. The concentration may lead to the lack of competition and client audit firm choices.
As a result, investors do not value Big 4 audit firms differently even after the disclosure of the
deficient inspection findings and the announcements of fines decisions. Another possible
reason is that the information may considered to be less relevant for investors as AFM do not
provide detailed information about the percentage of deficient engagements for public and
private companies. Moreover, the smaller litigation risks for audit firms together with the
potential outdated information may also lead to the lack of reaction.
Big 4 audit firms are also under inspection by the PCAOB as they have public clients
listed in the US. In additional analyses, I report the market reactions to the publications of the
PCAOB inspection reports. The results suggest that investors do not react significantly to the
disclosures, except for KPMG. In combination with the results of my main analysis, the market
participants do not adjust their valuation of auditing around all the events related to public
oversight. In another additional analysis, I continue to investigate how the borrowers in the
debt market react to the publications of AFM and the PCAOB inspection findings by
employing the cost of debt as a proxy. The results show that cost of debt decreases after the
publications of the first and second AFM inspection, suggesting an increase in perceived audit
quality. However, these results should be interpreted carefully as other important changes
happened in the audit market during that period, including disclosure of audit firms’
transparency reports and anticipated audit firm rotation. The lack of a control group makes it
impossible to distinguish the cause of the increased perceived audit quality. In contrast, the
analysis on the PCAOB inspection shows that the cost of debt increases, suggesting auditor

107
reputation damages. The natural diff-in-diff design in this analysis provides more credibility
for interpreting the results.
I contribute to the literature in several ways. Firstly, most prior research investigating
the effect of public oversight in auditing profession focuses on the US setting. In this paper, I
provide empirical evidence that AFM inspections in the Netherlands do not seem to have much
capital market impact. Secondly, I also look at the debt market reactions to the inspections,
which to the best of my knowledge has not been address in extant literature. This provides
some guidance for practice since debt serves an ultimate important role in companies’ financing
activities (Pittman and Fortin 2004).
I am aware that my results are subject to a number of limitations. First, my analysis
focuses on the Netherlands. So the findings may not be generalizable to other countries with
different audit market structures and regulation environments. Secondly, I do not have a control
group in my cost of debt study on the AFM inspections, and my cost of debt analyses are
relatively indirect tests. Thirdly, I only study cost of capital for public listed companies in this
paper. Future research could complement my research by looking at the private companies.
Market Reactions to Public Oversight: Evidence from the Netherlands


109
Chapter 5: Conclusion

Chapter 5
110
5.1 Summary
Being one of the most profound changes in the history of the auditing profession, public
oversight receives considerable attention from academics, regulators, stakeholders and society
at large. Prior literature has focused on investigating the impact of public oversight on
accounting quality and auditor reporting behavior of big audit firms in the US In this
dissertation, I extend this stream of literature by examining various effects of public oversight
in the US, both from the investor perspective and the audit firm perspective. Additionally, using
the public oversight setting in the Netherlands, I study how the publication of inspection reports
affects investors’ perceived audit quality in a non-US setting.
The results of my first study, described in chapter 2, provide some indication that
inspection reports issued by the PCAOB are value relevant for capital market investors. More
specifically, I find that stock market liquidity decreases after the publication of the first
inspection reports, regardless of the inspection results. This suggest that the effect of the
changed perceived audit quality is dominating after the first inspection. After the second
inspection, liquidity increases and the increase is driven by clients with deficient auditors who
do not contest the PCAOB inspection findings. In other words, the expected benefits of
disclosing the results of audit firm inspections only seem to become visible after the disclosure
of the second round inspection reports. Combined with the finding that liquidity first decreases,
the results suggest that there is a learning effect in incorporating the information conveyed in
the inspection reports and it helps to close the information gap after the first inspection.
However, the results show that liquidity does not significantly change after the third inspection,
suggesting that the informational value of inspection reports appears to fade out after the third
inspection round.
While my first study investigates how investors value PCAOB inspection reports, my
second study, described in chapter 3, focuses on whether publicly disclosed inspection findings
can shape auditor behavior. The intended goal of PCAOB inspections to improve audit quality
can only be achieved if inspection outcomes can provide sufficient incentives for audit firms
to adjust their behavior. Hence, I examine whether inspections affect audit fees of smaller audit
firms, which is viewed as a proxy for the input factor of audit quality, conditioning on the
content of the inspection reports.
The results of my second study indicate that audit fees increase on average after all first
three rounds of inspection. I conjecture that incentives stemming from litigation risks and
reputation damage affecting perceived competence following public disclosure of inspection
findings can shape the magnitude of audit fees changes. For audit firms with deficient
inspection findings, litigation risks and the possibility to get regulatory sanctions are arguably
higher than those with clean inspection reports, which leads to more incentives for deficient
audit firms to improve audit effort. In a competitive market, increased audit effort should be
reflected in audit fees. At the same time, deficient audit firms’ ability to raise their fees are
largely constrained by reputation loss if clients value the information provided in inspection
reports. I further show that the increase in audit fees is driven by audit firms without
engagement or disclosed quality control deficiencies. In contrast, audit firms with disclosed

Conclusion
111
quality control deficiencies experience decreases in audit fees, suggesting that clients perceive
Part II of PCAOB inspection reports to be better indicators of audit quality.
In addition, in my second study, I provide insights regarding the impact of inspections
on audit firms by investigating the change in personnel decisions and number of public clients.
The results show that deficient audit firms experienced a decrease in the number of CPAs,
which may suggest a seeking for lower labor cost. On the contrary, for clean audit firms, I
document an increase in the number of CPAs, which would be consistent with higher audit
effort. However, the number of public clients decreases for clean audit firms. Collectively, my
second study suggests that there appears to be a strong focus of public clients on negotiating
for the lowest possible audit fee instead of searching for higher audit quality, based on the
assumption that PCAOB inspection reports signal audit quality accurately. However, while my
first and second study suggest that PCAOB inspections lead to important changes in stock
market liquidity as well as audit firm behavior, it does not provide direct evidence that the
benefits outweigh the cost of public oversight.
As indicated in the introduction of the dissertation, more and more countries are
implementing public oversight in the footsteps of the PCAOB. Even though my first study
presented in chapter 2 finds that investors value the information provided in PCAOB inspection
reports, it remains an empirical question to what extent these findings can be generalized to
other countries with different formats of inspections and different institutional environments.
Hence, in my third study, presented in chapter 4, I use the public oversight setting in the
Netherlands, which shares some similarities and presents some important distinctions with the
PCAOB inspections, to shed some light on this question.
The similarities between the AFM inspections in the Netherlands and the PCAOB
inspections in the US include their fully independent nature and their inspection processes. The
differences pertain to aspects including inspection coverage, disclosure formats and
institutional environment such as litigation risks. I argue that these differences may affect the
impact of inspection findings on investors’ perceived audit quality. In my third study, I find
that the capital market does not react significantly to the publication of AFM inspection reports
regardless of their findings, even if these inspection reports disclose quality control deficiencies
in the audit firms and thus potentially convey even more information than PCAOB inspection
reports.
5.2 Contributions and future research
While the contribution of each study is discussed in the chapters describing the
respective studies, the combined findings of the three studies in my dissertation have important
implications for audit firms, regulators and researchers. Firstly, the results in my first and
second study do suggest that the way audit firms respond to PCAOB inspection findings have
an important impact on both investors and audit firms themselves. While the magnitude of
change in audit fees is not significant for audit firms stating that they disagree with PCAOB
findings, the contesting is considered to be a signal of unwillingness to improve audit quality,

Chapter 5
112
which is documented by negative market reactions in the first study. This group of audit firms
are also not hiring more CPAs while other audit firms are doing so. Hence, regulators should
draw more attention to these auditors and attempt to incentivize them to improve audit quality
in order to increase investor confidence.
Secondly, the results of the first two studies can be useful to regulators in the US in
setting guidelines regarding the future development of public oversight. For example, while
the first and second round inspection reports are valued by investors, the third round inspection
reports do no longer appear to be relevant. Combined with the findings in the second study that
clients regard quality control deficiencies as audit quality indicators, it is worth considering for
regulators to further improve the informativeness of the inspection reports by disclosing
additional information, especially information related to the quality control systems of audit
firms.
Thirdly, the combined results of this dissertation can be useful for oversight bodies
worldwide in developing and establishing auditor inspection systems.. In particular, regulators
need to be aware of their own specific institutional environment in order to improve the
efficiency of public oversight and strengthening its role in providing valuable information
regarding audit quality, especially given the fact that public oversight is costly.
There are several possible ways that future research can extend the studies presented in
this dissertation. First, while my studies provide insights on the economic consequences of
public oversight, they do not provide direct evidence on the cost benefit trade-off. Future
research may consider to engage in more direct cost benefit analyses. Second, most current
research on public oversight relates to the PCAOB while insights on the economic
consequences of public oversight in an international setting are limited. Hence, future studies
can extend the investigation of the economic consequences of public oversight in other
countries around the world and compare the main features that can improve the informativeness
and effectiveness of public oversight in different institutional settings. Finally, I have focused
in this dissertation on the impact of public oversight for the capital markets. However, public
oversight can also be relevant for other stakeholders. For example, public oversight in the
Netherlands covers both public and private companies, but also US inspection findings can
arguably provide useful information to other stakeholders as well. Future research can extend
my research by studying the impact on other stakeholders, such as private investors, tax
authorities, the public sector and the public interest in general.

References
113
References
Abbott, L. J., K. A. Gunny, and T. C. Zhang. 2013. When the PCAOB talks, who listens?
Evidence from stakeholder reaction to GAAP-deficient PCAOB inspection reports of
small auditors. Auditing: A Journal of Practice & Theory 32 (2): 1–31.
Abernathy, J. L., M. Barnes, and C. Stefaniak. 2013. A summary of 10 years of PCAOB
research: What have we learned? Journal of Accounting Literature 32 (1): 30–60.
Acito, A. A., C. E. Hogan, and R. D. Mergenthaler. 2017. The Effects of PCAOB Inspections
on Auditor-Client Relationships. The Accounting Review (Forthcoming).
AFM. 2010. Report on general findings regarding audit quality and quality monitoring 1
(September).
———. 2014. Results of the Inspection of the Quality of Statutory audits at the Big 4 Audit
Firms (September): 1–121.
Akerlof, G. A. 1970. The Market for “Lemons”: Quality Uncertainty and the Market
Mechanism. Quarterly Journal of Economics 84 (3): 488–500.
Akins, B. K., J. Ng, and R. S. Verdi. 2012. Investor competition over information and the
pricing of information asymmetry. The Accounting Review 87 (1): 35–58.
Amihud, Y. 2002. Illiquidity and stock returns: Cross-section and time-series effects. Journal
of Financial Markets 5 (1): 31–56.
Aobdia, D. 2015. The Impact of the PCAOB Individual Engagement Inspection Process –
Preliminary Evidence. Working paper. Public Company Accounting Oversight Board
(PCAOB), Center for Economic Analysis and Northwestern University.
Armstrong, C. S., J. E. Core, D. J. Taylor, and R. E. Verrecchia. 2011. When Does Information
Asymmetry Affect the Cost of Capital? Journal of Accounting Research 49 (1): 1–40.
Atiase, R. K. 1987. Market Implications of Predisclosure Information: Size and Exchange
Effects. Journal of Accounting Research 25 (1): 168–176.
AuditAnalytics. 2016. Audit fees and non-audit fees, a fourteen year trend.
Australia Securities & Investment Commission. 2004. CLERP 9 : Auditor and financial
reporting obligations.
Barron, O. E., and H. Qu. 2014. Information asymmetry and the ex ante impact of public
disclosure quality on price efficiency and the cost of capital: Evidence from a laboratory
market. The Accounting Review 89 (4): 1269–1297.
Barton, J. 2005. Who Cares about Auditor Reputation? Contemporary Accounting Research
22 (3): 549–586.
Bell, T. B., W. R. Landsman, and D. a Shackelford. 2001. Auditors’ Perceived Business Risk
and Audit Fees : Analysis and Evidence. Journal of Accounting Research 39 (1): 35–43.
Bhattacharya, N., Desai, H., & Venkataraman, K. (2013). Does earnings quality affect
information asymmetry? Evidence from trading costs. Contemporary Accounting
Research, 30(2), 482-516.
Biais, B., Glosten, L., & Spatt, C. (2005). Market microstructure: A survey of
microfoundations, empirical results, and policy implications. Journal of Financial
Markets, 8(2), 217-264.
Bills, K. L., and N. M. Stephens. 2016. Spatial Competition at the Intersection of the Large and
Small Audit Firm Markets. Auditing: A Journal of Practice & Theory 35 (1): 23–45.

References
114
Boone, J. P., I. K. Khurana, and K. K. Raman. 2015. Did the 2007 PCAOB Disciplinary Order
against Deloitte Impose Actual Costs on the Firm or Improve Its Audit Quality? The
Accounting Review 90 (2): 405–441.
Brown, S. J., and J. B. Warner. 1985. Using Daily Stock Returns. Journal of Financial
Economics 14 (1): 3–31.
Brown, S., S. A. Hillegeist, and K. Lo. 2004. Conference calls and information asymmetry.
Journal of Accounting and Economics 37 (3): 343–366.
Bushee, B. J., and C. Leuz. 2005. Economic consequences of SEC disclosure regulation:
Evidence from the OTC bulletin board. Journal of Accounting and Economics 39 (2):
233–264.
Carcello, J. V., C. Hollingsworth, and S. A. Mastrolia. 2011. The effect of PCAOB inspections
on Big 4 audit quality. Research in Accounting Regulation 23: 85–96.
Carson, Simnett, Thürheimer and Vanstraelen. 2017. The effect of national inspection regimes
on audit quality. Working paper, UNSW Sydney and Maastricht University.
Causholli, M., W. R. Knechel, H. Liny, and D. E. M. Sappington. 2010. Competitive
Procurement of a Credence Good: The Case of Auditing. Working paper. University of
Kentucky, University of Florida and University of Houston.
Chaney, P. K., and K. L. Philipich. 2002. Shredded reputation: The cost of audit failure. Journal
of Accounting Research 40 (4): 1221–1245.
Chen, C. J. P., X. Su, and R. Zhao. 2000. An Emerging Market’s Reaction to Initial Modified
Audit Opinions: Evidence from the Shanghai Stock Exchange. Contemporary Accounting
Research 17 (3): 429–455.
Chordia, T., Roll, R., & Subrahmanyam, A. (2000). Commonality in liquidity. Journal of
financial economics, 56(1), 3-28.
Christensen, H. B., L. Hail, and C. Leuz. 2013. Mandatory IFRS reporting and changes in
enforcement. Journal of Accounting and Economics 56 (2-3): 147–177.
Clinch, G., D. Stokes, and T. Zhu. 2012. Audit quality and information asymmetry between
traders. Accounting & Finance 52 (3): 743–765.
Coates, J. C., and S. Srinivasan. 2014. SOX after ten years: A multidisciplinary review.
Accounting Horizons 28 (3): 627–671.
Collins, D. W., and S. P. Kothari. 1989. An analysis of intertemporal and cross-sectional
determinants of earnings response coefficients. Journal of Accounting and Economics 11
(2–3): 143–181.
Craswell, A. T., J. R. Francis, and S. L. Taylor. 1995. Auditor Brand Name Reputations and
Industry Specializations. Journal of Accounting and Economics 20: 297–322.
Daske, H., L. Hail, C. Leuz, and R. Verdi. 2008. Mandatory IFRS reporting around the world:
Early evidence on the economic consequences. Journal of Accounting Research 46 (5):
1085–1142.
Daugherty, B., and W. Tervo. 2010. PCAOB Inspections of Smaller CPA Firms: The
Perspective of Inspected Firms. Accounting Horizons 24 (2): 189–219.
Davis, L. R., N. R. David, and G. Trompeter. 1993. Audit Effort, Audit Fees, and the Provision
of Nonaudit Services to Audit Clients. The Accounting Review 68 (1): 135–150.
Davis, L. R., and D. T. Simon. 1992. The Impact of SEC Disciplinary Actions on Audit Fees.
Auditing: A Journal of Practice & Theory 11 (1): 58–68.

References
115
DeAngelo, L. E. 1981. Auditor size and audit quality. Journal of Accounting and Economics 3
(3): 183–199.
Dee, C. C., A. Lulseged, and T. Zhang. 2011. Client Stock Market Reaction to PCAOB
Sanctions Against a Big 4 Auditor. Contemporary Accounting Research 28 (1): 263–291.
DeFond, M. L. 2010. How should the auditors be audited? Comparing the PCAOB Inspections
with the AICPA Peer Reviews. Journal of Accounting and Economics 49 (1–2): 104–108.
DeFond, M. L., and C. S. Lennox. 2011. The effect of SOX on small auditor exits and audit
quality. Journal of Accounting and Economics 52 (1): 21–40.
DeFond, M. L., and C. S. Lennox. 2017. Do PCAOB Inspections Improve the Quality of
Internal Control Audits? Journal of Accounting Research 55 (3): 591–627
DeFond, M. L., R. N. Hann, H. U. Xuesong, and E. Engel. 2005. Does the market value
financial expertise on audit committees of boards of directors? Journal of Accounting
Research 43 (2): 153–204.
De Fuentes, C., M. Illueca, and M. C. Pucheta-Martinez. 2015. External investigations and
disciplinary sanctions against auditors: the impact on audit quality. SERIEs 6 (3): 313–
347.
Dowling, C., W. R. Knechel, and R. Moroney. 2015. Public Oversight of Audit Firms: The
Slippery-Slope of Enforcing Regulation.
Elliott, R. K. 1998. Assurance services and the audit heritage. Auditing: A Journal of Practice
& Theory 17 (SUPPLEMENT): 1–7.
European Commission. 2017. Report from the commission to the council, the European cental
bank, the European systemic risk risk board and the European Parliament.
European Union. 2006. Directive 2006/43/EC of the European Parliament and of the Council.
Official Journal of the European Communities. Vol. L157.
Francis, J. R., E. L. Maydew, and H. C. Sparks. 1999. The role of Big 6 auditors in the credible
reporting of accruals. Auditing: A Journal of Practice & Theory 18 (2): 17–34.
Farrell, J. J., and H. B. Shadab. 2005. The Focus of Future PCAOB Auditor Inspections. The
CPA Journal June: 9.
Francis, J. R., and M. D. Yu. 2009. Big4 Office size and Audit Quality. The Accounting Review
84 (5): 1521–1552.
Francis, J. R., K. Reichelt, and D. Wang. 2005. The Pricing of National and City-Specific
Reputations for Industry Expertise in the US Audit Market. The Accounting Review 80
(1): 113–136.
Francis, J. R., and E. R. Wilson. 1988. Auditor Changes: A Joint Test of Theory Relating to
Agency Costs and Auditor Differentiation. The Accounting Review 63 (4): 663–680.
Freeman, R. N. 1987. The association between accounting earnings and security returns for
large and small firms. Journal of Accounting and Economics 9 (2): 195–228.
Fu, R., A. Kraft, and H. Zhang. 2012. Discussion of “Financial reporting frequency,
information asymmetry, and the cost of equity.” Journal of Accounting and Economics
54: 132–149.
Gilbertson, D. L., and T. L. Herron. 2009. PCAOB Enforcements: A Review of the First Three
Years. Current Issues in Auditing 3 (2): A15–A34.
Gipper, B., C. Leuz, and M. Maffett. 2015. Public Audit Oversight and Reporting Credibility:
Evidence from the PCAOB Inspection Regime. Working Paper. Stanford University and

References
116
University of Chicago
Glover, S. M., D. F. Prawitt, and M. H. Taylor. 2009. Audit Standard Setting and Inspection
for US Public Companies:A Critical Assessment and Recommendations for Fundamental
Change. Accounting Horizons 23 (2): 221–237.
Gramling, A. A., J. Krishnan, and Y. Zhang. 2011. Are PCAOB-Identified Audit Deficiencies
Associated with a Change in Reporting Decisions of Triennially Inspected Audit Firms?
Auditing: A Journal of Practice & Theory 30 (3): 59–79.
Gul, F. A., G. S. Zhou, and X. K. Zhu. 2013. Investor protection, firm informational problems,
big n auditors, and cost of debt around the world. Auditing: A Journal of Practice &
Theory 32 (3): 1–30.
Gunny, K., G. Krishnan, and T. Zhang. 2007. Is Audit Quality Associated With Auditor
Tenure, Industry Expertise, and Fees? Evidence from PCAOB Opinions. Working paper.
University of Colorado, George Mason University and Singapore Management
University.
Gunny, K. A., and T. C. Zhang. 2013. PCAOB inspection reports and audit quality. Journal of
Accounting and Public Policy 32: 136–160.
Hay, D. C., W. R. Knechel, and N. Wong. 2006. Audit Fees: A Meta-analysis of the Effect of
Supply and Demand Attributes. Contemporary Accounting Research 23 (1): 141–191.
Holthausen, R. W., and R. W. Leftwich. 1983. The economic consequences of accounting
choice implications of costly contracting and monitoring. Journal of Accounting and
Economics 5 (C): 77–117.
Hope, O. K., J. C. Langli, and W. B. Thomas. 2012. Agency conflicts and auditing in private
firms. Accounting, Organizations and Society 37: 500–517.
Khurana, I. K., and K. K. Raman. 2004. Litigation Risk and the Financial Reporting Credibility
of Big 4 versus Non-Big 4 Audits: Evidence from Anglo-American Countries. The
Accounting Review 79 (2): 473–495.
Klock, M. 1994. The Stock Market Reaction to a Change in Certifying Accountant. Journal of
Accounting, Auditing & Finance 9 (2): 339–347.
Knechel, W. R., V. Naiker, and G. Pacheco. 2007. Does Auditor Industry Specialization Matter?
Evidence from Market Reaction to Auditor Switches. Auditing: A Journal of Practice &
Theory 26 (1): 19–45.
Krishnaswami, S., and V. Subramaniam. 1999. Information asymmetry, valuation, and the
corporate spin-off decision. Journal of Financial Economics 53 (1): 73–112.
Krishnamurthy, S., J. Zhou, and N. Zhou. 2006. Auditor Reputation, Auditor Independence,
and the Stock-Market Impact of Andersen’s Indictment on Its Client Firms. Contemporary
Accounting Research 23 (2): 465–490.
Lamoreaux, P. T. 2016. Does PCAOB inspection access improve audit quality? An examination
of foreign firms listed in the United States. Journal of Accounting and Economics 61 (2–
3): 313–337.
Lawrence, A., M. Minutti-Meza, and P. Zhang. 2011. Can Big 4 versus Non-Big 4 Differences
in Audit-Quality Proxies BeAttributed to Client Characteristics? The Accounting Review
86 (1): 259–286.
Lennox, C., and J. Pittman. 2010. Auditing the auditors: Evidence on the recent reforms to the
external monitoring of audit firms. Journal of Accounting and Economics 49: 84–103.

References
117
Lesmond, D., J. Ogden, and C. Trzcinka. 1999. A New Estimate of Transactions Cost. The
Review of Financial Studies 12 (5): 1113–1141.
Leuz, C. 2003. IAS versus US GAAP: Information asymmetry-based evidence from
Germany’s new market. Journal of Accounting Research 41 (3): 445–472.
Leuz, C., and R. E. Verrecchia. 2000. The Economic Consequences of Increased Disclosure.
Journal of Accounting Research 38 (Supplement): 91–124.
Jensen, M. C., and W. H. Meckling. 1976. Theory of the firm: Managerial behavior, agency
costs and ownership structure. Journal of Financial Economics 3 (4): 305–360.
Johnstone, K. M., and J. C. Bedard. 2003. Risk Management in Client Acceptance Decisions.
The Accounting Review 78 (4): 1003–1025.
Knechel, W. R., N. Lasse, and Z. Mikko. 2013. Empirical evidence on the implicit determinants
of compensation in big 4 audit partnerships. Journal of Accounting Research 51 (2): 349–
387.
Lamoreaux, P. T. 2016. Does PCAOB inspection access improve audit quality? An
examination of foreign firms listed in the United States. Journal of Accounting and
Economics 61 (2-3): 313–337.
Larcker, D. F., and S. A. Richardson. 2004. Fees Paid to Audit Firms, Accrual Choices, and
Corporate Governance. Journal of Accounting Research 42 (3): 625–658.
Lennox, C. 2005. Management Ownership and Audit Firm Size. Contemporary Accounting
Research 22 (1): 205–227.
Lennox, C., and J. Pittman. 2010. Auditing the auditors: Evidence on the recent reforms to the
external monitoring of audit firms. Journal of Accounting and Economics 49: 84–103.
Lyon, J. D., and M. W. Maher. 2005. The importance of business risk in setting audit fees:
Evidence from cases of client misconduct. Journal of Accounting Research 43 (1): 133–
157.
Maijoor, S., and A. Vanstraelen. 2012. “Research opportunities in auditing in the EU,”
revisited. Auditing: A Journal of Practice & Theory 31 (1): 115–126.
Mansi, S. A., W. F. Maxwell, and D. P. Miller. 2004. Does auditor quality and tenure matter
to investors? Evidence from the bond market. Journal of Accounting Research 42 (4):
755–793.
Menon, K., and D. D. Williams. 2001. Long-term trends in audit fees. Auditing: A Journal of
Practice & Theory 20 (1): 115–136.
Minnis, M. 2011. The Value of Financial Statement Verification in Debt Financing: Evidence
from Private US Firms. Journal of Accounting Research 49 (2): 457–506.
Mohd, E. 2005. Accounting for Software Development Costs and Information Asymmetry.
The Accounting Review 80 (4): 1121–1231.
Morck, R., A. Shleifer, and R. W. Vishny. 1988. Management ownership and market valuation.
An empirical analysis. Journal of Financial Economics 20 (C): 293–315.
Myers, S. C., and N. S. Majluf. 1984. Corporate financing and investment decisions when firms
have information that investors do not have. Journal of Financial Economics 13 (2): 187–
221.
Nelson, M. W. 2006. Ameliorating Conflicts of Interest in Auditing : Effects of Recent
Reforms on Auditors and Their Clients. The Academy of Management Review 31 (1): 30–
42.
References
118
Offermanns, M., and E. Peek. 2011. Investor Reactions to PCAOB Inspection Reports. working
papers. Maastricht University.
Oliverio, M. E., and B. H. Newman. 2009. PCAOB Inspections: Perceptions of triennial firms
with no-deficiency inspections. Working paper. Pace University.
O’Hara, M. 2003. Liquidity and Price Discovery. Journal of Finance 58(4) (4): 1335–1354.
Palmrose, Z.-V. 2005. Maintaining the value and viability of independent auditors as
gatekeepers under SOX: An Auditing Masters proposal. Working Paper. University of
Southern California.
PCAOB. 2009. Making a Difference.
———. 2011. Protecting the Public Interest Through Audit Oversight.
Pittman, J. A., and S. Fortin. 2004. Auditor choice and the cost of debt capital for newly public
firms. Journal of Accounting and Economics 37 (1): 113–136.
Reynolds, J. K., and J. R. Francis. 2001. Does Size Matter? The Influence of Large Clients on
Office-level Auditor Reporting Decisions. Journal of Accounting and Economics 30:
375–400.
Ross, S. a. 1973. American Economic Association The Economic Theory of Agency : The
Principal ’ s Problem. The American Economic Review 63 (2): 134–139.
Roulstone, D. T. (2003). Analyst following and market liquidity. Contemporary Accounting
Research 20(3): 552-578.
Schelleman, C., and W. R. Knechel. 2010. Short-TermAccruals and the Pricing and Production
of Audit Services. Auditing: A Journal of Practice & Theory 29 (1): 221–250.
SEC 2016 ,available at https://www.sec.gov/news/pressrelease/2016-263.html
Seetharaman, A., F. A. Gul, and S. G. Lynn. 2002. Litigation risk and audit fees: Evidence
from UK firms cross-listed on US markets. Journal of Accounting and Economics 33: 91–
115.
Simunic, D. A. 1980. The Pricing of Audit Services: Theory and Evidence. Journal of
Accounting Research 18 (1): 161–190.
Simunic, D. A., and M. T. Stein. 1996. The Impact of Litigation Risk on Audit Pricing: A
Review of the Economics and the Evidence. Auditing: A Journal of Practice & Theory 15
(2): 135–138.
Sirois, L.-P., and D. A. Simunic. 2011. Auditor Size and Audit Quality Revisited: The
Importance of Audit Technology. Working paper. HEC Montreal and University of
British Columbia.
Skinner, D. J., and S. Srinivasan. 2012. Audit Quality and Auditor Reputation: Evidence from
Japan. The Accounting Review 87 (5): 1737–1765.
Stefaniak, C. M. 2009. Investigating The Effects of Post-audit Review Salience on Auditor
Judgements: A Comparative Ananlysis of Audit Planning and Reporting Decisions
Resulting From PCAOB Inspections and Internal Quality Reviews. Working paper.
University of Alabama.
Van Opijnen, M. 2016. Empirical Studies on Public Oversight,Working paper, Maastricht
University.
Van Tendeloo, B., and A. Vanstraelen. 2005. Earnings management under German GAAP
versus IFRS. European Accounting Review 14 (1): 155–180.
Vanstraelen, A., P. Vorst, and L. Zou. 2017. Economic Consequences of PCAOB Inspections :

References
119
Impact on stock market liquidity over Time. Maastricht University.
Willenborg, M. 1999. Empirical Analysis of the Economic Demand for Auditing in the Initial
Public Offerings Market. Journal of Accounting Research 37 (1): 225–238.
World Federation of Exchanges. 2016. Latest Statistics. In http://www.world-
exchanges.org/statistics/ytd
Zhou, H. 2007. Auditing standards, increased accounting disclosure, and information
asymmetry: Evidence from an emerging market. Journal of Accounting and Public Policy
26 (5): 584–620.

Appendix 1
120
Appendix 1: Variable definitions for Chapter2
Deficient equal to 1 for audit firms receiving PCAOB inspection reports with GAAS-
related or GAAP-related deficiencies.
Disagree equal to1 for audit firms who state that they disagree or do not fully agree
with the PCAOB findings.
Bid-ask spread the yearly median quoted spread (i.e., difference between the bid and ask
price divided by the midpoint and measured at the end of each trading day).
Price impact the yearly median of the Amihud (2002) illiquidity measure (i.e., daily
absolute stock return divided by US$ trading volume).
Zero Returns the proportion of trading days with zero daily stock returns out of all
potential trading days in a given year.
Total trading
costs
a yearly estimate of total round-trip transaction costs (i.e., bid–ask spreads,
commissions, as well as implicit costs such as short-sale constraints or
taxes) inferred from the series of daily security and aggregate market
returns, as developed by Lesmond, Ogden, and Trzcinka (1999).
Post1(2/3) equal to 1 for observations belongs to the one year period after the
publication of the first (second/third) round of inspection reports.
Def_disagree equal to 1 if the observation has a deficient auditor who disagreed with the
inspection findings after the publication of the inspection report, zero
otherwise.
Def_other equal to 1 if the observation has a deficient auditor who did not disagree
with the inspection findings after the publication of the inspection report,
zero otherwise.
Clean equal to 1 if the observation has a clean auditor after the publication of each
round’s inspection report, zero otherwise.
Size the yearly average of daily stock price times the number of shares
outstanding (in US$ millions).
ShareTurnover the annual US$ trading volume divided by market value of outstanding
equity.
Volatility the annual standard deviation of daily stock returns.
Analyst the number of analyst following the company in a given year.
Inst_holding the yearly average of number of shares hold by the institutional investors
divided by the number of shares outstanding.
Def1 equal to 1 for audit firms receiving PCAOB inspection reports with GAAS-
related or GAAP-related deficiency in the first inspection round.

Appendix 1
121
Def2 equal to 1 for audit firms receiving PCAOB inspection reports with GAAS-
related or GAAP-related deficiency in the second inspection round.
Period1(2/3) equal to 1 if the observation belongs to the period after the publication date
of the first (second/third) round inspection reports and before the
publication of the second (third/one year period after the publication of the
third) round inspection reports, zero otherwise.
Def1(2/3)_disag
ree
equal to 1 if the observation has a deficient auditor who disagreed with the
inspection findings for the first (second/third) round of inspection and
belongs to the period after the publication of the first (second/third) round
inspection results and before the publication of the second (third/one year
period after the publication of the third round of inspection reports) round
of inspection reports, zero otherwise.
Def1(2/3)_other equal to 1 if the observation has a deficient auditor who did not disagree
with the inspection findings for the first (second/third) round of inspections
and belongs to the period after the publication of the first (second/third)
round inspection results and before the publication of the second (third/one
year period after the publication of the third round of inspection reports)
round of inspection reports, zero otherwise.
Clean1/2/3 equal to 1 if the observation has a clean auditor for the first (second/third)
round of inspection and belongs to the period after the publication of the
first (second/third) round inspection results and before the publication of
the second (third/one year period after the publication of the third round of
inspection reports) round of inspection reports, zero otherwise.
Days the number of days between the publication of the current round and the
next round inspection reports.
Period1(2/3)
annual
equal to1 if the observation belongs to the period after the publication of
the first (second/third) inspection report and before the publication of the
second (third/fourth) inspection report, zero otherwise.

Appendix 2
122
Appendix 2: Variable definitions for Chapter3
AUDITFEE Amount of audit fees paid by the client for the audit in the
particular financial year, measured in US dollars.
ASSETS Total assets of the client firm, measured in US dollars.
INVERE Sum of inventory and receivables of the client divided by total
assets.
ROA Net income divided by total assets.
LOSS Indicator equal to one when net income is below zero.
OPINION Indicator equal to one when a going concern opinion was issued.
BUSY Indicator equal to one when the financial year-end is in
December.
FOREIGN Indicator equal to one when the client reports foreign income.
SEGMENT Number of business segments of the company.
SHORT Indicator equals to one for first year engagement as anew client.
TOTAL_FEE Total audit fee collected by the auditor in a year.
AVG_ASSET Average client total assets of the audit firm.
DISAGREE Indicator equal to 1 for deficient auditors who state disagreement
with the PCAOB findings.
OTHER Indicator equal to 1 for deficient auditors who do not state
disagreement with the PCAOB findings.
CLEAN Indicator equal to 1 for clean auditors.
QCD_D Indicator equal to 1 for auditors with disclosed QCDs.
QCD_ND Indicator equal to 1 for auditors with identified but not disclosed
QCDs.
NON-QCD Indicator equal to 1 for auditors without any QCDs identified.
POST Indicator equal to 1 if the fiscal year ended after the publication
of the inspection reports.
FIRST_DEF Indicator equal to 1 for auditors with deficient first inspection
results.
SECOND_DEF Indicator equal to 1 for auditors with deficient second inspection
results.

Appendix 2
123
FIRST-QCD Indicator equal to 1 for auditors with quality control deficiencies
in first inspection reports.
SECOND-QCD Indicator equal to 1 for auditors with d quality control
deficiencies in second inspection reports.
LOGNCPAS Natural logarithm of the number of CPAs of the audit firm.
LOGNCLIENTS Natural logarithm of the number of public clients of the audit
firm.
Period1 Indicator equal to 1 if the observation belongs to the period after
the publication date of the first and before the publication of the
second round inspection reports.
Period2 Indicator equal to 1 if the observation belongs to the period after
the publication date of the second and before the publication of
the third round inspection reports.
Period3 Indicator equal to 1 if the observation belongs to the period after
the publication date of the third round inspection reports.

Appendix 3
124
Appendix 3: Variable definitions for Chapter4
Rit Return for client i on day t.
Rmt AEX market index on day t.
ARit Abnormal return for client i on day t.
CARit Cumulative abnormal return for client i on day t.
CAARi Cumulative average abnormal return for on day t for all clients.
DT Indicator equal to one if the client is audited by DT.
EY Indicator equal to one if the client is audited by EY.
PWC Indicator equal to one if the client is audited by PWC.
LEVit The client company’s leverage ratio in the year before the events,
calculated as the total debt divided by total assets.
GROWTHit The growth in revenues in the year prior to the events.
Cost of debti,t+1 The interest paid in year t+1 divided by the average total debt in
year t+1 and year t.
POSTi,t+1 Equals 1 for financial year ends after the publication of
inspection results,0 otherwise.
InterestCoverageit Calculated as earnings before interest, tax and depreciation and
amortization (EBITDA) in year t divided by interest paid in year
t.
CurrentRatioi,t Calculated as current asset in year t divided by current liabilities
in year t.
PPEi,t Calculated as property, plant and equipment in year t divided by
total assets in year t.
LEVi,t Calculated as total debts in year t divided by total assets in year t.
ASSETi,t Total assets in year t.
GROWTHi,t+1 Calculated as sales growth from year t to year t+1.
Neg-equityi,t Indicator equal to 1 if total liability is larger than total asset in
year t.

125
Appendix 4: Valorization-addendum
With rising importance of global capital markets, mechanisms designed to secure their
proper functioning become increasingly important. External financing is based on the concept
that firms can credibly communicate their true economic performance by means of audited
financial statements. If investors lose confidence in the reliability of audited financial
information, market participation and the availability of capital decrease, harming financial
stability.
Public oversight of the auditing profession represents a mechanism intended to ensure
high audit quality and was installed in response to investor loss of confidence resulting from
high-profile financial reporting scandals in which auditors were also blamed. It is considered
as one of the most profound changes in the history of audit regulation. The US set the tone in
2002 by creating the Public Company Accounting Oversight Board (PCAOB) putting an end
to self-regulation of the auditing profession, which was the dominant model for many decades.
Subsequently, many other countries (including all EU member states) followed the US example
of installing independent public oversight in varying forms and stages of development. The
central aim of independent audit regulators is to ensure trust in the financial markets and
enhance the protection of investors and the public interest through audit oversight, enforcement
and improving audit quality.
Since the creation of the PCAOB, the value of stock trading and audit fees have only
further increased, which makes the relevance of independent public oversight on the auditing
profession even more important for regulators, audit firms as well as investors. For example,
from 2002 to 2015, the total value of stock traded in the US increased from US$ 17 trillion to
US$ 42 trillion (World Federation of Exchanges 2016). Similarly, total audit fees paid by
public listed companies have increased from US$ 2,902 million in 2002 to US$ 8,146 million
in 2015 (AuditAnalytics 2016).
Motivated by the debate on the effectiveness of public oversight, which is not
uncontested, and the paucity of empirical evidence, my dissertation investigates economic
consequences of public oversight and specifically the impact of disclosure of inspection
outcomes on information asymmetry and the cost of capital in the equity and debt market, and
auditor behavior. The findings from this dissertation can inform capital market participants in
their decision-making and provide insights to public oversight bodies on their impact on the
capital and audit market.
Specifically, the findings in Chapter 2 suggest that stock market liquidity in the small
audit firm market segment decreases on average after the publication of the first PCAOB
inspection reports regardless of the inspection outcome, implying an increased cost of capital,
which would be opposite to the regulatory intention of improving investor confidence.
However, liquidity increases after the publication of the second round inspection reports for
clients audited by clean auditors and deficient auditors who do not disagree with the PCAOB’s
findings, while there appears to be no change in liquidity after the third inspection. By means
of comparison, it is shown that stock market liquidity increases after the publication of the first
Appendix 4

126
inspection reports for the large audit firms. Overall, these findings suggest that PCAOB
inspection reports change investors’ perceptions of future audit quality and that there is a
learning process in the capital market when it comes to the interpretation of inspection reports.
These findings have implications for regulators in terms of considering providing more
guidance for investors to understand the inspection process as well as the findings, and being
aware that investors appear to react differently to inspection results of large versus smaller
audit firms.
The findings in Chapter 3, which investigates the behavior of smaller audit firms after
the publication of the PCAOB inspection findings, are relevant for both investors and
regulatory bodies. For investors, the results suggest that the audit firms’ reactions to the quality
control findings (i.e. Part II inspection outcomes) provide more useful information on future
audit quality compared to the engagement related findings (i.e. Part I inspection outcomes). By
utilizing this information effectively, investors may make better decisions. For regulators, the
findings of the study suggest that there is an important group of client companies in the smaller
audit firm market segment that appear to have a stronger interest in demanding lower audit fees
rather than audit quality. As regulators are using a “one size fits all” approach in implementing
public oversight, they should consider treating large and small audit firms differently to achieve
better performance. Furthermore, by knowing that Part II of the inspection reports are more
informative for companies in choosing their auditors, regulators may want to pay particular
attention to consider disclosing more, and potentially also more timely, information on the
audit firm quality control system, after having carefully evaluating the costs and benefits.
Finally, Chapter 4 examines how investors react to the publication of the Dutch AFM
inspection findings and penalty announcements. In contrast to the findings in Chapter 2 relating
to the US setting, it appears that the information is much less valued in the Netherlands. Hence,
regulators need to be aware of the institutional factors affecting investor perception of public
oversight.
Overall, the findings of this dissertation can help improve public oversight on the
auditing profession, with the ultimate goal to improve audit quality. In particular, the
dissertation provides innovative insights that regulators need to pay more attention to the
inherent differences between large and small public accounting firms in designing the public
oversight system, and the impact of institutional differences. Although the dissertation suggests
that there is room for further improvement of public oversight, this does not come without
costs. Specifically, it is questionable whether the costs of public oversight can be offset by the
potential benefits of increased audit quality, especially in the presence of a low audit quality
demand for certain type of companies in the market. Future research on this matter is warranted.
Appendix 4

127
Curriculum Vitae
Lei Zou was born on May 3rd, 1988 in Hunan Province, China. From 2006 – 2010 she studied
to obtain her undergraduate degree in Accounting at the School of Business and Economics,
Central South University (China). She obtained her MSc. in Business Research (with a
specialization in Accounting) from Maastricht University in August 2013. In September 2013
she became a Ph.D. candidate at Maastricht University at the Accounting and Information
Management department, focusing on auditing research. During her doctoral studies she has
been a visiting scholar at the University of Florida (U.S.). She has presented her work at various
accounting conferences such as the midyear Meeting of the Auditing Section of the American
Accounting Association (AAA), the International Symposium on Auditing Research, and the
European Auditing Research Network Symposium, and workshops at the ESSEC Business
School, the University of Amsterdam, the University of Melbourne, and the University of
Queensland. Since June 2017 she works as a Lecturer at the School of Accounting at University
of New South Wales (UNSW) Australia.