Economic and Social Survey of Asia and the Pacific 2014.pdf
260
-
Upload
khangminh22 -
Category
Documents
-
view
2 -
download
0
Transcript of Economic and Social Survey of Asia and the Pacific 2014.pdf
C
M
Y
CM
MY
CY
CMY
K
57-4-02343 GP04 Cove-ok.ai 1 22/7/2557 1:51:5157-4-02343 GP04 Cove-ok.ai 1 22/7/2557 1:51:51
ESCAP is the regional development arm of the United Nations and serves as the main economic and social development centre for the United Nations in Asia and the Pacific. Its mandate is to foster cooperation between its 53 members and 9 associate members. ESCAP provides the strategic link between global and country-level programmes and issues. It supports Governments of countries in the region in consolidating regional positions and advocates regional approaches to meeting the region’s unique socio-economic challenges in a globalizing world. The ESCAP office is located in Bangkok, Thailand. Please visit the ESCAP website at www.unescap.org for further information.
The shaded areas of the map indicate ESCAP members and associate members.
Front cover photo credits: UN Photo | Gawrav Sinha | Szefei
Regional connectivity
foR shaRed pRospeRity
ECONOMIC AND SOCIAL SURVEYOF ASIA AND THE PACIFIC
2014
ii
United Nations publicationSales No. E.14.II.F.4Copyright © United Nations 2014All rights reservedPrinted in BangkokISBN: 978-92-1-120675-3e-ISBN: 978-92-1-056695-7ISSN: 0252-5704ST/ESCAP/2693
This publication may be reproduced in whole or in part for educational or non-profit purposes without special permission from the copyright holder, provided that the source is acknowledged. The ESCAP Publications Office would appreciate receiving a copy of any publication that uses this publication as a source.
No use may be made of this publication for resale or any other commercial purpose whatsoever without prior permission. Applications for such permission, with a statement of the purpose and extent of reproduction, should be addressed to the Secretary of the Publications Board, United Nations, New York.
ECONOMIC AND SOCIAL SURVEY OF ASIA AND THE PACIFIC 2014
REgIONAL CONNECTIVITY FOR SHARED PROSPERITY
iii
The Asia and the Pacific region is the most economically dynamic in the world, yet despite significant progress in recent years it still possesses the largest number of people who need to overcome extreme poverty. Development outcomes in Asia and the Pacific will therefore be central to the progress of the world towards implementing the sustainable development vision of the United Nations beyond 2015.
The 2014 edition of the Economic and Social Survey of Asia and the Pacific tackles the important issue of increasing government revenue to finance sustainable development. The Survey demonstrates that there is significant potential for Governments in the region to increase financing by better mobilizing domestic resources and by strengthening the relevant institutional frameworks. The Survey also shows that the burden on individual citizens does not have to rise in order to achieve this objective, since improvements in efficiency and the reconfiguring of priorities can provide significant welfare gains for all.
Enhanced regional economic cooperation and partnerships will also be crucial for the success of the new development framework and goals. The Survey suggests how the countries of the region can more effectively spread the benefits of public policies across borders by focusing on linkages in the areas of transport, energy and information and communications technology.
I commend this publication to the widest possible audience as a useful input to the region’s deliberations during this important year as we work together to address climate change and shape a bold and inspiring future development agenda that leads the world on a more sustainable, equitable, peaceful and prosperous path.
BAN Ki-moonSecretary-General of the United Nations
July 2014
FOREWORD

iv
v
This 2014 edition of ESCAP’s flagship Economic and Social Survey of Asia and the Pacific has the added significance of being published during the 70th session of the Commission – and in a period of great transition for the countries and people of the Asia-Pacific region.
Responding to the mandate first given to the secretariat by our member States in another time of turmoil – the immediate aftermath of the Second World War – the Survey has been a regional authority on socio-economic development, examining issues of special concern and providing policy recommendations, since 1947.
A key message from the 2014 Survey is that, while the impacts of the global financial crisis may be starting to moderate, aggregate growth prospects for Asia and the Pacific remain subdued.
In addition to the importance of mitigating the risks of further capital volatility, the most pressing implication of this continuing malaise is the need for productive and counter-cyclical macroeconomic government support for the levels of sustainable growth required to tackle the socio-economic challenges of the region.
To address rising inequalities and the urgent need for greater and more sustainable formal sector employment, for instance, Governments are urged to consider a range of policy interventions such as increased spending on social protection; greater investment in youth employability; reducing key infrastructure deficits; and addressing the environmental degradation which constrains future growth.
Limited government resources, exacerbated by high levels of public debt and falling levels of development assistance, present clear obstacles to such interventions. This is why the mobilization of domestic resources, and options for increasing government revenues, are presented as special focus of Part I of the Survey, with a clear emphasis on increasing tax revenues.
ESCAP’s analysis reveals that, in some countries of the region, the gap between appropriate levels of tax collection and actual tax revenues amounts to more than
PREFACE
vi
5% of GDP, and that by embracing their tax potential, and closing existing tax gaps, some Asia-Pacific economies could raise their tax revenues by more than 70%.
A key recommendation of the 2014 Survey is the establishment of a regional tax forum, under the auspices of ESCAP, which could monitor tax legislation and regulations across Asia and the Pacific, help to develop regional best-practice, and create mechanisms to address issues ranging from avoiding tax competition for foreign investment, to double taxation, and preventing the illicit transfer of funds.
This is also the first edition of the Survey to incorporate ESCAP’s annual Theme Study, the subject of which for 2014 is Regional Connectivity for Shared Prosperity, which is presented as Part II.
Connectivity is a cornerstone of regional economic cooperation and integration – and has become a major priority for the countries of Asia and the Pacific, especially in the context of efforts to find new drivers of regional economic growth, and to create additional domestic and aggregate regional demand.
To best unlock the potential of ever-more closely interlinked production networks and value chains, a broader perspective on connectivity will be key. This kind of connectivity should not be considered sector by sector, but rather as part of an integrated whole, encompassing the development of corridors of prosperity through networks of trade, transport, ICT, energy, people, and technology.
The 2014 Survey makes, in other words, a valuable contribution to the important development dialogues underway in the Asia-Pacific region and beyond. It provides fresh data, new perspectives, and policy guidance on issues which are critical to fostering more inclusive and sustainable development.
Shamshad AkhtarUnder-Secretary-General of the United Nations and Executive Secretary, United Nations Economic and Social Commission for Asia and the Pacific
vii
The Economic and Social Survey of Asia and the Pacific 2014 is divided into two parts. Part I contains a review of the current socio-economic situation in the region and key challenges, as well as relevant policy recommendations. A special focus is domestic resource mobilization through government revenues. Part II contains the Theme Study on Regional Connectivity for Shared Prosperity for the consideration of the seventieth session of the Commission. It contains a discussion of the importance of regional connectivity for trade and development in the Asia-Pacific region and highlights priority areas where regional cooperation could further enhance such connectivity.
I. GROWTH PROSPECTS AND CHALLENGESGrowth and inflation prospects in 2014
The average growth rate of the developing economies of Asia and the Pacific is forecast to rise moderately in 2014 to 5.8% from 5.6% in 2013.
In line with the diversity of the region, economic growth momentum in 2014 will likely be varied across subregions. In South and South-West Asia, the forecast is for a significant increase in growth, to 4.7% from 3.9% in 2013, driven by progress in the global economy and improved household consumption and investment. Pacific island developing economies are also forecast to record a notable increase in growth, to 4.9% from 4% in 2013, mainly influenced by ongoing recovery in developed economies. East and North-East Asia is forecast to post stable growth in 2014, at 4.1%, as exports to developed countries strengthen and domestic demand in most economies remains firm. Growth in South-East Asia is projected to moderate further to 4.6% as domestic demand in major economies is likely to soften. North and Central Asia is forecast to experience growth decline to 1.3% in 2014 from 2.1% in 2013, due primarily to the impact of ongoing geopolitical instability on the economy of the Russian Federation and its spillover to neighbouring economies.
The inflation outlook in 2014 is generally moderate and headline inflation in the region is projected to be 4.8% in 2014, down from 5% in 2013.
However, a number of major economies, such as India, Indonesia and Pakistan, are forecast to continue to face significant price pressures. One positive factor for inflation in the region is that most commodity prices are likely to remain flat or decline over the next 12 months, due to slow global recovery and the winding back of quantitative easing by the United States Federal Reserve. However, this prospect may change due to geopolitical factors and supply shocks in major producing countries.
EXECUTIVE SUMMARY
viii
Key socio-economic challenges
• While growth in the developed economies is improving, their slow pace of recovery is restraining the growth potential of the Asia-Pacific region. Given the importance of these economies in terms of trade and investment linkages, their growth performance remains a key concern for the region.
• Policies in the developed economies are having a significant impact on the region through spillovers from the normalization of monetary policy by the United States. ESCAP analysis suggests that, under a worst-case scenario, the effects of further financial market turbulence could cut annual GDP growth by up to 0.7-0.9 percentage points in the most-affected countries.
• Export growth is being hampered by non-tariff trade protectionist measures globally and in the region. ESCAP analysis shows that these trade-restrictive policy measures resulted in an estimated reduced opportunity of merchandise exports of more than $255 billion in the Asia-Pacific region over the period 2009-2013, translating into a cumulative decline of more than 1.6 percentage points of regional output.
• Formal sector job creation remains low in many economies. Both before and after the recent global financial crisis, growth in GDP in the region has not been accompanied by commensurate expansion in formal sector employment. Particular concerns are the prevalence of vulnerable employment and youth unemployment. In 2013, 63.1% of women and 56% of men in the region were in vulnerable employment, while the youth unemployment rate is almost three times higher than the adult rate.
• Inequality is widespread in the region and continues to grow in many economies. ESCAP analysis of 40 countries in the region indicates that the poorest 20% of the population currently accounts for less than 10% of national income, with the poorest in some major developing economies experiencing a falling share of national income between the 1990s and 2000s.
Policy options to deal with the challenges
Productive government spending to support sustainable growth
The obstacles to higher growth in Asia and the Pacific are partly related to slow economic recovery in the developed world, but also to long-term structural impediments to growth. This highlights the need for productive and countercyclical government macroeconomic support. Such policies can support growth in the short term while helping remove structural impediments in the long term. Some possible supportive measures are highlighted below.
Social protection spending: Increasing the spending on social protection would help to support growth as well as reduce inequality. The social protection floor is a United Nations initiative and features prominently in the discussion about the development agenda beyond 2015. Public social security expenditure remains low at less than 2% of GDP in half the countries where data are available. More than 60% of the population of the Asia-Pacific region remain without any social protection coverage. An important challenge to increase the coverage and depth of social protection measures will be their sustainable financing. The private sector must also contribute and partner with Governments. Macroeconomic stability can be compromised without sustainable finance.
ix
Infrastructure spending: Governments need to address the significant shortage in infrastructure provision across the region. Infrastructure gaps are a significant barrier to national and regional connectivity. A recent ESCAP study estimated the infrastructure financing gaps in the Asia-Pacific region to be approximately $800-900 billion per annum. Existing forms of infrastructure investment in the region could be complemented with a new large-scale lending facility for infrastructure using innovative development financing sources. Apart from shortfalls in financing, it is clear that significant improvement is required in legal and regulatory frameworks for infrastructure investment across much of the region.
Environment-related spending: Governments will need to undertake spending to address environmental factors which would otherwise hamper growth prospects. Environmental degradation was estimated in 2012 to cost India almost 6% of GDP annually. The health costs of air and water pollution in China is estimated at about 4.3% of its GDP. Economic potential has also been affected by widespread loss of natural ecosystems and biodiversity. Apart from reducing environmental damage, policies are required to improve access to modern energy sources. Another area for action to ensure the sustainability of growth is better addressing climate change through improvement of climate finance. Public finance could focus on leveraging private funding to tackle climate challenges.
Investment in youth
Governments in the region are facing the enormous challenge of securing employment for the largest generation of young people in history. Nearly 717 million of the region’s population are young women and men aged 15 to 24. The transition between secondary and tertiary education is particularly important. Active labour market programmes will be required to effectively link education, training and skills development systems with the requirements of employers. To improve education systems will require paying special attention to gender inequalities. Although gender inequalities in education have fallen in the region over recent years, there are still significant disparities that translate into untapped productive potential for both medium and long-term growth.
Mitigating risks from capital volatility
Countries should improve the methods they use to mitigate the volatility of capital flows in three areas: ensuring adequate national foreign exchange reserves; moving towards a regional reserves mechanism; and complementing such policies with capital flows management measures. ESCAP analysis indicates that some economies in the region may currently have insufficient foreign exchange reserves to cover the exit of foreign funds from their financial markets. The lack of sufficient reserves at the national level to respond to the risks from capital flows volatility highlights the need for greater regional support. An alternative to current arrangements could be a comprehensive Asia-Pacific financial support mechanism using part of the sizeable foreign reserves available to some of the Governments of countries in the region. The use of foreign reserves does not deal with the negative impact on asset markets of any sudden outflow. Therefore, an important additional supportive measure could be capital flows management at the national level to deal with inflow surges in asset markets, as well as sudden large outflows. A general guideline should be for such measures to be a component of long-run policies to prevent economic booms and busts. These measures may be quantitative controls or market-based and some combinations of both depending on country-specific circumstances.
x
Domestic resource mobilization: options for expanding fiscal space
To adequately fund the development needs of the region, Governments need to expand fiscal space. There are several options for doing so, including higher levels of borrowing, making existing expenditure more efficient or reprioritizing expenditure to orient it more towards development. However, Governments should focus particularly on increasing tax revenues.
Tax collection in Asia-Pacific developing countries is currently neither sufficient nor equitable. Although many countries have been able to strengthen tax revenues over the past decade, central government taxes in developing Asia and the Pacific averaged only 14.8% of GDP in 2011, compared with 17.1% in Latin America and the Caribbean and 16.3% in sub-Saharan Africa. Only a few countries collected tax revenues of more than 20% of GDP in 2011, whereas in several others, tax-to-GDP ratios were close to single digits. This is far from the 25-35% of GDP that is considered one of the prerequisites for being able to provide the financing and expenditure to become a developed country.
The composition of tax revenues matters as much as does the level of revenues. Many economies have shifted from trade taxes, which remain a substantial component of indirect taxes, particularly in the Pacific, to taxes on goods and services, such as value added taxes (VAT) or general sales taxes (GST). Yet, in many countries revenues from VAT or GST have not been able to offset declining revenues from taxes on trade.
Indirect taxes are the largest source of tax revenue in more than half of all countries in the region; however, their contribution to total tax revenue has been declining in most countries. This shift is generally desirable as indirect taxes affect prices and thus influence resource reallocation, whereas direct taxes are more equitable as they can be progressive, with higher rates at higher levels of income.
Personal income tax revenues are low in many countries. This is in part due to untaxed activities in the informal sector or in agriculture. In many countries tax avoidance and non-compliance are also a concern.
Between 2007 and 2012, tax revenues increased at a higher rate than output in 12 of 20 countries; yet in many countries tax collection is below potential. In some countries, the gap between actual revenues collected and the level that would be appropriate given the economy’s structure is equivalent to 5% of GDP or more.
Countries are often not using their tax potential to the fullest extent due to the liberal use of exemptions and concessions. For instance, some countries offer preferential tax treatment for entire sectors. Also, at the individual level, taxpayers in most countries can take advantage of tax deductions and credits for a wide range of items. By embracing their tax potential and closing existing tax gaps, some economies could raise their tax revenues by more than 70%.
Policy options to enhance tax revenues
This Survey contains a number of policy options to enhance tax revenues.
Rationalize and extend tax systems to create larger tax bases. While relatively low tax rates would not create distortions in the allocation of resources, countries should also review their indirect taxes and retain only exemptions or concessions that are achieving their stated objectives. GST and VAT systems should be made simpler and could be extended to sectors that are currently exempt, while measures to offset the
xi
disproportionate impact on low-income persons must be maintained. There is also a case for expanding the base for customs duties to the import of services, as has already been done in some countries.
Strengthened revenues from direct taxes. This would require implementing mechanisms for taxing more widely capital gains in securities or property. Furthermore, various tax concessions should be reviewed for their costs and benefits and removed if found causing net loss. This also includes harmonizing tax rates so that ideally the rate is the same for companies and high-income individuals to preserve tax progressivity and prevent income shifting to reduce tax liabilities. It may be appropriate to eventually move to a dual income tax system that taxes labour and capital income separately.
Tackle tax evasion and tax fraud. This is a priority, especially considering that the region accounted for more than 61% of the $5.9 trillion of illicit capital outflows from developing countries between 2001 and 2010. Legislation should be strengthened to regulate transfer pricing and to apportion domestic and foreign operations of multinational corporations properly so that there is no loss of tax revenues, especially in the presence of treaties for avoidance of double taxation. They could address evasion through withholding or advance taxes and could increase incentives for compliance through simpler procedures and faster processing of refunds. They should consider the creation of special tax courts to tackle tax evasion and tax fraud.
Create a tax administration that is free from corruption, political interference and pressure from vested interests. This is needed to make the tax systems equitable and efficient. Human capacity must be expanded; administrations should be organized along functional lines; and information technology systems should be integrated. Also, tax assessments could be based on collateral evidence collected across government departments.
Regional cooperation should be strengthened for mobilizing tax revenues. For instance, effective regional cooperation can be used to help avoid double taxation, to combat transfer pricing by multinational corporations and to deal with tax havens. Tax harmonization and elimination of tax competition among countries, especially those belonging to such regional associations as the Association of Southeast Asian Nations or the South Asian Association for Regional Cooperation, may further foster revenues.
Countries should consider establishing an Asia-Pacific tax forum, under the aegis of ESCAP. Such a forum could monitor the tax legislation of member countries and publish a regular review of tax reforms. It could also act as a repository of tax laws, and hold seminars/workshops on emerging tax-related issues with a view to sharing best practices in tax policies, tax administration and tax reforms, and avoiding tax competition in order to attract foreign direct investment.
II. REGIONAL CONNECTIVITY FOR SHARED PROSPERITYThe role of regional connectivity in supporting economic growth and development
Over the past 50 years, the Asia-Pacific region has experienced unprecedented economic growth. That growth, along with better standards of education and health, has contributed to dramatic falls in poverty. However, the region’s growing prosperity has not been shared equally, and there are clear signs of rising income inequality, both within and between countries. Inequality is also becoming more pronounced in other ways, in terms of access to transport, information and communications technology (ICT) and energy resources, for example.
xii
The region’s recent economic growth has been driven largely by international trade, foreign direct investment and the emergence of global and regional production networks, as well as global value chains. These drivers, in turn, were facilitated by the progressive liberalization of trade, expansion of the maritime transport sector and diffusion of information and communications technologies and the Internet. These processes enabled multinational companies and smaller producers to connect with each other and develop new types of production and distribution networks. Meanwhile, Governments have supported these processes by investing in infrastructure and human capital development.
Enhanced connectivity has therefore played an influential role in shaping regional integration in Asia and the Pacific. Clearly, the contribution of “hard”, or physical, infrastructure networks to economic and social development has depended on “soft” infrastructure, including the policy, legal, regulatory and institutional frameworks in which they are located. In the current study, regional connectivity is regarded as the level and effectiveness of regional networks to facilitate flows of goods, services, people and knowledge. This extends the traditional focus of public policies beyond either physical or non-physical parameters to encompass both dimensions.
Into the future, trade and transport connectivity within the region will continue to be important, particularly as countries look towards regional markets to counterbalance the slowdown in the global economy. At the same time, new drivers of growth are expected to shape future patterns of economic and social development in the region, and with them, other types of regional networks will become increasingly important. Given that the effectiveness of each network is increasingly dependent on the connectivity of other networks, it is clear that any analysis of regional connectivity can no longer be confined to one or other type of network.
Key drivers shaping the future of regional connectivity
Trade and transport connectivity remains a priority: The recent economic slowdown has exposed the region’s vulnerability to fluctuations in the global economy and has shifted attention to domestic and regional markets as a means of stimulating growth and raising living standards. Despite significant investment in transport infrastructure at the national level, however, cross-border and regional land transport infrastructure networks remain underutilized for international trade. In addition to increasing investment in “hard” infrastructure, countries in the region can improve the “soft” infrastructure underpinning trade and transport, as well as implement other means of reducing logistics costs. In particular, countries can capitalize on various technological advances – which requires trade and transport connectivity to be pursued in conjunction with other forms of connectivity, such as information and communications technology (ICT).
ICT as an enabler and driver of growth: The Internet and mobile communications connectivity will continue to radically transform ways in which businesses operate and people interact, as they drive productivity and efficiency improvements in almost every sector of the economy. Increased ICT connectivity is also opening doors on knowledge generation and sharing, particularly for people living in remote or rural areas. Instant communications will be increasingly important in determining the efficiency of trade, including financial services, information and data management services and transport and logistics services.
Growth in trade in services: The Asian and Pacific region has become an important player in commercial services exports, broadly categorized as transportation, travel and other commercial services, as reflected in its growing share of world exports of commercial services. Tourism in particular has been expanding rapidly, with the region capturing nearly one quarter of total global tourist arrivals in 2013. As these
xiii
service sectors will rely more and more on access to fast and reliable Internet and telecommunications systems into the future, they offer alternative sources of growth for countries which are physically located away from regional production and consumption centres.
Energy connectivity and security: The region’s recent economic growth and rising affluence has resulted in a growing demand for energy resources and with that expanding demand, higher levels of greenhouse gas emissions. The region accounted for more than half the global total of such emissions in 2010. The Asia-Pacific region as a whole is well endowed with energy resources, but they are distributed unevenly. Access to clean energy also varies widely from country to country and even within countries. Against the backdrop of rising fuel prices, countries need to consider new forms of energy cooperation which will help balance the gaps in supply and demand across countries.
Responding to population dynamics: The Asia-Pacific region is undergoing population change of a magnitude and pace never before witnessed in human history. Although the size of its population has almost tripled in 60 years, nearly all countries in the region are now experiencing population ageing, albeit at different paces. As such, the region has countries with both ageing and shrinking populations, as well as countries with large populations of young people. Meanwhile, improved access to transport and information has led to greater cross-border mobility; the region is now host to 59 million international migrants, or one quarter of the world’s total stock of migrants. The implications of these trends are significant for the future social and economic development of the region, and point to the urgent need for effective policy responses.
Transitioning to knowledge-based economies: In order to diversify their economies and move up value chains, countries need people who have the skills and knowledge, as well as the innovative spirit, to develop both new products and processes. Strengthening knowledge networks for tertiary education, knowledge generation and knowledge sharing can help build the region’s knowledge and skills base. Sharing of knowledge and research between universities, researchers and industry also contributes to the development of “high-tech” clusters in some industries, such as those developing computer software. Recent economic history shows that “knowledge clusters” initially emerged in lower-cost countries with good availability of skilled labour that responded quickly to the global demand for standardized, less firm-specific knowledge services. By strengthening regional knowledge-sharing networks, more countries could participate in different types of clusters.
Regional strategies for enhancing regional connectivity
The issue for the Asia and Pacific region is not so much whether connectivity will increase across countries, but what forms those connections will take. While countries in the region have made significant progress in improving their domestic connectivity, the future of regional connectivity depends on how closely they can work together to strengthen networks in four critical areas: trade and transport connectivity; ICT connectivity; energy connectivity and people-to-people connectivity.
Regional connectivity is multifaceted, with the connectivity of one sector influenced by the connectivity of others. This gives rise to new challenges in terms of the need for greater coordination, not only across borders but also across sectors involving all stakeholders, including business and trade associations, social networks and civil society organizations. At the same time, it creates new opportunities for different elements to be combined in ways which will enhance the quality of these networks.
xiv
As they are still in the development stage, countries in the Asian and Pacific region have the chance to develop regional networks in an integrated and coordinated manner, which can reduce the costs and spread the benefits to a wider group of countries. Regional approaches can help countries look beyond their national boundaries and consider the “public goods” aspects of networks, while at the same time, help to identify and harness synergies across sectors. In this context, countries in the region need to put into place regional strategies for developing critical regional networks.
Trade and transport connectivity: While there are wide variations across countries in the quality of infrastructure, the region is already relatively well connected in terms of its transport infrastructure networks. However, its transport networks are not fully operationalized or integrated, leading to underutilization of networks, especially railways. Non-physical barriers at borders also persist, increasing trade and transport costs and delaying the movement of goods and people. By investing in intermodal facilities, such as dry ports, as well as in better physical linkages between different modes, Governments could increase transport options for shippers and traders. Regional intermodal transport networks will play a particularly important role in trade from landlocked developing countries and small island developing States, supporting these countries in participating more actively in international and regional trade. Greater use of ICT applications for trade and transport facilitation, both behind and at borders, would also improve the efficiency of freight movements and pave the way for the development of paperless trade and e-logistics.
ICT connectivity: While ICT connectivity is rapidly improving in the region, there is still a large “digital divide” both within and between countries. This is partly due to the region’s reliance on submarine cables and lack of sufficient terrestrial fibre-optic cables. A cohesive “meshed” regional network, combining terrestrial with submarine optical fibre, would provide cost-effective broadband access on both an intraregional and intercontinental basis as it would link Asia to Europe. Such an “Asia-Pacific information superhighway” should be based on a set of common principles; its development would require the active involvement of private sector partners and international organizations. There are also significant opportunities for the “co-habitation” of ICT and transport infrastructure networks. Already, fibre-optic cables are being laid along some national highway and railway systems. Such synergistic approaches can reduce the cost of developing a regional ICT network and facilitate maintenance of the network.
Energy connectivity: With recent advances in high-voltage transmission technology, it is now possible to envisage a regional energy network, which could reduce the gap in supply and demand by transferring power from energy-rich or lower-cost power countries to energy-poor or high-cost power countries. An “Asian energy highway” network could combine different types of energy transmission networks, including pipelines and cross-border power grids. The most efficient may be the development of a regional electricity power grid, connected to a regional electricity market. A regional grid could also link renewable energy sources to a large enough market to justify investments, thereby enhancing the viability of such projects.
People-to-people connectivity: Increased mobility across borders, as well as greater ICT connectivity, would open up vast new opportunities for international labour migration but also raise new challenges. Migrant origin and destination countries need to work together to take advantage of such labour flows and mitigate the risks which may accompany greater labour mobility. Meanwhile, improvements in ICT connectivity and transport links are making it easier for people to study abroad or enroll in distance learning programmes, as well as contribute to the growth of business and civil society networks. By promoting people-to-people connectivity, Governments could help their people access the region’s vast knowledge resources, as well as foster better understanding about the region’s diverse cultures and value systems.
xv
Strengthening institutional coordination and regional cooperation
The private sector has been leading the economic integration of the region, as the individuals, institutions and companies compete to boost productivity, relocate production activities to take advantage of cost differentials between countries, and try to gain access to major markets in the region. Ultimately, however, the main driving force behind regional connectivity is the political will of national Governments. To support the further integration of the region, therefore, Governments must take the lead in establishing robust institutional frameworks to plan and implement the regional connectivity agenda.
Strengthening institutional responses to regional connectivity
The increasingly complex nature of regional networks requires Governments to reach across sectoral boundaries to develop cross-sectoral policies, both at the national and regional levels. To achieve this, they will need to strengthen institutional mechanisms and make better use of existing forums, such as those provided by intergovernmental organizations. The Asian and Pacific region is home to a wide variety of intergovernmental organizations, many of which are already implementing various initiatives relating to regional connectivity. With the emergence of so many subregional initiatives, policy coordination among these organizations has become an urgent challenge. In this regard, regional institutions such as ESCAP have an important role to play in supporting and coordinating subregional integration efforts, as well as in serving as a vital link between subregional and global initiatives.
The experience of ESCAP shows that there are a variety of mechanisms, ranging from formal intergovernmental agreements and international conventions, to voluntary commitments by Governments which can be used to move the region’s connectivity agenda at the regional level. Given the significant role played by the private sector and civil society in shaping the region’s economic and social development, Governments also need to explore ways to reach out and involve other stakeholders in the development and implementation of such mechanisms.
Statistical standards for strengthened accountability and better policymaking
Official statistics help Governments to track progress and ensure that their decisions are based on evidence. They also enable Governments to develop a shared understanding of trends, issues and bottlenecks, which is fundamental for building consensus on cross-border issues, such as trade, labour mobility, immigration, educational qualifications, transport and tourism. However, in order to be comparable across countries, over time and across different data sources, statistics must adhere to internationally agreed standards.
To move forward the regional connectivity agenda, national Governments are strongly encouraged to adopt global statistical standards and build their capacities for collecting and disseminating their official statistics. They should also work more closely together through established forums, such as the United Nations Statistical Commission and the ESCAP Committee on Statistics, to define the type of statistics needed by policymakers, as well as identify new and innovative sources for these data.
Regional solutions for financing regional infrastructure networks
Infrastructure development invariably involves high capital costs, with benefits accruing over the longer run. The pace of infrastructure development is therefore progressing unevenly across the region and tends to be directed towards satisfying domestic needs. Yet the benefits of regional infrastructure networks extend over and
xvi
beyond national borders, pointing to the need to reconsider the networks as a type of “regional public good”. Such approaches can target the “weakest links” of these networks which affect the efficiency and coherence of the whole network, while at the same time enhancing the connectivity of the disadvantaged countries.
Countries should therefore explore regional mechanisms to pool the region’s financial resources, such as a regional infrastructure fund, a regional project preparatory facility, or an “Asian multi-donor platform”. There is also scope for greater private involvement in financing infrastructure projects, but most countries still lack the appropriate policy frameworks to develop and manage public-private partnership projects effectively. In this regard, Governments can learn from each other’s experiences in such partnerships, as well as how to manage and maintain their infrastructure networks more effectively.
Next steps in strengthening regional connectivity
This report looks at the ways in which better regional connectivity can contribute to the sustainable and inclusive development of the Asian and Pacific region. It finds that regional connectivity is inherently multifaceted, and that the benefits of this connectivity may be enhanced by combining different elements. Moreover, it suggests that networks are likely to become more integrated and interdependent as they evolve. Governments therefore have to develop cross-sectoral policies on connectivity, at national, subregional and regional levels.
Into the future, connectivity will certainly increase across countries. But what forms will those connections take and who will they benefit? The aim should be to ensure that they open new opportunities for all, especially for the region’s disadvantaged countries – the least developed countries, the landlocked developing countries, and the small island developing States.
These countries may wish to consider how to use their current endowments to build up their capacities in those industries which have the potential to grow. By taking advantage of new technologies, disadvantaged countries can become more integrated into the global economy. In particular, they should make greater use of communications technology, and particularly the Internet, to develop commercial services, such as transport, telecommunications, and financing, as these sectors in turn can support trade and manufacturing. Meanwhile, all countries in the region can support the disadvantaged countries by enhancing people-to-people connectivity – for example, by encouraging more interactions between students and workers.
As globalization continues, the region’s future will depend on how countries work together. Developing and managing regional networks therefore requires cross-country consensus. Governments need to further study and refine the strategies outlined in this study, and agree on the most appropriate sequencing of actions. And to better respond to the rapid evolution of these networks, national Governments and international organizations alike will have to strengthen institutional coordination. This should extend to people-to-people networks involving academia, the private sector and civil society – which can influence the direction and effectiveness of intergovernmental cooperation.
Ultimately, national Governments must take the lead in forging regional connectivity, both by making the necessary changes in their national policies, as well as by actively participating in regional initiatives on connectivity. ESCAP can support their efforts by providing a neutral platform for frank and informed discussions among relevant stakeholders. In this regard, the multi-sectoral Expert Working Groups being established in accordance with the 2013 Ministerial Declaration on Regional Economic Cooperation and Integration in Asia and the Pacific can help Governments to identify the best approaches for implementing these regional strategies.
xvii
acKnoWledgeMents
This report was prepared under the overall direction and guidance of Shamshad Akhtar, Under-Secretary-General of the United Nations and Executive Secretary of the Economic and Social Commission for Asia and the Pacific (ESCAP), and under the substantive direction of Anisuzzaman Chowdhury, Director of the Macroeconomic Policy and Development Division. The core team led by Muhammad Hussain Malik, included Shuvojit Banerjee, Sudip Ranjan Basu, Clovis Freire, Steve Loris Gui-Diby, Alberto Isgut, Zheng Jian, Daniel Jeongdae Lee, Oliver Paddison, Kiatkanid Pongpanich, Vatcharin Sirimaneetham and Marin Yari. Others who contributed from the Division were Aynul Hasan, Syed Nuruzzaman and Katinka Weinberger.
ESCAP staff who contributed substantively include: Rae Kwon Chung (Director), Masakazu Ichimura, Kohji Iwakami, Sungmin Kim, Hongpeng Liu, Aneta Nikolova, Kareff Rafisura, Hitomi Rankine, Donovan Storey and Sergey Tulinov of the Environment and Development Division; Shamika N. Sirimanne (Director), Tiziana Bonapace, Remi Lang and Dominic Leong of the Information and Communications Technology and Disaster Risk Reduction Division; Nanda Krairiksh (Director), Patrik Andersson, Chol O Han, Maren Jimenez, Manuel Mejido, Ermina Sokou and Vanessa Steinmayer of the Social Development Division; Krisana Boonpriroje, Rikke Munk Hansen, Eric Hermouet, Nongnuch Hiranyapaisansakul, Marko Javorsek, Marisa Limawongpranee, Sean Lovell, Nixie Mabanag, Teerapong Praphotjanaporn and Panpaka Supakalin of the Statistics Division; Ravi Ratnayake (Director), Witada Anukoonwattaka, Yann Duval, Mia Mikic and Heini Salonen of the Trade and Investment Division; Dong-Woo Ha (Director), Pierre Chartier, Sandeep Raj Jain, Fedor Kormilitsyn, Yuwei Li, Peter O’Neill, A.S.M. Abdul Quium, Heini Suominen, Mathieu Verougstraete and Fuyo Jenny Yamamoto of the Transport Division; Iosefa Maiava (Director), Sanjesh Naidu, Siope Ofa and David Smith of the ESCAP Pacific Office; Kilaparti Ramakrishna (Director), Yejin Ha and Sangmin Nam of the ESCAP Subregional Office for East and North-East Asia; Nikolay Pomoshchnikov (Director) and Bekhzod Rakhmatov of the ESCAP Subregional Office for North and Central Asia; and Nagesh Kumar (Director) and Matthew Hammill of the ESCAP Subregional Office for South and South-West Asia.
Valuable advice, comments and inputs were received from staff of the United Nations who include: Sukti Dasgupta and Phu Huynh of the International Labour Organization.
The following consultants provided inputs: Filomeno S. Sta. Ana III, Head, Action for Economic Reforms, the Philippines; Derek Atkinson, Australia; Manas Bhattacharya, India; Ahmad R. Jalali-Naini, Chairman, Economics Department, Institute for Management and Planning Studies, the Islamic Republic of Iran; Rina Oktaviani, Professor, Department of Economics, Faculty of Economics and Management, Bogor Agricultural University, Indonesia; Hafiz A. Pasha, Dean, School of Social Sciences, Beaconhouse National University, Pakistan; Biman C. Prasad, Professor and Chair, Oceania Development Network, University of the South Pacific, Fiji; Mahesh C. Uniyal, India; and A. Erinç Yeldan, Professor and Dean, Faculty of Economics, Yasar University, Turkey.
The report benefited from extensive comments and suggestions from an eminent group of policymakers, scholars and development practitioners, acting as external peer reviewers, namely: Prabir De, Professor
xviii
and Coordinator of ASEAN-India Centre, Research and Information System for Developing Countries, India; Bakhodur Eshonov, Director, Center for Economic Research, Uzbekistan; Saman Kelegama, Executive Director, Institute of Policy Studies, Sri Lanka; Abu Saeed Khan, Senior Policy Fellow, LIRNEasia, Sri Lanka; Ashfaque H. Khan, Principal and Dean, NUST Business School, Pakistan; Tagir Khuziyatov, Deputy Vice-President for International Affairs, Far Eastern Federal University, the Russian Federation; Sangkyom Kim, Vice President, Korea Institute for International Economic Policy, Republic of Korea; Pisit Puapan, Director of Macroeconomic Analysis Division, Fiscal Policy Office, Ministry of Finance, Thailand; Rathin Roy, Director, National Institute of Public Finance and Policy, India; Peter Warr, John Crawford Professor of Agricultural Economics and Head, Arndt-Corden Department of Economics, Australian National University, Australia; John Weeks, Professor Emeritus, School of Oriental and African Studies, University of London, United Kingdom; Christian Wilk, General Manager, Metacognition Consulting, Thailand; and Shunli Yao, Director, Institute for Applied International Trade, China.
Achara Jantarasaengaram, Pannipa Ongwisedpaiboon and Amornrut Supornsinchai of the Macroeconomic Policy and Development Division; and Srisakul Kanjanabus and Trygve Morset of the Transport Division, ESCAP, provided research assistance.
The manuscript was edited by Orestes Plasencia, Robert Blackwell, Alan Cooper and John Loftus, Editorial Unit of ESCAP. The graphic design was created by Nattawarath Hengviriyapanich, and the layout and printing were provided by Clung Wicha Press.
Sutinee Yeamkitpibul, supported by Patchara Arunsuwannakorn, Metinee Hunkosol, Chawarin Klongdee, Anong Pattanathanes and Woranut Sompitayanurak of the Macroeconomic Policy and Development Division proofread the manuscript and undertook all administrative processing necessary for the issuance and launch of the publication.
Francyne Harrigan, Katie Elles, Francesca Ross and Chavalit Boonthanom of the ESCAP Strategic Communications and Advocacy Section coordinated the launch and dissemination of the report.
xix
Page
Foreword ..................................................................................................................................................................... iii
Preface ......................................................................................................................................................................... v
Executive Summary ............................................................................................................................................... vii
Acknowledgements ................................................................................................................................................. xvii
Explanatory notes ................................................................................................................................................... xxviii
Abbreviations ............................................................................................................................................................ xxxi
PART I. GROWTH PROSPECTS AND CHALLENGES
Chapter 1. Maintaining growth momentum amid uncertainties and internal challenges ..... 1
Growth recovery under pressure ............................................................................... 3
Slow growth and policies of developed economies having an impact on the region ............................................................................................................. 3 Region’s growth and inflation prospects .................................................................... 10 Prospects in the region’s major developing economies ........................................... 13 Gradual trade recovery ................................................................................................ 16 Positive outlook for foreign direct investment ........................................................... 21
Socio-economic challenges ........................................................................................ 23
Jobs growth and quality still show mixed progress .................................................. 23 Inequality hampering sustainability of growth ........................................................... 25
Policy options to deal with longer-term challenges and near-term risks and vulnerabilities ..................................................................................................... 28
Productive government spending to support sustainable growth ........................... 28 Productive investment in youth ................................................................................... 31 Mitigating risks from volatility of capital flows ........................................................... 31
Conclusion ....................................................................................................................... 32
Chapter 2. Macroeconomic performance and policy challenges at the subregional level ....... 35
East and North-East Asia ............................................................................................. 38
Recovery under way as the external environment improves .................................. 38 Lower commodity prices kept inflation in check ....................................................... 41 Mixed performance on current account balances .................................................... 42 Policy responses and structural reforms: promotion of sustained growth ............. 43 Outlook for 2014 and policy challenges ..................................................................... 44
contents
xx
contents (continued)
Page
North and Central Asia .................................................................................................. 45
Slower economic growth due to subdued commodity prices .................................. 45 Inflation edged up on non-food items ......................................................................... 48 External current account balances generally deteriorated ...................................... 48 Policy responses and structural reforms ................................................................... 50 Outlook for 2014 and policy challenges ..................................................................... 52
Pacific ................................................................................................................................ 54
Pacific island developing economies:
Growth slowed amid lower commodity prices ........................................................... 54 Moderate inflationary pressure ................................................................................... 57 External current account deficits remained large ..................................................... 57 Policy responses and structural reforms: fiscal consolidation and private sector promotion .......................................................................................... 58 Outlook for 2014 and policy challenges ..................................................................... 60
Australia and New Zealand:
Growth performance weakened ................................................................................. 61 Inflationary pressure remained modest ..................................................................... 63 Stronger exports narrowed current account deficits ................................................. 63 Policy responses: fiscal consolidation ........................................................................ 64 Outlook for 2014 and policy challenges ..................................................................... 64
South and South-West Asia ......................................................................................... 64
Slight pickup in growth ................................................................................................. 64 Inflation softened but still elevated .............................................................................. 67 External current accounts improved on export rebound .......................................... 68 Policy responses and structural reforms: accommodative macroeconomic policies .......................................................................................... 70 Outlook for 2014 and policy challenges ........................................................................ 71
South-East Asia .............................................................................................................. 74
Diverse growth performance ....................................................................................... 74 Stable inflationary pressure ......................................................................................... 77 External current accounts: exports picked up towards year-end ............................ 78 Policy responses and structural reforms: multi-faceted reform agenda moves forward ................................................................................ 79 Outlook for 2014 and policy challenges ..................................................................... 81
Conclusion ....................................................................................................................... 83
xxi
Page
Chapter 3. Domestic resource mobilization: options for expanding fiscal space .................. 87
Creating fiscal space ..................................................................................................... 89
Boosting tax revenues .................................................................................................. 93
Composition of tax revenues ...................................................................................... 94
Indirect taxes ................................................................................................................. 94 Direct taxes ................................................................................................................... 96
Monitoring tax revenues ............................................................................................... 97
Tax buoyancy ................................................................................................................ 97 Tax potential .................................................................................................................. 98
Rates of major taxes ...................................................................................................... 100
Corporate taxes ............................................................................................................ 100 Income taxes ................................................................................................................. 102 Sales taxes ................................................................................................................... 103 Taxation of imports ....................................................................................................... 103
Exemptions and concessions .................................................................................... 106
Policy options to enhance tax revenue ..................................................................... 108
Broadening the tax base and rationalizing rates ...................................................... 108 Tackling tax evasion and tax fraud ............................................................................. 110 Improving tax administration ....................................................................................... 112 Sequencing tax reforms ............................................................................................... 113 Promoting regional cooperation .................................................................................. 114
Conclusion ....................................................................................................................... 115
Annex I. Data used in this chapter ............................................................................. 116
Annex II. Computation of tax buoyancy .................................................................... 116
Annex III. Estimation of tax potential and tax gap ................................................. 116
References part I ..................................................................................................................................... 119
PART II. REGIONAL CONNECTIVITY FOR SHARED PROSPERITY
Chapter 4. Regional connectivity for shared prosperity ............................................................... 127
Introduction ..................................................................................................................... 128
Connecting countries creates new opportunities for development ........................ 128
contents (continued)
xxii
Page
Understanding “regional connectivity” ....................................................................... 129
The role of regional connectivity in supporting growth and development ...... 129
Regional integration efforts drive initial trade growth ............................................... 129 Emergence of regional production networks and value chains .............................. 130 Explaining differences in subregional performance ................................................. 132 The role of trade and transport connectivity ............................................................. 133 Economies of scale in transport, competition and non-physical barriers to trade .... 134
New drivers of growth shaping development patterns into the future ............. 135
Trade and transport connectivity remains a priority ................................................. 135 ICT connectivity as an enabler and driver of growth ................................................ 136 Expanding the region’s trade in services ................................................................... 138 Energy connectivity and security ................................................................................ 139 Responding to population dynamics .......................................................................... 141 Transitioning to knowledge-based economies .......................................................... 142
Regional strategies for strengthening connectivity in the ESCAP region ........ 143
Annex I. Measuring the impact of broadband infrastructure on economic growth ................................................................................................. 143
Chapter 5. Regional strategies for strengthening regional connectivity .................................. 151
Trade and transport connectivity ............................................................................... 152
The status of trade and transport connectivity in the region ................................... 152 Upgrading and integration of regional transport networks ...................................... 153 Enhancing cooperation at border crossings .............................................................. 154 Harnessing ICT connectivity for trade and transport facilitation ............................. 157 Developing competitive regional transport and logistics services .......................... 160
Information and communications technology connectivity ................................ 162
The evolution of the “digital divide” in Asia and the Pacific ..................................... 162 Towards an Asia-Pacific information superhighway ................................................. 163 Harnessing cross-sectoral synergies for infrastructure development .................... 164 Strengthening the ICT connectivity of Pacific island economies ............................ 166
Energy connectivity ....................................................................................................... 168
Current status of energy connectivity in the region .................................................. 168 Towards an Asian Energy Highway ............................................................................ 170 The need for a strong institutional framework ........................................................... 172
People-to-people connectivity .................................................................................... 173
contents (continued)
xxiii
Page
Increasing mobility in the ESCAP region ................................................................... 173 Benefits and challenges of international labour migration ....................................... 173 Cooperative approaches to managing international labour migrant flows ............. 175 Strengthening knowledge networks of people and institutions ............................... 176 Strengthening business networks and associations ................................................ 178 Putting individuals at the heart of people-to-people connectivity ........................... 179
Chapter 6. Strengthening institutional coordination and regional cooperation ..................... 187
Strengthening institutional responses to regional connectivity ........................ 188
Coordination at the regional level ............................................................................... 190
Statistical standards for strengthened accountability and better policymaking .... 193
Strengthening statistical capacity in the Asian and Pacific region ......................... 196
Regional solutions for financing regional infrastructure networks ................... 196
Regional projects as “regional public goods” ............................................................ 196 Regional infrastructure funds ...................................................................................... 197 Regional Project Preparatory Facility ......................................................................... 198 Asian Multi-donor Platform .......................................................................................... 198 Public-Private Partnerships ......................................................................................... 199
Chapter 7. Conclusions ......................................................................................................................... 203
References part II .................................................................................................................................... 209
contents (continued)
xxiv
BoXesPART I
Page
1.1. How would financial market turbulence due to monetary policy normalization in the United States affect growth performance in Asia and the Pacific? .......................... 7
1.2. Potential and challenges for Asia-Pacific bond markets ................................................................. 9
1.3. Understanding China’s economic transformation programme ......................................................... 14
1.4. Opportunity loss due to trade-reducing measures for developing Asia-Pacific economies ...... 17
1.5. Growing divide between the poor and the rich in Asia and the Pacific ................................. 25
1.6. Strengthening social services in health and education: Turkey and Sri Lanka ...................... 29
2.1. The role of low-carbon cities to promote sustainable development in East and North-East Asia .......................................................................................................................................... 46
2.2. Urbanization challenges in North and Central Asia ......................................................................... 53
2.3. Strengthening the evidence base for disability policymaking in the Pacific ............................. 62
2.4. Empowering women, enabling development ......................................................................................... 73
2.5. ASEAN Declaration on Strengthening Social Protection ................................................................. 82
3.1. Difficulties with removing consumer subsidies .................................................................................... 91
3.2. Recent innovative tax reforms in the Asia-Pacific region ............................................................... 109
PART II
4.1 Containerization and the growth of international trade ............................................................... 134
4.2. Measuring the contribution of broadband to economic growth ................................................. 137
4.3. Growing energy demand fuels China’s regional energy connectivity efforts ........................... 140
5.1. Integrated check post at Attari, India-Pakistan border ............................................................... 156
5.2. ICT applications for smooth cross-border transport ................................................................... 157
5.3. Towards cross-border paperless trade in Asia and the Pacific ................................................. 160
5.4. Impact of deregulation on aviation in the Pacific ......................................................................... 161
5.5. Laying broadband cable along highways and railways ............................................................... 164
5.6. Gobitec and the Asian Super Grid ................................................................................................ 171
5.7. ICT connectivity enhances educational opportunities in the Pacific ......................................... 178
5.8. The “global Argonauts” of Hsinchu, Taiwan Province of China .................................................. 179
6.1. Strengthening national trade and transport coordination committees ...................................... 193
6.2. Statistical connectivity in ASEAN .................................................................................................. 194
6.3. Measuring progress towards the Millennium Development Goals ............................................ 195
6.4. ASEAN Infrastructure Fund: a possible “best practice” for future regional infrastructure financing ................................................................................................................ 198
xxv
figUResPART I
Page
1.1. Real GDP growth of major developed economies, quarter-on-quarter, 2007-2014 ................ 3
1.2. Exchange rate indices in selected developing Asia-Pacific economies, 2013-2014 ............... 5
1.3. Foreign reserve indices in selected developing Asia-Pacific economies, 2013-2014 ............ 6
1.4. Consumer price inflation in selected developing Asia-Pacific economies, 2012-2014 ........... 12
1.5. Policy interest rates in selected developing Asia-Pacific economies, 2012-2014 .................... 13
1.6. Quarterly changes in merchandise trade of selected Asia-Pacific economies, 2008-2013 .... 17
1.7. Trade balance of ASEAN with selected Asia-Pacific economies, 2000-2002 and 2011-2013 or latest available data ............................................................................................................................. 20
1.8. Foreign direct investment inflows to developing Asia-Pacific subregions, 2011-2013 ............ 22
1.9. Total and youth unemployment rates in selected Asia-Pacific economies, 2013 or latest available data ............................................................................................................................ 24
1.10. Income inequality in selected developing Asia-Pacific economies, 1990s and 2000s ......... 26
1.11. Debt per adult and inequality in selected global and Asia-Pacific economies ....................... 27
1.12. Vulnerability yardstick (short-term foreign exchange commitments as a percentage of foreign reserves) in selected developing Asia-Pacific economies, latest available data .................. 32
2.1. Investment-to-GDP ratio in selected East and North-East Asian economies, 2005-2013 ........ 40
2.2. Inflation in selected East and North-East Asian economies, 2000-2013 .................................. 41
2.3. External current account balance in selected East and North-East Asian economies, 2011-2013 ...................................................................................................................................................... 42
2.4. Budget balance in selected East and North-East Asian economies, 2011-2013 ................... 44
2.5. Inflation in North and Central Asian economies, changes in 2013 relative to 2012 ............ 48
2.6. External current account balance in North and Central Asian economies, 2010-2013 ........... 49
2.7. Budget balance in North and Central Asian economies, 2011-2013 .......................................... 50
2.8. Inflation in selected Pacific island developing economies, changes in 2013 relative to 2012 .... 57
2.9. External current account balance in selected Pacific island developing economies, 2011-2013 58
2.10. Budget balance in selected Pacific island developing economies, 2011-2013 ......................... 59
2.11. Economic growth of Australia and New Zealand, 2011-2014 ........................................................ 63
2.12. Inflation in selected Asia-Pacific subregions, 2000-2013 ................................................................. 67
2.13. External current account balance in selected South and South-West Asian economies, 2011-2013 ...................................................................................................................................................... 69
2.14. Investment-to-GDP ratio in selected South and South-West Asian economies, 2005-2013 70
2.15. Budget balance in selected South and South-West Asian economies, 2011-2013 ................ 70
2.16. Inflation in South-East Asian economies, changes in 2013 relative to 2012 .......................... 77
xxvi
Page
2.17. External current account balance in South-East Asian economies, 2011-2013 ...................... 78
2.18. Budget balance in selected South-East Asian economies, 2011-2013 ....................................... 79
3.1. Share of direct and indirect taxes in tax revenue, and tax revenues as a percentage of GDP, 2011 .............................................................................................................................................. 94
3.2. Contribution of taxes on trade to indirect taxes, 2011 (panel A) and changes in tax revenue from international trade, 1990-2011 (panel B) ................................................................ 95
3.3. Net change in non-trade tax revenue, trade taxes and overall revenue between 1990 and 2011 ...................................................................................................................................................... 96
3.4. Distribution of corporate income and personal income taxes, 2011 or latest year ............... 97
3.5. Stylized pattern of import duties .............................................................................................................. 105
PART II
4.1. Trade agreements in Asia and the Pacific .................................................................................... 130
4.2. Average cost of importing and exporting containers: comparison of ESCAP landlocked developing countries and Malaysia ............................................................................................ 133
4.3. Growth in container throughput, selected ports in Asia ............................................................. 135
4.4. Broadband indicators, selected Asian and Pacific economies, 2012 ....................................... 137
4.5. Top five importers and exporters by energy resource in Asia and the Pacific, 2010 (ktoe) ........ 140
4.6. Stock of international migrants in the ESCAP region, selected years ...................................... 142
5.1. Progress in upgrading routes of the Asian Highway Network, 2004-2010 ................................ 154
5.2. Current status of the Trans-Asian Railway network, 2014 ......................................................... 155
5.3. A single window road map in five evolutionary stages ............................................................... 159
5.4. Annual average growth in bandwidth vs. distribution of bandwidth added, by region (2008-2012) 162
5.5. Fibre-optic ducts and conduits are placed alongside a highway in the Republic of Korea ….. 166
5.6. Mobile subscriptions per 100 people in selected Pacific island economies, 2000-2012 ......... 167
5.7. Energy self-sufficiency indices for selected ESCAP member States and associate members, as projected for 2035 ................................................................................................ 168
5.8. Subregional initiatives on power grids and markets projected for 2035 ................................... 169
5.9. Road map for an Asian Energy Highway ...................................................................................... 172
5.10. Migrant workers deployed from selected Asian countries (2000, 2005, 2008 and 2010) ....... 174
5.11. Number of outbound internationally mobile students, 1999-2012 ............................................. 177
6.1. Example from the ASEAN Economic Scorecard, Competitive Economic Region (Pillar II) ....... 190
6.2. Percentage of compliance of legal frameworks for selected ESCAP countries (2008, 2011) .... 199
figURes (continued)
xxvii
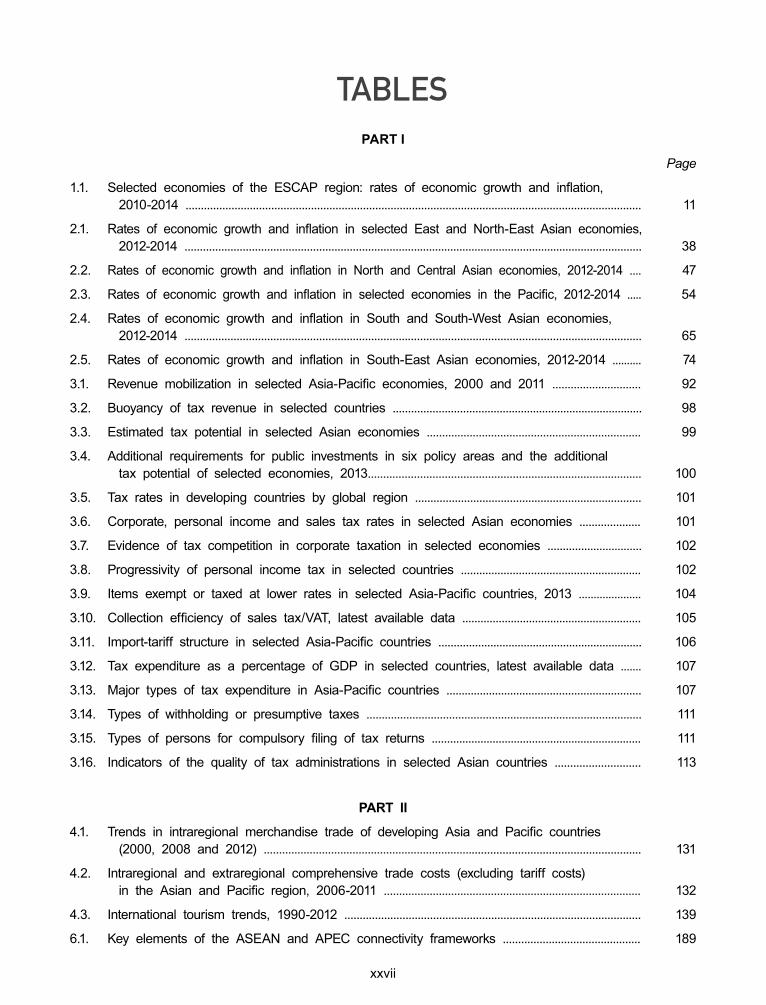
taBlesPART I
Page
1.1. Selected economies of the ESCAP region: rates of economic growth and inflation, 2010-2014 ..................................................................................................................................................... 11
2.1. Rates of economic growth and inflation in selected East and North-East Asian economies, 2012-2014 ...................................................................................................................................................... 38
2.2. Rates of economic growth and inflation in North and Central Asian economies, 2012-2014 .... 47
2.3. Rates of economic growth and inflation in selected economies in the Pacific, 2012-2014 ..... 54
2.4. Rates of economic growth and inflation in South and South-West Asian economies, 2012-2014 ..................................................................................................................................................... 65
2.5. Rates of economic growth and inflation in South-East Asian economies, 2012-2014 .......... 74
3.1. Revenue mobilization in selected Asia-Pacific economies, 2000 and 2011 ............................. 92
3.2. Buoyancy of tax revenue in selected countries .................................................................................. 98
3.3. Estimated tax potential in selected Asian economies ...................................................................... 99
3.4. Additional requirements for public investments in six policy areas and the additional tax potential of selected economies, 2013......................................................................................... 100
3.5. Tax rates in developing countries by global region .......................................................................... 101
3.6. Corporate, personal income and sales tax rates in selected Asian economies .................... 101
3.7. Evidence of tax competition in corporate taxation in selected economies ............................... 102
3.8. Progressivity of personal income tax in selected countries ........................................................... 102
3.9. Items exempt or taxed at lower rates in selected Asia-Pacific countries, 2013 ..................... 104
3.10. Collection efficiency of sales tax/VAT, latest available data ........................................................... 105
3.11. Import-tariff structure in selected Asia-Pacific countries ................................................................... 106
3.12. Tax expenditure as a percentage of GDP in selected countries, latest available data ....... 107
3.13. Major types of tax expenditure in Asia-Pacific countries ................................................................ 107
3.14. Types of withholding or presumptive taxes .......................................................................................... 111
3.15. Types of persons for compulsory filing of tax returns ..................................................................... 111
3.16. Indicators of the quality of tax administrations in selected Asian countries ............................ 113
PART II
4.1. Trends in intraregional merchandise trade of developing Asia and Pacific countries (2000, 2008 and 2012) ........................................................................................................................... 131
4.2. Intraregional and extraregional comprehensive trade costs (excluding tariff costs) in the Asian and Pacific region, 2006-2011 .................................................................................... 132
4.3. International tourism trends, 1990-2012 ................................................................................................. 139
6.1. Key elements of the ASEAN and APEC connectivity frameworks ............................................. 189
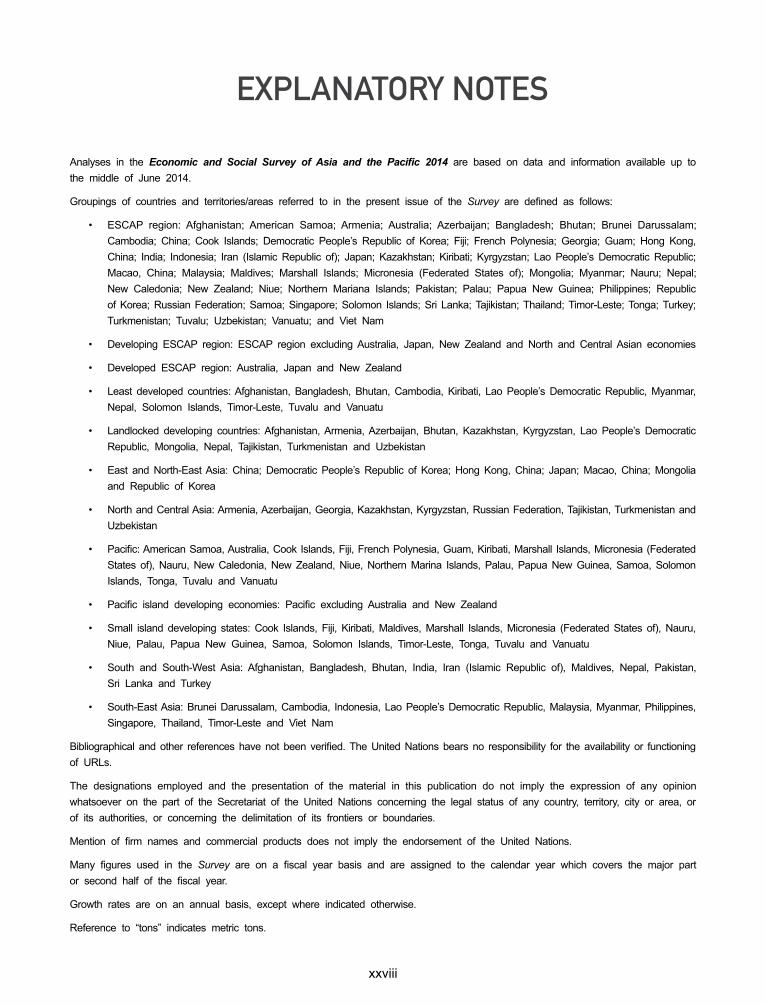
xxviii
Analyses in the Economic and Social Survey of Asia and the Pacific 2014 are based on data and information available up to the middle of June 2014.
Groupings of countries and territories/areas referred to in the present issue of the Survey are defined as follows:
• ESCAP region: Afghanistan; American Samoa; Armenia; Australia; Azerbaijan; Bangladesh; Bhutan; Brunei Darussalam; Cambodia; China; Cook Islands; Democratic People’s Republic of Korea; Fiji; French Polynesia; Georgia; Guam; Hong Kong, China; India; Indonesia; Iran (Islamic Republic of); Japan; Kazakhstan; Kiribati; Kyrgyzstan; Lao People’s Democratic Republic; Macao, China; Malaysia; Maldives; Marshall Islands; Micronesia (Federated States of); Mongolia; Myanmar; Nauru; Nepal; New Caledonia; New Zealand; Niue; Northern Mariana Islands; Pakistan; Palau; Papua New Guinea; Philippines; Republic of Korea; Russian Federation; Samoa; Singapore; Solomon Islands; Sri Lanka; Tajikistan; Thailand; Timor-Leste; Tonga; Turkey; Turkmenistan; Tuvalu; Uzbekistan; Vanuatu; and Viet Nam
• Developing ESCAP region: ESCAP region excluding Australia, Japan, New Zealand and North and Central Asian economies
• Developed ESCAP region: Australia, Japan and New Zealand
• Least developed countries: Afghanistan, Bangladesh, Bhutan, Cambodia, Kiribati, Lao People’s Democratic Republic, Myanmar, Nepal, Solomon Islands, Timor-Leste, Tuvalu and Vanuatu
• Landlocked developing countries: Afghanistan, Armenia, Azerbaijan, Bhutan, Kazakhstan, Kyrgyzstan, Lao People’s Democratic Republic, Mongolia, Nepal, Tajikistan, Turkmenistan and Uzbekistan
• East and North-East Asia: China; Democratic People’s Republic of Korea; Hong Kong, China; Japan; Macao, China; Mongolia and Republic of Korea
• North and Central Asia: Armenia, Azerbaijan, Georgia, Kazakhstan, Kyrgyzstan, Russian Federation, Tajikistan, Turkmenistan and Uzbekistan
• Pacific: American Samoa, Australia, Cook Islands, Fiji, French Polynesia, Guam, Kiribati, Marshall Islands, Micronesia (Federated States of), Nauru, New Caledonia, New Zealand, Niue, Northern Marina Islands, Palau, Papua New Guinea, Samoa, Solomon Islands, Tonga, Tuvalu and Vanuatu
• Pacific island developing economies: Pacific excluding Australia and New Zealand
• Small island developing states: Cook Islands, Fiji, Kiribati, Maldives, Marshall Islands, Micronesia (Federated States of), Nauru, Niue, Palau, Papua New Guinea, Samoa, Solomon Islands, Timor-Leste, Tonga, Tuvalu and Vanuatu
• South and South-West Asia: Afghanistan, Bangladesh, Bhutan, India, Iran (Islamic Republic of), Maldives, Nepal, Pakistan, Sri Lanka and Turkey
• South-East Asia: Brunei Darussalam, Cambodia, Indonesia, Lao People’s Democratic Republic, Malaysia, Myanmar, Philippines, Singapore, Thailand, Timor-Leste and Viet Nam
Bibliographical and other references have not been verified. The United Nations bears no responsibility for the availability or functioning of URLs.
The designations employed and the presentation of the material in this publication do not imply the expression of any opinion whatsoever on the part of the Secretariat of the United Nations concerning the legal status of any country, territory, city or area, or of its authorities, or concerning the delimitation of its frontiers or boundaries.
Mention of firm names and commercial products does not imply the endorsement of the United Nations.
Many figures used in the Survey are on a fiscal year basis and are assigned to the calendar year which covers the major part or second half of the fiscal year.
Growth rates are on an annual basis, except where indicated otherwise.
Reference to “tons” indicates metric tons.
eXplanatoRy notes
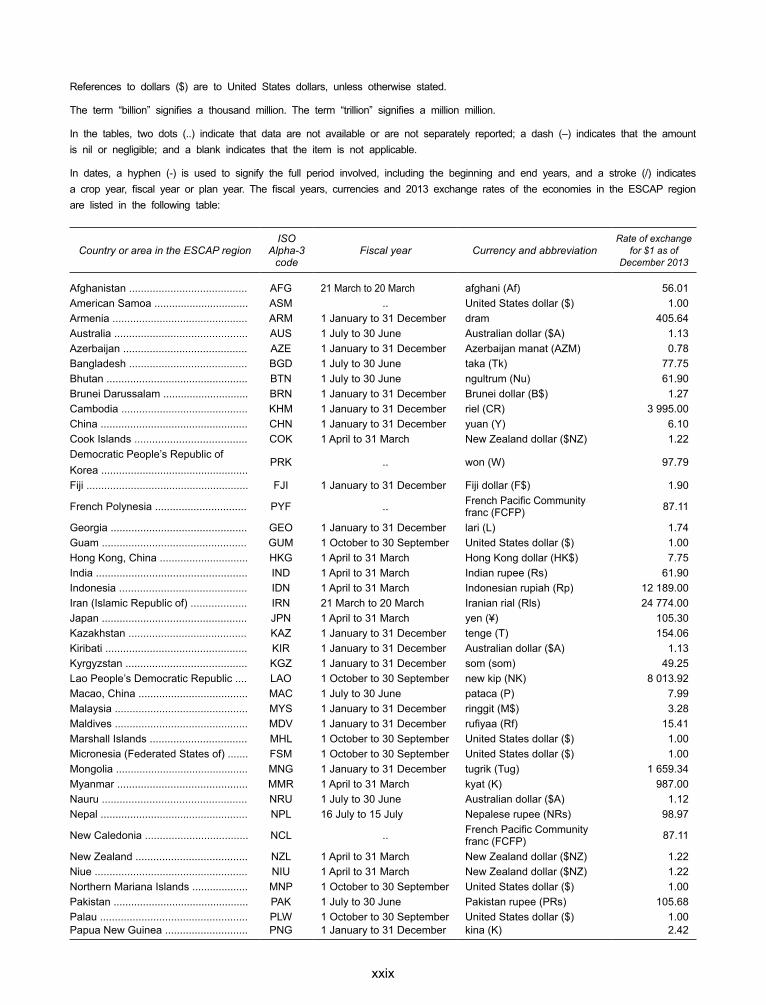
xxix
References to dollars ($) are to United States dollars, unless otherwise stated.
The term “billion” signifies a thousand million. The term “trillion” signifies a million million.
In the tables, two dots (..) indicate that data are not available or are not separately reported; a dash (–) indicates that the amount is nil or negligible; and a blank indicates that the item is not applicable.
In dates, a hyphen (-) is used to signify the full period involved, including the beginning and end years, and a stroke (/) indicates a crop year, fiscal year or plan year. The fiscal years, currencies and 2013 exchange rates of the economies in the ESCAP region are listed in the following table:
Country or area in the ESCAP regionISO
Alpha-3 code
Fiscal year Currency and abbreviationRate of exchange
for $1 as of December 2013
Afghanistan ........................................ AFG 21 March to 20 March afghani (Af) 56.01American Samoa ................................ ASM .. United States dollar ($) 1.00Armenia .............................................. ARM 1 January to 31 December dram 405.64Australia ............................................. AUS 1 July to 30 June Australian dollar ($A) 1.13Azerbaijan .......................................... AZE 1 January to 31 December Azerbaijan manat (AZM) 0.78Bangladesh ........................................ BGD 1 July to 30 June taka (Tk) 77.75Bhutan ................................................ BTN 1 July to 30 June ngultrum (Nu) 61.90Brunei Darussalam ............................. BRN 1 January to 31 December Brunei dollar (B$) 1.27Cambodia ........................................... KHM 1 January to 31 December riel (CR) 3 995.00China .................................................. CHN 1 January to 31 December yuan (Y) 6.10Cook Islands ...................................... COK 1 April to 31 March New Zealand dollar ($NZ) 1.22Democratic People’s Republic of Korea ..................................................
PRK .. won (W) 97.79
Fiji ....................................................... FJI 1 January to 31 December Fiji dollar (F$) 1.90
French Polynesia ............................... PYF .. French Pacific Community franc (FCFP) 87.11
Georgia .............................................. GEO 1 January to 31 December lari (L) 1.74Guam ................................................. GUM 1 October to 30 September United States dollar ($) 1.00Hong Kong, China .............................. HKG 1 April to 31 March Hong Kong dollar (HK$) 7.75India ................................................... IND 1 April to 31 March Indian rupee (Rs) 61.90Indonesia ........................................... IDN 1 April to 31 March Indonesian rupiah (Rp) 12 189.00Iran (Islamic Republic of) ................... IRN 21 March to 20 March Iranian rial (Rls) 24 774.00Japan ................................................. JPN 1 April to 31 March yen (¥) 105.30Kazakhstan ........................................ KAZ 1 January to 31 December tenge (T) 154.06Kiribati ................................................ KIR 1 January to 31 December Australian dollar ($A) 1.13Kyrgyzstan ......................................... KGZ 1 January to 31 December som (som) 49.25Lao People’s Democratic Republic .... LAO 1 October to 30 September new kip (NK) 8 013.92Macao, China ..................................... MAC 1 July to 30 June pataca (P) 7.99Malaysia ............................................. MYS 1 January to 31 December ringgit (M$) 3.28Maldives ............................................. MDV 1 January to 31 December rufiyaa (Rf) 15.41Marshall Islands ................................. MHL 1 October to 30 September United States dollar ($) 1.00Micronesia (Federated States of) ....... FSM 1 October to 30 September United States dollar ($) 1.00Mongolia ............................................. MNG 1 January to 31 December tugrik (Tug) 1 659.34Myanmar ............................................ MMR 1 April to 31 March kyat (K) 987.00Nauru ................................................. NRU 1 July to 30 June Australian dollar ($A) 1.12Nepal .................................................. NPL 16 July to 15 July Nepalese rupee (NRs) 98.97
New Caledonia ................................... NCL .. French Pacific Community franc (FCFP) 87.11
New Zealand ...................................... NZL 1 April to 31 March New Zealand dollar ($NZ) 1.22Niue .................................................... NIU 1 April to 31 March New Zealand dollar ($NZ) 1.22Northern Mariana Islands ................... MNP 1 October to 30 September United States dollar ($) 1.00Pakistan .............................................. PAK 1 July to 30 June Pakistan rupee (PRs) 105.68Palau .................................................. PLW 1 October to 30 September United States dollar ($) 1.00Papua New Guinea ............................ PNG 1 January to 31 December kina (K) 2.42
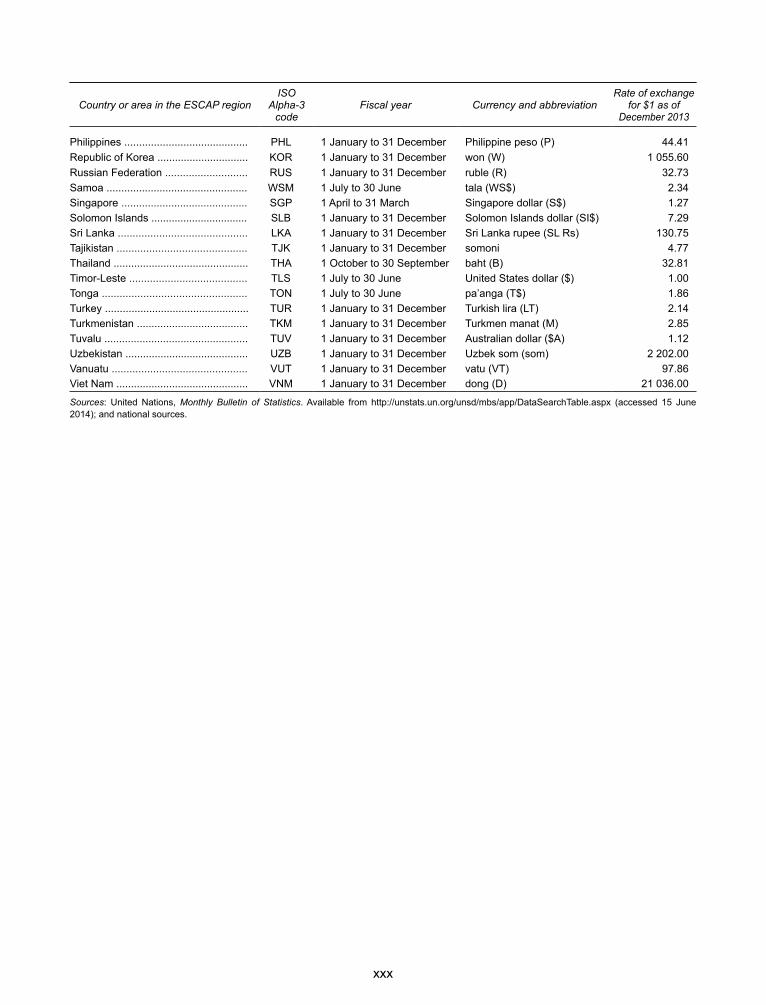
xxx
Country or area in the ESCAP regionISO
Alpha-3 code
Fiscal year Currency and abbreviationRate of exchange
for $1 as of December 2013
Philippines .......................................... PHL 1 January to 31 December Philippine peso (P) 44.41Republic of Korea ............................... KOR 1 January to 31 December won (W) 1 055.60Russian Federation ............................ RUS 1 January to 31 December ruble (R) 32.73Samoa ................................................ WSM 1 July to 30 June tala (WS$) 2.34Singapore ........................................... SGP 1 April to 31 March Singapore dollar (S$) 1.27Solomon Islands ................................. SLB 1 January to 31 December Solomon Islands dollar (SI$) 7.29Sri Lanka ............................................ LKA 1 January to 31 December Sri Lanka rupee (SL Rs) 130.75Tajikistan ............................................ TJK 1 January to 31 December somoni 4.77Thailand .............................................. THA 1 October to 30 September baht (B) 32.81Timor-Leste ........................................ TLS 1 July to 30 June United States dollar ($) 1.00Tonga ................................................. TON 1 July to 30 June pa’anga (T$) 1.86Turkey ................................................. TUR 1 January to 31 December Turkish lira (LT) 2.14Turkmenistan ...................................... TKM 1 January to 31 December Turkmen manat (M) 2.85Tuvalu ................................................. TUV 1 January to 31 December Australian dollar ($A) 1.12Uzbekistan .......................................... UZB 1 January to 31 December Uzbek som (som) 2 202.00Vanuatu .............................................. VUT 1 January to 31 December vatu (VT) 97.86Viet Nam ............................................. VNM 1 January to 31 December dong (D) 21 036.00
Sources: United Nations, Monthly Bulletin of Statistics. Available from http://unstats.un.org/unsd/mbs/app/DataSearchTable.aspx (accessed 15 June 2014); and national sources.
xxxi
aBBReviations
ABF Asian Bond Fund
ABMI Asian Bond Markets Initiative
ACSS ASEAN Community Statistical System
ADB Asian Development Bank
ADBI Asian Development Bank Institute
AEC ASEAN Economic Community
AEH Asian energy highway
AHSOM ASEAN Heads of Statistical Offices Meeting
AIF ASEAN Infrastructure Fund
AIIB Asian Infrastructure Investment Bank
APAIE Asia-Pacific Association for International Education
APEC Asia-Pacific Economic Cooperation
ASEAN Association of Southeast Asian Nations
ASEAN+3 ASEAN plus China, Japan and the Republic of Korea
ASW ASEAN Single Window Initiative
BIMSTEC Bay of Bengal Initiative for Multi-Sectoral Technical and Economic Cooperation
BRICS Brazil, Russian Federation, India, China and South Africa
CAREC Central Asia Regional Economic Cooperation
CDB China Development Bank
CIS Commonwealth of Independent States
CLMV Cambodia, Lao People’s Democratic Republic, Myanmar and Viet Nam
CMIM Chiang Mai Initiative Multilateralization
CO2 carbon dioxide
DTAA double taxation avoidance agreement
ECB European Central Bank
ECO Economic Cooperation Organisation
EMEAP Executives’ Meeting of East Asia and Pacific Central Banks Group
ESCAP Economic and Social Commission for Asia and the Pacific
EU European Union
EURASEC Eurasian Economic Community
FATS Framework for Action on Transport Services
FDI foreign direct investment
FTA free trade agreement
xxxii
aBBReviations (continued)
G20 Group of Twenty
GDP gross domestic product
GER gross enrolment ratio
GHI general health insurance
GLS generalized least squares
GMS Greater Mekong Subregion
GNP gross national product
GPS Global Positioning System
GST general sales tax
GW gigawatt
HVDC high-voltage direct current
ICD inland container depot
ICP integrated check posts
ICT information and communications technology
IEA International Energy Agency
IFC International Finance Corporation
ILO International Labour Organization
IMF International Monetary Fund
IP Internet protocol
IRU International Road Transport Union
IT information technology
ITU International Telecommunication Union
LDCs least developed countries
LLDCs landlocked developing countries
LNG liquefied natural gas
M&A mergers and acquisitions
MDGs Millennium Development Goals
MFN most favoured nation
NEAL-NET Northeast Asia Logistics Information Service Network
NTMs non-tariff measures
OECD Organisation for Economic Co-operation and Development
PAA Pan Asian E-commerce Alliance
PIF Pacific Islands Forum
xxxiii
aBBReviations (continued)
PPP purchasing power parity
PPPs public-private partnerships
RCEP Regional Comprehensive Economic Partnership
RFID radio-frequency identification
Rio+20 United Nations Conference on Sustainable Development
RSE recognized seasonal employer
SAARC South Asian Association for Regional Cooperation
SAFTA South Asian Free Trade Agreement
SASEC South Asia Subregional Economic Cooperation
SCADA supervisory control and data acquisition
SCO Shanghai Cooperation Organisation
SEZ special economic zones
SIDS small island developing States
SMEs small and medium-sized enterprises
SOE State-owned enterprise
SPC Secretariat of the Pacific Community
TAR Trans-Asian Railway
TASIM Trans-Eurasian Information Superhighway
TIN taxpayer identification number
TPP Trans-Pacific Partnership Agreement
UHNWIs ultra-high net worth individuals
UNCTAD United Nations Conference on Trade and Development
UNDP United Nations Development Programme
UNECE United Nations Economic Commission for Europe
UNESCO United Nations Educational, Scientific and Cultural Organization
UNNExT United Nations Network of Experts
UNWTO United Nations World Tourism Organization
US$ United States dollar
VAT value added tax
WCF World Chamber Federation
WHO World Health Organization
WTO World Trade Organization

xxxiv

xxxv
PART IgROWTH PROSPECTS
AND CHALLENgES
xxxvi
UN
PH
OTO
- K
IBA
E PA
RK
1
n 2014, the average growth rate of the developing economies ofAsiaand thePacific is forecast to rise to5.8%.This representsa modest increase of 0.2 percentage points over that of 2013.Although the developing Asia-Pacific economies continue to anchorthe global economic recovery, both external and internal factors are holding back their faster growth. Besides slow recovery in advancedeconomies, capital outflows due to the reversal of monetary policyin the United States of America pose difficulties for a number ofeconomies. Growth in some large developing economies in theregion is also challenged by infrastructure shortages, large budget deficits, inflationary pressure and rising inequality.
MAINTAINING GROWTH MOMENTUMAMID UNCERTAINTIES AND
INTERNAL CHALLENGES 1I
2
Economic and social survEy of asia and thE pacific 2014
Growth and macroeconomic stability in the region continue to be affected by growth prospects and policies of the developed world. While growthstrengthenedinmajordevelopedeconomiesin2013,it still remains weak and continues to have an impact on exports from the region. Concerns about thereduction inquantitativeeasingbytheUnitedStatesFederal Reserve (or the bond-buying programme) referred to as “tapering” caused significant volatilityin currency and asset markets first in September2013 and then again in January 2014.
The constrained domestic growth prospects of the region have
underlined the importance of productive countercyclical government spending
Domestic challenges also had an impact on some of the region’s major economies in 2013. Infrastructureshortageshave led to significant gaps inproductivecapacity.Thesegapshavecontributedtoinflationarypressures and rising balance-of-payments deficits.Asset prices have been driven up in emerging economies in recent years by surges in capital inflowsfollowingquantitativeeasinginthedevelopedworld.Ontheotherhand,someofthoseeconomiesexperiencedrapidoutflowsoflargeamountsofcapitalat the first sign of a possible reversal of UnitedStates monetary policy. These events point to thevulnerability of these emerging economies’ domestic financial sectors. Rising inequality has contributedsharply to growing household debt in a number of economies. This has increased the vulnerability oftheir populations to economic shocks, as well as contributed to current account imbalances.
The constrained domestic growth prospects of the region have underlined the importance of productive countercyclical government spending to support inclusive growth and sustainable development.Indeed, achieving inclusive and sustainable development will be the centre-piece of concerns of the entire international community as the development agenda is mapped out. A critical challenge withinthe region and globally will be locating the funding
for the necessary development programmes. Anumber of countries in the region, especially in South and South-West Asia, do not currently haveenough fiscal space for such additional spending.Policies to increase domestic resource mobilization, in particular fiscal space, as discussed in chapter3, will therefore be critical.
There is also a need to deepen regional economic cooperation and integration and utilize new and innovative mechanisms to finance development. A significant step in this regard has been recentrenewed interest among the member States in the creation of a regional financing agency for infrastructure. In October 2013, the President ofChina,Mr.XiJinping,proposedanAsianinfrastructureinvestment bank to promote connectivity and economic integration.1 ESCAPhasbeenproposingsuch a bank for a number of years to effectively deploy the region’s large foreign exchange reserves to meet its huge investment needs. This issue,among others, was considered at the MinisterialConference on Regional Economic Cooperationand Integration in Asia and the Pacific, convenedby ESCAP in December 2013. It was proposedthat working groups of experts would be formed to design and present proposals to Governmentsin the region on a new financial architecture andother key development challenges.
Thefollowingsectionsconsiderthechallengesfacingthe region in greater detail and then offer a number ofpolicyrecommendations.Thefirstofthesebeginswith a discussion of growth prospects in developed countries and the potential for spillover of developed countries’ policies toaffect growthandcapital flowsin the region.Growth and inflation prospects in theregion, including in some major regional economies, are then discussed. That section is followed bythe outlook for regional trade developments – both external and intraregional. Prospects for foreigncapital flows, including foreign direct investment (FDI), remittances and tourism are discussed next.Then the discussion is shifted to major socio-economic challenges in the region, which include the problem of job creation and its quality and
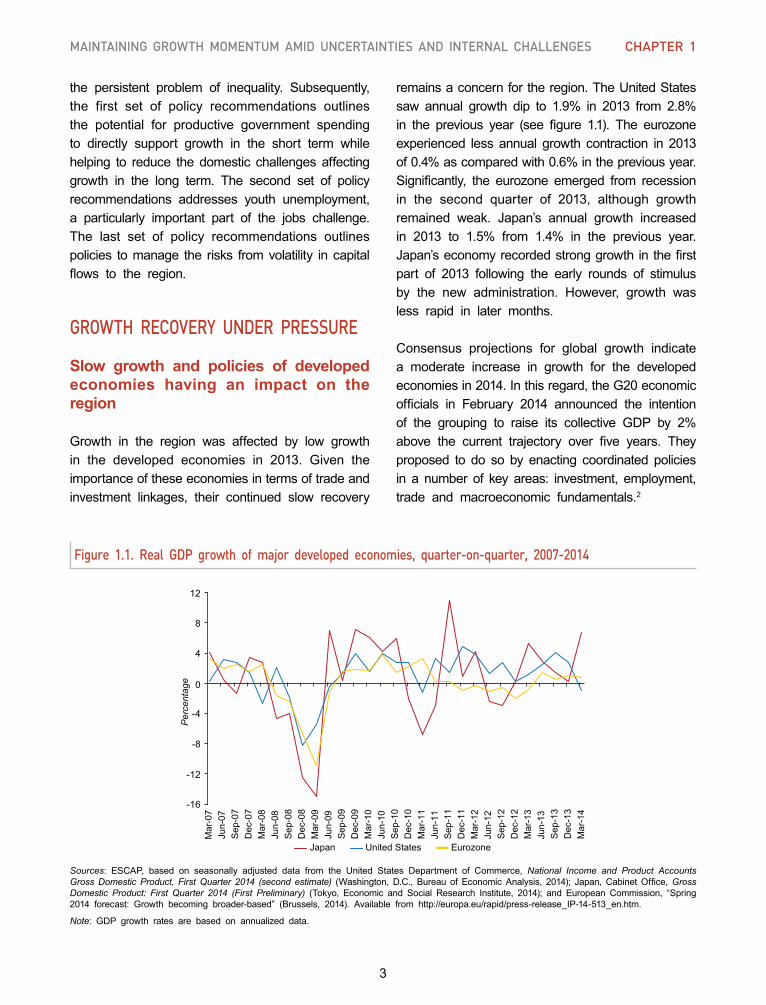
3
Maintaining growth MoMentuM aMid uncertainties and internal challenges chaPter 1
the persistent problem of inequality. Subsequently,the first set of policy recommendations outlines the potential for productive government spending to directly support growth in the short term while helping to reduce the domestic challenges affecting growth in the long term. The second set of policyrecommendations addresses youth unemployment, a particularly important part of the jobs challenge.The last set of policy recommendations outlinespolicies to manage the risks from volatility in capital flows to the region.
GROWTH RECOVERY UNDER PRESSURE
Slow growth and policies of developed economies having an impact on the region
Growth in the region was affected by low growthin the developed economies in 2013. Given theimportance of these economies in terms of trade and investment linkages, their continued slow recovery
remainsaconcernfortheregion.TheUnitedStatessaw annual growth dip to 1.9% in 2013 from 2.8%in the previous year (see figure 1.1). The eurozoneexperienced less annual growth contraction in 2013of0.4%ascomparedwith0.6%inthepreviousyear.Significantly, the eurozone emerged from recessionin the second quarter of 2013, although growthremained weak. Japan’s annual growth increasedin 2013 to 1.5% from 1.4% in the previous year.Japan’seconomyrecordedstronggrowth in thefirstpart of 2013 following the early rounds of stimulusby the new administration. However, growth wasless rapid in later months.
Consensus projections for global growth indicatea moderate increase in growth for the developed economiesin2014.Inthisregard,theG20economicofficials in February 2014 announced the intentionof the grouping to raise its collective GDP by 2%above the current trajectory over five years. Theyproposed to do so by enacting coordinated policies in a number of key areas: investment, employment, trade and macroeconomic fundamentals.2
Figure 1.1. Real GDP growth of major developed economies, quarter-on-quarter, 2007-2014
Sources: ESCAP, based on seasonally adjusted data from the United States Department of Commerce, National Income and Product Accounts Gross Domestic Product, First Quarter 2014 (second estimate) (Washington, D.C., Bureau of Economic Analysis, 2014); Japan, Cabinet Office,Gross Domestic Product: First Quarter 2014 (First Preliminary) (Tokyo, Economic and Social Research Institute, 2014); and European Commission, “Spring2014 forecast: Growth becoming broader-based” (Brussels, 2014). Available from http://europa.eu/rapid/press-release_IP-14-513_en.htm.
Note: GDP growth rates are based on annualized data.
-16
-12
-8
-4
0
4
8
12
Mar
-07
Jun-
07
Sep
-07
Dec
-07
Mar
-08
Jun-
08
Sep
-08
Dec
-08
Mar
-09
Jun-
09
Sep
-09
Dec
-09
Mar
-10
Jun-
10
Sep
-10
Dec
-10
Mar
-11
Jun-
11
Sep
-11
Dec
-11
Mar
-12
Jun-
12
Sep
-12
Dec
-12
Mar
-13
Jun-
13
Sep
-13
Dec
-13
Mar
-14
Japan United States Eurozone
Per
cent
age
4
Economic and social survEy of asia and thE pacific 2014
Itwillbechallenging tosignificantly increasegrowthin the major developed economies in the near term.For theUnitedStates,astrongself-sustainingrecovery has historically depended on consumer spending.However,withjoblessnessremaininghigh,a surge in consumer demand is unlikely to occur.The situation is exacerbated by a rise in inequality,with the well-off having benefited disproportionatelyfrom recent growth.3 As the well-off are unlikely to consume as great a proportion of their increased income as those on lower incomes, the increase in effective demand is likely to be less than would have been the case had there been no increase in inequality.
It will be challenging to significantly increase growth in the major developed
economies in the near term
Theeurozone isalsosubject tochallenges in2014.Theunemploymentrateisstillhighinmanyeurozonecountries and is contributing to the lack of self-sustaining consumption-led growth.While eurozonefinancial markets were reasonably calm in 2013,there remains the risk of macroeconomic instability resulting from any renewed loss of confidence by investors in the progress of debt resolution.Furthermore, with inflation in the eurozone runningat a worryingly low 0.5% as of May 2014, there isuncertainty regarding the possible risk of deflation.Theprospectof deflationwill increase if the referralof the Federal Constitutional Court of Germanyto the Court of Justice of the European Unionin February 2014 concerning the constitutionality of the European Central Bank’s outright monetarytransactionsschemeresultsintheBankbeingunableto pursue expansionary monetary policy.
Within the Asian and Pacific region, the growthoutlook for Japan will depend on the impact of theongoing reformprogramme.Theeconomy recordedan upturn in its growth with a set of economic stimuluspolicieswhichcameintoeffectin2013.Thefirst so-called “arrow” of the policies wasmonetarystimulus through a programme of bond-buying by
the Bank of Japan, with the objective of achievingan inflation rate of 2%. As a proportion of GDP,this has been the world’s largest-ever quantitativeeasing programme. The injection ofmoney into thedomestic financial system led to a boost in assetprices, and thus household wealth and consumer expenditure. Monetary expansion also causedan exchange rate depreciation that significantly boosted exports. The second “arrow” of policieswas a large fiscal stimulus package of 10.3 trillionyen ($116 billion) for infrastructure projects andstimulating private investment. The third “arrow”, tobe presented to the legislature for approval in mid-2014, is a growth strategy comprising a range of policies tochange thecountry’seconomicstructure.An accompanying reform during this phase was an increase in consumption tax from 5% to 8%effective from 1 April 2014. In 1997, when Japanlast increased the consumption tax, that measure slowed consumption demand considerably and abortedthecountry’snascentrecovery.Itispossiblethat there will be a dip in growth for the second quarter of 2014 (April-June) following the tax rise,a dip similar to the one that occurred in 1997.However, more important will be the extent of anexpected rebound in the third quarter of 2014; it istoo early to judge whether other government polices will continue to cushion or offset the impact of the consumption tax hike.
Apart from slow growth in developed economies, policies in the developed world also had significantimpacts on the region through spillovers from the taperingofquantitativeeasingby theUnitedStates.InJanuary2014therewasaboutofcapitaloutflowsfrom the asset markets of the region. The greatestfalls in equitymarketswere in Turkey (7.7%) and inIndia (4.4%). This followed a more widespread exitof funds in the third quarter of 2013 in expectationthat taperingwould start in September 2013. In theequity markets, the greatest decline was seen inTurkey (25%) during the period June-August 2013,followed by Indonesia and Thailand (nearly 20%).InAugust 2013alone, stockmarket capitalization inseven economies in the region declined by $323billion as compared with the previous month.
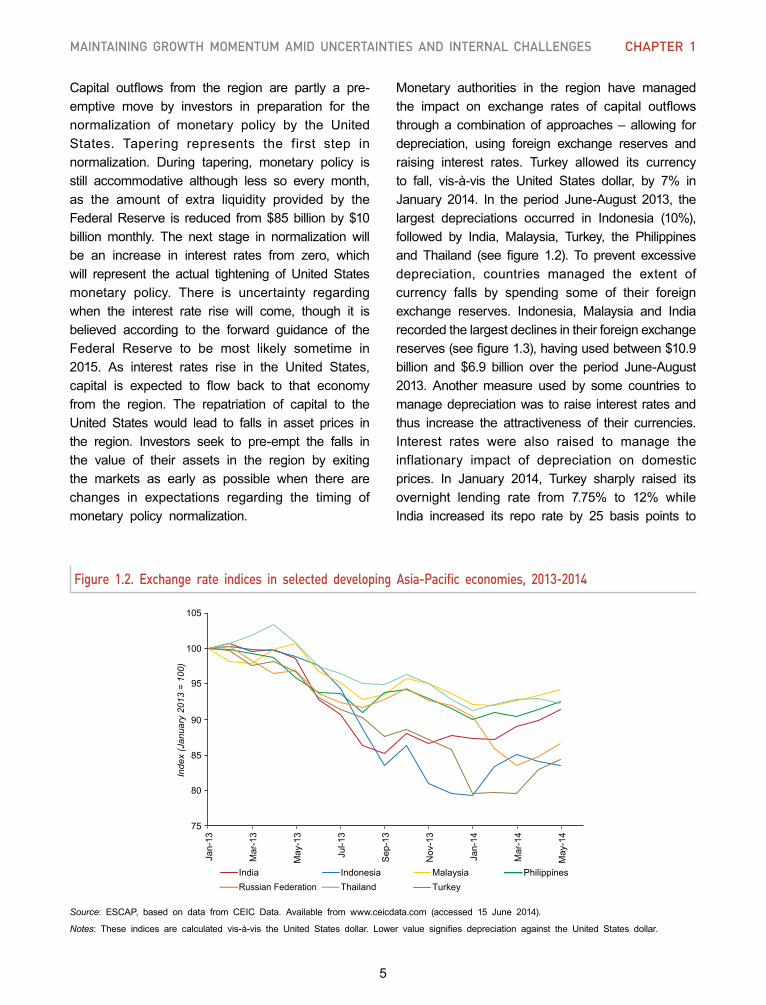
5
Maintaining growth MoMentuM aMid uncertainties and internal challenges chaPter 1
Capital outflows from the region are partly a pre-emptive move by investors in preparation for the normalization of monetary policy by the United States. Tapering represents the first step innormalization. During tapering, monetary policy isstill accommodative although less so every month, as the amount of extra liquidity provided by theFederalReserve is reduced from$85billionby$10billion monthly. The next stage in normalization willbe an increase in interest rates from zero, which will represent the actual tightening of United States monetary policy. There is uncertainty regardingwhen the interest rate rise will come, though it is believed according to the forward guidance of the Federal Reserve to be most likely sometime in 2015. As interest rates rise in the United States,capital is expected to flow back to that economyfrom the region. The repatriation of capital to theUnited States would lead to falls in asset prices in the region. Investors seek to pre-empt the falls inthe value of their assets in the region by exiting the markets as early as possible when there are changes in expectations regarding the timing of monetary policy normalization.
Monetary authorities in the region have managedthe impact on exchange rates of capital outflowsthrough a combination of approaches – allowing for depreciation, using foreign exchange reserves and raising interest rates. Turkey allowed its currencyto fall, vis-à-vis the United States dollar, by 7% inJanuary 2014. In the period June-August 2013, thelargest depreciations occurred in Indonesia (10%),followed by India, Malaysia, Turkey, the Philippinesand Thailand (see figure 1.2). To prevent excessivedepreciation, countries managed the extent of currency falls by spending some of their foreign exchange reserves. Indonesia, Malaysia and Indiarecorded the largest declines in their foreign exchange reserves(seefigure1.3),havingusedbetween$10.9billion and $6.9 billion over the period June-August2013. Anothermeasure used by some countries tomanage depreciation was to raise interest rates and thus increase the attractiveness of their currencies.Interest rates were also raised to manage the inflationary impact of depreciation on domestic prices. In January 2014, Turkey sharply raised itsovernight lending rate from 7.75% to 12% whileIndia increased its repo rate by 25 basis points to
Figure 1.2. Exchange rate indices in selected developing Asia-Pacific economies, 2013-2014
Source: ESCAP, based on data from CEIC Data. Available from www.ceicdata.com (accessed 15 June 2014).
Notes: These indices are calculated vis-à-vis the United States dollar. Lower value signifies depreciation against the United States dollar.
75
80
85
90
95
100
105
Jan-
13
Mar
-13
May
-13
Jul-1
3
Sep
-13
Nov
-13
Jan-
14
Mar
-14
May
-14
Inde
x (J
anua
ry 2
013
= 10
0)
India Indonesia Malaysia Philippines Russian Federation Thailand Turkey
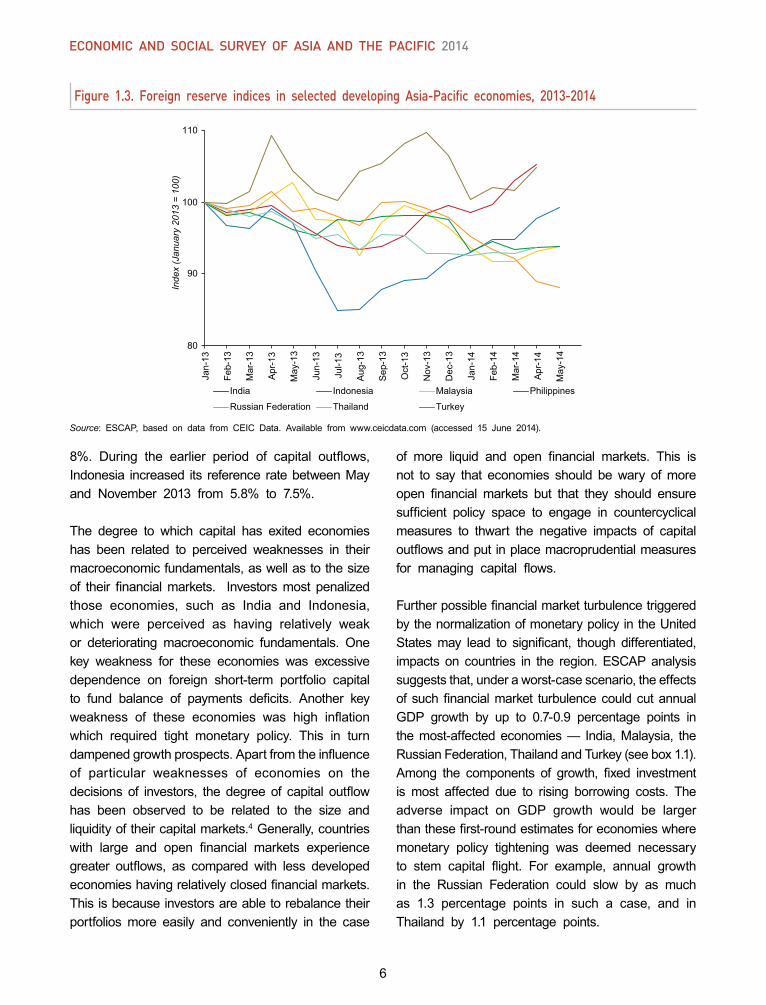
6
Economic and social survEy of asia and thE pacific 2014
Figure 1.3. Foreign reserve indices in selected developing Asia-Pacific economies, 2013-2014
8%. During the earlier period of capital outflows,Indonesia increased its reference ratebetweenMayand November 2013 from 5.8% to 7.5%.
The degree to which capital has exited economieshas been related to perceived weaknesses in their macroeconomic fundamentals, as well as to the size of their financialmarkets. Investorsmost penalizedthose economies, such as India and Indonesia, which were perceived as having relatively weak or deteriorating macroeconomic fundamentals. Onekey weakness for these economies was excessive dependence on foreign short-term portfolio capital to fund balance of payments deficits. Another keyweakness of these economies was high inflationwhich required tight monetary policy. This in turndampenedgrowthprospects.Apartfromtheinfluenceof particular weaknesses of economies on the decisions of investors, the degree of capital outflowhas been observed to be related to the size and liquidityoftheircapitalmarkets.4Generally,countrieswith large and open financial markets experiencegreater outflows, as compared with less developedeconomieshavingrelativelyclosedfinancialmarkets.Thisisbecauseinvestorsareabletorebalancetheirportfolios more easily and conveniently in the case
Source: ESCAP, based on data from CEIC Data. Available from www.ceicdata.com (accessed 15 June 2014).
of more liquid and open financial markets. This isnot to say that economies should be wary of more open financial markets but that they should ensuresufficient policy space to engage in countercyclicalmeasures to thwart the negative impacts of capital outflowsandputinplacemacroprudentialmeasuresfor managing capital flows.
Furtherpossiblefinancialmarketturbulencetriggeredby the normalization of monetary policy in the United Statesmay lead to significant, though differentiated,impacts on countries in the region. ESCAPanalysissuggests that, under a worst-case scenario, the effects ofsuchfinancialmarket turbulencecouldcutannualGDP growth by up to 0.7-0.9 percentage points inthemost-affectedeconomies— India,Malaysia, theRussianFederation,ThailandandTurkey(seebox1.1).Among the components of growth, fixed investmentis most affected due to rising borrowing costs. Theadverse impact on GDP growth would be largerthanthesefirst-roundestimatesforeconomieswheremonetary policy tightening was deemed necessary to stem capital flight. For example, annual growthin the Russian Federation could slow by as much as 1.3 percentage points in such a case, and inThailand by 1.1 percentage points.
80
90
100
110
Jan-
13
Feb-
13
Mar
-13
Apr
-13
May
-13
Jun-
13
Jul-1
3
Aug
-13
Sep
-13
Oct
-13
Nov
-13
Dec
-13
Jan-
14
Feb-
14
Mar
-14
Apr
-14
May
-14
Inde
x (J
anua
ry 2
013
= 10
0)
India Indonesia Malaysia Philippines
Russian Federation Thailand Turkey
7
Maintaining growth MoMentuM aMid uncertainties and internal challenges chaPter 1
Box 1.1. How would financial market turbulence due to monetary policy normalization in the United States affect growth performance in Asia and the Pacific?
An attempt is made here to assess the impact of possible financial market turbulence, triggered by the normalization of monetary policy in the United States, on economic growth in selected developing Asia-Pacific economies. The first stage of normalization is the tapering of quantitative easing; this process started in January 2014. In the next stage, interest rates will be increased from zero. There is uncertainty regarding when the interest rate rise will occur, though it is believed most likely to be sometime in 2015. A mismatch between market expectations on the timing, pace and magnitude of the normalization and actual policy announcement, or even speculation about the timing of the announcement, could lead to financial market turbulence, as was evident in many economies in the region in mid-2013. Using a macroeconomic simulation exercise, two possible scenarios of market turbulence are analysed below.
Under the “high-case scenario”, the magnitude of financial sector shocks, in terms of lower share prices and currency depreciation, is assumed to mimic what was observed during the months from May to August 2013, the period when the markets believed that the tapering would commence in September. It is further assumed that, as global financial liquidity tightens, bank lending falls and confidence weakens. There is also a generalized increase in risk aversion against emerging economies. Such a combination of shocks is set for a time period of one quarter after the policy announcement or speculation about the announcement. This scenario is also feasible when the normalization is as expected but policy responses by affected economies are viewed as too slow or ineffective.
Under the “low-case scenario”, communication on a change in policy direction is largely clear so the market is assumed mostly to have factored in the normalization decision. Market reactions and perceived risks are thus assumed to be more modest than in the high-case scenario. This scenario also accounts for a situation where the pace and/or the magnitude of the normalization are milder than market expectations.
It is assumed that turbulence resulting from the normalization decision will constrain output growth in emerging Asia-Pacific economies through at least two channels. First, corporate borrowing rates would rise amid tighter financial liquidity and heightened systemic risk premiums.a The second channel would be the effect of deteriorating market confidence and increased economic uncertainty on consumer spending and fixed investment.
The figure below depicts the differences between estimated GDP growth rates under the two scenarios and baseline growth rates, as projected by the Global Economic Model of Oxford Economics.b Under the high-case scenario, financial sector disruptions relating to the normalization decision could cut annual GDP growth by up to 0.7-0.9 percentage points in India, Malaysia, the Russian Federation, Thailand and Turkey. The impact would be sizeable, especially for economies where near-term economic growth is projected to be below potential, such as in the Russian Federation and Thailand, due to political factors. The simulation also suggests that the estimated output growth effect on emerging Asia-Pacific economies would be larger than for a group of major economies in Latin America, which ranges for the latter between 0.1 and 0.3 percentage points across the two scenarios.
The negative impact on output growth in economies occurs under these scenarios despite an increase in exports due to weaker currencies. This is because the export effect is outweighed by the negative impact on domestic demand components of GDP. Among the components of domestic demand, the greatest impact is on fixed investment due to higher borrowing costs. Indonesia, Malaysia, the Russian Federation and Thailand are likely to experience the greatest declines in fixed investment growth. Under the high-case scenario, annual fixed investment growth in these economies would be close to 3 percentage points lower than the baseline. Industrial output growth would decelerate and job losses would be higher than in the other economies considered
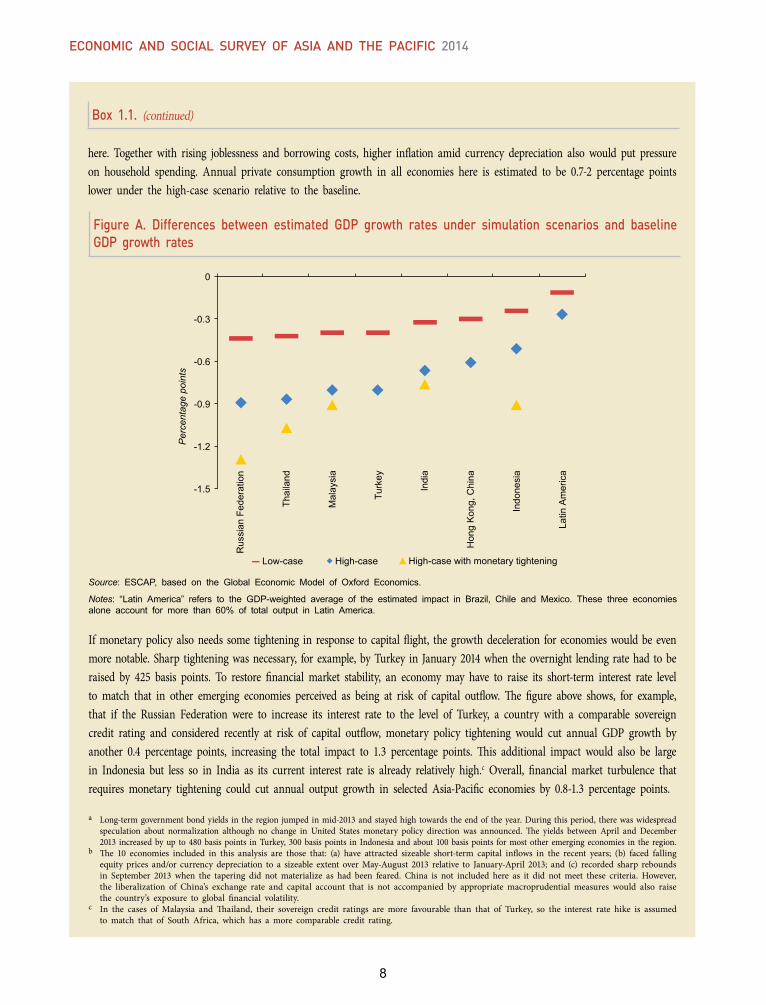
8
Economic and social survEy of asia and thE pacific 2014
Source: ESCAP, based on the Global Economic Model of Oxford Economics.
Notes: “Latin America” refers to the GDP-weighted average of the estimated impact in Brazil, Chile and Mexico. These three economiesalone account for more than 60% of total output in Latin America.
here. Together with rising joblessness and borrowing costs, higher inflation amid currency depreciation also would put pressure on household spending. Annual private consumption growth in all economies here is estimated to be 0.7-2 percentage points lower under the high-case scenario relative to the baseline.
Box 1.1. (continued)
-1.5
-1.2
-0.9
-0.6
-0.3
0
Rus
sian
Fed
erat
ion
Thai
land
Mal
aysi
a
Turk
ey
Indi
a
Hon
g K
ong,
Chi
na
Indo
nesi
a
Latin
Am
eric
aLow-case High-case High-case with monetary tightening
Per
cent
age
poin
ts
Figure A. Differences between estimated GDP growth rates under simulation scenarios and baseline GDP growth rates
If monetary policy also needs some tightening in response to capital flight, the growth deceleration for economies would be even more notable. Sharp tightening was necessary, for example, by Turkey in January 2014 when the overnight lending rate had to be raised by 425 basis points. To restore financial market stability, an economy may have to raise its short-term interest rate level to match that in other emerging economies perceived as being at risk of capital outflow. The figure above shows, for example, that if the Russian Federation were to increase its interest rate to the level of Turkey, a country with a comparable sovereign credit rating and considered recently at risk of capital outflow, monetary policy tightening would cut annual GDP growth by another 0.4 percentage points, increasing the total impact to 1.3 percentage points. This additional impact would also be large in Indonesia but less so in India as its current interest rate is already relatively high.c Overall, financial market turbulence that requires monetary tightening could cut annual output growth in selected Asia-Pacific economies by 0.8-1.3 percentage points.
a Long-term government bond yields in the region jumped in mid-2013 and stayed high towards the end of the year. During this period, there was widespread speculation about normalization although no change in United States monetary policy direction was announced. The yields between April and December 2013 increased by up to 480 basis points in Turkey, 300 basis points in Indonesia and about 100 basis points for most other emerging economies in the region.b The 10 economies included in this analysis are those that: (a) have attracted sizeable short-term capital inflows in the recent years; (b) faced falling equity prices and/or currency depreciation to a sizeable extent over May-August 2013 relative to January-April 2013; and (c) recorded sharp rebounds in September 2013 when the tapering did not materialize as had been feared. China is not included here as it did not meet these criteria. However, the liberalization of China’s exchange rate and capital account that is not accompanied by appropriate macroprudential measures would also raise the country’s exposure to global financial volatility.c In the cases of Malaysia and Thailand, their sovereign credit ratings are more favourable than that of Turkey, so the interest rate hike is assumed to match that of South Africa, which has a more comparable credit rating.
9
Maintaining growth MoMentuM aMid uncertainties and internal challenges chaPter 1
Apart from the short-term impact of volatile portfolio capitaloutflows,thelong-termimpactofnormalizationof monetary policy by the United States will be higher external borrowing rates for the region.Long-term interest rates for theUnitedStates dollarare expected to rise, which would lead to higher externalborrowingcostsforeconomiesintheregion.Foreign lending to the region has been spurred in recent years by the high liquidity flowing from thedevelopedworld (see box 1.2). Foreign lending hasbeen in the form of direct lending by foreign banks to domestic banks and through the purchase by foreigners of domestic corporate and government bonds.Theresulthasbeentheabilityofeconomiesin the regionwith open financialmarkets to borrowat historically low interest rates.
Higher external borrowing rates will have a directimpact on sovereign and corporate borrowing of regionaleconomiesfromabroad.Risingrateswillalsohave an impact on foreign borrowing by local banks for on-lending domestically, which may then in turn havetoincreasetheirdomesticinterestrates.Higherdomestic interest rates are likely to have an impact on local business growth generally and especially for small and medium-sized enterprises (SMEs) asthey are more dependent on bank lending. Thesemultiple impacts may have a significant impact onoverall GDP growth and employment generationin affected economies. If interest rates also needto be raised to prevent excessive capital outflow,there would be further negative impacts on growth and jobs.
Box 1.2. Potential and challenges for Asia-Pacific bond marketsa
With the low interest rates prevailing in advanced economies, the search for yield has led to significant liquidity flows from the developed world to the Asian region. This has had a notable impact on bond markets, particularly on corporate bonds. Thus, while the dominant source of financing remains bank-intermediated credit for companies, corporate bond issuance has accelerated. In 2013, in China it reached $97.4 billion compared with $23.6 billion in 2010. During the same timespan, corporate bond issuance increased almost five-fold in India, reaching $16.8 billion, and it increased to $15.8 billion in Singapore from $3.9 billion in 2010. In fact, between 2008 and 2012, annual issuance of corporate bonds in 10 economies in the region increased from $100 billion to $512 billion, before declining somewhat to $480 billion in 2013.b
Despite these increases, corporate bond markets remain relatively small and underdeveloped in the region compared with those of advanced countries. In 2013, corporate bond market capitalization was less than 20% of GDP in China, Indonesia, the Philippines, Thailand and Viet Nam. In India, it was less than 12% of GDP in 2012. Corporate bond market capitalization exceeded 50% of GDP only in Hong Kong, China; Malaysia; the Republic of Korea; and Singapore.
One consequence of underdeveloped bond markets is that the risks of supplying long-term capital are overly concentrated in the banking sector in the region. This is particularly so as tighter capital requirements under the Third Basel Accord (Basel III), such as higher capital reserve ratios, are likely to reduce the availability of bank financing. Countries need to enhance their capability to supply long-term capital for financing economic development and to ensure financial stability to safely intermediate external flows. Local currency bond markets and regional bond markets must therefore be developed further as they are important instruments for longer-term finance for corporations and for long-term investors, including pension funds and insurance companies.
Local currency bond markets lessen the risk of currency mismatch and maturity mismatch, thereby mitigating against risks associated with the sudden stop of capital inflows. In this regard, it seems that economies in the region have learned from the currency and maturity mismatches that triggered the Asian financial crisis in 1997, as local currency bonds accounted for more than 80% of corporate bonds during 2009 and 2013, compared with less than 30% in Latin America. Yet, in some economies, bonds denominated in foreign currencies continue to carry an important weight, notably in Indonesia, where during this period

10
Economic and social survEy of asia and thE pacific 2014
more than 80% of corporate bonds were denominated in foreign currencies. Moreover, since 2010 the importance of issuance of foreign-currency denominated bonds has been on the rise. This may be an indication that firms are taking advantage of lower dollar interest rates in recent years. However, greater foreign investor participation in domestic bond markets and more reliance on foreign currency issuance exposes economies to an additional source of capital outflow pressures. It does so by making local markets more sensitive to bond market developments in developed economies, and thereby vulnerable to external shocks.
Notwithstanding the increase in primary issuance of bonds, corporate bond market development is being impeded by low demand and low trading volumes in secondary markets. In part, this may be due to the fact that bond markets are not sufficiently integrated in the region or into the global economy. This hinders an efficient allocation of resources and robs markets of enforcement discipline and insurance mechanisms that exist in more closely integrated markets. Different and heterogeneous legal and regulatory frameworks impede the development of cross-border bond markets that would allow for greater circulation of the region’s high savings.
The development and integration of government bond markets is a further critical element of corporate bond market development, particularly as government bonds provide important benchmark yield curves. Several initiatives to create regional government bond markets have taken place in the past, including the Asian Bond Markets Initiative and the Asian Bond Fund 1 and Asian Bond Fund 2.c Yet, further progress currently remains limited.
Developing bond markets can provide an important source of financing for the region to address its development challenges. Despite having the highest savings rate in the world, most of the region’s surplus savings are invested abroad. The region would benefit from greater efforts to develop, strengthen and integrate regional bond markets. This would enable a shift from bank-centric systems towards deep, liquid, efficient and robust financial and capital markets at the national and regional levels that could better mobilize resources from within and outside the region.
a This box draws upon Levinger and Li (2014) and Turner (2014).b These economies comprise China; Hong Kong, China; India; Indonesia; the Republic of Korea; Malaysia; the Philippines; Singapore; Taiwan Province of China; Thailand; and Viet Nam.c For instance, to strengthen the Association of Southeast Asian Nations (ASEAN), China, Japan and the Republic of Korea (collectively known as ASEAN+3) launched the ASEAN+3 Asian Bond Market Initiative (ABMI) in 2002. In that same year, the Executives’ Meeting of East Asia-Pacific (EMEAP) central banks group launched the $1 billion Asian Bond Fund 1 (ABF 1); ABF 2, which invested in local currency bonds issued by sovereign and quasi-sovereign issuers in the same member economies as those in ABF 1, was launched in 2005.
Box 1.2. (continued)
Region’s growth and inflation prospects
The economic growth rate in the region in 2013increased slightly to 5.6% from 5.3% in 2012. ThedevelopingAsia-Pacificeconomies,havingrecoveredstrongly in 2010 with an average growth rate of more than 8%, have seen their annual growth ratedip below 6% starting in 2012. Apart from externalpressure on growth in the region because of the slow recovery of the developed economies, growth in Asia and the Pacific in 2013 also suffered dueto low growth in some major regional economies
as a result of domestic challenges. For a numberof reasons, China, India and Indonesia, whichhave large domestic markets, experienced relatively low growth in 2013 compared with their strongperformance earlier in the decade (see table 1.1).Growth in China remained unchanged at 7.7%in 2013 as compared with the previous year, butwas significantly down from the levels recorded in 2011 and earlier. India saw some increase ingrowth to 4.7% in 2013 from 4.5% in 2012, butit was substantially down from the level in 2011 and even more so compared with 2010. Indonesia

11
Maintaining growth MoMentuM aMid uncertainties and internal challenges chaPter 1
Table 1.1. Selected economies of the ESCAP region: rates of economic growth and inflation, 2010-2014
(Percentage)Real GDP growth Inflationa
Average pre-crisis growth
2005-20072010 2011 2012 2013 2014b 2010 2011 2012 2013 2014b
East and North-East Asiac 6.7 7.2 4.0 4.0 4.2 4.1 1.3 2.5 1.4 1.5 2.9East and North-East Asia (excluding Japan)c 10.9 9.5 8.0 6.4 6.6 6.6 3.2 5.1 2.6 2.4 3.0China 12.7 10.4 9.3 7.7 7.7 7.5 3.3 5.4 2.6 2.6 3.1DemocraticPeople’sRepublicofKorea .. .. .. .. .. .. .. .. .. .. ..HongKong,China 6.8 7.0 4.8 1.5 2.9 3.5 2.4 5.3 4.1 4.3 4.6Japan 2.1 4.7 -0.5 1.4 1.5 1.4 -0.7 -0.3 0.0 0.4 2.8Macao,China 16.5 26.4 21.3 9.1 11.9 11.3 2.8 5.8 6.1 5.5 6.0Mongolia 8.7 6.5 17.4 12.4 11.7 10.0 10.1 9.2 14.3 10.5 12.0RepublicofKorea 4.8 6.3 3.7 2.3 3.0 4.0 2.9 4.0 2.2 1.3 2.1
North and Central Asiac 8.2 4.4 4.7 3.8 2.1 1.3 7.0 8.6 5.1 6.7 5.5North and Central Asia (excluding Russian Federation)c 13.0 6.7 6.7 5.5 6.5 6.1 7.4 9.4 5.3 6.0 8.2
Armenia 13.6 2.2 4.7 7.2 3.5 4.5 8.2 7.8 2.6 5.8 5.0Azerbaijan 28.6 5.0 0.1 2.2 5.8 5.0 5.7 8.1 1.1 2.4 4.0Georgia 10.4 6.3 7.2 6.2 3.2 5.0 7.1 8.5 -0.9 -0.5 4.0Kazakhstan 9.8 7.0 7.5 5.0 6.0 5.4 7.1 8.3 5.1 5.8 9.3Kyrgyzstan 3.8 -0.5 6.0 -0.9 10.5 6.5 8.0 16.9 2.8 6.6 7.2Russian Federation 7.4 4.0 4.3 3.5 1.3 0.5 6.9 8.4 5.1 6.8 5.0Tajikistan 7.2 6.5 7.4 7.5 7.5 6.0 6.5 12.5 5.8 5.1 7.2Turkmenistan 12.0 9.2 14.7 11.1 10.1 10.4 10.0 12.0 8.5 9.0 11.0Uzbekistan 7.9 8.5 8.3 8.2 8.0 8.1 9.4 12.8 13.2 12.1 11.0
Pacificc, d 3.4 2.5 2.4 3.5 2.4 2.9 2.8 3.4 1.7 2.3 2.7Pacific island developing economiesc 3.2 5.2 7.6 5.3 4.0 4.9 4.6 6.4 2.6 3.7 4.9CookIslands 1.2 -3.0 1.0 4.4 3.2 2.2 -0.3 2.2 3.0 1.9 2.5Fiji -0.1 3.0 2.7 1.7 3.6 3.8 3.7 7.3 3.4 2.9 3.0Kiribati 2.1 -0.5 3.3 2.5 2.0 3.0 -3.9 1.5 -3.0 2.0 2.5MarshallIslands 2.0 5.8 0.6 3.2 0.8 3.0 1.8 5.4 4.3 1.6 1.5Micronesia(FederatedStatesof) 0.2 2.5 2.1 0.4 0.6 0.5 3.9 4.6 5.8 2.2 2.0Nauru -11.8 0.0 3.8 4.9 4.5 10.0 -0.6 -3.5 -0.5 1.4 5.0Palau 3.4 -1.1 6.9 4.8 -1.0 3.0 1.1 2.6 5.4 3.0 2.5PapuaNewGuinea 4.5 7.1 11.1 8.0 5.1 6.2 6.0 6.9 1.6 4.7 6.5Samoa 3.7 0.5 1.4 2.7 -0.5 2.0 0.0 3.1 6.2 -0.2 2.0Solomon Islands 6.4 7.9 10.6 4.8 3.2 3.7 1.0 7.4 5.9 5.6 5.5Tonga -1.3 3.3 2.9 0.8 1.6 2.0 5.1 3.8 2.5 0.8 2.0Tuvalu 2.7 -1.4 -0.6 0.2 1.1 2.0 -1.9 0.5 1.4 2.0 2.5Vanuatu 6.3 1.6 1.2 1.8 3.2 3.5 2.8 0.9 1.4 1.4 2.5
Developed countries (Australia and New Zealand)c 3.4 2.5 2.3 3.5 2.4 2.9 2.7 3.4 1.7 2.2 2.7Australia 3.4 2.6 2.5 3.6 2.4 2.8 2.8 3.3 1.8 2.4 2.8New Zealand 2.8 1.8 1.2 2.9 2.4 3.3 2.3 4.0 1.1 1.1 2.0
South and South-West Asiac, d 8.1 7.8 6.6 2.9 3.9 4.7 9.9 9.5 11.9 11.3 9.3Afghanistan 10.2 8.4 6.5 14.0 3.6 3.2 2.2 11.8 6.4 7.4 6.1Bangladesh 6.3 6.1 6.7 6.2 6.0 6.1 7.3 8.8 10.6 7.7 7.0Bhutan 10.6 11.7 8.6 4.6 6.9 7.1 6.1 8.3 13.5 8.7 7.6India 9.5 8.4 6.7 4.5 4.7 5.5 10.4 8.4 10.2 9.5 8.0Iran (Islamic Republic of) 6.1 5.9 3.0 -5.8 -1.7 1.5 12.4 21.5 30.5 35.2 23.0Maldives 7.2 7.1 6.5 1.3 3.7 4.5 6.1 11.3 10.9 4.0 5.0Nepal 3.2 4.0 3.8 4.5 3.6 4.5 9.6 9.6 8.3 9.9 9.8Pakistan 7.2 2.6 3.6 3.8 3.7 4.1 10.1 13.7 11.0 7.4 8.0SriLanka 6.9 8.0 8.2 6.3 7.3 7.6 6.2 6.7 7.5 6.9 6.0Turkey 6.7 9.0 8.6 2.2 4.0 4.0 8.6 6.5 8.9 7.5 7.6
South-East Asiac 6.1 8.1 4.6 5.5 4.9 4.6 4.0 5.5 3.9 3.9 4.0BruneiDarussalam 1.7 2.6 2.2 0.9 -1.8 1.2 0.4 2.0 0.5 0.4 0.5Cambodia 11.4 6.0 7.1 7.3 7.6 7.2 4.0 5.5 2.9 2.9 3.4Indonesia 5.8 6.2 6.5 6.2 5.8 5.4 5.1 5.4 4.3 6.4 5.5LaoPeople’sDemocraticRepublic 7.7 7.9 8.3 8.3 8.2 7.5 6.0 7.6 4.3 6.4 6.0Malaysia 5.9 7.4 5.1 5.6 4.7 5.0 1.7 3.2 1.7 2.1 3.0Myanmar 12.9 5.3 5.9 7.3 7.5 7.8 8.2 2.8 2.9 5.8 6.6Philippines 5.8 7.6 3.6 6.8 7.2 6.7 3.9 4.6 3.2 2.9 4.3Singapore 7.8 14.8 5.2 1.9 3.9 3.5 2.8 5.2 4.6 2.4 2.5Thailand 4.9 7.8 0.1 6.5 2.9 2.2 3.3 3.8 3.0 2.2 2.4Timor-Leste 5.0 9.5 12.0 8.3 8.1 8.0 6.9 13.5 10.9 10.6 9.5Viet Nam 8.4 6.4 6.2 5.2 5.4 5.7 9.2 18.7 9.1 6.6 6.2
Memorandum items:Developing ESCAP economies 9.5 8.8 7.2 5.3 5.6 5.8 5.1 6.3 5.3 5.0 4.8
Least developed countriese 6.0 5.5 6.0 5.6 5.5 5.6 6.5 7.8 8.6 6.8 6.3Landlocked developing countries 11.7 6.2 6.4 5.3 6.2 5.8 7.2 8.9 5.7 6.3 8.1Small island developing States 3.7 5.7 7.7 5.1 4.2 5.0 4.8 7.3 3.9 4.1 5.1
Developed ESCAP economies 2.3 4.3 0.0 1.7 1.6 1.6 -0.1 0.3 0.3 0.7 2.8Total ESCAP 6.8 6.9 4.4 3.9 3.9 4.0 3.3 4.3 3.4 3.6 4.1Sources: ESCAP, based on national sources; United Nations, Department of Economic and Social Affairs (2014). World Economic Situation and Prospects 2014, Sales No. E.14.II.C.2. Available from www.un.org/en/development/desa/policy/wesp/wesp_current/wesp2014.pdf; IMF, International Financial Statistics database. Available from http://elibrary-data.imf.org; ADB, Asian Development Outlook 2014 (Manila, 2014); CEIC Data. Available from www.ceicdata.com; and website of the Interstate StatisticalCommittee of the Commonwealth of Independent States. Available from www.cisstat.com, June 2014.a Changesintheconsumerpriceindex.b Forecasts(asof15June2014).c GDP figures at market prices in United States dollars in 2010 (at 2005 prices) are used as weights to calculate the regional and subregional aggregates.d The estimates and forecasts for countries relate to fiscal years defined as follows: 2013 refers to fiscal year spanning 1 April 2013 to 31 March 2014 in India; from 21 March 2013 to 20 March 2014 in Afghanistan and the Islamic Republic of Iran; from 1 July 2012 to 30 June 2013 in Bangladesh, Bhutan and Pakistan; and from 16 July 2012 to 15 July 2013 in Nepal.e Samoa is excluded from the calculation for 2014 due to its graduation from the least developed country category.

12
Economic and social survEy of asia and thE pacific 2014
0
1
2
3
4
5
6
Jan-
12
Mar
-12
May
-12
Jul-1
2
Sep
-12
Nov
-12
Jan-
13
Mar
-13
May
-13
Jul-1
3
Sep
-13
Nov
-13
Jan-
14
Mar
-14
May
-14
China Republic of Korea Singapore Thailand
0
1
2
3
4
5
6
Jan-
12
Mar
-12
May
-12
Jul-1
2
Sep
-12
Nov
-12
Jan-
13
Mar
-13
May
-13
Jul-1
3
Sep
-13
Nov
-13
Jan-
14
Mar
-14
May
-14
China Republic of Korea Singapore Thailand
Per
cent
age
experienced a decline in growth to 5.8% in 2013from 6.2% in 2012.
As expected for a large region, subregional growth experiences in 2013 differ. For example, subduedglobal commodity demand contributed to reduced growth of 2.1% in North and Central Asia and of4% in Pacific island developing economies. Growthalsoslowed to4.9% inSouth-EastAsia,affectedbyweaker domestic demand in larger economies.Eastand North-East Asia recorded a rebound to 4.2%with theexportofgoods reviving recently.Growth inSouth andSouth-WestAsia also picked up to 3.9%onrobustprivateconsumption.In2014,PacificislanddevelopingcountriesandSouthandSouth-WestAsiaare forecast to post stronger growth, while other subregions are forecast to have relatively stable or lower growth as compared with the previous year.
Inflation differed substantially across the region in2013. Inflation in exporting economies, such asthose in South-East Asia and East and North-East Asia, declined or remained stable in 2013 due toconstrainedglobal demand (see figure1.4).Despiterelatively robust domestic demand in many of these economies, overall slack owing to low export growth kept prices in check. Low inflation allowed for anaccommodative monetary policy in most of these countries, with policy interest rates lower or more
stable in 2013 than in the previous year (see figure1.5).Ontheotherhand, foranumberofeconomieswhere the export sector does not play as large a role, such as India, Indonesia and Pakistan, inflation remained high in 2013. Consequently,monetary policy was tightened for most of these economies during 2013. The inflation outlook in2014 isgenerallymoderateandheadline inflation inthe region is projected to be 4.8% in 2014, downfrom 5% in 2013 (see table 1.1). However, somemajor economies, such as India and Indonesia, will continue to face significant price pressures.
One positive factor for inflation in the region isthat most commodity prices are likely to remain flat or decline over the next 12 months due to slow global recovery and the winding back of quantitative easing by the United States FederalReserve. However, this prospect may change dueto geopolitical factors and supply shocks in major producing countries. Moreover, major measures tocurb financial speculation in commodity markets that had been agreed at the G20 Summit onFinancial Markets and the World Economy, whichwasheld inCannes,France, inNovember2011,stillremainunimplemented.Besides thedemand-supplyfundamentals, high global liquidity has played animportant role in supporting the persistently high prices of oil and globally traded food commodities
Figure 1.4. Consumer price inflation in selected developing Asia-Pacific economies, 2012-2014
High-inflation economiesLow-inflation economies
Source: ESCAP, based on data from CEIC Data. Available from www.ceicdata.com (accessed 15 June 2014).
0
2
4
6
8
10
12
14
16
18
20
Jan-
12
Mar
-12
May
-12
Jul-1
2
Sep
-12
Nov
-12
Jan-
13
Mar
-13
May
-13
Jul-1
3
Sep
-13
Nov
-13
Jan-
14
Mar
-14
May
-14
India Indonesia Pakistan Viet Nam Turkey
0
2
4
6
8
10
12
14
16
18
20
Jan-
12
Mar
-12
May
-12
Jul-1
2
Sep
-12
Nov
-12
Jan-
13
Mar
-13
May
-13
Jul-1
3
Sep
-13
Nov
-13
Jan-
14
Mar
-14
May
-14
India Indonesia Pakistan Viet Nam Turkey
Per
cent
age
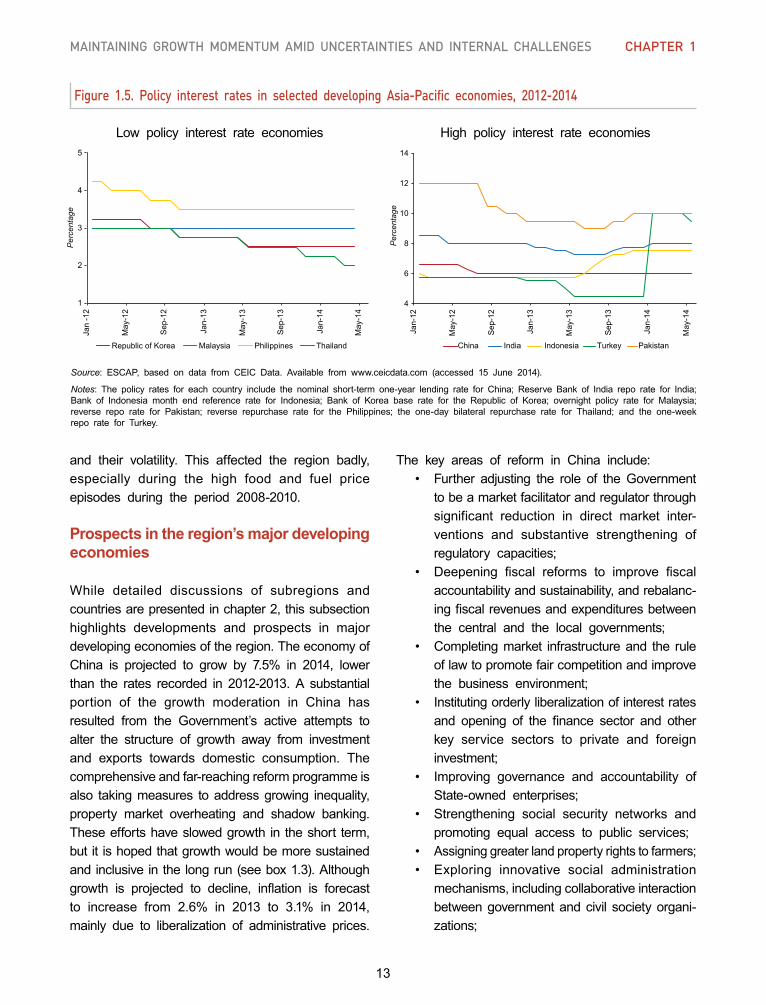
13
Maintaining growth MoMentuM aMid uncertainties and internal challenges chaPter 1
Figure 1.5. Policy interest rates in selected developing Asia-Pacific economies, 2012-2014
High policy interest rate economiesLow policy interest rate economies
Source: ESCAP, based on data from CEIC Data. Available from www.ceicdata.com (accessed 15 June 2014).
Notes: The policy rates for each country include the nominal short-term one-year lending rate for China; Reserve Bank of India repo rate for India;Bank of Indonesia month end reference rate for Indonesia; Bank of Korea base rate for the Republic of Korea; overnight policy rate for Malaysia;reverse repo rate for Pakistan; reverse repurchase rate for the Philippines; the one-day bilateral repurchase rate for Thailand; and the one-weekrepo rate for Turkey.
and their volatility. This affected the region badly,especially during the high food and fuel price episodes during the period 2008-2010.
Prospects in the region’s major developing economies
While detailed discussions of subregions andcountries are presented in chapter 2, this subsection highlights developments and prospects in major developingeconomiesoftheregion.TheeconomyofChina is projected to grow by 7.5% in 2014, lowerthan the rates recorded in 2012-2013. A substantialportion of the growth moderation in China hasresulted from the Government’s active attempts toalter the structure of growth away from investment and exports towards domestic consumption. Thecomprehensive and far-reaching reform programme is also takingmeasures toaddressgrowing inequality,property market overheating and shadow banking.Theseeffortshaveslowedgrowth in theshort term,but it is hoped that growth would be more sustained andinclusiveinthelongrun(seebox1.3).Althoughgrowth is projected to decline, inflation is forecastto increase from 2.6% in 2013 to 3.1% in 2014,mainly due to liberalization of administrative prices.
The key areas of reform in China include: • Further adjusting the role of theGovernment to be a market facilitator and regulator through significant reduction in direct market inter- ventions and substantive strengthening of regulatory capacities; • Deepening fiscal reforms to improve fiscal accountability and sustainability, and rebalanc- ingfiscalrevenuesandexpendituresbetween the central and the local governments; • Completingmarket infrastructureand the rule of law to promote fair competition and improve the business environment; • Institutingorderlyliberalizationofinterestrates and opening of the finance sector and other key service sectors to private and foreign investment; • Improving governance and accountability of State-owned enterprises; • Strengthening social security networks and promoting equal access to public services; • Assigninggreaterlandpropertyrightstofarmers; • Exploring innovative social administration mechanisms, including collaborative interaction between government and civil society organi- zations;
2009 2010 2011
4
6
8
10
12
14
Jan-
12
May
-12
Sep
-12
Jan-
13
May
-13
Sep
-13
Jan-
14
May
-14
Per
cent
age
China India Indonesia Turkey Pakistan
4
6
8
10
12
14
Jan-
12
May
-12
Sep
-12
Jan-
13
May
-13
Sep
-13
Jan-
14
May
-14
Per
cent
age
China India Indonesia Turkey Pakistan
2009 2010 2011
1
2
3
4
5
Jan
-12
May
-12
Sep
-12
Jan-
13
May
-13
Sep
-13
Jan-
14
May
-14
Per
cent
age
Republic of Korea Malaysia Philippines Thailand
1
2
3
4
5
Jan
-12
May
-12
Sep
-12
Jan-
13
May
-13
Sep
-13
Jan-
14
May
-14
Per
cent
age
Republic of Korea Malaysia Philippines Thailand

14
Economic and social survEy of asia and thE pacific 2014
Box 1.3. Understanding China’s economic transformation programme
The new master plan announced in late 2013 to “comprehensively deepen reforms” is a response to a number of socio-economic challenges in China – the unsustainable investment-driven growth model, increasing economic inequality and the pressing problem of environmental deterioration.
China has recognized that a holistic and well-coordinated reform plan is required to deal with interlinked and mutually reinforcing challenges. The investment-centric growth model, for instance, leads to income distribution favouring capital over labour. The increasing concentration of wealth in the richest group decreases overall propensity to consume, thus putting downward pressure on effective demand and reinforcing the reliance on investment and exports. Many cross-cutting issues contribute to these challenges. In particular, the broad GDP-oriented government interventions in the past not only fuelled excessive investment but also sometimes suppressed income equality and environment-related concerns. Policymakers have realized that reforms in isolated areas were not sufficient to deal with the interconnected challenges.
The successful shifting to a more balanced and healthier development trajectory is being based on four critical transformations. The first is the transformation in economic structure from industry, especially from capital, resource, energy and pollution-intensive heavy industry, to the modern service sectors. This transformation is planned to enhance job creation, decrease reliance on heavy industrial investments and provide multiple environmental benefits. The pledged reforms to remove market-entry barriers, cut red tape and lower the tax burden on service sectors will contribute to this transformation. Financial reform will play a key role in fostering an advanced and dynamic financial sector as the backbone of modern services. These far-reaching reforms will first be experimented in individual cities or SEZs, including the China (Shanghai) Pilot Free Trade Zone.
The second transformation is urbanization and the corresponding reforms in the social welfare regime. China’s urbanization rate is growing by 1 percentage point annually. The unprecedented rural-to-urban migration has the potential to create the largest middle class in the world and significantly boost domestic consumption demand, especially demand for services. To realize these benefits, the Government plans to provide more equal access to economic opportunities, as well as to public services.
Third, there is to be a transformation of government planning at all levels, from GDP-centric thinking to a balanced development philosophy embracing all three economic, social and environmental pillars. The innovative reforms in the incentive structure for government officials based on the broad development outcomes will be of particular importance. In addition to sophisticated score cards, for which design bias and rigidity persist, the proactive and collaborative interaction between the Government and civil society will greatly help in achieving the objectives and improve government accountability.
Last but not least, China’s integration into the global economy is to be further deepened. The rebalancing of the global trade regime and enhanced domestic economic strength require China to further diversify its ties with other economies through structural upgrading of trade composition and proactive outward investments. Further opening of the domestic market on the other hand will bring in critical know-how, especially for the development of modern service sectors.
In looking specifically at the financial reform package, which has generated significant international interest, three key components may be observed. The first is the increasing use over time of indirect tools and instruments to steer money supply and demand. The second is the liberalization of interest rates, with lending rates already liberalized and deposit rates to follow. The third component is the strengthening of financial regulatory oversight. These reforms are likely to have numerous positive impacts which will strengthen the overall efficiency and stability of the financial system. These include diversifying sources of financing
15
Maintaining growth MoMentuM aMid uncertainties and internal challenges chaPter 1
Box 1.3. (continued)
away from banks, which had mainly benefited State-owned enterprises and the corporate sector; creating improved efficiency of the financial market and capital allocation, which will improve access to credit for SMEs and those excluded from the formal financial system; generating a win-win situation for both households and corporations, with the former having better opportunities to diversify their savings and the latter access to alternate sources of financing; reducing and regulating the shadow banking system and therefore decreasing risks for the financial system and investors; and levelling the playing field in the regulatory and supervisory system and therefore reducing the opportunities for regulatory arbitrage.
One of the key approaches to mitigate the risks associated with the wide-ranging reform programme will be the proper pace and sequencing of reforms. It will be important, for example, to ensure that macroeconomic fundamentals are strong as the country moves towards full interest rate liberalization and capital account convertibility and that this is sequenced with strengthening of the financial system. A gradual approach has always been China’s approach to transition. As the experience of China and other countries shows, the gradual approach has a better chance of success – a point reiterated in ESCAP Surveys since the 1990s.
China’s transformative process over coming years will have profound implications for itself and for the Asia-Pacific region. Overall, more sustainable and balanced growth in China will be vital for the economic stability of the region. However, countries in Asia and the Pacific will have to adjust themselves to explore the opportunities opened and to be prepared for potential challenges. The opportunities include expanded consumption demand from China, growing FDI by China and the outward reallocation of low-tech industrial sectors from China. The challenges for economies in the region include slower demand growth by China for oil and industrial resources.
• Deepeningintegrationintotheglobaleconomy through accelerated FTA negotiations and policy experimentations in the newly established special economic zones (SEZs).
TheeconomicgrowthrateofIndiain2014isforecastto recover to 5.5%, after being below 5% in 2012-2013. The inflation outlook is also slightly better for2014, declining from 9.5% in 2013 to 8%. Fastergrowth is constrained by tight monetary and fiscalpolicies to reduce inflation and government debt.Supply-side factors, such as infrastructure bottlenecks and surges in food prices, were mainly responsible forhigherinflation.Deregulationofadministeredpricesand currency depreciation were also contributory factors. Monetary tightening was applied to preventformation of inflationary expectations. The impact ofhigher interest rates on growth is the dilemma that policymakersfaceindealingwithsupply-sideinflation.This is especially so when a country is open tocapital flowsanddoesnothaveenoughfiscalspaceto take countervailing measures to support growth.
Indonesia’s growth is forecast to decline in 2014 to 5.4% – the lowest rate in recent years. As inIndia, the growth slowdown is partly the result of monetary tightening to halt capital flight and currencydepreciation,aswellas tocombat inflation– estimated at 6.4% in 2013, compared with 4.3%in 2012. Inflationwas drivenmainly by fuel subsidycuts, currency depreciation and food price rises.TheGovernment of Indonesia,with a budget deficitestimated at 2.3% of GDP in 2013, is in a betterposition than India in terms of fiscal resources tosupport the economy amid the current slowdown.
Malaysia and Thailand are expected to recordgrowth rates of 5% and 2.2% respectively in 2014with moderate recovery in their external sectors.Growth for Thailand is projected to rebound in thesecond half of 2014 due to the easing of political uncertainty in recent months. Growth potential inboth Malaysia and Thailand is being held back bygrowingdomesticdebt.Governmentdebt inMalaysiaat 53% of GDP is the highest in South-East Asia
16
Economic and social survEy of asia and thE pacific 2014
and higher than in many emerging economies in Asia and the Pacific. Household debt (87% of GDP in2013) is also one of the highest in the region. As inMalaysia, household debt in Thailand is one of thehighest in the region at 82% of GDP in 2013. TheGovernment of Malaysia reduced public spending in2013inanattempttocutpublicdebt,whilemeasurestaken to control household spending on assets such as property also reduced private consumption. Theslowdown in consumption in Thailand can also beattributed partly to consumers paying off some of their debt.Growth inThailandwas furtherhamperedby the effects of political uncertainty, for example the inability to implement a proposed multibillion dollar infrastructure development plan.
The Philippines, in contrast to other major eco- nomies experiencing moderate growth, is forecast to experience a high growth rate of 6.7% in 2014.This is, however, lower than the strong growthperformanceof7.2% in2013despite thedestructionwrought by TyphoonHaiyan in November that year.ThePhilippinesprovidesanexampleofgrowthdrivenbya conducivepolicy climate.TheGovernment hasengaged in significant productive public spendingin infrastructure and social areas, while private investmenthasalsoincreased.Inflationhasremainedlow, offering the opportunity to support growth through accommodative monetary policy. A relatively smallbudget deficit (1.4% of GDP in 2013) also allowedfor substantial government development spending on infrastructure and other basic services during 2013.
Gradual trade recovery
Exports for the region are expected to pick up modestlyin2014afteradifficulttimeinthepreviousyear in line with increases in global trade as the developed economies experience somewhat higher growth in 2014. Merchandise export growth forAsia and the Pacific is likely to be slightly higherthan the 2.3% posted in 2013, although commodityexports may experience slower growth. Amongother factors, limited progress in multilateral trade negotiations is preventing an even more favourable outlook for trade. The multilateral trading system
has remained fragmented, as could be observed at the Ninth Ministerial Conference of the WorldTrade Organization (WTO), which was held in Bali,Indonesia, in December 2013. Global uncertaintiesalso threaten trade recovery.
Exports for the region are expected to pick up modestly in 2014
During 2012 and 2013, weak global demandadversely affected Asia-Pacific trade. Most ofthe major economies in the region had low and volatile export growth in 2013 as compared withtheir previous peak in 2011 (see figure 1.6). Importtrends are similar. In China, soft industrial outputand fixed investment performance resulted in a lacklustre import demand for commodities and intermediate goods. For countries highly involved inglobal valuechains, suchasMalaysia, theRepublicof Korea and Thailand, imports of electronic partsand components slowed significantly due to weakfinal demand in global markets.
The lowshareof leastdevelopedcountries inAsia-Pacific trade continues to be a concern. Thesecountries account for only 0.7% of total regionalexports,valuedat$50billionin2012.Itis,therefore,particularly important to integrate least developed countries more fully into regional supply chains by providing preferential market access and improving their productive capacity. At the same time, betterconnectivity is needed through improved hard and soft infrastructure for deeper trade integration across countries and subregions.
ESCAP analysis indicates that export growth hasbeen hampered by trade-reducing measures globally and regionally.5 It further shows that trade policy measures of major developed economies outside the Asia-Pacific region could result in an estimatedreduced opportunity of merchandise exports of some $255billion in the region,which could translate intoa cumulative decline of more than 1.6 percentagepoints of regional output, during the period 2009-2013(seebox1.4).Thiswouldbeanunderestimate
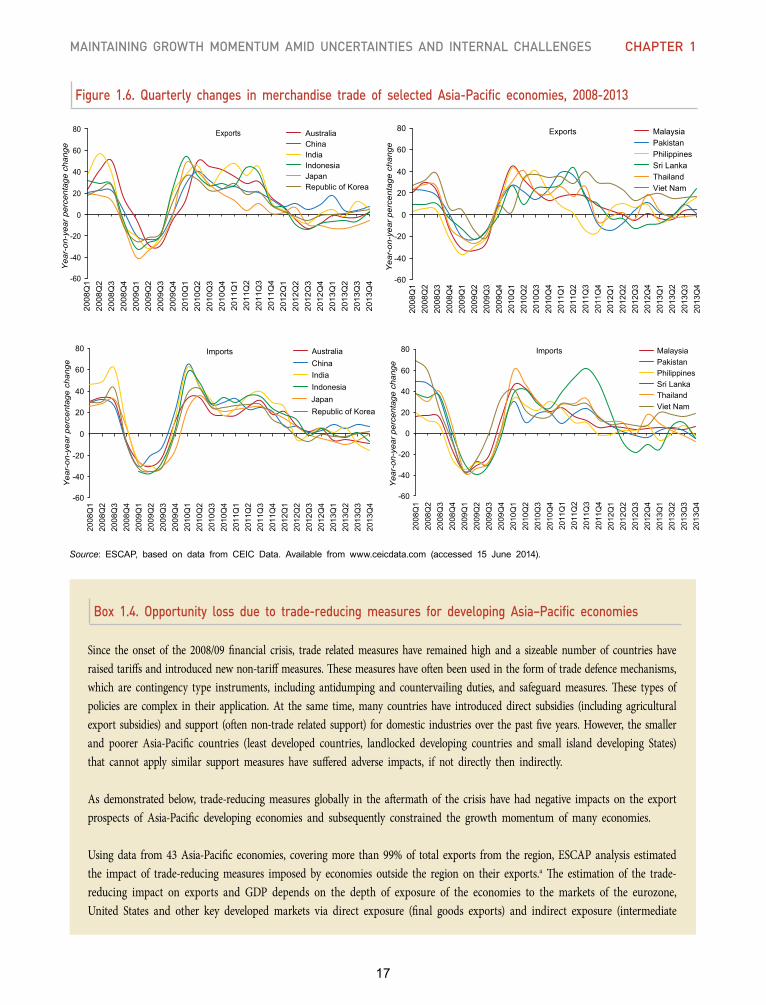
17
Maintaining growth MoMentuM aMid uncertainties and internal challenges chaPter 1
Source: ESCAP, based on data from CEIC Data. Available from www.ceicdata.com (accessed 15 June 2014).
Figure 1.6. Quarterly changes in merchandise trade of selected Asia-Pacific economies, 2008-2013
Box 1.4. Opportunity loss due to trade-reducing measures for developing Asia–Pacific economies
Since the onset of the 2008/09 financial crisis, trade related measures have remained high and a sizeable number of countries have raised tariffs and introduced new non-tariff measures. These measures have often been used in the form of trade defence mechanisms, which are contingency type instruments, including antidumping and countervailing duties, and safeguard measures. These types of policies are complex in their application. At the same time, many countries have introduced direct subsidies (including agricultural export subsidies) and support (often non-trade related support) for domestic industries over the past five years. However, the smaller and poorer Asia-Pacific countries (least developed countries, landlocked developing countries and small island developing States) that cannot apply similar support measures have suffered adverse impacts, if not directly then indirectly.
As demonstrated below, trade-reducing measures globally in the aftermath of the crisis have had negative impacts on the export prospects of Asia-Pacific developing economies and subsequently constrained the growth momentum of many economies.
Using data from 43 Asia-Pacific economies, covering more than 99% of total exports from the region, ESCAP analysis estimated the impact of trade-reducing measures imposed by economies outside the region on their exports.a The estimation of the trade-reducing impact on exports and GDP depends on the depth of exposure of the economies to the markets of the eurozone, United States and other key developed markets via direct exposure (final goods exports) and indirect exposure (intermediate
Australia China India Indonesia Japan Republic of Korea
-60
-40
-20
0
20
40
60
80
2008
Q1
2008
Q2
2008
Q3
2008
Q4
2009
Q1
2009
Q2
2009
Q3
2009
Q4
2010
Q1
2010
Q2
2010
Q3
2010
Q4
2011
Q1
2011
Q2
2011
Q3
2011
Q4
2012
Q1
2012
Q2
2012
Q3
2012
Q4
2013
Q1
2013
Q2
2013
Q3
2013
Q4
Yea
r-on
-yea
r per
cent
age
chan
ge
Exports Malaysia Pakistan Philippines Sri Lanka Thailand Viet Nam
-60
-40
-20
0
20
40
60
80
2008
Q1
2008
Q2
2008
Q3
2008
Q4
2009
Q1
2009
Q2
2009
Q3
2009
Q4
2010
Q1
2010
Q2
2010
Q3
2010
Q4
2011
Q1
2011
Q2
2011
Q3
2011
Q4
2012
Q1
2012
Q2
2012
Q3
2012
Q4
2013
Q1
2013
Q2
2013
Q3
2013
Q4
Yea
r-on
-yea
r per
cent
age
chan
ge
Exports
Malaysia Pakistan Philippines Sri Lanka Thailand Viet Nam
-60
-40
-20
0
20
40
60
80
2008
Q1
2008
Q2
2008
Q3
2008
Q4
2009
Q1
2009
Q2
2009
Q3
2009
Q4
2010
Q1
2010
Q2
2010
Q3
2010
Q4
2011
Q1
2011
Q2
2011
Q3
2011
Q4
2012
Q1
2012
Q2
2012
Q3
2012
Q4
2013
Q1
2013
Q2
2013
Q3
2013
Q4
Yea
r-on
-yea
r per
cent
age
chan
ge
Imports Australia China
Japan
India Indonesia
Republic of Korea
-60
-40
-20
0
20
40
60
80
2008
Q1
2008
Q2
2008
Q3
2008
Q4
2009
Q1
2009
Q2
2009
Q3
2009
Q4
2010
Q1
2010
Q2
2010
Q3
2010
Q4
2011
Q1
2011
Q2
2011
Q3
2011
Q4
2012
Q1
2012
Q2
2012
Q3
2012
Q4
2013
Q1
2013
Q2
2013
Q3
2013
Q4
Yea
r-on
-yea
r per
cent
age
chan
ge
Imports
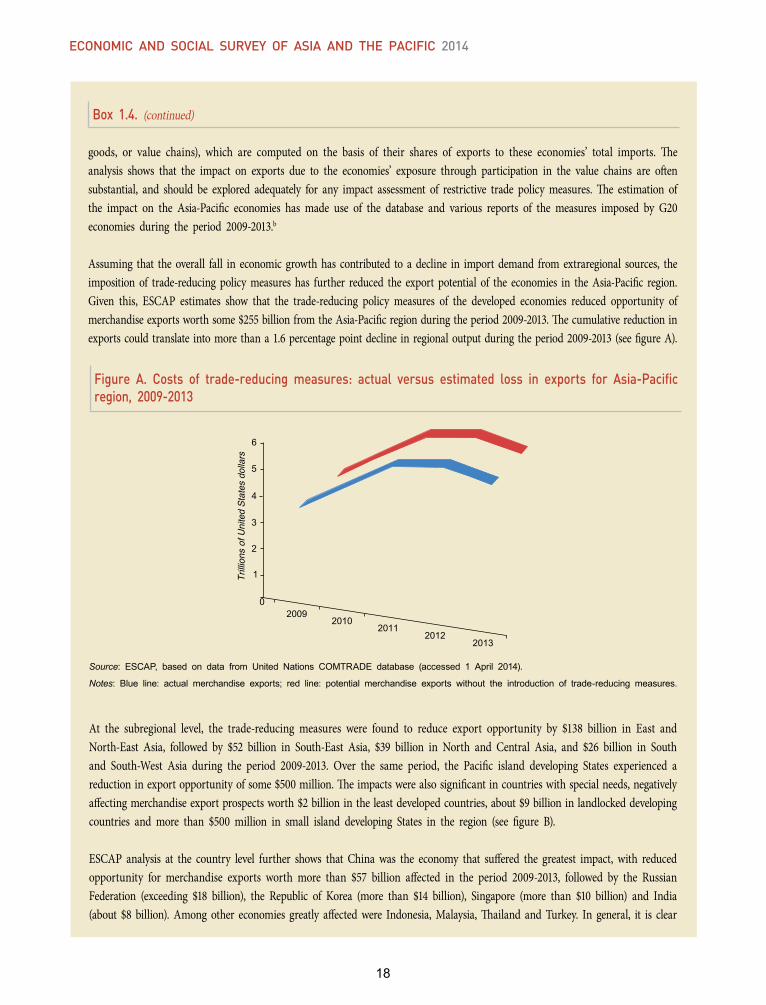
18
Economic and social survEy of asia and thE pacific 2014
Box 1.4. (continued)
Figure A. Costs of trade-reducing measures: actual versus estimated loss in exports for Asia-Pacific region, 2009-2013
goods, or value chains), which are computed on the basis of their shares of exports to these economies’ total imports. The analysis shows that the impact on exports due to the economies’ exposure through participation in the value chains are often substantial, and should be explored adequately for any impact assessment of restrictive trade policy measures. The estimation of the impact on the Asia-Pacific economies has made use of the database and various reports of the measures imposed by G20 economies during the period 2009-2013.b
Assuming that the overall fall in economic growth has contributed to a decline in import demand from extraregional sources, the imposition of trade-reducing policy measures has further reduced the export potential of the economies in the Asia-Pacific region. Given this, ESCAP estimates show that the trade-reducing policy measures of the developed economies reduced opportunity of merchandise exports worth some $255 billion from the Asia-Pacific region during the period 2009-2013. The cumulative reduction in exports could translate into more than a 1.6 percentage point decline in regional output during the period 2009-2013 (see figure A).
Source: ESCAP, based on data from United Nations COMTRADE database (accessed 1 April 2014).
Notes: Blue line: actual merchandise exports; red line: potential merchandise exports without the introduction of trade-reducing measures.
At the subregional level, the trade-reducing measures were found to reduce export opportunity by $138 billion in East and North-East Asia, followed by $52 billion in South-East Asia, $39 billion in North and Central Asia, and $26 billion in South and South-West Asia during the period 2009-2013. Over the same period, the Pacific island developing States experienced a reduction in export opportunity of some $500 million. The impacts were also significant in countries with special needs, negatively affecting merchandise export prospects worth $2 billion in the least developed countries, about $9 billion in landlocked developing countries and more than $500 million in small island developing States in the region (see figure B).
ESCAP analysis at the country level further shows that China was the economy that suffered the greatest impact, with reduced opportunity for merchandise exports worth more than $57 billion affected in the period 2009-2013, followed by the Russian Federation (exceeding $18 billion), the Republic of Korea (more than $14 billion), Singapore (more than $10 billion) and India (about $8 billion). Among other economies greatly affected were Indonesia, Malaysia, Thailand and Turkey. In general, it is clear
0
1
2
3
4
5
6
2009 2010
2011 2012
2013
Trilli
ons
of U
nite
d St
ates
dol
lars
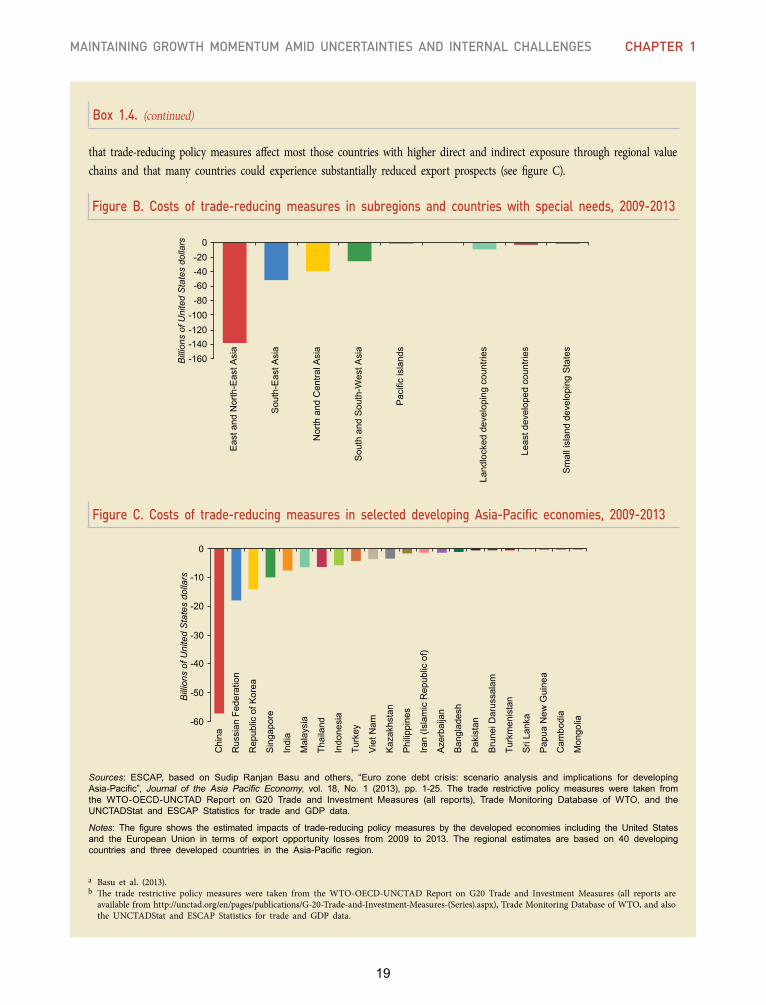
19
Maintaining growth MoMentuM aMid uncertainties and internal challenges chaPter 1
Box 1.4. (continued)
Figure C. Costs of trade-reducing measures in selected developing Asia-Pacific economies, 2009-2013
Sources: ESCAP, based on Sudip Ranjan Basu and others, “Euro zone debt crisis: scenario analysis and implications for developingAsia-Pacific”, Journal of the Asia Pacific Economy, vol. 18, No. 1 (2013), pp. 1-25. The trade restrictive policy measures were taken fromthe WTO-OECD-UNCTAD Report on G20 Trade and Investment Measures (all reports), Trade Monitoring Database of WTO, and theUNCTADStat and ESCAP Statistics for trade and GDP data.
Notes: The figure shows the estimated impacts of trade-reducing policy measures by the developed economies including the United Statesand the European Union in terms of export opportunity losses from 2009 to 2013. The regional estimates are based on 40 developingcountries and three developed countries in the Asia-Pacific region.
that trade-reducing policy measures affect most those countries with higher direct and indirect exposure through regional value chains and that many countries could experience substantially reduced export prospects (see figure C).
Figure B. Costs of trade-reducing measures in subregions and countries with special needs, 2009-2013
-160-140-120-100
-80-60-40-20
0E
ast a
nd N
orth
-Eas
t Asi
a
Sou
th-E
ast A
sia
Nor
th a
nd C
entra
l Asi
a
Sou
th a
nd S
outh
-Wes
t Asi
a
Pac
ific
isla
nds
Land
lock
ed d
evel
opin
g co
untri
es
Leas
t dev
elop
ed c
ount
ries
Sm
all i
slan
d de
velo
ping
Sta
tes
Billio
ns o
f Uni
ted
Stat
es d
olla
rs
-60
-50
-40
-30
-20
-10
0
Chi
na
Rus
sian
Fed
erat
ion
Rep
ublic
of K
orea
Sin
gapo
re
Indi
a
Mal
aysi
a
Thai
land
Indo
nesi
a
Turk
ey
Vie
t Nam
Kaz
akhs
tan
Phi
lippi
nes
Iran
(Isla
mic
Rep
ublic
of)
Aze
rbai
jan
Ban
glad
esh
Pak
ista
n
Bru
nei D
arus
sala
m
Turk
men
ista
n
Sri
Lank
a
Pap
ua N
ew G
uine
a
Cam
bodi
a
Mon
golia
Bill
ions
of U
nite
d S
tate
s do
llars
a Basu et al. (2013).b The trade restrictive policy measures were taken from the WTO-OECD-UNCTAD Report on G20 Trade and Investment Measures (all reports are available from http://unctad.org/en/pages/publications/G-20-Trade-and-Investment-Measures-(Series).aspx), Trade Monitoring Database of WTO, and also the UNCTADStat and ESCAP Statistics for trade and GDP data.
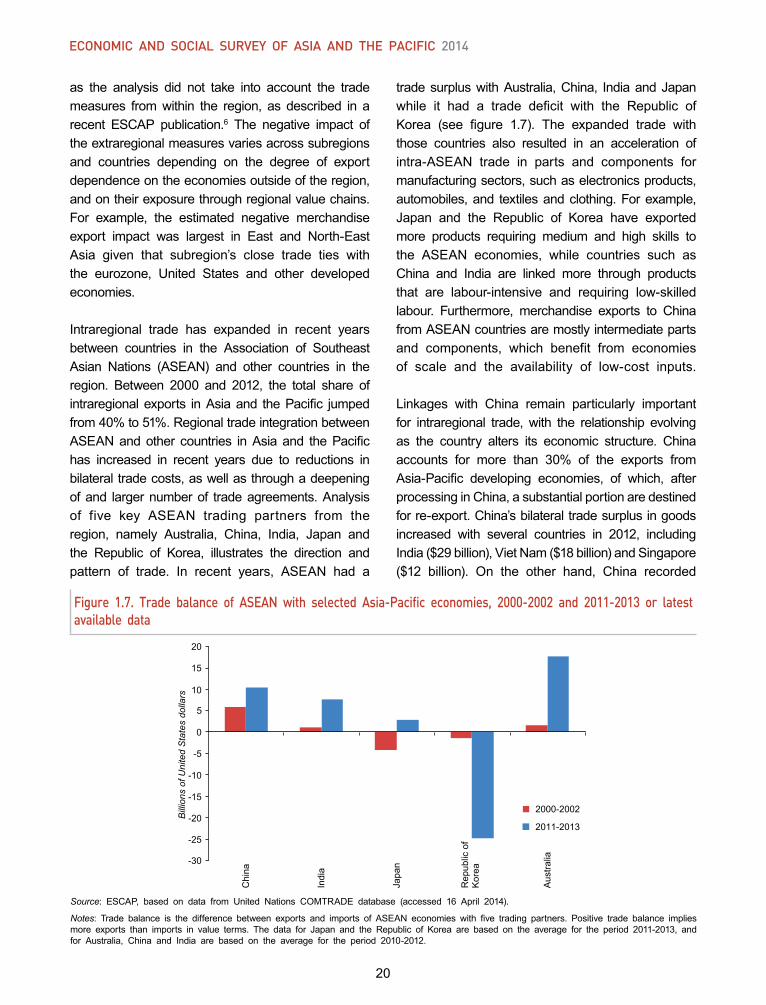
20
Economic and social survEy of asia and thE pacific 2014
as the analysis did not take into account the trade measures from within the region, as described in a recent ESCAP publication.6 The negative impact ofthe extraregional measures varies across subregions and countries depending on the degree of export dependence on the economies outside of the region, andontheirexposurethroughregionalvaluechains.For example, the estimated negative merchandise export impact was largest in East and North-East Asia given that subregion’s close trade ties with the eurozone, United States and other developed economies.
Intraregional trade has expanded in recent years between countries in the Association of Southeast Asian Nations (ASEAN) and other countries in the region. Between 2000 and 2012, the total share ofintraregionalexports inAsiaand thePacific jumpedfrom40%to51%.RegionaltradeintegrationbetweenASEANandother countries inAsia and thePacifichas increased in recent years due to reductions in bilateral trade costs, as well as through a deepening ofand largernumberof tradeagreements.Analysisof five key ASEAN trading partners from the region, namely Australia, China, India, Japan andthe Republic of Korea, illustrates the direction andpattern of trade. In recent years, ASEAN had a
tradesurpluswithAustralia,China, IndiaandJapanwhile it had a trade deficit with the Republic ofKorea (see figure 1.7). The expanded trade withthose countries also resulted in an acceleration of intra-ASEAN trade in parts and components for manufacturing sectors, such as electronics products, automobiles,and textilesandclothing.Forexample,Japan and the Republic of Korea have exportedmore products requiring medium and high skills tothe ASEAN economies, while countries such as China and India are linked more through productsthat are labour-intensive and requiring low-skilledlabour. Furthermore, merchandise exports to Chinafrom ASEAN countries are mostly intermediate parts and components, which benefit from economies of scale and the availability of low-cost inputs.
Linkages with China remain particularly importantfor intraregional trade, with the relationship evolving as the country alters its economic structure. Chinaaccounts for more than 30% of the exports fromAsia-Pacific developing economies, of which, afterprocessinginChina,asubstantialportionaredestinedforre-export.China’sbilateraltradesurplusingoodsincreased with several countries in 2012, including India($29billion),VietNam($18billion)andSingapore($12 billion). On the other hand, China recorded
Source: ESCAP, based on data from United Nations COMTRADE database (accessed 16 April 2014).
Notes: Trade balance is the difference between exports and imports of ASEAN economies with five trading partners. Positive trade balance impliesmore exports than imports in value terms. The data for Japan and the Republic of Korea are based on the average for the period 2011-2013, andfor Australia, China and India are based on the average for the period 2010-2012.
Figure 1.7. Trade balance of ASEAN with selected Asia-Pacific economies, 2000-2002 and 2011-2013 or latest available data
2000-2002
2011-2013
-30
-25
-20
-15
-10
-5
0
5
10
15
20
Chi
na
Indi
a
Japa
n
Rep
ublic
of
Kor
ea
Aus
tralia
Bill
ions
of U
nite
d S
tate
s do
llars
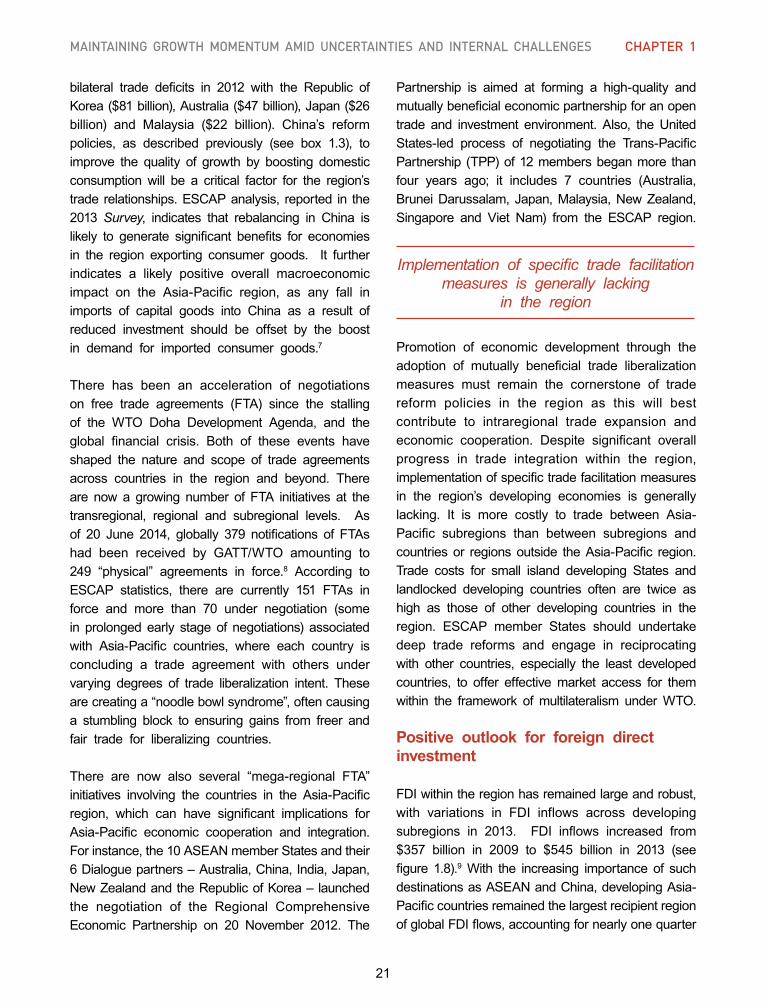
21
Maintaining growth MoMentuM aMid uncertainties and internal challenges chaPter 1
bilateral trade deficits in 2012 with the Republic ofKorea($81billion),Australia($47billion),Japan($26billion) and Malaysia ($22 billion). China’s reformpolicies, as described previously (see box 1.3), toimprove the quality of growth by boosting domesticconsumption will be a critical factor for the region’s trade relationships.ESCAPanalysis, reported in the2013Survey, indicates that rebalancing in China islikely to generate significant benefits for economiesin the region exporting consumer goods. It furtherindicates a likely positive overall macroeconomic impact on the Asia-Pacific region, as any fall inimports of capital goods into China as a result ofreduced investment should be offset by the boost in demand for imported consumer goods.7
There has been an acceleration of negotiationson free trade agreements (FTA) since the stallingof the WTO Doha Development Agenda, and theglobal financial crisis. Both of these events haveshaped the nature and scope of trade agreements across countries in the region and beyond. Thereare now a growing number of FTA initiatives at thetransregional, regional and subregional levels. Asof 20 June 2014, globally 379 notifications of FTAshad been received by GATT/WTO amounting to249 “physical” agreements in force.8 According to ESCAP statistics, there are currently 151 FTAs inforce and more than 70 under negotiation (somein prolonged early stage of negotiations) associated with Asia-Pacific countries, where each country isconcluding a trade agreement with others under varying degrees of trade liberalization intent. Theseare creating a “noodle bowl syndrome”, often causing a stumbling block to ensuring gains from freer and fair trade for liberalizing countries.
There are now also several “mega-regional FTA”initiatives involving the countries in the Asia-Pacificregion, which can have significant implications forAsia-Pacific economic cooperation and integration.For instance, the 10 ASEAN member States and their 6Dialoguepartners–Australia,China,India,Japan,NewZealandandtheRepublicofKorea–launchedthe negotiation of the Regional ComprehensiveEconomic Partnership on 20 November 2012. The
Partnership is aimed at forming a high-quality andmutuallybeneficialeconomicpartnershipforanopentrade and investment environment. Also, theUnitedStates-led process of negotiating the Trans-PacificPartnership (TPP)of12membersbeganmore thanfour years ago; it includes 7 countries (Australia,BruneiDarussalam,Japan,Malaysia,NewZealand,Singapore and Viet Nam) from the ESCAP region.
Implementation of specific trade facilitation measures is generally lacking
in the region
Promotion of economic development through the adoption of mutually beneficial trade liberalizationmeasures must remain the cornerstone of trade reform policies in the region as this will best contribute to intraregional trade expansion and economic cooperation. Despite significant overallprogress in trade integration within the region, implementationofspecifictradefacilitationmeasuresin the region’s developing economies is generally lacking. It is more costly to trade between Asia-Pacific subregions than between subregions andcountriesor regionsoutside theAsia-Pacific region.Trade costs for small island developing States andlandlocked developing countries often are twice as high as those of other developing countries in the region. ESCAP member States should undertakedeep trade reforms and engage in reciprocating with other countries, especially the least developed countries, to offer effective market access for them within the framework ofmultilateralism underWTO.
Positive outlook for foreign direct investment
FDIwithintheregionhasremainedlargeandrobust,with variations in FDI inflows across developingsubregions in 2013. FDI inflows increased from$357 billion in 2009 to $545 billion in 2013 (seefigure 1.8).9With the increasing importance of suchdestinationsasASEANandChina,developingAsia-PacificcountriesremainedthelargestrecipientregionofglobalFDIflows,accountingfornearlyonequarter
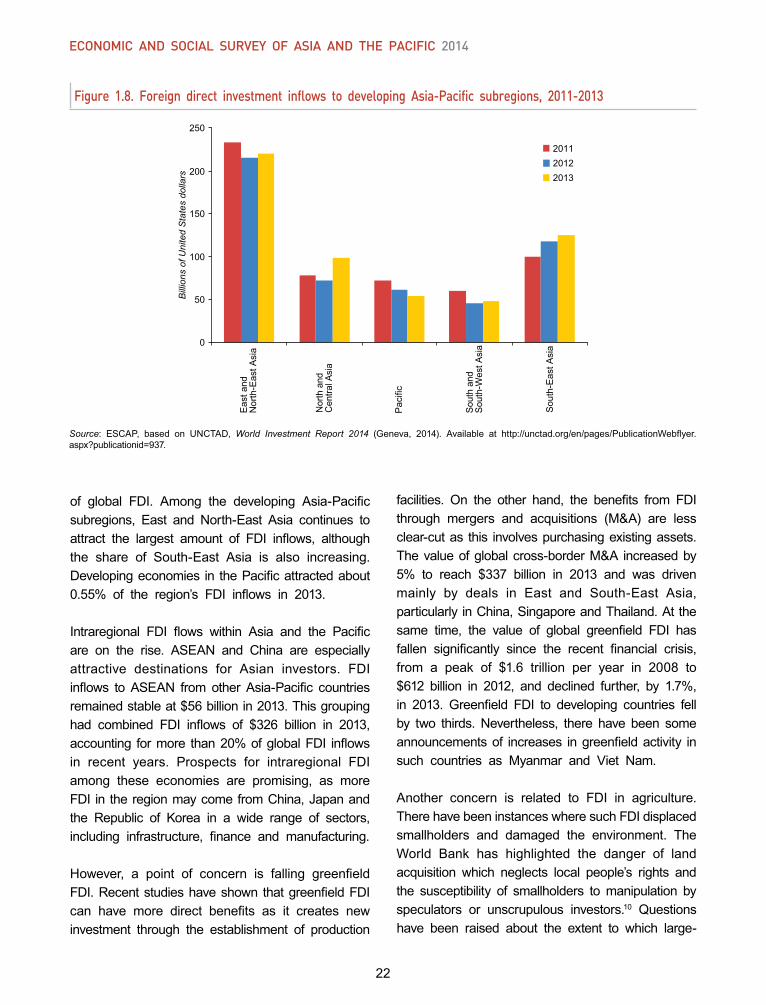
22
Economic and social survEy of asia and thE pacific 2014
of global FDI. Among the developing Asia-Pacificsubregions, East and North-East Asia continues to attract the largest amount of FDI inflows, althoughthe share of South-East Asia is also increasing.Developingeconomies in thePacificattractedabout0.55% of the region’s FDI inflows in 2013.
Intraregional FDI flows within Asia and the Pacificare on the rise. ASEAN and China are especiallyattractive destinations for Asian investors. FDIinflows to ASEAN from other Asia-Pacific countriesremainedstableat$56billionin2013.Thisgroupinghad combined FDI inflows of $326 billion in 2013,accounting formore than20%ofglobalFDI inflowsin recent years. Prospects for intraregional FDIamong these economies are promising, as more FDI in theregionmaycomefromChina,Japanandthe Republic of Korea in a wide range of sectors,including infrastructure, finance and manufacturing.
However, a point of concern is falling greenfieldFDI.Recentstudieshaveshown thatgreenfieldFDIcan have more direct benefits as it creates newinvestment through the establishment of production
facilities. On the other hand, the benefits from FDIthrough mergers and acquisitions (M&A) are lessclear-cutas this involvespurchasingexistingassets.Thevalueofglobalcross-borderM&A increasedby5% to reach $337 billion in 2013 and was drivenmainly by deals in East and South-East Asia, particularlyinChina,SingaporeandThailand.Atthesame time, the value of global greenfield FDI hasfallen significantly since the recent financial crisis,from a peak of $1.6 trillion per year in 2008 to$612 billion in 2012, and declined further, by 1.7%,in 2013. Greenfield FDI to developing countries fellby two thirds.Nevertheless, there have been someannouncementsof increases ingreenfieldactivity insuch countries as Myanmar and Viet Nam.
Another concern is related to FDI in agriculture.TherehavebeeninstanceswheresuchFDIdisplacedsmallholders and damaged the environment. TheWorld Bank has highlighted the danger of landacquisition which neglects local people’s rights andthe susceptibility of smallholders to manipulation by speculators or unscrupulous investors.10 Questions have been raised about the extent to which large-
Figure 1.8. Foreign direct investment inflows to developing Asia-Pacific subregions, 2011-2013
Source: ESCAP, based on UNCTAD, World Investment Report 2014 (Geneva, 2014). Available at http://unctad.org/en/pages/PublicationWebflyer.aspx?publicationid=937.
201120122013
0
50
100
150
200
250
Eas
t and
Nor
th-E
ast A
sia
Nor
th a
ndC
entra
l Asi
a
Pac
ific
Sout
h an
dSo
uth-
Wes
t Asi
a
Sou
th-E
ast A
sia
Bill
ions
of U
nite
d S
tate
s do
llars
23
Maintaining growth MoMentuM aMid uncertainties and internal challenges chaPter 1
scalelandacquisitionprovideslocalpeoplewithlong-term benefits and contributes to poverty reductionandsustainabledevelopment.Therefore,appropriatepolicies should be put into place to safeguard against speculative land investment or acquisition,as well as to prevent environmental degradation.Governments need to be vigilant to ensure thatFDI projects boost growth, create employment andincrease the technologicalcapacityof local industry.
InadditiontoFDI,thereisgrowingscopeforforeignexchange earnings for countries through remittances andtourism.AsiaandthePacificremainsthehighestremittance-receiving region in the world, both in absolute and relative terms. By 2013 remittancesto developing countries in Asia and thePacific hadincreased from $49 billion in 2000 to $265 billion.International tourism receipts increased from $169billion in 2004 to $320 billion in 2013. For manycountries intheregion,suchassomeinthePacific,the level of dependence on the tourism sector and related services is very significant at around 20%of GDP. Both remittances and tourism have thepotential to play a significant role in developmentin the region. However, policymakers must becognizant of drawbacks which require governmentactions. For example, the export of personnelmay exacerbate brain drain and worsen inequality.Similarly, uncontrolled expansion of tourism can have adverse ecological and social consequences.Aspects of remittances and tourism are discussed in greater detail in Part II of the Survey.
SOCIO-ECONOMIC CHALLENGES
Jobs growth and quality still show mixed progress
Considering themain socio-economic issues facingthe region, a principal concern is low job creation despite rapid growth in many economies. Overthe past decade, both before and after the crisis, growth inGDP in the regionwas not accompaniedby a commensurate expansion in formal sector employment. The developing Asia-Pacific region
witnessed such “jobless growth” during the period 2009-2013 as average GDP grew by 6.4% whileemployment grew by only 1.3%. During the pre-crisis period of 2000-2007, employment only grewby 1.7%. This phenomenon was due partly totechnological change and labour substitution, but also to the nature and pattern of economic growth that was not rooted in broad-based economy-wide development.
A principal socio-economic concern is low job creation despite rapid growth
in many economies
In 2013, labour market outcomes in terms of jobcreationweredecidedlymixed.Therateofjobgrowthin the formalsectorwashighest inMalaysia (8.8%),SriLanka(6.9%)andSingapore(4%).Intermsoftotaljob increases, the largest increaseswere1.2millionin Indonesia and1.1million inMalaysia. Growth injobs was also positive in Viet Nam (912,000) andthe Philippines (620,000). In Thailand, however, jobgrowth turnednegative,by1.2%(466,000),with thelargest declines being in agriculture and the hotel andrestaurantindustry.Inthedevelopedeconomiesof the region, job expansion was less than 1% inAustralia, Japan and New Zealand. Job creation inthe Pacific economies was also mixed.
To boost employment generation, some countrieshave undertaken active labour market programmes.Forexample,China initiated labourmarketpolicies toimproveaccesstoandthequalityoftrainingsystems,especially to benefit migrants from rural areas tourban industrial jobs. The Republic of Korea hasemployment programmes to enhance education and training for a specializedworkforce. For several low-income and middle-income countries, one of the key areas of focus should be to generate more productive and remunerative rural (off-farm) employment.
There are also concerns about job quality. Themajority of workers in the region are informally employed own-account or contributing family workers – with limited opportunities for finding work that is
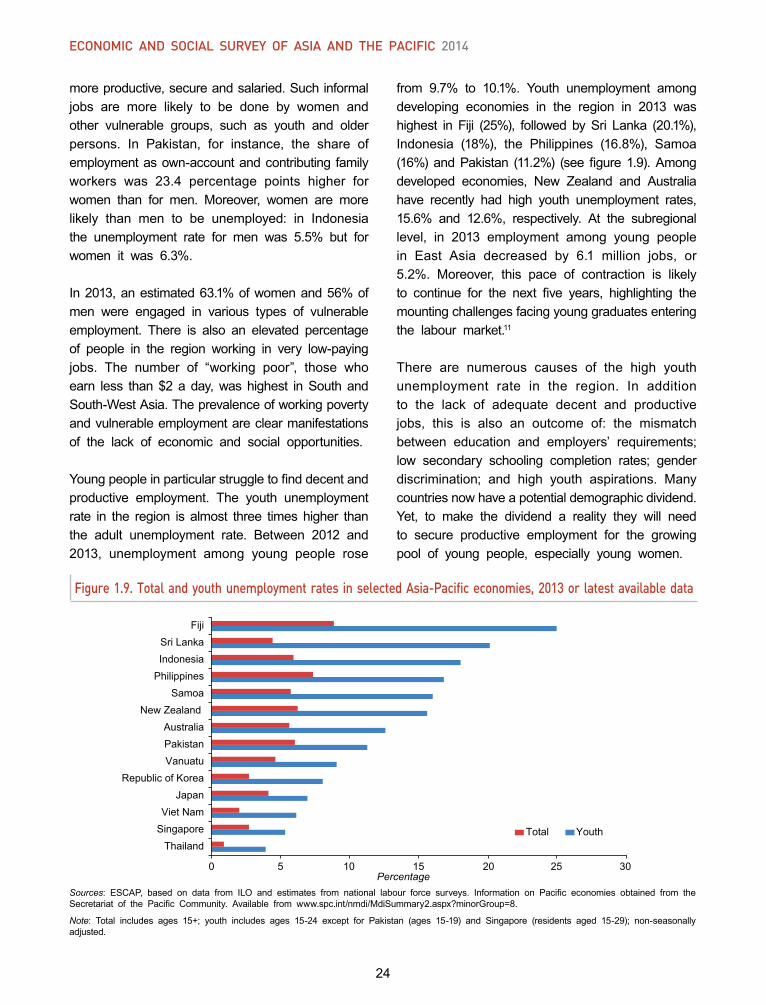
24
Economic and social survEy of asia and thE pacific 2014
moreproductive,secureandsalaried.Suchinformaljobs are more likely to be done by women and other vulnerable groups, such as youth and older persons. In Pakistan, for instance, the share ofemployment as own-account and contributing family workers was 23.4 percentage points higher forwomen than for men. Moreover, women are morelikely than men to be unemployed: in Indonesia the unemployment rate for men was 5.5% but forwomen it was 6.3%.
In2013,anestimated63.1%ofwomenand56%ofmen were engaged in various types of vulnerable employment. There is also an elevated percentageof people in the region working in very low-paying jobs. The number of “working poor”, those whoearn less than $2 a day, was highest in South and South-WestAsia.Theprevalenceofworkingpovertyand vulnerable employment are clear manifestations of the lack of economic and social opportunities.
Youngpeopleinparticularstruggletofinddecentandproductive employment. The youth unemploymentrate in the region is almost three times higher than the adult unemployment rate. Between 2012 and2013, unemployment among young people rose
Figure 1.9. Total and youth unemployment rates in selected Asia-Pacific economies, 2013 or latest available data
Sources: ESCAP, based on data from ILO and estimates from national labour force surveys. Information on Pacific economies obtained from theSecretariat of the Pacific Community. Available from www.spc.int/nmdi/MdiSummary2.aspx?minorGroup=8.
Note: Total includes ages 15+; youth includes ages 15-24 except for Pakistan (ages 15-19) and Singapore (residents aged 15-29); non-seasonallyadjusted.
from 9.7% to 10.1%. Youth unemployment amongdeveloping economies in the region in 2013 washighest in Fiji (25%), followed bySri Lanka (20.1%),Indonesia (18%), the Philippines (16.8%), Samoa(16%)andPakistan (11.2%) (seefigure1.9).Amongdeveloped economies, New Zealand and Australia have recently had high youth unemployment rates, 15.6% and 12.6%, respectively. At the subregionallevel, in 2013 employment among young peoplein East Asia decreased by 6.1 million jobs, or5.2%. Moreover, this pace of contraction is likelyto continue for the next five years, highlighting themounting challenges facing young graduates entering the labour market.11
There are numerous causes of the high youthunemployment rate in the region. In additionto the lack of adequate decent and productivejobs, this is also an outcome of: the mismatch between education and employers’ requirements;low secondary schooling completion rates; genderdiscrimination; and high youth aspirations. Manycountriesnowhaveapotentialdemographicdividend.Yet, to make the dividend a reality they will need to secure productive employment for the growing pool of young people, especially young women.
ThailandSingaporeViet Nam
JapanRepublic of Korea
VanuatuPakistanAustralia
New Zealand Samoa
PhilippinesIndonesiaSri Lanka
Fiji
0 5 10 15 20 25 30 Percentage
Total Youth
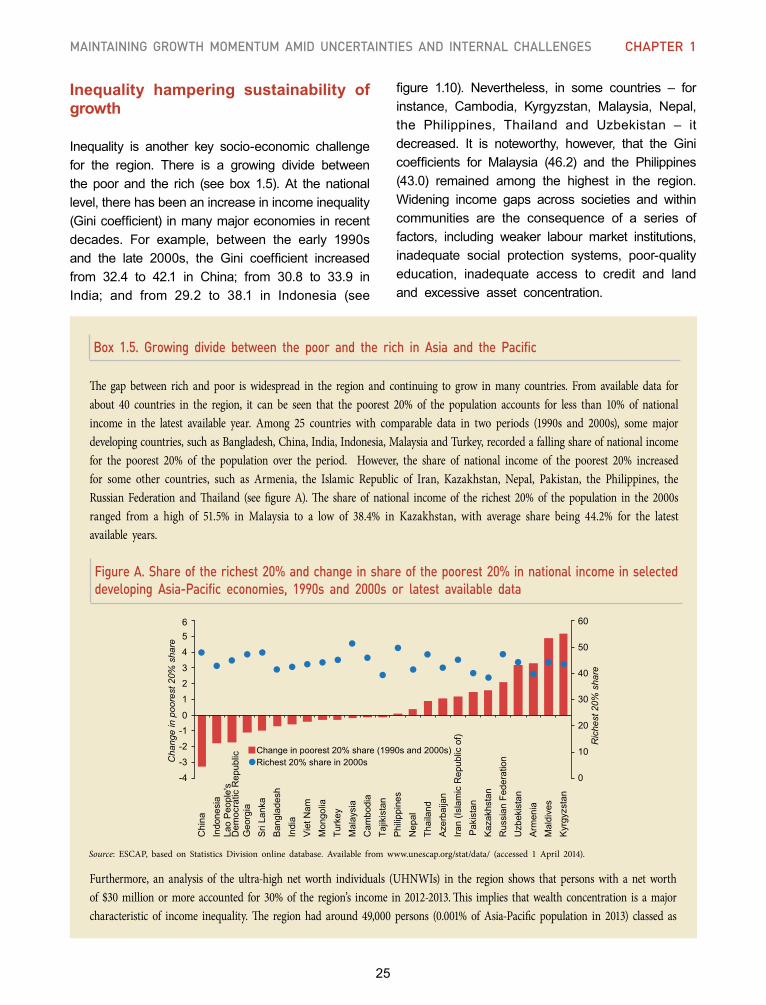
25
Maintaining growth MoMentuM aMid uncertainties and internal challenges chaPter 1
Box 1.5. Growing divide between the poor and the rich in Asia and the Pacific
The gap between rich and poor is widespread in the region and continuing to grow in many countries. From available data for about 40 countries in the region, it can be seen that the poorest 20% of the population accounts for less than 10% of national income in the latest available year. Among 25 countries with comparable data in two periods (1990s and 2000s), some major developing countries, such as Bangladesh, China, India, Indonesia, Malaysia and Turkey, recorded a falling share of national income for the poorest 20% of the population over the period. However, the share of national income of the poorest 20% increased for some other countries, such as Armenia, the Islamic Republic of Iran, Kazakhstan, Nepal, Pakistan, the Philippines, the Russian Federation and Thailand (see figure A). The share of national income of the richest 20% of the population in the 2000sranged from a high of 51.5% in Malaysia to a low of 38.4% in Kazakhstan, with average share being 44.2% for the latest available years.
Figure A. Share of the richest 20% and change in share of the poorest 20% in national income in selected developing Asia-Pacific economies, 1990s and 2000s or latest available data
Source: ESCAP, based on Statistics Division online database. Available from www.unescap.org/stat/data/ (accessed 1 April 2014).
0
10
20
30
40
50
60
-4
-3
-2
-10
1
23
4
56
Chi
na
Indo
nesi
a
Geo
rgia
S
ri La
nka
Ban
glad
esh
Indi
a V
iet N
am
Mon
golia
Tu
rkey
M
alay
sia
Cam
bodi
a Ta
jikis
tan
Phi
lippi
nes
Nep
al
Thai
land
A
zerb
aija
n Ira
n (Is
lam
ic R
epub
lic o
f)
Pak
ista
n K
azak
hsta
n R
ussi
an F
eder
atio
n U
zbek
ista
n A
rmen
ia
Mal
dive
s K
yrgy
zsta
n
Ric
hest
20%
sha
re
Cha
nge
in p
oore
st 2
0% s
hare
Change in poorest 20% share (1990s and 2000s) Richest 20% share in 2000s
Lao
Peo
ple'
sD
emoc
ratic
Rep
ublic
Furthermore, an analysis of the ultra-high net worth individuals (UHNWIs) in the region shows that persons with a net worth of $30 million or more accounted for 30% of the region’s income in 2012-2013. This implies that wealth concentration is a major characteristic of income inequality. The region had around 49,000 persons (0.001% of Asia-Pacific population in 2013) classed as
Inequality hampering sustainability of growth
Inequality is another key socio-economic challengefor the region. There is a growing divide betweenthe poor and the rich (see box 1.5). At the nationallevel,therehasbeenanincreaseinincomeinequality(Ginicoefficient) inmanymajoreconomies inrecentdecades. For example, between the early 1990sand the late 2000s, the Gini coefficient increasedfrom 32.4 to 42.1 in China; from 30.8 to 33.9 inIndia; and from 29.2 to 38.1 in Indonesia (see
figure 1.10). Nevertheless, in some countries – forinstance, Cambodia, Kyrgyzstan, Malaysia, Nepal,the Philippines, Thailand and Uzbekistan – itdecreased. It is noteworthy, however, that the Ginicoefficients for Malaysia (46.2) and the Philippines(43.0) remained among the highest in the region.Widening income gaps across societies and withincommunities are the consequence of a series offactors, including weaker labour market institutions, inadequate social protection systems, poor-qualityeducation, inadequate access to credit and landand excessive asset concentration.
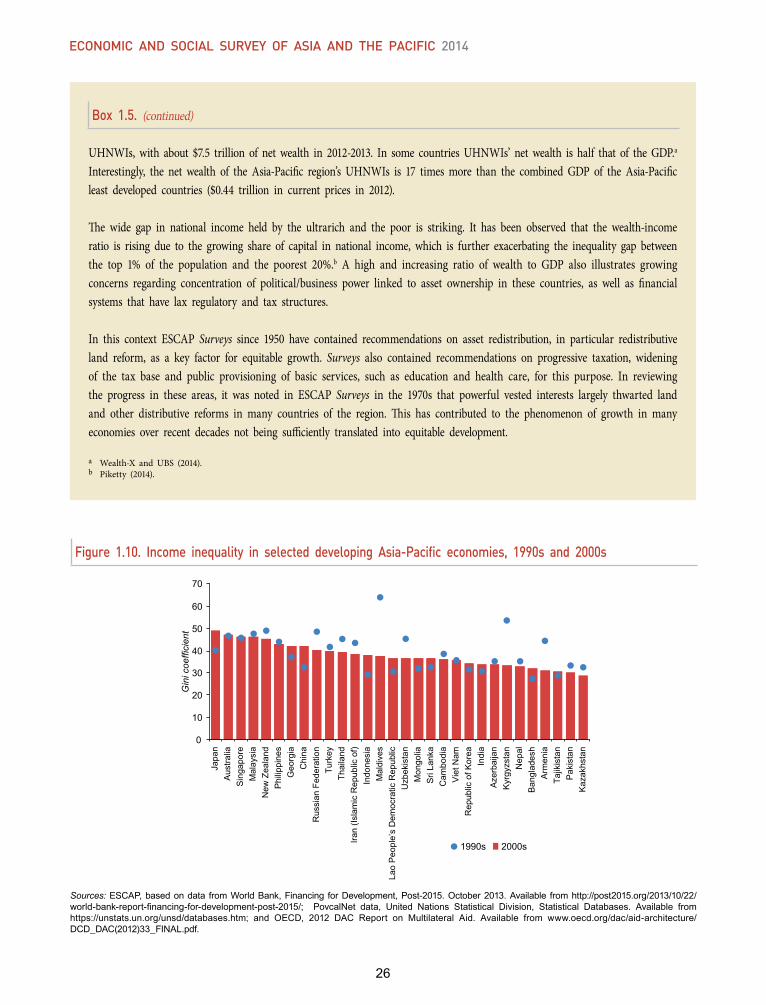
26
Economic and social survEy of asia and thE pacific 2014
UHNWIs, with about $7.5 trillion of net wealth in 2012-2013. In some countries UHNWIs’ net wealth is half that of the GDP.a Interestingly, the net wealth of the Asia-Pacific region’s UHNWIs is 17 times more than the combined GDP of the Asia-Pacific least developed countries ($0.44 trillion in current prices in 2012).
The wide gap in national income held by the ultrarich and the poor is striking. It has been observed that the wealth-income ratio is rising due to the growing share of capital in national income, which is further exacerbating the inequality gap between the top 1% of the population and the poorest 20%.b A high and increasing ratio of wealth to GDP also illustrates growing concerns regarding concentration of political/business power linked to asset ownership in these countries, as well as financial systems that have lax regulatory and tax structures.
In this context ESCAP Surveys since 1950 have contained recommendations on asset redistribution, in particular redistributive land reform, as a key factor for equitable growth. Surveys also contained recommendations on progressive taxation, widening of the tax base and public provisioning of basic services, such as education and health care, for this purpose. In reviewing the progress in these areas, it was noted in ESCAP Surveys in the 1970s that powerful vested interests largely thwarted land and other distributive reforms in many countries of the region. This has contributed to the phenomenon of growth in many economies over recent decades not being sufficiently translated into equitable development.
a Wealth-X and UBS (2014). b Piketty (2014).
Box 1.5. (continued)
Figure 1.10. Income inequality in selected developing Asia-Pacific economies, 1990s and 2000s
Sources:ESCAP,basedondata fromWorldBank,Financing forDevelopment,Post-2015.October2013.Available fromhttp://post2015.org/2013/10/22/world-bank-report-financing-for-development-post-2015/; PovcalNet data, United Nations Statistical Division, Statistical Databases. Available fromhttps://unstats.un.org/unsd/databases.htm; and OECD, 2012 DAC Report on Multilateral Aid. Available from www.oecd.org/dac/aid-architecture/DCD_DAC(2012)33_FINAL.pdf.
0
10
20
30
40
50
60
70
Japa
nA
ustra
liaS
inga
pore
Mal
aysi
aN
ew Z
eala
ndP
hilip
pine
sG
eorg
iaC
hina
Rus
sian
Fed
erat
ion
Turk
eyTh
aila
ndIra
n (Is
lam
ic R
epub
lic o
f)In
done
sia
Mal
dive
sLa
o P
eopl
e’s
Dem
ocra
tic R
epub
licU
zbek
ista
nM
ongo
liaS
ri La
nka
Cam
bodi
aV
iet N
amR
epub
lic o
f Kor
eaIn
dia
Aze
rbai
jan
Kyr
gyzs
tan
Nep
alB
angl
ades
hA
rmen
iaTa
jikis
tan
Pak
ista
nK
azak
hsta
n
Gin
i coe
ffici
ent
2000s 1990s
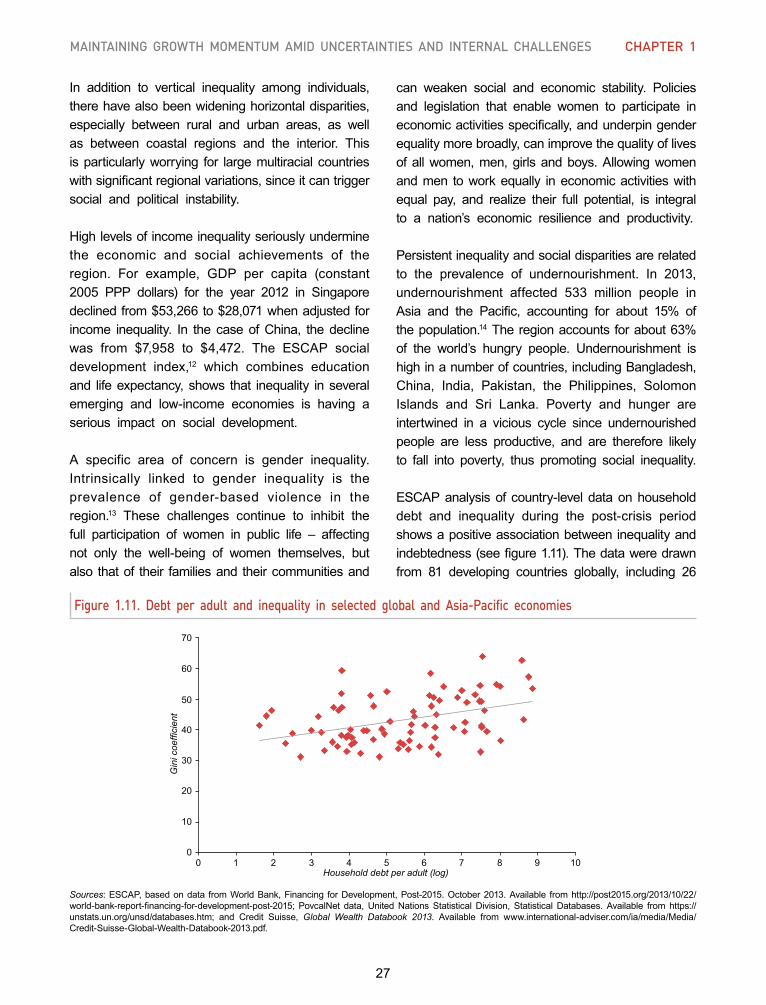
27
Maintaining growth MoMentuM aMid uncertainties and internal challenges chaPter 1
Figure 1.11. Debt per adult and inequality in selected global and Asia-Pacific economies
In addition to vertical inequality among individuals,there have also been widening horizontal disparities, especially between rural and urban areas, as well as between coastal regions and the interior. Thisis particularly worrying for large multiracial countries withsignificantregionalvariations,sinceitcantriggersocial and political instability.
Highlevelsofincomeinequalityseriouslyunderminethe economic and social achievements of the region. For example, GDP per capita (constant2005 PPP dollars) for the year 2012 in Singaporedeclinedfrom$53,266to$28,071whenadjustedforincome inequality. In the caseofChina, thedeclinewas from $7,958 to $4,472. The ESCAP socialdevelopment index,12 which combines education and lifeexpectancy,shows that inequality inseveralemerging and low-income economies is having a serious impact on social development.
A specific area of concern is gender inequality.Intrinsically linked to gender inequality is theprevalence of gender-based violence in the region.13 These challenges continue to inhibit thefull participation of women in public life – affecting not only the well-being of women themselves, but also that of their families and their communities and
can weaken social and economic stability. Policiesand legislation that enable women to participate in economicactivitiesspecifically,andunderpingenderequalitymorebroadly,canimprovethequalityoflivesofallwomen,men,girlsandboys.Allowingwomenandmen toworkequally ineconomicactivitieswithequal pay, and realize their full potential, is integralto a nation’s economic resilience and productivity.
Persistentinequalityandsocialdisparitiesarerelatedto the prevalence of undernourishment. In 2013,undernourishment affected 533 million people inAsia and the Pacific, accounting for about 15% ofthepopulation.14Theregionaccountsforabout63%of the world’s hungry people. Undernourishment ishighinanumberofcountries,includingBangladesh,China, India, Pakistan, the Philippines, SolomonIslands and Sri Lanka. Poverty and hunger areintertwined in a vicious cycle since undernourished people are less productive, and are therefore likely to fall into poverty, thus promoting social inequality.
ESCAPanalysisof country-leveldataonhouseholddebt and inequality during the post-crisis periodshowsapositiveassociationbetweeninequalityandindebtedness(seefigure1.11).Thedataweredrawnfrom 81 developing countries globally, including 26
Sources:ESCAP,basedondata fromWorldBank,Financing forDevelopment,Post-2015.October2013.Available fromhttp://post2015.org/2013/10/22/world-bank-report-financing-for-development-post-2015; PovcalNet data, UnitedNations Statistical Division, Statistical Databases. Available from https://unstats.un.org/unsd/databases.htm; and Credit Suisse, Global Wealth Databook 2013. Available from www.international-adviser.com/ia/media/Media/Credit-Suisse-Global-Wealth-Databook-2013.pdf.
0
10
20
30
40
50
60
70
0 1 2 3 4 5 6 7 8 9 10Household debt per adult (log)
Gin
i coe
ffici
ent
28
Economic and social survEy of asia and thE pacific 2014
economies from the region. This finding conformswith recent research at the IMF15 which shows how inequality can lead tohousehold indebtedness.With income growth lagging, the poorer sections ofsociety increase debt-financed consumption. This ismade possible by the availability of cheap credit, as higher income groups deposit their increasing wealth in the banking system. Such a transmissionprocess could lead to ever-rising household debt in countries with growing inequality, making themvulnerable to shocks. As households spend morethan they earn, countries face growing current account deficits, exacerbated by luxury imports bythe well-off.
POLICY OPTIONS TO DEAL WITH LONGER-TERM CHALLENGES AND NEAR-TERM RISKS AND VULNERABILITIES
Productive government spending to support sustainable growth
The obstacles to higher growth in the Asia-Pacificregion are partly related to slow economic recovery in the developed world, but also to long-term structural impediments togrowth.Thishighlights theneed for productive and countercyclical government macroeconomic support. Such policies can shoreup growth in the short term while helping remove structuralimpedimentsinthelongterm.Furthermore,the ongoing reallocation of international capital away from the region as monetary policy in the United States is normalized will increase the need for accommodating policies for domestic investment.This section highlights some possible supportivemeasures.
● Social protection spending – Increasing spending on social protection would help to support growth as well as reduce inequality. Recognizingthe importance and necessity of adequate socialprotection systems, the United Nations System Chief Executives Board for Coordination adoptedthe Social Protection Floor Initiative, which was endorsed by Member States at the United Nations
Conference on Sustainable Development (Rio+20).Social protection is now a development priority in the development agenda beyond 2015.16 Public social security expenditure remains low in the region at less than 2% of GDP in half of the countrieswhere data are available. More than 60% of thepopulation of theAsia-Pacific region remainwithoutany social protection coverage.
There is a need for productive and countercyclical government macroeconomic support to address the region’s structural
impediments
Particularly important areas for action include increased public provision of health and unemployment insurance, as well as pensions.Increased coverage of these needs reduces the need for precautionary savings by citizens and thus increases available income for consumption to supporteffectivedemand.As thepoorersectionsofsociety spend a greater proportion of their income than the better-off section, there can be positive impacts on growth. There is also a significantpositive correlation between the extent of coverage of social protection measures and reductions in inequality. Based on World Bank data,17 ESCAPfinds that,withinauniversal system, targeted socialprotection and labour market programmes are likely to reduce inequality. ESCAP has designed a socialprotection “toolbox” to facilitate the endeavours of policymakers in building stronger and more robust social protection systems.18 It enables policymakers to identify gaps at the national level, while providing useful examples on how to move forward.
Several countries in the region have recently initiated policies and programmes to enhance social welfare (see box 1.6). These include programmesaddressinghealthinIndonesia,ThailandandTurkey;education in Sri Lanka; food security in India; andemployment in theRepublicofKorea.Nevertheless,public social protection expenditure still remain very low in a large number of countries in the region.Moreover, coverage of social protection and labour
29
Maintaining growth MoMentuM aMid uncertainties and internal challenges chaPter 1
Box 1.6. Strengthening social services in health and education: Turkey and Sri Lanka
Some countries in Asia and the Pacific have made substantial progress in strengthening health and education services – as exemplified by health insurance in Turkey and universal education in Sri Lanka.
General Health Insurance in TurkeyIn 2008, the Government of Turkey launched the General Health Insurance scheme (GHI). This comprises two complementary schemes designed to extend health coverage to the entire population. Turkey’s health-care system dates back to the 1990s when lawmakers first began extending coverage to the informal sector as part of its 10-year Health Transformation Programme. Health-care coverage has increased rapidly – from 70% of the population in 2002 to 83% in 2010. Today, GHI provides contributory insurance for those able to pay, while providing a number of different groups with free coverage: persons below the age of 18; pregnant women; people employed by the Social Security Institution; stateless persons; refugees; those with income below one third of the minimum national threshold; and those in receipt of social assistance payments. GHI is implemented by the Ministry of Health through a network of 843 hospitals and 6,463 health centres. The scheme provides access to a comprehensive package and entitlements with reimbursement for a range of preventative, diagnostic and curative services. Co-payment is required for physical examinations, orthodontics and prostheses, healing materials, medicines and fertility treatments.
Universal Education System in Sri LankaSri Lanka’s high literacy rates among youth, currently at 98% for boys and 99% for girls, can be linked to policies for free and compulsory education dating back to the 1940s. More recently, in 1997 the Government passed an ordinance on compulsory education, further strengthening the national framework for universal primary education, providing free education at primary, secondary and university levels and compulsory education for all children between 5 and 13 years of age. As part of the education system, children are provided with free textbooks, two sets of uniforms and a mid-day meal (in designated areas). The Sri Lankan education system encourages skills development for suitable employment upon entering grade 9, offering students the option to continue with academic studies, enrol in an apprenticeship to enhance technical capability, or join agricultural production.
programmes varies considerably between countries and between income groups. For example, in theLaoPeople’s Democratic Republic the programmesdirectly benefit 1.65% of the total population whilefor thepoorestquintile theproportion isonly0.43%.On the other hand, in Thailand the correspondingfigures are 99.19% and 99.56%. Encouragingly,in Indonesia, Kyrgyzstan, the Russian Federation,Sri Lanka and Viet Nam the coverage of socialprotectionand labourprogrammeshasflowedmoreto the poorest quintile of the population.
An important challenge to increase the coverage and depth of social protection measures will be their sustainable financing. Critically, the design ofsocial protection measures will need to address growing budgetary demands due to the changing age structureofpopulations.Theprivatesectormustalso
contributeandpartnerwithGovernments.Meanwhile,further research needs to be conducted on effective methods for financing national programmes and onthe implications for government budgets.
● Infrastructure spending – Governments needto address the significant shortage in infrastructureprovision across the region. Adequate physicalinfrastructure in terms of transport, public services provision and telecommunications in both rural and urban areas, is essential for enabling countries to realize their economic potential. Apart from currentneeds, the demand for infrastructure is projected to increase significantly with growing populations andgreater urbanization. A recent study by ESCAPestimated the infrastructure financing gaps in theAsia-Pacific region to be of the order of $800-900 billion per annum.19 This total includes the
30
Economic and social survEy of asia and thE pacific 2014
requirement for national infrastructure in energy,transport, telecommunications, water and sanitation, and cross-country infrastructure projects in transport, energy and telecommunications. The private sectoracting alone is not coming close to meeting this requirement, with annual spending on infrastructureover the past 20 years averaging $13 billion andbeing concentrated in less risky investments.20
Apart from shortfalls in financing, it is clear thatsignificant improvement is required in legal andregulatory frameworks for infrastructure investment across much of the region. Recent years haveseen a lack of clarity in such frameworks and this has been a significant factor in the worsening ofinvestment climates and resulting reduction in new projects in many countries. Without improvementsin regulatory frameworks and policy certainty, even in the presence of adequate financing, investorswill remainwary of entering intomajor investments.Political instability also discourages private sector investment in large infrastructure projects.
Existing forms of infrastructure investment in the region could be complemented with a new large-
scale lending facility using innovative development financing sources
Existing forms of infrastructure investment in the region could be complemented with a new large-scale lending facility for infrastructure using innovative development financing sources. Such a regionalfacility could issue securities to enable the region’s central banks to be able to park their surplus reserves withit.Theinfrastructurefinancingfacilitycouldhelpcoordinate other sources of lending, such as that from multilateral and bilateral development agencies and private financial institutions. Its backing forinfrastructure projects could also signal opportunities to private investors. As a regional mechanism, thefacility could also be in a position to keep track of intraregional spillovers and finance economicallysignificant cross-border projects. Another possiblefunction of the facility could be to provide advisory
services and technical assistance in the financialdesign of infrastructure projects.
●Environment-related spending—Governmentswill need to undertake spending to address environmental factors which will otherwise hamper growthprospects.Environmentaldamage isalreadyconstraining growth in the region. For example,environmental degradation was estimated in 2012 to have cost India almost 6% of GDP annually.21
Air pollution and water pollution are seriously undermining economic prospects in many countries in the region due to serious health impacts. OneWorld Bank study estimates that the health costsof air andwater pollution inChina amount to about4.3%of itsGDP.By adding the non-health impactsof pollution, which are estimated to be about 1.5%of GDP, the total cost of air and water pollution inChina is about 5.8% of GDP.22Widespread loss ofnatural ecosystems and biodiversity has also had impacts on economic potential.
Apart from reducing environmental damage, policies are required to improve access to modern energysources. Using such sources can make growthmore sustainable and will contribute to increased growth by making households more productive. Toimprove access to modern energy, several countries have formulated investment strategies for energy infrastructure–aimedatimprovingenergyefficiencyandincreasingtheuseofrenewablesources.Thereare several examples. Bangladesh has initiated abiogas project to provide communities with clean andrenewableenergy;Nepalhasinitiatedanationalprogramme to integrate alternative energy sources with the socio-economic activities of women and men in rural communities; the Government of Indonesiaannounced a major reform plan to reduce gasoline subsidies;Thailandhasinstitutedarenewableenergypolicy;andVietNamhasadopteda lawconcerningan environment protection tax.
Another area for action to ensure the sustainability of growth is better addressing climate change through improving climate finance. Sources ofclimate finance should be mobilized both from
31
Maintaining growth MoMentuM aMid uncertainties and internal challenges chaPter 1
the public and private sectors. Public finance canfocus on leveraging private funding to tackle climate challenges.Specifically,climatefinancemechanismsshould bemainstreamed into the evolving financingframework in the context of the development agenda beyond 2015.
Productive investment in youth
Government policies are required to assist youth toacquire the education and skills required to obtaindecent and productive employment. The region isfacing the enormous challenge of securing such employment for the largest generation of young peopleinitshistory.Nearly717millionoftheregion’spopulation are young women and men aged 15 to24, with the issue being most acute in South and South-West Asia. While some of the problems arecausedbyalackofadequatedecentandproductivejobs, many young people are entering the labour force with skills that are limited or do not match the changingdemandsof labourmarkets.Governmentstherefore need to pay attention to the way in which youth develop from a young age and help prepare them for work with adequate knowledge, skills andexperience. In this context, the transition betweensecondary and tertiary education needs to take into account the capacities and potential of youth.Active labour market programmes will also be important to effectively link education, training and skills development systems with the requirementsof employers. The challenge of increasing accessto education is especially great for low-income economies, where the probability of obtaining tertiary-level education is low. In these economies,thegrossenrolmentratio(GER)intertiaryeducationis only 10%, while in high-income economies it is71%. Some of the biggest challenges are in Southand South-West Asia where GER is 14%, whichis the lowest in the Asia-Pacific region, comparedwith 56% in North and Central Asia.
Improving education systems will require payingspecial attention to gender inequalities. Althoughthese have fallen in education in the region over recent years, there are still disparities that translate
into untapped productive potential for both medium and long-term growth. The South and South-WestAsiansubregion is lagging,with8girls forevery10boys enrolled in secondary education, but an even greater concern is that only 3 women for every 4men are enrolled in tertiary education. There aremany barriers to female education – including the burden of household work, limited appreciation of the benefits of educating girls and women, and negative social and cultural attitudes. Addressingsuchprejudiceswillrequiregreaterinvestmentintherecruitment of female teachers and targeted support for poor families in order to render educational establishments more female-friendly.
Mitigating risks from volatility of capital flows
Countriesshouldbecognizantoftheneedtopossesssufficient foreign exchange reserves to help defendagainst excessive depreciation resulting from capital volatility. The build-up of reserves has been oneof the main tools of Governments to protect theircurrencies and prevent the macroeconomic instability resulting from sharp exchange rate depreciation.The ESCAP vulnerability yardstick considers thelevel of short-term foreign exchange commitments, comprising portfolio investment, short-term debt and quarterly imports, as a percentage of foreignreserves. It indicates that some economies in theregion may have insufficient foreign exchange reserves to cover the exit of foreign funds from their financial markets (see figure 1.12); hence theyface risks of excessive exchange rate depreciation.
Concerns about the lack of sufficient reserves at the national level to respond to capital volatility have highlighted the
need for greater regional support
Concerns about the lack of sufficient reserves atthe national level to respond to the risks from capital volatility have highlighted the need for greater regional support. Currency-related difficulties invariouscountries in2013highlightedthe lackofuse
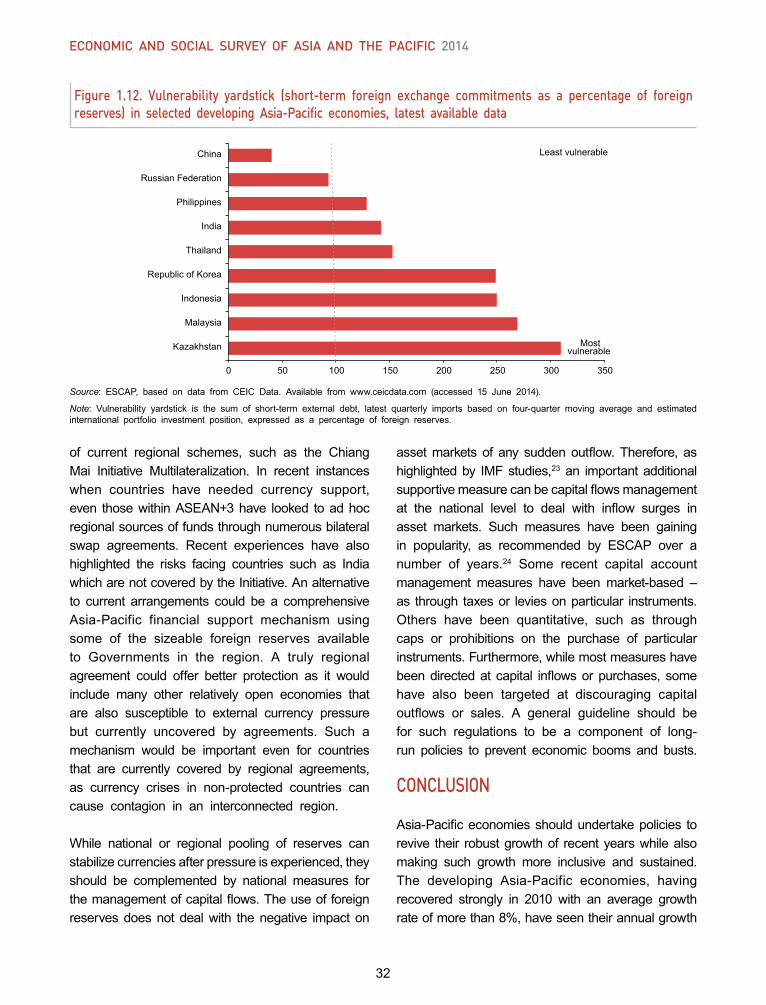
32
Economic and social survEy of asia and thE pacific 2014
Source: ESCAP, based on data from CEIC Data. Available from www.ceicdata.com (accessed 15 June 2014).
Note: Vulnerability yardstick is the sum of short-term external debt, latest quarterly imports based on four-quarter moving average and estimatedinternational portfolio investment position, expressed as a percentage of foreign reserves.
Figure 1.12. Vulnerability yardstick (short-term foreign exchange commitments as a percentage of foreign reserves) in selected developing Asia-Pacific economies, latest available data
0 50 100 150 200 250 300 350
Kazakhstan
Malaysia
Indonesia
Republic of Korea
Thailand
India
Philippines
Russian Federation
China Least vulnerable
Mostvulnerable
of current regional schemes, such as the ChiangMai Initiative Multilateralization. In recent instanceswhen countries have needed currency support, even thosewithinASEAN+3have looked toadhocregional sources of funds through numerous bilateral swap agreements. Recent experiences have alsohighlighted the risks facing countries such as India whicharenotcoveredbytheInitiative.Analternativeto current arrangements could be a comprehensive Asia-Pacific financial support mechanism using some of the sizeable foreign reserves available to Governments in the region. A truly regionalagreement could offer better protection as it would include many other relatively open economies that are also susceptible to external currency pressure but currently uncovered by agreements. Such amechanism would be important even for countries that are currently covered by regional agreements, as currency crises in non-protected countries can cause contagion in an interconnected region.
While national or regional pooling of reserves canstabilize currencies after pressure is experienced, they should be complemented by national measures for themanagementofcapitalflows.Theuseofforeignreserves does not deal with the negative impact on
assetmarkets of any suddenoutflow.Therefore, ashighlightedby IMFstudies,23 an important additional supportivemeasurecanbecapitalflowsmanagementat the national level to deal with inflow surges inasset markets. Such measures have been gainingin popularity, as recommended by ESCAP over anumber of years.24 Some recent capital account management measures have been market-based – as through taxesor leviesonparticular instruments.Others have been quantitative, such as throughcaps or prohibitions on the purchase of particular instruments.Furthermore,whilemostmeasureshavebeendirectedat capital inflowsorpurchases, somehave also been targeted at discouraging capital outflows or sales. A general guideline should befor such regulations to be a component of long-run policies to prevent economic booms and busts.
CONCLUSION
Asia-Pacificeconomiesshouldundertakepolicies torevive their robust growth of recent years while also making such growth more inclusive and sustained.The developing Asia-Pacific economies, havingrecovered strongly in 2010 with an average growth rateofmorethan8%,haveseentheirannualgrowth
33
Maintaining growth MoMentuM aMid uncertainties and internal challenges chaPter 1
rate dip below 6% since 2012. With constrainedgrowth prospects, productive government spending is critical for reviving growth. The obstacles tohigher growth in the Asia-Pacific region are partlyrelated to slow economic recovery in the developed world, but also to long-term structural impediments to growth. This situation highlights the opportunityfor productive and countercyclical government macroeconomic support. Such policies can supportgrowth in the short-term while helping remove structural impediments in the long term. Theseinclude policies directed towards reducing the high degree of economic insecurity in many economies, large development gaps, significant infrastructureshortagesandunsustainableenvironmental impacts.
In short, policymakers need to ensure that growth-generatingactivitiesareinclusive,inequalityreducingandenvironmentallysustainable.Thishasimplicationsfor sources of growth – both sectoral and spatial.Inclusive,equitableandsustainablegrowthdependson more dynamic industrial and agricultural sector activities which are green or environment-friendly instead of speculative activities concentrated in urban areas.Policymakersalsoneedtoidentifythesourcesof growth fluctuations – whether they are due tothe business cycle or structural factors – so that they can balance short-term stabilization objectives with long-term sustainable development objectives.Addressing long-term causes would require carefulstructural reforms.Anumberofmajoreconomies inthe region, China and Japan, are already engagedin comprehensive structural reform programmes, and their experiences can provide others with a useful guide.Someofthesedetailsarediscussedinchapter2. A critical challenge will be the funding of thesepolicies, which will require raising the resources ofGovernments. This issue is analysed in chapter 3.
Endnotes1 Xinhua (2013).
2 G20 (2014).
3 Saez (2013).
4 Eichengreen et al. (2013).
5 ESCAP (2013c).
6 ESCAP (2013a).
7 ESCAP (2013b).
8 WTO (2014).
9 UNCTAD (2014).
10World Bank (2012b).
11 ILO (2014).
12ESCAP (2012b); ESCAP (2013b).
13Fulu et al. (2013).
14FAO et al. (2013).
15Kumhof et al. (2011); Cynamon et al. (2013).
16United Nations (2012).
17World Bank (2014).
18FurtherdetailsoftheESCAPsocialprotection“toolbox” are available at www.socialprotection-toolbox.org/.
19ESCAP (2014).
20ADBI (2013).
21World Bank (2012a).
22World Bank (2007).
23IMF (2012a); IMF (2012b).
24ESCAP (2010); ESCAP (2013b).

34
BEN
DE
BR
UYN
35
BEN
DE
BR
UYN
conomic growth momentum and the macroeconomic situation vary widely among the countries in Asia and thePacific, in linewiththe diversity across the region. Several of the trade-dependent countries are likely toperformbetter in2014,as theglobaleconomic recoverygains traction. Their macroeconomic performances thus depend on the implementation of appropriate policy measures to deal with spillovers from developed economies. This requires careful examination of the underlying reasons for changes in the macroeconomic aggregates and the likely impact of policy measures. On the other hand, anumber of countries, mostly those with large domestic markets,are poised to experience either a growth slowdown or stagnation in 2014 due to diverse structural challenges. These countries need to accelerate structural reforms to deal with long-term impediments,while at the same time, address short-term macroeconomic issues.The macroeconomic performance of commodity-exporting countries varied widely in 2013. This group of economies faces the prospect of slowing growth in 2014. To counteract this, they should undertakepolicies to accelerate economic diversification.
E
MACROECONOMIC PERFORMANCEAND POLICY CHALLENGES AT
THE SUBREGIONAL LEVEL 2
36
Economic and social survEy of asia and thE pacific 2014
This chapter presents a more disaggregated analysis of macroeconomic performance in 2013 and the prospects for 2014 at the subregional level, withsomediscussioncentredon thecountry level,giventheir policy challenges. In the Survey,theAsia-Pacificregion is divided into five geographic subregions:East and North-East Asia; North and Central Asia; thePacific;SouthandSouth-WestAsia;andSouth-East Asia. An overview of macroeconomic and policy developments in these subregions is followed by more detailed discussions on each subregion.
The East and North-East Asian subregion comprises: China; Democratic People’s Republic ofKorea; Hong Kong, China; Japan; Macao, China;Mongolia; and the Republic of Korea. In this highlytrade-dependent subregion, growth picked up inmost of the economies by mid-2013, as globalgrowthprospects improved. Inparticular,a recoveryin exports to the United States led to increased economic activity. Notable economic-related trends in thesubregionwereasfollows.First,thedecelerationof growth in China in recent years has come to a halt, but as mentioned in chapter 1, the prospectsfor the Chinese economy to return to pre-global crisis growth rates are unlikely unless the economy is rebalanced to be more consumption-led. On the positive side, stimulus announced byChina in earlyApril 2014 should help contain a deceleration in growth. Second, China, Japan and the Republic ofKorea have formulated a range of structural reforms totacklelong-termimpediments.InthecaseofChina,some path-breaking announcements were made to push the economy more towards a market-based system. Japan has been pursuing an aggressiveand exceptional monetary policy stance coupled with strong fiscal stimulus to pull the economy out fromdeflation. This appears to be working as indicatedby recent signs of higher growth and inflation. Thecountry also intends to reform its tax system to address its growing public debt. The Republic ofKorea launched sizeable stimulus measures that focused on promoting corporate investment through tax reductions and job creation by initiating public projects. Third, on the external side, despite anincrease in the second half of 2013, exports for
the year decelerated, which had a negative impacton current account surpluses in some economies. Fourth,althoughthenetimpactsofstructuralreformsare yet to be seen, the strengthening of the globalrecoveryshouldhelpmaintainthesubregion’sgrowthmomentum in 2014.
The North and Central Asian subregion covers Armenia, Azerbaijan, Georgia, Kazakhstan,Kyrgyzstan, the Russian Federation, Tajikistan,TurkmenistanandUzbekistan.Amongthesecountries,there are net energy exporters and non-energy commodity exporters. Subdued global demand for energy, gold and non-precious metals has impededgrowthintheresource-basedeconomies,particularlyin the Russian Federation, which accounts for 80%of the subregion’s GDP. Thus, the economies ofthe subregion as a group grew at a slower pace in 2013 than in 2012. Few important trends are worth highlighting. First, the growth performancewithin thesubregionwasdiverse, ranging from1.3%in the Russian Federation to 10.5% in Kyrgyzstan.Similarly, the inflation rates also varied from 2.4%in Azerbaijan to 12.1% in Uzbekistan. Second, innet energy-importing and remittance-dependent economies, output growth declined as householdspending moderated due to a deceleration in workers’ remittances,adirect resultof theeconomicslowdownintheRussianFederation,thelargesthostof migrant workers in the subregion. Third, upwardadjustments in administered prices pushed inflationhigher in several of the economies in the subregion and applied further pressure on household spending. In response to inflationary pressures, monetarypolicy was tightened in some economies, with theRussian Federation hiking the interest rate by 200basis points. Fourth, a number of the countries inthe subregion increased public spending, especiallyonsocialprogrammes, tosustaindomesticdemand.This led to deteriorations in their fiscal balances.Fifth, on theexternal side, currentaccountbalancesgenerally deteriorated owing to subdued global commodity demand. Despite an expected reboundin theglobal economy in 2014, output growth in thesubregion is not likely to pick up as the economy of theRussianFederation furtherdecelerateson the
37
MacroeconoMic PerforMance and Policy challenges at the subregional level chaPter 2
back of conflict with Ukraine. In the medium term,diversification of economic growth drivers remains amajor challenge for the countries that continue to be highly dependent on commodity exports.
The Pacific subregion includes the Cook Islands,Fiji, Kiribati, the Marshall Islands, the FederatedStates of Micronesia, Nauru, Palau, Papua NewGuinea, Samoa, Solomon Islands, Tonga, Tuvalu,and Vanuatu. Australia and New Zealand are also partof thissubregion.ThePacific islanddevelopingeconomies face unique challenges, including smallpopulations, a poor resource base (except in afewexceptional cases), remoteness from theirmoredevelopedtradingpartners,frequentnaturaldisastersand the adverse impact of global climate change. These economies, as a whole, experienced lowereconomicgrowthin2013,mainlyduetoaneconomicslowdown in the resource-rich economies of Papua NewGuineaandSolomonIslands.Naturaldisastersalso constrained output growth in Fiji and Samoa. Moderating global food and fuel prices helped limitinflation in several of these economies in 2013,althoughoverall inflationincreasedmodestlyonhighpricerisesinPapuaNewGuineaamiditsweakeningcurrency.Budgetarydeficitsweregenerallynotverylarge in 2013 despite some increases in the larger economies. Heavy reliance on imported food and fuel together with limited export capacity generally led to sizeable external current account deficits.Some improvement in the growth performance of this subregion is expected in 2014, in line with themore positive outlook for the global economy and anincreaseinmineraloutputinPapuaNewGuinea.
Australia and New Zealand, the two developedeconomies of the subregion, experienced slowergrowthin2013.Inflationremainedlow,althoughNewZealandwas the first developed country globally toraise interest rates in March 2014 in anticipationof a trend towards higher rates in the United States. Both of these countries are committed to fiscal consolidation in the coming years. In 2014,growth is expected to remain relatively sluggish in Australia on weak mining investments, while NewZealand should record a rebound due to ongoing
reconstruction activities, better prospects for diaryindustry and higher net immigration.
The South and South-West Asian subregion comprises Afghanistan, Bangladesh, Bhutan, India,the Islamic Republic of Iran, Maldives, Nepal,Pakistan, Sri Lanka and Turkey. Economic growthin the subregion picked up slightly in 2013, as theeconomiesofBhutan,India,Maldives,SriLankaandTurkey expanded at a more rapid rate, aided byincreased household spending stemming from steady farm incomes and workers’ remittances. Energyshortages have constrained economic activities in several of these economies and political tensions and security issues capped growth in Afghanistan,Bangladesh,NepalandPakistan.Largefiscaldeficitslimitfiscalmanoeuvrabilitywithinthesubregion.Somedeceleration in the overall inflation rate occurred,but food inflation remained elevated. Meanwhile,the prospects of quantitative easing tapering in the United States triggered capital market volatility in India and Turkey. This underscored weak macroeconomic fundamentals,suchas largecurrentaccountdeficitsfinanced by short-term external borrowings. The large current account deficits are partly a reflectionof large fiscal deficits in the subregion. Monetarypolicy has been tightened to stem capital outflowsand combat financial market volatility. Despite this,economic growth in the subregion is projected to further increase in 2014 due to a stronger global economy.Tacklingsupply-sideconstraints,especiallyenergyshortages,remainsvitalforachievingmedium-term growth.
The South-East Asian subregion covers Brunei Darussalam,Cambodia,Indonesia,theLaoPeople’sDemocratic Republic, Malaysia, Myanmar, thePhilippines, Singapore, Thailand, Timor-Leste andViet Nam. Growth momentum in the subregionslowed somewhat in 2013. The sluggish global economic recovery held back exports, particularlyin the first half of the year. Growth in domesticdemand also decelerated in the large emerging economies, such as Indonesia, due to monetarytightening in response to higher inflation and capital flight. Domestic demand in Thailand was
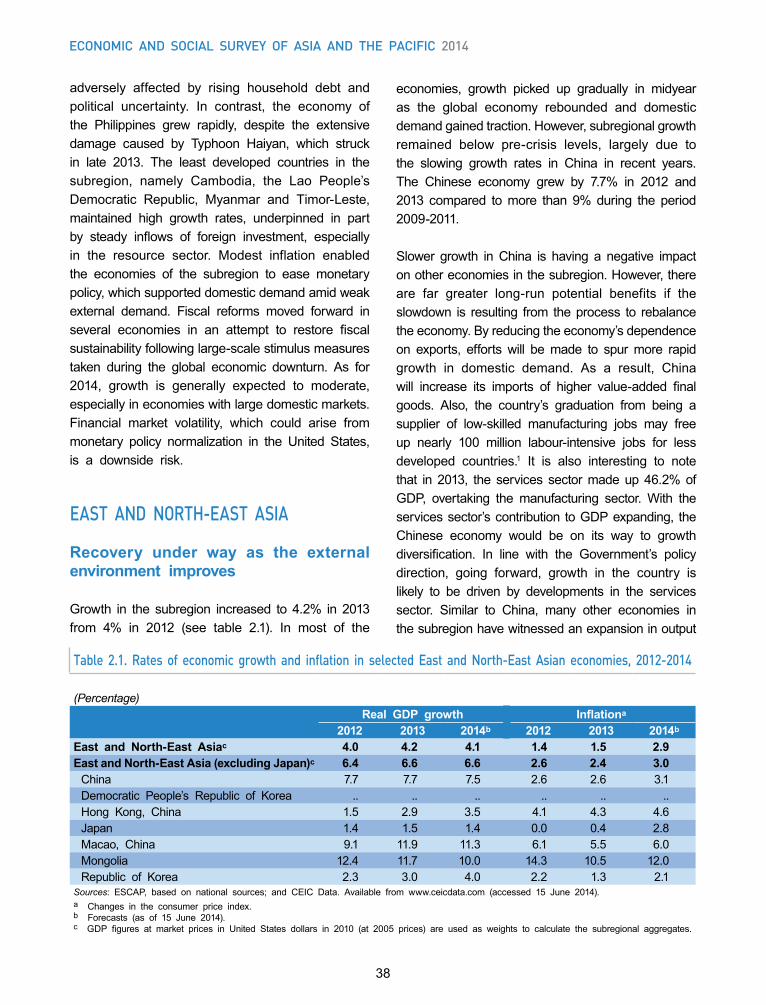
38
Economic and social survEy of asia and thE pacific 2014
adversely affected by rising household debt and political uncertainty. In contrast, the economy ofthe Philippines grew rapidly, despite the extensivedamage caused by Typhoon Haiyan, which struckin late 2013. The least developed countries in the subregion, namely Cambodia, the Lao People’sDemocratic Republic, Myanmar and Timor-Leste,maintained high growth rates, underpinned in partby steady inflows of foreign investment, especiallyin the resource sector. Modest inflation enabledthe economies of the subregion to ease monetary policy,whichsupporteddomesticdemandamidweakexternal demand. Fiscal reforms moved forward in several economies in an attempt to restore fiscalsustainability following large-scale stimulus measures taken during the global economic downturn. As for 2014, growth is generally expected to moderate,especially in economies with large domestic markets. Financial market volatility, which could arise frommonetary policy normalization in the United States,is a downside risk.
EAST AND NORTH-EAST ASIA
Recovery under way as the external environment improves
Growth in the subregion increased to 4.2% in 2013from 4% in 2012 (see table 2.1). In most of the
economies, growth picked up gradually in midyearas the global economy rebounded and domestic demandgainedtraction.However,subregionalgrowthremained below pre-crisis levels, largely due tothe slowing growth rates in China in recent years. The Chinese economy grew by 7.7% in 2012 and2013 compared tomore than 9%during the period2009-2011.
Slower growth in China is having a negative impact onothereconomiesinthesubregion.However,thereare far greater long-run potential benefits if the slowdown is resulting from the process to rebalance theeconomy.Byreducingtheeconomy’sdependenceon exports, efforts will bemade to spurmore rapidgrowth in domestic demand. As a result, Chinawill increase its imports of higher value-added finalgoods. Also, the country’s graduation from being asupplier of low-skilled manufacturing jobs may free up nearly 100 million labour-intensive jobs for less developed countries.1 It is also interesting to note that in 2013, the services sectormadeup 46.2%ofGDP, overtaking the manufacturing sector. With theservicessector’scontribution toGDPexpanding, theChinese economy would be on its way to growth diversification. In line with the Government’s policydirection, going forward, growth in the country islikely to be driven by developments in the services sector. Similar to China, many other economies inthe subregion have witnessed an expansion in output
Table 2.1. Rates of economic growth and inflation in selected East and North-East Asian economies, 2012-2014
(Percentage)Real GDP growth Inflationa
2012 2013 2014b 2012 2013 2014b
East and North-East Asiac 4.0 4.2 4.1 1.4 1.5 2.9East and North-East Asia (excluding Japan)c 6.4 6.6 6.6 2.6 2.4 3.0
China 7.7 7.7 7.5 2.6 2.6 3.1Democratic People’s Republic of Korea .. .. .. .. .. ..Hong Kong, China 1.5 2.9 3.5 4.1 4.3 4.6Japan 1.4 1.5 1.4 0.0 0.4 2.8Macao, China 9.1 11.9 11.3 6.1 5.5 6.0Mongolia 12.4 11.7 10.0 14.3 10.5 12.0Republic of Korea 2.3 3.0 4.0 2.2 1.3 2.1
Sources: ESCAP, based on national sources; and CEIC Data. Available from www.ceicdata.com (accessed 15 June 2014).a Changes in the consumer price index.b Forecasts (as of 15 June 2014).c GDP figures at market prices in United States dollars in 2010 (at 2005 prices) are used as weights to calculate the subregional aggregates.
39
MacroeconoMic PerforMance and Policy challenges at the subregional level chaPter 2
from their services sector. The share of the industrial sectorinGDPdecreasedinJapan,HongKong,Chinaand Macao, China, and remained largely stable inChinaandtheRepublicofKorea.Withtheexceptionof Mongolia, which is promoting agricultural outputin an effort to diversify the economy and reduce dependence on the mineral sector, the agriculturesector in all of the export-oriented economies in the subregion continued to shrink in recent years.
In 2013, the deceleration of growth over the pastfewyearscame toahalt inChina,as theeconomyexpanded by 7.7%, unchanged from the previousyear. Growth in 2013 was driven by consumptionandinvestment,whileprivateconsumptionremainedrelatively low, at only one-third of GDP, comparedto an average of 55% of GDP in other emergingAsia-Pacific economies. In contrast, investmentlevels remained high as a number of infrastructure projects were initiated around midyear. Investments in the propertymarket were also robust, helped byrapid credit expansion from the shadow banking sector and off-balance sheet commercial banks’transactions. Rising pressures on credit growthresulted in higher interbank lending rates, thoughit was encouraging that liquidity in non-housing sectorswasnotaffected.Nevertheless,rapidgrowthin shadow banking and off-balance sheet activities in recent years, as well as the possible propertybubble are matters of concerns. The authorities in China are cognizant of this and have taken measures to curb the risks arising from rapid growth of the sector. It should also be mentioned that the nature and content of shadow banking in China differ from westerncountries.Shadowbanking inChina,whichismainly composed of trust funds, is typically usedto finance riskier borrowers and transactions thatbanks cannot undertake due to regulations. Thus,shadow banking potentially could support the real economy. Moreover, shadow banking finances onlya small part of total credit in China.
Gross national savings in China remained excep- tionallyhigh,at51.4%ofGDP,in2013.Eventhoughprivate consumption during the past two decades expanded about 8% per annum, it was outstripped
by growth in savings. The high savings, in turn,funded rapid capital formation. Meanwhile, grossinvestmentexpandedbymore than12%annually inthe past few decades and as a result, its share ofGDP increased fromabout 38% in the early 1990sto 48.9% in 2013 (see figure2.1). Thehigh savingsand investment in China has been a topic of much debate as it is closely linked with transforming the economy to be more consumption-oriented. Manyattribute the excessive saving behaviour to rising housing prices and an inadequate social protection system.Inthisregard,accesstoaffordablefinancingoptions and stronger social safety measures would help relieve the need for high savings and boost private consumption.
Access to affordable financing options and stronger social safety measures would help relieve the need for high
savings and boost private consumption
Hong Kong, China enjoyed a stronger growthperformance of 2.9% in 2013, as compared with1.5%in2012.Robustprivateconsumptionremaineda key driver of the expansion, although inboundtourism was also an important factor. Merchandiseexportswereweak,as shipments to Japanand theUnited States declined.Wage pressures increased,butinflationremainedstable,thusboostinghouseholdreal incomes. Although the overall labour market appeared strong, the youth unemployment rateremained greater than 8%.
GrowthinMacao,Chinaacceleratedto11.9%in2013.Strong tourism growth spurred economic activities,with both arrivals and spending per visitor rising by about 5%. Private consumption expanded steadily,while fixed investment, mainly in the constructionsector, jumped by 15.1% and contributed markedlyto the overall growth of the economy.
TheDemocraticPeople’sRepublicofKoreareleaseslimited official economic data. Its economy is highlydependent on the agriculture sector and exports of light industry products and minerals. Favourable
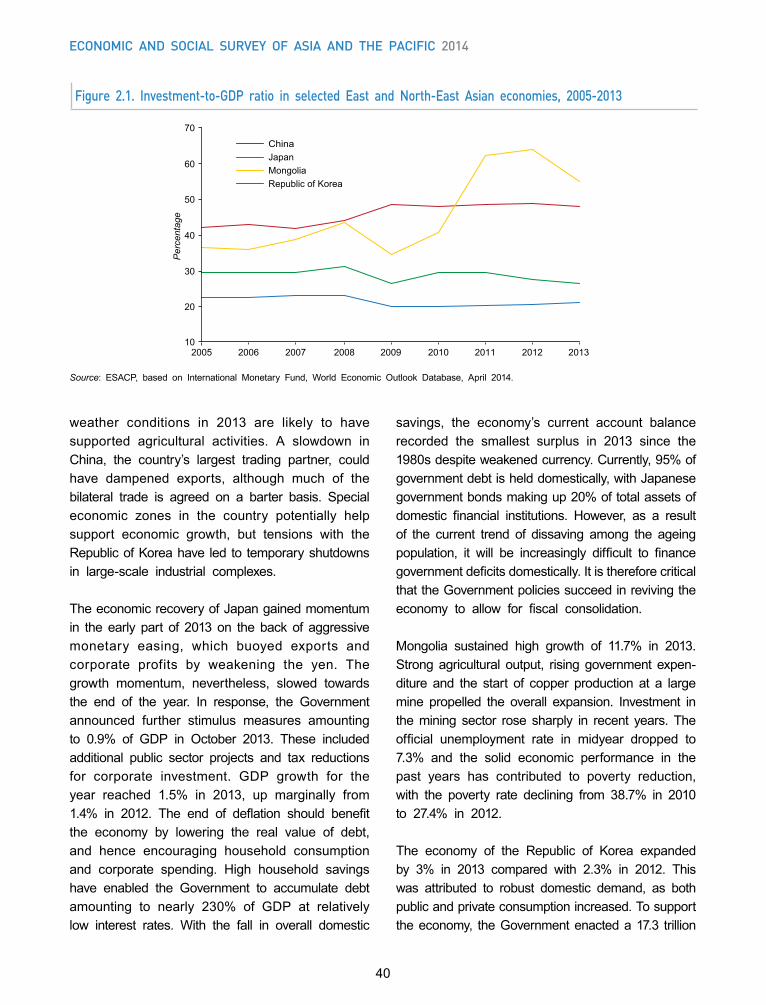
40
Economic and social survEy of asia and thE pacific 2014
weather conditions in 2013 are likely to have supported agricultural activities. A slowdown in China, the country’s largest trading partner, couldhave dampened exports, although much of thebilateral trade is agreed on a barter basis. Special economic zones in the country potentially help support economic growth, but tensions with theRepublicofKoreahave led to temporaryshutdownsin large-scale industrial complexes.
The economic recovery of Japangainedmomentumin the early part of 2013 on the back of aggressive monetary easing, which buoyed exports andcorporate profits by weakening the yen. The growth momentum, nevertheless, slowed towardsthe end of the year. In response, the Governmentannounced further stimulus measures amounting to 0.9% of GDP in October 2013. These includedadditional public sector projects and tax reductions for corporate investment. GDP growth for theyear reached 1.5% in 2013, up marginally from1.4% in 2012. The end of deflation should benefitthe economy by lowering the real value of debt,and hence encouraging household consumption and corporate spending. High household savings have enabled the Government to accumulate debtamounting to nearly 230% of GDP at relativelylow interest rates. With the fall in overall domestic
savings, the economy’s current account balancerecorded the smallest surplus in 2013 since the 1980sdespiteweakenedcurrency.Currently,95%ofgovernmentdebtishelddomestically,withJapanesegovernmentbondsmakingup20%oftotalassetsofdomestic financial institutions. However, as a resultof the current trend of dissaving among the ageing population, it will be increasingly difficult to financegovernmentdeficitsdomestically.ItisthereforecriticalthattheGovernmentpoliciessucceedinrevivingtheeconomy to allow for fiscal consolidation.
Mongolia sustained high growth of 11.7% in 2013.Strongagricultural output, rising government expen- diture and the start of copper production at a large mine propelled the overall expansion. Investment in the mining sector rose sharply in recent years. The official unemployment rate in midyear dropped to7.3% and the solid economic performance in thepast years has contributed to poverty reduction,with the poverty rate declining from 38.7% in 2010to 27.4% in 2012.
The economy of the Republic of Korea expandedby 3% in 2013 compared with 2.3% in 2012. Thiswas attributed to robust domestic demand, as bothpublic and private consumption increased. To support theeconomy, theGovernmentenacteda17.3 trillion
Source: ESACP, based on International Monetary Fund, World Economic Outlook Database, April 2014.
Figure 2.1. Investment-to-GDP ratio in selected East and North-East Asian economies, 2005-2013
10
20
30
40
50
60
70
2005 2006 2007 2008 2009 2010 2011 2012 2013
Per
cent
age
ChinaJapanMongoliaRepublic of Korea
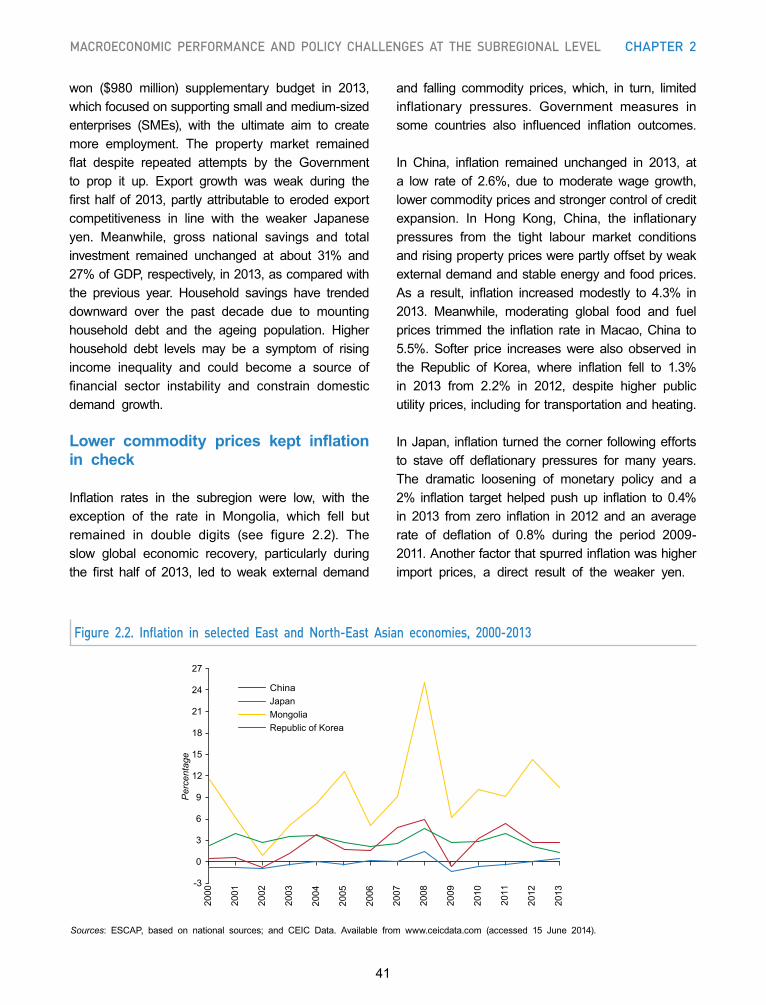
41
MacroeconoMic PerforMance and Policy challenges at the subregional level chaPter 2
won ($980 million) supplementary budget in 2013,which focused on supporting small and medium-sized enterprises (SMEs), with the ultimate aim to createmore employment. The property market remained flat despite repeated attempts by the Governmentto prop it up. Export growth was weak during the firsthalf of2013,partlyattributable toerodedexportcompetitiveness in line with the weaker Japaneseyen. Meanwhile, gross national savings and totalinvestment remained unchanged at about 31% and27%ofGDP,respectively,in2013,ascomparedwiththe previous year. Household savings have trended downward over the past decade due to mounting household debt and the ageing population. Higher household debt levels may be a symptom of rising income inequality and could become a source of financial sector instability and constrain domesticdemand growth.
Lower commodity prices kept inflation in check
Inflation rates in the subregion were low, with theexception of the rate in Mongolia, which fell butremained in double digits (see figure 2.2). Theslow global economic recovery, particularly duringthe first half of 2013, led to weak external demand
and falling commodity prices, which, in turn, limitedinflationary pressures. Government measures insome countries also influenced inflation outcomes.
In China, inflation remained unchanged in 2013, ata low rate of 2.6%, due tomoderate wage growth,lower commodity prices and stronger control of credit expansion. In Hong Kong, China, the inflationarypressures from the tight labour market conditions and rising property prices were partly offset by weak external demand and stable energy and food prices. As a result, inflation increasedmodestly to 4.3% in2013. Meanwhile, moderating global food and fuelprices trimmed the inflation rate inMacao,China to5.5%.Softer price increaseswere also observed inthe Republic of Korea, where inflation fell to 1.3%in 2013 from 2.2% in 2012, despite higher publicutilityprices,includingfortransportationandheating.
InJapan, inflationturnedthecorner followingeffortsto stave off deflationary pressures for many years.The dramatic loosening of monetary policy and a 2% inflation target helpedpushup inflation to 0.4%in 2013 from zero inflation in 2012 and an averagerate of deflation of 0.8% during the period 2009-2011.Anotherfactorthatspurredinflationwashigherimport prices, a direct result of the weaker yen.
Sources: ESCAP, based on national sources; and CEIC Data. Available from www.ceicdata.com (accessed 15 June 2014).
Figure 2.2. Inflation in selected East and North-East Asian economies, 2000-2013
-3
0
3
6
9
12
15
18
21
24
27
2000
2001
2002
2003
2004
2005
2006
2007
2008
2009
2010
2011
2012
2013
Per
cent
age
ChinaJapanMongoliaRepublic of Korea
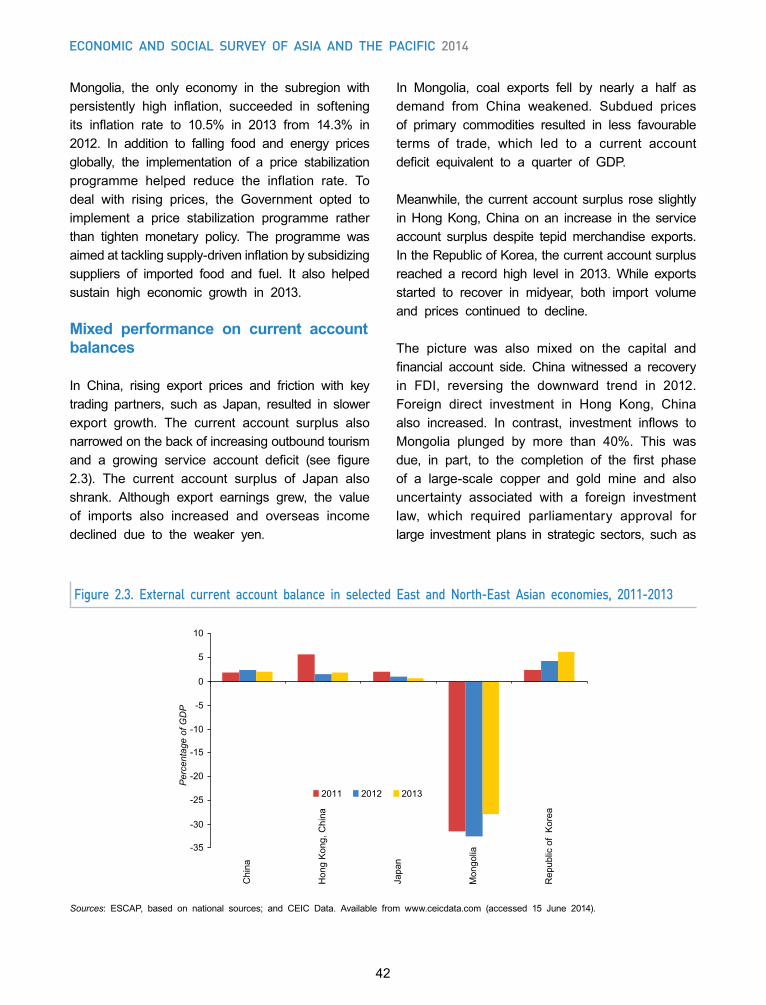
42
Economic and social survEy of asia and thE pacific 2014
Mongolia, the only economy in the subregion withpersistently high inflation, succeeded in softeningits inflation rate to 10.5% in 2013 from 14.3% in2012. In addition to falling food and energy prices globally, the implementation of a price stabilizationprogramme helped reduce the inflation rate. To deal with rising prices, the Government opted toimplement a price stabilization programme rather than tighten monetary policy. The programme was aimedattacklingsupply-driveninflationbysubsidizingsuppliers of imported food and fuel. It also helped sustain high economic growth in 2013.
Mixed performance on current account balances
In China, rising export prices and friction with keytrading partners, such as Japan, resulted in slowerexport growth. The current account surplus also narrowed on the back of increasing outbound tourism and a growing service account deficit (see figure2.3). The current account surplus of Japan alsoshrank. Although export earnings grew, the valueof imports also increased and overseas income declined due to the weaker yen.
Figure 2.3. External current account balance in selected East and North-East Asian economies, 2011-2013
Sources: ESCAP, based on national sources; and CEIC Data. Available from www.ceicdata.com (accessed 15 June 2014).
In Mongolia, coal exports fell by nearly a half asdemand from China weakened. Subdued prices of primary commodities resulted in less favourable terms of trade, which led to a current accountdeficit equivalent to a quarter of GDP.
Meanwhile, thecurrentaccountsurplus roseslightlyinHongKong,China on an increase in the serviceaccount surplus despite tepid merchandise exports. IntheRepublicofKorea,thecurrentaccountsurplusreached a record high level in 2013.While exportsstarted to recover in midyear, both import volumeand prices continued to decline.
The picture was also mixed on the capital and financial account side. China witnessed a recoveryin FDI, reversing the downward trend in 2012.Foreign direct investment in Hong Kong, Chinaalso increased. In contrast, investment inflows toMongolia plunged by more than 40%. This wasdue, in part, to the completion of the first phaseof a large-scale copper and gold mine and also uncertainty associated with a foreign investment law, which required parliamentary approval forlarge investment plans in strategic sectors, such as
-35
-30
-25
-20
-15
-10
-5
0
5
10
Chi
na
Hon
g K
ong,
Chi
na
Japa
n
Mon
golia
Rep
ublic
of
Kor
ea
Per
cent
age
of G
DP
2011 2012 2013
43
MacroeconoMic PerforMance and Policy challenges at the subregional level chaPter 2
minerals and finance. While the Government hassince introduced a new investment law that reduces theuncertaintyassociatedwiththeapprovalprocess,the balance between protecting long-term interest in key industries and attracting foreign investment needs to be carefully pursued.
Currencies in the subregion also moved in different directions. The Korean won appreciated against the United States dollar in 2013 as the country’s tradesurplus increased, but trading in the currency wasvolatile due to heightened global financial marketuncertainty arising from potential changes in the UnitedStatesmonetarypolicy.Recently,theChineseyuan has been trending higher, partly due to theliberalizationoftheexchangerate.TheJapaneseyenfell to a four-year low as the currency depreciated by 22% against the United States dollar by end of2013 as a result of extraordinary monetary easing.
Policy responses and structural reforms: promotion of sustained growth
With slower growth relative to the past trend andcontinued global economic uncertainty, macro- economic policies in the subregion focused on supporting growth through different means.
As discussed in chapter 1, in China, a bold reformpackage was released in November 2013 with an underlying theme to make the economy more balanced, sustainable, market-oriented and efficient.These reforms include accelerating the pace of interest rate liberalization and convertibility of the Chinese yuan.Also,manyof the long-standing issuesrelatedto state-owned enterprises are addressed in the reform package, such as allowing private investors to takepart in State investment projects and breaking all forms of administrativemonopolies, while increasingtheState’s contribution to public services.Measuresto tackle increasing inequality between rural and urban areas are also part of the reforms.
The two-decade battle Japan had with sluggisheconomic growth and deflation appeared to haveturned the corner in 2013 as the Government’s
three-pronged approach to revive the economy took effect. As highlighted in chapter 1, massivefiscal stimulus, more aggressive monetary easingand structural reforms resulted in positive inflationand improved growth. The initial positive results of monetary easing and fiscal stimulus packages willbe followed up with structural reform measures to increase the growth trajectory. These measures are aimed at, among other things, addressing labourmarket rigidities and deregulating the public utilities. TheJapaneseeconomystill facesmanychallenges,including mitigating the impact of the consumption tax hike introduced in April 2014.
Japan’s battle against sluggish growth and deflation has turned the corner
The Republic of Korea pursued policies aimed atreducing its dependence on exports and raising productivity in the services sector. Under an overall plan to raise theeconomy’spotential growth rate to4%, increase annual per capita income to $40,000and boost the share of employed persons in working-age population to 70% by 2017, the Governmentadoptedthreestrategies:(a) tostrengtheneconomicfundamentals;(b)topromotecreativityanddynamism;and (c) toboostdomesticdemand.Specificpoliciesinclude rolling back regulations, particularly thosethat are applicable to the services sector, shoringup the tax base while giving more tax benefits to startups and providing incentives to hire more women and youth.
Monetary policy remained accommodative in mosteconomies in the subregion. However, in China,growing concerns over shadow banking led to a hike in interest rates during which the 7-day repo ratejumpedtoarecord12%andtheovernightreporeached 25% in mid-2013. Interest rates declined in early 2014 as the central bank injected more than $42 billion into the economy to meet cashdemand.
The Bank of Japan continued its money marketoperations, which raised the money base by 60
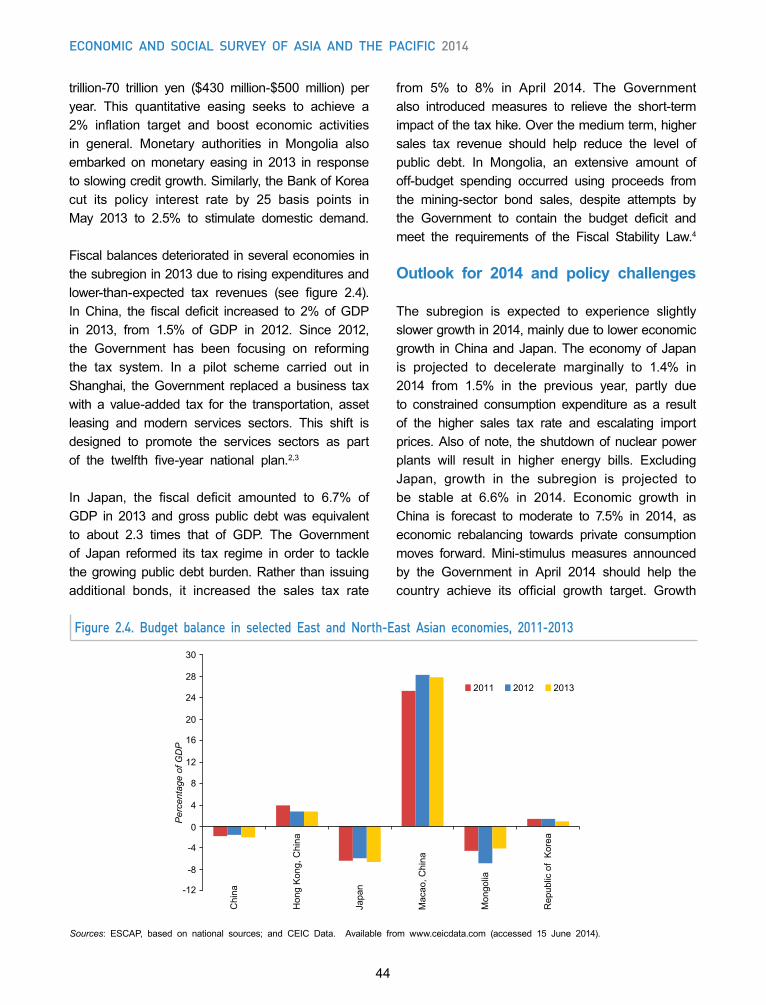
44
Economic and social survEy of asia and thE pacific 2014
trillion-70 trillion yen ($430 million-$500 million) peryear. This quantitative easing seeks to achieve a 2% inflation target and boost economic activitiesin general. Monetary authorities in Mongolia alsoembarked on monetary easing in 2013 in response toslowingcreditgrowth.Similarly,theBankofKoreacut its policy interest rate by 25 basis points in May 2013 to 2.5% to stimulate domestic demand.
Fiscal balances deteriorated in several economies in the subregion in 2013 due to rising expenditures and lower-than-expected tax revenues (see figure 2.4).InChina, the fiscal deficit increased to 2% ofGDPin 2013, from 1.5% of GDP in 2012. Since 2012,the Government has been focusing on reformingthe tax system. In a pilot scheme carried out in Shanghai, theGovernment replaceda business taxwith a value-added tax for the transportation, assetleasing and modern services sectors. This shift is designed to promote the services sectors as part of the twelfth five-year national plan.2,3
In Japan, the fiscal deficit amounted to 6.7% ofGDP in 2013 and gross public debtwas equivalentto about 2.3 times that of GDP. The Governmentof Japan reformed its tax regime in order to tacklethegrowingpublicdebtburden.Rather than issuingadditional bonds, it increased the sales tax rate
Sources: ESCAP, based on national sources; and CEIC Data. Available from www.ceicdata.com (accessed 15 June 2014).
Figure 2.4. Budget balance in selected East and North-East Asian economies, 2011-2013
from 5% to 8% in April 2014. The Governmentalso introduced measures to relieve the short-term impactofthetaxhike.Overthemediumterm,highersales tax revenue should help reduce the level of public debt. In Mongolia, an extensive amount ofoff-budget spending occurred using proceeds from the mining-sector bond sales, despite attempts bythe Government to contain the budget deficit andmeet the requirements of the Fiscal Stability Law.4
Outlook for 2014 and policy challenges
The subregion is expected to experience slightly slowergrowthin2014,mainlyduetolowereconomicgrowth inChinaandJapan.TheeconomyofJapanis projected to decelerate marginally to 1.4% in2014 from 1.5% in the previous year, partly dueto constrained consumption expenditure as a result of the higher sales tax rate and escalating import prices.Alsoofnote, theshutdownofnuclearpowerplants will result in higher energy bills. Excluding Japan, growth in the subregion is projected tobe stable at 6.6% in 2014. Economic growth inChina is forecast to moderate to 7.5% in 2014, aseconomic rebalancing towards private consumption moves forward. Mini-stimulus measures announcedby the Government in April 2014 should help thecountry achieve its official growth target. Growth
-12
-8
-4
0
4
8
12
16
20
24
28
30
Chi
na
Hon
g K
ong,
Chi
na
Japa
n
Mac
ao, C
hina
Mon
golia
Rep
ublic
of
Kor
ea
Per
cent
age
of G
DP
2011 2012 2013
45
MacroeconoMic PerforMance and Policy challenges at the subregional level chaPter 2
projections for China and Japan are discussed indetail in chapter 1.
The Republic of Korea is projected to grow morerapidly, at 4%, in 2014. A rebound in exports todeveloped markets should cushion the impact of a slowdown in China. Continued weakness in the real estate market and record levels of household debt are immediate challenges. In the medium term, improving productivity and income growthin the services sector and smaller firms is key toenhancing domestic demand. Most new servicesjobs are in low value-added sectors, such as retail,real estate and transportation. An incentive structure within a proper regulatory framework that supports high value-added services, such as banking andhealth care, could be promoted.
EconomicgrowthinMongoliaisexpectedtomoderateto 10% in 2014. The economy faces variouschallenges, including a sizeable deficit in externalbalances, resulting fromdecliningFDIand lowercoalexports to China. The lack of reliable and efficientrail transport has dented the export competitiveness of primary commodities to China. Export product and market diversification can help boost exports.
Employment for the elderly is becoming important given population ageing
Limited number of quality jobs for the elderlypopulation is one of the growing concerns in the subregion. Due to population ageing, employmentin the age group of 55-64 years has been steadily increasing.However,moreelderlyworkershavelow-paid jobs, are self-employed or are in the informalsector. As a result, poverty among the elderly ishigh. According to a recent official survey, nearlya quarter of all Chinese aged over 60 years live in poverty.5 A report by the OECD also showsthat more than 30% of people aged 65 and overin Hong Kong, China earn less than half of thenational median income. The elderly poverty rate is higher in the Republic of Korea. It stood at 48.6%in 2011, four percentage points higher than the
rate in 2007. Given the rapid growth of the elderlypopulation,thereisanurgentneedforthesubregionto examine the sustainability and effectiveness of national pension schemes.
The subregion also faces a number of environmental challenges due to, among other things, its rapidindustrialization and urbanization in the past decades. In box 2.1, the role of urban planning in achievingmore sustainable development is highlighted.
NORTH AND CENTRAL ASIA
Slower economic growth due to subdued commodity prices
Growth in the North and Central Asian subregionas a whole slowed to 2.1% in 2013 from 3.8% in2012 (see table 2.2). Many of the economies inthe subregion were affected by the sluggish global economic recovery due to their high dependence on exports of oil, gas, metals and other commodities.Also, as a result of strong economic linkages,particularly through remittances received from the Russian Federation and to a lesser extent fromKazakhstan, the slowdown in net energy exportersadversely affected consumer spending and GDPgrowth in the energy-importing and remittance-dependent economies in which the services sector comprised the largest share of the economy.
In Armenia, growth declined to 3.5% in 2013 froma high base of 7.2% in 2012. Softer internationalmetal prices largely underpinned the slowdown. Construction activities continued to shrink, as thesector has yet to recover from the slump resulting fromtheglobalfinancialcrisis.Onthedemandside,the contribution of private consumption to growth slowed in line with higher prices for imported gas and declines in real wages. A survey conducted by thecentralbanksuggeststhatconsumerconfidencewas at its lowest level since 2009.
Economic growth in Azerbaijan strengthened to 5.8% in 2013 from 2.2% in 2012. Non-oil sectors,
46
Economic and social survEy of asia and thE pacific 2014
Box 2.1. The role of low-carbon cities to promote sustainable development in East and North-East Asia
China, Japan and the Republic of Korea are among the world’s top importers of fossil fuels. Together, they account for about a quarter of global greenhouse gas emissions. Enhancing energy consumption efficiency is thus vital in East and North-East Asia. This box discusses how low-carbon cities help promote sustainable development in the subregion.
Cities are home to about half of humanity or around 3.5 billion people worldwide.a The share of urban population in East and North-East Asia is estimated to rise to more than 70% by the next decade.b By 2030, China alone is likely to have an additional 400 million city dwellers. About 220 Chinese cities will have more than one million residents.c The damaging effects on climate change can be significant since cities emit around 70% of total greenhouse gas emissions, while they occupy only 2% of the global land area.d
Despite these grim statistics, cities are uniquely positioned to tackle climate change by achieving greater efficiencies through better urban planning and greater citizen participation. Furthermore, many cities in the Asia-Pacific region are at a crossroads in developing and expanding infrastructure in support of economic growth. These choices made in urban infrastructure development will have a major influence on climate change.
Some of the key factors influencing energy use and carbon dioxide emissions are the compactness of urban settlements, nature of transportation systems, income and lifestyle, industrial process, construction technologies and waste disposal methods. In East and North-East Asia, income and lifestyle changes, such as the rapid increase in the number of vehicles, are cited as a major factor.e There are various ways cities can contribute to climate change mitigation, including by developing urban transport systems that support walking and cycling, constructing more eco-friendly buildings, and managing solid waste in a way that maximizes recycling and reuse. Structured tax incentives and emissions trading programmes can also be used to reduce the carbon intensity of urban industries.
Many cities in China, Japan and the Republic of Korea have set goals and taken steps to reduce greenhouse gas emissions. For example, in Hangzhou, China, the government has announced an ambitious plan to cut emissions by half. At the national level, the twelfth five-year plan targets a reduction in energy and carbon intensity by up to 17%.f An example of an initiative on low-carbon cities undertaken by Japan is the Bill of Basic Act on Global Warming Countermeasures. In the Republic of Korea, these initiatives are the Low Carbon, Green Growth Basic Act and Urban Planning Guidelines for Low-Carbon Green Growth.
a World Bank (2013a).b United Nations (2005).c Mckinsey Global Institute (2009).d United Nations (2011a).e Dhakal (2004).f China (2011).
whichaccountforabouthalfofGDP,ledtheupturn.This was especially seen in service activities; for example, the restaurants subsector was buoyed byimproving household demand and the construction industry benefitted from government spending oninfrastructure projects. Jobs created in the privatesector accounted for up to 40% of the new jobs.
Output growth in Georgia slowed to 3.2% in 2013from a high base of 6.2% in 2012. Domesticdemand, particularly government spending andprivate investment, weakened as a result ofpolitical uncertainty related to the general elections held in October 2013. The slowdown was broad-based, affecting such subsectors as agricultural,

47
MacroeconoMic PerforMance and Policy challenges at the subregional level chaPter 2
Table 2.2. Rates of economic growth and inflation in North and Central Asian economies, 2012-2014
(Percentage)Real GDP growth Inflationa
2012 2013 2014b 2012 2013 2014b
North and Central Asiac 3.8 2.1 1.3 5.1 6.7 5.5North and Central Asia (excluding Russian Federation)c 5.5 6.5 6.1 5.3 6.0 8.2
Armenia 7.2 3.5 4.5 2.6 5.8 5.0Azerbaijan 2.2 5.8 5.0 1.1 2.4 4.0Georgia 6.2 3.2 5.0 -0.9 -0.5 4.0Kazakhstan 5.0 6.0 5.4 5.1 5.8 9.3Kyrgyzstan -0.9 10.5 6.5 2.8 6.6 7.2Russian Federation 3.5 1.3 0.5 5.1 6.8 5.0Tajikistan 7.5 7.5 6.0 5.8 5.1 7.2Turkmenistan 11.1 10.1 10.4 8.5 9.0 11.0Uzbekistan 8.2 8.0 8.1 13.2 12.1 11.0
Sources: ESCAP, based on national sources; Interstate Statistical Committee of the Commonwealth of Independent States. Available from www.cisstat.com (accessed 15 June 2014); CEIC Data. Available from www.ceicdata.com (accessed 15 June 2014); and Economist Intelligence Unit,Country Reports.a Changes in the consumer price index.b Forecasts (as of 15 June 2014).c GDP figures at market prices in United States dollars in 2010 (at 2005 prices) are used as weights to calculate the subregional aggregates.
manufacturingandtrade.Despiteageneralincreaseinwage levels, weak employment prospects furtherhampered domestic demand.
Kazakhstan enjoyed more rapid economic growth of 6% in 2013 compared with 5% in the previousyear. Better agricultural performance and solid private consumption, supported by accommodativecredit policies for consumers, contributed to highergrowth. However, consumer loans by commercialbanks increased at the expense of credit extended to small businesses. Export earnings were weak on the back of sluggish world demand for oil. On the supply side, services sectors, such as trade andtransport, contributed significantly to output growth.Strong economic growth has led to job creation,but youth unemployment remains relatively high.
The economy of Kyrgyzstan staged a turnaround from a contraction of 0.9% in 2012 to 10.5% growth in2013. Gold production, which accounted for almosthalfofindustrialproduction,jumpedastheproductionproblems and labour tensions that depressed gold output in 2012 eased. The agriculture sector performed better too. The economy also benefitedfrom higher household consumption, resulting fromrobust employment and rising remittance inflows,
albeit at a slower pace. This was reflected in theimproved performance of the domestic retail trade sector.
In theRussianFederation,GDPgrowthdeceleratedfurther from 3.5% in 2012 to a four-year low of1.3% in 2013. Hydrocarbon exports were anaemicand related sectors, such as trade, industry andfinance,experiencedaslowdownonthebackofthesluggish global economy. Although capacity utilization was close to its pre-crisis level, fixed investmentremained weak as several public investment projects were completed. The economy was supported mainly by household consumption, which benefited fromeasy access to consumer loans and higher real wages. Growth performances in other countriesin the subregion, especially net energy importers,tend to be strongly linked to that of the RussianFederation through trade and workers’ remittances.
Tajikistan sustained high growth of 7.5% in 2013.Remittance inflows, which accounted for nearlyhalf of GDP, propelled household consumption.Similar to a number of other economies in the subregion, agricultural production was strong dueto large grain harvests, which helped contain foodinflation. Industrial activities were weaker, owing to
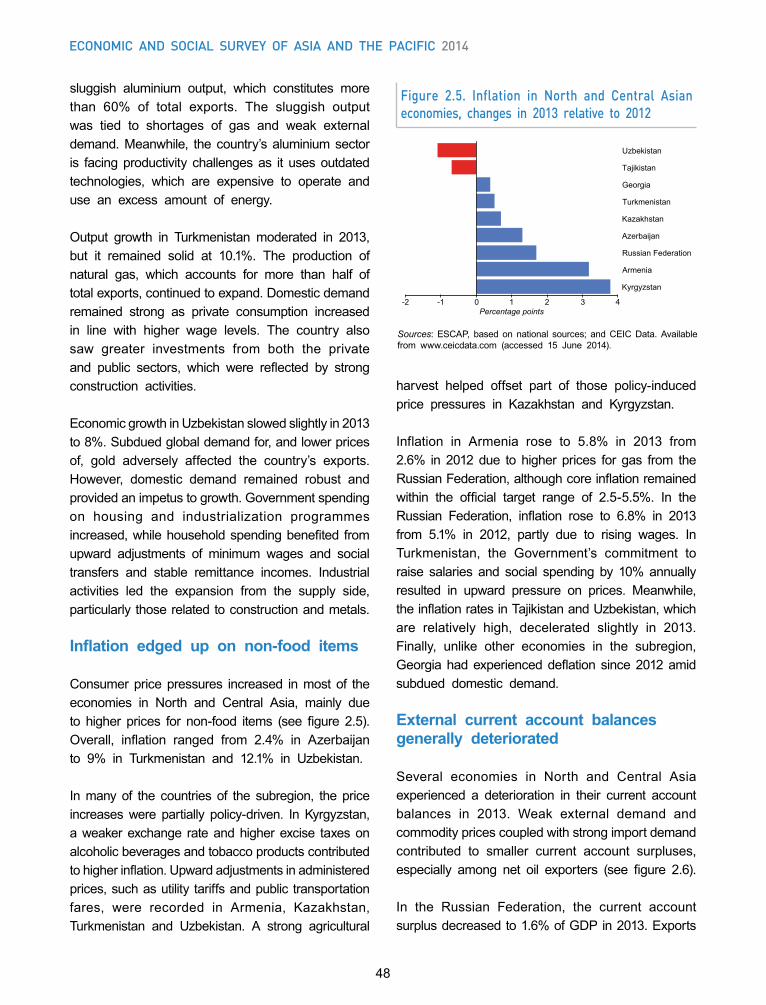
48
Economic and social survEy of asia and thE pacific 2014
sluggish aluminium output, which constitutes morethan 60% of total exports. The sluggish outputwas tied to shortages of gas and weak external demand.Meanwhile, thecountry’saluminiumsectoris facing productivity challenges as it uses outdated technologies, which are expensive to operate anduse an excess amount of energy.
Output growth in Turkmenistan moderated in 2013,but it remained solid at 10.1%. The production ofnatural gas, which accounts for more than half oftotalexports,continuedtoexpand.Domesticdemandremained strong as private consumption increased in line with higher wage levels. The country also saw greater investments from both the private and public sectors, which were reflected by strongconstruction activities.
Economic growth in Uzbekistan slowed slightly in 2013 to8%.Subduedglobaldemandfor,andlowerpricesof, gold adversely affected the country’s exports.However, domestic demand remained robust andprovidedanimpetustogrowth.Governmentspendingon housing and industrialization programmes increased,whilehouseholdspendingbenefited fromupward adjustments of minimum wages and social transfers and stable remittance incomes. Industrial activities led the expansion from the supply side,particularly those related to construction and metals.
Inflation edged up on non-food items
Consumer price pressures increased in most of the economies in North and Central Asia, mainly dueto higher prices for non-food items (see figure 2.5).Overall, inflation ranged from 2.4% in Azerbaijanto 9% in Turkmenistan and 12.1% in Uzbekistan.
Inmany of the countries of the subregion, the priceincreases were partially policy-driven. In Kyrgyzstan,a weaker exchange rate and higher excise taxes on alcoholic beverages and tobacco products contributed tohigherinflation.Upwardadjustmentsinadministeredprices,suchasutility tariffsandpublic transportationfares, were recorded in Armenia, Kazakhstan,Turkmenistan and Uzbekistan. A strong agricultural
harvest helped offset part of those policy-induced price pressures in Kazakhstan and Kyrgyzstan.
Inflation in Armenia rose to 5.8% in 2013 from2.6% in 2012due to higher prices for gas from theRussianFederation,althoughcoreinflationremainedwithin the official target range of 2.5-5.5%. In theRussian Federation, inflation rose to 6.8% in 2013from 5.1% in 2012, partly due to rising wages. InTurkmenistan, the Government’s commitment toraise salaries and social spending by 10%annuallyresulted in upward pressure on prices. Meanwhile,theinflationratesinTajikistanandUzbekistan,whichare relatively high, decelerated slightly in 2013.Finally, unlike other economies in the subregion,Georgiahadexperienceddeflationsince2012amidsubdued domestic demand.
External current account balances generally deteriorated
Several economies in North and Central Asia experienced a deterioration in their current account balances in 2013. Weak external demand andcommodity prices coupled with strong import demand contributed to smaller current account surpluses,especially among net oil exporters (see figure 2.6).
In the Russian Federation, the current accountsurplusdecreasedto1.6%ofGDPin2013.Exports
Sources: ESCAP, based on national sources; andCEICData. Availablefrom www.ceicdata.com (accessed 15 June 2014).
Figure 2.5. Inflation in North and Central Asian economies, changes in 2013 relative to 2012
-2 -1 0 1 2 3 4
Kyrgyzstan
Armenia
Russian Federation
Azerbaijan
Kazakhstan
Turkmenistan
Georgia
Tajikistan
Uzbekistan
Percentage points
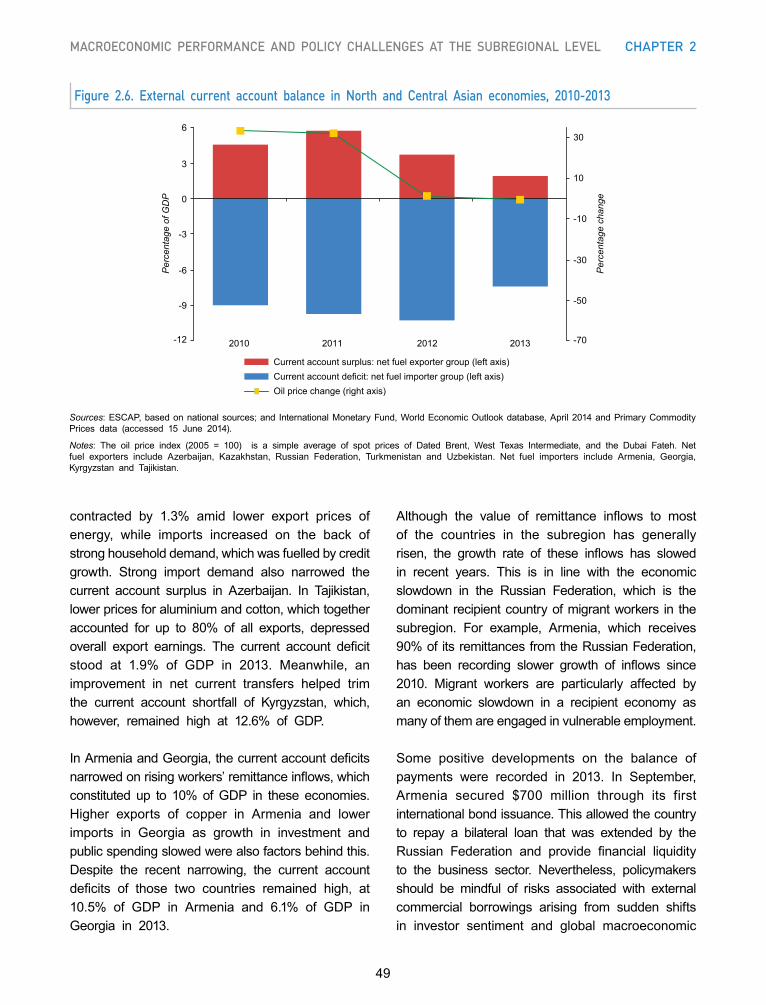
49
MacroeconoMic PerforMance and Policy challenges at the subregional level chaPter 2
Figure 2.6. External current account balance in North and Central Asian economies, 2010-2013
Sources:ESCAP,basedonnational sources;and InternationalMonetaryFund,WorldEconomicOutlookdatabase,April2014andPrimaryCommodityPrices data (accessed 15 June 2014).
Notes: The oil price index (2005 = 100) is a simple average of spot prices of Dated Brent, West Texas Intermediate, and the Dubai Fateh. Netfuel exporters include Azerbaijan, Kazakhstan, Russian Federation, Turkmenistan and Uzbekistan. Net fuel importers include Armenia, Georgia,Kyrgyzstan and Tajikistan.
Current account surplus: net fuel exporter group (left axis) Current account deficit: net fuel importer group (left axis) Oil price change (right axis)
-70
-50
-30
-10
10
30
-12
-9
-6
-3
0
3
6
2010 2011 2012 2013
Per
cent
age
chan
ge
Per
cent
age
of G
DP
contracted by 1.3% amid lower export prices ofenergy, while imports increased on the back ofstronghouseholddemand,whichwasfuelledbycreditgrowth. Strong import demand also narrowed the current account surplus in Azerbaijan. In Tajikistan,lowerpricesforaluminiumandcotton,whichtogetheraccounted for up to 80% of all exports, depressedoverall export earnings. The current account deficitstood at 1.9% of GDP in 2013. Meanwhile, animprovement in net current transfers helped trim the current account shortfall of Kyrgyzstan, which,however, remained high at 12.6% of GDP.
InArmeniaandGeorgia,thecurrentaccountdeficitsnarrowedonrisingworkers’remittanceinflows,whichconstituted up to 10%ofGDP in these economies.Higher exports of copper in Armenia and lower imports in Georgia as growth in investment andpublic spending slowed were also factors behind this. Despite the recent narrowing, the current accountdeficits of those two countries remained high, at10.5% of GDP in Armenia and 6.1% of GDP inGeorgia in 2013.
Although the value of remittance inflows to mostof the countries in the subregion has generally risen, the growth rate of these inflows has slowedin recent years. This is in line with the economic slowdown in the Russian Federation, which is thedominant recipient country of migrant workers in the subregion. For example, Armenia, which receives90%of itsremittancesfromtheRussianFederation,has been recording slower growth of inflows since2010. Migrant workers are particularly affected byan economic slowdown in a recipient economy as many of them are engaged in vulnerable employment.
Some positive developments on the balance of payments were recorded in 2013. In September,Armenia secured $700 million through its firstinternational bond issuance. This allowed the country to repay a bilateral loan that was extended by the Russian Federation and provide financial liquidityto the business sector. Nevertheless, policymakersshould be mindful of risks associated with external commercial borrowings arising from sudden shifts in investor sentiment and global macroeconomic
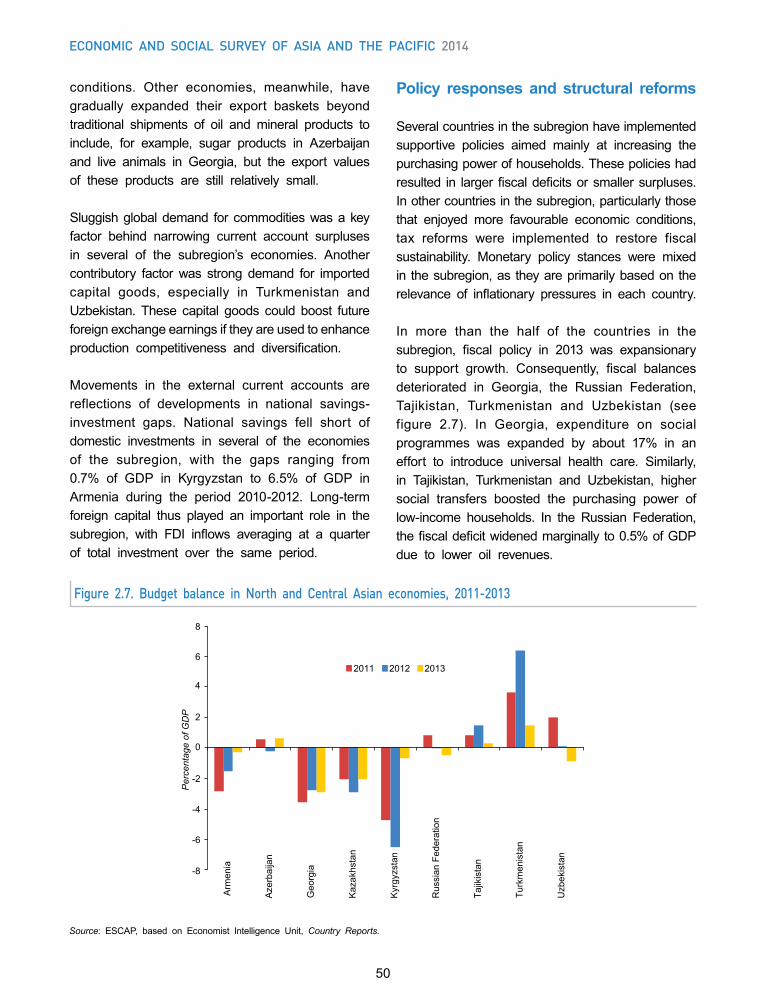
50
Economic and social survEy of asia and thE pacific 2014
conditions. Other economies, meanwhile, havegradually expanded their export baskets beyond traditional shipments of oil and mineral products to include, for example, sugar products in Azerbaijanand live animals in Georgia, but the export valuesof these products are still relatively small.
Sluggish global demand for commodities was a key factor behind narrowing current account surpluses in several of the subregion’s economies. Anothercontributory factor was strong demand for imported capital goods, especially in Turkmenistan andUzbekistan. These capital goods could boost future foreign exchange earnings if they are used to enhance production competitiveness and diversification.
Movements in the external current accounts arereflections of developments in national savings-investment gaps. National savings fell short of domestic investments in several of the economies of the subregion, with the gaps ranging from0.7% of GDP in Kyrgyzstan to 6.5% of GDP inArmenia during the period 2010-2012. Long-termforeign capital thus played an important role in the subregion, with FDI inflows averaging at a quarterof total investment over the same period.
Policy responses and structural reforms
Several countries in the subregion have implemented supportive policies aimed mainly at increasing the purchasing power of households. These policies had resulted in largerfiscaldeficitsorsmallersurpluses.Inothercountriesinthesubregion,particularlythosethat enjoyed more favourable economic conditions,tax reforms were implemented to restore fiscal sustainability. Monetary policy stances were mixedin thesubregion,as theyareprimarilybasedontherelevance of inflationary pressures in each country.
In more than the half of the countries in the subregion, fiscal policy in 2013 was expansionaryto support growth. Consequently, fiscal balancesdeteriorated in Georgia, the Russian Federation,Tajikistan, Turkmenistan and Uzbekistan (seefigure 2.7). In Georgia, expenditure on socialprogrammes was expanded by about 17% in aneffort to introduce universal health care. Similarly,in Tajikistan, Turkmenistan and Uzbekistan, highersocial transfers boosted the purchasing power of low-income households. In the Russian Federation,thefiscaldeficitwidenedmarginallyto0.5%ofGDPdue to lower oil revenues.
Source: ESCAP, based on Economist Intelligence Unit, Country Reports.
Figure 2.7. Budget balance in North and Central Asian economies, 2011-2013
2011 2012 2013
-8
-6
-4
-2
0
2
4
6
8
Arm
enia
Aze
rbai
jan
Geo
rgia
Kaz
akhs
tan
Kyr
gyzs
tan
Rus
sian
Fed
erat
ion
Tajik
ista
n
Turk
men
ista
n
Uzb
ekis
tan
Per
cent
age
of G
DP
51
MacroeconoMic PerforMance and Policy challenges at the subregional level chaPter 2
In several countries of the subregion, fiscal spaceexpanded in line with reforms in revenue collection. InAzerbaijan,forexample,strongereconomicgrowthcoupled with tax and customs administration reforms boostedgovernmentrevenues.InArmenia,taxreformsled to greater revenue collection despite an economic slowdown. In particular, the Government launcheda fiscal consolidation programme that entailed strengthening the tax and customs administration to increase tax revenues, which are currently amongthe lowest in the subregion in terms of GDP.
It is important to ensure that declines in public spending and increases in revenue
do not adversely affect the poor and vulnerable groups in the population
Some of the countries in the subregion also tried to rebuild sustainable fiscal paths by restrainingexpenditure. This was particularly the case in Kazakhstan and Kyrgyzstan. In Kazakhstan, publicspending on housing and utilities was cut. The country’s budget deficit thus narrowed to 2.1% ofGDP in 2013; however the impact of this changeon the budget allocation on lower-income groups shouldbecloselymonitored.InKyrgyzstan,spendingwas also rationalized, although education, socialsecurity and public health remained priority areas. This led to an improved fiscal performance in Kyrgyzstan,whichalsobenefited froma rebound inthe gold mining sector and higher economic growth. Overall, it is important to ensure that declines inpublic spending and increases in revenue do not adversely affect the poor and vulnerable groups in the population. To this end, coordinating fiscal andmonetary policies is critical for stimulating investment and reducing inflationary pressures on households.
Monetary policy stances in the subregion weremixed,withinterestratesremainingbelowthelevelsrecordedduring theglobalfinancialcrisis inseveralof the economies. In Armenia, the policy rate wasincreased in August 2013 for the first time in twoyears as authorities responded to higher inflationresulting in part from rising import prices of gas.
However, the policy rate was lowered in late 2013and early 2014 as a programme to peg Armenian gas prices to Russian domestic prices for a five-year period began. In Azerbaijan and Tajikistan,the policy stance was further eased to stimulate domestic demand. In Georgia, after a series ofpolicy rate cuts over 2013 to combat deflation,policy rate normalization began in early 2014 in line witha rise in inflation. InUzbekistan,moneysupplygrowth slowed, which helped weaken inflationarypressures triggered by a weaker currency, importrestrictions and higher public spending. A tighter policy stance was also noted in Kyrgyzstan on the back of robust economic activities.
IntheRussianFederation,despiteslowingeconomicgrowth, thepolicy interest rate remainedunchangedbetween September 2012 and February 2014 as inflation stayed above the central bank’s officialtarget.Tocontaininflation,thecentralbankintervenedactively in currency markets to limit the depreciation of the Russian rouble against the United Statesdollar. However, in early 2014, it hiked the policyinterest rate by 200 basis points to 7.5% to curbinflationary pressures emerging from continued currencydepreciationascapitaloutflowsaccelerated.
Changes also occurred in the implementation of monetary policy in the Russian Federation andKazakhstan.DirectinterventionsbytheCentralBankof Russia in the currency market in 2013 and theincrease in the policy interest rate in early 2014 reflected a shift in monetary policy managementfrom exchange rate targeting to inflation targeting.This shift is also backed by the strengthening of the supervisory role of the central bank through key amendments to theBankingLawandbyraising thereserve requirements forcommercialbanks. Indeed,in anticipation of the forthcoming implementation of Basel III, the solvability ratio of Tier 1 commonequity is set at 5%, compared to a ratio of 4.5%of Basel III.Moreover, in reaction to an increase inthehouseholddebt-to-incomeratiofrom15%in2010to 24% in 2013, the central bank has introducedhigher requirements for uncollateralized loans and increased the risk weights for consumer loans.
52
Economic and social survEy of asia and thE pacific 2014
Kazakhstan shifted from pegging its currency to the United States dollar to a multicurrency basket peg that comprises the Russian rouble, the euro andthe United States dollar. This change was initiated partly in reaction to closer economic ties between Kazakhstan and the Russian Federation.
To promote economic diversification, countries, suchas Armenia, Kazakhstan, Kyrgyzstan, Tajikistan,TurkmenistanandUzbekistan, have sought to attractmore FDI in non-resource based sectors. TheGovernment of Armenia announced deregulationpolicies,suchaseliminatingcompanyregistrationfeesand establishing a singlewindow for public services,to support the country’s medium-term growth. TheGovernment of Kazakhstan revised laws related topublic-private partnerships (PPPs) to increase theefficiency of public investments. These amendmentshelped expand the coverage of PPPs and authorized the use of international standards. In addition, theGovernment launched a programme to diversifyexports and boost agricultural output. Under this programme,agriculturalsubsidiesin2014willbetwiceas high as in 2013, which will aid producers whoare struggling with higher costs for imported goods.
Outlook for 2014 and policy challenges
In 2014, growth in the subregion as a whole isprojected to slow mainly due to expected lower growth in the Russian Federation. The fallout fromgeopolitical tensions related to Ukraine is expected to further depress already weak economic activity in the Russian Federation, which is projected to growby only 0.5%. Besides capital outflows, investmentin the country is also expected to suffer.Moreover,growth in the medium term is likely to remain well belowthepre-crisispacemainlyduetothecountry’shigh dependence on oil production, which is likelyto remain sluggish. Lower economic growth couldeventuallydampenthecountry’scurrentlytightlabourmarket,whichwouldweaken remittance incomes inseveral neighbouring economies.
The economy of Kazakhstan is projected to grow at a slightly lower rate of 5.4%, as newly imposed
restrictions on consumer credit weigh on household consumption. However, the devaluation of Kazakhtenge in February 2014 should boost net exports. Azerbaijan is projected to grow at a slower rate of 5% in line with lower public expenditures and lessexpansion in the oil industry. In Kyrgyzstan, growthcould soften relative to the high base in 2013, butshould still remain robust at an estimated rate of 6.5% in 2014. Export earnings are likely to remainsluggish,partlyduetoweakgoldprices.Remittancesarealsoexpectedtodecelerate.GrowthinTajikistancould ease to 6% as higher inflation is likely toconstrain private consumption, while cotton andaluminium prices are expected to rise only modestly.
In Turkmenistan, growth is expected to edge upto 10.4%, driven by public investments and privateconsumption, resulting from higher salaries andsocial transfers. Growth in Armenia is projected toincrease to 4.5% in 2014, helpedbyanagreementby the Government of the Russian Federation toreduce the price of gas imported by Armenia. As a result, lower domestic prices of gas and electricityshould help improve household spending and cut production costs. Economic growth in Georgia isexpected to rebound to 5% due to greater politicalstability and rising public expenditures directed at SMEs. Finally, lower profit and income taxesshould support industrial activities in Uzbekistan and help sustain the country’s high overall growthrate of 8.1%.
Foreign investment strategies should align more closely with regional
cooperation initiatives
The North and Central Asian economies should align their foreign investment strategies more closely with regional cooperation and integration initiatives in order to attract large-scale foreign investment in non-resource sectors, which thus far had beenlimited.MostNorth andCentralAsian countriesarerelatively small in terms of population so a more integrated subregion would be critical in reducing fixed business costs.
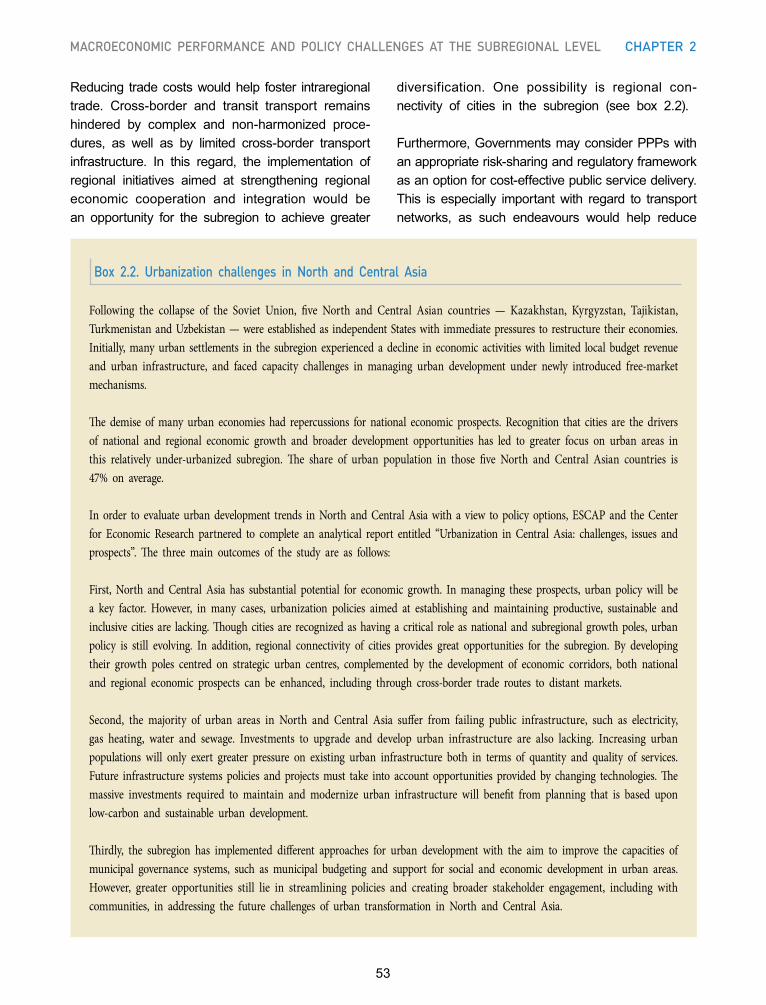
53
MacroeconoMic PerforMance and Policy challenges at the subregional level chaPter 2
Reducing tradecostswouldhelp foster intraregionaltrade. Cross-border and transit transport remains hindered by complex and non-harmonized proce- dures, as well as by limited cross-border transportinfrastructure. In this regard, the implementation ofregional initiatives aimed at strengthening regional economic cooperation and integration would be an opportunity for the subregion to achieve greater
diversification. One possibility is regional con- nectivity of cities in the subregion (see box 2.2).
Furthermore,GovernmentsmayconsiderPPPswithan appropriate risk-sharing and regulatory framework as an option for cost-effective public service delivery. This is especially important with regard to transport networks, as such endeavours would help reduce
Box 2.2. Urbanization challenges in North and Central Asia
Following the collapse of the Soviet Union, five North and Central Asian countries — Kazakhstan, Kyrgyzstan, Tajikistan, Turkmenistan and Uzbekistan — were established as independent States with immediate pressures to restructure their economies. Initially, many urban settlements in the subregion experienced a decline in economic activities with limited local budget revenue and urban infrastructure, and faced capacity challenges in managing urban development under newly introduced free-market mechanisms.
The demise of many urban economies had repercussions for national economic prospects. Recognition that cities are the drivers of national and regional economic growth and broader development opportunities has led to greater focus on urban areas in this relatively under-urbanized subregion. The share of urban population in those five North and Central Asian countries is 47% on average.
In order to evaluate urban development trends in North and Central Asia with a view to policy options, ESCAP and the Center for Economic Research partnered to complete an analytical report entitled “Urbanization in Central Asia: challenges, issues and prospects”. The three main outcomes of the study are as follows:
First, North and Central Asia has substantial potential for economic growth. In managing these prospects, urban policy will be a key factor. However, in many cases, urbanization policies aimed at establishing and maintaining productive, sustainable and inclusive cities are lacking. Though cities are recognized as having a critical role as national and subregional growth poles, urban policy is still evolving. In addition, regional connectivity of cities provides great opportunities for the subregion. By developing their growth poles centred on strategic urban centres, complemented by the development of economic corridors, both national and regional economic prospects can be enhanced, including through cross-border trade routes to distant markets.
Second, the majority of urban areas in North and Central Asia suffer from failing public infrastructure, such as electricity, gas heating, water and sewage. Investments to upgrade and develop urban infrastructure are also lacking. Increasing urban populations will only exert greater pressure on existing urban infrastructure both in terms of quantity and quality of services. Future infrastructure systems policies and projects must take into account opportunities provided by changing technologies. The massive investments required to maintain and modernize urban infrastructure will benefit from planning that is based upon low-carbon and sustainable urban development.
Thirdly, the subregion has implemented different approaches for urban development with the aim to improve the capacities of municipal governance systems, such as municipal budgeting and support for social and economic development in urban areas. However, greater opportunities still lie in streamlining policies and creating broader stakeholder engagement, including with communities, in addressing the future challenges of urban transformation in North and Central Asia.
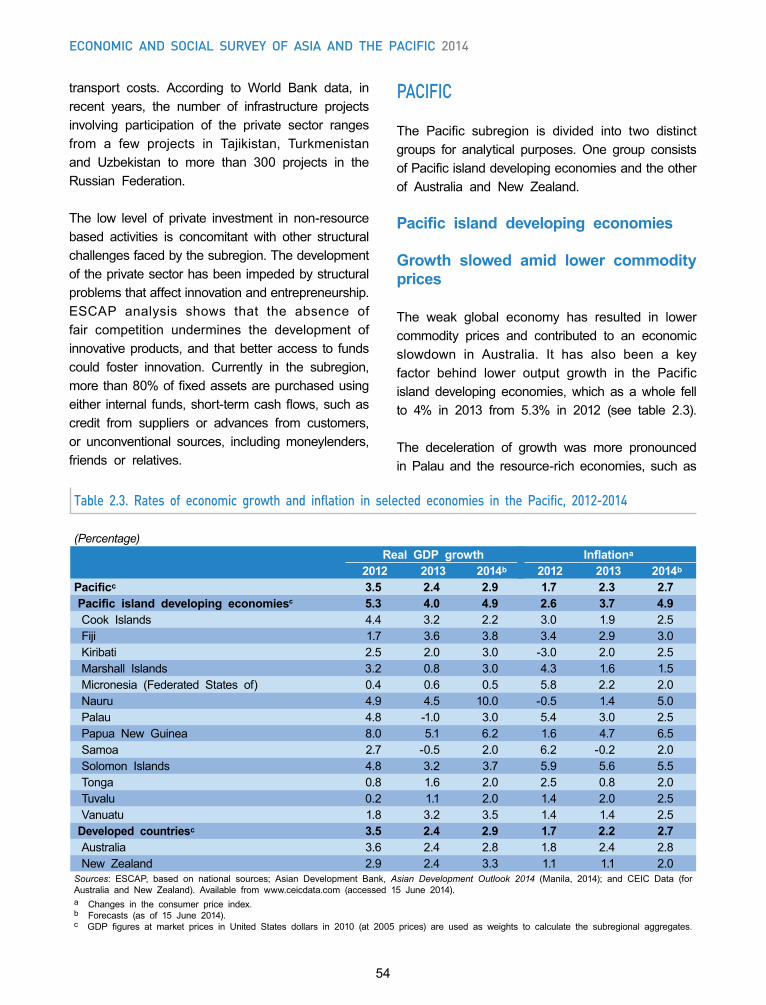
54
Economic and social survEy of asia and thE pacific 2014
Table 2.3. Rates of economic growth and inflation in selected economies in the Pacific, 2012-2014
(Percentage)Real GDP growth Inflationa
2012 2013 2014b 2012 2013 2014b
Pacificc 3.5 2.4 2.9 1.7 2.3 2.7Pacific island developing economiesc 5.3 4.0 4.9 2.6 3.7 4.9Cook Islands 4.4 3.2 2.2 3.0 1.9 2.5Fiji 1.7 3.6 3.8 3.4 2.9 3.0Kiribati 2.5 2.0 3.0 -3.0 2.0 2.5Marshall Islands 3.2 0.8 3.0 4.3 1.6 1.5Micronesia (Federated States of) 0.4 0.6 0.5 5.8 2.2 2.0Nauru 4.9 4.5 10.0 -0.5 1.4 5.0Palau 4.8 -1.0 3.0 5.4 3.0 2.5Papua New Guinea 8.0 5.1 6.2 1.6 4.7 6.5Samoa 2.7 -0.5 2.0 6.2 -0.2 2.0Solomon Islands 4.8 3.2 3.7 5.9 5.6 5.5Tonga 0.8 1.6 2.0 2.5 0.8 2.0Tuvalu 0.2 1.1 2.0 1.4 2.0 2.5Vanuatu 1.8 3.2 3.5 1.4 1.4 2.5
Developed countriesc 3.5 2.4 2.9 1.7 2.2 2.7Australia 3.6 2.4 2.8 1.8 2.4 2.8New Zealand 2.9 2.4 3.3 1.1 1.1 2.0
Sources: ESCAP, based on national sources; Asian Development Bank, Asian Development Outlook 2014 (Manila, 2014); and CEIC Data (forAustralia and New Zealand). Available from www.ceicdata.com (accessed 15 June 2014).a Changes in the consumer price index.b Forecasts (as of 15 June 2014).c GDP figures at market prices in United States dollars in 2010 (at 2005 prices) are used as weights to calculate the subregional aggregates.
transport costs. According to World Bank data, inrecent years, the number of infrastructure projectsinvolving participation of the private sector ranges from a few projects in Tajikistan, Turkmenistanand Uzbekistan to more than 300 projects in the Russian Federation.
The low level of private investment in non-resource based activities is concomitant with other structural challenges faced by the subregion. The development of the private sector has been impeded by structural problems that affect innovation and entrepreneurship. ESCAP analysis shows that the absence of fair competition undermines the development of innovativeproducts,and thatbetteraccess to fundscould foster innovation. Currently in the subregion,morethan80%offixedassetsarepurchasedusingeither internal funds,short-termcashflows,suchascredit from suppliers or advances from customers,or unconventional sources, includingmoneylenders,friends or relatives.
PACIFIC
The Pacific subregion is divided into two distinctgroups for analytical purposes. One group consists ofPacificislanddevelopingeconomiesandtheotherof Australia and New Zealand.
Pacific island developing economies
Growth slowed amid lower commodity prices
The weak global economy has resulted in lower commodity prices and contributed to an economic slowdown in Australia. It has also been a key factor behind lower output growth in the Pacific island developing economies,which as awhole fellto 4% in 2013 from 5.3% in 2012 (see table 2.3).
The deceleration of growth was more pronounced in Palau and the resource-rich economies, such as
55
MacroeconoMic PerforMance and Policy challenges at the subregional level chaPter 2
PapuaNewGuineaandSolomonIslands.Domesticfactors also affected the growth performance of individualcountries.InvestmentinPapuaNewGuineaslowed due to the completion of a large liquefiednatural gas project and the economy of Samoa was adversely affected by a tropical cyclone. On the other hand, growth in Fiji in 2013 was stimulated by anexpansion of government expenditure to rehabilitate andupgrade thecountry’s roadnetwork,aswellasby increased domestic investment and consumption.
ThestructureofPacificislanddevelopingeconomiesunderwentsomechangesover thepastdecade,astheagriculturaland industrysectors’sharesofGDPdeclined and the share of services sector increased. In Fiji, for instance, the share of the agriculturalsector declined from 18.8% of GDP in 1995 to12.1% in 2011, while in Samoa, it fell from 18.4%of GDP in 1995 to 9.8% of GDP in 2012. Theagriculture share in Papua New Guinea also fell,partly because the share of industry increased from 33.3% of GDP in 1995 to 44.2% of GDP in 2012,reflecting the domination of the mineral resourceboombeingexperiencedbythecountry. Incontrast,the contribution of the services sector to GDP hasbeen on the rise, mainly on the back of the largeand growing tourism sector in the subregion. The share of the services sector was more than 50%in most of the Pacific island economies in 2011.Despite the decline in agriculture’s share in GDP,the agriculture (including fisheries) continues to bethe main provider of employment in many of these economies, indicating low agricultural productivity.
Economic growth rates have been slow in Pacificislandeconomies, leading to joblessness,especiallyamong the youth. High levels of unemployment and underemployment are significant problems acrossthe Pacific. The global economic downturn madethe situation worse. For example, 53% of Samoanemployers had frozen or cut employment in 2009. The country’s largest industrial company, an autopartsmanufacturer,whichprovides16%ofallprivateformal sector jobs, cut its workforce by 70% in theaftermath of the global financial crisis when theautomotivemarket inAustraliaweakened.InKiribati,
about 2,000 persons enter the labour market eachyear,while the formaleconomygenerates less than500 jobs a year. In Vanuatu, the mismatch is alsosizeable, with 3,500 new entrants for less than700 jobs a year. Thus, in these countries, only afraction of the job seekers find paid employment.6 Youth and females are particularly disadvantaged. Less than 35% of women aged 20-29 years in theMarshall Islands, Samoa and Solomon Islands areofficially employed.
Total investment-to-GDP ratio is much higher than the savings ratio in all Pacific island developing countries, but it is still
generally low
While investment needs are large, the levels ofnational savings in these small economies are very low.InSolomonIslands,grossnationalsavingswasonly 13.5% of GDP in 2013. It was even lower,at 9.7% of GDP, in Papua New Guinea. Totalinvestment as a share of GDP is much higherthan the savings ratio in all of the Pacific islanddevelopingcountries,butstillinvestmentratiosamongthemgenerally remain low.However, the investmentratio in Fiji jumped to 28% in 2013 from 17% in2012, driven by the purchase of airplanes by FijiAirways. Papua NewGuinea attracted large FDI inthemining sector in recent years,which is taperingnow with the completion of a major project.
Growth in Fiji strengthened from 1.7% in 2012to 3.6% in 2013, in line with higher investment.Underpinned by its robust manufacturing and financial sectors, the expansion of the economywas broad-based with positive contributions from all sectors except for the mining and quarrying sector. In addition to increased public investment, tax cutsand higher tax thresholds and inward remittances helped boost domestic demand. Public investment in infrastructure and lower interest rates together with lower corporate tax rates induced private investment, resulting in the highest investment-to-GDP ratio of 28% in more than two decades.The economic rebound was held back somewhat
56
Economic and social survEy of asia and thE pacific 2014
by major floods, which affected agricultural outputand tourism revenue. Some of the policy priorities of the Government are to encourage exports andthe diversification of the economy, as consumptionand investment-led growth may not be sustainable in the medium term.
Key policy challenges are how to manage the windfall revenue from
resource projects and promote growth to benefit the wider community
EconomicexpansioninPapuaNewGuineasoftenedto 5.1% in 2013 from8% in 2012. The decelerationwas largely anticipated due to the slowdown in investment as a $20 billion liquefied natural gasproject nears completion. As a spillover, growthin construction halved to 12% in 2013 from 24%in 2012, and wholesale and retail trade growthdecelerated from 20% in 2012 to 5% in 2013.Meanwhile, theongoingdecline in theoperationsofa number of older mining and oil fields was morethan offset by a rise in output from new nickel project operations. The increased output was the main factor behind growth of 15% in the country’smining and quarrying sector in 2013. Agricultural and mining activities will continue to play a key role in driving the economy, although stronger commodityprices are needed to support future economic growth. Key policy challenges for the country are how to manage the windfall revenue from the gas project and the need to promote growth that benefits abroader section of the population.
The economy of Samoa shrank by 0.5% in 2013.The country is highly vulnerable to natural disasters as witnessed by the extensive damages caused by Tropical Cyclone Evan in many parts of the country in late 2012. The country’s medium-termdevelopmentplanidentifies14keypriorities,includingmacroeconomic stability, promoting tourism andbusiness development and improved access to essentialsocialservices,aswellas tosafedrinkingwater, sanitation and transport.
Growth in the Solomon Islands slowed to 3.2% in2013 from 4.8% in 2012 due to lower output ofwood logging, the result of declining forest cover.Despite attempts to diversify the economic base,the country remains dependent on exports of wood logs, fish and more recently minerals. Gold miningcould replace logging as the main growth driver in the coming years. Developing potential sectors,such as ecotourism, may broaden the economicbase. The country also needs to ensure sustainable forestry and fishing.
InVanuatu,outputgrowthpickedupto3.2%in2013,mainly due to an improvement in tourist arrivals. Despite the rebound, growthwas held back by slowimplementationofmajorpublicworksprojects,suchasthe country’s first fibre-optic cable. The developmentof seabedmining was also slow. The Government’spolicy priorities include fiscal and land reforms.
TheeconomyofNauruexpandedby4.5% in2013,down slightly from the pace seen in the previous year. Fishery output and phosphate exports supported the expansion.Growthwas also driven by activitiesrelated to the expansion of the Australian RegionalProcessing Centre of the asylum seekers, whichemploys more than 600 Nauruans and is the second largest employer after the Government. Care mustbe taken so that the rights of the refugees are protected according to the Convention relating to the Status of Refugees.
The Cook Islands recorded more modest economic growth of 3.2% in 2013, as public infrastructurespending and tourism receipts decreased. Growthof the Kiribati economy also slowed, to 2%, eventhough investment in public infrastructure increased. An economic slowdown was similarly observed in theMarshallIslands,whichpostedmodestgrowthof0.8%despiteongoinginfrastructureinvestments.Theeconomy of Palau recorded an economic contraction of 1% due to lower tourist arrivals.
Against this downward trend in several economies,economic growth in Tonga accelerated to 1.6% in2013. In Tuvalu, growth increased to 1.1%, with
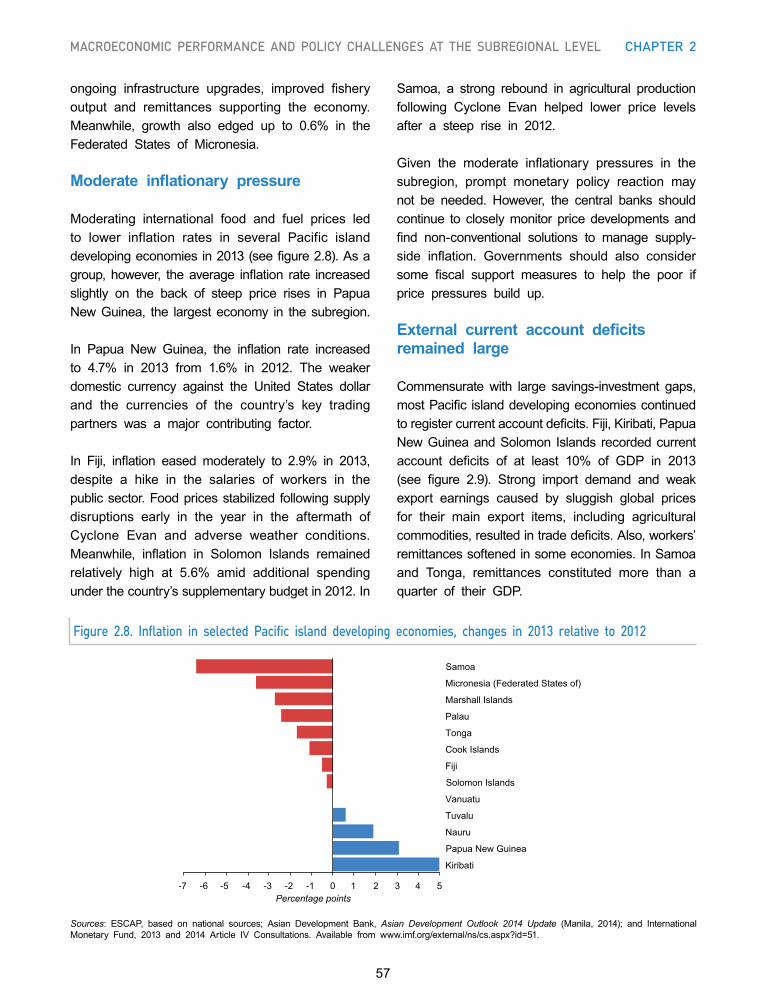
57
MacroeconoMic PerforMance and Policy challenges at the subregional level chaPter 2
Sources: ESCAP, based on national sources; Asian Development Bank, Asian Development Outlook 2014 Update (Manila, 2014); and InternationalMonetary Fund, 2013 and 2014 Article IV Consultations. Available from www.imf.org/external/ns/cs.aspx?id=51.
Figure 2.8. Inflation in selected Pacific island developing economies, changes in 2013 relative to 2012
ongoing infrastructure upgrades, improved fisheryoutput and remittances supporting the economy. Meanwhile, growth also edged up to 0.6% in theFederated States of Micronesia.
Moderate inflationary pressure
Moderating international food and fuel prices ledto lower inflation rates in several Pacific island developingeconomiesin2013(seefigure2.8).Asagroup,however, theaverage inflation rate increasedslightly on the back of steep price rises in Papua NewGuinea, the largesteconomy in thesubregion.
In Papua New Guinea, the inflation rate increasedto 4.7% in 2013 from 1.6% in 2012. The weakerdomestic currency against the United States dollar and the currencies of the country’s key tradingpartners was a major contributing factor.
In Fiji, inflation eased moderately to 2.9% in 2013,despite a hike in the salaries of workers in the public sector. Food prices stabilized following supply disruptions early in the year in the aftermath of Cyclone Evan and adverse weather conditions. Meanwhile, inflation in Solomon Islands remainedrelatively high at 5.6% amid additional spendingunderthecountry’ssupplementarybudgetin2012.In
Samoa, a strong rebound in agricultural productionfollowing Cyclone Evan helped lower price levels after a steep rise in 2012.
Given the moderate inflationary pressures in thesubregion, prompt monetary policy reaction maynot be needed. However, the central banks shouldcontinue to closely monitor price developments and find non-conventional solutions to manage supply-side inflation. Governments should also considersome fiscal support measures to help the poor ifprice pressures build up.
External current account deficits remained large
Commensurate with large savings-investment gaps,mostPacific islanddevelopingeconomiescontinuedtoregistercurrentaccountdeficits.Fiji,Kiribati,PapuaNewGuineaandSolomon Islands recordedcurrentaccount deficits of at least 10% of GDP in 2013(see figure 2.9). Strong import demand and weakexport earnings caused by sluggish global prices for their main export items, including agriculturalcommodities,resultedintradedeficits.Also,workers’remittances softened in some economies. In Samoa and Tonga, remittances constituted more than aquarter of their GDP.
-7 -6 -5 -4 -3 -2 -1 0 1 2 3 4 5
Kiribati
Papua New Guinea
Nauru
Tuvalu
Vanuatu
Solomon Islands
Fiji
Cook Islands
Tonga
Palau
Marshall Islands
Micronesia (Federated States of)
Samoa
Percentage points
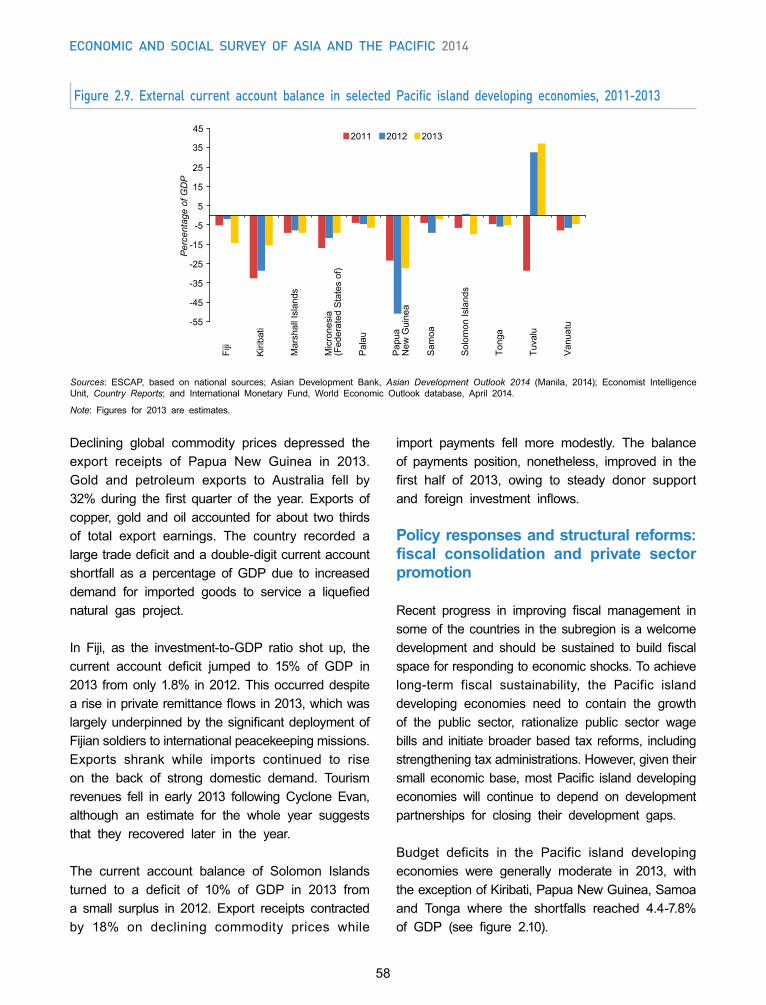
58
Economic and social survEy of asia and thE pacific 2014
Figure 2.9. External current account balance in selected Pacific island developing economies, 2011-2013
Declining global commodity prices depressed theexport receipts of Papua New Guinea in 2013.Gold and petroleum exports to Australia fell by32% during the first quarter of the year. Exports ofcopper, gold and oil accounted for about two thirdsof total export earnings. The country recorded a largetradedeficitandadouble-digitcurrentaccountshortfall as a percentage ofGDP due to increaseddemand for imported goods to service a liquefiednatural gas project.
In Fiji, as the investment-to-GDP ratio shot up, thecurrent account deficit jumped to 15% of GDP in2013 fromonly1.8% in2012.Thisoccurreddespiteariseinprivateremittanceflowsin2013,whichwaslargelyunderpinnedby thesignificantdeploymentofFijian soldiers to international peacekeeping missions. Exports shrank while imports continued to rise on the back of strong domestic demand. Tourism revenues fell in early 2013 following Cyclone Evan,although an estimate for the whole year suggests that they recovered later in the year.
The current account balance of Solomon Islands turned to a deficit of 10% of GDP in 2013 froma small surplus in 2012. Export receipts contracted by 18% on declining commodity prices while
Sources: ESCAP, based on national sources; Asian Development Bank, Asian Development Outlook 2014 (Manila, 2014); Economist IntelligenceUnit, Country Reports; and International Monetary Fund, World Economic Outlook database, April 2014.
Note: Figures for 2013 are estimates.
import payments fell more modestly. The balance of payments position, nonetheless, improved in thefirst half of 2013, owing to steady donor supportand foreign investment inflows.
Policy responses and structural reforms: fiscal consolidation and private sector promotion
Recent progress in improving fiscal management insome of the countries in the subregion is a welcome development and should be sustained to build fiscalspace for responding to economic shocks. To achieve long-term fiscal sustainability, the Pacific islanddeveloping economies need to contain the growth of the public sector, rationalize public sector wagebillsand initiatebroaderbased tax reforms, includingstrengtheningtaxadministrations.However,giventheirsmall economic base,mostPacific islanddevelopingeconomies will continue to depend on development partnerships for closing their development gaps.
Budget deficits in the Pacific island developing economies were generally moderate in 2013, withtheexceptionofKiribati,PapuaNewGuinea,Samoaand Tonga where the shortfalls reached 4.4-7.8%of GDP (see figure 2.10).
-55
-45
-35
-25
-15
-5
5
15
25
35
45
Fiji
Kiri
bati
Mar
shal
l Isl
ands
Mic
rone
sia
(Fed
erat
ed S
tate
s of
)
Pal
au
Pap
uaN
ew G
uine
a
Sam
oa
Sol
omon
Isla
nds
Tong
a
Tuva
lu
Van
uatu
Per
cent
age
of G
DP
2011 2012 2013
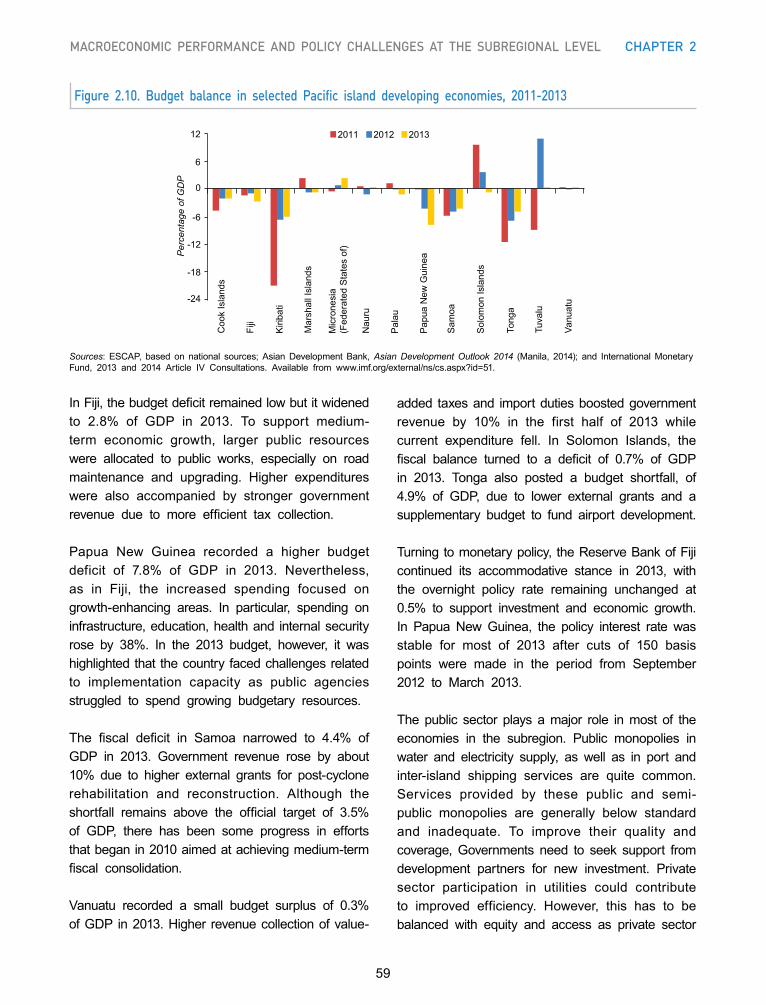
59
MacroeconoMic PerforMance and Policy challenges at the subregional level chaPter 2
InFiji,thebudgetdeficitremainedlowbutitwidenedto 2.8% of GDP in 2013. To support medium-term economic growth, larger public resourceswere allocated to public works, especially on roadmaintenance and upgrading. Higher expenditures were also accompanied by stronger government revenue due to more efficient tax collection.
Papua New Guinea recorded a higher budgetdeficit of 7.8% of GDP in 2013. Nevertheless,as in Fiji, the increased spending focused ongrowth-enhancing areas. In particular, spending oninfrastructure,education,healthand internalsecurityrose by 38%. In the 2013 budget, however, it washighlighted that the country faced challenges related to implementation capacity as public agencies struggled to spend growing budgetary resources.
The fiscal deficit in Samoa narrowed to 4.4% ofGDP in 2013. Government revenue rose by about10% due to higher external grants for post-cyclonerehabilitation and reconstruction. Although the shortfall remains above the official target of 3.5%of GDP, there has been some progress in effortsthat began in 2010 aimed at achieving medium-term fiscal consolidation.
Vanuatu recorded a small budget surplus of 0.3%ofGDP in2013.Higher revenuecollectionofvalue-
added taxes and import duties boosted government revenue by 10% in the first half of 2013 whilecurrent expenditure fell. In Solomon Islands, thefiscal balance turned to a deficit of 0.7% of GDPin 2013. Tonga also posted a budget shortfall, of4.9% of GDP, due to lower external grants and asupplementary budget to fund airport development.
Turningtomonetarypolicy, theReserveBankofFijicontinued its accommodative stance in 2013, withthe overnight policy rate remaining unchanged at 0.5% to support investment and economic growth.In Papua NewGuinea, the policy interest rate wasstable for most of 2013 after cuts of 150 basis points were made in the period from September 2012 to March 2013.
The public sector plays a major role in most of the economies in the subregion. Public monopolies in water and electricity supply, as well as in port andinter-island shipping services are quite common. Services provided by these public and semi-public monopolies are generally below standard and inadequate. To improve their quality and coverage,Governments need to seek support fromdevelopment partners for new investment. Private sector participation in utilities could contribute to improved efficiency. However, this has to bebalanced with equity and access as private sector
Figure 2.10. Budget balance in selected Pacific island developing economies, 2011-2013
Sources: ESCAP, based on national sources; AsianDevelopment Bank,Asian Development Outlook 2014 (Manila, 2014); and InternationalMonetaryFund, 2013 and 2014 Article IV Consultations. Available from www.imf.org/external/ns/cs.aspx?id=51.
-24
-18
-12
-6
0
6
12
C
ook
Isla
nds
F
iji
K
iriba
ti
M
arsh
all I
slan
ds
Mic
rone
sia
(Fed
erat
ed S
tate
s of
)
N
auru
P
alau
P
apua
New
Gui
nea
S
amoa
S
olom
on Is
land
s
T
onga
T
uval
u
V
anua
tu
2011 2012 2013
2011 2012 2013
-22
-17
-12
-7
-2
3
8
Coo
k Is
land
s
Fiji
Kiri
bati
Mar
shal
l Isl
ands
Mic
rone
sia
(Fed
erat
ed S
tate
s of
)
Nau
ru
Pal
au
Pap
ua N
ew G
uine
a
Sam
oa
Sol
omon
Isla
nds
Tong
a
Tuva
lu
Van
uatu
Per
cent
age
of G
DP
Per
cent
age
of G
DP
60
Economic and social survEy of asia and thE pacific 2014
involvement may lead to price hikes, especiallywhen the market size is small.
Limited market size may not accommodate enough producers for effective competition and a private monopoly may replace the public
monopoly
Aspartof its reformplans to improve theefficiencyof public enterprises, Fiji continued to encouragemore private sector participation. A public-private partnership was formed in April 2013 to manage the operations of the country’s main ports. Thisarrangement will improve the efficiency of the portfacilities, potentially resulting in higher trade. TheGovernmentalsoplanstodivestmostofitssharesinother key public enterprises in 2014. The deregulation oftheenergysectormovedforward,whichisexpectedto promote competition and facilitate the provision of efficient and affordable electricity services to thegeneralpublic.However,thelimitedmarketsizemaynot be able to accommodate enough producers for effective competition to occur and a private monopoly may replace the public monopoly. Therefore, thispolicy would require continuous monitoring. The Governmentalsoscrapped theminimuminvestmentvalue required for foreign investors and reduced the corporatetaxratepayablebyforeignfirmssettingupheadquartersinthecountryto17%.Theoutcomeofthis policy also needs to be monitored carefully as experienceselsewhere,especiallyinthesmallislandeconomies of the Caribbean, show that loweringtaxes does not lead to higher FDI (see chapter3 for more details). As a result, countries offeringlower taxes to foreign investors or corporations end up with a shrunken fiscal space.
Papua NewGuinea continued to pursue a nationalreform agenda that includes supporting greater private sector participation in the economy. Some of the key reform strategies include developing more efficientand competitive markets and streamlining business regulations. These reforms have improved the investment climate in the country. The Government
also remains committed to public sector reforms. As part of the rightsizing public sector reform,the Government plans to amalgamate governmentagencies with duplicate functions in 2014.
Outlook for 2014 and policy challenges
The expected global economic recovery in 2014,especiallyindevelopedeconomies,shouldprovideaboost formostPacific islanddevelopingeconomies.Thisisespeciallytrueforresource-richcountries,suchas Papua New Guinea and Solomon Islands, andfor the smaller economies dependent on remittances and tourism receipts. As a group, Pacific islanddeveloping economies are expected to enjoy more rapid economic growth of 4.9% in 2014.
The Papua New Guinea economy is projected togrow by 6.2% in 2014, an improvement over theprevious year. While the construction of a largeliquefied natural gas project was almost completedin the first half of 2014, the subsequent productionof natural gas will help propel economic growth. The economy should also be buoyed by a rebound in mining output, as major mines return to normalproduction following disruptions in 2013. The economy of Fiji is projected to grow at a slightly faster pace of 3.8%. Despite an expected fall inpublic investment, sectors, such as constructionand sugar, should support the projected expansionof the economy.
An expected rise in tourist arrivals should help SolomonIslandspostaslightlybettergrowth,of3.7%,in 2014. The economy of Samoa is projected to turn from a contraction in 2013 to expand 2% in 2014,due to an expansionary budget, which is aimed atstimulating growth. In Kiribati, higher growth of 3%is forecast based on expected stronger construction activity, of which much of it is tied to roads andairport projects financed mainly by development partners. Strong tourism revenue and a raft of planned infrastructure projects are likely to support growth of 3.5% in Vanuatu. The implementation ofmajor infrastructure projects, however, is subject toreceiving large foreign grants and loans.
61
MacroeconoMic PerforMance and Policy challenges at the subregional level chaPter 2
Many Pacific island developing economies willcontinue to face the growing challenge of providing basic services to the poor and vulnerable groups of the society. The situation is compounded by falling levels of official development assistance,lower agricultural productivity, growing populations,high youth unemployment, and low and uneveneconomic growth.
Pacific island countries face the increasing threat from climate change
Pacific island countries also have to deal with the increasing threat from climate change. Climate change, including ocean acidification and sea-levelrise, does not only affect the natural environment,suchascoastal resourcesand land loss,but italsohasanimpactoneconomicandsocialdevelopment,particularly for vulnerable populations. According to a recent report,7 themost significant economic lossesrelated to climate change could be felt in Papua New Guinea where they could amount to 15% ofGDP by 2100. The loss is estimated at 4-6% ofGDP inFiji,Samoa,Solomon IslandsandVanuatu.Access to, and timely implementation of, globalresources for adaptation and mitigation remain a priority for these small countries.
Itis,therefore,vitalforPacificislandcountriestoadoptpolicies that develop their comparative advantages in sectors suchasagriculture, tourismandfisheries inasustainablefashion,asthesesectorsenjoyuniquebiodiversity. These policies also need to promote jobs, particularly for the large pool of unemployedyouth. While large informal sectors in the Pacificeconomies have provided job opportunities, growthof formal sector employment is necessary to raise income levels. Further development of the private sector isalsoneeded,ascurrently thepublicsectoris a major source of job creation.
To enhance job-rich growth, these economiesneed more private sector investment, especially inniche markets that can overcome market size and distance disadvantages. They need to create an
enabling environment for private sector investments in labour-intensive sustainable ecotourism. This is crucial given the fragile ecological environment and rich biodiversity of the subregion and threat it faces from climate change. The Pacific island economiesalsoneed todevelop their financial systems, reformtheir legal and regulatory approaches and revamp their State enterprises.
The development of rural areas and outer islands through the provision of necessary infrastructure and support for leveraging sustainable resource-based sectors will foster improved livelihoods and mitigate rural-to-urban migration. Given thesignificant potential for small and microenterprisesin Pacific island developing economies, appropriatepolicies should include lowering barriers and costs of doing business. To undertake evidence-based policymaking, countries need to strengthen effortsto improve data collection and analysis, particularlyin social areas (see box 2.3).
Given their small size and limited economies ofscale, regional cooperation among Pacific islandcountries has served this group of economies well in such areas as sustainable fishery management.Regional cooperation in other areas, such asliberalizing theaviation sector, could lead to serviceimprovementsandefficienciesandthuswouldbenefitexport capacity and tourism potential. These small economies should also continue to explore and strengthen their trade and investment links with neighbouring countries and subregions, includingthe ASEAN, which is set to offer great trade andinvestment opportunities with the launch of the ASEAN Economic Community in 2015.
Australia and New Zealand
Growth performance weakened
The Australian economy slowed to 2.4% in 2013from 3.6% in 2012 (see figure 2.11). Mining sectorinvestment,whichpropelledgrowthinthepastyears,has started to wind down. The booming mining sector generally led to a stronger currency and
62
Economic and social survEy of asia and thE pacific 2014
Box 2.3. Strengthening the evidence base for disability policymaking in the Pacific
Disability in Pacific island developing countries has typically been an invisible issue. There is relatively little accurate official data on the incidence of disability and few services for people living with physical or mental impairments. Disability is low on the policy agenda and receives minimal proportions of national budgetary resources.a People with disabilities in these economies are among the poorest and most marginalized members of their communities.b Evidence suggests that the number of persons with disability is increasing due to high rates of diabetes-related amputations and blindness, increasing traffic and industrial accidents, and ageing populations.
Although Governments in Pacific island developing countries have been slow to address disability, there have been some positive changes in the past decade. There is increasing awareness of disability issues across the subregion, and enhanced political will to ensure that policies and development plans are disability-inclusive. Development partners and intergovernmental organizations have taken a strong lead in providing technical assistance and resources.
The Convention on the Rights of Persons with Disabilities provides a comprehensive framework for Pacific island developing countries to shape disability-inclusive development. Several economies have demonstrated political commitment to strengthening the protection and promotion of the rights of persons with disabilities by ratifying and implementing the Convention. Australia, New Zealand and Vanuatu ratified the Convention in 2008, followed by the Cook Islands in 2009 and Nauru in 2012. In 2013, Kiribati, Palau, Papua New Guinea and Tuvalu became States Parties to the Convention.
Another important milestone has been the Pacific Regional Strategy on Disability 2010-2015, which was developed based on the Convention. This was endorsed at the First Forum Disability Ministers’ Meeting, which was held in October 2009. The Strategy is based on the following: human rights principles; reducing vulnerability and risks of disabilities; and improving care, support and partnerships. It provides achievable guidelines to support national efforts to advance disability issues. The Strategy calls upon Governments and civil society to mainstream disability into all local and national policies and practices, including national censuses, labour force surveys, and household income and expenditure surveys.
Although there are signs that progress has been made, disability prevalence still remains grossly underestimated in most of the Pacific island developing countries. Except for a few countries that have recorded prevalence of 11-18.5%, such as Australia, Federated States of Micronesia, New Zealand and Vanuatu, prevalence for Pacific island countries is below 5%.c High reliance on census data with limited space for questions concerning disability and the lack of data collection instruments going beyond severe impairments are the two main reasons for this underestimation. The lack of relevant data collection on persons with disabilities is hampering not only the design, implementation and evaluation of effective policymaking, but more importantly, the quality of the lives of persons with disabilities.
a Tavola (2012).b Pacific Islands Forum Secretariat (2009).c ESCAP (2012a).
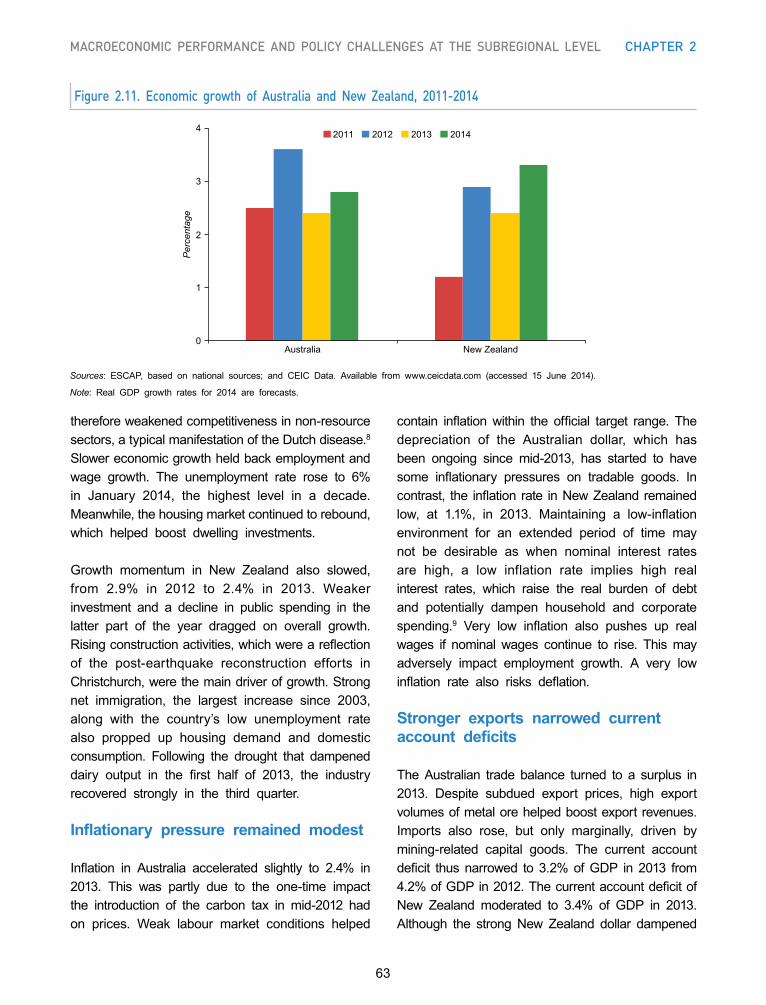
63
MacroeconoMic PerforMance and Policy challenges at the subregional level chaPter 2
therefore weakened competitiveness in non-resource sectors,atypicalmanifestationoftheDutchdisease.8 Slower economic growth held back employment and wage growth. The unemployment rate rose to 6%in January 2014, the highest level in a decade.Meanwhile,thehousingmarketcontinuedtorebound,which helped boost dwelling investments.
Growth momentum in New Zealand also slowed,from 2.9% in 2012 to 2.4% in 2013. Weakerinvestment and a decline in public spending in the latter part of the year dragged on overall growth. Risingconstructionactivities,whichwereareflectionof the post-earthquake reconstruction efforts in Christchurch,werethemaindriverofgrowth.Strongnet immigration, the largest increase since 2003,along with the country’s low unemployment ratealso propped up housing demand and domestic consumption. Following the drought that dampened dairy output in the first half of 2013, the industryrecovered strongly in the third quarter.
Inflationary pressure remained modest
Inflation in Australia accelerated slightly to 2.4% in2013. This was partly due to the one-time impact the introduction of the carbon tax in mid-2012 had on prices. Weak labour market conditions helped
contain inflationwithin the official target range. Thedepreciation of the Australian dollar, which hasbeen ongoing since mid-2013, has started to havesome inflationary pressures on tradable goods. Incontrast, the inflation rate inNewZealandremainedlow, at 1.1%, in 2013. Maintaining a low-inflationenvironment for an extended period of time may not be desirable as when nominal interest rates are high, a low inflation rate implies high realinterest rates, which raise the real burden of debtand potentially dampen household and corporate spending.9 Very low inflation also pushes up realwages if nominal wages continue to rise. This may adversely impact employment growth. A very low inflation rate also risks deflation.
Stronger exports narrowed current account deficits
The Australian trade balance turned to a surplus in 2013. Despite subdued export prices, high exportvolumes of metal ore helped boost export revenues. Imports also rose, but only marginally, driven bymining-related capital goods. The current account deficit thus narrowed to 3.2%ofGDP in 2013 from4.2%ofGDPin2012.ThecurrentaccountdeficitofNew Zealand moderated to 3.4% of GDP in 2013.Although the strong New Zealand dollar dampened
Sources: ESCAP, based on national sources; and CEIC Data. Available from www.ceicdata.com (accessed 15 June 2014).
Note: Real GDP growth rates for 2014 are forecasts.
Figure 2.11. Economic growth of Australia and New Zealand, 2011-2014
2011 2012 2013 2014
1
2
3
4
5
6
7
8
9
10
11
0
1
2
3
4
Australia New Zealand
Per
cent
age
64
Economic and social survEy of asia and thE pacific 2014
exportearningssomewhat,thecountrybenefitedfromfavourable terms of trade on rising export prices of dairy products.Morebroadly, stronger currencies inboth economies in recent years held back inbound tourism and the number of foreign students, andgenerally weakened non-commodity exports.
Policy responses: fiscal consolidation
In Australia, the budget deficit increased to 2.9% ofGDP in 2013, as resource tax revenues declined onthe back of falling commodity prices. The carbon tax and minerals resource rent tax will be cancelled from July 2014 amid some opposition from environmentalactivists. It is claimed that such a policy shift should reduce price pressures and boost the economy. A large transport infrastructure project is under way,which should help improve output in the medium term,aswellasbudgetpositions.Asustainablefiscalsurplus is targeted by 2025. Meanwhile, monetarypolicyhasbeenaccommodative.At theendof2013,the policy interest rate stood at 2.5%, a total of 225basis points lower than the level in November 2011.
In New Zealand, strong output growth in the earlypartof2013helpedlowerthefiscaldeficitto1.1%ofGDPinthefiscalyear2013.Despite largespendingrequirements for post-earthquake reconstruction activities,theGovernmentistargetingtobalancethebudget by 2015.Meanwhile,more robust economicactivities and rising inflation expectations promptedthe central bank to hike the policy rate three times in early 2014 to 3.25%. Prior to that, it had beenleft unchanged since March 2011. The effects ofrestrictions on the loan-to-value ratio for mortgage lending that were announced in October 2013 have started to ease pressure on the housing market,while rising interest rates are poised to have a further moderating effect.
Outlook for 2014 and policy challenges
Economic growth in Australia is likely to remain sluggish, at 2.8%, in 2014. This is due to fallingmininginvestments,fiscalrestraintandfragileprivateconsumption.Weak labourmarketconditionsshould
helpcontain inflation.Commodityexportsareset tocontinue to support the economy, but the outlookis constrained by a policy shift in China towards domestic demand-led growth, which will softendemandfor thecountry’scommodities.Thehousingmarketislikelytostrengthen,butthepossibilityofanassetbubbleshouldbemonitoredclosely.Monetarypolicy should not react to the orderly depreciation of the Australian dollar in recent months, as thiswas needed to improve the competitiveness of the non-resource sectors in order to supplement the fall in resources investments.
The Australian economy is likely to remain sluggish due to weak mining
investment
The New Zealand economy is projected to grow by 3.3%in2014.Highernetimmigration,betterprospectsforthediaryindustry,andthereconstructionactivitieswill continue to support theeconomy.However, thisis conditional on the strength of private consumption andinvestment,asfiscalconsolidationmovesforwardandmonetarypolicyistightened.Regardingpossibleheadwinds, the strong New Zealand dollar couldhurt export growth, while surging house pricesand monetary tightening in the United States may drive up interest rates further and put strains on investments and consumer spending.
SOUTH AND SOUTH-WEST ASIA
Slight pickup in growth
OverallgrowthinSouthandSouth-WestAsiapickedup to 3.9% in 2013 from 2.9% in 2012 (see table2.4), but it remained well below the 6.4% pacethat was registered in the years prior to the global financial turmoil.
Economic growth in Afghanistan dipped to 3.6%in the fiscal year 2013 after a bumper agriculturalharvest in the previous year that helped push the growth rate to 14%. Agriculture accounted for a
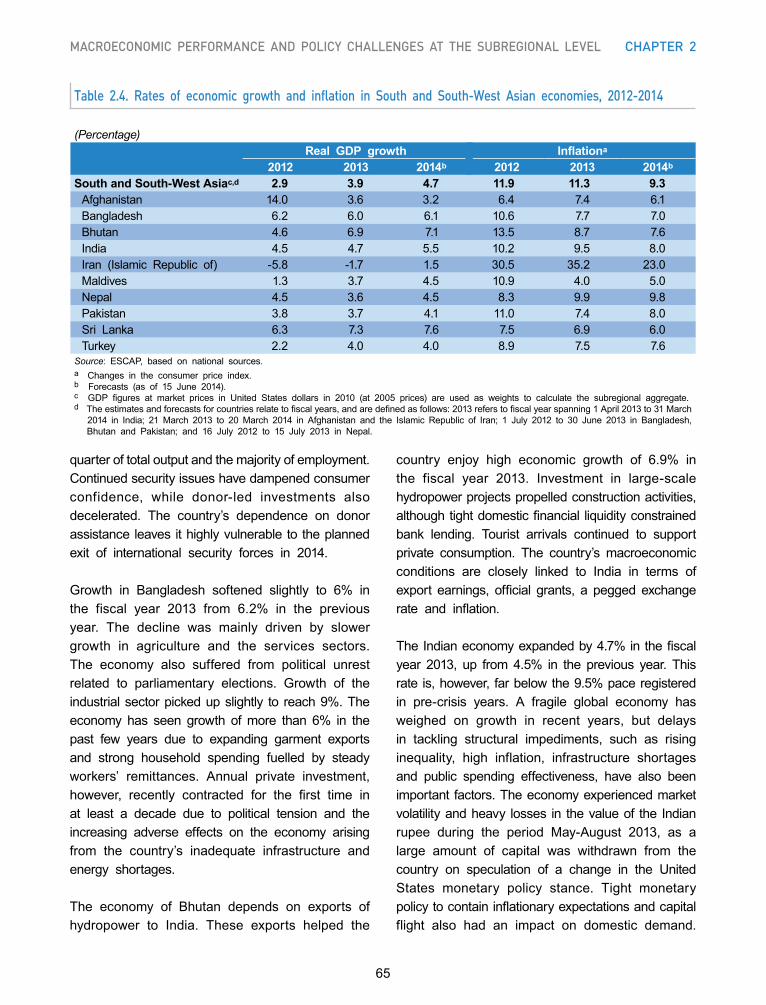
65
MacroeconoMic PerforMance and Policy challenges at the subregional level chaPter 2
quarter of total output and the majority of employment. Continued security issues have dampened consumer confidence, while donor-led investments alsodecelerated. The country’s dependence on donorassistance leaves it highly vulnerable to the planned exit of international security forces in 2014.
Growth in Bangladesh softened slightly to 6% inthe fiscal year 2013 from 6.2% in the previousyear. The decline was mainly driven by slower growth in agriculture and the services sectors. The economy also suffered from political unrest related to parliamentary elections. Growth of theindustrialsectorpickedupslightly to reach9%.Theeconomy has seen growth ofmore than 6% in thepast few years due to expanding garment exports and strong household spending fuelled by steady workers’ remittances. Annual private investment,however, recently contracted for the first time inat least a decade due to political tension and the increasing adverse effects on the economy arising from the country’s inadequate infrastructure andenergy shortages.
The economy of Bhutan depends on exports of hydropower to India. These exports helped the
country enjoy high economic growth of 6.9% inthe fiscal year 2013. Investment in large-scale hydropowerprojectspropelledconstructionactivities,althoughtightdomesticfinancial liquidityconstrainedbank lending. Tourist arrivals continued to support private consumption. The country’s macroeconomicconditions are closely linked to India in terms of export earnings, official grants, a pegged exchangerate and inflation.
TheIndianeconomyexpandedby4.7%inthefiscalyear 2013, up from 4.5% in the previous year. Thisrate is,however, farbelowthe9.5%paceregisteredin pre-crisis years. A fragile global economy has weighed on growth in recent years, but delaysin tackling structural impediments, such as risinginequality, high inflation, infrastructure shortagesand public spending effectiveness, have also beenimportant factors. The economy experienced market volatility and heavy losses in the value of the Indian rupee during the period May-August 2013, as alarge amount of capital was withdrawn from the country on speculation of a change in the United States monetary policy stance. Tight monetary policytocontaininflationaryexpectationsandcapitalflight also had an impact on domestic demand.
Table 2.4. Rates of economic growth and inflation in South and South-West Asian economies, 2012-2014
(Percentage)Real GDP growth Inflationa
2012 2013 2014b 2012 2013 2014b
South and South-West Asiac,d 2.9 3.9 4.7 11.9 11.3 9.3Afghanistan 14.0 3.6 3.2 6.4 7.4 6.1Bangladesh 6.2 6.0 6.1 10.6 7.7 7.0Bhutan 4.6 6.9 7.1 13.5 8.7 7.6India 4.5 4.7 5.5 10.2 9.5 8.0Iran (Islamic Republic of) -5.8 -1.7 1.5 30.5 35.2 23.0Maldives 1.3 3.7 4.5 10.9 4.0 5.0Nepal 4.5 3.6 4.5 8.3 9.9 9.8Pakistan 3.8 3.7 4.1 11.0 7.4 8.0Sri Lanka 6.3 7.3 7.6 7.5 6.9 6.0Turkey 2.2 4.0 4.0 8.9 7.5 7.6
Source: ESCAP, based on national sources.a Changes in the consumer price index.b Forecasts (as of 15 June 2014).c GDP figures at market prices in United States dollars in 2010 (at 2005 prices) are used as weights to calculate the subregional aggregate.dTheestimatesandforecastsforcountriesrelatetofiscalyears,andaredefinedasfollows:2013referstofiscalyearspanning1April2013to31March 2014 in India; 21 March 2013 to 20 March 2014 in Afghanistan and the Islamic Republic of Iran; 1 July 2012 to 30 June 2013 in Bangladesh, Bhutan and Pakistan; and 16 July 2012 to 15 July 2013 in Nepal.
66
Economic and social survEy of asia and thE pacific 2014
Consumer confidence deteriorated, with car salesin 2013 declining for the first time in a decade.Fixed investment also slowed, in line with sluggishdemand and higher interest rates. Subdued output growth pushed up the measured unemployment rate by one percentage point to 4.7%. Structuralchallenges have constrained the country’s capacityto weather capital market volatility as was seen in mid-2013.
Structural impediments like rising inequality and infrastructure shortages
held back economic growth
The economy of the Islamic Republic of Irancontracted for the second year in a row in the fiscalyear2013,thoughat1.7%,theratewasmuchlower than in 2012. International sanctions severely limited oil production and exports, which accountedfor nearly three fourths of GDP, as well as goodsimportsandaccesstointernationalfinancialmarkets.Lower global oil prices and sluggish householdspending amid high inflation and jobless rates alsocontributed to the economic decline. Prices spiked aftertheGovernmentloweredsignificantlytheofficialexchange rate in July 2013.
Maldives enjoyed more rapid growth, of 3.7%,in 2013, as compared with 1.3% in 2012. Thetourism sector, which accounts for one third ofGDP, recovered from a mild contraction recordedin 2012. Tourist arrivals rose by almost 20%, witha notable expansion in visitors from China. The fisheries sector expanded for the first time in sevenyears,whilemanufacturingandconstructionactivitieswere less robust.
In Nepal, economic growth in the fiscal year 2013fell to3.6%from4.5% in thepreviousyear.Politicaluncertainty resulted in weak budget implementation. Agricultural activities,whichaccount for one third ofthe economy, also slowed due to a poor monsoonharvest and limited access to fertilizers. Domesticproduction continued to be constrained by electricity shortages, while tourism and retail trade expanded.
Workers’ remittancesplayamajor role insustaininghousehold spending and growth of the economy. The country’s foreign exchange earnings rely onthese remittances, while limited production capacityhas made the country highly dependent on imported goods.
Economic growth in Pakistan was largely stable at 3.7% in the fiscal year 2013. Growing securityconcerns and energy shortages continued to hamper the business environment. Agricultural output growth decelerated in2013duetopoorweatherconditions,while industrial production picked up on capacity enhancement and investment in alternate energy,especially by large-scale manufacturing operations. On the demand side, an impetus to growth camefromprivateandpublicconsumption,whereasoverallinvestment remained sluggish. The investment-to-GDP ratio fell to 14.2% of GDP in 2013 from14.9% of GDP in the previous year.
Growth of the Sri Lankan economy accelerated to7.3% in 2013. Similar to most of its neighbouringcountries, output growth was mainly driven byhousehold consumption and supported by remittance inflows, a supportive monetary policy and steadytourism revenue. The hotels and restaurants sector advanced favourably,while theconstruction industrybenefited from reconstructionactivities in areas thatsufferedextensivedamageduringtheinternalconflictthat ended in 2009 and urban housing demand. Reducing large fiscal and external current accountdeficitsand improving thebusinessenvironmentareamong the Government’s policy priorities.
In Turkey, GDP growth rebounded to 4% in 2013from 2.2% in 2012. This is still well below the6.7% pace that was registered in the pre-crisisyears. The upturn in 2013 was domestic demand-led, especially through private consumption growth.Capital market disruptions were notable in mid-2013 and early 2014, largely triggered by the taperingof quantitative easing in the United States. This was partly a reflection of weak macroeconomic fundamentals, such as a sizeable external currentaccount deficit due to strong imports of oil and
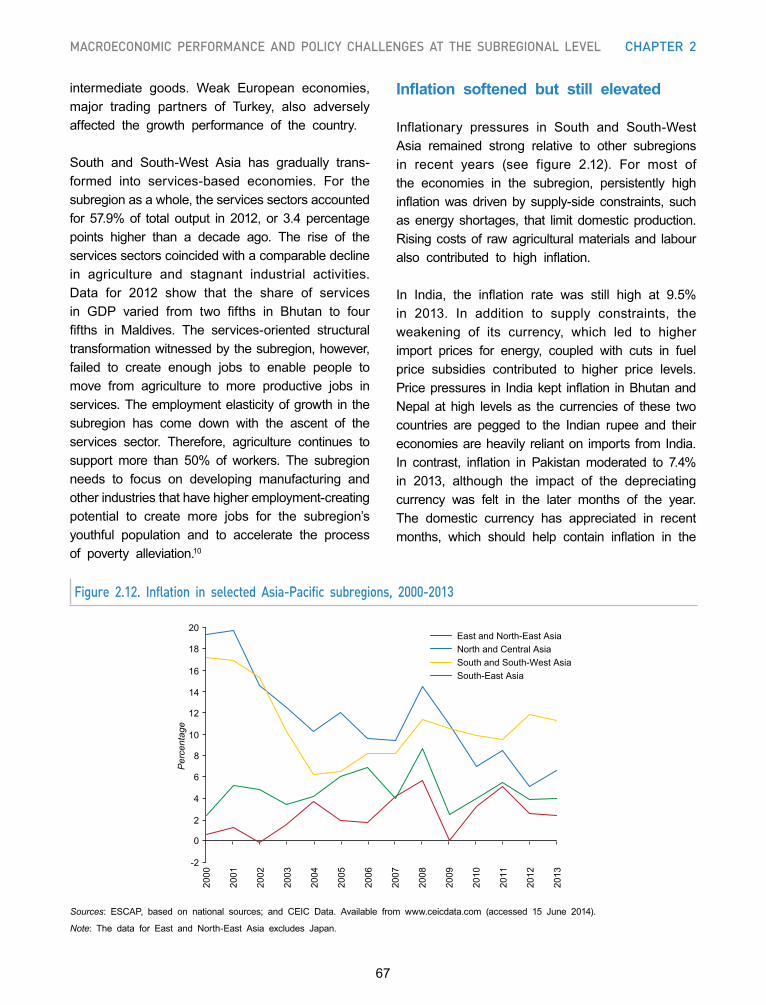
67
MacroeconoMic PerforMance and Policy challenges at the subregional level chaPter 2
intermediate goods. Weak European economies,major trading partners of Turkey, also adverselyaffected the growth performance of the country.
South and South-West Asia has gradually trans- formed into services-based economies. For the subregionasawhole,theservicessectorsaccountedfor 57.9%of total output in 2012, or 3.4 percentagepoints higher than a decade ago. The rise of the services sectors coincided with a comparable decline in agriculture and stagnant industrial activities. Data for 2012 show that the share of servicesin GDP varied from two fifths in Bhutan to fourfifths in Maldives. The services-oriented structuraltransformationwitnessedbythesubregion,however,failed to create enough jobs to enable people to move from agriculture to more productive jobs in services. The employment elasticity of growth in the subregion has come down with the ascent of the services sector. Therefore, agriculture continues tosupport more than 50% of workers. The subregionneeds to focus on developing manufacturing and other industries that have higher employment-creating potential to create more jobs for the subregion’syouthful population and to accelerate the process of poverty alleviation.10
Inflation softened but still elevated
Inflationary pressures in South and South-WestAsia remained strong relative to other subregions in recent years (see figure 2.12). For most ofthe economies in the subregion, persistently highinflationwasdrivenbysupply-sideconstraints, suchasenergy shortages, that limit domestic production.Risingcostsof rawagriculturalmaterialsand labouralso contributed to high inflation.
In India, the inflation rate was still high at 9.5%in 2013. In addition to supply constraints, theweakening of its currency, which led to higherimport prices for energy, coupled with cuts in fuelprice subsidies contributed to higher price levels. Pricepressures in Indiakept inflation inBhutanandNepal at high levels as the currencies of these two countries are pegged to the Indian rupee and their economies are heavily reliant on imports from India. In contrast, inflation in Pakistanmoderated to 7.4%in 2013, although the impact of the depreciatingcurrency was felt in the later months of the year. The domestic currency has appreciated in recent months, which should help contain inflation in the
Sources: ESCAP, based on national sources; and CEIC Data. Available from www.ceicdata.com (accessed 15 June 2014).
Note: The data for East and North-East Asia excludes Japan.
Figure 2.12. Inflation in selected Asia-Pacific subregions, 2000-2013
East and North-East Asia North and Central Asia South and South-West Asia South-East Asia
-2
0
2
4
6
8
10
12
14
16
18
20
2000
2001
2002
2003
2004
2005
2006
2007
2008
2009
2010
2011
2012
2013
Per
cent
age
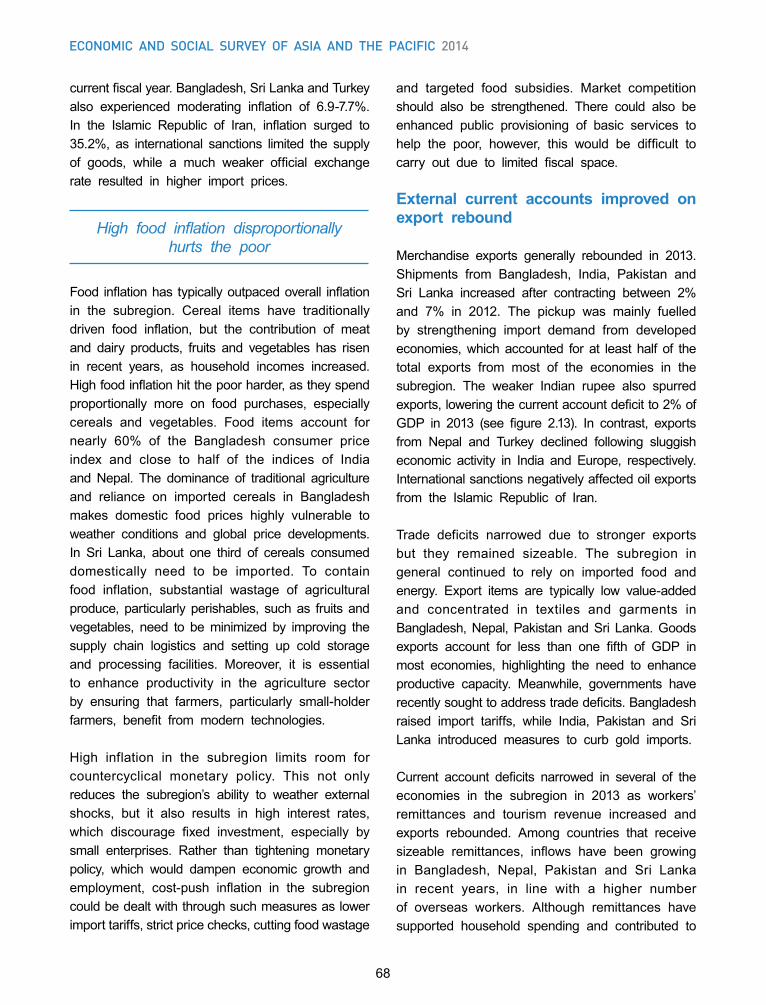
68
Economic and social survEy of asia and thE pacific 2014
currentfiscalyear.Bangladesh,SriLankaandTurkeyalso experienced moderating inflation of 6.9-7.7%.In the Islamic Republic of Iran, inflation surged to35.2%, as international sanctions limited the supplyof goods, while a much weaker official exchangerate resulted in higher import prices.
High food inflation disproportionally hurts the poor
Food inflationhas typicallyoutpacedoverall inflationin the subregion. Cereal items have traditionally driven food inflation, but the contribution of meatand dairy products, fruits and vegetables has risenin recent years, as household incomes increased.Highfoodinflationhitthepoorharder,astheyspendproportionally more on food purchases, especiallycereals and vegetables. Food items account for nearly 60% of the Bangladesh consumer priceindex and close to half of the indices of India and Nepal. The dominance of traditional agriculture and reliance on imported cereals in Bangladesh makes domestic food prices highly vulnerable to weather conditions and global price developments. In Sri Lanka, about one third of cereals consumeddomestically need to be imported. To contain food inflation, substantial wastage of agriculturalproduce, particularly perishables, suchas fruits andvegetables, need to beminimized by improving thesupply chain logistics and setting up cold storage and processing facilities. Moreover, it is essentialto enhance productivity in the agriculture sector by ensuring that farmers, particularly small-holderfarmers, benefit from modern technologies.
High inflation in the subregion limits room for countercyclical monetary policy. This not only reduces the subregion’s ability to weather externalshocks, but it also results in high interest rates,which discourage fixed investment, especially bysmall enterprises. Rather than tightening monetarypolicy, which would dampen economic growth andemployment, cost-push inflation in the subregioncould be dealt with through such measures as lower importtariffs,strictpricechecks,cuttingfoodwastage
and targeted food subsidies. Market competitionshould also be strengthened. There could also be enhanced public provisioning of basic services to help the poor, however, this would be difficult tocarry out due to limited fiscal space.
External current accounts improved on export rebound
Merchandise exports generally rebounded in 2013.Shipments from Bangladesh, India, Pakistan andSri Lanka increased after contracting between 2%and 7% in 2012. The pickup was mainly fuelledby strengthening import demand from developed economies,which accounted for at least half of thetotal exports from most of the economies in the subregion. The weaker Indian rupee also spurred exports,loweringthecurrentaccountdeficitto2%ofGDP in 2013 (see figure 2.13). In contrast, exportsfrom Nepal and Turkey declined following sluggish economic activity in India and Europe, respectively.International sanctions negatively affected oil exports from the Islamic Republic of Iran.
Trade deficits narrowed due to stronger exports but they remained sizeable. The subregion in general continued to rely on imported food and energy. Export items are typically low value-added and concentrated in textiles and garments in Bangladesh,Nepal,PakistanandSri Lanka.Goodsexports account for less than one fifth of GDP inmost economies, highlighting the need to enhanceproductive capacity. Meanwhile, governments haverecentlysoughttoaddresstradedeficits.Bangladeshraised import tariffs, while India, Pakistan and SriLanka introduced measures to curb gold imports.
Current account deficits narrowed in several of theeconomies in the subregion in 2013 as workers’remittances and tourism revenue increased and exports rebounded. Among countries that receive sizeable remittances, inflows have been growingin Bangladesh, Nepal, Pakistan and Sri Lankain recent years, in line with a higher numberof overseas workers. Although remittances have supported household spending and contributed to
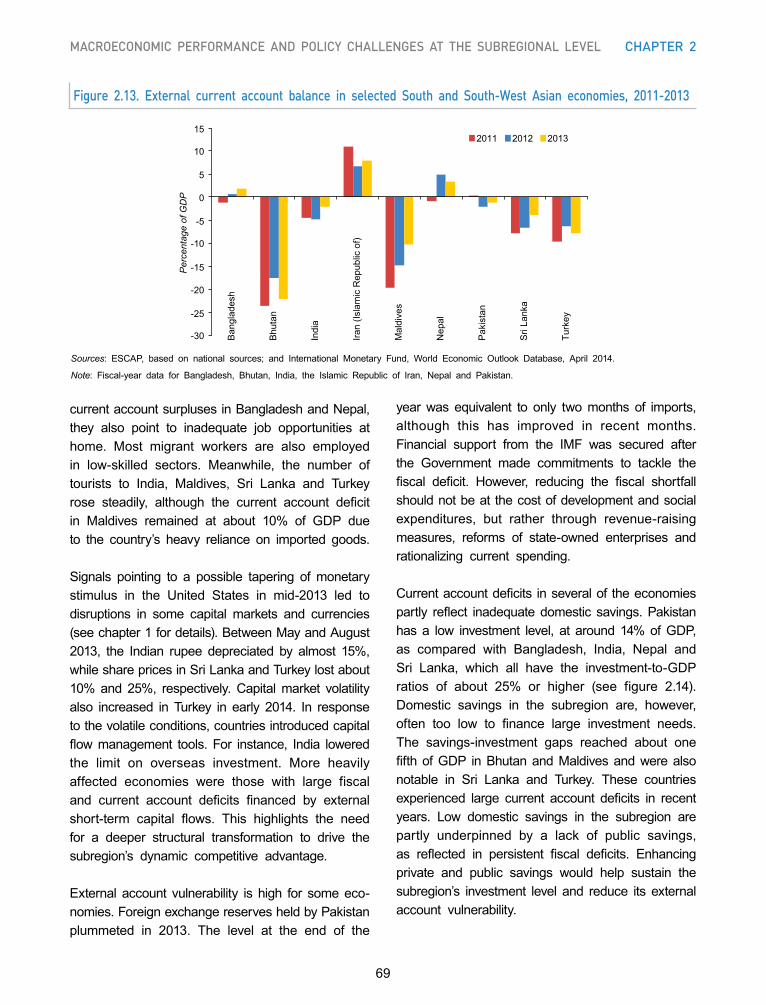
69
MacroeconoMic PerforMance and Policy challenges at the subregional level chaPter 2
Sources: ESCAP, based on national sources; and International Monetary Fund, World Economic Outlook Database, April 2014.
Note: Fiscal-year data for Bangladesh, Bhutan, India, the Islamic Republic of Iran, Nepal and Pakistan.
Figure 2.13. External current account balance in selected South and South-West Asian economies, 2011-2013
2011 2012 2013
-30
-25
-20
-15
-10
-5
0
5
10
15
Ban
glad
esh
Bhu
tan
Indi
a
Iran
(Isla
mic
Rep
ublic
of)
Mal
dive
s
Nep
al
Pak
ista
n
Sri
Lank
a
Turk
ey
Per
cent
age
of G
DP
currentaccountsurplusesinBangladeshandNepal,they also point to inadequate job opportunities at home. Most migrant workers are also employedin low-skilled sectors. Meanwhile, the number oftourists to India, Maldives, Sri Lanka and Turkeyrose steadily, although the current account deficitin Maldives remained at about 10% of GDP dueto the country’s heavy reliance on imported goods.
Signals pointing to a possible tapering of monetary stimulus in the United States in mid-2013 led to disruptions in some capital markets and currencies (seechapter1fordetails).BetweenMayandAugust2013, the Indian rupee depreciated by almost 15%,whilesharepricesinSriLankaandTurkeylostabout10%and 25%, respectively.Capitalmarket volatilityalso increased in Turkey in early 2014. In response tothevolatileconditions,countriesintroducedcapitalflowmanagement tools. For instance, India loweredthe limit on overseas investment. More heavilyaffected economies were those with large fiscal and current account deficits financed by externalshort-term capital flows. This highlights the needfor a deeper structural transformation to drive the subregion’s dynamic competitive advantage.
External account vulnerability is high for some eco- nomies. Foreign exchange reserves held by Pakistan plummeted in 2013. The level at the end of the
yearwas equivalent to only twomonths of imports,although this has improved in recent months. Financial support from the IMF was secured afterthe Government made commitments to tackle thefiscal deficit. However, reducing the fiscal shortfallshould not be at the cost of development and social expenditures, but rather through revenue-raisingmeasures, reforms of state-owned enterprises andrationalizing current spending.
Currentaccountdeficits inseveralof theeconomiespartly reflect inadequatedomestic savings.Pakistanhas a low investment level, at around14%ofGDP,as compared with Bangladesh, India, Nepal andSri Lanka, which all have the investment-to-GDPratios of about 25% or higher (see figure 2.14). Domestic savings in the subregion are, however,often too low to finance large investment needs.The savings-investment gaps reached about one fifthofGDP inBhutanandMaldivesandwerealsonotable in Sri Lanka and Turkey. These countriesexperienced large current account deficits in recentyears. Low domestic savings in the subregion arepartly underpinned by a lack of public savings,as reflected in persistent fiscal deficits. Enhancingprivate and public savings would help sustain the subregion’s investment level and reduce its externalaccount vulnerability.
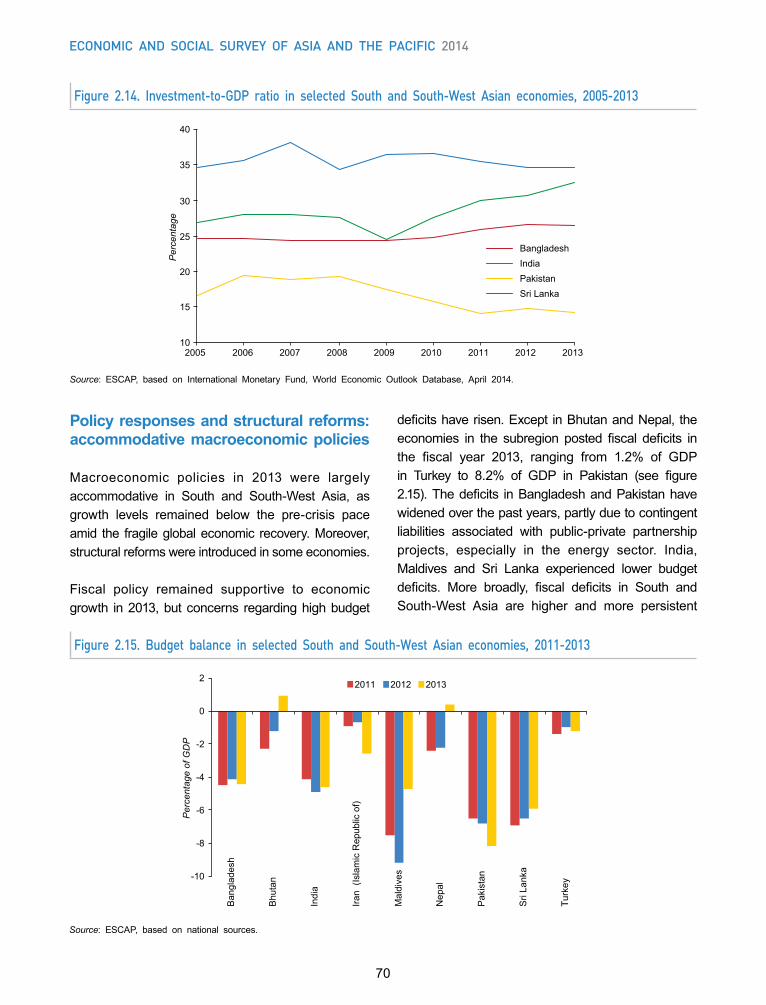
70
Economic and social survEy of asia and thE pacific 2014
Figure 2.15. Budget balance in selected South and South-West Asian economies, 2011-2013
Source: ESCAP, based on national sources.
2011 2012 2013
-10
-8
-6
-4
-2
0
2
Ban
glad
esh
Bhu
tan
Indi
a
Iran
(Isl
amic
Rep
ublic
of)
Mal
dive
s
Nep
al
Pak
ista
n
Sri
Lank
a
Turk
ey
Per
cent
age
of G
DP
Source: ESCAP, based on International Monetary Fund, World Economic Outlook Database, April 2014.
Figure 2.14. Investment-to-GDP ratio in selected South and South-West Asian economies, 2005-2013
Bangladesh India Pakistan Sri Lanka
10
15
20
25
30
35
40
2005 2006 2007 2008 2009 2010 2011 2012 2013
Per
cent
age
Policy responses and structural reforms: accommodative macroeconomic policies
Macroeconomic policies in 2013 were largelyaccommodative in South and South-West Asia, asgrowth levels remained below the pre-crisis pace amid the fragileglobaleconomic recovery.Moreover,structural reforms were introduced in some economies.
Fiscal policy remained supportive to economic growth in2013,butconcerns regardinghighbudget
deficitshaverisen.Except inBhutanandNepal, theeconomies in the subregion posted fiscal deficits inthe fiscal year 2013, ranging from 1.2% of GDPin Turkey to 8.2% of GDP in Pakistan (see figure2.15).Thedeficits inBangladeshandPakistanhavewidenedoverthepastyears,partlyduetocontingentliabilities associated with public-private partnership projects, especially in the energy sector. India,Maldives and Sri Lanka experienced lower budgetdeficits. More broadly, fiscal deficits in South andSouth-West Asia are higher and more persistent
71
MacroeconoMic PerforMance and Policy challenges at the subregional level chaPter 2
than in other subregions. They are driven primarily by a large informal economy, a small tax base, lossmaking state-owned enterprises and inefficient taxcollection. Attempts to address budget deficits musttherefore tackle these root causes instead of by cutting essential development and social expenditures to meet short-term exigencies.
Fiscal policy space is often limited in these countries. Expenditures on maintaining internal security and weakly targeted subsidies are considerable, whilethose on interest payments are as high as 30% oftotal spending in some of the economies. The public debt level is close to 80% of GDP in BangladeshandSriLankaandmore than50% inBhutan, Indiaand Pakistan. Sizeable public external debt in Sri Lankamakesthecountrysubjecttogreaterexchangerate risk. Limited fiscal space has not only reducedavailable funds for development expenditure, but ineconomies, such as Pakistan, a large proportion ofcurrent expenditure is financed through borrowing.InAfghanistanandBhutan, fiscal positionsarealsohighly dependent on external funding and grants.
Monetary policy was generally accommodative amidsomesofteningofinflationandfragileexternaldemand.In2013,policy interest ratecuts totalling50and100basispointsweremadeinBangladeshandSriLanka,respectively. In India, thepolicy ratewas cut steadilyfromJanuary2013untilSeptemberwhenthemonetarypolicy changed course in response to heightened capital market volatility. A similar turnaround was observed in Turkey in early 2014 to stem currency depreciationandcapitalflight,andinPakistan,inlate2013, as inflation edged up. The cash reserve ratiowas lowered in India, Nepal and Sri Lanka. Broadmoney supply growth was comparable to the past years. Loose monetary policy enabled strong bankcredit growth in Bangladesh, although the country’snon-performing loan ratiowas high at close to 10%.Meanwhile, monetary policy effectiveness is limitedin several of the economies, such as Afghanistandue to an underdeveloped financial system, Bhutanand Nepal as a result of pegged exchange rates with India, and the Islamic Republic of Iran due toa large informal market for foreign exchange.
Turningtothestructuralreformagenda,inthetwelfthnational development plan (2012-2017) of India, itis emphasized that the country needs to reverse the recent economic slowdown, while ensuring thatgrowth was more inclusive and sustainable. Tackling macroeconomic imbalances, particularly high fiscaland current account deficits, is also cited as animmediate policy challenge.11 Some of the country’srecent reform initiatives include: relaxing caps onforeign investment in such sectors as retail and telecommunications; allowing foreigners to invest in pension funds; setting up an investment committee to speed up the implementation of large infrastructure projects; passing a food security act that provides subsidized food grains to two thirds of the population; and introducing clearer guidelines on the land acquisitionprocess.Regardingfinancialreforms,thereare proposals to create a new category of banks that would focus on lending to small businesses and low-income households, and to introduce astructured monetary policy framework to increase central bank independence. The formation of a new GovernmentafterparliamentaryelectionsinApril-May2014 should provide impetus to economic reforms.
India’s national development plan aims to ensure more inclusive and sustainable
development
In Bangladesh, one key initiative is an amendmentin the labour law to strengthen worker rights by allowing more trade unions and requiring a provision for group insurance for work-related accidents. Another key development is the introduction of an online tax registration system, which facilitates taxpayments. Meanwhile, more recent initiatives havefocused on supporting the garment sector amid political disruptions. They included lower income tax for garment exporters and reduced lending rates on input procurement.
Outlook for 2014 and policy challenges
The outlook for the subregion in 2014 is positive. As discussedinchapter1 indetail, the Indian economy
72
Economic and social survEy of asia and thE pacific 2014
is expected to stage a modest recovery and grow by 5.5% in the fiscal year 2014. This recovery isto be supported by an improved performance in the industrial and services sectors. Higher growth in the developed countries will likely enhance external demand, which would be further supported by therecentdepreciationof the Indian rupee.However, tosecure growth, more emphasis must be placed onremoving structural impediments, building businessconfidence and creating fiscal space to support investment.Theremovalofinfrastructuredeficiencies,especially with regards to power and transport, isneeded to promote growth. The growth prospects of the country also depend on the pace of a structural reformagendacarriedoutby thenewGovernment.
Growth in Pakistan is projected to pick up to 4.1%in the fiscal year 2014. In recent months, therehave been some notable positive changes in the economy, including improved growth of large-scalemanufacturingindustries,expansioninprivatesectorcredit,accumulationofforeignexchangereservesandappreciation of the Pakistani rupee against the United States dollar. Despite these positive developments,the economy still faces many challenges and structural reforms are needed to address them. The investment-to-GDP ratio is one of the lowestin the subregion. Tackling the problem of severe energy shortages is key to promoting investment and growth on sustainable basis. There is also a need to reduce the country’s trade deficit by improvingproduction efficiency and export competitivenessand lowering its reliance on imported oil in meeting domestic energy needs. Also, the budget deficit,which continues to be large, needs to be reducedsignificantly in the coming years.
The economy of Bangladesh is projected to grow at a steady rate of 6.1% in the fiscal year 2014.The agricultural sector is expected to perform better due to improved weather conditions and last year’slowbase.However,slowerexpansionofexportsandfalling workers’ remittances may hold back growth.Massive investments in infrastructure are neededto raise growth to higher levels.
Sri Lanka is projected to maintain high growthmomentum,withitseconomyexpectedtoexpandatahigher rate of 7.6% in 2014. The high growth rate isexpectedtobesupportedbyanincreaseininvestment,particularly in infrastructure by the Government, afavourable macroeconomic environment and the continued recovery in the global economy. Greaterinvolvement of the private sector in economic activities will further enhance the growth prospects of the country. Further fiscal consolidation and improvingtax revenues, however, remain major challenges.
Relatively fast economic growth has translated into only a modest poverty
reduction
Strong hydropower exports should sustain high output growth of 7.1% inBhutan.Steady remittanceinflowsandtourismincomewouldparticularlybenefitMaldives andNepal, both ofwhich are expected togrowby4.5%.On the condition that thewithdrawalof international security forces from Afghanistan is smooth,theeconomyisprojectedtomaintainsteadygrowth of 3.2% in 2014.
The economy of the Islamic Republic of Iran islikely to expand by 1.5% in 2014 after contractingin the past two years. This improved performance is contingent upon eased sanctions on oil exports. In Turkey, growth is expected to be stable at 4%in 2014, as economies in theEuropeanUnion startto recover. However, further escalation in tensionsbetween the Russian Federation and Ukraine canundermine growth in Europe, as well as in Turkey.Domestic politics and uncertainty can also weighon growth.
The South and South-West Asia subregion hasenjoyedrelativelyrapideconomicgrowth,butthishastranslated into only a modest reduction of poverty. The proportion of the population living in poverty (basedon $1.25 a day) decreased steadily frommore thana half in the early 1990s to around 29% in 2010.However, thesubregion isstillhome toclose to40%of the world’s poor, up from 27% two decades ago.
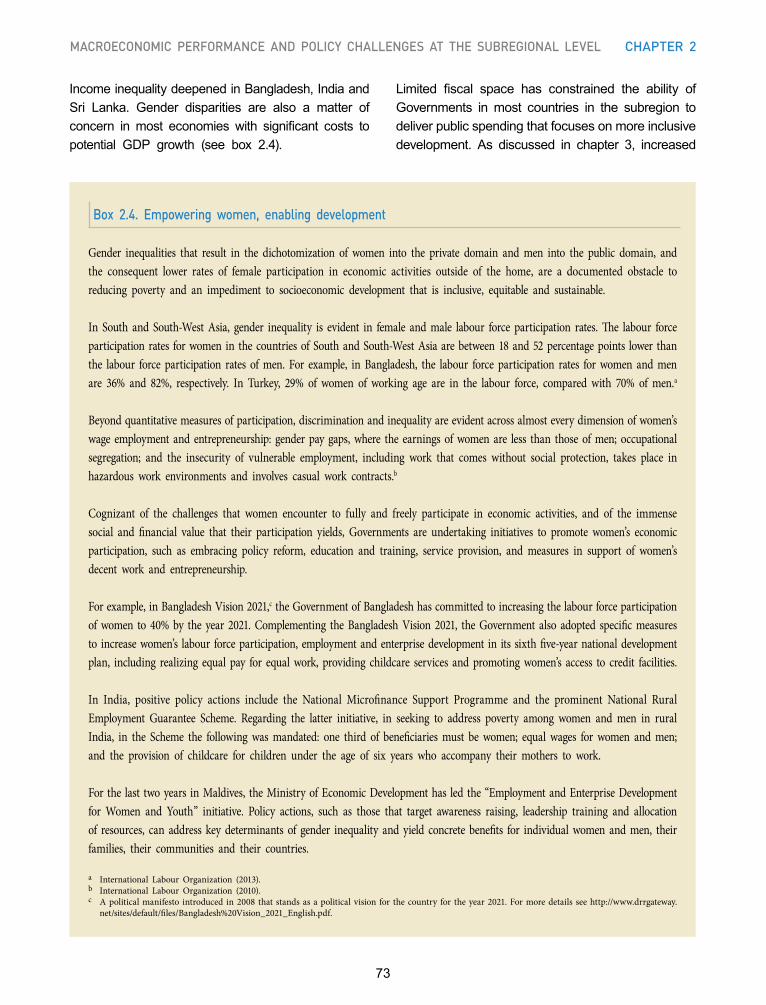
73
MacroeconoMic PerforMance and Policy challenges at the subregional level chaPter 2
Box 2.4. Empowering women, enabling development
Gender inequalities that result in the dichotomization of women into the private domain and men into the public domain, and the consequent lower rates of female participation in economic activities outside of the home, are a documented obstacle to reducing poverty and an impediment to socioeconomic development that is inclusive, equitable and sustainable.
In South and South-West Asia, gender inequality is evident in female and male labour force participation rates. The labour force participation rates for women in the countries of South and South-West Asia are between 18 and 52 percentage points lower than the labour force participation rates of men. For example, in Bangladesh, the labour force participation rates for women and men are 36% and 82%, respectively. In Turkey, 29% of women of working age are in the labour force, compared with 70% of men.a
Beyond quantitative measures of participation, discrimination and inequality are evident across almost every dimension of women’s wage employment and entrepreneurship: gender pay gaps, where the earnings of women are less than those of men; occupational segregation; and the insecurity of vulnerable employment, including work that comes without social protection, takes place in hazardous work environments and involves casual work contracts.b
Cognizant of the challenges that women encounter to fully and freely participate in economic activities, and of the immense social and financial value that their participation yields, Governments are undertaking initiatives to promote women’s economic participation, such as embracing policy reform, education and training, service provision, and measures in support of women’s decent work and entrepreneurship.
For example, in Bangladesh Vision 2021,c the Government of Bangladesh has committed to increasing the labour force participation of women to 40% by the year 2021. Complementing the Bangladesh Vision 2021, the Government also adopted specific measures to increase women’s labour force participation, employment and enterprise development in its sixth five-year national development plan, including realizing equal pay for equal work, providing childcare services and promoting women’s access to credit facilities.
In India, positive policy actions include the National Microfinance Support Programme and the prominent National Rural Employment Guarantee Scheme. Regarding the latter initiative, in seeking to address poverty among women and men in rural India, in the Scheme the following was mandated: one third of beneficiaries must be women; equal wages for women and men; and the provision of childcare for children under the age of six years who accompany their mothers to work.
For the last two years in Maldives, the Ministry of Economic Development has led the “Employment and Enterprise Development for Women and Youth” initiative. Policy actions, such as those that target awareness raising, leadership training and allocation of resources, can address key determinants of gender inequality and yield concrete benefits for individual women and men, their families, their communities and their countries.
a International Labour Organization (2013). b International Labour Organization (2010).c A political manifesto introduced in 2008 that stands as a political vision for the country for the year 2021. For more details see http://www.drrgateway. net/sites/default/files/Bangladesh%20Vision_2021_English.pdf.
IncomeinequalitydeepenedinBangladesh,IndiaandSri Lanka. Gender disparities are also a matter ofconcern in most economies with significant costs topotential GDP growth (see box 2.4).
Limited fiscal space has constrained the ability ofGovernments in most countries in the subregion todeliver public spending that focuses on more inclusive development. As discussed in chapter 3, increased
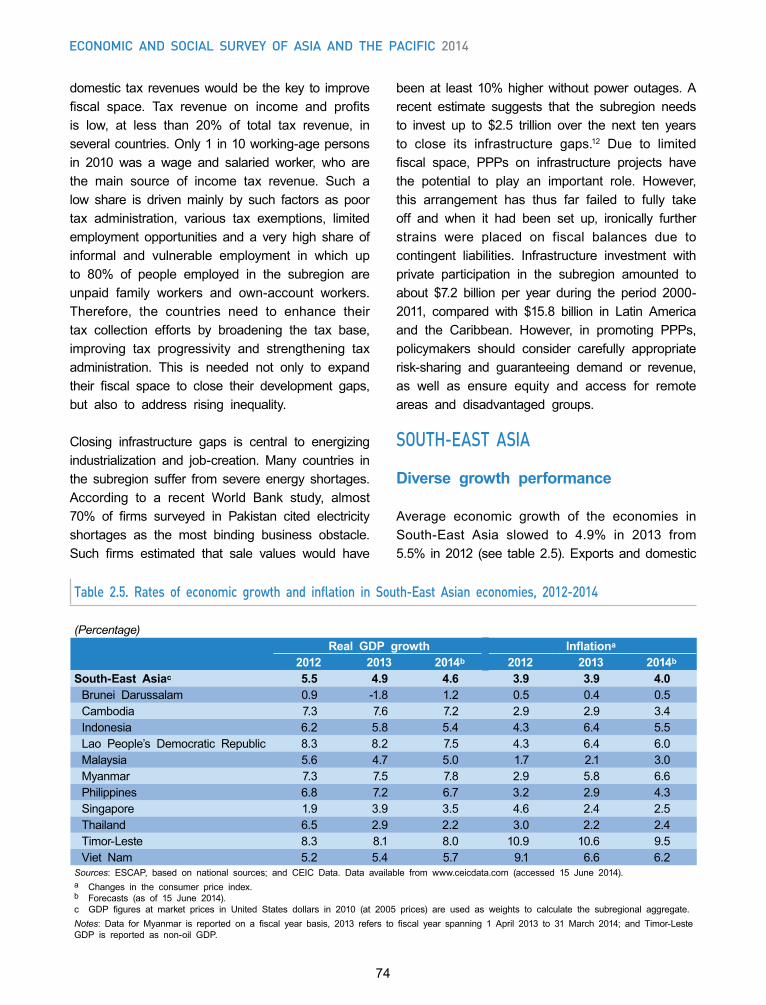
74
Economic and social survEy of asia and thE pacific 2014
domestic tax revenues would be the key to improve fiscal space. Tax revenue on income and profitsis low, at less than 20% of total tax revenue, inseveral countries. Only 1 in 10 working-age persons in 2010 was a wage and salaried worker, who arethe main source of income tax revenue. Such a low share is driven mainly by such factors as poor tax administration, various tax exemptions, limitedemployment opportunities and a very high share of informal and vulnerable employment in which up to 80% of people employed in the subregion areunpaid family workers and own-account workers. Therefore, the countries need to enhance theirtax collection efforts by broadening the tax base,improving tax progressivity and strengthening tax administration. This is needed not only to expand their fiscal space to close their development gaps,but also to address rising inequality.
Closing infrastructure gaps is central to energizing industrialization and job-creation. Many countries inthe subregion suffer from severe energy shortages. According to a recent World Bank study, almost70% of firms surveyed in Pakistan cited electricityshortages as the most binding business obstacle. Such firms estimated that sale values would have
beenat least 10%higherwithoutpoweroutages.Arecent estimate suggests that the subregion needs to invest up to $2.5 trillion over the next ten yearsto close its infrastructure gaps.12 Due to limitedfiscal space, PPPs on infrastructure projects havethe potential to play an important role. However,this arrangement has thus far failed to fully take off and when it had been set up, ironically furtherstrains were placed on fiscal balances due to contingent liabilities. Infrastructure investment with private participation in the subregion amounted to about $7.2 billion per year during the period 2000-2011, compared with $15.8 billion in Latin Americaand the Caribbean. However, in promoting PPPs,policymakers should consider carefully appropriate risk-sharing and guaranteeing demand or revenue,as well as ensure equity and access for remote areas and disadvantaged groups.
SOUTH-EAST ASIA
Diverse growth performance
Average economic growth of the economies in South-East Asia slowed to 4.9% in 2013 from5.5% in2012 (see table2.5).Exportsanddomestic
Table 2.5. Rates of economic growth and inflation in South-East Asian economies, 2012-2014
(Percentage)Real GDP growth Inflationa
2012 2013 2014b 2012 2013 2014b
South-East Asiac 5.5 4.9 4.6 3.9 3.9 4.0 Brunei Darussalam 0.9 -1.8 1.2 0.5 0.4 0.5Cambodia 7.3 7.6 7.2 2.9 2.9 3.4Indonesia 6.2 5.8 5.4 4.3 6.4 5.5Lao People’s Democratic Republic 8.3 8.2 7.5 4.3 6.4 6.0Malaysia 5.6 4.7 5.0 1.7 2.1 3.0Myanmar 7.3 7.5 7.8 2.9 5.8 6.6Philippines 6.8 7.2 6.7 3.2 2.9 4.3Singapore 1.9 3.9 3.5 4.6 2.4 2.5Thailand 6.5 2.9 2.2 3.0 2.2 2.4Timor-Leste 8.3 8.1 8.0 10.9 10.6 9.5Viet Nam 5.2 5.4 5.7 9.1 6.6 6.2
Sources: ESCAP, based on national sources; and CEIC Data. Data available from www.ceicdata.com (accessed 15 June 2014).a Changes in the consumer price index.b Forecasts (as of 15 June 2014).c GDP figures at market prices in United States dollars in 2010 (at 2005 prices) are used as weights to calculate the subregional aggregate.Notes: Data for Myanmar is reported on a fiscal year basis, 2013 refers to fiscal year spanning 1 April 2013 to 31 March 2014; and Timor-LesteGDP is reported as non-oil GDP.
75
MacroeconoMic PerforMance and Policy challenges at the subregional level chaPter 2
demand lostmomentum in Indonesia,MalaysiaandThailand. Bucking the trend was economic growth in thePhilippines,whichgrewatamore rapid rate.The economies of Cambodia, the Lao People’sDemocratic Republic and Myanmar continued toexpand at rate that exceeds 7%, despite significanthuman capital and infrastructure challenges.
In Brunei Darussalam, GDP contracted by 1.8%in 2013 after growing by 0.9% in 2012. Oil outputdeclined markedly in the second half of the year. Public investment and non-energy activities held up more favourably. Expanded petrochemical and refinery capacities are expected to support growthin the coming years, but diversification into sectors,such as banking and tourism, remains a priority.
The economy of Cambodia accelerated slightly to 7.6% in 2013. Garment exports continued to drivegrowth.Theminimumwage in thegarment industry,which employs about 600,000 workers, was raised;yet, working conditions still need to be improved.Beyondgarments,steadyagriculturalgrowthhasbeensupported by public investment in rice milling and storage facilities. Credit growth continued to expand rapidly,andthecountry’sbankingsectorreceivedthehighest FDI among the country’s service industries.However, the proportion of credit channelled tolong-term investments needs to be increased at the expense of credit for consumption and real estate.
Economic growth in Indonesia slowed amid monetary policy tightening
Outputgrowth in Indonesiaslowed to5.8% in2013from 6.2% in 2012, as the monetary policy wastightened to curb inflation and put a cap on thecurrent account deficit. Growth in fixed investmenteased on the back of higher interest rates and the depreciation of the Indonesian rupiah, while publicinvestment in infrastructure rose to about 3% ofGDP,thehighestlevelsincethe1997Asianfinancialcrisis. Export earnings remained subdued on softer global commodityprices,butadecrease in importsresulted in higher net exports for the year. Private
consumption held up more strongly, supported bytax reductions, cash transfers and higher minimumwages. The impact of slowing output growth was felt in the labour market, as the official unemploymentrateedgedup to6.25% inAugust2013 from6.14%in the previous year. Financial markets experienced increased volatility in mid-2013, triggered by fearsover the withdrawal of monetary policy support in the United States.
The economy of the Lao People’s DemocraticRepublic sustained high growth of 8.2% in 2013.Hydropower and mining activities continued to drive growth, but garments and other manufacturingactivities have emerged as important sources of outputandemploymentgrowth.Theservicessector,particularly telecommunications, also expandedrapidly. Accession to theWorld Trade Organizationin 2013 and the planned railway linking the capital city to major cities in southern China could open upnewopportunities.Developing human resourcesand institutional capacity would help the country benefit fully from these developments.
Growth in Malaysia slowed from 5.6% in 2012 to4.7% in 2013. Demand for the country’s exportswaned in the first half of the year and investmentgrowth softened albeit from a high base, as publicoutlaysdroppedsharply.Growthwasprimarilydrivenby private consumption, which rose by 7.6% amidlow inflation, robust employment expansionand theintroductionofminimumwages in2013.However,arapid increase in consumption in recent years has beenaccompanied by rising household debt levels,which has become a concern.On the supply side,growth in the export-oriented manufacturing sector and in some services sectors, such as finance,was sluggish, but communications, real estate andbusiness services expanded rapidly.
Economic growth in Myanmar accelerated slightlyto 7.5% in 2013, driven by natural gas exports andhigher investment in the energy sector. Improved business confidence following recent reforms hasattracted foreign investment in telecommunications,infrastructureandgarments,amongothers.Thiswas
76
Economic and social survEy of asia and thE pacific 2014
reflected in increasedcapital imports,newbusinessregistrations and rapid credit growth in the private sector. Nevertheless, significant challenges remain.Medium-term priorities include expanding access toelectricity in rural areas and developing the banking sector,astheeconomyremains largelycash-based.Telecommunication facilities are also limited, withmobile phone penetration estimated at only 11%,the fourth-lowest rate in the world.
The economy of the Philippines expanded by a robust 7.2%in2013,wellaboveitshistoricaltrend.Notably,the country posted a strong economic performance despite being struck by Typhoon Haiyan in November 2013, which caused extensive damage and morethan 6,000 confirmed deaths. Private consumptionbuoyed the economic expansion, supported bysteady overseas workers’ remittances. Investmentalso increased notably, particularly in construction,althoughoveralltheinvestment-to-GDPratioremainsrelatively low, at about 20% of GDP. Net exportshampered growth as imports rose while exports suffered from weak demand for semiconductors and other electronic components, which accountfor about 40% of total exports. Despite a boomingeconomy, the country’s official unemployment ratewas high, at 7.5%, in 2013.
The economy of Singapore rebounded from sluggish growth of 1.9% in 2012 to 3.9% in 2013. External-oriented sectors, such as manufacturing, wholesaletradeandtransportation,bouncedbackinthesecondhalf of 2013. Other sectors, such as constructionandbusinessservices,alsoregisteredimprovements,although the tight labour market weighed on some labour-intensivesectors.Inthecountry’s2014budget,the need to invest in labour-saving technologies and worker training is emphasized. Additional support for students from low-income families and elderly groups was also introduced to reduce income inequality.
The economy of Thailand slowed notably to 2.9%in 2013 froma high base of 6.5% in 2012.Exportsstalled as key items, such as electronics products,auto vehicles and rice, performed poorly. Weakmerchandise exports were, however, partially offset
by strong tourist arrivals. Domestic demand alsoweakenedastheeffectsoffiscalstimulusfadedandthe post-flood reconstructionwas completed.Risinghousehold debts, arrears in government subsidypayments to rice farmers and political uncertainty,whichbeganinNovember2013,haveputadamperon consumer confidence. Political tensions havealso delayed major public investment projects in water management and infrastructure and raised uncertainty over planned public spending. Taken together, the economy expanded by a mere 0.6%in the fourth quarter on a year-on-year basis.
Rising household debt and political uncertainty put a damper on consumer
confidence in Thailand
Non-oil economic growth in Timor-Leste softenedmarginally to 8.1% in 2013. Given moderating oilproduction during the year, overall GDP growthwas rather weak. The economy is driven largely by governmentspending,backedbythePetroleumFund,and energy-related sectors, such as construction.Domestic production is confined to subsistencefarming and coffee, resulting in high reliance onimported goods. A major challenge for the country is to effectively use oil revenues to foster social development and diversify the economic structure.
Economic growth in Viet Nam picked up slightly, to5.4%, in 2013. The economy recovered graduallyfrom the effects of a high-inflation episode and banking sector problems. Both consumption and investment grew at a steady pace. On the supply side, services continued to grow rapidly, whilemanufacturing picked up in the second half of the year.Nonetheless, therewasa12% increase in thereported number of firms that ceased operationsin 2013, as compared with 2012. Reform of state-ownedenterprises,whichaccount forabout40%ofGDP,wouldhelpenhance thequalityof investment.
In the least developed countries in the subregion — Cambodia,theLaoPeople’sDemocraticRepublicandMyanmar,industry’sshareofGDPmorethandoubled
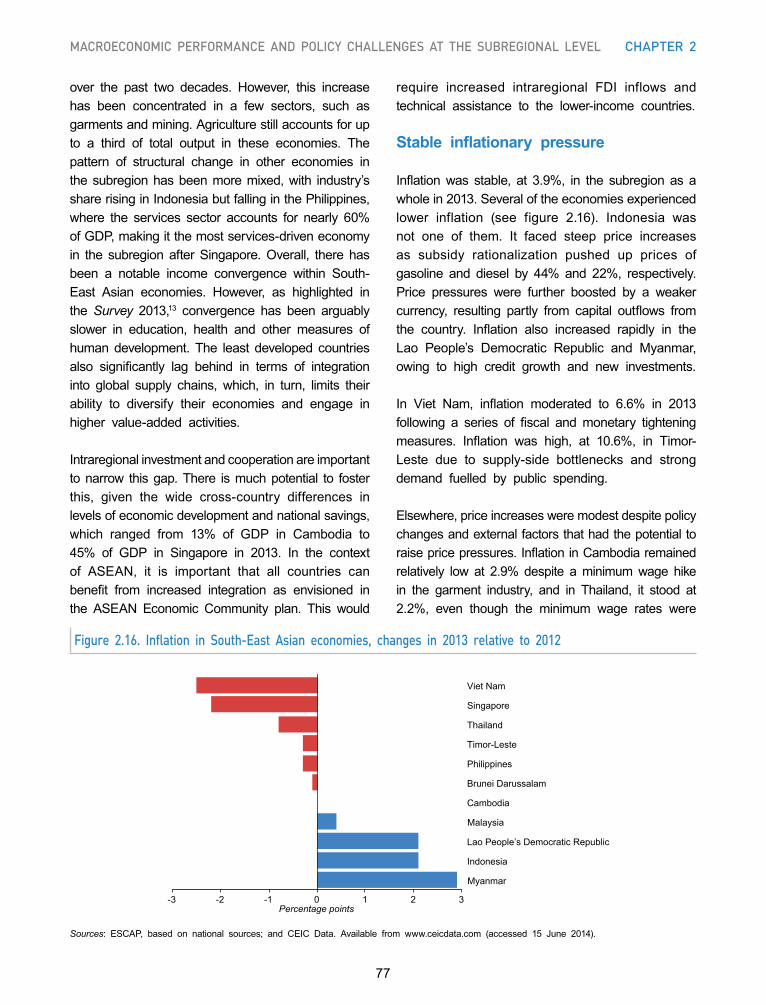
77
MacroeconoMic PerforMance and Policy challenges at the subregional level chaPter 2
over the past two decades. However, this increasehas been concentrated in a few sectors, such asgarments and mining. Agriculture still accounts for up to a third of total output in these economies. The pattern of structural change in other economies in thesubregionhasbeenmoremixed,with industry’ssharerisinginIndonesiabutfallinginthePhilippines,where the services sector accounts for nearly 60%ofGDP,makingitthemostservices-driveneconomyin the subregion afterSingapore.Overall, there hasbeen a notable income convergence within South-East Asian economies. However, as highlighted inthe Survey 2013,13 convergence has been arguably slower in education, health and other measures ofhuman development. The least developed countries also significantly lag behind in terms of integrationinto global supply chains, which, in turn, limits theirability to diversify their economies and engage in higher value-added activities.
Intraregional investment and cooperation are important to narrow this gap. There is much potential to foster this, given the wide cross-country differences inlevelsofeconomicdevelopmentandnationalsavings,which ranged from 13% of GDP in Cambodia to45% of GDP in Singapore in 2013. In the contextof ASEAN, it is important that all countries canbenefit from increased integration as envisioned inthe ASEAN Economic Community plan. This would
require increased intraregional FDI inflows andtechnical assistance to the lower-income countries.
Stable inflationary pressure
Inflationwas stable, at 3.9%, in the subregion as awhole in 2013. Several of the economies experienced lower inflation (see figure 2.16). Indonesia wasnot one of them. It faced steep price increases as subsidy rationalization pushed up prices of gasoline and diesel by 44% and 22%, respectively.Price pressures were further boosted by a weaker currency, resulting partly from capital outflows fromthe country. Inflation also increased rapidly in theLao People’s Democratic Republic and Myanmar,owing to high credit growth and new investments.
In Viet Nam, inflation moderated to 6.6% in 2013following a series of fiscal andmonetary tighteningmeasures. Inflation was high, at 10.6%, in Timor-Leste due to supply-side bottlenecks and strongdemand fuelled by public spending.
Elsewhere,priceincreasesweremodestdespitepolicychanges and external factors that had the potential to raisepricepressures.InflationinCambodiaremainedrelatively low at 2.9% despite aminimumwage hikein the garment industry, and in Thailand, it stood at2.2%, even though the minimum wage rates were
Sources: ESCAP, based on national sources; and CEIC Data. Available from www.ceicdata.com (accessed 15 June 2014).
Figure 2.16. Inflation in South-East Asian economies, changes in 2013 relative to 2012
-3 -2 -1 0 1 2 3
Myanmar
Indonesia
Lao People’s Democratic Republic
Malaysia
Cambodia
Brunei Darussalam
Philippines
Timor-Leste
Thailand
Singapore
Viet Nam
Percentage points
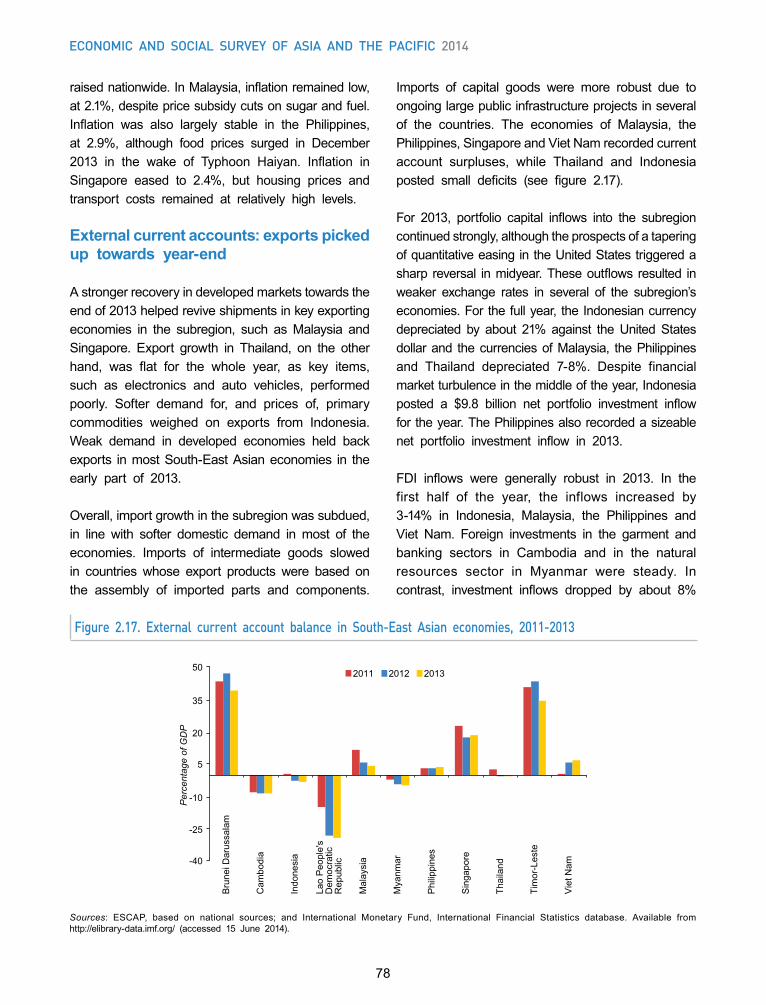
78
Economic and social survEy of asia and thE pacific 2014
Sources: ESCAP, based on national sources; and International Monetary Fund, International Financial Statistics database. Available from http://elibrary-data.imf.org/ (accessed 15 June 2014).
Figure 2.17. External current account balance in South-East Asian economies, 2011-2013
raisednationwide.InMalaysia,inflationremainedlow,at2.1%,despitepricesubsidycutsonsugarandfuel.Inflation was also largely stable in the Philippines,at 2.9%, although food prices surged in December2013 in the wake of Typhoon Haiyan. Inflation inSingapore eased to 2.4%, but housing prices andtransport costs remained at relatively high levels.
External current accounts: exports picked up towards year-end
A stronger recovery in developed markets towards the end of 2013 helped revive shipments in key exporting economies in the subregion, such asMalaysia andSingapore. Export growth in Thailand, on the otherhand, was flat for the whole year, as key items,such as electronics and auto vehicles, performedpoorly. Softer demand for, and prices of, primarycommodities weighed on exports from Indonesia. Weak demand in developed economies held backexports in most South-East Asian economies in the early part of 2013.
Overall,importgrowthinthesubregionwassubdued,in line with softer domestic demand in most of the economies. Imports of intermediate goods slowed in countries whose export products were based on the assembly of imported parts and components.
Imports of capital goods were more robust due to ongoing large public infrastructure projects in several of the countries. The economies of Malaysia, thePhilippines,SingaporeandVietNamrecordedcurrentaccount surpluses, while Thailand and Indonesiaposted small deficits (see figure 2.17).
For 2013, portfolio capital inflows into the subregioncontinuedstrongly,althoughtheprospectsofataperingof quantitative easing in the United States triggered a sharp reversal inmidyear.Theseoutflows resulted inweaker exchange rates in several of the subregion’seconomies.Forthefullyear, theIndonesiancurrencydepreciated by about 21% against theUnited Statesdollarand thecurrenciesofMalaysia, thePhilippinesand Thailand depreciated 7-8%. Despite financialmarketturbulenceinthemiddleoftheyear,Indonesiaposted a $9.8 billion net portfolio investment inflowfor the year. The Philippines also recorded a sizeable net portfolio investment inflow in 2013.
FDI inflows were generally robust in 2013. In thefirst half of the year, the inflows increased by3-14% in Indonesia, Malaysia, the Philippines andViet Nam. Foreign investments in the garment and banking sectors in Cambodia and in the natural resources sector in Myanmar were steady. Incontrast, investment inflows dropped by about 8%
2011 2012 2013
-40
-25
-10
5
20
35
50
Bru
nei D
arus
sala
m
Cam
bodi
a
Indo
nesi
a
Lao
Peo
ple'
sD
emoc
ratic
Rep
ublic
Mal
aysi
a
Mya
nmar
Phi
lippi
nes
Sin
gapo
re
Thai
land
Tim
or-L
este
Vie
t Nam
Per
cent
age
of G
DP
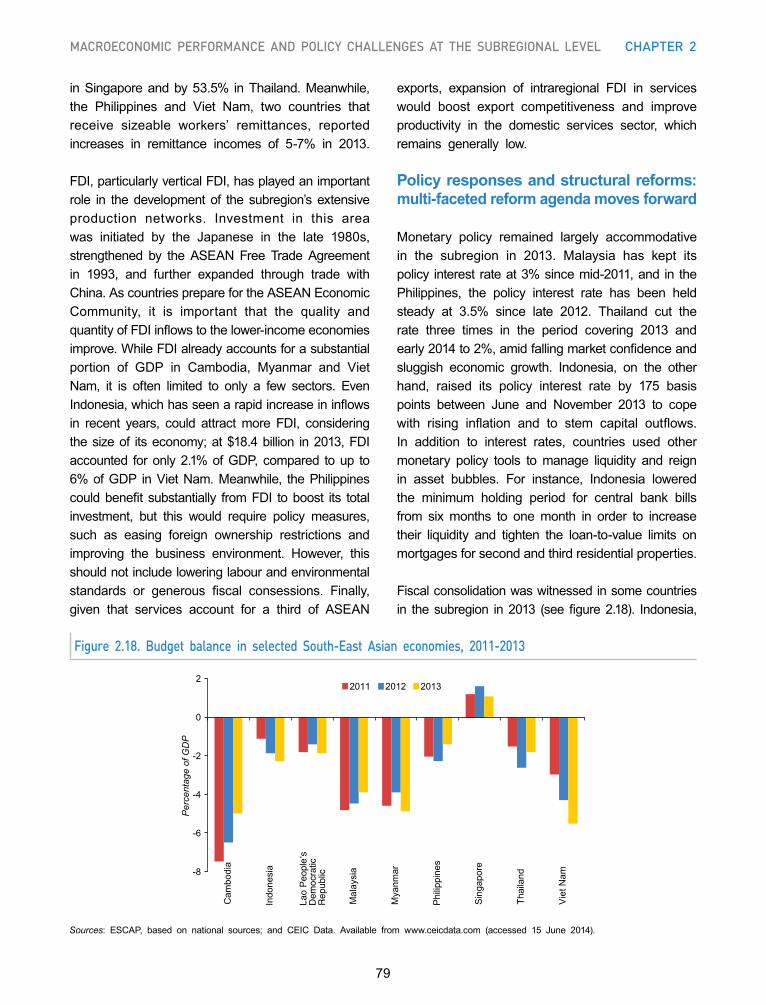
79
MacroeconoMic PerforMance and Policy challenges at the subregional level chaPter 2
inSingaporeandby53.5% inThailand.Meanwhile,the Philippines and Viet Nam, two countries thatreceive sizeable workers’ remittances, reportedincreases in remittance incomes of 5-7% in 2013.
FDI,particularlyverticalFDI,hasplayedanimportantrole in thedevelopment of the subregion’s extensiveproduction networks. Investment in this area was initiated by the Japanese in the late 1980s,strengthened by the ASEAN Free Trade Agreement in 1993, and further expanded through trade withChina. As countries prepare for the ASEAN Economic Community, it is important that the quality andquantityofFDIinflowstothelower-incomeeconomiesimprove.WhileFDIalreadyaccountsforasubstantialportion of GDP in Cambodia, Myanmar and VietNam, it is often limited to only a few sectors. EvenIndonesia,whichhasseenarapidincreaseininflowsin recent years, could attractmore FDI, consideringthesizeof itseconomy;at$18.4billion in2013,FDIaccounted foronly2.1%ofGDP,compared toup to6%ofGDP inVietNam.Meanwhile, thePhilippinescouldbenefit substantially fromFDI toboost its totalinvestment, but this would require policy measures,such as easing foreign ownership restrictions and improving the business environment. However, thisshould not include lowering labour and environmental standards or generous fiscal consessions. Finally,given that services account for a third of ASEAN
exports, expansion of intraregional FDI in serviceswould boost export competitiveness and improve productivity in the domestic services sector, whichremains generally low.
Policy responses and structural reforms: multi-faceted reform agenda moves forward
Monetary policy remained largely accommodativein the subregion in 2013. Malaysia has kept itspolicy interest rateat3%sincemid-2011,and in thePhilippines, the policy interest rate has been heldsteady at 3.5% since late 2012. Thailand cut therate three times in the period covering 2013 and early2014to2%,amidfallingmarketconfidenceandsluggish economic growth. Indonesia, on the otherhand, raised its policy interest rate by 175 basispoints between June and November 2013 to copewith rising inflation and to stem capital outflows.In addition to interest rates, countries used othermonetary policy tools to manage liquidity and reign in asset bubbles. For instance, Indonesia loweredthe minimum holding period for central bank bills from six months to one month in order to increase their liquidity and tighten the loan-to-value limits on mortgages for second and third residential properties.
Fiscal consolidation was witnessed in some countries in thesubregion in2013 (seefigure2.18). Indonesia,
Sources: ESCAP, based on national sources; and CEIC Data. Available from www.ceicdata.com (accessed 15 June 2014).
Figure 2.18. Budget balance in selected South-East Asian economies, 2011-2013
2011 2012 2013
-8
-6
-4
-2
0
2
Cam
bodi
a
Indo
nesi
a
Lao
Peop
le’s
Dem
ocra
ticR
epub
lic
Mal
aysi
a
Mya
nmar
Phi
lippi
nes
Sin
gapo
re
Thai
land
Vie
t Nam
Per
cent
age
of G
DP
80
Economic and social survEy of asia and thE pacific 2014
MalaysiaandthePhilippinesrationalizedenergypricesubsidies and/or raised electricity tariffs to restoremedium-term fiscal sustainability. Poorly targeted energy subsidies have taken up a sizeable amount of the national budget in the past in Indonesia and Malaysia, with little impact on poverty reduction.Indonesia decided in mid-2013 to cut fuel subsidies tocurbfiscaldeficit,however,despitethis,upto13%of government revenues had to be spent on fuel subsidies in 2013. Malaysia also marginally reducedits fuel subsidies in September 2013, after spendingsome 2.5% of GDP on fuel subsidies in 2012. Bothcountries offered assistance to low-income households through compensatory cash transfers and increased welfare payments. Indonesia hiked fuel prices by a third on average and provided cash transfers to mitigate the impact on poor households. While thefiscal savings from subsidy cuts have been lowerthan expected due to a weaker currency, subsidyrationalization should help provide greater fiscal resourcesforsocialspending,suchasonanuniversalhealth-care, which is to be introduced in 2014.
On the revenue side, Malaysia announced theintroduction of a 6% tax on goods and services inan effort to widen the tax base; it will come into effect in April 2015. This measure could help lower the public debt, which increased to nearly 55% ofGDP in 2013 from 40% ofGDP prior to the globalfinancial turmoil. However, any tax reform shouldtake into account and address the possible impact on low-income households. A revenue-boosting effort may also bewarranted in Indonesia, as non-oil taxrevenuehasbeenstagnant,ataround10%ofGDP,in the past years despite rapid economic growth. In the Philippines, tax administration reforms raisedthe share of government revenue inGDP to 15.2%in 2013. In Thailand, however, government revenuedeteriorated on the back of lower corporate tax rates and tax relief.
Countries in South-East Asia are introducing policy reforms on multiple fronts, including in reducingenergy subsidies and boosting public expenditures on infrastructure,education,healthandsocialprotection.Atthesametime,monetaryandfinancialauthorities
are using various macroprudential measures to address such issues as financial instability. In thePhilippines, the central bank redefined real estateactivities to lessen exposure of banks to the sector. In Indonesia,amorestringent ruleondownpaymentswas introduced to slow credit for the purchase of housing and automobiles. Similarly, in Malaysia,asset price build-ups in certain sectors have been dealt with by using macroprudential measures rather than by increasing the policy rate, which couldunnecessarily dampen overall domestic demand and hurt investment in productivity-enhancing projects.
Governments and central banks in the subregionare also working to expand access to financial servicestolow-incomehouseholdsandmicro,smalland medium-sized enterprises. For instance, thePhilippines Development Plan 2011-2016 envisionsa “development-oriented and inclusive financial system” with “effective interface of bank and non-bank products, delivery channels, technology andinnovationtoreachthefinanciallyexcluded”.14 In line with this, the central bank is expanding its financialliteracytrainingprogrammesandconsultingfinancialsector stakeholders to draft a national strategy for financial inclusion.
Timely implementation of public infrastructure projects remains a challenge
Infrastructure development is a medium-term policy priorityinseveralcountries,buttimelyimplementationof public sector projects remains a challenge. In Thailand,furtherdelaysinimplementingmajorpublicinvestment projects in water management and public transport would undermine national competitiveness. In the Philippines, the Government may need toconsider relaxing itsfiscal-deficitcapof2%ofGDPin order to finance the reconstruction of TyphoonHaiyan-hit areas and to close infrastructure gaps in general. The Philippines have launched several projects under PPPs since 2012, while Indonesiahas passed a land-acquisition bill to speed up the process for acquiring land for new infrastructure projects. In Malaysia, the Government’s Economic
81
MacroeconoMic PerforMance and Policy challenges at the subregional level chaPter 2
Transformation Programme is helping to generate a pipeline of infrastructure investment projects.
Social protection schemes have increased in the Philippines and Viet Nam in recent years. In the Philippines, the share of the population covered bythe government-owned health insurer increased from 62% in 2010 to 81% in 2013. Viet Nam introducedan unemployment insurance scheme in 2009, anddecided in 2012 to extend social security to half of the labour force by 2020. With the aim to achieveuniversal health coverage, Viet Nam introducedgovernment-subsidized health insurance premiums forvulnerablegroups,withcoveragebeingextendedto two thirds of the population in 2013.
Outlook for 2014 and policy challenges
Economic growth in South-East Asian economies as a group is set to moderate further in 2014 relative to2013.Growthprojections for Indonesia,Malaysia,the Philippines and Thailand are discussed in detail in chapter 1. Briefly, Indonesia is projected to growmore slowly, at 5.4%, amid subdued commodityexports and tight monetary policy. The impact of a sudden acceleration in tapering of eased monetary policy in the United States can also be stronger thananticipated, especially if structural issues, suchas current account deficits financed by short-termexternalborrowings,persist.InthePhilippines,growthcould ease to 6.7%, although strong remittanceinflowswouldcontinuetosustainprivateconsumption.InMalaysia,growthisprojectedtoincreaseslightlyto5%onstrongerexportsand investment.Thailand isexpected to experienceanother year of lowgrowth,although political uncertainty has eased somewhat in recent months. Projected growth at 2.2% assumesa rebound in the second half of the year.
TheeconomyofSingapore,whichishighlydependenton exports of goods and services, should benefitfromtheexpectedglobaleconomicrecovery.Growthis however projected at a slightly lower rate of 3.5% in 2014 mainly due to domestic challenges.Tight labour market conditions will weigh on growth. Rising labour costs without corresponding gains in
productivity isacauseofconcern.TheGovernmentis actively pursuing policies to raise productivity throughincentivepolicies,buttherealizationofgainswill take time. Meanwhile, growth is projected toimprove to 5.7% inVietNamamid improving creditconditions. Continuation of monetary policy caution andrenewedfocusonstructuralreforms,particularlythe restructuring of state-owned enterprises and the banking sector, should support projected growth.Private investment is also expected to pick up.
Growth prospects for 2014 in the least developedcountries are mixed. Output growth in Cambodia is expected to ease to 7.2%. Exports and investmentshould remain strong, but political and labourdisputesareaconcern.Similarly,growth in theLaoPeople’s Democratic Republic could slow to 7.5%fromahighbase,withhydropower,constructionandservices activities as the main drivers. Growth ofthe non-oil sectors in Timor-Leste is expected todecelerate marginally to 8%, as public expendituregrowth moderates amid efforts to ease demand-side pressures and enhance the quality of expenditures. Incontrast,economicgrowth inMyanmar is likely toaccelerate further to 7.8%, supported by increasesin gas production, trade and agricultural output.Expansion of electricity supply could lead to higher growththanwhatiscurrentlyprojected.However,theongoing ethnic conflict could hold back Myanmar’sprogress.
One of the policy priorities is to tackle widespread informal employment
Key downside risks to these outlooks are increased financialvolatilityandsubsequentmonetarytighteningthat would be due to unexpected changes in the direction ofmonetary policy in the United States, aweaker-than-expectedgrowthperformanceinChina,and any sharp rise in international food and fuel prices led by supply shocks.
One of the medium-term priorities is to expand productive employment opportunities. Official un- employment rates remain relatively high in Indonesia
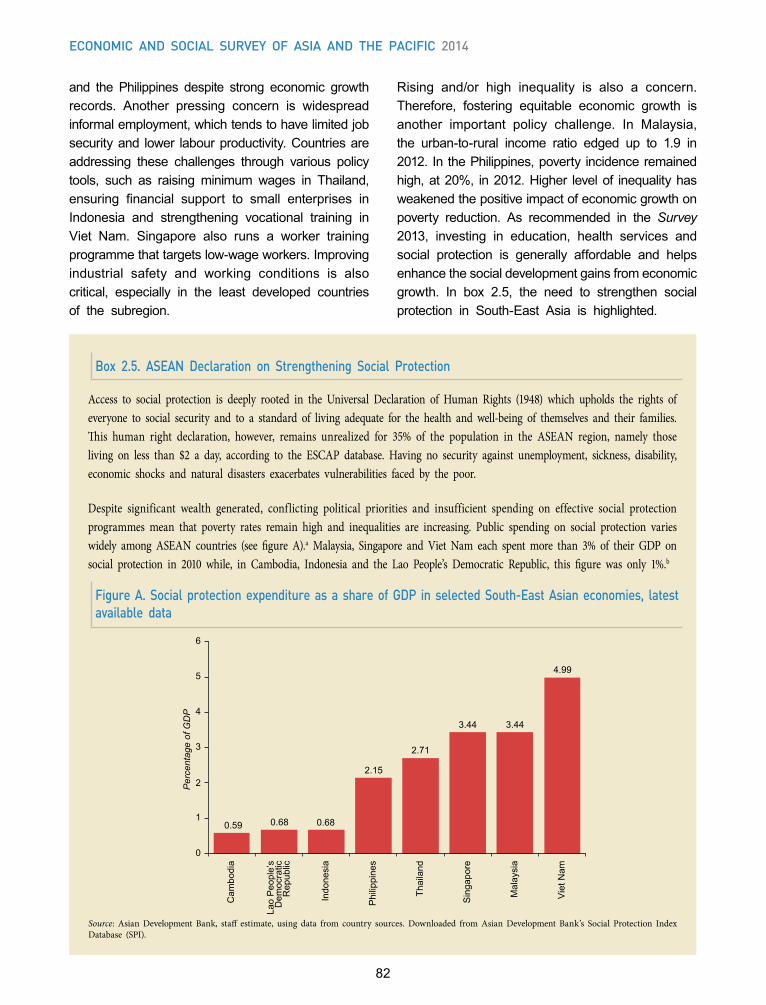
82
Economic and social survEy of asia and thE pacific 2014
Box 2.5. ASEAN Declaration on Strengthening Social Protection
Access to social protection is deeply rooted in the Universal Declaration of Human Rights (1948) which upholds the rights of everyone to social security and to a standard of living adequate for the health and well-being of themselves and their families. This human right declaration, however, remains unrealized for 35% of the population in the ASEAN region, namely those living on less than $2 a day, according to the ESCAP database. Having no security against unemployment, sickness, disability, economic shocks and natural disasters exacerbates vulnerabilities faced by the poor.
Despite significant wealth generated, conflicting political priorities and insufficient spending on effective social protection programmes mean that poverty rates remain high and inequalities are increasing. Public spending on social protection varies widely among ASEAN countries (see figure A).a Malaysia, Singapore and Viet Nam each spent more than 3% of their GDP on social protection in 2010 while, in Cambodia, Indonesia and the Lao People’s Democratic Republic, this figure was only 1%.b
Figure A. Social protection expenditure as a share of GDP in selected South-East Asian economies, latest available data
Source: Asian Development Bank, staff estimate, using data from country sources. Downloaded from Asian Development Bank’s Social Protection Index Database (SPI).
0.59 0.68 0.68
2.15
2.71
3.44 3.44
4.99
0
1
2
3
4
5
6
Cam
bodi
a
Lao
Peo
ple’
sD
emoc
ratic
Rep
ublic
Indo
nesi
a
Phi
lippi
nes
Thai
land
Sin
gapo
re
Mal
aysi
a
Vie
t Nam
Per
cent
age
of G
DP
and the Philippines despite strong economic growth records. Another pressing concern is widespread informalemployment,whichtendstohavelimitedjobsecurity and lower labour productivity. Countries are addressing these challenges through various policy tools, such as raising minimum wages in Thailand,ensuring financial support to small enterprises inIndonesia and strengthening vocational training in Viet Nam. Singapore also runs a worker training programme that targets low-wage workers. Improving industrial safety and working conditions is also critical, especially in the least developed countriesof the subregion.
Rising and/or high inequality is also a concern. Therefore, fostering equitable economic growth isanother important policy challenge. In Malaysia,the urban-to-rural income ratio edged up to 1.9 in 2012. InthePhilippines,poverty incidenceremainedhigh,at20%, in2012.Higher levelof inequalityhasweakened the positive impact of economic growth on poverty reduction. As recommended in the Survey 2013, investing in education, health services andsocial protection is generally affordable and helps enhance the social development gains from economic growth. In box 2.5, the need to strengthen socialprotection in South-East Asia is highlighted.
83
MacroeconoMic PerforMance and Policy challenges at the subregional level chaPter 2
Box 2.5. (continued)
Extension of social protection can take place along two dimensions — horizontal and vertical. The horizontal dimension (breadth) refers to the number of persons covered by existing schemes. The vertical dimension (depth) refers to the levels of benefits in existing schemes. The reported variation in social expenditure among ASEAN member countries conceals information on the choices of breadth and depth of social protection schemes and, as a result, the impact on the lives of potential and actual beneficiaries.
The 2008 ASEAN Charter recognizes social protection as a key foundation for inclusive and sustainable development.c To realize this commitment, ASEAN member countries adopted the Declaration on Strengthening Social Protection in October 2013 at the 23rd ASEAN Summit. Based on the Social Protection Floor framework, the Declaration sets common principles among countries, as they prepare for the ASEAN Economic Community, which takes effect in 2015. It recognizes social protection as a cross-cutting issue that requires participatory involvement of Governments, service providers, civil society and the private sector. Social protection is seen as an investment in people that should be supported by adequate resources.d
Among its strategies to improve social protection, the Declaration advocates the expansion of social insurance to the informal sector and the strengthening of social assistance programmes for persons with disabilities, elderly, children and other vulnerable groups. Furthermore, it calls for collective progress towards universal health coverage. Overall, the Declaration manifests ASEAN aspirations of pushing beyond economic integration, toward the rights-based imperatives of broader social and political integration.
a The calculation on social protection expenditures follows the definition of the Asian Development Bank Social Protection Index, as explained in ADB (2013b).b Expenditures for the provision of free public health care were not included in the calculation of the Social Protection Index and are thus not included as part of social protection expenditures. The indicator “Social protection expenditure as a percentage of GDP” only includes health expenditures that are implemented as forms of social insurance, or targeted as special assistance to particular vulnerable groups (social assistance).c Association of Southeast Asian Nations, The ASEAN Charter. Jakarta: ASEAN Secretariat, 2008. Available from www.asean.org/archive/publications/ ASEAN-Charter.pdf.d ASEAN Declaration on Strengthening Social Protection, adopted in Bandar Seri Begawan, Brunei Darussalam, 9 October 2013. Available from www.asean.org/images/archive/23rdASEANSummit/5.%20asean%20declaration%20on%20social%20protection_final.pdf.
CONCLUSION
The present chapter provides a survey of macro- economic developments during 2013 in the countries of Asia and the Pacific. In addition to economicgrowth, standard macroeconomic indicators, suchas fiscal balance, external current account balanceand inflation, are used. Generally, widening fiscaland external current account deficits and a risein inflation are interpreted as a deterioration of aneconomy.
While they are useful indicators, their aggregatelevels are not always informative about a country’smacroeconomichealth.Forexample, the IMF-WorldBankDevelopmentCommitteenoted“thefiscaldeficitis a useful indicator for purposes of stabilization and for controlling the growth of government liabilities,
but it offers little indication of longer term effects on government assets or on economic growth”.15 Since the external current account deficit generallymirrorsfiscaldeficits,theaggregatelevelsofexternalcurrent account deficits, too, do not indicate a lotto guide policies.
The above, however, does not mean that policy- makers should ignore developments in those indica- tors. The spirit of the discussion here is to draw attention to the fact that the devil is in the details. The aggregate levels are just warning bells.
Policymakers need to examine whether the rise in fiscaldeficitsorpublicdebt isdue to fallingrevenueor rising expenditure. If it is due to falling revenue,then more efforts would be needed to raise the revenuebaseandcollectionefficiency—thesubject
84
Economic and social survEy of asia and thE pacific 2014
matterofnextchapter.Whenabudgetdeficit isdueto rising spending, countries should see whether itis used for such activities as building better schools and hospitals. If so, there should be less concernas long-term debt would become sustainable when productivity increases. Likewise, policymakers needto examine the structure of the external current account. Policy responses would differ depending on whether the widening current account deficit isdue to imports of capital goods or luxury consumer goods, or it is driven by falling exports.
Policymakersalsoneedtodeterminewhetherfluctua- tionsinfiscaldeficitsareduetoashort-termbusinesscycle or long-term structural reasons. Fiscal deficitsnormally go up during an economic downturn due to both built-in automatic stabilizers (falling revenueand higher social security payments) and discretionary countercyclicalspending.Thesekindsofdeficitsrepairthemselvesover the cycle.On theother hand, risingfiscal deficits owing to structural reasons, such asinefficienttaxadministrationorescalatingpublicsectorwage bills, would require fiscal reforms.
Finally, some level of inflation is unavoidable. Itcould be even necessary to encourage resources toshift towardsdesirableactivities.Researchshowsthat moderate inflation does not necessarily harmeconomic growth.16 In contrast, high interest ratesneeded to control inflation may constrain accessto credit, especially to SMEs, and hence dampenjob creation. Moderate inflation lowers real wages,which can be helpful for job growth. Moderateinflation also reduces the real value of corporateand private debt, thus boosting domestic demand.17 Policymakers should also understand the causes of inflation. Is it demand or supply-driven? Is itssource primarily domestic or external? Policies todeal with inflation will differ based on answers tothese questions.
Therefore,extremecaution isneeded in interpretingaggregate macroeconomic indicators. Policymakers must not react to every movement in them. Policy design requires careful analysis of details at the disaggregate levels.
Endnotes1 See Lin (2011).
2 InChina,a value-added tax is leviedon thedifference between a commodity’s price before taxes and its production cost while a business tax is levied on a business’ gross revenue – for services revenue and does not provide credit for input tax. So the tax system overburdens the services industry compared to the manufacturing industry.
3 See China’s 12th Five-Year Plan (2011).
4 See World Bank (2013b) and Isakova, Plekhanov and Zettelmeyer (2012).
5 See China Health and Retirement Longitudinal Study (2013).
6 See AusAID (2012).
7 See ADB (2013a).
8 For example, global car companies, such as General Motors and Toyota Motors, plan to cease vehicle productions in Australia by 2017. It would leave not only workers in the auto sector unemployed, but also affect thoseemployed in downstreamsectors, suchas business services.
9 See IMF (2014).
10See ESCAP-SSWA (2012).
11See India, Planning Commission (2013).
12See Andrés, Biller and Dappe (2013).
13See ESCAP (2013b).
14See Philippines, National Economic and Development Authority (2011).
15See IMF-World Bank Development Committee (2006) and also IMF (2012c).
16See Bruno and Easterly (1998).
17See Akerlof and Shiller (2009).

85
MacroeconoMic PerforMance and Policy challenges at the subregional level chaPter 2
86
ESC
AP
PH
OTO
87
ESC
AP
PH
OTO
he previous chapters have highlighted some of the domestic challenges that economies in the region are facing, including infrastructure shortages, large budget deficits, inflationary pressure and rising and persisitent inequality. With constrained growth prospects, productive and countercyclical government spending is critical in supporting inclusive growth and sustainable development. One of the most pressing issues for any country determined to invest in development is to raise the necessary resources. This chapter therefore explores various options of mobilizing domestic resources, with a particular focus on tax revenues.
DOMESTIC RESOURCE MOBILIZATION:OPTIONS FOR EXPANDING
FISCAL SPACE 3T
88
Economic and social survEy of asia and thE pacific 2014
Governments that wish to increase the resources available for development have a range of options for unlocking the fiscal space for such spending. They can, for example, increase their borrowing, either domestically or from abroad. They can also create fiscal space by making existing public expenditure more efficient; and they can reprioritize public expenditure to orient it more towards development.
Strengthening tax revenues is the primary route for creating fiscal space
The focus in this chapter is on strengthening tax revenues as the primary route for creating fiscal space in the Asia-Pacific region. For one, international experience demonstrates that for a country to successfully implement its development and public expenditure strategies, it needs to mobilize its tax revenues. Indeed, it has been argued that a country must be able to collect taxes amounting to between 25% and 35% of its GDP to fulfil one of the key conditions to becoming a developed country.1 Yet, most developing countries in the region are far from this goal. In 2011, only seven developing economies in the region collected more than 20% of GDP as tax revenues, of which four were resource-rich. In contrast, tax-to-GDP ratios were close to, or in, single-digit levels in several other countries. In developing Asia and the Pacific, tax collection by central government averaged 14.8% of GDP in 2011, even lower than 16.3% of GDP in sub-Saharan Africa.
Indeed, tax revenues have in recent years increased at a higher rate than output in many countries in the region. Nevertheless, in many of the region’s developing countries tax collection is neither sufficient nor equitable. Experience across the region has demonstrated numerous opportunities for improving all forms of taxation, direct and indirect, whether of corporations or individuals. Strengthening tax revenues must therefore be considered key to creating fiscal space and delivering more resources for Governments to invest in development. This is particularly the case in those economies that are not
fully utilizing their tax potential, which is equivalent to 5% of GDP or more in some economies. Thus, by embracing their tax potential and closing existing tax gaps, tax revenues could in some cases be increased by over 70%.
It is shown in this chapter how tax revenues may be enhanced through a number of policy measures. Those include, in particular, broadening tax bases and rationalizing tax rates to provide greater incentives for tax compliance. In any case, countries must strive to make tax administrations more effective and transparent to tackle tax evasion and tax fraud. This could be achieved by sequencing reforms of tax policy and of tax administration, including setting up special tax courts to deal with tax fraud.
Strengthening regional tax cooperation would further contribute by stemming tax competition and the illicit transfer of funds. Moreover, countries may wish to consider establishing an Asia-Pacific tax forum under the aegis of ESCAP. This could monitor the tax legislation of member countries and publish a regular review of tax reforms with a view to harmonizing tax regulations and sharing best practices.
In the following sections some of the challenges that the region faces in raising more resources for development are considered. The advantages and disadvantages of various options, including non-tax revenues, for expanding fiscal space are briefly outlined. After this brief outline of the various options available, the level and composition of tax revenues in selected Asia-Pacific countries (where data are available) are examined. The following section contains an estimate of the tax potential in the region. The chapter concludes with an analysis of the main challenges that countries face in raising tax revenues and the policy options that are available to overcome them.
Data for this chapter come from the Government Finance Statistics database, supplemented with data from CEIC, national data sources and several background studies commissioned for this report. More details on the data sources are provided in annex I.
89
DOMESTIC RESOURCE MOBILIZATION: OPTIONS FOR EXPANDING FISCAL SPACE CHAPTER 3
CREATING FISCAL SPACE
There are a number of ways in which Governments can create fiscal space. For instance, countries with low levels of debt can consider borrowing to invest in development. In Kazakhstan and the Russian Federation, for instance, debt in 2012 was less than 13% of GDP, and in Cambodia, China and Indonesia it was less than 30%. In others, however, debt is significantly higher — more than 60% in India and Pakistan.2
Yet even in countries where levels of debt are low, expanding indebtedness can be risky. One problem is that the debt not utilized productively can lead to a drain on resources in the form of its servicing. In India in 2011, for example, net interest payments were equivalent to a quarter of total revenue, and in Pakistan they were one third. In the Philippines, debt in 2011 was equivalent to 36.2% of GDP, and interest payments were equivalent to a fifth of government revenue. In Turkey, debt reached 41.9% of GDP and interest payments were equivalent to one sixth of government revenues.
Other risks from borrowing include rising pressure on interest rates and potential crowding out of the private sector. Together, these developments complicate fiscal and monetary management as authorities struggle to tackle inflation or mitigate the consequences of capital outflows. Borrowings could also entail maturity mismatches — especially, if long-term projects are financed with short-term debt/funding from the financial system, which can cause problems if the short-term debt cannot be rolled over when its maturity expires. In the case of foreign currency borrowings, there will be additional risks including currency risks — as the Asian, Mexican and Russian experiences of the 1990s clearly demonstrated. Higher levels of foreign-denominated debt can also constrain countercyclical macroeconomic policy.3
Thus, as highlighted by the Development Committee (2006:14) of the IMF and World Bank, “the most attractive way for countries to create fiscal space is within existing borrowing parameters”. To avert
complications arising from borrowings (hedged or unhedged), Governments have the option to enhance the effectiveness and efficiency of existing resource use.4 This includes a shift in the composition of public expenditure, whereby funds are reallocated from current expenditure towards capital expenditure. Current expenditure includes spending on the wages and salaries of civil servants, interest payments, subsidies and expenditure on goods and services. Capital expenditure is associated with physical capital formation, including investment in infrastructure. Significant reallocating of expenditure is, however, often not possible as a certain level of current expenditure is always required for proper operation and maintenance in order to deliver quality services. Moreover, capital expenditure often entails current expenditure: greater investment to build schools, for example, will subsequently increase the demand for current expenditure on staff salaries.
Governments have the option to enhance the effectiveness and efficiency of existing resource use
Another option is to reduce expenditure on non-priority areas. One area to target for cuts would be defence expenditure, which makes little if any contribution to inclusive development. In several countries, including Bangladesh, China, Georgia, India, Pakistan, the Republic of Korea, the Russian Federation and Singapore, defence accounts for more than 10% of total public expenditure. In some countries, defence expenditure exceeds that on health and education combined. Political compulsion and other rigidities, including expenses outside the normal budgetary scrutiny, limit a country’s ability to rationalize and streamline the use of funds.
Another option would be to reduce various kind of subsidy — whether to consumers or producers, including public sector enterprises. In Bangladesh, the Islamic Republic of Iran, Pakistan and Thailand, for example, subsidies account for around 7% of total public expenditure, and in the Russian Federation for around 10%. In South-East Asia in 2012, energy
90
Economic and social survEy of asia and thE pacific 2014
subsidies alone amounted to $51 billion.5,6 While removing subsidies can be politically difficult, some interesting reforms have been achieved in certain areas (see box 3.1).
Governments seeking to increase fiscal space can also try to boost non-tax revenues, which primarily comprise royalties from natural resources, grants and revenues from property, and income from public enterprises that sell goods and services. In fact, many countries rely heavily on such revenues: in Afghanistan, Azerbaijan, Bhutan and the Islamic Republic of Iran, for example, non-tax revenues account for more than two thirds of total government revenues. In Cambodia, China, Hong Kong, China, Maldives, Mongolia, Myanmar, the Russian Federation and Turkey, they account for between one third and two thirds of government revenue (see table 3.1).
Non-tax revenues can be quite volatile and complicate fiscal planning
In many economies, non-tax revenues from natural resources play an important role. In Indonesia, natural resources account for more than 60% of non-tax revenues. In the Russian Federation, oil and gas revenues alone accounted for more than half of all revenues in 2012, and in the Islamic Republic of Iran, oil revenues also account for about one half of total revenues. Natural resources can deliver significant resources that Governments can use to forward development. However, managing such wealth poses additional challenges as Governments are often unable to tackle the institutional and policy challenges that come with natural resources. As a consequence, the human development indicators of many resource-rich countries compare less favourably with those of less-endowed countries.7
Between 2000 and 2011, a number of countries have seen significant changes in their non-tax revenues. This was particularly the case in the resource-rich economies of North and Central Asia, where non-tax revenues increased by 55% in the
Russian Federation and by more than 80% and 110% in Uzbekistan and Kazakhstan, respectively. In Azerbaijan, they increased more than fivefold.
On average, however, the increase in non-tax revenues in the region over this period was similar to that of tax revenues. Yet, non-tax revenues are significantly more volatile. This may be due not only to changes in prices of natural resources, but also a reflection of one-off revenues that may result, for instance, from the proceeds of privatizing state-owned enterprises or from other public sales, which can make year-to-year variations in non-tax revenues quite large. In Pakistan, for instance, non-tax revenues increased by more than 50% between fiscal years 2012 and 2013, largely due to central bank profits and an increase in external funds. Similarly, in India, where non-tax revenues have grown at a compound annual rate of more than 7.5% in the 10 years ending the fiscal year 2009/2010, the proceeds of auctions of wireless spectrum have recently contributed significantly to this growth, contrasting to more regular receipts of dividends and profits of state-owned enterprises, which have been rather sluggish.
Governments can increase non-tax revenues in a number of other ways. They can, for example, increase earnings from public enterprises by improving their efficiency and increasing their charges. Also, user fees charged for a variety of public services could be increased. However, there is a limit above which such fees cannot be raised, particularly as they are often more regressive in nature and adversely affect access of low-income groups. As far as natural resources are concerned, Governments can boost revenues by increasing royalty rates. However, these are often tied in with long-term contractual agreements that cannot be changed easily without upsetting investor confidence.
While non-tax revenues contribute significantly to overall revenue, the evidence above suggests that non-tax revenues can be quite volatile as they are influenced by one-off events or by global prices, which can change significantly without warning and
91
DOMESTIC RESOURCE MOBILIZATION: OPTIONS FOR EXPANDING FISCAL SPACE CHAPTER 3
Box 3.1. Difficulties with removing consumer subsidies
Subsidies on fuel and energy are inefficient and primarily benefit the non-poor. Furthermore, they inherently encourage wastage, and energy subsidies result in fuel-intensive production. Yet, removing or reducing subsidies is politically difficult; in many countries the removal of fuel and energy subsidies has sparked protests.
To address these problems, some 12 countries in Asia and the Pacific are implementing subsidy reforms. To offset the impact of phasing out of subsidies for the poor, Governments may opt to have compensatory policies, such as cash transfers. Indonesia and Malaysia, for example, are reducing fuel and energy subsidies to consumers and industry, and replacing them with targeted safety nets. In the Philippines, there are plans to limit rice and transport subsidies and move instead towards more targeted conditional cash transfer programmes. Timor-Leste also intends to reduce subsidies on rice and electricity. Similarly in Palau, the Government is considering phasing out water and sanitation subsidies, while in Kiribati policy discussions are focused on reforming distortionary subsidies to copra producers and other state-owned enterprises.a
Generally, the removal of subsidies helps create fiscal space to provide social protection, either targeted or universal. However, the real value of cash transfers, unless properly adjusted, could be eroded by inflation. Moreover, policies to remove subsidies must avoid one-size-fits-all approaches. Rather, reforms need to take into account their net welfare effect. For instance, if the subsidies that are being removed were benefiting primarily poor households, offering a meagre safety net only for the poorest may prove to be insufficient compensation to the extent that, in net terms, welfare will have declined. Policymakers also need to treat fuel or energy subsidies differently from food subsidies, which generally benefit low-income groups due to self-selection.
While many practitioners want to alleviate hardship with minimal targeted interventions for the poor, countries should aim for more. In particular, universalism is being increasingly espoused. For instance, world leaders, who were gathered at the High-level Plenary Meeting of the General Assembly on the Millennium Development Goals in 2010, declared that “… promoting universal access to social services and providing social protection floors can make an important contribution to consolidating and achieving further development gains”.b This was reiterated in the outcome document of United Nations Conference on Sustainable Development, which was held in Rio de Janeiro, Brazil, from 20 to 22 June 2013.c Similarly, in 2011, 193 Member States of the WHO committed to move towards universal health coverage.d This policy is also supported by the World Bank.e
The huge savings from the removal of subsidies should allow policymakers to be more ambitious and consider universal social protection systems and other policies that work for all citizens, instead of for a few. For instance, recent estimates of subsidies on fuel alone reached nearly 2% of GDP in the fiscal year 2011/2012 in India; in 2011, energy subsidies exceeded 3% of GDP in Bangladesh, Brunei, Indonesia and Pakistan and exceeded 5% of GDP in Kyrgyzstan, Turkmenistan and Uzbekistan.f According to ESCAP estimates, savings from these subsidies would, for example, in India and Bangladesh be sufficient to finance a comprehensive policy package comprising income security for the entire elderly population and all those with disabilities, as well as providing universal access to health and education.g In Pakistan and Indonesia, energy subsidies would, in addition, be sufficient to finance employment for everyone for 100 days per year, at a wage equivalent to the national poverty threshold.
a See http://policydialogue.org/publications/working_papers/age_of_austerity.b General Assembly resolution 65/1, para. 51.c See General Assembly resolution 66/288, annex, p. 107. d Resolution WHA64.9 (available at http://apps.who.int/gb/ebwha/pdf_files/WHA64/A64_R9-en.pdf ) of the Sixty-fourth World Health Assembly, held in May 2011.e See www.worldbank.org/en/topic/health/publication/universal-health-coverage-study-series.f IMF (2013).g ESCAP, Economic and Social Survey of Asia and the Pacific 2013: Forward-looking Macroeconomic Policies for Inclusive and Sustainable Development. (United Nations publication, Sales No. E.13.II.F.2). Available from www.unescap.org/resources/economic-and-social-survey-asia-and-pacific-2013.
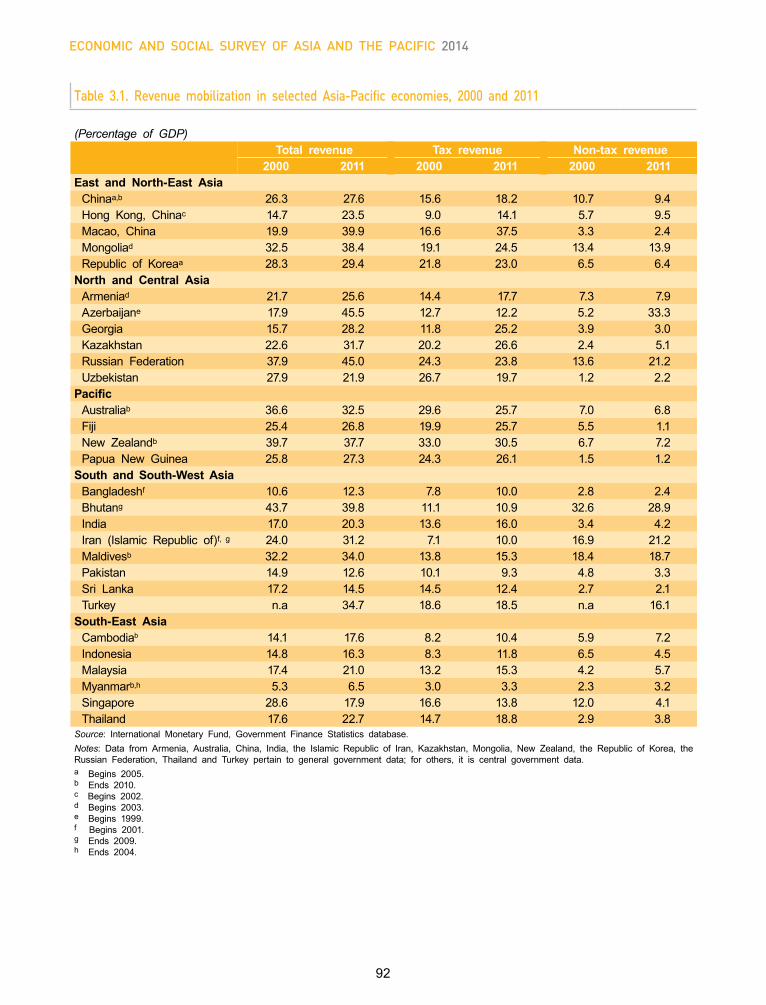
92
Economic and social survEy of asia and thE pacific 2014
Table 3.1. Revenue mobilization in selected Asia-Pacific economies, 2000 and 2011
(Percentage of GDP)Total revenue Tax revenue Non-tax revenue
2000 2011 2000 2011 2000 2011East and North-East Asia
Chinaa,b 26.3 27.6 15.6 18.2 10.7 9.4Hong Kong, Chinac 14.7 23.5 9.0 14.1 5.7 9.5Macao, China 19.9 39.9 16.6 37.5 3.3 2.4Mongoliad 32.5 38.4 19.1 24.5 13.4 13.9Republic of Koreaa 28.3 29.4 21.8 23.0 6.5 6.4
North and Central AsiaArmeniad 21.7 25.6 14.4 17.7 7.3 7.9Azerbaijane 17.9 45.5 12.7 12.2 5.2 33.3Georgia 15.7 28.2 11.8 25.2 3.9 3.0Kazakhstan 22.6 31.7 20.2 26.6 2.4 5.1Russian Federation 37.9 45.0 24.3 23.8 13.6 21.2Uzbekistan 27.9 21.9 26.7 19.7 1.2 2.2
PacificAustraliab 36.6 32.5 29.6 25.7 7.0 6.8Fiji 25.4 26.8 19.9 25.7 5.5 1.1New Zealandb 39.7 37.7 33.0 30.5 6.7 7.2Papua New Guinea 25.8 27.3 24.3 26.1 1.5 1.2
South and South-West AsiaBangladeshf 10.6 12.3 7.8 10.0 2.8 2.4Bhutang 43.7 39.8 11.1 10.9 32.6 28.9India 17.0 20.3 13.6 16.0 3.4 4.2Iran (Islamic Republic of)f, g 24.0 31.2 7.1 10.0 16.9 21.2Maldivesb 32.2 34.0 13.8 15.3 18.4 18.7Pakistan 14.9 12.6 10.1 9.3 4.8 3.3Sri Lanka 17.2 14.5 14.5 12.4 2.7 2.1Turkey n.a 34.7 18.6 18.5 n.a 16.1
South-East AsiaCambodiab 14.1 17.6 8.2 10.4 5.9 7.2Indonesia 14.8 16.3 8.3 11.8 6.5 4.5Malaysia 17.4 21.0 13.2 15.3 4.2 5.7Myanmarb,h 5.3 6.5 3.0 3.3 2.3 3.2Singapore 28.6 17.9 16.6 13.8 12.0 4.1Thailand 17.6 22.7 14.7 18.8 2.9 3.8
Source: International Monetary Fund, Government Finance Statistics database.Notes: Data from Armenia, Australia, China, India, the Islamic Republic of Iran, Kazakhstan, Mongolia, New Zealand, the Republic of Korea, the Russian Federation, Thailand and Turkey pertain to general government data; for others, it is central government data.a Begins 2005.b Ends 2010.c Begins 2002.d Begins 2003.e Begins 1999.f Begins 2001.g Ends 2009.h Ends 2004.
93
DOMESTIC RESOURCE MOBILIZATION: OPTIONS FOR EXPANDING FISCAL SPACE CHAPTER 3
are all but impossible to predict reliably. This volatility can clearly complicate fiscal planning. Moreover, as non-tax revenue from, for instance, natural resources will decline as resources are exhausted, they should not be considered as the main pillar of resources for long-term development planning. As a recent OECD (2012:23) report observes, “Taxation is key to promoting sustainable growth and poverty reduction. It provides developing countries with a stable and predictable fiscal environment to promote growth and to finance their social and physical infrastructural needs. Combined with economic growth, it reduces long-term reliance on aid and ensures good governance by promoting the accountability of governments to their citizens.”
In sum, while Governments have a range of options for increasing fiscal space, tax revenues bear the most potential as a source for reliable funding, especially when the current tax effort is low. The remainder of this chapter focuses in greater detail on tax revenues and related policy issues.
BOOSTING TAX REVENUES
In recent years, many economies in the Asia-Pacific region have been transformed. Some have moved from agriculture towards more diversified and industrialized economies. Some have transited from centrally-planned to more market-based economies. Yet, despite this general move up the value chain, overall in Asia and the Pacific, revenue collection is quite weak.
Compared with the developed economies, the developing countries in Asia and the Pacific are less successful in raising government revenue. In 2011, while overall government revenue (tax and non-tax) for the developed economies was 39.7% of GDP, for the developing countries it averaged only 26.1%. There were, however, notable differences between subregions — total revenue as a proportion of GDP was higher in East and North-East Asia at 31.8%, in North and Central Asia at 30.1%, in South and South-West Asia at 26.1% and the
Pacific at 25.5%, but lower in South-East Asia at 16.6%. As indicated in table 3.1, there were also large variations among countries — ranging from 45.5% of GDP in Azerbaijan to 6.5% in Myanmar. Table 3.1 also shows that between 2000 and 2011 some countries, including a number in North and Central Asia, managed to increase their revenues. In contrast, revenues decreased in several countries, including in Australia and Uzbekistan.
There are similar patterns in revenues specifically from tax. Overall Asia and the Pacific is less successful in tax collection than other developing regions — averaging only 14.8% of GDP in developing Asia-Pacific countries in 2011 for central government revenues, compared to an average of 17.1% of GDP in Latin America and the Caribbean, and 16.3% in sub-Saharan Africa.
Asia and the Pacific is less successful in tax collection than other developing
regions
In several countries, general government tax revenues are significantly greater than central government revenues. Taking this into account for the countries mentioned in annex I, developed countries of the region were more successful, generating 24.2% of GDP compared with 16.9% for the developing economies. Again, too, there are marked differences among countries. In Fiji, Kazakhstan and Papua New Guinea, for example, tax revenues were equivalent to more than 25% of GDP, whereas in Afghanistan, Bangladesh, the Islamic Republic of Iran, Myanmar and Pakistan the proportions were close to, or at, single-digit levels. Nevertheless, many countries have been able to strengthen their tax revenues over the past decade — with notable progress in Georgia, for example, and Mongolia.
All Governments need to collect taxes effectively. As mentioned earlier, one of the conditions for becoming a developed country is the ability to collect taxes amounting to between 25% and 35% of GDP.8 Most developing countries in Asia and the Pacific are far
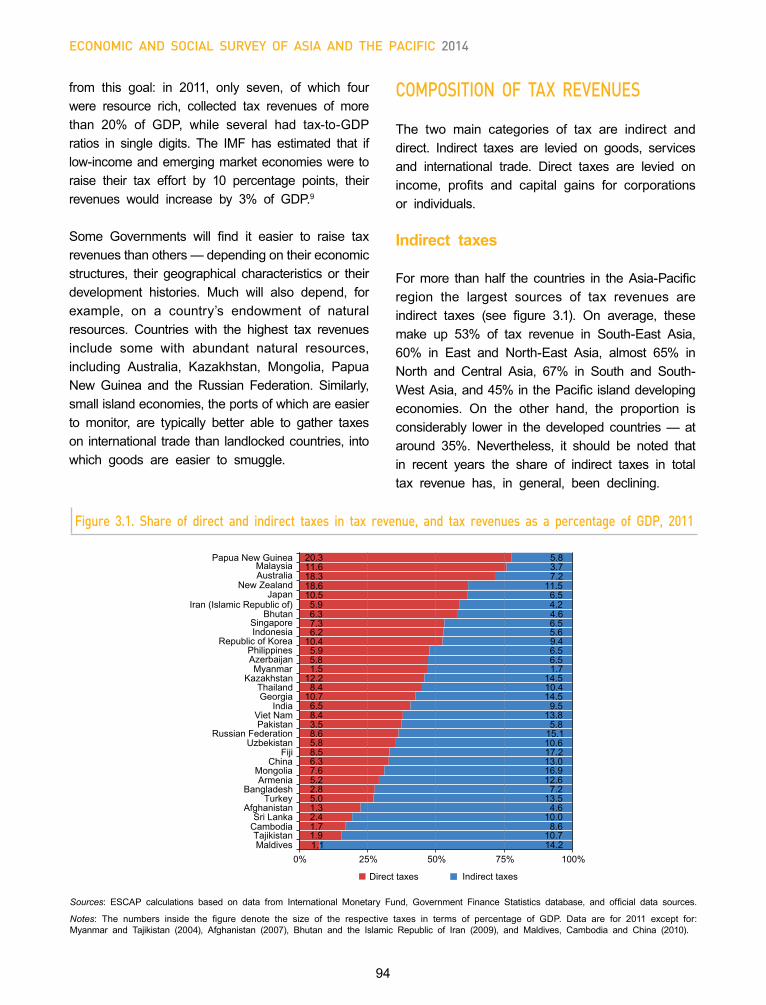
94
Economic and social survEy of asia and thE pacific 2014
from this goal: in 2011, only seven, of which four were resource rich, collected tax revenues of more than 20% of GDP, while several had tax-to-GDP ratios in single digits. The IMF has estimated that if low-income and emerging market economies were to raise their tax effort by 10 percentage points, their revenues would increase by 3% of GDP.9
Some Governments will find it easier to raise tax revenues than others — depending on their economic structures, their geographical characteristics or their development histories. Much will also depend, for example, on a country’s endowment of natural resources. Countries with the highest tax revenues include some with abundant natural resources, including Australia, Kazakhstan, Mongolia, Papua New Guinea and the Russian Federation. Similarly, small island economies, the ports of which are easier to monitor, are typically better able to gather taxes on international trade than landlocked countries, into which goods are easier to smuggle.
COMPOSITION OF TAX REVENUES
The two main categories of tax are indirect and direct. Indirect taxes are levied on goods, services and international trade. Direct taxes are levied on income, profits and capital gains for corporations or individuals.
Indirect taxes
For more than half the countries in the Asia-Pacific region the largest sources of tax revenues are indirect taxes (see figure 3.1). On average, these make up 53% of tax revenue in South-East Asia, 60% in East and North-East Asia, almost 65% in North and Central Asia, 67% in South and South-West Asia, and 45% in the Pacific island developing economies. On the other hand, the proportion is considerably lower in the developed countries — at around 35%. Nevertheless, it should be noted that in recent years the share of indirect taxes in total tax revenue has, in general, been declining.
Sources: ESCAP calculations based on data from International Monetary Fund, Government Finance Statistics database, and official data sources.
Notes: The numbers inside the figure denote the size of the respective taxes in terms of percentage of GDP. Data are for 2011 except for: Myanmar and Tajikistan (2004), Afghanistan (2007), Bhutan and the Islamic Republic of Iran (2009), and Maldives, Cambodia and China (2010).
Figure 3.1. Share of direct and indirect taxes in tax revenue, and tax revenues as a percentage of GDP, 2011
Chi
na
Hon
g K
ong,
Chi
na
Japa
n
Mac
ao,
Chi
na
Mon
golia
Rep
ublic
of
Kor
ea
-2
0
2
4
6
8
10
12
Per
cent
age
2009 2010 2011 2009 2010 2011
1.1 1.9 1.7 2.4 1.3 5.0 2.8 5.2 7.6 6.3 8.5 5.8 8.6 3.5 8.4 6.5
10.7 8.4
12.2 1.5 5.8 5.9
10.4 6.2 7.3 6.3 5.9
10.5 18.6
11.6
14.2 10.7
8.6 10.0
4.6 13.5
7.2 12.6 16.9 13.0 17.2 10.6 15.1 5.8
13.8 9.5
14.5 10.4 14.5
1.7 6.5 6.5 9.4 5.6 6.5 4.6 4.2 6.5
11.5
3.7
0% 25% 50% 75% 100% Maldives Tajikistan
Cambodia Sri Lanka
Afghanistan Turkey
Bangladesh Armenia
Mongolia China
Fiji Uzbekistan
Russian Federation Pakistan
Viet Nam India
Georgia Thailand
Kazakhstan Myanmar
Azerbaijan Philippines
Republic of Korea Indonesia Singapore
Bhutan Iran (Islamic Republic of)
Japan New Zealand
Australia Malaysia
Papua New Guinea
Direct taxes
5.8
7.2 18.3
20.3
Indirect taxes
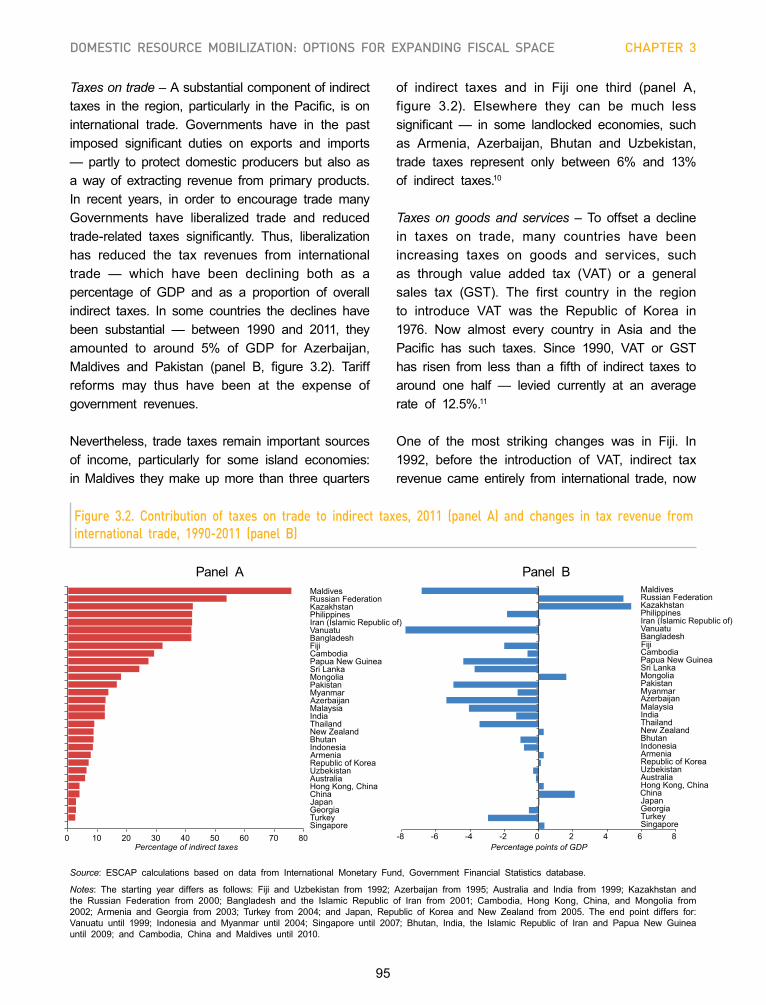
95
DOMESTIC RESOURCE MOBILIZATION: OPTIONS FOR EXPANDING FISCAL SPACE CHAPTER 3
Taxes on trade – A substantial component of indirect taxes in the region, particularly in the Pacific, is on international trade. Governments have in the past imposed significant duties on exports and imports — partly to protect domestic producers but also as a way of extracting revenue from primary products. In recent years, in order to encourage trade many Governments have liberalized trade and reduced trade-related taxes significantly. Thus, liberalization has reduced the tax revenues from international trade — which have been declining both as a percentage of GDP and as a proportion of overall indirect taxes. In some countries the declines have been substantial — between 1990 and 2011, they amounted to around 5% of GDP for Azerbaijan, Maldives and Pakistan (panel B, figure 3.2). Tariff reforms may thus have been at the expense of government revenues.
Nevertheless, trade taxes remain important sources of income, particularly for some island economies: in Maldives they make up more than three quarters
Figure 3.2. Contribution of taxes on trade to indirect taxes, 2011 (panel A) and changes in tax revenue from international trade, 1990-2011 (panel B)
of indirect taxes and in Fiji one third (panel A, figure 3.2). Elsewhere they can be much less significant — in some landlocked economies, such as Armenia, Azerbaijan, Bhutan and Uzbekistan, trade taxes represent only between 6% and 13% of indirect taxes.10
Taxes on goods and services – To offset a decline in taxes on trade, many countries have been increasing taxes on goods and services, such as through value added tax (VAT) or a general sales tax (GST). The first country in the region to introduce VAT was the Republic of Korea in 1976. Now almost every country in Asia and the Pacific has such taxes. Since 1990, VAT or GST has risen from less than a fifth of indirect taxes to around one half — levied currently at an average rate of 12.5%.11
One of the most striking changes was in Fiji. In 1992, before the introduction of VAT, indirect tax revenue came entirely from international trade, now
Source: ESCAP calculations based on data from International Monetary Fund, Government Financial Statistics database.
Notes: The starting year differs as follows: Fiji and Uzbekistan from 1992; Azerbaijan from 1995; Australia and India from 1999; Kazakhstan and the Russian Federation from 2000; Bangladesh and the Islamic Republic of Iran from 2001; Cambodia, Hong Kong, China, and Mongolia from 2002; Armenia and Georgia from 2003; Turkey from 2004; and Japan, Republic of Korea and New Zealand from 2005. The end point differs for: Vanuatu until 1999; Indonesia and Myanmar until 2004; Singapore until 2007; Bhutan, India, the Islamic Republic of Iran and Papua New Guinea until 2009; and Cambodia, China and Maldives until 2010.
Panel A Panel B
Chi
na
Hon
g K
ong,
Chi
na
Japa
n
Mac
ao,
Chi
na
Mon
golia
Rep
ublic
of
Kor
ea
-2
0
2
4
6
8
10
12
Per
cent
age
2009 2010 2011 2009 2010 2011
0 10 20 30 40 50 60 70 80Singapore Turkey Georgia Japan China Hong Kong, China Australia Uzbekistan Republic of Korea Armenia Indonesia Bhutan New Zealand Thailand India Malaysia Azerbaijan Myanmar Pakistan Mongolia Sri Lanka Papua New Guinea Cambodia Fiji Bangladesh Vanuatu Iran (Islamic Republic of) Philippines Kazakhstan Russian Federation Maldives
Percentage of indirect taxes -8 -6 -4 -2 0 2 4 6 8
Singapore Turkey Georgia Japan China Hong Kong, China Australia Uzbekistan Republic of Korea Armenia Indonesia Bhutan New Zealand Thailand India Malaysia Azerbaijan Myanmar Pakistan Mongolia Sri Lanka Papua New Guinea Cambodia Fiji Bangladesh Vanuatu Iran (Islamic Republic of) Philippines Kazakhstan Russian Federation Maldives
Percentage points of GDP
Chi
na
Hon
g K
ong,
Chi
na
Japa
n
Mac
ao,
Chi
na
Mon
golia
Rep
ublic
of
Kor
ea
-2
0
2
4
6
8
10
12
Per
cent
age
2009 2010 2011 2009 2010 2011
0 10 20 30 40 50 60 70 80Singapore Turkey Georgia Japan China Hong Kong, China Australia Uzbekistan Republic of Korea Armenia Indonesia Bhutan New Zealand Thailand India Malaysia Azerbaijan Myanmar Pakistan Mongolia Sri Lanka Papua New Guinea Cambodia Fiji Bangladesh Vanuatu Iran (Islamic Republic of) Philippines Kazakhstan Russian Federation Maldives
Percentage of indirect taxes -8 -6 -4 -2 0 2 4 6 8
Singapore Turkey Georgia Japan China Hong Kong, China Australia Uzbekistan Republic of Korea Armenia Indonesia Bhutan New Zealand Thailand India Malaysia Azerbaijan Myanmar Pakistan Mongolia Sri Lanka Papua New Guinea Cambodia Fiji Bangladesh Vanuatu Iran (Islamic Republic of) Philippines Kazakhstan Russian Federation Maldives
Percentage points of GDP
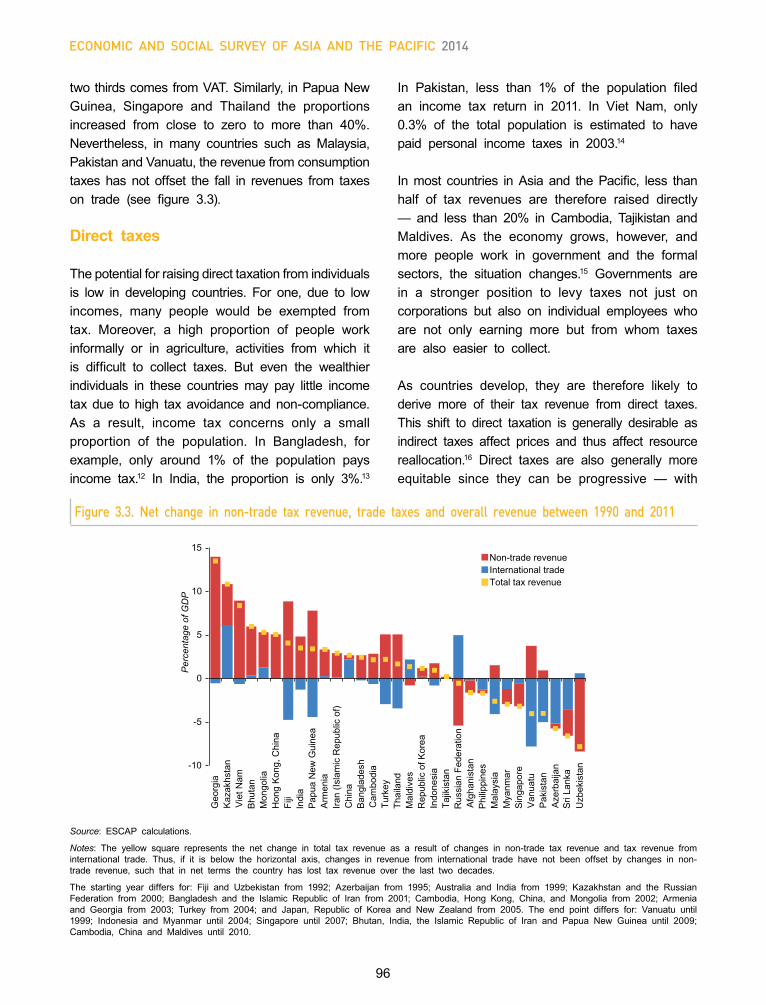
96
Economic and social survEy of asia and thE pacific 2014
two thirds comes from VAT. Similarly, in Papua New Guinea, Singapore and Thailand the proportions increased from close to zero to more than 40%. Nevertheless, in many countries such as Malaysia, Pakistan and Vanuatu, the revenue from consumption taxes has not offset the fall in revenues from taxes on trade (see figure 3.3).
Direct taxes
The potential for raising direct taxation from individuals is low in developing countries. For one, due to low incomes, many people would be exempted from tax. Moreover, a high proportion of people work informally or in agriculture, activities from which it is difficult to collect taxes. But even the wealthier individuals in these countries may pay little income tax due to high tax avoidance and non-compliance. As a result, income tax concerns only a small proportion of the population. In Bangladesh, for example, only around 1% of the population pays income tax.12 In India, the proportion is only 3%.13
In Pakistan, less than 1% of the population filed an income tax return in 2011. In Viet Nam, only 0.3% of the total population is estimated to have paid personal income taxes in 2003.14
In most countries in Asia and the Pacific, less than half of tax revenues are therefore raised directly — and less than 20% in Cambodia, Tajikistan and Maldives. As the economy grows, however, and more people work in government and the formal sectors, the situation changes.15 Governments are in a stronger position to levy taxes not just on corporations but also on individual employees who are not only earning more but from whom taxes are also easier to collect.
As countries develop, they are therefore likely to derive more of their tax revenue from direct taxes. This shift to direct taxation is generally desirable as indirect taxes affect prices and thus affect resource reallocation.16 Direct taxes are also generally more equitable since they can be progressive — with
Source: ESCAP calculations.
Notes: The yellow square represents the net change in total tax revenue as a result of changes in non-trade tax revenue and tax revenue from international trade. Thus, if it is below the horizontal axis, changes in revenue from international trade have not been offset by changes in non-trade revenue, such that in net terms the country has lost tax revenue over the last two decades.
The starting year differs for: Fiji and Uzbekistan from 1992; Azerbaijan from 1995; Australia and India from 1999; Kazakhstan and the Russian Federation from 2000; Bangladesh and the Islamic Republic of Iran from 2001; Cambodia, Hong Kong, China, and Mongolia from 2002; Armenia and Georgia from 2003; Turkey from 2004; and Japan, Republic of Korea and New Zealand from 2005. The end point differs for: Vanuatu until 1999; Indonesia and Myanmar until 2004; Singapore until 2007; Bhutan, India, the Islamic Republic of Iran and Papua New Guinea until 2009; Cambodia, China and Maldives until 2010.
Figure 3.3. Net change in non-trade tax revenue, trade taxes and overall revenue between 1990 and 2011
-10
-5
0
5
10
15
Geo
rgia
K
azak
hsta
n V
iet N
am
Bhu
tan
Mon
golia
H
ong
Kon
g, C
hina
Fi
ji In
dia
Pap
ua N
ew G
uine
a A
rmen
ia
Iran
(Isla
mic
Rep
ublic
of)
Chi
na
Ban
glad
esh
Cam
bodi
a Tu
rkey
Th
aila
nd
Mal
dive
s R
epub
lic o
f Kor
ea
Indo
nesi
a Ta
jikis
tan
Rus
sian
Fed
erat
ion
Afg
hani
stan
P
hilip
pine
s M
alay
sia
Mya
nmar
S
inga
pore
V
anua
tu
Pak
ista
n A
zerb
aija
n S
ri La
nka
Uzb
ekis
tan
Per
cent
age
of G
DP
Non-trade revenue International trade Total tax revenue
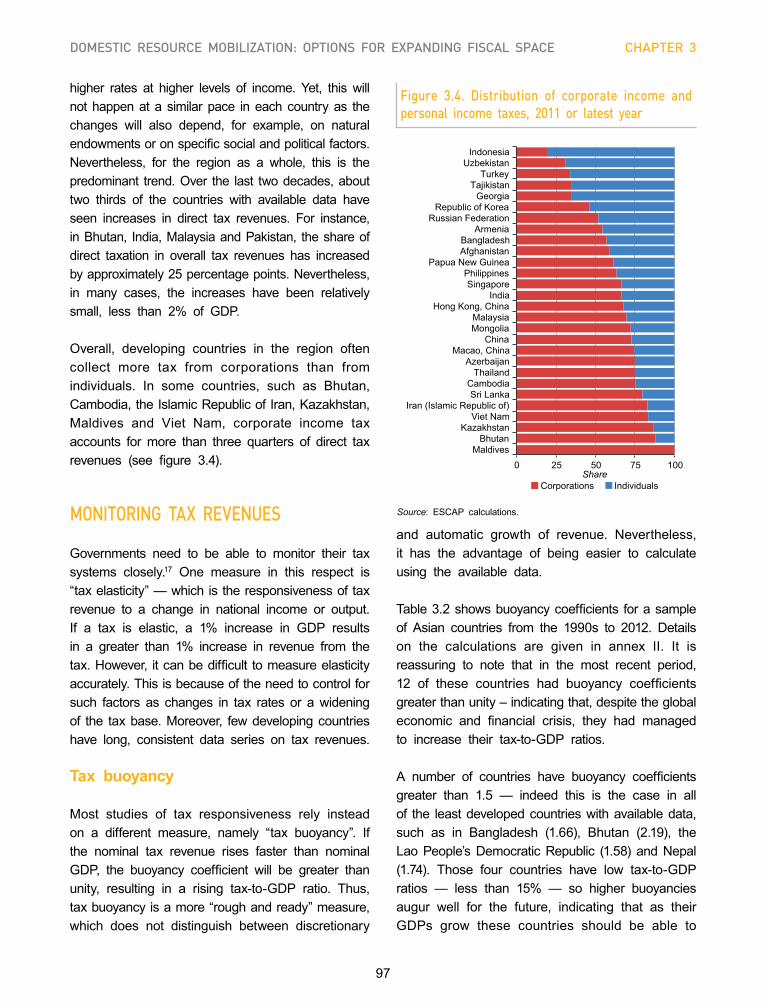
97
DOMESTIC RESOURCE MOBILIZATION: OPTIONS FOR EXPANDING FISCAL SPACE CHAPTER 3
Figure 3.4. Distribution of corporate income and personal income taxes, 2011 or latest year
higher rates at higher levels of income. Yet, this will not happen at a similar pace in each country as the changes will also depend, for example, on natural endowments or on specific social and political factors. Nevertheless, for the region as a whole, this is the predominant trend. Over the last two decades, about two thirds of the countries with available data have seen increases in direct tax revenues. For instance, in Bhutan, India, Malaysia and Pakistan, the share of direct taxation in overall tax revenues has increased by approximately 25 percentage points. Nevertheless, in many cases, the increases have been relatively small, less than 2% of GDP.
Overall, developing countries in the region often collect more tax from corporations than from individuals. In some countries, such as Bhutan, Cambodia, the Islamic Republic of Iran, Kazakhstan, Maldives and Viet Nam, corporate income tax accounts for more than three quarters of direct tax revenues (see figure 3.4).
MONITORING TAX REVENUES
Governments need to be able to monitor their tax systems closely.17 One measure in this respect is “tax elasticity” — which is the responsiveness of tax revenue to a change in national income or output. If a tax is elastic, a 1% increase in GDP results in a greater than 1% increase in revenue from the tax. However, it can be difficult to measure elasticity accurately. This is because of the need to control for such factors as changes in tax rates or a widening of the tax base. Moreover, few developing countries have long, consistent data series on tax revenues.
Tax buoyancy
Most studies of tax responsiveness rely instead on a different measure, namely “tax buoyancy”. If the nominal tax revenue rises faster than nominal GDP, the buoyancy coefficient will be greater than unity, resulting in a rising tax-to-GDP ratio. Thus, tax buoyancy is a more “rough and ready” measure, which does not distinguish between discretionary
Source: ESCAP calculations.
0 25 50 75 100
Maldives Bhutan
Kazakhstan Viet Nam
Iran (Islamic Republic of) Sri Lanka
Cambodia Thailand
Azerbaijan Macao, China
China Mongolia Malaysia
Hong Kong, China India
Singapore Philippines
Papua New Guinea Afghanistan Bangladesh
Armenia Russian Federation
Republic of Korea Georgia
Tajikistan Turkey
Uzbekistan Indonesia
Share Corporations Individuals
and automatic growth of revenue. Nevertheless, it has the advantage of being easier to calculate using the available data.
Table 3.2 shows buoyancy coefficients for a sample of Asian countries from the 1990s to 2012. Details on the calculations are given in annex II. It is reassuring to note that in the most recent period, 12 of these countries had buoyancy coefficients greater than unity – indicating that, despite the global economic and financial crisis, they had managed to increase their tax-to-GDP ratios.
A number of countries have buoyancy coefficients greater than 1.5 — indeed this is the case in all of the least developed countries with available data, such as in Bangladesh (1.66), Bhutan (2.19), the Lao People’s Democratic Republic (1.58) and Nepal (1.74). Those four countries have low tax-to-GDP ratios — less than 15% — so higher buoyancies augur well for the future, indicating that as their GDPs grow these countries should be able to
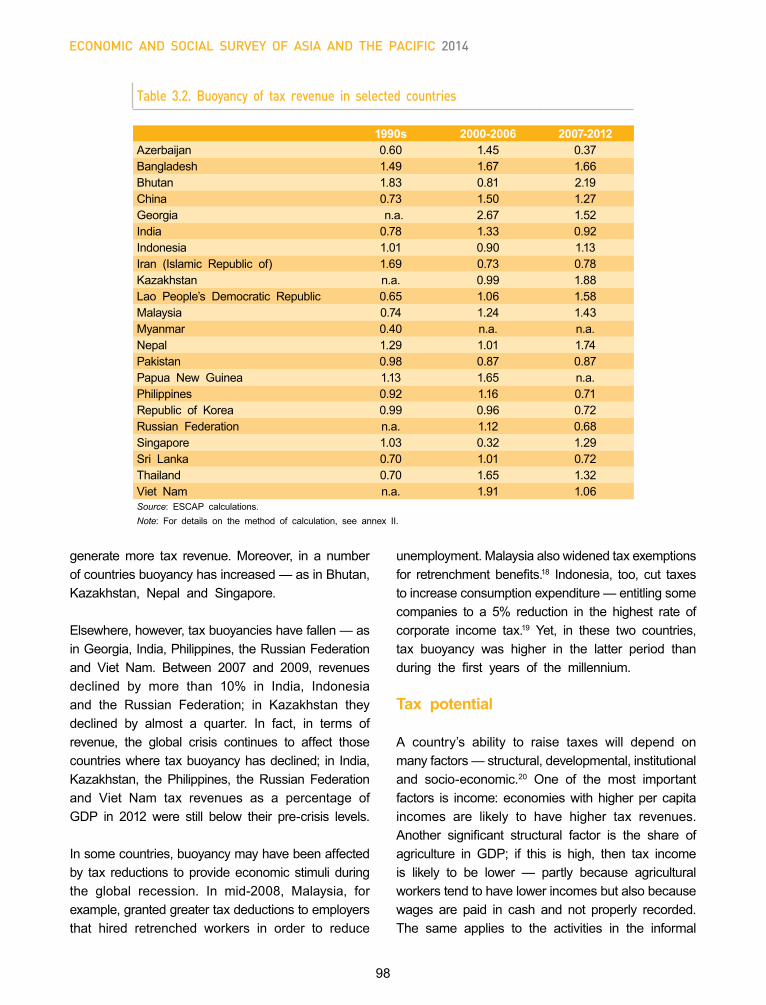
98
Economic and social survEy of asia and thE pacific 2014
Table 3.2. Buoyancy of tax revenue in selected countries
1990s 2000-2006 2007-2012Azerbaijan 0.60 1.45 0.37Bangladesh 1.49 1.67 1.66Bhutan 1.83 0.81 2.19China 0.73 1.50 1.27Georgia n.a. 2.67 1.52India 0.78 1.33 0.92Indonesia 1.01 0.90 1.13Iran (Islamic Republic of) 1.69 0.73 0.78Kazakhstan n.a. 0.99 1.88Lao People’s Democratic Republic 0.65 1.06 1.58Malaysia 0.74 1.24 1.43Myanmar 0.40 n.a. n.a.Nepal 1.29 1.01 1.74Pakistan 0.98 0.87 0.87Papua New Guinea 1.13 1.65 n.a. Philippines 0.92 1.16 0.71Republic of Korea 0.99 0.96 0.72Russian Federation n.a. 1.12 0.68Singapore 1.03 0.32 1.29Sri Lanka 0.70 1.01 0.72Thailand 0.70 1.65 1.32Viet Nam n.a. 1.91 1.06Source: ESCAP calculations.Note: For details on the method of calculation, see annex II.
generate more tax revenue. Moreover, in a number of countries buoyancy has increased — as in Bhutan, Kazakhstan, Nepal and Singapore.
Elsewhere, however, tax buoyancies have fallen — as in Georgia, India, Philippines, the Russian Federation and Viet Nam. Between 2007 and 2009, revenues declined by more than 10% in India, Indonesia and the Russian Federation; in Kazakhstan they declined by almost a quarter. In fact, in terms of revenue, the global crisis continues to affect those countries where tax buoyancy has declined; in India, Kazakhstan, the Philippines, the Russian Federation and Viet Nam tax revenues as a percentage of GDP in 2012 were still below their pre-crisis levels.
In some countries, buoyancy may have been affected by tax reductions to provide economic stimuli during the global recession. In mid-2008, Malaysia, for example, granted greater tax deductions to employers that hired retrenched workers in order to reduce
unemployment. Malaysia also widened tax exemptions for retrenchment benefits.18 Indonesia, too, cut taxes to increase consumption expenditure — entitling some companies to a 5% reduction in the highest rate of corporate income tax.19 Yet, in these two countries, tax buoyancy was higher in the latter period than during the first years of the millennium.
Tax potential
A country’s ability to raise taxes will depend on many factors — structural, developmental, institutional and socio-economic.20 One of the most important factors is income: economies with higher per capita incomes are likely to have higher tax revenues. Another significant structural factor is the share of agriculture in GDP; if this is high, then tax income is likely to be lower — partly because agricultural workers tend to have lower incomes but also because wages are paid in cash and not properly recorded. The same applies to the activities in the informal
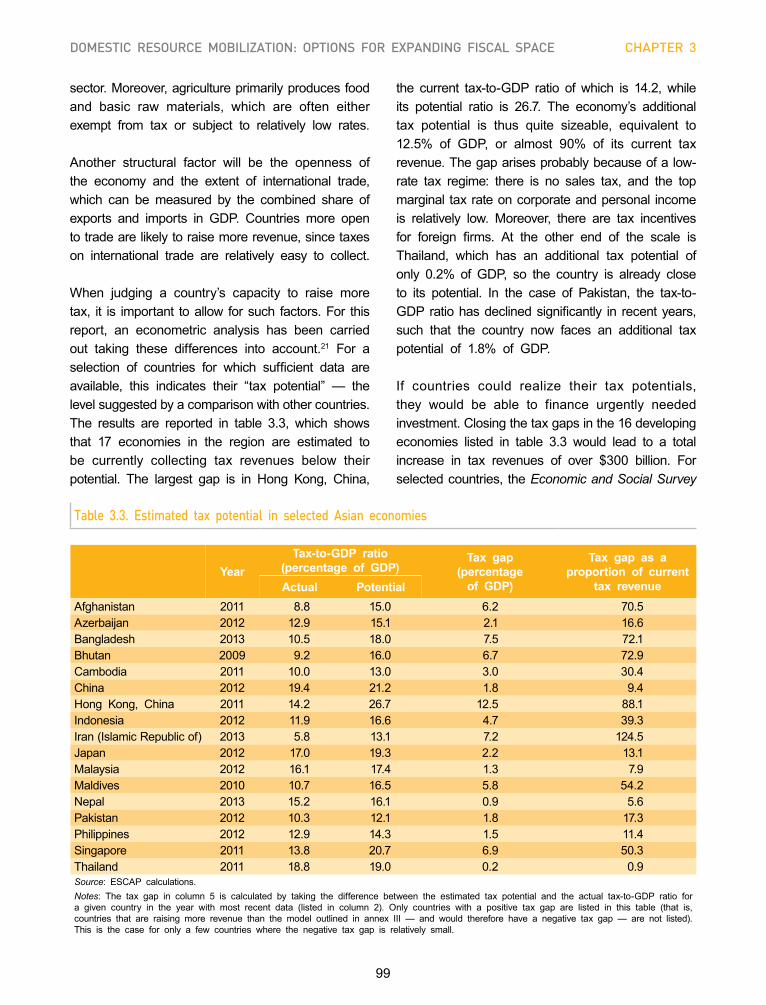
99
DOMESTIC RESOURCE MOBILIZATION: OPTIONS FOR EXPANDING FISCAL SPACE CHAPTER 3
sector. Moreover, agriculture primarily produces food and basic raw materials, which are often either exempt from tax or subject to relatively low rates.
Another structural factor will be the openness of the economy and the extent of international trade, which can be measured by the combined share of exports and imports in GDP. Countries more open to trade are likely to raise more revenue, since taxes on international trade are relatively easy to collect.
When judging a country’s capacity to raise more tax, it is important to allow for such factors. For this report, an econometric analysis has been carried out taking these differences into account.21 For a selection of countries for which sufficient data are available, this indicates their “tax potential” — the level suggested by a comparison with other countries. The results are reported in table 3.3, which shows that 17 economies in the region are estimated to be currently collecting tax revenues below their potential. The largest gap is in Hong Kong, China,
the current tax-to-GDP ratio of which is 14.2, while its potential ratio is 26.7. The economy’s additional tax potential is thus quite sizeable, equivalent to 12.5% of GDP, or almost 90% of its current tax revenue. The gap arises probably because of a low-rate tax regime: there is no sales tax, and the top marginal tax rate on corporate and personal income is relatively low. Moreover, there are tax incentives for foreign firms. At the other end of the scale is Thailand, which has an additional tax potential of only 0.2% of GDP, so the country is already close to its potential. In the case of Pakistan, the tax-to-GDP ratio has declined significantly in recent years, such that the country now faces an additional tax potential of 1.8% of GDP.
If countries could realize their tax potentials, they would be able to finance urgently needed investment. Closing the tax gaps in the 16 developing economies listed in table 3.3 would lead to a total increase in tax revenues of over $300 billion. For selected countries, the Economic and Social Survey
Table 3.3. Estimated tax potential in selected Asian economies
YearTax-to-GDP ratio
(percentage of GDP)Tax gap
(percentage of GDP)
Tax gap as a proportion of current
tax revenueActual PotentialAfghanistan 2011 8.8 15.0 6.2 70.5Azerbaijan 2012 12.9 15.1 2.1 16.6Bangladesh 2013 10.5 18.0 7.5 72.1Bhutan 2009 9.2 16.0 6.7 72.9Cambodia 2011 10.0 13.0 3.0 30.4China 2012 19.4 21.2 1.8 9.4Hong Kong, China 2011 14.2 26.7 12.5 88.1Indonesia 2012 11.9 16.6 4.7 39.3Iran (Islamic Republic of) 2013 5.8 13.1 7.2 124.5Japan 2012 17.0 19.3 2.2 13.1Malaysia 2012 16.1 17.4 1.3 7.9Maldives 2010 10.7 16.5 5.8 54.2Nepal 2013 15.2 16.1 0.9 5.6Pakistan 2012 10.3 12.1 1.8 17.3Philippines 2012 12.9 14.3 1.5 11.4Singapore 2011 13.8 20.7 6.9 50.3Thailand 2011 18.8 19.0 0.2 0.9Source: ESCAP calculations.Notes: The tax gap in column 5 is calculated by taking the difference between the estimated tax potential and the actual tax-to-GDP ratio for a given country in the year with most recent data (listed in column 2). Only countries with a positive tax gap are listed in this table (that is, countries that are raising more revenue than the model outlined in annex III — and would therefore have a negative tax gap — are not listed). This is the case for only a few countries where the negative tax gap is relatively small.
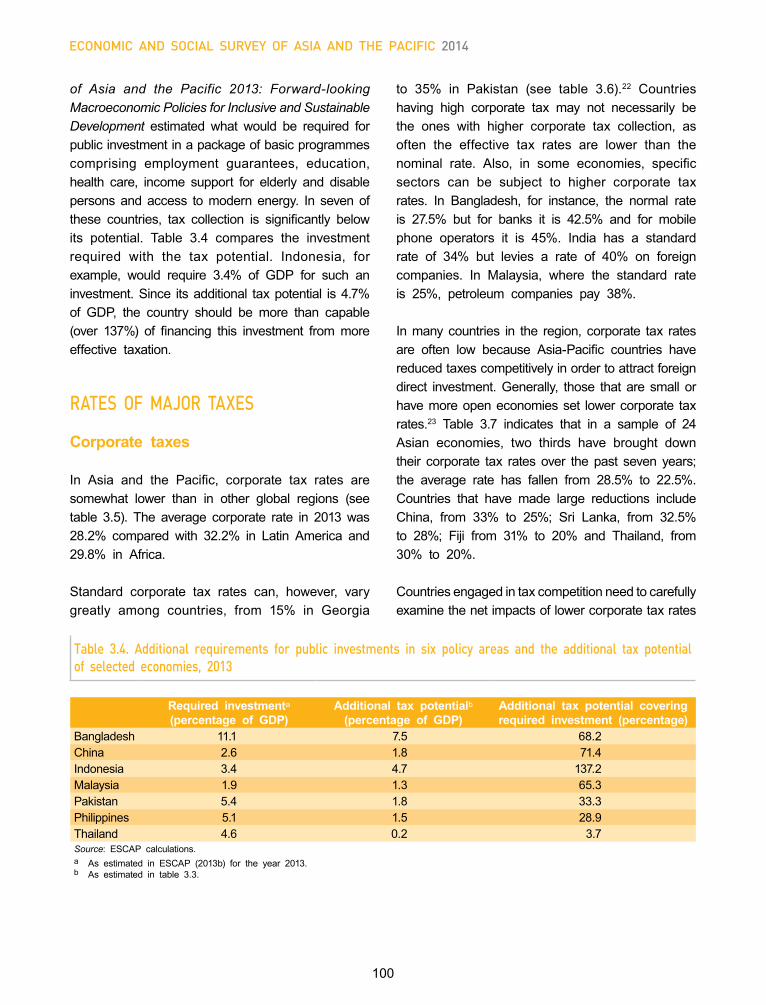
100
Economic and social survEy of asia and thE pacific 2014
Table 3.4. Additional requirements for public investments in six policy areas and the additional tax potential of selected economies, 2013
Required investmenta (percentage of GDP)
Additional tax potentialb (percentage of GDP)
Additional tax potential covering required investment (percentage)
Bangladesh 11.1 7.5 68.2China 2.6 1.8 71.4Indonesia 3.4 4.7 137.2Malaysia 1.9 1.3 65.3Pakistan 5.4 1.8 33.3Philippines 5.1 1.5 28.9Thailand 4.6 0.2 3.7Source: ESCAP calculations.a As estimated in ESCAP (2013b) for the year 2013.b As estimated in table 3.3.
of Asia and the Pacific 2013: Forward-looking Macroeconomic Policies for Inclusive and Sustainable Development estimated what would be required for public investment in a package of basic programmes comprising employment guarantees, education, health care, income support for elderly and disable persons and access to modern energy. In seven of these countries, tax collection is significantly below its potential. Table 3.4 compares the investment required with the tax potential. Indonesia, for example, would require 3.4% of GDP for such an investment. Since its additional tax potential is 4.7% of GDP, the country should be more than capable (over 137%) of financing this investment from more effective taxation.
RATES OF MAJOR TAXES
Corporate taxes
In Asia and the Pacific, corporate tax rates are somewhat lower than in other global regions (see table 3.5). The average corporate rate in 2013 was 28.2% compared with 32.2% in Latin America and 29.8% in Africa.
Standard corporate tax rates can, however, vary greatly among countries, from 15% in Georgia
to 35% in Pakistan (see table 3.6).22 Countries having high corporate tax may not necessarily be the ones with higher corporate tax collection, as often the effective tax rates are lower than the nominal rate. Also, in some economies, specific sectors can be subject to higher corporate tax rates. In Bangladesh, for instance, the normal rate is 27.5% but for banks it is 42.5% and for mobile phone operators it is 45%. India has a standard rate of 34% but levies a rate of 40% on foreign companies. In Malaysia, where the standard rate is 25%, petroleum companies pay 38%.
In many countries in the region, corporate tax rates are often low because Asia-Pacific countries have reduced taxes competitively in order to attract foreign direct investment. Generally, those that are small or have more open economies set lower corporate tax rates.23 Table 3.7 indicates that in a sample of 24 Asian economies, two thirds have brought down their corporate tax rates over the past seven years; the average rate has fallen from 28.5% to 22.5%. Countries that have made large reductions include China, from 33% to 25%; Sri Lanka, from 32.5% to 28%; Fiji from 31% to 20% and Thailand, from 30% to 20%.
Countries engaged in tax competition need to carefully examine the net impacts of lower corporate tax rates
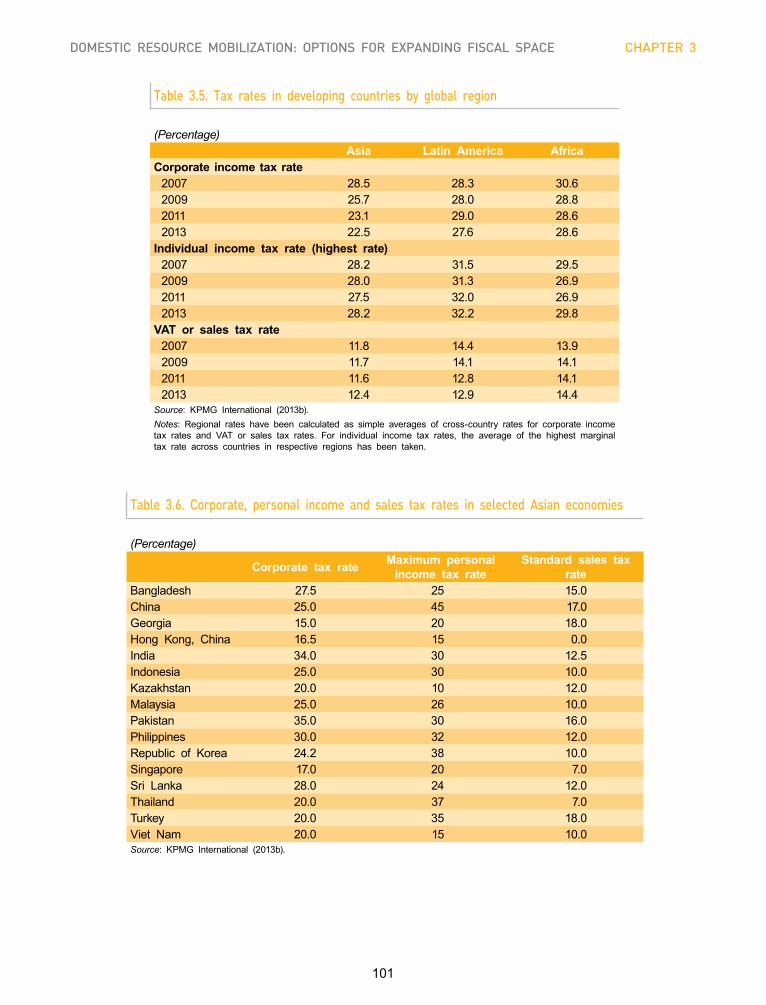
101
DOMESTIC RESOURCE MOBILIZATION: OPTIONS FOR EXPANDING FISCAL SPACE CHAPTER 3
Table 3.5. Tax rates in developing countries by global region
(Percentage)Asia Latin America Africa
Corporate income tax rate2007 28.5 28.3 30.62009 25.7 28.0 28.82011 23.1 29.0 28.62013 22.5 27.6 28.6
Individual income tax rate (highest rate)2007 28.2 31.5 29.52009 28.0 31.3 26.92011 27.5 32.0 26.92013 28.2 32.2 29.8
VAT or sales tax rate2007 11.8 14.4 13.92009 11.7 14.1 14.12011 11.6 12.8 14.12013 12.4 12.9 14.4
Source: KPMG International (2013b).Notes: Regional rates have been calculated as simple averages of cross-country rates for corporate income tax rates and VAT or sales tax rates. For individual income tax rates, the average of the highest marginal tax rate across countries in respective regions has been taken.
Table 3.6. Corporate, personal income and sales tax rates in selected Asian economies
(Percentage)
Corporate tax rate Maximum personal income tax rate
Standard sales tax rate
Bangladesh 27.5 25 15.0China 25.0 45 17.0Georgia 15.0 20 18.0Hong Kong, China 16.5 15 0.0India 34.0 30 12.5Indonesia 25.0 30 10.0Kazakhstan 20.0 10 12.0Malaysia 25.0 26 10.0Pakistan 35.0 30 16.0Philippines 30.0 32 12.0Republic of Korea 24.2 38 10.0Singapore 17.0 20 7.0Sri Lanka 28.0 24 12.0Thailand 20.0 37 7.0Turkey 20.0 35 18.0Viet Nam 20.0 15 10.0Source: KPMG International (2013b).
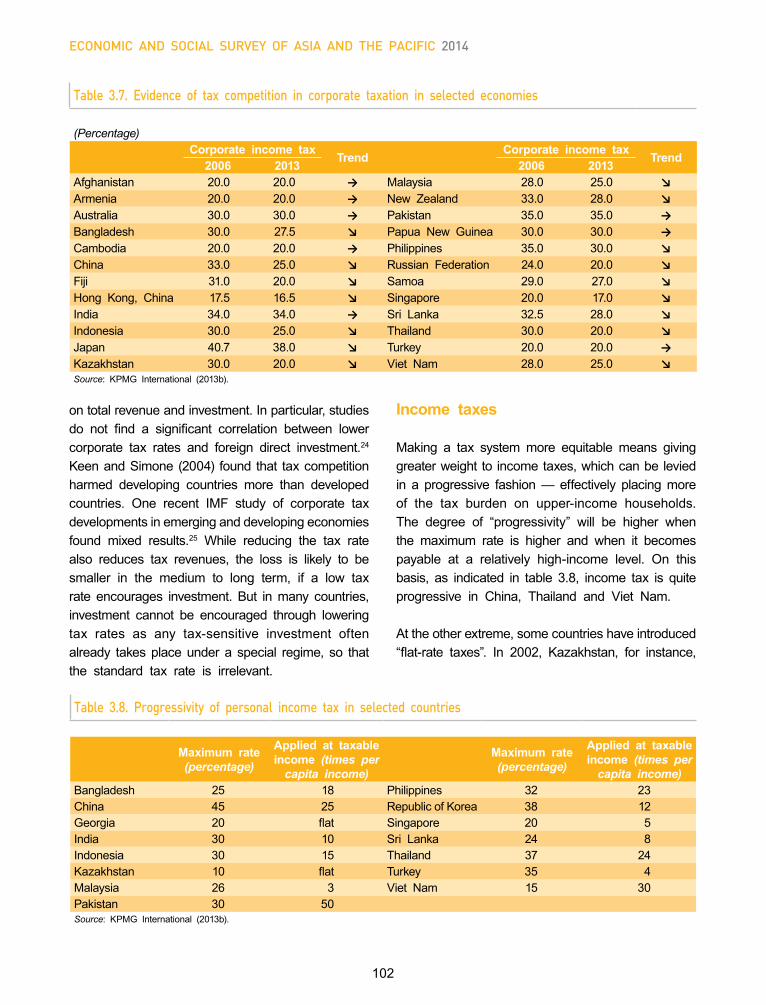
102
Economic and social survEy of asia and thE pacific 2014
Table 3.7. Evidence of tax competition in corporate taxation in selected economies
(Percentage)Corporate income tax Trend Corporate income tax Trend2006 2013 2006 2013
Afghanistan 20.0 20.0 → Malaysia 28.0 25.0 ↘Armenia 20.0 20.0 → New Zealand 33.0 28.0 ↘Australia 30.0 30.0 → Pakistan 35.0 35.0 →Bangladesh 30.0 27.5 ↘ Papua New Guinea 30.0 30.0 →Cambodia 20.0 20.0 → Philippines 35.0 30.0 ↘China 33.0 25.0 ↘ Russian Federation 24.0 20.0 ↘Fiji 31.0 20.0 ↘ Samoa 29.0 27.0 ↘Hong Kong, China 17.5 16.5 ↘ Singapore 20.0 17.0 ↘India 34.0 34.0 → Sri Lanka 32.5 28.0 ↘Indonesia 30.0 25.0 ↘ Thailand 30.0 20.0 ↘Japan 40.7 38.0 ↘ Turkey 20.0 20.0 →Kazakhstan 30.0 20.0 ↘ Viet Nam 28.0 25.0 ↘Source: KPMG International (2013b).
on total revenue and investment. In particular, studies do not find a significant correlation between lower corporate tax rates and foreign direct investment.24 Keen and Simone (2004) found that tax competition harmed developing countries more than developed countries. One recent IMF study of corporate tax developments in emerging and developing economies found mixed results.25 While reducing the tax rate also reduces tax revenues, the loss is likely to be smaller in the medium to long term, if a low tax rate encourages investment. But in many countries, investment cannot be encouraged through lowering tax rates as any tax-sensitive investment often already takes place under a special regime, so that the standard tax rate is irrelevant.
Table 3.8. Progressivity of personal income tax in selected countries
Maximum rate (percentage)
Applied at taxable income (times per
capita income)
Maximum rate (percentage)
Applied at taxable income (times per
capita income)Bangladesh 25 18 Philippines 32 23China 45 25 Republic of Korea 38 12Georgia 20 flat Singapore 20 5India 30 10 Sri Lanka 24 8Indonesia 30 15 Thailand 37 24Kazakhstan 10 flat Turkey 35 4Malaysia 26 3 Viet Nam 15 30Pakistan 30 50Source: KPMG International (2013b).
Income taxes
Making a tax system more equitable means giving greater weight to income taxes, which can be levied in a progressive fashion — effectively placing more of the tax burden on upper-income households. The degree of “progressivity” will be higher when the maximum rate is higher and when it becomes payable at a relatively high-income level. On this basis, as indicated in table 3.8, income tax is quite progressive in China, Thailand and Viet Nam.
At the other extreme, some countries have introduced “flat-rate taxes”. In 2002, Kazakhstan, for instance,
103
DOMESTIC RESOURCE MOBILIZATION: OPTIONS FOR EXPANDING FISCAL SPACE CHAPTER 3
harmonized all its income tax rates into a single rate of 10%. In 2001, the Russian Federation set a flat rate of 13% for all Russian tax residents. Georgia also has a flat rate, equivalent to 20%.
Flat taxes have advantages. The principal one is that they simplify the system, making it cheaper to administer. Simpler rules might also encourage greater tax compliance. Moreover, lowering the marginal tax burden might create incentives for investment and encourage employment especially of individuals in higher income brackets.26 However, there is little evidence that these benefits have been realized. In the Russian Federation, for example, revenues from personal income taxation did increase but this was due not to the reform but to improvements in tax administration. Moreover, the rate reduction did not seem to lead to improved compliance or greater work effort.27 Importantly, flat taxes are highly regressive. Given the widespread increase in income inequality in the region, the progressivity of taxes (or lack of) needs to be looked at very carefully.
An appropriate move may be to a dual income tax system that taxes income on
labour and capital separately
Given that flat taxes are regressive, a more appropriate move may be a dual income tax system that imposes increasing marginal rates on income but also taxes income on labour and capital separately.28 Capital income is usually taxed at a lower rate than labour income. This encourages savings and investment. Taxation of capital income separately allows flexibility to address global tax competition to attract capital. While the Nordic countries (Denmark, Finland, Norway and Sweden) were the first countries to set up such a dual income tax system, where labour income and capital income are taxed separately, others have followed. Yet, in most developing countries, tax systems do not treat labour and capital income separately. The complexity of dual tax systems raises many challenges, however, including separation of labour
and capital incomes. Further work is needed on the suitability of such a system for developing countries and how to overcome difficulties in its implementation.
Sales taxes
For sales taxes, a number of Asia-Pacific coun- tries have made the transition to VAT, including Bangladesh, Georgia, Indonesia, Kazakhstan, Pakistan, Sri Lanka, Thailand and Turkey. Other countries are also contemplating this move. Although sales taxes can raise considerable revenues they also have drawbacks. The main concern is equity: as the poor spend a larger percentage of their income on consumption, these taxes have a relatively greater impact on the poor than on the rich.29 In Bangladesh, for example, it has been found that VAT places a relatively higher burden on people in lower income groups.30 Another disadvantage is that the informal sector largely escapes the VAT net, discouraging businesses from making the transition to formal activities.31
It is possible to offset these effects to some extent by zero-rating or exempting certain goods and services. Indeed most countries also have exemptions and lower rates for certain items such as food (see table 3.9). However, the benefits of doing so must be weighed against increases in administrative costs.
The effectiveness of VAT and GST can be assessed through “collection efficiency”, which is the actual rate of taxation of value added in goods and services as a percentage of the standard rate. As indicated in table 3.10, collection efficiency is relatively high in Thailand, Turkey and some North and Central Asian countries, but much lower in Bangladesh, China, India and Pakistan, indicating tax exemptions and difficulties in implementation of the tax.
Taxation of imports
In the early stages of industrialization, countries generally levy high import tariffs — both to raise
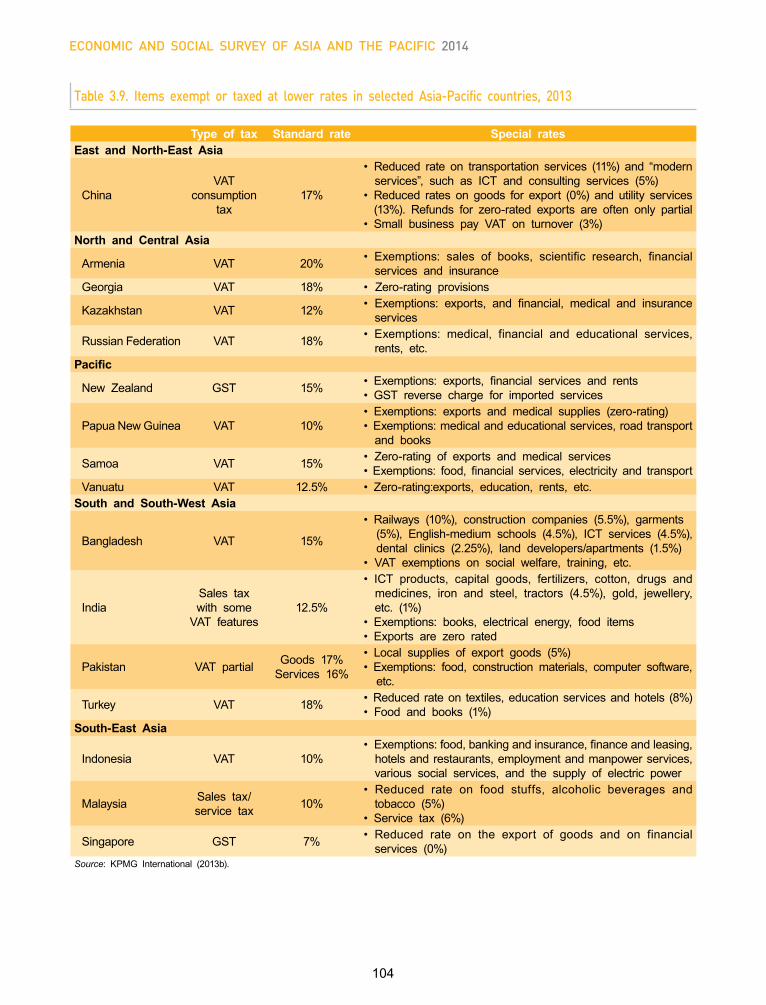
104
Economic and social survEy of asia and thE pacific 2014
Table 3.9. Items exempt or taxed at lower rates in selected Asia-Pacific countries, 2013
Type of tax Standard rate Special ratesEast and North-East Asia
ChinaVAT
consumption tax
17%
• Reduced rate on transportation services (11%) and “modern services”, such as ICT and consulting services (5%) • Reduced rates on goods for export (0%) and utility services (13%). Refunds for zero-rated exports are often only partial• Small business pay VAT on turnover (3%)
North and Central Asia
Armenia VAT 20% • Exemptions: sales of books, scientific research, financial services and insurance
Georgia VAT 18% • Zero-rating provisions
Kazakhstan VAT 12% • Exemptions: exports, and financial, medical and insurance services
Russian Federation VAT 18% • Exemptions: medical, financial and educational services, rents, etc.
Pacific
New Zealand GST 15% • Exemptions: exports, financial services and rents • GST reverse charge for imported services
Papua New Guinea VAT 10%• Exemptions: exports and medical supplies (zero-rating) • Exemptions: medical and educational services, road transport and books
Samoa VAT 15% • Zero-rating of exports and medical services • Exemptions: food, financial services, electricity and transport
Vanuatu VAT 12.5% • Zero-rating:exports, education, rents, etc.South and South-West Asia
Bangladesh VAT 15%
• Railways (10%), construction companies (5.5%), garments (5%), English-medium schools (4.5%), ICT services (4.5%), dental clinics (2.25%), land developers/apartments (1.5%)• VAT exemptions on social welfare, training, etc.
IndiaSales tax with some
VAT features12.5%
• ICT products, capital goods, fertilizers, cotton, drugs and medicines, iron and steel, tractors (4.5%), gold, jewellery, etc. (1%) • Exemptions: books, electrical energy, food items • Exports are zero rated
Pakistan VAT partial Goods 17%Services 16%
• Local supplies of export goods (5%) • Exemptions: food, construction materials, computer software, etc.
Turkey VAT 18% • Reduced rate on textiles, education services and hotels (8%) • Food and books (1%)
South-East Asia
Indonesia VAT 10%• Exemptions: food, banking and insurance, finance and leasing, hotels and restaurants, employment and manpower services, various social services, and the supply of electric power
Malaysia Sales tax/service tax 10%
• Reduced rate on food stuffs, alcoholic beverages and tobacco (5%) • Service tax (6%)
Singapore GST 7% • Reduced rate on the export of goods and on financial services (0%)
Source: KPMG International (2013b).
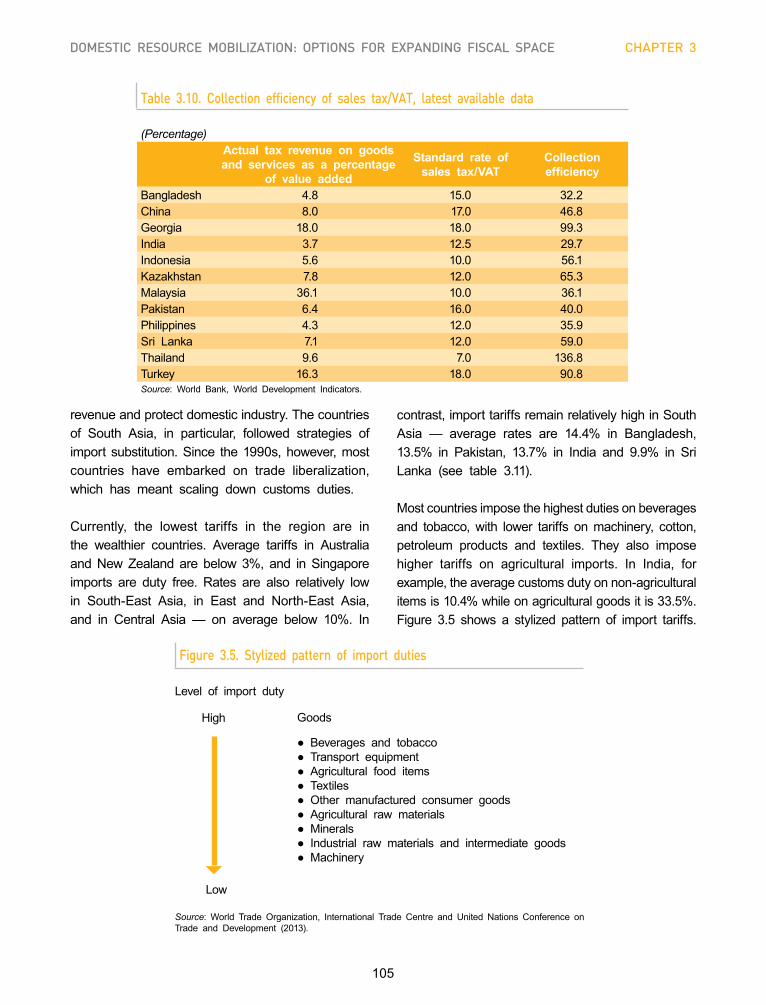
105
DOMESTIC RESOURCE MOBILIZATION: OPTIONS FOR EXPANDING FISCAL SPACE CHAPTER 3
Table 3.10. Collection efficiency of sales tax/VAT, latest available data
(Percentage)Actual tax revenue on goods and services as a percentage
of value added
Standard rate of sales tax/VAT
Collection efficiency
Bangladesh 4.8 15.0 32.2China 8.0 17.0 46.8Georgia 18.0 18.0 99.3India 3.7 12.5 29.7Indonesia 5.6 10.0 56.1Kazakhstan 7.8 12.0 65.3Malaysia 36.1 10.0 36.1Pakistan 6.4 16.0 40.0Philippines 4.3 12.0 35.9Sri Lanka 7.1 12.0 59.0Thailand 9.6 7.0 136.8Turkey 16.3 18.0 90.8Source: World Bank, World Development Indicators.
Figure 3.5. Stylized pattern of import duties
Source: World Trade Organization, International Trade Centre and United Nations Conference on Trade and Development (2013).
Low
Goods
● Beverages and tobacco● Transport equipment● Agricultural food items● Textiles● Other manufactured consumer goods● Agricultural raw materials● Minerals● Industrial raw materials and intermediate goods● Machinery
High
Level of import duty
revenue and protect domestic industry. The countries of South Asia, in particular, followed strategies of import substitution. Since the 1990s, however, most countries have embarked on trade liberalization, which has meant scaling down customs duties.
Currently, the lowest tariffs in the region are in the wealthier countries. Average tariffs in Australia and New Zealand are below 3%, and in Singapore imports are duty free. Rates are also relatively low in South-East Asia, in East and North-East Asia, and in Central Asia — on average below 10%. In
contrast, import tariffs remain relatively high in South Asia — average rates are 14.4% in Bangladesh, 13.5% in Pakistan, 13.7% in India and 9.9% in Sri Lanka (see table 3.11).
Most countries impose the highest duties on beverages and tobacco, with lower tariffs on machinery, cotton, petroleum products and textiles. They also impose higher tariffs on agricultural imports. In India, for example, the average customs duty on non-agricultural items is 10.4% while on agricultural goods it is 33.5%. Figure 3.5 shows a stylized pattern of import tariffs.
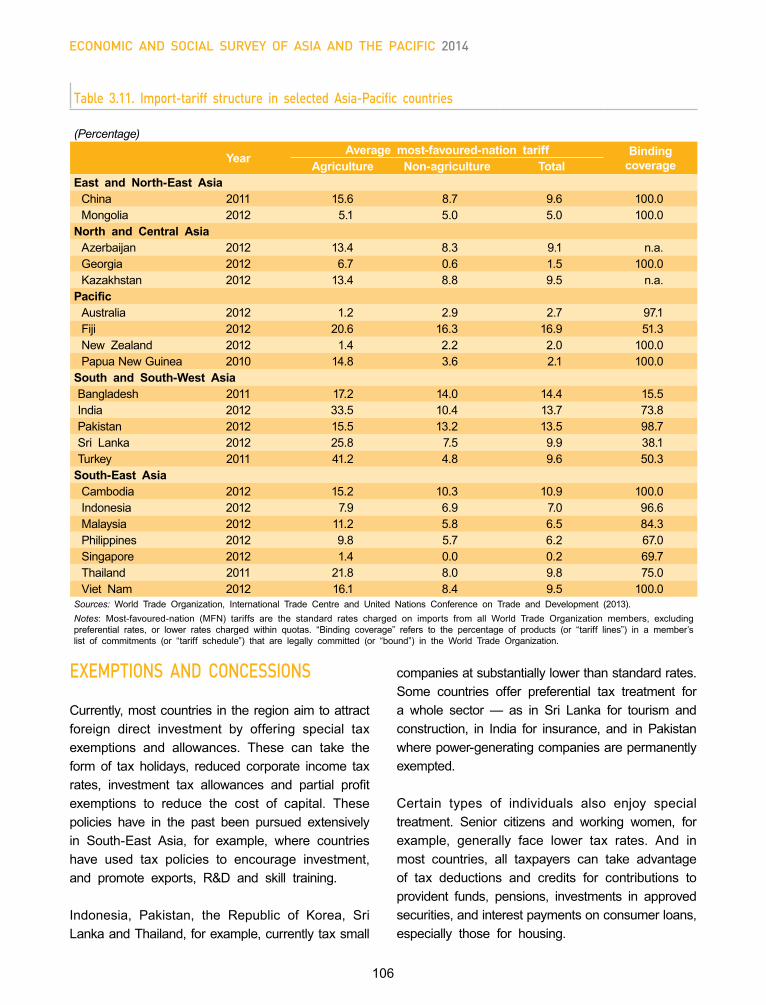
106
Economic and social survEy of asia and thE pacific 2014
EXEMPTIONS AND CONCESSIONS
Currently, most countries in the region aim to attract foreign direct investment by offering special tax exemptions and allowances. These can take the form of tax holidays, reduced corporate income tax rates, investment tax allowances and partial profit exemptions to reduce the cost of capital. These policies have in the past been pursued extensively in South-East Asia, for example, where countries have used tax policies to encourage investment, and promote exports, R&D and skill training.
Indonesia, Pakistan, the Republic of Korea, Sri Lanka and Thailand, for example, currently tax small
companies at substantially lower than standard rates. Some countries offer preferential tax treatment for a whole sector — as in Sri Lanka for tourism and construction, in India for insurance, and in Pakistan where power-generating companies are permanently exempted.
Certain types of individuals also enjoy special treatment. Senior citizens and working women, for example, generally face lower tax rates. And in most countries, all taxpayers can take advantage of tax deductions and credits for contributions to provident funds, pensions, investments in approved securities, and interest payments on consumer loans, especially those for housing.
Table 3.11. Import-tariff structure in selected Asia-Pacific countries
(Percentage)
Year Average most-favoured-nation tariff Binding coverageAgriculture Non-agriculture Total
East and North-East AsiaChina 2011 15.6 8.7 9.6 100.0Mongolia 2012 5.1 5.0 5.0 100.0
North and Central AsiaAzerbaijan 2012 13.4 8.3 9.1 n.a.Georgia 2012 6.7 0.6 1.5 100.0Kazakhstan 2012 13.4 8.8 9.5 n.a.
PacificAustralia 2012 1.2 2.9 2.7 97.1Fiji 2012 20.6 16.3 16.9 51.3New Zealand 2012 1.4 2.2 2.0 100.0Papua New Guinea 2010 14.8 3.6 2.1 100.0
South and South-West AsiaBangladesh 2011 17.2 14.0 14.4 15.5India 2012 33.5 10.4 13.7 73.8Pakistan 2012 15.5 13.2 13.5 98.7Sri Lanka 2012 25.8 7.5 9.9 38.1Turkey 2011 41.2 4.8 9.6 50.3
South-East AsiaCambodia 2012 15.2 10.3 10.9 100.0Indonesia 2012 7.9 6.9 7.0 96.6Malaysia 2012 11.2 5.8 6.5 84.3Philippines 2012 9.8 5.7 6.2 67.0Singapore 2012 1.4 0.0 0.2 69.7Thailand 2011 21.8 8.0 9.8 75.0Viet Nam 2012 16.1 8.4 9.5 100.0
Sources: World Trade Organization, International Trade Centre and United Nations Conference on Trade and Development (2013).Notes: Most-favoured-nation (MFN) tariffs are the standard rates charged on imports from all World Trade Organization members, excluding preferential rates, or lower rates charged within quotas. “Binding coverage” refers to the percentage of products (or “tariff lines”) in a member’s list of commitments (or “tariff schedule”) that are legally committed (or “bound”) in the World Trade Organization.
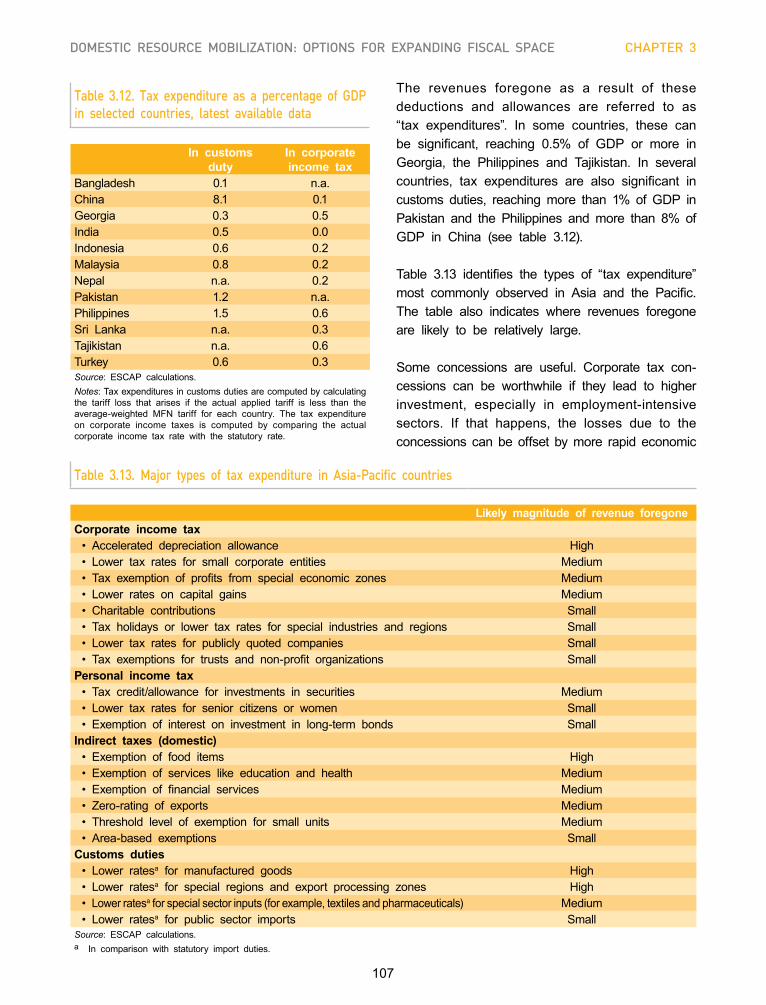
107
DOMESTIC RESOURCE MOBILIZATION: OPTIONS FOR EXPANDING FISCAL SPACE CHAPTER 3
Table 3.12. Tax expenditure as a percentage of GDP in selected countries, latest available data
In customs duty
In corporate income tax
Bangladesh 0.1 n.a.China 8.1 0.1Georgia 0.3 0.5India 0.5 0.0Indonesia 0.6 0.2Malaysia 0.8 0.2Nepal n.a. 0.2Pakistan 1.2 n.a.Philippines 1.5 0.6Sri Lanka n.a. 0.3Tajikistan n.a. 0.6Turkey 0.6 0.3Source: ESCAP calculations.Notes: Tax expenditures in customs duties are computed by calculating the tariff loss that arises if the actual applied tariff is less than the average-weighted MFN tariff for each country. The tax expenditure on corporate income taxes is computed by comparing the actual corporate income tax rate with the statutory rate.
Table 3.13. Major types of tax expenditure in Asia-Pacific countries
Likely magnitude of revenue foregoneCorporate income tax
• Accelerated depreciation allowance High• Lower tax rates for small corporate entities Medium• Tax exemption of profits from special economic zones Medium• Lower rates on capital gains Medium• Charitable contributions Small• Tax holidays or lower tax rates for special industries and regions Small• Lower tax rates for publicly quoted companies Small• Tax exemptions for trusts and non-profit organizations Small
Personal income tax• Tax credit/allowance for investments in securities Medium• Lower tax rates for senior citizens or women Small• Exemption of interest on investment in long-term bonds Small
Indirect taxes (domestic)• Exemption of food items High• Exemption of services like education and health Medium• Exemption of financial services Medium• Zero-rating of exports Medium• Threshold level of exemption for small units Medium• Area-based exemptions Small
Customs duties• Lower ratesa for manufactured goods High• Lower ratesa for special regions and export processing zones High• Lower ratesa for special sector inputs (for example, textiles and pharmaceuticals) Medium• Lower ratesa for public sector imports Small
Source: ESCAP calculations. a In comparison with statutory import duties.
The revenues foregone as a result of these deductions and allowances are referred to as “tax expenditures”. In some countries, these can be significant, reaching 0.5% of GDP or more in Georgia, the Philippines and Tajikistan. In several countries, tax expenditures are also significant in customs duties, reaching more than 1% of GDP in Pakistan and the Philippines and more than 8% of GDP in China (see table 3.12).
Table 3.13 identifies the types of “tax expenditure” most commonly observed in Asia and the Pacific. The table also indicates where revenues foregone are likely to be relatively large.
Some concessions are useful. Corporate tax con- cessions can be worthwhile if they lead to higher investment, especially in employment-intensive sectors. If that happens, the losses due to the concessions can be offset by more rapid economic
108
Economic and social survEy of asia and thE pacific 2014
growth. It can also be worthwhile to extend tax privileges to certain groups of individuals to address inequalities and offer incentives to increase the share of vulnerable or socially disadvantaged groups in employment.
Offering investment incentives can be costly and counterproductive
However, in many cases these concessions are unproductive.32 The IMF recently compared the cost of tax concessions in terms of revenues forgone with the benefits in terms of increased foreign direct investment. It found that the “costs are very large, while the benefits appear to be marginal at best. Forgone tax revenues range between 9.5% and 16% of GDP per year, whereas total foreign direct investment does not appear to depend on concessions”. Thus, it urged “rethinking of the use of concessions”.33 Several OECD studies have also concluded that offering investment incentives can be costly and counterproductive if the fundamentals of the potential investment fail to meet the requirements of serious investors.34
If foreign investors can offer something extra compared with domestic investors, it may be useful to offer them special incentives.35 If they do not, preferential tax treatment only distorts competition and puts local companies at a disadvantage. Industrial policy in developing countries should instead aim to attract foreign investors by offering more extensive modern infrastructure and a more highly skilled workforce.
POLICY OPTIONS TO ENHANCE TAX REVENUE
Countries with untapped tax potential can enhance tax revenues in a number of ways. Box 3.2 provides a few examples of innovative tax reforms in Asia and the Pacific. However, there are a number of priorities for most countries in the region. These include the need to broaden the tax base and rationalizing rates; tackling tax evasion and tax fraud;
improving tax administration and sequencing reforms appropriately; and promoting regional cooperation.
Broadening the tax base and rationalizing rates
Governments can take a number of measures to rationalize and extend their tax systems. One objective is to avoid very high rates, which lead to disproportionate welfare losses and increase the incentive for tax evasion. There are also disadvantages of high import tariffs. By providing high levels of protection to domestic industry, they reduce competition and the incentive for achieving higher levels of efficiency. They also encourage smuggling, illicit trade and under-invoicing of imports.
Overall the objectives should be to have large tax bases with relatively low and consistent tax rates such that they do not create distortions in the allocation of resources. Potential measures include:
(a) Reducing “tax expenditure” — Frequently, tax expenditure reflects rent-seeking behaviour by powerful, vested interests, so reducing it would make the tax system more equitable. Countries could review their tax system and retain only those exemptions or concessions that are achieving their stated objectives;
(b) Increasing collection efficiency — Electronic tax returns and pay-as-you-earn systems can enhance collection efficiency. Countries can also think of setting up “one stop” tax collection centres at convenient locations during the annual tax return period. This has been found quite successful in Bangladesh. In the case of GST and VAT, countries could aim for simpler, more consistent systems;
(c) Extending VAT/GST — VAT/GST frequently apply only to goods and the manufacturing sector. There is therefore substantial scope for extending VAT to services, which are often provided by large corporate entities, especially in banking and insurance, telecommunications, business- related services, information technologies, various
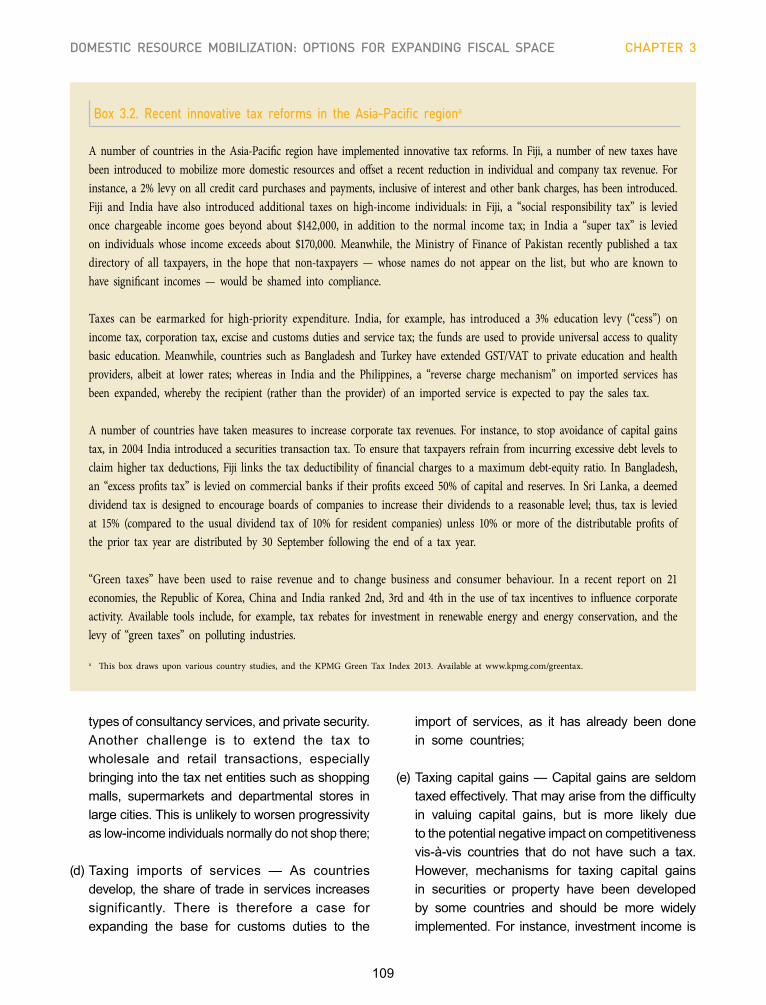
109
DOMESTIC RESOURCE MOBILIZATION: OPTIONS FOR EXPANDING FISCAL SPACE CHAPTER 3
Box 3.2. Recent innovative tax reforms in the Asia-Pacific regiona
A number of countries in the Asia-Pacific region have implemented innovative tax reforms. In Fiji, a number of new taxes have been introduced to mobilize more domestic resources and offset a recent reduction in individual and company tax revenue. For instance, a 2% levy on all credit card purchases and payments, inclusive of interest and other bank charges, has been introduced. Fiji and India have also introduced additional taxes on high-income individuals: in Fiji, a “social responsibility tax” is levied once chargeable income goes beyond about $142,000, in addition to the normal income tax; in India a “super tax” is levied on individuals whose income exceeds about $170,000. Meanwhile, the Ministry of Finance of Pakistan recently published a tax directory of all taxpayers, in the hope that non-taxpayers — whose names do not appear on the list, but who are known to have significant incomes — would be shamed into compliance.
Taxes can be earmarked for high-priority expenditure. India, for example, has introduced a 3% education levy (“cess”) on income tax, corporation tax, excise and customs duties and service tax; the funds are used to provide universal access to quality basic education. Meanwhile, countries such as Bangladesh and Turkey have extended GST/VAT to private education and health providers, albeit at lower rates; whereas in India and the Philippines, a “reverse charge mechanism” on imported services has been expanded, whereby the recipient (rather than the provider) of an imported service is expected to pay the sales tax.
A number of countries have taken measures to increase corporate tax revenues. For instance, to stop avoidance of capital gains tax, in 2004 India introduced a securities transaction tax. To ensure that taxpayers refrain from incurring excessive debt levels to claim higher tax deductions, Fiji links the tax deductibility of financial charges to a maximum debt-equity ratio. In Bangladesh, an “excess profits tax” is levied on commercial banks if their profits exceed 50% of capital and reserves. In Sri Lanka, a deemed dividend tax is designed to encourage boards of companies to increase their dividends to a reasonable level; thus, tax is levied at 15% (compared to the usual dividend tax of 10% for resident companies) unless 10% or more of the distributable profits of the prior tax year are distributed by 30 September following the end of a tax year.
“Green taxes” have been used to raise revenue and to change business and consumer behaviour. In a recent report on 21 economies, the Republic of Korea, China and India ranked 2nd, 3rd and 4th in the use of tax incentives to influence corporate activity. Available tools include, for example, tax rebates for investment in renewable energy and energy conservation, and the levy of “green taxes” on polluting industries.
a This box draws upon various country studies, and the KPMG Green Tax Index 2013. Available at www.kpmg.com/greentax.
types of consultancy services, and private security. Another challenge is to extend the tax to wholesale and retail transactions, especially bringing into the tax net entities such as shopping malls, supermarkets and departmental stores in large cities. This is unlikely to worsen progressivity as low-income individuals normally do not shop there;
(d) Taxing imports of services — As countries develop, the share of trade in services increases significantly. There is therefore a case for expanding the base for customs duties to the
import of services, as it has already been done in some countries;
(e) Taxing capital gains — Capital gains are seldom taxed effectively. That may arise from the difficulty in valuing capital gains, but is more likely due to the potential negative impact on competitiveness vis-à-vis countries that do not have such a tax. However, mechanisms for taxing capital gains in securities or property have been developed by some countries and should be more widely implemented. For instance, investment income is
110
Economic and social survEy of asia and thE pacific 2014
taxed at a flat withholding rate of 20% in China. As advocated above, the introduction of a dual income tax system in the region may be appropriate and could address the taxation of capital gains. Such a proposal should be examined more closely;
(f) Taxing foreign operations — As countries develop business interests abroad through outward foreign direct investment, it is necessary to develop mechanisms for proper apportionment of costs between their domestic and foreign operations, so that there is no loss of tax revenues, especially in the presence of treaties for avoidance of double taxation. It is essentially through such transfer pricing that many multinational corporations are reducing their tax liabilities;
(g) Harmonizing income tax rates — Ideally, the rate should be the same for companies and for high-income individuals. This is necessary not only to preserve the progressivity of the tax system but also to prevent distortions in the organizational form of economic activities and to prevent income shifting to reduce tax liabilities.
Tackling tax evasion and tax fraud
Significant financial resources flow out of developing countries illicitly.36 Some estimates for the losses range up to $5.9 trillion for developing countries as a whole for the period between 2001 and 2010.37 The Asia-Pacific region is considered the major source of these outflows, accounting for more than 60% of all illicit outflows from the developing world; 6 of the 10 countries with the largest illicit capital flows are in the Asia-Pacific region. Of all least developed countries, illicit outflows from Bangladesh are the largest, reaching $35 billion between 1990 and 2008.38
One mechanism for this is trade mispricing, that is overstating the value of imports or understating the value of exports, which has the effect of transferring profits from one country to another, generally from high- to low-tax regimes. Estimates of foregone tax revenues due to bilateral trade mispricing into the
European Union and the United States between 2005 and 2007 include $577 million for Pakistan, $350 million for Bangladesh and $475 million for Viet Nam.39
Significant financial resources flow out of developing countries illicitly
Countries have adopted different mechanisms to reduce tax evasion and fraud. The most popular way is to deduct the tax at source, through withholding or advance taxes, an approach which has been applied most extensively to combat evasion of personal income tax. Table 3.14 shows the different types of deductions at source, including those on earned or unearned income, on asset transactions, on particular types of expenditure and on economic activities or sectors.
There are two potential problems with such methods. First, there can be some loss of equity, especially where the burden of the tax deduction is shifted forward. Second, there is the likelihood of high levels of refunds. In some cases, this has been avoided by converting the withholding tax into a fixed or presumptive tax. Nevertheless, the contribution of withholding taxes can be large. For example, in Pakistan and Bangladesh they account for more than half of revenue from direct taxes. Moreover, given the difficulties in collecting sales taxes from wholesalers and retailers, some countries have introduced a withholding tax at the time of sale by manufacturers to traders. Alternatively, the tax paid by the manufacturer is not on the ex-factory price but on the retail price.
Another popular instrument for tackling tax evasion is the introduction of minimum taxes on companies and associations of persons. Tax is levied either on turnover or on booked gross profits. At the same time, some South Asian countries have incorporated a provision in their income tax laws whereby certain types of persons are required compulsorily to file returns of income and wealth. Penalties are prescribed in the event of non-filing. Table 3.15
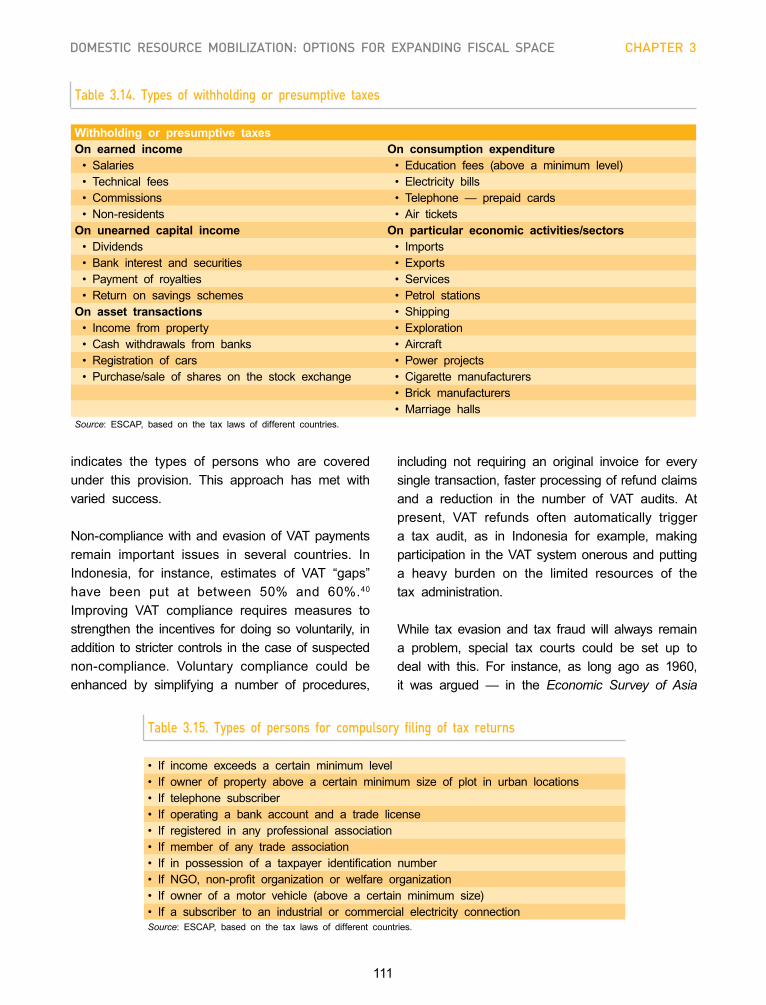
111
DOMESTIC RESOURCE MOBILIZATION: OPTIONS FOR EXPANDING FISCAL SPACE CHAPTER 3
Table 3.14. Types of withholding or presumptive taxes
Withholding or presumptive taxesOn earned income On consumption expenditure
• Salaries • Education fees (above a minimum level)• Technical fees • Electricity bills• Commissions • Telephone — prepaid cards• Non-residents • Air tickets
On unearned capital income On particular economic activities/sectors• Dividends • Imports• Bank interest and securities • Exports• Payment of royalties • Services• Return on savings schemes • Petrol stations
On asset transactions • Shipping• Income from property • Exploration• Cash withdrawals from banks • Aircraft• Registration of cars • Power projects• Purchase/sale of shares on the stock exchange • Cigarette manufacturers
• Brick manufacturers• Marriage halls
Source: ESCAP, based on the tax laws of different countries.
Table 3.15. Types of persons for compulsory filing of tax returns
• If income exceeds a certain minimum level • If owner of property above a certain minimum size of plot in urban locations • If telephone subscriber• If operating a bank account and a trade license• If registered in any professional association• If member of any trade association• If in possession of a taxpayer identification number• If NGO, non-profit organization or welfare organization• If owner of a motor vehicle (above a certain minimum size)• If a subscriber to an industrial or commercial electricity connectionSource: ESCAP, based on the tax laws of different countries.
indicates the types of persons who are covered under this provision. This approach has met with varied success.
Non-compliance with and evasion of VAT payments remain important issues in several countries. In Indonesia, for instance, estimates of VAT “gaps” have been put at between 50% and 60%.40 Improving VAT compliance requires measures to strengthen the incentives for doing so voluntarily, in addition to stricter controls in the case of suspected non-compliance. Voluntary compliance could be enhanced by simplifying a number of procedures,
including not requiring an original invoice for every single transaction, faster processing of refund claims and a reduction in the number of VAT audits. At present, VAT refunds often automatically trigger a tax audit, as in Indonesia for example, making participation in the VAT system onerous and putting a heavy burden on the limited resources of the tax administration.
While tax evasion and tax fraud will always remain a problem, special tax courts could be set up to deal with this. For instance, as long ago as 1960, it was argued — in the Economic Survey of Asia
112
Economic and social survEy of asia and thE pacific 2014
and the Far East 1960 — that “Special tax courts, instead of the ordinary legal machinery for civil suits, may be instituted and the legal processes tailored to deal expeditiously with the specific problems of tax evasion. A stricter supervision of the lucrative profession of company accountants and tax advisers or consultants might also bring to light the deficiencies of tax legislation and its practical application and administration.”41
Improving tax administration
A tax system that is both equitable and efficient will require a high-quality and effective tax administration — and one that is free from corruption, political interference and pressure from vested interests. One way to move in this direction is to give the revenue agencies a degree of institutional autonomy. Pakistan, for example, has recently established state-level autonomous revenue collection agencies.
Efficient tax administration requires adequate flows of information. Traditionally, different taxes have been collected by multiple agencies, which has made it difficult to collate information on individual taxpayers. In response, some countries have reorganized their systems along functional lines so that agencies dealing with issues such as intelligence, surveys, audits, legal issues and human resources provide inputs across all taxes.
Tax administrations should support taxpayers, lessen transaction costs
and reduce the potential for corruption
One of the primary tasks for tax offices is to detect new or evading taxpayers. A wealth of information can be derived from an information system on payment of withholding tax. Cross-checking against returns filed provides the basis for determining the extent of under-filing. Also, the national statistical agency should periodically undertake censuses of establishments.
Most modern tax systems rely on the filing of returns by taxpayers on the basis of self-assessment. Ideally, all taxpayers should be able to file their returns electronically. To deter evasion this has to be backed up by an effective audit system for examining a certain proportion of returns. This should be risk based, focusing on the taxpayers who are more likely to evade. A system of rewards that is linked to the amount of tax evasion identified could be established for tax officials.
Countries also have to decide on the extent of the powers of tax officials. India, for example, allows officials to raid premises. Pakistan has recently passed legislation allowing the tax agency to access bank accounts on a selective basis — though this has been vociferously resisted by taxpayers as an invasion of privacy, and banks are also reluctant to divulge this information. Any granting of powers to tax officials must not become a source of harassment or corruption. Moreover, it is essential that taxpayers have access to a fair and judicious appeals process. Some countries have tribunals run by tax officials. A better option is to have specialized tax courts, as mentioned earlier, under the judiciary. Delays in judgements will have to be avoided by specifying a maximum time limit for a decision.
The process of documentation can be facilitated by a system of taxpayer identification numbers. The numbers can be recorded in certain specified transactions. An electronic “data warehouse” of transactions can then provide evidence for the tax liability of an individual with a taxpayer identification number.
To boost revenues some countries have periodically granted tax amnesties. For example, Pakistan has recently announced immunity from audit to taxpayers who declare 25% higher income or make a fixed payment against previous non-filing of returns. The problem with amnesty schemes is that they erode the integrity of the tax system and create a disincentive for honest taxpayers.
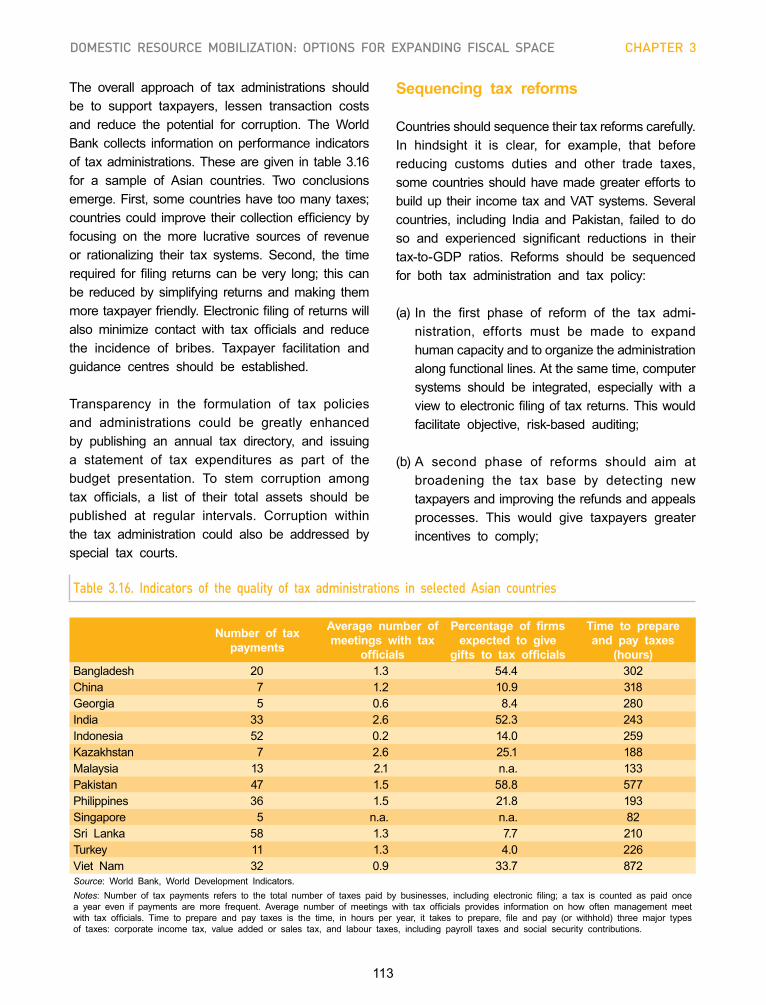
113
DOMESTIC RESOURCE MOBILIZATION: OPTIONS FOR EXPANDING FISCAL SPACE CHAPTER 3
Table 3.16. Indicators of the quality of tax administrations in selected Asian countries
Number of tax payments
Average number of meetings with tax
officials
Percentage of firms expected to give
gifts to tax officials
Time to prepare and pay taxes
(hours)Bangladesh 20 1.3 54.4 302China 7 1.2 10.9 318Georgia 5 0.6 8.4 280India 33 2.6 52.3 243Indonesia 52 0.2 14.0 259Kazakhstan 7 2.6 25.1 188Malaysia 13 2.1 n.a. 133Pakistan 47 1.5 58.8 577Philippines 36 1.5 21.8 193Singapore 5 n.a. n.a. 82Sri Lanka 58 1.3 7.7 210Turkey 11 1.3 4.0 226Viet Nam 32 0.9 33.7 872Source: World Bank, World Development Indicators.Notes: Number of tax payments refers to the total number of taxes paid by businesses, including electronic filing; a tax is counted as paid once a year even if payments are more frequent. Average number of meetings with tax officials provides information on how often management meet with tax officials. Time to prepare and pay taxes is the time, in hours per year, it takes to prepare, file and pay (or withhold) three major types of taxes: corporate income tax, value added or sales tax, and labour taxes, including payroll taxes and social security contributions.
The overall approach of tax administrations should be to support taxpayers, lessen transaction costs and reduce the potential for corruption. The World Bank collects information on performance indicators of tax administrations. These are given in table 3.16 for a sample of Asian countries. Two conclusions emerge. First, some countries have too many taxes; countries could improve their collection efficiency by focusing on the more lucrative sources of revenue or rationalizing their tax systems. Second, the time required for filing returns can be very long; this can be reduced by simplifying returns and making them more taxpayer friendly. Electronic filing of returns will also minimize contact with tax officials and reduce the incidence of bribes. Taxpayer facilitation and guidance centres should be established.
Transparency in the formulation of tax policies and administrations could be greatly enhanced by publishing an annual tax directory, and issuing a statement of tax expenditures as part of the budget presentation. To stem corruption among tax officials, a list of their total assets should be published at regular intervals. Corruption within the tax administration could also be addressed by special tax courts.
Sequencing tax reforms
Countries should sequence their tax reforms carefully. In hindsight it is clear, for example, that before reducing customs duties and other trade taxes, some countries should have made greater efforts to build up their income tax and VAT systems. Several countries, including India and Pakistan, failed to do so and experienced significant reductions in their tax-to-GDP ratios. Reforms should be sequenced for both tax administration and tax policy:
(a) In the first phase of reform of the tax admi- nistration, efforts must be made to expand human capacity and to organize the administration along functional lines. At the same time, computer systems should be integrated, especially with a view to electronic filing of tax returns. This would facilitate objective, risk-based auditing;
(b) A second phase of reforms should aim at broadening the tax base by detecting new taxpayers and improving the refunds and appeals processes. This would give taxpayers greater incentives to comply;
114
Economic and social survEy of asia and thE pacific 2014
(c) A third phase would involve second-generation reforms in which tax assessments would be based on collateral evidence collected across govern- ment departments. Compliance could be streng- thened further by reducing the multiplicity of taxes.
Governments will also need to sequence their reforms of tax policy.
(a) A first phase should aim at broadening the tax base by, for instance, expanding withholding and advance tax regimes, by expanding VAT to cover both goods and services, and in particular by reducing exemptions and concessions;
(b) A second reform phase would rationalize tax rates to reduce distortions and remove any existing tax anomalies;
(c) Finally, a third phase could tackle second- generation reforms by, for instance, strengthening laws to regulate transfer pricing and to determine global incomes liable for taxation. These reforms should also move from a withholding and presumptive tax regime to one based on self- assessment through filing of returns.
Promoting regional cooperation
Regional cooperation can play an important role in mobilizing domestic resources. Greater cooperation between countries would not only enable them to harmonize taxes and avoid tax competition, but would also help avoid double taxation, while tackling transfer pricing by multinational corporations. Regional cooperation can also be a useful tool to deal with tax havens. A regional tax forum of tax experts and officials could share best practices in tax policies, tax administration and tax reforms.
Harmonizing tax rates — Competition for foreign direct investment is leading to a “race to the bottom” in terms of taxation of profits. Countries belonging to regional associations, such as the South Asian Association for Regional Cooperation or the Association of Southeast Asian Nations,
may therefore wish to consider some degree of harmonization of taxation of profits of multinational companies.
Greater cooperation between countries would enable them to harmonize taxes
and avoid tax competition
Harmonizing import duties for transit trade — Another area for tax harmonization is for transit trade. There is, for example, significant transit trade via Pakistan to Afghanistan, of which a high proportion is smuggling. This happens because of the non-payment of taxes on goods meant for Afghanistan at Karachi port. The two countries could harmonize their import duties on smuggling-prone items in their customs tariff schedules. Revenues on transit cargo could be collected at the port of entry in Pakistan and reverted to Afghanistan, once certification is provided of the entry of goods into Afghan territory.
Combating transfer pricing — Multinational corpora- tions often price transactions between subsidiaries so as to divert more profits to low-tax countries. Regional cooperation can address such transfer pricing more forcefully. Around 20 Asian countries have already adopted transfer-pricing rules in their tax laws, mostly based on OECD lines. For instance, Indian legislation prescribes five methods to compute the “arm’s length price”. Tax officials must use the most appropriate method. The Income Tax Department of India ensures that most multinational corporations are audited for transfer pricing. This issue also highlights the case for greater harmonization of corporate tax rates.
Combating tax havens and illicit transfers — Regional cooperation will also be important to address the issue of tax havens and of illicit transfers of resources. Most of the options for addressing individual evasion involve better information reporting and additional enforcement. But there are also options that would involve fundamental changes in the law, such as shifting from a residence to a source basis for “passive income”, which comprises,
115
DOMESTIC RESOURCE MOBILIZATION: OPTIONS FOR EXPANDING FISCAL SPACE CHAPTER 3
for instance, rental income, interest earnings and dividends. An option that appears likely to recover significant revenues is the European Union Savings Directive (Council Directive 2003/48/EC), which requires member States to exchange information about interest earned on savings accounts held by non-residents. If the beneficial owner cannot be identified, a withholding tax could be imposed — a refund would be allowed if evidence of reporting to the home country could be shown. This directive has since been extended to cover all relevant income from both EU and non-EU investment funds (Council Directive 2014/48/EU).
There are also proposals for bilateral information treaties to provide for regular and automatic exchanges of information. This would relate to both civil and criminal issues. It would not require suspicion of a crime other than tax evasion, and would override bank secrecy laws in tax havens.
Agreements on double taxation — A further important aspect of regional cooperation will be to broaden double tax avoidance agreements (DTAAs). These bilateral agreements aim to avoid taxing enterprises twice for the same activity. This gives corporations greater confidence and encourages investment. India, for example, has comprehensive DTAAs with 88 countries. Under the Income Tax Act 1961, sections 90 and 91 provide specific relief to taxpayers to save them from double taxation. Similarly, Pakistan has DTAAs with 63 countries. ESCAP could prepare a generic DTAA and encourage member countries to sign bilateral agreements. It can work closely with the Committee of Experts on International Cooperation in Tax Matters, which is a subsidiary body of the Economic and Social Council. The Committee is responsible for keeping under review and updating, as necessary, the United Nations Model Double Taxation Convention between Developed and Developing Countries42 and the Manual for the Negotiation of Bilateral Tax Treaties between Developed and Developing Countries.43
There is a strong case for establishing an Asia-Pacific tax forum
An Asia-Pacific tax forum — Finally, there is a strong case for establishing an Asia-Pacific tax forum, possibly under the aegis of ESCAP. This forum could monitor the tax legislation of member countries and publish a regular review of tax reforms. It could also hold seminars on emerging tax issues with the participation of tax officials, experts and the private sector with a view to sharing best practices. The forum could also provide training and capacity development.
CONCLUSION
Countries across the Asia-Pacific region have significant potential for enhancing tax revenues. They can improve the quality of tax administration, rationalize tax rates, scale down tax expenditures and introduce mechanisms for curbing tax evasion.
While taxation is primarily a domestic policy issue, there are also many regional dimensions. Greater regional cooperation can strengthen domestic resource mobilization — particularly by enabling countries to avoid tax competition and to harmonize tax rates. Such cooperation could also involve exchanging information on cross-border capital flows into tax havens, tackling illicit transfers of funds, and signing agreements on double taxation.
The United Nations could play a useful role in developing conventions for the exchange of infor- mation among Asia-Pacific countries and between regions. ESCAP could set up an Asia-Pacific tax forum, which could act as a repository of tax laws, conduct periodic tax reviews of countries and hold seminars on emerging tax-related issues.
116
Economic and social survEy of asia and thE pacific 2014
Specifically, buoyancies were computed by using the following formula for two periods, t and t+k:
bt+k,t =△TAX/TAXt△GDP/GDPt
where △TAX represents the change in nominal tax revenues received by the Government during the period [t; t+k] and △GDP represents the change in nominal GDP during the period [t; t+k].
Annex III. Estimation of tax potential and tax gap
Tax potential represents the potential level of tax revenues as a percentage of GDP which corresponds to the structure of the economy. To capture the structure of economies, three commonly used variables were included in the estimation: the valued added of the agricultural sector, expressed as a percentage of GDP (AGRI); GDP per capita (GDPPC); and the degree of trade openness in a country (TRADE), calculated as the sum of exports and imports as a percentage of nominal GDP. Thus, the following equation was estimated over the period between 1990 and 2012 for a total of 144 countries:
taxit = 𝛽1 . AGRIit + 𝛽2 . GDPPCit + 𝛽3 . TRADEit + C + D + Ɛit
i and t correspond respectively to cross-section identifiers and to time and C denotes the intercept.
Regional dummies (D) were introduced to consider regional differences for Asia and the Pacific (AP), Europe (EU), sub-Saharan Africa (SS), Latin America and the Caribbean (LAC), and the Middle East (ME).
The estimation of coefficients was based on a generalized-least-squares approach with panel data. Potential heteroskedasticity of residuals was overcome by applying cross-section weights. The results of the estimation, with relevant test statistics showing a relatively good fit, are reported in table A1 below.
Annex I. Data used in this chapter
Data on tax revenue in this chapter have been sourced from the Government Finance Statistics database of the IMF and augmented by data from CEIC, national data sources and several background country studies that were commissioned for this chapter.
In principle, data are available for 34 developing countries, including: Afghanistan; Armenia; Azer- baijan; Bangladesh; Bhutan; Cambodia; China; Fiji; Georgia; Hong Kong, China; India; Indonesia; Iran (Islamic Republic of); Kazakhstan; Kyrgyzstan; Macao, China; Malaysia; Maldives; Mongolia; Myanmar; Nepal; Pakistan; Papua New Guinea; Philippines; Republic of Korea; Russian Federation; Singapore; Sri Lanka; Tajikistan; Thailand; Turkey; Uzbekistan; Vanuatu and Viet Nam. Data were also available for the three developed countries in the region: Australia, Japan and New Zealand.
The data cover the period from 1990 to 2011, unless otherwise noted. However, gaps exist for individual countries at different points in time. Also, unless otherwise noted, the data refer to central government data for all countries except for China, India, the Islamic Republic of Iran, Kazakhstan, Malaysia, the Russian Federation and Thailand. For these countries, data refer to general government data (unless otherwise noted) due to the significant difference (defined here as equivalent to more than 1 percentage point of GDP) between revenues collected at the central and at the general government level.
Annex II. Computation of tax buoyancy
There are a number of ways to calculate tax buoyancies (see Haughton, 1998). Due to the limitations of data availability, tax buoyancies in this chapter were estimated by calculating the ratio between the growth rate of nominal tax revenue and the growth rate of nominal GDP between two points in time. One advantage of this method helps to overcome short-term exceptional deviations and provides a broad picture of the reactivity of the fiscal system of a country.
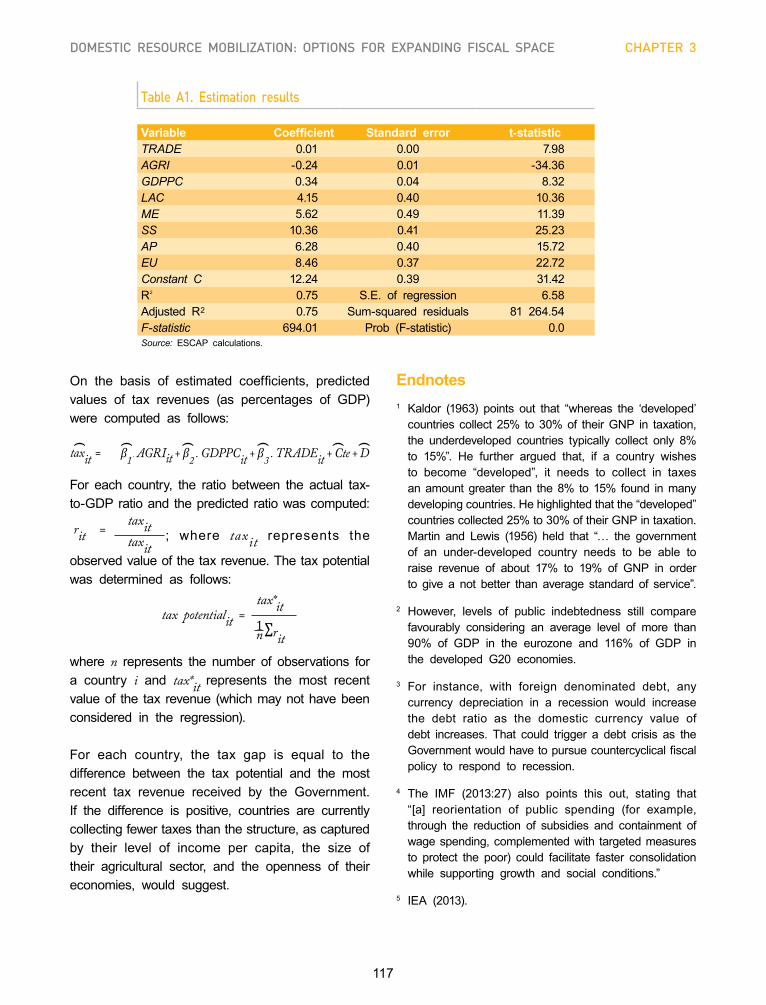
117
DOMESTIC RESOURCE MOBILIZATION: OPTIONS FOR EXPANDING FISCAL SPACE CHAPTER 3
On the basis of estimated coefficients, predicted values of tax revenues (as percentages of GDP) were computed as follows:
taxit = 𝛽1 . AGRIit + 𝛽2 . GDPPCit + 𝛽3 . TRADEit + Cte + D
For each country, the ratio between the actual tax-to-GDP ratio and the predicted ratio was computed:
; where taxit represents the
observed value of the tax revenue. The tax potential was determined as follows:
tax potentialit =tax*it
where n represents the number of observations for a country i and tax*it represents the most recent value of the tax revenue (which may not have been considered in the regression).
For each country, the tax gap is equal to the difference between the tax potential and the most recent tax revenue received by the Government. If the difference is positive, countries are currently collecting fewer taxes than the structure, as captured by their level of income per capita, the size of their agricultural sector, and the openness of their economies, would suggest.
Table A1. Estimation results
Variable Coefficient Standard error t-statisticTRADE 0.01 0.00 7.98AGRI -0.24 0.01 -34.36GDPPC 0.34 0.04 8.32LAC 4.15 0.40 10.36ME 5.62 0.49 11.39SS 10.36 0.41 25.23AP 6.28 0.40 15.72EU 8.46 0.37 22.72Constant C 12.24 0.39 31.42R2 0.75 S.E. of regression 6.58Adjusted R2 0.75 Sum-squared residuals 81 264.54F-statistic 694.01 Prob (F-statistic) 0.0Source: ESCAP calculations.
rit = taxittaxit
Endnotes1 Kaldor (1963) points out that “whereas the ‘developed’ countries collect 25% to 30% of their GNP in taxation, the underdeveloped countries typically collect only 8% to 15%”. He further argued that, if a country wishes to become “developed”, it needs to collect in taxes an amount greater than the 8% to 15% found in many developing countries. He highlighted that the “developed” countries collected 25% to 30% of their GNP in taxation. Martin and Lewis (1956) held that “… the government of an under-developed country needs to be able to raise revenue of about 17% to 19% of GNP in order to give a not better than average standard of service”.
2 However, levels of public indebtedness still compare favourably considering an average level of more than 90% of GDP in the eurozone and 116% of GDP in the developed G20 economies.
3 For instance, with foreign denominated debt, any currency depreciation in a recession would increase the debt ratio as the domestic currency value of debt increases. That could trigger a debt crisis as the Government would have to pursue countercyclical fiscal policy to respond to recession.
4 The IMF (2013:27) also points this out, stating that “[a] reorientation of public spending (for example, through the reduction of subsidies and containment of wage spending, complemented with targeted measures to protect the poor) could facilitate faster consolidation while supporting growth and social conditions.”
5 IEA (2013).
1n Ʃrit
118
Economic and social survEy of asia and thE pacific 2014
6 Subsidizing some critical sectors of an economy may be needed for building productive capacity and acquiring competitive advantage. But there is always the risk of perpetuating infant industries unless subsidies are given with a very clear objective, for example, to be able to export a certain proportion of the product subsidized by a targeted year. Likewise, while consumption subsidies are important for the poor, they are also an inefficient way to reach policy objectives as they may not be well targeted.
7 See IMF (2010).
8 See endnote 1.
9 As highlighted by the IMF (2013:29).
10 In two other landlocked countries, Mongolia and Kazakhstan, taxes on international trade remain relatively important, accounting for between 20% and 40% of indirect taxes. However, these two countries may represent outliers, benefitting from their abundant natural resources.
11 KPMG International (2013a).
12 Karim and Alauddin (2012).
13 India, Ministry of Finance (2012).
14 Shukla and others (2011).
15 Musgrave (1969).
16 Atkinson and Stiglitz (1976) consider the interaction of direct and indirect taxes in the attainment of efficiency and equity goals and show that when individuals differ only in their earning ability, Government can impose a general income tax and where the utility function is separable between labour and all commodities, there is no need to employ indirect taxation in the optimum tax design.
17 As noted in ESCAP (1983:107), “the calculation of such measures can be a useful preliminary exercise in national tax policy self-assessment and can activate policy makers in efforts towards improved resource mobilization performance”.
18 Doraisami (2011).
19 Deloitte (2009).
20 Musgrave and Musgrave (1989).
21 Details of the econometric analysis and method of calculation of the tax gap and the tax potential are provided in annex III.
22 However, in Pakistan small companies may be taxed at 25% subject to specific conditions.
23 Chen, Huang and Regis (2013).
24 See, for example, Myers (2011).
25 Abbas and Klemm (2012).
26 Saavedra (2007).
27 Ivanova, Keen and Klemm (2005).
28 Bird and Zolt (2011).
29 Bernardi, Gandullia and Fumagalli (2005).
30 Faridy and Sarker (2011).
31 Emran and Stiglitz (2005).
32 Bernardi, Gandullia and Fumagalli (2005).
33 Chai and Goyal (2008).
34 Oman (2000) and OECD (2001).
35 Blomström, Kokko and Mucchielli (2003).
36 The term “tax avoidance” refers to transactions that take place by individuals and corporations that fall within the scope of national and international laws, such as by moving revenues to lower-tax jurisdictions to reduce tax liabilities. “Tax evasion” and “tax fraud” refer to transactions that take place to conceal resources and remove them illicitly from any taxation. Examples of tax evasion and tax fraud include, for instance, under- reporting taxable income or transferring it illicitly outside of relevant tax jurisdictions.
37 Kar and Freitas (2012).
38 Kar (2011).
39 Christian Aid (2009).
40 Silvani and others (2008).
41 Economic Commission for Asia and the Far East (1961).
42 United Nations (2011b).
43 United Nations (2003).
119
REFERENCESPART I
Abbas, S.M. Ali, and Alexander Klemm (2012). A partial race to the bottom: corporate tax developments in emerging and developing economies. IMF Working Paper WP/12/28. Washington, D.C. Available from www.imf.org/ external/pubs/ft/wp/2012/wp1228.pdf.
Akerlof, George, and Robert J. Shiller (2009). Animal Spirits: How Human Psychology Drives the Economy, and Why It Matters for Global Capitalism, Princeton University Press.
Andrés, Luis, Dan Biller, and Matías Herrera Dappe (2013). Reducing poverty by closing South Asia’s infrastructure gap. Washington D.C.: World Bank and Australian Aid. Available from www.worldbank.org/content/dam/Worldbank/ document/SAR/Reducing%20Poverty%20by%20Closing%20South%20Asia%27s%20Infrastructure%20Gap_Web. pdf.
Asian Development Bank (2013a). Pacific Economic Monitor, December, Manila. Available from www.adb.org/publications/ pacific-economic-monitor-december-2013.
(2013b). The Social Protection Index: Assessing Results for Asia and the Pacific, Manila. Available from www. adb.org/publications/social-protection-index-assessing-results-asia-and-pacific.
Asian Development Bank Institute (2013). Asian Infrastructure Development: needs and a way forward. Presentation at Business Forum, 8th Transport Ministerial Meeting, Tokyo 4 September 2013. Available from www.apec- tmm8.org/pdf/business_forum/Session1-4.pdf.
Atkinson, Anthony Barnes, and Joseph E. Stiglitz (1976). The design of tax structure: direct versus indirect taxation. Journal of Public Economics, vol. 6, No. 1, pp. 55-75.
AusAID (2012). Social protection and economic growth in Pacific Island countries, Canberra, Commonwealth Government of Australia. Available from http://aid.dfat.gov.au/aidissues/foodsecurity/Documents/economic-growth.pdf.
Basu, Sudip Ranjan, Clovis Freire, Pisit Puapan, Vatcharin Sirimaneetham, and Yusuke Tateno (2013). Euro zone debt crisis: scenario analysis and implications for developing Asia-Pacific. Journal of the Asia Pacific Economy, vol. 18, No. 1 (January), pp. 1-25.
Bernardi, Luigi, Luca Gandullia, and Laura Fumagalli (2005). Tax systems and tax reforms in South and East Asia: overview of tax systems and main policy issues. MPRA Paper No. 1869. Available from http://mpra.ub.uni- muenchen.de/1869.
Bird, Richard M., and Eric M. Zolt (2011). Dual income taxation: a promising path to tax reform for developing countries. World Development, vol. 39, No. 10, pp. 1691-1703.

120
Economic and social survEy of asia and thE pacific 2014
Blomström, Magnus, Ari Kokko, and Jean-Louis Mucchielli (2003). The Economics of Foreign Direct Investment Incentives. Berlin, Heidelberg: Springer.
Bruno, Michael, and William Easterly (1998). Inflation crises and long-run growth. Journal of Monetary Economics, vol. 41, pp. 3-26.
Chai, Jingqing, and Rishi Goyal (2008). Tax concessions and foreign direct investment in the Eastern Caribbean Currency Union. IMF Working Paper. WP/08/257. Washington, D.C.
Chen, Yang, Weihong Huang, and Paulo J. Regis (2013). Do Asia and Pacific countries compete in corporate tax rates? Journal of the Asia Pacific Economy, vol. 19, No. 1, pp. 25-51.
China Health and Retirement Longitudinal Study (2013). Challenges of population aging in China: evidence from the National Baseline Survey of the China Health and Retirement Longitudinal Study (CHARLS), May. Available from http://charls.ccer.edu.cn/uploads/document/ public_documents/application/Challenges-of-Population-Aging-in- China-final0916.pdf.
China’s 12th Five-Year Plan (2011). Available from www.kpmg.com/cn/en/issuesandinsights/articlespublications/ publicationseries/5-years-plan/pages/default.aspx.
Christian Aid (2009). False profits: robbing the poor to keep the rich tax-free. Christian Aid Report, March. London. Available from www.christianaid.org.uk/images/false-profits.pdf.
Cynamon, Barry Z., and Steven M. Fazzari (2013). Inequality and household finance during the consumer age, January. Available from http://pages.wustl.edu/files/pages/imce/fazz/cyn-fazz_consinequ_130113.pdf.
Deloitte (2009). Tax responses to the global economic crisis. Available from www.deloitte.com/view/en_ve/ve/ ade2e23a4b101210VgnVCM100000ba42f00aRCRD.htm.
Development Committee (2006). Fiscal policy for growth and development: an interim report. Joint Ministerial Committee of the World Bank and IMF Board. Washington, D.C. Available from http://siteresources.worldbank.org/ DEVCOMMINT/Documentation/20890698/DC2006-0003(E)-FiscalPolicy.pdf.
Dhakal, Shobhakar (2004). Urban Energy Use and Greenhouse Gas Emissions in Asian Mega-Cities: Policies for a Sustainable Future. Kitakyushu, Japan: Urban Environmental Management Project, Institute for Global Environmental Strategies. Available from http://pub.iges.or.jp/modules/envirolib/upload/181/attach/complete_report.pdf.
Doraisarmi, Anita (2011). The global financial crisis: countercyclical fiscal policy issues and challenges in Malaysia, Indonesia, the Philippines, and Singapore. DBI working paper series No. 288.
Eichengreen, Barry, and Poonam Gupta (2013). Tapering talk: the impact of expectations of reduced federal reserve security purchases on emerging markets. World Bank Policy Research working paper No. 6754. Available from http://emlab.berkeley.edu/~eichengr/tapering_talk_12-16-13.pdf.
Emran, M. Shahe, and Joseph E. Stiglitz (2005). On selective indirect tax reform in developing countries. Journal of Public Economics, vol. 89, No. 4, pp. 599-623.
Faridy, Nahida, and Tapan Sarker (2011). Who really pays value added tax (VAT) in developing countries? Empirical evidence from Bangladesh. Working Paper No. 82. School of Accounting and Commercial Law, Victoria University of Wellington.
Food and Agriculture Organization, International Fund for Agricultural Development, and World Food Programme (2013). The State of Food Insecurity in the World 2013: The Multiple Dimensions of Food Security. Rome: FAO, 2013. Available from www.fao.org/docrep/018/i3434e/i343e.pdf.
121
RefeRences PART I
Fulu, E., Warner, X., Miedema, S., Jewkes, R., Roselli, T., and Lang, J. (2013). Why Do Some Men Use Violence Against Women and How Can We Prevent It? Quantitative Findings from the United Nations Multi-country Study on Men and Violence in Asia and the Pacific. Bangkok: United Nations Development Programme (UNDP), United Nations Population Fund (UNFPA), United Nations Entity for Gender Equality and the Empowerment of Women (UN Women), and United Nations Volunteers (UNV). Available from www.partners4 prevention.org/node/515.
G20 (2014). Communiqué of Meeting of Finance Ministers and Central Bank Governors, Sydney, 22-23 February. Available from www.g20.org/sites/default/files/g20_resources/library/Communique%20Meeting%20of%20G20%20 Finance%20Ministers%20and%20Central%20Bank%20Governors%20Sydney%2022-23%20February%202014_0.pdf.
Haughton, Jonathan (1998). Estimating tax buoyancy, elasticity and stability. United States Agency for International Development, EAGER/PSGE Excise Project.
India, Ministry of Finance (2012). Number of income tax payers in India is 33.73 million. PIB Release/DL/226 (15 May). Available from http://pibmumbai.gov.in/scripts/detail.asp?releaseId=E2012PR3272.
India, Planning Commission (2013). Twelfth Five Year Plan (2012–2017): Faster, More Inclusive and Sustainable Growth. Volume 1. New Delhi: Government of India. Available from http://planningcommission.gov.in/plans/planrel/12thplan/ welcome.html.
International Energy Agency (2013). Southeast Asia Energy Outlook. World Energy Outlook Special Report. Paris. Available from www.iea.org/publications/freepublications/publication/SoutheastAsiaEnergyOutlook_WEO2013SpecialReport.pdf.
International Labour Organization (2010). Gender Mainstreaming in Local Economic Development Strategies: A Guide. Geneva.
(2013). Global Employment Trends 2013: Recovering from a Second Jobs Dip. Geneva. Available from www. ilo.org/wcmsp5/groups/public/---dgreports/---dcomm/---publ/documents/publication/wcms_202326.pdf.
(2014). Global Employment Trends 2014: Risk of a Jobless Recovery? Geneva. Available from www.ilo.org/ wcmsp5/groups/public/---dgreports/---dcomm/---publ/documents/publication/wcms_233953.pdf.
International Monetary Fund (2010). Managing natural resource wealth. Topical Trust Fund. Program document revised (November). Available from www.imf.org/external/np/otm/2010/110110.pdf.
(2012a). Liberalising capital flows and managing outflows. Available from www.imf.org/external/np/pp/eng /2012/031312.pdf.
(2012b). The liberalisation and management of capital flows: an institutional view. Available from www.imf.org/ external/np/pp/eng/2012/111412.pdf.
(2012c). World Economic Outlook 2012: Coping with High Debt and Sluggish Growth. Washington, D.C. Available from www.imf.org/external/pubs/ft/weo/2012/02/pdf/text.pdf.
(2013). Reforming energy subsidies. IMF Policy Advice. Available from www.imf.org/external/np/fad/subsidies/ index.htm.
(2014). World Economic Outlook Update, January. Available from www.imf.org/external/pubs/ft/weo/2014/update/01/ pdf/0114.pdf.
International Monetary Fund, and World Bank (2006). Fiscal policy for growth and development: an interim report. Available from http://siteresources.worldbank.org/DEVCOMMINT/Documentation/20890698/DC2006-0003%28 E%29-FiscalPolicy.pdf.
122
Economic and social survEy of asia and thE pacific 2014
Isakova, Asel, Alexander Plekhanov, and Jeromin Zettelmeyer (2012). Managing Mongolia’s resource boom. Working paper No. 138, European Bank for Reconstruction and Development. Available from http://www.ebrd.com/ downloads/research/economics/workingpapers/wp0138.pdf.
Ivanova, Anna, Michael Keen, and Alexander Klemm (2005). The Russian “flat tax” reform.Economic Policy, vol. 20, No. 43, pp. 397-444.
Kaldor, N. (1963). Will underdeveloped countries learn to tax? Foreign Affairs, vol. 41, pp. 410-419.
Kar, Dev (2011). Illicit financial flows from the least developed countries: 1990-2008. United Nations Development Programme Discussion Paper. Available from http://works.bepress.com/dev_kar/3.
Kar, Dev, and Sarah Freitas (2012). Illicit financial flows from developing countries: 2001-2010. Global Financial Integrity. Available from http://iff.gfintegrity.org/iff2012/2012report.html.
Karim, Syed Md. Aminul, and Md. Alauddin (2012). Emerging tax issues in Asian countries. Presentation given at IMF-JapanHigh-level TaxConference forAsian andPacificCountries, Tokyo, 31 January-3 February. Available from www.imf.org/external/np/seminars/eng/2012/asiatax/pdf/bangladesh.pdf.
Keen, Micheal, and Alejandro Simone (2004). Is tax competition harming developing countries more than developed? Tax Notes International, Special Suppl., No. 28 (June), pp. 1317-1325.
KPMG International (2013a). Asia Pacific Indirect Tax Country Guide 2013. Available from www.kpmg.com/CH/ Documents/pub-20130516-aspac-itc-guide-en.pdf.
(2013b). Tax rates online. Available from www.kpmg.com/Global/en/services/Tax/tax-tools-and-resources/Pages/ tax-rates-online.aspx.
Kumhof, Michael, and Romain Rancière (2011). Unequal = Indebted, Finance & Development, vol. 48, No. 3 (September). Available from www.imf.org/external/pubs/ft/fandd/2011/09/Kumhof.htm.
Levinger, Hannah, and Chen Li (2014). What’s behind recent trends in Asian corporate bond markets? Current Issues: Emerging Markets, 31 January 2014. Deutsche Bank Research. Available from www.dbresearch.com/ PROD/DBR_INTERNET_EN-PROD/PROD0000000000328056/What%E2%80%99s+behind+recent+trends+in+ Asian+corporate+bond+markets%3F.PDF.
Lin,JustinYifu(2011).Fromflyinggeesetoleadingdragons:newopportunitiesandstrategiesforstructuraltransformation in developing countries. World Bank Policy Research working paper No. 5702. Washington, D.C.: World Bank.
Martin, A., and W.A. Lewis (1956). Patterns of public revenue and expenditure. Manchester School of Economic and Social Studies, vol. 24, No. 3 (September), pp. 203-244.
Mckinsey Global Institute (2009). Preparing for China’s urban billion. Available from http://www.mckinsey.com/insights/ urbanization/preparing_for_urban_billion_in_china.
Musgrave, Richard A. (1969). Fiscal Systems. New Haven, CT: Yale University Press.
Musgrave, Richard A., and Peggy B. Musgrave (1989). Public Finance in Theory and Practice.NewYork:McGraw-Hill.
Myers, Jayson (2011). The economic impact of corporate tax rate reductions. Canadian Manufacturers and Exporters. Available from www.wilsoncenter.org/sites/default/files/corporatetaxfinale.pdf.
Oman, Charles P. (2000). Policy Competition and Foreign Direct Investment: A Study of Competition Among Governments to Attract FDI. Paris: Organization for Economic Co-operation and Development. Available from www.oecd-ilibrary.org/development/policy-competition-for-foreign-direct-investment_9789264181083-en.
123
OrganizationforEconomicCo-operationandDevelopment(2001).Corporatetax incentivesfor foreigndirect investment. OECD Tax Policy Studies, No. 4. Paris.
(2012). OECD’s Current Tax Agenda 2012. Paris. Available from www.oecd.org/tax/OECDCurrentTaxAgenda2012.pdf.
Pacific Islands Forum Secretariat (2009). Pacific regional strategy on disability 2010-2015. Forum Disability Ministers’ Meeting, session nine, Rarotonga, Cook Islands, 21-23 October. Available from www.forumsec.org/resources/ uploads/attachments/documents/Pacific%20Regional%20Strategy%20on%20Disability.pdf.
Philippines, National Economic and Development Authority (2011). Philippine Development Plan 2011-2016. Available from www.neda.gov.ph/?p=1128.
Piketty, Thomas (2014). Capital in the Twenty-First Century. Cambridge, Massachusetts: Harvard University Press.
Saavedra, Pablo (2007). Flat income tax reforms. In Fiscal Policy and Economic Growth: Lessons for Eastern Europe and Central Asia. C. Grey, T. Lane, and A. Varoudakis, eds. Washington, D.C.: World Bank. Available fromhttp://siteresources.worldbank.org/INTECA/Resources/257896-1182288383968/FiscalPolicy&EconomicGrowth inECA_FullReport.pdf.
Saez, Emmanuel (2013). Striking it richer: the evolution of top incomes in the United States. University of California, Berkeley. Available from http://eml.berkeley.edu/~saez/saez-UStopincomes-2012.pdf.
Shukla, Gangadha Prasad, and others (2011). Tax reform in Vietnam: toward a more efficient and equitable system. IMF Working Paper 09/30. Washington D.C.: International Monetary Fund.
Silvani, Carlos, and others (2008). Tax administration reform and fiscal adjustment: the case of Indonesia (2001-07). IMF Working Paper 08/129. Washington, D.C.: International Monetary Fund.
Tavola, Helen (2012). Addressing inequality: disability in Pacific island countries. United Nations Economic and Social Commission for Asia and the Pacific, Pacific Office. Available from www.addc.org.au/documents/resources/ addressing-inequality-disability-in-the-pacific-island-countries_931.pdf.
Turner, Philip (2014). The global long-term interest rate, financial risks and policy choices in EMEs. BIS Working Papers No. 441. Basel, Switzerland.
United Nations (2003). Manual for the Negotiation of Bilateral Tax Treaties between Developed and Developing Countries. New York: Department of Economic and Social Affairs. ST/ESA/PAD/SER.E/37. Available from http://unpan1.un.org/intradoc/groups/public/documents/UN/UNPAN008579.pdf.
(2005). World urbanization prospects: the 2005 revision. Department of Economic and Social Affairs, Population Division. Available from www.un.org/esa/population/publications/WUP2005/2005wup.htm.
(2011a). Hot cities: battle-ground for climate change. United Nations Conference on Human Settlements (UN-Habitat). Available from http://mirror.unhabitat.org/downloads/docs/E_Hot_Cities.pdf.
(2011b). United Nations Model Double Taxation Convention between Developed and Developing Countries. New York: Department of Economic and Social Affairs. Available from www.un.org/esa/ffd/documents/UN_Model_2011_ Update.pdf.
(2012). Social protection: a development priority in the post-2015 UN development agenda. UN system task teamonthepost-2015developmentagenda.Availablefromwww.un.org/millenniumgoals/pdf/Think%20Pieces/16_ social_protection.pdf.
United Nations Conference on Trade and Development (2014). Global Investment Monitor, No. 15. (28 January). Available from http://unctad.org/en/PublicationsLibrary/webdiaeia2014d1_en.pdf.
RefeRences PART I
124
Economic and social survEy of asia and thE pacific 2014
United Nations, Economic and Social Commission for Asia and the Pacific (1983). Economic and Social Survey of Asia and the Pacific 1982. Sales No. E.83.II.F.1.
(2010). Economic and Social Survey of Asia and the Pacific 2010. Sales No. E.10.II.F.2.
(2012a). Disability at a Glance 2012: Strengthening the evidence base in Asia and the Pacific. Sales No. E.12.II.F.13.
(2012b). Economic and Social Survey of Asia and the Pacific 2012. Sales No. E.12.II.F.9.
(2013a). Asia-Pacific Trade and Investment Report 2013. Sales No. E.14.II.F.2.
(2013b). Economic and Social Survey of Asia and the Pacific 2013. Sales No. E.13.II.F.2.
(2013c). Economic and Social Survey of Asia and the Pacific 2013: Year-end Update. (ST/ESCAP/2673).
(2014). Sustainable development financing: perspectives from Asia and the Pacific. Paper presented at the Asia-Pacific Outreach Meeting on Sustainable Development Financing. Jakarta, Indonesia, 10-11 June.
United Nations, Economic and Social Commission for Asia and the Pacific, South and South-West Asia Office (2012). Regional Cooperation for Inclusive and Sustainable Development: South and South-West Asia Development Report 2012–13. New Delhi: Routledge, 2012. ST/ESCAP/2644.
United Nations, Economic Commission for Asia and the Far East (1961). Economic Survey of Asia and the Far East 1960. Sales No. E.61.II.F.1.
Wealth-X and UBS (2014). World Ultra Wealth Report 2012–2013. Available from http://wealthx.com/wealthreport/.
World Bank (2007). Cost of Pollution in China: Economic Estimates of Physical Damages. Available from www. worldbank.org/eapenvironment.
(2012a). Diagnostic Assessment of Select Environmental Challenges in India.Availablefromwww-wds.worldbank. org/external/default/WDSContentServer/WDSP/IB/2013/07/16/000442464_20130716091943/Rendered/PDF/70004 0v10ESW0P0box0374379B00PUBLIC0.pdf.
(2012b). Land and food security. Available from go.worldbank.org/S0D96SZZT0.
(2013a). Infographic: building low-carbon cities. Available from www.worldbank.org/en/news/feature/2013/10/24/ infographic-creditworthy-cities.
(2013b). Mongolia Economic Update, November. Available from http://www-wds.worldbank.org/external/default/ WDSContentServer/WDSP/IB/2013/11/07/000442464_20131107125022/Rendered/PDF/826050WP0Mongo00Box3 79865B00PUBLIC0.pdf.
(2014). ASPIRE database: the atlas of social protection - indicators of resilience and equity. Available from datatopics.worldbank.org/aspire/.
World Trade Organization (2014). Regional trade agreements. Available from www.wto.org/english/tratop_e/region_e/ region_e.htm.
World Trade Organization, International Trade Centre, and United Nations Conference on Trade and Development (2013). World Tariff Profiles 2013. Geneva: World Trade Organization. Available from www.wto.org/english/res_ e/reser_e/tariff_profiles_e.htm.
Xinhua (2013). China proposes establishing Asian infrastructure investment bank, 2 October 2013. Available from http://news.xinhuanet.com/english/china/2013-10/02/c_132769208.htm.
125
PART IIREGIONAL CONNECTIVITYFOR SHARED PROSPERITY
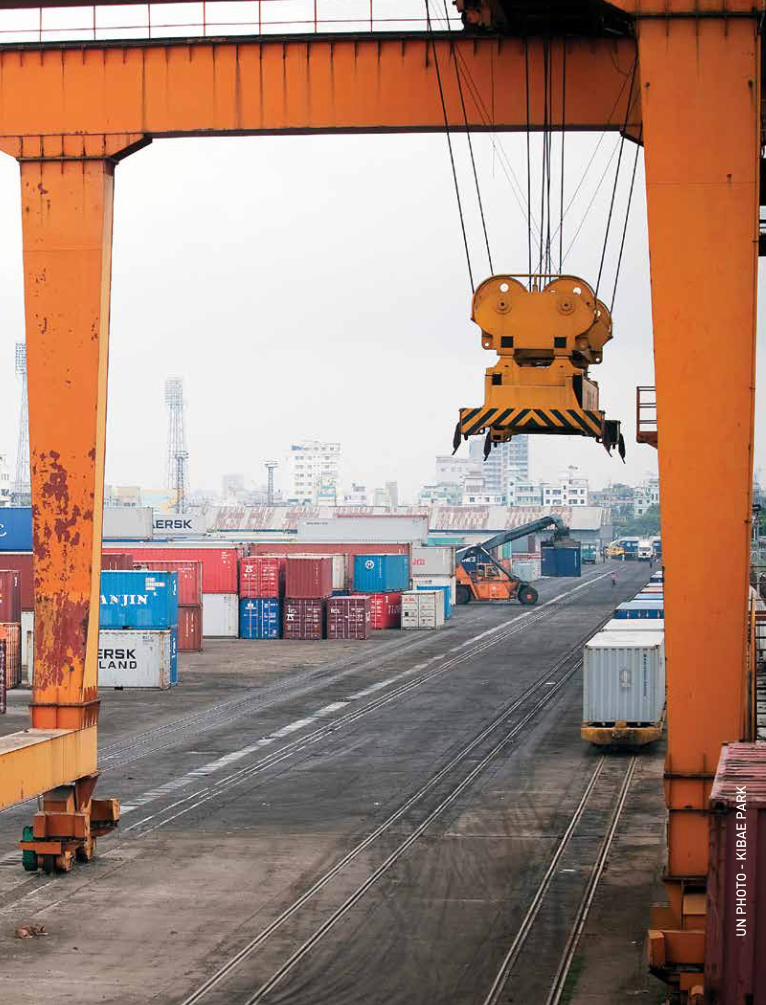
126
UN
PH
OTO
- K
IBA
E P
AR
K
127
REGIONAL CONNECTIVITY FOR SHARED PROSPERITY 4
he Asia and the Pacific region has grown rapidly, with the intensification of its networks of trade, production and people.However, these networks are denser and more productive in someparts of the region than in others. Over the coming decades,countries across Asia and the Pacific will be looking for ways toexpandconnectivityandtoensurethattheregion’sgrowingprosperityis more widely shared.
T
UN
PH
OTO
- K
IBA
E P
AR
K
128
Economic and social survEy of asia and thE pacific 2014
INTRODUCTION
Asia and the Pacific is the world’s most dynamicregion. Over the past 50 years it has experiencedunprecedented economic growth, much of whichhas been export driven, initially among the newlyindustrialized economies, but more recently also inChina and in India. This growth, along with betterstandards of education and health, has contributedtodramaticfallsinpoverty.Theregion’sachievementin poverty reduction has been remarkable: despitean overall population increase of about 900 millionpeople, the population living below $1.25 per daydropped from about 1.6 billion in 1990 to under750 million in 2011.1
However,asnotedbytheAsianDevelopmentBank, ESCAPandtheUnitedNationsDevelopmentProgramme in the publication entitled Asia-Pacific Aspirations: Perspectives for a Post-2015 Development Agenda, the region still has unacceptable levels of poverty.2 According to this report, almost two thirds of theworld’s poor, as measured by the $1.25 povertyline, live in this region. Indeed, reflecting the largepopulationsofChina, India, IndonesiaandPakistan,therearecurrentlymorepoorpeoplelivinginmiddle-incomecountriesthaninlow-incomecountries.Thereare also large numbers of people living just abovethe extreme poverty line, or in “near poverty”: if$2 per day is used as a benchmark, the numberof poor people doubles from 743 million to 1.64billion. In other words, about 40% of the region’spopulation subsists on less than $2 a day.3
Furthermore,theregion’sgrowingprosperityhasnotbeen shared equally, and there are clear signs ofrising inequality, bothwithin and between countries.As discussed in part I of theEconomic and Social Survey of Asia and the Pacific 2014, inequality hasdeclinedinsomecountriessincetheearly1990s,buthas increased in some larger economies, includingChina, India and Indonesia. Just as significant istheextent of inequality between countries.A recentstudy concluded that, in Asia, “the gap betweenadvanced economies and the least developed isthe largest of any region of the world”.4
Connecting countries creates new opportunities for development
One of the most important contributors to theregion’s economic growth has been infrastructuredevelopment – particularly in the transport, energyand telecommunications sectors.5 At the national level, public investment has been shown to have adirect impact on GDP growth, with some analysessuggesting that, on average, a 1% increase in thestock of infrastructure lifts GDP by 0.08%.6 These criticalinfrastructurenetworkshavestimulatedgrowthby providing domestic enterprises with access toa greater pool of resources and markets, therebyenabling them to scale up their production andreach a broader consumer base. Recent researchalso shows that improved telecommunications haveenhanced the access of rural communities toinformation and financial services.7
At the regional level, progress has been madein forging linkages between countries through thedevelopment of regional infrastructure networks,therebyopeningupbothphysicalandvirtualaccesstoregionalandglobalmarkets.Today,mostcountriesincontinentalAsiaareconnected through theAsianHighway and Trans-Asian Railway networks, whilecoastalcountriesandsmall islanddevelopingStatesare linked through maritime services. Moreover, inmost of the region’s capitals and major cities, itis now possible to connect to broadband Internet.
These linkages have driven the region’s economicsuccess by facilitating international trade, foreigndirect investment (FDI) flows,and theestablishmentofglobalandregionalproductionnetworksandglobalvaluechains.Thesenewsystemsformanufacturing,distribution and consumption have helped manycountries in the region to diversify their economies,reducing their dependence on traditional sectors,such as agriculture and natural resource extraction,andcreatingnewjobs,particularlyinlabour-intensivesectors, such as garments and electronics.
Emerging economies in particular have benefitedfrom regional andglobal value chains. InChina, for
129
REGIONAL CONNECTIVITY FOR SHARED PROSPERITY CHAPTER 4
example,theincomederivedfromtradeflowswithinglobalvaluechains,measuredas“exportofdomesticvalue added,” increased six-fold between 1995 and2009, and the number of jobs generated by exportof value added increased from 89 million in 1995to 146 million in 2008.8 However, not all countriesin the ESCAP region have been as successfulin terms of expanding trade and attracting moreinvestment to their economies.
It is therefore timely that the Commission selectedthe theme of “Regional connectivity for sharedprosperity” for its seventieth session, held in 2014.Ononehand, it isevidentthatcountriesandpeoplein theESCAPregionarebecomingmoreandmoreconnected in a variety of ways. On the other, it isless evident how this increasing connectivity has shaped the region’s recent development, and whatkindsofconnectivitywillbeneededtohelptoreducepovertyandtoachievemorebalancedandinclusivegrowthacross the region.Thisyear’sThemeStudy,whichconstitutespart IIof theEconomic and Social Survey of Asia and the Pacific 2014, explores these questions and presents a set of regional strategiesfor strengthening regional connectivity in Asia and the Pacific.
Understanding “regional connectivity”
In recent years, the concept of “connectivity”has broadened and entered into mainstreamdevelopment discourse. A good example is theMaster Plan on ASEAN Connectivity, which wasone of the first comprehensive strategic policyframeworks to explicitly address the issue ofconnectivity in various sectors. ESCAP has alsopromoted connectivity as a necessary and integralaspect of regional integration and has identified anumber of key regional networks at the core ofregional connectivity, namely trade and transport,information and communications technology (ICT),energyinfrastructureandpeople-to-peoplenetworks.9 These regional networks reinforce each other and as such their simultaneous development is criticalin achieving effective regional connectivity and in maximizing its benefits.
It is becoming evident that regional connectivitywilloffer best results if it enhances the effectiveness ofregionalnetworkstofacilitateflowsofgoods,services,people and knowledge. It is therefore necessaryto look beyond traditional analyses of connectivity,which were focused on the physical dimensions ofnetworks, to consider also their qualitative aspects.Given that the effectiveness of each network isincreasingly dependent on the connectivity of other networks, themultisectoralnatureof thesenetworksalso needs to be considered.
The present chapter begins with a discussion ofrecent drivers of economic growth in the ESCAPregion. It traces the evolution of international tradeand FDI and the role of trade and transportconnectivityinsupportingtheseflows.Itthencontainsa discussion of future drivers of growth that havethe potential to transform the spatial pattern of theregion’s economic and social development, and thetypes of connectivity that will be needed in orderto benefit from these drivers.
THE ROLE OF REGIONAL CONNECTIVITY IN SUPPORTING GROWTH AND DEVELOPMENT
Various factors have shaped the pace and patternof the region’s economic and social development.Some are related to geography – in terms oflocation and topography, as well as natural factorendowmentsandpopulationdensities.Other factorsare related to domestic government policies or theoccurrence of wars or natural disasters. However,numerous studies suggest that the main driversbehind the region’s economic success have beeninternational trade, FDI and the establishment ofglobal and regional production networks and globalvalue chains.10
Regional integration efforts drive initial trade growth
Trade in the ESCAP region has expanded as a result of a combination of converging and mutually
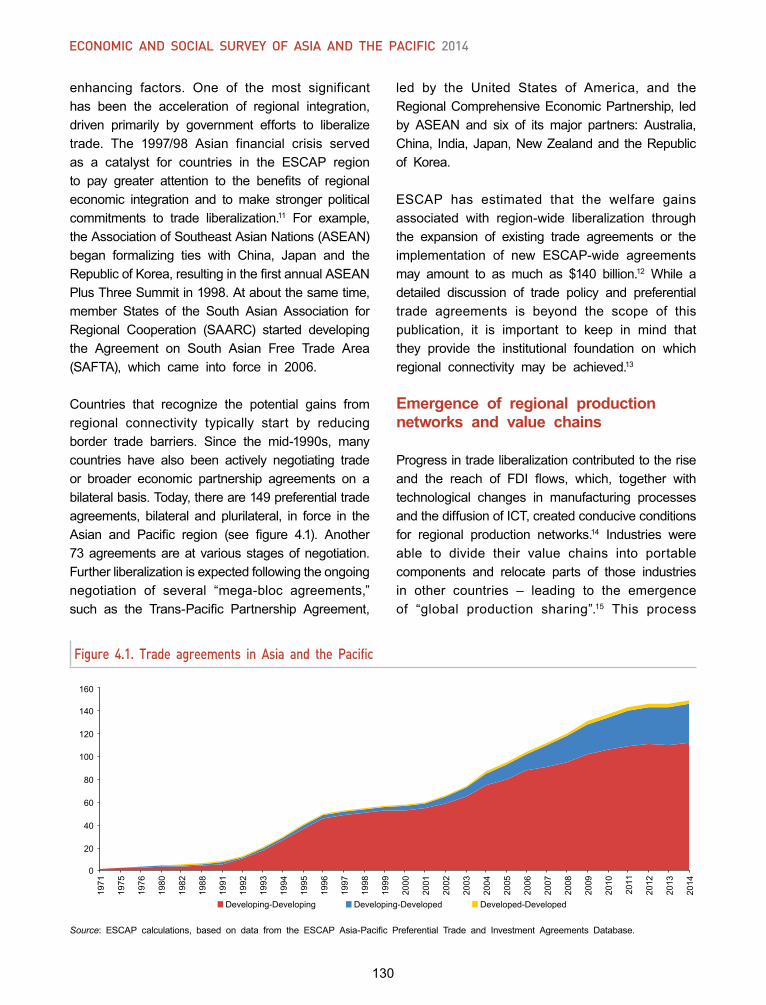
130
Economic and social survEy of asia and thE pacific 2014
enhancing factors. One of the most significanthas been the acceleration of regional integration,driven primarily by government efforts to liberalizetrade. The 1997/98 Asian financial crisis servedas a catalyst for countries in the ESCAP regionto pay greater attention to the benefits of regionaleconomic integration and to make stronger politicalcommitments to trade liberalization.11 For example,theAssociationofSoutheastAsianNations(ASEAN)began formalizing ties with China, Japan and theRepublicofKorea,resultinginthefirstannualASEANPlusThreeSummitin1998.Ataboutthesametime,member States of the South Asian Association forRegional Cooperation (SAARC) started developingthe Agreement on South Asian Free Trade Area(SAFTA), which came into force in 2006.
Countries that recognize the potential gains fromregional connectivity typically start by reducingborder trade barriers. Since the mid-1990s, manycountries have also been actively negotiating tradeor broader economic partnership agreements on abilateralbasis.Today,thereare149preferentialtradeagreements, bilateral and plurilateral, in force in theAsian and Pacific region (see figure 4.1). Another73agreementsareat variousstagesofnegotiation.Furtherliberalizationisexpectedfollowingtheongoingnegotiation of several “mega-bloc agreements,”such as the Trans-Pacific Partnership Agreement,
led by the United States of America, and theRegionalComprehensiveEconomicPartnership, ledby ASEAN and six of its major partners: Australia,China, India,Japan,NewZealandand theRepublicof Korea.
ESCAP has estimated that the welfare gainsassociated with region-wide liberalization throughthe expansion of existing trade agreements or theimplementation of new ESCAP-wide agreementsmay amount to as much as $140 billion.12 While a detailed discussion of trade policy and preferentialtrade agreements is beyond the scope of thispublication, it is important to keep in mind thatthey provide the institutional foundation on whichregional connectivity may be achieved.13
Emergence of regional production networks and value chains
Progressintradeliberalizationcontributedtotheriseand the reach of FDI flows, which, together withtechnological changes in manufacturing processesandthediffusionofICT,createdconduciveconditionsfor regional production networks.14 Industries wereable to divide their value chains into portablecomponents and relocate parts of those industriesin other countries – leading to the emergenceof “global production sharing”.15 This process
Figure 4.1. Trade agreements in Asia and the Pacific
Source: ESCAP calculations, based on data from the ESCAP Asia-Pacific Preferential Trade and Investment Agreements Database.
0
20
40
60
80
100
120
140
160
1971
1975
1976
1980
1982
1988
1991
1992
1993
1994
1995
1996
1997
1998
1999
2000
2001
2002
2003
2004
2005
2006
2007
2008
2009
2010
2011
2012
2013
2014
Developing-Developing Developing-Developed Developed-Developed
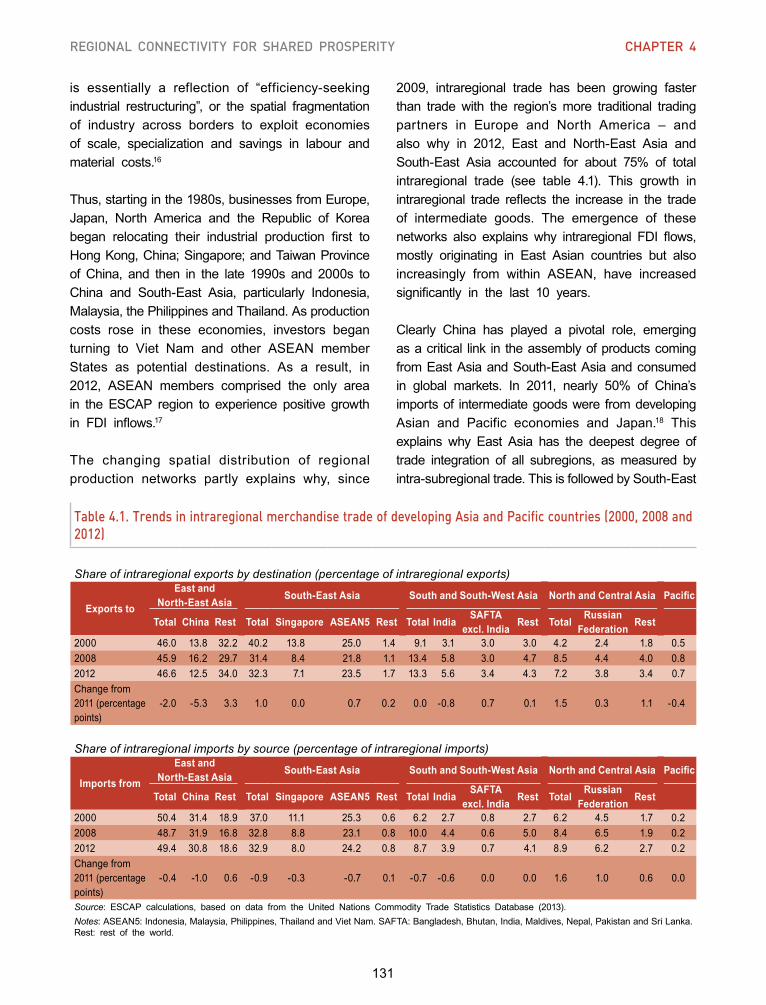
131
REGIONAL CONNECTIVITY FOR SHARED PROSPERITY CHAPTER 4
is essentially a reflection of “efficiency-seekingindustrial restructuring”, or the spatial fragmentationof industry across borders to exploit economiesof scale, specialization and savings in labour andmaterial costs.16
Thus,startinginthe1980s,businessesfromEurope,Japan, North America and the Republic of Koreabegan relocating their industrial production first toHongKong,China;Singapore;andTaiwanProvinceof China, and then in the late 1990s and 2000s toChina and South-East Asia, particularly Indonesia,Malaysia,thePhilippinesandThailand.Asproductioncosts rose in these economies, investors beganturning to Viet Nam and other ASEAN memberStates as potential destinations. As a result, in2012, ASEAN members comprised the only areain the ESCAP region to experience positive growth in FDI inflows.17
The changing spatial distribution of regionalproduction networks partly explains why, since
Table 4.1. Trends in intraregional merchandise trade of developing Asia and Pacific countries (2000, 2008 and 2012)
Share of intraregional exports by destination (percentage of intraregional exports)
Exports to
East and North-East Asia South-East Asia South and South-West Asia North and Central Asia Pacific
Total China Rest Total Singapore ASEAN5 Rest Total India SAFTA excl. India Rest Total Russian
Federation Rest
2000 46.0 13.8 32.2 40.2 13.8 25.0 1.4 9.1 3.1 3.0 3.0 4.2 2.4 1.8 0.52008 45.9 16.2 29.7 31.4 8.4 21.8 1.1 13.4 5.8 3.0 4.7 8.5 4.4 4.0 0.82012 46.6 12.5 34.0 32.3 7.1 23.5 1.7 13.3 5.6 3.4 4.3 7.2 3.8 3.4 0.7Changefrom2011(percentagepoints)
-2.0 -5.3 3.3 1.0 0.0 0.7 0.2 0.0 -0.8 0.7 0.1 1.5 0.3 1.1 -0.4
Share of intraregional imports by source (percentage of intraregional imports)
Imports from
East and North-East Asia South-East Asia South and South-West Asia North and Central Asia Pacific
Total China Rest Total Singapore ASEAN5 Rest Total India SAFTA excl. India Rest Total Russian
Federation Rest
2000 50.4 31.4 18.9 37.0 11.1 25.3 0.6 6.2 2.7 0.8 2.7 6.2 4.5 1.7 0.22008 48.7 31.9 16.8 32.8 8.8 23.1 0.8 10.0 4.4 0.6 5.0 8.4 6.5 1.9 0.22012 49.4 30.8 18.6 32.9 8.0 24.2 0.8 8.7 3.9 0.7 4.1 8.9 6.2 2.7 0.2Changefrom2011(percentage points)
-0.4 -1.0 0.6 -0.9 -0.3 -0.7 0.1 -0.7 -0.6 0.0 0.0 1.6 1.0 0.6 0.0
Source: ESCAP calculations, based on data from the United Nations Commodity Trade Statistics Database (2013).Notes:ASEAN5:Indonesia,Malaysia,Philippines,ThailandandVietNam.SAFTA:Bangladesh,Bhutan,India,Maldives,Nepal,PakistanandSriLanka. Rest: rest of the world.
2009, intraregional trade has been growing fasterthan trade with the region’smore traditional tradingpartners in Europe and North America – andalso why in 2012, East and North-East Asia andSouth-East Asia accounted for about 75% of totalintraregional trade (see table 4.1). This growth inintraregional trade reflects the increase in the tradeof intermediate goods. The emergence of thesenetworks also explains why intraregional FDI flows,mostly originating in East Asian countries but alsoincreasingly from within ASEAN, have increasedsignificantly in the last 10 years.
Clearly China has played a pivotal role, emergingasacritical link in theassemblyofproductscomingfromEastAsiaandSouth-EastAsiaandconsumedin global markets. In 2011, nearly 50% of China’simportsof intermediategoodswere fromdevelopingAsian and Pacific economies and Japan.18 This explains why East Asia has the deepest degree of trade integration of all subregions, asmeasured byintra-subregionaltrade.ThisisfollowedbySouth-East

132
Economic and social survEy of asia and thE pacific 2014
Asia,wherecountriessuchasMalaysiaandThailandhave become important players in electronics andautomobile production networks.
Explaining differences in subregional performance
Incontrast,othersubregionshaveparticipatedmuchless in intraregional trade and investment. As table4.1 shows, in 2012, South and South-West Asiaaccounted for only 13% of exports and 8.7% ofimports, while North and Central Asia had evensmaller shares at 7.2% and 8.9% of exports andimports, respectively. Intraregional FDI followedsimilar patterns. Meanwhile, intra-subregional tradeandinvestmentflowsinthesesubregionshavebeendominated by two large countries, namely Indiain South and South-West Asia, and the RussianFederation in North and Central Asia.
AlmostallcountriesintheESCAPregionhavetakensignificantmeasures to liberalize theirmarkets. Thedifferences in subregional trade performance aretherefore only partly explained by preferential and
regional trade and investment agreements. Otherfactors,particularlytradecosts,significantlyinfluencebusiness decisions on where to invest and trade.This result is confirmed by theESCAP-World BankTradeCostDatabase(seetable4.2).19Thisdatabaseprovidesacomprehensiveaggregatemeasureofallcosts involved in trading goods internationally with another partner (that is, bilaterally) relative to thoseinvolved in trading goods domestically. It thereforecaptures not only international transport costs andtariffs but alsoother trade costs, suchas thedirectand indirect costs associated with cumbersomeimport or export procedures and inefficient logisticsor payment services, as well as differences incurrencies and languages.
According to the above-mentioned ESCAP-WorldBankdatabase,comprehensivetradecostsbetweenSouth Asian economies (SAARC-4: Bangladesh,India, Pakistan and Sri Lanka) and South-EastAsian economies (ASEAN-4: Indonesia, Malaysia,Philippines and Thailand) are higher than thosebetweeneithersubregionandtheEuropeanUnionortheUnitedStates.Meanwhile,thedataalsosuggest
Table 4.2. Intraregional and extraregional comprehensive trade costs (excluding tariff costs) in the Asian and Pacific region, 2006-2011
Region ASEAN-4
East Asia-3
North and Central Asia
Pacific Islands Developing Economies
SAARC-4
Australia-NewZealand EU-3
ASEAN-4 77(10)
EastAsia-3 77(8)
52(-8)
North and Central Asia 387(6)
220(-11)
141(0)
PacificIslandsDevelopingEconomies
263(31)
268(36)
308(17)
107(-31)
SAARC-4 124(2)
124(2)
270(-10)
342(13)
107(4)
AustraliaandNewZealand
99(2)
91(-2)
323(-5)
137(48)
144(5)
54(4)
EU-3 111(8)
86(-4)
166(-3)
327(38)
114(7)
110(1)
46(0)
USA 84(13)
63(-1)
189(2)
228(19)
107(8)
97(2)
67(1)
Source:ESCAP-WorldBank(2014).Notes:Tradecostsmaybeinterpretedastariffequivalents.Percentagechangesintradecostsbetween2000-2005and2006-2011areinparentheses.ASEAN-4: Indonesia, Malaysia, Philippines and Thailand. East Asia-3: China, Japan and Republic of Korea. EU-3: France, Germany and UnitedKingdom of Great Britain and Northern Ireland. SAARC-4: Bangladesh, India, Pakistan and Sri Lanka. Pacific island developing economies: Fiji,Papua New Guinea, Tonga and Vanuatu. North and Central Asia: Armenia, Azerbaijan, Georgia, Kazakhstan, Kyrgyzstan and Russian Federation.
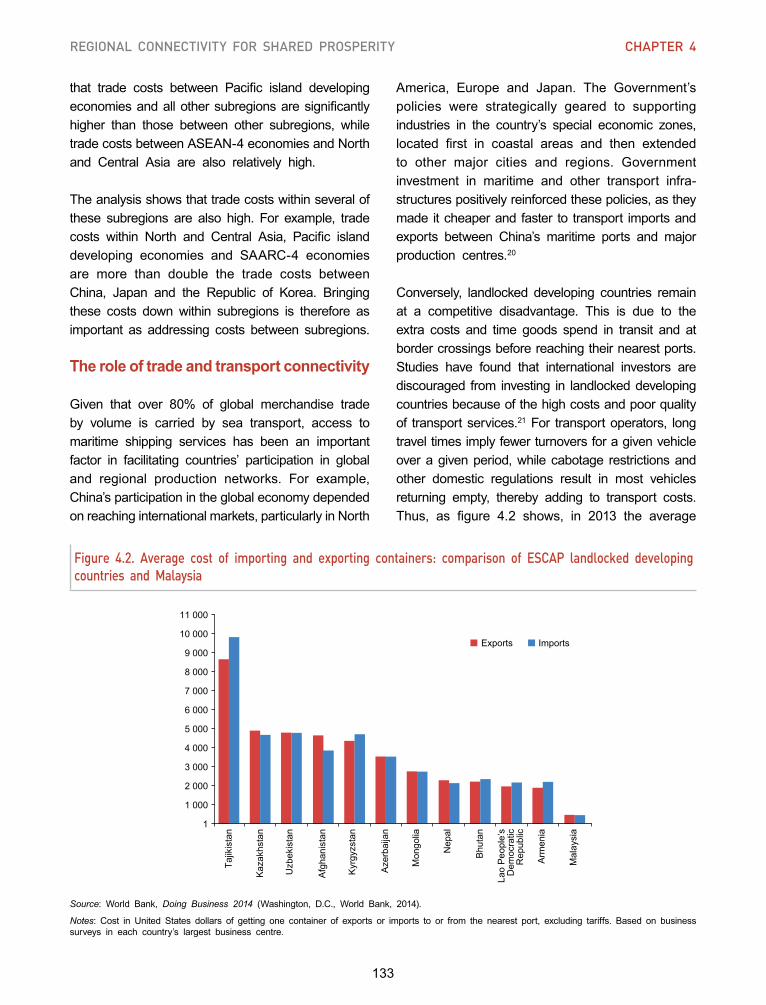
133
REGIONAL CONNECTIVITY FOR SHARED PROSPERITY CHAPTER 4
that trade costs between Pacific island developingeconomiesandallothersubregionsaresignificantlyhigher than those between other subregions, whiletradecostsbetweenASEAN-4economiesandNorthand Central Asia are also relatively high.
The analysis shows that trade costs within several of these subregions are also high. For example, tradecosts within North and Central Asia, Pacific islanddeveloping economies and SAARC-4 economiesare more than double the trade costs betweenChina, Japan and the Republic of Korea. Bringingthese costs down within subregions is therefore asimportant as addressing costs between subregions.
The role of trade and transport connectivity
Given that over 80% of global merchandise tradeby volume is carried by sea transport, access tomaritime shipping services has been an importantfactor in facilitating countries’ participation in globaland regional production networks. For example,China’sparticipationintheglobaleconomydependedonreachinginternationalmarkets,particularlyinNorth
America, Europe and Japan. The Government’spolicies were strategically geared to supportingindustries in the country’s special economic zones,located first in coastal areas and then extendedto other major cities and regions. Governmentinvestment in maritime and other transport infra- structurespositivelyreinforcedthesepolicies,astheymade itcheaperand faster to transport importsandexports between China’s maritime ports and majorproduction centres.20
Conversely, landlocked developing countries remainat a competitive disadvantage. This is due to theextra costs and time goods spend in transit and atbordercrossingsbeforereachingtheirnearestports.Studies have found that international investors arediscouraged from investing in landlockeddevelopingcountriesbecauseofthehighcostsandpoorqualityof transportservices.21 For transport operators, long traveltimesimplyfewerturnoversforagivenvehicleoveragivenperiod,whilecabotage restrictionsandother domestic regulations result in most vehiclesreturning empty, thereby adding to transport costs.Thus, as figure 4.2 shows, in 2013 the average
Figure 4.2. Average cost of importing and exporting containers: comparison of ESCAP landlocked developing countries and Malaysia
Source: World Bank, Doing Business 2014 (Washington, D.C., World Bank, 2014).
Notes: Cost in United States dollars of getting one container of exports or imports to or from the nearest port, excluding tariffs. Based on businesssurveys in each country’s largest business centre.
1
1 000
2 000
3 000
4 000
5 000
6 000
7 000
8 000
9 000
10 000
11 000
Exports Imports
Arm
enia
Mal
aysi
a
Bhu
tan
Nep
al
Mon
golia
Aze
rbai
jan
Afg
hani
stan
Kyr
gyzs
tan
Uzb
ekis
tan
Kaz
akhs
tan
Tajik
ista
n
Lao
Peo
ple’
sD
emoc
ratic
Rep
ublic
134
Economic and social survEy of asia and thE pacific 2014
cost of exporting goods from a landlocked countryin the regionwas8.5 timeshigher than itwas fromMalaysia, a country with one of the lowest tradecosts, while the average cost of importation was9.2 times higher.22
Meanwhile, numerous studies have also identifiedthe poor quality of transport infrastructure as amajorbarrier to trade in the region.23 InSouthAsia,for example, the poor quality of roads, as well asmissing sections and limited capacity near bordercrossings, reduces the connectivity of countries.24 Thus, the quality of infrastructure, as well asavailability, has been an important determinant oftrade and transport connectivity.
Economies of scale in transport, competition and non-physical barriers to trade25
The export-oriented growth of East and South-East Asian economies coincided with the rise ofcontainerizedtransport.Containersrevolutionizedtheway goodswere packed and shipped. Not only didthey reduce the costs of transporting goods and
make it economically viable to spread productionand assembly activities across borders, they alsoenableddifferentmodesoftransporttobeintegratedinto seamless systems by simplifying the transferof freight between modes (see box 4.1).
Containerization also allowed the volume of freightto be expanded. The competitiveness of maritimetransport is based on the principle of economiesof scale: ships can carry more volume than othertransportmodesatlowercostsperunit.Ascontainerships grew in size, the average price of containertransport fell, offsetting the increase in fuel prices.26 The principle of economies of scale also partlyexplains the configuration of shipping liner services,whicharetypicallybasedonhub-and-spokesystems:feeder ships from small ports carry goods to largerhub ports for consolidation, before large liner shipscarry the freight to major consumption centres.
Thus, by investing in the development of containerportsandshippingfacilities,economies inEastAsiaandSouth-EastAsiawereabletotakeadvantageofcheaperandmoreefficientmodesoftransport.Thisis reflected in the remarkable growth of container
Box 4.1. Containerization and the growth of international trade
The history of containerization holds several important lessons for the region’s connectivity agenda. Improved interoperability between transport modes transformed the economic geography of manufacturing, as low shipping costs made it economically feasible to manufacture many more goods in one country and consume them in another. Combined with ICT connectivity, this also led to the evolution of just-in-time manufacturing processes, with further savings in logistics costs.
The impact of containers was rooted in the fundamental principle of standardization. As early as 1961, the International Organization for Standardization set standard sizes for all containers, which enabled the shipping industry to develop and invest in new types of ships, containers and port facilities, and to expand into such new businesses as logistics. A recent study which looked at the effects of containerization on international trade found that containerization accounted for a 790% rise in bilateral trade between 22 industrialized countries over a period of 20 years, leading The Economist magazine to conclude that “the container has been more of a driver of globalization than all trade agreements in the past 50 years taken together.”
Thus, containers had far-reaching impacts on the evolution of international trade, manufacturing and logistics practices, demonstrating that relatively simple innovations can make a great difference to connectivity if all the relevant stakeholders agree to adopt them.
Source: “The humble hero,” Economist (May 2013).
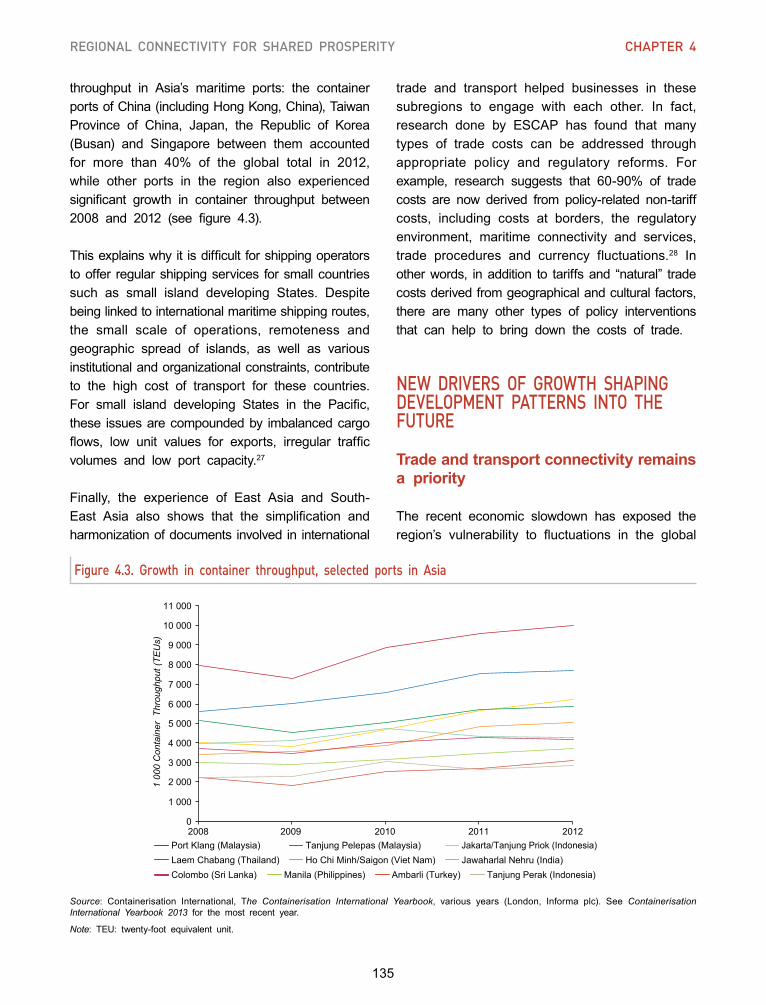
135
REGIONAL CONNECTIVITY FOR SHARED PROSPERITY CHAPTER 4
throughput in Asia’s maritime ports: the containerportsofChina(includingHongKong,China),TaiwanProvince of China, Japan, the Republic of Korea(Busan) and Singapore between them accountedfor more than 40% of the global total in 2012,while other ports in the region also experienced significant growth in container throughput between2008 and 2012 (see figure 4.3).
Thisexplainswhyit isdifficult forshippingoperatorstooffer regularshippingservices forsmallcountriessuch as small island developing States. Despitebeinglinkedtointernationalmaritimeshippingroutes,the small scale of operations, remoteness andgeographic spread of islands, as well as variousinstitutionalandorganizationalconstraints,contributeto the high cost of transport for these countries.For small island developing States in the Pacific,these issuesarecompoundedby imbalancedcargoflows, low unit values for exports, irregular trafficvolumes and low port capacity.27
Finally, the experience of East Asia and South-East Asia also shows that the simplification andharmonizationofdocuments involved in international
Figure 4.3. Growth in container throughput, selected ports in Asia
Chi
na
Hon
g K
ong,
Chi
na
Japa
n
Mac
ao,
Chi
na
Mon
golia
Rep
ublic
of
Kor
ea
-2
0
2
4
6
8
10
12
Per
cent
age
2009 2010 2011 2009 2010 2011
0
1 000
2 000
3 000
4 000
5 000
6 000
7 000
8 000
9 000
10 000
11 000
2008 2009 2010 2011 2012
1 00
0 C
onta
iner
Thr
ough
put (
TEU
s)
Port Klang (Malaysia) Tanjung Pelepas (Malaysia) Jakarta/Tanjung Priok (Indonesia) Laem Chabang (Thailand) Ho Chi Minh/Saigon (Viet Nam) Jawaharlal Nehru (India) Colombo (Sri Lanka) Manila (Philippines) Ambarli (Turkey) Tanjung Perak (Indonesia)
India Indonesia Malaysia Philippines Russian Federation Thailand Turkey
Source: Containerisation International, The Containerisation International Yearbook, various years (London, Informa plc). See Containerisation International Yearbook 2013 for the most recent year.
Note: TEU: twenty-foot equivalent unit.
trade and transport helped businesses in thesesubregions to engage with each other. In fact,research done by ESCAP has found that manytypes of trade costs can be addressed throughappropriate policy and regulatory reforms. Forexample, research suggests that 60-90% of tradecosts are now derived from policy-related non-tariffcosts, including costs at borders, the regulatoryenvironment, maritime connectivity and services,trade procedures and currency fluctuations.28 In otherwords, inaddition to tariffsand “natural” tradecostsderivedfromgeographicalandculturalfactors,there are many other types of policy interventionsthat can help to bring down the costs of trade.
NEW DRIVERS OF GROWTH SHAPING DEVELOPMENT PATTERNS INTO THE FUTURE
Trade and transport connectivity remains a priority
The recent economic slowdown has exposed theregion’s vulnerability to fluctuations in the global
136
Economic and social survEy of asia and thE pacific 2014
economy, in particular to spending and investmentpolicies of the United States and of Europeancountries.29 Thus, attention is shifting to thedevelopment of domestic and regional markets asa means of stimulating growth and raising livingstandards, while creating new trade opportunitiesfor the region’s poorer and smaller countries.
Nevertheless, the spreading of growth opportunitiesfrom the region’s more dynamic middle-incomecountries to their smaller and poorer neighbourscannot be taken for granted. Despite significantinvestment in transport infrastructure at the nationallevel, cross-border and regional land-transportinfrastructure networks remain underutilized forinternationaltrade.Inmanycountries,thepoorqualityofinfrastructure,lackofmaintenanceandunregulateduse of roads by heavy vehicles also add to costsand reduce the efficiency of these networks.
Atthesametime,thankstotechnologicaladvances,trade and investment are now determined less bygeographical distance and more by other factors,such as competitiveness, timeliness and security.Thishasledtoagrowinginterest in improving“soft”infrastructure underpinning trade and transport, aswellasothermeansofreducinglogisticscosts.BothASEANandtheAsia-PacificEconomicCooperation,forexample, focusontradeandtransport facilitationas part of their “institutional connectivity” agendas,while theNinthWorldTradeOrganizationMinisterialConference, held in Bali, Indonesia, from 3 to 6December 2013, attempted to address the issuethrough its Agreement on Trade Facilitation.30
Thus, one of the region’s main priorities should beto enhance trade and transport connectivity. Forthis purpose, countries can capitalize on varioustechnological advances. At the same time, tradeand transport connectivity can be pursued onlyin conjunction with efforts to enhance other typesof regional connectivity. As the region attempts toconsolidate its position in the global economy, aswell as to lessen the development gaps betweencountries, Governments need to consider ways toharness new drivers of growth.
ICT connectivity as an enabler and driver of growth
Continuous advances in ICT, in the form of mobiletelecommunicationsandtheInternet,areacceleratingregionaleconomicintegrationinAsiaandthePacific.ICT is both a new engine of economic growth inits own right and a valuable source of innovationacross all economic sectors. Access to the Internetis transforming the conduct of business and thedelivery of social services. Instant communicationsare becoming increasingly important in determiningtheefficiencyoftradeandservices,includingfinancialservices,informationanddatamanagementservices,and transport and logistics services.
New forms of ICT connectivity are opening doors to knowledge generation
and sharing
Meanwhile, the foremost tool for people-to-peopleconnectivityacrosscities,countriesandregionsistheInternet.New forms of ICT connectivity are openingdoorstoknowledgegenerationandsharing:distancelearning and broadband-enabled classrooms areincreasing educational opportunities, bringing digitaltextbooksandteachers toremotecitiesandvillages.Nowhere has this been more evident than in thePacific,where islandersnowhavenewopportunitiesto participate in tertiary education through distancelearning courses (see box 5.8 in the next chapter).Through the Internet, knowledge networks andcommunities of practice are emerging in every field,ranging fromscientific researchplatforms todisastermanagement networks to cultural interest groups.
However, Asia and the Pacific remains the mostdigitally divided region in the world. The high costof internationalbandwidthhasmadeInternetaccessunaffordable formuch of the region. It is estimatedthat roughly 30% of people in Asia and the Pacificuse the Internet, while only 7.4% are believedto have access to high-speed fixed broadband.31 Paradoxically, low levels of international bandwidthcorrelate with the high prices of basic monthly
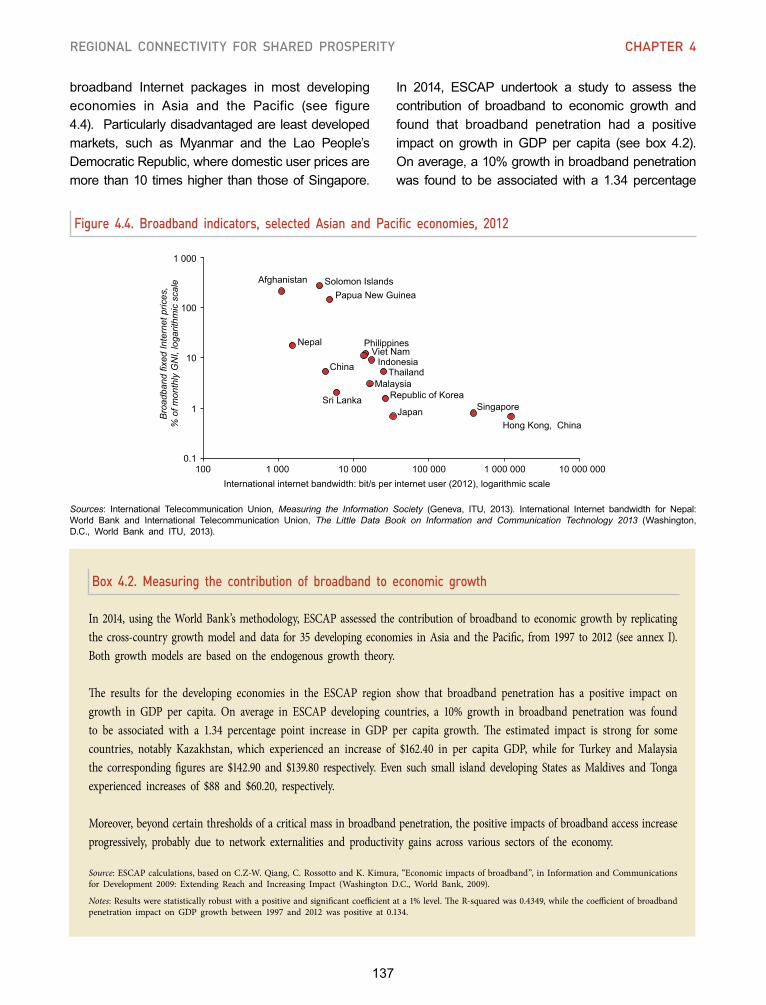
137
REGIONAL CONNECTIVITY FOR SHARED PROSPERITY CHAPTER 4
broadband Internet packages in most developingeconomies in Asia and the Pacific (see figure4.4).Particularlydisadvantagedareleastdevelopedmarkets, such as Myanmar and the Lao People’sDemocraticRepublic,wheredomesticuserpricesaremore than10 timeshigher than thoseofSingapore.
Figure 4.4. Broadband indicators, selected Asian and Pacific economies, 2012C
hina
Hon
g K
ong,
Chi
na
Japa
n
Mac
ao,
Chi
na
Mon
golia
Rep
ublic
of
Kor
ea
-2
0
2
4
6
8
10
12
Per
cent
age
2009 2010 2011 2009 2010 2011
Hong Kong, China
Singapore
Thailand
Japan
Republic of Korea
Philippines
Malaysia
Indonesia Viet Nam
Sri Lanka
Papua New Guinea
China
Solomon Islands
Nepal
Afghanistan
0.1
1
10
100
1 000
100 1 000 10 000 100 000 1 000 000 10 000 000
Bro
adba
nd fi
xed
Inte
rnet
pric
es,
% o
f mon
thly
GN
I, lo
garit
hmic
sca
le
International internet bandwidth: bit/s per internet user (2012), logarithmic scale
Sources: International Telecommunication Union, Measuring the Information Society (Geneva, ITU, 2013). International Internet bandwidth for Nepal:World Bank and International Telecommunication Union, The Little Data Book on Information and Communication Technology 2013 (Washington,D.C., World Bank and ITU, 2013).
In 2014, ESCAP undertook a study to assess thecontribution of broadband to economic growth andfound that broadband penetration had a positiveimpact on growth inGDP per capita (see box 4.2).Onaverage,a10%growthinbroadbandpenetrationwas found to be associatedwith a 1.34 percentage
Box 4.2. Measuring the contribution of broadband to economic growth
In 2014, using the World Bank’s methodology, ESCAP assessed the contribution of broadband to economic growth by replicating the cross-country growth model and data for 35 developing economies in Asia and the Pacific, from 1997 to 2012 (see annex I). Both growth models are based on the endogenous growth theory.
The results for the developing economies in the ESCAP region show that broadband penetration has a positive impact on growth in GDP per capita. On average in ESCAP developing countries, a 10% growth in broadband penetration was found to be associated with a 1.34 percentage point increase in GDP per capita growth. The estimated impact is strong for some countries, notably Kazakhstan, which experienced an increase of $162.40 in per capita GDP, while for Turkey and Malaysia the corresponding figures are $142.90 and $139.80 respectively. Even such small island developing States as Maldives and Tonga experienced increases of $88 and $60.20, respectively.
Moreover, beyond certain thresholds of a critical mass in broadband penetration, the positive impacts of broadband access increase progressively, probably due to network externalities and productivity gains across various sectors of the economy.
Source: ESCAP calculations, based on C.Z-W. Qiang, C. Rossotto and K. Kimura, “Economic impacts of broadband”, in Information and Communications for Development 2009: Extending Reach and Increasing Impact (Washington D.C., World Bank, 2009).
Notes: Results were statistically robust with a positive and significant coefficient at a 1% level. The R-squared was 0.4349, while the coefficient of broadband penetration impact on GDP growth between 1997 and 2012 was positive at 0.134.
138
Economic and social survEy of asia and thE pacific 2014
point increase inGDPpercapitagrowth forESCAPdeveloping countries, amounting to an average of$49.60 inGDPpercapita.ESCAP furtherestimatedthat a sizeable impact on GDP per capita can beachievedbyincreasingInternetaccess,asmeasuredby target4of theBroadbandCommission forDigitalDevelopment which states: “By 2015, Internet userpenetration should reach 60% worldwide, 50% indeveloping countries and 15% in LDCs”.32
Businesses and markets are driven and rewardedby the uptake of new technology and the speedat which information can be accessed. Similarly,individuals who can access broadband Internetare increasingly at an advantage over those who cannot. Thus, the “digital divide” is translating intonew types of inequality that cut across geography,gender, age groups and levels of income andeducation.Forexample,evenamongthenew“digitalnatives,” or thoseyoungadultswhohave interactedwithdigital technologies throughout their lives, thereare enormous disparities between countries: in theRepublicofKorea,99.6%ofyoungpeoplehavebeenactive on the Internet for at least 5 years, while in Timor-Leste this figure is less than 1%.33 This stark divide – young people in the region living intwo vastly different digital worlds – has enormousimplications for the future. The key challenge forcountries in the region will be to develop physicalinfrastructure to strengthen ICTconnectivity, aswellas to make the Internet accessible for all.
Expanding the region’s trade in services
During the recent period of global and regionalrecovery, global trade in goods has been outpacedbyglobaltradeinservices,particularlyindevelopingeconomies. Since the early 2000s, the Asian andPacific region has been performing better thanthe rest of the world. Between 2002 and 2012, itsshare of global exports of services rose from 23%to 28%, while its share of imports of services alsorose, from 27% to 31%.34
Inparticular, the region isbecomingan increasinglyimportant player in commercial services exports,
broadly categorized as transportation, travel andothercommercialservices.Notably,theexportgrowthof the region’s developing economies is faster thanthat of the region’s developed economies.35 Today, China; Hong Kong, China; India; the Republic ofKorea; and Singapore are the region’s leadingexporters of commercial services, while some non-traditional services exporters, such as Azerbaijan;Georgia; Kyrgyzstan; Macao, China; and Mongoliahave increased their share in total Asian services exports.36
The region’s most dynamic commercial services sector is travel, with growth
driven by intraregional demand
Services, in particular so-called infrastructuralservices,havewide-reachingeffectsonothersectors.Recent researchhas led tochanges in theway thatservicesareestimated(invalueaddedterms)andtoarecalculationof theroleofservices inglobal trade,including in theproductionofgoods.37 This research suggeststhatservicesthatsupportbetterconnectivity,namely transport, logistics,communications,finance,andbusinessandprofessional services facilitate theexpansion of trade in goods, as well as travel and international tourism.38
Meanwhile, the region’s most dynamic commercialservices sector is travel, with growth driven byintraregional demand. In 2013, the Asian andPacific region captured close to 23%of total globalinternational tourist arrivals, with South-East Asiaand South Asia leading the way in increasingtheir market share (see table 4.3). Improved airconnectivity has supported this growth. Accordingto statistics on airport passenger numbers, in 2012the region registerednearly1.69billionpassengers,an increase of 8% from that of the previous year.Thisnumberexceedsthetotalnumberofpassengersarriving and leaving airports in Europe and NorthAmerica, excluding transit passengers.39
For many least developed countries, landlockeddeveloping countries and small island developing
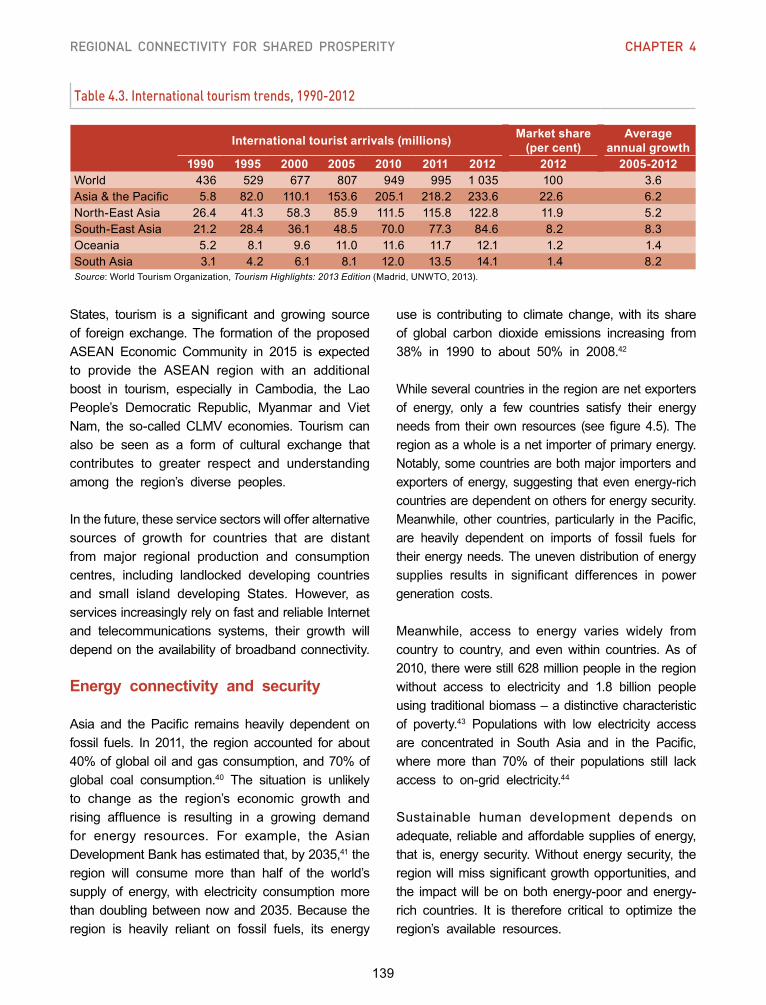
139
REGIONAL CONNECTIVITY FOR SHARED PROSPERITY CHAPTER 4
Table 4.3. International tourism trends, 1990-2012
International tourist arrivals (millions) Market share (per cent)
Average annual growth
1990 1995 2000 2005 2010 2011 2012 2012 2005-2012World 436 529 677 807 949 995 1035 100 3.6Asia&thePacific 5.8 82.0 110.1 153.6 205.1 218.2 233.6 22.6 6.2North-EastAsia 26.4 41.3 58.3 85.9 111.5 115.8 122.8 11.9 5.2South-EastAsia 21.2 28.4 36.1 48.5 70.0 77.3 84.6 8.2 8.3Oceania 5.2 8.1 9.6 11.0 11.6 11.7 12.1 1.2 1.4SouthAsia 3.1 4.2 6.1 8.1 12.0 13.5 14.1 1.4 8.2Source:WorldTourismOrganization,Tourism Highlights: 2013 Edition(Madrid,UNWTO,2013).
States, tourism is a significant and growing sourceof foreignexchange.The formationof theproposedASEAN Economic Community in 2015 is expectedto provide the ASEAN region with an additional boost in tourism, especially in Cambodia, the LaoPeople’s Democratic Republic, Myanmar and VietNam, the so-calledCLMV economies. Tourism canalso be seen as a form of cultural exchange thatcontributes to greater respect and understandingamong the region’s diverse peoples.
Inthefuture,theseservicesectorswillofferalternativesources of growth for countries that are distantfrom major regional production and consumptioncentres, including landlocked developing countriesand small island developing States. However, asservicesincreasinglyrelyonfastandreliableInternetand telecommunications systems, their growth willdependontheavailabilityofbroadbandconnectivity.
Energy connectivity and security
Asia and the Pacific remains heavily dependent onfossil fuels. In 2011, the region accounted for about40%ofglobaloilandgasconsumption,and70%ofglobal coal consumption.40 The situation is unlikelyto change as the region’s economic growth andrising affluence is resulting in a growing demandfor energy resources. For example, the AsianDevelopmentBankhasestimatedthat,by2035,41 the region will consume more than half of the world’ssupply of energy, with electricity consumptionmorethandoublingbetweennowand2035.Because theregion is heavily reliant on fossil fuels, its energy
use is contributing to climate change,with its shareof global carbon dioxide emissions increasing from38% in 1990 to about 50% in 2008.42
Whileseveralcountriesintheregionarenetexportersof energy, only a few countries satisfy their energyneeds from their own resources (see figure4.5).Theregionasawholeisanetimporterofprimaryenergy.Notably,somecountriesarebothmajorimportersandexportersofenergy, suggesting thatevenenergy-richcountriesaredependentonothersforenergysecurity.Meanwhile, other countries, particularly in thePacific,are heavily dependent on imports of fossil fuels fortheirenergyneeds.Theunevendistributionofenergysupplies results in significant differences in powergeneration costs.
Meanwhile, access to energy varies widely fromcountry to country, and evenwithin countries. As of2010,therewerestill628millionpeopleintheregionwithout access to electricity and 1.8 billion peopleusingtraditionalbiomass–adistinctivecharacteristicof poverty.43 Populations with low electricity accessare concentrated in South Asia and in the Pacific,where more than 70% of their populations still lackaccess to on-grid electricity.44
Sustainable human development depends onadequate,reliableandaffordablesuppliesofenergy,that is,energysecurity.Withoutenergysecurity, theregionwillmisssignificantgrowthopportunities,andthe impactwill beonbothenergy-poorandenergy-rich countries. It is therefore critical to optimize theregion’s available resources.
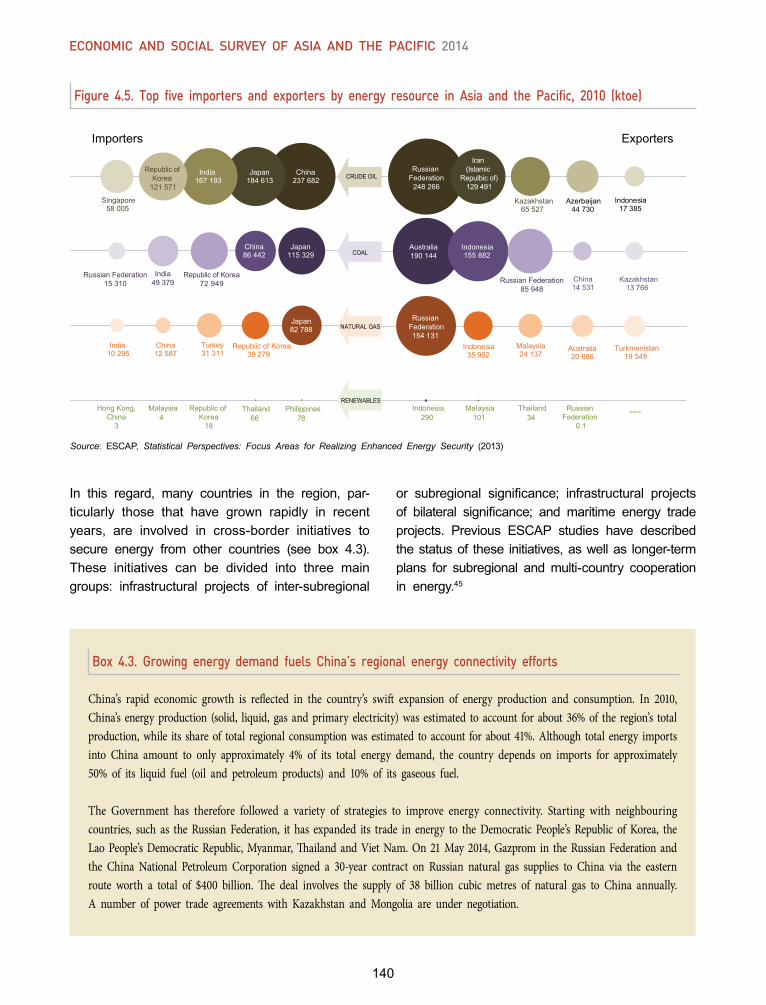
140
Economic and social survEy of asia and thE pacific 2014
Figure 4.5. Top five importers and exporters by energy resource in Asia and the Pacific, 2010 (ktoe)
Source: ESCAP, Statistical Perspectives: Focus Areas for Realizing Enhanced Energy Security (2013)
Box 4.3. Growing energy demand fuels China’s regional energy connectivity efforts
China’s rapid economic growth is reflected in the country’s swift expansion of energy production and consumption. In 2010, China’s energy production (solid, liquid, gas and primary electricity) was estimated to account for about 36% of the region’s total production, while its share of total regional consumption was estimated to account for about 41%. Although total energy imports into China amount to only approximately 4% of its total energy demand, the country depends on imports for approximately 50% of its liquid fuel (oil and petroleum products) and 10% of its gaseous fuel.
The Government has therefore followed a variety of strategies to improve energy connectivity. Starting with neighbouring countries, such as the Russian Federation, it has expanded its trade in energy to the Democratic People’s Republic of Korea, the Lao People’s Democratic Republic, Myanmar, Thailand and Viet Nam. On 21 May 2014, Gazprom in the Russian Federation and the China National Petroleum Corporation signed a 30-year contract on Russian natural gas supplies to China via the eastern route worth a total of $400 billion. The deal involves the supply of 38 billion cubic metres of natural gas to China annually. A number of power trade agreements with Kazakhstan and Mongolia are under negotiation.
China237 682
Japan184 613
India167 193
Republic of Korea
121 571
Singapore58 005
Japan115 329
China86 442
Republic of Korea72 949
India49 379
Russian Federation15 310
Japan82 788
Republic of Korea39 279
Turkey31 311
China12 587
India10 295
Philippines78
Thailand66
Republic of Korea
18
Malaysia4
Hong Kong,China
3
1
2
3
4
Importers Exporters
Australia190 144
Indonesia155 882
Russian Federation85 948
China14 531
Kazakhstan13 766
Russian Federation
248 266
Iran (Islamic
Repulbic of)129 491
Kazakhstan65 527
Azerbaijan44 730
Indonesia17 385
Russian Federation154 131
Indonesia35 952
Malaysia24 137
Australia20 886
Turkmenistan19 549
Indonesia290
Malaysia101
Thailand34
Russian Federation
0.1
---1
2
3
4CRUDE OIL
COAL
NATURAL GAS
RENEWABLES
In this regard, many countries in the region, par- ticularly those that have grown rapidly in recentyears, are involved in cross-border initiatives tosecure energy from other countries (see box 4.3).These initiatives can be divided into three maingroups: infrastructural projects of inter-subregional
or subregional significance; infrastructural projectsof bilateral significance; and maritime energy tradeprojects. Previous ESCAP studies have describedthestatusof these initiatives,aswellas longer-termplans for subregional andmulti-country cooperationin energy.45
141
REGIONAL CONNECTIVITY FOR SHARED PROSPERITY CHAPTER 4
Box 4.3. (continued)
What is needed now is greater energy connectivity at the regional level, along with measures toimprove energy efficiency and to adopt greeneroptions. This would reduce the gaps betweensupplyanddemand.One importantmeasurewouldbe to transfer power fromenergy-richor lower-costpower countries to energy-poor or high-cost powercountries, which would help to bridge the growingenergy divide and to ensure energy security forthe region as a whole.
Responding to population dynamics
A defining feature of the Asian and Pacific regionis its demographic heterogeneity. The population ischanging on a scale and at a pace never beforewitnessed in human history: between 1950 and2013, the region’spopulationnearly tripled, from1.5billion to 4.3 billion people.46 This unprecedentedgrowth in the population is a manifestation of thedemographic transition, where countriesmove froma regime of high mortality and high fertility to firstlow mortality and then low fertility.
Sincethe1970s,oneimplicationofthedemographictransition has been the increase in the proportion
of the population of working ages (ranging from 15to 59 years in most countries but from 15 to 64years in a few countries).47 The number of youngpeople inAsia and thePacific recently peaked andis projected to decline to 717 million in 2014, withalmost half (47%) living in South and South-WestAsia.48 At the same time, irrespective of their stagein the demographic transition, the populations of allcountries in the region are currently ageing.
Today, the Asian and Pacific region is host to 59millionmigrants–oronequarterof theworld’s totalstock.49Figure4.6showsthedistributionofmigrantsacrossESCAPsubregions,withthelargestincreasestaking place in South-East Asia and the Pacific. In2013, the largest number of migrants lived in theRussian Federation, followed by Australia, India,Pakistan and Thailand. Furthermore, internationalmigrants now constitutemore than one third of thepopulation in economies such as Macao, China(59%);BruneiDarussalam(49%);HongKong,China(39%); and Singapore (43%).50
The implications of these demographic trends are significantforthefutureeconomicandsocialdevelop- mentof theregion,andpoint to theurgentneed for
Meanwhile, the Government has also invested in the region’s physical infrastructure, such as pipelines and power grids. For example, the surge in imported gaseous fuel in China is the result of the completion of the gas pipeline from Turkmenistan to China through Uzbekistan and Kazakhstan in 2009. Unlike oil and gas, power grid connection has also provided opportunities for China to export its electricity to other countries. For instance, Viet Nam has signed a power purchase agreement with China Southern Power Grid to purchase 200 million Kwh annually, while Thailand is negotiating with China to have joint investment in hydropower projects in Yunnan and expects to buy electricity from China. Like other rapidly growing economies, China has become one of the major drivers of the region’s energy integration and interdependence.
Source:
United Nations Economic and Social Commission for Asia and the Pacific, Statistical Perspectives: Focus Areas for Realizing Enhanced Energy Security. Available from www.unescap.org/resources/statistical-perspectives-focus-areas-realizing-enhanced-energy-security
International Energy Agency, IEA World Energy Statistics and Balances database (2013). Available from www.oecd-ilibrary.org/energy/data/iea-world- energy-statistics-and-balances_enestats-data-en.
Financial Times, China and Russia to sign $400bn gas deal. (21. May 2014) Available from www.ft.com/intl/cms/s/0/d9a8b800-e09a-11e3-9534-00144feabdc0. html
Xinhua New Net, “The National Report on Economic Cooperation between China and GMS” (in Chinese). (September 2013). Available from baike. baidu.com/view/7109510.htm
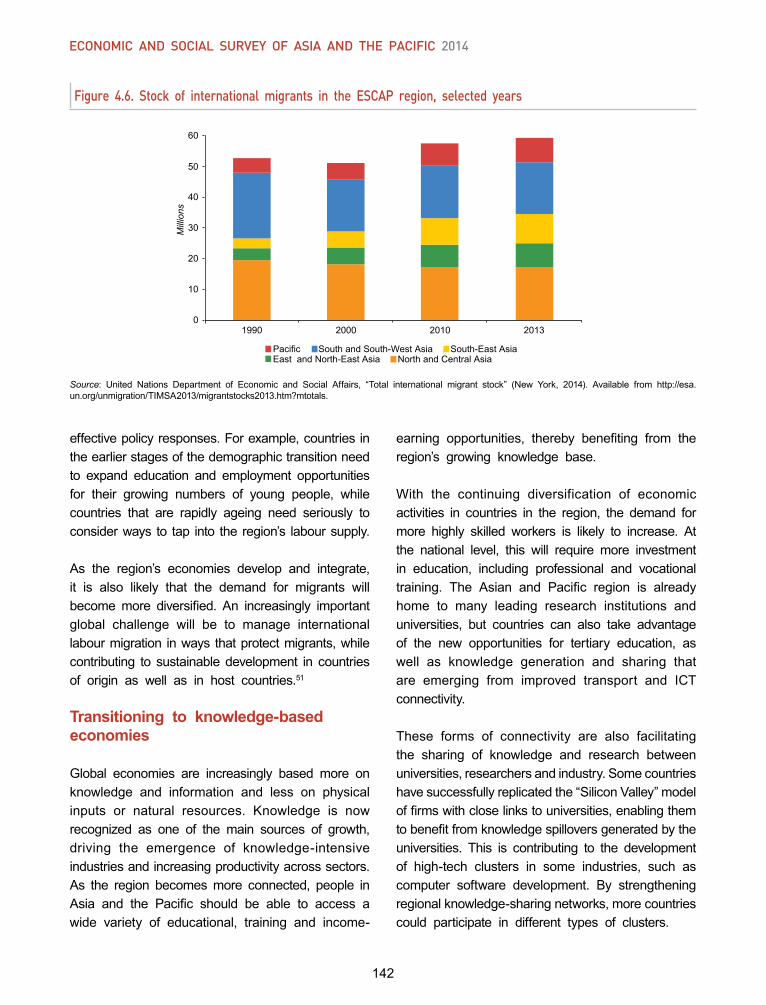
142
Economic and social survEy of asia and thE pacific 2014
Figure 4.6. Stock of international migrants in the ESCAP region, selected years
Source: United Nations Department of Economic and Social Affairs, “Total international migrant stock” (New York, 2014). Available from http://esa.un.org/unmigration/TIMSA2013/migrantstocks2013.htm?mtotals.
effectivepolicyresponses.Forexample,countriesintheearlierstagesofthedemographictransitionneedto expand education and employment opportunitiesfor their growing numbers of young people, whilecountries that are rapidly ageing need seriously toconsiderways to tap into the region’s laboursupply.
As the region’s economies develop and integrate,it is also likely that the demand for migrants willbecomemore diversified. An increasingly importantglobal challenge will be to manage internationallabourmigration inways thatprotectmigrants,whilecontributing to sustainable development in countriesof origin as well as in host countries.51
Transitioning to knowledge-based economies
Global economies are increasingly based more onknowledge and information and less on physicalinputs or natural resources. Knowledge is nowrecognized as one of the main sources of growth,driving the emergence of knowledge-intensiveindustriesandincreasingproductivityacrosssectors.As the region becomesmore connected, people inAsia and the Pacific should be able to access awide variety of educational, training and income-
earning opportunities, thereby benefiting from theregion’s growing knowledge base.
With the continuing diversification of economicactivities in countries in the region, the demand formore highly skilled workers is likely to increase. Atthe national level, this will require more investmentin education, including professional and vocationaltraining. The Asian and Pacific region is alreadyhome to many leading research institutions anduniversities, but countries can also take advantageof the new opportunities for tertiary education, aswell as knowledge generation and sharing thatare emerging from improved transport and ICTconnectivity.
These forms of connectivity are also facilitatingthe sharing of knowledge and research betweenuniversities,researchersandindustry.Somecountrieshavesuccessfullyreplicatedthe“SiliconValley”modeloffirmswithcloselinkstouniversities,enablingthemtobenefitfromknowledgespilloversgeneratedbytheuniversities. This is contributing to the developmentof high-tech clusters in some industries, such ascomputer software development. By strengtheningregionalknowledge-sharingnetworks,morecountriescould participate in different types of clusters.
Chi
na
Hon
g K
ong,
Chi
na
Japa
n
Mac
ao,
Chi
na
Mon
golia
Rep
ublic
of
Kor
ea
-2
0
2
4
6
8
10
12
Per
cent
age
Mill
ions
2009 2010 2011 2009 2010 2011
0
10
20
30
40
50
60
1990 2000 2010 2013
Pacific South and South-West Asia South-East Asia East and North-East Asia North and Central Asia
143
REGIONAL CONNECTIVITY FOR SHARED PROSPERITY CHAPTER 4
REGIONAL STRATEGIES FOR STRENGTHENING CONNECTIVITY IN THE ESCAP REGION
Regional connectivity is thus multifaceted: theconnectivityofonesectorinfluencestheconnectivityof others.TheexperienceofEastAsianeconomiessuggests that trade and transport connectivity areintricately intertwined, while ICT connectivity is becoming an integral part of all networks. Thishighlights the need for greater coordination, not only acrossbordersbutalsoacrosssectors.Atthesametime, there will be new opportunities for enhancingthe quality of these networks by combining thevarious elements in different ways.
Developing regional networks in a coordinated waycan help to spread the benefits from increasingregional connectivity more evenly across countries,particularly to the least developed countries,landlocked developing countries and small islanddevelopingStates.Giventheuniquespatialcontextsin which they are located, these countries need todrawontheircurrentendowmentsandfocusonthespecific aspects of connectivity that are expectedto become important in the future.
With this in mind, the next chapter describes thecurrent status of the connectivity of trade andtransport,ICT,energyandpeople-to-peoplenetworks,and outlines regional strategies for strengtheningthese critical networks. Chapter 6 emphasizes theimportanceofstrengtheninginstitutionalcoordinationand cooperation to address the multifaceted andcross-sectoral nature of regional connectivity, andrecommendswaysofenhancingregionalconnectivityforsharedprosperity.Chapter7concludesthepresentpublicationwithasummaryofkeyrecommendations.
Annex I. Measuring the impact of broadband infrastructure on economic growth
Studiesonthecontributionofbroadbandinfrastructuretoeconomicgrowthandincomehavemostlyfocused
on developed countries, and even then due to thenewnessofthetechnology,thetimespanofthedataandresearchisnotsufficienttorefinemethodologiesand results.Notwithstanding this, thepervasivenessof these technologies and their ever growing potential forwealth creation and transformative development,has given rise to a flurry of studies seeking tobetter understand the contributions.
In 2009, the World Bank published a study whichexaminedtheeconomicimpactofbroadband,througha cross-country regression analysis based on theendogenous growth theory. TheWorld Bankmodelreviewed 120 developing and developed countries.The oft quoted results show a positive impact ofbroadband penetration on GDP per capita growthrates, with “a 1.38 percentage point increase [in per capita GDP growth] for each 10% increase in [broadband] penetration”, in developing countries.52
Additionally, other studies have shown that unlesscountries strive todramatically increase their broad- banddeployment,theimpactswillremainbelowtheirpotential.Onestudyshows thatwith lowbroadbandaccess(under20%)anincreaseof10%inbroadbandpenetrationcontributes0.08% toGDPgrowth.53 For countrieswithmediumbroadbandaccess (20-30%),GDPincreasesby0.14%andwithbroadbandaccesshigher than 30%, the effect 0.23%.
In2014,ESCAPundertookastudyusing theWorldBank’s methodology to assess the contribution ofbroadband on per capita GDP growth. ESCAPreplicatedtheWorldBank’scross-countryregressionanalysis for 35 developing economies of its region,using updated data i.e. data from 1997 - the yearwhen ITU started collecting data on broadbandpenetration - up to 2012, the latest available. Theequation used is as follows:
GDP9712 = B0 + B1*GDP97 + B2*Literacy97 + B3*TELPEN + B4*IY9712 + μ
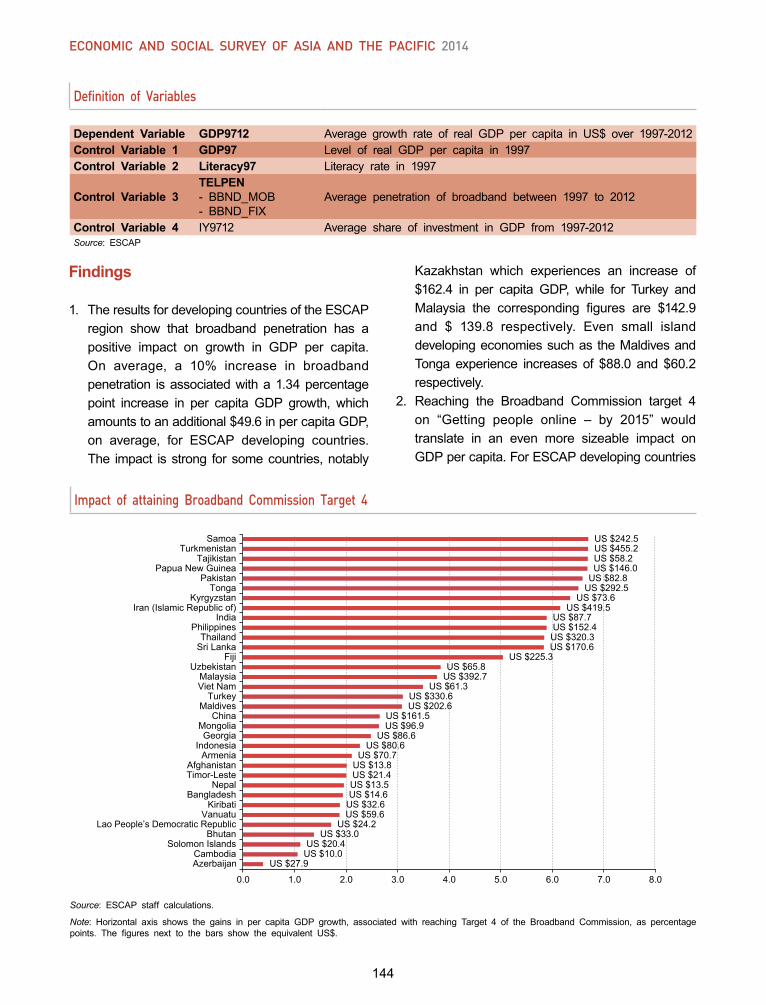
144
Economic and social survEy of asia and thE pacific 2014
Findings
1. TheresultsfordevelopingcountriesoftheESCAPregion show that broadband penetration has apositive impact on growth in GDP per capita.On average, a 10% increase in broadbandpenetration isassociatedwitha1.34percentagepoint increase in per capita GDP growth, whichamountstoanadditional$49.6inpercapitaGDP,on average, for ESCAP developing countries.The impact isstrong forsomecountries,notably
Definition of Variables
Dependent Variable GDP9712 Average growth rate of real GDP per capita in US$ over 1997-2012Control Variable 1 GDP97 Level of real GDP per capita in 1997Control Variable 2 Literacy97 Literacy rate in 1997
Control Variable 3TELPEN- BBND_MOB- BBND_FIX
Average penetration of broadband between 1997 to 2012
Control Variable 4 IY9712 Average share of investment in GDP from 1997-2012Source: ESCAP
Kazakhstan which experiences an increase of$162.4 in per capita GDP, while for Turkey andMalaysia the corresponding figures are $142.9and $ 139.8 respectively. Even small islanddevelopingeconomiessuchas theMaldivesandTonga experience increases of $88.0 and $60.2respectively.
2. Reaching the Broadband Commission target 4on “Getting people online – by 2015” wouldtranslate in an even more sizeable impact onGDPpercapita.ForESCAPdevelopingcountries
Impact of attaining Broadband Commission Target 4
Source: ESCAP staff calculations.
Note: Horizontal axis shows the gains in per capita GDP growth, associated with reaching Target 4 of the Broadband Commission, as percentagepoints. The figures next to the bars show the equivalent US$.
0.0 1.0 2.0 3.0 4.0 5.0 6.0 7.0 8.0
AzerbaijanCambodia
Solomon IslandsBhutan
Lao People’s Democratic RepublicVanuatu
KiribatiBangladesh
NepalTimor-LesteAfghanistan
ArmeniaIndonesia
GeorgiaMongolia
ChinaMaldives
TurkeyViet NamMalaysia
UzbekistanFiji
Sri LankaThailand
PhilippinesIndia
Iran (Islamic Republic of)Kyrgyzstan
TongaPakistan
Papua New GuineaTajikistan
TurkmenistanSamoa
US $27.9US $10.0
US $33.0US $20.4
US $161.5US $96.9
US $86.6US $80.6
US $13.8US $21.4US $13.5US $14.6
US $32.6US $59.6
US $24.2
US $455.2US $242.5
US $70.7
US $170.6US $225.3
US $65.8US $392.7
US $61.3US $330.6US $202.6
US $58.2US $146.0
US $82.8US $292.5
US $73.6US $419.5
US $87.7US $152.4US $320.3
145
REGIONAL CONNECTIVITY FOR SHARED PROSPERITY CHAPTER 4
onaverage,attainingtheBroadbandCommissionTarget 4 would yield an increase in per capitaGDP of $133.7 while, as shown in the figure,the impact is even larger for some countriessuch as Samoa and Turkmenistan. Even in acountry such as Azerbaijan that already has arelatively high broadband penetration of 47%,reaching the target would add $27.9 to percapita GDP. China, which has a penetrationrate of 30% would experience an increase inper capitaGDPof $161.5. Fiji, India, the IslamicRepublic of Iran, Kyrgyzstan, Pakistan, PapuaNew Guinea, Philippines, Samoa, Sri Lanka,Tajikistan, Thailand, Tonga, and TurkmenistanwouldseepercapitaGDPgrowthratesincreaseby more than 5 percentage points.
3. The above results could have a downward bias,duetotherelativelylowcurrentpenetrationlevelsof broadband. Nevertheless, they suggest thatbroadband penetration has growth benefits. Itshould also be noted that because demand forbroadband increases with wealth, penetrationrates are potentially endogenous, possiblyoverestimating the results.
Policy implications
Beyond certain thresholds of a critical mass inbroadband penetration, the positive impacts ofbroadband access increase progressively, dueto network externalities, productivity gains andincreases inhumanknowledgeandskills that leavenosectoroftheeconomyuntouched.Consequently,this should encourage policymakers to prioritizeinvestments in broadband infrastructure deploymentat the national and regional levels, and make abig push towards the attainment of the targets setout by the Broadband Commission. In unserved orunderservedareas,public-privatepartnershipswouldenhancethesustainabilityofinvestmentsandensurethat the goal of affordable and reliable connectivityavailable to all, at all times, is attained.
Deeper assessment of the linkage between ICTand variables suchasmarket structure, competitionand prices together with other measurable aspects
of prosperity (income, employment, cost of living)wouldrequiremoredata,includinglongertimeseries,that would allow the establishment of multiple datapoints for each economy in an endogenous growthregression. The Partnership on Measuring ICT forDevelopment,ofwhichESCAP isamember,wouldneed stepped up support so that it is in a positionto continue leading the global efforts in producingmore and better data on ICT.
Endnotes1 It should be noted that China accounted for the vastmajorityof this reduction:between1990and2009, thepercentage of China’s population living on less than$1.25 per day fell from 60.2% to 11.8%. See UnitedNations Economic and Social Commission for Asiaand the Pacific, Statistical Yearbook for Asia and the Pacific 2013. (United Nations Publication, Sales No.E.13.II.F.1.).
2 Asian Development Bank, United Nations Economicand Social Commission for Asia and the Pacific, andUnited Nations Development Programme. Asia-PacificAspirations:Perspectives for a Post-2015 Development Agenda – Asia-Pacific Regional MDGs Report 2012/13 (Bangkok, ADB, ESCAP and UNDP, 2013). Availablefrom www.adb.org/sites/default/files/pub/2013/asia-pacific-regional-mdgs-report.pdf.
3 United Nations Economic and Social Commission forAsia and the Pacific,Statistical Yearbook for Asia and the Pacific 2013.(UnitedNationsPublication,SalesNo.E.13.II.F.1.).
4 Asian Development Bank, Asia 2050: Realizing the Asian Century (Mandaluyong City, Philippines, ADB,2011). Available from www.adb.org/publications/asia-2050-realizing-asian-century.
5 AsianDevelopmentBankandAsianDevelopmentBankInstitute, Infrastructure for a Seamless Asia (Tokyo,ADB and ADBI, 2009). Available from www.adbi.org/files/2009.08.31.book.infrastructure.seamless.asia.pdf;and United Nations Economic and Social Commissionfor Asia and the Pacific,Growing Together: Economic Integration for an Inclusive and Sustainable Asia-Pacific Century. ST/ESCAP/2629.
6 P. Bom and J. Ligthart, “How productive is publiccapital?Ameta-analysis”,InternationalStudiesProgramWorking Paper No. 09-12 (Atlanta, Georgia, Andrew
146
Economic and social survEy of asia and thE pacific 2014
YoungSchoolofPolicyStudies,GeorgiaStateUniversity,2009). Results vary depending on the region as wellas the type of infrastructure.
7 TherearemanyrecentstudiesontheimpactofICTonrural producers. See for example the case of bankingservices in Papua New Guinea, which have helpedfarmersreduceriskthroughbettermarketinformationandpromptpayments.InternationalFinanceCorporation,“InPapuaNewGuinea,mobilebankingbringssavingsandsafety to farmers”, 23 September 2013. Available fromwww.ifc.org/wps/wcm/connect/region__ext_content/regions/east+asia+and+the+pacific/news/mobile+banking+saves+farmers+money.
8 OrganisationforEconomicCo-operationandDevelopment, World Trade Organization, and United NationsConferenceonTradeandDevelopment,“Implicationsofglobal value chains for trade, investment, developmentandjobs:preparedfor theG-20LeadersSummit,SaintPetersburg, Russian Federation, September 2013”, 6August 2013. Available from www.oecd.org/trade/G20-Global-Value-Chains-2013.pdf.
9 United Nations Economic and Social Commission forAsia and the Pacific, Growing Together: Economic Integration for an Inclusive and Sustainable Asia-Pacific Century. ST/ESCAP/2629.
10J.Weiss, “Export growth and industrial policy: lessonsfrom theEastAsianmiracle experience”, ADB InstituteDiscussion Paper No. 26 (ADBI, 2005). Available fromwww.adbi.org/files/2005.02.dp26.eastasia.govt.policy.pdf;J.Lin, “Fromflyinggeese to leadingdragons:newopportunitiesandstrategiesforstructuraltransformationin developing countries”, Global Policy, vol. 3, No. 4(November 2012), pp. 397-409; and M. Ando and F.Kimura, “The formation of international production anddistribution networks in East Asia”, NBER WorkingPaperNo.W10167(Cambridge,Massachusetts,NationalBureau of Economic Research, 2003). Available fromhttp://ssrn.com/abstract=478677.
11N.Kumar,“Regionaleconomicintegration,foreigndirectinvestmentandefficiency-seekingindustrialrestructuringin Asia: the case of India”, RIS Discussion Paper No.123 (NewDelhi, Research and Information System forDevelopingCountries,2007).Availablefromwww.eaber.org/sites/default/files/documents/RIS_Kumar_2007_02.pdf.
12United Nations Economic and Social Commission forAsia and the Pacific, Growing Together: Economic Integration for an Inclusive and Sustainable Asia-Pacific Century. ST/ESCAP/2629.
13For more on this, see United Nations Economic andSocial Commission for Asia and the Pacific, Growing Together: Economic Integration for an Inclusive and Sustainable Asia-Pacific Century. ST/ESCAP/2629.;United Nations Economic and Social Commissionfor Asia and the Pacific, Asia-Pacific Trade and Investment Report 2011: Post-crisis Trade and Investment Opportunities (United Nations publication,SalesNo.E.11.II.F.8).Available fromwww.unescap.org/sites/default/files/0%20-%20Full%20Report_21.pdf.; andUnited Nations Economic and Social Commission forAsiaandthePacific,Asia-Pacific Trade and Investment Report 2013: Turning the Tide – Towards Inclusive Trade and Development (United Nations publication,Sales No. E.14.II.F.2). Available from www.unescap.org/sites/default/files/Full%20Report.pdf.
14See for example D. te Velde and D. Bezemer,“Regional integration and foreign direct investment indeveloping countries”, Transnational Corporations, vol.15,No. 2 (August 2006), pp. 41-70;E.Yeyati, E.Steinand C. Daude, “Regional integration and the locationof FDI”, background paper for the seminar LookingBeyond Our Borders: Opportunities and Challengesof the New Regionalism, Inter-American DevelopmentBank, Fortaleza, Brazil, 11 March 2002. Availablefrom www.iadb.org/intal/intalcdi/PE/2009/03494a02.pdf; D. Medvedev, “Beyond trade: the impact ofpreferential trade agreements on foreign directinvestment inflows”, Policy Research Working PaperNo. 4065 (Washington, D.C., World Bank, 2006).Available from http://elibrary.worldbank.org/content/workingpaper/10.1596/1813-9450-4065; and G. DeMonie, J.P. Rodrigue and T. Notteboom, “Economiccycles in maritime shipping and ports: the path tothe crisis of 2008”, in Integrating Seaports and Trade Corridors,P.Hallandothers,eds. (AshgatePublishing,2010).
15P.Athukorala, “Production networks and trade patternsinEastAsia: regionalization or globalization?”,WorkingPaperSeriesonRegionalEconomic IntegrationNo.56(MandaluyongCity,Philippines,ADB,2010).Theauthorrefers to “global production sharing” as distributingproduction processes across different countries.
16N.Kumar,“Regionaleconomicintegration,foreigndirectinvestmentandefficiency-seekingindustrialrestructuringin Asia: the case of India”, RIS Discussion Paper No.123 (NewDelhi, Research and Information System forDevelopingCountries,2007).Availablefromwww.eaber.org/sites/default/files/documents/RIS_Kumar_2007_02.pdf.
147
REGIONAL CONNECTIVITY FOR SHARED PROSPERITY CHAPTER 4
17United Nations Economic and Social Commission forAsiaandthePacific,Asia-Pacific Trade and Investment Report 2013: Turning the Tide – Towards Inclusive Trade and Development (United Nations publication,Sales No. E.14.II.F.2). Available from www.unescap.org/sites/default/files/Full%20Report.pdf.
18United Nations Economic and Social Commission forAsiaandthePacific,Asia-Pacific Trade and Investment Report 2012: Recent Trends and Developments. ST/ESCAP/2650., figure 1.4, p. 19.
19The ESCAP-World Bank Trade Cost Database isavailable from http://databank.worldbank.org/data/views/variableselection/selectvariables.aspx?source=escap-world-bank:-international-trade-costs.
20K. Cullinane, W.T. Fei and S. Cullinane, “Containerterminaldevelopment inmainlandChinaand its impacton the competitiveness of the port of Hong Kong”,Transport Reviews, vol. 24, No.1 (2004), pp. 33-56.
21UnitedNationsConferenceonTradeandDevelopment,Review of Maritime Transport 2013 (United Nationspublication, Sales No. E.13.II.D.9).
22World Bank’s Doing Business reports, based on anaverageof the11landlockedcountries intheregionforwhichtherearedata(Afghanistan,Armenia,Azerbaijan,Bhutan, Kazakhstan, Kyrgyzstan, Lao People’sDemocratic Republic, Mongolia, Nepal, Tajikistan andUzbekistan).
23See among others Asian Development Bank andAsian Development Bank Institute, Infrastructure for a Seamless Asia(Tokyo,ADBandADBI,2009).Availablefrom www.adbi.org/files/2009.08.31.book.infrastructure.seamless.asia.pdf; and United Nations Economic andSocial Commission for Asia and the Pacific, Review of Developments in Transport in Asia and the Pacific.ST/ESCAP/2627.
24L. Andres, D. Biller and M. Dappe,Reducing Poverty by Closing South Asia’s Infrastructure Gap(WorldBankand Australian Aid, 2013). Available from documents.worldbank.org/curated/en/2013/12/19330904/reducing-poverty-closing-south-asias-infrastructure-gap.
25The literature on trade facilitation sometimes refers tonon-physical barriers as “man-made” barriers, giventhat many are the result of government policies.
26T. Notteboom, “Container shipping and ports: anoverview”, Review of Network Economics, Vol 3, No.2 (June 2004), pp. 86-106.
27United Nations Economic and Social Commissionfor Asia and the Pacific, Review of Developments in Transport in Asia and the Pacific. ST/ESCAP/2627.
28See Y. Duval and C. Utoktham, “Trade costs in Asiaand the Pacific: improved and sectoral estimates”,ESCAP Trade and Investment Division Staff WorkingPaper No. 05/11 (Bangkok, ESCAP, 2010). Availablefrom www.unescap.org/sites/default/files/TIDwp05_11.pdf; and, more recently, J.F. Arvis and others, “Tradecosts in the developing world: 1995-2010”, PolicyResearch Working Paper No. 6309 (Washington,D.C., World Bank, 2013). Available from http://elibrary.worldbank.org/doi/pdf/10.1596/1813-9450-6309.
29United Nations Economic and Social Commission forAsiaandthePacific,Asia-Pacific Trade and Investment Report 2013: Turning the Tide – Towards Inclusive Trade and Development (United Nations publication,Sales No. E.14.II.F.2). Available from www.unescap.org/sites/default/files/Full%20Report.pdf.
30 Contained in the Bali Ministerial Declaration, underMinisterial Decision WT/MIN(13)/36 - WT/L/911. TheBali Ministerial Declaration and decisions are availablefrom http://wto.org/english/thewto_e/minist_e/mc9_e/tempdocs_e.htm.
31International Telecommunication Union, WorldTelecommunication/ICT Indicators Database 2012.
32The Broadband Commission for Digital DevelopmentwasestablishedbytheInternationalTelecommunicationUnion and the United Nations Educational, Scientificand Cultural Organization in response to Secretary-General Ban Ki-Moon’s call to step up efforts by theUnited Nations to meet the Millennium DevelopmentGoals. The Broadband Targets for 2015 are availablefrom www.broadbandcommission.org/Documents/publications/Broadband_Targets.pdf.
33International Telecommunication Union, Measuring the Information Society 2013 (Geneva, ITU, 2013), p. 143.Available from www.itu.int/en/ITU-D/Statistics/Pages/publications/mis2013.aspx.
34United Nations Economic and Social Commission forAsiaandthePacific,Asia-Pacific Trade and Investment Report 2013: Turning the Tide – Towards Inclusive Trade and Development (United Nations publication,Sales No. E.14.II.F.2). Available from www.unescap.org/sites/default/files/Full%20Report.pdf.
35Ibid.
148
Economic and social survEy of asia and thE pacific 2014
36Ibid.Whileintraregionaltradeinservicesasapercentageof total trade is perceived to be relatively low, giventhe lack of data it is difficult to estimate its overallsize and dynamics.
37 OrganisationforEconomicCo-operationandDevelopment and World Trade Organization, OECD-WTO Tradein Value Added (TiVA) database (2014). Availablefrom www.oecd.org/industry/ind/measuringtradeinvalue-addedanoecd-wtojointinitiative.htm.
38Noting the integral role of services in productionfragmentation and global value chains, it is suggestedin the Asia-Pacific Trade and Investment Report 2013 that “…the rise of [Global Value Chains] was builton reduced costs of service links, inter alia. Noneof these chains can exist without efficient servicessuch as transport, logistics, communication, finance,and business and professional services.” See UnitedNationsEconomicandSocialCommissionforAsiaandthe Pacific, Asia-Pacific Trade and Investment Report 2013: Turning the Tide – Towards Inclusive Trade and Development (United Nations publication, SalesNo. E.14.II.F.2). Available from www.unescap.org/sites/default/files/Full%20Report.pdf.
39 Airports Council International, “ACI releases its 2012World Airport Traffic Report,”MediaRelease,3September2013. Available from www.aci.aero/media/bc5239b4-07ac-4d1f-8cbb-db8f1b093d80/News/Releases/2013/PR_2013_08_28_WATR_Release_pdf.
40 International Energy Agency, IEA World Energy Statistics and Balances database (2013). Available from www.oecd-ilibrary.org/energy/data/iea-world-energy-statistics-and-balances_enestats-data-en.
41Asian Development Bank,Asian Development Outlook 2013: Asia’s Energy Challenge. (Mandaluyong City,Philippines, ADB, 2013). Available from www.adb.org/sites/default/files/pub/2013/ado2013.pdf.
42United Nations Economic and Social Commission forAsia and the Pacific, Economic and Social Survey of Asia and the Pacific 2011: Sustaining Dynamism and Inclusive Development – Connectivity in the Region and Productive Capacity in Least Developed Countries (United Nations publication, Sales No. E.11.II.F.2).
43 International Energy Agency, World Energy Outlook 2012 (Paris, OECD/IEA, 2012). Available from www.iea.org/publications/freepublications/publication/WEO2012_free.pdf.
44Asian Development Bank, United Nations Economicand Social Commission for Asia and the Pacific, and
United Nations Development Programme. Asia-Pacific Aspirations: Perspectives for a Post-2015 Development Agenda – Asia-Pacific Regional MDGs Report 2012/13 (Bangkok, ADB, ESCAP and UNDP, 2013). Availablefrom www.adb.org/sites/default/files/pub/2013/asia-pacific-regional-mdgs-report.pdf.
45See for example United Nations Economic and SocialCommissionforAsiaandthePacific,Growing Together: Economic Integration for an Inclusive and Sustainable Asia-Pacific Century. ST/ESCAP/2629.
46Figuresfor1950arefromK.S.Seetharam,“Twenty-fiveyearsoftransitioninAsia’spopulationanddevelopment:a review of progress and potential”, Asia-Pacific Population Journal, vol. 27, No. 1 (June 2012), pp. 13-32.Figuresfor2013arefromUnitedNationsEconomicand Social Commission for Asia and the Pacific, 2013ESCAP Population Data Sheet. Available from www.unescapsdd.org/files/documents/PUB_Datasheet-2013.pdf.
47K.S.Seetharam,“Twenty-fiveyearsoftransitioninAsia’spopulation and development: a review of progress andpotential”, Asia-Pacific Population Journal, vol. 27, No.1 (June 2012), pp. 13-32.
48United Nations, Department of Economic and SocialAffairs,PopulationDivision,World Population Prospects: The 2012 Revision. (New York). Available from esa.un.org/wpp/.
49United Nations Department of Economic and SocialAffairs, Population Division, Trends in International Migrant Stock: the 2013 Revision. (New York).Available from esa.un.org/unmigration/TIMSO2013/migrantstocks2013.htm. Measuring internationalmigration is difficult because each country has its owndefinitionsofwhoqualifiesasamigrant.Migrantstocksconsist of people who have resided in a country forat least one year, but were either born in, or remainnationals of, another country. Figures onmigrant stocktherefore can include long-term residents and theirfamilymembers, aswell as temporary labourmigrantsand refugees.
50United Nations Department of Economic and SocialAffairs, Population Division, Total International MigrantStock(accessed6February2014).Availablefromhttp://esa.un.org/unmigration/TIMSA2013/migrantstocks2013.htm?mtotals.
51P. Martin, “Labour migration development indicatorsin the post-2015 global development framework”, inMigration and the United Nations Post-2015 Development Agenda (Geneva, International Organization for
149
REGIONAL CONNECTIVITY FOR SHARED PROSPERITY CHAPTER 4
Migration, 2013). Available from www.iom.int/files/live/sites/iom/files/What-We-Do/docs/Labour-Migration-and-Development-Indicators-in-the-Post-2015-Global-Development-Framework.pdf.
52 C.Z-W. Qiang, C. Rossotto and K. Kimura, “Economicimpactsofbroadband”,in Information and Communications for Development 2009: Extending Reach and Increasing Impact (Washington D.C., World Bank, 2009).
53P. Koutroumpis, “The Economic Impact of Broadbandon Growth: A simultaneous approach”, in Journal ofTelecommunications Policy. Vol. 33, No. 9., pp. 471-485 (Pergamon Press, New York, 2009).
150
UN
PH
OTO
- K
IBA
E P
AR
K
151
REGIONAL STRATEGIES FOR STRENGTHENING REGIONAL
CONNECTIVITY 5 egional connectivity requires integrating different types of regional networks, ranging from infrastructure networks to those concerned with knowledge-sharing. As they evolve, these networks are becoming more complex and interdependent. Developing regional networks in a strategic and coordinated way will spread the benefits more evenly across Asia and the Pacific, particularly to the least developed countries, landlocked developing countries and small island developing States. Given the unique spatial contexts in which they are situated, these countries will require different approaches and modalities for strengthening regional connectivity.
R
UN
PH
OTO
- K
IBA
E P
AR
K
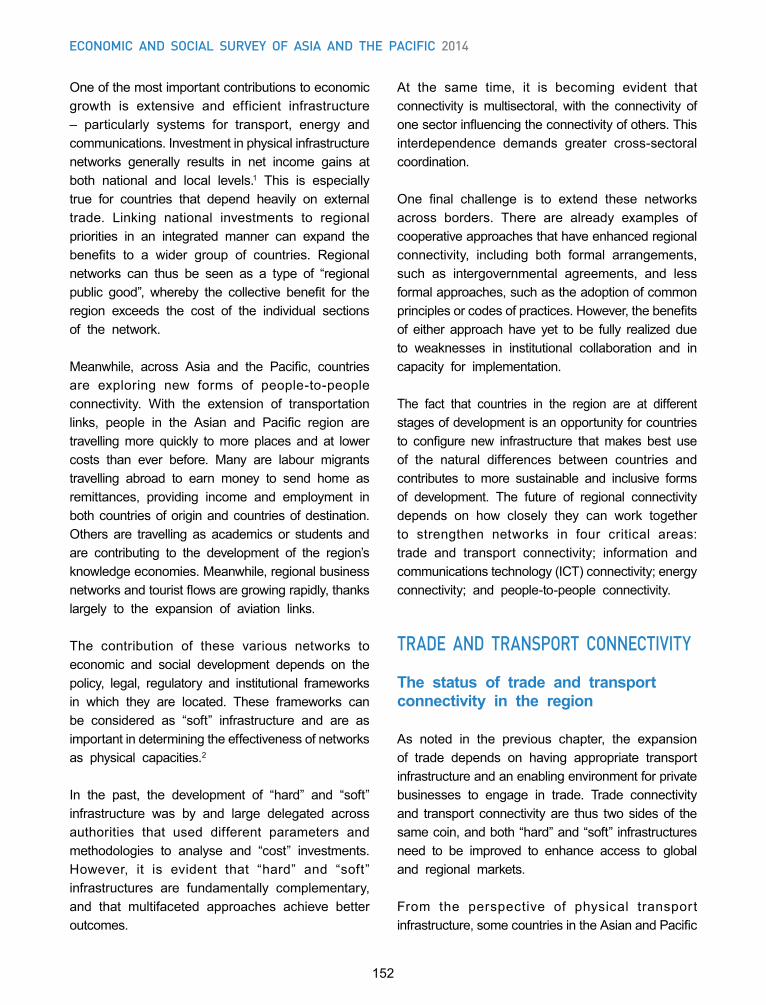
152
Economic and social survEy of asia and thE pacific 2014
One of the most important contributions to economic growth is extensive and efficient infrastructure – particularly systems for transport, energy and communications. Investment in physical infrastructure networks generally results in net income gains at both national and local levels.1 This is especially true for countries that depend heavily on external trade. Linking national investments to regional priorities in an integrated manner can expand the benefits to a wider group of countries. Regional networks can thus be seen as a type of “regional public good”, whereby the collective benefit for the region exceeds the cost of the individual sections of the network.
Meanwhile, across Asia and the Pacific, countries are exploring new forms of people-to-people connectivity. With the extension of transportation links, people in the Asian and Pacific region are travelling more quickly to more places and at lower costs than ever before. Many are labour migrants travelling abroad to earn money to send home as remittances, providing income and employment in both countries of origin and countries of destination. Others are travelling as academics or students and are contributing to the development of the region’s knowledge economies. Meanwhile, regional business networks and tourist flows are growing rapidly, thanks largely to the expansion of aviation links.
The contribution of these various networks to economic and social development depends on the policy, legal, regulatory and institutional frameworks in which they are located. These frameworks can be considered as “soft” infrastructure and are as important in determining the effectiveness of networks as physical capacities.2
In the past, the development of “hard” and “soft” infrastructure was by and large delegated across authorities that used different parameters and methodologies to analyse and “cost” investments. However, it is evident that “hard” and “soft” infrastructures are fundamentally complementary, and that multifaceted approaches achieve better outcomes.
At the same time, it is becoming evident that connectivity is multisectoral, with the connectivity of one sector influencing the connectivity of others. This interdependence demands greater cross-sectoral coordination.
One final challenge is to extend these networks across borders. There are already examples of cooperative approaches that have enhanced regional connectivity, including both formal arrangements, such as intergovernmental agreements, and less formal approaches, such as the adoption of common principles or codes of practices. However, the benefits of either approach have yet to be fully realized due to weaknesses in institutional collaboration and in capacity for implementation.
The fact that countries in the region are at different stages of development is an opportunity for countries to configure new infrastructure that makes best use of the natural differences between countries and contributes to more sustainable and inclusive forms of development. The future of regional connectivity depends on how closely they can work together to strengthen networks in four critical areas: trade and transport connectivity; information and communications technology (ICT) connectivity; energy connectivity; and people-to-people connectivity.
TRADE AND TRANSPORT CONNECTIVITY
The status of trade and transport connectivity in the region
As noted in the previous chapter, the expansion of trade depends on having appropriate transport infrastructure and an enabling environment for private businesses to engage in trade. Trade connectivity and transport connectivity are thus two sides of the same coin, and both “hard” and “soft” infrastructures need to be improved to enhance access to global and regional markets.
From the perspective of physical transport infrastructure, some countries in the Asian and Pacific
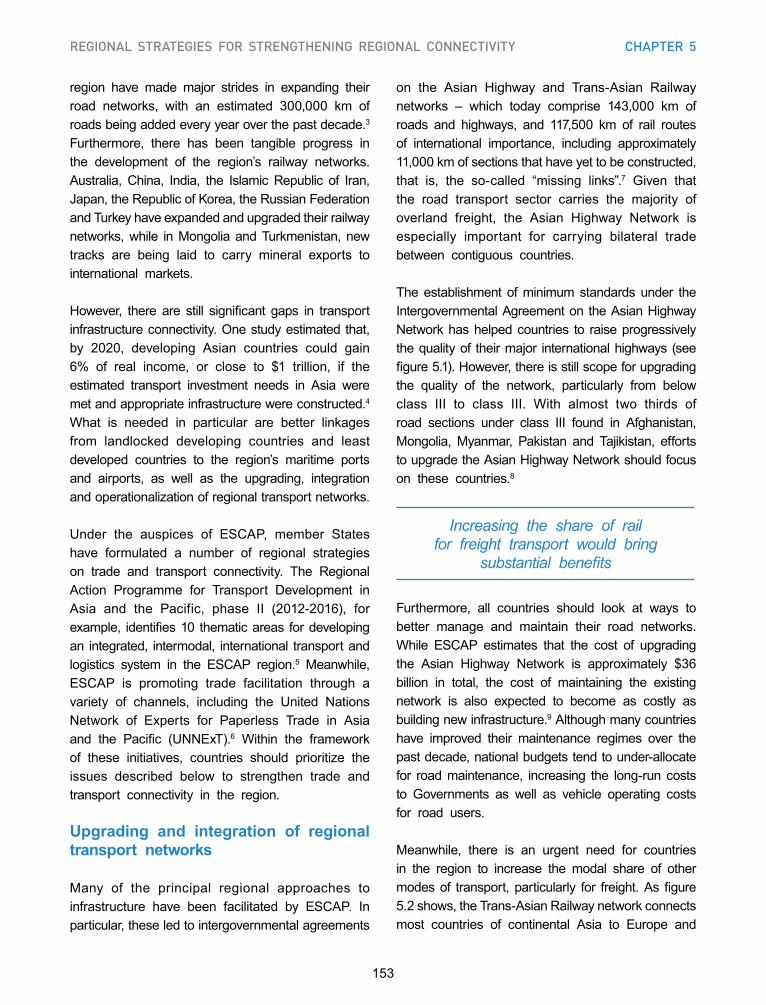
153
REGIONAL STRATEGIES FOR STRENGTHENING REGIONAL CONNECTIVITY CHAPTER 5
region have made major strides in expanding their road networks, with an estimated 300,000 km of roads being added every year over the past decade.3 Furthermore, there has been tangible progress in the development of the region’s railway networks. Australia, China, India, the Islamic Republic of Iran, Japan, the Republic of Korea, the Russian Federation and Turkey have expanded and upgraded their railway networks, while in Mongolia and Turkmenistan, new tracks are being laid to carry mineral exports to international markets.
However, there are still significant gaps in transport infrastructure connectivity. One study estimated that, by 2020, developing Asian countries could gain 6% of real income, or close to $1 trillion, if the estimated transport investment needs in Asia were met and appropriate infrastructure were constructed.4 What is needed in particular are better linkages from landlocked developing countries and least developed countries to the region’s maritime ports and airports, as well as the upgrading, integration and operationalization of regional transport networks.
Under the auspices of ESCAP, member States have formulated a number of regional strategies on trade and transport connectivity. The Regional Action Programme for Transport Development in Asia and the Pacific, phase II (2012-2016), for example, identifies 10 thematic areas for developing an integrated, intermodal, international transport and logistics system in the ESCAP region.5 Meanwhile, ESCAP is promoting trade facilitation through a variety of channels, including the United Nations Network of Experts for Paperless Trade in Asia and the Pacific (UNNExT).6 Within the framework of these initiatives, countries should prioritize the issues described below to strengthen trade and transport connectivity in the region.
Upgrading and integration of regional transport networks
Many of the principal regional approaches to infrastructure have been facilitated by ESCAP. In particular, these led to intergovernmental agreements
on the Asian Highway and Trans-Asian Railway networks – which today comprise 143,000 km of roads and highways, and 117,500 km of rail routes of international importance, including approximately 11,000 km of sections that have yet to be constructed, that is, the so-called “missing links”.7 Given that the road transport sector carries the majority of overland freight, the Asian Highway Network is especially important for carrying bilateral trade between contiguous countries.
The establishment of minimum standards under the Intergovernmental Agreement on the Asian Highway Network has helped countries to raise progressively the quality of their major international highways (see figure 5.1). However, there is still scope for upgrading the quality of the network, particularly from below class III to class III. With almost two thirds of road sections under class III found in Afghanistan, Mongolia, Myanmar, Pakistan and Tajikistan, efforts to upgrade the Asian Highway Network should focus on these countries.8
Increasing the share of rail for freight transport would bring
substantial benefits
Furthermore, all countries should look at ways to better manage and maintain their road networks. While ESCAP estimates that the cost of upgrading the Asian Highway Network is approximately $36 billion in total, the cost of maintaining the existing network is also expected to become as costly as building new infrastructure.9 Although many countries have improved their maintenance regimes over the past decade, national budgets tend to under-allocate for road maintenance, increasing the long-run costs to Governments as well as vehicle operating costs for road users.
Meanwhile, there is an urgent need for countries in the region to increase the modal share of other modes of transport, particularly for freight. As figure 5.2 shows, the Trans-Asian Railway network connects most countries of continental Asia to Europe and
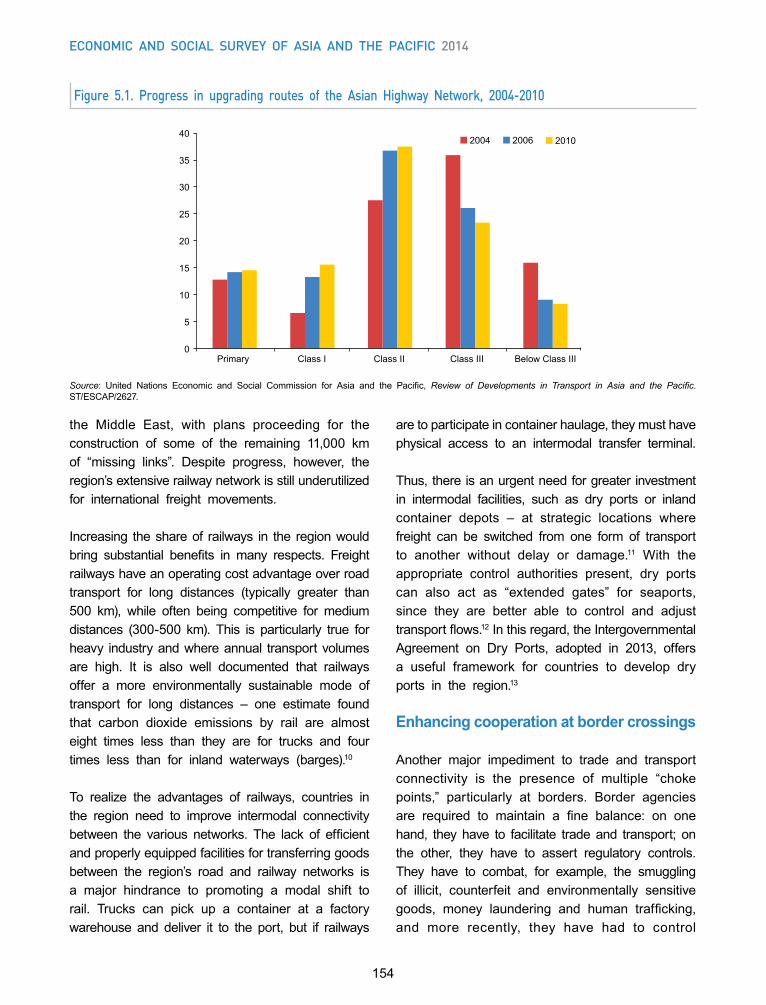
154
Economic and social survEy of asia and thE pacific 2014
the Middle East, with plans proceeding for the construction of some of the remaining 11,000 km of “missing links”. Despite progress, however, the region’s extensive railway network is still underutilized for international freight movements.
Increasing the share of railways in the region would bring substantial benefits in many respects. Freight railways have an operating cost advantage over road transport for long distances (typically greater than 500 km), while often being competitive for medium distances (300-500 km). This is particularly true for heavy industry and where annual transport volumes are high. It is also well documented that railways offer a more environmentally sustainable mode of transport for long distances – one estimate found that carbon dioxide emissions by rail are almost eight times less than they are for trucks and four times less than for inland waterways (barges).10
To realize the advantages of railways, countries in the region need to improve intermodal connectivity between the various networks. The lack of efficient and properly equipped facilities for transferring goods between the region’s road and railway networks is a major hindrance to promoting a modal shift to rail. Trucks can pick up a container at a factory warehouse and deliver it to the port, but if railways
Figure 5.1. Progress in upgrading routes of the Asian Highway Network, 2004-2010
0
5
10
15
20
30
25
35
40 2004 2006 2010
Primary Class I Class II Class III Below Class III
Source: United Nations Economic and Social Commission for Asia and the Pacific, Review of Developments in Transport in Asia and the Pacific. ST/ESCAP/2627.
are to participate in container haulage, they must have physical access to an intermodal transfer terminal.
Thus, there is an urgent need for greater investment in intermodal facilities, such as dry ports or inland container depots – at strategic locations where freight can be switched from one form of transport to another without delay or damage.11 With the appropriate control authorities present, dry ports can also act as “extended gates” for seaports, since they are better able to control and adjust transport flows.12 In this regard, the Intergovernmental Agreement on Dry Ports, adopted in 2013, offers a useful framework for countries to develop dry ports in the region.13
Enhancing cooperation at border crossings
Another major impediment to trade and transport connectivity is the presence of multiple “choke points,” particularly at borders. Border agencies are required to maintain a fine balance: on one hand, they have to facilitate trade and transport; on the other, they have to assert regulatory controls. They have to combat, for example, the smuggling of illicit, counterfeit and environmentally sensitive goods, money laundering and human trafficking, and more recently, they have had to control
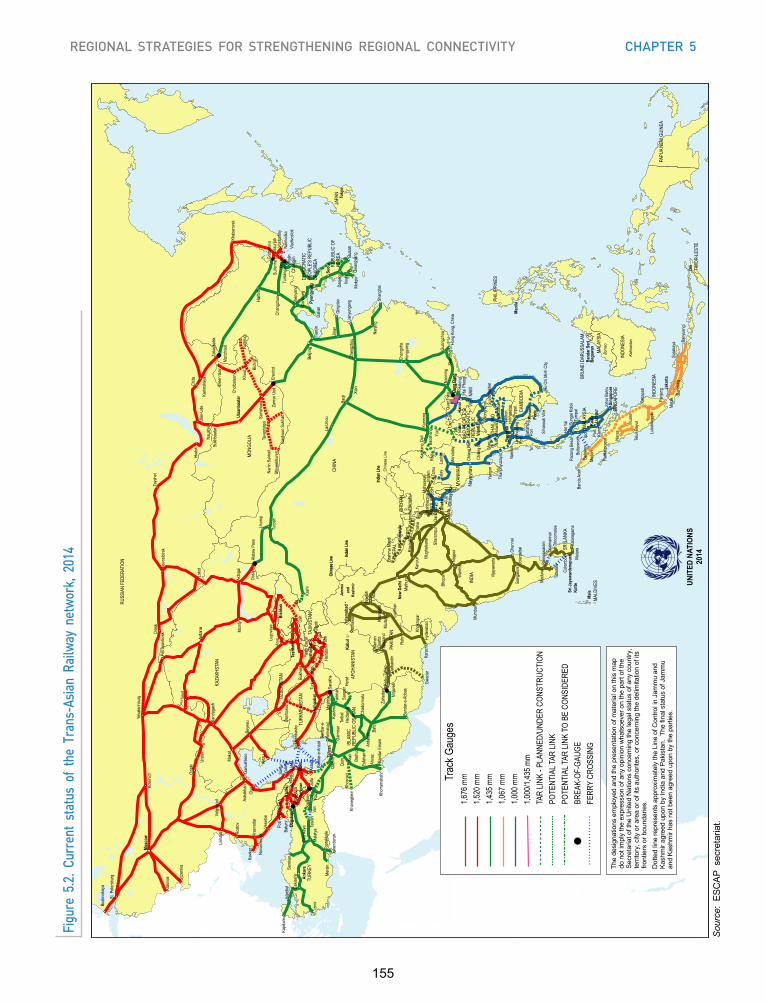
155
REGIONAL STRATEGIES FOR STRENGTHENING REGIONAL CONNECTIVITY CHAPTER 5
Figu
re 5
.2. C
urre
nt s
tatu
s of
the
Tra
ns-A
sian
Rai
lway
net
wor
k, 2
014
UNIT
ED N
ATIO
NS20
14
Zahe
danSa
rakh
s
Band
ar-e
-Abb
as
Tehr
an
REPU
BLIC
OF
IRAN
ISLA
MIC
Istan
bul
Anka
raTU
RKEY
Razi
Dogu
kapi
Band
ar-e
-Am
iraba
dTo
prak
kale
Isken
deru
n
Malat
ya
Sams
unKa
pikule
Qom
Bafq
Cetin
kaya
Mirja
veh
Izmir
Ban
dar E
mamGa
rmsa
r
Mersi
n
Khor
rams
hahr
Eskis
ehir
Tatva
nVa
nKapik
oyAs
tara
Band
ar-e
-Anz
ali
Ahva
z
Qazv
inMa
shha
d
Farim
anKa
shma
rTo
rbat
Heida
rieh
Badr
ud
Arda
kan
Esfah
anCh
ador
malu
Khos
ravi
Khan
eghe
inAr
ak
Jolfa
Sang
an
New
Delh
iNE
PAL
Islam
abad
Pesh
awar
Indian
Line
Chine
se Li
ne
Kabu
l
PAKI
STAN
Quett
a
Rohr
i
Jam
mu
an
d K
ashm
irAF
GHAN
ISTA
N
Kara
chi
INDI
AMu
mbai
Kolka
ta
Raxa
ulKath
man
du
Chen
nai
Tutic
orin
Talai
mann
ar
SRI L
ANKA
Colom
boSr
i Jay
ewar
dene
pura
Ko
tteMa
tara
BANG
LADE
SH
Dhak
a
BHUT
AN
Chitta
gong
Male
MALD
IVES
Indian
Line
Attar
iW
agah
Koh-
i-Taft
an
Bang
alore
Rame
swar
am
Nagp
ur
Thim
phu
Darsa
na
Biro
l Shah
bazp
urGw
adar
Lodh
ran
Bhop
al
Birg
unj
Brah
ma M
andi
Kaka
rvitta
Mathu
ra Vijay
awad
a
Sitar
ampu
r
Mugh
alsar
ai
Kanp
urPa
tna
War
dha
Madu
rai
Jolar
petta
i Trinc
omale
e
Cham
an
Multa
n
Hyde
raba
d
Khok
ropa
r
Dalba
ndin
Hera
t
Mahis
asan
Jiriba
m
Haira
ton
Spez
and
Khan
ewal
Katar
agam
a
Indian
Line
Chine
se Li
neCH
INA
Chine
se Li
ne
Seou
l REPU
BLIC
OF
KORE
ATo
kyo
JAPA
N
Alata
w Pa
ssUr
umqi
Zhen
gzho
u
Shan
ghai
Nanji
ng
Kunm
ing
Beiji
ngTia
njin
Dalia
nPy
ongy
ang
Harb
in
Rajin
Eren
hot
DEMO
CRAT
IC
OF K
OREA
PEOP
LE'S
REP
UBLIC
Manz
houli
Indian
Line
Liany
unga
ng
Qing
dao
Dand
ong
Mokp
o
Chan
gsha
Dong
Dan
g
Chan
gchu
n
Shen
yang
Turp
an
Kash
i
Ruili
Baoji
Heng
yang Ho
ng K
ong,
China
Suife
nhe
Gwan
gyan
g
Lanz
hou
Xian
Jinan
Guan
gzho
uNa
nning
Dali
Kach
ang Ba
osha
ng
Daeje
on
Tuma
ngan
g
Chon
gjin Bu
san
Iksan
Shen
zhen
Yuxi
Nakh
odka
Khab
arov
sk U
laanb
aata
r
Ulan
-Ude
Karim
skay
a
MONG
OLIA
Novo
sibirs
kOm
sk
Yeka
terinb
urg
Ozink
i
Mosc
ow
Kras
noe Sy
zemk
a
Astra
khan
Volgo
grad
RUSS
IAN
FEDE
RATI
ON
Zamy
n Uud
St. P
etersb
urg
Zaba
ykals
k
Tays
het
Chita
Irkuts
k
R. F.
Likha
ya
Buslo
vska
ya
Samu
r
Vese
loe
Loko
t
Sukh
baata
r
Olya
Ussu
rijsk
Kotel
nich
Kras
noda
rNo
voro
ssiis
k
Kavk
az
Grod
ekov
o
Rosto
v
Naus
hki
Vosto
chny
Khas
an
Vlad
ivosto
k
Shive
ekhu
ren
Gash
uun S
ukha
it
Tava
ntolgo
iSains
hand
Nariin
Suk
hait
Bich
igt
Numr
ugKh
uut
Choib
alsan
Eree
n tsa
v
AZER
BAIJA
N
Poti
Yere
van
Tbilis
i
Turkm
enba
shy
Baku
TURK
MENI
STAN
Ashg
abat
Batum
iGEOR
GIA
UZBE
KIST
AN
Tash
kent
TAJIK
ISTA
NBish
kek
Asta
na
Petro
pavlo
vsk
Aktog
ai
KAZA
KHST
AN
Aktau
Dosty
k
Arys
Maka
t
Beyn
euKand
agac
h
Dogu
kapi
Dush
anbe
Tobo
l
Ganu
shkin
o
Urals
k
Moint
y
Bukh
ara
ARME
NIA
Lugo
vaya
Yalam
a
Kurg
anTu
be
Yang
i Baz
ar
Kulya
bYa
van
Dash
owuz
Turkm
enab
ad
Osh
Tamu
MYAN
MAR
Lash
io
CAMB
ODIA
THAI
LAND
Bang
kok
Phno
m
Siha
nouk
Ville
Ho C
hi Mi
nh C
ity
HatY
ai
MALA
YSIA SI
NGAP
ORE
Sing
apor
e
Band
aAce
h
Mera
kINDO
NESI
A
Bany
uang
i
VIET
NAMHa
i Pho
ngHa
noi
Kuala
Kalim
anta
n
INDO
NESI
A
Born
eoMA
LAYS
IA
BRUN
EI D
ARUS
SALA
MBa
ndar
Ser
iBe
gawa
n
Sura
baya
Penh
Mani
la
PHILI
PPIN
ES
Lao
Cai Po
ipet
LAO
PEOP
LE'S
DEMO
CRAT
ICRE
PUBL
IC
Lubu
kling
gau
Kerta
pati
Ranta
upra
pat
Belaw
an
Namt
ok
Meda
nButte
rwor
th
Chian
g Mai
Nong
Kha
i
Chian
g Rai
Dong
Dan
g
TIMO
R-LE
STE
Panja
ng Band
ung
Vien
tiane Lu
mpu
r
Jaka
rta
Mand
alay
Joho
r Bah
ru
Pada
ng B
esar
Sung
ai Ko
lokTu
mpat
Port
Klan
g
Nakh
onra
tchas
ima
Satta
hipPo
rt
Lamc
haba
ngPo
rt
Kalay
Than
phyu
zaya
t
PAPU
A NE
W G
UINE
A
Suva
nnak
het
Mukd
ahan
Boten
Dili
Halon
g
Quan
Trieu
Teluk
Bay
urMuar
o
Nakh
onsa
wan
Mae S
od Nara
s
Nayp
yitaw
Yang
on
Ipoh
1,676
mm
1,520
mm
1,435
mm
1,067
mm
1,000
mm
1,000
/1,43
5 mm
TAR
LINK
- PLA
NNED
/UND
ER C
ONST
RUCT
ION
POTE
NTIA
L TAR
LINK
POTE
NTIA
L TAR
LINK
TO
BE C
ONSI
DERE
DBR
EAK-
OF-G
AUGE
FERR
Y CR
OSSI
NG
Trac
k Gau
ges
The
desi
gnat
ions
em
ploy
ed a
nd th
e pr
esen
tatio
n of
mat
eria
l on
this
map
do n
ot im
ply
the
expr
essi
on o
f any
opi
nion
wha
tsoe
ver o
n th
e pa
rt of
the
Secr
etar
iat o
f the
Uni
ted
Nat
ions
con
cern
ing
the
lega
l sta
tus
of a
ny c
ount
ry,
terri
tory
, city
or a
rea
or o
f its
aut
horit
es, o
r con
cern
ing
the
delim
itatio
n of
its
front
iers
or b
ound
arie
s.D
otte
d lin
e re
pres
ents
app
roxi
mat
ely
the
Line
of C
ontro
l in
Jam
mu
and
Kash
mir
agre
ed u
pon
by In
dia
and
Paki
stan
. Th
e fin
al s
tatu
s of
Jam
mu
and
Kash
mir
has
not b
een
agre
ed u
pon
by th
e pa
rties
.
Sou
rce:
ESC
AP
secr
etar
iat.
156
Economic and social survEy of asia and thE pacific 2014
health pandemics, such as that caused by avian influenza. This requires a large and diverse number of government authorities and agencies, including immigration, police, customs, quarantine, sanitary and phytosanitary inspection, and transport.
These controls are important, but they add to the cost, time and risk involved in moving freight by land. For example, the International Road Transport Union, through its New Eurasian Land Transport Initiative, found that border waiting times account for about 40% of time lost during transport, and that such a situation encourages corrupt practices that can account for 30% of transport costs.14 Such costs inhibit the expansion of trade in the region and undermine other important initiatives, such as tariff reductions.
Many countries in the region are already taking steps to enhance cooperation between their border
agencies, mostly on a bilateral basis. Kazakhstan and Kyrgyzstan, for example, began joint customs control and a single-stop inspection of vehicles, goods and passengers at border crossings in August 2012,15 while Georgia and Turkey also established joint customs control. In November 2011, China and Mongolia introduced the pilot implementation of a unified customs manifest. Within one year, the customs authorities processed 180,000 unified customs manifests, and the pilot was extended to other major border crossings between the two countries.16
The next step is to integrate check post facilities at all international border crossings, starting with those along the Asian Highway and Trans-Asian Railway networks. For example, India has begun implementing integrated check post (ICP) facilities with its neighbours starting with the Attari border check post with Pakistan (see box 5.1). Early reports
Box 5.1. Integrated check post at Attari, India-Pakistan border
In order to facilitate trade with neighbouring countries, the Government of India has launched an integrated check post (ICP) initiative. ICPs are expected to serve as single window facilities covering customs, immigration security and warehousing services. One ICP has been operational since 2012 at Attari on the India-Pakistan border.
Previously, cargo from Delhi to Lahore, Pakistan, was sent in four hops via the Nhava Sheva port in Maharashtra, India, by sea to Dubai, United Arab Emirates, where cargo was trans-shipped and transported to Karachi, Pakistan, and then from Karachi to Lahore over land. The shipment would thus take about 30 days to reach its destination. With the Attari-Wagah land route, the journey has been reduced to three days.
During 2012/13, the first year of operation of the ICP at Attari, imports grew by 81%, and exports registered an increase of 122% in value terms. Meanwhile, the number of trucks carrying export cargo from India through Attari increased from 3,882 to 41,248, while the number carrying import cargo increased from 19,087 to 33,599. This led to a 166% increase in customs revenue. In addition, it is reported that the incremental revenue during the post-project period recovered almost one third of the investment in one year, as taxes were also collected from services provided commercially. Land prices in the area have gone up substantially and a variety of organized commercial activities have sprung up on both sides of the border.
India is planning to open another 12 ICPs with various neighbours: 4 on the India-Nepal border, 1 on the India-Myanmar border and 7 on the India-Bangladesh border. Notably, the opening of the ICP at the border of Raxaul (India) and Birgunj (Nepal), which are linked by both road and rail, means that the ICP is integrated with both networks.
Source: ESCAP secretariat.
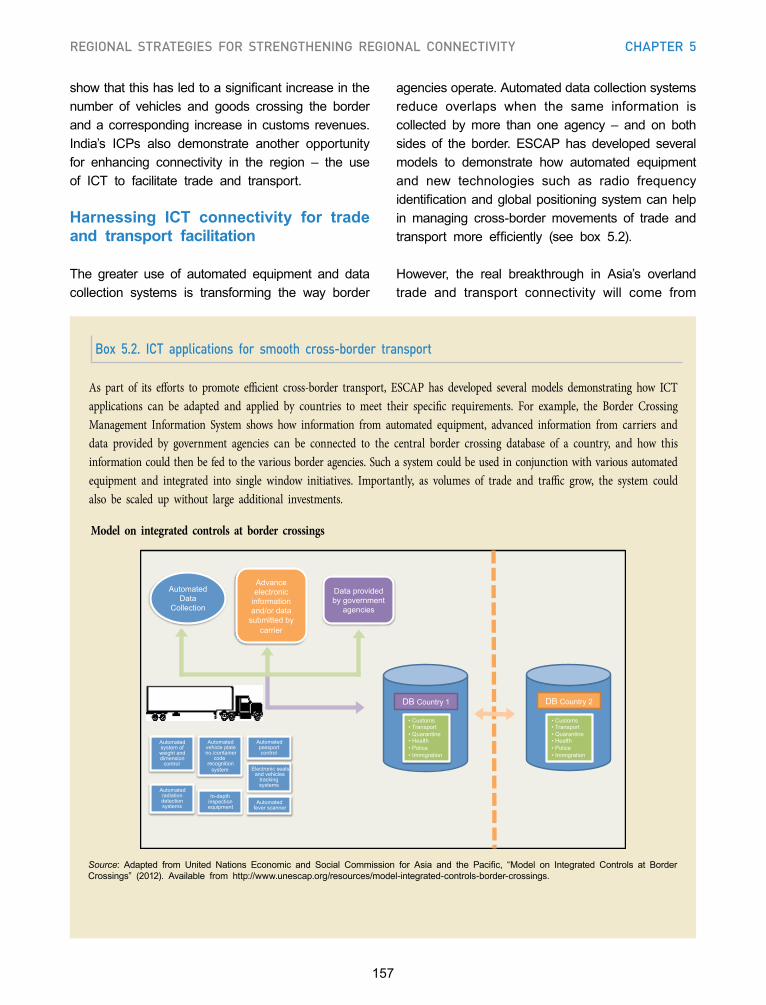
157
REGIONAL STRATEGIES FOR STRENGTHENING REGIONAL CONNECTIVITY CHAPTER 5
Box 5.2. ICT applications for smooth cross-border transport
As part of its efforts to promote efficient cross-border transport, ESCAP has developed several models demonstrating how ICT applications can be adapted and applied by countries to meet their specific requirements. For example, the Border Crossing Management Information System shows how information from automated equipment, advanced information from carriers and data provided by government agencies can be connected to the central border crossing database of a country, and how this information could then be fed to the various border agencies. Such a system could be used in conjunction with various automated equipment and integrated into single window initiatives. Importantly, as volumes of trade and traffic grow, the system could also be scaled up without large additional investments.
show that this has led to a significant increase in the number of vehicles and goods crossing the border and a corresponding increase in customs revenues. India’s ICPs also demonstrate another opportunity for enhancing connectivity in the region – the use of ICT to facilitate trade and transport.
Harnessing ICT connectivity for trade and transport facilitation
The greater use of automated equipment and data collection systems is transforming the way border
agencies operate. Automated data collection systems reduce overlaps when the same information is collected by more than one agency – and on both sides of the border. ESCAP has developed several models to demonstrate how automated equipment and new technologies such as radio frequency identification and global positioning system can help in managing cross-border movements of trade and transport more efficiently (see box 5.2).
However, the real breakthrough in Asia’s overland trade and transport connectivity will come from
Source: Adapted from United Nations Economic and Social Commission for Asia and the Pacific, “Model on Integrated Controls at Border Crossings” (2012). Available from http://www.unescap.org/resources/model-integrated-controls-border-crossings.
Model on integrated controls at border crossings
DB Country 1
• Customs • Transport • Quarantine • Health • Police • Immigration
Advance electronic
information and/or data
submitted by carrier
Automated Data
Collection
Data provided by government
agencies
Automated system of weight and dimension
control
Automated vehicle plate no./container
code recognition
system
Automated passport control
Electronic seals and vehicles
tracking systems
Automated fever scanner
Automated radiation detection systems
In-depth inspection equipment
• Customs • Transport • Quarantine • Health • Police • Immigration
DB Country 2
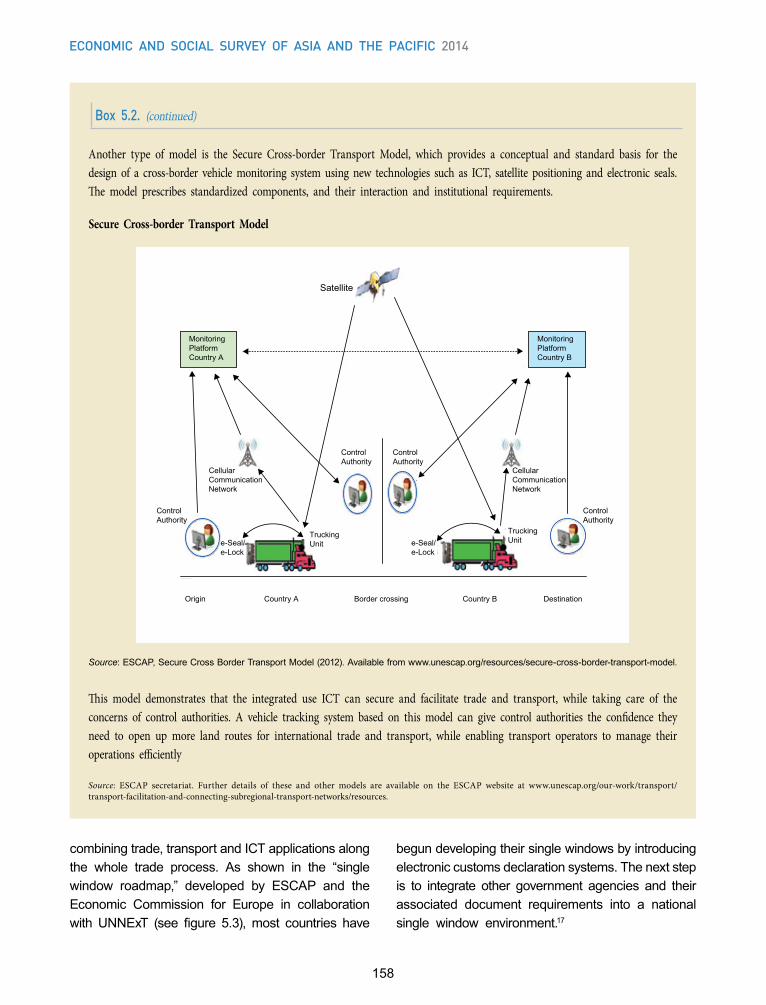
158
Economic and social survEy of asia and thE pacific 2014
Box 5.2. (continued)
Secure Cross-border Transport Model
Satellite
MonitoringPlatformCountry B
ControlAuthority
CellularCommunicationNetwork
TruckingUnit
TruckingUnit
ControlAuthority
ControlAuthority
ControlAuthority
CellularCommunicationNetwork
e-Seal/e-Lock
e-Seal/e-Lock
MonitoringPlatformCountry A
Origin Country A Border crossing Country B Destination
Another type of model is the Secure Cross-border Transport Model, which provides a conceptual and standard basis for the design of a cross-border vehicle monitoring system using new technologies such as ICT, satellite positioning and electronic seals. The model prescribes standardized components, and their interaction and institutional requirements.
combining trade, transport and ICT applications along the whole trade process. As shown in the “single window roadmap,” developed by ESCAP and the Economic Commission for Europe in collaboration with UNNExT (see figure 5.3), most countries have
begun developing their single windows by introducing electronic customs declaration systems. The next step is to integrate other government agencies and their associated document requirements into a national single window environment.17
Source: ESCAP, Secure Cross Border Transport Model (2012). Available from www.unescap.org/resources/secure-cross-border-transport-model.
This model demonstrates that the integrated use ICT can secure and facilitate trade and transport, while taking care of the concerns of control authorities. A vehicle tracking system based on this model can give control authorities the confidence they need to open up more land routes for international trade and transport, while enabling transport operators to manage their operations efficiently
Source: ESCAP secretariat. Further details of these and other models are available on the ESCAP website at www.unescap.org/our-work/transport/transport-facilitation-and-connecting-subregional-transport-networks/resources.
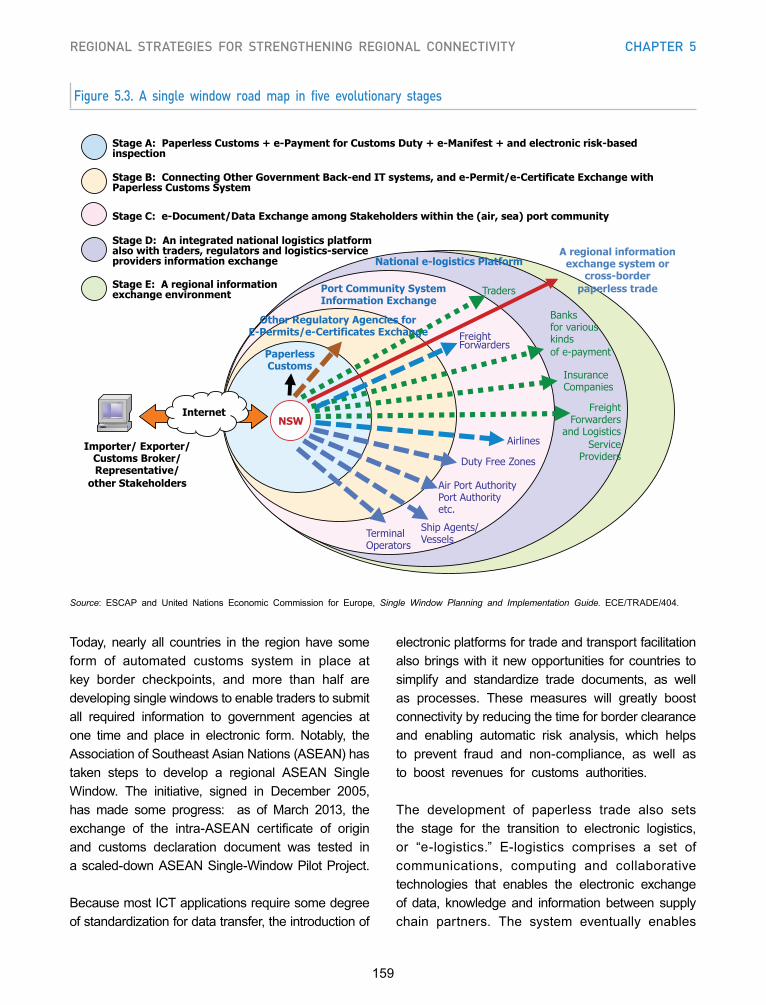
159
REGIONAL STRATEGIES FOR STRENGTHENING REGIONAL CONNECTIVITY CHAPTER 5
Figure 5.3. A single window road map in five evolutionary stages
Today, nearly all countries in the region have some form of automated customs system in place at key border checkpoints, and more than half are developing single windows to enable traders to submit all required information to government agencies at one time and place in electronic form. Notably, the Association of Southeast Asian Nations (ASEAN) has taken steps to develop a regional ASEAN Single Window. The initiative, signed in December 2005, has made some progress: as of March 2013, the exchange of the intra-ASEAN certificate of origin and customs declaration document was tested in a scaled-down ASEAN Single-Window Pilot Project.
Because most ICT applications require some degree of standardization for data transfer, the introduction of
Importer/ Exporter/ Customs Broker/ Representative/
other Stakeholders
NSW Internet
Terminal Operators
Air Port Authority Port Authority etc.
Banks for various kinds of e-payment
Insurance Companies
Ship Agents/ Vessels
Airlines
Paperless Customs
A regional information exchange system or
cross-border paperless trade
Other Regulatory Agencies for E-Permits/e-Certificates Exchange
Freight Forwarders
and Logistics Service
Providers Duty Free Zones
Traders
Stage A: Paperless Customs + e-Payment for Customs Duty + e-Manifest + and electronic risk-based inspection
Stage B: Connecting Other Government Back-end IT systems, and e-Permit/e-Certificate Exchange with Paperless Customs System
Stage C: e-Document/Data Exchange among Stakeholders within the (air, sea) port community
Stage E: A regional information exchange environment
Stage D: An integrated national logistics platform also with traders, regulators and logistics-service providers information exchange
Port Community System Information Exchange
National e-logistics Platform
Freight Forwarders
Source: ESCAP and United Nations Economic Commission for Europe, Single Window Planning and Implementation Guide. ECE/TRADE/404.
electronic platforms for trade and transport facilitation also brings with it new opportunities for countries to simplify and standardize trade documents, as well as processes. These measures will greatly boost connectivity by reducing the time for border clearance and enabling automatic risk analysis, which helps to prevent fraud and non-compliance, as well as to boost revenues for customs authorities.
The development of paperless trade also sets the stage for the transition to electronic logistics, or “e-logistics.” E-logistics comprises a set of communications, computing and collaborative technologies that enables the electronic exchange of data, knowledge and information between supply chain partners. The system eventually enables
160
Economic and social survEy of asia and thE pacific 2014
traders and domestic logistics service providers to interact and to track the progress of applications and registrations with government agencies.18 The further integration of paperless trade and transport systems, such as regulatory single windows, port community systems, e-payment or banking systems and national e-logistics systems, can ultimately give rise to national integrated paperless supply-chain platforms – and eventually to integrated systems along an entire chain of import-export operations.19
This is the ultimate target for regional cross-border paperless trade initiatives, such as the regional arrangements for cross-border paperless trade facilitation of ESCAP (see box 5.3) and the ASEAN Single Window. Initiatives led by the private sector, such as the Pan Asian E-commerce Alliance, which bring together single window operators from several countries, also show promise.20
Developing competitive regional transport and logistics services
The cost and quality of transport services are affected by the level of competition in the transport
Box 5.3. Towards cross-border paperless trade in Asia and the Pacific
Recognizing the potential benefits from conducting trade transactions using electronic rather than paper-based data and documentation, a number of countries in the Asian and Pacific region began implementing paperless trade systems in the late 1990s and early 2000s. However, most of these initiatives focused on information exchange between stakeholders domestically, while facilitating international trade inherently requires trade information to flow across borders along international supply chains. As a result, the flow of electronic trade information generated domestically faces both technical and legal barriers beyond the border, turning traders to conventional paper-based trade practices and reducing the overall benefits from paperless trade systems.
To overcome these barriers, the Commission adopted resolution 68/3 on enabling paperless trade and the cross-border recognition of electronic data and documents for inclusive and sustainable intraregional trade facilitation. A study conducted by the secretariat in consultation with national focal points and experts from UNNExT recommended that an intergovernmental agreement be developed to provide willing countries with an effective and long-term framework to jointly develop and implement cross-border paperless trade facilitation. The draft text of this arrangement is under negotiation and will be further revised over the course of 2014.
Source: United Nations Economic and Social Commission for Asia and the Pacific, Enhancing Regional Connectivity: Towards a Regional Arrangement for the Facilitation of Cross-border Paperless Trade. ST/ESCAP/2684. Available from www.unescap.org/sites/default/files/0%20-%20Full%20Report_35.pdf
sector. Research conducted in landlocked developing countries suggests that government regulations that protect domestic road-transport operators can contribute to rent-seeking monopolistic or oligopolistic behaviour, adding to the already high transport costs for traders in these countries.21
Experiences from the maritime and aviation sectors show that deregulating transport services can increase competition and reduce prices paid by customers. For example, the liberalization of the aviation sector in South-East Asia and the Pacific helped to lower airfares and provided a boost to tourism, a critical sector for many countries (see box 5.4).
The issue of deregulation is difficult to tackle, especially if it involves the opening of domestic markets to foreign operators. Currently, almost all countries in the ESCAP region restrict the entry of foreign transport service providers in their domestic markets. These barriers are partly responsible for the high transport costs in the region and they contribute to delays at land border crossings due to the time spent stuffing and unstuffing cargo between vehicles.
161
REGIONAL STRATEGIES FOR STRENGTHENING REGIONAL CONNECTIVITY CHAPTER 5
Box 5.4. Impact of deregulation on aviation in the Pacific
In Vanuatu and Samoa in the Pacific, the deregulation of the aviation sector has helped to improve regional transportation connectivity and to increase flows of tourists. In Vanuatu, Air Vanuatu was the national carrier, and in the late 1990s and early 2000s it suffered losses. Once the aviation sector in Vanuatu was deregulated in 2004, and low-budget carriers such as Pacific Blue were permitted to enter Vanuatu’s skies, passenger traffic between Australia and Vanuatu grew by 19%. Deregulation has allowed fares to drop, increased visitor arrivals and increased airline choices for passengers. Vanuatu is now served by five international airlines.
In Samoa, the nationally controlled carrier – Polynesian Airlines – suffered heavy losses during 2001-2004, and was not financially viable. In response, the Government reformed the aviation sector. It restructured Polynesian Airlines for domestic routes and ventured into a partnership with Virgin Australia. Gains in the tourism sector in Samoa have been attributed to this joint venture.
In both countries, the reforms resulted in more flights to regional hubs such as Australia, Fiji and New Zealand, and more competitive fares. In addition, the restructured national airlines are in better financial positions, reducing the burden on public finances.
Source: Taumoepeau and Kissling, Economic sustainability of airlines in the Pacific. Presented at the 31st Australasian Transport Research Forum (2008). Available from www.atrf.info/papers/2008/2008_Taumoepeau_Kissling.pdf
However, countries have begun to take steps towards the development of a regional market for transport services and logistics by allowing foreign transport operators to enter or to transit their territories along selected routes. Several countries have established bilateral or trilateral arrangements to allow cross-border movements by road without the need for transport permits. There are such arrangements between Armenia, the Islamic Republic of Iran and the Russian Federation, and between the Lao People’s Democratic Republic, Thailand and Viet Nam. China has also taken significant steps to open transport routes through major border crossings with Mongolia and Viet Nam.22
Progress can also be seen among member States of the Shanghai Cooperation Organization, which are finalizing a draft agreement on facilitating international road transport.23 Initially, about 15,500 km of roads are to be opened under this agreement, including a road from Lianyungang, China, to Saint Petersburg, Russian Federation. Also under the agreement, two seaports in China and the Russian Federation
will eventually be accessible for transit traffic from Central Asia.
In the case of railways, cross-border movements are often hampered by institutional differences in operating rules, tariff structures and licensing requirements for train drivers and crew. However, there are also examples of how countries can cooperate to provide regular and competitive international railway services. These include the long-running Trans-Siberian Railway linking the Russian Federation, Mongolia and China to the Far East and Europe; the Economic Cooperation Organization container block train between Istanbul (Turkey), Tehran and Islamabad; and the Chongqing-Xinjiang-Europe railway service between China and Germany via Kazakhstan, the Russian Federation, Belarus and Poland.24 ESCAP is now developing a draft regional strategic framework for the facilitation of rail in the region, which will identify and address the current obstacles to cross-border rail freight movements.
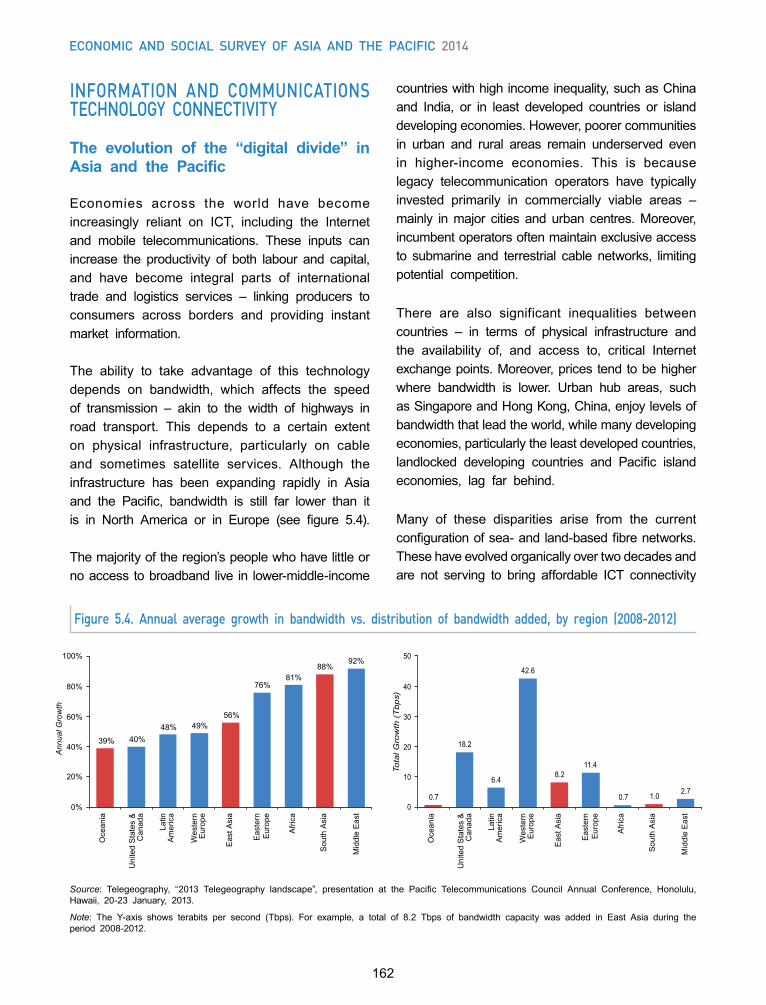
162
Economic and social survEy of asia and thE pacific 2014
INFORMATION AND COMMUNICATIONS TECHNOLOGY CONNECTIVITY
The evolution of the “digital divide” in Asia and the Pacific
Economies across the world have become increasingly reliant on ICT, including the Internet and mobile telecommunications. These inputs can increase the productivity of both labour and capital, and have become integral parts of international trade and logistics services – linking producers to consumers across borders and providing instant market information.
The ability to take advantage of this technology depends on bandwidth, which affects the speed of transmission – akin to the width of highways in road transport. This depends to a certain extent on physical infrastructure, particularly on cable and sometimes satellite services. Although the infrastructure has been expanding rapidly in Asia and the Pacific, bandwidth is still far lower than it is in North America or in Europe (see figure 5.4).
The majority of the region’s people who have little or no access to broadband live in lower-middle-income
countries with high income inequality, such as China and India, or in least developed countries or island developing economies. However, poorer communities in urban and rural areas remain underserved even in higher-income economies. This is because legacy telecommunication operators have typically invested primarily in commercially viable areas – mainly in major cities and urban centres. Moreover, incumbent operators often maintain exclusive access to submarine and terrestrial cable networks, limiting potential competition.
There are also significant inequalities between countries – in terms of physical infrastructure and the availability of, and access to, critical Internet exchange points. Moreover, prices tend to be higher where bandwidth is lower. Urban hub areas, such as Singapore and Hong Kong, China, enjoy levels of bandwidth that lead the world, while many developing economies, particularly the least developed countries, landlocked developing countries and Pacific island economies, lag far behind.
Many of these disparities arise from the current configuration of sea- and land-based fibre networks. These have evolved organically over two decades and are not serving to bring affordable ICT connectivity
Figure 5.4. Annual average growth in bandwidth vs. distribution of bandwidth added, by region (2008-2012)
Source: Telegeography, “2013 Telegeography landscape”, presentation at the Pacific Telecommunications Council Annual Conference, Honolulu, Hawaii, 20-23 January, 2013.
Note: The Y-axis shows terabits per second (Tbps). For example, a total of 8.2 Tbps of bandwidth capacity was added in East Asia during the period 2008-2012.
39% 40% 48% 49%
56%
76% 81%
88% 92%
0%
20%
40%
60%
80%
100%
Oce
ania
Eas
t Asi
a
Afri
ca
Sou
th A
sia
Mid
dle
Eas
t
Ann
ual G
row
th
Uni
ted
Sta
tes
&C
anad
a
Latin
Am
eric
a
Wes
tern
Eur
ope
Eas
tern
Eur
ope
0.7
18.2
6.4
42.6
8.2 11.4
0.7 1.0 2.7
0
10
20
30
40
50
Tota
l Gro
wth
(T
bps)
Oce
ania
Eas
t Asi
a
Afri
ca
Sou
th A
sia
Mid
dle
Eas
t
Uni
ted
Sta
tes
&C
anad
a
Latin
Am
eric
a
Wes
tern
Eur
ope
Eas
tern
Eur
ope
163
REGIONAL STRATEGIES FOR STRENGTHENING REGIONAL CONNECTIVITY CHAPTER 5
to all. There are, for example, insufficient land-based routes for international Internet traffic in Asia and the Pacific, so the region’s traffic is exchanged through submarine cables, and routings that are based on hub-and-spoke configurations. In East Asia, for example, key hubs are Hong Kong, China; Singapore; and Tokyo, or further afield in the United States of America. Thus, international network traffic must pass through multiple Internet exchange points.
Since the Asian and Pacific region relies heavily on submarine cables, it is also vulnerable to natural disasters, marine vessel accidents and even sabotage. For example, in 2009, Typhoon Morakot and a subsequent undersea earthquake damaged at least eight submarine cables and adversely affected voice and data traffic across South-East Asia, as well as in China, India and Japan. The overreliance of the region on submarine cables makes it more vulnerable to extreme weather events and natural disasters, which have been increasing in frequency and potency over the past decade.
Towards an Asia-Pacific information superhighway
In this regard, ESCAP has recently begun promoting the concept of an Asia-Pacific information super- highway: a cohesive “meshed” terrestrial fibre optic network for the region that would provide cost-effective broadband access on both an intraregional and intercontinental basis. A continent-wide terrestrial fibre optic network would complement the existing submarine cable networks.
A meshed network would not only bridge Asia’s vast landmass with competitive points of Internet access in Europe, it would also reduce the impact of outages from undersea cable accidents and natural disasters and open up opportunities for value added services. By linking Asia to Europe, the proposed Asia-Pacific information superhighway would enhance the physical ICT connectivity of landlocked countries that are located thousands of kilometres from undersea cables, while competition introduced by the network could lower the cost of
international bandwidth and provide Governments with incentives to liberalize international gateways.
The development of an Asia-Pacific information superhighway is a complex process requiring very close collaboration between member States, as well as with private sector partners and international organizations. While more work needs to be done to develop a concrete road map, ESCAP has identified the following principles that should underpin any regional strategy:
• The network should be fully integrated and coherent. It should provide robust cross-border connectivity across the continent, with a particular focus on reaching rural and less commercially profitable areas. A mesh configuration would allow for in-network healing in the event of physical cable outages or political instability that may affect network connectivity in individual countries.
• The network should be of uniform quality. Currently, some terrestrial networks are patchworks of domestic telecom networks, which provide variable quality and offer vastly different terms and service guarantees. A single uniform network with standard terms and quality of service would alleviate these problems.
• The network should leverage existing infrastructure. In order to remain cost effective, any pan-Asian terrestrial network would need to be based on the streamlined procurement of rights of way, as well as on uniform construction techniques and parameters. This could be realized through a partnership with existing long-distance infrastructure networks, such as the Asian Highway, the Trans-Asian Railway or power transmission networks. The proposed Asia-Pacific information superhighway could also build partnerships with ongoing and planned terrestrial links, such as the Trans-Eurasian Information Superhighway.
• The network must be cost-effective. If constructed on a proper scale in terms of both geographical
164
Economic and social survEy of asia and thE pacific 2014
coverage and transmission capacity, a pan-Asian terrestrial network could effectively compete with submarine infrastructure at both regional and intercontinental levels. In particular, a terrestrial network dimensioned around 100 Gbps transmission technology would benefit from a “last-mover’s advantage” and the recent step changes in 10G and 40G technology.
• The network should be open access and have non-discriminatory pricing. For it to achieve development and policy goals, as well as to best serve the region’s consumers, all purchasers of capacity must be able to access the network on equal, non-discriminatory terms. In an effort to overcome the high price of bandwidth in least developed, landlocked and Pacific island markets, the concept of non-discrimination should also be carried over on a geographical basis so that countries can receive bandwidth at equal prices.
Governments and the private sector could combine their resources and expertise to adopt a lower-risk model. This would involve sharing the investment cost among multiple telecom operators and Governments, on condition that the network be operated on an open-access basis.
Harnessing cross-sectoral synergies for infrastructure development
Given the low level of broadband penetration in continental Asia, there is a tremendous opportunity for Governments to look at synergistic approaches to developing an Asia-Pacific information superhighway. In particular, examples from the national ICT infrastructure development strategies of India, the Republic of Korea and the United States suggest that the “cohabitation” of fibre-optic cables with road and railway infrastructure networks can save on high capital costs and facilitate access to the fibre-optic cable for maintenance and repair (see box 5.5).
Box 5.5. Laying broadband cable along highways and railways
Globally, many countries have started to synchronize the deployment of broadband infrastructure with the new construction or maintenance of roads and railways. In the Republic of Korea, for example, fibre-optic cable infrastructure has been deployed along the highway backbone network. India has also been successful in deploying optical fibre beneath train tracks. As a result, RailTel Corporation of India Ltd. has become one of the region’s largest carrier-neutral telecom infrastructure providers and has deployed 45,000 km of fibre-optic cables, connecting more than 4,500 townships and several rural areas.
Together with the International Telecommunication Union, ESCAP has recently developed Asia-Pacific information superhighway maps, a set of online maps of transmission networks. These interactive maps enable the superimposition of Internet transmission infrastructure, such as fibre-optic cables, on the Asian Highway and the Trans-Asian Railway networks, which thus helps to identify where additional fibre-optic cable segments could be laid along highways and railways.
The figure shown is a screenshot from the International Telecommunication Union website, which currently hosts the online maps. The figures show the border areas between China and Myanmar. Given the probable increase in demand for international Internet Protocol by Myanmar, as well as the need to reinforce redundancy within the ASEAN region, a potentially interesting solution could be to lay optical fibre along planned Trans-Asian Railway tracks or Asian Highway route 3, which runs from Kunming, China, via Jinghong (Yunnan Province), into Mong La (Myanmar). From Mong La, the optical fibre could be linked up with the existing Myanmar network in Kengtung, where it meets existing terrestrial connections that run eastwards into the Lao People’s Democratic Republic and southward into Thailand (along Asian Highway route 2 and missing segments of the Trans-Asian Railway network route). This would create a regional crossroads for optical fibre to reinforce north-south and east-west redundancy in South-East Asia.
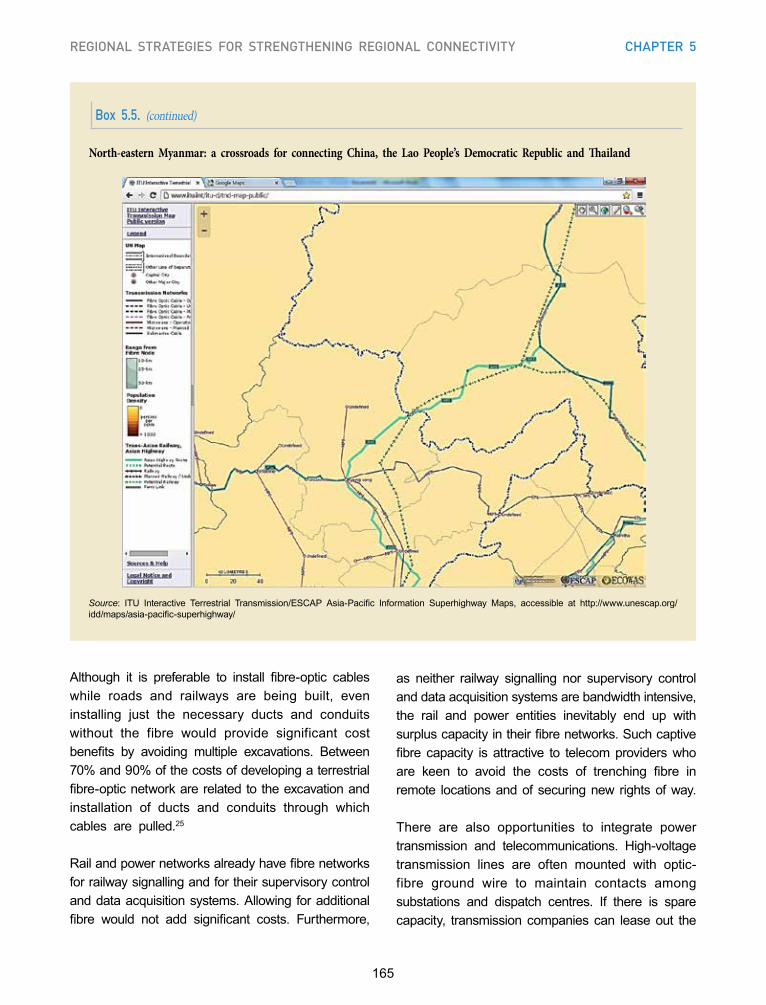
165
REGIONAL STRATEGIES FOR STRENGTHENING REGIONAL CONNECTIVITY CHAPTER 5
Box 5.5. (continued)
Source: ITU Interactive Terrestrial Transmission/ESCAP Asia-Pacific Information Superhighway Maps, accessible at http://www.unescap.org/idd/maps/asia-pacific-superhighway/
North-eastern Myanmar: a crossroads for connecting China, the Lao People’s Democratic Republic and ThailandC
hina
Hon
g K
ong,
Chi
na
Japa
n
Mac
ao,
Chi
na
Mon
golia
Rep
ublic
of
Kor
ea
-2
0
2
4
6
8
10
12
Per
cent
age
2009 2010 2011 2009 2010 2011
Although it is preferable to install fibre-optic cables while roads and railways are being built, even installing just the necessary ducts and conduits without the fibre would provide significant cost benefits by avoiding multiple excavations. Between 70% and 90% of the costs of developing a terrestrial fibre-optic network are related to the excavation and installation of ducts and conduits through which cables are pulled.25
Rail and power networks already have fibre networks for railway signalling and for their supervisory control and data acquisition systems. Allowing for additional fibre would not add significant costs. Furthermore,
as neither railway signalling nor supervisory control and data acquisition systems are bandwidth intensive, the rail and power entities inevitably end up with surplus capacity in their fibre networks. Such captive fibre capacity is attractive to telecom providers who are keen to avoid the costs of trenching fibre in remote locations and of securing new rights of way.
There are also opportunities to integrate power transmission and telecommunications. High-voltage transmission lines are often mounted with optic-fibre ground wire to maintain contacts among substations and dispatch centres. If there is spare capacity, transmission companies can lease out the
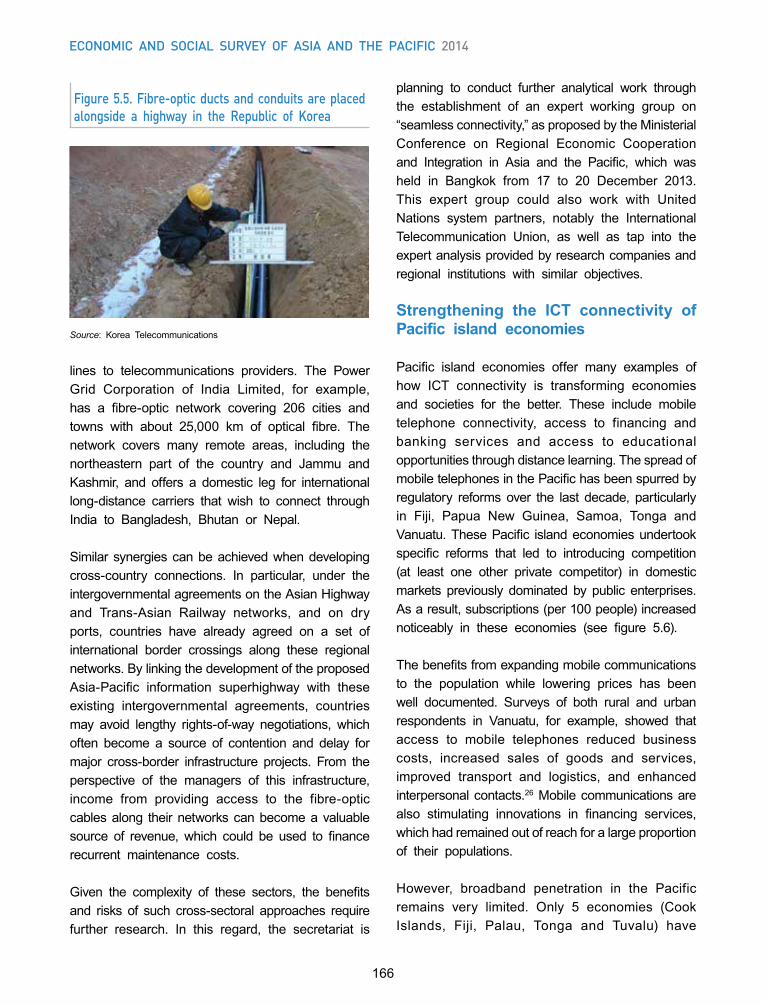
166
Economic and social survEy of asia and thE pacific 2014
lines to telecommunications providers. The Power Grid Corporation of India Limited, for example, has a fibre-optic network covering 206 cities and towns with about 25,000 km of optical fibre. The network covers many remote areas, including the northeastern part of the country and Jammu and Kashmir, and offers a domestic leg for international long-distance carriers that wish to connect through India to Bangladesh, Bhutan or Nepal.
Similar synergies can be achieved when developing cross-country connections. In particular, under the intergovernmental agreements on the Asian Highway and Trans-Asian Railway networks, and on dry ports, countries have already agreed on a set of international border crossings along these regional networks. By linking the development of the proposed Asia-Pacific information superhighway with these existing intergovernmental agreements, countries may avoid lengthy rights-of-way negotiations, which often become a source of contention and delay for major cross-border infrastructure projects. From the perspective of the managers of this infrastructure, income from providing access to the fibre-optic cables along their networks can become a valuable source of revenue, which could be used to finance recurrent maintenance costs.
Given the complexity of these sectors, the benefits and risks of such cross-sectoral approaches require further research. In this regard, the secretariat is
Figure 5.5. Fibre-optic ducts and conduits are placed alongside a highway in the Republic of Korea
Chi
na
Hon
g K
ong,
Chi
na
Japa
n
Mac
ao,
Chi
na
Mon
golia
Rep
ublic
of
Kor
ea
-2
0
2
4
6
8
10
12
Per
cent
age
2009 2010 2011 2009 2010 2011
Source: Korea Telecommunications
planning to conduct further analytical work through the establishment of an expert working group on “seamless connectivity,” as proposed by the Ministerial Conference on Regional Economic Cooperation and Integration in Asia and the Pacific, which was held in Bangkok from 17 to 20 December 2013. This expert group could also work with United Nations system partners, notably the International Telecommunication Union, as well as tap into the expert analysis provided by research companies and regional institutions with similar objectives.
Strengthening the ICT connectivity of Pacific island economies
Pacific island economies offer many examples of how ICT connectivity is transforming economies and societies for the better. These include mobile telephone connectivity, access to financing and banking services and access to educational opportunities through distance learning. The spread of mobile telephones in the Pacific has been spurred by regulatory reforms over the last decade, particularly in Fiji, Papua New Guinea, Samoa, Tonga and Vanuatu. These Pacific island economies undertook specific reforms that led to introducing competition (at least one other private competitor) in domestic markets previously dominated by public enterprises. As a result, subscriptions (per 100 people) increased noticeably in these economies (see figure 5.6).
The benefits from expanding mobile communications to the population while lowering prices has been well documented. Surveys of both rural and urban respondents in Vanuatu, for example, showed that access to mobile telephones reduced business costs, increased sales of goods and services, improved transport and logistics, and enhanced interpersonal contacts.26 Mobile communications are also stimulating innovations in financing services, which had remained out of reach for a large proportion of their populations.
However, broadband penetration in the Pacific remains very limited. Only 5 economies (Cook Islands, Fiji, Palau, Tonga and Tuvalu) have
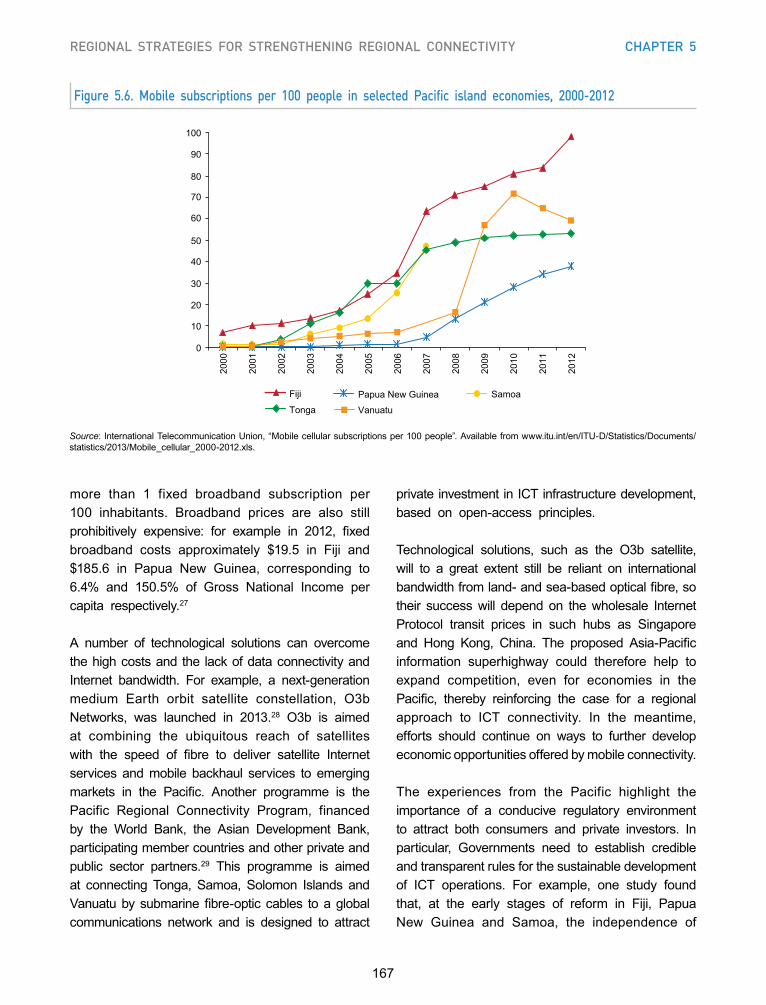
167
REGIONAL STRATEGIES FOR STRENGTHENING REGIONAL CONNECTIVITY CHAPTER 5
Figure 5.6. Mobile subscriptions per 100 people in selected Pacific island economies, 2000-2012
Source: International Telecommunication Union, “Mobile cellular subscriptions per 100 people”. Available from www.itu.int/en/ITU-D/Statistics/Documents/statistics/2013/Mobile_cellular_2000-2012.xls.
0
10
20
30
40
50
60
70
80
90
100
2000
2001
2002
2003
2004
2005
2006
2007
2008
2009
2010
2011
2012
Fiji Samoa
Vanuatu Tonga Papua New Guinea
more than 1 fixed broadband subscription per 100 inhabitants. Broadband prices are also still prohibitively expensive: for example in 2012, fixed broadband costs approximately $19.5 in Fiji and $185.6 in Papua New Guinea, corresponding to 6.4% and 150.5% of Gross National Income per capita respectively.27
A number of technological solutions can overcome the high costs and the lack of data connectivity and Internet bandwidth. For example, a next-generation medium Earth orbit satellite constellation, O3b Networks, was launched in 2013.28 O3b is aimed at combining the ubiquitous reach of satellites with the speed of fibre to deliver satellite Internet services and mobile backhaul services to emerging markets in the Pacific. Another programme is the Pacific Regional Connectivity Program, financed by the World Bank, the Asian Development Bank, participating member countries and other private and public sector partners.29 This programme is aimed at connecting Tonga, Samoa, Solomon Islands and Vanuatu by submarine fibre-optic cables to a global communications network and is designed to attract
private investment in ICT infrastructure development, based on open-access principles.
Technological solutions, such as the O3b satellite, will to a great extent still be reliant on international bandwidth from land- and sea-based optical fibre, so their success will depend on the wholesale Internet Protocol transit prices in such hubs as Singapore and Hong Kong, China. The proposed Asia-Pacific information superhighway could therefore help to expand competition, even for economies in the Pacific, thereby reinforcing the case for a regional approach to ICT connectivity. In the meantime, efforts should continue on ways to further develop economic opportunities offered by mobile connectivity.
The experiences from the Pacific highlight the importance of a conducive regulatory environment to attract both consumers and private investors. In particular, Governments need to establish credible and transparent rules for the sustainable development of ICT operations. For example, one study found that, at the early stages of reform in Fiji, Papua New Guinea and Samoa, the independence of
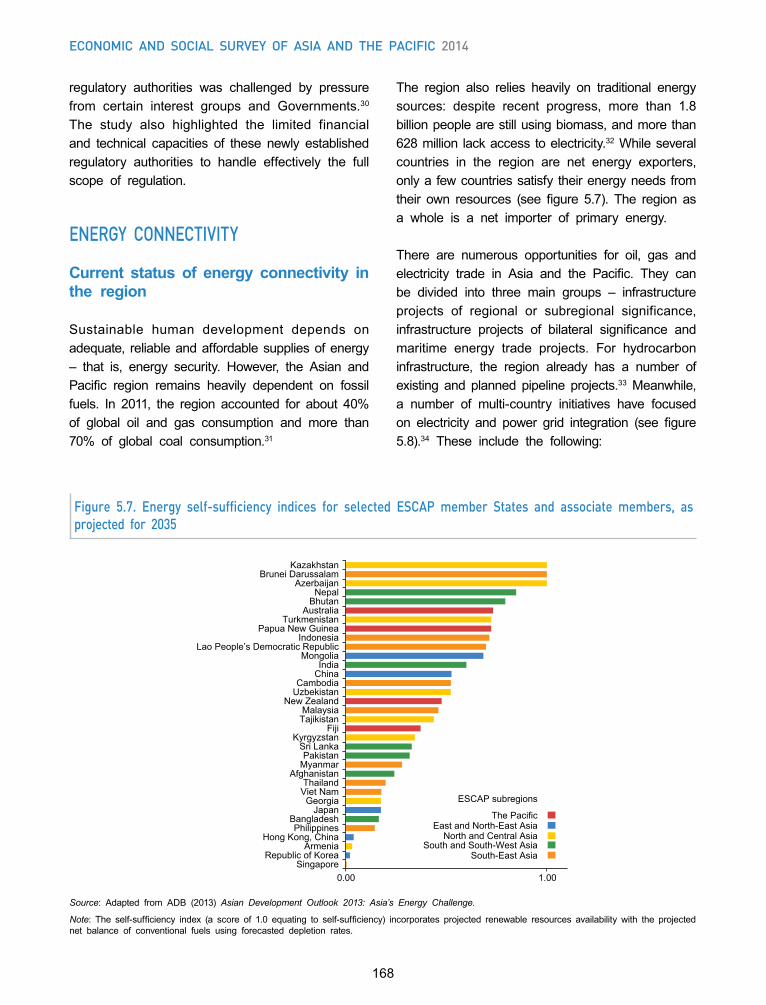
168
Economic and social survEy of asia and thE pacific 2014
regulatory authorities was challenged by pressure from certain interest groups and Governments.30 The study also highlighted the limited financial and technical capacities of these newly established regulatory authorities to handle effectively the full scope of regulation.
ENERGY CONNECTIVITY
Current status of energy connectivity in the region
Sustainable human development depends on adequate, reliable and affordable supplies of energy – that is, energy security. However, the Asian and Pacific region remains heavily dependent on fossil fuels. In 2011, the region accounted for about 40% of global oil and gas consumption and more than 70% of global coal consumption.31
The region also relies heavily on traditional energy sources: despite recent progress, more than 1.8 billion people are still using biomass, and more than 628 million lack access to electricity.32 While several countries in the region are net energy exporters, only a few countries satisfy their energy needs from their own resources (see figure 5.7). The region as a whole is a net importer of primary energy.
There are numerous opportunities for oil, gas and electricity trade in Asia and the Pacific. They can be divided into three main groups – infrastructure projects of regional or subregional significance, infrastructure projects of bilateral significance and maritime energy trade projects. For hydrocarbon infrastructure, the region already has a number of existing and planned pipeline projects.33 Meanwhile, a number of multi-country initiatives have focused on electricity and power grid integration (see figure 5.8).34 These include the following:
Figure 5.7. Energy self-sufficiency indices for selected ESCAP member States and associate members, as projected for 2035
0.00 1.00 Singapore
Republic of KoreaArmenia
Hong Kong, ChinaPhilippines
BangladeshJapan
GeorgiaViet NamThailand
AfghanistanMyanmarPakistan
Sri LankaKyrgyzstan
FijiTajikistanMalaysia
New ZealandUzbekistanCambodia
ChinaIndia
MongoliaLao People’s Democratic Republic
IndonesiaPapua New Guinea
TurkmenistanAustralia
BhutanNepal
AzerbaijanBrunei Darussalam
Kazakhstan
The PacificEast and North-East Asia
North and Central AsiaSouth and South-West Asia
South-East Asia
ESCAP subregions
Source: Adapted from ADB (2013) Asian Development Outlook 2013: Asia’s Energy Challenge.
Note: The self-sufficiency index (a score of 1.0 equating to self-sufficiency) incorporates projected renewable resources availability with the projected net balance of conventional fuels using forecasted depletion rates.
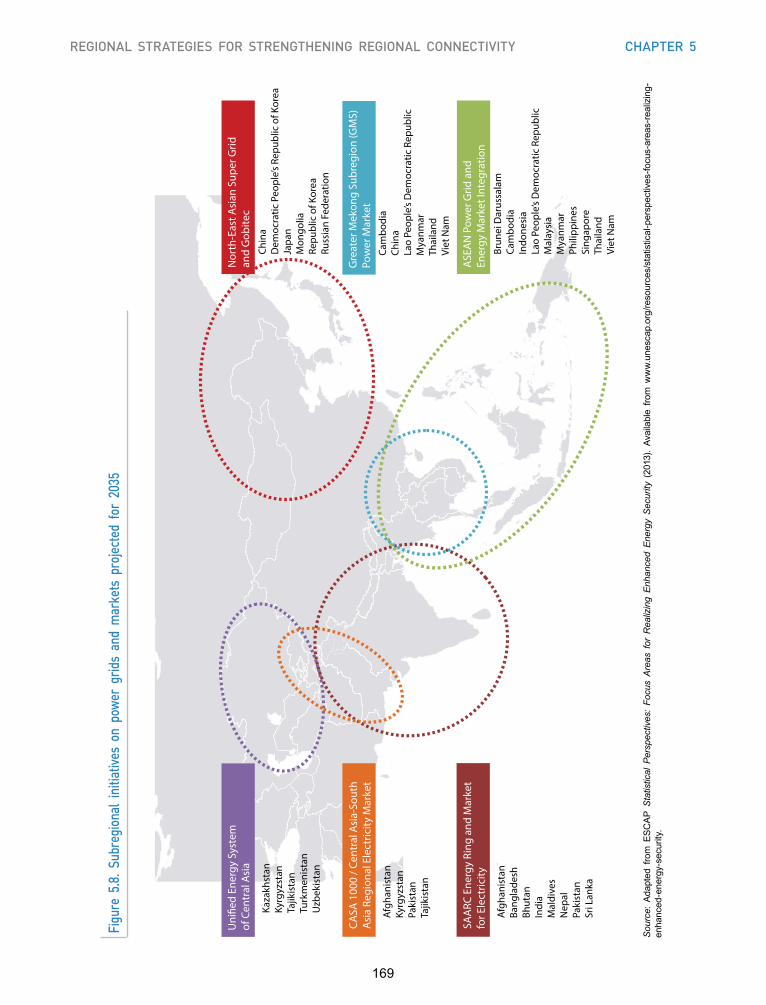
169
REGIONAL STRATEGIES FOR STRENGTHENING REGIONAL CONNECTIVITY CHAPTER 5
Figu
re 5
.8. S
ubre
gion
al in
itiat
ives
on p
ower
grid
s an
d m
arke
ts p
roje
cted
for
203
5
Afg
hani
stan
Bang
lade
sh
Bh
utan
Indi
aM
aldi
ves
Nep
alPa
kist
anSr
i Lan
ka
SAA
RC E
nerg
y Ri
ng a
nd M
arke
t fo
r Ele
ctric
ity
CASA
100
0 / C
entr
al A
sia-
Sout
h A
sia
Regi
onal
Ele
ctric
ity M
arke
t
Afg
hani
stan
Kyrg
yzst
anPa
kist
an
Tajik
ista
n
Kaza
khst
anKy
rgyz
stan
Tajik
ista
nTu
rkm
enis
tan
Uzb
ekis
tan
Uni
�ed
Ener
gy S
yste
m
of C
entr
al A
sia
Gre
ater
Mek
ong
Subr
egio
n (G
MS)
Po
wer
Mar
ket
Cam
bodi
a Ch
ina
La
o Pe
ople
’s D
emoc
ratic
Rep
ublic
M
yanm
arTh
aila
nd
Viet
Nam
Brun
ei D
arus
sala
mCa
mbo
dia
Indo
nesi
aLa
o Pe
ople
’s D
emoc
ratic
Rep
ublic
M
alay
sia
Mya
nmar
Ph
ilipp
ines
Si
ngap
ore
Thai
land
Viet
Nam
ASE
AN
Pow
er G
rid a
nd
Ener
gy M
arke
t Int
egra
tion
Chin
aD
emoc
ratic
Peo
ple’
s Re
publ
ic o
f Kor
eaJa
pan
Mon
golia
Re
publ
ic o
f Kor
ea
Russ
ian
Fede
ratio
n
Nor
th-E
ast A
sian
Sup
er G
rid
and
Gob
itec
Sou
rce:
Ada
pted
fro
m E
SCA
P S
tatis
tical
Per
spec
tives
: Fo
cus
Area
s fo
r R
ealiz
ing
Enha
nced
Ene
rgy
Sec
urity
(20
13).
Avai
labl
e fro
m w
ww
.une
scap
.org
/reso
urce
s/st
atis
tical
-per
spec
tives
-focu
s-ar
eas-
real
izin
g-en
hanc
ed-e
nerg
y-se
curit
y.
170
Economic and social survEy of asia and thE pacific 2014
• ASEAN Power Grid – An intergovernmental programme that has been optimizing energy trading opportunities within the region since the 1990s. Identified power interconnections are at various stages of progression.
• CASA-1000 – This flagship project for the Central Asia-South Asia Regional Electricity Market will use surplus hydropower from Kyrgyzstan and Tajikistan to meet power deficits in Afghanistan and Pakistan.
• Greater Mekong Subregion Power Market – This programme has identified opportunities for an integrated regional electricity market to align available supplies with demand requirements.
• SAARC Market for Electricity – This is a main component of the South Asian Association for Regional Cooperation (SAARC) Energy Ring, an intergovernmental programme to reduce power supply disruptions and delivery.
• Gobitec and an Asian super grid for renewable energies in North-East Asia – In North-East Asia there are multiple initiatives to utilize super grids to align abundant renewable supplies in the Gobi desert with demand in East Asia (see also box 5.6).
• Unified Energy System of Central Asia – Built in the 1970s in the former Union of Soviet Socialist Republics, the Unified Energy System network is a synchronous grid extending across the Russian Federation and Central Asian countries.
Countries in the region are using these initiatives to address energy supply imbalances and to improve the reliability of electricity distribution. However, most are based on unilateral or bilateral trading arrangements. Countries have yet to realize the economies of scale that would come from linking these subregional initiatives through a regional energy cooperation framework.
Towards an Asian Energy Highway
The region’s energy security could be enhanced by promoting cooperation between the region’s energy importers and energy exporters – by harmonizing policies and by exchanging knowledge, particularly
in the areas of energy efficiency and renewable energy technologies. This would not only lead to better physical connectivity between countries but also promote institutional cooperation, including the development of financial energy markets.
A regional energy arrangement could also explore low-carbon paths that place more emphasis on efficiency and take greater advantage of renewable resources. In addition, it could develop deep, liquid and transparent markets for crude oil, petroleum products and gas – while giving a higher priority to pipeline security and safety.
The region’s energy security could be enhanced by promoting
energy cooperation like the Asian Energy Highway
To move in this direction, in 2012 ESCAP member States accepted the concept of an integrated regional power grid, which could be termed the “Asian Energy Highway.”35 The highway would involve an integrated electricity grid based on a range of primary energy sources, whether fossil fuels, nuclear sources or renewables. The following encouraging developments are making such an integrated grid more feasible:• Several mutually beneficial power-trading
arrangements are progressing at various levels of subregional integration.
• High-voltage transmission systems, in particular high-voltage direct current (HVDC) systems, are improving the economic range for interconnecting power grids and unlocking access to remote energy resources. HVDC transmission systems are becoming cost competitive with more conventional modes of energy resource transportation – by rail, road and pipelines.
• “Smart grid” communication and management technologies are providing opportunities for improved load balancing and enabling greater optimization of energy flows. These are also more capable of absorbing intermittent renewable energy resources, such as solar and wind.
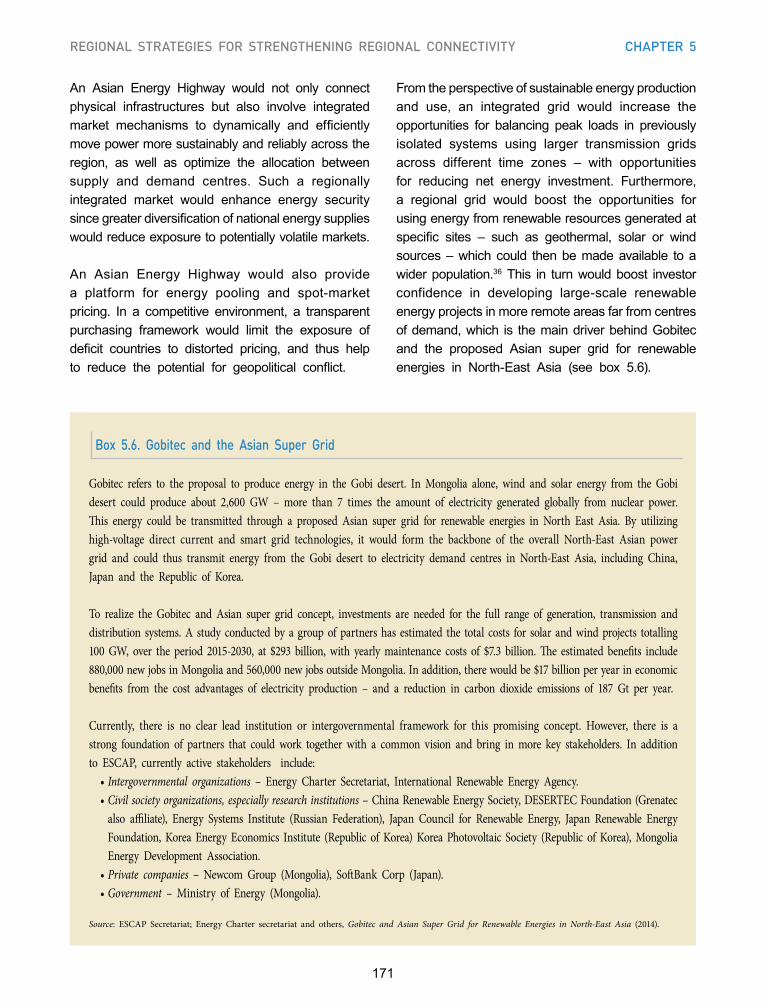
171
REGIONAL STRATEGIES FOR STRENGTHENING REGIONAL CONNECTIVITY CHAPTER 5
Box 5.6. Gobitec and the Asian Super Grid
Gobitec refers to the proposal to produce energy in the Gobi desert. In Mongolia alone, wind and solar energy from the Gobi desert could produce about 2,600 GW – more than 7 times the amount of electricity generated globally from nuclear power. This energy could be transmitted through a proposed Asian super grid for renewable energies in North East Asia. By utilizing high-voltage direct current and smart grid technologies, it would form the backbone of the overall North-East Asian power grid and could thus transmit energy from the Gobi desert to electricity demand centres in North-East Asia, including China, Japan and the Republic of Korea.
To realize the Gobitec and Asian super grid concept, investments are needed for the full range of generation, transmission and distribution systems. A study conducted by a group of partners has estimated the total costs for solar and wind projects totalling 100 GW, over the period 2015-2030, at $293 billion, with yearly maintenance costs of $7.3 billion. The estimated benefits include 880,000 new jobs in Mongolia and 560,000 new jobs outside Mongolia. In addition, there would be $17 billion per year in economic benefits from the cost advantages of electricity production – and a reduction in carbon dioxide emissions of 187 Gt per year.
Currently, there is no clear lead institution or intergovernmental framework for this promising concept. However, there is a strong foundation of partners that could work together with a common vision and bring in more key stakeholders. In addition to ESCAP, currently active stakeholders include: •Intergovernmental organizations – Energy Charter Secretariat, International Renewable Energy Agency. •Civil society organizations, especially research institutions – China Renewable Energy Society, DESERTEC Foundation (Grenatec also affiliate), Energy Systems Institute (Russian Federation), Japan Council for Renewable Energy, Japan Renewable Energy Foundation, Korea Energy Economics Institute (Republic of Korea) Korea Photovoltaic Society (Republic of Korea), Mongolia Energy Development Association. •Private companies – Newcom Group (Mongolia), SoftBank Corp (Japan). •Government – Ministry of Energy (Mongolia).
Source: ESCAP Secretariat; Energy Charter secretariat and others, Gobitec and Asian Super Grid for Renewable Energies in North-East Asia (2014).
An Asian Energy Highway would not only connect physical infrastructures but also involve integrated market mechanisms to dynamically and efficiently move power more sustainably and reliably across the region, as well as optimize the allocation between supply and demand centres. Such a regionally integrated market would enhance energy security since greater diversification of national energy supplies would reduce exposure to potentially volatile markets.
An Asian Energy Highway would also provide a platform for energy pooling and spot-market pricing. In a competitive environment, a transparent purchasing framework would limit the exposure of deficit countries to distorted pricing, and thus help to reduce the potential for geopolitical conflict.
From the perspective of sustainable energy production and use, an integrated grid would increase the opportunities for balancing peak loads in previously isolated systems using larger transmission grids across different time zones – with opportunities for reducing net energy investment. Furthermore, a regional grid would boost the opportunities for using energy from renewable resources generated at specific sites – such as geothermal, solar or wind sources – which could then be made available to a wider population.36 This in turn would boost investor confidence in developing large-scale renewable energy projects in more remote areas far from centres of demand, which is the main driver behind Gobitec and the proposed Asian super grid for renewable energies in North-East Asia (see box 5.6).
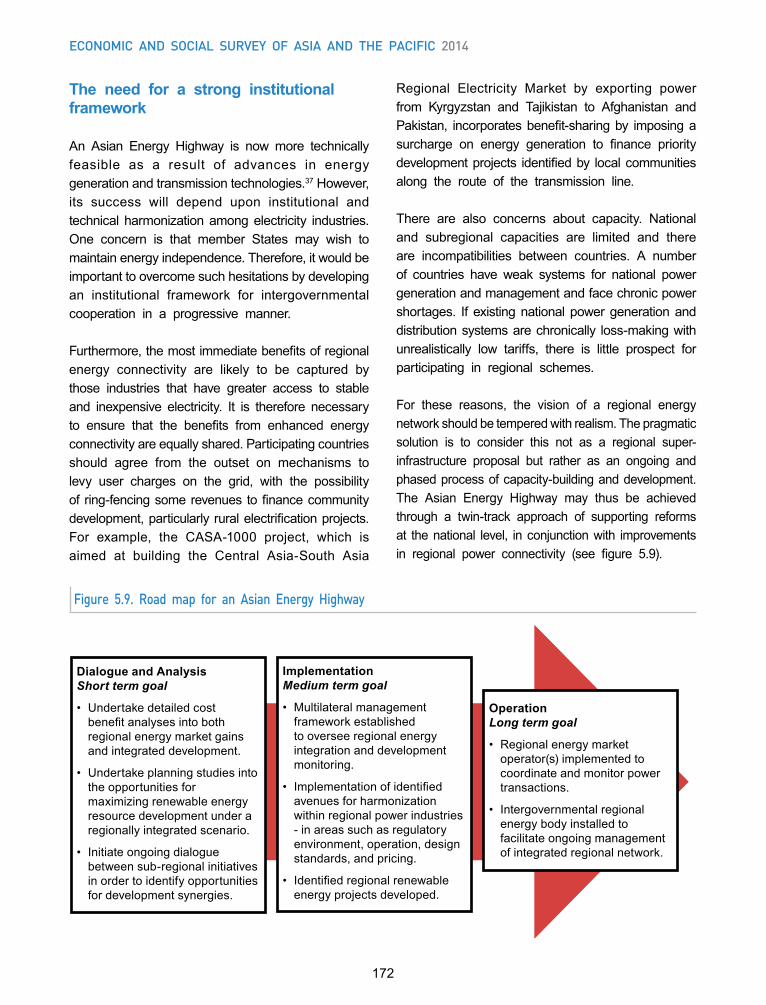
172
Economic and social survEy of asia and thE pacific 2014
The need for a strong institutional framework
An Asian Energy Highway is now more technically feasible as a result of advances in energy generation and transmission technologies.37 However, its success will depend upon institutional and technical harmonization among electricity industries. One concern is that member States may wish to maintain energy independence. Therefore, it would be important to overcome such hesitations by developing an institutional framework for intergovernmental cooperation in a progressive manner.
Furthermore, the most immediate benefits of regional energy connectivity are likely to be captured by those industries that have greater access to stable and inexpensive electricity. It is therefore necessary to ensure that the benefits from enhanced energy connectivity are equally shared. Participating countries should agree from the outset on mechanisms to levy user charges on the grid, with the possibility of ring-fencing some revenues to finance community development, particularly rural electrification projects. For example, the CASA-1000 project, which is aimed at building the Central Asia-South Asia
Regional Electricity Market by exporting power from Kyrgyzstan and Tajikistan to Afghanistan and Pakistan, incorporates benefit-sharing by imposing a surcharge on energy generation to finance priority development projects identified by local communities along the route of the transmission line.
There are also concerns about capacity. National and subregional capacities are limited and there are incompatibilities between countries. A number of countries have weak systems for national power generation and management and face chronic power shortages. If existing national power generation and distribution systems are chronically loss-making with unrealistically low tariffs, there is little prospect for participating in regional schemes.
For these reasons, the vision of a regional energy network should be tempered with realism. The pragmatic solution is to consider this not as a regional super-infrastructure proposal but rather as an ongoing and phased process of capacity-building and development. The Asian Energy Highway may thus be achieved through a twin-track approach of supporting reforms at the national level, in conjunction with improvements in regional power connectivity (see figure 5.9).
Chi
na
Hon
g K
ong,
Chi
na
Japa
n
Mac
ao,
Chi
na
Mon
golia
Rep
ublic
of
Kor
ea
-2
0
2
4
6
8
10
12
Per
cent
age
2009 2010 2011 2009 2010 2011
Dialogue and Analysis Short term goal
• Undertake detailed cost benefit analyses into both regional energy market gains and integrated development.
• Undertake planning studies into the opportunities for maximizing renewable energy resource development under a regionally integrated scenario.
• Initiate ongoing dialogue between sub-regional initiatives in order to identify opportunities for development synergies.
Operation Long term goal
• Regional energy market operator(s) implemented to coordinate and monitor power transactions.
• Intergovernmental regional energy body installed to facilitate ongoing management of integrated regional network.
Implementation Medium term goal
• Multilateral management framework established to oversee regional energy integration and development monitoring.
• Implementation of identified avenues for harmonization within regional power industries - in areas such as regulatory environment, operation, design standards, and pricing.
• Identified regional renewable energy projects developed.
Figure 5.9. Road map for an Asian Energy Highway
173
REGIONAL STRATEGIES FOR STRENGTHENING REGIONAL CONNECTIVITY CHAPTER 5
Nevertheless, it is important to ensure that near-term investments are compatible with a longer-term agenda of integration. Countries can reduce development costs and improve environmental performance by identifying at an early stage the opportunities for harmonization – in areas such as the regulatory environment, operation and design standards, energy pricing and ultimately development planning.
PEOPLE-TO-PEOPLE CONNECTIVITY
Increasing mobility in the ESCAP region
One of the most evident signs of connectivity in the ESCAP region is the movement of people across national borders. Whether it be for work, study, business or other purposes, international migration is an issue of concern for both countries of origin and countries of destination because it involves people’s lives and welfare. In many countries in the ESCAP region, migrants are not officially recognized. Existing national governance structures do not have well-defined spaces that delineate the relationship between government responsibilities and the rights and obligations of public citizenship.
International labour migration brings many benefits but also new risks
However, with increasing regional connectivity, it can be expected that the movement of people across national borders will increase. Furthermore, the region is undergoing a dramatic demographic transition, with some countries ageing so rapidly that their populations are expected to shrink, while others have a large youth population concentrated in prime employment ages.
Given that inclusive and sustainable human develop-ment is ultimately about widening people’s capabilities and opportunities, increased and better-managed international migration is an opportunity for the people of the ESCAP region to take advantage
Chi
na
Hon
g K
ong,
Chi
na
Japa
n
Mac
ao,
Chi
na
Mon
golia
Rep
ublic
of
Kor
ea
-2
0
2
4
6
8
10
12
Per
cent
age
2009 2010 2011 2009 2010 2011
of the region’s economic growth and to enhance their skills, training and knowledge. In this regard, it is necessary to consider a broad range of policy options for facilitating the movement of people, while also minimizing the potential negative impacts. Some frameworks for facilitating and managing the flow of people already exist. For example, under the ASEAN people-to-people connectivity framework, member States are planning ways to enhance tourism, education and cultural exchanges.38
Benefits and challenges of international labour migration
Increased regional mobility through managed, and sometimes temporary, labour migration can lead to shared prosperity in the region by addressing labour market needs, improving skills acquisition and serving as a risk mitigation strategy for households. A large part of the quantitative evidence on the benefits of shared prosperity that both countries of origin and countries of destination gain through migration is focused squarely on labour migration. This section therefore centres on international migration for the purpose of employment, as migration flows primarily driven by other factors may lie outside the scope of the present publication.
In Asia and the Pacific, international migration flows in recent years have predominately comprised temporary labour migrants. Figure 5.10 shows the number of temporary migrant workers deployed from the region’s main countries of origin, namely Bangladesh, India, Indonesia, Nepal, Pakistan, the Philippines, Sri Lanka and Thailand. If maritime workers are included, the Philippines deployed 1.2 million migrant workers in 2010. India and Indonesia have regularly deployed more than half a million workers annually in recent years. Large proportions of these deployments are directed to countries of the Gulf Cooperation Council, Jordan and Lebanon. However, many countries in the region, such as Thailand, are simultaneously origin, destination and transit countries for migrants. The volume of temporary labour migration flows indicates that the recruitment and placement of Asian and Pacific migrant workers is a large industry in itself.
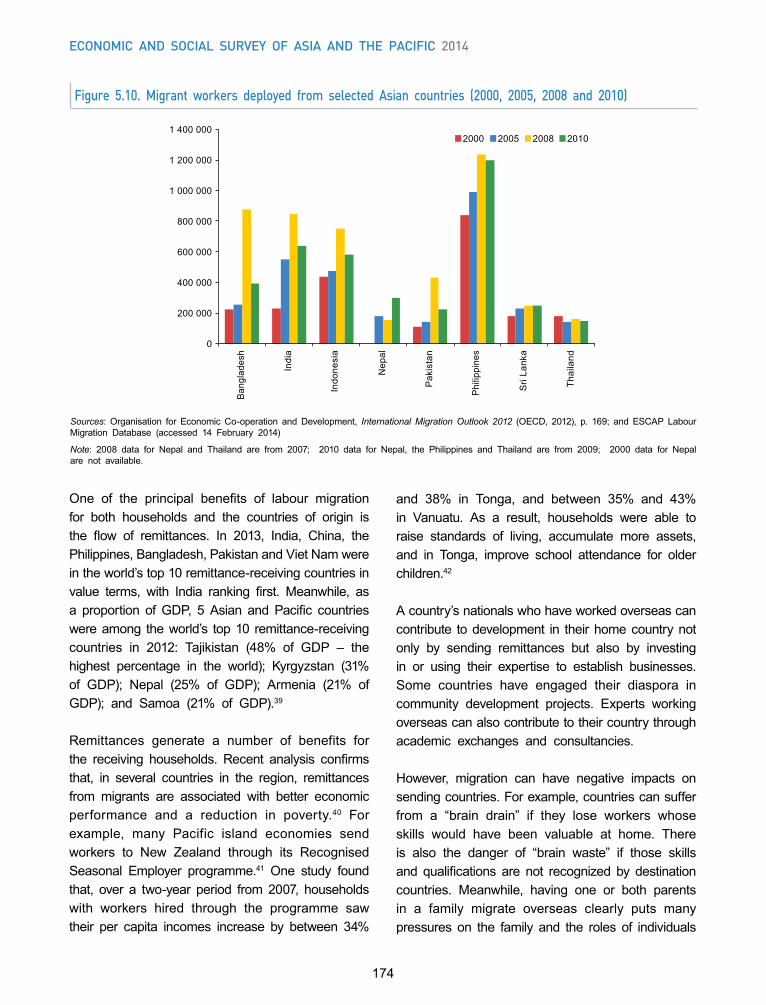
174
Economic and social survEy of asia and thE pacific 2014
One of the principal benefits of labour migration for both households and the countries of origin is the flow of remittances. In 2013, India, China, the Philippines, Bangladesh, Pakistan and Viet Nam were in the world’s top 10 remittance-receiving countries in value terms, with India ranking first. Meanwhile, as a proportion of GDP, 5 Asian and Pacific countries were among the world’s top 10 remittance-receiving countries in 2012: Tajikistan (48% of GDP – the highest percentage in the world); Kyrgyzstan (31% of GDP); Nepal (25% of GDP); Armenia (21% of GDP); and Samoa (21% of GDP).39
Remittances generate a number of benefits for the receiving households. Recent analysis confirms that, in several countries in the region, remittances from migrants are associated with better economic performance and a reduction in poverty.40 For example, many Pacific island economies send workers to New Zealand through its Recognised Seasonal Employer programme.41 One study found that, over a two-year period from 2007, households with workers hired through the programme saw their per capita incomes increase by between 34%
Figure 5.10. Migrant workers deployed from selected Asian countries (2000, 2005, 2008 and 2010)
Sources: Organisation for Economic Co-operation and Development, International Migration Outlook 2012 (OECD, 2012), p. 169; and ESCAP Labour Migration Database (accessed 14 February 2014)
Note: 2008 data for Nepal and Thailand are from 2007; 2010 data for Nepal, the Philippines and Thailand are from 2009; 2000 data for Nepal are not available.
0
200 000
400 000
600 000
800 000
1 000 000
1 200 000
1 400 000
Bang
lade
sh
Indi
a
Indo
nesi
a
Nep
al
Pak
ista
n
Phili
ppin
es
Sri
Lank
a
Thai
land
2000 2005 2008 2010
and 38% in Tonga, and between 35% and 43% in Vanuatu. As a result, households were able to raise standards of living, accumulate more assets, and in Tonga, improve school attendance for older children.42
A country’s nationals who have worked overseas can contribute to development in their home country not only by sending remittances but also by investing in or using their expertise to establish businesses. Some countries have engaged their diaspora in community development projects. Experts working overseas can also contribute to their country through academic exchanges and consultancies.
However, migration can have negative impacts on sending countries. For example, countries can suffer from a “brain drain” if they lose workers whose skills would have been valuable at home. There is also the danger of “brain waste” if those skills and qualifications are not recognized by destination countries. Meanwhile, having one or both parents in a family migrate overseas clearly puts many pressures on the family and the roles of individuals
175
REGIONAL STRATEGIES FOR STRENGTHENING REGIONAL CONNECTIVITY CHAPTER 5
in it. High-quality research on these impacts is limited, however, and has yielded mixed results.43
At the receiving end, destination countries generally benefit significantly from labour migration. At various points in time, high-income countries in the region, such as Australia, Brunei Darussalam, Japan, New Zealand, the Republic of Korea and Singapore, have filled gaps in their labour markets with migrant workers. Several studies document the key role of labour migration in GDP growth in Singapore, suggesting that this growth would not have been possible in the absence of migrants because employment growth outstripped the national labour supply.44
As migrant flows increase, social protection for migrants is becoming an urgent issue
Middle-income countries have also seen an increasing demand for foreign workers. In Malaysia, Maldives and Thailand, for example, the construction, manufacturing, tourism and several other sectors depend heavily on foreign labour. In certain industries, increasing the supply of labour through the employment of migrant workers can also help to keep wages relatively low, thus maintaining a country’s competitiveness.
The rapid growth of labour migration flows in the region has raised the issue of social protection, including access to health care and reproductive health services, and income security. Social protection schemes are often limited to the formal sector and the non-migrant population, while those workers who are covered by social protection schemes in their countries of origin may lose their entitlements once they take up residence in a new country. A particular challenge to women migrants is the lack of recognition of domestic work as an occupation. The recent extension of weekly rest to migrant domestic workers in Singapore and Thailand might be an indication of future efforts, stimulated by the Domestic Workers Convention, 2011 (No. 189), to improve legal protection.
Cooperative approaches to managing international labour migrant flows
ESCAP has identified migration as an “emerging opportunity for development,” but one that needs to be managed through both national action and multilateral dialogue and cooperation.45 Given that migration entails both benefits and risks for countries of origin and countries of destination, the responsibility for managing migration lies with both parties.
There are currently several examples of bilateral agreements between source and destination countries. Malaysia, the Republic of Korea and Thailand, for example, have bilateral agreements with many migrant-origin countries in the region. These may be formal agreements, which set out each side’s commitments and may provide for quotas, or they may be less formal agreements, such as memorandums of understanding, between countries of origin and countries of destination. Most destination countries prefer memorandums of understanding, probably because as non-binding agreements they are easier to negotiate and implement.
As the region’s economies become more integrated, there will be pressure on Governments to develop a geographically broader framework for managing migration. Such frameworks can begin at the subregional level and be expanded. For example, ASEAN has adopted the ASEAN Economic Community Blueprint, which is aimed at allowing for managed mobility or facilitated entry for the movement of natural persons engaged in trade in goods, services, and investments. Its member States are pursuing this goal through the progressive relaxation of visa requirements and institutional harmonization of categories of workers, although to date mutual recognition agreements have been negotiated for only a few priority professions – accountants, architects, dentists, doctors, nurses, surveyors and those of the tourism industry.
Furthermore, there is an urgent need for regional cooperation to establish common standards to protect the rights of migrants, as well as to prevent the
176
Economic and social survEy of asia and thE pacific 2014
trafficking of persons, which is increasingly taking place under the guise of consensual migration. At the global level, the principal instrument is the International Convention on the Protection of the Rights of All Migrant Workers and Members of Their Families.46 That convention, which entered into force in 2003, establishes minimum standards that States parties should apply to migrant workers and members of their families, irrespective of their migratory status. To date, however, the convention has been ratified by only eight countries in the ESCAP region (Azerbaijan, Bangladesh, Indonesia, Kyrgyzstan, the Philippines, Sri Lanka, Tajikistan and Turkey), while Armenia, Cambodia and Palau have signed but not yet ratified it.
There is a growing trend towards regional and subregional efforts to formalize the rights of migrant workers. For example, in 2007 ASEAN member States adopted the ASEAN Socio-Cultural Blueprint, which proposes several detailed actions towards the protection and promotion of the rights of migrant workers.47 Additionally, in 2009 ASEAN established the ASEAN Intergovernmental Commission on Human Rights, which includes as one of its mandates the protection of human rights of migrant workers.48 Meanwhile, to discuss coherent approaches to migration management, SAARC member States established the South Asia Migration Commission, involving civil society, academics, government officials, policy institutes, non-governmental organizations and human rights organizations.
Strengthening knowledge networks of people and institutions
As noted in the previous chapter, there is growing interest among countries in the region to transition towards knowledge-based economies. It has previously been shown in ESCAP studies that the countries with the highest sustained growth are those that have managed to diversify their exports. While producing a broad spectrum of goods, they have also entered exclusive production segments in which few others produce or export, typically in knowledge-based sectors.49
Achieving this transition required increased global and regional connectivity, and with it the smoother flow of knowledge and people. Successful innovation needs skilled workers who are familiar with both local cultural characteristics and international business practices and who are well connected through real-time communications and access to information.
Promoting student and academic exchanges can strengthen regional
knowledge networks
With education becoming more and more globalized, an increasing number of students are seeking tertiary education abroad. Many are going to countries in the Asian and Pacific region, which is home to numerous leading research institutions and universities. In 2012, Australia was the fourth largest host for international students globally, with 6% of mobile students, the Russian Federation was sixth with 4%, Japan seventh also with 4% and China ninth with 2%.50
Moreover, the region is a major source of students. As can be seen in figure 5.11, the region’s number of outbound international students has been steadily increasing over the last 15 years, and it is currently the source of approximately 50% of internationally mobile students. This has been mostly due to the rapid rise of students from China: with almost 700,000 students going abroad, China supplies more internationally mobile students than the next 7 countries combined.51
Tertiary education offers significant opportunities for cross-border linkages, knowledge generation and knowledge-sharing. The ESCAP region has numerous associations and organizations that promote such linkages, including the Asia-Pacific Association for International Education, the Association of Pacific Rim Universities and the South Asia Foundation.
ESCAP also actively promotes regional research networks. It contributed to the establishment of
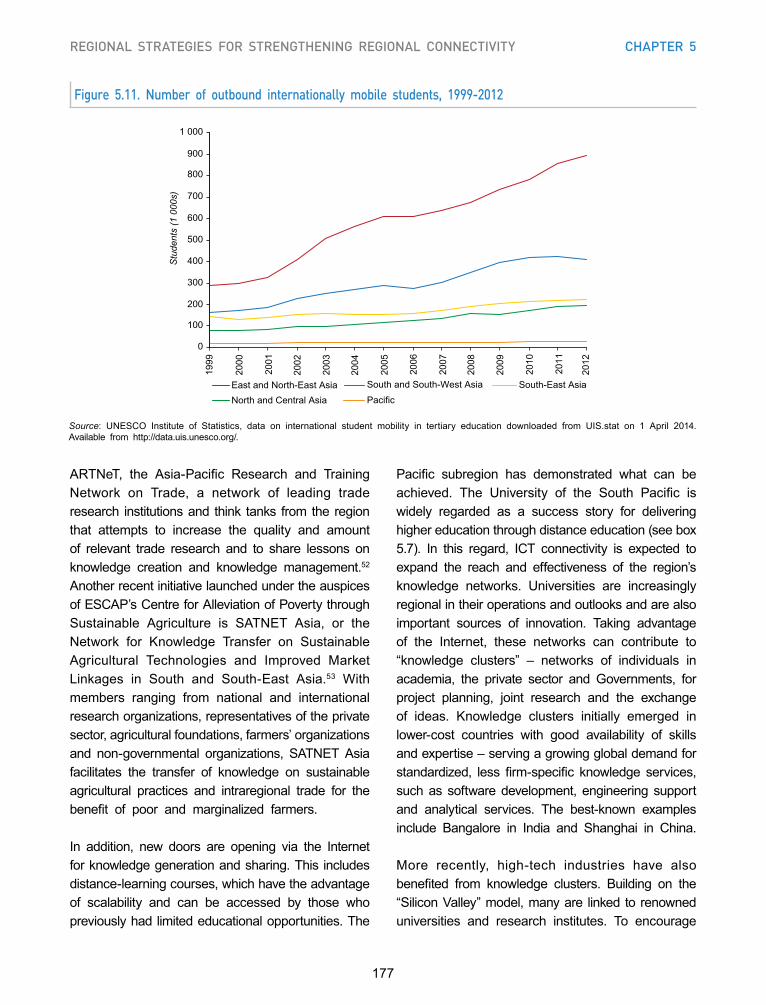
177
REGIONAL STRATEGIES FOR STRENGTHENING REGIONAL CONNECTIVITY CHAPTER 5
ARTNeT, the Asia-Pacific Research and Training Network on Trade, a network of leading trade research institutions and think tanks from the region that attempts to increase the quality and amount of relevant trade research and to share lessons on knowledge creation and knowledge management.52 Another recent initiative launched under the auspices of ESCAP’s Centre for Alleviation of Poverty through Sustainable Agriculture is SATNET Asia, or the Network for Knowledge Transfer on Sustainable Agricultural Technologies and Improved Market Linkages in South and South-East Asia.53 With members ranging from national and international research organizations, representatives of the private sector, agricultural foundations, farmers’ organizations and non-governmental organizations, SATNET Asia facilitates the transfer of knowledge on sustainable agricultural practices and intraregional trade for the benefit of poor and marginalized farmers.
In addition, new doors are opening via the Internet for knowledge generation and sharing. This includes distance-learning courses, which have the advantage of scalability and can be accessed by those who previously had limited educational opportunities. The
Figure 5.11. Number of outbound internationally mobile students, 1999-2012
0
100
200
300
400
500
600
700
800
900
1 000
1999
2000
2001
2002
2003
2004
2005
2006
2007
2008
2009
2010
2011
2012
Stud
ents
(1 0
00s)
East and North-East Asia South and South-West Asia South-East AsiaNorth and Central Asia Pacific
Source: UNESCO Institute of Statistics, data on international student mobility in tertiary education downloaded from UIS.stat on 1 April 2014. Available from http://data.uis.unesco.org/.
Pacific subregion has demonstrated what can be achieved. The University of the South Pacific is widely regarded as a success story for delivering higher education through distance education (see box 5.7). In this regard, ICT connectivity is expected to expand the reach and effectiveness of the region’s knowledge networks. Universities are increasingly regional in their operations and outlooks and are also important sources of innovation. Taking advantage of the Internet, these networks can contribute to “knowledge clusters” – networks of individuals in academia, the private sector and Governments, for project planning, joint research and the exchange of ideas. Knowledge clusters initially emerged in lower-cost countries with good availability of skills and expertise – serving a growing global demand for standardized, less firm-specific knowledge services, such as software development, engineering support and analytical services. The best-known examples include Bangalore in India and Shanghai in China.
More recently, high-tech industries have also benefited from knowledge clusters. Building on the “Silicon Valley” model, many are linked to renowned universities and research institutes. To encourage
178
Economic and social survEy of asia and thE pacific 2014
Box 5.7. ICT connectivity enhances educational opportunities in the Pacific
The University of the South Pacific is a multi-country university with a membership of 12 Pacific island economies: Cook Islands, Fiji, Kiribati, Marshall Islands, Nauru, Niue, Samoa, Solomon Islands, Tonga, Tokelau, Tuvalu and Vanuatu. In its early years, some courses were conducted via USPNet, a satellite communications network set up in 1973 as a means of distance education for students who could not study at the main campus in Suva.
In 2006, the Suva hub was upgraded to create an Internet Protocol platform. USPNet is now a stand-alone network with interactive video conferencing between all campuses. It provides an efficient means of delivering academic programmes through seminars, discussion groups, debates, lectures and tutorials. These forms of communication can be delivered simultaneously to students located in the network of campuses. The audio and video lectures are now loaded onto servers at the campuses and can be viewed by students at a time convenient to them. The availability of the Internet has made it possible to deliver online courses using course management software, which provides lecturers and tutors with online access and allows for the sending and receiving of assignments, and for participation in student discussion groups.
Thanks to continuous advances in ICT, the number of students enrolled in distance education increased from 90 students enrolled in 16 courses in 1976, to 5,400 students enrolled in 1996, to more than 10,000 students enrolled in over 200 courses in 2008. To reach an even larger number of students, the University is currently redesigning USPNet and introducing new mobile technologies to facilitate online learning.
Source: R. Duncan and J. McMaster, “The role of USPNet in capacity development in the South Pacific region”, Capacity Development Series (Mandaluyong City, Philippines, Asian Development Bank, 2008). Available from http://lencd.com/data/docs/25-USPNet_web.pdf; also University of South Pacific, “2013 Annual Report”, available from http://www.usp.ac.fj/fileadmin/scripts/AnnualReport/USPAnnualReport_2013/index.html#/Chapter_1
such clusters, many countries in the region have established science parks and are encouraging the development of networks of researchers and business people living in different countries, sometimes drawing on their diasporas abroad (see box 5.8). Firms in the science parks generally conduct more research and development than firms not located in such parks, perhaps because the close interaction with local universities enables firms to build on their knowledge.
In the future, there will likely be more cross-border collaboration between these types of knowledge clusters. Some countries in the region, including China, Japan, the Republic of Korea and the Russian Federation, are among the world’s leaders in terms of expenditure on research and development as a share of GDP, while almost 40% of all researchers in the world are located in Asia and the Pacific.54 With such a rich resource base, Governments, academic
institutions and the private sector can work together to develop knowledge industries. Countries in the region may gain from the experiences of Japan, Malaysia and the Republic of Korea, which have actively promoted this type of cooperation.
Strengthening business networks and associations
Business networks and associations constitute another important type of people-to-people network. Business networks and associations are usually composed of private enterprises within an industry or sector, or from various industries and sectors. While originally they were a means of bringing together domestic private enterprises, many international networks and associations have been established over the past few decades. Among the best known are the International Chamber of Commerce, the World Chambers Federation, the ASEAN Chambers
179
REGIONAL STRATEGIES FOR STRENGTHENING REGIONAL CONNECTIVITY CHAPTER 5
Box 5.8. The “global Argonauts” of Hsinchu, Taiwan Province of China
In the early 1960s, the GDP of Taiwan Province of China was similar to that of Zaire. Despite having a highly educated population, high-skill jobs were scarce, and the economy’s engineers were leaving to work abroad rather than at home. In particular, the number of Taiwanese people living in the United States grew rapidly, with many of them joining companies in Silicon Valley in the early years of the ICT revolution.
Helped by the expansion of the economy’s shipping sector, Taiwan Province of China got a foothold in the production networks of Japanese and United States electronics companies. This started as simple manufacturing activities, based on equipment specifications sent from overseas firms. However, as the traffic of engineers and business representatives between Silicon Valley and Taiwan Province of China built up, manufacturing companies moved into higher value added areas such as design.
This was supplemented by official policies, whereby the companies were supplied with lists of qualified Taiwanese people living in the United States; their flights to return home to the island economy were paid from official sources. These people, dubbed “the new Argonauts,” came with valuable connections and know-how. Their efforts were supplemented by creating institutions for technology transfer, venture capital and a fruitful environment for investment. The combination of these policies helped to create a vibrant cluster of technological innovation in Hsinchu, Taiwan Province of China, which later gave birth to highly successful high-tech companies, such as Acer Inc., and helped the economy to transition into a knowledge-based one.
Source: A. Saxenian, The New Argonauts: Regional Advantage in a Global Economy (Cambridge, Massachusetts, Harvard University Press, 2006).
of Commerce and Industry, the Confederation of Asia-Pacific Chambers of Commerce and Industry, and the SAARC Chamber of Commerce and Industry.
Such chambers advocate for and foster private sector development, as well as facilitate trade. The World Chambers Federation, for example, administers the ATA Carnet globally and also works with national chambers of commerce in issuing and attesting certificates of origin, which are required documents for international trade.55 Meanwhile, the SAARC Chamber of Commerce and Industry has worked with the SAARC secretariat to promote trade facilitation.
In the context of regional connectivity, business associations and networks help businesses in less developed countries to connect to businesses in other countries. Within the transport and logistics sector there are, for example, the International Road Transport Union, the International Air Transport Association, the International Federation of Freight Forwarders Associations and the International Chamber of Shipping.
In every sector, these associations raise the level of professional standards. In particular, business associations support the development of small and medium-sized enterprises, which by some estimates account for nearly 50% of all value addition within Asia and the Pacific.56 Networking among small and medium-sized enterprises in different countries helps them to identify common barriers to participation in regional and global production networks and markets.
Putting individuals at the heart of people-to-people connectivity
The various networks described above require different sets of policy responses, but ultimately they are all linked by the individuals within them. Within people-to-people connectivity there are therefore areas of similar or overlapping concern, where stakeholders can cooperate with each other and with other interested parties to discuss and design appropriate policies.
With regard to international labour migration, a comprehensive regional framework for managing
180
Economic and social survEy of asia and thE pacific 2014
labour migration for shared prosperity should include: protecting and promoting the rights of all migrants; more legal channels for labour migration; increased skills-recognition schemes; and further regional norm-setting and cooperation on managing migration. At the same time, regional approaches are not a substitute for structural reforms at the national level, or for the ratification of international conventions and instruments to protect the rights of migrants. Countries of origin can protect their workers by regulating recruitment agencies, ensuring that skills are properly assessed, requiring standard contracts, setting minimum wages and deploying more labour attachés abroad. Host countries can also provide migrant workers with greater protection through, inter alia, in-country orientation programmes and more effective labour inspection and by allowing greater flexibility in access to the labour market.
Meanwhile, Governments should support the efforts of the region’s universities and research institutions to build new knowledge networks and to promote student exchange programmes. For example, the Network of East Asian Think-tanks Working Group on Enhancing People to People Connectivity – Education, Tourism and Cultural Exchange recommends the systematization of regional quality assurance and credit transfer systems of higher education in ASEAN Plus Three.57 Another interesting proposal is the establishment of transnational collaborative higher education and research institutions, such as the ASEAN Cyber University, initiated by the Ministry of Education of the Republic of Korea in 2009, which links universities in Cambodia, Lao People’s Democratic Republic, Myanmar and Viet Nam with students in the region through a virtual learning platform.58
The future direction of people-to-people connectivity in the ESCAP region will also depend on better information about actual movements of people. At the national level, there is an urgent need for better data and analysis to underpin coherent policies, for example on the numbers of students studying abroad and the impact of labour migration on the development of countries of origin and countries of destination. International organizations, subregional
organizations, business associations and academic networks also need to share information and discuss optimum approaches to promoting the mobility of people while mitigating negative effects, including human trafficking. In this regard, ICT connectivity, with its potential to link networks of different stakeholders, presents tremendous opportunities for strengthening people-to-people connectivity.
Endnotes1 For a survey of the literature evaluating impacts of
infrastructure development, see A. Estache, “A survey of impact evaluation of infrastructure projects, programs and policies”, ECORE Discussion Paper No. 2010/16 (Brussels, ECORE, 2010). Available from www.ecore.be/DPs/dp_1270557731.pdf.
2 Asian Development Bank, Asian Economic Integration Monitor July 2012. (Mandaluyong City, Philippines, ADB, 2012). Available from http://aric.adb.org/pdf/aeim/AEIM_2012July_FullReport.pdf.
3 United Nations Economic and Social Commission for Asia and the Pacific, Review of Developments in Transport in Asia and the Pacific. ST/ESCAP/2627.
4 The Asian Development Bank Institute has developed a computable general equilibrium model to simulate the quantitative gains to countries from investing in regional transport infrastructure. Available from www.adbi.org/files/2010.06.30.wp223.regional.infrastructure.investment.asia.pdf.
5 United Nations Economic and Social Commission for Asia and the Pacific, The Regional Action Programme for Transport Development in Asia and the Pacific, Phase II (2012-2016), Ministerial Declaration on Transport Development in Asia and the Pacific (Bangkok, 12-16 March 2012). Available from www.unescap.org/sites/default/files/Booklet_B_RAP2012-2016.pdf.
6 UNNExT is a regional community of experts that conduct research and provide support on paperless trade and the single window. For further information, see www.unescap.org/tid/unnext/default.asp.
7 A “missing link” is (a) the absence of physical linkages between the railway networks of neighbouring countries or (b) the absence of continuous railway infrastructure within one country, often due, in this latter case, to local geography, for example Lake Van in eastern Turkey. Such missing links between networks of neighbouring
181
REGIONAL STRATEGIES FOR STRENGTHENING REGIONAL CONNECTIVITY CHAPTER 5
countries arise because the link was never there in the first place or because they ceased to exist due to political events. For an update on the status of missing links in the trans Asian railway network, see chapter 1 of United Nations Economic and Social Commission for Asia and the Pacific, Review of Developments in Transport in Asia and the Pacific. ST/ESCAP/2627.
8 The road classes under the Asian Highway classification and design standards define class III as the minimum desired standard, being a narrow two-lane road with double bituminous surface treatment. For full specifications, see annex III of the Intergovernmental Agreement on the Asian Highway Network (United Nations, Treaty Series, vol. 2323, No. 41607). Available from https://treaties.un.org/doc/source/RecentTexts/XI_B_34_E.pdf.
9 According to ESCAP estimates and country reports: upgrading 12,000 km of roads from below class III to class III standards would require $3.5 billion; strengthening the pavement of 31,500 km of class III roads to asphalt concrete (class II) without widening and geometrical improvements would require $7 billion; and upgrading 45,500 km (excluding roads in mountainous and hilly terrain) of class II roads to four lanes (class I) would require $25.5 billion.
10 International Union of Railways and Community of European Railway and Infrastructure Companies, Rail Transport and Environment: Facts and Figures (Paris and Brussels, UIC and CER, 2008). Available from www.uic.org/homepage/railways&environment_facts&figures.pdf.
11 According to the Intergovernmental Agreement on Dry Ports, “a dry port of international importance (‘dry port’) shall refer to an inland location as a logistics centre connected to one or more modes of transport for the handling, storage and regulatory inspection of goods moving in international trade and the execution of applicable customs control and formalities”. It may be distinguished from an inland container depot (ICD) in that it can accommodate all types of cargo, whereas an ICD specializes in the handling of containers and containerized cargo.
12 J. Woxenius, V. Roso and K. Lumsden, “The dry port concept: connecting seaports with their hinterland by rail”, ICLSP Conference Proceedings, Dalian, China (Goteborg, Sweden, Department of Transportation and Logistics, Chalmers University of Technology, 2004), pp. 305-319. Available from www.pol.gu.se/digitalAssets/1344/1344857_2004_iclsp_dalian_wox-ros-lum.pdf.
13 ESCAP, together with its member States, worked for several years on the development of the Intergovernmental Agreement on Dry Ports. Under this agreement, countries nominated important nodal points between the Asian Highway and Trans-Asian Railway networks to develop into dry ports.
14 NEA Transport Research Institute and International Road Transport Union, New Eurasian Land Transport Initiative: Final Report – Analysis of Monitoring Data Collected on NELTI Project Routes in 2008-2009 (2009). Available from www.iru.org/cms-filesystem-action?file=events_2009_almaty/NELTI-report-EN.pdf.
15 The opening of the joint customs control was the result of the Agreement between the Government of the Republic of Kazakhstan and the Government of the Kyrgyz Republic on Joint Control at the Kyrgyz-Kazakhstan Borders, signed in 2006.
16 United Nations Economic and Social Commission for Asia and the Pacific, Review of Developments in Transport in Asia and the Pacific. ST/ESCAP/2627. Chapter 2.
17 See United Nations Centre for Trade Facilitation and Electronic Business, Recommendation and Guidelines on Establishing a Single Window to Enhance the Efficient Exchange of Information between Trade and Government – Recommendation No. 33 (United Nations publication, Sales No. 05.II.E.9).
18 United Nations Economic and Social Commission for Asia and the Pacific and United Nations Economic Commission for Europe, Single Window Planning and Implementation Guide. ECE/TRADE/404.
19 The development of integrated systems was the focus of the joint United Nations Regional Commissions’ Global Trade Facilitation Forum, held in Bangkok on 18 and 19 November 2013. See http://unnext.unescap.org/gtfc13.asp for details.
20 See www.paa.net/.
21 J.F. Arvis and others, Connecting Landlocked Developing Countries to Markets: Trade Corridors in the 21st Century (Washington, D.C., World Bank, 2011). Available from https://openknowledge.worldbank.org/handle/10986/2286.
22 China and Mongolia renewed their agreement on international road transport, together with its protocol, in June 2011, opening 36 transport routes through 13 border crossings; the agreement also introduced long-term multiple-entry permits for the carriage of goods, in
182
Economic and social survEy of asia and thE pacific 2014
addition to short-term, single-entry permits. Meanwhile, China and Viet Nam amended their bilateral agreement on road transport in October 2011 and signed a new protocol for the implementation of the agreement in May 2012, allowing Chinese vehicles to travel to Hanoi and the seaport of Hai Phong in Viet Nam, and allowing Vietnamese vehicles access to important economic centres in China, such as Guangzhou, Shenzhen, Kunming and Nanning.
23 United Nations Economic and Social Commission for Asia and the Pacific, “Creating the silk super-highway in Central Asia”, Press Release, News Number G/73/2013, 29 November 2013. Available from www.unescap.org/news/creating-silk-super-highway-central-asia.
24 ESCAP has proposed extending this corridor to other parts of South Asia beginning with Delhi-Kolkata-Dhaka. It has been argued that the Istanbul-Tehran-Islamabad – Delhi-Kolkata-Dhaka container trade corridor could become an important trade route for intraregional trade, as well as help to make the subregion a hub of East-West trade.
25 Industry estimate; see for example the website of the United States of America, Office of Science and Technology Policy, which estimated that timing “broadband deployment activities to periods when streets are already under construction…can reduce network deployment costs along Federal roadways by up to 90 percent”. Available from www.whitehouse.gov/blog/2013/09/16/accelerating-broadband-infrastructure-deployment-across-united-states.
26 More than 1,000 households, representatives of Govern- ment, businesses, non-governmental organizations and youth were surveyed by the Pacific Institute of Public Policy. See S. O’Connor, A. Naemon and B. Sijapati-Basnett, Net Effects: Social and Economic Impacts of Telecommunications and Internet in Vanuatu – Research Findings Report 2011-2012 (Port Vila, Pacific Institute of Public Policy, 2012). Available from www.pacificpolicy.org/wp-content/uploads/2012/05/PiPP-Net-Effects-2011-Vanuatu-Telecomms-report1.pdf.
27 International Telecommunications Union, Measuring the Information Society 2013.
28 O3b Networks, “Fulfilling the promise: innovative satellite capacity for the Pacific’s”, paper presented at the APT/ITU Pacific Forum 2013, Apia, 22 April.
29 World Bank, Program Appraisal Document for a Regional Adaptable Program Loan for a Pacific Regional Connectivity Program. (Washington D.C., 2011)
30 S. ‘Ofa, Telecommunications Regulatory Reform in Small Island Developing States: the Impact of the WTO’s Telecommunications Commitment (Newcastle upon Tyne, United Kingdom, Cambridge Scholars Publishing, 2012).
31 International Energy Agency, IEA World Energy Statistics and Balances database (2013). Available from www.oecd-ilibrary.org/energy/data/iea-world-energy-statistics-and-balances_enestats-data-en.
32 International Energy Agency, World Energy Outlook 2012 (Paris, OECD/IEA, 2012). Available from www.iea.org/publications/freepublications/publication/WEO2012_free.pdf.
33 These include the East Siberia-Pacific Ocean oil pipeline, the Central Asia-China gas pipeline, the Turkmenistan-Afghanistan-Pakistan-India pipeline, the Islamic Republic of Iran-Pakistan-India pipeline and the Trans-ASEAN gas pipeline. There are also such projects as the Bangladesh-India/India-Bangladesh pipeline; the Indonesia-Philippines gas pipeline trade; Myanmar-India, Myanmar-Bangladesh, Myanmar-China pipeline gas; and the Malaysia-Thailand pipeline gas trade. In addition, there are opportunities for the maritime trading of liquefied natural gas. These include Malaysia to Bangladesh, India and China; Brunei Darussalam to China, India and Hong Kong, China; and maritime liquefied natural gas supplies of Pacific island countries.
34 Further examples of subregional energy cooperation initiatives can be found in United Nations Economic and Social Commission for Asia and the Pacific, Growing Together: Economic Integration for an Inclusive and Sustainable Asia-Pacific Century. ST/ESCAP/2629.
35 In Commission resolution 68/11 on connectivity for energy security, the Executive Secretary was requested to “identify options, in consultation with member States, that member States may choose on regional energy connectivity, including an intergovernmental framework that could be developed for an integrated regional power grid, which could be termed as the “Asian Energy Highway”, to analyse the socioeconomic and environmental benefits of each option as well as the challenges and opportunities towards the realization of each option”. See United Nations Economic and Social Commission for Asia and the Pacific, Official Records of the Economic and Social Council, Supplement No. 19 (E/2012/39-E/ESCAP/68/24).
36 World Energy Council, Regional Energy Integration in Africa (London, World Energy Council, 2005). Available from www.worldenergy.org/documents/integrationii.pdf.
183
REGIONAL STRATEGIES FOR STRENGTHENING REGIONAL CONNECTIVITY CHAPTER 5
37 Most notably, related to the high-voltage direct current transmission, such as: (a) improvements in their efficient ranges; (b) reduced footprint through reduced right-of-way requirements; (c) opportunities to interconnect grids by either land or sea (using cables); (d) the development of hybrid high-voltage direct current breakers that can respond to power interruptions and emergency situations, also providing an increased opportunity for network augmentation; (e) opportunity for asynchronous interconnections; and (f) developments in smart grid technology (with high capacity converter feeder transformers) that enhance opportunities for improvements in the geographical scale of grid interconnectivity, including improved renewable energy management through load smoothing. United Nations Economic and Social Commission for Asia and the Pacific, “Meeting report: Expert Group Meeting on Conceptualizing the Asian Energy Highway, 3-5 September 2013, Urumqi, China”. Available from www.unescap.org/sites/default/files/EGM-AEH-meeting-report_0.pdf.
38 Association of Southeast Asian Nations, Master Plan on ASEAN Connectivity. (Jakarta, Indonesia, 2010) Available from www.asean.org/archive/documents/MPAC.pdf.
39 World Bank, Migration and Remittance Flows: Recent Trends and Outlook, 2013-2016. Migration and Development Brief No. 21. (Washington D.C., 2013). These data refer to remittances sent through official channels. However, there are also large flows of remittances sent through informal channels. Money can be sent through informal carriers, or carried by travelling friends or the migrants themselves. For instance, 44% of respondents in Afghanistan, Bangladesh, India, Indonesia, Pakistan and Sri Lanka who reported sending international remittances did so through informal channels, while 15% of those respondents receiving international remittances did so through informal channels. See J. Kendall and others, Remittances, Payments, and Money Transfers: Behaviors of South Asians and Indonesians (Gallup Inc., 2013). Available from www.gallup.com/file/poll/161675/Remittances%20Payments%20and%20Money%20Transfers%20%20Behaviors%20of%20South%20Asians%20and%20Indonesians.pdfftele.
40 K. Imai and others, “Remittances, growth and poverty: new evidence from Asian countries”, Occasional Paper No. 15 (Rome, International Fund for Agricultural Development, 2012). Available from www.ifad.org/operations/projects/regions/pi/paper/15.pdf.
41 D. McKenzie and J. Gibson, “The development impact of a best practice seasonal worker policy”, Policy
Research Working Paper No. 5488 (Washington, DC, World Bank, 2010). Available from http://elibrary.worldbank.org/doi/book/10.1596/1813-9450-5488.
42 J. Gibson and D. McKenzie, “Development through seasonal worker programs: the case of New Zealand’s RSE Program”, Policy Research Working Paper No. 6762 (Washington DC, World Bank, 2012). Available from www-wds.worldbank.org/external/default/WDSContentServer/IW3P/IB/2014/01/28/000158349_20140128160906/Rendered/PDF/WPS6762.pdf.
43 B. Yeoh and T. Lam, “The costs of (im)mobility: children left behind and children who migrate with a parent”, in Perspectives on Gender and Migration (Bangkok, ESCAP, 2007).
44 For an overview of such studies, see M. Rahman, “Foreign manpower in Singapore: classes, policies and management”, Asia Research Institute Working Paper No. 57 (Singapore, Asia Research Institute, 2006). Available from www.ari.nus.edu.sg/showfile.asp?pubid=509&type=2.
45 United Nations Economic and Social Commission for Asia and the Pacific, International Migration: an Emerging Opportunity for the Socio-economic Development of the ESCAP Region, Social Policy Paper No. 6 (United Nations publication, Sales No. E.02.II.F.40).
46 A/RES/45/158.
47 Association of Southeast Asian Nations, ASEAN Socio-Cultural Community Blueprint (Jakarta, ASEAN, 2009). Available from www.asean.org/archive/5187-19.pdf.
48 Asia Pacific Forum of National Human Rights Institutions, Promoting and Protecting the Rights of Migrant Workers: the Role of National Human Rights Institutions (Sydney, Asia Pacific Forum of National Human Rights Institutions, 2012). Available from nhri.ohchr.org/EN/IHRS/Documents/APF%20publication%20-%20promoting%20and%20protecting%20the%20rights%20of%20migrant%20workers.pdf.
49 United Nations Economic and Social Commission for Asia and the Pacific, Economic and Social Survey of Asia and the Pacific 2011: Sustaining Dynamism and Inclusive Development – Connectivity in the Region and Productive Capacity in Least Developed Countries (United Nations publication, Sales No. E.11.II.F.2).
50 United Nations Educational, Scientific and Cultural Organization, Global Flow of Tertiary Students (2014). Available from www.uis.unesco.org/Education/Pages/international-student-flow-viz.aspx.
184
Economic and social survEy of asia and thE pacific 2014
51 Ibid.
52 More information on ARTNeT is available from http://artnet.unescap.org.
53 More information on SATNET Asia is available from www.uncapsa.org/theme2.asp.
54 United Nations Economic and Social Commission for Asia and the Pacific, Statistical Yearbook for Asia and the Pacific 2013. (United Nations Publication, Sales No. E.13.II.F.1.)
55 ATA Carnet is an international customs document that permits the duty- and tax-free temporary import of goods for up to one year, which is useful for commercial samples, professional equipment, and goods for use at trade fairs, shows and exhibitions. In the ESCAP region, China; Hong Kong, China; India; the Islamic Republic of Iran; Japan; Macao, China; Malaysia; Mongolia; Pakistan; the Republic of Korea; the Russian Federation; Singapore; Sri Lanka; Thailand; and Turkey accept and use ATA Carnets.
56 United Nations Economic and Social Commission for Asia and the Pacific, Policy Guidebook for SME Development in Asia and the Pacific, (United Nations publication, Sales No. E.12.II.F.2).
57 Network of East Asian Think-Tanks, NEAT Working Group on Enhancing People to People Connectivity: Education, Tourism and Cultural Exchange – Final Report (NEAT, 2013).
58 ASEAN Cyber University, “History”, 2014. Available from www.aseancu.org/about/history.jsp.

185
186
ESC
AP
PH
OTO
187
ESC
AP
PH
OTO
STRENGTHENING INSTITUTIONAL COORDINATION AND REGIONAL
COOPERATION 6 o plan and implement joint strategies for regional connectivity, countries need robust institutional frameworks. To strengthen institutional coordination and regional cooperation, intergovernmental organizations and programmes can serve as neutral platforms not only for policy coordination to establish regional norms but also for implementing global statistical standards for joint planning and monitoring, and for exploring new modalities for financing.
T
188
Economic and social survEy of asia and thE pacific 2014
There is no single formula for regional integration, with different forces driving the process in different regions. In the case of the European Union, for example, the rationale for integration was that economic interdependence would foster regional peace while at the same time increase the region’s productivity and competitiveness. Based on this premise, member States of the European Union worked towards a single common market by harmonizing policies and market rules. These would be enforced by pan-European institutions, backed up by substantial financial resources.
Regional integration in Asia and the Pacific has followed a less uniform trajectory. Integration has progressed at different rates from one subregion to another, and in different ways, depending on the sector. Bilateral and plurilateral agreements have liberalized trade, reduced tariffs and opened markets in almost all countries. However, apart from investing in maritime ports, Governments have concentrated on national rather than regional infrastructure. Indeed, overall integration has been driven less by Governments than by the private sector, led by multinational corporations which, in collaboration with local enterprises, established global and regional production networks.1
Nowadays, however, national Governments are seeking a more active role, looking beyond national borders and developing transnational strategies for strengthening regional connectivity. They can, for example, shape regional spatial development through their infrastructure investments and policies. They can also link domestic businesses and supranational regulatory bodies by establishing common standards and rules for business. National Governments also control the framework for cross-border flows of capital and labour.
With this in mind, Governments must take the lead in establishing robust institutional frameworks and reaching out to other countries to develop and implement joint strategies. In this regard, many subregional organizations are developing their own programmes or “road maps” for strengthening
connectivity. The present chapter contains a discussion of some of these strategies, and a description of how ESCAP can push forward a regional connectivity agenda which complements and supports those efforts.
STRENGTHENING INSTITUTIONAL RESPONSES TO REGIONAL CONNECTIVITY
The ESCAP region is home to many intergovern- mental organizations, operating at different levels and around different interests or themes. In the past, many subregional initiatives were launched in response to issues of common concern, or with specific sectoral objectives, particularly on trade and economic cooperation. Over the past decade, however, there has been a convergence of these different initiatives towards a more comprehensive subregional integration agenda. This appears to be the result of a deepening level of political commitment of the respective member States. For example, the Treaty on the Establishment of the Eurasian Economic Community was signed in Astana in October 2000 and came into effect in June 2001, with Belarus, Kazakhstan, Kyrgyzstan, the Russian Federation and Tajikistan, as the founding members.2 The Customs Union of Belarus, Kazakhstan and the Russian Federation came into effect in July 2010, while the Common Economic Space involving the three countries began operating on 1 January 2012. Spurred by the removal of trade barriers and the implementation of various other integration policies, trade between Belarus, Kazakhstan and the Russian Federation grew from $12.9 billion in 2009 to more than $24 billion in 2013.3
Subregional organizations are currently working
to enhance their connectivity
Also in 2012, the Eurasian Economic Commission was established to support the functions and development of the Customs Union and the Common Economic Space. In May 2014, Belarus, Kazakhstan and the
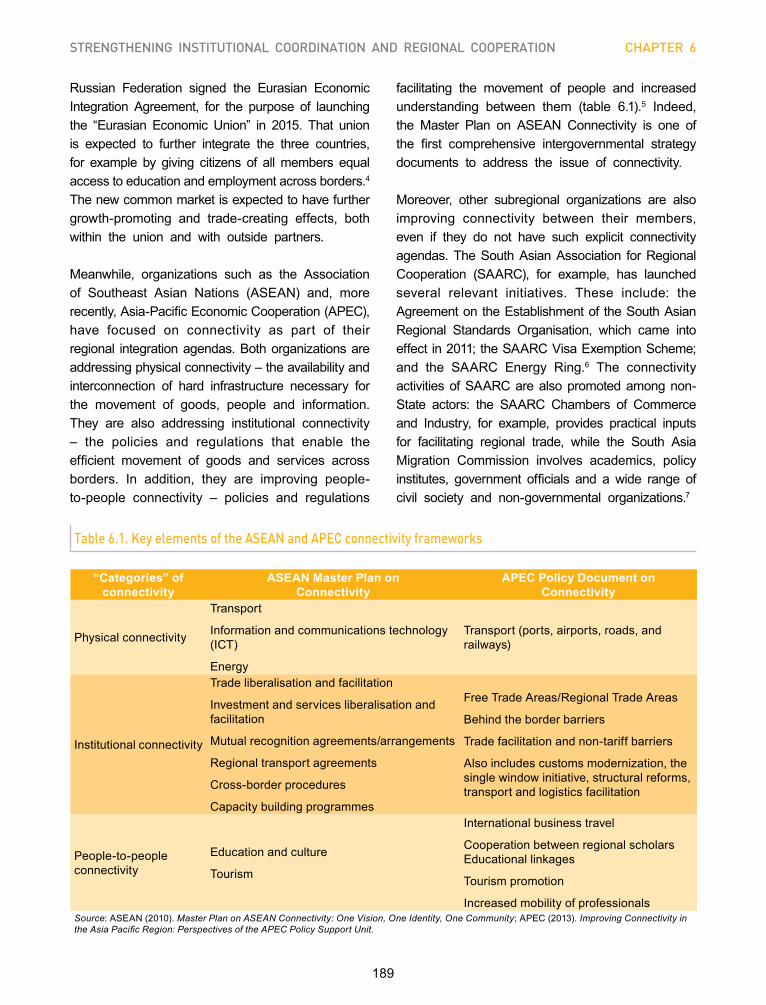
189
STRENGTHENING INSTITUTIONAL COORDINATION AND REGIONAL COOPERATION CHAPTER 6
Russian Federation signed the Eurasian Economic Integration Agreement, for the purpose of launching the “Eurasian Economic Union” in 2015. That union is expected to further integrate the three countries, for example by giving citizens of all members equal access to education and employment across borders.4 The new common market is expected to have further growth-promoting and trade-creating effects, both within the union and with outside partners.
Meanwhile, organizations such as the Association of Southeast Asian Nations (ASEAN) and, more recently, Asia-Pacific Economic Cooperation (APEC), have focused on connectivity as part of their regional integration agendas. Both organizations are addressing physical connectivity – the availability and interconnection of hard infrastructure necessary for the movement of goods, people and information. They are also addressing institutional connectivity – the policies and regulations that enable the efficient movement of goods and services across borders. In addition, they are improving people-to-people connectivity – policies and regulations
Table 6.1. Key elements of the ASEAN and APEC connectivity frameworks
“Categories” of connectivity
ASEAN Master Plan on Connectivity
APEC Policy Document on Connectivity
Physical connectivity
Transport
Information and communications technology (ICT)
Energy
Transport (ports, airports, roads, and railways)
Institutional connectivity
Trade liberalisation and facilitation
Investment and services liberalisation and facilitation
Mutual recognition agreements/arrangements
Regional transport agreements
Cross-border procedures
Capacity building programmes
Free Trade Areas/Regional Trade Areas
Behind the border barriers
Trade facilitation and non-tariff barriers
Also includes customs modernization, the single window initiative, structural reforms, transport and logistics facilitation
People-to-people connectivity
Education and culture
Tourism
International business travel
Cooperation between regional scholars Educational linkages
Tourism promotion
Increased mobility of professionalsSource: ASEAN (2010). Master Plan on ASEAN Connectivity: One Vision, One Identity, One Community; APEC (2013). Improving Connectivity in the Asia Pacific Region: Perspectives of the APEC Policy Support Unit.
facilitating the movement of people and increased understanding between them (table 6.1).5 Indeed, the Master Plan on ASEAN Connectivity is one of the first comprehensive intergovernmental strategy documents to address the issue of connectivity.
Moreover, other subregional organizations are also improving connectivity between their members, even if they do not have such explicit connectivity agendas. The South Asian Association for Regional Cooperation (SAARC), for example, has launched several relevant initiatives. These include: the Agreement on the Establishment of the South Asian Regional Standards Organisation, which came into effect in 2011; the SAARC Visa Exemption Scheme; and the SAARC Energy Ring.6 The connectivity activities of SAARC are also promoted among non-State actors: the SAARC Chambers of Commerce and Industry, for example, provides practical inputs for facilitating regional trade, while the South Asia Migration Commission involves academics, policy institutes, government officials and a wide range of civil society and non-governmental organizations.7
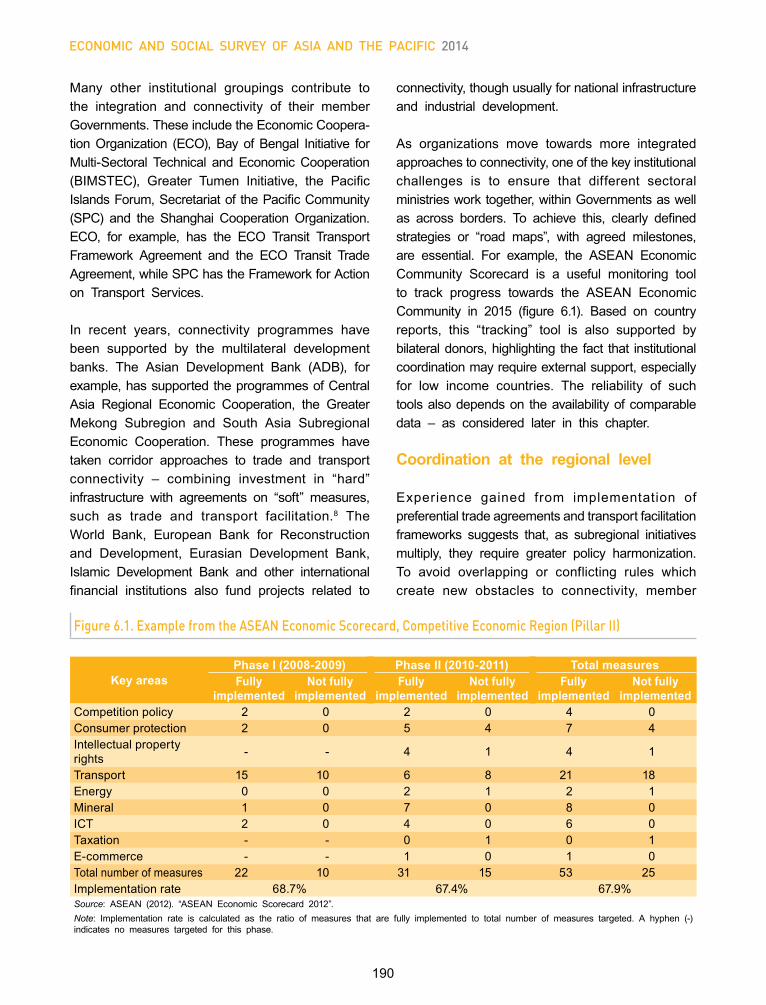
190
Economic and social survEy of asia and thE pacific 2014
Many other institutional groupings contribute to the integration and connectivity of their member Governments. These include the Economic Coopera- tion Organization (ECO), Bay of Bengal Initiative for Multi-Sectoral Technical and Economic Cooperation (BIMSTEC), Greater Tumen Initiative, the Pacific Islands Forum, Secretariat of the Pacific Community (SPC) and the Shanghai Cooperation Organization. ECO, for example, has the ECO Transit Transport Framework Agreement and the ECO Transit Trade Agreement, while SPC has the Framework for Action on Transport Services.
In recent years, connectivity programmes have been supported by the multilateral development banks. The Asian Development Bank (ADB), for example, has supported the programmes of Central Asia Regional Economic Cooperation, the Greater Mekong Subregion and South Asia Subregional Economic Cooperation. These programmes have taken corridor approaches to trade and transport connectivity – combining investment in “hard” infrastructure with agreements on “soft” measures, such as trade and transport facilitation.8 The World Bank, European Bank for Reconstruction and Development, Eurasian Development Bank, Islamic Development Bank and other international financial institutions also fund projects related to
connectivity, though usually for national infrastructure and industrial development.
As organizations move towards more integrated approaches to connectivity, one of the key institutional challenges is to ensure that different sectoral ministries work together, within Governments as well as across borders. To achieve this, clearly defined strategies or “road maps”, with agreed milestones, are essential. For example, the ASEAN Economic Community Scorecard is a useful monitoring tool to track progress towards the ASEAN Economic Community in 2015 (figure 6.1). Based on country reports, this “tracking” tool is also supported by bilateral donors, highlighting the fact that institutional coordination may require external support, especially for low income countries. The reliability of such tools also depends on the availability of comparable data – as considered later in this chapter.
Coordination at the regional level
Experience gained from implementation of preferential trade agreements and transport facilitation frameworks suggests that, as subregional initiatives multiply, they require greater policy harmonization. To avoid overlapping or conflicting rules which create new obstacles to connectivity, member
Figure 6.1. Example from the ASEAN Economic Scorecard, Competitive Economic Region (Pillar II)
Key areasPhase I (2008-2009) Phase II (2010-2011) Total measuresFully
implementedNot fully
implementedFully
implementedNot fully
implementedFully
implementedNot fully
implementedCompetition policy 2 0 2 0 4 0Consumer protection 2 0 5 4 7 4Intellectual property rights - - 4 1 4 1
Transport 15 10 6 8 21 18Energy 0 0 2 1 2 1Mineral 1 0 7 0 8 0ICT 2 0 4 0 6 0Taxation - - 0 1 0 1E-commerce - - 1 0 1 0Total number of measures 22 10 31 15 53 25Implementation rate 68.7% 67.4% 67.9%Source: ASEAN (2012). “ASEAN Economic Scorecard 2012”.Note: Implementation rate is calculated as the ratio of measures that are fully implemented to total number of measures targeted. A hyphen (-) indicates no measures targeted for this phase.
191
STRENGTHENING INSTITUTIONAL COORDINATION AND REGIONAL COOPERATION CHAPTER 6
States and organizations will need to coordinate their activities. For this purpose, they can turn to regional institutions such as ESCAP which can support and coordinate subregional integration, thus facilitating communications between subregional actors and analysing the impact of those initiatives from a regional perspective. Regional institutions can also link subregional and national connectivity policies with global initiatives and standards. Some examples are described below.
Formal frameworks relating to regional connectivityIn some cases, regional coordination can best be achieved through a formal framework. In the ESCAP region, the prominent examples relating to regional connectivity are the intergovernmental agreements on the Asian Highway and Trans-Asian Railway networks, and on dry ports. Developed under the auspices of ESCAP, these intergovernmental agreements have delineated routes and established basic infrastructure standards. Moreover, some sub-regional organizations, such as ASEAN, BIMSTEC and ECO, have used the Asian Highway as the basis for formulating their own road networks. Another formal framework currently under negotiation among ESCAP members in support of greater regional connectivity is a regional arrangement on the facilitation of cross-border paperless trade (see box 5.3 in the previous chapter).
Infrastructure projects benefit from intergovernmental agreements because they can have significant repercussions on neighbouring countries, which should be analysed and discussed before construction is begun. They also have long gestation periods so need continuing commitment. The annual working groups under the above-mentioned agreements provide regular forums in which relevant national authorities, along with subregional and other international organizations, can exchange information and negotiate amendments.
Other major formal frameworks with implications for regional connectivity are agreed at the global level. International agreements and conventions cover a wide range of subjects, such as the movement of goods, people and vehicles, and flows of capital.
For trade liberalization, the principal forum is the World Trade Organization. Other relevant agreements are overseen by specialized agencies of the United Nations, such as the International Labour Organization, the International Maritime Organization and the International Civil Aviation Organization, and the various secretariats for multilateral environmental agreements, which also oversee specific agreements. These international agreements and conventions can also be promoted by regional and subregional organizations as part of their norm-setting functions.
Global agreements and conventions can favorably be supplemented
on the regional level
International agreements may also be formulated or implemented by private sector associations and non-governmental organizations. For example, the International Road Transport Union is involved in the administration of the TIR (Transports Internationaux Routiers) Carnet, as mandated by the Customs Convention on the International Transport of Goods under Cover of TIR Carnets (1975).
For certain issues, however, it is easier to build consensus at the regional level. Global agreements and conventions can therefore be supplemented by regional-level agreements. One example is the Asia-Pacific Trade Agreement, which was previously known as the Bangkok Agreement. Serviced by the ESCAP secretariat, this is the oldest preferential trade agreement in the Asia-Pacific region; its scope has been expanded from lowering tariffs to addressing barriers to services, trade and investment among its members.
Further work is needed to promote relevant international agreements and conventions at the regional level, as well as to identify ways to effectively support national Governments in acceding to and implementing these agreements.
Voluntary commitments to regional strategiesMost commitments launched under the auspices
192
Economic and social survEy of asia and thE pacific 2014
of ESCAP are voluntary. The scope of these frameworks and the benefits that can be accrued from them are best achieved through consensus. This “locks in” the commitment of all participating States and discourages the emergence of discontented minorities. As one study noted, however, such an approach also involves “a steep trade-off between commitment and decisiveness.”9 This is because such commitments take longer to negotiate than the decisions taken, for example, by institutions or agencies that have more specific or narrower mandates. To accommodate divergent views among member States, these processes may also result in very general or broad types of commitment.
Cross sectoral strategies for increasing connectivity have
great potential ahead
In this regard, the most effective approach is to concentrate on specific objectives or sectors, for which it is possible to lay down some basic principles for achieving progress in particular areas. For example, the Regional Strategic Framework for the Facilitation of International Road Transport contains targets for harmonizing road transport facilitation practices and rules.10 Nevertheless, these strategies can also be linked to a broader connectivity agenda.
Strengthening cross-sectoral and multifaceted approaches to connectivityThe increasingly complex nature of regional connectivity will require strategies that are cross-sectoral. National Governments and international organizations will therefore need to reach out to other stakeholders, including the private sector, academia and civil society organizations, the networks of which form an integral part of the region’s connectivity.
One of the most important infrastructure develop-ments will be expanding overland broadband cable. This can be done by laying fibre-optic cables along existing regional transport networks so as to generate an “Asia-Pacific information superhighway”.
Further, as energy management systems become increasingly reliant on computers and information and communications technology (ICT), this may, in turn, form the basis of an “Asian energy highway”.
Given the complexity of each sector, the benefits and risks of cross-sectoral approaches require further research. Intergovernmental bodies, such as the annual sessions of the Commission and its legislative committees, offer a forum for different line ministries, as well as for experts from other intergovernmental organizations, civil society, the private sector and other stakeholders. In this way, they can work step-by-step towards developing regional cross-sectoral strategies.
In this regard, many of the strategies described in this study are expected to be refined and developed under the framework of the Bangkok Declaration on Regional Economic Cooperation and Integration in Asia and the Pacific. Through this declaration, ESCAP member and associate member States resolved to cooperate in a number of important areas: the formation of an integrated market; the development of seamless regional connectivity in transport, energy and information and communications technology; financing regional development; and taking initiatives to address shared vulnerabilities and risks.
Meanwhile, Governments can also promote cross-sectoral cooperation through national coordination mechanisms. For example, the main challenge in implementing trade and transport facilitation measures is not cost or complexity, but coordination between the various agencies and stakeholders involved. In this regard, national trade and transport coordination committees offer an effective model for agencies and other stakeholders to discuss optimum solutions to facilitate trade and transport (box 6.1).
Planning and implementing regional connectivity strategies also requires two additional ingredients: one is the availability of comparable, accurate and timely information and data; the other is finance. In the remainder of this chapter, these two issues will be examined in more detail.
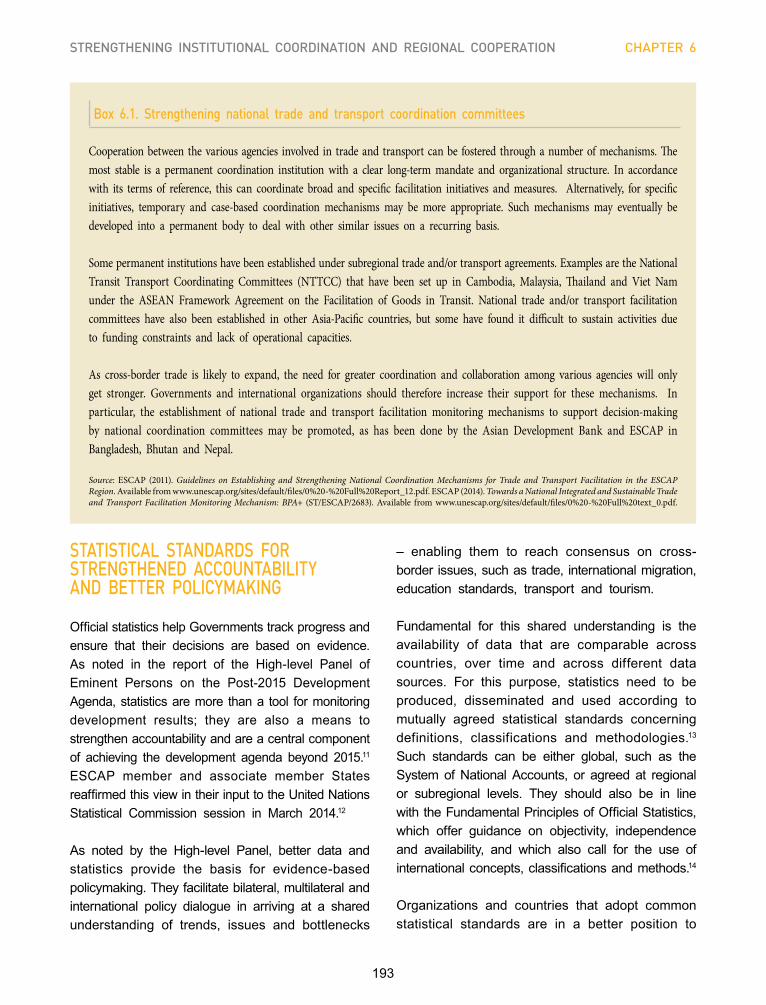
193
STRENGTHENING INSTITUTIONAL COORDINATION AND REGIONAL COOPERATION CHAPTER 6
Box 6.1. Strengthening national trade and transport coordination committees
Cooperation between the various agencies involved in trade and transport can be fostered through a number of mechanisms. The most stable is a permanent coordination institution with a clear long-term mandate and organizational structure. In accordance with its terms of reference, this can coordinate broad and specific facilitation initiatives and measures. Alternatively, for specific initiatives, temporary and case-based coordination mechanisms may be more appropriate. Such mechanisms may eventually be developed into a permanent body to deal with other similar issues on a recurring basis.
Some permanent institutions have been established under subregional trade and/or transport agreements. Examples are the National Transit Transport Coordinating Committees (NTTCC) that have been set up in Cambodia, Malaysia, Thailand and Viet Nam under the ASEAN Framework Agreement on the Facilitation of Goods in Transit. National trade and/or transport facilitation committees have also been established in other Asia-Pacific countries, but some have found it difficult to sustain activities due to funding constraints and lack of operational capacities.
As cross-border trade is likely to expand, the need for greater coordination and collaboration among various agencies will only get stronger. Governments and international organizations should therefore increase their support for these mechanisms. In particular, the establishment of national trade and transport facilitation monitoring mechanisms to support decision-making by national coordination committees may be promoted, as has been done by the Asian Development Bank and ESCAP in Bangladesh, Bhutan and Nepal.
Source: ESCAP (2011). Guidelines on Establishing and Strengthening National Coordination Mechanisms for Trade and Transport Facilitation in the ESCAP Region. Available from www.unescap.org/sites/default/files/0%20-%20Full%20Report_12.pdf. ESCAP (2014). Towards a National Integrated and Sustainable Trade and Transport Facilitation Monitoring Mechanism: BPA+ (ST/ESCAP/2683). Available from www.unescap.org/sites/default/files/0%20-%20Full%20text_0.pdf.
STATISTICAL STANDARDS FOR STRENGTHENED ACCOUNTABILITY AND BETTER POLICYmAKING
Official statistics help Governments track progress and ensure that their decisions are based on evidence. As noted in the report of the High-level Panel of Eminent Persons on the Post-2015 Development Agenda, statistics are more than a tool for monitoring development results; they are also a means to strengthen accountability and are a central component of achieving the development agenda beyond 2015.11 ESCAP member and associate member States reaffirmed this view in their input to the United Nations Statistical Commission session in March 2014.12
As noted by the High-level Panel, better data and statistics provide the basis for evidence-based policymaking. They facilitate bilateral, multilateral and international policy dialogue in arriving at a shared understanding of trends, issues and bottlenecks
– enabling them to reach consensus on cross-border issues, such as trade, international migration, education standards, transport and tourism.
Fundamental for this shared understanding is the availability of data that are comparable across countries, over time and across different data sources. For this purpose, statistics need to be produced, disseminated and used according to mutually agreed statistical standards concerning definitions, classifications and methodologies.13 Such standards can be either global, such as the System of National Accounts, or agreed at regional or subregional levels. They should also be in line with the Fundamental Principles of Official Statistics, which offer guidance on objectivity, independence and availability, and which also call for the use of international concepts, classifications and methods.14
Organizations and countries that adopt common statistical standards are in a better position to
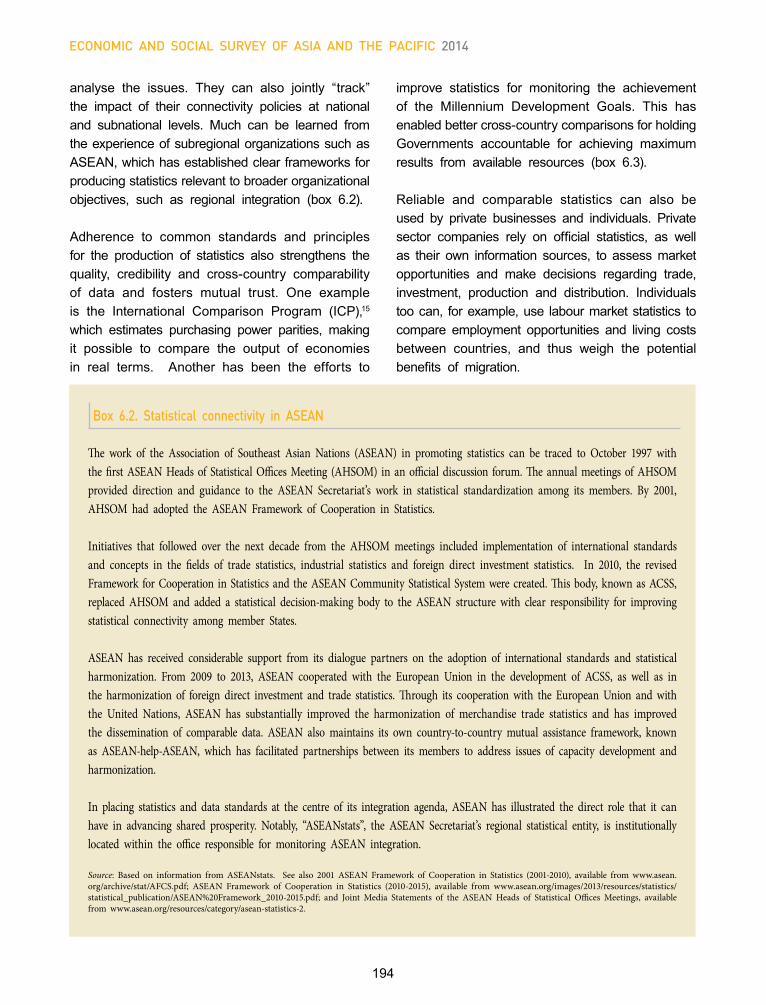
194
Economic and social survEy of asia and thE pacific 2014
analyse the issues. They can also jointly “track” the impact of their connectivity policies at national and subnational levels. Much can be learned from the experience of subregional organizations such as ASEAN, which has established clear frameworks for producing statistics relevant to broader organizational objectives, such as regional integration (box 6.2).
Adherence to common standards and principles for the production of statistics also strengthens the quality, credibility and cross-country comparability of data and fosters mutual trust. One example is the International Comparison Program (ICP),15 which estimates purchasing power parities, making it possible to compare the output of economies in real terms. Another has been the efforts to
improve statistics for monitoring the achievement of the Millennium Development Goals. This has enabled better cross-country comparisons for holding Governments accountable for achieving maximum results from available resources (box 6.3).
Reliable and comparable statistics can also be used by private businesses and individuals. Private sector companies rely on official statistics, as well as their own information sources, to assess market opportunities and make decisions regarding trade, investment, production and distribution. Individuals too can, for example, use labour market statistics to compare employment opportunities and living costs between countries, and thus weigh the potential benefits of migration.
Box 6.2. Statistical connectivity in ASEAN
The work of the Association of Southeast Asian Nations (ASEAN) in promoting statistics can be traced to October 1997 with the first ASEAN Heads of Statistical Offices Meeting (AHSOM) in an official discussion forum. The annual meetings of AHSOM provided direction and guidance to the ASEAN Secretariat’s work in statistical standardization among its members. By 2001, AHSOM had adopted the ASEAN Framework of Cooperation in Statistics.
Initiatives that followed over the next decade from the AHSOM meetings included implementation of international standards and concepts in the fields of trade statistics, industrial statistics and foreign direct investment statistics. In 2010, the revised Framework for Cooperation in Statistics and the ASEAN Community Statistical System were created. This body, known as ACSS, replaced AHSOM and added a statistical decision-making body to the ASEAN structure with clear responsibility for improving statistical connectivity among member States.
ASEAN has received considerable support from its dialogue partners on the adoption of international standards and statistical harmonization. From 2009 to 2013, ASEAN cooperated with the European Union in the development of ACSS, as well as in the harmonization of foreign direct investment and trade statistics. Through its cooperation with the European Union and with the United Nations, ASEAN has substantially improved the harmonization of merchandise trade statistics and has improved the dissemination of comparable data. ASEAN also maintains its own country-to-country mutual assistance framework, known as ASEAN-help-ASEAN, which has facilitated partnerships between its members to address issues of capacity development and harmonization.
In placing statistics and data standards at the centre of its integration agenda, ASEAN has illustrated the direct role that it can have in advancing shared prosperity. Notably, “ASEANstats”, the ASEAN Secretariat’s regional statistical entity, is institutionally located within the office responsible for monitoring ASEAN integration.
Source: Based on information from ASEANstats. See also 2001 ASEAN Framework of Cooperation in Statistics (2001-2010), available from www.asean.org/archive/stat/AFCS.pdf; ASEAN Framework of Cooperation in Statistics (2010-2015), available from www.asean.org/images/2013/resources/statistics/statistical_publication/ASEAN%20Framework_2010-2015.pdf; and Joint Media Statements of the ASEAN Heads of Statistical Offices Meetings, available from www.asean.org/resources/category/asean-statistics-2.
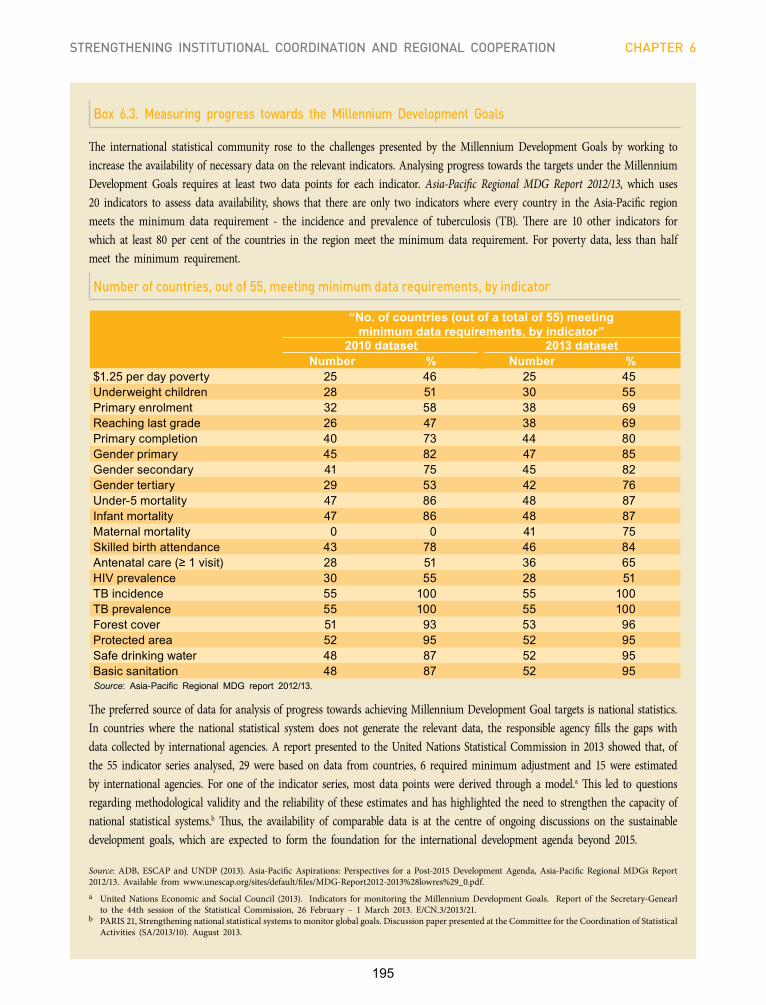
195
STRENGTHENING INSTITUTIONAL COORDINATION AND REGIONAL COOPERATION CHAPTER 6
Box 6.3. measuring progress towards the millennium Development Goals
The international statistical community rose to the challenges presented by the Millennium Development Goals by working to increase the availability of necessary data on the relevant indicators. Analysing progress towards the targets under the Millennium Development Goals requires at least two data points for each indicator. Asia-Pacific Regional MDG Report 2012/13, which uses 20 indicators to assess data availability, shows that there are only two indicators where every country in the Asia-Pacific region meets the minimum data requirement - the incidence and prevalence of tuberculosis (TB). There are 10 other indicators for which at least 80 per cent of the countries in the region meet the minimum data requirement. For poverty data, less than half meet the minimum requirement.
Number of countries, out of 55, meeting minimum data requirements, by indicator
“No. of countries (out of a total of 55) meeting minimum data requirements, by indicator”
2010 dataset 2013 datasetNumber % Number %
$1.25 per day poverty 25 46 25 45Underweight children 28 51 30 55Primary enrolment 32 58 38 69Reaching last grade 26 47 38 69Primary completion 40 73 44 80Gender primary 45 82 47 85Gender secondary 41 75 45 82Gender tertiary 29 53 42 76Under-5 mortality 47 86 48 87Infant mortality 47 86 48 87Maternal mortality 0 0 41 75Skilled birth attendance 43 78 46 84Antenatal care (≥ 1 visit) 28 51 36 65HIV prevalence 30 55 28 51TB incidence 55 100 55 100TB prevalence 55 100 55 100Forest cover 51 93 53 96Protected area 52 95 52 95Safe drinking water 48 87 52 95Basic sanitation 48 87 52 95Source: Asia-Pacific Regional MDG report 2012/13.
The preferred source of data for analysis of progress towards achieving Millennium Development Goal targets is national statistics. In countries where the national statistical system does not generate the relevant data, the responsible agency fills the gaps with data collected by international agencies. A report presented to the United Nations Statistical Commission in 2013 showed that, of the 55 indicator series analysed, 29 were based on data from countries, 6 required minimum adjustment and 15 were estimated by international agencies. For one of the indicator series, most data points were derived through a model.a This led to questions regarding methodological validity and the reliability of these estimates and has highlighted the need to strengthen the capacity of national statistical systems.b Thus, the availability of comparable data is at the centre of ongoing discussions on the sustainable development goals, which are expected to form the foundation for the international development agenda beyond 2015.
Source: ADB, ESCAP and UNDP (2013). Asia-Pacific Aspirations: Perspectives for a Post-2015 Development Agenda, Asia-Pacific Regional MDGs Report 2012/13. Available from www.unescap.org/sites/default/files/MDG-Report2012-2013%28lowres%29_0.pdf.a United Nations Economic and Social Council (2013). Indicators for monitoring the Millennium Development Goals. Report of the Secretary-Genearl to the 44th session of the Statistical Commission, 26 February – 1 March 2013. E/CN.3/2013/21. b PARIS 21, Strengthening national statistical systems to monitor global goals. Discussion paper presented at the Committee for the Coordination of Statistical Activities (SA/2013/10). August 2013.
196
Economic and social survEy of asia and thE pacific 2014
Strengthening statistical capacity in the Asian and Pacific region
Currently, statistics are often unavailable because many Governments lack the capacity to gather and use them.16 The ESCAP Committee on Statistics is therefore trying to achieve two goals by 2020: to ensure that all countries in the region can provide a basic range of population, economic, social and environment statistics; and second, to create a more adaptive and cost-effective information management environment for national statistical offices.17
Established forums can help produce the statistics needed to face
future challenges
The production of statistics requires the capacity to collect the required information, such as through surveys and population censuses, as well as to make the best possible use of available information, such as administrative records. The “new data revolution” offers great potential, but serious efforts are needed to bridge the gap between the traditional statistics community and new data producers ̶ to allow “non-official” data to complement and add value to officially recognized statistics.18 Towards this end, the United Nations has launched the “Global Pulse initiative”, which explores how policymakers can use digital data sources and real-time analysis to better understand human well-being and emerging vulnerabilities and protect people from shocks.19
To move the regional connectivity agenda forward, national Governments can work closely together through established forums such as the United Nations Statistical Commission and the ESCAP Committee on Statistics. This approach can help define the type of statistics needed by policymakers and develop relevant standards, including innovative data sources. National statistical systems of ESCAP member States can also support line ministries in monitoring regional strategies by coordinating data collection and verification.
REGIONAL SOLUTIONS FOR FINANCING REGIONAL INFRASTRUCTURE NETWORKS
Infrastructure development is progressing unevenly across the region and tends to be directed towards satisfying domestic needs. This is understandable since infrastructure development invariably involves high capital costs, with benefits accruing over the longer run. National infrastructure projects are therefore likely to progress faster than cross-border ones since they have lower risk profiles and shorter gestation times. Furthermore, for regional projects the costs and benefits can be unevenly distributed among the participants – or at least perceived to be so. They also require higher levels of regional and sectoral coordination and a commitment from all parties.
To overcome the obstacles to regional project financing, multilateral funding bodies, such as ADB and the World Bank have promoted “corridor approaches”. ADB, for example, has supported corridor development under the Greater Mekong Subregion programme, Central Asia Regional Economic Cooperation programme and South Asia Subregional Economic Cooperation programme. The ADB rationale is that economic corridors not only afford significant benefits to the major economic centres along the corridors, but also offer secondary infrastructural linkages to provide access to markets from rural areas.20 Nevertheless, countries must still borrow on the basis of sovereign loans, so countries may still have concerns over the distribution of costs and benefits.
Regional projects as “regional public goods”
ESCAP has suggested that regional infrastructure networks should be recognized as “regional public goods”, the collective benefit of which for the region are greater than the cost of the individual projects. On this basis, there is a strong case for regional approaches to financing critical infrastructure networks, in particular transport, energy and ICT.
197
STRENGTHENING INSTITUTIONAL COORDINATION AND REGIONAL COOPERATION CHAPTER 6
A “regional public goods” approach is particularly relevant for directing investment to the “weakest links” – improving their efficiency and coherence. This can help the landlocked and least developed countries, for example, to increase the quality of their national transport networks so that they are better connected to regional networks. For example, the recent developments in Myanmar have raised the prospect of better overland links through Myanmar, connecting South-East and South Asia. Such connectivity would not only enhance the mobility of goods and people between these subregions, but also open up new opportunities for access by India’s northeastern States.
Emerging regional networks need to be designed for future
shared prosperity
Fortunately, many countries in the region are in a strong economic position to build the necessary infrastructure and institutions. Some countries, such as China, India, Malaysia and Thailand, are already investing in physical infrastructure in neighbouring and other regional countries.21 However, they could enhance the benefits of those initiatives if they considered them within a wider regional framework. This would also assist them in adhering to international standards for project management, construction methods and environmental and social safeguards.
As they are still in the development stage, countries in the Asia-Pacific region have the chance to develop regional networks in an integrated and coordinated manner. This would reduce the costs and spread the benefits to a wider group of countries. To do so, however, countries have to agree on how to apportion costs and risks. A complicating factor is that regional projects are likely to have asymmetric impact on participating countries – whether in terms of the financial burden, or pollution or other adverse impacts in transit countries – while the main benefits accrue to neighbours. In order to better distribute benefits among participating countries, it may be
necessary to adopt additional measures, such as grants or concessional financing, to the countries affected, or allow them to charge toll fees.
Drawing on previous research, as well as the earlier discussion on a regional financial architecture in part I of this year’s Economic and Social Survey, the following section offers innovative approaches for financing regional infrastructure.
Regional infrastructure funds
An alternative to national or bilateral financing is to create regional infrastructure funds. By serving as a kind of “intermediary” between project sponsors and investors, such funds could complement existing forms of investment by mobilizing funds beyond governmental resources – from institutional investors, such as pension funds, sovereign wealth funds or foreign exchange reserves.
Two examples of regional infrastructure funds are the ASEAN Infrastructure Fund and the SAARC Development Fund. The ASEAN Infrastructure Fund has already started disbursing funds for projects (box 6.4). The World Bank also plans to establish a Global Infrastructure Facility, with contributions from the World Bank itself, members, sovereign wealth funds and pension funds, in order to try to channel more funding towards infrastructure development in developing countries. In addition, early in 2014, APEC announced progress in the development of its new APEC Multi Year Plan on Infrastructure Development and Investment, which specifically targets the region’s infrastructure through greater private sector investment.22
Another new actor is also on the steps, as negotiations on the newly proposed “BRICS” development bank are expected to be completed in 2014. The so-called “BRICS” bank was first announced by the five founding members, Brazil, the Russian Federation, India, China and South Africa, in 2012. The bank is likely to focus on infrastructure, with a capital base starting at $50 billion and eventually increasing to $100 billion.23
198
Economic and social survEy of asia and thE pacific 2014
In parallel with its involvement in the proposed BRICS bank, China has announced its intention to start a new “Asian Infrastructure Investment Bank” in 2014. Reports suggest that the bank will have an initial capital base of $50 billion, provided by China as well as other participating members.24 Such an “Asian Infrastructure Investment Bank” could cooperate with the World Bank, Asian Development Bank and other financial institutions to help bridge the infrastructure financing gaps in the region.
Regional Project Preparatory Facility
To be successful, regional infrastructure funds rely on a viable pipeline of projects with supportive feasibility studies. Unfortunately, many developing countries lack “bankable” projects because they do not have the legal, project financing and technical expertise. The preparation of regional transport
projects is costly and time-consuming, particularly given the lack of data on cross-border traffic flows.
Some analysts have therefore called for the creation of a regional infrastructure project preparatory facility to help Governments prepare bankable regional projects. Such a facility could also be an integral part of an Asian multi-donor platform.
Asian Multi-donor Platform
Another possible instrument would be an Asian multi-donor platform. This could collect grants from different donors and allocate them to national or multilateral development banks. The objective would be to use concessional resources to leverage more public and private funding for regional projects. Grant money could be used to lower the hurdle for financial feasibility or to reduce the risk associated
Box 6.4. ASEAN Infrastructure Fund: a possible “best practice” for future regional infrastructure financing
The idea behind the ASEAN Infrastructure Fund (AIF), which was set up by the Association of Southeast Asian Nations (ASEAN) in 2010, is to promote “infrastructures of development” within ASEAN developing country members. To finance AIF, the Asian Development Bank and ASEAN member States provided core equity amounting to $150 million and $335.2 million respectively. In addition, bonds will be issued to attract resources from institutional investors, such as central banks, which represent potentially a huge source of funding given the amount of foreign exchange reserves in the region. So far the Fund lends only to public entities, but the intention is to support public-private partnerships in the near future. As of the end of May 2014, the Fund had financed a power transmission project and a sanitation project in Indonesia worth $65 million; other projects are at advanced stages of preparation.
The Fund has a clause saying that at least 30 per cent of the financing should go to regional projects, including cross-border projects and national projects with significant regional impact. This arrangement can make financing available to regional infrastructure projects which otherwise would struggle to find financing on their own.
In May 2014, Myanmar announced its intention to contribute equity to the Fund, bringing all 10 member States into the Fund. In this regard, the Fund may serve as a useful example to others looking for multilateral approaches to financing infrastructure. Although the value of contributions varies, the fact that all members of ASEAN are providing funds to AIF signals a strong public commitment by Governments. Meanwhile, the Asian Development Bank continues to play an important role not only in terms of financing but also as the administrator of the Fund, which enables it to bring know-how, a pipeline of potential projects and the technical support needed to see projects to completion.
Source: ADB (2010). General Capital Increase V; ADB (2012). ADB Financial Profile 2012; ADB (2012). Proposed Equity Contribution and Administration of ASEAN Infrastructure Fund; ADB (2014) “Myanmar Set to Join ASEAN Infrastructure Fund in 2014”.

199
STRENGTHENING INSTITUTIONAL COORDINATION AND REGIONAL COOPERATION CHAPTER 6
Figure 6.2. Percentage of compliance of legal frameworks for selected ESCAP countries (2008, 2011)
with a specific project. Grant money could also be used to finance technical assistance aimed at unblocking, accelerating or improving the quality of regional projects.
For the recipient countries, the platform could serve as a single entry point for submitting project proposals. This would facilitate access to finance while decreasing dependence on a single partner. For the contributing countries such a platform could result in faster project implementation, lower administrative costs and greater impact. By facilitating joint operations, the platform could also enhance collaboration among participating institutions, including at the project level, for example by harmonizing their procedures.25
Public-Private Partnerships
Given the considerable pressure on national budgets, developing countries in the ESCAP region have also been taking measures to promote public-private partnerships (PPPs).26 This has been a particularly promising avenue in revenue-generating sectors, such as energy, ICT and transport, where user charges can be used to repay the investment. However, in the context of a regional project, the issue of how to charge user fees is complex and is one reason why such models have not been widely applied to cross-border projects.
Furthermore, attracting private sector interest requires Governments to take appropriate actions to create enabling environments for PPP development at the macro and sectoral levels, for example, by adopting regulations that will assure private investors that their legitimate rights will be adequately protected.27
Some countries may not yet be able to create an enabling environment, or may lack the capacity to design and manage PPPs. There are many different policy areas which need to be in place for Governments to enter into successful public-private partnerships, not least a sound legal framework. Figure 6.2 shows the change in “percentage of compliance” of legal frameworks for selected countries in the ESCAP region, conducted by the European Bank for Reconstruction and Development.28 Though the pace is slow, the graph suggests that some countries made progress between 2008 and 2011.
These countries can learn from other countries in the region by participating in PPP knowledge networks, such as those promoted by ESCAP. As a regional platform, ESCAP is well suited for supporting these networking activities, and has already organized several meetings at both ministerial and expert levels to facilitate the exchange of experience.
2011 2008
0 10 20 30 40 50 60 70 80 90 100
Mongolia
Russian Federation
Kazakhstan
Turkey
Kyrgyzstan
Uzbekistan
Azerbaijan
Tajikistan
Turkmenistan
Georgia
Armenia2011 2008
200
Economic and social survEy of asia and thE pacific 2014
Endnotes1 H. Kuroda, Infrastructure and regional cooperation.
Paper presented at the Annual Bank Conference on Development Economics, Tokyo, 2006.
2 Ukraine and Moldova have had observer status since May 2002 and Armenia, since January 2003. On 25 January 2006, a protocol was signed on Uzbekistan’s accession to the organization, but in October 2008 it suspended its participation in the work of EURASEC bodies. See EurAsEC Today 2013, accessible from www.evrazes.com/i/data/item7618-1.pdf.
3 Before the commencement of the Customs Union in 2009, it stood at $12.9 billion, according to the Ministry of Foreign Affairs, Republic of Kazakhstan (2014).
4 Washington Post (2014). Russia, Kazakhstan, Belarus form Eurasian Economic Union. Published May 29, 2014. Available from http://www.washingtonpost/com/world/europe/russia-kazakhstan-belarus-form-eurasina-economic-union/2014/05/29/de4a2c15-cb01-4c25-9bd6-7d5ac93466fd_story.html.
5 Asia-Pacif ic Economic Cooperation, Improving Connectivity in the Asia Pacific Region: Perspectives of the APEC Policy Support Unit (Singapore, APEC, 2013). Available from http://publications.apec.org/publication-detail.php?pub_id=1461.
6 The Declaration of the 14th SAARC Summit, held in 2007, stated that “The Heads of State or Government recognised the importance of connectivity in fulfilling these objectives. It was vital to first have better connectivity within South Asia and then with the rest of the world. They agreed to improve intra-regional connectivity, particularly physical, economic and people-to-people connectivity. They agreed to the vision of a South Asian community, where there was smooth flow of goods, services, peoples, technologies, knowledge, capital, culture and ideas in the region”. See www.saarc-sec.org/userfiles/Summit Declarations/14.
7 Institute of Peace and Conflict Studies, Konrad Adenauer Foundation, and India International Centre, SAARC towards Greater Connectivity. Conference report, Colombo, 15-16 January 2008. Available from www.ipcs.org/pdf_file/issue/860963938ConferenceReport-SAARC.pdf.
8 See for example Asian Development Bank, Sharing Growth and Prosperity: Strategy and Action Plan for the Greater Mekong Subregion Southern Economic Corridor (Mandaluyong City, Philippines, ADB, 2010).
Available from www.adb.org/ sites/default/files/pub/2010/gms-action-plan-east-west.pdf.
9 Asian Development Bank, Institutions for Regional Integration – Toward an Asian Economic Community (Mandaluyong City, Philippines, ADB, 2010). Available from http://aric.adb.org/ pdf/Institutions_for_Regionalization_Web.pdf.
10 United Nations, Economic and Social Commission for Asia and the Pacific, Regional strategic framework for the facilitation of international road transport. (Bangkok, 2012). Available from www.unescap.org/resources/regional-strategic-framework-facilitation-international-road-transport
11 United Nations, A New Global Partnership: Eradicate Poverty and Transform Economies through Sustainable Development, The Report of the High-level Panel of Eminent Persons on the Post-2015 Development Agenda. New York. Available from www.un.org/en/development/desa/policy/untaskteam_undf/HLP%20P2015%20Report.pdf.
12 United Nations Economic and Social Council, Report of the Economic and Social Commission for Asia and the Pacific on Statistics and the Post-2015 Development Agenda, Perspectives from the Asia-Pacific Region. Statistical Commission, forty-fifth session, 4-7 March 2014 (E/CN.3/2014/15)
13 In this study, the statistics referred to are “official statistics”, which are statistics produced and published by entities of a national statistical system.
14 United Nations Economic and Social Council, Report on the Statistical Commission Special Session, New York, 11-15 April 1994 (E/CN.3/1994/18); and United Nations Economic and Social Council (2013). Official Records of the Economic and Social Council, 2013, Supplement No. 4 (E/2013/24-E/CN.3/2013/33).
15 The success of ICP is based on: (a) detailed, agreed standards; (b) commitment of countries to adhere to those standards; (c) a comprehensive capacity development programme to enable countries to produce statistics in adherence to those standards; and (d) open access to the resulting statistics. See World Bank, International Comparison Program (ICP). Available from www.worldbank.org/data/icp.
16 That the capacity is insufficient has been recognized by the Economic and Social Council in its resolution 2006/6 on strengthening statistical capacity and more recently by the UN System Task Team on the Post-2015 Development Agenda report, entitled “Statistics
201
STRENGTHENING INSTITUTIONAL COORDINATION AND REGIONAL COOPERATION CHAPTER 6
and indicators for the post-2015 development agenda”. See United Nations Economic and Social Council (2006). Resolution 2006/6 on strengthening statistical capacity. Available from http://unstats.un.org/unsd/statcom/ecosoc/2006-6-ResStrengtheningStatCapacity.pdf.
17 For example, see United Nations, Economic and Social Commission for Asia and the Pacific (ESCAP), Make every life count: Regional strategic plan for the improvement of civil registration and vital statistics in Asia and the Pacific (E/ESCAP/CST(3)/6/Add.1). Available from www.unescap.org/sites/default/files/CST3 Regional strategic plan English.pdf; or ESCAP, Proposed regional programme for the improvement of economic statistics in Asia and the Pacific (E/ESCAP/CST(2)/5).
18 For example, the High-level Panel called for a “new data revolution” to enable the recent improvements in information technology to contribute to inclusive and sustainable development.
19 For example, the United Nations Global Pulse initiative is looking at ways to use data gathered from Twitter and Facebook to understand unemployment patterns, and how mobile phone data can be used to understand migration. See www.unglobalpulse.org.
20 Asian Development Bank, Sharing Growth and Prosperity: Strategy and Action Plan for the Greater Mekong Subregion Southern Economic Corridor (Mandaluyong City, Philippines, ADB, 2010). Available from www.adb.org/ sites/default/files/pub/2010/gms-action-plan-east-west.pdf.
21 For some examples of bilateral transport projects, see United Nations, Economic and Social Commission for Asia and the Pacific, Review of Developments in Transport in Asia and the Pacific. ST/ESCAP/2627.
22 Asia-Pacific Economic Cooperation, “APEC targets increased infrastructure investment”. APEC Senior Officials’ Meeting, Ningbo, China, 28 February 2014. Available from www.apec.org/Press/News-Releases/2014/0228_investment.aspx.
23 Reuters, BRICS aim to finish development bank preparations by July summit. 11 April 2014. Available from http://in.reuters.com/article/2014/04/10/g20-economy-brics-idINDEEA390GA20140410.
24 “Asian Infrastructure Investment Bank will guide capital”, 3 July 2014, http://news.xinhuanet.com/english/china/2014-07/03/c_126707343.htm.
25 This approach has been recently followed by the European Union in its development cooperation policy where different instruments have been created to use grants from the European Union to leverage loans from several European national and multilateral public financial institutions. For further information, see European Commission, “Promoting investment through the Neighbourhood Investment Facility (NIF)”. Available from. http://ec.europa.eu/ europeaid/where/neighbourhood/regional-cooperation/irc/investment_en.htm.
26 In the context of infrastructure projects, a public-private partnership describes a long-term contractual arrangement between the Government and one or more private companies, whereby the private companies provide building or rehabilitation works in exchange for operating rights. At the end of the period, the asset is usually transferred back to the Government.
27 More detailed information on the enabling environment is available in the ESCAP publication, entitled Review of Developments in Transport in Asia and the Pacific, 2013: Transport as a Key to Sustainable Development and Regional Integration (ST/ESCAP/2667) (see pages 66-77).
28 European Bank for Reconstruction and Development. Concession/PPP laws assessment 2011, final report. Available from www.ebrd.com/downloads/legal/concessions/pppreport.pdf.

202
ESC
AP
PH
OTO
203
ESC
AP
PH
OTO
CONCLUSIONS 7 he countries in Asia and the Pacific are driving the global economy and have become major forces in manufacturing, trade and services. Most of the dynamism has come from individual countries, but the future will be determined by how closely economies can work in combination – taking advantage of extended and more tightly integrated networks. At the same time, as various networks become more and more integrated, it will become increasingly important to have strong institutional coordination and cooperation at different levels. Intergovernmental organisations such as ESCAP can play a role in bringing together Governments and other stakeholders to discuss and implement actions to strengthen connectivity in the region.
T
204
Economic and social survEy of asia and thE pacific 2014
Over the past few decades, countries in Asia and the Pacific have recorded major achievements in boosting economic growth, stimulating technological change and reducing poverty. International trade, foreign direct investment and the emergence of global and regional production networks have driven many of those achievements, supported by the expansion of maritime links and the diffusion of information and communications technology (ICT), including the Internet. Trade and transport will continue to be important, but other drivers of growth, particularly ICT connectivity, energy connectivity and people-to-people connectivity, are expected to shape patterns of economic and social development into the future.
Some of these changes will continue to be driven by the private sector, as individual enterprises seek new ways of boosting productivity and relocate production and distribution to different countries across the region. In taking advantage of the progress in ICT and people-to-people connectivity, other types of networks, such as business associations and civil society groups, are also expected to play a greater role in the region’s development.
Ultimately, however, the main driving force behind regional connectivity is the political will of national Governments, which are linking together supra- national regulatory bodies, international standard-setting organizations and their own domestic businesses. They also control the framework for cross-border flows of capital and labour and can shape spatial development patterns through their investments and policies on infrastructure.
As various networks become more and more integrated, it will become increasingly important to have strong institutional coordination and cooperation, both within and between Governments. In the years ahead, Governments will find many more opportunities to work together to strengthen these mechanisms. There is therefore a need to build on the momentum of coordination and cooperation in the ESCAP region, both at the subregional and regional levels.
The key findings of the present study are summarized below.
Institutional coordination is key to strengthening regional connectivity
This report contains an examination of the ways in which better regional connectivity can contribute to the sustainable and inclusive development of the Asian and Pacific region. It was found through the study that regional connectivity is inherently multifaceted, and that the benefits of this connectivity may be enhanced by combining different elements. Moreover, it was suggested in the study that networks are likely to become more integrated and interdependent as they evolve.
Governments therefore have to develop cross-sectoral policies on connectivity, at national, subregional and regional levels. To achieve this, they can make greater use of existing intergovernmental forums, notably the annual sessions of the Commission and the legislative committees of ESCAP which can serve as neutral platforms for discussing and refining joint regional strategies.
Such strategies should be based on sound data and analysis, using global statistical standards, such as those promoted by the United Nations. Governments of countries in the region should also work together: to identify the types of statistics needed for joint planning and decision-making on regional connectivity; to build the capacity of national statistical systems to produce and disseminate internationally comparable statistics; and to make statistics more widely available to all users. Regional collaboration also enables joint engagement by countries in Asia and the Pacific in the development and promotion of global statistical standards, ensuring that regional priorities are better reflected in the global agenda.
In recognizing the importance of connectivity, many subregional and regional organizations have developed their own initiatives, such as the Master Plan on ASEAN Connectivity. To build on each other’s strengths and avoid duplication, the various
205
ConCLUSIonS CHAPTER 7
organizations involved must communicate more frequently to exchange information and knowledge. Given that many of the longer-term objectives of such organizations are similar, it would also be beneficial to develop joint initiatives and, where appropriate, to pool resources.
Countries in the region differ in many respects – in climatic or geographical conditions, as well as in income levels and technical capacities. To overcome these differences, countries should strive to adopt global and regional standards for both technical issues and procedures. Technical standards form the basis for the integration of networks, particularly for infrastructure, while procedural standards can greatly reduce delays and costs and thereby enhance connectivity at border crossings, particularly for the movement of goods, vehicles and people.
This work, however, can be ef fective only through collaboration with all of the relevant stakeholders. Trade and transport facilitation, for example, is primarily achieved through deeper coordination among the relevant agencies, both within Governments and across borders. Such coordination will be more effective if it has a clear focus or goal, such as establishing integrated border management systems and harmonizing procedures for cross-border trade and transport. As the region moves towards a regime of paperless trade, countries should step up efforts to adopt regional and international standards for both documents and procedures.
Regional connectivity is also being intensified by academic networks, business associations and civil society organizations. Not only do they serve as major conduits of people-to-people connectivity, they also help propagate global standards and act as partners in implementing regional strategies. These disparate groups can also work with national Governments and subregional organizations. This can be achieved through the convening power of ESCAP which can chart out some of the steps needed to implement these strategies.
Development of regional networks as “regional public goods”
One of the most important conditions for economic growth is the availability of extensive and efficient infrastructure, particularly transport, energy and communications systems. At the national level, these infrastructure networks provide domestic enterprises and agricultural producers with access to a greater pool of resources and markets – enabling them to scale up their production and diversify their products.
Countries have also made substantial progress in developing infrastructure networks at the regional level. Thus, most countries in continental Asia are connected through the Asian Highway and Trans-Asian Railway networks, while coastal countries and small island developing States are linked by maritime services. Meanwhile, many capitals and major cities in the region can now connect to broadband Internet. Various cross-border initiatives are also under way in the energy sector, particularly at the subregional level, linking energy-rich and energy-poor countries and enhancing the region’s overall energy security.
There is still much to be done on these networks to improve their reach and quality, and Governments should step up efforts to develop both the “soft” and “hard” infrastructure of these networks. However, this also represents a valuable opportunity. As they are still at relatively early stages, these networks can be developed in an integrated manner, reducing the costs and extending the benefits to a wider group of countries.
Developing and managing regional networks effectively requires cross-country consensus. Governments need to further study and refine the strategies outlined in this study and agree on the most appropriate sequencing of actions. They also need to consider potential negative impacts. These can arise from large infrastructure projects, for example, or from the increased movement of goods and people across borders. These aspects will require the development of appropriate institutions and mechanisms for regulatory oversight, with clear roles and responsibilities appropriately assigned.
206
Economic and social survEy of asia and thE pacific 2014
Infrastructure development invariably involves high capital costs, with benefits accruing over the longer run. To support investment in cross-border infrastructure, countries can build on the concept of regional public goods to establish regional financing mechanisms. In this way they can identify and target investments in areas that will yield the greatest benefit from a regional perspective, particularly where sections of the networks are weakest. A number of innovative approaches have been proposed in this study, such as the establishment of a regional infrastructure fund, an Asian multi-donor platform and a regional project preparatory facility. These proposals deserve further study and consideration by ESCAP member States.
At the same time, countries should explore the synergies and potential savings which can be accrued from the “cohabitation” of infrastructure networks, particularly the laying of fibre-optic cables along roads, railways and electricity distribution networks. This will require the line ministries in all affected countries to work together and also have detailed discussions with the private sector. In this regard, it is recommended that, when extending terrestrial fibre-optic networks, countries should try to take advantage of the existing intergovernmental frameworks of the Asian Highway and Trans-Asian Railway networks. This would facilitate negotiations over “rights of way”.
Enhancing regional connectivity for disadvantaged countries
Connectivity will certainly increase across countries. However, what forms will those connections take and who will they benefit? The aim should be to ensure that they open new opportunities for all, especially for the region’s disadvantaged countries – the least developed countries, the landlocked developing countries and the small island developing States.
The development options for these countries often depend on their location and their natural resources. Some landlocked developing countries, for example, have large reserves of natural mineral resources, while others have tremendous hydropower potential
which they are already exporting to neighbouring countries. Meanwhile, the small island developing States in the Pacific tend to have small and geographically dispersed populations and are relatively vulnerable to natural and environmental disasters and to the impacts of climate change.
At the same time, these groups of countries have some common characteristics. Typically they have relatively small markets and depend on a few export commodities. Owing to their location, as well as poor infrastructure, they may also be less connected to regional markets. This makes them more reliant on neighbouring countries or, in the case of the Pacific island States, on larger economies in the subregion.
In this regard, these countries may wish to consider how to use their current endowments to build up their capacities in those industries which have the potential to grow. In particular, they should also make greater use of communications technology, particularly the Internet, to develop other commercial services, such as transport, telecommunications and financing, as these sectors in turn can support trade and manufacturing. In this way they can participate more fully in regional production and distribution networks.
By taking advantage of new technologies, dis- advantaged countries can become more integrated into the global economy. Most developing countries lack the capacity to create their own new technology. Governments should therefore encourage technology transfer and import – through trade and investment, for example, or via the Internet or through exchanges of human capital. Meanwhile, all countries in the region can support disadvantaged countries by enhancing people-to-people connectivity – for example, by encouraging more interactions between students and workers.
Developing networks of people and knowledge
A country’s greatest asset is its people. Governments can expand the potential of their citizens in many ways. One is to promote greater mobility for both
207
ConCLUSIonS CHAPTER 7
skilled and unskilled workers. The Asian and Pacific region has almost one quarter of the world’s migrants so there would be enormous benefits from developing more coordinated approaches to manage international labour migration. Both source countries and destination countries should gain, while simultaneously protecting migrants and their families from the potential negative effects of migration.
People’s potential can also be developed through academic and civil society networks, which help develop and share knowledge. The ESCAP region is home to many excellent research institutes and universities that employ internationally recognized academics and researchers. National Governments can support these regional knowledge networks by encouraging their students and academics to study and work in other countries in the region. Governments can also contribute to the development of “knowledge clusters” by commissioning research and fostering exchange programmes among the various stakeholders.
Governments should also work closely with the private sector and its representatives, which are likely to be the region’s foremost ambassadors of connectivity. Business associations and networks of chambers of commerce can also help link small and medium-sized enterprises to the global marketplace. Such networks will enhance mutual understanding about different cultures and value systems. At the regional level, international and regional organizations should work with national Governments to institutionalize and enforce internationally accepted standard business practices and procedures, which would help to create a transparent and non-discriminatory business environment.
Next steps towards regional connectivity
As globalization continues, the region’s future will depend on how countries work together. The present study indicates how they have been doing so through regional networks of trade and transport, ICT, energy and people, and how they might intensify these networks in the future. As these networks become
more integrated, strategies to strengthen regional connectivity should be considered not sector by sector but as part of a whole.
In this regard, the regional strategies discussed in this study can serve as a catalyst for regional connectivity. The aim should be to ensure that these networks open new opportunities for all, especially for the region’s disadvantaged countries and for the poorest communities. Further, to better respond to the rapid evolution of these networks, national Governments and international organizations alike will have to strengthen institutional coordination. This should extend to people-to-people networks involving academia, the private sector and civil society, which can influence the direction and effectiveness of intergovernmental cooperation.
Ultimately, however, national Governments must take the lead in forging regional connectivity, both by making the necessary changes in their national policies, as well as by actively participating in regional initiatives on connectivity. ESCAP can support their efforts by providing a neutral platform for frank and informed discussions on these strategies among relevant stakeholders. In this regard, multisectoral expert working groups being established in accordance with the 2013 Bangkok Declaration on Regional Economic Cooperation and Integration in Asia and the Pacific1 can help Governments to identify the best approaches for implementing the regional strategies discussed in this study.
Endnote1 See E/ESCAP/MCREI/3.

208

209
Airports Council International (2013). ACI Releases its 2012 World Airport Traffic Report. Media release, 3 September 2013. Available from www.aci.aero/media/bc5239b4-07ac-4d1f-8cbb-db8f1b093d80/News/Releases/2013/ PR_2013_08_28_WATR_Release_pdf (accessed 8 May 2014).
Ando, M., and F. Kimura (2003). The formation of international production and distribution networks in East Asia. NBER Working Paper W10167. Available from ssrn.com/abstract=478677.
Arvis, J.F., and others (2011). Connecting Landlocked Developing Countries to Markets : Trade Corridors in the 21st Century. Washington D.C.: World Bank. Available from https://openknowledge.worldbank.org/handle/10986/2286.
Arvis, J.F., and others (2013). Trade costs in the developing world: 1995-2010. Policy Research Working Paper 6309. Washington D.C.: World Bank. Available from http://elibrary.worldbank.org/doi/pdf/10.1596/1813-9450-6309.
Asian Cyber University (2014). History of the ASEAN Cyber University. Available from www.aseancu.org/about/history.jsp.
Asia Pacific Forum of National Human Rights Institutions (2012). Promoting and protecting the rights of migrant workers: the role of National Human Rights Commissions. Sydney. Available from nhri.ohchr.org/EN/IHRS/ Documents/APF%20publication%20-%20promoting%20and%20protecting%20the%20rights%20of%20migrant%20 workers.pdf.
Asian Development Bank (2010a). Strategy and Action Plan for the Greater Mekong Subregion Southern Economic Corridor. Mandaluyong City. Available from www.adb.org/ sites/default/files/pub/2010/gms-action-plan-east-west.pdf.
(2010b). Institutions for Regional Integration – Towards an Asian Economic Community. Mandaluyong City. Available from http://aric.adb.org/ pdf/Institutions_for_Regionalization_Web.pdf.
(2010c). General Capital Increase V. Mandaluyong City. Available from www.adb.org/sites/default/files/pub/2010/ General-Capital-Increase-V.pdf.
(2011). Asia 2050 – Realizing the Asian Century. Mandaluyong City. Available from www.adb.org/publications/ asia-2050-realizing-asian-century.
(2012a). ADB Financial Profile 2012. Mandaluyong City. Available from www10.iadb.org/intal/intalcdi/PE/2012/07776.pdf.
(2012b). Asian Development Outlook 2012. Confronting Rising Inequality in Asia. Mandaluyong City. Available from www.adb.org/sites/default/files/pub/2012/ado2012.pdf.
(2012c). Asian Economic Integration Monitor July 2013. Mandaluyong City. Available from http://aric.adb.org/pdf/ aeim/AEIM_2012July_FullReport.pdf.
REFERENCESPART II
210
Economic and social survEy of asia and thE pacific 2014
(2012d). Proposed Equity Contribution and Administration of ASEAN Infrastructure Fund. Mandaluyong City. Available from www.adb.org/sites/default/files/projdocs/2011/45097-001-reg-rrp.pdf.
(2013a). Asian Development Outlook 2013: Asia’s Energy Challenge. Mandaluyong City. Available from www. adb.org/sites/default/files/pub/2013/ado2013.pdf.
(2013b). Energy Outlook for Asia and the Pacific. Mandaluyong City. Available from www.adb.org/publications/ energy-outlook-asia-and-pacific-2013.
(2014). Myanmar set to join ASEAN Infrastructure Fund in 2014, 23 May. Available from www.adb.org/news/ myanmar-set-join-asean-infrastructure-fund-2014. Accessed 8 June 2014.
Asian Development Bank and Asian Development Bank Institute (2009). Infrastructure for a Seamless Asia. Available from www.adbi.org/files/2009.08.31.book.infrastructure.seamless.asia.pdf.
Asian Development Bank, United Nations Economic and Social Commission for Asia and the Pacific, and United Nations Development Programme (2013). Asia-Pacific Aspirations: Perspectives for a Post 2015 Development Agenda. Asia-Pacific Regional MDGs Report 2012/2013. Bangkok. Available from www.adb.org/sites/default/ files/pub/2013/asia-pacific-regional-mdgs-report.pdf.
Asia-Pacific Economic Cooperation (2013). Improving Connectivity in the Asia Pacific Region: Perspectives of the APEC Policy Support Unit. Singapore. Available from http://publications.apec.org/publication-detail.php?pub_ id=1461.
(2014). APEC targets increased infrastructure investment. APEC Senior Officials’ Meeting, Ningbo, China, 28 February 2014. Available from www.apec.org/Press/News-Releases/2014/0228_investment.aspx.
Association of Southeast Asian Nations (2001). ASEAN Framework of Cooperation in Statistics, adopted 30 December 2001. Available from www.asean.org/archive/stat/AFCS.pdf.
(2009). ASEAN Socio-Cultural Community Blueprint. Available from www.asean.org/archive/5187-19.pdf.
(2010a). ASEAN Framework of Cooperation in Statistics (2010-2015), adopted 19 October 2010. Available from www.asean.org/images/2013/resources/statistics/statistical_publication/ASEAN%20Framework_2010-2015.pdf.
(2010b). Master Plan on ASEAN Connectivity. Available from www.asean.org/archive/documents/MPAC.pdf.
(2012). ASEAN Economic Scorecard 2012. Available from www.asean.org/resources/ publications/asean- publications/item/asean-economic-community-scorecard-3.
Athukorala, P. (2010). Production networks and trade patterns in East Asia: regionalization or globalization?. ADB Working Paper Series on Regional Economic Integration, No. 56, August 2010. Mandaluyong City: Asian Development Bank.
Barro, R. J. (1991). Economic growth in a cross section of countries. Quarterly Journal of Economics, vol. 106, No. 2, pp. 407-443.
Bom, P.R.D, and J.E. Lighthart (2009). How productive is public capital? A meta-analysis. Georgia State University, Andrew Yong School of Policy Studies, International Studies Program Working Paper 09-12.
Containerisation International (2013). The Containerisation International Yearbook. Available from http://europe.nxtbook. com/nxteu/informa/ci_yearbook2013/.
Cullinane, K., W.T. Fei, and S. Cullinane (2004). Container terminal development in Mainland China and its impact on the competitiveness of the port of Hong Kong. Transport Reviews, vol. 24, No. 1, pp. 33-56.
211
RefeRences PART II
Duncan, R., and J. McMaster (2008). The Role of USPNet incapacity Development in the South Pacific Region. Capacity Development Series. Mandaluyong City: Asian Development Bank. Available from www.adb.org/sites/ default/files/uspnet-capacity-development.pdf.
Duval, Y., and C. Uthoktham (2011). Trade costs in Asia and the Pacific: improved and sectoral estimates. ESCAP Working Paper 05/11. Bangkok: UN ESCAP. Available from www.unescap.org/sites/default/files/TIDwp05_11.pdf.
Energy Charter Secretariat, and others (2014). Gobitec and Asian Super Grid for Renewable Energies in North-East Asia. Available from www.encharter.org/fileadmin/user_upload/Publications/Gobitec_and_the_Asian_Supergrid_2014_ ENG.pdf.
Estache, A. (2010). A survey of impact evaluations of infrastructure projects, programs and policies. ECARES Working Paper, No. 5. Brussels: European Centre for Advanced Research in Economics. Available from www.ecore. be/DPs/dp_1270557731.pdf.
Estache, A., and G. Garsous (2012). The impact of infrastructure on growth in developing countries. IFC Economics Notes, Note 1. Washington D.C.: International Financial Corporation.
European Bank for Reconstruction and Development (2012). Concession/PPP laws assessment 2011, final report. Available from www.ebrd.com/downloads/legal/concessions/pppreport.pdf.
European Commission (2013). Promoting investment through the Neighbourhood Investment Facility (NIF). Brussels. Available from http://ec.europa.eu/europeaid/ where/neighbourhood/regional-cooperation/irc/investment_en.htm.
The Humble Hero (2013). Economist, 18 May. Available from www.economist.com/news/finance-and-economics/21578041- containers-have-been-more-important-globalisation-freer-trade-humble. Accessed 31 January 2014.
Imai, K., R. Gaiha, A. Ali, and N. Kaicker (2012). Remittances, growth and poverty: New evidence from Asian countries. Occasional Papers, 15. Rome: International Fund for Agricultural Development. Available from www.ifad.org/operations/projects/regions/pi/paper/15.pdf.
Institute of Peace and Conflict Studies, Konrad Adenauer Foundation, and India International Centre (2008). SAARC towards greater connectivity. Conference report, Colombo, Sri Lanka, 15-16 January. Available from www.ipcs. org/pdf_file/issue/860963938ConferenceReport-SAARC.pdf.
International Energy Agency (2012). World Energy Outlook 2012. Paris. Available from www.iea.org/publications/ freepublications/publication/WEO2012_free.pdf.
(2013). IEA World Energy Statistics and Balances. Available from www.oecd-ilibrary.org/energy/data/iea-world- energy-statistics-and-balances_enestats-data-en.
International Finance Corporation (2013). In Papua New Guinea, Mobile Banking Brings Savings and Safety to Farmers. East Asia and the Pacific News, 23 September 2013. Available from www.ifc.org/wps/wcm/connect/region__ ext_content/regions/east+asia+and+the+pacific/news/mobile+banking+saves+farmers+money.
International Telecommunications Union (2012). World Telecommunication/ICT Indicators database 2012.
(2013a). Measuring the Information Society Report 2013. Available from www.itu.int/en/ITU-D/Statistics/Pages/ publications/mis2013.aspx.
(2013b). Mobile cellular subscriptions per 100 people. Available from www.itu.int/en/ITU-D/Statistics/Documents/ statistics/2013/Mobile_cellular_2000-2012.xls.
International Union of Railways (2008). Rail Transport and Environment: Facts and Figures. Brussels: UIC and CER. Available from www.uic.org/homepage/railways&environment_facts&figures.pdf.
212
Economic and social survEy of asia and thE pacific 2014
Kazakhstan, Ministry of Foreign Affairs (2014). Factsheet: Kazakhstan and Eurasian Economic Union. Available from http://m.mfa.gov.kz/en/article/14922.
Kendall, J., and others (2013). Remittances Payments and Money Transfer Behaviors of South Asians and Indonesians. Gallup Inc. Available from www.gallup.com/file/poll/161675/Remittances%20Payments%20and%20Money%20 Transfers%20%20Behaviors%20of%20South%20Asians%20and%20Indonesians.pdfftele.
Kumar, N. (2007). Regional Economic Integration, Foreign Direct Investment and Efficiency-Seeking Industrial Restructuring in Asia: The Case of India. East Asian Bureau of Economic Research. Available from www.eaber.org/sites/ default/files/documents/RIS_Kumar_2007_02.pdf.
Kuroda, H. (2006). Infrastructure and regional cooperation. Paper presented at the Annual Bank Conference on Development Economics (ABCDE), Tokyo, 2006.
Lin, J. Y. (2012). From flying geese to leading dragons: new opportunities and strategies for structural transformation in developing countries. Global Policy, vol. 3, No. 4, pp. 397-409.
Martin, P. L. (2012). Labour migration and development indicators in the Post-2015 Global Development Framework. Working Paper prepared for the IOM World Migration Report. Geneva: International Organization for Migration. Available from www.iom.int/files/live/sites/iom/files/What-We-Do/docs/Labour-Migration-and-Development- Indicators-in-the-Post-2015-Global-Development-Framework.pdf.
McKenzie, D., and J. Gibson (2010). The development impact of a best practice seasonal worker policy. World Bank Policy Research Working Paper 5488. Washington, D.C.: World Bank. Available from http://elibrary.worldbank. org/doi/book/10.1596/1813-9450-5488.
(2012). Development through seasonal worker programs: the case of New Zealand’s RSE Program. Policy Research Working Paper no. WPS 6762. Washington D.C.: World Bank. Available from www-wds.worldbank. org/external/default/WDSContentServer/IW3P/IB/2014/01/28/000158349_20140128160906/Rendered/PDF/ WPS6762.pdf.
Medvedev, D. (2006). Beyond trade : the impact of preferential trade agreements on foreign direct investment inflows. World Bank Policy Research Working Paper 4065. Available from elibrary.worldbank.org/content/ workingpaper/10.1596/1813-9450-4065.
De Monie, G., J. Rodrigue, and T. Notteboom (2011). Economic Cycles in Maritime Shipping and Ports: the Path to the Crisis of 2008. In Integrating seaports and trade corridors, P.V. Hall, and others, eds. Ashgate Publishing.
NEA Transport Research Institute and International Road Transport Union (2009). New Eurasian Land Transport Initiative, Final Report. Available from www.iru.org/cms-filesystem-action?file=events_2009_almaty/NELTI-report- EN.pdf.
Network of East Asian Think-Tanks (2013). NEAT Working Group on Enhancing People to People Connectivity - Education, Tourism and Cultural Exchange. Final Report.
Network Strategies (2012). 2012 Internet access affordability in the Pacific islands. Industry Comment 14. Available from www.strategies.nzl.com/wpapers/2012014.htm.
O3b Networks (2013). Fulfilling the promise – innovative satellite capacity for the Pacific’s. Presented at the International Telecommunication Union and the Asia-Pacific Telecommunity Pacific Forum 2013, Apia, Samoa, 22 April.
O’Connor, S. , A. Naemon, and B. Sijapati-Basnett (2012). Net effects: social and economic impacts of telecommunications and internet in Vanuatu: research findings report 2011. Pacific Institute of Public Policy. Available from www. pacificpolicy.org/wp-content/uploads/2012/05/PiPP-Net-Effects-2011-Vanuatu-Telecomms-report1.pdf.

213
RefeRences PART II
‘Ofa, S.V. (2012). Telecommunications Regulatory Reform in Small Island Developing States: The Impact of the WTO’s Telecommunications Commitment. Newcastle upon Tyne: Cambridge Scholars Publishing.
Organisation for Economic Co-operation and Development (2013). International Migration Outlook 2012. Geneva. Available from http://dx.doi.org/10.1787/migr_outlook-2012-en.
(2013). Strengthening national statistical systems to monitor global goals. PARIS21 Discussion Paper.
Organisation for Economic Co-operation and Development, and World Trade Organization (2014). Trade in Value Added Database. Available from www.oecd.org/industry/ind/measuringtradeinvalue-addedanoecd-wtojointinitiative.htm.
Organisation for Economic Co-operation and Development, World Trade Organization, and United Nations Conference on Trade and Development (2013). Implications of global value chains for trade, investment, development and jobs. Prepared for the G-20 Leaders Summit, Russian Federation, Saint Petersburg, September 2013. Available from www.oecd.org/trade/G20-Global-Value-Chains-2013.pdf.
Pacific Institute of Public Policy (2011). Social and economic impact of introducing telecommunications in Vanuatu— Research Findings Report 2011-2012. Vanuatu. Available from www.pacificpolicy.org/wp-content/uploads/2012/05/ PiPP-Net-Effects-2011-Vanuatu-Telecomms-report1.pdf.
Qiang, Rossotto, and Kimura (2009). Economic Impacts of Broadband. In Information and Communications for Development: Extending Reach and Increasing Impact. pp 35-50. Washington D.C.: World Bank. Available from http://elibrary.worldbank.org/doi/pdf/10.1596/978-0-8213-7605-8.
Rahman, M. (2006). Foreign manpower in Singapore: classes, policies and management. Asia Research Institute Working Paper Series No. 57. Available from www.ari.nus.edu.sg/showfile.asp?pubid=509&type=2.
Russia, Kazakhstan, Belarus form Eurasian Economic Union (2014). Washington Post, 29 May. Available from www. washingtonpost.com/world/europe/russia-kazakhstan-belarus-form-eurasian-economic-union/2014/05/29/ de4a2c15-cb01-4c25-9bd6-7d5ac9e466fd_story.html.
Sandler, Todd (2007). Regional public goods, aid and development. Paper presented at ADBI seminar on Regional Public Goods, Aid and Development, 2007. Available from www.adbi.org/conf-seminar-papers/2007/11/06/2407. regional.public.goods.aid.development.
Seetharam, K.C. (2012). Twenty-five years of transition in Asia’s population and development: a review of progress and potential. Asia-Pacific Population Journal, vol. 27, No. 1, pp. 13-32.
Skeldon, R. (2013). The demand, supply and international movement of skills: a discussion with examples from the Asian region. Presentation delivered at the Third ADBI-OECD-ILO Round table on Labour Migration in Asia: Assessing Labour Market Requirements for Foreign Workers and Development Policies for Regional Skills Mobility. Bangkok, 23-25 January. Available from www.adbi.org/files/2013.01.24.cpp.sess4.2.skeldon.movement. skills.asia.pdf.
South Asian Association for Regional Cooperation (2007). The Declaration of the 14th SAARC Summit. New Delhi, India 2007. Available from www.saarc-sec.org/userfiles/Summit Declarations/14.
Taumoepeau, S., and C. Kissling (2013). Economic sustainability of airlines in the Pacific. Occasional Paper No. 8. Auckland: Centre for Research in International Education. Available from www.crie.org.nz/research-papers/ Occational-Paper-8-South-Pacific-Airline-Semisi.pdf.
Telegeography (2013). 2013 TeleGeography landscape. Presentation at the Pacific Telecommunications Council Annual Conference 2013, 20-23 January.
214
Economic and social survEy of asia and thE pacific 2014
Te Velde, D. W., and D. Bezemer (2006). Regional integration and foreign direct investment in developing countries. Transnational Corporations, vol. 15 No. 2, pp. 41-70.
United Nations (2013). A New Global Partnership: Eradicate Poverty and Transform Economies through Sustainable Development, The Report of the High-Level Panel of Eminent Persons on the Post-2015 Development Agenda. New York. Available from www.un.org/en/development/desa/policy/untaskteam_undf/HLP%20P2015%20Report.pdf.
United Nations, Centre for Trade Facilitation and Electronic Business (2005). Recommendation and Guidelines on Establishing a Single Window to Enhance the Efficient Exchange of Information Between Trade and Government. Recommendation No. 33. Sales No. 05.II.E.9.
United Nations Comtrade (2013). United Nations commodity trade statistics database. Available from http://wits. worldbank.org/. Accessed May 2013.
United Nations Conference on Trade and Development (2013). Review of Maritime Transport. Sales No. E.13.II.D.9.
United Nations, Department of Economic and Social Affairs, Population Division (2013a). Trends in International Migrant Stock: the 2013 Revision. New York.
(2013b). World Population Prospects: The 2012 Revision. New York. Available from http://esa.un.org/wpp/.
(2014). Total International Migration Stock. Available from http://esa.un.org/unmigration/TIMSA2013/migrant stocks2013.htm?mtotals. Accessed 6 February 2014.
United Nations, Economic and Social Commission for Asia and the Pacific (2001). International Migration: An Emerging Opportunity for the Socio-economic Development of the ESCAP Region. Social Policy Paper No. 6. Sales No. E.02.II.F.40.
(2010). Proposed regional programme for the improvement of economic statistics in Asia and the Pacific. Bangkok, 25 October. E/ESCAP/CST(2)/5.
(2011a). Asia Pacific Trade and Investment Report 2011: Post Crisis Trade and Investment Opportunities. Sales No. E.11.II.F.8.
(2011b). Economic and Social Survey of Asia and the Pacific 2011: Sustaining Dynamism and Inclusive Development: Connectivity in the Region and Productive Capacity in Least Developed Countries. Sales No. E.11.II.F.2.
(2011c). Guidelines on Establishing and Strengthening National Coordination Mechanisms for Trade and Transport Facilitation in the ESCAP Region. Bangkok. Available from www.unescap.org/sites/default/files/0%20 -%20Full%20Report_12.pdf.
(2012a). Asia-Pacific Trade and Investment Report 2012: Recent Trends and Developments. ST/ESCAP/2650.
(2012b). Connectivity for energy security, Commission resolution 68/11 of 23 May.
(2012c). Growing Together: Economic Integration for an Inclusive and Sustainable Asia-Pacific Century. ST/ESCAP/2629.
(2012d). Make every life count: Regional strategic plan for the improvement of civil registration and vital statistics in Asia and the Pacific. E/ESCAP/CST(3)/6/Add.1. Bangkok. Available from www.unescap.org/sites/ default/files/CST3 Regional strategic plan English.pdf.
(2012e). Policy Guidebook for SME Development in Asia and the Pacific. Sales No. E.12.II.F.2.
215
RefeRences PART II
(2012f). The Regional Action Programme for Transport Development in Asia and the Pacific, Phase II (2012- 2016), Ministerial Declaration on Transport Development in Asia and the Pacific, Bangkok, 12-16 March 2012. Available from www.unescap.org/sites/default/files/Booklet_B_RAP2012-2016.pdf.
(2012g). Regional Cooperation for Inclusive and Sustainable Development: South and South-West Asia Report 2012-13. New Delhi: UN Publications and Routledge. ST/ESCAP/2644.
(2012h). Regional strategic framework for the facilitation of international road transport. Bangkok. Available from www.unescap.org/resources/regional-strategic-framework-facilitation-international-road-transport.
(2013a). 2013 ESCAP population data sheet. Available from www.unescapsdd.org/files/documents/PUB_ Datasheet-2013.pdf.
(2013b). Asia-Pacific Trade and Investment Report 2013: Turning the Tide: Towards Inclusive Trade and Development. Sales No. E.14.II.F.2.
(2013c). Creating the Silk Super-Highway in Central Asia. ESCAP Press Release, News Number G/73/2013. Available from www.unescap.org/news/creating-silk-super-highway-central-asia.
(2013d). Enhancing regional connectivity: towards a regional arrangement for the racilitation of cross-border paperless trade. Studies in Trade and Investment, No. 78. ST/ESCAP/2684.
(2013e). Meeting report: Expert Group Meeting on Conceptualizing the Asian Energy Highway, Urumqi, China, 3-5 September 2013. Available from www.unescap.org/sites/default/files/EGM-AEH-meeting-report_0.pdf.
(2013f). Review of Developments in Transport in Asia and the Pacific. ST/ESCAP/2627.
(2013g). Statistical Perspectives: Focus Areas for Realizing Enhanced Energy Security. Available from www. unescap.org/resources/statistical-perspectives-focus-areas-realizing-enhanced-energy-security.
(2014a). Asia-Pacific Preferential Trade and Investment Agreements Database. Available from www.unescap. org/resources/asia-pacific-trade-and-investment-agreement-database-aptiad. Accessed 16 June 2014.
(2014b). Towards a National Integrated and Sustainable Trade and Transport Facilitation Monitoring Mechanism. ST/ESCAP/2683.
United Nations, Economic and Social Commission for Asia And The Pacific, and United Nations Economic Commission For Europe (2012). Single Window planing and implementation guide. ECE/TRADE/404.
United Nations, Economic and Social Commission for Asia And The Pacific, and the World Bank (2014). International Trade Costs Database. Available from http://databank.worldbank.org/data/views/variableselection/selectvariables. aspx?source=escap-world-bank-international-trade-costs.
United Nations Economic and Social Council (1994). Report on the Statistical Commission Special Session, New York, 11-15 April 1994. E/CN.3/1994/18.
(2006). Resolution 2006/6 on strengthening statistical capacity. Available from http://unstats.un.org/unsd/statcom/ ecosoc/2006-6-ResStrengtheningStatCapacity.pdf.
(2013a). Official Records of the Economic and Social Council, 2013, Supplement No. 4. E/2013/24-E/ CN.3/2013/33.
(2013b). Report of the Economic and Social Commission for Asia and the Pacific on statistics and the post- 2015 development agenda: perspectives from the Asia-Pacific region. Statistical Commission, Forty-fifth session, 4-7 March 2014. E/CN.3/2014/15.
216
Economic and social survEy of asia and thE pacific 2014
United Nations Educational, Scientific and Cultural Organization (2014). Global Flow of Tertiary Students. Available from www.uis.unesco.org/Education/Pages/international-student-flow-viz.aspx.
United Nations Educational, Scientific and Cultural Organization, Institute of Statistics (2014). International Student Mobility in Tertiary Education. Available from http://data.uis.unesco.org/.
United Nations, General Assembly (1990). International Convention on the Protection of the Rights of All Migrant Workers and Members of Their Families. Resolution 45/158 of 18 December 1990. A/RES/45/158.
United Nations Global Pulse (2014). Twitter and Facebook to understand unemployment patterns, and how mobile phone data can be used to understand migration. Available from www.unglobalpulse.org.
United Nations, World Tourism Organization (2013). Tourism Highlights 2013 Edition. Available from www.e-unwto. org/content/hq4538/fulltext.pdf.
Weiss, J. (2005). Export growth and industrial policy: lessons from the East Asian miracle experience. ADB Institute Discussion Paper No. 26, Febuary. Asian Development Bank Institute. Available from www.adbi.org/files/2005.02. dp26.eastasia.govt.policy.pdf.
World Bank (2011a). International Comparison Program (ICP). Available from www.worldbank.org/data/icp.
(2011b). Program Appraisal Document for a Regional Adaptable Program Loan for a Pacific Regional Connectivity Program. Washington D.C.
(2013a). Migration and remittance flows: recent trends and outlook, 2013-2016. Migration and Development Brief, 21. Washington D.C.
(2013b). Reducing poverty by closing South Asia’s infrastructure gap. Available from documents.worldbank.org/ curated/en/2013/12/19330904/reducing-poverty-closing-south-asias-infrastructure-gap.
(2014). Trading across borders. World Bank Doing Business Reports. Available from www.doingbusiness.org/ methodology/trading-across-borders.
World Bank, and International Telecommunications Union (2013). The Little Data Book on Information and Communication Technology. Available from https://openknowledge.worldbank.org/bitstream/handle/10986/14453/9780821398166. pdf?sequence=2.
World Energy Council (2005). Regional Energy Integration in Africa. Available from www.worldenergy.org/documents/ integrationii.pdf.
Woxenius, J., V. Roso, and K. Lumsden (2004). The dry port concept–connecting seaports with their hinterland by rail. In ICLSP Conference Proceedings, Dalian, pp. 305-19. Department of Transportation and Logistics, Chalmers University of Technology. Available from www.pol.gu.se/digitalAssets/1344/1344857_2004_iclsp_dalian_wox-ros-lum.pdf.
Yeoh, B.S.A., and T. Lam (2007). The costs of (im)mobility: children left behind and children who migrate with a parent. In Perspectives on Gender and Migration. Bangkok: ESCAP.
Yeyati, E. L., E. Stein, and C. Daude (2002). Looking Beyond Our Borders: Opportunities and Challenges of the New Regionalism. Inter American Development Bank. Available from www.iadb.org/intal/intalcdi/PE/2009/03494 a02.pdf.
Zhang, J., R. Kanbur, and C. Rhee (2014). Rising inequality in Asia and policy implications. ADBI Working Paper Series No. 463. Asian Development Bank Institute. Available from www.adbi.org/files/2014.02.21.wp463.rising. inequality.asia.policy.implications.pdf.
217
Since the 1957 issue, the Economic and Social Survey of Asia and the Pacific has, in addition to a review of the current situation of the region, contained a study or studies of some major aspect or problem of the economies of the Asian and Pacific region, as specified below:
1957: Postwar problems of economic development 1958: Review of postwar industrialization 1959: Foreign trade of ECAFE primary exporting countries 1960: Public finance in the postwar period 1961: Economic growth of ECAFE countries 1962: Asia’s trade with western Europe 1963: Imports substitution and export diversification 1964: Economic development and the role of the agricultural sector 1965: Economic development and human resources 1966: Aspects of the finance of development 1967: Policies and planning for export 1968: Economic problems of export-dependent countries. Implications of economic controls and liberalization 1969: Strategies for agricultural development. Intraregional trade as a growth strategy 1970: The role of foreign private investment in economic development and cooperation in the ECAFE region. Problems and prospects of the ECAFE region in the Second Development Decade 1971: Economic growth and social justice. Economic growth and employment. Economic growth and income distribution 1972: First biennial review of social and economic developments in ECAFE developing countries during the Second United Nations Development Decade 1973: Education and employment 1974: Mid-term review and appraisal of the International Development Strategy for the Second United Nations Development Decade in the ESCAP region, 1974 1975: Rural development, the small farmer and institutional reform 1976: Biennial review and appraisal of the International Development Strategy at the regional level for the Second United Nations Development Decade in the ESCAP region, 1976 1977: The international economic crises and developing Asia and the Pacific 1978: Biennial review and appraisal at the regional level of the International Development Strategy for the Second United Nations Development Decade 1979: Regional development strategy for the 1980s 1980: Short-term economic policy aspects of the energy situation in the ESCAP region 1981: Recent economic developments in major subregions of the ESCAP region 1982: Fiscal policy for development in the ESCAP region 1983: Implementing the International Development Strategy: major issues facing the developing ESCAP region 1984: Financing development 1985: Trade, trade policies and development 1986: Human resources development in Asia and the Pacific: problems, policies and perspectives 1987: International trade in primary commodities 1988: Recent economic and social developments 1989: Patterns of economic growth and structural transformation in the least developed and Pacific island countries of the ESCAP region: implications for development policy and planning for the 1990s 1990: Infrastructure development in the developing ESCAP region: needs, issues and policy options 1991: Challenges of macroeconomic management in the developing ESCAP region 1992: Expansion of investment and intraregional trade as a vehicle for enhancing regional economic cooperation and development in Asia and the Pacific 1993: Fiscal reform. Economic transformation and social development. Population dynamics: implications for development 1995: Reform and liberalization of the financial sector. Social security 1996: Enhancing the role of the private sector in development. The role of public expenditure in the provision of social services 1997: External financial and investment flows. Transport and communications 1998: Managing the external sector. Growth and equity 1999: Social impact of the economic crisis. Information technology, globalization, economic security and development 2000: Social security and safety nets. Economic and financial monitoring and surveillance 2001: Socio-economic implications of demographic dynamics. Financing for development 2002: The feasibility of achieving the Millennium Development Goals in Asia and the Pacific. Regional development cooperation in Asia and the Pacific 2003: The role of public expenditure in the provision of education and health. Environment-poverty nexus revisited: linkages and policy options 2004: Poverty reduction strategies: tackling the multidimensional nature of poverty 2005: Dynamics of population ageing: how can Asia and the Pacific respond? 2006: Emerging unemployment issues in Asia and the Pacific: rising to the challenges 2007: Gender inequality continues – at great cost 2008: Unequal benefits of growth – agriculture left behind 2009: Triple threats to development: food, fuel and climate change policy challenges 2010: Multiple imbalances and development gaps as new engines of growth. A regional policy agenda for regaining the dynamism2011: Regional connectivity and economic integration. Building the productive capacity of the least developed countries2012: Living with high commodity prices2013: Developmental macroeconomics: the critical role of public expenditure. Investing in inclusive and sustainable development
218
Economic and social survEy of asia and thE pacific 2014
The sales publications may be purchased from distributors of United Nations Publications throughout the world. They may also be obtained via the following options:
Mail orders to: United Nations Publications Web: un.org/publicationsPO Box 960 Tel: (1) (703) 661 1571Herndon, Virginia 20172 Fax: (1) (703) 996 1010United States of America Email: [email protected]
Chief Tel: (662) 288-1110 Conference and Documentation Services Section Fax: (662) 288-1000Office of the Executive SecretaryEconomic and Social Commission for Asia and the Pacific (ESCAP) United Nations Building Rajadamnern Nok Avenue Bangkok 10200, Thailand
For further information on publications in this series, please address your enquiries to:
Director Tel: (662) 288-1486Macroeconomic Policy and Development Division Fax: (662) 288-1000, 288-3007Economic and Social Commission for E-mail: [email protected] Asia and the Pacific (ESCAP) United Nations Building Rajadamnern Nok Avenue Bangkok 10200, Thailand
219
READERSHIP SURVEY
The Macroeconomic Policy and Development Division of ESCAP is undertaking an evaluation of this publication, Economic and Social Survey of Asia and the Pacific 2014, with a view to making future issues more useful for our readers. We would appreciate it if you could complete this questionnaire and return it, at your earliest convenience, to: Director Macroeconomic Policy and Development Division ESCAP, United Nations Building Rajadamnern Nok Avenue Bangkok 10200, THAILAND
QUESTIONNAIRE
Very Excellent good Average Poor
1. Please indicate your assessment of the quality of the publication on:
• Presentation/format 4 3 2 1 • Readability 4 3 2 1 • Timeliness of information 4 3 2 1 • Coverage of subject matter 4 3 2 1 • Analytical rigour 4 3 2 1 • Overall quality 4 3 2 1
2. How useful is the publication for your work?
• Provision of information 4 3 2 1 • Clarification of issues 4 3 2 1 • Its findings 4 3 2 1 • Policy suggestions 4 3 2 1 • Overall usefulness 4 3 2 1
3. Please give examples of how this publication has contributed to your work:
......................................................................................................................................................................................
......................................................................................................................................................................................
......................................................................................................................................................................................
......................................................................................................................................................................................
220
Economic and social survEy of asia and thE pacific 2014
Please use additional sheets of paper, if required, to answer the questions.Thank you for your kind cooperation in completing this questionnaire.
4. Suggestions for improving the publication:
..........................................................................................................................................................................................
..........................................................................................................................................................................................
..........................................................................................................................................................................................
..........................................................................................................................................................................................
5. Your background information, please:
Name: ...........................................................................................................................................................................
Title/position: ...............................................................................................................................................................
Institution: .....................................................................................................................................................................
Office address: ..........................................................................................................................................................
..........................................................................................................................................................................................
Please use additional sheets of paper, if required, to answer the questions.Thank you for your kind cooperation in completing this questionnaire.
ESCAP is the regional development arm of the United Nations and serves as the main economic and social development centre for the United Nations in Asia and the Pacific. Its mandate is to foster cooperation between its 53 members and 9 associate members. ESCAP provides the strategic link between global and country-level programmes and issues. It supports Governments of countries in the region in consolidating regional positions and advocates regional approaches to meeting the region’s unique socio-economic challenges in a globalizing world. The ESCAP office is located in Bangkok, Thailand. Please visit the ESCAP website at www.unescap.org for further information.
The shaded areas of the map indicate ESCAP members and associate members.
Front cover photo credits: UN Photo | Gawrav Sinha | Szefei
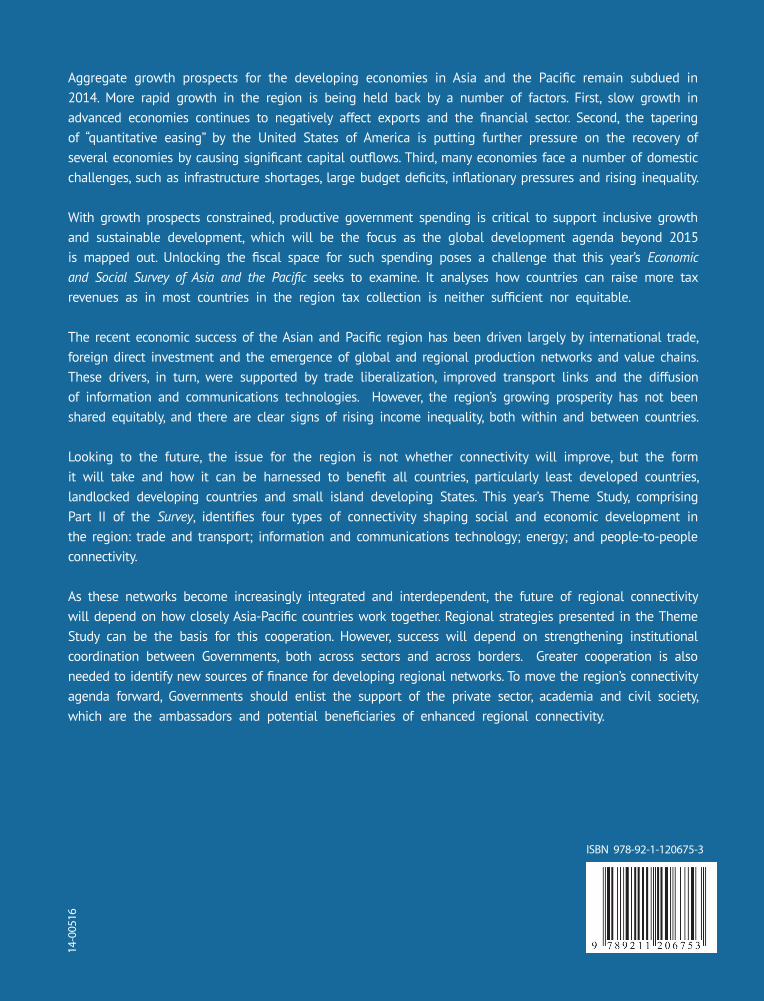
C
M
Y
CM
MY
CY
CMY
K
57-4-02343 GP04 Cove-ok.ai 1 22/7/2557 1:51:5157-4-02343 GP04 Cove-ok.ai 1 22/7/2557 1:51:51