Econ 1101 Summer 2013 Lecture 4
96
Econ 1101 Summer 2013 Lecture 4 Section 005 6/20/2013
-
Upload
khangminh22 -
Category
Documents
-
view
0 -
download
0
Transcript of Econ 1101 Summer 2013 Lecture 4
Econ 1101
Summer 2013
Lecture 4
Section 005
6/20/2013
Announcements
Homework 3 is due tonight at 11:45pm, CDT
Recitation starts today at 6.40pm (same room).
Another Aplia experiment (price ceilings):
2
*VMHE]�ERH�7EXYVHE]�RMKLX
8SHE]��EJXIV�����TQ�JSPPS[MRK�E���QMR�FVIEO�EJXIV�XLI�PIGXYVI�IRHW
Agenda for today
Taxes and subsidies
Case study with taxes
Introducing price ceilings
Impacts of price ceilings in Econland
Impacts of price ceiling in Aplialand
Supply Management in Econland and Canada
Handy summary of the effects of policies
3
Taxes
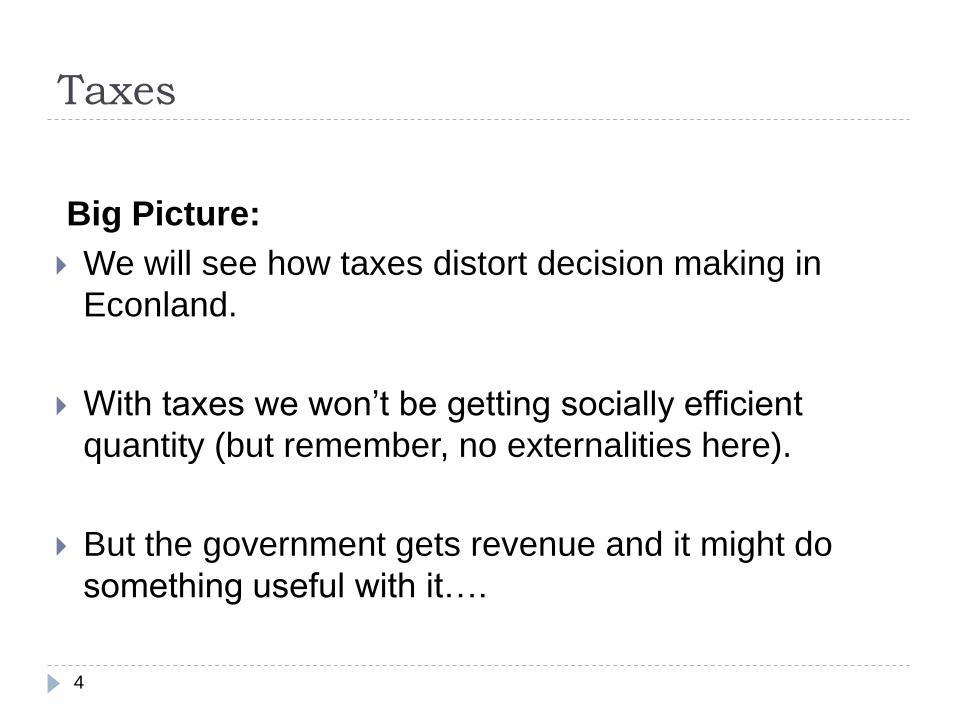
Big Picture:
We will see how taxes distort decision making in
Econland.
With taxes we won’t be getting socially efficient
quantity (but remember, no externalities here).
But the government gets revenue and it might do
something useful with it….
4

Taxes, cont’d
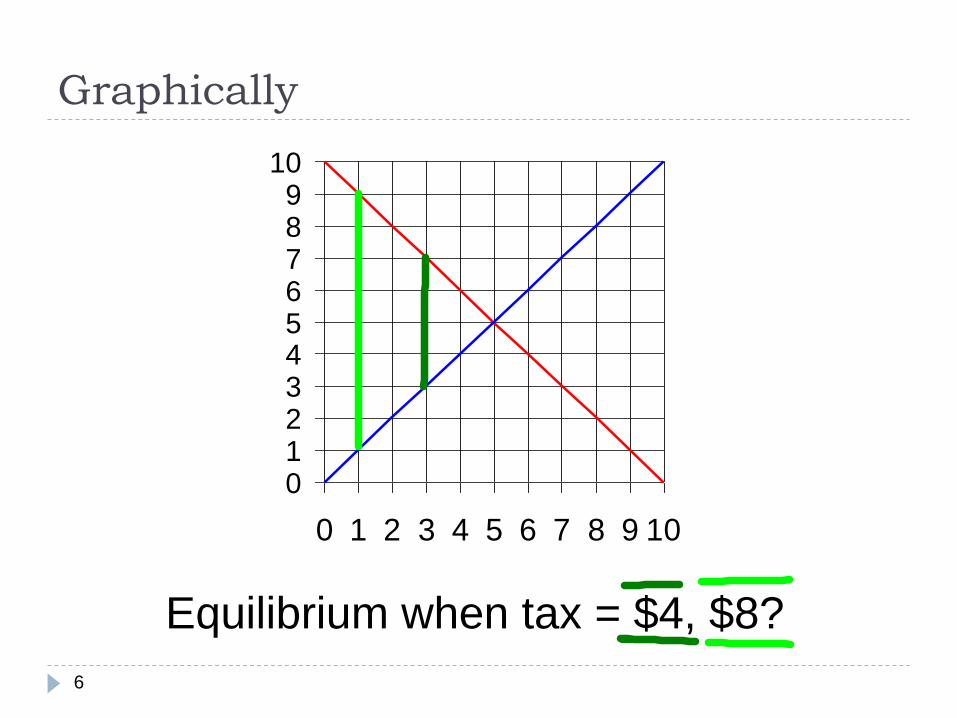
Tax is a wedge between price consumer pays and price producer receives (Note: a tax is also sometimes represented as a curve shift. The wedge and the curve shift is saying the exact same thing, but I like the wedge representation better)
Pd = tax + Ps
Pd is price that the consumers pay (price for demanders)
Ps is price that the producers get (price for suppliers)
To find equilibrium under tax, find quantity where distance between demand and supply equals the tax. (the wedge)
5
Graphically
6
Equilibrium when tax = $4, $8?
0123456789
10
0 1 2 3 4 5 6 7 8 9 10
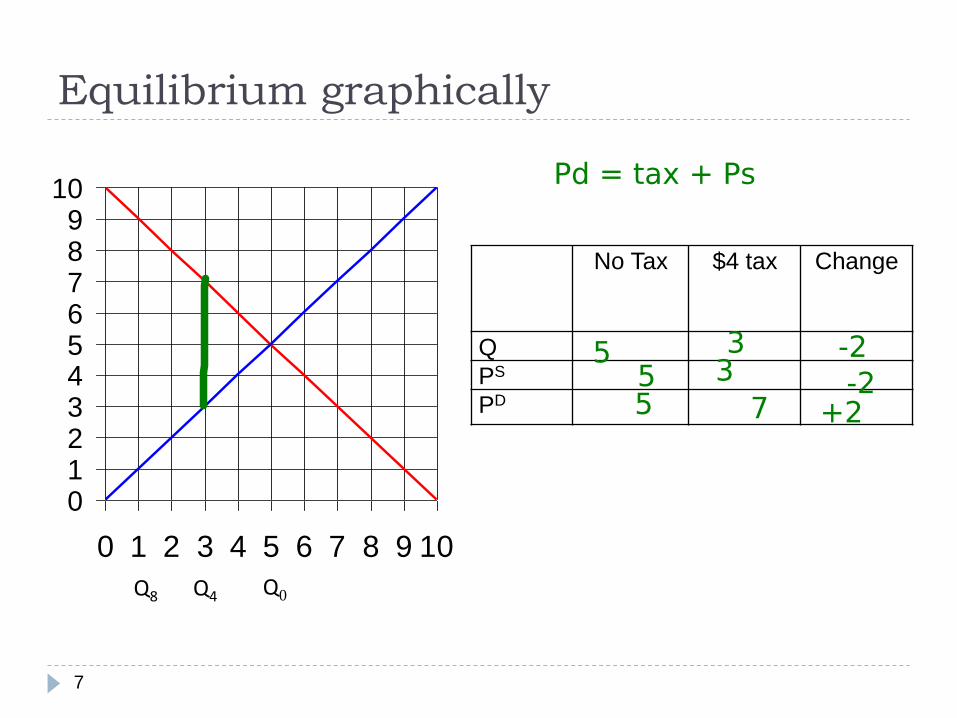
Equilibrium graphically
7
0123456789
10
0 1 2 3 4 5 6 7 8 9 10
Q8 Q4 Q0
No Tax $4 tax Change
Q
PS
PD
���
4H�!�XE\���4W
���
����
��
Taxes, cont’d
Great question: Are we always on the left side of the free market quantity with a tax?
What about a $4 widget subsidy
PS = PD + subsidy
8
;MXL�XE\��MR�KIRIVEP�]IW��I\GITX�JSV�SRI�I\XVIQI�GEWI �
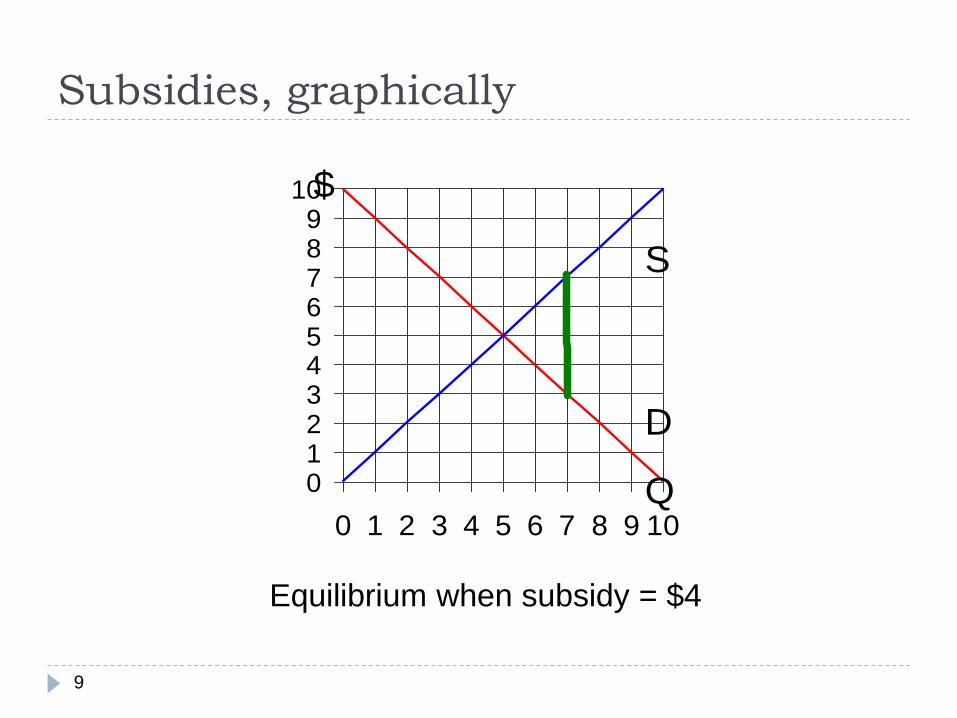
Subsidies, graphically
9
0123456789
10
0 1 2 3 4 5 6 7 8 9 10
S
D
Q
$
Equilibrium when subsidy = $4

Taxes, cont’d
Great question: In Econland, after the $4 tax,
ΔPD = +$2, ΔPS =–$2.
Do buyers and sellers always split the tax 50/50?
10
2S��MX�HITIRHW�SR� IPEWXMGMX]�
Taxes, cont’d
11
0123456789
10
0 1 2 3 4 5 6 7 8 9 10
S
D
Q
$
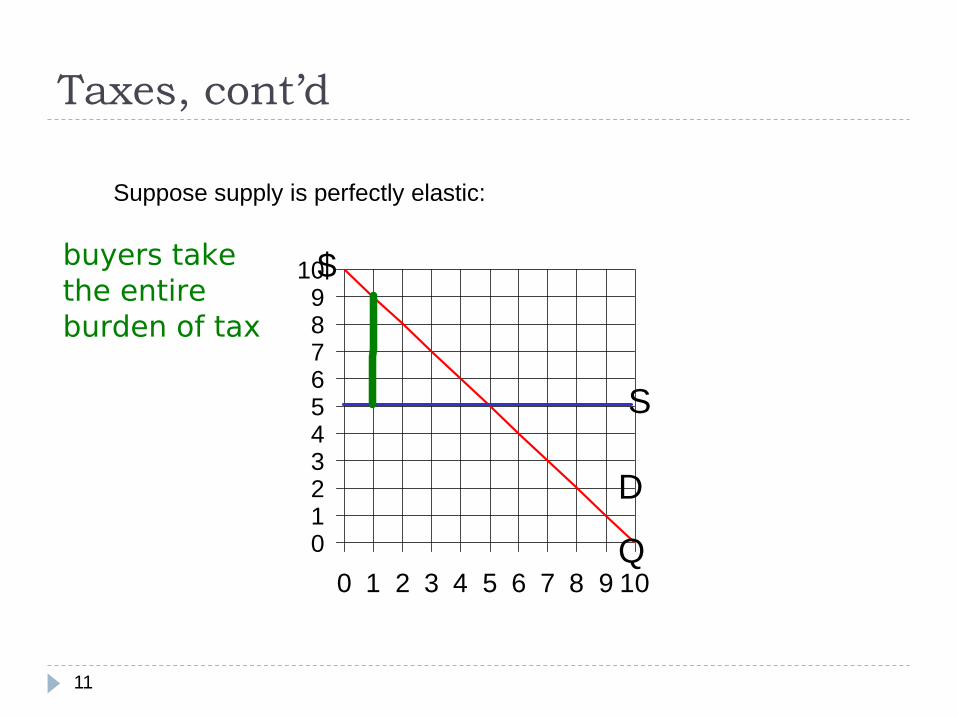
Suppose supply is perfectly elastic:
FY]IVW�XEOIXLI�IRXMVIFYVHIR�SJ�XE\
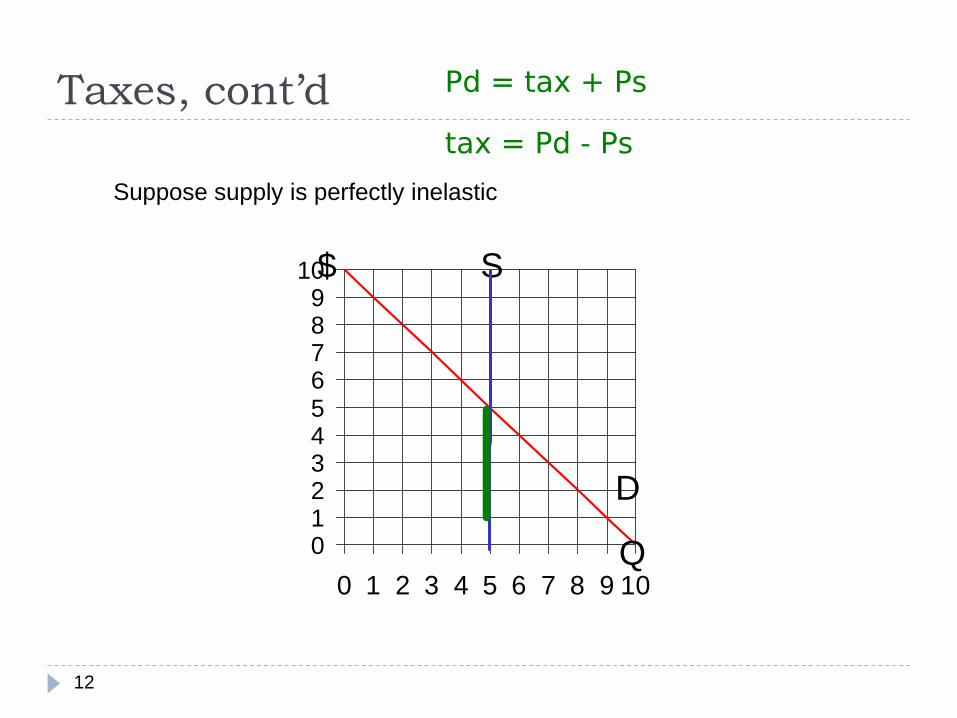
Taxes, cont’d
12
0123456789
10
0 1 2 3 4 5 6 7 8 9 10
S
D
Q
$
Suppose supply is perfectly inelastic
4H�!�XE\���4W
XE\�!�4H���4W

Big Idea
The more inelastic the side of the market you are on,
the more you pay of the tax!
Does this make intuitive sense?
13
-�LSTI�MX�HSIW���XLMRO�EFSYX�SYV�TVIZMSYW�I\EQTPI�MRWYPMR�FY]IVW��7MRGI�XLIMV�HIQERH�MW�TIVJIGXP]�MRIPEWXMG�XLI]�[MPP�TE]�XLI�IRXMVI�XE\�EQSYRX��WS�XLEX�XLI�TVSHYGIVW�TVMGI�GER�WXE]�YRGLERKIH�

Example
Let’s look at retail gas prices and gas taxes across
countries from Homework 3.
Key point: the world oil market is global. Since any
one country tends to be small, its own demand has a
small impact on world market. If Spain doubles its
demand, it won’t impact the global market (i.e. it won’t
drive the price of oil up on a global level)
14

Example, cont’d
15
0123456789
10
0 1 2 3 4 5 6 7 8 9 10
S
D
Q
$
Theory implies a gas tax in Spain gets passed on to consumers, Euro for
Euro. How does the theory do?
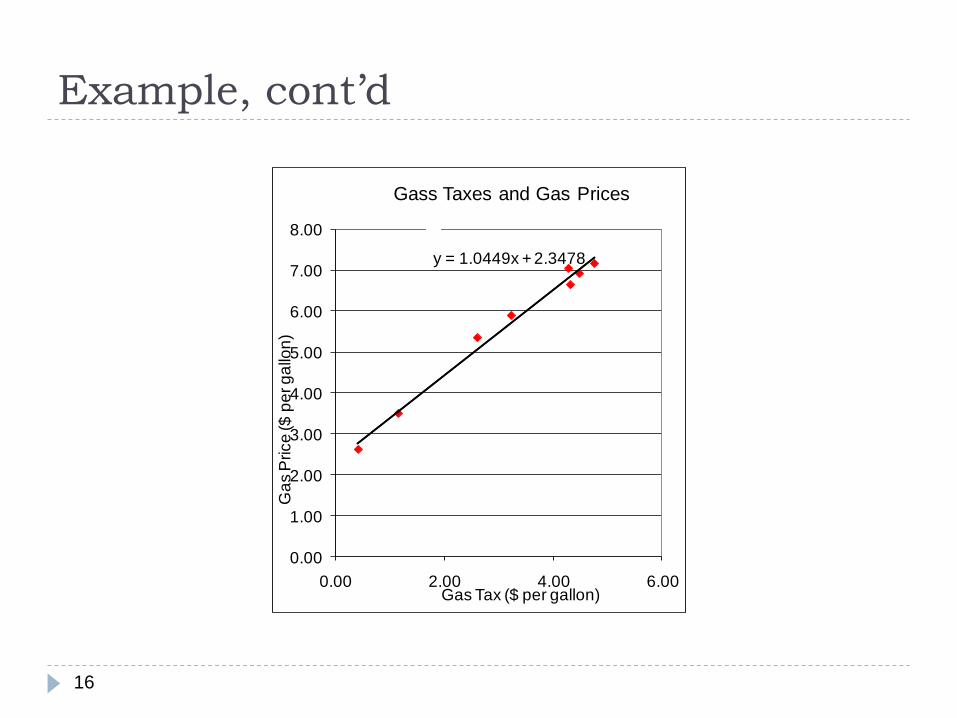
Example, cont’d
16
y = 1.0449x + 2.3478
0.00
1.00
2.00
3.00
4.00
5.00
6.00
7.00
8.00
0.00 2.00 4.00 6.00
Ga
s P
rice
($
pe
r g
allo
n)
Gas Tax ($ per gallon)
Gass Taxes and Gas Prices

Example, cont’d
The result is consistent with the theory. Note the slope
of the regression line is approximately one. The figure
shows that taxes are approximately passed along
dollar for dollar to consumers.
Comparing the U.S., with a tax of .40 and a price of
2.61 with Germany, with a tax of 4.76 and a price of
7.17 (all in $ per gallon), the difference in gas price of
4.56 is approximately equal to the difference in tax of
4.36. Of course, other things can contribute to
differences in gas prices across countries.
17

Taxes, cont’d
Let’s get back to Econland and the $4 tax.
Let’s do a welfare analysis of the effects of the tax!
18
Econland Surplus Calculation
19
No Tax $4 Tax Change
Q 5 3 -2
PS 5 3 -2
PD 5 7 2
CS
PS
Gov’t
Surplus
TS
��������
�
��
������
����
��� ����� ��

Econland Surplus Calculation
20
0123456789
10
0 1 2 3 4 5 6 7 8 9 10
Consumer Surplus at PD = 5
No
Tax
$4 Tax Change
Q 5 3 -2
PS 5 3 -2
PD 5 7 2
CS
PS
Gov’t
Surplus
TS
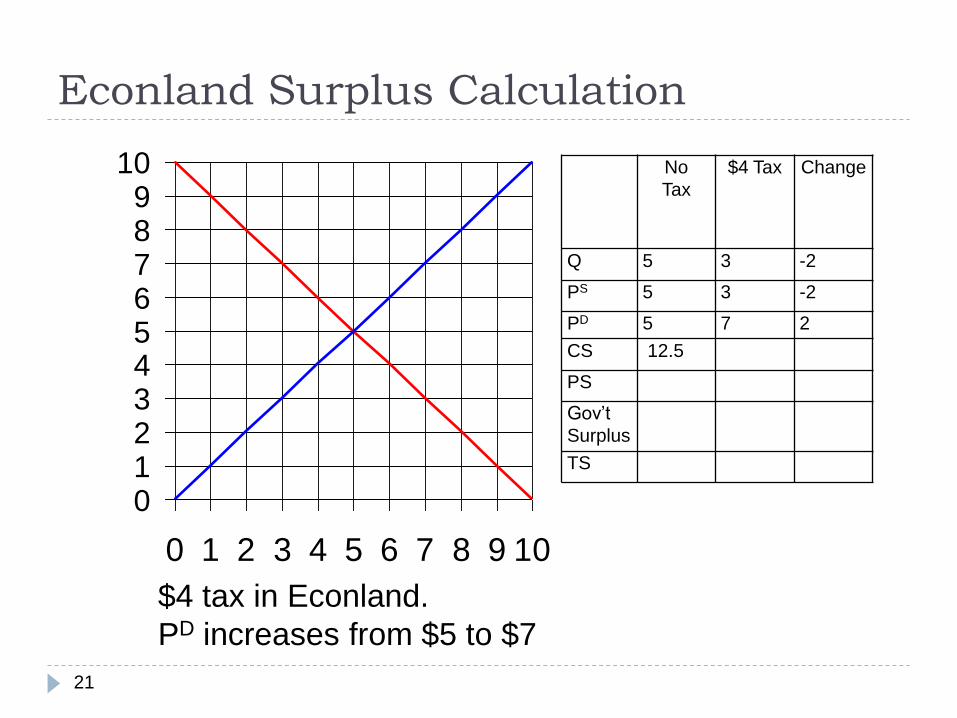
Econland Surplus Calculation
21
0123456789
10
0 1 2 3 4 5 6 7 8 9 10
$4 tax in Econland.
PD increases from $5 to $7
No
Tax
$4 Tax Change
Q 5 3 -2
PS 5 3 -2
PD 5 7 2
CS 12.5
PS
Gov’t
Surplus
TS

Econland Surplus Calculation
22
Consumer Surplus at PD = 7
0123456789
10
0 1 2 3 4 5 6 7 8 9 10
No
Tax
$4 Tax Change
Q 5 3 -2
PS 5 3 -2
PD 5 7 2
CS 12.5 4.5
PS
Gov’t
Surplus
TS

Econland Surplus Calculation
23
0123456789
10
0 1 2 3 4 5 6 7 8 9 10
Change in Consumer Surplus (ΔCS)
(PD from 5 to 7)
No
Tax
$4 Tax Change
Q 5 3 -2
PS 5 3 -2
PD 5 7 2
CS 12.5 4.5 -8
PS
Gov’t
Surplus
TS

Econland Surplus Calculation
24
Consumer Surplus at PD = 7
0123456789
10
0 1 2 3 4 5 6 7 8 9 10

Econland Surplus Calculation
25
0123456789
10
0 1 2 3 4 5 6 7 8 9 10
Change in Consumer Surplus (ΔCS)
(PD from 5 to 7)
Econland Surplus Calculation
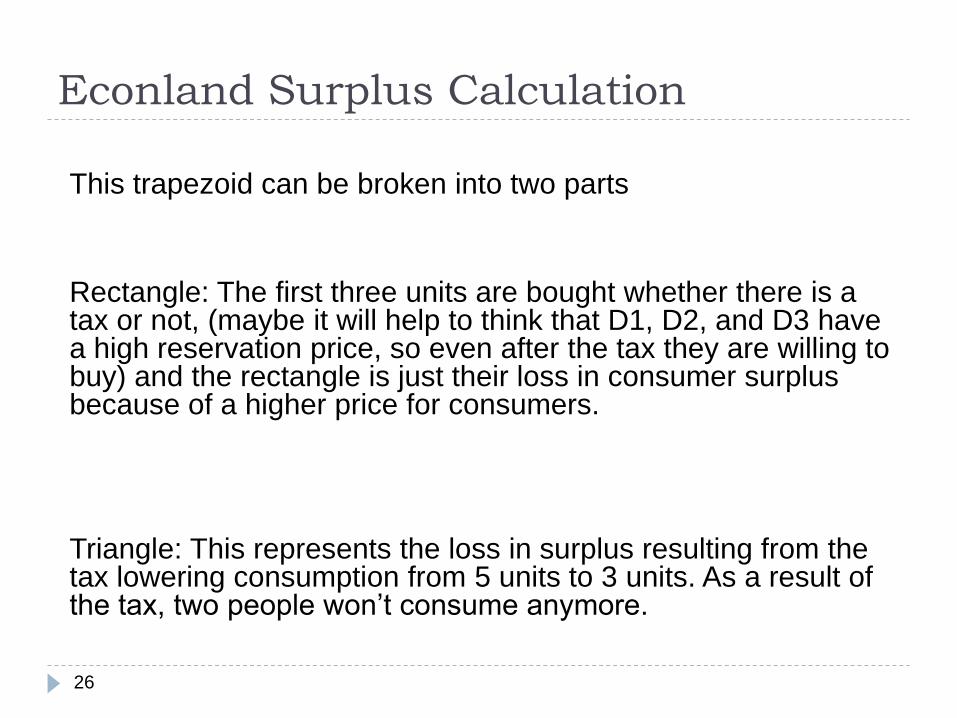
This trapezoid can be broken into two parts
Rectangle: The first three units are bought whether there is a tax or not, (maybe it will help to think that D1, D2, and D3 have a high reservation price, so even after the tax they are willing to buy) and the rectangle is just their loss in consumer surplus because of a higher price for consumers.
Triangle: This represents the loss in surplus resulting from the tax lowering consumption from 5 units to 3 units. As a result of the tax, two people won’t consume anymore.
26
Econland Surplus Calculation
27
0123456789
10
0 1 2 3 4 5 6 7 8 9 10
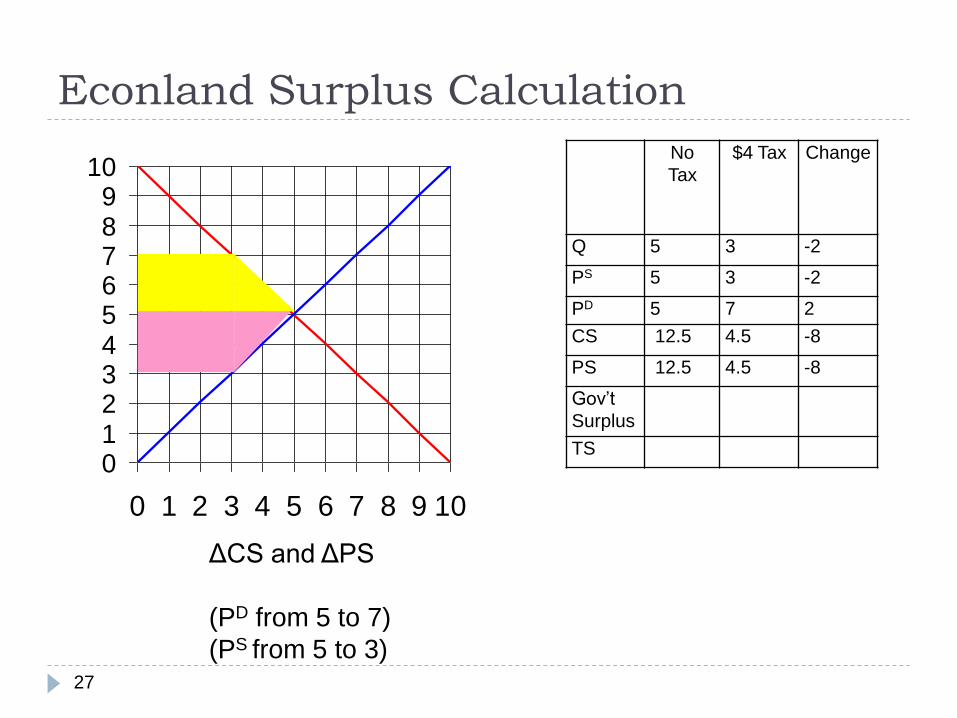
ΔCS and ΔPS
(PD from 5 to 7)
(PS from 5 to 3)
No
Tax
$4 Tax Change
Q 5 3 -2
PS 5 3 -2
PD 5 7 2
CS 12.5 4.5 -8
PS 12.5 4.5 -8
Gov’t
Surplus
TS

Econland Surplus Calculation
28
No Tax $4 Tax Change
Q 5 3 -2
PS 5 3 -2
PD 5 7 2
CS 12.5 4.5 -8
PS 12.5 4.5 -8
Gov’t
Surplus
0
TS 25

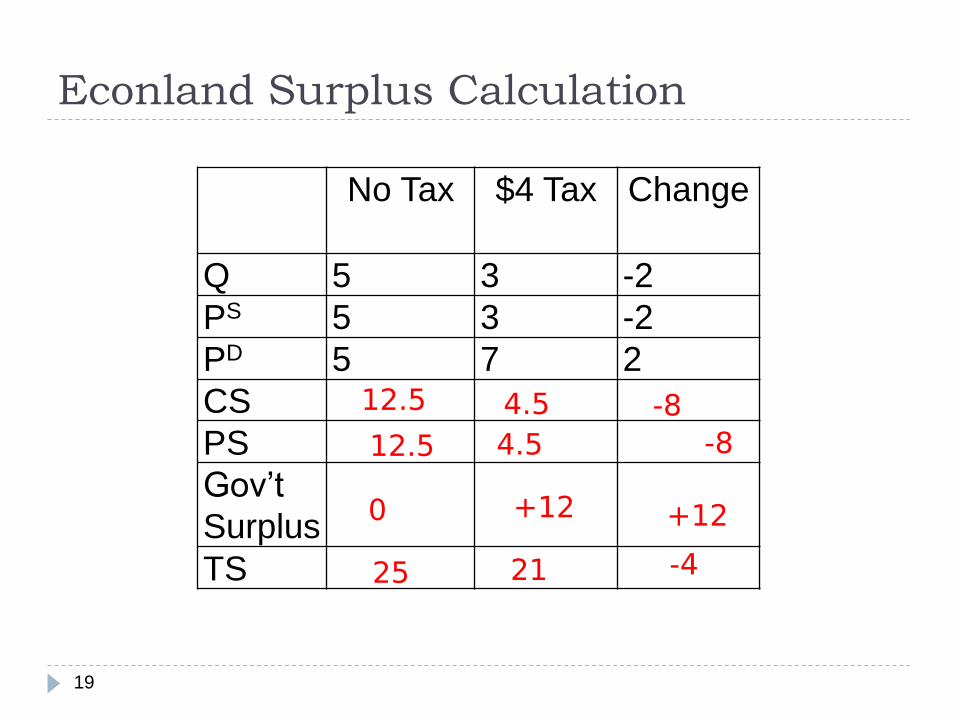
Econland Surplus Calculation
29
No Tax $4 Tax Change
Q 5 3 -2
PS 5 3 -2
PD 5 7 2
CS 12.5 4.5 -8
PS 12.5 4.5 -8
Gov’t
Surplus
0 12 12
TS 25 21 -4

Econland Surplus Calculation
30
0123456789
10
0 1 2 3 4 5 6 7 8 9 10
Change in Government
Surplus
ΔGS = Q × tax
= 3 × 4 = 12
0123456789
10
0 1 2 3 4 5 6 7 8 9 10

Taxes, cont’d
Allocation with tax not Pareto Efficient.
Pareto efficient allocations maximize the size of the pie. We can see from the loss of the triangle (the deadweight loss) that the pie is not as big as it can be.
Going back to the cheesecake example – some cheesecake pieces are being thrown into the trash, so consumers, producers, and government are not getting that cheesecake. Since in the free market, the total surplus is maximized (Pareto efficient), the allocation with tax is not Pareto efficient (because it does not maximize the size of the total surplus, as we have a dead weight loss).
31

Call in the Economics Doctor
Diagnosis the source of inefficiency.
Problem: Breakdown of General Principle 3, Efficient Quantity where
Marginal Reservation Price (MRP) equal to Marginal Cost (MC).
Q = 3 is too small (Tax puts wedge between MRP and MC)
(But note General Principle 1 and 2 continue to hold. Get efficient allocation of consumption and production.)
32
What about government spending?
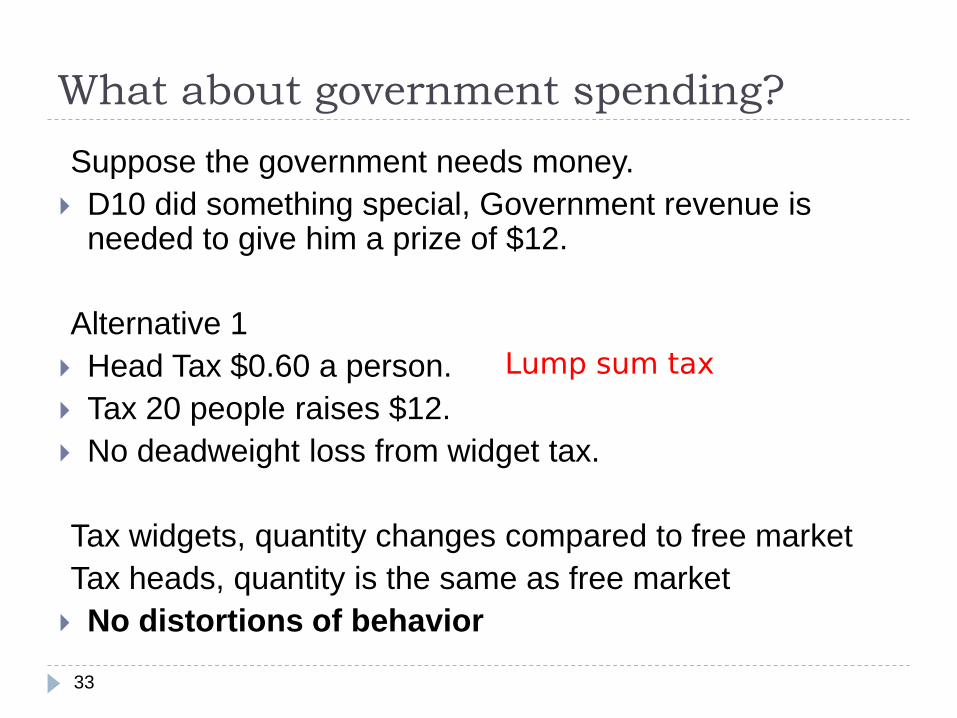
Suppose the government needs money.
D10 did something special, Government revenue is needed to give him a prize of $12.
Alternative 1
Head Tax $0.60 a person.
Tax 20 people raises $12.
No deadweight loss from widget tax.
Tax widgets, quantity changes compared to free market
Tax heads, quantity is the same as free market
No distortions of behavior
33
0YQT�WYQ�XE\

What about government spending?
Example: In 1377 in England, everyone over the age
of 14 had to pay a goat to the Crown (to fight war
with France)
Head tax is a regressive tax (low income taxes that
are a higher proportion of their income than high
income people)
34
What about government spending?
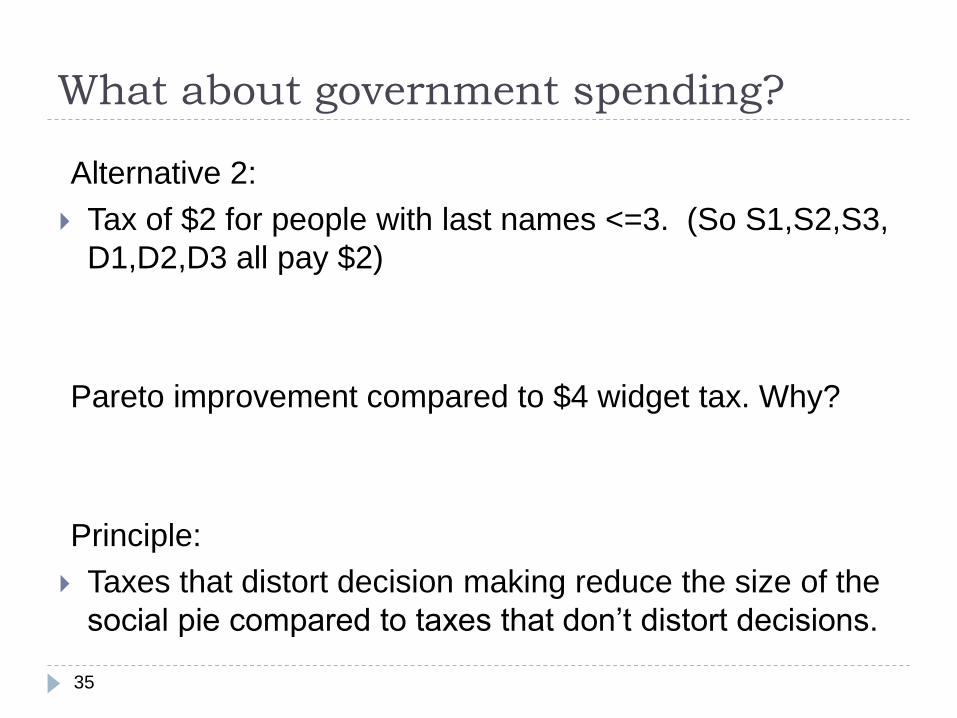
Alternative 2:
Tax of $2 for people with last names <=3. (So S1,S2,S3,
D1,D2,D3 all pay $2)
Pareto improvement compared to $4 widget tax. Why?
Principle:
Taxes that distort decision making reduce the size of the
social pie compared to taxes that don’t distort decisions.
35
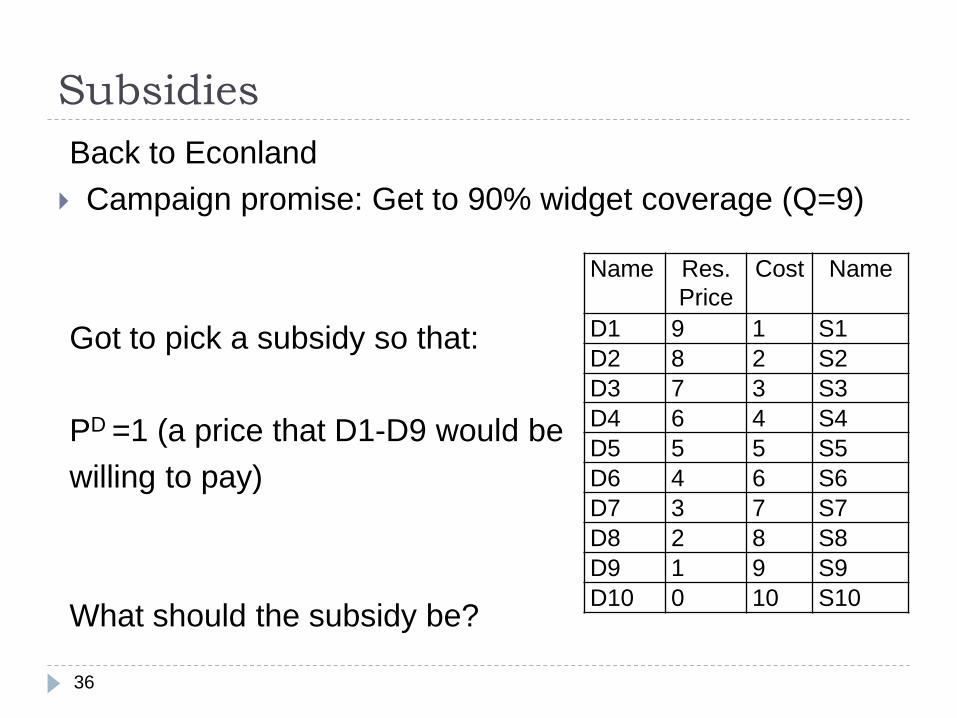
Subsidies
Back to Econland
Campaign promise: Get to 90% widget coverage (Q=9)
Got to pick a subsidy so that:
PD =1 (a price that D1-D9 would be
willing to pay)
What should the subsidy be?
36
Name Res.
Price
Cost Name
D1 9 1 S1
D2 8 2 S2
D3 7 3 S3
D4 6 4 S4
D5 5 5 S5
D6 4 6 S6
D7 3 7 S7
D8 2 8 S8
D9 1 9 S9
D10 0 10 S10

Subsidies, cont’d
37
0123456789
10
0 1 2 3 4 5 6 7 8 9 10
S
D
Q
$
Equilibrium when subsidy = ____
0123456789
10
0 1 2 3 4 5 6 7 8 9 10
S
D
Q
$
�
(0

Medicare and Social Security
New information about the demographics of
Econland:
D1 and S1 are the youngest people in the economy.
Age 1 in Econland years.
D2 and S2 are age 2, and so on.
Today’s D1 and S1 will become next year’s D2 and
S2. Today’s D2 and S2 will become D3 and S3, and
so on.
38

Medicare and Social Security
Econlandcare
Once people hit age 10, they get $2.25 to cover illness and
expenses.
D10 and S10 are the only ones who qualify. So program costs
government $4.50.
How can we finance this with a
widget tax?
39
0123456789
10
0 1 2 3 4 5 6 7 8 9 10
S
D
Q
$
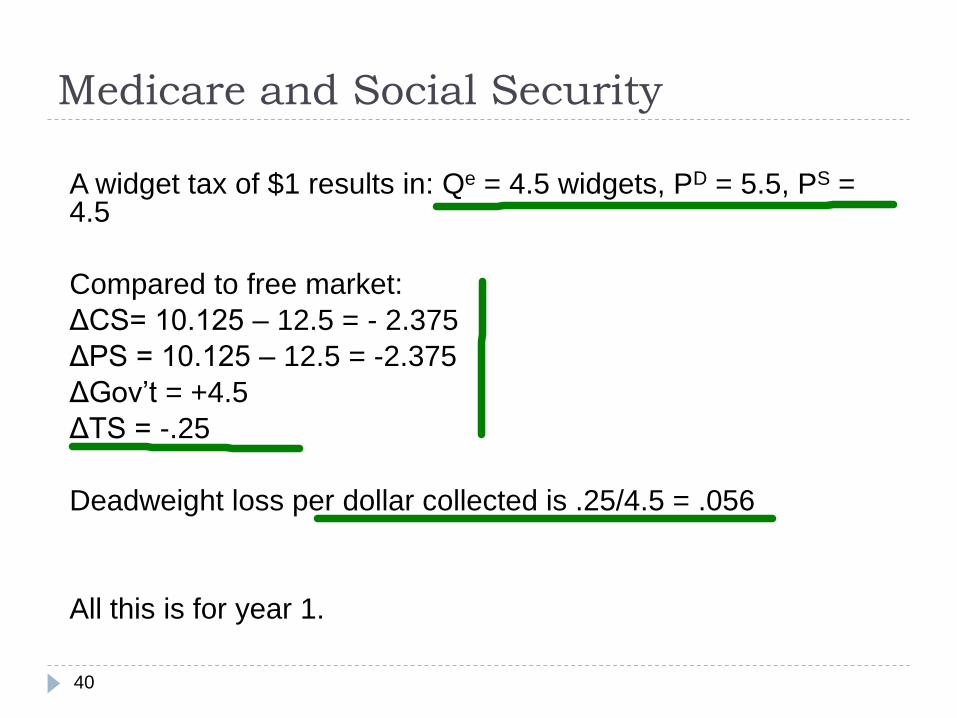
Medicare and Social Security
A widget tax of $1 results in: Qe = 4.5 widgets, PD = 5.5, PS = 4.5
Compared to free market:
ΔCS= 10.125 – 12.5 = - 2.375
ΔPS = 10.125 – 12.5 = -2.375
ΔGov’t = +4.5
ΔTS = -.25
Deadweight loss per dollar collected is .25/4.5 = .056
All this is for year 1.
40
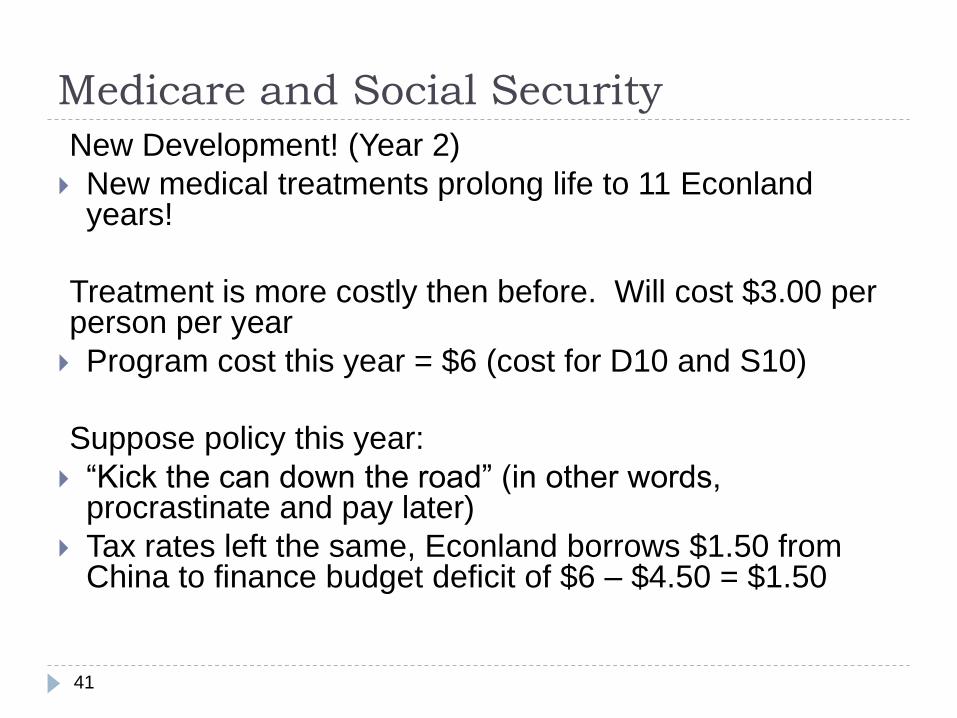
Medicare and Social Security
New Development! (Year 2)
New medical treatments prolong life to 11 Econland years!
Treatment is more costly then before. Will cost $3.00 per person per year
Program cost this year = $6 (cost for D10 and S10)
Suppose policy this year:
“Kick the can down the road” (in other words, procrastinate and pay later)
Tax rates left the same, Econland borrows $1.50 from China to finance budget deficit of $6 – $4.50 = $1.50
41

Medicare and Social Security
Year 3
Start with national debt = $1.50
Meet D11 and S11!
They still qualify for program, and now also D10 and S10.
If we keep the program as is, cost of Econlandcare = $12 = 4*$3.
Suppose fighting in Congress leads to another year of kicking can down the road.
Current deficit = $12 – $4.5 = $7.50
Add to debt of 1.50 at start of year (and leaving out interest payments for simplicity) yields a new debt of $9=$1.50+$7.50
42
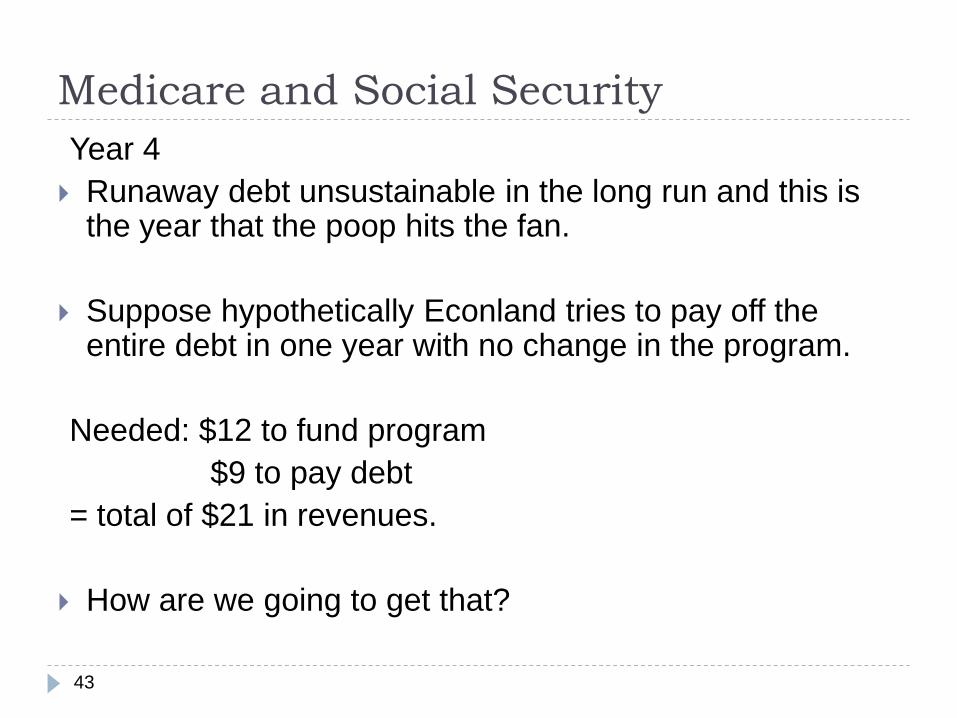
Medicare and Social Security
Year 4
Runaway debt unsustainable in the long run and this is the year that the poop hits the fan.
Suppose hypothetically Econland tries to pay off the entire debt in one year with no change in the program.
Needed: $12 to fund program
$9 to pay debt
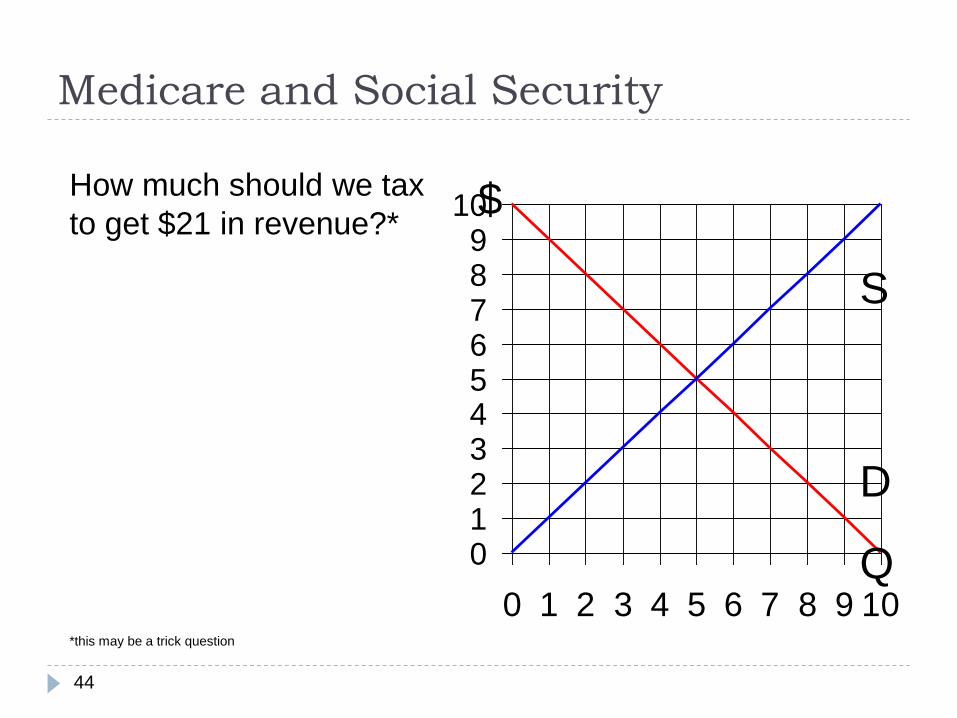
= total of $21 in revenues.
How are we going to get that?
43
Medicare and Social Security
44
How much should we tax
to get $21 in revenue?*
*this may be a trick question
0123456789
10
0 1 2 3 4 5 6 7 8 9 10
S
D
Q
$
Medicare and Social Security
45
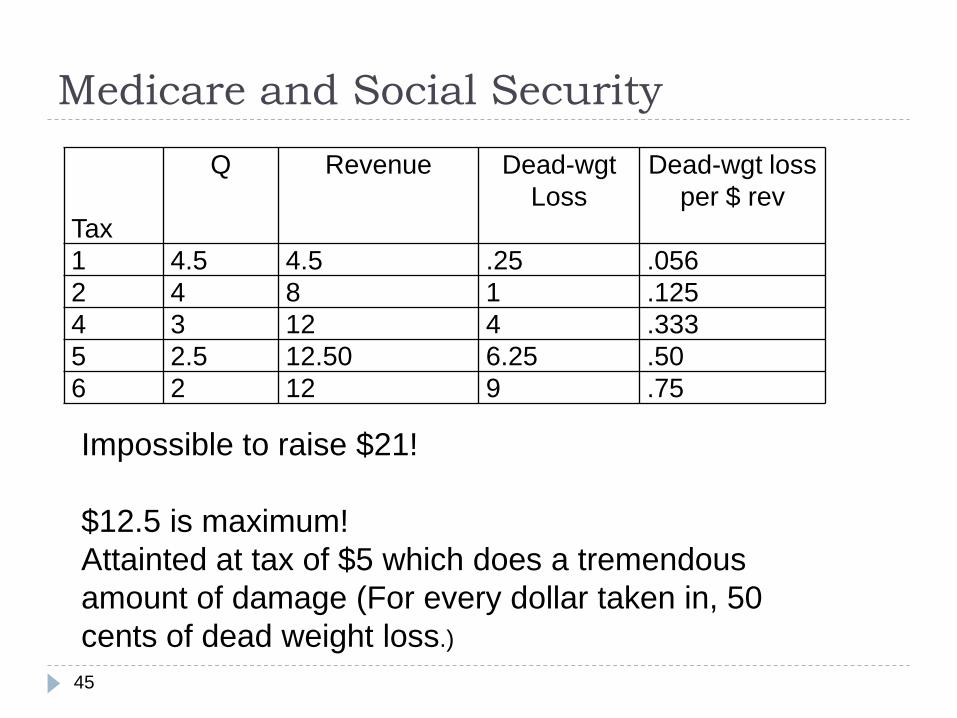
Tax
Q Revenue Dead-wgt
Loss
Dead-wgt loss
per $ rev
1 4.5 4.5 .25 .056
2 4 8 1 .125
4 3 12 4 .333
5 2.5 12.50 6.25 .50
6 2 12 9 .75
Impossible to raise $21!
$12.5 is maximum!
Attainted at tax of $5 which does a tremendous
amount of damage (For every dollar taken in, 50
cents of dead weight loss.)
Medicare and Social Security
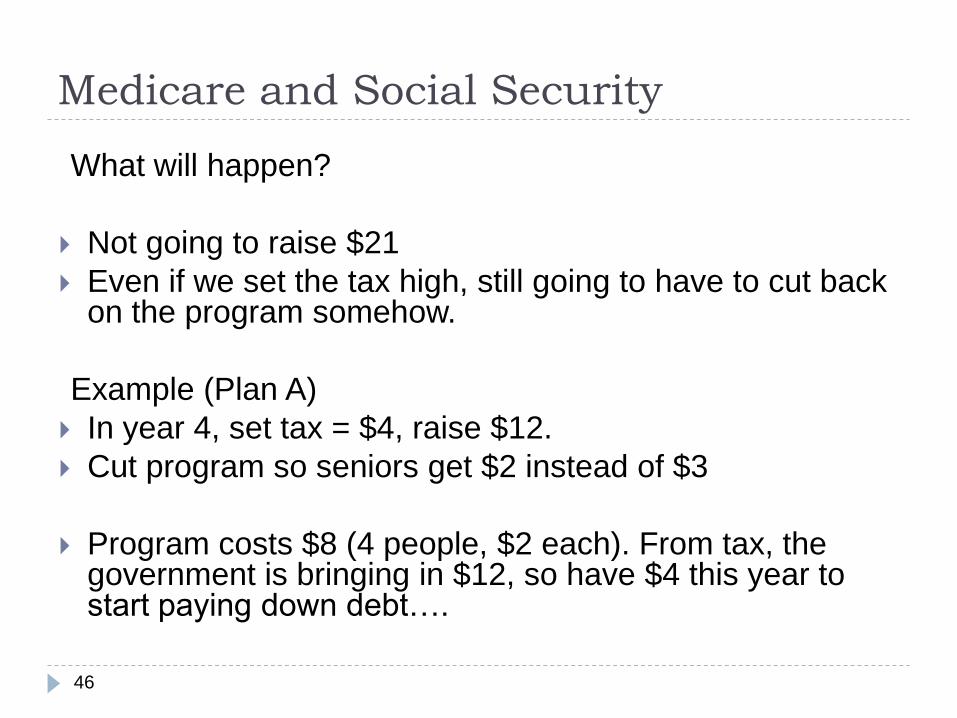
What will happen?
Not going to raise $21
Even if we set the tax high, still going to have to cut back on the program somehow.
Example (Plan A)
In year 4, set tax = $4, raise $12.
Cut program so seniors get $2 instead of $3
Program costs $8 (4 people, $2 each). From tax, the government is bringing in $12, so have $4 this year to start paying down debt….
46

Medicare and Social Security
Discussion of this outcome
1. High taxes in year 4 are very damaging to the widget economy. (33 cents lost per dollar in government revenue)
2. Equity issue – intergenerational transfer
Go back to year 3 when D10 and D11 were getting $3. They paid into a system earlier in their lives where the widget tax was only $1
Current young people are paying $4 in tax. But they will only get $2 in benefits.
47
)UYEPMX]

Medicare and Social Security
3. Costs of kicking can down the road.
Putting off the problem made the problem worse. The greater the tax, the greater the distortion. Keeping taxes low in year 2 and year 3 led to a big debt that forced up tax rates to damaging levels later.
Debt finance for a “one-shot” expenditure makes economic sense:
For example, U.S.’ involvement in World War II lasted four years and then was over (though debt finance spread payments over time)
Or for an individual in buying a house to borrow to spread the payments over time
48

Medicare and Social Security
Paying for senior citizens’ healthcare is different. It
isn’t “one shot.” It will always be there. If you get
behind on your payments, tomorrow you have to pay
not only for today’s cost, but tomorrow’s as well.
49
Medicare and Social Security
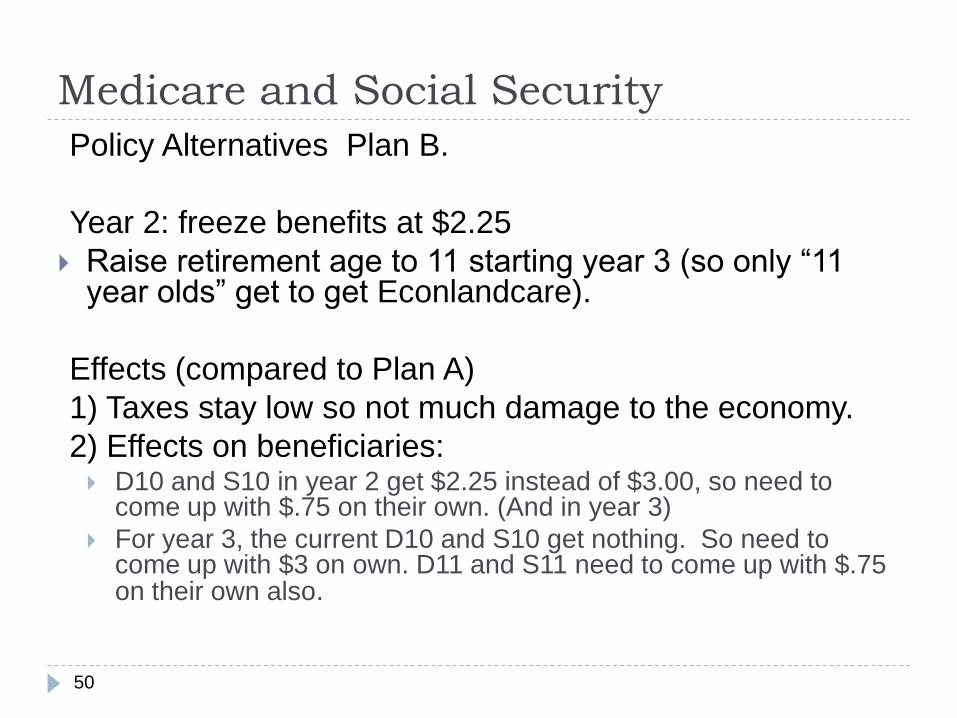
Policy Alternatives Plan B.
Year 2: freeze benefits at $2.25
Raise retirement age to 11 starting year 3 (so only “11 year olds” get to get Econlandcare).
Effects (compared to Plan A)
1) Taxes stay low so not much damage to the economy.
2) Effects on beneficiaries: D10 and S10 in year 2 get $2.25 instead of $3.00, so need to
come up with $.75 on their own. (And in year 3)
For year 3, the current D10 and S10 get nothing. So need to come up with $3 on own. D11 and S11 need to come up with $.75 on their own also.
50
Medicare and Social Security
What do we think of this?
On one hand: these people should be happy
compared to the old days (year 1) when people died
at age 10.
On the other hand, there may be a concern that old
people would suffer too much financial hardship.
Or maybe Plan B is irrelevant because old people
have enough political clout to keep Plan B off the
table.
51

Medicare and Social Security
Plan C?
Perhaps some coverage starting age 10. (Maybe
targeted based on need? But be wary that targeting
to poor creates own-incentive problems as the old
may spend down assets to qualify for benefits.)
But unlike plan A, start cutting the benefits sooner,
and start raising taxes earlier, so as to not kick the
can down the road.
52

Before the break
We looked at taxes and their impact on consumer/producer surplus and government revenue.
We found that with a tax on the good itself, there is a deadweight loss – meaning that the allocation of resources in the economy is NOT Pareto efficient.
We also looked at subsidies, and saw that we also get a deadweight loss – the government pays for MORE than what the consumer and producers get in what they gain in subsidies.
Now we want to look at other possible policies that the government can do. We will look at price ceilings, price floors, and quotas.
53

Price ceiling
54
Think about a balloon hitting a ceiling. The ceiling stops the
balloon from keep on going up, in the same way, a price
ceiling keeps the price from going up to the equilibrium.
DO NOT be confused: A price ceiling DOES NOT mean
you draw a line above the equilibrium! A price ceiling is
represented by a line below the equilibrium price.
With a price ceiling, there is a
_________________ WLSVXEKI
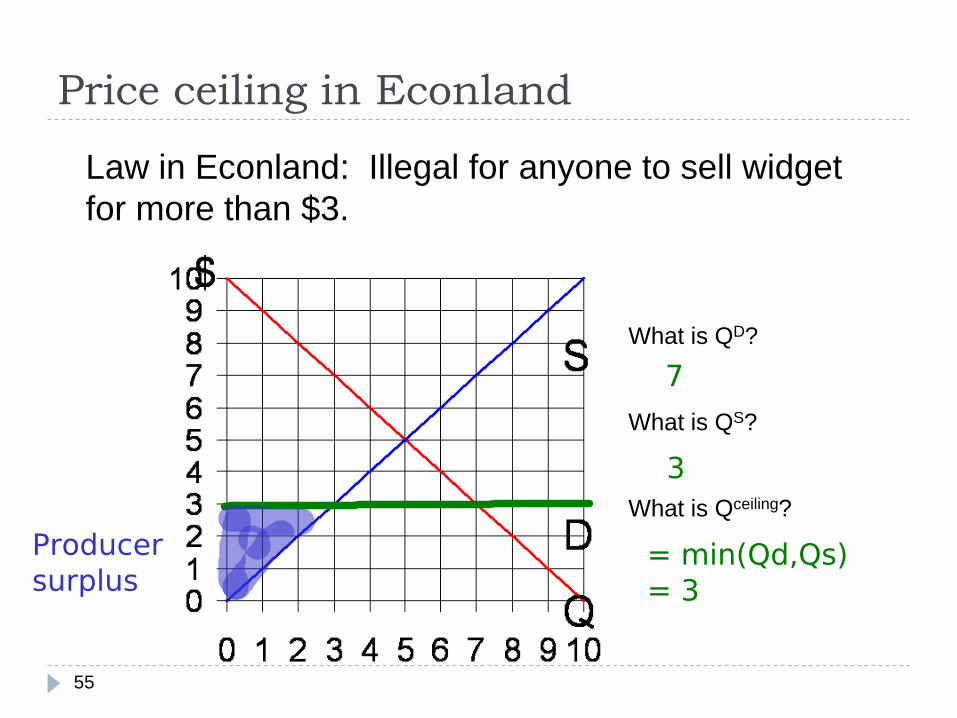
Price ceiling in Econland
55
Law in Econland: Illegal for anyone to sell widget
for more than $3.
What is QD?
What is QS?
What is Qceiling?
�
�
!�QMR�5H�5W !��
4VSHYGIVWYVTPYW
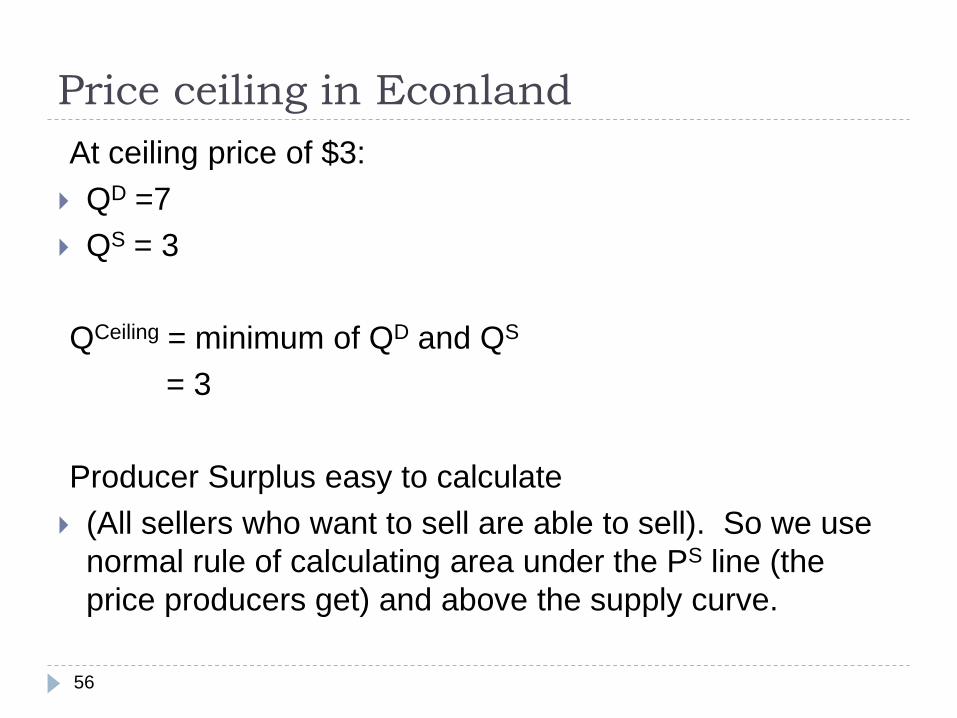
Price ceiling in Econland
At ceiling price of $3:
QD =7
QS = 3
QCeiling = minimum of QD and QS
= 3
Producer Surplus easy to calculate
(All sellers who want to sell are able to sell). So we use
normal rule of calculating area under the PS line (the
price producers get) and above the supply curve.
56

Price ceiling in Econland
What is CS?
It depends
Why?
57
;I�HSR�X�ORS[��[LMGL���GSRWYQIVW�KIX�XS�FY]�XLI�TVSHYGX�

Price ceiling in Econland
There are 7 people who want a widget (D1, D2, D3,
D4, D5, D6, D7), but only 3 are for sale.
CS depends on who gets the widgets because they
differ in their willingness to pay.
58

Price ceiling in Econland
59
One extreme case: perfectly efficient rationing:
Highest value consumers get the widgets (rationing
goes their way)

Price ceiling in Econland
60
Opposite extreme case: Perfectly inefficient
rationing - Lowest Value Consumers that want
widget get it. CS is much lower!
Of course, there are many different cases in between the two extreme cases.
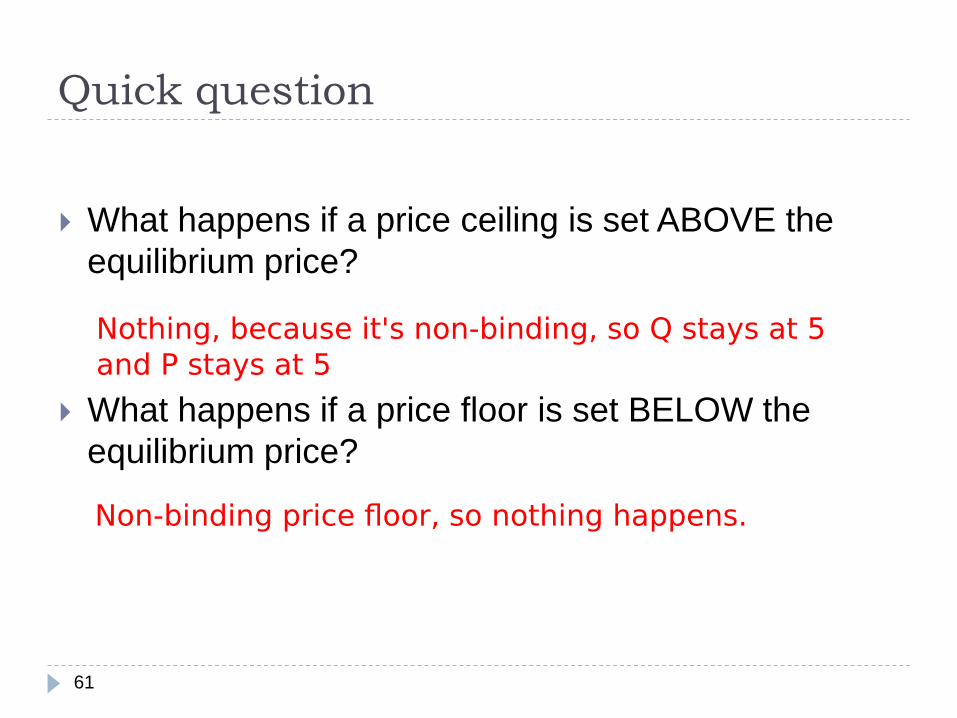
Quick question
What happens if a price ceiling is set ABOVE the
equilibrium price?
What happens if a price floor is set BELOW the
equilibrium price?
61
2SXLMRK��FIGEYWI�MX�W�RSR�FMRHMRK��WS�5�WXE]W�EX��ERH�4�WXE]W�EX��
2SR�FMRHMRK�TVMGI��SSV��WS�RSXLMRK�LETTIRW�

Price ceiling in Aplialand
Price Ceiling of $30 in Aplialand:
“Immoral to charge more than $30 for a textbook. Anyone
selling a text for more than this in Aplialand will be shot”.
If you were a buyer in the experiment, would you figure out
the optimal strategy?
What is optimal strategy of a seller?
62
&MH�����EW�WSSR�EW�TSWWMFPI�
����

63
Q*=125, Qc=87
Price ceiling in Aplialand
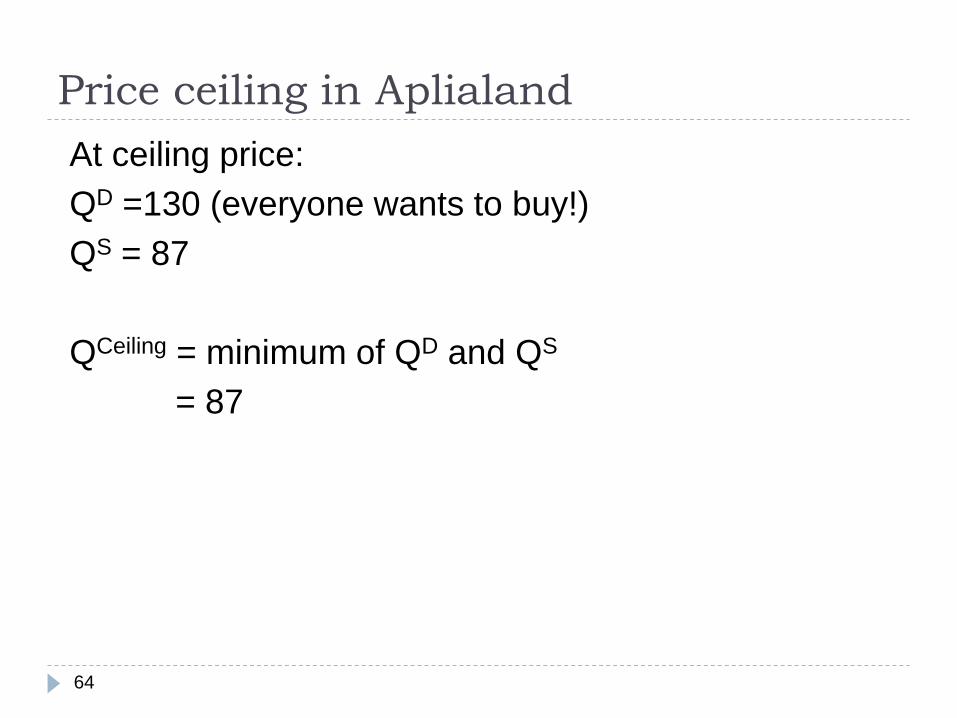
At ceiling price:
QD =130 (everyone wants to buy!)
QS = 87
QCeiling = minimum of QD and QS
= 87
64

Price ceiling in Aplialand
PS easy to calculate
(All sellers who want to sell are able to sell)
PS = Q*(30-10)*.5 = 870
What is CS?
It depends.
There are 130 people who want at book, but only 87 are for sale. CS depends on who gets the books because different people place different values on the goods.
65
Price ceiling in Aplialand
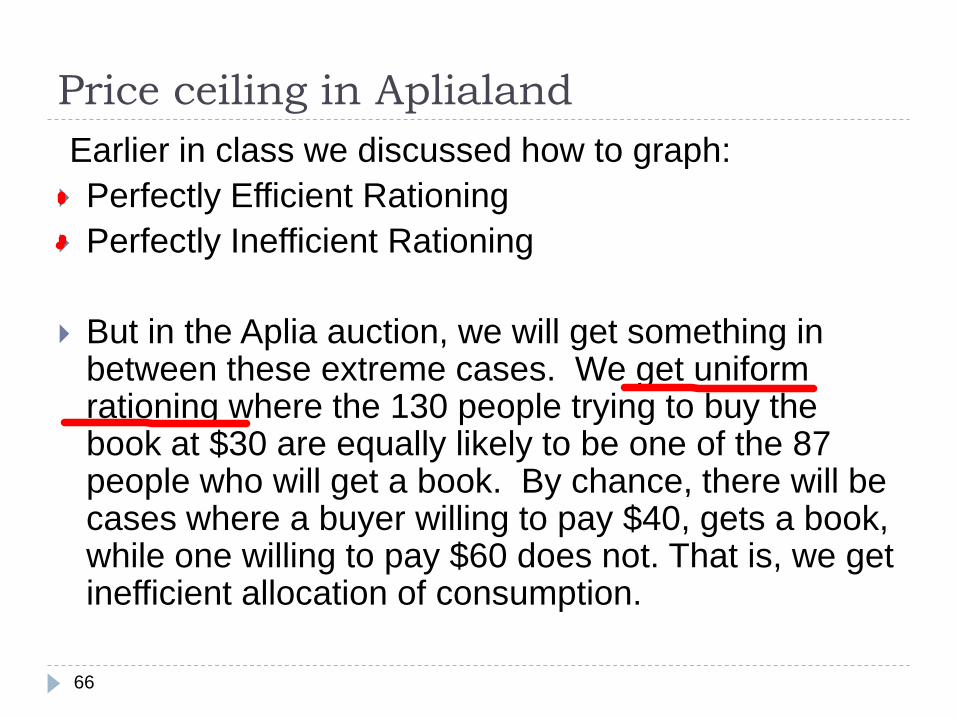
Earlier in class we discussed how to graph:
Perfectly Efficient Rationing
Perfectly Inefficient Rationing
But in the Aplia auction, we will get something in between these extreme cases. We get uniform rationing where the 130 people trying to buy the book at $30 are equally likely to be one of the 87 people who will get a book. By chance, there will be cases where a buyer willing to pay $40, gets a book, while one willing to pay $60 does not. That is, we get inefficient allocation of consumption.
66
Price ceiling in Aplialand
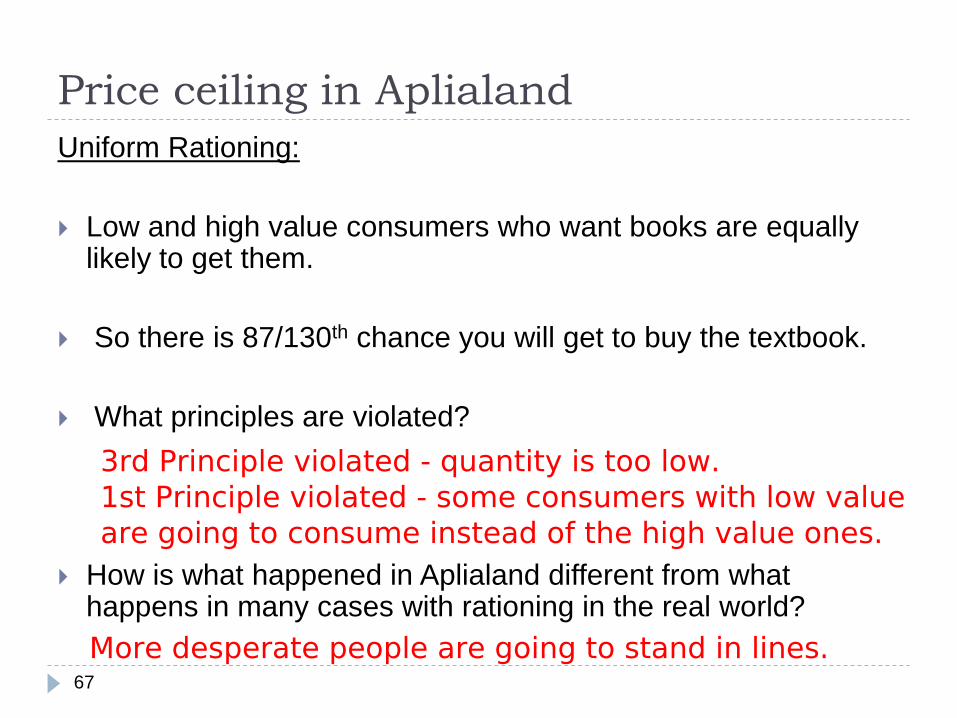
Uniform Rationing:
Low and high value consumers who want books are equally likely to get them.
So there is 87/130th chance you will get to buy the textbook.
What principles are violated?
How is what happened in Aplialand different from what happens in many cases with rationing in the real world?
67
�VH�4VMRGMTPI�ZMSPEXIH���UYERXMX]�MW�XSS�PS[��WX�4VMRGMTPI�ZMSPEXIH���WSQI�GSRWYQIVW�[MXL�PS[�ZEPYIEVI�KSMRK�XS�GSRWYQI�MRWXIEH�SJ�XLI�LMKL�ZEPYI�SRIW�
1SVI�HIWTIVEXI�TISTPI�EVI�KSMRK�XS�WXERH�MR�PMRIW�

Price ceiling with resales
68
Law in Econland: S people cannot sell widget for
more than $3.
D people allowed to resell at any price.
�VWX�LERH�QEVOIX
7YTTP]�WIGSRH�LERH�QEVOIX
WGEPTMRKTVS�X HIEH[IMKLX�PSWW
Price ceiling with resales
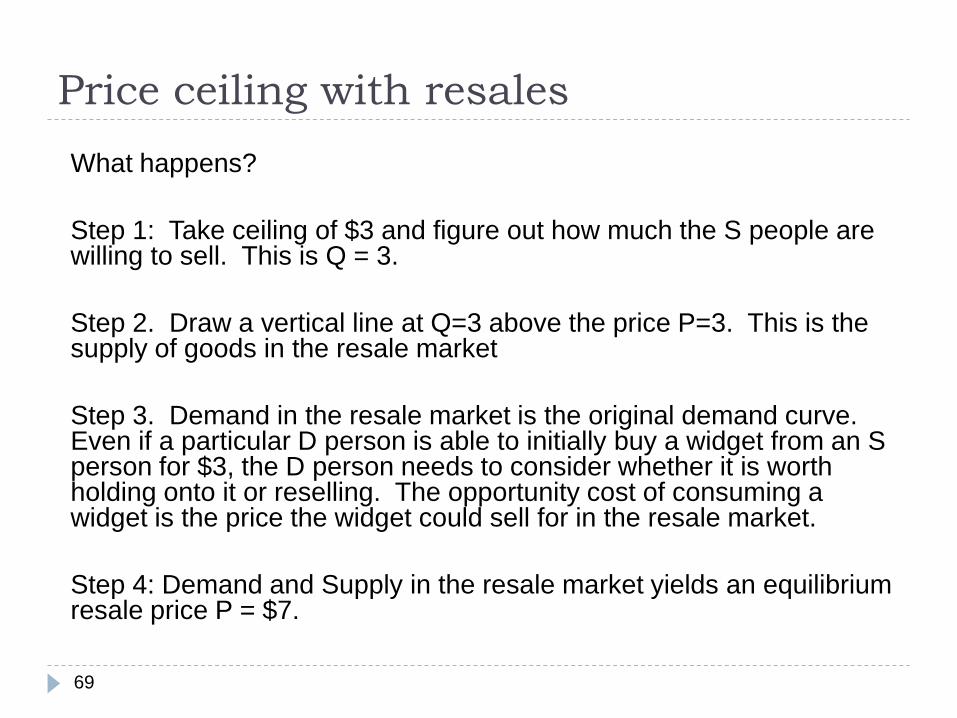
What happens?
Step 1: Take ceiling of $3 and figure out how much the S people are willing to sell. This is Q = 3.
Step 2. Draw a vertical line at Q=3 above the price P=3. This is the supply of goods in the resale market
Step 3. Demand in the resale market is the original demand curve. Even if a particular D person is able to initially buy a widget from an S person for $3, the D person needs to consider whether it is worth holding onto it or reselling. The opportunity cost of consuming a widget is the price the widget could sell for in the resale market.
Step 4: Demand and Supply in the resale market yields an equilibrium resale price P = $7.
69
Price ceiling with resales
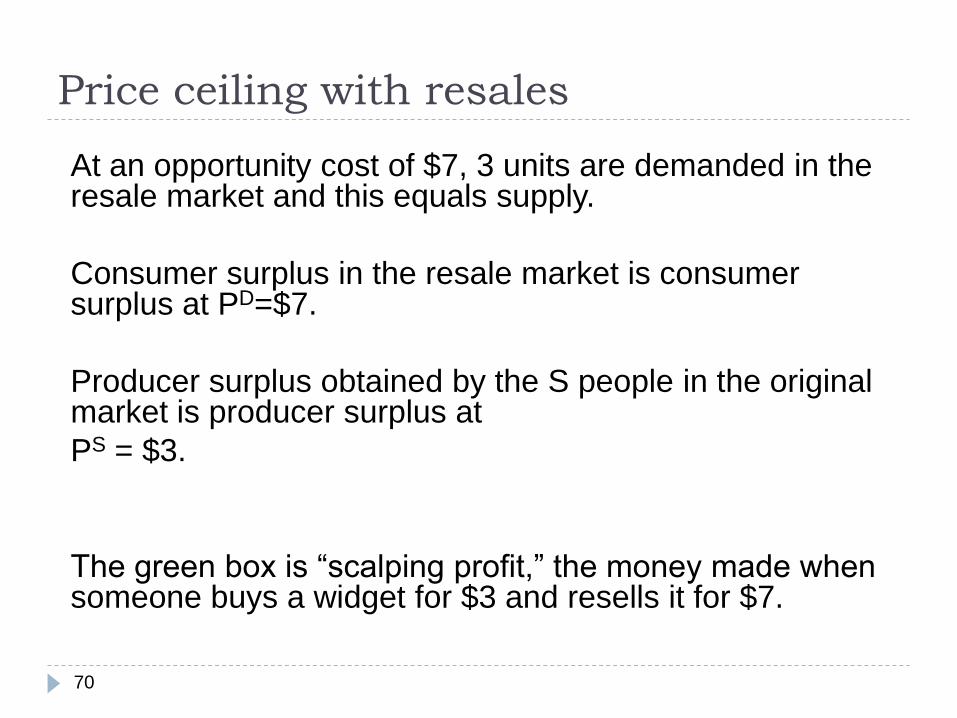
At an opportunity cost of $7, 3 units are demanded in the resale market and this equals supply.
Consumer surplus in the resale market is consumer surplus at PD=$7.
Producer surplus obtained by the S people in the original market is producer surplus at
PS = $3.
The green box is “scalping profit,” the money made when someone buys a widget for $3 and resells it for $7.
70

Price ceiling with resales
Note that when resale is possible, market forces will
ensure that the widgets end up going to those with the
highest willingness to pay. (That is, D1, D2, and D3
well end up outbidding the others and each will
consume a widget).
It may be the D10 gets lucky and buys all 3 widgets at
the initial price of $3 and sells them to D1, D2, and D3
at $7. In this case, D10 gets the green box of
scalping profit.
71
Price ceiling with resales
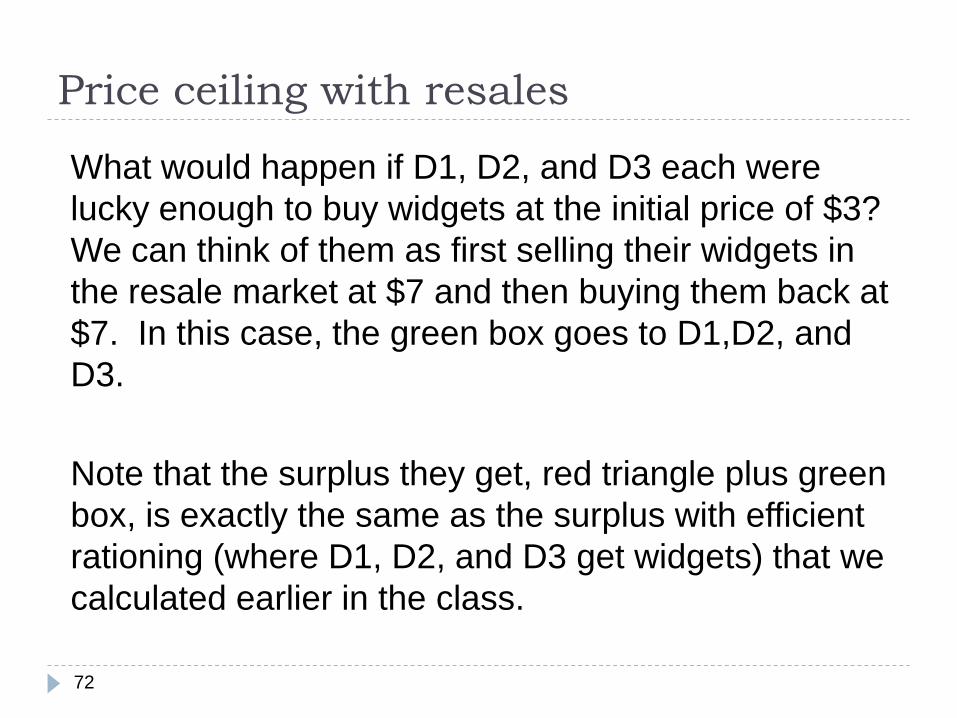
What would happen if D1, D2, and D3 each were
lucky enough to buy widgets at the initial price of $3?
We can think of them as first selling their widgets in
the resale market at $7 and then buying them back at
$7. In this case, the green box goes to D1,D2, and
D3.
Note that the surplus they get, red triangle plus green
box, is exactly the same as the surplus with efficient
rationing (where D1, D2, and D3 get widgets) that we
calculated earlier in the class.
72
Bottom Line
If a price ceiling of $3 is set and resale is illegal, then in general we expect two sources of inefficiency:
Output is too low (violates condition 3).
Highest valuation consumers don’t always get the good first (violates condition 1).
Even if resale is legal, it won’t do anything about quantity being too low. (The S people will still sell only 3 units at the price of $3). However, allowing the resale market means the free-market is put to work determining how the 3 available units are allocated. The workings of the market will ensure they end up going to the people with the highest willingness to pay.
73

Price floors
You should try to think about price floors on your
own. Basically, it’s the opposite case that the price is
set too high, so now consumer surplus is easy to find
but producer surplus depends on who gets to sell.
74
Price Controls: Big picture
Start with the first welfare theorem. With no externalities and no monopoly, the free-market allocation is Pareto efficient.
Price system acts as an invisible hand in such a way that:
Consumers willing to pay market price all buy (efficient allocation of consumption).
Producers with cost less than the market price produce (efficient allocation of production)
Value of last unit in equals its cost (efficient quantity)
75
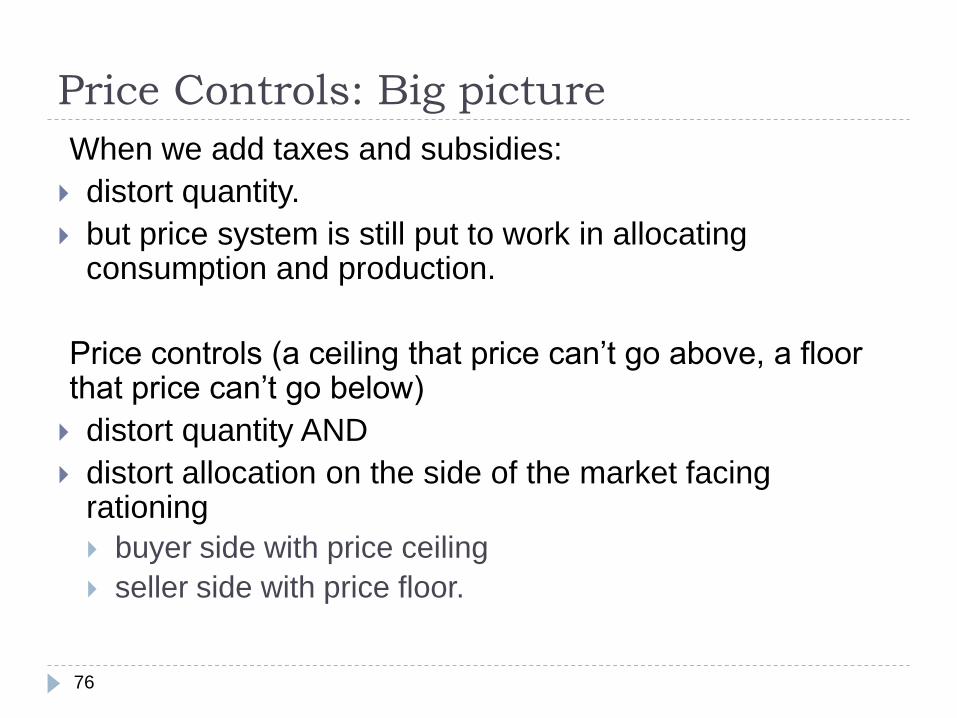
Price Controls: Big picture
When we add taxes and subsidies:
distort quantity.
but price system is still put to work in allocating consumption and production.
Price controls (a ceiling that price can’t go above, a floor that price can’t go below)
distort quantity AND
distort allocation on the side of the market facing rationing
buyer side with price ceiling
seller side with price floor.
76
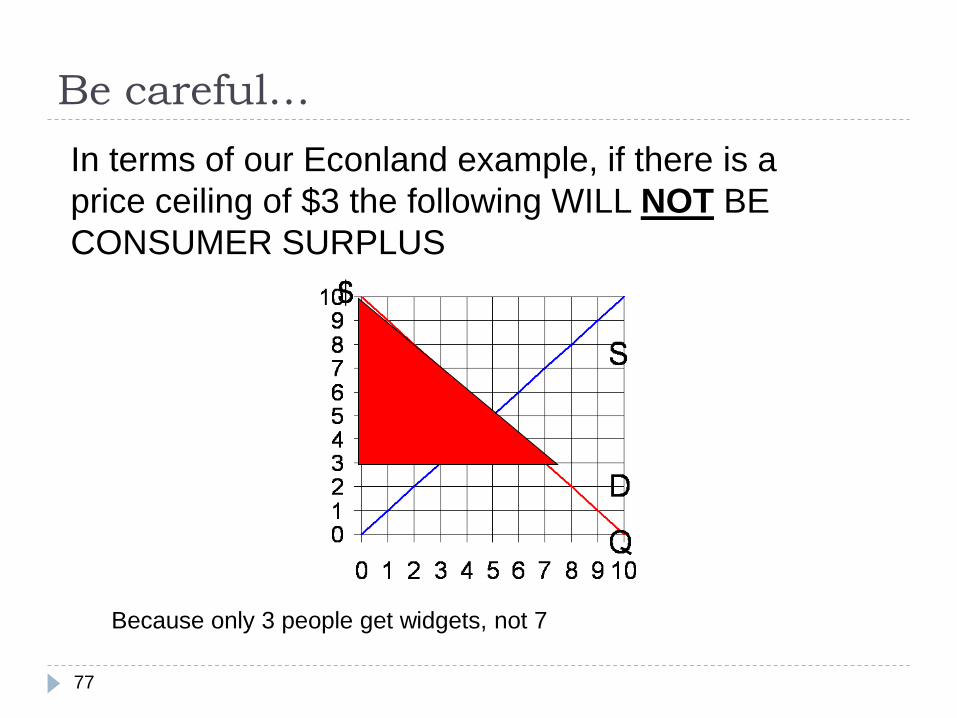
Be careful…
77
In terms of our Econland example, if there is a
price ceiling of $3 the following WILL NOT BE
CONSUMER SURPLUS
Because only 3 people get widgets, not 7
Cut 4 widgets out, loss of consumer surplus depends
upon where you do the cutting.
78

79
Cut 4 from right (efficient rationing)
80
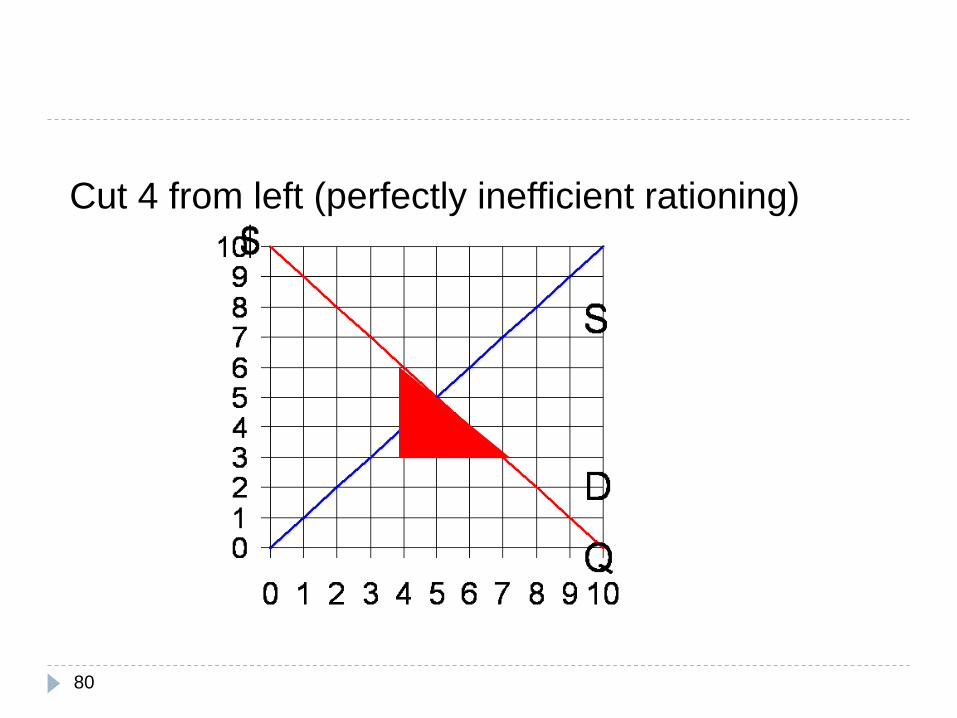
Cut 4 from left (perfectly inefficient rationing)

81
Or cut 4 this way, (something close to uniform
rationing, like what happened in Aplia
auction).

82
If resale is legal however, we still get consumer
surplus like that of efficient rationing. The only
difference is that somebody else takes over the
“scalping profit”.
Supply Management
83
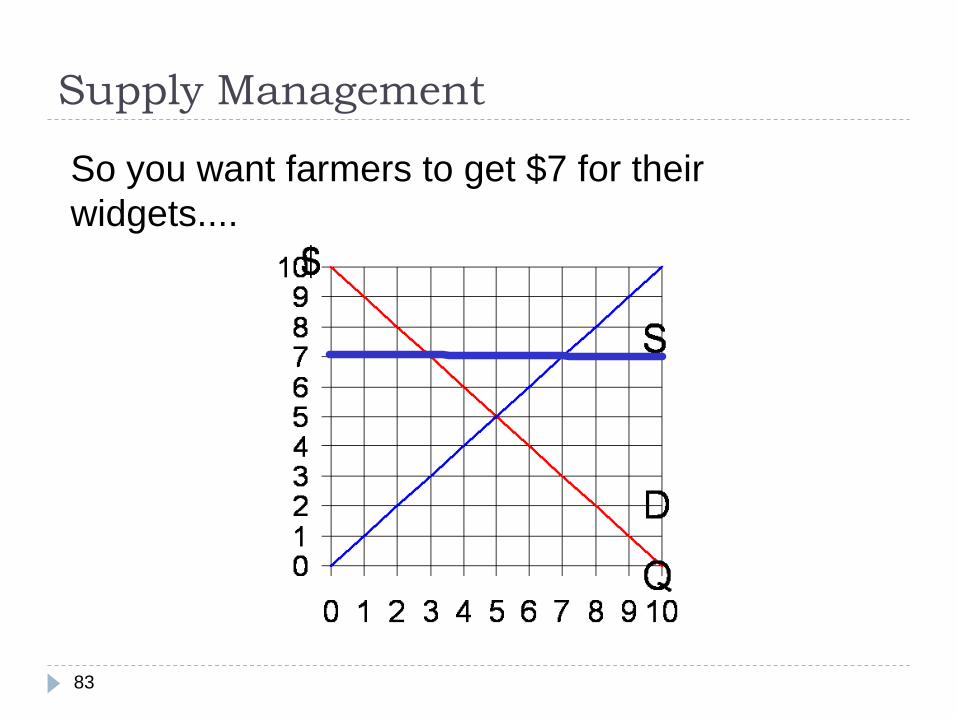
So you want farmers to get $7 for their
widgets....
Supply Management
There is excess supply when the price is 7 so something will have to be done about it.
In the US, maybe direct management. Perhaps subsidies for people to buy up the good, or the government directly purchases the good.
In Canada, mainly by supply management. Government organized cartel to hold back output (like the OPEC).
84
Supply Management in Canada
In order to sell milk in Canada, a farmer needs to own quota. Quota is a legal right created by the government and limited in supply.
Farmers are free to buy and sell quota in the quota exchange
How it currently works in Canada:
One quota unit is approximately what you need to sell the milk of one cow per day
85
Supply Management in Canada
Currently trading for $25,000 for one quota unit.
This is a lot more than what the cow costs!
In fact, this is the biggest cost of being in the dairy business. In the reading there is a link to a real estate listing where:
$5.8 million for the whole farm
Of that, $2.8 million is for the quota!
86

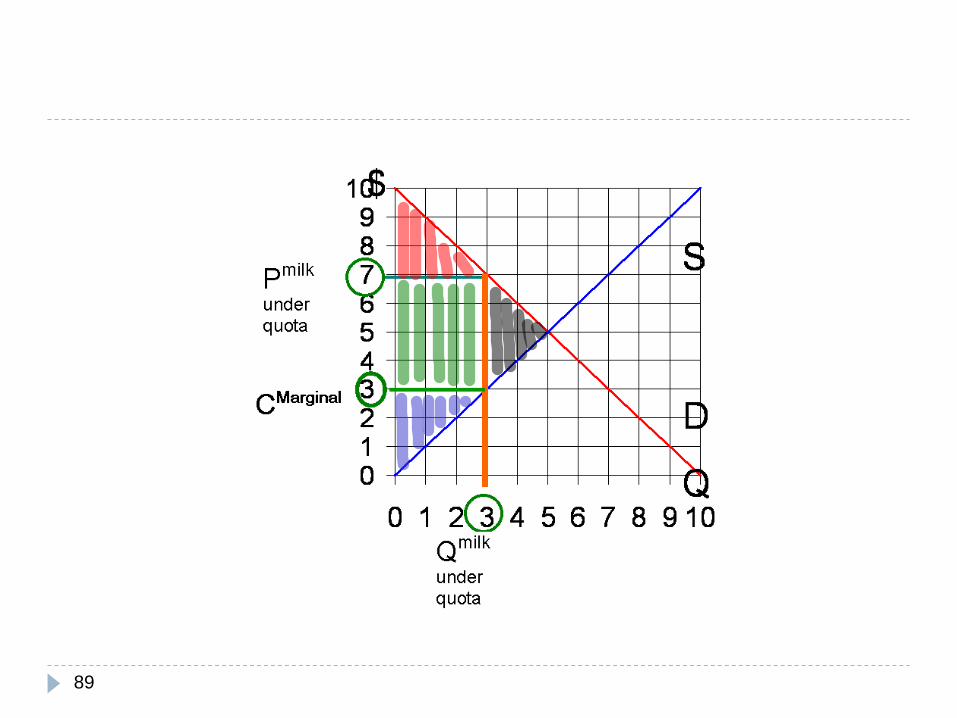
Supply Management in Canada
Let’s go back to Econland numbers and figure out what happens with quota=3.
Step 1: Compare total quota to free market quantity. If quota is more than free market, irrelevant and price of quota = 0. If quota quantity less, then market quantity is quota.
Here Quota=3 < 5 (unregulated Q)
Step 2: Get widget price from demand curve at quota.
Here P = $7.
87

Supply Management in Canada
Step 3: Set price of quota so marginal producer breaks even taking into account the opportunity cost of quota.
Total cost = $production cost
+ $cost of quota
Marginal production cost at Q = 3 is $3. (see this on S curve)
If total cost equals $7, marginal producer just breaks even.
Thus:
Price of quota = $7 - $3 = $4.
88
89
Why does this rule work?
Think of opportunity cost!
Let farmers maintain two books:
One for their milk business (where they deduct opportunity cost of using quota).
One for their quota business (where they make money of quota if they are lucky enough to have inherited some).
When price of quota equals $4, the marginal producer just breaks even on milk business.
90

91
Variable Free
Market
Quota of
3
Change
PMilk 5 $7 +2
Q 5 3 -2
PQuota 0 $4 +$4
CS 12.5 4.5 -8
PSMilk 12.5 4.5 -8
PSQuota 0 12 +12
PSCombined 12.5 16.5 +4
TS 25 21 -4

Call up the Economics Doctor:
What is the source of the inefficiency?
Violation of Principle 3, that the quantity be at the point where the value of the last unit consumed equals the cost of the last unit produced.
What if quota were not tradable?
We expect there to be an additional inefficiency. A violation of rule #2 that the lowest cost producers produce. If S6 inherits a quota unit and can’t sell it, she will produce instead of a lower cost producer.
92
The $4 we calculated in class is what they use of the quota for one day. In Canada, quota is good for today, tomorrow, the next day, etc.
The asset value is calculated by adding up the values of these various payments. We need to do present value calculations that involve interest rates that we will skip here.
But just to make the point, if we give the people in Econland a year to live, (and we don’t worry about interest rates) then the asset value of a unit of quota at the beginning of the year equals $4×365 = $1,460
93

Summary
94
Q
$
D
S
Qlow Qefficient For all the policies on
the next page:
Goes to consumers
Goes to producers
Is loss in total surplus
from output being too low
(Qlow instead of Qefficient)
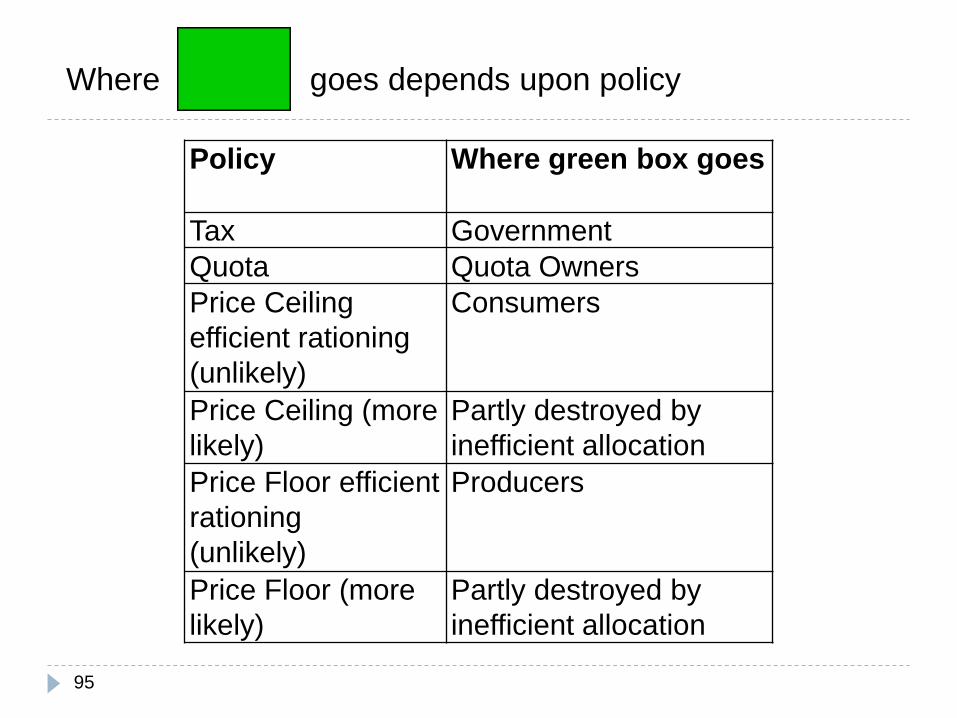
95
Policy Where green box goes
Tax Government
Quota Quota Owners
Price Ceiling
efficient rationing
(unlikely)
Consumers
Price Ceiling (more
likely)
Partly destroyed by
inefficient allocation
Price Floor efficient
rationing
(unlikely)
Producers
Price Floor (more
likely)
Partly destroyed by
inefficient allocation
Where goes depends upon policy

Where does subsidy fit the table?
It doesn’t fit in.
Subsidies make quantity higher than the equilibrium
quantity.
96